UNITED STATES
SECURITIES AND EXCHANGE COMMISSION
WASHINGTON, D.C. 20549
FORM 20-F
| | ¨ | REGISTRATION STATEMENT PURSUANT TO SECTION 12(b) OR (g) OF THE SECURITIES EXCHANGE ACT OF 1934 |
OR
| | x | ANNUAL REPORT PURSUANT TO SECTION 13 OR 15(d) OF THE SECURITIES EXCHANGE ACT OF 1934 |
For the fiscal year ended December 31, 2010
OR
| | ¨ | TRANSITION REPORT PURSUANT TO SECTION 13 OR 15(d) OF THE SECURITIES EXCHANGE ACT OF 1934 |
OR
| | ¨ | SHELL COMPANY REPORT PURSUANT TO SECTION 13 OR 15(d) OF THE SECURITIES EXCHANGE ACT OF 1934 |
Date of event requiring this shell company report
For the transition period from to
Commission file number 001-14370
COMPAÑÍA DE MINAS BUENAVENTURA S.A.A.
(Exact name of Registrant as specified in its charter)
BUENAVENTURA MINING COMPANY INC.
(Translation of Registrant’s name into English)
REPUBLIC OF PERU
(Jurisdiction of incorporation or organization)
CARLOS VILLARAN 790
SANTA CATALINA, LA VICTORIA, LIMA 13, PERU
(Address of principal executive offices)
Carlos E. Gálvez, Vice President and Chief Financial Officer
Telephone: (511) 419-2540
Facsimile: (511) 471-7349
Address: Carlos Villaran 790, Santa Catalina, La Victoria, Lima 13, Peru
(Name, telephone, e-mail and/or facsimile number and address of company contact person)
Securities registered or to be registered pursuant to Section 12(b) of the Act:
| Title of each class | | Name of each exchange on which registered |
| Common shares, nominal (par) value of ten | | New York Stock Exchange Inc.٭ |
| Peruvian Nuevos Soles per share | | Lima Stock Exchange |
| | | |
| American Depositary Shares (ADSs) | | New York Stock Exchange Inc. |
| representing one Common share each | | |
| ٭ | Not for trading but only in connection with the registration of ADSs pursuant to the requirements of the Securities Exchange Commission |
Securities registered or to be registered pursuant to Section 12(g) of the Act: None
Securities for which there is a reporting obligation pursuant to Section 15(d) of the Act: None
Indicate the number of outstanding shares of each of the issuer’s classes of capital or common stock as of the close of the period covered by the annual report.
| Common shares nominal (par) value of S/.10.00 per share | | | 274,889,924 | * |
| Investment shares nominal (par) value of S/.10.00 per share | | | 744,640 | |
Indicate by check mark if the registrant is a well-known seasoned issuer, as defined in Rule 405 of the Securities Act.
Yes x No ¨
If this report is an annual or transition report, indicate by check mark if the registrant is not required to file reports pursuant to Section 13 or 15(d) of the Securities Exchange Act of 1934.
Yes ¨ No x
Indicate by check mark whether the registrant (1) has filed all reports required to be filed by Section 13 or 15(d) of the Securities Exchange Act of 1934 during the preceding 12 months (or for such shorter period that the registrant was required to file such reports), and (2) has been subject to such filing requirements for the past 90 days.
Yes x No ¨
Indicate by check mark whether the registrant has submitted electronically and posted on its corporate Web site, if any, every Interactive Data File required to be submitted and posted pursuant to Rule 405 of Regulation S-T (§232.405 of this chapter) during the preceding 12 months (or for such shorter period that the registrant was required to submit and post such files).
Yes ¨ No ¨
Indicate by check mark whether the registrant is a large accelerated filer, an accelerated filer, or a non-accelerated filer. See definition of “accelerated filer and large accelerated filer” in Rule 12b-2 of the Exchange Act.
Large accelerated filer x Accelerated filer ¨ Non-accelerated filer ¨
Indicate by check mark which basis of accounting the registrant has used to prepare the financial statements included in this filing:
U.S. GAAP ¨ | International Financial Reporting Standards as issued
by the International Accounting Standards Board ¨ | Other x |
If “Other” has been checked in response to the previous question, indicate by check mark which financial statement item the registrant has elected to follow.
Item 17 ¨ Item 18 x
If this is an annual report, indicate by check mark whether the registrant is a shell company (as defined in Rule 12b-2 of the Exchange Act).
Yes ¨ No x
TABLE OF CONTENTS
| | | Page |
| | | |
| INTRODUCTION | | 1 |
| | | |
| PART I | | |
| ITEM 1. | Identity of Directors, Senior Management and Advisers | 3 |
| | | |
| ITEM 2. | Offer Statistics and Expected Timetable | 3 |
| | | |
| ITEM 3. | Key Information | 3 |
| | | |
| ITEM 4. | Information on the Company | 24 |
| | | |
| ITEM 4A. | Unresolved Staff Comments | 100 |
| | | |
| ITEM 5. | Operating and Financial Review and Prospects | 100 |
| | | |
| ITEM 6. | Directors, Senior Management and Employees | 152 |
| | | |
| ITEM 7. | Major Shareholders and Related Party Transactions | 159 |
| | | |
| ITEM 8. | Financial Information | 161 |
| | | |
| ITEM 9. | The Offer and Listing | 164 |
| | | |
| ITEM 10. | Additional Information | 167 |
| | | |
| ITEM 11. | Quantitative and Qualitative Disclosures About Market Risk | 177 |
| | | |
| ITEM 12. | Description of Securities Other Than Equity Securities | 179 |
| | | |
| PART II | | |
| ITEM 13. | Defaults, Dividend Arrearages and Delinquencies | 180 |
| | | |
| ITEM 14. | Material Modifications to the Rights of Security Holders and Use of Proceeds | 180 |
| | | |
| ITEM 15. | Controls and Procedures | 181 |
| | | |
| ITEM 16. | [Reserved] | 182 |
| | | |
| ITEM 16A. | Audit Committee Financial Expert | 182 |
| | | |
| ITEM 16B. | Code of Ethics | 183 |
| | | |
| ITEM 16C. | Principal Accountant Fees and Services | 183 |
| | | |
| ITEM 16D. | Exemptions from the Listing Standards for Audit Committees | 184 |
| | | |
| ITEM 16E. | Purchases of Equity Securities by the Issuer and Affiliated Purchasers | 184 |
| | | |
| ITEM 16F. | Change in Registrant’s Certifying Accountant | 184 |
| | | |
| ITEM 16G. | Corporate Governance | 184 |
| | | |
| PART III | | |
| ITEM 17. | Financial Statements | 184 |
| | | |
| ITEM 18. | Financial Statements | 185 |
| | | |
| ITEM 19. | Exhibits | 186 |
INTRODUCTION
Presentation of Financial Information
As used in this Annual Report on Form 20-F, or Annual Report, unless the context otherwise requires, references to “we,” “us,” “our,” “Company,” “BVN” or “Buenaventura” mean Compañía de Minas Buenaventura S.A.A. and its consolidated subsidiaries. Unless otherwise specified or the context otherwise requires, references to “$”, “US$”, “Dollars” and “U.S. Dollars” are to United States Dollars, and references to “S/.”, “Nuevo Sol” or “Nuevos Soles” are to Peruvian Nuevos Soles, the legal currency of the Republic of Peru, or Peru.
We present our consolidated financial statements in conformity with accounting principles generally accepted in Peru, which we refer to as Peruvian GAAP. See Note 32 to the Financial Statements for a description of the significant differences between the accounting principles we follow under Peruvian GAAP and the accounting principles generally accepted in the United States of America, which we refer to as U.S. GAAP, and Note 33 to the Financial Statements for a reconciliation to U.S. GAAP of net income and shareholders’ equity attributable to Buenaventura for the periods covered. Pursuant to the rules of the United States Securities and Exchange Commission, or the SEC, this Annual Report includes certain separate financial statements and other financial information of Minera Yanacocha S.R.L., or Yanacocha, and Sociedad Minera Cerro Verde S.A.A., or Cerro Verde. Yanacocha and Cerro Verde maintain their financial books and records in U.S. Dollars and present their financial statements in accordance with U.S. GAAP and Peruvian GAAP, reconciled to U.S. GAAP, respectively.
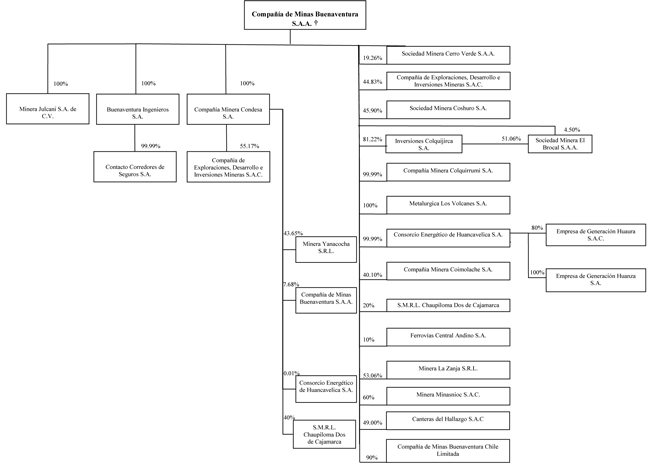
We record our investments in Yanacocha and Cerro Verde in accordance with the equity method as described in “Item 5. Operating and Financial Review and Prospects—The Company—General” and Note 2.3(e) to the Financial Statements. Our partnership interest in Yanacocha was calculated at 43.65 percent for the years ended December 31, 2009 and 2010. As of December 31, 2009 and 2010, our equity interest in Cerro Verde was 19.26 percent.
Exchange Rates
Effective January 1, 2006, our functional and reporting currency changed from the Nuevo Sol to the Dollar. This change resulted from an evaluation of the currency denominations of our cash flows in recent years and, in particular, reflects the increasing significance of dividends from affiliates denominated in Dollars to our financial position, results of operation and cash flows.
The translation of amounts expressed in nominal or constant Nuevos Soles with purchasing power as of a specified date by the then-prevailing exchange rate may result in presentation of Dollar amounts that differ from the Dollar amounts that would have been obtained by translating nominal or constant Nuevos Soles with purchasing power as of another specified date by the prevailing exchange rate on that specified date. See “Item 3. Key Information—Exchange Rates” for information regarding the average rates of exchange between the Nuevo Sol and the Dollar for the periods specified therein.
Certain amounts and percentages have been rounded for presentation purposes and may not sum exactly.
Forward-Looking Statements
Certain statements contained in this Annual Report are “forward-looking statements” as defined in the U.S. Private Securities Litigation Reform Act of 1995 and are intended to be covered by the safe harbor provided for under these sections. Our forward-looking statements are based on management’s assumptions and beliefs in light of the information currently available to it and may include, without limitation:
| | · | Our, Yanacocha’s and Cerro Verde’s costs and expenses; |
| | · | Estimates of future costs applicable to sales; |
| | · | Estimates of future exploration and production results; |
| | · | Plans for capital expenditures; |
| | · | Expected commencement dates of mining or metal production operations; and |
| | · | Estimates regarding potential cost savings and operating performance. |
The words “anticipates,” “may,” “can,” “plans,” “believes,” “estimates,” “expects,” “projects,” “intends,” “likely,” “will,” “should,” “to be,” and any similar expressions are intended to identify those assertions as forward-looking statements. In making any forward-looking statements, we believe that the expectations are based on reasonable assumptions. We caution readers that those statements are not guarantees of future performance and our actual results may differ materially from those anticipated, projected or assumed in the forward-looking statements. Important factors that can cause our actual results to differ materially from those anticipated in the forward-looking statements include:
| | · | Our, Yanacocha’s and Cerro Verde’s results of exploration; |
| | · | The results of our joint ventures; |
| | · | Geological and metallurgical assumptions; |
| | · | Timing of receipt of necessary governmental permits or approvals; |
| | · | Environmental risks; and |
| | · | Other factors described in more detail under “Item 3. Key Information—Risk Factors.” |
Many of the assumptions on which our forward-looking statements are based are likely to change after our forward-looking statements are made, including, for example commodity prices, which we cannot control, and our, Yanacocha’s and Cerro Verde’s production volumes and costs, some aspects of which we may or may not be able to control. Further, we may make changes to our business plans that could or will affect our results. We do not intend to update our forward-looking statements notwithstanding any changes in our assumptions, changes in our business plans, our actual experience, or other changes, and we undertake no obligation to update any forward-looking statements more frequently than required by applicable securities laws.
PART I
| ITEM 1. | Identity of Directors, Senior Management and Advisers |
Not applicable.
| ITEM 2. | Offer Statistics and Expected Timetable |
Not applicable.
A. Selected Financial Data
Selected Financial Information and Operating Data
The following information should be read in conjunction with, and is qualified in its entirety by reference to, the Financial Statements including the notes thereto appearing elsewhere in this Annual Report. The selected financial information as of December 31, 2009 and 2010, and for the years ended December 31, 2008, 2009 and 2010, is derived from the consolidated balance sheets and consolidated statements of income, respectively, included in the Financial Statements appearing elsewhere in this Annual Report. The selected financial information as of December 31, 2006, 2007 and 2008 and for the years ended December 31, 2006 and 2007 has been derived from consolidated balance sheets and consolidated statements of income, respectively, which are not included in this Annual Report. The report of Medina, Zaldivar, Paredes & Asociados (a member firm of Ernst & Young Global) on our 2009 and 2010 Financial Statements appears elsewhere in this Annual Report. The Financial Statements are prepared and presented in accordance with Peruvian GAAP, which differ in certain respects from U.S. GAAP. Note 32 to the Financial Statements provides a description of the principal differences between Peruvian GAAP and U.S. GAAP as such differences relate to us, and Note 33 to the Financial Statements provides a reconciliation to U.S. GAAP of our net income for the years ended 2008, 2009 and 2010, and shareholders’ equity as of December 31, 2008, 2009 and 2010. The operating data presented below is derived from our records and has not been subject to audit. The financial information and operating data presented below should be read in conjunction with “Item 5. Operating and Financial Review and Prospects—The Company,” the Financial Statements and the related notes thereto and other financial information included in this Annual Report.
| | | As of and for the year ended December 31, | |
| | | | | | | | | | | | | | | | |
| | | (In thousands of US$)(1) | |
| Income statement data: | | | | | | | | | | | | | | | |
| Peruvian GAAP | | | | | | | | | | | | | | | |
| Net sales of goods and services | | | 548,072 | | | | 747,021 | | | | 766,603 | | | | 819,357 | | | | 1,047,885 | |
| Royalty income | | | 48,475 | | | | 34,014 | | | | 48,760 | | | | 62,150 | | | | 55,883 | |
| Revenue associated with performance on executory gold delivery contracts | | | 50,325 | | | | 5,393 | | | | - | | | | - | | | | - | |
| Total income | | | 646,872 | | | | 786,428 | | | | 815,363 | | | | 881,507 | | | | 1,103,768 | |
| | | | | | | | | | | | | | | | | | | | | |
| Operating costs: | | | | | | | | | | | | | | | | | | | | |
| Cost of sales, without considering depreciation and amortization | | | (149,309 | ) | | | (182,007 | ) | | | (251,804 | ) | | | (280,342 | ) | | | (340,840 | ) |
| Exploration in units in operation | | | (38,264 | ) | | | (37,828 | ) | | | (57,003 | ) | | | (68,649 | ) | | | (91,441 | ) |
| Depreciation and amortization | | | (38,844 | ) | | | (49,550 | ) | | | (62,993 | ) | | | (73,536 | ) | | | (71,694 | ) |
| Total operating costs | | | (226,417 | ) | | | (269,385 | ) | | | (371,800 | ) | | | (422,527 | ) | | | (503,975 | ) |
| Gross income | | | 420,455 | | | | 517,043 | | | | 443,563 | | | | 458,980 | | | | 599,793 | |
| | | | | | | | | | | | | | | | | | | | | |
| Operating expenses: | | | | | | | | | | | | | | | | | | | | |
| Administrative expenses | | | (36,639 | ) | | | (59,205 | ) | | | (34,907 | ) | | | (88,760 | ) | | | (92,606 | ) |
| Royalties | | | (24,420 | ) | | | (33,978 | ) | | | (35,694 | ) | | | (39,646 | ) | | | (52,270 | ) |
| Exploration in non-operational areas | | | (36,190 | ) | | | (46,407 | ) | | | (55,231 | ) | | | (30,005 | ) | | | (36,105 | ) |
| Selling expenses | | | (5,928 | ) | | | (10,818 | ) | | | (15,386 | ) | | | (10,047 | ) | | | (9,375 | ) |
| Reimbursement of exploration expenses on projects | | | - | | | | - | | | | - | | | | - | | | | 15,013 | |
| Reversal (provision) for impairment of long-lived assets | | | - | | | | - | | | | (18,610 | ) | | | (3,325 | ) | | | 13,135 | |
| Total operating expenses | | | (103,177 | ) | | | (150,408 | ) | | | (159,828 | ) | | | (171,783 | ) | | | (162,208 | ) |
| Operating income before unusual item | | | 317,278 | | | | 366,635 | | | | 283,735 | | | | 287,197 | | | | 437,585 | |
| Net loss from release of commitments in commercial contracts | | | - | | | | (185,922 | ) | | | (415,135 | ) | | | - | | | | - | |
| Operating income (loss) after unusual item | | | 317,278 | | | | 180,713 | | | | (131,400 | ) | | | 287,197 | | | | 437,585 | |
| | | | | | | | | | | | | | | | | | | | | |
| Other income (expenses), net: | | | | | | | | | | | | | | | | | | | | |
| | | | | | | | | | | | | | | | | | | | | |
| Share in the results of associates | | | 313,168 | | | | 249,555 | | | | 340,929 | | | | 451,306 | | | | 428,742 | |
| Interest income | | | 7,949 | | | | 11,772 | | | | 17,851 | | | | 6,117 | | | | 8,203 | |
| Interest expense | | | (5,948 | ) | | | (8,614 | ) | | | (33,934 | ) | | | (15,090 | ) | | | (12,271 | ) |
| Gain (loss) from currency exchange difference, net | | | (308 | ) | | | 5,190 | | | | (12,198 | ) | | | 1,457 | | | | (750 | ) |
| Gain (loss) on change in the fair value of gold certificates | | | (4,861 | ) | | | 5,126 | | | | - | | | | - | | | | - | |
| Loss from change in the fair value of derivative financial instruments | | | (13,268 | ) | | | - | | | | - | | | | - | | | | - | |
| Other, net | | | (19,502 | ) | | | (8,686 | ) | | | (9,290 | ) | | | 2,553 | | | | 10,915 | |
| Total other income, net | | | 277,230 | | | | 254,343 | | | | 303,358 | | | | 446,343 | | | | 434,839 | |
| Income before workers’ profit sharing, income tax and minority interest | | | 594,508 | | | | 435,056 | | | | 171,958 | | | | 733,540 | | | | 872,424 | |
| Workers’ profit sharing, net | | | (14,271 | ) | | | (19,931 | ) | | | 4,725 | | | | (12,592 | ) | | | (28,724 | ) |
| Income tax, net | | | (64,033 | ) | | | (43,975 | ) | | | 26,645 | | | | (64,340 | ) | | | (116,327 | ) |
| Net income | | | 516,204 | | | | 371,150 | | | | 203,328 | | | | 656,608 | | | | 727,373 | |
| Net income attributable to minority interest | | | (88,147 | ) | | | (96,389 | ) | | | (50,045 | ) | | | (63,047 | ) | | | (64,439 | ) |
| | | | | | | | | | | | | | | | | | | | | |
| Net income attributable to Buenaventura | | | 428,057 | | | | 274,761 | | | | 153,283 | | | | 593,561 | | | | 662,934 | |
| | | | | | | | | | | | | | | | | | | | | |
Basic and diluted earnings per share(2)(3) | | | 1.68 | | | | 1.08 | | | | 0.60 | | | | 2.33 | | | | 2.61 | |
| | | | | | | | | | | | | | | | | | | | | |
Basic and diluted earnings per ADS(2)(3) | | | 1.68 | | | | 1.08 | | | | 0.60 | | | | 2.33 | | | | 2.61 | |
| | | As of and for the year ended December 31, | |
| | | | | | | | | | | | | | | | |
| | | (In thousands of US$)(1) | |
| Dividends per share | | | 0.24 | | | | 0.28 | | | | 0.20 | | | | 0.16 | | | | 0.46 | |
| | | | | | | | | | | | | | | | | | | | | |
| Average number of shares outstanding | | | 254,442,328 | | | | 254,442,328 | | | | 254,442,328 | | | | 254,442,328 | | | | 254,442,328 | |
| | | | | | | | | | | | | | | | | | | | | |
| U.S. GAAP | | | | | | | | | | | | | | | | | | | | |
| Operating income (loss) | | | 302,277 | | | | 345,618 | | | | (122,667 | ) | | | 274,695 | | | | 394,392 | |
| Net income | | | 424,697 | | | | 225,458 | | | | 160,170 | | | | 587,472 | | | | 652,545 | |
| | | | | | | | | | | | | | | | | | | | | |
Basic and diluted earnings per share(2)(3) | | | 1.67 | | | | 0.89 | | | | 0.63 | | | | 2.31 | | | | 2.56 | |
| | | | | | | | | | | | | | | | | | | | | |
Basic and diluted earnings per ADS(2)(3) | | | 1.67 | | | | 0.89 | | | | 0.63 | | | | 2.31 | | | | 2.56 | |
| | | | | | | | | | | | | | | | | | | | | |
| Balance sheet data: | | | | | | | | | | | | | | | | | | | | |
| Peruvian GAAP | | | | | | | | | | | | | | | | | | | | |
| Total assets | | | 1,735,771 | | | | 1,981,469 | | | | 2,268,298 | | | | 2,786,559 | | | | 3,302,445 | |
| Financial obligations | | | 10,606 | | | | 84,119 | | | | 327,295 | | | | 230,007 | | | | 57,152 | |
| Shareholders’ equity | | | 1,300,506 | | | | 1,580,216 | | | | 1,531,601 | | | | 2,064,255 | | | | 2,607,856 | |
| | | | | | | | | | | | | | | | | | | | | |
| U.S. GAAP | | | | | | | | | | | | | | | | | | | | |
| Total assets | | | 1,732,030 | | | | 1,972,207 | | | | 2,222,985 | | | | 2,728,369 | | | | 3,234,325 | |
| Shareholders’ equity | | | 1,205,328 | | | | 1,360,984 | | | | 1,486,288 | | | | 2,011,072 | | | | 2,538,244 | |
| | | | | | | | | | | | | | | | | | | | | |
| Operating data (unaudited): | | | | | | | | | | | | | | | | | | | | |
Production(4) | | | | | | | | | | | | | | | | | | | | |
| Gold (oz.) | | | 405,383 | | | | 403,955 | | | | 425,257 | | | | 426,465 | | | | 481,765 | |
| Silver (oz.) | | | 22,179,552 | | | | 19,430,511 | | | | 18,606,478 | | | | 16,824,190 | | | | 14,840,678 | |
Proven and probable reserves(5) | | | | | | | | | | | | | | | | | | | | |
| Gold (oz.) | | | 1,032,063 | | | | 1,315,925 | | | | 1,080,506 | | | | 2,276,166 | | | | 2,430,000 | |
| Silver (oz.) | | | 117,808,602 | | | | 102,195,344 | | | | 128,431,875 | | | | 160,163,971 | | | | 159,880,000 | |
| (1) | Except per share, per ADS, outstanding shares and operating data. |
| (2) | Income per share has been calculated for each year as net income divided by average number of shares outstanding during the year. As of December 31, 2006, the total number of Common Shares outstanding was 137,444,962, including 10,585,130 treasury shares, and the total number of Investment Shares outstanding was 372,320, including 15,933 treasury shares. On July 23, 2008, we conducted a two-for-one stock split of our outstanding Common Shares, Investment Shares and ADSs. As a result, we had 274,889,924 outstanding Common Shares, including 21,130,260 treasury shares, and 744,640 outstanding Investment Shares, including 61,976 treasury shares, as of December 31, 2008, 2009 and 2010. In accordance with our accounting policy related to basic and diluted earnings per share, the net income per basic and diluted share has been adjusted retroactively for all periods reported to reflect the stock split. See Note 2.3(u) to the Financial Statements. |
| (3) | We have no outstanding options, warrants or convertible securities that would have a dilutive effect on earnings per share. As a result, there is no difference between basic and diluted earnings per share or ADS. |
| (4) | The amounts in this table reflect the total production of all of our consolidated subsidiaries, including El Brocal (as defined further below), in which we owned a 46.08% controlling equity interest as of December 31, 2010. The production data in this table reflects 100% of El Brocal’s production. For the years ended December 31, 2006 to 2010, El Brocal produced 10.3 million, 7.1 million, 4.6 million, 3.7 million and 2.5 million ounces of silver, respectively, of which our equity share was 3.5 million, 2.4 million, 1.7 million, 1.7 million and 1.2 million ounces of silver. |
| (5) | Proven and probable reserves for our wholly-owned mines as of December 31, 2006, 2007, 2008, 2009 and 2010 were audited by an independent consultant, Algon Investment S.R.L. Proven and probable reserves for El Brocal’s mines as of December 31, 2006, 2007, 2008, 2009 and 2010 were audited by an independent consultant, AMEC plc. |
Yanacocha Selected Financial Information and Operating Data
The following table presents selected financial information and operating data for Yanacocha at the dates and for each of the periods indicated. This information should be read in conjunction with, and is qualified in its entirety by reference to, Yanacocha’s audited consolidated financial statements as of December 31, 2009 and 2010 and for the years ended December 31, 2008, 2009 and 2010, or the Yanacocha Consolidated Financial Statements, which Dongo-Soria Gaveglio y Asociados (a member firm of PricewaterhouseCoopers) audited. The report of Dongo-Soria Gaveglio y Asociados on the Yanacocha Consolidated Financial Statements appears elsewhere in this Annual Report. The selected financial information as of December 31, 2006, 2007 and 2008 and for the years ended December 31, 2006 and 2007 has been derived from balance sheets and statements of income, respectively, which are not included in this Annual Report. The Yanacocha Consolidated Financial Statements are prepared and presented in accordance with U.S. GAAP, which differ in certain respects from Peruvian GAAP. The significant differences between U.S. GAAP and Peruvian GAAP applicable to Yanacocha have been quantified in determining Yanacocha’s reported Peruvian GAAP selected financial data. The operating data presented below, which is based on 100 percent of Yanacocha’s production and reserves, is derived from Yanacocha’s records and has not been subject to audit. The financial information presented below should be read in conjunction with “Item 5. Operating and Financial Review and Prospects—Yanacocha,” the Yanacocha Consolidated Financial Statements and the related notes thereto and other financial information included in this Annual Report.
| | | As of and for the year ended December 31, | |
| | | | | | | | | | | | | | | | |
| | | (In thousands of US$)(1) | |
| | | | | | | | | | | | | | | | |
| Income statement data: | | | | | | | | | | | | | | | |
| U.S. GAAP | | | | | | | | | | | | | | | |
| | | | | | | | | | | | | | | | |
| Revenues | | | 1,543,212 | | | | 1,093,347 | | | | 1,612,618 | | | | 2,013,228 | | | | 1,778,260 | |
| | | | | | | | | | | | | | | | | | | | | |
| Costs and expenses: | | | | | | | | | | | | | | | | | | | | |
| Costs applicable to sales | | | (468,027 | ) | | | (506,261 | ) | | | (659,867 | ) | | | (671,055 | ) | | | (655,007 | ) |
| Depreciation, depletion and amortization | | | (171,730 | ) | | | (159,148 | ) | | | (169,131 | ) | | | (166,053 | ) | | | (160,424 | ) |
| Exploration costs | | | (32,254 | ) | | | (28,234 | ) | | | (28,151 | ) | | | (22,968 | ) | | | (34,579 | ) |
| General and administrative costs | | | (5,589 | ) | | | (2,928 | ) | | | (3,168 | ) | | | (3,602 | ) | | | (3,824 | ) |
| Other expenses | | | (108,646 | ) | | | (80,941 | ) | | | (83,424 | ) | | | (86,469 | ) | | | (69,122 | ) |
| Total operating expenses | | | (786,246 | ) | | | (777,512 | ) | | | (943,741 | ) | | | (950,147 | ) | | | (922,956 | ) |
| Operating income | | | 756,966 | | | | 315,835 | | | | 668,877 | | | | 1,063,081 | | | | 855,304 | |
| Interest expense and other | | | 6,825 | | | | 12,698 | | | | 3,642 | | | | (712 | ) | | | 4,263 | |
| Pre-tax income | | | 763,791 | | | | 328,533 | | | | 672,519 | | | | 1,062,369 | | | | 859,567 | |
| Income tax provision | | | (238,343 | ) | | | (107,044 | ) | | | (196,057 | ) | | | (335,293 | ) | | | (269,673 | ) |
| Net income before cumulative effect of change in accounting principles | | | 525,448 | | | | 221,489 | | | | 476,462 | | | | 727,076 | | | | 589,894 | |
| Cumulative effect of change in accounting principle, net | | | - | | | | - | | | | - | | | | - | | | | - | |
| Net income and comprehensive income | | | 525,448 | | | | 221,489 | | | | 476,462 | | | | 727,076 | | | | 589,894 | |
| | | | | | | | | | | | | | | | | | | | | |
| Peruvian GAAP | | | | | | | | | | | | | | | | | | | | |
Revenues(2) | | | 1,636,009 | | | | 1,148,546 | | | | 1,641,301 | | | | 2,089,119 | | | | 1,866,779 | |
| Operating income | | | 886,373 | | | | 379,541 | | | | 709,234 | | | | 1,130,271 | | | | 942,382 | |
Net income(3) | | | 567,659 | | | | 244,192 | | | | 463,814 | | | | 712,818 | | | | 591,173 | |
| | | | | | | | | | | | | | | | | | | | | |
| Balance sheet data: | | | | | | | | | | | | | | | | | | | | |
| U.S. GAAP | | | | | | | | | | | | | | | | | | | | |
| Total assets | | | 1,824,853 | | | | 1,895,884 | | | | 1,891,963 | | | | 2,466,500 | | | | 2,936,994 | |
| Total debt | | | 200,000 | | | | 218,111 | | | | 205,618 | | | | 178,336 | | | | 1,959 | |
| Partners’ equity | | | 1,196,409 | | | | 1,326,325 | | | | 1,212,787 | | | | 1,711,102 | | | | 2,302,145 | |
| Peruvian GAAP | | | | | | | | | | | | | | | | | | | | |
| Total assets | | | 1,823,480 | | | | 1,925,125 | | | | 1,911,583 | | | | 2,456,235 | | | | 2,930,575 | |
| Total debt | | | 200,000 | | | | 218,111 | | | | 205,618 | | | | 178,336 | | | | 1,959 | |
| Partners’ equity | | | 1,200,562 | | | | 1,353,180 | | | | 1,226,994 | | | | 1,711,051 | | | | 2,303,373 | |
| | | | | | | | | | | | | | | | | | | | | |
| Operating data (unaudited): | | | | | | | | | | | | | | | | | | | | |
| Gold produced (oz.) | | | 2,612,199 | | | | 1,563,669 | | | | 1,810,338 | | | | 2,058,180 | | | | 1,461,620 | |
| Gold proven and probable reserves (thousands of oz.) | | | 29,327 | | | | 27,594 | | | | 24,850 | | | | 22,362 | | | | 21,538 | |
| (1) | Except operating data. |
| (2) | Under U.S. GAAP, Yanacocha recognizes revenues when the price is determinable and upon delivery and transfer of title of gold to the customer. In addition, revenues from silver sales are credited to costs applicable to sales as a by-product credit. Under Peruvian GAAP, revenues, including gold and silver sales, are recognized when doré is delivered to the shipper. |
| (3) | U.S. GAAP net income was higher than Peruvian GAAP net income for the years ended December 31, 2008 and 2009, despite accounting for lower revenues under U.S. GAAP than would have been recorded under Peruvian GAAP, primarily due to differences related to the accounting treatment of depreciation expense. The higher threshold for capitalizing assets under U.S. GAAP resulted in depreciation expense for the years ended December 31, 2010, 2009 and 2008, respectively, that was approximately $12.0 million, $15.0 million and $26.3 million lower under U.S. GAAP than under Peruvian GAAP, which is the primary factor responsible for Yanacocha’s higher net income, despite lower revenues, under U.S. GAAP. |
Cerro Verde Selected Financial Information and Operating Data
The following table presents selected financial information and operating data for Cerro Verde at the dates and for each of the periods indicated. This information should be read in conjunction with, and is qualified in its entirety by reference to, Cerro Verde’s audited financial statements as of December 31, 2009 and 2010 and for the years ended December 31, 2008, 2009 and 2010, or the Cerro Verde Financial Statements. Medina, Zaldívar, Paredes & Asociados (a member firm of Ernst & Young Global) audited the Cerro Verde Financial Statements and the report of Medina, Zaldívar, Paredes & Asociados on Cerro Verde’s financial statements appears elsewhere in this Annual Report. The selected financial information as of December 31, 2006, 2007 and 2008 and for the years ended December 31, 2006 and 2007 has been derived from balance sheets and statements of income, respectively, which are not included in this Annual Report. The Cerro Verde Financial Statements are prepared and presented in accordance with Peruvian GAAP, which differs in certain respects from U.S. GAAP. Note 25 to the Cerro Verde Financial Statements provides a description of the principal differences between Peruvian GAAP and U.S. GAAP as such differences relate to Cerro Verde, and Note 26 to the Cerro Verde Financial Statements provides a reconciliation to U.S. GAAP of Cerro Verde’s net income for the years ended 2008, 2009 and 2010 and shareholders’ equity as of December 31, 2009 and 2010. The operating data presented below, which is based on 100 percent of Cerro Verde’s production and reserves, is derived from Cerro Verde’s records and has not been subject to audit. The financial information presented below should be read in conjunction with “Item 5. Operating and Financial Review and Prospects—Cerro Verde,” the Cerro Verde Financial Statements and the related notes thereto and other financial information included in this Annual Report.
| | | As of and for the year ended December 31, | |
| | | | | | | | | | | | | | | | |
| | | (In thousands of US$)(1) | |
| Income statement data: | | | | | | | | | | | | | | | |
| Peruvian GAAP | | | | | | | | | | | | | | | |
| Net sales of goods | | | 667,671 | | | | 1,794,559 | | | | 1,835,911 | | | | 1,757,510 | | | | 2,368,988 | |
| Total revenues | | | 667,671 | | | | 1,794,559 | | | | 1,835,911 | | | | 1,757,510 | | | | 2,368,988 | |
| Costs of sales | | | | | | | | | | | | | | | | | | | | |
| Total costs of sales | | | (140,423 | ) | | | (418,108 | ) | | | (596,741 | ) | | | (528,047 | ) | | | (571,363 | ) |
| Gross margin | | | 527,248 | | | | 1,376,451 | | | | 1,239,170 | | | | 1,229,463 | | | | 1,797,625 | |
| Operating expenses | | | | | | | | | | | | | | | | | | | | |
| Selling expenses | | | (3,538 | ) | | | (54,405 | ) | | | (78,190 | ) | | | (67,877 | ) | | | (76,638 | ) |
| Voluntary contribution | | | - | | | | (48,674 | ) | | | (29,496 | ) | | | (27,608 | ) | | | (41,081 | ) |
| Other operating expenses | | | (48,100 | ) | | | (2,432 | ) | | | (29,956 | ) | | | (9,718 | ) | | | (14,401 | ) |
| Total operating expenses | | | (51,638 | ) | | | (105,511 | ) | | | (137,642 | ) | | | (105,203 | ) | | | (132,120 | ) |
| Operating income | | | 475,610 | | | | 1,270,940 | | | | 1,101,528 | | | | 1,124,260 | | | | 1,665,505 | |
| Other income (expenses), net | | | | | | | | | | | | | | | | | | | | |
| Financial expense | | | (2,984 | ) | | | (23,346 | ) | | | (7,853 | ) | | | - | | | | (101 | ) |
| Financial income | | | 10,899 | | | | 33,168 | | | | 20,278 | | | | 1,665 | | | | 1,261 | |
| Other, net | | | (550 | ) | | | (426 | ) | | | (2,366 | ) | | | (3,796 | ) | | | 21 | |
| Total other income (expenses), net | | | 7,365 | | | | 9,396 | | | | 10,059 | | | | (2,131 | ) | | | 1,181 | |
| Profit before workers’ profit sharing and income tax | | | 482,975 | | | | 1,280,336 | | | | 1,111,587 | | | | 1,122,129 | | | | 1,666,686 | |
| Workers’ profit sharing | | | (42,805 | ) | | | (106,846 | ) | | | (88,349 | ) | | | (92,945 | ) | | | (137,551 | ) |
| Income tax | | | 4,451 | | | | (368,805 | ) | | | (304,805 | ) | | | (320,656 | ) | | | (474,712 | ) |
| Net income | | | 444,621 | | | | 804,685 | | | | 718,433 | | | | 708,528 | | | | 1,054,423 | |
| | | | | | | | | | | | | | | | | | | | | |
| Basic and diluted earnings per share | | | 1.270 | | | | 2.300 | | | | 2.052 | | | | 2.024 | | | | 3.012 | |
| Dividends per share | | | - | | | | 1.77 | | | | 2.399 | | | | 1.286 | | | | 2.714 | |
| | | | | | | | | | | | | | | | | | | | | |
| Average number of shares outstanding | | | 350,056,012 | | | | 350,056,012 | | | | 350,056,012 | | | | 350,056,012 | | | | 350,056,012 | |
| | | | | | | | | | | | | | | | | | | | | |
| U.S. GAAP | | | | | | | | | | | | | | | | | | | | |
| Operating income (loss) | | | 476,432 | | | | 1,284,612 | | | | 1,101,528 | | | | 1,124,260 | | | | 1,665,505 | |
| Net income | | | 445,443 | | | | 573,726 | | | | 718,433 | | | | 708,528 | | | | 1,054,423 | |
| | | | | | | | | | | | | | | | | | | | | |
| Basic and diluted earnings per share | | | 1.272 | | | | 1.640 | | | | 2.05 | | | | 2.024 | | | | 3.012 | |
| | | | | | | | | | | | | | | | | | | | | |
| Balance sheet data: | | | | | | | | | | | | | | | | | | | | |
| Peruvian GAAP | | | | | | | | | | | | | | | | | | | | |
| Total assets | | | 1,651,256 | | | | 2,035,576 | | | | 1,977,901 | | | | 1,913,165 | | | | 2,285,165 | |
| Total debt | | | 183,667 | | | | 73,764 | | | | - | | | | - | | | | - | |
| Shareholders’ equity | | | 1,261,057 | | | | 1,445,742 | | | | 1,324,175 | | | | 1,446,094 | | | | 1,550,517 | |
| | | | | | | | | | | | | | | | | | | | | |
| U.S. GAAP | | | | | | | | | | | | | | | | | | | | |
| Total assets | | | 1,637,584 | | | | 2,035,576 | | | | 1,977,901 | | | | 1,913,165 | | | | 2,285,165 | |
| Shareholders’ equity | | | 1,252,252 | | | | 1,205,978 | | | | 1,084,411 | | | | 1,206,330 | | | | 1,310,753 | |
| | | | | | | | | | | | | | | | | | | | | |
| Operating data (unaudited): | | | | | | | | | | | | | | | | | | | | |
| Production: | | | | | | | | | | | | | | | | | | | | |
| Copper (in thousands of recoverable pounds) | | | 221,726 | | | | 594,227 | | | | 694,486 | | | | 661,626 | | | | 667,363 | |
| Proven and probable reserves | | | | | | | | | | | | | | | | | | | | |
| Copper (in thousands of metric tons) | | | 1,741,432 | | | | 1,765,634 | | | | 3,022,581 | | | | 3,052,865 | | | | 3,571,531 | |
| (1) | Except per share and operating data |
Exchange Rates
The following table sets forth the high and low month-end rates and the average and end-of-period offered rates for the sale of Nuevos Soles in U.S. Dollars for the period indicated, as published by the Superintendencia de Bancos y Seguros (Superintendent of Bank and Insurance, or the SBS). The Federal Reserve Bank of New York does not report a noon buying rate for Nuevos Soles.
Exchange Rates
(Nuevos Soles per US$)(1)
| Year | | High(2) | | | Low(2) | | | Average(3) | | | Period end(4) | |
| | | | | | | | | | | | | |
| 2006 | | | 3.355 | | | | 3.194 | | | | 3.264 | | | | 3.194 | |
| 2007 | | | 3.201 | | | | 2.967 | | | | 3.123 | | | | 2.995 | |
| 2008 | | | 3.141 | | | | 2.690 | | | | 2.922 | | | | 3.139 | |
| 2009 | | | 3.259 | | | | 2.853 | | | | 3.012 | | | | 2.891 | |
| 2010 | | | 2.856 | | | | 2.787 | | | | 2.826 | | | | 2.809 | |
| | | | | | | | | | | | | | | | | |
| 2010 | | High(5) | | | Low(5) | | | Average(6) | | | Period end(7) | |
| December | | | 2.828 | | | | 2.800 | | | | 2.816 | | | | 2.809 | |
| | | | | | | | | | | | | | | | | |
| 2011 | | | | | | | | | | | | | | | | |
| January | | | 2.807 | | | | 2.772 | | | | 2.788 | | | | 2.773 | |
| February | | | 2.792 | | | | 2.766 | | | | 2.771 | | | | 2.775 | |
| March | | | 2.813 | | | | 2.767 | | | | 2.780 | | | | 2.805 | |
| April | | | 2.831 | | | | 2.799 | | | | 2.817 | | | | 2.827 | |
| May | | | 2.827 | | | | 2.749 | | | | 2.774 | | | | 2.771 | |
| (1) | Expressed in nominal (not inflation adjusted) Nuevos Soles. |
| (2) | Highest and lowest of the twelve month-end exchange rates for each year based on the offered rate. |
| (3) | Average of month-end exchange rates based on the offered rate. |
| (4) | End of period exchange rates based on the offered rate. |
| (5) | Highest and lowest of the exchange notes based on the offered rate on the last day of each month. |
| (6) | Average of the exchange rates based on the offered rate on the last date of each day in the relevant month. |
| (7) | The exchange rate based on the offered rate on the last day of each relevant month. |
Source: SBS
On June 24, 2011, the offered rate for Dollars as published by the SBS was S/.2.759 = US$1.00.
| B. | Capitalization and Indebtedness |
Not applicable.
| C. | Reasons for the Offer and Use of Proceeds |
Not applicable.
Factors Relating to the Company
Our, Yanacocha’s and Cerro Verde’s financial performance is highly dependent on our partners under our mining exploration agreements.
An integral part of our operations is the participation in mining exploration projects with experienced mining companies. Such projects benefit us by providing a source of outside funds for exploration of mining rights, giving us access to the holdings of outside parties without the risks and costs of outright acquisition. They also enable us to expand the scope of knowledge and experience of our senior management, geologists and engineers through increased contact with their counterparts from other organizations. We can be highly dependent upon our partners, co-venturers or other shareholders in a joint mining exploration project carrying out their obligations under the applicable joint mining exploration agreement or mining operating agreement. Such partners, co-venturers and other shareholders in a joint mining exploration venture may contribute capital to cover the expenses of the joint venture project or provide critical technological expertise and/or management and organizational expertise. See “Item 4. Information on the Company—Yanacocha—Business Overview” for a description of how we and Newmont Mining Corporation, a Delaware corporation, or Newmont Mining, have joined together to participate in Yanacocha and how Yanacocha is dependent upon Newmont Peru Limited, Peruvian Branch, or Newmont Peru, to provide management and other expertise to the Yanacocha project. If, however, a partner, a co-venturer or in certain cases another shareholder does not carry out its obligations under the applicable joint venture agreement, joint mining operating agreement, by-laws or shareholders agreement, the value of our investment in the joint mining exploration project could be adversely affected and we could incur significant expense in enforcing our rights or pursuing remedies. There can be no assurance that our current or future partners will fulfill their obligations under such agreements. See “Item 4. Information on the Company—Yanacocha” and “Item 4. Information on the Company—The Company—Business Overview—Exploration.”
Our investments in international operations are subject to political, economic, social and geographic risks of doing business in foreign countries.
Foreign operations are subject to certain risks inherent in conducting business abroad, including, among others, exposure to foreign currency fluctuations, devaluations or supply restrictions, exchange control regulations, government policies, price and wage controls, taxation, intervention, social instability and other political, economic or diplomatic developments beyond our control. There can be no assurance that our foreign exploration activities will not be adversely affected in the future.
Our, Yanacocha’s and Cerro Verde’s financial performance is highly dependent on the prices of gold, silver, copper and other metals.
Because our revenues are derived primarily from the sale of ore concentrates containing gold and silver, Yanacocha’s revenues are derived primarily from the sale of gold and silver and Cerro Verde’s revenues are derived primarily from copper sales, the prices we, Yanacocha and Cerro Verde obtain for gold, silver, copper and ore concentrates containing such metals, and our, Yanacocha’s and Cerro Verde’s earnings, are directly related to world market prices for such metals. Such prices have historically fluctuated widely and are affected by numerous factors beyond our control, including the overall demand for and worldwide supply of gold, silver, copper and other metals; the availability and price of competing commodities, international economic trends, currency exchange fluctuations, expectations of inflation, actions of commodity markets participants, consumption and demand patterns and political events in major producing countries. We have in the past engaged in hedging activities, such as forward sales and option contracts, to minimize our exposure to fluctuations in the prices of gold, silver and other metals. Due to actions taken in 2007 and early 2008 to release our gold hedge book from specified fixed prices, we are now completely unhedged as to the price at which our gold and silver will be sold. As a result, we are fully exposed to the effects of changes in prevailing market prices of gold and silver. See “Risk Factors—Factors Relating to the Company—Our base metal hedging strategies may not be successful, and any of our unhedged metal prices will continue to be subject to market fluctuations,” “Item 11. Quantitative and Qualitative Disclosures About Market Risk” and Note 29 to the Financial Statements. For information on gold and silver prices for each of the years in the five-year period ended December 31, 2010, see “Item 4. Information on the Company—The Company—Business Overview—Sales of Metal Concentrates.” On December 31, 2010 and April 28, 2011, the morning fixing price for gold on the London Bullion Market was US$1,410.25 per ounce and US$1,531 per ounce, respectively. On December 31, 2010 and April 28, 2011, the afternoon fixing spot price of silver on the London market, or London Spot, was US$30.63 per ounce and US$48.70 per ounce, respectively. On December 31, 2010 and April 28, 2011, the London Metal Exchange Settlement price for copper was US$9,739.50 per metric ton and US9,370.50 per metric ton, respectively.
The world market prices of gold, silver and copper have historically fluctuated widely and there is no assurance that the prices for these metals will continue to maintain their current high historical levels. We cannot predict whether metal prices will rise or fall in the future. A decline in the market price of one or more of these metals could adversely impact our revenues, net income and cash flows and adversely affect our ability to repay our debt and meet our other financial obligations.
In addition, sustained low gold, silver or copper prices could reduce revenues further through production declines due to cessation of the mining of deposits, or portions of deposits, that have become uneconomic at the then-prevailing market price; reduce or eliminate the profit that we currently expect from reserves; halt or delay the development of new projects; reduce funds available for exploration; and reduce existing reserves by removing ores from reserves that can no longer be economically processed at prevailing prices. Such declines in price and/or reductions in operations could also cause significant volatility in our financial performance and adversely affect the trading prices of our Common Shares and ADSs.
Economic, mining and other regulatory policies of the Peruvian government, as well as political, regulatory and economic developments in Peru, may have an adverse impact on our, Yanacocha’s and Cerro Verde’s business.
Our, Yanacocha’s and Cerro Verde’s activities in Peru depend on mining concessions for exploration, which we refer to as mining concessions, being obtained from the Peruvian Ministry of Energy and Mines, or MEM, in our case, and through the assignment of concessions granted to a related entity by the Peruvian government, in the case of Yanacocha. In addition, our and Yanacocha’s activities in Peru depend on provisional permits, obtained from the MEM, for exploration rights of the area of the claim, which we refer to as provisional permits, and together with mining concessions, referred to as mining rights, and/or processing concessions, obtained from the MEM, for treatment of mining ores, or processing concessions, as well as compliance by us and Yanacocha with certain agreements entered into with the Peruvian government. Under Peru’s current legal and regulatory regime, our mining rights have an indefinite term and Yanacocha’s assigned mining rights have a term of 20 years, contingent upon payment of the annual concession fee for each mining right, with an option to renew for an additional term of 20 years. The mining rights are maintained by meeting a minimum annual level of production or investment and by the annual payment of a concession fee. A fine is payable for the years in which minimum production or investment requirements are not met. In addition if, in any year, the concession fee is not paid, payment may be made the following year within the term provided for making such payment. Any payment made will be applied to the prior year if such prior year payment was not paid. Failure to pay such concession fees or fines for two consecutive years could result in the loss of one or more of the mining rights. However, mining and processing concessions will not lapse if the administrative authority failed to issue a resolution declaring the termination of the concession within the first five years following the date on which such payment failure occurred. Our and Yanacocha’s processing concessions enjoy the same duration and tenure as the mining rights, subject to payment of a fee based on nominal capacity for the processing plant. Failure to pay such processing fees or fines for two consecutive years could result in the loss of the processing concessions. We are, and Yanacocha has informed us that Yanacocha is, current in the payment of all amounts due in respect to its mining and processing concessions.
On June 24, 2004, the Peruvian Congress approved Law No. 28258 – Mining Royalties Law. This law established a mining royalty that owners of mining concessions must pay to the Peruvian government for the exploitation of metallic and non-metallic resources. The mining royalties are calculated on a sliding scale with rates ranging from 1 to 3 percent over the value of mineral concentrates based on international market prices. As provided by Law No. 28969, effective since January 26, 2007, government tax agencies are responsible for the collection of mining royalties. See “Item 4. Information on the Company—The Company—Business Overview—Regulatory Framework—Mining Royalties.” We made our first payment of the mining royalty pursuant to Law No. 28258 in 2004. Yanacocha and Cerro Verde were exempt from this payment pursuant to their Mining Law Stabilization Agreements under the General Mining Law with the Peruvian government. There can be no assurance that the Peruvian government will not impose additional mining royalties on us, Yanacocha or Cerro Verde in the future or that such mining royalties will not have an adverse effect on our, Yanacocha’s or Cerro Verde’s results of operations or financial condition.
In December 2008, Cerro Verde was notified by Peruvian tax authorities of their intent to assess mining royalties related to minerals processed by the Cerro Verde concentrator. In August 2009, Cerro Verde received a formal assessment in the amount of approximately US$34 million in connection with its alleged obligations for mining royalties and fines for the period from October 2006 to December 2007. In April 2010, SUNAT issued a ruling denying Cerro Verde’s protest of the assessment. In May 2010, Cerro Verde appealed this decision to the Peruvian Tax Court (Tribunal Fiscal). Cerro Verde has also been assessed approximately US$41 million in mining royalties and penalties for 2008. In February 2011, Superintendencia Nacional de Administración Tributaria, or SUNAT, issued a ruling denying Cerro Verde’s protest of the 2008 assessment, and Cerro Verde appealed this decision to the Peruvian Tax Court. Cerro Verde has also received a request for information regarding mining royalties for 2009. SUNAT may continue to assess mining royalties annually until the Peruvian Tax Court resolves this matter. Cerro Verde is challenging these royalties because its stability agreement with the Peruvian government exempts from royalties all minerals extracted from its mining concession, irrespective of the method used for processing those minerals. If Cerro Verde is ultimately responsible for payment of these royalties, it will also be liable for interest, which accrues at rates ranging from 7 to 18 percent based on the year accrued and the currency in which such amounts would be payable. As of December 31, 2010, the aggregate amount of royalties with interest assessed between October 2006 and December 2007 to which Cerro Verde may be subject approximated US$57 million, and the aggregate assessment with interest for 2008 approximated US$61 million. These outstanding amounts will continue to accrue interest at varying interest rates.
In addition, during 2006 Peruvian mining companies, represented by the Sociedad Nacional de Minería, Petróleo y Energía, agreed to a mining payment equivalent to 3.75 percent of income after taxes. The payment was negotiated with the Peruvian government and is intended to support government efforts to alleviate poverty. On December 21, 2006, the Peruvian government issued Supreme Decree No. 071-2006-EM, which approved the form of agreement to be entered into by mining companies and the Peruvian government and authorized the Minister of Economy and Finance and the Minister of Energy and Mines to sign such agreements. The form of agreement contains the conditions under which the negotiated payment will be paid by Peruvian mining companies. The payment amounts to 3.75 percent of Peruvian income after income tax, including 2.75 percent to be paid to a local mining fund and 1 percent to be paid to a regional mining fund. This payment was payable from 2006 through 2010, contingent on the price of gold.
In 2007, Cerro Verde negotiated an agreement with the Peruvian government that allowed a credit against contributions to the local mining fund for Cerro Verde’s work in constructing water and sewage treatment facilities in the Arequipa region in 2006. As of December 31, 2010, based on the Basic Engineering report on the Feasibility Study of the Water Treatment Plants, Cerro Verde estimates a total cost of approximately US$177.0 million, an amount that will be incurred in the next two years. Cerro Verde will be responsible for 50 percent of the total cost. The net present value of this obligation as of December 31, 2010 is approximately US$77.9 million, US$40.0 million of which was recognized as part of other operating expenses in the income statement for the year ended December 31, 2006, US$25.8 million of which was recognized in the income statement for the year ended December 31, 2008, US$7.8 million of which was recognized in the income statement for the year ended December 31, 2009 and US$4.3 million of which was recognized in the income statement for the year ended December 31, 2010. As part of the obligations assumed by Cerro Verde and as a way to guarantee the construction of the Water Plant, Cerro Verde established a guaranteed deposit in a local bank for an amount of S/.150 million (equivalent to approximately US$50 million as of the deposit date), which was replaced in April 2009 by a deposit in US dollars. The guaranteed deposit amount was equivalent to US$19.0 million as of December 31, 2010.
Following a run-off election on June 5, 2011, leftist candidate Ollanta Humala was elected president of Peru. Although we cannot predict the policies that Humala’s government will enact once he assumes office on July 28, 2011, Humala has expressed plans to increase royalties on mining companies in order to fund redistributive economic policies, such as increases in the minimum wage and state pension provisions. Specifically, Humala has said that he plans to introduce a tax on mining companies’ operating income. While he has stated that he will respect tax stabilization agreements, there can be no guarantee that his government will not attempt to renegotiate Yanacocha’s and Cerro Verde’s existing tax stabilization agreements. In addition, Humala has stated that he may implement a stricter environmental approach to the government’s approval of mining projects. He may also grant local indigenous communities increased consulting rights with regard to mining projects on their land. As a result, there can be no assurance that new laws that adversely impact our, Yanacocha’s and Cerro Verde’s tax and royalty payment obligations and environmental compliance costs will not be enacted in the near future. In addition, no assurance can be given that future legislative or regulatory developments proposed or championed by the Humala government of the type described above, or in similar areas or in any other area will have an adverse effect on our, Yanacocha’s or Cerro Verde’s business or results of operations.
Environmental and other laws and regulations may increase our costs of doing business, restrict our operations or result in operational delays.
Our, Yanacocha’s and Cerro Verde’s exploration, mining and milling activities, as well our and Yanacocha’s smelting and refining activities, are subject to a number of Peruvian laws and regulations, including environmental laws and regulations.
Additional matters subject to regulation include, but are not limited to, concession fees, transportation, production, water use and discharges, power use and generation, use and storage of explosives, surface rights, housing and other facilities for workers, reclamation, taxation, labor standards, mine safety and occupational health.
We anticipate additional laws and regulations will be enacted over time with respect to environmental matters. The development of more stringent environmental protection programs in Peru could impose constraints and additional costs on our, Yanacocha’s and Cerro Verde’s operations and require us, Yanacocha and Cerro Verde to make significant capital expenditures in the future. Although we believe we are substantially in compliance, and Yanacocha and Cerro Verde have advised us that Yanacocha and Cerro Verde are substantially in compliance, with all applicable environmental regulations, there can be no assurance that future legislative or regulatory developments will not have an adverse effect on our, Yanacocha’s or Cerro Verde’s business or results of operations. See “Item 4. Information on the Company—The Company—Business Overview—Regulatory Framework—Environmental Matters” and “—Permits” and “Item 4. Information on the Company—Yanacocha—Business Overview—Regulation, Permit and Environmental Matters.”
Our base metal hedging strategies may not be successful, and any of our unhedged metal prices will continue to be subject to market fluctuations.
Yanacocha and Cerro Verde have not engaged in, and are currently not engaged in, gold or copper price hedging activities, such as forward sales or option contracts, to minimize their exposure to fluctuations in the price of gold or copper. No assurance can be given, however, that Yanacocha or Cerro Verde will not enter into hedging transactions in the future or that such transactions, if entered into, will have the desired effect.
Our metals exploration efforts are highly speculative in nature and may not be successful.
Precious metals exploration, particularly gold exploration, is highly speculative in nature, involves many risks and frequently is unsuccessful. There can be no assurance that our, Yanacocha’s or Cerro Verde’s metals exploration efforts will be successful. Once mineralization is discovered, it may take a number of years from the initial phases of drilling before production is possible, during which time the economic feasibility of production may change. Substantial expenditures are required to establish proven and probable ore reserves through drilling, to determine metallurgical processes to extract the metals from the ore and, in the case of new properties, to construct mining and processing facilities. As a result of these uncertainties, no assurance can be given that our or Yanacocha’s exploration programs will result in the expansion or replacement of current production with new proven and probable ore reserves.
Advanced exploration projects have no operating history upon which to base estimates of proven and probable ore reserves and estimates of future cash operating costs. Such estimates are, to a large extent, based upon the interpretation of geologic data obtained from drill holes and other sampling techniques, and feasibility studies which derive estimates of cash operating costs based upon anticipated tonnage and grades of ore to be mined and processed, the configuration of the ore body, expected recovery rates of the mineral from the ore, comparable facility and equipment operating costs, anticipated climatic conditions and other factors. As a result, it is possible that actual cash operating costs and economic returns based upon proven and probable ore reserves may differ significantly from those originally estimated. Moreover, significant decreases in actual over expected prices may mean reserves, once found, will be uneconomical to produce. It is not unusual in new mining operations to experience unexpected problems during the start-up phase. Yanacocha and Cerro Verde used US$950 per ounce of gold and US$2.00 per pound of copper to calculate their gold and copper reserves, respectively, as of December 31, 2010; we used a fixed price of US$950 per ounce of gold and a three-year average historic price of US$16.00 per ounce of silver to calculate our proven and probable ore reserves as of December 31, 2010.
Increased operating costs could affect our profitability.
Costs at any particular mining location frequently are subject to variation due to a number of factors, such as changing ore grade, changing metallurgy and revisions to mine plans in response to the physical shape and location of the ore body. In addition, costs are affected by the price of commodities, such as fuel, electricity and labor. Commodity costs are at times subject to volatile price movements, including increases that could make production at certain operations less profitable. Reported costs may be affected by changes in accounting standards. A material increase in costs at any significant location could have a significant effect on our profitability.
Our business is capital intensive and we may not be able to finance necessary capital expenditures required to execute our business plans.
Precious metals exploration requires substantial capital expenditures for the exploration, extraction, production and processing stages and for machinery, equipment and experienced personnel. There can be no assurance that we or Yanacocha will generate sufficient cash flow and/or that we will have access to sufficient external sources of funds in the form of outside investment or loans to continue exploration activities at the same or higher levels than in the past.
Estimates of proven and probable reserves are subject to uncertainties and the volume and grade of ore actually recovered may vary from our estimates.
The proven and probable ore reserve figures presented in this Annual Report are our, Yanacocha’s and Cerro Verde’s estimates, and there can be no assurance that the level of recovery of gold, silver, copper and certain other metals will be realized. Reserve estimates may require revision based on actual production experience. Market price fluctuations of gold, silver and other metals, as well as increased production costs or reduced recovery rates, may render proven and probable ore reserves containing relatively lower grades of mineralization uneconomic to exploit and may ultimately result in a restatement of proven and probable ore reserves. Moreover, short-term operating factors relating to the reserves, such as the processing of different types of ore or ore grades, could adversely affect our or Yanacocha’s profitability in any particular accounting period. See “Item 4. Information on the Company—Property, Plants and Equipment—Our Property—Reserves” and “Item 4. Information on the Company—Property, Plants and Equipment—Yanacocha’s Properties—Reserves.”
We may be unable to replace reserves as they become depleted by production.
As we produce gold, silver, zinc and other metals, we deplete our ore reserves for such metals. To maintain production levels, we must replace depleted reserves by exploiting known ore bodies and locating new deposits. Success in exploration for gold, silver and the other metals we produce is very uncertain and there is a risk that our depletion of reserves will not be offset by new discoveries.
As of December 31, 2010, Yanacocha’s proven and probable reserves (excluding Conga’s proven and probable reserves) were estimated to be 9.7 million ounces of gold, representing a 7.8 percent decrease over Yanacocha’s proven and probable reserves as of December 31, 2009, which were estimated to be 10.5 million ounces of gold. The decrease in reserves of gold was mainly due to a mining depletion of 2.1 million ounces, unit cost increases, updated block models, revised pit designs, leach pad inventory adjustments, stockpile additions and leach pad capacity limitations, which was partially offset by an increase of 1.3 million ounces of gold reserves due to conversions from non-reserve mineralization to reserves in certain projects.
As of December 31, 2010, our proven and probable reserves were estimated to be 2.43 million ounces of gold, which represented a 7 percent increase from an estimated 2.28 million ounces of gold reserves as of December 31, 2009. The increase in reserves of gold was mainly due to the inclusion of reserves from Breapampa project.
Our operations are subject to risks, many of which are not insurable.
The business of mining, smelting and refining gold, silver, copper and other metals is generally subject to a number of risks and hazards, including industrial accidents, labor disputes, unusual or unexpected geological conditions, changes in the regulatory environment, environmental hazards and weather and other natural phenomena such as earthquakes. Such occurrences could result in damage to, or destruction of, mining properties or production facilities, personal injury or death, environmental damage, delays in mining, monetary losses and possible legal liability. We, Yanacocha and Cerro Verde each maintain insurance against risks that are typical in the mining industry in Peru and in amounts that we and Yanacocha believe to be adequate but which may not provide adequate coverage in certain circumstances. Insurance against certain risks (including certain liabilities for environmental pollution or other hazards as a result of exploration and production) is not generally available to us or Yanacocha or to other companies within the industry.
Increases in equipment costs, energy costs and other production costs, disruptions in energy supply and shortages in equipment and skilled labor may adversely affect our results of operations.
In recent years there has been a significant increase in mining activity worldwide in response to increased demand and significant increases in prices of natural resources. The opening of new mines and expansion of existing mines has led to increased demand for, and increased costs and shortages of, equipment, supplies and experienced personnel. These cost increases have significantly increased overall operating and capital budgets of companies like ours, and continuing shortages could affect the timing and feasibility of expansion projects.
Energy represents a significant portion of our production costs. Our principal energy sources are electricity, purchased petroleum products, natural gas and coal. An inability to procure sufficient energy at reasonable prices or disruptions in energy supply could adversely affect our profits, cash flow and growth opportunities. Our production costs are also affected by the prices of commodities we consume or use in our operations, such as sulfuric acid, grinding media, steel, reagents, liners, explosives and diluents. The prices of such commodities are influenced by supply and demand trends affecting the mining industry in general and other factors outside our control and such prices are at times subject to volatile movements. Increases in the cost of these commodities or disruptions in energy supply could make our operations less profitable, even in an environment of relatively high copper prices. Increases in the costs of commodities that we consume or use may also significantly affect the capital costs of new projects.
We may be adversely affected by labor disputes.
During the five years prior to April 30, 2007, we did not experience any strikes. Between April 2007 and June 2008, we were affected by five strikes, each lasting three to seven days, at our Uchucchacua, Orcopampa, Ishihuinca and Antapite mines. On October 19, 2009, the National Mining Federation held a two-day strike at our Uchucchacua mine. In 2010, we experienced two simultaneous strikes, each lasting approximately seven days, affecting operations at our Orcopampa, Uchucchacua and Antapite mines. In April 2011, we experienced a 21-day strike, which affected operations at our Uchucchacua mine. In May 2011, we experienced a three-day strike at our Orcopampa mine.
There can be no assurance that we will not experience strikes or other labor-related work stoppages that could have a material adverse effect on our operations and/or operating results in the future.
On June 10, 2008, the Sindicato Único de Trabajadores of Sociedad Minera de Cerro Verde S.A.A. commenced an 11-day strike at Cerro Verde. The strike, which was declared illegal by the Peruvian Work Ministry, ended on June 21, 2008 and did not negatively impact Cerro Verde’s operations. On November 15, 2008, Cerro Verde and the Sindicato Único de Trabajadores signed a union agreement that is retrospectively applicable from September 1, 2008 through August 31, 2011.
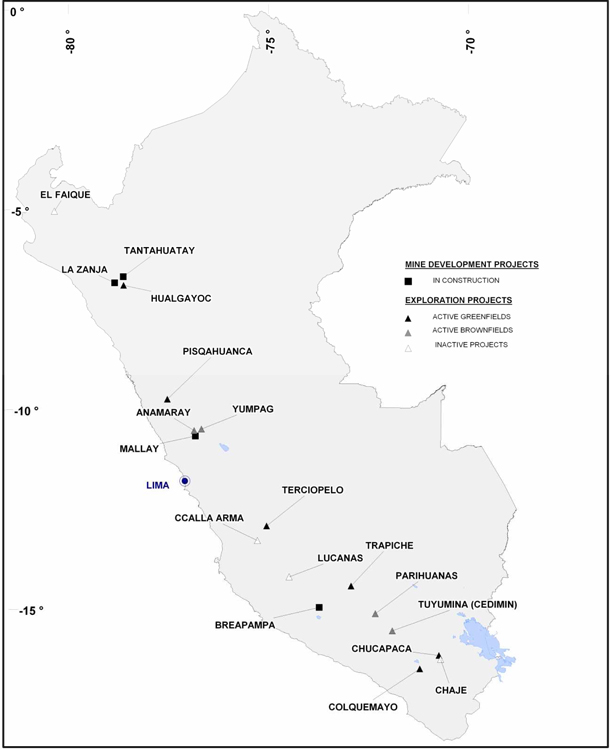
Our and Yanacocha’s operations are subject to political and social risks.
Our and Yanacocha’s exploration and production activities are potentially subject to political and social risks. Over the past several years, we and Yanacocha have been the target of local political protests, including community protests at our La Zanja project, a roadblock in protest of drilling activities at Yanacocha’s Cerro Quilish mine and a roadblock carried out by members of the Combayo community. In September 2004, due to the incidents at Cerro Quilish, Yanacocha suspended all drilling activities at this mine. In December 2004, Yanacocha removed the Cerro Quilish gold deposit from its proven and probable reserves. See “Item 4. Information on the Company—The Company—Business Overview—Greenfield Exploration Projects—La Zanja” and “Item 4. Information on the Company—Yanacocha—Legal Proceedings.” There can be no assurance that these incidents will not continue, or that similar incidents will not occur, or that the continuation or intensification of community protests would not adversely affect our or Yanacocha’s exploration and production activities or our or Yanacocha’s results of operations or financial condition.
We could face geotechnical challenges, which could adversely impact our production and profitability.
No assurances can be given that unanticipated adverse geotechnical and hydrological conditions, such as landslides and pit wall failures, will not occur in the future or that such events will be detected in advance. Geotechnical instabilities can be difficult to predict and are often affected by risks and hazards outside of our control, such as severe weather and considerable rainfall, which may lead to periodic floods, mudslides, wall instability, and seismic activity, which may result in slippage of material.
Geotechnical failures could result in limited or restricted access to mine sites, suspension of operations, government investigations, increased monitoring costs, remediation costs, loss of ore and other impacts, which could cause one or more of our projects to be less profitable than currently anticipated and could result in a material adverse effect on our results of operations and financial position.
We rely on contractors to conduct a significant portion of our operations and mine development projects.
A significant portion of our operations and mine development projects are currently conducted by contractors. As a result, our operations are subject to a number of risks, some of which are outside our control, including:
| | · | failure of a contractor to perform under its agreement; |
| | · | interruption of operations or increased costs in the event that a contractor ceases its business due to insolvency or other unforeseen events; |
| | · | failure of a contractor to comply with applicable legal and regulatory requirements, to the extent it is responsible for such compliance; and |
| | · | problems of a contractor with managing its workforce, labor unrest or other employment issues. |
In addition, we may incur liability to third parties as a result of the actions of our contractors. The occurrence of one or more of these risks could adversely affect our results of operations and financial position.
We are not, and do not intend to become, regulated as an investment company under the U.S. Investment Company Act of 1940, as amended, or the Investment Company Act, and if we were deemed an “investment company” under the U.S. Investment Company Act, applicable restrictions could make it impractical for us to operate as contemplated.
As of December 31, 2010, we owned a 43.65 percent partnership interest in Yanacocha and a 19.26 percent equity interest in Cerro Verde. These interests may constitute “investment securities” for purposes of the Investment Company Act.
Under the Investment Company Act, an investment company is defined in relevant part to include (i) any company that is or holds itself out as being engaged primarily, or proposes to engage primarily, in the business of investing, reinvesting or trading in securities and (ii) any company that owns or proposes to acquire investment securities having a value exceeding 40 percent of such company’s total assets (exclusive of certain items) on an unconsolidated basis. Issuers that are investment companies within the meaning of the Investment Company Act, and which do not qualify for an exemption from the provisions of such act, are required to register with the SEC and are subject to substantial regulations with respect to capital structure, operations, transactions with affiliates and other matters. If we were deemed to be an investment company and did not qualify for an exemption from the provisions of the Investment Company Act, we would be required to register with the SEC and would be subject to such regulations, which would be unduly burdensome and costly for us and possibly adversely impact us.
We received an order from the SEC on April 19, 1996 declaring us to be primarily engaged in a business other than that of an investment company and, therefore, not an investment company within the meaning of the Investment Company Act. We intend to conduct our operations and maintain our investments in a manner, and will take appropriate actions as necessary, to ensure we will not be deemed to be an investment company in the future. The SEC, however, upon its motion or upon application, may find that the circumstances that gave rise to the issuance of the order no longer exist, and as a result may revoke such order. There can be no assurance that such order will not be revoked.
Factors Relating to Peru
Peruvian political conditions may have an adverse impact on our, Yanacocha’s and Cerro Verde’s business.
All of our, Yanacocha’s and Cerro Verde’s operations are conducted in Peru. Accordingly, our, Yanacocha’s and Cerro Verde’s business, financial condition or results of operations could be affected by changes in economic or other policies of the Peruvian government or other political, regulatory or economic developments in Peru.
During the past several decades, Peru has had a history of political instability that has included military coups and a succession of regimes with differing policies and programs. Past governments have frequently played an interventionist role in the nation’s economy and social structure. Among other things, past governments have imposed controls on prices, exchange rates and local and foreign investment as well as limitations on imports, restricted the ability of companies to dismiss employees, expropriated private sector assets (including mining companies) and prohibited the remittance of profits to foreign investors.
During the 1980s, government policies restricted our ability, among other things, to repatriate funds and import products from abroad. In addition, currency exchange rates were strictly controlled, and all export sales were required to be deposited in Peru’s Banco Central de Reserva, or Central Bank, where they were exchanged from U.S. Dollars to Peruvian currency at less-than-favorable rates of exchange. These policies generally affected our results of operations. Controls on repatriation of funds limited the ability of our shareholders to receive dividends outside of Peru, but did not limit the ability of our shareholders to receive distributions of earnings in Peru. See “Item 10. Additional Information—Exchange Controls.”
In July 1990, Alberto Fujimori was elected president of Peru, and his administration implemented a broad-based reform of Peru’s political system, economy and social conditions, aimed at stabilizing the economy, restructuring the national government by reducing bureaucracy, privatizing state-owned companies, promoting private investment, developing and strengthening free markets, institutionalizing democratic representation and enacting programs for the strengthening of basic services related to education, health, housing and infrastructure. However, after Fujimori’s reelection to his third five-year term of office in 2000, Fujimori resigned from his post amid increasing social pressure. Following two years of political turmoil, Alejandro Toledo became president in 2001, and his government largely retained the economic policies of the previous government, focusing on promoting private investment, privatizing state-owned companies in various sectors including energy, mining and public services.
When no candidate in the 2006 elections garnered the required simple majority of votes, Ollanta Humala from the Partido Unión por el Peru, or the UPP, and Alan García Pérez of the Partido Alianza Popular Revolucionaria, or APRA, ran against each other in a second-round election. Alan García Pérez was elected, and his government largely continued the economic policies of its predecessor.
During the 1980s and early 1990s the Sendero Luminoso, or SL, and the Movimiento Revolucionario Tupac Amaru, or MRTA, terrorist organizations were particularly active in Peru. Although SL and MRTA were almost de-activated in 1992 and 1997 respectively, we cannot guarantee that acts by these or other terrorist organizations will not adversely affect our operations in the future.
Regional elections in Peru took place in October 2010. In addition, the Peruvian general election took place on April 10, 2011. As no presidential candidate received a majority of valid votes, a run-off election between the top two presidential candidates, Keiko Fujimori of Fuerza 2011 and Ollanta Humala of Gana Perú, was held on June 5, 2011. Humala was elected by a narrow margin and will be sworn in on July 28, 2011. During his 2006 presidential campaign, Humala, the leftist candidate, made statements indicating his intention to nationalize the mining sector, renegotiate what he considered unfair mining contracts and impose windfall profit taxes on mining activities, albeit without affecting competitiveness. Although Humala moderated his platform in the 2011 election, he initially expressed during his recent campaign his intention to increase taxes on mining companies. These taxes are expected to be calculated based on operating margin, but there can be no assurance regarding their structure. Moreover, some commentators have speculated that Humala harbors intentions to enact a radical agenda in spite of his newly professed center-left ideology. It is possible that, once Humala assumes office, government policies with respect to mining concessions and environmental regulations could be changed in a manner that is adverse to our, Yanacocha’s and Cerro Verde’s interests. As a result, although the current government has generally taken positions promoting private investment, we cannot predict future government positions on mining concessions, land tenure, environmental regulation or taxation or assure you that the Humala government will maintain a generally favorable business climate and economic policies.
Inflation, reduced economic growth and fluctuations in the Nuevo Sol exchange rate may adversely affect our financial condition and results of operation.
Over the past several decades, Peru has experienced periods of high inflation, slow or negative economic growth and substantial currency devaluation. The inflation rate in Peru, as measured by the Indice de Precios al Consumidor, or IPC, and published by Instituto Nacional de Estadística e Informática, or INEI, has fallen from a high of 7,649.7 percent in 1990 to 1.1 percent in 2006, 3.93 percent in 2007, 6.7 percent in 2008, 0.25 percent in 2009 and 2.08 percent in 2010. The Peruvian currency has been devalued numerous times during the last 20 years. The devaluation rate has decreased from a high of 4,019.3 percent in 1990 to a revaluation of 6.4 percent in 2006, a revaluation of 7.0 percent in 2007, a devaluation of 5.4 percent in 2008, a revaluation of 7.6 percent in 2009 and a revaluation of 2.08 percent in 2010. Our revenues and operating expenses are primarily denominated in U.S. Dollars. If inflation in Peru were to increase without a corresponding devaluation of the Nuevo Sol relative to the U.S. Dollar, our financial position and results of operations, and the market price of our Common Shares and American Depositary Shares, or ADSs, could be affected. Although the Peruvian government’s stabilization plan has significantly reduced inflation, and the Peruvian economy has experienced strong growth in recent years, there can be no assurance that inflation will not increase from its current level or that such growth will continue in the future at similar rates or at all.
Among the economic circumstances that could lead to a devaluation would be the decline of Peruvian foreign reserves to inadequate levels. Peru’s foreign reserves at December 31, 2010 were US$44.1 billion as compared to US$33.1 billion at December 31, 2009. Although actual foreign reserves must be maintained at levels that will allow the succeeding government the ability to manage the Peruvian economy and to assure monetary stability in the near future, there can be no assurance that Peru will be able to maintain adequate foreign reserves to meet its foreign currency denominated obligations, or that Peru will not devalue its currency should its foreign reserves decline. See “Item 3. Key Information—Selected Financial Data—Exchange Rates.”
Peru’s current account deficit is being funded partially by foreign direct investment. There can be no assurance that foreign direct investment will continue at current levels, particularly if adverse political or economic developments in Peru arise, a development that may also contribute to devaluation pressure.
Deterioration in economic and market conditions in Latin America, Peru and other emerging market countries could affect the prices of our Common Shares and American Depositary Receipts, or ADRs.
The market for securities issued by Peruvian companies is influenced by economic and market conditions in Peru and, to varying degrees, market conditions in other Latin American and emerging market countries. Within Peru, news of Ollanta Humala’s June 5, 2011 victory in the presidential election was followed by a 12 percent decline in both the Lima stock exchange (Bolsa de Valores de Lima, or BVL) and BVL’s mining sub-index the following day. The price of our ADRs fell 15 percent. A number of banking analysts lowered their recommendations on Peruvian mining companies following the election as a result of concerns of higher taxes and delays in mining projects. It is possible that the election of Humala will precipitate increased volatility in the Peruvian stock market in general and in the share price of Peruvian mining companies in particular.
Although economic conditions are different in each country, the reaction of investors to developments in one country is likely to cause the capital markets in other countries to fluctuate. For example, political and economic events, such as the crises in Venezuela, Ecuador, Bolivia, Brazil and Argentina, have influenced investors’ perceptions of risk with regard to Peru. The negative investor reaction to developments in our neighboring countries may adversely affect the market for securities issued by countries in the region, cause foreign investors to decrease the flow of capital into Latin America and introduce uncertainty about plans for further integration of regional economies.
Peruvian exchange and investment control policies could affect dividends paid to holders of Common Shares and ADRs.
Peruvian law currently imposes no restrictions on the ability of companies operating in Peru to transfer foreign currency from Peru to other countries, to convert Peruvian currency into foreign currency or foreign currency into Peruvian currency or to remit dividends abroad or on the ability of foreign investors to liquidate their investment and repatriate their capital. Prior to 1991, Peru had restrictive exchange controls and exchange rates. During the latter part of the 1980s, exchange restrictions prevented payment of dividends to our shareholders in the United States in U.S. Dollars. Accordingly, should such or similar controls be instituted, dividends paid to holders of Common Shares and, consequently, holders of ADRs, could be affected. There can be no assurance that the Peruvian government will continue to permit such transfers, remittances or conversion without restriction. See “Item 10. Additional Information—Exchange Controls.”
Our accounting standards and corporate disclosure may differ from the accounting standards used in and disclosure regularly published by or about issuers of securities in other countries, including the United States.
We prepare our financial statements using Peruvian GAAP, which differs in certain material respects from U.S. GAAP. Thus, the presentation of Peruvian financial statements and reported earnings may not be comparable to those companies whose financial statements are prepared in accordance with U.S. GAAP. See Note 32 to the Financial Statements for a description of the significant differences between Peruvian GAAP and U.S. GAAP, as such differences relate to us, and Note 33 for a reconciliation to U.S. GAAP of our net income and shareholders’ equity for the period included therein. In addition, as a foreign private issuer in the United States, we are subject to less intensive reporting requirements and information regarding us may not be as readily disseminated into the market.
Holders of our securities may find it difficult to enforce judgments against us outside of Peru.
We are organized under the laws of Peru. A significant majority of our directors and officers reside outside the United States (principally in Peru). All or a substantial portion of our assets or the assets of such persons are located outside the United States. As a result, it may not be possible for investors to effect service of process within the United States upon us or upon such persons or to enforce against them in federal or state courts in the United States judgments predicated upon the civil liability provisions of the federal securities laws of the United States. We have been advised by our Peruvian counsel that there is uncertainty as to the enforceability, in original actions in Peruvian courts, of liabilities predicated solely under the United States federal securities laws and as to the enforceability in Peruvian courts of judgments of United States courts obtained in actions predicated upon the civil liability provisions of the United States federal securities laws.
Factors Relating to the Common Shares and ADSs
The concentration of our capital stock ownership with the Benavides Family will limit our stockholders’ ability to influence corporate matters.
The aggregate percentage of the economic interest of our outstanding share capital controlled by Alberto Benavides de la Quintana, our former Chairman and Chief Executive Officer, and held by certain members of his immediate and extended family and their spouses, or the Benavides Family, as of April 30, 2011, was 27.58 percent. Because of the significant ownership interest the Benavides Family holds in common shares and because the Investment Shares held by others do not have voting rights, the Benavides Family has the power to elect a significant number of the outstanding directors and has significant influence over the outcome of substantially all matters to be decided by a vote of shareholders. In addition, under the terms of the Amended and Restated Deposit Agreement dated May 3, 2002, as further amended and restated as of November 12, 2003, among us, The Bank of New York Mellon (formerly The Bank of New York), as depositary, or the Depositary, and the owners and beneficial owners of ADSs, or the Amended and Restated Deposit Agreement, relating to our ADSs, if holders of ADSs do not provide the Depositary with timely instructions for the voting of Common Shares represented by such ADRs, the Depositary will be deemed to be instructed to give a person designated by us, which will likely be Alberto Benavides de la Quintana, a discretionary proxy to vote such shares, unless we inform the Depositary that we do not wish such proxy to be given.
Shareholders’ rights under Peruvian law may be fewer and less well-defined than shareholders’ rights in other countries, including the United States.
Our shareholders have fewer and less well-defined rights under applicable Peruvian law than they might have as shareholders of a corporation incorporated in a jurisdiction of the United States or certain other countries.
A sale of a substantial number of shares by the Benavides Family could have an adverse impact on the price of the Common Shares and ADSs.
Sales of a substantial number of our shares by members of the Benavides Family could materially and adversely affect prevailing market prices for the Common Shares and ADSs. There is no contractual restriction on the disposition of shares of our share capital by our shareholders, including the Benavides Family. Furthermore, under the Ley General de Sociedades Peruana, or Peruvian Companies Law, any restriction on the free sale of shares in a sociedad anónima abierta (open stock company) such as we are, is null and void.
Holders of ADSs may be unable to exercise preemptive rights and accretion rights available to the Common Shares underlying the ADSs.
Holders of the ADSs are, under Peruvian law, entitled to exercise preemptive rights and accretion rights on the Common Shares underlying the ADSs in the event of any future capital increase by us unless (x) the increase is approved, expressly stating that the shareholders have no preemptive rights to subscribe and pay for the Shares to be issued in such increase, by holders of Common Shares, holding at least 40 percent of the Common Shares, at a properly called meeting with a proper quorum and (y) the increase is not designed to improve directly or indirectly the shareholding of any shareholder. However, United States holders of ADSs may not be able to exercise through the Depositary for the ADSs the preemptive rights and accretion rights for Common Shares underlying their ADSs unless a registration statement under the Securities Act of 1933, as amended, or the Securities Act, is effective with respect to such rights or an exemption from the registration requirement thereunder is available. Any such rights offering would have a dilutive effect upon shareholders who are unable or unwilling to exercise their rights. We intend to evaluate, at the time of any rights offering, the costs and potential liabilities associated with any registration statement as well as the benefits to it of enabling the holders of ADSs to exercise such rights and will then make a decision as to whether to file such a registration statement. Therefore, no assurance can be given that any such registration statement would be filed. To the extent that holders of ADSs are unable to exercise such rights because a registration statement has not been filed and no exemption from such registration statement under the Securities Act is available, the Depositary will, to the extent practicable, sell such holders’ preemptive rights or accretion rights and distribute the net proceeds thereof, if any, to the holders of ADSs and such holders’ equity interest in us would be diluted proportionately. The Depositary has discretion to make rights available to holders of ADSs or to dispose of such rights and to make any net proceeds available to such holders. If, by the terms of any rights offering or for any other reason, the Depositary is not able to make such rights or such net proceeds available to any holder of ADSs, the Depositary may allow the rights to lapse.
| ITEM 4. | Information on the Company |
THE COMPANY
| A. | History and Development |
Overview
We are Peru’s largest publicly-traded precious metals company and are engaged in the exploration, mining and processing of gold, silver and, to a lesser extent, other metals in Peru. We currently operate the Julcani, Recuperada, Orcopampa, Poracota, Uchucchacua, Antapite and Ishihuinca mines and have controlling interests in two other mining companies which operate the Colquijirca, Marcapunta and Shila-Paula mines. We also own an electric power transmission company and an engineering services consulting company and have minority interests in several other mining companies, including a significant ownership interest in Yanacocha, a Peruvian partnership that operates South America’s largest gold mine, and Cerro Verde, a Peruvian company that operates a copper mine located in the south of Peru. For the year ended December 31, 2010, our consolidated net sales were US$1,047.9 million and our consolidated net income was US$662.9 million. The tables below summarize the total production and our equity share of production for the Julcani, Recuperada, Orcopampa, Poracota, Uchucchacua, Antapite and Ishihuinca, Shila-Paula, Colquijirca, Marcapunta, Yanacocha and Cerro Verde mines for the year ended December 31, 2010:
| | | TOTAL PRODUCTION | | | TOTAL EQUITY PRODUCTION | |
| | | | | | | | | | | | | | | | | | | | | | | | | | | | | | | | | | |
| UNIT | | BVN% PARTICIPATION | | | Silver Oz | | | Gold Oz | | | Lead DST | | | Zinc DST | | | Copper DST | | | Silver Oz | | | Gold Oz | | | Lead DST | | | Zinc DST | | | Copper DST | |
| | | | | | | | | | | | | | | | | | | | | | | | | | | | | | | | | | |
| Orcopampa | | | 100 | % | | | 104,400 | | | | 319,694 | | | | - | | | | - | | | | - | | | | 104,400 | | | | 319,694 | | | | - | | | | - | | | | - | |
| Poracota | | | 100 | % | | | 27,169 | | | | 59,803 | | | | - | | | | - | | | | - | | | | 27,169 | | | | 59,803 | | | | - | | | | - | | | | - | |
| Uchucchacua | | | 100 | % | | | 9,269,718 | | | | - | | | | 8,687 | | | | 7,702 | | | | - | | | | 9,269,718 | | | | - | | | | 8,687 | | | | 7,702 | | | | - | |
| Julcani | | | 100 | % | | | 2,237,063 | | | | 2,118 | | | | 2,202 | | | | - | | | | 305 | | | | 2,237,063 | | | | 2,118 | | | | 2,202 | | | | - | | | | 305 | |
| Recuperada | | | 100 | % | | | 571,189 | | | | - | | | | 3,488 | | | | 2,494 | | | | - | | | | 571,189 | | | | - | | | | 3,488 | | | | 2,494 | | | | - | |
| Antapite | | | 100 | % | | | 36,870 | | | | 35,803 | | | | - | | | | - | | | | - | | | | 36,870 | | | | 35,803 | | | | - | | | | - | | | | - | |
| Ishihuinca | | | 100 | % | | | - | | | | 917 | | | | - | | | | - | | | | 16 | | | | - | | | | 917 | | | | - | | | | - | | | | - | |
| Shila-Paula | | | 100 | % | | | 46,578 | | | | 14,157 | | | | - | | | | - | | | | - | | | | 46,578 | | | | 14,157 | | | | - | | | | - | | | | - | |
| El Brocal | | | 46.08 | % | | | 2,509,536 | | | | 5,549 | | | | 12,768 | | | | 38,955 | | | | 18,707 | | | | 1,156,394 | | | | 2,557 | | | | 5,883 | | | | 17,950 | | | | 8,620 | |
| La Zanja | | | 53.06 | % | | | 38,155 | | | | 43,727 | | | | - | | | | - | | | | - | | | | 20,245 | | | | 23,202 | | | | - | | | | - | | | | - | |
| Yanacocha | | | 43.65 | % | | | 3,561,991 | | | | 1,461,620 | | | | - | | | | - | | | | 267 | | | | 1,554,809 | | | | 637,997 | | | | - | | | | - | | | | 116 | |
| Cerro Verde | | | 19.26 | % | | | 1,625,741 | | | | - | | | | - | | | | - | | | | 343,748 | | | | 313,118 | | | | - | | | | - | | | | - | | | | 66,206 | |
| | | | | | | | | | | | | | | | | | | | | | | | | | | | | | | | | | | | | | | | | | | | | |
| TOTAL PRODUCTION | | | | 20,028,410 | | | | 1,943,388 | | | | 27,145 | | | | 49,151 | | | | 363,043 | | | | 15,337,553 | | | | 1,096,248 | | | | 20,260 | | | | 28,146 | | | | 75,247 | |
Compañía de Minas Buenaventura S.A.A., a sociedad anónima abierta (open stock company) under the laws of Peru, was originally established in 1953 as a sociedad anónima (company) under the laws of Peru, and currently operates under the laws of Peru. Our registered office is located at Carlos Villarán 790, Santa Catalina, La Victoria, Lima 13, Perú, telephone no. 5-11-419-2500. Our Internet website address is http://www.buenaventura.com. The information on our website is not a part of, and is not incorporated into, this document.
History
During our first 25 years, our efforts focused on the exploration of silver mines. During this period, we built up our principal mines in Peru, commencing with the acquisition of the Julcani mine in 1953. We commenced exploration of the Orcopampa mine in 1962 and operations in 1965. We began exploring the Uchucchacua mine site in 1960 and, after operating a pilot project in the area in the early 1970s with successful results, built an ore processing plant at the mine site, which began operations in 1975.
Because of political uncertainties in Peru in the mid-1970s, we explored mining possibilities in other countries in South America, including Colombia, Ecuador, Venezuela, Bolivia and Argentina. Exploration began on a small scale at the Toachi mine near Quito, Ecuador, but this project was discontinued in 1981 due to border disputes between Peru and Ecuador. At that time, we also decided to discontinue our exploration outside Peru and to intensify efforts in Peru.
Following a sharp increase in silver prices, which peaked in 1980, we initiated a program to explore for gold and, to a lesser extent, other metals in Peru to reduce our dependence on silver, since we believed the high price of silver could not be sustained. Faced with declining silver prices throughout the 1980s, we expanded silver output to reduce cash flow while at the same time continuing our exploration efforts for other metals. Exploration of gold anomalies in the Yanacocha district began in 1983 and an expansion of the Orcopampa mine, which had operated since 1967 as a silver-producing mine, to enable us to explore newly-discovered gold veins began in 1984 and was concluded in 1999. In 2002, after an intense exploration program of the Orcopampa mine, gold production was commenced in the Chipmo area. New gold mining operations commenced at the Ishihuinca mine in the early 1980s and at the Antapite mine in 2001.
Since the late 1980s, we have continued our efforts to decrease our exposure to silver price fluctuations and have pursued a plan to increase overall precious metals production and production efficiency. We have continued to expand our mineral reserves through the implementation of property acquisition and intensive exploration programs designed to increase reserves and production of gold. As part of this strategy, we acquired an equity interest in Yanacocha and conducted exploration leading to the discovery of gold mineralization and subsequent production of gold at the Orcopampa, Shila, Ishihuinca and Antapite mines. In addition, we acquired an equity interest in Cerro Verde, which operates an open-pit copper mine in Peru. These initiatives have transformed us from primarily a silver producer into primarily a gold producer, based on allocated revenue. In 2010, gold, copper, silver and other metals accounted for 58 percent, 24 percent, 12 percent and 6 percent, respectively, of our equity share of revenues in our consolidated subsidiaries, Yanacocha and Cerro Verde.
On January 14, 1992, we, through our wholly-owned subsidiary, Compañía Minera Condesa S.A., or Condesa, together with Newmont Second Capital Corporation, or Newmont Second, a wholly-owned subsidiary of Newmont Mining, and Société d’Etudes, de Recherches et d’Exploitations Miniéres, or Serem, a wholly-owned subsidiary of the Bureau de Recherches Geologiques et Minières, or BRGM, the geological and mining bureau of the French government, formed Yanacocha to continue exploration of the deposits at a mining site in the Cajamarca area. At that time, Yanacocha was 38 percent owned by Newmont Second, 24.7 percent owned by Serem, 32.3 percent owned by Condesa and 5 percent owned by The International Finance Corporation, or IFC, the branch of the World Bank that promotes private investments. As of April 30, 2011, our participation in Yanacocha was 43.65 percent, and Newmont Second’s was 51.35 percent, with IFC continuing to own 5 percent.
In October 2000, we and Newmont Mining agreed to consolidate our properties in Cajamarca, northern Peru, in Yanacocha. Under the consolidation plan and according to agreements signed in December 2000, we sold several assets to Yanacocha, including the Minas Conga project, the China Linda lime plant, mining rights, aerial land and other machinery and equipment and inventories. See “—Property, Plants and Equipment—Yanacocha’s Properties—Operating Properties.” We received approximately US$9 million in connection with this sale. We also entered into an administration agreement with Yanacocha, setting forth that we would manage the China Linda lime plant until December 18, 2010, for a monthly fee of US$10,000 plus reimbursement of all incurred costs. However, in December 2001, Yanacocha terminated the agreement and we ceased to manage the China Linda plant. As a result of the termination, we received a payment of US$1.8 million from Yanacocha.
On June 1, 2005, Cerro Verde conducted a capital increase whereby we subscribed 42,925,975 shares for US$154.9 million, increasing our interest in Cerro Verde from 9.17 percent to 18.21 percent. Freeport-McMoRan Copper & Gold Inc. maintains a majority interest in Cerro Verde. See “—Intermediate Holding Companies, Subsidiaries and Equity Participations—Sociedad Minera Cerro Verde S.A.A.” As of April 30, 2011, Cerro Verde was 53.56 percent owned by Cyprus Climax Metals Company, a subsidiary of Freeport-McMoRan Copper & Gold Inc., 21.00 percent owned by SMM Cerro Verde Netherlands B.V. and 19.26 percent owned by us.
Redesignation of our Shares and ADSs; Share Split
At our shareholders’ meeting held on April 30, 2002, following special meetings of our Series A shareholders and Series B shareholders on the same date, or the Special Meetings, amendments to our estatutos, or By-laws, were approved pursuant to the Special Meetings to effect the redesignation of each outstanding Series B Share as one Series A Share and the immediate redesignation thereafter of each Series A Share as one Common Share, or the Redesignation. The Redesignation was effective May 3, 2002. At that date, we had Common Shares with a nominal par value of S/.4.00 per share and Investment Shares also with a nominal par value of S/.4.00 per share. The Common Shares represent 100 percent of our outstanding share capital. The Investment Shares have no voting rights and are not, under Peruvian law and accounting rules, characterized as share capital.
Our ADSs have traded on the New York Stock Exchange Inc., or the New York Stock Exchange, since May 15, 1996. Prior to the Redesignation, each of our ADSs represented two Series B Shares. In connection with the Redesignation, we submitted a technical original listing application to the New York Stock Exchange dated April 25, 2002, or the Application, for the redesignation of our ADSs representing non-voting Class B Shares to ADSs representing voting Common Shares and the reservation of additional ADSs issuable upon redesignation of Class B Shares as Class A Shares and immediate redesignation thereafter of Class A Shares as Common Shares. The New York Stock Exchange approved the Application prior to the date of Redesignation and on May 3, 2002, each of our ADSs represented two Common Shares. Since that date, we have had Common Shares with a nominal par value of S/.4.00 per share. On November 3, 2003, we submitted a supplemental listing application to the New York Stock Exchange to modify the ratio of our ADSs, and on November 12, 2003, our ratio of Common Shares per ADSs was modified from two Common Shares per ADS to one Common Share per ADS.
In March 2008, our shareholders approved an increase in the nominal par value of our Common Shares and Investment Shares from S/.4.00 per Common Share or Investment Share to S/.20.00 per Common Share or Investment Share, as well as a subsequent two-for-one stock split of our Common Shares and Investment Shares. In July 2008, we conducted a two-for-one stock split of our outstanding Common Shares, Investment Shares and ADSs. As a result, we had 274,889,924 outstanding Common Shares, including 21,160,260 treasury shares, and 744,640 outstanding Investment Shares, including 61,976 treasury shares, as of December 31, 2010. In connection with the stock split, our By-laws were amended to decrease the nominal par value of our Common Shares and Investment Shares from S/.20.00 to S/.10.00 per Common Share or Investment Share.
Business Strategy
Our strategy is to strengthen our position as one of Peru’s leading gold and silver mining companies by expanding our reserves and production. We are currently engaged in an active exploration and mine development program and participate in several mining exploration projects with Newmont Mining, Sumitomo Metal Mining Peru S.A., or Sumitomo, Minera Gold Fields Peru S.A., or Gold Fields, Southern Copper Corporation, or SCC, Freeport and Teck Cominco Perú S.A., or Teck Cominco. Further, we seek to increase the efficiency and capacity of our mining operations. We are aware of our social and environmental responsibilities and aim to excel in the prevention, mitigation and rehabilitation of mining-related disturbances.
Maintaining an Active Exploration Program
We view an active exploration program as our primary means to obtain new reserves. As of March 31, 2011, we hold and currently evaluate, either directly or in conjunction with exploration partners, 501,140 hectares of mining rights, excluding an additional 232,013 hectares in mining properties which are consolidated in our production units (excluding 89,571 hectares in our La Zanja, Compañía Minera Coimolache S.A., or Coimolache, Colquirrumi and Compañía de Exploraciones, Desarrollo e Inversiones Mineras S.A.C., or Cedimin, subsidiaries). We are thus a major holder of mining rights in Peru, holding in excess of 1 million hectares on a consolidated basis with our subsidiaries, Minera Yanacocha and Sociedad Minera Cerro Verde.
During 2010 we spent approximately US$34.11 million on “greenfield” and US$9.24 million on “brownfield” exploration-related investments in Peru. Our “greenfield” investments focused on the following exploration projects: Chucapaca, Colquemayo, Breapampa, Terciopelo, Chaje, La Zanja, Lucanas, Pisqahuanca, Trapiche, Hualgayoc and El Faique projects. The 2010 exploration program was financed by internal funds. Our “brownfield” investments focused on the following exploration projects in 2010: Mallay, Yumpag, Huamani Huayta, Tuyumina and Parihuanas. In 2011, we intend to invest approximately US$16.7 million in the Huamanihuayta, Tuyumina, Parihuanas and Yumpag brownfield exploration projects. In 2011, we expect to invest approximately US$8.8 million in the following greenfield exploration projects: Pisqahuanca, Colquemayo, El Faique and Surichata. We also expect to invest approximately US$35.5 million in the following advanced exploration projects during 2011: Chucapaca, Trapiche and Hualgayoc.
Participation in Mining Exploration Agreements
In addition to managing and operating precious metals mines, we participate in mining exploration agreements with mining partners to reduce risks, gain exposure to new technologies and diversify revenues to include other metals. See “—Business Overview—Exploration.” We believe that maintaining our focus on mining operations complements our partnership strategy because the engineering and geological expertise gained from such operations enhances our ability to participate in and contribute to those projects.
Capital Expenditures
Our capital expenditures in the past three years have related principally to the acquisition of new mining properties, construction of new facilities and renewal of plant and equipment. Capital expenditures relating to exploration are not included herein and are discussed separately in “—Business Overview—Exploration.” Set forth below is information concerning capital expenditures incurred by us in respect of each of our principal operating mines (not including capital expenditures for administrative purposes or other non-mining subsidiaries) and by category of expenditure:
| | | Year Ended December 31, | |
| | | | | | | | | | |
| | | | | | (in thousands) | | | | |
| Julcani | | US$ | 1,150 | | | US$ | 765 | | | US$ | 853 | |
Uchucchacua(b) | | | 15,187 | | | | 7,157 | | | | 11,781 | |
Orcopampa(c) | | | 14,744 | | | | 8,163 | | | | 17,490 | |
| Recuperada | | | 2,525 | | | | 1,172 | | | | 1,284 | |
| Ishihuinca | | | 97 | | | | 9 | | | | 17 | |
| Shila-Paula | | | 1,661 | | | | 1,134 | | | | 1,429 | |
Colquijirca and Marcapunta(d) | | | 8,391 | | | | 72,389 | | | | 70,974 | |
| Antapite | | | 652 | | | | 49 | | | | 302 | |
| Conenhua | | | 1,776 | | | | 1,283 | | | | 3,204 | |
| Mallav | | | - | | | | - | | | | 7,735 | |
| La Zanja | | | - | | | | 26,481 | | | | 48,998 | |
| Huanza | | | - | | | | 6,492 | | | | 62,828 | |
| Total | | US$ | 46,183 | | | US$ | 125,094 | | | US$ | 226,895 | |
| | | Year Ended December 31, | |
| | | | | | | | | | |
| | | | | | (in thousands) | | | | |
| Machinery and equipment | | US$ | 3,639 | | | US$ | 4,796 | | | US$ | 12,658 | |
| Infrastructure | | | 23,981 | | | | 114,201 | | | | 187,534 | |
| Mining | | | 3,777 | | | | 1,102 | | | | 7,624 | |
| Milling | | | 9,594 | | | | 2,192 | | | | 13,754 | |
| Transportation | | | 397 | | | | 159 | | | | 1,108 | |
| Communications | | | 133 | | | | 118 | | | | 309 | |
| Environmental | | | 36 | | | | 0 | | | | 249 | |
| Other | | | 4,626 | | | | 2,526 | | | | 3,659 | |
| Total | | US$ | 46,183 | | | US$ | 125,094 | | | US$ | 226,895 | |
| (a) | Amounts do not include the following expenditures for mining concessions: US$0.55 million in 2010, US$21.99 million in 2009 and US$9.97 million in 2008. |
| (b) | For 2010, includes US$2.4 million for the construction of the second stage of the tailings treatment circuit. |
| (c) | For 2010, includes US$2.0 million for the second stage of the tailings dam retreatment project. |
| (d) | For 2009 and 2010, includes US$47.6 million and US$57.4 million, respectively, for the expansion of the El Brocal treatment plant from 6,000 MT per day to 18,000 MT per day. |
We financed our capital expenditures in 2008, 2009 and 2010 with internally-generated funds.
We have budgeted approximately US$200.0 million for capital expenditures for 2011. Exploration expenses in non-operating units are expected to be approximately US$44.3 million in 2011, including our US$28.5 million participation in the Chucapaca project. To fund our planned capital expenditures program, we plan to use internally-generated funds. See “Item 5. Operating and Financial Review and Prospects—The Company—Liquidity and Capital Resources.”
We continuously evaluate opportunities to expand our business within Peru, as well as in other countries as opportunities arise, and expect to continue to do so in the future. We may in the future decide to acquire part or all of the equity of, or undertake other transactions with, other companies involved in the same business as us or in other related businesses. However, there can be no assurance that we will decide to pursue any such new activity or transaction.
Production
We principally produce refined gold and silver, either as doré bars or concentrates, and other metals such as lead, zinc and copper as concentrates that we distribute and sell locally and internationally. The following table sets forth the production of the Antapite, Julcani, Uchucchacua, Orcopampa, Poracota, Recuperada, Ishihuinca, Colquijirca, Marcapunta and Shila-Paula mines by type of product for the last three years, calculated in each case on the basis of 100 percent of the applicable mine’s production. Production from Cerro Verde and Yanacocha are not included in these production figures.
| | | Year Ended December 31, (1) | |
| | | | | | | | | | |
Gold (oz.)(2) | | | 425,257 | | | | 426,465 | | | | 481,768 | |
| Silver (oz.) | | | 18,606,478 | | | | 16,824,190 | | | | 14,840,678 | |
Zinc (ST)(3) | | | 105,755 | | | | 85,464 | | | | 49,151 | |
| Lead (ST) | | | 44,299 | | | | 34,867 | | | | 27,145 | |
| Copper (ST) | | | 8,453 | | | | 9,140 | | | | 19,012 | |
| (1) | The amounts in this table reflect the total production of all of our consolidated subsidiaries, including El Brocal and La Zanja, in which we owned a 46.08% and 53.06% controlling equity interest, respectively, as of December 31, 2010. The production data in this table reflect 100% of El Brocal’s and 100% of La Zanja’s production. For the years ended December 31, 2008 to 2010, El Brocal produced 4.6, 3.8 and 2.5 million ounces of silver, respectively, of which our equity share was 1.7, 1.7 and 1.1 million ounces of silver. For the year ended December 31, 2010, La Zanja produced 0.04 million ounces of silver, of which our equity share was 0.02 million ounces of silver. |
| (2) | Throughout this Annual Report, “oz” refers to troy ounces of a fineness of 999.9 parts per 1,000, equal to 31.0135 grams. |
| (3) | Throughout this Annual Report, “ST” refers to short tons, each weighing 2,000 avoirdupois pounds. |
Exploration
We view exploration as our primary means of generating growth value for shareholders and typically maintain a portfolio of active exploration projects at various stages of exploration for mineral resources in Peru. We currently hold, either directly or in conjunction with exploration partners, 501,140 hectares of mining rights as part of our exploration program. We hold an additional 323,013 hectares in mining properties which are consolidated in our production units. We invested approximately US$22.6 million in exploration for Mineralized Material Not in Reserve, or NRM, during 2010, including exploration related to the Chucapaca, Colquemayo, Breapampa, Terciopelo, Chaje, La Zanja (Castrejon), Lucanas, Pisqahuanca, Trapiche, Hualgayoc, and El Faique projects. In addition, our exploration partners invested US$12.1 million in the Chucapaca, Lucanas, La Zanja, Hualgayoc and Ccalla Arma projects. In 2010, we completed 13,522 meters of diamond drilling in greenfield projects, and 38,979 meters of diamond drilling in advanced projects, including Chucapaca and La Zanja (Castrejón). In 2011, we plan to undertake 96,000 meters of diamond drilling and 18,000 meters of reverse circulation drilling.
In 2011, we expect to invest approximately US$44.3 million in greenfield exploration and brownfield exploration activities. Exploration programs at our principal operating mines are not included in our exploration budget and are accounted for as part of the operating costs for each mine. Exploration expenditures in greenfield and brownfield projects include all of the costs associated with manpower and activities such as geologists, contractors, engineering, drilling equipment, metallurgical testing and environmental, social, engineering and economic feasibility studies. Management of the exploration team prepares programs and budgets for individual projects each year and we allocate, subject to board approval, the proper amount to finance each particular exploration activity considered worthwhile. In light of the nature of mining exploration and in order to maintain flexibility to take advantage of opportunities, we allocate budgeted amounts by property or project only in the case of high geological expectation as decided by management. We also allocate non-budgeted amounts over the course of the year to new projects based on factual results, our needs and our geologists’ periodic evaluations and opinions regarding the progress of each opportunity and its potential for further exploration of minerals.
An integral part of our exploration program is the participation in mining exploration agreements with affiliates of experienced mining companies, including Newmont Peru S.R.L., Southern Copper Corporation, Gold Fields La Cima, Minera Gold Fields Peru S.A. and Sumitomo Metal Mining Peru S.A. The benefits of these joint exploration projects include greater investment in the exploration of our mining rights from the funds contributed by the partners, access to the assets of the partners without the costs and risks of outright acquisition, increased exposure to new exploration technologies and expansion of knowledge and sharing of experiences of management, geologists and engineers. In these mining exploration agreements, we may be the designated operator, an equity participant, the manager or a combination of these and other functions.
We do not generally conduct significant research and development activities other than investments in geological research and exploration as described herein.
The following table lists our current mine development projects, our effective participation in each project, our partners with respect to each project, the total hectares as of April 30, 2011, observed mineralization of each project and the total exploration expenditures during 2008, 2009 and 2010.
Exploration Projects | | Company’s Effective Participation | | Principal Partners | | Property Hectares | | Observed Mineralization | | Total Exploration Expenditures During 2008 | | | Total Exploration Expenditures During 2009 | | | Total Exploration Expenditures During 2010 | |
| | | | | | | | | | | | | | | | | | | | | | | |
| | | | | | | (US$ in millions) | | | (US$ in millions) | | | (US$ in millions) | |
| | | | | | | | | | | | | | | | | | | | | | | | |
| Joint Venture Projects: | | | | | | | | | | | | | | | | | | | | | | | |
| | | | | | | | | | | | | | | | | | | | | | | | | | | | | | | | | | | |
La Zanja(1) | | | 53.06 | % | Newmont | | | 32,821 | | Gold & copper | | | 8.45 | | | | 4.48 | | | | 1.29 | | | | 0.68 | | | | 1.91 | | | | 1.01 | |
Tantahuatay(2) | | | 40.10 | % | SCC, Espro | | | 17,742 | | Gold & copper | | | 4.62 | | | | 2.57 | | | | 3.59 | | | | 2.01 | | | | - | | | | - | |
| | | | | | | | | | | | | | | | | | | | | | | | | | | | | | | | | | | |
| Company’s Projects: | | | | | | | | | | | | | | | | | | | | | | | | | | | | | | | | | | |
| | | | | | | | | | | | | | | | | | | | | | | | | | | | | | | | | | | |
Breapampa(3) | | | 100.00 | % | None | | | 41,866 | | Gold & silver | | | 3.25 | | | | 3.25 | | | | 3.24 | | | | 3.24 | | | | 1.05 | | | | 1.05 | |
Mallay(4) | | | 100.00 | % | None | | | 7,030 | | Silver, lead & zinc | | | 8.52 | | | | 8.52 | | | | 6.12 | | | | 6.12 | | | | 9.78 | | | | 9.78 | |
| | | | | | | | | 99,459 | | | | | 24.84 | | | | 18.82 | | | | 14.24 | | | | 12.05 | | | | 12.74 | | | | 11.84 | |
| (1) | Prior to 2010, La Zanja was classified as a greenfield exploration project. |
| (2) | Prior to 2010, Tantahuatay was classified as a greenfield exploration project. |
| (3) | Prior to 2010, Breapampa was classified as a greenfield exploration project. |
| (4) | Prior to 2010, Mallay was classified as a brownfield exploration project. Includes 2010 Tinta, Condorsenja and Isguiz exploration costs. |
The following table lists our current greenfield exploration projects, our effective participation in each project, our partners with respect to each project, the total hectares as of May 31, 2011, observed mineralization of each project and the total exploration expenditures during 2008, 2009 and 2010.
Exploration Projects(1)(2) | | Company’s Effective Participation | | Principal Partners | | Property Hectares | | Observed Mineralization | | Total Exploration Expenditures During 2008 | | | Total Exploration Expenditures During 2009 | | | Total Exploration Expenditures During 2010 | |
| | | | | | | | | | | | | | | | | | | | | | | |
| | | | | | | (US$ in millions) | | | (US$ in millions) | | | (US$ in millions) | |
| | | | | | | | | | | | | | | | | | | | | | | | |
| Joint Venture Projects: | | | | | | | | | | | | | | | | | | | | | | | |
| | | | | | | | | | | | | | | | | | | | | | | | | | | | | | | | | | | |
| Ccalla Arma | | | 60.00 | % | Sumitomo | | | 7,300 | | Gold & copper | | | 0.34 | | | | 0.20 | | | | 0.46 | | | | 0.28 | | | | - | | | | - | |
| Chucapaca | | | 49.00 | % | Gold Fields | | | 12,900 | | Gold & copper | | | 1.86 | | | | 1.86 | | | | 7.01 | | | | 0.74 | | | | 21.18 | | | | 10.38 | |
| Hualgayoc | | | 50.00 | % | Gold Fields | | | 12,723 | | Silver, zinc & lead | | | 1.15 | | | | 0.57 | | | | 1.01 | | | | 0.51 | | | | 0.65 | | | | 0.32 | |
| Pisqahuanca | | | 75.00 | %(3) | None | | | 3,167 | | Silver & gold | | | - | | | | - | | | | - | | | | - | | | | 0.18 | | | | 0.18 | |
| Lucanas | | | 60.00 | % | Sumitomo | | | 13,300 | | Copper & gold | | | - | | | | - | | | | - | | | | - | | | | 0.19 | | | | 0.12 | |
| | | | | | | | | | | | | | | | | | | | | | | | | | | | | | | | | | | |
| Company’s Projects: | | | | | | | | | | | | | | | | | | | | | | | | | | | | | | | | | | |
| | | | | | | | | | | | | | | | | | | | | | | | | | | | | | | | | | | |
| Chaje | | | 100.00 | % | None | | | 17,800 | | Gold | | | - | | | | - | | | | - | | | | - | | | | 1.05 | | | | 1.05 | |
| Colquemayo | | | 100.00 | % | None | | | 28,800 | | Gold, silver & copper | | | - | | | | - | | | | - | | | | - | | | | 2.46 | | | | 2.46 | |
| El Faique | | | 100.00 | % | None | | | 18,209 | | Copper, zinc & gold | | | 0.42 | | | | 0.42 | | | | 0.39 | | | | 0.39 | | | | 0.49 | | | | 0.49 | |
| Terciopelo | | | 100.00 | % | None | | | 4,200 | | Gold & copper | | | - | | | | - | | | | 0.58 | | | | 0.58 | | | | 1.36 | | | | 1.36 | |
| Trapiche | | | 100.00 | % | None | | | 36,291 | | Copper & molybdenum | | | 2.87 | | | | 2.87 | | | | 3.16 | | | | 3.16 | | | | 1.39 | | | | 1.39 | |
Others(4) | | | 100.00 | % | None | | | 60,660 | | Gold & polymetallic | | | 3.34 | | | | 3.34 | | | | 3.44 | | | | 3.44 | | | | - | | | | - | |
| | | | | | | | | 215,350 | | | | | 9.98 | | | | 9.26 | | | | 12.61 | | | | 5.66 | | | | 28.95 | | | | 17.75 | |
| (1) | This table does not include projects abandoned by us, consolidated mining units or those placed on hold prior to 2008. |
| (2) | In addition to these projects, we continue to conduct exploration at all of our operating mines and our subsidiaries. |
| (3) | Buenaventura has an option to earn in up to 75% in this project. |
| (4) | Includes generative exploration in new areas and Argentina |
The following table lists our current brownfield exploration projects, our effective participation in each project, the total hectares as of May 31, 2011, observed mineralization of each project and the total exploration expenditures during 2008, 2009 and 2010.
Exploration Projects | | Company’s Effective Participation | | Principal Partners | | Property Hectares | | Observed Mineralization | | Total Exploration Expenditures During 2008 | | | Total Exploration Expenditures During 2009 | | | Total Exploration Expenditures During 2010 | |
| | | | | | | | | | | | | | | | | | | | | | | |
| | | | | | | (US$ in millions) | | | (US$ in millions) | | | (US$ in millions) | |
| | | | | | | | | | | | | | |
| Brownfield Projects: | | | | | | | | | | | | | |
Yumpag(1) | | | 100.00 | % | None | | | 832 | | Silver, lead & zinc | | | - | | | | - | | | | - | | | | - | | | | 0.75 | | | | 0.75 | |
Anamaray(2) | | | 100.00 | % | None | | | 6,952 | | Zinc, lead & silver | | | 1.01 | | | | 1.01 | | | | 1.00 | | | | 1.00 | | | | 0.64 | | | | 0.64 | |
Chancas(3) | | | 100.00 | % | None | | | 2,877 | | Silver | | | - | | | | - | | | | - | | | | - | | | | 1.40 | | | | 1.40 | |
Julcani(4) | | | 100.00 | % | None | | | 1,800 | | Silver | | | 2.01 | | | | 2.01 | | | | 2.47 | | | | 2.47 | | | | 0.72 | | | | 0.72 | |
Antapite(5) | | | 100.00 | % | None | | | 22,075 | | Gold & silver | | | 2.75 | | | | 2.75 | | | | 1.61 | | | | 1.61 | | | | 0.14 | | | | 0.14 | |
Poracota(6) | | | 100.00 | % | None | | | 6,974 | | Gold | | | 1.10 | | | | 1.10 | | | | 1.24 | | | | 1.24 | | | | 0.78 | | | | 0.78 | |
| Soras | | | 100.00 | % | None | | | 21,155 | | Gold, silver & copper | | | 0.24 | | | | 0.24 | | | | - | | | | - | | | | - | | | | - | |
| Layo | | | 100.00 | % | None | | | 737 | | Gold, silver & copper | | | 0.33 | | | | 0.33 | | | | - | | | | - | | | | - | | | | - | |
Orcopampa(7) | | | 100.00 | % | None | | | 12,000 | | Gold & silver | | | 0.96 | | | | 0.96 | | | | 0.97 | | | | 0.97 | | | | 2.91 | | | | 2.91 | |
Shila-Paula(8) | | | 100.00 | % | None | | | 41,152 | | Gold & silver | | | 1.77 | | | | 1.77 | | | | 0.58 | | | | 0.58 | | | | 1.90 | | | | 1.90 | |
| | | | | | | | | 116,554 | | | | | 10.17 | | | | 10.17 | | | | 7.87 | | | | 7.87 | | | | 9.24 | | | | 9.24 | |
| (1) | Includes 2010 Yumpag and Atalaya exploration costs (part of Uchucchacua’s brownfield exploration). |
| (2) | Includes 2010 Jancapata, San Francisco and Cuello Volcánico exploration costs (part of Uchucchacua’s brownfield exploration). |
| (3) | Includes 2010 Chiptag exploration costs. |
| (4) | Includes 2010 Prospecto Hallazgo (Recuperada) exploration costs. |
| (5) | Includes 2010 Carmencita, Ayamarca and Pucarumi exploration costs. |
| (6) | Includes 2010 Poracota Oeste (Huamani Huayta Oeste) exploration costs. |
| (7) | Includes 2010 Pucay, Pariguanas and Chipmo Superficie exploration costs. |
| (8) | Includes 2010 Tuyumina and Tania prospects exploration costs (part of Shila-Paula’s brownfield exploration). |
The following is a brief summary of current greenfield and brownfield exploration activities conducted by us directly and through joint exploration agreements that are believed to represent the best prospects for the discovery of new reserves. There can be no assurance, however, that any of our current exploration projects will result in viable mineral production or that any of the mineralization identified to date will ultimately result in an increase in our ore reserves. Non-reserve mineralization has been included in our 2010 Annual Report from the Tantahuatay, Breapampa and Mallay exploration and mine development projects. Set forth below is a map of all our exploration activities in Peru as of December 31, 2010:
Mine Development Projects
La Zanja. Minera La Zanja S.R.L., or La Zanja, controls 32,821 hectares of mineralized property located 35 kilometers northwest of Cajamarca city. We currently own 53 percent of La Zanja, with the remainder owned by Newmont Peru. In 2009, we obtained approval of our EIS in the La Zanja project and commenced construction of mine infrastructure. We began production during the second half of 2010. In 2011, we plan to commence construction of the Pampa Verde project, which will include a 7-kilometer road. This will allow for transport of the minerals to the lixiviation platform in the San Pedro area. Pampa Verde pit production is scheduled to commence in late 2011. During 2009, we and Newmont Peru invested US$1.3 million in total to conduct 3,154 meters of diamond drilling. We also discovered a new mineralized area in the Castrejón prospect, a copper-moly prospect located in the southern portion of the La Zanja claim block. In 2010, La Zanja invested US$1.9 million in the Castrejón prospect to conduct 10,975 meters of diamond drilling to delineate a preliminary sulfide resource. In addition, new targets with gold and silver mineralization on veins and structures were identified on the Pisit and Diablo Rojo prospects. In 2011, we plan to drill the Pisit and Diablo Rojo prospects.
Tantahuatay. The Tantahuatay project, a gold-copper project, is wholly owned by Coimolache, an entity that is 40.1 percent owned by us, 44.2 percent owned by SCC, and 15.7 percent owned by ESPRO S.A.C., a Peruvian-based holding company. Two of the five outcropping gold anomalies have reserves. Tantahuatay 2 and Ciénaga Norte were infill-drilled in 2002 and 2006, respectively; together they contain reserves of 658,000 ounces of gold and 7.7 million ounces of silver. The studies have been focused in the oxide zone only. Cyanidation column tests have been completed with good results, which indicate rapid extractions in the order of 80 to 90 percent, by low-concentration cyanide leaching. The Tantahuatay 2 prospect was the subject of Feasibility and Environmental Impact Studies conducted during 2007 and 2008 to assess the viability of a 12,000-ton per day open-pit/heap leach operation. Infill-drilling and metallurgical studies have been completed in the Ciénaga deposit, and a feasibility study has been finalized to assess the viability of a 15,000-ton per day open-pit/heap leach operation. Ciénaga’s environmental permit to construct a 10,000-ton per day open-pit operation is pending. We are focusing our efforts on resolving community issues and obtaining permits to continue our exploration and enhance support of our infill drilling and feasibility studies for both oxide and sulfide targets. In 2008, Coimolache invested US$4.6 million to conduct a feasibility study, which included analysis of basic engineering on the processing plant, detailed engineering on operating facilities (e.g., leach pad, waste dump and main roads) and definitive studies on a haul road and a mining plan. We presented an EIS of Tantahuatay 2. We obtained approval of the EIS in May 2009. Construction of the mine infrastructure commenced in July 2010. We expect to invest approximately US$80 million in order to produce approximately 100,000 ounces of gold during each of the next five years. We expect to start mining operations at the Tantahuatay site by mid-2011.
Mallay. The Mallay project consists of 2,250 hectares leased for 20 years and optioned for four years. On August 8, 2007, we exercised this option, and on September 20, 2007, Minera Los Rios S.R.L. transferred all of the mining rights for the Mallay prospect to us by public deed for US$1.25 million, the final payment for which was made in January 2010. During 2008, we invested US$8.52 million in 4,339 meters of underground exploration workings, 9,220 meters of diamond drilling and environmental permits and had estimated NRM of 540,000 DST, with 6.13 ounces per ton of silver, 0.022 ounces per ton of gold, 4.22 percent lead and 6.74 percent zinc. Gold was discovered in the Pierina vein inside the Jumasha limestone. During 2009, we invested US$6.12 million mainly on exploration of the Manto Isguiz and Jumasha limestone veins and also conducted a geological review of other prospective areas around Mallay. In addition, we increased NRM to a total of 673,565 DST with 6.67 ounces per ton of silver, 4.44 percent lead and 6.79 percent zinc. In 2010, we invested US$9.78 million in 12,183 meters of underground exploration workings and 12,183 meters of diamond drilling to explore other mineral veins, mainly the Fortuna Skarn in the mineralized structures of Maria and Manto Isguiz. We have calculated NRM at 1,086,984 DST, with 6.85 ounces per ton of silver, 0.015 ounces per ton of gold, 4.1 percent lead and 6.7 percent zinc. In 2011, we plan to invest US$7.0 million to continue exploration of Fortuna Skarn and the veins of Maria’s system, including underground exploration work and diamond drilling at depth.
Breapampa. The Breapampa project was a joint venture with Newmont Peru S.R.L. In December 2009, we executed an option in our joint venture agreement with Newmont to acquire 100 percent of the mining rights at Breapampa. The Breapampa project encompasses 41,866 hectares located in the southern portion of the Ayacucho region. It consists of gold and silver mineralization emplaced in epithermal high-sulfidation breccias in Tertiary volcanic rocks over the Parccaorcco hill and the Senccata area. During 2008, we invested US$3.3 million to conduct 5,452 meters of diamond drilling. After analyzing new field data, we reduced our estimate of NRM to 3,886,000 metric tons with an average grade of 1.48 grams per ton of gold and 23.35 grams per ton of silver. During 2008, we also acquired 300 hectares of land for future exploration. In 2009, we invested US$3.2 million to test gold mineralization in the Parccaorcco hill, Senccata and Pucagallo prospects inside the claim boundary. We also conducted 9,908 meters of diamond drilling. The recalculated inventory of NRM is 4,838,740 metric tons with an average grade of 1.26 grams per ton of gold and 21.06 grams per ton of silver in Parccaorcco hill. The NRM is 2,453,000 metric tons with an average grade of 0.63 grams per ton of gold and 4.30 grams per ton of silver in the Senccata prospect; and 3,995,000 metric tons with an average grade of 0.53 grams per ton of gold and 4.50 grams per ton of silver in the Pucagallo prospect. In 2009, we purchased surface rights and started the corresponding EIS in anticipation of future operation in Parccaorcco hill. In 2010, we invested US$2.8 million to undertake the EIS, develop a detailed engineering plan, implement a community relationship plan and purchase land. In 2011, we plan to obtain water use permits and a concession of benefits through the end of July 2011.
Greenfield Exploration Projects
Chucapaca. The Chucapaca project is a gold-copper project wholly owned by Canteras del Hallazgo S.A.C., or CDH, which is owned 51 percent by Gold Fields and 49 percent by us. The project encompasses a total of 12,900 hectares of mining properties that define the area of interest and is located in the Moquegua region in southern Peru. In March 2008, we entered into a lease and option agreement with Gold Fields for the Chucapaca project. As of April 30, 2009, we had completed 8,000 meters of diamond drilling for a total investment of US$2.67 million as part of stages 1 and 2 of the lease and option agreement. In February 2010, Gold Fields resumed control of the operation of the Chucapaca project by investing approximately US$8.0 million, which represents three times the exploration expenditure invested by us in this project, and taking a 51 percent equity interest in CDH. Gold Fields completed a total of 2,511 meters of reverse circulation drilling in 2004 over the Chucapaca prospect associated with potential epithermal high sulfidation mineralization within Tacaza Group volcanic rock formations. Our preliminary exploration identified base metal targets on the Chucapaca project referred to as the Canahuire and Katrina prospects. Our exploration program in 2008 resulted in the discovery of the Canahuire gold mineralization with encouraging results returned from the diamond drilling program. The program included the completion of 94 kilometers of geophysical magnetic and induced polarization surveys and 6,300 meters of diamond drilling on the Katrina and Canahuire prospects. We drilled approximately 7,800 meters on the Canahuire prospect and defined the continuity of a gold dominated breccia hosted mineralization over 800 meters strike.
In 2009, Gold Fields invested US$6.3 million to conduct 16,153 meters of diamond drilling over the Canahuire and Katrina prospects. In 2010, CDH invested US$21.2 million to conduct 30,392 meters of diamond drilling on the Canahuire and Katrina prospects. On May 11, 2010, we and Gold Fields announced a preliminary NRM of 83.7 million tons in sulfides with an average grade of 1.9 grams per ton or gold, 8.2 grams per ton of silver and 0.1 percent of copper for a total of 5.6 million ounces of gold equivalent, with a strip ratio of 3.5 to 1.0 using an open-pit model operation and 77 percent metallurgical recovery for gold, 82 percent for copper and 44 percent for silver. Mineralization remains open to the west, north and at depth. In 2011, CDH plans to invest US$28.5 million to complete 88,000 meters of diamond drilling in a 50-meter by 50-meter grid of the Canahuire prospect with test drilling at a number of other targets within the Chucapaca project, including additional drilling in the Katrina prospects. During 2011, we also plan to conduct a prefeasibility study and an EIS.
Trapiche. The Trapiche project is wholly owned by us and encompasses 36,291 hectares, with porphyry and skarn mineralization in the Apurimac region. The Apurimac region is part of a mineralized belt known as the Abancay Batholith where several iron, copper and gold deposits have been identified. In 2008, we invested US$2.9 million to conduct 5,484 meters of diamond drilling on the Trapiche Este, Millucucho and Cerro Colorado prospects. We also conducted an additional 18.2 kilometers of magnetic and induced polarization surveys over Trapiche Este. Based on the drilling and surveys that we conducted, we recalculated NRM to be 492 million tons with an average grade of 0.48 percent copper and 0.016 percent moly with a cutoff of 0.20 percent copper. In 2009, we invested US$3.2 million to conduct 5,282 meters of diamond drilling on the Trapiche porphyry and Millucucho skarn. As a result of the drilling, we recalculated NRM to be 490.2 million metric tons with an average grade of 0.47 percent of copper and 0.015 percent of moly with a cutoff of 0.2 percent of copper. In April 2009, we stopped field work to continue negotiations with the Mollebamba community relating to the future operation of this mine. In 2010, we invested US$1.4 million, which mainly related to negotiations with the Mollebamba community for the use of land and social support. In May 2011, we obtained the agreement for land use with the Mollebamba community. In the second half of 2011 and 2012, we plan to invest approximately US$5.5 million to complete a detailed surface exploration of copper oxides and to carry out a program of 4,000 meters of diamond drilling in the copper oxide area located in the western portion of Trapiche porphyry.
Hualgayoc. Hualgayoc is a silver, zinc and lead exploration project, with copper (moly-gold) potential, owned by Consolidada de Hualgayoc S.A., or Consolidada, which is owned 50 percent by Compañía Minera Colquirrumi S.A., or Colquirrumi, our 99.99 percent-owned subsidiary, and 50 percent by Goldfields La Cima S.A., the operator of the project and a wholly-owned subsidiary of Gold Fields. Consisting of 12,723 hectares, the project is located in the Hualgayoc district, Cajamarca region, and commenced operations in March 2005 with exploration for copper, gold, zinc and lead ore. On February 24, 2005, Colquirrumi signed an agreement with Gold Fields to explore the Hualgayoc district, including certain areas within the Colquirrumi project. During 2008, Consolidada invested US$1.15 million in 2,122 meters of diamond drilling in the Quijote prospect identified by Minera ABX Exploraciones S.A. in 1996 for a potential of polymetallic mineralization surrounding the intrusive porphyry with potassic alteration. The drilling campaign failed to define extension of the mineralization. Consolidada also focused on efforts to negotiate access to the Titan-Arabe target. In 2009, Consolidada invested US$1.01 million to start a diamond drilling campaign in the Titán-Árabe prospect. The project was suspended in September 2009 after an outburst of violence amongst the local community due to internal conflicts. In 2010, we invested US$0.3 million to maintain our mining properties and to restructure our exploration targets. In 2011, we plan to invest US$1.5 million to conduct 9,700 meters of diamond drilling from old underground workings at the Mesa de Plata, Barragan and Real levels. Ccalla Arma. The Ccalla Arma project is a joint mining exploration project with Sumitomo, a subsidiary of Sumitomo Corporation of Japan. We signed a consortium agreement with Sumitomo in December 2008, pursuant to which we have a 60 percent interest in the consortium and are responsible for its operation. The project encompasses 7,300 hectares of claims located in the Huancavelica region. During 2008, we conducted detailed mapping, sampling and geophysics. We and Sumitomo invested a total of US$0.34 million. In 2009, we and Sumitomo invested US$0.46 million to conduct a 1,200 meter drilling campaign on the Yanaorcco prospect located in the northern portion of the project. The Yanaorcco prospect was a target for a concealed porphyry copper-gold type deposit, but the results of the diamond drilling campaign were negative. We also explored the remaining areas within the consortium boundaries with no results. In 2010, we terminated our consortium agreement with Sumitomo. In 2011, we do not plan to conduct any further field work in this area
El Faique. The El Faique project, previously known as El Papayo, is wholly owned and operated by us. The project encompasses 18,209 hectares and is located in the Sechura desert of northern Peru in the Piura region. This project includes 3,200 hectares sold to us by Cedimin in 2006. The El Faique project consists of a deep massive sulfide deposit evidenced by diamond drilling 400 to 700 meters below the surface in the B5 gravimetric anomaly. This deposit contains NRM of 7.91 million tons, with 2.3 percent copper and significant traces of zinc and gold. In 2008, we invested US$0.4 million to get access to the surface above the B5, A7 and A9 anomalies. In 2009, we invested US$0.4 million in social infrastructure for the purpose of obtaining surface permits and properties. These efforts include hydrogeological studies for groundwater supply and also medical outreach to the communities involved. In 2010, we invested US$0.5 million to support local communities, with the goal of obtaining land permits. We consolidated our presence in the El Carmen, Ocoto Alto and Locuto communities and gained terrain in the El Papayo, La Greda, San Martin and Angostura communities. In 2011, we plan to continue our social efforts among the neighboring communities, with the goal of forming a mutually beneficial relationship between us and the regional government to undertake development projects for the communities.
Terciopelo. The Terciopelo project is located in the Huancavelica region, 20 kilometers south from Huancavelica city. The project encompasses 4,200 hectares of claims leased by Cedimin to us. In 2009, we invested US$0.6 million to conduct 1,154 meters of diamond drilling and 29 kilometers of geophysical survey on Terciopelo hill, a copper-gold porphyry and epithermal target. In 2010, we invested US$1.4 million to conduct a 1,494-meter diamond drilling campaign in the Andrea and Jacucucho areas. In March 2011, we decided to stop exploration work in this area because of the low-grade content we discovered as a result of the drilling campaign. We finished environmental remediation and obtained social agreements with the local community of Santa Barbara. We do not plan to conduct further exploration efforts in this project in 2011. We will attempt to engage a joint venture partner to conduct deeper drilling at this project.
Chaje. The Chaje project encompasses 17,800 hectares and is located in the Moquegua region in southern Peru. In 2010, we invested US$1.05 million to conduct 2,739 meters of diamond drilling and 12 kilometers of geophysics lines. We identified several narrow structures with gold and silver anomalies at the surface. The drilling campaign was designed to test the potential at depth, and we concluded that mineralization in Chaje is erratic, discontinuous and controlled by narrow structures. As a result, we do not plan to conduct any further exploration work in 2011.
Colquemayo. The Colquemayo project encompasses 28,800 hectares of claims and is located in the Moquegua region in southern Peru, 70 kilometers southwest of the Chucapaca project. Colquemayo was previously drilled by Rio Tinto plc in 2003, and was sold to Norsemont Mining Inc. in 2005, which subsequently abandoned the project in 2008. We reclaimed the property in 2009. The project is located in tertiary volcanic rocks covered by younger volcanic events. The high sulfidation alteration system covers an area of 40 square kilometers, including four prospective areas of gold, silver, copper and moly anomalies: Amata, Coripuquio, Cairani and Yanarico. In 2010, we invested US$2.46 million to conduct 9,282 meters of diamond drilling in the prospects of Amata and Coripuquio, 86 kilometers of geophysics lines and 13 kilometers of trenches. We are currently drilling to confirm a silver and copper resource. In 2011, we plan to invest US$2.9 million to conduct 13,000 meters of diamond drilling in the Amata, Yanarico and Cairani areas.
Pisqahuanca. Pisqahuanca is a new exploration project located in the Ancash region in northern Peru. We received 367 hectares of a submittal claim with a discrete silver (gold) oxide showing drill targets previously drilled by Barrick. We consolidated this property into a total land package of 3,167 hectares with multiple showings of epithermal, precious metal disseminations and veins. We are currently conducting an initial drilling program to test the continuity, metallurgy and ore potential. In 2010, we invested US$0.2 million to begin consolidation of the property. In 2011, we plan to invest approximately US$1.0 million in a first-pass drilling campaign.
Lucanas. The Lucanas project is a consortium agreement with Sumitomo. The project encompasses 13,300 hectares of volcanic terrain in the Lucanas province, Ayacucho region, in southern Peru. In 2010, we invested US$0.2 million in a program to conduct satellite image interpretation, geochemical sampling and distrital mapping. We were unable to identify a drilling target on this project. As a result, we do not plan to conduct further exploration work at Lucanas in 2011.
Brownfield Exploration Projects
Uchucchacua. The Uchucchacua brownfield exploration project is located in 12,579 hectares of our mining and exploration properties and was established in late 2004 and began operations in 2005. We are currently focusing our exploration efforts on three prospects: Anamaray-Jancapata, Yumpag and Chancas.
The Anamaray-Jancapata prospect is another silver, lead and zinc-bearing set of breccias and veins in limestone. During 2008, we invested US$1.01 million in 1,282 meters of underground exploration works and 616.0 meters of diamond drilling. During 2009, we invested US$1.00 million in 2,310 meters of underground exploration works and 12,937 meters of diamond drilling and recognized NRM of 356,087 dry short tons, or DST, with 6.26 ounces per ton of silver, 2.78 percent lead and 6.30 percent zinc. During 2010, we completed our exploration of the Cuello Volcánico area and the San Francisco mineralized structure and invested US$0.64 million in 2,830 meters of diamond drilling with confirmed NRM of 232,163 DST, with 8.6 ounces per ton of silver, 2.2 percent lead and 6.2 percent zinc. In 2011, we plan to explore the parallel veins close to the longitudinal fault and explore the San Francisco mineralized structure in greater depth. In 2011, we plan to invest approximately US$1.00 million to continue exploring the Anamaray-Jancapata prospect.
The Yumpag prospect consists of 832 hectares located 4 kilometers northeast of the Uchucchacua mine. The Yumpag prospect is considered an epithermal deposit of silver, lead, zinc and manganese hosted by cretaceous limestone rocks belonging to the Jumasha formation and abutting dioritic intrusive rocks from the Cenozoic era. Mineralization in the Yumpag prospect is structurally influenced by the Cachipampa geological fault, which also influences significant areas of silver mineralization at the Uchucchacua mine. During 2010, we invested $0.75 million in 6,354 meters of diamond drilling and had estimated NRM of 173,283 DST, with 8.05 ounces per short ton of silver, 0.19 percent lead, 0.46 percent zinc and 32.6 percent manganese in the Tomasa and Angelica ore bodies. In 2011, we plan to invest US$1.5 million in further exploration of the Yumpag prospect and other areas in its vicinity.
The Chancas prospect is located in the province of Oyon-Cajatambo in Lima, about 15 kilometers northwest of Mallay-Isguiz and adjacent to the old Chancas mine, which is currently inaccessible. The Chancas prospect consists of about 1,700 hectares, including the Chiptag exploration workings, and is wholly owned and operated by us. Our 2010 exploration identified significant mineralization of silver in the El Poderoso vein, and we have found indications of similar mineralization in the Plomomina vein and in other structures. During 2010, we invested US$1.4 million in 199 meters of underground mining workings and 2,544 meters of diamond drilling. We estimated NRM of 30,276 DST, with 11.9 ounces per ton of silver. In 2011, we plan to invest US$1.97 million in 900 meters of underground mining workings and 3,000 meters of diamond drilling in an expanded area of approximately 2,900 hectares, to which we have access as a result of an option agreement we signed with Minera Focus S.A.C. in December 2010.
Orcopampa. During 2008, we invested US$0.96 million in the Orcopampa brownfield area to conduct geophysical surveys, geological mapping, trenching and geochemical sampling in Mulañan-Calera NE, Pucay, Jechalle, Pucaylla, Pariguanas and Mamahuasi. During 2009, we invested US$0.97 million to conduct a diamond drilling program in prospective areas based on geological and geophysical surveys carried out during 2008. During 2010, we invested US$2.91 million in 10,438 meters of diamond drilling, and the performance of geophysical surveys and geological mapping in exploring the Natividad-Ocoruro, Chipmo Superficie, Quello-Quello, Pucay and Pariguanas prospects. We had estimated NRM of 252,131 DST, with 21.16 ounces per ton of silver and 0.018 ounces per ton of gold in the San Pedro and Pitanayo streaks of Pariguanas. In 2011, we plan to invest US$5.1 million in 1,850 meters of underground mining workings and 7,400 meters of diamond drilling, with a focus on the Pariguanas and Quello-Quello areas.
Julcani–Recuperada. In view of the encouraging results obtained at Julcani from the exploration work conducted on the Acchilla dome veins, we plan to explore other structures in the Condoray and Taype domes, as well as in the area between these two domes and Acchilla. During 2008, we invested US$1.73 million in the Estela area, mainly in underground workings and diamond drilling, and had calculated proven and probable ore reserves of 49,030 DST, with 20.9 ounces per ton of silver, 0.118 ounces per ton of gold, 0.8 percent lead, 0.20 percent zinc and 1.21 percent copper. In addition, we continued to conduct geological mapping in Pampa Castilla. In 2009, we invested US$1.66 million to continue exploration of the Estela mine area through underground works and diamond drilling and had calculated proven and probable ore reserves of 79,160 DST, with 19.9 ounces per ton of silver, 0.147 ounces per ton of gold and 1.46 percent copper. During 2010, all geographical exploration in the Acchilla and Estela mines was defined as part of the Julcani mining operations. In 2011, we plan to invest US$1.0 million to continue exploration around the Julcani area, including diamond drilling in the Condoray and Taype-Galindo domes.
Brownfield exploration activities in the Recuperada region focused on the Hallazgo area, where we are exploring a group of veins with silver, lead and zinc mineralization. Remnants of old mine workings in the areas of Carhuancho, together with information on the mining activity of this particular area in colonial times, appear to make Recuperada’s brownfield exploration a target worth studying and exploring. We invested US$0.28 million in 278 meters of underground workings, 85 meters of diamond drilling and environmental studies in 2008. In 2009, we had total exploration expenditures of US$0.81 million and conducted 918 meters of underground works. During 2010, we invested US$0.72 million in 716 meters of underground mining works and 692 meters of diamond drilling in exploring the Mariela, Gianina and Cecilia mineral veins. We identified proven and probable ore reserves of 2,060 DST, with 5.6 ounces per ton of silver, 6.0 percent lead and 1.5 percent zinc. We do not plan to undertake additional exploratory work in this area in 2011.
Shila-Paula. The Shila-Paula brownfield exploration is focused on several areas surrounding actual operating units such as Ampato, Paula Brownfield, Puncuhuayco-Ticlla, Tocracancha and other projects. During 2008, we invested US$1.77 million on 1,369 meters of underground workings and 1,508 meters of diamond drilling in the Ampato prospect. We have also completed geological surveys and diamond drilling in the Escribano prospect, which has yet to provide any promising leads on potential ore deposits. During 2009, we invested US$0.58 million to conduct geological exploration of the structural alignment of the Paula-Madrigal, Tuyumina, Tuti and Escribano prospects. During 2010, we focused on exploring the Olivia and Mirtha veins in the Tuyumina project, investing US$1.9 million in 377 meters of underground mine workings and 5,395 meters of diamond drilling. We had estimated NRM of 168,000 DST, with 16.05 ounces per ton of silver and 0.077 ounces per ton of gold. In 2011, we plan to invest US$5.2 million in 2,000 meters of mining works on two levels, supplemented by 5,000 meters of diamond drilling, as part of our efforts to continue exploration activities in the Tuyumina project.
Poracota. The Poracota mining exploration project, in which we acquired a 100 percent interest, is currently operated by the Orcopampa team. The Poracota project encompasses 6,974 hectares owned by Minas Poracota S.A., our wholly-owned subsidiary, and is located 20 kilometers west of the Orcopampa mine in southern Peru. The epithermal high sulfidation system is comprised of two main areas, Huamanihuayta and Perseverancia. During 2008, we invested US$1.10 million in brownfield exploration, mainly in diamond drilling at Poracota Oeste (West Huamanihuayta and Perseverancia projects). The drill cores show some lengths with strong silicification of rocks and crossed veinlets filled with pyrite and vuggy silica with low grades of gold and silver, which suggests probable mineralization activity at depth. During 2009, we invested US$1.24 million to conduct diamond drilling in Huamanihuayta Oeste and Graben Huamanihuayta and drilled a total of 3,204 meters. During 2010, we focused exploration activities on the Huamanihuayta Oeste project, investing US$0.78 million in 3,498 meters of diamond drilling to explore the northwest extension of the Maria Fe and Silvana veins. These drill holes were able to identify economic mineralization at depth, which defines an important exploration target. In 2011, we plan to conduct 3,000 meters of diamond drilling to define the important mineralization found at depth as well as explore a new alignment parallel to the Maria Fe-Silvana system that is located approximately 400 meters southeast of this system.
Soras. The Soras project is wholly owned by us and located adjacent to the Poracota project. The Soras project encompasses 21,155 hectares of hydrothermally altered and mineralized volcanic terrain in the Arequipa region. In 2004 and 2005, we identified two main mineralized structures, the Soraya and Soraya 1 veins, with surface ore grades of up to 26 grams per ton of gold. First-pass drilling identified two narrow veins with grades of 16 and 36 grams per ton of gold with an average of 5.9 ounces of silver and 3.8 percent copper. In 2006, we initiated underground workings and additional drilling to contour mineralization and generate new ore reserves. The Soraya vein system has been intercepted in the 4,720 crosscut with narrow, low-grade, northeast-trending pyritic enargite veins. The Soras surface and mining exploration projects have been transferred to the Poracota operation, which will manage future mine development and exploration. We did not engage in geological exploration of this project in 2010.
Competition
We believe that competition in the metals market is based primarily upon cost. We compete with other mining companies and private individuals for the acquisition of mining concessions and leases in Peru and for the recruitment and retention of qualified employees.
Sales of Metal Concentrates
All of our metal production is sold to smelters, traders and banks, either in concentrate or metal form, such as gold-silver concentrate, silver-lead concentrate, zinc concentrate, lead-gold-copper concentrate and gold and silver bullion. Our concentrates sales are made under one- to three-year, U.S. Dollar-denominated contracts, pursuant to which the selling price is based on world metal prices as follows: generally, in the case of gold and silver-based concentrates, the London Spot settlement prices for gold, less certain allowances, and the London Spot or the United States Commodities Exchange settlement price for silver, less certain allowances; and, in the case of base-metal concentrates, such as zinc, lead and copper, the London Metals Exchange, or LME, settlement prices for the specific metal, less certain allowances. Sales prices vary according to formulas that take into account agreed contractual average prices for a quotational period, generally being the month of, the month prior to, or the month following the scheduled month of shipment or delivery according to the terms of the contracts.
The historical average annual prices for gold and silver per ounce and our average annual gold and silver prices per ounce for each of the last five years are set forth below:
| | | | | | | |
| | | Average Annual Market Price | | | Our Average Annual Price(1) | | | Average Annual Market Price | | | Our Average Annual Price(1) | |
| | | US$/oz. (2) | | | US$/oz. | | | US$/oz.(3) | | | US$/oz. | |
| 2006 | | | 604.34 | | | | 354.98 | | | | 11.57 | | | | 11.92 | |
| 2007 | | | 696.66 | | | | 684.59 | | | | 13.39 | | | | 13.37 | |
| 2008 | | | 871.71 | | | | 872.21 | | | | 15.02 | | | | 14.26 | |
| 2009 | | | 972.98 | | | | 988.32 | | | | 14.65 | | | | 15.52 | |
| 2010 | | | 1,224.66 | | | | 1,253.35 | | | | 20.16 | | | | 20.86 | |
| 2011 (through April 30, 2011) | | | 1,405.72 | | | | 1,417.53 | | | | 34.11 | | | | 32.54 | |
| (1) | Our average annual price includes only the consolidated average annual price from the Julcani, Uchucchacua, Orcopampa, Antapite, Recuperada, Colquijirca, Marcapunta, Ishihuinca and Shila mines. |
| (2) | Average annual gold prices are based on the London PM fix as provided by Metals Week. |
| (3) | Average annual silver prices are based on London Spot prices. |
Most of the sales contracts we enter into with our customers state a specific amount of metal or concentrate the customer will purchase. We have sales commitments from various parties for nearly all of our estimated 2011 production; however, concentrates not sold under any of our contracts may be sold on a spot sale basis to merchants and consumers.
Sales and Markets
The following table sets forth our total revenues from the sale of gold, silver, lead, zinc and copper in the past three fiscal years:
| | | Year ended December 31(1) | |
| Product | | | | | | | | | |
| | | (In thousands of US$) | |
| Gold | | | 361,689 | | | | 414,324 | | | | 578,816 | |
| Silver | | | 235,554 | | | | 235,971 | | | | 274,834 | |
| Lead | | | 70,353 | | | | 58,204 | | | | 48,385 | |
| Zinc | | | 148,353 | | | | 112,807 | | | | 93,029 | |
| Copper | | | 44,801 | | | | 43,304 | | | | 129,383 | |
(1) Does not include refinery charges and penalties incurred in 2010, 2009 and 2008 of US$112,254,000, US$93,590,000 and US$132,187,000, respectively.
We sold our concentrates to 15 customers in 2010. Approximately 53 percent, 54 percent and 54 percent of our concentrate sales in 2008, 2009 and 2010, respectively, were sold outside Peru. Set forth below is a table that shows the percentage of sales of concentrate from our mines and gold bullion that were sold to our various customers from 2008 to 2010.
| | | Percentage of Concentrates and Gold Bullion Sales | |
| | | | | | | | | | |
| Export Sales: | | | | | | | | | |
| Johnson Matthey Limited | | | 11.68 | % | | | 44.91 | % | | | 49.90 | % |
| Glencore International AG | | | 0.91 | | | | 1.96 | | | | 0.75 | |
| Trafigura Beheer BV | | | 0.95 | | | | - | | | | - | |
| N.V. Umicore SA | | | 0.04 | | | | 1.82 | | | | 2.18 | |
| Transamine Trading SA | | | 0.94 | | | | 0.51 | | | | - | |
| J.P. Morgan Chase Bank | | | 15.15 | | | | 2.09 | | | | - | |
| MRI Trading AG | | | – | | | | 0.75 | | | | 0.13 | |
| Mitsui & Co. Precious Metals Inc. | | | 2.48 | | | | - | | | | - | |
| J Aron & Company | | | 8.83 | | | | - | | | | - | |
| MK Metal Trading GMBH | | | – | | | | 1.19 | | | | 0.19 | |
| Lois Dreyfus Commodities Metal Suisse SA | | | 2.09 | | | | 0.34 | | | | - | |
| Euromin SA | | | 0.52 | | | | - | | | | - | |
| Standard Bank PLC | | | - | | | | - | | | | 0.04 | |
| Met-Mex Peñoles SA de CV | | | 0.74 | | | | - | | | | - | |
| Barclays Bank PLC | | | 5.86 | | | | - | | | | - | |
| Traxxys North America LLC | | | 1.27 | | | | - | | | | - | |
| Korea Zinc Company Ltd. | | | 1.02 | | | | 0.07 | | | | - | |
| Mintrade Ltd. | | | 0.29 | | | | - | | | | 0.39 | |
| Total Export Sales | | | 52.77 | % | | | 53.64 | % | | | 53.58 | % |
| | | | | | | | | | | | | |
| Domestic Sales: | | | | | | | | | | | | |
| Doe Run Perú SRL | | | 15.00 | | | | 1.90 | | | | - | |
| Glencore Peru S.A.C. | | | - | | | | - | | | | 7.76 | |
| Consorcio Minero SA | | | 12.37 | | | | 14.56 | | | | 10.81 | |
| BHL Peru SAC | | | 0.26 | | | | - | | | | - | |
| Votorantim Metais – Cajamarquilla SA | | | 3.24 | | | | 4.40 | | | | 3.33 | |
| Sudamericana Trading SRL | | | 2.54 | | | | 1.31 | | | | 1.15 | |
| Ays SA | | | 10.00 | | | | 16.46 | | | | 10.50 | |
| MK Metal Trading Perú SAC | | | 3.82 | | | | 0.5 | | | | 0.88 | |
| Louis Dreyfus Peru SAC | | | - | | | | 6.48 | | | | 10.74 | |
| Traxxys Peru SAC | | | - | | | | 0.75 | | | | 1.25 | |
| Total Domestic Sales | | | 47.23 | % | | | 46.36 | % | | | 46.42 | % |
| Total Sales | | | 100 | % | | | 100 | % | | | 100 | % |
The following table shows our committed sales volumes of silver-lead, gold-silver and zinc concentrates from 2011 to 2013:
| | | Wet metric tons | | | Wet metric tons | | | Wet metric tons | |
| Concentrate | | 2011 | | | 2012 | | | 2013 | |
| Recuperada’s Silver-Lead | | | 8,000 | | | | 2,750 | | | | 3,500 | |
| Recuperada’s Zinc | | | 8,500 | | | | 4,245 | | | | - | |
| Uchucchacua’s Silver-Lead | | | 31,300 | | | | 16,750 | | | | 5,750 | |
| Uchucchacua’s Zinc | | | 19,490 | | | | 12,400 | | | | - | |
| Poracota’s Gold-Silver | | | 20,000 | | | | 6,300 | | | | - | |
| Julcani’s Silver-Lead | | | 5,485 | | | | - | | | | - | |
Note: The price of the concentrate supplied under the contract is based on specified market quotations minus deductions.
We also sell refined gold, which is derived from our operations at Orcopampa, Shila-Paula, Antapite, Ishihuinca and La Zanja and processed at a local smelter in Lima, to Johnson Matthey Public Limited Company, or Johnson Matthey, which further refines the gold. Pursuant to our agreement with Johnson Matthey, we supplied Johnson Matthey, at our option, with gold assaying in excess of 75 percent gold and approximately 20 percent silver, monthly from January 1, 2010 to December 31, 2010. The price of the gold supplied was determined based on, for the gold content, the quotation for gold at the London Gold Market PM fixing in U.S. Dollars, and for the silver content, the quotation for silver at the London Silver Market spot fixing in U.S. Dollars or at spot prices, minus, in each case, certain minimum charges, as well as charges for customs clearance and treatment of the gold (which varies depending on its gold and silver content). We may elect to have our material toll refined at Johnson Matthey’s Brampton, Canada works and returned to our account for sale to third parties. Pursuant to our agreement, we are responsible for delivering the gold to Johnson Matthey’s designated flight at the Lima airport.
Hedging/Normal Sales Contracts
Between 2003 and 2008, we modified the terms of certain derivative instruments in order to qualify them as normal sales contracts and eliminated the fixed or maximum price component on all of our outstanding gold commitments. These modifications required us to make aggregate payments of US$832.84 million during 2007 and 2008. As a result of these transactions, we are now completely unhedged as to the price at which our gold and silver will be sold. See “Item 3. Key Information—Risk Factors—Factors Relating to the Company—Our, Yanacocha’s and Cerro Verde’s financial performance is highly dependent on the prices of gold, silver, copper and the other metals” and “—Our base metal hedging strategies may not be successful, and any of our unhedged metal prices will continue to be subject to market fluctuations.”
At Sociedad Minera El Brocal S.A.A., or El Brocal, we implemented a base metal hedging policy for a maximum of 25 percent of El Brocal’s total payable metal contained per year, for up to three years. As of April 30, 2011, all transactions entered into have been average price options through non-delivery zero cost (Asian) option collars. Outstanding hedging commitments for 2011 to 2013 amount to 14 percent of payable metal and are as follows: 12,352 metric tons of copper at an average price range of US$6,966 to US$8,191 per metric ton.
Yanacocha and Cerro Verde have not engaged in, and are currently not engaged in, gold or copper price hedging activities, such as forward sales or option contracts, to minimize their respective exposures to fluctuations in the price of gold and copper.
Regulatory Framework
Mining and Processing Concessions
In Peru, as in many other countries, the government retains ownership of all subsurface land and mineral resources. The surface land, however, is owned by individual landowners. Our right to explore, extract, process and/or produce silver, gold and other metals is granted by the Peruvian government in the form of mining and processing concessions. The rights and obligations of holders of mining concessions, provisional permits and processing concessions are currently set forth in the General Mining Law (Single Unified Text approved by Supreme Decree 014-92-EM), which is administered by the MEM.
Pursuant to the General Mining Law (Single Unified Text approved by Supreme Decree 014-92-EM), in 1991 a system was established for granting new mining concessions, based on Universal Transversal Mercator Coordinates, or UTM Coordinates, to map the mining concessions and provisional permits on Peru’s land area. Under this system, filers of mining claims filed after 1991 must obtain a mining concession before they may explore the areas claimed. The application filed is known as petitorio. A holder of a provisional permit, granted with respect to claims over an area claimed before 1991 who follows proper procedures to comply with the 1991 system, however, is permitted to continue to explore the area claimed, subject to compliance with the legal requirements to develop exploration activities. Effective December 21, 2007, applications for mining concessions must be filed with the regional mining directors of each regional government and with INGEMMET.
Mining concessions granted since October 11, 2008 have an indefinite term, subject to (a) payment of an annual concession fee of US$3 per hectare claimed and (b) since 2009, as provided in Legislative Decrees Nos. 1010 and 1054, achieving a minimum annual production of one Tax Unit (Unidad Impositiva Tributaria), or approximately US$1,263, per hectare with respect to metallic resources, and ten percent of one Tax Unit, or approximately US$126, with respect to non-metallic resources. In case such minimum annual production is not achieved in the first six months after the expiration of the tenth year counted from the year following the year in which the title of the concession was granted, holders of mining concessions shall pay an annual fine amounting to 10 percent of the minimum annual production per hectare, payable starting in the eleventh year counted from the year following the year in which the title of the concession was granted until the year in which such minimum annual production is achieved.
If failure to achieve minimum production continues until the end of the fifteenth year since the title of the concession was granted, the concession will be cancelled. The penalty shall be paid in addition to the annual concession fee and is payable when such annual concession fee is due. However, such fifteen-year term can be extended for up to five additional years if the failure is due to force majeure, acts of God or any reason not imputable to the concessionaire, duly demonstrated and approved by the relevant authority.
As of March 7, 2011, we owned and administered, directly or indirectly, through subsidiaries or in conjunction with joint venture partners, approximately 1,015,493 hectares devoted to mineral exploration and mining operations. Mining rights and processing concessions are in full force and effect under applicable Peruvian laws. We believe that we are in compliance with all material terms and requirements applicable to the mining rights and processing concessions and that we are not subject to any condition, occurrence or event that would cause the revocation, cancellation, lapse, expiration or termination thereof, except that we may, from time to time, allow to lapse, revoke, cancel or terminate mining rights and processing concessions that are not material to the conduct of our business. The principal mining rights and processing concessions are (i) with respect to our mines, new applications (petitorios) filed for mining concessions at Julcani, Uchucchacua, Orcopampa, Colquijirca, Ishihuinca, Antapite, Recuperada and Shila-Paula; and (ii) with respect to our current exploration projects, new applications filed for mining concessions, the provisional pre-1991 permits and the mining concessions for the Tantahuatay, El Milagro, Trapiche, Breapampa and El Faique projects. The principal processing concessions are the processing concessions of the concentrators at Julcani, Uchucchacua, Orcopampa, Colquijirca, Ishihuinca, Antapite, Recuperada and Shila-Paula.
Both mining concessions and provisional permits claimed before 1991 conferred on their holders the right to mine underground ore reserves, and it is often the case that the titleholders of these mining rights are not the owners of the land surface. Since October 1996, pursuant to Peruvian regulations, all operators of new mining areas in Peru are required to have an agreement with the owners of the land surface above the mining rights to establish an easement upon such surface for mining purposes pursuant to General Mining Law. Supreme Decree 020-2008-EM, effective since April 12, 2008, provides that such agreement is required prior to starting exploration activities. In 2008, Legislative Decree No. 1064 went into effect and abrogated Law No. 26505 and the associated regulations contained in Supreme Decree No. 011-97-AG. However, in 2009, Law No. 29376 went into effect, abrogating Legislative Decree No. 1064 and reinstating Law No. 26505 and its associated regulations. The now-abrogated Legislative Decree No. 1064 had complicated negotiations between mining operators and owners of the surface land by requiring any agreement between the parties to be negotiated under general contracting rules as opposed to under the special rules contemplated by Law No. 26505 and its associated regulations and Law No. 26570. We have been actively seeking to acquire land surface, easements to land containing prospective geological exploration target sites, deposits that can be exploited in the future and areas suitable as plant or facility sites.
On December 19, 1998, Special Law No. 27015, the Law Regulating Mining Concessions in Urban Areas and Urban Expansion Areas, was released. Law No. 27015 was amended by Law No. 27560, the Urban Mining Concessions Law. Regulations pursuant to the Urban Mining Concessions Law were set forth in Supreme Decree No. 007-99-EM, as amended by Supreme Decree No. 041-2007-EM, effective as of July 26, 2007. Under the Urban Mining Concessions Law, metallic or non-metallic mining concessions will be granted in areas that have been or are designated as urban areas by municipal ordinances issued by the provincial municipality pursuant to the procedures set forth in the Regulations for the Territorial Conditioning, Urban Development and Environment approved by Supreme Decree No. 027-2003-Vivienda, published on October 6, 2003.
The granting of titles to metallic and non-metallic mining concessions in an area designated as an urban expansion area by means of municipal ordinances in force as of the date of filing of an application for a mining concession requires authorization through a Ministerial Resolution of the Ministry of Energy and Mines. The issuance of a Ministerial Resolution requires the receipt of a resolution of the Council of the applicable provincial municipality. The decision of whether or not to issue a Ministerial Resolution will be made within sixty days of receipt of such provincial municipality resolution. If the opinion is negative or if no opinion is issued, the application for the mining concession will be rejected. Any change from a metallic concession to a non-metallic concession and vice versa will be subject to these same requirements.
Applications for concessions in urban expansion areas will be presented on the basis of increments of 10 to 100 hectares under the UTM Coordinates system. A mining concession in an urban expansion area, whether metallic or non-metallic, will be granted for a term of 10 years, renewable for like terms under the procedures set forth above for the grant of the initial concession. In both urban areas and urban expansion areas the only legally valid easements for mining purposes are those which are entered into directly with the owner of the surface area.
Law No. 28964, which became effective on January 25, 2007, created the Organismo Supervisor de la Inversión en Energía y Minería (OSINERGMIN) as the government agency in charge of regulating and auditing the electricity, hydrocarbon and mining activities of companies. Law No. 28964 provides that the overview and audit of activities related to the environment, mining safety and health regulations may be performed by companies duly certified and approved by OSINERGMIN. However, pursuant to Supreme Decree 001-2010-MINAM, OSINERGMIN has transferred its environmental supervisory functions to the Environmental Evaluation and Oversight Agency, or OEFA. Beginning July 22, 2010, OEFA assumed the authority to carry out unexpected audits and levy fines on companies if they fail to comply with prescribed environmental standards.
Environmental Matters
In 2005, Peru enacted the General Environmental Law (Law No. 28611), revoking Legislative Decree 613, which contained the environmental law that previously governed Peru. Law No. 28611 establishes the main guidelines and principles to ensure a clean environment and incorporates a number of environmental management guidelines relating mainly to emissions standards. Pursuant to Law No. 28817, the National Environmental Authority has until July 22, 2008 to approve the environmental emission standards and the maximum permissible levels of emission following the procedure contemplated in Supreme Decree No. 033-2007-PCM.
Before the General Environmental Law was passed, the Peruvian government issued Supreme Decree No. 016-93-EM approving the Regulations of Title Fifteen of the General Mining Law, Regulations for Environmental Protection of the Mining and Metallurgical Activities, as amended and supplemented by Supreme Decrees Nos. 059-93-EM and 022-2002-EM. Following passage of the General Environmental Law, the Peruvian government issued (a) Supreme Decrees No. 03-2009-EM and 078-2009-EM, which included amendments to certain provisions of Supreme Decree No. 016-93-EM and (b) Supreme Decree No. 046-2001-EM containing the Safety and Hygienic Regulations for Mining Activities, as amended by Supreme Decree No. 018-2003-EM and Supreme Decree No. 046-2005-EM. This Supreme Decree was abrogated by Supreme Decree No. 055-2010-EM, which approved new Safety and Hygienic Regulations for Mining Activities, effective January 1, 2011. On April 2, 2008 Supreme Decree No. 020-2008-EM, approving new Environmental Regulations for Mining Exploration Activities, became effective. Holders of mining concessions, whether or not in urban areas or urban expansion areas, that want to develop mining exploration activities must comply with the provisions of such new regulations as well as those applicable provisions set forth in Supreme Decree No. 016-93-EM, as amended and supplemented by Supreme Decrees Nos. 059-93-EM, 029-99-EM, 022-2002-EM, 03-2009-EM and 078-2009-EM, as well as the provisions contained in the Safety and Hygienic Regulations for Mining Activities set forth in Supreme Decree No. 055-2010-EM, which replaced the regulations previously set forth pursuant to 046-2001-EM, as amended. Supreme Decree No. 016-93-EM and the Safety and Hygienic Regulations for Mining Activities set forth in Supreme Decree No. 055-2010-EM are also applicable to exploitation activities. Failure to comply with the provisions of the aforementioned regulations may be punished with a fine or by the temporary suspension of mining activities. In the event of continuing non-compliance, the mining concession may be revoked.
The MEM approves environmental studies and sets specific environmental standards. In particular, the MEM has established standards for emissions or discharges of liquid and gas effluents. Supervision of environmental commitments compliance was previously performed by OSINERGMIN, the body in charge of overseeing investment in the mining and hydrocarbon sectors. However, pursuant to Supreme Decree 001-2010-MINAM, OSINERGMIN has transferred its environmental supervision functions to the Environmental Evaluation and Oversight Agency, or OEFA. Starting on July 22, 2010, OEFA assumed the authority to carry out unexpected audits and fine companies if they fail to comply with prescribed environmental standards.
The MEM has issued regulations that establish maximum permissible levels of (i) emissions of liquid effluents and (ii) elements and compounds present in gaseous emissions resulting from the mining activities approved by Supreme Decree No. 010-2010-MIMAM and Ministerial Resolution Nos. 011/96-EM/VMM and 315-96-EM-VMM, respectively.
Generally, holders of mining rights and processing plants that were in operation prior to May 2, 1993 have a maximum of 10 years to comply with the maximum permissible levels; in the meantime, they must prepare their Programas de Adecuación y Manejo Ambiental (Environmental Adaptation and Management Programs, or PAMAs) to comply with more stringent maximum permissible levels. Under Peruvian environmental regulations passed in 1993, a company that initiated operations prior to May 2, 1993, as is the case for us and most of our affiliated companies, was required to file with the Peruvian government an Evaluación Ambiental Preliminar (Preliminary Environmental Evaluation, or EVAP) for each of its mining units to disclose any pollution problems in its operations and, thereafter, to submit a follow-up PAMA aimed at implementing measures in order to solve problems identified in the EVAP. Companies must correct the pollution problems relating to their mining activities within five years, while smelters must comply within ten years. These companies must allocate no less than one percent of their annual sales to redress the problems identified in their EVAPs and contemplated in their PAMAs. Mining and processing activities that began after May 2, 1993 or had at that time a specific environmental program will be required to file and obtain approval for an EIS before being authorized to operate. Mining and plant processing activities that began after May 2, 1993 are required to comply with the more stringent maximum permissible levels for liquid effluents from the initiation of their operations.
Many of our mining rights and processing plants were in operation prior to May 2, 1993, and we are in substantial compliance with the maximum permissible levels. EVAPs for Julcani, Uchucchacua, Orcopampa, Recuperada, Ishihuinca and Shila were all accepted between August and September 1995. Between November 2002 and April 2003, the MEM approved and verified the PAMAs for all these entities, issuing and approving resolution for each respective mining unit. The EISs for Paula, Antapite, Esperanza, Poracota and Pozo Rico were approved in 2001, 2001, 2006, 2007 and 2008, respectively.
EISs for capacity expansion at the Orcopampa, Uchucchacua and Antapite mines were approved in 2004, 2006 and 2008, respectively.
The MEM approved the EISs for the Huancarama-Chipmo-Poracota and La Zanja transmission lines and their substations in 2006 and 2008, respectively. This connection to the national grid should result in lower energy costs.
In 2009, the MEM approved the EISs for the La Zanja, Mallay, Tantahuatay Esperanza and Angélica Rublo Chico projects.
There were no regulations for mining explorations prior to DS No 038-98-EM-VMM, Reglamento de Exploración Minera (Law that regulates the Mining Explorations), which was published in 1998. In 2008, DS No 038-98-EM-VMM was abrogated and replaced by DS 020-2008-EM, which governs exploration mining activities, the permits and environmental documents required for such activities, the contents of such documents, the competent authorities to approve them and other related matters. Under DS 020-2008-EM, exploration activities are divided into 2 categories, Category I and Category II. Category I exploration activities are those involving no more than 20 drilling platforms and environmentally affecting no more than 10 hectares, while Category II exploration activities are those involving more than 20 drilling platforms and environmentally affecting more than 10 hectares. For exploration activities under Category I, an Environmental Impact Declaration, or EID, is required, and for exploration activities under Category II, a Semi-detailed Environmental Impact Study, or EISsd, is required, which incorporates technical, environmental and social matters. Exploration activities must start within the twelve months following the date that the EID or the EISsd is approved. The commitments assumed by mining companies in their EID, EISsd and EIS are mandatory; if they are not fulfilled, OSINERGMIN has the authority to fine these companies.
In May 2008, MEM enacted DS 028-2008, which establishes the right of every person to participate in the process of making decisions related to the sustainable development of mining activities on government territory. The EID, EIS and EISsd require local communities to have an opportunity to actively participate in this process.
The EA for Mallay was approved in August 2005. In 2006, the EAs for Hallazgo and Breapampa were approved and the ones for Angelica Rublo, El Milagro, Trapiche, Anamaray-Jancapata and Ampato were approved in 2007. The EID for Chucapaca was approved in 2008, and the ones for Mulanan and Pariguanas were approved in 2009.
In May 2008, the Environmental Ministry of Peru was established by legislative decree. The principal functions of the Environmental Ministry include formulating and implementing policies and regulations relating to environmental matters and controlling pollution through supervision and education. For example, the Environmental Ministry is responsible for approving Environmental Quality Standards for water and air. In the case of water quality standards, all the Peruvian mining companies must present updated environmental management plans by December 19, 2010. Also, the Environmental Ministry has to be in continuous communication with several institutions (DIGESA, IMARPE, DGAA, among others) and develop a decentralized system to manage natural resources and protect the environment. Some of the main regulations are the approval of Environmental Quality Standards for water and air. In the case of water, all the Peruvian mining companies must present their updated environmental management plans before December 19, 2010.
Except as described above, there are no material legal or administrative proceedings pending against us with respect to any environmental matters.
Law No. 28090, Ley que Regula el Cierre de Minas (Law that Regulates the Closing of Mines), was published on October 14, 2003, establishing the obligations and procedures that mining companies must follow to prepare, submit and execute plans for the closing of mines, or Closure Plans, and the granting of environmental guarantees to secure compliance with Closure Plans. Pursuant to Law No. 28090, as amended by Law No. 28507, published on May 8, 2005 and the Mine Closure Regulations approved by Supreme Decree 033-2005-EM, published on August 15, 2005, as amended by Supreme Decrees No. 035-2006-EM, No. 045-2006-EM and No. 054-2008-EM, we are required to (i) submit a Closure Plan for “New Projects” to the MEM within one year following approval of the EIS or PAMA, or in the case of “Existing Projects,” one year after August 15, 2005; (ii) submit a modification to the Closure Plan to the MEM within nine months after August 15, 2005; (iii) inform the MEM semi-annually of any progress on the conditions established in the Closure Plan; (iv) perform the Closure Plan consistent with the schedule approved by the MEM during the life of the concession; and (v) grant an environmental guarantee that covers the estimated amount of the Closure Plan. The guarantee may be in the form of cash, trusts, and any other guarantee contemplated in the Banking Law. Supreme Decree No. 045-2006-EM, dated August 14, 2006, amended Articles 8 and 51 of the Mine Closure Regulations relating to companies obliged to submit a duly approved Closure Plan. Article 51 refers to the method of calculating the guarantee. Supreme Decree No. 016-2005-EM governs the operation of the Registro de Entidades Autorizadas a Elaborar Planes de Cierre de Mina (Registry for Authorized Entities to Elaborate the Closing of Mines). Only the entities recorded in such registry are allowed to prepare the Closure Plan. The Mine Closure Regulations, Supreme Decree No. 033-2005-EM, deals with the effects on health, safety, property and the environment at the end of the productive life of mining-related facilities.
We have presented Closure Plans to the MEM for all of our mines and advanced explorations. To date, the MEM has approved our Closure Plans for Julcani, Recuperada, Uchucchacua, Orcopampa, Poracota, Antapite, Caravelí, Shila, Esperanza, Pozo Rico, Mallay, Trapiche, Angélica Rublo Chico and Anamaray-Jancapata.
On November 9, 2009 Supreme Decree No. 078-2009-EM became effective, creating additional environmental obligations for the holders of mining concessions. Under this provision, holders of mining concessions that have performed mining activities, including mining exploration, exploitation and processing activities or related activities, without having an Environmental Certification will be required to prepare and perform an Environmental Remediation Plan to cure the environmental impact in the areas in which such activities have been conducted. The Environmental Remediation Plan will contain a detailed description of all the mining items and activities performed without the correspondent Environmental Certification, including maps and related information, a detailed description of the environmental impacts created by such activities, a detailed description of the remediation actions, a detailed description of the compensation that is proposed to be made, a budget and schedule of the remediation activities, including their costs, a bond in favor of MEM for the cost of the execution of the measures contained in the Environmental Remediation Plan and other specific information contained in Article 4 of Supreme Decree No. 078-2009-EM.
Law No. 28271, Ley que Regula los Pasivos Ambientales de la Actividad Minera (Law that Regulates the Environmental Liabilities of Mining Activities), became effective on July 7, 2004 to regulate the identification of liabilities in mining activity and financial responsibility for remediation, in each case to mitigate any negative impact mining may have with respect to the health of the population, environment and property. Pursuant to Law No. 28271, as amended by Law No. 28526, published on May 25, 2005, Legislative Decree No. 1042, published on June 26, 2008, and the Mining Environmental Liabilities Regulations approved by Supreme Decree No. 059-2005-EM, published on December 8, 2005, as amended by Supreme Decree No. 003-2009-EM, the technical branch of the MEM will identify environmental liabilities, mining companies responsible for abandoned mining facilities, mining works and residue deposits that may be linked to such environmental liabilities and holders of inactive mining concessions with mining liabilities. Holders of inactive mining concessions with environmental mining liabilities will be required to submit a Closure Plan within one year of the date in which Supreme Decree No. 059-2005-EM became effective. The Peruvian government will only assume the environmental mining liabilities of unidentified holders. In addition, holders will enter into environmental remediation agreements with the MEM, acting through the General Directorate of Mining Environmental Affairs, to perform any studies and work necessary to control and mitigate the risk and effects of any contamination, which will be financed by the Fondo Nacional del Ambiente – FONAM. A Closure Plan must be submitted one year after the approval of the EIS by the General Directorate of Mining Environmental Affairs. On March 30, 2010, Ministerial Resolution No. 136-2010-MEM/DM, approving the forms of agreements for the voluntary remediation of mining liabilities, became effective.
We have presented Closure Plans to the MEM for all our mining concessions with environmental mining liabilities. To date, the MEM has approved the mining liabilities for Hualchocopa, Lircay, Bella Unión-Pucaray and Chaquelle.
We anticipate additional laws and regulations will be enacted over time with respect to environmental matters. The development of more stringent environmental protection programs in Peru could impose constraints and additional costs on our operations, and we would be required to make significant additional capital expenditures in the future. Although we believe that we are substantially in compliance with all applicable environmental regulations of which we are now aware, there is no assurance that future legislation or regulatory developments will not have an adverse effect on our business or results of operations.
Permits
We believe that our mines and facilities have all necessary material permits. All future exploration projects will require a variety of permits. Although we believe the permits for these projects can be obtained in a timely fashion, permitting procedures are complex, time-consuming and subject to potential regulatory delay. We cannot predict whether we will be able to renew our existing permits or whether material changes in existing permitting conditions will be imposed. Non-renewal of existing permits or the imposition of additional conditions could have a material adverse effect on our financial condition or results of operations.
Insurance
We maintain a comprehensive insurance program designed to address specific risks associated with our operations, in addition to covering the insured risks common to major mining companies. Our insurance program is provided through the local Peruvian insurance market and includes employers’ liability, comprehensive third party general liability, comprehensive automobile liability, all risk property on a replacement basis, including transit risks, business interruption insurance and mining equipment.
Mining Royalties
Article 20 of Law No. 26821, Ley Orgánica para el Aprovechamiento Sostenible de los Recursos Naturales, establishes that private companies must pay compensation to the Peruvian government for the economic use of natural resources. Law No. 28258, published on June 24, 2004 and amended by Law No. 28323, created a mining royalty (regalia minera) that holders of mining concessions must pay on a monthly basis to the Peruvian government for the exploitation of metallic and non-metallic resources. The royalty, which is the compensation referred to in Article 20 of Law No. 26821, Ley Orgánica para el Aprovechamiento Sostenible de los Recursos Naturales, is not considered a tax. However, it will be included in the scope of the Mining Law Stabilization Agreements and mining companies that are taxpayers and are party to such stabilization agreements will not have to pay this compensation or royalty during the life of their stabilization agreements. Although we are not party to a stabilization agreement, Yanacocha has entered into Mining Law Stabilization Agreements under the General Mining Law with the Peruvian government. See “Item 5. Operating and Financial Review and Prospects—Yanacocha—Operating Results.” Yanacocha has entered into stabilization agreements for the following mines: Carachugo, Yanacocha, La Quinua and Maqui Maqui. On January 1, 2010, the stabilization agreement for the Carachugo mine expired. As a result, Yanacocha accounted for $13.4 million in costs applicable to sales. Law No. 28969, effective since January 26, 2007, provides that government tax agencies are responsible for the collection of mining royalties and establishes rules relating to the calculation of royalties, valuation methods and penalties.
The royalty is calculated on revenue from sales of product (based on the international market price) less certain refining and transportation expenses. The mining royalty to be paid for ore concentrates with a value (i) up to US$60 million per year, is 1 percent of such value, (ii) between US$60 million and US$120 million per year, is 2 percent of such value and (ii) in excess of US$120 million per year, is 3 percent of such value. The MEM will publish the international market price of minerals and in the event that a mineral does not have an international market price, the mining royalty will be 1 percent of the mining component.
Negotiated Payment (voluntary contribution)
During 2006 Peruvian mining companies, represented by the Sociedad Nacional de Minería, Petróleo y Energía, agreed to a voluntary mining payment equivalent to 3.75 percent of net income after taxes. The payment was negotiated with the Peruvian government and is intended to support government efforts to alleviate poverty. On December 21, 2006, the Peruvian government issued Supreme Decree No. 071-2006-EM, which approved the form of agreement to be entered into by mining companies and the Peruvian government. The form of agreement contains the conditions under which the negotiated payment will be paid. The payment amounts to 3.75 percent of Peruvian net income after income tax, including 2.75 percent to be paid to a local mining fund and 1 percent to be paid to a regional mining fund. This payment is payable from 2006 through 2010, contingent on the price of gold. Payments are required to be made on or before April 30th of each year, after the income tax sworn declaration is submitted to the Peruvian tax authority. Pursuant to Supreme Decree 033-2007-EM, mining companies can make payments to the local and to the regional funds after such deadline provided that the prior approval of the Ministry of Energy and Mines and the Ministry of Economy and Finance is obtained. Fulfillment of the payment obligations will be controlled by an audit entity recorded as such with the Comisión Nacional Supervisora de Empresas y Valores (National Supervisory Commission of Business and Securities, or CONASEV) to be agreed upon among the mining company, the Ministry of Energy and Mines and the Ministry of Economy and Finance. We paid a total of US$1.5 million during the year ended December 31, 2010.
In February 2007, under the framework of this agreement executed with the Peruvian government (D.S. No. 071-2006-EM), we formed a trust in the Banco de Crédito del Perú to serve two funds: the Buenaventura Local Mining Fund and the Buenaventura Regional Mining Fund. Proceeds from these funds were used to provide school furniture, teacher training and healthcare equipment.
On November 8, 2007, Cerro Verde executed an agreement with the Peruvian government in accordance with the terms outlined above, resulting in a contribution of US$16.7 million and US$32.0 million for the years ended December 31, 2006 and 2007, respectively, which was paid in the first half of 2008. An expense of US$29.5 million was recorded in 2008 and was paid in the first half of 2009. An expense of US$27.6 million was recorded in 2009 and was paid in the first half of 2010. An expense of US$41.1 million was recorded in 2010. Each of these amounts is recorded as a negotiated payment (voluntary contribution) in the Cerro Verde Financial Statements.
Safety
The safety and health of our employees is our highest priority. We believe that we have implemented robust safety measures and work continuously to improve our occupational health and safety training and performance. We regularly monitor occupational health and safety performance and compliance through safety training programs, review and analysis of accident reports and other routine safety measures at our operating mines. Our Uchucchacua, Julcani, Antapite, Orcopampa and Shila-Paula mining units are Occupational Health and Safety Assessment Series 18001 certified.
Our safety program includes the following core components:
| | · | Risk Detection Training and Log Book: to train workers to detect, identify and record job-related hazards; |
| | · | Safety Performance Indicators: to regularly monitor the performance of each operating unit and target safety efforts and training; |
| | · | Specialized Safety Training: to provide training related to safety techniques and tools tailored to the risks associated with each employee’s job; |
| | · | Mine School: to provide on-site theoretical and practical training to employees in different fields of work; |
| | · | Implementation of International Safety Standards: to establish and comply with internationally accepted safety standards; and |
| | · | Safety Audits: to regularly audit safety procedures and systems at each operating mine by certified auditors. |
During 2010, we experienced 304 total reportable injuries, 138 lost-time injuries and 3 fatal injuries, as compared to 277 total reportable injuries, 140 lost-time injuries and 3 fatal injuries for the year ended December 31, 2009. Under Peruvian law, the number of lost-time injuries recorded includes restricted duty injuries and certain medical treatment injuries. The total number of reportable injuries includes lost-time injuries, as well as other minor and major first aid injuries.
C. Organizational Structure
As of April 30, 2011, we conducted our mining operations directly and through various majority-owned subsidiaries, controlled companies and other affiliated companies as described in the following organizational chart.
1
† All entities in this chart, with the exception of Minera Julcani S.A. de C.V. and Compañía de Minas Buenaventura Chile Limitada (which are organized in Mexico and Chile, respectively), are incorporated in Peru.
Intermediate Holding Companies, Subsidiaries and Equity Participations
Compañía Minera Condesa S.A.
Condesa, which is wholly owned by us, is a mining and facilities holding company with direct and indirect ownership participation in two mining-related entities, Cedimin and Yanacocha, and in exploration projects conducted by Minas Conga and Conenhua (as defined below). See “—Business Overview—Exploration.” As a partner in Yanacocha, Condesa shares responsibility for the investments made in the Yanacocha mine. In addition, on August 15, 2007, Cedimin transferred its equity interest in Chaupiloma to Condesa, and, as a result, Condesa now receives a portion of the royalty revenues paid by Yanacocha to Chaupiloma equal to such ownership interest. See “—S.M.R.L. Chaupiloma Dos de Cajamarca” below. Condesa also holds a 7.68 percent interest in us.
Compañía de Exploraciones, Desarrollo e Inversiones Mineras S.A.C.
Cedimin, wholly owned by us, is a mining and facilities holding company. At December 31, 2005, Cedimin held a 40 percent interest in S.M.R.L. Chaupiloma Dos de Cajamarca. See “—The Company—History and Development” and “—S.M.R.L. Chaupiloma Dos de Cajamarca” below. See “—The Company—History and Development” for a description of the legal proceedings in the Peruvian courts concerning the ownership of certain shares of Cedimin originally held by BRGM. On August 15, 2007, Cedimin transferred its equity interest in Chaupiloma to Condesa.
As of January 2, 2003, Minera Shila S.A.C. merged with and into Cedimin. As a result of the merger, our interest in Cedimin increased from 0.0009 percent before the merger to 44.83 percent after the merger, and Condesa’s interest in Cedimin decreased from 99.9991 percent before the merger to 55.17 percent after the merger. In addition, on October 22, 2004, Cedimin acquired a 100 percent equity interest in Inversiones Mineras Aureas S.A.C., or Mineras Aureas, which had a 49 percent interest in Minera Paula 49 S.A.C., or Minera Paula. As a result of this acquisition, Minera Paula became wholly owned by us. As of December 31, 2004, Mineras Aureas and Minera Paula merged with and into Cedimin and are no longer separate legal entities.
S.M.R.L. Chaupiloma Dos de Cajamarca
S.M.R.L. Chaupiloma Dos de Cajamarca, or Chaupiloma, is a Peruvian limited liability company that holds all of the mining rights for the areas mined by Yanacocha and Minas Conga. Chaupiloma receives a royalty that is calculated as a percentage of the total revenues of Yanacocha. We, Condesa and Newmont Peru own a 20 percent interest, a 40 percent interest and a 40 percent interest, respectively, in Chaupiloma. We own, directly and indirectly, through our interest in Condesa, a 60 percent interest in Chaupiloma.
Consorcio Energético Huancavelica S.A.
Consorcio Energético Huancavelica S.A., or Conenhua, is an electrical transmission company that provides a significant portion of our electrical needs through its transmission facilities. We own 100 percent of Conenhua and manage its operations. Conenhua obtained the concession for power transmission in the Huancavelica area in 1983, enabling us to buy energy from Electro Perú and to transmit electric power to our mining facilities through our own facilities. The provinces of Huancavelica, Angaraes, Acobamba and Castrovirreyna are now connected to the system. Conenhua also provides electric power to other mining companies in the area. In 2010, Conenhua sold 60.53 million kilowatt hours, or kWh, in Huancavelica. Conenhua has become the operator of Paragsha II-Uchucchacua, the power line that provides electricity to the Uchucchacua mine and two other mines and, in 2010, Conenhua provided 150.21 million kWh to those mines. Conenhua also operates the Callalli-Ares power line, which in 2010 provided 101.51 million kWh to the Orcopampa, Poracota and Shila-Paula mines, as well as Public Electric Distribution Company’s Small-Scale Electric System (PSE). In addition, Conenhua provides the Antapite mine with electricity, including electrical power service and maintenance and, in 2010, Conenhua provided 13.08 million kWh to this mine. In 2010, Conenhua provided 695.91 million kWh to Yanacocha, a 2.2 percent decrease compared to 2009. The primary San Miguel-La Zanja line, at 22.9 kilovolts, or kV, and the La Zanja electrical substation, in operation since 2010, transmitted 2.43 kWh. Conenhua’s revenues in 2010 amounted to US$26.81 million.
In order to secure a reliable energy supply from a clean and renewable source for our nearest operations and projects at competitive prices, Conenhua, through its subsidiary Empresa de Generación Huanza S.A., or Huanza, was commissioned to construct a 90.6 megawatt, or MW, capacity hydroelectric power plant in the valley of Santa Eulalia. This US$147 million project commenced in March 2010 and should be completed within a 33-month period. As of March 2011, total investment in the project was US$76.4 million, representing 52 percent of the entire budget; construction of 44 percent of the water conduction tunnel and 100 percent of the dam excavation was completed. Approximately 80 percent of the total investment has been financed through a finance lease obtained from Banco de Crédito del Peru.
Buenaventura Ingenieros S.A.
Buenaventura Ingenieros S.A., or BISA, one of our wholly-owned subsidiaries, has provided geological, engineering, design and construction consulting services to the mining sector for over 30 years. During this time, BISA has consulted in Peru, Chile, Argentina, Mexico and Ecuador on a range of projects, operations and expansions. In 1995, BISA created an environmental services group. In 2007, BISA inaugurated its Mineralogical Characterization Laboratory for the analysis of rocks and minerals. BISA owns a 99.99 percent interest in Contacto Corredores de Seguros S.A., an insurance brokerage company that provides insurance brokerage and related services to us and our affiliates. In 2008, 2009 and 2010, BISA participated in 210, 249 and 350 projects, respectively, for domestic and international mining industry customers in Latin America, including the preparation of Environmental Impact Studies and Environmental Adaptation and Management Programs. In 2010, BISA’s revenues amounted to US$32 million.
Minera Julcani S.A. de C.V.
Minera Julcani S.A. de C.V., or Minera Julcani, is a wholly-owned subsidiary created for the purpose of conducting exploration pursuant to our joint venture agreement with Solitario México S.A. de C.V., or Solitario. Under this agreement, Solitario granted us the exclusive right to conduct exploration within its properties situated in Hidalgo, Mexico. The first earn-in phase of this agreement allows us to earn a 51 percent participating interest by contributing all the results derived as a result of our exploration expenditures as of or during the 54 months following July 2010. We may withdraw at any time upon contribution of the mininmum required expense of US$2.0 million. Upon completion of the first earn-in phase, we may elect, in our sole discretion, to earn an additional 14 percent participating interest, for a total 65 percent participating interest, by completing a positive feasibility study at our cost as part of the second earn-in phase.
Sociedad Minera Coshuro S.A.
Sociedad Minera Coshuro S.A., or Coshuro, which began operations in December 1995, was created jointly by us and Newmont Peru to conduct gold mining exploration in the Yanacocha volcanic belt. Coshuro was 35 percent owned by us until December 20, 2000, on which date Newmont Peru transferred 10.9 percent of its interest in Coshuro to us. As a result, we currently hold a 45.9 percent interest in Coshuro. On August 13, 2002, Coshuro authorized the separation and transfer to us of all of the mining concessions granted to Coshuro pursuant to a Separation Agreement dated September 25, 2000. The mining concessions were transferred to La Zanja, in which we hold a 53.06 percent equity interest.
Inversiones Colquijirca S.A. / Sociedad Minera El Brocal S.A.A.
Sociedad Minera El Brocal S.A.A., or El Brocal, owns the Colquijirca and Marcapunta Norte mines. El Brocal was formed in 1956 and is engaged in the extraction, concentration and sale of concentrates of polymetallic minerals, mainly zinc, lead and silver. As of December 31, 2008, we held a 61.42 percent interest in Inversiones Colquijirca S.A., which in turn held a 51.06 percent interest in El Brocal, and a 4.50 percent direct interest in El Brocal’s mining properties. Our total equity interest in El Brocal was 35.77 percent as of December 31, 2008. On March 11, 2009, we purchased Teck Cominco’s equity stake in Inversiones Colquijirca S.A. for US$35.0 million, increasing our equity interest in Inversiones Colquijirca S.A. to 81.22 percent and our overall equity interest in El Brocal to 46.08 percent.
Minera La Zanja S.R.L.
Minera La Zanja S.R.L., or La Zanja, controls 32,070 hectares of mineralized ground in the La Zanja project, which is located 35 kilometers northwest of Cajamarca city. Originally, the La Zanja project was part of the Northern Peru joint mining exploration project, which was 35 percent owned by us and 65 percent owned by Newmont Peru. La Zanja, which is currently 53.06 percent owned by us and 46.94 percent owned by Newmont Peru, began operations in September 2010 as an open-pit mine producing gold and silver. During 2010, the mine produced 44,706 ounces of gold.
Compañia Minera Coimolache S.A.
Compañia Minera Coimolache S.A., or Coimolache, is a mining company that owns the Tantahuatay project, which is located in the province and district of Hualgayoc in the Cajamarca region. We, SCC and other third parties hold a 40 percent interest, a 40 percent interest and a 20 percent interest, respectively, in Coimolache. The Tantahuatay 2 ore deposit is located 35 kilometers northwest of the Yanacocha mine. We expect to invest approximately US$72 million through Coimolache and plan to produce an average of over 100,000 ounces of gold per year over the course of five years. We commenced construction in July 2010. Operations are expected to commence in mid-2011.
Canteras del Hallazgo S.A.C.
Canteras del Hallazgo S.A.C. holds mining rights to the Chucapaca project. We and Gold Fields hold a 49 percent interest and a 51 percent interest, respectively, in this company.
Ferrovías Central Andino S.A.
We hold 10 percent of Ferrovías Central Andino S.A., or Ferrovías, a railroad company, pursuant to a concession granted to a consortium of several companies in April 2000. Among the other companies holding interests in the share capital of Ferrovías are Railroad Development Corporation, Cemento Andino S.A., Commonwealth Development Corporation and others. Ferrovías provides transportation for concentrates from El Brocal’s mining operations.
Sociedad Minera Cerro Verde S.A.A.
We currently hold a 19.26 percent interest in Cerro Verde, which owns the Cerro Verde copper deposit located approximately 1,100 kilometers southeast of Lima. The Peruvian government previously owned and operated the mine. In November 1993, the Cerro Verde operation was privatized. Cyprus Climax Metals Company (now a subsidiary of Freeport-McMoRan Copper & Gold Inc.) bought 91.65 percent and, pursuant to Peruvian privatization laws, the employees of Cerro Verde purchased approximately 8.35 percent of the shares of Cerro Verde. Cyprus Climax Metals Company paid US$33.9 million for its equity interest in Cerro Verde and made a US$485 million capital commitment to finance the construction of the facilities. Freeport-McMoRan Copper & Gold Inc. is currently the operator and senior partner of Cerro Verde.
On June 1, 2005, Cerro Verde completed a capital increase. As a result of the capital increase, SMM Cerro Verde Netherlands B.V. acquired a 21 percent equity interest in Cerro Verde. In addition, we increased our equity interest in Cerro Verde from 9.17 percent to 18.21 percent. The remaining minority shareholders own 7.23 percent of Cerro Verde through shares publicly traded on the Lima Stock Exchange. As a result of the transaction, Cerro Verde received US$441.7 million in cash, net of US$1.0 million in expenses, and Phelps Dodge’s interest in Cerro Verde was reduced to 53.56 percent from 82.48 percent. In March 2007, Freeport-McMoRan Copper & Gold Inc. acquired Phelps Dodge. Freeport-McMoRan Copper & Gold Inc. maintains a majority interest in Cerro Verde. Since June 1, 2005, we have purchased additional common shares in Cerro Verde on the Lima Stock Exchange, increasing our interest to 19.26 percent as of December 31, 2010.
Presented in the table below is certain financial and operating data regarding Cerro Verde for the years ended December 31, 2008, 2009 and 2010:
| | | As of and for the year ended December 31, | |
| | | | | | | | | | |
Income statement data(1) | | | | | | | | | |
| Total revenues (US$ in thousands) | | | 1,835,911 | | | | 1,757,510 | | | | 2,368,988 | |
| Net income (US$ in thousands) | | | 718,433 | | | | 708,528 | | | | 1,054,423 | |
Proven and Probable Reserves (2) | | | | | | | | | | | | |
Proven: | | | | | | | | | | | | |
| Leachable ore reserves (metric tons in thousands) | | | 148,154 | | | | 120,805 | | | | 145,302 | |
| Millable ore reserves (metric tons in thousands) | | | 485,727 | | | | 745,904 | | | | 903,950 | |
Probable: | | | | | | | | | | | | |
| Leachable ore reserves (metric tons in thousands) | | | 139,597 | | | | 122,975 | | | | 97,911 | |
| Millable ore reserves (metric tons in thousands) | | | 2,249,103 | | | | 2,063,181 | | | | 2,424,368 | |
| Average copper grade of leachable ore reserves (%) | | | 0.46 | | | | 0.43 | | | | 0.41 | |
| Average copper grade of millable ore reserves (%) | | | 0.37 | | | | 0.40 | | | | 0.40 | |
Production(3) | | | | | | | | | | | | |
| Cathodes (in thousands of recoverable pounds) | | | 194,531 | | | | 206,514 | | | | 183,426 | |
| Concentrates (in thousands of recoverable pounds) | | | 499,955 | | | | 455,112 | | | | 483,937 | |
| Average realized price of copper sold (US$ per metric ton) | | | 6,952 | | | | 5,164 | | | | 7,539 | |
| (1) | Derived from Cerro Verde’s financial statements filed with CONASEV. See the Cerro Verde Financial Statements, including the notes thereto, appearing elsewhere in this Annual Report. |
| (2) | Reserve calculations are derived from the audited financial statements filed by Cerro Verde with CONASEV. See the Cerro Verde Financial Statements, including the notes thereto, appearing elsewhere in this Annual Report. The calculation or estimation of proven and probable ore reserves for Cerro Verde may differ in some respects to the calculations of proven and probable reserves for us and Yanacocha located elsewhere in this Annual Report. According to Cerro Verde, ore estimates for Cerro Verde are based upon engineering evaluations of assay values derived from samplings of drill holes and other openings. Cerro Verde’s ore estimates includes assessments or the resource, mining and metallurgy, as well as consideration of economic, marketing, legal, environmental, social and governmental factors, including projected long-term prices for copper and molybdenum and Cerro Verde’s estimate of future cost trends. |
| (3) | Derived from Cerro Verde’s financial statements filed with CONASEV. See the Cerro Verde Financial Statements, including the notes thereto, appearing elsewhere in this Annual Report. |
YANACOCHA
A. History and Development of the Company
Founded in Peru in 1992, Yanacocha is the largest gold producer in South America. Yanacocha produced 1,461,620 ounces of gold in 2010, its seventeenth full year of operations. Yanacocha’s operations are located in the Andes Mountains in Northern Peru in the area of Cajamarca, located approximately 900 kilometers north of Lima and north of the City of Cajamarca at an altitude of 4,000 meters above sea level. The Yanacocha property consists of six open-pit mines: Carachugo, Chaquicocha, Maqui Maqui, San José, Cerro Yanacocha and La Quinua. As of December 31, 2010, the Chaquicocha, Cerro Yanacocha and La Quinua mines were in operation. As of December 31, 2010, Yanacocha’s proven and probable reserves excluding Conga’s proven and probable reserves) were estimated to be 9.7 million ounces of gold, representing a 7.8 percent decrease over Yanacocha’s proven and probable reserves as of December 31, 2009, which were estimated to be 10.5 million ounces of gold. The decrease in reserves of gold was mainly due to a mining depletion of 2.1 million ounces, unit cost increases, updated block models, revised pit designs, leach pad inventory adjustments, stockpile additions and leach pad capacity limitations, which was partially offset by an increase of 1.3 million ounces of gold reserves due to conversion from non-reserve mineralization to reserves in certain projects,. As of December 31, 2010, Conga’s proven and probable reserves were estimated to be 11.8 million ounces of gold and 3.2 billion pounds of copper, representing no change from estimated 2009 gold and copper reserves. As of December 31, 2010, Yanacocha’s total proven and probable reserves (including Conga) were estimated to be 21.5 million ounces of gold, representing a 3.7 percent decrease over Yanacocha’s total proven and probable reserves as of December 31, 2009, which were estimated to be 22.4 million ounces of gold Yanacocha’s total proven and probable reserves of copper were 3.2 billion pounds as of December 31, 2010.
Proven and probable reserves are based on extensive drilling, sampling, mine modeling and metallurgical testing from which economic feasibility has been determined. Under the Management Contract (as defined below), Newmont Mining, in conjunction with Yanacocha, calculates Yanacocha’s reserves by methods generally applied within the mining industry and in accordance with SEC Industry Guide 7. Reserves represent estimated quantities of proven and probable ore that, under present and anticipated conditions, may be economically mined and processed. Newmont Mining has not quoted silver reserves at Yanacocha for the last year due to recovery issues.
Yanacocha’s mining activities encompass 310,001 hectares covered by 449 mining concessions. Of these 310,001 hectares, Chaupiloma holds the mining rights related to 109,642 hectares, which are covered by 165 mining concessions. Chaupiloma has assigned these mining concessions to Yanacocha pursuant to several assignments of mining rights. Chaupiloma is in the process of assigning six mining concessions to Yanacocha, and six mining concessions granted to Yanacocha are in the process of being transferred back to Chaupiloma.
In 1994, its first full year of production, Yanacocha produced 304,552 ounces of gold. Yanacocha produced 2,612,199 ounces in 2006, 1,563,669 ounces in 2007, 1,810,338 ounces in 2008, 2,058,180 ounces in 2009 and 1,461,620 ounces in 2010. The decrease in gold production in 2010 as compared to 2009 was mainly attributable to mine sequencing, which resulted in increased waste mining, lower leach placement, transitional stockpiling at La Quinua and lower mill ore grade and recovery. Yanacocha expects its 2011 production to decrease to between 1,315,000 to 1,412,000 ounces of gold, mainly as a result of decreases in the volume of ore placed and lower ore grades. Yanacocha believes that it was one of the world’s lowest cost gold producers in 2010, with a cost per ounce of gold sold of US$448. Yanacocha’s cost per ounce of gold sold was US$325 in 2009, US$358 in 2008, US$324 in 2007 and US$201 in 2006.
Yanacocha expects production of silver to decrease by approximately 66 percent from the 2010 production level to 1,216,250 ounces in 2011, mainly as a result of lower production at the mill and leach pads. Silver production was 24,467 ounces in 1993, Yanacocha’s first full year of production, 3,441,401 ounces in 2006, 2,318,696 ounces in 2007, 3,539,008 ounces in 2008, 4,367,258 ounces in 2009 and 3,561,991 ounces in 2010. The decrease in silver production in 2010 as compared to 2009 was mainly attributable to lower ore grade silver in the mill.
Yanacocha is owned 51.35 percent by Newmont Mining, through its wholly-owned subsidiary Newmont Second, 43.65 percent by us through our wholly-owned subsidiary Condesa and 5 percent by IFC. Yanacocha is managed by Newmont Peru. See “—Management of Yanacocha—General Manager/Management Agreement.” Since 1992, aggregate capital contributions of US$2.3 million have been made by Condesa, Newmont Second and IFC to Yanacocha. Although Yanacocha did not pay dividends during its development years, 1992 through 1994, cash dividends were distributed from 1995 to 2000. From 2001 to 2008, Yanacocha paid an aggregate of US$1,350 million in dividends in respect of 2000 through 2007 earnings. In 2009, Yanacocha paid an aggregated amount of US$230 million in dividends in respect of 2008 earnings. Yanacocha did not distribute cash dividends in 2010. Although Yanacocha has no fixed dividend policy, there is an understanding among the partners that the net income not required for sustaining capital expenditures or future development projects should be distributed after agreement between the two major shareholders, Newmont Mining and us.
In 2004, Yanacocha completed all of its investments necessary to obtain a tax credit under the government reinvestment program from 2001 through 2004. As of December 31, 2006, following the MEM’s completion of its audit of Yanacocha, Yanacocha received the MEM’s resolution of approval. Pursuant to this approval, Yanacocha capitalized US$189.6 million that had been recorded as restricted earnings, as required by law.
On October 31, 1999, pursuant to a public deed, Yanacocha changed its legal structure from a corporation to a partnership, changing its name from “Minera Yanacocha S.A.” to “Minera Yanacocha S.R.L.” As a result, Yanacocha (i) cannot have more than 20 partners; (ii) its capital stock is represented in participations; (iii) is not required to maintain a legal reserve (see Note 16 to Yanacocha Financial Statements); and (iv) will not receive a different income tax treatment under Peruvian law than it did as a corporation.
Capital Expenditures
Yanacocha’s capital expenditures from its formation in 1992 through 2010 have related principally to the construction of the Carachugo, Maqui Maqui, San José, Cerro Yanacocha and La Quinua mining operations, the construction of two plants at Carachugo and Yanacocha, each of which includes a leach solution processing facility and a smelter at each plant, the construction of four carbon column plants at Cerro Yanacocha and La Quinua, the acquisition of both new and used mining equipment, the construction of two dams, the construction of one agglomeration plant at La Quinua, the construction of a gold mill facility at Yanacocha, or the Yanacocha Gold Mill, and several expansions of the leach pads located at the Carachugo, Maqui Maqui, Cerro Yanacocha and La Quinua mining operations. Yanacocha’s capital expenditures from its formation through December 31, 2010 totaled approximately US$3,065.2 million, including capital expenditures of US$248.3 million in 2008, US$146.5 million in 2009 and US$298.6 million in 2010. In 2010, Yanacocha’s principal capital expenditures included US$131.9 million for the Conga project, US$23.3 million for the purchase of high altitude mining trucks, US$15.1 million for the construction of an alternate road to the coast of Peru, US$38.6 million for mine development at the El Tapado Oeste, Chaquicocha, Western Oxides and Maqui Maqui deposits, US$17.9 million for leach pad expansions at La Quinua (Stage 7B) and Carachugo (Stage 10C), US$6.9 million for the construction of a reverse osmosis plant for excess water treatment at Pampa Larga, US$6.5 million for the construction of a carbon column processing plant and US$4.7 million for the construction of a new central warehouse. In 2009, Yanacocha’s principal capital expenditures included US$29.5 million for the construction of an alternate road to the coast of Peru, US$27.4 million for the Conga project, US$21.7 million for mine development at the Chaquicocha and El Tapado Oeste deposits, US$15.1 million for the construction of an acid water treatment plant, US$11.9 million for leach pad expansions at La Quinua (Stage 7), US$7.2 million for the construction of a reverse osmosis plant for excess water treatment at Pampa Larga, US$5.5 million for expansions to the water pumping system to extract excess water at the La Quinua and Yanacocha pits and US$3.2 million for the construction of gold mill tailings pipelines. In 2008, Yanacocha’s principal capital expenditures included US$34.9 million for the Yanacocha Gold Mill, US$29.3 million for the Conga project, US$26.7 million for engineering at the east acid water treatment plant, US$20.7 million for waterways and irrigation channels acquired from the Quishuar, Encajón-Collotán and La Shacsha communities, US$14.1 million for the construction of an alternate road to the coast of Peru, US$12.9 million for the purchase of high altitude mining trucks, US$13.0 million for the foundation of the San José Reservoir trust, US$6.5 million for the construction of a reverse osmosis plant for excess water treatment at Pampa Larga, and US$27.2 million, US$13.7 million and US$6.7 million for the leach pad expansions at La Quinua (Stage 7), Carachugo (Stage 11) and Yanacocha (Stage 6), respectively.
Yanacocha anticipates that its capital expenditures for 2011 will be approximately US$1,036 million, which it plans to use primarily in connection with the continuation of the Conga project, mine development at the El Tapado Oeste, Chaquicocha, Western Oxides and Maqui Maqui deposits, expansion of the water pumping system to extract excess water, continuation of the construction of gold mill tailings pipelines, development of the Pangaea project, payments for waterways and irrigation channels acquired from the Quishuar, Encajón-Collotán and La Shacsha communities, land acquisitions and the purchase of one excavator.
Yanacocha expects that it will meet its working capital, capital expenditure and exploration requirements for the next several years from internally-generated funds, cash on hand and financing from banks and financial institutions. There can be no assurance that sufficient funding will be available to Yanacocha from internal or external sources to finance future working capital, capital expenditures and exploration and construction requirements, or that external funding will be available for such purposes on terms or at prices favorable to Yanacocha. A very significant decline in the price of gold would be reasonably likely to affect the availability of such sources of liquidity. See “Item 5. Operating and Financial Review and Prospects—Yanacocha—Liquidity and Capital Resources—Exploration Costs; Capital Expenditures.”
B. Business Overview
Description of Yanacocha’s Operations
The Yanacocha property consists of the following open-pit mines: Carachugo, Chaquicocha, Maqui Maqui, San José, Cerro Yanacocha, La Quinua Complex (La Quinua, El Tapado, Tapado Oeste), Cerro Negro Este, Western Oxide Pits (La Quinua Sur and Cerro Negro Oeste), Eastern Oxide Pits (Quecher Norte and Marleny) and Carachugo Alta. The Carachugo, Maqui Maqui, San José, Cerro Yanacocha, La Quinua Complex and Cerro Negro Este mining areas began operations in August 1993, October 1994, January 1996, the last quarter of 1997, October 2001 and April 2004, respectively. The Maqui Maqui open-pit mine temporarily ceased mining operations in 2000. Mining at Maqui Maqui resumed in 2010 and is expected to continue until 2012. The San José open-pit mine ceased operations in 2002, temporarily reopened in 2005 and closed again in 2006. Mining resumed at San José in 2010 and is expected to continue until 2012. The Carachugo open-pit mine ceased mining operations in 2004, although one ore processing facility remains in operation. The Cerro Yanacocha open-pit mine temporarily ceased mining operations in October 2010 but will be re-mined for deep transitional mill ore in 2015. The Cerro Negro Este open-pit mine temporarily ceased mining operations in March 2005 but will be re-mined as part of the Western Oxide expansion in 2011, while mining at La Quinua Sur will commence in June 2013. The Eastern Oxide expansion (Quecher Norte and Marleny) will commence mining in September 2012 and January 2013, respectively. Mining began at the Carachugo Alto open-pit mine in July 2010, the second phase of which is scheduled for June 2011.
Leach pads are located at Carachugo (410 million ton-capacity), Maqui Maqui (70 million ton-capacity), Cerro Yanacocha (470 million ton-capacity) and La Quinua (640 million ton-capacity, including the Western Oxides). Each of these leach pads includes at least two leach solution storage ponds and storm water ponds located down gradient from each leach pad. The Cerro Yanacocha site has two additional solution ponds attached to stages 6 and 7 for the segregation of solution generated from the treatment of transition ores. A raw water pond is used both for storm containment and to store excess solution during the wet season. La Quinua has an additional solution pond attached to stage 4.
Yanacocha has four processing facilities: Pampa Larga, Yanacocha Norte, La Quinua and the Yanacocha Gold Mill. The processing facilities can be used to process gold-bearing solutions from any of the leach pads through a network of solution pumping facilities located adjacent to the solution storage ponds or, in the case of the Yanacocha Gold Mill, to process high-grade gold ore to produce a gold-bearing solution for treatment at the La Quinua processing plant. The Pampa Larga facility includes Merrill-Crowe and carbon column gold recovery plants, and two four-stage water plants to allow treatment of excess process solutions accumulated during the rainy season. The Pampa Larga facility also includes the original gold refinery installation, which is maintained for emergency standby purposes only. The Yanacocha Norte facility includes Merrill-Crowe and carbon column gold recovery plants, three four-stage water treatment plants, and a reverse osmosis water plant to allow treatment of excess process solutions accumulated during the rainy season. This facility also contains primary refining and mercury retorting operations and an acid water treatment plant to allow neutralization of acid waters emanating from its mining operation and waste dumps prior to release into the environment. In addition, a slaking plant to provide lime for ensuring an alkaline pH on the pads and for water treatment purposes is located in close proximity to the facility. The La Quinua facility includes a carbon column gold recovery plant, an acid water treatment plant to allow neutralization of acid waters emanating from its mining operations and waste dumps prior to release into the environment, and a slaking plant to provide lime for ensuring an alkaline pH on the pads and for water treatment purposes.
The Yanacocha Gold Mill commenced operations in March 2008, with the first ore milled for production on March 26, 2008. Its total annual production is between 5.5 and 6.0 million dry metric tons, or DMT. The Yanacocha Gold Mill performs crushing, grinding, tank cyanidation, SART (Sulfidization, Acidification, Re-Neutralization and Thickening) and AVR (Acidfication, Volatilization and Re-Neutralization) processes for high-grade oxide and moderate Cu-grade ore. Production at the Yanacocha Gold Mill is expected to significantly impact Yanacocha’s future production capabilities, with total production measured in life-of-mine ounces at the Yanacocha Gold Mill representing 38 percent of the total ounces produced by Yanacocha. In order to balance mining production and Yanacocha Gold Mill total production capacity, Yanacocha has established ore stockpiles in which it deposits most of the ore from the pits, and feeds a small portion directly to the plant. The Yanacocha Gold Mill sources mill ore from the Yanacocha, Chaquicocha, El Tapado and Tapado Oeste pits.
Mining consists of a sequence of drilling, blasting, loading and hauling. Ore containing gold is transported from each mine to the nearest active leach pad while waste is taken to specially designed storage facilities. Unlike Yanacocha’s other mines, the ore in the La Quinua mine contains clays and fine grain material which can inhibit the heap leaching process if not handled properly. Initially, the La Quinua mine utilized an ore crushing and agglomeration process to improve the permeability of the ore prior to stacking ore on the leach pad. In May 2004, this process was replaced with a more inexpensive method whereby the ore is re-excavated using hydraulic shovels to a depth of four meters to improve permeability. Improved ore control to ensure proper blending of fine and coarse grained ore is an integral part of this process.
Ore is leached by introducing diluted solutions of cyanide through an irrigation system placed on top of the ore. This solution percolates through the ore, dissolving gold and silver as AuCN and AgCN complexes respectively, and results in a “pregnant” solution which drains to solution storage ponds to be transferred to the nearest recovery facility. Carbon column gold recovery plants typically treat lower grade solutions to produce a highly upgraded metal-bearing solution which in turn is routed to the Merrill-Crowe plants. Solution from the carbon column gold recovery plants or high grade solutions from the leach pads are sent to the Merrill-Crowe plants for gold extraction by a zinc precipitation process. The resulting gold precipitate is distilled by retorts (700°C) to remove mercury, and then smelted, producing doré bars currently assaying approximately 52 percent gold and 45 percent silver. The doré bars are transported from the processing plant by an outside security firm and refined outside of Peru. See “—Transportation and Refining.” The solution from which the gold is removed (barren solution) is recycled to the leach pads for further heap-leaching after having been reconstituted with cyanide. The leaching process is generally a closed system. However, during periods of high rainfall, excess water must be treated at the facilities located at Yanacocha Norte and Pampa Larga, which have been designed to meet or exceed standards for drinking water and for agriculture and livestock as set out by the Peruvian Ministry of Health, the U.S. Environmental Protection Agency, the State of Nevada Regulations and World Bank guidelines. See “—Regulation, Permit and Environmental Matters.”
Electric power for Yanacocha’s operations is currently provided by local power companies via two separate networks from the Cajamarca Norte substation in 60 kV and 220kV, respectively. Yanacocha also maintains diesel generation capacity for emergency requirements which have an aggregate power generation capacity of 22 MW. In addition, Yanacocha has been connected to the Peruvian national electricity grid since the end of 1997. Yanacocha currently receives its supply of electric power through a 220 kV power line originating in Trujillo, which is owned by Buenaventura and has the capacity to provide up to 150 MW to Yanacocha (although current contracted demand is limited to 70 MW). In addition, a 60 kV power line routed through Cajamarca permits Yanacocha to receive up to 10 MW. This power line is used only in emergencies. See “Item 5. Operating and Financial Review and Prospects.”
Water for Yanacocha’s operations is collected from rainfall and wells. All excess water used by Yanacocha undergoes treatment at the facilities described above.
Set forth below are certain unaudited operating data, for the years shown for each of Yanacocha’s mining operations that were then in operation:
| | | 2006 | | | 2007 | | | 2008 | | | 2009 | | | 2010 | |
| Mining Operations: | | | | | | | | | | | | | | | |
| Ore mined (DST): | | | | | | | | | | | | | | | |
| Cerro Yanacocha | | | 59,944,475 | | | | 56,696,685 | | | | 62,079,577 | | | | 74,309,421 | | | | 28,817,797 | |
| Carachugo | | | 950,355 | | | | 7,563,243 | | | | 6,037,340 | | | | 5,895,215 | | | | 23,455,796 | |
| Maqui Maqui | | | — | | | | — | | | | — | | | | — | | | | 1,267 | |
| La Quinua | | | 414,559 | | | | 35,283,067 | | | | 34,850,397 | | | | 66,806,796 | | | | 26,348,322 | |
| San José | | | 54,485,222 | | | | — | | | | — | | | | — | | | | 5,090,528 | |
| Total ore mined (DST) | | | 115,794,611 | | | | 99,542,995 | | | | 102,967,314 | | | | 147,011,432 | | | | 83,713,710 | |
| Average gold grade of ore mined (oz./DST): | | | | | | | | | | | | | | | | | | | | |
| Cerro Yanacocha | | | 0.030 | | | | 0.012 | | | | 0.023 | | | | 0.022 | | | | 0.032 | |
| Carachugo | | | 0.039 | | | | 0.047 | | | | 0.031 | | | | 0.022 | | | | 0.028 | |
| Maqui Maqui | | | — | | | | — | | | | — | | | | — | | | | 0.007 | |
| San José | | | 0.028 | | | | — | | | | — | | | | — | | | | 0.016 | |
| La Quinua | | | 0.021 | | | | 0.022 | | | | 0.016 | | | | 0.023 | | | | 0.019 | |
| Total average gold grade of ore mined (oz./DST) | | | 0.026 | | | | 0.019 | | | | 0.021 | | | | 0.022 | | | | 0.025 | |
| Gold Production (oz.): | | | | | | | | | | | | | | | | | | | | |
| Cerro Yanacocha | | | 1,035,794 | | | | 566,006 | | | | 701,063 | | | | 1,087,028 | | | | 659,080 | |
| Carachugo | | | 308,600 | | | | 307,867 | | | | 400,452 | | | | 453,374 | | | | 399,268 | |
| Maqui Maqui | | | 21,747 | | | | 21,460 | | | | 32,550 | | | | 18,555 | | | | 12,701 | |
| San José | | | — | | | | — | | | | — | | | | — | | | | — | |
| La Quinua | | | 1,246,058 | | | | 668,336 | | | | 676,273 | | | | 499,223 | | | | 390,571 | |
| Total gold (oz.) | | | 2,612,199 | | | | 1,563,669 | | | | 1,810,338 | | | | 2,058,180 | | | | 1,461,620 | |
Exploration
Yanacocha’s mining activities encompass 310,001 hectares covered by 449 mining concessions. Of these 310,001 hectares, Chaupiloma holds the mining rights related to 109,642 hectares, covered by 165 mining concessions, of which it has assigned 106,570 hectares to Yanacocha pursuant to several assignments of mining rights. Chaupiloma is in the process of assigning six mining concessions to Yanacocha, and six mining concessions granted to Yanacocha are in process of being transferred back to Chaupiloma.
Yanacocha has three processing concessions from the MEM for its processing plants: Cerro Yanacocha (Yanacocha Gold Mill, Cerro Negro, La Quinua and Yanacocha), Yanacocha (Carachugo and Pampa Larga) and China Linda. The processing concessions have indefinite terms, subject to the payment of an annual fee based on nominal capacity for the processing plant.
Exploration expenditures amounted to approximately US$28.2 million, US$23.0 million and US$26.4 million in 2008, 2009 and 2010, respectively. These expenditures have resulted in the identification of several deposits, which have been advanced to reserves, including Carachugo, Maqui Maqui, San José, Cerro Yanacocha, La Quinua (which includes Cerro Negro), Chaquicocha, El Tapado, El Tapado Oeste (Corimayo), Antonio, Quecher and Minas Conga (Perol, Chailhuagón and Amaro). Exploration expenditures have also been used to identify deep sulfide mineralization beneath the oxide deposits at El Tapado, El Tapado Oeste (Corimayo), Antonio, Maqui Maqui, Yanacocha and Chaquicocha. In 2011, exploration efforts will focus on further identifying sulfide mineralization beneath existing oxide resources, higher grade deep targets and copper-gold mineralization related to that in reserve at Minas Conga.
Yanacocha’s exploration expenditures include all of the costs associated with exploration activities such as drilling, geological and metallurgical testing. In addition, exploration costs cover engineering and project development costs on advanced stage projects. Yanacocha prepares a budget for each year and allocates an amount for exploration activities based on specific projects or regions.
Yanacocha intends to continue to develop the Cerro Yanacocha, La Quinua and Chaquicocha gold deposit projects and the Minas Conga gold-copper deposit project over the next several years, while continuing to explore the remainder of the Yanacocha district along with the adjacent Minas Conga and Solitario mineral holdings. Minas Conga currently consists of two gold-copper porphyry deposits located northeast of Yanacocha’s operating area in the provinces of Celendin, Cajamarca and Hualgayoc. This project, incorporated to reserves beginning in 2004 and 2005, reported 11.8 million ounces of gold reserves and 3.2 billion pounds of copper reserves as of December 31, 2010.
For 2011, Yanacocha estimates expenditures of US$22.0 million for exploration, which will be expensed, and an additional US$3.9 million related to delineation, characterization and sterilization activities for ore bodies that are currently classified as reserves, which will be capitalized. Both expenditure estimates are exclusive of significant development engineering charges. This budgeted amount will be expended mainly on sulfide development at Yanacocha, the Minas Conga environs and the San José gravel deposits along with an extensive exploration program in district and regional properties that Yanacocha controls.
Since exploration began in the Yanacocha district, over twenty hard-rock deposits and two fluvio-glacial deposits have been developed. As of December 31, 2007, Yanacocha reported proven and probable reserves of 14.5 ounces of gold in the Yanacocha district. In 2008, Yanacocha’s proven and probable gold reserves decreased mainly due to a mining depletion of 2.6 million ounces, as well as a decrease of 0.1 million ounces due to unit cost increases, additional drilling, updated block models, revised pit designs, leach pad inventory adjustments, transfer of reserves to non-reserve mineralization due to social issues and leach pad capacity limitations, partially offset by increases in metal prices, an increase in the expected recoverable ounces in leach pads and the improvement of pit design. In 2009, the decrease in Yanacocha’s proven and probable gold reserves was mainly due to a mining depletion of 2.7 million ounces; partially offset by an increase of 0.2 million ounces of gold reserves due to increases in metal prices, unit cost increases, additional drilling, updated block models, revised pit designs, leach pad inventory adjustments, stockpile additions, conversion from non-reserve mineralization to reserves and leach pad capacity limitations. As of December 31, 2010, the Yanacocha district’s proven and probable reserves (excluding Conga’s proven and probable reserves) were estimated to be 9.7 million ounces of gold, a 7.8 percent decrease from its proven and probable reserves as of December 31, 2009, which were estimated to be 10.5 million ounces of gold. This decrease in gold reserves was mainly due to a mining depletion of 2.1 million ounces, unit cost increases, updated block models, revised pit designs, leach pad inventory adjustments, stockpile additions and leach pad capacity limitations, which was partially offset by an increase of 1.3 million ounces of gold reserves due to conversion from non-reserve mineralization to reserves in certain projects.
As of December 31, 2010, Conga’s proven and probable reserves were estimated to be 11.8 million ounces of gold and 3.2 billion pounds of copper, representing no change from the 2009 gold and copper reserves, respectively.
Transportation and Refining
The doré bars produced by Yanacocha are transported to refineries outside of Peru and, accordingly, Yanacocha has entered into pre-established transportation contracts. Yanacocha has engaged Hermes Transportes Blindados S.A., or Hermes, to service its local transportation requirements. Under the terms of Yanacocha’s agreement with Hermes, the risk of loss with respect to the doré bars is assumed in its entirety by Hermes during the transportation of the doré bars from the mines to Jorge Chávez Airport in Lima. Thereafter, the responsibility for the doré bars shifts to the refiner, which has entered into a contract with an outside security firm to provide offshore transportation. The doré bars are melted, weighed and sampled in refineries abroad, which store the doré bars in strong-room vaults and assume responsibility there for the doré bars. Yanacocha pays a predetermined fee for the refining service. The final output from refineries, known as London Good Delivery gold and silver, is credited to Yanacocha’s London bullion accounts until transferred to purchasers.
Sales of Gold
Yanacocha’s gold sales are made through a monthly open-bidding process in which Yanacocha auctions its production corresponding to the next four to five weeks. This bidding process is set up by Yanacocha with approximately 10 financial institutions and trading firms prior to each month. Yanacocha collects bids and confirms sales. The gold is typically sold on the date of departure from Jorge Chávez Airport in Lima. If a portion of gold remains unsold, it is sold on the spot market within a few days. Silver is sold on the spot market approximately once a month to financial institutions or trading firms. The cash from such sales is received into a collection account in London against orders to the London bullion bank for deliveries of the gold and silver to the purchasers.
Delivery is made once a week and payments are collected on the day of confirmation. The payment price for the gold consists of either (i) the market price at the confirmation of the sale, or (ii) the average London PM Fixing price over the tendered period plus a small premium established pursuant to the bidding process. Since 1994, Yanacocha has consistently sold to five or six financial institutions and trading firms at each auction. Such buyers are market makers and active participants in precious metal markets.
Employees
As of December 31, 2010, Yanacocha had 3,287 employees. Compensation received by Yanacocha’s employees includes base salary and other non-cash benefits such as a health program and term life insurance. In addition, pursuant to the profit sharing plan mandated by Peruvian labor legislation, employees at Yanacocha are entitled to receive eight percent of Yanacocha’s annual pre-tax profits, or the Employee Profit Sharing Amount, with fifty percent of such profits to be distributed based on the number of days each employee worked during the preceding year and the remaining fifty percent of such profits to be distributed among the employees based on the aggregate annual salary of each employee. Effective January 1, 1997, the annual payment to each employee under the profit sharing plan cannot exceed 18 times such employee’s monthly salary, and any difference between the Employee Profit Sharing Amount and the aggregate amount paid to employees must be contributed by Yanacocha to the Fondo Nacional de Capacitación Laboral y Promoción del Empleo, or FONDO-EMPLEO, a public fund established to promote employment and employee training. Since 2005, if the amount contributed by Yanacocha exceeds 2,200 Unidades Impositivas Tributarias, or Tax Units, the excess should be dedicated exclusively to the financing of road infrastructure works and managed by the regional government.
In 1998, the Peruvian government issued additional regulations regarding the calculation of the workers’ participation. Such regulations utilized different criteria for determining employee profit sharing than those detailed under the law. Yanacocha followed the criteria established by the law in determining the amount to be paid to its employees since 1998. In December 2006, Yanacocha accrued US$14.9 million as a liability for the possible workers’ profit participation contingency. In addition, Yanacocha recorded and wrote off a receivable amounting to US$11.6 million. In September 2007, Yanacocha paid the balance of US$21.8 million (including interest) owed to employees, which exceeded the original amount accrued of US$6.9 million. The additional amount mostly relates to interest paid by Yanacocha to employees. As of December 31, 2009 and 2008, Yanacocha had recovered US$1.7 million and US$2.3 million, respectively, from FONDO-EMPLEO.
Pursuant to the Peruvian labor laws enacted in 1991, Yanacocha deposits funds for severance payments in a bank account selected by each employee and for the benefit of such employee, in both May and November of each year.
Yanacocha’s employees receive the benefit of one of two types of pension arrangements. All workers can choose to enroll in the system of the Oficina de Normalización Previsional (the Public Pension System, or ONP), or in a privately-managed system of individual contribution pension funds managed by the Administradoras de Fondos de Pensiones, or AFPs. Yanacocha is required to withhold 13 percent from the salary of each employee enrolled in the ONP system and pay such amount to the ONP system, and withhold between 12.37 percent and 12.96 percent from the salary of each employee enrolled in the AFP system and pay such amount to the respective AFP. Yanacocha has no liability for the performance of these pension plans.
In addition, Yanacocha pays approximately 9 percent of its total payroll to ES-SALUD, the Peruvian social security agency, for general health services for all employees. Law No. 26790 also requires Yanacocha to provide private insurance representing an average payment equal to 1.48 percent of the payroll of covered employees for employment-related incapacity and death for blue collar employees and other employees exposed to mining-related hazards.
Yanacocha has entered into arrangements with independent contractors that are responsible for the security services and staffing for several operational and administrative areas. As of December 31, 2010, independent contractors employed 6,665 persons who worked at Yanacocha’s operations. In 2004, Yanacocha entered into its first collective bargaining agreement with the Union, which was created on December 9, 2003. Because the Union’s 605 members as of December 31, 2006 represented a minority of Yanacocha’s employees, the collective bargaining agreement applied only to the Union’s members and expired on February 28, 2007. In May 2007, Yanacocha completed negotiations with the Union’s members and entered into a new collective bargaining agreement, which was applicable only to the Union’s members and effective from March 2007 to February 2010. In March 2010, Yanacocha completed negotiations with the Union on a new collective bargaining agreement, which is effective from March 2010 to February 2013. The Union has been under new leadership since January 2011. The Department of Industrial Relations meets regularly with Union leaders to address labor problems in the organization and to promote the creation of a productive and harmonious labor environment. The parties address their issues through open and transparent dialogue.
In November 2007, a small percentage of Union members engaged in a two-day strike notwithstanding the collective bargaining agreement that had been reached between Yanacocha and the Union. The strike did not have any material impact on Yanacocha’s operations; nevertheless, there can be no assurance that Yanacocha will not experience other strikes or labor-related work stoppages that could have a material adverse effect on its operations or its operating results.
Since commencement of operations, Yanacocha’s rate of turnover has been less than ten percent per year. Yanacocha has informed us that it considers its relations with its employees to be good. Yanacocha annually evaluates employee relations using an anonymous employee opinion survey to measure employee opinions of its benefits and policies. Approximately 80 percent of payroll employees participate in this survey each year.
Social Development
Since its formation, Yanacocha has been attentive to its relationship with the community in the fields of social relations and development.
Since 2006, the External Affairs Management, an internal department within Yanacocha, through its Community Relations and Rural Development Departments, has maintained social development programs that address rural communities and the city of Cajamarca. To implement these programs, Yanacocha developed active relationships with domestic and foreign institutions and organizations, including the Ministry of Health, the Ministry of Education, the Ministry of Agriculture, the Ministry of Foreign Trade and Tourism, Cajamarca local governments, International Finance Corporation, CITE Koriwasi, Cooperative Housing Foundation or CHF, Asociacion para el Desarrollo Rural de Cajamarca or ASPADERUC, Asociacion para el Desarrollo Forestal or ADEFOR, Camara Regional de Turismo or CARETUR, FONDO-EMPLEO, Antares, Asociación para el Desarrollo Local or ASODEL, Foncreagro, Cenfotur and Aprec, among others. Yanacocha also invested in its social development programs, including the Conga project, educational infrastructure, community capacity building, agriculture and health. In addition, Yanacocha invested in mitigation programs in areas such as Tual, La Quinua, La Shacsha, La Ramada, Lagamarca and Granja Porcón.
During 2010, Yanacocha invested a total of US$27.7 million in social issues, including US$6.6 million for social development at various projects including the Conga project and the “Asociación Los Andes de Cajamarca,” US$6.1 million for social impact mitigation related to social and livestock development projects, the construction of irrigation infrastructure, the development of a former landowner families program and the completion of pending commitments, and US$15.1 million for the construction of an alternate road to the coast of Peru. The social investment projects are focused on water management, local economic development, education, health and institutional strengthening.
Since 1993, Yanacocha has invested nearly US$284 million in social development programs including education, health, social infrastructure (schools and medical posts), productive infrastructure projects, rural electrification, roads, transformation plants, business promotion programs, local tourist programs, livestock and agricultural assistance programs.
Security
Yanacocha has 58 security employees on its payroll, including 9 employees responsible for the security of the region as a whole. In addition, there is a contracted security force of over 184 persons assigned to rotating shifts at its mine, its Lima offices, Cajamarca city and checkpoints along the road to the coast of Peru. Payroll security personnel are distributed such that five persons are assigned to the processing plants, one person is assigned to Yanacocha’s headquarters in Lima and one person each is assigned to the road running to the coast and Cajamarca city, respectively. The contracted security force is stationed throughout the region, at access points, offices and residential areas in Cajamarca and at check points Zero and Guitarrero on the road to the coast. In addition to the standing posts, there are 104 security personnel who patrol the mine perimeter and monitor the security CCTV and alarm systems. There are four shifts: three at the mine site and one at the other locations. No terrorist incidents have been recorded against Yanacocha’s personnel or property at its mining operations or at its headquarters in Lima.
Mining and Processing Concessions
Yanacocha’s mining activities encompass 310,001 hectares covered by 449 mining concessions. Of these 310,001 hectares, Chaupiloma holds the mining rights related to 109,642 hectares to Yanacocha, which are covered by 165 mining concessions, of which it has assigned 106,570 hectares to Yanacocha pursuant to several assignments of mining rights. These assignments each have an initial term of 20 years (with the exception of one contract that has an initial term of 17 years, and another with an initial term of 30 years) and expiring in 2012, 2014, 2015, 2018, 2021, 2024, 2025, 2026 and 2035, that are renewable at Yanacocha’s request for an additional 20-year term. Chaupiloma is in the process of assigning one mining concession to Yanacocha (La Verana 13), and six mining concessions granted to Yanacocha are in the process of being transferred back to Chaupiloma (Cuñacales 2, 3, 4, 5, 6 and Cahupiloma 71). Chaupiloma has not yet assigned 3,072 hectares covered by six mining concessions to Yanacocha (Chaupiloma 69, 70, 72, 73, 74 and La Verana 13). Approximately 24 percent of the mining concessions that have been assigned by Chaupiloma to Yanacocha were claimed prior to 1991. Chaupiloma is owned 40 percent by Newmont Peru and 60 percent by Condesa and Buenaventura.
Currently, 20 of the mining concessions assigned to Yanacocha are being utilized for mining operations. They are Chaupiloma Uno, Chaupiloma Dos, Chaupiloma Tres, Chaupiloma Cuatro, Chaupiloma Cinco, Chaupiloma Seis, Chaupiloma Once, Chaupiloma Doce, Chaupiloma Trece, Chaupiloma Catorce, Chaupiloma Dieciseis, Chaupiloma Diecisiete, Chaupiloma Dieciocho, Chaupiloma Veintiuno, Chaupiloma Veintiuno A2, Chaupiloma Cuarentaidos, Chaupiloma Cuarentaiseis, Chaupiloma Cincuentaicuatro, Mirtha III and Claudina Ocho (non-metallic operation). During 2010, metallic minerals were extracted from Chaupiloma Dos, Chaupiloma Tres, Chaupiloma Cuatro and Chaupiloma Once and non-metallic minerals were processed in Claudina Ocho.
The Carachugo, Chaquicocha and San José mining facilities are located on the mining concessions of Chaupiloma Tres, Chaupiloma Cuatro and Chaupiloma Cinco; the Maqui Maqui mining facility is located on the mining concessions of Chaupiloma Seis and Chaupiloma Doce; the Cerro Yanacocha mining operation is located on the Chaupiloma Uno, Chaupiloma Dos and Chaupiloma Tres mining concessions; the La Quinua mining facility is located on the Chaupiloma Dos, Chaupiloma Once, Chaupiloma Veintiuno, Chaupiloma Cuarentidos, Chaupiloma Cincuenticuatro, Mirtha III, Chaupiloma Trece and Chaupiloma Veintiuno A2 mining concessions; and the Calera China Linda mining operation is located on the Claudina Ocho mining concession.
According to Peruvian mining law, the assignee in an assignment of mining concessions assumes all the duties and rights of the holder of the concession. Management of Yanacocha believes that the mining concessions assigned to Yanacocha are in full force and effect under applicable Peruvian laws and that Yanacocha is in compliance with all material terms and requirements applicable to the mining concessions and is not experiencing any condition, occurrence or event known to it that would cause the revocation, cancellation, lapse, expiration or termination thereof, except that Yanacocha and Chaupiloma may, from time to time, remake, cancel, terminate or allow to lapse mining concessions assigned to Yanacocha that are not material to the conduct of Yanacocha’s business.
Yanacocha has been actively pursuing the acquisition of the land surface rights or obtaining easements relating to land positions containing prospective geological exploration target sites, deposits that can be developed in the future or areas that would be considered for plant or facility sites. To date, Yanacocha has acquired all the surface rights with respect to 24,502 hectares of the surface land covering its Carachugo, Chaquicocha, Maqui Maqui, Haussing, Laboratorio, Línea de Alta Tensión, Presas, Museo, Sorpresa Mishacocha, San José, Cerro Yanacocha, Las Lagunas, Minas Conga, China Linda, Amaru, Chasu and La Quinua (which includes the Cerro Negro deposit) mining operations, and a majority of the Cerro Quilish deposit and Calera China Linda.
In addition, as of December 31, 2010, Yanacocha had acquired 526.99 hectares, including 467.72 hectares of surface rights with respect to the Minas Conga deposit, 2 hectares for La Quinua, 1 hectare for China Linda, 7.62 hectares for Amaro, 7.59 hectares for Chasu and 41.06 hectares for exchange areas. See “—The Company—History and Development.”
| PROJECT | | Hectares as of December 31, 2009 | | | Exchanges | | | Hectares acquired in 2010 | | | Hectares as of December 31, 2010 | |
| Carachugo - San José - Chaquicocha | | | 3,589.0695 | | | | 0.1452 | | | | — | | | | 3,588.9243 | |
| Cerro Quilish - Cerro Negro | | | 2,849.4564 | | | | 0.0488 | | | | — | | | | 2,849.4076 | |
| Calera China Linda | | | 408.2170 | | | | — | | | | 1.0000 | | | | 409.2170 | |
| Haussing | | | 5.7368 | | | | — | | | | — | | | | 5.7368 | |
| La Quinua | | | 2,862.2465 | | | | — | | | | 2.0000 | | | | 2,864.2465 | |
| Laboratorio | | | 0.0961 | | | | — | | | | — | | | | 0.0961 | |
| Las Lagunas | | | 1,853.5829 | | | | — | | | | — | | | | 1,853.5829 | |
| Línea de Alta Tensión | | | 0.0150 | | | | — | | | | — | | | | 0.0150 | |
| Maqui Maqui | | | 1,957.2300 | | | | — | | | | — | | | | 1,957.2300 | |
| Presas | | | 203.1295 | | | | — | | | | — | | | | 203.1295 | |
| San Cirilo | | | 1,933.4371 | | | | — | | | | — | | | | 1,933.4371 | |
| Terrenos para Canjes | | | 491.4344 | | | | 67.7196 | | | | 41.0568 | | | | 464.7716 | |
| Cerro Yanacocha | | | 2,152.8441 | | | | — | | | | — | | | | 2,152.8441 | |
| Museo | | | 8.5595 | | | | — | | | | — | | | | 8.5595 | |
| Sorpresa Mishacocha | | | 594.8140 | | | | — | | | | — | | | | 594.8140 | |
| Conga | | | 5,137.5499 | | | | 4.1500 | | | | 467.7188 | | | | 5,601.1187 | |
| Amaro | | | | | | | | | | | 7.6227 | | | | 7.6227 | |
| Chasu | | | | | | | | | | | 7.5900 | | | | 7.5900 | |
| TOTAL | | | 24,047.4187 | | | | 72.0636 | | | | 526.9883 | | | | 24,502.3434 | |
Regulation, Permit and Environmental Matters
Yanacocha is subject to a full range of governmental regulation and supervision generally applicable to companies engaged in business in Peru, including mining laws, labor laws, social security laws, public health, consumer protection laws, environmental laws, securities laws and antitrust laws. See “—The Company—Business Overview—Regulatory Framework—Mining and Processing Concessions” and “—The Company—Business Overview—Regulatory Framework—Environmental Matters” for a general description of Peruvian regulations of mining companies and environmental obligations. See “—Mining and Processing Concessions” above for a discussion of Peruvian regulations relating to the mining and processing concessions utilized by Yanacocha in its mining operations.
Yanacocha is required to submit certain documentation with respect to its plans and operations for the review and approval of various Peruvian government entities, including the MEM, the Ministry of Agriculture, the Water National Authority, and the Ministry of Health. Yanacocha is required to file and obtain approval of an EIS with a Benefit Concession Permit for each of its mining operations before being authorized to operate such mine. EISs for the Carachugo, Maqui Maqui, San José, Cerro Yanacocha, La Quinua (including Cerro Negro) mining operations and China Linda lime plant have been approved. Pursuant to current Peruvian regulations, Yanacocha also submits supplemental EISs each time a project’s production rate or disturbed area used is expanded by more than 50 percent. In 2006, Yanacocha filed an EIS to expand its operations at the Yanacocha and La Quinua areas. After an EIS and the Benefit Concession Permit are approved and construction activities are initiated, a governmental-accredited environmental auditing firm is required to audit the operation. Each of the Carachugo, Maqui Maqui, San José, Cerro Yanacocha, La Quinua (including Cerro Negro) mining operations and China Linda lime plant has been and continues to be audited as required with no pollution problems identified.
Yanacocha’s corporate policy is to operate in compliance with all applicable laws and regulations and adopt and adhere to standards that are protective of both human health and the environment at the facilities it builds and operates. Additionally, Yanacocha has agreed to several environmental covenants in loans with the IFC that require Yanacocha to comply with relevant World Bank environmental guidelines and World Bank occupational health and safety guidelines. Although Yanacocha is no longer obligated to comply with these guidelines due to its repayment of the IFC loans, the IFC guidelines reflect best practices and Yanacocha will thus continue to treat them as binding. In addition, in 2005, Yanacocha became a signatory of the International Cyanide Code, which provides specific and strict standards on how to manage cyanide. Yanacocha completed the audit process in September 2007 and was certified under the International Cyanide Code during April 2008. In 2010, Yanacocha completed three government-accredited environmental audits, one IFC annual review report and a Newmont legal compliance audit.
Prior to the adoption of ASC 410 (SFAS No. 143), estimated future reclamation costs were based principally on legal and regulatory requirements and Newmont standards. Such costs for active mines were accrued and charged over the expected operating lives of the mines using the unit of production method based on proven and probable reserves. Future remediation costs for inactive mines were accrued based on management’s best estimate at the end of each period of the undiscounted costs expected to be incurred at a site. Such cost estimates included, where applicable, direct and ongoing care, maintenance and monitoring costs. Changes in estimates were reflected in earnings in the period an estimate was revised.
Yanacocha has informed us that its management believes that its operations are conducted in accordance with all applicable laws and regulations. All future exploration and construction projects require or will require a variety of permits. Although procedures for permit applications and approvals are customarily faster in Peru than in the United States, permitting procedures are still complex, time-consuming and subject to potential regulatory delay.
Yanacocha has informed us that as a result of the enactment of the new Water Resources Law and the new Rule for Exploration Activities, new environmental quality standards for water and new maximum permissible limits will require the adoption of new technologies for the adjustment of water treatment and management systems. In 2010, Yanacocha implemented a Water Management Project to improve its treatment system and water management in order to comply with the new water regulations.
Yanacocha has informed us that its management believes that it is in compliance with all applicable regulations and international standards concerning safety. For the year ended December 31, 2010, Yanacocha experienced 41 total reportable injuries. Yanacocha incurred approximately $479,090 in capital expenditures relating to safety matters during the year ended December 31, 2010.
In 2010, Yanacocha updated its mine closure plan and submitted it to the MEM for approval of its compliance with Peruvian regulations. During 2010, Yanacocha had two recertification audits, the first of which enabled Yanacocha to maintain the ISO 14001 Certification and the second of which was the ISO 17025 audit to Environmental Laboratory that enabled Yanacocha to maintain accreditation.
In 2010, Yanacocha submitted to the MEM’s Dirección General de Asuntos Ambientales Mineros, or the Director General of Mining Environmental Affiars, an amendment to the Cerro Negro Environmental Impact Study, or EIS, to allow mining at the Cerro Negro West pit, applied for authorization for construction/operation of the La Quinua 8A leach pad, La Quinua 7B leach pad and Carachugo 10B leach pad and submitted its Yanacocha Semi-detailed Environmental Impact Study, or EISsd. Yanacocha submitted and received approval for the following exploration activities: San José I EISsd, San José II EISsd, Colorado EISsd, Maqui Maqui EISsd, Cerro Negro EISsd and San Martin Declaration of Environment Impact. Yanacocha intends to submit EIS amendments regarding Cerro Negro and Suplementario Yanacocha Oeste to the MEM in 2011. In addition, Yanacocha expects to submit exploration environmental instruments for Yanacocha Verde and Chaquicocha Underground by mid-2011.
Insurance
Yanacocha maintains a comprehensive insurance program designed to address the specific risks associated with its operations, in addition to covering the normal insured risks encountered by major mining companies.
Yanacocha’s insurance program consists of a “Primary Program” and an “Umbrella/Excess Program.” Coverage under the Primary Program is provided through the local Peruvian insurance market and includes employers’ liability, comprehensive third party general liability, comprehensive automobile liability, and all risk property on a replacement basis, including transit risks, business interruption insurance and mining equipment. Coverage under the Umbrella/Excess Program is provided through Newmont Mining’s master worldwide insurance program and addresses claims that the Primary Program cannot, or will not, cover. During 2005 and 2004, Yanacocha received US$1.1 million and US$1.0 million, respectively, from its insurance program in connection with a mercury spill. Yanacocha received an additional US$14.4 million settlement in 2008 in connection with the same.
Financing Activities
On July 27, 2006, Yanacocha issued US$100 million in bonds in the Peruvian capital markets under a US$200 million bond program approved by the Peruvian securities regulatory authority. The bonds are held by various Peruvian entities, including pension funds, mutual funds, government funds and insurance companies. The issuance was comprised of US$42 million in floating rate notes bearing interest at LIBOR plus 1.4375 percent and US$58 million in fixed rate notes bearing interest at 7.0 percent. The bonds have a four-year grace period and amortize quarterly over six years. The bonds are unsecured and are non-recourse to both Newmont and us. Funds generated from the issuance will be used by Yanacocha primarily for capital expenditures. During 2010, Yanacocha repaid in full all amounts outstanding under these bonds.
On May 19, 2006, Yanacocha entered into a US$100 million bank facility with a syndicate of Peruvian commercial banks, comprised of Banco de Crédito del Perú, BBVA Banco Continental and Banco Wiese Sudameris (now Scotiabank Perú). Quarterly repayments began in May 2007 with final maturity in May 2014. Borrowings under the facility bear interest at a rate of LIBOR plus 1.875 percent. The loan is non-recourse to both Newmont and us. During 2010, Yanacocha repaid an aggregate of US$10.3 million outstanding under the credit facility in three quarterly installments, and repaid the balance of US$51.7 million.
In September 2007, Yanacocha entered into a leasing contract with Banco de Crédito del Perú related to the acquisition of nine high altitude mining trucks, which were delivered in 2007, for an aggregate of US$24.5 million, with a purchase option. The lease was for three years and bore an annual interest rate of 6.10 percent. Monthly payments began in January 2008. As of December 31, 2010, Yanacocha had fully repaid its obligations under the leasing contract.
In December 2007, Yanacocha entered into a leasing contract with Scotiabank related to the acquisition of six high altitude mining trucks for an aggregate of US$16.3 million, with a purchase option. The lease is for three years and bears interest at the rate of 6.00 percent per annum. One truck was delivered in 2007 and the remaining five trucks were delivered in 2008. Monthly payments began in May 2008.
By-Laws of Yanacocha
Yanacocha is governed by the Peruvian Companies Law and the estatutos (the combined articles of incorporation and by-laws) of Yanacocha, or the Yanacocha By-Laws.
Control Over Major Corporate Events
Pursuant to the Peruvian Companies Law and the Yanacocha By-Laws (including applicable quorum requirements), without the affirmative vote of the partners of Yanacocha representing at least 51 percent of the voting shares, none of the following may occur: (i) an increase or decrease in Yanacocha’s capital, (ii) the issuance of any debentures, (iii) any sale of an asset whose book value is at least 50 percent of the paid-in capital relating to such asset, (iv) any amendment to the Yanacocha By-Laws in order to change its business form, (v) the merger, consolidation, dissolution or liquidation of Yanacocha or (vi) any other amendment of the Yanacocha By-Laws.
Pursuant to the Shareholders Agreement among Newmont Second, Condesa, Compagnie Miniére Internationale Or S.A. and IFC, dated as of August 16, 1993, as amended by a General Amendment Letter, dated August 17, 1994, any member of the Executive Committee of Yanacocha who wishes to propose that Yanacocha’s Executive Committee authorize Yanacocha to take a Significant Action (as defined below) must (i) give written notice to each partner of such proposal prior to consideration thereof at a meeting of the Executive Committee and (ii) refrain from voting to approve such Significant Action until (x) the Executive Committee has received the consent of 80 percent of the partners of Yanacocha (a partner is deemed to have consented if no objection is received from such partner within 30 days after being notified) or (y) the Executive Committee has received the consent of at least 51 percent of the partners of Yanacocha and 45 days have elapsed since the member of the Executive Committee who proposed the Significant Action has responded in writing to objections received from objecting partners. “Significant Action” means (i) a disposal or sale of more than 20 percent by value of Yanacocha’s fixed assets, (ii) any planned shutdown or cessation of Yanacocha’s mining activities that is planned to last for more than one year, (iii) any capital expenditure by Yanacocha exceeding US$20 million, (iv) any disposal or sale by Yanacocha of the mining rights covered by certain concessions or (v) the approval of the construction of a project in the area owned by Yanacocha (other than the Carachugo mine and processing facilities).
Preemptive Rights
The Peruvian Companies Law and the Yanacocha By-Laws provide preemptive rights to all partners of Yanacocha. In the event of a capital increase, any partner has a preemptive right to pay its pro rata share of such increase in order to maintain such partner’s existing participation in Yanacocha.
In the event of a proposed transfer, exchange or sale, either voluntary or involuntary, of participation, collectively referred to as the Offered Participation, of one or more partners, any partner has a right to acquire the Offered Participation in proportion to its holdings of partners’ capital. In the event that not all of the partners wish to exercise this right or some indicate their decision to acquire a smaller share than that to which they are entitled, the other partners will be entitled to an increase, and consequently, the remaining participation will be distributed among them in proportion to such partners’ capital participation and within the maximum limit of the participation they have stated their intention to acquire. Finally, any Offered Participation remaining unsubscribed by the partners must first be offered to Yanacocha before they may be offered to third parties.
Legal Proceedings
Choropampa. In June 2000, a transport contractor of Yanacocha spilled approximately 151 kilograms of elemental mercury near the town of Choropampa, Peru, which is located 53 miles (85 kilometers) southwest of the Yanacocha mine. Elemental mercury is not used in Yanacocha’s operations but is a by-product of gold mining and was sold to a Lima firm for use in medical instruments and industrial applications. A comprehensive health and environmental remediation program was undertaken by Yanacocha in response to the incident. In August 2000, Yanacocha paid under protest a fine of S/.1.74 million Nuevos Soles (approximately US$0.6 million) to the Peruvian government. Yanacocha has entered into settlement agreements with a number of individuals impacted by the incident. As compensation for the disruption and inconvenience caused by the incident, Yanacocha entered into agreements with and provided a variety of public works in the three communities impacted by this incident. Yanacocha cannot predict the likelihood of additional expenditures related to this matter.
Additional lawsuits relating to the Choropampa incident were filed against Yanacocha in the local courts of Cajamarca, Peru in May 2002 by over 900 Peruvian citizens. However, a significant number of the plaintiffs in these lawsuits had entered into settlement agreements with Yanacocha prior to filing such claims, resulting in the existence of lawsuits whose plaintiffs were individuals who had previously settled. In April 2008, the Peruvian Supreme Court upheld the validity of these settlement agreements, which should result in the dismissal of all claims brought by plaintiffs who had previously settled. Yanacocha also has entered into settlement agreements with approximately 350 additional plaintiffs, which claims were unresolved. To date, the claims asserted by 212 plaintiffs relating to the Choropampa incident remain unresolved and unsettled. Yanacocha cannot reasonably predict the final outcome of any of the above-described lawsuits. The maximum additional expense related to these judicial claims is estimated to be approximately US$1.5 million.
From December 2010 to May 2011, Yanacocha was served notice of 2,218 new claims from approximately 25 plaintiffs who had previously signed off on court-arranged settlements with Yanacocha. Such plaintiffs are requesting that such arranged settlements be declared null and void and that they be granted a new settlement amount. Yanacocha’s legal counsel has determined that both the initial and subsequent claims will have expired in the periods established in laws and regulations presently in force in Peru. As a result, Yanacocha believes that the 2,218 new claims described above should be declared inadmissible.
Baños del Inca. In September 2006, the Municipality of Baños del Inca issued a declaration designating an area that includes the Carachugo Expansion and San José Projects as reserved and protected areas. Based on previous experience and actions taken by the Constitutional Tribunal, which is Peru’s court of last instance for constitutional issues, in respect of Cerro Quilish, in which it was ruled that such declaration did not affect Yanacocha’s mining rights, Yanacocha believes that Baños del Inca’s declaration should not impact its legal rights to exploit these concessions. On March 17, 2008, Yancocha filed a constitutional recourse against the Municipality of Baños del Inca claiming that the Municipality of Baños del Inca’s declaration should be made inapplicable. Lima’s Court of First Instance rejected the request of Municipality of Baños del Inca to dismiss the claim on the grounds that the Court of First Instance had no legal competence on the matter. After reviewing the claim, Lima’s Court of First Instance determined that Yanacocha’s claim was inadmissible due to the legal nature of Municipality of Baños del Inca’s declaration. Yanacocha filed an appeal with Lima’s Court of Second Instance to determine whether the Court of First Instance has jurisdiction to resolve the subject matter of the claim and declare certain areas of Peru protected.
San Pablo. In February 2007, the Municipality of San Pablo issued an ordinance designating an area that includes Las Lagunas and Pozo Seco as reserved and protected areas, where Yanacocha has mining rights. Based on previous experience and actions taken by the Constitutional Tribunal in respect of Cerro Quilish, in which it was ruled that such declaration did not affect Yanacocha’s mining rights, Yanacocha believes that San Pablo’s declaration should not impact its legal rights to exploit these concessions. Yanacocha has challenged this ordinance on the grounds that, under Peruvian law, local governments lack the authority to create such areas, denying the rights granted by Yanacocha’s mining concessions. Lima’s Court of First Instance rejected the complaint based on formal grounds. The decision of the court was appealed to Lima’s Court of Second Instance, which affirmed the ruling of the Court of First Instance in November 2008. Yanacocha then filed a constitional appeal with the Constitutional Tribunal. In December 2010, the Constitutional Tribunal rejected the ruling by Lima’s Court of Second Instance and confirmed that the complaint should be submitted to the Court of First Instance. The claim is currently pending resolution.
Clínica Internacional, Addeco, SDC Security. The employees of three contractor companies (Clínica Internacional, Adecco and SDC Security) have initiated judicial proceedings through which they demand their incorporation into Minera Yanacocha’s payroll. These contract employees claim that they are direct employees of Yanacocha and are entitled to the corresponding rights afforded to Yanacocha’s direct employees, arguing that they receive direct orders from Yanacocha and that most of the equipment they use is provided for by Yanacocha. All these proceedings, which involve a total of 97 workers, are pending resolution in Lima’s Court of First Instance.
Other than the legal proceedings described above, Yanacocha is involved in certain legal proceedings arising in the normal course of its business, none of which individually or in the aggregate is material to Yanacocha or its operations. For information regarding the legal proceedings relating to the ownership of Yanacocha’s equity, see “—The Company—History and Development.”
Management of Yanacocha
Executive Committee
Pursuant to the Yanacocha By-Laws, Yanacocha’s Executive Committee consists of six members, all of whom are appointed by the partners of Yanacocha. Richard T. O’Brien, President and Chief Executive Officer of Newmont Mining Corporation, has been appointed Chairman of Yanacocha’s Executive Committee, and Alberto Benavides, our former Chairman, serves as the Vice Chairman of Yanacocha’s Executive Committee through 2013. The Vice Chairman has the power to preside over the meetings of Yanacocha’s Executive Committee in the Chairman’s absence. The members of the Executive Committee are elected for a three-year term but may continue in their positions until the next election takes place and the newly elected members accept their positions. Alternate members are elected in the same manner as members and can act in place of and with all the authority of members when a member is unavailable, except that an alternate member may not act as either Chairman or Vice Chairman of Yanacocha’s Executive Committee. The Chairman has the right to cast the deciding vote in the event of a deadlock among Yanacocha’s Executive Committee.
General Manager/Management Agreement
The Yanacocha By-Laws provide that the Yanacocha Partners’ Meeting has the power to appoint and remove the Manager of Yanacocha; the Executive Committee has the power to appoint and remove other officers of Yanacocha, determine their duties and compensation and grant and revoke powers of attorney. Newmont Peru was named as Yanacocha’s Manager according to a publicly filed deed, and it continues to hold that position. Newmont Peru’s duties as Manager are defined in the Management Contract dated February 28, 1992, as amended, between Yanacocha and Newmont Peru. Pursuant to the Management Contract, Newmont Peru is responsible for managing, conducting and controlling the day-to-day operations of Yanacocha and keeping Yanacocha’s Executive Committee informed of all operations through the delivery of various written reports. The Management Contract was amended as of December 19, 2000. The amendment extends the term of the Management Contract for a period of 20 years starting at the date of amendment and provides that it may be extended for additional terms of 20 years upon request by Newmont Peru. Newmont Peru, however, may cancel the Management Contract by giving six months’ prior notice to Yanacocha. The Management Contract will be deemed terminated if, due to reasons attributable to the bad management of Yanacocha, except for reasons beyond its control, Newmont Peru is unable to substantially complete the agreed work programs. In exchange for its services as Manager, Newmont Peru receives remuneration of US$2 per ounce of gold production and its equivalent for copper production paid on a quarterly basis, which amount is expected to cover the overhead and administrative expenses for the management of the operations. Also, Newmont Peru may charge Yanacocha for the salaries of employees of Newmont Peru or its affiliates who are directly involved in the operation of Yanacocha. In 2010, Yanacocha accrued fees of US$2.9 million owed to Newmont Peru and its affiliates under the Management Contract.
Control Over Major Corporate Events
See “—By-Laws of Yanacocha” above for a description of certain provisions of Peruvian law and of the Yanacocha By-Laws relating to control over major corporate events.
Preemptive Rights and Rights of First Refusal
See “—By-Laws of Yanacocha” above for a description of certain provisions of Peruvian law and of the Yanacocha By-Laws relating to preemptive rights and rights of first refusal.
D. Property, Plants and Equipment
Our Property
Introduction
We operate seven mines: Julcani, Recuperada, Uchucchacua, Orcopampa, Poracota, Antapite and Ishihuinca. We also have controlling interests in two mining companies which operate the Shila-Paula, Colquijirca and Marcapunta mines. We also own an electric power transmission company, an engineering services consulting company and have minority interests in several other mining companies, including a significant ownership interest in Yanacocha and Cerro Verde. See “—The Company—Organizational Structure” and “—Intermediate Holding Companies, Subsidiaries and Equity Participations.” Set forth below is a map of our principal mining operations as of April 30, 2011.
Operating Properties
Orcopampa
The Orcopampa mine is wholly owned and operated by us. We lease the rights to the mining concessions of Orcopampa from a group of private investors. This lease, which was renewed in September 2003 and expires in 2043, stipulates a payment from us equal to 10 percent of production value, subject to certain conditions. Operations started in the Orcopampa mine in 1965. In 2010, we made lease payments of US$26.6 million. We operated Orcopampa as a silver mine until the late 1990s, when we also began to mine gold-bearing veins. In December 1996, Orcopampa S.A., then owner and operator of the Orcopampa mine, merged into us. As a result of the merger, Orcopampa S.A. assigned, and we assumed, the right to the mining concessions of Orcopampa. At December 31, 2010, the net total fixed assets of Orcopampa were approximately US$44.6 million.
The Orcopampa mine is located in the province of Castilla in the department of Arequipa, approximately 1,350 kilometers southeast of the city of Lima, at an altitude of between 3,800 and 4,500 meters above sea level. Access is by a 192-kilometer unpaved public road, which connects to the Pan American highway, and by airstrip.
The Orcopampa mining property consists of an epithermal gold telluride deposit hosted by early Miocene to Holocene calc-alkaline to high potassium calc-alkaline lava flows and domes of the Sarpane Complex, which forms part of the tertiary metallogenic (Au-Ag) belt of Southern Peru.
Mining at Orcopampa is conducted underground using the mechanized cut-and-fill method. Ore is processed at a mill located at Orcopampa. Until February 2004, the mill had a rated capacity of 1,200 DST per day and utilized both bulk flotation and gravity concentration processes. In 2008, a new semi-autogenous mill was installed as a primary mill, which allowed us to increase the mill’s rated capacity to 1,450 short tons per day, or stpd, and to replace the two existing rod and ball mills and the existing ball mill. These three mills are currently being used to treat the ore from the Poracota mine at a rate of 720 stpd.
Until February 2004, flotation concentrates were exported to different smelters around the world, while gravity concentrates continued to be treated at Los Volcanes, a small cyanidation plant located next to the Orcopampa mill that has been in operation since 1989. Until the end of 2001, Los Volcanes produced gold/silver electrolytic precipitates which were smelted and refined in Lima and then sold to Johnson Matthey. During the second half of 2001, we installed a Merrill-Crowe circuit and a smelter which began operations in December of that year, allowing us to produce doré bars from the gold and silver precipitate produced in the cyanidation plant of Los Volcanes.
Positive results from exploration conducted in the Nazareno and Prometida veins, changes in the characteristics of the ore and results from metallurgical tests performed in 2002 influenced our decision to replace the flotation process with the direct cyanidation of the ore. In January 2003, we initiated construction of a cyanidation circuit, which commenced operations on a continuous basis in March 2004 and therefore eliminated the production of flotation concentrates. The cyanidation circuit includes a 70 foot thickener from which a gold-rich solution is obtained and sent to the Merrill-Crowe unit for gold precipitation, six agitator tanks to which cyanide and activated carbon are added (Carbon in Leach process), and a carbon desorption circuit that includes an electrolytic cell for the recovery of gold and silver as precipitate. The Electrolytic and Merrill-Crowe precipitates are smelted into doré bars prior to shipment.
In June 2006, we engaged a metallurgical consultant to evaluate the possibility of installing a pressure leach circuit for the pre-treatment of gold ore from Poracota prior to cyanidation next to the Orcopampa plant. After a careful evaluation and review of all of the data available, we decided to continue with the project and engaged Aker Kvaerner Metals, Inc., or Aker Kvaerner, an engineering firm, to perform an engineering study. In July 2007, Aker Kvaerner issued a preliminary report which showed that the installation of an autoclave was not feasible after taking into account current Poracota ore reserves and metal prices. As a result, the Poracota ore will continue to be treated by flotation.
Electric power is generated and supplied by a 3,900 kW hydroelectric plant that is owned by us and a power line, which was connected to the Peruvian national electricity grid on September 12, 2002. Water for operations at Orcopampa is obtained from a lake and three rivers. When water is scarce, electric power for the Orcopampa mine can be provided by a 3,976 kW diesel generator.
During 2009, we completed 9,039 meters of underground exploration works and 26,290 meters of diamond drilling, mainly at depth in the Nazareno, Esperanza and Prometida veins. In addition, we are exploring the 3540 level of the Nazareno vein west extension through the Natividad area, the preliminary results of which were positive and merit further exploration. During 2010, we focused our geographical exploration below the 3,440-meter level on the Nazareno, Esperanza, Ramal Prometida, Keli, Lia, Melisa and other main veins. We completed 9,893 meters of underground mining exploration works and 30,036 meters of diamond drilling. As of December 31, 2010, we calculated Orcopampa’s total proven ore reserves of 701,630 DST, with 0.4 ounces per ton of silver and 0.618 ounces per ton of gold and probable ore reserves of 493,870 DST, with 0.4 ounces per ton of silver and 0.562 ounces per ton of gold. We estimated NRM at 1,023,530 DST, with 0.583 ounces per ton of gold. In 2011, we plan to continue exploration of the lower levels of the Chipmo mine after encountering positive results in drill holes that reached to the 3,000-meter level. We also plan to explore the Ocoruro area with diamond drilling.
During 2008, a cyanidation circuit was installed as part of the main circuit to treat the flotation tails stored in the number 3 tailings dam. The tails are transported by truck to a storage bin and then fed through a rotating drum where the solids are diluted with barren solution. Cyanidation leaching is performed in five agitator tanks containing activated carbon used to absorb the gold solution. The dissolved gold is absorbed by the carbon, which is later treated at Los Volcanes to recover the gold as doré bars. The cyanidation residue is pumped to the number 4 tailings dam. During 2008, a total of 11,448 ounces of gold and 4,255 ounces of silver were recovered from the number 3 tailings dam. In 2009, a total of 36,132 ounces of gold and 32,032 ounces of silver were recovered after treating the number 3 tailings dam. As of December 31, 2010, treatment of the number 3 tailing dam recovered a total of 24,078 ounces of gold and 24,427 ounces of silver that were added to Orcopampa’s gold production.
Set forth below are certain unaudited operating data for the periods shown for Orcopampa, calculated on the basis of 100 percent of the mine’s production.
| | | Year Ending December 31,(1) | |
| | | | | | | | | | | | | | | | |
| Mining Operations: | | | | | | | | | | | | | | | |
| Ore mined (ST) | | | 467,953 | | | | 478,669 | | | | 483,376 | | | | 484,621 | | | | 484,767 | |
| Average gold grade (oz./ST) | | | 0.564 | | | | 0.581 | | | | 0.587 | | | | 0.602 | | | | 0.625 | |
| Average silver grade (oz./ST) | | | 0.24 | | | | 0.26 | | | | 0.320 | | | | 0.21 | | | | 0.30 | |
| Production: | | | | | | | | | | | | | | | | | | | | |
| Gold (oz.) | | | 254,631 | | | | 267,935 | | | | 284,512 | | | | 315,277 | | | | 319,694 | |
| Silver (oz.) | | | 81,005 | | | | 77,666 | | | | 111,055 | | | | 91,525 | | | | 104,400 | |
Recovery rate (gold) (%)(3) | | | 96.0 | | | | 96.3 | | | | 95.5 | | | | 95.7 | | | | 95.9 | |
Recovery rate (silver) (%)(3) | | | 64.1 | | | | 62.4 | | | | 64.6 | | | | 57.8 | | | | 53.5 | |
| | | Year Ending December 31,(1) | |
| | | 2006 | | | 2007 | | | 2008(2) | | | 2009(2) | | | 2010 | |
Employees(4): | | | | | | | | | | | | | | | |
| Buenaventura employees | | | 400 | | | | 466 | | | | 449 | | | | 483 | | | | 528 | |
| Contractor employees | | | 790 | | | | 1,240 | | | | 1,074 | | | | 991 | | | | 1,002 | |
| (1) | Incorporates losses for mining dilution and recovery. |
| (2) | Incorporates gold and silver production from final tail treatment. During 2010, 24,078 ounces of gold and 24,427 ounces of silver were recovered. |
| (3) | Only reflects recovery rate of gold and silver from Chipmo ore. |
| (4) | Data for 2007 also includes employees at Poracota. |
In 2007, the increase of gold production was mainly due to an increase in the volume of ore treated and a slight increase in the average grade of gold in the ore. In 2008, the increase of gold production was due to an increase in the average gold grade and the volume of ore treated. In addition, Orcopampa’s total production of gold and silver includes 1,246 ounces of gold and 3,085 ounces of silver in 2007 and 2,042 ounces of gold and 9,456 ounces of silver in 2008 that were obtained from activated carbon columns installed in the barren solution stream and treatment of slag material received from Procesadora Sudamericana S.A., a precious metals refinery located in Lima. The increase in gold production in 2009 as compared to 2008 was mainly due to the treatment of the number 3 tailings dam. In 2011, gold production increased compared to the previous year mainly due to a slight increase in the average grade of gold ore mined, as well as the treatment of the number 3 tailings dam.
Poracota
Poracota is an underground mine, which is wholly owned and operated by us. Poracota encompasses 6,674 hectares and is located in the province of Condesuyos in the department of Arequipa, at an altitude of between 4,500 and 5,000 meters above sea level. Access to the mine is available by means of a 33-kilometer unpaved road connected to the Orcopampa mine.
Gold mineralization at Poracota has been classified as an epithermal high sulfidation system, which is formed by two main areas, Huamanihuayta and Perseverancia. The more important veins are María Fé, Silvana and Rocio, which are hosted by the tertiary rocks of the Huamanihuayta volcano.
As of December 31, 2010, we calculated Poracota’s proven reserves of 112,248 DST, with 0.418 ounces per ton of gold and 0.14 ounces per ton of silver, and probable reserves of 20,702 DST, with 0.288 ounces per ton of gold and 0.14 ounces per ton of silver. The NRM for sulphides and oxides was 1,238,343 DST, with 0.291 ounces per ton of gold and 1,975,968 DST, with 0.049 ounces per ton of gold, respectively. In 2011, we plan to continue exploration of levels 4600 and 4660 on the major veins through the use of underground mine workings and diamond drill holes.
As of December 31, 2010, Poracota’s net total fixed assets were approximately US$2.6 million.
Operations started in February 2007. Ore from the Poracota mine is treated by flotation at the Orcopampa concentrator plant. The following table shows the production obtained for the years ended December 31, 2007, 2008, 2009 and 2010:
| | | Year Ending December 31, | |
| | | | | | | | | | | | | |
| Mining Operations: | | | | | | | | | | | | |
| Ore mined (ST) | | | 61,867 | | | | 184,188 | | | | 244,450 | | | | 245,041 | |
| Average gold grade (oz./ST) | | | 0.318 | | | | 0.300 | | | | 0.261 | | | | 0.290 | |
| Average silver grade (oz./ST) | | | 0.11 | | | | 0.16 | | | | 0.16 | | | | 0.15 | |
| Production: | | | | | | | | | | | | | | | | |
| Gold (oz.) | | | 16,679 | | | | 46,126 | | | | 51,516 | | | | 59,803 | |
| Silver (oz.) | | | 5,499 | | | | 24,505 | | | | 30,395 | | | | 27,169 | |
| Recovery rate (gold) (%) | | | 84.8 | | | | 83.5 | | | | 80.8 | | | | 84.2 | |
| Recovery rate (silver) (%) | | | 80.1 | | | | 81.5 | | | | 79.1 | | | | 73.8 | |
Employees(1): | | | | | | | | | | | | | | | | |
| Buenaventura employees | | | - | | | | 54 | | | | 49 | | | | 54 | |
| Contractor employees | | | - | | | | 559 | | | | 681 | | | | 742 | |
| | (1) | For 2007, employees at Poracota are included in data for our Orcopampa mine. |
During 2008 we achieved full operating capacity, resulting in a significant increase in silver and gold production compared to 2007. The increase in the production of gold and silver is mainly due to an increase in tonnage treated at the mill, which currently averages 720 stpd. In 2010, the significant increase in gold production was mainly due to an important increase in the average gold grade in ore mined, in addition to an improvement in gold recovery.
Uchucchacua
The Uchucchacua mine is wholly owned and operated by us. Operations started in 1975, and Uchucchacua is currently our largest producer of silver. In 2010 we conducted 20,325 meters of geological explorations with underground works and 52,649 meters of explorations with diamond drilling in the Socorro, Carmen and Huantajalla mines. At December 31, 2010, proven ore reserves were 2,795,000 DST, with 13.4 ounces per ton of silver, 1.6 percent lead and 2.3 percent zinc, and probable ore reserves were 1,652,510 DST, with 13.5 ounces of silver per ton, 1.6 percent lead and 2.2 percent zinc. Total NRM was 2,930,426 DST, with 13.7 ounces per ton of silver, 2.05 percent lead and 2.69 percent zinc. In 2011, we plan to focus our exploration efforts on veins and bodies with high silver content at the intermediate levels of the Huantajalla and Carmen mines, as well as to continue exploration at low levels of the Socorro mine. At December 31, 2010, the net total fixed assets of Uchucchacua were approximately US$39.1 million.
Uchucchacua is located in the province of Oyón in the department of Lima, approximately 265 kilometers northeast of the city of Lima at an altitude of between 4,000 and 5,000 meters above sea level. Access is by an unpaved road, 145 kilometers in length, which connects to the Pan American highway.
Uchucchacua’s mineralization is hosted by Mesozoic limestone of the Jumasha Formation and is classified as a mesothermal polymetallic of silver-lead-zinc with important contents of manganese. The main mineralized structures are veins and ore bodies with high silver mineralization.
Mining at Uchucchacua is conducted underground utilizing cut-and-fill stopping, shrinkage stopping, and sublevel stopping methods. Ore is processed at a mill located at Uchucchacua. The mill, which has had a rated capacity of 2,500 DST per day since October 2006 and which had a 92.6 percent utilization rate and treated 823,039 short tons, or ST, in 2010, utilizes differential flotation to obtain a lead-silver concentrate and a zinc concentrate.
Electric power is generated by a 3,400 kW hydroelectric plant that we own and by a 3,025 kW diesel generator. We utilize a power line connecting Uchucchacua to the Peruvian national electricity grid and have electrical distribution facilities within the Uchucchacua mine. Water for operations at Uchucchacua is obtained from three lakes.
During 2007 and after performing some improvements in the cyanidation circuit at the Uchucchacua mine, a total of 914,912 ounces of silver were produced as silver bars. Out of this total, 659,984 ounces were obtained from silver-bearing pyrite concentrates and 254,928 ounces were produced from oxide ore. During 2008, a total of 914,943 ounces of silver were produced as silver bars. However, due to the fall in silver prices and the increase of mining and mill costs, the cyanidation circuit was shut down in November 2008. In March 2009, we resumed operations at the cyanidation circuit. In 2009, a total of 432,500 ounces of silver were produced in silver bars. During 2010, we produced 476,310 ounces of silver in silver bars. In 2011, we plan to produce over 600,000 ounces of silver in the cyanidation circuit.
Due to a continuous increase in the reserves of high-grade lead-zinc ores and low-grade silver ores, we decided to install a 500 stpd circuit. This lead-zinc sulphide circuit can also treat silver sulphide ores if necessary. With the addition of this circuit in August 2008, the mill has a rated capacity of 3,000 DST per day. In 2010, the circuit treated 1,013,395 ST of ore from the Uchucchacua and Pozo Rico mines.
Set forth below are certain unaudited operating data for the periods shown for Uchucchacua, calculated on the basis of 100 percent of the mine’s production.
| | | Year Ending December 31,(1) | |
| | | | | | | | | | | | | | | | |
| Mining Operations: | | | | | | | | | | | | | | | |
| Ore mined (ST) | | | 810,280 | | | | 850,463 | | | | 950,430 | | | | 1,017,117 | | | | 1,013,395 | |
| Average silver grade (oz./ST) | | | 16.04 | | | | 16.02 | | | | 16.00 | | | | 13.98 | | | | 12.93 | |
| Average zinc grade (%) | | | 1.24 | | | | 1.90 | | | | 2.03 | | | | 1.56 | | | | 1.47 | |
| Average lead grade (%) | | | 1.06 | | | | 1.31 | | | | 1.44 | | | | 1.10 | | | | 0.98 | |
| Production: | | | | | | | | | | | | | | | | | | | | |
| Silver (oz.) | | | 9,692,300 | | | | 9,873,772 | | | | 11,417,199 | | | | 10,555,566 | | | | 9,269,718 | |
| Zinc (ST) | | | 5,225 | | | | 8,657 | | | | 12,456 | | | | 9,049 | | | | 7,702 | |
| Lead (ST) | | | 7,718 | | | | 9,708 | | | | 12,237 | | | | 9,423 | | | | 8,687 | |
| Recovery rate (silver) (%) | | | 74.50 | | | | 72.50 | | | | 75.7 | | | | 74.0 | | | | 70.7 | |
| Employees: | | | | | | | | | | | | | | | | | | | | |
| Buenaventura employees | | | 462 | | | | 528 | | | | 566 | | | | 594 | | | | 545 | |
| Contractor employees | | | 931 | | | | 1,036 | | | | 1,381 | | | | 1,264 | | | | 1,188 | |
| (1) | Incorporates losses for mining dilution and recovery. |
| (2) | Incorporates total Pozo Rico mine production. Ore mined, metal grades and metal production include Pb/Zn ore and oxide ore treated. |
| (3) | Includes 7 Buenaventura employees and 126 contractor employees at the Pozo Rico mine. |
In 2007, a total of 31,053 ST of oxide ore was also mined and treated directly in the cyanidation plant, together with 18,057 ST of a silver-bearing pyrite concentrate that was produced and stored since 2000. The increase in silver production was mainly due to the silver bars produced at the cyanidation circuit. During 2008, a total of 11,417,199 ounces of silver were produced, of which 10,500,548 ounces were produced by flotation and 916,651 ounces were produced as silver bars. The increase in silver produced was mainly due to an increase in the volume of ore treated during the year. In 2009, total silver, lead and zinc production decreased mainly because of a sharp decrease in the grade of silver, lead and zinc in the ore treated and, to a lesser extent, a slight decrease in the total silver recovery. In 2010, total silver, lead and zinc production decreased, due both to a sharp decrease in the grade of silver, lead and zinc in the ore treated and a decrease in the total silver recovery rate.
Julcani
Julcani is an underground mine that is wholly owned and operated by us. We acquired Julcani in 1953 as our first operating mine. Julcani consists of 1,800 hectares, which are owned by us. In November 1999, due to the depletion of gold and silver reserves, we were forced to suspend production in Julcani and carry out exploration activities only. In 2003, we initiated an exploration program in the Acchilla area. In 2004, we continued the exploration and initiated exploitation of ore with positive results. Throughout 2010, our exploration activities focused on two mines: Acchilla and Estela. In Acchilla, we mainly explored the Jesús, Acchilla 2, Acchilla 7B and Jesús R2 veins on the 510 and 560 levels. In Estela, we have explored the María Jesús, Magdalena, Raquel, Angela and Cecilia veins. We completed 12,780 meters of underground exploration works and 6,594 meters of diamond drilling. At December 31, 2010, total proven ore reserves were 239,495 DST, with 18.7 ounces per ton of silver, 0.022 ounces per ton of gold, 2.3 percent lead and 0.37 percent copper, and total probable ore reserves were 100,790 DST, with 18.5 ounces per ton of silver, 0.035 ounces per ton of gold, 2.1 percent lead and 0.47 percent copper. Total estimated NRM was 257,175 DST, with 18.5 ounces per ton of silver, 0.032 ounces per ton of gold, 2.06 percent lead and 0.41 percent copper. In 2011, we plan to conduct intense underground mining exploration in Acchilla and Estela, deepening our geological exploration in both mines to approximately 60 meters, complemented by a diamond drill program. At December 31, 2010, the net total fixed assets of Julcani were approximately US$2.8 million.
Julcani is located in the province of Angaraes in the department of Huancavelica, approximately 500 kilometers southeast of Lima at an altitude of between 4,200 and 5,000 meters above sea level. Access is by a 195 kilometer unpaved public road, which connects to a paved public road and an airstrip.
Julcani is a large polymetallic deposit in Central Peru, which principally produces silver that occurs mainly as tetrahedrite in a multitude of mineralogically complex veins hosted by dacite domes, surge deposits and other tertiary volcanic rocks.
Run of mine ore is processed in a concentrator plant located 50 meters from the mine entrance. The ore is crushed and ground, and bulk flotation is used thereafter to obtain a silver-gold-lead concentrate. The plant has a rated capacity of 400 DST per day and had a 91.5 percent utilization rate in 2010. Until 2008, most of the ore treated in the mill came from the Acchilla mine. In 2009, the mill started to treat ore coming from the Estela mine. During 2010, the mill treated 25,450 ST of Estela ore. In 2011, we plan to mill approximately 10,000 ST per month, with 8,000 ST per month from Acchilla and 2,000 ST per month from Estela.
Electric power is generated by three Conenhua hydroelectric plants. Power generation capacity from these plants is 800 kW (Huapa), 1,200 kW (Tucsipampa) and 760 kW (Ingenio), respectively. We also rely on the Peruvian national electricity grid through Electro Perú, Peru’s national electric utility, for its remaining electrical power. Water for operations of Julcani is obtained from a creek, two springs and a lake.
Set forth below are certain unaudited operating data for the periods shown for Julcani, calculated on the basis of 100 percent of the mine’s production.
| | | Year Ending December 31,(1) | |
| | | | | | | | | | | | | | | | |
| Mining Operations: | | | | | | | | | | | | | | | |
| Ore mined (ST) | | | 80,450 | | | | 89,100 | | | | 95,700 | | | | 112,000 | | | | 127,500 | |
| Average gold grade (oz./ST) | | | 0.001 | | | | 0.001 | | | | 0.003 | | | | 0.010 | | | | 0.024 | |
| Average silver grade (oz./ST) | | | 18.80 | | | | 17.6 | | | | 17.88 | | | | 17.61 | | | | 18.96 | |
| Average lead grade | | | 2.10 | | | | 2.11 | | | | 2.49 | | | | 1.73 | | | | 1.89 | |
| Average copper grade (%) | | | 0.14 | | | | 0.14 | | | | 0.14 | | | | – | | | | 0.27 | |
| Production: | | | | | | | | | | | | | | | | | | | | |
| Gold (oz.) | | | 26.14 | | | | 26.88 | | | | 187 | | | | 799 | | | | 2,118 | |
| Silver (oz.) | | | 1,417,666 | | | | 1,483,428 | | | | 1,593,606 | | | | 1,819,375 | | | | 2,237,063 | |
| Lead (ST) | | | 1,529 | | | | 1,725 | | | | 2,162 | | | | 1,744 | | | | 2,202 | |
| Copper (ST) | | | 100 | | | | 98 | | | | 120 | | | | – | | | | 3.5 | |
| Recovery rate (gold) (%) | | | 25.2 | | | | 30.3 | | | | 67.2 | | | | 75.0 | | | | 76.1 | |
| Recovery rate (silver) (%) | | | 93.8 | | | | 94.6 | | | | 93.1 | | | | 92.2 | | | | 92.5 | |
| Employees: | | | | | | | | | | | | | | | | | | | | |
| Buenaventura employees | | | 102 | | | | 122 | | | | 158 | | | | 155 | | | | 157 | |
| Contractor employees | | | 549 | | | | 413 | | | | 548 | | | | 573 | | | | 518 | |
| (1) | Incorporates losses for mining dilution and recovery. |
| (2) | Incorporates Estela area mine production. |
The sharp increase in gold and silver production in 2010 compared with previous years was mainly due to an increase in the volume of ore treated at the plant and higher ore grades, in addition to a slight increase in gold and silver recovery rates.
Recuperada
The Recuperada mine is wholly owned and operated by us. Recuperada is located in the province of Huancavelica, in the department of Huancavelica, approximately 540 kilometers southeast of Lima at an altitude of between 4,300 and 4,800 meters above sea level. Access is by a 242-kilometer unpaved public road, which connects to the Pan American highway. Electricity is supplied by access to the Peruvian national electricity grid via a 50-kilometer power line, which has a capacity of 22 kilovolts and 4,000 kilowatts.
The Recuperada mining district principally contains polymetallic mineralization in veins of zinc, lead and silver (including the Teresita, Esperanza and Angelica deposits), as well as some silver-rich veins (including the María Luz, Nancy Luz and Rico Antimonio deposits). The stratigraphic column shows a layer of Mesozoic rocks beneath Cenozoic volcanic rocks and late dacitic-rhyolitic intrusive rocks penetrating previous rocks.
During 2010, we continued exploration of the Esperanza and Rico Antimonio mines and focused on exploration of Teresita at the 040 level on veta 1 and R-95. We have completed a total of 8.731 meters in underground mine works and 2.962 meters in diamond drilling.
At December 31, 2010, total proven ore reserves were 322,525 DST, with 5.9 ounces per ton of silver, 5.1 percent lead and 7.3 percent zinc, and total probable ore reserves were 201,740 DST, with 5.9 ounces per ton of silver, 4.6 percent lead and 6.8 percent zinc. Total estimated NRM was 583,470 DST, with 4.0 ounces per ton of silver, 5.2 percent lead and 7.7 percent zinc. In 2011, we plan to explore other areas around the Esperanza mine in search of silver ore, as well as to continue exploration in the Teresita mine.
Recuperada is an underground mine, using the conventional cut and fill mining method. Mine ore is processed at a concentrator plant on site with a processing capacity rate of 600 stpd. In early 2010, we completed the construction of tailing dams 3 and 4, which will allow us a storage capacity of approximately 3.5 years based on current production rates.
Set forth below are certain unaudited operating data for the periods shown for Recuperada, calculated on the basis of 100 percent of the mine’s production.
| | | Year Ending December 31, | |
| | | | | | | | | | | | | | | | |
| Mining Operations: | | | | | | | | | | | | | | | |
| Ore mined (ST) | | | 72,200 | | | | 98,970 | | | | 103,000 | | | | 57,620 | | | | 120,800 | |
| Average silver grade (oz./ST) | | | 7.32 | | | | 7.45 | | | | 6.52 | | | | 6.79 | | | | 5.03 | |
| Average lead grade (%) | | | 2.72 | | | | 2.38 | | | | 2.49 | | | | 2.87 | | | | 3.10 | |
| Average zinc grade (%) | | | 4.75 | | | | 3.78 | | | | 3.72 | | | | 3.69 | | | | 2.54 | |
| Production: | | | | | | | | | | | | | | | | | | | | |
| Silver (oz.) | | | 478,129 | | | | 695,970 | | | | 636,532 | | | | 370,500 | | | | 571,189 | |
| Lead (ST) | | | 1,781 | | | | 2,164 | | | | 2,383 | | | | 1,504 | | | | 3,488 | |
| Zinc (ST) | | | 3,039 | | | | 3,313 | | | | 3,317 | | | | 1,801 | | | | 2,494 | |
| Employees: | | | | | | | | | | | | | | | | | | | | |
| Buenaventura employees | | | 31 | | | | 84 | | | | 111 | | | | 94 | | | | 110 | |
| Contractor employees | | | 494 | | | | 542 | | | | 266 | | | | 260 | | | | 430 | |
In 2010, ore production at Recuperada increased by 109 percent compared to the previous year, which also caused an increase in the production of silver, lead and zinc.
Ishihuinca
In 1985, we purchased 51.0 percent of Inversiones Mineras del Sur S.A., or Inminsur, the owner and operator of the Ishihuinca mine. As a result of subsequent purchases of shares of Inminsur, we currently own 100 percent of Inminsur. Inminsur has leased the rights to the mining concessions of Ishihuinca from a third party. The lease agreement, which expires in 2015, stipulates payment by Inminsur to the lessor of a royalty of 7 percent of the price of the concentrates sold. At December 31, 2010, the net total fixed assets of Ishihuinca were approximately US$0.1 million.
The Ishihuinca mine is located in the province of Caravelí in the department of Arequipa, approximately 780 kilometers southeast of the city of Lima at an altitude of 2,200 meters above sea level. Access is by the Pan American highway.
Mining is conducted underground utilizing the conventional cut-and-fill stopping method. Ore is processed at a mill located at Ishihuinca. The mill, which has a rated capacity of 220 DST per day, utilizes bulk flotation and gravity concentration processes. The bulk flotation process produces a copper/gold concentrate, which is sold to a local mineral broker, and a gold-bearing pyrite concentrate which is leached with cyanide in agitator tanks. The gravity concentrates, from the gravity concentration processes, are treated by cyanidation in vats. The dissolved gold obtained from the cyanidation of the gold-bearing pyrite concentrate and gravity concentrate is precipitated on zinc dust (Merrill-Crowe process) and the resulting precipitate is refined in Lima and then sold to Johnson Matthey. The mill at the Ishihuinca mine was last modernized and expanded to operate at its current capacity in 1993.
Electric power is generated by three electric generators, with a capacity of 709 kW, 804 kW and 800 kW, respectively. Water for operations at Ishihuinca is obtained from nearby wells.
Ore reserves at December 31, 2010 were 17,146 DST, with 0.380 ounces per ton of gold. During 2010, we completed 1,018 meters in underground mine works and 1,357 meters in diamond drilling, exploring mainly the Cordova area. In 2011, we plan to continue our efforts to increase our reserves of gold ore by undertaking exploration in new areas.
Set forth below are certain unaudited operating data for the periods shown for Ishihuinca, calculated on the basis of 100 percent of the mine’s production.
| | | Year Ending December 31,(1) | |
| | | | | | | | | | | | | | | | |
| Mining Operations: | | | | | | | | | | | | | | | |
| Ore mined (ST) | | | 66,705 | | | | 54,740 | | | | 30,349 | | | | 3,055 | | | | 4,708 | |
| Average gold grade (oz./ST) | | | 0.377 | | | | 0.322 | | | | 0.318 | | | | 0.265 | | | | 0.223 | |
| Average copper grade (%) | | | 0.33 | | | | 0.437 | | | | 0.30 | | | | 0.45 | | | | 0.53 | |
| Production: | | | | | | | | | | | | | | | | | | | | |
| Gold (oz.) | | | 21,020 | | | | 14,814 | | | | 8,141 | | | | 638 | | | | 917 | |
| Copper (ST) | | | 141 | | | | 185 | | | | 70 | | | | 9 | | | | 16 | |
| Zinc (ST) | | | - | | | | - | | | | - | | | | - | | | | - | |
| Lead (ST) | | | - | | | | - | | | | - | | | | - | | | | - | |
| Recovery rate (gold)(%) | | | 83.3 | | | | 83.97 | | | | 84.3 | | | | 81.90 | | | | 80.3 | |
| Recovery rate (copper)(%) | | | - | | | | 76.90 | | | | 76.50 | | | | 66.80 | | | | 68.7 | |
| Employees: | | | | | | | | | | | | | | | | | | | | |
| Buenaventura employees | | | 87 | | | | 85 | | | | 75 | | | | 64 | | | | 50 | |
| Contractor employees | | | 338 | | | | 346 | | | | 80 | | | | 27 | | | | 30 | |
| | (1) | Incorporates losses for mining dilution and recovery. |
In 2010, ore production resulted from the treatment of minerals produced by mining exploration.
Antapite
Antapite is an underground mine that is wholly owned and operated by us. At December 31, 2010, the net total fixed assets of Antapite were approximately US$6.4 million.
Antapite is located in the province of Huaytará, in the department of Huancavelica, approximately 434 kilometers southeast of the city of Lima at an altitude of approximately 3,400 meters above sea level. The mine is accessed primarily by the Pan American highway and local roads. The Antapite mine consists of 20,800 hectares and is considered a gold mineralization deposit that has been classified as an epithermal low sulfidation in veins hosted by Eocene-Miocene calc-alkaline volcanic rocks.
In 2006, exploration efforts were centered on the Zorro Rojo and Reyna areas and consisted mainly of underground workings and diamond drill holes. Total calculated ore reserves as of December 31, 2006 were 466,135 DST with 0.343 ounces of gold. During 2007, we conducted 13,994 meters of underground exploration works and 18,517 meters of diamond drill holes in Zorro Rojo, Zorro Rojo’s branch, Antapite, Reyna, Reyna’s branch and the Liliana and Emperatriz veins. During 2008, we conducted intense exploration works primarily in the Juana Solitaria, Soledad Olvidada and Zorro Rojo veins. We completed 17,480 meters of underground exploration works and 31,212 meters of diamond drilling.
During 2010, we focused on exploring the Soledad Olvidada, Eliana, Milagros, Zorro Rojo Norte and Susan areas and completed 12,477 meters of underground mining and 24,510 meters of diamond drilling. As of December 31, 2010, total proven ore reserves were 36,161 DST with 0.248 ounces per ton of gold and 0.438 ounces per ton of silver, and total probable ore reserves were 13,961 DST with 0.251 ounces per ton of gold and 0.438 ounces per ton of silver. Total estimated NRM was 57,298 DST, with 0.345 ounces per ton of gold and 0.4 ounces per ton of silver. In 2011, we plan to focus our exploration efforts on the southeastern part of the mineralized alignments formed by the Soledad, Olvidada, Carolina, Amatista, Pucarumi and Furiosa veins to search for new ore reserves.
Mining is conducted underground utilizing the conventional cut-and-fill stopping method. Ore is processed at a cyanidation plant located at Antapite. The plant, which was completed in June 2001 with capacity for 272 DST per day, has increased its capacity to 600 DST per day since May 2003. The plant had a 68.0 percent utilization rate in 2010.
The Antapite mine obtains approximately 98.5 percent of its electric power through the Peruvian national electricity grid. Water for operations at Antapite is obtained from an underground drainage system.
Set forth below are certain unaudited operating data for the periods shown for Antapite, calculated on the basis of 100 percent of the mine’s production.
| | | Year Ending December 31,(1)(2) | |
| | | | | | | | | | | | | | | | |
| Mining Operations: | | | | | | | | | | | | | | | |
| Ore mined (ST) | | | 179,820 | | | | 178,969 | | | | 207,014 | | | | 142,760 | | | | 145,915 | |
| Average gold grade (oz./ST) | | | 0.60 | | | | 0.420 | | | | 0.220 | | | | 0.228 | | | | 0.254 | |
| Average silver grade (oz./ST) | | | 0.65 | | | | 0.73 | | | | 0.57 | | | | 0.46 | | | | 0.34 | |
| Production: | | | | | | | | | | | | | | | | | | | | |
| Gold (oz.) | | | 103,370 | | | | 72,171 | | | | 43,320 | | | | 31,004 | | | | 35,803 | |
| Silver (oz.) | | | 83,258 | | | | 90,368 | | | | 80,363 | | | | 50,100 | | | | 36,870 | |
| Recovery rate (gold) (%) | | | 96.6 | | | | 96.0 | | | | 94.2 | | | | 95.2 | | | | 96.8 | |
| Recovery rate (silver) (%) | | | 71.2 | | | | 69.2 | | | | 66.6 | | | | 76.3 | | | | 74.0 | |
| Employees: | | | | | | | | | | | | | | | | | | | | |
| Buenaventura employees | | | 195 | | | | 335 | | | | 318 | | | | 279 | | | | 283 | |
| Contractor employees | | | 1,241 | | | | 733 | | | | 745 | | | | 684 | | | | 651 | |
| | (1) | Incorporates losses for mining dilution and recovery. |
| | (2) | Data reflects only mining operations at the Paula mine. The Shila mine is currently not operating due to a lack of reserves. |
In 2010, gold production increased 15.5 percent compared to the previous year, mainly due to a higher gold feed grade and higher gold recovery rate. Silver production decreased by 26.4 percent compared to 2009, mainly due to a lower silver feed grade and lower silver recovery rate.
Shila-Paula
Shila and Paula are underground mines that are wholly owned and operated by Cedimin, our wholly-owned subsidiary. Shila and Paula encompass an aggregate of 41,152 hectares, which are owned by Cedimin. At December 31, 2010, the net total fixed assets of the Shila and Paula mining operations were approximately US$4.6 million.
As of December 31, 2010, we have proven ore reserves of 7,777 DST and probable ore reserves of 5,606 DST, with 0.589 ounces per ton of gold and 1.30 ounces per ton of silver. Total NRM was 7,535 DST, with 0.501 ounces per ton of gold and 0.90 ounces per ton of silver. All ore reserves and NRM are in the Paula mine. During 2010, we conducted significant exploration efforts in an attempt to increase Shila-Paula’s ore reserves, and completed 13,961 meters of underground mining works and 27,690 meters of diamond drilling. In 2011, we plan to access mineralization beneath the last accessible level, where it appears to improve at depth.
The Shila mine is located in the province of Castilla in the department of Arequipa, approximately 1,350 kilometers southeast of Lima and 25 kilometers south of the Orcopampa mining operation at an altitude of between 4,650 and 5,400 meters above sea level. Access is by a 250-kilometer unpaved road. The Shila mine is currently not operating due to a lack of ore reserves.
The Paula mine is located in the province of Castilla in the department of Arequipa, approximately 1,400 kilometers southeast of the city of Lima and 140 kilometers south of the Orcopampa mining operation, at an altitude of between 5,000 and 5,400 meters above sea level. Access is by a 300-kilometer highway from Arequipa.
Gold mineralization deposits in the Shila and Paula mines have been classified as epithermal low sulfidation of the Quartz-Adularia-Sericite type. The veins are hosted by tertiary volcanic rocks associated with the Chinchón and Huayta calderas.
Due to the high cost of transportation and smelting of the concentrates, we installed a small cyanidation plant at the Shila mine, which entered into operation in August of 2001 with a net capacity of 3,200 metric tons per year.
Mining operations are currently conducted only in the Paula mine. Mining is conducted underground using the conventional cut-and-fill stopping method. Ore is processed at a mill located at the Shila mine with a rated capacity of 230 DST per day. The mill had a 76.7 percent utilization rate in 2010. The mill utilizes bulk flotation and gravity concentration processes. Gravity concentrates and flotation concentrates are later treated together by cyanidation leaching. The extracted gold and silver values are precipitated using the Merrill-Crowe process and the gold/silver precipitate produced is sent to the smelter located next to the mill. We send the doré silver/gold bars to a refinery in Lima and the refined products are later sold overseas.
Electric power for Shila is provided by four diesel generators, two with a capacity of 650 kW, one with a capacity of 1,135 kW and one with a capacity of 1,600 kW, and a power line, which was connected to the Peruvian national electricity grid in April 2003. In January 2005, Paula was connected to the Peruvian national electricity grid and ceased operations at its two diesel generators, each with a 65 kW installed capacity. The water for operations at Paula is obtained from runoff from a snowpeak.
Set forth below are certain unaudited operating data for Shila-Paula, calculated on the basis of 100 percent of both mines’ combined production.
| | | Year Ending December 31,(1)(2) | |
| | | | | | | | | | | | | | | | |
| Mining Operations: | | | | | | | | | | | | | | | |
| Ore mined (ST) | | | 67,888 | | | | 68,858 | | | | 74,722 | | | | 65,526 | | | | 64,047 | |
| Average gold grade (oz./ST) | | | 0.418 | | | | 0.491 | | | | 0.549 | | | | 0.386 | | | | 0.234 | |
| Average silver grade (oz./ST) | | | 3.0 | | | | 2.1 | | | | 1.9 | | | | 1.75 | | | | 0.96 | |
| Production: | | | | | | | | | | | | | | | | | | | | |
| Gold (oz.) | | | 26,336 | | | | 32,261 | | | | 39,162 | | | | 24,072 | | | | 14,157 | |
| Silver (oz.) | | | 157,683 | | | | 104,711 | | | | 101,327 | | | | 85,994 | | | | 46,578 | |
| Recovery rate (gold) (%) | | | 92.8 | | | | 95.4 | | | | 95.5 | | | | 95.2 | | | | 94.4 | |
| Recovery rate (silver) (%) | | | 78.6 | | | | 72.4 | | | | 72.0 | | | | 74.8 | | | | 75.9 | |
| Employees: | | | | | | | | | | | | | | | | | | | | |
| Buenaventura employees | | | 153 | | | | 205 | | | | 249 | | | | 220 | | | | 217 | |
| Contractor employees | | | 537 | | | | 571 | | | | 685 | | | | 676 | | | | 525 | |
| | (1) | Incorporates losses for mining dilution and recovery. |
| | (2) | Data reflects only mining operations at the Paula mine. The Shila mine is currently not operating due to a lack of reserves. |
In 2010, total production of gold and silver decreased, mainly due to a decrease in gold and silver grades in the ore fed to the mill.
La Zanja
The La Zanja mine is located in the district of Pulan, in the province of Santa Cruz and department of Cajamarca in northern Peru. La Zanja consists of approximately 37,000 hectares and is located 48 kilometers northwest of the Yanacocha gold mine, at an average altitude of 3,500 meters above sea level. La Zanja is located within a large area of hydrothermal alteration, mainly related to epithermal gold deposits in high sulfidation environments, in addition to some intermediate to low sulfidation vein systems. We have recognized two ore deposits: San Pedro Sur and Cerro Pampa Verde. Geological exploration began in 1991, the construction phase of the project began in June 2009, the permit to start using the treatment plant was granted in August 2010, and we commenced production of refined doré bars in September 2010.
La Zanja, in which we hold a 53.06 percent interest and Newmont holds a 46.94 percent interest, operates the mine, Buenaventura holds 53.06 percent of shares, and Newmont holds the remaining 46.94 percent. Mining operations are conducted through the open-pit method and carbon-in-column circuits are utilized to recover gold from heap leach operations. The activated carbon and gold is then transported to Yanacocha to continue processing into doré bars.
Total proven and probable ore reserves at December 31, 2010 were 41,387,520 DST, with 0.016 ounces per ton of gold and 0.280 ounces per ton of silver. Total NRM was 7,920,000 DST, with 0.015 ounces per ton of gold and 0.250 ounces per ton of silver.
In 2011, we plan to complete a geological survey of Pampa Verde and begin production at Pampa Verde later this year. We also plan to complete the brownfield exploration phase of Castrejón and Cerro La Zanja, with a planned program of 10,000 meters of diamond drilling.
Set forth below are certain unaudited operating data for La Zanja, calculated on the basis of 100 percent of the mine’s production.
| | | Year Ending December 31, | |
| | | | | | | | | | | | | | | | |
| Mining Operations: | | | | | | | | | | | | | | | |
| Ore mined (ST) | | | - | | | | - | | | | - | | | | - | | | | 64,047 | |
| Average gold grade (oz./ST) | | | - | | | | - | | | | - | | | | - | | | | 0.234 | |
| Average silver grade (oz./ST) | | | - | | | | - | | | | - | | | | - | | | | 0.96 | |
| Production: | | | | | | | | | | | | | | | | | | | | |
| Gold (oz.) | | | - | | | | - | | | | - | | | | - | | | | 14,157 | |
| Silver (oz.) | | | - | | | | - | | | | - | | | | - | | | | 46,578 | |
| Recovery rate (gold) (%) | | | - | | | | - | | | | - | | | | - | | | | 94.4 | |
| Recovery rate (silver) (%) | | | - | | | | - | | | | - | | | | - | | | | 75.9 | |
| Employees: | | | | | | | | | | | | | | | | | | | | |
| Buenaventura employees | | | - | | | | - | | | | - | | | | - | | | | 217 | |
| Contractor employees | | | - | | | | - | | | | - | | | | - | | | | 525 | |
| | (1) | Data reflects mining operations at the San Pedro Sur deposit only. |
Colquijirca and Marcapunta Norte
The Colquijirca (also known as Tajo Norte) and Marcapunta Norte mines are wholly owned by El Brocal. El Brocal was founded in 1956 and is engaged in the extraction, concentration and sale of concentrates of polymetallic minerals—mainly zinc, copper, lead and silver. On March 11, 2009, we purchased Teck Cominco’s equity stake in Inversiones Colquijirca, increasing our equity interest in Colquijirca to 81.22 percent and our overall equity interest in El Brocal to 46.08 percent. As of December 31, 2010, we held an 81.42 percent interest in Inversiones Colquijirca, which in turn held a 41.57 percent interest in El Brocal, and a 4.25 percent direct interest in El Brocal’s mining properties. Our total equity interest in El Brocal was 45.82 percent as of December 31, 2010.
Total reserves of Colquijirca, as of December 31, 2010, were 69.751 million DMT, with a silver content of 0.92 ounces per DST, 2.24 percent of zinc and 0.74 percent of lead. Total reserves of Marcapunta Norte, as of December 31, 2010 were 7.207 million DST at 0.49 ounces of silver per DST, 0.015 ounces of gold per DST, and 2.38 percent of copper. At December 31, 2010 the net total fixed assets of Colquijirca and Marcapunta Norte were approximately US$80.099 million.
The Colquijirca and Marcapunta Norte mines are adjacent and are located 285 kilometers east of the city of Lima and 10 kilometers south of the city of Cerro de Pasco. El Brocal produces zinc and lead/silver concentrates from the Colquijirca mine and copper concentrates from the Marcapunta Norte mine. The Colquijirca mine consists of three important polymetallic deposits: the Tajo Norte deposit, which contains zinc, silver and lead ore; the Marcapunta deposit, which contains an auriferous mineralization in breccia oxides, a non-arsenic copper chalcosite mineralization, and an arsenic copper enargite mineralization as a continuation of the mineralized mantles of the Marcapunta Norte Mine; and the San Gregorio deposit, which contains zinc.
Mining at Colquijirca is conducted through the open-pit method from which zinc and lead concentrates are produced. El Brocal’s zinc concentrate typically contains 50 percent zinc, while its lead concentrate typically contains 55 percent lead. The concentrates are sold to local smelters and refiners due to current market conditions. Mining at Marcapunta Norte is conducted through the room and pillars method from which copper concentrates are produced. El Brocal’s copper concentrates typically contains 25 percent copper, 7 ounces of silver and 8 percent arsenic. The concentrates are sold to local traders. El Brocal’s mineral production increased significantly from 2002 to 2010, achieving an ore throughput of 3,494,718 DST for the year ended December 31, 2009.
The Huaraucaca concentrator plant processes ore from both mines. The capacity of the concentrator plant is 7,150 stpd and it processed 1.902 million ST of ore during 2010. The mill had a 98 percent utilization rate in 2010. The Colquijirca mine primarily relies on a power line, which was connected to the Peruvian national electricity grid in November 2002, for its electrical power.
In 2001, El Brocal initiated an intensive exploration program, financed by a capital increase in 2002 at the Marcapunta deposit, to confirm mineralization and find possible extensions. In 2002, exploration revealed gold-bearing arsenic copper resources in the Marcapunta deposit. El Brocal’s production greatly increased from 2002 to 2006. In 2008 El Brocal undertook an extensive exploration effort, drilling over 51,000 meters in an effort to increase and better delineate its reserves at the Colquijirca and Marcapunta Norte mines, as well as at the overall Marcapunta deposit.
In August 2008, we approved an expansion project requiring an estimated US$160 million investment. In February 2010, the budgeted amount was revised upwards to US$196.5 million. The project contemplates: expanding the Tajo Norte open pit mine to 15,000 MT per day; expanding the Marcapunta Norte underground mine to 3,000 MT per day; expanding and modernizing the Huaraucaca concentration plant to increase the capacity of the lead-zinc-silver circuit from 5,500 MT per day to 15,000 MT per day in order to treat ore from the Tajo Norte-La Llave mine, as well as to increase the capacity of the copper circuit for the treatment of ore from the Marcapunta mine from 1,000 MT per day to 3,000 MT per day; and building the Huachuacaja tailings facility and upgrading existing infrastructure to adjust to the new production capacity of 18,000 MT per day.
Total operating costs for 2009 amounted to US$55.73 per DMT of ore treated. The increase was mainly due to preparation and development activities at the open pit and underground mine as part of the expansion of the project to 18,000 DMT.
Set forth below are certain unaudited operating data for the Colquijirca mine calculated on the basis of 100 percent of the mine’s production.
| | | Year Ending December 31,(1) | |
| | | | | | | | | | | | | | | | |
| | | | | | | | | | | | | | | | |
| Mining Operations: | | | | | | | | | | | | | | | |
| Ore mined (ST) | | | 1,631,668 | | | | 2,055,485 | | | | 2,028,588 | | | | 1,940,119 | | | | 2,654,651 | |
| Average silver grade (oz./ST) | | | 8.17 | | | | 4.97 | | | | 3.38 | | | | 2.92 | | | | 2.48 | |
| Average zinc grade (%) | | | 5.90 | | | | 6.08 | | | | 6.10 | | | | 5.33 | | | | 2.77 | |
| Average lead grade (%) | | | 3.31 | | | | 2.66 | | | | 2.38 | | | | 1.90 | | | | 1.02 | |
| Production: | | | | | | | | | | | | | | | | | | | | |
| Silver (oz.) | | | 10,269,511 | | | | 7,076,377 | | | | 4,487,906 | | | | 3,651,041 | | | | 1,911,661 | |
| Zinc (ST) | | | 72,422 | | | | 93,505 | | | | 89,949 | | | | 74,615 | | | | 35,397 | |
| Lead (ST) | | | 33,408 | | | | 34,867 | | | | 27,525 | | | | 22,195 | | | | 11,678 | |
| Recovery rate (silver) in zinc (%) | | | 23.61 | | | | 25.92 | | | | 28.47 | | | | 27.0 | | | | 26.14 | |
| Recovery rate (zinc) (%) | | | 75.18 | | | | 74.82 | | | | 72.69 | | | | 72.2 | | | | 72.17 | |
| Recovery rate (silver) in lead (%) | | | 53.39 | | | | 43.33 | | | | 36.91 | | | | 37.0 | | | | 42.99 | |
| Recovery rate (lead) (%) | | | 61.88 | | | | 63.77 | | | | 57.01 | | | | 60.2 | | | | 66.22 | |
Employees (2): | | | | | | | | | | | | | | | | | | | | |
| El Brocal employees | | | 306 | | | | 345 | | | | 351 | | | | 358 | | | | 371 | |
| Contractor employees | | | 906 | | | | 1,056 | | | | 1,041 | | | | 1,956 | | | | 2,250 | |
| | (1) | Incorporates losses for mining dilution and recovery. |
| | (2) | Includes employees from the Marcapunta Norte mine. |
In 2010, ore grades for ore mined at Colquijirca dropped significantly. In order for the mining operations at Colquijirca to remain economically viable, we approved the expansion of operations as described above. Nevertheless, recovery rates remained stable with respect to 2009 results. The stripping ratio was 9.77, representing an increase of 7 percent over the previous year. This is a consequence of the high tonnage of barren material removed from the pit, which was 38 percent higher.
Set forth below are certain unaudited operating data for the Marcapunta Norte mine calculated on the basis of 100 percent of the mine’s production.
| | | Year Ending December 31,(1) | |
| | | | | | | | | | | | | |
| | | | | | | | | | | | | |
| Mining Operations: | | | | | | | | | | | | |
| Ore mined (ST) | | | 69,845 | | | | 354,993 | | | | 384,410 | | | | 840,067 | |
| Average silver grade (oz./ST) | | | 0.52 | | | | 0.54 | | | | 0.61 | | | | 0.53 | |
| Average gold grade (oz./ST) | | | 0.016 | | | | 0.018 | | | | 0.016 | | | | 0.017 | |
| Production: | | | | | | | | | | | | | | | | |
| Silver (oz.) | | | 27,048 | | | | 147,863 | | | | 169,694 | | | | 608,438 | |
| Gold (oz.) | | | 617 | | | | 3,810 | | | | 3,215 | | | | 6,081 | |
| Recovery rate (silver) in copper (%) | | | 74.89 | | | | 77.82 | | | | 72.4 | | | | 60.81 | |
| Recovery rate (gold) in copper (%) | | | 54.12 | | | | 60.82 | | | | 52.8 | | | | 45.79 | |
| | (1) | Incorporates losses for mining dilution and recovery. |
During 2010, we continued production at Marcapunta Norte using the room and pillar method. We conducted additional preparation, training and development work to increase production from 1,000 MT per day to 4,000 MT per day. We will apply the sub-level stopping method as production is expanded.
Reserves
We calculate our ore reserves by methods generally applied within the mining industry and in accordance with Commission Industry Guide 7. All mineral reserves are estimated quantities of proven and probable ore that under present conditions may be economically mined and processed.
The proven and probable ore reserve figures presented in this Annual Report are our and Yanacocha’s estimates, and no assurance can be given that the level of recovery of gold, silver and certain other metals will be realized. See “Item 3. Key Information—Risk Factors—Factors Relating to the Company—Estimates of proven and probable reserves are subject to uncertainties and the volume and grade of ore actually recovered may vary from our estimates.”
The term “reserves” refers to mineral deposits that could be economically and legally extracted or produced at the time of reserve determination. The term “proven reserves” means ore reserves for which (a) quantity is computed from dimensions revealed in outcrops, trenches, workings or drill holes, and grade and/or quality are computed from the results of detailed sampling, and (b) the sites for inspection, sampling and measurement are spaced so closely and the geologic character is so well defined that size, shape, depth and mineral content of reserves are well established. The term “probable reserves” means ore reserves for which quantity and grade and/or quality are computed from information similar to that used for proven reserves, but the sites for inspection, sampling and measurement are farther apart or are otherwise less adequately spaced. The degree of assurance, although lower than that for proven reserves, is high enough to assume continuity between points of observation.
The following table lists the proven and probable ore reserves at December 31, 2010 for each mining operation in which we have at least a 50 percent interest as well as the average grade of such ore, calculated on the basis of 100 percent of each mine’s reserves and US$950 per ounce of gold and US$16.00 per ounce of silver.
Proven and Probable Ore Reserves at December 31, 2010 (1)(2)(3)
| | | Julcani(4) | | Uchucchacua(5) | | Orcopampa(6) | | Recuperada(7) | | Colquijirca(8)(9) | | Marcapunta(8) (10) | | Ishihuinca | | Antapite(11) | | Shila- Paula(12) | | Poracota(13) | | La Zanja(14) | | Total/Average | |
| Ore Reserves (ST) | | 340,285 | | 4,447,515 | | 1,195,500 | | 524,265 | | 76,887,000 | | 7,945,000 | | 17,146 | | 50,122 | | 13,383 | | 132,950 | | 41,387,000 | | 132,940,166 | |
| Grade: | | | | | | | | | | | | | | | | | | | | | | | | | |
| Gold (oz./ST) | | 0.026 | | - | | 0.595 | | - | | - | | 0.012 | | 0.380 | | 0.249 | | 0.589 | | 0.398 | | 0.016 | | 0.012 | |
| Silver (oz./ST) | | 18.70 | | 13.43 | | 0.40 | | 5.50 | | 0.83 | | 0.44 | | - | | 0.40 | | 1.30 | | 0.16 | | 0.28 | | 1.12 | |
| Copper (%) | | 0.40 | | - | | - | | - | | - | | 2.38 | | - | | - | | - | | - | | - | | 0.14 | |
| Zinc (%) | | - | | 2.23 | | - | | 7.10 | | 2.24 | | - | | - | | - | | - | | - | | - | | 1.40 | |
| Lead (%) | | 2.3 | | 1.64 | | - | | 4.90 | | 0.74 | | - | | - | | - | | - | | - | | - | | 0.51 | |
| Content: | | | | | | | | | | | | | | | | | | | | | | | | | |
| Gold (oz.) | | 8,715 | | - | | 711,323 | | - | | - | | 95,340 | | 6,515 | | 12,476 | | 7,883 | | 52,892 | | 662,192 | | 1,557,336 | |
| Silver (oz.) | | 6,361,630 | | 59,717,455 | | 478,200 | | 2,883,458 | | 63,816,210 | | 3,495,800 | | - | | 21,928 | | 17,398 | | 20,940 | | 11,588,360 | | 148,401,379 | |
| Copper (ST) | | 1,345 | | - | | - | | - | | - | | 189,091 | | - | | - | | - | | - | | - | | 190,436 | |
| Zinc (ST) | | - | | 99,046 | | - | | 37,223 | | 1,722,269 | | - | | - | | - | | - | | - | | - | | 1,858,538 | |
| Lead (ST) | | 7,822 | | 72,893 | | - | | 25,689 | | 568,964 | | - | | - | | - | | - | | - | | - | | 675,368 | |
| (1) | Proven and probable reserves for our wholly-owned mines were audited by an independent consultant, Algon Investment S.R.L. Proven and probable reserves for El Brocal’s mines were audited by an independent consultant, AMEC plc. Reserves as stated are diluted and mineable. Incorporates losses for mining dilution and recovery. |
| (2) | The metallurgical recovery factors used to calculate the reserves for each of our mines include ore quality, gradation of ore (which impacts the effectiveness of reagents in releasing valuable particles), quality of water used to treat ore (recycled water contains impurities that can interfere with the chemical reaction of the reagents), quality of reagent used to treat ore. |
| (3) | For the year ended December 31, 2010, reserves for our wholly-owned and operated mines (which include all of the mines listed in the table above other than Colquijirca and Marcapunta) were calculated using the following prices: US$950.0 per ounce of gold, US$16.0 per ounce of silver, US$2,032.10 per metric ton of zinc, US$1921.20 per metric ton of lead and US$4,409.24 per metric ton of copper. |
| (4) | The metallurgical recovery factors that impacted the calculated reserves for Julcani at December 31, 2010 were whether the ore contained iron sulfide (Pirite) higher than 8% and the quality of water. |
| (5) | The metallurgical recovery factors that impacted the calculated reserves for Uchucchacua at December 31, 2010 were the complexity of the ore, the variation of ore grade and whether the ore contained oxides. |
| (6) | The metallurgical recovery factors that impacted the calculated reserves for Orcopampa at December 31, 2010 were water quality (recycled water contains impurities that can interfere with the chemical reaction of the reagents) and lower than estimated or expected ore grade. |
| (7) | The metallurgical recovery factors that impacted the calculated reserves for Recuperada at December 31, 2010 were the high variation in ore grade and the quality of water. |
| (8) | El Brocal, in which we owned a 46.08% controlling equity interest at December 31, 2010, owns the Colquijirca and Marcapunta mines. The reserves shown for Colquijirca and Marcapunta are the total reserves of the Colquijirca and Marcapunta mines and do not indicate our equity share. They were calculated using the following metal prices: US$800.0 per ounce of gold, US$14.00 per ounce of silver, US$2,032.10 per metric ton of zinc and US$1,921.20 per metric ton of lead. |
| (9) | The metallurgical recovery factors that impacted the calculated reserves for Colquijirca at December 31, 2010 were the high content of clay and soluble salts in the ore. |
| (10) | The metallurgical recovery factors that impacted the calculated reserves for Marcapunta at December 31, 2010 were the high content of arsenic in the ore and the hardness of the host rocks. |
| (11) | The metallurgical recovery factors that impacted the calculated reserves for Antapite at December 31, 2010 were the high variation in ore grade and the quality of water. |
| (12) | The metallurgical recovery factor that impacted the calculated reserves for Shila-Paula at December 31, 2010 was the high variation in ore grade. |
| (13) | The metallurgical recovery factors that impacted the calculated reserves for Poracota at December 31, 2010 were the high variation of the ore grade and the presence of coal content in the ore. |
| (14) | The reserves shown for La Zanja, in which we owned a 53.06% controlling equity interest at December 31, 2010, are the total reserves of the mine and do not indicate our equity share. They were calculated using the following metal prices: US$800.0 per ounce of gold and US$14.00 per ounce of silver. The factors that can impact La Zanja’s metallurgical recovery reserves are as follows: the clay content in ore higher than 10% and the iron sulfide (Pirite) content in ore higher than 3%. |
Nine underground mines and two open pit mines, Colquijirca and La Zanja, comprise our mining operations. Since establishing a significant amount of reserves in underground mines requires costly and extensive exploration programs, we have, in order to control costs, traditionally pursued an exploration and development program in our mines designed to establish an amount of reserves sufficient to permit the steady production of minerals over an extended period of time. The following table sets forth the aggregate amount of production of ore, gold and silver and the average grade of gold and silver for each of our eleven mines for the ten-year period ended December 31, 2010, calculated in each case on the basis of 100 percent of the relevant mine’s production.
| | | Julcani | | Uchucchacua | | Orcopampa(1) | | Recuperada | | Colquijirca(2) | | Marcapunta(2) | | Ishihuinca | | Antapite | | Shila- Paula | | Poracota | | La Zanja(3) | | Total | |
| Ore mined (ST) | | 775,000 | | 8,485,111 | | 4,385,231 | | 458,645 | | 15,833,555 | | 1,686,062 | | 401,421 | | 1,550,969 | | 651,937 | | 735,546 | | 5,181,302 | | 40,144,779 | |
| Gold produced (oz.) | | 4,943 | | - | | 2,373,271 | | 93 | | - | | 12,573 | | 146,384 | | 678,084 | | 276,450 | | 174,124 | | 43,727 | | 3,709,649 | |
| Average gold grade (oz./ST) | | 0.010 | | - | | 0.553 | | 0.0003 | | - | | 0.015 | | 0.426 | | 0.459 | | 0.447 | | 0.285 | | 0.025 | | 0.099 | |
| Silver produced (oz.) | | 12,948,690 | | 99,597,698 | | 897,203 | | 2,796,361 | | 43,977,569 | | 926,832 | | - | | 774,259 | | 3,092,778 | | 87,568 | | 38,155 | | 165,137,113 | |
| Average silver grade (oz./ST) | | 18.0 | | 15.87 | | 0.29 | | 6.50 | | 3.93 | | 0.85 | | - | | 0.75 | | 5.74 | | 0.15 | | 0.31 | | 5.56 | |
| (1) | Includes a cumulative total of 71,659 ounces of gold and 60,715 ounces of silver from final tail treatment. |
| (2) | El Brocal, in which we owned a 46.08% controlling equity interest as of December 31, 2010, owns the Colquijirca and Marcapunta mines. The production data shown for Colquijirca and Marcapunta are the total production data of the Colquijirca and Marcapunta mines and do not indicate our equity share. |
| (3) | The production data shown for La Zanja, in which we own a 53.06% controlling equity interest, is the total production data of the mine and does not indicate our equity share. |
Yanacocha’s Properties
Operating Properties
For operating data (including ore mined, average gold grade of ore mined and gold production) for each of Yanacocha’s operating properties and a description of how ore is processed and the source of electricity and water for each of Yanacocha’s operating properties, see “—Yanacocha—Overview” and “—Description of Yanacocha’s Operations.”
Carachugo - Chaquicocha
Chaquicocha Sur is an 85-hectare gold deposit (ultimate pit) which lies in the east-central part of the Yanacocha District, approximately 1 kilometer southeast of the mined out Carachugo deposit and 300 meters south of the Chaquicocha Norte pit.
Carachugo is a 90-hectare gold deposit with a leach pad that covers approximately 306 hectares. Carachugo, Yanacocha’s first mine, commenced operations in August 1993. Mining is conducted by the open-pit method. Carachugo has one Merril-Crowe-type ore processing facility. The Carachugo open-pit mine ceased mining operations in 2004, although one ore processing facility remains in operation.
Maqui Maqui
Maqui Maqui is a 75-hectare gold deposit with a leach pad covering 67 hectares, located five kilometers northeast of the Carachugo pit. Mining operations at Maqui Maqui began in October 1994 and used the open-pit mining method. Although mining operations at Maqui Maqui ceased in September 2000, gold recovery from the leach pad continues. The Maqui Maqui East expansion commenced operations in 2010.
San José
San José is a 100-hectare gold deposit, located 1.5 kilometers southwest of the Carachugo pit, that shares the leach pad located at Carachugo. Mining operations at San José began in January 1996 using the open-pit mining method. Mining operations at San José temporarily ceased during the fourth quarter of 2002 and reopened in 2005 to complete San José East. San José West started operations in early 2010.
Cerro Yanacocha
Cerro Yanacocha is a 247-hectare gold deposit (ultimate pit) with a leach pad covering approximately 310 hectares. The Cerro Yanacocha pit is located two kilometers northwest of the Carachugo pit. Operations began in the fourth quarter of 1997 using the open-pit mining method. Cerro Yanacocha includes a carbon column gold recovery plant and a Merrill-Crowe-type ore processing facility. Cerro Yanacocha temporarily ceased operations in October 2010 and expects to reopen in 2015.
La Quinua
La Quinua is a 450-hectare gold deposit (ultimate pit) with a leach pad covering 426 hectares. The La Quinua, El Tapado and El Tapado Oeste pits are located three kilometers southwest of the Cerro Yanacocha pit. Operations began in the fourth quarter of 2001 using the open-pit mining method. All solution processing occurs at the Cerro Yanacocha plant following treatment at the La Quinua leach pad and carbon column facility.
The La Quinua mining operation included Cerro Negro Este, a 15-hectare gold deposit (ultimate pit) which is located six kilometers southwest of the La Quinua pit. Cerro Negro Este utilized the La Quinua leach pad. Operations began in April 2004 using the open-pit mining method and all solution processing occurred at the Cerro Yanacocha plant following treatment at the La Quinua leach pad and carbon column facility. Mining operations at Cerro Negro Este ceased in March 2005.
Western Oxides
The Western Oxides are comprised of the Cerro Negro Oeste and La Quinua Sur open-pit mines. Cerro Negro Oeste, a 40-hectare gold deposit, is located 6.5 kilometers southwest of the La Quinua pit. Cerro Negro Oeste is scheduled to commence operations in July 2011 and complete operations in 2015. This pit utilizes the La Quinua leach pad as its ore facility. La Quinua Sur, a 110-hectare gold deposit, is located south of the Tapado Oeste pit and is completely covered by La Quinua gravel. La Quinua Sur is scheduled to commence mining activities in June 2013 and terminate in 2015. The ore mined from this pit will be processed at the La Quinua leach pad.
Eastern Oxides
The Eastern Oxides are comprised of the Quecher Norte and Marleny open-pit mines. The Quecher Norte pit, a 12-hectare deposit, is located to the east of the Carachugo pad. Quecher Norte is scheduled to commence mining operations in September 2012 and complete operations in 2014. The Marleny pit, an 8-hectare deposit, is located to the west of the Carachugo backfill. Marleny is scheduled to commence mining operations in January 2013 and complete operations in 2014.
Carachugo Alto
The Carachugo Alto pit, a 9-hectare deposit, is located to the east of the Carachugo backfill. Carachugo Alto commenced mining operations in July 2010, and its second phase is scheduled for June 2011 through July 2012.
China Linda
In October 1999, we commenced lime production at the China Linda plant, which is located 12 kilometers to the northeast of the Yanacocha installations, in Cajamarca. Access to the plant from Yanacocha is by a ten kilometer private, unpaved road. We had 100 percent ownership of China Linda until December 19, 2000, at which date the plant became Yanacocha’s property pursuant to the unitization of our and Newmont Mining’s properties in Northern Peru. In January 2002, Yanacocha took over the operation of the China Linda plant. See “Item 4. Information on the Company—The Company—History and Development.” Lime is used in the gold and silver mining process to regulate the alkalinity of the cyanide solutions in the leaching process and for pH control in water treatment applications. Currently, the plant has a production capacity of 78,000 tons of lime per year. Additionally, construction gravel is obtained as a sub-product.
Reserves
Proven and probable reserves are based on extensive drilling, sampling, mine modeling and metallurgical testing from which economic feasibility is determined. Under the Management Contract, Newmont Mining, in conjunction with Yanacocha, calculates Yanacocha’s reserves by methods generally applied within the mining industry and in accordance with SEC Industry Guide 7. Reserves represent estimated quantities of proven and probable ore that under present and anticipated conditions may be economically mined and processed.
The following table lists Yanacocha’s proven and probable reserves and the average grade of ore as of December 31, 2006 through December 31, 2010. The table also includes proven and probable reserves for the districts of Yanacocha and Conga, along with average grade of ore. Calculations with respect to the estimates of proven and probable reserves are based on a gold price of US$950 per ounce as of December 31, 2010, US$800 per ounce as of December 31, 2009, US$725 per ounce as of December 31, 2008, US$575 per ounce as of December 31, 2007 and US$500 per ounce as of December 31, 2006. Calculations with respect to Conga’s copper reserves were calculated at a price of US$2.50 per pound as of December 31, 2010, US$2.00 per pound as of December 31, 2009, US$2.00 per pound as of December 31, 2008, US$1.75 per pound as of December 31, 2007 and US$1.00 per pound as of December 31, 2006. The districts of Yanacocha’s and Conga’s proven and probable reserves represent the total quantity of ore to be extracted from the deposits, allowing for mining efficiencies and ore dilution. Ounces of gold and pounds of copper in the districts of Yanacocha’s and Conga’s proven and probable reserves are calculated prior to any losses during metallurgical treatment.
| | | Proven and Probable Reserves at December 31, 2010 | | | Proven and Probable Reserves at December 31, 2009 | | | Proven and Probable Reserves at December 31, 2008 | |
| | | Tonnage | | | Average Gold Grade | | | Ounces Contained | | | Tonnage | | | Average Gold Grade | | | Ounces Contained | | | Tonnage | | | Average Gold Grade | | | Ounces Contained | |
| | | (thousands of DST) | | | (oz./DST) | | | (thousands of ounces) | | | (thousands of DST) | | | (oz./DST) | | | (thousands of ounces) | | | (thousands of DST) | | | (oz./DST) | | | (thousands of ounces) | |
| Maqui Maqui | | | 9,339 | | | | 0.029 | | | | 274 | | | | 9,037 | | | | 0.030 | | | | 271 | | | | 9,411 | | | | 0.029 | | | | 275 | |
| Carachugo | | | 64,380 | | | | 0.033 | | | | 2,128 | | | | 78,906 | | | | 0.035 | | | | 2,737 | | | | 85,288 | | | | 0.033 | | | | 2,780 | |
| San José | | | 5,414 | | | | 0.017 | | | | 94 | | | | 10,194 | | | | 0.017 | | | | 175 | | | | 10,420 | | | | 0.017 | | | | 178 | |
| Giuliana | | | - | | | | - | | | | - | | | | - | | | | - | | | | - | | | | - | | | | - | | | | - | |
| Cerro Yanacocha | | | 16,030 | | | | 0.047 | | | | 756 | | | | 43,999 | | | | 0.039 | | | | 1,720 | | | | 110,123 | | | | 0.027 | | | | 3,007 | |
| La Quinua | | | 2,049 | | | | 0.016 | | | | 33 | | | | 21,431 | | | | 0.015 | | | | 320 | | | | 73,920 | | | | 0.015 | | | | 1,112 | |
| Tapado | | | 26,329 | | | | 0.039 | | | | 1,035 | | | | 38,931 | | | | 0.035 | | | | 1,371 | | | | 52,991 | | | | 0.038 | | | | 2,021 | |
| Corimayo | | | 57,229 | | | | 0.042 | | | | 2,409 | | | | 47,711 | | | | 0.048 | | | | 2,313 | | | | 58,867 | | | | 0.041 | | | | 2,405 | |
| La Quinua Sur | | | 55,648 | | | | 0.014 | | | | 781 | | | | - | | | | - | | | | - | | | | - | | | | - | | | | - | |
| Cerro Negro | | | 25,985 | | | | 0.017 | | | | 433 | | | | - | | | | - | | | | - | | | | - | | | | - | | | | - | |
| In process | | | 56,168 | | | | 0.031 | | | | 1,759 | | | | 57,074 | | | | 0.028 | | | | 1,619 | | | | 43,671 | | | | 0.028 | | | | 1,236 | |
| Subtotal Yanacocha/avg | | | 318,571 | | | | 0.030 | | | | 9,702 | | | | 307,283 | | | | 0.034 | | | | 10,526 | | | | 444,691 | | | | 0.029 | | | | 13,014 | |
| Subtotal Minas Conga/avg*. | | | 617,786 | | | | 0.019 | | | | 11,836 | | | | 617,786 | | | | 0.019 | | | | 11,836 | | | | 617,786 | | | | 0.019 | | | | 11,836 | |
| Total/average | | | 936,357 | | | | 0.023 | | | | 21,538 | | | | 925,069 | | | | 0.024 | | | | 22,362 | | | | 1,062,477 | | | | 0.023 | | | | 24,850 | |
| | | Proven and Probable Reserves at December 31, 2007 | | | Proven and Probable Reserves at December 31, 2006 | |
| | | Tonnage | | | Average Gold Grade | | | Ounces Contained | | | Tonnage | | | Average Gold Grade | | | Ounces Contained | |
| | | (thousands of DST) | | | (oz./DST) | | | (thousands of ounces) | | | (thousands of DST) | | | (oz./DST) | | | (thousands of ounces) | |
| Maqui Maqui | | | 7,206 | | | | 0.031 | | | | 225 | | | | 7,731 | | | | 0.026 | | | | 198 | |
| Carachugo | | | 83,782 | | | | 0.035 | | | | 2,931 | | | | 91,592 | | | | 0.035 | | | | 3,231 | |
| San José | | | 9,684 | | | | 0.017 | | | | 166 | | | | 9,067 | | | | 0.018 | | | | 160 | |
| Giuliana | | | 256 | | | | 0.024 | | | | 6 | | | | 1,560 | | | | 0.023 | | | | 36 | |
| Cerro Yanacocha | | | 165,376 | | | | 0.029 | | | | 4,781 | | | | 198,275 | | | | 0.026 | | | | 5,103 | |
| La Quinua | | | 88,824 | | | | 0.018 | | | | 1,609 | | | | 92,513 | | | | 0.018 | | | | 1,670 | |
| Tapado | | | 70,212 | | | | 0.033 | | | | 2,351 | | | | 73,681 | | | | 0.036 | | | | 2,661 | |
| Corimayo | | | 69,970 | | | | 0.035 | | | | 2,470 | | | | 63,053 | | | | 0.048 | | | | 3,019 | |
| In process | | | 42,908 | | | | 0.028 | | | | 1,219 | | | | 50,181 | | | | 0.028 | | | | 1,413 | |
| Subtotal Yanacocha/avg | | | 538,218 | | | | 0.029 | | | | 15,758 | | | | 587,653 | | | | 0.030 | | | | 17,491 | |
| Subtotal Minas Conga/avg | | | 617,786 | | | | 0.019 | | | | 11,836 | | | | 617,786 | | | | 0.019 | | | | 11,836 | |
| Total/average | | | 1,156,004 | | | | 0.024 | | | | 27,594 | | | | 1,205,439 | | | | 0.024 | | | | 29,327 | |
* Minas Conga’s proven and probable reserves as of December 31, 2010 include 3.23 billion pounds of 0.26 percent grade copper.
As of December 31, 2010, the Yanacocha district’s proven and probable reserves (excluding Conga’s proven and probable reserves) were estimated to be 9.7 million ounces of gold, a 7.8 percent decrease from the Yanacocha District’s proven and probable reserves as of December 31, 2009, which were estimated to be 10.5 million ounces of gold. The decrease in reserves of gold was mainly due to a mining depletion of 2.1 million ounces, unit cost increases, updated block models, revised pit designs, leach pad inventory adjustments, stockpile additions and leach pad capacity limitations, which was partially offset by an increase of 1.3 million ounces of gold reserves due to conversion from non-reserve mineralization to reserves in certain projects.
As of December 31, 2010, Conga’s proven and probable reserves were estimated to be 11.8 million ounces of gold and 3.2 billion pounds of copper, representing no change from the 2009 gold reserves and 2009 copper reserves, respectively
As of December 31, 2010, Yanacocha’s total proven and probable reserves (including Conga) were estimated to be 21.5 million ounces of gold, representing a 3.7 percent decrease over Yanacocha’s total proven and probable reserves as of December 31, 2009, which were estimated to be 22.4 million ounces of gold. Yanacocha’s total proven and probable reserves of copper were 3.2 billion pounds as of December 31, 2010, representing no change from Yanacocha’s total proven and probable reserves as of December 31, 2009. Newmont Mining did not quote silver reserves at Yanacocha for the year ended December 31, 2010.
Based on the current recovery rate and estimated gold production levels in 2010, Yanacocha’s proven and probable reserves as of December 31, 2010 will be depleted by 2015 unless Yanacocha continues to add to its reserves. Yanacocha’s management believes that its prospective land positions and mining concessions provide it with potential for future exploration and additions to its reserves.
ITEM 4A. Unresolved Staff Comments
None.
ITEM 5. Operating and Financial Review and Prospects
THE COMPANY
Introduction
The following discussion should be read in conjunction with the Financial Statements as of December 31, 2009 and 2010 and for the years ended December 31, 2008, 2009 and 2010 and the related notes thereto included elsewhere in this Annual Report. The Financial Statements are prepared and presented in accordance with Peruvian GAAP, which differ in certain respects from U.S. GAAP. Note 32 to the Financial Statements provides a description of the principal differences between Peruvian GAAP and U.S. GAAP, as such differences relate to us, and Note 33 to the Financial Statements provides a reconciliation to U.S. GAAP of our net income for the years ended December 31, 2008, 2009 and 2010 and shareholders’ equity as of December 31, 2008, 2009 and 2010. We present our financial statements in U.S. Dollars.
A. Operating Results
General
Overview. We were established in 1953 and are one of Peru’s leading producers of gold, silver and other metals. Our consolidated financial statements comprise all of our accounts and those of our subsidiaries, which include: (i) the Julcani, Recuperada, Uchucchacua, Orcopampa, Poracota, Antapite and Ishihuinca mining units; (ii) the Colquijirca, Marcapunta, Shila-Paula and La Zanja mines, which are owned through consolidated subsidiaries; (iii) Chaupiloma, which receives a royalty payment from Yanacocha; (iv) Condesa, which is mainly a holding company for investments in us, Yanacocha and other affiliated mining companies; (v) Conenhua, which is mainly engaged in the transmission of electric power to Yanacocha and other mining companies; (vi) Cerro Verde, which is an equity investee engaged in the exploitation and commercialization of copper; and (vii) other minor subsidiaries. During 2011, the construction of two major projects will take place through our subsidiaries: Coimolache (Tantahuatay project) and Huanza (Huanza hydroelectrical plant).
Yanacocha. A substantial part of our net income before income tax was derived from our equity interest in Yanacocha. We have a 43.65 percent equity participation in Yanacocha, which is held through our wholly-owned subsidiary, Condesa. Our interest in Yanacocha’s partnership’s equity is accounted for under the equity method and is included under the caption “Investment in associates” on our consolidated balance sheets. Although Yanacocha has no fixed dividend policy, there is an understanding among the partners that the net income not required for sustaining capital expenditures or future development projects should be distributed after agreement between the two major shareholders, Newmont Mining and us.
Cerro Verde. As of December 31, 2010 we had a 19.26 percent equity participation in Cerro Verde, which allows us to exercise significant influence over this company. As a result, we account for our investment in Cerro Verde using the equity method. Although Cerro Verde has no fixed dividend policy, there is an understanding that earnings not required for capital expenditures or future development projects are expected to be distributed.
Results of operations. The primary factors affecting our results of operations are (i) the amount of gold, silver, zinc and copper produced and sold by us; (ii) prevailing world market prices for gold, silver, zinc and copper; (iii) commercial terms with respect to the sale of ore concentrates; and (iv) our operating expenses.
Gold and silver price hedging. Our revenues and earnings are strongly influenced by world market prices for gold, silver, zinc and copper that fluctuate widely and over which we have no control. Depending upon the metal markets and other conditions, we may from time to time hedge our gold and silver sales in order to decrease our exposure to fluctuations in the prices of these metals. We are currently completely unhedged as to the price at which our gold and silver will be sold. As a result, we are fully exposed to the effects of changes in prevailing market prices of gold and silver.
During 2008, our indirect subsidiary, El Brocal, entered into price-hedging contracts (Asian swaps) to protect its future cash flows derived from sales. During 2010, El Brocal also entered into price-hedging option contracts at zero cost to protect future cash flows derived from sales. See “—Critical Accounting Policies—Fair value of derivative financial instruments – outstanding derivative contracts” for additional information.
Operating costs and expenses. Operating costs and expenses consist of (i) operating costs, which are direct production costs, the major component of operating expenses; (ii) exploration costs in operational mining sites; (iii) depreciation and amortization expenses; (iv) exploration costs in non-operational mining areas; (v) administrative expenses, which principally consist of personnel expenses; (vi) royalties, which consist of payments to third parties and the Peruvian government to operate leased mining rights; and (vii) selling expenses, which principally consist of freight expenses.
Reserves. We utilize geological mapping, projection of ore-bearing structures, diamond drilling, core logging and chemical assaying, in addition to drifting along previously indicated mineralization, to replace and grow reserves. In addition, we use metallurgical test-work of core and bulk samples as a follow-up activity to prove the amenability of any previously indicated mineralization to certain methods available on site. We continuously analyze this information with respect to tonnage, precious-metals average grades, metallurgical recoveries and economic value and allocate funds preferentially to those projects that have the best potential to sustain or enhance profitable mine production in the near-term. Our mining operations are primarily conducted underground and consist of deposits that are difficult to explore and measure in advance of mining and in which the value or prospects for ore based on geologic evidence exceeds the value based on proved reserves throughout most of the life of mines supported by them, or extramensurate deposits.
In addition, underground mine infrastructure, such as declines, shafts and/or dewatering/ore haulage crosscuts, that facilitate access to ore reserves are constructed and categorized as mine development. We consider such underground mine infrastructure vital to assure sustainable mine production and reserve production. The design, construction and implementation of our underground mine infrastructure are presented and supervised by our Operations Manager with the Board of Directors’ approval. We capitalize mine development and mineral land costs incurred after we have identified proven and probable reserves. Upon commencement of production, we amortize these costs over the expected life of the mining area, based on proven and probable reserves and other factors.
We believe that our replacement measures have been effective to increase reserves. Reserves at our Orcopampa mine, our principal gold mining operation, have increased steadily over the past five years. Gold reserves at the Orcopampa and Poracota mines have remained stable between 0.7 and 0.8 million ounces between the year ended December 31, 2006 and the year ended December 31, 2010. Silver reserves at the Uchucchacua mine, our principal silver mining operation, have decreased over the past five years, from 84.9 million ounces for the year ended December 31, 2006 to 62.2 million ounces for the year ended December 31, 2010.
Our other mining operations are smaller and have variable fluctuations in production and reserves due to complexities of the ore located in certain mining operations (such as the Colquijirca mine); the sale of certain mining operations (such as the Huallanca mine); partial and temporary closures of mining operations (such as the Shila-Paula and Recuperada mines); and the production of silver only as by-product of gold (such as the Orcopampa, Antapite and Shila-Paula mines).
Net income and net distributable income. Under Peruvian law, each company is required to establish a legal reserve of at least 20 percent of its paid-in capital on an unconsolidated basis. An annual contribution of at least 10 percent of net income must be made until such legal reserve equals 20 percent of paid-in capital. The legal reserve may offset losses or be capitalized. However, following any instance in which the reserve is used, Peruvian law calls for mandatory replenishment of the reserve.
Royalties. Royalty expenses consist mainly of payments made by us pursuant to lease agreements relating to mining rights for the Orcopampa and Ishihuinca mines. Specifically, we pay the applicable lessor a royalty of 10 percent of the value of the concentrates produced in the Orcopampa mine and 7 percent of the value of the concentrates produced in the Ishihuinca mine.
In addition, on June 24, 2004, the Peruvian Congress approved Law 28258 - Mining Royalties Law. This law established a mining royalty that owners of mining concessions must pay to the Peruvian government for the exploitation of metallic and non-metallic resources. The mining royalties are calculated on a sliding scale with rates ranging from one to three percent of the value of mineral concentrates based on international market prices. See “Item 4. Information on the Company—The Company—Business Overview—Regulatory Framework—Mining Royalties.”
Environmental protection laws and related regulations. Our business is subject to Peruvian laws and regulations relating to the exploration and mining of mineral properties, as well as the possible effects of such activities on the environment. We conduct our operations substantially in accordance with such laws and regulations.
According to environmental regulations set forth by the MEM, we submitted EVAPs for our operating mines in 1995. See “Item 4. Information on the Company—The Company—Business Overview—Regulatory Framework—Environmental Matters.” Based on the results of the EVAPs, PAMAs were prepared and submitted to the MEM in 1996 and approved by the MEM in 1997.
Pursuant to the environmental regulations, mines were given a five or ten-year period to comply with the agreements reflected in each PAMA. See “Item 4. Information on the Company—The Company—Business Overview—Regulatory Framework—Environmental Matters.” Upon completion of the project and agreement with regard to the financial investment, a final report of execution was submitted to the MEM and the MEM designated a group of independent companies, registered with the MEM, to conduct an audit of each PAMA. Thereafter, the MEM issued a resolution recognizing compliance with the relevant mine’s PAMA and completion of the adjustment process.
On July 6, 2004, the Peruvian Congress enacted Law No. 28271 - Ley que Regula los Pasivos Ambientales de la Actividad Minera (Law Governing the Environmental Liabilities of Mining Activities). This law regulates identification of potential environmental liabilities for mining activities and the means to remediate the affected areas. In order to comply with Law No. 28271, we are performing reviews in areas currently abandoned or inactive in which we previously carried out exploitation activities, in order to determine which remediation activities, if any, are necessary. In August 2006, we conducted and delivered an environmental liabilities inventory to the MEM for liabilities related to our former exploration activities. Subsequently, in December 2006 we presented the Environmental Liabilities Closure Plans for the MEM’s evaluation. See “Item 4. Information on the Company—The Company—Business Overview—Regulatory Framework—Environmental Matters.”
In May 2008, the Environmental Ministry of Peru was established by legislative decree. The principal functions of the Ministry include formulating and implementing policies and regulations relating to environmental matters and controlling pollution through supervision and education. Also, the Ministry has to be in continuous communication with several institutions (INRENA, DIGESA, IMARPE, DGAA, among others) and develop a decentralized system to manage natural resources and protect the environment.
In 2008, 2009 and 2010, we spent approximately US$7.18 million, US$9.0 million and US$9.0 million, respectively, in connection with environmental protection measures. We estimate that capital expenditures needed to comply with environmental regulations will be approximately US$12.0 million and US$12.0 million in 2011 and 2012, respectively. This amount will be used on items such as environmental monitoring, effluents treatment and environmental remediation. There are currently no legal or administrative proceedings against us for violation of environmental protection laws or other environmental regulations in Peru that could have a material adverse effect on our financial position or results of operations.
During 2009 and 2010, the Ministry of Energy and Mines approved our mine closure plans related to: (i) the following mining units: Julcani, Recuperada, Uchucchacua, Orcopampa, Antapite, Poracota and Ishihuinca; (ii) the following mining concessions with environmental mining liabilities: Hualchocopa, Lircay, Bella Unión-Pucaray, Chaquelle and Esperanza; and (iii) the following mining projects: Mallay, Angelica, Pozo Rico and Ancoyo. We have provided letters of credit for US$25.1 million to secure mine closure plans for the above-mentioned units.
Critical Accounting Policies and Estimates
The following is a discussion of our application of critical accounting policies that require our management, or Management, to make certain assumptions about matters that are highly uncertain at the time the accounting estimate is made, and where different estimates that Management reasonably could have used in the current period, or changes in the accounting estimate that are reasonably likely to occur from period to period, would have a material impact on our financial statements. Management has identified the following accounting estimates as critical:
| | ■ | Mineral reserves and resources; |
| | | Exploration and mine development costs; |
| | | Impairment of long-lived assets; |
| | | Deferred stripping costs; |
| | | Useful life of property, plant and equipment; |
| | | Amortization of capitalized mining costs; |
| | | Deferred income tax asset and recoverability; |
| | | Accrual for mine closing costs; |
| | | Fair value of derivative instruments; |
| | | Fair value of embedded derivative for concentrates sales; |
| | | Fair value of the liability related to long-term officer compensation; |
| | | Production start date; and |
We also have certain accounting policies that we consider to be important, such as our policies for investments carried at fair value, revenue recognition and exploration costs, that do not meet the definition of critical accounting estimates as they do not require Management to make estimates or judgments that are subjective or highly uncertain.
Management has discussed the development and selection of our critical accounting estimates with the Audit Committee of the Board of Directors.
Mineral reserves and resources
Recoverable proven and probable reserves are the part of a mineral deposit that can be economically and legally extracted or produced at the time of the reserve determination. The determination of reserves involves numerous uncertainties with respect to the ultimate geology of the ore bodies, including quantities, grades and recovery rates. Estimating the quantity and grade of reserves requires us to determine the size, shape and depth of our ore bodies by analyzing geological data, such as samplings of drill holes, tunnels and other underground workings. In addition to the geology of our mines, assumptions are required to determine the economic feasibility of mining these reserves, including estimates of future commodity prices and demand, the mining methods we use and the related costs incurred to develop and mine our reserves. Our estimates of recoverable proven and probable reserves are the responsibility of our employees and are audited by independent experts in mining, geology and reserve determination, such as Algon Investment S.R.L. for Buenaventura’s mining units and AMEC plc for El Brocal’s mining units.
Changes in estimated reserves could affect mainly the depreciation of fixed assets related directly to mining activity, the provision for mine closure, the assessment of the deferred asset’s recoverability and the amortization period for development costs.
Exploration and mine development costs
We review and evaluate our accounting policy regarding exploration and mine development costs, which requires judgment in determining whether it is likely that future exploitation will result in future economic benefits. The determination of reserves and mineral resources is a complex estimation that entails varying degrees of uncertainty depending on sub-classification, and these estimates directly impact the point of deferral of exploration and mine development costs. The deferral policy requires us to make certain estimates and assumptions about future events or circumstances—in particular, whether an economically viable extraction operation can be established. Estimates and assumptions made may change as new information becomes available. If, after the expenditure is capitalized, information becomes available suggesting that we are unlikely to recover the expenditure, the amount capitalized is written off in our profit and loss statement for the period in which the new information becomes available.
Impairment of long-lived assets
We assess at each reporting date whether there is an indication that an asset may be impaired. If any such indication exists, we estimate the asset’s recoverable amount. An asset’s recoverable amount is the higher of the asset’s fair value less costs to sell and its use value and is determined for an individual asset (cash-generating unit) unless the asset does not generate cash inflows that are clearly independent of those from other assets or groups of assets. These assessments require the use of estimates and assumptions such as long-term commodity prices, discount rates, operating costs, and others.
A cash-generating unit is the smallest identifiable group of assets, denominated a mining unit, that generates cash inflows from continuing use that are independent of the cash inflow generated by other assets or groups of assets. In order to determine cash-generating units, we have determined whether there is an active market for the minerals and metals produced by a mining unit.
When the carrying amount of an asset or of a cash-generating unit exceeds its recoverable amount, the asset is considered impaired and is written down to its recoverable amount. In assessing use value, the estimated future cash flows are discounted to their present value using a discount rate that reflects current market assessments of the time value of money and the risks specific to the asset.
Impairment losses are recognized in the statement of income in those expense categories consistent with the function of the impaired asset. A previously recognized impairment loss is reversed only if there has been a change in the estimates used to determine the asset’s recoverable amount since the last impairment loss was recognized. The increased amount cannot exceed the carrying amount that would have been determined, net of depreciation, had no impairment loss been recognized for the asset in prior years. Such reversal is recognized in the consolidated statement of income.
Future cash flow assumptions include, but are not limited to, estimates of recoverable ounces and tons of ore and metal, prices (which include current and historical prices, price trends and related factors), production levels and capital costs, all based on mine plans. Such future cash flow assumptions are valid when estimated but may change significantly when new information becomes available. Any difference between assumptions and actual market conditions could have an important effect on our financial condition and results of the operations.
During the fourth quarter of 2009, we updated our assessment of the recoverability of the book value of our long-term assets under the procedures established by IAS 36 – “Impairment of Assets” for five of our mining units (Recuperada, Poracota, Antapite, Julcani and Ishihuinca) and concluded that, as of December 31, 2009, there had not been significant changes in determining the amount recoverable compared with the book value of the cash-generating units. The estimated cash flows used to assess recoverability of our long-lived assets and measure the carrying value of our mining operations were derived from current business plans using near-term price forecasts reflective of the current environment and Management’s projections for long-term average metal prices and operating costs.
Our evaluation of long-lived assets resulted in the recognition of asset impairment charges of, US$3.3 million for 2009 (recognized as operating expense). These impairment charges had no impact on our operating cash flows.
During the fourth quarter of 2010, we updated our assessment of the recoverability of the book value of our long-term assets and reversed the impairment of the Antapite, Recuperada and Poracota mining units as of December 31, 2010 following positive changes in the assumptions used to calculate the impairment provision recorded in order to determine the recovery carrying amount of our long-lived assets. The impairment reversed as of December 31, 2010 amounted to US$16.2 million, with US$8.7 million recorded as “Mining concessions and property, plant and equipment” and US$7.6 million recorded as “Development costs.” See Notes 9, 10 and 11 to the Financial Statements.
Assessing the impairment of long-lived assets involves comparing their respective carrying amounts with their recoverable values. The recoverable value of an asset is the greater of its fair value less the cost of sale or its value in use.
In 2010, we recorded an impairment of our long-lived assets provision in connection with the Shila-Paula mining unit in the amount of US$3.1 million, with US$1.3 million recorded as “Mining concessions and property, plant and equipment” and US$1.8 million recorded as “Development costs.” The recoverable amount used in assessing the Shila-Paula cash generating unit is the fair value of its assets less the associated cost of sale. According to Management, the market value of the assets, discounting cost of sale, is US$4.7 million.
The recoverable value used in assessing the Poracota, Antapite and Recuperada units is their value in use. We estimated the use value of their long-lived assets using a discounted cash flow model. Cash flow was projected for the useful life of the mining units based on Management’s expectations. This useful life depends on several variables, including the mineral reserves of each unit.
Our asset impairment evaluations required us to make several assumptions in the discounted cash flow valuation of (i) our individual mining operations, including near and long-term metal price assumptions, production volumes, estimates of commodity-based and other input costs and (ii) proven and probable reserve estimates, including any costs to develop the reserves and the timing of producing the reserves, as well as the appropriate discount rate. Our December 31, 2008, 2009 and 2010 impairment evaluation was based on price assumptions reflecting prevailing metals prices for the following four years.
We believe events that could result in additional impairment of our long-lived assets include, but are not limited to, (i) decreases in future metal prices, (ii) decreases in estimated recoverable proven and probable reserves and (iii) any event that might otherwise have a material effect on mine site production levels or costs.
Deferred stripping cost
Stripping costs incurred in the development of a mine before production commences are capitalized as part of the cost of constructing the mine and subsequently amortized over the life of the mine on a units-of-production basis.
Where a mine operates several open pits that are regarded as separate operations for the purpose of mine planning, stripping costs are accounted for separately by reference to the ore from each separate pit. If, however, the pits are highly integrated for the purpose of the mine planning, the second and subsequent pits are regarded as extensions of the first pit in accounting for stripping costs. In such cases, the initial stripping (i.e., overburden and other waste removal) of the second and subsequent pits is considered to be production-phase stripping relating to the combined operation.
Stripping costs incurred subsequently during the production phase of a mine’s operation are deferred for those operations where this is the most appropriate basis for matching the cost against the related economic benefits and the effect is material. This is generally the case where there are fluctuations in stripping costs over the life of the mine. The amount of stripping costs deferred is based on the strip ratio obtained by dividing the tonnage of waste mined by the quantity of ore mined. Stripping costs incurred in the period are deferred to the extent that the current period ratio exceeds the life of the strip ratio. Such deferred costs are then charged to profit or loss to the extent that, in subsequent periods, the current period ratios falls short of the life of mine (or pit) ratio. The life of mine (or pit) ratio is based on economically recoverable reserves of the mine (or pit). Changes are accounted for prospectively, from the date of the change.
Useful life of property, plant and equipment
Depreciation is calculated under the straight-line method of accounting. The table set forth below reflects the estimated years of useful life for property, plant and equipment, based on current production levels and market prices:
| Property, Plant and Equipment | | Estimated Years of Useful Life |
| | | |
| Buildings, constructions and other | | 6 to 20 |
| Machinery and other equipment | | 4 to 10 |
Certain of our depreciable assets, primarily buildings and constructions, have a useful life in excess of the current productive life of the mines because such assets may be transferred to another mine or converted to another use when production at the mine where it is currently used ceases. In addition, the expected productive life of the mine is normally higher than the current life derived from the proven and probable reserves at year-end. Rather than exploring long-term reserves, we focus on sustaining current reserves.
Amortization of capitalized mining costs
We capitalize mine infrastructure and mineral land costs incurred after Management has identified proven and probable reserves. Upon commencement of production, we amortize these costs over their expected lives, based on proven and probable reserves and other factors.
The process of estimating quantities of reserves is complex, requiring subjective decisions in the evaluation of all available geological, geophysical, engineering and economic data. The data for a given ore body may also change substantially over time as a result of numerous factors, including, but not limited to, additional exploration and construction activity, evolving production history and the continual reassessment of the viability of production under various economic conditions.
A material revision to existing reserve estimates could occur because of, among other things: revisions to geological data or assumptions; changes in assumed prices; and results of drilling and exploration activities. We make every effort to ensure that reported reserve estimates represent the most accurate assessment possible. However, because of the subjective decisions Management has to make, as well as variances in available data for each ore body, these estimates are generally uncertain.
Changes in reserve quantities, including changes resulting from gold, silver, zinc, lead and copper price assumptions, would cause corresponding changes in amortization expense in periods subsequent to the revision, and could result in impairment of the carrying amount of property, plant and equipment and capitalized mining costs.
We estimate reserves for our direct operations assuming a US$950 per ounce gold price, a US$16.00 per ounce silver price and US$2,032 per metric ton zinc price.
The mines where amortization charges would be most significantly affected by changes in reserve estimates are Uchucchacua, Orcopampa, Colquijirca, Poracota, La Zanja and Antapite. These mines generally have the largest amounts of property, plant and equipment subject to depreciation and the highest per ounce amortization charges.
Deferred income tax asset and recoverability
Effective Income Tax Rate – 2010 and 2009
In preparing our annual consolidated financial statements, we estimate the actual amount of taxes currently payable or receivable as well as deferred tax assets and liabilities attributable to temporary differences between the tax and book bases of assets and liabilities. Deferred income tax assets and liabilities are measured using tax rates applicable to taxable income in the years in which these temporary differences are expected to be recovered or settled. The effect on deferred tax assets and liabilities of a change in tax rates and laws is recognized in income in the period in which such changes are enacted.
All deductible temporary differences and loss carry-forwards generate the recognition of deferred assets to the extent that it is probable that they can be used in calculating taxable income in future years. Deferred income tax and workers’ profit sharing liabilities are recognized for all deductible temporary differences and tax loss carry-forwards, to the extent that it is probable that taxable profit will be available against which the deductible temporary differences and unused tax losses can be utilized. The carrying amount of the deferred income tax and workers’ profit sharing assets is reviewed at each consolidated balance sheet date and reduced to the extent that it is no longer probable that sufficient taxable profit will be available to allow all or part of the deferred asset to be utilized. Unrecognized deferred assets are reassessed at each consolidated balance sheet date.
Deferred assets and liabilities are offset if there is a legal right to set them off and the taxes deferred relate to the same entity and the same tax authority.
Deferred tax assets, including those resulting from unused tax losses, require that we assess the probability that we would generate taxable earnings in future periods to apply the deferred tax assets. Estimated future taxable income is based on projections of cash flow from operations and application of the tax law existing in each jurisdiction. To the extent that actual future cash flows and taxable income differ significantly from those estimated, our ability to realize the deferred tax assets posted as of the reporting date may be affected.
In addition, future changes in the tax law in jurisdictions where we operate could limit our ability to obtain tax deductions in future periods.
At December 31, 2010 and 2009 our valuation allowance totaled US$3.1 million and US$3.6 million, respectively.
Inventories
Net realizable value tests are performed at least annually and represent the estimated future sales price of the product based on prevailing spot metals prices at the reporting date, less estimated costs to complete production and bring the product to sale.
Accrual for mine closing costs
We record a provision for mine closure when a legally enforceable obligation arises, which is independent of the full depletion of the mine reserves. Once such an obligation has been appropriately measured, it is recorded by creating a liability equal to the amount of the obligation and recording a corresponding increase to the carrying amount of the related long-lived asset (mine development cost and property, plant and equipment). Over time, the amount of the obligation changes, impacting recording and accretion expenses. Additionally, the capitalized cost is depreciated and/or amortized based on the useful lives of the related assets.
Any difference in the settlement of the liability will be recorded in the results of the period in which such settlement occurs. The changes in the fair value of an obligation or the useful life of the related assets that occur from the revision of the initial estimates should be recorded as an increase or decrease in the book value of the obligation and related asset.
Following our accounting treatment, we have recorded an accrual for mine closure costs of US$77.4 million as of December 31, 2010 in order to comply with governmental requirements for environmental remediation.
We assess our provision for closure of mining units annually. It is necessary to make significant estimates and assumptions in determining this provision because there are a number of factors that will affect the ultimate liability for this obligation. These factors include estimating the scope and costs of closing activities, technological changes, regulatory changes, increases in costs compared to inflation rates and changes in the discount rates. Such estimates or assumptions may result in actual expenses in the future that differ from the amounts provisioned at the time the provisions were established. The provision at the date of this report presents our best estimate of the present value of future costs for the closure of mining units.
Fair value of derivative financial instruments
(a) Outstanding derivative contracts
We recognize derivative instruments as assets or liabilities, measured at their fair value, in our consolidated balance sheets pursuant to IAS 39, “Financial Instruments — Recognition and Measurement.”
Subsidiary derivative contracts. During 2008, our indirect subsidiary, El Brocal, entered into price-hedging transaction contracts to cover future cash flows derived from its sales. Derivative contracts are recognized as assets and liabilities at fair value in the consolidated financial statements. El Brocal applies hedge accounting for those transactions that meet the specific criteria applicable in accordance with IAS-39. The key terms of these hedge agreements were negotiated to coincide with the negotiated terms of the commercial contracts to which they are related. The hedge of cash flow from future sales was assessed by El Brocal’s management as highly effective. The effectiveness of hedging transactions has been measured by means of the cumulative cash flow change offset method, which El Brocal management believes best reflects the objective of managing price risk. In 2010, El Brocal entered into price-hedging option contracts at zero cost to protect future cash flows derived from sales in 2011 and 2012.
The critical terms of hedging transactions have been negotiated with the brokers so as to agree with the terms negotiated in the related commercial contracts. These hedging options establish a maximum and a minimum price. When the average price for the quotation period is above the maximum price established, the purchase option in favor of the counterparty is activated, generating a payment to El Brocal of the difference between the two prices. On the other hand, when the average price for the quotation period is below the minimum price established, the sale option in favor of El Brocal is activated, resulting in receipt of the difference between the two prices.
Our derivative contracts. During 2007, we held gold put option contracts, which grant us the right to sell 17,500 ounces of gold at an average price of US$345 per ounce, depending on certain market conditions. These contracts were cancelled during April 2008 against a total payment in our favor of US$500.00.
As of December 31, 2009 and 2010 we did not hold gold derivative contracts.
(b) Embedded derivative due to changes of the prices in commercial contracts
Substantially all of our concentrate sales contracts provide final copper pricing in a specified period (generally one to four months from the shipment date) based on quoted LME prices. We ultimately receive market prices based on prices in the specified future period; however, the accounting rules applied to these sales result in changes recorded as revenue until the specified future period. We record revenues and invoice customers at the time of shipment based on the current LME prices, which result in an embedded derivative on our provisional priced concentrate sales that are adjusted to fair value through earnings of each period until the date of final pricing. To the extent final prices are higher or lower than what was recorded on a provisional basis, an increase or decrease to revenues is recorded each reporting period until the date of final pricing. See Notes 17 and 27 to the Financial Statements.
Fair value of the liability related to long-term officer compensation
Our senior executive officers are granted share appreciation rights, which can only be settled in cash, if the executive is working for us at each program’s settlement date. These programs are mainly structured in a ten-year term, allocated in several programs with progressive maturities. The average price of the granted share appreciation rights is assigned based on last quarter market quotation of the shares before the grant date and the settlement price is determined based on the variation of the market prices at the maturity date as compared to the price at the date of the grant.
We used the Turnbull & Wakeman Method to estimate the fair value of this liability and the principal assumptions made are as follows: the historical volatility, risk-free interest rate, dividend yield, period covered by the program and market value of the shares at closing. See Note 13(c) to the Financial Statements.
Contingencies
Contingent liabilities, when identified, are assessed as either remote, possible or probable. Contingent liabilities are recorded in the consolidated financial statements when it is probable that future events will confirm them and when their amount can be reasonably estimated. Contingent liabilities deemed as possible are only disclosed, together with a possible debit range, when determinable, in notes to the Financial Statements.
Contingent assets are not recognized in the financial statements; however, they may be disclosed in notes to the financial statements if it is probable that such contingent assets will be realized. See Note 30 to the Financial Statements.
Determining contingencies inherently involves the exercise of judgment and calculation of the estimated results of future events.
Production start date
We assess the stage of each mine under development to determine when a mine moves into the production stage. The criteria used to assess the start date are determined based on the nature of each mining project, the complexity of a plant and its location. We consider different relevant criteria for assessing when the mine is substantially complete and ready for its planned use. Some of these criteria are the level of capital expenditure compared to development cost estimates, a reasonable testing period for the mine’s plant and equipment and the ability to produce and sell the metal.
When a mine development project moves into the production stage, the capitalization of certain costs ceases, and they are considered as inventory or expenses, except for costs that qualify for capitalization. It is also at this point that depreciation or amortization commences.
Revenues
According to our accounting policies, revenue is recognized to the extent that it is probable that the economic benefits will flow to us. Revenue is measured at the fair value of the consideration received, excluding discounts and other sales taxes or duty.
Revenues from sales of concentrates, gold and silver are recognized when the significant risks and rewards of ownership have been transferred, which is considered to occur when title passes to the customer. This generally occurs when product is physically transferred to the buyer.
Results of Operations for the Years Ended December 31, 2010 and 2009
Net sales. Net sales increased by 28 percent, from US$819.4 million in 2009 to US$1,047.9 million in 2010, principally due to an increase in the average realized price of gold, silver and zinc in 2010, partially offset by a decrease in the volume of zinc, silver and lead sold during 2010, which was mainly due to lower production of zinc in Colquijirca as a result of the combined effect of lower ore grades. The following tables reflect the average realized price and volume sold of gold, silver, lead, zinc and copper during the years ended December 31, 2009 and 2010:
| | | | Year ended December 31, | | | | |
Average Realized Price | | | 2009 | | | | 2010 | | | Variation | |
| | | | | | | | | | | | |
| Gold (US$/oz.) | | | US$ | 988.32 | | | | US$ | 1,253.35 | | | | 27 | % |
| Silver (US$/oz.) | | | | 15.52 | | | | | 20.86 | | | | 34 | % |
| Lead (US$/MT) | | | | 1,926.41 | | | | | 2,106.41 | | | | 9.34 | % |
| Zinc (US$/MT) | | | | 1,757.17 | | | | | 2,135.57 | | | | 22 | % |
| Copper (US$/MT) | | | | 5,640.54 | | | | | 8,113.56 | | | | 44 | % |
| | | Year ended December 31, | | | | |
Volume Sold | | 2009 | | | 2010 | | | Variation | |
| | | | | | | | | | |
| Gold (oz.) | | | 419,222 | | | | 461,817 | | | | 10 | % |
| Silver (oz.) | | | 15,208,726 | | | | 13,176,383 | | | | (13 | )% |
| Lead (MT) | | | 30,214 | | | | 22,970 | | | | (24 | )% |
| Zinc (MT) | | | 64,198 | | | | 43,562 | | | | (32 | )% |
| Copper (MT) | | | 7,677 | | | | 15,946 | | | | 108 | % |
(a) Gold sales. The average sales price for gold increased from US$988.32 per ounce in 2009 to US$1,253.35 per ounce in 2010. Gold sales volume increased from 419,222 ounces in 2009 to 461,817 ounces in 2010. The combined effect of these changes resulted in a US$164.5 million increase in income from sales of gold in 2010 compared to 2009.
(b) Silver sales. Average realized silver prices increased from US$15.52 per ounce in 2009 to US$20.86 per ounce in 2010. The volume of silver sales decreased from 15,208,726 ounces in 2009 to 13,176,383 ounces in 2010. The combined effect of these changes resulted in a US$38.9 million increase in income from sales of silver in 2010 compared to 2009.
(c) Lead sales. Average realized lead prices increased from US$1,926.41 per metric ton in 2009 to US$2,106.41 per metric ton in 2010. Additionally, the volume of lead sold decreased from 30,214 metric tons in 2009 to 22,970 metric tons in 2010. The combined effect of these changes resulted in a US$9.8 million decrease in income from sales of lead in 2010 compared to 2009. This decrease was largely due to decreased lead production at our Colquijirca and Uchucchacua mines. Production at the Conquijirca mine decreased as a result of our decision to significantly reduce the production and sale of lead and zinc concentrate during the last quarter of 2010 in order to reserve our treatment and production capacity for use in our copper concentrate process.
(d) Zinc sales. Average realized zinc prices increased from US$1,757.17 per metric ton in 2009 to US$2,135.57 per metric ton in 2010. The volume of zinc sold decreased from 64,198 metric tons in 2009 to 43,562 metric tons in 2010. The combined effect of these changes resulted in a US$19.8 million decrease in income from sales of zinc in 2010 compared to 2009. This decrease was largely due to decreased zinc production at our Colquijirca mine, which resulted from our decision to significantly reduce the production and sale of lead and zinc concentrate during the last quarter of 2010 in order to reserve our treatment and production capacity for use in our copper concentrate process.
(e) Copper sales. Average copper prices increased from US$5,640.54 per metric ton in 2009 to US$8,113.56 per metric ton in 2010. The volume of copper sold increased from 7,677 metric tons in 2009 to 15,946 metric tons in 2010. The combined effect of these changes resulted in a US$86.1 million increase in income from sales of copper in 2010 compared to 2009. The increase was largely due to increased copper production at our Colquijirca mine, which resulted from our decision to significantly reduce the production and sale of lead and zinc concentrate during the last quarter of 2010 in order to reserve our treatment and production capacity for use in our copper concentrate process.
The revenues from gold, silver, lead, zinc and copper mentioned above do not include refinery charges and penalties incurred, which amounted to US$112.3 million in 2010, compared to US$93.6 million in 2009.
Royalty income. In 2010, royalty income received by Chaupiloma amounted to US$55.9 million, representing an 11 percent decrease from the US$62.1 million of royalty income received in 2009. This decrease is attributed to decreased sales by Yanacocha in 2010, partially offset by an increase in the average realized price of gold. See Note 31 to the Financial Statements. Yanacocha pays Chaupiloma, in which we directly and indirectly hold a 60 percent interest, a royalty equal to 3 percent of Yanacocha’s net sales.
Total operating costs. Total operating costs increased by 19 percent, from US$422.5 million in 2009 to US$504.0 million in 2010, due to the following:
(a) Cost of sales, without considering depreciation and amortization, increased by 22 percent, from US$280.3 million in 2009 to US$340.8 million in 2010. This increase was mainly due to: (i) an increase in contractor expenses due to higher productivity bonuses, (ii) an increase in labor costs due to the appreciation of the Peruvian Nuevo Sol and higher negotiation bonuses (iii) increased consumption of supplies and (iv) costs incurred in connection with commencing operations at La Zanja.
(b) Exploration in units in operation increased by 33 percent, from US$68.7 million in 2009 to US$91.4 million in 2010. These increased costs were principally due to an increase in exploration projects at our Orcopampa, Poracota, Shila-Paula and Uchucchacua mines. See Note 19 to the Financial Statements.
(c) Depreciation and amortization costs decreased by 2 percent, from US$73.5 million in 2009 to US$71.7 million in 2010, mainly due to the combined effect of decreased depreciation due to the change in useful life of the long-lived assets in the Colquijirca mining unit and increased depreciation of assets put into operation in 2010 at the La Zanja mining unit.
Total operating expenses. Operating expenses decreased by 6 percent, from US$171.8 million in 2009 to US$162.2 million in 2010, due to changes in the following components:
(a) Administrative expenses increased by 4 percent, from US$88.8 million in 2009 to US$92.6 million in 2010, mainly due to increased expenses relating to long-term compensation of our officers (stock appreciation rights). See Note 20 to the Financial Statements.
(b) Royalty expenses to third parties and the Peruvian government increased by 32 percent, from US$39.6 million in 2009 to US$52.3 million in 2010. Royalties paid to third parties amounted to US$21.2 million and US$27.7 million in 2009 and 2010, respectively. Royalties paid to the Peruvian government amounted to US$18.4 million and US$24.6 million in 2009 and 2010, respectively. The increase in royalties paid to third parties was mainly due to increased sales of gold produced at our Orcopampa mine. The increase in royalties paid to the Peruvian government was mainly due to an increase in sales of ore conentrates. Peruvian legislation requires owners of mining concessions to pay the Peruvian government for the exploitation of metallic and non-metallic resources. Mining royalties are calculated with rates ranging from 1 to 3 percent of the value of mineral concentrates or equivalent, according to the quoted market price published by the Ministry of Energy and Mines.
(c) Exploration in non-operational areas increased by 20 percent, from US$30.0 million in 2009 to US$36.1 million in 2010 due to new expenditures in our exploration areas, primarily in San Gregorio. See Note 22 to the Financial Statements.
(d) Reimbursement of exploration expenses on projects. We received reimbursement of US$15.0 million of exploration expenses from Compañía Minera Coimolache in connection with their approval of the production stage of the development program and financial support for the Tantahuatay project. The total budget for this project is estimated at US$110 million, with the project to be financed 30 percent by shareholders’ equity and 70 percent by loans from shareholders. We recognized as income the exploration expenses recorded as of December 31, 2009 and included them as accounts receivable under recovery of exploration expenses on projects.
(e) Reversal (provision) for impairment of long-lived assets resulted in a net recovery of US13.1 million being recorded in 2010. We updated our assessment of the recoverability of the book value of our long-lived assets and reversed the impairment of the Antapite, Recuperada and Poracota mining units as of December 31, 2010 following positive changes in the assumptions used to calculate the impairment provision recorded in order to determine the recovery carrying amount of our long-lived assets. The impairment reversed as of December 31, 2010 amounted to US$16.2 million, with US$8.6 million recorded as “Mining concessions and property, plant and equipment” and US$7.6 million recorded as “Development costs.” We also recorded an impairment of our long-lived assets from the Shila-Paula mining unit in the amount of US$3.1 million, with US$1.3 million recorded as “Mining concessions and property, plant and equipment” and US$1.8 million recorded as “Development costs.” See Note 11 to the Financial Statements.
Operating income before unusual item. As a result of the foregoing, operating income before unusual items increased by 52 percent, from US$287.2 million in 2009 to US$437.6 million in 2010.
Share in the results of related parties by equity method. Income from equity investments in related parties decreased by 5 percent, from US$451.3 million in 2009 to US$428.7 million in 2010, principally due to the decrease in earnings by Yanacocha, partially offset by increased earnings by Cerro Verde. Income from our interest in Yanacocha decreased by 18.83 percent, from US$316.2 million in 2009 to US$256.6 million in 2010. This decrease is attributed to decreased sales by Yanacocha in 2009, which resulted from a decrease in gold volume sold, partially offset by an increase in the average realized price of gold.
Workers’ profit sharing. Workers’ profit sharing expense increased from US$12.6 million in 2009 to US$28.7 million in 2010 as a result of an increase in our taxable income. Workers’ profit sharing is calculated by applying a percentage to our taxable income.
Income tax. Provision for income tax increased from US$64.3 million in 2009 to US$116.3 million in 2010, principally due to a:
| | (a) | US$138.9 million increase in pre-tax income, from US$733.5 million in 2009 to US$872.4 million in 2010, mainly due to an increase in the average price of gold during 2010; and |
| | (b) | US$28.1 million in deductible income from the recovery of exploration expenses on projects and reversal for impairment of long-lived assets. |
Minority interest. Minority interest expense increased by 2 percent, from US$63.0 million in 2009 to US$64.4 million in 2010, mainly due to an increase in contributions from El Brocal.
Net income. As a result of the foregoing, net income increased by 12 percent, from US$593.6 million in 2009 to US$662.9 million in 2010. As a percentage of net sales, net income was 63 percent in 2010 as compared to 72 percent in 2009.
Results of Operations for the Years Ended December 31, 2009 and 2008
Net sales. Net sales increased by 6.89 percent, from US$766.6 million in 2008 to US$819.4 million in 2009, principally due to an increase in the average realized price of gold, silver and lead in 2009, partially offset by a decrease in the volume of zinc, lead and silver sold during 2009, which was mainly due to lower production of zinc in Colquijirca as result of the combined effect of lower ore grades. The following tables reflect the average realized price and volume sold of gold, silver, lead, zinc and copper during the years ended December 31, 2008 and 2009:
| Average Realized Price | | Year ended December 31, | | | | |
| | | 2008 | | | 2009 | | | Variation | |
| | | | | | | | | | |
| Gold (US$/oz.) | | US$ | 872.21 | | | US$ | 988.32 | | | | 13 | % |
| Silver (US$/oz.) | | | 14.26 | | | | 15.52 | | | | 9 | % |
| Lead (US$/MT) | | | 1,858.59 | | | | 1,926.41 | | | | 4 | % |
| Zinc (US$/MT) | | | 1,798.20 | | | | 1,757.17 | | | | -2 | % |
| Copper (US$/MT) | | | 5,771.34 | | | | 5,640.54 | | | | -2 | % |
| Volume Sold | | Year ended December 31, | | | | |
| | | 2008 | | | 2009 | | | Variation | |
| | | | | | | | | | |
| Gold (oz.) | | | 414,682 | | | | 419,222 | | | | 1 | % |
| Silver (oz.) | | | 16,514,171 | | | | 15,208,726 | | | | -8 | % |
| Lead (MT) | | | 37,853 | | | | 30,214 | | | | -20 | % |
| Zinc (MT) | | | 82,501 | | | | 64,198 | | | | -22 | % |
| Copper (MT) | | | 7,763 | | | | 7,677 | | | | -1 | % |
(a) Gold sales. The average sales price for gold increased from US$872.21 per ounce in 2008 to US$988.32 per ounce in 2009. Gold sales volume increased from 414,682 ounces in 2008 to 419,222 ounces in 2009. These changes resulted in a US$52.6 million increase in income from sales of gold in 2009 compared to 2008.
(b) Silver sales. Average realized silver prices increased from US$14.26 per ounce in 2008 to US$15.52 per ounce in 2009. The volume of silver sales decreased from 16,514,171 ounces in 2008 to 15,208,726 ounces in 2009. The combined effect of these changes resulted in a US$0.4 million increase in income from sales of silver in 2009 compared to 2008.
(c) Lead sales. Average realized lead prices increased from US$1,858.59 per metric ton in 2008 to US$1,926.41 per metric ton in 2009. Additionally, the volume of lead sold decreased from 37,853 metric tons in 2008 to 30,214 metric tons in 2009. The combined effect of these changes resulted in a US$12.1 million decrease in income from sales of lead in 2009 compared to 2008. This decrease was largely due to decreased lead production at our Colquijirca and Uchucchacua mines.
(d) Zinc sales. Average realized zinc prices decreased from US$1,798.20 per metric ton in 2008 to US$1,757.17 per metric ton in 2009. The volume of zinc sold decreased from 82,501 metric tons in 2008 to 64,198 metric tons in 2009. These changes resulted in a US$35.5 million decrease in income from sales of zinc in 2009 compared to 2008. This decrease was largely due to decreased zinc production at our Colquijirca mine.
(e) Copper sales. Average copper prices decreased from US$5,771.34 per metric ton in 2008 to US$5,640.54 per metric ton in 2009. The volume of copper sold decreased from 7,763 metric tons in 2008 to 7,677 metric tons in 2009. These changes resulted in a US$1.5 million decrease in income from sales of copper in 2009 compared to 2008. This decrease was largely due to decreased copper production at our Colquijirca mine.
The revenues from gold, silver, lead, zinc and copper mentioned above do not include refinery charges and penalties incurred, which amounted to US$97.4 million in 2009, compared to US$133.5 million in 2008. This decrease was principally due to the lower volume of concentrates sold in 2009 compared to 2008.
Royalty income. In 2009, royalty income received by Chaupiloma amounted to US$62.1 million, representing a 27.3 percent increase from the US$48.8 million of royalty income received in 2008. This increase is attributed to increased sales by Yanacocha in 2009, which resulted from an increase in gold production and the average realized price. See Note 31 to the Financial Statements.
Total operating costs. Total operating costs increased by 13.6 percent, from US$371.8 million in 2008 to US$422.5 million in 2009, due to the following:
(a) Cost of sales, without considering depreciation and amortization, increased by 11.3 percent, from US$251.8 million in 2008 to US$280.3 million in 2009, mainly due a US$25.4 million increase as a result of an increase in services provided by third parties and a decrease in other production expenses. The increased expense due to services provided by third parties and other production expenses was mainly due to higher contractor expenses resulting from: (i) an increase in the cost of services rendered in our Uchucchacua mining unit of US$10.4 million mainly due to an increase in exploration activities and diamond drilling works in order to maintain our ore reserves level, (ii) an increase in the cost of services of US$8.6 million related to the re-treatment of old tailings at our Orcopampa mining unit, and (iii) an increase in the cost of services rendered in our Poracota mining unit of US$7.9 million mainly due to the increase in operating works relating to the increase in ore production during 2009.
(b) Exploration in units in operation increased by 20.5 percent, from US$57.0 million in 2008 to US$68.7 million in 2009. These increased costs were principally due to an increase in exploration projects at our Orcopampa, Poracota and Uchucchacua mines. See Note 19 to the Financial Statements.
(c) Depreciation and amortization costs increased by 16.7 percent, from US$63.0 million in 2008 to US$73.5 million in 2009, mainly due to higher charges for amortization of development costs related to our Orcopampa and Uchucchacua mines, and the depreciation of assets put into operation during 2009.
Total operating expenses. Operating expenses increased by 7.5 percent, from US$159.8 million in 2008 to US$171.8 million in 2009, due to changes in the following components:
(a) Exploration in non-operational areas decreased by 45.7 percent, from US$55.2 million in 2008 to US$30.0 million in 2009 due to lower expenditures in exploration areas, primarily in the Marcapunta, El Milagro and La Llave projects. See Note 22 to the Financial Statements.
(b) General and administrative expenses increased by 154.4 percent, from US$34.9 million in 2008 to US$88.8 million in 2009, mainly due to increased expenses relating to long-term officers’ compensation (stock appreciation rights). See Note 20 to the Financial Statements.
(c) Royalty expenses to third parties and the Peruvian government increased by 10.9 percent, from US$35.7 million in 2008 to US$39.6 million in 2009. Royalties paid to third parties amounted to US$18.8 million and US$21.1 million in 2008 and 2009, respectively. Royalties paid to the Peruvian government amounted to US$16.9 million and US$18.5 million in 2008 and 2009, respectively. The increase in royalties paid to third parties was mainly due to increased sales of gold produced at our Orcopampa mine. The increase in royalties paid to the Peruvian government was mainly due to the increase in sales of ore concentrates. Peruvian legislation requires owners of mining concessions to pay the Peruvian government for the exploitation of metallic and non-metallic resources. Mining royalties are calculated with rates ranging from 1 to 3 percent of the value of mineral concentrates or equivalent, according to the quoted market price published by the Ministry of Energy and Mines.
(d) Selling expenses decreased by 35.1 percent, from US$15.4 million in 2008 to US$10.0 million in 2009, due mainly to the decreased volume of minerals sold during 2009.
(e) Impairment of long-lived assets resulted in a loss of US$3.3 million being recorded in 2009. We evaluated our long-lived assets for impairment as of December 31, 2009, which resulted in a reduction in the carrying amount of mining concessions, property, plant and equipment and development costs to their recoverable amount. See Note 11 to the Financial Statements.
Operating income before unusual item. As a result of the foregoing, operating income before unusual items increased by 1.2 percent, from US$283.7 million in 2008 to US$287.2 million in 2009.
Net loss from release of commitments in commercial contracts. In January and February of 2008, we revised sales contracts with some customers, releasing the commitments on sales contracts to be able to sell the committed gold ounces at market prices in force between 2010 and 2012, in accordance with our gold availability. As a consequence, we were released from the obligation to sell 922,000 ounces of gold at fixed prices, varying between US$345 and US$451 per ounce of gold, and will instead sell the gold at the market price in force on the date of the physical delivery of the gold committed. For these transactions, we made a payment of US$517.1 million (US$82.6 million in January 2008 and US$434.6 million in February 2008, respectively) and recorded a decrease in the liability corresponding to the executory gold delivery contracts liability amounting to US$102.0 million with credit to income of the period. The resulting net loss of US$415.1 million is presented in the Net loss from release of commitments in sales contracts caption in the consolidated statements of income for the period ended December 31, 2008.
Share in the results of related parties by equity method. Income from equity investments in related parties increased by 32.4 percent, from US$340.9 million in 2008 to US$451.3 million in 2009, principally due to the increase in income from our equity investments in Yanacocha and Cerro Verde.
Income from our interest in Yanacocha increased by 53.6 percent, from US$206.5 million in 2008 to US$317.2 million in 2009. This increase is attributed to increased sales by Yanacocha in 2009, which resulted from an increase in gold production and an increase in the average realized price of gold.
Interest income. Interest income decreased by 65.9 percent, from US$17.9 million in 2008 to US$6.1 million in 2009, mainly due to a decrease in time deposit interest rates. We maintained US$508.4 million in time deposits as of December 31, 2008 compared to US$663.6 million as of December 31, 2009.
Interest expense. Interest expense decreased by 55.8 percent, from US$33.9 million in 2008 to US$15.0 million in 2009, due mainly to a decrease in our indebtedness from US$327.3 million as of December 31, 2008 to US$230.0 million as of December 31, 2009. See Notes 14 and 23 to the Financial Statements.
Other, net. Other, net increased from an expense of US$9.3 million in 2008 to an income of US$2.6 million in 2009. This change was principally due to a decrease in the provision for closure of mining units and exploration projects.
Gain (loss) on currency exchange difference. In 2008, we recorded a loss on currency exchange difference of US$12.2 million, compared to a gain on currency exchange difference of US$1.5 million in 2009. This difference was mainly due to a loss on currency exchange difference generated by higher time deposits maintained in Nuevos Soles by our subsidiary El Brocal (S/.123.1 million in 2008 compared to S/.41.4 million in 2009).
Workers’ profit sharing. Workers’ profit sharing income was US$4.7 million in 2008, compared to expense from workers’ profit sharing of US$12.6 million as a result of an increase in our taxable income. Provision for workers’ profit sharing is calculated by applying a percentage to our taxable income.
Income tax. Provision for income tax changed from income of US$26.6 million in 2008 to expense of US$64.3 million in 2009, principally due to:
| | (a) | Increase in pre-tax income. A US$561.6 million increase in pre-tax income, from US$171.9 million in 2008 to US$733.5 million in 2009, mainly due to a US$415.1 million decrease in the net loss as a result of the release of commitments in commercial contracts. We recorded a net loss of US$415.1 million in 2008, which is presented as an unusual item in the statement of income. No similar transaction was recorded in 2009. |
| | (b) | Non-taxable income. According to current tax regulations, equity participation in affiliates, including the receipt of dividends, is not taxable in Peru. In 2009, our equity participation in affiliated companies increased from US$340.9 million in 2008 to US$451.3 million in 2009, which reduced our income tax expense by US$160.7 million in 2009, compared to a US$121.4 million reduction in income tax expense due to this non-taxable income in 2008. |
Minority interest. Minority interest expense increased by 26.0 percent, from US$50.0 million in 2008 to US$63.0 million in 2009, mainly due to an increased contribution of profits from El Brocal.
Net income. As a result of the foregoing, net income increased by 287.2 percent, from US$153.3 million in 2008 to US$593.6 million in 2009. As a percentage of net sales, net income was 72.4 percent in 2009 as compared to 20.0 percent in 2008.
B. Liquidity and Capital Resources
As of December 31, 2010, we had cash and cash equivalents of US$582.9 million, compared to US$714.5 million at December 31, 2009.
Cash provided by operating activities for the years ended December 31, 2010 and 2009. Net cash and cash equivalents provided by operating activities were US$527.7 million in 2010 compared to US$526.1 million in 2009. The increase in net cash flow provided by operating activities was mainly attributable to the combined effect of: increased proceeds from sales, from US$738.5 million in 2009 to US$997.8 million in 2010; increased royalties received, from US$52.5 million in 2009 to US$58.8 million in 2010; increased payments to third parties, from US$335.5 million in 2009 to US$483.5 million in 2010; increased payments to employees, from US$94.9 million in 2009 to US$126.0 million in 2010, due mainly to both workers’ profit sharing between our subsidiary, El Brocal, and us and payments totaling US$14.2 million in 2010 in connection with stock appreciation rights; increased income tax paid, from US$37.1 million in 2009 to US$56.3 million in 2010; increased royalty payments, from US$39.4 million in 2009 to US$55.3 million in 2010, as a result of increased royalty payments to third parties and increased payments to the Peruvian government; decreased interest payments, from US$10.9 million in 2009 to US$6.4 million in 2010, as a result of decreased indebtedness in 2010; decreased dividends received from Yanacocha and Cerro Verde, from US$213.8 million in 2009 to US$183.0 million in 2010; and a decrease in value-added tax (VAT) recovered, from US$32.4 million in 2009 to US$7.5 million in 2010.
Cash provided by operating activities for the years ended December 31, 2009 and 2008. Net cash and cash equivalents provided by operating activities were US$526.1 million in 2009 compared to US$150.5 million in 2008. The increase in net cash flow provided by operating activities was mainly attributable to: a payment of US$517.1 million related to the release of commitments in commercial contracts during 2008; decreased payments to suppliers and third parties, from US$376.1 million in 2008 to US$335.5 million in 2009; decreased payments to employees, from US$111.1 million in 2008 to US$94.9 million in 2009, due mainly to the workers’ profit sharing between our subsidiary, El Brocal, and us; decreased payments of royalties, from US$41.4 million in 2008 to US$39.4 million in 2009, as a result of decreased royalty payments to third parties and decreased payments to the Peruvian government; decreased interest payments, from US$26.6 million in 2008 to US$10.9 million in 2009, as a result of decreased indebtedness in 2009; decreased proceeds from sales, from US$781.1 million in 2008 to US$738.5 million in 2009; decreased dividends received from Yanacocha and Cerro Verde, from US$413.6 million in 2008 to US$213.8 million in 2009; and decreased income tax payments from US$41.4 million in 2008 to US$37.1 million in 2009. These increases were partially offset by the following: the value added tax (IGV) recovered of US$32.4 million.
Cash used in investment activities for the years ended December 31, 2010 and 2009. Net cash and cash equivalents used in investing activities were US$177.9 million in 2009 compared to US$330.3 million in 2010. The increase in net cash flow used in investing activities in 2010 compared with 2009 was mainly attributable to increased additions to mining concessions and property, plant and equipment from US$152.2 million in 2009 to US$230.2 million in 2010 in connection with hydroelectric construction at our subsidiary Huanza, the leach pad at our subsidiary La Zanja and the expansion of the refining plant capacity at our subsidiary El Brocal, as well as an increase in income from mutual funds in the amount of US$50 million, which had been designated as a financial asset at fair value through profit or loss.
Cash used in investment activities for the years ended December 31, 2009 and 2008. Net cash and cash equivalents used in investing activities were US$75.9 million in 2008 compared to US$177.9 million in 2009. The change in net cash flow used in investing activities in 2009 compared with 2008 was mainly attributable to: increased additions to mining concessions and property, plant and equipment from US$71.3 million in 2008 to US$152.2 million in 2009; and increased expenditures related to investment shares from US$29.5 million in 2008 to US$37.9 million in 2009, mainly related to the acquisition of additional equity in El Brocal and Cerro Verde. The increase in cash used in investment activities was partially offset by a lower decrease in time deposits, which decreased by US$22.7 million in 2009 as compared to US$56.0 million in 2008.
Cash used in financing activities for the years ended December 31, 2010 and 2009. Net cash and cash equivalents used in financing activities were US$329.1 million in 2010 compared to net cash used in financing activities of US$165.8 million in 2009. The increase in net cash flow provided by financing activities in 2010 compared with 2009 was mainly attributable to: an increase in payments of financial obligations from US$97.3 million in 2009 to US$226.1 million in 2010; an increase in the payment of dividends to shareholders, from US$40.7 million in 2009 to US$117.0 million in 2010; and an increase in the payment of dividends to minority interest shareholders, from US$27.8 million in 2009 to US$39.2 million in 2010.
Cash provided by (used in) financing activities for the years ended December 31, 2009 and 2008. Net cash and cash equivalents used in financing activities were US$165.8 million in 2009 compared to net cash provided by financing activities of US$155.0 million in 2008. The decrease in net cash flow provided by financing activities in 2009 compared with 2008 was mainly attributable to: US$450 million in long-term debt incurred by us during 2008, a decrease in the payment of dividends to shareholders, from US$50.9 million in 2008 to US$40.7 million in 2009, and a decrease in payments of dividends to minority interest shareholders, from US$37.3 million in 2008 to US$27.8 million in 2009.
Long-Term Debt
On February 20, 2008, we borrowed US$450.0 million pursuant to a syndicated Bridge Loan Credit Agreement, led by Banco de Crédito del Peru, in order to finance the unwinding of our gold hedge book.
On May 21, 2008, in order to repay the US$450.0 million syndicated bridge loan, we borrowed US$450 million, referred to as the Syndicated Term Loan, under a new Term Loan Agreement, among us, as borrower, Condesa, as guarantor, Banco de Crédito del Peru, as administrative agent and collateral agent, and the lenders party thereto. Borrowings under the Syndicated Term Loan bear interest at a rate per annum equal to LIBOR plus 2.25 percent. Interest and installments of principal equal to 1/20th of the aggregate principal amount borrowed are payable quarterly until maturity in May 2013 (on which date all amounts outstanding will be payable). Obligations under the Syndicated Term Loan are guaranteed by Condesa, our wholly-owned subsidiary. The term loan agreement governing the Syndicated Term Loan contains certain customary covenants and events of default. See “Item 10. Additional Information—Material Contracts.”
The Syndicated Term Loan was initially secured by a pledge of our Common Shares held by Condesa. On January 23, 2009, we and the lenders party to the Syndicated Term Loan executed a consent and amendment to release the pledged collateral.
As of December 31, 2009, approximately US$205.33 million remained outstanding under the Syndicated Term Loan. On March 1, 2010, we repaid the full amount outstanding under the Syndicated Term Loan together with a prepayment fee of US$0.6 million.
On December 2, 2009, Banco de Crédito del Peru executed a financial lease agreement with Conenhua, Huanza and us in the amount of US$119 million for construction of a hydroelectric power station. The lease was executed in favor of Huanza as lessee, and commits us to act as joint surety of Huanza to guarantee Huanza’s payment obligations. The term of the lease is 10 years and the interest rate is (i) LIBOR plus 4 percent from the first disbursement until six months after the start of commercial operation of the power station and (ii) LIBOR plus 4.1 percent from six months after the start of commercial operation of the power station until maturity. As of December 31, 2010 and 2009, amounts outstanding under this lease were US$54.1 million and US$0.9 million, respectively.
Exploration Costs; Capital Expenditures
Total capital expenditures and exploration costs for 2011 and 2012 (excluding exploration costs at our principal mines, which are included as part of their cost of production) are estimated to be between approximately US$230.0 million and US$240.0 million per year. These budgeted expenditures include the following projects: the construction of the Tantahuatay and Breapampa projects, the expansion of the treatment plant in El Brocal, the construction of the Procesadora Industrial Rio Seco chemical plant to treat concentrates from Uchucchacua and the construction of the Huanza hydroelectrical plant.
During 2010 we spent approximately US$36.1 million on “greenfield” and US$91.4 million on “brownfield” exploration-related investments in Peru. Our “greenfield” investments focused on the following exploration projects: Chucapaca, Colquemayo, Breapampa, Terciopelo, Chaje, La Zanja, Lucanas, Pisqahuanca, Trapiche, Hualgayoc and El Faique. The 2010 exploration program was financed by internal funds. Our “brownfield” investments focused on the following exploration projects in 2010: Mallay, Yumpag, Huamani Huayta, Tuyumina and Parihuanas. In 2011, we intend to invest approximately US$16.7 million in the Huamanihuayta, Tuyumina, Parihuanas and Yumpag brownfield exploration projects. We expect to invest approximately US$8.8 million in the following greenfield exploration projects during 2011: Pisqahuanca, Colquemayo, El Faique and Surichata. We expect to invest approximately US$35.5 million in the following advanced exploration projects: Chucapaca, Trapiche and Hualgayoc.
We expect that we will meet our working capital, capital expenditure and exploration expense requirements for the next several years from internally generated funds, cash on hand and dividends received from our investments in non-consolidated mining operations, including Yanacocha. Additional financing, if necessary for the construction of any project, is expected to be obtained from borrowings under bank loans and the issuance of debt securities. There can be no assurance, however, that sufficient funding will be available to us from the internal or external sources to finance any future capital expenditure program, or that external funding will be available to us for such purpose on terms or at prices favorable to us. A very significant decline in the prices of gold and silver would be reasonably likely to affect the availability of such sources of liquidity. In addition, if we fund future capital expenditures from internal cash flow, there may be less funds available for the payment of dividends.
Recent Accounting Pronouncements
Peruvian GAAP
We prepare and present the Financial Statements in accordance with Peruvian GAAP, which are based on International Financial Reporting Standards, or IFRS, as adopted by the Peruvian Accounting Standards Board (the Consejo Normativo de Contabilidad, or CNC). As of May 15, 2011, there were no new accounting pronouncements under Peruvian GAAP approved by CNC that were applicable to us. The following IFRS and International Financial Reporting Interpretations Committee, or IFRIC, updates were issued internationally as of December 31, 2010 and could affect us, but were not yet approved by the CNC, for which reason they have not yet been implemented by us:
IFRS 9 “Financial Instruments,” which modifies the treatment and classification of financial assets established in IAS 39 “Financial Instruments: Measurement and Valuation,” effective internationally for periods beginning on or after January 1, 2013.
IFRS 10 “Consolidated Financial Statements,” issued in May 2011 by the IASB, establishes principles for the presentation and preparation of consolidated financial statements when an entity controls one or more other entities. IFRS 10 replaces the consolidation requirements in SIC-12 Consolidation—Special Purpose Entities and IAS 27 Consolidated and Separate Financial Statements and is effective for annual periods beginning on or after January 1, 2013. We have not assessed the impact, if any, of adopting this guidance.
IFRS 11 “Joint Arrangement,” issued in May 2011 by the IASB, provides for a more realistic reflection of joint arrangements by focusing on the rights and obligations of the arrangement, rather than its legal form. The standard addresses inconsistencies in the reporting of joint arrangements by requiring a single method to account for interests in jointly controlled entities. IFRS 11 supersedes IAS 31 Interests in Joint Ventures and SIC-13 Jointly Controlled Entities—Non-Monetary Contributions by Ventures, and is effective for annual periods beginning on or after January 1, 2013. We have not assessed the impact, if any, of adopting this guidance.
IFRS 12 “Disclosure of Interests in Other Entities,” issued in May 2011 by the IASB, is a new and comprehensive standard on disclosure requirements for all forms of interests in other entities, including subsidiaries, joint arrangements, associates and unconsolidated structured entities. IFRS 12 is effective for annual periods beginning on or after January 1, 2013. The Company has not assessed the impact, if any, of adopting this guidance.
IFRS 13 “Fair Value Measurement,” issued in May 2011, establishes new requirements relating to the measurement of fair value and the related disclosures for IFRS and U.S. GAAP. This guidance, set forth in IFRS 13 Fair Value Measurement and an update to ASC 820 in the FASB’s Accounting Standards Codification (formerly referred to as SFAS 157), represents the completion of one of the joint boards’ major projects to improve IFRS and U.S. GAAP and to bring about their convergence. This standard is effective for annual periods beginning on or after January 1, 2013. The Company has not assessed the impact, if any, of adopting this guidance.
IFRIC 18 “Transfers of Assets from Customers,” effective for annual periods beginning on or after July 1, 2009.
Through Resolution No. 102-2010-EF/94.01.1, CONASEV authorized full application of International Financial Reporting Standards, effective for all legal entities under its supervision from the year 2011. This adoption must include application of IFRS 1 “First-time Adoption of International Financial Reporting Standards.”
Our management is currently analyzing the impact that those standards and interpretations will have on our operations when such standards are approved by the CNC for application in Peru, as well as determining the implementation process and the adjustments necessary in order to be in compliance with this Resolution.
U.S. GAAP
ASU N° 2010-29 Business Combinations. In June 2009, the Financial Accounting Standards Board, or FASB, established the FASB Accounting Standards Codification, or ASC, as the single source of U.S. GAAP to be applied by nongovernmental entities. In December 2010, the ASC guidance for business combinations was updated to clarify existing guidance which requires a public entity to disclose pro forma revenue and earnings of the combined entity as though the business combination(s) that occurred during the current year had occurred as of the beginning of the comparable prior annual period only. The update also expands the supplemental pro forma disclosures required to include a description of the nature and amount of material, nonrecurring pro forma adjustments directly attributable to the business combination included in the reported pro forma revenue and earnings. The updated guidance is effective for our fiscal year beginning January 1, 2011. We are evaluating the potential impact of adopting this guidance on our consolidated financial position, results of operations and cash flows.
ASU N° 2010-06 Fair Value Accounting. In January 2010, the ASC guidance for fair value measurements and disclosure was updated to require enhanced detail in the level 3 reconciliation. The updated guidance is effective for our fiscal year beginning January 1, 2011. We expect minimal impact from adopting this guidance.
C. Research and Development
Not applicable.
YANACOCHA
Introduction
The following discussion should be read in conjunction with the Yanacocha Financial Statements as of December 31, 2009 and 2010 and for the years ended December 31, 2008, 2009 and 2010 and the related notes thereto included elsewhere in this Annual Report. The Yanacocha Financial Statements are prepared and presented in accordance with U.S. GAAP and in U.S. Dollars.
A. Operating Results
Overview
Yanacocha, the largest gold producer in South America, was established in Peru in January 1992, and commenced production activities in August 1993. Yanacocha’s operations are located in the Andes mountains in Northern Peru, in the area of Cajamarca which is located approximately 900 kilometers north of Lima and north of the City of Cajamarca, at an altitude of 4,000 meters above sea level. Yanacocha is 51.35 percent owned by Newmont Mining, through its wholly-owned subsidiary Newmont Second, 43.65 percent by us through our wholly-owned subsidiary Condesa, and 5 percent by IFC. Yanacocha is managed by Newmont Peru S.R.L. See “Item 4. Information on the Company—Yanacocha—Business Overview—Management of Yanacocha—General Manager/Management Agreement.” On October 31, 1999, pursuant to a public deed, Yanacocha changed its legal structure from a corporation to a partnership, changing its name from “Minera Yanacocha S.A.” to “Minera Yanacocha S.R.L.” As a result, Yanacocha (i) cannot have more than 20 partners; (ii) has its capital stock is represented in participations; (iii) is not required to maintain a legal reserve (see Note 16 to the Yanacocha Financial Statements); and (iv) will not receive a different income tax treatment under Peruvian law than it did as a corporation.
The table below highlights Yanacocha’s key financial and operating results:
Summary of Financial and Operating Performance
| | | | |
| | | | | | | | | | |
| Gold Sales (in thousands of US$) | | | 1,778,260 | | | | 2,013,228 | | | | 1,612,618 | |
| Gold sold (oz.) | | | 1,465,541 | | | | 2,068,205 | | | | 1,842,599 | |
| Average gold price received (US$/oz.) | | | 1,216 | | | | 973 | | | | 875 | |
| Costs applicable to sales (US$/oz.) | | | 448 | | | | 325 | | | | 358 | |
| Other expenses(in thousands of US$) | | | 69,122 | | | | 86,469 | | | | 83,424 | |
| Net income (in thousands of US$) | | | 589,894 | | | | 727,076 | | | | 476,462 | |
| Dividends paid (in thousands of US$) | | | - | | | | 230,000 | | | | 590,000 | |
Gold sales. Gold sales decreased by 12 percent, or US$235 million, from 2009 to 2010, due principally to a decrease in the volume of gold sold, as a result of decreased gold production. This decrease was partially offset by the higher average realized price for gold, which increased from US$973 per ounce in 2009 to US$1,216 per ounce in 2010. Yanacocha has not engaged in gold price hedging activities, such as forward sales or option contracts, to minimize its exposure to fluctuations in the price of gold.
Costs applicable to sales. Costs applicable to sales decreased by 2 percent from 2009 to 2010 due primarily to changes in inventory costs and decreases in workers’ profit participation, third-party royalties and selling expenses resulting from decreased sales, and increased by-product credit sales due to greater silver sales prices. Costs applicable to sales include: (i) operating costs, consisting primarily of direct production costs such as mining and treatment of the ore, which are the most significant components of costs applicable to sales, (ii) employee profit sharing of 8 percent of pre-tax profits calculated in accordance with Peruvian GAAP, (iii) royalties of 3 percent of the quarterly net sale value of all gold and silver extracted from the mining concessions payable to Chaupiloma after deducting refinery and transportation costs, (iv) management fees payable to Newmont Peru, the operator of Yanacocha, (v) selling expenses, (vi) credit from by-product sales, mainly in connection with silver sales, (vii) government mining royalties in connection with the Carachugo mine, which resulted from the expiration of its 15-year stability agreement on January 1, 2010 and (viii) other costs.
Other expenses. Other expenses decreased by 20 percent, or US$17.3 million, from 2009 to 2010, mainly due to a lower negotiated payment to the Peruvian government, and decreased expenses related to community development and external affairs.
Income tax. Yanacocha’s financial and operating results were impacted by a tax expense of US$269.7 million in 2010, as compared to US$334.8 million in 2009, which reflects Yanacocha’s decreased profitability, mainly due to lower revenues from the sale of gold as a consequence of decreased gold production.
Dividends. During the year ended December 31, 2010, Yanacocha did not pay dividends to its partners and did not reserve any money related to reinvestment programs.
Forward-looking statements. Certain key factors will affect Yanacocha’s future financial and operating results. These include, but are not limited to, fluctuations in the price of gold. Yanacocha expects 2011 gold sales to be between 1.3 and 1.4 million ounces at costs applicable to sales of approximately US$534 per ounce. Sales from 2012 through 2015 are expected to average approximately 1.3 million ounces at costs applicable to sales of approximately US$529 per ounce, primarily due to decreased gold production and higher contracted services and supplies.
Critical Accounting Policies
Yanacocha has furnished us with a discussion of its critical accounting policies or methods used in the preparation of its financial statements. Critical accounting policies are defined as those that are reflective of significant judgments and uncertainties and could potentially impact results under different assumptions and conditions. Note 2 to the Yanacocha Financial Statements includes a summary of the significant accounting policies and methods used in the preparation of the Yanacocha Financial Statements. The following is a brief discussion of the identified critical accounting policies and the estimates and judgments made by Yanacocha.
The Accounting Standards Codification
In June 2009, FASB established the ASC as the single source of U.S. GAAP to be applied by nongovernmental entities. The ASC is a new structure which took existing accounting pronouncements and organized them by accounting topic. Relevant authoritative literature issued by the SEC and select SEC staff interpretations and administrative literature were also included in the ASC. All other accounting guidance not included in the ASC is non-authoritative. The ASC was effective for Yanacocha’s annual period ended December 31, 2010. The adoption of the ASC did not have an impact on Yanacocha’s consolidated financial position, results of operations or cash flows.
Principles of Consolidation
The Consolidated Financial Statements include the accounts of Minera Yanacocha S.R.L. and the San José Reservoir Trust (“Trust”). In November 2008, Yanacocha funded the Trust to ensure continuous operation for the San José Reservoir after 2018. Yanacocha transferred $13 million to the Trust in 2008. No withdrawals are allowed until 2018 and Yanacocha is committed to a $23 million fund as of such date. This Trust is irrevocable and is a separate legal entity. The grantor is Yanacocha, the trustee is the Banco de Crédito del Perú and the beneficiary is Yanacocha. As a result, Yanacocha consolidates the Trust in its Consolidated Financial Statements.
Yanacocha’s Consolidated Financial Statements have been prepared in accordance with U.S. GAAP. The preparation of the Yanacocha’s Consolidated Financial Statements requires Yanacocha to make estimates and assumptions that affect the reported amounts of assets and liabilities and the related disclosure of contingent assets and liabilities at the date of the Consolidated Financial Statements and the reported amounts of revenues and expenses during the reporting period. The more significant areas requiring the use of management estimates and assumptions relate to (i) mineral reserves that are the basis for future cash flow estimates utilized in impairment calculations and units-of-production amortization calculations; (ii) environmental, reclamation and closure obligations; (iii) estimates of recoverable gold and other minerals in stockpile and leach pad inventories; (iv) write-downs of inventory, ore on leach pads and stockpiles to net realizable value; (v) employee benefit liabilities; (vi) valuation allowances for deferred tax assets; (vii) workers’ profit participation; (viii) reserves for contingencies and litigation; and (ix) the fair value and accounting treatment of financial instruments. Yanacocha bases its estimates on historical experience and on various other assumptions that are believed to be reasonable under the circumstances. Accordingly, actual results may differ significantly from these estimates under different assumptions or conditions.
The Consolidated Financial Statements are stated in U.S. dollars, Yanacocha’s functional currency, as most of its transactions are traded, collected and paid in such currency. All amounts are rounded to the nearest thousand ($000) unless otherwise stated. Transactions in other currencies are recorded in U.S. dollars based on exchange rates prevailing at the time of such transactions. Monetary assets and liabilities denominated in other currencies are translated into the U.S. dollar at exchange rates prevailing at the balance sheet dates, and any resulting gains or losses are reflected in current earnings.
Cash and Cash Equivalents
Cash and cash equivalents consist of all cash balances and highly liquid investments with an original maturity of three months or less. Because of the short maturity of these balances, the carrying amounts approximate their fair value. Restricted cash is excluded from cash and cash equivalents and is included in other current assets.
Investments
Management determines the appropriate classification of its investments in equity securities at the time of purchase and reevaluates such determinations at each reporting date. Yanacocha accounts for its equity security investments as available for sale securities in accordance with FASB Accounting Standards Codification (“ASC”) guidance on accounting for certain investments in debt and equity securities. Yanacocha periodically evaluates whether declines in fair values of its investments below Yanacocha’s carrying value are other-than-temporary in accordance with guidance for the meaning of other-than-temporary impairment and its application to certain investments. Yanacocha’s policy is to generally treat a decline in the investment’s quoted market value that has lasted continuously for more than six months as an other-than-temporary decline in value. Yanacocha also monitors its investments for events or changes in circumstances that have occurred that may have a significant adverse effect on the fair value of the investment and evaluates qualitative and quantitative factors regarding the severity and duration of the unrealized loss and Yanacocha’s ability to hold the investment until a forecasted recovery occurs to determine if the decline in value of an investment is other-than-temporary. Declines in fair value below Yanacocha’s carrying value deemed to be other-than-temporary are charged to earnings.
Stockpiles, Ore on Leach Pads and Inventories
As described below, costs that are incurred in or benefit the productive process are accumulated as stockpiles, ore on leach pads and inventories. Stockpiles, ore on leach pads and inventories are carried at the lower of average cost or net realizable value. Net realizable value represents the estimated future sales price of the product based on current and long-term metals prices, less the estimated costs to complete production and bring the product to sale. Write-downs of stockpiles, ore on leach pads and inventories resulting from net realizable value impairments are reported as a component of Costs applicable to sales. The current portion of stockpiles, ore on leach pads and inventories is determined based on the expected amounts to be processed within the next twelve months. Stockpiles, ore on leach pads and inventories not expected to be processed within the next twelve months are classified as long-term. The major classifications are as follows:
Stockpiles. Stockpiles represent ore mined and available for further processing. Stockpiles are measured by estimating the number of tons added and removed from the stockpile, the number of contained ounces (based on assay data) and the estimated metallurgical recovery rates (based on the expected processing method). Stockpile ore tonnages are verified by periodic surveys. Costs are allocated to a stockpile based on relative values of material stockpiled and processed using current mining costs incurred up to the point of stockpiling the ore, including applicable overhead and amortization relating to mining operations, and removed at the average cost per recoverable unit.
Ore on Leach Pads. The recovery of gold from certain gold oxide ores is achieved through the heap leaching process. Under this method, ore is placed on leach pads where it is treated with a chemical solution, which dissolves the gold contained in the ore. The resulting gold-bearing solution is further processed in a plant where the gold is recovered. Costs are added to ore on leach pads based on current mining costs, including applicable overhead and amortization relating to mining operations. Costs are removed from ore on leach pads as ounces are recovered based on the average cost per recoverable ounce of gold on the leach pad.
The estimates of recoverable gold on the leach pads are calculated from the quantities of ore placed on the pads (measured tons added to the leach pads), the grade of ore placed on the leach pads (based on assay data) and a recovery percentage (based on ore type). In general, the leach pads recover approximately 50 percent to 95 percent of the ultimate recoverable ounces in the first year of leaching, declining each year thereafter until the leaching process is complete.
Although the quantities of recoverable gold placed on the leach pads are reconciled by comparing the grades of ore placed on the pads to the quantities of gold actually recovered (metallurgical balancing), the nature of the leaching process inherently limits the ability to precisely monitor inventory levels. As a result, the metallurgical balancing process is constantly monitored and estimates are refined based on actual results over time. Historically, Yanacocha’s operating results have not been materially impacted by variations between the estimated and actual recoverable quantities of gold on its leach pads. Variations between actual and estimated quantities resulting from changes in assumptions and estimates that do not result in write-downs to net realizable value are accounted for on a prospective basis.
In-process Inventory. In-process inventories represent materials that are currently in the process of being converted to a saleable product. Yanacocha’s conversion processes vary depending on the nature of the ore and the specific processing facility and include mill in-circuit and leach in-circuit. In-process material is measured based on assays of the material fed into the process and the projected recoveries of the respective plants. In-process inventories are valued at the average cost of the material fed into the process attributable to the source material coming from the mines, stockpiles and/or leach pads plus the in-process conversion costs, including applicable amortization relating to the process facilities incurred to that point in the process.
Precious Metals Inventory. Precious metals include gold doré and/or gold bullion. Precious metals that result from Yanacocha’s mining, processing and refining activities are valued at the average cost of the respective in-process inventory.
Concentrate Inventory. Concentrate inventory represents silver, gold and copper concentrate available for shipment. Yanacocha values concentrate inventory at the average cost, including an allocable portion of support costs and amortization. Costs are added and removed to the concentrate inventory based on tons of concentrate and are valued at the lower of average cost or net realizable value.
Materials and Supplies
Materials and supplies are valued at the lower of average cost or net realizable value. Cost includes applicable taxes and freight.
Property, Plant and Mine Development
Facilities and Equipment. Expenditures for new facilities or equipment and expenditures that extend the useful lives of existing facilities or equipment are capitalized and recorded at cost. The facilities and equipment are amortized using the straight-line method at rates sufficient to amortize such costs over the estimated productive lives, which do not exceed the related estimated mine lives, of such facilities based on proven and probable reserves.
Mine Development. Mine development costs include engineering and metallurgical studies, drilling, and other related costs to delineate an ore body and the removal of overburden to initially expose an ore body at open-pit surface mines. Costs incurred before mineralization is classified as proven and probable reserves are expensed and classified as an exploration and advanced projects expense. Capitalization of mine development project costs that meet the definition of an asset begins once mineralization is classified as proven and probable reserves.
Drilling and related costs are capitalized for an ore body where proven and probable reserves exist, the activities are directed at obtaining additional information on the ore body or converting non-reserve mineralization to proven and probable reserves and the benefit is expected to be realized over a period beyond one year. All other drilling and related costs are expensed as incurred. Drilling costs incurred during the production phase for operational ore control are allocated to inventory costs and then included as a component of Costs applicable to sales.
The cost of removing overburden and waste materials to access the ore body at an open-pit mine prior to the production phase is referred to as “pre-stripping costs.” Pre-stripping costs are capitalized during the development of an open-pit mine. Where multiple open pits exist at a mining complex utilizing common processing facilities, pre-stripping costs are capitalized at each pit. The removal and production of de minimis saleable materials may occur during development and are recorded as Other income, net of incremental mining and processing costs.
The production phase of an open pit mine commences when saleable minerals, beyond a de minimis amount, are produced. Stripping costs incurred during the production phase of a mine are variable production costs that are included as a component of inventory to be recognized in Costs applicable to sales in the same period as the revenue from the sale of inventory.
Yanacocha’s definition of a mine and the mine’s production phase may differ from that of other companies in the mining industry resulting in incomparable allocations of stripping costs to deferred mine development and production costs. Other mining companies may expense pre-stripping costs associated with subsequent pits within a mining complex.
Mine development costs are amortized using the units-of production (“UOP”) method based on estimated recoverable ounces in proven and probable reserves. To the extent that these costs benefit an entire ore body, they are amortized over the estimated life of the ore body. Costs incurred to access specific ore blocks or areas that only provide benefit over the life of that area are amortized over the estimated life of that specific ore block or area.
Interest cost allocable to the cost of developing mining properties and to constructing new facilities is capitalized until assets are ready for their intended use.
Mineral Interests
Mineral interests include acquired interests in production, development and exploration stage properties. The mineral interests are capitalized at their fair value at the acquisition date, either as an individual asset purchase or as part of a business combination.
The value of such assets is primarily driven by the nature and amount of mineralized material believed to be contained in such properties. Production stage mineral interests represent interests in operating properties that contain proven and probable reserves. Development stage mineral interests represent interests in properties under development that contain proven and probable reserves. Exploration stage mineral interests represent interests in properties that are believed to potentially contain mineralized material consisting of (i) mineralized material such as inferred material within pits; measured, indicated and inferred material with insufficient drill spacing to qualify as proven and probable reserves; and inferred material in close proximity to proven and probable reserves; (ii) around-mine exploration potential such as inferred material not immediately adjacent to existing reserves and mineralization, but located within the immediate mine area; (iii) other mine-related exploration potential that is not part of measured, indicated or inferred material and is comprised mainly of material outside of the immediate mine area; (iv) greenfield exploration potential that is not associated with any other production, development or exploration stage property, as described above; or (v) any acquired right to explore or extract a potential mineral deposit. Yanacocha’s mineral rights generally are enforceable regardless of whether proven and probable reserves have been established. Yanacocha has the ability and intent to renew mineral interests where the existing term is not sufficient to recover all identified and valued proven and probable reserves and/or undeveloped mineralized material.
Yanacocha reviews and evaluates its long-lived assets for impairment when events or changes in circumstances indicate that the related carrying amounts may not be recoverable. Impairment is considered to exist if the total of the assets’ estimated future cash flows on an undiscounted basis are less than the carrying amount of the assets. An impairment loss is measured and recorded based on discounted estimated future cash flows. Future cash flows are estimated based on quantities of recoverable minerals, expected gold and other commodity prices (considering current and historical prices, trends and related factors), production levels, operating costs, capital requirements and reclamation costs, all based on life-of-mine plans. Existing proven and probable reserves and value beyond proven and probable reserves, including mineralization that is not part of the measured, indicated or inferred resource base, are included when determining the fair value of mine site reporting units at acquisition and, subsequently, in determining whether the assets are impaired. The term “recoverable minerals” refers to the estimated amount of gold or other commodities that will be obtained after taking into account losses during ore processing and treatment. Estimates of recoverable minerals from such exploration stage mineral interests are risk adjusted based on management’s relative confidence in such materials. In estimating future cash flows, assets are grouped at the lowest level of which there are identifiable cash flows that are largely independent of future cash flows from other asset groups. Yanacocha’s estimates of future cash flows are based on numerous assumptions and it is possible that actual future cash flows will be significantly different than the estimates, as actual future quantities of recoverable minerals, gold and other commodity prices, production levels and operating costs of production and capital are each subject to significant risks and uncertainties.
Revenue is recognized, net of treatment and refining charges, from a sale when persuasive evidence of an arrangement exists, the price is determinable, the product has been delivered, the title has been transferred to the customer and collection of the sales price is reasonably assured. Revenues from silver and copper sales are credited to Costs applicable to sales as a by-product credit. Concentrate sales are initially recorded based on provisional sales prices. Until final settlement occurs, adjustments to provisional sales prices are made to take into account the mark-to-market changes based on the forward prices for the estimated month of settlement. Provisional sales quantities are also adjusted for changes in metal quantities upon the receipt of new information and assay. Yanacocha’s sales based on a provisional price contain an embedded derivative that is required to be separated from the host contract for accounting purposes. The host contract is the receivable from the sale of the concentrates at the forward exchange price at the time of sale. The embedded derivative, which does not qualify for hedge accounting, is marked to market through earnings for each period prior to final settlement.
Income Tax and Profit Sharing
Yanacocha accounts for income tax and legally required profit sharing using the liability method, recognizing certain temporary differences between the financial reporting basis of Yanacocha’s liabilities and assets and the related income tax basis for such liabilities and assets. This method generates a net deferred income tax liability and profit sharing liability or net deferred income tax asset and profit sharing asset for Yanacocha, as measured by the statutory tax and profit sharing rates in effect as enacted. Yanacocha derives its deferred income tax charge or benefit and profit sharing charge or benefit by recording the change in the net deferred income tax liability and profit sharing liability or net deferred income tax asset and profit sharing asset balance for the year, based on Peruvian income tax and profit sharing rates.
Yanacocha’s deferred income tax assets include certain future tax benefits. Yanacocha records a valuation allowance against any portion of those deferred income tax assets when it believes, based on the weight of available evidence, it is more likely than not that some portion or all of the deferred income tax asset will not be realized.
Reclamation and Remediation Costs
Asset retirement obligations are recognized when incurred and recorded as liabilities at fair value. The liability is accreted over time through periodic charges to earnings. In addition, the asset retirement cost is capitalized as part of the asset’s carrying value and amortized over the life of the related asset. Reclamation costs are periodically adjusted to reflect changes in the estimated present value resulting from the passage of time and revisions to the estimates of either the timing or amount of the reclamation and abandonment costs. The retirement obligation is based on when spending for an existing environmental disturbance will occur. Yanacocha reviews, on an annual basis, unless otherwise deemed necessary, the retirement obligation at each mine site in accordance with accounting for asset retirement obligations.
Future remediation costs for inactive mines are accrued based on management’s best estimate at the end of each period of the costs expected to be incurred at a site. Such cost estimates include, where applicable, ongoing care, maintenance and monitoring costs. Changes in estimates at inactive mines are reflected in earnings in the period an estimate is revised.
Comprehensive Income
In addition to net income, comprehensive income (loss) includes all changes in equity during a period, such as cumulative unrecognized changes in fair value of marketable securities available for sale or other investments, except those resulting from investments by and distributions to owners.
Reclassifications
Certain amounts in prior years have been reclassified to conform to the 2010 presentation. Yanacocha reclassified certain income-based taxes from costs applicable to sales to an income and mining tax expense, and reclassified reclamation accretion and estimated revisions for non-operating sites from other expenses, net to reclamation and remediation.
Recently Adopted Accounting Pronouncements
Variable Interest Entities. In June 2009, the ASC guidance for consolidation accounting was updated to require an entity to perform a qualitative analysis to determine whether the enterprise’s variable interest gives it a controlling financial interest in a variable interest entity, or a VIE. This qualitative analysis identifies the primary beneficiary of a VIE as the entity that has both of the following characteristics: (i) the power to direct the activities of the VIE that most significantly impacts the entity’s economic performance and (ii) the obligation to absorb losses or receive benefits from the entity that could potentially be significant to the VIE. The updated guidance also requires ongoing reassessments of the primary beneficiary of a VIE. Adoption of the updated guidance, effective for Yanacocha’s fiscal year beginning January 1, 2010, had no impact on its consolidated financial position, results of operations or cash flows.
Fair Value Accounting. In January 2010, the ASC guidance for fair value measurements and disclosure was updated to require additional disclosures related to transfers in and out of Level 1 and 2 fair value measurements. The guidance was amended to clarify the level of disaggregation required for assets and liabilities and the disclosures required for inputs and valuation techniques used to measure the fair value of assets and liabilities that fall within either Level 2 or Level 3. The updated guidance was effective for Yanacocha’s fiscal year beginning January 1, 2010. The adoption had no impact on Yanacocha’s consolidated financial position, results of operations or cash flows. Refer to Note 20 in Yanacocha’s Consolidated Financial Statements for further details regarding Yanacocha’s assets and liabilities measured at fair value.
Recently Issued Accounting Pronouncements
Business Combinations. In December 2010, the ASC guidance for business combinations was updated to clarify existing guidance which requires a public entity to disclose pro forma revenue and earnings of the combined entity as though the business combination(s) that occurred during the current year had occurred as of the beginning of the comparable prior annual period only. The update also expands the supplemental pro forma disclosures required to include a description of the nature and amount of material, non-recurring pro forma adjustments directly attributable to the business combination included in the reported pro forma revenue and earnings. The updated guidance is effective for Yanacocha’s fiscal year beginning January 1, 2011. Yanacocha does not expect any impact from adopting this guidance.
Fair Value Accounting. In January 2010, the ASC guidance for fair value measurements and disclosure was updated to require enhanced detail in Level 3 reconciliation. The updated guidance is effective for Yanacocha’s fiscal year beginning January 1, 2011. Yanacocha expects minimal impact from the adoption of this guidance.
Results of Operations for the Years Ended December 31, 2010 and 2009
Sales
Sales decreased by 12 percent from US$2,013.2 million in 2009 to US$1,778.3 million in 2010, due primarily to a 29 percent decrease in the volume of gold sold, as a consequence of the lower level of gold production, partially offset by a higher average realized price, which increased from US$973 per ounce in 2009 to US$1,216 per ounce in 2010. Production by mine was as follows:
| | | | | | |
| | | (ounces) | |
| Cerro Yanacocha | | | 659,080 | | | | 1,087,028 | |
| Carachugo | | | 399,268 | | | | 453,374 | |
| Maqui Maqui | | | 12,701 | | | | 18,555 | |
| La Quinua | | | 390,571 | | | | 499,223 | |
| Total | | | 1,461,620 | | | | 2,058,180 | |
The decrease in gold produced in 2010 as compared to 2009 was mainly attributable to a decrease in the volume of leach and mill tons placed, which was 59.4 million DMT for the year ended December 31, 2010 as compared to 129.3 million DMT for the year ended December 31, 2009, a higher waste to ore ratio, which was 1.38 for the year ended December 31, 2010 as compared to 0.34 for the year ended December 31, 2009, and lower placed ore grade, which was 0.64 grams per ton for the year ended December 31, 2010 as compared to 0.78 grams per ton for the year ended December 31, 2009.
Costs applicable to sales
Costs applicable to sales decreased by 2 percent from US$671.5 million in 2009 to US$655 million in 2010 due primarily to inventory variation costs, decreases in workers’ profit participation and third-party royalty costs resulting from lower sales revenues, higher silver credit sales due to higher silver sales prices, and lower selling expenses, partially offset by higher operating costs mainly related to fuel and labor costs, and increased government mining royalties in connection with the Carachugo mine, which resulted from the expiration of its 15-year stability agreement on January 1, 2010. Costs applicable to sales per ounce of gold increased by 38 percent from US$325 in 2009 to US$448 in 2010, primarily as a result of a higher operating cost per ounce of US$457 in 2010 as compared to US$297 in 2009, a higher royalty expense per ounce of US$38 in 2010 as compared to US$26 in 2009, a higher workers’ profit participation expense per ounce of US$53 in 2010 as compared to US$47 in 2009, and higher government mining royalties of US$9 per ounce in 2010 as compared to US$0 in 2009 in connection with the Carachugo mine, which resulted from the expiration of its 15-year stability agreement on January 1, 2010.
Operating costs increased by 8 percent from US$613.7 million in 2009 to US$669.1 million in 2010. Operating costs consist primarily of drilling, blasting, loading, hauling and milling costs, which increased in 2010 primarily as a result of an increase in fuel prices, from an average of US$2.53 per gallon in 2009 to US$3.00 per gallon in 2010. Additional increases in operating costs resulted from higher labor costs as a result of hiring new employees and higher bonuses paid to employees, and higher maintenance costs related to repairs of haul truck fleets due to premature failures.
Royalty expense was US$55.8 million in 2010 as compared to US$62.3 million in 2009. The decrease in the royalty expense paid to Chaupiloma, which equals 3 percent of Yanacocha’s net sales, was directly related to the decrease in Yanacocha’s sales revenues.
Workers’ profit participation decreased by 15 percent, from US$90.7 million in 2009 to US$77.4 million in 2010. The decrease in workers’ profit participation expense is directly related to the decrease in Yanacocha’s taxable net income. Workers’ profit participation expense is calculated based on taxable net income and in accordance with Peruvian labor legislation. See “Item 4. Information on the Company—Yanacocha—Business Overview—Employees.”
Depreciation, depletion and amortization
Depreciation, depletion and amortization decreased by 3 percent from US$166.1 million in 2009 to US$160.4 million in 2010. This decrease was attributable principally to lower amortization related to lower ore mined in 2010 as compared to 2009 and lower amortization from asset retirement costs, partially offset by higher depreciation from inventory variation expenses.
Exploration expenses
Exploration costs increased by 51 percent from US$23.0 million in 2009 to US$34.6 million in 2010. This increase was attributable principally to increased perforation and advanced projects related to Minas Conga, an increased number of exploration works in connection with regional/oxide development programs and an increased number of advanced projects related to water treatment and information solutions.
Other expenses
Other expenses decreased by 20 percent, or US$17.3 million, from 2009 to 2010, mainly as a result of a lower negotiated payment to the Peruvian government and lower expenses related to community development and external affairs.
Peruvian mining companies, represented by the Sociedad Nacional de Minería, Petróleo y Energía, agreed to a mining payment equivalent to 3.75 percent of net income after taxes. On December 21, 2006, the Peruvian government issued Supreme Decree No. 071-2006-EM, which regulates the conditions under which the negotiated payment will be paid by Peruvian mining companies. The payment amounts to 3.75 percent of Peruvian net income after income tax, including 2.75 percent to be paid to a local mining fund and 1 percent to be paid to a regional mining fund. This payment was payable from 2006 through 2010, if certain conditions were met.
In 1998, the Peruvian government issued additional regulations regarding the calculation of workers’ profit participation, which limited to 18 monthly salaries the total amount to which each employee is entitled. However, there is a difference between the law and the regulations with regard to the criteria for the calculation. Yanacocha followed the criteria established by the law in determining the amount to be paid to its employees since 1998. As of December 31, 2006, Yanacocha recorded a charge of US$14.9 million to cover any payment derived from the different criteria established to make these payments in accordance with both the law and the regulations. In August 2007, the court reached an arbitration decision confirming that Yanacocha had overpaid FONDO-EMPLEO and the regional government. Although this is a final decision and cannot be appealed, it is not binding on the regional government. Yanacocha’s legal department, based on its best estimate, believes that it can recover a maximum of US$3.9 million of the US$5.3 million paid in excess to FONDO-EMPLEO. The remaining balance was charged to “Other expense, net.” As of December 31, 2009 and 2008, Yanacocha had recovered US$1.7 million and US$2.3 million, respectively, from FONDO-EMPLEO. Yanacocha did not recover any payments in 2010. In September 2007, Yanacocha paid the balance of US$21.8 million (including interest) owed to employees, which exceeded the original amount accrued of US$6.9 million. The additional amount mostly relates to interest paid by Yanacocha to employees.
Income tax provision
The decrease in income tax provision was directly related to Yanacocha’s decrease in taxable income. The net effective tax rate was 31.4 percent in 2010 compared to 31.5 percent in 2009. The statutory rate for both years was a weighted average of 30 percent. The factors that most significantly impacted Yanacocha’s net effective tax rate were related to lower non-deductible expenses.
The uniform income tax rate in Peru was 27 percent of taxable income in 2003. Effective January 1, 2004, the income tax rate in Peru is 30 percent of taxable income (Yanacocha, as explained below, has a stabilized corporate tax rate of 30 percent, excluding income from the La Quinua mine which had a tax rate of 27 percent until December 31, 2003 and 29 percent since January 1, 2004) and for financial statement purposes is calculated for Yanacocha in accordance with U.S. GAAP. Pursuant to Supreme Decree No. 027-98-EF, mining companies can obtain a tax benefit in the form of an investment credit, by effectively reinvesting non-distributed earnings into capital expansion projects that increase Yanacocha’s productivity. This investment credit is based on 80 percent of amounts reinvested and is obtained by application to and approval by the MEM.
Yanacocha has entered into Mining Law Stabilization Agreements under the General Mining Law with the Peruvian government. A Mining Law Stabilization Agreement is a standardized agreement prepared by the MEM, the Ministry of Economy and Finance, the Central Bank and other Peruvian governmental ministries. Such agreements (i) provide stabilized corporate tax rates, (ii) grant the ability to obtain VAT credit, (iii) provide full access to foreign currency and guarantee treatment in all foreign exchange matters as is given to Peruvian nationals, (iv) protect against foreign exchange controls and (v) grant the right to freely dispose of and export mineral products. Yanacocha has entered into such agreements with regard to the following mines: Carachugo/San José, Maqui Maqui, Cerro Yanacocha and La Quinua. Pursuant to these agreements, the income tax rate in Peru is 30 percent of taxable income, excluding income from the La Quinua mine which had a tax rate of 27 percent until December 31, 2003 and 29 percent since January 1, 2004. On January 1, 2010, the 15-year term of the Carachugo/San José mine’s tax stability agreement expired and, as a result, this mine no longer benefits from a tax stability agreement.
Net Income
As a consequence of the foregoing, net income decreased by 19 percent, or US$137.2 million, from US$727.1 million in 2009 to US$589.9 million in 2010. As a percentage of sales, net income decreased from 36 percent in 2009 to 33 percent in 2010.
Results of Operations for the Years Ended December 31, 2009 and 2008
Sales
Sales increased by 25 percent from US$1,612.6 million in 2008 to US$2,013.2 million in 2009, due primarily to a 12 percent increase in the volume of gold sold, as a consequence of the higher level of gold production, and a higher average realized price, which increased from US$875 per ounce in 2008 to US$973 per ounce in 2009. Production by mine was as follows:
| | | | | | |
| | | (ounces) | |
| Cerro Yanacocha | | | 1,087,028 | | | | 701,063 | |
| Carachugo | | | 453,374 | | | | 400,452 | |
| Maqui Maqui | | | 18,555 | | | | 32,550 | |
| La Quinua | | | 499,223 | | | | 676,273 | |
| Total | | | 2,058,180 | | | | 1,810,338 | |
The increase in gold produced in 2009 as compared to 2008 was mainly attributable to an increase in the volume of leach and mill tons placed, 129.3 million DMT for the year ended December 31, 2009 as compared to 92.6 million DMT for the year ended December 31, 2008, a lower waste to ore ratio, which was 0.34 for the year ended December 31, 2009 as compared to 1.05 for the year ended December 31, 2008, and a higher placed ore grade, which was 0.78 grams per ton for the year ended December 31, 2009 as compared to 0.71 grams per ton for the year ended December 31, 2008.
Costs applicable to sales
Costs applicable to sales increased by 2 percent from US$659.9 million in 2008 to US$671.5 million in 2009 due primarily to higher workers’ participation and royalty costs as a result of higher gold prices, partially offset by higher by-product. Costs applicable to sales per ounce of gold decreased by 9 percent from US$358 in 2008 to US$325 in 2009, primarily as a result of a lower operating cost per ounce of US$297 in 2009 as compared to US$323 in 2008, lower inventory variation credit per ounce of US$25 in 2009 as compared to US$4 in 2008 and higher by-product credit silver sales per ounce of US$31 as compared to US$27 in 2008. These costs were partially offset by a higher royalty expense per ounce of US$30 in 2009 as compared to US$26 in 2008 and a higher workers’ profit participation expense per ounce of US$47 in 2009 as compared to US$34 in 2008.
Operating costs increased by 3 percent from US$595.4 million in 2008 to US$613.7 million in 2009. Operating costs consist primarily of drilling, blasting, loading, hauling and milling costs, which increased in 2009 primarily as a result of (i) higher lime and cyanide costs and consumption related to higher ore tons placed in leach pads, (ii) higher maintenance costs related to repairs of haul trucks fleet due to premature failures, (iii) increased electricity used in water treatment and milling, (iv) higher grinding balls consumption due to a full year operation of the Yanacocha Gold Mill and (v) higher labor expenses for salary and bonus increases; partially offset by (i) lower diesel expense due to lower price, and (ii) increased capitalized costs in leach pad and precious metal inventories.
Royalty expense was US$62.3 million in 2009 as compared to US$48.6 million in 2008. The increase in the royalty expense paid to Chaupiloma, which equals 3 percent of Yanacocha’s net sales, was directly related to the increase in Yanacocha’s sales revenues.
Workers’ profit participation increased by 49 percent, from US$61.0 million in 2008 to US$90.7 million in 2009. The increase in workers’ profit participation expense is directly related to the increase in Yanacocha’s taxable net income. Workers’ profit participation expense is calculated based on taxable net income and in accordance with Peruvian labor legislation. See “Item 4. Information on the Company—Yanacocha—Business Overview—Employees.”
Depreciation, depletion and amortization
Depreciation, depletion and amortization decreased by 2 percent from US$169.1 million in 2008 to US$166.1 million in 2009. This decrease was attributable principally to lower depreciation from inventory variation expense, partially offset by higher amortization related to higher tons mined in 2009 as compared to 2008.
Exploration Expenses
Exploration costs decreased by 18 percent from US$28.2 million in 2008 to US$23.0 million in 2009. This decrease was attributable principally to lower perforation works at the Minas Conga and El Solitario projects; partially offset by advanced projects related to oxide/sulfide development programs and the Grande Basin project.
Other expenses
Other expenses increased by 4 percent, or US$3.0 million, from 2008 to 2009, mainly due to a higher negotiated payment to the government; partially offset by lower expenses related to community development and external affairs.
Peruvian mining companies, represented by the Sociedad Nacional de Minería, Petróleo y Energía, agreed to a mining payment equivalent to 3.75 percent of net income after taxes. On December 21, 2006, the Peruvian government issued Supreme Decree No. 071-2006-EM, which regulates the conditions under which the negotiated payment will be paid by Peruvian mining companies. The payment amounts to 3.75 percent of Peruvian net income after income tax, including 2.75 percent to be paid to a local mining fund and 1 percent to be paid to a regional mining fund. This payment is payable from 2006 through 2010, contingent on the price of gold.
Yanacocha will be released from paying the negotiated payment if Yanacocha has to undertake major obligations arising from new taxes or from the modification of existing taxes, and in particular taxes related to mining activities. Yanacocha also will be released if the gold price decreases below the average price for the prior year set by the London Bullion Market Association. The negotiated payment will recommence if gold prices subsequently rise above the reference price.
In 1998, the Peruvian government issued additional regulations regarding the calculation of the workers participation, which limited to 18 monthly salaries the total amount to which each employee is entitled. However, there is a difference between the law and the regulations with regard to the criteria for the calculation. Yanacocha followed the criteria established by the law in determining the amount to be paid to its employees since 1998. As of December 31, 2006, Yanacocha recorded a charge of US$14.9 million to cover any payment derived from the different criteria established to make these payments in accordance with both the law and the regulations. In August 2007, the court reached an arbitration decision confirming that Yanacocha had overpaid FONDO-EMPLEO and the regional government. Although this is a final decision and cannot be appealed, it is not binding on the regional government. Yanacocha’s legal department, based on its best estimate, believes that it can recover a maximum of US$3.9 million of the US$5.3 million paid in excess to FONDO-EMPLEO. The remaining balance was charged to “Other expense, net.” As of December 31, 2009, Yanacocha had recovered US$4.0 million from FONDO-EMPLEO. In September 2007, Yanacocha paid the balance of US$21.8 million (including interest) owed to employees, which exceeded the original amount accrued of US$6.9 million. The additional amount mostly relates to interest paid by Yanacocha to employees.
Income tax provision
The increase in income tax provision was directly related to Yanacocha’s increase in taxable income. The net effective tax rate was 31.5 percent in 2009 compared to 29.2 percent in 2008. The statutory rate for both years was a weighted average of 30 percent. The factors that most significantly impacted Yanacocha’s net effective tax rate were related to higher non-deductible expenses.
The uniform income tax rate in Peru was 27 percent of taxable income in 2003. Effective January 1, 2004, the income tax rate in Peru is 30 percent of taxable income (Yanacocha, as explained below, has a stabilized corporate tax rate of 30 percent, excluding income from the La Quinua mine which had a tax rate of 27 percent until December 31, 2003 and 29 percent since January 1, 2004) and for financial statement purposes is calculated for Yanacocha in accordance with U.S. GAAP. Pursuant to Supreme Decree No. 027-98-EF, mining companies can obtain a tax benefit in the form of an investment credit, by effectively reinvesting non-distributed earnings into capital expansion projects that increase Yanacocha’s productivity. This investment credit is based on 80 percent of amounts reinvested and is obtained by application to and approval by the MEM.
Yanacocha has entered into Mining Law Stabilization Agreements under the General Mining Law with the Peruvian government. A Mining Law Stabilization Agreement is a standardized agreement prepared by the MEM, the Ministry of Economy and Finance, the Central Bank and other Peruvian governmental ministries. Such agreements (i) provide stabilized corporate tax rates, (ii) grant the ability to obtain VAT credit, (iii) provide full access to foreign currency and guarantee treatment in all foreign exchange matters as is given to Peruvian nationals, (iv) protect against foreign exchange controls and (v) grant the right to freely dispose of and export mineral products. Yanacocha has entered into such agreements with regard to the following mines: Carachugo/San Jose, Maqui Maqui, Cerro Yanacocha and La Quinua. Pursuant to these agreements, the income tax rate in Peru is 30 percent of taxable income, excluding income from the La Quinua mine which had a tax rate of 27 percent until December 31, 2003 and 29 percent since January 1, 2004.
Net Income
As a consequence of the foregoing, net income increased by 53 percent, or US$250.6 million, from US$476.5 million in 2008 to US$727.1 million in 2009. As a percentage of sales, net income increased from 30 percent in 2008 to 36 percent in 2009.
B. Liquidity and Capital Resources
As of December 31, 2010, Yanacocha had cash and cash equivalents of US$880.9 million, substantially all of which were held in U.S. Dollars, as compared to US$732.6 million as of December 31, 2009.
Cash provided by operating activities
Yanacocha’s operations generated a net cash flow of US$621.7 million in 2010, US$981.4 in 2009 and US$744.5 million in 2008. The decrease in net cash flow provided by operating activities in 2010 was mainly due to lower sales revenues due to a decrease in the volume of gold sold, offset by higher average realized prices in 2010 and lower working capital related to higher income tax prepayments, higher accrued liabilities, and lower inventories. The increase in net cash flow provided by operating activities in 2009 was mainly due to higher sales revenues due to an increase in the volume of gold sold and higher average realized price during 2009, higher working capital related to higher VAT refunded and lower prepaids and higher by-product silver sales due to higher ounces sold and higher average realized price, partially offset by higher accrual of liabilities mainly related to income tax, workers’ participation expense and voluntary contribution.
Cash used in investing activities
Net cash used in investing activities was US$296.7 million in 2010, US$148.9 in 2009 and US$251.3 million in 2008. In 2010, Yanacocha’s investing activities consisted primarily of US$131.9 million for the Conga project, US$23.3 million for the purchase of high altitude mining trucks, US$15.1 million for the construction of an alternate road to the coast of Peru, US$38.6 million for mine development at the El Tapado Oeste, Chaquicocha, Western Oxides and Maqui Maqui deposits, US$17.9 million for leach pad expansions at La Quinua (Stage 7B) and Carachugo (Stage 10C), US$6.9 million for the construction of a reverse osmosis plant for excess water treatment at Pampa Larga, US$6.5 million for the construction of a carbon column processing plant and US$4.7 million for the construction of a new central warehouse. In 2009, Yanacocha’s investing activities consisted primarily of US$29.5 million for the construction of an alternate road to the coast of Peru, US$27.4 million for the Conga project, US$21.7 million for mine development at the Chaquicocha and El Tapado Oeste deposits, US$15.1 million for the construction of an acid water treatment plant, US$11.9 million for leach pad expansions at La Quinua (Stage 7), US$7.2 million for the construction of a reverse osmosis plant for excess water treatment at Pampa Larga, US$5.5 million for dewatering systems expansions at the La Quinua and Yanacocha pits and US$3.2 million for the construction of gold mill tailings pipelines.
Cash used in financing activities
Net cash used in financing activities was US$176.7 million in 2010, US$257.3 million in 2009 and US$624.0 million in 2008. In 2010, Yanacocha’s financing activities consisted primarily of US$176.4 million of debt repayments, including the repayment in full a credit facility and all amounts outstanding under a 2006 US$100 million bond issuance in the Peruvian capital markets under a $200 million bond program approved by the Peruvian securities regulatory authority. Yanacocha used the funds generated from the issuance primarily for capital expenditures. In 2009, financing activities consisted principally of US$230 million of dividends distributed to partners and US$27.3 million of debt repayments.
Exploration Costs; Capital Expenditures
Exploration
Yanacocha’s basic and advanced exploration costs during the period from 1992 through 2010 were financed with a combination of internally generated funds, advances from partners and loans from DEG and IFC. See Note 11 to the Yanacocha Financial Statements. During 2008, 2009 and 2010, Yanacocha incurred US$28.2 million, US$23.0 million and US$26.4 million, respectively, in exploration costs. In 2011, exploration efforts will focus on further identifying sulfide mineralization beneath existing oxide resources, higher grade deep targets and copper-gold mineralization at Minas Conga.
Capital Expenditures
Yanacocha’s capital expenditures from its formation in 1992 through 2010 were financed with a combination of internally generated funds, advances from partners, loans from DEG and IFC and proceeds from Yanacocha’s Receivables Securitization (see Note 11 to the Yanacocha Financial Statements). Such capital expenditures have related principally to the construction of the Carachugo, Maqui Maqui, San José, Cerro Yanacocha and La Quinua mining operations, the construction of the two plants at Carachugo and Yanacocha that include a leach solution processing facility and a smelter at each plant, the construction of four carbon column plants at Cerro Yanacocha and La Quinua, the acquisition of both new and used mining equipment, the construction of two dams, the construction of one agglomeration plant at La Quinua, the construction of a gold mill facility at Yanacocha and the expansion of the leach pads located at the Carachugo, Maqui Maqui, Cerro Yanacocha and La Quinua mining operations. Yanacocha’s capital expenditures from its formation through December 31, 2010 totaled approximately US$3,106.0 million. Yanacocha anticipates that its capital expenditures for 2011 will be approximately US$1,036.5 million, in connection with the continuation of the Minas Conga project, the continuation of mine development at the El Tapado Oeste, Chaquicocha, Western Oxides and Maqui Maqui deposits, the continuation of expansions to the water pumping system to extract excess water, continuation of the construction of gold mill tailings pipelines, the development of the Pangaea Project, payments for waterways and irrigation channels acquired from the Quishuar, Encajón-Collotán and La Shacsha communities, land acquisitions and the purchase of one evacuator.
C. Research and Development
Yanacocha is a mining exploration and production company and does not engage in research and development activities.
CERRO VERDE
Introduction
The following discussion should be read in conjunction with the Cerro Verde Financial Statements and the related notes thereto included elsewhere in this Annual Report. The Cerro Verde Financial Statements are prepared and presented in accordance with Peruvian GAAP.
A. Operating Results
Overview
We hold a 19.26 percent interest in Cerro Verde, which operates an open-pit and molybdenum mining complex located 20 miles southwest of Arequipa, Peru. The site is accessible by paved highway. The Cerro Verde mine has been in operation since 1976. The Cerro Verde mine is a porphyry copper deposit that has leachable oxide and secondary sulfide mineralization, and millable primary sulfide mineralization. The predominant copper minerals are brochantite, chrysocolla, malachite and copper “pitch”. Chalcocite and covellite are the most important secondary copper sulfide minerals. Chalcopyrite and molybdenite are the dominant primary sulfides.
Cerro Verde’s current operations consist of an open-pit copper mine and SX/EW leaching facilities. Leach-copper production is derived from a 39,000 metric ton-per-day crushed leach facility and a ROM leach system. This leaching operation has a capacity of approximately 200 million pounds of copper per year. A 108,000 metric ton-per-day concentrator was completed in late 2006, and processing of sulfide ore began in the fourth quarter of 2006. During 2010, Cerro Verde completed a project to increase throughput of the concentrator to approximately 120,000 metric tons of ore per day. Annual production between 2011 and 2013 is expected to range from 574 to 648 million pounds of copper per year, of which 111 to 125 million pounds would be our equity share of production, and 10 to 12 million pounds of molybdenum per year.
Cerro Verde has sufficient equipment to move an average of 308,000 metric tons of material per day using a fleet of 28 180-metric ton and 230-metric ton haul trucks loaded by five shovels with bucket sizes ranging in size from 21 to 53 cubic meters. Copper cathodes and concentrate production are transported approximately 70 miles by truck and rail to the Pacific Port of Matarani for shipment to international markets.
Cerro Verde receives electrical power under long-term contracts with Kallpa Generación S.A. and Empresa de Generación Eléctrica de Arequipa. Water for Cerro Verde’s processing operations comes from renewable sources through a series of storage reservoirs on the Rio Chili watershed that collect water primarily from seasonal precipitation. Cerro Verde’s participation in the Pillones Reservoir Project has secured water rights that Cerro Verde believes will be sufficient to support its currently planned operations. With the completion of the Bamputañe dam during 2009, an additional 40 million cubic meters of water storage was added to the system.
Critical Accounting Policies
Cerro Verde has furnished us with a discussion of its critical accounting policies or methods used in the preparation of its financial statements. Critical accounting policies are defined as those that are reflective of significant judgments and uncertainties and could potentially impact results under different assumptions and conditions. Note 2 to the Cerro Verde Financial Statements includes a summary of the significant accounting policies and methods used in the preparation of the Cerro Verde Financial Statements. The following is a brief discussion of the identified critical accounting policies and the estimates and judgments made by Cerro Verde.
Mineral Reserve and depreciation, Depletion and Amortization
Cerro Verde depreciates the life-of-mine mining and milling assets using the unit-of-production method based on the estimated recoverable proven and probable copper reserves. Cerro Verde has other assets that they depreciate on a straight-line basis over their estimated useful lives. The estimates of recoverable proven and probable copper reserves and the useful lives of the straight-line assets impact the depreciation, depletion and amortization expense.
Accounting for depreciation represents a critical accounting estimate because the determination of reserves involves uncertainties with respect to the ultimate geology of the reserves and the assumptions used in determining the economic feasibility of mining those reserves, including estimated copper prices and costs of conducting future mining activities. Additionally, changes in estimated recoverable proven and probable reserves and useful asset lives can have a material impact on net income. Cerro Verde performs annual assessments of the existing assets, including a review of asset costs and depreciable lives, in connection with the review of mine operating and development plans. When Cerro Verde determines that assigned asset lives do not reflect the expected remaining period of benefit, it makes prospective changes to those depreciable lives.
There are a number of uncertainties inherent in estimating quantities of reserves, including many factors beyond the control of Cerro Verde’s management. Ore reserve estimates are based upon engineering evaluations of samplings of drill holes. The estimates of recoverable proven and probable reserves are prepared by the employees of Cerro Verde, and a majority of these estimates are reviewed and verified by independent experts in mining, geology and reserve determination. At December 31, 2010, recoverable reserves included 9 billion pounds of copper proven reserves and 18 billion pounds of copper probable reserves. These estimates involve assumptions regarding future copper prices, the geology of Cerro Verde mine, the mining methods that Cerro Verde uses and the related costs it incurs to develop and mine the reserves. Changes in these assumptions could result in a material adjustment to Cerro Verde’s reserve estimates, which could result in changes to depreciation, depletion and amortization expense in future periods, with corresponding adjustments to net income.
Cerro Verde reviews and evaluates the long-lived assets for impairment when events or changes in economic circumstances indicate that the related carrying amount of such assets may not be recoverable. Changes to the estimates of recoverable proven and probable reserves could have an impact on the assessment of asset impairment. Revisions to the estimates of recoverable proven and probable copper reserves could give rise to an impairment of the assets.
Recoverable Copper
Cerro Verde records, as inventory, applicable costs for copper contained in mill and leach stockpiles that are expected to be processed in the future based on proven processing technologies. Mill and leach stockpiles are evaluated periodically to ensure that they are stated at the lower of cost or market. Accounting for recoverable copper from mill and leach stockpiles represents a critical accounting estimate because (i) it is generally impracticable to determine copper contained in mill and leach stockpiles by physical count, and therefore, requires management to employ reasonable estimation methods and (ii) recovery rates from leach stockpiles can vary significantly. The quantity of material delivered to mill and leach stockpiles is based on surveyed volumes of mined material and daily production records. Sampling and assaying of blast hole cutting determine the estimated copper grade contained in the material delivered to the mill and leach stockpiles.
Expected copper recovery rates for mill stockpiles are determined by metallurgical testing. The recoverable copper in mill stockpiles, once entered into the production process, can be extracted into copper concentrate almost immediately.
Processes and recovery rates are monitored continuously, and recovery rate estimates are adjusted periodically as additional information becomes available and as related technology changes.
Reclamation and Closure Cost
Reclamation is an ongoing activity that occurs throughout the life of a mine. In accordance with IAS 37 “Provisions, contingent liabilities and contingent assets”, Cerro Verde records the fair value of the estimated asset retirement obligations, or AROs, associated with tangible long-lived assets in the period incurred. Fair value is measured as the present value of cash flow estimates after considering inflation and then applying a market risk premium. The cost estimates are reflected on a third-party cost basis and comply with the legal obligation to retire tangible, long-lived assets as defined by IAS 37. These cost estimates may differ from financial assurance cost estimates for reclamation activities because of a variety of factors, including obtaining updated cost estimates for reclamation activities, the timing of reclamation activities, changes in scope and the exclusion of certain costs not accounted for under IAS 37.
Generally, ARO activities are specified by regulations or in permits issued by the relevant governing authority, and management judgment is required to estimate the extent and timing of expenditures based on life-of-mine planning. Accounting for reclamation and closure costs represents an estimate because (i) Cerro Verde will not incur most of these costs for a number of years, requiring us to make estimates over a long period, (ii) reclamation and closure laws and regulations could change in the future and/or circumstances affecting the operations could change, either of which could result in significant changes to the current plans, (iii) calculating the fair value or the AROs in accordance with IAS 37 requires management to estimates projected cash flows, make long-term assumptions about inflation rates, determine the credit-risk adjusted rate and determine market risk premiums that are appropriate for the operations and (iv) given the magnitude of the estimated reclamation and closure costs, changes in any or all of these estimates could have a significant impact on net income.
Environmental obligations
Accounting for environmental obligations represents a critical accounting estimate because changes to environmental laws and regulations and/or circumstances affecting operations could result in significant changes to the estimates, which could have a significant impact on net income. As management judgment and estimates are required to comply with applicable Peruvian GAAP guidance, on an annual basis, Cerro Verde reviews changes in facts and circumstances associated with the environmental obligations. Judgments and estimates are based upon available fact, existing technology, presently enacted law and regulations, remediation experience, whether or not Cerro Verde is a Potentially Responsible Party, or PRP, and the ability of other PRPs to pay their allocated portions, taking into consideration reasonably possible outcomes. The estimates can change substantially as additional information becomes available regarding the nature or extend of the contamination, required remediation methods and actions by or against governmental agencies or private parties.
Deferred Taxes
In preparing its annual financial statements, Cerro Verde estimates the actual amount of taxes currently payable or receivable as well as deferred tax assets and liabilities attributable to temporary differences between the financial statement carrying amounts of existing assets and liabilities and their respective tax basis. Deferred income tax assets and liabilities are measured using enacted tax rates expected to apply to taxable income in the years in which these temporary differences are expected to be recovered or settled. The effect on deferred tax assets and liabilities of a change in tax rate and laws is recognized in income in the period in which such changes are enacted.
All deductible temporary differences and loss carry-forwards generate the recognition of deferred assets to the extent that it is probable that they can be used in calculating taxable income in future years. Deferred income tax and workers’ profit sharing liabilities are recognized for all deductible temporary differences and tax loss carry-forwards, to the extent that it is probable that taxable profit will be available against which the deductible temporary differences and unused tax losses can be utilized. The carrying amount of the deferred income tax and workers’ profit sharing assets is reviewed at each consolidated balance sheet date and reduced to the extent that it is no longer probable that sufficient taxable profit will be available to allow all or part of the deferred asset to be utilized. Unrecognized deferred assets are reassessed at each consolidated balance sheet date.
Deferred assets and liabilities are offset if there is a legal right to set them off and the taxes deferred relate to the same entity and the same tax authority.
Impairment of long-lived assets
Cerro Verde evaluates its long-lived assets for impairment when events or changes in circumstances indicate that the related carrying amount of such assets may not be recoverable. During the fourth quarter of 2010, Cerro Verde concluded that the current economic environment and the significant declines in copper prices represented significant adverse changes in its business, which required Cerro Verde to evaluate its long-lived assets for impairment as of December 31, 2010, under the procedures established by IAS 36 – “Impairment of Assets.”
Cerro Verde’s asset impairment evaluations required it to make several assumptions in determining estimates of future cash flows to determine fair value of its individual mining operations, including near and long-term metal price assumptions, estimates of commodity-based and other input costs, proven and probable reserves estimates, including any costs to develop the reserves and the timing of producing the reserves, and use of the appropriate discount rate. Cerro Verde’s December 31, 2010 impairment evaluation was based on price assumptions reflecting prevailing metals prices for three years. As a result of the evaluation of the value in use of our long-lived assets, Cerro Verde determined that it was not required to record a loss due to the impairment of its long-lived assets.
Cerro Verde believes events that could result in additional impairment of its long-lived assets include, but are not limited to, (i) decreases in future metal prices, (ii) decrease in estimated recoverable proven and probable reserves and (iii) any event that might otherwise have a material effect on mine site production levels or costs. Refer to Note 7 to the Financial Statements for further discussion.
Results of Operations for the Years Ended December 31, 2010 and 2009
Net sales. Net sales, including mark-to-market adjustments for pounds of copper pending settlement, increased by 35 percent, from US$1,757.5 million in 2009 to US$2,368.9 million in 2010, principally due to an increase in the price of copper. The following tables reflect the average realized price and volume sold of copper (both cathode and concentrate) during the years ended December 31, 2009 and 2010:
| | | Year ended December 31, | | | | |
| | | | | | | | | | |
| Average price | | | | | | | | | | | | |
| Copper (US$/MT) | | US$ | 5,806 | | | US$ | 7,981 | | | | 37 | % |
| | | | | | | | | | | | | |
| Volume sold | | | | | | | | | | | | |
| Copper (MT) | | | 302,683 | | | | 296,821 | | | | (2 | )% |
Average realized copper prices per metric ton increased from US$5,806 in 2009 to US$7,981 in 2010. The volume of copper sold decreased from 302,683 metric tons in 2009 to 296,821 metric tons in 2010, mainly due to a decrease in the volume of copper cathodes sold. The combined effect of these changes resulted in a US$611.4 million increase in income from sales of copper in 2010 compared to 2009.
Total costs of sales. Total costs of sales increased by 8 percent, from US$528.0 million in 2009 to US$571.3 million in 2010, due to the following:
(a) Material and supplies consumption costs increased by 11 percent from US$248.4 million in 2009 to US$276.3 million in 2010, primarily related to increased utilization of materials and operating supplies.
(b) Depreciation and amortization costs increased by 13 percent from US$77.9 million in 2009 to US$87.9 million in 2010, due principally to an increase in depreciation charges.
(c) Energy costs increased by 8 percent from US$49.0 million in 2009 to US$53.0 million in 2010, mainly due to an increase in energy consumption during the milling process.
(d) Labor costs increased by 25 percent from US$63.9 million in 2009 to US$79.9 million in 2010, due mainly to salary increases granted to employees during 2010.
Total operating expenses. Operating expenses increased by 26 percent from US$105.2 million in 2009 to US$132.1 million in 2010, due to changes in the following components:
(a) Selling expenses increased by 13 percent from US$67.9 million in 2009 to US$76.6 million in 2010, due mainly to an increase in freight expenses for both cathodes and copper concentrates sold during 2010;
(b) Other operating expenses increased by 48 percent from US$9.7 million in 2009 to US$14.4 million in 2010 principally due to pre-feasibility studies for the expansion of mining operations charged in 2010; and
(c) Voluntary Contribution expense increased by 49 percent from US$27.6 million in 2009 to US$41.0 million in 2010.
Operating income. As a result of the foregoing, operating income increased by 48 percent, from US$1,124.2 million in 2009 to US$1,665.5 million in 2010.
Workers’ profit sharing. Workers’ profit sharing expense, including current and deferred expense, increased by 48 percent from US$92.9 million in 2009 to US$137.6 million in 2010. The net increase in workers’ profit sharing was due to higher taxable net income during 2010.
Income tax. Income tax expense, including current and deferred expense, increased by 48 percent from an expense of US$320.7 million in 2009 to an expense of US$474.7 million in 2010. Net current income tax expense increased due to an increase in net taxable income during 2010.
On February 13, 1998, Cerro Verde signed an Agreement of Guarantees and Measures to Promote Investment with the Government of Peru, under the Peruvian General Mining Law. Upon the approval of the agreement, Cerro Verde is subject to the tax in force at May 6, 1996. Cerro Verde has tax stability for a period of fifteen years counted from January 1, 1999. Pursuant to Supreme Decree No. 07-94-EF, mining companies can obtain a tax benefit in the form of an investment credit, by effectively reinvesting non-distributed earnings into capital expansion projects that increase Cerro Verde’s productivity. This investment credit is based on 80 percent of amounts reinvested and is obtained by application to and approval by the MEM. Under the terms of this reinvestment program, Cerro Verde reinvested an aggregate of approximately US$800 million of its earnings during 2005, 2006 and 2007. On October 30, 2009 through Resolution No. 213-2009/MEM-DGM, the MEM approved the execution of the reinvestment program for an amount of US$800 million. At the General Shareholders’ Meeting on December 2, 2009, Cerro Verde’s shareholders approved the capitalization of retained earnings to comply with the legal requirements under which Cerro Verde retains its right to the reinvestment mechanism established in article 72(b) of the General Mining Law. As a result of this agreement, Cerro Verde’s new capital stock increased to US$991 million, and the nominal value of the each share was increased to US$2.83.
Net income. As a result of the foregoing, net income increased by 49 percent from US$708.5 million in 2009 to US$1,054.4 million in 2010. As a percentage of net sales, net income was 45 percent in 2010, compared with 40 percent in 2009.
Results of Operations for the Years Ended December 31, 2009 and 2008
Net sales. Net sales, including market to market adjustments for pounds of copper pending settlement, decreased by 4.3 percent, from US$1,835.9 million in 2008 to US$1,757.5 million in 2009, principally due to a decrease in metric tons sold during 2009, partially offset by an increase in the average realized price of copper. The following tables reflect the average realized price and volume sold of copper (both cathode and concentrate) during the years ended December 31, 2008 and 2009:
| | | Year ended December 31, | | | | |
| | | | | | | | | | |
| Average price | | | | | | | | | | | | |
| Copper (US$/MT) | | $ | 5,557 | | | $ | 5,806 | | | | 4.5 | % |
| | | | | | | | | | | | | |
| Volume sold | | | | | | | | | | | | |
| Copper (MT) | | | 322,908 | | | | 302,683 | | | | (6.3 | )% |
Average realized copper prices per metric ton increased from US$5,557 in 2008 to US$5,806 in 2009. The volume of copper sold decreased from 322,908 metric tons in 2008 to 302,683 metric tons in 2009, mainly due to a decrease in the volume of copper concentrates sold. The combined effect of these changes resulted in a US$78.4 million decrease in income from sales of copper in 2009 compared to 2008.
Total costs of sales. Total costs of sales decreased by 11.51 percent, from US$596.7 million in 2008 to US$528.0 million in 2009, due to the following:
(a) Material and supplies consumption costs decreased by 5.23 percent from US$262.1 million in 2008 to US$248.4 million in 2009, primarily related to a decrease in the utilization of materials, supplies and spare parts and a decrease in maintenance costs for Cerro Verde’s concentrator plant.
(b) Depreciation and amortization costs decreased by 3.47 percent from US$80.7 million in 2008 to US$77.9 million in 2009, due principally to the adjustment of the cost value related to intangible assets and a decreased depreciation charge in 2009.
(c) Energy costs decreased by 5.41 percent from US$51.8 million in 2008 to US$49.0 million in 2009, mainly due to lower energy consumption in the milling and molybdenum processes and a reduction in the price of electricity.
(d) Labor costs decreased by 6.17 percent from US$68.1 million in 2008 to US$63.9 million in 2009, mainly due to a slight decrease in personnel in 2009, partially offset by the payment of a bonus in accordance with the union agreement negotiated with the Sindicato Único de Trabajadores de Sociedad Minera Cerro Verde in September 2008.
Total operating expenses. Operating expenses decreased by 23.55 percent from US$137.6 million in 2008 to US$105.2 million in 2009, due to changes in the following components:
(a) Selling expenses decreased by 13.06 percent from US$78.1 million in 2008 to US$67.9 million in 2009, mainly due to the decreased volume of copper sold during 2009;
(b) Other operating expenses decreased by 67.6 percent from US$29.9 million in 2008 to US$9.7 million in 2009 principally due to decreased expenses under a provision related to the construction of a water treatment plant in Arequipa, which totaled US$7.8 million in 2009 as compared to US$25.8 million in 2008; and
(c) Voluntary Contribution expense decreased by 6.44 percent from US$29.5 million in 2008 to US$27.6 million in 2009.
Operating income. As a result of the foregoing, operating income increased by 2.06 percent, from US$1,101.5 million in 2008 to US$1,124.2 million in 2009.
Financial income. Financial income decreased by 91.63 percent from US$20.3 million in 2008 to US$1.7 million in 2009, primarily related to decreased interest earned by Cerro Verde in marketable securities due to lower interest rates in the market during 2009. As of December 31, 2009 and 2008, these investments amounted to US$199.9 million and US$460.1 million, respectively.
Financial expense. Financial expense decreased by 100 percent from US$7.9 million in 2008, mainly due to the prepayment of all of Cerro Verde’s outstanding corporate bonds in September 2008. As of December 31, 2009, Cerro Verde had no outstanding indebtedness.
Workers’ profit sharing. Workers’ profit sharing expense, including current and deferred expenses, increased by 5.1 percent from US$88.4 million in 2008 to US$92.9 million in 2009. Current workers’ profit sharing expense decreased from US$100.6 million in 2008 to US$57.7 million in 2009 due to a reduction in taxable net income during 2009. Deferred workers’ profit sharing expense increased from a benefit of US$12.2 million in 2008 to an expense of US$35.2 million in 2009. The US$47.4 increase in deferred workers’ profit sharing expense is primarily related to provisional sales adjustments.
Income tax. Income tax expense, including current and deferred expenses, increased by 5.2 percent from an expense of US$304.8 million in 2008 to an expense of US$320.7 million in 2009. Current income tax expense decreased from US$346.9 million in 2008 to US$199.2 million in 2009 due to a reduction in taxable net income during 2009. Deferred income tax expense increased from a benefit of US$42.1 in 2008 to an expense of US$121.5 in 2009, primarily related to provisional sales adjustments.
On February 13, 1998, Cerro Verde signed an Agreement of Guarantees and Measures to Promote Investment with the Government of Peru, under the Peruvian General Mining Law. Upon the approval of the agreement, Cerro Verde is subject to the tax in force at May 6, 1996. Cerro Verde has tax stability for a period of fifteen years counted from January 1, 1999. Pursuant to Supreme Decree No. 07-94-EF, mining companies can obtain a tax benefit in the form of an investment credit, by effectively reinvesting non-distributed earnings into capital expansion projects that increase Cerro Verde’s productivity. This investment credit is based on 80 percent of amounts reinvested and is obtained by application to and approval by the MEM. Under the terms of this reinvestment program, Cerro Verde reinvested an aggregate of approximately US$800 million of its earnings during 2005, 2006 and 2007. On October 30, 2009 through Resolution No. 213-2009/MEM-DGM, the MEM approved the implementation of the reinvestment program for an amount of US$800 million. At the General Shareholders’ Meeting on December 2, 2009, Cerro Verde’s shareholders approved the capitalization of retained earnings to comply with the legal status due to which Cerro Verde retains its right to the reinvestment mechanism established in article 72(b) of the General Mining Law. As a result of this agreement Cerro Verde’s new capital stock increased to US$991 million, and the nominal value of the each share was increased to US$2.83.
Net income. As a result of the foregoing, net income decreased by 1.38 percent from US$718.4 million in 2008 to US$708.4 million in 2009. As a percentage of net sales, net income was 40.3 percent in 2009, compared with 39.1 percent in 2008.
B. Liquidity and Capital Resources
As of December 31, 2010, Cerro Verde had cash and cash equivalents of US$388.1 million, compared to US$203.3 million at December 31, 2009.
Cash provided by operating activities for the years ended December 31, 2010 and 2009. Net cash and cash equivalents provided by operating activities were US$1,256.9 million in 2010 and US$399.6 million in 2009. The increase in net cash flow provided by operating activities in 2010 compared with 2009 was mainly attributable to the following factors: increased collections from customers, from US$1,302.2 million in 2009 to US$2,395.0 million in 2010; decreased payments to suppliers and third parties, from US$516.4 million in 2009 to US$337.6 million in 2010; and increased payments of income tax, from US$215.4 million in 2009 to US$325.7 million in 2010.
Cash provided by operating activities for the years ended December 31, 2009 and 2008. Net cash and cash equivalents provided by operating activities were US$399.6 million in 2009 and US$903.9 million in 2008. The decrease in net cash flow provided by operating activities in 2009 compared with 2008 was mainly attributable to the following factors: decreased collections from customers, from US$1,797.4 million in 2008 to US$1,302.2 million in 2009; decreased payments to suppliers and third parties, from US$608.5 million in 2008 to US$516.4 million in 2009; decreased payments to personnel, from US$162.4 million in 2008 to US$114.7 million in 2009; decreased payments of other expenses due to contributions in favor of local government from US$97.4 million in 2008 to US$28 million in 2009; and decreased payments of income tax, from US$393.1 million in 2008 to US$215.4 million in 2009.
Cash used in investing activities. Net cash and cash equivalents used in investing activities were US$122.2 million in 2010, US$91.3 million in 2009 and US$133.8 million in 2008.
Cash used in investing activities for the years ended December 31, 2010 and 2009. Net cash used in investing activities increased from US$91.3 million in 2009 to US$122.2 million in 2010, mainly due to an increase in the purchases of property, plant and equipment.
Cash used in investing activities for the years ended December 31, 2009 and 2008. Net cash used in investing activities decreased from US$133.8 million in 2008 to US$91.3 million in 2009, mainly due to decreased purchases of property, plant and equipment.
Cash used in financing activities. Net cash and cash equivalents used in financing activities were US$950.0 million in 2010, US$586.6 in 2009 and US$918.8 million in 2008.
Cash used in financing activities for the years ended December 31, 2010 and 2009. The increase in net cash flow used in financing activities in 2010 compared with 2009 was mainly attributable to US$578.4 million increase in dividend payments, partially offset by a premium to capital of US$215.0 million paid in 2009.
Cash provided by financing activities for the years ended December 31, 2009 and 2008. The decrease in net cash flow used in financing activities in 2009 compared with 2008 was mainly attributable to a US$468.4 million decrease in dividend payments, partially offset by a US$215 million payment of premium capital in 2009.
Long-term Debt
As of December 31, 2010, Cerro Verde had no debt outstanding.
C. Research and Development
Not applicable.
D. Trend Information
The Company’s Trend Information
Other than as disclosed in this Annual Report, we are not aware of any trends, uncertainties, demands, commitments or events which are reasonably likely to have a material effect upon our net sales or revenues, income from continuing operations, profitability, liquidity or capital resources, or that would cause reported financial information to be not necessarily indicative of future operating results or financial condition.
For our exploration activities, there is no production, sales or inventory in a conventional sense. Our financial success is dependent upon the extent to which we are capable of discovering mineralization and the economic viability of exploration properties. The construction and operation of such properties may take years to complete and the resulting income, if any, cannot be determined with certainty. Further, the sales value of mineralization discovered by us is largely dependent upon factors beyond our control, including the market value at any given time of the metals produced.
Yanacocha’s Trend Information
Other than as disclosed in this Annual Report, Yanacocha has informed us that it is not aware of any trends, uncertainties, demands, commitments or events which are reasonably likely to have a material effect upon Yanacocha’s net sales or revenues, income from continuing operations, profitability, liquidity or capital resources, or that would cause reported financial information to not necessarily be indicative of future operating results or financial condition.
Cerro Verde’s Trend Information
Other than as disclosed in this Annual Report, Cerro Verde has informed us that it is not aware of any trends, uncertainties, demands, commitments or events which are reasonably likely to have a material effect upon Cerro Verde’s net sales or revenues, income from continuing operations, profitability, liquidity or capital resources, or that would cause reported financial information to not necessarily be indicative of future operating results or financial condition.
E. Off-Balance Sheet Arrangements
Our Off-Balance Sheet Information
There are no off-balance sheet arrangements that have or are reasonably likely to have a current or future effect on our financial condition, changes in financial condition, revenues or expenses, results of operations, liquidity, capital expenditures or capital resources that are material to investors.
Yanacocha’s Off-Balance Sheet Information
Yanacocha has informed us that there are no off-balance sheet arrangements that have or are reasonably likely to have a current or future effect on Yanacocha’s financial condition, changes in financial condition, revenues or expenses, results of operations, liquidity, capital expenditures or capital resources that are material to investors.
Cerro Verde’s Off-Balance Sheet Information
Cerro Verde has informed us that there are no off-balance sheet arrangements that have or are reasonably likely to have a current or future effect on Cerro Verde’s financial condition, changes in financial condition, revenues or expenses, results of operations, liquidity, capital expenditures or capital resources that are material to investors.
F. Tabular Disclosure of Contractual Obligations
Our Contractual Obligations
The following table shows our contractual obligations as of December 31, 2010:
| | | | | | Payments due by Period (US$ in millions) | |
| | | | | | Less than or equal to | | | 1-3 | | | 4-5 | | | After 5 | |
| | | | | | | | | | | | | | | | |
| Long-Term Debt (*) | | | 57.2 | | | | 2.0 | | | | 1.8 | | | | 53.4 | | | | - | |
| Capital Lease Obligations | | | - | | | | - | | | | - | | | | - | | | | - | |
| Reclamation and Remediation Liability | | | 77.4 | | | | 11.0 | | | | 17.8 | | | | 15.1 | | | | 33.5 | |
| Open Purchase Orders | | | - | | | | - | | | | - | | | | - | | | | - | |
| Other Long-Term Obligations (**) | | | 69.4 | | | | 20.2 | | | | 7.3 | | | | 30.8 | | | | 11.1 | |
| | | | | | | | | | | | | | | | | | | | | |
| Total Contractual Cash Obligations | | | 204.0 | | | | 33.2 | | | | 26.9 | | | | 99.3 | | | | 44.6 | |
(*) Long-term debt includes US$54.1 million, which corresponds to a financial lease agreement between Banco de Crédito and Conenhua, Huanza and us for construction of a hydroelectric power station.
As of December 31, 2010, we had no other commercial commitments.
Yanacocha’s Contractual Obligations
The following table shows Yanacocha’s contractual obligations as of December 31, 2010:
| | | | | | Payments due by Period (US$ in millions) | |
| | | | | | Less than or equal to | | | 1-3 | | | 4-5 | | | After 5 | |
| | | Total | | | year | | | years | | | years | | | years | |
| Long-Term Debt | | | - | | | | - | | | | - | | | | - | | | | - | |
| Capital Lease Obligations | | | 1.9 | | | | 1.9 | | | | - | | | | - | | | | - | |
| Reclamation and Remediation Liability | | | 287.9 | | | | 7.6 | | | | 22.7 | | | | 15.2 | | | | 242.4 | |
| Open Purchase Orders | | | - | | | | - | | | | - | | | | - | | | | - | |
| Other Long-Term Obligations (**) | | | 15.6 | | | | 15.6 | | | | - | | | | - | | | | - | |
| | | | | | | | | | | | | | | | | | | | | |
| Total Contractual Cash Obligations | | | 305.4 | | | | 25.1 | | | | 22.7 | | | | 15.2 | | | | 242.4 | |
(**) Other long-term contracts include deferred workers compensation obligations, power and fuel supply contract commitments and fuel and inventory obligations.
Cerro Verde’s Contractual Obligations
The following table shows Cerro Verde’s contractual obligations as of December 31, 2010:
| | | | | | Payments due by Period (US$ in millions) | |
| | | | | | Less than or equal to | | | 1-3 | | | 4-5 | | | After 5 | |
| | | | | | | | | | | | | | | | |
| Provision for remediation and mine closure | | | 12.1 | | | | - | | | | - | | | | - | | | | 12.1 | |
| | | | | | | | | | | | | | | | | | | | | |
| Total Contractual Cash Obligations | | | 12.1 | | | | - | | | | - | | | | - | | | | 12.1 | |
ITEM 6. Directors, Senior Management and Employees
A. Board of Directors and Senior Management
Our Board of Directors is responsible for policy decisions and our overall direction and other corporate matters in accordance with our By-laws and the Peruvian Companies Law. Our executive officers oversee our business and are responsible for the execution of the policy decisions of the Board of Directors. The Board of Directors, which must be comprised of seven members, is elected at the annual obligatory meeting of shareholders, or the Annual Obligatory Meeting, for a three year term. The last election took place in March 2011, and the next election is scheduled for March 2013. See “Item 10. Additional Information—Memorandum and Articles of Association.”
Our current directors and executive officers are as follows:
| Name | | Age | | Position | | Date First Appointed | | Current Term Ends |
| Directors | | | | | | | | |
| Roque Benavides | | 56 | | Chairman of the Board | | 1980 | | March 2013 |
| Timothy Snider | | 61 | | Director | | 2011 | | March 2013 |
| Luis Coleridge | | 74 | | Director | | 2000 | | March 2013 |
| Aubrey Laurence Paverd | | 72 | | Director | | 2002 | | March 2013 |
| Felipe Ortiz-de-Zevallos | | 63 | | Director | | 2003 | | March 2013 |
| Carlos del Solar | | 70 | | Director | | 2011 | | March 2013 |
| Germán Suárez | | 69 | | Director | | 2005 | | March 2013 |
| | | | | | | | | |
| Executive Officers | | | | | | | | |
Roque Benavides(1) | | 56 | | President and Chief Executive Officer | | 2001 | | |
| Carlos E. Gálvez | | 58 | | Vice President and Chief Financial Officer | | 2001 | | |
Raúl Benavides(1) | | 55 | | Business Development Vice President | | 1997 | | |
| Alejandro Hermoza | | 49 | | Vice President Community Relations | | 2008 | | |
| Francois Muths | | 59 | | Operations Vice President | | 2007 | | |
| César E. Vidal | | 56 | | Explorations Vice President | | 1996 | | |
José Miguel Morales(1) | | 65 | | General Counsel | | 1970 | | |
(1) Roque Benavides is the brother of Raúl Benavides, and José Miguel Morales is the brother-in-law of Roque Benavides and Raúl Benavides.
Set forth below is biographical information concerning members of our management:
Roque Benavides, Chairman of the Board, President and Chief Executive Officer and member of the Nominating Committee. Mr. Benavides has been a director since July 2004 and was our Chief Financial Officer from 1985 to February 2001, when he was appointed President and Chief Executive Officer. Prior to that time, he served as Assistant to our Chairman of the Board from 1980 to 1985 and as a Project Engineer from 1977 to 1979. Mr. Benavides also has been an alternate member of the Executive Committee of Yanacocha since 1992. In addition, he is an alternate board member of Cerro Verde and was the General Manager of Recuperada S.A., formerly one of our majority-owned subsidiaries that has since merged into us, from 1981 to 1996. He currently is serving as an executive officer and as a director of several of our related companies. He also has served as a director of the Sociedad Nacional de Minería, Petróleo y Energía (National Association of Minerals, Petroleum and Energy) since 1988, serving as Chairman of the Board from 1993 to 1995. Mr. Benavides served as chairman of the Confederación Nacional de Instituciones Empresariales Privadas (National Confederation of Private Companies, or CONFIEP) from 1999 to March 2001. In 2001, Mr. Benavides was appointed Vice Chairman of the World Gold Council and Vice Chairman of the Silver Institute in 2007. Mr. Benavides received a B.S. in Engineering from Pontificia Universidad Católica del Perú (Pontifical Catholic University of Peru) in Lima, Peru in 1977 and an M.B.A. from Henley, The Management College of Brunnel University in 1980, and completed the Program for Management Development at the Harvard Business School in 1985 and the Advanced Management Program at Templeton College of Oxford University in 1997. He is a board member of Banco de Crédito and Cementos Lima, both Peruvian companies.
Timothy Snider, Director and member of the Nominating/Corporate Governance Committee. Mr. Snider was appointed a director in March 2011. He serves as Chairman of Cupric Canyon Capital, LLC., a private equity company seeking investments in copper mining. In addition, he is a director of Compass Minerals International, Inc., and is Chairman of the Institute for Mineral Resources, a research organization sponsored by the University of Arizona. Mr. Snider is also a board member of the Northern Arizona University Foundation. Mr. Snider’s career in the copper business spans 41 years, the vast majority of which were with Phelps Dodge Corporation (now Freeport-McMoRan Copper and Gold). He began his career in 1970 as an underground mine laborer in the Copper Queen operation in Bisbee, Arizona, and held numerous operational, technical, and exploration positions at several of Phelps Dodge’s operations in the United States and Chile. He led Phelps Dodge in the application of hydrometallurgical processing during the 1980s and 1990s. In 1998, Mr. Snider was appointed President of Phelps Dodge Mining Company and in 2003 was promoted to President and Chief Operating Officer of Phelps Dodge Corporation. In these roles, he led the operational and technical integration of Phelps Dodge’s Cyprus-AMAX acquisition, led several greenfield and brownfield expansion projects, and helped to establish Phelps Dodge as one of the industry leaders in technology development and operational excellence. In early 2007, he assumed the role of President and Chief Operating Officer of Freeport-McMoRan Copper and Gold, Inc. upon Freeport’s acquisition of Phelps Dodge, a position he held until the end of the first quarter of 2008. Mr. Snider holds a B.S. in Geology and Chemistry from Northern Arizona University and is a graduate of the Wharton Advanced Management Program at the University of Pennsylvania.
Luis Coleridge, Director, Financial Expert, Chairman of the Audit Committee and member of the Nominating/Corporate Governance Committee. Mr. Coleridge was elected a Board Member on March 29, 2000. He is presently an independent business consultant. A retired partner of Arthur Andersen, Mr. Coleridge’s career as a public accountant spanned 33 years, in which he rose to the position of Managing Partner of Arthur Andersen’s Peruvian operations and retired in 1997. He was also professor of accounting and auditing at the Universidad Nacional Mayor de San Marcos, or UNMSM, and other Peruvian universities and colleges. Mr. Coleridge graduated from UNMSM with a B.S. degree in 1962 and completed post-graduate studies in Economics in 1964.
Aubrey Laurence Paverd, Director and member of the Nominating/Corporate Governance Committee. Dr. Paverd is currently a private consultant based in Melbourne, Australia. He has been a director since 2002. From 1994 to 2000, he held the position of Group Executive Exploration with North Ltd., a diversified mining company with gold and base metal mines in Australia, Europe, North and South America. His career with Newmont Mining Corporation spanned 21 years. He began as Chief Geologist of South Africa in 1973, rising through the positions of Chief Geologist at Tsumeb Corporation Ltd., Namibia, a subsidiary of Newmont, to assistant to the Vice President of Exploration in New York in 1979, Director of Foreign Exploration in 1981 and ultimately Vice President of Exploration when he left Newmont in 1994. Mr. Paverd was also a lecturer in geology at Rhodes University during 1972 and 1973 and worked as a field and mining geologist in Australia and Zambia during the period from 1962 to 1969. He received B.S. (Hons) and M.S. degrees from Rhodes University in 1961 and 1966 respectively and a Ph.D. from the University of James Cook North Queensland in 1972. Mr. Paverd is currently also a director of Randgold Resources Ltd., a London listed West African gold mining company.
Felipe Ortiz-de-Zevallos, Director and member of the Audit Committee, Compensation Committee and Nominating/Corporate Governance Committee. Mr. Ortiz-de-Zevallos has been a director since August 2003. He was President of the Universidad del Pacífico de Lima from 2004 to 2006 and is the founder and chairman of the Board of Grupo APOYO since 1977. Mr. Ortiz-de-Zevallos received a degree in Industrial Engineering from The National University of Engineering in 1968, received an M.S. in Administration and System Analysis from the University of Rochester in 1970 and completed the Owner/President Management program at Harvard Business School in 1996. He was the Peruvian ambassador to the United States of America from 2006 to March 2009.
Carlos del Solar, Director, member of the Compensation Committee and Nominating/Corporate Governance Committee. Mr. del Solar was appointed a director in March 2011. He graduated with degrees in Geology and Geological Engineering from the National University of San Marcos, earned a Master of Science degree from Stanford University, California and completed the Advanced Executive Management Program at the University of Piura. Between 1998 and 2001, Mr. del Solar served as President and General Manager of ARCO for Brazil, Colombia, Peru, and Trinidad. In April 2001, he joined Hunt Oil in Peru as President and General Manager. From January 2005 through January 2007, he served as President of the National Society of Mining, Petroleum and Energy and as First Vice President of the Peruvian Confederation of Private Business Associations (CONFIEP) from March 2007 through March 2009. Since March 2010, Mr. del Solar has served as Second Vice President of the Peruvian Exporters Committee (COMEXPERU). He is currently a director and member of the Executive Committees of the National Society of Mining, Petroleum and Energy, of the Peruvian Confederation of Private Business Associations (CONFIEP) and of COMEXPERU. Mr. del Solar also serves as President of the Advisory Council of the Graduate School of the Peruvian University of Applied Sciences (UPC).
German Suárez, Director and member of the Audit Committee, Compensation Committee and Nominating/Corporate Governance Committee. Mr. Suárez has been a director since March 2005. Mr. Suárez is an economist who was employed by the Central Bank from 1964 to 1990. From 1979 to 1980, he worked at the International Monetary Fund, or IMF, representing Peru, and from 1981 to 1990 he was in charge of different posts at the Ministry of Economy and Finance. Mr. Suárez served as Chairman of Banco de la Nación from 1990 to 1992 and Chairman of the Central Bank of Peru from 1992 to 2001. He was a member of the board of directors at Bladex, Extebandes and Arlabank, Latin American Reserves Fund, Credicorp Ltd. and Banco de Crédito del Peru. From 1993 to 2001, Mr. Suárez served as Governor of the IMF and Alternate Governor of the Inter-American Development. For the period from 2000 to 2001, Mr. Suárez was elected Chairman of the G-24 (IMF-World Bank). Mr. Suárez graduated from UNMSM with a B.S. in Economics in 1965 and received an M.A. in Economics from Columbia University in 1969.
Carlos E. Gálvez, Vice President and Chief Financial Officer. Mr. Gálvez was the Deputy Manager, Finance and Information Systems, from 1985 to February 2001, when he was appointed Vice President and Chief Financial Officer. He served as Deputy Manager of our Treasury from 1980 to 1985, and as Treasurer from 1978 to 1980. Mr. Gálvez has also served as director of Colquirrumi, our subsidiary, and was appointed director of Conenhua in 2000, director of El Brocal in 2002, director of Contacto S.A. in 2005. He has served as an alternate member of the Executive Committee of Yanacocha since 2005 and an alternate board member of Cerro Verde since 2005. He also has served as director of the Sociedad de Minería, Petróleo y Energía del Perú (Mining, Petroleum and Energy Society of Peru) since 2000. Prior to joining us, Mr. Gálvez served as Managerial Adjunct for Finance and Credit from 1971 to 1978 at Banco Minero del Perú (Mining Bank of Peru). He has also served as a board member of the Comité de Operación Económica del Sistema Eléctrico Nacional (Committee of Economic Operation of the National Electric System). Mr. Gálvez received his B.A. in Economics from the Universidad Nacional Federico Villarreal in 1976, his M.B.A. from the Universidad del Pacifico de Lima in 1980 and completed the Program for Management Development, in 1997, and the Advanced Management Program, in 2005, at The Harvard Business School.
Raúl Benavides Ganoza, Vice President Business Development. Mr. Benavides has been Vice President of Business Development since 1992. He is also a member of the Executive Committee of Yanacocha and board member of Cerro Verde and several of our related companies. From 1984 to 1996 he was General Manager (CEO) of Compañía de Minas Orcopampa. Prior to that time, Mr. Benavides was Manager of Operations from 1983 to 1984 and Mine Manager from 1980 to 1983 at Colquirrumi. Since 1995, he has been a professor of mining administration at Pontificia Universidad Católica del Perú. Mr. Benavides also has served as President of the Instituto de Ingenieros de Minas (Institute of Mining Engineering), was also the Founder and President of the Instituto de Seguridad Minera del Perú (Mining Safety Institute of Peru) from 1996 to 2000. Mr. Benavides received a B.S. in Mining Engineering from the University of Missouri-Rolla in 1980, an M.S. in Mineral Engineering-Management from Pennsylvania State University in 1984 and completed the Advanced Management Program at The Harvard Business School in 2001.
Alejandro Hermoza Maraví, Vice President Community Relations. A Mechanical Engineer graduated from the University of Maryland, Mr. Hermoza also holds an MSc in Engineering from the same University and an MBA from the Universidad de Ciencia Aplicadas – UPC. He worked as Development Manager for the Confederación Nacional de Instituciones Empresariales Privadas – CONFIEP, and later joined us in 2003, where he began as Deputy Manager for Administration and Human Resources.
Francois Muths, Vice President of Operations. Mr. Muths was appointed Vice President of Operations in February 2007. Prior to that time, Mr. Muths served as a director and general manager of Inversiones Mineras del Sur S.A., our wholly-owned subsidiary from 2005 to 2006, general manager from 1985 to 2005 and general superintendent of the Uchucchacua mine from 1981 to 1983. He received a B.S. in engineering from the National Engineering University of Peru and a M.S. in Mining Engineering from the Colorado School of Mines. In 2005, Mr. Muths completed the Program for Management Development at Harvard Business School.
César E. Vidal, Explorations Vice President. Mr. Vidal has been our Explorations Vice President since the beginning of 1996. Mr. Vidal also currently serves as director of El Brocal and Coimolache and as an alternate member of the Executive Committee of Yanacocha. From 1981 to 1987, he served as a geologist for BISA. Prior to joining us, from 1991 to 1995, he served as an independent economic geologist consultant to several mining companies, including us. From 1987 to 1991, he served as the chief geologist for Perubar S.A., a Peruvian zinc mining company. Mr. Vidal received his B.S. in Geology from UNI in 1977, a Ph.D. in Geology from the University of Liverpool in 1980 and certification as an engineering geologist in Peru from UNI in 1984. He also was a post-doctoral research fellow at the Universität Heidelberg (the University of Heidelberg) from 1985 to 1986. He completed the Advanced Management Program at Templeton College of Oxford University in 2005.
José Miguel Morales, General Counsel. Mr. Morales has been our General Counsel since 1973. From 1992 to 1995, Mr. Morales served as an alternate member of the Executive Committee of Yanacocha. Mr. Morales has also served as a member of the Executive Committee of Yanacocha since 1995. Mr. Morales currently serves as a director of seven of our nineteen mining and mining-related subsidiaries or affiliates. In addition, he has served as a director of the Instituto Nacional de Derecho de Minería y Petróleo (National Institute of Mining and Petroleum Law), serving as its President from 1989 to 1990 and as a director of the Sociedad de Minería y Petróleo del Perú (Mining and Petroleum Society of Peru) since 1998, serving as its vice chairman since 2000. He has been a director of the following non-mining related companies: Almacenera del Perú S.A. from 1992, Inversiones Cosepa S.A. from 1979, Hotel Costa del Pacífico S.A. from 1994 and El Pacífico—Peruana Suiza Compañía de Seguros from 1979. Since 1973, he also has been a partner of Estudio Aurelio García Sayán—Abogados, a Lima law firm. In February 2003, Mr. Morales was elected president of the Sociedad Nacional de Minería, Petróleo y Energía (National Association of Minerals, Petroleum and Energy). On January 31, 2005, Mr. Morales ended his tenure as President of Sociedad Nacional de Minería, Petróleo y Energía and was elected on March 16, 2005 President of Confederación Nacional de Instituciones Empresariales Privadas (National Confederation of Private Companies, or CONFIEP) until 2007. Mr. Morales received his law degree from Pontificia Universidad Católica del Perú in 1968 and completed the Sloan Program at Stanford University’s Graduate School of Business in 1976.
B. Compensation
During the year ended December 31, 2010, the aggregate amount of compensation that we paid to all directors and executive officers was approximately US$16.2 million, including director’s fees accrued in 2009 and paid in 2010. We do not disclose to our shareholders or otherwise make available public information as to the compensation of our individual directors or executive officers.
We have a long-term stock appreciation program, with a term of ten years once initiated, that allows certain executives to receive a cash remuneration equivalent to any excess of the market value at a future date over a stated price of a stated number of our ADSs. This program is in effect as long as the executives are employed by us at the settlement date of the program. See Note 13(c) to the Financial Statements.
C. Board Practices
The Audit Committee
The Audit Committee, which is composed entirely of independent directors as defined in Section 303A.02 of the New York Stock Exchange’s Listed Company Manual, is responsible for assisting the Board of Directors in the appointment of independent auditors, upon delegation of such responsibility by the shareholders at the general meeting of shareholders, or the General Meeting, and reviewing the scope of internal and external audits. The Audit Committee also reviews compliance with internal control systems, reviews our annual and quarterly financial statements, reviews financial statements before their presentation to the Comisión Nacional Supervisora de Empresas y Valores (National Supervisory Commission of Business and Securities, or CONASEV), the Bolsa de Valores de Lima (Lima Stock Exchange) and the SEC and maintains the integrity of the preparation of audits. The members of the Audit Committee are currently Messrs. Coleridge, Ortiz-de-Zevallos and Suárez.
The Compensation Committee
The Compensation Committee is responsible for evaluating executive performance and approving executive compensation, including compensation of the chief executive officer and any stock option compensation plans. The members of the Compensation Committee are currently Messrs. del Solar, Ortiz-de-Zevallos and Suárez.
Nominating/Corporate Governance Committee
The Nominating/Corporate Governance Committee is responsible for preparing the proposals for the general meetings in respect of the composition of the Board of Directors along with the director remuneration to be approved by the shareholders, and monitoring issues and practices related to corporate governance and to propose necessary actions in respect thereof. The members of the Nominating/Corporate Governance Committee are currently Messrs. Benavides-Ganoza, Coleridge, del-Solar, Paverd, Ortiz-de-Zevallos, Snider and Suárez.
D. Employees
At December 31, 2010, we and our subsidiaries had 2,540 employees. In addition, we have entered into arrangements with independent contractors, which employed 6,685 persons who worked at our operations. We have sought to strengthen our workforce by implementing a qualifications-based hiring policy and, with respect to employees working in the mines, reducing the average age of the workforce. As of December 31, 2010, the average tenure of our permanent laborers at the Julcani, Uchucchacua, Orcopampa, Recuperada, Ishihuinca and Antapite mines (the only mines for which we have long-term historical records) was approximately 15 years.
Of our 1,611 permanent employees, approximately 55 percent are members of nine different labor unions (including three unions and one labor union committee for clerical workers and five unions for laborers), which represent all clerical workers and laborers in collective bargaining negotiations with us. There are also three new unions for workers employed by independent contractors that were formed in 2008 and 2009, in our mines at Uchucchacua, Antapite and Orcopampa.
Each of the labor unions is a company-based union with an affiliation to a national union. Administrative personnel are not represented by unions. Labor relations for unionized and non-unionized employees in our production facilities, including compensation and benefits, are governed by collective bargaining agreements, the terms and length of which are negotiated throughout the year as the various collective bargaining agreements come up for renewal. These collective bargaining agreements are typically one year in length and set wages for the applicable period, including increases as negotiated and certain other employee benefits, such as overtime, bonuses and family benefits.
Compensation received by our employees includes salary, other cash payments (such as overtime, vacation pay and bonuses including, but not limited to, high altitude and underground mining bonuses) and non-cash benefits. Non-cash benefits include medical insurance, life insurance and training programs for workers and administrative staff. For mine and processing plant workers, benefits also include transportation services, meals or food allowances, education for children of our employees and housing, hospitals and a full range of social services for our permanent employees and their families at townsites near our mines in compliance with mining regulations. We voluntarily provide power, water and sewage services for the camp and houses of the workers as well as for certain towns nearby. In addition, pursuant to a profit-sharing plan mandated by Peruvian labor legislation, employees of mining companies in Peru are entitled to receive the Employee Profit Sharing Amount equivalent to eight percent of the annual pre-tax profits of their employer, fifty percent of such profits to be distributed based on the number of days each employee worked during the preceding year and the remaining fifty percent of such profits to be distributed based on the aggregate annual salary of each employee. Effective January 1, 1997, the annual payment to each employee under the profit sharing plan cannot exceed 18 times such employee’s monthly salary, and any difference between the Employee Profit Sharing Amount and the aggregate amount paid to employees must be contributed by us to the FONDO-EMPLEO, a fund established to promote employment and employee training.
Under Peruvian law, we may dismiss workers for cause by following certain formal procedures. We may dismiss a worker without cause, provided that we pay such worker a layoff indemnification in an amount equal to one and a half month’s salary for each full year worked plus the pro rata portion for any uncompleted year, not to exceed in the aggregate 12 months’ salary. Several decisions adopted by the Peruvian Constitutional Court, holding that an employee is entitled for reinstatement if no cause for dismissal is expressed by the employer or for failure to present evidence supporting the employer’s grounds, have limited our ability to dismiss a worker without cause. However, all employees are entitled to a severance payment upon termination of their employment, regardless of the reason for such termination, equal to approximately one month’s salary for each full year worked plus the pro rata portion for any uncompleted year. Pursuant to the Peruvian labor laws enacted in 1991, we deposit funds for severance payments in a bank account selected by each employee and for the benefit of such employee, in both May and November of each year.
Our permanent employees receive the benefit of one of two types of pension arrangements. All workers can choose to enroll in the ONP or in AFPs. We are required to withhold from each of the salaries of the employees enrolled in the ONP system approximately 13 percent of such employee’s salary, and pay such amount to the ONP system and withhold from the salary of each employee enrolled in the AFP system approximately 13 percent of such employee’s salary, and pay such amounts to the respective AFP (exact amount varies from one AFP to another). Additionally, for workers involved in mining and metallurgical processes, an additional 2 percent is withheld from their salaries, and we contribute an additional 2 percent to increase their pension funds. We have no liability for the performance of these pension plans. In addition, our independent contractors are responsible for covering severance and pension payments with respect to their employees.
In addition, we pay ES-SALUD nine percent of our total payroll for general health services for all permanent employees. Prior to May 1997, we were required to pay to ES-SALUD one percent of our payroll of blue collar employees for employment related illness and accidents, or the Workers Compensation Fund Payment. In addition, Law No. 26790 also requires us to provide private insurance representing an average payment equal to 1.30 percent of the payroll of covered employees for employment-related incapacity and death for blue collar employees and other employees exposed to mining-related hazards.
As of June 15, 2011, our directors and executive officers, as a group, owned 681,906 Common Shares, representing 0.27 percent of all the 254,442,328 Common and Investment Shares outstanding. Our directors and executive officers do not own any Investment Shares.
The share ownership of the Company’s directors and executive officers on an individual basis as of June 15, 2011 is set forth below:
| Shareholder | | Number of Common Shares | | | Percentage Beneficial Ownership of Common Shares | | | Number of Investment Shares | | | Percentage Beneficial Ownership of Investment Shares | | | Number of Common Shares and Investment Shares | | | Percentage Beneficial Ownership of Common Shares and Investment Shares | |
| | | | | | | | | | | | | | | | | | | |
Roque Benavides† | | | 365,398 | | | | 0.15 | | | | — | | | | — | | | | 365,398 | | | | 0.15 | |
| Timothy Snider | | | — | | | | — | | | | — | | | | — | | | | — | | | | — | |
| Luis Coleridge | | | — | | | | — | | | | — | | | | — | | | | — | | | | — | |
| Aubrey Laurence Paverd | | | — | | | | — | | | | — | | | | — | | | | — | | | | — | |
| Felipe Ortiz-de-Zevallos | | | — | | | | — | | | | — | | | | — | | | | — | | | | — | |
| Carlos del Solar | | | — | | | | — | | | | — | | | | — | | | | — | | | | — | |
| Germán Suárez | | | — | | | | — | | | | — | | | | — | | | | — | | | | — | |
Raúl Benavides† | | | 267,228 | | | | 0.11 | | | | — | | | | — | | | | 267,228 | | | | 0.11 | |
| Carlos E. Gálvez. | | | 48,770 | | | | 0.02 | | | | — | | | | — | | | | 48,770 | | | | 0.02 | |
| Alejandro Hermoza | | | — | | | | — | | | | — | | | | — | | | | — | | | | — | |
| Francois Muths | | | — | | | | — | | | | — | | | | — | | | | — | | | | — | |
| César E. Vidal | | | — | | | | — | | | | — | | | | — | | | | — | | | | — | |
| José Miguel Morales | | | — | | | | — | | | | — | | | | — | | | | — | | | | — | |
Directors and Executive Officers as a Group† | | | 681,396 | | | | 0.27 | % | | | — | | | | — | | | | 681,396 | | | | 0.27 | % |
† Does not include Common Shares owned by Roque Benavides and Raúl Benavides that are subject to usufructo agreements and related legal instruments with Alberto Benavides. These usufructo agreements and related legal instruments grant Alberto Benavides voting control over the Common Shares subject thereto and entitle Mr. Benavides to receive all dividends payable thereon during his lifetime. Alberto Benavides exercises voting control over the Common Shares subject to the usufructo agreements and related legal instruments, including 13,546,608 and 13,546,608 Common Shares owned by Roque Benavides and Raúl Benavides, respectively. The Common Shares subject to the usufructo agreements and related legal instruments are not included in the separate calculations of share ownership for Roque Benavides and Raúl Benavides in the table above.
| ITEM 7. | Major Shareholders and Related Party Transactions |
A. Major Shareholders
As of June 15, 2011, we had 274,889,924 Common Shares, including 21,160,260 treasury shares, and 744,640 Investment Shares, including 61,976 treasury shares. The Common Shares are voting securities. The table below sets forth certain information concerning ownership of (i) the Common Shares and Investment Shares and (ii) the aggregate Common Shares and Investment Shares, as of April 30, 2011 with respect to each shareholder known to us to own more than 2.5 percent of the outstanding Common Shares and with respect to all directors and executive officers as a group.
| Shareholder | | Number of Common Shares | | | Percentage Beneficial Ownership of Common Shares(2) | | | Number of Investment Shares | | | Percentage Beneficial Ownership of Investment Shares(3) | | | Number of Common Shares and Investment Shares | | | Percentage Beneficial Ownership of Common Shares and Investment Shares(4) | |
| | | | | | | | | | | | | | | | | | | |
Benavides Family(1) | | | 69,987,744 | | | | 27.51 | | | | — | | | | — | | | | 69,987,744 | | | | 25.39 | |
| BlackRock Investment Management (UK) Ltd. | | | 30,256,601 | | | | 11.90 | | | | — | | | | — | | | | 30,256,601 | | | | 11.90 | |
| Shareholder | | Number of Common Shares | | | Percentage Beneficial Ownership of Common Shares(2) | | | Number of Investment Shares | | | Percentage Beneficial Ownership of Investment Shares(3) | | | Number of Common Shares and Investment Shares | | | Percentage Beneficial Ownership of Common Shares and Investment Shares(4) | |
| Cia Minera Condesa S.A. | | | 21,160,260 | | | | 7.68 | | | | 61,976 | | | | 0.03 | | | | 21,222,236 | | | | 8.34 | |
| BlackRock Global Funds-World Mining Fund. | | | 12,350,000 | | | | 4.86 | | | | — | | | | — | | | | 12,350,000 | | | | 4.86 | |
| BlackRock Global Funds-World Gold Fund | | | 11,150,000 | | | | 4.39 | | | | — | | | | — | | | | 11,150,000 | | | | 4.39 | |
| BlackRock Global Investors. | | | 6,461,083 | | | | 2.54 | | | | — | | | | — | | | | 6,461,083 | | | | 2.57 | |
| Integra, AFP | | | 10,411,771 | | | | 4.10 | | | | — | | | | — | | | | 10,411,771 | | | | 4.10 | |
| Prima, AFP | | | 10,935,782 | | | | 4.30 | | | | — | | | | — | | | | 10,935,782 | | | | 4.30 | |
| Fidelity Management & Research | | | 7,171,574 | | | | 2.82 | | | | — | | | | — | | | | 7,171,574 | | | | 2.82 | |
| Horizonte, AFP | | | 7,871,035 | | | | 3.10 | | | | — | | | | — | | | | 7,871,035 | | | | 3.10 | |
| Profuturo, AFP | | | 7,540,247 | | | | 2.97 | | | | — | | | | — | | | | 7,540,247 | | | | 2.97 | |
| Directors and Executive Officers as a Group | | | 681,906 | | | | 0.27 | | | | — | | | | — | | | | 681,906 | | | | 0.27 | |
| | (1) | These Common Shares are owned by certain members of Alberto Benavides de la Quintana’s immediate and extended family and their spouses and include the Common Shares over which Alberto Benavides de la Quintana exercises voting and dispositive control pursuant to usufructo agreements and related legal instruments. |
| | (2) | Percentage calculated on the basis of 253,729,664 Common Shares outstanding, which excludes 21,160,260 treasury shares. |
| | (3) | Percentage calculated on the basis of 682,664 Investment Shares outstanding, which excludes 61,976 treasury shares. |
| | (4) | Percentage calculated on the basis of 254,412,328 Common Shares and Investment Shares outstanding, which excludes 21,222,236 treasury shares. |
As of April 30, 2011, we estimate that 143,848,019 ADSs were held in the United States, which represented approximately 52.33 percent of Common Shares outstanding. The number of institutional record holders of our Common Shares (or of ADSs representing our Common Shares) in the United States was 58 institutions.
B. Related Party Transactions
Except as otherwise disclosed herein, no director, senior officer, principal shareholder or any associate or affiliate thereof had any material interest, direct or indirect, in any transaction since the beginning of our last financial year that has materially affected us, or in any proposed transaction that would materially affect us. Except as otherwise disclosed herein, we have entered into no transactions with parties that are not “related parties” but who would be able to negotiate terms not available on an arm’s-length basis. From time to time in the ordinary course of business, we enter into management, exploration, mine construction, engineering and employment contracts with joint venture companies in which one or more of our direct or indirect subsidiaries holds equity or partnership interests.
Chaupiloma is the legal owner of the mineral rights operated by Yanacocha and receives a 3 percent royalty based on quarterly sales, after deducting refinery and transportation costs. Royalties amounted to US$48.8 million, US$62.3 million and US$55.9 million in 2008, 2009 and 2010, respectively, and are presented as royalty income in our consolidated statements of income.
Condesa received cash dividends from Yanacocha of approximately US$257.5 million and US$100.4 million in 2008 and 2009, respectively. Condesa did not receive a cash dividend from Yanacocha in 2010.
Cash dividends received from Cerro Verde amounted to approximately US$156.1 million in 2008, US$128.1 million in 2009 and US$183.0 million in 2010.
In March 2002, Buenaventura Ingenieros S.A. signed a technical service agreement with Yanacocha to perform a number of specialized activities and services. Pursuant to the agreement, the services performed relate to the construction of mining projects and include completion of analysis and studies, work plan design, and functions related to planning, monitoring and administrating the infrastructure projects required by Yanacocha in its operations. This contract expired on December 31, 2004 and was renewed in January 2005. The revenues related to this service contract amounted to approximately US$1.6 million for the year ended December 31, 2010, US$0.72 million for the year ended December 31, 2009 and US$1.1 million for the year ended December 31, 2008.
In November 2000, Conenhua signed an agreement with Yanacocha for the construction and operation of a 220 kW transmission line between Trujillo and Cajamarca, a 60 kW transmission line between Cajamarca and La Pajuela, and the Cajamarca Norte substation; this agreement also encompassed activities necessary to enlarge the Trujillo substation. Pursuant to this contract, the construction work was completed in October 2001. Concurrently, we and Yanacocha signed a 10-year agreement covering electric energy transmission and infrastructure operation beginning in November 2001. In exchange for us operating and managing the transmission project, Yanacocha pays an annual fee of US$3.7 million. The revenues for these services amounted to approximately US$4.8 million in each of 2010, 2009 and 2008, respectively.
C. Interests of Experts and Counsel
Not applicable.
| ITEM 8. | Financial Information |
A. Consolidated Statements and Other Financial Information
Consolidated Financial Statements
See “Item 19. Exhibits” for a list of financial statements filed under Item 18.
Other Financial Information
Legal Proceedings
Other than the legal proceedings relating to Yanacocha described in “Item 4. Information on the Company—Yanacocha—Business Overview—Legal Proceedings,” we and Yanacocha are each parties to certain other legal proceedings arising in the normal course of business, none of which, individually or in the aggregate, is material.
Dividends and Dividends Policy
We can distribute three kinds of dividends: (i) cash dividends, which are paid out of our net distributable income for each year, (ii) stock dividends that are akin to stock splits rather than distributions of earnings, which are issued for the purpose of adjusting the book value per share of our stock, and (iii) stock dividends for the purpose of capitalizing profits, in each case as described in more detail below. All shares outstanding and fully paid are entitled to share equally in any dividend declared based on the portion of our capital represented by such share. Shares of capital stock, which are only partially paid participate in a dividend or distribution in the same proportion that such shares have been paid at the time of the dividend or distribution. No cash dividend may be declared in respect of a given year unless we have earned net distributable income in respect of such year. However, we may declare dividends during the year. We may make interim provisional payments to shareholders in respect of net distributable income for the current fiscal year, which are referred to as “provisional dividends,” as explained below.
The Board of Directors, following the end of each fiscal year, makes a recommendation to the annual obligatory shareholders’ meeting regarding the amount and timing of payments, if any, to be made as dividends on our Common Shares and Investment Shares.
The dividend policy establishes that dividends will be not less than 20 percent of our net profits. In principle there are two kinds of dividend payments: the interim dividends, which are approved by the Board and are generally paid during the fourth quarter of the year, and the final dividend payment, which will be paid in accordance with the general shareholders’ meeting resolutions. However, the amount and timing of such payments is subject to the final approval at such annual obligatory shareholders’ meeting and Board meeting, as well as to the availability of earnings to distribute. According to the Peruvian Companies Law, shareholders can request a dividend of 50 percent or less of the previous year’s after-tax profits, net amounts allocated to the legal reserve, if there is an affirmative vote among holders of at least 20 percent of the total Common Shares outstanding.
Available earnings are subject to the following priorities. First, the mandatory employee profit sharing of eight percent of pre-tax profits (which may differ from pre-tax profits determined under Peruvian GAAP due to different depreciation treatment and different adjustments of non-taxable income and/or non-deductible expenses) is paid. Next, remaining earnings are taxed at the standard corporate income tax rate, which has been 30 percent since January 1, 2004. Not less than ten percent of such after-tax net profits must then be allocated to a legal reserve, which is not available thereafter except to cover future losses or for use in future capitalizations. Amounts reserved are nevertheless included in taxable income. The obligation to fund this reserve continues until the reserve constitutes 20 percent of the paid-in share capital. In addition, the holders of Common Shares can agree to allocate any portion of the net profits to any special reserve. The remainder of the net profits is available for distribution to shareholders. Any dividend approved by a shareholders’ meeting after December 31, 2002 is subject to an additional withholding tax at the rate of 4.1 percent of the total amount of dividends distributed to the shareholders who either are (i) individuals, whether domiciled or non-domiciled in Peru, or (ii) a non-domiciled company or entity. Dividends paid to domiciled companies or entities are not subject to such withholding tax. If any tax or other governmental charge will become payable by Scotiabank Peru, as custodian, the Depositary or us with respect to any ADR or any deposited securities represented by the ADSs evidenced by such ADR, such tax or other governmental charge will be payable by the owner or beneficial owner of such ADR to the Depositary.
Dividends on issued and outstanding Common Shares and Investment Shares are distributed in accordance with the proportion of the total capital represented by such respective shares. Dividends are distributed pro rata in accordance with the number of Common Shares or Investment Shares. Accordingly, any dividend declared would be apportioned 99.73 percent to the holders of Common Shares and 0.27 percent to the holders of Investment Shares. This proportion will not change in the future except and to the extent holders of Common Shares and Investment Shares exercise their preemptive rights disproportionately in any future issuance of Common Shares and Investment Shares, or we issue Common Shares without preemptive rights in accordance with Article 259 of the Peruvian Companies Law.
Holders of Common Shares and Investment Shares are not entitled to interest on dividend payments.
Holders of ADRs are entitled to receive dividends with respect to the Common Shares underlying the ADSs evidenced by such ADRs, subject to the terms of the related Amended and Restated Deposit Agreement, to the same extent as owners of Common Shares.
To the extent that we declare and pay dividends on the Common Shares, owners of the ADSs on the relevant record date are entitled to receive the dividends payable in respect of the Common Shares underlying the ADSs, subject to the terms of the Amended and Restated Deposit Agreement. Cash dividends are paid to the Depositary in Nuevos Soles and, except as otherwise described under the Amended and Restated Deposit Agreement, are converted by the Depositary into U.S. Dollars and paid to owners of ADRs net of currency conversion expenses. Under the Amended and Restated Deposit Agreement, the Depositary may, and will if we so request, distribute stock dividends in the form of additional ADRs evidencing whole ADSs resulting from a dividend or free distribution of Common Shares by us received by the Depositary. Cash dividends paid with respect to the Common Shares and amounts distributed with respect to ADSs are currently subject to a Peruvian withholding income tax of 4.1 percent. See “Item 10. Additional Information—Taxation—Peruvian Tax Considerations.”
We issue stock dividends for value per share of our stock. The book value of our share capital is based on the nominal (par) value of each share but is adjusted to account for inflation; thus, in inflationary periods, our book value will increase while the nominal value will remain constant. In order to adjust the book value of each share to equal or approximate the nominal value, we periodically issue new shares that are distributed as stock dividends to each existing shareholder in proportion to such shareholder’s existing holdings, unless it increases the nominal value of the existing shares. These stock dividends (which under the Peruvian income tax law are not considered dividends) do not change a stockholder’s percentage of interest in us. In addition, we may from time to time capitalize profits and, in such case, we have to distribute stock dividends representing the profits capitalized.
Dividends not collected within ten years will be retained by us, increasing our legal reserve, and the right to collect such dividends will expire.
Under Peruvian law, each company may make formal cash distributions only out of net distributable income (calculated on an individual, unconsolidated basis and demonstrated by a balance sheet at any given time). We, however, may pay provisional dividends. Payment of provisional dividends will be approved on the basis of financial statements which show the existence of net distributable income obtained during the current fiscal year. In the event that, following such an interim provisional payment, we suffer a loss or if we finish the fiscal year with a net income that is lower than the amount of provisional dividends paid during such fiscal year, we could legally require all shareholders (including holders of ADRs) to return such payment to us with interest. However, it has been and continues to be our policy not to require shareholders to return such payment of provisional dividends, but rather to cover such contingency through a “dividends paid in advance” account to be offset by future net distributable income.
The following table sets forth the amounts of interim and final cash dividends and the aggregate of cash dividends paid with respect to the years 2006 to 2010. Dividends with respect to the years 2006 to 2010 were paid per Common Share and ADS.
Year ended December 31, (1) | | Per Common Share | | | Per ADSs | | | Per Investment Share | |
| | | Interim | | | Final | | | Total | | | Interim | | | Final | | | Total | | | Interim | | | Final | | | Total | |
| 2006 | | | 0.25 | | | | 0.37 | | | | 0.62 | | | | 0.25 | | | | 0.37 | | | | 0.62 | | | | 0.25 | | | | 0.37 | | | | 0.62 | |
| 2007 | | | 0.18 | | | | 0.22 | | | | 0.40 | | | | 0.18 | | | | 0.22 | | | | 0.40 | | | | 0.18 | | | | 0.22 | | | | 0.40 | |
| 2008 | | | 0.09 | | | | 0.02 | | | | 0.11 | | | | 0.09 | | | | 0.02 | | | | 0.11 | | | | 0.09 | | | | 0.02 | | | | 0.11 | |
| 2009 | | | 0.02 | | | | 0.14 | | | | 0.16 | | | | 0.02 | | | | 0.14 | | | | 0.16 | | | | 0.02 | | | | 0.14 | | | | 0.16 | |
| 2010 | | | 0.30 | | | | 0.16 | | | | 0.46 | | | | 0.30 | | | | 0.16 | | | | 0.46 | | | | 0.30 | | | | 0.16 | | | | 0.46 | |
| | (1) | Interim and final dividend amounts are expressed in U.S. Dollars. |
Minority Shareholders
Law No. 28370, published on October 30, 2004, included in the Peruvian Companies Law certain provisions for the protection of the minority shareholders that were formerly contained in Law No. 26985, which had been abrogated. Legislative Decree No. 1061, effective since June 29, 2008, has amended certain of these provisions. Pursuant to Article 262-A of the Peruvian Companies Law, we will issue a notice within sixty days after the Annual Obligatory Shareholders’ Meeting, or after the expiration of the three-month period after the end of the prior fiscal year in which such Annual Obligatory Meeting is required to be held, the total number and value of any shares not claimed by shareholders, the name of such shareholders, the share quote in the securities market for such shares; the total amount of uncollected dividends; and where shares and dividends pending claim are available for the minority shareholders. The publication must be made in the official gazette “El Peruano,” on our website and on CONASEV’s website. Article 262-B describes the procedure to request share certificates and/or dividends. Pursuant to Article 262-C, we are required to submit to CONASEV within 60 days after having posted the notice on our website and on CONASEV’s website, the list of shareholders that have and have not picked up their share certificates and/or have or have not collected their dividends and evidence that such notice was made. Article 262-D provides that CONASEV, upon the review of appropriate documentation submitted by us, will issue a certificate stating that we have complied with the rules for the protection of the minority shareholders. Article 262-F describes the procedure for handling any claim that the minority shareholders may file, such claims to be solved by CONASEV.
B. Significant Changes
No significant change in our financial affairs has occurred since the date of the annual financial statements included in this Annual Report.
| ITEM 9. | The Offer and Listing |
A. Offer and Listing Details
Trading Information
The table below sets forth the trading volume and the high and low closing prices of the Common Shares and Investment Shares in Nuevos Soles. The table also includes the trading volume and the high and low closing prices of the ADSs representing the Common Shares in U.S. Dollars for the same periods. See “Item 4. Information on the Company—The Company—History and Development—History—Redesignation of Our Shares and ADSs; Share Split.”
| | | Common Shares(1) | | | ADSs(2) | | | Investment Shares(1) | |
| | | Trading Volume | | | High | | | Low | | | Trading Volume | | | High | | | Low | | | Trading Volume | | | High | | | Low | |
| | | (in millions) | | | (in nominal S/. per share) | | | (in millions) | | | (in US$ per ADS) | | | (in millions) | | | (in nominal S/. per share) | |
| Annual highs and lows | | | | | | | | | | | | | | | | | | | | | | | | | | | |
| | | | | | | | | | | | | | | | | | | | | | | | | | | | |
| 2006 | | | 2.33 | | | | 106.50 | | | | 77.12 | | | | 173.71 | | | | 32.49 | | | | 22.81 | | | | 0.04 | | | | 88.00 | | | | 73.00 | |
| 2007 | | | 1.53 | | | | 186.00 | | | | 82.50 | | | | 137.20 | | | | 61.00 | | | | 25.39 | | | | 0.02 | | | | 126.50 | | | | 82.00 | |
| 2008 | | | 1.63 | | | | 118.75 | | | | 33.00 | | | | 274.92 | | | | 42.89 | | | | 9.00 | | | | 0.02 | | | | 90.00 | | | | 40.00 | |
| 2009 | | | 2.53 | | | | 122.00 | | | | 45.05 | | | | 345.53 | | | | 42.69 | | | | 14.00 | | | | 0.61 | | | | 90.00 | | | | 40.00 | |
| 2010 | | | 1.44 | | | | 155.50 | | | | 83.00 | | | | 271.37 | | | | 57.20 | | | | 28.59 | | | | 0.04 | | | | 110.00 | | | | 78.00 | |
| | | | | | | | | | | | | | | | | | | | | | | | | | | | | | | | | | | | | |
| Quarterly highs and lows | | | | | | | | | | | | | | | | | | | | | | | | | | | | | | | | | | | | |
| | | | | | | | | | | | | | | | | | | | | | | | | | | | | | | | | | | | | |
| 2009 | | | | | | | | | | | | | | | | | | | | | | | | | | | | | | | | | | | | |
| 1st quarter | | | 0.81 | | | | 76.50 | | | | 45.05 | | | | 96.05 | | | | 25.11 | | | | 14.00 | | | | 0.59 | | | | 76.50 | | | | 40.00 | |
| 2nd quarter | | | 0.92 | | | | 85.50 | | | | 63.20 | | | | 76.49 | | | | 29.93 | | | | 19.09 | | | | 0.01 | | | | 45.94 | | | | 44.25 | |
| 3rd quarter | | | 0.26 | | | | 101.00 | | | | 66.00 | | | | 78.24 | | | | 35.35 | | | | 20.81 | | | | 0.01 | | | | 55.00 | | | | 47.00 | |
| 4th quarter | | | 0.56 | | | | 122.00 | | | | 89.00 | | | | 94.78 | | | | 42.69 | | | | 30.85 | | | | 0.01 | | | | 90.00 | | | | 50.00 | |
| | | | | | | | | | | | | | | | | | | | | | | | | | | | | | | | | | | | | |
| 2010 | | | | | | | | | | | | | | | | | | | | | | | | | | | | | | | | | | | | |
| 1st quarter | | | 0.28 | | | | 112.00 | | | | 83.00 | | | | 72.88 | | | | 38.84 | | | | 28.59 | | | | 0.01 | | | | 86.00 | | | | 78.00 | |
| 2nd quarter | | | 0.17 | | | | 114.50 | | | | 87.90 | | | | 85.56 | | | | 40.89 | | | | 29.84 | | | | 0.02 | | | | 87.50 | | | | 80.00 | |
| 3rd quarter | | | 0.34 | | | | 126.60 | | | | 100.50 | | | | 53.78 | | | | 45.20 | | | | 35.59 | | | | 0.01 | | | | 90.00 | | | | 86.00 | |
| 4th quarter | | | 0.65 | | | | 155.50 | | | | 126.50 | | | | 59.46 | | | | 57.20 | | | | 44.67 | | | | 0.01 | | | | 110.00 | | | | 100.00 | |
| | | | | | | | | | | | | | | | | | | | | | | | | | | | | | | | | | | | | |
| Monthly highs and lows | | | | | | | | | | | | | | | | | | | | | | | | | | | | | | | | | | | | |
| 2010 | | | | | | | | | | | | | | | | | | | | | | | | | | | | | | | | | | | | |
| November | | | 0.20 | | | | 120.50 | | | | 100.00 | | | | 27.19 | | | | 42.43 | | | | 33.06 | | | | 0.01 | | | | 76.50 | | | | 72.00 | |
| December | | | 0.15 | | | | 122.00 | | | | 89.00 | | | | 32.27 | | | | 42.69 | | | | 30.85 | | | | 0.01 | | | | 90.00 | | | | 78.00 | |
| 2011 | | | | | | | | | | | | | | | | | | | | | | | | | | | | | | | | | | | | |
| January | | | 0.10 | | | | 136.00 | | | | 113.00 | | | | 25.57 | | | | 49.53 | | | | 39.92 | | | | 0.00 | | | | 0.00 | | | | 0.00 | |
| February | | | 0.08 | | | | 129.50 | | | | 114.00 | | | | 27.06 | | | | 48.45 | | | | 39.30 | | | | 0.01 | | | | 110.00 | | | | 100.00 | |
| March | | | 0.05 | | | | 130.65 | | | | 117.20 | | | | 23.09 | | | | 47.49 | | | | 41.03 | | | | 0.01 | | | | 100.00 | | | | 100.00 | |
| April | | | 0.25 | | | | 121.80 | | | | 100.01 | | | | 30.56 | | | | 44.78 | | | | 37.03 | | | | 0.01 | | | | 100.00 | | | | 100.00 | |
(1) Source: Lima Stock Exchange
(2) Source: Bloomberg; Yahoo Finance
B. Plan of Distribution
Not applicable.
C. Trading Markets
Effective on May 3, 2002, we redesignated our Series B Shares and Series A Shares as Common Shares. From such date, each of our ADSs, which previously represented two Series B Shares, represented two Common Shares. Effective November 12, 2003, we modified the ratio of our ADSs from two Common Shares per ADS to one Common Share per ADS. See “Item 4. Information on the Company—The Company—History and Development—History—Redesignation of Our Shares and ADSs; Share Split.” Accordingly, since May 3, 2002, the Common Shares and ADSs representing the Common Shares (each ADS representing two Common Shares) have been listed and traded on the New York Stock Exchange under the symbol “BVN.” In addition, the Common Shares are listed and traded on the Lima Stock Exchange. The Investment Shares have been listed and traded on the Lima Stock Exchange since 1979.
As of April 30, 2011, the share capital with respect to the Common Shares was S/.2,748,899,240 represented by 274,889,924 shares and the share capital with respect to the Investment Shares was S/.7,446,400 represented by 744,640 shares. The Common Shares represent 100 percent of our outstanding share capital. The Investment Shares have no voting rights and are not, under Peruvian law and accounting rules, characterized as share capital. As of April 30, 2011, there were 1,260 owners of record of the Common Shares and 923 owners of record of the Investment Shares.
Historical Information
The Series B Shares and the ADSs which represented the Series B Shares (each ADS represented two Series B Shares) were listed, and the ADSs were traded, on the New York Stock Exchange from May 31, 1996 until May 2, 2002, under the symbol “BVN.” In addition, the Series B Shares were listed and traded on the Lima Stock Exchange from May 15, 1996 until May 2, 2002. The ADSs which represented the Series B Shares were issued under the terms of a Deposit Agreement dated May 20, 1996, among ourselves, the Depositary and the owners and beneficial owners of ADSs. The Series A Shares were listed and traded on the Lima Stock Exchange since 1971.
The creation of the Series B Shares was authorized at an extraordinary meeting of shareholders held on March 20, 1996. At that meeting, outstanding common shares were renamed as Series A Shares, and a capital increase of a new class of common shares, designated Series B Shares, was approved. On May 31, 1996, the Series B Shares began trading on the Lima Stock Exchange and on May 15, 1996, the ADSs began trading on the New York Stock Exchange. On November 26, 1997, we consummated the Series A Exchange Offer, pursuant to which we exchanged 32,472,952 Series A Shares for an equal number of Series B Shares. Immediately prior to the Series A Exchange Offer, there were 98,995,000 Series A Shares and 19,154,617 Series B Shares. Upon consummation of the exchange, there were 66,522,048 Series A Shares and 51,627,569 Series B Shares.
On December 10, 1998, we consummated an exchange offer pursuant to which we exchanged 18,666,198 Labor Shares (now known as Investment Shares) for 18,666,198 Series B Shares. On December 3, 1999, we commenced an exchange offer, pursuant to which we offered to exchange on a one-for-one basis, all outstanding Series A Shares and Investment Shares for our Series B Shares, or the Redemption and Exchange Offer. The Redemption and Exchange Offer terminated, in accordance with its terms, on January 13, 2000. As a result of the Redemption and Exchange Offer, 23,433,294 Series A Shares and 629,147 Investment Shares were tendered for redemption and/or exchange and accepted by us and were exchanged for equal numbers of Series B Shares. At December 31, 1999 (prior to the consummation of the Redemption and Exchange Offer), the share capital with respect to the Series A Shares was S/.66,522,048 represented by 66,522,048 shares; the share capital with respect to the Series B Shares was S/.70,293,767 represented by 70,293,767 shares; and the share capital with respect to the Investment Shares was S/.1,011,467 represented by 1,001,467 shares. Following the consummation of the Redemption and Exchange Offer, the share capital with respect to the Series A Shares was S/.43,088,754 represented by 43,088,754 shares; the share capital with respect to the Series B Shares was S/.94,356,208 represented by 94,356,208 shares and the share capital with respect to the Investment Shares was S/.372,320 represented by 372,320 shares.
In March 2008, our shareholders approved an increase in the nominal par value of our Common Shares and Investment Shares from S/.4.00 per Common Share or Investment Share to S/.20.00 per Common Share or Investment Share, as well as a subsequent two-for-one stock split of our Common Shares and Investment Shares. In July 2008, we conducted a two-for-one stock split of our outstanding Common Shares, Investment Shares and ADSs. As a result, we had 274,889,924 Common Shares and 744,640 Investment Shares outstanding as of July 24, 2008. In connection with the stock split, our by-laws were amended to decrease the nominal par value of our Common Shares and Investment Shares from S/.20.00 to S/.10.00 per Common Share or Investment Share.
D. Selling Shareholders
Not applicable.
E. Dilution
Not applicable.
F. Expenses of the Issue
Not applicable.
| ITEM 10. | Additional Information |
A. Share Capital
Not applicable.
B. Memorandum and Articles of Association
Organization and Register
We were formed on September 7, 1953 by public deed as a Peruvian sociedad anónima. However, in May of 1998, our By-laws were changed to conform with the new Peruvian Companies Law. The term of existence is indefinite and our principal place of business is Lima, Peru. We are registered under file number 02136988 at the Companies Registry of Lima.
We are managed by the General Meeting, the Board of Directors and the management.
Objectives and Purposes
Our legal purpose, as set forth in our Articles of Association and By-laws, is to engage in mining operations and related activities either directly or through majority-owned subsidiaries and controlled companies. Likewise, we may hold shares of companies performing mining operations.
Directors
The Board of Directors, which must be comprised of seven members, is elected at the Annual Obligatory Meeting. Any changes in the Board of Directors require the approval of the shareholders. The removal of the Board of Directors must be approved at a shareholders’ meeting, attended by holders of 75 percent of the Common Shares in the first summons and 70 percent of the Common Shares in the second summons, by resolution approved by at least two thirds of the total number of Common Shares outstanding. In the case of resignation of Directors, the Board of Directors may appoint substitute Directors who will serve until the next shareholders’ meeting.
Directors are elected as a group for a term of three years and may be reelected indefinitely. Pursuant to Article 29 of our By-laws, Directors are not required to be shareholders. The Board of Directors, in its first meeting after the Annual Obligatory Meeting during which elections are held, must choose from among its members a Chairman and a Vice Chairman. The Peruvian Companies Law requires that all companies (sociedades anónimas) provide for the representation of minority shareholders on their Boards of Directors. To that effect, each of our Common Shares gives the holder the right to as many votes as there are directors to be elected. Each holder may pool his votes in favor of one person or distribute them among various persons. Those candidates for the Board who receive the most votes are elected directors.
The Board of Directors meets when called by the Chairman of the Board, who is appointed by the Board. The Board of Directors is validly convened when all Directors are present and unanimously agree to carry out the meeting for the purpose of transacting the business that has been proposed. Pursuant to article 177 of the Peruvian Companies Law, Directors may be jointly and severally liable to us, the shareholders and third parties for their actions if they act with willful misconduct, gross negligence or abuse their powers.
Our By-laws do not contain any provisions related to a director’s power to vote on matters in which the director is materially interested. However, Article 180 of the Peruvian Companies Law requires a director with an interest that conflicts with an interest of ours on a specific matter to disclose such interest to us and abstain from participating in the deliberation and decision of the said matter. A director that contravenes such requirement is liable for the damages suffered by us and can be removed by the Board of Directors or a shareholders’ meeting upon the request of any shareholder or any member of the Board.
Our By-laws also do not contain any provisions with respect to the power of the Directors to vote upon matters relating to their own compensation. Nevertheless, Article 30 of the By-laws requires that the Board of Directors receive compensation of no more than 4 percent of the profits of each fiscal year after making deductions for workers’ profit sharing, taxes, reinvestment of profits for tax benefits and legal reserves. This amount will be submitted for ratification by the General Meeting during the annual obligatory meeting, at which time it approves the balance sheet, taxes, reinvestment of profits for tax benefits and legal reserves.
Our By-laws contain no provision relating to the directors’ power to borrow from us. However, Article 179 of the Peruvian Companies Law provides that directors of a company may enter into an agreement with such company only in the event that the agreement relates to operations the company performs in the regular course of business and in an arms-length transaction. Further, a company may provide a loan to a director or grant securities in his favor only in connection with operations that the company usually performs with third parties. Agreements, credits, loans or guarantees that do not meet the requirements set forth above require prior approval from at least two thirds of the members of the company’s Board of Directors. Directors are jointly liable to the company and the company’s creditors for contracts, credit, loans or securities executed or granted without complying with Article 179 of the Peruvian Companies Law.
Neither our By-laws nor the Peruvian Companies Law contain age limit requirements for the retirement or non-retirement of directors.
Shares and Voting Rights
We have two classes of shares, the Common Shares and the Investment Shares. The Common Shares represent 100 percent of our outstanding share capital. The Investment Shares have no voting rights and are not, under Peruvian law and accounting rules, characterized as share capital. The Common Shares and the Investment Shares may be either physical share certificates in registered form or book-entry securities in the CAVALI ICLV S.A. book-entry settlement system, also in registered form.
Holders of Common Shares are entitled to one vote per share, with the exception of the election of the Board of Directors, where each such holder is entitled to one vote per share per nominee. Each holder’s votes may be cast all for a single nominee or distributed among the nominees at the holder’s discretion. Holders of Common Shares may attend and vote at shareholders’ meetings either in person or through a proxy. Additionally, holders of Common Shares have the right to participate in the distribution of dividends and shareholder equity resulting from liquidation. Our By-laws do not establish a maximum time limit for the payment of the dividends. However, according to Article 232 of the Peruvian Companies Law, the right to collect past-due dividends in the case of public companies that are sociedades anónimas abiertas, as we are, expires at 10 years from the date on which the payment was due in accordance with the dividend declaration.
Our share capital may be increased by holders of Common Shares at a shareholders’ meeting. Capital reductions may be voluntary or mandatory and must be approved by holders of Common Shares at a shareholders’ meeting. Capital reductions are mandatory when accumulated losses exceed 50 percent of capital to the extent such accumulated losses are not offset by accumulated earnings and capital increases within the following fiscal year. Capital increases and reductions must be communicated to CONASEV, the Lima Stock Exchange and the Superintendencia Nacional de Administración Tributaria (SUNAT) and published in the official gazette El Peruano and in a widely circulated newspaper in the city in which we are located.
The Investment Shares do not represent our stock obligations. Holders of Investment Shares are neither entitled to exercise voting rights nor to participate in shareholders’ meetings. However, Investment Shares confer upon the holders thereof the right to participate in the dividends distributed according to their nominal value, in the same manner as Common Shares.
Changes in the Rights of Shareholders
Our By-laws do not contain special provisions relating to actions necessary to change the rights of holders of the classes of shares. However, Article 88 of the Peruvian Companies Law establishes that all shares of a same class must have the same rights and obligations, and that in the event that we decide to establish different rights and obligations we must create a different class of shares, which creation will be agreed upon by the General Meeting in accordance with the requirements for modification of the By-laws. The Common Shares are the only class of shares representing 100 percent of our share capital, and, therefore, each Common Share has the same rights and obligations of each other Common Share. These requirements are described under “—Shares and Voting Rights” above.
The rights of any class of shares may not be reduced except in accordance with the Peruvian Companies Law.
Shareholders’ Meetings
Pursuant to Peruvian law and our By-Laws, the Annual Obligatory Meeting must be held during the three-month period after the end of each fiscal year. Additional General Meetings may be held during the year. Because we are a sociedad anónima abierta, we are subject to the special control of CONASEV, as provided in Article 253 of the Peruvian Companies Law. If we do not hold the Annual Obligatory Meeting during the three-month period after the end of each fiscal year or any other shareholders’ meeting required by the Peruvian Companies Law or our By-Laws, CONASEV will directly, or at the request of at least one shareholder of the Common Shares, call for such a meeting, which will take place in a reasonable period of time. Other shareholders’ meetings are convened by the Board of Directors when deemed convenient for us or when it is requested by the holders of at least five percent of the Common Shares, provided that such Common Shares do not have their voting rights suspended. If, at the request of holders of five percent of the Common Shares, the shareholders’ meeting is not convened by the Board of Directors within 15 business days of the receipt of such request, or the Board expressly or implicitly refuses to convene the shareholders’ meeting, CONASEV will call for such meeting after giving notice to the Board of such request. The Board is deemed to have implicitly refused to convene the meeting if the Board (a) does not convene a shareholders’ meeting within 15 business days of receipt of the request, (b) suspends or amends the terms of the agenda or the date of the meeting prescribed by the request or (c) schedules the shareholders’ meeting more than 45 days after the date on which the summons is published. If CONASEV calls for a shareholders’ meeting, CONASEV will indicate the place, time and hour of the meeting, the agenda and the person who will preside. If it is a meeting other than the Annual Obligatory Meeting or a shareholders’ meeting required by the Peruvian Companies Law or the By-Laws, the agenda will contain those matters requested by the shareholders who requested the meeting. Resolución CONASEV No. 111-2003-EF-94.10, as amended by Resolución CONASEV No. 016-2004-EF/94.10, Resolución CONASEV No. 015-2005-EF/94.10 and Resolución CONASEV No. 070-2010-EF/94.01.1, approved provisions related to the right of the minority shareholders to obtain information regarding a sociedad anónima abierta such as us and to request CONASEV to call a shareholders’ meeting if it is not called by the sociedad anónima abierta upon request, for which purpose Resolución CONASEV No. 007-2006-EF/94.10 will apply. Notwithstanding the notice requirements as described in the preceding two sentences, any shareholders’ meeting will be deemed called and legally installed, provided that the shareholders representing all of the voting shares are present, and provided that every present shareholder, whether or not such shareholder has paid the full price of such shareholder’s shares, agrees to hold the shareholders’ meeting and accepts the business to be discussed therein. Holders of Investment Shares have no right to request the Board to convene shareholders’ meetings.
Since we are a sociedad anónima abierta, notice of shareholders’ meetings must be given by publication of a notice, with the publication occurring at least 25 days prior to any shareholders’ meeting, in El Peruano and in a widely circulated newspaper in the city in which we are located. The notice requirement may be waived at the shareholders’ meeting by holders of 100 percent of the outstanding Common Shares. According to Article 25 of the By-Laws and Article 257 of the Peruvian Companies Law, shareholders’ meetings called for the purpose of considering a capital increase or decrease, the issuance of obligations, a change in the By-Laws, the sale in a single act of assets with an accounting value that exceeds 50 percent of our capital stock, a merger, division, reorganization, transformation or dissolution, are subject to a first, second and third quorum call, each of the second and third quorum to occur upon the failure of the preceding one. A quorum for the first call requires the presence of shareholders holding 50 percent of our total voting shares. For the second call, the presence of shareholders holding at least 25 percent of our total voting shares constitutes a quorum, and for the third call there is no quorum requirement. These decisions require the approval of the majority of the voting shares represented at the shareholders’ meeting. General Meetings convened to consider all other matters are subject to a first and second quorum call, the second quorum call to occur upon the failure of the first quorum.
In the case of shareholders’ meetings called for the purpose of considering the removal of members of the Board of Directors, at least 75 percent and 70 percent of the total number of Common Shares outstanding are required to be represented at the shareholders’ meeting on the first quorum call and second quorum call respectively. Provided such quorum is attained, the affirmative vote of no less than two thirds of the total number of Common Shares outstanding is required to effect the removal of members of the Board of Directors. The special quorum and voting requirements described above cannot be modified at a shareholders’ meeting called for the purpose of considering the removal of members of the Board of Directors.
Under our By-Laws, the following actions are to be taken at the annual obligatory shareholders’ meetings: approval of our balance sheets, profit and loss statements and annual reports; approval of management performance; allocation of profits; election of external auditors; election of the members of the Board of Directors; and any other matters submitted by the Board of Directors. The following actions are to be taken at the same annual shareholders’ meetings if the quorum and majority requirements are met or at any other shareholders’ meeting: any amendment of the By-Laws; any decision to increase or reduce capital; any decision to issue debt; initiating investigations or requesting auditor’s reports; liquidating, spinning-off, merging, consolidating, dissolving, or changing our business form or structure.
In accordance with Article 21 of the By-laws, only those holders of Common Shares whose names are inscribed in the Share Register not less than 10 days in advance of a meeting will be entitled to attend shareholders’ meetings and to exercise their rights.
Limitations on the Rights of Nonresident or Foreign Shareholders
There are no limitations in our By-laws or the Peruvian Companies Law on the rights of nonresident or foreign shareholders to own securities or exercise voting rights on our securities.
Change in Control
There are no provisions in our By-laws that would have the effect of delaying, deferring or preventing a change in control.
Disclosure of Share Holdings
There are no provisions in our By-laws governing the ownership threshold above which share ownership must be disclosed. However, according to Regulation No. 009-2006-EF.94.10 of the CONASEV, which became effective on May 3, 2006, as amended by Regulation No. 020-2006-EF.94.10 and Regulation No. 05-2009-EF-94.01.1 of CONASEV, when an individual or financial group acquires, in one act or various successive acts, a significant percentage (more than 25 percent) of the voting shares of a company, as well as upon any person or group increasing its ownership above the 50 percent and 60 percent thresholds, a procedure known as Oferta Pública de Adquisición, or Takeover Bid, must be followed. This has the effect of alerting other shareholders and the market that an individual or financial group has acquired a significant percentage of a company’s voting shares, and gives other shareholders the opportunity to sell their shares at the price offered by the purchaser. The purchaser is obliged to launch a Takeover Bid unless it is exempt pursuant to Regulation No. 009-2006-EF.94.10 of the CONASEV as amended. The purchase of ADRs is exempted from the Takeover Bid unless the holders: (i) exercises the voting rights of the Common Shares underlying the ADSs evidenced by such ADRs, or (ii) requests the delivery of such underlying Common Shares. In addition, CONASEV and the Lima Stock Exchange must be notified of any transfer of more than 5 percent of our paid-in-capital.
Changes in the Capital
Our By-laws do not establish special conditions for increases or reductions of capital that are more stringent than is required by the Peruvian Companies Law. Furthermore, the Peruvian Companies Law forbids sociedades anónimas abiertas, such as us, from including in their by-laws stipulations limiting the transfer of their shares or restraining their trading in other ways. We cannot recognize a shareholders’ agreement that contemplates limitations, restrictions or preferential rights on the transfer of shares, even if such agreement is recorded in our Share Register (matrícula de acciones) or in CAVALI.
C. Material Contracts
On December 2, 2009, Banco de Crédito del Peru, as lessor, executed a financial lease agreement with Conenhua, Huanza, as lessee, and us, as guarantor, in the amount of US$119 million for construction of a hydroelectric power station. The term of the lease is ten years and the interest rate is (i) LIBOR plus 4 percent from the first disbursement until six months after the start of commercial operation of the power station and (ii) LIBOR plus 4.1 percent from six months after the start of commercial operation of the power station until maturity. An English summary of the financial lease agreement is filed as Exhibit 4.2 of this Annual Report.
D. Exchange Controls
Since August 1990, there have been no exchange controls in Peru and all foreign exchange transactions are based on free market exchange rates. Prior to August 1990, the Peruvian foreign exchange market consisted of several alternative exchange rates. Additionally, during the 1990s, the Peruvian currency has experienced a significant number of large devaluations, and Peru has consequently adopted, and operated under, various exchange rate control practices and exchange rate determination policies, ranging from strict control over exchange rates to market determination of rates. Current Peruvian regulations on foreign investment allow the foreign holders of equity shares of Peruvian companies to receive and repatriate 100 percent of the cash dividends distributed by such companies. Such investors are allowed to purchase foreign exchange at free market currency rates through any member of the Peruvian banking system and transfer such foreign currency outside Peru without restriction.
E. Taxation
The following summarizes the material Peruvian and United States tax consequences under present law of the purchase, ownership and disposition of ADSs or Common Shares. The discussion is not a full description of all tax considerations that may be relevant to a decision to purchase ADSs or Common Shares. In particular, this discussion deals only with holders that hold ADSs or Common Shares as capital assets and that have the U.S. Dollar as their functional currency. The summary does not address the tax treatment of certain investors that may be subject to special tax rules, such as banks, securities dealers, insurance companies, tax-exempt entities, persons that will hold ADSs or Common Shares as a position in a “straddle” or “conversion transaction” for tax purposes and holders of ten percent or more of our voting shares. There is no tax treaty currently in effect between Peru and the United States, except for a treaty to exchange tax information. The information to be exchanged is defined in such treaty as any data or declaration that may be relevant or essential to the administration and application of taxes. Accordingly, the discussions below of Peruvian and U.S. tax considerations are based on the domestic law of each of Peru and the United States which are subject to change and possibly with retroactive effect.
As used herein, “Peruvian holder” means an owner of ADSs or Common Shares that is (i) an individual domiciled in Peru, (ii) a business entity created under the laws of Peru, or (iii) a Peruvian branch, agency or permanent establishment of a non-Peruvian individual or entity. “U.S. Holder” means a beneficial owner of ADSs or Common Shares that is (i) a United States citizen or resident, (ii) a domestic corporation or partnership, (iii) a trust subject to the control of a U.S. fiduciary and the primary supervision of a U.S. court or (iv) estate the income of which is subject to United States Federal income taxation regardless of its source.
Peruvian Tax Considerations
Cash Dividends and Other Distributions
Cash dividends paid with respect to Common Shares and amounts distributed with respect to ADSs are currently subject to a Peruvian withholding Income Tax, at a rate of 4.1 percent over the dividend paid, when the dividend is paid to shareholders that are: (i) individuals, whether resident or nonresident in Peru or (ii) nonresident entities. As a general rule, the distribution of additional Common Shares representing profits, distribution of shares which differ from the distribution of earnings or profits, as well as the distribution of preemptive rights with respect to Common Shares, which are carried out as part of a pro rata distribution to all shareholders, will not be subject to Peruvian Income Tax or withholding taxes.
Capital Gains
Pursuant to Article 6 of the Peruvian Income Tax Law (hereinafter, “ITL”), individuals and entities resident in Peru are subject to Peruvian Income Tax on their worldwide income while non-resident individuals or entities are subject to Peruvian Income Tax on their Peruvian source income only.
Furthermore, the ITL states that income deriving from the disposal of securities issued by Peruvian entities is considered Peruvian source income subject to the Income Tax.
With respect to this matter, Article 2 of the ITL, as amended by Legislative Decree 945, defines: (i) capital gains as any revenue deriving from the disposal of capital goods; and (ii) capital goods as those whose purpose is not to be traded in the regular course of a business. Moreover, Article 2 of the ITL states that income deriving from the disposal of shares and similar securities is considered a capital gain.
Accordingly, capital gains deriving from the disposal of securities are considered Peruvian source income subject to Peruvian Income Tax.
Currently, regardless of whether or not the transferor is domiciled in Peru, the ITL establishes that taxable income resulting from the disposal of securities is determined by the difference between the sale price of the securities and its tax basis. However, prior to December 31, 2009, capital gains resulting from the disposal of ADSs or Common Shares issued by legal entities incorporated in Peru were exempt from Peruvian Income Tax if: (i) in the case of non-regular individuals (i.e., individuals who do not frequently trade securities), the transaction was carried out prior to December 31, 2009; and (ii) in the case of shareholders other than individuals, the transaction was carried out on the Lima Stock Exchange (floor session) prior to December 31, 2009.
Effective January 1, 2010, the exemption was repealed and, as such, capital gains resulting from the disposal of ADSs or Common Shares issued by legal entities incorporated in Peru became subject to Peruvian Income Tax. For non-resident entities or individuals, capital gains will be subject to an Income Tax rate of either 5 percent or 30 percent, depending where the transaction takes place. If the transaction is consummated within Peru, the Income Tax rate is 5 percent; if the transaction is consummated outside of Peru, capital gains are taxed at a rate of 30 percent.
The ITL Regulations have defined transactions consummated within Peru to mean that the securities at issue are transferred through the Lima Stock Exchange. In contrast, the transaction is considered to have been consummated abroad when (i) the securities at issue are not registered on the Lima Stock Exchange or (ii) registered securities are not transferred through the Lima Stock Exchange.
For nonresident individuals, the first five Tax Units (approximately US$6,400) of capital gains deriving from the transfer of securities are exempt from the Income Tax. However, if the transferor is a resident entity, capital gains deriving from the disposal of securities will be treated as any other taxable income subject to the 30 percent Corporate Income Tax rate.
Furthermore, if the transferor is a resident individual, the first five Tax Units (approximately US$6,400) of capital gains deriving from the transfer of securities are exempt from the Income Tax. The excess is subject to the 6.25 percent annual Income Tax rate regardless of whether or not the transaction is carried out on the Lima Stock Exchange and regardless of how many transactions are carried out by such individual. In this case, the 6.25 percent Income Tax rate will be applicable over the annual net capital gain, which is calculated by deducting from the annual gross capital gain the following (in the order listed): (i) the non-taxable income of approximately the first US$6,400; (ii) 20 percent of the annual gross capital gain and (iii) annual losses resulting from the disposal of shares during the same fiscal year.
Moreover, if the transferor, either a resident or nonresident individual or entity, acquired the ADSs or Common Shares that were exempt from the Income Tax before January 1, 2010, pursuant to a special provision of the ITL, the tax basis is the higher of: (i) the acquisition cost; (ii) the face or nominal value of the shares or (iii) the stock market value at closing on December 31, 2009.
If the transferor, whether resident or nonresident in Peru, acquires the ADSs or Common Shares on or after January 1, 2010, the tax basis is: (i) for shares purchased by the transferor, the acquisition price paid for the shares; (ii) for shares received by the transferor as a result of a capital stock increase because of a capitalization of net profits, the face or nominal value of such shares; (iii) for other shares received free of any payment, the stock market value of such shares if listed on the Lima Stock Exchange or, if not, the face or nominal value of such shares and (iv) for shares of the same type acquired at different opportunities and at different values, the tax basis will be the weighted average cost.
The aforementioned rules are also applicable to ADSs or Common Shares acquired before January 1, 2010 that were not exempt from the Income Tax as of December 31, 2009.
On December 31, 2010, Law No. 29645 was promulgated and took effect from January 1, 2011. This law states that in any transaction of Peruvian securities through the Lima Stock Exchange, CAVALI (the Peruvian clearing house) will act as withholding agent. As a result of this amendment, the nonresident will no longer have to self-assess and pay its Income Tax liability directly to the Peruvian Tax Administration.
Law No. 29645 technically been into force since January 1, 2011. However, due to the fact that implementing regulations have not yet been enacted for 2011, CAVALI has not yet begun acting as a withholding agent. As a result, with regard to securities transferred though the Lima Stock Exchange by a nonresident transferor, such nonresident transferor must still self-assess and pay its Income Tax liability directly to Peruvian tax authorities within the first 12 working days following the month in which Peruvian source income was earned.
If the purchaser is resident in Peru and the sale is not performed through the Lima Stock Exchange, the purchaser will act as withholding agent.
However, if the transferor is a resident entity, such transferor is solely responsible for its Peruvian Income Tax on capital gains resulting from the disposal of ADSs or Common Shares, regardless of whether such securities are listed on the Lima Stock Exchange or elsewhere.
If the transferor is an individual domiciled in Peru and the sale is carried out through the Lima Stock Exchange, according to Law No. 29645, CAVALI will act as withholding agent. However, due to the fact that implementing regulations have not yet been enacted for 2011, CAVALI has not yet begun acting as a withholding agent. As a result, resident individual transferors are still required to pay Income Tax directly to the Peruvian tax authorities.
Other Considerations
No Peruvian estate or gift taxes are imposed on the gratuitous transfer of ADSs or Common Shares. No stamp, transfer or similar tax applies to any transfer of Common Shares, except for commissions payable by seller and buyer to the Lima Stock Exchange (0.15 percent of value sold), fees payable to CONASEV (0.05 percent of value sold), brokers’ fees (about 0.05 percent to 1 percent of value sold) and Value Added Tax (at the rate of 18 percent) on commissions and fees. Any investor who sells its Common Shares on the Lima Stock Exchange will incur these fees and taxes upon purchase and sale of the Common Shares.
United States Federal Income Tax Considerations
Assuming the obligations contemplated by the Amended and Restated Deposit Agreement are being performed in accordance with its terms, holders of ADSs (or ADRs evidencing ADSs) generally will be treated for United States federal income tax purposes as the owners of the Common Shares represented by those ADSs.
Cash Dividends and Other Distributions
Cash dividends paid with respect to Common Shares or Common Shares represented by ADSs generally are includible in the gross income of a U.S. Holder as ordinary income. Dividends generally are treated as foreign source income. Dividends paid to a U.S. Holder that is a corporation are not eligible for the dividends received deduction available to corporations. Under current law, a maximum 15 percent U.S. tax rate is imposed on the dividend income of an individual U.S. holder with respect to dividends paid by a domestic corporation or “qualified foreign corporation” if certain holding period requirements are met. A qualified foreign corporation generally includes a foreign corporation if (i) its shares are readily tradable on an established securities market in the U.S. or (ii) it is eligible for benefits under a comprehensive U.S. income tax treaty. Clause (i) will apply with respect to ADSs if such ADSs are readily tradable on an established securities market in the U.S. The ADSs are traded on the New York Stock Exchange. As a result, we believe that we should be treated as a qualified foreign corporation and, therefore, dividends paid to an individual U.S. holder with respect to ADSs for which the minimum holding period requirement is met should be taxed at a maximum rate of 15 percent. The maximum 15 percent tax rate is effective with respect to dividends included in income during the period beginning on or after January 1, 2003, and ending December 31, 2012. Dividends paid in Nuevos Soles are includible in a United States dollar amount based on the exchange rate in effect on the date of receipt (which, in the case of ADSs, will be the date of receipt by the Depositary) whether or not the payment is converted into U.S. Dollars at that time. Any gain or loss recognized upon a subsequent sale or conversion of the Nuevos Soles for a different amount of U.S. Dollars will be United States source ordinary income or loss. Distributions to U.S. Holders of additional Common Shares or preemptive rights with respect to Common Shares that are made as part of a pro rata distribution to all of our shareholders generally will not be subject to United States federal income tax but in other circumstances may constitute a taxable dividend.
A U.S. Holder will be entitled to a foreign tax credit for Peruvian taxes imposed by withholding or otherwise, subject to generally applicable limitations and restrictions. In the case of U.S. individuals for whom the reduced rate of tax on dividends applies, such limitations and restrictions will appropriately take into account the rate differential under rules similar to section 904(b)(2)(B) of the Internal Revenue Code. The rules governing foreign tax credits are complex and U.S. Holders should consult their tax advisors regarding their application to the particular circumstances of such holder.
A non-U.S. Holder generally is not subject to United States Federal income or withholding tax on dividends paid with respect to Common Shares or Common Shares represented by ADSs, unless such income is effectively connected with the conduct by the non-U.S. Holder of a trade or business within the United States.
Capital Gains
U.S. Holders will recognize capital gain or loss on the sale or other disposition of ADSs or Common Shares (or preemptive rights with respect to such shares) held by the U.S. Holder or by the Depositary. U.S. Holders will not recognize gain or loss on deposits or withdrawals of Common Shares in exchange for ADSs or on the exercise of preemptive rights. Any gain recognized by a U.S. Holder generally will be treated as United States source income. Consequently, in the case of a disposition of Common Shares or ADSs in a transaction subject to Peruvian tax, the U.S. Holder may not be able to claim the foreign tax credit for any Peruvian tax imposed on the gain unless it has sufficient foreign source income from other sources against which it can apply the credit. Generally, gain or loss will be a long-term capital gain or loss if the U.S. Holder’s holding period for such Common Shares or ADSs exceeds one year. Long-term capital gain for an individual U.S. Holder is generally subject to a reduced rate of tax. With respect to sales occurring on or after May 6, 2003, but before January 1, 2013, the long-term capital gain tax rate for an individual U.S. Holder is 15 percent.
A non-U.S. Holder of ADSs or Common Shares will not be subject to United States income or withholding tax on gain from the sale or other disposition of ADSs or Common Shares unless (i) such gain is effectively connected with the conduct of a trade or business within the United States or (ii) the non-U.S. Holder is an individual who is present in the United States for at least 183 days during the taxable year of the disposition and certain other conditions are met.
Passive Foreign Investment Company
We believe that we are not and will not become a passive foreign investment company for United States Federal income tax purposes. A foreign corporation is a passive foreign investment company, or PFIC, in any taxable year in which, after taking into account the income and assets of certain subsidiaries pursuant to the applicable look-through rules, either (i) at least 75 percent of its gross income is passive income or (ii) at least 50 percent of the average value of its assets is attributable to assets that produce passive income or are held for the production of passive income.
If we were a PFIC in any year during which a U.S. Holder owned ADSs or Common Shares, we would not be treated as a “qualified foreign corporation” for purposes of qualifying dividends paid to a U.S. Holder for the preferential 15 percent maximum U.S. tax rate noted above and the U.S. Holder would be subject to additional taxes on any excess distributions received from us and any gain realized from the sale or other disposition of ADSs or Common Shares (regardless of whether we continued to be a PFIC). A U.S. Holder has an excess distribution to the extent that distributions on ADSs or Common Shares during a taxable year exceed 125 percent of the average amount received during the three preceding taxable years (or, if shorter, the U.S. Holder’s holding period for the ADSs or Common Shares). To compute the tax on an excess distribution or any gain, (i) the excess distribution or the gain is allocated ratably over the U.S. Holder’s holding period for the ADSs or Common Shares, (ii) the amount allocated to the current taxable year is taxed as ordinary income and (iii) the amount allocated to other taxable years is taxed at the highest applicable marginal rate in effect for each year and an interest charge is imposed to recover the deemed benefit from the deferred payment of the tax attributable to each year.
If we were a PFIC, U.S. holders of interests in a holder of ADSs or Common Shares may be treated as indirect holders of their proportionate share of the ADSs or Common Shares and may be taxed on their proportionate share of any excess distribution or gain attributable to the ADSs or Common Shares. An indirect holder also must treat an appropriate portion of its gain on the sale or disposition of its interest in the actual holder as gain on the sale of the ADSs or Common Shares.
Information Reporting and Backup Withholding
Dividends in respect of the ADSs or Common Shares and the proceeds from the sale, exchange, or redemption of the ADSs or Common Shares may be reported to the United States Internal Revenue Service and a backup withholding tax may apply to such amounts unless the holder (i) is a domestic corporation (which may be required to establish its exemption by carrying its status on U.S. Internal Revenue Service Form W-9), (ii) in the case of a U.S. Holder other than a corporation, provides an accurate taxpayer identification number in the manner required by applicable law, (iii) in the case of a non-U.S. Holder, provides a properly executed U.S. Internal Revenue Service Form W-8BEN; or other successor Form, or (iv) otherwise establishes a basis for exemption. The amount of any backup withholding from a payment to a U.S. Holder generally will be allowed as a credit against the U.S. Holder’s United States Federal income tax liability.
F. Dividends and Paying Agents
Not applicable.
G. Statement by Experts
Not applicable.
H. Documents on Display
We are subject to the informational requirements of the United States Securities Exchange Act of 1934, as amended. In accordance with these requirements, we file annual reports and other information to the SEC. These materials, including this Annual Report on Form 20-F and the exhibits hereto, may be inspected and copied at the SEC’s Public Reference Room at 100 F Street, N.E., Washington, D.C. 20549 and at the SEC’s regional offices at 175 W. Jackson Boulevard, Suite 900, Chicago, Illinois 60604, and 3 World Financial Center, Suite 400, New York, New York 10281-1022. Copies of the materials may be obtained from the Public Reference Room of the SEC at 100 F Street, N.E., Washington, D.C. 20549 at prescribed rates. The public may obtain information on the operation of the SEC’s Public Reference Room by calling the SEC in the United States at 1-800-SEC-0330. The SEC also maintains a web site at http://www.sec.gov that contains reports, proxy statements and other information regarding registrants that file electronically with the SEC. Form 20-F reports and some of the other information submitted by us to the SEC may be accessed through this web site.
I. Subsidiary Information
Not applicable.
| ITEM 11. | Quantitative and Qualitative Disclosures About Market Risk |
The following discussion contains forward-looking statements that are subject to risks and uncertainties, many of which are outside of our control. Our primary market risks are related to fluctuations in the prices of gold, silver, zinc and lead. To a lesser extent, we are subject to market risk related to fluctuations in US$/Nuevo Sol exchange rates and to market risk related to interest rate fluctuation on our cash balances.
Commodity Contracts
Gold, silver, lead and copper hedging and sensitivity to market price
Our revenues and expenses are to a great extent influenced by world market prices for gold, copper, silver, zinc and lead that fluctuate widely and over which we have no control. Until 1998, we pursued a limited economic hedging and options strategy, locking in metals prices on a medium-term basis when we considered market prices attractive. However, in 1998 we adopted a new hedging strategy, in order to focus on long-term position-taking on the price of precious metals.
Between 2003 and 2008, we modified the terms of certain derivative instruments in order to qualify them as normal sales contracts and eliminated the fixed or maximum price component on all of our outstanding gold commitments. These modifications required us to make aggregate payments of US$832.84 million during 2007 and 2008. As a result of these transactions, we are now completely unhedged as to the price at which our gold and silver will be sold. See “Item 3. Key Information—Risk Factors—Factors Relating to the Company—Our, Yanacocha’s and Cerro Verde’s financial performance is highly dependent on the prices of gold, silver, copper and the other metals” and “—Our base metal hedging strategies may not be successful, and any of our unhedged metal prices will continue to be subject to market fluctuations.”
As of April 30, 2011, we had no fixed price commitments for the sale of our metals. As of April 30, 2011, we had no silver derivative contracts or gold convertible put option contracts in place.
At El Brocal, we implemented a base metal hedging policy for a maximum of 25 percent of El Brocal’s total payable metal contained per year, for up to three years. As of March 31, 2011, all transactions entered have been average price options through non-delivery zero cost (Asian) option collars. Outstanding hedging commitments for 2011 to 2013 amount to 14 percent of payable metal and are as follows: 12,352 metric tons of copper at an average range of US$6,966 to US$8,191 per metric ton.
Yanacocha and Cerro Verde have informed us that they have generally not engaged in, and are currently not engaged in, gold or copper price hedging activities, such as forward sales or option contracts, to minimize their exposure to fluctuations in the prices of gold or copper.
Normal Sales
We had no normal sales contracts with fixed or capped prices outstanding as of April 30, 2011.
Foreign currency risk
We buy and sell our products and obtain capital facilities and investment in U.S. Dollars. The assets and liabilities in different currencies from the U.S. dollar (Nuevos Soles) are not significant. We estimate that the future exchange rate fluctuations of Peruvian currency versus the U.S. dollar will not significantly affect the results of our future operations.
Interest Rate Sensitivity
We reduce our exposure to the risks due to variations in interest rates by engaging in financial obligations and capital leasing with fixed interest rates. See Note 28 to the Financial Statements. Consequently, we do not use derivative instruments to manage this risk and we do not expect to incur significant losses based on interest risks.
| ITEM 12. | Description of Securities Other Than Equity Securities |
A. Debt Securities
Not applicable.
B. Warrants and Rights
Not applicable.
C. Other Securities
Not applicable.
D. American Depositary Shares
The Depositary collects its fees for delivery and surrender of ADSs directly from investors depositing shares or surrendering ADSs for the purpose of withdrawal or from intermediaries acting for them. The Depositary collects fees for making distributions to investors by deducting those fees from the amounts distributed or by selling a portion of distributable property to pay the fees. The Depositary may collect its annual fee for depositary services by deductions from cash distributions or by directly billing investors or by charging the book-entry system accounts of participants acting for them. The Depositary may generally refuse to provide fee-attracting services until its fees for those services are paid. The following table summarizes the fees and expenses payable by holders of ADSs:
Persons depositing or withdrawing shares must pay: | For: |
| US$5.00 (or less) per 100 ADSs (or portion of 100 ADSs) | • Issuance of ADSs, including issuances resulting from a distribution of shares or rights or other property • Cancellation of ADSs for the purpose of withdrawal, including if the deposit agreement terminates |
| A fee equivalent to the fee that would be payable if securities distributed to you had been shares and the shares had been deposited for issuance of ADSs | • Distribution of securities distributed to holders of deposited securities which are distributed by the depositary to ADS registered holders |
| Registration or transfer fees | • Transfer and registration of shares on our share register to or from the name of the Depositary or its agent when you deposit or withdraw shares |
| Expenses of the Depositary | • Cable, telex and facsimile transmissions (when expressly provided in the deposit agreement) • Converting foreign currency to U.S. dollars |
| Taxes and other governmental charges the Depositary or the custodian have to pay on any ADS or share underlying an ADS, for example, stock transfer taxes, stamp duty or withholding taxes | • As necessary |
| Any charges incurred by the Depositary or its agents for servicing the deposited securities | • As necessary |
Fees Incurred in Past Annual Period
From January 1, 2010 to April 30, 2011, we received no fees from the Depositary related to our ADR facility, including continuing annual stock exchange listing fees, standard out-of-pocket maintenance costs for the ADRs (consisting of the expenses of postage and envelopes for mailing annual and interim financial reports, printing and distributing dividend checks, electronic filing of U.S. Federal tax information, mailing required tax forms, stationery, postage, facsimile, and telephone calls), any applicable performance indicators relating to the ADR facility, underwriting fees and legal fees.
Fees to be Paid in the Future
The Depositary has agreed to reimburse us for expenses we incur that are related to establishment and maintenance expenses of the ADS program. The Depositary has agreed to reimburse us for our continuing annual stock exchange listing fees. The Depositary has also agreed to pay the standard out-of-pocket maintenance costs for the ADRs, which consist of the expenses of postage and envelopes for mailing annual and interim financial reports, printing and distributing dividend checks, electronic filing of U.S. Federal tax information, mailing required tax forms, stationery, postage, facsimile, and telephone calls. It has also agreed to reimburse us annually for certain investor relationship programs or special investor relations promotional activities. In certain instances, the Depositary has agreed to provide additional payments to us based on any applicable performance indicators relating to the ADR facility. There are limits on the amount of expenses for which the Depositary will reimburse us, but the amount of reimbursement available to us is not necessarily tied to the amount of fees the Depositary collects from investors.
The Depositary collects its fees for delivery and surrender of ADSs directly from investors depositing shares or surrendering ADSs for the purpose of withdrawal or from intermediaries acting for them. The Depositary collects fees for making distributions to investors by deducting those fees from the amounts distributed or by selling a portion of distributable property to pay the fees. The Depositary may collect its annual fee for depositary services by deduction from cash distributions or by directly billing investors or by charging the book-entry system accounts of participants acting for them. The Depositary may generally refuse to provide fee-attracting services until its fees for those services are paid.
PART II
| ITEM 13. | Defaults, Dividend Arrearages and Delinquencies |
Not applicable.
| ITEM 14. | Material Modifications to the Rights of Security Holders and Use of Proceeds |
Not applicable.
| ITEM 15. | Controls and Procedures |
Evaluation of Disclosure Controls and Procedures
As of December 31, 2010, we carried out an evaluation under the supervision and with the participation of our management, including our Chief Executive Officer and Chief Financial Officer, of the effectiveness of the design and operation of our disclosure controls and procedures. There are inherent limitations to the effectiveness of any system of disclosure controls and procedures, including the possibility of human error and the circumvention or overriding of the controls and procedures. Accordingly, even effective disclosure controls and procedures can only provide reasonable assurance of achieving their control objectives. Based upon and as of the date of our evaluation, our Chief Executive Officer and Chief Financial Officer concluded that the disclosure controls and procedures are effective to provide reasonable assurance that information required to be disclosed in the reports we file and submit under the United States Securities Exchange Act of 1934, as amended, is recorded, processed, summarized and reported as and when required.
Management’s Annual Report on Internal Control over Financial Reporting
Our management is responsible for establishing and maintaining adequate internal control over financial reporting. Internal control over financial reporting is a process designed to provide reasonable assurance regarding the reliability of financial reporting and the preparation of financial statements for external reporting purposes in accordance with generally accepted accounting principles. Because of its inherent limitations, internal control over financial reporting may not prevent or detect misstatements. Our management has assessed the effectiveness of our internal control over financial reporting as of December 31, 2010. In making its assessment, management has utilized the criteria set forth by the Committee of Sponsoring Organizations (COSO) of the Treadway Commission in Internal Control—Integrated Framework. Our management concluded that based on its assessment, our internal control over financial reporting was effective as of December 31, 2010.
Our independent registered public accounting firm, Medina, Zaldivar, Paredes & Asociadoes, has issued an attestation report on our internal control over financial reporting, which is included below.
Attestation Report of the Independent Registered Public Accounting Firm
To the Board of Directors and Shareholders of Compañía de Minas Buenaventura S.A.A.
We have audited Compañía de Minas Buenaventura S.A.A.’s internal control over financial reporting as of December 31, 2010, based on criteria established in Internal Control - Integrated Framework issued by the Committee of Sponsoring Organizations of the Treadway Commission (the COSO criteria). Compañía de Minas Buenaventura S.A.A.’s management is responsible for maintaining effective internal control over financial reporting, and for its assessment of the effectiveness of internal control over financial reporting included in the accompanying Management’s report. Our responsibility is to express an opinion on the company’s internal control over financial reporting based on our audit.
We conducted our audit in accordance with the standards of the Public Company Accounting Oversight Board (United States). Those standards require that we plan and perform the audit to obtain reasonable assurance about whether effective internal control over financial reporting was maintained in all material respects. Our audit included obtaining an understanding of internal control over financial reporting, assessing the risk that a material weakness exists, testing and evaluating the design and operating effectiveness of internal control based on the assessed risk, and performing such other procedures as we considered necessary in the circumstances. We believe that our audit provides a reasonable basis for our opinion.
A company’s internal control over financial reporting is a process designed to provide reasonable assurance regarding the reliability of financial reporting and the preparation of financial statements for external purposes in accordance with generally accepted accounting principles. A company’s internal control over financial reporting includes those policies and procedures that (1) pertain to the maintenance of records that, in reasonable detail, accurately and fairly reflect the transactions and dispositions of the assets of the company; (2) provide reasonable assurance that transactions are recorded as necessary to permit preparation of financial statements in accordance with generally accepted accounting principles, and that receipts and expenditures of the company are being made only in accordance with authorizations of management and directors of the company; and (3) provide reasonable assurance regarding prevention or timely detection of unauthorized acquisition, use, or disposition of the company’s assets that could have a material effect on the financial statements.
Because of its inherent limitations, internal control over financial reporting may not prevent or detect misstatements. Also, projections of any evaluation of effectiveness to future periods are subject to the risk that controls may become inadequate because of changes in conditions, or that the degree of compliance with the policies or procedures may deteriorate.
In our opinion, Compañía de Minas Buenaventura S.A.A. and subsidiaries maintained, in all material respects, effective internal control over financial reporting as of December 31, 2010, based on the COSO criteria.
We also have audited, in accordance with the standards of the Public Company Accounting Oversight Board (United States), the consolidated balance sheets of Compañía de Minas Buenaventura S.A.A. and subsidiaries as of December 31, 2010 and 2009, and the related consolidated statements of income, shareholders’ equity, and cash flows for each of the three years in the period ended December 31, 2010 of Compañía de Minas Buenaventura S.A.A. and subsidiaries and our report dated June 24, 2011, expressed an unqualified opinion thereon.
/S/ MEDINA, ZALDIVAR, PAREDES & ASOCIADOS
Countersigned by:
/S/ MARCO ANTONIO ZALDÍVAR
Marco Antonio Zaldivar
C.C.P.A. Register No. 12477
Lima, Peru
June 24, 2011
Changes in Internal Control Over Financial Reporting
There has been no change in our internal control over financial reporting during 2010 that has materially affected, or is reasonably likely to materially affect, our internal control over financial reporting.
| ITEM 16A. | Audit Committee Financial Expert |
The Board of Directors has determined that Mr. Luis Coleridge is the Audit Committee financial expert as defined in Item 16A of Form 20-F. The Board of Directors has also determined that Mr. Coleridge and each of the other members of the Audit Committee are “independent directors” as defined in Section 303A.02 of the NYSE’s Listed Company Manual.
We have adopted a written code of business conduct and ethics that applies to our principal executive officer, principal financial officer, principal accounting officer and controller, or persons performing similar functions, as well as all other employees. Our code of business conduct and ethics is posted on, and within five days following the date of any amendment or waiver we intend to disclose any amendments to or waivers from our code of business conduct and ethics on, our website, which is located at http://www.buenaventura.com. The information on our website is not a part of, nor incorporated into, this document.
| ITEM 16C. | Principal Accountant Fees and Services |
The Audit Committee proposed at the General Meeting that Medina, Zaldivar, Paredes & Asociados, a member firm of Ernst & Young Global, be elected as the independent auditor for 2010. Medina, Zaldivar, Paredes & Asociados has served as our independent public accountant for each of the fiscal years in the two-year period ended December 31, 2009 and 2010, for which audited financial statements appear in this annual report on Form 20-F.
The following table presents the aggregate fees for professional services and other services rendered by Medina, Zaldivar, Paredes & Asociados for 2009 and 2010.
| | | Year ended December 31, | |
| | | 2009 | | | 2010 | |
| Audit Fees | | US$ | 775,013 | | | US$ | 906,982 | |
| Tax Fees | | US$ | 205,545 | | | US$ | 214,179 | |
| Total | | US$ | 980,558 | | | US$ | 1,121,161 | |
Audit Fees. Audit fees in the above table are the aggregate fees billed by Medina, Zaldivar, Paredes & Asociados in connection with the audit of our annual financial statements, the review of our quarterly financial statements and statutory and regulatory audits. In addition, the amounts in the above table includes fees that were incurred in connection with the audit of internal control over financial reporting in 2009 and 2010.
Tax Fees. Tax fees in the above table are fees billed by Medina, Zaldivar, Paredes & Asociados in connection with review of income tax filings, transfer pricing studies and tax consultations.
Audit Committee Pre-approval Policies and Procedures
Our Audit Committee is responsible for the oversight of the independent auditor. The Audit Committee has adopted a policy regarding pre-approval of audit services provided by our independent auditors, or the Policy. In accordance with the Policy, the Audit Committee must pre-approve the provision of services by our independent auditor for all audit and non-audit services prior to commencement of the specified service. The requests for pre-approval are submitted to the Audit Committee by the Chief Financial Officer and following approval by audit committee members an engagement letter is executed. The Audit Committee approved all audit and tax fees in 2010.
| ITEM 16D. | Exemptions from the Listing Standards for Audit Committees |
| ITEM 16E. | Purchases of Equity Securities by the Issuer and Affiliated Purchasers |
For the year ended December 31, 2010, neither we nor any person acting on our behalf made any purchase of our Common Shares.
| ITEM 16F. | Change in Registrant’s Certifying Accountant |
None.
| ITEM 16G. | Corporate Governance |
There are significant differences in the corporate governance practices followed by us as compared to those followed by United States domestic companies under the New York Stock Exchange, or NYSE, listing standards. The NYSE listing standards provide that the board of directors of a United States domestic listed company must consist of a majority of independent directors and that certain committees must consist solely of independent directors. Under Peruvian corporate governance practices, a Peruvian company is not required to have a majority of the members of the board of directors be independent.
The listing standards for the NYSE also require that United States domestic companies have an audit committee, a nominating/corporate governance committee and a compensation committee. Each of these committees must consist solely of independent directors and must have a written charter that addresses certain matters specified in the listing standards. Peruvian corporate governance practices permit the Board of Directors of a Peruvian company to form special governance bodies in accordance with the needs of such company and do not require that these special governance bodies be composed partially or entirely of independent directors. We maintain three committees, which include the Audit Committee, the Compensation Committee and the Nominating/Corporate Governance Committee. Our Board of Directors has determined that our Audit Committee is composed entirely of independent directors, as defined in the NYSE’s Listed Company Manual.
The NYSE’s listing standards also require United States domestic companies to adopt and disclose corporate governance guidelines. In July 2002, CONASEV and a committee comprised of regulatory agencies and associations prepared and published a list of suggested corporate governance guidelines called “Principles of Good Governance for Peruvian Companies.” These principles are disclosed on CONASEV’s website at http://www.conasev.gob.pe. Our code of business conduct and ethics establishes our principles of good corporate governance and, as indicated in “Item 16B. Code of Ethics,” is posted on our website.
PART III
| ITEM 17. | Financial Statements |
| ITEM 18. | Financial Statements |
(a) Index to Financial Statements and Schedules
| | | Page |
| | | |
| COMPAÑIA DE MINAS BUENAVENTURA S.A.A. AND SUBSIDIARIES | | |
| | | |
| Report of Independent Registered Public Accounting Firm | | F-3 |
| | | |
| Consolidated Balance Sheet As of December 31, 2009 and 2010 | | F-4 |
| | | |
| Consolidated Statement of Income For the years ended December 31, 2008, 2009 and 2010 | | F-6 |
| | | |
| Consolidated Statement of Changes in Shareholders’ Equity for the years ended December 31, 2008, 2009 and 2010 | | F-7 |
| | | |
| Consolidated Statement of Cash Flows For the years ended December 31, 2008, 2009 and 2010 | | F-9 |
| | | |
| Notes to the Consolidated Financial Statements | | F-11 |
| | | |
| MINERA YANACOCHA S.R.L. | | |
| | | |
| Report of the Independent Registered Public Accounting Firm | | F-90 |
| | | |
| Consolidated Statements of Income for the years ended December 31, 2008, 2009 and 2010 | | F-91 |
| | | |
| Consolidated Statements of Cash Flows for the years ended December 31, 2008, 2009 and 2010 | | F-92 |
| | | |
| Consolidated Balance Sheets as of December 31, 2009 and 2010 | | F-93 |
| | | |
| Consolidated Statements of Changes in Partners' Equity for the years ended December 31, 2008, 2009 and 2010 | | F-94 |
| | | |
| Notes to the Consolidated Financial Statements | | F-95 |
| | | |
| SOCIEDAD MINERA CERRO VERDE S.A.A. | | |
| | | |
| Report of the Independent Registered Public Accounting Firm | | F-119 |
| | | |
| Balance Sheets as of December 31, 2009 and 2010 | | F-120 |
| | | |
| Statements of income for the years ended December 31, 2008, 2009 and 2010 | | F-121 |
| | | |
| Statements of changes in Shareholders’ Equity for the years ended December 31, 2008, 2009 and 2010 | | F-122 |
| | | |
| Statements of cash flows for the years ended December 31, 2008, 2009 and 2010 | | F-123 |
| | | |
| Notes to the financial statements | | F-125 |
| | 1.1 | By-Laws (Estatutos) of Compañía de Minas Buenaventura S.A.A., as amended April 30, 2002 (incorporated by reference from Compañía de Minas Buenaventura S.A.A. Annual Report on Form 20-F for the year ended December 31, 2002, filed on June 25, 2003). |
| | 1.2 | By-Laws (Estatutos) of Minera Yanacocha S. R. L., as amended October 18, 1999 (incorporated by reference from Compañía de Minas Buenaventura S.A.A. Annual Report on Form 20-F for the year ended December 31, 2002, filed on June 25, 2003). |
| | 4.1 | Shareholders Agreement among SMM Cerro Verde Netherlands B.V., Sumitomo Metal Mining Co., Ltd., Sumitomo Corporation, Summit Global Management B.V., Compañía de Minas Buenaventura S.A.A., Cyprus Climax Metals Company, Phelps Dodge Corporation and Sociedad Minera Cerno Verde S.A.A. dated June 1, 2005 (incorporated by reference from Compañía de Minas Buenaventura S.A.A. Annual Report on Form 20-F for the year ended December 31, 2005, filed on June 6, 2006). |
| | 4.2 | English Summary of the Financial Lease Agreement (Arrendamiento Financiero), dated as of December 2, 2009, by and among Banco de Crédito del Peru, as lessor, Compañía de Minas Buenaventura S.A.A., as guarantor, Empresa de Generación de Huanza, S.A., as lessee, and Consorcio Energetico Huancavelica S.A.† |
| | 11 | Code of Conduct and Ethics (incorporated by reference from Compañía de Minas Buenaventura S.A.A. Annual Report on Form 20-F for the year ended December 31, 2002, filed on June 25, 2003). |
| | 12.1 | Certification of Chief Executive Officer of Compañía de Minas Buenaventura S.A.A. pursuant to Section 302 of the Sarbanes-Oxley Act of 2002.† |
| | 12.2 | Certification of Chief Financial Officer of Compañía de Minas Buenaventura S.A.A. pursuant to Section 302 of the Sarbanes-Oxley Act of 2002.† |
| | 13.1 | Certification of Chief Executive Officer of Compañía de Minas Buenaventura S.A.A. pursuant to Section 906 of the Sarbanes-Oxley Act of 2002.† |
| | 13.2 | Certification of Chief Financial Officer of Compañía de Minas Buenaventura S.A.A. pursuant to Section 906 of the Sarbanes-Oxley Act of 2002.† |
† Filed herewith.
SIGNATURE
The registrant hereby certifies that it meets all of the requirements for filing on Form 20-F and that it has duly caused and authorized the undersigned to sign this annual report on its behalf.
| | COMPAÑÍA DE MINAS BUENAVENTURA S.A.A. |
| | |
| | By: | /S/ CARLOS E. GÁLVEZ PINILLOS |
| | | Carlos E. Gálvez Pinillos |
| | | Chief Financial Officer |
Dated: June 28, 2011
Index to the Financial Statements
| | | Page |
| | | |
| Compañía de Minas Buenaventura S.A.A. and subsidiaries | | |
| | | |
| Report of Independent Registered Public Accounting Firm | | F-3 |
| | | |
| Consolidated Balance Sheet As of December 31, 2009 and 2010 | | F-4 |
| | | |
| Consolidated Statement of Income For the years ended December 31, 2008, 2009 and 2010 | | F-6 |
| | | |
| Consolidated Statement of Changes in Shareholders’ Equity for the years ended December 31, 2008, 2009 and 2010 | | F-7 |
| | | |
| Consolidated Statement of Cash Flows For the years ended December 31, 2008, 2009 and 2010 | | F-9 |
| | | |
| Notes to the Consolidated Financial Statements | | F-11 |
| | | |
| Minera Yanacocha S.R.L. | | |
| | | |
| Report of the Independent Registered Public Accounting Firm | | F-90 |
| | | |
| Consolidated Statements of Income for the years ended December 31, 2008, 2009 and 2010 | | F-91 |
| | | |
| Consolidated Statements of Cash Flows for the years ended December 31, 2008, 2009 and 2010 | | F-92 |
| | | |
| Consolidated Balance Sheets as of December 31, 2009 and 2010 | | F-93 |
| | | |
| Consolidated Statements of Changes in Partners' Equity for the years ended December 31, 2008, 2009 and 2010 | | F-94 |
| | | |
| Notes to the Consolidated Financial Statements | | F-95 |
| | | |
| Sociedad Minera Cerro Verde S.A.A | | |
| | | |
| Report of the Independent Registered Public Accounting Firm | | F-119 |
| | | |
| Balance Sheets as of December 31, 2009 and 2010 | | F-120 |
| | | |
| Statements of income for the years ended December 31, 2008, 2009 and 2010 | | F-121 |
| | | |
| Statements of changes in Shareholders’ Equity for the years ended December 31, 2008, 2009 and 2010 | | F-122 |
| | | |
| Statements of cash flows for the years ended December 31, 2008, 2009 and 2010 | | F-123 |
| | | |
| Notes to the financial statements | | F-125 |
Compañía de Minas Buenaventura S.A.A. and Subsidiaries
Consolidated Financial Statements as of December 31, 2010, 2009 and 2008, together with the Report of Independent Registered Public Accounting Firm
Contents
| Report of Independent Registered Public Accounting Firm | | F-3 |
| | | |
| Consolidated Balance Sheet | | F-4 |
| | | |
| Consolidated Statement of Income | | F-6 |
| | | |
| Consolidated Statement of Changes in Shareholders’ Equity | | F-7 |
| | | |
| Consolidated Statement of Cash Flows | | F-9 |
| | | |
| Notes to the Consolidated Financial Statements | | F-11 |
| ERNST & YOUNG | | Medina, Zaldivar, Paredes |
| | | & Asociados Sociedad Civil |
Report of Independent Registered Public Accounting Firm
To the Board of Directors and Shareholders of Compañía de Minas Buenaventura S.A.A.
We have audited the accompanying consolidated balance sheet of Compañía de Minas Buenaventura S.A.A. (a Peruvian corporation) and subsidiaries (together the "Company") as of December 31, 2010 and 2009 and the related consolidated statements of income, shareholders’ equity and cash flows for each of the three years in the period ended December 31, 2010. These financial statements are the responsibility of the Company's management. Our responsibility is to express an opinion on these financial statements based on our audits. We have not audited the financial statements as of and for each of the years ended December 31, 2010, 2009 and 2008 of Minera Yanacocha S.R.L (an associate in which the Company has a 43.65% interest through its subsidiary, Compañía Minera Condesa S.A.). Those statements were audited by other auditors whose reports were furnished to us and our opinion, insofar as it relates to the amounts included for Minera Yanacocha S.R.L., is based solely on the reports of the other auditors. In the consolidated financial statements of the Company, the investment on the balance sheet amounts to US$1,004.3, US$746.1 and US$528.3 as of December 31, 2010, 2009 and 2008, respectively; and the share in the net income of this entity amounts to US$257.65, US$317.7 and US$208.3 million for the years ended December 31, 2010, 2009 and 2008.
We conducted our audits in accordance with the standards of the Public Company Accounting Oversight Board (United States). Those standards require that we plan and perform the audit to obtain reasonable assurance about whether the consolidated financial statements are free from material misstatement. An audit includes examining, on a test basis, evidence supporting the amounts and disclosures in the financial statements. An audit also includes assessing the accounting principles used and significant estimates made by management, as well as evaluating the overall financial statement presentation. We believe that our audits and the reports of the other auditors provide a reasonable basis for our opinion.
In our opinion, based on our audit and the reports of other auditors on Minera Yanacocha S.R.L., the consolidated financial statements referred to above present fairly, in all material respects, the consolidated financial position of Compañía de Minas Buenaventura S.A.A. and subsidiaries as of December 31, 2010 and 2009, and the consolidated results of their operations and their cash flows for the years ended December 31, 2010, 2009 and 2008, in conformity with accounting principles generally accepted in Peru, which differ in certain respects from U.S. generally accepted accounting principles (see notes 32 and 33 to the consolidated financial statements).
We also have audited, in accordance with the standards of the Public Company Accounting Oversight Board (United States), Compañía de Minas Buenaventura S.A.A.´s internal control over financial reporting as of December 31, 2010, based on criteria established in Internal Control - Integrated Framework issued by the Committee of Sponsoring Organizations of the Treadway Commission and our report dated June 24, 2011 expressed an unqualified opinion thereon.
Lima, Peru,
June 24, 2011
Countersigned by:
/S/ MARCO ANTONIO ZALDÍVAR
Marco Antonio Zaldívar
C.P.C.A. Register No.12477
Compañía de Minas Buenaventura S.A.A. and Subsidiaries
Consolidated Balance Sheet
As of December 31, 2010 and 2009
| | | | | | | | | |
| | | | | | US$(000) | | | US$(000) | |
| | | | | | | | | | |
| Assets | | | | | | | | | |
| Current assets | | | | | | | | | |
| Cash and cash equivalents | | | 4 | (a) | | | 600,796 | | | | 714,454 | |
| Financial assets at fair value through profit or loss | | | 5 | | | | 50,154 | | | | - | |
| Trade accounts receivable, net | | | 6 | (a) | | | 160,928 | | | | 122,950 | |
| Other accounts receivable | | | | | | | 23,593 | | | | 14,346 | |
| Accounts receivable from associates | | | 31 | (c) | | | 18,903 | | | | 21,866 | |
| Embedded derivatives for concentrates sales | | | 27 | (c) | | | 13,645 | | | | 4,838 | |
| Inventory, net | | | 7 | (a) | | | 82,081 | | | | 40,385 | |
| Prepaid expenses | | | | | | | 21,615 | | | | 14,368 | |
| Total current assets | | | | | | | 971,715 | | | | 933,207 | |
| | | | | | | | | | | | | |
| Other accounts receivable | | | | | | | 1,538 | | | | 1,457 | |
| Other accounts receivable from associates | | | 31 | (b) | | | 20,736 | | | | - | |
| Long-term inventory | | | 7 | (a) | | | 27,104 | | | | 4,602 | |
| Prepaid expenses | | | | | | | 12,887 | | | | 10,787 | |
| Investment in associates | | | 8 | (a) | | | 1,404,659 | | | | 1,126,167 | |
| Mining concessions and property, plant and equipment, net | | | 9 | (a) | | | 532,577 | | | | 351,784 | |
| Development costs, net | | | 10 | | | | 86,340 | | | | 91,633 | |
| Deferred income tax and workers´ profit sharing asset | | | 24 | (a) | | | 238,794 | | | | 261,877 | |
| Other assets | | | | | | | 6,095 | | | | 5,045 | |
| | | | | | | | | | | | | |
| Total assets | | | | | | | 3,302,445 | | | | 2,786,559 | |
| | | | | | | | | | | | | |
| Liabilities and shareholders’ equity, net | | | | | | | | | | | | |
| Current liabilities | | | | | | | | | | | | |
| Trade accounts payable | | | 12 | | | | 91,374 | | | | 61,357 | |
| Income tax payable | | | | | | | 26,538 | | | | 20,528 | |
| Other accounts payable | | | 13 | (a) | | | 115,838 | | | | 84,001 | |
The accompanying notes are an integral part of the consolidated balance sheet.
| | | Note | | 2010 | | | 2009 | |
| | | | | US$(000) | | | US$(000) | |
| Other accounts payable to associates | | | 31 | (c) | | | 1,584 | | | | - | |
| Embedded derivatives for concentrates sales | | | 27 | (c) | | | - | | | | 292 | |
| Derivative financial instruments liability | | | 27 | (a) | | | 16,291 | | | | 1,468 | |
| Financial obligations | | | 14 | (a) | | | 2,018 | | | | 79,452 | |
| | | | | | | | | | | | | |
| Total current liabilities | | | | | | | 253,643 | | | | 247,098 | |
| | | | | | | | | | | | | |
| Other accounts payable | | | 13 | (a) | | | 116,214 | | | | 102,053 | |
| Other accounts payable to associates | | | 31 | (b) | | | 1,370 | | | | - | |
| Financial obligations | | | 14 | (a) | | | 55,134 | | | | 150,555 | |
| Derivative financial instruments liability | | | 27 | (a) | | | 6,897 | | | | 5,375 | |
| Deferred income tax and workers’ profit sharing liability | | | 24 | (a) | | | 25,101 | | | | 18,158 | |
| | | | | | | | | | | | | |
| Total liabilities | | | | | | | 458,359 | | | | 523,239 | |
| | | | | | | | | | | | | |
| Shareholders’ equity, net | | | 15 | | | | | | | | | |
| Capital stock, net of treasury shares for US$62,622,000 in 2010 and 2009 | | | | | | | 750,540 | | | | 750,540 | |
| Investment shares, net of treasury shares for US$142,000 in 2010 and 2009 | | | | | | | 2,019 | | | | 2,019 | |
| Additional paid-in capital | | | | | | | 225,978 | | | | 225,978 | |
| Legal reserve | | | | | | | 162,633 | | | | 112,363 | |
| Other reserves | | | | | | | 269 | | | | 269 | |
| Retained earnings | | | | | | | 1,506,725 | | | | 1,011,077 | |
| Cumulative translation loss | | | | | | | (34,075 | ) | | | (34,075 | ) |
| Cumulative unrealized, gain (loss) | | | | | | | (6,233 | ) | | | (3,916 | ) |
| | | | | | | | | | | | | |
| | | | | | | | 2,607,856 | | | | 2,064,255 | |
| Minority interest | | | | | | | 236,230 | | | | 199,065 | |
| | | | | | | | | | | | | |
| Total shareholders’ equity, net | | | | | | | 2,844,086 | | | | 2,263,320 | |
| | | | | | | | | | | | | |
| Total liabilities and shareholders’ equity, net | | | | | | | 3,302,445 | | | | 2,786,559 | |
The accompanying notes are an integral part of the consolidated balance sheet.
Compañía de Minas Buenaventura S.A.A. and Subsidiaries
Consolidated Statement of Income
For the years ended December 31, 2010, 2009 and 2008
| | | | | | | | | | | | | |
| | | | | | US$(000) | | | US$(000) | | | US$(000) | |
| | | | | | | | | | | | | |
| Operating income | | | | | | | | | | | | |
| Net sales | | | 17 | | | | 1,047,885 | | | | 819,357 | | | | 766,603 | |
| Royalty income | | | 31(a) | | | | 55,883 | | | | 62,150 | | | | 48,760 | |
| Total income | | | | | | | 1,103,768 | | | | 881,507 | | | | 815,363 | |
| Operating costs | | | | | | | | | | | | | | | | |
| Cost of sales, without considering depreciation and amortization | | | 18 | | | | 340,840 | | | | 280,342 | | | | 251,804 | |
| Exploration in units in operation | | | 19 | | | | 91,441 | | | | 68,649 | | | | 57,003 | |
| Depreciation and amortization | | | | | | | 71,694 | | | | 73,536 | | | | 62,993 | |
| Total operating costs | | | | | | | 503,975 | | | | 422,527 | | | | 371,800 | |
| Gross income | | | | | | | 599,793 | | | | 458,980 | | | | 443,563 | |
| Operating incomes (expenses) | | | | | | | | | | | | | | | | |
| Administrative | | | 20 | | | | (92,606 | ) | | | (88,760 | ) | | | (34,907 | ) |
| Royalties | | | 21 | | | | (52,270 | ) | | | (39,646 | ) | | | (35,694 | ) |
| Exploring in non-operating areas | | | 22 | | | | (36,105 | ) | | | (30,005 | ) | | | (55,231 | ) |
| Selling | | | | | | | (9,375 | ) | | | (10,047 | ) | | | (15,386 | ) |
| Reimbursement of exploration expenses on projects | | | 8(e) | | | | 15,013 | | | | - | | | | - | |
| Reversal (provision) for impairment of long-lived assets | | | 11 | | | | 13,135 | | | | (3,325 | ) | | | (18,610 | ) |
| Total operating expenses | | | | | | | (162,208 | ) | | | (171,783 | ) | | | (159,828 | ) |
| Operating income before unusual item | | | | | | | 437,585 | | | | 287,197 | | | | 283,735 | |
| Net loss from release of commitments in commercial contracts | | | 17(a) | | | | - | | | | - | | | | (415,135 | ) |
| Operating income (loss) after unusual item | | | | | | | 437,585 | | | | 287,197 | | | | (131,400 | ) |
| Other income (expenses), net | | | | | | | | | | | | | | | | |
| Share in the results of associates | | | 8(b) | | | | 428,742 | | | | 451,306 | | | | 340,929 | |
| Interest income | | | | | | | 8,203 | | | | 6,117 | | | | 17,851 | |
| Interest expense | | | | | | | (12,271 | ) | | | (15,090 | ) | | | (33,934 | ) |
| Gain (loss) from currency exchange difference, net | | | | | | | (750 | ) | | | 1,457 | | | | (12,198 | ) |
| Other, net | | | 23 | | | | 10,915 | | | | 2,553 | | | | (9,290 | ) |
| Total other income, net | | | | | | | 434,839 | | | | 446,343 | | | | 303,358 | |
| Income before workers´profit sharing, income tax and minority interest | | | | | | | 872,424 | | | | 733,540 | | | | 171,958 | |
| Workers’ profit sharing | | | 24(b) | | | | (28,724 | ) | | | (12,592 | ) | | | 4,725 | |
| Income tax | | | 24(b) | | | | (116,327 | ) | | | (64,340 | ) | | | 26,645 | |
| Net income | | | | | | | 727,373 | | | | 656,608 | | | | 203,328 | |
| Net income attributable to minority interest | | | | | | | 64,439 | | | | 63,047 | | | | 50,045 | |
| Net income attributable to Buenaventura | | | | | | | 662,934 | | | | 593,561 | | | | 153,283 | |
| Basic and diluted earmings per share atributable to Buenaventura stated in U.S. dollars | | | 25 | | | | 2.61 | | | | 2.33 | | | | 0.60 | |
| Weighted average number of shares outstanding (common and investment), considering stock split effect, in units | | | 25 | | | | 254,442,328 | | | | 254,442,328 | | | | 254,442,328 | |
The accompanying notes are an integral part of the consolidated balance sheet.
Compañía de Minas Buenaventura S.A.A. and Subsidiaries
Consolidated Statement of Changes in Shareholders’ Equity
For the years ended December 31, 2010, 2009 and 2008
| | | Capital stocks net of treasury shares | | | | | | | | | | | | | | | | | | | | | | | | | | | | | | | |
| | | Number of shares outstanding | | | | | | | | | | | | | | | | | | | | | Cumulative translation loss | | | Cumulative unrealized gain (loss) | | | | | | | | | | |
| | | | | | US$(000) | | | US$(000) | | | US$(000) | | | US$(000) | | | US$(000) | | | US$(000) | | | US$(000) | | | US$(000) | | | US$(000) | | | US$(000) | | | US$(000) | |
| Balance as of January 1, 2008 | | | 126,879,832 | | | | 173,930 | | | | 473 | | | | 177,713 | | | | 37,679 | | | | 269 | | | | 1,056,937 | | | | (34,075 | ) | | | 1,676 | | | | 1,414,602 | | | | 165,614 | | | | 1,580,216 | |
| Dividends declared and paid, note 15(d) | | | - | | | | - | | | | - | | | | - | | | | - | | | | - | | | | (50,888 | ) | | | - | | | | - | | | | (50,888 | ) | | | (37,275 | ) | | | (88,163 | ) |
| Capitalization of retained earnings, note 15(e) | | | - | | | | 576,610 | | | | 1,546 | | | | 48,265 | | | | - | | | | - | | | | (626,421 | ) | | | - | | | | - | | | | - | | | | - | | | | - | |
| Shares issued as a result of stock split, note 15(f) | | | 126,879,832 | | | | - | | | | - | | | | - | | | | - | | | | - | | | | - | | | | - | | | | - | | | | - | | | | - | | | | - | |
| Net change in unrealized gain on hedging derivative financial instruments held by El Brocal, note 27(b) | | | - | | | | - | | | | - | | | | - | | | | - | | | | - | | | | - | | | | - | | | | 14,644 | | | | 14,644 | | | | 28,100 | | | | 42,744 | |
| Net change in unrealized gain on other investments | | | - | | | | - | | | | - | | | | - | | | | - | | | | - | | | | - | | | | - | | | | (40 | ) | | | (40 | ) | | | - | | | | (40 | ) |
| Decrease of minority interest in El Brocal | | | - | | | | - | | | | - | | | | - | | | | - | | | | - | | | | - | | | | - | | | | - | | | | - | | | | (9,093 | ) | | | (9,093 | ) |
| Capitalization of debt to minority shareholder of La Zanja | | | - | | | | - | | | | - | | | | - | | | | - | | | | - | | | | - | | | | - | | | | - | | | | - | | | | 7,755 | | | | 7,755 | |
| Net income | | | - | | | | - | | | | - | | | | - | | | | - | | | | - | | | | 153,283 | | | | - | | | | - | | | | 153,283 | | | | 50,045 | | | | 203,328 | |
| Transfer to legal reserve, note 15(c) | | | - | | | | - | | | | - | | | | - | | | | 15,328 | | | | - | | | | (15,328 | ) | | | - | | | | - | | | | - | | | | - | | | | - | |
| Balance as of December 31, 2008 | | | 253,759,664 | | | | 750,540 | | | | 2,019 | | | | 225,978 | | | | 53,007 | | | | 269 | | | | 517,583 | | | | (34,075 | ) | | | 16,280 | | | | 1,531,601 | | | | 205,146 | | | | 1,736,747 | |
| Dividends declared and paid, note 15(d) | | | - | | | | - | | | | - | | | | - | | | | - | | | | - | | | | (40,711 | ) | | | - | | | | - | | | | (40,711 | ) | | | (27,756 | ) | | | (68,467 | ) |
| Net change in unrealized gain on hedging derivative financial instruments held by El Brocal, note 27(b) | | | - | | | | - | | | | - | | | | - | | | | - | | | | - | | | | - | | | | - | | | | (20,753 | ) | | | (20,753 | ) | | | (31,527 | ) | | | (52,280 | ) |
| Net change in unrealized gain on other investments | | | - | | | | - | | | | - | | | | - | | | | - | | | | - | | | | - | | | | - | | | | 557 | | | | 557 | | | | - | | | | 557 | |
| Decrease of minority interest in El Brocal | | | - | | | | - | | | | - | | | | - | | | | - | | | | - | | | | - | | | | - | | | | - | | | | - | | | | (28,565 | ) | | | (28,565 | ) |
| Capitalization of debt to minority shareholder of La Zanja | | | - | | | | - | | | | - | | | | - | | | | - | | | | - | | | | - | | | | - | | | | - | | | | - | | | | 18,720 | | | | 18,720 | |
| Net income | | | - | | | | - | | | | - | | | | - | | | | - | | | | - | | | | 593,561 | | | | - | | | | - | | | | 593,561 | | | | 63,047 | | | | 656,608 | |
| Transfer to legal reserve, note 15(c) | | | - | | | | - | | | | - | | | | - | | | | 59,356 | | | | - | | | | (59,356 | ) | | | - | | | | - | | | | - | | | | - | | | | - | |
The accompanying notes are an integral part of the consolidated balance sheet.
| | | Capital stocks net of treasury shares | | | | | | | | | | | | | | | | | | | | | | | | | | | | | | |
| | | Number of shares outstanding | | | | | | | | | | | | | | | | | | | | | Cumulative translation loss | | | Cumulative unrealized gain (loss) | | | | | | | | | |
| Balance as of December 31, 2009 | | | 253,759,664 | | | | 750,540 | | | | 2,019 | | | | 225,978 | | | | 112,363 | | | | 269 | | | | 1,011,077 | | | | (34,075 | ) | | | (3,916 | ) | | | 2,064,255 | | | | 199,065 | | | | 2,263,320 | |
| Dividends declared and paid, note 15(d) | | | - | | | | - | | | | - | | | | - | | | | - | | | | - | | | | (117,043 | ) | | | - | | | | - | | | | (117,043 | ) | | | (39,176 | ) | | | (156,219 | ) |
| Net change in unrealized gain on hedging derivative financial instruments held by El Brocal, note 27(b) | | | - | | | | - | | | | - | | | | - | | | | - | | | | - | | | | - | | | | - | | | | (2,794 | ) | | | (2,794 | ) | | | (7,732 | ) | | | (10,526 | ) |
| Net change in unrealized gain on other investments | | | - | | | | - | | | | - | | | | - | | | | - | | | | - | | | | - | | | | - | | | | 477 | | | | 477 | | | | - | | | | 477 | |
| Expired dividends | | | - | | | | - | | | | - | | | | - | | | | 27 | | | | - | | | | - | | | | - | | | | - | | | | 27 | | | | - | | | | 27 | |
| Capitalization of debt to minority shareholder of La Zanja | | | - | | | | - | | | | - | | | | - | | | | - | | | | - | | | | - | | | | - | | | | - | | | | - | | | | 19,634 | | | | 19,634 | |
| Net income | | | - | | | | - | | | | - | | | | - | | | | - | | | | - | | | | 662,934 | | | | - | | | | - | | | | 662,934 | | | | 64,439 | | | | 727,373 | |
| Transfer to legal reserve, note 15(c) | | | - | | | | - | | | | - | | | | - | | | | 50,243 | | | | - | | | | (50,243 | ) | | | - | | | | - | | | | - | | | | - | | | | - | |
| Balance as of December 31, 2010 | | | 253,759,664 | | | | 750,540 | | | | 2,019 | | | | 225,978 | | | | 162,633 | | | | 269 | | | | 1,506,725 | | | | (34,075 | ) | | | (6,233 | ) | | | 2,607,856 | | | | 236,230 | | | | 2,844,086 | |
The accompanying notes are an integral part of the consolidated balance sheet.
Compañía de Minas Buenaventura S.A.A. and Subsidiaries
Consolidated Statement of Cash Flows
For the years ended December 31, 2010, 2009 and 2008
| | | | | | | | | | |
| | | US$(000) | | | US$(000) | | | US$(000) | |
| Operating activities | | | | | | | | | |
| Proceeds from sales | | | 997,829 | | | | 738,501 | | | | 781,116 | |
| Dividends received | | | 182,955 | | | | 213,845 | | | | 413,602 | |
| Royalty received | | | 58,825 | | | | 52,474 | | | | 50,550 | |
| Interest received | | | 8,098 | | | | 6,698 | | | | 18,461 | |
| Value added tax (VAT) recovered | | | 7,480 | | | | 32,387 | | | | - | |
| Payments to suppliers and third parties | | | (483,503 | ) | | | (335,473 | ) | | | (376,054 | ) |
| Payments to employees | | | (126,042 | ) | | | (94,906 | ) | | | (111,110 | ) |
| Income tax paid | | | (56,251 | ) | | | (37,105 | ) | | | (41,360 | ) |
| Payments of royalties | | | (55,265 | ) | | | (39,416 | ) | | | (41,401 | ) |
| Payments of interest | | | (6,377 | ) | | | (10,876 | ) | | | (26,622 | ) |
| Release of commitments in commercial contracts | | | - | | | | - | | | | (517,143 | ) |
| Net cash and cash equivalents provided by operating activities | | | 527,749 | | | | 526,129 | | | | 150,039 | |
| Investment activities | | | | | | | | | | | | |
| Proceeds from sale of plant and equipment | | | 694 | | | | 410 | | | | 754 | |
| Additions to mining concessions and property, plant and equipment | | | (230,180 | ) | | | (152,177 | ) | | | (71,252 | ) |
| Additions to financial assets at fair value through profit or loss | | | (50,000 | ) | | | - | | | | - | |
| Payments for purchase of investment shares | | | (19,625 | ) | | | (37,936 | ) | | | (29,541 | ) |
| Decrease (increase) in time deposits | | | (17,935 | ) | | | 22,725 | | | | 56,023 | |
| Disbursements for development activities | | | (13,222 | ) | | | (10,969 | ) | | | (31,873 | ) |
| Settlement in escrow account | | | - | | | | - | | | | 177,811 | |
| Increase in escrow account | | | - | | | | - | | | | (177,811 | ) |
| Net cash and cash equivalents used in investment activities | | | (330,268 | ) | | | (177,947 | ) | | | (75,889 | ) |
| Financing activities | | | | | | | | | | | | |
| Increase in financial obligations | | | 53,262 | | | | - | | | | 450,000 | |
| Payments of financial obligations | | | (226,117 | ) | | | (97,288 | ) | | | (206,824 | ) |
| Dividends paid | | | (117,043 | ) | | | (40,711 | ) | | | (50,888 | ) |
| Dividends paid to minority shareholders | | | (39,176 | ) | | | (27,756 | ) | | | (37,275 | ) |
| Proceeds from bank loans | | | - | | | | - | | | | 510,000 | |
| Payments of bank loans | | | - | | | | - | | | | (510,000 | ) |
| | | | | | | | | | | | | |
| Net cash and cash equivalents provided by (used in) financing activities | | | (329,074 | ) | | | (165,755 | ) | | | 155,013 | |
| Net increase (decrease) in cash and cash equivalents for the period | | | (131,593 | ) | | | 182,427 | | | | 229,163 | |
| Cash and cash equivalents at beginning of period | | | 714,454 | | | | 532,027 | | | | 302,864 | |
| Cash and cash equivalents at the period-end, note 4(a) | | | 582,861 | | | | 714,454 | | | | 532,027 | |
Consolidated Statement of Cash Flows (continued)
| | | | | | | | | | |
| | | US$(000) | | | US$(000) | | | US$(000) | |
| Reconciliation of net income to cash and cash equivalents provided by operating activities | | | | | | | | | |
| Net income attributable to Buenaventura | | | 662,934 | | | | 593,561 | | | | 153,283 | |
| Add (less) | | | | | | | | | | | | |
| Depreciation and amortization | | | 71,694 | | | | 73,536 | | | | 62,993 | |
| Net income attributable to minority interest | | | 64,439 | | | | 63,047 | | | | 50,045 | |
| Provision (reversal) for long-term officers´compensation | | | 42,425 | | | | 29,073 | | | | (7,678 | ) |
| Deferred income tax and workers´profit sharing | | | 35,846 | | | | (5,653 | ) | | | (91,565 | ) |
| Accretion expense of the provision for closure of mining units | | | 6,392 | | | | 4,839 | | | | 6,265 | |
| Net cost of plant and equipment retired and sold | | | 3,141 | | | | 462 | | | | 2,534 | |
| Provision for slow moving and obsolescence supplies | | | 2,025 | | | | 414 | | | | 684 | |
| Loss (gain) from currency exchange difference, net | | | 750 | | | | (1,457 | ) | | | 12,198 | |
| Share in the results of related parties by equity method, net of dividends received in cash | | | (245,787 | ) | | | (237,461 | ) | | | 72,673 | |
| Provision for estimated fair value of embedded derivatives of concentrate sales and adjustments on open liquidations | | | (20,500 | ) | | | (6,199 | ) | | | 9,729 | |
| Provision (reversal) for impairment of long-lived assets | | | (13,135 | ) | | | 3,325 | | | | 18,610 | |
| Income tax paid in excess | | | (3,099 | ) | | | - | | | | - | |
| Provision for closure of mining units and exploration projects | | | (1,821 | ) | | | 455 | | | | 13,066 | |
| Income of commitments in commercial contracts | | | - | | | | - | | | | (102,008 | ) |
| Allowance for doubtful trade accounts receivable | | | - | | | | 18,594 | | | | 5,372 | |
| Other | | | 11,346 | | | | (9,006 | ) | | | 1,566 | |
| Net changes in operating assets and liabilities accounts | | | | | | | | | | | | |
| Decrease (increase) in operating assets - | | | | | | | | | | | | |
| Trade accounts receivable, net | | | (37,978 | ) | | | (57,284 | ) | | | 41,874 | |
| Other accounts receivable | | | (19,476 | ) | | | (16,193 | ) | | | (4,328 | ) |
| Other accounts receivable from associates | | | (22,764 | ) | | | (4,984 | ) | | | 1,309 | |
| Derivative financial instruments | | | - | | | | - | | | | (14,644 | ) |
| Inventory, net | | | (64,198 | ) | | | (1,498 | ) | | | (8,323 | ) |
| Prepaid expenses | | | (9,347 | ) | | | 16,040 | | | | (19,824 | ) |
| Increase (decrease) in operating liabilities - | | | | | | | | | | | | |
| Trade accounts payable | | | 33,141 | | | | 23,851 | | | | 11,282 | |
| Income tax payable | | | 6,010 | | | | 15,967 | | | | (10,788 | ) |
| Other accounts payable | | | 25,711 | | | | 22,700 | | | | (54,286 | ) |
| Net cash and cash equivalents provided by operating activities | | | 527,749 | | | | 526,129 | | | | 150,039 | |
| Transactions that did not affect cash flows: | | | | | | | | | | | | |
| Increase in the book of long-lived assets | | | - | | | | 6,203 | | | | 14,220 | |
The accompanying notes are an integral part of the consolidated balance sheet.
Compañía de Minas Buenaventura S.A.A. and Subsidiaries
Notes to the Consolidated Financial Statements
As of December 31, 2010, 2009 and 2008
| 1. | Identification and business activity |
Compañía de Minas Buenaventura S.A.A. (hereafter “Buenaventura” or “the Company”) is a publicly traded corporation incorporated in 1953. Buenaventura’s stock is traded on the Lima and New York Stock Exchanges through American Depositary Receipts (ADRs), which represent Company shares deposited in the Bank of New York. Buenaventura’s legal domicile is at Carlos Villaran Avenue 790, Santa Catalina, La Victoria, Lima, Peru.
Buenaventura (individually and in association with third parties) is engaged in the exploration, extraction, concentration, smelting and commercialization of polymetallic ores and metals.
Buenaventura directly operates seven mining units located in Peru: Uchucchacua, Orcopampa, Poracota, Julcani, Recuperada, Antapite and Ishihuinca. In addition, the Company has a controlling interest in Sociedad Minera El Brocal S.A.A. (hereinafter “El Brocal”), which operates the Colquijirca mining unit, and in Compañía de Exploraciones, Desarrollo e Inversiones Mineras S.A.C. (hereinafter “Cedimin”), which operates the Shila - Paula mining unit. The Company also holds interests in a number of other mining companies. The Company also owns an electric power distribution company, an electric power generation company (in construction stage) and a mining engineering services company. See note 1(d).
| | (c) | Approval of consolidated financial statements – |
The accompanying consolidated financial statements have been approved by Management and Audit Committee on June 22, 2011. The consolidated financial statements as of December 31, 2009 were approved by Management and Audit Committee on May 14, 2010.
| | (d) | The consolidated financial statements include the financial statements of the following subsidiaries: |
| | | Ownership percentage as of | |
| | | | | | | |
| | | | | | | | | | | | | |
| | | % | | | % | | | % | | | % | |
| Investment and mining concessions held, exploration and exploitation of minerals | | | | | | | | | | | | |
| | | | | | | | | | | | | | | | | |
| Compañía de Exploraciones, Desarrollo e Inversiones Mineras S.A.C. - CEDIMIN | | | 44.83 | | | | 55.17 | | | | 44.83 | | | | 55.17 | |
| | | | | | | | | | | | | | | | | |
| Compañía Minera Condesa S.A. | | | 100.00 | | | | - | | | | 100.00 | | | | - | |
| Compañía Minera Colquirrumi S.A. | | | 90.00 | | | | - | | | | 90.00 | | | | - | |
| Sociedad Minera El Brocal S.A.A. (i) (e) | | | 4.25 | | | | 39.23 | | | | 4.25 | | | | 39.17 | |
| Inversiones Colquijirca S.A. (ii) | | | 81.42 | | | | - | | | | 81.30 | | | | - | |
Notes to the consolidated financial statements (continued)
| | | Ownership percentage as of | |
| | | | | | | |
| | | | | | | | | | | | | |
| | | % | | | % | | | % | | | % | |
| S.M.R.L. Chaupiloma Dos de Cajamarca | | | 20.00 | | | | 40.00 | | | | 20.00 | | | | 40.00 | |
| Minera La Zanja S.R.L. (f) | | | 53.06 | | | | - | | | | 53.06 | | | | - | |
| Minera Julcani S.A. de C.V. | | | 100.00 | | | | - | | | | - | | | | - | |
| Electric power activity | | | | | | | | | | | | | | | | |
| Consorcio Energético de Huancavelica S.A. | | | 100.00 | | | | - | | | | 100.00 | | | | - | |
| Empresa de Generación Huanza S.A. (g) | | | - | | | | 100.00 | | | | - | | | | 100.00 | |
| Services | | | | | | | | | | | | | | | | |
| Buenaventura Ingenieros S.A. | | | 100.00 | | | | - | | | | 100.00 | | | | - | |
| Contacto Corredores de Seguros S.A. | | | - | | | | 100.00 | | | | - | | | | 100.00 | |
| | (i) | The equity share in capital stock (common shares with voting rights) is 46.08 and 46.02 percent as of December 31, 2010 and 2009, respectively. |
| | (ii) | Inversiones Colquijirca S.A. has 51.06 percent interest in Sociedad Minera El Brocal S.A.A., through which Buenaventura held and indirect participation of 39.23 and 39.17 percent in El Brocal as of December 31, 2010 and 2009, respectively. |
| | (e) | Project for the expansion of El Brocal operations - |
On August 15, 2008, the El Brocal Board of Directors approved a project to expand its operations in order to reach a treatment level of 18,000 MT per day of ore from its Tajo Norte and Marcapunta mines. This project will allow processing ore with a lower lead–zinc grade from the La Llave zone and copper from Marcapunta Norte previously classified, divided in three stages:
| | - | First stage: Optimization of the current plant of 5,000 DMT/day to 7,000 DMT/day. |
| | - | Second stage: New concentrate plant 2,490 DMT/day. |
| | - | Third stage: Expansion of the new plant from 2,490 DMT/day to 11,000 DMT/day. |
As of December 31, 2010, the Company concluded the first stage and start-up the optimization phase of the current plant. At the end of the year 2010, the Company initiated the second stage.
As of December 31, 2010 and 2009, El Brocal had executed the following works related to the project to expand operations the cost of which, based on the project economic feasibility study carried out by Management, have been capitalized:
Notes to the consolidated financial statements (continued)
| | | | | | | |
| | | US$(000) | | | US$(000) | |
| Mine development costs | | | | | | |
| Expansion of Tajo Norte – Marcapunta Norte | | | 16,246 | | | | 15,801 | |
| Mining concessions and property, plant and equipment | | | | | | | | |
| Expansion of refining plant capacity to 18,000 DMT | | | 74,067 | | | | 47,605 | |
| Expansion of power grid | | | 7,174 | | | | 1,510 | |
| Optimization of crushing plant and conveyor belt | | | 4,766 | | | | 2,741 | |
| Construction of Huachacaja tailings area | | | 3,217 | | | | 1,389 | |
| Feasibility study | | | 2,582 | | | | 2,082 | |
| Other minor activities | | | 3,647 | | | | 2,030 | |
| | | | 95,453 | | | | 57,357 | |
| Total | | | 111,699 | | | | 73,158 | |
The movement of the work related to the project to expand operations by the year 2010 is presented below:
| | | | | | | | | | | | | |
| | | US$(000) | | | US$(000) | | | US$(000) | | | US$(000) | |
| | | | | | | | | | | | | |
| Expansion of refining plant capacity to 18,000 DMT | | | 47,605 | | | | 45,287 | | | | (18,825 | ) | | | 74,067 | |
| Expansion of Tajo Norte – Marcapunta Norte | | | 15,801 | | | | 445 | | | | - | | | | 16,246 | |
| Expansion of power grid | | | 1,510 | | | | 5,664 | | | | - | | | | 7,174 | |
| Optimization of crushing plant and conveyor belt | | | 2,741 | | | | 2,025 | | | | - | | | | 4,766 | |
| Construction of Huachacaja tailings area | | | 1,389 | | | | 1,828 | | | | - | | | | 3,217 | |
| Feasibility study | | | 2,082 | | | | 500 | | | | - | | | | 2,582 | |
| Other minor activities | | | 2,030 | | | | 1,617 | | | | - | | | | 3,647 | |
| | | | 73,158 | | | | 57,366 | | | | (18,825 | ) | | | 111,699 | |
Minera La Zanja S.R.L. (hereafter “La Zanja”), is located in the province of Santa Cruz, district of Pulan in the Cajamarca region and has reserves of 675,000 ounces of gold (unaudited).
La Zanja began operations in the third quarter of 2010. As of December 31, 2010, the production amounted to 43,728 ounces of gold.
On June 24, 2010, the shareholders of La Zanja, approved the capitalization of contributions amounting US$95,779,000.
Notes to the consolidated financial statements (continued)
| | (g) | Construction of hydroelectric power station – |
In November 2009 the Consorcio Energetico de Huancavelica S.A. Board of Directors approved construction of the 90.6-MW capacity Huanza hydroelectric power station, located in the Santa Eulalia river valley. This investment project of US$147,000,000, has been executed since March 2010; its construction is expected to take thirty-three months. This project is being financed with a US$119,000,000 financial leasing agreement executed with Banco de Credito del Peru and with Consorcio Energetico de Huancavelica S.A.’s own resources. As of December 31, 2010, the investment in this project amounted to US$63,958,000 (US$865,000 as of December 31, 2009).
| 2. | Significant accounting principles |
In the preparation and presentation of the financial statements, Management has followed International Financial Reporting Standards (IFRS) as adopted and effective in Peru as of December 31, 2010, 2009 and 2008, which differ in certain respects from accounting principles generally accepted in the United States of America (“U.S. GAAP”). A description of these differences and their effects on net income and shareholders’ equity is set forth in Notes 32 and 33. The financial statements derive from the statutory financial statement presentation and include certain additional disclosures in order to conform more closely to the form and content of financial statements required by the Securities and Exchange Commission of the United States of America (the “SEC”).
| | 2.1. | Basis of presentation and accounting changes - |
The consolidated financial statements of the Company have been prepared in accordance with generally accepted accounting principles in Peru. The accounting principles in Peru correspond to the International Financial Reporting Standards – IFRS approved by the Peruvian Accounting Standards Board (hereinafter “CNC” by its Spanish acronym), as of December 31, 2010 and 2009. As of the date of these financial statements, CNC has approved the implementation of IFRS 1 to 8, IAS 1 to 41, SIC 1 to 32 and IFRICs 1 to 14, which will be effective for the Company´s consolidated financial statements ended in the year 2011.
In Peru CNC allows to use the equity method to record in the separate financial statements (non-consolidated) the investments in subsidiaries, associates and joint ventures.
At the meeting of the International Financial Reporting Interpretations Committee (IFRIC) held in November 2010, it was concluded that the workers´ profit sharing must be recorded pursuant to IAS 19 “Employee Benefits” and not pursuant to IAS 12 “Income Tax”. Consequently, an entity must no calculate and record a deferred asset or liability for workers´ profit sharing for temporary differences. In Peru, the practice was to calculate and record deferred profit sharing in the financial statements. The National Supervisory Commission for Companies and Securities (hereinafter “CONASEV” by its Spanish acronym) through circular letter N° 298-2010-EF/94.06.3, required the application of this interpretation beginning with fiscal year 2011 (optional for 2010). The change is to be treated as a change in accounting policy and comparative period(s) will be restated according to IAS 8 “Accounting Policies, Changes in Accounting Estimates and Errors”.
The Company’s Management has decided not to early adopt this change which will be applied during fiscal year 2011, see accounting principles in note 2.3(s). The Company’s Management does not expect that this change would have a significant effect on the consolidated financial statements.
The consolidated financial statements have been prepared on a historical cost basis, except for derivative financial instruments that have been measured at fair value through profit or loss, the asset retirement obligationand the liability for stock appreciation rights that have been measured at fair value. The consolidated financial statements are presented in U.S. dollars and all value are rounded to the nearest thousand (US$ thousand) except when otherwise indicated, see note 2.3(a).
Notes to the consolidated financial statements (continued)
Principles of consolidation -
The consolidated financial statements include the accounts of Buenaventura and the accounts of those subsidiaries in which possess more than 50 percent equity participation and/or exercises control. All significant inter-company balances and transactions have been eliminated.
See note 1(d) for a list of the companies included in the consolidated financial statements.
The financial statements for subsidiaries are prepared for the same reporting period as the parent company, using accounting consistent principles and policies.
The shareholders’ equity attributable to the minority interest is shown in the consolidated balance sheet. Earnings attributable to the minority interest are shown separately in the consolidated statement of income.
Sales of minority interests result in gains or losses, which are recognized in the consolidated statement of income.
| | 2.2. | Significant estimates, judgments and assumptions |
The preparation of financial statements in conformity with generally accepted accounting principles in Peru requires Management to make estimates and assumptions in order to determine the amounts of the assets and liabilities, the disclosure of contingent assets and liabilities and the amounts of revenues and expenses to be reported for the years ended December 31, 2010, 2009 and 2008. In Management´s opinion, these estimates were made on the basis of their best knowledge of the relevant facts and circumstances at the date of preparation of financial statements consolidated; however, the final results could be different from the estimates included in the consolidated financial statements. However, actual outcomes can differ from these estimates, those differences will be recorded in the statements of income of the year that occurred.
Company´s Management considers the following significant estimates to prepare the consolidated financial statements:
| | (a) | Provision for closure of mining units – (note 2.3(o) and note 13(b)) |
The Company assesses its provision for closure of mining units annually. It is necessary to make significant estimates and assumptions in determining this provision, because there are numerous factors that will affect the ultimate liability for this obligation. These factors include estimating the scope and costs of closing activities, technological changes, changes in the regulations, increases in costs compared to inflation rates and changes in the discount rates. Such estimates or assumptions may result in actual expenses in the future that differ from the amounts provisioned at the time of establishing the provision. The provision at the date of this report presents the best Management´s estimate of the present value of future costs for closure of mining units.
| | (b) | Determination of mineral reserves and resources - |
The Company computes its reserves using methods generally applied by the mining industry in accordance with international guidelines. All reserves computed, which are audited by an independent third party (Algon Investment S.R.L.), represent the estimated amounts of proved and probable ore that can be processed economically under the present conditions.
The process of estimating the amount of reserves is complex and requires making subjective decisions at the time of evaluating all the geologic, geophysical, engineering and economic information that is available. Revisions could occur in estimated reserves due to, among other things, revisions of the geologic data or assumptions, changes in assumed prices, production costs and the results of exploration activities.
Notes to the consolidated financial statements (continued)
Changes in estimated reserves could affect mainly the depreciation of fixed assets related directly to mining activity, provision for mine closure, assessment of the deferred asset’s recoverability and the amortization period for development costs.
| | (c) | Exploration and mine development costs – (note 10, 19 and 22) |
The application of the Company’s accounting policy for exploration and mine development costs requires judgment in determining whether it is likely that future economic benefits are likely either from future exploitation. The determination of reserves and mineral resources is a complex estimation that requires varying degrees of uncertainty depending on sub-classification and these estimates directly impact the point of deferral of exploration and mine development costs and its amortization method for development cost. The deferral policy requires Management to make certain estimates and assumptions about future events or circumstances, in particular whether an economically viable extraction operation can be established. Estimates and assumptions made may change if new information becomes available. If, after expenditure is capitalised, information becomes available suggesting that the recovery of expenditure is unlikely, the amount capitalised is written off in profit or loss in the period when the new information becomes available.
| | (d) | Impairment of non-financial assets – (note 11) |
The Company assesses at each reporting date whether there is an indication that an asset may be impaired. If any such indication exists, the Company makes an estimate of the asset’s recoverable amount. An asset’s recoverable amount is the higher of an asset’s fair value less costs to sell and its use value and is determined for an individual asset (cash-generating unit) unless the asset does not generate cash inflows that are clearly independent of those from other assets or groups of assets. These assessments require the use of estimates and assumptions such as long-term commodity prices, discount rates, operating costs, and others.
A cash-generating unit is the smallest identifiable group of assets, denominated a mining unit, that generates cash inflows from continuing use that are independent of the cash inflow generated by other assets or groups of assets. In order to determine cash-generating units, the Company has determined whether there is an active market for the minerals and metals produced by a mining unit.
When the carrying amount of an asset or of a cash-generating unit exceeds its recoverable amount, the asset is considered impaired and is written down to its recoverable amount. In assessing use value, the estimated future cash flows are discounted to their present value using a discount rate that reflects current market assessments of the time value of money and the risks specific to the asset.
Impairment losses are recognized in the statement of income in those expense categories consistent with the function of the impaired asset. A previously recognized impairment loss is reversed only if there has been a change in the estimates used to determine the asset’s recoverable amount since the last impairment loss was recognized. The increased amount cannot exceed the carrying amount that would have been determined, net of depreciation, had no impairment loss been recognized for the asset in prior years. Such reversal is recognized in the consolidated statement of income.
| | (e) | Deferred stripping costs – (Note 2.3 (j)) |
The costs to remove overburden and other waste material to gain access the ore body (stripping costs) incurred by the Company before the operation of a mining project, are capitalized as part of the mine development cost, and subsequently will be amortized on units-of-production basis, using proven and probable reserves.
Notes to the consolidated financial statements (continued)
Stripping costs incurred after production commences are included in the operating cost. The operating cost is included as part of the inventory extracted during the period in which the stripping cost was incurred.
The calculation requires the use of judgments and assumptions like waste material tons to be removed during the useful life of the mining unit and the reserves economically recoverable extracted. The changes in the useful life and the design of the mining unit usually will result in changes in the relation of waste material expected (waste material / mineral reserves). The changes are recorded prospective.
| | (f) | Contingencies – (note 30) |
By their nature, contingencies will only be resolved when one or more future events do or do not occur. Determining contingencies inherently involves the exercise of judgment and calculation of the estimated results of future events.
Loss contingencies are recorded in the consolidated financial statements when it is probable their occurrence and they can be reasonably estimated. In other case, they are only disclosed in notes to the consolidated financial statements.
Contingent assets are not recognized in the consolidated financial statements; however, they are disclosed in notes to the consolidated financial statements if it is probable that such contingent assets will be realized.
| | (g) | Production start date – (note 10) |
The Company assesses the stage of each mine under development to determine when a mine moves into the production stage. The criteria used to assess the start date are determined based on the nature of each mining project, the complexity of a plant and its location. The Company considers different relevant criteria for assessing when the mine is substantially complete and ready for its planned use. Some of these criteria are the level of capital expenditure compared to development costs estimates, a reasonable testing period for the mine’s plant and equipment, the ability to produce and sell the metal.
When a mine development project moves into the production stage, the capitalization of certain costs ceases, and they are considered as inventory or expenses, except for costs that qualify for capitalization. It is also at this point that depreciation or amortization commences.
| | (h) | Recovery of deferred tax assets – (note 24) |
An assessment is required to determine whether deferred tax assets should be recognized in the consolidated balance sheet. Deferred tax assets, including those resulting from unused tax losses, require Management to assess the probability that the Company would generate taxable earnings in future periods to apply the deferred tax assets. Estimated future taxable income is based on projections of cash flows from operations and application of the tax law existing in each jurisdiction. To the extent to which future cash flows and taxable income differ significantly from those estimated; they could have an impact on the Company’s capability to realize the deferred tax assets posted as of the reporting date.
In addition, future changes in the tax law in jurisdictions where the Company operates could limit the Company’s capability to obtain tax deductions in future periods.
Notes to the consolidated financial statements (continued)
Net realisable value tests are performed at least annually and represent the estimated future sales price of the product based on prevailing spot metals prices at the reporting date, less estimated costs to complete production and bring the product to sale.
| | 2.3. | Summary of significant accounting principles and policies - |
| | (a) | Foreign currency translation - |
Functional and presentation currency-
Financial statements are presented in U.S. dollars, which is the Company’s functional and presentation currency.
Transactions and balances in foreign currency -
Transactions in foreign currency (any currency different from the functional currency) are initially recorded at the functional currency rate in force at the date of the transaction. The exchange rates issued by the Superintendencia de Banca y Seguros y AFP (SBS) are used in translating foreign currency. Monetary assets and liabilities denominated in foreign currencies are translated at the functional currency rate of exchange ruling at the consolidated balance sheet date. Exchange differences resulting from the settlement of the transactions in foreign currencies and from the translation of the monetary assets and liabilities at the exchange rates at year-end are recognized in the consolidated statement of income.
Non-monetary items that are measured in terms of historical cost in a foreign currency are translated using the exchange rates as of the dates of the initial transactions.
Initial recognition and measurement
Financial assets within the scope of IAS 39 are classified as financial assets at fair value through profit or loss, loans and receivables, held-to-maturity investments, available-for-sale financial assets, or as derivatives designated as hedging instruments. When financial assets are recognized initially, they are measured at fair value. The Company determines the classification of its financial assets after initial recognition and, where allowed and appropriate, re-evaluates this designation at each financial year end.
All financial assets are recognized initially at fair value plus, the direct costs initially attributed to the transaction, except for financial assets at fair value, for which any transaction costs derived are recognized in results.
Purchases or sales of financial assets that require delivery of assets within a time frame established by regulation or convention in the marketplace (conventional transactions) are recognized on the date of the transaction, that is to say, on the date on which the Company commits to sell the asset.
The Company’s financial assets include cash and cash equivalents, financial assets at fair value through profit or loss, trade accounts receivable, other accounts receivable, accounts receivable from associates and embedded derivatives for concentrates sales.
Subsequent measurement -
The subsequent measurement of financial assets depends on their classification, as detailed below:
Notes to the consolidated financial statements (continued)
Financial assets at fair value through profit or loss -
Financial assets at fair value through profit or loss includes financial assets held for trading and financial assets designated upon initial recognition as at fair value through profit or loss. Derivatives are also classified as held for trading unless they are designated as effective hedging instruments. Assets within this category are classified as current assets if they are held for trading or it is expected to realize them within the next twelve months counted as from the consolidated balance sheet date. Gain or losses on investments held for trading are recognized in profit and loss. The Company has classified as financial assets at fair value through profit or loss its mutual funds of variable income, see note 5.
Any embedded derivatives contained in commercial contracts are recorded as separated derivatives and posted at their fair value if the directly associated economic features and risks are not related to the commercial contract and the contract has not been classified as a negotiable financial asset or at fair value with a charge to results. Any gains or losses from changes in the fair value of embedded derivatives are posted in the consolidated income statement.
Notes to the consolidated financial statements (continued)
Loans and receivables -
The Company has the following accounts: cash and cash equivalents, trade accounts receivable, accounts receivable from associates and other accounts receivable, in this category; they are stated at the transaction value, net of an allowance for doubtful accounts when applicable.
All such instruments are non-derivative financial assets with fixed or determinable payments that are not quoted in an active market. After initial measurement loans and receivables are subsequently carried at amortized cost using the effective interest method less any provision for impairment.
The Company assesses whether as of the date of its consolidated financial statements, there is objective evidence of an impairment in the value of financial assets (such as the debtor’s probability of insolvency, significant financial difficulties, failure to pay principal or interest or any observable evidence indicating that the estimated future flows associated with the loans or accounts receivable have decreased. The amount of the impairment is measured as the difference between the book value of the assets and the present value of the estimated future cash flows, discounted at an original effective interest rate or one applicable for similar transactions. The carrying amount of the receivable is reduced by means of an allowance account. The amount of the loss must be recognized in the consolidated statement of income. Impaired accounts receivable or loans are written off when they are considered uncollectible.
If the amount of the loss should decrease in a subsequent period, the Company reverses it with a credit entry to the consolidated income statement.
Available-for-sale financial investments -
Available-for-sale financial assets are those non-derivative financial assets that are designated as available-for-sale or are not classified in any of the other categories. After initial measurement, available for sale financial assets are measured at fair value with unrealized gains or losses being recognized directly in equity. When the investment is disposed of, the cumulative gain or loss previously recorded in equity is recognized in the consolidated statement of income. The Company did not maintain any available-for-sale financial investment as of December 31, 2010 and 2009.
Held-to-maturity investments -
Held-to-maturity investments are non-derivative financial assets with fixed or determinable payments and fixed maturities that the Company’s Management has the positive intention and ability to hold to maturity. After initial recognition the Company measures their held-to-maturity investments at amortized cost using the effective interest method. Gains and losses are recognized in the statement of income when the investment is disposed, had impairment or through amortization. The Company did not maintain any held-to-maturity investment as of December 31, 2010 and 2009.
Derecognition of financial assets
A financial asset is derecognised when:
| | - | The rights to receive cash flows from such asset have expired. |
| | - | The Company has transferred its rights to receive cash flows from the asset or has assumed an obligation to pay the received cash flows to a third party under a pass-through arrangement; and |
Notes to the consolidated financial statements (continued)
| | (i) | The Company has transferred substantially all of the risks and rewards of the asset or; |
| | (ii) | Not having transferred or retained substantially all of the risks and rewards of the asset, it has transferred its control. |
In the event that the Company transfers its rights to receive cash flows from an asset or has entered into a pass-through arrangement, but has not transferred substantially all the risks and rewards and still maintains control over of the asset, it must recognize the liabilities associated. Assets transferred and the liabilities associated are measured on a basis that reflects the rights and obligations that the Company has retained.
Offsetting of financial instruments -
Financial assets and liabilities are offset and the net amount reported in the consolidated balance sheet, if there is a currently enforceable legal right to offset the recognized amounts and there is an intention to settle on a net basis, or to realize the assets and settle the liability simultaneously.
Fair value of financial instruments -
The fair value of financial instruments that are traded in active markets is determined on each reporting date by reference to quoted market prices or dealer price quotations (bid price for long positions and ask price for short positions), without any deduction for transaction costs.
In the case of financial instruments that are not traded in an active market, fair value is determined using appropriate valuation techniques. Such techniques may include using recent arm´s length market transactions; reference to the current fair value of another instrument that is substantially same, an analysis of the adjusted flow of funds or other valuation models.
An analysis of fair values of financial instruments and further details as to how they are measured are provided in note 29.
Current versus non-current classification –
Derivative instruments that are not designated as cash-flow hedging instruments are classified as current or non-current, or are separated into a current and a non-current portion based on an assessment of the facts and circumstances (for example, the underlying cash flows).
Embedded derivatives that are not closely related to the main contract are classified consistently with the cash flows of the host contract.
Derivative instruments designated as cash-flow hedging instruments are classified in accordance with the classification of the underlying element hedged. The derivative instrument is separated into a current and a non-current portion only if a reliable allocation can be made.
| | (c) | Cash and cash equivalents - |
The cash and cash equivalents caption presented in the Company’s consolidated balance sheet includes all cash on hand and deposited in banks, including time deposits whose maturities are three months or more.
Notes to the consolidated financial statements (continued)
Furthermore, this caption presented in the Company’s consolidated statements of cash flows includes cash on hand, time deposits and highly liquid investments with original maturities of three months or less.
| | (d) | Business combinations - |
The purchase method of accounting is applied whereby the purchase consideration is allocated to the identifiable assets, liabilities and contingent liabilities (identifiable net assets) on the basis of fair value at the date of acquisition. Mineral reserves and resources that are able to be reliably measured are recognized in the assessment of fair values on acquisition.
The cost of the business combination is the aggregate of: (a) the fair values at the date of exchange, of assets given, liabilities incurred or assumed, and equity instruments issued by the acquirer in exchange for control of the acquiree; and (b) and costs directly attributable to the business combination.
On the case of mergers with entities over which it exercises control, the Company uses the pooling of interests method. According to this method, the financial statements of the acquiring entity and the entity acquired are treated as if they were consolidated financial statements. The comparative financial statements are amended to show the effects of the merger.
| | (e) | Investments in associates - |
Investments in entities in which the Company’s ownership is greater than 20 percent or exercise significant influence are accounted for using the equity method. Under this method, the investment in the associate is carried in the consolidated balance sheet at cost plus acquisition changes in the Company’s share of net assets of the associate. The amount paid in excess of the fair value of the share of net assets of the associate is included in the carrying amount of the investment and is amortized using the units-of-production method based on proven and probable reserves. The consolidated statement of income reflects the share of the results of operations of the associate. Gains and losses resulting from transactions between the Company and the associate are eliminated to the extent of the interest in the associate.
The reporting dates of the associates and the Company are identical and the associates´ accounting policies are consistent with those used by the Company for like transactions and events in similar circumstances. L The functional and presentation currency of the associates Yanacocha (through its subsidiary, Compañía Minera Condesa S.A.) and Cerro Verde is the U.S. dollar.
After the application of the equity method, the Company determines whether it is necessary to recognize an additional impairment loss of the Company’s investment in associates. The Company determines at each balance sheet date whether there is any objective evidence that the investment in associate is impaired. If this is the case, the Company calculates the amount of impairment as being the difference between the fair value of the associate and the acquisition cost and recognizes the amount in the consolidated statement of income.
| | (f) | Interest in joint ventures - |
Jointly controlled assets
A jointly controlled asset offers joint ownership, by the Company and other companies, of assets contributed or acquired for the corporate purpose of a joint venture, without giving rise to the establishment of a company, corporation or other entity. Notes to the consolidated financial statements (continued)
When a company’s activities are conducted through jointly controlled assets, the Company recognizes its interest in the jointly controlled assets and the liabilities that have been incurred, as well as its interest in the liabilities jointly incurred with other companies, the respective income and operating costs in the consolidated financial statements and a percentage of its production.
Inventories are stated at the lower of average cost or net realizable value. Net realizable value is defined as the estimated sales price obtainable in the ordinary course of business, less estimated costs of completion and the estimated costs necessary to make the sale.
Cost is determined by the weighted average method and comprises direct purchase costs and an appropriate portion of fixed and variable overhead costs, including depreciation and amortization, incurred in converting materials into finished goods.
The accrual for obsolescence for spare parts and supplies are based on an item-by-item analysis completed by the Company’s Management and related amounts are charged to expense in the period in which the obsolescence is deemed to have occurred.
| | (h) | Property, plant and equipment - |
The “Mining rights and property, plant and equipment, net” caption is stated at cost, net of accumulated depreciation and accumulated impairment in value. The initial cost of an asset comprises its purchase price or construction cost, including customs duties and non-reimbursable taxes, as well as any expense necessary to put such asset into operation, the initial estimates of any rehabilitation obligation and, in the case of qualifying assets, the cost of debt and any expense directly attributable to bringing the asset into operation. The capitalized value of leasings are included in the “Mining rights and property, plant and equipment, net” caption.
Depreciation -
Depreciation is calculated under the straight-line method of accounting considering the lower of estimated useful lives of the asset or estimated reserves of the mining unit. The useful lives are the following:
| | |
| | |
| Buildings, construction and other | Between 6 and 20 |
| Machinery and equipment | Between 5 and 10 |
| Transportation units | 5 |
| Furniture and fixtures | 10 |
| Computer equipment | 4 |
An item of property, plant and equipment is derecognized upon disposal or when no future economic benefits are expected from its use or disposal. Any gain or loss arising from derecognizing an asset (calculated as the difference between the proceeds from the sale and the book value of the asset) is included in the consolidated statement of income in the year the asset is derecognized. Notes to the consolidated financial statements (continued)
The asset’s residual value, useful lives and methods of depreciation are reviewed, and adjusted if appropriate, at each financial year end.
Major maintenance and repairs -
Expenses on major maintenance refits or repairs comprise the cost of replacement assets or parts of assets and overhaul costs. The expense is capitalized when an asset or part of an asset that was depreciated separately is replaced and eliminated from the books and it is probable that the future economic benefits associated with such asset or part of an asset will flow to the Company during an additional period of useful life.
When the replaced part of the assets was not considered separately as a component, replacement value is used in order to estimate the book value of the assets replaced, which is immediately written off.
| | (i) | Mining rights and concessions - |
Mining rights correspond to the mineral reserves and acquisitions of mining concessions allocated as part of the cost of business combinations that took place in previous years. Mining rights are presented as part of the Mining rights and property, plant and equipment, net caption, and represent the Company’s ownership of mining properties that contain the mineral reserves acquired. Those mining rights related to mineral reserves are amortised following the units-of-production method based on proven and probable reserves.
Mining concessions correspond to exploration rights in areas of interest to the Company allocated as part of the cost of business combinations that took place in previous years. Mining concessions are capitalized in the consolidated balance sheet and represent the Company’s ownership of mining properties of geologic interest. Mining concessions are depreciated starting from the production phase following the units-of-production method based on proven and probable reserves. In the event that the Company abandons these concessions, the costs associated are written off in the consolidated statement of income.
At the end of each year, the Company assesses each mining unit to see whether there is any indication of that the value of its mining rights has been impaired. If such indication exists, the Company estimates the recoverable amount of the assets. See note 2.2(d).
| | (j) | Deferred stripping costs - |
Stripping costs incurred in the development of a mine before production commences are capitalized as part of the cost of constructing the mine and subsequently amortised over the life of the mine on a units-of-production basis.
Where a mine operates several open pits that are regarded as separate operations for the purpose of mine planning, stripping costs are accounted for separately by reference to the ore from each separate pit. If, however, the pits are highly integrated for the purpose of the mine planning, the second and subsequent pits are regarded as extensions of the first pit in accounting for stripping costs. In such cases, the initial stripping, (i.e. overburden and other waste removal) of the second and subsequent pits is considered to be production phase stripping relating to the combined operation.
Stripping costs incurred subsequently during the production phase of its operation are deferred for those operations where this is the most appropriate basis for matching the cost against the related economic benefits and the effect is material. This is generally the case where there are fluctuations in stripping costs over the life of the mine. The amount of stripping costs deferred is based on the strip ratio obtained by dividing the tonnage of waste mined by the quantity of ore mined. Stripping costs incurred in the period are deferred to the extent that the current period ratio exceeds the life of the strip ratio. Such deferred costs are then charged to profit or loss to the extent that, in subsequent periods, the current period ratios falls short of the life of mine (or pit) ratio. The life of mine (or pit) ratio is based on economically recoverable reserves of the mine (or pit). Changes are accounted for prospectively, from the date of the change.
Notes to the consolidated financial statements (continued)
| | (k) | Exploration and mine development costs - |
Exploration costs are charged to expense as incurred. These costs primarily include costs for material and fuels used in exploration, costs of topographical surveys, drilling costs and payments made to contractors. When the Company determines that a mineral property can be economically developed by establishing the existence of proved and probable reserves, the costs incurred to develop the property, including the costs incurred to further delineate the ore body and remove topsoil, rocks and other mineral waste to initially expose the ore body are capitalized.
Mine development costs are amortized using the units-of-production method, based on proven and probable reserves.
Disbursements related to costs that are exploratory in nature that are incurred after proven and probable reserves have been established are charged to expense as incurred.
| | (l) | Financial liabilities - |
Initial recognition and measurement
Financial liabilities within the scope of IAS 39 are classified as financial liabilities at fair value through profit or loss, loans or as derivatives designated as hedging instruments, as relevant.
The Company determines the classification of its financial liabilities at initial recognition. All financial liabilities are recognized initially at fair value, plus directly attributable transaction costs, except in the case of loans, which are recognized initially at the fair value of the cash received, less any costs directly attributable to the transaction.
The Company’s financial liabilities include trade accounts payable, other liabilities, long-term debt and derivative financial instruments.
Subsequent measurement -
The subsequent measurement of financial liabilities depends on their classification, as detailed below:
Financial liabilities at fair value through profit or loss -
Financial liabilities at fair value through profit or loss include financial liabilities held for trading and financial liabilities designated upon initial recognition as at fair value through profit or loss. This category includes derivative financial instruments entered into by the Company that are not designated as hedging instruments as defined in IAS 39. Separated embedded derivatives are also classified as held for trading unless they are designated as cash-flow hedging instruments. Any gains or losses on liabilities held for trading are recognized in the consolidated statement of income. The Company has not designated any financial liability at fair value through profit or loss.
Notes to the consolidated financial statements (continued)
Interest-bearing loans and borrowing -
After their initial recognition, interest-bearing loans and borrowings are subsequently measured at amortized cost using the effective interest rate (EIR) method. Any profit or loss is recognized in the consolidated statement of income when the liability is terminated, as well as through the process of amortizing the effective interest rate. Amortized costs are calculated taking into account any discount or premium on acquisition and fees or costs that are an integral part of the effective interest rate. Amortization of the effective interest rate is included in financial cost in the consolidated statement of income.
Derecognition of financial liabilities
A financial liability is derecognized when the obligation under the liability is discharged or cancelled or expired. When an existing financial liability is replaced by another one from the same lender on substantially different terms, or the terms are substantially modified, such replacement or amendment is treated as a derecognition of the original liability and the recognition of a new liability, and the difference in the respective carrying amount is recognized in the consolidated income statement.
The determination of whether an arrangement is, or contains, a lease is based on the substance of the agreement on its inception date. It requires consideration as to whether the fulfillment of the arrangement is dependent on the use of a specific asset or assets or the arrangement conveys a right to use the asset. A reassessment is made after inception of the lease if one of the following applies:
| | (i) | There is a change in the contractual terms, other than a renewal or extension of the arrangement. |
| | (ii) | A renewal option is exercised or extension granted, unless the term of the renewal or extension was initially included in the lease term. |
| | (iii) | There is a change in the determination of whether fulfillment is dependent on a specific asset; or |
| | (iv) | There is a substantial change to the asset. |
Where a reassessment is made, lease accounting shall commence or cease starting from the date when the change of circumstances gives rise to reassessment for scenarios (i), (iii) or (iv), and at the date of the renewal or extension period for scenario (ii).
The Company as lessee
Financial leases that transfer substantially all the risks and rewards incidental to ownership of the leased item, are capitalized at the inception of the lease at fair value of the leased asset or, if lower, at the present value of the minimum lease payments. Lease payments are apportioned between finance charges and the reduction of the lease liability so as to achieve a constant periodic rate of interest on the remaining balance of the liability. Financial charges are recognized in the consolidated statement of income.
Capitalized leased assets are depreciated over the shorter of the estimated useful life of the asset and the lease term, if there is no reasonable certainty that the Company will obtain ownership by the end of the lease term.
A lease is classified as an operating lease if it does not transfer substantially all off the risk and rewards incidental to ownership.
Operating lease payments are recognized as an expense in the consolidated statement of income on a straight-line basis over the lease term. Notes to the consolidated financial statements (continued)
| | (n) | Share-based payments - |
Senior executives of the Company are granted share appreciation rights, which can only be settled in cash. The liability for these transactions is measured at each reporting date until settlement.
According to IFRS 2 “Share-Based Payments”, the cost of cash-settled transactions is measured initially at fair value at the grant date using a binomial model (see more details in note 13(c)). This fair value is expensed over the period until vesting with recognition of a corresponding liability. The liability is re-measured at each balance sheet date up to and including the settlement date with changes in fair value recognized in profit and loss.
General -
Provisions are recognized when the Company has a present obligation (legal or constructive) as a result of a past event, it is probable that an outflow of resources embodying economic benefits will be required to settle the obligation and a reliable estimate can be made of the amount of the obligation. Provisions are reviewed periodically and are adjusted to reflect the best estimate available as of the date of the consolidated balance sheet. The expense relating to any provision is presented in the consolidated statement of income. When they are significant, provisions are discounted using a current rate that reflects, where appropriate, the risks specific to the liability. When discounting is used, the increase in the provision due to the passage of time is recognized as a financial expense.
Provision for closure of mining units -
On initially entering the liability for this obligation, it is posted at its fair value, offset by a greater a book value for long-lived assets related to development costs and fixed assets.
The liability is subsequently increased in each period to reflect the cost of interest considered in the initial estimate of fair value and, in addition, the capitalized cost is depreciated or amortized based on the useful life of the related asset. When eliminating the liability, the Company posts any resulting gain or loss. Changes in the fair value of the obligation or the useful life of the related asset that arise from review of the initial estimates are recognized as an increase or decrease in the book value of the obligation and the related assets in accordance with IAS 16 Property, Plant and Equipment. Any reduction in a mine closure liability and, therefore, any reduction of the related asset, may not exceed the book value of such asset. If so, any excess over book value is immediately transferred to the consolidated statement of income.
If a change in estimate results in an increase in the closure liability and, therefore, an addition to the asset’s book value, the Company must consider whether or not this is an indication of impairment of the asset as a whole, and conduct impairment testing pursuant to IAS 36. Furthermore, in the case of mature mines, if the revised mining assets net of the closure provisions exceed the recoverable value, such portion of the increase is charged directly to expense. In the case of mines already closed, changes in estimated costs are recognized immediately in the consolidated statement of income. Likewise, any closure liability that arises as a result of a mine’s production phase must be included in expenses as and when incurred.
Notes to the consolidated financial statements (continued)
The Company, through a subsidiary, has treasury shares (common and investment shares). The nominal values of these shares are presented net of the capital stock and investment shares amounts.
The effect of the dividends income arising from the treasury shares held by the subsidiary are excluded for calculating the share´s in subsidiary and associates income and are presented net from declared a paid dividends in the consolidated statements of changes in shareholders´ equity.
Revenue is recognized to the extent that it is probable that the economic benefits will flow to the Company. Revenue is measured at the fair value of the consideration received, excluding discounts. The following specific recognition criteria must also be met before revenue is recognized:
Sales of concentrates, gold and silver -
Revenues from sales of concentrates, gold and silver are recognized when the significant risks and rewards of ownership are transferred to the buyer, and selling price are known or can be reasonably estimated.
As far as the measurement of revenues from the sale of concentrate, the Company assigns a provisional value to these sales, since they are subject to a final price adjustment at the end of a contractually-set period, which normally ranges between 30 and 180 days after delivery of the concentrate to the customer. Exposure to changes in metals price generates an embedded derivative that must be separated from the commercial contract. At the close of each period, the sale price used initially is adjusted in accordance with the future price for the quotation period stipulated in the contract. Adjustment of the provisional sale value is posted as an increase or decrease in net sales.
Interest received -
Financial income is recognized as interest accrues.
Borrowing costs directly relating to the acquisition, construction or production of a qualifying asset are capitalized, and added to the project’s cost until such time as the assets are considered substantially ready for their planned use, that is to say, when they are capable of generating commercial production. Where funds are borrowed specifically to finance a project, the amount capitalized represents the actual borrowing costs incurred. Where surplus funds are available for a short term out of money borrowed specifically to finance a project, the income generated from the temporary investment of such amounts is also capitalized and deducted from the total capitalized borrowing cost. Where the funds used to finance a project form part of general borrowings, the amount capitalized is calculated using a weighted average of rates applicable to relevant general borrowings of the Company during the period. All other borrowing costs are recognized in the consolidated statement of income in the period in which they are incurred.
| | (s) | Income Tax and workers´ profit sharing - |
Current portion of the Income Tax and workers’ profit sharing
Income Tax and workers’ profit sharing for the current period are measured based on the unconsolidated financial statements at the amount expected to be paid to the tax authorities and workers, respectively. The rates and laws used to compute the amount are those in force as of the date of the consolidated balance sheet date.
Notes to the consolidated financial statements (continued)
Deferred portion of income tax and workers’ profit sharing -
The income tax and workers’ profit sharing for future periods are recognized using the liability method, considering the temporary differences between the tax and accounting bases of assets and liabilities as of the date of the consolidated balance sheet. Deferred income tax and workers’ profit sharing liabilities are recognized for all taxable temporary differences, except for taxable temporary differences associated with investments in subsidiaries and associates where the timing of the reversal of the temporary differences can be controlled and it is probable that the temporary differences will reverse in the foreseeable future.
All deductible temporary differences and loss carryforwards generate the recognition of deferred assets to the extent that it is probable that they can be used in calculating taxable income in future years. Deferred income tax and workers’ profit sharing liabilities are recognized for all deductible temporary differences and tax loss carry-forwards, to the extent that is probable that taxable profit will be available against which the deductible temporary differences and unused tax losses can be utilized. The carrying amount of the deferred income tax and workers’ profit sharing assets is reviewed at each consolidated balance sheet date and reduced to the extent that it is no longer probable that sufficient taxable profit will be available to allow all or part of the deferred asset to be utilized. Unrecognized deferred assets are reassessed at each consolidated balance sheet date.
Deferred assets and liabilities are offset if there is a legal right to set them off and the taxes deferred relate to the same entity and the same tax authority.
Recovery of deferred tax assets -
An assessment is required to determine whether deferred tax assets should be recognized in the consolidated balance sheet. Deferred tax assets, including those resulting from unused tax losses, require Management to assess the probability that the Company would generate taxable earnings in future periods to apply the deferred tax assets. Estimated future taxable income is based on projections of cash flows from operations and application of the tax law existing in each jurisdiction. To the extent to which future cash flows and taxable income differ significantly from those estimated; they could have an impact on the Company’s capability to realize the deferred tax assets posted as of the reporting date.
In addition, future changes in the tax law in jurisdictions where the Company operates could limit the Company’s capability to obtain tax deductions in future periods.
| | (t) | Derivative financial instruments - |
Derivatives not designated as hedging instruments -
Derivative contracts are recognized as assets and liabilities at fair value in the consolidated balance sheet. Changes in the fair value of derivative contracts not qualifying as hedging instruments are recorded in the “Loss from Change in the Fair Value of Derivative Instruments” caption in the consolidated statements of income.
Derivatives designated as hedging instruments -
The El Brocal subsidiary uses derivative instruments to manage its exposure to changes in metals prices. In order to manage special risks, El Brocal applies hedge accounting for those transactions that meet the specific criteria applicable.
Notes to the consolidated financial statements (continued)
At the beginning of the hedge relation, El Brocal formally documents the relationship between the item hedged and the hedging instrument, including the nature of the risk, the objective and the strategy to be taken to carry out the hedging, and the method to be used to estimate the effectiveness of the hedge relation.
A formal assessment is made upon beginning the hedge relation, to assure that the hedging instrument is highly effective in offsetting the risk designated in the item hedged. Hedges are formally assessed every half. A hedge is considered as highly effective if it is expected that the changes in cash flow attributed to the risk hedged during the period for which the hedge is designated are offset within a range from 80 to 125 percent. As of December 31, 2010 and 2009, El Brocal subsidiary had contracted derivative instruments on metals quotes under the Asian swap and collar option modes that qualify as cash-flow hedging instruments.
For those cash flow hedges that qualify as such, any gain or loss from the effective portion of the hedging instrument is initially recognized in the statement of changes in shareholders’ equity in the “Unrealized gain (loss) on valuation of derivative financial instruments for hedging, net” caption. Any gain or loss from the ineffective portion of the hedging instrument is initially recognized in the consolidated statement of income in the “Interest expenses” caption. When the cash flow hedged affects the consolidated statement of income, any gain or loss from the hedging instrument is posted in the “Net sales” caption of the consolidated statement of income.
| | (u) | Basic and diluted earnings per share – |
Basic and diluted earnings per share have been calculated based on the weighted average number of common and investment shares outstanding at the date of the consolidated balance sheets; treasury shares have been excluded from the calculation. When the number of shares is modified as a result of capitalization of retained earnings, share splits or share grouping, the net income per basic and diluted shares is adjusted retroactively for all of the periods reported. If the change occurs after the date of the consolidated financial statements, but before the financial statement are authorized for issue, the calculation of net income per basic and diluted share for all of the reported periods must be based on the new number of shares, see note 25.
An operating segment is a component of an entity: (i) that engages in business activities from which it may earn revenues and incur expenses (including revenues and expenses relating to transactions with other components of the same entity), (ii) whose operating results are regularly reviewed by the entity's chief operating decision maker to make decisions about resources to be allocated to the segment and assess its performance, and (iii) for which discrete financial information is available. See note 26.
| | (w) | Comparative financial statements – |
With the propose of improving the consolidates balance sheet presentation, the Company had made a reclassification in royalties payable to third parties from “Other accounts payable” caption amounting to US$3,124,000 to “Trade accounts payable” caption as of December 31, 2009. As of December 31, 2010, the royalties payable to third parties amounted to US$2,880,000 and are shown in “Trade accounts payable” caption.
| | 2.4. | New International Financial Reporting Standards (IFRS) internationally issued but not mandatory in Peru – |
On August 23, 2010 CNC issued resolution N°044-2010- EF-94 authorizing the application of new IFRS beginning January 1, 2011, with early adoption permitted. The resolution prescribed the use of the 2009 version of the IAS, IFRS, IFRIC and SIC with modifications made as of May 2010, with the following exceptions:
Notes to the consolidated financial statements (continued)
| | - | IFRS 9 “Financial Instruments” modifies the treatment and classification of the financial asset according to IAS 39 “Financial Instruments: Recognition and Measurement” and is effective for annual periods beginning on or after January 1, 2013. |
| | - | IFRS 10 “Consolidated Financial Statements”, issued in May 2011 by the IASB, establishes principles for the presentation and preparation of consolidated financial statements when an entity controls one or more other entities. IFRS 10 replaces the consolidation requirements in SIC-12 Consolidation—Special Purpose Entities and IAS 27 Consolidated and Separate Financial Statements and is effective for annual periods beginning on or after 1 January 2013. The Company has not assessed the impact, if any, of adopting this guidance. |
| | - | IFRS 11 “Joint Arrangement”, issued in May 2011 by the IASB, provides for a more realistic reflection of joint arrangements by focusing on the rights and obligations of the arrangement, rather than its legal form. The standard addresses inconsistencies in the reporting of joint arrangements by requiring a single method to account for interests in jointly controlled entities. IFRS 11 supersedes IAS 31 Interests in Joint Ventures and SIC-13 Jointly Controlled Entities - Non-Monetary Contributions by Ventures, and is effective for annual periods beginning on or after 1 January 2013. The Company has not assessed the impact, if any, of adopting this guidance. |
| | - | IFRS 12 “Disclosure of Interests in other entities”, issued in May 2011 by the IASB, is a new and comprehensive standard on disclosure requirements for all forms of interests in other entities, including subsidiaries, joint arrangements, associates and unconsolidated structured entities. IFRS 12 is effective for annual periods beginning on or after 1 January 2013. The Company has not assessed the impact, if any, of adopting this guidance. |
| | - | IFRS 13 “Fair Value Measurement”, issued in May 2011 establishes new requirements on how to measure fair value and the related disclosures for IFRSs and US generally accepted accounting principles (GAAP). The guidance, set out in IFRS 13 Fair Value Measurement and an update to ASC 820 in the FASB’s Accounting Standards Codification (formerly referred to as SFAS 157), completes a major project of the boards’ joint work to improve IFRSs and US GAAP and to bring about their convergence. The standard is effective for annual periods beginning on or after 1 January 2013. The Company has not assessed the impact, if any, of adopting this guidance. |
| | - | IFRIC 18 “Transfers of Assets from Customers”, effective for annual periods beginning on or after July 1, 2009. |
Through Resolution N°102-2010-EF/94.01.1, CONASEV authorized full application of International Financial Reporting Standards – “IFRS” international effective for all legal entities under its supervision from the year 2011.
This adoption must include application of IFRS 1 - First-time Adoption of International Financial Reporting Standards.
To date, the Company’s Management is performing the implementation process and the determination of the adjustments in order to follow this Resolution.
| 3. | Transactions in Nuevos Soles |
Transactions in Nuevos Soles take place at the exchange rates published by the Superintendent of Banks, Insurance and AFP. As of December 31, 2010, the exchange rates for U.S. dollars were S/.2.808 for purchase and S/. 2.809 for sale (S/.2.888 for purchase and S/.2.891 for sale as of December 31, 2009) and have been applied by the Company for asset and liability accounts, respectively.
Notes to the consolidated financial statements (continued)
As of December 31, 2010, the El Brocal subsidiary has S/.55,000,000 (S/.36,500,000 as of December 31, 2009) in time deposits. There are no significant additional monetary assets or liabilities denominated in Nuevos Soles as of December 31, 2010 and 2009.
| 4. | Cash and cash equivalents |
| | (a) | The table below presents the components of this caption: |
| | | | | | | |
| | | US$(000) | | | US$(000) | |
| | | | | | | |
| Cash | | | 696 | | | | 555 | |
| Bank accounts | | | 124,270 | | | | 50,274 | |
| Time deposits (b) | | | 457,895 | | | | 663,625 | |
| Cash balances included in the consolidated statement of cash flows | | | 582,861 | | | | 714,454 | |
| Time deposits with original maturity greater than 90 days (c) | | | 17,935 | | | | - | |
| | | | 600,796 | | | | 714,454 | |
| | (b) | The table below presents the components of time deposits as of December 31, 2010: |
| Currency | | | | | | |
| | | | % | | US$(000) | |
| | | | | | | |
| U.S. dollars | From 7 to 63 days | | From 0.16 to 1.45 | | | 453,000 | |
| Nuevos Soles | From 78 to 90 days | | From 2.5 to 3.05 | | | 4,895 | |
| | | | | | | 457,895 | |
The table below presents the components of time deposits as of December 31, 2009:
| Currency | | | | | | |
| | | | % | | US$(000) | |
| | | | | | | |
| U.S. dollars | From 5 to 90 days | | From 0.3 to 1.00 | | | 651,000 | |
| Nuevos Soles | From 25 to 75 days | | From 1.05 to 1.35 | | | 12,625 | |
| | | | | | | 663,625 | |
Notes to the consolidated financial statements (continued)
| | (c) | As of December 31, 2010, it mainly corresponds to time deposits maintained by El Brocal and Buenaventura Ingenieros S.A.: |
| Currency | | | | | | |
| | | | % | | US$(000) | |
| | | | | | | |
| Nuevos Soles | From 91 to 123 days | | From 2.75 to 3.40 | | | 14,685 | |
| U.S. dollars | From 91 to 104 days | | From 1.25 to 1.30 | | | 3,250 | |
| | | | | | | 17,935 | |
| 5. | Financial assets at fair value through profit or loss |
Buenventura´s Management decided to invest the excess cash in mutual funds of variable income, which had been designated as financial assets at fair value through profit or loss. According to note 2.3(b), the Company recorded in the year 2010 an increase in the net investment amounted to US$154,000 to profit and loss to take this investment at fair value as of December 31, 2010. The table below presents the components of this caption:
| Issuer | | | |
| | | US$(000) | |
| | | | |
| Credifondo S.A. SAF | | | 50,154 | |
| | | | 50,154 | |
This fund is comprised by a portfolio of investments issued by Peruvian Goverment and financial entities with high reputation in the local market. The outcome of the investment is variable. The fund is considered a low-risk investment. According to Management´s opinion, this fund is highly liquid.
Notes to the consolidated financial statements (continued)
| 6. | Trade accounts receivable, net |
| | (a) | The table below presents the components of this caption: |
| | | | | | | |
| | | US$(000) | | | US$(000) | |
| | | | | | | |
| Louis Dreyfus Commodities Metals | | | 46,893 | | | | 9,016 | |
| Johnson Matthey Limited | | | 40,736 | | | | 42,110 | |
| Glencore Perú S.A. | | | 20,396 | | | | - | |
| Doe Run Perú S.R.L. | | | 16,814 | | | | 16,814 | |
| N.V. Umicore | | | 15,187 | | | | - | |
| Consorcio Minero S.A. – CORMIN | | | 12,538 | | | | 18,954 | |
| Votorantim Metais Cajamarquilla S.A. | | | 6,402 | | | | 3,306 | |
| Traxys Perú S.A.C. | | | 5,347 | | | | - | |
| BHL Perú S.A.C. | | | 4,927 | | | | 4,927 | |
| Glencore International A.G. | | | 4,166 | | | | 11,144 | |
| Sudamericana Trading S.R.L. | | | 1,660 | | | | 1,917 | |
| AYS S.A. | | | 1,098 | | | | 30,601 | |
| MK Metal Trading Perú S.A.C. | | | - | | | | 2,525 | |
| Other | | | 6,505 | | | | 3,377 | |
| | | | 182,669 | | | | 144,691 | |
| Allowance for doubtful accounts, (b) | | | (21,741 | ) | | | (21,741 | ) |
| | | | 160,928 | | | | 122,950 | |
The accounts receivable are denominated in U.S. dollars, have current maturities and do not accrue interest. These accounts receivable are unsecured.
Notes to the consolidated financial statements (continued)
As of December 31, 2010 and 2009, the aging of the trade accounts receivable balance was as follows:
| | | 2010 | | | 2009 | |
| | | | | | | | | | | | | | | | | | | |
| | | US$(000) | | | US$(000) | | | US$(000) | | | US$(000) | | | US$(000) | | | US$(000) | |
| | | | | | | | | | | | | | | | | | | |
| Not due - | | | 160,928 | | | | - | | | | 160,928 | | | | 122,595 | | | | - | | | | 122,595 | |
| | | | | | | | | | | | | | | | | | | | | | | | | |
| Due - | | | | | | | | | | | | | | | | | | | | | | | | |
| From 1 to 30 days | | | - | | | | - | | | | - | | | | 111 | | | | - | | | | 111 | |
| From 31 to 60 days | | | - | | | | - | | | | - | | | | 86 | | | | - | | | | 86 | |
| From 61 to 120 days | | | - | | | | - | | | | - | | | | 158 | | | | - | | | | 158 | |
| More than 120 days | | | - | | | | 21,741 | | | | 21,741 | | | | - | | | | 21,741 | | | | 21,741 | |
| | | | 160,928 | | | | 21,741 | | | | 182,669 | | | | 122,950 | | | | 21,741 | | | | 144,691 | |
In the process of estimating the allowance for doubtful accounts, the Company's Management constantly evaluates market conditions, for which it uses analysis of aging and risk-rating reports for commercial operations.
| | (b) | The allowance for doubtful accounts had the following movement in 2010, 2009 and 2008: |
| | | | | | | | | | |
| | | US$(000) | | | US$(000) | | | US$(000) | |
| | | | | | | | | | |
| Opening balance | | | 21,741 | | | | 5,372 | | | | - | |
| Provision for the period , note 20 | | | - | | | | 16,814 | | | | 5,372 | |
| Decreases | | | - | | | | (445 | ) | | | - | |
| Ending balance | | | 21,741 | | | | 21,741 | | | | 5,372 | |
In the opinion of the Company’s Management, the allowance for doubtful accounts is sufficient to cover the risk of non-performance as of the consolidated balance sheet date.
Notes to the consolidated financial statements (continued)
| | (a) | The table below presents the components of this caption: |
| | | | | | | |
| | | US$(000) | | | US$(000) | |
| | | | | | | |
| Products in process, note 18 | | | 77,188 | | | | 15,788 | |
| Spare parts and supplies | | | 30,392 | | | | 24,684 | |
| Finished goods, note 18 | | | 6,696 | | | | 7,581 | |
| | | | 114,276 | | | | 48,053 | |
| Provision for impairment of value of inventory (c) | | | (5,091 | ) | | | (3,066 | ) |
| | | | 109,185 | | | | 44,987 | |
| Less non-current portion (b) | | | (27,104 | ) | | | (4,602 | ) |
| Current portion | | | 82,081 | | | | 40,385 | |
| | (b) | The table below presents the detail of long-term inventory which corresponds to classified mineral that is kept in transition and south deposit fields as of December 31, 2010 and 2009 in El Brocal: |
| | | | | | | |
| | | US$(000) | | | DMT | | | US$(000) | | | DMT | |
| Classified mineral | | | | | | | | | | | | |
| Type I (zinc mineral) | | | 1,381 | | | | 614,137 | | | | - | | | | - | |
| Type II (copper mineral) | | | 4,062 | | | | 562,761 | | | | 3,391 | | | | 130,310 | |
| Type III (lead/zinc mineral) | | | 23,042 | | | | 2,623,264 | | | | 1,211 | | | | 46,543 | |
| | | | 28,485 | | | | 3,800,162 | | | | 4,602 | | | | 176,853 | |
| Non-current portion | | | (27,104 | ) | | | | | | | (4,602 | ) | | | | |
| Current portion | | | 1,381 | | | | | | | | - | | | | | |
According to El Brocal´s operation plan, the classified mineral which is from Tajo-Norte is being treated in the new expansion of the concentrator plant. During the twelve months period ended as of December 31, 2010, El Brocal had been treated 136,091, 12,865 and 240,689 metric tons of mineral type I, II and III, respectively.
Notes to the consolidated financial statements (continued)
| | (c) | The provision for impairment of value of inventory had the following movement during the years 2010, 2009 and 2008: |
| | | | | | | | | | |
| | | US$(000) | | | US$(000) | | | US$(000) | |
| | | | | | | | | | |
| Opening balance | | | 3,066 | | | | 2,652 | | | | 1,968 | |
| Provision for impairment of finished goods, note 18 | | | 1,648 | | | | 449 | | | | 794 | |
| Provision for impairment of spare parts and supplies, note 23 | | | 716 | | | | 360 | | | | 16 | |
| Reversal of provision, note 23 | | | (339 | ) | | | (360 | ) | | | (16 | ) |
| Write-offs | | | - | | | | (35 | ) | | | (110 | ) |
| Ending balance | | | 5,091 | | | | 3,066 | | | | 2,652 | |
In the opinion of Company Management, the provision for impairment of value of inventory adequately covers this risk as of the date of the consolidated balance sheet.
| | (a) | The table below presents the components of this caption: |
| | | Share in shareholders’ equity | | | | |
| | | | | | | | | | | | | |
| | | % | | | % | | | US$(000) | | | US$(000) | |
| Investments held under the equity method - | | | | | | | | | | | | |
| Minera Yanacocha S.R.L. (c) | | | | | | | | | | | | |
| Equity share | | | 43.65 | | | | 43.65 | | | | 1,004,276 | | | | 746,128 | |
| Payment in excess of the share in fair value of assets and liabilities, net | | | | | | | | | | | 15,214 | | | | 16,248 | |
| | | | | | | | | | | | 1,019,490 | | | | 762,376 | |
| Sociedad Minera Cerro Verde S.A.A. (c) | | | | | | | | | | | | | | | | |
| Equity share | | | 19.26 | | | | 19.26 | | | | 298,598 | | | | 278,489 | |
| Payment in excess of the share in fair value of assets and liabilities, net | | | | | | | | | | | 83,279 | | | | 84,694 | |
| | | | | | | | | | | | 381,877 | | | | 363,183 | |
| | | | | | | | | | | | | | | | | |
| Canteras del Hallazgo S.A.C. | | | 49.00 | | | | 49.00 | | | | 2,700 | | | | 3 | |
| | | | | | | | | | | | | | | | | |
| Available-for-sale investments - | | | | | | | | | | | | | | | | |
| Other | | | | | | | | | | | 592 | | | | 605 | |
| | | | | | | | | | | | 1,404,659 | | | | 1,126,167 | |
Notes to the consolidated financial statements (continued)
| | (b) | The table below presents the net share in results of associates: |
| | | | | | | | | | |
| | | US$(000) | | | US$(000) | | | US$(000) | |
| | | | | | | | | | |
| Minera Yanacocha S.R.L. | | | 256,612 | | | | 316,154 | | | | 206,478 | |
| Sociedad Minera Cerro Verde S.A.A. | | | 201,649 | | | | 135,152 | | | | 134,451 | |
| Compañía Minera Coimolache S.A.C. (e) | | | (15,859 | ) | | | - | | | | - | |
| Canteras del Hallazgo S.A.C. (f) | | | (13,660 | ) | | | - | | | | - | |
| | | | 428,742 | | | | 451,306 | | | | 340,929 | |
| | (c) | The table below presents the movement in the investments in Yanacocha and Cerro Verde: |
| | | | | | | |
| | | 2010 | | | 2009 | | | 2010 | | | 2009 | |
| | | US$(000) | | | US$(000) | | | US$(000) | | | US$(000) | |
| | | | | | | | | | | | | |
| Opening balance | | | 746,128 | | | | 528,330 | | | | 278,489 | | | | 252,242 | |
| Share in associated companies | | | 257,646 | | | | 317,653 | | | | 203,064 | | | | 136,813 | |
| Payments for acquisition of additional shares | | | - | | | | - | | | | - | | | | 2,884 | |
| Dividends received | | | - | | | | (100,395 | ) | | | (182,955 | ) | | | (113,450 | ) |
| Other | | | 502 | | | | 540 | | | | - | | | | - | |
| Ending balance | | | 1,004,276 | | | | 746,128 | | | | 298,598 | | | | 278,489 | |
The table below presents the movement in the payments in excess of the share in the fair value of assets and liabilities acquired from Yanacocha and Cerro Verde:
| | | | | | | |
| | | | | | | | | | | | | |
| | | US$(000) | | | US$(000) | | | US$(000) | | | US$(000) | |
| | | | | | | | | | | | | |
| Opening balance | | | 16,248 | | | | 17,748 | | | | 84,694 | | | | 81,089 | |
| Amount paid in excess of the fair value of assets and liabilities | | | - | | | | - | | | | - | | | | 5,266 | |
| Amortization of excess amount paid | | | (1,034 | ) | | | (1,500 | ) | | | (1,415 | ) | | | (1,661 | ) |
| Ending balance | | | 15,214 | | | | 16,248 | | | | 83,279 | | | | 84,694 | |
| | (d) | The investments held in Yanacocha (a gold mine located in Cajamarca, Peru) and Cerro Verde (a copper mine located in Arequipa, Peru), represent the Company’s most significant investments. The share in their results has been significant in relation to the Company’s net earnings in 2010, 2009 and 2008. |
The table below presents the principal audited amounts in the Yanacocha and Cerro Verde financial statements, adjusted to conform to Buenaventura’s accounting practices.
Notes to the consolidated financial statements (continued)
| | | | | | | |
| | | | | | | | | | | | | | | | | | | |
| | | US$(000) | | | US$(000) | | | US$(000) | | | US$(000) | | | US$(000) | | | US$(000) | |
| | | | | | | | | | | | | | | | | | | |
| Balance Sheet | | | | | | | | | | | | | | | | | | |
| Total assets | | | 2,936,994 | | | | 2,466,500 | | | | 1,895,681 | | | | 2,285,165 | | | | 1,913,164 | | | | 1,983,572 | |
| Total liabilities | | | 634,848 | | | | 755,398 | | | | 682,893 | | | | 734,648 | | | | 467,070 | | | | 659,397 | |
| Shareholders’ equity | | | 2,302,146 | | | | 1,711,102 | | | | 1,212,788 | | | | 1,550,517 | | | | 1,446,094 | | | | 1,324,175 | |
| Results | | | | | | | | | | | | | | | | | | | | | | | | |
| Total income | | | 1,778,260 | | | | 2,013,228 | | | | 1,612,618 | | | | 2,368,988 | | | | 1,757,510 | | | | 1,835,911 | |
| Operating income | | | 855,309 | | | | 1,062,629 | | | | 668,877 | | | | 1,665,505 | | | | 1,124,260 | | | | 1,099,162 | |
| Net income | | | 589,894 | | | | 727,076 | | | | 476,462 | | | | 1,054,423 | | | | 708,529 | | | | 718,433 | |
| | (e) | Compañia Minera Coimolache S.A.: Tantahuatay Project – |
Tantahuatay Project is located in the province of Hualgayoc, distric of Hualgayoc and Chugur in Cajamarca region and has reserves of 658,000 ounces of gold (unaudited). The open pit will be mined and the ore will be leached in piles in an initial rate of 12,000 MT/day. The construction investment for the Project is estimated in US$80,000,000. As of December 31, 2010, the shareholders contribution amounted to US$45,940,300, in which the Company participation amount to 40.095 percent.
The environmental study was approved on June 22, 2009, the construction authorization was issue by the General Direction of Mining, hereinafter “DGM”, by its Spanish acronym, on May 25, 2010 and the mining plan was approved by the DGM on November 4, 2010. The construction of the project started in July 2010 and the physical advance as of December 31, 2010 is 41%. The Management estimated the start-up of the mining operations will be on the second semester of 2011.
On October 18, 2010, the Shareholders´Meeting of Compañía Minera Coimolache S.A. approved the development program and financial support of Tantahuatay Project to be taken into production stage. The total budget of the project was estimated in US$110,000,000 and the project financing structure should be: 30% shareholders´s equity and 70% loans from shareholders. .
| | (f) | Canteras del Hallazgo S.A.C.: Chucapaca Project – |
The mining project is located in Moquegua. There are evidences of gold, copper and silver in Chucapaca project zone, Canahuire deposit. The mineral resources are estimated in 5.6 million onces, with a potencial mineralization that could be expanded with a diamond drilling program.
As of December 31, 2010, the shareholders contribution amounted to US$33,309,000 in which Buenaventura´s participation amount to 49 percent.
Notes to the consolidated financial statements (continued)
| 9. | Mining concessions and property, plant and equipment, net |
| | (a) | Below is presented the movement in cost, depreciation and amortization, as well as the provision for accumulated impairment of long-lived assets during the year 2010: |
| | | | | | | | | | | | | | | | | | | |
| | | US$(000) | | | US$(000) | | | US$(000) | | | US$(000) | | | US$(000) | | | US$(000) | |
| Cost | | | | | | | | | | | | | | | | | | |
| Land | | | 2,668 | | | | - | | | | - | | | | - | | | | - | | | | 2,668 | |
| Mining land | | | 7,215 | | | | - | | | | - | | | | - | | | | - | | | | 7,215 | |
| Mining concessions, note 30(c) | | | 15,000 | | | | - | | | | - | | | | - | | | | - | | | | 15,000 | |
| Mining concessions (b) | | | 123,881 | | | | 546 | | | | - | | | | - | | | | - | | | | 124,427 | |
| Buildings, construction and other | | | 184,029 | | | | 4,047 | | | | (1,290 | ) | | | - | | | | 72,260 | | | | 259,046 | |
| Machinery and equipment | | | 221,218 | | | | 27,579 | | | | (1,420 | ) | | | (1,013 | ) | | | 38,585 | | | | 284,949 | |
| Transportation units | | | 8,015 | | | | 650 | | | | (57 | ) | | | (255 | ) | | | 971 | | | | 9,324 | |
| Furniture and mixtures | | | 13,864 | | | | 218 | | | | (17 | ) | | | (9 | ) | | | 50 | | | | 14,106 | |
| Units in transit | | | 9,983 | | | | 19,895 | | | | - | | | | - | | | | (20,594 | ) | | | 9,284 | |
| Works in progress (c) | | | 118,842 | | | | 180,030 | | | | (1,907 | ) | | | - | | | | (91,272 | ) | | | 205,693 | |
| Mine closure costs | | | 32,696 | | | | 958 | | | | - | | | | - | | | | - | | | | 33,654 | |
| | | | 737,411 | | | | 233,923 | | | | (4,691 | ) | | | (1,277 | ) | | | - | | | | 965,366 | |
| Accumulated depreciation and amortization | | | | | | | | | | | | | | | | | | | | | | | | |
| Mining land | | | 5,571 | | | | - | | | | - | | | | - | | | | - | | | | 5,571 | |
| Mining concessions (b) | | | 54,899 | | | | 5,044 | | | | - | | | | - | | | | - | | | | 59,943 | |
| Buildings, construction and other | | | 118,347 | | | | 24,829 | | | | (673 | ) | | | - | | | | - | | | | 142,503 | |
| Machinery and equipment | | | 166,411 | | | | 23,452 | | | | (922 | ) | | | (983 | ) | | | (5 | ) | | | 187,953 | |
| Transportation units | | | 5,525 | | | | 1,020 | | | | (33 | ) | | | (192 | ) | | | 5 | | | | 6,325 | |
| Furniture and mixtures | | | 4,121 | | | | 1,001 | | | | (16 | ) | | | (8 | ) | | | - | | | | 5,098 | |
| Mine closure costs | | | 18,190 | | | | 1,969 | | | | - | | | | - | | | | - | | | | 20,159 | |
| | | | 373,064 | | | | 57,315 | | | | (1,644 | ) | | | (1,183 | ) | | | - | | | | 427,552 | |
Notes to the consolidated financial statements (continued)
| | | | | | | | | | | | | | | | | | | |
| | | US$(000) | | | US$(000) | | | US$(000) | | | US$(000) | | | US$(000) | | | US$(000) | |
| | | | | | | | | | | | | | | | | | | |
| Provision for impairment of long-lived assets, note 11 | | | | | | | | | | | | | | | | | | |
| | | | | | | | | | | | | | | | | | | |
| Mining concessions (b) | | | 2,805 | | | | - | | | | - | | | | - | | | | - | | | | 2,805 | |
| Property, plant and equipment | | | 9,758 | | | | 1,338 | | | | (8,664 | ) | | | - | | | | - | | | | 2,432 | |
| | | | 12,563 | | | | 1,338 | | | | (8,664 | ) | | | - | | | | - | | | | 5,237 | |
| | | | | | | | | | | | | | | | | | | | | | | | | |
| Net cost | | | 351,784 | | | | | | | | | | | | | | | | | | | | 532,577 | |
Notes to the consolidated financial statements (continued)
The table below presents the movement of the cost and accumulated amortization of the mining concessions by mining units:
| | | Balance as of January 1, 2010 | | | | | | Balance as of December 31, 2010 | |
| | | US$(000) | | | US$(000) | | | US$(000) | |
| Cost | | | | | | | | | |
| Compañía de Exploraciones, Desarrollo e Inversiones Mineras S.A.C.- CEDIMIN | | | 51,138 | | | | - | | | | 51,138 | |
| Inversiones Colquijirca S.A. | | | 43,103 | | | | 546 | | | | 43,649 | |
| Sociedad Minera El Brocal S.A.A. | | | 13,542 | | | | - | | | | 13,542 | |
| Inversiones Mineras del Sur S.A. | | | 11,662 | | | | - | | | | 11,662 | |
| Minas Poracota S.A. | | | 2,864 | | | | - | | | | 2,864 | |
| Minera Paula 49 S.A.C. | | | 1,572 | | | | - | | | | 1,572 | |
| | | | 123,881 | | | | 546 | | | | 124,427 | |
| Accumulated amortization | | | | | | | | | | | | |
| Compañía de Exploraciones, Desarrollo e Inversiones Mineras S.A.C. – CEDIMIN | | | 30,994 | | | | 1,904 | | | | 32,898 | |
| Inversiones Colquijirca S.A. | | | 13,042 | | | | 1,147 | | | | 14,189 | |
| Sociedad Minera El Brocal S.A.A. | | | 2,245 | | | | 430 | | | | 2,675 | |
| Inversiones Mineras del Sur S.A. | | | 5,730 | | | | 700 | | | | 6,430 | |
| Minas Poracota S.A. | | | 1,405 | | | | 774 | | | | 2,179 | |
| Minera Paula 49 S.A.C. | | | 1,483 | | | | 89 | | | | 1,572 | |
| | | | 54,899 | | | | 5,044 | | | | 59,943 | |
| Provision for impairment of mining concessions | | | | | | | | | | | | |
| Inversiones Mineras del Sur S.A., note 11 | | | 2,805 | | | | - | | | | 2,805 | |
As of December 31, 2010, the balance of the principles works in progress by subsidiaries are the following:
| | | | |
| | | US$(000) | |
| | | | |
| Compañía de Minas Buenaventura S.A.A. | | | |
| Road construction, Project Mallay | | | 3,319 | |
| Benefit plant, Project Mallay | | | 2,468 | |
| Tailings treatment circuit stage II, Orcopampa | | | 2,371 | |
| Regrowth of cyanide tailings dam stage II, Uchucchacua | | | 1,031 | |
Notes to the consolidated financial statements (continued)
| | | | |
| | | US$(000) | |
| | | | |
| Civil works – winch installation, Uchucchacua | | | 1,007 | |
| | | | | |
| Sociedad Minera El Brocal S.A.A. | | | | |
| Expansion of refining plant capacity, note 1(e) | | | 95,453 | |
| Regrowth of tailings dam N° 6 y 7 | | | 14,428 | |
| Hodroelectric Río Blanco – Jupayragra | | | 8,629 | |
| Diversion project Rio San Juan | | | 1,486 | |
| | | | | |
| Minera La Zanja S.A. | | | | |
| Leach pad II stage | | | 2,412 | |
| Leach pad I stage | | | 2,300 | |
| | | | | |
| Empresa de Generación Huanza S.A. | | | | |
| Hidroelectric construction | | | 35,792 | |
| Water convegance system | | | 12,138 | |
| Access roads | | | 5,543 | |
| Transmition lines in 60 kv | | | 2,683 | |
| | | | | |
| Other minor | | | 14,633 | |
| | | | 205,693 | |
The Company’s Management expects these works in progress to be completed during the years 2011 and 2012.
| 10. | Mine development costs, net |
The table below presents the movement of the cost, accumulated amortization and provision for impairment of mine development by mining units:
| | | Balance as of January 1, de 2010 | | | | | | Balance as of December 31, de 2010 | |
| | | US$(000) | | | US$(000) | | | US$(000) | |
| Cost | | | | | | | | | |
| Orcopampa | | | 58,882 | | | | 1,450 | | | | 60,332 | |
| Uchucchacua | | | 43,128 | | | | 4,184 | | | | 47,312 | |
| Poracota | | | 32,035 | | | | - | | | | 32,035 | |
| Antapite | | | 18,999 | | | | - | | | | 18,999 | |
| La Llave, note 1(e) | | | 15,801 | | | | 445 | | | | 16,246 | |
| Recuperada | | | 8,128 | | | | 2,310 | | | | 10,438 | |
| La Zanja | | | - | | | | 5,844 | | | | 5,844 | |
| Julcani | | | 4,801 | | | | 3,007 | | | | 7,808 | |
| Shila - Paula | | | 2,628 | | | | 4,317 | | | | 6,945 | |
| Ishihuinca | | | 1,027 | | | | - | | | | 1,027 | |
Notes to the consolidated financial statements (continued)
| | | Balance as of January 1, de 2010 | | | | | | Balance as of December 31, de 2010 | |
| | | US$(000) | | | US$(000) | | | US$(000) | |
| Mallay | | | - | | | | 575 | | | | 575 | |
| Mine closure costs | | | 28,108 | | | | (1,157 | ) | | | 26,951 | |
| | | | 213,537 | | | | 20,975 | | | | 234,512 | |
| Accumulated amortization | | | | | | | | | | | | |
| Orcopampa | | | 35,694 | | | | 7,695 | | | | 43,389 | |
| Uchucchacua | | | 29,069 | | | | 3,063 | | | | 32,132 | |
| Poracota | | | 11,342 | | | | 8,811 | | | | 20,153 | |
| Antapite | | | 17,309 | | | | 1,422 | | | | 18,731 | |
| Recuperada | | | 1,433 | | | | 1,004 | | | | 2,437 | |
| La Zanja | | | - | | | | 4,689 | | | | 4,689 | |
| Julcani | | | 622 | | | | 339 | | | | 961 | |
| Shila – Paula | | | 815 | | | | 2,567 | | | | 3,382 | |
| Ishihuinca | | | 1,027 | | | | - | | | | 1,027 | |
| Mine closure costs | | | 15,221 | | | | 2,487 | | | | 17,708 | |
| | | | 112,532 | | | | 32,077 | | | | 144,609 | |
| Provision for impairment of mine development costs | | | | | | | | | | | | |
| Antapite | | | 1,726 | | | | (1,726 | ) | | | - | |
| Recuperada | | | 4,748 | | | | (4,748 | ) | | | - | |
| Poracota | | | 1,085 | | | | (1,085 | ) | | | - | |
| Shila - Paula | | | 1,813 | | | | 1,750 | | | | 3,563 | |
| | | | 9,372 | | | | (5,809 | ) | | | 3,563 | |
| | | | 91,633 | | | | | | | | 86,340 | |
| 11. | Reversal (provision) for impairment of long-lived assets and investments in associates |
Mining rights, property, plant and equipment and development costs -
The table below presents the components of the loss from impairment of long-lived assets recorded by Buenaventura and subsidiaries:
As of December 31, 2010:
| Cash-generating unit | | Mining concessions and property, plant and equipment | | | | | | Total as of December 31, 2010 | |
| | | US$(000) | | | US$(000) | | | US$(000) | |
| | | | | | | | | | |
| Shila - Paula | | | 2,432 | | | | 3,563 | | | | 5,995 | |
| Antapite | | | 2,805 | | | | - | | | | 2,805 | |
| Total | | | 5,237 | | | | 3,563 | | | | 8,800 | |
Notes to the consolidated financial statements (continued)
As of December 31, 2009:
| Cash-generating unit | | Mining concessions and property, plant and equipment | | | | | | Total as of December 31, 2009 | |
| | | US$(000) | | | US$(000) | | | US$(000) | |
| | | | | | | | | | |
| Antapite | | | 9,346 | | | | 1,726 | | | | 11,072 | |
| Recuperada | | | 2,123 | | | | 4,748 | | | | 6,871 | |
| Shila - Paula | | | 1,094 | | | | 1,813 | | | | 2,907 | |
| Poracota | | | - | | | | 1,085 | | | | 1,085 | |
| Total | | | 12,563 | | | | 9,372 | | | | 21,935 | |
The table below presents the components and movement of the reversal for impairment of long-lived assets recorded by Buenaventura and subsidiaries:
| Cash-generating unit | | Balance as of January 1, 2010 | | | Mining concessions and property, plant and equipment | | | | | | | | | Total as of December 31,2010 | |
| | | US$(000) | | | US$(000) | | | US$(000) | | | US$(000) | | | US$(000) | |
| | | | | | | | | | | | | | | | |
| Shila - Paula | | | 2,907 | | | | 1,338 | | | | 1,750 | | | | 3,088 | | | | 5,995 | |
| Antapite | | | 11,072 | | | | (6,541 | ) | | | (1,726 | ) | | | (8,267 | ) | | | 2,805 | |
| Recuperada | | | 6,871 | | | | (2,123 | ) | | | (4,748 | ) | | | (6,871 | ) | | | - | |
| Poracota | | | 1,085 | | | | - | | | | (1,085 | ) | | | (1,085 | ) | | | - | |
| Total | | | 21,935 | | | | (7,326 | ) | | | (5,809 | ) | | | (13,135 | ) | | | 8,800 | |
During the year 2010, the Company’s Management updated its assessment of the recoverability of the book value of its long-lived assets and reversed the impairment of Antapite, Recuperada and Poracota mining units as of December 31, 2010, as a consequence of positive changes in the assumptions used to calculate the impairment provision recorded in order to determine the recovery carrying amount of long-lived assets. The impairment reversed as of December 31, 2010 amounted to US$16,223,000 (US$8,664,000 corresponds to “Mining concessions and property, plant and equipment” chapter and US$7,559,000 corresponds to “Development costs” chapter, see notes 9 and 10, respectively. Notes to the consolidated financial statements (continued)
Assessing the impairment of long-lived assets involves comparing their respective carrying amount with their recoverable values. The recoverable value of assets is the greater of its fair value less the costs of sale or its value in use. The Management made the required estimation.
During the year 2010, the Company recorded an impairment of long –lived assets provision from Shila-Paula mining unit amounted to US$3,088,000 (US$1,338,000 corresponds to “Mining concessions and property, plant and equipment” chapter and US$1,750,000 corresponds to “Development costs” chapter).
The recoverable amount used in assessing the Shila-Paula cash generating unit is the fair value of the assets located in this unit less the associated costs of sale. According to Management, the market value of the assets, discounting costs of sale, amounts to US$4,676,000.
The recoverable value used in assessing the Poracota, Antapite and Recuperada units is their value in use. The Company estimated the use value of its long-lived assets using a discounted cash-flow model. Cash flow was projected for the useful life of the mining units based on Management’s expectations. This useful life depends on several variables, including the mineral reserves of each unit.
The following assumptions have been used for calculating the value in use:
| | (i) | Production volumes: the production volumes of the Antapite, Recuperada and Poracota units are substantiated by the reserves and resources audited as of December 31, 2010 and 2009, considering Management’s production plan for the coming years. According to such reserves, the Antapite unit has a production horizon of one year, Recuperada of four year and Poracota of three years (the Antapite unit had a horizon of one year, Recuperada of four years and Poracota of four year as of December 31, 2009). Management believes that there will not be significant changes in estimated production volumes that would result in the present value of long-lived assets exceeding their recoverable value. |
| | (ii) | Discount rates: Future cash flows have been adjusted according to the specific risk assigned to this type of asset and discounted at a pre-tax rate of 7.73 percent (9.91 percent as of December 31, 2009). The discount rate used is the Weighted Average Cost of Capital (WACC). Management believes that there will not be significant changes in the discount rate that could increase the impairment loss. |
| | (iii) | Metals prices: The Company has used future metals prices (forward metal prices) obtained from the average of estimates made by foreign investment banks. |
| | (iv) | Operating costs: The Company has projected its operating costs in relation to its cost structure as of the date of the consolidated balance sheet. Management believes that there will not be significant changes in estimated operating costs considered that could increase the impairment loss. |
In the opinion of the Company’s Management, the provision for impairment of long-lived assets of Shila-Paula mining unit and the reversal impairment of long-lived assets of Antapite, Recuperada and Poracota mining units as of the date of the consolidated balance sheet disclosure properly the changes made in the assumptions.
Investments in associates -
As of December 31, 2010 and 2009, in the case of Yanacocha the Company’s Management concluded that there was no objective evidence of impairment as of the consolidated balance sheet date derived from internal and external indicators (rising trend in the international price of gold, constant level of reserves and an increase in the annual net profit reported). In addition, in the case of associate Cerro Verde, the Company’s Management compared the investment’s fair value according to market capitalization with the investment’s book value, and determined that there was no impairment as of the consolidated balance sheet date.
Notes to the consolidated financial statements (continued)
| 12. | Trade accounts payable |
Trade accounts payable arise mainly from the acquisition of material, supplies and spare parts and services provided by third parties. These obligations are mostly denominated in U.S. dollars, have current maturities and do not accrue interest. No specific guarantees have been granted for these obligations. Trade accounts payable amount to US$91,374,000 as of December 31, 2010 (US$61,357,000 as of December 31, 2009).
| 13. | Other accounts payable |
| | (a) | The table below presents the components of this caption: |
| | | | | | | |
| | | US$(000) | | | US$(000) | |
| Provision for closure of mining units and exploration projects (b) | | | 77,427 | | | | 84,361 | |
| Stock appreciation rights (c) | | | 69,380 | | | | 41,131 | |
| Workers’ profit sharing payable | | | 21,014 | | | | 14,862 | |
| Taxes payable | | | 13,671 | | | | 9,635 | |
| Remuneration and similar benefits payable | | | 12,929 | | | | 9,298 | |
| Loan payable to Newmont | | | 11,906 | | | | - | |
| Provision for environmental liabilities | | | 6,085 | | | | 6,210 | |
| Provision for labor contingencies | | | 3,765 | | | | 4,454 | |
| Royalties payable to the Peruvian State | | | 3,511 | | | | 2,307 | |
| Voluntary mining contribution payable | | | 1,903 | | | | 1,437 | |
| Provision for community contingencies | | | 1,442 | | | | 1,211 | |
| Dividends payable | | | 925 | | | | 781 | |
| Interest payable | | | - | | | | 502 | |
| Other liabilities | | | 8,094 | | | | 9,865 | |
| | | | 232,052 | | | | 186,054 | |
| Less - Long-term portion | | | | | | | | |
| Provision for closure of mining units and exploration projects (b) | | | 66,496 | | | | 69,219 | |
| Stock appreciation rights (c) | | | 49,170 | | | | 26,955 | |
| Provision for environmental liabilities | | | 545 | | | | 5,834 | |
| Other | | | 3 | | | | 45 | |
| | | | 116,214 | | | | 102,053 | |
| Current portion | | | 115,838 | | | | 84,001 | |
Notes to the consolidated financial statements (continued)
| | | Provision for closure of mining units and exploration projects – |
The table below presents the movement of the provision for closure of mining units and exploration projects:
| | | US$(000) | |
| | | | |
| Balance as of January 1, 2009 | | | 83,485 | |
| | | | | |
| Disbursements | | | (10,385 | ) |
| Additions in new operating areas | | | 6,422 | |
| Accretion expense | | | 4,839 | |
| Balance as of December 31,2009 | | | 84,361 | |
| | | | | |
| Disbursements | | | (11,967 | ) |
| Changes in estimates | | | (1,359 | ) |
| Accretion expense | | | 6,392 | |
| Balance as of December 31, 2010 | | | 77,427 | |
The provision for closure of mining units and exploration projects represents the present value of the closure costs that are expected to be incurred between the years 2011 and 2024. Estimates of the costs for closure of mining units are based on studies prepared by independent advisers that meet the environmental regulations in effect. The provision for closure of mining units and exploration projects corresponds mostly to activities that must be carried out for restoring the mining units and areas affected by operation and production activities. The principal works to be performed correspond to earthworks, re-vegetation efforts and dismantling of the plants. Closure budgets are reviewed regularly to take into account any significant change in the studies conducted. Nevertheless, the closure costs of mining units will depend on the market prices for the closure works required, which would reflect future economic conditions. Also, the time when the disbursements will be made depends on the useful life of the mine, which will be based on future metals prices.
As of December 31, 2010, the future value of the provision for closure of mining units and exploration projects was US$109,131,000, which has been discounted using the annual risk-free rate of 5.98 per cent, resulting in an updated liability of US$77,427,000 (US$126,232,000, which was discounted using the annual risk-free rate of 6.29 per cent, resulting in an updated liability of US$84,361,000 as of December 31, 2009). The Company believes that this liability is sufficient to meet the current environmental protection laws approved by the Ministry of Energy and Mines.
To date the Ministry of Energy and Mines has approved the following mine closure plans:
Notes to the consolidated financial statements (continued)
| | | | |
| Mallay project | | R.D. N°208-2008-MEM-AAM | | September 2, 2008 |
| Ishihuinca mining unit | | R.D. N°303-2008-MEM-AAM | | December 5, 2008 |
| Administrative Economic Unit Ancoyo accumulation | | R.D. N°309-2008-MEM-AAM | | December 12, 2008 |
| Angelica project | | R.D. N°058-2009-MEM-AAM | | March 12, 2009 |
| Recuperada mining unit | | R.D. N°116-2009-MEM-AAM | | May 14, 2009 |
| Uchucchacua mining unit | | R.D. N°123-2009-MEM-AAM | | May 21, 2009 |
| Administrative Economic Unit Chaquelle | | R.D. N°177-2009-MEM-AAM | | June 23, 2009 |
| Julcani mining unit | | R.D. N°233-2009-MEM-AAM | | July 31, 2009 |
| Administrative Economic Unit Esperanza 2001 | | R.D. N°291-2009-MEM-AAM | | September 23, 2009 |
| Pozo Rico project | | R.D. N°381-2009-MEM-DGAAM | | November 26, 2009 |
| Orcopampa mining unit | | R.D. N°398-2009-MEM-DGAAM | | December 2, 2009 |
| Antapite mining unit | | R.D. N°418-2009-MEM-DGAAM | | December 18, 2009 |
| Poracota mining unit | | R.D.N°774-2010-MEM-AAM | | August 16, 2010 |
The Company has constituted letters of credit to Ministry of Energy and Mines for US$25,058,000 to secure mine closure plans for the above-mentioned units.
(c) Stock Appreciation Rights
Senior executives of the Company are granted share appreciation rights, which can only be settled in cash, if the executive is working for the Company at each program’s settlement date. These programs are mainly structured in a ten-year term, allocated in several programs with progressive maturities. The settlement of each program is determined based on the variation of the market prices at the maturity date as compared to the price at the date of the grant.
The table below presents the principal assumptions used by the Company to estimate the fair value as of December 31, 2010 and 2009:
| | | | | | | |
| | | | | | | |
| Historical volatility | | | 50.46 | % | | | 51.24 | % |
| Risk-free interest rate | | | 0.00 | % | | | 0.00 | % |
| Dividend yield | | | 1.20 | % | | | 1.22 | % |
| Period covered by the program | | 10 years | | | 10 years | |
| Market value of the shares at closing | | US$ | 48.96 | | | US$ | 33.47 | |
The table below presents the movement of the shares subject to the compensation program for the years 2010 and 2009:
Notes to the consolidated financial statements (continued)
| | | | |
| | | | | | | |
| | | | | | | |
| Opening balance | | | 4,846,000 | | | | 4,425,600 | |
| Granted during the year | | | 790,000 | | | | 785,000 | |
| Settled during the year | | | (289,950 | ) | | | (364,600 | ) |
| Ending balance | | | 5,346,050 | | | | 4,846,000 | |
The payment obligation of shares subject to the compensation program per year are as follows: 569,034 in 2011; 664,138 in 2012; 935,372 in 2013; 1,055,730 in 2014; 1,139,728 in 2015 and 982,048 thereafter.
The average real prices for the programs granted and expiring in the months of January 2010 and 2009 were US$36.93 and US$15.74 per share, respectively.
The table below presents the movement of the stock appreciation rights for the years 2010 and 2009:
| | | | | | | |
| | | US$(000) | | | US$(000) | |
| | | | | | | |
| Opening balance | | | 41,131 | | | | 14,024 | |
| Provision of the year | | | 39,988 | | | | 27,500 | |
| Valuation of shares granted during the year | | | 2,437 | | | | 1,573 | |
| Payments made during the year | | | (14,176 | ) | | | (1,966 | ) |
| | | | 69,380 | | | | 41,131 | |
| Less - non-current portion | | | 49,170 | | | | 26,955 | |
| Current portion | | | 20,210 | | | | 14,176 | |
Notes to the consolidated financial statements (continued)
| | (a) | The table below presents the detail of financials obligations as of December 31, 2010 and 2009: |
| | | | | | | | | | | | | | | | | |
| | | US$ (000) | | | | | | | | | | US$(000) | | | US$(000) | |
| Empresa de Generacion Huanza S.A. | | | | | | | | | | | | | | | | |
| Leasing (b) | | 119,000 | | Joint surety | | Three-month Libor plus 4.00% (4.303% as of December 31, 2010) | | | Quarterly maturities to during 7 years from capitalization | | | 54,127 | | | 865 | |
| Consorcio Energetico de Huancavelica S.A. | | | | | | | | | | | | | | | | |
| BBVA Banco Continental | | 9,000 | | None | | Three-month Libor plus 1.25% (1.553% as of December 31, 2010) | | | Quarterly maturities of US$500,000 from March 2009 to June 2012 | | | 3,000 | | | 5,000 | |
| Contacto Corredores de Seguros S.A. | | | | | | | | | | | | | | | | |
| Mitsui – Masa Leasing | | 38 | | None | | 7.14 | % | | Monthly maturities from May 2009 to May 2011 | | | 20 | | | 34 | |
| | | 57 | | None | | 8.71 | % | | Monthly maturities from March 2008 to February 2011 | | | 5 | | | 21 | |
| Compañia de Minas Buenaventura S.A.A. | | | | | | | | | | | | | | | | |
| Syndicated Loan Agreement (d) | | 450,000 | | None | | Three-month Libor plus 2.25% (2.56% as of December 31, 2009) | | | Quarterly maturities of US$14,667,000 from August 2008 to May 2013. Prepayments may be made on each quarterly due date | | | - | | | 205,333 | |
| Banco de Credito del Peru | | 75,000 | | Secured interest of US$13,748,000 | | Three-month Libor plus 0.85% (1.10% as of December 31, 2009) | | | Quarterly maturities of US$9,375,000 from September 2008 to June 2010 | | | - | | | 18,750 | |
| Sociedad Minera El Brocal S.A. | | | | | | | | | | | | | | | | |
| Banco de Credito del Peru | | 376 | | Goods leased | | 5.34 | % | | - | | | - | | | 4 | |
| | | | | | | | | | | | | 57,152 | | | 230,007 | |
| Non-current portion (c) | | | | | | | | | | | | (55,134 | ) | | (150,555 | ) |
| Current portion | | | | | | | | | | | | 2,018 | | | 79,452 | |
Notes to the consolidated financial statements (continued)
| | (b) | On December 2, 2009 Banco de Credito, hereinafter "the Bank", executed a financial lease agreement with Consorcio Energético Huancavelica S.A., Empresa de Generación Huanza S.A. and Compañía de Minas Buenaventura S.A.A. for construction of a hydroelectric power station. This financial lease for US$119,000,000 is in favor of Empresa de Generación Huanza S.A., hereinafter "the Lessee". This agreement stipulates that Buenaventura commits itself as a joint surety of the Lessee, guaranteeing fulfillment of the pecuniary obligations in favor of the bank. To December 31, 2010, the total disbursement by the bank amounted to US$54,127,000 (US$865,000 as of December 31, 2009). |
| | (c) | The financial obligations held by Buenaventura and its subsidiaries matures as follows: |
| Year | | | | | | |
| | | US$(000) | | | US$(000) | |
| | | | | | | |
| 2011 | | | 2,018 | | | | 79,452 | |
| 2012 | | | 1,200 | | | | 61,548 | |
| 2013 | | | 600 | | | | 59,674 | |
| 2014 thereafter | | | 53,334 | | | | 29,333 | |
| | | | 57,152 | | | | 230,007 | |
| Current portion | | | (2,018 | ) | | | (79,452 | ) |
| | | | | | | | | |
| Non current portion | | | 55,134 | | | | 150,555 | |
| | (d) | In the first quarter of 2010, the Company paid the syndicated loan amounting to US$205,333,000 as of December 31, 2009. During 2010, the Company paid for commissions US$616,000. |
The interest expense related to the Syndicated Loan Agreement amounts to US$857,000 to the payment loan day (US$7,778,000 for the period ended December 31, 2009).
The working capital loan with Banco de Crédito del Perú was paid according to quarterly maturities amounting to US$9,375,000. The last payment was made in June 2010.
Notes to the consolidated financial statements (continued)
| 15. | Shareholders’ equity, net |
The Company’s share capital is stated in Nuevos Soles (S/.) and consists of common shares with voting rights that represent 100 percent of the Company’s issued capital. The table below presents the components of the capital stock as of December 31, 2010 and 2009:
| | | | | | | |
| | | | | | | | | | | | | | | | | | | |
| | | | | | S/(000) | | | US$(000) | | | | | | S/(000) | | | US$(000) | |
| | | | | | | | | | | | | | | | | | | | | |
| Common shares | | | 274,889,924 | | | | 2,748,899 | | | | 813,162 | | | | 274,889,924 | | | | 2,748,899 | | | | 813,162 | |
| Treasury shares | | | (21,130,260 | ) | | | (211,303 | ) | | | (62,622 | ) | | | (21,130,260 | ) | | | (211,303 | ) | | | (62,622 | ) |
| | | | 253,759,664 | | | | 2,537,596 | | | | 750,540 | | | | 253,759,664 | | | | 2,537,596 | | | | 750,540 | |
The market value of common shares amounted to US$48.43 as of December 31, 2010 (US$33.34 as of December 31, 2009) and it presented a trading frequency of 80 per cent (95 per cent as of December 31, 2009).
Investment shares do not have voting rights or participate in shareholders’ meetings but do participate in the distribution of dividends. The table below presents the components of investment shares as of December 31, 2010 and 2009:
| | | | | | | |
| | | | | | | | | | | | | | | | | | | |
| | | | | | S/(000) | | | US$(000) | | | | | | S/(000) | | | US$(000) | |
| | | | | | | | | | | | | | | | | | | | | |
| Investment shares | | | 744,640 | | | | 7,446 | | | | 2,161 | | | | 744,640 | | | | 7,446 | | | | 2,161 | |
| Treasury investment shares | | | (61,976 | ) | | | (619 | ) | | | (142 | ) | | | (61,976 | ) | | | (619 | ) | | | (142 | ) |
| | | | 682,664 | | | | 6,827 | | | | 2,019 | | | | 682,664 | | | | 6,827 | | | | 2,019 | |
The market value of investment shares amounted to US$37.39 as of December 31, 2010 (US$29.43 as of December 31, 2009) and it presented a trading frequency of 25 per cent (30 per cent as of December 31, 2009).
Notes to the consolidated financial statements (continued)
The Peruvian Corporations Law (Ley General de Sociedades) requires that a minimum of ten percent of the distributable earnings for each period, after deducting the income tax, be transferred to a legal reserve until the latter is equal to 20 percent of the capital stock. This legal reserve can be used to offset losses or may be capitalized, with the obligation, in both cases, to replenish it.
For the year ending December 31, 2010, Buenaventura increased its legal reserve by the amount of US$50,243,000, which has been set aside from the net profit corresponding to the period 2010 for the legal reserve is equal to 20 percent of capital stock (US$59,356,000 and US$15,328,000 for the year ending December 31, 2009 and 2008, respectively).
| | (d) | Dividends declared and paid - |
The table below presents the dividends declared and paid in 2010, 2009 and 2008:
| Meeting | | | | Dividends Declared and paid | | | | |
| | | | | US$ | | | US$ | |
| | | | | | | | | |
| 2010 Dividends | | | | | | | | |
| Mandatory Annual Shareholders’ Meeting | | March 26 | | | 82,690,000 | | | | 0.30 | |
| Board of Directors’ Meeting | | October 28 | | | 44,101,000 | | | | 0.16 | |
| Less – Dividends of treasury shares | | | | | (9,748,000 | ) | | | | |
| | | | | | | | | | | |
| | | | | | 117,043,000 | | | | | |
| | | | | | | | | | | |
| 2009 Dividends | | | | | | | | | | |
| Mandatory Annual Shareholders’ Meeting | | March 27 | | | 5,513,000 | | | | 0.02 | |
| Board of Directors’ Meeting | | October 29 | | | 38,589,000 | | | | 0.14 | |
| Less – Dividends of treasury shares | | | | | (3,391,000 | ) | | | | |
| | | | | | | | | | | |
| | | | | | 40,711,000 | | | | | |
| | | | | | | | | | | |
| 2008 Dividends | | | | | | | | | | |
| Mandatory Annual Shareholders’ Meeting | | March 27 | | | 30,320,000 | | | | 0.11 | |
| Board of Directors’ Meeting | | October 30 | | | 24,806,000 | | | | 0.09 | |
| Less – Dividends of treasury shares | | | | | (4,238,000 | ) | | | | |
| | | | | | | | | | | |
| | | | | | 50,888,000 | | | | | |
Notes to the consolidated financial statements (continued)
As of December 31, 2010, 2009 and 2008, the effect of declared and paid dividends by subsidiaries to minority shareholders, is made up as follows:
| | | | | | | | | | |
| | | US$(000) | | | US$(000) | | | US$(000) | |
| | | | | | | | | | |
| Sociedad Minera El Brocal S.A.A. | | | 19,383 | | | | 11,514 | | | | 23,338 | |
| S.M.R.L. Chaupiloma Dos de Cajamarca | | | 3,688 | | | | 14,051 | | | | 13,937 | |
| Inversiones Colquijirca S.A. | | | 16,105 | | | | 2,191 | | | | - | |
| | | | | | | | | | | | | |
| | | | 39,176 | | | | 27,756 | | | | 37,275 | |
| | (e) | Capitalization of retained earnings - |
The Mandatory annual Shareholders’ Meeting held March 27, 2008, agreed to increase the nominal (par) value of the common and investment shares from S/4.00 to S/20.00 each. For this, the Meeting approved the following capitalizations:
| | (i) | Capitalization of results from exposure to inflation as of December 31, 2004 accumulated of capital stock and investment shares amounting to S/96,858,000 (US$28,230,000). As of capitalization date, results from exposure to inflation was included as part of capital stock. As a consequence, no additional movement was required in the consolidated statement of changes in shareholders’ equity. |
| | (ii) | Capitalization of retained earnings amounting to S/2,108,219,000 (US$626,421,000) increased the capital stock and investment shares accounts by US$576,610,000 (net of treasury stock for US$48,160,000) and US$1,546,000 (net of treasury stock for US$105,000), respectively. |
As a result of the capitalizations, the nominal value of treasury shares (common and investment) increased from US$14,499,000 to US$62,764,000 (an increase of US$48,265,000). In compliance with accounting standards, the Company shows the nominal value of treasury shares net from the capital stock, as a consequence the increase in the nominal value of the treasury shares was offset withthe same value of increase of capital stock increasing the additional capital account of consolidated statement of changes in shareholders’ equity.
In the General Shareholders Meeting held March 27, 2008, shareholders agreed that once the capitalization of retained earnings described in paragraph (e) were registered in Peru’s public registries, these would be split by changing the nominal value of common and investment shares from S/20.00 to S/10.00.
The Board of Directors in its session of July 1, 2008 agreed on the schedule to carry out this splitting of Company shares. According to this schedule, the date of registration of the operation was July 18, 2008. As from July 21, 2008 the Lima Stock Exchange traded the new number of shares effective as of such date (254,442,328 shares made up by 253,759,664 common shares and 682,664 investment shares) and as from July 23, 2008 the New York Stock Exchange did the same.
Notes to the consolidated financial statements (continued)
| | (a) | The Company and its subsidiaries are subject to the Peruvian tax system. As of December 31, 2010, the income tax rate was 30 percent on taxable income. |
Legal entities and individuals not domiciled in Peru are subject to an additional tax of 4.1 percent on the dividends received.
Through Law N°29666, published on February 20, 2011, it is restored the 16 percent of Value Added Tax being applicable from March 1, 2011.
Additionally, through Law N°29667, published in the same date, the Financial Transactions Tax is reduced to 0.005%, being applicable from April 1, 2011.
| | (b) | During the four years following the year of filing tax returns the tax authorities have the power to review and, as applicable, correct the income tax computed by the Company. The Income Tax and Value Added Tax (“IGV” by its Spanish acronym) returns for the following years are open to review by Tax Authorities: |
| | Years open to review by Tax Authorities |
| | | |
| Compañía de Minas Buenaventura S.A.A. | | 2007, 2008, 2009 y 2010 |
| Buenaventura Ingenieros S.A. | | 2006, 2007, 2009 y 2010 |
| Compañía de Exploraciones, Desarrollo e Inversiones Mineras S.A.C. – CEDIMIN | | 2006, 2007, 2008, 2009 y 2010 |
| Compañía Minera Condesa S.A. | | 2006, 2007, 2008, 2009 y 2010 |
| Compañía Minera Colquirrumi S.A. | | 2006, 2007, 2008, 2009 y 2010 |
| Consorcio Energético de Huancavelica S.A. | | 2007, 2008, 2009 y 2010 |
| Contacto Corredores de Seguros S.A. | | 2006, 2007, 2008, 2009 y 2010 |
| Inversiones Colquijirca S.A. | | 2006, 2007, 2008, 2009 y 2010 |
| Sociedad Minera El Brocal S.A.A. | | 2006, 2007, 2008, 2009 y 2010 |
| Minas Conga S.R.L. | | 2006, 2007 y 2008 |
| S.M.R.L. Chaupiloma Dos de Cajamarca | | 2006, 2007, 2008, 2009 y 2010 |
| Minera La Zanja S.R.L. | | 2006, 2007, 2008, 2009 y 2010 |
Due to the possible interpretations that the Tax Authorities may give to legislation in effect, it is not possible to determine whether or not any of the tax audits that will perform will result in increased liabilities for the Company. For that reason any tax or surcharge that could arise from future tax audits would be applied to the income of the period in which it is determined. In Management's opinion, any possible additional payment of taxes in the entities mentioned before would not have a material effect on the consolidated financial statements as of December 31, 2010 and 2009.
Buenaventura -
Buenaventura’s Income Tax Returns for the 2000 and 2003 periods have been audited by Tax Authorities. As a result of the aforesaid, the Tax Administration has issued assessments denying recognition of Buenaventura’s tax-loss carryforwards reported as of December 31, 2000 and 2003 amounting to S/.67,263,000 (equivalent to US$23,946,000) and S/.18,224,000 (equivalent to US$6,488,000). The Tax Authorities considered certain non-taxable income – dividends – as taxable income for the purpose of determining tax-loss carryforwards. To date, the Tax Administration has issued a resolution, on the claim petition filed by the Company, to ratify the assesment made in the audit. In the opinion of Management and its legal advisors, this interpretation has no legal basis, and Buenaventura could obtain a favorable result in the tax claim procedure initiated against the above-mentioned assessments.
Notes to the consolidated financial statements (continued)
During the year 2007, the Tax Administration audited Buenaventura’s Income Tax Returns for the 2004 and 2005 periods. As a consequence of the aforementioned, the Tax Administration issued assessments denying recognition of some tax deductions by S/.77,921,000 (equivalent to US$27,740,000) in 2004 and S/.119,785,000 (equivalent to US$42,643,000) in 2005. The Tax Authorities considered as taxable income the reversal of the provision related to commercial contracts, which in that time were not deducted to calculate Income Tax. To date, the Tax Administration has issued a resolution, on the claim petition filed by the Company, to ratify the assessment made in the audit. In the opinion of Management and its legal advisors, this interpretation has no legal basis, and Buenaventura could obtain a favourable result in the tax claim procedure initiated against the above-mentioned assessments. Consequently, the Company had not recorded any liabilities related to these claims as of December 31, 2010.
During the year 2010, the Tax Administration audited Buenaventura’s Income Tax and Value Added Tax for the 2006 period. As a consequence of the aforementioned, the Tax Administration does not recognize some tax deductions made by the Company amounting to S/.184,452,000 (equivalent to US$65,665,000. The Tax Authorities considered as taxable income the reversal of the provision related to commercial contracts. Also, the Tax Administration considered the explosive delivery to mining contractors as a transaction subject to Income Tax and Value Added Tax amounting to S/.12,275,000 (equivalent to US$4,370,000). In the opinion of Management and its legal advisors, this interpretation has no legal basis, and Buenaventura could obtain a favourable result in the tax claim procedure initiated against the above-mentioned assessments.
The Income Tax and Value Added Tax declared by the Company for the years 2007 to 2010 are subject to be audited by tax authorities. Due to the possible interpretations that the Tax Authorities may give to legislation in effect, it is not possible to determine whether or not any of the tax audits that will perform will result in increased liabilities for the Company. For that reason any tax or surcharge that could arise from future tax audits would be applied to the income of the period in which it is determined. However, in Management's opinion, any possible additional payment of taxes would not have a material effect on the consolidated financial statements as of December 31, 2010 and 2009.
Cedimin -
Cedimin´s Income Tax Return for the 2002 period has been audited by the Tax Administration. As a result, the Tax Administration has issued assessments modifying the tax-loss carryforward declared by Cedimin. The principal objection is against having considered Cedimin´s loss of S/.22,041,000 (US$7,847,000) on the sale of Minera Huallanca S.A.C. and Minera Yanaquihua S.A. shares as non-deductible. In the opinion of Cedimin´s Management, this interpretation has no legal basis, for which reason Cedimin would obtain a favorable result in the tax claim procedure initiated against the above-indicated assessment.
Condesa -
Condesa´s Income Tax Returns for the 2000, 2001 and 2003 periods have been audited by the Tax Administration. As a result of the aforesaid, the Tax Administration has issued assessments reducing the tax-loss carryforwards from previous years, which Condesa had reported in those periods, by S/.31,338,000 (US$11,156,000). For these periods, the principal objection is against having considered non-taxable income (dividends) as taxable for purposes of determining the tax-loss carryforward. In the opinion of Condesa´s Management, this interpretation has no legal basis, for which reason Condesa would obtain a favorable result in the tax claim procedure initiated against the above-mentioned assessments.
Sociedad Minera El Brocal S.A.A. -
In 2006 the Tax Administration audited the Sociedad Minera El Brocal S.A.A. (El Brocal) Income tax return for the 2003 period, determining objections of S/.2,292,000 to net income for the period for under-reporting sales by the improper deduction of freight and insurance on mineral exports. These objections were not accepted by El Brocal and are currently being protested. In the opinion of El Brocal’s Management, this interpretation has no merit, for which reason there would be a favorable result in the proceeding indicated. Notes to the consolidated financial statements (continued)
Buenaventura has decided to recognize a deferred income tax asset insofar as there it is more likely than not that the tax-loss carryforward can be used to offset future net income.
See note 24.
| | (c) | As of December 31, 2010 and 2009, the tax-loss carryforward determined by Buenaventura amounts to approximately S/.1,133,541,000 and S/.1,489,376,000, respectively (equivalent to US$403,371,000 and US$525,232,000). In November 2010, a restated income tax return was submitted for 2009 which increased the tax-loss carryforward. As allowed by the Income Tax Law, Buenaventura has chosen a system for offsetting this loss with an annual cap equivalent to 50 percent of net future taxable income, until exhausting this amount. The amount of the tax-loss carryforward is subject to the results of the audits mentioned in the previous paragraph (b). |
Buenaventura has decided to recognize a deferred income tax asset insofar as there it is more likely than not that the tax-loss carryforward can be used to offset future taxable net income. See note 24.
| | (d) | For purposes of determining the Income Tax and Value Added Tax (“IGV” by its Spanish acronym), the transfer prices for transactions with related companies and companies domiciled in territories with little or no taxation must be substantiated with documentation and information on the valuation methods used and the criteria considered for their determination. Based on analysis of the Company's operations, the Company’s Management and its legal advisers believe that, as a result of the application of these standards, no material contingencies will arise for the Company as of December 31, 2010 and 2009. |
The Company’s revenues are mostly from sales of gold and precious metals in the form of concentrates, including silver-lead, silver-gold, zinc and lead-gold-copper concentrates and ounces of gold. The table below presents the net sales to customers by geographic region and product type:
| | | | | | | | | | |
| | | US$(000) | | | US$(000) | | | US$(000) | |
| Net sales by geographic region | | | | | | | | | |
| America | | | 504,648 | | | | 344,065 | | | | 173,898 | |
| Peru | | | 479,126 | | | | 376,483 | | | | 356,309 | |
| Europa | | | 35,937 | | | | 44,588 | | | | 153,701 | |
| Asia | | | 7,944 | | | | 30,627 | | | | 41,197 | |
| Oceania | | | - | | | | 9,806 | | | | 7,725 | |
| Africa | | | - | | | | - | | | | 14,080 | |
| | | | 1,027,655 | | | | 805,569 | | | | 746,910 | |
| Services rendered | | | | | | | | | | | | |
| Peru | | | 20,230 | | | | 12,182 | | | | 19,693 | |
| Asia | | | - | | | | 1,606 | | | | - | |
| | | | 1,047,885 | | | | 819,357 | | | | 766,603 | |
Notes to the consolidated financial statements (continued)
| | | | | | | | | | |
| | | US$(000) | | | US$(000) | | | US$(000) | |
| Net sales by product | | | | | | | | | |
| Gold | | | 578,582 | | | | 413,989 | | | | 360,682 | |
| Silver | | | 274,624 | | | | 235,023 | | | | 238,679 | |
| Copper | | | 129,444 | | | | 42,988 | | | | 44,604 | |
| Zinc | | | 92,884 | | | | 112,695 | | | | 148,270 | |
| Lead | | | 46,913 | | | | 56,498 | | | | 68,439 | |
| Coal | | | - | | | | - | | | | 111 | |
| | | | 1,122,447 | | | | 861,193 | | | | 860,785 | |
| Deductions | | | (112,254 | ) | | | (93,590 | ) | | | (132,187 | ) |
| Prior-period settlements | | | (4,922 | ) | | | 3,762 | | | | 6,638 | |
| | | | 1,005,271 | | | | 771,365 | | | | 735,236 | |
| Embedded derivatives from sale of concentrate (b) | | | 13,870 | | | | 6,152 | | | | (102 | ) |
| Adjustment to open provisional liquidations | | | 6,630 | | | | 47 | | | | (9,627 | ) |
| Hedging operations | | | 1,884 | | | | 28,005 | | | | 21,403 | |
| | | | 1,027,655 | | | | 805,569 | | | | 746,910 | |
| Sale of services, power and other minor items | | | 20,230 | | | | 13,788 | | | | 19,693 | |
| | | | 1,047,885 | | | | 819,357 | | | | 766,603 | |
| | (a) | In January and February of 2008, Buenaventura revised the sales contracts with other customers, to release the commitments on sales contracts to be able to sell the committed gold ounces at market prices in force between the years 2010 – 2012, in accordance with Buenaventura’s gold availability. |
As consequence of the aforementioned, Buenaventura was released from the obligation to sell 922,000 ounces of gold at fixed prices, varying between US$345 and US$451 per ounces of gold; thus, they will be sold at the market price in force on the date of the physical delivery of the gold committed.
For these transactions, Buenaventura has made a payment of US$517,143,000 (US$82,592,000 in January 2008 and US$434,551,000 in February 2008, respectively) and recorded a decrease in the liability corresponding to the executory gold delivery contracts liability amounting to US$102,008,000 with credit to income of the period. The resulting net loss of US$415,135,000 is presented in the “Net loss from release of commitments in sales contracts” caption in the consolidated statements of income for the period ended December 31, 2008.
As of December 31, 2010, Buenaventura has been released of commitments (related to quantity, date and price) on all the sales contracts entered into for the sale of ounces of gold.
The Company’s sales based on a provisional sales price contain an embedded derivative, which is required to be bifurcated from the host contract. The host contract is the sale of the metals contained in the concentrates at the current spot LME price. The embedded derivative, which does not qualify for hedge accounting, is marked-to-market through earnings each period. At December 31, 2009 and 2008, the Company had consolidated embedded derivatives based on forward prices for the expected settlement dates. Final prices on these sales will be established over the next several months pursuant to terms of sales contracts. The impact of fluctuations in the forward prices used for these derivatives through the settlement date is reflected as derivative gains and losses in revenues.
Concentrate sales include adjustments to the provisional sale value resulting from changes in the fair value of the embedded derivative. These adjustments resulted in higher sales by US$13,870,000, US$6,152,000 and lower sales by US$102,000 in 2010, 2009 and 2008, respectively. See notes 17 and 27(c). Notes to the consolidated financial statements (continued)
| | (c) | Concentration of sales - |
In 2010, the three most important customers represented 48%, 10% and 10% of total sales (46%, 16% y 13% of total sales in 2009). As of December 31, 2010, 34% of the accounts receivable are related to these customers (75% as of December 31, 2009). The Company's sales of gold and concentrates are delivered to investment banks and national and international well known companies. See note 28(b). Some have sales contracts that guarantee supplying them the production from the Company’s mines at prices that are based on market quotations.
| 18. | Costs of sales, without considering depreciation and amortization |
The table below presents the components of this caption:
| | | | | | | | | | |
| | | US$(000) | | | US$(000) | | | US$(000) | |
| | | | | | | | | | |
| Opening balance of products in process, note 7(a) | | | 15,788 | | | | 11,562 | | | | 12,333 | |
| Opening balance of finished goods, note 7(a) | | | 7,581 | | | | 9,529 | | | | 7,875 | |
| Services provided by third parties | | | 167,510 | | | | 98,939 | | | | 48,622 | |
| Consumption of materials and supplies | | | 86,946 | | | | 66,022 | | | | 64,401 | |
| Direct labor | | | 69,929 | | | | 53,926 | | | | 48,264 | |
| Electricity and water | | | 20,890 | | | | 9,479 | | | | 13,988 | |
| Transport | | | 10,538 | | | | 11,059 | | | | 9,364 | |
| Other production expenses | | | 43,894 | | | | 42,746 | | | | 67,254 | |
| Provision for impairment of finished gods, note 7(c) | | | 1,648 | | | | 449 | | | | 794 | |
| Final balance of products in process, note 7(a) | | | (77,188 | ) | | | (15,788 | ) | | | (11,562 | ) |
| Final balance of finished goods, note 7(a) | | | (6,696 | ) | | | (7,581 | ) | | | (9,529 | ) |
| | | | 340,840 | | | | 280,342 | | | | 251,804 | |
| 19. | Exploration in operating units |
The table below presents the components of this caption:
| | | | | | | | | | |
| | | US$(000) | | | US$(000) | | | US$(000) | |
| Exploration expenses | | | | | | | | | |
| Orcopampa | | | 28,719 | | | | 20,352 | | | | 13,493 | |
| Poracota | | | 18,390 | | | | 13,267 | | | | 5,892 | |
| Uchucchacua | | | 16,683 | | | | 14,958 | | | | 11,518 | |
| Shila - Paula | | | 10,688 | | | | 6,538 | | | | 8,261 | |
Notes to the consolidated financial statements (continued)
| | | | | | | | | | |
| | | US$(000) | | | US$(000) | | | US$(000) | |
| Antapite | | | 6,346 | | | | 7,437 | | | | 9,684 | |
| Recuperada | | | 5,246 | | | | 1,979 | | | | 2,963 | |
| Julcani | | | 5,105 | | | | 3,791 | | | | 3,808 | |
| La Zanja | | | 264 | | | | - | | | | - | |
| Ishihuinca | | | - | | | | 305 | | | | 1,384 | |
| Tajo Norte | | | - | | | | 22 | | | | - | |
| | | | 91,441 | | | | 68,649 | | | | 57,003 | |
| 20. | Administrative expense |
The table below presents the components of this caption:
| | | | | | | | | | |
| | | US$(000) | | | US$(000) | | | US$(000) | |
| | | | | | | | | | |
| Stock appreciation rights | | | 42,425 | | | | 29,073 | | | | (7,678 | ) |
| Personnel expense | | | 21,783 | | | | 20,587 | | | | 18,117 | |
| Miscellaneous expenses | | | 13,718 | | | | 9,165 | | | | 8,647 | |
| Professional fees | | | 6,490 | | | | 6,816 | | | | 6,201 | |
| Allowance for doubtful accounts of other accounts receivable | | | 2,000 | | | | 1,780 | | | | - | |
| Board of Directors’ participation | | | 2,384 | | | | 2,064 | | | | 2,091 | |
| Rent | | | 1,248 | | | | 187 | | | | 258 | |
| Insurance | | | 856 | | | | 777 | | | | 738 | |
| Supplies | | | 665 | | | | 938 | | | | 597 | |
| Maintenance | | | 534 | | | | 298 | | | | 303 | |
| Amortization of other assets | | | 503 | | | | 261 | | | | 261 | |
| Allowance for doubtful accounts of accounts receivable, note 6(b) | | | - | | | | 16,814 | | | | 5,372 | |
| | | | 92,606 | | | | 88,760 | | | | 34,907 | |
The table below presents the components of this caption:
| | | | | | | | | | |
| | | US$(000) | | | US$(000) | | | US$(000) | |
| | | | | | | | | | |
| Sindicato Minero de Orcopampa S.A., note 30(b) | | | 27,572 | | | | 21,133 | | | | 18,275 | |
| Peruvian State | | | 24,613 | | | | 18,452 | | | | 16,883 | |
| Minera El Futuro de Ica S.R.L., note 31(b) | | | 85 | | | | 61 | | | | 536 | |
| | | | 52,270 | | | | 39,646 | | | | 35,694 | |
Notes to the consolidated financial statements (continued)
| 22. | Exploration in non-operating areas |
The expenses incurred in 2010, 2009 and 2008 by exploration area are presented below:
| | | | | | | | | | |
| | | US$(000) | | | US$(000) | | | US$(000) | |
| Outside of mining units | | | | | | | | | |
| Mallay | | | 9,251 | | | | 7,305 | | | | 8,002 | |
| San Gregorio | | | 2,837 | | | | - | | | | - | |
| Colquemayo | | | 2,759 | | | | 487 | | | | - | |
| Consolidado de Hualgayoc | | | 2,126 | | | | 602 | | | | - | |
| San Pedro Sur | | | 1,940 | | | | - | | | | - | |
| Breapampa | | | 1,486 | | | | 3,238 | | | | 3,259 | |
| Trapiche | | | 1,321 | | | | 3,058 | | | | 2,701 | |
| Terciopelo | | | 1,230 | | | | 528 | | | | - | |
| Chaje | | | 1,042 | | | | - | | | | - | |
| Anamaray | | | 828 | | | | 1,050 | | | | 1,051 | |
| Chiptaj - Chancas | | | 784 | | | | - | | | | - | |
| Taguas | | | 540 | | | | - | | | | - | |
| El Faique | | | 477 | | | | 374 | | | | 401 | |
| Regional Puno | | | 319 | | | | - | | | | - | |
| Yumpag | | | 312 | | | | - | | | | - | |
| Puquo Garpo | | | 210 | | | | - | | | | - | |
| Pachuca Norte - México | | | 203 | | | | - | | | | - | |
| Pisqahuanca | | | 177 | | | | - | | | | - | |
| Soras Poracota | | | 109 | | | | 158 | | | | 2,426 | |
| Chucapaca | | | 106 | | | | 705 | | | | 1,786 | |
| Chacua (San Francisco) | | | 105 | | | | - | | | | 2,118 | |
| Focus | | | 104 | | | | - | | | | - | |
| Argentina | | | 93 | | | | 600 | | | | 1,923 | |
| Hatun Orco | | | 69 | | | | 131 | | | | 2,109 | |
| Aguas Calientes | | | 45 | | | | 189 | | | | - | |
| El Milagro | | | 10 | | | | 164 | | | | 2,936 | |
| Los Pircos-Cirato | | | 1 | | | | 124 | | | | 191 | |
| Ccaccapaqui | | | 1 | | | | 87 | | | | - | |
| Tantahuatay | | | - | | | | 1,796 | | | | 2,109 | |
| La Llave | | | - | | | | 276 | | | | 2,591 | |
| Jaguar- Brazil | | | - | | | | 207 | | | | - | |
| Pampa Andino | | | - | | | | 5 | | | | 67 | |
| La Zanja | | | - | | | | 4,538 | | | | 8,446 | |
| Other minor projects less than US$50,000 | | | 4,203 | | | | 662 | | | | 2,448 | |
| | | | 32,688 | | | | 26,284 | | | | 44,564 | |
| In mining units | | | | | | | | | | | | |
| Marcapunta | | | 3,417 | | | | 3,504 | | | | 10,667 | |
| Others | | | - | | | | 217 | | | | - | |
| | | | 36,105 | | | | 30,005 | | | | 55,231 | |
Notes to the consolidated financial statements (continued)
The table below presents the components of this caption:
| | | | | | | | | | |
| | | US$(000) | | | US$(000) | | | US$(000) | |
| | | | | | | | | | |
| Other income | | | | | | | | | |
| Sale of supplies and services to third parties | | | 10,462 | | | | 2,935 | | | | 3,873 | |
| Change in accounting estimates | | | 6,127 | | | | 1,922 | | | | 1,887 | |
| Sales of goods and services to associates | | | 1,814 | | | | | | | | | |
| Reversal of the provision for impairment of inventory, note 7(c) | | | 339 | | | | 360 | | | | 16 | |
| Net gain on sale of property, plant and equipment | | | 220 | | | | 332 | | | | 971 | |
| Sale of rights | | | 218 | | | | 1,005 | | | | 1,720 | |
| Income from insurance proceeds | | | 25 | | | | 353 | | | | 11 | |
| Recovery of Minera Yanaquihua S.R.L. doubtful account | | | - | | | | - | | | | 1,320 | |
| Other, net | | | 5,502 | | | | 1,238 | | | | - | |
| | | | 24,707 | | | | 8,145 | | | | 9,798 | |
| | | | | | | | | | | | | |
| Other expenses | | | | | | | | | | | | |
| Services provided by third parties | | | (4,281 | ) | | | (2,109 | ) | | | (320 | ) |
| Adjustment of provision for closure of mining units and exploration projects | | | (2,349 | ) | | | (455 | ) | | | (10,129 | ) |
| Voluntary mining contribution | | | (1,938 | ) | | | (1,530 | ) | | | (1,700 | ) |
| Provision for contingencies (labor, environmental and community) | | | (892 | ) | | | (889 | ) | | | (1,338 | ) |
| Late and additional taxes | | | (732 | ) | | | (249 | ) | | | (711 | ) |
| Provision for impairment of spare parts and supplies, note 7(c) | | | (716 | ) | | | (360 | ) | | | (16 | ) |
| Administrative services | | | (667 | ) | | | - | | | | (1,140 | ) |
| Other, net | | | (2,217 | ) | | | - | | | | (3,734 | ) |
| | | | (13,792 | ) | | | (5,592 | ) | | | (19,088 | ) |
| | | | | | | | | | | | | |
| Net | | | 10,915 | | | | 2,553 | | | | (9,290 | ) |
Notes to the consolidated financial statements (continued)
| 24. | Income tax and workers´ profit sharing |
| | (a) | The Company and its subsidiaries recognize the effects of timing differences between the accounting basis and the tax basis. The table below presents the components of this caption, according to the items that give rise to them: |
| | | | | | Credit (debit) to the consolidated statement of income | | | | | | Credit (debit) to the consolidated statement of income | | | Credit (debit) to the consolidated changes in shareholders´equity | | | | |
| | | | | | | | | | | | | | | | | | | | | | | | | | | | |
| | | US$(000) | | | US$(000) | | | US$(000) | | | US$(000) | | | US$(000) | | | US$(000) | | | US$(000) | | | US$(000) | | | US$(000) | |
| | | | | | | | | | | | | | | | | | | | | | | | | | | | |
| Deferred asset included in results | | | | | | | | | | | | | | | | | | | | | | | | | | | |
| Tax - loss carryforward | | | 194,958 | | | | (2,548 | ) | | | (738 | ) | | | 191,672 | | | | (33,267 | ) | | | (9,641 | ) | | | - | | | | - | | | | 148,764 | |
| Stock appreciation rights provision | | | 4,993 | | | | 7,458 | | | | 2,161 | | | | 14,612 | | | | 7,847 | | | | 2,240 | | | | - | | | | - | | | | 24,699 | |
| Difference in depreciation and amortization rates | | | 10,946 | | | | 4,369 | | | | 1,266 | | | | 16,581 | | | | 6,107 | | | | 1,772 | | | | - | | | | - | | | | 24,460 | |
| Provision for closure of mining units, net | | | 14,818 | | | | 2,109 | | | | 611 | | | | 17,538 | | | | (561 | ) | | | (163 | ) | | | - | | | | - | | | | 16,814 | |
| Loss from translation into U.S. dollars | | | 1,119 | | | | 3,722 | | | | 1,079 | | | | 5,920 | | | | 776 | | | | 219 | | | | - | | | | - | | | | 6,915 | |
| Environmental liability for Mina Santa Barbara | | | 1,773 | | | | - | | | | - | | | | 1,773 | | | | - | | | | - | | | | - | | | | - | | | | 1,773 | |
| Embedded derivative from sale of concentrates | | | 2,955 | | | | (2,291 | ) | | | (664 | ) | | | - | | | | 1,140 | | | | 331 | | | | - | | | | - | | | | 1,471 | |
Notes to the consolidated financial statements (continued)
| | | | | | Credit (debit) to the consolidated statement of income | | | | | | Credit (debit) to the consolidated statement of income | | | Credit (debit) to the consolidated changes in shareholders´equity | | | | |
| | | | | | | | | | | | | | | | | | | | | | | | | | | | |
| | | US$(000) | | | US$(000) | | | US$(000) | | | US$(000) | | | US$(000) | | | US$(000) | | | US$(000) | | | US$(000) | | | US$(000) | |
| | | | | | | | | | | | | | | | | | | | | | | | | | | | |
| Impairment of property, plant, machinery and equipment, and development costs | | | 4,513 | | | | 979 | | | | 284 | | | | 5,776 | | | | (4,478 | ) | | | (1,298 | ) | | | - | | | | - | | | | - | |
| Other | | | 8,923 | | | | 166 | | | | 47 | | | | 9,136 | | | | (280 | ) | | | (101 | ) | | | - | | | | - | | | | 8,755 | |
| | | | 244,998 | | | | 13,964 | | | | 4,046 | | | | 263,008 | | | | (22,716 | ) | | | (6,641 | ) | | | - | | | | - | | | | 233,651 | |
| Less – Allowance for deferred asset recoverability | | | (2,850 | ) | | | (557 | ) | | | (159 | ) | | | (3,566 | ) | | | 353 | | | | 101 | | | | - | | | | - | | | | (3,112 | ) |
| | | | 242,148 | | | | 13,407 | | | | 3,887 | | | | 259,442 | | | | (22,363 | ) | | | (6,540 | ) | | | - | | | | - | | | | 230,539 | |
| | | | | | | | | | | | | | | | | | | | | | | | | | | | | | | | | | | | | |
| Deferred asset included in retained earnings | | | | | | | | | | | | | | | | | | | | | | | | | | | | | | | | | | | | |
| Derivative financial instruments | | | - | | | | 1,888 | | | | 547 | | | | 2,435 | | | | - | | | | - | | | | 4,540 | | | | 1,280 | | | | 8,255 | |
| Deferred asset, net | | | 242,148 | | | | 15,295 | | | | 4,434 | | | | 261,877 | | | | (22,363 | ) | | | (6,540 | ) | | | 4,540 | | | | 1,280 | | | | 238,794 | |
| | | | | | | | | | | | | | | | | | | | | | | | | | | | | | | | | | | | | |
| Deferred liability included in results | | | | | | | | | | | | | | | | | | | | | | | | | | | | | | | | | | | | |
| Differences in amortization rates for development costs | | | (5,878 | ) | | | (7,772 | ) | | | (2,255 | ) | | | (15,905 | ) | | | (4,365 | ) | | | (1,267 | ) | | | - | | | | - | | | | (21,537 | ) |
| Embedded derivative from sale of concentrates | | | - | | | | (1,335 | ) | | | (387 | ) | | | (1,722 | ) | | | (1,210 | ) | | | (350 | ) | | | - | | | | - | | | | (3,282 | ) |
| Other | | | (639 | ) | | | 84 | | | | 24 | | | | (531 | ) | | | 193 | | | | 56 | | | | - | | | | - | | | | (282 | ) |
| | | | (6,517 | ) | | | (9,023 | ) | | | (2,618 | ) | | | (18,158 | ) | | | (5,382 | ) | | | (1,561 | ) | | | - | | | | - | | | | (25,101 | ) |
Notes to the consolidated financial statements (continued)
| | | | | | Credit (debit) to the consolidated statement of income | | | | | | Credit (debit) to the consolidated statement of income | | | Credit (debit) to the consolidated changes in shareholders´equity | | | | |
| | | | | | | | | | | | | | | | | | | | | | | | | | | | |
| | | US$(000) | | | US$(000) | | | US$(000) | | | US$(000) | | | US$(000) | | | US$(000) | | | US$(000) | | | US$(000) | | | US$(000) | |
| | | | | | | | | | | | | | | | | | | | | | | | | | | | |
| Less deferred liability included in retained earnings | | | | | | | | | | | | | | | | | | | | | | | | | | | |
| Derivative financial instruments | | | (26,464 | ) | | | 20,517 | | | | 5,947 | | | | - | | | | - | | | | - | | | | - | | | | - | | | | - | |
| Deferred liability, net | | | (32,981 | ) | | | 11,494 | | | | 3,329 | | | | (18,158 | ) | | | (5,382 | ) | | | (1,561 | ) | | | - | | | | - | | | | (25,101 | ) |
Buenaventura has not recognized deferred income tax and workers’ profit sharing liabilities in relation to the excess of the accounting basis over the tax basis of investments in shares due to the following:
| | - | In the case of the Cerro Verde associate, Buenaventura has not recognized a deferred income tax and workers’ profit sharing asset for US$322,726,000 as of December 31, 2010 (deferred asset of US$61,547,000 as of December 31, 2009) given that Buenaventura Management, even though only exercising significant influence over this associate, has the intention and capacity to hold this investment until its copper reserves are depleted; in this sense, Management believes that the timing differences will be reversed by means of dividends to be received in the future that, according to the tax rules in effect in Peru, are not subject to the income tax paid by the Company. There is no legal or contractual obligation that would require the Company’s Management to sell its investment in this associate (which event would result in a taxable capital gain based on current tax law). |
| | - | In the case of the Yanacocha associate, Buenaventura has not recognized a deferred income tax and workers’ profit sharing liability for US$307,618,000 as of December 31,2010 (deferred liability of US$217,450,000 as of December 31, 2009) given that Buenaventura Management, even though only exercising significant influence over this associate, has the intention and capacity to hold this investment until its gold and silver reserves are depleted; in this sense, Management believes that the timing differences will be reversed by means of dividends to be received in the future that, according to the tax rules in effect in Peru, are not subject to the income tax paid by the Company. There is no legal or contractual obligation that would require the Company’s Management to sell its investment in this associate (which event would result in a taxable capital gain based on current tax law). |
| | (b) | The table below presents the current and deferred portions of the provisions for Income Tax and workers’ profit sharing shown in the consolidated statement of income for the years 2010, 2009, and 2008: |
| | | | | | | | | | |
| | | US$(000) | | | US$(000) | | | US$(000) | |
| | | | | | | | | | |
| Income (expense) for income tax purposes | | | | | | | | | |
| Current | | | | | | | | | |
| Compañía de Minas Buenaventura S.A.A. | | | (38,003 | ) | | | (24,366 | ) | | | - | |
| Inversiones Colquijirca S.A. | | | (27,765 | ) | | | (23,950 | ) | | | (23,548 | ) |
| S.M.R.L. Chaupiloma Dos de Cajamarca | | | (16,411 | ) | | | (18,247 | ) | | | (14,303 | ) |
| Minera La Zanja S.A. | | | (3,793 | ) | | | - | | | | - | |
| Consorcio Energético de Huancavelica S.A. | | | (1,364 | ) | | | (932 | ) | | | (1,550 | ) |
| Compañía de Exploraciones, Desarrollo e Inversiones Mineras S.A.C - Cedimin S.A.C. | | | - | | | | (37 | ) | | | (3,933 | ) |
| Other | | | (1,246 | ) | | | (1,192 | ) | | | (1,080 | ) |
| | | | (88,582 | ) | | | (68,724 | ) | | | (44,414 | ) |
| | | | | | | | | | |
| | | US$(000) | | | US$(000) | | | US$(000) | |
| | | | | | | | | | |
| Deferred | | | | | | | | | |
| Compañía de Minas Buenaventura S.A.A. | | | (23,647 | ) | | | (4,338 | ) | | | 74,252 | |
| Minera La Zanja S.A. | | | (4,268 | ) | | | 9,169 | | | | - | |
| Inversiones Colquijirca S.A. | | | (477 | ) | | | (1,138 | ) | | | (3,234 | ) |
| Other | | | 647 | | | | 691 | | | | 41 | |
| | | | (27,745 | ) | | | 4,384 | | | | 71,059 | |
| Total | | | (116,327 | ) | | | (64,340 | ) | | | 26,645 | |
| | | | | | | | | | |
| | | US$(000) | | | US$(000) | | | US$(000) | |
| | | | | | | | | | |
| Workers’ profit sharing income (expense) (i) | | | | | | | | | |
| Current | | | | | | | | | |
| Compañía de Minas Buenaventura S.A.A. : | | | | | | | | | |
| Current – legal | | | (11,015 | ) | | | (6,497 | ) | | | - | |
| Current - without effect of unusual item | | | - | | | | - | | | | (7,503 | ) |
| Inversiones Colquijirca S.A. | | | (8,048 | ) | | | (6,943 | ) | | | (6,826 | ) |
| Minera La Zanja S.A. | | | (1,100 | ) | | | - | | | | - | |
| Consorcio Energético de Huancavelica S.A. | | | (239 | ) | | | (238 | ) | | | (272 | ) |
| Compañía de Exploraciones, Desarrollo e Inversiones Mineras S.A.C - Cedimin S.A.C. | | | - | | | | (10 | ) | | | (1,143 | ) |
| Other | | | (221 | ) | | | (173 | ) | | | (150 | ) |
| | | | (20,623 | ) | | | (13,861 | ) | | | (15,894 | ) |
| | | | | | | | | | | | | |
| Deferred | | | | | | | | | | | | |
| Compañía de Minas Buenaventura S.A.A. | | | (6,854 | ) | | | (1,258 | ) | | | 21,523 | |
| Minera La Zanja S.A. | | | (1,237 | ) | | | 2,658 | | | | - | |
| Inversiones Colquijirca S.A. | | | (138 | ) | | | (330 | ) | | | (937 | ) |
| Other | | | 128 | | | | 199 | | | | 33 | |
| | | | (8,101 | ) | | | 1,269 | | | | 20,619 | |
| Total | | | (28,724 | ) | | | (12,592 | ) | | | 4,725 | |
| | (i) | According to Peruvian law, mining companies with more than 20 employees must have a workers’ profit sharing plan equivalent to 8 percent of annual taxable income. As of December 31, 2010, 2009, and 2008, S.M.R.L. Chaupiloma Dos de Cajamarca and Compañía Minera Condesa S.A. had less than 20 employees. To December 31, 2008, Contacto Corredores de Seguros S.A. had less than 20 employees. |
| | (c) | During the years 2010, 2009, and 2008, the provisions posted for workers’ profit sharing and Income Tax in the Statement of Income were determined as follows: |
| | | | | | | | | | |
| | | US$(000) | | | US$(000) | | | US$(000) | |
| | | | | | | | | | |
| Income before workers’ profit sharing and income tax | | | 872,424 | | | | 733,540 | | | | 171,958 | |
| Effect of share in associated companies for the equity method | | | (428,742 | ) | | | (451,306 | ) | | | (340,929 | ) |
| | | | 443,682 | | | | 282,234 | | | | (168,971 | ) |
| | | | | | | | | | | | | |
| Combined legal rate | | | 35.60 | % | | | 35.60 | % | | | 35.60 | % |
| Workers’ profit sharing and income tax expense according to combined legal rate | | | 157,951 | | | | 100,475 | | | | (60,154 | ) |
| Current workers’ profit sharing – without effect of unusual item | | | - | | | | - | | | | 7,503 | |
| | | | | | | | | | | | | |
| Permanent differences: | | | | | | | | | | | | |
| Expenses not deductible for tax purposes | | | 2,329 | | | | 2,120 | | | | 3,062 | |
| Reversal of the provision for impairment of long-lived assets | | | (5,775 | ) | | | - | | | | - | |
| Recovery of exploration expenses in Tantahuatay project | | | (5,345 | ) | | | - | | | | - | |
| Effect of translation to U.S. dollars | | | (2,737 | ) | | | (10,244 | ) | | | 6,186 | |
| Adjustment of provision for closure of mining units and exploration projects | | | (1,205 | ) | | | - | | | | - | |
| Recognition of deferred asset for Minera La Zanja S.R.L. tax - loss carryforward | | | - | | | | (11,826 | ) | | | - | |
| Financial income from tax-exempt interest | | | (450 | ) | | | (828 | ) | | | 3,609 | |
| Other permanent items | | | 283 | | | | (2,765 | ) | | | 8,424 | |
| Total | | | 145,051 | | | | 76,932 | | | | (31,370 | ) |
| | | | | | | | | | | | | |
| Income (expense) for income tax purposes | | | (116,327 | ) | | | (64,340 | ) | | | 26,645 | |
| Income (expense) for workers’ profit sharing | | | (28,724 | ) | | | (12,592 | ) | | | 4,725 | |
| Total | | | (145,051 | ) | | | (76,932 | ) | | | 31,370 | |
| 25. | Basic and diluted earnings per share |
Basic earnings per share are computed by dividing net earnings for the period by the weighted average number of shares outstanding during the year.
Computation of the earnings per share as of December 31, 2010, 2009 and 2008 is presented below:
| | | | | | | | | | |
| | | | | | | | | | |
| Net income attributable to Buenaventura (numerator) – US$ | | | 662,934,000 | | | | 593,561,000 | | | | 153,283,000 | |
| Common shares, note 15(a) | | | 253,759,664 | | | | 253,759,664 | | | | 253,759,664 | |
| Investment shares, note 15(b) | | | 682,664 | | | | 682,664 | | | | 682,664 | |
| Shares (denominator) | | | 254,442,328 | | | | 254,442,328 | | | | 254,442,328 | |
| Basic and diluted earnings per share attributable to Buenaventura – US$ | | | 2.61 | | | | 2.33 | | | | 0.60 | |
Basic and diluted earnings per share are the same given that there are no instruments that have a dilutive effect on earnings.
| 26. | Disclosure of information on segments |
International Financial Reporting Standard (IFRS) 8 – “Operating Segments” requires that corporations present financial information taking into account the information reported that the chief operating decision maker uses internally for evaluating the performance of operating segments and allocating resources to those segments (a “through the eyes of management” approach). The Company´s chief operating decision maker uses the business and geographical segment of the Company to make operating decisions. A business segment is a component that provides a single product or service or a group of related products and services and that is subject to risks and returns that are different from those of other business segments. A geographic segment is a component that provides products and services within a particular economic ambit and that is subject to risks and returns that are different from those of components operating in other economic ambits.
| 27. | Derivative Financial Instruments |
Derivative contracts -
Buenaventura
As of December 31, 2010 and 2009, Buenaventura had no derivative contracts.
El Brocal -
El Brocal has a policy of carrying out transactions to hedge metals prices using anyone of the derivative instruments existing in the financial market for up to a term of 3 years, for a total of no more than 25% of the estimated metal content of its annual production each year. The El Brocal Board of Directors meeting of February 23, 2007 named a Hedging Committee to be responsible for approving all hedging transactions, after their contracting and/or execution. El Brocal maintains lines of credit without margin with brokers on the London Metals Exchange (LME).
| | (a) | Mineral quote hedging operations |
Hedging contracts: Collar options at zero cost -
During 2010, El Brocal subscribed price-hedging option contracts at zero cost to insure future flows originating from its sales for the years 2011 and 2012. The critical terms of hedging transactions have been negotiated with the brokers so as to agree with the terms negotiated in the related commercial contracts.
These hedging options establish a maximum and a minimum price. When the average price for the quotation period is above the maximum price established, the purchase option in favor of the counterpart is activated, generating a payment to El Brocal of the difference between the two prices. On the other hand, when the average price for the quotation period is below the minimum price established, the sale option in favor of El Brocal is activated, resulting in receipt of the difference between the two prices.
Cash-hedging operations as of December 31, 2010 were:
| Metal | | Monthly average amount FMT | | | Total Amount FMT | | | Fixed average price per FMT | | Periods | | Fair value | |
| | | | | | | | | US$ | | | | US$(000) | |
| | | | | | | | | | | | | | |
| Zero cost collar-option contracts | | | | | | | |
| Copper | | | 150 | | | | 1,650 | | | | 5,500 - 7,063 | | February 2011 – December 2011 | | | (4,249 | ) |
| Copper | | | 150 | | | | 1,650 | | | | 6,000 - 7,050 | | February 2011 – December 2011 | | | (4,236 | ) |
| Copper | | | 150 | | | | 1,650 | | | | 5,500 - 8,020 | | February 2011 – December 2011 | | | (2,993 | ) |
| Copper | | | 193 | | | | 2,126 | | | | 7,500 - 8,750 | | February 2011 – December 2011 | | | (2,413 | ) |
| Copper | | | 250 | | | | 3,000 | | | | 7,500 - 8,415 | | January 2012 – December 2012 | | | (3,456 | ) |
| Copper | | | 193 | | | | 2,126 | | | | 7,500 - 8,760 | | February 2011 – December 2011 | | | (2,400 | ) |
| Copper | | | 250 | | | | 3,000 | | | | 7,500 - 8,425 | | January 2012 – December 2012 | | | (3,441 | ) |
| | | | | | | | | | | | | | | | | | |
| Fair value of hedging instruments | | | | | | | | | (23,188 | ) |
| | | | | | | | | | | | | | | | | | |
| Less – non-current portion | | | | | | | | | (6,897 | ) |
| | | | | | | | | | | | | | | | | | |
| Current portion | | | | | | | | | (16,291 | ) |
The fair value of the derivative hedging instruments held as of December 31, 2009 was US$6,843,000, which is presented in the "Derivative financial instruments" caption of the consolidated balance sheet (with a US$1,468,000 and US$5,375,000 current and non-current composition, respectively).
The cash-flow hedges for sales to be made in coming years have been assessed by El Brocal Management as highly effective. Effectiveness has been measured by the flow-compensation method, since El Brocal Management considers it as the method that best reflects the risk management objective with regard to coverage.
As of December 31, 2010, El Brocal, as a result of the hedging transactions settled as of December 31, 2010, held payable accounts of US$227,000 from London Metal Exchange brokers, which is presented in “Other accounts payable” caption (US$1,703,000 to December 31, 2009 were presented in the "Other accounts receivable" caption of the consolidated balance sheet).
| | (b) | The change in the "Unrealized results, gain (loss)” equity account is as follows: |
| | | Hedge derivative financial instruments | | | Income tax and workers’ profit sharing | | | Net change in unrealized gain (loss) on hedging derivative financial instruments | |
| | | US$(000) | | | US$(000) | | | US$(000) | |
| | | | | | | | | | |
| Balance as of January 1, 2008 | | | 7,964 | | | | (2,835 | ) | | | 5,129 | |
| | | | | | | | | | | | | |
| Gains from hedging transactions settled during the period | | | (21,403 | ) | | | 7,619 | | | | (13,784 | ) |
| Unrealised gain on hedge derivative financial instruments | | | 87,776 | | | | (31,248 | ) | | | 56,528 | |
| Total change in derivative financial instruments for hedging | | | 66,373 | | | | (23,629 | ) | | | 42,744 | |
| | | | | | | | | | | | | |
| Balance as of January 1, 2009 | | | 74,337 | | | | (26,464 | ) | | | 47,873 | |
| | | | | | | | | | | | | |
| Gains from hedging transactions settled during the period | | | (28,005 | ) | | | 9,970 | | | | (18,035 | ) |
| Unrealized losses on hedge derivative financial instruments | | | (53,175 | ) | | | 18,930 | | | | (34,245 | ) |
| Total change in derivative financial instruments for hedging | | | (81,180 | ) | | | 28,900 | | | | (52,280 | ) |
| | | | | | | | | | | | | |
| Balance as of December 31, 2009 | | | (6,843 | ) | | | 2,436 | | | | (4,407 | ) |
| | | | | | | | | | | | | |
| Gains from hedging transactions settled during the period | | | (1,884 | ) | | | 671 | | | | (1,213 | ) |
| Unrealized losses on hedge derivative financial instruments | | | (14,461 | ) | | | 5,148 | | | | (9,313 | ) |
| Total change in derivative financial instruments for hedging | | | (16,345 | ) | | | 5,819 | | | | (10,526 | ) |
| | | | | | | | | | | | | |
| Balance as of December 31, 2010 | | | (23,188 | ) | | | 8,255 | | | | (14,933 | ) |
| | (c) | Embedded derivatives from changes in the provisional prices of commercial settlements - |
As of December 31, 2010 and 2009, the fair value of the embedded derivatives contained in commercial contracts amounted to a gain of US$13,645,000 (a gain of US$9,222,000 posted by El Brocal and a gain of US$4,423,000 posted by Buenaventura) and US$4,546,000 (a gain of US$3,582,000 posted by El Brocal and a loss of US$292,000 posted by Buenaventura), respectively. The related liabilities are presented in the “Embedded derivatives from sale of concentrate" caption of the consolidated balance sheet.
As of December 31, 2010 and 2009 the changes in the fair value of embedded derivatives yielded gains amounting to US$13,870,000 and US$6,152,000, respectively, and a loss amounting to US$102,000 in the year 2008 were present in the “Net sales” caption of the consolidated statement of income. The futures quotes for the dates on which it is expected to settle the open positions as of December 31, 2010 and 2009 are taken from publications of the London Metals Exchange.
Embedded derivatives from concentrate sales held by Buenaventura and El Brocal as of December 31, 2010:
| | | | | | | | | | | |
| | | | | | | | | | | | | |
| | | | | | | US$ | | | US$ | | | US$(000) | |
| | | | | | | | | | | | | | |
| Gold | | 4,831 DMT | | January - April | | | 1,389.30 | | | | 1,384.00 | | | | 41 | |
| Silver | | 1,296,646 DMT | | January - April | | | 20.30 – 29.18 | | | | 29.49 – 29.52 | | | | 3,641 | |
| Lead | | 2,172 DMT | | January - April | | | 2,169.14 – 2,400.26 | | | | 2,594.00 – 2,614.00 | | | | 666 | |
| Zinc | | 6,768 DMT | | January - April | | | 2,252.86 – 2,296.55 | | | | 2,396.25 – 2,435.00 | | | | 197 | |
| Copper | | 40,826 DMT | | January – June | | | 7,652.58 – 9,167.00 | | | | 9,508.00 – 9,705.00 | | | | 9,008 | |
| Gold | | 16,278 Onces | | January | | | 1,382.92 | | | | 1,388.41 | | | | 92 | |
| | | | | | | | | | | | | | | | | |
| | | | | | | | | | | | | | | | 13,645 | |
Embedded derivatives from concentrate sales held by Buenaventura and El Brocal as of December 31, 2009:
| | | | | | | | | | | |
| Metal | | Amount | | Maturity 2010 | | Provisional | | | Future | | | Fair value | |
| | | | | | | US$ | | | US$ | | | US$(000) | |
| | | | | | | | | | | | | | |
| Gold | | 8,535 DMT | | December - January | | | 1,108.67 - 1,189.28 | | | | 1,133.42 - 1,150.70 | | | | 69 | |
| Silver | | 2,432,066 DMT | | September - January | | | 15.90 - 19.07 | | | | 16.39 - 18.68 | | | | (955 | ) |
| Copper | | 17,211 DMT | | January - February | | | 5,216.00 - 6,982.00 | | | | 7,399.00 - 7,389.00 | | | | 3,195 | |
| Lead | | 17,568 DMT | | September - February | | | 1,900.00 - 2,329.00 | | | | 2,204.55 - 2,505.50 | | | | 145 | |
| Zinc | | 42,012 DMT | | November - February | | | 1,880.08 - 2,376.00 | | | | 2,193.38 - 2,574.00 | | | | 1,771 | |
| Gold | | 40,375 Onces | | January | | | 1,105.50 - 1,192.50 | | | | 1,134.50 - 1,138.34 | | | | 321 | |
| | | | | | | | | | | | | | | | 4,546 | |
| | (d) | Fair value hierarchy - |
The Company uses the following hierarchy for determining and disclosing the fair value of financial instruments which are measured at fair value by valuation technique:
Level 1: Quoted (unadjusted) prices in active markets for identical assets or liabilities.
Level 2: Other techniques for which all inputs which have a significant effect on the recorded fair value are observable, either directly or indirectly.
Level 3: Techniques which use inputs which have a significant effect on the recorded fair value that are not based on observable market data.
The financial instruments measured at fair value used by the Company, use level 1 valuation techniques in the periods ended as of December 31, 2010 and 2009.
There has been no transfer between fair value levels during the reporting period.
| 28. | Financial – risk management objectives and policies |
The Company’s activities expose it to a variety of financial risks. The principal risks that could adversely affect the Company’s financial assets and liabilities and its future cash flows are exchange-rate risk, risk of changes in the prices of minerals, interest-rate risk, liquidity risk and credit risk. The Company’s risk management program deals with minimizing the potential adverse effects on its financial performance.
The Company’s Management is expert as to the conditions existing in the market and, based on its knowledge and experience, reviews and decides on policies to manage each of these risks, which are described in the following paragraphs. This also includes analyses seeking to reveal sensitivity in the Company’s financial instruments to changes in market variables and show the impact on the consolidated statement of income or equity, if necessary. Financial instruments that are affected by market risks include accounts receivable, accounts payable, embedded derivatives and derivative financial instruments.
The Board of Directors reviews and approves policies to manage each of these risks, which are described below:
Market risk is the risk that the fair value of the future cash flows from financial instruments should fluctuate as a result of changes in market prices. The market risks that apply to the Company include three types of risk: exchange-rate risk, risk of changes in the prices of minerals and interest-rate risk. Financial instruments affected by market risks include loans, deposits and derivative financial instruments.
The sensitivity analysis in this section relates to the positions as of December 31, 2010 and 2009, and has been prepared considering that the proportion of financial instruments in foreign currency remains constant.
The Company bills the sale of its products (locally and abroad) mostly in United States dollars. Exchange-rate risk arises mainly from deposits and other accounts payable in Nuevos Soles. The Company mitigates the effect of exposure to exchange-rate risk by carrying out almost all of its transactions in its functional currency. Management retains smaller amounts in Nuevos Soles in order to cover its needs (taxes and compensation) in this currency.
As of December 31, 2010, the Company had posted a net loss of US$750,000 from exchange differences (in the 2009 period, a net gain of US$1,457,000 from exchange differences) from the translation of balances in Nuevos Soles to the functional currency.
A table showing the effect on results of a reasonable change in foreign-currency exchange rates is presented below, with all other variables kept constant:
| | | Exchange-rate increase / decrease | | | Effect on earnings before income tax and workers’ profit sharing | |
| | | | | | US$(000) | |
| | | | | | | |
| 2010 | | | | | | |
| Exchange rate | | | +10 | % | | | 3,032 | |
| Exchange rate | | | -10 | % | | | (3,617 | ) |
| | | | | | | | | |
| 2009 | | | | | | | | |
| Exchange rate | | | +10 | % | | | 3,683 | |
| Exchange rate | | | -10 | % | | | (4,502 | ) |
| | (a.2) | Risk of changes in the prices of minerals |
The international price of minerals has an important impact on the results of the Company’s operations. These prices are affected by changes in the global economy. Minerals producers are generally incapable of directly influencing this price; however, the Company’s profitability is influenced by means of Management’s effective control over its costs and the efficiency of its operations.
Buenaventura –
The Company does not have financial hedging instruments for managing this risk.
Embedded derivatives
The Company allocates a provisional sales value to the sales that are subject to future settlement pursuant to the commercial contracts signed with its customers. Exposure to changes in the price of metals generates an embedded derivative that must be separated from the commercial contract. At each period’s closing, the value of provisional sales is adjusted in accordance with the estimated price for the quotation period stipulated in the contract. Adjustment of the provisional sale value is posted as an increase or decrease in net sales. See note 2.3(q).
The estimated change in the price for sales pending final settlement, which is disclosed within the net sales of embedded derivative to December 31, 2010, amounted to US$13,645,000 (Note 27(c)). The estimate corresponding to such settlements as closed in January 2011 were reduced by 4 percent with respect to the actual value settled. In the case of settlements that still maintain their provisional value; their estimate to January 2011 was reduced by 16 percent due to the drop in metals prices.
El Brocal –
In order to cover the risk resulting from a drop in the prices of metals to be marketed, El Brocal signed derivative contracts that qualify as cash-flow hedges. See note 27(a).
In order to control and follow up on hedges, El Brocal approved a hedging policy “Policy for Hedging Metals Prices”, which is carried out and enforced together with the Policy for Management of Financial Risks. Likewise, El Brocal has a Hedging Committee with the objective of mitigating the risks associated with the changes and volatility taking place in metals prices.
With respect to future prices as of December 31, 2010 and 2009 and the fair value as of those dates of the position in derivative financial instruments for hedging contracted by El Brocal, a sensitivity analysis of the position’s fair value is presented considering a change on the order of 10 per cent for the relevant prices, while all other variables remain constant:
| | | Effect on unrealised gain (loss) on hedge derivative financial instruments, net | |
| | | US$(000) | |
| 2010 | | | |
| Increase of 10 percent in future quotes | | | |
| Hedges in effect for 2011 | | | (7,785 | ) |
| Hedges in effect for 2012 | | | (4,950 | ) |
| | | | (12,735 | ) |
| Decrease of 10 percent in future quotes | | | | |
| Hedges in effect for 2011 | | | 7,190 | |
| Hedges in effect for 2012 | | | 4,875 | |
| | | | 12,065 | |
| | | | | |
| 2009 | | | | |
| Increase of 10 percent in future quotes | | | | |
| Hedges in effect for 2010 | | | (3,580 | ) |
| Hedges in effect for 2011 | | | (2,201 | ) |
| | | | (5,781 | ) |
| Decrease of 10 percent in future quotes | | | | |
| Hedges in effect for 2010 | | | 3,059 | |
| Hedges in effect for 2011 | | | 2,439 | |
| | | | 5,498 | |
The Company is exposure to interest-rate risk change specially by its long-term financial obligations.
In the case, the interest-rate subject to the long-term financial obligation changes on the order of 10 per cent for LIBOR rate as of December 31. 2010 and 2009, respectively, the effect on income before workers´ profit sharing and income tax had not been significant. The effect is shown above:
| | | Increase / decrease in Libor rate | | | | |
| | | (percentage points) | | | US$(000) | |
| | | | | | | |
| 2010 | | | | | | |
| Interest rate | | | + 10.0 | | | | 1 | |
| Interest rate | | | - 10.0 | | | | (1 | ) |
| | | | | | | | | |
| 2009 | | | | | | | | |
| Interest rate | | | + 10.0 | | | | 84 | |
| Interest rate | | | - 10.0 | | | | (84 | ) |
The Company’s credit risk arises from the inability of debtors to be able to fulfill their obligations, to the extent to which they are overdue. Therefore, the Company deposits its excess funds in leading financial institutions, establishes conservative credit policies and constantly evaluates conditions of the market in which it is involved, for which it uses risk-rating reports for commercial and credit transactions.
There is concentration-of-credit risk when there are changes in the economic, industrial or geographic factors that equally affect the counterparts related to the Company. The Company’s gold and concentrate sales are made to investment banks and companies of recognized national and international prestige. Transactions are executed with various counterparts with credit solvency, which mitigates any significant concentration of credit.
Trade accounts receivable are denominated in United States dollars; their due dates are the dates of emission on the proof of payment, which amounts becomes cash in days following their due dates. The Company’s sales of the Company are made to domestic and foreign customers; as of December 31, 2010 it had a portfolio of 11 customers (9 customers as of December 31, 2009). See concentration of sales in note 17(c). The Company performs an assessment on those debts whose collection is estimated as a variable to determine the allowance for doubtful accounts.
Credit risk is limited to the book value of the financial assets as of the consolidated balance sheet date. These assets consist mainly of cash and cash equivalents, trade accounts receivable, other accounts receivable and derivative financial instruments.
Collections in January 2011 amounted to US$123,086,000, which represents 76% percent of the balances receivable as of December 31, 2010.
Prudent management of liquidity risk implies maintaining sufficient cash and cash equivalents and the possibility of committing or having financing committed through an adequate number of credit sources. The Company maintains suitable levels of cash and cash equivalents; its shareholders also include companies with economic backing and it has sufficient credit capacity to allow it to have access to lines of credit in leading financial entities.
The Company continually monitors its liquidity reserves based on cash flow projections.
An analysis of the Company’s financial liabilities classified according to their aging is presented below, considering the period from their due date to the consolidated balance sheet date:
| | | | | | | | | | | | | | | | |
| | | US$(000) | | | US$(000) | | | US$(000) | | | US$(000) | | | US$(000) | |
| | | | | | | | | | | | | | | | |
| As of December 31, 2010 | | | | | | | | | | | | | | | |
| Trade accounts payable | | | 91,374 | | | | - | | | | - | | | | - | | | | 91,374 | |
| Provision for mine closure and exploration projects | | | 15,912 | | | | 6,086 | | | | 16,025 | | | | 39,404 | | | | 77,427 | |
| Provision for executive compensation | | | 20,210 | | | | 7,285 | | | | 30,833 | | | | 11,052 | | | | 69,380 | |
| Long-term debt (principal and interest) | | | 2,018 | | | | 1,200 | | | | 600 | | | | 53,334 | | | | 57,152 | |
| Financial hedging instruments | | | 16,291 | | | | 6,897 | | | | - | | | | - | | | | 23,188 | |
| Other accounts payable | | | 79,718 | | | | 545 | | | | - | | | | 4,982 | | | | 85,245 | |
| | | | | | | | | | | | | | | | | | | | | |
| Total | | | 225,523 | | | | 22,013 | | | | 47,458 | | | | 108,772 | | | | 403,766 | |
| | | | | | | | | | | | | | | | | | | | | |
| As of December 31, 2009 | | | | | | | | | | | | | | | | | | | | |
| Trade accounts payable | | | 61,357 | | | | - | | | | - | | | | - | | | | 61,357 | |
| Provision for mine closure and exploration projects | | | 15,142 | | | | 18,911 | | | | 27,334 | | | | 22,974 | | | | 84,361 | |
| Provision for executive compensation | | | 14,175 | | | | 7,521 | | | | 16,928 | | | | 2,506 | | | | 41,130 | |
| Long-term debt (principal and interest) | | | 84,380 | | | | 64,532 | | | | 90,787 | | | | - | | | | 239,699 | |
| Financial hedging instruments | | | 1,468 | | | | 5,375 | | | | - | | | | - | | | | 6,843 | |
| Embedded derivative from sale of concentrate | | | 292 | | | | - | | | | - | | | | - | | | | 292 | |
| Other accounts payable | | | 54,683 | | | | 5,879 | | | | - | | | | - | | | | 60,562 | |
| | | | 231,497 | | | | 102,218 | | | | 135,049 | | | | 25,480 | | | | 494,244 | |
The objective is to safeguard the Company’s capacity to continue as a going concern for the purpose of providing returns for shareholders, benefits for the stakeholders and maintaining an optimal structure that allows reducing the cost of capital.
The Company manages its capital structure and makes adjustments to confront changes in the market’s economic conditions. The Company’s policy is to finance all its short and long-term projects with its own operating resources. In order to maintain or adapt the capital structure, the Company may amend the policy for dividend payments to shareholders, return capital to its shareholders or issue new shares. There were no changes in objectives, policies or procedures during the years ending December 31, 2010 and 2009.
| 29. | Fair value of financial instruments |
Fair value is defined as the amount at which assets would be exchanged or liabilities settled between knowing and willing parties In an arm’s length transaction
When a financial instrument is traded in a liquid and active market, its price as set in a real market transaction offers the best evidence of its fair value. When no price is set in the market or the latter may not be indicative of the instrument’s fair value, the market value of another substantially similar instrument, the analysis of discounted flows or other applicable techniques may be used to determine this fair value, which is materially affected by the assumptions used. Although Management has used its best judgment in estimating the fair values of its financial instruments, any technique for making these estimates entails a certain level of inherent fragility. As a result, fair value may not be indicative of the net realizable or liquidation value of financial instruments.
The following methods and assumptions were used in order to estimate fair values:
Financial instruments whose fair value is similar to their book value –
For financial assets and liabilities such as cash, banks and time deposits, accounts receivable, accounts payable and other current liabilities that are liquid or have short-term maturities (less than three months), it is estimated that their book value is similar to their fair value.
El Brocal carries out derivative financial instrument transactions with financial entities having investment grade credit ratings. These derivative financial instruments products are estimated using market valuation techniques; the majority of contracts are derivative instruments for hedging metals prices.
The valuation technique most frequently applied includes the projections of flows using models and the calculation of present value. These models incorporate numerous variables such as the counterpart entity’s credit-risk rating and future quotes for the prices of minerals.
Financial instruments at fixed and variable rates –
The fair value of financial assets and liabilities at fixed and variable rates at amortised cost is determined by comparing the market interest rates at the time of their initial recognition to the current market rates with regard to similar financial instruments. The estimated fair value of deposits that accrue interest is determined by means of cash flows discounted using the prevailing market interest rates in the currency with similar maturities and credit risks.
Based on the foregoing, the book value of cash, banks and time deposits, trade accounts receivable, miscellaneous accounts receivable, accounts receivable from associates, trade accounts payable, other accounts payable and long-term debt approaches their fair market values.
| 30. | Commitments and contingencies |
The Company’s exploration and exploitation activities are subject to environmental protection standards.
Law No. 28090, regulates the obligations and procedures that must be met by the holders of mining activities for the preparation, filing and implementation of Mine Closure Plans, as well as the establishment of the corresponding environmental guarantees to secure fulfillment of the investments that this includes, subject to the principles of protection, preservation and recovery of the environment.
Law No. 28271 regulates environmental liabilities in mining activities. This Law has the objectives of ruling the identification of mining activity’s environmental liabilities and financing the remediation of the affected areas. According to this law, environmental liabilities refer to the impact caused to the environment by abandoned or inactive mining operations.
In compliance with the above-mentioned laws, the Company presented preliminary environmental studies and Environmental Adaptation and Management Programs (EAMP) for mining units. The Ministry of Energy and Mines has approved the EAMP presented by the Company for its mining units and exploration projects. See detail of plans approved in note 13(b).
The Company believes that the liabilities posted are sufficient to comply with the environmental regulations in effect in Peru. See detail in note 13(b).
Sindicato Minero Orcopampa S.A. -
The Company pays 10 per cent on the valued production of mineral obtained from the concessions leased by Sindicato Minero Orcopampa S.A. This concession is in force until the year 2043. See note 21.
Minera El Futuro de Ica S.R.L. -
Inminsur entered into a contract with Minera El Futuro de Ica S.R.L. to operate leased mining concessions in the department of Arequipa. The contractual terms establish that the lease is subject to payment of a royalty equivalent to seven percent of the monthly value of the sale of concentrates. As part of the merger with Buenaventura, the contract will be in force until the year 2015. See note 21.
| | (c) | Purchase option contracts and joint ventures - |
During the ordinary course of business, the Company executes contracts to undertake exploration works in third-party concessions. Under the terms of these contracts, the Company generally has an option to acquire the concession or to invest in it in order to earn a share in the holding company. In order to exercise these options, the Company must fulfill certain obligations during the contract term. The Company’s failure to perform the obligations established therein is usually grounds for termination of these contracts.
The Company may terminate these contracts at any time during their terms, generally after having performed at least the minimum obligations established. Along this line, the Company constantly analyzes the advisability of whether or not to continue with such contractual relationships.
As set forth in note 2.3(f) ,the investments made in joint ventures during the years 2010, 2009 and 2008 amounted to US$1,561,000, US$4,308,000 and US$5,286,000, respectively, and are posted in the "Exploration in non-operative areas" caption. See note 22. There are no significant commitments with regard to these contracts for the following years.
Buenaventura -
Buenaventura is a party in legal procedures that have arisen in the normal course of its activities; nevertheless, in the opinion of Buenaventura’s Management, none of these procedures, in particular or as a whole, could result in material contingencies.
Yanacocha -
Mercury spill in Choropampa -
In June 2000, a transport contractor of Yanacocha spilled approximately 151 kilograms of elemental mercury near the town of Choropampa, Peru, which is located 53 miles (85 kilometers) southwest of the Yanacocha mine. Elemental mercury is not used in Yanacocha’s operations but is a by-product of gold mining and was sold to a Lima firm for use in medical instruments and industrial applications. A comprehensive health and environmental remediation program was undertaken by Yanacocha in response to the incident. In August 2000, Yanacocha paid under protest a fine of 1,740,000 Peruvian soles (approximately $0.5 million) to the Peruvian government.
Yanacocha has entered into settlement agreements with a number of individuals impacted by the incident. As compensation for the disruption and inconvenience caused by the incident, Yanacocha entered into agreements with and provided a variety of public works in the three communities impacted by this incident. Yanacocha cannot predict the likelihood of additional expenditures related to this matter. Yanacocha and other defendants have been named in lawsuits filed by approximately 1,100 Peruvian citizens in Denver District Court for the State of Colorado. These actions seek compensatory damages based on claims associated with the elemental mercury spill incident. The parties in these cases agreed to submit these matters to binding arbitration. In October 2007, the parties to the arbitration entered a court-approved settlement agreement, resolving most of these cases.
Additional lawsuits relating to the Choropampa incident were filed against Yanacocha in the local courts of Cajamarca, Peru, in May 2002 by over 900 Peruvian citizens. A significant number of the plaintiffs in these lawsuits entered into settlement agreements with Yanacocha prior to filing such claims. In April 2008, the Peruvian Supreme Court upheld the validity of these settlement agreements, which should result in the dismissal of all claims brought by previously settled plaintiffs. Yanacocha has also entered into settlement agreements with approximately 350 additional plaintiffs. The claims asserted by approximately 212 plaintiffs remain. Yanacocha can not reasonably predict the final outcome or estimate the possible loss relating to such claims. The maximum additional expense related to these judicial claims is estimated at US$1.5 million.
Up to December 2010, Minera Yanacocha had been notified with 18 additional demands, which should result in the dismissal of all claims brought by previously settled plaintiffs.
Baños del Inca
In September 2006 the Municipality of Baños del Inca issued a declaration designating an area that includes the Carachugo Expansion and San Jose Projects as reserved and protected areas. Based on previous experience and actions taken by the Constitutional Tribunal (Peru Court of Last instance for Constitutional issues) in respect of Cerro Quilish in which it was ruled that such declaration did not affect the Company’s mining rights, the Company believes that Baños del Inca’s declaration, should not impact the Company’s legal rights to exploit these concessions.
On March 17, 2008, the Lima Court rejected a Baños del Inca Municipality request which did not recognize Lima’s Jurisdiction. The legal proceeding is currently pending resolution in Lima’s Court of First Instance.
San Pablo
On February 16, 2007 the Municipality of San Pablo issued an ordinance designating an area that includes Las Lagunas and Pozo Seco as reserved and protected areas, where the Company has mining rights. Based on previous experience and actions taken by the Constitutional Tribunal in respect of Cerro Quilish in which it was ruled that such declaration did not affect the Company’s mining rights, the Company believes that San Pablo’s declaration, should not impact the Company’s legal rights to exploit these concessions. The Company has challenged this ordinance on the grounds that, under Peruvian law, local governments lack the authority to create such areas, denying the rights granted by the Company’s mining concessions. The Court in the First Instance rejected the complaint based on formal grounds.
On November 19, 2008, Lima’s Court confirmed the ruling from the First Instance, rejecting the case based on formal ground. A constitution complaint was submitted to the Constitutional Court. On December 10, 2010, Constitutional Court repealed the resolution of the Second Civil Chamber of the Superior Court of Lima and ordered to admit the claim. The process is being returned to court to meet the provisions of the Constitution Court.
Clinica Internacional, Addeco, SGC Security
Workers of three contractors companies (Clinica Internacional, Adecco, Security SGC) have initiated judicial proceedings through which they demand their incorporation as Minera Yanacocha´s direct workers. The workers deem they are direct employees of Yanacocha with all the labor rights, arguing that they receive direct orders from Minera Yanacocha and that most of the equipment they use is provided by Yanacocha. All proceedings, which involve a total of 97 workers are pending First Instance resolution. However, since some workers withdrew the process, now only involves 85 workers. For Clinica Internacional´s workers, it has been issued court sentence, declaring no suit in the claim, but pointing out that outsourcing that kept Yanacocha would have been distorted, so that decision has been appealed and it is pending the second instance pronouncement. In the case of Adecco´s workers the first court sentence is pending. In the case of SGC Security´s workers the court sentence, declared the claims with no suit, but is awaiting the second instance sentence.
| 31. | Transactions with associates companies |
| | (a) | The Company has carried out the following transactions with its associates in the years 2010, 2009 and 2008: |
| | | | | | | | | | |
| | | US$(000) | | | US$(000) | | | US$(000) | |
| | | | | | | | | | |
| Minera Yanacocha S.R.L. | | | | | | | | | |
| Paid royalties to: | | | | | | | | | |
| S.M.R.L. Chaupiloma Dos de Cajamarca | | | 55,883 | | | | 62,150 | | | | 48,760 | |
| | | | | | | | | | | | | |
| Granted dividends to: | | | | | | | | | | | | |
| Compañia Minera Condesa S.A. | | | - | | | | 100,395 | | | | 257,536 | |
| | | | | | | | | | | | | |
| Services received by: | | | | | | | | | | | | |
| Buenaventura Ingenieros S.A (Implementation of specific work orders) | | | 1,575 | | | | 720 | | | | 1,144 | |
| Consorcio Energetico de Huancavelica S.A. (Electric power transmission) | | | 4,788 | | | | 4,788 | | | | 4,788 | |
| | | | | | | | | | | | | |
| Sociedad Minera Cerro Verde S.A.A. | | | | | | | | | | | | |
| Granted dividends to: | | | | | | | | | | | | |
| Compañia de Minas Buenaventura S.A.A. | | | 182,955 | | | | 113,450 | | | | 156,067 | |
| | | | | | | | | | | | | |
| Compañía Minera Coimolache S.A. | | | | | | | | | | | | |
| Income for: | | | | | | | | | | | | |
| Compañia de Minas Buenaventura S.A.A (Expenses recovery of exploration projects), nota 8(e) | | | 15,013 | | | | - | | | | - | |
| | (b) | As a result of the transactions indicated before, the Company had the following accounts receivable from associates: |
| Accounts receivable | | | | | | |
| | | US$(000) | | | US$(000) | |
| | | | | | | |
| Compañia Minera Coimolache S.A. | | | 20,787 | | | | 72 | |
| Minera Yanacocha S.R.L. | | | 18,852 | | | | 21,794 | |
| | | | | | | | | |
| | | | 39,639 | | | | 21,866 | |
| Less - noncurrent portion | | | | | | | | |
| Compañia Minera Coimolache S.A. | | | (20,736 | ) | | | - | |
| | | | 18,903 | | | | 21,866 | |
| Accounts payable | | | | | | |
| | | US$(000) | | | US$(000) | |
| | | | | | | |
| Compañia Minera Coimolache S.A. | | | 1,697 | | | | - | |
| Minera Yanacocha S.R.L. | | | 1,257 | | | | - | |
| | | | 2,954 | | | | - | |
| Less – noncurrent portion | | | | | | | | |
| Compañia Minera Coimolache S.A. | | | (1,370 | ) | | | - | |
| | | | 1,584 | | | | - | |
| 32. | Summary of significant differences between accounting principles followed by the Company and U.S. generally accepted accounting principles |
| a) | Differences in measurement: |
The Company's consolidated financial statements have been prepared in accordance with Peruvian GAAP which differs in certain respects from U.S. GAAP. The effects of these differences are reflected in Note 33 and are principally related to the items discussed in the following paragraphs:
Investment in associates
Peruvian GAAP – In the consolidated financial statements, Yanacocha and Cerro Verde are accounted for by the equity method. The consolidated results and shareholders’ equity include the participation in Yanacocha and Cerro Verde which are obtained from their financial statements prepared following Peruvian GAAP, modified to recognize the current accounting policies of Buenaventura.
U.S. GAAP – The consolidated results and shareholders’ equity under U.S. GAAP include the shares in Yanacocha and Cerro Verde obtained from those entities financial statements prepared in accordance with U.S. GAAP.
Deferred income tax and workers´profit sharing
Peruvian GAAP – Under paragraph 70 of IAS 1, Presentation of Financial Statements, deferred tax assets and liabilities are always classified as non-current assets or liabilities.
U.S.GAAP – Deferred income tax liabilities and assets shall be classified as current or non-current based on the classification of the related asset or liability for financial reporting purposes.
Under Peruvian GAAP, IAS 12 – Income Taxes, the Company must consider the effect on the deferred income tax and workers’ profit sharing generated by maintaining book basis in U.S. dollars and a tax basis in Nuevos Soles (for tax purposes, the functional currency is Nuevos Soles). US GAAP, ASC 740 Income Taxes , prohibits the recognition of a deferred tax liability or asset for differences related to non-monetary assets and liabilities that, under ASC 830 Foreign Currency Translation , are remeasured from the local currency into the functional currency using historical exchange rates and that result from changes in exchange rates. Therefore, the deferred income tax recorded under Peruvian GAAP has been included as a reconciliation item, see note 33.
Provision for closure of mining units and exploration projects
Peruvian GAAP – Under Peruvian GAAP, based on IFRIC 1 and IAS 37 – Provisions are adjusted at each balance sheet date to reflect the current best estimate. If the provision was discounted, the provision should increase in each period to reflect the passage of time. The interest rate used to measure that change is pre-tax rate that reflects current market assessments of the time value of money and the risks specific to the liability as of each consolidated balance sheet date. Under Peruvian GAAP, the accretion expense amounted US$6,392,000 for the year ended December 31, 2010.
U.S. GAAP – Under U.S. GAAP, ASC 410 Asset Retirement and Environmental Obligations), changes to an asset retirement obligation due to the passage of time are measured by applying an interest method of accretion to the amount of the liability at the beginning of the period. The interest rate used to measure that change is the credit-adjusted riskfree rate that existed when the liability, or portion thereof, was initially measured. That change is recognized as an increase in the carrying amount of the ARO and as accretion expense (not interest). Under US GAAP the accretion expense amounted US$5,777,000 as of December 31, 2010.
Cumulative translation loss
Until December 31, 2005, the Company had designated Peruvian Nuevos Soles as its functional and reporting currency. Effective January 1, 2006, the functional and reporting currency of the Company is U.S. dollar for Peruvian GAAP and U.S. GAAP purposes. The methodology of translation from Nuevos Soles into U.S. dollars is described in note 2.3 (a) of the consolidated financial statements.
Peruvian GAAP – Under Peruvian GAAP, based on IAS 21 - The Effects of Changes in Foreign Exchange Rates, when there is a change in an entity’s functional currency, the entity shall apply the translation procedures applicable to the new functional currency prospectively from the date of the change using the exchange rate at the date of the change. The resulting translated amounts for non-monetary items are treated as their historical cost. Therefore, for Peruvian GAAP purposes, the Company has translated equity accounts into U.S. dollars using the exchange rate as of December 31, 2005 when it changed its functional currency from Peruvian Soles to U.S. dollars.
U.S. GAAP – Under U.S. GAAP, based on ASC 830 Foreign Currency Translation equity accounts should be translated into U.S. dollars using historical exchange rates. The cumulative translation loss amounts to US$19,323,000 (US GAAP) and US$34,075,000 (Peru GAAP) as of December 31, 2010 and 2009. It has no effect on total equity as of December 31, 2010 and 2009.
Reversal (provision) of impairment of long-lived assets
Peruvian GAAP – Under Peruvian GAAP, based on IAS 36 – Impairment loss is calculated by comparing the net carrying amount of the asset to its recoverable amount, which is the higher of its value in use or fair value less costs to sell. Under IAS 36 the provision amounted US$3,088,000 for the year ended December 31, 2010.
A reversal of an impairment loss for a cash-generating unit shall be allocated to the assets of the unit, except for goodwill, pro rata with the carrying amounts of those assets. These increases, in carrying amounts shall be treated as reversals of impairment losses for individual assets and recognized in profit and loss. As of December 31, 2010 the reversal amounted to US$16,223,000.
U.S. GAAP – Under U.S. GAAP, ASC 360 Accounting for the impairment or disposal of long-lived assets, Impairment is considered to exist if total estimated undiscounted cash flows are less than the carrying amount of the asset and an impairment loss is then measured as the amount by which the carrying value of the asset exceeds its fair value. Once recognized, an impairment loss is not reversed. Under ASC 360 the provision amounted US$2,386,000 as of December 31, 2010.
After an impairment loss is recognized, the adjusted carrying amount of the intangible asset shall be its new accounting basis. Subsequent reversal of a previously recognized impairment loss is prohibited.
Differences related to its associates:
The Company recorded the effects of the differences, between Peruvian GAAP and U.S. GAAP, identified by its associates as part of share in investment in associate caption. The effects of these differences are reflected in Note 33 and are principally related to the items discussed in the following paragraphs:
Share in investment in associates
Under Peruvian GAAP, current and deferred tax assets and liabilities are measured at the tax rate applicable to undistributed profits and thus the income tax consequences of dividends are recognized when a liability to pay the dividend is recognized.
U.S. GAAP – Deferred income tax assets and liabilities are classified in accordance with the classification of the underlying items which generated such assets and liabilities.
Cerro Verde measures current and deferred tax assets and liabilities at the applicable tax rate. With respect to the income tax consequences of basis differences of undistributed earnings, Cerro Verde recognizes deferred tax liabilities at the applicable tax rate based on its tax planning strategies. Due to the change in controlling shareholder in 2007, Cerro Verde reassessed certain of its tax planning strategies and, as a result, Cerro Verde recorded deferred income tax liabilities related to certain undistributed earnings.
| Differences in presentation: |
Royalties and unusual item related to net loss from release of commitments in commercial contracts
Peruvian GAAP – Royalties granted to the Peruvian State and third parties amounting to US$52,270,000, US$39,646,000 and US$35,694,000 in 2010, 2009 and 2008, respectively, as well as the unusual item related to net loss from release of commitments in commercial contracts amounting to US$415,135,000 in 2008, are presented as part of operating expenses.
US GAAP – The royalties above mentioned must be presented as part of operating costs, affecting the gross margin. The presentation of the loss on the derivative contracts as unusual item is not permitted.
Workers' profit sharing
Peruvian GAAP – Workers' profit sharing expense (income) is separately presented in the consolidated statements of income in a similar way as income tax expense (income). Also, deferred workers' profit sharing asset (liability) is separately presented in the consolidated balance sheets in a similar way as deferred income tax assets (liabilities).
U.S. GAAP – The practice is to recognize the workers' profit sharing expense (income) as part of operating expense (income). Also, deferred workers' profit sharing assets (liabilities) shall be classified as current or non-current based on the classification of the related assets or liability for financial reporting purposes.
| 33. | Reconciliation between net income and shareholders' equity determined under Peruvian GAAP and U.S. GAAP |
The reconciliation tables below show only the reconciliation of net income and shareholders’s equity attributable to Buenaventura because there are no differences between Peruvian GAAP and U.S. GAAP that affect the minority interests.
The following is a summary of the adjustments to net income for the years ended December 31, 2010, 2009 and 2008 and to shareholders' equity as of December 31, 2010 and 2009 that would be required if U.S. GAAP had been applied instead of Peruvian GAAP in the consolidated financial statements:
| | | | | | | | | | |
| | | US$(000) | | | US$(000) | | | US$(000) | |
| | | | | | | | | | |
| Net income attributable to Buenaventura, under Peruvian GAAP | | | 662,934 | | | | 593,561 | | | | 153,283 | |
| Items increasing (decreasing) reported net income | | | | | | | | | | | | |
| Share in investment in associate | | | - | | | | - | | | | (1,301 | ) |
| Deferred income tax and workers’ profit sharing assets, net | | | 5,480 | | | | (452 | ) | | | (996 | ) |
| Financial expense (income) of the provision for closure of mining units | | | 615 | | | | (2,107 | ) | | | - | |
| Deferred income tax and workers´ profit sharing arising from having a functional currency different from the currency used for tax purposes | | | (995 | ) | | | (4,801 | ) | | | 6,385 | |
| Reversal (provision) of impairment of long-lived assets | | | (15,521 | ) | | | 1,239 | | | | 2,767 | |
| Other | | | 32 | | | | 32 | | | | 32 | |
| Net adjustments | | | (10,389 | ) | | | (6,089 | ) | | | 6,887 | |
| | | | | | | | | | | | | |
| Net income attributable to Buenaventura, under U.S. GAAP | | | 652,545 | | | | 587,472 | | | | 160,170 | |
| | | | | | | | | | | | | |
| Other comprehensive income (loss) | | | | | | | | | | | | |
| Unrealized gain on other investments | | | 477 | | | | 557 | | | | (40 | ) |
| Unrealized gain (loss) on valuation of hedge derivative financial instruments, net | | | (2,794 | ) | | | (20,753 | ) | | | 14,644 | |
| | | | | | | | | | | | | |
| Total comprehensive income under U.S. GAAP attributable to Buenaventura | | | 650,228 | | | | 567,276 | | | | 174,774 | |
| | | | | | | | | | | | | |
| Accumulated other comprehensive income (loss) under U.S. GAAP attributable to Buenaventura | | | | | | | | | | | | |
| Unrealized gain on other investments | | | 1,152 | | | | 675 | | | | 118 | |
| Cumulative translation loss | | | (34,075 | ) | | | (34,075 | ) | | | (34,075 | ) |
| Unrealized gain (loss) on valuation of hedge derivative financial instruments, net | | | (7,385 | ) | | | (4,591 | ) | | | 16,162 | |
| Other | | | 643 | | | | 643 | | | | 643 | |
| Total accumulated other comprehensive loss under U.S. GAAP attributable to Buenaventura | | | (39,665 | ) | | | (37,348 | ) | | | (17,152 | ) |
| | | | | | | | | | | | | |
| Basic and diluted income per share under U.S. GAAP attributable to Buenaventura | | | 2.56 | | | | 2.31 | | | | 0.63 | |
| | | | | | | | | | |
| | | US$(000) | | | US$(000) | | | US$(000) | |
| | | | | | | | | | |
| Shareholders’ equity attributable to Buenaventura, according to the financial statements under Peruvian GAAP | | | 2,607,856 | | | | 2,064,255 | | | | 1,531,601 | |
| Items increasing (decreasing) reported shareholders’ equity | | | | | | | | | | | | |
| Share in investment in associate | | | (45,657 | ) | | | (45,657 | ) | | | (45,657 | ) |
| Provision for impairment of long-term assets, net | | | (15,701 | ) | | | 336 | | | | 1,287 | |
| Deferred income tax and worker's profit sharing arising from having a functional currency different from the currency used for tax purposes | | | (6,915 | ) | | | (5,920 | ) | | | (1,119 | ) |
| Financial expense (income) of the provision for closure of mining units | | | (1,492 | ) | | | (2,107 | ) | | | - | |
| Other | | | 153 | | | | 165 | | | | 176 | |
| Shareholders’ equity attributable to Buenaventura, according to the financial statements under U.S. GAAP | | | 2,538,244 | | | | 2,011,072 | | | | 1,486,288 | |
The following is a roll forward of the components of shareholders' equity attributable to Buenaventura under U.S. GAAP:
| | | US$(000) | |
| | | | |
| Shareholders’ equity attributable to Buenaventura, under U.S. GAAP at December 31, 2007 | | | 1,360,984 | |
| Net Income in accordance with U.S. GAAP | | | 160,170 | |
| Declared and paid dividends | | | (50,888 | ) |
| Unrealized loss on other investments | | | (40 | ) |
| Unrealized gain on valuation of hedge derivate financial instruments, net | | | 14,644 | |
| Other | | | 1,418 | |
| Shareholders’ equity attributable to Buenaventura, under U.S. GAAP at December 31, 2008 | | | 1,486,288 | |
| | | | | |
| Net Income in accordance with U.S. GAAP | | | 587,472 | |
| Declared and paid dividends | | | (40,711 | ) |
| Unrealized gain on other investments | | | 557 | |
| Unrealized loss on valuation of hedge derivate financial instruments, net | | | (20,753 | ) |
| Other | | | (1,781 | ) |
| Shareholders’ equity attributable to Buenaventura, under U.S. GAAP at December 31, 2009 | | | 2,011,072 | |
| | | | | |
| Net income in accordance with U.S. GAAP | | | 652,545 | |
| Declared and paid dividends | | | (117,043 | ) |
| Unrealized gain on other investments | | | 477 | |
| Unrealized gain on valuation of hedge derivate financial instruments, net | | | (2,794 | ) |
| Other | | | (6,013 | ) |
| Shareholders’ equity attributable to Buenaventura, under U.S. GAAP at December 31, 2010 | | | 2,538,244 | |
Recently adopted accounting pronouncements:
ASU N° 2010-06 Fair Value Accounting
In January 2010, ASC guidance for fair value measurements and disclosure was updated to require additional disclosures related to transfers in and out of level 1 and 2 fair value measurements. The guidance was amended to clarify the level of disaggregation required for assets and liabilities and the disclosures required for inputs and valuation techniques used to measure the fair value of assets and liabilities that fall in either level 2 or level 3. The updated guidance was effective for the Company’s fiscal year beginning January 1, 2010. The adoption had no impact on the Company’s consolidated financial statements. See notes 27 and 29 for further details regarding the Company’s assets and liabilities measured at fair value.
| 34. | Recently issued Accounting Pronouncements |
ASU N° 2010-29 Business Combinations
In December 2010, the ASC guidance for business combinations was updated to clarify existing guidance which requires a public entity to disclose pro forma revenue and earnings of the combined entity as though the business combination(s) that occurred during the current year had occurred as of the beginning of the comparable prior annual period only. The update also expands the supplemental pro forma disclosures required to include a description of the nature and amount of material, nonrecurring pro forma adjustments directly attributable to the business combination included in the reported pro forma revenue and earnings. The updated guidance is effective for the Company’s fiscal year beginning January 1, 2011. The Company is evaluating the potential impact of adopting this guidance on the Company’s consolidated financial position, results of operations and cash flows.
ASU N° 2010-06 Fair Value Accounting
In January 2010, the ASC guidance for fair value measurements and disclosure was updated to require enhanced detail in the level 3 reconciliation. The updated guidance is effective for the Company’s fiscal year beginning January 1, 2011. The Company expects minimal impact from adopting this guidance.
MINERA YANACOCHA S.R.L.
CONSOLIDATED FINANCIAL STATEMENTS
DECEMBER 31, 2010
| CONTENTS | | Page |
| | | |
| Report of the Independent Registered and Certified Public Accounting Firm | | F-F-90 |
| | | |
| Consolidated Statements of Income for each of the three years in the period ended December 31, 2010 | | F-F-91 |
| | | |
| Consolidated Statements of Cash Flows for each of the three years in the period ended December 31, 2010 | | F-F-92 |
| | | |
| Consolidated Balance Sheets at December 31, 2010 and 2009 | | F-F-93 |
| | | |
| Consolidated Statements of Changes in Partners' Equity for each of the three years in the period ended December 31, 2010 | | F-F-94 |
| | | |
| Notes to the Consolidated Financial Statements | | F-F-95 |
| PricewaterhouseCoopers | Dongo-Soria, Gaveglio y Asociados |
| | Sociedad Civil |
| | de Responsabilidad Limitada |
| | Av. Santo Toribio 143 |
| | Lima 27, Perú |
| | Apartado 1434-2869 |
| | Telfs.: (51 1) 211-6500 411-5800 |
| | Fax : (51 1) 211-6560 |
REPORT OF THE INDEPENDENT REGISTERED AND CERTIFIED PUBLIC ACCOUNTING FIRM
February 21, 2011
To the Partners and the Executive Committee of
Minera Yanacocha S.R.L.
In our opinion, the accompanying consolidated balance sheets and the related consolidated statements of income, changes in partners’ equity and cash flows, present fairly, in ail material respects, the financial position of Minera Yanacocha S.R.L. at December 31, 2010 and 2009, and the results of their operations and its cash flows for each of the three years in the period ended December 31, 2010 in conformity with accounting principles generally accepted in the United States of America. These financial statements are the responsibility of the Company’s management. Our responsibility is to express an opinion on these consolidated financial statements based on our audits. We conducted our audits of these financiai statements in accordance with the standards of the Public Company Accounting Oversight Board (United States). Those standards require that we plan and perform the audits to obtain reasonable assurance about whether the financial statements are free of material misstatement. An audit of financial statements includes examining, on a test basis, evidence supporting the amounts and disclosures in the financial statements, assessing the accounting principles used and significant estimates made by management, and evaluating the overall financial statement presentation. We believe that our audits provide a reasonable basis for our opinion.
| Countersigned by |
| |
| /S/ FERNANDO GAVEGLIO | (partner) |
| |
| Fernando Gaveglio |
| |
| Peruvian Certified Public Accountant |
| Registration No.01-19847 |
Minera Yanacocha S.R.L.
Consolidated Statements of Income
| | | | |
| | | | | | | | | | |
| | | (dollars in thousands) | |
| Revenues | | $ | 1,778,260 | | | $ | 2,013,228 | | | $ | 1,612,618 | |
| | | | | | | | | | | | | |
| Costs and expenses | | | | | | | | | | | | |
Costs applicable to sales (1) | | | 655,007 | | | | 671,055 | | | | 659,867 | |
| Amortization | | | 160,424 | | | | 166,053 | | | | 169,131 | |
| Reclamation and remediation | | | 14,632 | | | | 13,016 | | | | 11,174 | |
| Exploration and advanced projects | | | 34,579 | | | | 22,968 | | | | 28,151 | |
| Other expense, net (Note 3) | | | 58,314 | | | | 77,055 | | | | 75,418 | |
| | | | 922,956 | | | | 950,147 | | | | 943,741 | |
| | | | | | | | | | | | | |
| Other income (expense) | | | | | | | | | | | | |
| Other income, net (Note 4) | | | 7,313 | | | | 3,886 | | | | 11,239 | |
| Interest expense, net of capitalized interest of $4,404, $4,212 and $5,002, respectively | | | (3,050 | ) | | | (4,598 | ) | | | (7,597 | ) |
| | | | 4,263 | | | | (712 | ) | | | 3,642 | |
| | | | | | | | | | | | | |
| Income before income tax | | | 859,567 | | | | 1,062,369 | | | | 672,519 | |
| Income tax expense (Note 5) | | | (269,673 | ) | | | (335,293 | ) | | | (196,057 | ) |
| Net income | | $ | 589,894 | | | $ | 727,076 | | | $ | 476,462 | |
| | | | | | | | | | | | | |
| Other comprehensive income, net of tax | | | 1,149 | | | | 1,239 | | | | – | |
| Comprehensive income | | $ | 591,043 | | | $ | 728,315 | | | $ | 476,462 | |
(1) Excludes of Amortization and Reclamation and remediation
The accompanying notes are an integral part of these consolidated financial statements.
Minera Yanacocha S.R.L.
Consolidated Statements of Cash Flows
| | | | |
| | | | | | | | | | |
| | | (dollars in thousands) | |
| Operating activities: | | | | | | | | | |
| Net income | | $ | 589,894 | | | $ | 727,076 | | | $ | 476,462 | |
| Adjustments to reconcile net income to net cash provided from operating activities: | | | | | | | | | | | | |
| Amortization | | | 160,424 | | | | 166,053 | | | | 169,131 | |
| Deferred income tax | | | 3,932 | | | | 25,413 | | | | 1,024 | |
| Deferred workers' profit participation | | | 985 | | | | 7,513 | | | | 297 | |
| Reclamation and remediation | | | 14,632 | | | | 13,016 | | | | 11,174 | |
| Other operating adjustments | | | 762 | | | | 3,060 | | | | 2,304 | |
| Decrease (increase) in operating assets: | | | | | | | | | | | | |
| Inventories, stockpiles and ore on leach pads | | | (111,255 | ) | | | (28,582 | ) | | | (17,707 | ) |
| Other assets | | | 16,043 | | | | 13,359 | | | | 15,656 | |
| Increase (decrease) in operating liabilities: | | | | | | | | | | | | |
| Accounts payable and other accrued liabilities ... | | | (48,562 | ) | | | 58,548 | | | | 92,996 | |
| Reclamation liabilities | | | (5,191 | ) | | | (4,091 | ) | | | (6,800 | ) |
| Net cash provided from operations | | | 621,664 | | | | 981,365 | | | | 744,537 | |
| | | | | | | | | | | | | |
| Investing activities: | | | | | | | | | | | | |
| Additions to property, plant and mine development ... | | | (297,257 | ) | | | (150,262 | ) | | | (239,336 | ) |
| Funding of long-term investment (Note 1) | | | — | | | | — | | | | (13,000 | ) |
| Proceeds from sale of assets | | | 509 | | | | 1,345 | | | | 991 | |
| Net cash used in investing activities | | | (296,748 | ) | | | (148,917 | ) | | | (251,345 | ) |
| | | | | | | | | | | | | |
| Financing activities: | | | | | | | | | | | | |
| Change in restricted cash | | | (286 | ) | | | (57 | ) | | | (9,174 | ) |
| Repayment of debt | | | (176,377 | ) | | | (27,282 | ) | | | (24,868 | ) |
| Distributions to partners | | | — | | | | (230,000 | ) | | | (590,000 | ) |
| Net cash used in financing activities | | | (176,663 | ) | | | (257,339 | ) | | | (624,042 | ) |
| Net change in cash and cash equivalents | | | 148,253 | | | | 575,109 | | | | (130,850 | ) |
| Cash and cash equivalents at beginning of the year | | | 732,635 | | | | 157,526 | | | | 288,376 | |
| Cash and cash equivalents at end of the year | | $ | 880,888 | | | $ | 732,635 | | | $ | 157,526 | |
See Note 17 for supplemental cash flow information.
The accompanying notes are an integral part of these consolidated financial statements.
Minera Yanacocha S.R.L.
Consolidated Balance Sheets
| | | | |
| | | | | | | |
| | | (dollars in thousands) | |
| ASSETS | | | | | | |
| Cash and cash equivalents | | $ | 880,888 | | | $ | 732,635 | |
| Accounts receivable (Note 6) | | | 25,807 | | | | 32,653 | |
| Due from related parties (Note 12) | | | 1,804 | | | | 4,196 | |
| Inventories (Note 7) | | | 55,941 | | | | 46,077 | |
| Stockpiles and ore on leach pads (Note 8) | | | 166,998 | | | | 172,447 | |
| Deferred income tax assets (Note 5) | | | 8,746 | | | | 8,746 | |
| Other current assets (Note 9} | | | 14,035 | | | | 18,176 | |
| Current assets | | | 1,154,219 | | | | 1,014,930 | |
| | | | | | | | | |
| Property, plant and mine development, net (Note 10) | | | 1,437,300 | | | | 1,234,694 | |
| Long-term stockpiles and ore on leach pads (Note 8) | | | 328,874 | | | | 197,554 | |
| Other long-term assets (Note 9) | | | 16,601 | | | | 19,322 | |
| Total assets | | $ | 2,936,994 | | | $ | 2,466,500 | |
| | | | | | | | | |
| LIABILITIES | | | | | | | | |
| Current portion of debt (Note 11) | | $ | 1,959 | | | $ | 36,101 | |
| Accounts payable | | | 68,299 | | | | 62,168 | |
| Due to related parties (Note 12} | | | 38,083 | | | | 27,591 | |
| Workers' profit participation (Note 13) | | | 48,699 | | | | 57,551 | |
| Income tax payable | | | 1,254 | | | | 68,704 | |
| Other current liabilities (Note 14) | | | 96,064 | | | | 79,468 | |
| Current liabilities | | | 254,358 | | | | 331,583 | |
| | | | | | | | | |
| Debt (Note 11) | | | — | | | | 142,235 | |
| Reclamation and remediation liabilities (Note 15) | | | 280,315 | | | | 187,711 | |
| Deferred workers' profit participation (Note 13) | | | 18,150 | | | | 17,164 | |
| Deferred income tax liabilities (Note 5) | | | 72,412 | | | | 67,995 | |
| Other long-term liabilities | | | 9,614 | | | | 8,710 | |
| Total liabilities | | | 634,849 | | | | 755,398 | |
| | | | | | | | | |
| Commitments and contingencies (Note 19) | | | | | | | | |
| | | | | | | | | |
| PARTNERS' EQUITY | | | | | | | | |
| Partners' contributions | | | 398,216 | | | | 398,216 | |
| Additional contributions | | | 226 | | | | 226 | |
| Accumulated other comprehensive income | | | 2,388 | | | | 1,239 | |
| Retained earnings | | | 1,901,315 | | | | 1,311,421 | |
| Total partners' equity (Note 16) | | | 2,302,145 | | | | 1,711,102 | |
| Total liabilities and partners' equity | | $ | 2,936,994 | | | $ | 2,466,500 | |
The accompanying notes are an integral part of these consolidated financial statements.
Minera Yanacocha S.R.L.
Consolidated Statements of Changes in Partners' Equity
| | | | | | | | | | | | Accumulated Other Comprehensive Income | | | | |
| Balance at January 1, 2008 | | $ | 398,216 | | | $ | 226 | | | $ | 927,883 | | | $ | — | | | $ | 1,326,325 | |
| Distributions of profits to the partners | | | — | | | | — | | | | (590,000 | ) | | | — | | | | (590,000 | ) |
| Net income | | | — | | | | — | | | | 476,462 | | | | — | | | | 476,462 | |
| Balance at December 31, 2008 | | $ | 398,216 | | | $ | 226 | | | $ | 814,345 | | | $ | — | | | $ | 1,212,787 | |
| Distributions of profits to the partners | | | — | | | | — | | | | (230,000 | ) | | | — | | | | (230,000 | ) |
| Unrealized gain on marketable securities, net of income tax | | | — | | | | — | | | | — | | | | 1,239 | | | | 1,239 | |
| Net income | | | — | | | | | | | | 727,076 | | | | — | | | | 727,076 | |
| Balance at December 31, 2009 | | $ | 398,216 | | | $ | 226 | | | $ | 1,311,421 | | | $ | 1,239 | | | $ | 1,711,102 | |
| Unrealized gain on marketable securities, net of income tax | | | — | | | | — | | | | — | | | | 1,149 | | | | 1,149 | |
| Net income | | | — | | | | — | | | | 589,894 | | | | — | | | | 589,894 | |
| | | | | | | | | | | | | | | | | | | | | |
| Balance at December 31, 2010 | | $ | 398,216 | | | $ | 226 | | | $ | 1,901,315 | | | $ | 2,388 | | | $ | 7,302,145 | |
The accompanying notes are an integral part of these consolidated financial statements.
Minera Yanacochoa S.R.L.
Notes to the Consolidated Financial Statements
(dollars in thousands unless otherwise stated)
Minera Yanacocha S.R.L. (the “Company”), formerly Minera Yanacocha S.A., was incorporated in Peru on January 14, 1992 and commenced operations in 1993. The Company is engaged in the production of gold and exploration and development of gold and copper under the mining concessions it owns or that are owned by S.M.R.L. Chaupiloma Dos de Cajamarca (“Chaupiloma”).
The Company is owned 51.35% by Newmont Second Capital Corporation, a 100% indirectly owned subsidiary of Newmont Mining Corporation (“Newmont”), 43.65% owned by Compañia Minera Condesa S.A., which is 100% owned by Compañia de Minas Buenaventura S.A.A. (“Buenaventura”) and 5% owned by the International Finance Corporation
The majority Partners of the Company (or their affiliates) also own the majority interest in Chaupiloma. In accordance with a mining lease, amended effective January 1, 1994, the Company pays Chaupiloma a 3% royalty based on quarterly production sold at current market prices, after deducting refinery and transportation costs. The royalty agreement expires in 2012, but can be extended at the Company’s option.
Located in the Cajamarca province of Peru, the Company’s operation consists of three active open pit mines: Cerro Yanacocha, La Quinua and Chaquicocha. Reclamation and/or backfilling activities at Carachugo, San Jose and Maqui Maqui are currently underway. Gold-bearing ores are transported to one of four leach pads for gold recovery using conventional heap-leaching or milling, which commenced commercial production in the second quarter of 2008, followed by Merrill-Crowe zinc precipitation and smelting where a final doré product is poured. The doré is then shipped offsite for refining and is sold on the worldwide gold markets.
Gold mining requires the use of specialized facilities and technology. The Company relies heavily on such facilities and technology to maintain production levels. Also, the cash flow and profitability of the Company’s operations are significantly affected by the market price of gold. Gold prices can fluctuate widely and are affected by numerous factors beyond the Company’s control. During 2010, 2009 and 2008, the Company sold 1.46 million, 2.07 million and 1.84 million ounces of gold, respectively.
The Conga project consists of two gold-copper porphyry deposits located northeast of the Yanacocha operating area in the provinces of Celendin, Cajamarca and Hualgayoc. The Conga project has proven and probable reserves of 11.8 million (unaudited) ounces of contained gold and 3.2 billion (unaudited) pounds of contained copper at December 31, 2010 and 2009.
Total proven and probable reserves contained in the three active open pits, other pits to be developed, in the stockpiles, in process and the Conga project are approximately 21.5 million (unaudited) and 22.3 million (unaudited) ounces of contained gold at December 31, 2010 and 2009, respectively and 3.2 billion (unaudited) pounds of contained copper at December 31, 2010 and 2009.
| 2. | Significant Accounting Policies |
Principles of Consolidation
The Consolidated Financial Statements include the accounts of Minera Yanacocha S.R.L and the San Jose Reservoir Trust (“Trust”). In November 2008, the Company funded the Trust to ensure continuous operation for the San Jose Reservoir after 2018. The Company transferred $13,000 to the Trust in 2008. No withdrawals are allowed until 2018 and the Company is committed to a $23,000 fund as of such date. This Trust is irrevocable and is a separate legal entity. The grantor is the Company, thetrustee is the Banco de Crédito del Peru and the beneficiary is the Company; therefore, the Company consolidates the Trust in its Consolidated Financial Statements.
Use of Estimates
The Company’s Consolidated Financial Statements have been prepared in accordance with accounting principles generally accepted in the United States of America. The preparation of the Company’s Consolidated Financial Statements requires the Company to make estimates and assumptions that affect the reported amounts of assets and liabilities and the related disclosure of contingent assets and liabilities at the date of the Consolidated Financial Statements and the reported amounts of revenues and expenses during the reporting period. The more significant areas requiring the use of management estimates and assumptions relate to mineral reserves that are the basis for future cash flow estimates utilized in impairment calculations and units-of-production amortization calculations; environmental, reclamation and closure obligations; estimates of recoverable gold and other minerals in stockpile and leach pad inventories; write-downs of inventory, ore on leach pads and stockpiles to net realizable value; employee benefit liabilities; valuation allowances for deferred tax assets; workers’ profit participation; reserves for contingencies and litigation; and the fair value and accounting treatment of financial instruments. The Company bases its estimates on historical experience and on various other assumptions that are believed to be reasonable under the circumstances. Accordingly, actual results may differ significantly from these estimates under different assumptions or conditions.
Currency
The Consolidated Financial Statements are stated in U.S. dollars, the Company’s functional currency, as most of its transactions are traded, collected and paid in such currency. Transactions in other currencies are recorded in U.S. dollars based on exchange rates prevailing at the time of such transactions. Monetary assets and liabilities denominated in other currencies are translated into the U.S. dollar at exchange rates prevailing at the balance sheet dates, and any resulting gains or losses are reflected in current earnings.
Cash and Cash Equivalents
Cash and cash equivalents consist of all cash balances and highly liquid investments with an original maturity of three months or less. Because of the short maturity of these balances, the carrying amounts approximate their fair value. Restricted cash is excluded from cash and cash equivalents and is included in Other current assets.
Investments
Management determines the appropriate classification of its investments in equity securities at the time of purchase and reevaluates such determinations at each reporting date. The Company accounts for its equity security investments as available for sale securities in accordance with FASB Accounting Standards Codification (“ASC”) guidance on accounting for certain investments in debt and equity securities. The Company periodically evaluates whether declines in fair values of its investments below the Company’s carrying value are other-than-temporary in accordance with guidance for the meaning of other-than-temporary impairment and its application to certain investments. The Company’s policy is to generally treat a decline in the investment’s quoted market value that has lasted continuously for more than six months as an other-than-temporary decline in value. The Company also monitors its investments for events or changes in circumstances that have occurred that may have a significant adverse effect on the fair value of the investment and evaluates qualitative and quantitative factors regarding the severity and duration of the unrealized loss and the Company’s ability to hold the investment until a forecasted recovery occurs to determine if the decline in value of an investment is other-than-temporary, Declines in fair value below the Company’s carrying value deemed to be other-than-temporary are charged to earnings.
Stockpiles, Ore on Leach Pads and Inventories
As described below, costs that are incurred in or benefit the productive process are accumulated as stockpiles, ore on leach pads and inventories. Stockpiles, ore on leach pads and inventories are carried at the lower of average cost or net realizable value. Net realizable value represents the estimated future sales price of the product based on current and long-term metals prices, less the estimated costs to complete production and bring the product to sale. Write-downs of stockpiles, ore on leach pads and inventories resulting from net realizable value impairments are reported as a component of Costs applicable to sales. The current portion of stockpiles, ore on leach pads and inventories is determined based on the expected amounts to be processed within the next twelve months. Stockpiles, ore on leach pads and inventories not expected to be processed within the next twelve months are classified as long-term. The major classifications are as follows;
Stockpiles
Stockpiles represent ore mined and available for further processing. Stockpiles are measured by estimating the number of tons added and removed from the stockpile, the number of contained ounces (based on assay data) and the estimated metallurgical recovery rates (based on the expected processing method). Stockpile ore tonnages are verified by periodic surveys. Costs are allocated to a stockpile based on relative values of material stockpiled and processed using current mining costs incurred up to the point of stockpiling the ore, including applicable overhead and amortization relating to mining operations, and removed at the average cost per recoverable unit.
Ore on Leach Pads
The recovery of gold from certain gold oxide ores is achieved through the heap leaching process. Under this method, ore is placed on leach pads where it is treated with a chemical solution, which dissolves the gold contained in the ore. The resulting gold-bearing solution is further processed in a plant where the gold is recovered. Costs are added to ore on leach pads based on current mining costs, including applicable overhead and amortization relating to mining operations. Costs are removed from ore on leach pads as ounces are recovered based on the average cost per recoverable ounce of gold on the leach pad.
The estimates of recoverable gold on the leach pads are calculated from the quantities of ore placed on the pads (measured tons added to the leach pads), the grade of ore placed on the leach pads (based on assay data) and a recovery percentage (based on ore type). In general, the leach pads recover approximately 50% to 95% of the ultimate recoverable ounces in the first year of leaching, declining each year thereafter until the leaching process is complete.
Although the quantities of recoverable gold placed on the leach pads are reconciled by comparing the grades of ore placed on the pads to the quantities of gold actually recovered (metallurgical balancing), the nature of the leaching process inherently limits the ability to precisely monitor inventory levels. As a result, the metallurgical balancing process is constantly monitored and estimates are refined based on actual results over time. Historically, the Company’s operating results have not been materially impacted by variations between the estimated and actual recoverable quantities of gold on its leach pads. Variations between actual and estimated quantities resulting from changes in assumptions and estimates that do not result in write-downs to net realizable value are accounted for on a prospective basis.
In-process Inventory
In-process inventories represent materials that are currently in the process of being converted to a saleable product. The conversion processes vary depending on the nature of the ore and the specific processing facility, and include mill in-circuitand leach in-circuit. In-process material is measured based on assays of the material fed into the process and the projected recoveries of the respective plants. In-process inventories are valued at the average cost of the material fed into the process attributable to the source material coming from the mines, stockpiles and/or leach pads plus the in-process conversion costs, including applicable amortization relating to the process facilities incurred to that point In the process.
Precious Metals Inventory
Precious metals include gold doré and/or gold bullion. Precious metals that result from the Company’s mining, processing and refining activities are valued at the average cost of the respective in-process inventory.
Concentrate Inventory
Concentrate inventories represent silver, gold and copper concentrate available for shipment. The Company values concentrate inventory at the average cost, including an allocable portion of support costs and amortization. Costs are added and removed to the concentrate inventory based on tons of concentrate and are valued at the lower of average cost or net realizable value.
Materials and Supplies
Materials and supplies are valued at the lower of average cost or net realizable value. Cost includes applicable taxes and freight.
Property, Plant and Mine Development
Facilities and Equipment
Expenditures for new facilities or equipment and expenditures that extend the useful lives of existing facilities or equipment are capitalized and recorded at cost. The facilities and equipment are amortized using the straight-line method at rates sufficient to amortize such costs over the estimated productive lives, which do not exceed the related estimated mine lives, of such facilities based on proven and probable reserves.
Mine Development
Mine development costs include engineering and metallurgical studies, drilling and other related costs to delineate an ore body, and the removal of overburden to initially expose an ore body at open pit surface mines. Costs incurred before mineralization is classified as proven and probable reserves are expensed and classified as Exploration and Advanced projects expense. Capitalization of mine development project costs, that meet the definition of an asset, begins once mineralization is classified as proven and probable reserves.
Drilling and related costs are capitalized for an ore body where proven and probable reserves exist, the activities are directed at obtaining additional information on the ore body or converting non-reserve mineralization to proven and probable reserves and the benefit is expected to be realized over a period beyond one year. All other drilling and related costs are expensed as incurred. Drilling costs incurred during the production phase for operational ore control are allocated to inventory costs and then included as a component of Costs applicable to sales.
The cost of removing overburden and waste materials to access the ore body at an open pit mine prior to the production phase are referred to as “pre-stripping costs”. Pre-stripping costs are capitalized during the development of an open pit mine. Where multiple open pits exist at a mining complex utilizing common processing facilities, pre-stripping costs are capitalized at each pit. The removal and production of de minimis saleable materials may occur during development and are recorded as Other income, net of incremental mining and processing costs.
The production phase of an open pit mine commences when saleable minerals, beyond a de minimis amount, are produced. Stripping costs incurred during the production phase of a mine are variable production costs that are included as a component of inventory to be recognized in Costs applicable to sales in the same period as the revenue from the sale of inventory.
The Company’s definition of a mine and the mine’s production phase may differ from that of other companies in the mining industry resulting in incomparable allocations of stripping costs to deferred mine development and production costs. Other mining companies may expense pre-stripping costs associated with subsequent pits within a mining complex.
Mine development costs are amortized using the units-of production (“UOP”) method based on estimated recoverable ounces in proven and probable reserves. To the extent that these costs benefit an entire ore body, they are amortized over the estimated life of the ore body. Costs incurred to access specific ore blocks or areas that only provide benefit over the life of that area are amortized over the estimated life of that specific ore block or area.
Interest cost allocable to the cost of developing mining properties and to constructing new facilities is capitalized until assets are ready for their intended use.
Mineral Interests
Mineral interests include acquired interests in production, development and exploration stage properties. The mineral interests are capitalized at their fair value at the acquisition date, either as an individual asset purchase or as part of a business combination.
The value of such assets is primarily driven by the nature and amount of mineralized material believed to be contained in such properties. Production stage mineral interests represent interests in operating properties that contain proven and probable reserves. Development stage mineral interests represent interests in properties under development that contain proven and probable reserves. Exploration stage mineral interests represent interests in properties that are believed to potentially contain mineralized material consisting of (i) mineralized material such as inferred material within pits; measured, indicated and inferred material with insufficient drill spacing to qualify as proven and probable reserves; and inferred material in close proximity to proven and probable reserves; (ii) around-mine exploration potential such as inferred material not immediately adjacent to existing reserves and mineralization, but located within the immediate mine area; (iii) other mine-related exploration potential that is not part of measured, indicated or inferred material and is comprised mainly of material outside of the immediate mine area; (iv) greenfields exploration potential that is not associated with any other production, development or exploration stage property, as described above; or (v) any acquired right to explore or extract a potential mineral deposit. The Company’s mineral rights generally are enforceable regardless of whether proven and probable reserves have been established. The Company has the ability and intent to renew mineral interests where the existing term is not sufficient to recover all identified and valued proven and probable reserves and/or undeveloped mineralized material.
Asset Impairment
The Company reviews and evaluates its long-lived assets for impairment when events or changes in circumstances indicate that the related carrying amounts may not be recoverable. Impairment is considered to exist if the total of the assets estimated future cash flows on an undiscounted basis are less than the carrying amount of the assets. An impairment loss is measured and recorded based on discounted estimated future cash flows. Future cash flows are estimated based on quantities of recoverable minerals, expected gold and other commodity prices (considering current and historical prices, trends and related factors), production levels, operating costs, capital requirements and reclamation costs, all based on iife-of-mine plans, Existing proven and probable reserves and value beyond proven and probable reserves, including mineralization that is not part of the measured, indicated or inferred resource base, are included when determining the fair value of mine site reporting units at acquisition and, subsequently, in determining whether the assets are impaired. The term “recoverable minerals” refers to the estimated amount of gold or other commodities that will be obtained after taking into account losses during ore processing and treatment. Estimates of recoverable minerals from such exploration stage mineral interests are risk adjusted based on management’s relative confidence in such materials. In estimating future cash flows, assets are grouped at the lowest level of which there are identifiable cash flows that are largely independent of future cash flows from other asset groups. The Company’s estimates of future cash flows are based on numerous assumptions and it is possible that actual future cash flows will be significantly different than the estimates, as actual future quantities of recoverable minerals, gold and other commodity prices, production levels and operating costs of production and capital are each subject to significant risks and uncertainties.
Revenue Recognition
Revenue is recognized, net of treatment and refining charges, from a sale when persuasive evidence of an arrangement exists, the price is determinabie, the product has been delivered, the title has been transferred to the customer and collection of the sales price is reasonably assured. Revenues from silver and copper sales are credited to Costs applicable to sales as a by-product credit.
Concentrate sales are initially recorded based on provisional sales prices. Until final settlement occurs, adjustments to provisional sales prices are made to take into account the mark-to-market changes based on the forward prices for the estimated month of settlement, For changes in metal quantities upon receipt of new information and assay, the provisional sales quantities are adjusted as well.
The Company’s sales based on a provisional price contain an embedded derivative that is required to be separated from the host contract for accounting purposes. The host contract is the receivable from the sale of the concentrates at the forward exchange price at the time of sale. The embedded derivative, which does not qualify for hedge accounting, is marked to market through earnings each period prior to final settlement.
Income Tax and Profit Sharing
The Company accounts for income tax and legally required profit sharing using the liability method, recognizing certain temporary differences between the financial reporting basis of the Company’s liabilities and assets and the related income tax basis for such liabilities and assets. This method generates a net deferred income tax liability and profit sharing liability or net deferred income tax asset and profit sharing asset for the Company, as measured by the statutory tax and profit sharing rates in effect as enacted. The Company derives its deferred income tax charge or benefit and profit sharing charge or benefit by recording the change in the net deferred income tax liability and profit sharing liability or net deferred income tax asset and profit sharing asset balance for the year, based on Peruvian income tax and profit sharing rates.
The Company’s deferred income tax assets include certain future tax benefits. The Company records a valuation allowance against any portion of those deferred income tax assets when it believes, based on the weight of available evidence, it is more likely than not that some portion or all of the deferred income tax asset will not be realized.
Reclamation and Remediation Costs
Asset retirement obligations are recognized when incurred and recorded as liabilities at fair value. The liability is accreted over time through periodic charges to earnings. In addition, the asset retirement cost is capitalized as part of the asset’s carrying value and amortized over the life of the related asset. Reclamation costs are periodically adjusted to reflect changes in the estimated present value resulting from the passage of time and revisions to the estimates of either the timing or amount of the reclamation and abandonment costs. The retirement obligation is based on when spending for an existing environmental disturbance will occur. The Company reviews, on an annual basis, unless otherwise deemed necessary, the retirement obligation at each mine site in accordance with accounting for asset retirement obligations.
Future remediation costs for inactive mines are accrued based on management’s best estimate at the end of each period of the costs expected to be incurred at a site. Such cost estimates include, where applicable, ongoing care, maintenance and monitoring costs. Changes in estimates at inactive mines are reflected in earnings in the period an estimate is revised.
Comprehensive Income
In addition to Net income, Comprehensive income (loss) includes all changes in equity during a period, such as cumulative unrecognized changes in fair value of marketable securities available-for-sale or other investments, except those resulting from investments by and distributions to owners.
Reclassifications
Certain amounts in prior years have been reclassified to conform to the 2010 presentation. The Company reclassified certain income based taxes from Costs applicable to sales to Income and mining tax expense, and reclassified reclamation accretion and estimate revisions for non-operating sites from Other expense, net to Reclamation and remediation.
Recently Adopted Accounting Pronouncements
Variable Interest Entities
In June 2009, the ASC guidance for consolidation accounting was updated to require an entity to perform a qualitative analysis to determine whether the enterprise’s variable interest gives it a controlling financial interest in a VIE. This qualitative analysis identifies the primary beneficiary of a VIE as the entity that has both of the following characteristics: (i) the power to direct the activities of a VIE that most significantly impact the entity’s economic performance and (ii) the obligation to absorb losses or receive benefits from the entity that could potentially be significant to the VIE. The updated guidance also requires ongoing reassessments of the primary beneficiary of a VIE. Adoption of the updated guidance, effective for the Company’s fiscal year beginning January 1, 2010, had no impact on the Company’s consolidated financial position, results of operations or cash flows.
Fair Value Accounting
In January 2010, ASC guidance for fair value measurements and disclosure was updated to require additional disclosures related to transfers in and out of level 1 and 2 fair value measurements. The guidance was amended to clarify the level of disaggregation required for assets and liabilities and the disclosures required for inputs and valuation techniques used to measure the fair value of assets and liabilities that fall in either level 2 or level 3. The updated guidance was effective for the Company’s fiscal year beginning January 1, 2010. The adoption had no impact on the Company’s consolidated financial position, results of operations or cash flows. Refer to Note 20 for further details regarding the Company’s assets and liabilities measured at fair value.
Recently Issued Accounting Pronouncements
Business Combinations
In December 2010, the ASC guidance for business combinations was updated to clarify existing guidance which requires a public entity to disclose pro forma revenue and earnings of the combined entity as though the business combination(s) that occurred during the current year had occurred as of the beginning of the comparable prior annual period only. The update also expands the supplemental pro forma disclosures required to include a description of the nature and amount of material, nonrecurring pro forma adjustments directly attributable to the business combination included in the reported pro forma revenue and earnings. The updated guidance is effective for the Company’s fiscal year beginning January 1, 2011. The Company does not expect any impact from adopting this guidance.
Fair Value Accounting
In January 2010, the ASC guidance for fair value measurements and disclosure was updated to require enhanced detail in the level 3 reconciliation. The updated guidance is effective the Company’s fiscal year beginning January 1, 2011. The Company expects minimal impact from adopting this guidance.
| | | | |
| | | | | | | | | | |
| Negotiated payment | | $ | 13,346 | | | $ | 28,019 | | | $ | 18,492 | |
| Community development and external affairs | | | 16,002 | | | | 21,673 | | | | 39,251 | |
| Regional administration | | | 20,725 | | | | 18,477 | | | | 14,223 | |
| World Gold Council dues | | | 3,824 | | | | 3,602 | | | | 3,168 | |
| Write-down of long-lived assets | | | 312 | | | | 2,923 | | | | 442 | |
| Choropampa mercury spill (Note 19) | | | 119 | | | | 606 | | | | (5,941 | ) |
| Other | | | 3,986 | | | | 1,755 | | | | 5,783 | |
| | | $ | 58,314 | | | $ | 77,055 | | | $ | 75,418 | |
The 2008 Choropampa mercury spill includes $14,387 reimbursed by the insurers for legal fees and expenses.
Negotiated Payment
During 2006 mining companies represented by the Sociedad Nacional de Mineria, Petróleo y Energia (SNMPE) agreed to a mining payment equivalent to 3.75% of Peruvian net income after taxes. This agreement was valid through 2010. The funds are managed by an association designated by the Company. Mining companies contributed these funds to participate in the government efforts to eradicate poverty in Peru in the current favorable economic environment.
In December 2006, the Peruvian Government approved legislation regulating the conditions in which the negotiated payment was paid by Peruvian mining companies. The payment amounts to 3.75% of Peruvian net income after income tax (2.75% paid to a Local Mining Fund and 1% paid to a Regional Mining Fund), payable for 2006 and the following four years if certain conditions were met.
| | | | |
| | | | | | | | | | |
| Interest income | | $ | 2,196 | | | $ | 3,832 | | | $ | 11,636 | |
| Income from developing projects, net | | | 2,171 | | | | — | | | | — | |
| Foreign currency exchange gain (loss) | | | 998 | | | | (2,490 | ) | | | (1,592 | ) |
| Gain (loss) on sale of assets | | | (208 | ) | | | 815 | | | | 236 | |
| Other | | | 2,156 | | | | 1,729 | | | | 959 | |
| | | $ | 7,313 | | | $ | 3,886 | | | $ | 11,239 | |
Tax Stabilization Agreements
The Company has entered into the following tax stability agreements, each with a term of 15 years:
| | | | Date of the Tax Agreement | | |
| | | | | | | |
| Carachugo/San José | | January 1, 1995 | | May 19, 1994 | | October 29, 1999 |
| Maqui Maqui | | January 1, 1997 | | September 12, 1994 | | May 6, 1994 |
| Cerro Yanacocha | | January 1, 2000 | | September 16, 1998 | | May 22, 1997 |
| La Quinua | | January 1, 2004 | | August 25, 2003 | | August 25, 2003 |
These agreements guarantee the Company’s use of the tax regimes shown in the table above and permit maintenance of its accounting records in U.S. dollars.
The Carachugo/San José tax stability agreement is no longer in effect beginning January 1, 2010, as 15 years have lapsed.
The Company has determined the taxable income according to its understanding, and that of its legal advisors, of the applicable tax legislation. This legislation requires adding to and deducting from accounting income as determined in the financial statements, those items that the referred legislation recognizes as taxable and non-taxable, respectively.
For the years ended December 31, 2010, 2009 and 2008 the income tax rate was 30% except for the La Quinua mine for which the required 29% income tax rate applied.
Reinvestment of Earnings
Mining companies are allowed to obtain a tax benefit by effectively reinvesting those non-distributed earnings into capital expansion projects that increase the Company’s productivity (“Reinvestment Program”). The tax benefit is based on earnings effectively obtained and up to the maximum amount of the Reinvestment Program applied to and approved by the Ministry of Energy and Mines (“MEM”), amount that must be presented as Restricted earnings.
In 2003, the Company received a resolution from the MEM, in which it approved the Reinvestment Program for the years 2001 to 2004 for an amount of $189,600. In 2004, the Company transferred $189,600 from Retained earnings to Restricted earnings according with the above Reinvestment Program in prior years. The reinvestment tax benefit reduced income tax expense by $56,900.
In 2004, the Company took a benefit on only 80% of the Investment Credit based on an initial interpretation of the law. However, in 2008, based on an updated opinion from the Company’s legal advisors, the Company could have taken the tax benefit on 100% of the Investment Credit approved in the Reinvestment Program.
Based on this new evaluation, the Company recorded in 2008 a tax receivable of $11,400 in Other current assets with a corresponding reduction to Income tax expense, related to the 20% remaining tax benefit from its 2001 - 2004 Reinvestment Program as final assessments were completed.
Peruvian Income Tax and Workers’ Profit Participation
The current income tax and workers’ profit participation expense (Note 13) was determined as follows:
| | | | |
| | | | | | | | | | |
| Income before workers' profit participation and income tax in accordance with Peruvian GAAP | | $ | 941,101 | | | $ | 1,130,731 | | | $ | 728,940 | |
| Plus: | | | | | | | | | | | | |
| Non-deductible expenses | | | 33,622 | | | | 48,492 | | | | 43,213 | |
| Reclamation (environmental) reserve liability | | | 24,944 | | | | 25,429 | | | | 22,159 | |
| Capitalized interest amortization | | | 4,879 | | | | 4,850 | | | | 4,761 | |
| Contingencies and commitments' accruals | | | 1,777 | | | | 682 | | | | 10,309 | |
| San Jose Reservoir amortization | | | — | | | | — | | | | 3,102 | |
| Accounts receivable write-off | | | 112 | | | | — | | | | 2,753 | |
| Provision for obsolescence of inventories | | | 1,195 | | | | — | | | | 2,023 | |
| Provision for government mining royalties | | | 1,608 | | | | — | | | | — | |
| Other | | | 6,963 | | | | 6,423 | | | | 3,855 | |
| | | | 75,100 | | | | 85,876 | | | | 92,175 | |
| Less: | | | | | | | | | | | | |
| Amortization and mineral interests | | | (11,211 | ) | | | (1,867 | ) | | | (30,722 | ) |
| Tax depreciation rate adjustment | | | (19,872 | ) | | | (37,410 | ) | | | — | |
| Kuntur Wasi road construction tax benefit | | | — | | | | (23,423 | ) | | | (13,038 | ) |
| Reclamation (environmental) reserve expense | | | (5,191 | ) | | | (4,091 | ) | | | (6,800 | ) |
| Capitalized interest | | | (4,404 | ) | | | (4,212 | ) | | | (5,002 | ) |
| Leasing benefit | | | (5,796 | ) | | | (4,979 | ) | | | (2,872 | ) |
| Other | | | — | | | | (6,905 | ) | | | — | |
| | | | (46,474 | ) | | | (82,887 | ) | | | (58,434 | ) |
| Base to calculate workers' profit participation | | | 969,727 | | | | 1,133,720 | | | | 762,681 | |
| Workers' profit participation (8%) | | | (77,578 | ) | | | (90,698 | ) | | | (61,015 | ) |
| Taxable income | | $ | 892,149 | | | $ | 1,043,022 | | | $ | 701,666 | |
| | | | | | | | | | | | | |
| Income tax (30%) | | $ | 267,645 | | | $ | 312,907 | | | $ | 210,500 | |
| Credit for charitable donations | | | (930 | ) | | | (936 | ) | | | (976 | ) |
| Adjustment due to income tax rate applicable to La Quinua | | | (1,615 | ) | | | (1,901 | ) | | | (1,965 | ) |
| Current income tax | | $ | 265,100 | | | $ | 310,070 | | | $ | 207,559 | |
Income Tax - Reconciliation from Peru Tax Return to Income Tax Expense and Tax Balance Sheets
The Company’s income tax provision consisted of the following:
| | | | |
| | | | | | | | | | |
| Current Peru tax return | | $ | 265,100 | | | $ | 310,070 | | | $ | 207,559 | |
| Income tax prior year adjustments | | | 505 | | | | (642 | ) | | | (12,526 | ) |
| Current | | | 265,605 | | | | 309,428 | | | | 195,033 | |
| Deferred | | | 3,932 | | | | 25,413 | | | | 1,024 | |
| Current state local tax | | | 136 | | | | 452 | | | | — | |
| Income tax expense | | $ | 269,673 | | | $ | 335,293 | | | $ | 196,057 | |
Income tax prior year adjustments in 2008 are mainly related to the remaining tax benefit from the 2001-2004 Reinvestment Program.
Income tax expense differs from the amount computed by applying the statutory Peruvian corporate income tax rate of 30% to pre-tax income as a result of the following:
| | | | |
| | | | | | | | | | |
| Income before tax provision | | $ | 859,567 | | | $ | 1,062,369 | | | $ | 672,519 | |
| Peruvian statutory rate | | | 30 | % | | | 30 | % | | | 30 | % |
| income tax at statutory rate | | | 257,870 | | | | 318,711 | | | | 201,756 | |
| income tax recognized through amendment of tax returns | | | — | | | | — | | | | (11,376 | ) |
| Adjustment due to income tax rate applicable to La Quinua | | | (1,615 | ) | | | (1,901 | ) | | | (1,965 | ) |
| Negotiated payment | | | 4,004 | | | | 8,406 | | | | 5,548 | |
| Donations | | | 4,399 | | | | 5,270 | | | | 4,587 | |
| Other (non-deductible expenses and tax credits) | | | 5,015 | | | | 4,807 | | | | (2,493 | ) |
| Total income tax expense | | $ | 269,673 | | | $ | 335,293 | | | $ | 196,057 | |
Components of deferred income tax liabilities and assets were as follows:
| | | | |
| | | | | | | |
| Deferred tax assets: | | | | | | |
| Reclamation and remediation costs | | $ | 33,080 | | | $ | 29,494 | |
| Accounts payable and accrued expenses | | | 4,587 | | | | 3,982 | |
| Deferred workers' profit participation | | | 5,445 | | | | 5,149 | |
| Other | | | 3,501 | | | | 7,057 | |
| | | | 46,613 | | | | 45,682 | |
| Deferred tax liabilities: | | | | | | | | |
| Property, plant and mine development costs | | | (92,035 | ) | | | (90,100 | ) |
| Inventories | | | (17,203 | ) | | | (14,097 | ) |
| Debt issuance costs | | | — | | | | (229 | ) |
| Other | | | (1,041 | ) | | | (505 | ) |
| | | | (110,279 | ) | | | (104,931 | ) |
| Net deferred tax liability | | $ | (63,666 | ) | | $ | (59,249 | ) |
| | | At December 31, | |
| | | | | | | |
| Current deferred tax assets | | $ | 8,746 | | | $ | 8,746 | |
| Less: | | | | | | | | |
| Non-current deferred tax liabilities | | | (72,412 | ) | | | (67,995 | ) |
| Net deferred tax liability | | $ | (63,666 | ) | | $ | (59,249 | ) |
The Company adopted updated accounting guidance on January 1, 2007 which clarifies the accounting and reporting for uncertainties in the application of the income tax laws to the Company’s operations. The guidance prescribes a comprehensive model for the financial statement recognition, measurement, presentation and disclosure of uncertain tax positions taken or expected to be taken in income tax returns. At December 31, 2010 and 2009, the Company had $5,566 of total gross unrecognized tax benefits that, if recognized, would impact the Company’s effective income tax rate, A reconciliation of the beginning and ending amount of gross unrecognized tax benefits is as follows:
| | | | | | | |
| Total amount of gross unrecognized tax benefits at the beginning of year | | $ | 5,566 | | | $ | 5,566 | |
| Additions for tax positions of prior years | | | — | | | | — | |
| Additions for tax positions of current year | | | — | | | | — | |
| Reductions due to settlements with taxing authorities | | | — | | | | — | |
| Reductions due to lapse of statute of limitations | | | — | | | | — | |
| Total amount of gross unrecognized tax benefits at end of year | | $ | 5,566 | | | $ | 5,566 | |
| | | | |
| | | | | | | |
| Value added tax credit | | $ | 11,776 | | | $ | 16,879 | |
| Tax receivable | | | 5,662 | | | | 5,662 | |
| Trade accounts receivable | | | 5,524 | | | | 8,113 | |
| Employee receivables | | | 366 | | | | 657 | |
| Other | | | 2,479 | | | | 1,342 | |
| | | $ | 25,807 | | | $ | 32,653 | |
| | | | |
| | | | | | | |
| Leach in-process | | $ | 4,969 | | | $ | 3,102 | |
| Mill in circuit | | | 2,863 | | | | 1,096 | |
| Precious metals | | | 803 | | | | 1,915 | |
| Materials and supplies | | | 47,306 | | | | 39,964 | |
| | | $ | 55,941 | | | $ | 46,077 | |
| 8. | Stockpiles and Ore on Leach Pads |
| | | | |
| | | | | | | |
| Current: | | | | | | |
| Stockpiles | | $ | 12,333 | | | $ | 33,433 | |
| Ore on leach pads | | | 154,665 | | | | 139,014 | |
| | | $ | 166,998 | | | $ | 172,447 | |
| Non-current: | | | | | | | | |
| Stockpiles | | $ | 56,859 | | | $ | — | |
| Ore on leach pads | | | 272,015 | | | | 197,554 | |
| | | $ | 328,874 | | | $ | 197,554 | |
| | | | |
| | | | | | | |
| Other current assets: | | | | | | |
| Prepayments to suppliers and contractors | | $ | 2,972 | | | $ | 5,284 | |
| Claims for tax refunds | | | 4,038 | | | | 4,038 | |
| Restricted cash | | | 512 | | | | 226 | |
| Prepaid expenses and other | | | 6,513 | | | | 8,628 | |
| | | $ | 14,035 | | | $ | 18,176 | |
| Other long-term assets: | | | | | | | | |
| San Jose Reservoir Trust assets | | $ | 16,412 | | | $ | 14,930 | |
| Other receivables,. | | | — | | | | 3,588 | |
| Other | | | 189 | | | | 804 | |
| | | $ | 16,601 | | | $ | 19,322 | |
| 10. | Property, Plant and Mine Development, Net |
| | | At December 31, 2010 | | | At December 31, 2009 | |
| | | | | | | | | | | | | | | | | | | |
| Land | | $ | 52,322 | | | | — | | | | 52,322 | | | $ | 40,581 | | | $ | — | | | $ | 40,581 | |
| Facilities and equipment | | | 2,198,614 | | | | (1,506,706 | ) | | | 691,908 | | | | 2,139,835 | | | | (1,368,284 | ) | | | 771,551 | |
| Mine development | | | 478,552 | | | | (241,463 | ) | | | 237,089 | | | | 431,614 | | | | (206,099 | ) | | | 225,515 | |
| Mineral interests | | | 69,482 | | | | (7,738 | ) | | | 61,744 | | | | 68,391 | | | | (7,375 | ) | | | 61,016 | |
| Asset retirement cost | | | 235,866 | | | | (107,822 | ) | | | 128,044 | | | | 148,851 | | | | (97,510 | ) | | | 51,341 | |
| Construction-in-progress | | | 266,193 | | | | — | | | | 266,193 | | | | 84,690 | | | | — | | | | 84,690 | |
| | | $ | 3,301,029 | | | | (1,863,729 | ) | | | 1,437,300 | | | $ | 2,913,962 | | | $ | (1,679,268 | ) | | $ | 1,234,694 | |
| Leased assets included above in facilities and equipment | | $ | 74,367 | | | | (45,363 | ) | | | 29,004 | | | $ | 75,295 | | | $ | (40,195 | ) | | $ | 35,100 | |
Construction-in-progress for 2010 of $266,193 primarily related to project development costs for Conga, surface mine development, the construction of an alternative road to the coast, and leach pads expansion.
Construction-in-progress for 2009 of $84,690 primarily related to project infrastructure, a water treatment plant and a tailings pipeline.
The additions to Asset Retirement cost in 2010 include $87,015 due mainly to increased unit costs for Carachugo and La Quinua areas.
| | | Estimated Useful Lives of | | |
| Facilities and equipment | | Facilities | | 12 to 25 |
| | | Leach pads | | 5 |
| | | Equipment | | 7 to 10.5 |
| | | Ail remaining assets | | 5 |
| Mine development | | UOP based on ounces mined | | 8 to 21 |
| Mineral interests | | UOP for producing property | | 12 |
| Asset retirement cost | | Related asset | | 5 to 15 |
| | | | | | | |
| | | | | | | | | | | | | | | | | | | |
| Mineral interests: | | | | | | | | | | | | | | | | | | |
| Production stage | | $ | 31,817 | | | $ | (7,379 | ) | | $ | 24,438 | | | $ | 30,862 | | | $ | (7,016 | ) | | $ | 23,846 | |
| Development stage | | | 20,298 | | | | (174 | ) | | | 20,124 | | | | 20,298 | | | | (174 | ) | | | 20,124 | |
| Exploration stage | | | 17,367 | | | | (185 | ) | | | 17,182 | | | | 17,231 | | | | (185 | ) | | | 17,046 | |
| | | $ | 69,482 | | | $ | (7,738 | ) | | $ | 61,744 | | | $ | 68,391 | | | $ | (7,375 | ) | | $ | 61,016 | |
| | | | |
| | | | | | | |
| Credit facility | | $ | — | | | $ | 62,069 | |
| Bonds: | | | | | | | | |
| Floating rate | | | — | | | | 42,000 | |
| Fixed rate | | | — | | | | 58,000 | |
| Truck leases | | | 1,959 | | | | 16,267 | |
| | | | 1,959 | | | | 178,336 | |
| Less current portion | | | (1,959 | ) | | | (36,101 | ) |
| | | $ | — | | | $ | 142,235 | |
Credit Facility
During 2009, the Company made four quarterly payments on the credit facility for a total amount of $13,793. During 2010, the company made three quarterly payments on the credit facility for a total of $10,344 and the remaining balance of $51,724 was repaid in November.
During 2006, the Company entered into an uncollateralized $100,000 bank financing with a syndicate of Peruvian commercial banks. Quarterly repayments of $3,448 started in May 2007 with final maturity in May 2014. Borrowings under the facility have beard interest at a rate of LIBOR plus 1.875%.
Bonds
In 2010, the Company made one payment on the bonds for a total amount of $4,000. In October, the Company fully repaid the outstanding balances of the bonds for a total amount of $96,000. During 2006, the Company issued $100,000 of bonds into the Peruvian capital markets comprised of $42,000 of floating interest rate bonds bearing interest at a rate of LIBOR plus 1.4375% and $58,000 of fixed rate bonds bearing an annual interest of 7.0%. Quarterly repayments of $4,000 began in July 2010 for six years. The bonds are uncollateralized.
Truck Leases
During 2010 and 2009, the Company made monthly payments on truck leases totaling $14,308 and $13,490, respectively.
Banco de Crédito del Perú
In September 2007, the Company entered into a leasing contract with Banco de Crédito del Perú related to the acquisition of nine haul trucks for a total of $24,498, with a purchase option. The lease period is three years bearing annual interest at a rate of 6.10%. The trucks were delivered in 2007 and monthly repayments began in January 2008. At December 31, 2010 the leasing contract was fully repaid.
Scotiabank
In December 2007, the Company entered into a leasing contract with Scotiabank related to the acquisition of six haul trucks for a total of $16,332, with a purchase option. One truck was delivered in 2007, while the remaining five trucks were delivered in 2008. The lease period is three years bearing annual interest at a rate of 6.00% and monthly repayments began in May 2008.
Compliance with Covenants
The financing agreements required the Company to comply with certain financial covenants including debt coverage ratios. In addition, there were covenants addressing the extent to which, the Company could incur additional indebtedness and distributions of earnings to the Partners. As of the date of full repayment of the bonds and the credit facility, the Company was in compliance with these covenants.
| 12. | Due To/From Related Parties |
The Company has the following amounts due from and to related parties:
| | | | |
| | | | | | | |
| Due from related parties: | | | | | | |
| Newmont Insurance Limited | | $ | 1,000 | | | $ | 4,000 | |
| Suriname Gold | | | 583 | | | | — | |
| Newmont Peru S.R.L | | | 174 | | | | 170 | |
| Newmont Santa Fe Pacific Chile | | | 31 | | | | 10 | |
| Newmont USA Limited | | | 16 | | | | 16 | |
| | | $ | 1,804 | | | $ | 4,196 | |
| | | At December 31, | |
| | | | | | | |
| Due to related parties: | | | | | | |
| S.M.R.L. Chaupiloma Dos de Caiamarca | | $ | 14,414 | | | $ | 17,521 | |
| Newmont Peru S.R.L. | | | 11,621 | | | | 5,307 | |
| Newmont Technologies Limited | | | 5,162 | | | | 3,534 | |
| Newmont USA Limited | | | 5,871 | | | | 1,144 | |
| Newmont Santa Fe Pacific Chile | | | 1,015 | | | | 85 | |
| | | $ | 38,083 | | | $ | 27,591 | |
Management, exploration, mine development, engineering and employment services are provided pursuant to contracts with affiliates. The corresponding charges totaled $65,115 and $54,970 in 2010 and 2009, respectively.
As described in Note 1, the Company pays to Chaupiloma a 3% royalty based on quarterly production sold at current market prices, after deducting refinery and transportation costs. Royalty expense totaled $55,765, $62,317 and $48,584 in 2010, 2009 and 2008, respectively and is included in Costs applicable to sales.
| 13. | Workers’ Profit Participation |
In accordance with Peruvian legislation, the Company maintains an employee profit sharing plan equal to 8% of annual taxable income. Distributions to employees under the plan are based 50% on the number of days that each employee worked during the preceding year and 50% on proportionate annual salary levels.
In 2010, 2009 and 2008, the current expense portion of workers’ profit participation amounted to $77,578, $90,698 and $61,015, respectively, which was included in Costs applicable to sales. In 2010 and 2009, $136 and $452, respectively, corresponding to the excess over the amount to be paid to the employees, was classified as Income tax expense.
Peruvian law limits payments of annual profit sharing per employee to eighteen months salary but continues to base total profit sharing on 8% of taxable income, notwithstanding the per employee limitation. Supreme Decree N°009-98-TR, published on August 6, 1998, provides that the excess of total profit sharing for the year over aggregate profit sharing payable to all employees be paid to the Fondo Nacional de Capacitación Laboral y de Promoción del Empleo (“FONDOEMPLEO”). Law 28464 published in January 2005, which modified art.3 of Law Decree 892, provides that the excess of total profit sharing for the year over aggregate profit sharing payable to all employees be applied to training of employees and construction of public facilities. Supreme Decree N° 002-2005-TR, published in May 6, 2005, establishes a limit of 2,200 UIT (inflation measurement unit, of S/.3,600 new Peruvian sol at December 31, 2010) in the contributions to FONDOEMPLEO indicating that the difference goes to the Regional Government.
In 1998, the Peruvian Government issued additional regulations regarding the calculation of the workers’ profit participation, which limited to 18 monthly salaries the total amount each employee is entitled to. However, there is a difference between the Law and its regulations. The Law establishes that the 18 months limit should be based upon 18 times the remuneration earned by the employee in December of the respective year. However the regulation established an average approach for the calculation, by means of which, the total of the compensation earned by the employee during the year divided by the number of months worked provides the monthly salary cap on which the limit of 18 salaries is then calculated (including any bonus paid).
The Company followed the criteria established by the Law in determining the amount to be paid to its employees since 1998. At December 31, 2006, the Company recorded a charge of $14,900, included in Other expenses, net, to cover any payment derived from the different criteria established to make these payments by both the law and the regulation. A decision on the applicable criteria was requested to the Court.
In August 2007, the Court enacted an arbitration decision confirming that the Company had paid in excess to FONDOEMPLEO and the Regional Government. This decision is considered the last instance and it cannot be appealed, however it is not binding to the Regional Government. In this regard, the Company, based on its best estimate, believed that the highest amount to be recovered from FONDOEMPLEO was only $3,900 of the $5,300 paid in excess. The remaining balance was charged to Other expense, net. In 2009 and 2008, the Company recovered $1,700 and $2,300, respectively, from FONDOEMPLEO.
| 14. | Other Current Liabilities |
| | | | |
| | | | | | | |
| Capital projects | | $ | 24,400 | | | $ | 10,814 | |
| Operating costs | | | 16,823 | | | | 11,729 | |
| Negotiated payment | | | 13,346 | | | | 28,424 | |
| Contractors fund retention guarantee | | | 9,005 | | | | 8,371 | |
| Payroll and other benefits | | | 8,457 | | | | 6,831 | |
| Reclamation and remediation | | | 7,575 | | | | 3,724 | |
| Income tax withholding | | | 5,731 | | | | 3,485 | |
| Taxes other than income tax | | | 5,655 | | | | 2,603 | |
| Deferred revenues | | | 3,627 | | | | 2,529 | |
| Interest payable | | | 96 | | | | 818 | |
| Other | | | 1,349 | | | | 140 | |
| | | $ | 96,064 | | | $ | 79,468 | |
| 15. | Reclamation and Remediation Liabilities |
The Company’s mining and exploration activities are subject to various laws and regulations governing the protection of the environment. These laws and regulations are continually changing and are generally becoming more restrictive. The Company conducts its operations so as to protect the public health and environment and believes its operations are in compliance with all applicable laws and regulations in all material respects. The Company has made, and expects to make in the future, expenditures to comply with such laws and regulations, but cannot predict the amount of such future expenditures, Estimated future reclamation costs are based principally on legal and regulatory requirements.
The liability corresponds primarily to activities to be performed in the reclamation and remediation of mining activities once the gold extraction process has been finished. These activities include reclamation of the mine sites, operating water treatment plants, revegetation and earthworks.
The following is a reconciliation of the tola! liability for reclamation and remediation:
| Balance at December 31, 2008 | | $ | 181,098 | |
| Additions, change in estimates and other, net | | | 1,412 | |
| Liabilities settled | | | (4,091 | ) |
| Accretion | | | 13,016 | |
| Balance at December 31 2009 | | $ | 191,435 | |
| Additions change in estimates and other net | | | 87,182 | |
| Liabilities settled | | | (5,191 | ) |
| Accretion | | | 14,464 | |
| Balance at December 31, 2010 | | $ | 287,890 | |
The current portion of Reclamation and remediation liabilities of $7,575 and $3,724 at December 31, 2010 and 2009, respectively, are included in Other current liabilities.
Increases in the asset retirement obligation in 2010 relate primarily to the projected remediation and reclamation costs for the expansion project, mainly at Carachugo and La Quinua; and in 2009 relate primarily to the expanded mining operations at La Quinua and Maqui Maqui.
Partners’ Contributions
Partners’ contributions represent 1,278,451,304 common partnership interests with a par value of one Peruvian Nuevo sol each, fully subscribed and paid. Such partnership interest includes 720,407,310 that are owned by foreign investors.
Under current Peruvian regulations, there is no restriction on remittance of dividends or repatriation of foreign investment, except as discussed in sections below.
The legal structure of the Company is that of a Limited Liability Partnership. The main characteristics of such structure are: (i) the number of Partners cannot exceed 20, (ii) the capital is represented by partnership interests, and (iii) there is no obligation to create a legal reserve,
Retained Earnings
Effective January 1, 2003, distribution of earnings for Partners other than legal entities domiciled in Peru is subject to a withholding tax of 4.1%.
Accumulated Other Comprehensive Income
At December 31, 2010 and 2009, the Company had net unrealized gains of $2,388 and $1,239, respectively, in Accumulated other comprehensive income related to unrealized profit of the San Jose Reservoir Trust.
| 17. | Supplemental Cash Flow Information |
Net cash provided from operations includes the following cash payments:
| | | | |
| | | | | | | | | | |
| Income tax paid | | $ | 332,954 | | | $ | 265,529 | | | $ | 184,234 | |
| Interest paid, net of amounts capitalized | | $ | 1,737 | | | $ | 8,925 | | | $ | 7,963 | |
| 18. | Major Customers and Export Sales |
The Company is not economically dependent on a limited number of customers for the sale of its product because gold can be sold through various commodity market traders worldwide. In 2010, sales to one customer accounted for $1,326,000 which represented 75% of total annual sales. In 2009, sales to one customer accounted for $1,489,000 which represented 74% of total annual sales. In 2008, sales to one customer accounted for $1,210,000 which represented 75% of total annual sales. All gold sales were made outside Peru.
| 19. | Commitments and Contingencies |
Tax Contingencies
Tax contingencies are provided for under ASC guidance (see Notes 2 and 5).
Peruvian Mining Royalty
During the second quarter of 2004, the Peruvian Government enacted legislation to establish a sliding scale mining royalty of up to 3% based on the volume of mine production. The royalty is calculated on revenue from sales of product less certain refining and transportation expenses. While the Peruvian royalty became effective during the second quarter of 2004, it does not apply to those projects that had stabilization agreements prior to the adoption of the royalty law. The Company’s current production is derived from projects that were stabilized prior to the enactment of the royalty legislation with the exception of the Carachugo/San Jose tax stabilization agreement which was no longer in effect beginning January 1, 2010; thus, during 2010, the Company accrued $13,481 and charged to Costs Applicable to Sates. Future production from non-stabilized projects, including the Carachugo/San Jose area could be subject to this royalty.
Unitization of Properties
in December 2000, as a result of the unitization plan carried out by the Partners, the Company signed several asset transfer and mining lease agreements with related entities. The main conditions are:
| | · | The Company must pay to Chaupiloma, 3% of the quarterly net sales, according to the lease agreement. The mining rights subject to this 3% royalty are those identified in the lease agreement as part of the “Area of Influence of Chaupiloma”. Some of these mining rights are in exploitation and the rest of them in exploration. |
| | · | The Company must pay to S.M.R.L Coshuro (“Coshuro”) and Buenaventura, 3% of the quarterly net sales, according to the transfer agreement. The mining rights subject to this 3% royalty are those identified in the transfer agreement, and are located out of the “Area of Influence of Chaupiloma” and within the “Area of Influence of the Joint Venture”. These mining rights are currently under exploration. |
| | · | The Company must pay to Los Tapados S.A., 3% of the quarterly net sales proceeds of mineral extracted from the transferred and leased concessions of Los Tapados S.A. The transferred and leased concessions of Los Tapados S.A. are also subject to a previously existing royalty on the minerals. These mining rights are currently under exploration. |
Legal Proceedings
Choropampa (mercury spill)
In June 2000, a transport contractor of Yanacocha spilled approximately 151 kilograms of elemental mercury near the town of Choropampa, Peru, which is located 53 miles (85 kilometers) southwest of the Yanacocha mine. Elemental mercury is not used in Yanacocha’s operations but is a by-product of gold mining and was sold to a Lima firm for use in medical instruments and industrial applications. A comprehensive health and environmental remediation program was undertaken by Yanacocha in response to the incident. In August 2000, Yanacocha paid under protest a fine of 1,740,000 Peruvian soles (approximately $600) to the Peruvian government. Yanacocha has entered into settlement agreements with a number of individuals impacted by the incident. As compensation for the disruption and inconvenience caused by the incident, Yanacocha entered into agreements with and provided a variety of public works in the three communities impacted by this incident. Yanacocha cannot predict the likelihood of additional expenditures related to this matter.
Additional lawsuits relating to the Choropampa incident were filed against Yanacocha in the local courts of Cajamarca, Peru, in May 2002 by over 900 Peruvian citizens. A significant number of the plaintiffs in these lawsuits entered into settlement agreements with Yanacocha prior to filing such claims. In April 2008, the Peruvian Supreme Court upheld the validity of these settlement agreements, which should result in the dismissal of all claims brought by previously settled plaintiffs. Yanacocha has also entered into settlement agreements with approximately 350 additional plaintiffs. The claims asserted by approximately 212 plaintiffs remain. In December 2010, the Company resolved 18 additional claims which should result in the dismissal of all claims brought by previously settled plaintiffs. Yanacocha can not reasonably predict the final outcome or estimate the possible loss relating to such claims.
Baños del Inca
In September 2006, the Municipality of Baños del Inca issued a declaration designating an area that includes the Carachugo Expansion and San Jose Projects as reserved and protected areas. Based on previous experience and actions taken by the Constitutional Tribunal (Peru Court of Last instance for Constitutional issues) in respect of Cerro Quilish in which it was ruled that such declaration did not affect the Company’s mining rights, the Company believes that Baños del Inca’s declaration, should not impact the Company’s legal rights to exploit these concessions.
In March 2008, the Lima Court rejected a Baños del Inca Municipality request which did not recognize Lima’s Jurisdiction. The legal proceeding is currently pending resolution in Lima’s Court of First Instance.
San Pablo
In February 2007 the Municipality of San Pablo issued an ordinance designating an area that includes Las Lagunas and Pozo Seco as reserved and protected areas, where the Company has mining rights. Based on previous experience and actions taken by the Constitutional Tribunal in respect of Cerro Quilish in which it was ruled that such declaration did not affect the Company’s mining rights, the Company believes that San Pablo’s declaration should not impact the Company’s legal rights to exploit these concessions. The Company has challenged this ordinance on the grounds that, under Peruvian law, local governments lack the authority to create such areas, denying the rights granted by the Company’s mining concessions. The Court in the First Instance rejected the complaint based on formal grounds. The resolution of the Court was appealed before Lima’s Court of Second Instance.
In November 2008, Lima’s Court affirmed the ruling from the First Instance,
In December 2010, the Constitutional Court rejected the Second Instance and confirmed the complaint should be submitted to the Second instance. The process is currently pending resolution.
Clínica Internacional, Addeco, SDC Security
Workers of three contractor companies (Clínica Internacional, Addeco, and SDC Security) have initiated judicial proceeding through which they demand their incorporation into Minera Yanacocha’s payroll. The workers deem they are direct employees of the Company with all the rights, arguing that they receive direct orders from Minera Yanacocha and that most of the equipment they use is given by the Company. All proceedings, which involve a total of 85 workers, are pending First instance resolution.
Fair value accounting establishes a fair value hierarchy that prioritizes the inputs to valuation techniques used to measure fair value. The hierarchy gives the highest priority to unadjusted quoted prices in active markets for identical assets or liabilities (Level 1 measurements) and the lowest priority to unobservable inputs (Level 3 measurements). The three levels of the fair value hierarchy are described below:
| | Level 1 | Unadjusted quoted prices in active markets that are accessible at the measurement date for identical, unrestricted assets or liabilities; |
| | Level 2 | Quoted prices in markets that are not active, or inputs that are observable, either directly or indirectly, for substantially the full term of the asset or liability; and |
| | Level 3 | Prices or valuation techniques that require inputs that are both significant to the fair value measurement and unobservable (supported by little or no market activity). |
The following table sets forth the Company’s assets measured at fair value on a recurring basis (at least annually) by level within the fair value hierarchy. As required by accounting guidance, assets and liabilities are classified in their entirety based on the lowest level of input that is significant to the fair value measurement.
| | | Fair Value at December 31, 2010 | |
| | | | | | | | | | | | | |
| Assets: | | | | | | | | | | | | |
| San Jose Reservoir Trust assets | | $ | 16,412 | | | $ | 16,412 | | | $ | — | | | $ | — | |
| Trade receivable from provisional silver, gold and copper concentrate sales, net | | | 5,524 | | | | 5,524 | | | | — | | | | — | |
| | | $ | 21,936 | | | $ | 21,936 | | | $ | — | | | $ | — | |
The Company’s San Jose Reservoir Trust assets are made up of marketable equity and debt securities that are valued using quoted market prices in active markets and as such are classified within Level 1 of the fair value hierarchy. The fair value of the marketable equity securities is calculated as the quoted market price of the marketable equity security multiplied by the quantity of shares held by the Company.
The Company’s net trade receivable from provisional silver, gold, and copper concentrate sales is valued using quoted market prices based on the forward the COMEX Silver Index, the London Bullion Market Association P.M. fix (“London P.M. fix”) (gold), and the London Metal Exchange (“LME”) (copper), and, as such, is classified within Level 1 of the fair value hierarchy.
Sociedad Minera Cerro Verde S.A.A.
Financial Statements as of December 31, 2010, 2009 and 2008 together with the Report of Independent Registered Public Accounting Firm
Contents
| Report of Independent Registered Public Accounting Firm | F-119 |
| | |
| Financial Statements | |
| | |
| Balance Sheets | F-120 |
| | |
| Statements of Income | F-121 |
| | |
| Statements of Changes in Shareholders’ Equity | F-122 |
| | |
| Statements of Cash Flows | F-123 |
| | |
| Notes to the Financial Statements | F-125 |
Report of Independent Registered Public Accounting Firm
| ERNST & YOUNG | Medina, Zaldivar, Paredes |
| | & Asociados Sociedad Civil |
To the Board of Directors and the Shareholders of Sociedad Minera Cerro Verde S.A.A.
We have audited the accompanying balance sheets of Sociedad Minera Cerro Verde S.A.A. (a Peruvian company, subsidiary of Freeport-McMoRan Copper & Gold Inc.) as of December 31, 2010 and 2009, and the related statements of income, shareholders’ equity and cash flows for the years ended December 31, 2010, 2009 and 2008. These financial statements are the responsibility of the Company’s management. Our responsibility is to express an opinion on these financial statements based on our audits.We conducted our audits in accordance with the auditing standards of the Public Company Accounting Oversight Board (United States). Those standards require that we plan and perform the audit to obtain reasonable assurance about whether the financial statements are free of material misstatement. We were not engaged to perform an audit of the Company’s internal control over financial reporting. Our audits included consideration of internal control over financial reporting as a basis of designing audit procedures that are appropriate in the circumstances, but not for the purpose of expressing an opinion on the effectiveness of the Company’s internal control over financial reporting. Accordingly, we express no such opinion. An audit also includes examining, on a test basis, evidence supporting the amounts and disclosures in the financial statements. An audit also includes assessing the accounting principles used and significant estimates made by management, as well as evaluating the overall financial statement presentation. We believe that our audits provide a reasonable basis for our opinion.
In our opinion, the financial statements referred to above present fairly, in all material respects, the financial position of Sociedad Minera Cerro Verde S.A.A. as of December 31, 2010 and 2009 and the results of its operations and its cash flows for each of the years ended December 31, 2010, 2009 and 2008, in conformity with generally accepted accounting principles in Peru, which differ in certain respects from U.S. generally accepted accounting principles (see notes 25, 26 and 27 to the financial statements).
Lima, Peru,
May 15, 2011
| Countersigned by: |
| |
| |
| /S/ MARCO ANTONIO ZALDÍVAR |
| Marco Antonio Zaldívar |
| C.P.C.C. Register No.12477 |
Sociedad Minera Cerro Verde S.A.A.
Balance Sheets
As of December 31, 2010 and 2009
| | Note | | 2010 | | | 2009 | |
| | | | US$(000) | | | US$(000) | |
| Assets | | | | | | | |
| Current Assets | | | | | | | |
| Cash and cash equivalents | 4 | | | 388,113 | | | | 203,391 | |
| Trade accounts receivable from third parties | | | | 27,593 | | | | 24,792 | |
| Trade accounts receivable from affiliates | 5 | | | 290,709 | | | | 216,562 | |
| Value added tax credit | | | | 7,219 | | | | 4,228 | |
| Embedded derivative related to price of copper | 20 | | | 133,217 | | | | 64,760 | |
| Other accounts receivable | | | | 14,974 | | | | 6,335 | |
| Inventories, net | 6 | | | 165,094 | | | | 156,319 | |
| Prepaid expenses | | | | 6,056 | | | | 4,178 | |
| Total current assets | | | | 1,032,975 | | | | 680,565 | |
| Other assets | 17(d) | | | 19,002 | | | | 49,535 | |
| Long-term inventories | 6 | | | 115,086 | | | | 91,235 | |
| Property, plant and equipment, net | 7 | | | 1,109,953 | | | | 1,082,051 | |
| Intangible, net | 17(c) | | | 8,149 | | | | 9,779 | |
| | | | | | | | | | |
| Total assets | | | | 2,285,165 | | | | 1,913,165 | |
| | | | | | | | | | |
| Liabilities and shareholders’ equity, net | | | | | | | | | |
| Current liabilities | | | | | | | | | |
| Trade accounts payable | 8 | | | 67,376 | | | | 39,798 | |
| Trade accounts payable to affiliates | 18(d) | | | 3,851 | | | | 2,719 | |
| Income tax payable | | | | 174,275 | | | | 83,792 | |
| Workers’ profit sharing payable | | | | 110,065 | | | | 48,254 | |
| Other accounts payable | 9 | | | 133,057 | | | | 76,516 | |
| Total current liabilities | | | | 488,624 | | | | 251,079 | |
| Provision for remediation and mine closure | 17(a) | | | 12,106 | | | | 18,642 | |
| Deferred income tax and workers’ profit sharing, net | 10(a) | | | 231,714 | | | | 158,040 | |
| Other accounts payable, long-term | 9 | | | 2,204 | | | | 39,310 | |
| Total liabilities | | | | 734,648 | | | | 467,071 | |
| Shareholders’ equity, net | 11 | | | | | | | | |
| Capital stock | | | | 990,659 | | | | 990,659 | |
| Legal reserve | | | | 198,132 | | | | 198,132 | |
| Retained earnings | | | | 361,726 | | | | 257,303 | |
| Total shareholders’ equity, net | | | | 1,550,517 | | | | 1,446,094 | |
| | | | | | | | | | |
| Total liabilities and shareholders’ equity, net | | | | 2,285,165 | | | | 1,913,165 | |
The accompanying notes are an integral part of these balance sheets.
Sociedad Minera Cerro Verde S.A.A.
Statements of Income
For the years ended December 31, 2010, 2009 and 2008
| | Note | | 2010 | | | 2009 | | | 2008 | |
| | | | US$(000) | | | US$(000) | | | US$(000) | |
| | | | | | | | | | | |
| Net sales | 13 | | | 2,368,988 | | | | 1,757,510 | | | | 1,835,911 | |
| | | | | | | | | | | | | | |
| Cost of sales | 14 | | | (571,363 | ) | | | (528,047 | ) | | | (596,741 | ) |
| Gross revenue | | | | 1,797,625 | | | | 1,229,463 | | | | 1,239,170 | |
| | | | | | | | | | | | | | |
| Operating Expenses | | | | | | | | | | | | | |
| Selling expenses | 15 | | | (76,638 | ) | | | (67,877 | ) | | | (78,190 | ) |
| Voluntary contribution | 17(b) | | | (41,081 | ) | | | (27,608 | ) | | | (29,496 | ) |
| Other operating expenses | 17(d) | | | (14,401 | ) | | | (9,718 | ) | | | (29,956 | ) |
| Operating income | | | | 1,665,505 | | | | 1,124,260 | | | | 1,101,528 | |
| | | | | | | | | | | | | | |
| Other income (expenses) | | | | | | | | | | | | | |
| Financial expenses | 16 | | | (101 | ) | | | – | | | | (7,853 | ) |
| Financial income | 16 | | | 1,261 | | | | 1,665 | | | | 20,278 | |
| Other, net | | | | 21 | | | | (3,796 | ) | | | (2,366 | ) |
| Profit before workers’ profit sharing and income tax | | | | 1,666,686 | | | | 1,122,129 | | | | 1,111,587 | |
| | | | | | | | | | | | | | |
| Workers’ profit sharing | | | | | | | | | | | | | |
| Current | 12(b) | | | (120,995 | ) | | | (57,740 | ) | | | (100,556 | ) |
| Deferred | 10(a) | | | (16,556 | ) | | | (35,205 | ) | | | 12,207 | |
| Income tax | | | | | | | | | | | | | |
| Current | 12(b) | | | (417,594 | ) | | | (199,197 | ) | | | (346,919 | ) |
| Deferred | 10(a) | | | (57,118 | ) | | | (121,459 | ) | | | 42,114 | |
| | | | | | | | | | | | | | |
| Net Income | | | | 1,054,423 | | | | 708,528 | | | | 718,433 | |
| | | | | | | | | | | | | | |
| Basic and diluted earnings per share (stated in U.S dollars) | 19 | | | 3.01 | | | | 2.02 | | | | 2.05 | |
| Weighted average number of shares outstanding | 19 | | | 350,056,012 | | | | 350,056,012 | | | | 350,056,012 | |
The accompanying notes are an integral part of these financial statements.
Sociedad Minera Cerro Verde S.A.A.
Statements of Changes in Shareholders’ Equity
For the years ended December 31, 2010, 2009 and 2008
| | | Capital stock | | | Additional paid-in capital | | | Legal Reserve | | | Restricted earnings | | | Retained earnings | | | Total | |
| | | US$(000) | | | US$(000) | | | US$(000) | | | US$(000) | | | US$(000) | | | US$(000) | |
| | | | | | | | | | | | | | | | | | | |
| Balance as of January 1, 2008 | | | 189,030 | | | | 375,660 | | | | 37,845 | | | | 800,030 | | | | 43,177 | | | | 1,445,742 | |
| | | | | | | | | | | | | | | | | | | | | | | | | |
| Dividend distributions, note 11(f) | | | – | | | | – | | | | – | | | | – | | | | (840,000 | ) | | | (840,000 | ) |
| Net income | | | – | | | | – | | | | – | | | | – | | | | 718,433 | | | | 718,433 | |
| Balance as of December 31, 2008 | | | 189,030 | | | | 375,660 | | | | 37,845 | | | | 800,030 | | | | (78,390 | ) | | | 1,324,175 | |
| | | | | | | | | | | | | | | | | | | | | | | | | |
| Premium capital distribution, note 11(b) | | | – | | | | (215,000 | ) | | | – | | | | – | | | | – | | | | (215,000 | ) |
| Recovery of dividends paid in excess in 2008, note 11 (f) | | | – | | | | – | | | | – | | | | – | | | | 78,390 | | | | 78,390 | |
| Dividend distributions, note 11(f) | | | – | | | | – | | | | – | | | | – | | | | (450,000 | ) | | | (450,000 | ) |
| Capitalization of restricted earnings, note 11(b) and 11(d) | | | 801,629 | | | | (1,599 | ) | | | – | | | | (800,030 | ) | | | – | | | | – | |
| Transfer to legal reserve, note 11(b) | | | – | | | | (159,061 | ) | | | 160,287 | | | | – | | | | (1,225 | ) | | | 1 | |
| Net income | | | – | | | | – | | | | – | | | | – | | | | 708,528 | | | | 708,528 | |
| Balance as of December 31, 2009 | | | 990,659 | | | | – | | | | 198,132 | | | | – | | | | 257,303 | | | | 1,446,094 | |
| | | | | | | | | | | | | | | | | | | | | | | | | |
| Dividend distributions, note 11(f) | | | – | | | | – | | | | – | | | | – | | | | (950,000 | ) | | | (950,000 | ) |
| Net income | | | – | | | | – | | | | – | | | | – | | | | 1,054,423 | | | | 1,054,423 | |
| | | | | | | | | | | | | | | | | | | | | | | | | |
| Balance as of December 31, 2010 | | | 990,659 | | | | – | | | | 198,132 | | | | – | | | | 361,726 | | | | 1,550,517 | |
The accompanying notes are an integral part of these financial statements.
Sociedad Minera Cerro Verde S.A.A.
Statements of Cash Flows
For the years ended December 31, 2010, 2009 and 2008
| | | 2010 | | | 2009 | | | 2008 | |
| | | US$(000) | | | US$(000) | | | US$(000) | |
| | | | | | | | | | |
| Operating activities | | | | | | | | | |
| Net income | | | 1,054,423 | | | | 708,528 | | | | 718,433 | |
| Adjustments to net income that do not affect net cash flow from operating activities | | | | | | | | | | | | |
| Depreciation | | | 86,326 | | | | 77,971 | | | | 79,035 | |
| Deferred income tax and workers’ profit sharing | | | 73,674 | | | | 156,664 | | | | (54,321 | ) |
| Amortization of intangible assets | | | 1,630 | | | | (100 | ) | | | 1,711 | |
| Accretion expense due to mine closure accrual | | | 1,301 | | | | 1,698 | | | | 1,310 | |
| Other | | | (372 | ) | | | (14 | ) | | | (314 | ) |
| Amortization of debt issuance costs | | | - | | | | - | | | | 4,986 | |
| Net changes in operating assets and liabilities accounts | | | | | | | | | | | | |
| Net decrease (net increase) in operating assets | | | | | | | | | | | | |
| Trade accounts receivable from third parties | | | (2,801 | ) | | | (16,080 | ) | | | 31,444 | |
| Trade accounts receivable from affiliates | | | (74,147 | ) | | | (127,519 | ) | | | 117,470 | |
| Value added tax credit | | | (2,991 | ) | | | 7,386 | | | | (5,759 | ) |
| Embedded derivative related to price of copper | | | (68,457 | ) | | | (64,760 | ) | | | - | |
| Other accounts receivable | | | (8,639 | ) | | | (5,029 | ) | | | (306 | ) |
| Inventories | | | (32,101 | ) | | | 1,638 | | | | (115,185 | ) |
| Prepaid expenses | | | (1,878 | ) | | | 2,587 | | | | (3,726 | ) |
| Other assets | | | 30,533 | | | | (783 | ) | | | (48,752 | ) |
| Net Increase (net decrease) in operating liabilities | | | | | | | | | | | | |
| Trade accounts payable | | | 27,578 | | | | (46,192 | ) | | | 35,596 | |
| Trade accounts payable to affiliates | | | 1,132 | | | | (3,678 | ) | | | (1,695 | ) |
| Embedded derivative related to price of copper | | | - | | | | (255,035 | ) | | | 205,269 | |
| Income tax payable | | | 90,483 | | | | (8,030 | ) | | | (46,184 | ) |
| Workers’ profit sharing payable | | | 61,811 | | | | (43,727 | ) | | | (7,668 | ) |
| Other accounts payable | | | 19,436 | | | | 14,064 | | | | (7,473 | ) |
| Net cash and cash equivalents provided by operating activities | | | 1,256,941 | | | | 399,589 | | | | 903,871 | |
Statements of Cash Flows (continue)
| | | 2010 | | | 2009 | | | 2008 | |
| | | US$(000) | | | US$(000) | | | US$(000) | |
| | | | | | | | | | |
| Investing activities | | | | | | | | | |
| Purchase of property, plant and equipment | | | (122,256 | ) | | | (91,559 | ) | | | (133,779 | ) |
| Proceeds from sales of plant and equipment | | | 37 | | | | 227 | | | | 42 | |
| Net cash and cash equivalents used in investing activities | | | (122,219 | ) | | | (91,332 | ) | | | (133,737 | ) |
| | | | | | | | | | | | | |
| Financing activities | | | | | | | | | | | | |
| Payment of dividends | | | (950,000 | ) | | | (371,610 | ) | | | (840,000 | ) |
| Payment of premium capital | | | – | | | | (215,000 | ) | | | – | |
| Payments of financial obligations | | | – | | | | – | | | | (78,750 | ) |
| Net cash and cash equivalents used in financing activities | | | (950,000 | ) | | | (586,610 | ) | | | (918,750 | ) |
| Net increase (net decrease) in cash and cash equivalents during the year | | | 184,722 | | | | (278,353 | ) | | | (148,616 | ) |
| Cash and cash equivalents at beginning of year | | | 203,391 | | | | 481,744 | | | | 630,360 | |
| | | | | | | | | | | | | |
| Cash and cash equivalents at year-end | | | 388,113 | | | | 203,391 | | | | 481,744 | |
Additional information of the statement of cash flow:
| Income tax payments | | | 327,111 | | | | 207,227 | | | | 267,849 | |
| Payments of financial expenses | | | – | | | | – | | | | 7,853 | |
The accompanying notes are an integral part of these financial statements.
Sociedad Minera Cerro Verde S.A.A.
Notes to the Financial Statements
As of December 31, 2010, 2009 and 2008
| 1. | Identification and business activity |
Sociedad Minera Cerro Verde S.A.A. (hereinafter “the Company”) was incorporated in Peru on August 20, 1993 as a result of the privatization process carried out by the Peruvian State in that year. The Company has listed its shares on the Lima Stock Exchange since November 14, 2000.
On March 19, 2007, Freeport-McMoRan Copper & Gold Inc. (“Freeport”) completed the acquisition of Phelps Dodge Corporation (“Phelps Dodge”). Freeport, through its subsidiary Cyprus Climax Metals Company, owns 53.56% of the voting shares of the Company. Additionally, SMM Cerro Verde Netherlands B.V. (a subsidiary of Sumitomo Metal Mining Company), Compañía de Minas Buenaventura S.A.A. and the minority stakeholders own 21%, 19.26% and 6.18% of the voting shares of the Company, respectively.
The Company’s legal address is Asiento Minero Cerro Verde S/N Uchumayo – Arequipa. The ore deposits are located southwest of the city of Arequipa.
The Company’s activities are regulated by the Peruvian General Mining Law and comprise the extraction, production and sale of copper cathodes and concentrates.
| | (c) | Approval of financial statements – |
The financial statements as of December 31, 2010 have been approved by Management on May 15, 2011. The financial statements as of December 31, 2009 have been approved by Management on May 12, 2010.
| 2. | Significant accounting principles and policies |
In the preparation and presentation of the financial statements, Management has followed International Financial Reporting Standards (IFRS) as adopted and effective in Peru as of December 31, 2010, 2009 and 2008, which differ in certain respects from accounting principles generally accepted in the United States of America (“U.S. GAAP”). A description of these differences and their effects on net income and shareholders’ equity is set forth in Notes 25 and 26. The financial statements are derived from the statutory financial statement presentation and include certain additional disclosures in order to conform more closely to the form and content of financial statements required by the Securities and Exchange Commission of the United States of America (the “SEC”).
Notes to the Financial Statements (continued)
| | 2.1. | Basis of presentation and accounting changes - |
The financial statements of the Company have been prepared in accordance with generally accepted accounting principles in Peru. The accounting principles in Peru correspond to the International Financial Reporting Standards – (“IFRS”) approved by the Peruvian Accounting Standards Board (hereinafter “PASB”) The IFRS incorporate the International Accounting Standards (IAS) and the respective pronouncements issued by the Standards Interpretations Committees (SIC and IFRIC). As of the date of these financial statements, the PASB has formalized the implementation of IFRS 1 to 8, IAS 1 to 41, SIC 1 to 32 and IFRICs 1 to 14.
The accounting principles and practices adopted by the Company are consistent with the ones used in the previous year, except for the following standards and IFRICs adopted in Peru starting January 1, 2010:
| | – | Revisions of IFRS 3 and IAS 27- effective July 1, 2009. The amendments did not have any impact on the financial position or performance of the Company. |
| | – | Modifications to IFRSs - In April 2009 and May 2008, the IASB published and approved modifications to several different international standards, covering a large number of accounting matters. The primary objective of the modifications is to remove inconsistencies and clarify wording and its adoption can result in changes to accounting policies. The adoption of the following amendments issued in 2009 resulted in changes to accounting policies but did not have any impact on the financial position or performance of the Company. |
| | – | IFRS 8 “Operating Segments”; clarifies that segment assets and liabilities need only be reported when those assets and liabilities are included in measures that are used by the chief operating decision maker. This modification did not have any impact on the Company. |
| | – | IAS 7 “Statement of Cash Flows”; states that only an expenditure that results in recognizing an asset can be classified as a cash flow from investing activities. This modification did not have any impact on the Company. |
| | – | IAS 23 “Borrowing Costs”; the definition of borrowing costs is revised to consolidate the two types of items that are considered components: 1) amortization of discounts or premiums and ancillary costs incurred, 2) interest expense calculated in accordance with the effective interest rate method in IAS 39. This modification did not have any impact on the Company. |
| | – | IAS 36 “Impairment of Assets”; the amendment clarifies that the largest cash generating unit permitted for allocating goodwill for impairment testing is the operating segment as defined in IFRS 8. This modification did not have any impact on the Company. |
Amendments to the following standards did not have any impact on the accounting policies, financial position or performance of the Company:
| | – | IAS 1 “Presentation of Financial Statements” |
Notes to the Financial Statements (continued)
| | – | IAS 38 “Intangible Assets” |
| | – | IAS 39 “Financial Instruments: Recognition and Measurement” |
At the November 2010 IFRIC meeting, it was concluded that employee profit sharing must be accounted for in accordance with IAS 19 “Employee Benefits” and not according to IAS 12 “Income Taxes”. Consequently, an entity is only required to recognize a liability when an employee has provided service; deferred profit sharing must not be recorded for timing differences because this is a future service that cannot be considered an obligation or right under IAS 19. In Peru, the historical practice was to calculate and record deferred profit sharing in the financial statements. The National Supervisory Commission for Companies and Securities (hereinafter “CONASEV” by its Spanish acronym) through circular letter N° 298-2010-EF/94.06.3, required the application of this interpretation beginning with fiscal year 2011 (optional for 2010). The change is to be treated as a change in accounting policy and comparative period(s) will be restated according to IAS 8 “Accounting Policies, Changes in Accounting Estimates and Errors”.
Management has decided not to early adopt this change which will be applied during fiscal year 2011, see accounting principles in note 2.2(p). Management expects that the total effect of this change in the statement of income will be a higher income of approximately US$18,744,000 for the year 2010.
The financial statements have been prepared in terms of historical cost except for derivative financial instruments which have been measured at current fair value. The accompanying financial statements are presented in United States dollars; all figures have been rounded to thousands, except when otherwise indicated. See note 3.
The PASB through Resolution N°044-2010- EF-94 on August 23, 2010, authorized the application of IFRS beginning January 1, 2011, with early adoption permitted. The resolution prescribed the use of the 2009 version of the IAS, IFRS, IFRIC and SIC with modifications made as of May 2010, with the following exceptions:
| | – | IFRS 9 “Financial Instruments” modifies the treatment and classification of the financial asset according to IAS 39 “Financial Instruments: Recognition and Measurement” and is effective for annual periods beginning on or after January 1, 2013. |
| | – | IFRIC 18 “Transfers of Assets from Customers”, effective for annual periods beginning on or after July 1, 2009. |
| | – | It is important to mention that Article 4 of PASB Resolution Nº 034-2005-EF/93.01 dated February 17, 2005 annulled IAS 15 “Information Reflecting the Effects of Changing Prices”, IAS 22 “Business Combinations”, and IAS 35 “Discontinued Operations”. Also article 5 of PASB Resolution Nº 040-2008-EF/93.01 dated March 14, 2008 annulled IAS14 “Segment Reporting”, IAS 30 “Disclosures in Financial Statements of Banks and Similar Financial Institutions”, and IAS 32 “Financial Instruments: Presentation and Disclosures (modified in 2003)”. |
Notes to the Financial Statements (continued)
Through Resolution N°102-2010-EF/94.01.1, CONASEV authorized full application of IFRS for all legal entities under its supervision. The Company has chosen to adopt IFRS in full effective with the fiscal period ending December 31, 2011.
This adoption must include application of IFRS 1 - First-time Adoption of International Financial Reporting Standards. To date, Management is performing the implementation process and the determination of the adjustments in order to follow this Resolution.
The preparation of financial statements in conformity with generally accepted accounting principles in Peru requires Management to make estimates and assumptions in order to determine the amounts of the assets and liabilities, the disclosure of contingent assets and liabilities and the amounts of revenues and expenses to be reported for the years ended December 31, 2010 and 2009. In Management’s opinion, these estimates were made on the basis of their best knowledge of the relevant facts and circumstances at the date of preparation of financial statements; however, the final results could be different from the estimates included in the financial statements.
The most significant estimates considered in the preparation of the accompanying financial statements are: (i) the copper cathode and concentrate provisional sales prices which are initially recorded according to the terms of sales contracts and that occurred after the shipped date, (ii) the expected copper recovery rates used to estimate copper contained in the in-process inventories, (iii) the provision for obsolescence of materials and supplies, (iv) the useful life and the recoverable amount of property, plant and equipment, (v) the determination of ore reserves and (vi) the provision for remediation and mine closure costs. Any difference between the estimated and actual amounts is recorded in the year of occurrence.
| | 2.2. | Summary of significant accounting principles and policies - |
| | (a) | Foreign currency translation - |
Functional and presentation currency -
Financial statements are presented in US dollars, which is the Company’s functional and presentation currency.
Transactions and balances in foreign currency -
Transactions that are not originated in the functional currency are considered foreign currency transactions. Initially, transactions in foreign currency are recorded at the exchange rate in effect on the transaction dates. Later, at each balance sheet date: (a) monetary assets and liabilities denominated in foreign currencies are translated using the exchange rate on that date, and (b) non-monetary items denominated in foreign currencies, that are measured in terms of historical cost are translated using the exchange rates in effect on the dates of the initial transactions. The exchange rates issued by the Superintendencia de Banca, Seguros y AFP (SBS) are used in translating foreign currency.
Exchange differences resulting from the settlement of monetary items or from the translation of monetary items at exchange rates different from those originally used are recognized as gains and losses of the current period.
Notes to the Financial Statements (continued)
Initial recognition and measurement
According to IAS 39 “Financial instruments: Recognition and Measurement” the Company classifies its financial assets in the following categories: at fair value through profit or loss, loans and receivables, held-to-maturity investments and available-for-sale. Management determines the classification of its financial assets at initial recognition and re-evaluates this classification at every balance sheet date.
All financial assets are recognized initially at fair value plus the direct costs initially attributed to the transaction, except for financial assets at fair value, for which any transaction costs derived are recognized in results.
Purchases or sales of financial assets that require delivery of assets within a time frame established by regulation or convention in the marketplace (conventional transactions) are recognized on the date of the transaction, that is to say, on the date on which the Company commits to sell the asset.
The Company’s financial assets include cash and cash equivalents, trade accounts receivable, other accounts receivable, and trade accounts receivable from affiliates.
Subsequent measurement
The subsequent measurement of financial assets depends on their classification as follows:
Financial assets at fair value through profit or loss -
This category has two sub-categories: held-for-trading financial assets and those designated at fair value through profit or loss at the time of acquisition. A financial asset is classified in this category if acquired principally for the purpose of its sale in the short term or if so designated by Management. Derivative financial instruments also are classified as trading, unless they are designated a hedge. Assets in this category are classified as current assets if they are either held for trading or are expected to be traded within 12 months of the balance sheet date. Financial assets at fair value through profit or loss are carried in the statement of financial position at fair value with changes recognized in “Financial income” or “Financial expenses” in the statement of income.
Derivatives embedded in host contracts are accounted for as separate derivatives and recorded at fair value if their economic characteristics and risks are not closely related to those of the host contracts and not held for trading or designated at fair value through profit or loss. These embedded derivatives are measured at fair value with changes recognized in the statement of income.
Receivables -
The Company has the following accounts: Trade accounts receivable from third parties and affiliates, and other accounts receivable; they are stated at the transaction value, net of an allowance for doubtful accounts when applicable.
Notes to the Financial Statements (continued)
All such instruments are non-derivative financial assets with fixed or determinable payments that are not quoted in an active market. After initial measurement receivables are subsequently carried at amortized cost using the effective interest method less any provision for impairment.
The Company assesses whether, as of the date of its financial statements, there is objective evidence of an impairment in the value of financial assets (such as the debtor’s probability of insolvency, significant financial difficulties, failure to pay principal or interest or any observable evidence indicating that the estimated future flows associated with the accounts receivable have decreased. The amount of the impairment is measured as the difference between the book value of the assets and the present value of the estimated future cash flows, discounted at an original effective interest rate or one applicable for similar transactions. The carrying amount of the receivable is reduced by means of an allowance account. The amount of the loss must be recognized in the statement of income. Impaired accounts receivable or loans are written off when they are considered uncollectible.
If the amount of the loss should decrease in a subsequent period, the Company reverses it with a credit entry to the statement of income.
Derecognition -
A financial asset is derecognized when:
| | – | The rights to receive cash flows from the asset have expired. |
| | – | The Company has transferred its rights to receive cash flow from the asset or has assumed an obligation to pay the received cash flow in full without material delay to a third party under a pass-through arrangement; and |
| | – | The Company has transferred substantially all the risks and rewards of the asset or, the Company has neither, transferred nor retained substantially all the risks and rewards of the asset, but has transferred control of the asset. |
In the event that the Company transfers its rights to receive cash flows from an asset or has entered into a pass-through arrangement, but has not transferred substantially all the risks and rewards and still maintains control over of the asset, it must recognize the associated liabilities. Assets transferred and the associated liabilities are measured on a basis that reflects the rights and obligations that the Company has retained.
Fair value of financial instruments -
The fair value of financial instruments that are traded in active markets is determined on each reporting date by reference to quoted market prices or dealer price quotations (bid price for long positions and ask price for short positions), without any deduction for transaction costs.
In the case of financial instruments that are not traded in an active market, fair value is determined using appropriate valuation techniques. Such techniques may include using recent arm’s length market transactions; reference to the current fair value of another instrument that is substantially the same, an analysis of the adjusted flow of funds or other valuation models.
Notes to the Financial Statements (continued)
An analysis of fair values of financial instruments and further details as to how they are measured are provided in note 23.
Current versus non-current classification -
Derivative instruments that are not designated as cash-flow hedging instruments are classified as current or non-current, or are separated into a current and a non-current portion based on an assessment of the facts and circumstances (for example, the underlying cash flows).
Embedded derivatives are classified consistently with the cash flows of the host contract.
Derivative instruments designated as cash-flow hedging instruments are classified in accordance with the classification of the underlying element hedged. The derivative instrument is separated into a current and a non-current portion only if a reliable allocation can be made.
| | (c) | Cash and cash equivalents - |
The cash and cash equivalents caption presented in the Company’s balance sheets and statements of cash flows includes all cash on hand and deposited in banks.
Furthermore, this caption presented in the Company’s statements of cash flows includes cash on hand, and highly liquid investments with original maturities of three months or less. If there is any restricted cash deposit, it is shown separately in the balance sheet.
Inventories are stated at the lower of cost or the net realizable value. Cost of finished products and work in progress is determined by using the first-in, first-out (FIFO) method. Cost of materials and supplies is determined by using the weighted average method, except in the case of the cost of in-transit inventories is determined under the specific identification method. The cost of the finished and in process inventory includes the third parties services, materials and supplies consumption, labor, other direct and indirect costs. Net realizable value is the estimated future sales price based on prevailing spot metal prices, less estimated cost to complete production and bring the inventory to sale.
The accrual for materials and supplies obsolescence is based on an item-by-item analysis completed by Management, and the related amount is charged to expense in the period in which the obsolescence is deemed to have occurred.
Notes to the Financial Statements (continued)
| | (e) | Property, plant and equipment - |
The “Property, plant and equipment, net” caption is stated at cost, net of accumulated depreciation and accumulated impairment in value. The initial cost of an asset comprises its purchase price or construction cost, including customs duties and non-reimbursable taxes, as well as any expense necessary to put such asset into operation, the initial estimates of any rehabilitation obligation and, in the case of qualifying assets, the cost of debt and any expense directly attributable to bringing the asset into operation. Such cost includes the cost of replacing part of the plant and equipment when that cost is incurred, if the recognition criteria are met. In addition, when each major inspection is performed, its cost is recognized in the carrying amount of the asset as a replacement if the recognition criteria are satisfied. Other repair and maintenance costs are recognized as expenses as incurred.
Major maintenance and repairs -
Subsequent costs are included in the asset’s carrying amount or recognized as a separate asset, as appropriate, only when it is probable that future economic benefits associated with the item will flow to the Company and the cost of the item can be measured reliably. Repair and maintenance costs are charged to the cost of production during the period in which they are incurred.
Expenses on major maintenance refits or repairs comprise the cost of replacement assets or parts of assets and overhaul costs. The expense is capitalized when an asset or part of an asset that was depreciated separately is replaced and eliminated from the books and it is probable that the future economic benefits associated with such asset or part of an asset will flow to the Company during an additional period of useful life.
Depreciation -
Land is not depreciated. Depreciation on items of property, plant and equipment directly related to the useful life of the mine is calculated by using the units-of-production method, based on the proven and probable reserves. Other assets are depreciated by using the straight-line method based on the following estimated useful lives:
| | | Years | |
| | | | |
| Buildings and other constructions | | Between 10 and 30 | |
| Machinery and equipment | | Between 3 and 25 | |
| Transportation units | | 7 | |
| Furniture and fixtures | | 7 | |
| Other equipment | | Between 3 and 15 | |
Estimated recoverable reserves are used in determining the depreciation and amortization of mine specific assets. This results in a depreciation / amortization charge proportional to the depletion of the anticipated remaining life of mine production. Each item’s life, which is assessed annually, has regard to i) physical life limitations, and ii) present assessments of economically recoverable reserves of the mine property. These calculations require the use of estimates and assumptions, including the amount of recoverable reserves.
An item of property, plant and equipment is derecognized upon disposal or when no future economic benefits are expected from its use or disposal. Any gain or loss arising from derecognizing an asset (calculated as the difference between the proceeds from the sale and the book value of the asset) is included in the statement of income in the year the asset is derecognized.
Notes to the Financial Statements (continued)
The asset’s residual value, useful lives and methods of depreciation are reviewed, and adjusted if appropriate, at each financial year end.
The intangible assets acquired are recorded at cost less accumulated amortization. As indicated in note 17 (c), the Company has recognized as an intangible asset the fair value of the future benefit related to the acquisition of electrical energy at a fixed price. The related cost is amortized based on the life of the agreement, which terminates December 31, 2015.
| | (g) | Determination of mineral reserves and resources - |
The Company computes its reserves using methods generally applied by the mining industry in accordance with international guidelines. All reserves computed, which are reviewed by an independent third party, represent the estimated amounts of proved and probable ore that can be processed economically under the present conditions.
The process of estimating the amount of reserves is complex and requires making subjective decisions at the time of evaluating all the geologic, geophysical, engineering and economic information that is available. Revisions could occur in estimated reserves due to, among other things, revisions of the geologic data or assumptions, changes in assumed prices, production costs and the results of exploration activities.
Changes in estimated reserves could affect mainly the depreciation of fixed assets related directly to mining activity, and the provision for mine closure.
| | (h) | Impairment of non-financial assets - |
The Company assesses at each reporting date whether there is an indication that an asset may be impaired. If any such indication exists, the Company makes an estimate of the asset’s recoverable amount. An asset’s recoverable amount is the higher of an asset’s fair value less costs to sell and its value in use and is determined for an individual asset, unless the asset does not generate cash inflows that are largely independent of those from other assets or groups of assets.
A cash-generating unit is the smallest identifiable group of assets, a mining unit, that generates cash inflows from continuing use that are independent of the cash inflow generated by other assets or groups of assets. In order to determine cash-generating units, the Company has determined whether there is an active market for the minerals and metals produced by a mining unit.
When the carrying amount of an asset exceeds its recoverable amount, the asset is considered impaired and is written down to its recoverable amount. In assessing value in use, the estimated future cash flows are discounted to their present value using a discount rate that reflects current market assessments of the time value of money and the risks specific to the asset.
Impairment losses are recognized in the statement of income in those expense categories consistent with the function of the impaired asset. A previously recognized impairment loss is reversed only if there has been a change in the estimates used to determine the asset’s recoverable amount since the last impairment loss was recognized. The revised valuation cannot exceed the carrying amount that would have been determined, net of depreciation, had no impairment loss been recognized for the asset in prior years. Such reversal is recognized in the statements of income.
Notes to the Financial Statements (continued)
| | (i) | Fair value hierarchy - |
Where the fair value of financial assets and financial liabilities recorded in the statement of financial position cannot be derived from active markets, their fair value is determined using valuation techniques including the discounted cash flow model. The inputs to these models are taken from observable markets where possible, but where this is not feasible, a degree of judgment is required in establishing fair values. The judgments include considerations of inputs such as liquidity risk, credit risk and volatility. Changes in assumptions about these factors could affect the reported fair value of financial instruments.
| | (j) | Financial liabilities - |
Initial recognition and measurement -
Financial liabilities within the scope of IAS 39 are classified as financial liabilities at fair value through profit or loss, loans and borrowings, or as derivatives designated as hedging instruments in an effective hedge, as appropriate. The Company determines the classification of its financial liabilities at initial recognition.
All financial liabilities are recognized initially at fair value and in the case of loans and borrowings, plus directly attributable transaction costs.
The financial liabilities include trade accounts payables, trade accounts payable to affiliates and other accounts payable.
The Company has not designated any derivatives as hedging instruments in an effective hedge.
Subsequent measurement -
The measurement of financial liabilities depends on their classification as follows:
Financial liabilities at fair value through profit or loss -
Financial liabilities at fair value through profit or loss include financial liabilities held for trading and financial liabilities designated upon initial recognition as at fair value through profit or loss.
Financial liabilities are classified as held for trading if they are acquired for the purpose of selling in the near term. This category includes derivative financial instruments entered into by the Company that are not designated as hedging instruments in hedge relationships as defined by IAS 39. Separated embedded derivatives are also classified as held for trading unless they are designated as effective hedging instruments.
Gains or losses on liabilities held for trading are recognized in profit or loss.
Notes to the Financial Statements (continued)
The Company has not designated any financial liabilities upon initial recognition as at fair value through profit or loss.
Derecognition of financial liabilities -
A financial liability is derecognized when the obligation under the liability is discharged or cancelled or expires. When an existing financial liability is replaced by another from the same lender on substantially different terms, or the terms of an existing liability are substantially modified, such an exchange or modification is treated as a derecognition of the original liability and the recognition of a new liability, and the difference in the respective carrying amounts is recognized in the statement of income.
| | (k) | Offsetting of financial instruments - |
Financial assets and financial liabilities are offset and the net amount reported in the balance sheet if, and only if, there is a currently enforceable legal right to offset the recognized amounts and there is a Management intention to settle on a net basis, or to realize the assets and settle the liabilities simultaneously.
General -
A provision is recognized only when the Company has a present obligation (legal or constructive) as a result of a past event, it is probable that resources of the Company will be required to settle the obligation, and the related amount can be fairly estimated. Provisions are reviewed periodically and are adjusted to reflect the best estimate available on the date of the balance sheet. The expense relating to any provision is presented in the statements of income. Provisions are discounted using a current rate that reflects, where appropriate, the risks specific to the liability. When discounting is used, the increase in the provision due to the passage of time is recognized as a financial expense.
Provision for remediation and mine closure -
The Company assesses its provision for closure of mining units annually. It is necessary to make significant estimates and assumptions in determining this provision because there are numerous factors that will affect the ultimate liability for this obligation. These factors include estimating the scope and costs of closing activities, technological changes, changes in the regulations, increases in costs compared to inflation rates and changes in the discount rates. Such estimates or assumptions may result in actual expenses in the future that differ from the amounts provisioned at the time of establishing the provision.
The Company records a provision for remediation and mine closure when a legally enforceable obligation arises. The Company estimates the present value of its future obligations for remediation and mine closure (asset retirement obligation or “ARO”) and increases the carrying amount of the related asset (asset retirement cost or “ARC”) to be retired in the future, which is included in the “Property, plant and equipment” caption in the balance sheet. Subsequently, ARC is amortized to expense during the useful life of the related assets. The recognized provision is increased in each period to reflect the interest cost considered in the initial fair-value estimate. Changes in the fair value of the obligation or the useful life of the related asset that arise from review of the initial estimates are recognized as an increase or decrease in the book value of the obligation and the related assets in accordance with IAS 16 “Property, Plant and Equipment”. Any reduction in a mine closure liability and, therefore, any reduction of the related asset, may not exceed the book value of such asset. If so, any excess over book value is immediately transferred to the statement of income.
Notes to the Financial Statements (continued)
If a change in estimate results in an increase in the closure liability and, therefore, an addition to the asset’s book value, the Company must consider whether or not this is an indication of impairment of the asset as a whole, and conduct impairment testing pursuant to IAS 36.
By their nature, contingencies will only be resolved when one or more future events do or do not occur. Determining contingencies inherently involves the exercise of judgment and calculation of the estimated results of future events.
Loss contingencies are recorded in the financial statements when their occurrence is probable and they can be reasonably estimated. Otherwise, contingencies are only disclosed in notes to the financial statements.
Contingent assets are not recognized in the financial statements; however, they are disclosed in notes to the financial statements if it is probable that such contingent assets will be realized.
The Company sells copper cathodes and concentrates pursuant to sales contracts entered into with customers. Revenue is recognized when the amount can be reliably measured, it is probable that future economic benefits will flow to the Company and all significant risks (including title and insurance risk) and rewards of ownership have passed to the customer. The amount of revenue is not considered reliably measurable until all contingencies relating to the sale have been resolved.
Embedded derivative -
Copper sales are provisionally sales priced at the time of shipment. The provisional prices are finalized in a specified future period in accordance with the terms specified in the relevant sales contract and based on quoted LME monthly average spot prices. The Company receives market prices based on prices in the specified future period, which results in price fluctuations recorded through revenues until the date of settlement. The Company records revenues and invoices customers at the time of shipment based on then-current LME prices, which results in an embedded derivative that is required to be bifurcated from the host contract.
Interest income -
Interest income is recognized as interest accrues using the effective interest rate.
Notes to the Financial Statements (continued)
| | (o) | Tax credits for reinvestment programs - |
The tax benefit from the reinvestment programs, note 12(c), was recognized in the year in which investments related to the reinvestment programs were made. Any temporary difference between the tax benefit applied in the year and the income tax payable was considered as a deferred income tax.
| | (p) | Income tax and workers’ profit sharing - |
Current income tax and workers’ profit sharing -
Income tax and workers’ profit sharing for the current period are measured at the amounts expected to be paid to the tax authorities and workers. Income tax is calculated using Company-specific information. According to law, the workers’ profit sharing amount is calculated using the same tax basis as the income tax calculation.
Deferred portion of income tax and workers’ profit sharing -
Deferred tax assets and liabilities are recognized for all deductible temporary differences between the tax bases of assets and liabilities and their carrying amounts for financial reporting purposes. Deferred tax assets and liabilities are measured at the tax rates that are expected to apply to the year when the asset is realized or the liability is settled. Deferred tax assets and liabilities reflects the taxable consequences that the Company expects to recover or offset the amount of assets and liabilities at the date of the financial statements.
Deferred tax assets and liabilities are recognized without considering when it is estimated that the temporary differences will be offset (current or non-current). Unrecognized deferred tax assets are reassessed at the end of each reporting period and are recognized to the extent that it has become probable that future taxable profit will be available to allow the deferred tax asset to be recovered.
Recovery of deferred tax assets -
An assessment is required to determine whether deferred tax assets should be recognized in the balance sheet. Deferred tax assets, including those resulting from unused tax losses, require Management to assess the probability that the Company would generate taxable earnings in future periods to apply the deferred tax assets. Estimated future taxable income is based on projections of cash flows from operations and application of the tax law existing in each jurisdiction. To the extent to which future cash flows and taxable income differ significantly from those estimated; they could have an impact on the Company’s ability to realize the deferred tax assets reported as of the reporting date.
In addition, future changes in applicable tax law could limit the Company’s ability to obtain tax deductions in future periods.
Any differences between estimated and realized deferred tax assets are recorded when realized.
Notes to the Financial Statements (continued)
Borrowing costs directly relating to the acquisition, construction or production of a qualifying asset are capitalized and added to the project’s cost until such time as the assets are considered substantially ready for their planned use, that is to say, when they are capable of generating commercial production. All other borrowing costs are recognized in the statement of income in the period in which they are incurred.
| | (r) | Basic and diluted earnings per share - |
Basic and diluted earnings per share have been calculated based on the weighted average number of common shares outstanding for the period. As of December 31, 2010 and 2009, the Company did not maintain financial instruments with diluting effects; as a result, the basic and diluted earnings per share are the same for 2010 and 2009.
An operating segment is a component of an entity:
| | (a) | that engages in business activities from which it may earn revenues and incur expenses (including revenues and expenses relating to transactions with other components of the same entity), |
| | (b) | whose operating results are regularly reviewed by the entity’s chief operating decision maker to make decisions about resources to be allocated to the segment and assess its performance, and |
| | (c) | for which discrete financial information is available. |
| | (t) | New accounting pronouncements - |
The following standards were issued as of December 31, 2010 and have been approved by the PASB:
| | – | IAS 24 “Related Party Disclosures” - revised (effective for annual periods beginning on or after January 1, 2011) – IAS 24 clarified the definition of a related party to simplify the identification of such relationships and to eliminate inconsistencies in its application. Management does not expect any significant impact of this standard on its financial position or performance. |
| | – | IAS 32 “Financial Instruments: Presentation – Classification of Rights Issues” (Amendment) - The amendment to IAS 32 is effective for annual periods beginning on or after February 1, 2010 and amended the definition of a financial liability in order to classify rights issues (and certain options or warrants) as equity instruments in cases where such rights are given pro rata to all of the existing owners of the same class of an entity’s non-derivative equity instruments, or to acquire a fixed number of the entity’s own equity instruments for a fixed amount in any currency. Management does not expect any significant impact of this standard on its financial position or performance. |
Notes to the Financial Statements (continued)
| | – | IFRS 9 “Financial Instruments: Classification and Measurement” (effective for annual periods beginning on or after January 1, 2013) – This standard modifies the classification and measurement of financial assets as defined in IAS 39 “Financial Instruments: Recognition and Measurement”. |
| | – | IFRIC 14 “Prepayments of a Minimum Funding Requirement” (Amendment) – The amendment to IFRIC 14 is effective for annual periods beginning on or after January 1, 2011 with retrospective application. The amendment provides guidance on assessing the recoverable amount of a net pension asset. The amendment permits an entity to treat the prepayment of a minimum funding requirement as an asset. Management does not expect any significant impact of this interpretation on its financial position or performance. |
| | – | IFRIC 19 “Extinguishing Financial Liabilities with Equity Instruments” – IFRIC 19 is effective for annual periods beginning on or after July 1, 2010. The interpretation clarifies that equity instruments issued to a creditor to extinguish a financial liability qualify as consideration paid. The equity instruments issued are measured at their fair value. In case this cannot be reliably measured, the instruments are measured at the fair value of the liability extinguished. Any gain or loss is recognized immediately in profit or loss. Management does not expect any significant impact of this interpretation on its financial position or performance. |
| | – | “Modifications to IFRS’s” – the IASB published and approved modifications to several different international standards covering a large number of accounting matters. The amendments have not been adopted as they become effective for annual periods on or after either July 1, 2010 or January 1, 2011. To date, Management is analyzing the impact of these standards: |
| | – | IFRS 1 “Accounting Policy Changes in the Year of Adoption” clarifies that in the interim financial report the Company should explain any changes in its accounting policies or the IFRS 1 exemptions it applied and updated reconciliations required by this standard. Also, it clarified that a first-time adopter is exempt from all the requirements of IAS 8. |
| | – | IFRS 7 “Clarification of Disclosures” clarifies the interaction between the qualitative and quantitative disclosures of the nature and extent of risks arising from financial instruments. This modification will contribute to disclosure of information in a way that better enables users to evaluate an entity’s exposure. |
| | – | IAS 1 “Clarification of Statement of Changes in Equity” requires an entity to provide a reconciliation of changes in each component of equity either in the statement of changes in equity or in the notes to the financial statements. |
| | – | IAS 27 “Transition Requirements for Amendments Arising as a Result of IAS 27 Consolidated and Separate Financial Statements” requires an entity apply most of the amendments of IAS 27 prospectively. |
| | – | IAS 34 “Significant Events and Transactions” requires that companies should disclose in their interim financial statements information related to those events and transactions and shall update the relevant information presented in the most recent annual financial report. |
Notes to the Financial Statements (continued)
| 3. | Transactions in Nuevos Soles |
Transactions in nuevos soles take place at the exchange rates published by the Superintendent of Banks, Insurance and AFP. As of December 31, 2010, the exchange rates published by this Institution were S/2.808 for US$1 for buying and S/2.809 for US$1 for selling (S/2.888 for US$1 for buying and S/2.891 for US$1 for selling as of December 31, 2009). These rates have been applied to the appropriate asset and liability accounts. As of December 31, 2010 and 2009, the Company had not maintained other significant assets or liabilities in nuevos soles.
| 4. | Cash and cash equivalents |
| | (a) | This item is made up us follows: |
| | | 2010 | | | 2009 | |
| | | US$(000) | | | US$(000) | |
| | | | | | | |
| Cash in banks | | | 5,260 | | | | 3,536 | |
| Cash equivalents (b) | | | 382,853 | | | | 199,855 | |
| | | | | | | | | |
| | | | 388,113 | | | | 203,391 | |
| | (b) | As of December 31, 2010 and 2009 this caption comprises a portfolio of investments in foreign money market fund securities, which yield variable returns, and are classified as highly liquid current assets because they are highly liquid and since Management plans to use them for its short-term cash needs. Because of the short maturity of these investments, less than 90 days, the carrying amount of these investments corresponds to their fair value at the date of the financial statements. Changes in the fair value of these investments are recognized as financial income in the statements of income, see note 16. |
| 5. | Trade accounts receivable from affiliates |
| | (a) | This item is made up as follows: |
| | | 2010 | | | 2009 | |
| | | US$(000) | | | US$(000) | |
| | | | | | | |
| Freeport - McMoRan Corporation (b) | | | 195,250 | | | | 98,615 | |
| Sumitomo Metal Mining Company, Ltd. (c) | | | 86,691 | | | | 114,061 | |
| Climax Molybdenum Marketing Corporation (d) | | | 8,767 | | | | 3,886 | |
| Minera Phelps Dodge S.A.C. | | | 1 | | | | – | |
| | | | | | | | | |
| | | | 290,709 | | | | 216,562 | |
Trade accounts receivable are denominated in U.S. dollars, have current maturity, do not bear interest and have no specific guarantees. Sales to affiliates are made at market prices.
| | (b) | Accounts receivables from Freeport–McMoRan Corporation (FMC) , which is wholly owned by Freeport, corresponds to sales of the Company’s copper concentrate and cathode pursuant to signed agreements. |
Notes to the Financial Statements (continued)
On October 15, 2006, the Company signed a long-term contract with FMC (previously Phelps Dodge) through which it committed to sell 20% of its production of copper concentrate. In the year 2010, the sales of concentrate copper to FMC amounted to US$725,863,000 (US$522,089,000 in 2009).
Additionally, in the year 2010, the Company sold copper cathodes to FMC for US$318,948,000 (US$4,757,000 in 2009). The sales were executed in accordance with the availability of the copper cathodes; the conditions were agreed upon for each shipment.
| | (c) | On June 1, 2005, the Company signed a long-term agreement with Sumitomo Metal Mining Company Ltd., by means of which it committed to sell 50% of its annual copper concentrate production from its primary sulfide processing plant, until December 31, 2016. In the year 2010, the sales to Sumitomo Metal Mining Company, Ltd. amounted to US$716,740,000 (US$612,775,000 in 2009). |
| | (d) | On October 1, 2006, the Company signed a long-term agreement with Climax Molybdenum Marketing Corporation (CMMC), which is wholly owned by FMC, for the sale of molybdenum concentrate. This contract was valid for one year and is renewable until one of the parties expresses its desire to terminate it. In 2010, sales to CMMC amounted to US$106,682,000 (US$15,319,000 in 2009). In September 2009, the Company restarted molybdenum production, which had been curtailed in early 2009 as a result of weak market conditions. |
| | (e) | According to Management’s analysis, an account receivable is considered impaired when it has been classified as uncollectible and therefore, disclosed as a provision for doubtful accounts. As of December 31, 2010 and 2009, Management believed that they did not have uncollectible accounts receivable since its major customers have prestige in the international market and the amounts will be collected in full. |
| | (a) | This item is made up as follows: |
| | | 2010 | | | 2009 | |
| | | US$(000) | | | US$(000) | |
| | | | | | | |
| Copper cathodes | | | 6,081 | | | | 3,767 | |
| Copper concentrate | | | 6,609 | | | | 1,281 | |
| Molybdenum concentrate | | | 867 | | | | 808 | |
| Inventory in process | | | 139,241 | | | | 118,274 | |
| Materials and supplies | | | 125,118 | | | | 124,683 | |
| Inventory in transit | | | 3,994 | | | | 996 | |
| | | | 281,910 | | | | 249,809 | |
| | | | | | | | | |
| Provision for obsolescence of materials and supplies (b) | | | (1,730 | ) | | | (2,255 | ) |
| | | | 280,180 | | | | 247,554 | |
| | | | | | | | | |
| Long-term inventory in process (c) | | | (115,086 | ) | | | (91,235 | ) |
| | | | | | | | | |
| | | | 165,094 | | | | 156,319 | |
Notes to the Financial Statements (continued)
| | (b) | In Management’s opinion, the provision for obsolescence of materials and supplies is sufficient to cover the risks of obsolescence as of the date of financial statements. |
| | (c) | This item corresponds principally to low grade sulfide ore mined and placed in the stockpiles, and ready to be processed in the concentrator. According to the Company’s operating plans, this ore will be used in concentrate production in future years. Additionally, it includes the copper pounds contained in leach pads, for which recovery is achieved through its exposure to acidic solutions and subsequent transfer to the electro winning plant to produce copper cathodes. The expected recovery of copper pounds contained in leach stockpiles is estimated based upon metallurgical assays performed on t the material. |
Notes to the Financial Statements (continued)
| 7. | Property, plant and equipment, net |
| | (a) | The changes in cost and accumulated depreciation accounts as of December 31, 2010, are shown below: |
| | | Beginning balance | | | Additions | | | Adjustments and reclassifications | | | Transfers | | | Ending balance | |
| | | US$(000) | | | US$(000) | | | US$(000) | | | US$(000) | | | US$(000) | |
| | | | | | | | | | | | | | | | |
| | | | | | | | | | | | | | | | |
| Cost | | | | | | | | | | | | | | | |
| Land | | | 1,497 | | | | – | | | | – | | | | – | | | | 1,497 | |
| Buildings and other constructions | | | 100,115 | | | | – | | | | (11,557 | ) | | | 2,484 | | | | 91,042 | |
| Machinery and equipment | | | 1,340,344 | | | | – | | | | 11,566 | | | | 95,166 | | | | 1,447,076 | |
| Transportation units | | | 8,415 | | | | – | | | | (283 | ) | | | 717 | | | | 8,849 | |
| Furniture and fixtures | | | 786 | | | | – | | | | – | | | | – | | | | 786 | |
| Other equipment | | | 9,761 | | | | – | | | | (890 | ) | | | 2,991 | | | | 11,862 | |
| Work in progress and transit units | | | 48,903 | | | | 122,256 | | | | - | | | | (101,358 | ) | | | 69,801 | |
| Remediation and mine closure costs | | | 13,081 | | | | 178 | | | | (8,015 | ) | | | – | | | | 5,244 | |
| | | | 1,522,902 | | | | 122,434 | | | | (9,179 | ) | | | – | | | | 1,636,157 | |
| | | | | | | | | | | | | | | | | | | | | |
| Accumulated depreciation | | | | | | | | | | | | | | | | | | | | |
| Buildings and other constructions | | | 23,307 | | | | 2,712 | | | | – | | | | – | | | | 26,019 | |
| Machinery and equipment | | | 402,181 | | | | 81,747 | | | | (250 | ) | | | – | | | | 483,678 | |
| Transportation units | | | 6,213 | | | | 619 | | | | (99 | ) | | | – | | | | 6,733 | |
| Furniture and fixtures | | | 437 | | | | 95 | | | | – | | | | – | | | | 532 | |
| Other equipment | | | 6,201 | | | | 851 | | | | (624 | ) | | | – | | | | 6,428 | |
| Remediation and mine closure costs | | | 2,512 | | | | 302 | | | | – | | | | – | | | | 2,814 | |
| | | | 440,851 | | | | 86,326 | | | | (973 | ) | | | – | | | | 526,204 | |
| Net cost | | | 1,082,051 | | | | | | | | | | | | | | | | 1,109,953 | |
| | (b) | The Company maintains as of December 31, 2010, fully depreciated assets amounting to US$41,254,000 (US$41,593,000 as of December 31, 2009). Currently, these assets are being used by the Company and are primarily machinery and equipment. |
| | (c) | As of December 31, 2010, the work in progress and transit units correspond primarily to the expansion projects for PAD 1, (Phase 2) and PAD 4B. |
| | (d) | The Company maintains insurance on its principal assets in accordance with Management’s policies. |
Notes to the Financial Statements (continued)
Trade accounts payable are mainly originated by the acquisition of materials, supplies and spare parts for the mining activities of the Company. These obligations are mainly denominated in U.S. dollars, have current maturities and do not accrue interest. No guarantees have been granted.
This item is made up of the following:
| | | 2010 | | | 2009 | |
| | | US$(000) | | | US$(000) | |
| | | | | | | |
| Voluntary contribution, see note 17(b) | | | 41,081 | | | | 27,608 | |
| Water plant , see note 17 (d) | | | 56,960 | | | | 73,560 | |
| Fund in advance received–Xstrata Tintaya S.A. (a) | | | 3,184 | | | | 4,001 | |
| Fund in advance received from clients (b) | | | 22,126 | | | | – | |
| Other accounts payable | | | 11,910 | | | | 10,657 | |
| | | | 135,261 | | | | 115,826 | |
| | | | | | | | | |
| Fund in advance received, long – term portion (a) | | | (2,204 | ) | | | (3,060 | ) |
| Water plant, long-term portion | | | – | | | | (36,250 | ) |
| Other accounts payable, short – term | | | (2,204 | ) | | | (39,310 | ) |
| | | | | | | | | |
| Other accounts payable, long – term | | | 133,057 | | | | 76,516 | |
| | (a) | Represents an advance granted by Xstrata Tintaya S.A. for construction, engineering and installation of a 20,000 tonne sulfuric acid tank, which is used by the Company to provide the receipt, storage and dispensing of acid for a period of 5 years. |
| | (b) | Represents an advance granted by a customer, JP Morgan Metals & Concentrates LLC, as part of a copper concentrate sale delivered in January 2011. |
Notes to the Financial Statements (continued)
| 10. | Deferred income tax and profit sharing, net |
| | (a) | The Company recognizes the effect of temporary differences between the tax bases of assets and liabilities and their carrying amounts for financial reporting purposes. The composition of this item is made up as follows: |
| | | As of January 1, 2009 | | | Debit (credit) to the statement of Income | | | As of December 31, 2009 | | | Debit (credit) to the statement of Income | | | As of December 31, 2010 | |
| | | US$(000) | | | US$(000) | | | US$(000) | | | US$(000) | | | US$(000) | |
| | | | | | | | | | | | | | | | |
| Deferred income tax and worker’s profit sharing asset | | | | | | | | | | | | | | | |
| Provision for water plant construction | | | 24,312 | | | | 2,777 | | | | 27,089 | | | | 1,554 | | | | 28,643 | |
| Difference in valuation of inventories | | | 227 | | | | 2,985 | | | | 3,212 | | | | 2,644 | | | | 5,856 | |
| Provision for remediation and mine closure | | | 2,324 | | | | 550 | | | | 2,874 | | | | 571 | | | | 3,445 | |
| Deferred stripping costs | | | 1,082 | | | | (88 | ) | | | 994 | | | | (127 | ) | | | 867 | |
| Price adjustment of copper cathodes and concentrates | | | 90,793 | | | | (90,793 | ) | | | - | | | | - | | | | - | |
| Other provisions | | | 1,609 | | | | 562 | | | | 2,171 | | | | (777 | ) | | | 1,394 | |
| | | | 120,347 | | | | (84,007 | ) | | | 36,340 | | | | 3,865 | | | | 40,205 | |
| | | | | | | | | | | | | | | | | | | | | |
| Deferred expense tax and worker’s profit sharing liability | | | | | | | | | | | | | | | | | | | | |
| Difference in depreciation method | | | 121,723 | | | | 49,603 | | | | 171,326 | | | | 53,168 | | | | 224,494 | |
| Price adjustment of copper cathodes and concentrates | | | – | | | | 23,054 | | | | 23,054 | | | | 24,371 | | | | 47,425 | |
| | | | 121,723 | | | | 72,657 | | | | 194,380 | | | | 77,539 | | | | 271,919 | |
| | | | | | | | | | | | | | | | | | | | | |
| Deferred liabilities, net | | | 1,376 | | | | 156,664 | | | | 158,040 | | | | 73,674 | | | | 231,714 | |
| | | | | | | | | | | | | | | | | | | | | |
| Total charge to the statement of income | | | | | | | 156,664 | | | | | | | | 73,674 | | | | | |
Notes to the Financial Statements (continued)
| | (b) | The reconciliation of the legal combined rate with the effective rate of Income tax for the years 2010, 2009 and 2008, is shown below: |
| | | 2010 | | | 2009 | | | 2008 | |
| | | US$(000) | | | US$(000) | | | US$(000) | |
| | | | | | | | | | |
| Income before workers’ profit sharing and income tax | | | 1,666,686 | | | | 1,122,129 | | | | 1,111,587 | |
| Income tax rate | | | 30 | % | | | 30 | % | | | 30 | % |
| Expected income tax expense | | | 500,006 | | | | 336,639 | | | | 333,476 | |
| | | | | | | | | | | | | |
| Expected workers’ profit sharing tax benefit | | | (41,265 | ) | | | (27,883 | ) | | | (26,504 | ) |
| | | | 458,741 | | | | 308,756 | | | | 306,972 | |
| Tax effect of expenses that are not deductible in determining taxable profit: | | | | | | | | | | | | |
| Voluntary contribution | | | 12,324 | | | | 9,828 | | | | 7,669 | |
| Provision for water plant | | | - | | | | - | | | | (12,000 | ) |
| Others | | | 3,647 | | | | 2,072 | | | | 2,164 | |
| | | | | | | | | | | | | |
| Current and deferred income tax expense | | | 474,712 | | | | 320,656 | | | | 304,805 | |
| 11. | Shareholders’ equity, net |
As of December 31, 2010 and 2009 the authorized, subscribed and paid-up capital in accordance with the Company’s by-laws and its related modifications was 350,056,012 common shares.
According to the shareholders agreement of July 11, 2003, the nominal value of the shares was denominated in US dollars and amount to US$0.54 each. As a consequence of the capitalization of restricted earnings associated with tax benefit (reinvestment credit), see point (d), as of December 2009, the nominal value of the share were increased to US$2.83 each.
As of December 31, 2010 the quoted price of these shares is US$54.10 per share (US$23.30 per share as of December 31, 2009) and their frequency of trading is daily, as in 2009.
Notes to the Financial Statements (continued)
As of December 31, 2010 the Company’s capital stock structure is as follows:
| Percentage of individual interest in capital | | Number of shareholders | | | Total percentage interest | |
| | | | | | | |
| Up to 1.00 | | | 3,530 | | | | 6.18 | |
| From 1.01 to 20.00 | | | 1 | | | | 19.26 | |
| From 20.01 to 30.00 | | | 1 | | | | 21.00 | |
| From 30.01 to 60.00 | | | 1 | | | | 53.56 | |
| | | | 3,533 | | | | 100.00 | |
As of December 31, 2009 the Company’s capital stock structure is as follows:
| Percentage of individual interest in capital | | Number of shareholders | | | Total percentage interest | |
| | | | | | | |
| Up to 1.00 | | | 3,876 | | | | 6.18 | |
| From 1.01 to 20.00 | | | 1 | | | | 19.26 | |
| From 20.01 to 30.00 | | | 1 | | | | 21.00 | |
| From 30.01 to 60.00 | | | 1 | | | | 53.56 | |
| | | | 3,879 | | | | 100.00 | |
| | (b) | Additional paid-in capital – |
As of December 31, 2008 this account comprised the difference between the conversion of the par value equity shares into U.S. dollars, as well as the issue premium resulting from the capital increase on April 18, 2005 and refined in the Director’s meeting on June 1, 2005.
In the Director’s meeting held on October 22, 2009, it was agreed to pay to shareholders US$215,000,000 from additional paid-in capital, which corresponds to the premium capital paid to shareholders in previous years. This amount was paid to the shareholders on November 20, 2009.
Moreover, as a result of capitalizing the restricted earnings associated with a tax benefit (reinvestment credit) recorded by the Company (see point (d)), it decreased the additional paid-in capital account by US$1,599,000 originated by changes in the nominal value of the shares and the rounding generated by the conversion of the par value equity shares into U.S. dollars.
In December 2009, the Company transferred the remaining balance of additional paid-in capital amounting to US$159,061,000 to the legal reserve account in order to cover part of the 20% of the paid capital as of December 31, 2009 (see point (c)).
In accordance with the Peruvian Companies Act, this reserve is created through the transfer of 10% of the earnings for the year up to a maximum of 20% of the paid-in capital. The legal reserve must be used to compensate for losses in the absence of non-distributed earnings or non-restricted reserves, and transfers made to compensate for losses must be replaced with future earnings. This reserve may also be used to increase capital stock but the balance must be restored from future earnings.
Notes to the Financial Statements (continued)
Pursuant to Supreme Decree N°07-94-EM, mining companies may obtain a tax benefit (reinvestment credit) by effectively reinvesting non-distributed earnings into capital expansion projects that increase productivity, see note 12(c). According to such Supreme Decree, the restricted earnings of the Company were transferred to a restricted earnings equity account and will be transferred to the capital stock once the Ministry of Energy and Mines approves the investment.
On October 30, 2009, through Director Resolution No 213-2009/MEM-DGM, the Ministry of Energy and Mines informed the Company of the approval of the reinvestment program execution under retained earnings for the years 2004, 2005, 2006 and 2007 amounting to US$800,030,000. On December 2, 2009, the General Shareholders’ Meeting approved the capitalization of retained earnings to comply with the legal requirements under which the Company retains its right to the reinvestment mechanism established in article 72(b) of the General Mining Law. As a result of this agreement the capital stock increased to US$990,659,000.
In accordance with the mining stability agreement entered into with the Peruvian Government, note 12(a), the Company is authorized to distribute, without any restrictions, all capital invested (except for the retained earnings capitalized in 2009, see point (d) above) and dividends. In addition, dividends and any other form of capital distribution to domestic entities are tax exempt.
Since 2003, dividends paid to shareholders, other than domiciled legal entities, are subject to a 4.1% income tax which is withheld and paid by the Company.
| | (f) | Dividend Distribution - |
At the Directors’ meeting held on May 28, 2008, it was agreed to pay a special dividend of US$380,000,000, an amount that comprised of US$43,177,000 from 2007 earnings and US$336,823,000 in advance of earnings for the year 2008. This dividend was executed under article 230° of the General Corporations Law.
At the Directors’ meeting held on September 1, 2008, it was agreed to pay a special dividend of US$460,000,000 from 2008 earnings (US$1.314 per common share). The 2008 distributions have been executed under the requirements of article 230° of the General Corporation Law.
As a result of the dividends paid in advance, approved by the Board of Directors on September 1, 2008, the shareholders received excess dividends of US$78,390,000 from the year 2008. The annual shareholder meeting held on March 30, 2009 approved the application of the excess dividends against profits of future periods for those who continued to hold their shares.
At the Directors’ meeting held on August 14, 2009, it was agreed to pay a special dividend of US$100,000,000 (US$0.286 per common share). This dividend was paid in advance of 2009 profits and therefore, it was executed under article 230° of the General Corporation Law and was paid on September 11, 2009. In relation to the agreed dividend, in the case of those shareholders of the Company who held that status at the record date (September 4, 2009) and that on September 30, 2009 received dividends in excess in 2008, the Company proceeded to offset the amount owed by the shareholders, amounting to US$78,390,000 against the amount that each shareholder received on that date.
Notes to the Financial Statements (continued)
At the Directors’ meeting held on November 18, 2009, it was agreed to pay a special dividend of US$350,000,000 (US$0.9998 per common share). This dividend was paid in advance of 2009 profits and therefore, it was executed under article 230° of the General Corporation Law and was paid on December 18, 2009. The total amount of this dividend was applied against retained earnings as of October 31, 2009.
At the Directors’ meeting held on June 15, 2010 it was agreed to pay a dividend of US$400,000,000 (US$1.1427 per common share). Of this amount, US$257,303,000 corresponds to the retained earnings as of December 31, 2009, and US$142,697,000 was applied to earnings for the year 2010. This dividend was paid to shareholders of record at July 19, 2010.
At the Directors’ meeting held on November 8, 2010 it was agreed to approve the payment of dividends amounting to US$550,000,000 (US$1.5712 per common share). The total amount of this dividend was applied to retained earnings as of October 31, 2010, and earnings for the year 2010.
| | (a) | On February 13, 1998, the Company signed an Agreement of Guarantees and Measures to Promote Investments with the Government of Peru, under the Peruvian General Mining Law. Upon approval of the agreement, the Company is subject to the tax regulations in force at May 6, 1996. In addition, the Company has tax stability for a period of fifteen years beginning January 1, 1999. |
| | (b) | The income tax rate applicable to the Company is 30%. In addition, the Company is subject to a minimum income tax equivalent to 2% of total assets, net of accumulated depreciation and amortization. The tax charged against earnings is the higher of the income tax under the tax stability agreements and the minimum income tax. In years 2010, 2009 and 2008, income tax was calculated under the general tax rules. |
Notes to the Financial Statements (continued)
For the years 2010, 2009 and 2008 the taxable income and the income tax calculations are as follow:
| | | 2010 | | | 2009 | | | 2008 | |
| | | US$(000) | | | US$(000) | | | US$(000) | |
| | | | | | | | | | |
| Profit before workers’ profit sharing and income tax | | | 1,666,686 | | | | 1,122,129 | | | | 1,111,587 | |
| Plus | | | | | | | | | | | | |
| Price adjustment of copper cathodes and concentrates | | | 64,760 | | | | – | | | | 255,035 | |
| Water plant, Bamputañe dam and voluntary contribution | | | 45,379 | | | | 36,344 | | | | 57,789 | |
| Non – deductible expenses | | | 4,354 | | | | 3,849 | | | | 3,825 | |
| Amortization of others assets | | | 1,273 | | | | 1,268 | | | | 1,361 | |
| Adjustment of inventory in process and finished goods | | | 11,030 | | | | 9,824 | | | | – | |
| Other additions | | | 1,594 | | | | 1,017 | | | | 3,893 | |
| | | | 128,390 | | | | 52,302 | | | | 321,903 | |
| Less | | | | | | �� | | | | | | |
| Price adjustment of copper cathodes and concentrates | | | (133,217 | ) | | | (64,760 | ) | | | – | |
| Depreciation at an annual rate of 20% | | | (149,722 | ) | | | (137,621 | ) | | | (117,592 | ) |
| Reversal of adjustment of prior year related to the prices of copper cathodes and concentrates | | | – | | | | (255,035 | ) | | | (49,428 | ) |
| Adjustment of inventory in process and finished goods | | | – | | | | – | | | | (9,515 | ) |
| | | | (282,939 | ) | | | (457,416 | ) | | | (176,535 | ) |
| Sub-total | | | 1,512,137 | | | | 717,015 | | | | 1,256,955 | |
| Workers’ profit sharing (8%) | | | (120,971 | ) | | | (57,361 | ) | | | (100,556 | ) |
| Net profit | | | 1,391,166 | | | | 659,654 | | | | 1,156,399 | |
| | | | | | | | | | | | | |
| Income tax (30%) | | | (417,350 | ) | | | (197,896 | ) | | | (346,919 | ) |
| | | | | | | | | | | | | |
| Prior years workers’ profit sharing | | | (24 | ) | | | (379 | ) | | | – | |
| Prior years income taxes | | | (244 | ) | | | (1,301 | ) | | | – | |
| Total current income taxes charged to results | | | 417,594 | | | | 199,197 | | | | 346,919 | |
| Total current workers’ profit sharing charged to results | | | 120,995 | | | | 57,740 | | | | 100,556 | |
| | (c) | Pursuant to Supreme Decree No.07-94-EM, the Company can obtain a tax benefit (¨Investment Credit¨) by effectively reinvesting non-distributed earnings into capital expansion projects that increase the Company’s productivity. The investment program must be reviewed and approved by the Ministry of Energy and Mines (MEM). |
On September 3 and October 25, 2004 the Company submitted for approval by the MEM, a Reinvestment Program in the amount of US$800,030,000 related to the construction of a sulfide processing facility to be executed in the period between October 2004 and February 2007. On December 9, 2004 through the Ministerial Resolution No.510-2004-MEM/DM, the MEM approved the Company’s Reinvestment Program application.
Under the terms of the Reinvestment Program, the Company reinvested the earnings obtained in the years 2004, 2005, 2006 and 2007, a total of approximately US$800,000,000, which resulted in lower income tax expense of approximately US$240,000,000 during those years. According to the requirement of Article N°7 of the Supreme Decree N°07-94-EM, the Company has successfully documented the reinvestment before the MEM.
Notes to the Financial Statements (continued)
On October 30, 2009 through Resolution No 213-2009/MEM-DGM, the MEM approved the execution of the Reinvestment Program from non-distributed earnings of the years 2004, 2005, 2006 and 2007 for an amount of US$800,030,000, after which, according to the requirements of the General Mining Law, the Company capitalized that amount (see note 11 (d)).
| | (d) | Peruvian Tax Authorities have the right to examine, and, if necessary, amend the income tax as determined by the Company during the last four years, calculated from the year following that in which the tax returns are filed. The income tax filings for the years 2002 through 2010 and the value added tax filings for the period from December 2006 to December 2010 are open to examination by the tax authorities. To date, tax authorities have finished the reviews of income tax and valued added tax for the years 2002 to 2005, which are currently under administrative process. The filings for 2006 are currently under review. |
Due to the many possible interpretations of current legislation, it is not possible to determine whether or not future reviews will result in tax liabilities for the Company. In the event that additional taxes are payable, including interest and surcharges, as a result of the Tax Authority reviews, they will be charged to expense in the period assessed and paid. In Management’s and legal advisors’ opinion, any additional tax assessment would not be significant to the financial statements as of December 31, 2010 and 2009.
| | (e) | On June 23, 2004, Law No.28258 - Mining Royalty Law was approved, and requires the holder of a mineral concession to pay a royalty in return for the exploitation of metallic and non metallic minerals, which is calculated using rates from one to three percent of the value of concentrate or its equivalent according to the international price of the commodity published by the MEM. |
Based on the stability contract described in letter (a), the payment of the mining royalties is not applicable to the Company, because this law was approved after the Company signed the stability contract with the Peruvian Government.
Notes to the Financial Statements (continued)
| | (a) | This item is made up of the following: |
| | | | | | | | | | |
| | | Pounds(000) | | | US$(000) | | | Pounds(000) | | | US$(000) | | | Pounds(000) | | | US$(000) | |
| | | (Unaudited) | | | | | | (Unaudited) | | | | | | (Unaudited) | | | | |
| | | | | | | | | | | | | | | | | | | |
| Copper concentrates | | | 472,494 | | | | 1,607,815 | | | | 458,757 | | | | 1,215,050 | | | | 517,359 | | | | 1,175,739 | |
| Copper cathodes | | | 181,883 | | | | 625,827 | | | | 208,544 | | | | 506,317 | | | | 189,462 | | | | 581,164 | |
| Other | | | | | | | 135,346 | | | | | | | | 36,143 | | | | | | | | 79,008 | |
| | | | | | | | | | | | | | | | | | | | | | | | | |
| | | | | | | | 2,368,988 | | | | | | | | 1,757,510 | | | | | | | | 1,835,911 | |
Embedded derivative -
As of December 31, 2010 and 2009, the Company had embedded derivatives based on estimated future prices for the expected settlement dates. Final prices on these sales will be established over the next several months pursuant to terms of sales contracts. The adjustment in the forward prices used for these embedded derivatives through the settlement date is reflected as derivative gains and losses in revenues.
Copper concentrate and cathode sales include adjustments to the provisional sale value resulting from changes in the fair value of the embedded derivative. These adjustments resulted in higher sales by US$68,457,000, US$319,795,000 and US$255,035,000 in the years 2010, 2009 and 2008; respectively.
Sales between affiliates amount to US$1,868,233,000 for the year ended December 31, 2010 (US$1,154,940,000 for the year ended December 31, 2009 and US$1,147,631,000 for the year ended December 31, 2008). See note 18(b).
Notes to the Financial Statements (continued)
| | (b) | The following table shows net sales by geographic region based on the final destination port: |
| | | 2010 | | | 2009 | | | 2008 | |
| | | US$(000) | | | US$(000) | | | US$(000) | |
| | | | | | | | | | |
| Asia | | | 1,374,467 | | | | 998,454 | | | | 1,071,574 | |
| North America | | | 219,320 | | | | 343,190 | | | | 174,661 | |
| Europe | | | 483,208 | | | | 271,007 | | | | 282,481 | |
| Peru | | | 291,993 | | | | 144,859 | | | | 296,085 | |
| South America | | | – | | | | – | | | | 11,110 | |
| | | | | | | | | | | | | |
| | | | 2,368,988 | | | | 1,757,510 | | | | 1,835,911 | |
| | This item is made up of the following: |
| | | 2010 | | | 2009 | | | 2008 | |
| | | US$(000) | | | US$(000) | | | US$(000) | |
| | | | | | | | | | |
| Opening balance of finished goods | | | 5,856 | | | | 11,504 | | | | 14,350 | |
| | | | | | | | | | | | | |
| Add (less) | | | | | | | | | | | | |
| Materials and supplies | | | 276,297 | | | | 248,447 | | | | 262,129 | |
| Depreciation and amortization | | | 87,956 | | | | 77,871 | | | | 80,746 | |
| Labor | | | 79,914 | | | | 63,879 | | | | 68,091 | |
| Third parties services | | | 69,350 | | | | 66,907 | | | | 105,843 | |
| Energy | | | 53,001 | | | | 49,061 | | | | 51,773 | |
| Other costs | | | 33,513 | | | | 35,570 | | | | 59,664 | |
| Variation of inventories in process | | | (20,967 | ) | | | (19,336 | ) | | | (34,351 | ) |
| Ending balance of finished goods | | | (13,557 | ) | | | (5,856 | ) | | | (11,504 | ) |
| | | | | | | | | | | | | |
| | | | 571,363 | | | | 528,047 | | | | 596,741 | |
This item is made up of the following:
| | | 2010 | | | 2009 | | | 2008 | |
| | | US$(000) | | | US$(000) | | | US$(000) | |
| | | | | | | | | | |
| Concentrate’s freight | | | 62,789 | | | | 56,576 | | | | 67,004 | |
| Uploading / handling | | | 6,842 | | | | 6,479 | | | | 6,934 | |
| Commissions and other sale expenses | | | 3,996 | | | | 4,265 | | | | 3,721 | |
| Cathode’s freight | | | 3,011 | | | | 557 | | | | 531 | |
| | | | | | | | | | | | | |
| | | | 76,638 | | | | 67,877 | | | | 78,190 | |
Notes to the Financial Statements (continued)
| 16. | Financial income and expense |
This item is made up of the following:
| | | 2010 | | | 2009 | | | 2008 | |
| | | US$(000) | | | US$(000) | | | US$(000) | |
| | | | | | | | | | |
| Financial expenses | | | | | | | | | |
| Amortization of debt issuance costs | | | – | | | | – | | | | 4,986 | |
| Interest on corporate bonds | | | – | | | | – | | | | 2,685 | |
| Other financial expenses | | | 101 | | | | – | | | | 182 | |
| | | | | | | | | | | | | |
| | | | 101 | | | | – | | | | 7,853 | |
| Financial income | | | | | | | | | | | | |
| Gain on fair value of cash equivalents, note 4(b) | | | 1,261 | | | | 1,637 | | | | 18,825 | |
| Other financial income | | | – | | | | 28 | | | | 1,453 | |
| | | | | | | | | | | | | |
| | | | 1,261 | | | | 1,665 | | | | 20,278 | |
| 17. | Commitments and contingencies |
| | (a) | Environmental matters - |
The Company’s mining and exploration activities are subject to environmental protection standards. In order to comply with these standards, the Company has obtained the approval for the Environment Adequacy Program (PAMA) and of the Environmental Impact Studies (EIA), required for the operation of Cerro Verde’s production unit.
On October 14, 2003 law N°28090 was enacted, which regulates the commitments and procedures that entities involved in mining activities must follow in order to prepare, file and implement a mine site closing plan, as well as the respective environmental guarantees that assure compliance with the plan in accordance with protection, conservation and restoration of the environment. On August 15, 2005 the regulations regarding this law were approved.
During year 2006, in compliance with the mentioned law, the Company completed the closing plans for its mine site. On October 5, 2009 the MEM issued Resolution N°203-2009 MEM – AAA, approving the mine closure plan of the Company.
The estimate of remediation and mine closing costs is based on studies prepared by independent consultants, who comply with the current environmental regulations. This provision corresponds mainly to the activities to be performed in order to restore the areas affected by mining activities. The main tasks to be performed include ground removal, revegetation labor and dismantling of plant and equipment.
The table below presents the changes in the provision for remediation and mine closing:
| | | US$(000) | |
| | | | |
| Balance as of January 1, 2008 | | | 15,634 | |
| Accretion expense | | | 1,310 | |
| Balance as of December 31, 2008 | | | 16,944 | |
| Accretion expense | | | 1,698 | |
| Balance as of December 31, 2009 | | | 18,642 | |
| Accretion expense | | | 1,479 | |
| Changes in the estimates | | | (8,015 | ) |
| Balance as of December 31, 2010 | | | 12,106 | |
Notes to the Financial Statements (continued)
Closure budgets are reviewed regularly to take into account any significant change in the studies conducted. Nevertheless, the closure costs of mining units will depend on the market prices for the closure works required, which would reflect future economic conditions. Also, the time when the disbursements will be made depends on the useful life of the mine, which will be based on future metals prices.
The Company believes that this liability is sufficient to meet the current environmental protection laws approved by the MEM.
| | (b) | Voluntary contribution of 3.75% on profits - |
In 2006 Peruvian mining companies, represented by the National Society of Mining, Oil and Energy (SNMPE), started a negotiation process with the Peruvian Government to define the terms and conditions for a voluntary contribution of 3.75% of net income, which would be deducted, when applicable from the payment of mining royalties. The objective of the mining companies is to contribute to the Peruvian Government’s efforts in eradicating poverty in Peru and generate a favorable economic environment.
On December 21, 2006 the Peruvian Government released Supreme Decree 071-2006-EM regulating the terms and conditions under which the voluntary contribution would be paid by mining companies in Peru. Under this regulation, the Peruvian government established the requirements for the agreements that would be negotiated individually by the mining companies. This regulation establishes that the contribution:
| | i) | Will be equivalent to 3.75% of net income under Peruvian GAAP, |
| | ii) | Will be paid for 2006 and the four subsequent years, dependent on the level of international metal prices, and |
| | iii) | Will not be tax deductible. |
The rate of the voluntary contribution is broken down as follows:
| | – | 2.75% for the Local Mining Fund |
| | – | 1.00% for the Regional Mining Fund |
On November 8, 2007 the Company signed with the Peruvian State the contract of voluntary contribution, complying with the requirements described previously. An expense of US$48,674,000 was recorded in the year 2007 (US$16,673,000 and US$32,001,000 corresponding to the contributions in the years 2006 and 2007, respectively), US$29,496,000 in the year 2008, US$27,608,000 in the year 2009 and US$41,081,000 in the year 2010, these are recorded in the voluntary contribution caption in the income statement. From these amounts, US$41,081,000, US$27,608,000, and US$27,991,000 were payable as of December 31, 2010, 2009 and 2008, respectively, see note 9.
Notes to the Financial Statements (continued)
This voluntary contribution covered the years 2006 through 2010. It is not certain whether the voluntary contribution will be extended, abandoned, or replaced by a tax or different mechanism.
| | (c) | Construction of Bamputañe Dam - |
On December 29, 2004 the Company signed a contract with “Empresa de Generación Eléctrica de Arequipa S.A.” (EGASA) to meet the needs of electricity supply of its mining operations. According to the contract, EGASA committed to supply electricity for the period starting January 1, 2007 and ending December 31, 2015 at a fixed rate for the duration of the contract and the Company committed to construct the Bamputañe Dam located in the Santa Lucía district, in the province of Lampa, in the department of Puno. At that date the construction budget was estimated at US$5,000,000. On June 11, 2008, EGASA and the Company signed an addendum to the contract for the construction of the Bamputañe Dam, in which the parties recognized and declared that the Bamputañe Dam construction budget would be significantly higher than amount estimated initially. According to the feasibility studies performed by the Company as of December 31, 2008, it was estimated that the new construction cost would be approximately US$14,000,000. On December 1, 2009 the Company formally transferred Bamputañe dam to EGASA at a final cost totaling US$11,390,000. This cost is being amortized over the life of the EGASA agreement, terminating December 31, 2015.
As of December 31, 2010, the net value of the intangible asset related to this arrangement amounts to US$8,149,000 (net of amortization of US$3,241,000).
| | (d) | Water treatment plant - |
On August 2, 2006 the Company and the civil society and authorities of Arequipa (hereinafter, the Committee) signed an agreement by means of which the Company agreed to finance and provide the technical studies and plans necessary to construct a fresh water treatment plant in Alto Cayma and a waste water treatment plant. The agreement establishes that the costs to be incurred in the construction of the drinking water treatment plant will be assumed by the Company and those of the waste water treatment plant by the municipalities of the province of Arequipa, and if any difference arises between the costs required by both plants a compensation will be applied in order to grant that 50% of the total cost of both plants will be assumed by each party.
As of December 31, 2010, based on the Basic Engineering report on the Feasibility Study of the Water Treatment Plants, the Company estimates a total cost of approximately US$177,000,000 for both plants. Of this amount, the Company will be in charge of 50% of the total cost ascending to US$88,500,000, the fair value of which is US$77,900,000 as of December 31, 2010. US$40,000,000 was recognized in operating expenses in 2006, US$25,800,000 in the year 2008, US$7,800,000 in the year 2009, and US$4,300,000 in the year 2010.
On September 18, 2009 the Company contracted with “Consorcio Alto Cayma” (comprised of the following companies: Befesa, Graña y Montero and Aguas de Sevilla) for the design, construction and commissioning of the water treatment plant.
Notes to the Financial Statements (continued)
As of December 31, 2010, amounts expended for construction of the water treatment plant totaled approximately US$20,940,000. As of December 31, 2010 the liability related to the construction of the water plant amounts to US$56,960,000
As part of the obligation assumed by the Company and as a way to guarantee construction of the plant, the Company established a guaranteed deposit in a local bank for an amount of S/.150,000,000 (equivalent to US$50,000,000 as of the deposit date in September 2008). This amount was replaced in April 2009 by a deposit in US dollars. The balance in the account at December 31, 2010 is US$19,002,000 (US$49,535,000 as of December 31, 2009) and is presented in the “Other assets” caption in the balance sheets. The disbursements from the account include prepays to third parties related to the construction of the water treatment plant.
| 18. | Transactions with affiliates |
| | (a) | The Company has transactions with its shareholders (see note 1 to the financial statements) and uses the Management services of Minera Phelps Dodge del Perú S.A.C., a subsidiary of PD Perú Inc. |
| | (b) | During the years 2010 and 2009, the Company engaged in the following transactions with its affiliates: |
| | | 2010 | | | 2009 | | | 2008 | |
| | | US$(000) | | | US$(000) | | | US$(000) | |
| Revenues / (expenses) | | | | | | | | | |
| Copper cathode sales, note 5 | | | 318,948 | | | | 4,757 | | | | 17,119 | |
| Copper concentrate sales, note 5 | | | 1,442,603 | | | | 1,134,864 | | | | 1,075,128 | |
| Molybdenum sales, note 5 | | | 106,682 | | | | 15,319 | | | | 55,384 | |
| Management services (c) | | | (17,850 | ) | | | (17,565 | ) | | | (20,130 | ) |
| | (c) | On June 1, 2005, the Company and Minera Phelps Dodge del Perú S.A.C. signed an agreement whereby Minera Phelps Dodge del Perú S.A.C. was appointed as the general manager of the Company. |
| | (d) | As a result of these transactions, the Company has trade accounts receivable from affiliates as described in note 5 and has the following liabilities as of December 31, 2010 and 2009: |
| | | 2010 | | | 2009 | |
| | | US$(000) | | | US$(000) | |
| Accounts payable | | | | | | |
| Minera Phelps Dodge del Perú S.A.C. | | | 1,679 | | | | 1,386 | |
| Freeport - McMoRan Sales Company | | | 1,530 | | | | 1,279 | |
| Freeport - McMoRan Corporation | | | 641 | | | | 42 | |
| PD Mining Service Chile | | | 1 | | | | – | |
| Sociedad Contractual Minera Candelaria | | | – | | | | 12 | |
| | | | 3,851 | | | | 2,719 | |
Terms and transaction with related parties
Transactions with related parties are made at normal market prices. Outstanding balances at year-end are unsecured, interest free and settlement occurs in cash. There have been no guarantees provided or received for any related party receivables. As of December 31, 2010 and 2009 the Company, after diligent review of the financial position of the related parties and current market conditions, had not recorded any impairment of receivables relating to amounts owed by related parties.
Notes to the Financial Statements (continued)
Basic and diluted earnings per common share have been determined as follows:
| | | 2010 | | | 2009 | | | 2008 | |
| | | | | | | | | | |
| Net income | | | 1,054,423,000 | | | | 708,528,000 | | | | 718,433,000 | |
| Weighted average number of shares outstanding | | | 350,056,012 | | | | 350,056,012 | | | | 350,056,012 | |
| Basic and diluted earnings per share | | US$ | 3.01 | | | US$ | 2.02 | | | US$ | 2.05 | |
Basic and diluted earnings per share are calculated by dividing earnings by the weighted-average number of outstanding shares for the year.
| 20. | Embedded derivative related to copper price |
As is indicated in note 2.2(n), the exposure to the risk of changes in the market prices of copper and molybdenum, is considered as an embedded derivative and it is related to market contracts signed with the customers.
As of December 31, 2010 and 2009, the provisional liquidations of the estimated futures prices (in copper and molybdenum pounds) and their final maturity periods were as follow:
| | | | | | | | |
| Metal | | Pounds payable | | Maturity 2011 | | Provisional pricing | | | Forward pricing | | | Fair value | |
| | | (000) | | | | US$ | | | US$ | | | US$(000) | |
| Copper: | | | | | | | | | | | | | | |
| -Concentrate | | | 210,349 | | January to April | | Between 3.50 to 4.07 | | | Between 4.35 and 4.37 | | | | 127,220 | |
| -Cathode | | | 7,715 | | January | | 4.11 | | | 4.37 | | | | 3,297 | |
| Molybdenum | | | 4,645 | | January to February | | Up to 14.94 | | | 16.40 | | | | 2,700 | |
| | | | | | | | | | | | | | | 133,217 | |
| | | | | | | | |
| Metal | | Pounds payable | | Maturity 2010 | | Provisional pricing | | | Forward pricing | | | Fair value | |
| | | (000) | | | | US$ | | | US$ | | | US$(000) | |
| Copper: | | | | | | | | | | | | | | |
| -Concentrate | | | 141,112 | | January to May | | Between 2.83 and 3.17 | | | Between 3.34 and 3.35 | | | | 61,914 | |
| -Cathode | | | 14,329 | | January | | 3.14 | | | 3.33 | | | | 2,787 | |
| Molybdenum | | | 389 | | January | | 10.97 | | | 11.75 | | | | 59 | |
| | | | | | | | | | | | | | | 64,760 | |
The final pricing that the Company estimated as of December 31, 2010 and 2009 were based on London Metal Exchange information.
Notes to the Financial Statements (continued)
| 21. | Disclosure of information on segments |
IFRS 8 “Operating Segments” requires that corporations present financial information taking into account the information reported that the chief operating decision maker uses internally for evaluating the performance of operating segments and allocating resources to those segments (a “through the eyes of management” approach). The Company’s chief operating decision maker uses the business and geographical segment of the Company to make operating decisions. A business segment is a component that provides a single product or service or a group of related products and services and that is subject to risks and returns that are different from those of other business segments. A geographic segment is a component that provides products and services within a particular economic ambit and that is subject to risks and returns that are different from those of components operating in other economic ambits.
The Company’s only operating segment is mining.
Sales to customers are broken down by geographic region based on final destination port (see note 13).
| 22. | Objectives and policies of financial risk management |
The Company’s activities are exposed to different financial risks, the main risks that could adversely affect the Company’s financial assets and liabilities or future cash flows are: the risk arising from changes in market prices of minerals, interest rate risk, liquidity risk, credit risk and capital risk. The Company’s financial risk management program focuses on mitigating potential adverse effects on its financial performance.
Management knows the conditions prevailing in the market and based on its knowledge and experience, manages the risks which are summarized below. Moreover, the following note also includes a sensitivity analysis that is intended to illustrate the sensitivity to changes in market variables on the Company’s financial statements and show the impact on profit or loss and shareholders’ equity, where applicable. Financial instruments affected by market risk include cash and cash equivalents, trade accounts receivable, trade accounts payable and the embedded derivative related to copper price.
The sensitivity has been prepared for years ended December 31, 2010 and 2009 using the amounts of debt and other financial assets and liabilities held at those reporting dates.
It is Freeport’s policy that no trading in derivatives for speculative purposes shall be undertaken. At this stage, the Company does not currently apply any form of hedge accounting.
The Board of Directors reviews and approves policies for managing each of these risks which are summarized below:
Market risk is the risk that the fair value of future cash flows of a financial instrument will fluctuate because of changes in market prices. Market prices comprise two types of risk: the risk arising from changes in market prices of minerals and interest rate risk. Financial instruments affected by market risk include loans and borrowings, deposits and derivative financial instruments.
Notes to the Financial Statements (continued)
The sensitivity analyses in the following section are related to the positions as of December 31, 2010 and 2009. The sensitivity analyses have been prepared on the assumption that the amount of the financial instruments in foreign currency is constant.
Commodity price risk -
The international prices of copper and molybdenum have a material impact on the Company’s operating results. These prices are affected by global economic changes. Generally, individual copper and molybdenum producers are unable to influence these prices directly, but the Company’s profitability is influenced through Management’s effective control of the cost and efficiency of operations.
The Company manages this risk through the use of sales commitments with customers. The Company has not hedged its exposure to price fluctuation.
Embedded derivative related to price of copper –
The Company assigned a provisional sales value to copper sales that are subject to a future settlement agreement in accordance with the terms specified in the relevant sales contracts. Exposure to changes in metal prices generates an embedded derivative which is required to be bifurcated from the host contract. At period end, the provisional sales are adjusted based on an estimated future price for the quotation period agreed in the contract. The provisional sales adjustment is recorded as an increase or decrease in net sales. See note 2.2(n).
The table below summarizes the effect on profit before income tax and workers’ profit sharing caused by changes in the copper price. This analysis is based on the assumption that the copper price has increased or decreased by 10% while all other variables are held constant. The 2010 positive scenario uses prices between US$/lb 4.79 to 4.81 (US$/lb 3.67 to 3.69 in the year 2009); whereas the negative scenario uses prices between US$/lb 3.92 to 3.94 (US$/lb 3.00 to 3.02 in the year 2009).
| | | Effect on profit before income tax and workers’ profit sharing | |
| | | US$(000) | |
| 2010 | | | |
| Increase in copper and molybdenum international quotes | | | 78,995 | |
| Decrease in copper and molybdenum international quotes | | | (78,995 | ) |
| | | | | |
| 2009 | | | | |
| Increase in copper and molybdenum international quotes | | | 48,453 | |
| Decrease in copper and molybdenum international quotes | | | (48,561 | ) |
Interest-rate risk –
The Company’s exposure to this risk arises from changes in the interest rates in its financial instruments and liabilities. The Company does not hold financial instruments subject to a fixed interest rate as of December 31, 2010 and 2009. Among financial assets, the Company has high-grade securities convertible to cash with variable rates and which are not expected to result in losses associated with interest risk rate.
Notes to the Financial Statements (continued)
Liquidity risk arises from situations in which cash might not be available to pay obligations at maturity and at a reasonable cost. The Company maintains adequate liquidity by properly managing the maturities of assets and liabilities to satisfy unexpected liquidity requirements. Cerro Verde sells cathode and copper and molybdenum concentrates to recognized companies in the mining sector worldwide. In addition, the Company currently has the possibility to obtain funds from financial institutions if it is required to meet its contractual obligations. The following table shows the maturities of assets and liabilities on the balance sheet as of December 31, 2010 and 2009:
| | | On demand | | | Less than 3 months | | | 3 to 12 months | | | 1 to 5 years | | | Total | |
| | | US$(000) | | | US$(000) | | | US$(000) | | | US$(000) | | | US$(000) | |
| | | | | | | | | | | | | | | | |
| As of December 31, 2010 | | | | | | | | | | | | | | | |
| Trade accounts payable | | | – | | | | 55,489 | | | | 11,887 | | | | – | | | | 67,376 | |
| Other accounts payable | | | – | | | | 34,597 | | | | 102,311 | | | | 2,204 | | | | 139,112 | |
| Provision for remediation and mine closure | | | – | | | | – | | | | – | | | | 12,106 | | | | 12,106 | |
| Total | | | – | | | | 90,086 | | | | 114,198 | | | | 14,310 | | | | 218,594 | |
| | | On demand | | | Less than 3 months | | | 3 to 12 months | | | 1 to 5 years | | | Total | |
| | | US$(000) | | | US$(000) | | | US$(000) | | | US$(000) | | | US$(000) | |
| | | | | | | | | | | | | | | | |
| As of December 31, 2009 | | | | | | | | | | | | | | | |
| Trade accounts payable | | | – | | | | 38,167 | | | | 1,631 | | | | – | | | | 39,798 | |
| Other accounts payable | | | – | | | | 10,532 | | | | 68,703 | | | | 39,310 | | | | 118,545 | |
| Provision for remediation and mine closure | | | – | | | | – | | | | – | | | | 18,642 | | | | 18,642 | |
| Total | | | – | | | | 48,699 | | | | 70,334 | | | | 57,952 | | | | 176,985 | |
Notes to the Financial Statements (continued)
The Company’s exposure to credit risk arises from a counterparty’s inability to fully pay committed amounts at maturity and the failure of third parties in transactions of cash and cash equivalents, which is limited to the account balances in banks and financial institutions and trade accounts receivable at the date of the balance sheet. To manage this risk, the Company has an established treasury policy, which only allows the deposit of surplus funds in highly rated institutions, by establishing conservative credit policies and through a constant evaluation of market conditions. Consequently, the Company does not expect to incur losses on accounts involving potential credit risks.
The concentration of credit risk also exists when economic changes occur in industry or geography that affect third parties in the same way, adding a risk exposure to the Company. In this sense, the Company’s customer portfolio is focused mainly on customers residing abroad, and as of December 31, 2010, three major customers of the Company represent approximately 82% of sales (three customers accounted 85% of sales in 2009). Two of these clients are related to the Company and have a solid financial structure.
The credit risk is limited to the book value of financial assets on the balance sheet date, which consists primarily of cash and cash equivalents, trade accounts receivable from third parties and trade accounts receivable from affiliates. The Company has not hedged its exposure to credit risk.
The objective is to safeguard the Company’s ability to continue as a going concern in order to provide returns for shareholders and benefits for stakeholders and maintain an optimal structure that would reduce the cost of capital.
The Company manages its capital structure and makes adjustments to it, in light of changes in economic conditions. To maintain or adjust the capital structure, the Company controls dividend payments to shareholders, the return of capital to shareholders and the issue of new shares. No changes were made in the objectives, policies or processes during the years ending December 31, 2010 and 2009.
| 23. | Fair value of financial instruments |
Fair value is defined as the amount at which assets would be exchanged or liabilities settled between knowing and willing parties in an arm’s length transaction.
When a financial instrument is traded in an active and liquid market, its quoted market price in an actual transaction provides the best evidence of its fair value. When a quoted market price is not available, or may not be indicative of the fair value of the instrument, to determine such fair value, the current market value of another instrument that is substantially similar, discounted cash flow analysis, or other estimation techniques may be used, all of which are significantly affected by assumptions used. Although Management uses its best judgment in estimating the fair value of these financial instruments, there are inherent weaknesses in any estimation technique. As a result, the fair value may not be indicative of the net realizable or liquidation value.
Notes to the Financial Statements (continued)
The methodologies and assumptions used depend on the terms and feature risk of each financial instrument.
Financial instruments whose fair value is similar to their book value –
Assets and liabilities with a maturity of less than three months have been considered as cash and cash equivalents. The fair values of trade accounts receivable from third parties, trade accounts from affiliates, trade accounts payable, trade accounts payable to affiliates and other accounts payable, are not significantly different from their carrying values.
Based on the criteria described above, no significant differences were identified, between the carrying value and fair value of financial instruments as of December 31, 2010 and 2009.
| 24. | Mineral reserves (unaudited) |
As of December 31, 2010 and 2009, the Company’s estimated recoverable proven and probable mineral reserves were:
| | | | | | | |
| | | 2010 | | | 2009 | | | 2010 | | | 2009 | |
| | | | | | | | | | | | | |
| Mineral for leaching | | | 243,213 | | | | 243,780 | | | | 0.41 | | | | 0.43 | |
| Mineral for milling | | | 3,328,318 | | | | 2,809,085 | | | | 0.40 | | | | 0.40 | |
Copper production in thousands of recoverable pounds was as follow:
| | | 2010 | | | 2009 | |
| | | | | | | |
| Cathodes | | | 183,426 | | | | 206,514 | |
| Concentrate | | | 483,937 | | | | 455,112 | |
Average London Metals Exchange price per metric ton:
| | | 2010 | | | 2009 | |
| | | US$/MT | | | US$/MT | |
| Copper | | | 7,539 | | | | 5,164 | |
| 25. | Summary of significant differences between accounting principles followed by the Company and U.S. generally accepted accounting principles |
| | (a) | Differences in measurement - |
The Company’s financial statements have been prepared in accordance with Peruvian GAAP which differs in certain respects from U.S. GAAP. The effects of these differences are reflected in Note 26 and are principally related to the items discussed in the following paragraphs:
Income tax
Peruvian GAAP – Under paragraph 70 of IAS I “Presentation of Financial Statements” deferred tax assets and liabilities are always classified as non-current assets or liabilities.
Notes to the Financial Statements (continued)
Additionally, under Peruvian GAAP, current and deferred tax assets and liabilities are measured at the tax rate applicable to undistributed profits and thus the income tax consequences of dividends are recognized when a liability to pay the dividend is recognized.
U.S. GAAP – Deferred income tax assets and liabilities are classified in accordance with the classification of the underlying items which generated such assets and liabilities.
The Company measures current and deferred tax assets and liabilities at the applicable tax rate. With respect to the income tax consequences of basis differences of undistributed earnings, the Company recognizes deferred tax liabilities at the applicable tax rate based on its tax planning strategies. Due to the change in controlling shareholder in 2007, the Company reassessed certain of its tax planning strategies and, as a result, the Company recorded deferred income tax liabilities related to certain undistributed earnings.
| | (b) | Differences in presentation - |
Presentation of voluntary contributions
Peruvian GAAP − Voluntary contribution amounting to US$41,081,000 is presented as part of operating expenses.
U.S. GAAP − Voluntary contribution amounting to US$41,081,000 must be presented as part of cost of sales in the income statement.
Workers’ profit sharing
Peruvian GAAP − Workers’ profit sharing expense (income) is separately presented in the statements of income in a similar way as income tax expense (income). Also, deferred workers’ profit sharing asset (liability) is separately presented in the balance sheets in a similar way as deferred income tax assets (liabilities).
U.S. GAAP − The practice is to recognize the workers’ profit sharing expense (income) as part of operating cost and profit sharing contributions, which are paid to the government, is recognized as part of current income tax. Also, deferred workers’ profit sharing assets (liabilities) shall be classified as current or non−current based on the classification of the related asset or liability for financial reporting purposes.
| 26. | Reconciliation between net income and shareholders’ equity determined under Peruvian GAAP and U.S. GAAP |
The following is a summary of the adjustments to net income for the years ended December 31, 2010, 2009 and 2008 and to shareholders’ equity as of December 31, 2010, 2009 and 2008 that would be required if U.S. GAAP had been applied instead of Peruvian GAAP in the financial statements:
| | | 2010 | | | 2009 | | | 2008 | |
| | | US$(000) | | | US$(000) | | | US$(000) | |
| | | | | | | | | | |
| Net income under Peruvian and U.S. GAAP | | | 1,054,423 | | | | 708,528 | | | | 718,433 | |
| Basic and diluted income per share under Peruvian and U.S. GAAP | | | 3.01 | | | | 2.02 | | | | 2.05 | |
Notes to the Financial Statements (continued)
| | | 2010 | | | 2009 | | | 2008 | |
| | | US$(000) | | | US$(000) | | | US$(000) | |
| Shareholders’ equity under Peruvian GAAP | | | 1,550,517 | | | | 1,446,094 | | | | 1,324,175 | |
| Items increasing (decreasing) reported shareholder’s equity: | | | | | | | | | | | | |
| Deferred income tax | | | (239,764 | ) | | | (239,764 | ) | | | (239,764 | ) |
| Shareholders’ equity under U.S. GAAP | | | 1,310,753 | | | | 1,206,330 | | | | 1,084,411 | |
The following is a roll forward of the components of shareholders’ equity under U.S. GAAP:
| | | US$(000) | |
| | | | |
| Shareholders’ equity under U.S. GAAP at January 01, 2008 | | | 1,205,978 | |
| Paid dividends | | | (840,000 | ) |
| Net income in accordance with U.S. GAAP | | | 718,433 | |
| Shareholders’ equity under U.S. GAAP at December 31, 2008 | | | 1,084,411 | |
| Paid dividends | | | (450,000 | ) |
| Premium capital distribution | | | (215,000 | ) |
| Recovery of dividends paid in excess in 2008 | | | 78,390 | |
| Transfer to legal reserve | | | 1 | |
| Net income in accordance with US.GAAP | | | 708,528 | |
| Shareholders’ equity under U.S. GAAP at December 31, 2009 | | | 1,206,330 | |
| Paid dividends | | | (950,000 | ) |
| Net income in accordance with US.GAAP | | | 1,054,423 | |
| Shareholders’ equity under U.S. GAAP at December 31, 2010 | | | 1,310,753 | |
| 27. | New U.S. GAAP Accounting Pronouncements |
Recently Adopted Accounting Pronouncements -
Accounting Standards Update (ASU) N° 2010-06 Fair Value Accounting
In January 2010, the Accounting Standards Codification (ASC) guidance for fair value measurements and disclosure was updated to require additional disclosures related to transfers in and out of level 1 and 2 fair value measurements along with the reasons for the transfers. The guidance was amended to clarify the level of disaggregation required for assets and liabilities and the disclosures required for inputs and valuation techniques used to measure the fair value of assets and liabilities that fall in either level 2 or level 3. The updated guidance was effective for the Company’s fiscal year beginning January 1, 2010. The adoption had no impact on the Company’s financial statements. See note 23 for further details regarding the Company’s assets and liabilities measured at fair value.
Additionally, the ASC guidance updated require enhanced detail in the level 3 reconciliation. This requirement is effective for the Company’s fiscal year beginning January 1, 2011. The Company expects minimal impact from adopting this guidance.
Notes to the Financial Statements (continued)
Recently Issued Accounting Pronouncements -
ASU N° 2010-29 Business Combinations
In December 2010, the ASC guidance for business combinations was updated to clarify existing guidance which requires a public entity to disclose pro forma revenue and earnings of the combined entity as though the business combination(s) that occurred during the current year had occurred as of the beginning of the comparable prior annual period only. The update also expands the supplemental pro forma disclosures required to include a description of the nature and amount of material, nonrecurring pro forma adjustments directly attributable to the business combination included in the reported pro forma revenue and earnings. The updated guidance is effective for the Company’s fiscal year beginning January 1, 2011. The Company is evaluating the potential impact of adopting this guidance on the Company’s financial position, results of operations and cash flows.
Exhibit Index
| Exhibit No. | | Document Description |
| | | |
| 1.1 | | By-Laws (Estatutos) of Compañía de Minas Buenaventura S.A.A., as amended April 30, 2002 (incorporated by reference from Compañía de Minas Buenaventura S.A.A. Annual Report on Form 20-F for the year ended December 31, 2002, filed on June 25, 2003). |
| | | |
| 1.2 | | By-Laws (Estatutos) of Minera Yanacocha S. R. L., as amended October 18, 1999 (incorporated by reference from Compañía de Minas Buenaventura S.A.A. Annual Report on Form 20-F for the year ended December 31, 2002, filed on June 25, 2003). |
| | | |
| 4.1 | | Shareholders Agreement among SMM Cerro Verde Netherlands B.V., Sumitomo Metal Mining Co., Ltd., Sumitomo Corporation, Summit Global Management B.V., Compañía de Minas Buenaventura S.A.A., Cyprus Climax Metals Company, Phelps Dodge Corporation and Sociedad Minera Cerno Verde S.A.A. dated June 1, 2005 (incorporated by reference from Compañía de Minas Buenaventura S.A.A. Annual Report on Form 20-F for the year ended December 31, 2005, filed on June 6, 2006). |
| | | |
| 4.2 | | English Summary of the Financial Lease Agreement (Arrendamiento Financiero), dated as of December 2, 2009, by and among Banco de Crédito del Peru, as lessor, Compañía de Minas Buenaventura S.A.A., as guarantor, Empresa de Generación de Huanza, S.A., as lessee, and Consorcio Energetico Huancavelica S.A.† |
| | | |
| 11 | | Code of Conduct and Ethics (incorporated by reference from Compañía de Minas Buenaventura S.A.A. Annual Report on Form 20-F for the year ended December 31, 2002, filed on June 25, 2003). |
| | | |
| 12.1 | | Certification of Chief Executive Officer of Compañía de Minas Buenaventura S.A.A. pursuant to Section 302 of the Sarbanes-Oxley Act of 2002. † |
| | | |
| 12.2 | | Certification of Chief Financial Officer of Compañía de Minas Buenaventura S.A.A. pursuant to Section 302 of the Sarbanes-Oxley Act of 2002. † |
| | | |
| 13.1 | | Certification of Chief Executive Officer of Compañía de Minas Buenaventura S.A.A. pursuant to Section 906 of the Sarbanes-Oxley Act of 2002. † |
| | | |
| 13.2 | | Certification of Chief Financial Officer of Compañía de Minas Buenaventura S.A.A. pursuant to Section 906 of the Sarbanes-Oxley Act of 2002. † |
† Filed herewith.