UNITED STATES
SECURITIES AND EXCHANGE COMMISSION
Washington, D.C. 20549
FORM 6-K
REPORT OF FOREIGN ISSUER
PURSUANT TO RULE 13a-16 OR 15b-16 OF
THE SECURITIES EXCHANGE ACT OF 1934
PURSUANT TO RULE 13a-16 OR 15b-16 OF
THE SECURITIES EXCHANGE ACT OF 1934
For the month of October 2020
Commission File Number 001-14370
COMPANIA DE MINAS BUENAVENTURA S.A.A.
(Exact name of registrant as specified in its charter)
BUENAVENTURA MINING COMPANY INC.
(Translation of registrant’s name into English)
(Translation of registrant’s name into English)
Republic of Peru
(Jurisdiction of incorporation or organization)
(Jurisdiction of incorporation or organization)
CARLOS VILLARAN 790
SANTA CATALINA, LIMA 13, PERU
(Address of principal executive offices)
SANTA CATALINA, LIMA 13, PERU
(Address of principal executive offices)
Indicate by check mark whether the registrant files or will file annual reports under cover Form 20-F or Form 40-F.
Form 20-F ____X___ Form 40-F _______
Indicate by check mark if the registrant is submitting the Form 6-K in paper as permitted by Regulation S-T Rule 101(b)(1): [ ]
Indicate by check mark if the registrant is submitting the Form 6-K in paper as permitted by Regulation S-T Rule 101(b)(7): [ ]
Indicate by check mark if the registrant is submitting the Form 6-K in paper as permitted by Regulation S-T Rule 101(b)(7): [ ]
Indicate by check mark whether the registrant by furnishing the information contained in this Form is also thereby furnishing the information to the Commission pursuant to Rule 12g3-2(b) under the Securities Exchange Act of 1934.
Yes _______ No ___X____
If “Yes” is marked, indicate below the file number assigned to the registrant in connection with Rule 12g3-2(b): Not applicable.
Buenaventura Announces
Third Quarter and Nine Month 2020 Results
Lima, Peru, October 29, 2020 – Compañia de Minas Buenaventura S.A.A. (“Buenaventura” or “the Company”) (NYSE: BVN; Lima Stock Exchange: BUE.LM), Peru’s largest publicly-traded precious metals mining company, today announced results for the third quarter (3Q20) and nine-month (9M20) period ended September 30, 2020. All figures have been prepared in accordance with IFRS (International Financial Reporting Standards) on a non-GAAP basis and are stated in U.S. dollars (US$).
Third Quarter 2020 Highlights:
| ● | Third quarter 2020 EBITDA from direct operations reflected a positive trend on both a sequential and year on year basis, despite the effects of COVID-19 on Buenaventura’s operations during the quarter. EBITDA from direct operations reached US$ 68.5 million for the 3Q20, compared to US$ 26.5 million in 2Q20 and US$ 58.4 million reported in 3Q19. |
| ● | 3Q20 Adjusted EBITDA including associated companies reached US$ 183.9 million, compared to US$ 168.2 million in 3Q19. |
| ● | 3Q20 capital expenditures were US$ 12.6 million, compared to US$ 28.0 million for the same period in 2019. |
| ● | 3Q20 net income was US$ 24.4 million, compared to US$ 4.5 million for the same period in 2019. |
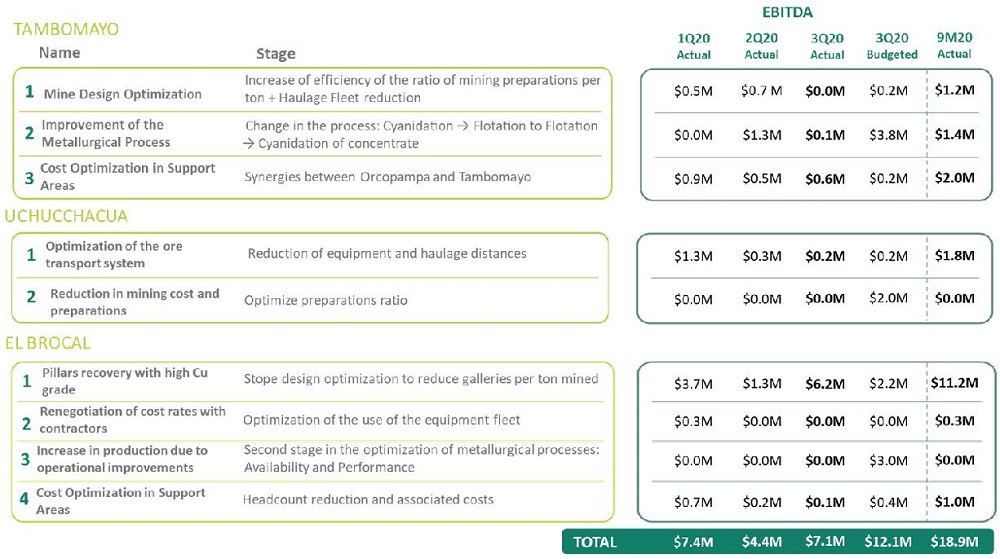
| ● | The Company´s De-Bottlenecking Program continued to progress at a reduced level during the 3Q20. The program’s 2020 focus is on Buenaventura’s Tambomayo, Uchucchacua and El Brocal mines (please refer to page 7 for related details). |
| ● | Buenaventura’s cash position reached US$ 265 million for the third quarter 2020. |
| ● | The Company has released its updated guidance for the full year 2020 (please refer to page 2 for related details). |
| ● | In line with the Company’s ongoing focus on cash preservation, on October 29, 2020 Buenaventura successfully refinanced the final US$ 113 million leasing payment for its Huanza hydroelectric power plant, effective November 2, 2020. This extends the maturity by 18 months (bullet) at rate of Libor 30-days + 2.10%. |
Financial Highlights (in millions of US$, except EPS figures):
| 3Q20 | 3Q19 | Var | 9M20 | 9M19 | Var | |
| Total Revenues | 228.2 | 230.2 | -1% | 440.5 | 632.4 | -30% |
| Operating Profit | 12.7 | -6.9 | N.A. | -64.8 | -49.3 | -31% |
| EBITDA Direct Operations | 68.5 | 58.4 | 17% | 88.1 | 133.2 | -34% |
| Adjusted EBITDA (Inc Associates) | 183.9 | 168.2 | 9% | 298.5 | 472.5 | -37% |
| Net Income | 24.4 | 4.5 | 442% | -75.7 | 41.5 | N.A. |
| EPS* | 0.10 | 0.02 | 442% | -0.30 | 0.16 | N.A. |
(*) As of September 30, 2020 Buenaventura had a weighted average number of shares outstanding of 253,986,867.

Compañía de Minas Buenaventura S.A.A. First Quarter 2020 Results Page 2 of 27 |
Updated Guidance 1, 2 |
3Q20 Production per Metal and 2020 Guidance (100% Basis) | |||||||||
| Tambomayo | 1Q | 2Q | July | Aug | Sept | 3Q | 9M20 | 2020E | |
| Au [Oz] | 14,549 | 17,121 | 4,007 | 5,891 | 6,210 | 16,108 | 47,778 | 70k - 74k | |
| Ag [Oz] | 385,532 | 410,010 | 86,292 | 154,874 | 154,746 | 395,913 | 1,191,454 | 1.5M - 1.7M | |
| Pb [MT] | 1,194 | 1,190 | 408 | 509 | 555 | 1,472 | 3,856 | 5.6k - 5.8k | |
| Zn [MT] | 1,267 | 831 | 318 | 401 | 574 | 1,292 | 3,390 | 5.2k - 5.6k | |
| Orcopampa | 1Q | 2Q | July | Aug | Sept | 3Q | 9M20 | 2020E | |
| Au [Oz] | 8,160 | 7,612 | 4,384 | 6,777 | 3,936 | 15,096 | 30,869 | 40k - 42k | |
| Coimolache | 1Q | 2Q | July | Aug | Sept | 3Q | 9M20 | 2020E | |
| Au [Oz] | 22,493 | 13,551 | 8,399 | 8,115 | 9,959 | 26,473 | 62,517 | 100k - 106k | |
| La Zanja | 1Q | 2Q | July | Aug | Sept | 3Q | 9M20 | 2020E | |
| Au [Oz] | 3,297 | 3,028 | 1,610 | 2,076 | 1,401 | 5,087 | 11,411 | 13k - 16k | |
| Yanacocha | 1Q | 2Q | July | Aug | Sept | 3Q | 9M20 | 2020E | |
| Au [Oz] | 121,802 | 67,827 | 25,901 | 26,543 | 27,430 | 79,874 | 269,503 | 335k** | |
| Julcani | 1Q | 2Q | July | Aug | Sept | 3Q | 9M20 | 2020E | |
| Ag [Oz] | 550,552 | 136,177 | 0 | 0 | 323,495 | 323,495 | 1,010,224 | 1.4M - 1.6M | |
| Pb [MT] | 149 | 29 | 0 | 0 | 76 | 76 | 254 | 380 - 430 | |
| Uchucchacua | 1Q | 2Q | July | Aug | Sept | 3Q | 9M20 | 2020E | |
| Ag [Oz] | 1,956,463 | 979,008 | 0 | 200,149 | 590,164 | 790,313 | 3,725,784 | 4.4M - 5.0M | |
| Pb [MT] | 2,273 | 753 | 0 | 225 | 531 | 756 | 3,782 | 4.7k - 5.0k | |
| Zn [MT] | 2,360 | 462 | 0 | 212 | 716 | 928 | 3,750 | 4.7k - 5.0k | |
| El Brocal | 1Q | 2Q | July | Aug | Sept | 3Q | 9M20 | 2020E | |
| Au [Oz] | 4,054 | 1,049 | 1,039 | 1,080 | 1,236 | 3,354 | 8,457 | 12k - 14k | |
| Ag [Oz] | 678,067 | 248,693 | 400,846 | 487,026 | 591,455 | 1,479,327 | 2,406,087 | 3.6M - 4.0M | |
| Pb [MT] | 5,460 | 2,188 | 2,628 | 2,188 | 3,367 | 8,182 | 15,830 | 17k - 19k | |
| Zn [MT] | 15,058 | 4,385 | 8,195 | 6,564 | 7,517 | 22,277 | 41,719 | 48k - 51k | |
| Cu [MT] | 9,122 | 3,045 | 3,132 | 2,754 | 3,303 | 9,190 | 21,356 | 33k - 36k | |
| 1. | 2020 outlook projections shown above are considered forward-looking statements and represent management’s good faith estimates or expectations of future production results as of October 29, 2020. |
| 2. | Please consider that this updated guidance could potentially be adversely impacted due to further effects related to COVID-19. |
| 3. | As announced by Newmont. |
Compañía de Minas Buenaventura S.A.A. First Quarter 2020 Results Page 3 of 27 |
Operating Revenues |
Operating Revenues
3Q20 net sales were US$ 223.4 million, in line with US$ 223.6 million reported in 3Q19. Despite the lower volume sold due to the effects of COVID-19, excluding zinc volumes, higher prices (excluding lead) helped to maintain steady net sales figures compared to those reported in 2019.
Royalty income decreased 28% in the 3Q20 to US$ 4.8 million, from US$ 6.6 million in 3Q19. This was due to a 33% decrease in Yanacocha revenues.
| Operating Highlights | 3Q20 | 3Q19 | % | 9M20 | 9M19 | % | |
Net Sales (in millions of US$) | 223.4 | 223.6 | 0% | 426.4 | 615.0 | -31% | |
Average Realized Gold Price (US$/oz) (1) (2) | 1,939 | 1,493 | 30% | 1,835 | 1,373 | 34% | |
Average Realized Gold Price (US$/oz) Inc. Affiliates (2)(3) | 1,923 | 1,480 | 30% | 1,766 | 1,371 | 29% | |
Average Realized Silver Price (US$/oz) (1) (2) | 27.19 | 17.69 | 54% | 20.92 | 16.00 | 31% | |
Average Realized Lead Price (US$/MT) (1) (2) | 1,659 | 1,947 | -15% | 1,620 | 1,934 | -16% | |
Average Realized Zinc Price (US$/MT) (1) (2) | 2,349 | 1,961 | 20% | 2,005 | 2,584 | -22% | |
Average Realized Copper Price (US$/MT) (1) (2) | 6,448 | 5,584 | 15% | 5,875 | 5,889 | 0% |
| Volume Sold | 3Q20 | 3Q19 | % | 9M20 | 9M19 | % |
Consolidated Gold Oz (1) | 42,462 | 48,003 | -12% | 87,537 | 129,444 | -32% |
Gold Oz Inc. Associated Companies (3) | 87,713 | 132,649 | -34% | 229,565 | 357,559 | -36% |
Consolidated Silver Oz (1) | 2,794,158 | 4,600,098 | -39% | 7,264,405 | 13,444,555 | -46% |
Consolidated Lead MT (1) | 9,493 | 10,588 | -10% | 20,850 | 35,137 | -41% |
Consolidated Zinc MT (1) | 20,347 | 13,412 | 52% | 40,402 | 45,251 | -11% |
Consolidated Copper MT (1) | 8,811 | 12,000 | -27% | 20,034 | 29,507 | -32% |
(1) Buenaventura Consolidated figure includes 100% of Buenaventura’s operating units, 100% of La Zanja and 100% of El Brocal.
(2) The realized price takes into account the adjustments of quotational periods.
(3) Considers 100% of Buenaventura’s operating units, 100% of La Zanja, 100% of El Brocal, 40.095% of Coimolache and 43.65% of Yanacocha.
Compañía de Minas Buenaventura S.A.A. First Quarter 2020 Results Page 4 of 27 |
Production and Operating Costs |
Production and Operating Costs
Buenaventura’s 3Q20 equity gold production was 81,595 ounces, compared to 121,466 ounces produced in 3Q19. This was primarily due to a 26% percent production decrease at Tambomayo, as these operations reached full production capacity in September, and a 44% production decrease at Yanacocha due to continued effects of COVID-19.
Silver equity production decreased by 47% year on year, primarily due to a 71% decrease in production at the Uchucchacua mine, as this mine did not achieve full capacity during the third quarter 2020. Lead equity production decreased by 20% year on year, primarily due to an 84% decrease at the Uchucchacua mine. Zinc equity production increased by 22% year on year, primarily due to a 148% production increase at El Brocal.
| Equity Production | 3Q20 | 3Q19 | % | 9M20 | 9M19 | % |
Gold Oz Direct Operations(1) | 36,115 | 39,277 | -8% | 90,071 | 119,213 | -24% |
Gold Oz including Associated(2) Companies | 81,595 | 121,466 | -33% | 232,776 | 349,623 | -33% |
Silver Oz Direct Operations(1) | 2,437,019 | 4,610,266 | -47% | 7,442,716 | 13,466,680 | -45% |
| Silver Oz including Associated Companies | 2,975,584 | 4,994,392 | -40% | 8,780,896 | 14,505,596 | -39% |
| Lead MT | 7,331 | 9,185 | -20% | 17,617 | 30,444 | -42% |
| Zinc MT | 15,904 | 13,088 | 22% | 32,768 | 42,018 | -22% |
Copper MT Direct Operations(1) | 5,667 | 7,853 | -28% | 13,193 | 19,325 | -32% |
Copper MT including Associated Companies(3) | 24,996 | 28,719 | -13% | 66,362 | 84,559 | -22% |
| Consolidated Production | 3Q20 | 3Q19 | % | 9M20 | 9M19 | % |
Gold Oz(4) | 39,797 | 44,386 | -10% | 98,690 | 136,015 | -27% |
Silver Oz(4) | 3,021,550 | 5,003,175 | -40% | 8,397,762 | 14,741,848 | -43% |
Lead MT(4) | 10,487 | 10,879 | -4% | 23,723 | 37,299 | -36% |
Zinc MT(4) | 24,497 | 16,547 | 48% | 48,859 | 54,326 | -10% |
Copper MT(4) | 9,211 | 12,754 | -28% | 21,430 | 31,372 | -32% |
(1) Buenaventura’s Direct Operations includes 100% of Buenaventura’s operating units, 53.06% of La Zanja and 61.43% of El Brocal.
(2) Based on 100% of Buenaventura´s operating units, 53.06% of La Zanja, 61.43% of el Brocal, 40.095% of Coimolache and 43.65% of Yanacocha.
(3) Based on 100% of Buenaventura´s operating units, 61.43% of el Brocal and 19.58% of Cerro Verde.
(4) Based on 100% of Buenaventura’s operating units, 100% of La Zanja and 100% of El Brocal.
Compañía de Minas Buenaventura S.A.A. First Quarter 2020 Results Page 5 of 27 |
Tambomayo (100% owned by Buenaventura)
| Production | |||||||
| 3Q20 | 3Q19 | Var % | 9M20 | 9M19 | Var % | ||
| Gold | Oz | 16,108 | 21,740 | -26% | 47,778 | 70,384 | -32% |
| Silver | Oz | 395,913 | 641,247 | -38% | 1,191,454 | 1,714,523 | -31% |
| Cost Applicable to Sales | |||||||
| 3Q20 | 3Q19 | Var % | 9M20 | 9M19 | Var % | ||
| Gold | US$/Oz | 821 | 695 | 18% | 910 | 647 | 41% |
3Q20 year on year gold production at Tambomayo decreased 26% mainly due to a reduction in ore treated due to COVID-19 restrictions. However, full capacity was achieved in September. Cost Applicable to Sales (CAS) increased to 821 US$/Oz in 3Q20, compared to 695 US$/Oz in 3Q19, primarily due to at 33% decrease in volume sold.
Orcopampa (100% owned by Buenaventura)
| Production | |||||||
| 3Q20 | 3Q19 | Var % | 9M20 | 9M19 | Var % | ||
| Gold | Oz | 15,096 | 10,721 | 41% | 30,869 | 27,434 | 13% |
| Silver | Oz | 2,774 | 3,924 | -29% | 6,655 | 14,424 | -54% |
| Cost Applicable to Sales | |||||||
| 3Q20 | 3Q19 | Var % | 9M20 | 9M19 | Var % | ||
| Gold | US$/Oz | 754 | 1,699 | -56% | 820 | 1,776 | -54% |
The increase in 3Q20 gold production at Orcopampa was mainly due to higher ore grade (a 46% year on year improvement). Cost Applicable to Sales (CAS) decreased to 754 US$/Oz in 3Q20, compared to 1,699 US$/Oz in 3Q19, primarily due to a 52% increase in volume sold.
Operating costs for those months of suspended activities without production due to COVID-19 have been recognized as “Unabsorbed costs due to production stoppage.” In the case of Orcopampa, US$ 3.2 million has been classified as “Unabsorbed cost” for the 9M20.
La Zanja (53.06% owned by Buenaventura)
| Production | |||||||
| 3Q20 | 3Q19 | Var % | 9M20 | 9M19 | Var % | ||
| Gold | Oz | 5,087 | 6,224 | -18% | 11,411 | 25,283 | -55% |
| Silver | Oz | 29,728 | 20,384 | 46% | 57,558 | 80,988 | -29% |
| Cost Applicable to Sales | |||||||
| 3Q20 | 3Q19 | Var % | 9M20 | 9M19 | Var % | ||
| Gold | US$/Oz | 1,689 | 1,039 | 62% | 1,706 | 1,095 | 56% |
3Q20 gold production decreased by 18% year on year despite an increased throughput, primarily due to a lower ore grade. 3Q20 Cost Applicable to Sales (CAS) was 1,689 US$/Oz; an 62% increase compared to 1,039 US$/Oz in 3Q19, mainly due to a 16% decrease in volume sold.
Operating costs for those months of suspended activities without production due to COVID-19 have been recognized as “Unabsorbed cost due to production stoppage.” In the case of La Zanja, US$ 0.2 million has been classified as “Unabsorbed cost” for the 9M20.
Compañía de Minas Buenaventura S.A.A. First Quarter 2020 Results Page 6 of 27 |
Coimolache (40.10% owned by Buenaventura)
| Production | |||||||
| 3Q20 | 3Q19 | Var % | 9M20 | 9M19 | Var % | ||
| Gold | Oz | 26,473 | 49,683 | -47% | 62,517 | 110,722 | -44% |
| Silver | Oz | 187,379 | 239,053 | -22% | 454,337 | 460,980 | -1% |
| Cost Applicable to Sales | |||||||
| 3Q20 | 3Q19 | Var % | 9M20 | 9M19 | Var % | ||
| Gold | US$/Oz | 800 | 630 | 27% | 884 | 679 | 30% |
3Q20 gold production at Coimolache decreased by 47% year on year, primarily due to a reduction in ore treated due to COVID-19 restrictions, full capacity was achieved in September. 3Q20 Cost Applicable to Sales (CAS) was 800 US$/Oz; a 27% increase compared to 630 US$/Oz in 3Q19, mainly due to a 47% decrease in volume sold.
Uchucchacua (100% owned by Buenaventura)
| Production | |||||||
| 3Q20 | 3Q19 | Var % | 9M20 | 9M19 | Var % | ||
| Silver | Oz | 790,313 | 2,684,854 | -71% | 3,725,784 | 7,764,583 | -52% |
| Zinc | MT | 928 | 5,101 | -82% | 3,750 | 15,099 | -75% |
| Lead | MT | 756 | 4,708 | -84% | 3,782 | 13,461 | -72% |
| Cost Applicable to Sales | |||||||
| 3Q20 | 3Q19 | Var % | 9M20 | 9M19 | Var % | ||
| Silver | US$/Oz | 27.65 | 11.60 | 138% | 19.46 | 11.10 | 75% |
3Q20 silver production at Uchucchacua decreased by 71%, primarily due to a reduction in ore treated due to COVID-19 restrictions. Uchucchacua did not achieve full capacity during the third quarter 2020 mainly due to a reduced workforce and shortage of workers required to successfully operate at full capacity. Cost Applicable to Sales (CAS) in 3Q20 increased by 138% year on year.
Operating costs for those months of suspended activities without production due to COVID-19 have been recognized as “Unabsorbed costs due to production stoppage”. In the case of Uchucchacua US$ 6.0 million and US$ 8.9 million have been classified as “Unabsorbed costs” during 3Q20 and 9M20, respectively.
Julcani (100% owned by Buenaventura)
| Production | |||||||
| 3Q20 | 3Q19 | Var % | 9M20 | 9M19 | Var % | ||
| Silver | Oz | 323,495 | 658,883 | -51% | 1,010,224 | 1,959,780 | -48% |
| Cost Applicable to Sales | |||||||
| 3Q20 | 3Q19 | Var % | 9M20 | 9M19 | Var % | ||
| Silver | US$/Oz | 11.10 | 13.26 | -16% | 14.65 | 13.59 | 8% |
3Q20 silver production decreased 51% year on year due to a 62% reduction in ore treated despite a 6% increase in silver grades. Silver production for the third quarter 2020 includes 53,071 silver ounces derived from tailings dam retreatment. 3Q20 Cost Applicable to Sales (CAS) of 11.10 US$/Oz was 16% lower than 13.26 US$/Oz in 3Q19, mainly due to the retreatment of tailings dams.
Compañía de Minas Buenaventura S.A.A. First Quarter 2020 Results Page 7 of 27 |
As a result of suspended activities during this year due to COVID-19, operating costs during those months without production have been recognized as “Unabsorbed costs due to production stoppage.” In the case of Julcani, US$ 3.2 million and US$5.0 million have been classified as “Unabsorbed costs” for the 3Q20 and 9M20, respectively.
El Brocal (61.43% owned by Buenaventura)
| Production | |||||||
| 3Q20 | 3Q19 | Var % | 9M20 | 9M19 | Var % | ||
| Copper | MT | 9,190 | 12,707 | -28% | 21,356 | 31,234 | -32% |
| Zinc | MT | 22,277 | 8,968 | 148% | 41,719 | 31,911 | 31% |
| Silver | Oz | 1,479,327 | 993,883 | 49% | 2,406,087 | 3,207,550 | -25% |
| Cost Applicable to Sales | |||||||
| 3Q20 | 3Q19 | Var % | 9M20 | 9M19 | Var % | ||
| Zinc | US$/MT | 1,807 | 1,646 | 10% | 1,803 | 2,007 | -10% |
| Copper | US$/MT | 4,843 | 4,987 | -3% | 5,022 | 5,400 | -7% |
3Q20 copper production for El Brocal decreased by 28% year on year due to a 32% decrease in ore treated, primarily due to a reduced workforce resulting from COVID-19 restrictions, despite higher ore grades (2%) and a higher recovery rate (3%) during the quarter. 3Q20 zinc production increased by 148% year on year as a result of a 44% increase in ore treated and a 53% increase in grades compared to the same period in 2019.
In 3Q20, Copper Cost Applicable to Sales (CAS) was in-line with that of 3Q19. Zinc CAS increased by 10% year on year for the third quarter 2020, mainly due to increased commercial deductions resulting from less favorable market conditions as compared to 2019.
Operating costs for those months of suspended activities without production due to COVID-19 have been recognized as “Unabsorbed costs due to production stoppage”. In the case of El Brocal, US$ 9.2 million was classified as “Unabsorbed costs” for the 9M20.
De-Bottlenecking Program – 2020 Update |
Buenaventura’s De-Bottlenecking Program progressed well during the third quarter 2020, particularly considering the current challenging circumstances, and successfully generated incremental EBITDA as is illustrated below:
Compañía de Minas Buenaventura S.A.A. First Quarter 2020 Results Page 8 of 27 |
General and Administrative Expenses |
3Q20 General and Administrative expenses were US$ 16.8 million; a 4% decrease as compared to US$ 17.4 million in 3Q19. This is due to the Company´s successful cost containment and expense reduction during the quarter, which partially offset the adverse effects of Peru’s State of Emergency.
Exploration in Non-Operating Areas |
3Q20 exploration costs in Non-Operating Areas were US$ 1.8 million, compared with US$ 2.4 million in 3Q19. During the period, Buenaventura focused exploration efforts primarily on its Emperatriz project, amounting to US$ 1.2 million in exploration costs during 3Q20.
Share in Associated Companies |
During 3Q20, Buenaventura’s share in associated companies was US$ 34.2 million, compared to US$ 37.8 million reported in 3Q19, comprised of:
Share in the Result of Associates (in millions of US$) | 3Q20 | 3Q19 | Var | 9M20 | 9M19 | Var |
Cerro Verde | 22.7 | 8.9 | 154% | 24.3 | 58.6 | -59% |
Yanacocha | 8.1 | 23.4 | -65% | -9.0 | 44.3 | N.A. |
Coimolache | 3.9 | 5.4 | -28% | 1.5 | 7.1 | -80% |
Others | -0.5 | 0.2 | N.A. | -0.7 | -0.3 | 127% |
| Total | 34.2 | 37.8 | -9% | 16.1 | 110.0 | -85% |
YANACOCHA
At Yanacocha, which is 43.65% owned by Buenaventura, 3Q20 gold production was 79,874 ounces, 34,865 ounces of which were attributable to Buenaventura. This represents a 44% decrease as compared to the 142,654 ounces produced in 3Q19; 62,268 ounces of which were attributable to Buenaventura.
For 9M20, gold production was 269,503, 117,638 ounces of which were attributable to Buenaventura; a 37% decrease as compared to 426,153 ounces in 9M19, 186,016 ounces of which were attributable to Buenaventura.
In 3Q20, Yanacocha reported a net income of US$ 18.6 million, compared to a net income of US$ 53.7 million reported in 3Q19. CAS in 3Q20 was 1,036 US$/Oz; a 40% increase compared to 741 US$/Oz in 3Q19, mainly due to a 46% decrease in volume sold.
Capital expenditures at Yanacocha were US$ 21.6 million in 3Q20.
The Yanacocha Sulfides project
| • | Currently in the Definitive Feasibility Stage |
| • | Study work and engineering continue to successfully progress remotely |
| • | Decision to proceed expected in 2021. |
| • | The Environmental Impact Assessment study was approved in March 2019. |
Compañía de Minas Buenaventura S.A.A. First Quarter 2020 Results Page 9 of 27 |
CERRO VERDE
At Cerro Verde (19.58% owned by Buenaventura), 3Q20 copper production was 98,718 MT, 19,329 MT of which is attributable to Buenaventura; a decrease as compared to 106,567 MT produced in 3Q19, 20,866 MT of which was attributable to Buenaventura.
9M20 copper production was 271,549 MT; 53,169 MT of which was attributable to Buenaventura. 9M19 copper production was 333,163 MT; 65,233 MT of which was attributable to Buenaventura.
Cerro Verde reported a 3Q20 net income of US$ 115.8 million compared to net income of US$ 45.5 million in 3Q19. This is primarily due to a US$ 136.1 million net sales increase primarily attributed to higher average realized copper price (US$ 3.20 per pound in the third quarter of 2020, compared to US$2.47 per pound in the third quarter of 2019). This was partially offset by a higher income tax expense of US$66.3 million.
Capital expenditures at Cerro Verde were US$ 28.5 million in 3Q20.
COIMOLACHE (Tantahuatay operation)
At Coimolache (40.10% owned by Buenaventura), 3Q20 attributable contribution to net income was US$ 3.9 million, as compared to positive US$ 5.4 million in 3Q19.
***
Company Description
Compañía de Minas Buenaventura S.A.A. is Peru’s largest, publicly traded, precious metals company and a major holder of mining rights in Peru. The Company is engaged in the mining, processing, development and exploration of gold and silver and other metals via wholly owned mines as well as through its participation in joint exploration projects.
Buenaventura currently operates several mines in Peru: Orcopampa*, Uchucchacua*, Julcani*, El Brocal, La Zanja and Coimolache, and is developing the Tambomayo project.
The Company owns 43.65% of Minera Yanacocha S.R.L (a partnership with Newmont Mining Corporation), an important precious metal producer; 19.58% of Sociedad Minera Cerro Verde, an important Peruvian copper producer.
For a printed version of the Company’s 2019 Form 20-F, please contact the investor relations contacts on page 1 of this report, or download the PDF format file from the Company’s web site at www.buenaventura.com.
(*) Operations wholly owned by Buenaventura
Note on Forward-Looking Statements This press release and related conference call contain, in addition to historical information, forward-looking statements including statements related to the Company’s ability to manage its business and liquidity during and after the COVID-19 pandemic, the impact of the COVID-19 pandemic on the Company’s results of operations, including net revenues, earnings and cash flows, the Company’s ability to reduce costs and capital spending in response to the COVID-19 pandemic if needed, the Company’s balance sheet, liquidity and inventory position throughout and following the COVID-19 pandemic, the Company’s prospects for financial performance, growth and achievement of its long-term growth algorithm following the COVID-19 pandemic, future dividends and share repurchases. This press release may also contain forward-looking information (as defined in the U.S. Private Securities Litigation Reform Act of 1995) that involve risks and uncertainties, including those concerning the Company’s, Yanacocha’s and Cerro Verde’s costs and expenses, results of exploration, the continued improving efficiency of operations, prevailing market prices of gold, silver, copper and other metals mined, the success of joint ventures, estimates of future explorations, development and production, subsidiaries’ plans for capital expenditures, estimates of reserves and Peruvian political, economic, social and legal developments. These forward-looking statements reflect the Company’s view with respect to the Company’s, Yanacocha’s and Cerro Verde’s future financial performance. Actual results could differ materially from those projected in the forward-looking statements as a result of a variety of factors discussed elsewhere in this Press Release. |
Compañía de Minas Buenaventura S.A.A. First Quarter 2020 Results Page 10 of 27 |
**Tables to follow**
APPENDIX 1
Equity Participation in Subsidiaries and Associates (as of September 30, 2020) | |||
| BVN | Operating | ||
| Equity % | Mines / Business | ||
El Molle Verde S.A.C* | 100.00 | Trapiche Project | |
Minera La Zanja S.A* | 53.06 | La Zanja | |
Sociedad Minera El Brocal S.A.A* | 61.43 | Colquijirca and Marcapunta | |
Compañía Minera Coimolache S.A. ** | 40.10 | Tantahuatay | |
Minera Yanacocha S.R.L. ** | 43.65 | Yanacocha | |
Sociedad Minera Cerro Verde S.A.A ** | 19.58 | Cerro Verde | |
Processadora Industrial Rio Seco S.A* | 100.00 | Rio Seco chemical plant | |
Consorcio Energético de Huancavelica S.A* | 100.00 | Energy – Huanza Hydroelectrical plant | |
(*) Consolidated
(**) Equity Accounting
Compañía de Minas Buenaventura S.A.A. First Quarter 2020 Results Page 11 of 27 |
APPENDIX 2
| Gold Production | 14 | 17 | ||||||
| Mining Unit | Operating Results | Unit | 3Q20 | 3Q19 | △% | 9M20 | 9M19 | △ % |
| Underground | ||||||||
| Tambomayo | Ore Milled | DMT | 112,489 | 154,461 | -27% | 359,305 | 458,555 | -22% |
Ore Grade | Gr/MT | 5.21 | 5.43 | -4% | 5.04 | 5.76 | -12% | |
Recovery Rate | % | 85.53 | 80.65 | 6% | 82.02 | 82.91 | -1% | |
Ounces Produced* | Oz | 16,108 | 21,740 | -26% | 47,778 | 70,384 | -32% | |
| Orcopampa | Ore Milled | DMT | 28,386 | 28,704 | -1% | 64,078 | 91,096 | -30% |
Ore Grade | Gr/MT | 17.01 | 11.67 | 46% | 15.31 | 9.58 | 60% | |
Recovery Rate | % | 97.25 | 96.90 | 0% | 97.38 | 96.66 | 1% | |
Ounces Produced* | Oz | 15,096 | 10,721 | 41% | 30,869 | 27,434 | 13% | |
| Open Pit | ||||||||
| La Zanja | Ounces Produced | Oz | 5,087 | 6,224 | -18% | 11,411 | 25,283 | -55% |
| Tantahuatay | Ounces Produced | Oz | 26,473 | 49,683 | -47% | 62,517 | 110,722 | -44% |
(*) Includes ounces from retreatment of tailing dams | ||||||||
| Silver Production | ||||||||
| Mining Unit | Operating Results | Unit | 3Q20 | 3Q19 | △% | 9M20 | 9M19 | △ % |
| Underground | ||||||||
| Tambomayo | Ore Milled | DMT | 112,489 | 154,461 | -27% | 359,305 | 458,555 | -22% |
Ore Grade | Oz/MT | 4.24 | 4.82 | -12% | 4.13 | 4.26 | -3% | |
Recovery Rate | % | 83.07 | 86.20 | -4% | 80.35 | 87.74 | -8% | |
Ounces Produced | Oz | 395,913 | 641,247 | -38% | 1,191,454 | 1,714,523 | -31% | |
| Uchucchacua | Ore Milled | DMT | 84,772 | 362,020 | -77% | 402,544 | 961,053 | -58% |
Ore Grade | Oz/MT | 10.14 | 9.03 | 12% | 10.12 | 9.37 | 8% | |
Recovery Rate | % | 91.97 | 82.16 | 12% | 91.50 | 86.25 | 6% | |
Ounces Produced | Oz | 790,313 | 2,684,854 | -71% | 3,725,784 | 7,764,583 | -52% | |
| Julcani | Ore Milled | DMT | 30,048 | 31,507 | -5% | 62,973 | 92,550 | -32% |
Ore Grade | Oz/MT | 11.72 | 21.65 | -46% | 16.87 | 21.98 | -23% | |
Recovery Rate | % | 91.90 | 96.59 | -5% | 95.08 | 96.34 | -1% | |
Ounces Produced | Oz | 323,495 | 658,883 | -51% | 1,010,224 | 1,959,780 | -48% | |
| Marcapunta | Ore Milled | DMT | 525,419 | 767,096 | -32% | 1,187,428 | 2,116,351 | -44% |
Ore Grade | Oz/MT | 0.70 | 0.90 | -22% | 0.70 | 0.79 | -11% | |
Recovery Rate | % | 72.61 | 61.70 | 18% | 68.50 | 61.93 | 11% | |
Ounces Produced | Oz | 267,271 | 423,778 | -37% | 572,944 | 1,040,034 | -45% | |
| Open Pit | ||||||||
| Tajo Norte | Ore Milled | DMT | 919,572 | 636,418 | 44% | 2,009,589 | 2,590,782 | -22% |
Ore Grade | Oz/MT | 1.78 | 1.49 | 19% | 1.27 | 1.32 | -4% | |
Recovery Rate | % | 74.17 | 60.16 | 23% | 71.58 | 63.21 | 13% | |
Ounces Produced | Oz | 1,212,056 | 570,105 | 113% | 1,833,143 | 2,167,515 | -15% | |
Compañía de Minas Buenaventura S.A.A. First Quarter 2020 Results Page 12 of 27 |
| Zinc Production | ||||||||
| Mining Unit | Operating Results | Unit | 3Q20 | 3Q19 | △% | 9M20 | 9M19 | △ % |
| Underground | ||||||||
| Tambomayo | Ore Milled | DMT | 112,489 | 154,461 | -27% | 359,305 | 458,555 | -22% |
Ore Grade | % | 2.19 | 2.02 | 8% | 1.81 | 2.05 | -12% | |
Recovery Rate | % | 52.51 | 79.38 | -34% | 52.11 | 77.86 | -33% | |
MT Produced | MT | 1,292 | 2,478 | -48% | 3,390 | 7,316 | -54% | |
| Uchucchacua | Ore Milled | DMT | 84,772 | 362,020 | -77% | 402,544 | 961,053 | -58% |
Ore Grade | % | 1.81 | 2.23 | -19% | 1.58 | 2.41 | -34% | |
Recovery Rate | % | 60.37 | 63.25 | -5% | 58.95 | 65.15 | -10% | |
MT Produced | MT | 928 | 5,101 | -82% | 3,750 | 15,099 | -75% | |
| Open Pit | ||||||||
| Tajo Norte | Ore Milled | DMT | 919,572 | 636,418 | 44% | 2,009,589 | 2,590,782 | -22% |
Ore Grade | % | 4.09 | 2.68 | 53% | 3.72 | 2.26 | 64% | |
Recovery Rate | % | 59.28 | 52.60 | 13% | 55.82 | 54.45 | 3% | |
MT Produced | MT | 22,277 | 8,968 | 148% | 41,719 | 31,911 | 31% | |
| Copper Production | ||||||||
| Mining Unit | Operating Results | Unit | 3Q20 | 3Q19 | △% | 9M20 | 9M19 | △ % |
| Underground | ||||||||
| Marcapunta | Ore Milled | DMT | 525,419 | 767,096 | -32% | 1,187,428 | 2,116,351 | -44% |
Ore Grade | % | 1.90 | 1.87 | 2% | 1.94 | 1.68 | 16% | |
Recovery Rate | % | 91.86 | 88.76 | 3% | 92.63 | 88.01 | 5% | |
MT Produced | MT | 9,190 | 12,707 | -28% | 21,356 | 31,234 | -32% | |
Compañía de Minas Buenaventura S.A.A. First Quarter 2020 Results Page 13 of 27 |
APPENDIX 3: Adjusted EBITDA Reconciliation (in thousand US$)
| 3Q20 | 3Q19 | 9M20 | 9M19 | |
| Net Income | 27,371 | 737 | -90,480 | 30,415 |
| Add / Subtract: | 41,085 | 57,618 | 178,601 | 102,760 |
Depreciation and Amortization in cost of sales | 56,856 | 60,211 | 130,495 | 168,729 |
Share in associated companies by the equity method, net | -34,212 | -37,771 | -16,066 | -109,988 |
Interest expense | 7,410 | 11,994 | 23,130 | 33,679 |
Impairment of inventories | -5,787 | 1,106 | 8,670 | -1,017 |
Provision of bonuses and compensations | 2,541 | 2,276 | 10,569 | 12,058 |
Depreciation and Amortization in other, net | 874 | 2,507 | 2,749 | 4,286 |
Loss (gain) on currency exchange difference | 776 | 1,455 | 3,891 | 1,672 |
Profit from discontinued operations | 1,468 | 2,129 | 4,280 | 6,643 |
Provision (credit) for income tax, net | 10,824 | 16,139 | 12,659 | -6,113 |
Depreciation and amortization in administration expenses | 26 | 28 | 77 | 556 |
Workers' participation provision | -928 | -1,611 | -2,240 | -5,656 |
Interest income | 1,237 | -827 | 387 | -2,089 |
Provision (reversal) for contingencies | - | -18 | - | - |
| EBITDA Buenaventura Direct Operations | 68,456 | 58,355 | 88,121 | 133,175 |
| EBITDA Yanacocha (43.65%) | 29,800 | 49,434 | 67,373 | 119,163 |
| EBITDA Cerro Verde (19.58%) | 73,356 | 42,553 | 118,889 | 187,783 |
| EBITDA Coimolache (40.095%) | 12,284 | 17,870 | 24,122 | 32,345 |
| EBITDA Buenaventura + All Associates | 183,896 | 168,212 | 298,505 | 472,466 |
*Cerro Verde’s EBITDA now considers D&A related to the capitalization of the stripping.
Note:
EBITDA (Buenaventura Direct Operations) consists of earnings before net interest, taxes, depreciation and amortization, share in associated companies, net, loss on currency exchange difference, other, net, provision for workers’ profit sharing and provision for long-term officers’ compensation.
EBITDA (including associated companies) consists of EBITDA (Buenaventura Direct Operations), plus (1) Buenaventura’s equity share of EBITDA (Yanacocha) (2) Buenaventura’s equity share of EBITDA (Cerro Verde), plus (3) Buenaventura’s equity share of EBITDA (Coimolache). All EBITDA mentioned were similarly calculated using financial information provided to Buenaventura by the associated companies.
Buenaventura presents EBITDA (Buenaventura Direct Operations) and EBITDA (including affiliates) to provide further information with respect to its operating performance and the operating performance of its equity investees, the affiliates. EBITDA (Buenaventura Direct Operations) and EBITDA (including affiliates) are not a measure of financial performance under IFRS, and may not be comparable to similarly titled measures of other companies. You should not consider EBITDA (Buenaventura Direct Operations) and EBITDA (including affiliates) as alternatives to operating income or net income determined in accordance with IFRS, as an indicator of Buenaventura’s, affiliates operating performance, or as an alternative to cash flows from operating activities, determined in accordance with IFRS, as an indicator of cash flows or as a measure of liquidity.
Compañía de Minas Buenaventura S.A.A. First Quarter 2020 Results Page 14 of 27 |
APPENDIX 4: COST APPLICABLE TO SALES RECONCILIATION
Reconciliation of Costs Applicable to Sales and Cost Applicable to Sales per Unit Sold
Cost applicable to sales consists of cost of sales, excluding depreciation and amortization, plus selling expenses. Cost applicable to sales per unit sold for each mine consists of cost applicable to sales for a particular metal produced at a given mine divided by the volume of such metal produced at such mine in the specified period. We note that cost applicable to sales is not directly comparable to the cash operating cost figures disclosed in previously furnished earnings releases.
Cost applicable to sales and Cost applicable to sales per unit of mineral sold are not measures of financial performance under IFRS, and may not be comparable to similarly titled measures of other companies. We consider Cost applicable to sales and Cost applicable to sales per unit of mineral sold to be key measures in managing and evaluating our operating performance. These measures are widely reported in the precious metals industry as a benchmark for performance, but do not have standardized meanings. You should not consider Cost applicable to sales or Cost applicable to sales per unit of mineral sold as alternatives to cost of sales determined in accordance with IFRS, as indicators of our operating performance. Cost applicable to sales and Cost applicable to sales per unit of mineral sold are calculated without adjusting for by-product revenue amounts.
Operations’ Cost applicable to sales does not include operating cost for those months during which Buenaventura’s operations were suspended due to COVID-19, as these have been classified as “Unabsorbed costs due to production stoppage” within the financial statements.
The tables below set forth (i) a reconciliation of consolidated Cost of sales, excluding depreciation and amortization to consolidated Cost applicable to sales, (ii) reconciliations of the components of Cost applicable to sales (by mine and mineral) to the corresponding consolidated line items set forth on our consolidated statements of profit or loss for the three and nine months ended September 30, 2015 and 2016, and (iii) reconciliations of Cost of sales, excluding depreciation and amortization to Cost applicable to sales for each of our mining units. The amounts set forth in Cost applicable to sales and Cost applicable to sales per unit sold for each mine and mineral indicated in the tables below can be reconciled to the amounts set forth on our consolidated statements of profit or loss for the three and nine months ended September 30, 2015 and 2016 by reference to the reconciliations of Cost of sales, excluding depreciation and amortization (by mine and mineral), Selling Expenses (by mine and metal) expenses and Exploration in units in operations (by mine and mineral) to consolidated Cost of sales, excluding depreciation and amortization, consolidated Selling Expenses and consolidated Exploration in units in operations expenses, respectively, set forth below.
Compañía de Minas Buenaventura S.A.A. First Quarter 2020 Results Page 15 of 27 |
| Set forth below is a reconciliation of consolidated Cost of sales, excluding depreciation and amortization, | ||||||||||||||||
| to consolidated Cost applicable to sales: | ||||||||||||||||
| For the 3 months ended September 30 | For the 9 months ended September 30 | |||||||||||||||
| 2020 | 2019 | 2020 | 2019 | |||||||||||||
| (in thousands of US$) | ||||||||||||||||
| Consolidated Cost of sales excluding depreciation and amortization | 112,052 | 129,238 | 259,032 | 373,062 | ||||||||||||
| Add: | ||||||||||||||||
| Consolidated Exploration in units in operation | 7,598 | 10,119 | 16,063 | 34,829 | ||||||||||||
| Consolidated Commercial deductions | 56,429 | 52,510 | 126,430 | 154,041 | ||||||||||||
| Consolidated Selling expenses | 5,289 | 6,195 | 12,067 | 16,486 | ||||||||||||
| Consolidated Cost applicable to sales | 181,369 | 198,062 | 413,592 | 578,418 | ||||||||||||
| Set forth below is a reconciliation of Cost of sales, excluding depreciation and amortization | ||||||||||||||||
| (by mine and mineral) to consolidated Cost of sales: | ||||||||||||||||
| For the 3 months ended September 30 | For the 9 months ended September 30 | |||||||||||||||
| 2020 | 2019 | 2020 | 2019 | |||||||||||||
Cost of sales by mine and mineral | (in thousands of US$) | |||||||||||||||
| Julcani, Gold | 33 | 3 | -52 | 20 | ||||||||||||
| Julcani, Silver | 2,213 | 6,152 | 9,951 | 18,433 | ||||||||||||
| Julcani, Lead | 26 | 274 | 144 | 770 | ||||||||||||
| Julcani, Copper | 6 | 16 | 26 | 48 | ||||||||||||
| Orcopampa, Gold | 11,284 | 17,444 | 21,104 | 38,407 | ||||||||||||
| Orcopampa, Silver | 32 | 88 | 54 | 197 | ||||||||||||
| Orcopampa, Copper | 0 | 0 | 0 | 0 | ||||||||||||
| Uchucchacua, Gold | 0 | 0 | 0 | 0 | ||||||||||||
| Uchucchacua, Silver | 17,614 | 19,642 | 47,276 | 54,960 | ||||||||||||
| Uchucchacua, Lead | 683 | 3,665 | 3,231 | 11,018 | ||||||||||||
| Uchucchacua, Zinc | 1,122 | 3,235 | 3,631 | 14,682 | ||||||||||||
| Tambomayo, Gold | 10,919 | 14,610 | 28,098 | 34,148 | ||||||||||||
| Tambomayo, Silver | 3,512 | 4,675 | 8,172 | 9,860 | ||||||||||||
| Tambomayo, Zinc | 891 | 1,614 | 1,925 | 5,782 | ||||||||||||
| Tambomayo, Lead | 575 | 1,625 | 2,227 | 3,803 | ||||||||||||
| La Zanja, Gold | 8,954 | 6,483 | 21,193 | 26,461 | ||||||||||||
| La Zanja, Silver | 820 | 225 | 1,811 | 896 | ||||||||||||
| El Brocal, Gold | 1,462 | 2,594 | 4,050 | 5,387 | ||||||||||||
| El Brocal, Silver | 10,423 | 6,103 | 16,713 | 18,944 | ||||||||||||
| El Brocal, Lead | 4,245 | 3,433 | 9,491 | 15,041 | ||||||||||||
| El Brocal, Zinc | 15,899 | 6,596 | 29,112 | 31,845 | ||||||||||||
| El Brocal, Copper | 20,355 | 29,776 | 48,400 | 78,836 | ||||||||||||
| Other Small Units, Gold | ||||||||||||||||
| Other Small Units, Silver | ||||||||||||||||
| Other Small Units, Lead | ||||||||||||||||
| Other Small Units, Zinc | ||||||||||||||||
| Non Mining Units | 984 | 985 | 2,475 | 3,523 | ||||||||||||
| Consolidated Cost of sales, excluding depreciation and amortization | 112,052 | 129,238 | 259,032 | 373,062 | ||||||||||||
Compañía de Minas Buenaventura S.A.A. First Quarter 2020 Results Page 16 of 27 |
| Set forth below is a reconciliation of Exploration expenses in units in operation (by mine and mineral) to consolidated Exploration expenses in mining units: | ||||||||||||||||
| For the 3 months ended September 30 | For the 9 months ended September 30 | |||||||||||||||
| 2020 | 2019 | 2020 | 2019 | |||||||||||||
Exploration expenses in units in operation by mine and mineral | (in thousands of US$) | |||||||||||||||
| Julcani, Gold | 6 | 1 | -9 | 5 | ||||||||||||
| Julcani, Silver | 391 | 1,457 | 1,774 | 4,305 | ||||||||||||
| Julcani, Lead | 5 | 65 | 26 | 180 | ||||||||||||
| Julcani, Copper | 1 | 4 | 5 | 11 | ||||||||||||
| Orcopampa, Gold | 1,345 | 1,572 | 2,855 | 7,670 | ||||||||||||
| Orcopampa, Silver | 4 | 8 | 7 | 39 | ||||||||||||
| Orcopampa, Copper | 0 | 0 | 0 | 0 | ||||||||||||
| Uchucchacua, Gold | 0 | 0 | 0 | 0 | ||||||||||||
| Uchucchacua, Silver | 1,008 | 1,231 | 3,287 | 4,692 | ||||||||||||
| Uchucchacua, Lead | 39 | 230 | 225 | 941 | ||||||||||||
| Uchucchacua, Zinc | 64 | 203 | 252 | 1,253 | ||||||||||||
| Tambomayo, Gold | 2,175 | 1,848 | 3,123 | 5,940 | ||||||||||||
| Tambomayo, Silver | 699 | 591 | 908 | 1,715 | ||||||||||||
| Tambomayo, Lead | 177 | 204 | 248 | 662 | ||||||||||||
| Tambomayo, Zinc | 114 | 205 | 214 | 1,006 | ||||||||||||
| La Zanja, Gold | 0 | 0 | 1 | 1 | ||||||||||||
| La Zanja, Silver | 0 | 0 | 0 | 0 | ||||||||||||
| El Brocal, Gold | 44 | 134 | 118 | 230 | ||||||||||||
| El Brocal, Silver | 312 | 315 | 488 | 809 | ||||||||||||
| El Brocal, Lead | 127 | 177 | 277 | 642 | ||||||||||||
| El Brocal, Zinc | 477 | 340 | 850 | 1,360 | ||||||||||||
| El Brocal, Copper | 610 | 1,535 | 1,414 | 3,367 | ||||||||||||
| Non Mining Units | 0 | 0 | 0 | 0 | ||||||||||||
| Consolidated Exploration expenses in units in operation | 7,598 | 10,119 | 16,063 | 34,829 | ||||||||||||
| Set forth below is a reconciliation of Commercial Deductions in units in operation (by mine and mineral) | ||||||||||||||||
| to consolidated Commercial deductions: | ||||||||||||||||
| For the 3 months ended September 30 | For the 9 months ended September 30 | |||||||||||||||
| 2020 | 2019 | 2020 | 2019 | |||||||||||||
Commercial Deductions in units in operation by mine and mineral | (in thousands of US$) | |||||||||||||||
| Julcani, Gold | 13 | 0 | -3 | 2 | ||||||||||||
| Julcani, Silver | 522 | 906 | 1,565 | 2,401 | ||||||||||||
| Julcani, Lead | 5 | 39 | 22 | 99 | ||||||||||||
| Julcani, Copper | 2 | 3 | 5 | 8 | ||||||||||||
| Mallay, Gold | 0 | 0 | 0 | 0 | ||||||||||||
| Mallay, Silver | 0 | 0 | 0 | 0 | ||||||||||||
| Mallay, Lead | 0 | 0 | 0 | 0 | ||||||||||||
| Mallay, Zinc | 0 | 0 | 0 | 0 | ||||||||||||
| Orcopampa, Gold | 104 | 73 | 192 | 102 | ||||||||||||
| Orcopampa, Silver | 8 | 2 | 9 | 1 | ||||||||||||
| Orcopampa, Copper | 0 | 0 | 0 | 0 | ||||||||||||
| Uchucchacua, Gold | 0 | 1 | 1 | -1 | ||||||||||||
| Uchucchacua, Silver | 5,006 | 5,903 | 13,759 | 17,349 | ||||||||||||
| Uchucchacua, Lead | 104 | 749 | 816 | 1,983 | ||||||||||||
| Uchucchacua, Zinc | 197 | 1,550 | 1,560 | 7,791 | ||||||||||||
| Tambomayo, Gold | 887 | 1,364 | 3,122 | 3,874 | ||||||||||||
| Tambomayo, Silver | 864 | 1,105 | 2,361 | 2,721 | ||||||||||||
| Tambomayo, Lead | 173 | 324 | 671 | 1,050 | ||||||||||||
| Tambomayo, Zinc | 610 | 1,570 | 2,049 | 4,846 | ||||||||||||
| La Zanja, Gold | 47 | 18 | 347 | 85 | ||||||||||||
| La Zanja, Silver | 4 | 0 | 18 | 2 | ||||||||||||
| El Brocal, Gold | 1,520 | 2,334 | 4,114 | 4,919 | ||||||||||||
| El Brocal, Silver | 7,317 | 3,785 | 11,580 | 10,272 | ||||||||||||
| El Brocal, Lead | 2,251 | 873 | 5,367 | 3,842 | ||||||||||||
| El Brocal, Zinc | 16,306 | 5,042 | 30,831 | 19,592 | ||||||||||||
| El Brocal, Copper | 20,489 | 26,870 | 48,044 | 73,104 | ||||||||||||
| Non Mining Units | 0 | 0 | 0 | 0 | ||||||||||||
| Consolidated Commercial deductions in units in operation | 56,429 | 52,510 | 126,430 | 154,041 | ||||||||||||
Compañía de Minas Buenaventura S.A.A. First Quarter 2020 Results Page 17 of 27 |
| Set forth below is a reconciliation of Selling expenses (by mine and mineral) to consolidated | ||||||||||||||||
| Selling expenses: | ||||||||||||||||
| For the 3 months ended September 30 | For the 9 months ended September 30 | |||||||||||||||
| 2020 | 2019 | 2020 | 2019 | |||||||||||||
Selling expenses by mine and mineral | (in thousands of US$) | |||||||||||||||
| Julcani, Gold | 1 | 0 | -1 | 0 | ||||||||||||
| Julcani, Silver | 85 | 96 | 234 | 265 | ||||||||||||
| Julcani, Lead | 1 | 4 | 3 | 11 | ||||||||||||
| Julcani, Copper | 0 | 0 | 1 | 1 | ||||||||||||
| Orcopampa, Gold | 202 | 79 | 324 | 165 | ||||||||||||
| Orcopampa, Silver | 1 | 0 | 1 | 1 | ||||||||||||
| Orcopampa, Copper | 0 | 0 | 0 | 0 | ||||||||||||
| Uchucchacua, Gold | 0 | 0 | 0 | 0 | ||||||||||||
| Uchucchacua, Silver | 580 | 1,254 | 1,845 | 2,653 | ||||||||||||
| Uchucchacua, Lead | 22 | 234 | 126 | 532 | ||||||||||||
| Uchucchacua, Zinc | 37 | 206 | 142 | 709 | ||||||||||||
| Tambomayo, Gold | 681 | 647 | 1,704 | 1,555 | ||||||||||||
| Tambomayo, Silver | 219 | 207 | 496 | 449 | ||||||||||||
| Tambomayo, Lead | 56 | 72 | 135 | 173 | ||||||||||||
| Tambomayo, Zinc | 36 | 72 | 117 | 263 | ||||||||||||
| La Zanja, Gold | 27 | 83 | 74 | 261 | ||||||||||||
| La Zanja, Silver | 3 | 3 | 6 | 9 | ||||||||||||
| El Brocal, Gold | 83 | 143 | 222 | 271 | ||||||||||||
| El Brocal, Silver | 592 | 336 | 915 | 952 | ||||||||||||
| El Brocal, Lead | 241 | 189 | 519 | 755 | ||||||||||||
| El Brocal, Zinc | 903 | 363 | 1,593 | 1,600 | ||||||||||||
| El Brocal, Copper | 1,156 | 1,639 | 2,649 | 3,960 | ||||||||||||
| Non Mining Units | 362 | 567 | 962 | 1,901 | ||||||||||||
| Consolidated Selling expenses | 5,289 | 6,195 | 12,067 | 16,486 | ||||||||||||
Compañía de Minas Buenaventura S.A.A. First Quarter 2020 Results Page 18 of 27 |
| JULCANI | ||||||||||||
| 3Q 2020 | 3Q 2019 | |||||||||||
| GOLD (OZ) | SILVER (OZ) | LEAD (MT) | ZINC (MT) | COPPER (MT) | TOTAL | GOLD (OZ) | SILVER (OZ) | LEAD (MT) | ZINC (MT) | COPPER (MT) | TOTAL | |
| Cost of Sales (without D&A) (US$000) | 33 | 2,213 | 26 | - | 6 | 2,278 | 3 | 6,152 | 274 | - | 16 | 6,445 |
| Add: | ||||||||||||
| Exploration Expenses (US$000) | 6 | 391 | 5 | - | 1 | 402 | 1 | 1,457 | 65 | - | 4 | 1,526 |
| Commercial Deductions (US$000) | 13 | 522 | 5 | - | 2 | 542 | 0 | 906 | 39 | - | 3 | 948 |
| Selling Expenses (US$000) | 1 | 84.51 | 0.99 | - | 0 | 87 | 0 | 96 | 4 | - | 0 | 101 |
| Cost Applicable to Sales (US$000) | 53 | 3,210 | 37 | - | 9 | 3,309 | 4 | 8,610 | 383 | - | 23 | 9,020 |
| Divide: | ||||||||||||
| Volume Sold | 70 | 289,258 | 58 | - | 13 | Not Applicable | 0 | 649,276 | 256 | - | 6 | Not Applicable |
| CAS | 756 | 11.10 | 632 | - | 743 | Not Applicable | 12,347 | 13.26 | 1,495 | - | 3,977 | Not Applicable |
| ORCOPAMPA | ||||||||||||
| 3Q 2020 | 3Q 2019 | |||||||||||
| GOLD (OZ) | SILVER (OZ) | LEAD (MT) | ZINC (MT) | COPPER (MT) | TOTAL | GOLD (OZ) | SILVER (OZ) | LEAD (MT) | ZINC (MT) | COPPER (MT) | TOTAL | |
| Cost of Sales (without D&A) (US$000) | 11,284 | 32 | - | - | - | 11,316 | 17,444 | 88 | - | - | - | 17,532 |
| Add: | - | |||||||||||
| Exploration Expenses (US$000) | 1,345 | 4 | - | - | - | 1,349 | 1,572 | 8 | - | - | - | 1,580 |
| Commercial Deductions (US$000) | 104 | 8 | - | - | - | 113 | 73 | 2 | - | - | - | 74 |
| Selling Expenses (US$000) | 202 | 1 | - | - | - | 203 | 79 | 0 | - | - | - | 79 |
| Cost Applicable to Sales (US$000) | 12,936 | 45 | - | - | - | 12,981 | 19,167 | 98 | - | - | - | 19,265 |
| Divide: | ||||||||||||
| Volume Sold | 17,159 | 3,913 | - | - | - | Not Applicable | 11,283 | 4,544 | - | - | - | Not Applicable |
| CAS | 754 | 11.43 | - | - | - | Not Applicable | 1,699 | 21.62 | - | - | - | Not Applicable |
| UCHUCCHACUA | ||||||||||||
| 3Q 2020 | 3Q 2019 | |||||||||||
| GOLD (OZ) | SILVER (OZ) | LEAD (MT) | ZINC (MT) | COPPER (MT) | TOTAL | GOLD (OZ) | SILVER (OZ) | LEAD (MT) | ZINC (MT) | COPPER (MT) | TOTAL | |
| Cost of Sales (without D&A) (US$000) | - | 17,614 | 683 | 1,122 | - | 19,419 | - | 19,642 | 3,665 | 3,235 | - | 26,542 |
| Add: | ||||||||||||
| Exploration Expenses (US$000) | - | 1,008 | 39 | 64 | - | 1,111 | - | 1,231 | 230 | 203 | - | 1,664 |
| Commercial Deductions (US$000) | - | 5,006 | 104 | 197 | - | 5,307 | 1 | 5,903 | 749 | 1,550 | - | 8,203 |
| Selling Expenses (US$000) | - | 580 | 22 | 37 | - | 639 | - | 1,254 | 234 | 206 | - | 1,694 |
| Cost Applicable to Sales (US$000) | - | 24,208 | 848 | 1,420 | - | 26,476 | 1 | 28,029 | 4,878 | 5,194 | - | 38,103 |
| Divide: | ||||||||||||
| Volume Sold | - | 875,489 | 738 | 699 | - | Not Applicable | - | 2,415,985 | 4,072 | 3,843 | - | Not Applicable |
| CAS | - | 27.65 | 1,149 | 2,032 | - | No Applicable | - | 11.60 | 1,198 | 1,352 | - | No Applicable |
| TAMBOMAYO | ||||||||||||
| 3Q 2020 | 3Q 2019 | |||||||||||
| GOLD (OZ) | SILVER (OZ) | LEAD (MT) | ZINC (MT) | COPPER (MT) | TOTAL | GOLD (OZ) | SILVER (OZ) | LEAD (MT) | ZINC (MT) | COPPER (MT) | TOTAL | |
| Cost of Sales (without D&A) (US$000) | 10,919 | 3,512 | 891 | 575 | - | 15,897 | 14,610 | 4,675 | 1,614 | 1,625 | - | 22,524 |
| Add: | ||||||||||||
| Exploration Expenses (US$000) | 2,175 | 699 | 177 | 114 | - | 3,166 | 1,848 | 591 | 204 | 205 | - | 2,849 |
| Commercial Deductions (US$000) | 887 | 864 | 173 | 610 | - | 2,534 | 1,364 | 1,105 | 324 | 1,570 | - | 4,363 |
| Selling Expenses (US$000) | 681 | 219 | 56 | 36 | - | 992 | 647 | 207 | 72 | 72 | - | 998 |
| Cost Applicable to Sales (US$000) | 14,662 | 5,295 | 1,297 | 1,335 | - | 22,589 | 18,470 | 6,579 | 2,213 | 3,472 | - | 30,734 |
| Divide: | ||||||||||||
| Volume Sold | 17,849 | 406,946 | 1,680 | 1,058 | - | Not Applicable | 26,568 | 705,669 | 2,084 | 2,070 | - | Not Applicable |
| CAS | 821 | 13.01 | 772 | 1,261 | - | No Applicable | 695 | 9.32 | 1,062 | 1,677 | - | No Applicable |
| JULCANI | ||||||||||||
| 9M 2020 | 9M 2019 | |||||||||||
| GOLD (OZ) | SILVER (OZ) | LEAD (MT) | ZINC (MT) | COPPER (MT) | TOTAL | GOLD (OZ) | SILVER (OZ) | LEAD (MT) | ZINC (MT) | COPPER (MT) | TOTAL | |
| Cost of Sales (without D&A) (US$000) | -52 | 9,951 | 144 | - | 26 | 10,069 | 20 | 18,433 | 770 | - | 48 | 19,272 |
| Add: | ||||||||||||
| Exploration Expenses (US$000) | -9 | 1,774 | 26 | - | 5 | 1,795 | 5 | 4,305 | 180 | - | 11 | 4,501 |
| Commercial Deductions (US$000) | -3 | 1,565 | 22 | - | 5 | 1,590 | 2 | 2,401 | 99 | - | 8 | 2,510 |
| Selling Expenses (US$000) | -1 | 234 | 3 | - | 1 | 237 | 0 | 265 | 11 | - | 1 | 277 |
| Cost Applicable to Sales (US$000) | -66 | 13,525 | 195 | - | 37 | 13,691 | 28 | 25,404 | 1,060 | - | 68 | 26,560 |
| Divide: | ||||||||||||
| Volume Sold | 70 | 922,903 | 179 | - | 19 | Not Applicable | 17 | 1,868,683 | 645 | - | 14 | No Aplicable |
| CAS | - | 14.65 | 1,093 | - | 1,939 | No Applicable | 1,625 | 13.59 | 1,642 | - | 4,906 | No Applicable |
| ORCOPAMPA | ||||||||||||
| 9M 2020 | 9M 2019 | |||||||||||
| GOLD (OZ) | SILVER (OZ) | LEAD (MT) | ZINC (MT) | COPPER (MT) | TOTAL | GOLD (OZ) | SILVER (OZ) | LEAD (MT) | ZINC (MT) | COPPER (MT) | TOTAL | |
| Cost of Sales (without D&A) (US$000) | 21,104 | 54 | - | - | - | 21,158 | 38,407 | 197 | - | - | - | 38,604 |
| Add: | ||||||||||||
| Exploration Expenses (US$000) | 2,855 | 7 | - | - | - | 2,862 | 7,670 | 39 | - | - | - | 7,709 |
| Commercial Deductions (US$000) | 192 | 9 | - | - | - | 201 | 102 | 1 | - | - | - | 103 |
| Selling Expenses (US$000) | 324 | 1 | - | - | - | 325 | 165 | 1 | - | - | - | 166 |
| Cost Applicable to Sales (US$000) | 24,475 | 71 | - | - | - | 24,546 | 46,344 | 239 | - | - | - | 46,582 |
| Divide: | ||||||||||||
| Volume Sold | 29,849 | 6,497 | - | - | - | Not Applicable | 26,102 | 11,200 | - | - | - | Not Applicable |
| CAS | 820 | 10.92 | - | - | - | No Applicable | 1,776 | 21.30 | - | - | - | No Applicable |
| UCHUCCHACUA | ||||||||||||
| 9M 2020 | 9M 2019 | |||||||||||
| GOLD (OZ) | SILVER (OZ) | LEAD (MT) | ZINC (MT) | COPPER (MT) | TOTAL | GOLD (OZ) | SILVER (OZ) | LEAD (MT) | ZINC (MT) | COPPER (MT) | TOTAL | |
| Cost of Sales (without D&A) (US$000) | - | 47,276 | 3,231 | 3,631 | - | 54,138 | - | 54,960 | 11,018 | 14,682 | - | 80,661 |
| Add: | ||||||||||||
| Exploration Expenses (US$000) | - | 3,287 | 225 | 252 | - | 3,764 | - | 4,692 | 941 | 1,253 | - | 6,886 |
| Commercial Deductions (US$000) | 1 | 13,759 | 816 | 1,560 | - | 16,136 | -1 | 17,349 | 1,983 | 7,791 | - | 27,121 |
| Selling Expenses (US$000) | - | 1,845 | 126 | 142 | - | 2,113 | - | 2,653 | 532 | 709 | - | 3,894 |
| Cost Applicable to Sales (US$000) | 1 | 66,167 | 4,398 | 5,585 | - | 76,151 | -1 | 79,654 | 14,474 | 24,435 | - | 118,562 |
| Divide: | ||||||||||||
| Volume Sold | - | 3,399,834 | 3,113 | 2,939 | - | Not Applicable | 0 | 7,173,934 | 11,877 | 12,104 | - | Not Applicable |
| CAS | - | 19.46 | 1,413 | 1,900 | - | No Applicable | - | 11.10 | 1,219 | 2,019 | - | No Applicable |
| TAMBOMAYO | ||||||||||||
| 9M 2020 | 9M 2019 | |||||||||||
| GOLD (OZ) | SILVER (OZ) | LEAD (MT) | ZINC (MT) | COPPER (MT) | TOTAL | GOLD (OZ) | SILVER (OZ) | LEAD (MT) | ZINC (MT) | COPPER (MT) | TOTAL | |
| Cost of Sales (without D&A) (US$000) | 28,098 | 8,172 | 2,227 | 1,925 | - | 40,422 | 34,148 | 9,860 | 3,803 | 5,782 | - | 53,593 |
| Add: | ||||||||||||
| Exploration Expenses (US$000) | 3,123 | 908 | 248 | 214 | - | 4,493 | 5,940 | 1,715 | 662 | 1,006 | - | 9,323 |
| Commercial Deductions (US$000) | 3,122 | 2,361 | 671 | 2,049 | - | 8,202 | 3,874 | 2,721 | 1,050 | 4,846 | - | 12,491 |
| Selling Expenses (US$000) | 1,704 | 496 | 135 | 117 | - | 2,452 | 1,555 | 449 | 173 | 263 | - | 2,441 |
| Cost Applicable to Sales (US$000) | 36,047 | 11,936 | 3,281 | 4,305 | - | 55,569 | 45,517 | 14,745 | 5,688 | 11,898 | - | 77,848 |
| Divide: | ||||||||||||
| Volume Sold | 39,634 | 1,004,636 | 3,508 | 2,860 | - | Not Applicable | 70,396 | 1,694,588 | 5,429 | 6,050 | - | Not Applicable |
| CAS | 910 | 11.88 | 935 | 1,505 | - | No Applicable | 647 | 8.70 | 1,048 | 1,967 | - | Not Applicable |
Compañía de Minas Buenaventura S.A.A. First Quarter 2020 Results Page 19 of 27 |
| LA ZANJA | ||||||||||||
| 3Q 2020 | 3Q 2019 | |||||||||||
| GOLD (OZ) | SILVER (OZ) | LEAD (MT) | ZINC (MT) | COPPER (MT) | TOTAL | GOLD (OZ) | SILVER (OZ) | LEAD (MT) | ZINC (MT) | COPPER (MT) | TOTAL | |
| Cost of Sales (without D&A) (US$000) | 8,954 | 820 | - | - | - | 9,774 | 6,483 | 225 | - | - | - | 6,708 |
| Add: | ||||||||||||
| Exploration Expenses (US$000) | - | - | - | - | - | - | - | - | - | - | - | - |
| Commercial Deductions (US$000) | 47 | 4 | - | - | - | 50 | 18 | 0 | - | - | - | 18 |
| Selling Expenses (US$000) | 27 | 3 | - | - | - | 30 | 83 | 3 | - | - | - | 86 |
| Cost Applicable to Sales (US$000) | 9,028 | 826 | - | - | - | 9,854 | 6,584 | 228 | - | - | - | 6,812 |
| Divide: | ||||||||||||
| Volume Sold | 5,346 | 36,425 | - | - | - | Not Applicable | 6,335 | 19,924 | - | - | - | Not Applicable |
| CAS | 1,689 | 22.68 | - | - | - | Not Applicable | 1,039 | 11.44 | - | - | - | Not Applicable |
| BROCAL | ||||||||||||
| 3Q 2020 | 3Q 2019 | |||||||||||
| GOLD (OZ) | SILVER (OZ) | LEAD (MT) | ZINC (MT) | COPPER (MT) | TOTAL | GOLD (OZ) | SILVER (OZ) | LEAD (MT) | ZINC (MT) | COPPER (MT) | TOTAL | |
| Cost of Sales (without D&A) (US$000) | 1,462 | 10,423 | 4,245 | 15,899 | 20,355 | 52,384 | 2,594 | 6,103 | 3,433 | 6,596 | 29,776 | 48,502 |
| Add: | ||||||||||||
| Exploration Expenses (US$000) | 44 | 312 | 127 | 477 | 610 | 1,570 | 134 | 315 | 177 | 340 | 1,535 | 2,500 |
| Commercial Deductions (US$000) | 1,520 | 7,317 | 2,251 | 16,306 | 20,489 | 47,882 | 2,334 | 3,785 | 873 | 5,042 | 26,870 | 38,904 |
| Selling Expenses (US$000) | 83 | 592 | 241 | 903 | 1,156 | 2,976 | 143 | 336 | 189 | 363 | 1,639 | 2,670 |
| Cost Applicable to Sales (US$000) | 3,109 | 18,644 | 6,865 | 33,585 | 42,610 | 104,813 | 5,205 | 10,538 | 4,672 | 12,341 | 59,820 | 92,576 |
| Divide: | ||||||||||||
| Volume Sold | 2,038 | 1,182,127 | 7,017 | 18,589 | 8,799 | Not Applicable | 3,817 | 804,700 | 4,176 | 7,499 | 11,995 | Not Applicable |
| CAS | 1,525 | 15.77 | 978 | 1,807 | 4,843 | Not Applicable | 1,364 | 13.10 | 1,119 | 1,646 | 4,987 | Not Applicable |
| NON MINING COMPANIES | ||||||||||||
| 3Q 2020 | 3Q 2019 | |||||||||||
| GOLD (OZ) | SILVER (OZ) | LEAD (MT) | ZINC (MT) | COPPER (MT) | TOTAL | GOLD (OZ) | SILVER (OZ) | LEAD (MT) | ZINC (MT) | COPPER (MT) | TOTAL | |
| Cost of Sales (without D&A) (US$000) | - | - | - | - | - | 984 | - | - | - | - | - | 985 |
| Add: | ||||||||||||
| Selling Expenses (US$000) | - | - | - | - | - | 362 | - | - | - | - | - | 567 |
| Total (US$000) | - | - | - | - | - | 1,346 | - | - | - | - | - | 1,552 |
| BUENAVENTURA CONSOLIDATED | ||||||||||||
| 3Q 2020 | 3Q 2019 | |||||||||||
| GOLD (OZ) | SILVER (OZ) | LEAD (MT) | ZINC (MT) | COPPER (MT) | TOTAL | GOLD (OZ) | SILVER (OZ) | LEAD (MT) | ZINC (MT) | COPPER (MT) | TOTAL | |
| Cost of Sales (without D&A) (US$000) | 32,652 | 34,614 | 5,845 | 17,596 | 20,361 | 112,052 | 41,134 | 36,884 | 8,987 | 11,456 | 29,792 | 129,238 |
| Add: | ||||||||||||
| Exploration Expenses (US$000) | 3,569 | 2,414 | 348 | 655 | 611 | 7,598 | 3,554 | 3,602 | 676 | 748 | 1,539 | 10,119 |
| Commercial Deductions (US$000) | 2,571 | 13,722 | 2,533 | 17,113 | 20,491 | 56,429 | 3,791 | 11,701 | 1,985 | 8,161 | 26,873 | 52,510 |
| Selling Expenses (US$000) | 996 | 1,479 | 320 | 976 | 1,157 | 5,289 | 952 | 1,896 | 499 | 642 | 1,639 | 6,195 |
| Cost Applicable to Sales (US$000) | 39,789 | 52,228 | 9,047 | 36,340 | 42,620 | 181,369 | 49,431 | 54,083 | 12,146 | 21,007 | 59,842 | 198,062 |
| Divide: | ||||||||||||
| Volume Sold | 42,462 | 2,794,158 | 9,493 | 20,347 | 8,811 | Not Applicable | 48,003 | 4,600,098 | 10,588 | 13,412 | 12,000 | Not Applicable |
| CAS | 937 | 18.69 | 953 | 1,786 | 4,837 | Not Applicable | 1,030 | 11.76 | 1,147 | 1,566 | 4,987 | Not Applicable |
| COIMOLACHE | ||||||||||||
| 3Q 2020 | 3Q 2019 | |||||||||||
| GOLD (OZ) | SILVER (OZ) | LEAD (MT) | ZINC (MT) | COPPER (MT) | TOTAL | GOLD (OZ) | SILVER (OZ) | LEAD (MT) | ZINC (MT) | COPPER (MT) | TOTAL | |
| Cost of Sales (without D&A) (US$000) | 20,216 | 1,942 | - | - | - | 22,158 | 28,960.33 | 1,678 | - | - | - | 30,638 |
| Add: | ||||||||||||
| Exploration Expenses (US$000) | 153 | 15 | - | - | - | 168 | 1,423.53 | 82 | - | - | - | 1,506 |
| Commercial Deductions (US$000) | 121 | 9 | - | - | - | 130 | 124 | 7 | - | - | - | 130 |
| Selling Expenses (US$000) | 239 | 23 | - | - | - | 262 | 436 | 25 | - | - | - | 461 |
| Cost Applicable to Sales (US$000) | 20,729 | 1,989 | - | - | - | 22,718 | 30,943 | 1,792 | - | - | - | 32,735 |
| Divide: | ||||||||||||
| Volume Sold | 25,901 | 183,213 | - | - | - | Not Applicable | 49,095 | 239,346 | - | - | - | Not Applicable |
| CAS | 800 | 10.86 | - | - | - | Not Applicable | 630 | 7.49 | - | - | - | Not Applicable |
| LA ZANJA | ||||||||||||
| 9M 2020 | 9M 2019 | |||||||||||
| GOLD (OZ) | SILVER (OZ) | LEAD (MT) | ZINC (MT) | COPPER (MT) | TOTAL | GOLD (OZ) | SILVER (OZ) | LEAD (MT) | ZINC (MT) | COPPER (MT) | TOTAL | |
| Cost of Sales (without D&A) (US$000) | 21,193 | 1,811 | - | - | - | 23,004 | 26,461 | 896 | - | - | - | 27,357 |
| Add: | ||||||||||||
| Exploration Expenses (US$000) | 1 | 0 | - | - | - | 1 | 1 | 0 | - | - | - | 1 |
| Commercial Deductions (US$000) | 347 | 18 | - | - | - | 365 | 85 | 2 | - | - | - | 87 |
| Selling Expenses (US$000) | 74 | 6 | - | - | - | 80 | 261 | 9 | - | - | - | 270 |
| Cost Applicable to Sales (US$000) | 21,615 | 1,835 | - | - | - | 23,450 | 26,808 | 907 | - | - | - | 27,715 |
| Divide: | ||||||||||||
| Volume Sold | 12,673 | 94,704 | - | - | - | Not Applicable | 24,477 | 71,158 | - | - | - | Not Applicable |
| CAS | 1,706 | 19.38 | - | - | - | No Applicable | 1,095 | 12.74 | - | - | - | Not Applicable |
| BROCAL | ||||||||||||
| 9M 2020 | 9M 2019 | |||||||||||
| GOLD (OZ) | SILVER (OZ) | LEAD (MT) | ZINC (MT) | COPPER (MT) | TOTAL | GOLD (OZ) | SILVER (OZ) | LEAD (MT) | ZINC (MT) | COPPER (MT) | TOTAL | |
| Cost of Sales (without D&A) (US$000) | 4,050 | 16,713 | 9,491 | 29,112 | 48,400 | 107,766 | 5,387 | 18,944 | 15,041 | 31,845 | 78,836 | 150,052 |
| Add: | ||||||||||||
| Exploration Expenses (US$000) | 118 | 488 | 277 | 850 | 1,414 | 3,148 | 230 | 809 | 642 | 1,360 | 3,367.21 | 6,409 |
| Commercial Deductions (US$000) | 4,114 | 11,580 | 5,367 | 30,831 | 48,044 | 99,936 | 4,919 | 10,272 | 3,842 | 19,592 | 73,104 | 111,729 |
| Selling Expenses (US$000) | 222 | 915 | 519 | 1,593 | 2,649 | 5,898 | 271 | 952 | 755 | 1,600 | 3,960 | 7,537 |
| Cost Applicable to Sales (US$000) | 8,504 | 29,695 | 15,654 | 62,388 | 100,507 | 216,748 | 10,807 | 30,976 | 20,281 | 54,396 | 159,267 | 275,727 |
| Divide: | ||||||||||||
| Volume Sold | 5,310 | 1,835,831 | 14,050 | 34,603 | 20,015 | Not Applicable | 8,452 | 2,624,992 | 17,185 | 27,097 | 29,493 | Not Applicable |
| CAS | 1,602 | 16.18 | 1,114 | 1,803 | 5,022 | No Applicable | 1,279 | 11.80 | 1,180 | 2,007 | 5,400 | Not Applicable |
| NON MINING COMPANIES | ||||||||||||
| 9M 2020 | 9M 2019 | |||||||||||
| GOLD (OZ) | SILVER (OZ) | LEAD (MT) | ZINC (MT) | COPPER (MT) | TOTAL | GOLD (OZ) | SILVER (OZ) | LEAD (MT) | ZINC (MT) | COPPER (MT) | TOTAL | |
| Cost of Sales (without D&A) (US$000) | - | - | - | - | - | 2,475 | - | - | - | - | - | 3,523 |
| Add: | - | - | ||||||||||
| Selling Expenses (US$000) | - | - | - | - | - | 962 | - | - | - | - | - | 1,901 |
| Total (US$000) | - | - | - | - | - | 3,437 | - | - | - | - | - | 5,424 |
| BUENAVENTURA CONSOLIDATED | ||||||||||||
| 9M 2020 | 9M 2019 | |||||||||||
| GOLD (OZ) | SILVER (OZ) | LEAD (MT) | ZINC (MT) | COPPER (MT) | TOTAL | GOLD (OZ) | SILVER (OZ) | LEAD (MT) | ZINC (MT) | COPPER (MT) | TOTAL | |
| Cost of Sales (without D&A) (US$000) | 74,393 | 83,976 | 15,093 | 34,669 | 48,426 | 259,032 | 104,423 | 103,290 | 30,633 | 52,309 | 78,884 | 373,062 |
| Add: | ||||||||||||
| Exploration Expenses (US$000) | 6,088 | 6,465 | 775 | 1,317 | 1,419 | 16,063 | 13,846 | 11,561 | 2,425 | 3,619 | 3,378 | 34,829 |
| Commercial Deductions (US$000) | 7,773 | 29,292 | 6,876 | 34,440 | 48,049 | 126,430 | 8,982 | 32,745 | 6,973 | 32,229 | 73,112 | 154,041 |
| Selling Expenses (US$000) | 2,323 | 3,497 | 784 | 1,852 | 2,650 | 12,067 | 2,253 | 4,329 | 1,472 | 2,572 | 3,961 | 16,486 |
| Cost Applicable to Sales (US$000) | 90,576 | 123,230 | 23,528 | 72,278 | 100,543 | 413,592 | 129,503 | 151,924 | 41,503 | 90,729 | 159,335 | 578,418 |
| Divide: | ||||||||||||
| Volume Sold | 87,537 | 7,264,405 | 20,850 | 40,402 | 20,034 | Not Applicable | 129,444 | 13,444,555 | 35,137 | 45,251 | 29,507 | Not Applicable |
| CAS | 1,035 | 16.96 | 1,128 | 1,789 | 5,019 | Not Applicable | 1,000 | 11.30 | 1,181 | 2,005 | 5,400 | Not Applicable |
| COIMOLACHE | ||||||||||||
| 9M 2020 | 9M 2019 | |||||||||||
| GOLD (OZ) | SILVER (OZ) | LEAD (MT) | ZINC (MT) | COPPER (MT) | TOTAL | GOLD (OZ) | SILVER (OZ) | LEAD (MT) | ZINC (MT) | COPPER (MT) | TOTAL | |
| Cost of Sales (without D&A) (US$000) | 54,782 | 4,589 | - | - | - | 59,371 | 69,593 | 3,400 | - | - | - | 72,993 |
| Add: | ||||||||||||
| Exploration Expenses (US$000) | 961 | 81 | - | - | - | 1,042 | 3,929 | 192 | - | - | - | 4,121 |
| Commercial Deductions (US$000) | 460 | 46 | - | - | - | 506 | 295 | 14 | - | - | - | 309 |
| Selling Expenses (US$000) | 735 | 62 | - | - | - | 797 | 747 | 36 | - | - | - | 783 |
| Cost Applicable to Sales (US$000) | 56,939 | 4,778 | - | - | - | 61,716 | 74,564 | 3,642 | - | - | - | 78,206 |
| Divide: | ||||||||||||
| Volume Sold | 64,428 | 474,143 | - | - | - | Not Applicable | 109,741 | 449,973 | - | - | - | Not Applicable |
| CAS | 884 | 10.08 | - | - | - | No Applicable | 679 | 8.09 | - | - | - | Not Applicable |
Compañía de Minas Buenaventura S.A.A. First Quarter 2020 Results Page 20 of 27 |
| Buenaventura | ||||||||||||||||||||||||||||||||
| All-in Sustaining Cost for 3Q20 | ||||||||||||||||||||||||||||||||
Buenaventura1 | La Zanja | Tantahuatay | Attributable 2 | |||||||||||||||||||||||||||||
| 3Q20 | 3Q20 | 3Q20 | 3Q20 | |||||||||||||||||||||||||||||
| Au Ounces Sold Net | 35,078 | 5,346 | 25,901 | 48,299 | ||||||||||||||||||||||||||||
| 3Q20 | US$ 000' | US$ 000' | US$ 000' | |||||||||||||||||||||||||||||
| Income Statement & Cash Flow | US$ 000' | US$/Oz Au | US$ 000' | US$/Oz Au | US$ 000' | US$/Oz Au | US$ 000' | US$/Oz Au | ||||||||||||||||||||||||
| Cost of Sales | 53,587 | 1,528 | 8,115 | 1,518 | 22,158 | 855 | 66,777 | 1,383 | ||||||||||||||||||||||||
| Exploration in Operating Units | 6,027 | 172 | 0 | 0 | 168 | 6 | 6,094 | 126 | ||||||||||||||||||||||||
| Royalties | 2,838 | 81 | 0 | 0 | 0 | 0 | 2,838 | 59 | ||||||||||||||||||||||||
Comercial Deductions3 | 8,496 | 242 | 50 | 9 | 130 | 5 | 8,575 | 178 | ||||||||||||||||||||||||
| Selling Expenses | 2,152 | 61 | 30 | 6 | 262 | 10 | 2,273 | 47 | ||||||||||||||||||||||||
| Administrative Expenses | 10,783 | 307 | 467 | 87 | 1,039 | 40 | 11,447 | 237 | ||||||||||||||||||||||||
| Other, net | -1,771 | -50 | 599 | 112 | -134 | -5 | -1,507 | -31 | ||||||||||||||||||||||||
Sustaining Capex4 | 735 | 21 | 80 | 15 | 5,290 | 204 | 2,899 | 60 | ||||||||||||||||||||||||
| By-product Credit | -53,298 | -1,519 | -974 | -182 | -4,802 | -185 | -2,442 | -51 | ||||||||||||||||||||||||
| All-in Sustaining Cost | 29,549 | 842 | 8,368 | 1,565 | 24,112 | 931 | 43,657 | 904 | ||||||||||||||||||||||||
| *All-in Sustaining Cost does not include: Depreciation and Amortization, Stoppage of mining units, Exploration in non-operating areas. | ||||||||||||||||||||||||||||||||
Notes: | ||||||||||||||||||||||||||||||||
| 1. Non-consolidated financial statements for Compañia De Minas Buenaventura S.A.A. | ||||||||||||||||||||||||||||||||
| 2. Considers 100% from Compañia De Minas Buenaventura S.A.A., 53.06% from La Zanja and 40.095% from Tantahuatay. | ||||||||||||||||||||||||||||||||
| 3. For all metals produced. | ||||||||||||||||||||||||||||||||
| 4. Sustaining Capex + Growth Capex equals Acquisitions of mining concessions, development costs, property, plant and equipment. | ||||||||||||||||||||||||||||||||
Compañía de Minas Buenaventura S.A.A. First Quarter 2020 Results Page 21 of 27 |
| Buenaventura | ||||||||||||||||||||||||||||||||
| All-in Sustaining Cost for 3Q19 | ||||||||||||||||||||||||||||||||
Buenaventura1 | La Zanja | Tantahuatay | Attributable 2 | |||||||||||||||||||||||||||||
| 3Q19 | 3Q19 | 3Q19 | 3Q19 | |||||||||||||||||||||||||||||
| Au Ounces Sold Net | 37,851 | 6,335 | 49,095 | 60,897 | ||||||||||||||||||||||||||||
| 3Q19 | 3Q19 | 3Q19 | 3Q19 | |||||||||||||||||||||||||||||
| Income Statement & Cash Flow | US$ 000' | US$/Oz Au | US$ 000' | US$/Oz Au | US$ 000' | US$/Oz Au | US$ 000' | US$/Oz Au | ||||||||||||||||||||||||
| Cost of Sales | 78,938 | 2,085 | 7,282 | 1,150 | 30,638 | 624 | 95,086 | 1,561 | ||||||||||||||||||||||||
| Exploration in Operating Units | 7,619 | 201 | 0 | 0 | 1,506 | 31 | 8,223 | 135 | ||||||||||||||||||||||||
| Royalties | 1,589 | 42 | 0 | 0 | 1,589 | 26 | ||||||||||||||||||||||||||
Comercial Deductions3 | 13,588 | 359 | 18 | 3 | 130 | 3 | 13,650 | 224 | ||||||||||||||||||||||||
| Selling Expenses | 3,066 | 81 | 86 | 14 | 460 | 9 | 3,296 | 54 | ||||||||||||||||||||||||
| Administrative Expenses | 11,859 | 313 | 604 | 95 | 1,082 | 22 | 12,613 | 207 | ||||||||||||||||||||||||
| Other, net | 4,910 | 130 | 316 | 50 | 233 | 5 | 5,171 | 85 | ||||||||||||||||||||||||
Sustaining Capex4 | 6,464 | 171 | 274 | 43 | 7,525 | 153 | 9,627 | 158 | ||||||||||||||||||||||||
| By-product Credit | -91,718 | -2,423 | -334 | -53 | -4,254 | -87 | -1,883 | -31 | ||||||||||||||||||||||||
| All-in Sustaining Cost | 36,315 | 959 | 8,247 | 1,302 | 37,320 | 760 | 55,655 | 914 | ||||||||||||||||||||||||
| *All-in Sustaining Cost does not include: Depreciation and Amortization, Stoppage of mining units, Exploration in non-operating areas. | ||||||||||||||||||||||||||||||||
Notes: | ||||||||||||||||||||||||||||||||
| 1. Non-consolidated financial statements for Compañia De Minas Buenaventura S.A.A. | ||||||||||||||||||||||||||||||||
| 2. Considers 100% from Compañia De Minas Buenaventura S.A.A., 53.06% from La Zanja and 40.095% from Tantahuatay. | ||||||||||||||||||||||||||||||||
| 3. For all metals produced. | ||||||||||||||||||||||||||||||||
| 4. Sustaining Capex + Growth Capex equals Acquisitions of mining concessions, development costs, property, plant and equipment. | ||||||||||||||||||||||||||||||||
Compañía de Minas Buenaventura S.A.A. First Quarter 2020 Results Page 22 of 27 |
| All-in Sustaining Cost for 9M20 | ||||||||||||||||||||||||||||||||
Buenaventura1 | La Zanja | Tantahuatay | Attributable 2 | |||||||||||||||||||||||||||||
| 9M20 | 9M20 | 9M20 | 9M20 | |||||||||||||||||||||||||||||
| Au Ounces Sold Net | 69,553 | 12,673 | 64,428 | 102,110 | ||||||||||||||||||||||||||||
| 9M20 | 9M20 | 9M20 | 9M20 | |||||||||||||||||||||||||||||
| Income Statement & Cash Flow | US$ 000' | US$/Oz Au | US$ 000' | US$/Oz Au | US$ 000' | US$/Oz Au | US$ 000' | US$/Oz Au | ||||||||||||||||||||||||
| Cost of Sales | 140,876 | 2,025 | 20,234 | 1,597 | 59,371 | 922 | 175,417 | 1,718 | ||||||||||||||||||||||||
| Exploration in Operating Units | 12,913 | 186 | 1 | 0 | 1,042 | 16 | 13,331 | 131 | ||||||||||||||||||||||||
| Royalties | 4,471 | 64 | 0 | 0 | 0 | 0 | 4,471 | 44 | ||||||||||||||||||||||||
Comercial Deductions3 | 26,129 | 376 | 365 | 29 | 506 | 8 | 26,526 | 260 | ||||||||||||||||||||||||
| Selling Expenses | 5,584 | 80 | 80 | 6 | 797 | 12 | 5,946 | 58 | ||||||||||||||||||||||||
| Administrative Expenses | 31,838 | 458 | 1,492 | 118 | 3,172 | 49 | 33,901 | 332 | ||||||||||||||||||||||||
| Other, net | -946 | -14 | 882 | 70 | 108 | 2 | -435 | -4 | ||||||||||||||||||||||||
Sustaining Capex4 | 4,018 | 58 | 563 | 44 | 7,585 | 118 | 7,358 | 72 | ||||||||||||||||||||||||
| By-product Credit | -130,339 | -1,874 | -1,983 | -156 | -9,530 | -148 | -4,873 | -48 | ||||||||||||||||||||||||
| All-in Sustaining Cost | 94,543 | 1,359 | 21,634 | 1,707 | 63,052 | 979 | 131,303 | 1,286 | ||||||||||||||||||||||||
| *All-in Sustaining Cost does not include: Depreciation and Amortization, Stoppage of mining units, Exploration in non-operating areas. | ||||||||||||||||||||||||||||||||
Notes: | ||||||||||||||||||||||||||||||||
| 1. Non-consolidated financial statements for Compañia De Minas Buenaventura S.A.A. | ||||||||||||||||||||||||||||||||
| 2. Considers 100% from Compañia De Minas Buenaventura S.A.A., 53.06% from La Zanja and 40.095% from Tantahuatay. | ||||||||||||||||||||||||||||||||
| 3. For all metals produced. | ||||||||||||||||||||||||||||||||
| 4. Sustaining Capex + Growth Capex equals Acquisitions of mining concessions, development costs, property, plant and equipment. | ||||||||||||||||||||||||||||||||
Compañía de Minas Buenaventura S.A.A. First Quarter 2020 Results Page 23 of 27 |
| Buenaventura | ||||||||||||||||||||||||||||||||
| All-in Sustaining Cost for 9M19 | ||||||||||||||||||||||||||||||||
Buenaventura1 | La Zanja | Tantahuatay | Attributable 2 | |||||||||||||||||||||||||||||
| 9M19 | 9M19 | 9M19 | 9M19 | |||||||||||||||||||||||||||||
| Au Ounces Sold Net | 96,515 | 24,477 | 109,741 | 153,503 | ||||||||||||||||||||||||||||
| 9M19 | 9M19 | 9M19 | 9M19 | |||||||||||||||||||||||||||||
| Income Statement & Cash Flow | US$ 000' | US$/Oz Au | US$ 000' | US$/Oz Au | US$ 000' | US$/Oz Au | US$ 000' | US$/Oz Au | ||||||||||||||||||||||||
| Cost of Sales | 210,090 | 2,177 | 28,211 | 1,153 | 72,993 | 665 | 254,325 | 1,657 | ||||||||||||||||||||||||
| Exploration in Operating Units | 28,419 | 294 | 2 | 0 | 4,121 | 38 | 30,072 | 196 | ||||||||||||||||||||||||
| Royalties | 3,146 | 33 | 0 | 0 | 3,146 | 20 | ||||||||||||||||||||||||||
Comercial Deductions3 | 42,279 | 438 | 87 | 4 | 309 | 3 | 42,449 | 277 | ||||||||||||||||||||||||
| Selling Expenses | 7,309 | 76 | 270 | 11 | 783 | 7 | 7,766 | 51 | ||||||||||||||||||||||||
| Administrative Expenses | 35,281 | 366 | 2,162 | 88 | 3,463 | 32 | 37,817 | 246 | ||||||||||||||||||||||||
| Other, net | 9,972 | 103 | 1,136 | 46 | 416 | 4 | 10,742 | 70 | ||||||||||||||||||||||||
Sustaining Capex4 | 14,853 | 154 | 1,483 | 61 | 15,968 | 146 | 22,042 | 144 | ||||||||||||||||||||||||
| By-product Credit | -253,691 | -2,629 | -1,133 | -46 | -7,474 | -68 | -3,598 | -23 | ||||||||||||||||||||||||
| All-in Sustaining Cost | 97,658 | 1,012 | 32,218 | 1,316 | 90,579 | 825 | 151,071 | 984 | ||||||||||||||||||||||||
Notes: | ||||||||||||||||||||||||||||||||
| 1. Non-consolidated financial statements for Compañia De Minas Buenaventura S.A.A. | ||||||||||||||||||||||||||||||||
| 2. Considers 100% from Compañia De Minas Buenaventura S.A.A., 53.06% from La Zanja and 40.095% from Tantahuatay. | ||||||||||||||||||||||||||||||||
| 3. For all metals produced. | ||||||||||||||||||||||||||||||||
| 4. Sustaining Capex + Growth Capex equals Acquisitions of mining concessions, development costs, property, plant and equipment. | ||||||||||||||||||||||||||||||||
Compañía de Minas Buenaventura S.A.A. First Quarter 2020 Results Page 24 of 27 |
APPENDIX 6
| Compañía de Minas Buenaventura S.A.A. and Subsidiaries | ||||||||
| Consolidated Statement of Financial Position | ||||||||
| As of September 30, 2020 and December 31, 2019 | ||||||||
| 2020 | 2019 | |||||||
| Assets | US$(000) | US$(000) | ||||||
| Current assets | ||||||||
| Cash and cash equivalents | 264,816 | 210,046 | ||||||
| Trade and other accounts receivable, net | 185,734 | 287,712 | ||||||
| Inventory, net | 108,721 | 97,973 | ||||||
| Income tax credit | 17,377 | 31,919 | ||||||
| Prepaid expenses | 11,160 | 20,969 | ||||||
| 587,808 | 648,619 | |||||||
| Assets classified as held for sale | 3,874 | - | ||||||
| 591,682 | 648,619 | |||||||
| Non-current assets | ||||||||
| Trade and other receivables, net | 84,878 | 88,515 | ||||||
| Inventories, net | 312 | 394 | ||||||
| Investment in associates and joint venture | 1,516,591 | 1,488,247 | ||||||
| Mining concessions, development costs, right-of-use, property, plant and equipment, net | 1,654,650 | 1,754,372 | ||||||
| Investment properties, net | 191 | 204 | ||||||
| Deferred income tax asset, net | 72,541 | 74,556 | ||||||
| Prepaid expenses | 25,027 | 25,692 | ||||||
| Other assets | 26,674 | 26,675 | ||||||
| 3,380,864 | 3,458,655 | |||||||
| Total assets | 3,972,546 | 4,107,274 | ||||||
| Liabilities and shareholders’ equity, net | ||||||||
| Current liabilities | ||||||||
| Bank loans | 67,992 | 55,000 | ||||||
| Trade and other payables | 137,001 | 166,244 | ||||||
| Provisions, contingent liabilities and other liabilities | 75,469 | 72,771 | ||||||
| Income tax payable | 2,288 | 5,650 | ||||||
| Financial obligations | 141,451 | 265,692 | ||||||
| Hedge derivative financial instruments | 1,671 | - | ||||||
| 425,872 | 565,357 | |||||||
| Liabilities directly associated with assets classified as held for sale | 5,755 | - | ||||||
| 431,627 | 565,357 | |||||||
| Non-current liabilities | ||||||||
| Trade and other payables | - | 616 | ||||||
| Provisions, contingent liabilities and other liabilities | 218,550 | 221,736 | ||||||
| Financial obligations | 397,896 | 305,996 | ||||||
| Contingent consideration liability | 23,701 | 16,410 | ||||||
| Deferred income tax liabilities, net | 32,773 | 28,959 | ||||||
| 672,920 | 573,717 | |||||||
| Total liabilities | 1,104,547 | 1,139,074 | ||||||
| Shareholders’ equity, net | ||||||||
| Capital stock | 750,497 | 750,497 | ||||||
| Investment shares | 791 | 791 | ||||||
| Additional paid-in capital | 218,450 | 218,450 | ||||||
| Legal reserve | 163,194 | 163,168 | ||||||
| Other reserves | 269 | 269 | ||||||
| Retained earnings | 1,559,553 | 1,639,658 | ||||||
| Other reserves of equity | (2,275 | ) | (1,311 | ) | ||||
| Shareholders’ equity, net attributable to owners of the parent | 2,690,479 | 2,771,522 | ||||||
| Non-controlling interest | 177,520 | 196,678 | ||||||
| Total shareholders’ equity, net | 2,867,999 | 2,968,200 | ||||||
| Total liabilities and shareholders’ equity, net | 3,972,546 | 4,107,274 | ||||||
Compañía de Minas Buenaventura S.A.A. First Quarter 2020 Results Page 25 of 27 |
| Compañía de Minas Buenaventura S.A.A. and Subsidiaries | ||||||||||||||||
| Consolidated Statement of Income | ||||||||||||||||
| For the three and nine-month periods ended September 30, 2020 and 2019 | ||||||||||||||||
For the three-month period ended September 30, | For the nine-month period ended September 30, | |||||||||||||||
| 2020 | 2019 | 2020 | 2019 | |||||||||||||
| Continuing operations | US$(000) | US$(000) | US$(000) | US$(000) | ||||||||||||
| Operating income | ||||||||||||||||
| Net sales of goods | 219,763 | 218,989 | 417,080 | 602,624 | ||||||||||||
| Net sales of services | 3,675 | 4,603 | 9,360 | 12,340 | ||||||||||||
| Royalty income | 4,757 | 6,599 | 14,042 | 17,434 | ||||||||||||
| Total operating income | 228,195 | 230,191 | 440,482 | 632,398 | ||||||||||||
| Operating costs | ||||||||||||||||
| Cost of sales of goods, without considering depreciation and amortization | (111,635 | ) | (128,588 | ) | (258,012 | ) | (370,929 | ) | ||||||||
| Cost of sales of services, without considering depreciation and amortization | (417 | ) | (650 | ) | (1,020 | ) | (2,133 | ) | ||||||||
| Unabsorbed cost due to production stoppage | (9,207 | ) | - | (27,924 | ) | - | ||||||||||
| Depreciation and amortization | (56,856 | ) | (60,211 | ) | (130,495 | ) | (168,729 | ) | ||||||||
| Exploration in operating units | (7,598 | ) | (10,119 | ) | (16,063 | ) | (34,829 | ) | ||||||||
| Mining royalties | (4,560 | ) | (3,701 | ) | (8,135 | ) | (9,105 | ) | ||||||||
| Total operating costs | (190,273 | ) | (203,269 | ) | (441,649 | ) | (585,725 | ) | ||||||||
| Gross profit (loss) | 37,922 | 26,922 | (1,167 | ) | 46,673 | |||||||||||
| Operating expenses, net | ||||||||||||||||
| Administrative expenses | (16,808 | ) | (17,445 | ) | (49,843 | ) | (54,849 | ) | ||||||||
| Selling expenses | (5,289 | ) | (6,195 | ) | (12,067 | ) | (16,486 | ) | ||||||||
| Exploration in non-operating areas | (1,802 | ) | (2,371 | ) | (5,267 | ) | (9,139 | ) | ||||||||
| Reversal (provision) for contingencies and others | (1,237 | ) | 827 | (387 | ) | 2,089 | ||||||||||
| Other, net | (77 | ) | (8,666 | ) | 3,905 | (17,636 | ) | |||||||||
| Total operating expenses, net | (25,213 | ) | (33,850 | ) | (63,659 | ) | (96,021 | ) | ||||||||
| Operating profit (loss) | 12,709 | (6,928 | ) | (64,826 | ) | (49,348 | ) | |||||||||
| Other income (expense), net | ||||||||||||||||
| Share in the results of associates and joint venture | 34,212 | 37,771 | 16,066 | 109,988 | ||||||||||||
| Financial income | 928 | 1,611 | 2,240 | 5,656 | ||||||||||||
| Financial costs | (7,410 | ) | (11,994 | ) | (23,130 | ) | (33,679 | ) | ||||||||
| Net gain (loss) from currency exchange difference | (776 | ) | (1,455 | ) | (3,891 | ) | (1,672 | ) | ||||||||
| Total other income (expense), net | 26,954 | 25,933 | (8,715 | ) | 80,293 | |||||||||||
| Profit (loss) before income tax | 39,663 | 19,005 | (73,541 | ) | 30,945 | |||||||||||
| Current income tax | (3,230 | ) | (1,583 | ) | (6,337 | ) | (5,326 | ) | ||||||||
| Deferred income tax | (7,594 | ) | (14,556 | ) | (6,322 | ) | 11,439 | |||||||||
| Profit (loss) from continuing operations | 28,839 | 2,866 | (86,200 | ) | 37,058 | |||||||||||
| Discontinued operations | ||||||||||||||||
| Loss from discontinued operations attributable to equity holders of the parent | (1,468 | ) | (2,129 | ) | (4,280 | ) | (6,643 | ) | ||||||||
| Net profit (loss) | 27,371 | 737 | (90,480 | ) | 30,415 | |||||||||||
| Attributable to: | ||||||||||||||||
| Owners of the parent | 24,399 | 4,500 | (75,708 | ) | 41,464 | |||||||||||
| Non-controlling interest | 2,972 | (3,763 | ) | (14,772 | ) | (11,049 | ) | |||||||||
| 27,371 | 737 | (90,480 | ) | 30,415 | ||||||||||||
| Basic and diluted profit (loss) per share attributable to | ||||||||||||||||
| equity holders of the parent, stated in U.S. dollars | 0.10 | 0.02 | (0.30 | ) | 0.16 | |||||||||||
Compañía de Minas Buenaventura S.A.A. First Quarter 2020 Results Page 26 of 27 |
| Compañía de Minas Buenaventura S.A.A. and Subsidiaries | ||||||||||||||||
| Consolidated Statement of Cash Flows | ||||||||||||||||
| For the three and nine-month periods ended September 30, 2020 and 2019 | ||||||||||||||||
For the three-month period ended September 30, | For the nine-month period ended September 30, | |||||||||||||||
| 2020 | 2019 | 2020 | 2019 | |||||||||||||
| US$(000) | US$(000) | US$(000) | US$(000) | |||||||||||||
| Operating activities | ||||||||||||||||
| Proceeds from sales | 188,994 | 216,206 | 499,840 | 608,200 | ||||||||||||
| Tax recovered | 21,781 | 7,261 | 36,608 | 29,546 | ||||||||||||
| Royalty received | 4,199 | 5,152 | 16,694 | 16,087 | ||||||||||||
| Proceeds from dividends | - | 1,545 | 5,132 | 30,921 | ||||||||||||
| Insurance collection | 4,381 | - | 4,381 | - | ||||||||||||
| Interest received | 120 | - | 1,603 | 523 | ||||||||||||
| Payments to suppliers and third-parties, and other net | (86,230 | ) | (143,161 | ) | (324,556 | ) | (465,056 | ) | ||||||||
| Payments to employees | (32,513 | ) | (33,652 | ) | (98,067 | ) | (106,828 | ) | ||||||||
| Payments of income taxes and royalties paid to State | (3,805 | ) | (6,030 | ) | (17,783 | ) | (16,080 | ) | ||||||||
| Payments of interest | (4,892 | ) | (6,232 | ) | (17,518 | ) | (20,811 | ) | ||||||||
| Payments of mining royalties | (2,838 | ) | (1,569 | ) | (4,471 | ) | (3,146 | ) | ||||||||
| Net cash and cash equivalents provided by operating activities | 89,197 | 39,520 | 101,863 | 73,356 | ||||||||||||
| Investing activities | ||||||||||||||||
| Proceeds from sales of mining concessions, property, plant and equipment | 285 | 280 | 21,469 | 702 | ||||||||||||
| Purchase of shares | - | - | (13,453 | ) | - | |||||||||||
| Acquisitions of mining concessions, development costs, property, plant and equipment | (12,601 | ) | (27,971 | ) | (34,082 | ) | (64,255 | ) | ||||||||
| Acquisitions of other assets | (305 | ) | (1,040 | ) | (1,111 | ) | (2,468 | ) | ||||||||
| Net cash and cash equivalents used in investing activities | (12,621 | ) | (28,731 | ) | (27,177 | ) | (66,021 | ) | ||||||||
| Financing activities | ||||||||||||||||
| Proceeds of bank loans | 10,811 | 50,000 | 18,019 | 55,000 | ||||||||||||
| Payments of bank loans | - | (50,000 | ) | (5,000 | ) | (95,000 | ) | |||||||||
| Payments of financial obligations | (15,180 | ) | (10,429 | ) | (29,210 | ) | (33,657 | ) | ||||||||
| Dividends paid to controlling shareholders | - | - | - | (15,240 | ) | |||||||||||
| Dividends paid to non-controlling interest | (2,660 | ) | (2,319 | ) | (3,940 | ) | (5,419 | ) | ||||||||
| Decrease (increase) of restricted bank accounts | (244 | ) | (2,367 | ) | 215 | (2,511 | ) | |||||||||
| Net cash and cash equivalents used in financing activities | (7,273 | ) | (15,115 | ) | (19,916 | ) | (96,827 | ) | ||||||||
| Net increase (decrease) in cash and cash equivalents during the period | 69,303 | (4,326 | ) | 54,770 | (89,492 | ) | ||||||||||
| Cash and cash equivalents at the beginning of the period | 195,513 | 284,034 | 210,046 | 369,200 | ||||||||||||
| Cash and cash equivalents at period-end | 264,816 | 279,708 | 264,816 | 279,708 | ||||||||||||
Compañía de Minas Buenaventura S.A.A. First Quarter 2020 Results Page 27 of 27 |
For the three-month period ended September 30, | For the nine-month period ended September 30, | |||||||||||||||
| 2020 | 2019 | 2020 | 2019 | |||||||||||||
| US$(000) | US$(000) | US$(000) | US$(000) | |||||||||||||
| Reconciliation of net profit to cash and cash equivalents provided | ||||||||||||||||
| by operating activities | ||||||||||||||||
| Net profit (loss) | 27,371 | 737 | (90,480 | ) | 30,415 | |||||||||||
| Plus (less): | ||||||||||||||||
| Depreciation and amortization in cost of sales | 56,856 | 60,211 | 130,495 | 168,729 | ||||||||||||
| Depreciation and amortization in other, net | 27 | 28 | 77 | 556 | ||||||||||||
Depreciation and amortization in administration expenses | 874 | 2,507 | 2,749 | 4,286 | ||||||||||||
| Net share in results of associates and joint venture | (34,212 | ) | (37,771 | ) | (16,066 | ) | (109,988 | ) | ||||||||
| Reversal (provision) for impairment loss of inventories | (5,787 | ) | 1,422 | 8,670 | (701 | ) | ||||||||||
| Bonus provision - executives & employes | 2,541 | 2,276 | 10,569 | 12,058 | ||||||||||||
| Accretion expense of provision for closure of mining units and exploration projects | 1,737 | 2,352 | 5,002 | 8,152 | ||||||||||||
| Net loss (gain) from currency exchange difference | 776 | 1,455 | 3,891 | 1,672 | ||||||||||||
| Provision for estimated fair value of sales | 1,101 | (1,506 | ) | 2,260 | 3,181 | |||||||||||
| Deferred income tax expense (income) | 7,594 | 14,556 | 6,322 | (11,439 | ) | |||||||||||
| Recovery (expense) for provision for contingencies | 1,237 | (827 | ) | 387 | (2,089 | ) | ||||||||||
| Hedge derivative instruments | 2,566 | (1,300 | ) | 2,566 | (4,322 | ) | ||||||||||
| Fair Value of provision for contingences liabilities | 1,150 | 1,462 | 1,150 | 1,462 | ||||||||||||
| Other net | (11,937 | ) | (9,630 | ) | (5,237 | ) | (9,641 | ) | ||||||||
| Net changes in operating assets and liabilities: | ||||||||||||||||
| Decrease (increase) in operating assets - | ||||||||||||||||
| Trade and other accounts receivable | (10,836 | ) | (9,259 | ) | 83,384 | 917 | ||||||||||
| Inventories | 16,002 | 15,020 | (19,336 | ) | 26,383 | |||||||||||
| Income tax credit | (889 | ) | (3,093 | ) | 14,542 | (4,000 | ) | |||||||||
| Prepaid expenses | 2,497 | 3,432 | 10,474 | 3,740 | ||||||||||||
| Increase (decrease) in operating liabilities - | ||||||||||||||||
| Trade and other accounts payable | 33,430 | (4,771 | ) | (29,859 | ) | (55,761 | ) | |||||||||
| Provisions, contingent liabilities and other liabilities | (3,904 | ) | 260 | (21,467 | ) | (21,366 | ) | |||||||||
| Income tax payable | 1,003 | 414 | (3,362 | ) | 191 | |||||||||||
| Proceeds from dividends | - | 1,545 | 5,132 | 30,921 | ||||||||||||
| Net cash and cash equivalents provided by operating activities | 89,197 | 39,520 | 101,863 | 73,356 | ||||||||||||
Signature
Pursuant to the requirements of the Securities Exchange Act of 1934, the registrant has duly caused this report to be signed on its behalf by the undersigned, thereunto duly authorized.
COMPAÑÍA DE MINAS BUENAVENTURA S.A.A.
By: /s/ DANIEL DOMINGUEZ
Name: Daniel Dominguez
Title: Chief Financial Officer
Date: October 29, 2020