EXHIBIT 99.1
ICT GROUP
NASDAQ: ICTG
August 2005
Company Statements
This presentation contains certain forward-looking statements that are subject to risks and uncertainties. Forward-looking statements include without limitation certain information relating to the effect of competition in the telemarketing industry, ICT Group’s ability to execute its business strategy, the development of alliances upon terms acceptable to ICT Group and the achievement of the anticipated benefits of such alliances, as well as statements that are preceded by, followed by or include the words “believes,” “expects,” “estimates,” “anticipates,” “plans,” “should,” or similar expressions. For such statements, ICT Group claims the protection of the safe harbor for forward-looking statements contained in the Private Securities Litigation Reform Act of 1995. Actual events or results may differ materially from those discussed in the forward-looking statements as a result of various factors, including without limitation, those discussed in ICT Group’s annual report on Form 10-K for the year ended December 31, 2004 and other documents filed by ICT Group with the Securities and Exchange Commission. ICT Group makes no undertaking and disclaims any obligation to update such forward-looking statements.
This presentation shows net income for 1996, 2002, 2003, 2004 and 2005 exclusive of special charges. In 1996 the Company reported a pre-tax, nonrecurring, non-cash charge of $12.7M which was primarily associated with the granting of options, concurrent with the Company’s IPO, to replace certain previously granted expiring options. In 2002 the Company incurred special charges of $12.6M, pre-tax. This included charges of $8.9M, pre-tax, associated with the closing and scaling back of facilities and staff in the U.S. and Europe. It also included $3.7M, pre-tax, of additional charges, including a $1.4M charge for a client claim, a $1.7M charge for the costs associated with the defense of a class action litigation and a $0.6M charge for costs associated with a postponed underwritten public offering. In 2003, the Company incurred special charges of $4.0M, pre-tax associated with a class action litigation which were partially offset by a $0.7M partial reversal of the 2002 restructuring charge. In 2004, the Company incurred special charges of $10.3M, pre-tax associated with costs incurred to defend and the settlement of a class action litigation.
In 1H05, the Company incurred special charges of $0.6M associated with the class action litigation.
August 2005
ICT GROUP
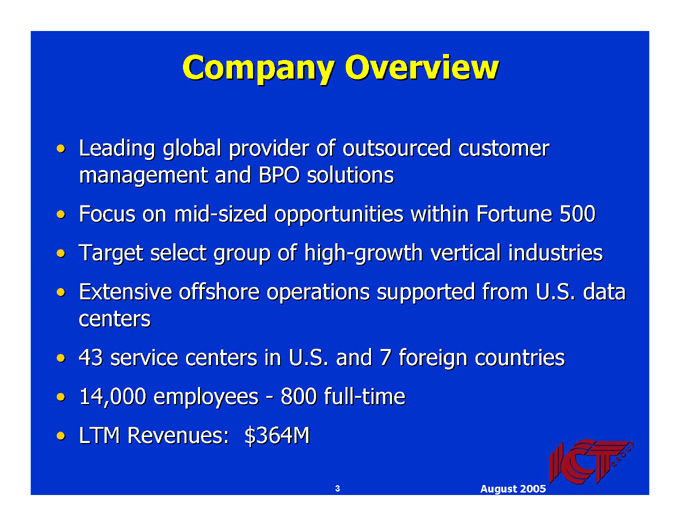
Company Overview
Leading global provider of outsourced customer management and BPO solutions
Focus on mid-sized opportunities within Fortune 500
Target select group of high-growth vertical industries
Extensive offshore operations supported from U.S. data centers
43 service centers in U.S. and 7 foreign countries
14,000 employees - 800 full-time
LTM Revenues: $364M
August 2005
ICT GROUP
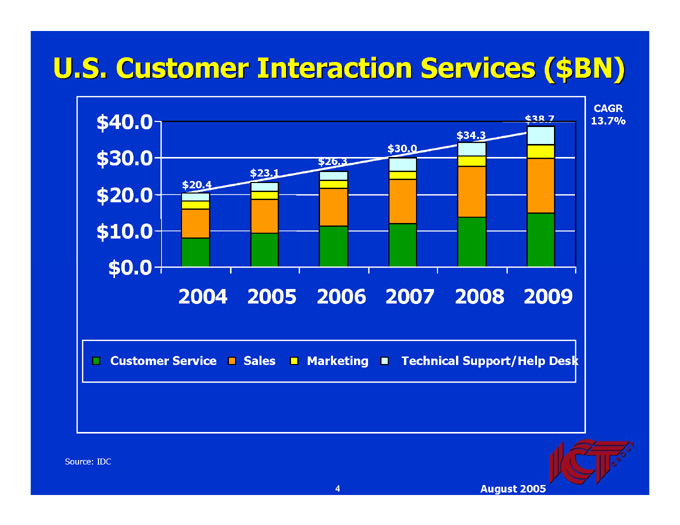
U.S. Customer Interaction Services ($BN)
CAGR 13.7%
$38.7
$34.3
$30.0
$26.3
$23.1
$20.4
$40.0
$30.0
$20.0
$10.0
$0.0
2004
2005
2006
2007
2008
2009
Customer Service
Sales
Marketing
Technical Support/Help Desk
Source: IDC
August 2005
ICT GROUP
Why Invest in ICT Now?
Shifted business model for accelerated revenue and earnings growth
Focused on broader-based outsourced services and lower-cost offshore operations
Leveraged existing strength in financial services and health care markets to expand into new verticals
Captured 26 customer service wins over last 18 months
Strong pipeline of new opportunities across multiple verticals
Expect EPS to more than double in 2005 on improved margins and 20% revenue growth
August 2005
ICT GROUP
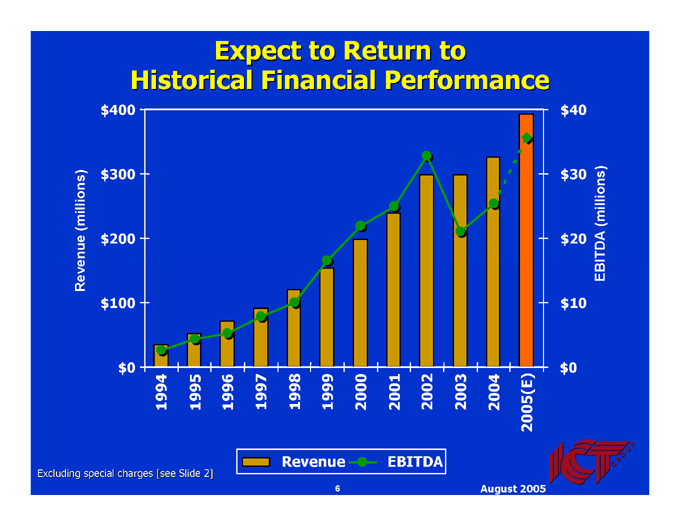
Expect to Return to Historical Financial Performance
EBITDA (millions)
Revenue (millions)
$400
$300
$200
$100
$0
$40
$30
$20
$10
$0
1994
1995
1996
1997
1998
1999
2000
2001
2002
2003
2004
2005(E)
Revenue
EBITDA
Excluding special charges [see Slide 2]
August 2005
ICT GROUP
Profitability Growth Drivers
Shift to more consistent services business while improving operating performance of sales business
Price increases to offset impact of FX rates
Higher margins at offshore operations in Philippines
Initial build-out largely complete: 1,250 stations
Layering additional services to leverage infrastructure
Increased capacity utilization:
$41,100 annualized revenue per workstation in 2Q05
Growth of higher margin marketing and technology services
August 2005
ICT GROUP
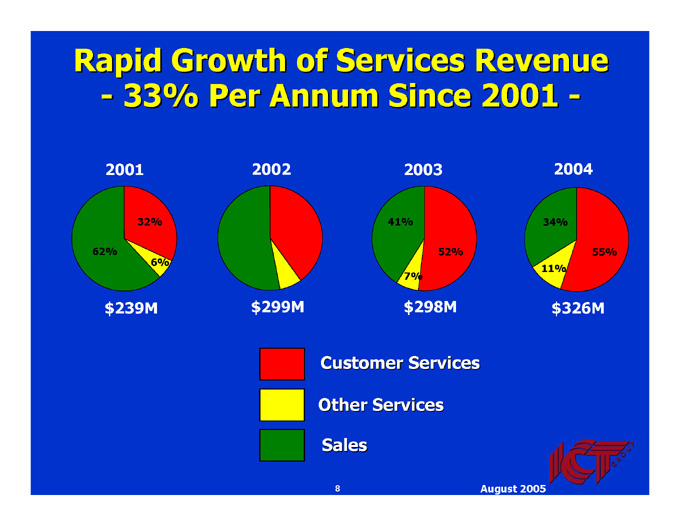
Rapid Growth of Services Revenue - 33% Per Annum Since 2001 -
2001
2002
2003
2004
32%
62%
6%
40%
53%
7%
41%
52%
7%
55%
34%
11%
$298M
$326M
$239M
$299M
Customer Services
Other Services
Sales
August 2005
ICT GROUP
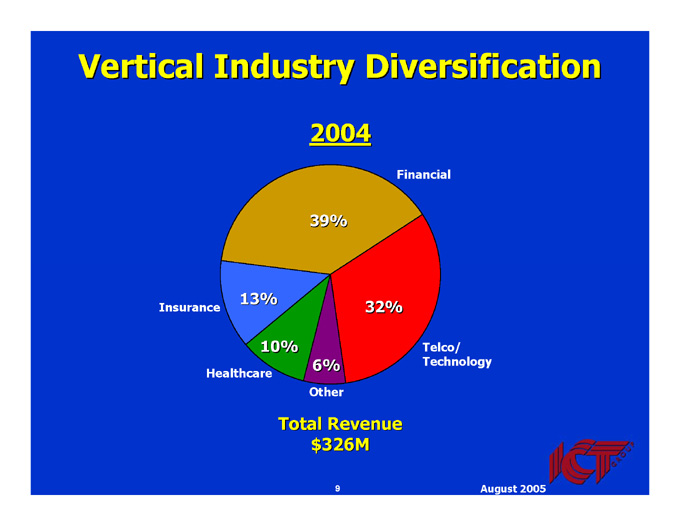
Vertical Industry Diversification
2004
39%
13%
32%
10%
6%
Financial
Insurance
Telco/Technology
Healthcare
Other
Total Revenue
$326M
August 2005
ICT GROUP
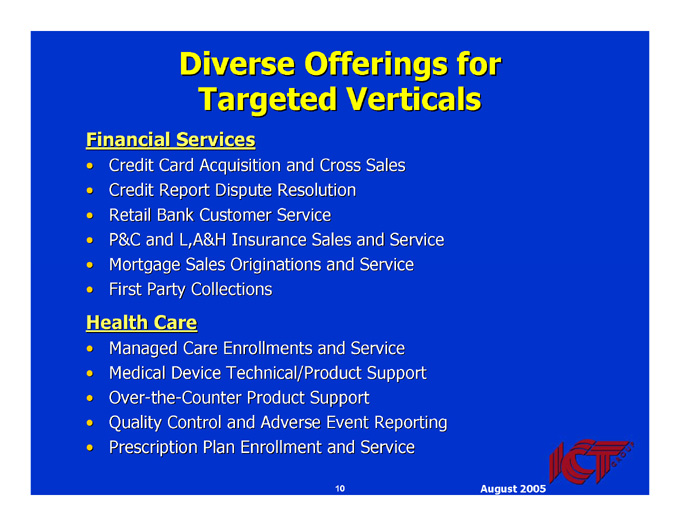
Diverse Offerings for Targeted Verticals
Financial Services
Credit Card Acquisition and Cross Sales
Credit Report Dispute Resolution
Retail Bank Customer Service
P&C and L,A&H Insurance Sales and Service
Mortgage Sales Originations and Service
First Party Collections
Health Care
Managed Care Enrollments and Service
Medical Device Technical/Product Support
Over-the-Counter Product Support
Quality Control and Adverse Event Reporting
Prescription Plan Enrollment and Service
August 2005
ICT GROUP

Recent Wins Across Broad Base of Clients and Industries
Financial: GMAC; Washington Mutual
Pharmaceutical: J&J; Abbott Labs; Pfizer
Health Care: Aetna; HealthNet
Technology: SAP; Sun Microsystems
Consumer Electronics: Panasonic; VTech
Business Services: D&B
Consumer Products: Hallmark; Petro
Government: GSA; FEMA
August 2005
ICT GROUP

Key Clients in Major Verticals
August 2005
ICT GROUP
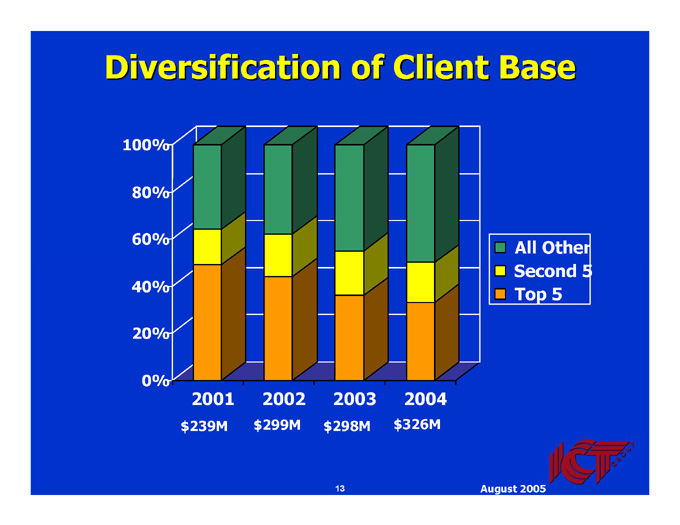
Diversification of Client Base
100%
80%
60%
40%
20%
0%
2003
2002
2001
2004
$299M
$239M
$298M
$326M
All Other
Second 5
Top 5
August 2005
ICT GROUP
Consistent Technology Platform Worldwide
Best-in-class technology platform:
Centralized architecture for reliability/flexibility
VoIP telephony reduces costs
Redundant private network for voice & data communications
Intense focus on quality
All centers are ISO 9001:2000 certified
August 2005
ICT GROUP
Global Capabilities
Based on proven international expertise
Support targeted local country markets
Concurrently provide low cost near-shore and offshore solutions
Strengthens competitive position and improves profitability
Impact of increased call volumes from lower priced offshore operations now outweighs impact of lower pricing on revenue growth
August 2005
ICT GROUP

Global Strategy: Markets & Operations
U.K.
Ireland
Canada
U.S.
Philippines
Mexico
Caribbean
India
Australia
Served Market
Served Market with External Production
External Production
Planned External Production
August 2005
ICT GROUP
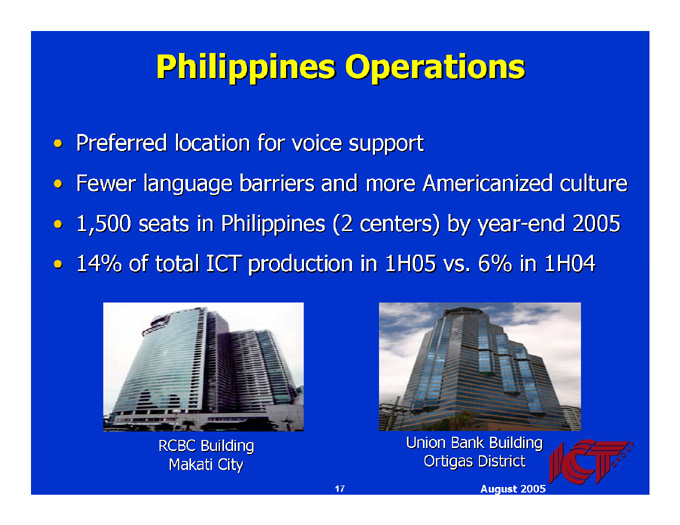
Philippines Operations
Preferred location for voice support
Fewer language barriers and more Americanized culture
1,500 seats in Philippines (2 centers) by year-end 2005
14% of total ICT production in 1H05 vs. 6% in 1H04
RCBC Building Makati City
Union Bank Building Ortigas District
August 2005
ICT GROUP
Leverage Offshore Operations to Target New BPO Opportunities
Use offshore operations during off-peak hours to support other BPO services
Amortize infrastructure costs over expanded business base
Raise utilization rates resulting in higher revenue and margin per workstation and higher ROIC
Cross-sell new services with existing and new clients
Add services through internal expansion, strategic relationships and acquisitions
August 2005
ICT GROUP
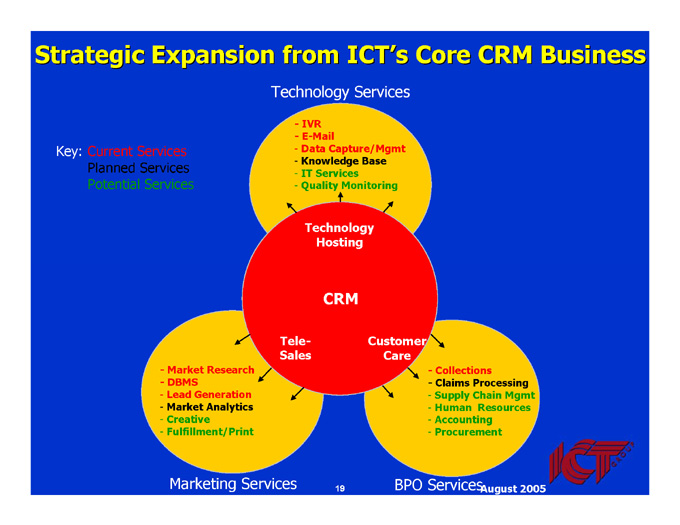
Strategic Expansion from ICT’s Core CRM Business
Technology Services
Key: Current Services
Planned Services
Potential Services
- IVR
- E-Mail
Data Capture/Mgmt
Knowledge Base
IT Services
Quality Monitoring
Technology
Hosting
CRM
Customer
Care
Tele- Sales
- Collections
- Claims Processing
- Supply Chain Mgmt
- Human Resources
- Accounting
- Procurement
- Market Research
- DBMS
- Lead Generation
- Market Analytics
- Creative
- Fulfillment/Print
BPO Services
Marketing Services
August 2005
ICT GROUP
Financial
Summary
August 2005
ICT GROUP
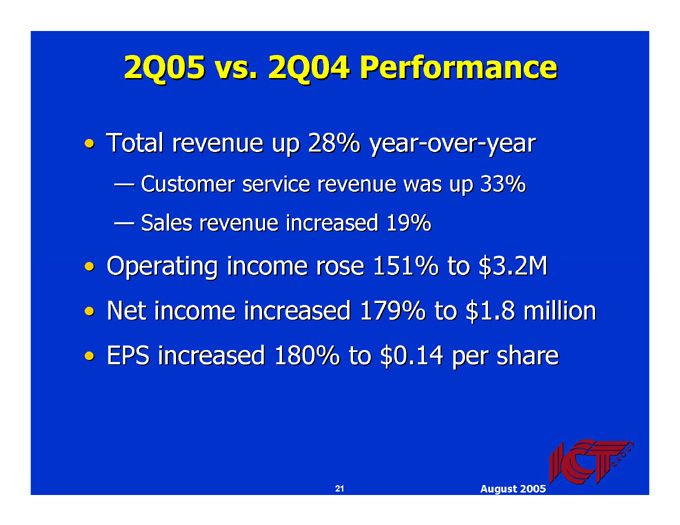
2Q05 vs. 2Q04 Performance
Total revenue up 28% year-over-year
Customer service revenue was up 33%
Sales revenue increased 19%
Operating income rose 151% to $3.2M
Net income increased 179% to $1.8 million
EPS increased 180% to $0.14 per share
August 2005
ICT GROUP
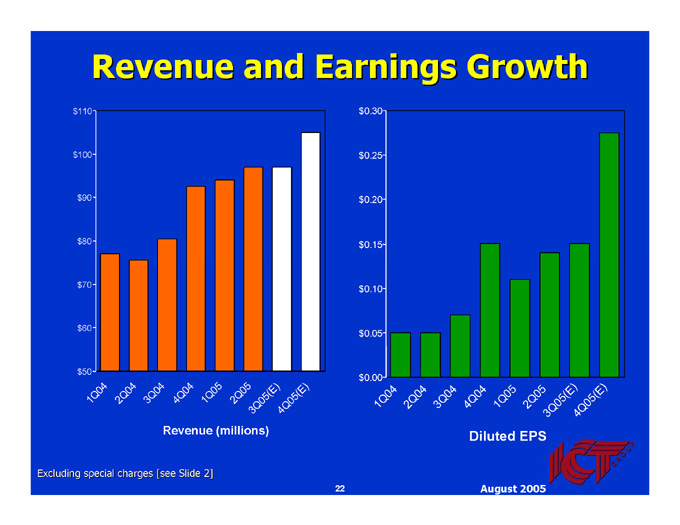
Revenue and Earnings Growth
$110
$100
$90
$80
$70
$60
$50
$0.30
$0.25
$0.20
$0.15
$0.10
$0.05
$0.00
1Q05
2Q04
3Q04
4Q04
1Q04
2Q05
3Q05(E)
4Q05(E)
1Q04
2Q04
3Q04
4Q04
1Q05
2Q05
3Q05(E)
4Q05(E)
Revenue (millions)
Diluted EPS
Excluding special charges [see Slide 2]
August 2005
ICT GROUP
Balance Sheet and Cash Flow
June 30, 2005
$14.4 million of Cash and Cash Equivalents
$56 million of Working Capital
2.4 current ratio
Expanded bank credit facility to $125 million
$79 million available borrowing capacity,
Plus $50 million accordion feature
$70 million in Shareholders’ Equity
Generated $9.1 million Free Cash Flow from Operations in 1H05
August 2005
ICT GROUP

Summary
August 2005
ICT GROUP
Positive Outlook
Solid top-line growth and improved profitability
Three year internal growth targets of:
Revenue of 10-15% per annum
Operating margins to reach 7-8%
16 new and extended contracts in 2004: 10 in 1H05
Expanded near-shore and offshore operations
Broader technology, marketing and BPO service offerings
Strong financial position to invest in future internal growth and pursue strategic acquisitions to accelerate revenue, margin and earnings growth
August 2005
ICT GROUP

ICT GROUP
NASDAQ: ICTG
August 2005