Exhibit 99.1

8 TH ANNUAL
NEEDHAM & CO. GROWTH CONFERENCE
ICT GROUP, INC.
NASDAQ: ICTG
John Brennan, Chairman & CEO
January 10, 2006
Company Statements
This presentation contains certain forward-looking statements that are subject to risks and uncertainties. Forward-looking statements include without limitation certain information relating to the effect of competition in the telemarketing industry, ICT Group’s ability to execute its business strategy, the development of alliances upon terms acceptable to ICT Group and the achievement of the anticipated benefits of such alliances, as well as statements that are preceded by, followed by or include the words “believes,” “expects,” “estimates,” “anticipates,” “plans,” “should,” or similar expressions. For such statements, ICT Group claims the protection of the safe harbor for forward-looking statements contained in the Private Securities Litigation Reform Act of 1995. Actual events or results may differ materially from those discussed in the forward-looking statements as a result of various factors, including without limitation, those discussed in ICT Group’s annual report on Form 10-K for the year ended December 31, 2004 and other documents filed by ICT Group with the Securities and Exchange Commission. ICT Group makes no undertaking and disclaims any obligation to update such forward-looking statements.
This presentation shows net income for 1996, 2002, 2003, 2004 and 2005 exclusive of special charges. In 1996 the Company reported a pre-tax, nonrecurring, non-cash charge of $12.7M which was primarily associated with the granting of options, concurrent with the Company’s IPO, to replace certain previously granted expiring options. In 2002 the Company incurred special charges of $12.6M, pre-tax. This included charges of $8.9M, pre-tax, associated with the closing and scaling back of facilities and staff in the U.S. and Europe. It also included $3.7M, pre-tax, of additional charges, including a $1.4M charge for a client claim, a $1.7M charge for the costs associated with the defense of a class action litigation and a $0.6M charge for costs associated with a postponed underwritten public offering. In 2003, the Company incurred special charges of $4.0M, pre-tax associated with a class action litigation which were partially offset by a $0.7M partial reversal of the 2002 restructuring charge. In 2004, the Company incurred special charges of $10.3M, pre-tax associated with costs incurred to defend and the settlement of a class action litigation. In 2005, the Company received a $4.1M insurance recovery and incurred special charges of $0.6M, pre-tax associated with the class action litigation.
2
January 10, 2006
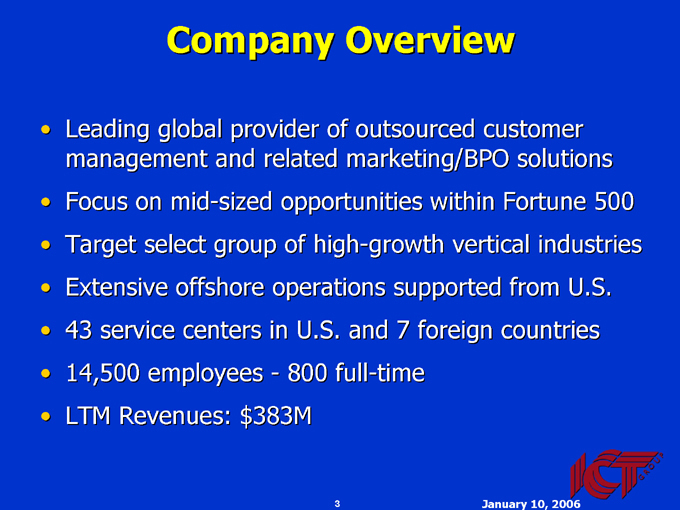
Company Overview
Leading global provider of outsourced customer management and related marketing/BPO solutions
Focus on mid-sized opportunities within Fortune 500
Target select group of high-growth vertical industries
Extensive offshore operations supported from U.S.
43 service centers in U.S. and 7 foreign countries
14,500 employees - 800 full-time
LTM Revenues: $383M
January 10, 2006
3
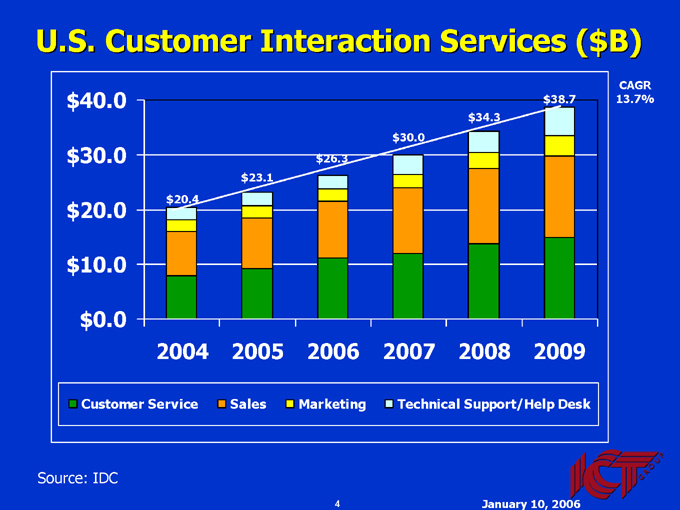
U.S. Customer Interaction Services ($B)
$40.0
$30.0
$20.0
$10.0
$0.0
$20.4 $23.1 $26.3 $30.0 $34.3 $38.7
CAGR 13.7%
2004 2005 2006 2007 2008 2009
Customer Service
Sales
Marketing
Technical Support/Help Desk
Source: IDC
January 10, 2006
4
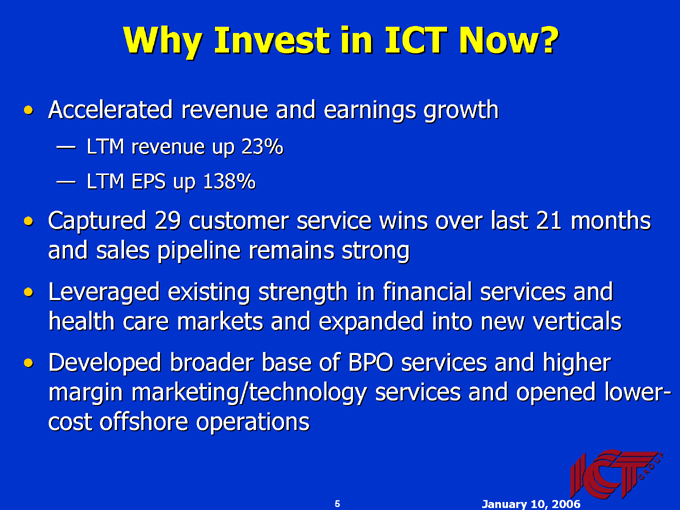
Why Invest in ICT Now?
Accelerated revenue and earnings growth
LTM revenue up 23%
LTM EPS up 138%
Captured 29 customer service wins over last 21 months and sales pipeline remains strong
Leveraged existing strength in financial services and health care markets and expanded into new verticals
Developed broader base of BPO services and higher margin marketing/technology services and opened lower-cost offshore operations
January 10, 2006
5
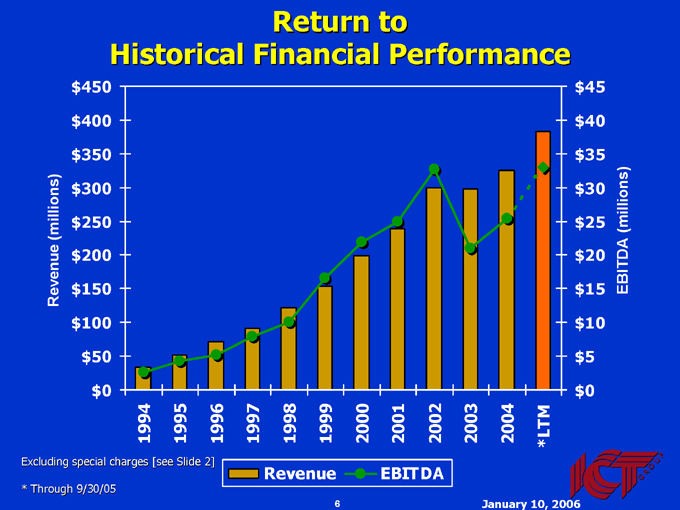
Return to
Historical Financial Performance
Revenue (millions) $450 $400 $350 $300 $250 $200 $150 $100 $50 $0
1994 1995 1996 1997 1998 1999 2000 2001 2002 2003 2004 *LTM
$45 $40 $35 $30 $25 $20 $15 $10 $5 $0
EBITDA (millions)
Excluding special charges [see Slide 2]
* Through 9/30/05
Revenue
EBITDA
January 10, 2006
6
Key Growth Drivers
Shifted to more consistent services business while improving operating performance of sales business
Focused on select verticals while diversifying customer base
Developed and implemented successful offshore strategy
Improved profitability in international markets
Added higher margin marketing and technology services
January 10, 2006
7
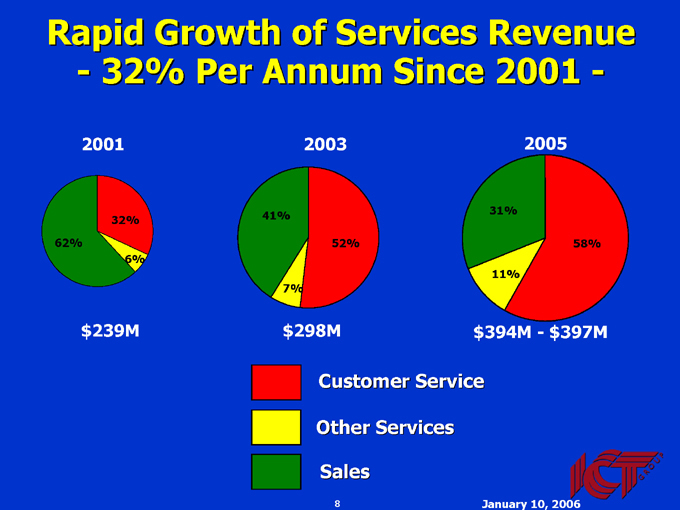
Rapid Growth of Services Revenue
- 32% Per Annum Since 2001 -
2001
62%
32%
6% $239M
2003
41%
7%
52% $298M
2005
31%
11%
58%
$394M - $397M
Customer Service
Other Services Sales
January 10, 2006
8
Focusing Resources on Select Markets
ICT differentiates itself through its vertical marketing expertise and application knowledge base
Have become an industry leader in financial services and health care sectors: account for 64% of revenue
Improved our sales close rate and enabled cross-selling of additional services to existing clients
Now applying vertical expertise strategy to expand into new markets: government, technology and energy
January 10, 2006
9
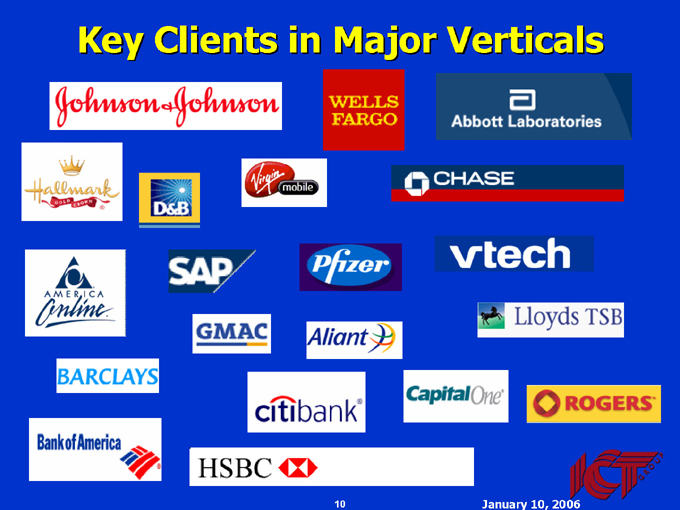
Key Clients in Major Verticals
January 10, 2006
10
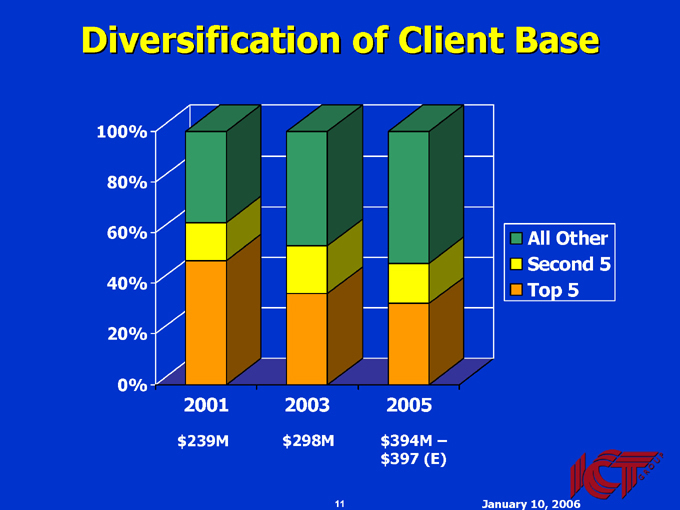
Diversification of Client Base
100%
80%
60%
40%
20%
0%
2001 2003 2005
$239M $298M $394M –$397 (E)
All Other
Second 5
Top 5
January 10, 2006
11
Global Capabilities
Based on proven international expertise
Initially supported local country markets
Expanded to provide low cost near-shore and offshore solutions
Launched home shoring alternative in 2H05
Evaluating additional expansion for 2006
January 10, 2006
12
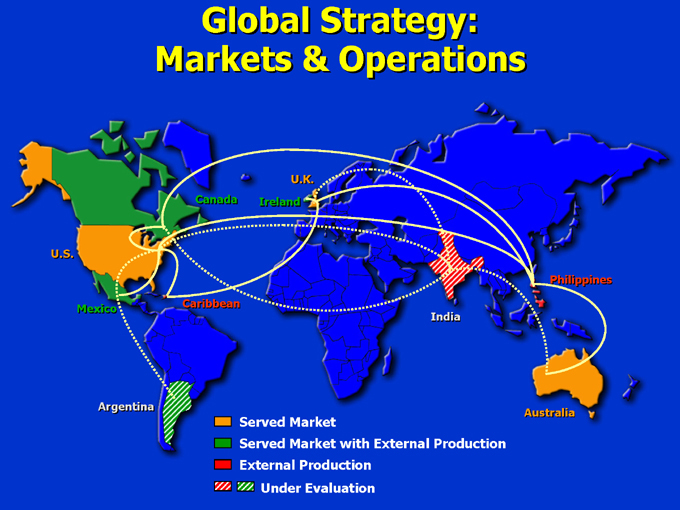
Global Strategy: Markets & Operations
Served Market
Served Market with External Production
External Production
Under Evaluation
U.S.
Mexico
Argentina
Canada
Caribbean
U.K.
Ireland
India
Philippines
Australia
Consistent Technology Platform Worldwide
Best-in-class technology platform:
Centralized architecture for reliability/flexibility
VoIP telephony to reduce costs
Redundant private network for voice & data communications
Intense focus on quality
All centers are ISO 9001:2000 certified
January 10, 2006
14
Philippines Operations
Preferred location for voice support
Fewer language barriers; more Americanized culture
1,560 seats in 2 centers by year-end 2005
16% of ICT production YTD 2005 vs. 8% YTD 2004
Third facility to be opened in 1Q06
Fourth facility under consideration
January 10, 2006
15
Leveraging Offshore Operations to Target New BPO Opportunities
Use offshore operations during off-peak hours to support other BPO services for new and existing clients
Amortize infrastructure over expanded business base
Raise utilization rates resulting in higher revenue and margin per workstation and higher ROIC
Add services through internal expansion, strategic relationships and acquisitions
January 10, 2006
16
Margin Enhancement from CRM Technology Services
Expanded service offerings now include:
Hosted CRM, e-mail and knowledge-base software
Hosted ACD, IVR and message alert services
Small but growing part of business achieving operating margins in excess of 25%
Awarded 10 new projects in 3Q05 which are expected to generate $2.5M to $3.0M of higher margin revenue over next 12 months
January 10, 2006
17
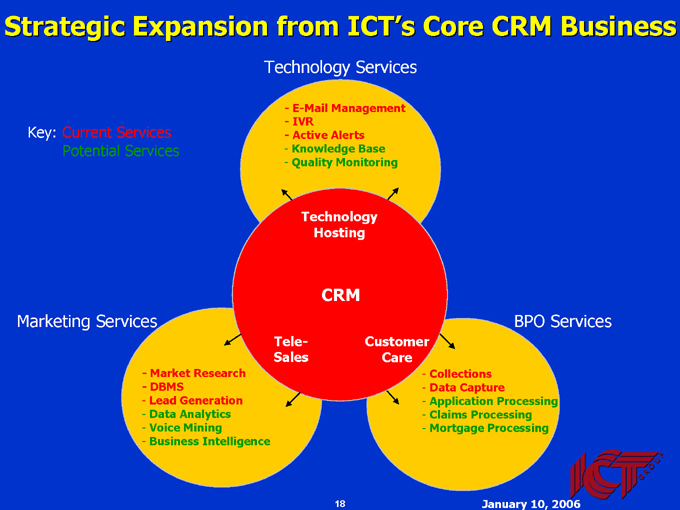
Strategic Expansion from ICT’s Core CRM Business
Technology Services
Key: Current Services Potential Services
E-Mail Management
IVR
Active Alerts
Knowledge Base
Quality Monitoring
Technology Hosting
CRM
Tele-Sales
Customer Care
Marketing Services
Market Research DBMS
Lead Generation Data Analytics Voice Mining Business Intelligence
Collections Data Capture
Application Processing Claims Processing Mortgage Processing
BPO Services
January 10, 2006
18

Financial Summary
January 10, 2006
19
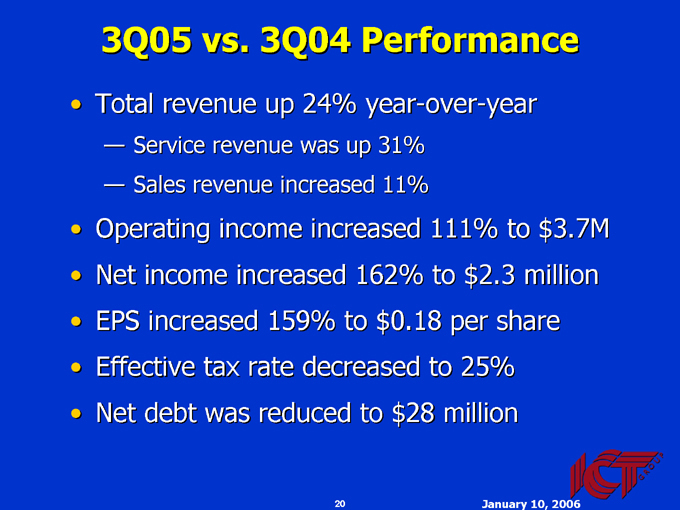
3Q05 vs. 3Q04 Performance
Total revenue up 24% year-over-year
Service revenue was up 31%
Sales revenue increased 11%
Operating income increased 111% to $3.7M
Net income increased 162% to $2.3 million
EPS increased 159% to $0.18 per share
Effective tax rate decreased to 25%
Net debt was reduced to $28 million
January 10, 2006
20
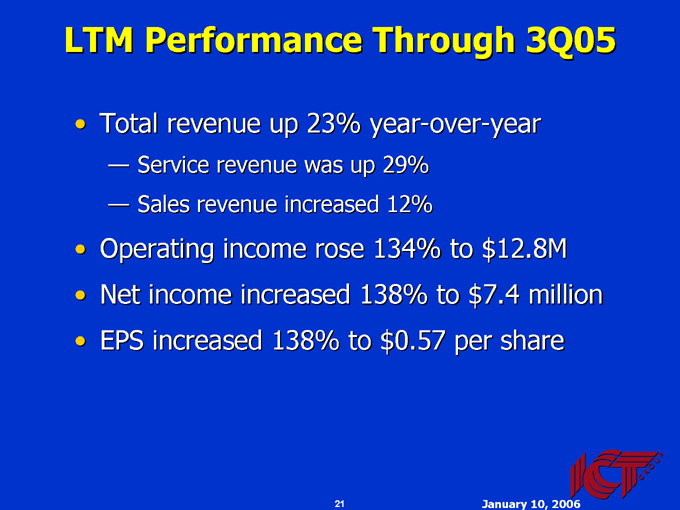
LTM Performance Through 3Q05
Total revenue up 23% year-over-year
Service revenue was up 29%
Sales revenue increased 12%
Operating income rose 134% to $12.8M
Net income increased 138% to $7.4 million
EPS increased 138% to $0.57 per share
January 10, 2006
21
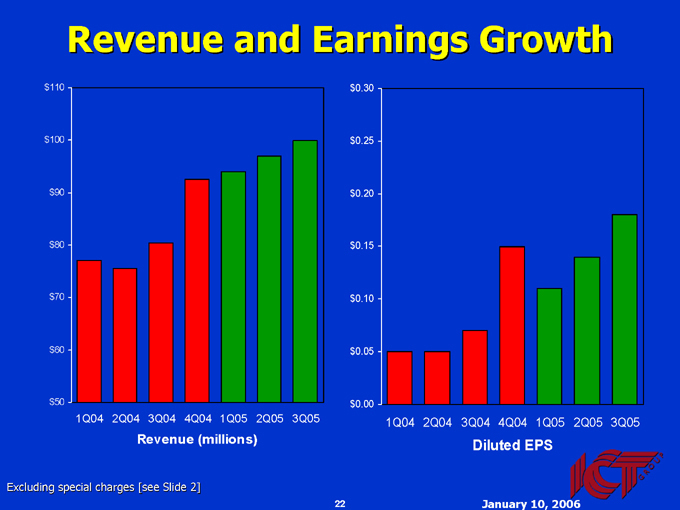
Revenue and Earnings Growth $110 $100 $90 $80 $70 $60 $50
1Q04 2Q04 3Q04 4Q04 1Q05 2Q05 3Q05
Revenue (millions) $0.30 $0.25 $0.20 $0.15 $0.10 $0.05 $0.00
1Q04 2Q04 3Q04 4Q04 1Q05 2Q05 3Q05
Diluted EPS
Excluding special charges [see Slide 2]
January 10, 2006
22
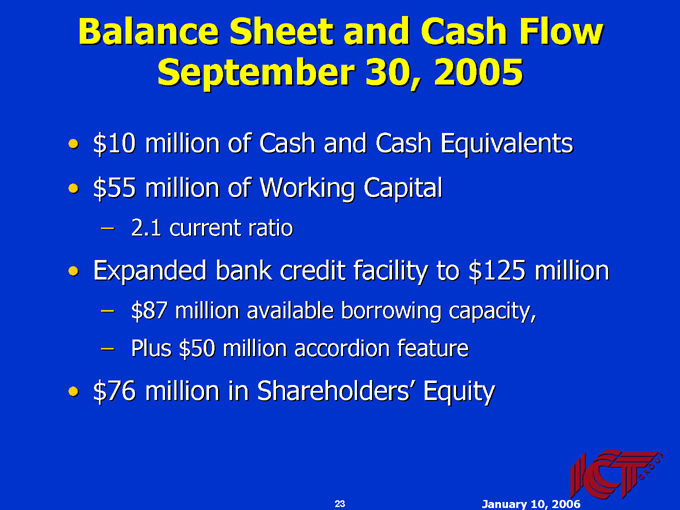
Balance Sheet and Cash Flow September 30, 2005
$10 million of Cash and Cash Equivalents
$55 million of Working Capital
2.1 current ratio
Expanded bank credit facility to $125 million
$87 million available borrowing capacity,
Plus $50 million accordion feature
$76 million in Shareholders’ Equity
January 10, 2006
23

Summary
January 10, 2006
24
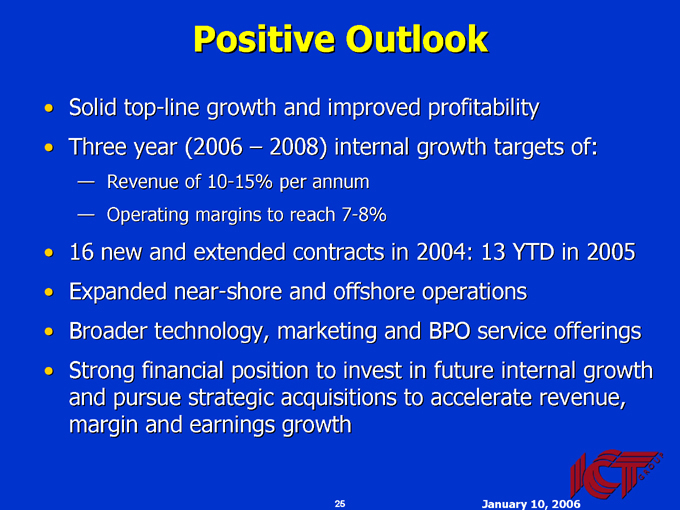
Positive Outlook
Solid top-line growth and improved profitability
Three year (2006 – 2008) internal growth targets of:
Revenue of 10-15% per annum
Operating margins to reach 7-8%
16 new and extended contracts in 2004: 13 YTD in 2005
Expanded near-shore and offshore operations
Broader technology, marketing and BPO service offerings
Strong financial position to invest in future internal growth and pursue strategic acquisitions to accelerate revenue, margin and earnings growth
January 10, 2006
25
NASDAQ: ICTG
January 10, 2006