Exhibit 99.1

Robert W. Baird & Co.’s 2006 Growth Stock Conference
ICT Group, Inc.
May 9, 2006 NASDAQ: ICTG
Company Statements
This presentation contains certain forward-looking statements that are subject to risks and uncertainties. Forward-looking statements include without limitation certain information relating to the effect of competition in its industry, ICT Group’s ability to execute its business strategy, the development of alliances upon terms acceptable to ICT Group and the achievement of the anticipated benefits of such alliances, as well as statements that are preceded by, followed by or include the words “believes,” “expects,” “estimates,” “anticipates,” “plans,” “should,” or similar expressions. For such statements, ICT Group claims the protection of the safe harbor for forward-looking statements contained in the Private Securities Litigation Reform Act of 1995. Actual events or results may differ materially from those discussed in the forward-looking statements as a result of various factors, including without limitation, those discussed in ICT Group’s annual report on Form 10-K for the year ended December 31, 2005 and other documents filed by ICT Group with the Securities and Exchange Commission. ICT Group makes no undertaking and disclaims any obligation to update such forward-looking statements.
This presentation shows ICT Group financials for 2003, 2004 and 2005 exclusive of special charges. In 2003, the Company incurred special charges of $4.7M, pre-tax associated with a class action litigation which were partially offset by a $0.7M partial reversal of a 2002 restructuring charge. In 2004, the Company incurred special charges of $10.3M, pre-tax associated with costs incurred to defend and the settlement of a class action litigation. In 2005, the Company received $4.2M of insurance recoveries and incurred $0.6M of litigation costs, pre-tax associated with the class action litigation.
2
Company Overview
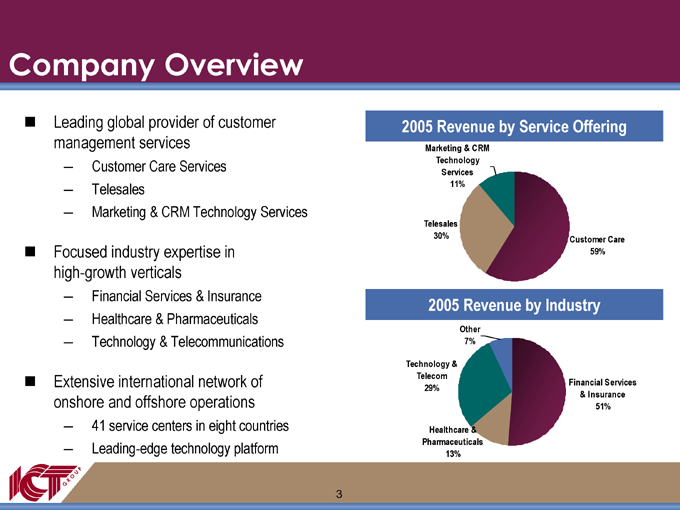
Leading global provider of customer management services
Customer Care Services
Telesales
Marketing & CRM Technology Services
Focused industry expertise in high-growth verticals
Financial Services & Insurance
Healthcare & Pharmaceuticals
Technology & Telecommunications
Extensive international network of onshore and offshore operations
41 service centers in eight countries
Leading-edge technology platform
2005 Revenue by Service Offering
Marketing & CRM
Technology Services 11%
Customer Care 59%
Telesales 30%
2005 Revenue by Industry
Other 7%
Financial Services & Insurance 51%
Healthcare & Pharmaceuticals 13%
Technology & Telecom 29%
3
Consistent History of Strong Revenue Growth
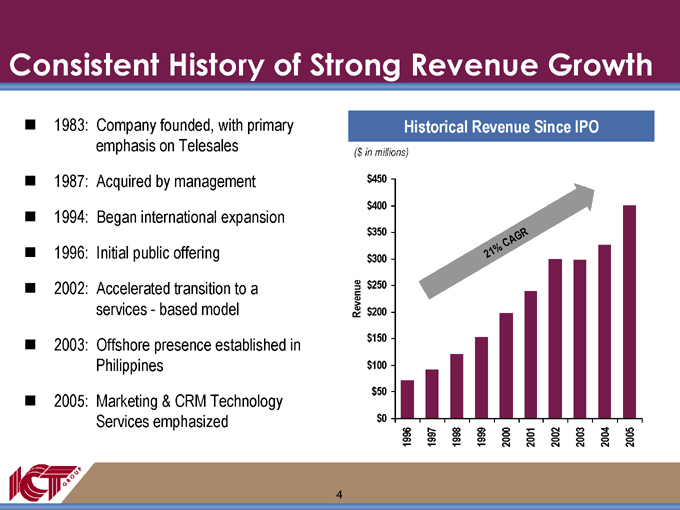
1983: Company founded, with primary emphasis on Telesales
1987: Acquired by management
1994: Began international expansion
1996: Initial public offering
2002: Accelerated transition to a services—based model
2003: Offshore presence established in Philippines
2005: Marketing & CRM Technology Services emphasized
Historical Revenue Since IPO
($ in millions) $450 $400 $350 $300
Revenue $250 $200
$150 $100 $50 $0
21%
CA
GR
1996
1997
1998
1999
2000
2001
2002
2003
2004
2005
4
Positioned for Strong and Consistent Growth
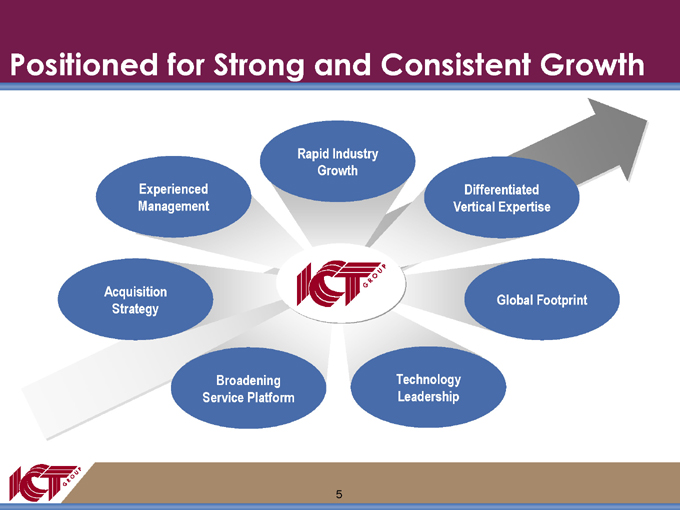
Rapid Industry Growth
Differentiated Vertical Expertise
Global Footprint
Technology Leadership
Broadening Service Platform
Acquisition Strategy
Experienced Management
5
Rapidly Growing Market Demand
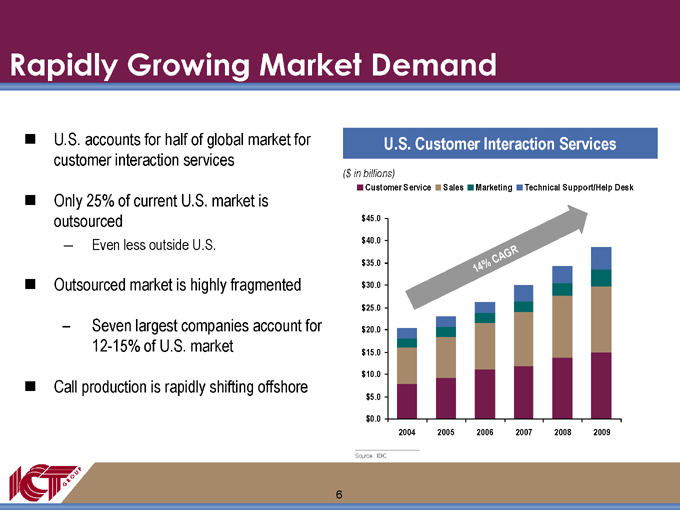
U.S. accounts for half of global market for customer interaction services
Only 25% of current U.S. market is outsourced
Even less outside U.S.
Outsourced market is highly fragmented
Seven largest companies account for 12-15% of U.S. market
Call production is rapidly shifting offshore
U.S. Customer Interaction Services
($ in billions)
Customer Service
Sales Marketing
Technical Support/Help Desk $45.0 $40.0 $35.0 $30.0 $25.0 $20.0 $15.0 $10.0 $5.0 $0.0
14%
CA
GR
2004
2005
2006
2007
2008
2009
Source: IDC.
6
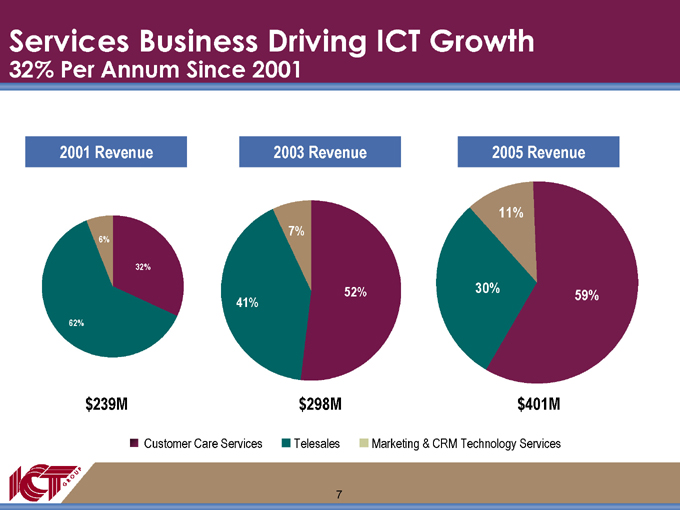
Services Business Driving ICT Growth
32% Per Annum Since 2001
2001 Revenue
6%
32%
62% $239M
2003 Revenue
7%
52%
41% $298M
2005 Revenue
11%
59%
30% $401M
Customer Care Services
Telesales
Marketing & CRM Technology Services
7
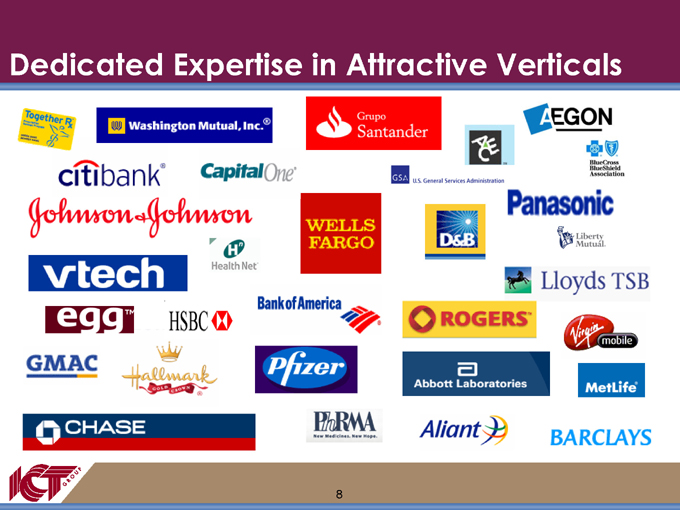
Dedicated Expertise in Attractive Verticals
8
Diversified Client Base
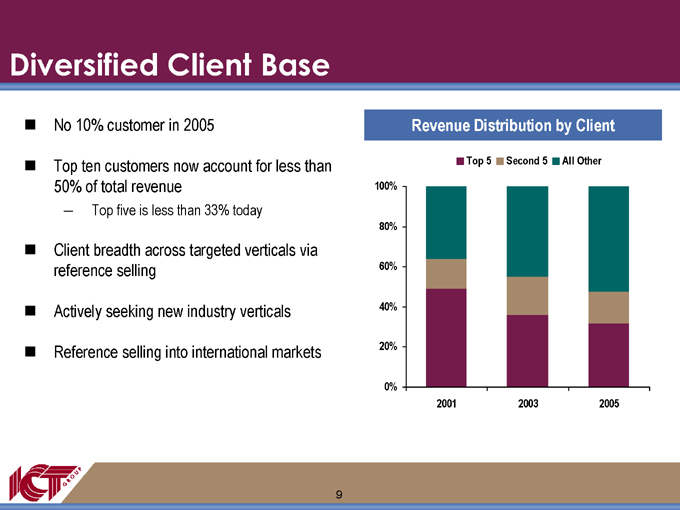
No 10% customer in 2005
Top ten customers now account for less than 50% of total revenue
Top five is less than 33% today
Client breadth across targeted verticals via reference selling
Actively seeking new industry verticals
Reference selling into international markets
Revenue Distribution by Client
Top 5
Second 5
All Other
100% 80% 60% 40% 20% 0%
2001
2003
2005
9
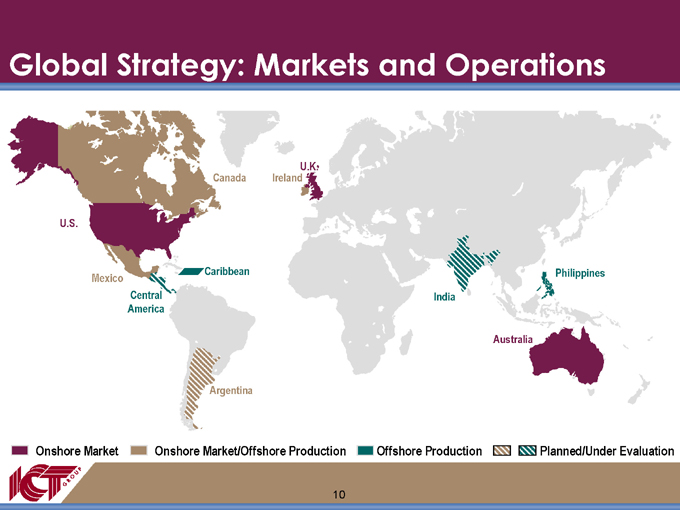
Global Strategy: Markets and Operations
U.S.
Mexico
Central America
Argentina
Caribbean
Canada
Ireland
U.K.
India
Australia
Philippines
Onshore Market
Onshore Market/Offshore Production
Offshore Production
Planned/Under Evaluation
10
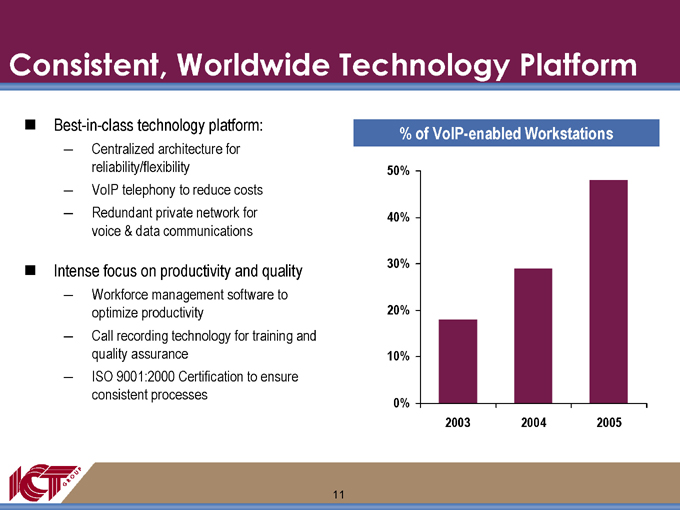
Consistent, Worldwide Technology Platform
Best-in-class technology platform:
Centralized architecture for reliability/flexibility
VoIP telephony to reduce costs
Redundant private network for voice & data communications
Intense focus on productivity and quality
Workforce management software to optimize productivity
Call recording technology for training and quality assurance
ISO 9001:2000 Certification to ensure consistent processes
% of VolP-enabled Workstations
50% 40% 30% 20% 10% 0%
2003
2004
2005
11
New Services Driving Incremental Growth
Cross-selling services in targeted verticals
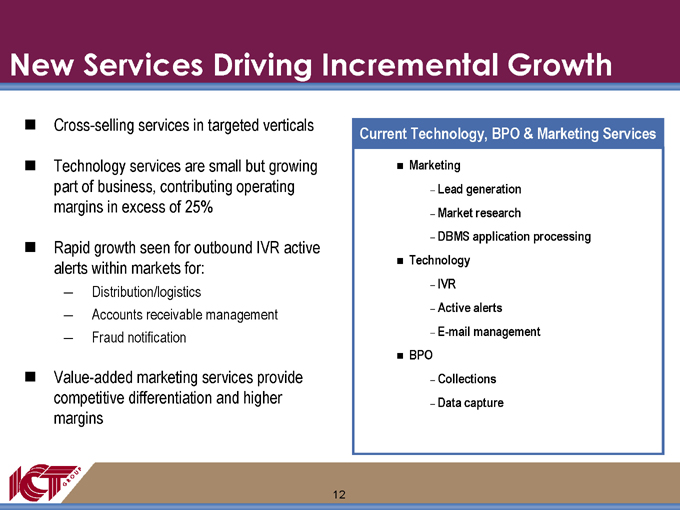
Technology services are small but growing part of business, contributing operating margins in excess of 25%
Rapid growth seen for outbound IVR active alerts within markets for:
Distribution/logistics
Accounts receivable management
Fraud notification
Value-added marketing services provide competitive differentiation and higher margins
Current Technology, BPO & Marketing Services
Marketing
Lead generation
Market research
DBMS application processing
Technology
IVR
Active alerts
E-mail management
BPO
Collections
Data capture
12
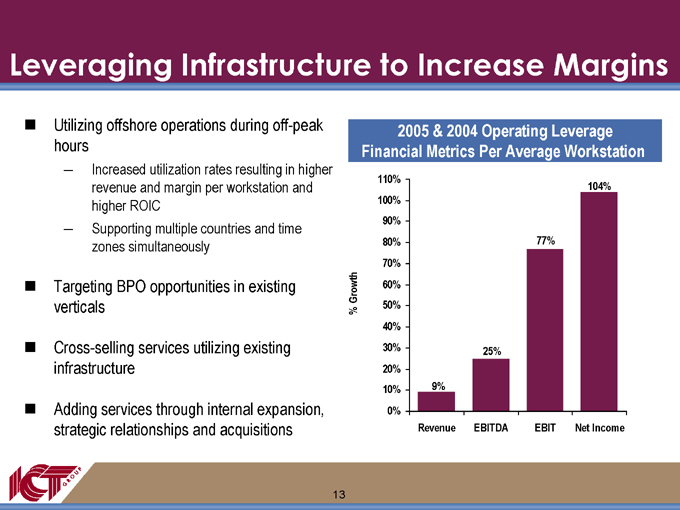
Leveraging Infrastructure to Increase Margins
Utilizing offshore operations during off-peak hours
Increased utilization rates resulting in higher revenue and margin per workstation and higher ROIC
Supporting multiple countries and time zones simultaneously
Targeting BPO opportunities in existing verticals
Cross-selling services utilizing existing infrastructure
Adding services through internal expansion, strategic relationships and acquisitions
2005 & 2004 Operating Leverage Financial Metrics Per Average Workstation
% Growth
110% 100% 90% 80% 70% 60% 50% 40% 30% 20% 10% 0%
9%
Revenue
25%
EBITDA
77%
EBIT
104%
Net Income
13

Strategic Acquisitions to Complement and Expand ICT’s Core CRM Business
Key: Current Services Potential Services
E-Mail Management IVR
Active Alerts Knowledge Base Quality Monitoring
CRM Technology Services
Technology Services
Marketing Services
Market Research DBMS
Lead Generation Data Analytics Voice Mining Business Intelligence
Tele-Sales
CRM
Customer Care
Collections Data Capture
Application Processing Claims Processing Mortgage Processing
BPO Services
14
Key Growth Drivers
Broadening base of higher margin, value-added services
Expanding number of targeted vertical markets
Opening new geographic markets for production and revenue growth
Accelerating growth through acquisitions and strategic alliances
15

Financial Overview
Attractive Financial Characteristics
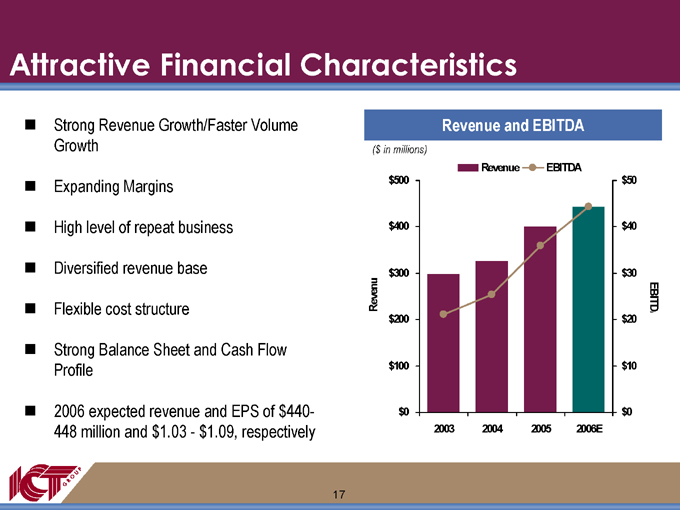
Strong Revenue Growth/Faster Volume Growth
Expanding Margins
High level of repeat business
Diversified revenue base
Flexible cost structure
Strong Balance Sheet and Cash Flow Profile
2006 expected revenue and EPS of $440-448 million and $1.03—$1.09, respectively
Revenue and EBITDA
($ in millions)
Revenue
EBITDA
Revenu $500 $400 $300 $200 $100 $0
2003
2004
2005
2006E
$50 $40 $30 $20 $10 $0
EBITD
17
Strong Growth Trends
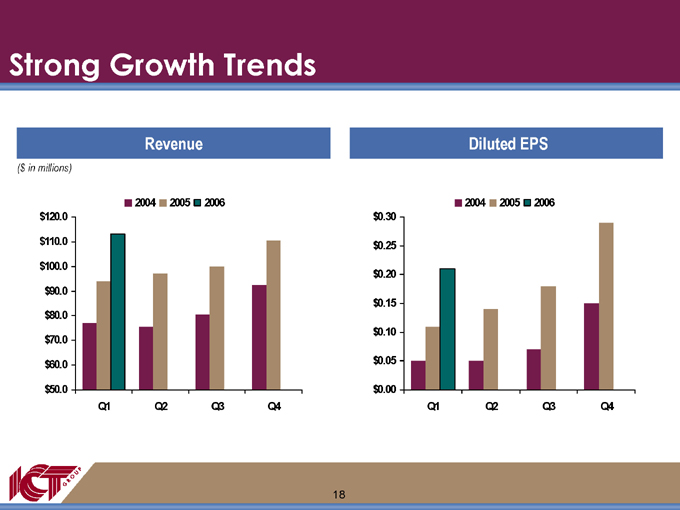
Revenue
($ in millions)
2004
2005
2006 $120.0 $110.0 $100.0 $90.0 $80.0 $70.0 $60.0 $50.0
Q1
Q2
Q3
Q4
Diluted EPS
2004
2005
2006 $0.30 $0.25 $0.20 $0.15 $0.10 $0.05 $0.00
Q1
Q2
Q3
Q4
18
Multiple Factors Driving Increased Margins
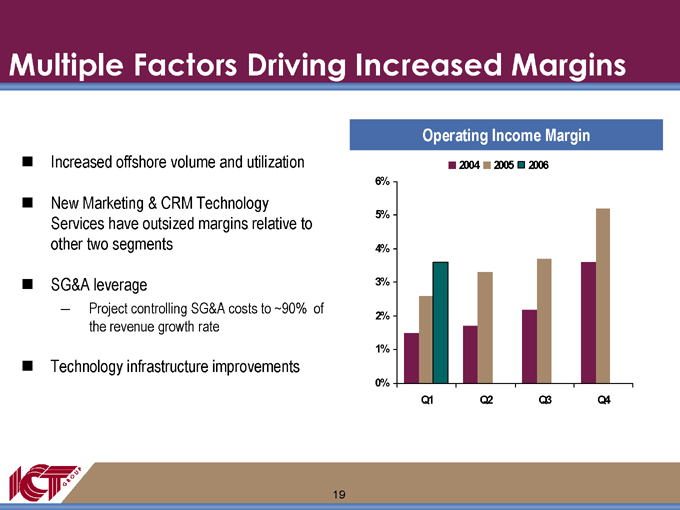
Increased offshore volume and utilization
New Marketing & CRM Technology Services have outsized margins relative to other two segments
SG&A leverage
Project controlling SG&A costs to ~90% of the revenue growth rate
Technology infrastructure improvements
Operating Income Margin
2004
2005
2006
6% 5% 4% 3% 2% 1% 0%
Q1
Q2
Q3
Q4
19
Improving Cash Flow
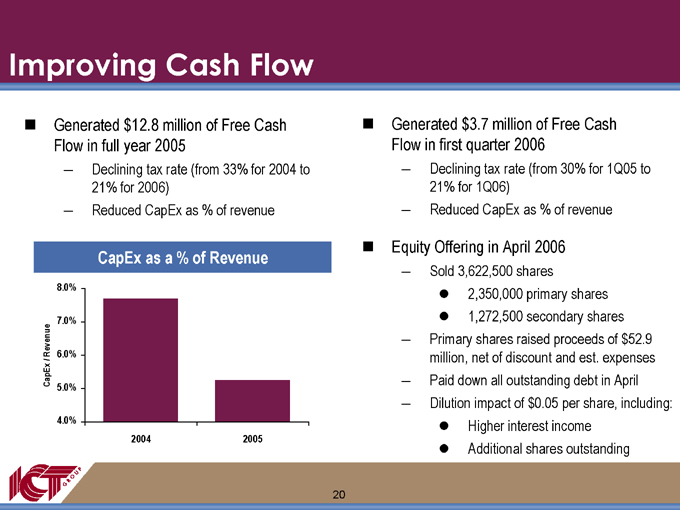
Generated $12.8 million of Free Cash Flow in full year 2005
Declining tax rate (from 33% for 2004 to 21% for 2006)
Reduced CapEx as % of revenue
CapEx as a % of Revenue
8.0%
7.0%
Revenue
6.0%
CapEx / 5.0% 4.0%
2004
2005
Generated $3.7 million of Free Cash Flow in first quarter 2006
Declining tax rate (from 30% for 1Q05 to 21% for 1Q06)
Reduced CapEx as % of revenue
Equity Offering in April 2006
Sold 3,622,500 shares
2,350,000 primary shares
1,272,500 secondary shares
Primary shares raised proceeds of $52.9 million, net of discount and est. expenses
Paid down all outstanding debt in April
Dilution impact of $0.05 per share, including:
Higher interest income
Additional shares outstanding
20
Positive Outlook for ICT Group
Solid top-line growth and improved profitability with three year internal targets of:
Revenue up 40-50% by 2008 (from 2005 level)
Operating margins to double by 2008 (from 2005 level)
Strong pipeline of new business opportunities
Expanding near-shore and offshore operations
Broader Marketing & CRM Technology services and BPO service offering platform
Strong financial position to invest in future internal growth and pursue strategic acquisitions to accelerate revenue, margin and earnings growth
21

Robert W. Baird & Co.’s 2006 Growth Stock Conference
ICT Group, Inc.
May 9, 2006 NASDAQ: ICTG