Table of Contents
UNITED STATES
SECURITIES AND EXCHANGE COMMISSION
Washington, D.C. 20549
FORM 10-K
(Mark One)
| x | Annual report pursuant to section 13 or 15(d) of the Securities Exchange Act of 1934 |
For the fiscal year ended December 31, 2006
or
| ¨ | Transition report pursuant to section 13 or 15(d) of the Securities Exchange Act of 1934 |
Commission File Number 0-20807
ICT GROUP, INC.
(Exact name of registrant as specified in its charter.)
| Pennsylvania | 23-2458937 | |
(State or Other Jurisdiction of Incorporation or Organization) | (I.R.S. Employer Identification No.) | |
100 Brandywine Boulevard Newtown, PA | 18940 | |
| (Address of Principal Executive Offices) | (Zip Code) | |
Registrant’s telephone number including area code: (267) 685-5000
Securities registered pursuant to Section 12(b) of the Act: NONE
Securities registered pursuant to Section 12(g) of the Act:
Common Stock, par value $.01
(Title of Class)
Indicate by check mark if the registrant is a well-known seasoned issuer, as defined in Rule 405 of the Securities Act. YES ¨ NO x
Indicate by check mark if the registrant is not required to file reports pursuant to Section 13 or Section 15(d) of the Act. YES ¨ NO x
Indicate by check mark whether the registrant (1) has filed all reports required to be filed by Section 13 or 15(d) of the Securities Exchange Act of 1934 during the preceding 12 months (or for such shorter period that the registrant was required to file such reports) and (2) has been subject to such filing requirements for the past 90 days. YES x NO ¨
Indicate by check mark if disclosure of delinquent filers pursuant to Item 405 of Regulation S-K is not contained herein, and will not be contained, to the best of registrant’s knowledge, in definitive proxy or information statements incorporated by reference in Part III of this Form 10-K or any amendment to this Form 10-K. ¨
Indicate by checkmark whether the registrant is a large accelerated filer, an accelerated filer, or a non-accelerated filer (as defined in Exchange Act Rule 12b-2).
Large Accelerated Filer ¨ Accelerated Filer x Non-accelerated Filer ¨
Indicate by checkmark whether the registrant is a shell company (as defined in Rule 12b-2 of the Act). YES ¨ NO x
The aggregate market value of the voting stock held by non-affiliates of the registrant as of June 30, 2006, was approximately $196,100,000. Such aggregate market value was computed by reference to the closing sale price of the Common Stock as reported on the National Market of The Nasdaq Stock Market on June 30, 2006. For purposes of this calculation only, the registrant has defined affiliates as consisting solely of all directors, executive officers and beneficial owners of more than ten percent of the common stock of the Company. In making such calculation, registrant is not making a determination of the affiliate or non-affiliate status of any holders of shares of Common Stock. The number of shares of the registrant’s Common Stock outstanding as of March 6, 2007, was 15,759,729.
DOCUMENTS INCORPORATED BY REFERENCE
Portions of the registrant’s definitive Proxy Statement relating to its 2007 Annual Meeting of Shareholders, to be filed no later than April 30, 2007, are incorporated by reference in Part III hereof.
Unless the context indicates otherwise, “ICT Group,” “ICT,” the “Company,” “we,” “our,” and “us” refer to ICT Group, Inc., and where appropriate, one or more of its subsidiaries.
Table of Contents
FORM 10-K ANNUAL REPORT
For Fiscal Year Ended December 31, 2006
TABLE OF CONTENTS
Table of Contents
This document contains certain forward-looking statements that are subject to risks and uncertainties. Forward-looking statements include statements relating to the appropriateness of our reserves for contingencies, the realizability of our deferred tax assets, our belief regarding our critical accounting policies, our ability to finance our operations and capital requirements into 2008, our expectation regarding work opportunity tax credits, our share-based awards, our ability to finance our long-term commitments, certain information relating to outsourcing trends as well as other trends in the outsourced business services industry and the overall domestic economy, our business strategy including the markets in which we operate, the services we provide, our ability to attract new clients and customers, our expectation to grow through both internal expansion and selective acquisition, the benefits of certain technologies we have acquired or plan to acquire and the investment we plan to make in technology, our plans regarding international expansion, the implementation of quality standards, the seasonality of our business, the adequacy of our current facilities and the availability of additional or alternative space, our dividend policy, variations in operating results and liquidity, as well as information contained elsewhere in this document where statements are preceded by, followed by or include the words “will,” “should,” “believes,” “plans,” “intends,” “expects,” “anticipates” or similar expressions. For such statements, we claim the protection of the safe harbor for forward-looking statements contained in the Private Securities Litigation Reform Act of 1995. The forward-looking statements in this document are subject to risks and uncertainties that could cause the assumptions underlying such forward-looking statements and the actual results to differ materially from those expressed in or implied by the statements. All forward-looking statements included in this report are based on information available to us as of the date of this report, and we assume no obligation to update these cautionary statements or any forward-looking statements.
| ITEM 1. | BUSINESS |
We are a leading global provider of outsourced customer management and business process outsourcing solutions. Our comprehensive, balanced mix of sales, service, marketing and technology solutions includes: customer care/retention, technical support and customer acquisition, cross-selling/upselling as well as market research, database marketing, data capture/collection, e-mail management, collections and other back-office business processing services.
We also offer a comprehensive suite of Customer Relationship Management (CRM) technologies, which are available on a hosted basis for use by clients at their own in-house facilities, or on a co-sourced basis in conjunction with our fully integrated, Web-enabled contact centers. These technologies include: automatic call distribution (ACD) voice processing, interactive voice response (IVR) and advanced speech recognition (ASR), Voice over Internet Protocol (VoIP), contact management, automated e-mail management and processing, sales force and marketing automation, alert notification and Web self-help, for the delivery of consistent, quality customer care across multiple channels.
Industry Overview
Outsourced business services have evolved significantly in recent years. Competitive pressures, advancements in technology and an accelerating trend toward outsourcing have resulted in the demand for more complex, interactive and highly customized customer management solutions, using a combination of home-shore, near-shore and offshore facilities. Outsourced service providers are now expected to serve more as a business “partner,” offering their clients value-added strategies rather than traditional commodity-based customer interaction and sales and service support applications.
Our Approach
We have distinguished ourselves in the industry with our balanced growth strategy, industry expertise, customer-oriented focus, comprehensive portfolio of services, substantial resources across global operations and technology infrastructure capable of supporting future expansion. We continue to expand our worldwide network
1
Table of Contents
of state-of-the-art operations centers in order to deliver globally integrated customer care, end-to-end telesales and marketing and CRM technology services to meet the specific needs of our clients.
With over 20 years of expertise in outsourced customer management services, ICT Group is well positioned for continued growth in a large and growing market. By leveraging our experienced Management team, proven business model, global infrastructure, operating and technology investments and expertise in target industries, Management intends to advance our position as a leading global supplier of integrated customer management and related business process outsourcing solutions by:
Focusing on Targeted Vertical Markets. We have historically targeted specific markets based on our vertical expertise and recognition of important industry-specific trends. Our Management believes that these vertical markets have both improving demand characteristics and increased outsourcing needs, which offer strong growth opportunities. Currently, we are focused on exploiting new business opportunities in the financial services and insurance, telecommunications, technology, energy services, business and consumer products and services and government markets. We will also use strategic relationships to develop new business in these targeted verticals as well as explore and develop new vertical markets.
Broadening our Services Platform. Large multinational companies are looking for a broader complement of services from their external service providers. We will focus on expanding our higher-margin, value-added services to fulfill these broader client needs, helping to differentiate ICT Group from our competitors. We continue to increase revenue from our IVR services for both inbound response and outbound alert applications. We also provide back-office data capture, document imaging, mail processing, receivables management, time-sensitive transaction printing and fulfillment services. We plan to grow these services and to develop or acquire new services to expand opportunities with both existing and prospective clients.
Maintaining Technology Leadership. We intend to continue making substantial investments in technology to maintain our information technology (IT) competitive advantage. We have been an industry leader in the implementation of innovative contact center and CRM technologies, including VoIP technology. This has resulted in improved operating efficiencies and cost savings for our clients. We have centralized our contact center technologies in North America into three major hubs, which allows us to provide additional security and redundancy, regardless of where clients’ programs are operated. We will continue this focus on leading-edge technology, helping to further streamline clients’ operations and yielding improved operating margins and performance.
Increasing International Presence. With operations in the U.S., Canada, Europe, Australia, Mexico, Barbados, Costa Rica, Argentina, India and the Philippines, we offer our clients increased flexibility and geographically diverse locations. In 2006, we expanded existing near-shore and offshore operations in Mexico and the Philippines, opened new facilities in Costa Rica and India, and acquired Proyectar Connect S.A., an Argentina-based customer management services company with an established, expanding client base and strong presence in the Argentine market. A major component of our continued revenue growth and profitability strategy is to accelerate the shift of call volume production to lower-cost, higher-margin offshore locations.
At the same time, we plan to strengthen and build our position in international markets, including Latin and South America, Europe and Asia-Pacific. In Argentina, we plan to begin providing offshore English and Spanish support for the U.S. market and potentially multi-lingual support for the European market. In Europe and Australia, we are focused on expanding our customer care services business opportunities as well as leveraging our strong financial services vertical position, to deliver cost-effective offshore voice and back-office BPO support services from VoIP-connected facilities in Canada, India, the Philippines and Barbados.
Continuing Commitment to Quality Service. We have consistently emphasized quality service and extensive employee training by investing in quality assurance personnel and procedures. We intend to continue our commitment to providing quality service as well as our quality-focused service process engineering and continuous process development initiatives, as demonstrated by our certification with ISO 9001:2000 standards.
2
Table of Contents
Developing Strategic Alliances and Acquisitions. We intend to explore strategic alliances with, and select acquisitions of, domestic and international businesses that provide complementary outsourced services. This will enable us to enter new vertical and geographic markets and provide a broader mix of services to our clients as well as to broaden our geographic reach in a timely, cost-efficient manner.
Our Services
Our services are provided through contact centers located across the globe and include customer care/retention, technical support and customer acquisition, cross-selling/upselling as well as market research, database marketing, data capture/collection, e-mail management, accounts receivable and other back-office business processing services and CRM technology hosting on behalf of customers operating in our target industries. Recent technological advancements have allowed us to better manage production output at each operations center by routing customer interactions to different centers depending on required skills and capacity. The technology assets may be located at a different physical location or country than the contact center. Accordingly, many of our contact centers are not limited to performing only one of the above-mentioned services. Rather, they can perform a variety of different services for a number of different customers/programs.
We offer the following services to our clients:
Customer Care Services. We provide outsourced customer care support services across a broad range of industries. Depending on client needs, we will assume sole or shared responsibility for the management of a client’s customer care operation—at the client’s facility or at one of our contact centers. As of December 31, 2006, we operated contact centers in the U.S., Canada, England, Ireland, Australia, Argentina, Costa Rica and the Philippines, which provided customer care services for our clients. Certain contact centers in the U.S., Mexico and Costa Rica provide bilingual English and Spanish services. Certain contact centers in Canada provide bilingual English and French services. Our contact centers in Ireland provide pan-European, multilingual services supporting the European marketplace.
We provide Tier I and Tier II technical support services for IT, telecommunications and consumer electronics companies, supporting both business- and consumer-based customers. As of December 31, 2006, we operated contact centers in the U.S., Canada and the Philippines, which provided technical support services for our clients.
Telesales. Our telesales business operation provides inbound and outbound telesales support activities primarily for clients in the financial services, insurance and telecommunications industries. As of December 31, 2006, this business is supported by contact centers located throughout the U.S., Canada, Ireland, England, Australia, Argentina, Costa Rica, Mexico, Barbados and the Philippines. Certain contact centers in the U.S. provide bilingual English and Spanish telesales. Certain contact centers in Canada provide bilingual English and French telesales. Our contact centers in Ireland provide pan-European, multilingual telesales supporting the European marketplace.
Marketing, Technology and BPO Solutions. We also support businesses across a range of industries with marketing research, data collection, database marketing services, data entry, scanning, and accounts receivable management and provide a comprehensive suite of CRM technologies, including IVR and advanced speech recognition, ACD voice processing, e-mail management and processing, alert notification and other contact management technologies. As of December 31, 2006, this organization supported our clients from operations centers located in the U.S., Canada, India and the Philippines. Our CRM technologies are available on a hosted basis for use by clients at their own in-house facilities, or on a co-sourced basis in conjunction with our fully integrated state-of-the-art customer contact centers.
Additional financial information regarding our segment and geographic areas is presented in Note 16 to our consolidated financial statements included in this Annual Report on Form 10-K.
3
Table of Contents
Target Industries
Our domestic salesforce is organized by specific vertical industries, which enables our sales personnel to develop in-depth industry and product knowledge. Several of the industries that we serve are undergoing deregulation and consolidation, which provides us with additional opportunities as businesses search for cost-effective solutions for their customer care, telesales, marketing and CRM technology-related customer support needs. Selected industries we target include:
Financial Services and Insurance
We provide retail banks, mortgage companies, credit rating agencies, insurance carriers and other financial services organizations with a wide range of services, including card holder acquisition, active account generation, account balance transfer, account retention, insurance telesales and customer service. Our Financial Marketing Services operation offers banking services, such as marketing and servicing home equity loans, lines of credit, loan-by-phone, checking and deposit account acquisition, mortgage loans and other traditional banking products.
Telecommunications
We provide customer service and telesales support for major telecommunications companies, including long distance, cellular and cable.
Healthcare Services
Through our Healthcare Services business organization, we support pharmaceutical and medical device manufacturers, health insurance companies and other healthcare-related suppliers, for a variety of sales and customer care applications. For example, we provide patient assistance for prescription savings programs, technical/product support for medical device manufacturers and member enrollment services for healthcare insurance companies.
Technology and Consumer Electronics Products and Services
We provide customer service and telesales support for clients in the computer technology and consumer electronics industries. These applications include, but are not limited to: customer service, first-level customer technical support, customer care/retention, lead generation and direct sales.
Technology
We invest heavily in systems and software technologies designed to improve our operations productivity, thereby lowering the effective cost per contact made or received, and to improve sales and customer service effectiveness by providing our sales and service representatives with real-time access to customer and product information. We believe we were one of the first fully automated teleservices companies and among the first to implement predictive dialing technology for outbound telemarketing and market research, to provide collaborative Web browsing services and to provide VoIP capabilities.
Through a global implementation of VoIP, we have obtained a redundant voice and data network infrastructure (based on VoIP technology) from our telecommunications vendors that can seamlessly route inbound and outbound voice traffic to our contact centers worldwide. As an example, our percentage of VoIP-enabled workstations has increased from approximately 20% in 2003 to 56% in 2006. VoIP technology has also enabled us to reduce our operating costs.
We utilize a scalable set of UNIX and Windows processors to support our outbound and inbound contact center operations. Dedicated UNIX and Windows processors are used for inbound contact centers, while
4
Table of Contents
predictive dialing systems, networked to UNIX and Windows processors at our corporate data centers, are used for outbound contact centers. The predictive dialing systems support call and data management. The UNIX and Windows processors provide centralized list management, data consolidation, report generation and also interface with client order processing systems.
We use software to prepare outbound and inbound scripts, manage, update and reference client data files, collect statistical transaction and performance data and assist in the preparation of internal and external reports. This software includes our proprietary list management system (LMS) as well as Siebel Systems Contact Management system. Our use of the Siebel Systems software as well as Oracle’s database management system provides a scalable and robust suite of applications to support our clients’ business needs. We also use a proprietary IVR system that runs on industry standard operating systems and interfaces with our telephony system through Intel’s Dialogic interface cards. This IVR system provides an automated method to handle voice calls and interfaces with Nuance, an industry-leading speech recognition system.
Quality Assurance, Personnel and Training
We place heavy emphasis on the delivery of quality service on calls made or taken on behalf of our clients. This is accomplished through extensive employee training and development programs, augmented with highly developed quality assurance personnel and solid business practices. Our quality assurance and training departments are responsible for the development, implementation and enforcement of policies and procedures used in operating the contact centers. The selection and training of telephone service representatives, training and professional development of operations center management personnel, monitoring of calls and verification and editing of all sales are performed through our Quality Assurance and Training organizations. Through our Quality Assurance department, our internal staff as well as the staff of our clients are able to perform real time on-site and remote call monitoring to maintain quality and efficiency. Sales confirmations are recorded, with the customer’s consent, in order to verify the accuracy and authenticity of transactions. Additionally, we are able to provide our clients with immediate updates on the progress of an ongoing program. Access to this data allows our operations Management and our clients to identify potential campaign shortfalls and to immediately modify or enhance the program. Digital recording technology has been deployed to all of our contact centers and allows the consolidation of all verification activities into geographically centralized locations and effectively creates a “third-party” verification center. Verification results are available to our operations Management and our client services Management by the end of each calling day. Also, each center can access the recordings for review with supervisory staff or the service representative.
Our commitment to providing quality service is further illustrated by our certification with ISO 9001:2000 standards, which are administered by the International Organization for Standardization and represent an international consensus on the essential features of a quality system to ensure the effective operation of a business. All domestic and international sales and service centers are ISO 9001:2000 compliant. Our ISO 9001:2000 certification is at the core of our Quality Management System, and is the key driver to our process- driven, continuous improvement orientation.
Employees
Management believes that a key driver of our success is the quality of our employees. We tailor our recruiting and training techniques toward the industries we serve. As part of the setup of each client program, service representatives receive a detailed review of each program in which they are to participate along with training regarding the background, structure and philosophy of the client that is sponsoring the program. As is typical in our business, most of our service representatives are part-time or temporary employees. As of December 31, 2006, we employed 20,019 people, of which 19,108 were part-time or temporary employees. Except for our employee base in Argentina, none of our employees are currently represented by a labor union. We consider our relations with our employees to be good.
5
Table of Contents
Clients
We target those companies that we believe have the greatest potential to generate recurring revenue to the Company based on their ongoing direct sales and customer service needs. At December 31, 2006, we provided direct sales, market research and customer service to over 150 clients.
Our customer care clients typically enter into multi-year contractual relationships that may contain provisions for early contract terminations, while we generally operate under month-to-month contractual relationships with our telesales clients. The pricing component of a contract is often comprised of a base service charge and separate charges for ancillary services. Our services are generally based upon per-minute or hourly rates. On occasion, we perform services for which we are paid incentives based on completed sales.
For each of the years ended December 31, 2006 and 2005, there were no customers which comprised more than 10% of our revenue. For the year ended December 31, 2004, we had one customer, Virgin Mobile USA, LLC, which comprised 11% of our revenue. For the years ended December 31, 2006, 2005 and 2004, our top ten customers accounted for 48%, 48% and 50% of our total revenue, respectively.
Competition
The customer management and business process outsourcing services industry is very competitive and our principal competition in our primary markets comes from large service organizations, including, but not limited to: Convergys Corporation, SITEL Corporation, Sykes Enterprises, TeleTech Holdings, Inc., APAC Customer Services, Inc., West Corporation, PeopleSupport, Inc., and StarTek, Inc. We also compete with numerous independent firms, some of which are as large or larger than we are, as well as the in-house operations of many of our clients or potential clients. In addition, many businesses that are significant consumers of these services utilize more than one service firm at a time and may reallocate work among various firms from time to time. Some of this work is contracted on an individual project basis, with the result that we and other firms seeking such business are required to compete with each other frequently as individual projects are initiated. Furthermore, we believe there is a trend among some businesses toward outsourcing the management of their contact centers to large, multi-service competitors, some of which may be substantially larger with greater financial resources than us.
Quarterly Results and Seasonality
We have experienced, and expect to continue to experience, quarterly variations in operating results, principally as a result of the timing of programs conducted by new and existing clients (particularly programs with substantial amounts of upfront project setup costs), and selling, general and administrative expenses to support the growth and development of existing and new business units.
Our business tends to be strongest in the fourth quarter due to the high level of client sales and service activity for the holiday season, while the first quarter often reflects a slowdown relating to the cessation of that activity. Currently, 74% of our revenue is being generated from service programs, which generally have less seasonality than sales programs. Typically, we experience higher call volumes and improved financial results during the second half of our fiscal year as compared to the first half.
Government Regulation
Both the Federal and state governments regulate telemarketing sales practices in the U.S. The Federal Telephone Consumer Protection Act of 1991 (the TCPA), enforced by the Federal Communications Commission (the FCC), imposes restrictions on unsolicited telephone calls to residential telephone subscribers. Under the TCPA, it is unlawful to initiate telephone solicitation to residential telephone subscribers before 8:00 A.M. or after 9:00 P.M. local time at the subscriber’s location, or to use automated telephone dialing systems or artificial or pre-recorded voices to certain subscribers. Additionally, the TCPA requires telemarketing firms to develop a
6
Table of Contents
written policy implementing a “do-not-call” registry, and to train its telemarketing personnel to comply with these restrictions. The TCPA creates a right of action for both consumers and state attorneys general. A court may award actual damages or minimum statutory damages of $500 for certain violations, which may be trebled for willful or knowing violations. Currently, we train our service representatives to comply with the regulations of the TCPA and program our call management system to avoid initiating telephone calls during restricted hours or to individuals maintained on an applicable do-not-call list.
The Federal Trade Commission (the FTC) regulates both general sales practices and telemarketing specifically. Under the Federal Trade Commission Act (the FTC Act), the FTC has broad authority to prohibit a variety of advertising or marketing practices that may constitute “unfair or deceptive acts and practices.” Pursuant to its general enforcement powers, the FTC can obtain a variety of types of equitable relief, including injunctions, refunds, disgorgement, the posting of bonds and bars from continuing to do business, for a violation of the acts and regulations it enforces.
The FTC also administers the Federal Telemarketing and Consumer Fraud and Abuse Prevention Act of 1994 (the TCFAPA). Under the TCFAPA, the FTC adopted the Telemarketing Sales Rule (TSR), which prohibits deceptive, unfair or abusive practices in telemarketing sales. Generally, the TSR prohibits misrepresentations of the cost, quantity, terms, restrictions, performance or characteristics of products or services offered by telephone solicitation or of refund, cancellation or exchange policies. The TSR also regulates the use of prize promotions in telemarketing to prevent deception and requires that a telemarketer identify promptly and clearly the seller on whose behalf the telemarketer is calling, the purpose of the call, the nature of the goods or services offered and, if applicable, that no purchase or payment is necessary to win a prize. The TSR also requires that telemarketers maintain records on various aspects of their business. Analogous restrictions apply to industries regulated by the FCC.
The FTC amended the TSR with changes that became effective in March 2003. The changes to the TSR imposed new limits on the use of predictive dialers, the technology that automatically dials a certain number of telephone numbers and routes the connected calls to telephone sales representatives as they become available. Although this technology utilizes complex algorithms in an attempt to ensure that no consumers are contacted without available telephone sales representatives to handle the calls, this situation occasionally occurs, resulting in what is known as an “abandoned” call. The new regulations place limits on the permissible numbers of such abandoned calls, and requires that telemarketers play a recorded message to all consumers who receive such calls. These regulations also create new limitations on the use of credit card account numbers and other consumer information, and require telemarketers to transmit caller identification information to consumers. These regulations also require the transmission of a telephone number and when made available by the telemarketer’s carrier, the name of the telemarketer or seller.
Also in 2003, the Do-Not-Call Implementation Act (the DNC Act) was signed into law. In response to the requirements set forth by the DNC Act, the FCC amended its TCPA rules. The amended rules became effective on June 26, 2003. The amendments, which were similar to the changes made to the TSR, authorized the creation of a National Do-Not-Call registry, placed a limit on the number of calls abandoned by the predictive dialer and required the transmission of a telephone number to be shown by caller ID.
In response to these changes in the TSR and the TCPA, we appointed a Compliance Manager who is responsible for managing the Compliance Committee that ensures our compliance with the new regulations. The regulations associated with the National Do-Not-Call registry were enforced by the Federal government beginning October, 2003.
Most states have enacted statutes similar to the TCFAPA generally prohibiting unfair or deceptive acts and practices. Additionally, some states have enacted laws and others are considering enacting laws targeted directly at telemarketing practices. For example, telephone sales in certain states are not final until a written contract is delivered to and signed by the buyer, and such a contract often may be canceled within three business days. At
7
Table of Contents
least one state also prohibits telemarketers from requiring credit card payment, and several other states require certain telemarketers to obtain licenses, post bonds or submit sales scripts to the state’s attorney general. Under the more general statutes, depending on the willfulness and severity of the violation, penalties can include imprisonment, fines and a range of equitable remedies such as consumer redress or the posting of bonds before continuing in business. Many of the statutes directed specifically at telemarketing practices provide for a private right of action for the recovery of damages or provide for enforcement by state agencies permitting the recovery of significant civil or criminal penalties, costs and attorneys’ fees. We cannot be assured that any such laws, if enacted, will not adversely affect or limit our current or future operations.
In addition to the laws regulating telephone sales activities, there are federal and state laws governing consumer privacy, such as the Gramm-Leach-Bliley Act and the Health Insurance Portability and Accountability Act. In addition, the USA PATRIOT Act imposes some requirements that affect some of our clients in the financial services sector.
The various industries that we serve are also subject to government regulation. For example, our work on client programs involving the sale of insurance products implicates state licensing and regulatory requirements. In addition, our work on behalf of our pharmaceutical clients requires knowledge of Food and Drug Administration regulations regarding the reporting of adverse events.
In addition to Federal regulation, activity at the state and Federal level regarding laws that impact the teleservices industry has intensified over the past several years. States have enacted a variety of laws regulating marketing via telephone. Do-not-call lists, restricted hours or days, registration, request to continue solicitation and no rebuttal laws are common in many states. We have developed a system to facilitate compliance with all of these laws. Our Compliance Committee, comprised of members from our Quality Assurance, Operations, Client Services, Legal and IT departments, is responsible for compliance. Our participation on the Direct Marketing Association and the American Telemarketing Association Legislative Committees helps to enable our timely notification of proposed legislation.
Internationally, the various countries outside of the United States in which we have operations generally have less detailed regulatory frameworks for teleservices activities. Instead, many of these countries have laws and/or regulations regulating consumer privacy and the collection and use of consumer data. The most prominent of these is the European Union’s Data Privacy Directive.
In Canada, the Canadian Radio-Television and Telecommunications Commission enforces a variety of rules affecting the teleservices industry, including regulations on unsolicited communications via automatic dialing and announcing devices. On January 1, 2004, the Personal Information Protection and Electronic Documents Act (“PIPEDA”), a federal law regulating the collection and use of an individual’s personal information, became effective. PIPEDA requires, among other things, the establishment of a privacy policy and procedure and the appointment of a privacy officer. Our legal and compliance groups are currently monitoring provincial legislative activity in this area, as PIPEDA permits individual provinces to enact their own, more stringent privacy laws.
Investor Information
You can access financial and other information in the Investors section of our website. The website address is www.ictgroup.com. We make available through our website, free of charge, copies of our Annual Report on Form 10-K, quarterly reports on Form 10-Q, current reports on Form 8-K and amendments to those reports filed or furnished pursuant to Section 13(a) or 15(d) of the Securities Exchange Act of 1934 as soon as reasonably practicable after filing such material electronically or otherwise furnishing it to the Securities and Exchange Commission (the SEC). In addition, we make available through our website, free of charge, copies of our Code of Ethics for the Chief Executive Officer and Senior Financial Officers and our Code of Conduct. To the extent that there are any waivers of, or amendments to, either code, we intend to report the waiver or amendment in the Investors section of our website. These documents are also available in print form to any shareholder who
8
Table of Contents
requests them. Requests should be directed to the Legal Department of ICT Group, Inc., 100 Brandywine Boulevard, Newtown, PA 18940. The information on the website listed above is not and should not be considered part of this Annual Report on Form 10-K and is not incorporated by reference in this document. This website is only intended to be an inactive textual reference. You can also read and copy any materials we file with the SEC at the SEC’s Public Reference Room at 100 F Street N.E., Washington, D.C. 20459. You can contact the Public Reference Room at 1-800-SEC-0330. Because we file our documents electronically with the SEC, you can also access them at www.sec.gov.
We were incorporated in the Commonwealth of Pennsylvania in 1987. Our executive offices are located at 100 Brandywine Boulevard, Newtown, PA 18940. Our telephone number is (267) 685-5000.
| ITEM 1A. | RISK FACTORS |
An investment in our Company involves a substantial risk of loss. You should carefully consider the risks described below together with all of the other information included in this Annual Report on Form 10-K before making an investment decision. The risks and uncertainties described below are not the only ones facing us.
RISKS RELATING TO OUR BUSINESS
We may not be able to manage our growth effectively, which could adversely affect our results of operations.
We have experienced rapid growth over the past few years and currently expect to continue a high rate of growth. Rapid growth places a significant strain on our Management, operations and resources. Our future performance and profitability will depend on our ability to:
| • | build our infrastructure to meet the demands of our clients; |
| • | successfully recruit, train and retain qualified personnel in a cost-effective manner; |
| • | maintain state-of-the-art technology to compete effectively in the outsourced business services industry; |
| • | effectively oversee and manage our contact centers as we expand geographically, including internationally; |
| • | effectively manage the growth and implementation of our customer contact centers; |
| • | successfully introduce newer cost-effective near-shore, offshore and home-shore outsourced business service solutions; |
| • | select and serve new vertical markets; |
| • | successfully expand our service offerings from our core customer relationship management business to include enhanced technology, marketing and business process outsourcing services; |
| • | successfully integrate any acquired businesses; |
| • | manage our business in light of general economic conditions and conditions which may affect in particular our clients and other companies in the markets we serve; |
| • | manage our operating costs as we expand and grow our business, and |
| • | maximize the income tax benefits from the locations in which we operate under tax holidays. |
If we are unable to keep pace with technological changes, our business will be harmed.
Our business is highly dependent on our computer and telecommunications equipment and software capabilities. Our failure to maintain the competitiveness of our technological capabilities or to respond
9
Table of Contents
effectively to technological changes could have a material adverse effect on our business, results of operations or financial condition. Our continued growth and future profitability will be highly dependent on a number of factors, including our ability to:
| • | expand our existing solution offerings; |
| • | achieve cost efficiencies in our existing customer contact center operations; |
| • | introduce new solutions that leverage and respond to changing technological developments, and |
| • | keep current with technology advances. |
There can be no assurance that technologies or services developed by our competitors or vendors will not render our products or services non-competitive or obsolete, that we can successfully develop and market any new services or products, that any such new services or products will be commercially successful or that the integration of automated customer support capabilities will achieve intended cost reductions. In addition, the inability of equipment vendors and service providers to supply equipment and services on a timely basis could harm our operations and financial condition.
Our results of operations may be subject to significant fluctuations.
Our quarterly and annual operating results have fluctuated in the past and may vary in the future due to a wide variety of factors, including:
| • | the commencement and expiration or termination of contracts; |
| • | our revenue mix; |
| • | the amount and timing of new business; |
| • | the impact of litigation and associated costs; |
| • | the financial strength of our clients and the collectibility of our receivables; |
| • | our ability to successfully open new contact centers or to expand existing centers in a timely fashion; |
| • | the timing of additional selling, general and administrative expenses; |
| • | competitive conditions in our industry; |
| • | the impact of adverse weather conditions or natural disasters; |
| • | our sources of pre-tax income, which will impact our overall effective tax rate, and |
| • | changes in statutory income tax rates and tax laws and expiration of tax holidays in the jurisdictions in which we operate. |
Historically, our business has been strongest in the fourth quarter due to the high level of client sales activity during the fall holiday season. In the past, during the first quarter, our business has generally leveled off or slowed from the previous quarter as a result of reduced client sales activity and client transitions to new marketing programs during the first quarter of the calendar year. In addition, we have generally expanded our operations in the first and third quarters, without a commensurate increase in revenue in those quarters, to support anticipated business growth beginning in the second and fourth quarters, respectively. However, more recently, we have experienced quarterly fluctuations in our business as a result of other factors, such as the timing of demand for the particular services we offer in the specific geographical areas we service.
Due to these factors, our quarterly revenue, expenses and results of operations could vary significantly in the future. You should take these factors into account when evaluating past periods and, because of the potential variability in our quarterly results, you should not rely upon results of past periods as an indication of our future performance. In addition, because our operating results may vary significantly from quarter to quarter, results
10
Table of Contents
may not meet the expectations of securities analysts and investors, and this could cause the price of our common stock to fluctuate significantly.
Our contracts often are short-term or may be subject to early termination by our clients, which could cause our operating results to fluctuate.
We generally operate under month-to-month contractual relationships with our teleservices clients. The potentially brief duration of certain teleservices programs we implement for clients could cause our operating results to fluctuate. In addition, while our customer care management services unit generally enters into longer-term contractual relationships, those contracts often provide for early termination at the client’s discretion. Certain of those contracts require the client to pay a contractually agreed amount in the event of early termination, but others do not. We cannot assure you that we will be able to collect such amount or that such amount, if received, will sufficiently compensate us for our investment in the canceled program or for the revenue we may lose as a result of early termination.
We generate a significant portion of our revenue from a small number of major clients.
For the year ended December 31, 2006, our top ten clients accounted for 48% of our total revenue. The loss of one of these clients or the failure to maintain the current service levels for these customers could have a material adverse effect on our business, financial condition and results of operations. Many of our contracts are cancelable by the customer with limited notice, therefore these contracts do not necessarily ensure that we will generate a minimum level of revenue to cover our fixed operating costs.
Our business may be affected by the success of our clients’ products and services.
In most of our client programs, we generate revenue based, in large part, on the amount of time our customer service representatives devote to our clients’ customers. Consequently, the amount of revenue generated from any particular client program is dependent upon consumers’ interest in, and use of, the client’s products and/or services. There can be no assurance that our clients will continue to market products and services or develop new products and services that require them to use our services.
We depend on particular industries for a majority of our revenues.
We currently generate a majority of our revenue from clients in the financial services and insurance industries, healthcare industries and telecommunications and technology industries. Our growth and financial results are largely dependent on continued demand for our services from clients in these industries and current trends in these industries to outsource certain business services. If any of these industries experiences a downturn, our clients in these sectors may do less business with us, or they may elect to perform the services provided by us in-house. If there are any trends in any of these industries to reduce or eliminate the use of outsourced business services, our financial results could be negatively affected. Our revenue by industry is as follows:
| For the years ended December 31, | |||||||||
| 2006 | 2005 | 2004 | |||||||
Financial services and insurance | 49 | % | 51 | % | 52 | % | |||
Telecommunications and technology | 24 | % | 29 | % | 32 | % | |||
Healthcare | 20 | % | 13 | % | 10 | % | |||
Other | 7 | % | 7 | % | 6 | % | |||
We may be unable to cost-effectively hire or retain qualified personnel, which could materially increase our costs.
Our business is labor intensive and is characterized by high personnel turnover, particularly at new contact centers. Most of our employees receive modest hourly wages and work part time. A higher turnover rate among
11
Table of Contents
our employees would increase our recruiting and training costs and decrease operating efficiencies and productivity. Some of our operations require specially trained employees and growth in our business will require us to recruit and train qualified personnel at an accelerated rate from time to time. We may not be able to successfully hire, train and retain sufficient qualified personnel to adequately staff for existing business or future growth, particularly when we undertake new client relationships in industries in which we have not previously provided services. In addition, a significant portion of our costs consists of wages paid to hourly workers. An increase in hourly wages, costs of employee benefits or employment taxes could materially adversely affect us.
Our profitability will be adversely affected if we do not maintain sufficient capacity utilization.
Our profitability is influenced significantly by how we utilize our workstation capacity. We attempt to maximize utilization during all periods. However, because much of our business is inbound, we typically experience significantly higher utilization during peak (weekday) periods than during off-peak (night and weekend) periods. In addition, we have experienced, and in the future may experience, at least in the short-term, idle peak period capacity when we open a new customer interaction center or terminate or complete a large client program. From time to time we assess the expected long-term capacity utilization of our centers. Accordingly, we may, if deemed necessary, consolidate or shut down under performing centers in order to maintain or improve targeted utilization and margins. There can be no assurance that we will be able to achieve or maintain optimal customer interaction center capacity utilization.
Interruptions or failures of our technology infrastructure could harm our business and reputation.
We are highly dependent on the stability of our computer and communications equipment, systems and software, and our telecommunications carrier networks. These systems could be interrupted by natural disasters, power losses, operating malfunctions or computer viruses and other disruptions caused by unauthorized or illegal access to our systems. If an interruption occurs, the contracts we have with our clients may provide for damages and for termination or re-negotiation. Our property damage insurance may not adequately compensate us for any losses we may incur. Although we have put in place a disaster recovery program, any interruption in or failure of our technology equipment systems could have a material adverse effect on our business. During the fourth quarter of 2006, we did experience a short-term interruption in our technology infrastructure in the Philippines due to an underwater earthquake that occurred in the Pacific Rim.
A significant interruption in telephone service could harm our business.
Any significant interruption in telephone service or developments that limit the ability of telephone companies to provide us with increased capacity in the future and could harm our existing operations and prospects for future growth.
Future acquisitions will involve risks.
While we historically have grown our business primarily through internal expansion, we established our presence in Argentina through the acquisition of Proyectar Connect S.A. in November 2006, and we expect to continue our growth through both internal expansion and selective acquisitions of companies that would augment our service offerings, facilitate our entry into new sectors and/or geographic markets and otherwise expand our business. We will not be able to acquire other businesses if we cannot identify suitable acquisition opportunities, reach mutually agreeable terms with acquisition candidates or obtain additional financing, if amounts in excess of the availability under our existing credit facility are necessary, to pay for any acquisitions that we undertake. The negotiation of potential acquisitions as well as the integration of acquired businesses could require us to incur significant costs and cause diversion of our Management’s time and resources. Future acquisitions could result in:
| • | dilutive issuances of equity securities; |
| • | a decline in our operating results; |
12
Table of Contents
| • | incurrence of debt and contingent liabilities; |
| • | recording of goodwill and other intangibles that could become impaired, and |
| • | other acquisition-related expenses. |
Some or all of these items could have a material adverse effect on our business. Any businesses we acquire may not generate sales and profitability sufficient to justify our investment. If we fail to successfully integrate an acquired business, we may not be able to realize the synergies we anticipated in valuing that business. In addition, to the extent that consolidation becomes more prevalent in our industry, the prices for suitable acquisition candidates may increase to unacceptable levels and thus limit our ability to grow through acquisitions.
Our international operations are susceptible to business and political risks and changes in foreign currency exchange rates that could adversely affect our results of operations.
We operate our business in various countries outside the United States, including Canada, Ireland, the United Kingdom, Australia, Mexico, Barbados, India, Argentina, Costa Rica and the Philippines. As of December 31, 2006, over 60% of our employees were located outside the United States and they generated a significant amount of our revenue. North American companies, in particular, have created a demand for offshore outsourcing capacity. As a result, we expect to continue expansion through start-up operations and acquisitions in additional countries. Expansion of our existing international operations and entry into additional countries will require Management attention and financial resources. In addition, there are certain risks inherent in conducting business internationally including: the imposition of trade barriers, foreign exchange restrictions, longer payment cycles, greater difficulties in accounts receivables collection, difficulties in complying with a variety of foreign laws, changes in legal or regulatory requirements, difficulties in staffing and managing foreign operations, political instability and potentially adverse tax consequences. To the extent we experience these risks, our business and results of operations could be adversely affected.
We conduct our business in various foreign currencies and are exposed to market risk from changes in foreign currency exchange rates and interest rates, which could impact our results of operations and financial condition. While we do attempt to mitigate some of this risk through hedging arrangements, we may not be successful to the extent that these arrangements are ineffective or not fully effective. We also are subject to certain exposures arising from the translation and consolidation of the financial results of our foreign subsidiaries. A significant change in the value of the dollar against the currency of one or more countries in which we operate may have a material adverse effect on our results of operations.
Future litigation may result in significant costs for defense purposes or for settlement purposes, both of which may not be covered by our current insurance programs. Litigation may also take away Management focus from the business and could significantly impact our financial results.
We disclose that our business, not unlike other businesses, may face litigation from time to time. In 2005, we settled a large class action lawsuit for alleged wage rate violations for $14.75 million, which was only partially covered by insurance coverage. Although this specific litigation was resolved, we cannot predict whether any other material suits, claims, or investigations may arise in the future for similar claims. Irrespective of the outcome of any potential lawsuits or potential actions, claims, or investigations relating to the same or any other subject matter, we may incur substantial defense costs and possibly settlement costs, which may not be covered in their entirety by insurance. Litigation may also take away Management focus from the business, which, in addition to the costs that we may incur, could result in harm to our business, financial condition, results of operations and cash flows.
Our business could be significantly disrupted if we lose members of our Management team.
We believe that our success depends to a significant degree upon the continued contributions of our executive officers and other key personnel, both individually and as a group. Our future performance will be
13
Table of Contents
substantially dependent on our ability to retain them. The loss of the services of any of our executive officers, particularly John J. Brennan, our Chief Executive Officer, could prevent us from executing our business strategy.
We may not be able to effectively win business against our competition.
The industries in which we compete is highly competitive. We compete with:
| • | the in-house business services operations of our clients or potential clients; |
| • | other outsourced business service providers, some of which have greater resources than we have, and |
| • | providers of other marketing and CRM formats and, in particular, other forms of direct marketing such as interactive shopping and data collection through television, the Internet and other media. |
Many businesses that are significant consumers of CRM solutions use more than one CRM solutions firm at a time and reallocate work among various firms from time to time. We and other firms seeking to perform outsourced CRM solutions are frequently required to compete with each other as individual programs are initiated. We cannot be certain that we will be able to compete effectively against our current competitors or that additional competitors, some of which may have greater resources than we have, will not enter the industry and compete effectively against us. As competition in the industry increases, we may face increasing pressure on the prices for our services.
If the trend toward outsourcing or the growth in the industries we serve decreases, our growth may suffer.
Our growth depends in part on continued demand for our services prompted by the outsourcing trend, as well as continued growth in the industries we serve. If interest in outsourcing wanes because of economic, political, or other conditions, or if there is a significant downturn in the industries in which we operate, our business and our growth could suffer.
Consumer resistance to our services could harm our industry.
As the outsourced business services industry continues to grow, the effectiveness of CRM solutions as a direct marketing tool may decrease as a result of consumer saturation and increased consumer resistance to customer acquisition activities, particularly direct sales.
Government regulation of our industry and the industries we serve may increase our costs and restrict the operation and growth of our business.
Both the United States Federal and various state governments regulate our business and the outsourced business services industry as a whole. The Federal Telemarketing and Consumer Fraud and Abuse Prevention Act of 1994 broadly authorizes the FTC to issue regulations restricting certain telemarketing practices and prohibiting misrepresentations in telephone sales. The FTC regulations implementing the TCFAPA are commonly referred to as the Telemarketing Sales Rule. Our operations outside the United States are also subject to regulation. Please refer to Part I, Item 1: “Government Regulation” of this Form 10-K for more detailed information. In addition to current laws, rules and regulations that regulate our business, bills are frequently introduced in Congress to regulate the use of credit information. We cannot predict whether additional Federal or state legislation will be enacted that regulates our business. Additional Federal or state legislation could limit our activities or increase our cost of doing business, which could cause our operating results to suffer.
Several of the industries we serve, particularly the financial services, insurance, healthcare, telecommunications and information technology industries, are subject to government regulation. We could be subject to a variety of regulatory enforcement or private actions for our failure or the failure of our clients to comply with these regulations. Our results of operations could be adversely impacted if the effect of government regulation of the industries we serve is to reduce the demand for our services or expose us to potential liability.
14
Table of Contents
We and our employees who sell insurance products are required to be licensed by various state insurance commissions for the particular type of insurance product sold and to participate in regular continuing education programs. Our participation in these insurance programs requires us to comply with certain state regulations, changes in which could materially increase our operating costs associated with complying with these regulations.
Security and privacy breaches of the systems we use to protect personal data could adversely affect our business, results of operations and financial condition.
Our databases contain personal data of our clients’ customers, including credit card and healthcare information. Any security or privacy breach of these databases could expose us to liability, increase our expenses relating to the resolution of these breaches and deter our clients from selecting our services. Our data security procedures may not effectively address evolving security risks or address the security and privacy concerns of existing or potential clients. Any failures in our security and privacy measures could adversely affect our business, financial condition and results of operations.
We may not be able to adequately protect our proprietary information or technology.
Third parties may infringe upon or misappropriate our trademarks, trade names, trade secrets or other intellectual property rights, which could adversely affect our business, results of operations and financial condition, and litigation may be necessary to enforce our intellectual property rights, protect our trade secrets or determine the validity and scope of the proprietary rights of others. The steps we have taken to deter misappropriation of our proprietary information and technology or client data may be insufficient to protect us, and we may be unable to prevent infringement of our intellectual property rights or misappropriation of our proprietary information. Any infringement or misappropriation could harm any competitive advantage we currently derive or may derive from our proprietary rights. In addition, because we operate in many foreign jurisdictions, we may not be able to protect our intellectual property in the foreign jurisdictions in which we operate.
Our technology and services may infringe upon the intellectual property rights of others.
Third parties may assert claims against us alleging that we are violating or infringing upon their intellectual property rights. Any claims and any resulting litigation could subject us to significant liability for damages. An adverse determination in any litigation of this type could require us to design around a third party’s patent, license alternative technology from another party or reduce or modify our product and service offerings. In addition, litigation is time-consuming and expensive to defend and could result in the diversion of our time and resources. Any claims from third parties may also result in limitations on our ability to use the intellectual property subject to these claims.
Terrorism and the possibility of further acts of violence or war may have a material adverse effect on our operations.
Terrorist attacks, such as those that occurred on September 11, 2001, the response by the United States and further acts of violence or war may affect the market on which our common stock trades, the markets in which we operate, our operations and profitability and your investment. Further terrorist attacks against the United States or other countries may occur. The potential near-term and long-term effect of these attacks on our business, the market for our common stock and the global economy is uncertain. The consequences of any terrorist attacks, or any armed conflicts that may result, are unpredictable, and we may not be able to foresee events that could have an adverse effect on our business or the trading price of our common stock.
15
Table of Contents
RISKS RELATING TO OUR COMMON STOCK
A Voting Trust controlled by our Chief Executive Officer and one of our directors controls 29% of our outstanding common stock.
A Voting Trust controlled by John J. Brennan, our Chief Executive Officer, and his brother Donald P. Brennan, one of our directors, controls approximately 29% of our outstanding common stock. John J. Brennan controls an additional 8% of our outstanding common stock through shares he personally owns and through voting agreements he has entered into with our employees. Eileen Brennan Oakley, daughter of Donald P. Brennan and Trustee of the 1996 and 1997 Brennan Family Trusts, controls nearly 8% of our outstanding common stock held by those Trusts. As a result, John J. Brennan, Donald P. Brennan and Eileen Brennan Oakley have substantial influence in determining the outcome of matters requiring shareholder approval.
Our stock price has been and may continue to be highly volatile.
From January 1, 2005, through February 28, 2007, the closing market price of our common stock fluctuated from a low of $8.40 to a high of $36.55. Because much of our common stock is owned by affiliates, the number of shares that is subject to daily trading on the market is limited. Therefore, the volatility of our stock price is exacerbated by relatively low trading volumes. The market price of our common stock may continue to be volatile and may be significantly affected by:
| • | actual or anticipated fluctuations in our operating results; |
| • | announcements of new services by us or our competitors; |
| • | developments with respect to conditions and trends in our industry or in the industries we serve; |
| • | governmental regulation; |
| • | general market conditions; |
| • | the loss of a significant client or a significant change in the volume of services we provide to a client; |
| • | levels of liquidity in our stock’s trading volumes, and |
| • | other factors, many of which are beyond our control. |
These factors may adversely affect the trading price of our common stock, regardless of our actual operating performance, and could prevent you from selling your common stock at or above the price at which you purchased it. In addition, the stock market has, recently and from time to time, experienced significant price and volume fluctuations that have adversely affected the market prices of securities of companies without regard to their operating performances.
Anti-takeover provisions in our articles of incorporation, bylaws and Pennsylvania law and the right of our board of directors to issue preferred stock without shareholder approval could make a third-party acquisition of ICT Group difficult.
Provisions of our articles of incorporation and bylaws may have an anti-takeover effect and may delay, defer or prevent a tender offer or takeover attempt not approved by our board of directors, including those made at a premium over the prevailing market price of our common stock.
Our board of directors, limitations on calling a special meeting of our shareholders and the authority of our board to issue preferred stock and establish certain rights, preferences, privileges, limitations and other special rights thereof without any further vote or action by our shareholders could have the effect of delaying, impeding or discouraging the acquisition of control of us in a transaction not approved by our board of directors.
In general, Subchapter F of Chapter 25 of the Pennsylvania Business Corporation Law delays for five years and imposes conditions upon “business combinations” between an “interested shareholder” and us, unless prior approval of our board of directors is given. The term “business combination” is defined broadly to include various merger, consolidation, division, exchange or sale transactions, including transactions using our assets for
16
Table of Contents
purchase price amortization or refinancing purposes. An “interested shareholder,” in general, would be a beneficial owner of shares entitling that person to cast at least 20% of the votes that all shareholders would be entitled to cast in an election of directors.
We do not currently intend to pay dividends. As a result, shareholders are likely to benefit from an investment in our common stock only if it appreciates in value.
We have never declared or paid any cash dividends on our common stock. Moreover, we currently intend to retain any future earnings to finance future growth and working capital needs and, therefore, do not anticipate paying any cash dividends in the foreseeable future. As a result, obtaining a return on an investment in our common stock will depend upon any future appreciation in its value. We cannot guarantee that our common stock will appreciate in value or even maintain the price at which shareholders have purchased their shares.
| ITEM 1B. | UNRESOLVED STAFF COMMENTS |
None.
| ITEM 2. | PROPERTIES |
As of December 31, 2006, our corporate headquarters was located in Newtown, Pennsylvania in leased facilities consisting of approximately 105,000 square feet of office space rented under a lease that expires in 2017. In addition to the corporate headquarters staff, certain other divisional and operations personnel are located in the facility. We also lease all of the facilities used in our operations. These lease commitments expire generally between March 2007 and April 2014 and typically contain renewal options. Management believes that its existing facilities are suitable and adequate for our current operations, but additional facilities will be required to support growth. Management believes that suitable additional or alternative space will be available as needed on commercially reasonable terms.
The following table lists our Company’s contact center locations as of December 31, 2006.
Locations |
Conway, AR; Morrilton, AR; Nogales, AZ (2); Colorado Springs, CO; |
| ITEM 3. | LEGAL PROCEEDINGS |
On April 28, 2006, a broker with whom we executed an agreement in June 2001 filed a Demand for Arbitration and Statement of Claim against us with the American Arbitration Association. The Demand alleged various contract, quasi-contract and tort claims against us arising out of commissions we allegedly owe this broker pursuant to the June 2001 agreement for work we perform for one of our customers. We filed an Answer to the Demand on June 14, 2006 denying the allegations. Since that time, the parties have engaged in discovery. On January 16, 2007, the broker filed an Amended Demand and an expert report estimating $1.1 million of commissions allegedly owed for work we already performed and estimating $5.6 million of future commissions
17
Table of Contents
for work he projects we might perform over the next seven years. We believe that we have paid this broker all amounts due under the June 2001 agreement, have denied the allegations of the Amended Demand, and intend to vigorously defend ourselves against the claims. On March 2, 2007, we filed a Motion for Partial Summary Judgment with the three person arbitration panel seeking judgment in our favor on the broker’s tort, unjust enrichment, punitive damages, interest and attorney’s fees claims, as well as on several of the broker’s contract claims, including the claim for future commissions. The arbitration hearing is currently scheduled for the end of May 2007. The June 2001 agreement states that the decision of a majority of the arbitration panel shall be final and binding on the parties. It is too early for us at this stage of the proceedings to determine the likelihood of an unfavorable outcome or to estimate the amount or range of possible loss.
In addition to the above matter, from time to time, we are involved in litigation incidental to our business. Litigation can be expensive and disruptive to normal business operations. Accruals for litigation claims are provided to the extent that any losses are determined to be probable and estimable. Although the ultimate outcome of these claims or lawsuits cannot be ascertained, it is our opinion, based on present information and advice received from counsel, that the disposition or ultimate determination of such claims or lawsuits is not likely to have a material adverse effect on our Company.
| ITEM 4. | SUBMISSION OF MATTERS TO A VOTE OF SECURITY HOLDERS |
None.
| ITEM 5. | MARKET FOR REGISTRANT’S COMMON EQUITY, RELATED STOCKHOLDER MATTERS AND ISSUER PURCHASES OF EQUITY SECURITIES |
| a) | Market Information: |
Our common stock trades on The Nasdaq Global Stock Market under the symbol “ICTG.” The following table sets forth, for the periods indicated, the high and low closing sales prices as quoted on The Nasdaq National Market.
| High | Low | |||||
Fiscal 2005: | ||||||
First Quarter | $ | 11.99 | $ | 8.40 | ||
Second Quarter | 11.30 | 8.65 | ||||
Third Quarter | 12.75 | 9.10 | ||||
Fourth Quarter | 17.43 | 11.31 | ||||
Fiscal 2006: | ||||||
First Quarter | $ | 27.76 | $ | 15.73 | ||
Second Quarter | 28.71 | 23.50 | ||||
Third Quarter | 32.07 | 21.98 | ||||
Fourth Quarter | 36.55 | 30.72 | ||||
| b) | Holders: |
As of March 6, 2007, there were 51 holders of record of the Company’s common stock, which excludes shareholders whose shares are held in nominee or “street” name by brokers. On March 6, 2007, the closing sale price of the common stock as reported by The Nasdaq Global Stock Market was $27.43.
| c) | Dividend Policy: |
We have never declared or paid any cash dividends on our capital stock. Management currently intends to retain its earnings to finance future growth and working capital needs and, therefore, does not anticipate paying any cash dividends in the foreseeable future. Additionally, our credit agreement limits the payment of dividends.
18
Table of Contents
| d) | Securities Authorized for Issuance under Equity Plans: |
The ICT Group, Inc. 2006 Equity Compensation Plan (the 2006 Plan), authorized up to 768,941 shares of common stock for issuance in connection with the granting to employees and consultants of incentive and non-qualified stock options, restricted stock, restricted stock units (RSU), stock appreciation rights and other awards based on our common stock. The awards are established by the Compensation Committee of our board of directors (the Compensation Committee). As of December 31, 2006, 672,046 shares of common stock were available for issuance under the 2006 Plan.
The ICT Group, Inc. 2006 Non-Employee Directors Plan (the 2006 Directors Plan) authorized up to 127,500 shares of common stock for issuances of non-qualified stock options and RSUs to non-employee directors. As of December 31, 2006, 115,000 shares of common stock were available for issuance under the 2006 Directors Plan.
| e) | Performance Graph: |
The graph below compares the cumulative total stockholder return on the Company’s common stock with the cumulative total return of two peer groups selected by the Company and of the Nasdaq Stock Market (U.S.) Index (the Nasdaq index). Two peer groups are presented in the graph, including the group presented in the prior year (Old Peer Group) and a new group (New Peer Group). The Old Peer Group consists of Aegis Communications Group, Inc., APAC Customer Services, Inc., West Corporation, SITEL Corporation, Convergys Corporation, Sykes Enterprises, and Teletech Holdings, Inc. During 2006, Aegis Communications Group, Inc., West Corporation and SITEL Corporation were acquired and ultimately ceased being publicly traded companies. The New Peer Group includes all the remaining members of the Old Peer Group along with PeopleSupport, Inc., and StarTek, Inc. The Company believes that the New Peer Group provides a better reference point for investors when evaluating the Company’s performance. The graph assumes that the value of the investment in the common stock of the Company, the stocks comprising the Nasdaq Index and the stocks comprising the Old Peer Group and the New Peer Group was $100 at January 1, 2002.
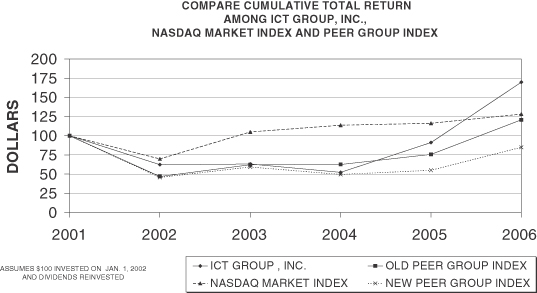
| Fiscal Year Ended | ||||||||||||||||||
| 1/1/2002 | 12/31/2002 | 12/31/2003 | 12/31/2004 | 12/31/2005 | 12/31/2006 | |||||||||||||
ICT Group, Inc. | $ | 100.00 | $ | 62.28 | $ | 63.08 | $ | 52.18 | $ | 91.08 | $ | 169.75 | ||||||
NASDAQ Market Index | 100.00 | 69.75 | 104.88 | 113.70 | 116.19 | 128.12 | ||||||||||||
Old Peer Group | 100.00 | 46.84 | 62.10 | 62.51 | 75.57 | 120.72 | ||||||||||||
New Peer Group | 100.00 | 45.66 | 59.25 | 49.47 | 54.95 | 84.94 | ||||||||||||
19
Table of Contents
| ITEM 6. | SELECTED FINANCIAL DATA |
The following selected financial data are derived from the consolidated financial statements of the Company. The data should be read in conjunction with “Management’s Discussion and Analysis of Financial Condition and Results of Operations” in Item 7 and the consolidated financial statements and related notes thereto included in Item 8 of this Form 10-K.
| For the Year Ended December 31, | ||||||||||||||||||
| 2006 | 2005 | 2004 | 2003 | 2002 | ||||||||||||||
| (In thousands, except per share amounts) | ||||||||||||||||||
Statement of Operations Data: | ||||||||||||||||||
Revenue | $ | 447,912 | $ | 401,334 | $ | 325,529 | $ | 298,142 | $ | 298,926 | ||||||||
Operating expenses: | ||||||||||||||||||
Cost of services | 273,618 | 244,572 | 194,365 | 179,679 | 172,109 | |||||||||||||
Selling, general and administrative | 155,435 | 141,601 | 123,559 | 115,273 | 111,529 | |||||||||||||
Litigation costs (recoveries) (1) | — | (3,611 | ) | 10,338 | 4,693 | 1,200 | ||||||||||||
Restructuring charge (reversal) | — | — | — | (686 | ) | 8,894 | ||||||||||||
| 429,053 | 382,562 | 328,262 | 298,959 | 293,732 | ||||||||||||||
Operating income (loss) | 18,859 | 18,772 | (2,733 | ) | (817 | ) | 5,194 | |||||||||||
Interest expense, net | 160 | 2,464 | 1,594 | 1,183 | 828 | |||||||||||||
Income (loss) before income taxes | 18,699 | 16,308 | (4,327 | ) | (2,000 | ) | 4,366 | |||||||||||
Income tax provision (benefit) | 1,888 | 4,133 | (1,634 | ) | (856 | ) | 1,398 | |||||||||||
Net income (loss) | $ | 16,811 | $ | 12,175 | $ | (2,693 | ) | $ | (1,144 | ) | $ | 2,968 | ||||||
Diluted earnings (loss) per share | $ | 1.11 | $ | 0.94 | $ | (0.21 | ) | $ | (0.09 | ) | $ | 0.23 | ||||||
Shares used in computing diluted earnings (loss) per share | 15,164 | 12,964 | 12,571 | 12,483 | 13,021 | |||||||||||||
(1) See Note 13 to the consolidated financial statements | ||||||||||||||||||
| As of December 31, | ||||||||||||||||||
| 2006 | 2005 | 2004 | 2003 | 2002 | ||||||||||||||
| (In thousands) | ||||||||||||||||||
Balance Sheet Data: | ||||||||||||||||||
Cash and cash equivalents | $ | 32,367 | $ | 10,428 | $ | 11,419 | $ | 12,091 | $ | 10,779 | ||||||||
Working capital | 79,523 | 56,881 | 48,739 | 50,000 | 45,288 | |||||||||||||
Total assets | 215,666 | 172,759 | 160,576 | 135,825 | 130,818 | |||||||||||||
Long-term debt, less current maturities | — | 35,000 | 39,000 | 30,000 | 19,000 | |||||||||||||
Shareholders’ equity | 161,145 | 81,012 | 68,948 | 70,551 | 68,036 | |||||||||||||
| ITEM 7. | MANAGEMENT’S DISCUSSION AND ANALYSIS OF FINANCIAL CONDITION AND RESULTS OF OPERATIONS |
Overview
We are a leading global provider of outsourced customer management support services. Our comprehensive, balanced mix of services includes:
| • | Customer Care Services(including customer care, retention and technical support); |
| • | Telesales, and |
| • | Marketing, Technology and Business Process Outsourcing(BPO) Solutions(including market research, database marketing, interactive voice response (IVR), alert notification, e-mail management, data capture and collections and other back-office business processing services). |
20
Table of Contents
We provide our services through contact centers located throughout the world, including the U.S., Ireland, the U.K., Canada, Australia, Mexico, Barbados, the Philippines, Costa Rica and Argentina. As of December 31, 2006, we had operations in 43 contact centers from which we support clients primarily in the financial services, insurance, healthcare, telecommunications, information technology, business and consumer services, government and energy services sectors.
Our domestic sales force is organized by specific industry verticals, which enables our sales personnel to develop in-depth industry and product knowledge. We also have sales operations in the U.K., Canada, Mexico, Australia and Argentina.
We invest heavily in systems and software technologies designed to improve productivity, thereby lowering the effective cost per contact made or received. Our systems and software technologies are also designed to improve sales and customer service effectiveness by providing sales and service representatives with real-time access to customer and product information. We currently offer and/or utilize a comprehensive suite of CRM technologies, available on a hosted basis for use by clients at their own in-house facilities or on a co-sourced basis in conjunction with our fully integrated, Web-enabled contact centers. Our technologies include automatic call distribution (ACD) voice processing, IVR, advanced speech recognition (ASR), Voice over Internet Protocol (VoIP), contact management, automated e-mail management and processing, sales force and marketing automation, alert notification and Web self-help.
We believe that we were one of the first fully automated outsourced customer management services companies, and we were among the first such companies to implement predictive dialing technology for telemarketing and market research, provide collaborative Web browsing services and utilize VoIP capabilities. Through our global implementation of VoIP, we have established a redundant voice and data network infrastructure that can seamlessly route inbound and outbound voice traffic to our contact centers worldwide. We do not provide telecommunications or VoIP services to the general public.
Our customer care/retention clients typically enter into longer-term, contractual relationships that may contain provisions for early contract terminations. We generally operate under month-to-month contractual relationships with our telesales clients. The pricing component of a contract is often comprised of a base service charge and separate charges for ancillary services. Our services are generally priced based upon per-minute or hourly rates. On occasion, we perform services for which we are paid incentives based on completed sales. The nature of our business is such that we generally compete with other outsourced service providers as well as the retained in-house call center operations of our customers. This can create pricing pressures and impact the rates we can charge in our contracts.
Revenue is recognized as the services are performed, and is generally based on hours or minutes of work performed; however, certain types of revenue relating to upfront project setup costs must be deferred and recognized over a period of time, typically the length of the customer contract. The incremental direct cost associated with this revenue is also deferred over the same period of time. Some of our client contracts have performance standards, which can result in adjustments to monthly billings if the standards are not met. Any required adjustments to our monthly billings are reflected in our revenue on an as-incurred basis.
We refer to our revenue as either Sales revenue or Services revenue. Our Sales revenue includes outbound telesales for new customer acquisition and cross-selling products and services to existing customers. Services revenue encompasses all our other revenue, which is classified into the categories of customer service and ancillary services. Customer service includes inbound order handling, customer care, help desk support, technical support and patient assistance whereas ancillary services include market research, database marketing, lead qualification, technology hosting, data processing, data entry, receivables management and other BPO activities.
Results for 2006 reflect the following:
| • | Increased revenue, which grew 12% compared to 2005 results. |
| • | Growth in our Services revenue was 19% compared to 2005 and was driven by growth in customer care services. |
21
Table of Contents
| • | Sales revenue declined 4% compared to 2005, primarily due to the shift of this business to offshore contact centers, which have lower revenue rates per production hour. |
| • | Strengthening of our competitive position in key vertical markets, primarily financial services and insurance, healthcare, and expansion of our presence in other markets including telecommunications, government and energy services. |
| • | Expansion of the scope of our hosted technology services with the introduction of outbound IVR alert services. |
| • | Net income increased by 38% as compared to 2005, driven largely by: |
| • | The shift of call production to lower-cost, higher-margin offshore locations. For example, our Philippines operations handled approximately 24% of total production as compared to 16% of total production in 2005. |
| • | Reduction of our estimated effective income tax rate to 10% in 2006 from 25% in 2005, primarily as a result of continued offshore expansion in the Philippines. |
| • | A public offering of our common stock in which we raised $53.1 million of net proceeds, a portion of which was used to repay all outstanding amounts under our revolving credit facility (Credit Facility). |
We continued to expand our near-shore and offshore operations during 2006 by:
| • | Opening our third Philippine contact center in Marakina, Manila City, where we have 1,000 workstations in place as of December 31, 2006. Our three contact centers in the Philippines account for 22% of our total workstations. |
| • | Completing an acquisition of Proyectar Connect S.A., an Argentina-based customer management services company with headquarters in Buenos Aires, on November 30, 2006. |
| • | Opening a 100-seat (expandable to 300-seat) facility in Hyderabad, India, which we are currently using to provide back-office support and quality assurance for U.S. clients. In addition to its current operations, we expect to use this facility to provide back-office and voice support for U.K. clients. |
| • | Opening a facility capable of supporting up to 350 seats in San Jose, Costa Rica. |
| • | Actively marketing Canada as a near-shore alternative for U.K. clients and prospects. |
Our future profitability will be impacted, among other things, by our ability to expand our service offerings to existing customers as well as our ability to obtain new customers and grow new vertical markets. Our profitability is also impacted by our ability to manage costs and mitigate the effects of foreign currency exchange risk. Our business is very labor-intensive and consequently, in an effort to reduce costs and be as competitive as possible in the marketplace, we have been moving some of our services to near-shore and offshore contact centers, which typically have lower labor costs.
Some of these benefits, however, may be offset by the expanded training and associated costs we may incur because of our service mix. Many of our customer care services require more complex and costly training processes and to the extent we cannot bill these amounts to our clients, our profitability will be impacted. In addition to the more complex training, the employees who work on our customer care programs are generally paid a higher hourly rate because of the more complex level of services they are providing.
We believe that our success in 2007 will be largely dependent on our ability to continue capturing new business and leveraging the investment we have made in our infrastructure by expanding our business service offerings. We believe that major corporations will continue to leverage the skills of companies like ours and that the services outsourced will continue to expand beyond the contact center services that currently comprise the large majority of our business. We plan to leverage our existing strength in the financial services and insurance and healthcare markets and provide additional business services to our customers in these industries. To capitalize on these opportunities, we will continue to enhance the technologies we use.
22
Table of Contents
Critical Accounting Policies and Estimates
Our consolidated financial statements have been prepared in accordance with accounting principles generally accepted in the United States. These generally accepted accounting principles require Management to make estimates and assumptions that affect the reported amounts of assets and liabilities and disclosure of contingent assets and liabilities at the date of the financial statements and the reported amount of revenue and expenses during the reporting period. Actual results could differ from those estimates.
Our significant accounting policies are described in Note 2 to the consolidated financial statements, included in Item 8 of this Form 10-K. The following discussion addresses our critical accounting policies, which are those that are most important to the portrayal of our financial condition and results and require Management’s most difficult, subjective and complex judgments, often as a result of the need to make estimates about the effect of matters that are inherently uncertain. If actual results were to differ significantly from estimates made, the reported results could be materially affected. However, we are not currently aware of any reasonably likely events or circumstances that would result in materially different results. Senior Management has reviewed these critical accounting policies and estimates with our audit committee.
Revenue Recognition
Revenue is typically calculated based on contracted per-minute or hourly rates with customers. We recognize revenue as services are performed, generally based on billable minutes or hours of work incurred. Some of our client contracts have performance standards, which can result in adjustments to monthly billings if the standards are not met. Any required adjustments to our monthly billings are reflected in our revenue on an as-incurred basis.
In order to provide our business services solutions, we may incur certain upfront project set-up costs specific to each customer contract. In certain instances, we can bill the customer for these costs; however, because the delivered item (project set-up services) does not have stand alone value to the customer, revenue is deferred and recognized as services are provided over the contract term or until contract termination, should that occur prior to the end of the contract term. To the extent we have billed these costs and there are no customer issues with collection, we will defer the project set-up costs and amortize such amounts over the program period, over the remaining contract term or until contract termination. The costs incurred are deferred only to the extent of the amounts billed. Amounts collected from customers prior to the performance of services are also recorded as deferred revenue. Deferred revenue totaled $6.0 million and $8.1 million as of December 31, 2006 and 2005, respectively. The current portion is included in accrued expenses and other liabilities with the non-current portion included in other liabilities in the accompanying consolidated balance sheets. The deferred revenue related to upfront project set-up costs was $5.0 million and $4.8 million as of December 31, 2006 and 2005, respectively. The current portion of the deferred cost associated with this revenue is included in prepaid expenses and other assets with the non-current portion included in other assets in the accompanying consolidated balance sheets. The deferred costs totaled $3.4 million and $3.3 million at December 31, 2006 and 2005, respectively.
Our revenue recognition policy is in accordance with Staff Accounting Bulletin No. 104, “Revenue Recognition,” and Emerging Issues Task Force Issue (EITF) 00-21, “Revenue Arrangements with Multiple Deliverables.”
Allowance for Doubtful Accounts
Our accounts receivable balances are net of an estimated allowance for uncollectible accounts. Management continuously monitors collections and payments from customers and maintains an allowance for uncollectible accounts based upon our historical write-off experience and any specific customer collection issues that have been identified. Other items considered in estimating the allowance for uncollectible accounts include the age of the receivables, the financial status of our customers and general economic conditions. Because the allowance for uncollectible accounts is an estimate, it may be necessary to adjust the allowance for doubtful accounts if actual
23
Table of Contents
bad debt expense exceeds the estimated reserve. We are subject to concentration risks as certain of our customers, as well as certain of the industries we support, generate a high percentage of our total revenue and corresponding receivables. Accounts receivable, net of the allowance for doubtful accounts, was approximately $83.7 million and $82.7 million as of December 31, 2006 and 2005, respectively, representing approximately 39% and 48% of total assets, respectively. Given the significance of accounts receivable to our consolidated financial statements, the determination of net realizable values is considered to be a critical accounting estimate.
Impairment of Goodwill and Other Intangible Assets
Goodwill and other intangible assets are recorded as a result of business combinations. As of December 31, 2006 and 2005, we had $12.9 million and $3.5 million of goodwill, respectively. We also had $2.3 million and $612,000 of other intangible assets, net of amortization, at December 31, 2006 and 2005, respectively. The increase in both goodwill and other intangible assets was due to our acquisition of Proyectar Connect S.A. An impairment of these assets could have a significant impact on our results of operations. An impairment exists when events have occurred or circumstances exist that would cause the fair value of these assets to fall below their carrying value. Although goodwill is no longer required to be amortized, we are required to perform an annual impairment review of our goodwill. This impairment review, which is performed in the fourth quarter of each year, is a discounted cash flow analysis using projected cash flows of the Company. On an interim basis, we also evaluate whether any events have occurred or whether any circumstances exist that could indicate an impairment of our goodwill. Other intangible assets are evaluated similar to other long-lived assets in accordance with Statement of Financial Accounting Standards (SFAS) No. 144, “Accounting for the Impairment or Disposal of Long-Lived Assets,” as discussed below. For the years ended December 31, 2006, 2005 and 2004, there were no impairment charges related to goodwill and other intangible assets.
Impairment of Long-Lived Assets
We continually evaluate whether events or circumstances have occurred that would indicate that the remaining estimated useful lives of our long-lived assets may warrant revision or that the remaining balance may not be recoverable. When factors indicate that long-lived assets should be evaluated for possible impairment, an estimate of the related undiscounted cash flows over the remaining life of the long-lived assets is used to measure recoverability. Some of the more important factors we consider include our financial performance relative to our expected and historical performance, significant changes in the way we manage our operations, negative events that have occurred, and negative industry and economic trends. If any impairment is indicated, measurement of the impairment will be based on the difference between the carrying value and fair value of the asset, generally determined based on the present value of expected future cash flows associated with the use of the asset. For the years ended December 31, 2006, 2005 and 2004, we recorded impairment charges of $14,000, $458,000 and $0, respectively. In 2005, the impairment charge was associated with facilities that we exited early. Net property and equipment as of December 31, 2006 and 2005 totaled $61.7 million and $56.9 million, respectively, representing approximately 29% and 33% of total assets, respectively.
Accounting for Income Taxes
As part of the process of preparing our consolidated financial statements, Management is required to estimate income taxes in each of the jurisdictions in which we operate. This process involves estimating our actual current tax expense together with assessing temporary differences resulting from differing treatment of items, such as depreciation of property and equipment, for tax and accounting purposes. These differences result in deferred tax assets and liabilities, which are included within the consolidated balance sheet. We must then assess the likelihood that our deferred tax assets will be realized through future taxable income. We also have deferred tax assets relating to net operating loss (NOL) carryforwards for state tax purposes, foreign NOL carryforwards and Federal tax credit carryforwards. With respect to our state NOLs, we do not believe it is more likely than not that these deferred tax assets will be realized. Accordingly, a valuation allowance of $3.2 million has been recorded against these deferred tax assets, of which $1.6 million was recorded in 2006. At
24
Table of Contents
December 31, 2006, we have $34.4 million of NOL carryforwards relating to our foreign operations in Australia and the United Kingdom, resulting in a gross deferred tax asset of $10.3 million. Currently, Management does not expect to be able to utilize these NOLs to offset future taxable income, and therefore these deferred tax assets have a full valuation allowance recorded against them. Our ability to realize any of the above NOLs in the future will depend upon the Company’s ability to generate profits in the various tax jurisdictions to which they apply.
The amount of the deferred tax assets considered realizable, however, could be reduced in the near-term if estimates of future taxable income are reduced. We will continue to evaluate and assess the realizability of all deferred tax assets and adjust valuation allowances, if required in the future.
Restructuring Charges
As of December 31, 2006, we had a remaining accrual of $913,000 for the amount of estimated costs required to terminate the leases and close the facilities included in the December 2002 restructuring. The original charge of $8.9 million consisted of severance, site closure costs and asset impairments. Certain estimates were made in determining the amount of the charge for site closure costs and asset impairments, but no estimate for sublease income was made, given the market conditions at that time and the inability to find suitable tenants. The amount of the charge will be subject to change over time if a suitable tenant is identified or to the extent we are able to negotiate early lease terminations.
During 2006 and 2005, we did not enter into any sublease arrangements nor did we negotiate any termination settlements for the facilities that remain under contract. The cash payments recorded against the remaining accrual were related to the ongoing lease obligations.
Accounting for Contingencies
In the ordinary course of business, we have entered into various contractual relationships with strategic corporate partners, customers, suppliers, vendors and other parties. As such, we could be subject to litigation, claims or assessments arising from any or all of these relationships, or from our relationships with our employees. Management accounts for contingencies such as these in accordance with SFAS No. 5, “Accounting for Contingencies.” SFAS No. 5 requires an estimated loss contingency be recorded when information available prior to the issuance of financial statements indicates that it is probable that an asset has been impaired or a liability has been incurred at the date of the financial statements and the amount of the loss can be reasonably estimated. SFAS No. 5 and its interpretations further state that when there is a range of loss and no amount within that range is a better estimate than any other, that the minimum amount in the range should be accrued. Accounting for contingencies arising from contractual or legal proceedings requires Management to use its best judgment when estimating an accrual related to such contingencies. As additional information becomes known, the accrual for a loss contingency could fluctuate, thereby creating variability in our results of operations from period to period. Likewise, an actual loss arising from a loss contingency which significantly exceeds the amount accrued could have a material adverse impact on our operating results for the period in which such actual loss becomes known.
Share-Based Compensation
Prior to January 1, 2006, we used the intrinsic value method of accounting for share-based employee compensation in accordance with Accounting Principles Board (APB) Opinion No. 25, “Accounting for Stock Issued to Employees,” and related interpretations. Under APB Opinion No. 25, no compensation expense was recognized for stock options because the exercise price of stock options equaled the market price of our stock on the dates of grant. We also provided the pro forma disclosures required under SFAS No. 123, “Accounting for Stock-Based Compensation,” as amended by SFAS No. 148, “Accounting for Stock-Based Compensation-Transition and Disclosure.”
25
Table of Contents
Effective January 1, 2006, we adopted SFAS No. 123 (revised 2004), “Share-Based Payment” (SFAS No. 123R). SFAS No. 123R replaces SFAS No. 123 and supersedes APB Opinion No. 25 and amends SFAS No. 95, “Statement of Cash Flows.” SFAS No. 123R eliminates the ability to account for share-based compensation transactions using the intrinsic value method under APB Opinion No. 25, and requires that share-based awards be accounted for using a fair value based method. SFAS No. 123R requires compensation costs related to share-based payment transactions to be recognized in the financial statements over the period that an employee provides service in exchange for the award. We have adopted SFAS No. 123R using the modified prospective method.
Under the modified prospective method, we are required to record compensation expense for awards granted, modified or settled subsequent to the adoption of SFAS No. 123R over the related vesting period of such awards and record compensation expense prospectively for the unvested portion of awards issued and outstanding at the date of adoption over the remaining vesting period of such awards based on the original estimated fair value of such awards. No change in the results from prior periods is permitted under the modified prospective method. Accordingly, we have not restated prior period amounts. We determine the fair value of stock options using the Black-Scholes valuation model. Inherent in this valuation model are various assumptions and estimates, including, but not limited to, stock price volatility, risk-free borrowing rate and employee stock option exercise behaviors. We also utilize incentive compensation plans that have performance conditions, which require Management to estimate the level of performance that will be achieved. The share-based compensation expense recorded is partially based on the estimated achievement level of the performance targets.
Results of Operations
The following is a discussion of the major categories set forth in the consolidated statement of operations.
| (dollars in thousands) | 2006 | 2005 | 2004 | % change 2006 vs. 2005 | % change 2005 vs. 2004 | ||||||||||
Revenue: | $ | 447,912 | $ | 401,334 | $ | 325,529 | 11.6 | % | 23.3 | % | |||||
Services | 330,943 | 278,999 | 215,173 | 18.6 | % | 29.7 | % | ||||||||
Sales | 116,969 | 122,335 | 110,356 | -4.4 | % | 10.9 | % | ||||||||
Average Number of Workstations | 11,396 | 9,805 | 8,683 | ||||||||||||
During 2006 and 2005, our increased revenue was driven by significant growth in our call production hours. Our call production hours increased by 18% and 24% in each year, respectively, as compared to the prior year.
The $46.6 million increase in revenue for 2006 was driven solely by growth in our Services revenue. Services revenue, which is made up primarily of customer service programs, increased to 74% of total revenue during 2006 as compared to 70% during 2005. A large part of the growth in Services revenue for 2006 was attributable to the services we performed for various healthcare clients in support of the Federal government’s Medicare Part D registration process. This registration process ended in the second quarter of 2006. Sales revenue declined during 2006 as compared to 2005, which can largely be attributed to the shift of this business to offshore centers, which have lower revenue rates per production hour. Total revenue per average workstation in production during 2006 decreased by 4% to $39,304 from $40,932 during 2005. The decline is primarily due to our recent expansion in the Philippines, where we have opened our third contact center and the resultant lower revenue rates as we migrate work offshore.
The $75.8 million increase in revenue for 2005 was largely driven by growth in our Services revenue, which accounted for over 84% of this increase and reflects the continuing growth in outsourced customer support. Services revenue increased to 70% of total revenue during 2005 compared to 66% during 2004. The growth in 2005 was driven primarily by expansion of new contracts in the healthcare, technology and government industries. Our Sales revenue also increased and reflected our strong growth in certain of our international
26
Table of Contents
markets. Total revenue per average workstation increased by 9% to $40,932 from $37,490 during 2004, primarily due to increased utilization rates and the growth in ancillary revenue.
As we continue to perform work for our customers in near-shore and offshore locations, our revenue will be impacted by fluctuations in foreign currency exchange rates. Changes in foreign exchange rates had a positive impact on total revenue of $4.1 million in 2006 compared to 2005, and was primarily due to changes in the Canadian dollar, the Euro and the British pound sterling. In 2005, changes in foreign exchange rates had a positive impact on total revenue of approximately $3.7 million compared to 2004, and was also primarily due to changes in the Canadian dollar, the Euro and the British pound sterling.
| (dollars in thousands) | 2006 | 2005 | 2004 | % change 2006 vs. 2005 | % change 2005 vs. 2004 | |||||||||||||
Cost of Services: | $ | 273,618 | $ | 244,572 | $ | 194,365 | 11.9 | % | 25.8 | % | ||||||||
Labor costs | 195,769 | 174,118 | 137,867 | 12.4 | % | 26.3 | % | |||||||||||
Telecom costs | 22,225 | 19,389 | 17,875 | 14.6 | % | 8.5 | % | |||||||||||
Other direct costs | 55,624 | 51,065 | 38,623 | 8.9 | % | 32.2 | % | |||||||||||
Total Cost of Services as a Percentage of Revenue | 61.1 | % | 60.9 | % | 59.7 | % | ||||||||||||
Production Hours (in thousands) | 18,260 | 15,478 | 12,488 | |||||||||||||||
Our cost of services consists primarily of direct labor costs associated with our customer service representatives (CSRs) and telecommunications costs. Other direct costs we incur for our client programs include information technology support, quality assurance, other billable labor and support services costs.
In 2006, the increase in our cost of services over 2005 was driven primarily by direct labor cost increases directly attributable to increased production hours as well as increases in other costs of services. Our labor costs are impacted by production hour volume, foreign exchange rates and changes in hourly payroll rates. Our direct labor cost per production hour decreased in fiscal year 2006 to $10.72 from $11.25 in fiscal year 2005. The decrease reflects an overall decline in wage rates of approximately 7% in 2006 compared to 2005. This decrease is due to the volume of services performed in lower-wage offshore contact centers, partially offset by the impact of foreign currency exchange rates. Foreign currency exchange rates had an overall impact of increasing our cost of services by $6.5 million compared to 2005. However, the primary reason for the increase in direct labor cost overall was the increased volume of production hours necessary to support our revenue growth.
The increase in telecom costs during 2006 was volume- and product mix-driven, although our actual telecom cost per production hour decreased to $1.22 in 2006 from $1.25 in 2005. Contributing to this decline per production hour were refunds of $755,000, net of consultant fees, relating to Federal excise taxes that the U.S. Treasury Department has agreed to refund on long distance telephone service provided to companies. Other direct costs increased primarily due to increases in other billable labor ($1.1 million) and quality assurance ($1.8 million). Some of our other inbound customer care services, particularly those in the healthcare industry, require a variety of ancillary services that are off the phone, which tends to drive our other billable labor costs. Our quality assurance costs are typically a function of our call volume and tend to increase as our volume of business increases.
In 2005, the increase in cost of services of $50.2 million over 2004 was driven primarily by labor cost increases of $36.3 million. The labor cost increases were primarily volume driven. To a lesser extent, labor costs were impacted by foreign exchange and changes in hourly rates for our contact center staff. Our labor cost per production hour in 2005 was $11.25 compared to $11.04 in 2004, and reflected an overall increase in wage rates of approximately 1%, as well as the impact of foreign currency. Foreign currency exchange rates had an overall impact of increasing our cost of services by $4.9 million compared to 2004. Conversely, due to advances made in the technologies we used in providing our services, the greater propensity of customer service clients to cover their own telecommunications costs and the continuing commoditization of telecom services, our telecom cost
27
Table of Contents
per production hour decreased 13% to $1.25 in 2005 from $1.43 in 2004. Other direct costs increased primarily due to increases in our subcontracting costs ($4.3 million), other billable labor ($3.9 million) and quality assurance ($2.2 million). Rapid changes in call volume that are deemed to be short-term in nature are often handled through subcontracting arrangements.
| (dollars in thousands) | 2006 | 2005 | 2004 | % change 2006 vs. 2005 | % change 2005 vs. 2004 | |||||||||||||
Selling, General & Administrative Expenses: | $ | 155,435 | $ | 141,601 | $ | 123,559 | 9.8 | % | 14.6 | % | ||||||||
Salaries, benefits and other personnel-related costs | 65,382 | 56,716 | 48,774 | 15.3 | % | 16.3 | % | |||||||||||
Facilities and equipment costs | 53,163 | 50,934 | 45,017 | 4.4 | % | 13.1 | % | |||||||||||
Depreciation and amortization | 23,662 | 20,790 | 17,822 | 13.8 | % | 16.7 | % | |||||||||||
Other SG&A costs | 13,228 | 13,161 | 11,946 | 0.5 | % | 10.2 | % | |||||||||||
Total SG&A as a Percentage of Revenue | 34.7 | % | 35.3 | % | 38.0 | % | ||||||||||||
Selling, general and administrative (SG&A) expenses are primarily comprised of salaries and benefits, rental expenses relating to our facilities and some of our equipment, equipment maintenance and depreciation and amortization.
SG&A expenses increased by $13.8 million in 2006 compared to 2005, primarily as a result of increased salaries and benefits costs along with facilities costs. Salaries and benefits costs increased primarily due to headcount increases as well as increases in base wage rates. Our facilities costs, which consist primarily of rent expense, increased by $2.2 million. During 2006, we opened two new contact centers in the United States, one new contact center in the Philippines and new contact centers in India and Costa Rica, as we continued to expand our worldwide operations. Approximately 37% of our SG&A expenses were incurred in foreign locations, which are subject to changes in foreign exchange rates. Foreign exchange rates had the effect of increasing SG&A expenses by approximately $800,000 in 2006 compared to 2005. As a percentage of revenue, our SG&A expenses declined in 2006 from 2005, primarily as a result of our ability to manage our revenue growth by increasing utilization of existing infrastructure
SG&A expenses increased by $18.0 million in 2005 compared to 2004, primarily as a result of increases in salaries and benefits and increased facilities costs. Salaries and benefits costs increased primarily due to headcount increases. Our facilities costs, which consist primarily of rent expense, increased by $5.9 million. During 2005, we opened three new contact centers in the United States and one new contact center in the Philippines to meet increasing demand for our outsourced customer care services. Approximately 34% of our SG&A expenses were incurred in foreign locations, which are subject to changes in foreign exchange rates. Foreign exchange rates had the effect of increasing SG&A expenses by approximately $1.6 million in 2005 compared to 2004. As a percentage of revenue, our SG&A expenses declined in 2005 from 2004 primarily as a result of our ability to manage our revenue growth by increasing utilization of existing infrastructure.
| (dollars in thousands) | 2006 | 2005 | 2004 | % change 2006 vs. 2005 | % change 2005 vs. 2004 | |||||||||||
Litigation Costs (Recoveries): | $ | — | $ | (3,611 | ) | $ | 10,338 | -100.0 | % | -134.9 | % | |||||
In prior years, litigation costs associated with the Shingleton litigation were disclosed separately. There were no litigation costs in 2006, as this matter was fully resolved in the prior year. In 2005, we had recoveries from one of our insurance carriers of $4.1 million. These insurance proceeds were partially offset by incurred legal expenses of $604,000. The insurance proceeds represent the culmination of litigation we were pursuing against one of the insurance carriers involved in the Shingleton litigation. In addition to the proceeds from the insurance carrier, we also settled a related matter with one of our insurance brokers for a $115,000 recovery. In 2004, litigation costs associated with the Shingleton litigation totaled $10.3 million.
28
Table of Contents
| (dollars in thousands) | 2006 | 2005 | 2004 | % change 2006 vs. 2005 | % change 2005 vs. 2004 | |||||||||||||
Interest Expense: | $ | (940 | ) | $ | (2,637 | ) | $ | (1,729 | ) | -64.4 | % | 52.5 | % | |||||
Interest Income: | $ | 780 | $ | 173 | $ | 135 | 350.9 | % | 28.1 | % | ||||||||
In 2006, the decrease in interest expense was due to the fact that we repaid all amounts outstanding under our Credit Facility in April 2006, using proceeds from our $53.1 million equity offering. Notwithstanding the repayment, the weighted average interest rate in 2006 on amounts outstanding under the Credit Facility was 6.2% compared to 5.0% in 2005. The remaining proceeds from the equity offering were used for general corporate purposes as well as investments in money market accounts, which significantly increased our interest income during 2006 compared to 2005. We earned interest at blended rates of 5.0% during 2006 on our money market investments compared to 2.8% in 2005.
In 2005, the increase in net interest expense over 2004 was the result of increased average daily outstanding balances under our Credit Facility during 2005 compared to 2004, as well as higher interest rates. Average borrowings were approximately $47.0 million in 2005 compared to $39.7 million in 2004. The weighted average interest rate on amounts outstanding under our Credit Facility was 5.0% in 2005 compared to 3.7% in 2004.
| (dollars in thousands) | 2006 | 2005 | 2004 | % change 2006 vs. 2005 | % change 2005 vs. 2004 | |||||||||||
Income Tax Provision (Benefit): | $ | 1,888 | $ | 4,133 | $ | (1,634 | ) | -54.3 | % | -352.9 | % | |||||
Our income tax provision (benefit) decreased by $2.2 million in 2006 and increased by $5.8 million in 2005. The effective income tax rate for the years ended December 31, 2006 and 2005 was 10% and 25%, respectively. Our effective income tax rate in 2004 was an income tax benefit of 38%.
Our 2006 effective tax rate is reflective of the fact that approximately $14.4 million of the Company’s pre-tax profit was generated in the Philippines, which was not subject to income tax as a result of incentive tax holidays. Also impacting the rate in 2006 was $1.2 million of work opportunity tax credits, which resulted in an income tax benefit of $776,000. The Federal government renewed legislation in the fourth quarter of 2006 to continue this credit program.
In 2005, the decrease in our effective income tax rate was primarily due to the Company generating $4.4 million of profit in the Philippines, which was not subject to income tax as a result of incentive tax holidays. Our income tax provision in 2005 reflects the recording of additional valuation allowances of $1.1 million recorded for the remaining deferred tax assets related to our net operating loss carryforwards in Australia. Also, during 2005, the Internal Revenue Service denied a claim we had filed for research and development (R&D) credits associated with a previous tax year. While we plan to appeal, we have determined that a full valuation allowance should be recorded on any remaining deferred tax assets associated with R&D credits. Therefore, an additional $599,000 of valuation allowance was recorded in 2005. The impact on our effective income tax rate of these increases in valuation allowances was partially offset by work opportunity tax credits of approximately $605,000.
Quarterly Results and Seasonality
We have experienced, and expect to continue to experience, quarterly variations in operating results, principally as a result of the timing of programs conducted by new and existing clients (particularly programs with substantial amounts of upfront project set-up costs), and selling, general and administrative expenses to support the growth and development of existing and new business units.
Our business tends to be strongest in the fourth quarter due to the high level of client sales and service activity for the holiday season, while the first quarter often reflects a slowdown relating to the cessation of that activity. Currently, 74% of our revenue is being generated from service programs, which generally have less seasonality than sales programs. Typically, we experience higher call volumes and improved financial results during the second half of our fiscal year as compared to the first half.
29
Table of Contents
Our results in the fourth quarter of 2006 were impacted by certain weather-related events and an earthquake in the Pacific Rim, both of which caused reduction in call center activity and fourth quarter profit. Partially offsetting these events were certain discrete income tax items, which reduced our effective income tax rate. Our results in the third quarter of 2006 benefited from a reduction in our effective tax rate due to certain discrete income tax items. Our results in the third quarter of 2005 included the receipt of $4.1 million in insurance proceeds related to the Shingleton litigation, and also reflected certain discrete income tax items, which had the effect of reducing our income tax provision in that quarter. Our fourth quarter 2004 results were impacted by the $7.7 million accrual for the settlement amount of the Shingleton litigation, partially offset by the receipt of $2.7 million of insurance proceeds.
Liquidity and Capital Resources
At December 31, 2006, we had $32.4 million of cash and cash equivalents compared to $10.4 million at December 31, 2005.
We generate cash through various means, primarily through cash from operations and, when required, through borrowings under our Credit Facility. In April 2006, we also raised $53.1 million through a registered equity offering. The primary areas of our business in which we spend cash include capital expenditures, payments of principal and interest on amounts owed under our Credit Facility, if applicable, and costs of operations.
Cash From Operations
Cash provided by operations in 2006, 2005 and 2004 was $34.8 million, $26.1 million and $13.1 million, respectively.
Cash from operations in 2006 was primarily generated by net income of $16.8 million and various non-cash expenses of $24.6 million. The non-cash expenses included $23.7 million of depreciation and amortization and non-cash share-based compensation of $1.9 million, partially offset by $1.0 million of deferred income tax benefits and other non-cash items. Changes in our working capital accounts (exclusive of cash and cash equivalents) and non-current assets and liabilities decreased cash flow from operations by $6.7 million. This decrease in cash flow was primarily due to a decrease in accrued expenses of $8.7 million, offset by changes in our other working capital accounts (exclusive of cash and cash equivalents) and non-current assets and liabilities which generated $2.0 million of positive cash flow. Included in accrued expenses at December 31, 2005 was an amount of $6.6 million that was owed to a customer which is an association comprised of several member companies. The $6.6 million represented amounts previously collected from the association that were re-billed to the member companies at the request of the association in order to reflect a revised billing arrangement. The $6.6 million re-billed to the member companies was collected by us prior to December 31, 2005, and such amount was repaid to the association’s customers in the first half of 2006.
Cash from operations in 2005 was primarily generated by net income of $12.2 million and various non-cash expenses of $25.4 million. The non-cash expenses included $20.8 million of depreciation and amortization and $4.0 million of deferred income tax expense. The net income and non-cash items were partially offset by the payment of our Shingleton litigation settlement of $14.8 million. Other working capital changes (exclusive of cash and cash equivalents) and changes in non-current assets and liabilities resulted in an additional $3.3 million of operating cash flow. A $19.1 million increase in accounts payable and accrued expenses was driven by higher accruals for payroll and related expenses, higher deferred revenue and $6.6 million of amounts due to a customer, as described above. This increase was partially offset by a $17.8 million increase in accounts receivable which was due to higher revenue and a slightly extended collection cycle. Much of the cash associated with these fourth quarter receivables was collected in January and February of 2006.
Cash from operations in 2004 was primarily generated by a net loss of $2.7 million, which was offset by non-cash expenses of $18.4 million, primarily depreciation and amortization, and increased litigation accruals of
30
Table of Contents
$10.4 million. The additional litigation accrual is associated with the Shingleton settlement. Changes in working capital (exclusive of cash and cash equivalents and the increased litigation accrual) and changes in non-current assets and liabilities accounted for a $13.0 million decrease in cash flow from operations and was driven primarily by an increase in accounts receivable. Our accounts receivable increased because of the significant growth in revenue in the fourth quarter of 2004. Much of the cash associated with these fourth quarter receivables was collected in January and February of 2005.
Credit Facility
In 2006, 2005 and 2004, we had net borrowings (repayments) under the Credit Facility of $(35.0) million, $(4.0) million and $9.0 million, respectively. We repaid our outstanding borrowings using proceeds from the equity offering we completed in April 2006 and had no outstanding borrowings under the Credit Facility as of December 31, 2006. The primary use of borrowings was to fund a portion of our capital expenditures each year. In March 2005, some of our borrowings were used to make payment on the Shingleton settlement. These borrowings were repaid in 2005 with cash flow provided by operations. Additionally, in 2004, borrowings under our Credit Facility were used to pay a portion of the purchase price for the acquisition of DPS Data Group LLC (DPS). We paid $1.1 million, $2.7 million and $1.4 million of interest expense for amounts outstanding for each of those years.
Our Credit Facility is a $125.0 million secured revolving facility with a $5.0 million sub-limit for swing line loans and a $30.0 million sub-limit for multicurrency borrowings. The Credit Facility includes a $50.0 million accordion feature, which will allow us to increase our borrowing capacity to $175.0 million, subject to obtaining commitments for the incremental capacity from existing or new lenders. As of December 31, 2006, we were in compliance with all of the covenants contained in the Credit Facility.
Borrowings under the Credit Facility can bear interest at various rates, depending upon the type of loan. We have two borrowing options, either a “Base Rate” option, under which interest rate is calculated using the higher of the federal funds rate plus 0.5% or the Bank of America prime rate, plus a spread ranging from 0% to 0.75%, or a “Eurocurrency Rate” option, under which interest rate is calculated using LIBOR plus a spread ranging from 1.00% to 2.25%. The amount of the spread under each borrowing option depends on our ratio of funded debt to EBITDA (which, for purposes of the Credit Facility, is defined as income before interest expense, interest income, income taxes, and depreciation and amortization and certain other charges).
In 2005, we incurred $596,000 of debt issuance costs associated with the Credit Facility. These costs have been deferred and are being amortized over the five-year term of the Credit Facility.
Equity Transactions
In April 2006, we completed an offering of our common stock. We sold 2,350,000 shares and generated proceeds of $53.1 million, net of underwriting discount and offering costs. A portion of these proceeds was used to repay amounts outstanding under our Credit Facility, which at the time was $34.0 million. Management expects to continue using the remaining proceeds for working capital, business acquisitions and other general corporate needs.
During 2006, we generated $5.2 million in proceeds from the exercise of employee stock options, which also resulted in $3.8 million of positive cash flow from related income tax benefits.
Litigation
In March 2005, we announced a settlement with the plaintiffs in the Shingleton litigation and made payments of $14.8 million to satisfy our obligations under the settlement. This payment was funded with cash-on-hand, borrowings under our Credit Facility and proceeds from responsive insurance coverage. Under the
31
Table of Contents
terms of the settlement, ICT, without admitting liability or wrongdoing, agreed to pay $14.75 million to the plaintiff class to settle all allegations relating to unpaid wages, bonuses and other claims, as well as payments for liquidated damages allowed by West Virginia law of 30 days of wages plus interest, which was being sought for all class members regardless of the amount of wages allegedly unpaid. The settlement agreement was approved by the Court on June 27, 2005.
In 2005, our total legal costs associated with this litigation were $604,000. Until the litigation was settled, we had spent significant resources defending the Company in both the class action and its related litigation. Our associated legal costs in 2004 were $2.6 million. We did recover some of these costs from our insurance carriers. We received a payment of $2.7 million in March 2005 from one of the insurers, which was used to pay a portion of the settlement amount. During the third quarter of 2005, we negotiated a settlement with the other insurer and collected the $4.1 million settlement amount. In addition to the proceeds from the insurance carrier, we also settled a related matter in 2005 with one of our insurance brokers for $115,000, which was collected in January 2006. There is no remaining liability associated with the Shingleton litigation.
Capital Expenditures and Business Combinations
In 2006, we spent $25.9 million on capital expenditures compared to $21.1 million and $25.1 million in 2005 and 2004, respectively. For each year, these amounts represented the vast majority of our investing activities. A portion of our capital expenditures is reflected in our workstation growth. We had 12,719 workstations in operation at December 31, 2006, compared to 10,662 workstations at December 31, 2005 and 9,264 at December 31, 2004.
In 2006, we added a net total of 2,057 workstations. This included 1,080 workstations added to our contact centers in the Philippines, primarily through the opening of our third Philippine contact center in 2006. We also added 670 workstations through our acquisition of Proyectar Connect S.A. on November 30, 2006. For purposes of determining revenue per average workstation, we have only included one-third of the Proyectar workstations since we only generated one month of revenue in Argentina for the fourth quarter of 2006. The remaining 307 net workstations were added in a variety of our existing facilities both domestically and offshore. We spent approximately $18.8 million on workstation expansion. The remainder of our capital expenditures related primarily to information technology hardware and software.
In 2005, we added a net total of 1,398 workstations. This included 692 workstations added to our near-shore and offshore locations, located primarily in the Philippines and Mexico. The remaining 706 workstations were added in our domestic contact centers. We spent approximately $14.8 million on workstation expansion. The remainder of our capital expenditures related primarily to information technology hardware and software.
In 2004, we added a net total of 941 workstations at our contact centers in the U.S. and abroad. In 2004, 981 new workstations were added in the Philippines, where we opened our second contact center. We spent approximately $11.5 million on workstation expansion. We also made significant investments in our information technology resources. Approximately $11.4 million was spent on hardware and software and on various upgrades and enhancements to our contact center dialing technologies.
In addition to capital expenditures, we spent $11.0 million, $178,000 and $3.0 million in 2006, 2005 and 2004, respectively, on business combinations. On November 30, 2006, we purchased the stock of Proyectar Connect S.A., a company located in Argentina that provides inbound and outbound customer support services. The cash paid was $11.0 million, including transaction costs and net of cash acquired. In connection with this transaction, we may pay additional cash consideration of up to $4.0 million contingent upon the achievement of specific financial goals for the twelve months ending May 31, 2007. In March 2005, we made the final payment associated with our acquisition of Grupo Teleinter, S.A. de C.V., a contact center in Mexico City, which was acquired in 2002 for $1.6 million. This payment of $178,000 was contingent upon the subsidiary’s operating results and was agreed to at the time of the acquisition. The amounts paid in 2005 were accounted for as
32
Table of Contents
additional goodwill. In April 2004, we acquired the assets of DPS for $3.0 million. This amount included approximately $111,000 of direct costs incurred for the transaction. In connection with the acquisition of DPS, we agreed to pay the shareholders of DPS additional consideration based on the achievement of specific financial goals for 2004. These goals were not achieved and therefore no additional amounts were paid out under this agreement.
Our operations will continue to require significant capital expenditures to support the growth of our business. Historically, equipment purchases have been financed through cash generated from operations, the Credit Facility and our ability to acquire equipment through operating leases. We believe that cash-on-hand, together with cash flow generated from operations, the ability to acquire equipment through operating leases, and funds available under our Credit Facility, will be sufficient to finance our current operations and planned capital expenditures at least into 2008.
Commitments and Obligations
As of December 31, 2006, we are parties to various agreements that create contractual obligations and commercial commitments. These obligations and commitments will have an impact on future liquidity and the availability of capital resources. We expect to satisfy our contractual obligations through cash flows generated from operations. We would also consider accessing the capital markets to meet our needs, although we can make no assurances that this type of financing would be available when we might need it. The table noted below presents a summary of these obligations and commitments:
Contractual Obligations:
| Payments Due By Period | |||||||||||||||
(in thousands) Description | Total | Less than 1 Year | 1 to 3 Years | 3 to 5 Years | More than 5 Years | ||||||||||
Operating leases (1) | $ | 74,837 | $ | 21,254 | $ | 24,794 | $ | 12,195 | $ | 16,594 | |||||
Telephone contract commitments | 11,854 | 6,454 | 5,400 | — | — | ||||||||||
Credit Facility (2) | — | — | — | — | — | ||||||||||
Total contractual obligations | $ | 86,691 | $ | 27,708 | $ | 30,194 | $ | 12,195 | $ | 16,594 | |||||
| (1) | Includes facility and equipment operating leases, some of which call for payment of direct operating costs in addition to rent. These obligation amounts include future minimum lease payments and exclude such direct operating costs. |
| (2) | At December 31, 2006, we did not have any borrowings outstanding under the Credit Facility. The amount of the unused Credit Facility at December 31, 2006 was $125.0 million. For additional information, see Note 8 to the consolidated financial statements, included in Item 8 of this Form 10-K. |
Our table of contractual obligations excludes purchase orders for merchandise and supplies in the normal course of business that are expected to be liquidated within 12 months.
Recent Accounting Pronouncements
In June 2006, the Financial Accounting Standards Board (FASB) issued FASB Interpretation No. (FIN) 48, “Accounting for Uncertainty in Income Taxes.” Among other things, FIN 48 prescribes a “more likely than not” recognition threshold and measurement attribute for the financial statement recognition and de-recognition of a tax position taken or expected to be taken in a tax return. This Interpretation is effective for fiscal years beginning after December 15, 2006. The cumulative effect of adopting FIN 48 will be recorded as a charge to opening retained earnings in the first quarter of 2007. The Company is currently evaluating the effects of implementing this new standard.
33
Table of Contents
In September 2006, the SEC released Staff Accounting Bulletin No. 108, “Considering the Effects of Prior Year Misstatements when Quantifying Misstatements in Current Year Financial Statements” (SAB 108). SAB 108 provides interpretive guidance on the SEC’s views regarding the process of quantifying the materiality of financial statement misstatements. SAB 108 is effective for fiscal years ending after November 15, 2006, with early application permitted for the first interim period ending after November 15, 2006. The adoption of SAB 108 did not have any effect on our results of operations or financial position.
In September 2006, the FASB issued SFAS No. 157, “Fair Value Measurements.” SFAS No. 157 defines fair value, establishes a framework and gives guidance regarding the methods used for measuring fair value, and expands disclosures about fair value measurements. SFAS No. 157 is effective for financial statements issued for fiscal years beginning after November 15, 2007, and interim periods within those fiscal years. We are currently assessing the impact that SFAS No. 157 will have on our results of operations and financial position.
| ITEM 7A. | QUANTITATIVE AND QUALITATIVE DISCLOSURES ABOUT MARKET RISK |
Our operations are exposed to market risks primarily as a result of changes in interest and foreign currency exchange rates. We do not use derivative financial instruments for speculative or trading purposes. We perform a sensitivity analysis to determine the effects that market risk exposures may have on our debt and other financial instruments. Information provided by the sensitivity analysis does not necessarily represent the actual changes in fair value that would be incurred under normal market conditions because, due to practical limitations, all variables other than the specific market risk factor are held constant.
Interest Rate Risk
Our exposure to market risk for changes in interest rates has historically related to our Credit Facility as well as investments in short-term, interest-bearing securities such as money market accounts. A change in market interest rates exposes us to the risk of earnings or cash flow loss but would not impact the fair value of the related underlying instrument. Borrowings under our Credit Facility are subject to variable LIBOR or prime base rate pricing. Interest earned on our cash balances is based on current market rates. Accordingly, a 1.0% change (100 basis points) in these rates would have resulted in net interest income and expense changing by approximately $40,000 and $410,000 for the years ended December 31, 2006 and 2005, respectively. Interest expense for the year ended December 31, 2006, consists primarily of amortization of debt issuance costs associated with our Credit Facility. We have not incurred any interest expense on actual borrowings since May 2006. Correspondingly, our interest income earned has increased significantly as we have higher levels of invested cash due to the equity offering. The interest rates in effect for the Credit Facility at any point in time approximate market rates; thus, the fair value of any outstanding borrowings approximates its reported value. In the past, Management has not entered into financial instruments such as interest rate swaps or interest rate lock agreements. However, we may consider using these instruments to manage the impact of changes in interest rates based on Management’s assessment of future interest rates, volatility of the yield curve and our ability to access the capital markets in a timely manner
Foreign Currency Risk
We have operations in Canada, Ireland, the United Kingdom, Australia, Barbados, Mexico, the Philippines, India, Argentina and Costa Rica that are subject to foreign currency fluctuations. Our most significant foreign currency exposures occur when revenue is generated in one foreign currency and corresponding expenses are generated in another foreign currency. Currently, our most significant exposure has been with our Canadian and Philippine operations, where revenue is generated in U.S. dollars (USD) and the corresponding expenses are generated in either Canadian dollars (CAD) or Philippine pesos (PHP). We mitigate a portion of these exposures through foreign currency derivative contracts.
The impact of foreign currencies will continue to present economic challenges for us and could negatively impact overall earnings. A 5% change in the value of the USD relative to foreign currencies would have had an impact of approximately $3.4 million and $2.5 million on our earnings for the years ended December 31, 2006 and 2005, respectively.
34
Table of Contents
| ITEM 8. | FINANCIAL STATEMENTS AND SUPPLEMENTARY DATA |
Our consolidated financial statements being filed under this Item 8 can be found beginning on page F-1 of this Annual Report on Form 10-K.
| ITEM 9. | CHANGES IN AND DISAGREEMENTS WITH ACCOUNTANTS ON ACCOUNTING AND FINANCIAL DISCLOSURE |
None.
| ITEM 9A. | CONTROLS AND PROCEDURES |
| (a) | Evaluation of Disclosure Controls and Procedures |
Our Management, with the participation of our Chief Executive Officer and Chief Financial Officer, evaluated the effectiveness of our disclosure controls and procedures as of the end of the period covered by this report. Based on that evaluation, the Chief Executive Officer and Chief Financial Officer concluded that our disclosure controls and procedures as of the end of the period covered by this report are functioning effectively to provide reasonable assurance that the information required to be disclosed by us in reports filed under the Securities Exchange Act of 1934 is (i) recorded, processed, summarized and reported within the time periods specified in the SEC’s rules and forms and (ii) accumulated and communicated to our Management, including our Chief Executive Officer and Chief Financial Officer, as appropriate, to allow timely decisions regarding disclosure.
| (b) | Management’s Report on Internal Control Over Financial Reporting |
Our Management’s report on internal control over financial reporting is set forth in Item 8 of this Annual Report on Form 10-K and can be found on page F-2.
| (c) | Change in Internal Control over Financial Reporting |
No change in our internal control over financial reporting occurred during our most recent fiscal quarter that has materially affected, or is reasonably likely to materially affect, our internal control over financial reporting.
| ITEM 9B. | OTHER INFORMATION |
None.
| ITEM 10. | DIRECTORS, EXECUTIVE OFFICERS AND CORPORATE GOVERNANCE |
Information with respect to this item is incorporated by reference from our definitive proxy statement in connection with our 2007 Annual Meeting of Shareholders, to be filed no later than April 30, 2007 (the Proxy Statement).
| ITEM 11. | EXECUTIVE COMPENSATION |
Information with respect to this item is incorporated by reference from the Proxy Statement.
| ITEM 12. | SECURITY OWNERSHIP OF CERTAIN BENEFICIAL OWNERS AND MANAGEMENT AND RELATED STOCKHOLDER MATTERS |
Information with respect to this item is incorporated by reference from the Proxy Statement.
35
Table of Contents
| ITEM 13. | CERTAIN RELATIONSHIPS AND RELATED TRANSACTIONS AND DIRECTOR INDEPENDENCE |
Information with respect to this item is incorporated by reference from the Proxy Statement.
| ITEM 14. | PRINCIPAL ACCOUNTANT FEES AND SERVICES |
Information with respect to this item is incorporated by reference from the Proxy Statement.
| ITEM 15. | EXHIBITS AND FINANCIAL STATEMENT SCHEDULES |
Financial Statements and Financial Statement Schedules
See Index to Consolidated Financial Statements and Financial Statement Schedule on page F-1.
Exhibits
The following is a list of exhibits filed as part of this Annual Report on Form 10-K. Where so indicated by footnote, exhibits which were previously filed are incorporated herein by reference. For exhibits incorporated by reference, the location of the exhibit in the previous filing is indicated parenthetically.
| 3.1 | Amended and Restated Articles of Incorporation of the Company (Filed as Exhibit 3.1 to Amendment No. 2 to the Company’s Registration Statement on Form S-1 on June 4, 1996 (Registration No. 333-4150)) | |
| 3.2 | Amended and Restated Bylaws of the Company (Filed as Exhibit 3.2 to Amendment No. 2 to the Company’s Registration Statement on Form S-1 on June 4, 1996 (Registration No. 333-4150)) | |
| 9.1 | Amended and Restated Voting Trust Agreement among John J. Brennan, Donald P. Brennan and the Company, dated October 16, 2000 (Filed as Exhibit 99.1 to the Company’s Annual Report on Form 10-K for the year ended December 31, 2000) | |
| 10.4 | ICT Group, Inc. 2006 Equity Compensation Plan, which amended the ICT Group, Inc. 1996 Equity Compensation Plan (Filed with Company’s Definitive Proxy Statement on April 17, 2006) + | |
| 10.5 | ICT Group, Inc. 2006 Non-Employee Directors Plan, which amended the ICT Group, Inc. 1996 Non-Employee Directors Plan (Filed with Company’s Definitive Proxy Statement on April 17, 2006) + | |
| 10.6 | ICT Group, Inc. Non-Qualified Deferred Compensation Plan (Filed as Exhibit 10.19 to the Company’s Annual Report on Form 10-K for the year ended December 31, 1999) + | |
| 10.7 | Form of Voting Agreement between the Company and certain option holders (Filed as Exhibit 10.13 to the Company’s Registration Statement on Form S-1 on April 26, 1996 (Registration No. 333-4150)) | |
| 10.8 | Amended and Restated Shareholders Agreement among John J. Brennan, Donald P. Brennan, the Company and certain family trusts, dated October 16, 2000 (Filed as Exhibit 99.2 to the Company’s Annual Report on Form 10-K for the year ended December 31, 2000) | |
| 10.12 | Employment Agreement between Vincent A. Paccapaniccia and the Company, dated August 24, 1998 (Filed as Exhibit 10.14 to the Company’s Annual Report on Form 10-K for the year ended December 31, 1998) + | |
| 10.13 | Employment Agreement between Timothy F. Kowalski and the Company, dated July 7, 1997 (Filed as Exhibit 10.17 to the Company’s Annual Report on Form 10-K for the year ended December 31, 1999) + | |
36
Table of Contents
| 10.14 | Amendment to Employment Agreement between Vincent A. Paccapaniccia and the Company, dated January 2, 2002 (Filed as Exhibit 10.14 to the Company’s Annual Report on Form 10-K for the year ended December 31, 2001) + | |
| 10.16 | Employment Agreement between Pam Goyke and the Company, dated September 11, 2000 (Filed as Exhibit 10.21 to the Company’s Annual Report on Form 10-K for the year ended December 31, 2000) + | |
| 10.17 | Employment Agreement between Dean Kilpatrick and the Company, dated May 5, 1995 (Filed as Exhibit 10.22 to the Company’s Annual Report on Form 10-K for the year ended December 31, 2000) + | |
| 10.20 | Lease Agreement between Brandywine Operating Partnership, L.P., dated January 23, 2001 (Filed as Exhibit 10.23 to the Company’s Annual Report on Form 10-K for the year ended December 31, 2000) | |
| 10.22 | Amendment to Employment Agreement between Dean Kilpatrick and the Company, dated January 2, 2002 (Filed as Exhibit 10.22 to the Company’s Annual Report on Form 10-K for the year ended December 31, 2001) + | |
| 10.26 | Employment Agreement between John L. Magee and the Company, dated August 1, 2002 (Filed as Exhibit 10.26 to the Company’s Annual Report on Form 10-K for the year ended December 31, 2002) + | |
| 10.27 | Amendment to Employment Agreement between Vincent A. Paccapaniccia and the Company, dated October 1, 2002 (Filed as Exhibit 10.27 to the Company’s Annual Report on Form 10-K for the year ended December 31, 2002) + | |
| 10.29 | Amendment to Employment Agreement between Pam Goyke and the Company, dated October 1, 2002 (Filed as Exhibit 10.29 to the Company’s Annual Report on Form 10-K for the year ended December 31, 2002) + | |
| 10.30 | Amendment to Employment Agreement between Dean Kilpatrick and the Company, dated October 1, 2002 (Filed as Exhibit 10.30 to the Company’s Annual Report on Form 10-K for the year ended December 31, 2002) + | |
| 10.31 | Employment Agreement between John Campbell and the Company, dated March 1, 2003 (Filed as Exhibit 10.31 to the Company’s Annual Report on Form 10-K for the year ended December 31, 2002) + | |
| 10.32 | Amendment to Employment Agreement between Timothy F. Kowalski and the Company, dated March 17, 2003 (Filed as Exhibit 10.32 to the Company’s Annual Report on Form 10-K for the year ended December 31, 2002) + | |
| 10.33 | Employment Agreement between Jeffrey Moore and the Company, dated November 7, 2003 (Filed as Exhibit 10.33 to the Company’s Annual Report on Form 10-K for the year ended December 31, 2003) + | |
| 10.34 | Employment Agreement between Donald T. McCormick and the Company, dated December 1, 1999 (Filed as Exhibit 10.34 to the Company’s Quarterly Report on Form 10-Q for the quarter ended June 30, 2004) + | |
| 10.35 | Employment Agreement between James Shannon and the Company, dated September 15, 2002 (Filed as Exhibit 10.35 to the Company’s Quarterly Report on Form 10-Q for the quarter ended June 30, 2004) + | |
| 10.36 | ICT Group, Inc. Incentive Plan (Filed as Exhibit 10.1 to the Company’s Current Report on Form 8-K filed March 15, 2005) + | |
| 10.37 | Description of Compensation of Non-Employee Directors (Filed as Exhibit 10.37 to the Company’s Annual Report on Form 10-K for the year ended December 31, 2004) + | |
| 10.38 | Employment Agreement between Janice A. Jones and the Company dated January 2, 2002, as amended on September 1, 2002 (Filed as Exhibit 10.38 to the Company’s Annual Report on Form 10-K for the year ended December 31, 2004) + | |
37
Table of Contents
| 10.39 | Proposed Settlement Agreement for the Shingleton class action litigation, dated February 25, 2005 (Filed as Exhibit 10.39 to the Company’s Quarterly Report on Form 10-Q for the quarter ended March 31, 2005) | |
| 10.40 | Settlement Agreement and Mutual Release with Federal Insurance Company, dated February 25, 2005 (Filed as Exhibit 10.40 to the Company’s Quarterly Report on Form 10-Q for the quarter ended March 31, 2005) | |
| 10.41 | Amended and Restated Voting Trust Agreement among John J. Brennan, Donald P. Brennan and the Company, dated April 1, 2004 (Filed as Exhibit 10.41 to the Company’s Quarterly Report on Form 10-Q for the quarter ended March 31, 2005) | |
| 10.42 | Voting Agreement among John J. Brennan, Eileen Brennan Oakley and the Company, dated April 1, 2004 (Filed as Exhibit 10.42 to the Company’s Quarterly Report on Form 10-Q for the quarter ended March 31, 2005) | |
| 10.43 | Amended and Restated Credit Agreement, dated as of June 24, 2005, among the Registrant, certain subsidiaries of the Registrant named therein as guarantors, the lenders named therein, and Bank of America, N.A. as Administrative Agent, Swing Line Lender and L/C Issuer (Filed as Exhibit 10.43 to the Company’s Quarterly Report on Form 10-Q for the quarter ended June 30, 2005) | |
| 10.44 | Amended and Restated Security Agreement, dated as of June 24, 2005, among the Registrant, certain subsidiaries of the Registrant named therein as grantors, and Bank of America, N.A. as Administrative Agent (Filed as Exhibit 10.44 to the Company’s Quarterly Report on Form 10-Q for the quarter ended June 30, 2005) | |
| 10.45 | Amended and Restated Pledge Agreement, dated as of June 24, 2005, among the Registrant, certain subsidiaries of the Registrant named therein as pledgors, and Bank of America, N.A. as Administrative Agent (Filed as Exhibit 10.45 to the Company’s Quarterly Report on Form 10-Q for the quarter ended June 30, 2005) | |
| 10.46 | Employment Agreement between Lloyd M. Wirshba and the Company, dated July 5, 2005 (Filed as Exhibit 10.46 to the Company’s Quarterly Report on Form 10-Q for the quarter ended June 30, 2005) + | |
| 10.47 | Settlement Agreement and Mutual Release, dated August 10, 2005, by and between ICT Group, Inc. with various Individual Insureds and National Union Fire Insurance Company, referred to as National Union (Filed as Exhibit 10.47 to the Company’s Quarterly Report on Form 10-Q for the quarter ended September 30, 2005) | |
| 10.48 | ICT Group, Inc. Non-Qualified Retirement Plan (The Basic Plan Document, Adoption Agreement and amendments thereto are Filed as Exhibit 10.48 to the Company’s Annual Report on Form 10-K for the year ended December 31, 2005) + | |
| 10.49 | ICT Group, Inc. 1996 Equity Compensation Plan Grant Form (Filed as Exhibit 10.49 to the Company’s Annual Report on Form 10-K for the year ended December 31, 2005) + | |
| 10.50 | Non-qualified Stock Option Grant Letter for Lloyd M. Wirshba (Filed as Exhibit 10.1 to the Company’ Current Report on Form 8-K, dated February 27, 2006) + | |
| 10.51 | Employment Agreement between John J. Brennan and the Company, dated March 13, 2006 (Filed as Exhibit 99 to the Company’s Current Report on Form 8-K dated March 17, 2006) + | |
| 10.52 | ICT Group, Inc. Long Term Incentive Plan (Filed as Exhibit 10.1 to the Company’s Current Report on Form 8-K filed April 3, 2006) + | |
| 10.53 | Underwriting Agreement dated April 6, 2006, between ICT Group, Inc., the Selling Shareholders, and the Underwriters (Filed as Exhibit 1.1 to the Company’s Current Report on Form 8-K filed April 6, 2006) | |
38
Table of Contents
| 10.54 | ICT Group, Inc. 2006 Non-Employee Directors Plan Grant Form for Restricted Stock Units (Filed as Exhibit 10.54 to the Company’s Quarterly Report on Form 10-Q for the quarter ended June 30, 2006) + | |
| 10.55 | ICT Group, Inc. 2006 Equity Compensation Plan Grant Form for Restricted Stock Units (Filed as Exhibit 10.55 to the Company’s Annual Report on Form 10-k for the year ended December 31, 2006) +* | |
| 21 | List of Subsidiaries * | |
| 23 | Consent of KPMG LLP * | |
| 31.1 | Chief Executive Officer’s Rule 13a-14(a)/15d-14(a) Certification * | |
| 31.2 | Chief Financial Officer’s Rule 13a-14(a)/15d-14(a) Certification * | |
32.1 | Chief Executive Officer’s Section 1350 Certification * | |
32.2 | Chief Financial Officer’s Section 1350 Certification * | |
| + | Compensation plans and arrangements for executives and others. |
| * | Filed herewith |
Financial Statements and Financial Statement Schedules
See Index to Consolidated Financial Statements and Financial Statement Schedule on page F-1.
39
Table of Contents
Pursuant to the requirements of Section 13 or 15(d) of the Securities Exchange Act of 1934, the registrant has duly caused this report to be signed on its behalf by the undersigned, thereunto duly authorized.
ICT GROUP, INC. (Registrant) | ||||||||
Dated: March 9, 2007 | By: | /s/ JOHN J. BRENNAN | ||||||
| John J. Brennan | ||||||||
| Chairman, President and Chief Executive Officer | ||||||||
Pursuant to the requirements of the Securities Exchange Act of 1934, this report has been signed below by the following persons on behalf of the registrant and in the capacities and on the dates indicated.
Signature | Title | Date | ||||
By: | /s/ JOHN J. BRENNAN John J. Brennan | Chairman, President and Chief Executive Officer and Director (principal executive officer) | March 9, 2007 | |||
By: | /s/ VINCENT A. PACCAPANICCIA Vincent A. Paccapaniccia | Executive Vice President, Corporate Finance and Chief Financial Officer (principal financial and accounting officer) | March 9, 2007 | |||
By: | /s/ DONALD P. BRENNAN Donald P. Brennan | Vice-Chairman | March 9, 2007 | |||
By: | /s/ BERNARD SOMERS Bernard Somers | Director | March 9, 2007 | |||
By: | /s/ JOHN STOOPS John Stoops | Director | March 9, 2007 | |||
By: | /s/ SETH LEHR Seth Lehr | Director | March 9, 2007 | |||
By: | /s/ GORDON COBURN Gordon Coburn | Director | March 9, 2007 | |||
40
Table of Contents
| Exhibit No. | Description | |
| 3.1 | Amended and Restated Articles of Incorporation of the Company (Filed as Exhibit 3.1 to Amendment No. 2 to the Company’s Registration Statement on Form S-1 on June 4, 1996 (Registration No. 333-4150)) | |
| 3.2 | Amended and Restated Bylaws of the Company (Filed as Exhibit 3.2 to Amendment No. 2 to the Company’s Registration Statement on Form S-1 on June 4, 1996 (Registration No. 333-4150)) | |
| 9.1 | Amended and Restated Voting Trust Agreement among John J. Brennan, Donald P. Brennan and the Company, dated October 16, 2000 (Filed as Exhibit 99.1 to the Company’s Annual Report on Form 10-K for the year ended December 31, 2000) | |
| 10.4 | ICT Group, Inc. 2006 Equity Compensation Plan, which amended the ICT Group, Inc. 1996 Equity Compensation Plan (Filed with Company’s Definitive Proxy Statement on April 17, 2006)+ | |
| 10.5 | ICT Group, Inc. 2006 Non-Employee Directors Plan, which amended the ICT Group, Inc. 1996 Non-Employee Directors Plan (Filed with Company’s Definitive Proxy Statement on April 17, 2006)+ | |
| 10.6 | ICT Group, Inc. Non-Qualified Deferred Compensation Plan (Filed as Exhibit 10.19 to the Company’s Annual Report on Form 10-K for the year ended December 31, 1999)+ | |
| 10.7 | Form of Voting Agreement between the Company and certain option holders (Filed as Exhibit 10.13 to the Company’s Registration Statement on Form S-1 on April 26, 1996 (Registration No. 333-4150)) | |
| 10.8 | Amended and Restated Shareholders Agreement among John J. Brennan, Donald P. Brennan, the Company and certain family trusts, dated October 16, 2000 (Filed as Exhibit 99.2 to the Company’s Annual Report on Form 10-K for the year ended December 31, 2000) | |
| 10.12 | Employment Agreement between Vincent A. Paccapaniccia and the Company, dated August 24, 1998 (Filed as Exhibit 10.14 to the Company’s Annual Report on Form 10-K for the year ended December 31, 1998)+ | |
| 10.13 | Employment Agreement between Timothy F. Kowalski and the Company, dated July 7, 1997 (Filed as Exhibit 10.17 to the Company’s Annual Report on Form 10-K for the year ended December 31, 1999)+ | |
| 10.14 | Amendment to Employment Agreement between Vincent A. Paccapaniccia and the Company, dated January 2, 2002 (Filed as Exhibit 10.14 to the Company’s Annual Report on Form 10-K for the year ended December 31, 2001)+ | |
| 10.16 | Employment Agreement between Pam Goyke and the Company, dated September 11, 2000 (Filed as Exhibit 10.21 to the Company’s Annual Report on Form 10-K for the year ended December 31, 2000)+ | |
| 10.17 | Employment Agreement between Dean Kilpatrick and the Company, dated May 5, 1995 (Filed as Exhibit 10.22 to the Company’s Annual Report on Form 10-K for the year ended December 31, 2000)+ | |
| 10.20 | Lease Agreement between Brandywine Operating Partnership, L.P., dated January 23, 2001 (Filed as Exhibit 10.23 to the Company’s Annual Report on Form 10-K for the year ended December 31, 2000) | |
| 10.22 | Amendment to Employment Agreement between Dean Kilpatrick and the Company, dated January 2, 2002 (Filed as Exhibit 10.22 to the Company’s Annual Report on Form 10-K for the year ended December 31, 2001)+ | |
| 10.26 | Employment Agreement between John L. Magee and the Company, dated August 1, 2002 (Filed as Exhibit 10.26 to the Company’s Annual Report on Form 10-K for the year ended December 31, 2002)+ | |
41
Table of Contents
| Exhibit No. | Description | |
| 10.27 | Amendment to Employment Agreement between Vincent A. Paccapaniccia and the Company, dated October 1, 2002 (Filed as Exhibit 10.27 to the Company’s Annual Report on Form 10-K for the year ended December 31, 2002)+ | |
| 10.29 | Amendment to Employment Agreement between Pam Goyke and the Company, dated October 1, 2002 (Filed as Exhibit 10.29 to the Company’s Annual Report on Form 10-K for the year ended December 31, 2002)+ | |
| 10.30 | Amendment to Employment Agreement between Dean Kilpatrick and the Company, dated October 1, 2002 (Filed as Exhibit 10.30 to the Company’s Annual Report on Form 10-K for the year ended December 31, 2002)+ | |
| 10.31 | Employment Agreement between John Campbell and the Company, dated March 1, 2003 (Filed as Exhibit 10.31 to the Company’s Annual Report on Form 10-K for the year ended December 31, 2002)+ | |
| 10.32 | Amendment to Employment Agreement between Timothy F. Kowalski and the Company, dated March 17, 2003 (Filed as Exhibit 10.32 to the Company’s Annual Report on Form 10-K for the year ended December 31, 2002)+ | |
| 10.33 | Employment Agreement between Jeffrey Moore and the Company, dated November 7, 2003 (Filed as Exhibit 10.33 to the Company’s Annual Report on Form 10-K for the year ended December 31, 2003)+ | |
| 10.34 | Employment Agreement between Donald T. McCormick and the Company, dated December 1, 1999 (Filed as Exhibit 10.34 to the Company’s Quarterly Report on Form 10-Q for the quarter ended June 30, 2004)+ | |
| 10.35 | Employment Agreement between James Shannon and the Company, dated September 15, 2002 (Filed as Exhibit 10.35 to the Company’s Quarterly Report on Form 10-Q for the quarter ended June 30, 2004)+ | |
| 10.36 | ICT Group, Inc. Incentive Plan (Filed as Exhibit 10.1 to the Company’s Current Report on Form 8-K filed March 15, 2005)+ | |
| 10.37 | Description of Compensation of Non-Employee Directors (Filed as Exhibit 10.37 to the Company’s Annual Report on Form 10-K for the year ended December 31, 2004)+ | |
| 10.38 | Employment Agreement between Janice A. Jones and the Company dated January 2, 2002, as amended on September 1, 2002 (Filed as Exhibit 10.38 to the Company’s Annual Report on Form 10-K for the year ended December 31, 2004)+ | |
| 10.39 | Proposed Settlement Agreement for the Shingleton class action litigation, dated February 25, 2005 (Filed as Exhibit 10.39 to the Company’s Quarterly Report on Form 10-Q for the quarter ended March 31, 2005) | |
| 10.40 | Settlement Agreement and Mutual Release with Federal Insurance Company, dated February 25, 2005 (Filed as Exhibit 10.40 to the Company’s Quarterly Report on Form 10-Q for the quarter ended March 31, 2005) | |
| 10.41 | Amended and Restated Voting Trust Agreement among John J. Brennan, Donald P. Brennan and the Company, dated April 1, 2004 (Filed as Exhibit 10.41 to the Company’s Quarterly Report on Form 10-Q for the quarter ended March 31, 2005) | |
| 10.42 | Voting Agreement among John J. Brennan, Eileen Brennan Oakley and the Company, dated April 1, 2004 (Filed as Exhibit 10.42 to the Company’s Quarterly Report on Form 10-Q for the quarter ended March 31, 2005) | |
| 10.43 | Amended and Restated Credit Agreement, dated as of June 24, 2005, among the Registrant, certain subsidiaries of the Registrant named therein as guarantors, the lenders named therein, and Bank of America, N.A. as Administrative Agent, Swing Line Lender and L/C Issuer (Filed as Exhibit 10.43 to the Company’s Quarterly Report on Form 10-Q for the quarter ended June 30, 2005) | |
42
Table of Contents
| Exhibit No. | Description | |
| 10.44 | Amended and Restated Security Agreement, dated as of June 24, 2005, among the Registrant, certain subsidiaries of the Registrant named therein as grantors, and Bank of America, N.A. as Administrative Agent (Filed as Exhibit 10.44 to the Company’s Quarterly Report on Form 10-Q for the quarter ended June 30, 2005) | |
| 10.45 | Amended and Restated Pledge Agreement, dated as of June 24, 2005, among the Registrant, certain subsidiaries of the Registrant named therein as pledgors, and Bank of America, N.A. as Administrative Agent (Filed as Exhibit 10.45 to the Company’s Quarterly Report on Form 10-Q for the quarter ended June 30, 2005) | |
| 10.46 | Employment Agreement between Lloyd M. Wirshba and the Company, dated July 5, 2005 (Filed as Exhibit 10.46 to the Company’s Quarterly Report on Form 10-Q for the quarter ended June 30, 2005)+ | |
| 10.47 | Settlement Agreement and Mutual Release, dated August 10, 2005 by and between ICT Group, Inc. with various Individual Insureds and National Union Fire Insurance Company, referred to as National Union (Filed as Exhibit 10.47 to the Company’s Quarterly Report on Form 10-Q for the quarter ended September 30, 2005) | |
| 10.48 | ICT Group, Inc. Non-Qualified Retirement Plan (The Basic Plan Document, Adoption Agreement and amendments thereto are Filed as Exhibit 10.48 to the Company’s Annual Report on Form 10-K for the year ended December 31, 2005)+ | |
| 10.49 | ICT Group, Inc. 1996 Equity Compensation Plan Grant Form (Filed as Exhibit 10.49 to the Company’s Annual Report on Form 10-K for the year ended December 31, 2005)+ | |
| 10.50 | Non-qualified Stock Option Grant Letter for Lloyd M. Wirshba (Filed as Exhibit 10.1 to the Company’s Current Report on Form 8-K, dated February 27, 2006)+ | |
| 10.51 | Employment Agreement between John J. Brennan and the Company, dated March 13, 2006 (Filed as Exhibit 99 to the Company’s Current Report on Form 8-K dated March 17, 2006)+ | |
| 10.52 | ICT Group, Inc. Long Term Incentive Plan (Filed as Exhibit 10.1 to the Company’s Current Report on Form 8-K filed April 3, 2006)+ | |
| 10.53 | Underwriting Agreement dated April 6, 2006 between ICT Group, Inc., the Selling Shareholders, and the Underwriters (Filed as Exhibit 1.1 to the Company’s Current Report on Form 8-K filed April 6, 2006) | |
| 10.54 | ICT Group, Inc. 2006 Non-Employee Directors Plan Grant Form for Restricted Stock Units (Filed as Exhibit 10.54 to the Company’s Quarterly Report on Form 10-Q for the quarter ended June 30, 2006)+ | |
| 10.55 | ICT Group, Inc. 2006 Equity Compensation Plan Grant Form for Restricted Stock Units (Filed as Exhibit 10.55 to the Company’s Annual Report on Form 10-k for the year ended December 31, 2006)+ * | |
| 21 | List of Subsidiaries * | |
| 23 | Consent of KPMG LLP * | |
| 31.1 | Chief Executive Officer’s Rule 13a-14(a)/15d-14(a) Certification * | |
| 31.2 | Chief Financial Officer’s Rule 13a-14(a)/15d-14(a) Certification * | |
| 32.1 | Chief Executive Officer’s Section 1350 Certification * | |
| 32.2 | Chief Financial Officer’s Section 1350 Certification * | |
| + | Compensation plans and arrangements for executives and others. |
| * | Filed herewith. |
43
Table of Contents
ICT GROUP, INC. AND SUBSIDIARIES
INDEX TO CONSOLIDATED FINANCIAL STATEMENTS AND
FINANCIAL STATEMENT SCHEDULE
| Page | ||
MANAGEMENT’S REPORT ON INTERNAL CONTROL OVER FINANCIAL REPORTING | F-2 | |
| F-3 | ||
| F-5 | ||
| F-6 | ||
| F-7 | ||
| F-8 | ||
| F-9 | ||
FINANCIAL STATEMENT SCHEDULE: | ||
| F-33 | ||
Table of Contents
Management’s Report on Internal Control over Financial Reporting
Management of ICT Group, Inc. (the Company) is responsible for establishing and maintaining adequate internal control over financial reporting. Internal control over financial reporting is a process designed to provide reasonable assurance regarding the reliability of financial reporting and the preparation of consolidated financial statements for external purposes in accordance with generally accepted accounting principles. A company’s internal control over financial reporting includes those policies and procedures that pertain to the maintenance of records that, in reasonable detail, accurately and fairly reflect the transactions and dispositions of the assets of the company; provide reasonable assurance that transactions are recorded as necessary to permit preparation of financial statements in accordance with generally accepted accounting principles, and that receipts and expenditures of the company are being made only in accordance with authorizations of management and directors of the company; and provide reasonable assurance regarding prevention or timely detection of unauthorized acquisition, use, or disposition of the company’s assets that could have a material effect on the financial statements.
Because of its inherent limitations, internal control over financial reporting may not prevent or detect misstatements. Also, projections of any evaluation of effectiveness to future periods are subject to the risk that controls may become inadequate because of changes in conditions, or that the degree of compliance with the policies or procedures may deteriorate.
Management evaluated the Company’s internal control over financial reporting as of December 31, 2006. In making this assessment, Management used the framework established inInternal Control-Integrated Framework issued by the Committee of Sponsoring Organizations of the Treadway Commission (COSO). As a result of this assessment and based on the criteria in the COSO framework, Management has concluded that, as of December 31, 2006, the Company’s internal control over financial reporting was effective.
The Company’s independent registered public accounting firm, KPMG LLP, has audited Management’s assessment of the Company’s internal control over financial reporting. Their opinions on Management’s assessment and the effectiveness of the Company’s internal control over financial reporting appears on page F-3 in this Annual Report on Form 10-K.
| /s/ JOHN J. BRENNAN |
| John J. Brennan |
| Chairman, President and Chief Executive Officer |
| /s/ VINCENT A. PACCAPANICCIA |
| Vincent A. Paccapaniccia |
| Executive Vice President, Corporate Finance and Chief Financial Officer |
March 9, 2007
F-2
Table of Contents
Report of Independent Registered Public Accounting Firm
The Board of Directors and Shareholders
ICT Group, Inc.:
We have audited management’s assessment, included in the accompanyingManagement’s Report on Internal Control over Financial Reporting,that ICT Group, Inc. maintained effective internal control over financial reporting as of December 31, 2006, based on criteria established inInternal Control—Integrated Framework issued by the Committee of Sponsoring Organizations of the Treadway Commission (COSO).ICT Group, Inc.’s management is responsible for maintaining effective internal control over financial reporting and for its assessment of the effectiveness of internal control over financial reporting. Our responsibility is to express an opinion on management’s assessment and an opinion on the effectiveness of the Company’s internal control over financial reporting based on our audit.
We conducted our audit in accordance with the standards of the Public Company Accounting Oversight Board (United States). Those standards require that we plan and perform the audit to obtain reasonable assurance about whether effective internal control over financial reporting was maintained in all material respects. Our audit included obtaining an understanding of internal control over financial reporting, evaluating management’s assessment, testing and evaluating the design and operating effectiveness of internal control, and performing such other procedures as we considered necessary in the circumstances. We believe that our audit provides a reasonable basis for our opinion.
A company’s internal control over financial reporting is a process designed to provide reasonable assurance regarding the reliability of financial reporting and the preparation of financial statements for external purposes in accordance with generally accepted accounting principles. A company’s internal control over financial reporting includes those policies and procedures that (1) pertain to the maintenance of records that, in reasonable detail, accurately and fairly reflect the transactions and dispositions of the assets of the company; (2) provide reasonable assurance that transactions are recorded as necessary to permit preparation of financial statements in accordance with generally accepted accounting principles, and that receipts and expenditures of the company are being made only in accordance with authorizations of management and directors of the company; and (3) provide reasonable assurance regarding prevention or timely detection of unauthorized acquisition, use, or disposition of the company’s assets that could have a material effect on the financial statements.
Because of its inherent limitations, internal control over financial reporting may not prevent or detect misstatements. Also, projections of any evaluation of effectiveness to future periods are subject to the risk that controls may become inadequate because of changes in conditions, or that the degree of compliance with the policies or procedures may deteriorate.
In our opinion, management’s assessment that ICT Group, Inc. maintained effective internal control over financial reporting as of December 31, 2006, is fairly stated, in all material respects, based on criteria established inInternal Control—Integrated Framework issued by the Committee of Sponsoring Organizations of the Treadway Commission (COSO).Also, in our opinion, ICT Group, Inc. maintained, in all material respects, effective internal control over financial reporting as of December 31, 2006, based on criteria established inInternal Control—Integrated Framework issued by the Committee of Sponsoring Organizations of the Treadway Commission (COSO).
We also have audited, in accordance with the standards of the Public Company Accounting Oversight Board (United States), the consolidated balance sheets of ICT Group, Inc. and subsidiaries as of December 31, 2006 and 2005, and the related consolidated statements of operations, shareholders’ equity and cash flows for each of the years in the three-year period ended December 31, 2006, and our report dated March 9, 2007 expressed an unqualified opinion on those consolidated financial statements.
/s/ KPMG LLP
Philadelphia, Pennsylvania
March 9, 2007
F-3
Table of Contents
Report of Independent Registered Public Accounting Firm
The Board of Directors and Shareholders
ICT Group, Inc.:
We have audited the accompanying consolidated balance sheets of ICT Group, Inc. and subsidiaries as of December 31, 2006 and 2005, and the related consolidated statements of operations, shareholders’ equity and cash flows for each of the years in the three-year period ended December 31, 2006. In connection with our audits of the consolidated financial statements, we also have audited the financial statement schedule, “Valuation and Qualifying Accounts.” These consolidated financial statements and financial statement schedule are the responsibility of the Company’s management. Our responsibility is to express an opinion on these consolidated financial statements and financial statement schedule based on our audits.
We conducted our audits in accordance with the standards of the Public Company Accounting Oversight Board (United States). Those standards require that we plan and perform the audit to obtain reasonable assurance about whether the financial statements are free of material misstatement. An audit includes examining, on a test basis, evidence supporting the amounts and disclosures in the financial statements. An audit also includes assessing the accounting principles used and significant estimates made by management, as well as evaluating the overall financial statement presentation. We believe that our audits provide a reasonable basis for our opinion.
In our opinion, the consolidated financial statements referred to above present fairly, in all material respects, the financial position of ICT Group, Inc. and subsidiaries as of December 31, 2006 and 2005, and the results of their operations and their cash flows for each of the years in the three-year period ended December 31, 2006, in conformity with U.S. generally accepted accounting principles. Also in our opinion, the related financial statement schedule, when considered in relation to the basic consolidated financial statements taken as a whole, presents fairly, in all material respects, the information set forth therein.
As discussed in Note 2 to the consolidated financial statements, effective January 1, 2006, the Company adopted the fair value method of accounting for stock-based compensation as required by Statement of Financial Accounting Standards No. 123(R),Share-Based Payment.
We also have audited, in accordance with the standards of the Public Company Accounting Oversight Board (United States), the effectiveness of ICT Group, Inc.’s internal control over financial reporting as of December 31, 2006, based on criteria established inInternal Control—Integrated Framework issued by the Committee of Sponsoring Organizations of the Treadway Commission (COSO), and our report dated March 9, 2007 expressed an unqualified opinion on management’s assessment of, and the effective operation of, internal control over financial reporting.
/s/ KPMG LLP
Philadelphia, Pennsylvania
March 9, 2007
F-4
Table of Contents
ICT GROUP, INC. AND SUBSIDIARIES
CONSOLIDATED BALANCE SHEETS
(In thousands, except per share amounts)
| December 31, | ||||||
| 2006 | 2005 | |||||
| ASSETS | ||||||
CURRENT ASSETS: | ||||||
Cash and cash equivalents | $ | 32,367 | $ | 10,428 | ||
Accounts receivable, net of allowance for doubtful accounts of $489 and $362 | 83,673 | 82,656 | ||||
Prepaid expenses and other current assets | 10,898 | 11,198 | ||||
Income taxes receivable | 2,676 | — | ||||
Deferred income taxes | 250 | 4,238 | ||||
Total current assets | 129,864 | 108,520 | ||||
PROPERTY AND EQUIPMENT, NET | 61,667 | 56,924 | ||||
DEFERRED INCOME TAXES | 4,756 | — | ||||
GOODWILL | 12,862 | 3,477 | ||||
OTHER ASSETS | 6,517 | 3,838 | ||||
| $ | 215,666 | $ | 172,759 | |||
| LIABILITIES AND SHAREHOLDERS’ EQUITY | ||||||
CURRENT LIABILITIES: | ||||||
Accounts payable | $ | 21,376 | $ | 19,946 | ||
Accrued expenses and other current liabilities | 22,506 | 30,898 | ||||
Income taxes payable | 4,193 | 795 | ||||
Deferred income taxes | 2,266 | — | ||||
Total current liabilities | 50,341 | 51,639 | ||||
LINE OF CREDIT | — | 35,000 | ||||
OTHER LIABILITIES | 3,443 | 2,880 | ||||
DEFERRED INCOME TAXES | 737 | 2,228 | ||||
COMMITMENTS AND CONTINGENCIES (NOTE 13) | ||||||
SHAREHOLDERS’ EQUITY: | ||||||
Preferred stock, $0.01 par value 5,000 shares authorized, none issued | — | — | ||||
Common stock, $0.01 par value, 40,000 shares authorized, 15,734 and 12,789 shares issued and outstanding | 157 | 128 | ||||
Additional paid-in capital | 115,633 | 51,791 | ||||
Retained earnings | 44,377 | 27,566 | ||||
Accumulated other comprehensive income | 978 | 1,527 | ||||
Total shareholders’ equity | 161,145 | 81,012 | ||||
| $ | 215,666 | $ | 172,759 | |||
The accompanying notes are an integral part of these consolidated financial statements.
F-5
Table of Contents
ICT GROUP, INC. AND SUBSIDIARIES
CONSOLIDATED STATEMENTS OF OPERATIONS
(In thousands, except per share amounts)
| For the Year Ended December 31, | ||||||||||||
| 2006 | 2005 | 2004 | ||||||||||
REVENUE | $ | 447,912 | $ | 401,334 | $ | 325,529 | ||||||
OPERATING EXPENSES: | ||||||||||||
Cost of services | 273,618 | 244,572 | 194,365 | |||||||||
Selling, general and administrative (including share-based compensation of $1,949, $0 and $0, respectively) | 155,435 | 141,601 | 123,559 | |||||||||
Litigation costs (recoveries) | — | (3,611 | ) | 10,338 | ||||||||
| 429,053 | 382,562 | 328,262 | ||||||||||
Operating income (loss) | 18,859 | 18,772 | (2,733 | ) | ||||||||
INTEREST EXPENSE | (940 | ) | (2,637 | ) | (1,729 | ) | ||||||
INTEREST INCOME | 780 | 173 | 135 | |||||||||
Income (loss) before income taxes | 18,699 | 16,308 | (4,327 | ) | ||||||||
INCOME TAX PROVISION (BENEFIT) | 1,888 | 4,133 | (1,634 | ) | ||||||||
NET INCOME (LOSS) | $ | 16,811 | $ | 12,175 | $ | (2,693 | ) | |||||
EARNINGS (LOSS) PER SHARE: | ||||||||||||
Basic earnings (loss) per share | $ | 1.14 | $ | 0.96 | $ | (0.21 | ) | |||||
Diluted earnings (loss) per share | $ | 1.11 | $ | 0.94 | $ | (0.21 | ) | |||||
Shares used in computing basic earnings (loss) per share | 14,713 | 12,722 | 12,571 | |||||||||
Shares used in computing diluted earnings (loss) per share | 15,164 | 12,964 | 12,571 | |||||||||
The accompanying notes are an integral part of these consolidated financial statements.
F-6
Table of Contents
ICT GROUP, INC. AND SUBSIDIARIES
CONSOLIDATED STATEMENTS OF SHAREHOLDERS’ EQUITY
(In thousands)
| Common Stock | Additional Paid-in Capital | Retained Earnings | Accumulated Other Comprehensive Income | Total Shareholders’ Equity | ||||||||||||||||
| Shares | Amount | |||||||||||||||||||
BALANCE, JANUARY 1, 2004 | 12,483 | $ | 125 | $ | 51,485 | $ | 18,084 | $ | 857 | $ | 70,551 | |||||||||
Exercise of stock options and related income tax benefit | 163 | 2 | 271 | — | — | 273 | ||||||||||||||
Comprehensive loss: | ||||||||||||||||||||
Net loss | — | — | — | (2,693 | ) | — | (2,693 | ) | ||||||||||||
Currency translation adjustment | — | — | — | — | 538 | 538 | ||||||||||||||
Unrealized gain on derivative instruments, net of tax | — | — | — | — | 279 | 279 | ||||||||||||||
Total comprehensive loss | (1,876 | ) | ||||||||||||||||||
BALANCE, DECEMBER 31, 2004 | 12,646 | 127 | 51,756 | 15,391 | 1,674 | 68,948 | ||||||||||||||
Exercise of stock options and related income tax benefit | 143 | 1 | 35 | — | — | 36 | ||||||||||||||
Comprehensive income: | ||||||||||||||||||||
Net income | — | — | — | 12,175 | — | 12,175 | ||||||||||||||
Currency translation adjustment | — | — | — | — | (497 | ) | (497 | ) | ||||||||||||
Unrealized gain on derivative instruments, net of tax | — | — | — | — | 350 | 350 | ||||||||||||||
Total comprehensive income | 12,028 | |||||||||||||||||||
BALANCE, DECEMBER 31, 2005 | 12,789 | 128 | 51,791 | 27,566 | 1,527 | 81,012 | ||||||||||||||
Exercise of stock options and related income tax benefit | 591 | 6 | 5,172 | — | — | 5,178 | ||||||||||||||
Income tax benefit relating to the exercise of stock options | 3,848 | 3,848 | ||||||||||||||||||
Vesting of restricted share unit awards | 4 | — | — | — | — | — | ||||||||||||||
Share-based compensation | — | — | 1,791 | — | — | 1,791 | ||||||||||||||
Proceeds from equity offering, net of offering costs | 2,350 | 23 | 53,031 | — | — | 53,054 | ||||||||||||||
Comprehensive income: | ||||||||||||||||||||
Net income | — | — | — | 16,811 | — | 16,811 | ||||||||||||||
Currency translation adjustment | — | — | — | — | 252 | 252 | ||||||||||||||
Unrealized loss on derivative instruments, net of tax | — | — | — | — | (801 | ) | (801 | ) | ||||||||||||
Total comprehensive income | 16,262 | |||||||||||||||||||
BALANCE, DECEMBER 31, 2006 | 15,734 | $ | 157 | $ | 115,633 | $ | 44,377 | $ | 978 | $ | 161,145 | |||||||||
The accompanying notes are an integral part of these consolidated financial statements.
F-7
Table of Contents
ICT GROUP, INC. AND SUBSIDIARIES
CONSOLIDATED STATEMENTS OF CASH FLOWS
(In thousands)
| For the Year Ended December 31, | ||||||||||||
| 2006 | 2005 | 2004 | ||||||||||
CASH FLOWS FROM OPERATING ACTIVITIES: | ||||||||||||
Net income (loss) | $ | 16,811 | $ | 12,175 | $ | (2,693 | ) | |||||
Adjustments to reconcile net income (loss) to net cash provided by operating activities: | ||||||||||||
Depreciation and amortization | 23,662 | 20,790 | 17,822 | |||||||||
Share-based compensation | 1,949 | — | — | |||||||||
Tax benefit of stock option exercises | — | 109 | 169 | |||||||||
Deferred income tax (benefit) expense | (1,195 | ) | 4,029 | 181 | ||||||||
Amortization of deferred financing costs | 181 | 194 | 209 | |||||||||
Gain on sale of equipment | — | (184 | ) | — | ||||||||
Asset impairment | 14 | 458 | — | |||||||||
(Increase) decrease in: | ||||||||||||
Accounts receivable | 1,052 | (17,755 | ) | (15,327 | ) | |||||||
Prepaid expenses and other | 626 | 2,727 | (2,076 | ) | ||||||||
Other assets | (725 | ) | (418 | ) | (455 | ) | ||||||
Increase (decrease) in: | ||||||||||||
Accounts payable | 373 | 3,176 | 3,274 | |||||||||
Accrued expenses and other liabilities | (8,708 | ) | 15,962 | 1,172 | ||||||||
Income taxes | 722 | (420 | ) | 375 | ||||||||
Accrued litigation | — | (14,750 | ) | 10,403 | ||||||||
Net cash provided by operating activities | 34,762 | 26,093 | 13,054 | |||||||||
CASH FLOWS FROM INVESTING ACTIVITIES: | ||||||||||||
Net sales of marketable securities | — | — | 5,500 | |||||||||
Purchases of property and equipment | (25,942 | ) | (21,132 | ) | (25,135 | ) | ||||||
Proceeds from sale of equipment | — | 249 | — | |||||||||
Cash paid for acquired businesses, net of cash acquired | (10,955 | ) | (178 | ) | (3,011 | ) | ||||||
Net cash used in investing activities | (36,897 | ) | (21,061 | ) | (22,646 | ) | ||||||
CASH FLOWS FROM FINANCING ACTIVITIES: | ||||||||||||
Borrowings under line of credit | 10,000 | 45,000 | 45,000 | |||||||||
Payments on line of credit | (45,000 | ) | (49,000 | ) | (36,000 | ) | ||||||
Proceeds from equity offering, net of offering costs | 53,054 | — | — | |||||||||
Payment of debt issuance costs | — | (596 | ) | — | ||||||||
Proceeds from exercise of stock options | 5,178 | 209 | 339 | |||||||||
Tax benefit of stock option exercises | 3,848 | — | — | |||||||||
Net cash provided by (used in) financing activities | 27,080 | (4,387 | ) | 9,339 | ||||||||
EFFECT OF FOREIGN EXCHANGE RATE CHANGE ON CASH AND CASH EQUIVALENTS | (3,006 | ) | (1,636 | ) | (419 | ) | ||||||
NET INCREASE (DECREASE) IN CASH AND CASH EQUIVALENTS | 21,939 | (991 | ) | (672 | ) | |||||||
CASH AND CASH EQUIVALENTS, BEGINNING OF YEAR | 10,428 | 11,419 | 12,091 | |||||||||
CASH AND CASH EQUIVALENTS, END OF YEAR | $ | 32,367 | $ | 10,428 | $ | 11,419 | ||||||
The accompanying notes are an integral part of these consolidated financial statements.
F-8
Table of Contents
ICT GROUP, INC. AND SUBSIDIARIES
NOTES TO CONSOLIDATED FINANCIAL STATEMENTS
DECEMBER 31, 2006, 2005 AND 2004
Note 1: BACKGROUND
ICT Group, Inc. (incorporated in the Commonwealth of Pennsylvania in 1987) and subsidiaries (the Company), is a leading global provider of outsourced customer management and business process outsourcing solutions. We provide a comprehensive mix of sales, service, marketing and business services outsourcing solutions. We manage customer operations centers in the U.S., U.K., Ireland, Canada, Australia, Mexico, Barbados, Argentina, India, Costa Rica and the Philippines from which we support domestic and multinational corporations and institutions, primarily in the financial services, insurance, telecommunications, healthcare, information technology, government and energy services industries. Unless the context indicates otherwise, “ICT,” the “Company,” “we,” “our,” and “us” refer to ICT Group, Inc., and, where appropriate, one or more of its subsidiaries.
Note 2: SUMMARY OF SIGNIFICANT ACCOUNTING POLICIES
Principles of Consolidation
The consolidated financial statements include the accounts of ICT Group, Inc. and its wholly-owned and controlled subsidiaries. All material intercompany balances and transactions have been eliminated in consolidation.
Pursuant to Statement of Financial Accounting Standards (SFAS) No. 52, “Foreign Currency Translation,” the functional currency of our foreign subsidiaries is their local currency. Therefore, all assets and liabilities of our foreign subsidiaries are translated at the period-end currency exchange rate and revenue and expenses are translated at an average currency exchange rate for the period. The resulting translation adjustment is accumulated in a separate component of shareholders’ equity. Gains and losses on the remeasurement of intercompany loans that are treated as a permanent investment because repayment is not planned or anticipated in the near future are accumulated in a separate component of shareholders’ equity. Gains and losses on the remeasurement of intercompany loans which are expected to be repaid are included in the determination of net income or loss.
Use of Estimates
The preparation of consolidated financial statements in conformity with accounting principles generally accepted in the United States of America requires Management to make estimates and assumptions that affect the reported amounts of assets and liabilities and disclosure of contingent assets and liabilities at the date of the financial statements and the reported amounts of revenue and expenses during the reporting period. Significant items subject to such estimates and assumptions include the valuation of property and equipment, the assessment of the recoverability of goodwill and intangible assets, valuation allowances for receivables and deferred income tax assets, restructuring accruals, litigation contingencies and the fair value of derivative instruments. Actual results could differ from those estimates.
Revenue Recognition
Revenue is typically calculated based on contracted per-minute or hourly rates with customers. We recognize revenue as services are performed, generally based on billable minutes or hours of work incurred. Some of our client contracts have performance standards, which can result in adjustments to monthly billings if the standards are not met. Any required adjustments to our monthly billings are reflected in our revenue on an as-incurred basis.
F-9
Table of Contents
In order to provide our business services solutions, we may incur certain upfront project set-up costs specific to each customer contract. In certain instances, we can bill the customer for these costs; however, because the delivered item (project set-up services) does not have stand alone value to the customer, revenue is deferred and recognized as services are provided over the contract term or until contract termination, should that occur prior to the end of the contract term. To the extent we have billed these costs and there are no customer issues with collection, we will defer the project set-up costs and amortize such amounts over the program period, remaining contract term or until contract termination. The costs incurred are deferred only to the extent of the amounts billed. Amounts collected from customers prior to the performance of services are also recorded as deferred revenue. Deferred revenue totaled $6.0 million and $8.1 million as of December 31, 2006 and 2005, respectively. The current portion is included in accrued expenses and other current liabilities with the non-current portion included in other liabilities in the accompanying consolidated balance sheets. The deferred revenue related to upfront project set-up costs was $5.0 million and $4.8 million as of December 31, 2006 and 2005, respectively. The current portion of the deferred cost associated with this revenue is included in prepaid expenses and other current assets with the non-current portion included in other assets in the accompanying consolidated balance sheets. The deferred costs totaled $3.4 million and $3.3 million at December 31, 2006 and 2005, respectively.
Our revenue recognition policy is in accordance with Staff Accounting Bulletin No. 104, “Revenue Recognition,” and Emerging Issues Task Force Issue 00-21, “Revenue Arrangements with Multiple Deliverables.”
Grant Income
We earn income from government grants, primarily in Ireland and Canada. We recognize the grant income as we incur the related costs, primarily payroll, for which the grant is intended to compensate. Grant income is recorded as a reduction of the related expense in the consolidated statement of operations. If we have already incurred the costs, then we recognize grant income during the period in which the grant becomes a receivable or is collected. If there are additional conditions attached to the grant, we evaluate the conditions and only record income if there is reasonable assurance that we will comply with the conditions. Many of our grants have conditions relating to the maintenance of specified levels of employees, with which we have the intent and ability to comply. To the extent we are not able to remain in compliance with the terms of certain of the grants, we may have to refund a portion of the grant. To date, no such amounts have been required to be refunded. Grant receivables are recorded in prepaid expenses and other on our consolidated balance sheet.
Cash and Cash Equivalents
Cash and cash equivalents include cash and highly liquid investments with purchased maturities of three months or less. Cash equivalents at December 31, 2006 and 2005 consisted of an overnight repurchase agreement and money market accounts.
Marketable Securities
To the extent we maintain certain investments in marketable securities, we account for them according to SFAS No. 115, “Accounting for Certain Investments in Debt and Equity Securities.” Available-for-sale securities are carried at fair value with unrealized gains and losses recorded in accumulated other comprehensive income, net of the related tax effect, if any. Any declines in the fair value of the securities that are considered “other than temporary” are recognized currently in the statement of operations as an impairment of the security. Subsequent recoveries in the fair value, if any, are not recognized in the statement of operations, but as a component of accumulated other comprehensive income, as indicated above.
F-10
Table of Contents
Accounts Receivable
Accounts receivable are recorded at the invoiced amount and do not bear interest. The allowance for doubtful accounts represents Management’s best estimate of the amount of probable credit losses in existing accounts receivable. We determine the allowance based on historical write-off experience and any specific customer collection issues that have been identified. We review our allowance for doubtful accounts monthly. Past due balances are reviewed individually for collectibility. Account balances are charged off against the allowance after all means of collection have been exhausted and the potential for recovery is considered remote. Amounts charged to expense in 2006, 2005 and 2004 were $475,000, $150,000 and $205,000, respectively. We do not have any off-balance sheet credit exposure related to our customers.
Property and Equipment
Property and equipment are recorded at cost. Depreciation and amortization are provided over the estimated useful lives of the applicable assets using the straight-line method. The lives used are as follows:
Communications and computer equipment | 3-7 years | |
Furniture and fixtures | 5-7 years | |
Leasehold improvements | Lesser of lease term or useful life |
Depreciation and amortization expense relating to property and equipment was $23.3 million, $20.4 million and $17.5 million for the years ended December 31, 2006, 2005 and 2004, respectively. Repairs and maintenance are charged to expense as incurred. Additions and betterments are capitalized and amortized over their estimated useful lives. Improvements made to our leased facilities are amortized into expense over the remaining lease term.
Under the provisions of Statement of Position 98-1, “Accounting for Costs of Computer Software Developed or Obtained for Internal Use,” we capitalize the costs associated with software developed or obtained for internal use when both the preliminary project stage is completed and Management has authorized funding for the project, and it is probable that the project will be completed and used to perform the function intended. Capitalized costs include only (i) external direct costs of materials and services consumed in developing or obtaining internal-use software, (ii) direct payroll and payroll-related costs relating to the time spent by employees on each internal-use software project, and (iii) interest costs incurred, when material, while developing internal-use software. Capitalization of such costs ceases no later than the point at which the project is substantially complete and ready for its intended purpose. We capitalized $968,000, $948,000 and $1.7 million of costs during 2006, 2005 and 2004, respectively, which have been included in communications and computer equipment. These costs are amortized on a project-by-project basis over the estimated useful life, typically three years, beginning when the software is placed into operations and is ready for its intended purpose. At December 31, 2006 and 2005, there was $829,000 and $503,000, respectively, of capitalized costs associated with projects that are still in progress, and therefore are not currently being amortized.
Goodwill and Other Intangible Assets
Goodwill and other intangible assets are recorded in connection with business combinations (see Note 5). An impairment may exist when events have occurred or circumstances exist that would cause the fair value of these assets to fall below their carrying value. Although goodwill is no longer required to be amortized, we are required to perform an annual impairment review of our goodwill. This impairment review, which is performed in the fourth quarter of each year, is a discounted cash flow analysis using projected cash flows of the Company. Management has determined that we have one reporting unit for purposes of applying SFAS No. 142, “Goodwill and Other Intangible Assets,” based on our current reporting structure. We performed our impairment test as of December 31, 2006, and determined that goodwill was not impaired. On an interim basis, we also evaluate whether any events have occurred or whether any circumstances exist which could indicate an impairment of our
F-11
Table of Contents
goodwill. For the years ended December 31, 2006, 2005 and 2004, there were no impairment charges taken against goodwill. Other intangible assets are evaluated under the provision of SFAS No. 144 “Accounting for the Impairment or Disposal of Long-Lived Assets,” as discussed below. There were no impairment charges taken against other intangible assets for the years ended December 31, 2006, 2005 and 2004.
Impairment of Long-Lived Assets
Under the provisions of SFAS No. 144, long-lived assets, such as property and equipment and intangible assets, are to be reviewed for impairment whenever events or changes in circumstances indicate that the carrying amount of an asset may not be recoverable. We continually evaluate whether events or circumstances have occurred that would indicate that the remaining estimated useful life of long-lived assets may warrant revision or that the remaining balance may not be recoverable. When factors indicate that long-lived assets should be evaluated for possible impairment, we use an estimate of the related undiscounted cash flows over the remaining life of the long-lived assets to measure recoverability. If impairment is indicated, measurement of the impairment is based on the difference between the carrying value and fair value of the assets, generally determined based on the present value of expected future cash flows associated with the use of the asset. For the years ended December 31, 2006, 2005 and 2004, we recorded impairment charges of $14,000, $458,000 and $0, respectively.
Income Taxes
Income taxes are accounted for under the asset and liability method in accordance with SFAS No. 109, “Accounting for Income Taxes.” Deferred tax assets and liabilities are recognized for the future tax consequences attributable to differences between the financial statement carrying amounts of existing assets and liabilities and their respective tax bases and operating loss and tax credit carryforwards. Deferred tax assets and liabilities are measured using enacted tax rates expected to apply to taxable income in the years in which such items are expected to be recovered or settled. The effect on deferred tax assets and liabilities of a change in tax rates is recognized in the period that includes the enactment date.
Derivative Instruments
Derivative instruments are recorded at fair value on the consolidated balance sheet. We account for these derivative instruments pursuant to SFAS No. 133, “Accounting for Derivative Instruments and Hedging Activities” as amended by SFAS No. 138, “Accounting for Certain Derivative Instruments and Certain Hedging Activities” and SFAS No. 149, “Amendment of Statement 133 on Derivative Instruments and Hedging Activities.” Our derivatives are designated as cash flow hedges (see Note 17); therefore, to the extent the Company’s derivatives qualify for accounting as a hedging instrument, changes in fair value are recorded through accumulated other comprehensive income until settlement of the instrument, at which time gains and/or losses are realized.
Fair Value of Financial Instruments
Financial instruments consist primarily of cash and cash equivalents, accounts receivable, accounts payable and a line of credit. Management believes that the carrying value of these assets and liabilities are representative of their respective fair values due to the short-term nature of those instruments. To the extent we have any outstanding borrowings under our line of credit, the fair value would approximate its reported value because our interest rate is variable and reflects current market rates.
Concentration of Credit Risk
Financial instruments that potentially subject us to concentrations of credit risk consist principally of cash, cash equivalents and accounts receivable. We perform periodic evaluations of the relative credit standing of the financial institutions with which we do business. We maintain cash accounts that at times may exceed federally
F-12
Table of Contents
insured limits; however, we have not experienced any losses from maintaining cash accounts in excess of such limits. Management believes that we are not exposed to any significant risks on our cash accounts. Accounts receivable are subject to the financial condition of our customers. We periodically evaluate the financial condition of our customers and generally do not require collateral. Although we are an international business, much of our customer base is located in North America and not necessarily in the offshore locations where we operate. Our allowance for doubtful accounts reflects current market conditions and Management’s assessment regarding the collectibility of our receivables.
Share-Based Compensation
Prior to January 1, 2006, we used the intrinsic value method of accounting for share-based employee compensation in accordance with Accounting Principles Board (APB) Opinion No. 25, “Accounting for Stock Issued to Employees,” and related interpretations. Under APB Opinion No. 25, no compensation expense was recognized for stock options because the exercise price of stock options equaled the market price of our stock on the dates of grant. We also provided the pro forma disclosures required under SFAS No. 123, “Accounting for Stock-Based Compensation,” as amended by SFAS No. 148, “Accounting for Stock-Based Compensation -Transition and Disclosure.”
Effective January 1, 2006, we adopted SFAS No. 123 (revised 2004), “Share-Based Payment” (SFAS No. 123R). SFAS No. 123R replaces SFAS No. 123 and supersedes APB Opinion No. 25 and amends SFAS No. 95, “Statement of Cash Flows.” SFAS No. 123R eliminates the ability to account for share-based compensation transactions using the intrinsic value method under APB Opinion No. 25, and requires that share-based awards be accounted for using a fair value based method. SFAS No. 123R requires compensation costs related to share-based payment transactions to be recognized in the financial statements over the period that an employee provides service in exchange for the award. We have adopted SFAS No. 123R using the modified prospective method.
Under the modified prospective method, we are required to record compensation expense for awards granted, modified or settled subsequent to the adoption of SFAS No. 123R over the related vesting period of such awards and record compensation expense prospectively for the unvested portion of awards issued and outstanding at the date of adoption over the remaining vesting period of such awards based on the original estimated fair value of such awards. No change in the results from prior periods is permitted under the modified prospective method. Accordingly, we have not restated prior period amounts. We determine the fair value of stock options using the Black-Scholes valuation model. Inherent in this valuation model are various assumptions and estimates, including, but not limited to, stock price volatility, risk-free borrowing rate and employee stock option exercise behaviors. We also utilize incentive compensation plans that have performance conditions, which require management to estimate the level of performance that will be achieved. The share-based compensation expense recorded is partially based on the estimated achievement level of the performance targets (see Note 11).
The following table illustrates the effect on net income and earnings per share had compensation cost for our share-based compensation plans been determined under SFAS No. 123 for the years ended December 31, 2005 and 2004.
| For the years ended December 31, | |||||||
| In thousands, except per share data | 2005 | 2004 | |||||
Net income (loss), as reported | $ | 12,175 | $ | (2,693 | ) | ||
Deduct: Total stock-based employee compensation expense determined under fair value based method for all awards, net of tax | 432 | 459 | |||||
Pro forma net income (loss) | $ | 11,743 | $ | (3,152 | ) | ||
Diluted earnings (loss) per share, as reported | $ | 0.94 | $ | (0.21 | ) | ||
Pro forma diluted earnings (loss) per share | $ | 0.90 | $ | (0.25 | ) | ||
F-13
Table of Contents
Prior to the adoption of SFAS No. 123R, we recorded benefits associated with tax deductions that were in excess of compensation expense recognized for financial reporting purposes for stock options as a cash flow from operations. SFAS No. 123R requires these excess benefits to be recorded as a component of cash flows from financing activities. For the year ended December 31, 2006, we recorded approximately $3.8 million of tax benefits through financing activities, which would have been recorded through operating activities in prior years.
Comprehensive Income
SFAS No. 130, “Reporting Comprehensive Income,” requires companies to classify items of other comprehensive income (loss) by their nature in a financial statement and display the accumulated balance of other comprehensive income (loss) separately from retained earnings and additional paid-in capital in the equity section of the balance sheet. For the years ended December 31, 2006, 2005 and 2004, accumulated other comprehensive income consisted of foreign currency translation adjustments and unrealized gains and losses on outstanding derivative instruments.
As of December 31, 2006, 2005 and 2004, the accumulated balances for each classification of other comprehensive income were as follows:
| For the years ended December 31, | ||||||||||
| (in thousands) | 2006 | 2005 | 2004 | |||||||
Derivative instruments, net of tax | $ | (164 | ) | $ | 637 | $ | 287 | |||
Foreign currency translation adjustments | 1,142 | 890 | 1,387 | |||||||
Accumulated other comprehensive income | $ | 978 | $ | 1,527 | $ | 1,674 | ||||
Commitments and Contingencies
Liabilities for loss contingencies arising from claims, assessments, litigation, fines and penalties and other sources are recorded when it is probable that a liability has been incurred and the amount of the assessment can be reasonably estimated (see Note 13). Legal costs associated with loss contingencies are recorded as they are incurred.
Leasing Arrangements
SFAS No. 13, “Accounting for Leases” and SFAS No. 98, “Accounting for Leases,” require companies to assess the classification of the leases they enter into as either a capital lease or an operating lease. Capital leases are considered financing arrangements and are accounted for on the balance sheet. Operating leases are considered to be rental arrangements and are not recorded on the balance sheet. See Note 13, where we disclose our future commitments under operating leases.
Reclassifications
Certain prior year amounts have been reclassified to conform to the current period presentation.
Recent Accounting Pronouncements
In June 2006, the Financial Accounting Standards Board (FASB) issued FASB Interpretation No. (FIN) 48, “Accounting for Uncertainty in Income Taxes.” Among other things, FIN 48 prescribes a “more likely than not” recognition threshold and measurement attribute for the financial statement recognition and de-recognition of a tax position taken or expected to be taken in a tax return. This Interpretation is effective for fiscal years beginning after December 15, 2006. The cumulative effect of adopting FIN 48 will be recorded as a charge to opening retained earnings in the first quarter of 2007. The Company is currently evaluating the effects of implementing this new standard.
F-14
Table of Contents
In September 2006, the Securities and Exchange Commission (SEC) released Staff Accounting Bulletin No. 108, “Considering the Effects of Prior Year Misstatements when Quantifying Misstatements in Current Year Financial Statements” (SAB 108). SAB 108 provides interpretive guidance on the SEC’s views regarding the process of quantifying the materiality of financial statement misstatements. SAB 108 is effective for fiscal years ending after November 15, 2006, with early application permitted for the first interim period ending after November 15, 2006. The adoption of SAB 108 did not have any effect on our results of operations or financial position.
In September 2006, the FASB issued SFAS No. 157, “Fair Value Measurements.” SFAS No. 157 defines fair value, establishes a framework and gives guidance regarding the methods used for measuring fair value, and expands disclosures about fair value measurements. SFAS No. 157 is effective for financial statements issued for fiscal years beginning after November 15, 2007, and interim periods within those fiscal years. We are currently assessing the impact that SFAS No. 157 will have on our results of operations and financial position.
Note 3: EARNINGS PER SHARE
Basic earnings (loss) per share (Basic EPS) is computed by dividing net income (loss) by the weighted average number of shares of common stock outstanding. Diluted earnings (loss) per share (Diluted EPS) is computed by dividing net income (loss) by the weighted average number of shares of common stock outstanding, after giving effect to the potential dilution from the exercise of securities, such as stock options, into shares of common stock as if those securities were exercised. A reconciliation of shares used to compute EPS is shown below.
| For the years ended December 31, | ||||||||||
| (in thousands, except per share amounts) | 2006 | 2005 | 2004 | |||||||
Net income (loss) | $ | 16,811 | $ | 12,175 | $ | (2,693 | ) | |||
Basic earnings (loss) per share: | ||||||||||
Weighted average shares outstanding | 14,713 | 12,722 | 12,571 | |||||||
Basic earnings (loss) per share | $ | 1.14 | $ | 0.96 | $ | (0.21 | ) | |||
Diluted earnings (loss) per share: | ||||||||||
Weighted average shares outstanding | 14,713 | 12,722 | 12,571 | |||||||
Dilutive shares resulting from common stock equivalents (1) | 451 | 242 | — | |||||||
Shares used in computing diluted earnings (loss) per share | 15,164 | 12,964 | 12,571 | |||||||
| �� | ||||||||||
Diluted earnings (loss) per share | $ | 1.11 | $ | 0.94 | $ | (0.21 | ) | |||
| (1) | Given the Company’s loss for the year ended December 31, 2004, Diluted EPS is the same as Basic EPS as all common stock equivalents would be antidilutive. Accordingly, the dilutive effect of 315 shares resulting from stock equivalents in 2004 is not included. For the years ended December 31, 2006 and 2005, the dilutive effect of 194 and 353 shares, respectively, resulting from common stock equivalents was not included as the result would be antidilutive. |
F-15
Table of Contents
Note 4: PROPERTY AND EQUIPMENT
Property and equipment consists of the following:
| December 31, | ||||||||
| (in thousands) | 2006 | 2005 | ||||||
Communications and computer equipment | $ | 150,818 | $ | 129,519 | ||||
Furniture and fixtures | 29,964 | 27,205 | ||||||
Leasehold improvements | 29,022 | 21,672 | ||||||
| 209,804 | 178,396 | |||||||
Less—Accumulated depreciation and amortization | (148,137 | ) | (121,472 | ) | ||||
| $ | 61,667 | $ | 56,924 | |||||
Note 5: GOODWILL AND OTHER ASSETS
Goodwill and other assets consist of the following:
| December 31, | ||||||
| (in thousands) | 2006 | 2005 | ||||
Goodwill | $ | 12,862 | $ | 3,477 | ||
Other Assets | ||||||
Deposits | $ | 2,692 | $ | 2,042 | ||
Other intangible assets, net of accumulated amortization of $1,202 and $836 | 2,341 | 612 | ||||
Non-current deferred costs | 856 | 375 | ||||
Deferred financing costs, net of accumulated amortization of $1,317 and $1,136 | 628 | 809 | ||||
| $ | 6,517 | $ | 3,838 | |||
On November 30, 2006, we purchased the stock of Proyectar Connect S.A., a company located in Argentina that provides inbound and outbound customer support services. Management expects this acquisition to further strengthen our market position in Central and South America. In addition to providing a base for further expansion in this region, we also anticipate using this operation to provide cost-effective offshore bilingual English/Spanish support services for the U.S. market and potentially multi-lingual support services for clients and prospects in Europe. This transaction was accounted for as a purchase business combination, and accordingly, the results of operations and cash flows of the business acquired are included in the accompanying consolidated financial statements from the date of acquisition. Pro forma combined results of operations are not presented since the results of operations as reported in the accompanying consolidated financial statements would not be materially different.
F-16
Table of Contents
The cash paid was $11.0 million, including transaction costs and net of cash acquired. There was $9.4 million of goodwill recorded in connection with this acquisition along with estimated intangible assets of $2.0 million. Because this was an acquisition of stock, none of the recorded intangibles are deductible for Argentine tax purposes. The purchase price allocation associated with this transaction is currently preliminary and is shown below:
| (in thousands) | ||||
Accounts receivable | $ | 1,533 | ||
Property and equipment | 717 | |||
Customer relationship | 2,000 | |||
Non-compete | 30 | |||
Goodwill | 9,351 | |||
Other assets | 70 | |||
Deferred income taxes | (711 | ) | ||
Liabilities assumed | (2,035 | ) | ||
Cash paid, net of cash acquired of $241 | $ | 10,955 | ||
In connection with this transaction, we may pay additional cash consideration of up to $4.0 million contingent upon the achievement of specific financial goals for the twelve months ending May 31, 2007. Any additional consideration paid will be recorded as additional goodwill.
With respect to the intangibles, the non-compete intangibles are being amortized on a straight-line basis over their stated terms of three years and the customer relationship intangible is being amortized over a four-year period. Our purchase price allocation is preliminary, pending the finalization of our intangible asset valuation.
On April 5, 2004, we purchased the assets and assumed certain liabilities of DPS Data Group LLC (DPS). DPS provides various back-office administrative and data entry services for customers in the financial services industry. Management believes the service offerings of DPS complement the business services we currently offer to our customers. This transaction was accounted for as a purchase business combination, and accordingly, the results of operations and cash flows of the business acquired are included in the accompanying consolidated financial statements from the date of acquisition. Pro forma combined results of operations are not presented since the results of operations as reported in the accompanying consolidated financial statements would not be materially different.
The cash paid was $3.0 million, including transaction costs. There was $2.0 million of goodwill recorded in connection with this acquisition along with identified intangible assets of $820,000. The entire amount of goodwill is expected to be deductible for tax purposes. The purchase price allocation associated with this transaction is shown below:
| (in thousands) | ||||
Accounts receivable | $ | 270 | ||
Property and equipment | 120 | |||
Customer relationship | 740 | |||
Non-compete | 80 | |||
Goodwill | 2,027 | |||
Other assets | 7 | |||
Liabilities assumed | (233 | ) | ||
Cash paid | $ | 3,011 | ||
In connection with this transaction, there was additional consideration that was contingent upon the achievement of specific financial goals for 2004. The goals were not attained and no amounts were paid out under this agreement.
F-17
Table of Contents
With respect to the intangibles, the non-compete intangibles are being amortized on a straight-line basis over their stated terms of six years and the customer relationship intangible is being amortized over a seven-year period.
On March 31, 2005, we made an additional payment of $178,000 relating to the acquisition of Grupo TeleInter, S.A. de C.V., which we had acquired in October 2002. This final payment, which was based on a contingent payment provision in the purchase agreement, was recorded as additional goodwill.
Our intangible assets, other than goodwill, and the related accumulated amortization and net book value are as follows.
| December 31, | ||||||||
| (in thousands) | 2006 | 2005 | ||||||
Customer-related | $ | 3,433 | $ | 1,368 | ||||
Non-compete agreements | 110 | 80 | ||||||
| 3,543 | 1,448 | |||||||
Less: Accumulated amortization | (1,202 | ) | (836 | ) | ||||
| $ | 2,341 | $ | 612 | |||||
Amortization expense was $344,000, $341,000 and $303,000 for the years ended December 31, 2006, 2005 and 2004, respectively. The estimated amortization expense for intangible assets derived from business combinations for fiscal years 2007, 2008, 2009, 2010 and 2011 is $648,000, $605,000, $580,000, $500,000 and $8,000, respectively.
Deferred financing costs represent costs we incurred in renewing our Credit Facility (see Note 8). These costs are being amortized on a straight-line basis as interest expense over the five-year term of the agreement.
Note 6: ACCRUED EXPENSES AND OTHERCURRENT LIABILITIES
Accrued expenses and other consists of the following:
| December 31, | ||||||
| (in thousands) | 2006 | 2005 | ||||
Payroll and related benefits | $ | 15,854 | $ | 12,534 | ||
Due to customer | — | 6,632 | ||||
Current portion of restructuring (Note 18) | 319 | 352 | ||||
Telecommunications expense | 164 | 1,177 | ||||
Sales and VAT taxes | 493 | 686 | ||||
Accrued facilities | 401 | 496 | ||||
Deferred revenue | 4,805 | 7,611 | ||||
Other | 470 | 1,410 | ||||
| $ | 22,506 | $ | 30,898 | |||
The amount classified as due to customer represents amounts previously collected from a customer that were re-billed to other related entities of this customer at the request of the customer, in order to reflect a revised billing arrangement. This amount was collected by us prior to December 31, 2005, and was due back to the customer when all re-billed amounts were collected. These amounts were collected in full from the other parties and were paid back to the customer in the first half of 2006.
F-18
Table of Contents
Note 7: OTHER LIABILITIES
Other liabilities consist of the following:
| December 31, | ||||||
| (in thousands) | 2006 | 2005 | ||||
Non-current portion of restructuring (Note 18) | $ | 594 | $ | 932 | ||
Non-current deferred revenue | 1,221 | 535 | ||||
Accrued facilities | 1,582 | 1,246 | ||||
Other | 46 | 167 | ||||
| $ | 3,443 | $ | 2,880 | |||
Note 8: LINES OF CREDIT AND LONG-TERM DEBT
Our revolving credit facility (the Credit Facility) is structured as a $125.0 million secured revolving facility with a $5.0 million sub-limit for swing line loans and a $30.0 million sub-limit for multicurrency borrowings. The Credit Facility includes a $50.0 million accordion feature, which allows us to increase our borrowing capacity to $175.0 million, subject to obtaining commitments for the incremental capacity from existing or new lenders. The Credit Facility matures on June 24, 2010.
Borrowings under the Credit Facility can bear interest at various rates, depending upon the type of loan. We have two borrowing options, either a “Base Rate” option, under which the interest rate is calculated using the higher of the federal funds rate plus 0.5% or the Bank of America prime rate, plus a spread ranging from 0% to 0.75%, or a “Eurocurrency Rate” option, under which the interest rate is calculated using LIBOR plus a spread ranging from 1% to 2.25%. The amount of the spread under each borrowing option depends on our ratio of funded debt to EBITDA (which, for purposes of the Credit Facility, is defined as income before interest expense, interest income, income taxes, and depreciation and amortization and certain other charges). In April 2006, we repaid all outstanding amounts under the Credit Facility using proceeds from our equity offering (see Note 12). At December 31, 2006, we had no outstanding borrowings.
For the years ended December 31, 2006, 2005 and 2004, our interest expense related to our Credit Facility, exclusive of the amortization of debt issuance costs, was $710,000, $2.4 million and $1.5 million, respectively.
The Credit Facility contains certain affirmative and negative covenants including limitations on specified levels of consolidated leverage, consolidated fixed charges and minimum net worth requirements, and includes limitations on, among other things, liens, mergers, consolidations, sales of assets, incurrence of debt and capital expenditures. We are also required to pay a quarterly commitment fee ranging from 0.2% to 0.5% of the unused amount. Upon the occurrence of an event of default under the Credit Facility, such as non-payment or failure to observe specific covenants, the lenders would be entitled to declare all amounts outstanding under the facility immediately due and payable. As of December 31, 2006, we were in compliance with all covenants contained in the Credit Facility.
At December 31, 2006, we had $628,000 of unamortized debt issuance costs associated with the Credit Facility that are being amortized over the remaining term of the Credit Facility. At December 31, 2006, there were no outstanding foreign currency loans nor were there any outstanding letters of credit. The amount of the unused Credit Facility at December 31, 2006 was $125.0 million. The Credit Facility can be drawn upon through June 24, 2010, at which time all amounts outstanding must be repaid. Borrowings under the Credit Facility are collateralized with substantially all of our assets, as well as the capital stock of our subsidiaries.
F-19
Table of Contents
Note 9: INCOME TAXES
The components of income (loss) before income taxes are as follows:
| For the years ended December 31, | |||||||||||
| (in thousands) | 2006 | 2005 | 2004 | ||||||||
Domestic | $ | (1,401 | ) | $ | 11,011 | $ | 414 | ||||
Foreign | 20,100 | 5,297 | (4,741 | ) | |||||||
| $ | 18,699 | $ | 16,308 | $ | (4,327 | ) | |||||
The provision (benefit) for income taxes includes federal, state and foreign taxes payable and deferred taxes related to temporary differences between the financial statements and tax bases of assets and liabilities and operating loss and tax credit carryforwards. The components of the income tax provision (benefit) are as follows:
| For the years ended December 31, | ||||||||||||
| (in thousands) | 2006 | 2005 | 2004 | |||||||||
Current: | ||||||||||||
Federal | $ | (636 | ) | $ | 1,736 | $ | (625 | ) | ||||
State | (41 | ) | 66 | (7 | ) | |||||||
Foreign | 3,760 | (1,698 | ) | (1,183 | ) | |||||||
| 3,083 | 104 | (1,815 | ) | |||||||||
Deferred: | ||||||||||||
Federal | (1,224 | ) | 3,390 | 371 | ||||||||
State | 6 | 16 | 58 | |||||||||
Foreign | 23 | 623 | (248 | ) | ||||||||
| (1,195 | ) | 4,029 | 181 | |||||||||
| $ | 1,888 | $ | 4,133 | $ | (1,634 | ) | ||||||
The appropriate income tax effect of each type of temporary difference is as follows:
| (in thousands) | December 31, | |||||||
| 2006 | 2005 | |||||||
Deferred tax assets: | ||||||||
Accruals and reserves not currently deductible for tax | $ | 4,192 | $ | 3,702 | ||||
Federal tax credits | 2,002 | 1,719 | ||||||
State net operating loss carryforwards | 3,194 | 1,686 | ||||||
Foreign net operating loss carryforwards | 10,323 | 7,679 | ||||||
Other | 873 | — | ||||||
Total deferred tax assets | 20,584 | 14,786 | ||||||
Valuation allowance | (14,229 | ) | (10,548 | ) | ||||
Total deferred tax assets, net of valuation allowance | 6,355 | 4,238 | ||||||
Deferred tax liabilities: | ||||||||
Prepaid expenses | 2,754 | — | ||||||
Depreciation and amortization | 1,598 | 2,228 | ||||||
Total deferred tax liabilities | 4,352 | 2,228 | ||||||
Net deferred tax assets | $ | 2,003 | $ | 2,010 | ||||
F-20
Table of Contents
State Net Operating Losses:
A portion of our deferred tax asset relates to the income tax effect of net operating loss (NOL) carryforwards for state tax purposes. Management does not believe it is more likely than not that these assets will be realized. Accordingly, the Company has recorded a valuation allowance of $3.2 million against these assets. This valuation allowance reflects an additional amount of $1.6 million that was recorded in 2006. The state net operating loss carryforwards expire at various dates between 2007 and 2026.
Foreign Net Operating Losses:
At December 31, 2006, we have $34.4 million of NOL carryforwards for tax purposes relating to our subsidiary in Australia and our operation in the United Kingdom, which is a branch of the U.S. entity for tax purposes. The Australian NOLs are $9.2 million and do not expire under Australian tax law and can be carried forward to offset taxable income in future years. Management has evaluated the expected utilization of these carryforwards and determined that it was more likely than not that the Australian carryforwards will not be utilized. Accordingly, we have recorded a full valuation allowance of $2.8 million against these deferred tax assets. Our U.K. branch is part of our U.S. consolidated tax group. Accordingly, we have been able to utilize the NOLs generated by our U.K. branch to offset taxable income in the U.S. At December 31, 2006, the total NOLs accumulated by our U.K. branch were $25.2 million. Management has evaluated the expected utilization of these carryforwards and determined that it was more likely than not that the U.K. carryforwards will not be utilized. Accordingly, we have recorded a full valuation allowance against these deferred tax assets. Our ability to realize any of our NOLs in the future will depend upon the Company’s ability to generate profits in the various tax jurisdictions to which they apply.
Federal Tax Credits:
At December 31, 2006, we had $2.0 million of work opportunity tax credits that we earned in 2003, 2005 and 2006. Management expects to amend a prior year return and utilize these credits to offset taxable income or will carryforward these credits and apply them to a future taxable year. Accordingly, there is no valuation allowance placed against these credits.
Also, as of December 31, 2006, we had received payments of $366,000 for federal tax credits relating to research and development efforts for the 2001 fiscal period. We have also filed claims for credits covering 2002 and 2005. During 2005, the Internal Revenue Service denied our claim for the credits associated with our 2000 tax year. While we plan to appeal, we have determined that any cash received from claims filed during the normal course of business should be fully reserved until the claim is either audited or the statute of limitations expires. Therefore, we have not recorded any tax benefits from these claims. These federal tax credits expire between 2022 and 2025.
There are no valuation allowances recorded for any other deferred tax assets. Although realization is not assured, Management believes it is more likely than not that the remaining deferred tax assets will be realized. The amount of the deferred tax asset considered realizable, however, could be reduced in the future, if estimates of future taxable income are reduced.
Foreign Subsidiaries:
At December 31, 2006, there were approximately $34 million of accumulated undistributed earnings of non-U.S. subsidiaries that are considered to be permanently reinvested. A deferred tax liability will be recognized when we are no longer able to demonstrate that we plan to permanently reinvest undistributed earnings. If such earnings were remitted to the parent company, applicable U.S. federal income and foreign withholding taxes may be partially offset by foreign tax credits.
F-21
Table of Contents
We have been granted various income tax holidays as an incentive to attract foreign investment by the governments of the Philippines and Costa Rica. Generally, an income tax holiday is an agreement between the Company and a foreign government under which the Company receives certain tax benefits in that country, such as exemption from taxation on profits derived from export related activities. In the Philippines, we are registered under the Philippines Economic Zone Authority (PEZA) and have been granted three separate agreements. The agreements expire in 2007, 2010 and 2012, respectively. Currently, Philippine law does allow for extensions of the PEZA tax exemptions. Therefore, we intend to apply for those extensions as our current exemptions expire. Our operation in Costa Rica is located in a Free Trade Zone, which provides exemptions from income taxes for a four-year period, ending in mid-2010. We then have a partial tax holiday for an additional four years through mid-2014. We do not have any other tax holidays in the jurisdictions in which we operate. The income tax benefit in 2006 attributable to the tax status of our Philippine subsidiary was approximately $5.0 million or $0.33 per diluted share. The income tax benefit attributable to the tax status of our Costa Rica subsidiary was insignificant.
In 2005, we completed a reorganization of our Philippine operations. The primary purpose of the reorganization was to obtain flexibility with respect to investments in our Philippine operations. From 2003 through the time of the reorganization, the profits earned in the Philippines were considered Subpart F income for U.S. tax purposes. In 2005, approximately $4.7 million of profits in the Philippines was considered Subpart F income.
Tax Benefits Associated with Share-Based Awards:
In 2006, we recorded deferred tax benefits of $651,000 associated with share-based compensation recognized for financial reporting purposes. Depending on the Company’s stock price at the time options are exercised or restricted stock units vest, the actual tax deduction benefit we will receive may be less than the carrying amount of the previously recorded deferred tax asset. The difference or shortfall between the actual tax deduction benefit and the deferred tax asset recorded is reversed either through the income tax provision, resulting in additional income tax expense, or through a reduction of additional paid-in-capital (APIC) on the consolidated balance sheet. During 2006, there were no shortfalls recorded as a reduction of APIC. During 2005 and 2004, $272,000 and $235,000 of shortfalls were recorded as a reduction of APIC, respectively.
Effective Rate Reconciliation:
The reconciliation of the statutory federal income tax rate to our effective income tax rate is as follows:
| For the years ended December 31, | |||||||||
| 2006 | 2005 | 2004 | |||||||
Federal statutory tax rate | 34.0 | % | 34.0 | % | 34.0 | % | |||
State income taxes, net of federal tax benefit | (0.1 | ) | 0.1 | (1.0 | ) | ||||
Difference between U.S. and non-U.S. rates | (26.7 | ) | (21.9 | ) | 4.3 | ||||
Subpart F income | 1.3 | 9.7 | — | ||||||
Tax credits and other | (2.2 | ) | (5.0 | ) | 21.9 | ||||
Valuation allowance | 3.3 | 6.8 | (21.7 | ) | |||||
Permanent differences | 0.5 | 1.6 | 0.3 | ||||||
| 10.1 | % | 25.3 | % | 37.8 | % | ||||
Note 10: PROFIT SHARING PLAN
We maintain a trusteed profit sharing plan (Section 401(k)) for all qualified employees, as defined. The Company matches 50% of employee contributions, up to a maximum of 6% of the employee’s compensation;
F-22
Table of Contents
however, it may also make additional contributions to the plan based upon profit levels and other factors. No such additional contributions were made in 2006, 2005 or 2004. Employees are fully vested in their contributions, while full vesting in the Company’s contributions occurs upon death, disability, retirement or completion of five years of service. In 2006, 2005 and 2004, the Company’s contributions were $993,000, $811,000 and $728,000, respectively. The plan’s trustees are the Management of the Company.
We also maintain a Non-Qualified Deferred Compensation Plan for certain employees. This plan allows certain employees to defer a portion of their compensation on a pre-tax basis. Employees are fully vested in their deferred amounts, but withdrawals are not permitted until the plan is terminated, the employee attains age 65, or the employee terminates, becomes disabled, or dies or upon lapsing of any deferral elections made by the employee. Other withdrawals are permitted for unforeseeable emergencies only. In 2006, 2005 and 2004, the Company matched 10% of employee deferrals, up to certain limits with vesting of Company matching contributions occurring ratably over three years. The amount matched totaled $113,000, $39,000 and $111,000 in 2006, 2005 and 2004, respectively.
Note 11: EQUITY PLANS AND SHARE-BASED COMPENSATION
We have share-based compensation plans covering a variety of employee groups, including executive Management, the Board of Directors and other full-time employees.
Equity Plans:
The ICT Group, Inc. 1996 Equity Compensation Plan (the 1996 Plan) authorized up to 2,220,000 shares of common stock for issuance in connection with the granting to employees and consultants of incentive and nonqualified stock options, restricted stock, restricted stock units (RSU), stock appreciation rights and other awards based on our common stock. The awards are established by the Compensation Committee of the Board of Directors (the Compensation Committee).
On May 17, 2006, our shareholders approved an amendment and restatement of the 1996 Plan. The amended and restated 1996 Plan is known as the ICT Group, Inc. 2006 Equity Compensation Plan (the 2006 Plan). The 2006 Plan revises the 1996 Plan to (i) provide for the term of the 2006 Plan to be through May 16, 2016; (ii) expand the individuals eligible to receive grants under the 2006 Plan to include non-employee directors; (iii) prohibit the repricing of options unless the shareholders approve the repricing; (iv) allow the Compensation Committee to permit or require deferrals under the 2006 Plan; (v) allow grantees to transfer nonqualified stock options to family members or one or more trusts or entities for the benefit of or owned by such family members; and (vi) make other clarifying and updating changes. As of December 31, 2006, 672,046 shares of common stock were available for issuance under the 2006 Plan.
The ICT Group, Inc. 1996 Non-Employee Directors Plan (the 1996 Directors Plan) authorized up to 250,000 shares of common stock for issuances of nonqualified stock options and RSUs to non-employee directors. On May 17, 2006, our shareholders approved an amendment and restatement of the 1996 Directors Plan. The amended and restated 1996 Directors Plan is known as the ICT Group, Inc. 2006 Non-Employee Directors Plan (the 2006 Directors Plan). The 2006 Directors Plan revises the 1996 Directors Plan to (i) extend the term of the plan to May 16, 2016; (ii) remove the provisions relating to formula stock option grants; (iii) provide for the annual grant of RSUs; (iv) provide for the discretion to grant stock awards; and (v) make other clarifying and updating changes. As of December 31, 2006, 115,000 shares of common stock were available for issuance under the 2006 Directors Plan.
Share-Based Compensation:
The consolidated statements of operations for the year ended December 31, 2006, reflects share-based compensation expense of $1.9 million related to our stock options awards and RSU awards, as described below.
F-23
Table of Contents
The deferred income tax benefit recorded related to share-based compensation expense for the year ended December 31, 2006 was $651,000. We normally issue new shares to satisfy option exercises and the vesting of RSUs under our plans. The following table summarizes our share-based compensation for 2006, by award-type:
| (in thousands) | For the year ended December 31, 2006 | ||
Share-based compensation: | |||
Stock options | $ | 528 | |
RSUs | 1,421 | ||
Total share-based compensation | $ | 1,949 | |
Long-Term Incentive Plan:
On May 17, 2006, our shareholders approved the ICT Group, Inc. Long-Term Incentive Plan (the LTIP). Shareholder approval was sought so that the compensation attributable to incentive awards under the LTIP may qualify for an exemption from the $1.0 million deduction limit under section 162(m) of the Internal Revenue Code of 1986, as amended (the Code).
The LTIP provides for both a performance-based incentive and an executive retention incentive. The LTIP first establishes a performance-based incentive by requiring achievement of specific annual financial targets over a three-year period in order to determine the ultimate value of an award under the LTIP. The Compensation Committee determines what portion of an award is payable in cash and what portion is payable through an RSU award. Because the number of RSUs to be awarded depends on the price of the Company’s stock at the date the performance level is determined and the award, if any, is made by the Compensation Committee, we do not have a grant date for accounting purposes until the number of RSUs is known. Therefore, the LTIP will be liability-classified until the RSUs are awarded and a grant date is established. The Compensation Committee may impose a vesting schedule with respect to any award under the LTIP, which provides an additional executive retention incentive. All equity awards under the LTIP will be issued under the 2006 Plan. For the year ended December 31, 2006, we recognized no compensation expense pursuant to the LTIP since the minimum incentive targets, as defined by the LTIP, were not achieved for fiscal year 2006. All compensation expense relating to the LTIP is based on Management’s best estimate at that time as to what financial targets will be achieved. This estimate is re-evaluated quarterly and adjusted to reflect Management’s then best estimate.
Stock Option Awards:
Stock option awards are available under our current existing equity plans, which are described above. Stock options are granted with exercise prices not less than the fair market value of the underlying common stock on the date of grant. Options are exercisable for periods not to exceed ten years, as determined by the Compensation Committee, and generally vest over a three- or four-year period. Vesting terms can vary, however, stock option awards typically have a graded vesting schedule, based solely on continued service of the award holder. For these types of awards, we have made an accounting policy decision to recognize compensation expense based on the grant date fair value of the award on a straight-line basis over the requisite service period, which for these awards is the vesting period. None of the stock options granted to date have performance-based or market-based vesting conditions.
The fair value for each option grant is determined on the date of grant using the Black-Scholes option-pricing model. The Black-Scholes valuation model requires the input of various assumptions. We have relied on observations of historical stock prices to calculate our estimate of volatility. The risk free interest rates used were actual U.S. treasury zero-coupon securities with maturity terms that approximated the expected term of the option as of the date of grant. The expected term of the option represents the period of time the option is expected
F-24
Table of Contents
to be outstanding and is estimated based on our historical exercise patterns. The following assumptions were used for grants made during years ended December 31, 2006, 2005 and 2004.
| For the years ended December 31, | |||||||||
| 2006 | 2005 | 2004 | |||||||
Expected dividend yield | 0.0 | % | 0.0 | % | 0.0 | % | |||
Volatility | 68 | % | 67 | % | 63 | % | |||
Risk free interest rate | 5.12 | % | 4.26 | % | 4.35 | % | |||
Expected life | 6.7 years | 7.6 years | 8 years | ||||||
The weighted average fair value of the options granted during the years ended December 31, 2006, 2005 and 2004 was estimated at $16.25, $7.03 and $8.01, respectively.
Aggregated information regarding stock options outstanding is summarized below.
| Shares | Weighted Average Exercise Price | Weighted Average Remaining Contractual Term | Aggregate Intrinsic Value | ||||||||
Outstanding, January 1, 2004 | 1,355,838 | $ | 7.97 | ||||||||
Granted | 57,560 | 11.35 | |||||||||
Exercised | (163,000 | ) | 2.08 | ||||||||
Canceled/forfeited | (31,185 | ) | 12.88 | ||||||||
Outstanding, December 31, 2004 | 1,219,213 | 8.78 | |||||||||
Granted | 144,000 | 9.99 | |||||||||
Exercised | (143,650 | ) | 1.45 | ||||||||
Canceled/forfeited | (55,275 | ) | 13.55 | ||||||||
Outstanding, December 31, 2005 | 1,164,288 | 9.61 | |||||||||
Granted | 26,000 | 23.22 | |||||||||
Exercised | (591,038 | ) | 8.76 | ||||||||
Canceled/forfeited | (5,505 | ) | 17.94 | ||||||||
Outstanding, December 31, 2006 | 593,745 | $ | 10.97 | 5.2 years | $ | 12,250,228 | |||||
Vested and exercisable at December 31, 2006 | 471,145 | $ | 10.55 | 4.4 years | $ | 9,917,277 | |||||
Expected to vest as of December 31, 2006 | 587,615 | $ | 10.95 | 5.2 years | |||||||
The aggregate intrinsic value in the table above represents the total pre-tax intrinsic value that would have been received by the option holders had all the option holders exercised their options on December 31, 2006. The intrinsic value for each stock option is measured as the difference between the closing stock price on the last trading day of the year and the exercise price.
The total aggregate intrinsic value of options exercised during the years ended December 31, 2006, 2005 and 2004 was $11.5 million, $188,000 and $299,000, respectively. Cash received from the exercises during the years ended December 31, 2006, 2005 and 2004 was $5.2 million, $209,000 and $339,000. The current year proceeds are included within the financing activity section of our consolidated statements of cash flows.
F-25
Table of Contents
The following table summarizes information about stock options outstanding as of December 31, 2006.
| Options Outstanding | Options Exercisable | |||||||||||||
Range of Exercise Price | Vested | Unvested | Weighted Average Remaining Life | Weighted Average Exercise Price | Number Exercisable | Weighted Average Exercise Price | ||||||||
$3.40 to $5.00 | 78,400 | — | 1.9 | $ | 3.76 | 78,400 | $ | 3.76 | ||||||
$5.01 to $10.00 | 105,250 | 79,850 | 6.5 | 9.03 | 105,250 | 8.65 | ||||||||
$10.01 to $15.00 | 206,495 | 20,750 | 4.9 | 11.65 | 206,495 | 11.56 | ||||||||
$15.01 to $20.00 | 73,500 | 8,000 | 5.6 | 16.70 | 73,500 | 16.69 | ||||||||
$20.01 to $25.00 | 7,500 | — | 5.4 | 20.27 | 7,500 | 20.27 | ||||||||
$25.01 to $27.75 | — | 14,000 | 9.4 | 27.49 | — | — | ||||||||
$3.40 to $ 27.75 | 471,145 | 122,600 | 5.2 | 10.97 | 471,145 | 10.55 | ||||||||
As of December 31, 2006, there was $591,000 of unrecognized compensation expense related to non-vested stock options that is expected to be recognized over a weighted-average period of 1.8 years.
Restricted Stock Units:
During the first quarter of 2006, we began issuing RSUs for incentive compensation purposes. Historically, stock options were used as the equity award vehicle under our incentive compensation plans. We expect future equity awards to be predominantly in the form of RSUs. RSU awards can have performance conditions, service conditions or both. Similar to stock option awards, vesting terms can vary for RSUs. For RSU awards with a graded vesting schedule and with only service conditions, we recognize compensation expense based on the grant date fair value of the award on a straight-line basis over the vesting period. The fair value of an RSU is the fair value of the Company’s common stock (closing market price) on the date of grant.
To the extent an RSU award has performance conditions and graded vesting, we will treat each vesting tranche as an individual award and recognize compensation expense on a straight-line basis over the requisite service period for each tranche. The requisite service period over which we will record compensation expense is a combination of the performance period and subsequent vesting period based on continued service.
The following table summarizes the changes in non-vested RSUs that have only service conditions for the year ended December 31, 2006.
| Shares | Weighted Average Grant Date Fair Value | Aggregate Intrinsic Value | |||||||
Non-vested RSUs at January 1, 2006 | — | — | |||||||
Granted | 161,796 | $ | 24.61 | ||||||
Vested | (4,180 | ) | 19.36 | ||||||
Canceled/forfeited | — | — | |||||||
Non-vested RSUs at December 31, 2006 | 157,616 | $ | 24.75 | $ | 1,078,093 | ||||
We recorded compensation expense of $835,000 for the year ended December 31, 2006, for RSU awards with only service conditions. As of December 31, 2006, all of the above non-vested RSUs are expected to vest. As of December 31, 2006, there was $3.3 million of unrecognized compensation expense related to non-vested RSUs that is expected to be recognized over a weighted average period of 2.1 years. The total aggregate fair value of RSUs that vested and were converted to shares of common stock during the year ended December 31, 2006 was $81,000.
F-26
Table of Contents
Included in the above table are 50,000 RSUs granted by the Company with only service conditions that are expected to be cash-settled upon vesting. Accordingly, compensation expense associated with these RSUs is not fixed and is marked-to-market based on the Company’s stock price at the end of each reporting period. As of December 31, 2006, $317,000 of expenses has been recognized for these RSUs, which has been recorded as a liability within accrued expenses and other current liabilities on our consolidated balance sheet.
We have also granted RSU awards with performance and time-based vesting conditions. The grant date fair value of these awards was $24.39 per RSU. Subject to meeting certain financial criteria for 2006, up to 100,000 RSUs could have been earned. Based on 2006 financial results, it was determined that 83,108 RSUs were earned, subject to the provision of future service. For the year ended December 31, 2006, we have recorded compensation expense of $586,000 for these RSUs. Since these performance-based RSUs have graded vesting, compensation expense will be recognized over the vesting period of each tranche as if it was a separate award. As of December 31, 2006, there was $1.4 million of unrecognized compensation expense to be recognized over a weighted average period of 1.7 years, assuming all 83,108 RSUs ultimately vest.
Similarly, we have granted RSU awards with performance and time-based vesting conditions relative to the Company’s 2007 financial performance. Subject to meeting certain financial criteria, up to 100,000 RSUs will be issued, subject to the provision of future service. The grant date fair value of these awards was also $24.39 per RSU. We have not recognized any compensation expense in 2006 associated with these RSUs as the performance period has not yet commenced.
Note 12: EQUITY OFFERING
In April 2006, we sold 2,350,000 shares of our common stock in a public offering. The equity offering was registered on our shelf registration statement on Form S-3. The underwriters in the transaction purchased the shares at a price of $22.74 per share, reflecting an underwriting discount of $1.26 per share from the $24.00 per share price to the public. The transaction generated $53.1 million of proceeds for the Company, net of underwriting discounts and offering costs. A portion of the proceeds was used to repay all amounts outstanding under the Credit Facility. The balance of the proceeds, or approximately $19 million, is being used for working capital and other general corporate purposes. The underwriting discount amounted to 5.25% of the gross proceeds. Offering costs totaled $385,000 and were comprised of the incremental costs directly attributable to the offering, including legal fees, accounting fees and printing fees. Both the underwriting discount and the offering costs were netted against the gross proceeds from the offering.
As part of this transaction, certain shareholders sold shares that were beneficially owned by them. These sales were also issued through our shelf registration statement. These shareholders sold 1,272,500 shares at $24.00 per share, less the underwriting discount of $1.26 per share. The Company received no proceeds from the sale of these shares.
F-27
Table of Contents
Note 13: COMMITMENTS AND CONTINGENCIES
Leases
We lease office facilities and certain equipment under operating leases. Rent expense was $24.4 million, $26.4 million and $26.0 million for the years ended December 31, 2006, 2005 and 2004, respectively. For the year ended December 31, 2006, our facilities leases represented 82% of all rent expense, with equipment leases comprising the other 18%. As of December 31, 2006, we do not have any equipment leases for which the term extends beyond 2010. As of December 31, 2006, future minimum rentals for all operating leases are as follows:
| (in thousands) | Total | Facilities | Equipment | ||||||
2007 | $ | 21,254 | $ | 17,218 | $ | 4,036 | |||
2008 | 14,809 | 14,058 | 751 | ||||||
2009 | 9,985 | 9,775 | 210 | ||||||
2010 | 6,986 | 6,981 | 5 | ||||||
2011 | 5,209 | 5,209 | — | ||||||
2012 and thereafter | 16,594 | 16,594 | — | ||||||
| $ | 74,837 | $ | 69,835 | $ | 5,002 | ||||
Telecommunications Contracts
We enter into agreements, ranging from one to three years, with our telephone long-distance carriers, which provide for, among other things, annual minimum purchases based on volume and termination penalties. Currently, we have contractual agreements with eight different carriers. Annual minimum purchases associated with these agreements are $6.5 million, $5.3 million and $100,000 for 2007, 2008 and 2009, respectively. We currently do not have any contracts with long-distance carriers extending into 2010.
Employment Agreements
We have renewable employment agreements with twelve key executives with terms ranging from one to three years. The agreements provide for, among other things, severance payments ranging from six months to three years.
Litigation
On April 28, 2006, a broker with whom we executed an agreement in June 2001 filed a Demand for Arbitration and Statement of Claim against us with the American Arbitration Association. The Demand alleged various contract, quasi-contract and tort claims against us arising out of commissions we allegedly owe this broker pursuant to the June 2001 agreement for work we perform for one of our customers. We filed an Answer to the Demand on June 14, 2006 denying the allegations. Since that time, the parties have engaged in discovery. On January 16, 2007, the broker filed an Amended Demand and an expert report estimating $1.1 million of commissions allegedly owed for work we already performed and estimating $5.6 million of future commissions for work he projects we might perform over the next seven years. We believe that we have paid this broker all amounts due under the June 2001 agreement, have denied the allegations of the Amended Demand, and intend to vigorously defend ourselves against the claims. On March 2, 2007, we filed a Motion for Partial Summary Judgment with the three person arbitration panel seeking judgment in our favor on the broker’s tort, unjust enrichment, punitive damages, interest and attorney’s fees claims, as well as on several of the broker’s contract claims, including the claim for future commissions. The arbitration hearing is currently scheduled for the end of May 2007. The June 2001 agreement states that the decision of a majority of the arbitration panel shall be final and binding on the parties. It is too early for us at this stage of the proceedings to determine the likelihood of an unfavorable outcome or to estimate the amount or range of possible loss.
In 1998, William Shingleton filed a class action lawsuit against us in the Circuit Court of Berkeley County, West Virginia. The lawsuit alleged that we and twelve current and former members of our Management had
F-28
Table of Contents
violated the West Virginia Wage Payment and Collection Act for failure to pay promised signing and incentive bonuses and wage increases, failure to compensate employees for short breaks or “transition” periods, production hours worked and improper deductions for the cost of purchasing telephone headsets.
On March 1, 2005, we announced a settlement with the plaintiffs to this litigation. Under the terms of the settlement, ICT agreed to pay $14.8 million to the plaintiff class to settle all allegations relating to unpaid wages, bonuses and other claims, as well as payments for liquidated damages allowed by West Virginia law, plus interest. Of the $14.8 million settlement payment that we made, $6.9 million was recovered from our insurance carriers during 2005. Our 2004 results reflect the accrual for the settlement amount partially offset by $2.7 million of insurance proceeds. Our 2005 results also reflect insurance proceeds of $4.2 million, offset by $604,000 of legal expenses that we incurred to complete the requirements set forth in the settlement. There is no contingent liability remaining for this litigation.
In addition to the above matters, from time to time, we are involved in litigation incidental to our business. Litigation can be expensive and disruptive to normal business operations. Accruals for litigation claims are provided to the extent that any losses are determined to be probable and estimable. Although the ultimate outcome of these claims or lawsuits cannot be ascertained, it is our opinion, based on present information and advice received from counsel, that the disposition or ultimate determination of such claims or lawsuits will not have a material adverse effect on our Company.
Note 14: SUPPLEMENTAL CASH FLOW INFORMATION
For the years ended December 31, 2006, 2005 and 2004, we paid interest of $1.1 million, $2.7 million and $1.4 million, respectively. For the years ended December 31, 2006, 2005 and 2004, we received income tax refunds, net of payments, of $1.7 million, $1.0 million and $1.5 million , respectively.
Note 15: CUSTOMER CONCENTRATION
The following table summarizes our revenue by industry. The loss of one or more of our major customers or an economic downturn in the financial services and insurance, telecommunications and technology, and healthcare industries could have a material adverse effect on our business.
| For the years ended December 31, | |||||||||
| 2006 | 2005 | 2004 | |||||||
Financial services and insurance | 49 | % | 51 | % | 52 | % | |||
Telecommunications and technology | 24 | % | 29 | % | 32 | % | |||
Healthcare | 20 | % | 13 | % | 10 | % | |||
Other | 7 | % | 7 | % | 6 | % | |||
For each of the years ended December 31, 2006 and 2005, there were no customers which comprised more than 10% of our revenue. For the year ended December 31, 2004, we had one customer, Virgin Mobile USA, LLC, who comprised 11% of our revenue. For the years ended December 31, 2006, 2005 and 2004, our top ten customers accounted for 48%, 48% and 50% of our total revenue, respectively.
Note 16: OPERATING AND GEOGRAPHIC INFORMATION
Based on guidance in SFAS No. 131, “Disclosures about Segments of an Enterprise and Related Information,” we believe that we have one reportable segment. Our services are provided through contact centers located throughout the world and include customer care management services as well as telesales, database marketing services, marketing research services, technology hosting services and data management and
F-29
Table of Contents
collection services on behalf of customers operating in our target industries. Technological advancements have allowed us to better control production output at each contact center by routing customer call lists to different centers depending on capacity. A contact center and the technology assets utilized by the contact center may have different geographic locations. Accordingly, many of our contact centers are not limited to performing only one of the above-mentioned services; rather, they can perform a variety of different services for different customers in different geographic markets.
The following table shows information by geographic area. For purposes of our disclosure, revenue is attributed to countries based on the location of the customer being served and property and equipment is attributed to countries based on physical location of the asset.
| For the years Ended December 31, | |||||||||
| (in thousands) | 2006 | 2005 | 2004 | ||||||
Revenue: | |||||||||
United States | $ | 347,319 | $ | 312,963 | $ | 254,566 | |||
Canada | 65,965 | 47,245 | 35,208 | ||||||
Other foreign countries | 34,628 | 41,126 | 35,755 | ||||||
| $ | 447,912 | $ | 401,334 | $ | 325,529 | ||||
| At December 31, | |||||||||
| (in thousands) | 2006 | 2005 | |||||||
Property and equipment, net: | |||||||||
United States | $ | 31,653 | $ | 32,797 | |||||
Canada | 7,651 | 9,753 | |||||||
Philippines | 14,044 | 8,936 | |||||||
Other foreign countries | 8,319 | 5,438 | |||||||
| $ | 61,667 | $ | 56,924 | ||||||
Note 17: DERIVATIVE INSTRUMENTS
We have operations in Canada, Ireland, the United Kingdom, Australia, Barbados, Mexico, Argentina, Costa Rica, India and the Philippines that are subject to foreign currency fluctuations. As currency rates change, translation of the statement of operations from local currencies to U.S. dollars affects year-to-year comparability of operating results.
Our most significant foreign currency exposures occur when revenue and associated accounts receivable are collected in one currency and expenses incurred to generate that revenue are paid in another currency. Our most significant area of exposure has been with the Canadian operations, where a portion of revenue is generated in U.S. dollars (USD) and the corresponding expenses are generated in Canadian dollars (CAD). We also experience foreign currency exposure in the Philippines, where the revenue is typically earned in USD, but operating costs are denominated in Philippine pesos (PHP). Recently, the PHP has experienced increased volatility with respect to the USD. As we continue to increase outsourcing to the Philippines, we will experience a greater degree of foreign currency exposure. We mitigate a portion of this exposure with foreign currency derivative contracts.
The foreign currency forward contracts and currency options that are used to hedge these exposures are designated as cash flow hedges. The gain or loss from the effective portion of the hedge is reported as a component of accumulated other comprehensive income in shareholders’ equity until settlement of the contract occurs. Settlement occurs in the same period that the hedged item affects earnings. Any gain or loss from the ineffective portion of the hedge that exceeds the cumulative change in the present value of future cash flows of the hedged item, if any, is recognized immediately in the consolidated statement of operations. For accounting
F-30
Table of Contents
purposes, effectiveness refers to the cumulative changes in the fair value of the derivative instrument being highly correlated to the inverse changes in the fair value of the hedged item.
For the years ended December 31, 2006, 2005 and 2004, we realized gains of $1.7 million, $278,000 and $390,000 on the derivative instruments, respectively. As of December 31, 2006, outstanding derivative instruments had a fair value of $252,000 of unrealized losses ($164,000 net of tax). As of December 31, 2005, outstanding derivative instruments had a fair value of $981,000 of unrealized gains ($637,000 net of tax). The outstanding derivative instruments at December 31, 2006, serve to hedge a portion of our foreign currency exposure denominated in CAD and PHP from January 2007 through December 2007.
In 2006, we also entered into a foreign exchange forward contract to reduce the effects of foreign currency fluctuations related to an $11.0 million intercompany note payable from our Netherlands subsidiary to a U.S. subsidiary. These gains and losses are recognized in earnings as the Company elected not to designate the contract as an accounting hedge. The gains and losses on this foreign exchange forward contract are expected to offset the foreign currency remeasurement gains and losses recorded on the note payable. The fair value of this contract was $104,000 as of December 31, 2006, and is recorded as a component of prepaid expenses and other current assets in the accompanying consolidated balance sheets.
Note 18: CORPORATE RESTRUCTURING
In December 2002, we announced a corporate restructuring and recorded an $8.9 million pre-tax restructuring charge in connection with a plan to reduce our cost structure by closing all or part of ten contact centers prior to the end of their existing lease terms. This charge included severance of $1.1 million, ongoing obligations associated with various real estate and equipment leases of $7.2 million, and the write-off of $573,000 of leasehold improvements, security deposits and certain property and equipment. A rollforward of the restructuring accrual is summarized as follows:
| (in thousands) | Severance | Lease Obligations and Facility Exit Costs | ||||||
Accrual at December 31, 2003 | $ | 6 | $ | 2,836 | ||||
Cash Payments | (6 | ) | (1,001 | ) | ||||
Accrual at December 31, 2004 | $ | — | 1,835 | |||||
Cash Payments | (551 | ) | ||||||
Accrual at December 31, 2005 | 1,284 | |||||||
Cash Payments | 371 | |||||||
Accrual at December 31, 2006 | $ | 913 | ||||||
During 2006, 2005 and 2004, we did not enter into any sublease arrangements nor did we negotiate any termination settlements for the facilities that remain under contract. The majority of cash payments made were related to the ongoing lease obligations. We continue to evaluate and update our estimate of the remaining liabilities. At December 31, 2006 and 2005, $594,000 and$932,000, respectively of the restructuring accrual is recorded in other liabilities in the consolidated balance sheet, which represents lease obligation payments and estimated facility exit cost payments to be made beyond one year. At December 31, 2006, the expiration date of the remaining facility lease is 2009. The balance of the restructuring accrual is included in accrued expenses and other current liabilities on our consolidated balance sheet at December 31, 2006 and 2005.
F-31
Table of Contents
Note 19: QUARTERLY FINANCIAL DATA (unaudited)
(In thousands except per share data)
| Quarter Ended | ||||||||||||||||||||||||
| March 31, | June 30, | September 30, | December 31, | |||||||||||||||||||||
| (in thousands) | 2006 | 2005 | 2006 | 2005 | 2006 | 2005 | 2006 | 2005 | ||||||||||||||||
Revenue | $ | 113,053 | $ | 94,019 | $ | 111,339 | $ | 96,991 | $ | 106,357 | $ | 99,921 | $ | 117,163 | $ | 110,403 | ||||||||
Gross margin | 43,126 | 37,457 | 44,490 | 38,836 | 43,007 | 38,766 | 43,671 | 41,709 | ||||||||||||||||
Operating income | 4,120 | 2,007 | 4,935 | 3,151 | 4,936 | 7,760 | 4,868 | 5,854 | ||||||||||||||||
Income before income taxes | 3,496 | 1,520 | 4,942 | 2,492 | 5,177 | 7,104 | 5,084 | 5,192 | ||||||||||||||||
Net income | 2,762 | 1,064 | 3,904 | 1,744 | 5,043 | 5,472 | 5,102 | 3,895 | ||||||||||||||||
Diluted earnings per share | $ | 0.21 | $ | 0.08 | $ | 0.25 | $ | 0.14 | $ | 0.32 | $ | 0.42 | $ | 0.32 | $ | 0.30 | ||||||||
Quarterly Results and Seasonality
We have experienced, and expect to continue to experience, quarterly variations in operating results, principally as a result of the timing of programs conducted by new and existing clients (particularly programs with substantial amounts of upfront project set-up costs), and selling, general and administrative expenses to support the growth and development of existing and new business units.
Our business tends to be strongest in the fourth quarter due to the high level of client sales and service activity for the holiday season, while the first quarter often reflects a slowdown relating to the cessation of that activity. Currently, 74% of our revenue is being generated from service programs, which generally have less seasonality than sales programs. Typically, we experience higher call volumes and improved financial results during the second half of our fiscal year as compared to the first half.
Our results in the fourth quarter of 2006 were impacted by certain weather-related events and an earthquake in the Pacific Rim, both of which caused reduction in call center activity and fourth quarter profit. Partially offsetting these events were certain discrete income tax items, which reduced our effective income tax rate. Our results in the third quarter of 2006 benefited from a reduction in our effective tax rate due to certain discrete income tax items. Our results in the third quarter of 2005 included the receipt of $4.1 million in insurance proceeds related to the Shingleton litigation, and also reflected certain discrete income tax items, which had the effect of reducing our income tax provision in that quarter. Our fourth quarter 2004 results were impacted by the $7.7 million accrual for the settlement amount of the Shingleton litigation, partially offset by the receipt of $2.7 million of insurance proceeds.
F-32
Table of Contents
ICT GROUP, INC. AND SUBSIDIARIES
SCHEDULE II—VALUATION AND QUALIFYING ACCOUNTS
(in thousands) Description | Balance, Beginning of Year (2) | Charged to Expense/ Provision (2) | Deductions / Reversals (1) | Balance, End of Year | |||||||||
Allowance for doubtful accounts: | |||||||||||||
2006 | $ | 362 | $ | 475 | $ | (348 | ) | $ | 489 | ||||
2005 | $ | 439 | $ | 150 | $ | (227 | ) | $ | 362 | ||||
2004 | $ | 337 | $ | 205 | $ | (103 | ) | $ | 439 | ||||
Income tax valuation allowance: | |||||||||||||
2006 | $ | 10,548 | $ | 3,681 | $ | — | $ | 14,229 | |||||
2005 | $ | 9,156 | $ | 1,392 | $ | — | $ | 10,548 | |||||
2004 | $ | 5,788 | $ | 3,368 | $ | — | $ | 9,156 | |||||
| (1) | Amounts listed in this column relating to the allowance for doubtful accounts reflect balances that had been fully reserved and were written off during the year. |
| (2) | The amounts in these columns relating to the income tax valuation allowance have been adjusted to reflect valuation allowances that have historically been recorded against net operating losses incurred by ICT Group, Inc.’s U.K. Branch. |
F-33