 ICT Group Meeting for Investors and Analysts November 27, 2007 NASDAQ: ICTG Exhibit 99.1 |
 2 Company Statements This presentation contains certain forward-looking statements that are subject to risks and uncertainties. Forward-looking statements include without limitation forecasts of revenue, earnings, production hours and margins, migration of domestic work offshore, ICT Group’s ability to execute its business strategy and the achievement of the anticipated benefits of such strategy, as well as statements that are preceded by, followed by or include the words “believes,” “expects,” “estimates,” “anticipates,” “plans,” “should,” or similar expressions. For such statements, ICT Group claims the protection of the safe harbor for forward-looking statements contained in the Private Securities Litigation Reform Act of 1995. Actual events or results may differ materially from those discussed in the forward-looking statements as a result of various factors, including without limitation, those discussed in ICT Group’s annual report on Form 10-K for the year ended December 31, 2006 and other documents filed by ICT Group with the Securities and Exchange Commission. ICT Group makes no undertaking and disclaims any obligation to update such forward-looking statements. This presentation shows EBITDA for 1996, 2002, 2003, 2004, 2005 and 2007 exclusive of special charges. In 1996 the Company reported a pre-tax, nonrecurring, non-cash charge of $12.7M which was primarily associated with the granting of options, concurrent with the Company’s IPO, to replace certain previously granted expiring options. In 2002 the Company incurred special charges of $12.6M, pre-tax. This included charges of $8.9M, pre-tax, associated with the closing and scaling back of facilities and staff in the U.S. and Europe. It also included pre-tax charges of a $1.4M charge for a claim with an active client, a $1.7M charge for the costs associated with the defense of a class action litigation and a $0.6M charge for costs associated with a postponed underwritten public offering. In 2003, the Company incurred special charges of $4.7M, pre-tax associated with a class action litigation which were partially offset by a $0.7M partial reversal of a 2002 restructuring charge. In 2004, the Company incurred special charges of $10.3M, pre-tax associated with costs incurred to defend and the settlement of a class action litigation. In 2005, the Company received $4.2M of insurance recoveries and incurred $0.6M of litigation costs, pre-tax associated with the class action litigation. In the first nine months of 2007, the Company incurred pre-tax charges of $1.0M to settle a broker claim and $4.6M of restructuring charges, and expects to incur additional restructuring charges in the fourth quarter of 2007. |
 3 ICT Group Strategic Direction Overview John Brennan Vertical Market Dynamics Duffy Campbell North American Market Trends Jack Magee Offshore Migration of US Business Expansion of Canadian Business International Markets Guy Gray Marketing & Technology Services Tim Kowalski |
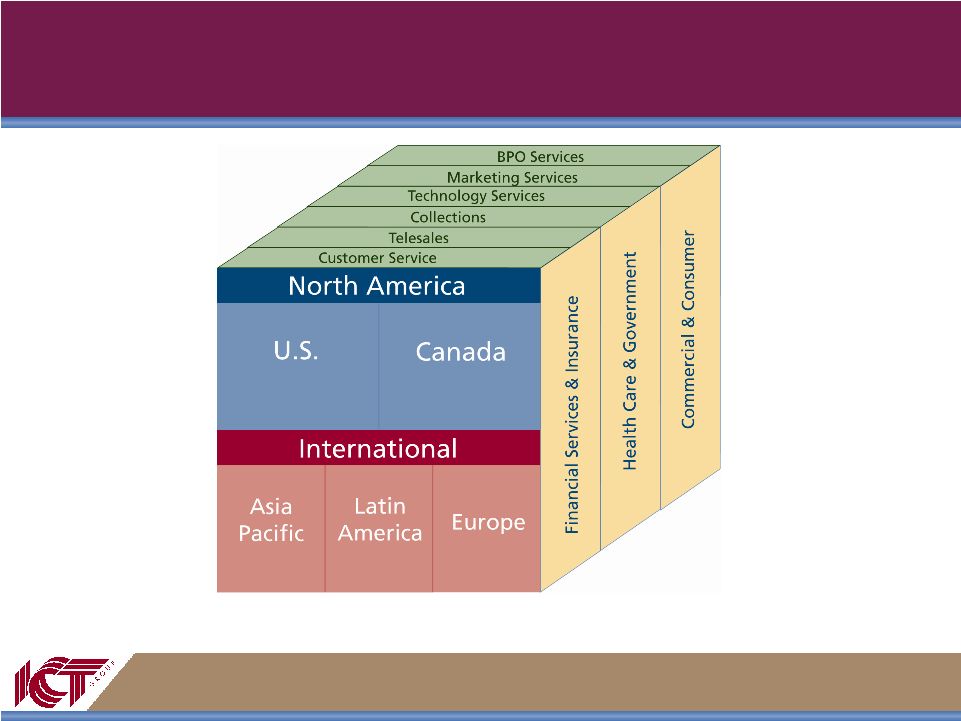 4 ICT Group Leading global provider of outsourced customer management services |
 5 Strong Revenue Growth in International Markets 2006 Actual Int'l. 8% Canada 14% U.S. 78% 2008 Forecast Int'l. 14% Canada 19% U.S. 67% * International includes Europe, Latin America and Asia Pacific |
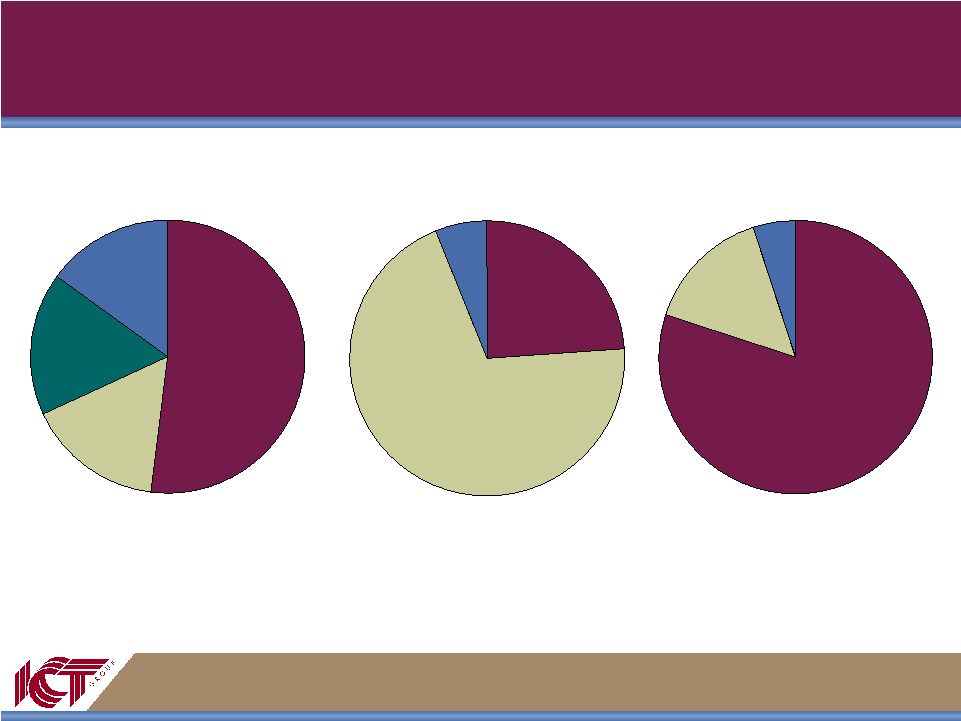 6 2007 Revenue By Vertical Differs By Country Other 15% Healthcare 17% Financial Services & Insurance 52% Other 6% Financial Services & Insurance 24% Financial Services & Insurance 80% Other 5% U.S. Canada International Communications 16% Communications 70% Communications 15% |
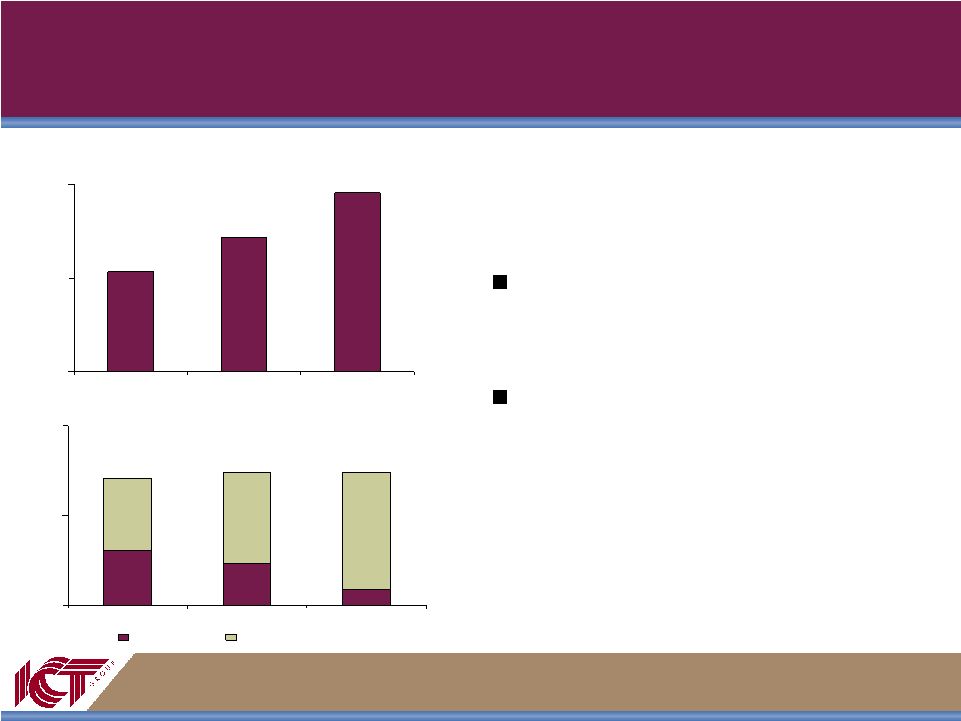
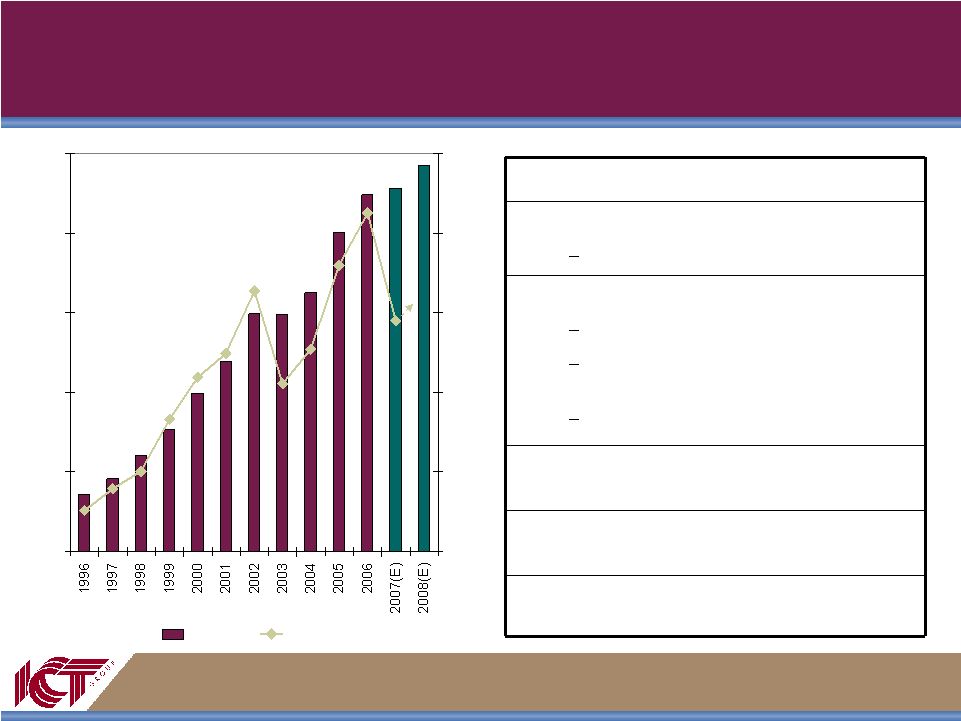
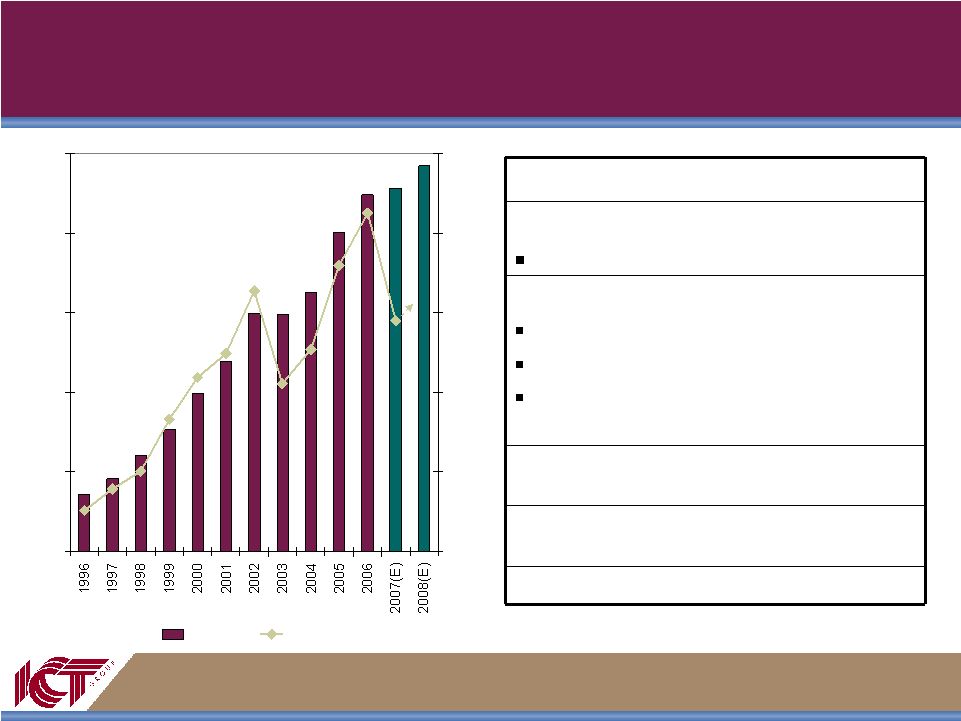 7 Expect to Return to Historical Financial Performance $0 $100 $200 $300 $400 $500 $0 $10 $20 $30 $40 $50 Revenue EBITDA Accelerated growth in BPO and related services Shifted Canadian capacity to support rapid business growth in Canada Aggressively downsized U.S. capacity in response to market demands Accelerated expansion of offshore operations Added 2,000 seats in the Philippines during 2007 Successfully transitioned major client program to Manila Developed additional capacity in Latin America Stabilized first quarter client issues Top 10 customers rated Very Good to Excellent 2007 Update |
 8 2008 Growth Strategies Continue migration of U.S. call production to higher margin, offshore facilities Accelerate revenue growth and profitability improvement in International markets Enhance higher margin value-added services |
 9 Vertical Market Dynamics |
 10 ICT Group Vertical Market Strategy Remain focused on key verticals Support varying offshore client requirements Enterprise sell across geographies Cross-sell value added services Other 12% Healthcare 20% Financial Services & Insurance 49% Healthcare 13% Other 10% Financial Services & Insurance 47% 2006 2008 Communications 30% Communications 19% |
 11 Financial Services – Market Trends Softness in certain segments being offset by growth in other segments Softness in certain U.S. segments: Credit card acquisition Mortgage origination Growth in: Product cross-selling Collections Offshore customer service and BPO International markets |
 12 Communications – Market Trends Expanded demand to support: Wireless Cable Internet access Satellite Most opportunities demand offshore solution but selected on-shore opportunities remain Business–to–Business Culturally unique services Achieving growth in International Markets |
 13 Healthcare – Market Trends Managed care business has leveled off after Medicare Part D bubble Maintaining strong position in pharmaceutical sector Expect increased cost pressure in all market segments will lead to outsourcing growth Plan to broaden Healthcare service base through BPO acquisitions |
 14 Emerging Vertical Markets Government Success with GSA, including First Contact purchasing vehicle Continued focus on Federal opportunities Energy Services U.S. opportunity is mostly with unregulated companies Stronger growth in International markets Retail & consumer products Consumer and wholesale club member support Inbound telesales ability complements our onshore / offshore customer service |
 15 North American Market Trends |
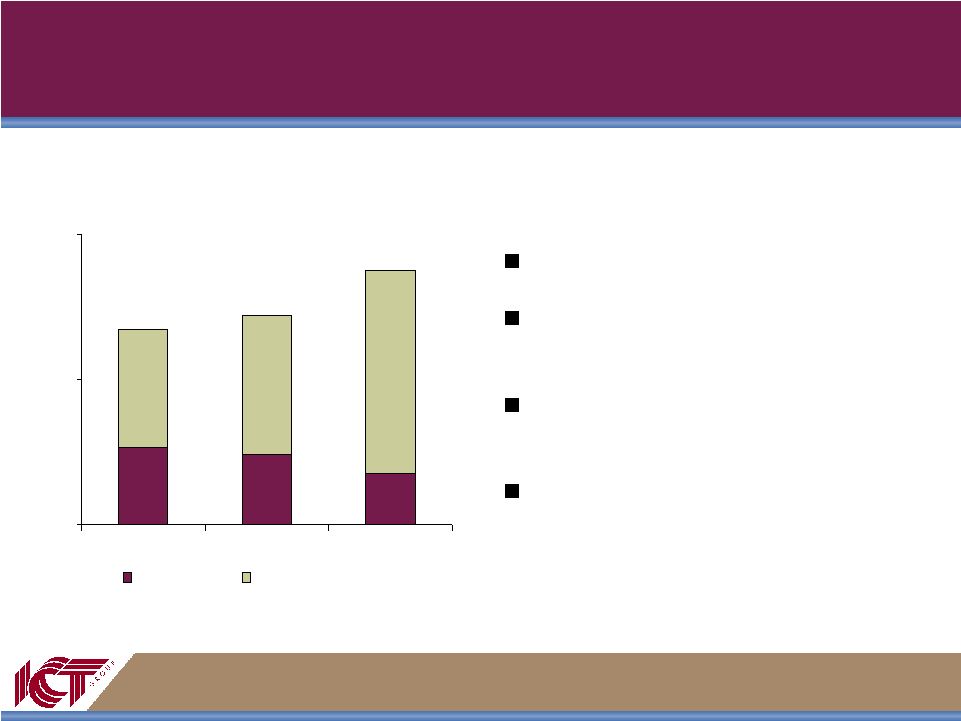
 16 U.S. Market Production Shifting Offshore Revenue 0 200 400 2006 2007 2008 U.S. Canada Philippines Latin America Production Hours 0 10 20 2006 2007 2008 U.S. Canada Philippines Latin America Migration to lower priced / cost offshore facilities has slowed U.S. revenue growth, but is leading to improved margins Offshore production is expected to reach to 65% in 2008, up from 33% in 2006 Canada’s declining share has resulted from currency shift and preference for offshore pricing Latin America being developed as an alternative offshore location for ICT clients |
 17 ICT Offshore Migration Varies By Vertical Offshore shift led by Financial Services Communications shifting offshore at an accelerated pace Healthcare and Government have not moved yet 0% 0% 0% Healthcare / Government 62% 39% 26% Communications 80% 65% 49% Financial Services 2008 2007 2006 Percentage U.S. Market Produced Offshore |
 18 Canada Revenue Growing Rapidly Revenue 0 60 120 2006 2007 2008 Canadian revenue growth driven by increased business from new and existing Canadian clients Canadian market has shown limited interest in offshore sourcing to date Canadian Production 0 3 6 2006 2007 2008 U.S. Clients Canadian Clients |
 19 International Markets |
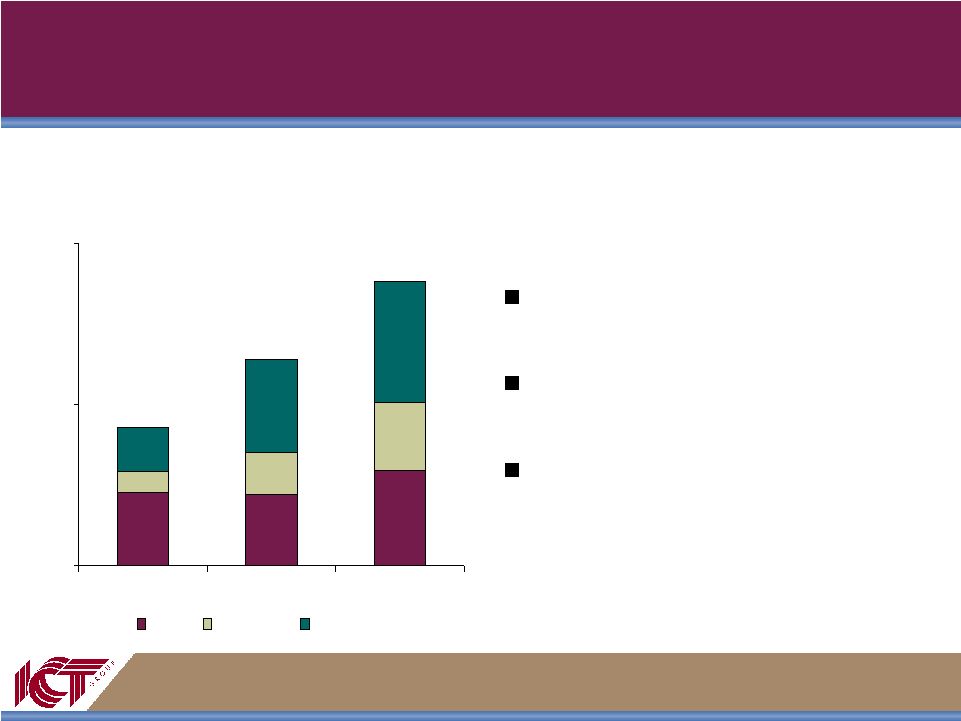 20 International Markets Showing Strong Growth Strong and growing outsourcing marketplace Leveraging global infrastructure and client relationships Creating new offshore options Revenue $0 $40 $80 2006 2007 2008 Europe Asia Pacific Latin America |
 21 Europe Revenue $0 $15 $30 2006 2007 2008 Primarily focused on the UK and Ireland Success in positioning offshore solutions: Canada, Philippines and Latin America Strong in Financial Services sector with increasing emphasis on other verticals Expanding product mix into BPO services |
 22 Asia Pacific Revenue $0 $10 $20 2006 2007 2008 New management team leading the turnaround Currently operating in the Australian market Opened second facility during 2007 Diversifying our applications and expanding our customer base Utilizing Philippines as an offshore solution |
 23 Latin America Revenue $0 $15 $30 2006 2007 2008 Acquired Mexico operation in 2002 One of our most profitable business units Expanding to a second facility in 2008 Supports Mexico and US clients Acquired Argentina operation in late 2006 Currently servicing the domestic market In 2008 will develop as a multilingual offshore solution for U.S. and Europe Established new regional management structure in 2007 |
 24 Marketing & Technology Services |
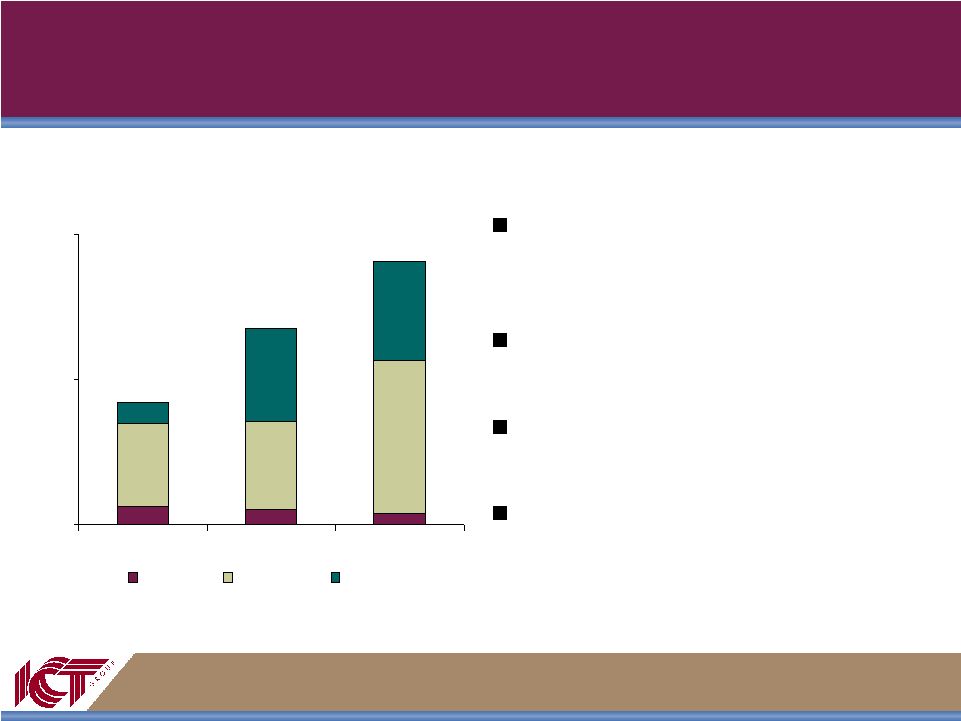
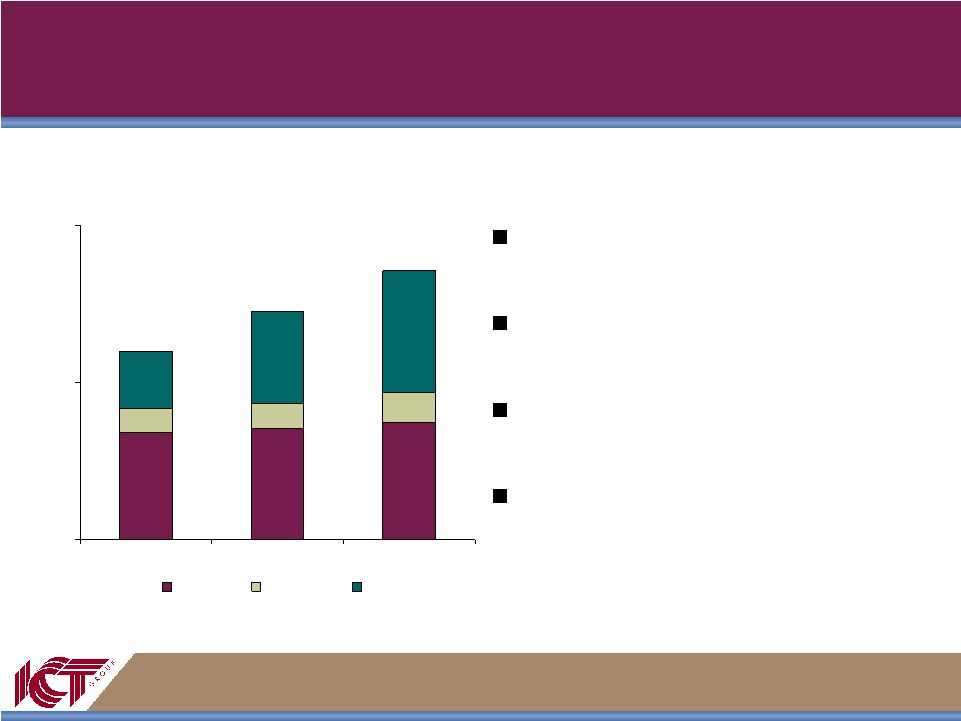 25 Marketing & Technology Services $0 $35 $70 2006 2007 2008 Marketing Technology BPO Continued growth of ICT Group’s value added / higher margin businesses Emphasis on cross-selling to existing customer base Introduced into International markets during 2007 Exploring expansion through acquisitions in our targeted verticals |
 26 Marketing Services Provide competitive differentiation and higher margins Production also shifting offshore Launched dedicated B2B business unit in 2007 Continued growth will further leverage offshore resources Production Hours 0 400 800 2006 2007 2008 North America Offshore |
 27 CRM Technology Services Operating margins in excess of 25% Evolution of CRM Technologies business into IVR services, particularly active alerts Competitive differentiation for IVR is ICT Group’s international capabilities Targeting Financial Services, Healthcare and Collections markets Revenue $0 $4 $8 2006 2007 2008 Hosted Services Inbound & Outbound IVR |
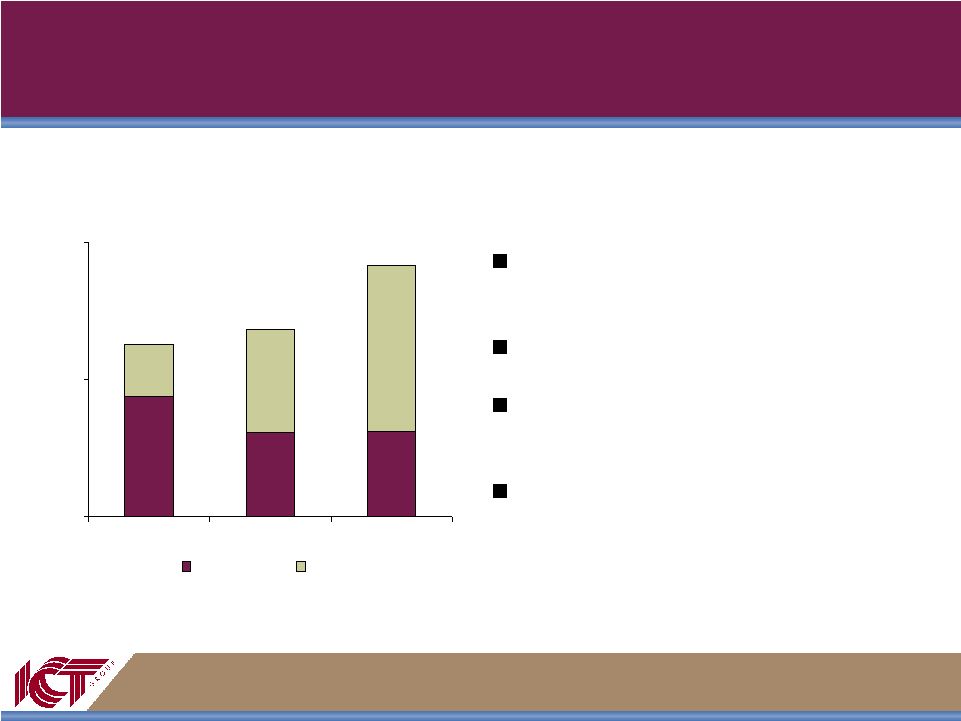
 28 BPO Services Progression of BPO Services toward providing higher value / higher margin services Exclusively offshore production, except for scanning / mail processing BPO programs yielding higher seat utilization Collections growth driven by relationships with major financial institutions Revenue $0 $15 $30 2006 2007 2008 Entry Level Value Added Collections |
 29 2008 Outlook |
 30 Positive Outlook for ICT Group $0 $100 $200 $300 $400 $500 $0 $10 $20 $30 $40 $50 Revenue EBITDA Continue organic BPO growth with potential for acquisitions Accelerate revenue growth and profitability of International markets Align North American capacity with projected 2008 demand Offshore migration will be leveling off Begin provincial development in the Philippines Add approximately 1,000 workstations in Philippines Expand Latin American alternatives Continue to improve customer relationships $40M new business sold in 3Q07 benefits 2008 2008 Expectations |
 31 Questions & Answers |