
| | |
Lewis J. Critelli President &Chief Executive Officer We strongly encourage you to read the financial section of this Annual Report for a more detailed analysis of our results. | We are truly pleased to report to you that your Company had a very solid financial performance in 2010 in what continues to be an inordinately challenging economic environment. Norwood Financial Corp had record earnings of $7,313,000 for the year ended December 31, 2010, an increase of $250,000 or 3.5% over the prior year. Earnings per share on a fully diluted basis were $2.64 in 2010 increasing from $2.55 in 2009. With the increase in earnings and our continued strong capital position, we declared cash dividends of $1.13 per share compared to $1.09 per share in 2009. This marks the nineteenth consecutive year of increased cash dividends for our stockholders. The return on average assets for the year was 1.37% with a return on average equity of 10.87%. Norwood ended the year with total assets of $537.0 million, loans receivable of $356.9 million, total deposits of $393.9 million and stockholders’ equity of $67.7 million. The Company’s capital position remains strong and is at the top level of its peer group in all measures of regulatory capital. Loans receivable totaled $356.9 million as of December 31, 2010, which is a slight decrease from 2009. The decline was due to sales of residential mortgage | | loans. During the year, the Company sold $12.4 million of fixed rate residential mortgages for purposes of interest rate risk management. This was partially offset by growth in commercial real estate loans. As a result of the continuing slowdown in the local economy, high unemployment levels and a soft real estate market, we spent a great deal of effort addressing credit quality issues. As of December 31, 2010, total non-performing loans were $4,079,000 and represented 1.14% of total loans compared to $5,015,000 or 1.38% as of December 31, 2009. Though our credit quality ratios remain strong, we still see the slow economic climate impacting our customers. Net charge-offs for the year totaled $837,000 compared to $465,000 in 2009. As of December 31, 2010, the allowance for loan losses totaled $5,616,000 and 1.57% of total loans, compared to $5,453,000 and 1.50% of total loans at December 31, 2009. For the year, net interest income (fully taxable equivalent) totaled $20,662,000, an increase of $790,000 or 4.0% over 2009. The net interest margin (fte) remained strong throughout the year and increased 1 basis point to 4.04%. We offset a decline in the yield on earning assets by reducing our cost of deposits and other borrowings. Other income for 2010 totaled $4,064,000 compared to $5,392,000 in 2009. The decrease was principally due to a lower level of earnings and receipts of proceeds on bank owned life insurance policies which totaled $391,000 in 2010 compared to $1,196,000 in 2009. The Company also had a $150,000 gain on the sale of deposits related to a branch closure in the 2009 period. The 2010 period includes $307,000 in gains on the sales of |
| $12.4 million of mortgage loans and the valuation of servicing rights compared to $481,000 in similar gains on $21.6 million of mortgage loan sales and servicing rights in the 2009 period. For the year ended December 31, 2010, other expense totaled $12,753,000 compared to $13,471,000 for the similar period in 2009, a decrease of $718,000. The decrease was due in part to lower FDIC insurance assessments which totaled $474,000 in 2010 compared to $710,000 in 2009, including a $225,000 special assessment in 2009. There was also a lower level of foreclosed real estate costs which totaled $41,000 in the 2010 period and $436,000 in 2009. To perform consistently, even in a tough economic environment, Norwood Financial Corp and Wayne Bank have always relied on the following solid fundamentals of banking: Loan money to people you know using solid underwriting standards. Wayne Bank has never wavered from our high standards of lending to consumers and businesses alike, and we have money to lend to our customers. In 2010, we originated over $33 million in commercial loan volume. We helped to finance numerous projects that have helped our communities. Job creation in the small business sector will help lead the way for economic recovery. To assist with job creation, we have become more active in the Small Business Administration and USDA lending programs. Both government agencies offer guarantees on certain loans made to qualifying small businesses. We also originated over $37 million in residential mortgages and other types of consumer loans. With the current low interest rates many customers were | | able to refinance, shorten the term of their mortgage and/or lower their monthly payments. Fund your loans with local deposits while maintaining a strong liquidity position. During 2010, we increased our percentage of checking and savings accounts to 60.0% from 50.7% in 2009. This consistent customer deposit base allows us to continue to lend to our communities. We manage the Bank to ensure that we always have ample liquidity to maintain flexibility during challenging times. We strive to operate efficiently. This is directly related to the technology we offer our customers and the methods we utilize to process data. The challenge is to serve our customers while maintaining operating efficiencies and the regulatory controls required. Our approach, like many community banking organizations today, has been to partner with service providers having the resources to help us meet these challenges. After a major study of alternatives, we concluded the “Fiserv Premier” system to be our best fit for the future. We expect to implement this new system during the second quarter of 2011. This should provide opportunities to upgrade various systems we utilize for day-to-day operations, and will directly benefit our customers. Additionally, we will seek improved capabilities for those customers who prefer self-service banking. We plan to offer e-statements as we continue to go paperless. The use of online banking continues to grow and we currently have almost 9,000 Internet banking customers. As another option, we are evaluating a mobile banking product. Our Business Link Remote Deposit Capture service | |
| has 30 customers and will handle almost 250,000 items for those customers. During 2011, we also plan to continue upgrading ATMs while adding self-service coin counters and automated currency handling equipment at select branches. Maintain a high level of capital. We have never aggressively leveraged our balance sheet. Our tier 1 capital is over 17% and is at the top end of our peer group. We have always stressed “high quality” capital which among other things means conservative accounting, strong loan loss reserves and a high component of tangible common equity. The higher the quality of capital the more prepared one is for tough times. Wayne Bank contributed to almost 200 local causes ranging from fire companies, school athletics, art and musical events, builders’ associations and a variety of nonprofit groups. Generous donations were also made through the Commonwealth of Pennsylvania, Department of Community and Economic Development’s Educational Improvement Tax Credit (EITC) program. The Bank distributed almost $80,000 to six local organizations via the EITC guidelines. We are pleased to be able to direct these funds to causes that support the local community, especially the children. The Bank contributed to a variety of organizations, such as, The United Way of Lackawanna and Wayne Counties, the various Chambers of Commerce, the Greater Honesdale Partnership, the Wayne County YMCA, and the Pike County Builders’ Association. Management and employees serve on many boards of directors to assist in supporting them with their management | | and expertise. Dorflinger-Suydam Wildlife sanctuary, the Wayne County Builders’ association, the Northeastern Pennsylvania alliance, the United Way of Lackawanna and Wayne Counties, and the Pike County Chamber of Commerce, are just a small sampling of the organizations where Wayne Bank’s employees participate on their board as members. This is what sets a community bank apart from a regional or national bank. Teach Children to Save is a national campaign that raises awareness about the important role that banks and bankers play in helping young people develop lifelong savings habits. It was the 14th anniversary of the organization and Wayne Bank’s employees presented interactive lessons on the importance of saving money to almost 400 students from the Delaware Valley School District in Northeastern Pennsylvania in honor of the Teach Children to Save program. Eight employees taught sixteen 3rd grade classes from Delaware Valley School District in Milford, Dingmans Ferry, and Shohola. We firmly believe that the financial literacy of our young people is crucial to building a growing economy. Quality people build a quality organization. We were very fortunate in 2010 to add a number of seasoned professionals to our staff. William S. Lance was hired as senior Vice President and Chief Financial Officer of Norwood Financial Corp and Wayne Bank. Bill has over 30 years of financial experience working with banks in Northeastern Pennsylvania and has an extensive and varied background in monitoring and overseeing the financial aspects of a bank. Terri A. Garringer filled the |

| position of Community Office Manager in Lakewood. Mark W. Ranzan was hired as Vice President, Commercial lender and is based in the Tannersville Community Office. Mark has twenty-four years of experience in commercial lending in Monroe County. There were a number of employees who received promotions during the year for their achievements. William Henigan, who has been with Wayne Bank since 1999 as a Commercial Lender, was elevated to Senior Vice President. Bill primarily handles commercial loan customers in Monroe County. Ryan French was promoted to Vice President, Director of Human Resources, after joining Wayne Bank in 2009. Jessica Santiago, a Customer Service Representative in the Marshalls Creek office, was promoted to Assistant Branch Manager of our Marshalls Creek office. Jessica has been with the Bank since 2004. We are pleased to note two employees recorded milestones in their careers with Wayne Bank: Barbara Keesler celebrated thirty years with Wayne Bank and Rosemary Engvaldsen achieved twenty-five years of service. We appreciate their years of commitment and dedication. A significant group of employees also reached the fifteen year mark which included: John H. Sanders, Marianne Glamann, and Mary Ann Mansour. In addition 6 employees made the mark of 10 years, and 7 employees attained 5 years of service. In total, this group of employees has almost 200 years of Wayne Bank experience. This level of experience truly helps us better serve our customers. A number of employees made 2010 the last of their working years. Stepping into retirement was: Bill Murray, Mortgage | | Loan Originator, who had worked for the Bank since 1994; Betty Rufano, who held the position of Head Teller in the Milford Community Office and worked for the Bank since 2003; and Sally Timko, who most recently held the position of Electronic Banking Specialist in Honesdale and had started with the Bank in 1982. We wish them extended health and many years of happiness and leisure during their retirement years. Unfortunately, during the course of the year, Norwood Financial Corp and Wayne Bank mourned the loss of a long term member of the Board of Directors, Mr. Gary Rickard. He had served on the Board since 1978. Mr. Rickard was well-known throughout Wayne County as a partner of his family’s farm, Clearfield Farms. We will miss his contributions and presence on the board. On December 15, 2010, we were very excited to announce that we had entered into a definitive merger agreement pursuant to which Norwood Financial Corp will acquire North Penn Bancorp, Inc. in a stock and cash transaction. This transaction will expand our existing footprint in Monroe County and give us an entry into Lackawanna County. Wayne Bank currently has three offices in Monroe County and with the addition of North Penn Bank’s two offices we will be better positioned to serve customers throughout the county. North Penn’s three offices in Lackawanna County will give Wayne Bank a solid base in a more densely populated market west of Wayne Bank’s existing franchise. The addition of North Penn Bank will bring Norwood’s assets to just under $700 million with 16 branches serving four counties with the addition |

of Lackawanna in Northeastern PA. The merger is expected to close pending regulatory approval in June of 2011. The staff of both organizations are busy working to integrate the banks. We expect this larger version of Wayne Bank to offer expanded products and services throughout Northeastern Pennsylvania. We look forward to welcoming the North Penn customers, stockholders and employees. For almost 140 years Wayne Bank has been a symbol of strength, safety and | | security for the communities, customers and stockholders we serve. We are proud to continue that tradition. Bank with confidence. Please consider us for all your financial needs. We truly appreciate your support. Lewis J. Critelli President & Chief Executive Officer | |

2010 CONSOLIDATED FINANCIAL REPORT |
Management's Discussion & Analysis | 10 |
| | |
Management's Report On Internal Control Over
Financial Reporting | 31 |
| | |
Reports Of Independent Registered Public Accounting Firm | 32 |
| | |
Consolidated Balance Sheets | 35 |
| | |
Consolidated Statements Of Income | 36 |
| | |
Consolidated Statements Of Stockholders' Equity | 37 |
| | |
Consolidated Statements Of Cash Flows | 38 |
| | |
Notes To Consolidated Financial Statements | 39 |
| | |
Investor Information | 68 |
NORWOOD FINANCIAL CORP - 2010 CONSOLIDATED FINANCIAL REPORT
MANAGEMENT’S DISCUSSION AND ANALYSIS
INTRODUCTION
This Management’s Discussion and Analysis and related financial data are presented to assist in the understanding and evaluation of the financial condition and results of operations for Norwood Financial Corp (the Company) and its subsidiary Wayne Bank (the Bank) as of December 31, 2010 and 2009 and for the years ended December 31, 2010, 2009, and 2008. This section should be read in conjunction with the consolidated financial statements and related footnotes.
FORWARD-LOOKING STATEMENTS
The Private Securities Litigation Reform Act of 1995 contains safe harbor provisions regarding forward-looking statements. When used in this discussion, the words believes, anticipates, contemplates, expects, and similar expressions are intended to identify forward-looking statements. Such statements are subject to certain risks and uncertainties, which could cause actual results to differ materially from those projected. Those risks and uncertainties include changes in Federal and State laws, changes in interest rates, risks associated with the proposed acquisition of North Penn Bancorp, the ability to control costs and expenses, demand for real estate, changes in regulatory environment and general economic conditions. The Company undertakes no obligation to publicly release the results of any revisions to those forward-looking statements which may be made to reflect events or circumstances after the date hereof or to reflect the occurrence of unanticipated events.
CRITICAL ACCOUNTING POLICIES
Note 2 to the Company’s consolidated financial statements (incorporated by reference in Item 8 of the Form 10-K) lists significant accounting policies used in the development and presentation of its financial statements. This discussion and analysis, the significant accounting policies, and other financial statement disclosures identify and address key variables and other qualitative and quantitative factors that are necessary for an understanding and evaluation of the Company and its results of operations.
Material estimates that are particularly susceptible to significant change in the near term relate to the determination of the allowance for loan losses, the potential impairment of restricted stock, accounting for stock options, the valuation of deferred tax assets, the determination of other-than-temporary impairment on securities and the fair value of financial instruments. Please refer to the discussion of the allowance for loan losses calculation under “Non-performing Assets and Allowance for Loan Losses” in the “Financial Condition” section.
The deferred income taxes reflect temporary differences in the recognition of the revenue and expenses for tax reporting and financial statement purposes, principally because certain items are recognized in different periods for financial reporting and tax return purposes. Although realization is not assured, the Company believes it is more likely than not that all deferred tax assets will be realized.
In estimating other-than-temporary impairment losses on securities, the Company considers 1) the length of time and extent to which the fair value has been less than cost and 2) the financial condition of the issuer. The Company does not have the intent to sell these securities and it is more likely than not that it will not sell the securities before recovery of their cost basis. The Company believes that the unrealized losses at December 31, 2010 and 2009 represent temporary impairment of the securities.
EMERGENCY ECONOMIC STABILIZATION ACT OF 2008
In response to recent unprecedented market turmoil, the Emergency Economic Stabilization Act (“EESA”) was enacted on October 3, 2008. EESA authorizes the Secretary of the Treasury to purchase up to $700 billion in troubled assets from financial institutions under the Troubled Asset Relief Program or TARP.
NORWOOD FINANCIAL CORP - 2010 CONSOLIDATED FINANCIAL REPORT
Among many provisions, the EESA increased the maximum deposit insurance amount up to $250,000 until December 31, 2009, which had been extended to June 30, 2010 and subsequently made the increase permanent. It also removed the statutory limits on the FDIC’s ability to borrow from the Treasury during this period. The FDIC did not take the temporary increase in deposit insurance coverage into account when setting assessments. EESA allows financial institutions to treat any loss on the preferred stock of the Federal National Mortgage Association or Federal Home Loan Mortgage Corporation as an ordinary loss for tax purposes.
Pursuant to his authority under EESA, the Secretary of the Treasury created the TARP Capital Purchase Plan (CPP) under which the Treasury Department will invest up to $250 billion in senior preferred stock of U.S. banks and savings associations or their holding companies. Qualifying financial institutions may issue senior preferred stock with a value equal to not less than 1% of risk-weighted assets and not more than the lesser of $25 billion or 3% of risk-weighted assets. The senior preferred stock will pay dividends at the rate of 5% per annum until the fifth anniversary of the investment and thereafter at the rate of 9% per annum. The senior preferred may be redeemed at any time in whole or in part by the financial institution. No dividends may be paid on common stock unless dividends have been paid on the senior preferred stock. Until the third anniversary of the issuance of the senior preferred, the consent of the U.S. Treasury will be required for any increase in the dividends on the common stock or for any stock repurchases unless the senior preferred has been redeemed in its entirety or the Treasury has transferred the senior preferred to third parties. The senior preferred will not have voting rights other than the right to vote as a class on the issuance of any preferred stock ranking senior, any change in its terms or any merger, exchange or similar transaction that would adversely affect its rights. Prior to issuance, the financial institution and its senior executive officers must modify or terminate all benefit plans and arrangements to comply with EESA. Senior executives must also waive any claims against the Department of Treasury. In connection with the issuance of the senior preferred, participating institutions must issue the Secretary immediately exercisable 10-year warrants to purchase common stock with an aggregate market price equal to 15% of the amount of senior preferred.
Due to its strong capital position, the Company decided not to participate in the CPP.
RESULTS OF OPERATIONS – SUMMARY
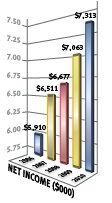
Net income for the Company for the year-ended December 31, 2010 totaled $7,313,000, an increase of $250,000 or 3.5% over the $7,063,000 earned in 2009. The resulting basic and diluted earnings per share were $2.65 and $2.64, respectively, increasing from $2.57 and $2.55 respectively in 2009. The return on average assets (ROA) for the year ended December 31, 2010 was 1.37% with a return on average equity (ROE) of 10.87% compared to an ROA of 1.38% and an ROE of 11.40% for the prior year. The increase in earnings was attributable to an increase in net interest income on a fully taxable equivalent basis (fte) of $790,000 and a reduction in operating expenses of $718,000. A $1,328,000 decrease in other income was partially offset by a $685,000 reduction in the provision for loan losses.
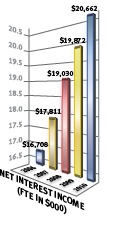
Net interest income on a fully taxable equivalent basis (fte) totaled $20,662,000 in 2010, which was $790,000 or 4.0%, higher than the $19,872,000 reported last year. The improvement recorded in net interest income can be attributed to an $18.1 million increase in average earning assets which exceeded the $15.1 million of growth in average interest bearing liabilities. Effective asset/liability management strategies also contributed to the improved earnings as a thirty-eight basis point reduction in the yield on earning assets was offset by a fifty basis point decrease in the cost of interest bearing liabilities.
Average loans outstanding remained relatively stable in 2010 as the current economic downturn impacted the Company’s ability to extend credit to qualifying borrowers. The Company also sold $12.4 million of fixed-rate residential mortgage loans in 2010 to reduce its risk to rising interest rates. As a result of negative growth and an eleven basis point reduction in the yield earned, income generated by the loan portfolio decreased $393,000 from
NORWOOD FINANCIAL CORP - 2010 CONSOLIDATED FINANCIAL REPORT
the prior year total. Income from the securities portfolio also declined $520,000 as new taxable securities were added at historically low interest rate levels to replace proceeds received from sales, maturities or calls. Income from tax free securities improved $642,000 as the Company took advantage of historically wide spreads in the municipal markets to increase the outstanding balance of these securities by $11.0 million on average. Average interest bearing liabilities grew $15.1 million but a fifty basis point reduction in the cost of these funds resulted in a decrease in total interest expense of $1,703,000 compared to 2009. The majority of the reduced cost can be attributed to time deposits which matured and were replaced at current market rates. The Company’s provision for loan losses decreased $685,000 based upon management’s evaluation of the adequacy of the allowance for loan losses.
Other income for the year ended 2010 totaled $4,064,000 compared to $5,392,000 in 2009, a decrease of $1,328,000. The earnings and proceeds on bank owned life insurance policies totaled $391,000 in 2010 compared to $1,196,000 in 2009, while service charges and fees declined $245,000 related to service charges on deposits. Gains on the sales of investment securities totaled $448,000 on sales of $23.9 million for the 2010 period compared to $463,000 on sales of $15.4 million for the 2009 period. The Company also had a $150,000 gain on the sale of deposits related to a branch closure in the 2009 period. The 2010 period includes $307,000 in gains and servicing rights on the sale of $12.4 million of mortgage loans compared to $481,000 in similar gains on sales of $21.6 million of mortgage loans and servicing rights in the 2009 period.
For the year ended December 31, 2010, other expense totaled $12,753,000 compared to $13,471,000 for the similar period in 2009, a decrease of $718,000. The decrease was due in part to a reduction in FDIC insurance assessments which decreased $236,000 from the 2009 total and a lower level of foreclosed real estate costs which totaled $41,000 in the 2010 period and $436,000 in 2009. The 2009 period also included $267,000 related to the funding of an employee benefit plan.
The following table sets forth changes in net income (in thousands):
| Net income 2009 | | $ | 7,063 | |
| Net interest income | | | 555 | |
| Provision for loan losses | | | 685 | |
| Earnings and proceeds on BOLI | | | (805 | ) |
| Gains on sales of mortgage loans and servicing rights | | | (174 | ) |
| Gain on sale of deposits | | | (150 | ) |
| Other income | | | (199 | ) |
| Salaries and employee benefits | | | 322 | |
| FDIC insurance assessments | | | 236 | |
| Foreclosed real estate owned | | | 395 | |
| Professional fees | | | (239 | ) |
| Other expenses | | | 4 | |
| Income tax expense | | | (380 | ) |
| Net income for 2010 | | $ | 7,313 | |
Net income for the Company for the year-ended December 31, 2009 totaled $7,063,000, an increase of $386,000 or 5.8% over the $6,677,000 earned in 2008. The resulting basic and diluted earnings per share were $2.57 and $2.55, respectively, increasing from $2.44 and $2.41 respectively in 2008. The return on average
NORWOOD FINANCIAL CORP - 2010 CONSOLIDATED FINANCIAL REPORT
assets (ROA) for the year ended December 31, 2009 was 1.38% with a return on average equity (ROE) of 11.40% compared to an ROA of 1.36% and an ROE of 11.79% for the prior year. The increase in earnings was attributable to an increase in net interest income on a fully taxable equivalent basis (fte) of $842,000 and $816,000 of tax-exempt proceeds from a bank-owned life insurance (BOLI) policy which is $1,371,000 net of tax. This was partially offset by a $950,000 increase in the provision for loan losses and $620,000 in higher FDIC insurance assessments, the net of which is $1,036,000 after tax.
Net interest income on a fully taxable equivalent basis (fte) totaled $19,872,000 in 2009, an increase of $842,000 as compared to the prior year. Net interest income was favorably impacted by a $25.1 million increase in average earning assets for 2009 compared to average earning assets in 2008. The net interest margin decreased 4 basis points to 4.03% for 2009. The decrease in margin was due to the low interest rate environment in 2009 with an average prime rate of 3.25% and federal funds rate of .25% compared to 5.09% and 1.84%, respectively in 2008. As a result, the yield on earning assets (fte) for 2009 was 5.60% compared to 6.14% in 2008. This impact on the yield on earning assets was partially offset by a 63 basis point decrease in the cost of interest-bearing liabilities.
Loans receivable increased $14.1 million or 4.0% from the prior year-end. The increase in loans was centered in commercial real estate. The Company experienced a significant volume of residential mortgage refinancing activity in 2009. During the year, the Company sold $21.7 million of fixed rate residential mortgages for purposes of interest rate risk management. As a result of the general slow down in the local economy, higher unemployment and a softer real estate market, the Company did experience an increase in non-performing loans in 2009. As of December 31, 2009, total non-performing loans were $5,015,000 and represented 1.38% of total loans compared to $2,087,000 or .60% as of December 31, 2008. The increase was principally due to one commercial real estate loan and a home equity loan in which the Bank is in a first lien position. For the year ended December 31, 2009, net charge-offs totaled $465,000 compared to $583,000 in 2008. With the increase in non-performing loans, higher unemployment, soft real estate market and slow economy, the Company increased its provision for loan losses to $1,685,000 for the year 2009 compared to $735,000 for the year 2008. As of December 31, 2009, the allowance for loan losses totaled $5,453,000 and 1.50% of total loans increasing from $4,233,000 and 1.21% of loans at December 31, 2008.
Other income for 2009 totaled $5,392,000 compared to $4,087,000 in 2008, an increase of $1,305,000. The earnings and proceeds on bank owned life insurance policies totaled $1,196,000 in 2009 compared to $344,000 in 2008. Gains on the sales of investment securities totaled $463,000 on sales of $15.4 million for the 2009 period compared to $18,000 in losses in the 2008 period. The Company also had a $150,000 gain on the sale of deposits related to a branch closure in the 2009 period. The 2009 period includes $481,000 in gains on the sales of $21.6 million of mortgage loans and servicing rights compared to $499,000 in similar gains on sales of $14.4 million of mortgage loans and servicing rights in the 2008 period.
For the year ended December 31, 2009, other expense totaled $13,471,000 compared to $12,240,000 for the similar period in 2008, an increase of $1,231,000. The increase was due in part to higher FDIC insurance assessments which increased $620,000 including the special assessment of $225,000. This was partially offset by a lower level of foreclosed real estate costs which totaled $436,000 in the 2009 period and $582,000 in 2008. Income tax expense for the year 2009 totaled $2,282,000 for an effective tax rate of 24.4% compared to $2,836,000 of federal income tax expense and an effective tax rate of 29.8% for the prior year. The reduction in the effective tax rate is principally due to the receipt of $816,000 in tax exempt BOLI proceeds in 2009.
NORWOOD FINANCIAL CORP - 2010 CONSOLIDATED FINANCIAL REPORT
The following table sets forth changes in net income (in thousands):
| Net income 2008 | | $ | 6,677 | |
| Net interest income | | | 708 | |
| Provision for loan losses | | | (950 | ) |
| Earnings and proceeds on BOLI | | | 852 | |
| Net realized gains on sales of securities | | | 481 | |
| Other income | | | (28 | ) |
| Salaries and employee benefits | | | (783 | ) |
| FDIC insurance assessments | | | (620 | ) |
| Other expenses | | | 172 | |
| Income tax expense | | | 554 | |
| Net income for 2009 | | $ | 7,063 | |
FINANCIAL CONDITION
TOTAL ASSETS
Total assets as of December 31, 2010, were $537.0 million compared to $529.7 million as of year-end 2009, an increase of $7.3 million or 1.3%. The increase in assets was limited by the Company’s ability to increase loans outstanding in the current economic environment combined with limited opportunities available to increase the securities portfolio.
LOANS RECEIVABLE
As of December 31, 2010, loans receivable totaled $356.9 million compared to $363.5 million as of year-end 2009, a decrease of $6.6 million. Loan growth, principally in commercial real estate was offset by a lower level of home equity loans, sales of residential real estate loans and a net run-off in indirect automobile financing, which is included in consumer loans to individuals.
Residential real estate, which includes home equity lending, totaled $124.6 million as of December 31, 2010, compared to $130.3 million as of year-end 2009, a decrease of $5.7 million. The Company experienced a significant amount of residential mortgage refinancing activity in 2010 as customers took advantage of the low interest rate environment. The Company does not originate any non-traditional mortgage products such as interest-only loans or option adjustable rate mortgages and has no sub-prime mortgage exposure. The Company evaluates sales of its long-term fixed rate residential loan production for interest rate risk management, with $12.4 million of long term fixed rate loans sold into the secondary market during 2010. In the current low interest rate environment, the Company expects to continue selling mortgage loans in 2011. The Company experienced a slow down and net decrease in home equity lending of $2.1 million to $45.1 million as of December 31, 2010. The decrease was due in part to consumers paying off home equity loans with proceeds from mortgage refinancing. The slow down in home equity lending is also indicative of lower real estate values.
Commercial loans consist principally of loans made to small businesses within the Company’s market and are usually secured by real estate or other assets of the borrower. Commercial real estate loans totaled $184.1 million as of December 31, 2010, increasing from $180.3 million as of December 31, 2009. The terms for commercial real estate loans are typically 15 to 20 years, with adjustable rates based on a spread to the prime rate or fixed for the initial three to five year period then adjusting to a spread to the prime rate. The majority of the Company’s commercial real estate portfolio is owner occupied and includes the personal guarantees of the principals.
NORWOOD FINANCIAL CORP - 2010 CONSOLIDATED FINANCIAL REPORT
The growth in commercial real estate lending in 2010 was centered in loans to the hospitality lodging industry and summer camps all within the Bank’s primary market area. Commercial loans consisting principally of lines of credit and term loans secured by equipment or other assets decreased $1.7 million to $22.4 million as of December 31, 2010. The decrease was principally due to pay-offs in equipment loans and lower usage on lines of credit.
The Company’s indirect lending portfolio (included in consumer loans to individuals) declined $900,000 to $7.5 million as of December 31, 2010. The Company has de-emphasized indirect automobile lending and as a result of the soft economy has also experienced a general slow down in other indirect financing.
ALLOWANCE FOR LOAN LOSSES AND NON-PERFORMING ASSETS
The allowance for loan losses totaled $5,616,000 as of December 31, 2010 and represented 1.57% of total loans receivable compared to $5,453,000 and 1.50% of total loans as of year-end 2009. Net charge-offs for 2010 totaled $837,000 and represented .24% of average loans compared to $465,000 and .14% of average loans in 2009.
As of December 31, 2010, non-performing loans totaled $4,079,000 and represented 1.14% of total loans compared to $5,015,000 or 1.38% as of December 31, 2009. Based on the level of non-performing loans, high unemployment, soft real estate market and a slow economy the Company added $1,000,000 to the provision for loan losses for the year ended December 31, 2010 compared to $1,685,000 in 2009.
The Company’s loan review process assesses the adequacy of the allowance for loan losses on a quarterly basis. The process includes a review of the risks inherent in the loan portfolio. It includes an analysis of impaired loans and a historical review of losses. Other factors considered in the analysis include; concentrations of credit in specific industries in the commercial portfolio; the local and regional economic condition; trends in delinquencies, internal risk rating classification, large dollar loans of over $2 million and growth in the portfolio.
The Company has limited exposure to higher-risk loans. There are no option ARM products, interest only loans, subprime loans or loans with initial teaser rates in its residential real estate portfolio. The Company has $14.7 million of junior lien home equity loans. For 2010 net charge-offs for this portfolio totaled $118,000.
As of December 31, 2010, the Company considered its concentration of credit risk profile to be acceptable. The two highest concentrations are in the hospitality lodging industry and summer camps. In 2010 there were no losses in either portfolio while one motel loan was delinquent and considered impaired.
Due to weaker economic conditions the Company has seen an increase in its internally adversely classified loans. The Company assesses a loss factor against the classified loans, which is based on prior experience. Classified loans which are considered impaired are measured on a loan by loan basis. The Company values such loans by either the present value of expected cash flows, the loans obtainable market price or the fair value of collateral if the loan is collateral dependent.
At December 31, 2010, the recorded investment in impaired loans, not requiring an allowance for loan losses was $6,111,000 (net of charge-offs against the allowance for loan losses of $220,000) and those impaired loans requiring an allowance totaled $8,641,000 (net of a charge-off against the allowance for loan losses of $480,000). The recorded investment in impaired loans not requiring an allowance for loan losses was $6,962,000 (net of $154,000) and $1,065,000 (net of $480,000) requiring an allowance for loan losses as of December 31, 2009.
Non-performing assets consist of non-performing loans and real estate owned as a result of foreclosure, which is held for sale. Loans are placed on non-accrual status when management believes that a borrower’s financial condition is such that collection of interest is doubtful. Commercial and real estate related loans are generally
NORWOOD FINANCIAL CORP - 2010 CONSOLIDATED FINANCIAL REPORT
placed on non-accrual when interest is 90 days delinquent. When loans are placed on non-accrual, accrued interest is reversed from current earnings.
As of December 31, 2010, non-performing loans totaled $4,079,000 and represented 1.14% of total loans decreasing from $5,015,000 and 1.38% of total loans as of December 31, 2009. The decrease was principally due to the resolution and payment on one loan that was included in non-performing loans as of December 31, 2009. Foreclosed real estate owned totaled $748,000 as of December 31, 2010 and $392,000 as of December 31, 2009. The increase is principally due to the addition of a commercial property located in Pike County which is carried at $448,000 as of December 31, 2010.
As a result of its analysis, after applying these factors, management considers the allowance as of December 31, 2010, adequate. However, there can be no assurance that the allowance for loan losses will be adequate to cover significant losses, if any that might be incurred in the future.
The following table sets forth information with respect to the Company’s allowance for loan losses at the
dates indicated:
| | | Year-ended December 31, | |
| | | (dollars in thousands) | |
| | | 2010 | | | 2009 | | | 2008 | | | 2007 | | | 2006 | |
| | | | | | | | | | | | | | | | |
| Allowance balance at beginning of period | | $ | 5,453 | | | $ | 4,233 | | | $ | 4,081 | | | $ | 3,828 | | | $ | 3,669 | |
| Charge-offs: | | | | | | | | | | | | | | | | | | | | |
| Commercial and all other | | | (85 | ) | | | (17 | ) | | | (7 | ) | | | — | | | | — | |
| Real Estate | | | (699 | ) | | | (358 | ) | | | (465 | ) | | | (4 | ) | | | — | |
| Consumer | | | (82 | ) | | | (139 | ) | | | (171 | ) | | | (117 | ) | | | (150 | ) |
| Total | | | (866 | ) | | | (514 | ) | | | (643 | ) | | | (121 | ) | | | (150 | ) |
| Recoveries: | | | | | | | | | | | | | | | | | | | | |
| Commercial and all other | | | — | | | | 11 | | | | — | | | | — | | | | 18 | |
| Real Estate | | | 2 | | | | 4 | | | | 1 | | | | 2 | | | | 2 | |
| Consumer | | | 27 | | | | 34 | | | | 59 | | | | 54 | | | | 65 | |
| Lease Financing | | | — | | | | — | | | | — | | | | 3 | | | | 4 | |
| Total | | | 29 | | | | 49 | | | | 60 | | | | 59 | | | | 89 | |
| Provision expense | | | 1,000 | | | | 1,685 | | | | 735 | | | | 315 | | | | 220 | |
| Allowance balance at end of period | | $ | 5,616 | | | $ | 5,453 | | | $ | 4,233 | | | $ | 4,081 | | | $ | 3,828 | |
| Allowance for loan losses as a percent | | | | | | | | | | | | | | | | | | | | |
of total loans outstanding | | | 1.57 | % | | | 1.50 | % | | | 1.21 | % | | | 1.23 | % | | | 1.21 | % |
| Net loans charged off as a percent of average loans outstanding | | | .24 | % | | | .13 | % | | | .17 | % | | | .02 | % | | | .02 | % |
| Allowance coverage of non-performing loans | | | 1.4 | x | | | 1.1 | x | | | 2.0 | x | | | 5.0 | x | | | 9.4 | x |
NORWOOD FINANCIAL CORP - 2010 CONSOLIDATED FINANCIAL REPORT
The following table sets forth information regarding non-performing assets.
| | | December 31, | |
| | | (dollars in thousands) | |
| | | 2010 | | | 2009 | | | 2008 | | | 2007 | | | 2006 | |
| Non-accrual loans: | | | | | | | | | | | | | | | |
| Commercial and all other | | $ | 513 | | | $ | — | | | $ | — | | | $ | — | | | $ | — | |
| Real estate | | | 3,527 | | | | 4,916 | | | | 2,087 | | | | 109 | | | | 392 | |
| Consumer | | | — | | | | — | | | | — | | | | 2 | | | | 17 | |
| Total | | | 4,040 | | | | 4,916 | | | | 2,087 | | | | 111 | | | | 409 | |
| | | | | | | | | | | | | | | | | | | | | |
| Accruing loans which are contractually past due 90 days or more | | | 39 | | | | 99 | | | | — | | | | 52 | | | | — | |
| | | | | | | | | | | | | | | | | | | | | |
| Total non-performing loans | | | 4,079 | | | | 5,015 | | | | 2,087 | | | | 163 | | | | 409 | |
| Foreclosed real estate | | | 748 | | | | 392 | | | | 660 | | | | — | | | | — | |
| Total non-performing assets | | $ | 4,827 | | | $ | 5,407 | | | $ | 2,747 | | | $ | 163 | | | $ | 409 | |
| | | | | | | | | | | | | | | | | | | | | |
| Non-performing loans to total loans | | | 1.14 | % | | | 1.38 | % | | | .60 | % | | | .05 | % | | | .13 | % |
| | | | | | | | | | | | | | | | | | | | | |
| Non-performing loans to total assets | | | .76 | % | | | .95 | % | | | .41 | % | | | .03 | % | | | .09 | % |
| | | | | | | | | | | | | | | | | | | | | |
| Non-performing assets to total assets | | | .90 | % | | | 1.02 | % | | | .54 | % | | | .03 | % | | | .09 | % |
SECURITIES
The securities portfolio consists principally of issues of United States Government agencies, including mortgage-backed securities, municipal obligations, and corporate debt. In accordance with generally accepted accounting principles in the United States, the Company classifies its investments into two categories: held to maturity (HTM) and available for sale (AFS). The Company does not have a trading account. Securities classified as HTM are those in which the Company has the ability and the intent to hold the security until contractual maturity. As of December 31, 2010, the HTM portfolio totaled $170,000 and consisted of one municipal obligation. Securities classified as AFS are eligible to be sold due to liquidity needs or interest rate risk management. These securities are adjusted to and carried at their fair value with any unrealized gains or losses recorded net of deferred income taxes, as an adjustment to capital and reported in the equity section of the balance sheet as other comprehensive income. As of December 31, 2010, $145.8 million of securities were so classified and carried at their fair value, with unrealized appreciation net of tax, of $1,137,000, included in accumulated other comprehensive income as a component of stockholders’ equity.
As of December 31, 2010, the average life of the portfolio was 4.5 years. The Company has maintained a relatively short average life in the portfolio in order to generate cash flow to support loan growth and maintain liquidity levels. During 2010, a significant portion of cash flow generated from the proceeds of called U.S. agency securities were reinvested in tax-free municipal bonds to take advantage of historically wide spreads in the municipal bond market and to reduce the Company’s federal income tax liability. Purchases for the year totaled $106.7 million with securities called, maturities and cash flow of $66.1 million and proceeds from sales of $23.9 million. The purchases were funded principally by cash flow generated from the portfolio. The carrying value of the securities portfolio is as follows:
NORWOOD FINANCIAL CORP - 2010 CONSOLIDATED FINANCIAL REPORT
| | | 2010 | | | 2009 | |
| | | (dollars in thousands) | |
| | | Carrying Value | | | % of portfolio | | | Carry Value | | | % of portfolio | |
| U.S. Government agencies | | $ | 30,268 | | | | 20.7 | % | | $ | 39,772 | | | | 30.3 | % |
| States and political subdivisions | | | 49,936 | | | | 34.2 | % | | | 32,343 | | | | 24.6 | % |
| Corporate obligations | | | 4,249 | | | | 2.9 | % | | | 5,240 | | | | 4.0 | % |
| Mortgage-backed securities - | | | | | | | | | | | | | | | | |
| government sponsored entities | | | 60,928 | | | | 41.8 | % | | | 53,154 | | | | 40.5 | % |
| Equity securities - financial services | | | 604 | | | | 0.4 | % | | | 776 | | | | 0.6 | % |
| Total | | $ | 145,985 | | | | 100.0 | % | | $ | 131,285 | | | | 100.0 | % |
The portfolio had $8.0 million of adjustable rate instruments, principally adjustable rate mortgage backed securities as of December 31, 2010 compared to $19.5 million at year end 2009. The portfolio contained no private label mortgage backed securities, collateralized debt obligations (CDOs), trust preferreds, and no off-balance sheet derivatives were in use. The U.S. Government agency portfolio consists principally of callable notes with final maturities of generally less than five years. As of December 31, 2010, the portfolio included $8.0 million of step-up bonds. The mortgage backed securities are pass-through bonds with Fannie Mae (FNMA), Freddie Mac (FHLMC), and Government National Mortgage Association (GNMA). The Company has no exposure to common or preferred stock of FNMA or FHLMC.
The Company evaluates the securities in its portfolio for other-than-temporary-impairment (OTTI) as fair value declines below cost. In estimating OTTI management considers (1) the length of time and the extent of the decline in fair value and (2) the financial condition and near-term prospects of the issuer. As of December 31, 2010 the Company held 61 securities which had a combined unrealized loss of $1.2 million. Management believes that these losses are principally due to changes in interest rates and represent temporary impairment as the Company does not have the intent to sell these securities and it is more likely than not that it will not have to sell the securities before recovery of their cost basis. The Company holds a small portfolio of equity securities of other financial institutions the value of which has been impacted by weakened conditions of the financial market. In 2009, the Company recorded an OTTI charge on two equity holdings totaling $31,000. No additional impairment charges have been recognized.
FAIR VALUE OF FINANCIAL INSTRUMENTS
The Company uses fair value measurements to record fair value adjustments to certain financial instruments and determine fair value disclosures (see Note 16 of Notes to the Consolidated Financial Statements).
Approximately $145.8 million, which represents 27.2% of total assets at December 31, 2010, consisted of financial instruments recorded at fair value on a recurring basis. This amount consists entirely of the Company’s available for sale securities portfolio. The Company uses valuation methodologies involving market-based or market derived information, collectively Level 1 and 2 measurements, to measure fair value. There were no transfers into or out of Level 3 for any instruments for the years ending December 31, 2010 and 2009.
The Company utilizes a third party provider to perform valuations of the investments. Methods used to perform the valuations include: pricing models that vary based on asset class, available trade and bid information, actual transacted prices, and proprietary models for valuations of state and municipal obligations. In addition, the Company has a sample of fixed-income securities valued by another independent source. The Company does not adjust values received from its providers, unless it is evident that fair value measurement is not consistent with generally accepted accounting principles in the United States.
NORWOOD FINANCIAL CORP - 2010 CONSOLIDATED FINANCIAL REPORT
The Company also utilizes a third party provider to provide an estimated fair value of certain loan servicing rights. Fair value for the purpose of this measurement is defined as the amount at which the asset could be exchanged in a current transaction between willing parties, other than in a forced liquidation. The estimated fair value of mortgage servicing rights as of December 31, 2010 and 2009 was $274,000 and $179,000, respectively.
DEPOSITS
The Company, through the eleven branches of the Bank, provides a full range of deposit products to its retail and business customers. These products include interest-bearing and non-interest bearing transaction accounts, statement savings and money market accounts. Time deposits consist of certificates of deposit (CDs) with terms of up to five years and include Individual Retirement Accounts. The Bank participates in the Jumbo CD ($100,000 and over) markets with local municipalities and school districts, which are typically awarded on a competitive bid basis. The Company has no brokered deposits.
Total deposits as of December 31, 2010, totaled $393.9 million increasing $2.4 million from $391.5 million as of year-end 2009. The increase was principally due to a higher level of money market and savings deposits which increased by $16.7 million.
Time deposits over $100,000, which consist principally of school district funds, other public funds and short-term deposits from large commercial customers with maturities generally less than one year, totaled $60.0 million as of December 31, 2010, compared to $66.6 million at year-end 2009. The decrease was principally due to a lower level of CDs with local school districts. These deposits are subject to competitive bid and the Company bases its bid on current interest rates, loan demand, investment portfolio structure and the relative cost of other funding sources.
As of December 31, 2010, non-interest bearing demand deposits totaled $62.2 million compared to $59.8 million at year-end 2009. The increase is partially attributable to a higher level of commercial deposits, as a result of growth in the commercial loan portfolio. Cash management accounts in the form of securities sold under agreements to repurchase included in short-term borrowings, totaled $33.1 million at year end 2010 compared to $25.6 million as of December 31, 2009. These balances represent commercial and municipal customers’ funds invested in overnight securities. The Company considers these accounts as a source of core funding.
MARKET RISK
Interest rate sensitivity and the repricing characteristics of assets and liabilities are managed by the Asset and Liability Management Committee (ALCO). The principal objective of the ALCO is to maximize net interest income within acceptable levels of risk, which are established by policy. Interest rate risk is monitored and managed by using financial modeling techniques to measure the impact of changes in interest rates.
Net interest income, which is the primary source of the Company’s earnings, is impacted by changes in interest rates and the relationship of different interest rates. To manage the impact of the rate changes, the balance sheet should be structured so that repricing opportunities exist for both assets and liabilities at approximately the same time intervals. The Company uses net interest simulation to assist in interest rate risk management. The process includes simulating various interest rate environments and their impact on net interest income. As of December 31, 2010, the level of net interest income at risk in a 200 basis points increase was within the Company’s policy limit of a decline less than 8% of net interest income. Due to the inability to reduce many deposit rates by the full 200 basis points, the Company’s net interest income at risk was slightly (8.74%) outside the policy limit in a 200 basis point declining scenario. The Company feels that the risk is minimal.
NORWOOD FINANCIAL CORP - 2010 CONSOLIDATED FINANCIAL REPORT
Imbalances in repricing opportunities at a given point in time reflect interest-sensitivity gaps measured as the difference between rate-sensitive assets and rate-sensitive liabilities. These are static gap measurements that do not take into account any future activity, and as such are principally used as early indicators of potential interest rate exposures over specific intervals.
At December 31, 2010, the Bank had a positive 90 day interest sensitivity gap of $41.3 million or 7.7% of total assets. A positive gap indicates that the balance sheet has a higher level of rate-sensitive assets (RSA) than rate-sensitive liabilities (RSL) at the specific time interval. This would indicate that in an increasing rate environment, the yield on interest-earning assets would increase faster than the cost of interest-bearing liabilities in the 90 day time frame. The level of RSA and RSL for an interval is managed by ALCO strategies, including adjusting the average life of the investment portfolio through purchase and sales, pricing of deposit liabilities to attract long or short term time deposits, utilizing borrowings to fund loan growth, loan pricing to encourage variable rate products and evaluation of loan sales of long term fixed rate mortgages.
The Company analyzes and measures the time periods in which RSA and RSL will mature or reprice in accordance with their contractual terms and assumptions. Management believes that the assumptions used are reasonable. The interest rate sensitivity of assets and liabilities could vary substantially if differing assumptions were used or if actual experience differs from the assumptions used in the analysis. For example, although certain assets and liabilities may have similar maturities or periods to repricing, they may react in differing degrees to changes in market interest rates. The interest rates on certain types of assets and liabilities may fluctuate in advance of changes in market interest rates, while interest rates on other types may lag behind changes in market rates. Interest rates may change at different rates changing the shape of the yield curve. The level of rates on the investment securities may also be affected by the spread relationship between different investments. This was evident in 2010 and 2009 as the spread between certain asset classes were at historical highs in relation to treasuries due to market liquidity and credit concerns. Further, in the event of a significant change in interest rates, prepayment and early withdrawal levels would likely deviate significantly from those assumed. Finally, the ability of borrowers to service their adjustable-rate debt may decrease in the event of an interest rate increase. It should be noted that the operating results of the Company are not subject to foreign currency exchange or commodity price risk.
NORWOOD FINANCIAL CORP - 2010 CONSOLIDATED FINANCIAL REPORT
The following table displays interest-sensitivity as of December 31, 2010 (in thousands):
| | | 3 Months of Less | | | 3-12 Months | | | 1-3 Years | | | Over 3 Years | | | Total | |
| | | | | | | | | | | | | | | | |
| Federal funds sold and | | | | | | | | | | | | | | | |
| interest-bearing deposits | | $ | 10,593 | | | $ | 250 | | | $ | — | | | $ | — | | | $ | 10,843 | |
| Securities | | | 10,916 | | | | 31,003 | | | | 48,110 | | | | 55,956 | | | | 145,985 | |
| Loans Receivable | | | 85,565 | | | | 67,052 | | | | 108,295 | | | | 95,943 | | | | 356,855 | |
| Total Rate Sensitive Assets (RSA) | | | 107,074 | | | | 98,305 | | | | 156,405 | | | | 151,899 | | | | 513,683 | |
| | | | | | | | | | | | | | | | | | | | | |
| Non-maturity interest-bearing deposits | | | 25,197 | | | | 28,014 | | | | 74,303 | | | | 31,807 | | | | 159,321 | |
| Time Deposits | | | 30,009 | | | | 77,797 | | | | 46,458 | | | | 18,042 | | | | 172,306 | |
| Borrowings | | | 10,527 | | | | 26,107 | | | | 24,675 | | | | 10,000 | | | | 71,309 | |
| Total Rate Sensitive Liabilities (RSL) | | | 65,733 | | | | 131,918 | | | | 145,436 | | | | 59,849 | | | | 402,936 | |
| | | | | | | | | | | | | | | | | | | | | |
| As of December 31, 2010 | | | | | | | | | | | | | | | | | | | | |
| Interest sensitivity gap | | $ | 41,341 | | | $ | (33,613 | ) | | $ | 10,969 | | | $ | 92,050 | | | $ | 110,747 | |
| Cumulative gap | | | 41,341 | | | | 7,728 | | | | 18,697 | | | | 110,747 | | | | | |
| RSA/RSL-cumulative | | | 162.9 | % | | | 103.9 | % | | | 105.5 | % | | | 127.5 | % | | | | |
| | | | | | | | | | | | | | | | | | | | | |
| As of December 31, 2009 | | | | | | | | | | | | | | | | | | | | |
| Interest sensitivity gap | | $ | 26,256 | | | $ | (35,423 | ) | | $ | (20,986 | ) | | $ | 135,313 | | | $ | 105,160 | |
| Cumulative gap | | | 26,256 | | | | (9,167 | ) | | | (30,153 | ) | | | 105,160 | | | | | |
| RSA/RSL-cumulative | | | 128.9 | % | | | 95.5 | % | | | 91.2 | % | | | 126.3 | % | | | | |
Certain interest-bearing deposits with no stated maturity dates are included in the interest-sensitivity table above. The balances allocated to the respective time periods represent an estimate of the total outstanding balance that has the potential to migrate either through withdrawal or transfer to time deposits, thereby impacting the interest-sensitivity position of the Company. The estimates were derived from industry-wide statistical information and do not represent historic results.
LIQUIDITY
Liquidity is the ability to fund customers’ borrowing needs and their deposit withdrawal requests while supporting asset growth. The Company’s primary sources of liquidity include deposit generation, asset maturities, cash flow from payments on loans and securities and access to borrowing from the Federal Home Loan Bank and other correspondent banks.
As of December 31, 2010, the Company had cash and cash equivalents of $16.6 million in the form of cash, due from banks, balances with the Federal Reserve Bank, short-term deposits with other institutions and Federal Funds sold. In addition, the Company had total securities available for sale of $145.8 million, which could be used for liquidity needs. This totals $162.4 million and represents 30.2% of total assets compared to $148.0 million and 27.9% of total assets as of December 31, 2009. The Company also monitors other liquidity measures, all of which were within the Company’s policy guidelines as of December 31, 2010. Based upon these measures, the Company believes its liquidity position is adequate.
The Company maintains established lines of credit with the Federal Home Loan Bank of Pittsburgh (FHLB), the Atlantic Central Bankers Bank (ACBB) and other correspondent banks, which support liquidity needs. The total available under all the lines was $43 million, with $-0- outstanding at December 31, 2010 and December 31, 2009. The maximum borrowing capacity from FHLB was $182.7 million. As of December 31, 2010, the Company had $38 million in term borrowings from the FHLB, compared to $43 million at December 31, 2009.
NORWOOD FINANCIAL CORP - 2010 CONSOLIDATED FINANCIAL REPORT
OFF-BALANCE SHEET ARRANGEMENTS
The Company’s financial statements do not reflect various commitments that are made in the normal course of business, which may involve some liquidity risk. These commitments consist mainly of unfunded loans and letters of credit made under the same standards as on-balance sheet instruments. Unused commitments, as of December 31, 2010 totaled $55.4 million. They consisted of $21.4 million in commercial real estate, construction and land developments loans, $15.1 million in home equity lines of credit, $3.6 million in standby letters of credit and $15.3 million in other unused commitments, principally commercial lines of credit. Because these instruments have fixed maturity dates and because many of them will expire without being drawn upon, they do not represent any significant liquidity risk.
Management believes that any amounts actually drawn upon can be funded in the normal course of operations. The Company has no investment in or financial relationship with any unconsolidated entities that are reasonably likely to have a material effect on liquidity or the availability of capital resources.
The following table represents the aggregate of on and off-balance sheet contractual obligations to make future payments (in thousands):
Contractual Obligations
| | | December 31, 2010 | |
| | | Total | | | Less than 1 year | | | 1-3 years | | | 4-5 years | | | Over 5 years | |
| Time deposits | | $ | 172,306 | | | $ | 107,806 | | | $ | 46,458 | | | $ | 18,042 | | | $ | — | |
| Long-term debt | | | 38,000 | | | | 18,000 | | | | 10,000 | | | | — | | | | 10,000 | |
| Operating leases | | | 3,105 | | | | 259 | | | | 536 | | | | 514 | | | | 1,796 | |
| | | $ | 213,411 | | | $ | 126,065 | | | $ | 56,994 | | | $ | 18,556 | | | $ | 11,796 | |
RESULTS OF OPERATIONS
NET INTEREST INCOME
Net interest income is the most significant source of revenue for the Company and represented 82.9% of total revenue for the year ended December 31, 2010. Net interest income (fte) totaled $20,662,000 for the year ended December 31, 2010 compared to $19,872,000 for 2009, an increase of $790,000 or 4.0%. The resulting fte net interest spread and net interest margin were 3.72% and 4.04% respectively in 2010 compared to 3.60% and 4.03%, respectively in 2009.
Interest income (fte) for the year ended December 31, 2010 totaled $26,685,000 compared to $27,598,000 in 2009. The fte yield on average earning assets was 5.22% in 2010 which was 38 basis points lower than the 5.60% recorded in 2009. Interest income was negatively impacted by the continued period of historically low interest rates, most notably in the area of taxable securities where the yield decreased 101 basis points compared to the prior year. As securities matured or were called prior to maturity, new securities were added at current market levels resulting in the decreased yield. Also contributing to the reduced yield was an $11.9 million increase in average interest bearing deposits with banks which earned .29% in 2010. The yield on average loans outstanding decreased only 11 basis points in 2010 as the Federal Reserve maintained a prime rate of 3.25% throughout 2010 and a significant portion of floating rate loans were affected by floor rates. The decrease in yield was partially offset by an $18.1 million increase in average earning assets compared to 2009.
Interest expense for the year ended December 31, 2010 totaled $6,023,000 which resulted in an average cost of interest bearing liabilities of 1.50% compared to interest expense of $7,726,000 and an average cost of 2.00% in 2009. The extended period of low interest rates impacted all deposit categories as the Company continued to
NORWOOD FINANCIAL CORP - 2010 CONSOLIDATED FINANCIAL REPORT
reduce the rates paid to current market levels. Time deposits, which represent the Company’s largest category of deposits, were the most significantly impacted as higher costing deposits matured and were reinvested at lower rates. The cost of time deposits decreased 77 basis points during the year from 2.80% to 2.03%. Average short-term borrowings, which totaled $25.9 million in 2010, repriced downward by 66 basis points in 2010 to .45%.
Net interest income represented 78.0% of total revenue for the year ended December 31, 2009. Net interest income (fte) totaled $19,872,000 for the year ended December 31, 2009 compared to $19,030,000 for 2008, an increase of $842,000 or 4.4%. The resulting fte net interest spread and net interest margin were 3.60% and 4.03% respectively in 2009 compared to 3.51% and 4.07%, respectively in 2008.
Interest income (fte) for the year ended December 31, 2009 totaled $27,598,000 compared to $28,724,000 for 2008. The fte yield on average earning assets for 2009 was 5.60%, decreasing 54 basis points from 6.14% in 2008. Interest income was unfavorably impacted by the significant decrease in short-term interest rates. During 2009, the prime interest rate averaged 3.25% compared to 5.09% during 2008. The Federal Funds rate and other short-term market rates showed a similar lower trend. This decline in short-term rates impacts the Company’s floating rate loans principally commercial real estate, lines of credit and home equity lines of credit which are based on a spread to the prime rate. As of December 31, 2009, $58.1 million of loans were immediately repriceable. The decrease in yield was partially offset by a $25.1 million increase in average earning assets for the year 2009 compared to 2008.
Interest income (fte) earned on loans totaled $21,688,000 for the year ended December 31, 2009 with a resulting fte yield of 6.09% compared to $22,161,000 with an fte yield of 6.61% in 2008. The decrease was due to the lower prime interest rate in 2009, partially offset by growth of $21.2 million in average loans. The Company also established interest rate floors on lines of credit to offset the decrease in the prime rate. The securities available-for-sale portfolio averaged $129.4 million in 2009 with interest income (fte) of $5,830,000 and a yield (fte) of 4.51% compared to $130.9 million with interest income (fte) of $6,473,000 and yield (fte) of 4.94% in 2008. The decrease in yield in 2009 was principally due to higher yielding investments maturing and reinvested at the current lower interest rates.
Federal Funds sold and interest-bearing deposits with banks averaged $6.6 million at a yield of .29% compared to $1.1 million at a yield of 2.53% in 2008. The increase in Fed Funds at the current low yield had a negative impact on the margin in 2009.
Interest expense for the year-ended December 31, 2009 totaled $7,726,000 with an average cost of interest-bearing liabilities of 2.00% compared to interest expense of $9,694,000 with an average cost of 2.63% in 2008. The decrease was principally due to a lower level of short-term interest rates. In the lower rate environment, the Company reduced rates paid on money market accounts, time deposits and cash management accounts (included in short-term borrowings). The cost of time deposits decreased 101 basis points to 2.80% in 2009 from 3.81% in 2008, as higher costing time deposits matured and were replaced at lower rates. The rate on short-term borrowings principally cash management accounts declined 103 basis points to 1.11% in 2009 from 2.14% in 2008.
OTHER INCOME
Other income totaled $4,064,000 for the year ended December 31, 2010 which was $1,328,000 lower than the 2009 total. The decrease was due primarily to several non-recurring items recorded in 2009 including the receipt of $816,000 of proceeds from an insurance claim on bank-owned life insurance and a $150,000 gain on the sale of deposits related to a branch closure. Gains from the sale of mortgage loans also decreased $174,000 from the prior period. Additionally, fees recognized from non-sufficient funds (NSF) decreased $223,000
NORWOOD FINANCIAL CORP - 2010 CONSOLIDATED FINANCIAL REPORT
compared to 2009 as customers more efficiently managed their accounts and amendments to banking regulations reduced the volume of customers impacted by these fees.
Other income for the year-ended December 31, 2009 totaled $5,392,000 compared to $4,087,000 in 2008, an increase of $1,305,000. The increase is partially due to the receipt of $816,000 in proceeds from a death claim on a bank-owned life insurance policy. The Company took advantage of the low interest rate environment and sold $15.4 million of investment securities at a gain of $463,000 compared to $18,000 in losses in 2008. The Company also had a $150,000 gain on the sale of deposits related to a branch closure in the 2009 period. Service charges and fees decreased $124,000 principally due to a lower volume of NSF fees. The decline in NSF fees was also related to the branch closure.
Other Income (dollars in thousands) For the year-ended December 31 | | | | | | | | | |
| | | 2010 | | | 2009 | | | 2008 | |
| Service charges on deposit accounts | | $ | 151 | | | $ | 165 | | | $ | 194 | |
| ATM Fees | | | 288 | | | | 273 | | | | 280 | |
| NSF Fees | | | 1,058 | | | | 1,281 | | | | 1,424 | |
| Gain on sale of deposits | | | — | | | | 150 | | | | — | |
| Safe deposit box rental | | | 53 | | | | 52 | | | | 55 | |
| Loan related service fees | | | 292 | | | | 390 | | | | 281 | |
| Debit card | | | 413 | | | | 373 | | | | 376 | |
| Fiduciary activities | | | 405 | | | | 354 | | | | 404 | |
| Commissions on mutual funds & annuities | | | 116 | | | | 112 | | | | 105 | |
| Gain on sales of mortgage loans and servicing rights | | | 307 | | | | 481 | | | | 499 | |
| Earnings on and proceeds from bank-owned life insurance | | | 391 | | | | 1,196 | | | | 344 | |
| Other income | | | 142 | | | | 102 | | | | 143 | |
| | | | 3,616 | | | | 4,929 | | | | 4,105 | |
| Net realized gains (losses) on sales of securities | | | 448 | | | | 463 | | | | (18 | ) |
| Total | | $ | 4,064 | | | $ | 5,392 | | | $ | 4,087 | |
OTHER EXPENSES
Other expenses totaled $12,753,000 for the year ended December 31, 2010 which represents a decrease of $718,000, or 5.3%, from the $13,471,000 recorded in 2009. Salaries and employee benefits costs, which represent 51.0% of total other expense, decreased $322,000 in 2010. This decrease includes the $267,000 cost incurred in 2009 related to a retirement plan, which was funded by proceeds from a bank-owned life insurance policy included in other income. In 2010, the Company also incurred a $91,000 expense to pay out a portion of its post-retirement life insurance obligation which was offset by a corresponding reduction in federal income tax expense. FDIC insurance expense decreased $236,000 compared to the prior period due to the $225,000 special assessment paid in 2009. Costs related to foreclosed real estate properties also decreased $395,000 from last year, while professional fees increased $239,000 due primarily to merger related expenses incurred in connection with the proposed acquisition of North Penn Bancorp. The Company’s efficiency ratio, which measures total other expenses as a percentage of net interest income (fte) plus other income, was 51.6% in 2010 compared to 53.3% in 2009.
Other expenses totaled $13,471,000 in 2009 compared to $12,240,000 for 2008, an increase of $1,231,000. Salaries and employee benefit costs increased $783,000. The increase included $267,000 related to a retirement plan which was funded by proceeds from a BOLI policy included in other income.
NORWOOD FINANCIAL CORP - 2010 CONSOLIDATED FINANCIAL REPORT
The Company also paid out a portion of its post-retirement life insurance obligation, $136,000, which was offset by a reduction to federal income tax. FDIC insurance assessments totaled $710,000, an increase of $620,000 over the prior year. The increase included a special assessment of $225,000 which was based on five basis points of assets less Tier 1 capital as of June 30, 2009. Instead of imposing an additional special assessment, the FDIC required all banks to prepay their estimated risk-based assessment for the fourth quarter of 2009 and for all of 2010, 2011 and 2012 on December 30, 2009. The bank pre-paid $1,711,000 which is included in other assets and will be amortized over 36 months. The efficiency ratio, which is total other expenses as a percentage of net interest income (fte) plus other income for the year ended December 31, 2009 was 53.3%.
INCOME TAXES
Income tax expense for the year ended December 31, 2010 totaled $2,662,000 which results in an effective tax rate of 26.7% compared to $2,282,000 and 24.4% for 2009. The reduced rate in 2009 reflected the benefit from $816,000 of insurance proceeds which were exempt from federal income taxes. Excluding this item, the effective rate in 2009 would have been 26.8%.
Income tax expense for the year ended December 31, 2009 totaled $2,282,000 for an effective tax rate of 24.4% compared to an expense of $2,836,000 and an effective tax rate of 29.8% for 2008. The decrease in the effective tax rate was due to the receipt of $816,000 in proceeds from a BOLI policy which is exempt from federal income taxes and a $136,000 reduction to tax related to post-retirement life insurance benefits. Excluding these two items the effective tax rate for 2009 was 27.8%.
CAPITAL AND DIVIDENDS
Total stockholders’ equity as of December 31, 2010, was $67.7 million, compared to $64.5 million as of year-end 2009. The increase was principally due to retention of earnings of $4,193,000 after cash dividends declared of $3,120,000. Accumulated other comprehensive income decreased $953,000 in 2010 due to an increase in overall interest rates and the impact on fixed rate securities. As of December 31, 2010 the Company had a leverage capital ratio of 12.41%, Tier 1 risk-based capital of 18.44% and total risk-based capital of 19.74% compared to, 11.87%, 16.97% and 18.27%, respectively, in 2009. The Company did not participate in the Treasury Department’s TARP Capital Purchase Program.
The Company’s stock is traded on the Nasdaq Global market under the symbol, NWFL. As of December 31, 2010, there were approximately 1,500 shareholders based on transfer agent mailings.
The following table sets forth the price range and cash dividends declared per share regarding common stock for the period indicated:
| | Closing Price Range | | Cash dividends |
| | High | Low | | declared per share |
| Year 2010 | | | | | | | | |
| First Quarter | $ | 29.18 | | $ | 25.22 | | $ | .28 |
| Second Quarter | | 28.06 | | | 24.18 | | | .28 |
| Third Quarter | | 28.75 | | | 25.00 | | | .28 |
| Fourth Quarter | | 29.75 | | | 26.38 | | | .29 |
| | | | | | | | | |
| Year 2009 | | | | | | | | |
| First Quarter | $ | 29.45 | | $ | 22.95 | | $ | .27 |
| Second Quarter | | 32.00 | | | 24.10 | | | .27 |
| Third Quarter | | 33.25 | | | 30.57 | | | .27 |
| Fourth Quarter | | 31.10 | | | 25.50 | | | .28 |
| | | | | | | | | |
NORWOOD FINANCIAL CORP - 2010 CONSOLIDATED FINANCIAL REPORT
The book value of the common stock was $24.45 as of December 31, 2010 compared to $23.25 as of December 31, 2009. As of year-end 2010, the stock price was $27.77, compared to $28.59 as of December 31, 2009.
NON-GAAP FINANCIAL MEASURES
This annual report contains or references tax-equivalent interest income and net interest income, which are non-GAAP financial measures. Tax-equivalent interest income and net interest income are derived from GAAP interest income and net interest income using an assumed tax rate of 34%. We believe the presentation of interest income and net interest income on a tax-equivalent basis ensures comparability of interest income and net interest income arising from both taxable and tax-exempt sources and is consistent with industry practice. Tax-equivalent net interest income is reconciled to GAAP net interest income on page 29. Although the Company believes that these non-GAAP financial measures enhance investors’ understanding of our business and performance, these non-GAAP financial measures should not be considered an alternative to GAAP measures.
CHANGE IN AUDITORS
On August 11, 2009, the Company dismissed Beard Miller Company LLP (“BMC”) as the Company’s independent public accountants, and engaged S.R. Snodgrass, A.C. to serve as the Company’s independent public accountants. The appointment of Snodgrass and the dismissal of BMC were approved by the Audit Committee of the Company’s Board of Directors. BMC audited the Company’s consolidated financial statements for the year ended December 31, 2008. BMC’s report did not contain an adverse opinion or disclaimer of opinion, and was not qualified or modified as to uncertainty, audit scope or accounting principles. During the year ended December 31, 2008 and from December 31, 2008 through August 11, 2009, there were no disagreements or reportable events between the Company and BMC on any matters of accounting principles or practices, financial statement disclosure, or auditing scope or procedure, which, if not resolved to the satisfaction of BMC, would have caused them to make a reference to the subject matter of the disagreements or reportable events in connection with their reports. BMC subsequently became known as ParenteBeard LLC.
NORWOOD FINANCIAL CORP - 2010 CONSOLIDATED FINANCIAL REPORT
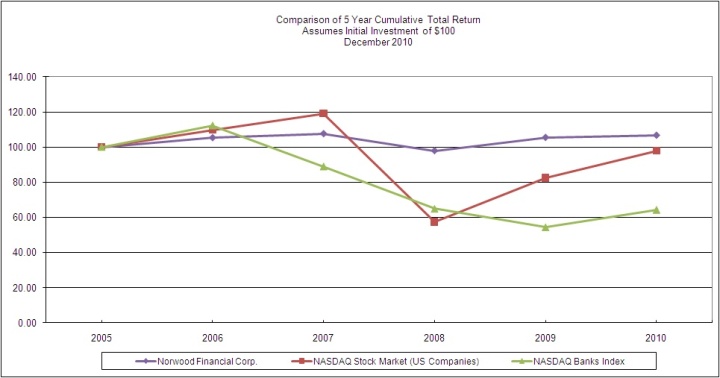
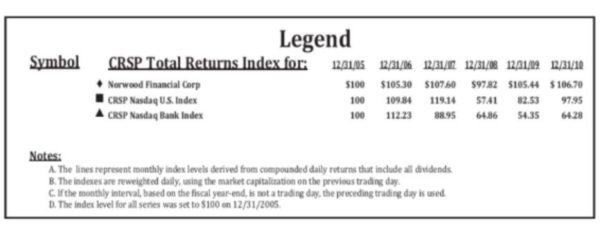
STOCK PERFORMANCE GRAPH
Set forth below is a stock performance graph comparing the cumulative total shareholder return on the Common Stock with (a) the cumulative total stockholder return on stocks included in the Nasdaq Stock Market index and (b) the cumulative total stockholder return on stocks included in the Nasdaq Bank index, as prepared by the Center for Research in Securities Prices (“CRSP”) at the University of Chicago. All three investment comparisons assume the investment of $100 at the market close on December 31, 2005 and the reinvestment of dividends paid. The graph provides comparison at December 31, 2005 and each fiscal year through December 31, 2010.
There can be no assurance that the Company’s future stock performance will be the same or similar to the historical performance shown in the above graph. The Company neither makes nor endorses any predictions as to stock performance.
NORWOOD FINANCIAL CORP - 2010 CONSOLIDATED FINANCIAL REPORT
NORWOOD FINANCIAL CORP
SUMMARY OF QUARTERLY RESULTS (UNAUDITED)
(Dollars in thousands, except per share amounts)
| 2010 | | | | | | | | | | | | |
| | | December 31 | | | September 30 | | | June 30 | | | March 31 | |
| Interest income | | $ | 6,273 | | | $ | 6,395 | | | $ | 6,377 | | | $ | 6,642 | |
| Interest expense | | | 1,357 | | | | 1,476 | | | | 1,545 | | | | 1,645 | |
| Net interest income | | | 4,916 | | | | 4,919 | | | | 4,832 | | | | 4,997 | |
| Provision for loan losses | | | 270 | | | | 250 | | | | 150 | | | | 330 | |
| Other income | | | 943 | | | | 874 | | | | 952 | | | | 847 | |
| Net realized gains on sales of securities | | | 68 | | | | 161 | | | | 64 | | | | 155 | |
| Other expense | | | 3,305 | | | | 3,112 | | | | 3,176 | | | | 3,160 | |
| | | | | | | | | | | | | | | | | |
| Income before income taxes | | | 2,352 | | | | 2,592 | | | | 2,522 | | | | 2,509 | |
| Income tax expense | | | 544 | | | | 702 | | | | 704 | | | | 712 | |
| NET INCOME | | $ | 1,808 | | | $ | 1,890 | | | $ | 1,818 | | | $ | 1,797 | |
| | | | | | | | | | | | | | | | | |
| Basic earnings per share | | $ | .65 | | | $ | .68 | | | $ | .66 | | | $ | .65 | |
| | | | | | | | | | | | | | | | | |
| Diluted earnings per share | | $ | .65 | | | $ | .68 | | | $ | .66 | | | $ | .65 | |
| | | | | | | | | | | | | | | | | |
| 2009 | | | | | | | | | | | | | | | | |
| | | December 31 | | | September 30 | | | June 30 | | | March 31 | |
| | | | | | | | | | | | | | | | | |
| Interest income | | $ | 6,722 | | | $ | 6,680 | | | $ | 6,743 | | | $ | 6,690 | |
| Interest expense | | | 1,895 | | | | 1,914 | | | | 1,908 | | | | 2,009 | |
| Net interest income | | | 4,827 | | | | 4,766 | | | | 4,835 | | | | 4,681 | |
| Provision for loan losses | | | 1,100 | | | | 140 | | | | 220 | | | | 225 | |
| Other income | | | 1,885 | | | | 928 | | | | 996 | | | | 1,120 | |
| Net realized gain on sales of securities | | | 40 | | | | 90 | | | | 172 | | | | 161 | |
| Other expense | | | 3,702 | | | | 3,174 | | | | 3,320 | | | | 3,275 | |
| | | | | | | | | | | | | | | | | |
| Income before income taxes | | | 1,950 | | | | 2,470 | | | | 2,463 | | | | 2,462 | |
| Income tax expense | | | 148 | | | | 695 | | | | 714 | | | | 725 | |
| NET INCOME | | $ | 1,802 | | | $ | 1,775 | | | $ | 1,749 | | | $ | 1,737 | |
| | | | | | | | | | | | | | | | | |
| Basic earnings per share | | $ | 0.65 | | | $ | 0.64 | | | $ | 0.64 | | | $ | 0.64 | |
| | | | | | | | | | | | | | | | | |
| Diluted earnings per share | | $ | 0.65 | | | $ | 0.64 | | | $ | 0.62 | | | $ | 0.63 | |
NORWOOD FINANCIAL CORP - 2010 CONSOLIDATED FINANCIAL REPORT
NORWOOD FINANCIAL CORP CONSOLIDATED AVERAGE BALANCE SHEETS WITH RESULTANT INTEREST AND RATES
(Tax-Equivalent Basis, dollars in thousands)
Year Ended December 31 | | 2010 | | | 2009 | | | 2008 | |
| | | Average Balance(2) | | | Interest(1) | | | Avg Rate | | | Average Balance(2) | | | Interest(1) | | | Avg Rate | | | Average Balance(2) | | | Interest(1) | | | Avg Rate | |
| | | | | | | | | | | | | | | | | | | | | | | | | | | | |
| ASSETS | | | | | | | | | | | | | | | | | | | | | | | | | | | |
| Interest Earning Assets: | | | | | | | | | | | | | | | | | | | | | | | | | | | |
| Federal funds sold | | $ | 3,000 | | | $ | 10 | | | | .33 | % | | $ | 2,031 | | | $ | 5 | | | | 0.25 | % | | $ | 1,082 | | | $ | 28 | | | | 2.59 | % |
| Interest bearing deposits with banks | | | 16,415 | | | | 47 | | | | .29 | | | | 4,552 | | | | 14 | | | | 0.31 | | | | 66 | | | | 1 | | | | 1.52 | |
| Securities held to maturity | | | 280 | | | | 24 | | | | 8.57 | | | | 707 | | | | 61 | | | | 8.63 | | | | 706 | | | | 61 | | | | 8.64 | |
| Securities available for sale | | | | | | | | | | | | | | | | | | | | | | | | | | | | | | | | | | | | |
| Taxable | | | 95,121 | | | | 2,969 | | | | 3.12 | | | | 100,120 | | | | 4,131 | | | | 4.13 | | | | 108,809 | | | | 5,207 | | | | 4.79 | |
| Tax-exempt | | | 40,332 | | | | 2,340 | | | | 5.80 | | | | 29,283 | | | | 1,699 | | | | 5.80 | | | | 22,108 | | | | 1,266 | | | | 5.73 | |
| Total securities available for sale | | | 135,453 | | | | 5,309 | | | | 3.92 | | | | 129,403 | | | | 5,830 | | | | 4.51 | | | | 130,917 | | | | 6,473 | | | | 4.94 | |
| Loans receivable (3,4) | | | 355,980 | | | | 21,295 | | | | 5.98 | | | | 356,345 | | | | 21,688 | | | | 6.09 | | | | 335,137 | | | | 22,161 | | | | 6.61 | |
| Total interest earning assets | | | 511,128 | | | | 26,685 | | | | 5.22 | | | | 493,038 | | | | 27,598 | | | | 5.60 | | | | 467,908 | | | | 28,724 | | | | 6.14 | |
| Non-interest earning assets: | | | | | | | | | | | | | | | | | | | | | | | | | | | | | | | | | | | | |
| Cash and due from banks | | | 7,402 | | | | | | | | | | | | 6,935 | | | | | | | | | | | | 8,102 | | | | | | | | | |
| Allowance for loan losses | | | (5,476 | ) | | | | | | | | | | | (4,539 | ) | | | | | | | | | | | (4,013 | ) | | | | | | | | |
| Other assets | | | 22,638 | | | | | | | | | | | | 17,309 | | | | | | | | | | | | 17,687 | | | | | | | | | |
| Total non-interest earning assets | | | 24,564 | | | | | | | | | | | | 19,705 | | | | | | | | | | | | 21,776 | | | | | | | | | |
| TOTAL ASSETS | | $ | 535,692 | | | | | | | | | | | $ | 512,743 | | | | | | | | | | | $ | 489,684 | | | | | | | | | |
| | | | | | | | | | | | | | | | | | | | | | | | | | | | | | | | | | | | | |
| LIABILITIES AND STOCKHOLDERS' EQUITY | | | | | | | | | | | | | | | | | | | | | | | | | | | | | | | | | | | | |
| Interest Bearing Liabilities: | | | | | | | | | | | | | | | | | | | | | | | | | | | | | | | | | | | | |
| Interest bearing demand and money market | | $ | 107,997 | | | | 571 | | | | .53 | | | $ | 98,968 | | | | 731 | | | | 0.74 | | | $ | 102,358 | | | | 1,449 | | | | 1.42 | |
| Savings | | | 48,588 | | | | 109 | | | | .22 | | | | 44,526 | | | | 158 | | | | 0.35 | | | | 44,510 | | | | 208 | | | | 0.47 | |
| Time | | | 177,761 | | | | 3,603 | | | | 2.03 | | | | 174,201 | | | | 4,876 | | | | 2.80 | | | | 160,462 | | | | 6,116 | | | | 3.81 | |
| Total interest-bearing deposits | | | 334,346 | | | | 4,283 | | | | 1.28 | | | | 317,695 | | | | 5,765 | | | | 1.81 | | | | 307,330 | | | | 7,773 | | | | 2.53 | |
| Short-term borrowings | | | 25,932 | | | | 117 | | | | .45 | | | | 26,233 | | | | 292 | | | | 1.11 | | | | 32,328 | | | | 693 | | | | 2.14 | |
| Other borrowings | | | 41,712 | | | | 1,623 | | | | 3.89 | | | | 43,000 | | | | 1,669 | | | | 3.88 | | | | 28,710 | | | | 1,228 | | | | 4.28 | |
| Total interest bearing liabilities | | | 401,990 | | | | 6,023 | | | | 1.50 | | | | 386,928 | | | | 7,726 | | | | 2.00 | | | | 368,368 | | | | 9,694 | | | | 2.63 | |
| Non-interest bearing liabilities: | | | | | | | | | | | | | | | | | | | | | | | | | | | | | | | | | | | | |
| Non-interest bearing demand deposits | | | 61,966 | | | | | | | | | | | | 59,224 | | | | | | | | | | | | 59,759 | | | | | | | | | |
| Other liabilities | | | 4,433 | | | | | | | | | | | | 4,615 | | | | | | | | | | | | 4,908 | | | | | | | | | |
| Total non-interest bearing liabilities | | | 66,399 | | | | | | | | | | | | 63,839 | | | | | | | | | | | | 64,667 | | | | | | | | | |
| Stockholders' equity | | | 67,303 | | | | | | | | | | | | 61,976 | | | | | | | | | | | | 56,649 | | | | | | | | | |
| TOTAL LIABILITIES AND STOCKHOLDERS' EQUITY | | $ | 535,692 | | | | | | | | | | | $ | 512,743 | | | | | | | | | | | $ | 489,684 | | | | | | | | | |
| | | | | | | | | | | | | | | | | | | | | | | | | | | | | | | | | | | | | |
| Net interest income | | | | | | | | | | | | | | | | | | | | | | | | | | | | | | | | | | | | |
| (tax-equivalent basis) | | | | | | | 20,662 | | | | 3.72 | % | | | | | | | 19,872 | | | | 3.60 | % | | | | | | | 19,030 | | | | 3.51 | % |
| Tax-equivalent basis adjustment | | | | | | | (998 | ) | | | | | | | | | | | (763 | ) | | | | | | | | | | | (629 | ) | | | | |
| Net Interest Income | | | | | | $ | 19,664 | | | | | | | | | | | $ | 19,109 | | | | | | | | | | | $ | 18,401 | | | | | |
| | | | | | | | | | | | | | | | | | | | | | | | | | | | | | | | | | | | | |
| Net Interest margin | | | | | | | | | | | | | | | | | | | | | | | | | | | | | | | | | | | | |
| (tax-equivalent basis) | | | | | | | | | | | 4.04 | % | | | | | | | | | | | 4.03 | % | | | | | | | | | | | 4.07 | % |
| 1. | Interest and yields are presented on a tax-equivalent basis using a marginal tax rate of 34%. |
| 2. | Average balances have been calculated based on daily balances. |
| 3. | Loan balances include non-accrual loans and are net of unearned income. |
| 4. | Loan yields include the effect of amortization of deferred fees net of costs. |
NORWOOD FINANCIAL CORP - 2010 CONSOLIDATED FINANCIAL REPORT
RATE/VOLUME ANALYSIS
The following table shows the fully taxable equivalent effect of changes in volumes and rates on interest income and interest expense.
| | | Increase/(Decrease) | |
| (dollars in thousands) | | 2010 compared to 2009 | | | 2009 compared to 2008 | |
| | | Variance due to | | | Variance due to | |
| | | Volume | | | Rate | | | Net | | | Volume | | | Rate | | | Net | |
| INTEREST EARNING ASSETS: | | | | | | | | | | | | | | | | | | |
| Federal funds sold | | $ | 3 | | | $ | 1 | | | $ | 4 | | | $ | 14 | | | $ | (37 | ) | | $ | (23 | ) |
| Interest bearing deposits with banks | | | 34 | | | | (1 | ) | | | 33 | | | | 14 | | | | (1 | ) | | | 13 | |
| Securities held to maturity | | | (37 | ) | | | 0 | | | | (37 | ) | | | 0 | | | | 0 | | | | 0 | |
| Securities available for sale | | | | | | | | | | | | | | | | | | | | | | | | |
| Taxable | | | (198 | ) | | | (964 | ) | | | (1,162 | ) | | | (395 | ) | | | (681 | ) | | | (1,076 | ) |
| Tax-exempt | | | 641 | | | | 1 | | | | 642 | | | | 416 | | | | 17 | | | | 433 | |
| Total securities available for sale | | | 443 | | | | (963 | ) | | | (520 | ) | | | 21 | | | | (664 | ) | | | (643 | ) |
| Loans receivable | | | (22 | ) | | | (371 | ) | | | (393 | ) | | | 1,353 | | | | (1,826 | ) | | | (473 | ) |
| Total interest earning assets | | | 421 | | | | (1,334 | ) | | | (913 | ) | | | 1,402 | | | | (2,528 | ) | | | (1,126 | ) |
| | | | | | | | | | | | | | | | | | | | | | | | | |
| INTEREST BEARING LIABILITIES: | | | | | | | | | | | | | | | | | | | | | | | | |
Interest- bearing demand
and money market | | | 62 | | | | (222 | ) | | | (160 | ) | | | (47 | ) | | | (671 | ) | | | (718 | ) |
| Savings | | | 13 | | | | (62 | ) | | | (49 | ) | | | 0 | | | | (50 | ) | | | (50 | ) |
| Time | | | 98 | | | | (1,371 | ) | | | (1,273 | ) | | | 490 | | | | (1,730 | ) | | | (1,240 | ) |
| Total interest- bearing deposits | | | 173 | | | | (1,655 | ) | | | (1,482 | ) | | | 443 | | | | (2,451 | ) | | | (2,008 | ) |
| Short-term borrowings | | | (3 | ) | | | (172 | ) | | | (175 | ) | | | (113 | ) | | | (288 | ) | | | (401 | ) |
| Long term debt | | | (50 | ) | | | 4 | | | | (46 | ) | | | 564 | | | | (123 | ) | | | 441 | |
| Total interest bearing liabilities | | | 120 | | | | (1,823 | ) | | | (1,703 | ) | | | 894 | | | | (2,862 | ) | | | (1,968 | ) |
| Net interest income | | | | | | | | | | | | | | | | | | | | | | | | |
| (tax-equivalent basis) | | $ | 301 | | | $ | 489 | | | $ | 790 | | | $ | 508 | | | $ | 334 | | | $ | 842 | |
Changes in net interest income that could not be specifically identified as either a rate or volume change were allocated proportionately to changes in volume and changes in rate.
NORWOOD FINANCIAL CORP - 2010 CONSOLIDATED FINANCIAL REPORT
MANAGEMENT’S REPORT ON INTERNAL CONTROL OVER FINANCIAL REPORTING
TO THE STOCKHOLDERS OF NORWOOD FINANCIAL CORP
Management of Norwood Financial Corp and its subsidiary (Norwood) is responsible for establishing and maintaining adequate internal control over financial reporting as defined in Rules 13a-15(f) and 15d-15(f) under the Securities Exchange Act of 1934. Norwood’s internal control over financial reporting is designed to provide reasonable assurance regarding the reliability of financial reporting and the preparation of the consolidated financial statements for external purposes in accordance with accounting principles generally accepted in the United States of America.
Norwood’s internal control over financial reporting includes those policies and procedures that (1) pertain to the maintenance of records that, in reasonable detail, accurately and fairly reflect the transactions and dispositions of the assets of Norwood; (2) provide reasonable assurance that transactions are recorded as necessary to permit preparation of financial statements in accordance with generally accepted accounting principles, and that our receipts and expenditures are being made only in accordance with authorizations of Norwood’s management and directors; and (3) provide reasonable assurance regarding prevention or timely detection of unauthorized acquisition, use or disposition of Norwood’s assets that could have a material effect on the consolidated financial statements.
Because of its inherent limitations, internal control over financial reporting may not prevent or detect misstatements. Also, projections of any evaluation of effectiveness to future periods are subject to the risk that controls may become inadequate because of changes in conditions, or that the degree of compliance with the policies or procedures may deteriorate.
Management assessed the effectiveness of Norwood’s internal control over financial reporting as of December 31, 2010. In making this assessment, management used the criteria set forth by the Committee of Sponsoring Organizations of the Treadway Commission in “Internal Control – Integrated Framework.” Based on our assessment and those criteria, management determined that Norwood maintained effective internal control over financial reporting as of December 31, 2010.
Norwood’s Independent registered certified public accounting firm has audited the effectiveness of Norwood’s internal control over financial reporting. Their report appears on page 32.
|  |
| Lewis J. Critelli | William S. Lance |
| President and Chief | Senior Vice President and |
| Exeutive Officer | Chief Financial Officer |
NORWOOD FINANCIAL CORP - 2010 CONSOLIDATED FINANCIAL REPORT
REPORT OF INDEPENDENT REGISTERED PUBLIC ACCOUNTING FIRM
To the Board of Directors and
Stockholders of Norwood Financial Corp.
Honesdale, Pennsylvania
We have audited the accompanying consolidated balance sheet of Norwood Financial Corp. and its subsidiary as of December 31, 2010 and 2009, and the related consolidated statements of income, stockholders’ equity, and cash flows for the years then ended. These financial statements are the responsibility of Norwood Financial Corp. and its subsidiary’s management. Our responsibility is to express an opinion on these financial statements based on our audits. The financial statements of Norwood Financial Corp. and its subsidiary for the year ended December 31, 2008 were audited by other auditors whose report, dated March 10, 2009, expressed an unqualified opinion on those statements.
We conducted our audit in accordance with the standards of the Public Company Accounting Oversight Board (United States). Those standards require that we plan and perform the audit to obtain reasonable assurance about whether the financial statements are free of material misstatement. An audit includes examining, on a test basis, evidence supporting the amounts and disclosures in the financial statements. An audit also includes assessing the accounting principles used and significant estimates made by management, as well as evaluating the overall financial statement presentation. We believe that our audit provides a reasonable basis for our opinion.
In our opinion, the consolidated financial statements referred to above present fairly, in all material respects, the financial position of Norwood Financial Corp. and its subsidiary as of December 31, 2010 and 2009, and the results of their operations and their cash flows for the years then ended in conformity with U.S. generally accepted accounting principles.
We have also audited in accordance with the standards of the Public Company Accounting Oversight Board (United States), Norwood Financial Corp. and its subsidiary’s internal control over financial reporting as of December 31, 2010, based on criteria established in Internal Control – Integrated Framework issued by the Committee of Sponsoring Organizations of the Treadway Commission, and our report dated March 8, 2011, expressed an unqualified opinion on the effectiveness of Norwood Financial Corp.’s internal control over financial reporting.
 S.R. Snodgrass, A. C.
2100 Corporate Drive
Suite 400
Wexford, PA
March 8, 2011
NORWOOD FINANCIAL CORP - 2010 CONSOLIDATED FINANCIAL REPORT
REPORT OF INDEPENDENT REGISTERED PUBLIC ACCOUNTING FIRM
To the Board of Directors and
Stockholders of Norwood Financial Corp.
Honesdale, Pennsylvania
We have audited Norwood Financial Corp. and its subsidiary’s internal control over financial reporting as of December 31, 2010 and 2009, based on criteria established in Internal Control – Integrated Framework issued by the Committee of Sponsoring Organizations of the Treadway Commission. Norwood Financial Corp. and its subsidiary’s management is responsible for maintaining effective internal control over financial reporting and for its assessment of the effectiveness of internal control over financial reporting included in the accompanying Management’s Report on Internal Control Over Financial Reporting. Our responsibility is to express an opinion on the Company’s internal control over financial reporting based on our audit.
We conducted our audit in accordance with the standards of the Public Company Accounting Oversight Board (United States). Those standards require that we plan and perform the audit to obtain reasonable assurance about whether effective internal control over financial reporting was maintained in all material respects. Our audit included obtaining an understanding of internal control over financial reporting, assessing the risk that a material weakness exists, and testing and evaluating the design and operating effectiveness of internal control based on the assessed risk. Our audit also included performing such other procedures as we considered necessary in the circumstances. We believe that our audit provides a reasonable basis for our opinion.
A company’s internal control over financial reporting is a process designed to provide reasonable assurance regarding the reliability of financial reporting and the preparation of financial statements for external purposes in accordance with generally accepted accounting principles. A company’s internal control over financial reporting includes those policies and procedures that (a) pertain to the maintenance of records that, in reasonable detail, accurately and fairly reflect the transactions and dispositions of the assets of the company; (b) provide reasonable assurance that transactions are recorded as necessary to permit preparation of financial statements in accordance with generally accepted accounting principles, and that receipts and expenditures of the company are being made only in accordance with authorizations of management and directors of the company; and (c) provide reasonable assurance regarding prevention or timely detection of unauthorized acquisition, use, or disposition of the company’s assets that could have a material effect on the financial statements.
Because of its inherent limitations, internal control over financial reporting may not prevent or detect misstatements. Also, projections of any evaluation of effectiveness to future periods are subject to the risk that controls may become inadequate because of changes in conditions, or that the degree of compliance with the policies or procedures may deteriorate.
In our opinion, Norwood Financial Corp. and its subsidiary maintained, in all material respects, effective internal control over financial reporting as of December 31, 2010, based on criteria established in Internal Control – Integrated Framework issued by the Committee of Sponsoring Organizations of the Treadway Commission.
We have also audited in accordance with the standards of the Public Company Accounting Oversight Board (United States), the accompanying consolidated balance sheets of Norwood Financial Corp. and its subsidiary as of December 31, 2010 and 2009, and the related consolidated statements of income, stockholders’ equity, and cash flows for the years then ended and our report dated March 8, 2011, expressed an unqualified opinion.
S.R. Snodgrass, A. C. 2100 Corporate Drive
Suite 400
Wexford, PA
March 8, 2011
NORWOOD FINANCIAL CORP - 2010 CONSOLIDATED FINANCIAL REPORT
REPORT OF INDEPENDENT REGISTERED PUBLIC ACCOUNTING FIRM
To the Board of Directors and
Stockholders of Norwood Financial Corp.
Honesdale, Pennsylvania
We have audited the accompanying consolidated statements of income, stockholders’ equity, and cash flows of Norwood Financial Corp. and its subsidiary for the year ended December 31, 2008. Norwood Financial Corp. and its subsidiary’s management is responsible for these consolidated financial statements. Our responsibility is to express an opinion on these consolidated financial statements based on our audit.
We conducted our audit in accordance with the standards of the Public Company Accounting Oversight Board (United States). Those standards require that we plan and perform the audit to obtain reasonable assurance about whether the consolidated financial statements are free of material misstatement. An audit includes examining, on a test basis, evidence supporting the amounts and disclosures in the consolidated financial statements. An audit also includes assessing the accounting principles used and significant estimates made by management, as well as evaluating the overall financial statement presentation. We believe that our audit provides a reasonable basis for our opinion.
In our opinion, the consolidated financial statements referred to above present fairly, in all material respects, the consolidated results of operations and cash flows of Norwood Financial Corp. and its subsidiary for the year ended December 31, 2008, in conformity with accounting principles generally accepted in the United States of America.
Parente Beard LLC
Lancaster, Pennsylvania
March 8, 2011
NORWOOD FINANCIAL CORP - 2010 CONSOLIDATED FINANCIAL REPORT
CONSOLIDATED BALANCE SHEETS
| | | December 31, | |
| | | 2010 | | | 2009 | |
| | | (In Thousands, | |
| | | Except Share Data) | |
| ASSETS | |
| Cash and due from banks | | $ | 5,782 | | | $ | 6,498 | |
| Interest bearing deposits with banks | | | 7,843 | | | | 7,857 | |
| Federal funds sold | | | 3,000 | | | | 3,000 | |
| | | | | | | | | |
| Cash and cash equivalents | | | 16,625 | | | | 17,355 | |
| | | | | | | | | |
| Securities available for sale | | | 145,815 | | | | 130,577 | |
| Securities held to maturity, fair value 2010: $179, 2009: $722 | | | 170 | | | | 708 | |
| Loans receivable (net of allowance for loan losses 2010: $5,616; 2009: $5,453) | | | 351,239 | | | | 358,021 | |
| Investment in Federal Home Loan Bank Stock, at cost | | | 3,361 | | | | 3,538 | |
| Bank premises and equipment, net | | | 4,904 | | | | 5,189 | |
| Bank owned life insurance | | | 8,249 | | | | 7,889 | |
| Accrued interest receivable | | | 2,166 | | | | 2,200 | |
| Foreclosed real estate owned | | | 748 | | | | 392 | |
| Other assets | | | 3,728 | | | | 3,827 | |
| | | | | | | | | |
| Total Assets | | $ | 537,005 | | | $ | 529,696 | |
| | | | | | | | | |
| LIABILITIES AND STOCKHOLDERS’ EQUITY | |
Liabilities | | | | | | | | |
| Deposits: | | | | | | | | |
| Non-interest bearing demand | | $ | 62,238 | | | $ | 59,820 | |
| Interest bearing demand | | | 38,168 | | | | 34,410 | |
| Money market deposit accounts | | | 70,812 | | | | 60,035 | |
| Savings | | | 50,341 | | | | 44,423 | |
| Time | | | 172,306 | | | | 192,785 | |
| | | | | | | | | |
| Total Deposits | | | 393,865 | | | | 391,473 | |
| | | | | | | | | |
| Short-term borrowings | | | 33,309 | | | | 25,803 | |
| Other borrowings | | | 38,000 | | | | 43,000 | |
| Accrued interest payable | | | 1,536 | | | | 2,057 | |
| Other liabilities | | | 2,597 | | | | 2,892 | |
| | | | | | | | | |
| Total Liabilities | | | 469,307 | | | | 465,225 | |
| | | | | | | | | |
| Stockholders’ Equity | | | | | | | | |
| Common stock, $.10 par value, authorized 10,000,000 shares, issued: 2,840,872 | | | 284 | | | | 284 | |
| Surplus | | | 9,826 | | | | 9,764 | |
| Retained earnings | | | 58,648 | | | | 54,455 | |
| Treasury stock at cost: 2010: 72,068 shares, 2009: 68,436 shares | | | (2,197 | ) | | | (2,122 | ) |
| Accumulated other comprehensive income | | | 1,137 | | | | 2,090 | |
| | | | | | | | | |
| Total Stockholders’ Equity | | | 67,698 | | | | 64,471 | |
| | | | | | | | | |
| Total Liabilities and Stockholders’ Equity | | $ | 537,005 | | | $ | 529,696 | |
See notes to consolidated financial statements.
NORWOOD FINANCIAL CORP - 2010 CONSOLIDATED FINANCIAL REPORT
CONSOLIDATED STATEMENTS OF INCOME
| | | Years Ended December 31, | |
| | | 2010 | | | 2009 | | | 2008 | |
| | | (In Thousands, Except per Share Data) | |
| INTEREST INCOME | | | | | | | | | |
| Loans receivable, including fees | | $ | 21,101 | | | $ | 21,523 | | | $ | 21,983 | |
| Securities: | | | | | | | | | | | | |
| Taxable | | | 2,969 | | | | 4,131 | | | | 5,207 | |
| Tax exempt | | | 1,560 | | | | 1,162 | | | | 876 | |
| Other | | | 57 | | | | 19 | | | | 29 | |
| | | | | | | | | | | | | |
| Total Interest Income | | | 25,687 | | | | 26,835 | | | | 28,095 | |
| | | | | | | | | | | | | |
| INTEREST EXPENSE | | | | | | | | | | | | |
| Deposits | | | 4,283 | | | | 5,765 | | | | 7,773 | |
| Short-term borrowings | | | 117 | | | | 292 | | | | 693 | |
| Other borrowings | | | 1,623 | | | | 1,669 | | | | 1,228 | |
| | | | | | | | | | | | | |
| Total Interest Expense | | | 6,023 | | | | 7,726 | | | | 9,694 | |
| | | | | | | | | | | | | |
| Net Interest Income | | | 19,664 | | | | 19,109 | | | | 18,401 | |
| | | | | | | | | | | | | |
| PROVISION FOR LOAN LOSSES | | | 1,000 | | | | 1,685 | | | | 735 | |
| | | | | | | | | | | | | |
| Net Interest Income after Provision for Loan Losses | | | 18,664 | | | | 17,424 | | | | 17,666 | |
| | | | | | | | | | | | | |
| OTHER INCOME | | | | | | | | | | | | |
| Service charges and fees | | | 2,231 | | | | 2,476 | | | | 2,600 | |
| Income from fiduciary activities | | | 405 | | | | 354 | | | | 404 | |
| Net realized gains (losses) on sales of securities | | | 448 | | | | 463 | | | | (18 | ) |
| Gain on sales of loans and servicing rights | | | 307 | | | | 481 | | | | 499 | |
| Earnings on life insurance policies | | | 391 | | | | 1,196 | | | | 344 | |
| Gain on sale of deposits | | | — | | | | 150 | | | | — | |
| Other | | | 282 | | | | 272 | | | | 258 | |
| | | | | | | | | | | | | |
| Total Other Income | | | 4,064 | | | | 5,392 | | | | 4,087 | |
| | | | | | | | | | | | | |
| OTHER EXPENSES | | | | | | | | | | | | |
| Salaries and employee benefits | | | 6,507 | | | | 6,829 | | | | 6,046 | |
| Occupancy | | | 1,136 | | | | 1,133 | | | | 1,118 | |
| Furniture and equipment | | | 424 | | | | 458 | | | | 507 | |
| Data processing related operations | | | 803 | | | | 788 | | | | 753 | |
| Federal Deposit Insurance Corporation insurance assessment | | | 474 | | | | 710 | | | | 90 | |
| Advertising | | | 187 | | | | 186 | | | | 213 | |
| Professional fees | | | 650 | | | | 411 | | | | 331 | |
| Postage and telephone | | | 484 | | | | 487 | | | | 521 | |
| Taxes, other than income | | | 524 | | | | 484 | | | | 504 | |
| Foreclosed real estate owned | | | 41 | | | | 436 | | | | 582 | |
| Amortization of intangible assets | | | 52 | | | | 52 | | | | 52 | |
| Other | | | 1,471 | | | | 1,497 | | | | 1,523 | |
| | | | | | | | | | | | | |
| Total Other Expenses | | | 12,753 | | | | 13,471 | | | | 12,240 | |
| | | | | | | | | | | | | |
| Income before Income Taxes | | | 9,975 | | | | 9,345 | | | | 9,513 | |
| | | | | | | | | | | | | |
| INCOME TAX EXPENSE | | | 2,662 | | | | 2,282 | | | | 2,836 | |
| | | | | | | | | | | | | |
| Net Income | | $ | 7,313 | | | $ | 7,063 | | | $ | 6,677 | |
| | | | | | | | | | | | | |
| EARNINGS PER SHARE | | | | | | | | | | | | |
| Basic | | $ | 2.65 | | | $ | 2.57 | | | $ | 2.44 | |
| Diluted | | $ | 2.64 | | | $ | 2.55 | | | $ | 2.41 | |
See notes to consolidated financial statements.
NORWOOD FINANCIAL CORP - 2010 CONSOLIDATED FINANCIAL REPORT
CONSOLIDATED STATEMENTS OF STOCKHOLDERS’ EQUITY
| | | Years Ended December 31, 2010, 2009 and 2008 | |
| | | | | | | | | | | | | | | | | | | | | Accumulated | | | | |
| | | | | | | | | | | | | | | | | | | | | Other | | | | |
| | | Common Stock | | | | | | Retained | | | Treasury | | | Comprehensive | | | | |
| | | Shares | | | Amount | | | Surplus | | | Earnings | | | Shares | | | Amount | | | Income (Loss) | | | Total | |
| | | (Dollars in Thousands, Except Per Share Data) | |
| | | | | | | | | | | | | | | | | | | | | | | | | |
| BALANCE – DECEMBER 31, 2007 | | | 2,840,872 | | | $ | 284 | | | $ | 10,159 | | | $ | 47,030 | | | | 87,256 | | | $ | (2,708 | ) | | $ | 1,054 | | | $ | 55,819 | |
| Comprehensive Income: | | | | | | | | | | | | | | | | | | | | | | | | | | | | | | | | |
| Net Income | | | - | | | | - | | | | - | | | | 6,677 | | | | - | | | | - | | | | - | | | | 6,677 | |
| Change in unrealized gains on securities available for sale, net of reclassification adjustment and tax effects | | | - | | | | - | | | | - | | | | - | | | | - | | | | - | | | | 225 | | | | 225 | |
| | | | | | | | | | | | | | | | | | | | | | | | | | | | | | | | | |
Total Comprehensive
Income | | | - | | | | - | | | | - | | | | - | | | | - | | | | - | | | | - | | | | 6,902 | |
| | | | | | | | | | | | | | | | | | | | | | | | | | | | | | | | | |
| Cash dividends declared, $1.02 per share | | | - | | | | - | | | | - | | | | (2,789 | ) | | | - | | | | - | | | | - | | | | (2,789 | ) |
| Acquisition of treasury stock | | | - | | | | - | | | | - | | | | - | | | | 50,632 | | | | (1,583 | ) | | | - | | | | (1,583 | ) |
| Stock options exercised | | | - | | | | - | | | | (455 | ) | | | - | | | | (27,979 | ) | | | 875 | | | | - | | | | 420 | |
| Tax benefit of stock options exercised | | | - | | | | - | | | | 134 | | | | - | | | | - | | | | - | | | | - | | | | 134 | |
| Sale of treasury stock for ESOP | | | - | | | | - | | | | (20 | ) | | | - | | | | (5,599 | ) | | | 173 | | | | - | | | | 153 | |
| Compensation expense related to stock options | | | - | | | | - | | | | 154 | | | | - | | | | - | | | | - | | | | - | | | | 154 | |
Cumulative effect of net periodic postretirement benefit | | | - | | | | - | | | | - | | | | (520 | ) | | | - | | | | - | | | | - | | | | (520 | ) |
| | | | | | | | | | | | | | | | | | | | | | | | | | | | | | | | | |
| BALANCE – DECEMBER 31, 2008 | | | 2,840,872 | | | | 284 | | | | 9,972 | | | | 50,398 | | | | 104,310 | | | | (3,243 | ) | | | 1,279 | | | | 58,690 | |
| Comprehensive income: | | | | | | | | | | | | | | | | | | | | | | | | | | | | | | | | |
| Net income | | | - | | | | - | | | | - | | | | 7,063 | | | | - | | | | - | | | | - | | | | 7,063 | |
| Change in unrealized gains on securities available for sale, net of reclassification adjustment and tax effects | | | - | | | | - | | | | - | | | | - | | | | - | | | | - | | | | 811 | | | | 811 | |
| | | | | | | | | | | | | | | | | | | | | | | | | | | | | | | | | |
Total Comprehensive
Income | | | - | | | | - | | | | - | | | | - | | | | - | | | | - | | | | - | | | | 7,874 | |
| | | | | | | | | | | | | | | | | | | | | | | | | | | | | | | | | |
| Cash dividends declared, $1.09 per share | | | - | | | | - | | | | - | | | | (3,006 | ) | | | - | | | | - | | | | - | | | | (3,006 | ) |
| Acquisition of treasury stock | | | - | | | | - | | | | - | | | | - | | | | 2,519 | | | | (68 | ) | | | - | | | | (68 | ) |
| Stock options exercised | | | - | | | | - | | | | (492 | ) | | | - | | | | (32,528 | ) | | | 1,009 | | | | - | | | | 517 | |
| Tax benefit of stock options exercised | | | - | | | | - | | | | 164 | | | | - | | | | - | | | | - | | | | - | | | | 164 | |
| Sale of treasury stock for ESOP | | | - | | | | - | | | | (14 | ) | | | - | | | | (5,865 | ) | | | 180 | | | | - | | | | 166 | |
| Compensation expense related to stock options | | | - | | | | - | | | | 134 | | | | - | | | | - | | | | - | | | | - | | | | 134 | |
| | | | | | | | | | | | | | | | | | | | | | | | | | | | | | | | | |
| BALANCE – DECEMBER 31, 2009 | | | 2,840,872 | | | | 284 | | | | 9,764 | | | | 54,455 | | | | 68,436 | | | | (2,122 | ) | | | 2,090 | | | | 64,471 | |
| Comprehensive income: | | | | | | | | | | | | | | | | | | | | | | | | | | | | | | | | |
| Net income | | | - | | | | - | | | | - | | | | 7,313 | | | | - | | | | - | | | | - | | | | 7,313 | |
| Change in unrealized losses on securities available for sale, net of reclassification adjustment and tax effects | | | - | | | | - | | | | - | | | | - | | | | - | | | | - | | | | (953 | ) | | | (953 | ) |
| | | | | | | | | | | | | | | | | | | | | | | | | | | | | | | | | |
Total Comprehensive
Income | | | - | | | | - | | | | - | | | | - | | | | - | | | | - | | | | - | | | | 6,360 | |
| | | | | | | | | | | | | | | | | | | | | | | | | | | | | | | | | |
| Cash dividends declared $1.13 per share | | | - | | | | - | | | | - | | | | (3,120 | ) | | | - | | | | - | | | | - | | | | (3,120 | ) |
| Acquisition of treasury stock | | | - | | | | - | | | | - | | | | - | | | | 18,571 | | | | (529 | ) | | | - | | | | (529 | ) |
| Stock options exercised | | | - | | | | - | | | | (120 | ) | | | - | | | | (9,276 | ) | | | 283 | | | | - | | | | 163 | |
| Tax benefit on stock options | | | - | | | | - | | | | 34 | | | | - | | | | - | | | | - | | | | - | | | | 34 | |
| Sale of treasury stock for ESOP | | | - | | | | - | | | | (15 | ) | | | - | | | | (5,663 | ) | | | 171 | | | | - | | | | 156 | |
| Compensation expense related to stock options | | | - | | | | - | | | | 163 | | | | - | | | | - | | | | - | | | | - | | | | 163 | |
| | | | | | | | | | | | | | | | | | | | | | | | | | | | | | | | | |
| BALANCE – DECEMBER 31, 2010 | | | 2,840,872 | | | $ | 284 | | | $ | 9,826 | | | $ | 58,648 | | | | 72,068 | | | $ | (2,197 | ) | | $ | 1,137 | | | $ | 67,698 | |
See notes to consolidated financial statements.
NORWOOD FINANCIAL CORP - 2010 CONSOLIDATED FINANCIAL REPORT
CONSOLIDATED STATEMENTS OF CASH FLOWS
| | | Years Ended December 31, | |
| | | 2010 | | | 2009 | | | 2008 | |
| | | (In Thousands) | |
| CASH FLOWS FROM OPERATING ACTIVITIES | | | | | | | | | |
| Net income | | $ | 7,313 | | | $ | 7,063 | | | $ | 6,677 | |
| Adjustments to reconcile net income to net cash provided by operating activities: | | | | | | | | | | | | |
| Provision for loan losses | | | 1,000 | | | | 1,685 | | | | 735 | |
| Depreciation | | | 459 | | | | 546 | | | | 577 | |
| Amortization of intangible assets | | | 52 | | | | 52 | | | | 52 | |
| Deferred income taxes | | | (205 | ) | | | (749 | ) | | | 36 | |
| Net amortization of securities premiums and discounts | | | 462 | | | | 156 | | | | 44 | |
| Net realized (gains) losses on sales of securities | | | (448 | ) | | | (463 | ) | | | 18 | |
| Gain on sale of deposits | | | — | | | | (150 | ) | | | — | |
| Gain on life insurance policy | | | — | | | | (816 | ) | | | — | |
| Net increase in investment in life insurance | | | (358 | ) | | | (351 | ) | | | (301 | ) |
| Loss (gain) on sale of bank premises and equipment and foreclosed real estate | | | (3 | ) | | | 360 | | | | 540 | |
| Gain on sale of mortgage loans and servicing rights | | | (307 | ) | | | (481 | ) | | | (499 | ) |
| Mortgage loans originated for sale | | | (12,488 | ) | | | (21,743 | ) | | | (866 | ) |
| Proceeds from sale of mortgage loans originated for sale | | | 12,795 | | | | 22,224 | | | | 881 | |
| Compensation expense related to stock options | | | 163 | | | | 134 | | | | 154 | |
| Decrease (increase) in accrued interest receivable and other assets | | | 989 | | | | (1,528 | ) | | | (68 | ) |
| Increase (decrease) in accrued interest payable and other liabilities | | | (843 | ) | | | 65 | | | | (829 | ) |
| | | | | | | | | | | | | |
| Net Cash Provided by Operating Activities | | | 8,581 | | | | 6,004 | | | | 7,151 | |
| | | | | | | | | | | | | |
| CASH FLOWS FROM INVESTING ACTIVITIES | | | | | | | | | | | | |
| Securities available for sale: | | | | | | | | | | | | |
| Proceeds from sales | | | 23,944 | | | | 15,449 | | | | 67 | |
| Proceeds from maturities and principal reductions on mortgage-backed securities | | | 66,102 | | | | 44,047 | | | | 39,319 | |
| Purchases | | | (106,742 | ) | | | (58,409 | ) | | | (45,254 | ) |
| Securities held to maturity, proceeds from maturities | | | 540 | | | | — | | | | — | |
| Purchase of FHLB stock | | | — | | | | — | | | | (2,386 | ) |
| Redemption of FHLB stock | | | 177 | | | | — | | | | 920 | |
| Net (increase) decrease in loans | | | 5,118 | | | | (14,912 | ) | | | (33,523 | ) |
| Proceeds from sale of mortgage loans | | | — | | | | — | | | | 13,988 | |
| Proceeds from life insurance policy | | | — | | | | 1,346 | | | | — | |
| Purchase of bank premises and equipment | | | (179 | ) | | | (248 | ) | | | (325 | ) |
| Proceeds from sales of premises and equipment and foreclosed real estate | | | 100 | | | | 121 | | | | — | |
| | | | | | | | | | | | | |
| Net Cash Used in Investing Activities | | | (10,940 | ) | | | (12,606 | ) | | | (27,194 | ) |
| | | | | | | | | | | | | |
| CASH FLOWS FROM FINANCING ACTIVITIES | | | | | | | | | | | | |
| Net increase (decrease) in deposits | | | 2,392 | | | | 35,594 | | | | (10,365 | ) |
| Deposits sold | | | — | | | | (3,606 | ) | | | — | |
| Net increase (decrease) in short-term borrowings | | | 7,506 | | | | (12,323 | ) | | | 11,440 | |
| Proceeds from other borrowings | | | — | | | | — | | | | 25,000 | |
| Repayments of other borrowings | | | (5,000 | ) | | | — | | | | (5,000 | ) |
| Stock options exercised | | | 163 | | | | 517 | | | | 420 | |
| Tax benefit of stock options exercised | | | 34 | | | | 164 | | | | 134 | |
| ESOP purchase of shares from treasury stock | | | 156 | | | | 166 | | | | 153 | |
| Purchase of treasury stock | | | (529 | ) | | | (68 | ) | | | (1,583 | ) |
| Cash dividends paid | | | (3,093 | ) | | | (2,967 | ) | | | (2,740 | ) |
| | | | | | | | | | | | | |
| Net Cash Provided by Financing Activities | | | 1,629 | | | | 17,477 | | | | 17,459 | |
| | | | | | | | | | | | | |
| Net Increase (Decrease) in Cash and Cash Equivalents | | | (730 | ) | | | 10,875 | | | | (2,584 | ) |
| | | | | | | | | | | | | |
| CASH AND CASH EQUIVALENTS – BEGINNING | | | 17,355 | | | | 6,480 | | | | 9,064 | |
| CASH AND CASH EQUIVALENTS – ENDING | | $ | 16,625 | | | $ | 17,355 | | | $ | 6,480 | |
See notes to consolidated financial statements.
NORWOOD FINANCIAL CORP - 2010 CONSOLIDATED FINANCIAL REPORT
NOTES TO CONSOLIDATED FINANCIAL STATEMENTS
NOTE 1 - NATURE OF OPERATIONS
Norwood Financial Corp (Company) is a one bank holding company. Wayne Bank (Bank) is a wholly-owned subsidiary of the Company. The Bank is a state-chartered bank located in Honesdale, Pennsylvania. The Company derives substantially all of its income from the bank related services which include interest earnings on commercial mortgages, residential real estate mortgages, commercial and consumer loans, as well as interest earnings on investment securities and fees from deposit services to its customers. The Company is subject to regulation and supervision by the Federal Reserve Board while the Bank is subject to regulation and supervision by the Federal Deposit Insurance Corporation and the Pennsylvania Department of Banking.
NOTE 2 - SUMMARY OF SIGNIFICANT ACCOUNTING POLICIES
Principles of Consolidation
The consolidated financial statements include the accounts of the Company and its wholly-owned subsidiary, the Bank, and the Bank’s wholly-owned subsidiaries, WCB Realty Corp., Norwood Investment Corp., Norwood Settlement Services, LLC and WTRO Properties. All significant intercompany accounts and transactions have been eliminated in consolidation.
Estimates
The preparation of financial statements in conformity with accounting principles generally accepted in the United States of America requires management to make estimates and assumptions that affect the reported amounts of assets and liabilities and disclosure of contingent assets and liabilities at the date of the financial statements and the reported amounts of revenues and expenses during the reporting period. Actual results could differ from those estimates. Material estimates that are particularly susceptible to significant change in the near term relate to the determination of the allowance for loan losses, the potential impairment of restricted stock, the valuation of deferred tax assets, the determination of other-than-temporary impairment on securities and the fair value of financial instruments.
Significant Group Concentrations of Credit Risk
Most of the Company’s activities are with customers located within northeastern Pennsylvania. Note 3 discusses the types of securities that the Company invests in. Note 4 discusses the types of lending that the Company engages in. The Company does not have any significant concentrations to any one industry or customer.
Concentrations of Credit Risk
The Bank operates primarily in Wayne, Pike and Monroe Counties, Pennsylvania and, accordingly, has extended credit primarily to commercial entities and individuals in this area whose ability to honor their contracts is influenced by the region’s economy. These customers are also the primary depositors of the Bank. The Bank is limited in extending credit by legal lending limits to any single borrower or group of borrowers.
Securities
Securities classified as available for sale are those securities that the Company intends to hold for an indefinite period of time but not necessarily to maturity. Any decision to sell a security classified as available for sale would be based on various factors, including significant movement in interest rates, changes in maturity mix of the Company’s assets and liabilities, liquidity needs, regulatory capital considerations and other similar factors. Securities available for sale are carried at fair value. Unrealized gains and losses are reported in other comprehensive income, net of the related deferred tax effect. Realized gains or losses, determined on the basis of the cost of the specific securities sold, are included in earnings. Premiums and discounts are recognized in interest income using a method which approximates the interest method over the term of the security.
NORWOOD FINANCIAL CORP - 2010 CONSOLIDATED FINANCIAL REPORT
NOTE 2 - SUMMARY OF SIGNIFICANT ACCOUNTING POLICIES (CONTINUED)
Bonds, notes and debentures for which the Company has the positive intent and ability to hold to maturity are reported at cost, adjusted for premiums and discounts that are recognized in interest income using the interest method over the term of the security.
Management determines the appropriate classification of debt securities at the time of purchase and re-evaluates such designation as of each balance sheet date.
Declines in the fair value of held to maturity and available for sale securities below their cost that are deemed to be other than temporary are reflected in earnings as realized losses. In estimating other-than-temporary impairment losses, management considers (1) the length of time and the extent to which the fair value has been less than cost, (2) the financial condition and near-term prospects of the issuer, and (3) the intent of the Company to not sell the securities and it is more likely than not that it will not have to sell the securities before recovery of their cost basis.
The Company, as a member of the Federal Home Loan Bank (FHLB) system is required to maintain an investment in capital stock of its district FHLB according to a predetermined formula. This restricted stock has no quoted market value and is carried at cost.
In December 2008, the FHLB of Pittsburgh notified member banks that it was suspending dividend payments and the repurchase of excess capital stock. In October, 2010, the FHLB of Pittsburgh repurchased a portion of member bank’s excess stock, but notified member banks that decisions regarding future capital stock repurchases will be made on a quarterly basis.
Management evaluates the restricted stock for impairment. Management’s determination of whether these investments are impaired is based on their assessment of the ultimate recoverability of their cost rather than by recognizing temporary declines in value. The determination of whether a decline affects the ultimate recoverability of their cost is influenced by criteria such as (1) the significance of the decline in net assets of the FHLB as compared to the capital stock amount for the FHLB and the length of time this situation has persisted, (2) commitments by the FHLB to make payments required by law or regulation and the level of such payments in relation to the operating performance of the FHLB, and (3) the impact of legislative and regulatory changes on institutions and, accordingly, on the customer base of the FHLB. Management believes no impairment charge is necessary related to FHLB stock as of December 31, 2010.
Loans Receivable
Loans receivable that management has the intent and ability to hold for the foreseeable future or until maturity or payoff are stated at their outstanding unpaid principal balances, net of an allowance for loan losses and any deferred fees. Interest income is accrued on the unpaid principal balance. Loan origination fees are deferred and recognized as an adjustment of the yield (interest income) of the related loans. The Company is generally amortizing these amounts over the contractual life of the loan.
The accrual of interest is generally discontinued when the contractual payment of principal or interest has become 90 days past due or management has serious doubts about further collectability of principal or interest, even though the loan is currently performing. A loan may remain on accrual status if it is in the process of collection and is either guaranteed or well secured. When a loan is placed on nonaccrual status, unpaid interest credited to income in the current year is reversed and unpaid interest accrued in prior years is charged against the allowance for loan losses. Interest received on nonaccrual loans generally is either applied against principal or reported as interest income, according to management’s judgment as to the collectability of principal. Generally, loans are restored to accrual status when the obligation is brought current, has performed in accordance with the contractual terms for a reasonable period of time and the ultimate collectability of the total contractual principal and interest is no longer in doubt.
NORWOOD FINANCIAL CORP - 2010 CONSOLIDATED FINANCIAL REPORT
NOTE 2 - SUMMARY OF SIGNIFICANT ACCOUNTING POLICIES (CONTINUED)
Mortgage Servicing Rights
Servicing assets are recognized as separate assets when rights are acquired through purchase or through the sale of financial assets. Capitalized servicing rights are reported in other assets and are amortized into noninterest income in proportion to, and over the period of, the estimated future net servicing income of the underlying financial assets. Servicing assets are evaluated for impairment based upon a third party appraisal. Fair value is determined using prices for similar assets with similar characteristics, when available, or based upon discounted cash flows using market-based assumptions. Impairment is recognized through a valuation allowance to the extent that fair value is less than the capitalized amount. The Company’s loan servicing assets at December 31, 2010 and 2009, were not impaired. Total servicing assets included in other assets as of December 31, 2010 and 2009, were $250,000 and $179,000, respectively.
Allowance for Loan Losses
The allowance for loan losses is established through provisions for loan losses charged against income. Loans deemed to be uncollectible are charged against the allowance for loan losses, and subsequent recoveries, if any, are credited to the allowance.
The allowance for loan losses is maintained at a level considered adequate to provide for losses that can be reasonably anticipated. Management’s periodic evaluation of the adequacy of the allowance is based on the Company’s past loan loss experience, known and inherent risks in the portfolio, adverse situations that may affect the borrower’s ability to repay, the estimated value of any underlying collateral, composition of the loan portfolio, current economic conditions and other relevant factors. This evaluation is inherently subjective as it requires material estimates that may be susceptible to significant revision as more information becomes available.
The allowance consists of specific, general and unallocated components. The specific component relates to loans that are classified as either doubtful, substandard or special mention. For such loans that are also classified as impaired, an allowance is established when the discounted cash flows (or collateral value or observable market price) of the impaired loan is lower than the carrying value of that loan. The general component covers non-classified loans and is based on historical loss experience adjusted for qualitative factors. An unallocated component is maintained to cover uncertainties that could affect management’s estimate of probable losses. The unallocated component of the allowance reflects the margin of imprecision inherent in the underlying assumptions used in the methodologies for estimating specific and general losses in the portfolio.
A loan is considered impaired when, based on current information and events, it is probable that the Company will be unable to collect the scheduled payments of principal or interest when due according to the contractual terms of the loan agreement. Factors considered by management in determining impairment include payment status, collateral value and the probability of collecting scheduled principal and interest payments when due. Loans that experience insignificant payment delays and payment shortfalls generally are not classified as impaired. Management determines the significance of payment delays and payment shortfalls on a case-by-case basis, taking into consideration all of the circumstances surrounding the loan and the borrower, including the length of the delay, the reasons for the delay, the borrower’s prior payment record and the amount of the shortfall in relation to the principal and interest owed. Impairment is measured on a loan by loan basis for commercial and construction loans by either the present value of expected future cash flows discounted at the loan’s effective interest rate, the loan’s obtainable market price or the fair value of the collateral if the loan is collateral dependent.
Large groups of smaller balance homogeneous loans are collectively evaluated for impairment. Accordingly, the Company does not separately identify individual consumer and residential real estate loans for impairment disclosures, unless such loans are the subject of a restructuring agreement.
NORWOOD FINANCIAL CORP - 2010 CONSOLIDATED FINANCIAL REPORT
NOTE 2 - SUMMARY OF SIGNIFICANT ACCOUNTING POLICIES (CONTINUED)
Premises and Equipment
Land is carried at cost. Premises and equipment are stated at cost less accumulated depreciation. Depreciation expense is calculated principally on the straight-line method over the respective assets estimated useful lives as follows:
| | Years |
Buildings and improvements | 10 - 40 |
Furniture and equipment | 3 - 10 |
Transfers of Financial Assets
Transfers of financial assets, including loan and loan participation sales, are accounted for as sales, when control over the assets has been surrendered. Control over transferred assets is deemed to be surrendered when (1) the assets have been isolated from the Company, (2) the transferee obtains the right (free of conditions that constrain it from taking advantage of that right) to pledge or exchange the transferred assets and (3) the Company does not maintain effective control over the transferred assets through an agreement to repurchase them before their maturity.
Foreclosed Real Estate
Real estate properties acquired through, or in lieu of, loan foreclosure are to be sold and are initially recorded at fair value less cost to sell at the date of foreclosure establishing a new cost basis. After foreclosure, valuations are periodically performed by management and the real estate is carried at the lower of its carrying amount or fair value less cost to sell. Revenue and expenses from operations and changes in the valuation allowance are included in other expenses.
Bank Owned Life Insurance
The Company invests in bank owned life insurance (“BOLI”) as a source of funding for employee benefit expenses. BOLI involves the purchasing of life insurance by the Bank on a chosen group of employees. The Company is the owner and beneficiary of the policies. This life insurance investment is carried at the cash surrender value of the underlying policies. Income from the increase in cash surrender value of the policies is included in other income on the income statement.
Intangible Assets
At December 31, 2010 and 2009, the Company had intangible assets of $13,000 and $65,000 arising from the purchase of deposits in 1996, which is net of accumulated amortization of $767,000 and $715,000 which are included in other assets. These intangible assets will continue to be amortized on a straight-line basis over fifteen years. Amortization expense related to intangible assets was $52,000 for each of the years ended December 31, 2010, 2009 and 2008. The amortization expense will be $13,000 for the year ended December 31, 2011.
Income Taxes
Deferred income tax assets and liabilities are determined based on the differences between financial statement carrying amounts and the tax basis of existing assets and liabilities. These differences are measured at the enacted tax rates that will be in effect when these differences reverse. Deferred tax assets are reduced by a valuation allowance when, in the opinion of management, it is more likely than not that some portion of the deferred tax assets will not be realized. As changes in tax laws or rates are enacted, deferred tax assets and liabilities are adjusted through the provision for income taxes. The Company and its subsidiary file a consolidated federal income tax return. The Company recognizes interest and penalties on income taxes as a component of income tax expense.
NORWOOD FINANCIAL CORP - 2010 CONSOLIDATED FINANCIAL REPORT
NOTE 2 - SUMMARY OF SIGNIFICANT ACCOUNTING POLICIES (CONTINUED)
The Company analyzes each tax position taken in its tax returns and determine the likelihood that the position will be realized. Only tax positions that are “more-likely-than-not” to be realized can be recognized in an entity’s financial statements. For tax positions that do not meet this recognition threshold, an entity will record an unrecognized tax benefit for the difference between the position taken on the tax return and the amount recognized in the financial statements. The Company does not have any unrecognized tax benefits at December 31, 2010 or 2009 or during the years then ended. No unrecognized tax benefits are expected to arise within the next twelve months.
Advertising Costs
Advertising costs are expensed as incurred.
Earnings per Share
Basic earnings per share represents income available to common stockholders divided by the weighted average number of common shares outstanding during the period. Diluted earnings per share reflects additional common shares that would have been outstanding if dilutive potential common shares had been issued, as well as any adjustment to income that would result from the assumed issuance. Potential common shares that may be issued by the Company relate solely to outstanding stock options and are determined using the treasury stock method. Treasury shares are not deemed outstanding for earnings per share calculations.
Stock Option Plans
The Company recognizes the value of share-based payment transactions as compensation costs in the financial statements over the period that an employee provides service in exchange for the award. The fair value of the share-based payments is estimated using the Black-Scholes option-pricing model. The Company used the modified-prospective transition method to record compensation expense. Under the modified prospective method, companies are required to record compensation cost for new and modified awards over the related vesting period of such awards and record compensation cost prospectively for the unvested portion, at the date of adoption, of previously issued and outstanding awards over the remaining vesting period of such awards. No change to prior periods presented is permitted under the modified prospective method.
Fair Value Measurements
The fair value hierarchy prioritizes the inputs to valuation methods used to measure fair value. The hierarchy gives the highest priority to unadjusted quoted prices in active markets for identical assets or liabilities (Level 1 measurements) and the lowest priority to unobservable inputs (Level 3 measurements). The three levels of the fair value hierarchy are as follows:
| Level 1: | Unadjusted quoted prices in active markets that are accessible at the measurement date for identical, unrestricted assets or liabilities. |
| | |
| Level 2: | Quoted prices in markets that are not active, or inputs that are observable either directly or indirectly, for substantially the full term of the asset or liability. |
| | |
| Level 3: | Prices or valuation techniques that require inputs that are both significant to the fair value measurement and are unobservable (i.e. supported with little or no market activity). |
An asset’s or liability’s level within the fair value hierarchy is based on the lowest level of input that is significant to the fair value measurement.
NORWOOD FINANCIAL CORP - 2010 CONSOLIDATED FINANCIAL REPORT
NOTE 2 - SUMMARY OF SIGNIFICANT ACCOUNTING POLICIES (CONTINUED)
Cash Flow Information
For the purposes of reporting cash flows, cash and cash equivalents include cash on hand, amounts due from banks, interest-bearing deposits with banks and federal funds sold.
Cash payments for interest for the period December 31, 2010, 2009 and 2008 were $6,544,000, $7,916,000 and $10,645,000, respectively. Cash payments for income taxes in 2010 were $2,742,000 compared to $2,441,000 in 2009 and $3,138,000 in 2008. Non-cash investing activity for 2010, 2009, and 2008 included foreclosed mortgage loans transferred to real estate owned and repossession of other assets of $589,000, $296,000 and $1,328,000, respectively.
Off-Balance Sheet Financial Instruments
In the ordinary course of business, the Company has entered into off-balance sheet financial instruments consisting of commitments to extend credit, letters of credit and commitments to sell loans. Such financial instruments are recorded in the balance sheets when they become receivable or payable.
Trust Assets
Assets held by the Company in a fiduciary capacity for customers are not included in the financial statements since such items are not assets of the Company. Trust income is reported on the accrual method.
Comprehensive Income
Accounting principles generally require that recognized revenue, expenses, gains and losses be included in net income. Although certain changes in assets and liabilities, such as unrealized gains and losses on available for sale securities, are reported as a separate component of the equity section of the balance sheet, such items, along with net income, are components of comprehensive income.
The components of other comprehensive income and related tax effects are as follows:
| | | Years Ended December 31, | |
| | | 2010 | | | 2009 | | | 2008 | |
| | | (In Thousands) | |
| Unrealized holding gains (losses) on available for sale securities | | $ | (994 | ) | | $ | 1,701 | | | $ | 311 | |
| Reclassification adjustment for gains (losses) realized in income | | | 448 | | | | 463 | | | | (18 | ) |
| | | | | | | | | | | | | |
| Net Unrealized Gains (Losses) | | | (1,442 | ) | | | 1,238 | | | | 329 | |
| | | | | | | | | | | | | |
| Income tax expense (benefit) | | | (489 | ) | | | 427 | | | | 104 | |
| | | | | | | | | | | | | |
| Net of Tax Amount | | $ | (953 | ) | | $ | 811 | | | $ | 225 | |
Segment Reporting
The Company acts as an independent community financial service provider and offers traditional banking and related financial services to individual, business and government customers. Through its branch and automated teller machine network, the Company offers a full array of commercial and retail financial services, including the taking of time, savings and demand deposits; the making of commercial, consumer and mortgage loans; and the providing of safe deposit services. The Company also performs personal, corporate, pension and fiduciary services through its Trust Department.
Management does not separately allocate expenses, including the cost of funding loan demand, between the commercial, retail, mortgage banking and trust operations of the Company. As such, discrete information is not available and segment reporting would not be meaningful.
NORWOOD FINANCIAL CORP - 2010 CONSOLIDATED FINANCIAL REPORT
NOTE 2 - SUMMARY OF SIGNIFICANT ACCOUNTING POLICIES (CONTINUED)
New Accounting Standards
In January 2010, the FASB issued ASU 2010-05, Compensation – Stock Compensation (Topic 718): Escrowed Share Arrangements and the Presumption of Compensation. ASU 2010-05 updates existing guidance to address the SEC staff’s views on overcoming the presumption that for certain shareholders escrowed share arrangements represent compensation. ASU 2010-05 is effective January 15, 2010. The adoption of this guidance did not have a material impact on the Company’s financial position.
In January 2010, the FASB issued ASU No. 2010-06, Fair Value Measurements and Disclosures (Topic 820): Improving Disclosures about Fair Value Measurements. ASU 2010-06 amends Subtopic 820-10 to clarify existing disclosures, require new disclosures, and includes conforming amendments to guidance on employers’ disclosures about postretirement benefit plan assets. ASU 2010-06 is effective for interim and annual periods beginning after December 15, 2009, except for disclosures about purchases, sales, issuances, and settlements in the roll forward of activity in Level 3 fair value measurements. Those disclosures are effective for fiscal years beginning after December 15, 2010 and for interim periods within those fiscal years. The Company has presented the necessary disclosures in the Note 8 herein.
In February 2010, the FASB issued ASU 2010-08, Technical Corrections to Various Topics. ASU 2010-08 clarifies guidance on embedded derivatives and hedging. ASU 2010-08 is effective for interim and annual periods beginning after December 15, 2009. The adoption of this guidance did not have a material impact on the Company’s financial position or results of operation.
In March 2010, the FASB issued ASU 2010-11, Derivatives and Hedging. ASU 2010-11 provides clarification and related additional examples to improve financial reporting by resolving potential ambiguity about the breadth of the embedded credit derivative scope exception in ASC 815-15-15-8. ASU 2010-11 is effective at the beginning of the first fiscal quarter beginning after June 15, 2010. The adoption of this guidance did not have a significant impact on the Company’s financial statements.
In April 2010, the FASB issued ASU 2010-18, Receivables (Topic 310): Effect of a Loan Modification When the Loan is a Part of a Pool That is Accounted for as a Single Asset – a consensus of the FASB Emerging Issues Task Force. ASU 2010-18 clarifies the treatment for a modified loan that was acquired as part of a pool of assets. Refinancing or restructuring the loan does not make it eligible for removal from the pool, the FASB said. The amendment will be effective for loans that are part of an asset pool and are modified during financial reporting periods that end July 15, 2010. The adoption of this guidance did not have a significant impact on the Company’s financial statements.
In July 2010, FASB issued ASU No. 2010-20, Receivables (Topic 310): Disclosures about the Credit Quality of Financing Receivables and the Allowance for Credit Losses. ASU 2010-20 is intended to provide additional information to assist financial statement users in assessing an entity’s credit risk exposures and evaluating the adequacy of its allowance for credit losses. The disclosures as of the end of a reporting period are effective for interim and annual reporting periods ending on or after December 15, 2010. The disclosures about activity that occurs during a reporting period are effective for interim and annual reporting periods beginning on or after December 15, 2010. The amendments in ASU 2010-20 encourage, but do not require, comparative disclosures for earlier reporting periods that ended before initial adoption. However, an entity should provide comparative disclosures for those reporting periods ending after initial adoption. The Company has presented the necessary disclosures in Note 5 herein.
NORWOOD FINANCIAL CORP - 2010 CONSOLIDATED FINANCIAL REPORT
NOTE 2 - SUMMARY OF SIGNIFICANT ACCOUNTING POLICIES (CONTINUED)
In September, 2010, the FASB issued ASU 2010-25, Plan Accounting – Defined Contribution Pension Plans. The amendments in this ASU require that participant loans be classified as notes receivable from participants, which are segregated from plan investments and measured at their unpaid principal balance plus any accrued but unpaid interest. The amendments in this update are effective for fiscal years ending after December 15, 2010 and are not expected to have a significant impact on the Company’s financial statements.
In October, 2010, the FASB issued ASU 2010-26, Accounting for Costs Associated with Acquiring or Renewing Insurance Contracts. This ASU addresses the diversity in practice regarding the interpretation of which costs relating to the acquisition of new or renewal insurance contracts qualify for deferral. The amendments are effective for fiscal years and interim periods within those fiscal years, beginning after December 15, 2011 and are not expected to have a significant impact on the Company’s financial statements.
In December, 2010, the FASB issued ASU 2010-28, When to Perform Step 2 of the Goodwill Impairment Test for Reporting Units with Zero or Negative Carrying Amounts. This ASU modifies Step 1 of the goodwill impairment test for reporting units with zero or negative carrying amounts. For those reporting units, an entity is required to perform Step 2 of the goodwill impairment test if it is more likely than not that a goodwill impairment exists. In determining whether it is more likely than not that a goodwill impairment exists, an entity should consider whether there are any adverse qualitative factors indicating an impairment may exist. The qualitative factors are consistent with the existing guidance, which requires that goodwill of a reporting unit be tested for impairment between annual tests if an event occurs or circumstances change that would more likely than not reduce the fair value of a reporting unit below its carrying amount. For public entities, the amendments in this update are effective for fiscal year, and interim periods within those years, beginning after December 15, 2010. Early adoption is not permitted. For nonpublic entities, the amendments are effective for fiscal years, and interim periods within those years, beginning after December 15, 2011. Nonpublic entities may early adopt the amendments using the effective date for public entities. This ASU is not expected to have a significant impact on the Company’s financial statements.
In December 2010, the FASB issued ASU 2010-29, Disclosure of Supplementary Pro Forma Information for Business Combinations. The amendments in this update specify that if a public entity presents comparative financial statements, the entity should disclose revenue and earnings of the combined entity as though the business combination(s) that occurred during the current year had occurred as of the beginning of the comparable prior annual reporting period only. The amendments also expand the supplemental pro forma disclosures under Topic 805 to include a description of the nature and amount of material, nonrecurring pro forma adjustments directly attributable to the business combination included in the reported pro forma revenue and earnings. The amendments in this update are effective prospectively for business combinations for which the acquisition date is on or after the beginning of the first annual reporting period beginning on or after December 15, 2010. Early adoption is permitted. This ASU is not expected to have a significant impact on the Company’s financial statements.
NOTE 3 – CHANGE IN ACCOUNTING PRINCIPLE
Generally accepted accounting principles in the United States require the recognition of a liability related to the postretirement benefits covered by an endorsement split-dollar life insurance arrangement. The employer (who is also the policyholder) has a liability for the benefit it is providing to its employee. As such, if the policyholder has agreed to maintain the insurance policy in force for the employee’s benefit during his or her retirement, then the liability recognized during the employee’s active service period should be based on the future cost of insurance to be incurred during the employee’s retirement. Alternatively, if the policyholder has
NORWOOD FINANCIAL CORP - 2010 CONSOLIDATED FINANCIAL REPORT
NOTE 3 – CHANGE IN ACCOUNTING PRINCIPLE (CONTINUED)
agreed to provide the employee with a death benefit, then the liability for the future death benefit should be recognized. For transition, an entity can choose to apply the guidance using either of the following approaches: (a) a change in accounting principle through retrospective application to all periods presented or (b) a change in accounting principle through a cumulative-effect adjustment to the balance in retained earnings at the beginning of the year of adoption. The Company has chosen approach (b) and recorded a cumulative effect adjustment as of January 1, 2008 to the balance of retained earnings of $520,000. Net Periodic Postretirement Benefit expense included in salaries and employee benefits was $135,000 and $166,000 for the years ended December 31, 2010 and 2009, respectively.
NOTE 4 - SECURITIES
The amortized cost and fair value of securities were as follows:
| | | December 31, 2010 | |
| | | | | | Gross | | | Gross | | | | |
| | | Amortized | | | Unrealized | | | Unrealized | | | Fair | |
| | | Cost | | | Gains | | | Losses | | | Value | |
| | | (In Thousands) | |
| AVAILABLE FOR SALE: | | | | | | | | | | | | |
| U.S. Government agencies | | $ | 30,194 | | | $ | 392 | | | $ | (318 | ) | | $ | 30,268 | |
| States and political subdivisions | | | 49,880 | | | | 510 | | | | (624 | ) | | | 49,766 | |
| Corporate obligations | | | 4,018 | | | | 231 | | | | — | | | | 4,249 | |
| Mortgage-backed securities - | | | | | | | | | | | | | | | | |
| government sponsored entities | | | 59,770 | | | | 1,398 | | | | (240 | ) | | | 60,928 | |
| | | | | | | | | | | | | | | | | |
| Equity securities - financial services | | | 224 | | | | 381 | | | | (1 | ) | | | 604 | |
| | | $ | 144,086 | | | $ | 2,912 | | | $ | (1,183 | ) | | $ | 145,815 | |
| HELD TO MATURITY: | | | | | | | | | | | | | | | | |
| States and political subdivisions | | $ | 170 | | | $ | 9 | | | $ | — | | | $ | 179 | |
| | | | | | | | | | | | | | | | | |
| | | | |
| | | December 31, 2009 | |
| | | | | | | Gross | | | Gross | | | | | |
| | | Amortized | | | Unrealized | | | Unrealized | | | Fair | |
| | | Cost | | | Gains | | | Losses | | | Value | |
| | | (In Thousands) | |
| AVAILABLE FOR SALE: | | | | | | | | | | | | | | | | |
| U.S. Government agencies | | $ | 39,607 | | | $ | 295 | | | $ | (130 | ) | | $ | 39,772 | |
| States and political subdivisions | | | 30,872 | | | | 780 | | | | (17 | ) | | | 31,635 | |
| Corporate obligations | | | 5,043 | | | | 200 | | | | (3 | ) | | | 5,240 | |
| Mortgage-backed securities - | | | | | | | | | | | | | | | | |
| government sponsored entities | | | 51,554 | | | | 1,618 | | | | (18 | ) | | | 53,154 | |
| | | | 127,076 | | | | 2,893 | | | | (168 | ) | | | 129,801 | |
| | | | | | | | | | | | | | | | | |
| Equity securities - financial services | | | 330 | | | | 451 | | | | (5 | ) | | | 776 | |
| | | $ | 127,406 | | | $ | 3,344 | | | $ | (173 | ) | | $ | 130,577 | |
| HELD TO MATURITY: | | | | | | | | | | | | | | | | |
| States and political subdivisions | | $ | 708 | | | $ | 14 | | | $ | — | | | $ | 722 | |
NORWOOD FINANCIAL CORP - 2010 CONSOLIDATED FINANCIAL REPORT
NOTE 4 - SECURITIES (CONTINUED)
The following tables show the Company’s investments’ gross unrealized losses and fair value aggregated by length of time that individual securities have been in a continuous unrealized loss position:
| | | December 31, 2010 | |
| | | Less than 12 Months | | | 12 Months or More | | | Total | |
| | | Fair | | | Unrealized | | | Fair | | | Unrealized | | | Fair | | | Unrealized | |
| | | Value | | | Losses | | | Value | | | Losses | | | Value | | | Losses | |
| | | (In Thousands) | |
| U.S. Government agencies | | $ | 8,696 | | | $ | (318 | ) | | $ | — | | | $ | — | | | $ | 8,696 | | | $ | (318 | ) |
| States and political subdivisions | | | 21,829 | | | | (624 | ) | | | — | | | | — | | | | 21,829 | | | | (624 | ) |
| Mortgage-backed securities - | | | | | | | | | | | | | | | | | | | | | | | | |
| government sponsored entities | | | 20,113 | | | | (240 | ) | | | — | | | | — | | | | 20,113 | | | | (240 | ) |
| Equity securities - financial services | | | 15 | | | | (1 | ) | | | — | | | | — | | | | 15 | | | | (1 | ) |
| | | $ | 50,653 | | | $ | (1,183 | ) | | $ | — | | | $ | — | | | $ | 50,653 | | | $ | (1,183 | ) |
| | | | | | | | | | | | | | | | | | | | | | | | | |
| | | December 31, 2009 | |
| | | Less than 12 Months | | | 12 Months or More | | | Total | |
| | | Fair | | | Unrealized | | | Fair | | | Unrealized | | | Fair | | | Unrealized | |
| | | Value | | | Losses | | | Value | | | Losses | | | Value | | | Losses | |
| | | (In Thousands) | |
| | | | | | | | | | | | | | | | | | | | | | | | | |
| U.S. Government agencies | | $ | 15,366 | | | $ | (130 | ) | | $ | — | | | $ | — | | | $ | 15,366 | | | $ | (130 | ) |
| States and political subdivisions | | | 1,413 | | | | (17 | ) | | | — | | | | — | | | | 1,413 | | | | (17 | ) |
| Corporate obligations | | | 997 | | | | (3 | ) | | | — | | | | — | | | | 997 | | | | (3 | ) |
| Mortgage-backed securities - | | | | | | | | | | | | | | | | | | | | | | | | |
| government sponsored entities | | | 3,655 | | | | (18 | ) | | | — | | | | — | | | | 3,655 | | | | (18 | ) |
| Equity Securities - financial services | | | 49 | | | | (3 | ) | | | 5 | | | | (2 | ) | | | 54 | | | | (5 | ) |
| | | $ | 21,480 | | | $ | (171 | ) | | $ | 5 | | | $ | (2 | ) | | $ | 21,485 | | | $ | (173 | ) |
The Company has 61 securities in the less than twelve month category and no securities in the twelve months or more category as of December 31, 2010 compared to 24 securities in the less than twelve month category and 1 security greater than twelve months as of December 31, 2009. In management’s opinion, the unrealized losses in the U.S. Government agencies and the mortgage-backed securities reflect changes in interest rates subsequent to the acquisition of specific securities. The unrealized losses in the States and Political Subdivisions also reflect a widening of spreads due to liquidity and credit concerns in the municipal debt markets. The Company holds a small amount of equity securities in other financial institutions, the value of which has been impacted by weakened conditions of the financial market. In 2009, the Company recorded an other-than-temporary-impairment charge on two equity holdings totaling $31,000. No additional other-than-temporary-impairment charges were recorded in 2010. Management believes that all other unrealized losses represent temporary impairment of the securities, as it is the intent of the Company to not sell the securities and it is more likely than not that it will not have to sell the securities before recovery of their cost basis.
The amortized cost and fair value of securities as of December 31, 2010 by contractual maturity, are shown below. Expected maturities may differ from contractual maturities because borrowers may have the right to prepay obligations with or without call or prepayment penalties.
NORWOOD FINANCIAL CORP - 2010 CONSOLIDATED FINANCIAL REPORT
NOTE 4 - SECURITIES (CONTINUED)
| | | Available for Sale | | | Held to Maturity | |
| | | Amortized | | | Fair | | | Amortized | | | Fair | |
| | | Cost | | | Value | | | Cost | | | Value | |
| | | (In Thousands) | |
| Due in one year or less | | $ | 1,001 | | | $ | 1,005 | | | $ | — | | | $ | — | |
| Due after one year through five years | | | 31,803 | | | | 32,425 | | | | 170 | | | | 179 | |
| Due after five years through ten years | | | 22,604 | | | | 22,623 | | | | — | | | | — | |
| Due after ten years | | | 28,684 | | | | 28,230 | | | | — | | | | — | |
| | | | 84,092 | | | | 84,283 | | | | 170 | | | | 179 | |
| Mortgage-backed securities - | | | | | | | | | | | | | | | | |
| government sponsored entities | | | 59,770 | | | | 60,928 | | | | — | | | | — | |
| | | $ | 143,862 | | | $ | 145,211 | | | $ | 170 | | | $ | 179 | |
Gross realized gains and gross realized losses on sales of securities available for sale were $450,000 and $2,000, respectively, in 2010, compared to $597,000 and $134,000, respectively, in 2009, and $44,000 and $62,000, respectively, in 2008. The proceeds from the sales of securities totaled $23,944,000, $15,449,000 and $67,000 for the years ended December 31, 2010, 2009 and 2008, respectively.
Securities with a carrying value of $71,412,000 and $65,438,000 at December 31, 2010 and 2009, respectively, were pledged to secure public deposits, U.S. Treasury demand notes, securities sold under agreements to repurchase and for other purposes as required or permitted by law.
NOTE 5 - LOANS RECEIVABLE AND ALLOWANCE FOR LOAN LOSSES
The components of loans receivable at December 31 were as follows:
| | | 2010 | | | 2009 | |
| | | (In Thousands) | |
| Real estate: | | | | | | |
| Residential | | $ | 124,562 | | | $ | 130,318 | |
| Commercial | | | 184,094 | | | | 180,266 | |
| Construction | | | 12,638 | | | | 14,405 | |
| Commercial, financial and agricultural | | | 22,386 | | | | 24,116 | |
| Consumer loans to individuals | | | 13,668 | | | | 14,850 | |
| | | | 357,348 | | | | 363,955 | |
| Unearned income and deferred fees | | | (493 | ) | | | (481 | ) |
| Allowance for loan losses | | | (5,616 | ) | | | (5,453 | ) |
| | | $ | 351,239 | | | $ | 358,021 | |
| | | Real Estate Loans | | | | | | | | | | |
| | | | | | | | | | | | Commercial | | | Consumer | | | | |
| | | Residential | | | Commercial | | | Construction | | | Loans | | | Loans | | | Total | |
| December 31, 2010 | | | | | | | | | | | | | | | | | | |
| Total Loans | | $ | 124,562 | | | $ | 184,094 | | | $ | 12,638 | | | $ | 22,386 | | | $ | 13,668 | | | $ | 357,348 | |
| | | | | | | | | | | | | | | | | | | | | | | | | |
| Individually evaluated for impairment | | $ | — | | | $ | 14,239 | | | $ | — | | | $ | 513 | | | $ | — | | | $ | 14,752 | |
| | | | | | | | | | | | | | | | | | | | | | | | | |
| Collectively evaluated for impairment | | $ | 124,562 | | | $ | 169,855 | | | $ | 12,638 | | | $ | 21,873 | | | $ | 13,668 | | | $ | 342,596 | |
NORWOOD FINANCIAL CORP - 2010 CONSOLIDATED FINANCIAL REPORT
NOTE 5 - LOANS RECEIVABLE AND ALLOWANCE FOR LOAN LOSSES (CONTINUED)
The Company maintains a loan review system, which allows for a periodic review of our loan portfolio and the early identification of potential impaired loans. Such system takes into consideration, among other things, delinquency status, size of loans, type and market value of collateral and financial condition of the borrowers. Specific loan loss allowances are established for identified losses based on a review of such information. A loan evaluated for impairment is considered to be impaired when, based on current information and events, it is probably that we will be unable to collect all amounts due according to the contractual terms of the loan agreement. All loans identified as impaired are evaluated independently. We do not aggregate such loans for evaluation purposes. Impairment is measured on a loan-by-loan basis for commercial and construction loans by the present value of expected future cash flows discounted at the loan’s effective interest rate, the loan’s obtainable market price, or the fair value of the collateral if the loan is collateral-dependent.
Large groups of smaller balance homogeneous loans are collectively evaluated for impairment. Accordingly, the Company does not separately identify individual consumer and residential mortgage loans for impairment disclosures, unless such loans are part of a larger relationship that is impaired, or are classified as a troubled debt restructuring.
A loan is considered to be a troubled debt restructuring (“TDR”) loan when the Company grants a concession to the borrower because of the borrower’s financial condition that it would not otherwise consider. Such concessions include the reduction of interest rates, forgiveness of principal or interest, or other modifications of interest rates that are less than the current market rate for new obligations with similar risk. TDR loans that are in compliance with their modified terms and that yield a market rate may be removed from the TDR status after a period of performance.
The following table includes the recorded investment and unpaid principal balances for impaired loans with the associated allowance amount, if applicable. Also presented are the average recorded investments in the impaired loans and the related amount of interest recognized during the time within the period that the impaired loans were impaired.
| | | | | | Unpaid | | | | | | Average | | | Interest | |
| | | Recorded | | | Principal | | | Associated | | | Recorded | | | Income | |
| | | Investment | | | Balance | | | Allowance | | | Investment | | | Recognized | |
| December 31, 2010 | | | | | | | | | | | | | | | |
| With no related allowance recorded: | | | | | | | | | | | | | | | |
| Real Estate Loans | | | | | | | | | | | | | | | |
| Residential | | $ | — | | | $ | — | | | $ | — | | | $ | — | | | $ | — | |
| Construction | | | — | | | | — | | | | — | | | | — | | | | — | |
| Commercial | | | 5,598 | | | | 5,598 | | | | — | | | | 5,088 | | | | 266 | |
| Commercial Loans | | | 513 | | | | 513 | | | | — | | | | 115 | | | | — | |
| Consumer Loans | | | — | | | | — | | | | — | | | | — | | | | — | |
| Total | | | 6,111 | | | | 6,111 | | | | — | | | | 5,203 | | | | 266 | |
| With an allowance recorded: | | | | | | | | | | | | | | | | | | | | |
| Real Estate Loans | | | | | | | | | | | | | | | | | | | | |
| Residential | | | — | | | | — | | | | — | | | | — | | | | — | |
| Construction | | | — | | | | — | | | | — | | | | — | | | | — | |
| Commercial | | | 8,641 | | | | 8,548 | | | | 1,648 | | | | 4,734 | | | | 119 | |
| Commercial Loans | | | — | | | | — | | | | — | | | | 159 | | | | — | |
| Consumer Loans | | | — | | | | — | | | | — | | | | — | | | | — | |
| Total | | | 8,641 | | | | 8,548 | | | | 1,648 | | | | 4,893 | | | | 119 | |
| Total: | | | | | | | | | | | | | | | | | | | | |
| Real Estate loans | | | | | | | | | | | | | | | | | | | | |
| Residential | | | — | | | | — | | | | — | | | | — | | | | — | |
| Construction | | | — | | | | — | | | | — | | | | — | | | | — | |
| Commercial | | | 14,239 | | | | 14,146 | | | | 1,648 | | | | 9,822 | | | | 385 | |
| Commercial Loans | | | 513 | | | | 513 | | | | — | | | | 274 | | | | — | |
| Consumer Loans | | | — | | | | — | | | | — | | | | — | | | | — | |
| Total Impaired Loans | | $ | 14,752 | | | $ | 14,659 | | | $ | 1,618 | | | $ | 10,096 | | | $ | 385 | |
NORWOOD FINANCIAL CORP - 2010 CONSOLIDATED FINANCIAL REPORT
NOTE 5 - LOANS RECEIVABLE AND ALLOWANCE FOR LOAN LOSSES (CONTINUED)
Management uses a seven point internal risk rating system to monitor the credit quality of the overall loan portfolio. The first three categories are considered not criticized, and are aggregated as “Pass” rated. The criticized rating categories utilized by management generally follow bank regulatory definitions. The Special Mention category includes assets that are currently protected but are potentially weak, resulting in an undue and unwarranted credit risk, but not to the point of justifying a Substandard classification. Loans in the Substandard category have well-defined weaknesses that jeopardize the liquidation of the debt, and have a distinct possibility that some loss will be sustained if the weakenesses are not corrected. All loans greater than 90 days past due are considered Substandard. Any portion of a loan that has been charged off is placed in the Loss category.
To help ensure that risk ratings are accurate and reflect the present and future capacity of borrowers to repay a loan as agreed, the Bank has a structured loan rating process with several layers of internal and external oversight. Generally, consumer and residential mortgage loans are included in the Pass categories unless a specific action, such as non performance, repossession, or death occurs to raise awareness of a possible credit event. The Bank’s Loan Review Department is responsible for the timely and accurate risk rating of the loans on an ongoing basis. Every credit which must be approved by Loan Committee or the Board of Directors is assigned a risk rating at time of consideration. Loan Review also annually reviews relationships of $500,000 and over to assign or re-affirm risk ratings. Loans in the Substandard categories that are collectively evaluated for impairment are given separate consideration in the determination of the allowance.
The following table presents the classes of the loan portfolio summarized by the aggregate Pass and the criticized categories of Special Mention, Substandard, Doubtful and Loss within the internal risk rating system as of December 31, 2010 (in thousands):
| | | | | | Special | | | | | | | | | | | | | |
| | | Pass | | | Mention | | | Substandard | | | Doubtful | | | Loss | | | Total | |
| December 31, 2010 | | | | | | | | | | | | | | | | | | |
| Commercial real estate loans | | $ | 165,226 | | | $ | 1,780 | | | $ | 17,088 | | | $ | — | | | $ | — | | | $ | 184,094 | |
| Commercial loans | | | 21,759 | | | | 75 | | | | 552 | | | | — | | | | — | | | | 22,386 | |
| Total | | $ | 186,985 | | | $ | 1,855 | | | $ | 17,640 | | | $ | — | | | $ | — | | | $ | 206,480 | |
For residential real estate loans, construction loans and consumer loans, the Company evaluates credit quality based on the performance of the individual credits. The following table presents the recorded investment in the loan classes based on payment activity as of December 31, 2010 (in thousands):
| December 31, 2010 | | Performing | | | Nonperforming | | | Total | |
| Residential real estate loans | | $ | 123,623 | | | $ | 939 | | | $ | 124,562 | |
| Construction | | | 12,638 | | | | — | | | $ | 12,638 | |
| Consumer loans | | | 13,668 | | | | — | | | $ | 13,668 | |
| Total | | $ | 149,929 | | | $ | 939 | | | $ | 150,868 | |
NORWOOD FINANCIAL CORP - 2010 CONSOLIDATED FINANCIAL REPORT
NOTE 5 - LOANS RECEIVABLE AND ALLOWANCE FOR LOAN LOSSES (CONTINUED)
Management further monitors the performance and credit quality of the loan portfolio by analyzing the age of the portfolio as determined by the length of time a recorded payment is past due. The following table presents the classes of the loan portfolio summarized by the aging categories of performing loans and nonaccrual loans as of December 31, 2010 (in thousands):
| | | | | | | | | | | | Greater than | | | | | | | | | | |
| | | | | | | | | | | | 90 Days | | | | | | Total Past | | | | |
| | | | | | | | | | | | Past Due | | | | | | Due and | | | | |
| | | | | | 31-60 Days | | | 61-90 Days | | | and still | | | Non- | | | Non- | | | Total | |
| December 31, 2010 | | Current | | | Past Due | | | Past Due | | | accruing | | | Accrual | | | Accrual | | | Loans | |
| Real Estate loans | | | | | | | | | | | | | | | | | | | | | |
Residential | | $ | 123,177 | | | $ | 407 | | | $ | — | | | $ | 39 | | | $ | 939 | | | $ | 1,385 | | | $ | 124,562 | |
Construction | | | 12,622 | | | | 16 | | | | — | | | | — | | | | — | | | | 16 | | | | 12,638 | |
Commercial | | | 176,981 | | | | 3,047 | | | | 1,478 | | | | — | | | | 2,588 | | | | 7,113 | | | | 184,094 | |
| Commercial loans | | | 21,858 | | | | 15 | | | | — | | | | — | | | | 513 | | | | 528 | | | | 22,386 | |
| Consumer loans | | | 13,642 | | | | 24 | | | | 2 | | | | — | | | | — | | | | 26 | | | | 13,668 | |
| Total | | $ | 348,280 | | | $ | 3,509 | | | $ | 1,480 | | | $ | 39 | | | $ | 4,040 | | | $ | 9,068 | | | $ | 357,348 | |
The following table presents changes in the allowance for loan losses:
| | | Years Ended December 31, | |
| | | 2010 | | | 2009 | | | 2008 | |
| | | (In Thousands) | |
| | | | | | | | | | |
| Allowance balance at beginning of period | | $ | 5,453 | | | $ | 4,233 | | | $ | 4,081 | |
| Charge-offs: | | | | | | | | | | | | |
| Commercial and all other | | | (85 | ) | | | (17 | ) | | | (7 | ) |
| Real Estate | | | (699 | ) | | | (358 | ) | | | (465 | ) |
| Consumer | | | (82 | ) | | | (139 | ) | | | (171 | ) |
| Total | | | (866 | ) | | | (514 | ) | | | (643 | ) |
| Recoveries: | | | | | | | | | | | | |
| Commercial and all other | | | — | | | | 11 | | | | — | |
| Real Estate | | | 2 | | | | 4 | | | | 1 | |
| Consumer | | | 27 | | | | 34 | | | | 59 | |
| Total | | | 29 | | | | 49 | | | | 60 | |
| Provision expense | | | 1,000 | | | | 1,685 | | | | 735 | |
| Allowance balance at end of period | | $ | 5,616 | | | $ | 5,453 | | | $ | 4,233 | |
The following table presents the allowance for loan losses by the classes of the loan portfolio:
| (In thousands) | | | | | | | | | | | | | | | | | | |
| | | Residential | | | Commercial | | | | | | | | | | | | | |
| | | Real Estate | | | Real Estate | | | Construction | | | Commercial | | | Consumer | | | Total | |
| December 31, 2010 | | | | | | | | | | | | | | | | | | |
| Allowance for loan losses: | | | | | | | | | | | | | | | | | | |
| | | | | | | | | | | | | | | | | | | |
| Ending balance | | $ | 1,167 | | | $ | 3,976 | | | $ | 110 | | | $ | 171 | | | $ | 192 | | | $ | 5,616 | |
| | | | | | | | | | | | | | | | | | | | | | | | | |
| Ending balance individually evaluated for impairment | | $ | — | | | $ | 1,648 | | | $ | — | | | $ | — | | | $ | — | | | $ | 1,648 | |
| Ending balance collectively evaluated for impairment | | $ | 1,167 | | | $ | 2,328 | | | $ | 110 | | | $ | 171 | | | $ | 192 | | | $ | 3,968 | |
| | | | | | | | | | | | | | | | | | | | | | | | | |
| Total loans: | | | | | | | | | | | | | | | | | | | | | | | | |
| Ending balance | | $ | 124,562 | | | $ | 184,094 | | | $ | 12,638 | | | $ | 22,386 | | | $ | 13,668 | | | $ | 357,348 | |
| Ending balance individually evaluated for impairment | | $ | — | | | $ | 14,239 | | | $ | — | | | $ | 513 | | | $ | — | | | $ | 14,752 | |
| Ending balance collectively evaluated for impairment | | $ | 124,562 | | �� | $ | 169,855 | | | $ | 12,638 | | | $ | 21,873 | | | $ | 13,668 | | | $ | 342,596 | |
NORWOOD FINANCIAL CORP - 2010 CONSOLIDATED FINANCIAL REPORT
NOTE 5 - LOANS RECEIVABLE AND ALLOWANCE FOR LOAN LOSSES (CONTINUED)
The recorded investment in impaired loans, not requiring an allowance for loan losses was $6,111,000 (net of charge-offs against the allowance for loan losses of $220,000) and $6,962,000 (net of charge-offs against the allowance for loan losses of $154,000) at December 31, 2010 and 2009, respectively. The recorded investment in impaired loans requiring an allowance for loan losses was $8,641,000 (net of a charge-off against the allowance for loan losses of $480,000) and $1,065,000 (net of a charge-off against the allowance for loan losses of $480,000) at December 31, 2010 and 2009, respectively. The specific reserve related to impaired loans was $1,648,000 for 2010 and $36,000 for 2009. For the years ended December 31, 2010, 2009 and 2008, the average recorded investment in these impaired loans was $10,096,000, $3,585,000 and $3,331,000 and the interest income recognized on these impaired loans was $385,000, $139,000 and $143,000, respectively.
Loans on which the accrual of interest has been discontinued amounted to $4,040,000 and $4,916,000 at December 31, 2010 and 2009, respectively. Loan balances past due 90 days or more and still accruing interest, but which management expects will eventually be paid in full, amounted to $39,000 and $99,000 at December 31, 2010 and 2009, respectively. Interest income that would have been recorded on loans accounted for on a non-accrual basis under the original terms of the loans was $339,000, $188,000 and $31,000 for 2010, 2009 and 2008, respectively.
The Company’s primary business activity is with customers located in northeastern Pennsylvania. Accordingly, the Company has extended credit primarily to commercial entities and individuals in this area whose ability to honor their contracts is influenced by the region’s economy.
As of December 31, 2010, the Company considered its concentration of credit risk to be acceptable. The two highest concentrations are in the hospitality lodging industry and summer camps, with loans outstanding of $38.9 million, or 55.1% of capital, to the hospitality lodging industry and $22.2 million, or 31.5% of capital, to summer camps. In 2010, there were no losses in either portfolio. As of December 31, 2010, one motel loan with an outstanding balance of $3,047,000 was delinquent and considered impaired.
Gross realized gains and gross realized losses on sales of residential mortgage loans were $247,000 and $13,000, respectively, in 2010 compared to $309,000 and $6,000, respectively, in 2009 and $410,000 and $0, respectively, in 2008. The proceeds from the sales of residential mortgage loans totaled $12.4 million, $21.8 million and $14.4 million for the years ended December 31, 2010, 2009 and 2008, respectively.
NOTE 6 - PREMISES AND EQUIPMENT
Components of premises and equipment at December 31 are as follows:
| | | 2010 | | | 2009 | |
| | | (In Thousands) | |
| Land and improvements | | $ | 925 | | | $ | 925 | |
| Buildings and improvements | | | 7,975 | | | | 7,933 | |
| Furniture and equipment | | | 5,253 | | | | 5,158 | |
| | | | 14,153 | | | | 14,016 | |
| Accumulated depreciation | | | (9,249 | ) | | | (8,827 | ) |
| | | $ | 4,904 | | | $ | 5,189 | |
Depreciation expense totaled $459,000, $546,000 and $577,000 for the years ended December 31, 2010, 2009 and 2008, respectively.
NORWOOD FINANCIAL CORP - 2010 CONSOLIDATED FINANCIAL REPORT
NOTE 6 - PREMISES AND EQUIPMENT (CONTINUED)
Certain facilities are leased under various operating leases. Rental expense for these leases was $254,000, $284,000 and $280,000, for the years ended December 31, 2010, 2009 and 2008. Future minimum rental commitments under noncancellable leases as of December 31, 2010 were as follows (in thousands):
| | 2011 | | $ | 259 | |
| | 2012 | | | 267 | |
| | 2013 | | | 269 | |
| | 2014 | | | 259 | |
| | 2015 | | | 255 | |
| | Thereafter | | | 1,796 | |
| | | | $ | 3,105 | |
NOTE 7 - DEPOSITS
Aggregate time deposits in denominations of $100,000 or more were $60,015,000 and $66,631,000 at December 31, 2010 and 2009, respectively.
At December 31, 2010, the scheduled maturities of time deposits are as follows (in thousands):
| | 2011 | | $ | 107,806 | |
| | 2012 | | | 32,063 | |
| | 2013 | | | 14,395 | |
| | 2014 | | | 13,872 | |
| | 2015 | | | 4,170 | |
| | | | $ | 172,306 | |
NOTE 8 - BORROWINGS
Short-term borrowings at December 31 consist of the following:
| | | 2010 | | | 2009 | |
| | | (In Thousands) | |
| | | | | | | |
| Securities sold under agreements to repurchase | | $ | 33,110 | | | $ | 25,606 | |
| U.S. Treasury demand notes | | | 199 | | | | 197 | |
| | | $ | 33,309 | | | $ | 25,803 | |
The outstanding balances and related information of short-term borrowings are summarized as follows:
| | | Years Ended December 31, | |
| | | 2010 | | | 2009 | |
| | | (Dollars In Thousands) | |
| | | | | | | |
| Average balance during the year | | $ | 26,100 | | | $ | 26,402 | |
| Average interest rate during the year | | | .45 | % | | | 1.11 | % |
| Maximum month-end balance during the year | | $ | 40,068 | | | $ | 35,323 | |
| Weighted average interest rate at the end of the year | | | .37 | % | | | .56 | % |
Securities sold under agreements to repurchase generally mature within one day to one year from the transaction date. Securities with an amortized cost and fair value of $34,502,000 and $34,494,000 at December 31, 2010 and $26,910,000 and $27,240,000 at December 31, 2009 were pledged as collateral for these agreements. The securities underlying the agreements were under the Company’s control.
The Bank maintains a U. S. Treasury tax and loan note option account for the deposit of withholding taxes, corporate income taxes and certain other payments to the federal government. Deposits are subject to withdrawal and are evidenced by an open-ended interest-bearing note. Borrowings under this note option account were $199,000 and $197,000 at December 31, 2010 and 2009, respectively.
NORWOOD FINANCIAL CORP - 2010 CONSOLIDATED FINANCIAL REPORT
NOTE 8 - BORROWINGS (CONTINUED)
The Company has a line of credit commitment available from the FHLB of Pittsburgh for borrowings of up to $20,000,000 which expires in December 2011. There were no borrowings under this line at December 31, 2010 and 2009. The Company has a line of credit commitment available from Atlantic Central Bankers Bank for $7,000,000 which expires on June 30, 2011. There were no borrowings under this line of credit at December 31, 2010 and 2009. The Company has a line of credit commitment available which has no expiration date from PNC Bank for $16,000,000. There were no borrowings under this line of credit at December 31, 2010 and December 31, 2009.
Other borrowings consisted of the following at December 31, 2010 and 2009:
| | | 2010 | | | 2009 | |
| | | (In Thousands) | |
| Notes with the FHLB: | | | | | | |
| Fixed rate note due September 2010 at 3.53% | | $ | — | | | $ | 5,000 | |
| Convertible note due January 2011 at 5.24% | | | 3,000 | | | | 3,000 | |
| Convertible note due August 2011 at 2.69% | | | 10,000 | | | | 10,000 | |
| Fixed rate note due September 2011 at 4.06% | | | 5,000 | | | | 5,000 | |
| Convertible note due October 2012 at 4.37% | | | 5,000 | | | | 5,000 | |
| Convertible note due May 2013 at 3.015% | | | 5,000 | | | | 5,000 | |
| Convertible note due January 2017 at 4.71% | | | 10,000 | | | | 10,000 | |
| | | $ | 38,000 | | | $ | 43,000 | |
The convertible notes contain an option which allows the FHLB, at quarterly intervals, to change the note to an adjustable-rate advance at three-month LIBOR plus 11 to 19 basis points. If the notes are converted, the option allows the Bank to put the funds back to the FHLB at no charge.
Contractual maturities of other borrowings at December 31, 2010 are as follows (in thousands):
| | 2011 | | | 18,000 | |
| | 2012 | | | 5,000 | |
| | 2013 | | | 5,000 | |
| | 2014 | | | — | |
| | Thereafter | | | 10,000 | |
| | | | $ | 38,000 | |
The Bank’s maximum borrowing capacity with the FHLB was $182,707,000 of which $38,000,000 was outstanding at December 31, 2010. Advances from the FHLB are secured by qualifying assets of the Bank.
NOTE 9 - EMPLOYEE BENEFIT PLANS
The Company has a defined contributory profit-sharing plan which includes provisions of a 401(k) plan. The plan permits employees to make pre-tax contributions up to 15% of the employee’s compensation. The amount of contributions to the plan, including matching contributions, is at the discretion of the Board of Directors. All employees over the age of 21 are eligible to participate in the plan after one year of employment. Employee contributions are vested at all times, and any Company contributions are fully vested after five years. The Company’s contributions are expensed as the cost is incurred, funded currently, and amounted to $342,000, $373,000 and $317,000 for the years ended December 31, 2010, 2009 and 2008, respectively.
The Company has a non-qualified supplemental executive retirement plan for the benefit of certain executive officers. At December 31, 2010 and 2009, other liabilities include $1,445,000 and $1,419,000 accrued under the Plan. Compensation expense includes approximately $115,000, $360,000 and $96,000 relating to the
NORWOOD FINANCIAL CORP - 2010 CONSOLIDATED FINANCIAL REPORT
NOTE 9 - EMPLOYEE BENEFIT PLANS (CONTINUED)
supplemental executive retirement plan for 2010, 2009 and 2008, respectively. To fund the benefits under this plan, the Company is the owner of single premium life insurance policies on participants in the non-qualified retirement plan. At December 31, 2010 and 2009, the cash value of these policies was $8,249,000 and $7,889,000, respectively.
The Company has a leveraged employee stock ownership plan (“ESOP”) for the benefit of employees who meet the eligibility requirements which include having completed one year of service with the Company and having attained age twenty-one. The ESOP Trust purchased shares of the Company’s common stock with proceeds from a loan from the Company. The Bank made cash contributions to the ESOP on an annual basis sufficient to enable the ESOP to make the required loan payments. The loan bears interest at the prime rate adjusted annually. Interest is payable annually and principal payable in equal annual installments over ten years. The loan was secured by the shares of the stock purchased and was paid off in 2006.
As the debt was repaid, shares were released from collateral and allocated to qualified employees based on the proportion of debt service paid in the year. The shares pledged as collateral are reported as unallocated ESOP shares in the consolidated balance sheets. As shares are released from collateral, the Company reports compensation expense equal to the current market price of the shares, and the shares become outstanding for earnings per share computations. Dividends on allocated ESOP shares are recorded as a reduction of retained earnings and dividends on unallocated ESOP shares are recorded as a reduction of debt.
Compensation expense for the ESOP was $-0- for the years ended December 31, 2010, 2009 and 2008, respectively.
The status of the ESOP shares at December 31 are as follows:
| | | 2010 | | | 2009 | |
| Allocated shares | | | 138,556 | | | | 158,903 | |
| Shares released from allocation | | | 52,353 | | | | 32,006 | |
| | | | | | | | | |
| Total ESOP shares | | | 190,909 | | | | 190,909 | |
NOTE 10 - INCOME TAXES
The components of the provision for federal income taxes are as follows:
| | | Years Ended December 31, | |
| | | 2010 | | | 2009 | | | 2008 | |
| | | (In Thousands) | |
| Current | | $ | 2,867 | | | $ | 3,031 | | | $ | 2,800 | |
| Deferred | | | (205 | ) | | | (749 | ) | | | 36 | |
| | | $ | 2,662 | | | $ | 2,282 | | | $ | 2,836 | |
Deferred income taxes reflect temporary differences in the recognition of revenue and expenses for tax reporting and financial statement purposes, principally because certain items, such as, the allowance for loan losses and loan fees are recognized in different periods for financial reporting and tax return purposes. A valuation allowance has not been established for deferred tax assets. Realization of the deferred tax assets is dependent on generating sufficient taxable income. Although realization is not assured, management believes it is more likely than not that all of the deferred tax asset will be realized. Deferred tax assets are recorded in other assets.
NORWOOD FINANCIAL CORP - 2010 CONSOLIDATED FINANCIAL REPORT
NOTE 10 - INCOME TAXES (CONTINUED)
Income tax expense of the Company is less than the amounts computed by applying statutory federal income tax rates to income before income taxes because of the following:
| | | Percentage of Income | |
| | | before Income Taxes | |
| | | Years Ended December 31, | |
| | | 2010 | | | 2009 | | | 2008 | |
| Tax at statutory rates | | | 34.0 | % | | | 34.0 | % | | | 34.0 | % |
| Tax exempt interest income, net of interest expense disallowance | | | (6.2 | ) | | | (5.0 | ) | | | (3.9 | ) |
| Incentive stock options | | | 0.5 | | | | 0.4 | | | | 0.5 | |
| Earnings on life insurance | | | (1.1 | ) | | | (4.1 | ) | | | (0.7 | ) |
| Other | | | (0.5 | ) | | | (0.9 | ) | | | (0.1 | ) |
| | | | 26.7 | % | | | 24.4 | % | | | 29.8 | % |
The income tax provision includes $152,000 and $157,000 of income taxes relating to realized securities gains for the years ended December 31, 2010 and 2009, respectively, and $6,000 of income tax credit relating to realized securities losses for the year ended December 31, 2008.
The net deferred tax asset included in other assets in the accompanying balance sheets includes the following amounts of deferred tax assets and liabilities:
| | | 2010 | | | 2009 | |
| | | (In Thousands) | |
| Deferred tax assets: | | | | | | |
| Allowance for loan losses | | $ | 1,789 | | | $ | 1,682 | |
| Deferred compensation | | | 491 | | | | 482 | |
| Intangible assets | | | 5 | | | | 26 | |
| Other | | | 191 | | | | 122 | |
| Foreclosed real estate valuation allowance | | | 123 | | | | 126 | |
| | | | | | | | | |
| Total Deferred Tax Assets | | | 2,599 | | | | 2,438 | |
| | | | | | | | | |
| Deferred tax liabilities: | | | | | | | | |
| Premises and equipment | | | 276 | | | | 268 | |
| Deferred loan fees | | | 225 | | | | 277 | |
| Net unrealized gains on securities | | | 591 | | | | 1,080 | |
| | | | | | | | | |
| Total Deferred Tax Liabilities | | | 1,092 | | | | 1,625 | |
| | | | | | | | | |
| Net Deferred Tax Asset | | $ | 1,507 | | | $ | 813 | |
No valuation was established at December 31, 2010 and 2009, due to the Company’s ability to carry back taxes paid in prior years and anticipated future taxable income as evidenced by the Company’s earnings potential. There is currently no liability for uncertain tax positions and no known unrecognized tax benefits. The Company recognizes, when applicable, interest and penalties related to unrecognized tax benefits in the provision for income taxes in the Statement of Income. The Company’s federal and state income tax returns for taxable years through 2006 have been closed for purposes of examination by the Internal Revenue Service and the Pennsylvania Department of Revenue.
NORWOOD FINANCIAL CORP - 2010 CONSOLIDATED FINANCIAL REPORT
NOTE 11 - TRANSACTIONS WITH EXECUTIVE OFFICERS AND DIRECTORS
Certain directors and executive officers of the Company, their families and their affiliates are customers of the Bank. Any transactions with such parties, including loans and commitments, were in the ordinary course of business at normal terms, including interest rates and collateralization, prevailing at the time and did not represent more than normal risks. At December 31, 2010 and 2009 such loans amounted to $3,345,000 and $3,530,000, respectively. During 2010, new loans to such related parties totaled $1,370,000 and repayments and other reductions aggregated $1,555,000.
NOTE 12 - REGULATORY MATTERS AND STOCKHOLDERS’ EQUITY
The Company and Bank are subject to various regulatory capital requirements administered by the federal banking agencies. Failure to meet minimum capital requirements can initiate certain mandatory and possibly additional discretionary actions by regulators that, if undertaken, could have a direct material effect on the Company’s financial statements. Under capital adequacy guidelines and the regulatory framework for prompt corrective action, the Company must meet specific capital guidelines that involve quantitative measures of the Company’s assets, liabilities and certain off-balance sheet items as calculated under regulatory accounting practices. The Company’s capital amounts and classification are also subject to qualitative judgments by the regulators about components, risk-weightings and other factors.
Quantitative measures established by regulation to ensure capital adequacy require the Company and the Bank to maintain minimum amounts and ratios (set forth in the table below) of total and Tier 1 capital (as defined in the regulations) to risk-weighted assets, and of Tier 1 capital to average assets. Management believes, as of December 31, 2010 and 2009, that the Company and the Bank meet all capital adequacy requirements to which they are subject.
As of December 31, 2010, the most recent notification from the regulators has categorized the Bank as well capitalized under the regulatory framework for prompt corrective action. There are no conditions or events since that notification that management believes have changed the Bank’s category.
The Bank’s actual capital amounts and ratios are presented in the table:
| | | Actual | | | For Capital Adequacy Purposes | | | To Be Well Capitalized under Prompt Corrective Action | |
| | | Amount | | | Ratio | | | Amount | | | Ratio | | | Amount | | | Ratio | |
| | | �� | | | | | | | | | | | | | | | | |
| As of December 31, 2010: | | | | | | | | | | | | | | | | | | |
| Total capital (to risk-weighted assets) | | $ | 69,713 | | | | 19.23 | % | | $ | ≥28,995 | | | | ≥8.00 | % | | $ | ≥36,243 | | | | ≥10.00 | % |
| Tier 1 capital (to risk-weighted assets) | | | 65,027 | | | | 17.94 | | | | ≥14,497 | | | | ≥4.00 | | | | ≥21,746 | | | | ≥6.00 | |
| Tier 1 capital (to average assets) | | | 65,027 | | | | 12.14 | | | | ≥21,432 | | | | ≥4.00 | | | | ≥26,790 | | | | ≥5.00 | |
| | | | | | | | | | | | | | | | | | | | | | | | | |
| As of December 31, 2009: | | | | | | | | | | | | | | | | | | | | | | | | |
| Total capital (to risk-weighted assets) | | $ | 65,197 | | | | 17.85 | % | | $ | ≥29,227 | | | | ≥8 .00 | % | | $ | ≥36,534 | | | | ≥10.00 | % |
| Tier 1 capital (to risk-weighted assets) | | | 60,469 | | | | 16.55 | | | | ≥14,614 | | | | ≥4.00 | | | | ≥21,920 | | | | ≥6.00 | |
| Tier 1 capital (to average assets) | | | 60,469 | | | | 11.53 | | | | ≥20,974 | | | | ≥4.00 | | | | ≥26,217 | | | | ≥5.00 | |
The Company’s ratios do not differ significantly from the Bank’s ratios presented above.
The Bank is required to maintain average cash reserve balances in vault cash or with the Federal Reserve Bank. The amount of these restricted cash reserve balances at December 31, 2010 and 2009 was approximately $309,000 and $229,000, respectively.
NORWOOD FINANCIAL CORP - 2010 CONSOLIDATED FINANCIAL REPORT
NOTE 12 - REGULATORY MATTERS AND STOCKHOLDERS’ EQUITY (CONTINUED)
Under Pennsylvania banking law, the Bank is subject to certain restrictions on the amount of dividends that it may declare without prior regulatory approval. At December 31, 2010, $58,159,000 of retained earnings were available for dividends without prior regulatory approval, subject to the regulatory capital requirements discussed above. Under Federal Reserve regulations, the Bank is limited as to the amount it may lend affiliates, including the Company, unless such loans are collateralized by specific obligations.
NOTE 13 - STOCK OPTION PLANS
The Company’s shareholders approved the Norwood Financial Corp 2006 Stock Option Plan at the Annual Meeting on April 26, 2006. An aggregate of 250,000 shares of authorized but unissued Common Stock of the Company were reserved for future issuance under the Plan. This includes up to 40,000 shares for awards to outside directors. Under this plan, the Company granted 28,000 options, which included 4,000 options granted to outside directors in 2010, 24,000 options, which included 4,000 options granted to outside directors in 2009 and 24,000 options in 2008 which included 4,000 options granted to outside directors.
Total unrecognized compensation cost related to nonvested options under the Plan was $165,000 as of December 31, 2010, $158,000 as of December 31, 2009 and $130,000 as of December 31, 2008. Salaries and employee benefits expense includes $162,000, $134,000 and $154,000 of compensation costs related to options for the years ended December 31, 2010, 2009 and 2008, respectively. Net income was reduced by $153,000, $127,000 and $144,000 for the years ended December 31, 2010, 2009 and 2008, respectively.
A summary of the Company’s stock option activity and related information for the years ended December 31 follows:
| | | | | | 2010 | | | | | | | | | 2009 | | | | | | | | | 2008 | | | | |
| | | | | | Weighted | | | | | | | | | Weighted | | | | | | | | | Weighted | | | | |
| | | | | | Average | | | Average | | | | | | Average | | | Average | | | | | | Average | | | Average | |
| | | | | | Exercise | | | Intrinsic | | | | | | Exercise | | | Intrinsic | | | | | | Exercise | | | Intrinsic | |
| | | Options | | | Price | | | Value | | | Options | | | Price | | | Value | | | Options | | | Price | | | Value | |
| | | | | | | | | | | | | | | | | | | | | | | | | | | | |
| Outstanding, beginning of year | | | 170,915 | | | $ | 28.07 | | | | | | | 176,443 | | | $ | 25.78 | | | | | | | 180,422 | | | $ | 24.04 | | | | |
| Granted | | | 28,000 | | | | 27.74 | | | | | | | 27,000 | | | | 28.60 | | | | | | | 24,000 | | | | 27.50 | | | | |
| Exercised | | | (9,276 | ) | | | 17.68 | | | | | | | (32,528 | ) | | | 15.83 | | | | | | | (27,979 | ) | | | 14.98 | | | | |
| Forfeited | | | — | | | | — | | | | | | | — | | | | — | | | | | | | — | | | | — | | | | |
| | | | | | | | | | | | | | | | | | | | | | | | | | | | | | | | | | |
| Outstanding, end of year | | | 189,639 | | | $ | 28.52 | | | $ | 146,361 | | | | 170,915 | | | $ | 28.07 | | | $ | 286,464 | | | | 176,443 | | | $ | 25.95 | | | $ | 273,487 | |
| | | | | | | | | | | | | | | | | | | | | | | | | | | | | | | | | | | | | |
| Exercisable, end of year | | | 161,639 | | | $ | 28.66 | | | $ | 145,471 | | | | 146,915 | | | | 27.98 | | | | 259,461 | | | | | | | | | | | | | |
Exercise prices for options outstanding as of December 31, 2010 ranged from $16.98 to $31.50 per share. The weighted average remaining contractual life is 6.6 years.
The fair value of each option grant is estimated on the date of grant using the Black-Scholes option pricing with the following weighted average assumptions:
| | | Years Ended December 31, | |
| | | 2010 | | | 2009 | | | 2008 | |
| Dividend yield | | | 3.04 | % | | | 2.89 | % | | | 2.79 | % |
| Expected life | | 7 years | | | 7 years | | �� | 7 years | |
| Expected volatility | | | 27.18 | % | | | 27.39 | % | | | 25.08 | % |
| Risk-free interest rate | | | 2.72 | % | | | 3.11 | % | | | 2.01 | % |
| Weighted average fair value of options granted | | $ | 6.12 | | | $ | 6.77 | | | $ | 5.43 | |
NORWOOD FINANCIAL CORP - 2010 CONSOLIDATED FINANCIAL REPORT
NOTE 13 - STOCK OPTION PLANS (CONTINUED)
The expected volatility is based on historical volatility. The risk-free interest rates for periods within the contractual life of the awards are based on the U.S. Treasury yield curve in effect at the time of the grant. The expected life is based on historical exercise experience. The dividend yield assumption is based on the Company’s history and expectation of dividend payouts.
Proceeds from stock option exercises totaled $163,000 in 2010. Shares issued in connection with stock options exercises are issued from available treasury shares. If no treasury shares are available, new shares are issued from available authorized shares. During 2010, all the shares issued in connection with stock option exercises, 9,276 shares in total, were issued from available treasury shares.
As of December 31, 2010, outstanding stock options consist of the following:
| | | Options Outstanding | | | Average Exercise Price | | | Remaining Life, Years | | | Options Exercisable | | | Average Exercise Price | |
| | | | | | | | | | | | | | | | |
| | | | 1,575 | | | $ | 16.98 | | | | 1.0 | | | | 1,575 | | | $ | 16.98 | |
| | | | 6,298 | | | | 19.05 | | | | 2.0 | | | | 6,298 | | | | 19.05 | |
| | | | 17,616 | | | | 23.95 | | | | 3.0 | | | | 17,616 | | | | 23.95 | |
| | | | 20,475 | | | | 30.00 | | | | 4.0 | | | | 20,475 | | | | 30.00 | |
| | | | 24,675 | | | | 30.38 | | | | 5.3 | | | | 24,675 | | | | 30.38 | |
| | | | 22,000 | | | | 31.50 | | | | 6.0 | | | | 22,000 | | | | 31.50 | |
| | | | 22,000 | | | | 31.25 | | | | 7.0 | | | | 22,000 | | | | 31.25 | |
| | | | 23,000 | | | | 27.50 | | | | 8.0 | | | | 23,000 | | | | 27.50 | |
| | | | 1,000 | | | | 28.90 | | | | 8.3 | | | | 1,000 | | | | 28.90 | |
| | | | 23,000 | | | | 28.59 | | | | 9.0 | | | | 23,000 | | | | 28.59 | |
| | | | 1,000 | | | | 26.88 | | | | 9.2 | | | | — | | | | — | |
| | | | 27,000 | | | | 27.77 | | | | 10.0 | | | | — | | | | — | |
| Total | | | 189,639 | | | $ | 28.52 | | | | 6.6 | | | | 161,639 | | | $ | 28.66 | |
NOTE 14 - EARNINGS PER SHARE
The following table sets forth the computations of basic and diluted earnings per share:
| | | Years Ended December 31, | |
| | | 2010 | | | 2009 | | | 2008 | |
| | | (In Thousands, Except per Share Data) | |
| | | | | | | | | | |
| Numerator, net income | | $ | 7,313 | | | $ | 7,063 | | | $ | 6,677 | |
| | | | | | | | | | | | | |
| Denominator: | | | | | | | | | | | | |
| Denominator for basic earnings per share, weighted average shares | | | 2,762 | | | | 2,750 | | | | 2,740 | |
| Effect of dilutive securities, employee stock options | | | 4 | | | | 16 | | | | 29 | |
| | | | | | | | | | | | | |
| Denominator for diluted earnings per share, adjusted weighted average shares and assumed conversions | | | 2,766 | | | | 2,766 | | | | 2,769 | |
| | | | | | | | | | | | | |
| Basic earnings per common share | | $ | 2.65 | | | $ | 2.57 | | | $ | 2.44 | |
| | | | | | | | | | | | | |
| Diluted earnings per common share | | $ | 2.64 | | | $ | 2.55 | | | $ | 2.41 | |
Stock options which had no intrinsic value because their effect would be anti-dilutive and therefore would not be included in the diluted EPS calculation were 140,150, 109,821 and 89,150 for the years ended December 31, 2010, 2009 and 2008, respectively.
NORWOOD FINANCIAL CORP - 2010 CONSOLIDATED FINANCIAL REPORT
NOTE 15 - OFF-BALANCE SHEET FINANCIAL INSTRUMENTS
The Bank is a party to financial instruments with off-balance-sheet risk in the normal course of business to meet the financing needs of its customers. These financial instruments include commitments to extend credit and letters of credit. Those instruments involve, to varying degrees, elements of credit and interest rate risk in excess of the amount recognized in the balance sheets.
The Bank’s exposure to credit loss in the event of nonperformance by the other party to the financial instrument for commitments to extend credit and letters of credit is represented by the contractual amount of those instruments. The Bank uses the same credit policies in making commitments and conditional obligations as it does for on-balance sheet instruments.
A summary of the Bank’s financial instrument commitments is as follows:
| | | December 31, | |
| | | 2010 | | | 2009 | |
| | | (In Thousands) | |
| | | | | | | |
| Commitments to grant loans | | $ | 21,448 | | | $ | 17,713 | |
| Unfunded commitments under lines of credit | | | 30,311 | | | | 36,809 | |
| Standby letters of credit | | | 3,605 | | | | 3,679 | |
| | | $ | 55,364 | | | $ | 58,201 | |
Commitments to extend credit are agreements to lend to a customer as long as there is no violation of any condition established in the contract. Commitments generally have fixed expiration dates or other termination clauses and may require payment of a fee. Since some of the commitments are expected to expire without being drawn upon, the total commitment amount does not necessarily represent future cash requirements. The Bank evaluates each customer’s credit worthiness on a case-by-case basis. The amount of collateral obtained, if deemed necessary by the Bank upon extension of credit, is based on management’s credit evaluation of the customer and generally consists of real estate.
Standby letters of credit are conditional commitments issued by the Bank to guarantee the performance of a customer to a third party. The majority of these standby letters of credit expire within the next twelve months. The credit risk involved in issuing letters of credit is essentially the same as that involved in extending other loan commitments. The Bank requires collateral supporting these letters of credit when deemed necessary. Management believes that the proceeds obtained through a liquidation of such collateral would be sufficient to cover the maximum potential amount of future payments required under the corresponding guarantees.
NOTE 16 - FAIR VALUES OF FINANCIAL INSTRUMENTS
Management uses its best judgment in estimating the fair value of the Company’s financial instruments; however, there are inherent weaknesses in any estimation technique. Therefore, for substantially all financial instruments, the fair value estimates herein are not necessarily indicative of the amounts the Company could have realized in a sales transaction on the dates indicated. The estimated fair value amounts have been measured as of their respective year ends and have not been re-evaluated or updated for purposes of these consolidated financial statements subsequent to those respective dates. As such, the estimated fair values of these financial instruments subsequent to the respective reporting dates may be different than the amounts reported at each year end.
NORWOOD FINANCIAL CORP - 2010 CONSOLIDATED FINANCIAL REPORT
NOTE 16 - FAIR VALUES OF FINANCIAL INSTRUMENTS (CONTINUED)
The fair value hierarchy prioritizes the inputs to valuation methods used to measure fair value. The hierarchy gives the highest priority to unadjusted quoted prices in active markets for identical assets or liabilities (Level 1 measurements) and the lowest priority to unobservable inputs (Level 3 measurements). The three levels of the fair value hierarchy are as follows:
| Level 1: | Unadjusted quoted prices in active markets that are accessible at the measurement date for identical, unrestricted assets or liabilities. |
| | |
| Level 2: | Quoted prices in markets that are not active, or inputs that are observable either directly or indirectly, for substantially the full term of the asset or liability. |
| | |
| Level 3: | Prices or valuation techniques that require inputs that are both significant to the fair value measurement and unobservable (i.e., supported with little or no market activity). |
An asset’s or liability’s level within the fair value hierarchy is based on the lowest level of input that is significant to the fair value measurement.
For financial assets measured at fair value on a recurring basis, the fair value measurements by level within the fair value hierarchy used at December 31, 2010 and 2009 are as follows:
| | | Fair Value Measurement Reporting Date using | |
| Description | | Total | | | (Level 1) Quoted Prices in Active Markets for Identical Assets | | | (Level 2) Significant Other Observable Inputs | | | (Level 3) Significant Unobservable Inputs | |
| December 31, 2010 | | | | | | | | | | | | |
| Available for Sale: | | | | | | | | | | | | |
| U.S. Government agencies | | $ | 30,268 | | | $ | — | | | $ | 30,268 | | | $ | — | |
| States and political subdivisions | | | 49,766 | | | | — | | | | 49,766 | | | | — | |
| Corporate obligations | | | 4,249 | | | | — | | | | 4,249 | | | | — | |
| Mortgage-backed securities - | | | | | | | | | | | | | | | | |
| government sponsored entities | | | 60,928 | | | | — | | | | 60,928 | | | | — | |
| Equity securities - financial services | | | 604 | | | | 604 | | | | — | | | | — | |
| Total available for sale | | $ | 145,815 | | | $ | 604 | | | $ | 145,211 | | | $ | — | |
| | | | | | | | | | | | | | | | | |
| December 31, 2009 | | | | | | | | | | | | | | | | |
| Available for Sale: | | | | | | | | | | | | | | | | |
| U.S. Government agencies | | $ | 39,772 | | | $ | — | | | $ | 39,772 | | | $ | — | |
| States and political subdivisions | | | 31,635 | | | | — | | | | 31,635 | | | | — | |
| Corporate obligations | | | 5,240 | | | | — | | | | 5,240 | | | | — | |
| Mortgage-backed securities - | | | | | | | | | | | | | | | | |
| government sponsored entities | | | 53,154 | | | | — | | | | 53,154 | | | | — | |
| Equity securities - financial services | | | 776 | | | | 776 | | | | — | | | | — | |
| Total available for sale | | $ | 130,577 | | | $ | 776 | | | $ | 129,801 | | | $ | — | |
NORWOOD FINANCIAL CORP - 2010 CONSOLIDATED FINANCIAL REPORT
NOTE 16 - FAIR VALUES OF FINANCIAL INSTRUMENTS (CONTINUED)
For financial assets measured at fair value on a nonrecurring basis, the fair value measurements by level within the fair value hierarchy used at December 31, 2010 and 2009 are as follows:
| | | Fair Value Measurement Reporting Date using | |
| Description | | Total | | | (Level 1) Quoted Prices in Active Markets for Identical Assets | | | (Level 2) Significant Other Observable Inputs | | | (Level 3) Significant Unobservable Inputs | |
| December 31, 2010 | | | | | | | | | | | | |
| Impaired Loans | | $ | 13,104 | | | $ | — | | | $ | 7,038 | | | $ | 6,066 | |
| Foreclosed real estate owned | | | 748 | | | | — | | | | 748 | | | | — | |
| | | $ | 13,852 | | | $ | — | | | $ | 7,786 | | | $ | 6,066 | |
| December 31, 2009 | | | | | | | | | | | | | | | | |
| Impaired Loans | | $ | 7,991 | | | $ | — | | | $ | 3,797 | | | $ | 4,194 | |
| Foreclosed real estate owned | | | 392 | | | | — | | | | 392 | | | | — | |
| | | $ | 8,383 | | | $ | — | | | $ | 4,189 | | | $ | 4,194 | |
The following information should not be interpreted as an estimate of the fair value of the entire Company since a fair value calculation is only provided for a limited portion of the Company’s assets and liabilities. Due to a wide range of valuation techniques and the degree of subjectivity used in making the estimates, comparisons between the Company’s disclosures and those of other companies may not be meaningful.
The following methods and assumptions were used to estimate the fair values of the Company’s financial instruments at December 31, 2010 and 2009.
Cash and cash equivalents (carried at cost):
The carrying amounts reported in the consolidated balance sheet for cash and short-term instruments approximate those assets’ fair values.
Securities:
The fair value of securities available for sale (carried at fair value) and held to maturity (carried at amortized cost) are determined by obtaining quoted market prices on nationally recognized securities exchanges (Level 1), or matrix pricing (Level 2), which is a mathematical technique used widely in the industry to value debt securities without relying exclusively on quoted market prices for the specific securities but rather by relying on the securities’ relationship to other benchmark quoted prices. For certain securities which are not traded in active markets or are subject to transfer restrictions, valuations are adjusted to reflect illiquidity and/or non-transferability, and such adjustments are generally based on available market evidence (Level 3). In the absence of such evidence, management’s best estimate is used. Management’s best estimate consists of both internal and external support on certain Level 3 investments. Internal cash flow models using a present value formula that includes assumptions market participants would use along with indicative exit pricing obtained from broker/dealers (where available) are used to support fair values of certain Level 3 investments, if applicable.
Loans receivable (carried at cost):
The fair values of loans are estimated using discounted cash flow analyses, using market rates at the balance sheet date that reflect the credit and interest rate-risk inherent in the loans. Projected future cash flows are calculated based upon contractual maturity or call dates, projected repayments and prepayments of principal. Generally, for variable rate loans that reprice frequently and with no significant change in credit risk, fair values are based on carrying values.
NORWOOD FINANCIAL CORP - 2010 CONSOLIDATED FINANCIAL REPORT
NOTE 16 - FAIR VALUES OF FINANCIAL INSTRUMENTS (CONTINUED)
Impaired loans (generally carried at fair value):
The Company measures impairment generally based on the fair value of the loan’s collateral. Fair value is generally determined based upon independent third-party appraisals of the properties, or discounted cash flows based upon the lowest level of input that is significant to the fair value measurements.
As of December 31, 2010, the fair value investment in impaired loans totaled $13,104,000 which includes three loans for $8.6 million for which a valuation allowance has been provided based on current collateral values and seven loans for $6.1 million which do not require a valuation allowance since the current collateral value exceeds the loan value. As of December 31, 2010, the Company has recognized charge-offs against the allowance for loan losses on impaired loans in the amount of $700,000 over the life of the loans.
As of December 31, 2009, the fair value investment in impaired loans was $7,991,000 which included two loans for $1.0 million for which a valuation allowance had been provided based on the estimated value of the collateral and five loans for $7.0 million which did not require a valuation allowance since the estimated realizable value of the collateral exceeded the recorded investment in the loan. As of December 31, 2009, the Company had recognized a cumulative charge-off against the allowance for loan losses in the amount of $634,000 on impaired loans.
Mortgage Servicing Rights (generally carried at cost):
The Company utilizes a third party provider to estimate the fair value of certain loan servicing rights. Fair value for the purpose of this measurement is defined as the amount at which the asset could be exchanged in a current transaction between willing parties, other than in a forced liquidation.
Foreclosed real estate owned (carried at fair value):
Real estate properties acquired through, or in lieu of loan foreclosure are to be sold and are carried at fair value less estimated cost to sell. Fair value is based upon independent market prices, appraised value of the collateral or management’s estimation of the value of the collateral. These assets are included in Level 2 fair value based upon the lowest level of input that is significant to the fair value measurement.
Restricted investment in Federal Home Loan Bank stock (carried at cost):
The Company, as a member of the Federal Home Loan Bank (FHLB) system is required to maintain an investment in capital stock of its district FHLB according to a predetermined formula. This restricted stock has no quoted market value and is carried at cost.
In December 2008, the FHLB of Pittsburgh notified member banks that it was suspending dividend payments and the repurchase of excess capital stock. In October, 2010, the FHLB of Pittsburgh repurchased a portion of member bank’s excess stock, but notified member banks that decisions regarding future capital stock repurchases will be made on a quarterly basis.
Management evaluates the restricted stock for impairment. Management’s determination of whether these investments are impaired is based on their assessment of the ultimate recoverability of their cost rather than by recognizing temporary declines in value. The determination of whether a decline affects the ultimate recoverability of their cost is influenced by criteria such as (1) the significance of the decline in net assets of the FHLB as compared to the capital stock amount for the FHLB and the length of time this situation has persisted, (2) commitments by the FHLB to make payments required by law or regulation and the level of such payments in relation to the operating performance of the FHLB, and (3) the impact of legislative and regulatory changes on institutions and, accordingly, on the customer base of the FHLB. Management believes no impairment charge is necessary related to FHLB stock as of December 31, 2010.
NORWOOD FINANCIAL CORP - 2010 CONSOLIDATED FINANCIAL REPORT
NOTE 16 - FAIR VALUES OF FINANCIAL INSTRUMENTS (CONTINUED)
Accrued interest receivable and payable (carried at cost):
The carrying amount of accrued interest receivable and accrued interest payable approximates its fair value.
Deposit liabilities (carried at cost):
The fair values disclosed for demand deposits (e.g., interest and noninterest checking, passbook savings and money market accounts) are, by definition, equal to the amount payable on demand at the reporting date (i.e., their carrying amounts). Fair values for fixed-rate certificates of deposit are estimated using a discounted cash flow calculation that applies interest rates currently being offered in the market on certificates to a schedule of aggregated expected monthly maturities on time deposits.
Short-term borrowings (carried at cost):
The carrying amounts of short-term borrowings approximate their fair values.
Other borrowings (carried at cost):
Fair values of FHLB advances are estimated using discounted cash flow analysis, based on quoted prices for new FHLB advances with similar credit risk characteristics, terms and remaining maturity. These prices obtained from this active market represent a market value that is deemed to represent the transfer price if the liability were assumed by a third party.
Off-balance sheet financial instruments (disclosed at cost):
Fair values for the Company’s off-balance sheet financial instruments (lending commitments and letters of credit) are based on fees currently charged in the market to enter into similar agreements, taking into account, the remaining terms of the agreements and the counterparties’ credit standing.
The estimated fair values of the Bank’s financial instruments were as follows at December 31, 2010 and December 31, 2009.
| | | December 31, 2010 | | | December 31, 2009 | |
| | | Carrying | | | Fair | | | Carrying | | | Fair | |
| | | Amount | | | Value | | | Amount | | | Value | |
| | | (In Thousands) | |
| Financial assets: | | | | | | | | | | | | |
| Cash and due from banks, interest bearing deposits with banks and federal funds sold | | $ | 16,625 | | | $ | 16,625 | | | $ | 17,355 | | | $ | 17,355 | |
| Securities | | | 145,985 | | | | 145,994 | | | | 131,285 | | | | 131,299 | |
| Loans receivable, net | | | 351,239 | | | | 358,873 | | | | 358,021 | | | | 368,180 | |
| Mortgage servicing rights | | | 250 | | | | 274 | | | | 179 | | | | 179 | |
| Investment in FHLB stock | | | 3,361 | | | | 3,361 | | | | 3,538 | | | | 3,538 | |
| Accrued interest receivable | | | 2,166 | | | | 2,166 | | | | 2,200 | | | | 2,200 | |
| | | | | | | | | | | | | | | | | |
| Financial liabilities: | | | | | | | | | | | | | | | | |
| Deposits | | | 393,865 | | | | 395,157 | | | | 391,473 | | | | 392,445 | |
| Short-term borrowings | | | 33,309 | | | | 33,309 | | | | 25,803 | | | | 25,803 | |
| Other borrowings | | | 38,000 | | | | 40,413 | | | | 43,000 | | | | 45,591 | |
| Accrued interest payable | | | 1,536 | | | | 1,536 | | | | 2,057 | | | | 2,057 | |
| | | | | | | | | | | | | | | | | |
| Off-balance sheet financial instruments: | | | | | | | | | | | | | | | | |
| Commitments to extend credit and outstanding letters of credit | | | — | | | | — | | | | — | | | | — | |
NORWOOD FINANCIAL CORP - 2010 CONSOLIDATED FINANCIAL REPORT
NOTE 17 – PROPOSED ACQUISITION OF NORTH PENN BANCORP, INC.
On December 15, 2010, the Company announced the signing of a definitive merger agreement pursuant to which Norwood Financial Corp would acquire North Penn Bancorp, Inc. in a stock and cash transaction. The proposed acquisition is an in-market transaction that will expand the Company’s existing footprint in Monroe County, Pennsylvania and extends its footprint into Lackawanna County, Pennsylvania.
North Penn Bancorp, Inc. is the holding company for North Penn Bank, a Pennsylvania savings bank that conducts its business from its main office in Scranton, Pennsylvania and four branch offices, in the northeastern Pennsylvania counties of Lackawanna and Monroe. As of September 30, 2010, North Penn Bancorp, Inc. had total assets of $164.5 million, total net loans of $119.7 million, total deposits of $136.5 million and total stockholders’ equity of $19.9 million.
Under the terms of the agreement, the Company will acquire all of the outstanding shares of North Penn Bancorp, Inc. for a total purchase price of approximately $27.1 million. North Penn Bank will be merged into Wayne Bank, with Wayne as the surviving entity. It is expected that the merger will be consummated in the second quarter of 2011 subject to certain conditions, including regulatory and North Penn stockholder approvals.
NORWOOD FINANCIAL CORP - 2010 CONSOLIDATED FINANCIAL REPORT
NOTE 18 - NORWOOD FINANCIAL CORP (PARENT COMPANY ONLY) FINANCIAL INFORMATION
| BALANCE SHEETS | |
| | | | | | December 31, | |
| | | | | | 2010 | | | 2009 | |
| | | | | | (In Thousands) | |
| ASSETS | |
| Cash on deposit in bank subsidiary | | | | | $ | 346 | | | $ | 697 | |
| Securities available for sale | | | | | | 212 | | | | 359 | |
| Investment in bank subsidiary | | | | | | 66,163 | | | | 62,571 | |
| Other assets | | | | | | 1,812 | | | | 1,620 | |
| | | | | | $ | 68,533 | | | $ | 65,247 | |
| LIABILITIES AND STOCKHOLDERS’ EQUITY | |
| Liabilities | | | | | $ | 835 | | | $ | 776 | |
| Stockholders’ equity | | | | | | 67,698 | | | | 64,471 | |
| | | | | | $ | 68,533 | | | $ | 65,247 | |
| STATEMENTS OF INCOME | |
| | | Years Ended December 31, | |
| | | 2010 | | | | 2009 | | | | 2008 | |
| | | (In Thousands) | |
| Income: | | | | | | | | | | | |
| Dividends from bank subsidiary | | $ | 3,120 | | | $ | 3,005 | | | $ | 3,990 | |
| Other interest income | | | 17 | | | | 19 | | | | 25 | |
| Net realized gain (loss) on sales of securities | | | 66 | | | | (134 | ) | | | (62 | ) |
| | | | 3,203 | | | | 2,890 | | | | 3,953 | |
| Expenses | | | 323 | | | | 176 | | | | 164 | |
| | | | 2,880 | | | | 2,714 | | | | 3,789 | |
| Income tax benefit | | | (82 | ) | | | (99 | ) | | | (68 | ) |
| | | | 2,962 | | | | 2,813 | | | | 3,857 | |
| Equity in undistributed earnings of subsidiary | | | 4,351 | | | | 4,250 | | | | 2,820 | |
| Net Income | | $ | 7,313 | | | $ | 7,063 | | | $ | 6,677 | |
| | | | | | | | | | | | | |
| STATEMENTS OF CASH FLOWS | |
| | | Years Ended December 31, | |
| | | | 2010 | | | | 2009 | | | | 2008 | |
| | | (In Thousands) | |
| CASH FLOWS FROM OPERATING ACTIVITIES | | | | | | | | | | | | |
| Net income | | $ | 7,313 | | | $ | 7,063 | | | $ | 6,677 | |
| Adjustments to reconcile net income to net cash provided by operating activities: | | | | | | | | | | | | |
| Undistributed earnings of bank subsidiary | | | (4,351 | ) | | | (4,250 | ) | | | (2,820 | ) |
| Net (gains) losses on sales of securities | | | (66 | ) | | | 134 | | | | — | |
| Other, net | | | (144 | ) | | | (300 | ) | | | (190 | ) |
| Net Cash Provided by Operating Activities | | | 2,752 | | | | 2,647 | | | | 3,667 | |
| | | | | | | | | | | | | |
| CASH FLOWS FROM INVESTING ACTIVITIES | | | | | | | | | | | | |
| Proceeds from sale of securities | | | 166 | | | | 22 | | | | 17 | |
| | | | | | | | | | | | | |
| Net Cash Provided by Investing Activities | | | 166 | | | | 22 | | | | 17 | |
| | | | | | | | | | | | | |
| CASH FLOWS FROM FINANCING ACTIVITIES | | | | | | | | | | | | |
| Stock options exercised | | | 163 | | | | 517 | | | | 420 | |
| Tax benefit of stock options exercised | | | 34 | | | | 164 | | | | 134 | |
| ESOP purchase of shares from treasury stock | | | 156 | | | | 166 | | | | 153 | |
| Acquisition of treasury stock | | | (529 | ) | | | (68 | ) | | | (1,583 | ) |
| Cash dividends paid | | | (3,093 | ) | | | (2,967 | ) | | | (2,740 | ) |
| Net Cash Used in Financing Activities | | | (3,269 | ) | | | (2,188 | ) | | | (3,616 | ) |
| Net Increase (Decrease) in Cash and Cash Equivalents | | | (351 | ) | | | 481 | | | | 68 | |
| | | | | | | | | | | | | |
| Cash and Cash Equivalents - Beginning | | | 697 | | | | 216 | | | | 148 | |
| | | | | | | | | | | | | |
| Cash and Cash Equivalents - Ending | | $ | 346 | | | $ | 697 | | | $ | 216 | |
NORWOOD FINANCIAL CORP - 2010 CONSOLIDATED FINANCIAL REPORT
INVESTOR INFORMATION
STOCK LISTING
Norwood Financial Corp stock is traded on the Nasdaq Global Market under the symbol NWFL. The following firms are known to make a market in the Company’s stock:
| Boenning & Scattergood, Inc. | Janney Montgomery Scott, LLC |
| West Conshohocken, PA | Scranton, PA 18503 |
| 800-496-1170 | 800-638-4417 |
| | |
| RBC Capital Markets | Stifel Nicolaus |
| Philadelphia, PA 19103 | St. Louis, MO |
| 888-848-4677 | 314-342-2000 |
TRANSFER AGENT
IST Shareholder Services, 209 West Jackson Blvd., Suite 903, Chicago, IL 60606. Stockholders who may have questions regarding their stock ownership should contact the Transfer Agent at 312-427-2953.
DIVIDEND CALENDAR
Dividends on Norwood Financial Corp common stock, if approved by the Board of Directors are customarily paid on or about February 1, May 1, August 1 and November 1.
AUTOMATIC DIVIDEND REINVESTMENT PLAN
The Plan, open to all shareholders, provides the opportunity to have dividends automatically reinvested into Norwood stock. Participants in the Plan may also elect to make cash contributions to purchase additional shares of common stock. Shareholders do not incur brokerage commissions for the transactions. Please contact the transfer agent for additional information.
SEC REPORTS AND ADDITIONAL INFORMATION
A copy of the Company’s annual report on Form 10-K for its fiscal year ended December 31, 2010 including financial statements and schedules thereto, required to be filed with the Securities and Exchange Commission may be obtained upon written request of any stockholder, investor or analyst by contacting Edward C. Kasper, Executive Vice President and Secretary, Norwood Financial Corp., 717 Main Street, PO Box 269, Honesdale, PA 18431, 570-253-1455.