| FREE WRITING PROSPECTUS | ||
| FILED PURSUANT TO RULE 433 | ||
| �� | REGISTRATION FILE NO.: 333-226943-06 | |
January 21, 2020
FREE WRITING PROSPECTUS
STRUCTURAL AND COLLATERAL TERM SHEET
$899,096,873
(Approximate Total Mortgage Pool Balance)
$762,321,000
(Approximate Offered Certificates)
BENCHMARK 2020-B16 |
Deutsche Mortgage & Asset Receiving Corporation
Depositor
German American Capital Corporation
JPMorgan Chase Bank, National Association
Citi Real Estate Funding Inc.
Sponsors and Mortgage Loan Sellers
| Deutsche Bank Securities | Citigroup | J.P. Morgan |
| Co-Lead Managers and Joint Bookrunners | ||
| Academy Securities | Drexel Hamilton |
| Co-Managers | |
The depositor has filed a registration statement (including the prospectus) with the Securities and Exchange Commission (File No. 333-226943) for the offering to which this communication relates. Before you invest, you should read the prospectus in the registration statement and other documents the depositor has filed with the Securities and Exchange Commission for more complete information about the depositor, the issuing entity and this offering. You may get these documents for free by visiting EDGAR on the Securities and Exchange Commission website at www.sec.gov. Alternatively, the depositor or Deutsche Bank Securities Inc., any other underwriter, or any dealer participating in this offering will arrange to send you the prospectus if you request it by calling toll-free 1-800-503-4611 or by emailing: prospectus.cpdg@db.com. The offered certificates referred to in these materials, and the asset pool backing them, are subject to modification or revision (including the possibility that one or more classes of certificates may be split, combined or eliminated at any time prior to issuance or availability of a final prospectus) and are offered on a “when, as and if issued” basis. You understand that, when you are considering the purchase of these certificates, a contract of sale will come into being no sooner than the date on which the relevant class has been priced and we have verified the allocation of certificates to be made to you; any “indications of interest” expressed by you, and any “soft circles” generated by us, will not create binding contractual obligations for you or us. This free writing prospectus does not contain all information that is required to be included in the prospectus.
| Capitalized terms used but not defined herein have the meanings assigned to them in the Preliminary Prospectus expected to be dated January 21, 2020 relating to the offered certificates (hereinafter referred to as the “Preliminary Prospectus”). |
| KEY FEATURES OF SECURITIZATION |
| Offering Terms: | ||
| Co-Lead Managers and Joint Bookrunners: | Deutsche Bank Securities Inc., J.P. Morgan Securities LLC and Citigroup Global Markets Inc. | |
| Co-Managers: | Academy Securities, Inc. and Drexel Hamilton, LLC | |
| Sponsors and Mortgage Loan Sellers: | German American Capital Corporation* (“GACC”) (27.5%), JPMorgan Chase Bank, National Association (“JPMCB”) (45.2%) and Citi Real Estate Funding Inc. (“CREFI”) (27.2%)*An indirect wholly owned subsidiary of Deutsche Bank AG | |
| Master Servicer: | Midland Loan Services, a Division of PNC Bank, National Association | |
| Operating Advisor: | Park Bridge Lender Services LLC | |
| Asset Representations Reviewer: | Park Bridge Lender Services LLC | |
| Special Servicer: | KeyBank National Association | |
| Certificate Administrator: | Wells Fargo Bank, National Association | |
| Trustee: | Wells Fargo Bank, National Association | |
| Rating Agencies: | Fitch Ratings, Inc. (“Fitch”), Kroll Bond Rating Agency, Inc. (“KBRA”), and Moody’s Investors Service, Inc. (“Moody’s”). | |
| Credit Risk Retention: | For a discussion on the manner in which the U.S. credit risk retention requirements are being satisfied by GACC, as retaining sponsor, see “Credit Risk Retention” in the Preliminary Prospectus. Note that this securitization transaction is not being structured to satisfy EU risk retention and due diligence requirements. | |
| Determination Date: | 11thday of each month, or if such 11th day is not a business day, the immediately following business day, commencing in March 2020. | |
| Distribution Date: | 4thbusiness day following the Determination Date in each month, commencing in March 2020. | |
| Cut-off Date: | With respect to each mortgage loan, the later of the related payment date of such mortgage loan in February 2020 (or, in the case of any mortgage loan that has its first due date subsequent to February 2020, the date that would have been its due date in February 2020 under the terms of that mortgage loan if a monthly payment were scheduled to be due in that month) and the date of origination of such mortgage loan. Unless otherwise noted, all mortgage loan statistics are based on balances as of the Cut-off Date. | |
| Closing Date: | On or about February 12, 2020 | |
| Settlement Terms: | DTC, Euroclear and Clearstream, same day funds, with accrued interest. | |
| ERISA Eligible: | All of the Offered Certificates are expected to be ERISA eligible. | |
| SMMEA Eligible: | None of the Offered Certificates will be SMMEA eligible. | |
| Day Count: | 30/360 | |
| Tax Treatment: | REMIC | |
| Rated Final Distribution Date: | February 2053 | |
| Minimum Denominations: | $10,000 (for each class of offered principal balance certificates) and $100,000 (for each class of offered interest-only certificates) and in each case in multiples of $1 thereafter. | |
| Clean-up Call: | 1% (with certain exceptions described under“Pooling and Servicing Agreement—Termination; Retirement of Certificates”in the Preliminary Prospectus) | |
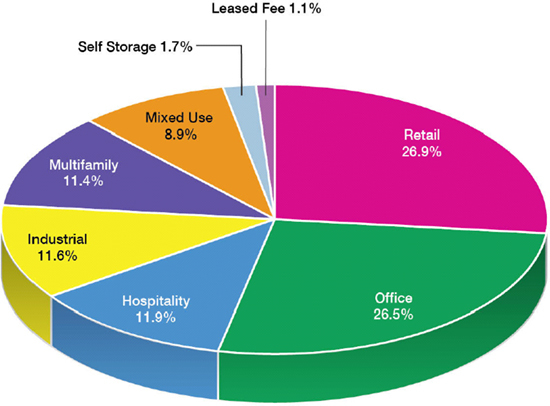
| Distribution of Collateral by Property Type |
THE INFORMATION IN THIS STRUCTURAL AND COLLATERAL TERM SHEET IS NOT COMPLETE AND MAY BE AMENDED PRIOR TO THE TIME OF SALE. THIS TERM SHEET IS NOT AN OFFER TO SELL THESE SECURITIES AND IT IS NOT A SOLICITATION OF AN OFFER TO BUY THESE SECURITIES IN ANY JURISDICTION WHERE THE OFFER OR SALE IS NOT PERMITTED.
2
| TRANSACTION HIGHLIGHTS |
| Mortgage Loan Sellers | Number of Mortgage Loans | Number of Mortgaged Properties | Aggregate Cut-off Date Balance | % of Initial Outstanding Pool Balance |
| German American Capital Corporation | 7 | 39 | $225,200,000 | 25.0% |
| JPMorgan Chase Bank, National Association | 13 | 14 | $354,301,873 | 39.4% |
| Citi Real Estate Funding Inc. | 11 | 22 | $214,595,000 | 23.9% |
| JPMorgan Chase Bank, National Association/Citi Real Estate Funding Inc.(1) | 1 | 1 | $60,000,000 | 6.7% |
| German American Capital Corporation/JPMorgan Chase Bank, National Association(2) | 1 | 1 | $45,000,000 | 5.0% |
| Total: | 33 | 77 | $899,096,873 | 100.0% |
Collateral Facts | ||||
| Initial Outstanding Pool Balance: | $899,096,873 | |||
| Number of Mortgage Loans: | 33 | |||
| Number of Mortgaged Properties: | 77 | |||
| Average Mortgage Loan Cut-off Date Balance: | $27,245,360 | |||
| Weighted Average Mortgage Rate: | 3.6060% | |||
| Weighted Average Mortgage Loan Original Term to Maturity Date or ARD (months): | 118 | |||
| Weighted Average Mortgage Loan Remaining Term to Maturity Date or ARD (months): | 116 | |||
| Weighted Average Mortgage Loan Seasoning (months): | 1 | |||
| % of Mortgaged Properties Leased to a Single Tenant: | 18.9% | |||
Credit Statistics(3) | ||||
| Weighted Average Mortgage Loan U/W NCF DSCR: | 3.20x | |||
| Weighted Average Mortgage Loan Cut-off Date LTV(4)(5): | 52.8% | |||
| Weighted Average Mortgage Loan Maturity Date or ARD LTV(4): | 51.9% | |||
| Weighted Average U/W NOI Debt Yield(5): | 12.1% | |||
Amortization Overview | ||||
| % Mortgage Loans with Amortization through Maturity Date or ARD: | 3.8% | |||
| % Mortgage Loans which pay Interest Only through Maturity or ARD Date: | 88.6% | |||
| % Mortgage Loans which pay Interest Only followed by Amortization through Maturity Date or ARD: | 7.5% | |||
| Weighted Average Remaining Amortization Term (months)(6): | 360 | |||
Amortization Overview | ||||
| % Mortgage Loans with Upfront or Ongoing Tax Reserves: | 38.0% | |||
| % Mortgage Loans with Upfront or Ongoing Replacement Reserves(7): | 37.4% | |||
| % Mortgage Loans with Upfront or Ongoing Insurance Reserves: | 25.1% | |||
| % Mortgage Loans with Upfront or Ongoing TI/LC Reserves(8): | 44.1% | |||
| % Mortgage Loans with In Place Hard Lockboxes: | 73.1% | |||
| % Mortgage Loans with Cash Traps Triggered at DSCR Levels ≥ 1.10x: | 67.6% | |||
| % Mortgage Loans with Cash Traps Triggered at Debt Yield Levels ≥ 5.75%: | 32.4% | |||
| Prepayment Provisions | ||||
| % Mortgage Loans with Defeasance Only After a Lockout Period and Prior to an Open Period: | 59.7% | |||
| % Mortgage Loans with Prepayment Only After a Lockout Period and Prior to an Open Period with a Yield Maintenance Charge: | 23.2% | |||
| % Mortgage Loans with Prepayment with Yield Maintenance Charge or with Defeasance or Yield Maintenance Charge Prior to an Open Period: | 10.6% | |||
| % Mortgage Loans with Prepayment Only After a Lockout Period and Prior to an Open Period with Defeasance or a Yield Maintenance Charge: | 6.6% | |||
| (1) | Includes the $60.0 millionpari passu portion of the Bellagio Hotel and Casino mortgage loan, as to which JPMCB is acting as mortgage loan seller of the $30.0 million Note A-3-C2 and CREFI is acting as the mortgage loan seller of the $30.0 million Note A-2-C2. |
| (2) | Includes the $45.0 millionpari passu portion of the 1633 Broadway mortgage loan, as to which GACC is acting as mortgage loan seller of the $22.5 million Note A-2-C-1-B and JPMCB is acting as the mortgage loan seller of the $22.5 million Note A-3-C-1-B. |
| (3) | The LTV, DSCR and Debt Yield calculations include any relatedpari passu companion loan(s) and exclude any related subordinate companion loan(s) and/or mezzanine loan(s). |
| (4) | With respect to 5 mortgage loans (18.1%) (including Bellagio Hotel and Casino, 650 Madison Avenue, 181 West Madison, Fairfield Inn & Suites Spokane and Springhill Suites Florence), the Cut-off Date LTV and Maturity Date or ARD LTV have been calculated using a value other than the “As Is” appraised values. For additional information please see the footnotes to Annex A-1 in the Preliminary Prospectus. |
| (5) | With respect to the Landing Square mortgage loan (4.0%) the Cut-off Date LTV and U/W NOI Debt Yield is calculated based on the Cut-off Date Balance net of a capex holdback reserve. |
| (6) | Excludes mortgage loans which are interest only for the full loan term. |
| (7) | Includes FF&E reserves. |
| (8) | Represents the percent of the allocated Initial Outstanding Pool Balance of office, retail and mixed use properties only structured with TI/LC reserves. |
THE INFORMATION IN THIS STRUCTURAL AND COLLATERAL TERM SHEET IS NOT COMPLETE AND MAY BE AMENDED PRIOR TO THE TIME OF SALE. THIS TERM SHEET IS NOT AN OFFER TO SELL THESE SECURITIES AND IT IS NOT A SOLICITATION OF AN OFFER TO BUY THESE SECURITIES IN ANY JURISDICTION WHERE THE OFFER OR SALE IS NOT PERMITTED.
3
Benchmark 2020-B16 Mortgage Trust |
| STRUCTURE SUMMARY |
OFFERED CERTIFICATES
| Class(1) | Ratings (Moody’s/Fitch/KBRA) | Initial Certificate Balance or Notional | Initial Subordination | Weighted (years)(4) | Principal (months)(4) | Certificate Principal to Value Ratio(5) | Certificate NOI Debt Yield(6) | |
| Class A-1 | Aaa(sf)/AAAsf/AAA(sf) | $4,592,000 | 30.000%(7) | 3.07 | 1 – 58 | 37.0% | 17.3% | |
| Class A-2 | Aaa(sf)/AAAsf/AAA(sf) | $10,098,000 | 30.000%(7) | 4.84 | 58 – 58 | 37.0% | 17.3% | |
| Class A-3 | Aaa(sf)/AAAsf/AAA(sf) | $40,849,000 | 30.000%(7) | 6.84 | 82 – 82 | 37.0% | 17.3% | |
| Class A-SB | Aaa(sf)/AAAsf/AAA(sf) | $9,800,000 | 30.000%(7) | 7.47 | 58 – 118 | 37.0% | 17.3% | |
| Class A-4 | Aaa(sf)/AAAsf/AAA(sf) | (8) | 30.000%(7) | (8) | (8) | 37.0% | 17.3% | |
| Class A-5 | Aaa(sf)/AAAsf/AAA(sf) | (8) | 30.000%(7) | (8) | (8) | 37.0% | 17.3% | |
| Class X-A(9) | Aa1(sf)/AAAsf/AAA(sf) | $691,854,000(10) | N/A | N/A | N/A | N/A | N/A | |
| Class A-M | Aa2(sf)/AAAsf/AAA(sf) | $93,955,000 | 19.000% | 9.93 | 119 – 119 | 42.8% | 14.9% | |
| Class B | NR/AA-sf/AA(sf) | $36,301,000 | 14.750% | 9.93 | 119 – 119 | 45.0% | 14.2% | |
| Class C | NR/A-sf/A-(sf) | $34,166,000 | 10.750% | 9.93 | 119 – 119 | 47.1% | 13.6% | |
NON-OFFERED CERTIFICATES
| Class(1) | Ratings (Moody’s/Fitch/KBRA) | Initial Certificate Balance or Notional | Initial Subordination | Weighted Average Life | Principal (months)(4) | Certificate Principal to Value Ratio(5) | Certificate NOI Debt Yield(6) | |
| Class X-B(9) | NR/A-sf/AAA(sf) | $70,467,000(10) | N/A | N/A | N/A | N/A | N/A | |
| Class X-D(9) | NR/BBB-sf/BBB-(sf) | $40,572,000(10) | N/A | N/A | N/A | N/A | N/A | |
| Class X-F(9) | NR/BB-sf/BB-(sf) | $16,015,000(10) | N/A | N/A | N/A | N/A | N/A | |
| Class X-G(9) | NR/B-sf/B-(sf) | $8,541,000(10) | N/A | N/A | N/A | N/A | N/A | |
| Class X-H(9) | NR/NR/NR | $26,692,872(10) | N/A | N/A | N/A | N/A | N/A | |
| Class D | NR/BBBsf/BBB+(sf) | $23,489,000 | 8.000% | 9.93 | 119 – 119 | 48.6% | 13.2% | |
| Class E | NR/BBB-sf/BBB-(sf) | $17,083,000 | 6.000% | 9.98 | 119 – 120 | 49.6% | 12.9% | |
| Class F | NR/BB-sf/BB-(sf) | $16,015,000 | 4.125% | 10.01 | 120 – 120 | 50.6% | 12.6% | |
| Class G | NR/B-sf/B(sf) | $8,541,000 | 3.125% | 10.01 | 120 – 120 | 51.1% | 12.5% | |
| Class H | NR/NR/NR | $26,692,872 | 0.000% | 10.01 | 120 – 120 | 52.8% | 12.1% | |
NON-OFFERED VERTICAL RISK RETENTION INTEREST
| Non-Offered Vertical Risk Retention Interest | Ratings (Moody’s/Fitch/KBRA) | Initial Certificate Balance or Notional | Initial Subordination | Weighted Average Life | Principal (months)(11) | Certificate Principal to Value Ratio | Certificate NOI Debt Yield |
| VRR Interest(12)(13) | NR/NR/NR | $44,955,000 | N/A | 9.62 | 1 - 120 | N/A | N/A |
| (1) | The pass-through rates for the Class A-1, Class A-2, Class A-3, Class A-SB, Class A-4, Class A-5, Class A-M, Class B, Class C, Class D, Class E, Class F, Class G and Class H certificates (collectively, the “Principal Balance Certificates”) in each case, will be one of: (i) a fixedper annum rate, (ii) the weighted average of the net mortgage rates on the mortgage loans (in each case, adjusted, if necessary, to accrue on the basis of a 360-day year consisting of twelve 30-day months) as of their respective due dates in the month preceding the month in which such Distribution Date occurs (the “WAC Rate”), (iii) a rate equal to the lesser of a specified pass-through rate and the WAC Rate or (iv) the WAC Rate less a specified rate. |
| (2) | Approximate; subject to a permitted variance of plus or minus 5%. The Certificate Balance of the VRR Interest is not included in the Certificate Balance or Notional Amount of any Class of Certificates set forth under “Offered Certificates” or “Non-Offered Certificates” in the table above. |
| (3) | The initial subordination levels are calculated based on the initial Certificate Balance. The approximate initial credit support percentages shown in the table above do not take into account the VRR Interest. However, losses incurred on the mortgage loans will be allocated between the VRR Interest and the Principal Balance Certificates,pro ratain accordance with their respective outstanding Certificate Balances. See “Credit Risk Retention” and “Description of the Certificates” in the Preliminary Prospectus. |
| (4) | The weighted average life and principal window during which distributions of principal would be received as set forth in the table with respect to each class of Principal Balance Certificates are based on (i) modeling assumptions described in the Preliminary Prospectus and (ii) assumptions that there are no prepayments, modifications or losses in respect of the mortgage loans and there are no extensions or forbearances of maturity dates of the mortgage loans. The weighted average life and principal window of the Class A-4 and Class A-5 certificates are subject to change as described in footnote (8) below. |
| (5) | “Certificate Principal to Value Ratio” for any class of Principal Balance Certificates is calculated as the product of (a) the weighted average mortgage loan Cut-off Date LTV of the mortgage loans, multiplied by (b) a fraction, the numerator of which is the total initial Certificate Balance of the related class of Principal Balance Certificates and all other classes of Principal Balance Certificates, if any, that are senior to such class, and the denominator of which is the total initial Certificate Balance of all classes of Principal Balance Certificates. The Certificate Principal to Value Ratios of the Class A-1, Class A-2, Class A-3, Class A-SB, Class A-4 and Class A-5 certificates are calculated in the aggregate for those classes as if they were a single class. |
| (6) | “Certificate Underwritten NOI Debt Yield” for any class of Principal Balance Certificates is calculated as the product of (a) the weighted average Underwritten NOI Debt Yield for the mortgage loans, multiplied by (b) a fraction, the numerator of which is the total initial Certificate Balance of all classes of Principal Balance Certificates and the denominator of which is the total initial Certificate Balance of such class of Principal Balance Certificates and all other classes of Principal Balance Certificates, if any, that are senior to such class. The Underwritten NOI Debt Yields of the Class A-1, Class A-2, Class A-3, Class A-SB, Class A-4 and Class A-5 certificates are calculated in the aggregate for those classes as if they were a single class. |
| (7) | The initial subordination levels for the Class A-1, Class A-2, Class A-3, Class A-SB, Class A-4 and Class A-5 certificates are represented in the aggregate. |
| (8) | The exact initial Certificate Balances of the Class A-4 and Class A-5 certificates are unknown and will be determined based on the final pricing of those classes of certificates. However, the respective initial Certificate Balances, weighted average lives and principal windows of the Class A-4 and Class A-5 certificates are expected to be within the applicable ranges reflected in the following chart. The aggregate initial Certificate Balance of the Class A-4 and Class A-5 certificates is expected to be approximately $532,560,000, subject to a variance of plus or minus 5.0%. |
| Class of Certificates | Expected Range of Initial Certificate Balance | Expected Range of Weighted Avg. Life (years)(4) | Expected Range of Principal Window (months)(4) | |||
| Class A-4 | $0 - $266,000,000 | NAP - 9.84 | NAP / 118-118 | |||
| Class A-5 | $266,560,000 - $532,560,000 | 9.87 - 9.86 | 118-119 / 118-119 |
| (9) | As further described in the Preliminary Prospectus, the pass-through rate applicable to the Class X-A, Class X-B, Class X-D, Class X-F, Class X-G and Class X-H certificates (collectively, the “Class X Certificates” and, together with the Principal Balance Certificates, the “Regular Certificates”) for each Distribution Date will generally be equal to the excess of (i) the WAC Rate over (ii)(A) with respect to the Class X-A certificates, the weighted average of the pass-through rates of the Class A-1, Class A-2, Class A-3, Class A-SB, Class A-4, Class A-5 and Class A-M certificates (based on their respective Certificate Balances immediately prior to such Distribution Date), (B) with respect to the Class X-B certificates, the weighted average of the pass-through rates of the Class B and Class C certificates (based on their respective Certificate Balances immediately prior to such Distribution Date), (C) with respect to the Class X-D certificates, the weighted average of the pass-through rates of the Class D and Class E certificates (based on their respective Certificate Balances immediately prior to such Distribution Date), (D) with respect to the Class X-F certificates, the pass-through rate of the Class F certificates, (E) with respect to the Class X-G certificates, the pass-through rate of the Class G certificates and (F) with respect to the Class X-H certificates, the pass-through rate of the Class H certificates. |
THE INFORMATION IN THIS STRUCTURAL AND COLLATERAL TERM SHEET IS NOT COMPLETE AND MAY BE AMENDED PRIOR TO THE TIME OF SALE. THIS TERM SHEET IS NOT AN OFFER TO SELL THESE SECURITIES AND IT IS NOT A SOLICITATION OF AN OFFER TO BUY THESE SECURITIES IN ANY JURISDICTION WHERE THE OFFER OR SALE IS NOT PERMITTED.
4
Benchmark 2020-B16 Mortgage Trust |
| STRUCTURE SUMMARY |
| (10) | The Class X Certificates will not have Certificate Balances. None of the Class X Certificates will be entitled to distributions of principal. The interest accrual amounts on the Class X-A certificates will be calculated by reference to a notional amount equal to the aggregate Certificate Balances of the Class A-1, Class A-2, Class A-3, Class A-SB, Class A-4, Class A-5 and Class A-M certificates. The interest accrual amounts on the Class X-B certificates will be calculated by reference to a notional amount equal to the aggregate Certificate Balances of the Class B and Class C certificates. The interest accrual amounts on the Class X-D certificates will be calculated by reference to a notional amount equal to the aggregate Certificate Balances of the Class D and Class E certificates. The interest accrual amounts on the Class X-F certificates will be calculated by reference to a notional amount equal to the Certificate Balance of the Class F certificates. The interest accrual amounts on the Class X-G certificates will be calculated by reference to a notional amount equal to the Certificate Balance of the Class G certificates. The interest accrual amounts on the Class X-H certificates will be calculated by reference to a notional amount equal to the Certificate Balance of the Class H certificates. The notional amount of each class of Class X Certificates is subject to change depending upon the final pricing of the Principal Balance Certificates, as follows: (1) if as a result of such pricing the pass-through rate of any class of Principal Balance Certificates whose Certificate Balance comprises such notional amount is equal to the WAC Rate, the Certificate Balance of such class of Principal Balance Certificates may not be part of, and will reduce accordingly, such notional amount of such class of Class X Certificates (or, if as a result of such pricing the pass-through rate of such class of Class X Certificates is equal to zero, such class of Class X Certificates may not be issued on the Closing Date), and/or (2) if as a result of such pricing the pass-through rate of any class of Principal Balance Certificates that does not comprise such notional amount of such class of Class X Certificates is less than the WAC Rate, such class of Principal Balance Certificates may become a part of, and will increase accordingly, such notional amount of such class of Class X Certificates. |
| (11) | The weighted average life and principal window during which distributions of principal would be received as set forth in the foregoing table with respect to the VRR Interest (as defined below) are based on the assumptions set forth under “Yield and Maturity Considerations—Weighted Average Life” in the Preliminary Prospectus and on the assumptions that there are no prepayments, modifications or losses in respect of the mortgage loans and that there are no extensions or forbearances of maturity dates of the mortgage loans. |
| (12) | German American Capital Corporation, as the retaining sponsor, is expected to acquire from the depositor, on the Closing Date, an “eligible vertical interest” (as defined in Regulation RR) in the form of a single vertical security (the “VRR Interest”), representing approximately 5% of all classes of Principal Balance Certificates and the VRR Interest. The VRR Interest will be retained by certain retaining parties in accordance with the credit risk retention rules applicable to this securitization transaction. See “Credit Risk Retention” in the Preliminary Prospectus. The VRR Interest is a class of Certificates. |
| (13) | Although it does not have a specified pass-through rate (other than for tax reporting purposes), the effective interest rate for the VRR Interest will be the WAC rate. |
| Class A-2 Principal Paydown(1) |
| Class | Mortgage Loan Seller | Mortgage Loan | Property Type | Cut-off Date Balance | Remaining Term to Maturity (Mos.) | Cut-off Date LTV Ratio | U/W NCF DSCR | U/W NOI Debt Yield | |
| A-2 | JPMCB | 300-314 North College Street | Retail | $10,630,000 | 58 | 67.5% | 2.07x | 9.3% | |
| (1) | This table reflects the mortgage loans whose balloon payments will be applied to pay down the Class A-2 certificates, assuming (i) that none of the mortgage loans experience prepayments, defaults or losses, (ii) there are no extensions of maturity dates and (iii) each mortgage loan is paid in full on its stated maturity date. See “Yield and Maturity Considerations—Yield Considerations” in the Preliminary Prospectus. |
| Class A-3 Principal Paydown(1) |
| Class | Mortgage Loan Seller | Mortgage Loan | Property Type | Cut-off Date Balance | Remaining Term to Maturity (Mos.) | Cut-off Date LTV Ratio | U/W NCF DSCR | U/W NOI Debt Yield | |
| A-3 | JPMCB | 181 West Madison | Office | $43,000,000 | 82 | 28.8% | 4.67x | 20.4% | |
| (1) | This table reflects the mortgage loans whose balloon payments will be applied to pay down the Class A-3 certificates, assuming (i) that none of the mortgage loans experience prepayments, defaults or losses, (ii) there are no extensions of maturity dates and (iii) each mortgage loan is paid in full on its stated maturity date. See “Yield and Maturity Considerations—Yield Considerations” in the Preliminary Prospectus. |
THE INFORMATION IN THIS STRUCTURAL AND COLLATERAL TERM SHEET IS NOT COMPLETE AND MAY BE AMENDED PRIOR TO THE TIME OF SALE. THIS TERM SHEET IS NOT AN OFFER TO SELL THESE SECURITIES AND IT IS NOT A SOLICITATION OF AN OFFER TO BUY THESE SECURITIES IN ANY JURISDICTION WHERE THE OFFER OR SALE IS NOT PERMITTED.
5
Benchmark 2020-B16 Mortgage Trust
|
| OVERVIEW OF MORTGAGE POOL CHARACTERISTICS |
| Ten Largest Mortgage Loans | |||||||||
| Mortgage Loan | Mortgage Loan Seller | City, State | Property Type | Mortgage Loan Cut-off Date | % of Initial Outstanding Pool Balance | Cut-off Date Balance per NRA/Room(1) | Cut-off Date LTV(1)(2) | U/W NCF DSCR after | U/W NOI Debt Yield(1) |
| Harrison Retail | GACC | New York, NY | Retail | $65,000,000 | 7.2% | $737 | 65.0% | 2.20x | 8.2% |
| Bellagio Hotel and Casino | JPMCB/CREFI | Las Vegas, NV | Hospitality | 60,000,000 | 6.7% | $426,189 | 39.3% | 8.42x | 28.3% |
| Kings Plaza | JPMCB | Brooklyn, NY | Retail | 50,000,000 | 5.6% | $600 | 54.1% | 3.07x | 10.7% |
| 3500 Lacey | JPMCB | Downers Grove, IL | Office | 50,000,000 | 5.6% | $147 | 66.5% | 2.38x | 11.3% |
| FedEx Redmond | JPMCB | Redmond, WA | Industrial | 45,140,000 | 5.0% | $215 | 55.4% | 2.15x | 8.6% |
| 560 Mission Street | GACC | San Francisco, CA | Office | 45,000,000 | 5.0% | $449 | 35.6% | 5.23x | 14.2% |
| 1633 Broadway | GACC/JPMCB | New York, NY | Office | 45,000,000 | 5.0% | $391 | 41.7% | 3.84x | 11.9% |
| Starwood Industrial Portfolio | GACC | Various, Various | Industrial | 45,000,000 | 5.0% | $36 | 45.2% | 3.67x | 13.1% |
| 650 Madison Avenue | CREFI | New York, NY | Mixed Use | 45,000,000 | 5.0% | $977 | 48.5% | 2.74x | 10.0% |
| 181 West Madison | JPMCB | Chicago, IL | Office | 43,000,000 | 4.8% | $114 | 28.8% | 4.67x | 20.4% |
| Total/Weighted Average | $493,140,000 | 54.8% | 48.8% | 3.88x | 13.8% | ||||
| (1) | The Cut-off Date Balance per NRA/Room Cut-off Date LTV, U/W NCF DSCR after IO and U/W NOI Debt Yield calculations include any relatedpari passu companion loan(s) and exclude any related subordinate companion loan(s) and/or mezzanine loan(s). |
| (2) | With respect to the Bellagio Hotel and Casino, 650 Madison Avenue and 181 West Madison mortgage loans, the Cut-off Date LTV have been calculated based on the appraised values other than “As Is”. For additional information please see the footnotes to Annex A-1 in the Preliminary Prospectus. |
| Existing Mezzanine Debt Summary | ||||||||||
| Mortgage Loan | Mortgage Loan Cut-off Date Balance | Pari Passu/ | Mezzanine Debt Cut-off Date Balance | Trust U/W NCF DSCR | Total Debt U/W NCF DSCR(1)(2) | Trust Cut-off Date LTV | Total Debt Cut-off Date LTV(1) | Trust U/W NOI Debt Yield | Total Debt U/W NOI Debt Yield(1) | |
| Kings Plaza(2) | $50,000,000 | $437,000,000 | $53,000,000 | 3.07x | 1.73x | 54.1% | 60.0% | 10.7% | 9.6% | |
| 510 East 14th Street | $35,000,000 | $50,000,000 | $75,000,000 | 3.62x | 1.36x | 29.5% | 55.6% | 10.9% | 5.8% | |
| 490-504 Myrtle Avenue | $35,000,000 | $50,000,000 | $20,000,000 | 1.92x | 1.28x | 60.2% | 74.3% | 7.4% | 6.0% | |
| (1) | Total Debt U/W NCF DSCR, Total Debt Cut-off Date LTV and Total Debt U/W NOI Debt Yield calculations include any relatedpari passu companion loan(s), any related subordinate companion loan(s) and/or any related mezzanine loan(s). |
| (2) | The Kings Plaza mezzanine loan is interest only for the first five years of the loan term then fully amortizing based on a five-year schedule. Total Debt U/W NCF DSCR is based on the first 12 month period of the amortization period of the loan. |
| Subordinate Debt Summary | |||||||||
| Mortgage Loan | Mortgage Cut-off Date Balance | Pari Passu | Subordinate Debt Cut-off Date Balance | Trust U/W NCF DSCR | Total Debt U/W NCF DSCR(1) | Trust Cut-off Date LTV(2) | Total Debt Cut-off Date LTV(1)(2) | Trust U/W NOI Debt Yield | Total Debt U/W NOI Debt Yield(1) |
| Bellagio Hotel and Casino | $60,000,000 | $1,616,200,000 | $1,333,800,000 | 8.42x | 4.06x | 39.3% | 70.7% | 28.3% | 15.7% |
| 1633 Broadway | $45,000,000 | $956,000,000 | $249,000,000 | 3.84x | 3.08x | 41.7% | 52.1% | 11.9% | 9.5% |
| Starwood Industrial Portfolio | $45,000,000 | $99,500,000 | $65,527,072 | 3.67x | 2.53x | 45.2% | 65.7% | 13.1% | 9.0% |
| 650 Madison Avenue | $45,000,000 | $541,800,000 | $213,200,000 | 2.74x | 2.01x | 48.5% | 66.1% | 10.0% | 7.3% |
| 181 West Madison | $43,000,000 | $64,900,000 | $132,100,000 | 4.67x | 2.10x | 28.8% | 64.0% | 20.4% | 9.2% |
| (1) | Total Debt U/W NCF DSCR, Total Debt Cut-off Date LTV and Total Debt U/W NOI Debt Yield calculations include any relatedpari passu companion loan(s), related subordinate companion loan(s) and/or related mezzanine loan(s). |
| (2) | With respect to the Bellagio Hotel and Casino, 650 Madison Avenue and 181 West Madison mortgage loans, the Trust Cut-off Date LTV and Total Debt Cut-off Date LTV have been calculated based on the appraised values other than “As Is”. For additional information please see the footnotes to Annex A-1 in the Preliminary Prospectus. |
THE INFORMATION IN THIS STRUCTURAL AND COLLATERAL TERM SHEET IS NOT COMPLETE AND MAY BE AMENDED PRIOR TO THE TIME OF SALE. THIS TERM SHEET IS NOT AN OFFER TO SELL THESE SECURITIES AND IT IS NOT A SOLICITATION OF AN OFFER TO BUY THESE SECURITIES IN ANY JURISDICTION WHERE THE OFFER OR SALE IS NOT PERMITTED.
6
Benchmark 2020-B16 Mortgage Trust
|
| OVERVIEW OF MORTGAGE POOL CHARACTERISTICS |
| Companion Loan Summary | |||||||||
| Loan No. | Mortgage Loan | Note(s) | Original Balance ($) | Cut-off Date Balance ($) | Holder of Note(1) | Lead Servicer for Whole Loan (Y/N) | Master Under Lead | Special | |
| 2 | Bellagio Hotel and Casino | A-1-C1 | $100,000,000 | $100,000,000 | BANK 2020-BNK25 | No | |||
| A-2-C1 | $60,000,000 | $60,000,000 | GSMS 2020-GC45 | No | |||||
| A-1-S1, A-1-S2, A-2-S1, A-2-S2, A-3-S1, A-3-S2 | $716,000,000 | $716,000,000 | BX 2019-OC11 | Yes (A-1-S1) | KeyBank | Situs | |||
| A-2-C2, A-3-C2 | $60,000,000 | $60,000,000 | Benchmark 2020-B16 | No | |||||
| A-1-RL, A-2-RL, A-3-RL | $360,200,000 | $360,200,000 | Third party investor | No | |||||
| A-1-C2, A-1-C3, A-1-C4, A-1-C5 | $200,000,000 | $200,000,000 | MSNBA | No | |||||
| A-2-C3 | $60,000,000 | $60,000,000 | CREFI | No | |||||
| A-3-C1, A-3-C3, A-3-C4, A-3-C5, A-3-C6 | $120,000,000 | $120,000,000 | JPMCB | No | |||||
| Total Senior Notes | $1,676,200,000 | $1,676,200,000 | |||||||
| B-1-S, B-2-S, B-3-S | $510,700,000 | $510,700,000 | BX 2019-OC11 | No | |||||
| B-1-RL, B-2-RL, B-3-RL | $139,800,000 | $139,800,000 | Third party investor | No | |||||
| C-1-S, C-2-S, C-3-S | $683,300,000 | $683,300,000 | BX 2019-OC11 | No | |||||
| Total | $3,010,000,000 | $3,010,000,000 | |||||||
| 3 | Kings Plaza | A-1-1 | $70,000,000 | $70,000,000 | JPMCB | Yes(2) | Midland | KeyBank | |
| A-1-2 | $50,000,000 | $50,000,000 | Benchmark 2020-B16 | No | |||||
| A-1-3, A-1-4 | $51,108,108 | $51,108,108 | JPMCB | No | |||||
| A-2-1, A-2-2, A-2-3, A-2-4 | $157,945,946 | $157,945,946 | SGFC | No | |||||
| A-3-1 | $50,000,000 | $50,000,000 | BANK 2020-BNK25 | No | |||||
| A-3-2, A-3-3 | $82,945,946 | $82,945,946 | WF | No | |||||
| A-3-4 | $25,000,000 | $25,000,000 | BANK 2020-BNK25 | No | |||||
| Total | $487,000,000 | $487,000,000 | |||||||
| 4 | 3500 Lacey | Note A-1 | $50,000,000 | $50,000,000 | Benchmark 2020-B16 | Yes | Midland | KeyBank | |
| Note A-2 | $35,800,000 | $35,800,000 | JPMCB | No | |||||
| Total | $85,800,000 | $85,800,000 | |||||||
| 6 | 560 Mission Street | A-1 | $60,000,000 | $60,000,000 | GSMS 2020-GC45 | No | |||
| A-1-2-A, A-1-4 | $45,000,000 | $45,000,000 | Benchmark 2020-B16 | Yes | Midland | KeyBank | |||
| A-1-2-B, A-1-3 | $45,000,000 | $45,000,000 | DBRI | No | |||||
| A-2-1 | $100,000,000 | $100,000,000 | BANK 2020-BNK25 | No | |||||
| A-2-2 | $50,000,000 | $50,000,000 | BANA | No | |||||
| Total | $300,000,000 | $300,000,000 | |||||||
THE INFORMATION IN THIS STRUCTURAL AND COLLATERAL TERM SHEET IS NOT COMPLETE AND MAY BE AMENDED PRIOR TO THE TIME OF SALE. THIS TERM SHEET IS NOT AN OFFER TO SELL THESE SECURITIES AND IT IS NOT A SOLICITATION OF AN OFFER TO BUY THESE SECURITIES IN ANY JURISDICTION WHERE THE OFFER OR SALE IS NOT PERMITTED.
7
Benchmark 2020-B16 Mortgage Trust
|
| OVERVIEW OF MORTGAGE POOL CHARACTERISTICS |
| Loan No. | Mortgage Loan | Note(s) | Original Balance ($) | Cut-off Date Balance ($) | Holder of Note | Lead Servicer for Whole Loan (Y/N) | Master Servicer Under Lead Securitization | Special Servicer Under Lead Securitization |
| 7 | 1633 Broadway | A-1-S-1, A-2-S-1, A-3-S-1, A-4-S-1 | $1,000,000 | $1,000,000 | BWAY 2019-1633 | No | ||
| A-1-C-1, A-1-C-3, A-1-C-4, A-1-C-5, A-1-C-6, A-1-C-7 | $205,000,000 | $205,000,000 | GS Bank | No(3) | ||||
| A-1-C-2, A-2-C-5 | $60,000,000 | $60,000,000 | GSMS 2020-GC45 | No | ||||
| A-2-C-1-A, A-2-C-2, A-2-C-3, A-2-C-4, A-2-C-6, A-2-C-7 | $212,500,000 | $212,500,000 | DBRI | No | ||||
| A-2-C-1-B, A-3-C-1-B | $45,000,000 | $45,000,000 | Benchmark 2020-B16 | No | ||||
| A-3-C-1-A, A-3-C-2, A-3-C-3, A-3-C-4, A-3-C-5, A-3-C-6, A-3-C-7 | $227,500,000 | $227,500,000 | JPMCB | No | ||||
| A-4-C-1, A-4-C-2 | $100,000,000 | $100,000,000 | BANK 2020-BNK25 | No | ||||
| A-4-C-3, A-4-C-4, A-4-C-5, A-4-C-6, A-4-C-7 | $150,000,000 | $150,000,000 | WFB | No | ||||
| Total Senior Notes | $1,001,000,000 | $1,001,000,000 | ||||||
| B-1, B-2, B-3, B-4 | $249,000,000 | $249,000,000 | BWAY 2019-1633 | Yes(3) | KeyBank | Situs | ||
| Total | $1,250,000,000 | $1,250,000,000 | ||||||
| 8 | Starwood Industrial Portfolio | A-1, A-2-2 | $60,000,000 | $60,000,000 | GSMS 2020-GC45 | No | ||
| A-2-1, A-3-1 | $45,000,000 | $45,000,000 | Benchmark 2020-B16 | No | ||||
| A-3-2, A-4 | $39,500,000 | $39,500,000 | DBRI | |||||
| Total Senior Notes | $144,500,000 | $144,500,000 | ||||||
| B-1 | $65,527,072 | $65,527,072 | GSMS 2020-GC45 | Yes(4) | Midland | Midland | ||
| Total | $210,027,072 | $210,027,072 | ||||||
| 9 | 650 Madison Avenue | A-1-1 | $50,000,000 | $50,000,000 | CGCMT 2019-C7 | No(5) | ||
| A-1-2-1 | $40,000,000 | $40,000,000 | CCRE | No | ||||
| A-1-3, A-2-1 | $50,000,000 | $50,000,000 | GSMS 2020-GC45 | No | ||||
| A-1-4, A-1-6 | $137,900,000 | $137,900,000 | CREFI | No | ||||
| A-1-5 | $45,000,000 | $45,000,000 | Benchmark 2020-B16 | No | ||||
| A-2-2, A-2-3, A-2-4, A-2-5, A-2-6, A-2-7, A-2-8 | $116,450,000 | $116,450,000 | GSBI | No | ||||
| A-3-1, A-3-2, A-3-3 | $146,450,000 | $146,450,000 | BCREI | No | ||||
| A-4, A-5, A-6, A-7 | $1,000,000 | $1,000,000 | MAD 2019-650M | No | ||||
| Total Senior Notes | $586,800,000 | $586,800,000 | ||||||
| B-1, B-2, B-3, B-4 | $213,200,000 | $213,200,000 | MAD 2019-650M | Yes(5) | KeyBank | LNR | ||
| Total | $800,000,000 | $800,000,000 | ||||||
| 10 | 181 West Madison | A-1 | $1,000,000 | $1,000,000 | JPMCC 2020-LOOP | No | ||
| A-2 | $43,000,000 | $43,000,000 | Benchmark 2020-B16 | No(6) | ||||
| A-3, A-4 | $63,900,000 | $63,900,000 | JPMCB | No | ||||
| Total Senior Notes | $107,900,000 | $107,900,000 | ||||||
| B-1 | $132,100,000 | $132,100,000 | JPMCC 2020-LOOP | Yes(6) | KeyBank | Situs | ||
| Total | $240,000,000 | $240,000,000 | ||||||
| 13 | 510 East 14th Street | A-1-1 | $35,000,000 | $35,000,000 | Benchmark 2020-B16 | No | ||
| A-1-2 | $15,000,000 | $15,000,000 | CREFI | No | ||||
| A-2 | $35,000,000 | $35,000,000 | GSMS 2020-GC45 | Yes | Midland | Midland | ||
| Total | $85,000,000 | $85,000,000 |
THE INFORMATION IN THIS STRUCTURAL AND COLLATERAL TERM SHEET IS NOT COMPLETE AND MAY BE AMENDED PRIOR TO THE TIME OF SALE. THIS TERM SHEET IS NOT AN OFFER TO SELL THESE SECURITIES AND IT IS NOT A SOLICITATION OF AN OFFER TO BUY THESE SECURITIES IN ANY JURISDICTION WHERE THE OFFER OR SALE IS NOT PERMITTED.
8
Benchmark 2020-B16 Mortgage Trust
|
| OVERVIEW OF MORTGAGE POOL CHARACTERISTICS |
| Loan No. | Mortgage Loan | Note(s) | Original Balance ($) | Cut-off Date Balance ($) | Holder of Note | Lead Servicer for Whole Loan (Y/N) | Master Servicer Under Lead Securitization | Special Servicer Under Lead Securitization |
| 14 | 490-504 Myrtle Avenue | A-1 | $50,000,000 | $50,000,000 | CGCMT 2019-C7 | Yes | Wells Fargo | LNR |
| A2 | $35,000,000 | $35,000,000 | Benchmark 2020-B16 | No | ||||
| Total | $85,000,000 | $85,000,000 | ||||||
| 24 | Giant Anchored Portfolio | A-1-A | $38,500,000 | $38,500,000 | CGCMT 2019-C7 | Yes | Wells Fargo | LNR |
| A-1-B | $10,000,000 | $10,000,000 | Benchmark 2020-B16 | No | ||||
| A-2-A | $30,000,000 | $30,000,000 | BANK 2019-BNK24 | No | ||||
| A-2-B | $18,500,000 | $18,500,000 | WFB | No | ||||
| Total | $97,000,000 | $97,000,000 |
| (1) | The identification of a securitization trust means we have identified another securitization trust that has closed or as to which a preliminary prospectus (or preliminary offering circular) or final prospectus (or final offering circular) has printed that has or is expected to include the identified Mortgage Note(s). |
| (2) | Prior to the servicing shift securitization date, the related whole loan will be serviced under the pooling and servicing agreement for this transaction. From and after the related servicing shift securitization date, the related servicing shift whole loan will be serviced under the related servicing shift pooling and servicing agreement. |
| (3) | With respect to the 1633 Broadway Whole Loan, the initial Control Notes are Note B-1, Note B-2, Note B-3 and Note B-4. During the continuance of a control shift event related to the BWAY 2019-1633 securitization transaction (i.e., when the most senior class of certificates in such transaction have been control appraised out), Note A-1-C1 will be the Control Note; provided, however, that the 1633 Broadway Whole Loan will continue to be serviced by the master servicer, and if necessary, the special servicer, under the BWAY 2019-1633 trust and servicing agreement. See “Description of the Mortgage Pool—The Whole Loans—The Non-Serviced AB Whole Loans—The 1633 Broadway Whole Loan” in the Preliminary Prospectus. |
| (4) | With respect to the Starwood Industrial Portfolio Whole Loan, the initial Control Note is Note B-1. During the continuance of a control appraisal period related to the Starwood Industrial Portfolio Whole Loan, Note A-2-1 will be the Control Note; provided, however, that the Starwood Industrial Portfolio Whole Loan will continue to be serviced by the master servicer, and if necessary, the special servicer, under the GSMS 2020-GC45 pooling and servicing agreement. See “Description of the Mortgage Pool—The Whole Loans—The Non-Serviced AB Whole Loans—The Starwood Industrial Portfolio Whole Loan” in the Preliminary Prospectus. |
| (5) | With respect to the 650 Madison Avenue Whole Loan, the initial Control Note is Note B-1. During the continuance of a control appraisal period related to the 650 Madison Avenue Whole Loan, Note A-1-1 will be the Control Note; provided, however, that the 650 Madison Avenue Whole Loan will continue to be serviced by the master servicer, and if necessary, the special servicer, under the MAD 2019-650M trust and servicing agreement. See “Description of the Mortgage Pool—The Whole Loans—The Non-Serviced AB Whole Loans—The 650 Madison Avenue Whole Loan” in the Preliminary Prospectus. |
| (6) | With respect to the 181 West Madison Whole Loan, the initial Control Note is Note B-1. During the continuance of a trust loan control event relating to the JPMCC 2020-LOOP securitization transaction (i.e., when the class G certificates in such transaction have been control appraised out, but the class C certificates in such transaction have not been control appraised out), a specified percentage of the certificateholders of such transaction will be entitled to exercise the rights of the Control Note to replace the special servicer (but no certificateholder will have any other rights of the Control Note). During the control shift event relating to the JPMCC 2020-LOOP securitization transaction (i.e., when the class C certificates in such transaction have been control appraised out), Note A-2 will be the Control Note; provided however, that the 181 West Madison Whole Loan will continue to be serviced by the master servicer, and if necessary, the special servicer, under the JPMCC 2020-LOOP trust and servicing agreement See “Description of the Mortgage Pool—The Whole Loans—The Non-Serviced AB Whole Loans—The 181 West Madison Whole Loan” in the Preliminary Prospectus. |
THE INFORMATION IN THIS STRUCTURAL AND COLLATERAL TERM SHEET IS NOT COMPLETE AND MAY BE AMENDED PRIOR TO THE TIME OF SALE. THIS TERM SHEET IS NOT AN OFFER TO SELL THESE SECURITIES AND IT IS NOT A SOLICITATION OF AN OFFER TO BUY THESE SECURITIES IN ANY JURISDICTION WHERE THE OFFER OR SALE IS NOT PERMITTED.
9
Benchmark 2020-B16 Mortgage Trust
|
| OVERVIEW OF MORTGAGE POOL CHARACTERISTICS |
| Distribution of Cut-off Date Balances(1) | ||||||||||
| Range of Cut-off Date Balances | Number of Mortgage Loans | Aggregate Cut-off Date Balance | % of Initial Pool Balance | Weighted Averages | ||||||
| Mortgage Rate | Stated Remaining Term (Mos.) | U/W NCF DSCR | Cut-off Date LTV(2) | Maturity Date LTV(2) | ||||||
| $3,725,000 | - | $7,499,999 | 7 | $40,395,000 | 4.5% | 4.0210% | 119 | 2.09x | 63.7% | 58.9% |
| $7,500,000 | - | $14,999,999 | 6 | $66,461,873 | 7.4% | 3.8547% | 109 | 2.39x | 67.8% | 65.2% |
| $15,000,000 | - | $24,999,999 | 3 | $59,350,000 | 6.6% | 3.6773% | 120 | 2.87x | 52.0% | 52.0% |
| $25,000,000 | - | $49,999,999 | 13 | $507,890,000 | 56.5% | 3.5444% | 115 | 3.04x | 48.7% | 47.7% |
| $50,000,000 | - | $65,000,000 | 4 | $225,000,000 | 25.0% | 3.5782% | 119 | 4.09x | 56.1% | 56.1% |
| Total/Weighted Average | 33 | $899,096,873 | 100.0% | 3.6060% | 116 | 3.20x | 52.8% | 51.9% | ||
| Distribution of Mortgage Rates(1) | ||||||||||
| Range of Mortgage Rates | Number of Mortgage Loans | Aggregate Cut-off Date Balance | % of Initial Pool | Weighted Averages | ||||||
| Mortgage Rate | Stated Remaining Term (Mos.) | U/W NCF DSCR | Cut-off Date LTV(2) | Maturity Date LTV(2) | ||||||
| 2.5890% | - | 2.9999% | 3 | $125,000,000 | 13.9% | 2.8260% | 118 | 4.28x | 36.1% | 36.1% |
| 3.0000% | - | 3.4999% | 5 | $215,000,000 | 23.9% | 3.3026% | 118 | 4.66x | 46.4% | 46.4% |
| 3.5000% | - | 3.9999% | 15 | $401,567,000 | 44.7% | 3.7617% | 115 | 2.56x | 56.3% | 56.1% |
| 4.0000% | - | 4.3500% | 10 | $157,529,873 | 17.5% | 4.2421% | 115 | 1.99x | 66.2% | 61.1% |
| Total/Weighted Average | 33 | $899,096,873 | 100.0% | 3.6060% | 116 | 3.20x | 52.8% | 51.9% | ||
| Property Type Distribution(1)(3)(4) | |||||||||||
| Property Type | Number of Mortgaged Properties | Aggregate Cut-off Date Balance | % of Initial Outstanding Pool Balance | Number of NRA/Units/Rooms | Weighted Averages | ||||||
Cut-off Date NRA/Units/Rooms | Mortgage Rate | Stated Remaining Term (Mos.) | Occupancy | U/W NCF DSCR | Cut-off Date LTV(2) | Maturity LTV(2) | |||||
| Retail | 18 | $242,055,000 | 26.9% | 2,815,754 | $406 | 3.5987% | 116 | 98.8% | 2.58x | 59.0% | 58.7% |
| Anchored(5) | 17 | $231,425,000 | 25.7% | 2,779,143 | $411 | 3.5773% | 119 | 98.8% | 2.60x | 58.6% | 58.3% |
| Unanchored | 1 | $10,630,000 | 1.2% | 36,611 | $290 | 4.0650% | 58 | 100.0% | 2.07x | 67.5% | 67.5% |
| Office | 7 | $238,032,000 | 26.5% | 5,014,134 | $284 | 3.5301% | 112 | 95.9% | 3.68x | 46.1% | 46.1% |
| CBD | 4 | $166,500,000 | 18.5% | 4,251,283 | $346 | 3.2756% | 109 | 96.0% | 4.13x | 37.8% | 37.8% |
| Suburban | 3 | $71,532,000 | 8.0% | 762,851 | $140 | 4.1226% | 118 | 95.9% | 2.65x | 65.5% | 65.5% |
| Hospitality | 5 | $107,199,873 | 11.9% | 4,409 | $290,300 | 3.5798% | 119 | 82.4% | 5.79x | 47.5% | 43.3% |
| Full Service | 3 | $92,700,000 | 10.3% | 4,230 | $322,692 | 3.4858% | 119 | 82.9% | 6.38x | 44.6% | 41.5% |
| Select Service | 1 | $7,999,873 | 0.9% | 84 | $95,237 | 4.2760% | 118 | 77.8% | 2.09x | 67.8% | 54.5% |
| Limited Service | 1 | $6,500,000 | 0.7% | 95 | $68,421 | 4.0640% | 119 | 80.2% | 1.94x | 64.4% | 55.8% |
| Industrial | 35 | $104,245,000 | 11.6% | 4,410,567 | $125 | 3.5915% | 118 | 99.4% | 2.82x | 52.3% | 52.3% |
| Warehouse/Distribution | 33 | $102,448,944 | 11.4% | 4,238,472 | $126 | 3.5978% | 118 | 99.4% | 2.80x | 52.4% | 52.4% |
| Cold Storage | 2 | $1,796,056 | 0.2% | 172,095 | $34 | 3.2310% | 118 | 100.0% | 3.67x | 45.2% | 45.2% |
| Multifamily | 4 | $102,800,000 | 11.4% | 604 | $373,444 | 4.0355% | 119 | 96.0% | 1.62x | 66.0% | 63.9% |
| Mid Rise | 3 | $66,600,000 | 7.4% | 282 | $515,321 | 3.8837% | 118 | 98.0% | 1.83x | 61.7% | 61.7% |
| Garden | 1 | $36,200,000 | 4.0% | 322 | $112,422 | 4.3150% | 119 | 92.2% | 1.22x | 73.9% | 68.1% |
| Mixed Use | 2 | $80,000,000 | 8.9% | 600,575 | $232,971 | 3.2384% | 118 | 98.5% | 3.13x | 40.2% | 40.2% |
| Office/Retail | 1 | $45,000,000 | 5.0% | 600,415 | $977 | 3.4860% | 118 | 97.4% | 2.74x | 48.5% | 48.5% |
| Multifamily/Retail | 1 | $35,000,000 | 3.9% | 160 | $531,250 | 2.9200% | 118 | 100.0% | 3.62x | 29.5% | 29.5% |
| Self-Storage | 5 | $15,175,000 | 1.7% | 271,983 | $58 | 4.1598% | 118 | 84.7% | 1.47x | 69.5% | 60.4% |
| Leased Fee | 1 | $9,590,000 | 1.1% | 131,802 | $73 | 3.7100% | 119 | NAP | 2.52x | 70.0% | 70.0% |
| Total/Weighted Average | 77 | $899,096,873 | 100.0% | 3.6060% | 116 | 95.5% | 3.20x | 52.8% | 51.9% | ||
| Geographic Distribution(1)(3) | ||||||||
| State/Location | Number of Properties | Aggregate Cut-off Date Balance | % of Initial Outstanding Pool Balance | Weighted Averages | ||||
| Mortgage Rate | Stated Remaining Term (Mos.) | U/W NCF DSCR | Cut-off Date LTV(2) | Maturity Date LTV(2) | ||||
| New York | 10 | $332,900,000 | 37.0% | 3.4254% | 118 | 2.78x | 52.6% | 52.6% |
| New York City | 9 | $321,600,000 | 35.8% | 3.4183% | 119 | 2.79x | 52.3% | 52.3% |
| New York State | 1 | $11,300,000 | 1.3% | 3.6300% | 118 | 2.62x | 59.4% | 59.4% |
| Illinois | 9 | $122,717,194 | 13.6% | 4.0182% | 106 | 3.26x | 51.3% | 51.3% |
| California | 3 | $85,000,000 | 9.5% | 3.1605% | 118 | 3.91x | 41.7% | 41.7% |
| Northern | 2 | $78,500,000 | 8.7% | 3.0973% | 118 | 4.00x | 40.4% | 40.4% |
| Southern | 1 | $6,500,000 | 0.7% | 3.9240% | 118 | 2.86x | 57.0% | 57.0% |
| Nevada | 1 | $60,000,000 | 6.7% | 3.1702% | 118 | 8.42x | 39.3% | 39.3% |
| North Carolina | 4 | $59,230,000 | 6.6% | 3.9160% | 108 | 2.50x | 58.2% | 53.4% |
| Washington | 2 | $53,139,873 | 5.9% | 3.9311% | 119 | 2.14x | 57.3% | 55.3% |
| Other | 48 | $186,109,806 | 20.7% | 3.8097% | 119 | 2.43x | 60.8% | 58.3% |
| Total/Weighted Average | 77 | $899,096,873 | 100.0% | 3.6060% | 116 | 3.20x | 52.8% | 51.9% |
THE INFORMATION IN THIS STRUCTURAL AND COLLATERAL TERM SHEET IS NOT COMPLETE AND MAY BE AMENDED PRIOR TO THE TIME OF SALE. THIS TERM SHEET IS NOT AN OFFER TO SELL THESE SECURITIES AND IT IS NOT A SOLICITATION OF AN OFFER TO BUY THESE SECURITIES IN ANY JURISDICTION WHERE THE OFFER OR SALE IS NOT PERMITTED.
10
Benchmark 2020-B16 Mortgage Trust
|
| OVERVIEW OF MORTGAGE POOL CHARACTERISTICS |
| Distribution of Cut-off Date LTVs(1)(2) | ||||||||||
| Range of Cut-off Date LTVs | Number of Mortgage Loans | Aggregate Cut-off Date Balance | % of Initial Outstanding Pool Balance | Weighted Averages | ||||||
| Mortgage Rate | Stated Term | U/W NCF DSCR | Cut-off Date LTV | Maturity Date LTV(2) | ||||||
| 28.8% | - | 54.9% | 12 | $463,700,000 | 51.6% | 3.3348% | 115 | 4.19x | 42.4% | 41.8% |
| 55.0% | - | 59.9% | 5 | $106,110,000 | 11.8% | 3.7786% | 119 | 2.42x | 57.6% | 57.6% |
| 60.0% | - | 64.9% | 5 | $110,587,000 | 12.3% | 3.8213% | 119 | 2.17x | 62.3% | 61.8% |
| 65.0% | - | 69.9% | 6 | $154,534,873 | 17.2% | 3.9343% | 114 | 2.21x | 65.9% | 64.8% |
| 70.0% | - | 74.3% | 5 | $64,165,000 | 7.1% | 4.1190% | 119 | 1.50x | 73.0% | 67.4% |
| Total/Weighted Average | 33 | $899,096,873 | 100.0% | 3.6060% | 116 | 3.20x | 52.8% | 51.9% | ||
| Distribution of Maturity Date or ARD LTVs(1)(2) | ||||||||||
| Range of Maturity Date or ARD LTVs | Number of Mortgage Loans | Aggregate Cut-off Date Balance | % of Initial Outstanding Pool Balance | Weighted Averages | ||||||
| Mortgage Rate | Stated Term | U/W NCF DSCR | Cut-off Date LTV(2) | Maturity Date or ARD LTV | ||||||
| 28.8% | - | 49.9% | 11 | $413,700,000 | 46.0% | 3.3319% | 115 | 4.32x | 40.9% | 40.3% |
| 50.0% | - | 54.9% | 2 | $57,999,873 | 6.5% | 3.4853% | 119 | 2.93x | 56.0% | 54.2% |
| 55.0% | - | 59.9% | 7 | $119,410,000 | 13.3% | 3.8244% | 119 | 2.34x | 58.5% | 57.6% |
| 60.0% | - | 70.0% | 13 | $307,987,000 | 34.3% | 3.9123% | 117 | 2.08x | 66.0% | 64.9% |
| Total/Weighted Average | 33 | $899,096,873 | 100.0% | 3.6060% | 116 | 3.20x | 52.8% | 51.9% | ||
| Distribution of Underwritten NCF Debt Service Coverages(1) | ||||||||||
| Range of Underwritten NCF Debt Service Coverages | Number of Mortgage Loans | Aggregate Cut-off Date Balance | % of Initial Outstanding Pool Balance | Weighted Averages | ||||||
| Mortgage Rate | Stated Remaining Term (Mos.) | U/W NCF DSCR | Cut-off Date LTV(2) | Maturity Date or ARD LTV(2) | ||||||
| 1.22x | - | 1.49x | 2 | $43,000,000 | 4.8% | 4.3142% | 119 | 1.24x | 72.9% | 66.6% |
| 1.50x | - | 1.74x | 4 | $49,975,000 | 5.6% | 3.9740% | 119 | 1.66x | 66.8% | 63.8% |
| 1.75x | - | 2.49x | 11 | $296,049,873 | 32.9% | 3.8726% | 117 | 2.21x | 61.0% | 60.5% |
| 2.50x | - | 3.49x | 9 | $222,072,000 | 24.7% | 3.6265% | 119 | 2.82x | 54.6% | 53.4% |
| 3.50x | - | 8.42x | 7 | $288,000,000 | 32.0% | 3.1466% | 113 | 5.07x | 37.7% | 37.7% |
| Total/Weighted Average | 33 | $899,096,873 | 100.0% | 3.6060% | 116 | 3.20x | 52.8% | 51.9% | ||
| Original Terms to Maturity or ARD(1) | |||||||||||
| Original Terms to Maturity or ARD | Number of Mortgage Loans | Aggregate Cut-off Date Balance | % of Initial Outstanding Pool Balance | Weighted Averages | |||||||
| Mortgage Rate | Stated Remaining Term (Mos.) | U/W NCF DSCR | Cut-off Date LTV(2) | Maturity Date or ARD LTV(2) | |||||||
| 60 | - | 60 | 1 | $10,630,000 | 1.2% | 4.0650% | 58 | 2.07x | 67.5% | 67.5% | |
| 84 | - | 84 | 1 | $43,000,000 | 4.8% | 3.9000% | 82 | 4.67x | 28.8% | 28.8% | |
| 119 | - | 120 | 31 | $845,466,873 | 94.0% | 3.5853% | 119 | 3.14x | 53.9% | 52.9% | |
| Total/Weighted Average | 33 | $899,096,873 | 100.0% | 3.6060% | 116 | 3.20x | 52.8% | 51.9% | |||
| Distribution of Remaining Terms to Maturity or ARD(1) | ||||||||||
| Range of Remaining Terms to Maturity or ARD | Number of Mortgage Loans | Aggregate Cut-off Date Balance | % of Initial Outstanding Pool Balance | Weighted Averages | ||||||
| Mortgage Rate | Stated Remaining Term (Mos.) | U/W NCF DSCR | Cut-off Date LTV(2) | Maturity Date or ARD LTV(2) | ||||||
| 58 | - | 58 | 1 | $10,630,000 | 1.2% | 4.0650% | 58 | 2.07x | 67.5% | 67.5% |
| 82 | - | 82 | 1 | $43,000,000 | 4.8% | 3.9000% | 82 | 4.67x | 28.8% | 28.8% |
| 118 | - | 120 | 31 | $845,466,873 | 94.0% | 3.5853% | 119 | 3.14x | 53.9% | 52.9% |
| Total/Weighted Average | 33 | $899,096,873 | 100.0% | 3.6060% | 116 | 3.20x | 52.8% | 51.9% | ||
| Distribution of Underwritten NOI Debt Yields(1)(4) | ||||||||||
| Range of Underwritten NOI Debt Yields | Number of Mortgage Loans | Aggregate Cut-off Date Balance | % of Initial Outstanding Pool Balance | Weighted Averages | ||||||
| Mortgage Rate | Stated Remaining Term (Mos.) | U/W NCF DSCR | Cut-off Date LTV Ratio(2) | Maturity Date or ARD LTV(2) | ||||||
| 7.1% | - | 8.9% | 9 | $242,395,000 | 27.0% | 3.8685% | 119 | 1.91x | 63.7% | 62.4% |
| 9.0% | - | 9.9% | 7 | $133,970,000 | 14.9% | 3.7598% | 114 | 2.35x | 59.7% | 58.8% |
| 10.0% | - | 12.4% | 8 | $261,394,873 | 29.1% | 3.5263% | 118 | 3.03x | 49.9% | 49.5% |
| 12.5% | - | 14.9% | 7 | $158,337,000 | 17.6% | 3.2909% | 118 | 3.81x | 47.0% | 44.9% |
| 15.0% | - | 28.3% | 2 | $103,000,000 | 11.5% | 3.4748% | 103 | 6.85x | 34.9% | 34.9% |
| Total/Weighted Average | 33 | $899,096,873 | 100.0% | 3.6060% | 116 | 3.20x | 52.8% | 51.9% | ||
THE INFORMATION IN THIS STRUCTURAL AND COLLATERAL TERM SHEET IS NOT COMPLETE AND MAY BE AMENDED PRIOR TO THE TIME OF SALE. THIS TERM SHEET IS NOT AN OFFER TO SELL THESE SECURITIES AND IT IS NOT A SOLICITATION OF AN OFFER TO BUY THESE SECURITIES IN ANY JURISDICTION WHERE THE OFFER OR SALE IS NOT PERMITTED.
11
Benchmark 2020-B16 Mortgage Trust
|
| OVERVIEW OF MORTGAGE POOL CHARACTERISTICS |
| Amortization Types(1) | ||||||||
| Amortization Type | Number of Mortgage Loans | Aggregate Cut-off Date Balance | % of Initial Outstanding Pool Balance | Weighted Averages | ||||
| Mortgage Rate | Stated Term | U/W NCF DSCR | Cut-off Date LTV Ratio(2) | Maturity Date or ARD LTV(2) | ||||
| Interest Only | 25 | $797,022,000 | 88.6% | 3.5332% | 116 | 3.39x | 51.0% | 51.0% |
| Interest Only, then Amortizing | 6 | $67,875,000 | 7.5% | 4.1907% | 119 | 1.39x | 72.1% | 65.1% |
| Amortizing Balloon | 2 | $34,199,873 | 3.8% | 4.1412% | 120 | 2.46x | 56.8% | 45.4% |
| Total/Weighted Average | 33 | $899,096,873 | 100.0% | 3.6060% | 116 | 3.20x | 52.8% | 51.9% |
Footnotes:
| (1) | The U/W NCF DSCR, Cut-off Date LTV Ratio, Maturity Date or ARD LTV, Underwritten NOI Debt Yield and Cut-off Date Balance per # of NRA/Units/Rooms calculations include any relatedpari passu companion loan(s) and exclude any related subordinate companion loan(s) and/or mezzanine loan(s). |
| (2) | With respect to 5 mortgage loans (18.1%) (including Bellagio Hotel and Casino, 650 Madison Avenue, 181 West Madison, Fairfield Inn & Suites Spokane and Springhill Suites Florence), the Cut-off Date LTV and Maturity Date or ARD LTV have been calculated using a value other than the “As Is” appraised values. For additional information please see the footnotes to Annex A-1 in the Preliminary Prospectus. |
| (3) | Reflects allocated loan amount for properties securing multi-property Mortgage Loans. |
| (4) | With respect to the Landing Square mortgage loan (4.0%) the Cut-off Date LTV and U/W NOI Debt Yield is calculated based on the Cut-off Date Balance net of a capex holdback reserve. |
| (5) | Anchored retail includes specialty retail, other, super-regional mall, single tenant and shadow anchored properties. |
THE INFORMATION IN THIS STRUCTURAL AND COLLATERAL TERM SHEET IS NOT COMPLETE AND MAY BE AMENDED PRIOR TO THE TIME OF SALE. THIS TERM SHEET IS NOT AN OFFER TO SELL THESE SECURITIES AND IT IS NOT A SOLICITATION OF AN OFFER TO BUY THESE SECURITIES IN ANY JURISDICTION WHERE THE OFFER OR SALE IS NOT PERMITTED.
12
Benchmark 2020-B16 Mortgage Trust
|
STRUCTURE OVERVIEW |
| The aggregate amount available for distribution to holders of the Certificates (including the VRR Interest) on each Distribution Date will be: (i) the gross amount of interest, principal, yield maintenance charges and prepayment premiums collected with respect to the Mortgage Loans in the applicable one-month collection period, net of specified expenses of the issuing entity, including fees payable therefrom to, and losses, liabilities, costs and expenses reimbursable or indemnifiable therefrom to, the Master Servicer, the Special Servicer, the Certificate Administrator, the Trustee, the Operating Advisor, the Asset Representations Reviewer and CREFC®; and (ii) allocated to amounts available for distribution to the holders of the VRR Interest, on the one hand, and amounts available for distribution to the holders of the remaining Certificates (the “Non-VRR Certificates”), on the other hand. On each Distribution Date, the portion of such aggregate available funds allocable to: (a) the VRR Interest will be the product of such aggregate available funds multiplied by a fraction, expressed as a percentage, the numerator of which is the initial Certificate Balance of the VRR Interest, and the denominator of which is the aggregate initial Certificate Balance of the Principal Balance Certificates and the initial Certificate Balance of the VRR Interest (the “VRR Percentage”); and (b) the Non-VRR Certificates will at all times be the product of such aggregate available funds multiplied by the difference between 100% and the VRR Percentage (such difference, the “Non-VRR Percentage”). See “Credit Risk Retention” and “Description of the Certificates” in the Preliminary Prospectus.
| |
| Payments in respect of the Non-VRR Percentage of principal on the Non-VRR Certificates will be distributed, first, to the Class A-SB certificates, until the Certificate Balance of such class is reduced to the planned principal balance for the related Distribution Date set forth on Annex F to the Preliminary Prospectus, then, to the Class A-1, Class A-2, Class A-3, Class A-4, Class A-5, Class A-SB, Class A-M, Class B, Class C, Class D, Class E, Class F, Class G and Class H certificates, in that order, until the Certificate Balance of each such class is reduced to zero. Notwithstanding the foregoing, if the total Certificate Balance of the Class A-M, Class B, Class C, Class D, Class E, Class F, Class G and Class H certificates have been reduced to zero as a result of loss allocation, payments in respect of principal of the certificates will be distributed, first, to the Class A-1, Class A-2, Class A-3, Class A-SB, Class A-4 and Class A-5 certificates, on a pro rata basis, based on the Certificate Balance of each such class, then, to the extent of any recoveries on realized losses, to the Class A-M, Class B, Class C, Class D, Class E, Class F, Class G and Class H certificates, in that order, in each case until the Certificate Balance of each such class is reduced to zero (or previously allocated realized losses have been fully reimbursed).
Each class of Class X Certificates will not be entitled to receive distributions of principal; however, (i) the notional amount of the Class X-A certificates will be reduced by the aggregate amount of principal distributions and realized losses allocated to the Class A-1, Class A-2, Class A-3, Class A-SB, Class A-4, Class A-5 and Class A-M certificates; (ii) the notional amount of the Class X-B certificates will be reduced by the aggregate amount of principal distributions and realized losses allocated to the Class B and Class C certificates; (iii) the notional amount of the Class X-D certificates will be reduced by the aggregate amount of principal distributions and realized losses allocated to the Class D and Class E certificates; (iv) the notional amount of the Class X-F certificates will be reduced by the principal distributions and realized losses allocated to the Class F certificates; (v) the notional amount of the Class X-G certificates will be reduced by the principal distributions and realized losses allocated to the Class G certificates; and the notional amount of the Class X-H certificates will be reduced by the principal distributions and realized losses allocated to the Class H certificates.
| |
Interest Payments: | On each Distribution Date, interest accrued for each class of Non-VRR Certificates at the applicable pass-through rate will be distributed in the following order of priority, to the extent of the Non-VRR Percentage of the aggregate available funds (exclusive of any portion thereof that represents the Non-VRR Percentage of any yield maintenance charges and prepayment premiums): first, to the Class A-1, Class A-2, Class A-3, Class A-SB, Class A-4, Class A-5, Class X-A, Class X-B, Class X-D, Class X-F, Class X-G and Class X-H certificates, on a pro rata basis, based on the accrued and unpaid interest on each such class and then, to the Class A-M, Class B, Class C, Class D, Class E, Class F, Class G and Class H certificates, in that order, in each case until the interest payable to each such class is paid in full. |
THE INFORMATION IN THIS STRUCTURAL AND COLLATERAL TERM SHEET IS NOT COMPLETE AND MAY BE AMENDED PRIOR TO THE TIME OF SALE. THIS TERM SHEET IS NOT AN OFFER TO SELL THESE SECURITIES AND IT IS NOT A SOLICITATION OF AN OFFER TO BUY THESE SECURITIES IN ANY JURISDICTION WHERE THE OFFER OR SALE IS NOT PERMITTED.
13
Benchmark 2020-B16 Mortgage Trust
|
STRUCTURE OVERVIEW |
| The pass-through rates applicable to the Class A-1, Class A-2, Class A-3, Class A-SB, Class A-4, Class A-5, Class A-M, Class B, Class C, Class D, Class E, Class F, Class G and Class H certificates for each Distribution Date will equal one of: (i) a fixed per annum rate, (ii) the WAC Rate, (iii) a rate equal to the lesser of a specified pass-through rate and the WAC Rate or (iv) the WAC Rate less a specified rate.
As further described in the Preliminary Prospectus, the pass-through rates applicable to the Class X Certificates for each Distribution Date will generally be equal to the excess of (i) the WAC Rate over (ii) (A) with respect to the Class X-A certificates, the weighted average of the pass-through rates of the Class A-1, Class A-2, Class A-3, Class A-SB, Class A-4, Class A-5 and Class A-M certificates (weighted based on their respective Certificate Balances immediately prior to that Distribution Date), (B) with respect to the Class X-B certificates, the weighted average of the pass-through rates of the Class B and Class C certificates (weighted based on their respective Certificate Balances immediately prior to that Distribution Date), (C) with respect to the Class X-D certificates, the weighted average of the pass-through rates of the Class D and Class E certificates (weighted based on their respective Certificate Balances immediately prior to that Distribution Date), (D) with respect to the Class X-F certificates, the pass-through rate of the Class F certificates, (E) with respect to the Class X-G certificates, the pass-through rate of the Class G certificates and (F) with respect to the Class X-H certificates, the pass-through rate of the Class H certificates.
| |
| Prepayment interest shortfalls will be allocated pro rata based on interest entitlements, in reduction of the interest otherwise payable with respect to each of the interest-bearing classes of certificates.
| |
| The Non-VRR Percentage of losses on the Mortgage Loans will be allocated to each class of Non-VRR Certificates entitled to principal in reverse alphabetical order starting with Class H through and including Class A-M and then to Class A-1, Class A-2, Class A-3, Class A-SB, Class A-4 and Class A-5 certificates on a pro rata basis based on the Certificate Balance of each such class. The notional amount of any class of Class X Certificates will be reduced by the aggregate amount of realized losses allocated to the class(es) of certificates that are component(s) of the notional amount of such class of Class X Certificates.
| |
Prepayment Premiums:
|
| A percentage of the Non-VRR Percentage of all prepayment premiums (either fixed prepayment premiums or yield maintenance amounts) collected on the Mortgage Loans will be allocated to each of the Class A-1, Class A-2, Class A-3, Class A-SB, Class A-4, Class A-5, Class A-M, Class B, Class C, Class D and Class E certificates (the “YM P&I Certificates”) then entitled to principal distributions, which percentage will be equal to the product of (a) a fraction, not greater than one, the numerator of which is the amount of principal distributed to such class on such Distribution Date and the denominator of which is the total amount of principal distributed to the holders of the Class A-1, Class A-2, Class A-3, Class A-SB, Class A-4, Class A-5, Class A-M, Class B, Class C, Class D, Class E, Class F, Class G and Class H certificates on such Distribution Date, and the Base Interest Fraction.
The “Base Interest Fraction” for any principal prepayment on any Mortgage Loan and for:
(A) any of the Class A-1 through Class E certificates with a Pass-Through Rate equal to either the WAC Rate or the WAC Rate less a specified rate, will be a fraction (not greater than one)(a) whose numerator is the greater of zero and the amount, if any, by which (i) the Pass-Through Rate on such class of certificates exceeds (ii) the yield rate (as provided by the master servicer) used in calculating the prepayment premium or yield maintenance charge, as applicable, with respect to such principal prepayment and (b) whose denominator is the amount, if any, by which (i) the Net Mortgage Rate on such Mortgage Loan during the related interest accrual period exceeds (ii) the yield rate (as provided by the master servicer) used in calculating the prepayment premium or yield maintenance charge, as applicable, with respect to such principal prepayment; provided, however, that if such yield rate is greater than or equal to the Net Mortgage Rate on such Mortgage Loan during the related interest accrual period, then the respective Base Interest Fraction will be zero; provided, further, that if such yield rate is greater than or equal to the Net Mortgage Rate on such Mortgage Loan during the related interest accrual period, but less than the Pass-Through Rate described in clause (a)(i) above, then the respective Base Interest Fraction will be one; and
|
THE INFORMATION IN THIS STRUCTURAL AND COLLATERAL TERM SHEET IS NOT COMPLETE AND MAY BE AMENDED PRIOR TO THE TIME OF SALE. THIS TERM SHEET IS NOT AN OFFER TO SELL THESE SECURITIES AND IT IS NOT A SOLICITATION OF AN OFFER TO BUY THESE SECURITIES IN ANY JURISDICTION WHERE THE OFFER OR SALE IS NOT PERMITTED.
14
Benchmark 2020-B16 Mortgage Trust
|
STRUCTURE OVERVIEW |
|
| (B) any of the Class A-1 through Class E certificates with a Pass-Through Rate equal to a fixed per annum rate, will be a fraction (not greater than one)(a) whose numerator is the greater of zero and the amount, if any, by which (i) the Pass-Through Rate on such class of certificates exceeds (ii) the yield rate (as provided by the master servicer) used in calculating the prepayment premium or yield maintenance charge, as applicable, with respect to such principal prepayment and (b) whose denominator is the amount, if any, by which (i) the Mortgage Rate on such Mortgage Loan (without regard to any increase in the interest rate of any ARD Loan after the related Anticipated Repayment Date, and net of the Administrative Cost Rate) during the related interest accrual period multiplied by 365/360 exceeds (ii) the yield rate (as provided by the master servicer) used in calculating the prepayment premium or yield maintenance charge, as applicable, with respect to such principal prepayment; provided, however, that if such yield rate is greater than or equal to the amount set forth in clause (b)(i) above, then the respective Base Interest Fraction will be zero; provided, further, that if such yield rate is greater than or equal to the amount set forth in clause (b)(i) above, but less than the Pass-Through Rate described in clause (a)(i) above, then the respective Base Interest Fraction will be one.
The remaining percentage of the Non-VRR Percentage of prepayment premiums will be allocated to the Class X-A, Class X-B and Class X-D certificates in the manner described in the Preliminary Prospectus. In general, this formula provides for an increase in the percentage of prepayment premiums allocated to the YM P&I Certificates then entitled to principal distributions relative to the Class X-A, Class X-B and Class X-D certificates as Discount Rates decrease and a decrease in the percentage allocated to such classes as Discount Rates rise.
|
Whole Loans: |
| The mortgaged properties identified on Annex A-1 to the Preliminary Prospectus as Bellagio Hotel and Casino, Kings Plaza, 3500 Lacey, 560 Mission Street, 1633 Broadway, Starwood Industrial Portfolio, 650 Madison Avenue, 181 West Madison, 510 East 14th Street, 490-504 Myrtle Avenue and Giant Anchored Portfolio each secure both a mortgage loan to be included in the trust fund and one or more other companion loans that will not be included in the trust fund, each of which will be pari passu and/or subordinate in right of payment with the mortgage loan included in the trust fund. We refer to each such group of related loans as a “whole loan”.
As of the Closing Date, the pari passu companion loans and the subordinate companion loans are expected to be held by the party identified in “—Companion Loan Summary” above and the table titled “Whole Loan Control Notes and Non-Control Notes” in “Description of the Mortgage Pool—The Whole Loans—General” in the Preliminary Prospectus.
|
Control Rights and Directing Holder: |
| Controlling Class Certificateholders will generally have certain control rights over servicing matters with respect to each Serviced Mortgage Loan and any related Serviced Companion Loans. The majority owner or appointed representative of the class of Control Eligible Certificates that is the Controlling Class (such owner or representative, the “Directing Holder”) will be entitled to direct the Special Servicer to take, or refrain from taking certain actions with respect to each Serviced Mortgage Loan and any related Serviced Companion Loans. Furthermore, the Directing Holder will also have the right to receive notice and consent to certain material actions that the Master Servicer and the Special Servicer proposes to take with respect to each Serviced Mortgage Loan and any related Serviced Companion Loans.
It is expected that Ellington Management Group, LLC or its affiliate will be the initial Directing Holder with respect to each Serviced Mortgage Loan and any related Serviced Companion Loans.
For a description of the directing holder for each Non-Serviced Whole Loan, see “Description of the Mortgage Pool—The Whole Loans” and “Pooling and Servicing Agreement—The Directing Holder” in the Preliminary Prospectus.
|
Control Eligible Certificates: |
| Class F, Class G and Class H certificates.
|
| The Controlling Class will be the most subordinate class of Control Eligible Certificates then outstanding that has an aggregate Certificate Balance, as notionally reduced by any appraisal reduction amounts and any collateral deficiency amounts allocable to such class, equal to at least 25% of the initial Certificate Balance of such class; provided that if at any time the Certificate Balances of all Control Eligible Certificates, as notionally reduced by any appraisal reduction amounts (but without regard to any collateral deficiency amounts) allocable to such classes, have been reduced to zero, then the “Controlling Class” will be the most subordinate class of Control Eligible Certificates that has an aggregate principal balance greater than zero;
|
THE INFORMATION IN THIS STRUCTURAL AND COLLATERAL TERM SHEET IS NOT COMPLETE AND MAY BE AMENDED PRIOR TO THE TIME OF SALE. THIS TERM SHEET IS NOT AN OFFER TO SELL THESE SECURITIES AND IT IS NOT A SOLICITATION OF AN OFFER TO BUY THESE SECURITIES IN ANY JURISDICTION WHERE THE OFFER OR SALE IS NOT PERMITTED.
15
Benchmark 2020-B16 Mortgage Trust
|
STRUCTURE OVERVIEW |
| provided, further that if at any time the Certificate Balances of the Class A-1, Class A-2, Class A-3, Class A-SB, Class A-4, Class A-5, Class A-M, Class B, Class C, Class D and Class E certificates have been reduced to zero as a result of the allocation of principal payments on the Mortgage Loans, then the Controlling Class will be the most subordinate class of Control Eligible Certificates that has an aggregate Certificate Balance greater than zero (without regard to the application of appraisal reduction amounts or any collateral deficiency amounts to notionally reduce the Certificate Balance of such class).
The Controlling Class as of the Closing Date will be the Class H certificates.
| |
| Any class of Control Eligible Certificates that has been determined, as a result of appraisal reductions amounts and collateral deficiency amounts allocable to such class, to no longer be the Controlling Class.
| |
| Holders of the majority of any class of Control Eligible Certificates that is determined at any time of determination to no longer be the Controlling Class as a result of an allocation of appraisal reduction amounts and collateral deficiency amounts in respect of such class will have the right, at their sole expense, to require the Special Servicer to order a second appraisal for any Serviced Mortgage Loan for which an appraisal reduction event has occurred or as to which there exists a collateral deficiency amount. Upon receipt of the second appraisal, the Special Servicer will be required to send the appraisal to the Master Servicer, who will be required to recalculate the appraisal reduction amount or collateral deficiency amount based on the second appraisal, and if required by such recalculation, the Special Servicer will reinstate the Appraised-Out Class as the Controlling Class. The Holders of an Appraised-Out Class requesting a second appraisal will not be entitled to exercise any rights of the Controlling Class until such time, if any, as the class is reinstated as the Controlling Class.
| |
Control Termination Event: |
| Will occur with respect to any Mortgage Loan, Serviced Whole Loan or the Starwood Industrial Portfolio Whole Loan when the Class F certificates have a Certificate Balance (taking into account the application of any appraisal reduction amounts and collateral deficiency amounts to notionally reduce the Certificate Balance of such class) reduced to less than 25% of the initial Certificate Balance of that class; provided that a Control Termination Event will not be deemed to be continuing in the event the Certificate Balances of all Classes of Principal Balance Certificates other than the Control Eligible Certificates have been reduced to zero. With respect to an excluded loan relating to the Directing Holder, a Control Termination Event will be deemed to exist.
Upon the occurrence and the continuance of a Control Termination Event, the Directing Holder will no longer have any control rights. The Directing Holder will no longer have the right to direct certain actions of the Special Servicer and will no longer have consent rights with respect to certain material actions that the Master Servicer or Special Servicer proposes to take with respect to a Serviced Mortgage Loan and any related Serviced Companion Loans.
Upon the occurrence and continuation of a Control Termination Event, the Directing Holder will retain non-binding consultation rights with respect to certain material actions that the Special Servicer proposes to take with respect to a Serviced Mortgage Loan and any related Serviced Companion Loans. Such consultation rights will continue until the occurrence of a Consultation Termination Event.
|
| Will occur with respect to any Mortgage Loan, Serviced Whole Loan or Starwood Industrial Portfolio Whole Loan when there is no class of Control Eligible Certificates that has a then-outstanding Certificate Balance equal to at least 25% of the initial Certificate Balance of that class, in each case, without regard to the application of any appraisal reduction amounts and collateral deficiency amounts; provided that a Consultation Termination Event will not be deemed to be continuing in the event the Certificate Balances of all Classes of Principal Balance Certificates other than the Control Eligible Certificates have been reduced to zero. With respect to an excluded loan relating to the Directing Holder, a Consultation Termination Event will be deemed to exist.
Upon the occurrence and continuance of a Consultation Termination Event, the Directing Holder will have no rights under the PSA other than those rights that all Certificateholders have.
|
THE INFORMATION IN THIS STRUCTURAL AND COLLATERAL TERM SHEET IS NOT COMPLETE AND MAY BE AMENDED PRIOR TO THE TIME OF SALE. THIS TERM SHEET IS NOT AN OFFER TO SELL THESE SECURITIES AND IT IS NOT A SOLICITATION OF AN OFFER TO BUY THESE SECURITIES IN ANY JURISDICTION WHERE THE OFFER OR SALE IS NOT PERMITTED.
16
Benchmark 2020-B16 Mortgage Trust
|
STRUCTURE OVERVIEW |
| The risk retention consultation parties will have certain non-binding consultation rights with respect to certain material servicing actions. Each holder of the VRR Interest, which is expected to be transferred on the Closing Date by GACC to Deutsche Bank AG, New York Branch (“DBNY”), JPMCB and CREFI, will be entitled to appoint a risk retention consultation party. Each of DBNY, JPMCB and CREFI are expected to be appointed as the initial risk retention consultation parties.
| |
| The Directing Holder will appoint the initial Special Servicer with respect to each Serviced Mortgage Loan and any related Serviced Companion Loans as of the Closing Date. Prior to the occurrence and continuance of a Control Termination Event, the Directing Holder generally may replace the Special Servicer with respect to each Serviced Mortgage Loan and any related Serviced Companion Loans with or without cause at any time.
Upon the occurrence and during the continuance of a Control Termination Event, the Directing Holder will no longer have the right to replace the Special Servicer and such replacement (other than with respect to the Non-Serviced Whole Loans) will occur based on a vote of holders of all voting eligible classes of certificates as described below. See “Description of the Mortgage Pool—The Whole Loans” and “Pooling and Servicing Agreement” in the Preliminary Prospectus for a description of the special servicer appointment and replacement rights with respect to Non-Serviced Whole Loans.
| |
| Other than with respect to Non-Serviced Whole Loans, if a Control Termination Event has occurred and is continuing, upon (i) the written direction of holders of certificates evidencing not less than 25% of the voting rights of all classes of Principal Balance Certificates and the VRR Interest (taking into account the application of appraisal reduction amounts to notionally reduce the Certificate Balances of classes to which such appraisal reduction amounts are allocable) and requesting a vote to replace the Special Servicer with a replacement special servicer, (ii) payment by such requesting holders to the Certificate Administrator of all reasonable fees and expenses to be incurred by the Certificate Administrator in connection with administering such vote and (iii) delivery by such holders to the Certificate Administrator and Trustee of written confirmations from each Rating Agency that the appointment of the replacement Special Servicer will not result in a downgrade of the certificates, the Certificate Administrator will be required to promptly post notice of such request on the Certificate Administrator’s website and concurrently provide written notice of such request by mail to all Certificateholders of such request and conduct the solicitation of votes of all certificates in such regard. Upon the written direction (within 180 days) of (i) holders of Principal Balance Certificates and the VRR Interest evidencing at least 66 2/3% of a Certificateholder Quorum or (ii) holders of Principal Balance Certificates and the VRR Interest evidencing more than 50% of the aggregate voting rights of Principal Balance Certificates and the VRR Interest outstanding that has not been reduced to less than 25% of its initial Certificate Balance through the application of appraisal reduction amounts and realized losses), the Trustee will immediately replace the Special Servicer with the replacement Special Servicer (other than with respect to Non-Serviced Whole Loans).
“Certificateholder Quorum” means, in connection with any solicitation of votes in connection with the replacement of the Special Servicer as described above or the Asset Representations Reviewer as described below, the holders of certificates evidencing at least 50% of the aggregate voting rights (taking into account other than with respect to the termination of the Asset Representations Reviewer, the application of any appraisal reduction amounts to notionally reduce the Certificate Balance of the certificates) of all Principal Balance Certificates and the VRR Interest, on an aggregate basis.
During the continuance of a Control Termination Event, if the Operating Advisor determines that (1) the Special Servicer is not performing its duties as required under the PSA or is otherwise not acting in accordance with the Servicing Standard and (2) the replacement of the Special Servicer would be in the best interest of the Certificateholders as a collective whole, then the Operating Advisor will have the right to recommend the replacement of the Special Servicer. The Operating Advisor’s recommendation to replace the Special Servicer (other than with respect Non-Serviced Whole Loans) must be confirmed by a majority of a quorum of Certificateholders (which, for this purpose, is the Certificateholders that evidence at least 20% of the Voting Rights (taking into account the application of any appraisal reduction amounts to notionally reduce the respective Certificate Balances) of all Principal Balance Certificates and the VRR Interest on an aggregate basis within 180 days from the time such recommendation |
THE INFORMATION IN THIS STRUCTURAL AND COLLATERAL TERM SHEET IS NOT COMPLETE AND MAY BE AMENDED PRIOR TO THE TIME OF SALE. THIS TERM SHEET IS NOT AN OFFER TO SELL THESE SECURITIES AND IT IS NOT A SOLICITATION OF AN OFFER TO BUY THESE SECURITIES IN ANY JURISDICTION WHERE THE OFFER OR SALE IS NOT PERMITTED.
17
Benchmark 2020-B16 Mortgage Trust
|
STRUCTURE OVERVIEW |
| is posted to the Certificate Administrator website and is subject to the receipt of written confirmations from each Rating Agency that the appointment of the replacement Special Servicer will not result in a downgrade of the certificates.
See “Description of the Mortgage Pool—The Whole Loans” and “Pooling and Servicing Agreement” in the Preliminary Prospectus for a description of the special servicer appointment and replacement rights with respect to Non-Serviced Whole Loans.
| |
| The workout fees and liquidation fees payable to a Special Servicer under the PSA will be an amount equal to the lesser of: (1) 1.0% (or 0.50%, in the case of the 560 Mission Street Whole Loan) of each collection of interest and principal following a workout or liquidation, subject to a minimum of $25,000 and (2) $1,000,000 per workout or liquidation. All Modification Fees actually paid to the Special Servicer in connection with a workout or liquidation or in connection with any prior workout or partial liquidation that occurred within the prior 18 months will be deducted from the total workout fee (only after receipt by the Special Servicer of workout fees of $25,000) and/or liquidation fees payable (other than Modification Fees earned while the Mortgage Loan was not in special servicing). In addition, the total amount of workout and liquidation fees actually payable by the Trust under the PSA will be capped in the aggregate at $1,000,000 for each related Mortgage Loan. If a new special servicer begins servicing the related Mortgage Loan, all amounts paid to the prior special servicer will be disregarded for purposes of calculating the cap.
| |
Special Servicer Compensation: |
| The special servicing fee will equal 0.25% per annum of the stated principal balance of the related specially serviced loan or REO property, as applicable. The Special Servicer and its affiliates will be prohibited from receiving or retaining any compensation or any other remuneration under the PSA (including, without limitation, in the form of commissions, brokerage fees, rebates, or as a result of any other fee-sharing arrangement) from any person (including, without limitation, the issuing entity, any borrower, any manager, any guarantor or indemnitor in respect of a Serviced Mortgage Loan and any related Serviced Companion Loans, and any purchaser of any Serviced Mortgage Loan and any related Serviced Companion Loan or REO Property) in connection with the disposition, workout or foreclosure of any Serviced Mortgage Loan and any related Serviced Companion Loans, the management or disposition of any REO Property, or the performance of any other special servicing duties under the PSA, other than as expressly permitted in the PSA and other than commercially reasonable treasury management fees, banking fees, property condition report fees, customary title agent fees and insurance commissions or fees received or retained by the Special Servicer or any of its Affiliates in connection with any services performed by such party with respect to any Mortgage Loan, Serviced Whole Loan or REO Property. Subject to certain limited exceptions, the Special Servicer will also be required to report any compensation or other remuneration the Special Servicer or its affiliates have received from any person and such information will be disclosed in the Certificateholders’ monthly distribution date statement.
|
Operating Advisor: |
| With respect to the Serviced Mortgage Loans and any related Serviced Companion Loans the Operating Advisor will have access to any final asset status report and all information available with respect to the transaction on the Certificate Administrator’s website and will have certain monitoring responsibilities on behalf of the entire trust. After the occurrence and during the continuance of a Control Termination Event, the Operating Advisor will have consultation rights with respect to certain major decisions.
The Operating Advisor will be subject to termination with respect to any Serviced Mortgage Loan and Serviced Whole Loan, during the continuance of a Control Termination Event, if holders of at least 15% of the aggregate voting rights of the certificates (in connection with termination and replacement relating to the Mortgage Loans) vote to terminate and replace the Operating Advisor and such vote is approved by holders of more than 50% of the applicable voting rights that exercise their right to vote (in the case of each of such vote and approval, taking into account Realized Losses and the application of any appraisal reduction amounts to notionally reduce the Certificate Balance of the certificates), provided that holders of at least 50% of the applicable voting rights have exercised their right to vote. The holders initiating such vote will be responsible for the fees and expenses in connection with the vote and replacement.
The Operating Advisor will not have consultation rights in respect of Non-Serviced Mortgage Loans. |
THE INFORMATION IN THIS STRUCTURAL AND COLLATERAL TERM SHEET IS NOT COMPLETE AND MAY BE AMENDED PRIOR TO THE TIME OF SALE. THIS TERM SHEET IS NOT AN OFFER TO SELL THESE SECURITIES AND IT IS NOT A SOLICITATION OF AN OFFER TO BUY THESE SECURITIES IN ANY JURISDICTION WHERE THE OFFER OR SALE IS NOT PERMITTED.
18
Benchmark 2020-B16 Mortgage Trust
|
STRUCTURE OVERVIEW |
Asset Representations Reviewer: |
| The Asset Representations Reviewer will be required to review certain delinquent Mortgage Loans after a specified delinquency threshold has been exceeded and the required percentage of Certificateholders vote to direct a review of such delinquent Mortgage Loans. An asset review will occur when either (1) Mortgage Loans with an aggregate outstanding principal balance of 25% or more of the aggregate outstanding principal balance of all of the Mortgage Loans (including any REO loans (or a portion of any REO loan in the case of a whole loan)) held by the issuing entity as of the end of the applicable collection period are delinquent loans or (2)(A) prior to and including the second anniversary of the Closing Date, at least 10 Mortgage Loans are delinquent loans as of the end of the applicable collection period and the outstanding principal balance of such delinquent loans in the aggregate constitutes at least 15% of the aggregate outstanding principal balance of all of the Mortgage Loans (including any REO loans (or a portion of any REO loan in the case of a whole loan)) held by the issuing entity as of the end of the applicable collection period, or (B) after the second anniversary of the Closing Date, at least 15 Mortgage Loans are delinquent loans as of the end of the applicable collection period and the outstanding principal balance of such delinquent loans in the aggregate constitutes at least 20% of the aggregate outstanding principal balance of all of the Mortgage Loans (including any REO loans (or a portion of any REO loan in the case of a whole loan)) held by the issuing entity as of the end of the applicable collection period.
The Asset Representations Reviewer may be terminated and replaced without cause. Upon (i) the written direction of Certificateholders evidencing not less than 25% of the voting rights (taking into account Realized Losses, but without regard to the application of any appraisal reduction amounts to notionally reduce the Certificate Balance of the certificates) requesting a vote to terminate and replace the Asset Representations Reviewer with a proposed successor asset representations reviewer that is an eligible asset representations reviewer, and (ii) payment by such holders to the Certificate Administrator of the reasonable fees and expenses to be incurred by the Certificate Administrator in connection with administering such vote, the Certificate Administrator will promptly provide notice to all Certificateholders and the Asset Representations Reviewer of such request by posting such notice on its internet website, and by mailing such notice to all Certificateholders and the Asset Representations Reviewer. Upon the written direction of Certificateholders evidencing at least 75% of a Certificateholder Quorum, the Trustee will terminate all of the rights and obligations of the Asset Representations Reviewer under the PSA by written notice to the Asset Representations Reviewer, and the proposed successor Asset Representations Reviewer will be appointed. See “Pooling and Servicing Agreement—The Asset Representations Reviewer” in the Preliminary Prospectus.
|
Dispute Resolution Provisions: |
| Each Mortgage Loan Seller will be subject to the dispute resolution provisions set forth in the PSA to the extent those provisions are triggered with respect to any Mortgage Loan sold to the depositor by such Mortgage Loan Seller and such Mortgage Loan Seller will be obligated under the related mortgage loan purchase agreement to comply with all applicable provisions and to take part in any mediation or arbitration proceedings that may result.
Generally, in the event that a repurchase request as described in the Preliminary Prospectus is not “Resolved” within 180 days after the related Mortgage Loan Seller receives such Repurchase Request, then the enforcing servicer will be required to send a notice to the initial requesting Certificateholder (if any) indicating the enforcing servicer’s intended course of action with respect to the Repurchase Request. If (a) the enforcing servicer’s intended course of action with respect to the Repurchase Request does not involve pursuing further action to exercise rights against the related Mortgage Loan Seller with respect to the Repurchase Request and the initial requesting Certificateholder, if any, or any other Certificateholder or Certificate Owner wishes to exercise its right to refer the matter to mediation (including nonbinding arbitration) or arbitration, or (b) the enforcing servicer’s intended course of action is to pursue further action to exercise rights against the related Mortgage Loan Seller with respect to the Repurchase Request but the initial requesting Certificateholder, if any, or any other Certificateholder or Certificate Owner does not agree with the dispute resolution method selected by the enforcing servicer, then the initial requesting Certificateholder, if any, or such other Certificateholder or Certificate Owner may deliver a written notice to the enforcing servicer indicating its intent to exercise its right to refer the matter to either mediation or arbitration.
“Resolved” means, with respect to a Repurchase Request, (i) that the related material defect or material breach has been cured, (ii) the related Mortgage Loan has been repurchased in accordance with the related mortgage loan purchase agreement, (iii) a mortgage loan has been substituted for the related Mortgage Loan in accordance with the related mortgage loan
|
THE INFORMATION IN THIS STRUCTURAL AND COLLATERAL TERM SHEET IS NOT COMPLETE AND MAY BE AMENDED PRIOR TO THE TIME OF SALE. THIS TERM SHEET IS NOT AN OFFER TO SELL THESE SECURITIES AND IT IS NOT A SOLICITATION OF AN OFFER TO BUY THESE SECURITIES IN ANY JURISDICTION WHERE THE OFFER OR SALE IS NOT PERMITTED.
19
Benchmark 2020-B16 Mortgage Trust
|
STRUCTURE OVERVIEW |
|
| purchase agreement, (iv) the applicable Mortgage Loan Seller made the loss of value payment, (v) a contractually binding agreement is entered into between the enforcing servicer, on behalf of the issuing entity, and the related Mortgage Loan Seller that settles the related Mortgage Loan Seller’s obligations under the related mortgage loan purchase agreement, or (vi) the related Mortgage Loan is no longer property of the issuing entity as a result of a sale or other disposition in accordance with the PSA. See “Pooling and Servicing Agreement—Dispute Resolution Provisions” in the Preliminary Prospectus.
|
Liquidated Loan Waterfall: |
| On liquidation of any Mortgage Loan, all net liquidation proceeds will be applied according to the PSA, so that amounts allocated as a recovery of accrued and unpaid interest will not, in the first instance, include (a) any amount by which the interest portion of P&I Advances previously made was reduced as a result of appraisal reduction amounts and (b) Accrued AB Loan Interest. After the adjusted interest amount is so allocated, any remaining net liquidation proceeds will be allocated to pay principal on the Mortgage Loan until the unpaid principal amount of the Mortgage Loan has been reduced to zero. Any remaining liquidation proceeds would then be allocated as a recovery of (a) accrued and unpaid interest corresponding to the amount by which the interest portion of P&I Advances previously made was reduced as a result of appraisal reduction amounts and (b) any Accrued AB Loan Interest. |
THE INFORMATION IN THIS STRUCTURAL AND COLLATERAL TERM SHEET IS NOT COMPLETE AND MAY BE AMENDED PRIOR TO THE TIME OF SALE. THIS TERM SHEET IS NOT AN OFFER TO SELL THESE SECURITIES AND IT IS NOT A SOLICITATION OF AN OFFER TO BUY THESE SECURITIES IN ANY JURISDICTION WHERE THE OFFER OR SALE IS NOT PERMITTED.
20
(THIS PAGE INTENTIONALLY LEFT BLANK)
21
350 Amsterdam Avenue New York, NY 10024 | Collateral Asset Summary – Loan No. 1 Harrison Retail | Cut-off Date Balance: Cut-off Date LTV: U/W NCF DSCR: U/W NOI Debt Yield: | $65,000,000 65.0% 2.20x 8.2% |
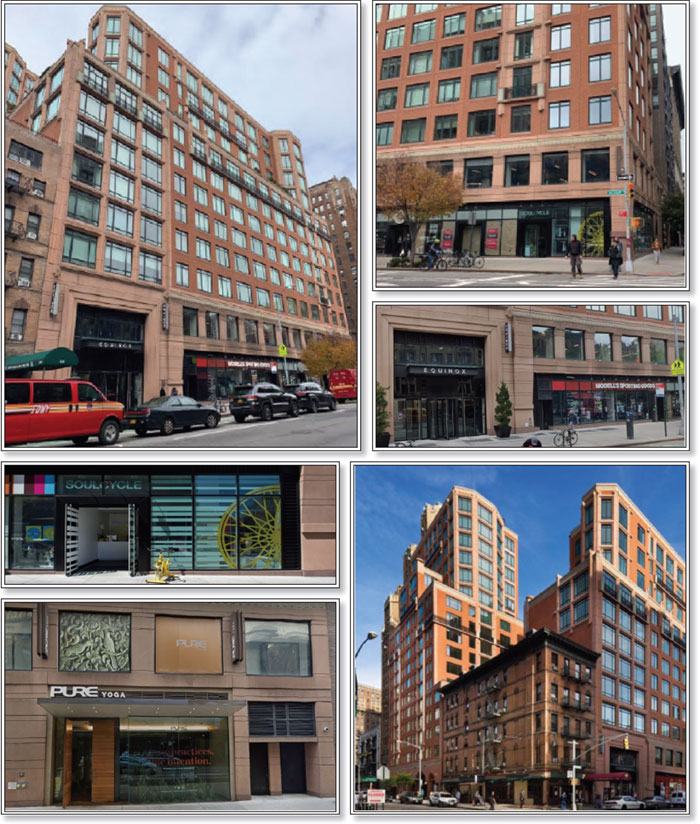
THE INFORMATION IN THIS STRUCTURAL AND COLLATERAL TERM SHEET IS NOT COMPLETE AND MAY BE AMENDED PRIOR TO THE TIME OF SALE. THIS TERM SHEET IS NOT AN OFFER TO SELL THESE SECURITIES AND IT IS NOT A SOLICITATION OF AN OFFER TO BUY THESE SECURITIES IN ANY JURISDICTION WHERE THE OFFER OR SALE IS NOT PERMITTED.
22
350 Amsterdam Avenue New York, NY 10024 | Collateral Asset Summary – Loan No. 1 Harrison Retail | Cut-off Date Balance: Cut-off Date LTV: U/W NCF DSCR: U/W NOI Debt Yield: | $65,000,000 65.0% 2.20x 8.2% |
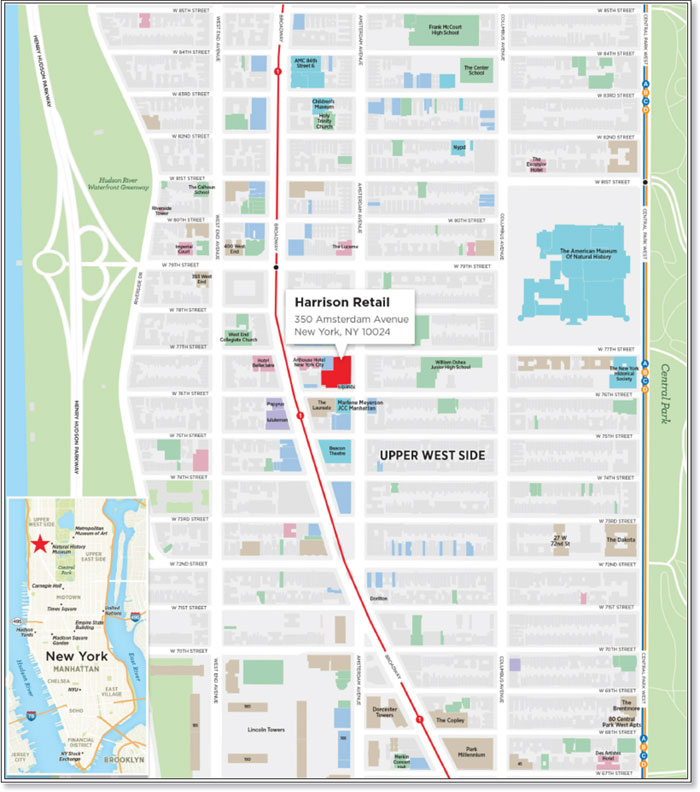
THE INFORMATION IN THIS STRUCTURAL AND COLLATERAL TERM SHEET IS NOT COMPLETE AND MAY BE AMENDED PRIOR TO THE TIME OF SALE. THIS TERM SHEET IS NOT AN OFFER TO SELL THESE SECURITIES AND IT IS NOT A SOLICITATION OF AN OFFER TO BUY THESE SECURITIES IN ANY JURISDICTION WHERE THE OFFER OR SALE IS NOT PERMITTED.
23
350 Amsterdam Avenue New York, NY 10024 | Collateral Asset Summary – Loan No. 1 Harrison Retail | Cut-off Date Balance: Cut-off Date LTV: U/W NCF DSCR: U/W NOI Debt Yield: | $65,000,000 65.0% 2.20x 8.2% |
Mortgage Loan Information | |
GACC | |
Refinance | |
The Related Companies, L.P. | |
Harrison Retail Associates LLC | |
$65,000,000 | |
$65,000,000 | |
7.2% | |
3.53000% | |
6th of each month | |
February 6, 2020 | |
January 6, 2030 | |
Interest Only | |
None | |
L(25), D(90), O(5) | |
Hard / Springing | |
Reserves(1) | |||
| Initial | Monthly | Cap |
Taxes: | $0 | Springing | NAP |
Insurance: | $0 | Springing | NAP |
Replacement: | $0 | Springing | NAP |
TI/LC: | $0 | Springing | NAP |
Free Rent: | $213,313 | NAP | NAP |
Lease Sweep: | $0 | Springing | NAP |
Condominium: | $0 | Springing | NAP |
Property Information | ||
Single Asset | ||
Anchored Retail | ||
Fee Simple | ||
New York, NY | ||
2009 / NAP | ||
88,254 | ||
Related Management Company, L.P. | ||
$5,307,028 | ||
$5,112,869 | ||
$100,000,000 | ||
November 20, 2019 | ||
| ||
Historical NOI | ||
Most Recent NOI: | $5,243,585 (T-9 September 30, 2019 Ann.) | |
2018 NOI: | $5,050,045 (December 31, 2018) | |
2017 NOI: | $5,237,375 (December 31, 2017) | |
2016 NOI: | $5,359,982 (December 31, 2016) | |
| ||
Historical Occupancy | ||
Most Recent Occupancy: | 100.0% (November 30, 2019) | |
2018 Occupancy: | 96.6% (December 31, 2018) | |
2017 Occupancy: | 96.6% (December 31, 2017) | |
2016 Occupancy: | 100.0% (December 31, 2016) | |
|
|
|
Financial Information | ||||||
Tranche | Cut-off Date Balance | Balance per Sq. Ft. Cut-off / Balloon | LTV Cut-off / Balloon | U/W DSCR NOI / NCF | U/W Debt Yield NOI / NCF | U/W Debt Yield at Balloon NOI / NCF |
Mortgage Loan | $65,000,000 | $737 / $737 | 65.0% / 65.0% | 2.28x / 2.20x | 8.2% / 7.9% | 8.2% / 7.9% |
(1) | See “Initial and Ongoing Reserves” herein. |
THE INFORMATION IN THIS STRUCTURAL AND COLLATERAL TERM SHEET IS NOT COMPLETE AND MAY BE AMENDED PRIOR TO THE TIME OF SALE. THIS TERM SHEET IS NOT AN OFFER TO SELL THESE SECURITIES AND IT IS NOT A SOLICITATION OF AN OFFER TO BUY THESE SECURITIES IN ANY JURISDICTION WHERE THE OFFER OR SALE IS NOT PERMITTED.
24
350 Amsterdam Avenue New York, NY 10024 | Collateral Asset Summary – Loan No. 1 Harrison Retail | Cut-off Date Balance: Cut-off Date LTV: U/W NCF DSCR: U/W NOI Debt Yield: | $65,000,000 65.0% 2.20x 8.2% |
The Loan. The Harrison Retail mortgage loan (the “Harrison Retail Loan”) has an outstanding principal balance as of the Cut-off Date of $65,000,000. The Harrison Retail Loan is secured by the borrower’s fee simple interest in one retail and one garage condominium unit totaling 88,254 sq. ft., located in New York, New York (the “Harrison Retail Property”).
The Harrison Retail Loan has a 10-year interest-only term and accrues interest at a rate of 3.53000% per annum. The Harrison Retail Loan was primarily used to repay the existing loan, fund upfront reserves, pay closing costs and return approximately $24.0 million to the borrower sponsor. Based on the “As Is” appraised value of $100 million as of November 20, 2019, the Cut-off Date LTV Ratio is 65.0%. The Harrison Retail Property was most recently financed in the COMM 2010-C1 securitization.
Sources and Uses | ||||||
Sources | Proceeds | % of Total |
| Uses | Proceeds | % of Total |
Mortgage Loan | $65,000,000 | 100.0% |
| Loan Payoff | $38,394,618 | 59.1% |
|
|
|
| Upfront Reserves | 213,313 | 0.3 |
|
|
|
| Closing Costs | 2,382,308 | 3.7 |
|
|
|
| Return of Equity | 24,009,761 | 36.9 |
Total Sources | $65,000,000 | 100.0% |
| Total Uses | $65,000,000 | 100.0% |
The Borrower / Borrower Sponsor. The borrower is Harrison Retail Associates LLC, a Delaware limited liability company structured to be a bankruptcy-remote entity with two independent directors in its organizational structure. Legal counsel to the borrower delivered a non-consolidation opinion in connection with the origination of the Harrison Retail Loan.
The borrower sponsor and non-recourse carveout guarantor is The Related Companies, L.P. (“Related”). Related is a privately owned real estate company with experience in development, acquisitions, management, finance, fund management, marketing, and sales. Related has over $60 billion of real estate assets owned or under development including mixed-use, residential, retail, office, and affordable properties in premier markets. Headquartered in New York City, Related has offices and significant real estate assets in Boston, Chicago, Los Angeles, San Francisco, South Florida, Washington, DC, Abu Dhabi, and London, and developed the 2.8 million sq. ft. Time Warner Center in New York City and the 72-acre Rosemary Square in West Palm Beach. Related is the developer of the Hudson Yards, a 28-acre 20 million sq. ft. property located on the West Side of Manhattan. In addition, Related has recently completed LEED-certified residential buildings including The Brompton, The Harrison, MiMA and Superior Ink in New York City, The Clarendon in Boston and The Century in Los Angeles. Related also owns Equinox Fitness Clubs and has a partnership interest in Union Square Events, a catering, culture, sports, and events business.
THE INFORMATION IN THIS STRUCTURAL AND COLLATERAL TERM SHEET IS NOT COMPLETE AND MAY BE AMENDED PRIOR TO THE TIME OF SALE. THIS TERM SHEET IS NOT AN OFFER TO SELL THESE SECURITIES AND IT IS NOT A SOLICITATION OF AN OFFER TO BUY THESE SECURITIES IN ANY JURISDICTION WHERE THE OFFER OR SALE IS NOT PERMITTED.
25
350 Amsterdam Avenue New York, NY 10024 | Collateral Asset Summary – Loan No. 1 Harrison Retail | Cut-off Date Balance: Cut-off Date LTV: U/W NCF DSCR: U/W NOI Debt Yield: | $65,000,000 65.0% 2.20x 8.2% |
The Property.
Tenant Summary(1) | ||||||
Tenant | Credit Rating (Fitch/Moody’s/S&P) | Net Rentable Area (Sq. Ft.) | % of Net Rentable Area | U/W Base Rent PSF | % of Total U/W Base Rent | Lease Expiration |
Equinox(2) | NR / NR / NR | 34,376 | 39.0% | $79.52 | 43.6% | 2/29/2024 |
Champion Parking | NR / NR / NR | 20,324 | 23.0% | $18.46 | 6.0% | 4/30/2030 |
Pure Yoga(2) | NR / NR / NR | 19,768 | 22.4% | $60.89 | 19.2% | 6/30/2030 |
Modell’s(3) | NR / NR / NR | 7,316 | 8.3% | $114.28 | 13.3% | 11/30/2020 |
SoulCycle(2)(4) | NR / NR / NR | 3,362 | 3.8% | $162.49 | 8.7% | 5/31/2030 |
Bond Vet(5) | NR / NR / NR | 1,824 | 2.1% | $163.66 | 4.8% | 7/15/2030 |
Juice Press | NR / NR / NR | 1,284 | 1.5% | $210.38 | 4.3% | 6/30/2030 |
Subtotal / Wtd. Avg. |
| 88,254 | 100.0% | $70.97 | 100.0% |
|
Vacant |
| 0 | 0.0% |
|
|
|
Total |
| 88,254 | 100.0% |
|
|
|
(1) | Based on the underwritten rent roll dated November 30, 2019. |
(2) | Equinox, Pure Yoga and SoulCycle are subsidiaries of the borrower sponsor, Related. |
(3) | Modell’s has been at the Harrison Retail Property since June 2010. The current store sq. ft. is in line with Modell’s current business plan of maintaining and opening stores within a range of 6,000 and 8,000 sq. ft. |
(4) | SoulCycle recently agreed to extend its lease for an additional 10-year term and expanded its space by 1,330 sq. ft. The expansion includes the construction of a locker room with additional bathrooms and showers. The SoulCycle expansion lease will commence upon substantial completion of the landlord’s work which is estimated to be completed in February 2020. SoulCycle leases (i) 2,032 sq. ft. with an U/W Base Rent of $187.02 PSF and (ii) 1,330 sq. ft. with an U/W Base Rent of $125.00 PSF. |
(5) | Bond Vet recently executed a lease which commenced in January 2020. Bond Vet has six months of free rent which was reserved for at loan origination. Bond Vet is currently building out its space and is expected to take occupancy and commence paying rent in June 2020. We cannot assure you that Bond Vet will take occupancy or commence paying rent as expected or at all. |
Lease Rollover Schedule(1) | ||||||||
Year | # of | Total | % of Total Sq. | Cumulative | Cumulative % | Annual U/W | % U/W Base | Cumulative % |
MTM | 0 | 0 | 0.0% | 0 | 0.0% | $0.00 | 0.0% | 0.0% |
2020 | 1 | 7,316 | 8.3% | 7,316 | 8.3% | $114.28 | 13.3% | 13.3% |
2021 | 0 | 0 | 0.0% | 7,316 | 8.3% | $0.00 | 0.0% | 13.3% |
2022 | 0 | 0 | 0.0% | 7,316 | 8.3% | $0.00 | 0.0% | 13.3% |
2023 | 0 | 0 | 0.0% | 7,316 | 8.3% | $0.00 | 0.0% | 13.3% |
2024 | 1 | 34,376 | 39.0% | 41,692 | 47.2% | $79.52 | 43.6% | 57.0% |
2025 | 0 | 0 | 0.0% | 41,692 | 47.2% | $0.00 | 0.0% | 57.0% |
2026 | 0 | 0 | 0.0% | 41,692 | 47.2% | $0.00 | 0.0% | 57.0% |
2027 | 0 | 0 | 0.0% | 41,692 | 47.2% | $0.00 | 0.0% | 57.0% |
2028 | 0 | 0 | 0.0% | 41,692 | 47.2% | $0.00 | 0.0% | 57.0% |
2029 | 0 | 0 | 0.0% | 41,692 | 47.2% | $0.00 | 0.0% | 57.0% |
2030 | 6 | 46,562 | 52.8% | 88,254 | 100.0% | $57.85 | 43.0% | 100.0% |
2031 & Thereafter | 0 | 0 | 0.0% | 88,254 | 100.0% | $0.00 | 0.0% | 100.0% |
Vacant | NAP | 0 | 0.0% | 88,254 | 100.0% | NAP | NAP |
|
Total / Wtd. Avg. | 8 | 88,254 | 100.0% |
|
| $70.97 | 100.0% |
|
(1) | Based on the underwritten rent roll dated November 30, 2019. |
The Harrison Retail Property consists of a four-level retail condominium unit and a garage condominium unit located along Amsterdam Avenue between West 76th Street and 77th Street in the Upper West Side of Manhattan. The Harrison Retail Property is situated at the base of a 127 unit, 16-story luxury residential condominium development (“The Harrison”) and was built in 2009 by Related. The retail portion (the “Retail Unit) totals approximately 67,930 sq. ft. across four floors and is anchored by Equinox (34,376 sq. ft.; 39.0% of NRA), which is located on the ground, second and lower levels. Juice Press, SoulCycle and Modell’s occupy the ground floor retail space, with Pure Yoga located in the lower level. The garage is located in two floors of the sub cellar and is leased to Champion Parking (20,324 sq. ft.; 58 spaces) (the “Garage Unit”).
The Harrison Retail Property is part of a condominium regime comprised of 127 residential units (non-collateral) (collectively, the “Residential Unit”) and a commercial unit (the “Commercial Unit”), which includes the Retail Unit and the Garage Unit. The owner of the Commercial Unit has the right to appoint two of the seven members on the condominium board and has a 24.697% common interest (with the remaining 75.303% common interest belonging to the Residential Unit owners). The Retail Unit benefits from a 421-a tax abatement expiring in fiscal year 2021/2022. The Garage Unit has no such tax abatement.
As of November 30, 2019, the Harrison Retail Property was 100.0% leased to seven distinct tenants. Since 2009, the Harrison Retail Property has maintained an occupancy of at least 96.6% each year. The tenants at the Harrison Retail Property are concentrated in the
THE INFORMATION IN THIS STRUCTURAL AND COLLATERAL TERM SHEET IS NOT COMPLETE AND MAY BE AMENDED PRIOR TO THE TIME OF SALE. THIS TERM SHEET IS NOT AN OFFER TO SELL THESE SECURITIES AND IT IS NOT A SOLICITATION OF AN OFFER TO BUY THESE SECURITIES IN ANY JURISDICTION WHERE THE OFFER OR SALE IS NOT PERMITTED.
26
350 Amsterdam Avenue New York, NY 10024 | Collateral Asset Summary – Loan No. 1 Harrison Retail | Cut-off Date Balance: Cut-off Date LTV: U/W NCF DSCR: U/W NOI Debt Yield: | $65,000,000 65.0% 2.20x 8.2% |
lifestyle/fitness sector, and have a weighted average lease term of 17.2 years. Equinox, Modell’s, Champion Parking, SoulCycle are all original tenants that have been at the Harrison Retail Property since construction.
Major Tenants.
Equinox (34,376 sq. ft.; 39.0% of NRA; 43.6% of U/W Base Rent) was founded in 1991 and is a luxury gym and fitness club with over 100 locations throughout North America and Europe. Equinox offers a members-only experience centered around health, wellness and community. Equinox offers athletic training, barre, cycling, dance, pilates, pool, running and yoga classes. Amenities at the Equinox include, spas, steam rooms, saunas, locker rooms with showers, laundry service, child day care and personal or group workout classes. Equinox operates fitness brands including Pure Yoga, Blink Fitness and SoulCycle. Equinox has been a tenant at the Harrison Retail Property since August 2008 and has two, five-year renewal options remaining. The base rent for the first renewal option is equal to the greater of (i) fair market value and (ii) $3,034,606 per year. The base rent for the second renewal option is equal to the greater of (i) fair market value and (ii) 112.0% of the prior year’s rent. Equinox has no termination options.
Champion Parking (20,324 sq. ft.; 23.0% of NRA; 6.0% of U/W Base Rent) is a family run New York City-based garage operater that has been in business since 1949. Champion Parking operates 40 garages across New York City that offer monthly and transient parking. Champion Parking has been a tenant at the Harrison Retail Property since May 2010 and has no renewal options remaining. Champion Parking has no termination options.
Pure Yoga (19,768 sq. ft.; 22.4% of NRA; 19.2% of U/W Base Rent) is a yoga studio offering a variety of fitness classes including yoga, barre, and conditioning. Pure Yoga was founded in Asia in 2002 before opening locations on the Upper East and West sides of Manhattan in 2008 when they partnered with Equinox. While some Pure Yoga locations operate within or through Equinox, the Equinox and Pure Yoga are separate tenants at the Harrison Retail Property. Pure Yoga has been a tenant at the Harrison Retail Property since December 2009 and has two, five-year renewal options remaining with a base rent equal to 95.0% of fair market value. Pure Yoga has no termination options.
Environmental Matters. The Phase I environmental report dated November 25, 2019 recommended no further action at the Harrison Retail Property.
The Market. The Harrison Retail Property is located in the Upper West Side defined as Broadway from West 60th Street to West 86th Street and Columbus Avenue from West 66th Street to West 72nd Street. The Upper West Side submarket is home to private schools, colleges, and also has access to two major parks: Central Park (to the east) and Riverside Park (to the west). Also located in the Upper West Side submarket are a number of upscale hotels along with major cultural institutions such as Lincoln Center for the Performing Arts, and the Museum of Natural History. The Harrison Retail Property is accessible by the No. 1, No. 2 and No. 3 buses and the A, B, C and D subway lines.
According to the appraisal, the Harrison Retail Property is located in the Upper West Side retail submarket. As of the third quarter of 2019, the Upper West Side retail submarket had an inventory of 327 retail units with a vacancy rate of 11.3%. The average asking rent over the same period for ground floor retail was $334 PSF.
The appraisal identified 12 directly competitive grade level retail lease comparables in the Upper West Side submarket. Comparable leases range in size from 1,000 sq. ft. to 4,300 sq. ft. The weighted average rent PSF is approximately $158.20.
Comparable Retail Leases(1) | |||||
Property Name | Tenant Name | Tenant Leased Space | Lease Date | Lease Term (years) | Base Rent PSF |
2050 Broadway | Lenscrafters | 1,380 | Oct-19 | 10 | $230.00 |
2038 Broadway | Charles Schwab | 4,300 | Aug-19 | 5 | $175.00 |
594 Amsterdam Avenue | Amsterdam Ale House | 2,000 | Jul-19 | 10 | $115.00 |
2409 Broadway | The Shade Store | 1,500 | Jun-19 | 10 | $155.00 |
2547 Broadway | Confidential Restaurant | 1,000 | Mar-19 | 10 | $180.00 |
158 West 72nd Street | Seven Hills Grill | 1,800 | Jan-19 | 10 | $133.00 |
377 Amsterdam Avenue | Tacombi | 4,206 | Aug-18 | 10 | $100.00 |
2187 Broadway | Confidential Spa | 1,000 | Jun-18 | 10 | $240.00 |
370 Columbus Avenue | Sushi of Gari | 2,000 | Feb-18 | 12 | $200.00 |
279 Amsterdam Avenue | Blue Bottle Café | 1,000 | Jan-18 | 10 | $240.00 |
466 Amsterdam Avenue | Bar Veloce | 1,037 | Jan-18 | 10 | $145.00 |
158 West 72nd Street | Turkish Grill | 1,800 | Jan-18 | 10 | $133.00 |
(1) | Source: Appraisal. |
THE INFORMATION IN THIS STRUCTURAL AND COLLATERAL TERM SHEET IS NOT COMPLETE AND MAY BE AMENDED PRIOR TO THE TIME OF SALE. THIS TERM SHEET IS NOT AN OFFER TO SELL THESE SECURITIES AND IT IS NOT A SOLICITATION OF AN OFFER TO BUY THESE SECURITIES IN ANY JURISDICTION WHERE THE OFFER OR SALE IS NOT PERMITTED.
27
350 Amsterdam Avenue New York, NY 10024 | Collateral Asset Summary – Loan No. 1 Harrison Retail | Cut-off Date Balance: Cut-off Date LTV: U/W NCF DSCR: U/W NOI Debt Yield: | $65,000,000 65.0% 2.20x 8.2% |
Cash Flow Analysis.
Cash Flow Analysis | ||||||
2016 | 2017 | 2018 | T-9 9/30/2019 Annualized | U/W | U/W PSF | |
Base Rent(1) | $5,692,763 | $5,665,198 | $5,459,974 | $5,749,252 | $6,263,499 | $70.97 |
Rent Steps(2) | 0 | 0 | 0 | 0 | 167,561 | 1.90 |
Vacant Income | 0 | 0 | 0 | 0 | 0 | 0.00 |
Gross Potential Rent | $5,692,763 | $5,665,198 | $5,459,974 | $5,749,252 | $6,431,060 | $72.87 |
Total Reimbursements | 880,200 | 1,166,442 | 1,313,110 | 1,241,651 | 1,797,090 | 20.36 |
Other Income | 115,931 | 118,979 | 167,194 | 307,219 | 142,140 | 1.61 |
Less: Vacancy | 0 | 0 | 0 | 0 | (418,514) | (4.74) |
Effective Gross Income | $6,688,894 | $6,950,619 | $6,940,278 | $7,298,121 | $7,951,775 | $90.10 |
Total Fixed Expenses(3) | 908,323 | 1,137,582 | 1,347,604 | 1,494,023 | 1,883,447 | 21.34 |
Total Operating Expenses | 420,589 | 575,662 | 542,629 | 560,513 | 761,300 | 8.63 |
Net Operating Income | $5,359,982 | $5,237,375 | $5,050,045 | $5,243,585 | $5,307,028 | $60.13 |
TI/LC | 18,883 | 0 | 0 | 4,524 | 176,508 | 2.00 |
Capital Expenditures | 0 | 0 | 0 | 631 | 17,651 | 0.20 |
Net Cash Flow | $5,341,100 | $5,237,375 | $5,050,045 | $5,238,431 | $5,112,869 | $57.93 |
|
|
|
|
|
| |
(1) | U/W Base Rent is based on the underwritten rent roll dated November 30, 2019. |
(2) | Rent Steps represent contractual rent increases through October 2020. |
(3) | The Retail Unit benefits from a 421-a tax abatement expiring in fiscal year 2021/2022. The Garage Unit has no such tax abatement. The taxes are underwritten to the sponsor’s budgeted figure of $1,883,447. The fully unabated taxes for the 2019/2020 fiscal year are equal to $2,051,466. |
Property Management. The Harrison Retail Property is managed by Related Management Company, L.P., an affiliate of the borrower sponsor.
Lockbox / Cash Management. The Harrison Retail Loan is structured with a hard lockbox and springing cash management. At origination, a clearing account controlled by the lender (the “Clearing Account”) was established by the borrower, into which all rents, revenues and receipts from the Harrison Retail Property are required to be deposited directly by the tenants. If a Trigger Period (as defined below) exists, sums on deposit in the deposit account will be applied to payment of all monthly amounts due under the loan documents (including, without limitation, taxes and insurance reserves, debt service and all other required reserves) and property operating expenses incurred pursuant to an approved budget, with any excess funds held by the lender as additional collateral for the Harrison Retail Loan (provided that upon the occurrence of an event of default under the loan documents, the funds in the cash management account may be applied to amounts owed under the loan documents in such amounts, order and manner as the lender will elect in its sole discretion). If no Trigger Period exists, the funds in the clearing account will be swept on each business day into the borrower’s operating account and, if a Trigger Period exists, such funds will be swept on each business day into a deposit account controlled by the lender.
A “Trigger Period” will occur upon (i) an event of default under the loan documents, (ii) the commencement of a Lease Sweep Period (as defined below) or (iii) the commencement of a Low Debt Yield Period (as defined below).
A “Low Debt Yield Period” will occur if the debt yield is less than 6.00% at the end of any calendar quarter. A Low Debt Yield Period will cease to exist if such combined debt yield is at least 6.00% at the end of any two consecutive quarters. The debt yield may be tested by the lender quarterly.
A “Lease Sweep Period” will occur upon (a) the occurrence of a Lease Sweep Tenant (as defined below) insolvency proceeding, (b) a material monetary or non-monetary default by a Lease Sweep Tenant, (c) the date a Lease Sweep Tenant “goes dark” and ceases operations in a majority of its Lease Sweep Lease (as defined below) space, (d) the date the borrower or property manager receives written notice from the Lease Sweep Tenant that it is electing to surrender, cancel or terminate its lease or electing to not renew its lease or (e) the earlier of (i) the date that is six months prior to the expiration of a Lease Sweep Lease or (ii) the date required under a Lease Sweep Lease by which the Lease Sweep Tenant is required to give notice of its exercise of a renewal option (and such renewal has not been so exercised).
A Lease Sweep Period will end upon, (i) with respect to clause (a) above, the applicable tenant insolvency proceeding has terminated, (ii) with respect to clause (b) above, upon the date the default has been cured by the Lease Sweep Tenant, (iii) with respect to clause (c), (d) and (e) above, the portion of the Lease Sweep Lease space in which Lease Sweep Tenant has “gone dark” or the portion that has been contracted, surrendered, canceled, terminated or not renewed, as applicable, is leased pursuant to one or more qualified leases, (iv) with respect to clause (c) above, the date the Lease Sweep Tenant is no longer “dark” and operations are being conducted in a
THE INFORMATION IN THIS STRUCTURAL AND COLLATERAL TERM SHEET IS NOT COMPLETE AND MAY BE AMENDED PRIOR TO THE TIME OF SALE. THIS TERM SHEET IS NOT AN OFFER TO SELL THESE SECURITIES AND IT IS NOT A SOLICITATION OF AN OFFER TO BUY THESE SECURITIES IN ANY JURISDICTION WHERE THE OFFER OR SALE IS NOT PERMITTED.
28
350 Amsterdam Avenue New York, NY 10024 | Collateral Asset Summary – Loan No. 1 Harrison Retail | Cut-off Date Balance: Cut-off Date LTV: U/W NCF DSCR: U/W NOI Debt Yield: | $65,000,000 65.0% 2.20x 8.2% |
majority of its space and (v) with respect to clause (a), (b), (c), (d) and (e) above, the date on which (i) to the extent a portion of the applicable Lease Sweep Lease space has not been re-tenanted, the amount of lease sweep funds deposited into the lease sweep account (including any Lease Sweep Lease termination payments deposited into the lease sweep account) is equal to the applicable Lease Sweep Deposit Amount (as defined below) with respect to such vacant space, and (ii) to the extent a portion of the applicable Lease Sweep Lease space has been re-tenanted pursuant to one or more qualified leases, sufficient funds (in addition to the Lease Sweep Deposit Amount), if the amounts on deposit in the lease sweep account are insufficient, have been accumulated in the Lease Sweep Account to cover all required approved Lease Sweep Lease space leasing expenses, free rent periods, and/or rent abatement periods set forth in all such qualified leases and all other landlord obligations of an inducement nature with respect to such qualified leases If the borrower funds the amounts required in this clause (v), no other action will be required on the part of the borrower to cure the Lease Sweep Period.
A “Lease Sweep Lease” means each of (i) the Equinox lease, and any replacement lease covering a majority of the space currently demised under the Equinox lease, and (ii) the Modell’s lease, and any replacement lease covering a majority of the space currently demised under the Modell’s lease.
A “Lease Sweep Tenant” means the then current tenant under a Lease Sweep Lease and any guarantor under the lease.
A “Lease Sweep Deposit Amount” means if a Lease Sweep Period has commenced and is continuing, an amount equal to the total rentable sq. ft. that has not been re-tenanted or renewed of the applicable Lease Sweep Lease, multiplied by $75.00.
Initial and Ongoing Reserves. At loan origination, the borrower deposited approximately $213,313 into a free rent reserve related to the execution of the Bond Vet lease (approximately $149,260) and the SoulCycle expansion space (approximately $64,053). Upon the commencement of a Trigger Period other than a Trigger Period caused solely by the continuance of a Lease Sweep Period, the borrower will be required to make monthly payments of (i) 1/12th of the property taxes estimated over the next year into a tax reserve, (ii) 1/12th of the estimated annual insurance premiums into an insurance reserve, unless an acceptable blanket insurance policy is in place, (iii) $1,470.90 into a replacement reserve, (iv) $11,031.75 into a rollover reserve and (v) 1/12th of the estimated annual common charges.
Current Mezzanine or Subordinate Indebtedness. None.
Future Mezzanine or Subordinate Indebtedness Permitted. None.
Partial Release. None.
THE INFORMATION IN THIS STRUCTURAL AND COLLATERAL TERM SHEET IS NOT COMPLETE AND MAY BE AMENDED PRIOR TO THE TIME OF SALE. THIS TERM SHEET IS NOT AN OFFER TO SELL THESE SECURITIES AND IT IS NOT A SOLICITATION OF AN OFFER TO BUY THESE SECURITIES IN ANY JURISDICTION WHERE THE OFFER OR SALE IS NOT PERMITTED.
29
3600 South Las Vegas Boulevard Las Vegas, NV 89109 | Collateral Asset Summary – Loan No. 2 Bellagio Hotel and Casino | Cut-off Date Balance: Cut-off Date LTV: U/W NCF DSCR: U/W NOI Debt Yield: | $60,000,000 39.3% 8.42x 28.3% |

THE INFORMATION IN THIS STRUCTURAL AND COLLATERAL TERM SHEET IS NOT COMPLETE AND MAY BE AMENDED PRIOR TO THE TIME OF SALE. THIS TERM SHEET IS NOT AN OFFER TO SELL THESE SECURITIES AND IT IS NOT A SOLICITATION OF AN OFFER TO BUY THESE SECURITIES IN ANY JURISDICTION WHERE THE OFFER OR SALE IS NOT PERMITTED.
30
3600 South Las Vegas Boulevard Las Vegas, NV 89109 | Collateral Asset Summary – Loan No. 2 Bellagio Hotel and Casino | Cut-off Date Balance: Cut-off Date LTV: U/W NCF DSCR: U/W NOI Debt Yield: | $60,000,000 39.3% 8.42x 28.3% |
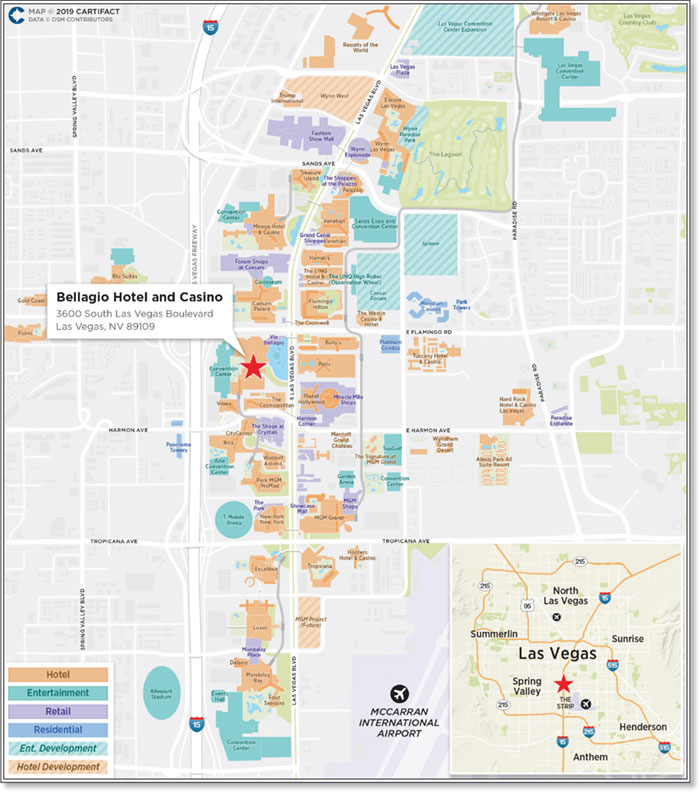
THE INFORMATION IN THIS STRUCTURAL AND COLLATERAL TERM SHEET IS NOT COMPLETE AND MAY BE AMENDED PRIOR TO THE TIME OF SALE. THIS TERM SHEET IS NOT AN OFFER TO SELL THESE SECURITIES AND IT IS NOT A SOLICITATION OF AN OFFER TO BUY THESE SECURITIES IN ANY JURISDICTION WHERE THE OFFER OR SALE IS NOT PERMITTED.
31
3600 South Las Vegas Boulevard Las Vegas, NV 89109 | Collateral Asset Summary – Loan No. 2 Bellagio Hotel and Casino | Cut-off Date Balance: Cut-off Date LTV: U/W NCF DSCR: U/W NOI Debt Yield: | $60,000,000 39.3% 8.42x 28.3% |
Mortgage Loan Information | |
JPMCB/CREFI | |
Acquisition | |
| |
BBB-sf / AA+(sf) / A1(sf) | |
BREIT Operating Partnership L.P. | |
BCORE Paradise LLC | |
$60,000,000 | |
$60,000,000 | |
6.7% | |
3.170153% | |
5th of each month | |
January 5, 2020 | |
December 5, 2029 | |
Interest Only | |
$1,616,200,000 Pari Passu Debt; $650,500,000 B-Notes; $683,300,000 C-Notes; Future Mezzanine Debt Permitted | |
YM0.5(26), DorYM0.5(87), O(7) | |
Hard / Springing | |
Reserves(5) | |||
| Initial | Monthly | Cap |
Taxes: | $0 | Springing | NAP |
Insurance: | $0 | Springing | NAP |
FF&E: | $0 | Springing | NAP |
| |||
Property Information | ||
Single Asset | ||
Full Service Hospitality | ||
Fee Simple / Leasehold | ||
Las Vegas, NV | ||
1997 / 2019 | ||
3,933 | ||
Self-Managed | ||
$474,065,315 | ||
$453,829,378 | ||
$4,260,000,000 | ||
October 16, 2019 | ||
| ||
| ||
Historical NOI(8) | ||
Most Recent NOI: | $474,065,315 (T-12 September 30, 2019) | |
2018 NOI: | $489,866,042 (December 31, 2018) | |
2017 NOI: | $505,736,234 (December 31, 2017) | |
2016 NOI: | $480,822,095 (December 31, 2016) | |
| ||
Historical Occupancy | ||
Most Recent Occupancy(6): | 94.8% (September 30, 2019) | |
2018 Occupancy(6): | 94.9% (December 31, 2018) | |
2017 Occupancy(6): | 92.9% (December 31, 2017) | |
2016 Occupancy(6): | 93.5% (December 31, 2016) | |
|
|
|
Financial Information(2) | ||||||
Tranche | Cut-off Date Balance | Balance per Room Cut-off / Balloon | LTV(7) Cut-off / Balloon | U/W DSCR(8) NOI / NCF | U/W Debt Yield(8) NOI / NCF | U/W Debt Yield at Balloon(8) NOI / NCF |
Mortgage Loan | $60,000,000 |
|
|
|
|
|
Pari Passu Notes | $1,616,200,000 |
|
|
|
|
|
Total Senior Notes | $1,676,200,000 | $426,189 / $426,189 | 39.3% / 39.3% | 8.80x / 8.42x | 28.3% / 27.1% | 28.3% / 27.1% |
B Notes | $650,500,000 |
|
|
|
|
|
C Notes | $683,300,000 |
|
|
|
|
|
Whole Loan | $3,010,000,000 | $765,319 / $765,319 | 70.7% / 70.7% | 4.24x / 4.06x | 15.7% / 15.1% | 15.7% / 15.1% |
(1) | The Bellagio Hotel and Casino Whole Loan (as defined below) was co-originated by Morgan Stanley Bank, N.A. (“MSBNA”), JPMorgan Chase Bank, National Association (“JPMCB”) and Citi Real Estate Funding Inc. (“CREFI”). |
(2) | The Bellagio Hotel and Casino Loan (as defined below) is part of the Bellagio Hotel and Casino Whole Loan, which is comprised of (i) 23 pari passu senior promissory notes with an aggregate Cut-off Date balance of $1,676,200,000 (the “Bellagio Hotel and Casino Senior Notes,” and collectively, the “Bellagio Hotel and Casino Senior Loan”), (ii) six promissory notes with an aggregate Cut-off Date balance of $650,500,000 which are pari passu with each other and subordinate to the Bellagio Hotel and Casino Senior Notes (the “Bellagio Hotel and Casino Junior A Notes”), and (iii) three promissory notes with an aggregate Cut-off Date balance of $683,300,000 which are pari passu with each other and subordinate to the Bellagio Hotel and Casino Senior Notes and the Bellagio Hotel and Casino Junior A Notes (the “Bellagio Hotel and Casino Junior B Notes” and collectively with the Bellagio Hotel and Casino Junior A Notes, the “Bellagio Hotel and Casino Subordinate Companion Loan”). |
(3) | Reflects the Bellagio Hotel and Casino Senior Notes only. The Bellagio Hotel and Casino Junior A Notes also accrue interest at the rate of 3.170153% per annum. The Bellagio Hotel and Casino Junior B Notes accrue interest at the rate of 5.35000% per annum. |
(4) | The defeasance lockout period will be 26 payments beginning with and including the first payment date of January 5, 2020. The Bellagio Hotel and Casino Borrower (as defined below) has the option to defease the full Bellagio Hotel and Casino Whole Loan after the earlier to occur of (i) two years after the closing date of the securitization that includes the last note to be securitized and (ii) November 15, 2022. The Bellagio Hotel and Casino Whole Loan may be prepaid in whole or in part at any time, subject to payment of the applicable yield maintenance premium if such prepayment occurs prior to June 5, 2029. |
(5) | See “Initial and Ongoing Reserves” herein. |
(6) | Size and Occupancy are based solely on the hotel at the Bellagio Hotel and Casino Property (as defined below). As of the trailing 12 months ended September 30, 2019, approximately 29.6% of revenues were from gaming, 28.4% from hotel, 24.7% from food & beverage 9.0% from entertainment and 8.3% from other sources. |
(7) | The Appraised Value of $4,260,000,000 set forth above is the appraised value solely with respect to real property at the Bellagio Hotel and Casino Property, excluding personal property and intangible property attributable to the Bellagio Hotel and Casino Property (the “Real Property Appraised Value”). The appraisal also includes an “As Leased-Sale-Leaseback Appraised Value,” which is equal to the Real Property Appraised Value. The Appraised Value of $6,500,000,000 (“As-Is Appraised Value”) includes personal property and intangible property attributable to the Bellagio Hotel and Casino Property. The personal property and intangible property relating to the Bellagio Hotel and Casino Property are owned by the Bellagio Tenant (as defined below), as more particularly provided in the Bellagio Lease (as defined below), which granted a security interest in certain property of Bellagio Tenant (with certain exclusions as more particularly described in the Bellagio Lease) in favor of the Bellagio Hotel and Casino Borrower (as defined below), and such security interest was collaterally assigned by the Bellagio Hotel and Casino Borrower to the lender. The Cut-off Date LTV Ratio and LTV Ratio at Maturity based on the As-Is Appraised Value are 25.8% and 25.8%, respectively, based on the Bellagio Hotel and Casino Senior Loan. |
(8) | The Bellagio Hotel and Casino Property was acquired by the Bellagio Hotel and Casino Borrower in a sale-leaseback transaction from Bellagio, LLC, an indirectly wholly owned subsidiary of MGM Resorts International, which entered into a new 30-year lease, with two 10-year extension options to operate the Bellagio Hotel and Casino Property. The Bellagio Tenant owns a 5% equity interest in the Bellagio Hotel and Casino Borrower. Financial and other information presented in this term sheet is presented on a “look through” basis, before rent due under the Bellagio Lease. For so long as the Bellagio Lease is in effect, the Bellagio Hotel and Casino Borrower will be entitled only to the rent due under the Bellagio Lease and not to the underlying rent and other income from the Bellagio Hotel and Casino Property. The initial Bellagio Lease annual rent is $245,000,000, and U/W NCF DSCR, U/W NCF Debt Yield and U/W NCF Debt Yield at Maturity for the Bellagio Hotel and Casino Whole Loan based on such initial annual rent are 2.19x, 8.1% and 8.1% respectively. |
(9) | Fitch, KBRA and Moody’s provided the listed assessments for the Bellagio Hotel and Casino Loan in the context of its inclusion in the mortgage pool. |
THE INFORMATION IN THIS STRUCTURAL AND COLLATERAL TERM SHEET IS NOT COMPLETE AND MAY BE AMENDED PRIOR TO THE TIME OF SALE. THIS TERM SHEET IS NOT AN OFFER TO SELL THESE SECURITIES AND IT IS NOT A SOLICITATION OF AN OFFER TO BUY THESE SECURITIES IN ANY JURISDICTION WHERE THE OFFER OR SALE IS NOT PERMITTED.
32
3600 South Las Vegas Boulevard Las Vegas, NV 89109 | Collateral Asset Summary – Loan No. 2 Bellagio Hotel and Casino | Cut-off Date Balance: Cut-off Date LTV: U/W NCF DSCR: U/W NOI Debt Yield: | $60,000,000 39.3% 8.42x 28.3% |
The Loan. The Bellagio Hotel and Casino mortgage loan (the “Bellagio Hotel and Casino Loan”) is part of a fixed rate whole loan secured by the borrower’s fee simple and leasehold interest in an approximately 3,933 key full service hotel located in Las Vegas, Nevada (the “Bellagio Hotel and Casino Property”). The Bellagio Hotel and Casino Loan is evidenced by the non-controlling Notes A-2-C2 and A-3-C2 with an aggregate original principal balance and outstanding principal balance as of the Cut-off Date of $60.0 million. The Bellagio Hotel and Casino Loan is part of a $3.01 billion whole loan that is evidenced by 32 promissory notes (the “Bellagio Hotel and Casino Whole Loan”). Only the Bellagio Hotel and Casino Loan will be included in the mortgage pool for the Benchmark 2020-B16 mortgage trust.
The relationship between the holders of the Bellagio Hotel and Casino Whole Loan will be governed by a co-lender agreement as described under “Description of the Mortgage Pool—The Whole Loans—The Non-Serviced AB Whole Loans—The Bellagio Hotel and Casino Whole Loan” in the Preliminary Prospectus.
Whole Loan Summary | ||||||
Note | Original Balance | Cut-off Date Balance |
| Note Holder | Controlling Piece | |
Note A-2-C2, A-3-C2 | $60,000,000 | $60,000,000 |
| Benchmark 2020-B16 | No | |
Note A-1-C1 | $100,000,000 | $100,000,000 |
| BANK 2020-BNK25(1) | No | |
Note A-2-C1 | $60,000,000 | $60,000,000 |
| GSMS 2020-GC45(2) | No | |
Note A-1-S1, A-1-S2, A-2-S1, A-2-S2, A-3-S1, A-3-S2 | $716,000,000 | $716,000,000 |
| BX 2019-OC11 | Yes(3) | |
Note A-1-RL, A-2-RL, A-3-RL | $360,200,000 | $360,200,000 |
| Third party investor | No | |
Note A-1-C2, A-1-C3, A-1-C4, A-1-C5 | $200,000,000 | $200,000,000 |
| MSNBA(4) | No | |
Note A-2-C3 | $60,000,000 | $60,000,000 |
| CREFI(4) | No | |
Note A-3-C1, A-3-C3, A-3-C4, A-3-C5, A-3-C6 | $120,000,000 | $120,000,000 |
| JPMCB(4) | No | |
Total Senior Notes | $1,676,200,000 | $1,676,200,000 |
|
|
| |
Note B-1-S, B-2-S, B-3-S | $510,700,000 | $510,700,000 |
| BX 2019-OC11 | No | |
Note B-1-RL, B-2-RL, B-3-RL | $139,800,000 | $139,800,000 |
| Third party investor | No | |
Total Junior A Notes | $650,500,000 | $650,500,000 |
|
|
| |
Note C-1-S, C-2-S, C-3-S | $683,300,000 | $683,300,000 |
| BX 2019-OC11 | No(5) | |
Whole Loan | $3,010,000,000 | $3,010,000,000 |
|
|
| |
|
|
|
|
|
|
|
(1) | The BANK 2020-BNK25 transaction is expected to close on or about February 13, 2020. |
(2) | The GSMS 2020-GC45 transaction is expected to close prior to the Closing Date. |
(3) | The controlling note is Note A-1-S1. |
(4) | Expected to be contributed to one or more future securitization transactions. |
(5) | The Bellagio Hotel and Casino Junior A Notes are subordinate to the Bellagio Hotel and Casino Senior Notes, and the Bellagio Hotel and Casino Junior B Notes are subordinate to the Bellagio Hotel and Casino Senior Notes and the Bellagio Hotel and Casino Junior A Notes. |
The Bellagio Hotel and Casino Whole Loan has a ten-year interest-only term. The Bellagio Hotel and Casino Senior Notes and Junior A Notes accrue at the rate of 3.170153% per annum. The Bellagio Hotel and Casino Junior B Notes accrue interest at the rate of 5.35000% per annum. The Bellagio Hotel and Casino Whole Loan proceeds along with borrower sponsor equity were used to purchase the Bellagio Hotel and Casino Property for approximately $4.25 billion. Based on the “As-Is” Appraised Value of $6.5 billion as of October 16, 2019, the Cut-off Date LTV and Maturity Date LTV for the Bellagio Hotel and Casino Senior Loan are 25.8% and 25.8%, respectively.
Sources and Uses | ||||||
Sources | Proceeds | % of Total |
| Uses | Proceeds | % of Total |
Senior Notes | $1,676,200,000 | 39.3% |
| Purchase Price | $4,250,000,000 | 99.8% |
Junior A Notes | 1,333,800,000 | 31.3 |
| Closing Costs | 10,591,035 | 0.2 |
Sponsor Equity(1) | 1,250,591,035 | 29.4 |
|
|
|
|
Total Sources | $4,260,591,035 | 100.0% |
| Total Uses | $4,260,591,035 | 100.0% |
(1) | Includes MGM’s approximately $62.4 million of retained equity interest in the Bellagio Hotel and Casino Property after the sale-leaseback. |
The Borrower / Borrower Sponsor. The borrower is BCORE Paradise LLC (the “Bellagio Hotel and Casino Borrower”), a Delaware limited liability company and single purpose entity with two independent directors. BREIT Operating Partnership L.P. (“BREIT OP”) is the borrower sponsor and the non-recourse carveout guarantor. BREIT OP is a subsidiary of Blackstone Real Estate Investment Trust, Inc. (“BREIT”). BREIT is a non-traded REIT focused on investing in commercial real estate properties diversified by sector with an emphasis on providing investors with access to Blackstone’s institutional real estate investment platform. BREIT seeks to directly own stabilized income-generating United States commercial real estate across the key property types, including multifamily, industrial, retail, hotel, healthcare and office. BREIT is managed by an external advisor, BX REIT Advisors L.L.C., which is an affiliate of The Blackstone Group Inc. (“Blackstone”). Blackstone’s real estate assets under management included 144,000 hotel rooms as of June 30, 2019, making Blackstone one of the largest hospitality investors in the United States. Blackstone’s experience of owning and managing hotels includes Cosmopolitan Las Vegas, Hotel Del Coronado, Grand Wailea, Arizona Biltmore, Ritz Carlton Kapalua, and Turtle Bay Resort. Legal counsel to the borrower delivered a non-consolidation opinion in connection with the origination of the Bellagio Hotel and Casino Whole Loan.
THE INFORMATION IN THIS STRUCTURAL AND COLLATERAL TERM SHEET IS NOT COMPLETE AND MAY BE AMENDED PRIOR TO THE TIME OF SALE. THIS TERM SHEET IS NOT AN OFFER TO SELL THESE SECURITIES AND IT IS NOT A SOLICITATION OF AN OFFER TO BUY THESE SECURITIES IN ANY JURISDICTION WHERE THE OFFER OR SALE IS NOT PERMITTED.
33
3600 South Las Vegas Boulevard Las Vegas, NV 89109 | Collateral Asset Summary – Loan No. 2 Bellagio Hotel and Casino | Cut-off Date Balance: Cut-off Date LTV: U/W NCF DSCR: U/W NOI Debt Yield: | $60,000,000 39.3% 8.42x 28.3% |
The non-recourse carveout guarantor’s liability for bankruptcy related recourse events is capped at an amount equal to 10% of the aggregate outstanding principal balance of the Bellagio Hotel and Casino Whole Loan as of the date of the event. In addition, only the related single purpose entity borrower, and not the non-recourse carveout guarantor, is liable for breaches of environmental covenants, and the single purpose entity borrower is the only party liable under the environmental indemnity; provided, however, that if the Bellagio Hotel and Casino Borrower fails to maintain an environmental insurance policy required under the loan documents, the non-recourse carveout guarantor is liable for losses other than (x) for any amounts in excess of the applicable coverage amounts under the environmental policy had the same been renewed, replaced or extended as required under the loan agreement and (y) for any amounts recovered under the environmental policy. In addition, recourse for transfers of the Bellagio Hotel and Casino Property or controlling equity interests in the Bellagio Hotel and Casino Borrower is loss recourse, rather than full recourse.
The Property. The Bellagio Hotel and Casino Property is a full-service luxury resort and casino property located on the Las Vegas Strip, between The Cosmopolitan and Caesar’s Palace, and across from the Paris Las Vegas Hotel & Casino and Bally’s Las Vegas Hotel & Casino. The Bellagio covers approximately 77 acres and consists of 3,933 hotel rooms and suites in two hotel towers – the Main Tower and the Spa Tower. The Main Tower offers panoramic views of the Las Vegas Strip and the Fountains of Bellagio. The Bellagio Hotel and Casino Property contains approximately 154,000 sq. ft. of casino space, featuring approximately 1,700 slot machines and 144 gaming tables, approximately 200,000 sq. ft. of event space, 29 food and beverage outlets, an approximately 55,000 sq. ft. spa, five swimming pools, approximately 85,000 sq. ft. of retail space featuring approximately 30 retailers, and a botanical garden. The Bellagio is also the home to Cirque du Soleil’s “O”, an aquatic, acrobatic theater production that has been in residence at the Bellagio since October 1998. Guestrooms range from one to three bedrooms. Standard room amenities include a flat-panel television, high-speed internet and 24-hour in room dining. The guest bathrooms are finished with porcelain tile flooring and tub/shower surrounds, granite vanity countertops, and wall-mounted lighting fixtures. Additional amenities include access to five outdoor swimming pools with 51 private cabanas, four whirlpools, two wedding chapels, a fitness center, a spa, a salon and barber shop, concierge services, the Fountains of Bellagio, the Bellagio Gallery of Fine Art, the Conservatory and Botanical Gardens, on-site entertainment, retail outlets, a FedEx business center and transportation services.
Approximately $371.9 million (approximately $94,600 per key) has been invested in the Bellagio Hotel and Casino Property since 2010, including approximately $165 million on room renovations (approximately $42,000 per key). In 2011 and 2012 the Bellagio Hotel and Casino Property underwent a $66.6 million renovation on the Main Tower and a $39.7 million renovation on the Spa Tower. ADR increased 2.9% from 2011 to 2012 and an additional 2.8% from 2012 to 2013. In 2014 and 2015 the Bellagio Hotel and Casino Property underwent a $59.1 million renovation on the suites in the Main Tower. Total hotel operating revenue increased to approximately $363.7 million in 2016, representing a 6.3% year over year increase compared to 2015. ADR increased 5.1% year over year and RevPAR increased 5.5% in the same time period. Approximately $12.8 million was spent on the renovation of Sadelle’s and Spago restaurants. Sadelle’s replaced Café Bellagio in December 2018 and Spago opened in June 2018, replacing Todd English Olives.
The Bellagio Hotel and Casino Property was acquired by the Bellagio Hotel and Casino Borrower in a sale-leaseback transaction from Bellagio, LLC (the “Bellagio Tenant”), an indirectly wholly owned subsidiary of MGM Resorts International (“MGM”), which entered into a new 30-year lease, with two 10-year extension options (the “Bellagio Lease”) to operate the Bellagio Hotel and Casino Property. Under the Bellagio Lease, the Bellagio Tenant is required to pay to the Bellagio Hotel and Casino Borrower an initial lease rent of $245.0 million per annum (the “Bellagio Lease Rent”), subject to annual increases of (i) 2.0% for the first 10 years of the lease term, and (ii) thereafter, the greater of 2.0% or the United States Department of Labor, Bureau of Labor Statistics Revised Consumer Price Index for All Urban Consumers (1982-84=100), U.S. City Average (“CPI”) (capped at 3.0% in years 11-20 and 4.0% thereafter) for the remainder of the initial lease term. MGM (NYSE: MGM, rated Ba3/BB/BB- by Moody’s, Fitch and S&P) guarantees the payment and performance of all monetary obligations and certain other obligations of the Bellagio Tenant under the Bellagio Lease. In connection with the sale-leaseback, the Bellagio Tenant is required under the Bellagio Lease to make capital improvements intended to ensure that the Bellagio Hotel and Casino Property remains competitive with other top tier Las Vegas Strip offerings going forward. For the four year period from 2020 through 2023, under the Bellagio Lease, the Bellagio Tenant is required to spend 5.0% of net revenues (subject to a minimum of $275.0 million total) on capital expenditures, in the aggregate. During each four year period (on a rolling basis) beginning in 2024 through the end of the Bellagio Hotel and Casino Whole Loan term, the Bellagio Tenant is required to spend 3.0% of net revenues on capital expenditures. Under the terms of the Bellagio Lease, the Bellagio Tenant is also required to reserve on a monthly basis 1.5% of net revenues each year to fund capital expenditures (which are made available to the Bellagio Tenant for capital expenditures and FF&E). As of the trailing twelve months ended September 30, 2019, approximately 29.6% of revenues were from gaming, 28.4% from hotel, 24.7% from food & beverage, 9.0% from entertainment and 8.3% from other sources.
The Bellagio Hotel and Casino Property includes a variety of retail tenants, including brands such as Chanel, Tiffany & Co., Gucci, Hermes, Christian Dior, Breguet and Harry Winston. The retail space totals approximately 85,000 sq. ft. and generated approximately $54.6 million in revenue as of December 31, 2018. The Bellagio Tenant is currently budgeting for the addition of a luxury retail store in the Bellagio Hotel and Casino Property lobby. We cannot assure you that this change will occur as expected or at all.
The hotel component of the Bellagio Hotel and Casino Property has maintained an occupancy at or above 92.3% since 2006 with an 11-year average occupancy of 93.4%. As of TTM September 2019, the Bellagio Hotel and Casino Property had an average of 3,933 rooms available with an occupancy of 94.8%, an ADR of $281.69 and a RevPAR of $267.18.
THE INFORMATION IN THIS STRUCTURAL AND COLLATERAL TERM SHEET IS NOT COMPLETE AND MAY BE AMENDED PRIOR TO THE TIME OF SALE. THIS TERM SHEET IS NOT AN OFFER TO SELL THESE SECURITIES AND IT IS NOT A SOLICITATION OF AN OFFER TO BUY THESE SECURITIES IN ANY JURISDICTION WHERE THE OFFER OR SALE IS NOT PERMITTED.
34
3600 South Las Vegas Boulevard Las Vegas, NV 89109 | Collateral Asset Summary – Loan No. 2 Bellagio Hotel and Casino | Cut-off Date Balance: Cut-off Date LTV: U/W NCF DSCR: U/W NOI Debt Yield: | $60,000,000 39.3% 8.42x 28.3% |
Hotel Performance(1) | |||||||||||||
| 2008 | 2009 | 2010 | 2011 | 2012 | 2013 | 2014 | 2015 | 2016 | 2017 | 2018 | TTM Sept. | 11-Year |
Occupancy | 95.0% | 94.2% | 92.5% | 93.3% | 92.9% | 92.3% | 93.1% | 93.2% | 93.5% | 92.9% | 94.9% | 94.8% | 93.4% |
ADR | $261 | $204 | $204 | $230 | $237 | $243 | $254 | $257 | $270 | $276 | $278 | $282 | $247 |
RevPAR | $248 | $192 | $189 | $215 | $220 | $225 | $236 | $240 | $253 | $257 | $264 | $267 | $231 |
Room Revenue ($mm) | $349.9 | $271.2 | $271.1 | $297.3 | $311.5 | $321.7 | $337.6 | $342.2 | $363.7 | $368.1 | $378.9 | $382.8 | $328.5 |
(1) | The financial information presented in this table is consistent with the manner in which MGM management assesses these results and allocates resources. Accordingly, the results and information presented in this table may differ, in some respects, from how such results and information would be presented in standalone financial statements. |
(2) | Average excludes TTM September 2019. |
The Bellagio Hotel and Casino Property contains approximately 154,000 sq. ft. of casino space, featuring approximately 1,700 slot machines and 144 gaming tables. The casino facilities include table games such as blackjack, craps, roulette, baccarat and poker.
Casino Performance | |||||||||||||
| 2008 | 2009 | 2010 | 2011 | 2012 | 2013 | 2014 | 2015 | 2016 | 2017 | 2018 | 5-Year | 11-Year |
Slot Units | 2,376 | 2,298 | 2,250 | 2,205 | 2,100 | 2,118 | 2,063 | 1,935 | 1,873 | 1,827 | 1,732 | 1,886 | 2,071 |
Table Units | 151 | 153 | 154 | 152 | 147 | 146 | 144 | 146 | 145 | 145 | 144 | 145 | 148 |
Gaming Revenue ($mm) | $352.75 | $306.87 | $289.51 | $319.11 | $298.61 | $335.58 | $381.50 | $369.71 | $439.66 | $435.93 | $422.86 | $409.93 | $359.28 |
% Change in Gaming Revenue | - | -13.0% | -5.7% | 10.2% | -6.4% | 12.4% | 13.7% | -3.1% | 18.9% | -0.8% | -3.0% | N/A | N/A |
Cash Flow Analysis.
Cash Flow Analysis(1) | ||||||
| 2016 | 2017 | 2018 | T-12 9/30/2019 | U/W | U/W (Per Room) |
Occupancy | 93.5% | 92.9% | 94.9% | 94.8% | 94.8% |
|
ADR | $270.29 | $276.24 | $278.28 | $281.69 | $281.69 |
|
RevPAR | $252.78 | $256.53 | $264.19 | $267.18 | $267.18 |
|
|
|
|
|
|
|
|
Room Revenue | $363,677,441 | $368,058,522 | $378,860,233 | $382,839,838 | $382,839,838 | $97,340 |
F&B Revenue | 347,665,102 | 341,830,126 | 334,447,851 | 333,149,122 | 333,149,122 | $84,706 |
Gaming | 439,662,976 | 435,933,726 | 422,862,787 | 399,769,284 | 399,769,284 | $101,645 |
Entertainment | 121,953,371 | 119,207,719 | 120,427,525 | 121,762,603 | 121,762,603 | $30,959 |
Other Revenue(2) | 91,179,322 | 100,540,676 | 111,236,871 | 111,541,617 | 111,541,617 | $28,360 |
Total Revenue | $1,364,138,212 | $1,365,570,769 | $1,367,835,267 | $1,349,062,464 | $1,349,062,464 | $343,011 |
Room Expense | 105,289,765 | 107,330,702 | 111,385,859 | 111,344,926 | 111,344,926 | $28,310 |
F&B Expense | 266,202,142 | 258,789,184 | 257,609,113 | 256,340,473 | 256,340,473 | $65,177 |
Other Departmental Expenses | 335,693,118 | 322,639,400 | 332,481,659 | 330,066,360 | 330,066,360 | $83,922 |
Total Departmental Expenses | $707,185,025 | $688,759,286 | $701,476,631 | $697,751,759 | $697,751,759 | $177,410 |
Gross Operating Income | $656,953,187 | $676,811,483 | $666,358,636 | $651,310,705 | $651,310,705 | $165,602 |
Total Undistributed Expenses | 128,812,269 | 127,583,150 | 128,495,099 | 128,324,048 | 128,324,048 | $32,628 |
Gross Operating Profit | $528,140,918 | $549,228,333 | $537,863,537 | $522,986,657 | $522,986,657 | $132,974 |
Management Fee | 26,957,472 | 24,326,134 | 26,005,109 | 26,682,737 | 26,682,737 | $6,784 |
Taxes | 17,112,907 | 16,070,971 | 18,230,324 | 17,763,857 | 17,763,857 | $4,517 |
Insurance | 3,248,444 | 3,094,994 | 3,762,062 | 4,474,748 | 4,474,748 | $1,138 |
Total Fixed Charges | 20,361,351 | 19,165,965 | 21,992,386 | 22,238,605 | 22,238,605 | $5,654 |
Total Operating Expenses | $883,316,117 | $859,834,535 | $877,969,225 | $874,997,149 | $874,997,149 | $222,476 |
Net Operating Income | $480,822,095 | $505,736,234 | $489,866,042 | $474,065,315 | $474,065,315 | $120,535 |
Capital Expenditures | 0 | 0 | 0 | 0 | 20,235,937 | $5,145 |
Net Cash Flow | $480,822,095 | $505,736,234 | $489,866,042 | $474,065,315 | $453,829,378 | $115,390 |
(1) | The information above is presented on a “look through” basis, before rent due under the Bellagio Lease. For so long as the Bellagio Lease is in effect, the Bellagio Hotel and Casino Borrower will be entitled only to the rent due under the Bellagio Lease and not to the underlying rent and other income from the Bellagio Hotel and Casino Property. The initial Bellagio Lease annual rent is $245,000,000, and DSCR and Debt Yield for the Bellagio Hotel and Casino Whole Loan based on such initial annual rent are 2.19x and 8.1% respectively. |
(2) | Other Revenue and Other Departmental Expenses include retail other operations. |
Environmental Matters. The Phase I environmental report dated November 6, 2019 did not identify any recognized environmental conditions at the Bellagio Hotel and Casino Property.
The Market. The Bellagio Hotel and Casino Property is located on the Las Vegas Strip in the heart of Las Vegas, Nevada. Visitor volume and airport passenger traffic into the Las Vegas region have more than doubled from 1990 to 2018. In connection with the financial
THE INFORMATION IN THIS STRUCTURAL AND COLLATERAL TERM SHEET IS NOT COMPLETE AND MAY BE AMENDED PRIOR TO THE TIME OF SALE. THIS TERM SHEET IS NOT AN OFFER TO SELL THESE SECURITIES AND IT IS NOT A SOLICITATION OF AN OFFER TO BUY THESE SECURITIES IN ANY JURISDICTION WHERE THE OFFER OR SALE IS NOT PERMITTED.
35
3600 South Las Vegas Boulevard Las Vegas, NV 89109 | Collateral Asset Summary – Loan No. 2 Bellagio Hotel and Casino | Cut-off Date Balance: Cut-off Date LTV: U/W NCF DSCR: U/W NOI Debt Yield: | $60,000,000 39.3% 8.42x 28.3% |
downturn in 2008 and 2009, the Las Vegas Market generally experienced a contraction. During 2010, the market began to rebound and visitation has returned to or near peak levels. 2018 Year-over-Year, Airport Passenger Traffic is up 2.5% and Clark County Gaming Revenues are up 2.7%.
Market Overview(1) | |||||||||||
Category | 1990 | 2009 | 2010 | 2011 | 2012 | 2013 | 2014 | 2015 | 2016 | 2017 | 2018 |
Visitor Volume (thousands) | 20,954 | 36,351 | 37,335 | 38,929 | 39,727 | 39,668 | 41,127 | 42,312 | 42,936 | 42,214 | 42,117 |
YoY % Change | NAP | -3.0% | 2.7% | 4.3% | 2.1% | -0.1% | 3.7% | 2.9% | 1.5% | -1.7% | -0.2% |
Clark County Gaming Revenues ($mm) | $4,104 | $8,838 | $8,909 | $9,223 | $9,400 | $9,674 | $9,554 | $9,618 | $9,714 | $9,979 | $10,250 |
YoY % Change | NAP | -9.8% | 0.8% | 3.5% | 1.9% | 2.9% | -1.2% | 0.7% | 1.0% | 2.7% | 2.7% |
Hotel / Motel Rooms Inventory | 73,730 | 148,941 | 148,935 | 150,161 | 150,481 | 150,593 | 150,544 | 149,213 | 149,339 | 148,896 | 149,158 |
YoY % Change | NAP | 6.0% | 0.0% | 0.8% | 0.2% | 0.1% | 0.0% | -0.9% | 0.1% | -0.3% | 0.2% |
Airport Passenger Traffic (thousands) | 19,090 | 40,469 | 39,757 | 41,481 | 41,668 | 41,857 | 42,885 | 45,389 | 47,435 | 48,500 | 49,717 |
YoY % Change | NAP | -8.2% | -1.8% | 4.3% | 0.4% | 0.5% | 2.5% | 5.8% | 4.5% | 2.2% | 2.5% |
Convention Attendance (thousands) | 1,742 | 4,492 | 4,473 | 4,865 | 4,944 | 5,107 | 5,195 | 5,891 | 6,311 | 6,646 | 6,502 |
YoY % Change | NAP | -23.9% | -0.4% | 8.8% | 1.6% | 3.3% | 1.7% | 13.4% | 7.1% | 5.3% | -2.2% |
(1) | Source: Las Vegas Convention and Visitors Authority. |
The Las Vegas Strip has traditionally enjoyed high occupancy rates compared to the national average. From 2014 to year to date May 2019, occupancy across the Las Vegas Strip increased from 88.8% to 90.3%. ADR for the Las Vegas Strip increased by approximately 18.3% from $126 in 2014 to $149 for year to date May 2019. Improving trends in ADR have been driven by more properties adding resort fees, improvement in the convention segment, as well as the addition of higher-quality room supply.
Historical Occupancy, ADR, RevPAR(1) | |||||||||
| Competitive Set | Bellagio Hotel and Casino Property | Penetration Factor | ||||||
Year | Occupancy | ADR | RevPAR | Occupancy | ADR | RevPAR | Occupancy | ADR | RevPAR |
2018 | 91.1% | $281.66 | $257.01 | 94.9% | $278.28 | $264.19 | 104.2% | 98.8% | 102.8% |
(1) | Source: Appraisal. |
The primary competitive set for the Bellagio Hotel and Casino Property comprises five hotels located on the Las Vegas Strip. These properties total 22,840 rooms and include the 4,004 room Aria Resort & Casino, 4,748 room Wynn/Encore Resort and Casino, 7,117 room Venetian/Palazzo Resort and Casino, 2,995 room Cosmopolitan Resort and Casino and 3,976 room Caesar’s Palace.
Comparable Properties | |||||||
Property Name | No. of Rooms | Year Opened | Meeting Space (sq. ft.) | Gaming Space (sq. ft.) | Estimated 2018 Occ. | Estimated 2018 ADR | Estimated 2018 RevPAR |
Bellagio Hotel and Casino Property | 3,933 | 1998 | 200,000 | 154,000 | 94.9% | $278.28 | $264.19 |
Aria Resort & Casino | 4,004 | 2009 | 500,000 | 150,000 | 91.0% | $265.00 | $241.15 |
Wynn/Encore Resort and Casino | 4,748 | 2006/2008 | 290,000 | 191,424 | 90.0% | $300.00 | $270.00 |
Venetian/Palazzo Resort and Casino | 7,117 | 1999/2010 | 450,000 | 335,878 | 91.0% | $295.00 | $268.45 |
Cosmopolitan Resort and Casino | 2,995 | 2010 | 152,000 | 68,981 | 95.0% | $325.00 | $308.75 |
Caesar’s Palace | 3,976 | 1966 | 300,000 | 124,200 | 90.0% | $220.00 | $198.00 |
Property Management. The Bellagio Hotel and Casino Property is managed by the Bellagio Tenant.
Lockbox / Cash Management. The Bellagio Hotel and Casino Whole Loan is structured with a hard lockbox solely for payments of rent made to the Bellagio Hotel and Casino Borrower by the Bellagio Tenant under the Bellagio Lease. However, if the Bellagio Hotel and Casino Property is no longer subject to the Bellagio Lease, then (i) if it is subject to a brand management agreement or casino management agreement, rents and cash receipts required to be remitted to the Bellagio Hotel and Casino Borrower pursuant to the brand management agreement and/or casino management agreement (which may be paid initially to the brand manager and/or casino manager or an account maintained by such manager, and from which such manager may have the right to deduct its fees, reserves and other funds), will be required to be remitted to the lockbox account within one business day of the date such amounts would have otherwise
THE INFORMATION IN THIS STRUCTURAL AND COLLATERAL TERM SHEET IS NOT COMPLETE AND MAY BE AMENDED PRIOR TO THE TIME OF SALE. THIS TERM SHEET IS NOT AN OFFER TO SELL THESE SECURITIES AND IT IS NOT A SOLICITATION OF AN OFFER TO BUY THESE SECURITIES IN ANY JURISDICTION WHERE THE OFFER OR SALE IS NOT PERMITTED.
36
3600 South Las Vegas Boulevard Las Vegas, NV 89109 | Collateral Asset Summary – Loan No. 2 Bellagio Hotel and Casino | Cut-off Date Balance: Cut-off Date LTV: U/W NCF DSCR: U/W NOI Debt Yield: | $60,000,000 39.3% 8.42x 28.3% |
been transferred to the Bellagio Hotel and Casino Borrower, and (ii) if no brand management agreement is in effect, the Bellagio Hotel and Casino Borrower will be required to deposit rents from the Bellagio Hotel and Casino Property into the lockbox account no less than twice per week.
The Bellagio Hotel and Casino Whole Loan is structured with springing cash management. If no Cash Trap Period exists, amounts on deposit in the lockbox account are required to be disbursed to the Bellagio Hotel and Casino Borrower’s operating account. During the continuance of a Cash Trap Period, funds in the lockbox account are required to be deposited into a lender controlled cash management account. During the continuance of a Cash Trap Period, funds in the cash management account are required to be applied (i) if the Bellagio Hotel and Casino Property is not subject to the Bellagio Lease, to make deposits into the tax and insurance reserves (if any), as described below under “Initial and Ongoing Reserves”, (ii) if the Bellagio Hotel and Casino Property is not subject to the Bellagio Lease, to pay hotel taxes and custodial funds (funds collected by the Bellagio Hotel and Casino Borrower on a third party’s behalf that must be paid or remitted to a third party), (iii) to pay debt service on the Bellagio Hotel and Casino Whole Loan, (iv) if the Bellagio Hotel and Casino Property is not subject to the Bellagio Lease, to pay operating expenses set forth in the annual budget (which is required to be reasonably approved by the lender during an event of default or DSCR Trigger Period, subject to certain exceptions for life, health and safety matters, or if a brand management agreement and/or casino management agreement is in effect, for items as to which the Bellagio Hotel and Casino Borrower does not have approval rights under such agreement(s)), (v) if the Bellagio Hotel and Casino Property is not subject to the Bellagio Lease, to make deposits into the recurring replacements reserve, as described below under “Initial and Ongoing Reserves,” and (vi) to pay any remainder into an excess cash flow account, (x) to be held by the lender as additional security for the Bellagio Hotel and Casino Whole Loan during the continuance of the Cash Trap Period (unless the Bellagio Hotel and Casino Borrower has delivered an Excess Cash Flow Guaranty (as defined below), in which event such remainder will be remitted to the Bellagio Hotel and Casino Borrower), or (y) if no Cash Trap Period is continuing, to be disbursed to an account designated by the Bellagio Hotel and Casino Borrower.
Notwithstanding the existence of an event of default under the Bellagio Hotel and Casino Whole Loan, unless a Priority Payment Cessation Event (as defined below) has occurred, the lender is required to apply amounts on deposit in the cash management account to pay taxes, insurance premiums, hotel taxes and custodial funds, and then to pay protective advances, and any amounts remaining after such payments may be applied to any obligations of the Bellagio Hotel and Casino Borrower under the loan documents as the lender may determine in its sole discretion.
“Priority Payment Cessation Event” means (a) the initiation of (x) judicial or non-judicial foreclosure proceedings, (y) proceedings for appointment of a receiver or (z) similar remedies permitted by the loan documents relating to all or a material portion of the Bellagio Hotel and Casino Property, and/or (b) the imposition of a stay, an injunction or a similar judicially imposed device that has the effect of preventing the lender from exercising its remedies under the loan documents.
For so long as the Bellagio Hotel and Casino Property is subject to the Bellagio Lease, funds in the excess cash flow reserve are required to be disbursed, at the Bellagio Hotel and Casino Borrower’s request, to pay (i) debt service and/or debt service under any mezzanine loan entered into pursuant to the loan documents, (ii) voluntary prepayment of the (A) Bellagio Hotel and Casino Whole Loan or mandatory prepayment in connection with a casualty or condemnation or (B) voluntary prepayment of any mezzanine loan or mandatory prepayment thereof in connection with a casualty or condemnation (provided such prepayment is made pro rata between the Bellagio Hotel and Casino Whole Loan and any such mezzanine loan), (iii) prepayments to cure a DSCR Trigger, (iv) costs associated with the Bellagio Lease, (v) any fees and costs payable by the Bellagio Hotel and Casino Borrower, including to the lender, subject to and in compliance with the loan documents, including without limitation costs related to a letter of credit or renewal of the required environmental insurance policy, (vi) legal, audit, tax and accounting (including actual costs incurred by BREIT OP (directly or indirectly) and its service providers for back-office accounting and for costs associated with the Bellagio Hotel and Casino Property or Bellagio Hotel and Casino Borrower); provided that excess cash flow may not be used to enforce Bellagio Hotel and Casino Borrower’s rights under the loan documents or defend any enforcement by the lender of its rights under the loan documents, (vii) distributions to maintain the status of BREIT and other affiliated real estate investment trusts (“REITs”) as REITs and avoid imposition of any entity level tax on such REITs, provided such distributions may not exceed 10% of all deposits made into the excess cash flow reserve as of the date of determination, and (viii) other items reasonably approved by the lender. If the Bellagio Hotel and Casino Property is not subject to the Bellagio Lease, in addition to the items described above, funds in the excess cash flow reserve are required to be disbursed, at the request of the Bellagio Hotel and Casino Borrower, among other things listed in accordance with the loan documents, (i) to pay operating expenses (including management fees, franchise fees and other fees, charges or costs, payable to the manager under a casino management agreement or brand management agreement or the franchisor under a franchise agreement), (ii) emergency repairs and/or life safety issues, (iii) capital expenditures, replacements, alterations, PIP Work or brand-mandated work, (iv) hotel taxes and custodial funds, (v) costs incurred in connection with the purchase of any furniture, fixtures and equipment, (vi) costs of restoration in excess of available net proceeds, (vii) costs associated with any ground lease or any other leases, and (viii) payment of shortfalls in required deposits to other reserve accounts.
For so long as no event of default is continuing, the Bellagio Hotel and Casino Borrower will be permitted to deliver a guaranty of the payment of excess cash flow in a form attached to the loan agreement from BREIT, BREIT OP or another affiliate of the Bellagio Hotel and Casino Borrower which is controlled by BREIT or BREIT OP and satisfies certain net worth requirements (an “Excess Cash Flow
THE INFORMATION IN THIS STRUCTURAL AND COLLATERAL TERM SHEET IS NOT COMPLETE AND MAY BE AMENDED PRIOR TO THE TIME OF SALE. THIS TERM SHEET IS NOT AN OFFER TO SELL THESE SECURITIES AND IT IS NOT A SOLICITATION OF AN OFFER TO BUY THESE SECURITIES IN ANY JURISDICTION WHERE THE OFFER OR SALE IS NOT PERMITTED.
37
3600 South Las Vegas Boulevard Las Vegas, NV 89109 | Collateral Asset Summary – Loan No. 2 Bellagio Hotel and Casino | Cut-off Date Balance: Cut-off Date LTV: U/W NCF DSCR: U/W NOI Debt Yield: | $60,000,000 39.3% 8.42x 28.3% |
Guaranty”) in lieu of depositing excess cash flow into the excess cash flow reserve, provided, that it is a condition to delivery of an Excess Cash Flow Guaranty that (i) if the aggregate obligations under the Excess Cash Flow Guaranty (plus any outstanding amount under any letter of credit delivered under the Bellagio Hotel and Casino Whole Loan if the applicant thereunder is BREIT OP or a subsidiary of BREIT OP that directly or indirectly owns 49% or more of the equity interests in the Bellagio Hotel and Casino Borrower) exceed 15%, a new non-consolidation opinion in respect of the Excess Cash Flow Guaranty reasonably satisfactory to the lender must be delivered and (ii) an enforceability opinion must be delivered. Pursuant to the loan documents, upon the earliest to occur of (i) a monetary event of default, (ii) a Priority Payment Cessation Event, and (iii) the delivery of a deed in lieu of foreclosure, the Bellagio Hotel and Casino Borrower (or guarantor under the Excess Cash Flow Guaranty) is required to remit to the lender an amount equal to the amount of excess cash flow that was disbursed to the Bellagio Hotel and Casino Borrower in lieu of being deposited into the excess cash flow reserve, less the amount that the Bellagio Hotel and Casino Borrower would have been permitted to withdraw from the excess cash flow reserve, as described above, as of such date, which amount will at the lender’s option either be deposited into the excess cash flow reserve or applied as if it had been contained in the excess cash flow reserve.
Initial and Ongoing Reserves. At loan origination, the borrower was not required to deposit any initial reserves.
Real Estate Taxes – For so long as the Bellagio Hotel and Casino Property is subject to the Bellagio Lease, no reserves for real estate taxes are required under the loan documents. If the Bellagio Hotel and Casino Property is not subject to the Bellagio Lease, solely if a Cash Trap Period (as defined below) is in effect, the loan documents provide for ongoing monthly reserves for real estate taxes in an amount equal to 1/12th of the real estate taxes that the lender estimates will be payable during the next twelve months. Notwithstanding the foregoing, the requirement for such monthly reserves will be reduced dollar for dollar by any taxes paid or reserved for by a brand manager or casino operator pursuant to a brand management or casino management agreement relating to the Bellagio Hotel and Casino Property.
Insurance Reserves – For so long as the Bellagio Hotel and Casino Property is subject to the Bellagio Lease, no reserves for insurance premiums are required under the loan documents. If the Bellagio Hotel and Casino Property is not subject to the Bellagio Lease, solely if a Cash Trap Period is in effect, the loan documents provide for ongoing monthly reserves for insurance premiums in an amount equal to 1/12th of the insurance premiums that the lender estimates will be payable for the renewal of the insurance policies. Notwithstanding the foregoing, the requirement for such monthly reserves will be reduced dollar for dollar by any insurance premiums paid or reserved for by a brand manager or casino operator pursuant to a brand management or casino management agreement relating to the Bellagio Hotel and Casino Property. In addition, such monthly reserves will not be required so long as (i) no event of default is continuing, and (ii) the insurance coverage for the Bellagio Hotel and Casino Property is included in a blanket policy reasonably acceptable to the lender.
Replacement Reserve – For so long as the Bellagio Hotel and Casino Property is subject to the Bellagio Lease, no reserves for replacements are required under the loan documents. If the Bellagio Hotel and Casino Property is not subject to the Bellagio Lease, the loan documents provide for monthly deposits into a replacement reserve equal to (i) on each payment date during a Cash Trap Period, the Replacement Reserve Monthly Deposit (as defined below) and (ii) if a Cash Trap Period does not exist, on the first payment date of each calendar quarter, an amount equal to the lesser of (x) the positive difference between (A) the aggregate amount of Replacement Reserve Monthly Deposits that would have been funded during the calendar year to date and (B) the sum of the aggregate amount for the calendar year to date of funds expended on replacements, property improvement plan work (“PIP Work”) and brand mandated work and any amounts actually deposited into the replacement reserve, and (y) from and after January 1, 2024, for each four year period commencing on January 1, 2020, the positive difference between (A) (i) 4.0% of net revenue from guest rooms and borrower-managed food and beverage operations and (ii) 0.5% of all other net revenue (other than non-recurring items), in each case during such four year period and (B) the sum of the aggregate amount expended on replacements, PIP Work and brand mandated work and any amounts actually deposited into the replacement reserve, in each case during such four year period. Notwithstanding the foregoing, the requirement for such reserves will be reduced dollar for dollar by any reserves for replacements, PIP Work or brand mandated work reserved for by a brand manager or casino operator pursuant to a brand management or casino management agreement relating to the Bellagio Hotel and Casino Property.
“Replacement Reserve Monthly Deposit” means an amount equal to (i) 4.0% of net revenue from guest rooms and borrower-managed food and beverage operations for the calendar month that is two calendar months prior to the calendar month in which the applicable deposit to the replacement reserve is to be made and (ii) 0.5% of all other net revenue (other than non-recurring items) for the calendar month that is two calendar months prior to the calendar month in which the applicable deposit to the replacement reserve is to be made.
A “Cash Trap Period” will commence (a) upon the occurrence of an event of default under the loan documents, (b) upon the occurrence of a DSCR Trigger Event (as defined below) or (c) upon the occurrence of a Bellagio Tenant Bankruptcy Event (as defined below), and will terminate upon (x) with respect to clause (a), the cure of such event of default, (y) with respect to clause (b), the termination of such DSCR Trigger Event, or (z) with respect to clause (c), the occurrence of a Bellagio Tenant Bankruptcy Event Cure (as defined below).
A “Bellagio Tenant Bankruptcy Event” will occur if the Bellagio Tenant makes an assignment for the benefit of creditors or if a receiver, liquidator or trustee is appointed for Bellagio Tenant or if Bellagio Tenant is adjudicated a bankrupt or insolvent, or if any bankruptcy action is filed, provided that, if such bankruptcy action was involuntary and not consented to by Bellagio Tenant, upon the same not being discharged, stayed or dismissed within 90 days.
THE INFORMATION IN THIS STRUCTURAL AND COLLATERAL TERM SHEET IS NOT COMPLETE AND MAY BE AMENDED PRIOR TO THE TIME OF SALE. THIS TERM SHEET IS NOT AN OFFER TO SELL THESE SECURITIES AND IT IS NOT A SOLICITATION OF AN OFFER TO BUY THESE SECURITIES IN ANY JURISDICTION WHERE THE OFFER OR SALE IS NOT PERMITTED.
38
3600 South Las Vegas Boulevard Las Vegas, NV 89109 | Collateral Asset Summary – Loan No. 2 Bellagio Hotel and Casino | Cut-off Date Balance: Cut-off Date LTV: U/W NCF DSCR: U/W NOI Debt Yield: | $60,000,000 39.3% 8.42x 28.3% |
A “Bellagio Tenant Bankruptcy Event Cure” means the occurrence of any of the following events: (i) Bellagio Tenant, as debtor in possession, or a trustee for Bellagio Tenant, has assumed the Bellagio Lease pursuant to the bankruptcy code, and an order authorizing the assumption of the Bellagio Lease has been granted by the applicable court and Bellagio Tenant has satisfied its obligations under the bankruptcy code; or (ii) Bellagio Tenant (or a qualifying replacement tenant) has entered into the Bellagio Lease (or a qualifying replacement lease) in accordance with the terms of the loan documents, provided that, if the initial Bellagio Lease is terminated and not otherwise replaced in accordance with the terms of the loan documents, a Bellagio Tenant Bankruptcy Event Cure will be deemed to have occurred if either (x) the debt service coverage ratio (based on the Adjusted EBITDA (as defined below) and the Bellagio Hotel and Casino Whole Loan debt service) (hereinafter, the “Whole Loan DSCR”) equals or exceeds 2.50x for two consecutive calendar quarters following the occurrence of the related Bellagio Tenant Bankruptcy Event or (y) the Bellagio Hotel and Casino Borrower makes voluntary prepayments in accordance with the terms of the Bellagio Hotel and Casino Whole Loan documents in an amount necessary to achieve a Whole Loan DSCR equal to or greater than 2.50x, in which case such Bellagio Tenant Bankruptcy Event will terminate upon such prepayment.
A “DSCR Trigger Event” will occur if the Whole Loan DSCR is less than 2.50x at the end of two consecutive calendar quarters, and will end if, provided no event of default is continuing under the loan documents, (i) the Whole Loan DSCR is equal to or greater than 2.50x for two consecutive calendar quarters, or (ii) the Bellagio Hotel and Casino Borrower has prepaid the Bellagio Hotel and Casino Whole Loan in accordance with the term of the loan documents in an amount necessary to achieve a Whole Loan DSCR equal to or greater than 2.50x, provided that, in the event that a prepayment under clause (ii) occurs, the DSCR Trigger Event will terminate upon such prepayment.
“Adjusted EBITDA” means EBITDA plus, without duplication, any Bellagio Lease rent reflected in Net Income, and, without duplication, in each case as determined in accordance with the Bellagio Lease and generally accepted accounting principles (“GAAP”) consistently applied using the Existing Accounting Guidelines.
“EBITDA” means for any test period and with respect to any Person or facility (as applicable), the sum of (a) Net Income of such Person or facility for that period, plus or minus the following (without duplication in each case) to the extent reflected in Net Income for that period, plus (b) any extraordinary loss, and, without duplication, any loss associated with the early retirement of indebtedness and with any disposition not in the ordinary course of business, minus (c) any extraordinary gain, and, without duplication, any gains associated with the early retirement of indebtedness and with any disposition not in the ordinary course of business, plus (d) interest charges of such Person or facility for that period, less (e) interest income of such Person or facility for that period, plus (f) the aggregate amount of expense for federal, foreign, state and local taxes on or measured by income of such Person or facility for that period excluding gaming taxes (whether or not payable during that period), minus (g) the aggregate amount of benefit for federal, foreign, state and local taxes on or measured by income of such Person or facility for that period excluding gaming taxes (whether or not receivable during that period), plus (h) depreciation, amortization, plus (i) all non-recurring and/or other non-cash expenses which will be limited to third party expenses in connection with an acquisition or disposition of an asset, plus (j) loss on sale or disposal of an asset, and write downs and impairments of an asset, minus (k) all non-recurring and/or other non-cash income in connection with an acquisition or disposition, and gain on sale of an asset, plus (l) expenses classified as “pre-opening and start-up expenses” on the applicable financial statements of that Person or facility for that fiscal period which will be limited to costs related directly to the facility’s primary intended use (hospitality, entertainment, gaming and/or pari mutual use, together with ancillary or complementary uses), minus (m) non-cash reversal of an accrual or reserve not recorded in the ordinary course, plus or minus (n) the impact of any foreign currency gains or losses and related swaps, plus (o) all long-term non-cash expenses realized in connection with or resulting from equity or equity-linked compensation plans, employee benefit plans or agreements or post-employment benefit plans or agreements, stock appreciation or similar rights, stock options, restricted stock, preferred stock, stock appreciation or other similar rights, in each case as determined in accordance with GAAP, consistently applied using the Existing Accounting Guidelines.
“Existing Accounting Guidelines” means the Bellagio Tenant’s accounting guidelines and policies in effect as of the Bellagio Lease commencement date and which are subject to change to the extent not material or to the extent needed to reflect changes in generally accepted accounting principles.
“Net Income” means, with respect to any fiscal period and with respect to any person, the net income (or net loss) of that person, determined in accordance with the Bellagio Lease and GAAP, consistently applied using the Existing Accounting Guidelines.
“Person” means any individual, corporation, partnership, joint venture, limited liability company, estate, trust, unincorporated association, any federal, state, county or municipal government or any bureau, department or agency thereof and any fiduciary acting in such capacity on behalf of any of the foregoing.
Current Mezzanine or Subordinate Indebtedness. In addition to the Bellagio Hotel and Casino Loan, the Bellagio Hotel and Casino Property also secures the Bellagio Hotel and Casino Senior Notes not included in the Benchmark 2020-B16 trust, which have an aggregate Cut-off Date principal balance of $1,616,200,000, and the Bellagio Hotel and Casino Subordinate Companion Loans (which are comprised of the Bellagio Hotel and Casino Junior A Notes, which have an aggregate Cut-off Date principal balance of $650,500,000,
THE INFORMATION IN THIS STRUCTURAL AND COLLATERAL TERM SHEET IS NOT COMPLETE AND MAY BE AMENDED PRIOR TO THE TIME OF SALE. THIS TERM SHEET IS NOT AN OFFER TO SELL THESE SECURITIES AND IT IS NOT A SOLICITATION OF AN OFFER TO BUY THESE SECURITIES IN ANY JURISDICTION WHERE THE OFFER OR SALE IS NOT PERMITTED.
39
3600 South Las Vegas Boulevard Las Vegas, NV 89109 | Collateral Asset Summary – Loan No. 2 Bellagio Hotel and Casino | Cut-off Date Balance: Cut-off Date LTV: U/W NCF DSCR: U/W NOI Debt Yield: | $60,000,000 39.3% 8.42x 28.3% |
and the Bellagio Hotel and Casino Junior B Notes, which have an aggregate Cut-off Date principal balance of $683,300,000). The Bellagio Hotel and Casino Senior Notes not included in the Benchmark 2020-B16 trust and the Bellagio Hotel and Casino Junior A Notes accrue interest at the same rate as the Bellagio Hotel and Casino Loan. The Bellagio Hotel and Casino Junior B Notes accrue interest at the rate of 5.3500000% per annum. The Bellagio Hotel and Casino Loan is entitled to payments of interest and principal on a pro rata and pari passu basis with the Bellagio Hotel and Casino Senior Notes not included in the Benchmark 2020-B16 trust. The Bellagio Hotel and Casino Loan and the Bellagio Hotel and Casino Senior Notes not included in the Benchmark 2020-B16 trust are generally senior to the Bellagio Hotel and Casino Junior A Notes and the Bellagio Hotel and Casino Junior B Notes, and the Bellagio Hotel and Casino Junior A Notes are generally senior to the Bellagio Hotel and Casino Junior B Notes.
Future Mezzanine or Subordinate Indebtedness Permitted. The loan documents provide for a one time right of a parent entity of the Bellagio Hotel and Casino Borrower to obtain a mezzanine loan secured by the direct or indirect equity interests in the Bellagio Hotel and Casino Borrower, provided that certain conditions are satisfied, including but not limited to (i) the principal amount of the mezzanine loan can in no event be greater than an amount equal to the amount which will yield (x) an aggregate loan-to-value ratio that does not exceed 72.0%, and (y) a Whole Loan DSCR that is not less than 4.24x and (ii) the mezzanine lender enters into an intercreditor agreement reasonably acceptable to the lender and the mezzanine lender. No rating agency confirmation is required for the mezzanine loan, and the mezzanine loan is not required to be co-terminous with the Bellagio Hotel and Casino Whole Loan. The mezzanine loan documents may permit voluntary prepayment of the mezzanine loan without corresponding prepayment of the Bellagio Hotel and Casino Whole Loan (except that prepayments of the mezzanine loan to cure a DSCR Trigger Event or prepayments from the excess cash flow reserve must be made concurrently with a pro rata prepayment of the Bellagio Hotel and Casino Whole Loan). In addition, the mezzanine loan documents may permit that, provided no event of default is continuing under the Bellagio Hotel and Casino Whole Loan, the mezzanine borrower may prepay the mezzanine loan at a discount pursuant to negotiated transactions with only the mezzanine lender.
Partial Release. None.
Ground Lease. A portion of the Bellagio Hotel and Casino Property, consisting of approximately 0.84 acres located at the southeast corner of the Bellagio Hotel and Casino Property, which currently houses the Bellagio’s marquee sign and a portion of the walkway leading from the sidewalk on Las Vegas Boulevard to the main entrance to the hotel, is ground leased pursuant to a ground lease from MKB Company (the “MKB Ground Lease”). The initial term of the MKB Ground Lease expires on April 27, 2033. The Bellagio Hotel and Casino Borrower, as ground lessee, has two renewal options of 20 years each, so long as the Bellagio Hotel and Casino Borrower provides at least one year prior written notice to the ground lessor and is not in default under the MKB Ground Lease both as of the date it exercises its option and on the date of commencement of the option term. The initial annual ground rent was $225,000 beginning in April 1995 and has adjusted on an annual basis based on the Consumer Price Index since that time, plus an additional $75,000 increase in annual ground rent that occurred in April 2014. The current annual ground rent for the MKB Ground Lease is $503,702.77. The ground rent is subject to annual increase (including during the extension terms) based on a formula based on the Consumer Price Index. The MKB Ground Lease lacks certain customary lender protections. See the exceptions to representations and warranties set forth in the Preliminary Prospectus.
THE INFORMATION IN THIS STRUCTURAL AND COLLATERAL TERM SHEET IS NOT COMPLETE AND MAY BE AMENDED PRIOR TO THE TIME OF SALE. THIS TERM SHEET IS NOT AN OFFER TO SELL THESE SECURITIES AND IT IS NOT A SOLICITATION OF AN OFFER TO BUY THESE SECURITIES IN ANY JURISDICTION WHERE THE OFFER OR SALE IS NOT PERMITTED.
40
(THIS PAGE INTENTIONALLY LEFT BLANK)
41
5100 Kings Plaza Brooklyn, NY 11234 | Collateral Asset Summary – Loan No. 3 Kings Plaza | Cut-off Date Balance: Cut-off Date LTV: U/W NCF DSCR: U/W NOI Debt Yield: | $50,000,000 54.1% 3.07x 10.7% |

THE INFORMATION IN THIS STRUCTURAL AND COLLATERAL TERM SHEET IS NOT COMPLETE AND MAY BE AMENDED PRIOR TO THE TIME OF SALE. THIS TERM SHEET IS NOT AN OFFER TO SELL THESE SECURITIES AND IT IS NOT A SOLICITATION OF AN OFFER TO BUY THESE SECURITIES IN ANY JURISDICTION WHERE THE OFFER OR SALE IS NOT PERMITTED.
42
5100 Kings Plaza Brooklyn, NY 11234 | Collateral Asset Summary – Loan No. 3 Kings Plaza | Cut-off Date Balance: Cut-off Date LTV: U/W NCF DSCR: U/W NOI Debt Yield: | $50,000,000 54.1% 3.07x 10.7% |
THE INFORMATION IN THIS STRUCTURAL AND COLLATERAL TERM SHEET IS NOT COMPLETE AND MAY BE AMENDED PRIOR TO THE TIME OF SALE. THIS TERM SHEET IS NOT AN OFFER TO SELL THESE SECURITIES AND IT IS NOT A SOLICITATION OF AN OFFER TO BUY THESE SECURITIES IN ANY JURISDICTION WHERE THE OFFER OR SALE IS NOT PERMITTED.
43
5100 Kings Plaza Brooklyn, NY 11234 | Collateral Asset Summary – Loan No. 3 Kings Plaza | Cut-off Date Balance: Cut-off Date LTV: U/W NCF DSCR: U/W NOI Debt Yield: | $50,000,000 54.1% 3.07x 10.7% |
THE INFORMATION IN THIS STRUCTURAL AND COLLATERAL TERM SHEET IS NOT COMPLETE AND MAY BE AMENDED PRIOR TO THE TIME OF SALE. THIS TERM SHEET IS NOT AN OFFER TO SELL THESE SECURITIES AND IT IS NOT A SOLICITATION OF AN OFFER TO BUY THESE SECURITIES IN ANY JURISDICTION WHERE THE OFFER OR SALE IS NOT PERMITTED.
44
5100 Kings Plaza Brooklyn, NY 11234 | Collateral Asset Summary – Loan No. 3 Kings Plaza | Cut-off Date Balance: Cut-off Date LTV: U/W NCF DSCR: U/W NOI Debt Yield: | $50,000,000 54.1% 3.07x 10.7% |

THE INFORMATION IN THIS STRUCTURAL AND COLLATERAL TERM SHEET IS NOT COMPLETE AND MAY BE AMENDED PRIOR TO THE TIME OF SALE. THIS TERM SHEET IS NOT AN OFFER TO SELL THESE SECURITIES AND IT IS NOT A SOLICITATION OF AN OFFER TO BUY THESE SECURITIES IN ANY JURISDICTION WHERE THE OFFER OR SALE IS NOT PERMITTED.
45
5100 Kings Plaza Brooklyn, NY 11234 | Collateral Asset Summary – Loan No. 3 Kings Plaza | Cut-off Date Balance: Cut-off Date LTV: U/W NCF DSCR: U/W NOI Debt Yield: | $50,000,000 54.1% 3.07x 10.7% |

THE INFORMATION IN THIS STRUCTURAL AND COLLATERAL TERM SHEET IS NOT COMPLETE AND MAY BE AMENDED PRIOR TO THE TIME OF SALE. THIS TERM SHEET IS NOT AN OFFER TO SELL THESE SECURITIES AND IT IS NOT A SOLICITATION OF AN OFFER TO BUY THESE SECURITIES IN ANY JURISDICTION WHERE THE OFFER OR SALE IS NOT PERMITTED.
46
5100 Kings Plaza Brooklyn, NY 11234 | Collateral Asset Summary – Loan No. 3 Kings Plaza | Cut-off Date Balance: Cut-off Date LTV: U/W NCF DSCR: U/W NOI Debt Yield: | $50,000,000 54.1% 3.07x 10.7% |
Mortgage Loan Information | |
JPMCB | |
Refinance | |
| |
BBBsf / BBB-(sf) / Baa3(sf) | |
The Macerich Partnership, L.P. | |
Brooklyn Kings Plaza LLC; Kings Plaza Ground Lease LLC | |
$50,000,000 | |
$50,000,000 | |
5.6% | |
3.35880% | |
1st of each month | |
February 1, 2020 | |
January 1, 2030 | |
Interest Only | |
$437,000,000 Pari Passu Debt; $53,000,000 Mezzanine Debt | |
L(25), YM1(90), O(5) | |
Hard / Springing | |
Reserves(5) | |||
| Initial | Monthly | Cap |
Taxes: | $0 | Springing | NAP |
Insurance: | $0 | Springing | NAP |
Replacement: | $0 | Springing | (5) |
TI/LC: | $0 | Springing | (5) |
Ground Rent: | $0 | Springing | NAP |
Property Information | |
Single Asset | |
Super Regional Mall | |
Fee Simple/Leasehold | |
Brooklyn, NY | |
1969 / 2018 | |
811,797 | |
Macerich Property Management Company, LLC | |
$52,040,925 | |
$50,950,970 | |
$900,000,000 | |
October 17, 2019 | |
| |
Historical NOI | |
Most Recent NOI(6)(7): | $47,457,344 (T-12 September 30, 2019) |
2018 NOI: | $42,088,187 (December 31, 2018) |
2017 NOI: | $39,436,748 (December 31, 2017) |
2016 NOI: | $42,598,711 (December 31, 2016) |
| |
Historical Occupancy | |
Most Recent Occupancy(7): | 96.7% (October 31, 2019) |
2018 Occupancy: | 97.9% (December 31, 2018) |
2017 Occupancy: | 96.6% (December 31, 2017) |
2016 Occupancy: | 95.2% (December 31, 2016) |
Financial Information(2)(3)(8) | ||||||
Tranche | Cut-off Date Balance | Balance per Sq. Ft. Cut-off / Balloon | LTV Cut-off / Balloon | U/W DSCR NOI / NCF | U/W Debt Yield NOI / NCF | U/W Debt Yield at Balloon NOI / NCF |
Mortgage Loan | $50,000,000 |
|
|
|
|
|
Pari Passu Notes | 437,000,000 |
|
|
|
|
|
Whole Loan | $487,000,000 | $600 / $600 | 54.1% / 54.1% | 3.14x / 3.07x | 10.7% / 10.5% | 10.7% / 10.5% |
Mezzanine Loan | 53,000,000 |
|
|
|
|
|
Total Debt | $540,000,000 | $665 / $600 | 60.0% / 54.1% | 1.77x / 1.73x | 9.6% / 9.4% | 10.7% / 10.5% |
(1) | The Kings Plaza Whole Loan (as defined below) was co-originated by JP Morgan Chase Bank, National Association (“JPMCB”), Wells Fargo Bank, National Association (“WF”) and Société Générale Financial Corporation (“SGFC”). |
(2) | The Kings Plaza Loan (as defined below) consists of the non-controlling Note A-1-2 and is part of a whole loan evidenced by 12 pari passu notes with an aggregate outstanding principal balance as of the Cut-off Date of $487.0 million. For additional information, see “The Loan” herein. |
(3) | See “Current Mezzanine or Secured Subordinate Indebtedness” herein. |
(4) | The lockout period will be at least 25 payments beginning with February 1, 2020. The borrower has the option to prepay in full, together with an amount equal to the greater of yield maintenance or 1% of the outstanding principal balance of the Kings Plaza Whole Loan after the earlier to occur of (i) two years after the closing date of the securitization that includes the last pari passu note to be securitized and (ii) February 1, 2023. The lockout period of 25 payments is based on the expected Benchmark 2020-B16 transaction closing date occurring in February 2020. The actual lockout period may be longer. |
(5) | See “Initial Reserves and Ongoing Reserves” herein. |
(6) | The increase in Underwritten NOI from Most Recent NOI is primarily attributable to (i) rent steps taken 12 months out until February 1, 2021 (based on the Kings Plaza Whole Loan’s securitization in February of 2020) and straight-lined rents for investment grade-rated tenants and (ii) projected increases in power plant revenue as this component of the property stabilizes. |
(7) | Though currently in occupancy and paying rent, Forever 21 has been underwritten as vacant. Forever 21 has been in occupancy at the Kings Plaza Property since 2010 pursuant to a lease expiring in January 2020. Forever 21 filed for Chapter 11 bankruptcy in September 2019. The Forever 21 tenant and the borrower are currently negotiating a 3-year renewal with the tenant, which is pending court approval. |
(8) | The Kings Plaza Mezzanine Loan (as defined below) is interest only for the first five years of the loan term then fully amortizing based on a five-year schedule. Total Debt DSCR is based on the first 12 month period during the amortization period of the Kings Plaza Mezzanine Loan. |
(9) | Fitch, KBRA and Moody’s provided the listed assessments for the Kings Plaza Loan in the context of its inclusion in the mortgage pool. |
THE INFORMATION IN THIS STRUCTURAL AND COLLATERAL TERM SHEET IS NOT COMPLETE AND MAY BE AMENDED PRIOR TO THE TIME OF SALE. THIS TERM SHEET IS NOT AN OFFER TO SELL THESE SECURITIES AND IT IS NOT A SOLICITATION OF AN OFFER TO BUY THESE SECURITIES IN ANY JURISDICTION WHERE THE OFFER OR SALE IS NOT PERMITTED.
47
5100 Kings Plaza Brooklyn, NY 11234 | Collateral Asset Summary – Loan No. 3 Kings Plaza | Cut-off Date Balance: Cut-off Date LTV: U/W NCF DSCR: U/W NOI Debt Yield: | $50,000,000 54.1% 3.07x 10.7% |
The Loan. The Kings Plaza mortgage loan (the “Kings Plaza Loan”) is part of a whole loan that has an aggregate outstanding principal balance as of the Cut-off Date of $487.0 million (the “Kings Plaza Whole Loan”), which is secured by a first mortgage lien on the borrowers’ fee simple and leasehold interests in a 811,797 sq. ft. super regional mall located in Brooklyn, New York (the “Kings Plaza Property”). The Kings Plaza Whole Loan is comprised of 12 pari passu notes with an aggregate original principal balance as of the Cut-off Date of $487.0 million, of which Note A-1-2, with an outstanding principal balance as of the Cut-off Date of $50.0 million, is being contributed to the Benchmark 2020-B16 trust and constitute the Kings Plaza Loan. The remaining notes are expected to be contributed to one or more securitization trusts.
The relationship between the holders of the Kings Plaza Whole Loan will be governed by a co-lender agreement as described under the “Description of the Mortgage Pool—The Whole Loans— The Serviced Pari Passu Whole Loans“ and “—The Non-Serviced Pari Passu Whole Loans” in the Preliminary Prospectus.
Whole Loan Summary | |||||
Note | Original Balance | Cut-off Date Balance | Note Holder | Controlling Piece | |
A-1-1 | $70,000,000 | $70,000,000 | JPMCB | Yes | |
A-1-2 | $50,000,000 | $50,000,000 | Benchmark 2020-B16 | No | |
A-1-3 | $30,000,000 | $30,000,000 | JPMCB | No | |
A-1-4 | $21,108,108 | $21,108,108 | JPMCB | No | |
A-2-1 | $60,000,000 | $60,000,000 | SGFC | No | |
A-2-2 | $50,000,000 | $50,000,000 | SGFC | No | |
A-2-3 | $35,000,000 | $35,000,000 | SGFC | No | |
A-2-4 | $12,945,946 | $12,945,946 | SGFC | No | |
A-3-1 | $50,000,000 | $50,000,000 | BANK 2020-BNK25(1) | No | |
A-3-2 | $50,000,000 | $50,000,000 | WF | No | |
A-3-3 | $32,945,946 | $32,945,946 | WF | No | |
A-3-4 | $25,000,000 | $25,000,000 | BANK 2020-BNK25(1) | No | |
Whole Loan | $487,000,000 | $487,000,000 |
|
| |
|
|
|
|
|
|
(1) | The Bank 2020-BNK25 transaction is expected to close on or about February 13, 2020. |
The Kings Plaza Whole Loan has a 10-year interest-only term and accrues interest at a fixed annual rate equal to 3.35880% per annum. The Kings Plaza Whole Loan proceeds along with the Kings Plaza Mezzanine Loan, were used to refinance existing debt, pay closing costs, and return equity to the borrowers. Based on the “As Is” appraised value of $900.0 million as of October 17, 2019, the Kings Plaza Cut-off Date LTV Ratio for the Kings Plaza Whole Loan and the Total Debt Cut-off Date LTV Ratio is 54.1% and 60.0%, respectively.
Sources and Uses | |||||||
Sources | Proceeds | % of Total |
| Uses | Proceeds | % of Total | |
Whole Loan | $487,000,000 | 90.2% |
| Loan Payoff | $428,649,060 | 79.4 | % |
Mezzanine Loan | 53,000,000 | 9.8 |
| Return of Equity | 105,237,541 | 19.5 |
|
|
|
|
| Closing Costs | 6,113,399 | 1.1 |
|
Total Sources | $540,000,000 | 100.0% |
| Total Uses | $540,000,000 | 100.0 | % |
The Borrowers / Borrower Sponsors. The borrowers are Brooklyn Kings Plaza LLC and Kings Plaza Ground Lease LLC, each organized as a Delaware limited liability company and structured to be bankruptcy remote with two independent directors. The borrower sponsor and the non-recourse guarantor is The Macerich Partnership, L.P. The Macerich Partnership, L.P. is part of the parent organization The Macerich Company (“Macerich”), which ranks among the largest owners, operators and developers of retail real estate in the United States. Founded in 1964, Macerich has 47 properties in 15 different states primarily concentrated in California, Arizona and New York. Additionally, Macerich (NYSE:MAC), an S&P 500 company, reported total revenues of $960 million as of December 31, 2018. Macerich also reported $9.03 billion in total assets under management. Legal counsel to the borrowers delivered a non-consolidation opinion in connection with the origination of the Kings Plaza Whole Loan.
THE INFORMATION IN THIS STRUCTURAL AND COLLATERAL TERM SHEET IS NOT COMPLETE AND MAY BE AMENDED PRIOR TO THE TIME OF SALE. THIS TERM SHEET IS NOT AN OFFER TO SELL THESE SECURITIES AND IT IS NOT A SOLICITATION OF AN OFFER TO BUY THESE SECURITIES IN ANY JURISDICTION WHERE THE OFFER OR SALE IS NOT PERMITTED.
48
5100 Kings Plaza Brooklyn, NY 11234 | Collateral Asset Summary – Loan No. 3 Kings Plaza | Cut-off Date Balance: Cut-off Date LTV: U/W NCF DSCR: U/W NOI Debt Yield: | $50,000,000 54.1% 3.07x 10.7% |
The Property.
Tenant Summary |
| |||||||||
Tenant | Ratings (Fitch/Moody’s/S&P)(1) | Net Rentable Area (Sq. Ft.) | % of Net Rentable Area |
| U/W Base Rent PSF(2) | % of Total U/W Base Rent(2) | Lease Expiration |
Sales PSF(3) | Occupancy Cost(3) | |
| ||||||||||
Lowe’s Home Centers | NR/Baa1/BBB+ | 114,000 | 14.0% |
| $19.30 | 5.6% | 5/31/2028 | $391 | 6.3% | |
Primark(4) | NR/NR/NR | 102,805 | 12.7 |
| 35.17 | 9.2 | 7/31/2038 | NAV | NAV | |
JCPenney(5) | CCC+/Caa3/CCC | 94,895 | 11.7 |
| 7.57 | 1.8 | 7/31/2038 | $159 | 9.8% | |
Burlington | BB+/NR/BB+ | 55,078 | 6.8 |
| 22.25 | 3.1 | 7/31/2028 | NAV | NAV | |
Best Buy | NR/Baa1/BBB | 53,371 | 6.6 |
| 52.80 | 7.2 | 1/31/2032 | NAV | NAV | |
Zara | NR/NR/NR | 33,771 | 4.2 |
| 34.22 | 2.9 | 7/31/2028 | $512 | 7.3% | |
H&M | NR/NR/NR | 25,151 | 3.1 |
| 88.44 | 5.7 | 1/31/2024 | $441 | 19.2% | |
Old Navy | NR/Baa2/BB | 18,256 | 2.2 |
| 68.94 | 3.2 | 1/31/2025 | $403 | 19.6% | |
Victoria’s Secret | NR/Ba2/BB- | 12,034 | 1.5 |
| 69.60 | 2.1 | 1/31/2023 | $705 | 20.5% | |
Ulta Beauty | NR/NR/NR | 10,924 | 1.3 |
| 82.50 | 2.3 | 10/31/2027 | $637 | 19.3% | |
Subtotal / Wtd. Avg. |
| 520,285 | 64.1% |
| $32.59 | 43.3% |
|
|
| |
Remaining Tenants |
| 255,766 | 31.5 |
| 86.95 | 56.7 |
|
|
| |
Total Occupied(6) |
| 776,051 | 95.6% |
| $50.50 | 100.0% |
|
|
| |
Vacant Space(7)(8) |
| 35,746 | 4.4 |
|
|
|
|
|
| |
Total / Wtd. Avg. |
| 811,797 | 100.0% |
|
|
|
|
|
| |
|
|
|
|
|
|
|
|
|
|
|
(1) | Certain ratings are those of the parent company whether or not the parent guarantees the lease. |
(2) | U/W Base Rent PSF and % of Total U/W Base Rent reflect the following: (a) in-place leases based on the October 2019 rent roll and (b) contractual rent steps of $1,139,421 through February 1, 2021, and (c) straight-lined rental income of $735,253 for investment grade rated tenants including Best Buy, Old Navy, Michael Kors, Chase, Vans, Verizon Wireless, Haagen-Dazs, Starbucks Coffee and Aeropostale. |
(3) | Information as provided by the borrower sponsor based on each tenant’s actual base rent and reimbursements for the trailing 12-month period ending September 30, 2019. |
(4) | Primark has the right to terminate its lease on July 7, 2028 with 12 months’ notice provided that, as of the termination date, (i) the tenant is Primark US Corp., or a Primark successor, and (ii) the tenant is not in default of its lease beyond any applicable notice and cure period; however, such termination option will be automatically terminated and of no force or effect if either (a) another Primark store opens for business within a certain radius of the Kings Plaza Property, or (b) the tenant or any of its affiliates own, operate, otherwise become financially interested in any other Primark store or any other store branded under the Primark name within the radius. |
(5) | JCPenney is underwritten to percentage rent in lieu per the tenants’ respective lease. JCPenney percentage rent in lieu of 5.0% is based on T-12 September 2019 sales. |
(6) | Includes All Seasons Marine Corp. which is the ground lease tenant at the Kings Plaza Property and has an annual ground lease payment of $122,957. |
(7) | Vacant Space is inclusive of Forever 21, which is currently in occupancy and paying rent at the Kings Plaza Property but underwritten as vacant with no underwritten base rent. Forever 21 has been in occupancy at the Kings Plaza Property since 2010 pursuant to a lease expiring in January 2020. Forever 21 filed for Chapter 11 bankruptcy in September 2019. The Forever 21 Tenant and the borrowers are currently negotiating a 3-year renewal with the tenant, which is pending court approval. |
(8) | Includes 9,065 sq. ft. of space that is occupied by temporary or kiosk tenants with no underwritten base rent. |
The following table presents certain information relating to the historical sales at the Kings Plaza Property:
Tenant Sales PSF(1) | |||||||
| 2015 | 2016 | 2017 | 2018 | TTM September 2019 Sales | TTM September 2019 Sales PSF |
TTM Occupancy Cost % |
Lowe’s Home Center | $406 | $398 | $396 | $390 | $44,601,794 | $391 | 6.3% |
H&M | $587 | $601 | $544 | $459 | $11,101,789 | $441 | 19.2% |
Victoria’s Secret | $839 | $771 | $677 | $704 | $8,479,695 | $705 | 20.5% |
Old Navy | $454 | $435 | $445 | $412 | $7,352,403 | $403 | 19.6% |
JCPenney(2) | NAP | NAP | NAP | NAP | $14,361,075 | $159 | 9.8% |
ULTA Beauty(3) | NAP | NAP | NAP | $593 | $6,960,000 | $637 | 19.3% |
Zara(4) | NAP | NAP | NAP | NAP | $17,275,825 | $512 | 7.3% |
|
|
|
|
|
|
|
|
Total Comparable In-Line Sales (<10,000 SF) | $695 | $718 | $685 | $734 | $137,113,597 | $753 | 19.0% |
(1) | Information as provided by the borrower sponsor and only includes tenants reporting sales. |
(2) | JCPenney’s lease commenced in July 2018 after the Sears redevelopment. |
(3) | ULTA Beauty had a lease commencement date in October 2017. |
| (4) | Zara had a lease commencement date in August 2018. |
Historical and Current Occupancy(1)(2)(3) | ||||||
| 2014 | 2015 | 2016 | 2017 | 2018 | Current |
Kings Plaza (%) | 91.9% | 92.3% | 95.2% | 96.6% | 97.9% | 96.7% |
(1) | Current occupancy is based on the October 2019 underwritten rent roll. |
(2) | Current occupancy included temporary tenants which account for 9,065 sq. ft. at the Kings Plaza Property. |
(3) | Though currently in occupancy and paying rent, Forever 21 has been underwritten as vacant with no underwritten base rent. Forever 21 has been in occupancy at the Kings Plaza Property since 2010 pursuant to a lease expiring in January 2020. Forever 21 filed for Chapter 11 bankruptcy in September 2019. The Forever 21 tenant and the borrower are currently negotiating a 3-year renewal with the tenant, which is pending court approval. |
THE INFORMATION IN THIS STRUCTURAL AND COLLATERAL TERM SHEET IS NOT COMPLETE AND MAY BE AMENDED PRIOR TO THE TIME OF SALE. THIS TERM SHEET IS NOT AN OFFER TO SELL THESE SECURITIES AND IT IS NOT A SOLICITATION OF AN OFFER TO BUY THESE SECURITIES IN ANY JURISDICTION WHERE THE OFFER OR SALE IS NOT PERMITTED.
49
5100 Kings Plaza Brooklyn, NY 11234 | Collateral Asset Summary – Loan No. 3 Kings Plaza | Cut-off Date Balance: Cut-off Date LTV: U/W NCF DSCR: U/W NOI Debt Yield: | $50,000,000 54.1% 3.07x 10.7% |
Lease Rollover Schedule(1) | ||||||||
Year | Number of Leases Expiring(2) | Total Expiring Sq. Ft. | % of Total Sq. Ft. Expiring | Cumulative Sq. Ft. Expiring | Cumulative % of Sq. Ft. Expiring | Annual U/W Base Rent PSF(3) | % U/W Base Rent Rolling(3) | Cumulative % of U/W Base Rent |
MTM | 7 | 29,864 | 3.7% | 29,864 | 3.7% | $90.63 | 6.9% | 6.9% |
2020(4) | 5 | 12,737 | 1.6% | 42,601 | 5.2% | $27.08 | 0.9% | 7.8% |
2021 | 8 | 21,346 | 2.6% | 63,947 | 7.9% | $70.81 | 3.9% | 11.6% |
2022 | 15 | 26,624 | 3.3% | 90,571 | 11.2% | $93.37 | 6.3% | 18.0% |
2023 | 9 | 24,161 | 3.0% | 114,732 | 14.1% | $95.16 | 5.9% | 23.9% |
2024 | 10 | 43,309 | 5.3% | 158,041 | 19.5% | $89.33 | 9.9% | 33.7% |
2025 | 9 | 40,150 | 4.9% | 198,191 | 24.4% | $78.54 | 8.0% | 41.8% |
2026 | 13 | 41,603 | 5.1% | 239,794 | 29.5% | $93.61 | 9.9% | 51.7% |
2027 | 8 | 29,981 | 3.7% | 269,775 | 33.2% | $85.63 | 6.5% | 58.3% |
2028 | 10 | 219,491 | 27.0% | 489,266 | 60.3% | $27.92 | 15.6% | 73.9% |
2029 | 13 | 35,714 | 4.4% | 524,980 | 64.7% | $86.29 | 7.9% | 81.8% |
2030 | 0 | 0 | 0.0% | 524,980 | 64.7% | $0.00 | 0.0% | 81.8% |
2031 & Thereafter | 3 | 251,071 | 30.9% | 776,051 | 95.6% | $28.48 | 18.2% | 100.0% |
Vacant(5)(6) | NAP | 35,746 | 4.4% | 811,797 | 100.0% | NAP | NAP | 100.0% |
Total / Wtd. Avg. | 110 | 811,797 | 100.0% |
|
| $50.50 | 100.00% |
|
(1) | Certain tenants may have lease termination options that are exercisable prior to the originally stated expiration date of the subject lease and are not considered in the lease rollover schedule. |
(2) | Number of Leases Expiring excludes temporary kiosks and storage units located across the King’s Plaza Property. |
(3) | Annual U/W Base Rent PSF and % U/W Base Rent Rolling reflect the following: (a) in-place leases based on the October 2019 rent roll, (b) contractual rent steps of $1,139,421 through February 1, 2021 and (c) straight-lined rental income of $735,253 for investment grade rated tenants including Best Buy, Old Navy, Michael Kors, Chase, Vans, Verizon Wireless, Haagen-Dazs, Starbucks Coffee and Aeropostale. |
(4) | Includes All Seasons Marine Corp. which is the ground lease tenant at the Kings Plaza Property and has an annual ground lease payment of $122,957. |
(5) | Vacant space is inclusive of Forever 21, which is currently in occupancy and paying rent at the Kings Plaza Property but underwritten as vacant with no underwritten base rent. Forever 21 has been in occupancy at the Kings Plaza Property since 2010 pursuant to a lease expiring in January 2020. Forever 21 filed for Chapter 11 bankruptcy in September 2019. The Forever 21 Tenant and the borrowers are currently negotiating a 3-year renewal with the tenant, which is pending court approval. |
(6) | Vacant space includes 9,065 sq. ft. associated with temporary tenants currently in occupancy across the King’s Plaza Property. |
The Kings Plaza Property is an 811,797 sq. ft. enclosed, four-story super regional shopping center located in Brooklyn, New York. Built in 1969 and renovated in 2018, the collateral consists of the retail center, a power plant and a 3,739 space parking garage (3.26 spaces per 1,000 sq. ft.). A portion of the collateral including the parking garage ingress/egress, the Marina Building and a portion of the ground under the parking garage is subject to a ground lease as further described under “Ground Lease” herein.
The Kings Plaza Property is situated across approximately 21.6 acres of land with frontage along Flatbush Avenue and located at the intersection of Flatbush Avenue and Avenue U in Brooklyn, New York. The Kings Plaza Property is the only enclosed super-regional mall in Brooklyn. The Kings Plaza Property is anchored by Macy’s, Lowe’s Home Centers, Primark, JCPenney, Burlington and Best Buy. Additional anchors include Zara, H&M, Old Navy, Victoria’s Secret, ULTA Beauty and Forever 21. According to the appraisal, Primark expects its Kings Plaza Property location to generate the highest revenue in the United States, exceeding its Boston flagship store location. Primark does not report sales at the Kings Plaza Property, however, the appraisal estimated Primark’s Kings Plaza Property location sales to be approximately $45 to $50 million annually. Macy’s, which is not part of the collateral, occupies approximately 339,000 sq. ft. attached to the Kings Plaza Property (the “Macy’s Parcel”). The Kings Plaza Property Macy’s location was selected as one of the Macy’s “Growth 100” locations for 2020. The retailer is experimenting with new concepts directed at improving store fixtures and facilities. As part of the program, Macy’s will receive an estimated $4 to $5 million to remodel the store in the upcoming years. This typically consists of technology upgrades, dressing room upgrades, new flooring, lighting, painting and improvements to the exterior of the space. Forever 21 currently occupies 22,802 sq. ft. at the Kings Plaza Property. Forever 21 has been in occupancy since 2010 and is pursuant to a lease expiring on January 31, 2020. Forever 21 filed for Chapter 11 bankruptcy in September 2019 and is currently negotiating a three-year renewal at the Kings Plaza Property at $900,000 in annual base rent, which is pending court approval. Forever 21 reported T-12 September 2019 sales of approximately $237 PSF. Though in occupancy and paying rent, Forever 21 has been underwritten as vacant.
The Kings Plaza Property is currently 96.7% leased as of October 31, 2019. For those tenants reporting sales, the Kings Plaza Property generated approximately $351.98 million in gross sales as of the trailing twelve month period ending September 2019. The Kings Plaza Property generates approximately 46.8% of its top line revenue from department stores and in-line tenants over 10,000 sq. ft. Total in-line sales excluding temporary tenants accounts for approximately 85.7% of total revenue generated at the property. Since the sponsor renovated the kings Plaza Property, in-line sales have increased from $665 per sq. ft. in 2014 to $753 per sq. ft. as of September 2019. Additionally, in-line occupancy costs have decreased from year end 2014 to September 2019 from 20.6% to 19.0%.
Since acquiring the Kings Plaza Property in 2012, the borrower sponsor has invested approximately $290.3 million ($358 PSF) in capital improvements including renovations of the mall and parking garage, leasing capital and power plant upgrades. Most notable capital projects at the Kings Plaza Property included the $144.7 million redevelopment of the 290,000 sq. ft., former four-level Sears’s box. The borrower sponsor negotiated an early termination with Sears to recapture the space in 2016. The redevelopment included a four-story glass atrium, a new façade, exterior improvements and a new entry with visual and vertical connections to all four levels. In 2018, the space previously occupied by Sears re-opened with Brooklyn’s first Primark and Zara, a new JCPenney and a new Burlington. Combined, these retailers generate a total gross rent that is approximately 31.2% higher than that of the former Sears. Prior to the Sears re-
THE INFORMATION IN THIS STRUCTURAL AND COLLATERAL TERM SHEET IS NOT COMPLETE AND MAY BE AMENDED PRIOR TO THE TIME OF SALE. THIS TERM SHEET IS NOT AN OFFER TO SELL THESE SECURITIES AND IT IS NOT A SOLICITATION OF AN OFFER TO BUY THESE SECURITIES IN ANY JURISDICTION WHERE THE OFFER OR SALE IS NOT PERMITTED.
50
5100 Kings Plaza Brooklyn, NY 11234 | Collateral Asset Summary – Loan No. 3 Kings Plaza | Cut-off Date Balance: Cut-off Date LTV: U/W NCF DSCR: U/W NOI Debt Yield: | $50,000,000 54.1% 3.07x 10.7% |
development, the Kings Plaza Property underwent $22.0 million in renovations throughout 2014 and 2015. These renovations included a refreshed interior and energy efficient LED lighting, new flooring including both carpet and tile, a new ceiling, wall paint, new signage, the addition of six soft seating areas, free Wi-Fi for guests and security system upgrades.
The Kings Plaza Property operates a stand-alone power plant located on the roof which provides electricity for the shopping center as well as the surrounding area. In 2019, the borrower sponsor completed a $17.5 million project allowing the power plant to interconnect with the local Consolidated Edison (“ConEd”) grid. This connection allowed the Kings Plaza Property to export its surplus electric capacity during peak load demands, which is an additional profit center for the Kings Plaza Property. Tenants at the Kings Plaza Property purchase their utilities directly from the plant at ConEd rates but due to operating cost efficiencies, expenses are kept below the billed rates allowing the power plant to generate a profit. The power plant system went live in July 2019 and is expected to generate approximately $1.3 million in participation revenue and $1.3 million in operating cost savings through year end 2019. In 2020, expected revenue is approximately $1.8 million and the income stream will reach stabilization in 2021 at approximately $2.1 million.
Environmental Matters. Based on a Phase I environmental report dated November 22, 2019, the environmental consultant did not identify evidence of any recognized environmental conditions or recommendations for further action at the Kings Plaza Property, other than providing secondary containment for drums containing petroleum products or hazardous substances at the Kings Plaza Property and continued compliance with an existing operations and maintenance plan for asbestos-containing materials.
The Market. The Kings Plaza Property is located in Brooklyn, New York located at the intersection of Flatbush Avenue and Avenue U. Primary access to the Kings Plaza Property is provided via the Belt Parkway, the region’s primary north-south route, situated approximately 3.9 miles northeast of the Kings Plaza Property. The Kings Plaza Property is located approximately 1.4 miles southeast of Kings Highway and is approximately 10.6 miles southwest of the John F. Kennedy International Airport. According to a third party report, over 69,000 vehicles pass through the area daily and more than 1,000 buses delivering up to 40,000 passengers to the Kings Plaza Property operate each week day. Per the appraisal, the estimated 2019 population within a one-, three- and five-mile radius of the Kings Plaza Property was 51,596, 601,221 and 1,737,025, respectively with estimated 2019 average household income of $117,474, $89,529, and $78,194, respectively.
The Kings Plaza Property is located in the South Brooklyn submarket of the New York retail market. According to a third party report, as of year-end 2019, the New York retail market had an inventory of approximately 593.4 million sq. ft., an overall vacancy rate of 4.0% and average asking rents of $42.34 PSF. According to a third party report dated August 2019, the South Brooklyn submarket had an inventory of approximately 42.9 million sq. ft., an overall vacancy rate of 3.1% and average asking rents of approximately $42.31 PSF. The concluded market rents for the South Brooklyn retail submarket was $42.90 PSF. As of October 2019, the Kings Plaza Property had a weighted average underwritten base rent of $50.50 PSF which is slightly above the market rent for the South Brooklyn retail submarket.
The following table presents certain information relating to the primary competition for the Kings Plaza Property:
Competitive Set(1) | |||||||
| Distance to Subject (mi.) | Property Type | Year Built/ Renovated | Total GLA | Total Occupancy | Sales PSF | Anchors |
Kings Plaza | N/A | Super Regional Mall | 1969/2018 | 811,797 | 96.7%(2) | $736(3) | Macy’s (non-collateral), Lowe’s Home Centers, Primark, JCPenney, Burlington, Best Buy, Forever 21, H&M, Zara |
Primary Competition |
|
|
|
|
|
|
|
Gateway Center I & II | 6.4 | Power Center | 2001/NAP | 1,200,000 | 97.0% | $450 | BJ’s Wholesale Club, Burlington, Home Depot, JCPenney, Shoprite, Target |
Queens Center | 16.4 | Super Regional Mall | 1973/2004 | 1,172,180 | 99.0% | $1430 | JCPenney, Macy’s |
Green Acres Mall | 14.3 | Super Regional Mall | 1956/2016 | 2,075,000 | 96.0% | $615 | JCPenney, Macy’s, Sears, Kohl’s (Vacant) |
Secondary Competition |
|
|
|
|
|
|
|
Staten Island Mall | 19.0 | Super Regional Mall | 1972/2018 | 1,700,000 | 92.0% | NAV | JCPenney, Macy’s, Primark, Sears (Vacant) |
Roosevelt Field | 28.7 | Super Regional Mall | 1956/2014 | 2,330,000 | 97.0% | $1,200 | Bloomingdales, Dick’s Sporting Goods, JCPenney, Macy’s, Neiman Marcus, Nordstrom |
(1) | Source: Appraisal. |
(2) | Occupancy as of October 31, 2019. |
(3) | Comparable in-line and food court sales shown as of September 2019. |
THE INFORMATION IN THIS STRUCTURAL AND COLLATERAL TERM SHEET IS NOT COMPLETE AND MAY BE AMENDED PRIOR TO THE TIME OF SALE. THIS TERM SHEET IS NOT AN OFFER TO SELL THESE SECURITIES AND IT IS NOT A SOLICITATION OF AN OFFER TO BUY THESE SECURITIES IN ANY JURISDICTION WHERE THE OFFER OR SALE IS NOT PERMITTED.
51
5100 Kings Plaza Brooklyn, NY 11234 | Collateral Asset Summary – Loan No. 3 Kings Plaza | Cut-off Date Balance: Cut-off Date LTV: U/W NCF DSCR: U/W NOI Debt Yield: | $50,000,000 54.1% 3.07x 10.7% |
Cash Flow Analysis.
Cash Flow Analysis | ||||||
| 2016 | 2017 | 2018 | T-12 9/30/2019 | U/W | U/W (PSF) |
Base Rent(1) | $32,606,560 | $28,991,086 | $33,095,904 | $36,690,592 | $38,005,038 | $46.82 |
Straight-Line Rent(2) | 0 | 0 | 0 | 0 | 735,253 | $0.91 |
Vacant Income | 0 | 0 | 0 | 0 | 2,227,628 | $2.74 |
Gross Potential Rent | $32,606,560 | $28,991,086 | $33,095,904 | $36,690,592 | $40,967,919 | $50.47 |
Total Reimbursements(3) | 29,793,723 | 28,145,401 | 28,424,111 | 30,047,457 | 30,961,099 | $38.14 |
% in Lieu/Percentage Rent(4) | 293,672 | 201,320 | 735,279 | 1,476,667 | 2,195,355 | $2.70 |
Bad Debt | (265,786) | (597,346) | (612,614) | (338,749) | 0 | $0.00 |
Vacancy/Credit Loss | 0 | 0 | 0 | 0 | (3,678,863) | ($4.53) |
Temporary Specialty Leasing | 3,312,047 | 2,761,118 | 2,254,340 | 2,411,429 | 2,411,429 | $2.97 |
Power Plant Income | 0 | 0 | 0 | 960,000 | 1,804,680 | $2.22 |
Other Income(5) | 6,019,024 | 5,421,663 | 5,787,129 | 5,068,245 | 6,383,568 | $7.86 |
Effective Gross Income | $71,759,240 | $64,923,243 | $69,684,148 | $76,315,642 | $81,045,187 | $99.83 |
Real Estate Taxes | 13,832,938 | 10,772,620 | 12,489,143 | 14,498,321 | 15,242,004 | 18.78 |
Insurance | 329,601 | 266,664 | 243,524 | 273,222 | 320,964 | 0.40 |
Other Operating Expenses | 14,997,990 | 14,447,211 | 14,863,294 | 14,086,756 | 13,441,294 | 16.56 |
Total Expenses | $29,160,529 | $25,486,495 | $27,595,961 | $28,858,298 | $29,004,262 | $35.73 |
Net Operating Income(6) | 42,598,711 | 39,436,748 | $42,088,187 | $47,457,344 | $52,040,925 | $64.11 |
TI/LC | 0 | 0 | 0 | 0 | 995,395 | $1.23 |
Capital Expenditures | 0 | 0 | 0 | 0 | 139,559 | $0.17 |
Net Cash Flow | $42,598,711 | $39,436,748 | $42,088,187 | $47,457,344 | $50,905,970 | $62.71 |
(1) | U/W Base Rent reflects the following: (a) in-place leases based on the October 2019 rent roll where Forever 21 is underwritten as vacant and (b) contractual rent steps of $1,139,421 through February 1, 2021. |
(2) | Straight-lined rental income of $735,253 for investment grade rated tenants including Best Buy, Old Navy, Michael Kors, Chase, Vans, Verizon Wireless, Haagen-Dazs, Starbucks Coffee and Aeropostale. |
(3) | Total reimbursements includes contractual reimbursements from the Macy’s Parcel which is not part of the collateral. |
(4) | Includes % in lieu for JCPenney, Charlotte Russe and Parfois. |
(5) | Other Income includes storage income, business development, parking income and ground rent income associated with All Seasons Marine Corp. |
(6) | The increase in Underwritten NOI from Most Recent NOI is primarily attributable to (i) rent steps taken 12 months out until February 1, 2021 (based on the Kings Plaza Whole Loan’s securitization in February of 2020) and straight-lined rents for investment grade-rated tenants and (ii) projected increases in power plant revenue as this component of the property stabilizes. |
Property Management. The Kings Plaza Property is managed by Macerich Property Management Company, LLC, a Delaware limited liability company and an affiliate of the borrowers.
Lockbox / Cash Management. The Kings Plaza Whole Loan is structured with a hard lockbox and springing cash management. The borrowers were required at loan origination to deliver tenant direction letters directing all tenants at the Kings Plaza Property to deposit all rents and payments directly into a lender-controlled lockbox account at a deposit bank reasonably acceptable to the lender (the “Deposit Bank”). In addition, in accordance with the Power Plant Owner Agreement (the “KPE Agreement”) between Kings Plaza Energy LLC (“KPE”), a Delaware limited liability company and an affiliate of the Kings Plaza Borrowers, and the Lender, KPE is required to deposit amounts received by KPE directly into a lockbox account established and maintained by KPE at the Deposit Bank. Each of the borrowers, the related managers, and KPE is required to deposit any funds it receives into the applicable lockbox account within three business days of receipt. So long as no Trigger Period (as defined below) is continuing, all funds deposited into the each lockbox account are required to be transferred to or at the direction of the borrowers. Upon the commencement of a Trigger Period, none of the borrowers or KPE will have access to the funds in its lockbox account, and such funds are required to be swept on a weekly basis and on the second business day preceding each payment date into a lender-controlled cash management account.
A “Trigger Period” will commence upon (i) an event of default under the loan documents; (ii) the commencement of a Low Debt Service Period; and (iii) the occurrence of an event of default with respect to the Kings Plaza Mezzanine Loan; and ends if (A) with respect to clause (i), the event of default under the loan documents has been cured, (B) with respect to clause (ii), the Low Debt Service Period has ended, or (C) with respect to clause (iii), the lender has received notice from the applicable mezzanine lenders that no event of default with respect to the Kings Plaza Mezzanine Loan is continuing.
A “Low Debt Service Period” will commence if either (i) the debt service coverage ratio under the loan documents is less than 1.43x, or (ii) the aggregate debt service coverage ratio under the loan documents and the loan documents pursuant to the Kings Plaza Mezzanine Loan is less than 1.25x, and ends (a) with respect to clause (i), if the Kings Plaza Property has achieved a debt service coverage ratio with respect to the Kings Plaza Whole Loan of at least 1.48x, or (b) with respect to clause (ii), if the Kings Plaza Property has achieved an aggregate debt service coverage ratio with respect to the Kings Plaza Whole Loan and Kings Plaza Mezzanine Loan of at least 1.30x, in each case, for two consecutive calendar quarters.
THE INFORMATION IN THIS STRUCTURAL AND COLLATERAL TERM SHEET IS NOT COMPLETE AND MAY BE AMENDED PRIOR TO THE TIME OF SALE. THIS TERM SHEET IS NOT AN OFFER TO SELL THESE SECURITIES AND IT IS NOT A SOLICITATION OF AN OFFER TO BUY THESE SECURITIES IN ANY JURISDICTION WHERE THE OFFER OR SALE IS NOT PERMITTED.
52
5100 Kings Plaza Brooklyn, NY 11234 | Collateral Asset Summary – Loan No. 3 Kings Plaza | Cut-off Date Balance: Cut-off Date LTV: U/W NCF DSCR: U/W NOI Debt Yield: | $50,000,000 54.1% 3.07x 10.7% |
Initial and Ongoing Reserves. At loan origination, the borrowers were not required to fund any initial reserves.
Real Estate Taxes and Insurance Reserves – On a monthly basis, during the continuance of a Trigger Period, the borrowers are required to reserve 1/12th of the estimated annual property taxes and 1/12th of the estimated annual insurance premiums. The monthly tax reserve requirement will be waived if (i) no Trigger Period is continuing and (ii) the borrowers continue to deliver evidence reasonably satisfactory to the lender that all taxes and insurance have been timely paid. The monthly insurance reserve requirement is also waived if the borrowers provides the Lender with evidence that the insurance policies required to be maintained by the borrowers are maintained pursuant to blanket policies that comply with the requirements of the loan documents.
Replacements Reserve – On a monthly basis, during the continuance of a Trigger Period, the borrowers will be required to reserve a monthly amount equal to the gross leasable area of the Kings Plaza Property (excluding the Macy’s Parcel and the portion that is occupied by Lowe’s Home Centers and any other tenant that is required to pay for all repairs and maintenance costs for its entire leased premises) multiplied by $0.25 and divided by 12. At such time the balance of the replacement reserve account reaches an amount equal to 24 times the required monthly deposit, the borrower’s obligation to make monthly deposits into the replacement reserve account will be waived.
TI/LC Reserve – On a monthly basis, during the continuance of a Trigger Period, the borrowers will be required to reserve an amount equal to the gross leasable area of the Kings Plaza Property (excluding the Macy’s Parcel) multiplied by $1.50 and divided by 12. However, the borrowers will not be required to make any portion of the monthly TI/LC reserve deposit if the amount then on deposit in the TI/LC reserve is equal to or exceeds 24 times the required monthly deposit.
Ground Rent Reserve – On a monthly basis, during the continuance of a Trigger Period, the borrowers will be required to reserve an amount equal to the monthly ground rent due, as applicable, under the ground leases. However, as long as no Trigger Period has occurred or is continuing, the borrowers’ obligations with respect to monthly deposits to the ground rent reserve account will be waived.
Ground Lease. A portion of the Kings Plaza Property, comprising of the parking garage ingress/egress, the marina building (the “Marina Building”) and a portion of the ground under the parking garage covering a total of 10,278 sq. ft. (1.3% of the net rentable area), is subject to a ground lease with the City of New York. The original lease term expired on May 28, 2018 and the borrowers exercised their first of five extension options. Three, 10-year extension options and one 9-year option remain for a fully extended expiration date of May 28, 2067. All Seasons Marine Corp. (the “Subtenant”) currently subleases the Marina Building from the borrowers, which is part of the ground leased land that is owned by the City of New York. The initial lease term expired in 2005, subsequent to which the Subtenant extended its sublease on a one- and two-year basis. A one-year extension through November 30, 2020 was recently executed by the Subtenant. Annual base rent equals $122,957 through the payment date occurring in May 2028. The annual ground lease payment will increase by 20% effective each time an extension term is exercised.
Current Mezzanine or Secured Subordinate Indebtedness. Concurrently with the funding of the Kings Plaza Whole Loan, JPMCB, SGFC and WF funded a mezzanine loan in the amount of $53.0 million (the “Kings Plaza Mezzanine Loan”). The Kings Plaza Mezzanine Loan is secured by the pledge of the direct equity interest in the borrowers and is coterminous with the Kings Plaza Whole Loan. The Kings Plaza Mezzanine Loan accrues interest at a rate of 6.00000% per annum and following a five-year interest only period, is fully amortized by the maturity date of January 1, 2030 pursuant to a fixed amortization schedule. Based on the Kings Plaza Whole Loan and the Kings Plaza Mezzanine Loan, the cumulative Cut-off Date LTV is 60.0%, the cumulative U/W NCF DSCR is 1.73x and the cumulative U/W NOI Debt Yield is 9.6%. The rights of the related mezzanine lenders under the Kings Plaza Mezzanine Loan are further described under “Description of the Mortgage Pool—Additional Indebtedness—Mezzanine Indebtedness” in the Preliminary Prospectus.
Future Mezzanine or Subordinate Indebtedness Permitted. None, other than a corporate financing arrangement with a pledge by the borrower sponsor or affiliates of their indirect ownership of the borrower, with respect to which, among other requirements, the value of the Mortgaged Property constitutes no more than 15% of the value of all assets securing such credit facility.
Release of Collateral. The borrowers will have the right to transfer and obtain a release of all or a portion of the parking garage at the Kings Plaza Property for redevelopment so long as the redevelopment will not materially impair the use of the garage by customers at the Kings Plaza Property. In addition, the borrowers have the right to convert excess space in the parking garage into multifamily units. The parking garage (such portion of the parking garage, the “Release Parcel”), may be released in whole or in part, provided that, among other things: (i) no event of default has occurred and is continuing under the loan documents, (ii) the borrowers have delivered not less than 30 days’ prior written notice to the lender, (iii) the borrowers pays the lender a processing fee in the amount of $15,000 and any additional reasonable costs and expenses incurred by the proposed transfer or release of the Release Parcel, (iv) the net revenue generated by parking operations at the Kings Plaza Property is not diminished by more than a de minimis amount as a result of the release of the Release Parcel, (v) the remaining Kings Plaza Property constitutes a separate tax lot, (vi) the number of parking spaces at the Kings Plaza Property is not reduced to a number below the number of parking spaces required to satisfy zoning requirements, (vii) the satisfaction of REMIC requirements, (viii) the development of the Release Parcel is restricted for a non-retail use; provided, however, that up to 10% of the gross leasable area may be used for retail purposes; provided, further, that none of the borrowers or the borrower sponsor may cause or solicit any existing retail tenant at the Kings Plaza Property to lease space at the Release Parcel.
THE INFORMATION IN THIS STRUCTURAL AND COLLATERAL TERM SHEET IS NOT COMPLETE AND MAY BE AMENDED PRIOR TO THE TIME OF SALE. THIS TERM SHEET IS NOT AN OFFER TO SELL THESE SECURITIES AND IT IS NOT A SOLICITATION OF AN OFFER TO BUY THESE SECURITIES IN ANY JURISDICTION WHERE THE OFFER OR SALE IS NOT PERMITTED.
53
3500 Lacey Road Downers Grove, IL 60515 | Collateral Asset Summary – Loan No. 4 3500 Lacey | Cut-off Date Balance: Cut-off Date LTV: U/W NCF DSCR: U/W NOI Debt Yield: | $50,000,000 66.5% 2.38x 11.3% |

THE INFORMATION IN THIS STRUCTURAL AND COLLATERAL TERM SHEET IS NOT COMPLETE AND MAY BE AMENDED PRIOR TO THE TIME OF SALE. THIS TERM SHEET IS NOT AN OFFER TO SELL THESE SECURITIES AND IT IS NOT A SOLICITATION OF AN OFFER TO BUY THESE SECURITIES IN ANY JURISDICTION WHERE THE OFFER OR SALE IS NOT PERMITTED.
54
3500 Lacey Road Downers Grove, IL 60515 | Collateral Asset Summary – Loan No. 4 3500 Lacey | Cut-off Date Balance: Cut-off Date LTV: U/W NCF DSCR: U/W NOI Debt Yield: | $50,000,000 66.5% 2.38x 11.3% |
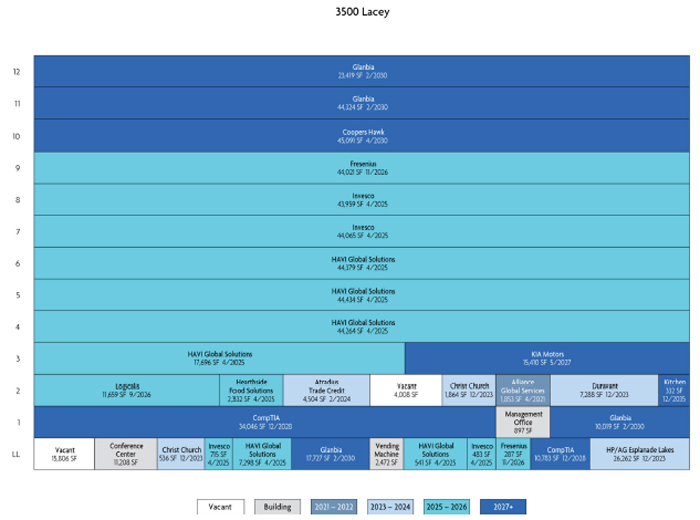
THE INFORMATION IN THIS STRUCTURAL AND COLLATERAL TERM SHEET IS NOT COMPLETE AND MAY BE AMENDED PRIOR TO THE TIME OF SALE. THIS TERM SHEET IS NOT AN OFFER TO SELL THESE SECURITIES AND IT IS NOT A SOLICITATION OF AN OFFER TO BUY THESE SECURITIES IN ANY JURISDICTION WHERE THE OFFER OR SALE IS NOT PERMITTED.
55
3500 Lacey Road Downers Grove, IL 60515 | Collateral Asset Summary – Loan No. 4 3500 Lacey | Cut-off Date Balance: Cut-off Date LTV: U/W NCF DSCR: U/W NOI��Debt Yield: | $50,000,000 66.5% 2.38x 11.3% |

THE INFORMATION IN THIS STRUCTURAL AND COLLATERAL TERM SHEET IS NOT COMPLETE AND MAY BE AMENDED PRIOR TO THE TIME OF SALE. THIS TERM SHEET IS NOT AN OFFER TO SELL THESE SECURITIES AND IT IS NOT A SOLICITATION OF AN OFFER TO BUY THESE SECURITIES IN ANY JURISDICTION WHERE THE OFFER OR SALE IS NOT PERMITTED.
56
3500 Lacey Road Downers Grove, IL 60515 | Collateral Asset Summary – Loan No. 4 3500 Lacey | Cut-off Date Balance: Cut-off Date LTV: U/W NCF DSCR: U/W NOI Debt Yield: | $50,000,000 66.5% 2.38x 11.3% |
Mortgage Loan Information | |
JPMCB | |
Acquisition | |
Jack Kim | |
KORE 3500 Lacey Owner, LLC | |
$50,000,000 | |
$50,000,000 | |
5.6% | |
4.35000% | |
1st of each month | |
January 1, 2020 | |
December 1, 2029 | |
Interest Only | |
$35,800,000 Pari Passu Debt | |
L(25), YM1(91), O(4) | |
Hard / Springing | |
Reserves(2) | |||
| Initial | Monthly | Cap |
Taxes: | $437,987 | $109,497 | NAP |
Insurance: | $15,884 | $15,884 | NAP |
Replacement: | $7,300 | $7,300 | NAP |
TI/LC: | $48,665 | $48,665 | $2,336,000 |
Outstanding Free Rent: | $1,763,787 | $0 | NAP |
Outstanding TI/LC: | $387,266 | $0 | NAP |
Property Information | ||
Single Asset | ||
Suburban Office | ||
Fee Simple | ||
Downers Grove, IL | ||
1992 / 2014-2018 | ||
583,982 | ||
Kore Management, LLC; Jones Lang LaSalle | ||
| Americas (Illinois), L.P. | |
$9,692,039 | ||
$9,020,460 | ||
$129,000,000 | ||
September 3, 2019 | ||
| ||
Historical NOI | ||
Most Recent NOI: | $9,838,753 (T-12 August 31, 2019) | |
2018 NOI: | $9,932,818 (December 31, 2018) | |
2017 NOI: | $9,724,208 (December 31, 2017) | |
2016 NOI: | $7,962,582 (December 31, 2016) | |
| ||
Historical Occupancy | ||
Most Recent Occupancy: | 96.6% (September 1, 2019) | |
2018 Occupancy: | 95.1% (December 31, 2018) | |
2017 Occupancy: | 93.6% (December 31, 2017) | |
2016 Occupancy: | 87.2% (December 31, 2016) | |
|
|
|
Financial Information(1) | ||||||
Tranche | Cut-off Date Balance | Balance PSF Cut-off / Balloon | LTV Cut-off / Balloon | U/W DSCR NOI / NCF | U/W Debt Yield NOI / NCF | U/W Debt Yield at Balloon NOI / NCF |
Mortgage Loan | $50,000,000 |
|
|
|
|
|
Pari Passu Notes | 35,800,000 |
|
|
|
|
|
Whole Loan | $85,800,000 | $147 / $147 | 66.5% / 66.5% | 2.56x / 2.38x | 11.3% / 10.5% | 11.3% / 10.5% |
(1) | The 3500 Lacey Loan (as defined below) consists of the controlling Note A-1 and is part of the 3500 Lacey Whole Loan (as defined below) evidenced by two pari passu notes with an aggregate outstanding principal balance as of the Cut-off Date of $85.8 million. For additional information, see “The Loan” herein. |
(2) | See “Initial and Ongoing Reserves” herein. |
THE INFORMATION IN THIS STRUCTURAL AND COLLATERAL TERM SHEET IS NOT COMPLETE AND MAY BE AMENDED PRIOR TO THE TIME OF SALE. THIS TERM SHEET IS NOT AN OFFER TO SELL THESE SECURITIES AND IT IS NOT A SOLICITATION OF AN OFFER TO BUY THESE SECURITIES IN ANY JURISDICTION WHERE THE OFFER OR SALE IS NOT PERMITTED.
57
3500 Lacey Road Downers Grove, IL 60515 | Collateral Asset Summary – Loan No. 4 3500 Lacey | Cut-off Date Balance: Cut-off Date LTV: U/W NCF DSCR: U/W NOI Debt Yield: | $50,000,000 66.5% 2.38x 11.3% |
The Loan. The 3500 Lacey mortgage loan (the “3500 Lacey Loan”) is part of a whole loan with an aggregate outstanding principal balance as of the Cut-off Date of $85.8 million (the “3500 Lacey Whole Loan”) evidenced by two pari passu notes that are together secured by a first mortgage encumbering the borrower’s fee simple interest in a 583,982 sq. ft. Class A, LEED Silver trophy office building located in Downers Grove, Illinois (the “3500 Lacey Property”). The 3500 Lacey Loan, which is evidenced by the controlling Note A-1, has an original principal balance and outstanding principal balance as of the Cut-off Date of $50.0 million.
The relationship between the holders of the 3500 Lacey Whole Loan will be governed by a co-lender agreement as described under “Description of the Mortgage Pool—The Whole Loans—The Serviced Pari Passu Whole Loans” in the Preliminary Prospectus.
Whole Loan Summary | |||||
Note | Original Balance | Cut-off Date Balance |
| Note Holder | Controlling Piece |
Note A-1 | $50,000,000 | $50,000,000 |
| Benchmark 2020-B16 | Yes |
Note A-2 | 35,800,000 | 35,800,000 |
| JPMCB | No |
Whole Loan | $85,800,000 | $85,800,000 |
|
|
|
The 3500 Lacey Whole Loan has a 10-year interest-only term and accrues interest at a rate of 4.35000% per annum. The 3500 Lacey Whole Loan proceeds, along with a $33.0 million preferred equity investment and approximately $13.8 million of borrower sponsor equity, were used to acquire the 3500 Lacey Property, fund reserves and pay closing costs. Based on the “As Is” appraised value of $129.0 million as of September 3, 2019, the Cut-off Date LTV Ratio is 66.5%. The 3500 Lacey Whole Loan has not been included in any prior securitizations.
Sources and Uses | ||||||
Sources | Proceeds | % of Total |
| Uses | Proceeds | % of Total |
Whole Loan | $85,800,000 | 64.7% | Purchase Price | $128,500,000 | 96.9% | |
Preferred Equity | 33,000,000 | 24.9 | Upfront Reserves | 1,393,201 | 1.1 | |
Borrower Equity | 13,754,090 | 10.4 | Closing Costs | 2,660,889 | 2.0 | |
Total Sources | $132,554,090 | 100.0% | Total Uses | $132,554,090 | 100.0% | |
The Borrower / Borrower Sponsor. The borrower is KORE 3500 Lacey Owner, LLC, a Delaware limited liability company and a single purpose entity with two independent managers in its organizational structure. Legal counsel to the borrower delivered a non-consolidation opinion in connection with the origination of the 3500 Lacey Whole Loan. The borrower is indirectly owned and controlled by Jack Kim, the borrower sponsor and founder of KORE Investments (“KORE”). KORE is a Denver-based real estate company specializing in acquisitions, development, asset management and property management for office, industrial, retail and multifamily properties. Founded in 2003, KORE has accumulated commercial real estate in various states across the United States. Notable acquisitions include the $115.2 million, 242,000 sq. ft. Denver Tech Center building that houses Re/Max’s headquarters, the $11.8 million Harmswood Office Center in Chicago and the $10.8 million, 91,000 sq. ft. Republic Park I office building in Greenwood Village, Colorado.
THE INFORMATION IN THIS STRUCTURAL AND COLLATERAL TERM SHEET IS NOT COMPLETE AND MAY BE AMENDED PRIOR TO THE TIME OF SALE. THIS TERM SHEET IS NOT AN OFFER TO SELL THESE SECURITIES AND IT IS NOT A SOLICITATION OF AN OFFER TO BUY THESE SECURITIES IN ANY JURISDICTION WHERE THE OFFER OR SALE IS NOT PERMITTED.
58
3500 Lacey Road Downers Grove, IL 60515 | Collateral Asset Summary – Loan No. 4 3500 Lacey | Cut-off Date Balance: Cut-off Date LTV: U/W NCF DSCR: U/W NOI Debt Yield: | $50,000,000 66.5% 2.38x 11.3% |
The Property.
Tenant Summary(1) | ||||||
Tenant(2) | Credit Rating (Moody’s/Fitch/S&P)(3) | Net Rentable Area | % of Net | U/W Base Rent | % of Total U/W Base Rent | Lease Expiration(4) |
HAVI Global Solutions(4) | NR / NR / NR | 158,612 | 27.2% | $20.97 | 30.2% | 4/30/2025 |
Glanbia(5) | NR / NR / NR | 95,489 | 16.4% | $19.46 | 16.9% | 2/28/2030 |
Invesco(6) | A2 / A- / BBB+ | 89,222 | 15.3% | $23.70 | 19.2% | 4/30/2025 |
Coopers Hawk | NR / NR / NR | 45,091 | 7.7% | $20.75 | 8.5% | 4/30/2030 |
CompTIA(7) | NR / NR / NR | 44,829 | 7.7% | $15.46 | 6.3% | 12/31/2028 |
Fresenius(8) | Baa3 / BBB- / BBB | 44,308 | 7.6% | $23.66 | 9.5% | 11/30/2026 |
HP/AG Esplanade Lakes(9) | NR / NR / NR | 26,262 | 4.5% | $2.91 | 0.7% | 12/31/2023 |
KIA Motors(10) | Baa1 / BBB+ / BBB+ | 15,410 | 2.6% | $21.91 | 3.1% | 5/31/2027 |
Logicalls | NR / NR / NR | 11,659 | 2.0% | $20.59 | 2.2% | 9/30/2026 |
Duravant | NR / NR / NR | 7,288 | 1.2% | $21.45 | 1.4% | 12/31/2023 |
Total Major Tenants |
| 538,170 | 92.2% | $20.04 | 98.0% |
|
Other Occupied(11) |
| 25,998 | 4.5% | $8.66 | 2.0% |
|
Total Occupied |
| 564,168 | 96.6% | $19.52 | 100.0% |
|
Vacant |
| 19,814 | 3.4% |
|
|
|
Total / Wtd. Avg. |
| 583,982 | 100.0% |
|
|
|
|
|
|
|
|
|
|
(1) | Based on the underwritten rent roll dated September 1, 2019 inclusive of rent steps through November 2020. |
(2) | All tenants operate under a NNN structure with the exception of the Esplanade Lakes ballroom/event space tenant. |
(3) | In certain instances, ratings provided are those of the parent company of the entity shown, whether or not the parent guarantees the lease. |
(4) | HAVI Global Solutions has a one-time right to terminate its lease effective as of August 2022 with no less than 12 months’ prior notice and the payment of an estimated termination fee of $5,236,299. In addition, HAVI Global Solutions has subleased (a) 17,696 sq. ft. to Hearthside Food Solutions, LLC at a base rent of $23.40 PSF and (b) 22,132 sq. ft. to Donnelley Financial, LLC at a base rent of $22.20 PSF. Both subleases are coterminous with the underlying lease to HAVI Global Solutions, which expires in April 2025. |
(5) | Glanbia has a right to terminate its lease effective as of February 2026 with no less than 6 months’ prior notice and the payment of an estimated termination fee of $4,101,067. |
(6) | Invesco has a right to terminate its lease effective as of May 2021 with no less than 12 months’ prior notice and the payment of an estimated termination fee of $3,789,544. |
(7) | CompTIA has a right to terminate its lease effective as of December 2026 with no less than 12 months’ prior notice and the payment of an estimated termination fee of $971,316. |
(8) | Fresenius has a right to terminate its lease effective as of December 2020 with no less than 12 months’ prior notice and the payment of an estimated termination fee of $2,340,159. |
(9) | HP/AG Esplanade Lakes is a café at the 3500 Lacey Property. |
(10) | Kia Motors has a right to terminate its lease effective as of June 2024 with no less than 12 months’ prior notice and the payment of an estimated termination fee of $650,895. |
(11) | Other Occupied is inclusive of 14,909 sq. ft. associated with management and associated amenity spaces, including the conference center, the management office, a kitchen and vending machine space which have no attributable underwritten base rent. |
Lease Rollover Schedule(1)(2) | ||||||||
Year | # of Leases Expiring | Total Expiring Sq. Ft. | % of Total Sq. Ft. Expiring | Cumulative Sq. Ft. Expiring | Cumulative % of Sq. Ft. Expiring | Annual U/W Base Rent PSF(3) | % U/W Base Rent Rolling(3) | Cumulative % of U/W Base Rent |
MTM | 0 | 0 | 0.0% | 0 | 0.0% | $0.00 | 0.0% | 0.0% |
2020 | 0 | 0 | 0.0% | 0 | 0.0% | $0.00 | 0.0% | 0.0% |
2021 | 1 | 1,853 | 0.3% | 1,853 | 0.3% | $20.87 | 0.4% | 0.4% |
2022 | 0 | 0 | 0.0% | 1,853 | 0.3% | $0.00 | 0.0% | 0.4% |
2023 | 3 | 35,950 | 6.2% | 37,803 | 6.5% | $7.72 | 2.5% | 2.9% |
2024 | 1 | 4,504 | 0.8% | 42,307 | 7.2% | $20.26 | 0.8% | 3.7% |
2025 | 3 | 250,166 | 42.8% | 292,473 | 50.1% | $21.95 | 49.9% | 53.6% |
2026 | 2 | 55,967 | 9.6% | 348,440 | 59.7% | $23.02 | 11.7% | 65.3% |
2027 | 1 | 15,410 | 2.6% | 363,850 | 62.3% | $21.91 | 3.1% | 68.3% |
2028 | 1 | 44,829 | 7.7% | 408,679 | 70.0% | $15.46 | 6.3% | 74.6% |
2029 | 0 | 0 | 0.0% | 408,679 | 70.0% | $0.00 | 0.0% | 74.6% |
2030 | 2 | 140,580 | 24.1% | 549,259 | 94.1% | $19.88 | 25.4% | 100.0% |
2031 and Thereafter(4) | 4 | 14,909 | 2.6% | 564,168 | 96.6% | $0.00 | 0.0% | 100.0% |
Vacant | NAP | 19,814 | 3.4% | 583,982 | 100.0% | NAP | NAP | NAP |
Total / Wtd. Avg. | 18 | 583,982 | 100.0% |
|
| $19.52 | 100.0% |
|
(1) | Based on the underwritten rent roll dated September 1, 2019 inclusive of rent steps through November 2020. |
(2) | Certain tenants may have termination or contraction options (which may become exercisable prior to the originally stated expiration date of the tenant lease) that are not considered in the above Lease Rollover Schedule. |
(3) | U/W Base Rent PSF and % of Total U/W Base Rent Rolling reflect the following: (a) in-place leases based on the September 2019 rent roll, (b) contractual rent steps of $209,575 through November 1, 2020, and (c) straight-lined rental income of $305,095 for investment grade rated tenants including Invesco, Fresenius and KIA Motors. |
(4) | 2031 and Thereafter is inclusive of 14,909 sq. ft. associated with management and associated amenity spaces, including the conference center, the management office, a kitchen and vending machine space with no attributable underwritten base rent. |
The 3500 Lacey Property is a 583,982 sq. ft., Class A, LEED Silver office building in Downers Grove, Illinois, a suburb of Chicago. The 3500 Lacey Property is comprised of 13 stories of office space adjacent to a six-level structured parking deck with 1,642 spaces along with 163 additional surface parking spaces located on the perimeter of the building, bringing the total number of parking spaces to 1,805, resulting in a parking ratio of approximately 3.1 spaces per 1,000 sq. ft. of net rentable area.
THE INFORMATION IN THIS STRUCTURAL AND COLLATERAL TERM SHEET IS NOT COMPLETE AND MAY BE AMENDED PRIOR TO THE TIME OF SALE. THIS TERM SHEET IS NOT AN OFFER TO SELL THESE SECURITIES AND IT IS NOT A SOLICITATION OF AN OFFER TO BUY THESE SECURITIES IN ANY JURISDICTION WHERE THE OFFER OR SALE IS NOT PERMITTED.
59
3500 Lacey Road Downers Grove, IL 60515 | Collateral Asset Summary – Loan No. 4 3500 Lacey | Cut-off Date Balance: Cut-off Date LTV: U/W NCF DSCR: U/W NOI Debt Yield: | $50,000,000 66.5% 2.38x 11.3% |
The 3500 Lacey Property was built in 1992 as a build to suit headquarters for Spiegel Corporation and was previously the headquarters for Sara Lee Corp. According to the previous owner of the 3500 Lacey Property, Sara Lee Corp occupied approximately 80% of net rentable area and vacated in 2012. Two years after Sara Lee Corp’s full departure, the 3500 Lacey Property was approximately 86% occupied with new tenants. Since 2014, the 3500 Lacey Property has undergone an approximately $7.4 million renovation in order to reposition it as a best-in-class multi-tenant building. Renovations to the 3500 Lacey Property included lobby renovations, elevator modernization, conference center, restrooms, updated signage and building mechanical systems. The 3500 Lacey Property was awarded an Energy Star label in 2008, 2009, 2010 and 2012 for its operating efficiency, and LEED Silver Certification. Amenities at the 3500 Lacey Property include a full-service cafeteria, 11,208 sq. ft. of newly renovated conference facilities, the 9,500 sq. ft. Esplanade Lakes Ballroom and event space, fitness center, covered parking garage with electric car charging stations, car wash and rush hour shuttle service to the local Metra station.
As of September 1, 2019, the 3500 Lacey Property was 96.6% leased to 14 distinct tenants operating in a variety of industries including financial services, insurance, automotive, technology and real estate. The 3500 Lacey Property tenants have a weighted average in-place rent of $19.52 sq. ft. and a remaining lease term of approximately 7.1 years. Additionally, 58.9% of net rentable area and 61.9% of underwritten rent is attributable to corporate headquarters for four tenants: HAVI Global Solutions, Glanbia, Cooper’s Hawk, and CompTIA. The 3500 Lacey Property is part of the Esplanade at Locust Point corporate campus, a 1.6 million sq. ft., 100-acre master development that features multiple parks, ponds and roadways. Campus amenities include the DoubleTree Esplanade Lakes; Bright Horizon Daycare, a nationally recognized child care center; The Esplanade Fitness Center, a full-service health club; and rush hour shuttle service connecting Metra BNSF Line Belmont Station, the 3500 Lacey Property, and the greater campus.
Major Tenants.
HAVI Global Solutions (158,612 sq. ft.; 27.2% of NRA; 30.2% of U/W Base Rent) HAVI Global Solutions is a privately owned global company that focuses on innovating, optimizing, and managing the supply chains of leading brands. Established in 1974, HAVI Global Solutions began by providing the supply chain needs for a Fortune 100 restaurant, and since then, the company has grown to serve an international client base with several lines of business which include marketing dynamics, supply chain management, packing and logistics. The 3500 Lacey Property has been HAVI’s global headquarters since 2013 and employs over 10,000 individuals in more than 100 countries. In May 2013, HAVI Global Solutions executed its lease at the 3500 Lacey Property and expanded it in March 2014 and currently has space on floors three through six. HAVI has a lease expiration date of April 2025 with a termination option that is effective in August 2022 and the payment of an estimated termination fee of $5,236,299.
Glanbia (95,489 sq. ft.; 16.4% of NRA; 16.9% of U/W Base Rent) Glanbia is a global nutrition group headquartered at the 3500 Lacey Property with shares listed on the Irish and London Stock Exchanges. Glanbia is a global firm aimed at providing better nutrition for individuals around the world. Glanbia has eight premium brands such as Gold Standard protein, Optimum Nutrition, IsoPure, and Nutramino health and wellness products. Glanbia has primarily focused on dairy ingredients that supplement these brands; however, the company is also a leading manufacturer of cheddar cheese in the United States. Employing 6,600 people across 32 countries, Glanbia has experienced double-digit growth for the past eight consecutive years. In addition to a food laboratory on the ground floor, the 3500 Lacey Property houses Glanbia’s corporate staff. Glanbia originally executed its lease at the 3500 Lacey Property in March 2015 and currently occupies floors 11 and 12. Glanbia has a lease expiration date of February 2030 with a termination option that is effective in February 2026 and the payment of an estimated termination fee of $4,101,067.
Invesco (89,222 sq. ft.; 15.3% of NRA; 19.2% of U/W Base Rent) Invesco Advisors, Inc. is an investment management firm offering investment strategies through a diverse set of vehicles across major equity, fixed-income, and alternative asset classes. Formerly known as Invesco PowerShares, the company has been based on the western suburbs of Chicago since its creation in 2002. Invesco Advisors, Inc. currently has more than $1,200 billion in assets under management, recorded approximately $3.8 billion in net revenues in 2018, and employs more than 8,000 individuals. Invesco Ltd., the parent company, has earned a Moody’s credit rating of A2, a S&P rating of BBB+ and Fitch rating of A- which signifies its strong credit-worthiness. Invesco executed its lease at the 3500 Lacey Property in May 2013 and currently occupies floors seven and eight. Invesco has a lease expiration date of April 2025 with a termination option that is effective in May 2021 and the payment of an estimated termination fee of $3,789,544.
Environmental Matters. The Phase I environmental report dated September 13, 2019 recommended no further action at the 3500 Lacey Property.
The Market. The 3500 Lacey Property is located in Downers Grove, DuPage County, Illinois, approximately 22 miles west of Chicago’s central business district and is part of the Suburban Chicago office market. The boundaries of the 3500 Lacey Property’s immediate area are Butterfield Road to the north, Warrenville Road and Ogden Avenue to the south, Interstate 355 to the east, and State Route 53 to the west, offering its tenants access to local demand drivers. According to the appraisal, Chicago is a major Great Lakes port and is considered the commercial, financial, industrial, and cultural center of the Midwest. The 3500 Lacey Property is part of the Chicago-Naperville-Elgin IL-IN-WI core based statistical area, in which the top four employers are Advocate Health Care System, Northwestern Memorial HealthCare, University of Chicago and JPMorgan Chase & Co. According to the appraisal, the estimated 2018 population within a one-, three- and five-mile radius of the 3500 Lacey Property is 4,064, 80,104 and 269,441, respectively. Additionally, according to the appraisal, over the same period, the average household income within a one-, three- and five-mile radius was $135,882, $118,742 and $123,340, respectively.
THE INFORMATION IN THIS STRUCTURAL AND COLLATERAL TERM SHEET IS NOT COMPLETE AND MAY BE AMENDED PRIOR TO THE TIME OF SALE. THIS TERM SHEET IS NOT AN OFFER TO SELL THESE SECURITIES AND IT IS NOT A SOLICITATION OF AN OFFER TO BUY THESE SECURITIES IN ANY JURISDICTION WHERE THE OFFER OR SALE IS NOT PERMITTED.
60
3500 Lacey Road Downers Grove, IL 60515 | Collateral Asset Summary – Loan No. 4 3500 Lacey | Cut-off Date Balance: Cut-off Date LTV: U/W NCF DSCR: U/W NOI Debt Yield: | $50,000,000 66.5% 2.38x 11.3% |
The 3500 Lacey Property is located within the Eastern East/West Corridor office submarket, within the Suburban Chicago office market. As of the second quarter of 2019, the Eastern East/West Corridor submarket included nearly 21.6 million sq. ft. of office space comprising approximately 21.5% of the Chicago non-central business district office market with a total vacancy rate of 19.8%. The 3500 Lacey Property is located adjacent to the convergence of I-355 and I-88 and the nearby Butterfield and I-355 interchange. The submarket benefits from its geographically central location, highway access, proximity to O’Hare International Airport, and close proximity to upper-income communities in DuPage County. As of the second quarter 2019, the Eastern East/West Corridor had an average direct asking rent of $23.72 PSF.
The appraisal identified 12 competitive office rent comparables located in the immediate market area. The comparable properties were built between 1980 and 2008 and range in size between 164,000 sq. ft. to 656,301 sq. ft. NNN rents range from $19.00 to $25.00 PSF, with a survey average of approximately $20.36 PSF. The appraisal’s concluded office market rent for the 3500 Lacey Property is $18.80 PSF, which is approximately 3.7% lower than the 3500 Lacey Property’s underwritten rent of $19.52 PSF.
Cash Flow Analysis.
| Cash Flow Analysis(1) | ||||||
| 2016 | 2017 | 2018 | T-12 Aug 2019 | U/W | U/W PSF | |
Base Rent(1)(2) | $9,702,071 | $10,220,404 | $10,204,086 | $10,392,644 | $11,011,262 | $18.86 | |
Vacant Income | 0 | 0 | 0 | 0 | 229,577 | 0.39 | |
Gross Potential Rent | $9,702,071 | $10,220,404 | $10,204,086 | $10,392,644 | $11,240,838 | $19.25 | |
Total Reimbursements | 5,474,200 | 6,125,736 | 6,393,020 | 6,424,783 | 6,271,808 | 10.74 | |
Parking Income | 243,010 | 291,623 | 373,357 | 417,117 | 138,638 | 0.24 | |
Less: Vacancy | (712,944) | (405,375) | (201,943) | (154,950) | (1,313,448) | (2.25) | |
Effective Gross Income | $14,141,321 | $16,116,813 | $16,731,767 | $16,670,953 | $16,337,836 | $27.98 | |
Total Fixed Expenses | 1,195,854 | 1,247,525 | 1,437,782 | 1,516,357 | 1,504,573 | 2.58 | |
Total Operating Expenses | 4,982,885 | 5,145,080 | 5,361,167 | 5,315,843 | 5,141,224 | 8.80 | |
Net Operating Income | $7,962,582 | $9,724,208 | $9,932,818 | $9,838,753 | $9,692,039 | $16.60 | |
TI/LC | 0 | 0 | 0 | 0 | 583,982 | 1.00 | |
Capital Expenditures/ Replacement Reserves | 0 | 0 | 0 | 0 | 87,597 | 0.15 | |
Net Cash Flow | $7,962,582 | $9,724,208 | $9,932,818 | $9,838,753 | $9,020,460 | $15.45 | |
|
|
|
|
|
|
|
|
(1) | U/W Base Rent reflects the following: (a) in-place leases based on the September 2019 rent roll, (b) contractual rent steps of $209,575 through November 1, 2020, and (c) straight-lined rental income of $305,095 for investment grade rated tenants including Invesco, Fresenius and KIA Motors. |
(2) | All tenants operate under a NNN Structure with the exception of the Esplanade Lakes Ballroom/event space tenant. |
Property Management. The 3500 Lacey Property is managed by Kore Management, LLC, a Colorado limited liability company, and Jones Lang LaSalle Americas (Illinois), L.P., a Illinois limited partnership.
Lockbox / Cash Management. The 3500 Lacey Whole Loan is structured with a hard lockbox and springing cash management. The borrower was required at origination to deliver tenant direction letters instructing all tenants to deposit rents into a lender controlled lockbox account. So long as no Cash Sweep Event (as defined below) then exists, all funds deposited into the lockbox account are required to be transferred within three business days to or at the direction of the borrower. All funds on deposit in the cash management account, following the occurrence and during the continuance of a Cash Sweep Event, following payment of taxes and insurance, debt service, required reserves and operating expenses, are required to be deposited into the excess cash flow reserve, to be held and disbursed in accordance with the terms of the loan documents. During the continuance of an event of default, the lender may apply such funds in such order and priority as the lender determines. The lender has been granted a first priority security interest in the cash management account.
A “Cash Sweep Event” means the occurrence and continuance of (i) an event of default, (ii) any bankruptcy action of the borrower or property manager, (iii) a DSCR Trigger Event (as defined below) or (iv) a Significant Tenant Trigger (as defined below) or (v) a Significant Tenant Termination Trigger (as defined below).
A Cash Sweep Event may be cured upon the following: (a) if caused solely by the occurrence of a DSCR Trigger Event, the achievement of a debt service coverage ratio of 1.80x or greater for two consecutive quarters based upon the trailing six-month period immediately preceding the date of determination, (b) if caused solely by an event of default, the acceptance by the lender of a cure of such event of default, or (c) if the caused solely by a bankruptcy action of the property manager, if the borrower replaces the property manager with a property manager under a replacement management agreement, each approved by the lender in accordance with the loan documents, within 60 days or such bankruptcy action is dismissed within 60 days without any material adverse consequences to the 3500 Lacey Whole Loan, the 3500 Lacey Property or the operation thereof; (d) if caused by a Significant Tenant Trigger, the occurrence of a Significant Tenant Trigger Cure or (e) if caused by a Significant Tenant Termination Trigger (as defined below), the occurrence of a Significant Tenant Termination Trigger Cure (as defined below); provided that (i) no event of default has occurred and is continuing, and (ii) the borrower has paid all of the lender’s reasonable out-of-pocket expenses incurred in connection with such Cash Sweep Event Cure, and (iii) in no event will the borrower have the right to cure a Cash Sweep Event occurring by reason of any bankruptcy action of the borrower.
THE INFORMATION IN THIS STRUCTURAL AND COLLATERAL TERM SHEET IS NOT COMPLETE AND MAY BE AMENDED PRIOR TO THE TIME OF SALE. THIS TERM SHEET IS NOT AN OFFER TO SELL THESE SECURITIES AND IT IS NOT A SOLICITATION OF AN OFFER TO BUY THESE SECURITIES IN ANY JURISDICTION WHERE THE OFFER OR SALE IS NOT PERMITTED.
61
3500 Lacey Road Downers Grove, IL 60515 | Collateral Asset Summary – Loan No. 4 3500 Lacey | Cut-off Date Balance: Cut-off Date LTV: U/W NCF DSCR: U/W NOI Debt Yield: | $50,000,000 66.5% 2.38x 11.3% |
“DSCR Trigger Event” means the debt service coverage ratio of the 3500 Lacey Whole Loan (as calculated in accordance with the loan documents) based on the trailing six-month period immediately preceding the date of determination is less than 1.75x.
“Significant Tenant Termination Trigger” means that HAVI Global Solutions (i) does not renew its lease on or prior to the date that is 12 months prior to the expiration dates of its lease or (ii) otherwise gives notice of its intention to terminate or not to renew its lease.
“Significant Tenant Termination Trigger Cure” means the date (i) upon which HAVI Global Solutions renews its lease for a rental amount of not less than 95% of the rent provided in its lease and for period of not less than three years or, (ii) on which the lender has received evidence that the borrower has entered into a replacement lease with a replacement tenant, each acceptable to the lender, such replacement tenant has taken occupancy (a “Re-tenanting Event”), and all current landlord obligations under such replacement lease have been performed, and a replacement lease or leases (A) demise individually or in the aggregate at least 95% of the premises covered by HAVI Global Solutions’ lease, (B) have an initial term of not less than five years, and (C) provide for a rental amount of not less than 95% of the rent under HAVI Global Solutions’ lease.
“Significant Tenant Trigger” means that HAVI Global Solutions (i) vacates, surrenders, or ceases to conduct its normal business operations at substantially all of its demised premises, terminates or cancels its lease or otherwise “goes dark” or (ii) becomes insolvent or a debtor in any bankruptcy action.
“Significant Tenant Trigger Cure” means the date on which (i) a Re-tenanting Event has occurred or (ii) the borrower delivers to the lender cash collateral or an acceptable letter of credit in an amount acceptable to the lender in its sole discretion, or (iii) the bankruptcy action that caused the Significant Tenant Trigger is dismissed without any material adverse consequences to the 3500 Lacey Whole Loan or the 3500 Lacey Property and HAVI Global Solutions has affirmed its lease pursuant to a final non-appealable order of a court of competent jurisdiction in each case as determined by the lender in its reasonable discretion.
Initial and Ongoing Reserves. At loan origination, the borrower deposited (i) approximately $1,763,787 into an outstanding free rent reserve in connection with three leases, (ii) approximately $437,987 into a real estate tax reserve, (iii) approximately $387,266 into outstanding TI/LC reserve in connection with two leases, (iv) approximately $15,884 into an insurance reserve, (v) approximately $48,665 into a rollover reserve and (vii) $7,300 into a replacement reserve.
Tax Reserve. The borrower is required to deposit into a real estate tax reserve, on a monthly basis, 1/12th of the estimated annual real estate taxes, which currently equates to approximately $109,497 per month (approximately $2.28 PSF).
Insurance Reserve. The borrower is required to deposit into an insurance reserve, on a monthly basis, 1/12th of estimated insurance premiums, which currently equates to approximately $15,884 per month (approximately $0.36 PSF). In the event the borrower obtains and maintains a blanket insurance policy acceptable to the lender and no event of default has occurred and is continuing, the requirement for monthly deposits into the insurance reserve will be waived.
TI/LC Reserve. The borrower is required to deposit into the TI/LC reserve, on a monthly basis, approximately $48,665 (approximately $0.96 PSF), subject to a cap of approximately $2,336,000.
Replacement Reserve. The borrower is required to deposit into the replacement reserve, on a monthly basis, approximately $7,300 (approximately $0.12 PSF).
Preferred Equity. MEPT 3500 Lacey Road, LLC (the “3500 Lacey PE Member”), a core, open-end private equity real estate fund advised by BentallGreenOak, which owned the 3500 Lacey Property since 2003 and sold it to the borrower, is a member of the sole member of the borrower (the “3500 Lacey JV”). 3500 Lacey PE Member has made a preferred equity contribution in the amount of $33,000,000 to 3500 Lacey JV. Under the related limited liability company agreement (the “3500 Lacey LLC Agreement”) between the 3500 Lacey PE Member and the 3500 Lacey JV’s managing member, which is the non-recourse carveout guarantor of the 3500 Lacey Whole Loan (the “3500 Lacey Managing Member”), the 3500 Lacey PE Member is entitled to: (a) a quarterly preferred return payment from the net cash flow from operation of the 3500 Lacey Property (after payment of all operating expenses of the 3500 Lacey JV and of the 3500 Lacey Property) in an amount equal to 10.0% per annum for the first 36 months from the effective date of the 3500 Lacey LLC Agreement and 12.0% per annum thereafter (the “Preferred Return”); and (b) in the event of any sale, disposition, financing, refinancing, casualty or condemnation with respect to the 3500 Lacey Property (each such event, a “3500 Lacey Capital Event”), the net proceeds resulting from such 3500 Lacey Capital Event (after payment of all expenses related to the capital event) in an amount equal to any unpaid Preferred Return and the amount of unreturned Preferred Equity Contribution. Except as described above, 3500 Lacey PE Member is not entitled to the return of any of its capital contributions or the Preferred Return, and any unrepaid capital contributions or Preferred Return will not be a liability of 3500 Lacey JV. Please see “Description of the Mortgage Pool – Additional Indebtedness – Preferred Equity” in the Preliminary Prospectus for additional information.
Future Mezzanine or Subordinate Indebtedness Permitted. None.
Partial Release. None.
THE INFORMATION IN THIS STRUCTURAL AND COLLATERAL TERM SHEET IS NOT COMPLETE AND MAY BE AMENDED PRIOR TO THE TIME OF SALE. THIS TERM SHEET IS NOT AN OFFER TO SELL THESE SECURITIES AND IT IS NOT A SOLICITATION OF AN OFFER TO BUY THESE SECURITIES IN ANY JURISDICTION WHERE THE OFFER OR SALE IS NOT PERMITTED.
62
(THIS PAGE INTENTIONALLY LEFT BLANK)
63
18795 Northeast 73rd Street Redmond, WA 98052 | Collateral Asset Summary – Loan No. 5 FedEx Redmond | Cut-off Date Balance: Cut-off Date LTV: U/W NCF DSCR: U/W NOI Debt Yield: | $45,140,000 55.4% 2.15x 8.6% |
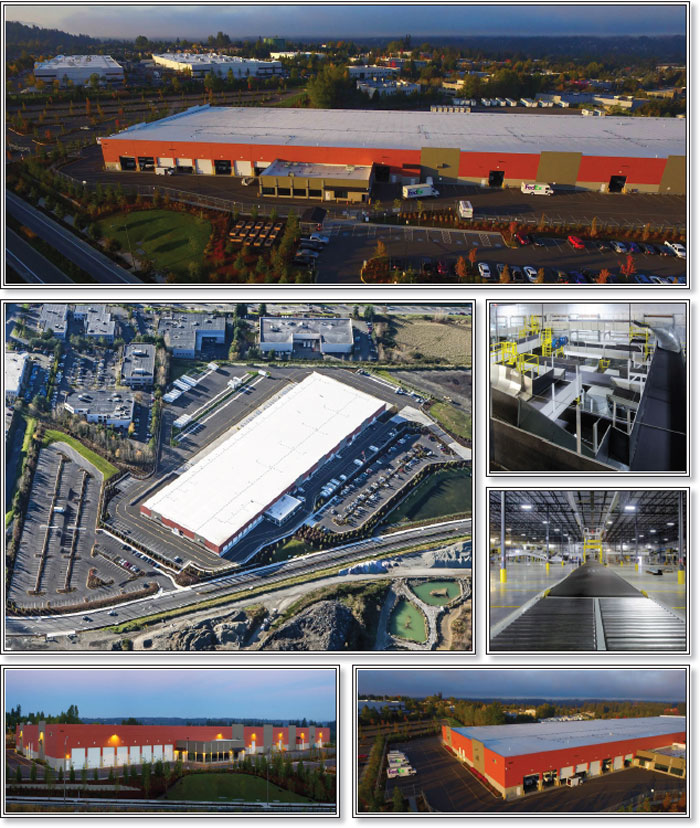
THE INFORMATION IN THIS STRUCTURAL AND COLLATERAL TERM SHEET IS NOT COMPLETE AND MAY BE AMENDED PRIOR TO THE TIME OF SALE. THIS TERM SHEET IS NOT AN OFFER TO SELL THESE SECURITIES AND IT IS NOT A SOLICITATION OF AN OFFER TO BUY THESE SECURITIES IN ANY JURISDICTION WHERE THE OFFER OR SALE IS NOT PERMITTED.
64
18795 Northeast 73rd Street Redmond, WA 98052 | Collateral Asset Summary – Loan No. 5 FedEx Redmond | Cut-off Date Balance: Cut-off Date LTV: U/W NCF DSCR: U/W NOI Debt Yield: | $45,140,000 55.4% 2.15x 8.6% |
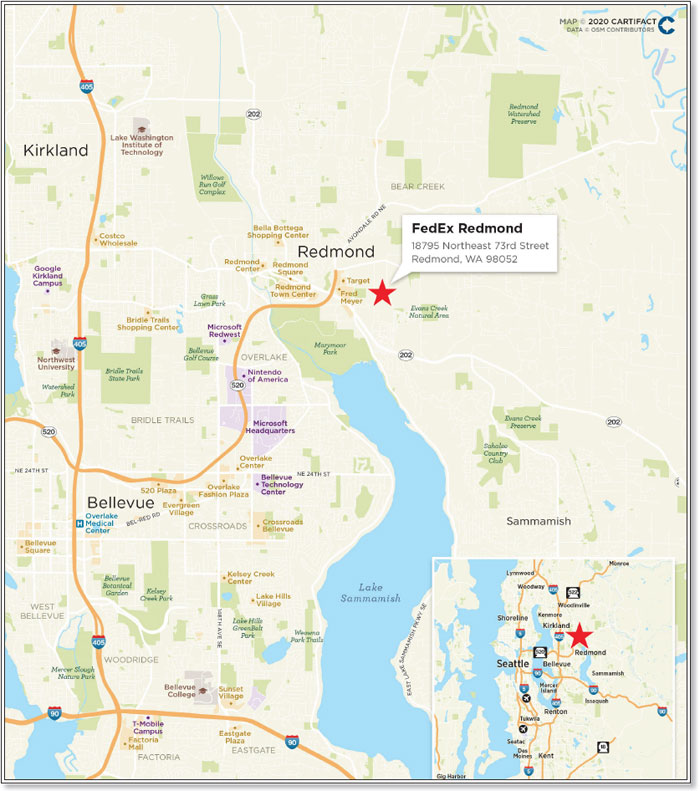
THE INFORMATION IN THIS STRUCTURAL AND COLLATERAL TERM SHEET IS NOT COMPLETE AND MAY BE AMENDED PRIOR TO THE TIME OF SALE. THIS TERM SHEET IS NOT AN OFFER TO SELL THESE SECURITIES AND IT IS NOT A SOLICITATION OF AN OFFER TO BUY THESE SECURITIES IN ANY JURISDICTION WHERE THE OFFER OR SALE IS NOT PERMITTED.
65
18795 Northeast 73rd Street Redmond, WA 98052 | Collateral Asset Summary – Loan No. 5 FedEx Redmond | Cut-off Date Balance: Cut-off Date LTV: U/W NCF DSCR: U/W NOI Debt Yield: | $45,140,000 55.4% 2.15x 8.6% |
Mortgage Loan Information | |
JPMCB | |
Acquisition | |
RREEF Property Trust | |
RPT Seattle East Industrial, LLC | |
$45,140,000 | |
$45,140,000 | |
5.0% | |
3.87000% | |
1st of each month | |
February 1, 2020 | |
January 1, 2030 | |
Interest Only | |
None | |
L(25), YM1(92), O(3) | |
Hard / Springing | |
Reserves(1) | |||||
| Initial | Monthly | Cap | ||
Taxes: | $0 | Springing | NAP | ||
Insurance: | $0 | Springing | NAP | ||
Replacement: | $0 | Springing | NAP | ||
TI/LC: | $0 | Springing | NAP | ||
Property Information | |||
Single Asset | |||
Warehouse/Distribution Industrial | |||
Fee Simple | |||
Redmond, WA | |||
2013 / NAP | |||
210,321 | |||
CBRE, Inc. | |||
$3,892,027 | |||
$3,807,899 | |||
$81,500,000 | |||
November 20, 2019 | |||
| |||
Historical NOI | |||
Most Recent NOI: | $3,894,096 (T-12 September 30, 2019) | ||
2018 NOI: | $3,782,577 (December 31, 2018) | ||
2017 NOI: | $3,708,939 (December 31, 2017) | ||
2016 NOI(3): | NAV | ||
| |||
Historical Occupancy(4) | |||
Most Recent Occupancy: | 100.0% (February 1, 2020) | ||
2018 Occupancy: | 100.0% (December 31, 2018) | ||
2017 Occupancy: | 100.0% (December 31, 2017) | ||
2016 Occupancy: | 100.0% (December 31, 2016) | ||
|
|
|
|
Financial Information | ||||||
Tranche | Cut-off Date Balance | Balance per Sq. Ft. Cut-off / Balloon | LTV Cut-off / Balloon | U/W DSCR NOI / NCF | U/W Debt Yield NOI / NCF | U/W Debt Yield at Balloon NOI / NCF |
Mortgage Loan | $45,140,000 | $215 / $215 | 55.4% / 55.4% | 2.20x / 2.15x | 8.6% / 8.4% | 8.6% / 8.4% |
(1) | See “Initial and Ongoing Reserves” herein. |
(2) | The appraiser determined a “Hypothetical Go-Dark Value” of $60.4 million, which results in a 74.7% Loan-to-Dark Value. |
(3) | 2016 NOI is not available as the prior owner provided financials dating back to 2017 during acquisition due diligence. |
(4) | The FedEx Redmond Property (as defined below) is a single tenant property that has been fully occupied by FedEx Ground Package System Inc. since 2013. |
THE INFORMATION IN THIS STRUCTURAL AND COLLATERAL TERM SHEET IS NOT COMPLETE AND MAY BE AMENDED PRIOR TO THE TIME OF SALE. THIS TERM SHEET IS NOT AN OFFER TO SELL THESE SECURITIES AND IT IS NOT A SOLICITATION OF AN OFFER TO BUY THESE SECURITIES IN ANY JURISDICTION WHERE THE OFFER OR SALE IS NOT PERMITTED.
66
18795 Northeast 73rd Street Redmond, WA 98052 | Collateral Asset Summary – Loan No. 5 FedEx Redmond | Cut-off Date Balance: Cut-off Date LTV: U/W NCF DSCR: U/W NOI Debt Yield: | $45,140,000 55.4% 2.15x 8.6% |
The Loan. The FedEx Redmond mortgage loan (the “FedEx Redmond Loan”) is a fixed rate loan that has an outstanding principal balance as of the Cut-off Date of $45.14 million, which is secured by a first mortgage lien on the borrower’s fee simple interest in a 210,321 sq. ft. warehouse/distribution industrial property located in Redmond, Washington (the “FedEx Redmond Property”). The FedEx Redmond Loan has a 10-year interest only term and accrues interest at a rate of 3.87000% per annum. The FedEx Redmond Loan proceeds along with borrower equity were used to acquire the FedEx Redmond Property and pay closing costs. Based on the “as is” appraised value of $81.5 million as of November 20, 2019, the FedEx Redmond Loan Cut-off Date LTV ratio is 55.4%.
Sources and Uses | ||||||
Sources | Proceeds | % of Total |
| Uses | Proceeds | % of Total |
Mortgage Loan | $45,140,000 | 55.1% |
| Purchase Price | $81,500,000 | 99.6% |
Borrower Equity | 36,719,241 | 44.9 |
| Closing Costs | 359,241 | 0.4 |
Total Sources | $81,859,241 | 100.0% |
| Total Uses | $81,859,241 | 100.0% |
The Borrower / Borrower Sponsor: The borrower is RPT Seattle East Industrial, LLC, a Delaware limited liability company, and a single purpose entity with one independent manager in its organizational structure. Legal counsel to the borrower delivered a non-consolidation opinion in connection with the origination of the FedEx Redmond Loan. The borrower sponsor is RREEF Property Trust, a subsidiary of DWS Group. DWS Group is a global asset manager based in Germany with approximately EUR 752 billion in assets under management. DWS Group currently has approximately 3,600 employees located across 22 countries and approximately $62 billion in real estate assets globally. RREEF Property Trust is a non-listed, publicly registered real estate investment trust that currently owns 14 assets located across eight states. The borrower, which is a single purpose entity with no assets other than the FedEx Redmond Property, is the sole party liable for breaches or violations of the nonrecourse carveout provisions in the loan documents.
The Property. The FedEx Redmond Property is a 210,321 sq. ft. LEED Silver, Class A industrial warehouse/distribution property located on an approximately 23.4-acre site in Redmond, Washington. The FedEx Redmond Property was built-to-suit for FedEx Ground Package System Inc. (“FedEx Ground”) in 2013 and currently serves as a last mile distribution center. According to the borrower sponsor, it is estimated that FedEx Ground has invested over $11.0 million in the FedEx Redmond Property. The FedEx Redmond Property features a custom-built in-place conveyor system that runs 24 hours a day, which sorts and organizes packages for shipping from 62 loading bays with clear heights ranging from 24-30 feet. The FedEx Redmond Property includes 482 surface parking spaces, resulting in a parking ratio of approximately 2.3 spaces per 1,000 sq. ft.
The FedEx Redmond Property is currently 100.0% leased to FedEx Ground through July 2028 with two, five-year extension options. FedEx Ground is a subsidiary of FedEx Corp which operates primarily in three segments, FedEx Express, FedEx Ground and FedEx Freight. FedEx Ground is a leading North American provider of small-package ground delivery services and the fastest growing segment of FedEx Corp, with revenue growing by approximately 11.6% from 2018 to 2019, reporting approximately $20.5 billion in revenue in 2019. FedEx Ground currently makes up approximately 29.4% of FedEx Corp’s 2019 annual revenue. As of May 31, 2019, FedEx Ground consisted of 619 distribution facilities and has 110,000 employees.
Tenant Summary(1) | ||||||
Tenant | Credit Rating (Moody’s/Fitch/S&P)(2) | Net Rentable Area (Sq. Ft.) | % of Net Rentable Area | U/W Base Rent PSF | % of Total U/W Base Rent | Lease Expiration |
FedEx Ground | Baa2/NR/BBB | 210,321 | 100.0% | $19.10 | 100.0% | 7/31/2028 |
Total Occupied |
| 210,321 | 100.0% | $19.10 | 100.0% |
|
Vacant |
| 0 | 0.0% |
|
|
|
Total / Wtd. Avg. |
| 210,321 | 100.0% |
|
|
|
|
|
|
|
|
|
|
(1) | Based on the underwritten rent roll. |
(2) | In certain instances, ratings provided are those of the parent company of the entity shown, whether or not the parent company guarantees the lease. |
THE INFORMATION IN THIS STRUCTURAL AND COLLATERAL TERM SHEET IS NOT COMPLETE AND MAY BE AMENDED PRIOR TO THE TIME OF SALE. THIS TERM SHEET IS NOT AN OFFER TO SELL THESE SECURITIES AND IT IS NOT A SOLICITATION OF AN OFFER TO BUY THESE SECURITIES IN ANY JURISDICTION WHERE THE OFFER OR SALE IS NOT PERMITTED.
67
18795 Northeast 73rd Street Redmond, WA 98052 | Collateral Asset Summary – Loan No. 5 FedEx Redmond | Cut-off Date Balance: Cut-off Date LTV: U/W NCF DSCR: U/W NOI Debt Yield: | $45,140,000 55.4% 2.15x 8.6% |
Lease Rollover Schedule(1) | ||||||||
Year | # of Leases Expiring | Total Expiring Sq. Ft. | % of Total Sq. Ft. Expiring | Cumulative Sq. Ft. Expiring | Cumulative % of Sq. Ft. Expiring | Annual U/W Base Rent per Sq. Ft. | % U/W Base Rent Rolling | Cumulative % of U/W Base Rent |
MTM | 0 | 0 | 0.0% | 0 | 0.0% | $0.00 | 0.0% | 0.0% |
2020 | 0 | 0 | 0.0 | 0 | 0.0% | $0.00 | 0.0 | 0.0% |
2021 | 0 | 0 | 0.0 | 0 | 0.0% | $0.00 | 0.0 | 0.0% |
2022 | 0 | 0 | 0.0 | 0 | 0.0% | $0.00 | 0.0 | 0.0% |
2023 | 0 | 0 | 0.0 | 0 | 0.0% | $0.00 | 0.0 | 0.0% |
2024 | 0 | 0 | 0.0 | 0 | 0.0% | $0.00 | 0.0 | 0.0% |
2025 | 0 | 0 | 0.0 | 0 | 0.0% | $0.00 | 0.0 | 0.0% |
2026 | 0 | 0 | 0.0 | 0 | 0.0% | $0.00 | 0.0 | 0.0% |
2027 | 0 | 0 | 0.0 | 0 | 0.0% | $0.00 | 0.0 | 0.0% |
2028 | 1 | 210,321 | 100.0 | 210,321 | 100.0% | $19.10 | 100.0 | 100.0% |
2029 | 0 | 0 | 0.0 | 210,321 | 100.0% | $0.00 | 0.0 | 100.0% |
2030 | 0 | 0 | 0.0 | 210,321 | 100.0% | $0.00 | 0.0 | 100.0% |
2031 & Thereafter | 0 | 0 | 0.0 | 210,321 | 100.0% | $0.00 | 0.0 | 100.0% |
Vacant | NAP | 0 | 0.0 | 210,321 | 100.0% | NAP | NAP |
|
Total / Wtd. Avg. | 1 | 210,321 | 100.0% |
|
| $19.10 | 100.0% |
|
(1) | Based on the underwritten rent roll. |
Environmental Matters. The Phase I environmental report dated December 3, 2019 recommended no further action at the FedEx Redmond Property.
The Market. The FedEx Redmond Property is located in King County, Washington in the eastside market area at the interchange of Northeast Union Hill Road and Avondale Road, at the point where Avondale Road becomes State Route 520. The FedEx Redmond Property is located approximately 2.0 miles east of downtown Redmond, approximately 4.5 miles northeast of the Microsoft campus, approximately 8.5 miles northeast of the Bellevue central business district and approximately 17.0 miles west of the Seattle central business district. According to the appraisal, the FedEx Redmond Property is also located approximately 2.0 miles south of Facebook’s new location, estimated to be an approximately 650,000 sq. ft. development and projected to be completed in late 2021.This Facebook location is expected to house the Facebook Reality Labs/Oculus business. Microsoft also has plans to expand and redevelop its existing campus and Google will expand its existing corporate campus in Kirkland, Washington, approximately 5.0 miles west of the FedEx Redmond Property.
The FedEx Redmond Property is located within the Redmond East industrial submarket of the Eastside industrial market. As of the third quarter of 2019, the Eastside industrial market consisted of approximately 36.7 million sq. ft. of industrial space with a total vacancy rate of 3.1%. The Redmond East submarket totaled approximately 4.0 million sq. ft. with a total vacancy of 7.8%. From 2014 through the third quarter of 2019, total vacancy in the Redmond East submarket has decreased by approximately 28.4%, due to the market’s strong last-mile location near residential and employment bases.
The appraisal identified eight competitive industrial rent comparables located across eight properties nationwide. The comparable properties were built between 2002 and 2019 and range in size between 71,835 sq. ft. to 373,750 sq. ft. NNN rents range from $9.07 to $17.52 PSF, with a weighted average of approximately $12.65 PSF. The appraisal’s concluded industrial market rent for the FedEx Redmond Property is $18.50 PSF., which is in-line with the FedEx Redmond Property’s in-place office rent of $19.10 PSF.
Cash Flow Analysis(1) | |||||
| 2017 | 2018 | T-12 9/30/2019 | U/W | U/W PSF |
Base Rent(3) | $3,708,939 | $3,782,577 | $3,900,439 | $4,016,879 | $19.10 |
Vacant Income | 0 | 0 | 0 | 0 | 0.00 |
Gross Potential Rent | $3,708,939 | $3,782,577 | $3,900,439 | $4,016,879 | $19.10 |
Total Reimbursements | 104,659 | 105,775 | 120,206 | 609,000 | 2.90 |
Total Other Income | 0 | 0 | 0 | 0 | 0.00 |
Less: Vacancy | 0 | 0 | 0 | (115,647) | (0.55) |
Effective Gross Income | $3,813,598 | $3,888,352 | $4,020,645 | $4,510,232 | $21.44 |
Total Operating Expenses | 104,659 | 105,775 | 126,549 | 618,205 | 2.94 |
Net Operating Income | $3,708,939 | $3,782,577 | $3,894,096 | $3,892,027 | $18.51 |
TI/LC | 0 | 0 | 0 | 63,096 | 0.30 |
Capital Expenditures | 0 | 0 | 0 | 21,032 | 0.10 |
Net Cash Flow | $3,708,939 | $3,782,577 | $3,894,096 | $3,807,899 | $18.11 |
(1) | 2016 financials are not available as the prior owner provided financials dating back to 2017 during acquisition due diligence. |
(2) | U/W Base Rent is inclusive of $126,403 in straight line rent for FedEx Ground, which represents its average rent over its loan term. |
THE INFORMATION IN THIS STRUCTURAL AND COLLATERAL TERM SHEET IS NOT COMPLETE AND MAY BE AMENDED PRIOR TO THE TIME OF SALE. THIS TERM SHEET IS NOT AN OFFER TO SELL THESE SECURITIES AND IT IS NOT A SOLICITATION OF AN OFFER TO BUY THESE SECURITIES IN ANY JURISDICTION WHERE THE OFFER OR SALE IS NOT PERMITTED.
68
18795 Northeast 73rd Street Redmond, WA 98052 | Collateral Asset Summary – Loan No. 5 FedEx Redmond | Cut-off Date Balance: Cut-off Date LTV: U/W NCF DSCR: U/W NOI Debt Yield: | $45,140,000 55.4% 2.15x 8.6% |
Property Management. The FedEx Redmond Property is managed by CBRE, Inc. a Delaware corporation.
Lockbox / Cash Management. The FedEx Redmond Loan is structured with a hard lockbox and springing cash management. The borrower was required at origination to deliver tenant direction letters instructing all tenants to deposit rents into a lender controlled lockbox account. So long as no Cash Sweep Event (as defined below) then exists, all funds deposited into the lockbox account are required to be transferred on each business day to or at the direction of the borrower. Upon the occurrence and during the continuance of a Cash Sweep Event, all funds in the lockbox account are required to be swept on each business day to a cash management account under the control of the lender to be applied and disbursed for payment of taxes, insurance premiums, operating expenses, debt service, reserves, and other amounts payable in accordance with the loan documents, and all excess cash flow funds remaining in the cash management account after the application of such funds in accordance with the loan documents are required to be held by the lender in an excess cash flow reserve account as additional collateral for the FedEx Redmond Loan. During the continuance of an event of default, the lender may apply such funds in such order and priority as the lender determines. The lender has been granted a first priority security interest in the cash management account.
A “Cash Sweep Event” means the occurrence and continuation of (i) an event of default, (ii) any bankruptcy action of the borrower or property manager, (iii) a DSCR Trigger Event (as defined below), (iv) a FedEx Trigger Event (as defined below), or (v) Non-Renewal Trigger Event (as defined below).
A Cash Sweep Event may be cured no more than four times in the aggregate during the term of the FedEx Redmond Loan if, with respect to a Cash Sweep Event caused solely by (a) clause (i) above, the lender has accepted a cure by the borrower of the related event of default, (b) clause (ii) above, the borrower has replaced the property manager with a qualified manager under a replacement management agreement within 60 days in accordance with the FedEx Redmond Loan documents, (c) clause (iii) above, a DSCR Cure Event (as defined below) has taken place, (d) clause (iv) above, a FedEx Trigger Event Cure (as defined below), or (e) clause (v) above, the borrower satisfies FedEx Replacement Lease Criteria (as defined below) or FedEx Renewal Criteria (as defined below).
“DSCR Trigger Event” means the debt service coverage ratio of the FedEx Redmond Loan (as calculated in accordance with the loan documents) based on the trailing three-month period immediately preceding the date of determination is less than 1.30x.
“FedEx Trigger Event” means (i) any bankruptcy action of FedEx Ground or FedEx Corp, (ii) if FedEx Ground goes dark, vacates or abandons its premises at the FedEx Redmond Property or (iii) if FedEx Ground notifies the borrower it intends to terminate its lease.
“DSCR Cure Event” means (a) the debt service coverage ratio of the FedEx Redmond Loan (as calculated in accordance with the FedEx Redmond Loan documents), based on the trailing three-month period immediately preceding the date of determination, is at least 1.30x for two consecutive quarters, or (b) the borrower has deposited with the lender cash or a letter of credit that, if used to reduce the outstanding principal balance of the FedEx Redmond Loan, would result in the achievement of a debt service coverage ratio of 1.30x or greater for two consecutive quarters based on the trailing three-month period immediately preceding the date of determination.
“FedEx Trigger Event Cure” means with respect to a FedEx Trigger Event cause solely by (a) clause (i) or (iii) in the definition of FedEx Trigger Event, the borrower satisfies the FedEx Replacement Lease Criteria (as defined below) or (b) clause (ii) in the definition of FedEx Trigger Event, either (A) the borrower satisfies the FedEx Replacement Lease Criteria or (B) FedEx Ground is in physical occupancy and paying full contractual rent and has delivered a satisfactory estoppel certificate.
“FedEx Replacement Lease Criteria” means the borrower has entered into one or more leases approved by the lender with one or more replacement tenants approved by the lender with respect to at least 75% of the space formerly leased by FedEx Ground with each such replacement tenant in physical occupancy, and has satisfied certain other related conditions set forth in the loan documents.
“FedEx Renewal Criteria” means the lender has received satisfactory evidence that FedEx Ground has renewed its lease for a term not less than five years and delivered a satisfactory estoppel certificate.
“Non-Renewal Trigger Event” means the borrower has failed to satisfy the FedEx Renewal Criteria on or before the date that is 15 months prior to the expiration date of the FedEx lease.
Initial and Ongoing Reserves. At loan origination, the borrower was not required to make any upfront deposits.
Tax Reserve. During the continuance of a Cash Sweep Event, the borrower is required to deposit into a real estate tax reserve, on a monthly basis, 1/12th of the estimated annual real estate taxes. In the event the borrower provides evidence reasonably satisfactory to the lender that all taxes and other charges have been paid prior to the related due date and there is no event of default continuing, the requirement for monthly deposits into the tax reserve will be waived.
Insurance Reserve. During the continuance of a Cash Sweep Event, the borrower is required to deposit into an insurance reserve, on a monthly basis, 1/12th of estimated insurance premiums.
THE INFORMATION IN THIS STRUCTURAL AND COLLATERAL TERM SHEET IS NOT COMPLETE AND MAY BE AMENDED PRIOR TO THE TIME OF SALE. THIS TERM SHEET IS NOT AN OFFER TO SELL THESE SECURITIES AND IT IS NOT A SOLICITATION OF AN OFFER TO BUY THESE SECURITIES IN ANY JURISDICTION WHERE THE OFFER OR SALE IS NOT PERMITTED.
69
18795 Northeast 73rd Street Redmond, WA 98052 | Collateral Asset Summary – Loan No. 5 FedEx Redmond | Cut-off Date Balance: Cut-off Date LTV: U/W NCF DSCR: U/W NOI Debt Yield: | $45,140,000 55.4% 2.15x 8.6% |
Replacements Reserve – During the continuance of a Cash Sweep Event (except as caused solely by a Non-Renewal Trigger Event), the borrower is required to reserve monthly $3,505.35 for a replacement reserve.
TI/LC Reserve – During the continuance of a Cash Sweep Event (except as caused solely by a Non-Renewal Trigger Event), the borrower is required to reserve monthly an amount equal to $8,763.38 for a TI/LC reserve.
Current Mezzanine or Subordinate Indebtedness. None.
Future Mezzanine or Subordinate Indebtedness Permitted. None.
Partial Release. None.
THE INFORMATION IN THIS STRUCTURAL AND COLLATERAL TERM SHEET IS NOT COMPLETE AND MAY BE AMENDED PRIOR TO THE TIME OF SALE. THIS TERM SHEET IS NOT AN OFFER TO SELL THESE SECURITIES AND IT IS NOT A SOLICITATION OF AN OFFER TO BUY THESE SECURITIES IN ANY JURISDICTION WHERE THE OFFER OR SALE IS NOT PERMITTED.
70
(THIS PAGE INTENTIONALLY LEFT BLANK)
71
560 Mission Street San Francisco, CA 94105 | Collateral Asset Summary – Loan No. 6 560 Mission Street | Cut-off Date Balance: Cut-off Date LTV: U/W NCF DSCR: U/W NOI Debt Yield: | $45,000,000 35.6% 5.23x 14.2% |

THE INFORMATION IN THIS STRUCTURAL AND COLLATERAL TERM SHEET IS NOT COMPLETE AND MAY BE AMENDED PRIOR TO THE TIME OF SALE. THIS TERM SHEET IS NOT AN OFFER TO SELL THESE SECURITIES AND IT IS NOT A SOLICITATION OF AN OFFER TO BUY THESE SECURITIES IN ANY JURISDICTION WHERE THE OFFER OR SALE IS NOT PERMITTED.
72
560 Mission Street San Francisco, CA 94105 | Collateral Asset Summary – Loan No. 6 560 Mission Street | Cut-off Date Balance: Cut-off Date LTV: U/W NCF DSCR: U/W NOI Debt Yield: | $45,000,000 35.6% 5.23x 14.2% |
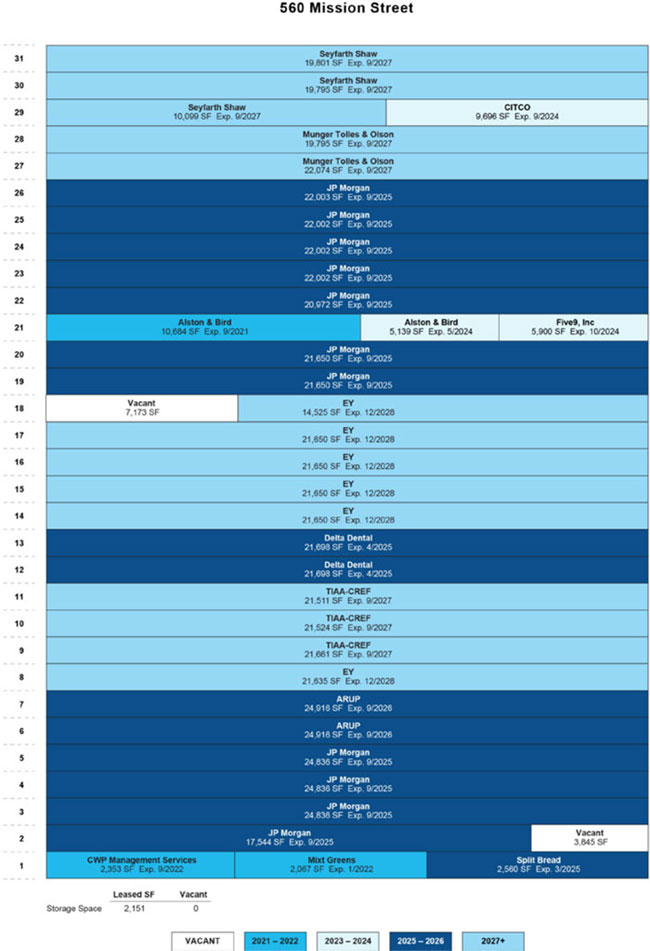
THE INFORMATION IN THIS STRUCTURAL AND COLLATERAL TERM SHEET IS NOT COMPLETE AND MAY BE AMENDED PRIOR TO THE TIME OF SALE. THIS TERM SHEET IS NOT AN OFFER TO SELL THESE SECURITIES AND IT IS NOT A SOLICITATION OF AN OFFER TO BUY THESE SECURITIES IN ANY JURISDICTION WHERE THE OFFER OR SALE IS NOT PERMITTED.
73
560 Mission Street San Francisco, CA 94105 | Collateral Asset Summary – Loan No. 6 560 Mission Street | Cut-off Date Balance: Cut-off Date LTV: U/W NCF DSCR: U/W NOI Debt Yield: | $45,000,000 35.6% 5.23x 14.2% |

THE INFORMATION IN THIS STRUCTURAL AND COLLATERAL TERM SHEET IS NOT COMPLETE AND MAY BE AMENDED PRIOR TO THE TIME OF SALE. THIS TERM SHEET IS NOT AN OFFER TO SELL THESE SECURITIES AND IT IS NOT A SOLICITATION OF AN OFFER TO BUY THESE SECURITIES IN ANY JURISDICTION WHERE THE OFFER OR SALE IS NOT PERMITTED.
74
560 Mission Street San Francisco, CA 94105 | Collateral Asset Summary – Loan No. 6 560 Mission Street | Cut-off Date Balance: Cut-off Date LTV: U/W NCF DSCR: U/W NOI Debt Yield: | $45,000,000 35.6% 5.23x 14.2% |
Mortgage Loan Information | |
GACC | |
Recapitalization | |
| |
AA-sf / AA-(sf) / A1(sf) | |
National Office Partners LLC | |
NOP 560 Mission, LLC | |
$45,000,000 | |
$45,000,000 | |
5.0% | |
2.58900% | |
6th of each month | |
January 6, 2020 | |
December 6, 2029 | |
Interest Only | |
$255,000,000 Pari Passu Debt; Permitted Mezzanine Debt | |
L(26), DorYM1(87), O(7) | |
Hard / Springing | |
Reserves(3) | |||
| Initial | Monthly | Cap |
Taxes: | $0 | Springing | NAP |
Insurance: | $0 | Springing | NAP |
Replacement: | $0 | Springing | $267,260 |
TI/LC: | $2,152,612 | Springing | $2,004,447 |
Free Rent: | $0 | $0 | NAP |
Property Information | |
Single Asset | |
CBD Office | |
Fee Simple | |
San Francisco, CA | |
2002 / NAP | |
668,149 | |
CommonWealth Partners Management Services, L.P. | |
$42,674,098 | |
$41,204,170 | |
$842,000,000 | |
October 31, 2019 | |
Historical NOI | |
Most Recent NOI: | $38,313,473 (T-12 September 30, 2019) |
2018 NOI: | $37,869,525 (December 31, 2018) |
2017 NOI: | $30,771,436 (December 31, 2017) |
2016 NOI: | $37,844,766 (December 31, 2016) |
| |
Historical Occupancy | |
Most Recent Occupancy: | 98.4% (October 31, 2019) |
2018 Occupancy: | 97.3% (December 31, 2018) |
2017 Occupancy: | 97.8% (December 31, 2017) |
2016 Occupancy: | NAV |
Financial Information(1) | ||||||
Tranche | Cut-off Date | Balance per Sq. Ft. Cut-off / Balloon | LTV Cut-off / Balloon | U/W DSCR NOI / NCF | U/W Debt Yield NOI / NCF | U/W Debt Yield at Balloon NOI / NCF |
Mortgage Loan | $45,000,000 |
|
|
|
|
|
Pari Passu Notes | $255,000,000 |
|
|
|
|
|
Whole Loan | $300,000,000 | $449 / $449 | 35.6% / 35.6% | 5.42x / 5.23x | 14.2% / 13.7% | 14.2% / 13.7% |
(1) | The 560 Mission Street Loan (as defined below) is evidenced by the controlling Note A-2-1-A and non-controlling Note A-1-4 and is part of a whole loan evidenced by seven pari passu notes with an aggregate outstanding principal balance as of the Cut-off Date of $300.0 million. The Financial Information presented in the chart above reflects the aggregate Cut-off Date balance of the $300.0 million 560 Mission Street Whole Loan. |
(2) | The lockout period will be at least 26 payments beginning with and including the first payment date of January 6, 2020. At any time after the earlier to occur of (i) December 5, 2022 or (ii) the second anniversary of the securitization closing date of the last note to be securitized, the 560 Mission Street Whole Loan may be (i) defeased as permitted under the loan documents or (ii) prepaid with a prepayment fee in an amount equal to the greater of (a) the yield maintenance amount, or (b) 1.00% of the outstanding principal balance as of the prepayment date. The assumed lockout period of 26 months is based on the expected closing date of the Benchmark 2020-B16 securitization in February 2020. The actual lockout period may be longer. |
(3) | See “Initial and Ongoing Reserves” herein. |
(4) | Fitch, KBRA and Moody’s provided the listed assessments for the 560 Mission Loan in the context of its inclusion in the mortgage pool. |
THE INFORMATION IN THIS STRUCTURAL AND COLLATERAL TERM SHEET IS NOT COMPLETE AND MAY BE AMENDED PRIOR TO THE TIME OF SALE. THIS TERM SHEET IS NOT AN OFFER TO SELL THESE SECURITIES AND IT IS NOT A SOLICITATION OF AN OFFER TO BUY THESE SECURITIES IN ANY JURISDICTION WHERE THE OFFER OR SALE IS NOT PERMITTED.
75
560 Mission Street San Francisco, CA 94105 | Collateral Asset Summary – Loan No. 6 560 Mission Street | Cut-off Date Balance: Cut-off Date LTV: U/W NCF DSCR: U/W NOI Debt Yield: | $45,000,000 35.6% 5.23x 14.2% |
The Loan. The 560 Mission Street mortgage loan (the “560 Mission Street Loan”) is part of a whole loan that has an outstanding principal balance as of the Cut-off Date of $300,000,000 (the “560 Mission Street Whole Loan”). The 560 Mission Street Whole Loan is secured by the borrower’s fee simple interest in a 668,149 sq. ft., office building located in San Francisco, California (the “560 Mission Street Property”). The 560 Mission Street Whole Loan is comprised of seven pari passu notes with an aggregate original principal balance as of the Cut-off Date of $300.0 million, of which only the controlling Note A-1-2-A and non-controlling A-1-4, with an aggregate outstanding principal balance as of the Cut-off Date of $45.0 million, are being contributed to the Benchmark 2020-B16 Trust and constitutes the 560 Mission Street Loan.
The relationship between the holders of the 560 Mission Street Whole Loan will be governed by a co-lender agreement as described under “Description of the Mortgage Pool—The Whole Loans—The Serviced Pari Passu Whole Loans” in the Preliminary Prospectus.
Whole Loan Summary | ||||
Note | Original Balance | Cut-off Date Balance | Note Holder | Controlling Piece |
Note A-1-1 | $60,000,000 | $60,000,000 | GSMS 2020-GC45(1) | No |
Note A-1-2-A | 30,000,000 | 30,000,000 | Benchmark 2020-B16 | Yes |
Note A-1-2-B | 20,000,000 | 20,000,000 | DBRI(3) | No |
Note A-1-3 | 25,000,000 | 25,000,000 | DBRI(3) | No |
Note A-1-4 | 15,000,000 | 15,000,000 | Benchmark 2020-B16 | No |
Note A-2-1 | 100,000,000 | 100,000,000 | BANA(3) | No |
Note A-2-2 | 50,000,000 | 50,000,000 | BANK 2020-BNK25(2) | No |
Total | $300,000,000 | $218,000,000 |
|
|
(1) | The GSMS 2020-GC45 transaction is expected to close prior to the Closing Date. |
(2) | The BANK 2020-BNK25 transaction is expected to close on or about February 13, 2020. |
(3) | The related notes are currently held by the Note Holder identified in the table above and are expected to be contributed to one or more future securitization transactions. |
The 560 Mission Street Loan has a 10-year interest-only term and accrues interest at a rate of 2.58900% per annum. Proceeds of the 560 Mission Street Whole Loan was primarily used to recapitalize the 560 Mission Property, fund upfront reserves and pay closing costs. Based on the “As Is” appraised value of $842.0 million as of October 31, 2019, the Cut-off Date LTV Ratio is 35.6%.
Sources and Uses | ||||||
Sources | Proceeds | % of Total |
| Uses | Proceeds | % of Total |
Whole Loan | $300,000,000 | 100.0% |
| Loan Payoff | $295,451,251 | 98.5% |
|
|
|
| Upfront Reserves | 2,396,137 | 0.8 |
|
|
|
| Closing Costs | 2,152,612 | 0.7 |
|
|
|
|
|
|
|
Total Sources | $300,000,000 | 100.0% |
| Total Uses | $300,000,000 | 100.0% |
The Borrower / Borrower Sponsor. The borrower is NOP 560 Mission, LLC, a Delaware limited liability company. Legal counsel to the borrower delivered a non-consolidation opinion in connection with the origination of the 560 Mission Street Whole Loan. There is no non-recourse carve-out guarantor and no separate environmental indemnitor for the 560 Mission Street Whole Loan.
The borrower is owned and controlled by National Office Partners LLC, a joint venture between California Public Employees’ Retirement System (“CalPERS”) and CommonWealth Partners, LLC (“CWP”). CalPERS is the nation’s largest public pension fund. The CalPERS retirement system serves more than 1.9 million members and the CalPERS health program administers benefits for 1.4 million members and their families. CWC is a privately held, vertically integrated real estate investment, development and management firm based in Los Angeles, with offices across the United States.
THE INFORMATION IN THIS STRUCTURAL AND COLLATERAL TERM SHEET IS NOT COMPLETE AND MAY BE AMENDED PRIOR TO THE TIME OF SALE. THIS TERM SHEET IS NOT AN OFFER TO SELL THESE SECURITIES AND IT IS NOT A SOLICITATION OF AN OFFER TO BUY THESE SECURITIES IN ANY JURISDICTION WHERE THE OFFER OR SALE IS NOT PERMITTED.
76
560 Mission Street San Francisco, CA 94105 | Collateral Asset Summary – Loan No. 6 560 Mission Street | Cut-off Date Balance: Cut-off Date LTV: U/W NCF DSCR: U/W NOI Debt Yield: | $45,000,000 35.6% 5.23x 14.2% |
Tenant Summary(1) | ||||||||
Tenant | Credit Rating (Fitch/Moody’s/S&P)(2) | Net Rentable Area | % of Net | U/W Base Rent | % of Total U/W | Lease | ||
JPMorgan(3) | AA- / A2 / A- | 246,384 | 36.9 | % | $75.04 | 36.6 | % | 9/30/2025 |
EY | NR / NR / NR | 122,760 | 18.4 |
| $69.68 | 16.9 |
| 12/31/2028 |
TIAA-CREF(4) | NR / NR / NR | 64,696 | 9.7 |
| $76.39 | 9.8 |
| 9/30/2027 |
ARUP | NR / NR / NR | 49,832 | 7.5 |
| $72.14 | 7.1 |
| 9/30/2026 |
Seyfarth Shaw(5) | NR / NR / NR | 49,695 | 7.4 |
| $93.36 | 9.2 |
| 9/30/2027 |
Delta Dental | NR / NR / NR | 43,396 | 6.5 |
| $75.19 | 6.5 |
| 4/30/2025 |
Munger Tolles & Olson | NR / NR / NR | 41,869 | 6.3 |
| $91.24 | 7.6 |
| 9/30/2027 |
Alston & Bird(6) | NR / NR / NR | 15,823 | 2.4 |
| $84.85 | 2.7 |
| Various |
CITCO | NR / NR / NR | 9,696 | 1.5 |
| $91.24 | 1.8 |
| 9/30/2024 |
Five9, Inc | NR / NR / NR | 5,900 | 0.9 |
| $89.00 | 1.0 |
| 10/31/2024 |
Total / Wtd. Avg. Major Tenants |
| 650,051 | 97.3 | % | $77.00 | 99.2 | % |
|
Remaining Tenants |
| 7,080 | 1.1 |
| $59.61 | 0.8 | % |
|
Total / Wtd. Avg. Occupied Collateral |
| 657,131 | 98.4 | % | $76.81 | 100.0 | % |
|
Vacant |
| 11,018 | 1.6 | % |
|
|
|
|
Total |
| 668,149 | 100.0 | % |
|
|
| |
(1) | Based on the underwritten rent roll as of October 31, 2019. |
(2) | Certain ratings are those of the parent company whether or not the parent guarantees the lease. |
(3) | JPMorgan has the right at any time through September 30, 2021 to terminate its lease with respect to one full floor of its leased premises upon 12 months’ prior notice and payment of a termination fee. |
(4) | TIAA-CREF has the one-time right to terminate the lease for all or any portion of its space effective as of March 31, 2023 upon written notice on or before March 31, 2022 and payment of a termination fee. |
(5) | Seyfarth Shaw has the one-time right to terminate its lease with respect to the 29th floor effective as of September 30, 2022 upon written notice on or before September 30, 2021 and payment of a termination fee. |
(6) | Alston & Bird has 10,684 sq. ft. expiring September 30, 2021 and 5,139 sq. ft. expiring May 31, 2024. |
Lease Rollover Schedule(1) | ||||||||||
Year | # of Leases Expiring | Total Expiring Sq. Ft. | % of Total Sq. Ft. Expiring | Cumulative Sq. Ft. Expiring | Cumulative % of Sq. Ft. Expiring | Annual U/W Base PSF | % U/W Base Rent Rolling | Cumulative % of U/W Base Rent | ||
MTM | 0 | 0 | 0.0 | % | 0 | 0.0% | $0.00 | 0.0 | % | 0.0% |
2020 | 0 | 0 | 0.0 |
| 0 | 0.0% | $0.00 | 0.0 |
| 0.0% |
2021 | 2 | 10,784 | 1.6 |
| 10,784 | 1.6% | $83.22 | 1.8 |
| 1.8% |
2022 | 2 | 4,420 | 0.7 |
| 15,204 | 2.3% | $59.19 | 0.5 |
| 2.3% |
2023 | 0 | 0 | 0.0 |
| 15,204 | 2.3% | $0.00 | 0.0 |
| 2.3% |
2024 | 3 | 20,735 | 3.1 |
| 35,939 | 5.4% | $89.55 | 3.7 |
| 6.0% |
2025 | 15 | 292,340 | 43.8 |
| 328,279 | 49.1% | $74.95 | 43.4 |
| 49.4% |
2026 | 2 | 49,832 | 7.5 |
| 378,111 | 56.6% | $72.14 | 7.1 |
| 56.5% |
2027 | 8 | 156,260 | 23.4 |
| 534,371 | 80.0% | $85.77 | 26.6 |
| 83.1% |
2028 | 6 | 122,760 | 18.4 |
| 657,131 | 98.4% | $69.68 | 16.9 |
| 100.0% |
2029 | 0 | 0 | 0.0 |
| 657,131 | 98.4% | $0.00 | 0.0 |
| 100.0% |
2030 | 0 | 0 | 0.0 |
| 657,131 | 98.4% | $0.00 | 0.0 |
| 100.0% |
2031 & Thereafter | 0 | 0 | 0.0 |
| 657,131 | 98.4% | $0.00 | 0.0 |
| 100.0% |
Vacant | NAP | 11,018 | 1.6 |
| 668,149 | 100.0% | $0.00 | 0.0 |
|
|
Total / Wtd. Avg. | 38 | 668,149 | 100.0 | % |
|
| $76.81 | 100.0 | % |
|
(1) | Based on the underwritten rent roll dated October 31, 2019. |
The 560 Mission Street Property is a 31-story Class A LEED Platinum office building totaling 668,149 sq. ft. located in San Francisco, California. The 560 Mission Street Property is 98.4% leased, as of October 31, 2019, to 13 tenants from industries including technology, financial services, consulting services, insurance and law. No tenant comprises more than 36.9% of net rentable area or 36.6% of underwritten base rent.
The 560 Mission Street Property has floor-to-ceiling glass and column-free space throughout the building allowing for 360-degree access to light and air. The 560 Mission Street Property has held the LEED Platinum designation since 2010 and received awards from a building management agency in 2010 and 2011. There is a two-level, below-grade parking garage that has 117 parking spaces, including seven handicapped parking spaces.
The borrower sponsor has invested approximately $2.5 million in capital since 2014. Recent leasing at the 560 Mission Street Property includes 90,621 sq. ft. of new and renewal leases since 2018, including new leases with Delta Dental (43,396 sq. ft.) and expansion leases with TIAA-CREF (21,661 sq. ft.) and EY (14,525 sq. ft.). The borrower sponsor has made investments to both the common areas and back-of-house infrastructure including new lobby and plaza furniture, elevator lobby upgrade, garage enhancement with bike area, and restroom and shower room upgrades. The bike area is able to house 70 bicycles.
THE INFORMATION IN THIS STRUCTURAL AND COLLATERAL TERM SHEET IS NOT COMPLETE AND MAY BE AMENDED PRIOR TO THE TIME OF SALE. THIS TERM SHEET IS NOT AN OFFER TO SELL THESE SECURITIES AND IT IS NOT A SOLICITATION OF AN OFFER TO BUY THESE SECURITIES IN ANY JURISDICTION WHERE THE OFFER OR SALE IS NOT PERMITTED.
77
560 Mission Street San Francisco, CA 94105 | Collateral Asset Summary – Loan No. 6 560 Mission Street | Cut-off Date Balance: Cut-off Date LTV: U/W NCF DSCR: U/W NOI Debt Yield: | $45,000,000 35.6% 5.23x 14.2% |
Major Tenants.
JPMorgan (246,384 sq. ft.; 36.9% of NRA; 36.6% of U/W Base Rent) JPMorgan Chase (“JPMorgan”) is an American multinational investment bank and financial services holding company headquartered in New York City. As of the third quarter of 2019, JPMorgan had revenues of approximately $29.3 billion and a net income of approximately $9.1 billion. In addition, JPMorgan had assets of approximately $2.6 trillion with a presence in over 100 markets. JPMorgan is incorporated in New York City. JPMorgan has two, five-year options to renew at least 50% of its premises with 17 - 20 months’ notice. The first option is at 95% of base rent and the second option is at market rent. JPMorgan also has a right of first offer to lease any space in the building effective October 1, 2018. In addition, JPMorgan has an option to terminate one full floor effective between September 30, 2018 and September 30, 2021 with 12 months’ notice and termination fee of between approximately $137,136 and $210,495 depending on the floor terminated, plus the unamortized leasing costs at 8% interest. JPMorgan initially leased the entire 560 Mission Street Property and later reduced its footprint and subleased portions of its space to certain of the current tenants.
EY (122,760 sq. ft.; 18.4% of NRA; 16.9% of U/W Base Rent) EY occupies six suites with leases expiring in December 2028. EY is a multinational professional services firm headquartered in London, England, United Kingdom. EY is one of the largest professional services firms in the world. Along with Deloitte, KPMG and PricewaterhouseCoopers, EY is considered one of the “Big Four” accounting firms. EY has two, five-year options to renew its entire premises at market rent with 12 - 15 months’ notice. EY also has an option to expand and occupy 50%-100% of a full floor with notice by October 1, 2021 and delivery date between April 2022 and October 2024.
TIAA-CREF (64,696 sq. ft.; 9.7% of NRA; 9.8% of U/W Base Rent) TIAA-CREF is a financial services organization that provides financial services in the academic, research, medical, cultural and governmental fields. TIAA-CREF has one, five-year option to renew at least two contiguous floors at market rent with 15-18 months’ notice. In addition, TIAA-CREF has a one-time option to terminate its lease for any or all of its leased premises effective March 31, 2023 with notice by March 31, 2022 and a termination fee equal to the unamortized leasing costs at 8% interest.
Environmental Matters. The Phase I environmental report dated November 25, 2019 recommended no further action at the 560 Mission Street Property.
The Market. The 560 Mission Street Property is located in San Francisco, in the South Financial District submarket.
The South Financial District submarket is the historic center of business activity in San Francisco. The submarket represents half of the metropolitan’s central business district, in conjunction with the North Financial District. The Financial District contains well-known buildings, including the Transamerica Pyramid, 555 California Street (formerly Bank of America Center), 101 California Street, and Embarcadero Center. These skyscrapers are heavily tenanted by financial institutions, and house many Fortune 500 firms, including Wells Fargo, Citigroup, Amazon’s Twitch division, and PricewaterhouseCoopers. According to a third party market research report, the South Financial District office submarket has a total inventory of 30,508,228 sq. ft. as of October 1, 2019.
The following chart displays six lease comparables for the office space. The office lease comparables range from $81.96 PSF to $114.96 PSF.
Comparable Retail Leases(1) | |||||
Property Name | Tenant Name | Tenant Leased Space | Lease Date | Lease Term (years) | Base Rent PSF |
560 Mission Street San Francisco, CA | Various | Various | Various | Various | $76.81(2) |
Blue Shield California Building San Francisco, CA | Glassdoor | 11,688 | Jun-19 | 10.3 | $87.96 |
140 New Montgomery Street San Francisco, CA | Benchmark Capital Partners | 12,364 | Jun-19 | 10 | $114.96 |
303 Second Street San Francisco, CA | Sony (PlayStation) | 130,888 | Jun-19 | 10.3 | $90.00 |
101 California Street San Francisco, CA | The Blackstone Group | 24,424 | Jun-19 | 10.0 | $114.96 |
201 Mission Street San Francisco, CA | Silicon Legal Strategy | 17,636 | Jul-19 | 5.1 | $81.96 |
Pine Street Center San Francisco, CA | Bank of the Orient | 10,353 | Oct-19 | 6.2 | $84.00 |
| (1) | Based on the appraisal. |
| (2) | Based on the underwritten rent roll as of October 31, 2019 |
THE INFORMATION IN THIS STRUCTURAL AND COLLATERAL TERM SHEET IS NOT COMPLETE AND MAY BE AMENDED PRIOR TO THE TIME OF SALE. THIS TERM SHEET IS NOT AN OFFER TO SELL THESE SECURITIES AND IT IS NOT A SOLICITATION OF AN OFFER TO BUY THESE SECURITIES IN ANY JURISDICTION WHERE THE OFFER OR SALE IS NOT PERMITTED.
78
560 Mission Street San Francisco, CA 94105 | Collateral Asset Summary – Loan No. 6 560 Mission Street | Cut-off Date Balance: Cut-off Date LTV: U/W NCF DSCR: U/W NOI Debt Yield: | $45,000,000 35.6% 5.23x 14.2% |
Cash Flow Analysis.
Cash Flow Analysis(1) | ||||||
| 2016 | 2017 | 2018 | T-12 9/30/2019 Ann. | U/W | U/W PSF(2) |
Base Rent | $36,190,949 | $31,345,165 | $47,586,908 | $48,362,119 | $50,476,593 | $75.55 |
Credit Tenant Rent Steps(3) | 0 | 0 | 0 | 0 | 2,163,939 | $3.24 |
Rent Steps(4) | 0 | 0 | 0 | 0 | 1,099,025 | $1.64 |
Vacant Income | 0 | 0 | 0 | 0 | 946,514 | $1.42 |
Gross Potential Rent | $36,190,949 | $31,345,165 | $47,586,908 | $48,362,119 | 54,686,071 | $81.85 |
Total Reimbursements | 11,308,135 | 8,261,973 | 40,660 | 422,347 | 229,001 | $0.34 |
Other Income(5) | 2,886,498 | 2,749,759 | 1,944,237 | 2,008,255 | 2,008,255 | $3.01 |
Less: Vacancy | 0 | 0 | 0 | 0 | (2,185,140) | ($3.27) |
Effective Gross Income | $50,385,582 | $42,356,897 | $49,571,805 | $50,792,721 | $54,738,187 | $81.93 |
Total Fixed Expenses | 3,550,012 | 3,668,410 | 3,657,573 | 3,789,694 | 4,128,107 | $6.18 |
Total Operating Expenses | 8,990,804 | 7,917,051 | 8,044,708 | 8,689,554 | 7,935,981 | $11.88 |
Net Operating Income | $37,844,766 | $30,771,436 | $37,869,525 | $38,313,473 | $42,674,098 | $63.87 |
TI/LC | 0 | 0 | 0 | 0 | 1,336,298 | $2.00 |
Capital Expenditures | 0 | 0 | 0 | 0 | 133,630 | $0.20 |
Net Cash Flow | $37,844,766 | $30,771,436 | $37,869,525 | $38,313,473 | $41,204,170 | $61.67 |
(1) | Certain items such as straight line rent, interest expense, interest income, lease cancellation income, depreciation, amortization, debt service payments and any other non-recurring or non-operating items were excluded from the historical presentation and are not considered for the underwritten cash flow. |
(2) | U/W PSF is based on 668,149 sq. ft. |
(3) | Represents straight-line average rent for the tenants, TIAA-CREF, JPMorgan, Seyfarth Shaw and Munger Tolles & Olson through the earlier of the loan term or lease term. |
(4) | Includes contractual rent steps through November 1, 2020. |
(5) | Underwritten Other Income consists of parking income ($1,491,645), net tenant service revenue ($191,861), and miscellaneous income ($324,748). |
Property Management. The 560 Mission Street Property is currently managed by Commonwealth Partners Management Services, L.P., an affiliate of the borrower.
Lockbox / Cash Management. The 560 Mission Street Whole Loan is structured with a hard lockbox and springing cash management. The borrower is required to cause tenants to deposit rents directly into a lender-controlled lockbox account. In addition, the borrower and the property manager are required to deposit all rents and gross revenue from the 560 Mission Street Property into such lockbox account within two business days of receipt. If no 560 Mission Street Trigger Period exists, on each business day, all funds in the lockbox account are required to be swept into the borrower’s operating account. Following the occurrence and during the continuance of a 560 Mission Street Trigger Period, all funds in the lockbox account are required to be swept each business day to a segregated cash management account under the control of the lender and disbursed in accordance with the loan documents to make deposits into the tax and insurance reserves, as described under “Escrows“ to pay debt service on the 560 Mission Street Whole Loan, to make deposits into the capital expenditure and rollover reserves as described under “Escrows” to pay monthly operating expenses as set forth in the lender-approved annual budget, to pay mezzanine debt service if a mezzanine loan is then outstanding, to pay lender-approved extraordinary expenses, and to pay any remainder (i) if a 560 Mission Street Cash Trap Trigger Period is continuing, to a cash collateral account to be held as additional collateral for the 560 Mission Street Whole Loan during the continuance of such 560 Mission Street Cash Trap Trigger Period and (ii) if no 560 Mission Street Cash Trap Trigger period is continuing, to the borrower.
A “560 Mission Street Trigger Period” means each period (i) commencing upon an event of default under the loan documents or, if a mezzanine loan is then outstanding, under such mezzanine loan and ending if the applicable event of default has been cured and the cure accepted by the applicable lender, (ii) during a 560 Mission Street Low Debt Yield Trigger Period or (iii) during a 560 Mission Street Cash Trap Trigger Period.
A “560 Mission Street Low Debt Yield Trigger Period” will commence if, as of the last day of any calendar quarter, the debt yield (as calculated under the loan documents) is less than 7.0% for two consecutive calendar quarters and will end if a debt yield of at least 7.0% has been achieved for two consecutive calendar quarters.
A “560 Mission Street Cash Trap Trigger Period” will commence if, as of the last day of any calendar quarter, the debt yield is less than 6.50% for two consecutive calendar quarters and will end if a debt yield of at least 6.5% has been achieved for two consecutive calendar quarters; provided that, if the debt yield is greater than 6.5% but does not exceed 7.0%, a 560 Mission Street Low Debt Yield Trigger Period will still exist notwithstanding the expiration of the 560 Mission Street Cash Trap Trigger Period.
At any time after the lockout expiration date, the borrower has the right to prepay the 560 Mission Street Whole Loan (or deliver cash or a letter of credit meeting the requirements of the loan documents in an amount equal to the amount of the prepayment that would be required) in order for the borrower to satisfy the thresholds set forth in the definitions of either a 560 Mission Street Cash Trap Trigger Period or a 560 Mission Street Low Debt Yield Trigger Period. If prior to the open prepayment date, the prepayment fee in an amount
THE INFORMATION IN THIS STRUCTURAL AND COLLATERAL TERM SHEET IS NOT COMPLETE AND MAY BE AMENDED PRIOR TO THE TIME OF SALE. THIS TERM SHEET IS NOT AN OFFER TO SELL THESE SECURITIES AND IT IS NOT A SOLICITATION OF AN OFFER TO BUY THESE SECURITIES IN ANY JURISDICTION WHERE THE OFFER OR SALE IS NOT PERMITTED.
79
560 Mission Street San Francisco, CA 94105 | Collateral Asset Summary – Loan No. 6 560 Mission Street | Cut-off Date Balance: Cut-off Date LTV: U/W NCF DSCR: U/W NOI Debt Yield: | $45,000,000 35.6% 5.23x 14.2% |
equal to the greater of (i) the yield maintenance amount, or (ii) one percent (1%) of the outstanding principal balance as of the prepayment date is required in connection with any such prepayment.
Initial and Ongoing Reserves. At loan origination, the borrower deposited approximately $2,152,612 into a tenant improvements and leasing commissions reserve. On each due date during the continuance of a 560 Mission Street Trigger Period, the borrower will be required to fund (i) a tax and insurance reserve in an amount equal to 1/12th of the taxes and insurance premiums that the lender estimates will be payable during the next ensuing 12 months, unless in the case of insurance premiums, the borrower is maintaining a blanket policy in accordance with the related loan documents, (ii) a capital expenditure reserve in the amount of approximately $11,136, capped at approximately $267,260 and (iii) a rollover reserve in the amount of approximately $83,519, capped at approximately $2,004,447. The borrower is permitted to deposit cash or a letter of credit meeting the requirements of the loan documents in an amount equal to the funds then required to be deposited into the capital expenditure reserve or rollover reserve in order to prevent a sweep of funds into such account.
Current Mezzanine or Subordinate Indebtedness. None.
Future Mezzanine or Subordinate Indebtedness Permitted. The owner of the direct or indirect equity interests of the borrower is permitted to incur mezzanine debt (the “560 Mission Street Permitted Mezzanine Loan”) secured by a pledge of direct or indirect equity interests in the borrower, provided that certain conditions set forth in the loan documents are satisfied, including, without limitation: (i) the principal amount of the 560 Mission Street Permitted Mezzanine Loan may not exceed $180,000,000; (ii) after giving effect to the 560 Mission Street Permitted Mezzanine Loan, (a) the loan-to-value ratio of the 560 Mission Street Whole Loan and the 560 Mission Street Permitted Mezzanine Loan (collectively, the “Total Debt”) is no greater than 60.0%, (b) the debt service coverage ratio on the Total Debt is at least 2.00x, and (c) the debt yield on the Total Debt is at least 8.0%; (iii) the 560 Mission Street Permitted Mezzanine Loan is at least co-terminous with the 560 Mission Street Whole Loan and has either a fixed rate or a hedged floating rate that results in a Total Debt debt service coverage ratio of at least 2.00x, (iv) the holder of the 560 Mission Street Permitted Mezzanine Loan enters into an intercreditor agreement with the lender in form and substance reasonably acceptable to the lender and the rating agencies; and (v) a rating agency confirmation is delivered in connection with the consummation of the 560 Mission Street Permitted Mezzanine Loan.
Partial Release. None.
THE INFORMATION IN THIS STRUCTURAL AND COLLATERAL TERM SHEET IS NOT COMPLETE AND MAY BE AMENDED PRIOR TO THE TIME OF SALE. THIS TERM SHEET IS NOT AN OFFER TO SELL THESE SECURITIES AND IT IS NOT A SOLICITATION OF AN OFFER TO BUY THESE SECURITIES IN ANY JURISDICTION WHERE THE OFFER OR SALE IS NOT PERMITTED.
80
(THIS PAGE INTENTIONALLY LEFT BLANK)
81
1633 Broadway New York, NY 10019 | Collateral Asset Summary – Loan No. 7 1633 Broadway | Cut-off Date Balance: Cut-off Date LTV: U/W NCF DSCR: U/W NOI Debt Yield: | $45,000,000 41.7% 3.84x 11.9% |

THE INFORMATION IN THIS STRUCTURAL AND COLLATERAL TERM SHEET IS NOT COMPLETE AND MAY BE AMENDED PRIOR TO THE TIME OF SALE. THIS TERM SHEET IS NOT AN OFFER TO SELL THESE SECURITIES AND IT IS NOT A SOLICITATION OF AN OFFER TO BUY THESE SECURITIES IN ANY JURISDICTION WHERE THE OFFER OR SALE IS NOT PERMITTED.
82
1633 Broadway New York, NY 10019 | Collateral Asset Summary – Loan No. 7 1633 Broadway | Cut-off Date Balance: Cut-off Date LTV: U/W NCF DSCR: U/W NOI Debt Yield: | $45,000,000 41.7% 3.84x 11.9% |
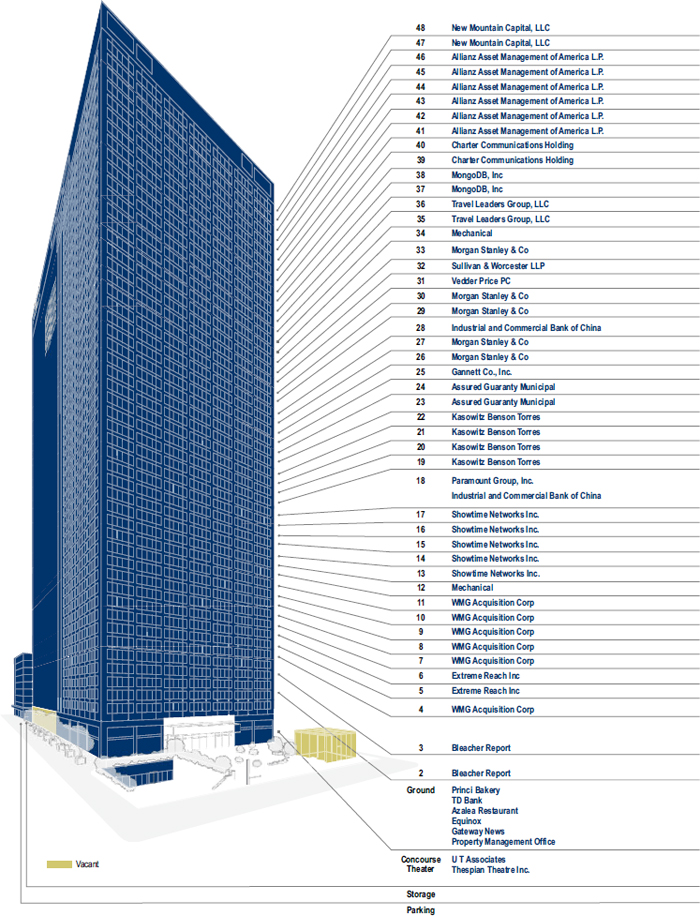
THE INFORMATION IN THIS STRUCTURAL AND COLLATERAL TERM SHEET IS NOT COMPLETE AND MAY BE AMENDED PRIOR TO THE TIME OF SALE. THIS TERM SHEET IS NOT AN OFFER TO SELL THESE SECURITIES AND IT IS NOT A SOLICITATION OF AN OFFER TO BUY THESE SECURITIES IN ANY JURISDICTION WHERE THE OFFER OR SALE IS NOT PERMITTED.
83
1633 Broadway New York, NY 10019 | Collateral Asset Summary – Loan No. 7 1633 Broadway | Cut-off Date Balance: Cut-off Date LTV: U/W NCF DSCR: U/W NOI Debt Yield: | $45,000,000 41.7% 3.84x 11.9% |
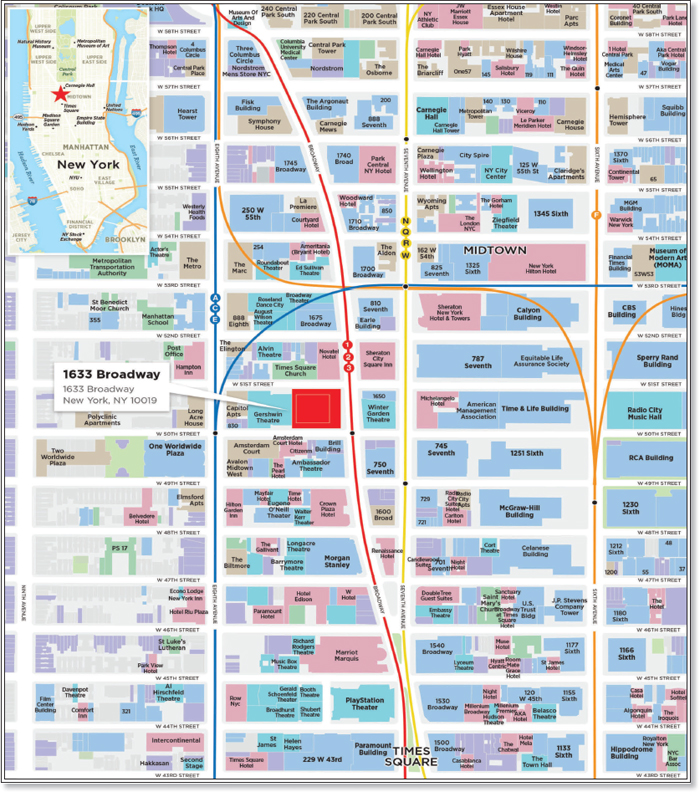
THE INFORMATION IN THIS STRUCTURAL AND COLLATERAL TERM SHEET IS NOT COMPLETE AND MAY BE AMENDED PRIOR TO THE TIME OF SALE. THIS TERM SHEET IS NOT AN OFFER TO SELL THESE SECURITIES AND IT IS NOT A SOLICITATION OF AN OFFER TO BUY THESE SECURITIES IN ANY JURISDICTION WHERE THE OFFER OR SALE IS NOT PERMITTED.
84
1633 Broadway New York, NY 10019 | Collateral Asset Summary – Loan No. 7 1633 Broadway | Cut-off Date Balance: Cut-off Date LTV: U/W NCF DSCR: U/W NOI Debt Yield: | $45,000,000 41.7% 3.84x 11.9% |
Mortgage Loan Information | |
Loan Sellers(1): | GACC/JPMCB |
Loan Purpose: | Refinance |
Credit Assessment |
|
(Fitch/KBRA/Moody’s)(5): | BBB-sf / A(sf) / Baa1(sf) |
Borrower Sponsor: | Paramount Group Operating Partnership LP |
Borrowers: | PGREF I 1633 Broadway Tower, L.P. and PGREF I 1633 Broadway Land, L.P. |
Original Balance(2): | $45,000,000 |
Cut-off Date Balance(2): | $45,000,000 |
% by Initial UPB: | 5.0% |
Interest Rate: | 2.99000% |
Payment Date: | 6th of each month |
First Payment Date: | January 6, 2020 |
Maturity Date: | December 6, 2029 |
Amortization: | Interest Only |
$956,000,000 Pari Passu Debt; $249,000,000 Subordinate Debt | |
L(26), D(87), O(7) | |
Hard / Springing | |
Reserves(4) | |||
| Initial | Monthly | Cap |
Taxes: | $0 | Springing | NAP |
Insurance: | $0 | Springing | NAP |
Replacement Reserve: | $0 | Springing | $1,024,605 |
TI/LC Reserve: | $0 | Springing | $5,123,024 |
Unfunded Tenant Improvements: | $36,389,727 | $0 | NAP |
Property Information | |
Single Asset | |
CBD Office | |
Fee Simple | |
New York, NY | |
1972 / 2013 | |
2,561,512 | |
Paramount Group Property-Asset Management LLC | |
$119,150,163 | |
$116,677,727 | |
$2,400,000,000 | |
October 24, 2019 | |
| |
Historical NOI | |
Most Recent NOI: | $110,809,315 (T-12 September 30, 2019) |
2018 NOI: | $109,098,450 (December 31, 2018) |
2017 NOI: | $94,190,007 (December 31, 2017) |
2016 NOI: | $93,821,386 (December 31, 2016) |
| |
Historical Occupancy | |
Most Recent Occupancy: | 98.4% (October 31, 2019) |
2018 Occupancy: | 95.4% (December 31, 2018) |
2017 Occupancy: | 95.4% (December 31, 2017) |
2016 Occupancy: | 86.3% (December 31, 2016) |
Financial Information(1)(2) | ||||||
Tranche | Cut-off Date Balance | Balance per Sq. Ft. Cut-off / Balloon | LTV Cut-off / Balloon | U/W DSCR NOI / NCF | U/W Debt Yield NOI / NCF | U/W Debt Yield at Balloon NOI / NCF |
Mortgage Loan | $45,000,000 |
|
|
|
|
|
Pari Passu Notes | 956,000,000 |
|
|
|
|
|
Total Senior Notes | $1,001,000,000 | $391 / $391 | 41.7% / 41.7% | 3.93x / 3.84x | 11.9% / 11.7% | 11.9% / 11.7% |
Subordinate Notes | 249,000,000 |
|
|
|
|
|
Total Debt | $1,250,000,000 | $488 / $488 | 52.1% / 52.1% | 3.14x / 3.08x | 9.5% / 9.3% | 9.5% / 9.3% |
(1) | The 1633 Broadway Whole Loan (as defined below) was co-originated by DBR Investments Co. Limited (“DBRI”), JPMCB, Goldman Sachs Bank USA and Wells Fargo Bank, National Association. GACC subsequently acquired from DBRI, and is selling Note A-2-C-1-B with a Cut-off Date Balance of $22,500,000. JPMCB is selling Note A-3-C-1-B with a Cut-off Date Balance of $22,500,000. |
(2) | The 1633 Broadway Loan (as defined below) consists of the non-controlling Note A-2-C-1-B and A-3-C-1-B with an aggregate original principal balance and outstanding principal balance as of the Cut-off Date of $45.0 million. The 1633 Broadway Loan is part the 1633 Broadway Whole Loan evidenced by 34 senior pari passu notes and four pari passu subordinate notes, with an aggregate principal balance as of the Cut-off Date of $1.25 billion. For additional information, see “The Loan” herein. |
(3) | The lockout period will be at least 26 payments beginning with and including January 6, 2020. The borrower has the option to defease the 1633 Broadway Whole Loan in full after the earlier to occur of (i) two years after the closing date of the securitization that includes the last note to be securitized and (ii) November 25, 2022. |
(4) | See “Initial and Ongoing Reserves” herein. |
(5) | Fitch, KBRA and Moody’s provided the listed assessments for the 1633 Broadway Loan in the context of its inclusion in the mortgage pool. |
THE INFORMATION IN THIS STRUCTURAL AND COLLATERAL TERM SHEET IS NOT COMPLETE AND MAY BE AMENDED PRIOR TO THE TIME OF SALE. THIS TERM SHEET IS NOT AN OFFER TO SELL THESE SECURITIES AND IT IS NOT A SOLICITATION OF AN OFFER TO BUY THESE SECURITIES IN ANY JURISDICTION WHERE THE OFFER OR SALE IS NOT PERMITTED.
85
1633 Broadway New York, NY 10019 | Collateral Asset Summary – Loan No. 7 1633 Broadway | Cut-off Date Balance: Cut-off Date LTV: U/W NCF DSCR: U/W NOI Debt Yield: | $45,000,000 41.7% 3.84x 11.9% |
The Loan. The 1633 Broadway mortgage loan (the “1633 Broadway Loan”) is part of a whole loan (the “1633 Broadway Whole Loan”) consisting of 34 pari passu senior notes with an outstanding aggregate principal balance as of the Cut-off Date of $1,001,000,000 (collectively the “1633 Broadway Senior Notes”) and four pari passu subordinate notes with an aggregate outstanding principal balance as of the Cut-of Date of $249,000,000 (the “1633 Broadway Subordinate Notes”). The 1633 Broadway Whole Loan is secured by a first mortgage encumbering the borrowers’ fee simple interest in an office building in New York, New York (the “1633 Broadway Property”). The 1633 Broadway Loan, which is evidenced by the non-controlling Note A-2-C-1-B and A-3-C-1-B, has an aggregate original principal balance and outstanding principal balance as of the Cut-off Date of $45,000,000.
The relationship between the holders of the 1633 Broadway Whole Loan will be governed by a co-lender agreement as described under “Description of the Mortgage Pool—The Whole Loans—The Non-Serviced AB Whole Loans—The 1633 Broadway Whole Loan” in the Preliminary Prospectus.
Whole Loan Summary | |||||
Note | Original Balance | Cut-off Date Balance |
| Note Holder | Controlling Piece |
A-1-S-1, A-2-S-1, A-3-S-1, A-4-S-1 | $1,000,000 | $1,000,000 |
| BWAY 2019-1633 | No |
A-1-C-1, A-1-C-3, A-1-C-4, A-1-C-5, A-1-C-6, A-1-C-7 | 205,000,000 | 205,000,000 |
| GS Bank(1) | No(2) |
A-1-C-2, A-2-C-5 | 60,000,000 | 60,000,000 |
| GSMS 2020-GC45(3) | No |
A-2-C-1-B, A-3-C-1-B | 45,000,000 | 45,000,000 |
| Benchmark 2020-B16 | No |
A-2-C-1-A, A-2-C-2, A-2-C-3, A-2-C-4, A-2-C-6, A-2-C-7 | 212,500,000 | 212,500,000 |
| DBRI(1) | No |
A-3-C-1-A, A-3-C-2, A-3-C-3, A-3-C-4, A-3-C-5, A-3-C-6, A-3-C-7 | 227,500,000 | 227,500,000 |
| JPMCB(1) | No |
A-4-C-1, A-4-C-2 | 100,000,000 | 100,000,000 |
| BANK 2020-BNK25(4) | No |
A-4-C-3, A-4-C-4, A-4-C-5, A-4-C-6, A-4-C-7 | 150,000,000 | 150,000,000 |
| WFB(1) | No |
Total Senior Notes | $1,001,000,000 | $1,001,000,000 |
|
|
|
Note B-1, B-2, B-3, B-4 | $249,000,000 | $249,000,000 |
| BWAY 2019-1633 | Yes(2) |
Whole Loan | $1,250,000,000 | $1,250,000,000 |
|
|
|
(1) | The related notes are currently held by the Note Holder identified in the table above and are expected to be contributed to one or more future securitization transactions. |
(2) | During the continuance of a control appraisal relating to the BWAY 2019-1633 securitization transaction (i.e., when the most senior class of certificates in such transaction have been control appraised out), Note A-1-C-1 will be the controlling piece. See “Description of the Mortgage Pool—The Whole Loans—The Non-Serviced AB Whole Loans—The 1633 Broadway Whole Loan” in the Preliminary Prospectus. |
(3) | The GSMS 2020-GC45 transaction is expected to close prior to the Closing Date. |
(4) | The BANK 2020-BNK25 transaction is expected to close on or about February 13, 2020. |
The 1633 Broadway Whole Loan has a 10-year interest-only term and accrues interest at a rate of 2.99000% per annum. The 1633 Broadway Whole Loan was primarily used to repay the existing loan, fund upfront reserves, pay closing costs and return approximately $139.9 million to the borrower sponsor. Based on the “As Is” appraised value of $2.4 billion as of October 24, 2019 and the Cut-off Date balance of the 1633 Broadway Senior Notes, the Cut-off Date LTV Ratio is 41.7%.
Sources and Uses | ||||||
Sources | Proceeds | % of Total |
| Uses | Proceeds | % of Total |
Senior Notes | $1,001,000,000 | 80.1% |
| Loan Payoff | $1,052,884,467 | 84.2% |
Subordinate Notes | 249,000,000 | 19.9 |
| Upfront Reserves | 36,389,727 | 2.9 |
|
|
|
| Closing Costs | 20,840,154 | 1.7 |
|
|
|
| Return of Equity | 139,885,652 | 11.2 |
Total Sources | $1,250,000,000 | 100.0% |
| Total Uses | $1,250,000,000 | 100.0% |
The Borrowers / Borrower Sponsor. The borrowers are PGREF I 1633 Broadway Tower, L.P. and PGREF I 1633 Broadway Land, L.P., each a Delaware limited partnership. PGREF I 1633 Broadway Land, L.P. owns the 1633 Broadway Property entirely in fee and also ground leases the 1633 Broadway Property to PGREF I 1633 Broadway Tower, L.P. (i.e., both landlord and tenant interests in the ground lease are pledged as collateral, in addition to the fee interest in the 1633 Broadway Property). Legal counsel to the borrowers delivered a non-consolidation opinion in connection with the origination of the 1633 Broadway Whole Loan. There is no non-recourse carveout guarantor or separate environmental indemnitor with respect to the 1633 Broadway Whole Loan.
The borrower sponsor is Paramount Group Operating Partnership LP, which indirectly owns and controls the borrowers. Paramount Group, Inc. (NYSE: PGRE), an approximately 91.0% general partner of the borrower sponsor, is a real estate investment trust that currently owns and/or manages a 13.4 million sq. ft. portfolio of 18 Class A office and retail buildings in New York, Washington, D.C., and San Francisco. Paramount Group, Inc. has a New York portfolio that includes: 1633 Broadway, 1301 Avenue of the Americas, 1325 Avenue of the Americas, 31 West 52nd Street, 900 Third Avenue, 712 Fifth Avenue, 60 Wall Street, 745 Fifth Avenue, 718 Fifth Avenue, and 0 Bond Street.
The Property. The 1633 Broadway Property is an approximately 2.6 million sq. ft., 48-story office tower that is situated with a full block of Broadway frontage between 50th and 51st Streets in Midtown Manhattan. The 1633 Broadway Property contains views of the Hudson River, Central Park, and Midtown from above the 36th floor. In addition to the office space, the 1633 Broadway Property includes retail
THE INFORMATION IN THIS STRUCTURAL AND COLLATERAL TERM SHEET IS NOT COMPLETE AND MAY BE AMENDED PRIOR TO THE TIME OF SALE. THIS TERM SHEET IS NOT AN OFFER TO SELL THESE SECURITIES AND IT IS NOT A SOLICITATION OF AN OFFER TO BUY THESE SECURITIES IN ANY JURISDICTION WHERE THE OFFER OR SALE IS NOT PERMITTED.
86
1633 Broadway New York, NY 10019 | Collateral Asset Summary – Loan No. 7 1633 Broadway | Cut-off Date Balance: Cut-off Date LTV: U/W NCF DSCR: U/W NOI Debt Yield: | $45,000,000 41.7% 3.84x 11.9% |
space (anchored by Equinox), a parking garage across three levels below grade, two theaters comprising a total of 145,192 sq. ft. (the Gershwin Theatre and Circle in the Square Theatre) and storage space comprising 18,384 sq. ft.
The 1633 Broadway Property is located on a 90,400 sq. ft. parcel comprising the entire western block front of Broadway between West 50th and West 51st Streets within the Westside office submarket of Midtown. The 1633 Broadway Property was constructed in 1972 and was most recently renovated in 2013. Since 2010, the borrower sponsor has invested a total of approximately $41.6 million in lobby renovations, plaza redevelopment, and retail renovations. In addition, the borrower sponsor has invested approximately $230 million in tenant improvements and leasing commissions since 2010. Going forward, the borrower sponsor provided a 10-year renovation budget which totals approximately $55.98 million; the renovation budget is anticipated to be utilized for items including a roof replacement, structural upgrades, fire alarm system upgrades, Gershwin Theatre upgrades, completion of the terrace on the 47th and 48th floors, and development of the Retail Cube. Such renovations are not required by the 1633 Broadway Whole Loan documents, and have not been reserved for. We cannot assure you that such renovation will proceed as expected or at all.
The 1633 Broadway Property comprises 2,561,512 sq. ft. and was 98.4% leased as of October 31, 2019. The 1633 Broadway Property benefits from a strong office component, which is currently 100.0% leased to 17 tenants. The retail space within the 1633 Broadway Property totals approximately 80,000 sq. ft. of net rentable area and is anchored by Equinox (25,458 sq. ft.) through February 2040. Approximately 94.3% of the underwritten rent is from office tenants.
The 1633 Broadway Property features two theatres that comprise 5.7% of the total net rentable area and account for 1.2% of the underwritten rental revenue. The larger of the two theatres is the U. T. Associates of the Gershwin Theatre (“Gershwin Theatre”), which is notable for hosting Wicked since 2003. The Gershwin Theatre contains three, five-year renewal options that could potentially extend the term through May 2042. The 1633 Broadway Property contains an additional theatre known as the Circle in the Square, which comprises approximately 800 seats and 34,570 sq. ft. and currently hosts the show OKLAHOMA! The 1633 Broadway Property also houses the Circle in the Square Theatre School, the only accredited training conservatory associated with a Broadway theatre, which offers two, two-year training programs, in acting and musical theatre. The tenant currently pays a total contract rent of $864,250 or $25.00 PSF through September 2021.
The parking component within the 1633 Broadway Property consists of 250-space parking garage across three levels below grade and comprises 64,158 sq. ft. The parking area is currently leased to ABM Parking Services, Inc., a parking garage operator, which is expected to occupy the space through July 2026. The parking garage operator is responsible for a contract rent of approximately $2.39 million, or $10,167 per space, which will increase by 1.50% per annum throughout the remainder of its lease.
Major Tenants.
Allianz Asset Management of America L.P. (“Allianz”) (320,911 sq. ft., 12.5% of NRA, 15.7% of U/W Base Rent) is an asset manager with over 800 investment professionals in 25 offices worldwide and manages assets for individuals, families and institutions. The 1633 Broadway Property serves as the United States headquarters for Allianz. Allianz occupies six suites with leases expiring in January 2031.
Morgan Stanley & Co (“Morgan Stanley”) (260,829 sq. ft., 10.2% of NRA; 11.1% of U/W Base Rent) is a financial holding company, that provides various financial products and services to corporations, governments, financial institutions and individuals in the Americas, Europe, the Middle East, Africa and Asia. Morgan Stanley operates through three segments: Institutional Securities, Wealth Management and Investment Management. Morgan Stanley occupies five suites with leases expiring in March 2032.
WMG Acquisition Corp (“Warner Music Group”) (293,888 sq. ft., 11.5% of NRA; 10.4% of U/W Base Rent) is an American multinational entertainment and record label conglomerate. It is one of the “Big Three” recording companies and the third largest in the global music industry, next to Universal Music Group and Sony Music Entertainment. Warner Music Group is headquartered at the 1633 Broadway Property.
THE INFORMATION IN THIS STRUCTURAL AND COLLATERAL TERM SHEET IS NOT COMPLETE AND MAY BE AMENDED PRIOR TO THE TIME OF SALE. THIS TERM SHEET IS NOT AN OFFER TO SELL THESE SECURITIES AND IT IS NOT A SOLICITATION OF AN OFFER TO BUY THESE SECURITIES IN ANY JURISDICTION WHERE THE OFFER OR SALE IS NOT PERMITTED.
87
1633 Broadway New York, NY 10019 | Collateral Asset Summary – Loan No. 7 1633 Broadway | Cut-off Date Balance: Cut-off Date LTV: U/W NCF DSCR: U/W NOI Debt Yield: | $45,000,000 41.7% 3.84x 11.9% |
Tenant Summary(1) | ||||||
Tenant | Credit Rating (Moody’s/Fitch/S&P)(2) | Net Rentable Area | % of Net Rentable | U/W Base Rent | % of Total U/W | Lease |
Allianz(4) | AA-/Aa3/AA | 320,911 | 12.5% | $82.66 | 15.7% | 1/31/2031 |
Morgan Stanley(5) | A/A3/BBB+ | 260,829 | 10.2 | $71.61 | 11.1 | 3/31/2032 |
WMG Acquisition Corp(6) | NR/NR/NR | 293,888 | 11.5 | $59.62 | 10.4 | 7/31/2029 |
Showtime Networks Inc | BBB/Baa2/BBB | 261,196 | 10.2 | $55.28 | 8.6 | 1/31/2026 |
Kasowitz Benson Torres(7) | NR/NR/NR | 203,394 | 7.9 | $68.00 | 8.2 | 3/31/2037 |
New Mountain Capital, LLC(8) | NR/NR/NR | 108,374 | 4.2 | $86.00 | 5.5 | 10/15/2035 |
Charter Communications Holding | NR/Ba2/BB+ | 106,176 | 4.1 | $84.00 | 5.3 | 12/15/2025 |
MongoDB, Inc. | NR/NR/NR | 106,230 | 4.1 | $76.00 | 4.8 | 12/31/2029 |
Travel Leaders Group, LLC | NR/NR/B+ | 107,205 | 4.2 | $74.58 | 4.7 | 12/31/2033 |
Assured Guaranty Municipal | NR/NR/A | 103,838 | 4.1 | $69.88 | 4.3 | 2/28/2032 |
Subtotal |
| 1,872,041 | 73.1% | $70.81 | 78.5% |
|
Remaining Tenants |
| 649,710 | 25.4 | $55.74 | 21.5 |
|
Total / Wtd. Avg. Occupied |
| 2,521,751 | 98.5% | $66.93 | 100.0% |
|
Vacant Space |
| 39,761 | 1.6 |
|
|
|
Total / Wtd. Avg. |
| 2,561,512 | 100.0% |
|
|
|
(1) | Based on the underwritten rent roll dated October 31, 2019. |
(2) | Certain ratings are those of the parent company whether or not the parent guarantees the lease. |
(3) | Borrowers’ owned space. Does not include non-owned anchors or outparcels. |
(4) | Allianz subleases 20,600 sq. ft. of suite 4600 (totaling 54,118 sq. ft.) to Triumph Hospitality at a base rent of $46.80 PSF through December 30, 2030. Triumph Hospitality further subleases 3,000 sq. ft. of suite 4600 to Stein Adler Dabah & Zelkowitz at a base rent of $41.33 PSF through July 31, 2022. U/W Base Rent is based on the contractual rent under the prime lease. |
(5) | Morgan Stanley has the option to terminate its lease as to all or any portion (but not less than one full floor) of its space at any time after April 1, 2027, upon 18 months’ notice and payment of a termination fee. |
(6) | WMG Acquisition Corp subleases 3,815 sq. ft. of suite 0400 (totaling 36,854 sq. ft.) to Cooper Investment Partners LLC at a base rent of $58.37 PSF on a month-to-month basis. U/W Base Rent is based on the contractual rent under the prime lease. |
(7) | Kasowitz Benson Torres subleases a collective 32,487 sq. ft. of Suite 2200 (totaling 50,718 sq. ft.) to three tenants. Delcath Systems, Inc. subleases 6,877 sq. ft. and pays a rent of $68.50 PSF through February 28, 2021; Avalonbay Communities subleases 12,145 sq. ft. through October 31, 2026 and pays a current rent of $74.00 PSF; Cresa New York subleases 13,195 sq. ft. and pays a rent of $65.00 PSF through April 30, 2021. Kasowitz Benson Torres has the right to terminate all or a portion of one full floor of the premises located on the uppermost or lowermost floors (provided that the terminated space must be in a commercially reasonable configuration), effective as of March 31, 2024, upon notice by March 31, 2023. U/W Base Rent is based on the contractual rent under the prime lease and payment of a termination fee. |
(8) | New Mountain Capital, LLC has executed a lease but has not yet taken occupancy or begun paying rent. We cannot assure you that they will take occupancy or begin paying rent as expected or at all. |
Lease Rollover Schedule(1)(2) | ||||||||
Year | # of Leases Expiring | Total Expiring Sq. Ft. | % of Total Sq. Ft. Expiring | Cumulative Sq. Ft. Expiring | Cumulative % of Sq. Ft. Expiring | Annual U/W Base Rent PSF | % U/W Base Rent Rolling | Cumulative % of U/W Base Rent |
MTM | 10 | 9,482 | 0.4% | 9,482 | 0.4% | $67.30 | 0.4% | 0.4 |
2020 | 2 | 960 | 0.0 | 10,442 | 0.4% | $30.00 | 0.0 | 0.4 |
2021 | 3 | 86,460 | 3.4 | 96,902 | 3.8% | $55.01 | 2.8 | 3.2 |
2022 | 4 | 116,337 | 4.5 | 213,239 | 8.3% | $24.18 | 1.7 | 4.9 |
2023 | 2 | 38,550 | 1.5 | 251,789 | 9.8% | $33.72 | 0.8 | 5.7 |
2024 | 1 | 51,276 | 2.0 | 303,065 | 11.8% | $91.00 | 2.8 | 8.4 |
2025 | 1 | 106,176 | 4.1 | 409,241 | 16.0% | $84.00 | 5.3 | 13.7 |
2026 | 3 | 383,584 | 15.0 | 792,825 | 31.0% | $53.18 | 12.1 | 25.8 |
2027 | 2 | 55,247 | 2.2 | 848,072 | 33.1% | $82.98 | 2.7 | 28.5 |
2028 | 2 | 90,001 | 3.5 | 938,073 | 36.6% | $67.15 | 3.6 | 32.1 |
2029 | 3 | 399,717 | 15.6 | 1,337,790 | 52.2% | $63.99 | 15.2 | 47.2 |
2030 | 0 | 0 | 0.0 | 1,337,790 | 52.2% | $0.00 | 0.0 | 47.2 |
Thereafter | 10 | 1,183,961 | 46.2 | 2,521,751 | 98.4% | $75.21 | 52.8 | 100.0 |
Vacant | NAP | 39,761 | 1.6 | 2,561,512 | 100.0% | NAP | NAP |
|
Total / Wtd. Avg. | 43 | 2,561,512 | 100.0% |
|
| $66.93 | 100.0% |
|
|
|
|
|
|
|
|
|
|
(1) | Based on the underwritten rent roll dated October 31, 2019. |
(2) | Certain tenants may have termination options that are exercisable prior to the originally stated expiration date of the subject lease and that are not considered in the Lease Expiration Schedule. |
Environmental Matters. According to a Phase I environmental report, dated October 30, 2019, there are no recognized environmental conditions or recommendations for further action at the 1633 Broadway Property, other than the development and implementation of an asbestos operations and maintenance program.
The Market. The 1633 Broadway Property is located in the Times Square neighborhood of Midtown Manhattan, a high traffic commercial corridor that produces 15% of New York City’s economic output. The neighborhood is bounded by 41st Street to the south and 52nd Street to the north between Avenue of the Americas and Eighth Avenue. The 1633 Broadway Property is located within one block of the 50th Street/Broadway, 50th Street and 49th Street subway stations, which serve the 1, 2, C, E, N, R and W lines.
THE INFORMATION IN THIS STRUCTURAL AND COLLATERAL TERM SHEET IS NOT COMPLETE AND MAY BE AMENDED PRIOR TO THE TIME OF SALE. THIS TERM SHEET IS NOT AN OFFER TO SELL THESE SECURITIES AND IT IS NOT A SOLICITATION OF AN OFFER TO BUY THESE SECURITIES IN ANY JURISDICTION WHERE THE OFFER OR SALE IS NOT PERMITTED.
88
1633 Broadway New York, NY 10019 | Collateral Asset Summary – Loan No. 7 1633 Broadway | Cut-off Date Balance: Cut-off Date LTV: U/W NCF DSCR: U/W NOI Debt Yield: | $45,000,000 41.7% 3.84x 11.9% |
According to the appraisal, the 1633 Broadway Property is located within the Westside office submarket of Midtown within the Manhattan market. Historically, the submarket has benefitted from the office space located around the boundaries of Central Park along major corridors such as West 57th Street, Broadway and Seventh Avenue, which consist primarily of Class A office product that take advantage of protected Central Park Views. The area’s proximity to these locations has assisted with the historically low vacancy and availability rates exhibited by this submarket since 2010. As of the third quarter of 2019, the Westside office submarket had an existing inventory of approximately 25.7 million sq. ft., a vacancy rate of 5.4% and an average asking rent of $66.21 PSF. As of the third quarter of 2019, the Manhattan office market had an existing inventory of approximately 456.1 million sq. ft., a vacancy rate of 5.9% and an average asking rent of $79.25 PSF.
Competitive Set – Comparable Office Leases(1) | ||||||
Location | Total GLA | Tenant Name | Lease Date / Term | Lease Area (sq. ft.) | Monthly | Lease |
1633 Broadway New York, NY | 2,561,512 |
|
|
|
|
|
1155 Avenue of the Americas New York, NY | 752,996 | BKD, LLC | September 2019 / 162 Mos. | 20,899 | $77.00 | MG |
1 Rockefeller Plaza New York, NY | 603,397 | Veteran Advisers, Inc. | September 2019 / 92 Mos. | 2,552 | $83.50 | MG |
1675 Broadway New York, NY | 878,321 | Davis & Gilbert LLP | August 2019 / 192 Mos. | 85,852 | $72.00 | MG |
142 West 57th Street New York, NY | 255,586 | Wedbush Securities Inc. | August 2019 / 130 Mos. | 15,626 | $65.00 | MG |
1251 Avenue of the Americas New York, NY | 2,364,000 | IHI Americas, Inc | July 2019 / 124 Mos. | 9,438 | $70.50 | MG |
1345 Avenue of the Americas New York, NY | 1,998,994 | Global Infrastructure Partners | June 2019 / 204 Mos. | 84,856 | $89.50 | MG |
810 Seventh Avenue New York, NY | 765,000 | Colonial Consulting LLC | May 2019 / 150 Mos. | 17,320 | $71.00 | MG |
1271 Avenue of the Americas New York, NY | 2,100,000 | Greenhill & Company | May 2019 / 183 Mos. | 77,622 | $91.00 | MG |
1271 Avenue of the Americas New York, NY | 2,100,000 | AIG - American International Group, Inc. | April 2019 / 198 Mos. | 320,237 | $97.13 | MG |
1700 Broadway New York, NY | 625,000 | Excel Sports Management, LLC | April 2019 / 91 Mos. | 17,078 | $79.00 | MG |
1325 Avenue of the Americas New York, NY | 808,998 | Dominus Capital, L.P. | March 2019 / 126 Mos. | 9,361 | $75.00 | MG |
1290 Avenue of the Americas New York, NY | 2,113,000 | Linklaters, LLP | March 2019 / 193 Mos. | 90,508 | $84.00 | MG |
1177 Avenue of the Americas New York, NY | 1,000,000 | Mill Point Capital | January 2019 / 126 Mos. | 11,644 | $87.00 | MG |
1700 Broadway New York, NY | 625,000 | M. Arthur Gensler, Jr. & Associates, Inc. | January 2019 / 119 Mos. | 13,237 | $71.00 | MG |
114 West 47th Street New York, NY | 658,000 | IFM Investments | October 2018 / 180 Mos. | 18,000 | $68.00 | MG |
(1) | Source: Appraisal. |
THE INFORMATION IN THIS STRUCTURAL AND COLLATERAL TERM SHEET IS NOT COMPLETE AND MAY BE AMENDED PRIOR TO THE TIME OF SALE. THIS TERM SHEET IS NOT AN OFFER TO SELL THESE SECURITIES AND IT IS NOT A SOLICITATION OF AN OFFER TO BUY THESE SECURITIES IN ANY JURISDICTION WHERE THE OFFER OR SALE IS NOT PERMITTED.
89
1633 Broadway New York, NY 10019 | Collateral Asset Summary – Loan No. 7 1633 Broadway | Cut-off Date Balance: Cut-off Date LTV: U/W NCF DSCR: U/W NOI Debt Yield: | $45,000,000 41.7% 3.84x 11.9% |
Cash Flow Analysis.
Cash Flow Analysis(1) | ||||||
| 2016 | 2017 | 2018 | T-12 9/30/2019 | Underwritten | U/W PSF |
Base Rent(2) | $141,156,682 | $143,219,431 | $160,621,035 | $161,646,240 | $168,770,601 | $65.89 |
Credit Tenant Rent Steps(3) | 0 | 0 | 0 | 0 | 7,558,579 | 2.95 |
Vacant Space | 0 | 0 | 0 | 0 | 2,879,875 | 1.12 |
Reimbursements | 9,150,315 | 11,228,307 | 13,952,510 | 16,874,074 | 15,267,588 | 5.96 |
Gross Potential Rent | $150,306,997 | $154,447,738 | $174,573,545 | $178,520,314 | $194,476,643 | $75.92 |
Other Income(4) | 5,692,549 | 5,017,065 | 4,645,691 | 4,240,034 | 4,279,853 | 1.67 |
Concessions | 0 | 0 | 0 | 0 | 0 | 0.00 |
Vacancy & Credit Loss | (309,756) | 0 | 0 | 0 | (8,170,549) | (3.19) |
Effective Gross Income | $155,689,790 | $159,464,803 | $179,219,236 | $182,760,348 | $190,585,947 | $74.40 |
Real Estate Taxes | $35,413,254 | $38,391,946 | $41,366,170 | $43,693,114 | $45,478,153 | $17.75 |
Insurance | 1,061,417 | 908,564 | 1,009,544 | 1,082,131 | 1,069,190 | 0.42 |
Management Fee | 2,507,162 | 2,981,306 | 3,149,432 | 3,287,347 | 1,000,000 | 0.39 |
Other Operating Expenses | 22,886,571 | 22,992,980 | 24,595,640 | 23,888,441 | 23,888,441 | 9.33 |
Total Operating Expenses | $61,868,404 | $65,274,796 | $70,120,786 | $71,951,033 | $71,435,784 | $27.89 |
Net Operating Income | $93,821,386 | $94,190,007 | $109,098,450 | $110,809,315 | $119,150,163 | $46.52 |
TI/LC | 0 | 0 | 0 | 0 | 2,011,364 | 0.79 |
Capital Expenditures | 0 | 0 | 0 | 0 | 461,072 | 0.18 |
Net Cash Flow | $93,821,386 | $94,190,007 | $109,098,450 | $110,809,315 | $116,677,727 | $45.55 |
(1) | Non-recurring or non-operating items were excluded from the historical presentation and are not considered for the underwritten cash flow. |
(2) | Underwritten Base Rent reflects annualized in-place rents as of October 31, 2019 ($167,497,806), with contractual rent steps through November 30, 2020 ($1,272,795). |
(3) | Reflects the net present value of contractual rent step increments over the lease term using a discount rate of 7.0% (for investment grade tenants). |
(4) | Other Income consists of overage rent, storage income, parking income, lease termination income, tenant work order income and other miscellaneous income. |
Property Management. The 1633 Broadway Property is currently managed by Paramount Group Property-Asset Management LLC.
Lockbox / Cash Management. The 1633 Broadway Whole Loan is structured with a hard lockbox and springing cash management. The borrowers are required to direct each tenant at the 1633 Broadway Property to deposit rents directly into a lender-controlled lockbox account. In addition, the borrowers are required to cause all cash revenues relating to the 1633 Broadway Property and all other money received by the borrowers or the property manager with respect to the 1633 Broadway Property (other than tenant security deposits) to be deposited into the lockbox account or a lender-controlled cash management account within one business day of receipt. On each business day during the continuance of a 1633 Broadway Trigger Period or an event of default under the loan documents, all amounts in the lockbox account are required to be remitted to the cash management account. On each business day that no 1633 Broadway Trigger Period or event of default under the loan documents is continuing, all funds in the lockbox account are required to be swept into a borrower-controlled operating account.
On each due date during the continuance of a 1633 Broadway Trigger Period or, at the lender’s discretion, during an event of default under the loan documents, all funds on deposit in the cash management account after payment of debt service, required reserves and budgeted operating expenses are required to be reserved as additional collateral for the 1633 Broadway Whole Loan.
A “1633 Broadway Trigger Period” means each period (i) commencing when the debt yield (as calculated under the loan documents), determined as of the last day of each of two consecutive fiscal quarters, is less than 5.75%, and concluding when the debt yield (as calculated under the loan documents), determined as of the last day of each of two consecutive fiscal quarters thereafter, is at least 5.75%, and (ii) commencing upon the borrowers’ failure to deliver annual, quarterly or monthly financial reports as and when required under the loan documents and concluding when such reports are delivered and indicate that no other 1633 Broadway Trigger Period is ongoing.
Provided no event of default under the loan documents is continuing, the borrowers have the right to avoid the commencement, or terminate the continuance, of a 1633 Broadway Trigger Period by delivering to the lender additional collateral in the form of a guaranty, letter of credit and/or cash that is reasonably acceptable to the lender and that would, when subtracted from the then-outstanding principal balance of the 1633 Broadway Whole Loan, result in a debt yield (as calculated under the loan documents) equal to or greater than 5.75%.
THE INFORMATION IN THIS STRUCTURAL AND COLLATERAL TERM SHEET IS NOT COMPLETE AND MAY BE AMENDED PRIOR TO THE TIME OF SALE. THIS TERM SHEET IS NOT AN OFFER TO SELL THESE SECURITIES AND IT IS NOT A SOLICITATION OF AN OFFER TO BUY THESE SECURITIES IN ANY JURISDICTION WHERE THE OFFER OR SALE IS NOT PERMITTED.
90
1633 Broadway New York, NY 10019 | Collateral Asset Summary – Loan No. 7 1633 Broadway | Cut-off Date Balance: Cut-off Date LTV: U/W NCF DSCR: U/W NOI Debt Yield: | $45,000,000 41.7% 3.84x 11.9% |
Initial and Ongoing Reserves. On the origination date, the borrowers provided a guaranty from Paramount Group Operating Partnership LP of up to $4,000,000 and funded a reserve of approximately $36,389,727 with respect to unfunded tenant improvements, tenant allowance and leasing commissions and free rent obligations consisting of (a) $24,105,228 for certain outstanding tenant improvements, (b) $804,393 for certain outstanding leasing commissions and (c) $15,480,107 for certain outstanding free rent. Subsequently, the borrowers substituted a letter of credit for the cash on reserve in such reserve account.
On each due date during the continuance of a 1633 Broadway Trigger Period, the borrowers are required to fund (i) a tax and insurance reserve in an amount equal to 1/12th of the taxes and insurance premiums that the lender reasonably estimates will be payable during the next ensuing 12 months, unless in the case of insurance premiums, the borrowers are maintaining a blanket policy in accordance with the related loan documents; (ii) a tenant improvement and leasing commission reserve in an amount equal to $213,459.33 (capped at $5,123,024); and (iii) a capital expenditure reserve in an amount equal to $42,691.87 (capped at $1,024,604.80).
Current Mezzanine or Subordinate Indebtedness. The 1633 Broadway Subordinate Notes have an aggregate outstanding principal balance as of the Cut-off Date of $249.0 million and accrue interest at a fixed rate of 2.9900% per annum. Each of the 1633 Broadway Subordinate Notes have a 120-month term and is interest only for the full term. For additional information, see “Description of the Mortgage Pool—The Whole Loans—The Non-Serviced AB Whole Loans—The 1633 Broadway Whole Loan” in the Preliminary Prospectus.
Future Mezzanine or Subordinate Indebtedness Permitted. On or after November 25, 2020, the owner of the direct or indirect equity interests of the borrowers is permitted to incur mezzanine debt (the “1633 Broadway Permitted Mezzanine Loan”) secured by a pledge of direct or indirect equity interests in the borrowers, provided that certain conditions set forth in the loan documents are satisfied, including, without limitation: (i) the loan-to-value ratio (as calculated under the loan documents and taking into account the mezzanine loan and the 1633 Broadway Whole Loan) is no greater than 52.08%, (ii) the debt service coverage ratio (as calculated under the loan documents and taking into account the mezzanine loan and the 1633 Broadway Whole Loan) is at least 3.08x, and (iii) the debt yield (as calculated under the loan documents and taking into account the mezzanine loan and the 1633 Broadway Whole Loan) is at least 9.35%; (iv) the execution of a subordination and intercreditor agreement that is reasonably acceptable to the lender; and (iv) receipt of a Rating Agency Confirmation.
Partial Release. None.
THE INFORMATION IN THIS STRUCTURAL AND COLLATERAL TERM SHEET IS NOT COMPLETE AND MAY BE AMENDED PRIOR TO THE TIME OF SALE. THIS TERM SHEET IS NOT AN OFFER TO SELL THESE SECURITIES AND IT IS NOT A SOLICITATION OF AN OFFER TO BUY THESE SECURITIES IN ANY JURISDICTION WHERE THE OFFER OR SALE IS NOT PERMITTED.
91
Various | Collateral Asset Summary – Loan No. 8 Starwood Industrial Portfolio | Cut-off Date Balance: Cut-off Date LTV: U/W NCF DSCR: U/W NOI Debt Yield: | $45,000,000 45.2% 3.67x 13.1% |
THE INFORMATION IN THIS STRUCTURAL AND COLLATERAL TERM SHEET IS NOT COMPLETE AND MAY BE AMENDED PRIOR TO THE TIME OF SALE. THIS TERM SHEET IS NOT AN OFFER TO SELL THESE SECURITIES AND IT IS NOT A SOLICITATION OF AN OFFER TO BUY THESE SECURITIES IN ANY JURISDICTION WHERE THE OFFER OR SALE IS NOT PERMITTED.
92
Various | Collateral Asset Summary – Loan No. 8 Starwood Industrial Portfolio | Cut-off Date Balance: Cut-off Date LTV: U/W NCF DSCR: U/W NOI Debt Yield: | $45,000,000 45.2% 3.67x 13.1% |

THE INFORMATION IN THIS STRUCTURAL AND COLLATERAL TERM SHEET IS NOT COMPLETE AND MAY BE AMENDED PRIOR TO THE TIME OF SALE. THIS TERM SHEET IS NOT AN OFFER TO SELL THESE SECURITIES AND IT IS NOT A SOLICITATION OF AN OFFER TO BUY THESE SECURITIES IN ANY JURISDICTION WHERE THE OFFER OR SALE IS NOT PERMITTED.
93
Various | Collateral Asset Summary – Loan No. 8 Starwood Industrial Portfolio | Cut-off Date Balance: Cut-off Date LTV: U/W NCF DSCR: U/W NOI Debt Yield: | $45,000,000 45.2% 3.67x 13.1% |
Mortgage Loan Information(1) | |
Loan Seller: | GACC |
Loan Purpose: | Acquisition |
Credit Assessment |
|
(Fitch/KBRA/Moody’s)(6): | BBB-sf / BBB-(sf) / Baa2(sf) |
Borrower Sponsor: | Starwood Real Estate Income Trust |
Borrower(1): | Various |
Original Balance(2): | $45,000,000 |
Cut-off Date Balance(2): | $45,000,000 |
% by Initial UPB: | 5.0% |
Interest Rate: | 3.23100% |
Payment Date: | 6th of each month |
First Payment Date: | January 6, 2020 |
Maturity Date: | December 6, 2029 |
Amortization: | Interest Only |
Additional Debt: | $99,500,000 Pari Passu Debt $65,527,072 Subordinate Debt |
Call Protection(3): | L(26), D(90), O(4) |
Lockbox / Cash Management: | Hard / Springing |
Reserves(4) | ||||
| Initial | Monthly | Cap | |
Taxes: | $0 | Springing | NAP | |
Insurance: | $0 | Springing | NAP | |
Replacement: | $0 | Springing | $1,221,119 | |
TI/LC: | $0 | Springing | $2,849,277 | |
Roof Repair Reserve: | $880,000 | $0 | NAP | |
|
|
|
|
|
Property Information | ||
Single Asset / Portfolio: | Portfolio of 33 properties | |
Property Type: | Industrial | |
Collateral: | Fee Simple | |
Location: | Various | |
Year Built / Renovated: | Various / Various | |
Total Sq. Ft.: | 4,070,396 | |
Property Management: | Becknell Services, L.L.C. | |
Underwritten NOI: | $18,877,110 | |
Underwritten NCF: | $17,383,310 | |
Appraised Value(5): | $319,450,000 | |
Appraisal Date: | Various | |
| ||
Historical NOI | ||
TTM: | NAV | |
2018 NOI: | $17,113,200 (December 31, 2018) | |
2017 NOI: | $16,323,706 (December 31, 2017) | |
2016 NOI | NAV | |
| ||
Historical Occupancy | ||
Most Recent Occupancy: | 98.4% (Various) | |
2018 Occupancy: | 95.3% (December 31, 2018) | |
2017 Occupancy : | 94.2% (December 31, 2017) | |
2016 Occupancy: | 95.0% (December 31, 2016) | |
|
|
|
Financial Information(2)(5) | ||||||
Tranche | Cut-off Date Balance | Balance per Sq. Ft. Cut-off / Balloon | LTV Cut-off / Balloon | U/W DSCR NOI / NCF | U/W Debt Yield NOI / NCF | U/W Debt Yield at Balloon NOI / NCF |
Mortgage Loan | $45,000,000 |
|
|
|
|
|
Pari Passu Notes | 99,500,000 |
|
|
|
|
|
Total Senior Notes | $144,500,000 | $36 / $36 | 45.2% / 45.2% | 3.99x / 3.67x | 13.1% / 12.0% | 13.1% / 12.0% |
Subordinate Notes | 65,527,072 |
|
|
|
|
|
Total Debt | $210,027,072 | $52 / $52 | 65.7% / 65.7% | 2.74x / 2.53x | 9.0% / 8.3% | 9.0% / 8.3% |
(1) | The borrowers are 33 newly formed owners of the respective Starwood Industrial Portfolio Properties, each a special purpose, bankruptcy-remote, Delaware limited liability company. Legal counsel to the borrowers provided a non-consolidation opinion in connection with the origination of the Starwood Industrial Portfolio Whole Loan. See “The Borrowers / Borrower Sponsor” herein. |
(2) | The Starwood Industrial Portfolio Loan is evidenced by the non-controlling Note A-2-1 and Note A-3-1 and is part of the Starwood Industrial Portfolio Whole Loan evidenced by six senior pari passu notes and one subordinate note, with an aggregate outstanding principal balance as of the Cut-off Date of $210,027,072. For additional information, see “The Loan“ below. See “Current Mezzanine or Subordinate Indebtedness” herein. |
(3) | The lockout period will be at least 26 payments beginning with and including January 6, 2020. The borrowers have the option to defease the Starwood Industrial Portfolio Whole Loan in full after the earlier to occur of (i) two years after the closing date of the securitization that includes the last note to be securitized and (ii) November 26, 2022. |
(4) | See “Initial and Ongoing Reserves” herein. |
(5) | The Appraised Value is based on an aggregate “as-is” value of the Starwood Industrial Portfolio Properties. |
(6) | Fitch, KBRA and Moody’s provided the listed assessments for the Starwood Industrial Portfolio Loan in the context of its inclusion in the mortgage pool. |
THE INFORMATION IN THIS STRUCTURAL AND COLLATERAL TERM SHEET IS NOT COMPLETE AND MAY BE AMENDED PRIOR TO THE TIME OF SALE. THIS TERM SHEET IS NOT AN OFFER TO SELL THESE SECURITIES AND IT IS NOT A SOLICITATION OF AN OFFER TO BUY THESE SECURITIES IN ANY JURISDICTION WHERE THE OFFER OR SALE IS NOT PERMITTED.
94
Various | Collateral Asset Summary – Loan No. 8 Starwood Industrial Portfolio | Cut-off Date Balance: Cut-off Date LTV: U/W NCF DSCR: U/W NOI Debt Yield: | $45,000,000 45.2% 3.67x 13.1% |
The Loan. The Starwood Industrial Portfolio mortgage loan (the “Starwood Industrial Portfolio Loan”) is part of a whole loan (the “Starwood Industrial Portfolio Whole Loan”) consisting of six senior pari passu promissory notes with an aggregate principal balance as of the Cut-off Date of $144,500,000 (the “Starwood Industrial Portfolio Senior Notes”) and one controlling subordinate promissory note with a principal balance as of the Cut-off Date of $65,527,072 (the “Starwood Industrial Portfolio Subordinate Note”). The Starwood Industrial Portfolio Whole Loan has an aggregate principal balance as of the Cut-off Date of $210,027,072 and is secured by a first mortgage encumbering the borrowers’ fee simple interests in a 33 property industrial portfolio located in the Chicago, Indianapolis, Columbus, and Milwaukee markets, comprising 4,070,396 sq. ft. of net rentable area (the “Starwood Industrial Portfolio Properties” or the “Portfolio”). The Starwood Industrial Portfolio Loan, which will be included in the Benchmark 2020-B16 securitization transaction, is evidenced by the non-controlling Note A-2-1 and Note A-3-1, has an aggregate outstanding principal balance as of the Cut-off Date of $45,000,000 and represents approximately 5.0% of the Initial Pool Balance.
The Starwood Industrial Portfolio Whole Loan has a ten-year interest-only term and accrues interest at a fixed rate of 3.23100% per annum. The proceeds of the Starwood Industrial Portfolio Whole Loan and a new cash contribution from the borrower sponsor were primarily used to fund the acquisition of the Starwood Industrial Portfolio Properties, fund upfront reserves and pay origination costs. The aggregate purchase price for the Starwood Industrial Portfolio Properties equaled approximately $319.6 million.
The relationship between the holders of the Starwood Industrial Portfolio Whole Loan will be governed by a co-lender agreement as described under “Description of the Mortgage Pool—The Whole Loans—The Non-Serviced AB Whole Loans—The Starwood Industrial Portfolio Whole Loan” in the Preliminary Prospectus.
Whole Loan Summary | |||||
Note | Original Balance | Cut-off Date Balance |
| Note Holder | Controlling Piece |
A-1 | $50,000,000 | $50,000,000 |
| GSMS 2020-GC45(1) | No |
A-2-1 | 30,000,000 | 30,000,000 |
| Benchmark 2020-B16 | No(2) |
A-2-2 | 10,000,000 | 10,000,000 |
| GSMS 2020-GC45(1) | No |
A-3-1 | 15,000,000 | 15,000,000 |
| Benchmark 2020-B16 | No |
A-3-2 | 15,000,000 | 15,000,000 |
| DBRI(3) |
|
A-4 | 24,500,000 | 24,500,000 |
| DBRI(3) | No |
Senior Notes | $144,500,000 | $144,500,000 |
|
|
|
B-1 | 65,527,072 | 65,527,072 |
| GSMS 2020-GC45(1) | Yes(2) |
Whole Loan | $210,027,072 | $210,027,072 |
|
|
|
(1) | The GSMS 2020-GC45 transaction is expected to close prior to the Closing Date. |
(2) | The holder of the Starwood Industrial Portfolio Subordinate Note will have the right to appoint the special servicer of the Starwood Industrial Portfolio Whole Loan and to direct certain decisions with respect to the Starwood Industrial Portfolio Whole Loan, unless a control appraisal period exists under the related co-lender agreement; provided that during the occurrence of a control appraisal event with respect to the Starwood Industrial Portfolio Whole Loan, the holder of the Starwood Industrial Portfolio Note A-2-1, expected to be included in the Benchmark 2020-B16 securitization transaction will have such rights; however, the Starwood Industrial Portfolio Whole Loan will continue be serviced by the GSMS 2020-GC45 securitization transaction. For so long as the Starwood Industrial Portfolio Subordinate Note is included in the GSMS 2020-GC45 securitization, and a control appraisal period does not exist, such rights will be exercised by the directing holder of the GSMS 2020-GC45 loan-specific certificates. See “Description of the Mortgage Pool—The Whole Loans—The Non-Serviced AB Whole Loans—The Starwood Industrial Portfolio Whole Loan” in the Preliminary Prospectus for additional information. |
(3) | Expected to be contributed to one or more future securitization transactions. |
Sources and Uses | ||||||
Sources | Proceeds | % of Total |
| Uses | Proceeds | % of Total |
Senior Notes | $144,500,000 | 44.5% |
| Purchase Price | $319,625,000 | 98.5% |
Subordinate Notes | 65,527,072 | 20.2 |
| Closing Costs | 4,078,862 | 1.3 |
Principal’s Equity Contribution | 114,556,790 | 35.3 |
| Upfront Reserves | 880,000 | 0.3 |
Total Sources | $324,583,862 | 100.0% |
| Total Uses | $324,583,862 | 100.0% |
The Borrowers / Borrower Sponsor. The borrowers are 33 newly formed owners of the respective Starwood Industrial Portfolio Properties, each a special purpose, bankruptcy-remote, Delaware limited liability company with two independent directors. Legal counsel to the borrowers provided a non-consolidation opinion in connection with the origination of the Starwood Industrial Portfolio Whole Loan.
The borrower sponsor is Starwood Real Estate Income Trust (“SREIT”). The non-recourse carveout guarantor is Starwood REIT Operating Partnership, L.P., which has SREIT as its sole equity holder and sole general partner. The liability of the non-recourse carveout guarantor for bankruptcy-related recourse events is capped at 20% of the then outstanding principal balance of the Starwood Industrial Portfolio Whole Loan, plus reasonable out-of-pocket costs and expenses of enforcement.
The borrowers are owned by a joint venture between affiliates of SREIT and Becknell Industrial (“Becknell”). Starwood Capital Group (“Starwood”), a parent of SREIT, is a private investment firm founded in 1991 and currently headquartered in Miami, Florida. Since its inception, Starwood has acquired assets in every major real estate asset class. In 2018, Starwood launched SREIT, a public, non-traded, perpetual life real estate investment trust and Starwood’s only dedicated investment vehicle for core-plus investing with an investment strategy to acquire a portfolio of real estate across the United States and Europe and over all major asset classes. As of November 30, 2019, SREIT had a portfolio comprised of 70 properties.
THE INFORMATION IN THIS STRUCTURAL AND COLLATERAL TERM SHEET IS NOT COMPLETE AND MAY BE AMENDED PRIOR TO THE TIME OF SALE. THIS TERM SHEET IS NOT AN OFFER TO SELL THESE SECURITIES AND IT IS NOT A SOLICITATION OF AN OFFER TO BUY THESE SECURITIES IN ANY JURISDICTION WHERE THE OFFER OR SALE IS NOT PERMITTED.
95
Various | Collateral Asset Summary – Loan No. 8 Starwood Industrial Portfolio | Cut-off Date Balance: Cut-off Date LTV: U/W NCF DSCR: U/W NOI Debt Yield: | $45,000,000 45.2% 3.67x 13.1% |
Becknell is a privately held national real estate development firm focused exclusively on industrial buildings, including distribution centers, warehouses, processing and assembly plants, and manufacturing plants. Becknell’s industrial portfolio includes more than 25.4 million sq. ft. of real estate across 33 states, and has approximately 400 acres of developable land. Becknell developed over 79% of the assets that comprise the Portfolio, was the operating partner of the seller from which the borrowers acquired the portfolio and retained a 5.0% equity interest following the acquisition of the Portfolio by the borrowers.
The Properties.
Tenant Summary(1) | |||||||
Tenant / Building |
| Ratings (Fitch/Moody’s/S&P)(2) | Net Rentable Area (Sq. Ft.) | % of Net Rentable Area | U/W Base Rent PSF(3) | % of Total U/W Base Rent | Lease Expiration |
Property Name | |||||||
Bimbo Bakeries(2) | Various | NR/NR/NR | 105,080 | 2.6% | $11.61 | 6.4% | Various |
CTDI | 5900 North Meadows Drive | NR/NR/NR | 269,831 | 6.6 | $3.43 | 4.9 | 2/28/2023 |
McJunkin Corp. | 101 45th Street | NR/NR/NR | 140,980 | 3.5 | $5.56 | 4.1 | 12/31/2023 |
Staley(3) | 333 45th Street | NR/NR/NR | 140,000 | 3.4 | $5.12 | 3.8 | 7/31/2024 |
The Harvard Drug Store(4) | 8401 Bearing Drive | NR/NR/NR | 196,200 | 4.8 | $3.56 | 3.7 | 6/30/2025 |
Foremost Groups(5) | Various | NR/NR/NR | 141,846 | 3.5 | $4.54 | 3.4 | Various |
Anixter International, Inc. | W234N2091 Ridgeview Parkway Court | NR/NR/NR | 105,444 | 2.6 | $5.88 | 3.3 | 6/30/2030 |
Meadowbrook Meat Company | 2240 Creekside Parkway | NR/NR/NR | 125,000 | 3.1 | $4.85 | 3.2 | 3/31/2024 |
Mondelez | 221 South Swift Road | NR/NR/NR | 110,000 | 2.7 | $5.36 | 3.1 | 8/31/2020 |
API Heat Transfer | 4700 Ironwood Drive | NR/NR/NR | 123,200 | 3.0 | $4.67 | 3.0 | 7/31/2026 |
Total / Wtd. Avg. Major Tenants |
| 1,457,581 | 35.8% | $5.06 | 38.8% |
| |
Remaining Tenants |
|
| 2,546,898 | 62.6% | $4.56 | 61.2% |
|
Total / Wtd. Avg. Occupied Collateral |
| 4,004,479 | 98.4% | $4.74 | 100.0% |
| |
Vacant |
|
| 65,917 | 1.6 |
|
|
|
Total |
|
| 4,070,396 | 100.0% |
|
|
|
|
|
|
|
|
|
|
|
(1) | Based on the underwritten rent roll dated as of November 26, 2019. |
(2) | Bimbo Bakeries occupies 45,000 sq. ft. at 12857 South Hamlin Court with a lease expiration date of November 30, 2029, 40,080 sq. ft. at 1695 Glen Ellyn Road with a lease expiration date of February 28, 2027, and 20,000 sq. ft. at 845 Telser Road with a lease expiration date of May 31, 2031. |
(3) | Staley has the right to terminate its lease as of July 31, 2021 upon not less than 270 days prior written notice and payment of a termination fee equal to 6 months of the rent in effect as of the termination date plus the unamortized leasing commission amount equal to approximately $419,570. |
(4) | The Harvard Drug Store has a one-time right to terminate its lease effective as of June 30, 2022, as follows- provided the tenant is (A) (i) not in default under the lease and (ii) occupying less than 75% of the leased premises, or (B) the landlord, after written notice from the tenant, is unable to accommodate an expansion of at least 20% of the leased premises, then the tenant may terminate the lease by giving the landlord written notice no later than June 30, 2021, and paying the landlord an early termination fee of $775,000. |
(5) | Foremost Groups occupies 87,985 sq. ft. at 6221-6241 Northwind Parkway with a lease expiration date of November 30, 2020 and 53,861 sq. ft. at 6451-6471 Northwind Parkway with a lease expiration date of July 31, 2022. |
THE INFORMATION IN THIS STRUCTURAL AND COLLATERAL TERM SHEET IS NOT COMPLETE AND MAY BE AMENDED PRIOR TO THE TIME OF SALE. THIS TERM SHEET IS NOT AN OFFER TO SELL THESE SECURITIES AND IT IS NOT A SOLICITATION OF AN OFFER TO BUY THESE SECURITIES IN ANY JURISDICTION WHERE THE OFFER OR SALE IS NOT PERMITTED.
96
Various | Collateral Asset Summary – Loan No. 8 Starwood Industrial Portfolio | Cut-off Date Balance: Cut-off Date LTV: U/W NCF DSCR: U/W NOI Debt Yield: | $45,000,000 45.2% 3.67x 13.1% |
Lease Rollover Schedule(1) | ||||||||
Year | # of Leases Expiring | Total Expiring Sq. Ft. | % of Total Sq. Ft. Expiring | Cumulative Expiring | Cumulative % Sq. Ft. Expiring | Annual U/W Base Rent PSF | % U/W Base Rent Rolling | Cumulative % of U/W Base Rent |
MTM | 0 | 0 | 0.0% | 0 | 0.0% | $0.00 | 0.0% | 0.0% |
2020 | 5 | 337,771 | 8.3 | 337,771 | 8.3% | $5.08 | 9.0 | 9.0% |
2021 | 6 | 403,470 | 9.9 | 741,241 | 18.2% | $4.88 | 10.4 | 19.4% |
2022 | 7 | 345,204 | 8.5 | 1,086,445 | 26.7% | $4.80 | 8.7 | 28.1% |
2023 | 8 | 994,622 | 24.4 | 2,081,067 | 51.1% | $4.05 | 21.2 | 49.3% |
2024 | 8 | 596,861 | 14.7 | 2,677,928 | 65.8% | $4.65 | 14.6 | 63.9% |
2025 | 4 | 331,862 | 8.2 | 3,009,790 | 73.9% | $4.34 | 7.6 | 71.5% |
2026 | 3 | 249,750 | 6.1 | 3,259,540 | 80.1% | $4.88 | 6.4 | 77.9% |
2027 | 1 | 40,080 | 1.0 | 3,299,620 | 81.1% | $11.94 | 2.5 | 80.4% |
2028 | 0 | 0 | 0.0 | 3,299,620 | 81.1% | $0.00 | 0.0 | 80.4% |
2029 | 1 | 45,000 | 1.1 | 3,344,620 | 82.2% | $9.85 | 2.3 | 82.8% |
2030 | 3 | 253,564 | 6.2 | 3,598,184 | 88.4% | $5.96 | 7.9 | 90.7% |
2031 & Thereafter | 4 | 406,295 | 10.0 | 4,004,479 | 98.4% | $4.35 | 9.3 | 100.0% |
Vacant | NAP | 65,917 | 1.6 | 4,070,396 | 100.0% | NAP | NAP |
|
Total / Wtd. Avg. | 50 | 4,070,396 | 100.0% |
|
| $4.74 | 100.0% |
|
(1) | Based on the underwritten rent roll dated as of November 26, 2019. |
(2) | Certain tenants may have termination options that are exercisable prior to the originally stated expiration date of the subject lease and that are not considered in the Lease Expiration Schedule. |
THE INFORMATION IN THIS STRUCTURAL AND COLLATERAL TERM SHEET IS NOT COMPLETE AND MAY BE AMENDED PRIOR TO THE TIME OF SALE. THIS TERM SHEET IS NOT AN OFFER TO SELL THESE SECURITIES AND IT IS NOT A SOLICITATION OF AN OFFER TO BUY THESE SECURITIES IN ANY JURISDICTION WHERE THE OFFER OR SALE IS NOT PERMITTED.
97
Various | Collateral Asset Summary – Loan No. 8 Starwood Industrial Portfolio | Cut-off Date Balance: Cut-off Date LTV: U/W NCF DSCR: U/W NOI Debt Yield: | $45,000,000 45.2% 3.67x 13.1% |
The Starwood Industrial Portfolio Properties are comprised of 33 industrial properties built between 1992 and 2016. The Starwood Industrial Portfolio Properties include 4,070,396 sq. ft. of industrial space across the Chicago, Indianapolis, Columbus, and Milwaukee markets.
Portfolio Summary | |||||||||||
Property Name | City, State | Property Subtype | Allocated Whole Loan Amount | Total GLA | Year Built | As-Is Appraised Value | UW NCF | Market | Occ. (%) | Clear Height | Truck Doors |
101 45th Street | Munster, IN | Warehouse/Distribution | 16,042,137 | 349,988 | 1992 | 24,400,000 | 1,515,360 | Chicago | 81.2% | 26 | 46 |
4820-4850 Indianapolis Road | Whitestown, IN | Warehouse/Distribution | 12,360,335 | 323,000 | 2016 | 18,800,000 | 932,732 | Indianapolis | 100.0% | 32 | 36 |
8401 Bearing Drive | Indianapolis, IN | Warehouse/Distribution | 12,031,603 | 266,400 | 2015 | 18,300,000 | 998,252 | Indianapolis | 100.0% | 24 | 22 |
5900 North Meadows Drive | Grove City, OH | Warehouse/Distribution | 10,650,927 | 269,831 | 1997 | 16,200,000 | 761,601 | Columbus | 100.0% | 28 | 40 |
5701 North Meadows Drive | Grove City, OH | Warehouse/Distribution | 9,796,223 | 268,905 | 1997 | 14,900,000 | 706,940 | Columbus | 100.0% | 24 | 30 |
8421 Bearing Drive | Indianapolis, IN | Warehouse/Distribution | 8,481,294 | 124,200 | 2015 | 12,900,000 | 653,850 | Indianapolis | 100.0% | 24 | 16 |
6451-6471 Northwind Parkway | Hobart, IN | Warehouse/Distribution | 8,218,308 | 159,813 | 2016 | 12,500,000 | 701,437 | Chicago | 100.0% | 28 | 11 |
4910-4938 Indianapolis Road | Whitestown, IN | Warehouse/Distribution | 8,021,068 | 156,000 | 2016 | 12,200,000 | 612,752 | Indianapolis | 100.0% | 32 | 15 |
6221-6241 Northwind Parkway | Hobart, IN | Warehouse/Distribution | 7,889,575 | 150,000 | 2009 | 12,000,000 | 586,266 | Chicago | 100.0% | 24 | 15 |
775 Commerce Parkway West Drive | Greenwood, IN | Warehouse/Distribution | 7,560,843 | 155,000 | 2014 | 11,500,000 | 644,690 | Indianapolis | 100.0% | 28 | 8 |
1901 Northwind Parkway | Hobart, IN | Warehouse/Distribution | 7,297,857 | 101,437 | 2006 | 11,100,000 | 719,263 | Chicago | 100.0% | 24 | 7 |
333 45th Street | Munster, IN | Warehouse/Distribution | 6,969,125 | 140,000 | 1999 | 10,600,000 | 595,176 | Chicago | 100.0% | 24 | 39 |
221 South Swift Road | Addison, IL | Warehouse/Distribution | 6,706,139 | 110,000 | 1995 | 10,200,000 | 485,806 | Chicago | 100.0% | 24 | 12 |
W234N2091 Ridgeview Parkway Court | Pewaukee, WI | Warehouse/Distribution | 6,311,660 | 105,444 | 2001 | 9,600,000 | 546,610 | Milwaukee | 100.0% | 25 | 4 |
2240 Creekside Parkway | Lockbourne, OH | Warehouse/Distribution | 6,048,674 | 125,000 | 2012 | 9,200,000 | 512,332 | Columbus | 100.0% | 32 | 26 |
201 South Swift Road | Addison, IL | Warehouse/Distribution | 5,982,928 | 85,000 | 1995 | 9,100,000 | 417,772 | Chicago | 100.0% | 24 | 3 |
8441 Bearing Drive | Indianapolis, IN | Warehouse/Distribution | 5,917,182 | 124,200 | 2015 | 9,000,000 | 421,531 | Indianapolis | 100.0% | 28 | 4 |
4700 Ironwood Drive | Franklin, WI | Warehouse/Distribution | 5,785,689 | 123,200 | 2000 | 8,800,000 | 492,219 | Milwaukee | 100.0% | 24 | 8 |
4410 North 132nd Street | Butler, WI | Warehouse/Distribution | 5,588,449 | 100,000 | 1998 | 8,500,000 | 467,788 | Milwaukee | 100.0% | 28 | 10 |
999 Gerdt Court | Greenwood, IN | Warehouse/Distribution | 5,456,956 | 132,315 | 2001 | 8,300,000 | 401,917 | Indianapolis | 100.0% | 24 | 20 |
480 45th Street | Munster, IN | Cold Storage | 5,391,210 | 107,095 | 2002 | 8,200,000 | 566,700 | Chicago | 100.0% | 30 | 21 |
12857 South Hamlin Court | Alsip, IL | Warehouse/Distribution | 5,128,224 | 45,000 | 2014 | 7,800,000 | 445,676 | Chicago | 100.0% | 24 | 40 |
1695 Glen Ellyn Road | Glendale Heights, IL | Warehouse/Distribution | 4,799,492 | 40,080 | 2011 | 7,300,000 | 445,272 | Chicago | 100.0% | 24 | 42 |
1701-1721 Northwind Parkway | Hobart, IN | Warehouse/Distribution | 4,733,745 | 94,786 | 2005 | 7,200,000 | 404,616 | Chicago | 100.0% | 24 | 8 |
1245 Lakeside Drive | Romeoville, IL | Warehouse/Distribution | $4,142,027 | 59,976 | 1998 | 6,300,000 | $283,831 | Chicago | 100.0% | 24 | 14 |
3890 Perry Boulevard | Whitestown, IN | Warehouse/Distribution | 4,076,281 | 70,000 | 2008 | 6,200,000 | 296,728 | Indianapolis | 100.0% | 24 | 5 |
215 45th Street | Munster, IN | Cold Storage | 2,991,464 | 65,000 | 2000 | 4,550,000 | 265,335 | Chicago | 100.0% | 24 | 13 |
845 Telser Road | Lake Zurich, IL | Warehouse/Distribution | 2,958,591 | 20,000 | 2016 | 4,500,000 | 301,135 | Chicago | 100.0% | 24 | 19 |
1851 Northwind Parkway | Hobart, IN | Warehouse/Distribution | 2,958,591 | 18,120 | 2014 | 4,500,000 | 292,468 | Chicago | 100.0% | 22 | 0 |
1650 Northwind Parkway | Hobart, IN | Warehouse/Distribution | 2,629,858 | 50,400 | 2006 | 4,000,000 | 222,544 | Chicago | 100.0% | 24 | 4 |
225 45th Street | Munster, IN | Warehouse/Distribution | 2,629,858 | 45,000 | 2000 | 4,000,000 | 207,338 | Chicago | 100.0% | 24 | 1 |
1600-1640 Northwind Parkway | Hobart, IN | Warehouse/Distribution | 2,564,112 | 50,206 | 2006 | 3,900,000 | 311,602 | Chicago | 100.0% | 24 | 8 |
235 45th Street | Munster, IN | Warehouse/Distribution | 1,906,647 | 35,000 | 2000 | 2,900,000 | 165,774 | Chicago | 100.0% | 24 | 8 |
Total / Wtd. Avg. |
|
| $210,027,072 | 4,070,396 |
| $319,450,000 | $17,383,310 |
| 98.4% |
|
|
THE INFORMATION IN THIS STRUCTURAL AND COLLATERAL TERM SHEET IS NOT COMPLETE AND MAY BE AMENDED PRIOR TO THE TIME OF SALE. THIS TERM SHEET IS NOT AN OFFER TO SELL THESE SECURITIES AND IT IS NOT A SOLICITATION OF AN OFFER TO BUY THESE SECURITIES IN ANY JURISDICTION WHERE THE OFFER OR SALE IS NOT PERMITTED.
98
Various | Collateral Asset Summary – Loan No. 8 Starwood Industrial Portfolio | Cut-off Date Balance: Cut-off Date LTV: U/W NCF DSCR: U/W NOI Debt Yield: | $45,000,000 45.2% 3.67x 13.1% |
Major Tenants. Bimbo Bakeries (“BBU”) (105,080 sq. ft.; 2.6% of NRA; 6.4% of U/W base rent). BBU occupies 105,080 sq. ft. across three of the Starwood Industrial Portfolio Properties. BBU is the American corporate arm of the Mexican multinational bakery product manufacturing company Grupo Bimbo. BBU owns brands such as Thomas, Sara Lee, Arnold, Brownberry, Oroweat, Entemann’s and BallPark. BBU operates more than 60 bakeries, employs more than 22,000 associates and distributes products through 11,000 sales routes throughout the United States. BBU has 3, 5-year renewal options remaining.
Communications Test Design, Inc. (“CTDI”) (269,831 sq. ft.; 6.6% of NRA; 4.9% of U/W base rent). Founded in 1975, CTDI is a full-service, global engineering, repair and logistics company providing best-cost solutions to the communications industry. CTDI’s customers include the major wireline and wireless telecom carriers, cable service providers, and major original equipment manufacturers from around the world. CTDI maintains its corporate headquarters in West Chester, Pennsylvania, and has more than 14,000 employees in over 90 facilities worldwide. CTDI has two, five-year renewal options remaining.
McJunkin Corp (140,980 sq. ft.; 3.5% of NRA; 4.1% of underwritten base rent). McJunkin Corp occupies 140,980 sq. ft. and is an affiliate of MRC Global Inc. (NYSE: MRC). MRC Global Inc. is a large distributor of pipes, valves and fittings (PVF) and related infrastructure products and services to the energy industry. Through approximately 260 service locations worldwide, approximately 3,350 employees and with nearly 100 years of history, MRC Global Inc. provides supply chain solutions and technical product expertise to customers globally across diversified end-markets including the upstream, midstream (including gas utilities) and downstream (including industrials). MRC Global Inc. manages a complex network of over 200,000 SKUs and 11,000 suppliers simplifying the supply chain for its over 15,000 customers. As of the fiscal year ending December 31, 2018, MRC Global Inc. had total revenues of approximately $4.2 billion.
Environmental Matters. According to the Phase I environmental reports as of dates ranging from October 4, 2019 to October 22, 2019, there are no recognized environmental conditions or recommendations for further action at the Starwood Industrial Portfolio Properties.
The Market.
Chicago Industrial Market (51.4% of Portfolio Underwritten Net Cash Flow): The Starwood Industrial Portfolio has a total of 19 properties located within the greater Chicago market, which comprise approximately 1.7 million sq. ft. of net rentable area (42.4% of the Portfolio) and account for approximately $8.9 million of Underwritten Net Cash Flow. The Chicago market currently has approximately 21.7 million sq. ft. of logistics, specialized industrial, and flex space under construction and is projected to absorb approximately 16.3 million sq. ft. in 2019. Average market vacancy and asking rents across the logistics, specialized industrial, and flex property types for the market are 6.0% and $7.21 PSF, respectively. The Starwood Industrial Portfolio Properties in the Chicago market within the Portfolio have an average in place base rent of $5.83 PSF.
Indianapolis Industrial Market (28.5% of Portfolio Underwritten Net Cash Flow): The Portfolio has a total of 8 properties located within the Indianapolis market, which comprise approximately 1.4 million sq. ft. (33.2% of the Portfolio) and account for approximately $5.0 million of Underwritten Net Cash Flow. The Indianapolis market currently has approximately 10.5 million sq. ft. of logistics, specialized industrial, and flex space under construction and is projected to absorb approximately 6.9 million sq. ft. in 2019. Average market vacancy and asking rents across the logistics, specialized industrial, and flex property types for the market are 4.2% and $5.66 PSF., respectively. The Starwood Industrial Portfolio Properties in the Indianapolis market within the Portfolio have an average in place base rent of $3.94 PSF.
Columbus Industrial Market (11.4% of Portfolio Underwritten Net Cash Flow): The Portfolio has a total of 3 properties located within the greater Columbus market, which comprise approximately 664,000 sq. ft. of net rentable area (16.3% of the Portfolio) and account for approximately $2.0 million of Underwritten Net Cash Flow. The Columbus market currently has approximately 8.5 million sq. ft. of logistics, specialized industrial, and flex space under construction and is projected to absorb approximately 1.3 million sq. ft. in 2019. Average market vacancy and asking rent across the logistics, specialized industrial, and flex property types for the market are 4.9% and $5.27 PSF, respectively. The Starwood Industrial Portfolio Properties in the Columbus market within the Portfolio have an average in place base rent of $3.41 PSF.
Milwaukee Industrial Market (8.7% of Portfolio Underwritten Net Cash Flow): The Portfolio has a total of 3 properties located within the greater Milwaukee market, which comprise approximately 329,000 sq. ft. of net rentable area (8.1% of the Portfolio) and account for approximately $1.5 million of Underwritten Net Cash Flow. The Milwaukee market currently has approximately 3.7 million sq. ft. of logistics, specialized industrial, and flex space under construction and is projected to absorb approximately 1.6 million sq. ft. in 2019. Average market vacancy and asking rents across the logistics, specialized industrial, and flex property types for the market are 4.3% and $5.49 PSF, respectively. The Starwood Industrial Portfolio Properties in the Milwaukee market within the Portfolio have an average in place base rent of $5.30 PSF.
THE INFORMATION IN THIS STRUCTURAL AND COLLATERAL TERM SHEET IS NOT COMPLETE AND MAY BE AMENDED PRIOR TO THE TIME OF SALE. THIS TERM SHEET IS NOT AN OFFER TO SELL THESE SECURITIES AND IT IS NOT A SOLICITATION OF AN OFFER TO BUY THESE SECURITIES IN ANY JURISDICTION WHERE THE OFFER OR SALE IS NOT PERMITTED.
99
Various | Collateral Asset Summary – Loan No. 8 Starwood Industrial Portfolio | Cut-off Date Balance: Cut-off Date LTV: U/W NCF DSCR: U/W NOI Debt Yield: | $45,000,000 45.2% 3.67x 13.1% |
Cash Flow Analysis.
Cash Flow Analysis(1) | ||||
| 2017 | 2018 | UW | UW $ PSF |
Base Rent | $17,761,827 | $18,194,059 | $18,996,900 | $4.67 |
Credit Tenant Rent Steps(2) | 0 | 0 | 125,409 | 0.03 |
Rent Steps(3) | 0 | 0 | 777,976 | 0.19 |
Potential Income from Vacant Space | 0 | 0 | 409,588 | 0.10 |
Gross Potential Rent | $17,761,827 | $18,194,059 | $20,309,873 | $4.99 |
Reimbursements | 3,887,131 | 4,522,879 | 7,050,809 | 1.73 |
Other Income | 273,775 | 211,290 | 363,911 | 0.09 |
Total Gross Income | $21,922,734 | $22,928,228 | $27,724,593 | $6.81 |
Economic Vacancy & Credit Loss | (863,911) | (601,476) | (1,386,230) | (0.34) |
Effective Gross Income | $21,058,823 | $22,326,752 | $26,338,363 | $6.47 |
Real Estate Taxes | $2,954,345 | $3,195,756 | $4,751,637 | $1.17 |
Insurance | 112,657 | 83,689 | 253,241 | 0.06 |
Management Fee | 361,955 | 362,002 | 790,151 | 0.19 |
Other Operating Expenses | 1,306,160 | 1,572,106 | 1,666,224 | 0.41 |
Total Operating Expenses | $4,735,117 | $5,213,552 | $7,461,253 | $1.83 |
Net Operating Income | $16,323,706 | $17,113,200 | $18,877,110 | $4.64 |
Replacement Reserves | 0 | 0 | 610,559 | 0.15 |
TI/LC | 0 | 0 | 883,240 | 0.22 |
Net Cash Flow | $16,323,706 | $17,113,200 | $17,383,310 | $4.27 |
(1) | Certain items such as interest expense, interest income, lease cancellation income, depreciation, amortization, debt service payments and any other non-recurring or non-operating items are not considered for the underwritten cash flow. |
(2) | Represents straight-line average rent for tenants Bimbo Bakeries, Johnson Controls, FedEx Ground Package Systems, Inc., and The Harvard Drug Store through the earlier of the loan term or lease term. |
(3) | Rent Steps are through December 2020. |
Property Management. The Starwood Industrial Portfolio Properties are managed by Becknell Services, L.L.C., an Illinois limited liability company and an affiliate of the borrowers. The lender may require the borrowers to replace the property manager with another property manager chosen by the borrowers and approved by the lender in its sole discretion and terminate the existing management agreement without payment of any termination fees or other costs upon the occurrence of any one or more of the following events: (i) after the acceleration of the Starwood Industrial Portfolio Whole Loan, (ii) from and after a maturity default or (iii) if the property manager become insolvent or a debtor in any bankruptcy or insolvency proceeding; provided, however, that if the new property manager replacing such insolvent property manager is not an affiliate of the borrowers and is otherwise a qualified manager under the loan documents, and no event of default is then continuing, then the lender’s consent will not be required to replace the insolvent property manager.
Lockbox / Cash Management. The loan documents require a lender-controlled hard lockbox account with springing cash management. The borrowers are required to cause tenants to deposit rents directly into the lockbox account. In addition, the borrowers and the property manager are required to deposit all rents and gross revenue from the Starwood Industrial Portfolio Properties into such lockbox account within two business days of receipt. During the continuance of a Trigger Period, all funds in the lockbox account are required to be swept into a lender-controlled cash management account on a daily basis and applied to make required deposits into the tax and insurance reserves, if any, as described above under “—Escrows,“ to pay debt service on the Starwood Industrial Portfolio Whole Loan, to make required deposits into the replacement and rollover reserves, if any, as described above under “—Escrows,” to pay operating expenses set forth in the annual budget (which must be reasonably approved by the lender during a Trigger Period) and lender-approved extraordinary expenses, and to pay any remainder to a cash collateral account to be held as additional security for the Starwood Industrial Portfolio Whole Loan during the continuance of such Trigger Period.
A “Trigger Period” means a period commencing upon (i) an event of default under the loan documents, or (ii) the debt yield of the Starwood Industrial Portfolio Whole Loan falling below 6.25% as of the last day of any calendar quarter.
A Trigger Period will expire upon (a) in the case of a Trigger Period caused by the event described in clause (i) above, such event of default being cured (and the cure having been accepted by the lender), or (ii) in the case of a Trigger Period caused by the event described in clause (ii) above, upon the debt yield being equal to or greater than 6.25% as of the last day of any calendar quarter. The borrowers may cure a Trigger Period caused by clause (ii) above by delivering to the lender cash or a letter of credit meeting the requirements of
THE INFORMATION IN THIS STRUCTURAL AND COLLATERAL TERM SHEET IS NOT COMPLETE AND MAY BE AMENDED PRIOR TO THE TIME OF SALE. THIS TERM SHEET IS NOT AN OFFER TO SELL THESE SECURITIES AND IT IS NOT A SOLICITATION OF AN OFFER TO BUY THESE SECURITIES IN ANY JURISDICTION WHERE THE OFFER OR SALE IS NOT PERMITTED.
100
Various | Collateral Asset Summary – Loan No. 8 Starwood Industrial Portfolio | Cut-off Date Balance: Cut-off Date LTV: U/W NCF DSCR: U/W NOI Debt Yield: | $45,000,000 45.2% 3.67x 13.1% |
the loan documents in an amount which, if applied to repay the outstanding principal balance of the Starwood Industrial Portfolio Whole Loan would cause the debt yield to equal 6.25%.
Initial and Ongoing Reserves. On the origination date of the Starwood Industrial Portfolio Whole Loan, the borrowers funded reserves of $880,000 for roof repairs.
On each due date during the continuance of a Trigger Period, the borrowers will be required to fund the following reserves, (i) 1/12th of the real estate taxes that the lender estimates will be payable over the next-ensuing 12-month period, (ii) 1/12th of the amount that the lender estimates will be necessary to pay insurance premiums for the renewal of coverage, provided that an insurance reserve will be waived if the Starwood Industrial Portfolio Properties are covered under an acceptable blanket policy, (iii) 1/12th of the product of $0.15 multiplied by the aggregate sq. ft. of the Starwood Industrial Portfolio Properties for capital expenditures (which currently equates to a monthly deposit of $50,880 during a Trigger Period), which monthly deposit is suspended for so long as the total amount in the capital expenditures reserve exceeds the product of $0.30 multiplied by the aggregate sq. ft. of the Starwood Industrial Portfolio Properties, and (iv) 1/12th of the product of $0.35 multiplied by the aggregate sq. ft. of the Starwood Industrial Portfolio Properties for tenant improvements and leasing commissions (which currently equates to a monthly deposit of $118,720 during a Trigger Period), which monthly deposit is suspended for so long as the total amount in the leasing reserve exceeds the product of $0.70 multiplied by the aggregate sq. ft. of the Starwood Industrial Portfolio Properties.
Current Mezzanine or Subordinate Indebtedness. The Starwood Industrial Portfolio Subordinate Note has an outstanding principal balance as of the Cut-off Date of $65,527,072 and accrues interest at an interest rate of 3.23100% per annum. The Starwood Industrial Portfolio Subordinate Note has a 120-month term and is interest-only for the full term of the loan. For additional information, see “Description of the Mortgage Pool—The Whole Loans—The Non-Serviced AB Whole Loans—The Starwood Industrial Portfolio Whole Loan” in the Preliminary Prospectus.
Future Mezzanine or Subordinate Indebtedness Permitted. None.
Partial Release. In connection with an arm’s length sale of an individual property to an unrelated third party, the borrowers may obtain the release of an individual property or properties from the lien of the Starwood Industrial Portfolio Whole Loan after the Defeasance Lockout Expiration Date (as defined below), upon prepayment of the applicable Release Price (as defined below) for the subject property or properties, together with, if prior to the open period, a prepayment fee equal to the greater of (i) 1% of the applicable Release Price and (ii) a yield maintenance premium, and satisfaction of the conditions set forth in the loan documents, including but not limited to: (a) the debt yield after giving effect to such release is at least the greater of (x) 7.77% and (y) the debt yield immediately prior to such release (which such prong (y) of the test will not apply if the debt yield after such release is greater than 8.45%) and (b) no event of default under the loan documents has occurred and is continuing. In addition to the foregoing, no partial release will be permitted unless the loan-to-value ratio of the remaining properties (such value to be determined by lender in its reasonable discretion based on a commercially reasonable valuation method permitted to a REMIC trust and which will exclude the value of personal property or going concern value, if any) is greater than 125%. The borrowers may make an additional prepayment of the Starwood Industrial Portfolio Whole Loan in order to satisfy the foregoing REMIC test.
A “Defeasance Lockout Expiration Date” means the earlier of (A) two years after the “startup day” of the final REMIC that holds any note that evidences all or any portion of the Starwood Industrial Portfolio Whole Loan or (B) November 26, 2022.
A “Release Price” means (i) for releases with respect to the first 20% prepaid in connection with releases, 105% of the related allocated loan amount for such released property and (ii) for all releases after 20% has been prepaid in connection with releases, 110% of the related allocated loan amount for such released property, and (iii) in connection with a release that would result in and exceed the Release Amount Adjustment Trigger (defined below), an amount equal to the sum of: (a) the portion of the allocated loan amount for such property(ies) being released, such that if calculated by the immediately preceding clause (i), such release price would result in (but not exceed) the Release Amount Adjustment Trigger, multiplied by 105%, plus (b) the remaining allocated loan amount for such property(ies), multiplied by 110%.
A “Release Amount Adjustment Trigger” will occur upon the prepayment of the first 20% of the outstanding principal balance in connection with the release of one or more properties pursuant to the loan documents.
THE INFORMATION IN THIS STRUCTURAL AND COLLATERAL TERM SHEET IS NOT COMPLETE AND MAY BE AMENDED PRIOR TO THE TIME OF SALE. THIS TERM SHEET IS NOT AN OFFER TO SELL THESE SECURITIES AND IT IS NOT A SOLICITATION OF AN OFFER TO BUY THESE SECURITIES IN ANY JURISDICTION WHERE THE OFFER OR SALE IS NOT PERMITTED.
101
650 Madison Avenue New York, NY 10022 | Collateral Asset Summary – Loan No. 9 650 Madison Avenue | Cut-off Date Balance: Cut-off Date LTV: U/W NCF DSCR: U/W NOI Debt Yield: | $50,000,000 70.7% 2.74x 10.0% |

THE INFORMATION IN THIS STRUCTURAL AND COLLATERAL TERM SHEET IS NOT COMPLETE AND MAY BE AMENDED PRIOR TO THE TIME OF SALE. THIS TERM SHEET IS NOT AN OFFER TO SELL THESE SECURITIES AND IT IS NOT A SOLICITATION OF AN OFFER TO BUY THESE SECURITIES IN ANY JURISDICTION WHERE THE OFFER OR SALE IS NOT PERMITTED.
102
650 Madison Avenue New York, NY 10022 | Collateral Asset Summary – Loan No. 9 650 Madison Avenue | Cut-off Date Balance: Cut-off Date LTV: U/W NCF DSCR: U/W NOI Debt Yield: | $45,000,000 48.5% 2.74x 10.0% |
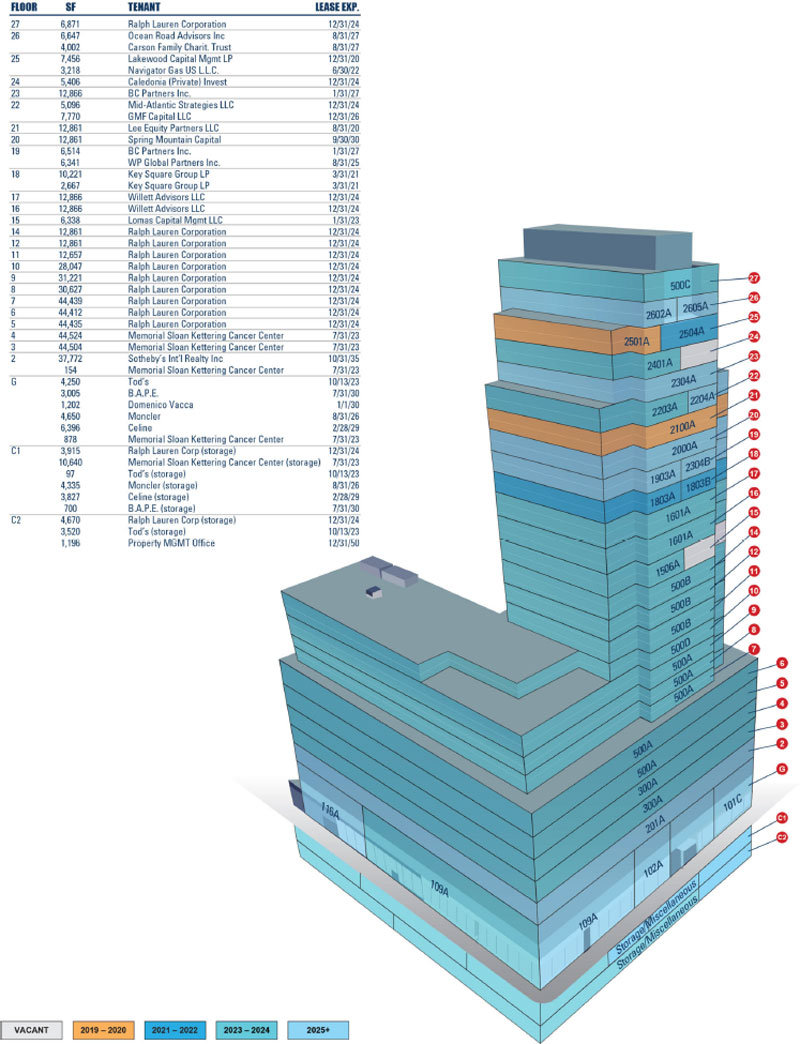
THE INFORMATION IN THIS STRUCTURAL AND COLLATERAL TERM SHEET IS NOT COMPLETE AND MAY BE AMENDED PRIOR TO THE TIME OF SALE. THIS TERM SHEET IS NOT AN OFFER TO SELL THESE SECURITIES AND IT IS NOT A SOLICITATION OF AN OFFER TO BUY THESE SECURITIES IN ANY JURISDICTION WHERE THE OFFER OR SALE IS NOT PERMITTED.
103
650 Madison Avenue New York, NY 10022 | Collateral Asset Summary – Loan No. 9 650 Madison Avenue | Cut-off Date Balance: Cut-off Date LTV: U/W NCF DSCR: U/W NOI Debt Yield: | $45,000,000 48.5% 2.74x 10.0% |

THE INFORMATION IN THIS STRUCTURAL AND COLLATERAL TERM SHEET IS NOT COMPLETE AND MAY BE AMENDED PRIOR TO THE TIME OF SALE. THIS TERM SHEET IS NOT AN OFFER TO SELL THESE SECURITIES AND IT IS NOT A SOLICITATION OF AN OFFER TO BUY THESE SECURITIES IN ANY JURISDICTION WHERE THE OFFER OR SALE IS NOT PERMITTED.
104
650 Madison Avenue New York, NY 10022 | Collateral Asset Summary – Loan No. 9 650 Madison Avenue | Cut-off Date Balance: Cut-off Date LTV: U/W NCF DSCR: U/W NOI Debt Yield: | $45,000,000 48.5% 2.74x 10.0% |
Mortgage Loan Information | |
Loan Seller:(1) | CREFI |
Loan Purpose: | Refinance |
Credit Assessment |
|
(Fitch/KBRA)(7): | BBB-sf / BBB-(sf) |
Borrower Sponsors: | Vornado Realty L.P., OPG Investment Holdings (US), LLC |
Borrower: | 650 Madison Owner LLC |
Original Balance:(2) | $45,000,000 |
Cut-off Date Balance:(2) | $45,000,000 |
% by Initial UPB: | 5.0% |
Interest Rate: | 3.48600% |
Payment Date: | 8th of each month |
First Payment Date: | January 8, 2020 |
Maturity Date: | December 8, 2029 |
Amortization: | Interest Only |
$541,800,000 Pari Passu Debt & $213,200,000 Subordinate Debt | |
L(26), D(87), O(7) | |
Hard / Springing | |
Reserves(4) | |||
| Initial | Monthly | Cap |
Taxes: | $0 | Springing | NAP |
Insurance: | $0 | Springing | NAP |
Replacement: | $0 | Springing | NAP |
TI/LC: | $0 | Springing | NAP |
Other: | $9,576,014 | $0 | NAP |
Property Information | |
Single Asset | |
Mixed Use | |
Fee Simple | |
New York, NY | |
1957, 1987 / 2015 | |
600,415 | |
650 Madison Office Manager LLC, and 650 Madison Retail Manager LLC | |
$58,426,495 | |
$56,776,391 | |
$1,210,000,000 | |
10/31/2019 | |
| |
Historical NOI | |
Most Recent NOI:(6) | $50,961,537 (T-12 September 30, 2019) |
2018 NOI: | $48,557,496 (December 31, 2018) |
2017 NOI: | $46,541,346 (December 31, 2017) |
2016 NOI: | $42,701,194 (December 31, 2016) |
| |
Historical Occupancy | |
Most Recent Occupancy: | 97.4% (October 1, 2019) |
2018 Occupancy: | 92.2% (December 31, 2018) |
2017 Occupancy: | 92.6% (December 31, 2017) |
2016 Occupancy: | 94.3% (December 31, 2016) |
Financial Information(2) | ||||||
Tranche | Cut-off Date Balance | Balance per Sq. Ft. Cut-off / Balloon | LTV Cut-off / Balloon | U/W DSCR NOI / NCF | U/W Debt Yield NOI / NCF | U/W Debt Yield at Balloon NOI / NCF |
Mortgage Loan | $45,000,000 |
|
|
|
|
|
Pari Passu Notes | $541,800,000 |
|
|
|
|
|
Total Senior Notes | $586,800,000 | $977/ $977 | 48.5% / 48.5% | 2.82x / 2.74x | 10.0% / 9.7% | 10.0% / 9.7% |
Subordinate Debt | $213,200,000 |
|
|
|
|
|
Whole Loan | $800,000,000 | $1,332 / $1,332 | 66.1% / 66.1% | 2.07x / 2.01x | 7.3% / 7.1% | 7.3% / 7.1% |
(1) | The 650 Madison Avenue Whole Loan (as defined below) was co-originated by Citi Real Estate Funding Inc. (‘CREFI”), Barclays Capital Real Estate Inc. (“BCREI”), BMO Harris Bank N.A. (“BMO Harris”), and Goldman Sachs Bank USA (“GSBI”). |
(2) | The Cut-off Date Balance of $45,000,000 represents the non-controlling note A-1-5, which is part of the 650 Madison Avenue Whole Loan evidenced by 25 notes having an aggregate outstanding principal balance as of the Cut-off Date of $800,000,000. For additional information see “The Loan” herein. |
(3) | The defeasance lockout period, with respect to a defeasance of the 650 Madison Avenue Whole Loan, will be at least 26 payment dates beginning with and including the first payment date of January 8, 2020. Defeasance of the full $800.0 million 650 Madison Avenue Whole Loan is permitted after the date that is the earlier of (i) two years from the closing date of the securitization that includes the last note to be securitized and (ii) November 26, 2022. Prepayment in whole, but not in part, of the 650 Madison Avenue Whole Loan is permitted on or after the payment date in June 2029 without the payment of a yield maintenance premium. |
(4) | See “Initial and Ongoing Reserves” herein. Initial Other reserves consist of (i) $3,197,699 for outstanding tenant improvements and/or leasing commissions and (ii) $6,378,315 for free rent. |
(5) | The Appraised Value (Other Than “As-Is”) reflects the “Hypothetical As-Is” appraised value of $1,210,000,000 as of October 31, 2019, which assumes which assumes that the 650 Madison Avenue Property will have in place reserves of approximately $10,000,000 at origination. At origination of the 650 Madison Avenue Whole Loan, approximately $9,500,000 was reserved. |
(6) | The increase from TTM 9/30/2019 Net Operating Income to Underwritten Net Operating Income at the 650 Madison Avenue Property is primarily attributable to the signing of six new leases since December 2018 as well as contractual rent steps. |
(7) | Fitch and KBRA provided the listed assessments for the 650 Madison Loan in the context of its inclusion in the mortgage pool. |
THE INFORMATION IN THIS STRUCTURAL AND COLLATERAL TERM SHEET IS NOT COMPLETE AND MAY BE AMENDED PRIOR TO THE TIME OF SALE. THIS TERM SHEET IS NOT AN OFFER TO SELL THESE SECURITIES AND IT IS NOT A SOLICITATION OF AN OFFER TO BUY THESE SECURITIES IN ANY JURISDICTION WHERE THE OFFER OR SALE IS NOT PERMITTED.
105
650 Madison Avenue New York, NY 10022 | Collateral Asset Summary – Loan No. 9 650 Madison Avenue | Cut-off Date Balance: Cut-off Date LTV: U/W NCF DSCR: U/W NOI Debt Yield: | $45,000,000 48.5% 2.74x 10.0% |
The Loan. The 650 Madison Avenue mortgage loan (the “650 Madison Avenue Loan”) is part of a whole loan (the “650 Madison Avenue Whole Loan”) evidenced by 25 notes comprising (i) 21 senior pari passu notes (collectively the “650 Madison Avenue Senior Pari Passu Notes”) with an aggregate outstanding principal balance as of the Cut-off Date of $586,800,000, and (ii) four junior pari passu notes (collectively, the “650 Madison Avenue Junior Non-Trust Notes”) with an aggregate outstanding principal balance as of the Cut-off Date of $213,200,000. The 650 Madison Avenue Junior Non-Trust Notes are subordinate to the 650 Madison Avenue Senior Pari Passu Notes and to the extent described in “Description of the Mortgage Pool—The Whole Loans—The Non-Serviced AB Whole Loans —The 650 Madison Avenue Whole Loan“ in the Preliminary Prospectus. The aggregate outstanding principal balance as of the Cut-off Date of all the notes evidencing the 650 Madison Avenue Whole Loan is $800,000,000. The 650 Madison Avenue Whole Loan is secured by the borrower’s fee simple interest in a Class A office and retail building located in New York, New York (the “650 Madison Avenue Property”). The 650 Madison Avenue Loan, which is evidenced by the non-controlling note A-1-5, has an outstanding principal balance as of the Cut-off Date of $45,000,000 and represents approximately 5.0% of the Initial Pool Balance. The related companion loans are evidenced by (i) 20 senior pari passu notes (collectively, the “650 Madison Avenue Senior Pari Passu Companion Loans”) which have an aggregate outstanding principal balance as of the Cut-off Date of $541,800,000 and (ii) the 650 Madison Avenue Junior Non-Trust Notes, as detailed in the note summary table below. The 650 Madison Avenue Whole Loan was originated by CREFI, BCREI, BMO Harris and GSBI on November 26, 2019. Each note evidencing the 650 Madison Avenue Whole Loan has an interest rate of 3.48600% per annum. The borrower utilized the proceeds of the 650 Madison Avenue Whole Loan, existing loan reserves and new borrower sponsor equity to refinance the existing debt on the 650 Madison Avenue Property, fund upfront reserves and pay closing and defeasance costs.
The table below summarizes the promissory notes that comprise the 650 Madison Avenue Whole Loan. The relationship between the holders of the 650 Madison Avenue Whole Loan is governed by a co-lender agreement as described under “Description of the Mortgage Pool–The Whole Loans—The Non-Serviced AB Whole Loans—The 650 Madison Avenue Whole Loan” in the Preliminary Prospectus.
Whole Loan Summary | ||||||
Note | Original Balance | Cut-off Date Balance | Note Holder | Controlling Piece | ||
A-1-1 | $50,000,000 |
| $50,000,000 |
| CGCMT 2019-C7 | No(1) |
A-1-3, A-2-1 | 50,000,000 |
| 50,000,000 |
| GSMS 2020-GC45(2) | No |
A-1-4 | 50,000,000 |
| 50,000,000 |
| CREFI(3) | No |
A-1-5 | 45,000,000 |
| 45,000,000 |
| Benchmark 2020-B16 | No |
A-1-6 | 87,900,000 |
| 87,900,000 |
| CREFI(3) | No |
A-1-2-1 | 40,000,000 |
| 40,000,000 |
| CCRE(3) | No |
A-2-2, A-2-3, A-2-4, A-2-5, A-2-6, A-2-7, A-2-8 | 116,450,000 |
| 116,450,000 |
| GSBI(3) | No |
A-3-1, A-3-2, A-3-3 | 146,450,000 |
| 146,450,000 |
| BCREI(3) | No |
A-4, A-5, A-6, A-7 | 1,000,000 |
| 1,000,000 |
| MAD 2019-650M | No |
Total Senior Notes | $586,800,000 |
| $586,800,000 |
|
|
|
B-1, B-2, B-3, B-4 | 213,200,000 |
| 213,200,000 |
| MAD 2019-650M | Yes(1) |
Whole Loan | $800,000,000 |
| $800,000,000 |
|
|
|
| (1) | The initial Controlling Note is note B-1, so long as no related control appraisal period has occurred and is continuing. If and for so long as a control appraisal period has occurred and is continuing, then the Controlling Note will be note A-1-1. See “Description of the Mortgage Pool— The Whole Loans—The Non-Serviced AB Whole Loans— The 650 Madison Avenue Whole Loan” in the Preliminary Prospectus. |
| (2) | The GSMS 2020-GC45 transaction is expected to close prior to the Closing Date. |
| (3) | Expected to be contributed to one or more future securitization transactions. |
The 650 Madison Avenue Whole Loan had an initial term of 120 months and has a remaining term of 118 months as of the Cut-off Date. The 650 Madison Avenue Whole Loan requires payment of interest only until the scheduled maturity date, which is the due date in December 2029. Voluntary prepayment of the 650 Madison Avenue Whole Loan without payment of a yield maintenance premium is permitted on or after the due date in June 2029. Defeasance of the 650 Madison Avenue Whole Loan with direct, noncallable obligations of the United States of America or other obligations which are “government securities” is permitted under the 650 Madison Avenue Whole Loan documents at any time after the earlier of November 26, 2022 or the second anniversary of the securitization of the last portion of the 650 Madison Avenue Whole Loan.
Sources and Use(1) | ||||||
Sources | Proceeds | % of Total |
| Uses | Proceeds | % of Total |
Senior Notes | $586,800,000 | 70.7% |
| Loan Payoff | $800,000,000 | 96.4% |
Junior Notes | 213,200,000 | 25.7 |
| Defeasance Costs | 14,157,786 | 1.7 |
Existing Loan Reserves | 20,051,781 | 2.4 |
| Upfront Reserves | 9,576,014 | 1.2 |
Principals New Cash Contribution | 9,510,787 | 1.1 |
| Closing Costs | 5,828,767 | 0.7 |
Total Sources | $829,562,568 | 100.0% |
| Total Uses | $829,562,568 | 100.0% |
(1) | The borrower sponsors acquired the 650 Madison Avenue Property for a purchase price of approximately $1.3 billion in 2013. Since acquisition, the borrower sponsors have invested approximately $37.5 million in capital expenditures and $51.6 million in tenant improvements and leasing commissions at the 650 Madison Avenue Property, implying total hard equity of $583.4 million remaining in the transaction following the closing of the 650 Madison Avenue Whole Loan. |
THE INFORMATION IN THIS STRUCTURAL AND COLLATERAL TERM SHEET IS NOT COMPLETE AND MAY BE AMENDED PRIOR TO THE TIME OF SALE. THIS TERM SHEET IS NOT AN OFFER TO SELL THESE SECURITIES AND IT IS NOT A SOLICITATION OF AN OFFER TO BUY THESE SECURITIES IN ANY JURISDICTION WHERE THE OFFER OR SALE IS NOT PERMITTED.
106
650 Madison Avenue New York, NY 10022 | Collateral Asset Summary – Loan No. 9 650 Madison Avenue | Cut-off Date Balance: Cut-off Date LTV: U/W NCF DSCR: U/W NOI Debt Yield: | $45,000,000 48.5% 2.74x 10.0% |
The Borrower / Borrower Sponsor. The borrower is 650 Madison Owner LLC, a Delaware limited liability company and single purpose entity with two independent directors. Legal counsel to the borrower delivered a non-consolidation opinion in connection with the origination of the 650 Madison Avenue Whole Loan.
The borrower sponsors and non-recourse carveout guarantors are Vornado Realty L.P. (“Vornado”) and OPG Investment Holdings (US), LLC (“Oxford”). Vornado and Oxford are liable on a several basis, 50% to Vornado and 50% to Oxford, subject to, with respect to each guarantor, an $80,000,000 cap on the full recourse carve-outs relating to bankruptcy and substantive consolidation and a $400,000,000 cap on all other guaranteed obligations. Vornado is one of the largest owners and operators of commercial real estate in the United States with a portfolio of Class A office, high-value street retail and other property types primarily located in New York City, aggregating over 37.1 million sq. ft. Oxford is a global real estate investor with approximately $45.0 billion of assets under management on behalf of Ontario Municipal Employees Retirement System (“OMERS”), one of Canada’s largest pension plans. In New York City, Oxford partnered with Crown Acquisitions to acquire Olympic Tower (a 380,000 sq. ft. office tower with retail space which includes the Cartier Mansion, Versace townhouse, Furla, and Armani Exchange), and with the Related Companies in the development of Hudson Yards. The joint venture of Vornado and Oxford includes other investors such as Crown Acquisitions. Crown Acquisitions is a real estate firm focused on luxury retail and has previously served as the 650 Madison Avenue Property’s retail operating advisor.
The Property.
Tenant Summary(1) | |||||||||||
Office Tenant Names | Ratings (Fitch/Moody’s/S&P)(2) | Net Rentable Area (Sq. Ft.) | % of Net |
| U/W Base Rent PSF(3) | % of Total U/W Base Rent(3) | Lease Expiration(4) | ||||
Ralph Lauren(5) | NR / A2 / A- | 277,016 |
| 46.1% |
|
| $89.41 |
| 32.5 | % | 12/31/2024 |
Memorial Sloan Kettering Cancer Center(6) | AA / Aa3 / AA- | 100,700 |
| 16.8 |
|
| $92.97 |
| 12.3 |
| 7/31/2023 |
Willett Advisors LLC | NR / NR / NR | 25,732 |
| 4.3 |
|
| $155.00 |
| 5.2 |
| 12/31/2024 |
Sotheby’s Int’l Realty, Inc.(7) | NR / B3 / B+ | 37,772 |
| 6.3 |
|
| $91.60 |
| 4.5 |
| 11/30/2035 |
BC Partners Inc. |
| 19,380 |
| 3.2 |
|
| $118.58 |
| 3.0 |
| 1/31/2027 |
Largest Office Tenants |
| 460,600 |
| 76.7% |
|
| $95.26 |
| 57.6 | % |
|
Remaining Office Tenants |
| 92,080 |
| 15.3 |
|
| $119.00 |
| 14.4 |
|
|
Total / Wtd. Avg. All Office Tenants |
| 552,680 |
| 92.0% |
|
| $99.21 |
| 72.0 | % |
|
|
|
|
|
|
|
|
| ||||
Retail Tenant Names | Ratings (Fitch/Moody’s/S&P)(2) | Net Rentable Area (Sq. Ft.) | % of Net |
| U/W Base Rent PSF(3) | % of Total U/W Base Rent(3) | Lease Expiration | ||||
Celine | NR / A1 / A+ | 10,223 |
| 1.7% |
|
| $841.24 |
| 11.3 | % | 2/28/2029 |
Moncler(8) | NR / NR / NR | 8,985 |
| 1.5 |
|
| $667.78 |
| 7.9 |
| 8/31/2026 |
Tod’s | NR / NR / NR | 7,867 |
| 1.3 |
|
| $680.90 |
| 7.0 |
| 10/13/2023 |
B.A.P.E.(9) | NR / NR / NR | 3,705 |
| 0.6 |
|
| $298.52 |
| 1.5 |
| 7/31/2030 |
Domenica Vacca(9) | NR / NR / NR | 1,202 |
| 0.2 |
|
| $239.60 |
| 0.4 |
| 3/30/2030 |
Largest Retail Tenants |
| 31,982 |
| 5.3% |
|
| $667.58 |
| 28.0 | % |
|
|
|
|
|
|
|
|
|
|
|
|
|
Vacant |
| 15,753 |
| 2.6 |
|
| NAP |
| NAP |
|
|
Total / Wtd. Avg.(10) |
| 600,415 |
| 100.0% |
|
| $130.31 |
| 100.0 | % |
|
|
|
|
|
|
|
|
| ||||
(1) | Based on the underwritten rent roll dated October 1, 2019. |
(2) | Certain ratings are those of the parent company whether or not the parent guarantees the lease. |
(3) | U/W Base Rent includes contractual rent steps through July 2020 for non-investment grade-rated tenants and the straight-line average for investment grade-rated tenants. U/W Base Rent excludes $10,080 attributable to an elevator marketing contract with Captivate LLC (0 sq. ft.). |
(4) | Certain tenants reflected in the chart above and other tenants, although paying rent, may not be in occupancy with respect to all or a portion of their leased space, and/or under certain conditions may have the option to terminate all or a portion of their leased space prior to the lease expiration date. See “Description of the Mortgage Pool—Tenant Issues—Lease Expirations and Terminations” in the Preliminary Prospectus for more information regarding the foregoing and related tenant issues. |
(5) | Ralph Lauren has one, 10-year renewal option under its lease. |
(6) | Memorial Sloan Kettering Cancer Center has the one-time option to terminate its lease upon at least 18 months prior written notice to the landlord, provided that (a) the termination date is not earlier than July 1, 2020, (b) the termination date is not later than June 30, 2022, (c) the termination date is at least 18 months following the date upon which the termination notice is received by the landlord and (d) MSKCC pays to the landlord the termination payment simultaneously with the giving of such termination notice. The tenant also has one, five-year renewal option in its lease. |
(7) | Sotheby’s International Realty, Inc. has one, five-year renewal option in its lease. |
(8) | Moncler has one, five-year renewal option in its lease. |
(9) | B.A.P.E. and Domenico Vacca are currently completing the build-out of their space and are expected to take occupancy in early 2020. |
(10) | Total tenant Net Rentable Area is inclusive of the property management office but there is no associated rent. |
THE INFORMATION IN THIS STRUCTURAL AND COLLATERAL TERM SHEET IS NOT COMPLETE AND MAY BE AMENDED PRIOR TO THE TIME OF SALE. THIS TERM SHEET IS NOT AN OFFER TO SELL THESE SECURITIES AND IT IS NOT A SOLICITATION OF AN OFFER TO BUY THESE SECURITIES IN ANY JURISDICTION WHERE THE OFFER OR SALE IS NOT PERMITTED.
107
650 Madison Avenue New York, NY 10022 | Collateral Asset Summary – Loan No. 9 650 Madison Avenue | Cut-off Date Balance: Cut-off Date LTV: U/W NCF DSCR: U/W NOI Debt Yield: | $45,000,000 48.5% 2.74x 10.0% |
Lease Rollover Schedule(1) | ||||||||
Year | # of Leases Expiring | Total Expiring Sq. Ft. | % of Total Sq. Ft. Expiring | Cumulative Sq. Ft. Expiring | Cumulative % of Sq. Ft. Expiring | Annual U/W Base Rent PSF(2) | % U/W Base Rent Rolling(3) | Cumulative % of U/W Base Rent(3) |
MTM | 0 | 0 | 0.0% | 0 | 0.0% | $0.00 | 0.0% | 0.0% |
2020 | 2 | 20,317 | 3.4 | 20,317 | 3.4% | $122.02 | 3.3 | 3.3% |
2021 | 3 | 12,888 | 2.2 | 33,205 | 5.5% | $119.38 | 2.0 | 5.3% |
2022 | 2 | 3,218 | 0.5 | 36,423 | 6.1% | $110.00 | 0.5 | 5.7% |
2023 | 4 | 114,905 | 19.2 | 151,328 | 25.3% | $133.33 | 20.1 | 25.8% |
2024 | 13 | 313,250 | 52.3 | 464,578 | 77.5% | $96.16 | 39.5 | 65.4% |
2025 | 1 | 6,341 | 1.1 | 470,919 | 78.6% | $115.00 | 1.0 | 66.3% |
2026 | 2 | 16,755 | 2.8 | 487,674 | 81.4% | $416.07 | 9.1 | 75.5% |
2027 | 4 | 30,029 | 5.0 | 517,703 | 86.4% | $128.75 | 5.1 | 80.6% |
2028 | 1 | 0 | 0.0 | 517,703 | 86.4% | $0.00 | 0.0 | 80.6% |
2029 | 1 | 10,223 | 1.7 | 527,926 | 88.1% | $841.24 | 11.3 | 91.9% |
2030 & Thereafter | 5 | 55,540 | 9.3 | 583,466 | 97.4% | $111.71 | 8.1 | 100.0% |
Vacant | 0 | 15,753 | 2.6 | 599,219 | 100.0% | $0.00 | 0.0 |
|
Total / Wtd. Avg.(4) | 38 | 599,219 | 100.0% |
|
| $130.59 | 100.0% |
|
| (1) | Based on the underwritten rent roll dated October 1, 2019. |
| (2) | Calculated based on the approximate square footage occupied by each collateral tenant. |
| (3) | U/W Base Rent includes contractual rent steps through July 2020 for non-investment grade-rated tenants and the straight-line average for investment grade-rated tenants. |
| (4) | Excludes 1,196 sq. ft. which is non-revenue and attributable to the property management office. |
The 650 Madison Avenue Property is a 27-story, 600,415 sq. ft. Class A office building with grade level retail located in Midtown Manhattan on Madison Avenue between 59th and 60th Streets. The 650 Madison Avenue Property consists of 543,834 sq. ft. of Class A office space, 22,310 sq. ft. of ground floor retail space, and 34,271 sq. ft. of below-grade storage and flex space. The 650 Madison Avenue Property was originally constructed in 1957 as an eight-story building and in 1987 underwent a significant expansion and renovation that added the office tower. Based on the underwritten rent roll dated October 1, 2019, the 650 Madison Avenue Property is currently 97.4% leased (based on net rentable area) to a diverse tenant roster including fashion (Ralph Lauren Corporation (“Ralph Lauren”)), healthcare (Memorial Sloan Kettering Cancer Center (“MSKCC”), luxury goods (Celine, Inc. (“Celine”)), as well as finance (Willett Advisors LLC). The top three tenants by U/W Gross Rent are all investment grade rated tenants and account for 64.6% of net rentable area and 58.9% of U/W Gross Rent.
Office (92.0% of NRA; 74.5% of in-place U/W Gross Rent) The 543,834 sq. ft. of Class A office space at the 650 Madison Avenue Property is currently 97.9% occupied by 17 tenants that collectively contribute 72.0% of U/W Base Rent and 74.5% of U/W Gross Rent (inclusive of storage rent derived from office tenants). 358,491 sq. ft. of the office space (65.9% of Class A office net rentable area) at the 650 Madison Avenue Property is leased to two investment grade-rated office tenants (Ralph Lauren and MSKCC).
Major Office Tenants.
Ralph Lauren (277,016 sq. ft.; 46.1% of NRA; 32.5% of U/W Base Rent): Ralph Lauren (rated A2/A- by Moody’s/S&P), occupies 46.1% of the 650 Madison Avenue Property’s net rentable area and accounts for 36.0% of U/W Gross Rent. The tenant has occupied space in the 650 Madison Avenue Property since 1989 and has expanded several times. The 650 Madison Avenue Property serves as Ralph Lauren’s international headquarters. Ralph Lauren designs, markets, and distributes apparel, accessories, fragrances, and home furnishings under a wide range of brands and its operations include wholesale, retail, and licensing.
Memorial Sloan Kettering Cancer Center (100,700 sq. ft.; 16.8% of NRA; 12.3% of U/W Base Rent): MSKCC (rated AA/Aa3/AA- by Moody’s/Fitch/S&P), occupies 16.8% of the 650 Madison Avenue Property’s net rentable area and accounts for 13.0% of U/W Gross Rent. MSKCC signed a 10-year lease in 2013 to take over the approximately 100,000 sq. ft. medical office space that was previously occupied by Columbia Doctors, a faculty-run medical practice of Columbia University. The tenant has a separate entrance on the 60th Street and uses the space for medical purposes. MSKCC is a cancer treatment and research institution in New York City, founded in 1884 as the New York Cancer Hospital. MSKCC is the largest and oldest private cancer center in the world, and is one of 50 National Cancer Institute-designated Comprehensive Cancer Centers.
Retail (5.3% of NRA; 25.5% of in-place U/W Gross Rent) The 22,310 sq. ft. of ground floor retail space at the 650 Madison Avenue Property is currently 87.4% occupied by five tenants that collectively contribute 28.0% of U/W Base Rent and 25.5% of U/W Gross Rent (inclusive of storage rent derived from retail tenants).
The ground floor retail space spans an entire block of the Madison Avenue retail corridor and, along with the second floor office space, was previously primarily occupied by Crate & Barrel until 2015. Since then, the borrower sponsors have executed leases with multiple luxury retailers including Celine, Moncler USA Inc (“Moncler”) (each utilizing its space as its respective brand’s flagship location) and B.A.P.E. in the ground floor retail space and an institutional tenant, Sotheby’s Int’l Realty Inc (“Sotheby’s”), in the second floor office space. The re-leasing has further diversified the rent roll at the 650 Madison Avenue Property and, based on U/W Gross Rent, the new
THE INFORMATION IN THIS STRUCTURAL AND COLLATERAL TERM SHEET IS NOT COMPLETE AND MAY BE AMENDED PRIOR TO THE TIME OF SALE. THIS TERM SHEET IS NOT AN OFFER TO SELL THESE SECURITIES AND IT IS NOT A SOLICITATION OF AN OFFER TO BUY THESE SECURITIES IN ANY JURISDICTION WHERE THE OFFER OR SALE IS NOT PERMITTED.
108
650 Madison Avenue New York, NY 10022 | Collateral Asset Summary – Loan No. 9 650 Madison Avenue | Cut-off Date Balance: Cut-off Date LTV: U/W NCF DSCR: U/W NOI Debt Yield: | $45,000,000 48.5% 2.74x 10.0% |
leases have extended the weighted average lease expiration date of the space previously occupied by Crate & Barrel (excluding Tod’s, which has been a ground floor retail tenant at the 650 Madison Avenue Property since 1998) to August 2029.
Major Retail Tenant.
Celine Inc. (10,223 sq. ft.; 1.7% of NRA; 11.3% of U/W Base Rent): LVMH (rated A1/A+ by Moody’s/S&P), occupies 1.7% of net rentable area and accounts for 10.0% of U/W Gross Rent. Founded in 1945 by Céline Vipiana, Celine is a French ready-to-wear and leather luxury goods brand that has been owned by LVMH group (OTCMKTS: LVMUY) since 1996. The brand owns approximately 140 stores worldwide and is distributed through a network including department stores such as Barneys New York (New York), Bergdorf Goodman (New York), Harrods (London) and Galeries Lafayette (Paris). The retail space showcases Celine’s NYC flagship store as well as the world’s largest Celine store.
Environmental Matters. The Phase I environmental report dated October 29, 2019 recognized no environmental conditions nor recommended any further action at the 650 Madison Avenue Property.
The Market. The 650 Madison Avenue Property occupies a full block along Madison Avenue between East 59th and 60th Streets within the Plaza District office submarket and the Madison Avenue retail submarket. The Plaza District is the largest office submarket by sq. ft. in the United States and is bounded by 65th Street to the north, the East River to the east, 47th Street on the south, and Avenue of the Americas on the west. The Madison Avenue retail submarket is located on Madison Avenue between 57th and 72nd Streets. According to the appraisal, Class A office space in the Plaza District had an inventory of approximately 78.2 million sq. ft. of office space, direct asking rents of $99.29 per sq. ft. and a direct vacancy rate of 8.1% as of the third quarter of 2019. According to the appraisal, the 650 Madison Avenue Property is located within the Madison/Fifth Avenue Class A office micro-market. As of the third quarter of 2019, the Madison/Fifth Avenue Class A office micro-market had an inventory of approximately 18.9 million sq. ft. of office space and direct asking rents of $102.23 per sq. ft. The 650 Madison Avenue Property’s U/W Gross Rents for office space range from $94.04 per sq. ft. to $176.76 per sq. ft., which is comparable to the Direct Asking Rent per sq. ft. for the appraiser’s competitive set as set forth below.
In determining market rent for the 650 Madison Avenue Property, the appraiser identified the nine comparable office buildings listed in the table below.
Competitive Set (Office Buildings)(1) | |||||||
|
|
|
|
|
| Direct Asking Rent per SF | |
Property | Office Area (NRA) | Direct Avail. SF | Sublease Avail. SF | Occupied % Direct | Occupied % Total | Low | High |
510 Madison Avenue | 350,000 | 12,640 | 11,500 | 96.4% | 93.1% | $99.00 | $129.00 |
520 Madison Avenue | 849,600 | 114,847 | 0 | 86.5% | 86.5% | $105.00 | $128.00 |
590 Madison Avenue | 1,016,413 | 215,501 | 32,189 | 78.8% | 75.6% | $90.00 | $145.00 |
660 Madison Avenue | 239,113 | 0 | 24,544 | 100.0% | 89.7% | NAP | NAP |
712 Fifth Avenue | 457,281 | 72,333 | 12,090 | 84.2% | 81.5% | $115.00 | $175.00 |
745 Fifth Avenue | 410,000 | 17,938 | 22,301 | 95.6% | 90.2% | $128.00 | $150.00 |
399 Park Avenue | 1,250,000 | 96,203 | 47,488 | 92.3% | 88.5% | $110.00 | $110.00 |
450 Park Avenue | 247,242 | 7,841 | 0 | 96.8% | 96.8% | $125.00 | $125.00 |
499 Park Avenue | 265,000 | 11,303 | 11,512 | 95.7% | 91.4% | $100.00 | $100.00 |
Total | 5,084,649 | 548,606 | 161,624 |
|
|
|
|
Wtd. Avg.(2) | 564,961 | 60,956 | 17,958 | 89.2% | 86.0% | $90.00 | $175.00 |
(1) | Source: Appraisal. |
(2) | Wtd. Avg. figures for the Direct Asking Rent per sq. ft. represent the low and high end of each respective range. |
THE INFORMATION IN THIS STRUCTURAL AND COLLATERAL TERM SHEET IS NOT COMPLETE AND MAY BE AMENDED PRIOR TO THE TIME OF SALE. THIS TERM SHEET IS NOT AN OFFER TO SELL THESE SECURITIES AND IT IS NOT A SOLICITATION OF AN OFFER TO BUY THESE SECURITIES IN ANY JURISDICTION WHERE THE OFFER OR SALE IS NOT PERMITTED.
109
650 Madison Avenue New York, NY 10022 | Collateral Asset Summary – Loan No. 9 650 Madison Avenue | Cut-off Date Balance: Cut-off Date LTV: U/W NCF DSCR: U/W NOI Debt Yield: | $45,000,000 48.5% 2.74x 10.0% |
The appraisal concluded blended market rents of $108.87 per sq. ft. and $986.96 per sq. ft. for the office and ground level retail space, respectively. Based on the appraiser’s market rents, the 650 Madison Avenue Property’s in-place rent is approximately 8.0% below market rent.
Market Rent Analysis (Office) |
| Market Rent Analysis (Retail) | ||
Floors | Rent PSF |
| Tenant Category | Rent PSF |
Concourse | $50.00 |
| Below Grade | $35.00 |
2 to 7 | $97.00 |
| 60th Corner | $1,250.00 |
8 to 10 | $106.00 |
| 60th Street | $250.00 |
11 to 15 | $116.00 |
| 59th Corner | $1,250.00 |
16 to 18 | $127.00 |
| 59th Street | $350.00 |
19 to 22 | $137.00 |
| 59th Midblock | $550.00 |
23 to 27 | $147.00 |
| Inline | $1,250.00 |
Cash Flow Analysis.
Cash Flow Analysis(1) | ||||||
| 2016 | 2017 | 2018 | T-12 9/30/2019 | U/W | U/W (PSF) |
Base Rent(2) | $60,021,833 | $65,301,771 | $65,936,214 | $68,490,075 | $74,787,979 | $124.56 |
Reimbursements | 7,020,651 | 7,750,395 | 8,784,226 | 9,361,042 | 10,762,016 | $17.92 |
Rent Step(3) | 0 | 0 | 0 | 0 | 1,406,588 | $2.34 |
Potential Income | 0 | 0 | 0 | 0 | 3,327,410 | $5.54 |
Other Income | 222,390 | 265,643 | 319,055 | 362,098 | 371,407 | $0.62 |
Gross Potential Rent | $67,264,874 | $73,317,809 | $75,039,495 | $78,213,215 | $90,655,399 | $150.99 |
Less: Vacancy(4) | (86,339) | (829,105) | 0 | 75,003 | (3,327,410) | ($5.54) |
Effective Gross Income | $67,178,535 | $72,488,704 | $75,039,495 | $78,288,218 | $87,327,989 | $145.45 |
Real Estate Taxes | 15,935,782 | 16,699,910 | 17,606,496 | 18,301,078 | 19,659,925 | $32.74 |
Insurance | 396,387 | 393,355 | 378,835 | 380,309 | 382,942 | $0.64 |
Management Fee | 1,117,542 | 1,475,379 | 1,413,137 | 1,402,802 | 873,280 | $1.45 |
Total Other Expenses | 7,027,630 | 7,378,714 | 7,083,531 | 7,242,492 | 7,985,348 | $13.30 |
Net Operating Income(5) | $42,701,194 | $46,541,346 | $48,557,496 | $50,961,537 | $58,426,495 | $97.31 |
Replacement Reserves | 0 | 0 | 0 | 0 | 150,104 | $0.25 |
TI/LC | 0 | 0 | 0 | 0 | 1,500,000 | $2.50 |
Net Cash Flow | $42,701,194 | $46,541,346 | $48,557,496 | $50,961,537 | $56,776,391 | $94.56 |
| (1) | Certain items such as straight line rent, interest expense, interest income, lease cancellation income, depreciation, amortization, debt service payments and any other non-recurring or non-operating items were excluded from the historical presentation and are not considered for the underwritten cash flow |
| (2) | U/W Base Rent is based on the underwritten rent roll dated October 1, 2019. Base Rent excludes free rent due during each applicable period |
| (3) | Contractual rent steps through include $1,406,588 underwritten for various tenants through July 1, 2020. |
| (4) | U/W Vacancy represents the underwritten economic vacancy of 3.7%. |
| (5) | The increase from TTM 9/30/2019 Net Operating Income to Underwritten Net Operating Income at the 650 Madison Avenue Property is primarily attributable to the signing of six new leases since December 2018 as well as contractual rent steps. |
Property Management. The 650 Madison Avenue Property is managed by 650 Madison Office Manager LLC with respect to the office space and 650 Madison Retail Manager LLC with respect to the retail space, each a Delaware limited liability company and an affiliate of the borrower sponsors, pursuant to separate management agreements. Under the loan documents, the lender may require the borrower to terminate any management agreement and replace the applicable property manager if: (i) an event of default under the loan documents exists, (ii) there exists a material default by the property manager under the management agreement beyond all applicable notice and cure periods, or (iii) the property manager becomes insolvent or a debtor in any bankruptcy or insolvency proceeding or (iv) the property manager has engaged in gross negligence, fraud, willful misconduct or misappropriation of funds. Provided that no event of default is occurring under the loan documents, the borrower may, without lender’s approval and without a rating agency confirmation, terminate the management agreement and replace the manager with certain managers as set forth in the loan documents.
Lockbox / Cash Management. The 650 Madison Avenue Whole Loan is subject to a hard lockbox with springing cash management. The borrower is required to cause all rents to be delivered directly to the clearing account with the clearing bank. During the continuance of a 650 Madison Avenue Trigger Period (as defined below) or a 650 Madison Avenue Specified Tenant Trigger Period (as defined below), the clearing bank will be required to transfer all amounts on deposit in the clearing account once each business day to the cash management account. Funds on deposit in the cash management account will be applied on each payment date in the order and priority set forth in the loan documents. In the absence of a 650 Madison Avenue Trigger Period or a 650 Madison Avenue Specified Tenant Trigger Period, all excess cash flow will be deposited into the borrower’s operating account. During a 650 Madison Avenue Trigger Period, the excess cash flow will be held by the lender and applied in accordance with the terms of the loan documents.
THE INFORMATION IN THIS STRUCTURAL AND COLLATERAL TERM SHEET IS NOT COMPLETE AND MAY BE AMENDED PRIOR TO THE TIME OF SALE. THIS TERM SHEET IS NOT AN OFFER TO SELL THESE SECURITIES AND IT IS NOT A SOLICITATION OF AN OFFER TO BUY THESE SECURITIES IN ANY JURISDICTION WHERE THE OFFER OR SALE IS NOT PERMITTED.
110
650 Madison Avenue New York, NY 10022 | Collateral Asset Summary – Loan No. 9 650 Madison Avenue | Cut-off Date Balance: Cut-off Date LTV: U/W NCF DSCR: U/W NOI Debt Yield: | $45,000,000 48.5% 2.74x 10.0% |
A “650 Madison Avenue Trigger Period” means a period (A) commencing upon the earliest to occur of: (i) the debt yield falling below 6.00% for two consecutive quarters, or (ii) an event of default, and (B) terminating upon (x) with respect to clause (i) above, the debt yield being equal or greater than 6.00% for two consecutive quarters or the delivery by borrower to lender of cash collateral or a letter of credit in order to achieve such debt yield, or (y) with respect to clause (ii) above, the event of default has been cured.
For the avoidance of doubt, the existence of a 650 Madison Specified Tenant Trigger Period will not, by itself, cause a 650 Madison Trigger Period.
Upon a 650 Madison Specified Tenant Trigger Period and prior to a 650 Madison Specified Tenant Trigger Period Cure (as defined below), a Specified Tenant (as defined below) reserve will be funded monthly until the lender has swept up to $80.00 per sq. ft. for the vacating Specified Tenant space into the Specified Tenant reserve. Funds in the Specified Tenant reserve will be released to the borrower upon the occurrence of an applicable 650 Madison Avenue Specified Tenant Trigger Period Cure.
A “650 Madison Avenue Specified Tenant Trigger Period” means a period commencing upon the earliest of: (i) any bankruptcy of Ralph Lauren (together with any single tenant replacing the foregoing and paying no less than 30% of the total gross rent payable at the Property, a “Specified Tenant”), (ii) delivery of any notice of termination or cancellation by a Specified Tenant for all or any portion of the Specified Tenant’s lease and/or if any Specified Tenant’s lease fails to otherwise be in full force and effect, (iii) the Specified Tenant being in monetary default of base rent or any material non-monetary default under the Specified Tenant’s lease beyond applicable notice and cure periods, (iv) the Specified Tenant failing to be in actual, physical possession and operating or dark in the Specified Tenant’s space, provided that it will not be a trigger under this clause (iv) if such Specified Tenant is rated an investment grade rated tenant by at least one of Moody’s, S&P and/or Fitch, or (v) a Specified Tenant’s failure to provide written notice to the borrower of renewal of its lease upon the earlier to occur of 18 months prior to its then current applicable lease expiration and the renewal notice period required under the applicable lease, and ending upon the occurrence of an applicable 650 Madison Avenue Specified Tenant Trigger Period Cure.
A “650 Madison Avenue Specified Tenant Trigger Period Cure” means as applicable, (a) the Specified Tenant affirming its lease in the applicable bankruptcy proceeding pursuant to a final, non-appealable order, (b) the lender’s receipt of reasonably satisfactory evidence that, among other things, the applicable vacant or dark space referred to in clause (iv) of the definition of “650 Madison Avenue Specified Tenant Trigger Period” is leased, open for business and the applicable tenant is paying full unabated rent, (c) the lender’s receipt of evidence reasonably satisfactory that the default under the Specified Tenant’s lease has been cured, (d) the Specified Tenant’s revocation or rescission of all termination or cancellation notices with respect to the Specified Tenant’s lease and reaffirmation that the Specified Tenant’s lease is in full force and effect, and/or (e) the lender receives reasonably satisfactory evidence that (i) the Specified Tenant has renewed its lease prior to its then applicable lease expiration or (ii) the Specified Tenant’s space is leased for a minimum term of five (5) years, the replacement tenant has taken actual physical possession of the Specified Tenant’s space and the replacement tenant is paying full unabated rent. A 650 Madison Avenue Specified Tenant Trigger Period Cure will also be deemed to have occurred if the debt yield is equal to or greater than 7.5% (excluding gross revenue from any Specified Tenant who is then subject to a 650 Madison Avenue Specified Tenant Trigger Period, but including revenue on a pro forma basis from any new lease with respect to all or any portion of the space demised to such Specified Tenant that was entered into in accordance with the terms of this 650 Madison Avenue Whole Loan agreement).
Condominium Conversion. The borrower has the right to convert the entire 650 Madison Avenue Property to a commercial condominium form of ownership (a “Condominium Conversion”), provided that, among other conditions (i) the resulting condominium regime (the “Condominium”) consists exclusively of the three condominium units (collectively, the “Condominium Units”, each, a “Condominium Unit”) identified in the 650 Madison Avenue Whole Loan documents, (ii) no event of default is continuing, (iii) the condominium declaration and bylaws, all related documents, instruments and agreements (collectively the “Condominium Documents”) will be in the respective forms indicated in the 650 Madison Avenue Whole Loan documents or as otherwise approved by the lender in writing (which approval must not be unreasonably withheld, conditioned or delayed), and (iv) the borrower delivers to the lender such usual and customary documents and other agreements as may be reasonably required by the lender in connection with the Condominium Conversion, including, but not limited to, an amendment to the mortgage and amendments and reaffirmations to the terms and conditions of the 650 Madison Avenue Whole Loan documents reasonably required by the lender, and (v) the borrower has the right to transfer the Condominium Units to one or more transferee borrowers that will assume on a joint and several basis all of borrower’s obligations under the 650 Madison Avenue Whole Loan documents, provided (A) such transferee borrowers will be either (I) controlled by an eligible qualified owner in accordance with the 650 Madison Avenue Whole Loan documents that owns (x) by itself, at least 20% of the common equity interest in such transferee borrowers and (y) together with one or more other eligible qualified owner and/or institutional investors, at least 51% of the common equity interest in such transferee borrowers, with any person owning 10% or more of the equity interests in transferee borrower being a qualified transferee or (II) owned and controlled by one or more entities approved by the lender that are qualified transferees and are otherwise qualified to own the 650 Madison Avenue Property, and (B) rating agency confirmation will be required solely with respect to the legal structure of the transferee borrower(s), the documentation of the loan assumption and the related legal opinions
Initial and Ongoing Reserves. At origination of the 650 Madison Avenue Whole Loan, the borrower funded reserves of (i) $3,197,699 for outstanding tenant improvements and/or leasing commissions and (ii) $6,378,315 for free rent.
THE INFORMATION IN THIS STRUCTURAL AND COLLATERAL TERM SHEET IS NOT COMPLETE AND MAY BE AMENDED PRIOR TO THE TIME OF SALE. THIS TERM SHEET IS NOT AN OFFER TO SELL THESE SECURITIES AND IT IS NOT A SOLICITATION OF AN OFFER TO BUY THESE SECURITIES IN ANY JURISDICTION WHERE THE OFFER OR SALE IS NOT PERMITTED.
111
650 Madison Avenue New York, NY 10022 | Collateral Asset Summary – Loan No. 9 650 Madison Avenue | Cut-off Date Balance: Cut-off Date LTV: U/W NCF DSCR: U/W NOI Debt Yield: | $45,000,000 48.5% 2.74x 10.0% |
Tax Reserve: On each monthly payment date during the continuance of a 650 Madison Avenue Trigger Period or 650 Madison Avenue Specified Tenant Trigger Period, the borrower is required to deposit 1/12th of an amount which would be sufficient to pay taxes for the next ensuing 12 months.
Insurance Reserve: On each monthly payment date during the continuance of a 650 Madison Avenue Trigger Period or a 650 Madison Avenue Specified Tenant Trigger Period, insurance deposits are required in an amount equal to 1/12th of an amount which would be sufficient to pay the insurance premium due for the renewal of the coverage afforded by the insurance policies upon the expiration thereof. If the liability or casualty insurance policy maintained by the borrower covering the 650 Madison Avenue Property constitutes an acceptable blanket policy, then no insurance deposits are required.
TI/LC Reserve: On each monthly payment date during the continuance of a 650 Madison Avenue Trigger Period, the borrower is required to deposit into the rollover account an amount equal to $125,000.
Replacement Reserve: On each monthly payment date during the continuance of a 650 Madison Avenue Trigger Period, the borrower is required to deposit into the capital expenditure account an amount equal to 1/12th of $0.25 multiplied by the aggregate number of rentable sq. ft. then contained in the 650 Madison Avenue Property, which for avoidance of doubt will exclude rentable square footage contained in any Condominium Unit that was previously released from the collateral for the 650 Madison Avenue Whole Loan.
Operating Expense Reserve: On each monthly payment date during the continuance of a 650 Madison Avenue Trigger Period or a 650 Madison Avenue Specified Tenant Trigger Period, the borrower is required to deposit into the operating expense account an amount sufficient to pay monthly operating expenses for the month immediately preceding the month in which such payment date occurs in accordance with the approved annual budget.
Current Mezzanine or Subordinate Indebtedness. On the origination date of the 650 Madison Avenue Whole Loan, CREFI, BCREI, BMO Harris and GSBI funded the 650 Madison Avenue Junior Non-Trust Notes in the amount of $213,200,000. The 650 Madison Avenue Junior Non-Trust Notes have an interest rate of 3.48600% per annum and is coterminous with the 650 Madison Avenue Senior Pari Passu Notes. The 650 Madison Avenue Whole Loan is subject to a co-lender agreement.
Future Mezzanine or Subordinate Indebtedness Permitted. None.
Partial Release. Provided no event of default is continuing, the borrower has the right at any time after the earlier of (a) November 26, 2022, and (b) the date that is two years after the closing date of the securitization that includes the last note to be securitized, and provided that a Condominium Conversion has occurred, to obtain the release of one or more Condominium Units solely in connection with a partial defeasance, subject to the satisfaction of certain conditions including, without limitation, (i) defeasing a portion of the 650 Madison Avenue Whole Loan in an amount that is equal to or greater than 125% of an allocated loan amount for the applicable Condominium Unit determined by dividing the 650 Madison Avenue Whole Loan among the various condominium units pro rata based on their respective appraised values based upon an appraisal of the 650 Madison Avenue Property at the time of the release, provided that (x) the debt yield with respect to the condominium unit(s) remaining subject to the lien of the mortgage after such partial defeasance is, in the aggregate, equal to or greater than 7.3% and (y) the loan-to-value ratio with respect to the Condominium Unit(s) remaining subject to the lien of the mortgage after such partial defeasance is equal to or less than 67%, in each case unless approved by the lender in its reasonable discretion, (ii) after giving effect to the partial defeasance, the debt yield for the four calendar quarters then most recently ended, recalculated to include only income and expense attributable to the portion of the 650 Madison Avenue Property that continues to be subject to the liens of the loan documents after the contemplated defeasance and to exclude the interest expense on the aggregate amount defeased, is no less than the greater of (x) 7.3% and (y) the lesser of (a) the debt yield immediately prior to such release, and (b) 9.125%, and (iii) at the lender’s request, delivery of a rating agency confirmation.
THE INFORMATION IN THIS STRUCTURAL AND COLLATERAL TERM SHEET IS NOT COMPLETE AND MAY BE AMENDED PRIOR TO THE TIME OF SALE. THIS TERM SHEET IS NOT AN OFFER TO SELL THESE SECURITIES AND IT IS NOT A SOLICITATION OF AN OFFER TO BUY THESE SECURITIES IN ANY JURISDICTION WHERE THE OFFER OR SALE IS NOT PERMITTED.
112
(THIS PAGE INTENTIONALLY LEFT BLANK)
113
181 West Madison Street Chicago, IL 60602 | Collateral Asset Summary – Loan No. 10 181 West Madison | Cut-off Date Balance: Cut-off Date LTV: U/W NCF DSCR: U/W NOI Debt Yield: | $43,000,000 28.8% 4.67x 20.4% |
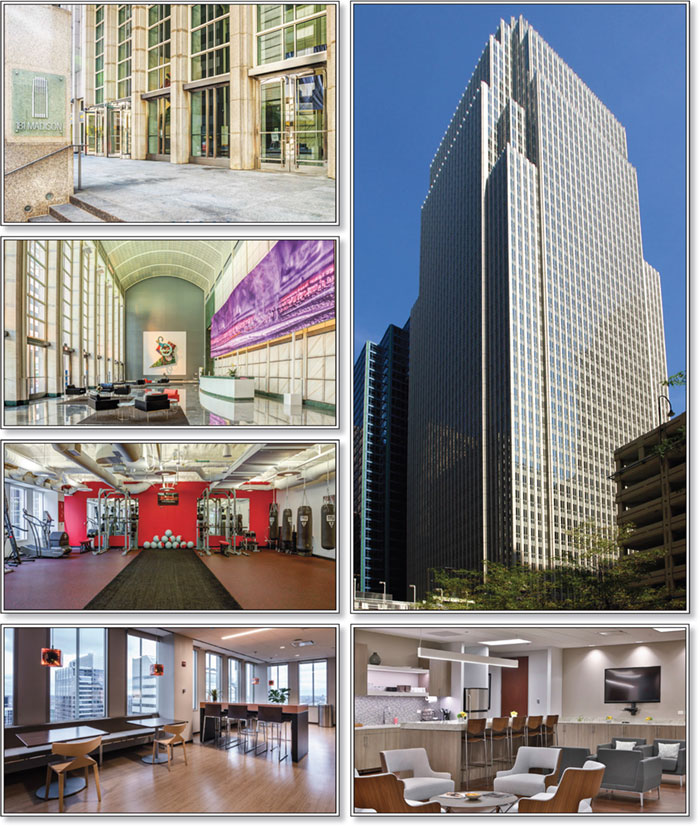
THE INFORMATION IN THIS STRUCTURAL AND COLLATERAL TERM SHEET IS NOT COMPLETE AND MAY BE AMENDED PRIOR TO THE TIME OF SALE. THIS TERM SHEET IS NOT AN OFFER TO SELL THESE SECURITIES AND IT IS NOT A SOLICITATION OF AN OFFER TO BUY THESE SECURITIES IN ANY JURISDICTION WHERE THE OFFER OR SALE IS NOT PERMITTED.
114
181 West Madison Street Chicago, IL 60602 | Collateral Asset Summary – Loan No. 10 181 West Madison | Cut-off Date Balance: Cut-off Date LTV: U/W NCF DSCR: U/W NOI Debt Yield: | $43,000,000 28.8% 4.67x 20.4% |
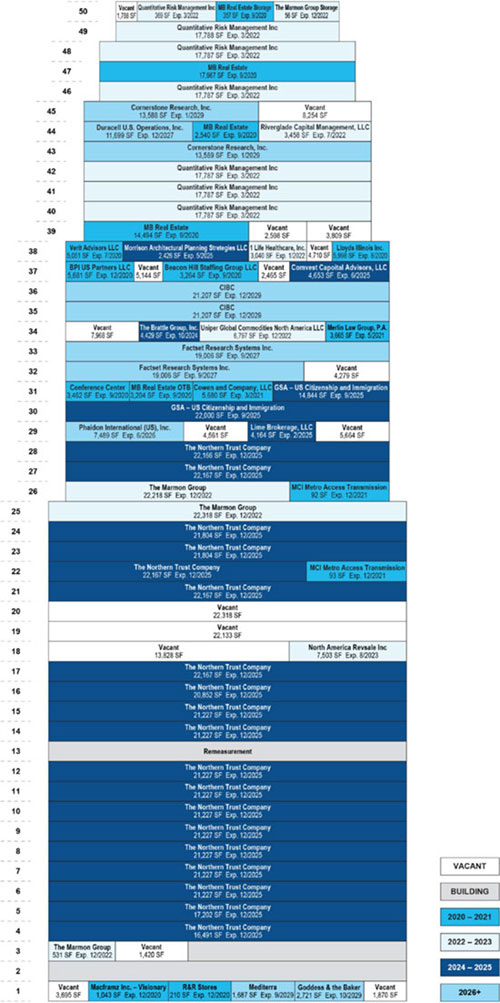
THE INFORMATION IN THIS STRUCTURAL AND COLLATERAL TERM SHEET IS NOT COMPLETE AND MAY BE AMENDED PRIOR TO THE TIME OF SALE. THIS TERM SHEET IS NOT AN OFFER TO SELL THESE SECURITIES AND IT IS NOT A SOLICITATION OF AN OFFER TO BUY THESE SECURITIES IN ANY JURISDICTION WHERE THE OFFER OR SALE IS NOT PERMITTED.
115
181 West Madison Street Chicago, IL 60602 | Collateral Asset Summary – Loan No. 10 181 West Madison | Cut-off Date Balance: Cut-off Date LTV: U/W NCF DSCR: U/W NOI Debt Yield: | $43,000,000 28.8% 4.67x 20.4% |
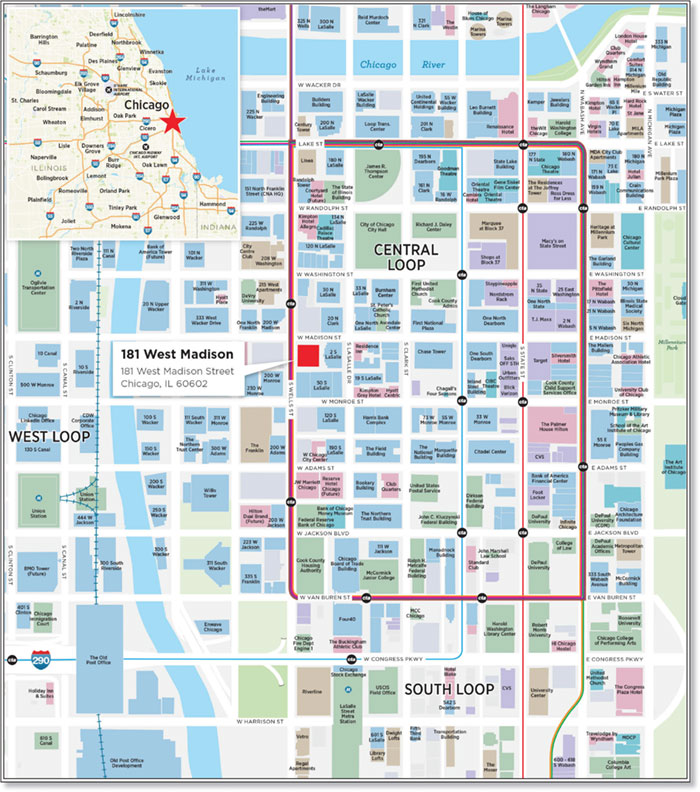
THE INFORMATION IN THIS STRUCTURAL AND COLLATERAL TERM SHEET IS NOT COMPLETE AND MAY BE AMENDED PRIOR TO THE TIME OF SALE. THIS TERM SHEET IS NOT AN OFFER TO SELL THESE SECURITIES AND IT IS NOT A SOLICITATION OF AN OFFER TO BUY THESE SECURITIES IN ANY JURISDICTION WHERE THE OFFER OR SALE IS NOT PERMITTED.
116
181 West Madison Street Chicago, IL 60602 | Collateral Asset Summary – Loan No. 10 181 West Madison | Cut-off Date Balance: Cut-off Date LTV: U/W NCF DSCR: U/W NOI Debt Yield: | $43,000,000 28.8% 4.67x 20.4% |
Mortgage Loan Information | |
JPMCB | |
Refinance | |
| |
BBB-sf / AA(sf) / Aa2(sf) | |
HNA Group North America LLC | |
181 West Madison Property LLC | |
$43,000,000 | |
$43,000,000 | |
4.8% | |
3.90000% | |
1st of each month | |
January 1, 2020 | |
December 1, 2026 | |
Interest Only | |
$64,900,000 Pari Passu Debt; $132,100,000 Subordinate Debt | |
L(26), D(53), O(5) | |
Hard / Springing | |
Reserves(4) | |||
| Initial | Monthly | Cap |
Taxes: | $0 | Springing | NAP |
Insurance: | $0 | Springing | NAP |
Replacement: | $0 | Springing | $567,660 |
TI/LC: | $157,683 | $157,683 | $7,000,000 |
Outstanding Free Rent: | $1,532,852 | NAP | NAP |
Outstanding CapEx: | $60,000 | NAP | NAP |
Outstanding Rollover: | $1,229,826 | NAP | NAP |
Property Information | ||
Single Asset | ||
CBD Office | ||
Fee Simple | ||
Chicago, IL | ||
1990 / 2016 | ||
946,099 | ||
MB Real Estate Services Inc. | ||
$22,010,506 | ||
$19,929,089 | ||
$375,289,826 | ||
October 22, 2019 | ||
| ||
Historical NOI | ||
Most Recent NOI: | $21,846,296 (T-12 September 30, 2019) | |
2018 NOI: | $21,302,406 (December 31, 2018) | |
2017 NOI: | $23,203,111 (December 31, 2017) | |
2016 NOI(7): | NAV | |
| ||
Historical Occupancy | ||
Most Recent Occupancy: | 87.7% (November 30, 2019) | |
2018 Occupancy: | 87.0% (December 31, 2018) | |
2017 Occupancy: | 88.0% (December 31, 2017) | |
2016 Occupancy(7): | NAV | |
|
|
|
Financial Information(1)(2) | ||||||
Tranche | Cut-off Date Balance | Balance per sq. ft. Cut-off / Balloon | LTV Cut-off / Balloon | U/W DSCR NOI / NCF | U/W Debt Yield NOI / NCF | U/W Debt Yield at Balloon NOI / NCF |
Mortgage Loan | $43,000,000 |
|
|
|
|
|
Pari Passu Notes | $64,900,000 |
|
|
|
|
|
Senior Notes | $107,900,000 | $114 / $114 | 28.8% / 28.8% | 5.16x / 4.67x | 20.4% / 18.5% | 20.4% / 18.5% |
Subordinate Debt | $132,100,000 |
|
|
|
|
|
Whole Loan | $240,000,000 | $254 / $254 | 64.0% / 64.0% | 2.32x / 2.10x | 9.2% / 8.3% | 9.2% / 8.3% |
(1) | The 181 West Madison Loan (as defined below) consists of the non-controlling Note A-2 and is part of the 181 West Madison Whole Loan (as defined below) evidenced by four pari passu senior notes and one subordinate note, with an aggregate outstanding principal balance as of the Cut-off Date of $240.0 million. For additional information, see “The Loan” herein. |
(2) | See “Current Mezzanine or Subordinate Indebtedness” herein. |
(3) | The lockout period will be 26 payments beginning with and including the first payment date in January 2020. The borrower has the option to defease the full $240,000,000 181 West Madison Whole Loan after the earlier to occur of (i) two years after the closing date of the securitization that includes the last note to be securitized and (ii) January 1, 2023. The lockout period of 26 payments is based on the expected Benchmark 2020-B16 transaction closing date occurring in February 2020. The actual lockout period may be longer. |
(4) | See “Initial and Ongoing Reserves” herein. |
(5) | Underwritten NOI and Underwritten NCF are inclusive of (i) contractual rent steps taken through November 2020 and (ii) straight-lined rent through the 181 West Madison Whole Loan maturity date for investment-grade rated tenants Northern Trust and CIBC (each as defined below). |
(6) | Appraised Value is reflective of the “As Hypothetical” Appraised Value as determined by Cushman & Wakefield, Inc., which assumes the Borrower Sponsor has escrowed $1,289,826 for remaining capital expenses and unfunded tenant improvement allowances associated with CIBC. At origination, the borrower reserved $1,229,826 for all outstanding tenant improvements and $60,000 for outstanding capital expenditures. The “As-Is” appraised value as of October 22, 2019 is $374.0 million, which results in a Whole Loan LTV at Cut-off Balance of approximately 64.2%. |
(7) | 2016 NOI and 2016 Occupancy are not available as the borrower sponsor acquired the 181 West Madison Property (as defined below) in March of 2017. |
(8) | Fitch, KBRA and Moody’s provided the listed assessments for the 181 West Madison Loan in the context of its inclusion in the mortgage pool. |
THE INFORMATION IN THIS STRUCTURAL AND COLLATERAL TERM SHEET IS NOT COMPLETE AND MAY BE AMENDED PRIOR TO THE TIME OF SALE. THIS TERM SHEET IS NOT AN OFFER TO SELL THESE SECURITIES AND IT IS NOT A SOLICITATION OF AN OFFER TO BUY THESE SECURITIES IN ANY JURISDICTION WHERE THE OFFER OR SALE IS NOT PERMITTED.
117
181 West Madison Street Chicago, IL 60602 | Collateral Asset Summary – Loan No. 10 181 West Madison | Cut-off Date Balance: Cut-off Date LTV: U/W NCF DSCR: U/W NOI Debt Yield: | $43,000,000 28.8% 4.67x 20.4% |
The Loan. The 181 West Madison mortgage loan (the “181 West Madison Loan”) is part of a fixed rate loan secured by the first mortgages encumbering the borrower’s fee simple interest in an approximately 946,099 sq. ft. Class A office tower located in Chicago, Illinois (the “181 West Madison Property”). The 181 West Madison Loan is evidenced by the non-controlling Note A-2 with an original principal balance and outstanding principal balance as of the Cut-off Date of $43.0 million. The 181 West Madison Loan is part of a $240.0 million whole loan that is evidenced by four pari passu senior notes with an aggregate original balance of $107.9 million (the “181 West Madison Senior Notes”) and one subordinate note with an original balance of $132.1 million (the “181 West Madison Junior Note” and together with 181 West Madison Senior Notes, the “181 West Madison Whole Loan”). The 181 West Madison Loan, which will be included in the Benchmark 2020-B16 securitization transaction, is evidenced by the non-controlling Note A-2, which has an outstanding principal balance as of the Cut-off Date of $43,000,000.
The relationship between the holders of the 181 West Madison Senior Notes and the 181 West Madison Junior Notes will be governed by a co-lender agreement as described under “Description of the Mortgage Pool—The Whole Loans—The Non-Serviced AB Whole Loans—The 181 West Madison Whole Loan” in the Preliminary Prospectus.
Whole Loan Summary | |||||
Note | Original Balance | Cut-off Date Balance |
| Note Holder | Controlling Piece |
Note A-1 | $1,000,000 | $1,000,000 |
| JPMCC 2020-LOOP(1) | No |
Note A-2 | $43,000,000 | $43,000,000 |
| Benchmark 2020-B16 | No(2) |
Note A-3 | $40,000,000 | $40,000,000 |
| JPMCB | No |
Note A-4 | $23,900,000 | $23,900,000 |
| JPMCB | No |
Senior Notes | $107,900,000 | $107,900,000 |
|
|
|
Note B-1 | $132,100,000 | $132,100,000 |
| JPMCC 2020-LOOP(1) | Yes(2) |
Whole Loan | $240,000,000 | $240,000,000 |
|
|
|
(1) | The JPMCC 2020-LOOP transaction is expected to close prior to the Closing Date. |
(2) | The initial controlling piece is Note B-1. During the continuance of a trust loan control event relating to the JPMCC 2020-LOOP securitization transaction (i.e., when the class G certificates in such transaction have been control appraised out, but the class C certificates in such transaction have not been control appraised out), a specified percentage of the certificateholders of such transaction will be entitled to exercise the rights of the controlling piece to replace the special servicer (but no certificateholder will have any other rights of the controlling piece). During the control shift event relating to the JPMCC 2020-LOOP securitization transaction (i.e., when the class C certificates in such transaction have been control appraised out), Note A-2 will be the controlling piece; provided however, that the 181 West Madison Whole Loan will continue to be serviced by the master servicer, and if necessary, the special servicer, under the JPMCC 2020-LOOP trust and servicing agreement. See “Description of the Mortgage Pool—The Whole Loans—The Non-Serviced AB Whole Loans—The 181 West Madison Whole Loan” in the Preliminary Prospectus. |
The 181 West Madison Whole Loan has a seven-year interest-only term and accrues interest at a fixed rate of 3.90000% per annum. The 181 West Madison Whole Loan proceeds were used to refinance existing debt, pay closing costs and fund upfront reserves. Based on the “As Hypothetical” appraised value of approximately $375.3 million as of October 22, 2019, the Cut-off Date LTV Ratio for the 181 West Madison Whole Loan is 64.0%. The most recent financing of the 181 West Madison Whole Loan is expected to be included in the JPMCC 2020-LOOP transaction.
Sources and Uses | ||||||
Sources | Proceeds | % of Total |
| Uses | Proceeds | % of Total |
Whole Loan | $240,000,000 | 99.6% |
| Loan Payoff | $235,188,488 | 97.6% |
Sponsor Equity | 1,027,259 | 0.4% |
| Upfront Reserves | 2,980,361 | 1.2% |
|
|
|
| Closing Costs | 2,858,410 | 1.2% |
Total Sources | $241,027,259 | 100.0% |
| Total Uses | $241,027,259 | 100.0% |
The Borrower / Borrower Sponsor. The borrower is 181 West Madison Property LLC, a Delaware limited liability company structured to be a bankruptcy-remote entity with two independent directors in its organizational structure (the “Borrower”). The borrower is controlled by HNA Group North America LLC, the borrower sponsor (“HNA”). HNA is a China based Fortune Global 500 conglomerate with core divisions of aviation, tourism and real estate. As of November 11, 2019, HNA Group North America LLC controls approximately $2.1 billion of United States commercial real estate which includes 245 Park Avenue in New York City, the 181 West Madison property and the Casa Hotel at 66-70 West 45th Street in New York City. Legal counsel to the borrower delivered a non-consolidation opinion in connection with the origination of the 181 West Madison Whole Loan. The borrower, which is a single purpose entity with no assets other than the 181 West Madison Property, is the sole party liable for breaches or violations of the nonrecourse carveout provisions in the loan documents.
THE INFORMATION IN THIS STRUCTURAL AND COLLATERAL TERM SHEET IS NOT COMPLETE AND MAY BE AMENDED PRIOR TO THE TIME OF SALE. THIS TERM SHEET IS NOT AN OFFER TO SELL THESE SECURITIES AND IT IS NOT A SOLICITATION OF AN OFFER TO BUY THESE SECURITIES IN ANY JURISDICTION WHERE THE OFFER OR SALE IS NOT PERMITTED.
118
181 West Madison Street Chicago, IL 60602 | Collateral Asset Summary – Loan No. 10 181 West Madison | Cut-off Date Balance: Cut-off Date LTV: U/W NCF DSCR: U/W NOI Debt Yield: | $43,000,000 28.8% 4.67x 20.4% |
The Property.
Tenant Summary(1) | |||||||
Tenant |
| Credit Rating (Moody’s/Fitch/S&P)(2) | Net Rentable | % of Net | U/W Base Rent | % of Total U/W | Lease |
The Northern Trust Company |
| A2 / AA- / AA- | 400,030 | 42.3% | $21.31 | 40.2% | 12/31/2025 |
Quantitative Risk Management Inc |
| NR / NR / NR | 107,092 | 11.3% | $29.63 | 15.0% | 3/31/2022 |
The Marmon Group |
| Aa2 / AA- / AA | 45,123 | 4.8% | $30.78 | 6.5% | 12/31/2022 |
GSA - US Citizenship and Immigration |
| Aaa / AAA / AA+ | 36,844 | 3.9% | $33.75 | 5.9% | 9/21/2025 |
CIBC |
| Aa2 / NR / A+ | 42,414 | 4.5% | $26.41 | 5.3% | 12/31/2029 |
Factset Research Systems Inc. |
| NR / NR / NR | 38,012 | 4.0% | $28.42 | 5.1% | 9/30/2027 |
MB Real Estate |
| NR / NR / NR | 38,598 | 4.1% | $23.82 | 4.3% | 9/30/2020 |
Cornerstone Research, Inc. |
| NR / NR / NR | 27,177 | 2.9% | $30.43 | 3.9% | 1/31/2029 |
Duracell U.S. Operations, Inc. |
| Aa2 / AA- / AA | 11,699 | 1.2% | $29.98 | 1.7% | 12/31/2027 |
BPI US Partners LLC |
| NR / NR / NR | 5,681 | 0.6% | $53.72 | 1.4% | 12/31/2020 |
Total Major Office |
|
| 752,670 | 79.6% | $25.16 | 89.2% |
|
Other Occupied(5) |
|
| 76,925 | 8.1% | $29.76 | 10.8% |
|
Total Occupied Office and Retail |
|
| 829,595 | 87.7% | $25.58 | 100.0% |
|
Vacant |
|
| 116,504 | 12.3% |
|
|
|
Total / Wtd. Avg. |
|
| 946,099 | 100.0% |
|
|
|
(1) | Based on the underwritten rent roll dated November 30, 2019. |
(2) | In certain instances, ratings provided are those of the parent company of the entity shown, whether or not the parent company guarantees the lease. |
(3) | Underwritten NOI and Underwritten NCF are inclusive of (i) contractual rent steps taken through November 2020 and (ii) straight-lined rent through the 181 West Madison Whole Loan maturity date for investment-grade rated tenants Northern Trust and CIBC. |
(4) | Certain tenants may have termination or contraction options which may become exercisable prior to the originally stated expiration date of the tenant lease. |
(5) | Other Occupied is inclusive of (i) 3,462 sq. ft. of conference center space with no attributable underwritten base rent and (ii) 5,661 sq. ft. of retail space. |
Lease Rollover Schedule(1)(2) | ||||||||
Year | # of Tenants Expiring(3) | Total Expiring sq. ft. | % of Total sq. Ft. Expiring | Cumulative sq. ft. Expiring | Cumulative % of sq. ft. Expiring | Annual U/W Base Rent per sq. ft. | % U/W Base Rent Rolling | Cumulative % of U/W Base Rent |
2020 & MTM(4) | 7 | 63,307 | 6.7% | 63,307 | 6.7% | $27.97 | 8.3% | 8.3% |
2021 | 3 | 9,530 | 1.0% | 72,837 | 7.7% | $28.13 | 1.3% | 9.6% |
2022 | 5 | 165,510 | 17.5% | 238,347 | 25.2% | $30.00 | 23.4% | 33.0% |
2023 | 1 | 7,503 | 0.8% | 245,850 | 26.0% | $28.71 | 1.0% | 34.0% |
2024 | 1 | 4,429 | 0.5% | 250,279 | 26.5% | $26.65 | 0.6% | 34.6% |
2025 | 5 | 448,117 | 47.4% | 698,396 | 73.8% | $22.50 | 47.5% | 82.1% |
2026 | 1 | 7,489 | 0.8% | 705,885 | 74.6% | $26.65 | 0.9% | 83.0% |
2027 | 2 | 49,711 | 5.3% | 755,596 | 79.9% | $28.79 | 6.7% | 89.8% |
2028 | 0 | 0 | 0.0% | 755,596 | 79.9% | $0.00 | 0.0% | 89.8% |
2029 | 4 | 73,999 | 7.8% | 829,595 | 87.7% | $29.36 | 10.2% | 100.0% |
2030 & Thereafter | 0 | 0 | 0.0% | 829,595 | 87.7% | $0.00 | 0.0% | 100.0% |
Vacant | NAP | 116,504 | 12.3% | 946,099 | 100.0% | $0.00 | 0.0% |
|
Total / Wtd. Avg. | 29 | 946,099 | 100.0% |
|
| $25.58 | 100.0% |
|
(1) | Based on the underwritten rent roll dated November 30, 2019. |
(2) | Certain tenants may have termination or contraction options (which may become exercisable prior to the originally stated expiration date of the tenant lease) that are not considered in the above Lease Rollover Schedule. |
(3) | # of Tenants Expiring excludes telecom space, conference centers and storage space. |
(4) | 2020 & MTM is inclusive of 3,462 sq. ft. associated with conference center and 357 sq. ft. of storage space associated with MB Real Estate, each of which has no attributable underwritten base rent. |
The 181 West Madison Property is a 50-story, 946,099 sq. ft., Class A, LEED Certified Gold, office tower located in Chicago, Illinois. The 181 West Madison Property is located at the southeast corner of West Madison and South Wells Streets in Chicago’s central business district (“CBD”). There are 56 on-site garage parking spaces. The 181 West Madison Property was originally constructed in 1990 by Cesar Pelli & Associates and has since undergone renovations in 2016. The borrower sponsor purchased the 181 West Madison Property in March 2017 and since then have invested approximately $15.5 million into capital expenditures at the 181 West Madison Property. Recent renovations at the 181 West Madison property include modernized elevators, main lobby renovations, improvements to the tenant lounge, fitness center improvements and general cosmetic upgrades.
As of November 30, 2019, the 181 West Madison Property was 87.7% leased to 29 tenants across the banking, government, technology, advertising and industrial sectors. The 181 West Madison Property’s ten largest office tenants (five of which have investment grade credit ratings) occupy 752,670 sq. ft. accounting for approximately 79.6% of net rentable area and 89.2% of underwritten base rent, with a weighted average underwritten base rent of $25.16 PSF. The largest tenant at the 181 West Madison Property, The Northern Trust Company (“Northern Trust”), accounts for approximately 42.3% of net rentable area and 40.2% of underwritten base rent. Northern Trust has been at
THE INFORMATION IN THIS STRUCTURAL AND COLLATERAL TERM SHEET IS NOT COMPLETE AND MAY BE AMENDED PRIOR TO THE TIME OF SALE. THIS TERM SHEET IS NOT AN OFFER TO SELL THESE SECURITIES AND IT IS NOT A SOLICITATION OF AN OFFER TO BUY THESE SECURITIES IN ANY JURISDICTION WHERE THE OFFER OR SALE IS NOT PERMITTED.
119
181 West Madison Street Chicago, IL 60602 | Collateral Asset Summary – Loan No. 10 181 West Madison | Cut-off Date Balance: Cut-off Date LTV: U/W NCF DSCR: U/W NOI Debt Yield: | $43,000,000 28.8% 4.67x 20.4% |
the property since 2000 and has continuously invested in the 181 West Madison Property over that time period while also expanding its footprint at the property. The 181 West Madison Property serves as one of two headquarter buildings for Northern Trust. Northern Trust owns and fully occupies the adjacent 50 South LaSalle building, which also serves as a headquarters for its operations. Northern Trust has re-financed its long term commitment to the property through a comprehensive remodeling of seven floors over the past five years at a cost of approximately $75 to $90 PSF. Northern Trust paid for a sky bridge that connects its offices on the 7th floor of the 181 West Madison Property to the adjacent 50 South Lasalle property. The 181 West Madison Property also serves as the headquarter location for Quantitative Risk Management Inc (“QRM”) (11.3% of net rentable area, 15.0% of underwritten base rent) and The Marmon Group (4.8% of net rentable area, 6.5% of underwritten base rent) the second and third largest tenants, respectively, by underwritten base rent.
The 181 West Madison Property is surrounded by a variety of cultural attractions, entertainment venues, restaurants and retail outlets located throughout the Central Loop, one of Chicago’s primary central business districts (the “Central Loop”). Notable demand generators in the Chicago Loop include a variety of theaters and museums such as the Auditorium Theatre, Cadillac Palace Theatre, The Chicago Theatre, The Goodman Theatre, Bank of America (formerly Shubert) Theatre and the Art Institute of Chicago. Millennium Park is another demand driver in the market. Millennium Park opened in July 2004, featuring world class art exhibits, a state-of-the-art open air band shell, flower and sculpture gardens, a small indoor music and dance theatre and a commuter bicycle center. A recent impact study prepared for the City of Chicago reports that Millennium Park is anticipated to generate $1.4 billion in residential development, $1.9 billion in hotel, retail and entertainment revenues and attract approximately 36 million visitors over the next decade. According to the Chicago Tribune, the Central Loop is also “the largest college town in Illinois,” with 20 higher education institutions with over 60,000 students in the Central Loop area.
Major Tenants.
The Northern Trust Corporation (400,030 sq. ft.; 42.3% of NRA; 40.2% of U/W Base Rent) (rated A2/AA-/AA- by Moody’s, Fitch and S&P) is an international financial services company headquartered in Chicago, Illinois. It provides investment management, asset and fund administration and fiduciary and banking services. Northern Trust employs approximately 20,000 people in offices across 20 U.S. states and 23 international locations throughout North America, Europe and the Asia-Pacific region. As of year-end 2018, Northern Trust reported $6.0 billion in revenue, $1.6 billion in net income and $1.1 trillion in assets under management. Northern Trust occupies its space through December 2025 with two, five-year renewal options remaining.
Quantitative Risk Management Inc. (107,092 sq. ft.; 11.3% of NRA; 15.0% of U/W Base Rent) Quantitative Risk Management, founded in 1987, is an enterprise risk management consulting firm. QRM aims to provide expert analytics and risk management advice to financial institutions worldwide. QRM is a financial risk consultancy of industry-leading organizations. With offices in Chicago, London, and Singapore, QRM works with companies worldwide, including clients on six continents and in over 30 countries. QRM’s client list numbers over 150 financial institutions worldwide, including 9 of the top 10 United States banking companies. The 181 West Madison Property is home of QRM’s global headquarters. QRM occupies its space through March 2022 and has one, five-year renewal option remaining.
The Marmon Group (45,123 sq. ft.; 4.8% of NRA; 6.5% of U/W Base Rent) The Marmon Group (rated Aa2/A+/AA by Moody’s, Fitch and S&P), a Berkshire Hathaway company, is a global industrial organization comprising 11 diverse business sectors and more than 125 autonomous manufacturing and service businesses. Some of the sectors of business include retail solutions, food service technologies, water technologies, transportation products, crane services and electrical and medical products. Marmon businesses operate more than 400 manufacturing, distribution and service facilities, and employ more than 22,000 people worldwide. Revenues exceeded $8.1 billion in 2018. The Marmon Group occupies its space through December 2022 and with one, five-year renewal option remaining.
Environmental Matters. The Phase I environmental report dated November 13, 2019 recommended no further action at the 181 West Madison Property.
The Market. Chicago is one of the largest business centers of the Midwest. The 181 West Madison Property falls within the Chicago-Naperville-Joliet metropolitan statistical area (“MSA”). The MSA ranks second nationally in total office inventory behind New York, containing nearly 233.2 million sq. ft. The 181 West Madison Property is located in the Central Loop submarket of Chicago. The Central Loop office submarket is one of the seven submarkets in Chicago’s CBD. The Central Loop, which is considered to be in the heart of the CBD financial district, is bound by Chicago River to the north, Harrison Street to the south, State Street to the east and Wells Street to the west. As of third quarter 2019, the submarket included 61 buildings with more than 34 million sq. ft. of office space. The Central Loop submarket comprises approximately 25.5% of the Chicago CBD office market.
According to the appraisal, as of third quarter of 2019, Class A office space in the Central Loop submarket had inventory of nearly 10.7 million sq. ft. with a market vacancy of 12.9% and overall asking rents of $46.11 per sq. ft. on a gross basis, while the overall CBD had a vacancy of 13.1% and asking rents of $40.32 PSF on a gross basis. In recent years, the submarket has benefitted from the influx of technology, advertising, media and information companies, as the submarket is one of the primary office submarkets in downtown Chicago. Many large corporations, including 33 Fortune 500 companies, are headquartered in Chicago. Furthermore, the MSA has an employment base comprised of more than 4.8 million employees. Year-to-date overall net absorption measured more than 1.2 million sq. ft. in third quarter 2019 in the Chicago CBD office market as move-ins outpaced move-outs. This was a sharp increase from the 498,806 sq. ft. of positive net absorption recorded through third quarter 2018 indicating a clear appetite for higher quality space, Class A product recorded nearly 1.5 million sq. ft. of positive year-to-date net absorption.
THE INFORMATION IN THIS STRUCTURAL AND COLLATERAL TERM SHEET IS NOT COMPLETE AND MAY BE AMENDED PRIOR TO THE TIME OF SALE. THIS TERM SHEET IS NOT AN OFFER TO SELL THESE SECURITIES AND IT IS NOT A SOLICITATION OF AN OFFER TO BUY THESE SECURITIES IN ANY JURISDICTION WHERE THE OFFER OR SALE IS NOT PERMITTED.
120
181 West Madison Street Chicago, IL 60602 | Collateral Asset Summary – Loan No. 10 181 West Madison | Cut-off Date Balance: Cut-off Date LTV: U/W NCF DSCR: U/W NOI Debt Yield: | $43,000,000 28.8% 4.67x 20.4% |
The appraisal identified eight comparable office leases across eight directly competitive office properties in the Central Loop and surrounding submarkets. Base rent across approximately 718,526 sq. ft. of recently executed leases ranges from $24.50 to $34.50 PSF. The appraisal’s concluded office market rent for the 181 West Madison Property is $26.07 PSF, in-line with the weighted average underwritten base rent for office space at the 181 West Madison Property of $25.37 PSF.
The appraisal identified six comparable property sale transactions that have occurred since July 2017 with a weighted average sales price of $386.60 PSF, in excess of the 181 West Madison Property’s acquisition price of approximately $379.45 PSF, highlighting the borrower sponsor’s attractive basis in the 181 West Madison Property. Year-to-date overall net absorption measured more than 1.2 million sq. ft. in third quarter 2019 in the Chicago CBD office market as move-ins outpaced move-outs. This was a sharp increase from the 498,806 sq. ft. of positive net absorption recorded through third quarter 2018. In addition, Class A product recorded nearly 1.5 million sq. ft. of positive year-to-date net absorption.
Cash Flow Analysis.
| Cash Flow Analysis(1) | |||||
| 2017 | 2018 | T-12 9/30/2019 | U/W | U/W per sq. ft.(1) | |
Base Rent(2) | $24,971,036 | $23,735,144 | $24,454,073 | $21,223,015 | $22.43 | |
Vacant Income | $0 | $0 | $0 | $3,361,566 | $3.55 | |
Gross Potential Rent | $24,971,036 | $23,735,144 | $24,454,073 | $24,584,581 | $25.99 | |
Total Reimbursements | $14,020,576 | $14,430,076 | $14,935,883 | $17,294,407 | $18.28 | |
Less: Vacancy/Credit Loss | ($401,185) | $0 | $0 | ($3,361,566) | ($3.55) | |
Miscellaneous Income | $405,878 | $311,107 | $410,957 | $180,499 | $0.19 | |
Add-On for IG Tenant(3) | $0 | $0 | $0 | $2,696,844 | $2.85 | |
Effective Gross Income | $38,996,305 | $38,476,327 | $39,800,913 | $41,394,765 | $43.75 | |
Total Fixed Expenses | $9,022,865 | $9,939,202 | $10,598,169 | $11,066,586 | $11.70 | |
Total Operating Expenses | $6,770,329 | $7,234,719 | $7,356,448 | $8,317,672 | $8.79 | |
Net Operating Income | $23,203,111 | $21,302,406 | $21,846,296 | $22,010,506 | $23.26 | |
TI/LC | $0 | $0 | $0 | $1,892,198 | $2.00 | |
Capital Expenditures | $0 | $0 | $0 | $189,220 | $0.20 | |
Net Cash Flow | $23,203,111 | $21,302,406 | $21,846,296 | $19,929,089 | $21.06 | |
|
|
|
|
|
|
|
(1) | Based on the underwritten rent roll dated November 30, 2019. |
(2) | Underwritten NOI and Underwritten NCF are inclusive of (i) contractual rent steps taken through November 2020 and (ii) straight-lined rent through the 181 West Madison Whole Loan maturity date for investment-grade rated tenants Northern Trust and CIBC. |
(3) | Add-On for IG Tenant is inclusive of an additional increase for investment grade tenants Northern Trust and CIBC, which have been straight-lined through the 181 West Madison Whole Loan term. |
Property Management. The 181 West Madison Property is managed by MB Real Estate Services Inc., a Delaware corporation. MB Real Estate Services Inc., is a full-service real estate company that acquires, develops, leases and manages real estate across the United States.
Lockbox / Cash Management. The 181 West Madison Whole Loan is structured with a hard lockbox and springing cash management. The borrower was required at loan origination to deliver a tenant direction letter to each existing tenant at the 181 West Madison Property directing each tenant to remit its rent checks directly to a lender-controlled lockbox. The borrower is also required to deliver a tenant direction letter to each future commercial tenant. So long as no Cash Sweep Event (as defined below) then exists, all funds deposited into the lockbox account are required to be transferred on each business day to or at the direction of the borrower. Upon the occurrence and during the continuance of a Cash Sweep Event, all funds in the lockbox account are required to be swept on each business day to a lender-controlled cash management account to be applied and disbursed for payment of taxes, insurance premiums, operating expenses, debt service, reserves and other amounts payable in accordance with the loan documents. All excess cash flow funds remaining in the cash management account after the application of such funds in accordance with the loan documents are required to be held by the lender in an excess cash flow reserve account as additional collateral for the 181 West Madison Whole Loan. Upon the occurrence and during the continuance of an event of default under the loan documents or any bankruptcy action of the borrower or property manager, the lender may apply funds to the debt in such priority as it may determine.
A “Cash Sweep Event” means each period commencing on the occurrence of (i) an event of default under the loan documents, (ii) any bankruptcy or insolvency action of the borrower, (iii) any bankruptcy or insolvency action of the property manager which (a) results in the bank accounts associated with the 181 West Madison Property being subsumed in a bankruptcy or insolvency action, (b) has a material adverse effect on the operation of the 181 West Madison Property (the “Property Manager Trigger”), (iv) the debt service coverage ratio being less than 1.30x on any date of determination for the calendar quarter immediately preceding the date of such determination, based upon annualized gross income from operation and operating expenses for the trailing three-month period immediately preceding such date of determination (a “DSCR Trigger Event”) and (iv) a Tenant Trigger Event (as defined below).
A “Tenant Trigger Event” means (a) any bankruptcy or insolvency action of Northern Trust, (b) the occurrence of the date that is 18 months prior to the expiration date of the Northern Trust lease, provided that Northern Trust has not renewed the Northern Trust lease
THE INFORMATION IN THIS STRUCTURAL AND COLLATERAL TERM SHEET IS NOT COMPLETE AND MAY BE AMENDED PRIOR TO THE TIME OF SALE. THIS TERM SHEET IS NOT AN OFFER TO SELL THESE SECURITIES AND IT IS NOT A SOLICITATION OF AN OFFER TO BUY THESE SECURITIES IN ANY JURISDICTION WHERE THE OFFER OR SALE IS NOT PERMITTED.
121
181 West Madison Street Chicago, IL 60602 | Collateral Asset Summary – Loan No. 10 181 West Madison | Cut-off Date Balance: Cut-off Date LTV: U/W NCF DSCR: U/W NOI Debt Yield: | $43,000,000 28.8% 4.67x 20.4% |
with respect to at least 80.0% of its premises, (c) the occurrence of a default by Northern Trust under the Northern Trust lease which remains uncured beyond all applicable notice and cure periods.
A “Cash Sweep Event Cure” means, (a) if caused by an event of default, the acceptance by the lender of a cure of such event of default; (b) if caused by a Property Manager Trigger, if the borrower replaces the property manager with a manager approved by the lender under a replacement management agreement in accordance with the loan documents within 60 days of such Property Manager Trigger; (c) if caused by the occurrence of a DSCR Trigger Event, (i) the achievement of a debt service coverage ratio of 1.30x or greater for six consecutive months based upon the trailing three month period immediately preceding the date of determination or (ii) the borrower effects a DSCR Cure Action (as defined below), or (d) if caused solely by the occurrence of a Tenant Trigger Event, the occurrence of a Tenant Cure Event; provided (i) no event of default is continuing, (ii) a Cash Sweep Event Cure may occur no more than a total of five times in the aggregate during the term of the 181 West Madison Whole Loan (provided, however, that there will be no limit on the number of times a DSCR Cure Action (as defined below) may occur, (iii) the borrower has paid all of the lender’s reasonable expenses incurred in connection with such Cash Sweep Event Cure, and (iv) in no event may the borrower have the right to cure a Cash Sweep Event caused by bankruptcy or insolvency of the borrower.
A “DSCR Cure Action” means satisfaction of the following conditions: (a) the borrower has delivered a letter of credit (the “Low Debt Service Period Threshold Letter of Credit”) with a notional amount which, if applied to the 181 West Madison Whole Loan, would result in a debt service coverage ratio of at least 1.30x based upon the trailing three month period immediately preceding the date of determination (the “DSCR Cure Assumed Paydown Amount”) and (b) no Cash Sweep Event resulting from a separate event has occurred which has not been cured; provided, among other conditions set forth in the loan documents, that (x) the amount of the Low Debt Service Period Threshold Letter of Credit (together with the amount of any other letters of credit that have been delivered by borrower to lender pursuant to the loan documents) may not exceed 10% of the outstanding principal of the 181 West Madison Whole Loan, unless such excess is permitted under a new additional insolvency opinion delivered in connection with the DSCR Cure Action, and (y) the borrower has no reimbursement obligations with respect to such Low Debt Service Period Threshold Letter of Credit.
“Tenant Cure Event” means either (x) the occurrence of: (i) the replacement of Northern Trust with one or more tenants approved by the lender leasing not less than 80% of the leasable area of the premises occupied by Northern Trust, in accordance with the loan documents, and (ii) delivery of a tenant estoppel confirming the lease and that the tenant has accepted the demised premises with respect to each such replacement tenant or (y) the lender’s acceptance of satisfactory evidence of a cure of Northern Trust’s default under its lease.
“Reserve Trigger Event” commences upon the earlier to occur of (i) the debt service coverage ratio based on underwritten net cash flow falls below 1.60x at the end of any quarter, based on a trailing three (3) month basis and (ii) a Cash Sweep Event has occurred and is continuing on a monthly basis thereafter.
Initial and Ongoing Reserves. At loan origination, the borrower deposited approximately $1,532,852 for outstanding free rent associated with six tenants, approximately $1,229,826 for outstanding rollover, approximately $157,683 into a TI/LC reserve and approximately $60,000 for outstanding capital expenditures.
Tax Reserve. The borrower is required to deposit into a real estate tax reserve, on a monthly basis, 1/12th of the estimated annual real estate taxes. In the event that (i) the borrower provides evidence reasonably satisfactory to the lender that all taxes and other charges have been paid prior to the related due date, (ii) no Reserve Trigger Event has occurred and (iii) there is no event of default continuing, the requirement for monthly deposits into the tax reserve will be waived.
Insurance Reserve. The borrower is required to deposit into an insurance reserve, on a monthly basis, 1/12th of estimated insurance premiums. In the event that (i) the borrower obtains and maintains a blanket insurance policy acceptable to the lender, (ii) no Reserve Trigger Event has occurred and (iii) there is no event of default continuing, the requirement for monthly deposits into the insurance reserve will be waived.
TI/LC Reserves. On each payment date, the borrower is required to deposit $157,683 into a tenant improvement and leasing commissions reserve account, subject to a cap of $7,000,000.
Replacement Reserves. Commencing upon a Reserve Trigger Event, the borrower is required to deposit into a replacement reserve an amount equal to $0.20 PSF (deposited monthly in an amount equal to $15,768), subject to a cap of $567,660.
Current Mezzanine or Subordinate Indebtedness. The 181 West Madison Junior Note, with an outstanding principal balance as of the Cut-off Date of $132.1 million, accrues interest at a fixed rate of 3.90000% per annum. The 181 West Madison Junior Note has an 84-month term and is interest only for the full term. For additional information, see “Description of the Mortgage Pool—The Whole Loans—The Non- Serviced AB Whole Loans—The 181 West Madison Whole Loan” in the Preliminary Prospectus.
Future Mezzanine or Subordinate Indebtedness Permitted. None.
Partial Release. None.
THE INFORMATION IN THIS STRUCTURAL AND COLLATERAL TERM SHEET IS NOT COMPLETE AND MAY BE AMENDED PRIOR TO THE TIME OF SALE. THIS TERM SHEET IS NOT AN OFFER TO SELL THESE SECURITIES AND IT IS NOT A SOLICITATION OF AN OFFER TO BUY THESE SECURITIES IN ANY JURISDICTION WHERE THE OFFER OR SALE IS NOT PERMITTED.
122
(THIS PAGE INTENTIONALLY LEFT BLANK)
123
Various
| Collateral Asset Summary – Loan No. 11 Middleton Net Lease Portfolio | Cut-off Date Balance: Cut-off Date LTV: U/W NCF DSCR: U/W NOI Debt Yield: | $42,250,000 59.4% 2.62x 9.9% |
Mortgage Loan Information | |
Loan Seller: | CREFI |
Loan Purpose: | Recapitalization / Acquisition |
Borrower Sponsors: | Mitchel Greenberg; Peter Holstein; Keith Jaffee |
Borrowers: | Middleton Income Investors West Seneca LLC, Middleton Income Investors Cranberry LLC, Middleton Income Investors Asheboro LLC and Middleton Income Investors Concord LLC |
Original Balance: | $42,250,000 |
Cut-off Date Balance: | $42,250,000 |
% by Initial UPB: | 4.7% |
Interest Rate: | 3.63000% |
Payment Date: | 6th of each month |
First Payment Date: | January 6, 2020 |
Maturity Date: | December 6, 2029 |
Amortization: | Interest Only |
Additional Debt: | None |
Call Protection: | L(26), D(90), O(4) |
Lockbox / Cash Management: | Springing Hard / Springing |
Reserves | |||
| Initial | Monthly | Cap |
Taxes: | $0 | Springing | NAP |
Insurance: | $0 | Springing | NAP |
Replacement: | $0 | Springing | NAP |
TI/LC: | $0 | Springing | NAP |
Required Repairs: | $0 | NAP | NAP |
Property Information | |
Single Asset / Portfolio: | Portfolio of four properties |
Property Type: | Single Tenant Retail |
Collateral: | Fee Simple |
Location: | Various |
Year Built / Renovated: | Various / Various |
Total Sq. Ft.: | 716,871 |
Property Management: | Self-Managed |
Underwritten NOI: | $4,171,675 |
Underwritten NCF: | $4,071,334 |
Appraised Value: | $71,150,000 |
Appraisal Date: | Various |
| |
Historical NOI(1) | |
Most Recent NOI: | NAV |
2018 NOI: | NAV |
2017 NOI: | NAV |
2016 NOI: | NAV |
| |
Historical Occupancy(1) | |
Most Recent Occupancy: | 100.0% (February 6, 2020) |
2018 Occupancy: | NAV |
2017 Occupancy: | NAV |
2016 Occupancy: | NAV |
Financial Information | ||||||
Tranche | Cut-off Date Balance | Balance per Sq. Ft. Cut-off / Balloon | LTV Cut-off / Balloon | U/W DSCR NOI / NCF | U/W Debt Yield NOI / NCF | U/W Debt Yield at Balloon NOI / NCF |
Mortgage Loan | $42,250,000 | $59 / $59 | 59.4% / 59.4% | 2.68x / 2.62x | 9.9% / 9.6% | 9.9% / 9.6% |
(1) | The borrower sponsors acquired three of the Middleton Net Lease Portfolio Properties in 2019. As a result, Historical NOI and Historical Occupancy are not available. Please see “The Properties” herein. |
THE INFORMATION IN THIS STRUCTURAL AND COLLATERAL TERM SHEET IS NOT COMPLETE AND MAY BE AMENDED PRIOR TO THE TIME OF SALE. THIS TERM SHEET IS NOT AN OFFER TO SELL THESE SECURITIES AND IT IS NOT A SOLICITATION OF AN OFFER TO BUY THESE SECURITIES IN ANY JURISDICTION WHERE THE OFFER OR SALE IS NOT PERMITTED.
124
Various
| Collateral Asset Summary – Loan No. 11 Middleton Net Lease Portfolio | Cut-off Date Balance: Cut-off Date LTV: U/W NCF DSCR: U/W NOI Debt Yield: | $42,250,000 59.4% 2.62x 9.9% |
Portfolio Summary(1) | ||||||||||
Property Name | City | State | Sole Tenant | Property Type | Sq. Ft. | Occupancy | Allocated Loan Amount ($) | % of Allocated Loan Amount | UW NCF | Appraised Value(2) |
Asheboro - Walmart | Asheboro | NC | Walmart | Retail | 221,896 | 100% | $11,700,000.00 | 27.7% | $1,116,504 | $19,650,000 |
West Seneca - Home Depot | West Seneca | NY | Home Depot | Retail | 103,344 | 100% | $11,300,000.00 | 26.7% | $1,137,974 | $19,000,000 |
Concord - Walmart | Concord | NC | Walmart | Retail | 203,750 | 100% | $10,700,000.00 | 25.3% | $1,025,358 | $18,000,000 |
Cranberry - Walmart | Cranberry | PA | Walmart Supercenter | Retail | 187,881 | 100% | $8,550,000.00 | 20.2% | $791,498 | $14,500,000 |
Total / Wtd. Avg. |
|
|
|
| 716,871 | 100% | $42,250,000.00 | 100.0% | $4,071,334 | $71,150,000 |
(1) | Based on the underwritten rent roll dated October 1, 2019. |
(2) | Source: Appraisal. The appraisal used capitalization rates equal to 5.75% for West Seneca – Home Depot, and 6.00% for Asheboro – Walmart, Cranberry – Walmart and Concord – Walmart, for the direct capitalization value approach. |
Sources and Uses(1) | ||||||||
Sources | Proceeds | % of Total | Uses | Proceeds | % of Total | |||
Whole Loan | $42,250,000 | 87.0 | % | Loan Payoff | $28,514,089 | 58.7 | % | |
Borrower Sponsor Equity | 6,000,479 | 12.4 |
| Purchase Price | $19,191,300 | 39.5 |
| |
Other Sources(2) | 292,611 | 0.6 |
| Closing Costs | 837,702 | 1.7 |
| |
Total Sources | $48,543,091 | 100.0 | % | Total Uses | $48,543,091 | 100.0 | % | |
(1) | The Middleton Net Lease Portfolio loan proceeds and sponsors’ equity was used to (i) pay down approximately $28.5 million of an existing line of credit that was utilized to purchase the West Seneca - Home Depot, Concord – Walmart, and Cranberry - Walmart properties, (ii) fund the acquisition of the Asheboro - Walmart property and (iii) pay closing costs. |
The Borrowers / Borrower Sponsors. The four borrowing entities for the Middleton Net lease Portfolio loan are Middleton Income Investors Cranberry LLC, Middleton Income Investors Concord LLC, Middleton Income Investors Asheboro LLC, and Middleton Income Investors West Seneca LLC, all Delaware limited liability companies and special purpose entities with at least one independent director in its organizational structure. Legal counsel to the borrowers delivered a non-consolidation opinion in connection with the origination of the Middleton Net Lease Portfolio loan.
The borrower sponsors and non-recourse carveout guarantors are Mitchel Greenberg, Keith Jaffee, and Peter Holstein. Middleton Partners LLC (“Middleton”) is a private real estate investment company, which serves as the platform for investment activities of Mitchell Greenberg, Keith Jaffee, and Peter Holstein. Middleton is based out of Chicago and is active in commercial real estate and lower middle market manufacturing, distribution, and service companies. Middleton’s real estate portfolio exceeds 3 million sq. ft. across a variety of markets and property types, including commercial office, hospitality and multifamily assets. The principals’ real estate experience includes the acquisition and development of office, industrial, retail, residential, medical office and data center properties. Project sizes range from a few thousand to several hundred thousand sq. ft., with valuations from $2.5 million to $100 million.
The Properties. The Middleton Net Lease Portfolio properties (the “Middleton Net Lease Portfolio Properties”) are comprised of four single-tenant retail properties totaling 716,871 sq. ft. located in North Carolina, Pennsylvania, and New York. The Middleton Net Lease Portfolio Properties were acquired for $69,776,141. The West Seneca - Home Depot, Concord - Walmart, and Cranberry - Walmart were acquired in all cash transactions in 2019.
The Asheboro - Walmart property consists of 221,896 sq. ft. (31.0% of NRA) of single-tenant retail space, located in Asheboro, North Carolina. The Asheboro - Walmart property was constructed in 1999 and is situated on a 21.27-acre site with 1,094 parking spaces, resulting in a parking ratio of 4.93 per 1,000 sq. ft. The Asheboro - Walmart is located along the US Highway 64/NC Highway 49 corridor, the primary retail corridor in Asheboro, and is in close proximity to other major retailers such as JC Penney, Sears, Belk, and Dillard’s. As of February 6, 2020, the Asheboro - Walmart property is 100.0% occupied by Walmart. Walmart has a lease expiration date of October 31, 2029 with no termination options, four, five-year renewal options remaining and UW base rent of $5.32 per sq. ft.
The West Seneca - Home Depot property consists of 103,344 sq. ft. (14.4% of NRA) of single-tenant retail space, located in West Seneca, New York. The West Seneca - Home Depot property was constructed in 1996 and underwent a renovation in 2016. Situated on a 10.15 acre site, the West Seneca - Home Depot property offers 1,000 parking spaces, resulting in a parking ratio of 9.68 per 1,000 sq. ft. The
THE INFORMATION IN THIS STRUCTURAL AND COLLATERAL TERM SHEET IS NOT COMPLETE AND MAY BE AMENDED PRIOR TO THE TIME OF SALE. THIS TERM SHEET IS NOT AN OFFER TO SELL THESE SECURITIES AND IT IS NOT A SOLICITATION OF AN OFFER TO BUY THESE SECURITIES IN ANY JURISDICTION WHERE THE OFFER OR SALE IS NOT PERMITTED.
125
Various | Collateral Asset Summary – Loan No. 11 Middleton Net Lease Portfolio | Cut-off Date Balance: Cut-off Date LTV: U/W NCF DSCR: U/W NOI Debt Yield: | $42,250,000 59.4% 2.62x 9.9% |
West Seneca - Home Depot property is located along Ridge Road and is approximately 0.5 miles west of Interstate 90, providing convenient east-west access across Upstate New York to the metropolitan centers of Buffalo, Rochester, Syracuse, and Albany. As of February 6, 2020, the West Seneca - Home Depot was 100.0% occupied by Home Depot. Home Depot has a lease expiration date of January 31, 2031 with no termination options, three, five-year renewal options remaining and UW base rent of $11.45 PSF.
The Concord - Walmart property consists of 203,750 sq. ft. (28.4% of NRA) of single-tenant retail space, located in Concord, North Carolina. The Concord - Walmart property was constructed in 1999 and is situated on a 17.97-acre site with 913 parking spaces, resulting in a parking ratio of 4.48 per 1,000 sq. ft. Concord’s central business district is located approximately two miles north of the subject, while Charlotte’s central business district is located approximately 20 miles southwest of the subject. As of February 6, 2020, the Concord - Walmart property was 100.0% occupied by Walmart. Walmart has a lease expiration date of January 31, 2030 with no termination options, twelve, nine-year renewal options remaining and UW base of $5.29 PSF.
The Cranberry - Walmart property consists of 187,881 sq. ft. (26.2% of NRA) of single-tenant retail space, located in Cranberry, Pennsylvania. The Cranberry - Walmart property was constructed in 1999 and is situated on a 17.70-acre site with 868 parking spaces, resulting in a parking ratio of 4.62 per 1,000 sq. ft. As of February 6, 2020, the Cranberry - Walmart property was 100.0% occupied by Walmart Supercenter. Walmart Supercenter has a lease expiration date of July 20, 2029 with no termination options, ten, five-year renewal options remaining and UW base rent of $4.63 per sq. ft.
Tenant Summary(1) | |||||||||||
Property Name/Tenant | Ratings (Moody’s/S&P/Fitch)(2) | Net Rentable Area (Sq. Ft.) | % of Net |
| U/W Base Rent PSF(3) | % of Total U/W Base Rent(3) | Lease Expiration | ||||
West Seneca - Home Depot(4) | A2 / A / A | 103,344 |
| 14.4 | % |
| $11.45 |
| 27.4 | % | 1/31/2031 |
Asheboro - Walmart(5) | Aa2 / AA / AA | 221,896 |
| 31.0 |
|
| 5.32 |
| 27.4 |
| 10/31/2029 |
Concord - Walmart(6) | Aa2 / AA / AA | 203,750 |
| 28.4 |
|
| 5.29 |
| 25.0 |
| 1/31/2030 |
Cranberry - Walmart(7) | Aa2 / AA / AA | 187,881 |
| 26.2 |
|
| 4.63 |
| 20.2 |
| 7/20/2029 |
Total Occupied Space |
| 716,871 |
| 100.0 | % |
| $6.01 |
| 100.0 | % |
|
Vacant |
| 0 |
| 0.0 |
|
|
|
|
|
|
|
Total |
| 716,871 |
| 100.0 | % |
|
|
|
|
|
|
(1) | Based on the underwritten rent roll dated October 1, 2019. |
(2) | Certain ratings are those of the parent company whether or not the parent guarantees the lease. |
(3) | U/W Base Rent PSF and % of Total U/W Base Rent includes $98,177 of contractual rent steps underwritten based on the straight line average of all rent steps for West Seneca - Home Depot through the term of the Middleton Net Lease Portfolio loan. |
(4) | Tenant has three, five-year renewal options. |
(5) | Tenant has four, five-year lease renewal options. |
(6) | Tenant has twelve, nine-year renewal options. |
(7) | Tenant has ten, five-year renewal options. |
THE INFORMATION IN THIS STRUCTURAL AND COLLATERAL TERM SHEET IS NOT COMPLETE AND MAY BE AMENDED PRIOR TO THE TIME OF SALE. THIS TERM SHEET IS NOT AN OFFER TO SELL THESE SECURITIES AND IT IS NOT A SOLICITATION OF AN OFFER TO BUY THESE SECURITIES IN ANY JURISDICTION WHERE THE OFFER OR SALE IS NOT PERMITTED.
126
Various
| Collateral Asset Summary – Loan No. 11 Middleton Net Lease Portfolio | Cut-off Date Balance: Cut-off Date LTV: U/W NCF DSCR: U/W NOI Debt Yield: | $42,250,000 59.4% 2.62x 9.9% |
Lease Rollover Schedule(1) | |||||||||||||||||||||||
Year |
| # of Leases Expiring |
| Total Expiring Sq. Ft. |
| % of Total Sq. Ft. Expiring |
| Cumulative Sq. Ft. Expiring |
| Cumulative % of Sq. Ft. Expiring |
| Annual U/W Base Rent PSF(2) |
| % U/W Base Rent Rolling(2) |
| Cumulative % of U/W Base Rent(2) | |||||||
MTM |
| 0 |
| 0 |
|
| 0.0% |
|
| 0 |
|
| 0.0% |
|
| $0 |
|
| 0.0% |
|
| 0.0% |
|
2020 |
| 0 |
| 0 |
|
| 0.0% |
|
| 0 |
|
| 0.0% |
|
| $0 |
|
| 0.0% |
|
| 0.0% |
|
2021 |
| 0 |
| 0 |
|
| 0.0% |
|
| 0 |
|
| 0.0% |
|
| $0 |
|
| 0.0% |
|
| 0.0% |
|
2022 |
| 0 |
| 0 |
|
| 0.0% |
|
| 0 |
|
| 0.0% |
|
| $0 |
|
| 0.0% |
|
| 0.0% |
|
2023 |
| 0 |
| 0 |
|
| 0.0% |
|
| 0 |
|
| 0.0% |
|
| $0 |
|
| 0.0% |
|
| 0.0% |
|
2024 |
| 0 |
| 0 |
|
| 0.0% |
|
| 0 |
|
| 0.0% |
|
| $0 |
|
| 0.0% |
|
| 0.0% |
|
2025 |
| 0 |
| 0 |
|
| 0.0% |
|
| 0 |
|
| 0.0% |
|
| $0 |
|
| 0.0% |
|
| 0.0% |
|
2026 |
| 0 |
| 0 |
|
| 0.0% |
|
| 0 |
|
| 0.0% |
|
| $0 |
|
| 0.0% |
|
| 0.0% |
|
2027 |
| 0 |
| 0 |
|
| 0.0% |
|
| 0 |
|
| 0.0% |
|
| $0 |
|
| 0.0% |
|
| 0.0% |
|
2028 |
| 0 |
| 0 |
|
| 0.0% |
|
| 0 |
|
| 0.0% |
|
| $0 |
|
| 0.0% |
|
| 0.0% |
|
2029 |
| 2 |
| 409,777 |
|
| 57.2% |
|
| 409,777 |
|
| 57.2% |
|
| $5.00 |
|
| 47.5% |
|
| 47.5% |
|
2030 |
| 1 |
| 203,750 |
|
| 28.4% |
|
| 613,527 |
|
| 85.6% |
|
| $5.29 |
|
| 25.0% |
|
| 72.6% |
|
Thereafter |
| 1 |
| 103,344 |
|
| 14.4% |
|
| 716,871 |
|
| 100.0% |
|
| $11.45 |
|
| 27.4% |
|
| 100.0% |
|
Vacant |
| NAP |
| 0 |
|
| 0.0% |
|
| 716,871 |
|
| 100.0% |
|
| NAP |
|
| NAP |
|
| NAP |
|
Total / Wtd. Avg. |
| 4 |
| 716,871 |
|
| 100.0% |
|
|
|
|
|
|
|
| $6.01 |
|
| 100.0% |
|
|
|
|
(1) | Based on the underwritten rent roll dated October 1, 2019. |
(2) | Annual U/W Base Rent PSF, % U/W Base Rent Rolling and Cumulative % of U/W Base Rent contractual rent steps underwritten based on the straight line average of all rent steps for West Seneca - Home Depot through the term of the Middleton Net Lease Portfolio loan. |
Cash Flow Analysis.
Cash Flow Analysis(3) | ||
| U/W | U/W (PSF) |
Base Rent | $4,213,724 | $5.88 |
Reimbursements | 1,690,180 | $2.36 |
Rent Steps(1) | 98,177 | $0.14 |
Gross Potential Rent | $6,002,081 | $8.37 |
Other Income | 0 | $0.00 |
Vacancy & Credit Loss(2) | (140,226) | ($0.20) |
Effective Gross Income | $5,861,855 | $8.18 |
Real Estate Taxes | 959,327 | $1.34 |
Insurance | 46,802 | $0.07 |
Management Fee | 146,546 | $0.20 |
Total Other Expenses | 537,505 | $0.75 |
Net Operating Income | $4,171,675 | $5.82 |
Replacement Reserves | 71,687 | $0.10 |
TI/LC | 28,654 | $0.04 |
Net Cash Flow | $4,071,334 | $5.68 |
(1) | Rent Steps includes $98,177 of contractual rent steps underwritten based on the straight line average of all rent steps for West Seneca - Home Depot through the term of the Middleton Net Lease Portfolio loan. |
(2) | U/W Vacancy & Credit Loss represents the underwritten economic vacancy of 2.3%. |
(3) | The borrower sponsors acquired three of the Middleton Net Lease Portfolio Properties in 2019. As a result, historical cash flows are not available. |
THE INFORMATION IN THIS STRUCTURAL AND COLLATERAL TERM SHEET IS NOT COMPLETE AND MAY BE AMENDED PRIOR TO THE TIME OF SALE. THIS TERM SHEET IS NOT AN OFFER TO SELL THESE SECURITIES AND IT IS NOT A SOLICITATION OF AN OFFER TO BUY THESE SECURITIES IN ANY JURISDICTION WHERE THE OFFER OR SALE IS NOT PERMITTED.
127
3378 Greenbriar Parkway Southwest Atlanta, GA 30331 | Collateral Asset Summary – Loan No. 12 Landing Square | Cut-off Date Balance: Cut-off Date LTV: U/W NCF DSCR: U/W NOI Debt Yield: | $36,200,000 73.9% 1.22x 7.9% |
Mortgage Loan Information | |
Loan Seller: | GACC |
Loan Purpose: | Acquisition |
Borrower Sponsor: | Edward I. Biskind |
Borrower: | Landing Square Multifamily Limited Partnership |
Original Balance: | $36,200,000 |
Cut-off Date Balance: | $36,200,000 |
% by Initial UPB: | 4.0% |
Interest Rate: | 4.31500% |
Payment Date: | 6th of each month |
First Payment Date: | February 6, 2020 |
Maturity Date: | January 6, 2030 |
Amortization: | Interest only for first 36 months, 360 months thereafter |
None | |
L(25), D(91), O(4) | |
Soft / Springing | |
Reserves | |||
| Initial | Monthly | Cap |
Taxes: | $97,754 | $32,585 | NAP |
Insurance: | $0 | Springing | NAP |
Replacement: | $0 | $6,064 | NAP |
TI/LC Reserve: | $0 | NAP | NAP |
Capital Expenditure Holdback(1): | $2,000,000 | NAP | NAP |
Property Information | |
Single Asset | |
Garden Multifamily | |
Fee Simple | |
Atlanta, GA | |
2008 / NAP | |
322 | |
DayRise Residential, LLC | |
$2,704,827 | |
$2,632,055 | |
$46,300,000 | |
September 9, 2019 | |
| |
Historical NOI(2) | |
Most Recent NOI: | $2,687,874 (T-12 October 31, 2019) |
2018 NOI: | $2,119,814 (December 31, 2018) |
2017 NOI: | $1,657,299 (December 31, 2017) |
2016 NOI(4): | NAV |
| |
Historical Occupancy | |
Most Recent Occupancy: | 92.2% (November 15, 2019) |
2018 Occupancy: | 93.6% (December 31, 2018) |
2017 Occupancy: | 90.3% (December 31, 2017) |
2016 Occupancy(4): | NAV |
Financial Information(3) | ||||||
Tranche | Cut-off Date Balance | Balance per Unit Cut-off / Balloon | LTV Cut-off / Balloon | U/W DSCR NOI / NCF | U/W Debt Yield NOI / NCF | U/W Debt Yield at Balloon NOI / NCF |
Mortgage Loan | $36,200,000 | $112,422 / $97,984 | 73.9% / 68.1% | 1.26x / 1.22x | 7.9% / 7.7% | 8.6% / 8.3% |
(1) | At origination, the lender escrowed 100% of the borrower’s capital improvement budget of $2.0 million. The initial $1.0 million of the holdback will be available for immediate release as work is completed and reimbursed pursuant to the borrower’s budget. The remainder of the Capital Expenditure reserve will be released based on (1) satisfactory completion of the work as evidenced by invoices submitted to the servicer and (2) achieving a debt yield of 7.3% or greater based on the fully funded loan amount. |
(2) | Since 2017, approximately $1.4 million ($4,120/unit) in capital expenditures has been invested into the Landing Square Property (as defined below), which led to increases in rental rates over the period from 2017 to T-12 October 31, 2019. |
(3) | The U/W Debt Yield NOI (%), U/W Debt Yield NCF (%), and Cut-off Date LTV are calculated net of a $2,000,000 holdback reserve. The U/W Debt Yield NOI and U/W Debt Yield NCF (%) calculated based on the fully funded loan amount of $36,200,000 are 7.5% and 7.3%, respectively. The Cut-off Date LTV calculated based on the fully funded loan amount of $36,200,000 is 78.2%. |
(4) | Historical financial information and occupancy for 2016 are not available since the Landing Square Property was acquired at origination. |
THE INFORMATION IN THIS STRUCTURAL AND COLLATERAL TERM SHEET IS NOT COMPLETE AND MAY BE AMENDED PRIOR TO THE TIME OF SALE. THIS TERM SHEET IS NOT AN OFFER TO SELL THESE SECURITIES AND IT IS NOT A SOLICITATION OF AN OFFER TO BUY THESE SECURITIES IN ANY JURISDICTION WHERE THE OFFER OR SALE IS NOT PERMITTED.
128
3378 Greenbriar Parkway Southwest Atlanta, GA 30331 | Collateral Asset Summary – Loan No. 12 Landing Square | Cut-off Date Balance: Cut-off Date LTV: U/W NCF DSCR: U/W NOI Debt Yield: | $36,200,000 73.9% 1.22x 7.9% |
Sources and Uses | ||||||||
Sources | Proceeds | % of Total |
| Uses | Proceeds | % of Total | ||
Loan Amount | $36,200,000 | 75.1 | % |
| Purchase Price | $45,600,000 | 94.6 | % |
Principal’s New Cash Equity | 11,977,673 | 24.9 |
|
| Capital Expenditure Holdback | 2,000,000 | 4.2 |
|
|
|
|
|
| Closing Costs | 479,918 | 1.0 |
|
|
|
|
|
| Tax Reserves | 97,754 | 0.2 |
|
Total Sources | $48,177,673 | 100.0 | % |
| Total Uses | $48,177,673 | 100.0 | % |
The Borrower / Borrower Sponsor. The borrower is Landing Square Multifamily Limited Partnership, a Delaware limited liability company structured to be a bankruptcy-remote entity with two independent directors in its organizational structure. Legal counsel to the borrowers delivered a non-consolidation opinion in connection with the origination of the Landing Square loan.
The borrower sponsor and non-recourse carveout guarantor is Edward I. Biskind. Edward I. Biskand is the co-founder and managing partner of Intercapital Group and has over 30 years’ experience in real estate investment, development and management. InterCapital Group was formed in 2010 and is a full-service, vertically integrated investment firm with property and construction management services provided by its affiliate, Dayrise Residential. InterCapital Group currently owns or manages 11,537 units across 41 properties.
The Property. The Landing Square Property is a 322-unit, garden-style multifamily property located at 3378 Greenbriar Parkway Southwest, Atlanta, Georgia. The Landing Square Property was built in 2008 and is situated on a 17.51-acre site. The improvements consist of 16 buildings including 10, three-story residential buildings, a pool/fitness building, a single-story leasing office/clubhouse, and four garage buildings. Landing Square Property amenities include a swimming pool, barbeque grills, fitness center, business center, clubhouse and playground. Surface parking is provided throughout the Landing Square Property for 435 vehicles (1.35 spaces per unit). The Landing Square Property is currently 92.2% occupied per the rent roll dated November 15, 2019. The Landing Square Property’s unit mix includes one, two and three bedroom floorplans with an average unit size of 1,096 sq. ft.
Multifamily Unit Mix(1)(2) | ||||||
Unit Type | # of Units | % of Total Units | Occupancy | Average Unit Size (Sq. Ft.) | Average Rent Per Unit | Average Rent PSF/Year |
1BR/1BA | 106 | 32.9% | 94.3% | 778 | $984 | $15.21 |
2BR/2BA | 166 | 51.6% | 90.4% | 1,167 | $1,241 | $12.80 |
3BR/2BA | 50 | 15.5% | 94.0% | 1,532 | $1,472 | $11.53 |
Total / Wtd. Avg. | 322 | 100.0% | 92.2% | 1,095 | $1,191 | $13.10 |
(1) | Based on the underwritten rent roll dated November 15, 2019. |
(2) | Occupancy, Average Unit Size (sq. ft.), and Average Monthly In-Place Rents represent a weighted average of the various unit type layouts. |
THE INFORMATION IN THIS STRUCTURAL AND COLLATERAL TERM SHEET IS NOT COMPLETE AND MAY BE AMENDED PRIOR TO THE TIME OF SALE. THIS TERM SHEET IS NOT AN OFFER TO SELL THESE SECURITIES AND IT IS NOT A SOLICITATION OF AN OFFER TO BUY THESE SECURITIES IN ANY JURISDICTION WHERE THE OFFER OR SALE IS NOT PERMITTED.
129
3378 Greenbriar Parkway Southwest Atlanta, GA 30331 | Collateral Asset Summary – Loan No. 12 Landing Square | Cut-off Date Balance: Cut-off Date LTV: U/W NCF DSCR: U/W NOI Debt Yield: | $36,200,000 73.9% 1.22x 7.9% |
Cash Flow Analysis.
Cash Flow Analysis | |||||
| 2017 | 2018 | T-12 10/31/2019 | U/W | U/W Per Unit |
Gross Potential Rent | $3,950,968 | $4,233,411 | $4,428,877 | $4,572,390 | $14,199.97 |
Vacancy | (403,081) | (360,522) | (237,271) | (272,338) | ($845.77) |
Bad Debt | (199,731) | (193,329) | (111,717) | (62,756) | ($194.90) |
Concessions | (61,221) | (22,687) | (2,620) | 0 | $0.00 |
Net Rental Income | $ 3,286,934 | $ 3,656,872 | $ 4,077,269 | $ 4,237,296 | $ 13,159.30 |
Parking Income | 9,543 | 13,303 | 23,107 | 23,107 | $71.76 |
Other Income(1) | 333,248 | 411,648 | 456,678 | 456,678 | $1,418.26 |
Effective Gross Income | $ 3,629,725 | $ 4,081,822 | $ 4,557,054 | $ 4,717,081 | $ 14,649.32 |
Real Estate Taxes | 473,583 | 448,511 | 400,819 | 599,571 | $1,862.02 |
Management Fee | 142,765 | 167,989 | 165,546 | 141,512 | $439.48 |
Other Expenses | 1,356,078 | 1,345,508 | 1,302,815 | 1,271,171 | $3,947.74 |
Total Expenses | $ 1,972,426 | $ 1,962,008 | $ 1,869,180 | $ 2,012,254 | $ 6,249.24 |
Net Operating Income | $ 1,657,299 | $ 2,119,814 | $ 2,687,874 | $ 2,704,827 | $ 8,400.08 |
Replacement Reserves | 80,500 | 80,500 | 80,500 | 72,772 | $226.00 |
Net Cash Flow | $ 1,576,799 | $ 2,039,314 | $ 2,607,374 | $ 2,632,055 | $ 8,174.08 |
(1) | Other Income includes utility reimbursements and other general items. |
THE INFORMATION IN THIS STRUCTURAL AND COLLATERAL TERM SHEET IS NOT COMPLETE AND MAY BE AMENDED PRIOR TO THE TIME OF SALE. THIS TERM SHEET IS NOT AN OFFER TO SELL THESE SECURITIES AND IT IS NOT A SOLICITATION OF AN OFFER TO BUY THESE SECURITIES IN ANY JURISDICTION WHERE THE OFFER OR SALE IS NOT PERMITTED.
130
(THIS PAGE INTENTIONALLY LEFT BLANK)
131
510 East 14th Street New York, NY 10009 | Collateral Asset Summary – Loan No. 13 510 East 14th Street | Cut-off Date Balance: Cut-off Date LTV: U/W NCF DSCR: U/W NOI Debt Yield: | $35,000,000 29.5% 3.62x 10.9% |
| Mortgage Loan Information | |
| Loan Seller: | CREFI |
| Loan Purpose: | Refinance |
| Credit Assessment | |
| (Fitch/KBRA)(6): | BBB-sf / BBB(sf) |
| Borrower Sponsors: | Extell Limited and Gershon Barnett (A/K/A Gary Barnett) |
| Borrowers: | East Village 14 Owner LLC and East Village 14 TRS LLC |
| Original Balance: | $35,000,000 |
| Cut-off Date Balance: | $35,000,000 |
| % by Initial UPB: | 3.9% |
| Interest Rate: | 2.92000% |
| Payment Date: | 6thof each month |
| First Payment Date: | February 6, 2020 |
| Maturity Date: | December 6, 2029 |
| Amortization: | Interest Only |
| Additional Debt(1): | $50,000,000Pari Passu Debt; $75,000,000 Mezzanine Debt |
| Call Protection(2): | YM1(25), DorYM1(90), O(4) |
| Lockbox / Cash Management: | Soft (Residential) / Hard (Retail) / In Place |
| Reserves | |||
| Initial | Monthly | Cap | |
| Taxes: | $29,052 | $14,526 | NAP |
| Insurance: | $0 | Springing | NAP |
| Replacement: | $0 | $2,996 | NAP |
| TI/LC: | $1,208,046 | $0 | NAP |
| Free / Gap Rent: | $1,291,954 | $0 | NAP |
| Mezzanine Loan Debt Service: | $1,000,000 | $0 | NAP |
| Prepaid Rent: | $588,293 | $0 | NAP |
| Citibank Lease: | $500,000 | $0 | NAP |
| Ground Rent: | $440,000 | $220,000 | NAP |
| Property Information | |
| Single Asset / Portfolio: | Single Asset |
| Property Type: | Multifamily / Retail |
| Collateral: | Leasehold |
| Location: | New York, NY |
| Year Built / Renovated: | 2018 / NAP |
| Total Units(3): | 160 |
| Property Management: | Extell Management Services Inc. |
| Underwritten NOI(4): | $9,291,050 |
| Underwritten NCF: | $9,112,149 |
| Appraised Value: | $287,900,000 |
| Appraisal Date: | September 25, 2019 |
| Historical NOI(5) | |
| Most Recent NOI: | $4,682,834 (T-12 September 30, 2019) |
| 2018 NOI: | NAP |
| 2017 NOI: | NAP |
| 2016 NOI: | NAP |
Historical Occupancy(5) | |
| Most Recent Occupancy: | 100.0% (September 30, 2019) |
| 2018 Occupancy: | NAP |
| 2017 Occupancy: | NAP |
| 2016 Occupancy: | NAP |
| Financial Information(1) | ||||||
| Tranche | Cut-off Date Balance | Balance per Sq. Ft. Cut-off / Balloon | LTV Cut-off / Balloon | U/W DSCR NOI / NCF | U/W Debt Yield NOI / NCF(3) | U/W Debt Yield at Balloon NOI / NCF |
| Mortgage Loan | $35,000,000 | |||||
| Pari Passu Notes | $50,000,000 | |||||
| Whole Loan | $85,000,000 | $531,250 / $531,250 | 29.5% / 29.5% | 3.69x / 3.62x | 10.9% / 10.7% | 10.9% / 10.7% |
| Mezzanine Loan | $75,000,000 | |||||
| Total Debt | $160,000,000 | $1,000,000 / $1,000,000 | 55.6% / 55.6% | 1.39x / 1.36x | 5.8% / 5.7% | 5.8% / 5.7% |
| (1) | The 510 East 14th Street loan is part of a whole loan evidenced by threepari passu notes with an aggregate outstanding principal balance as of the Cut-off Date of $85.0 million. In addition, there is one mezzanine loan with an outstanding principal balance as of the Cut-off Date of $75.0 million related to the 510 East 14th Street whole loan. |
| (2) | The borrowers have the option to (i) prepay the full $85.0 million 510 East 14th Street whole loan at any time prior to September 6, 2029, with payment of a yield maintenance premium, or (ii) defease the full $85.0 million 510 East 14th Street whole loan at any time after the earlier of (i) 24 months following the closing date of the securitization that includes the lastpari passu note to be securitized and (ii) December 12, 2022. |
| (3) | See “The Property” herein. |
| (4) | The increase from Most Recent NOI to Underwritten NOI at the 510 East 14th Street Property is primarily attributable to the property having been built in 2018, and having not reached stabilization until late 2019. |
| (5) | Historical information was unavailable because the 510 East 14th Street Property was built in 2018. |
| (6) | Fitch and KBRA provided the listed assessments for the 510 East 14th Street loan in the context of its inclusion of the mortgage pool. |
THE INFORMATION IN THIS STRUCTURAL AND COLLATERAL TERM SHEET IS NOT COMPLETE AND MAY BE AMENDED PRIOR TO THE TIME OF SALE. THIS TERM SHEET IS NOT AN OFFER TO SELL THESE SECURITIES AND IT IS NOT A SOLICITATION OF AN OFFER TO BUY THESE SECURITIES IN ANY JURISDICTION WHERE THE OFFER OR SALE IS NOT PERMITTED.
132
510 East 14th Street New York, NY 10009 | Collateral Asset Summary – Loan No. 13 510 East 14th Street | Cut-off Date Balance: Cut-off Date LTV: U/W NCF DSCR: U/W NOI Debt Yield: | $35,000,000 29.5% 3.62x 10.9% |
The relationship between the holders of the 510 East 14th Street whole loan will be governed by a co-lender agreement as described under “Description of the Mortgage Pool—The Whole Loans—The Non-Serviced Pari Passu Whole Loans” in the Preliminary Prospectus.
| Whole Loan Summary | |||||
| Note | Original Balance | Cut-off Date Balance | Note Holder | Controlling Piece | |
| Note A-1-1 | $35,000,000 | $35,000,000 | Benchmark 2020-B16 | No | |
| Note A-1-2 | 15,000,000 | 15,000,000 | CREFI | No | |
| Note A-2 | 35,000,000 | 35,000,000 | GSMS 2020-GC45(1) | Yes | |
| Whole Loan | $85,000,000 | $85,000,000 | |||
(1) The GSMS 2020-GC45 securitization transaction is expected to close prior to the Closing Date.
| Sources and Uses | ||||||||
| Sources | Proceeds | % of Total | Uses | Proceeds | % of Total | |||
| Whole Loan | $85,000,000 | 53.1 | % | Existing Debt Payoff | $140,169,788 | 87.6 | % | |
| Mezzanine Loan | 75,000,000 | 46.9 | Return of Equity | 11,980,564 | 7.5 | |||
| Upfront Reserves | 5,057,345 | 3.2 | ||||||
| Closing Costs | 2,792,303 | 1.7 | ||||||
| Total Sources | $160,000,000 | 100.0 | % | Total Uses | $160,000,000 | 100.0 | % | |
The Borrowers / Borrower Sponsors.The borrowers for the 510 East 14th Street whole loan are East Village 14 Owner LLC and East Village 14 TRS LLC, both Delaware limited liability companies and single purpose entities with two independent managers. Legal counsel to the borrowers delivered a non-consolidation opinion in connection with the origination of the 510 East 14th Street loan.
The borrower sponsors and non-recourse carveout guarantors are Extell Limited, a British Virgin Islands company (“Extell”) and Gershon Barnett (A/K/A Gary Barnett) (“Garry Barnett”). Founded in 1989 by Gary Barnett, Extell is a full-service development company driven by an internal team of talented real estate professionals whose combined breadth of experience includes all areas of real estate development. Extell currently has a portfolio of over 25 million sq. ft. of past and future developments.
The Property. The 510 East 14th Street Property (“510 East 14th Street Property”) consists of the borrowers’ interest in a newly constructed, Class A luxury multifamily building totaling 160 units and 56,377 sq. ft. of commercial space located at 510 East 14th Street in New York, New York. The 510 East 14th Street Property is a seven-story building with 110 market rate units and 50 affordable units. The building amenities include a fitness center, indoor pool, rooftop decks, putting green, common lounge, children’s playroom, pet grooming station, and 24-hour attended lobby. All of the residential units include an in-unit washer/dryer combo. There are 55 units with private outdoor areas, and all three-bedroom units have private gardening areas on roof.
The market rate unit mix at the 510 East 14th Street Property consists of 13 studio apartments, 44 one-bedroom apartments, 39 two-bedroom apartments, and 14 three-bedroom units. The affordable unit mix at the 510 East 14th Street Property consists of 12 studio apartments, 13 one-bedroom apartments, and 25 two-bedroom apartments. As of the underwritten rent roll dated September 30, 2019, the 510 East 14th Street Property was 100.0% occupied for both market rate units and affordable units.
Tax Abatement. The 510 East 14th Street Property benefits under the 421-a Affordable Housing NY Program tax abatement Option B, which provides an exemption of 100% of any increase in assessed value from the tax year prior to the commencement date for 25 years, and includes both the residential and commercial portions of the property. For years 26-35 this exemption is reduced to the percentage of affordable units (31.3% of occupied units). In connection with the tax abatement, 50 of the 160 residential units at the 510 East 14th Street Property are reserved for affordable housing. Taxes were underwritten at the current abated tax amount of $826,024 per annum.
Ground Lease. The 510 East 14th Street Property is leased pursuant to a ground lease, and is subject to two condominium regimes, Pursuant to the ground lease, which expires in 2111, the leasehold estate consists of the ground lessor’s interest in the units of each condominium regime. Pursuant to the ground lease, provided no default has occurred and is continuing under the ground lease, the ground lessor has granted to the borrower, as tenant under the ground lease, certain of the ground lessor’s rights and powers under the condominium documents, including, but not limited to, the ground lessor’s right to enforce the obligations of the condominium board (a) to perform the condominium obligations and (b) as otherwise necessary for the borrower to exercise all of the ground lessor’s rights and obligations as a unit owner. Provided no default has occurred and is continuing under the ground lease, the ground lessor also granted the borrower the right to exercise certain rights and powers of the ground lessor as a unit owner under the condominium documents, and designated the borrower as ground lessor’s proxy with respect thereto.
THE INFORMATION IN THIS STRUCTURAL AND COLLATERAL TERM SHEET IS NOT COMPLETE AND MAY BE AMENDED PRIOR TO THE TIME OF SALE. THIS TERM SHEET IS NOT AN OFFER TO SELL THESE SECURITIES AND IT IS NOT A SOLICITATION OF AN OFFER TO BUY THESE SECURITIES IN ANY JURISDICTION WHERE THE OFFER OR SALE IS NOT PERMITTED.
133
510 East 14th Street New York, NY 10009 | Collateral Asset Summary – Loan No. 13 510 East 14th Street | Cut-off Date Balance: Cut-off Date LTV: U/W NCF DSCR: U/W NOI Debt Yield: | $35,000,000 29.5% 3.62x 10.9% |
The following table presents unit mix information with respect to the 510 East 14th Street Property.
| Unit Mix(1)(2) | ||||||||
Unit Type | Total Units | Occupied Units | Average Unit Size (SF) | In-Place Average Rent per Month | ||||
| Studio – Market Rate | 13 | 13 | 553 | $4,560 | ||||
| 1-BR – Market Rate | 44 | 44 | 737 | $5,511 | ||||
| 2-BR – Market Rate | 39 | 39 | 1,170 | $8,614 | ||||
| 3-BR – Market Rate | 14 | 14 | 1,688 | $13,804 | ||||
| Subtotal / Wtd. Avg. (Market Rate Units) | 110 | 110 | 990 | $7,554 | ||||
| Studio - Affordable | 12 | 12 | 420 | $1,128 | ||||
| `1-BR – Affordable | 13 | 13 | 634 | $1,870 | ||||
| 2-BR - Affordable | 25 | 25 | 946 | $2,733 | ||||
| Subtotal / Wtd. Avg. (Affordable Units) | 50 | 50 | 739 | $2,123 | ||||
| Total / Wtd. Avg. (All Units) | 160 | 160 | 911 | $5,857 | ||||
| (1) | Based on the underwritten rent roll dated September 30, 2019. |
| (2) | Subtotal / Wtd. Avg. (market rate units) and Subtotal / Wtd. Avg. (affordable units) are weighted based on occupied units. |
The following table represents the tenant summary with respect to the retail space of the 510 East 14th Street Property.
| Tenant Summary(1) | ||||||||||
Property Name/Tenant | Ratings (Moody’s/S&P/Fitch)(2) | Net Rentable Area (Sq. Ft.) | % of Net Rentable Area | U/W Base Rent PSF | % of Total U/W Base Rent | Lease Expiration | ||||
| Target(3) | A2 / A / A- | 27,766 | 49.3 | % | $100.75 | 69.2 | % | 1/31/2049 | ||
| Bright Horizons(4) | NR / BB- / NR | 10,616 | 18.8 | 60.29 | 15.8 | 11/30/2034 | ||||
| 14th Street Medical Arts | NR / NR / NR | 4,018 | 7.1 | 91.60 | 9.1 | 10/30/2039 | ||||
| Sally Beauty Supply(5) | NR / BB- / NR | 1,995 | 3.5 | 120.00 | 5.9 | 1/31/2030 | ||||
| Total Occupied Space | 44,395 | 78.7 | % | $91.11 | 100.0 | % | ||||
| Vacant(6) | 11,982 | 21.3 | ||||||||
| Total | 56,377 | 100.0 | % | |||||||
| (1) | Based on the underwritten rent roll dated September 30, 2019. |
| (2) | Certain ratings are those of the parent company whether or not the parent guarantees the lease. |
| (3) | Target has one, 10-year renewal option upon 30 months’ notice at the greater of the fair market rent and 110% of the final year rent. Target also has the right to go dark at any time with the landlord’s right of recapture after 180 days of closure. |
| (4) | Bright Horizons has two, five-year renewal options upon 18 months’ notice at the fair market rent. Bright Horizons lease is guaranteed by Bright Horizons Family Solutions Inc. Bright Horizons has the right to go dark with no right of the landlord to recapture. |
| (5) | Sally Beauty Supply has one, five-year renewal option upon 12 months’ notice at $151.88 PSF. Sally Beauty Supply has the right to go dark after the end of year-one on 60 days’ notice if operations are no longer economically viable. The landlord has the right to recapture at any time. |
| (6) | Vacant space includes Citibank, which has signed a letter of intent for a lease on 4,455 sq. ft. at the 510 East 14th Street Property. |
THE INFORMATION IN THIS STRUCTURAL AND COLLATERAL TERM SHEET IS NOT COMPLETE AND MAY BE AMENDED PRIOR TO THE TIME OF SALE. THIS TERM SHEET IS NOT AN OFFER TO SELL THESE SECURITIES AND IT IS NOT A SOLICITATION OF AN OFFER TO BUY THESE SECURITIES IN ANY JURISDICTION WHERE THE OFFER OR SALE IS NOT PERMITTED.
134
510 East 14th Street New York, NY 10009 | Collateral Asset Summary – Loan No. 13 510 East 14th Street | Cut-off Date Balance: Cut-off Date LTV: U/W NCF DSCR: U/W NOI Debt Yield: | $35,000,000 29.5% 3.62x 10.9% |
Cash Flow Analysis.
| Cash Flow Analysis(1) | |||
| T-12 9/30/2019 | U/W(4) | U/W per Unit(3) | |
| Base Rent | $9,229,639 | $11,245,463 | $70,284 |
| Potential Income from Vacant Units | 0 | 0 | $0 |
| Gross Potential Income – Apts. | $9,229,639 | $11,245,463 | $70,284 |
| Other Income | 27,805 | 189,505 | $1,184 |
| Less: Vacancy(2) | (1,322,750) | (984,952) | ($6,156) |
| Effective Gross Income – Apts. | $7,934,694 | $10,450,016 | $65,313 |
| Commercial Rental Income | 2,980,002 | 4,584,960 | $81 |
| Potential Income from Commercial Vacant Space | 0 | 940,875 | $17 |
| Other Income | 65,427 | 60,726 | $1 |
| Gross Potential Income - Commercial | $3,045,429 | $5,586,561 | $99 |
| Less: Vacancy | (480,000) | (940,875) | ($17) |
| Effective Gross Income – Commercial | $2,565,429 | $4,645,686 | $82 |
| Total Effective Gross Income | $10,500,123 | $15,095,702 | $94,348 |
| Total Operating Expenses | 5,817,289 | 5,804,651 | $36,279 |
| Net Operating Income(5) | $4,682,834 | $9,291,050 | $58,069 |
| Capital Expenditures | 0 | 48,457 | $303 |
| TI/LC(3) | 0 | 130,445 | $2 |
| Net Cash Flow | $4,682,834 | $9,112,149 | $56,951 |
| (1) | Based on underwritten rent roll dated September 30, 2019. |
| (2) | U/W Vacancy represents the economic vacancy of 8.8%. |
| (3) | Commercial U/W per unit is calculated using 56,377 sq. ft. |
| (4) | The increase in U/W Base Rent from T-12 September 30, 2019 is primarily due to the 510 East 14th Street Property being in lease up until the multifamily units were 100.0% occupied as of September 30, 2019. Three leases for the commercial space totaling 16,629 sq. ft. of space and $1,247,436 of underwritten base rent commenced or are expected to commence between October 2019 and February 2020. |
| (5) | The increase from Most Recent NOI to Underwritten NOI at the 510 East 14th Street Property is primarily attributable to the property having been built in 2018, and having not reached stabilization until late 2019. |
THE INFORMATION IN THIS STRUCTURAL AND COLLATERAL TERM SHEET IS NOT COMPLETE AND MAY BE AMENDED PRIOR TO THE TIME OF SALE. THIS TERM SHEET IS NOT AN OFFER TO SELL THESE SECURITIES AND IT IS NOT A SOLICITATION OF AN OFFER TO BUY THESE SECURITIES IN ANY JURISDICTION WHERE THE OFFER OR SALE IS NOT PERMITTED.
135
Various Brooklyn, NY 11205 | Collateral Asset Summary – Loan No. 14 490-504 Myrtle Avenue | Cut-off Date Balance: Cut-off Date LTV: U/W NCF DSCR: U/W NOI Debt Yield: | $35,000,000 60.2% 1.92x 7.4% |
| Mortgage Loan Information | |
| Loan Seller: | JPMCB |
| Loan Purpose: | Refinance |
| Borrower Sponsors: | Brian Shatz; Josh Zegen |
| Borrower: | 490 Myrtle Residential Owner LLC; 504 Myrtle Residential Owner LLC |
| Original Balance(1): | $35,000,000 |
| Cut-off Date Balance(1): | $35,000,000 |
| % by Initial UPB: | 3.9% |
| Interest Rate: | 3.78764% |
| Payment Date: | 6thof each month |
| First Payment Date: | January 6, 2020 |
| Maturity Date: | December 6, 2029 |
| Amortization: | Interest Only |
| Additional Debt(1): | $50,000,000Pari PassuDebt $20,000,000 Mezzanine Loan |
| Call Protection(2): | L(26), D(89), O(5) |
| Lockbox / Cash Management: | Hard / Springing |
| Reserves | |||
| Initial | Monthly | Cap | |
| Taxes: | $0 | $13,195 | NAP |
| Insurance: | $52,358 | $10,472 | NAP |
| Replacement: | $0 | $4,917 | NAP |
| TI/LC: | $0 | $0 | NAP |
| Condominium Reserve | $0 | Springing | NAP |
| Property Information | |
| Single Asset / Portfolio: | Portfolio of two properties |
| Property Type: | Mid Rise Multifamily |
| Collateral: | Fee Simple |
| Location: | Brooklyn, NY |
| Year Built / Renovated: | Various / NAP |
| Total Units: | 236 |
| Property Management: | Silverstone Property Group, LLC |
| Underwritten NOI(3): | $6,320,091 |
| Underwritten NCF: | $6,261,091 |
| Appraised Value: | $141,300,000 |
| Appraisal Date: | September 4, 2019 |
| Historical NOI(3) | |
| Most Recent NOI: | $5,426,801 (T-12 September 30, 2019) |
| 2018 NOI(4): | NAV |
| 2017 NOI(4): | NAV |
| 2016 NOI(4): | NAV |
| Historical Occupancy(2) | |
| Most Recent Occupancy: | 96.2% (October 25, 2019) |
| 2018 Occupancy(4): | NAV |
| 2017 Occupancy(4): | NAV |
| 2016 Occupancy(4): | NAV |
| Financial Information(1) | ||||||
| Tranche | Cut-off Date Balance | Balance per Unit Cut-off / Balloon | LTV Cut-off / Balloon | U/W DSCR NOI / NCF | U/W Debt Yield NOI / NCF | U/W Debt Yield at Balloon NOI / NCF |
| Mortgage Loan | $35,000,000 | |||||
| Pari Passu Notes | $50,000,000 | |||||
| Whole Loan | $85,000,000 | $360,169 / $360,169 | 60.2% / 60.2% | 1.94x / 1.92x | 7.4% / 7.4% | 7.4% / 7.4% |
| Mezzanine Loan | $20,000,000 | |||||
| Total Debt | $105,000,000 | $444,915 / $444,915 | 74.3% / 74.3% | 1.29x / 1.28x | 6.0% / 6.0% | 6.0% / 6.0% |
| (1) | The 490-504 Myrtle Avenue loan consists of the non-controlling Note A-2 with a Cut-off Date balance of $35,000,000 and is part of a whole loan evidenced by twopari passu notes with an aggregate outstanding principal balance as of the Cut-off Date of $85.0 million. |
| (2) | The lockout period will be 26 payments beginning with and including the first payment date of January 6, 2020. The 490-504 Myrtle Avenue borrower has the option to defease the full $85.0 million 490-504 Myrtle Avenue Whole Loan after the earlier to occur of (i) two years after the closing date of the securitization that includes the last note to be securitized and (ii) November 18, 2022. |
| (3) | The increase from T-12 (9/30/2019) Net Operating Income to U/W Net Operating Income is primarily attributable to an increase in occupancy due to the 504 Myrtle Avenue Property being opened as well as concession burn off. |
| (4) | The 504 Myrtle Avenue Property (as defined below) was constructed in 2017 and was in lease-up from October 2017 through June 2019, therefore no historical information is available for the 490-504 Myrtle Avenue whole loan except the September 30, 2019 trailing twelve months. |
THE INFORMATION IN THIS STRUCTURAL AND COLLATERAL TERM SHEET IS NOT COMPLETE AND MAY BE AMENDED PRIOR TO THE TIME OF SALE. THIS TERM SHEET IS NOT AN OFFER TO SELL THESE SECURITIES AND IT IS NOT A SOLICITATION OF AN OFFER TO BUY THESE SECURITIES IN ANY JURISDICTION WHERE THE OFFER OR SALE IS NOT PERMITTED.
136
Various Brooklyn, NY 11205 | Collateral Asset Summary – Loan No. 14 490-504 Myrtle Avenue | Cut-off Date Balance: Cut-off Date LTV: U/W NCF DSCR: U/W NOI Debt Yield: | $35,000,000 60.2% 1.92x 7.4% |
The relationship between the holders of the 490-504 Myrtle Avenue whole loan will be governed by a co-lender agreement as described under “Description of the Mortgage Pool—The Whole Loans—The Non-Serviced Pari Passu Whole Loans”in the Preliminary Prospectus.
| Whole Loan Summary | |||||
| Note | Original Balance | Cut-off Date Balance | Note Holder | Controlling Piece | |
| Note A-1 | $50,000,000 | $50,000,000 | CGCMT 2019-C7 | Yes | |
| Note A-2 | 35,000,000 | 35,000,000 | Benchmark 2020-B16 | No | |
| Whole Loan | $85,000,000 | $85,000,000 | |||
| Sources and Uses | ||||||
| Sources | Proceeds | % of Total | Uses | Proceeds | % of Total | |
| Whole Loan | $85,000,000 | 81.0% | Loan Payoff | $102,417,123 | 97.5% | |
| Mezzanine Loan | 20,000,000 | 19.0% | Closing Costs | 1,601,715 | 1.5% | |
| Return of Equity | 928,803 | 0.9% | ||||
| Upfront Reserves | 52,358 | 0.1% | ||||
| Total Sources | $105,000,000 | 100.0% | Total Uses | $105,000,000 | 100.0% | |
The Borrowers / Borrower Sponsors.The borrowers are 490 Myrtle Residential Owner LLC and 504 Myrtle Residential Owner LLC, each a Delaware limited liability company structured to be bankruptcy remote with one independent director. The 490 Myrtle Residential Owner LLC is 100% owned by 490 Myrtle Residential MB LLC and 504 Myrtle Residential Owner LLC is 100% owned by 504 Myrtle Residential MB LLC. 490 Myrtle Residential MB LLC is 100% owned by 490 Myrtle Residential Holdings LP and 504 Myrtle Residential MB LLC is 100% owned by 504 Myrtle Residential Holdings LP. Both 490 Myrtle Residential Holdings LP and 504 Myrtle Residential Holdings LP are 99.99% owned by SPD Myrtle Avenue LLC and 0.01% owned and controlled by SDG Myrtle Manager LLC as a general partner. Legal counsel to the borrowers delivered a non-consolidation opinion in connection with the origination of 490-504 Myrtle Avenue Whole Loan. Brian Shatz and Josh Zegen, of Madison Realty Capital, are the nonrecourse carve-out guarantors for the 490-504 Myrtle Avenue whole loan. Madison Realty Capital is a New York City-based real estate private equity firm focused on debt and equity investment strategies. Founded in 2004, Madison Realty Capital has closed on approximately $12.0 billion of transactions in the multifamily, retail, office, industrial and hotel sectors.
The Property.The 490-504 Myrtle Avenue property portfolio (“the “490-504 Myrtle Avenue Property Portfolio”) is comprised of two adjacent, newly developed, Class A buildings totaling 236 units located in the Clinton Hill neighborhood of Brooklyn, New York. The two buildings, comprising the 490-504 Myrtle Avenue Property Portfolio, are located at 490 Myrtle Avenue (the “490 Myrtle Avenue Property”) and 504 Myrtle Avenue (the “504 Myrtle Avenue Property”) and are 95.7% and 96.5% occupied, respectively, with an average occupancy of 96.2% as of October 25, 2019. The 490-504 Myrtle Avenue Property Portfolio consists of 188 fair market value units (80.0%) and 48 affordable units (20.0%). Each building is part of a separate condominium structure. The 490 Myrtle Avenue Property is comprised of the residential unit of the 490 Myrtle Avenue condominium, which has a 75% interest in the common elements of the 490 Myrtle Avenue condominium. The 504 Myrtle Avenue Property is comprised of the residential unit and the garage unit of the 504 Myrtle Avenue condominium, which has an aggregate 86.2% interest in the common elements of the 504 Myrtle Avenue condominium. For more information regarding the condominium ownership structure, please see “Description of the Mortgage Pool—Mortgage Pool Characteristics—Condominium and Other Shared Interests” in the Preliminary Prospectus.
According to the appraisal, the 490 Myrtle Avenue Property contains approximately 81,000 gross sq. ft. across seven stories. The 490 Myrtle Avenue Property was constructed in 2015, and contains a total of 93 units of which 74 are market apartments and 19 affordable apartments. The unit-mix consists of 24 studios, 35 one-bedroom apartments and 34 two bedroom apartments. The 490 Myrtle Avenue Property is serviced by elevators and stairways and the building entrance is a 24-hour attended doorway. The interior finishes, at the 490 Myrtle Avenue Property, include natural wood, white oak flooring throughout the apartments along with white and grey Caesarstone countertops and backsplashes in the kitchens. The kitchens also include soft-close doors and stainless steel appliances. Amenities consist of a fitness center, roof deck, laundry room, dog run, pet grooming station and outdoor courtyard and select units within the building feature private terraces or balconies. The 490 Myrtle Avenue Property also contains non-collateral retail components. The 490 Myrtle Avenue Property benefits from a 421(a) tax abatement. For more information regarding the 421(a) tax abatement, please see “Description of the Mortgage Pool—Real Estate and Other Tax Considerations” in the Preliminary Prospectus.
According to the appraisal, the 504 Myrtle Avenue Property contains approximately 105,000 gross sq. ft. across seven stories. It was constructed in 2017 and it contains a total of 143 units of which 114 are market apartments and 29 affordable apartments. The unit-mix consists of 47 studios, 62 one-bedroom apartments and 34 two-bedroom apartments. The 504 Myrtle Avenue Property is serviced by elevators and stairways and the building entrance is a 24-hour attended doorway. The interior finishes, at the 504 Myrtle Avenue Property, include all-white designer kitchens with stainless steel appliances, black Caesarstone countertops and Carrara marble backsplashes. The bathrooms feature subway tile and deep soaking bathtubs and the apartments also include in-unit washers and dryers. According to the appraisal, amenities consist of a fitness center, roof deck, game room, bicycle storage, laundry room and outdoor courtyard. The 504 Myrtle Avenue Property also contains a non-collateral retail component and a parking component, which is part of the collateral. The 504 Myrtle Avenue Property also benefits from a 421(a) tax abatement. For more information regarding the 421(a) tax abatement, please see “Description of the Mortgage Pool—Real Estate and Other Tax Considerations” in the Preliminary Prospectus.
THE INFORMATION IN THIS STRUCTURAL AND COLLATERAL TERM SHEET IS NOT COMPLETE AND MAY BE AMENDED PRIOR TO THE TIME OF SALE. THIS TERM SHEET IS NOT AN OFFER TO SELL THESE SECURITIES AND IT IS NOT A SOLICITATION OF AN OFFER TO BUY THESE SECURITIES IN ANY JURISDICTION WHERE THE OFFER OR SALE IS NOT PERMITTED.
137
Various Brooklyn, NY 11205 | Collateral Asset Summary – Loan No. 14 490-504 Myrtle Avenue | Cut-off Date Balance: Cut-off Date LTV: U/W NCF DSCR: U/W NOI Debt Yield: | $35,000,000 60.2% 1.92x 7.4% |
The 490-504 Myrtle Avenue Property Portfolio is located within Clinton Hill in Kings County, New York which is part of the New York-Jersey City-White Plains metro area (“New York Metro”). The appraisal notes that overall population, personal income and total employment are the primary economic drivers of apartment demand. According to the appraisal, the area is expected to experience significant growth and over the next five years. In addition, according to the appraisal, Brooklyn is anticipated to have the highest increase in population of any of the five boroughs of New York City with an increase of 4.0%. Total employment in the New York market is projected to grow by 157,100 jobs during the 2019-2024 period. The top five major employers within the New York Metro area are: City of New York (City Hall), New York City Department of Education, the US Government, the Metropolitan Transportation Authority and the State of New York. According to the appraisal, for the 2019-2024 period, new supply is expected to average 13,386 units, while net absorption is expected to average 12,411 units lagging new supply. Vacancy rates are expected to remain 3.3%, while rents are forecasted to rise to $3,043.
According to the appraisal, the Clinton Hill neighborhood is located in Brooklyn and is part of the Bushwick multifamily submarket. The neighborhood boundaries are Flushing Avenue (north), Atlantic Avenue (south), Classon Avenue (east) and Clermont Avenue (west). The 490-504 Myrtle Avenue Property Portfolio’s immediate neighborhood consists primarily of multifamily residential, transportation/utility and public institutional uses. Per the appraisal, primary east-west access to the 490-504 Myrtle Avenue Property Portfolio’s neighborhood is provided by Eastern Parkway and Atlantic Avenue and north-south access is provided by Nostrand and Bedford Avenues. The Brooklyn Battery Tunnel, Brooklyn Bridge and Manhattan Bridge to the west of the 490-504 Myrtle Avenue Property Portfolio all provide access to and from Manhattan. Additionally, public transportation is readily available in the area with bus access along Fulton Street as well as Clinton/Washington Avenue subway station, which services the A-C line. The A-C line provides transportation into downtown Manhattan as well as opportunities to transfer to other lines. Additionally, per the appraisal, the G subway line, which services much of Brooklyn and Queens, runs through the center of Clinton Hill and allows travel north to Williamsburg and Queens, as well as the Cobble Hill, Boerum Hill, Gowanus and Park Slope neighborhoods to the west and south.
For the 490-504 Myrtle Avenue Property Portfolio’s immediate neighborhood, the estimated year-end 2019 population is projected to be 48,748 with an average household income of $95,858. According to the appraisal, as of the first quarter of 2019, the total inventory within the submarket is 36,225 units with a 2.8% average vacancy, asking rents of $2,354 per month and net absorption of a positive 338 units. The overall growth, per the appraisal, is expected to continue as both residential and commercial demand continues to rise.
Multifamily Unit Mix(1) | |||||||
| Unit Type | # of Units(2) | % of Units | Occupied Units(1) | % Occupied | Average Unit Size (SF) | Average Market Rent per Month(3) | In-Place Average Rent per Month |
| 490 Myrtle | |||||||
| Studio_FM | 18 | 19.4% | 16 | 88.9% | 420 | $2,500 | $2,483 |
| Studio_HPD | 5 | 5.4 | 5 | 100.0 | 524 | NAP | 866 |
| Studio_Super | 1 | 1.1 | 0 | 0.0 | 534 | 2,500 | 0 |
| 1 Bedroom_FM | 28 | 30.1 | 27 | 96.4 | 575 | 3,100 | 2,966 |
| 1 Bedroom_HPD | 7 | 7.5 | 7 | 100.0 | 654 | NAP | 896 |
| 2 Bedroom_FM | 27 | 29.0 | 27 | 100.0 | 1002 | 4,700 | 4,718 |
| 2 Bedroom_HPD | 7 | 7.5 | 7 | 100.0 | 880 | NAP | 1,094 |
| Subtotal/Wtd. Avg. | 93 | 100.0% | 89 | 95.7% | 695 | $3,530 | $2,982 |
| 504 Myrtle | |||||||
| Studio_FM | 21 | 14.7% | 19 | 90.5% | 428 | $2,700 | $2,601 |
| Alcove Studio_FM | 16 | 11.2 | 15 | 93.8 | 467 | 2,700 | 2,658 |
| Studio_HPD | 8 | 5.6 | 8 | 100.0 | 365 | NAP | 758 |
| Alcove Studio_HPD | 2 | 1.4 | 2 | 100.0 | 478 | NAP | 735 |
| 1-Bedroom_FM | 45 | 31.5 | 45 | 100.0 | 580 | 3,100 | 3,037 |
| 1-Bedroom Plus_FM | 5 | 3.5 | 5 | 100.0 | 668 | 3,100 | 3,209 |
| 1-Bedroom_HPD | 3 | 2.1 | 3 | 100.0 | 616 | NAP | 747 |
| 1-Bedroom Plus_HPD | 9 | 6.3 | 8 | 88.9 | 442 | NAP | 755 |
| 2-Bedroom_FM | 27 | 18.9 | 26 | 96.3 | 831 | 4,500 | 4,438 |
| 2-Bedroom_HPD | 7 | 4.9 | 7 | 100.0 | 824 | NAP | 894 |
| Subtotal/Wtd. Avg. | 143 | 100.0% | 138 | 96.5% | 586 | $3,302 | $2,750 |
| Total / Wtd. Avg. | 236 | 100.0% | 227 | 96.2% | 629 | $3,391 | $2,832 |
| (1) | Based on the underwritten rent roll dated October 25, 2019. |
| (2) | 48 of the units are rent-stabilized, and the remaining 188 units are market-rate units. |
| (3) | Source: Appraisal |
THE INFORMATION IN THIS STRUCTURAL AND COLLATERAL TERM SHEET IS NOT COMPLETE AND MAY BE AMENDED PRIOR TO THE TIME OF SALE. THIS TERM SHEET IS NOT AN OFFER TO SELL THESE SECURITIES AND IT IS NOT A SOLICITATION OF AN OFFER TO BUY THESE SECURITIES IN ANY JURISDICTION WHERE THE OFFER OR SALE IS NOT PERMITTED.
138
Various Brooklyn, NY 11205 | Collateral Asset Summary – Loan No. 14 490-504 Myrtle Avenue | Cut-off Date Balance: Cut-off Date LTV: U/W NCF DSCR: U/W NOI Debt Yield: | $35,000,000 60.2% 1.92x 7.4% |
Cash Flow Analysis.
| Cash Flow Analysis(1) | |||
| T-12 9/30/2019 | U/W | U/W Per unit | |
| Base Rent(2) | $7,721,572 | $7,738,779 | $32,791 |
| Vacant Income | 0 | 287,292 | $1,217 |
| Gross Potential Rent | $7,721,572 | $8,026,071 | $34,009 |
| Vacancy & Credit Loss & Concessions(3) | $(586,010) | (287,292) | ($1,217) |
| Other Income(4) | 51,663 | 98,041 | $415 |
| Effective Gross Income | $7,187,225 | $7,836,820 | $33,207 |
| Real Estate Taxes(5) | $163,259 | $150,803 | $639 |
| Insurance | 97,277 | 119,676 | $507 |
| Management Fee | 215,617 | 235,105 | $996 |
| Other Operating Expenses | 1,284,272 | 1,011,145 | $4,285 |
| Total Operating Expenses | $1,760,424 | $1,516,729 | $6,427 |
| Net Operating Income(6) | $5,426,801 | $6,320,091 | $26,780 |
| Replacement Reserves | 0 | 59,000 | $250 |
| Net Cash Flow | $5,426,801 | $6,261,091 | $26,530 |
| (1) | The 490-504 Myrtle Avenue Property Portfolio, which is comprised of two buildings, the 490 Myrtle Avenue Property and the 504 Myrtle Avenue Property, includes the 490 Myrtle Avenue Property which was constructed in 2015 and the 504 Myrtle Avenue Property that was more recently constructed in 2017 and was in lease up from October 2017 through June 2019. Therefore no historical information is available for the 490-504 Myrtle Avenue Property Portfolio as a whole. |
| (2) | Underwritten Base Rent is based on the combined occupied units of 490 Myrtle Avenue Property and the 504 Myrtle Avenue Property as of the underwritten rent roll dated October 25, 2019. |
| (3) | Vacancy & Credit Loss & Concessions is underwritten to the current 3.6% economic vacancy. |
| (4) | Other Income consists of parking income, storage fees, late fees, laundry revenue, key & lock fees and miscellaneous income. |
| (5) | The 504 Myrtle Avenue Property is currently in year 2 of a 25-year 421-a tax abatement program and the 490 Myrtle Avenue Property is currently in year 3 of a 25-year 421-a tax abatement program. Each property receives a 100% exemption on any increases in assessed value for the first 21 years, and the exemption percentage declines by 20% each year in years 22-25. In connection with the 421-a tax abatement, rental amounts for rental tenants are capped at 1.5% for one-year leases and 2.5% for two-year leases. Taxes were underwritten at the average abated amount of (i) $710 per unit with respect to the 490 Myrtle Avenue Property and (ii) $593 per unit with respect to the 504 Myrtle Avenue Property. |
| (6) | The increase from T-12 (9/30/2019) Net Operating Income to U/W Net Operating Income is primarily attributable to an increase in occupancy due to the 504 Myrtle Avenue Property being opened as well as concession burn off. |
THE INFORMATION IN THIS STRUCTURAL AND COLLATERAL TERM SHEET IS NOT COMPLETE AND MAY BE AMENDED PRIOR TO THE TIME OF SALE. THIS TERM SHEET IS NOT AN OFFER TO SELL THESE SECURITIES AND IT IS NOT A SOLICITATION OF AN OFFER TO BUY THESE SECURITIES IN ANY JURISDICTION WHERE THE OFFER OR SALE IS NOT PERMITTED.
139
1019 Market Street San Francisco, CA 94103 | Collateral Asset Summary – Loan No. 15 1019 Market | Cut-off Date Balance: Cut-off Date LTV: U/W NCF DSCR: U/W NOI Debt Yield: | $33,500,000 46.9% 2.34x 9.7% |
Mortgage Loan Information | |
JPMCB | |
Refinance | |
DWS Grundbesitz GmbH | |
1019 Market Street, L.P. | |
$33,500,000 | |
$33,500,000 | |
3.7% | |
3.78000% | |
1st of each month | |
February 1, 2020 | |
January 1, 2030 | |
Interest Only | |
None | |
L(25), YM1(92), O(3) | |
Hard / Springing | |
Reserves | |||
| Initial | Monthly | Cap |
Taxes: | $0 | Springing | NAP |
Insurance: | $0 | Springing | NAP |
Replacement(2): | $0 | Springing | NAP |
TI/LC: | $1,877,080 | $6,294 | $4,908,995 |
Property Information | ||
Single Asset | ||
CBD Office | ||
Fee Simple | ||
San Francisco, CA | ||
1909 / 2014 | ||
75,523 | ||
Transwestern Property Company West, L.L.C., d/b/a Transwestern | ||
$3,234,192 | ||
$3,001,944 | ||
$71,400,000 | ||
$59,500,000 | ||
November 7, 2019 | ||
| ||
Historical NOI | ||
Most Recent NOI(3): | $3,289,961 (T-10 October 31, 2019 Ann.) | |
2018 NOI(3): | $3,633,523 (December 31, 2018) | |
2017 NOI(3): | $2,899,948 (December 31, 2017) | |
2016 NOI: | $2,892,237 (December 31, 2016) | |
| ||
Historical Occupancy | ||
Most Recent Occupancy: | 100.0% (September 1, 2019) | |
2018 Occupancy: | 100.0% (December 31, 2018) | |
2017 Occupancy: | 100.0% (December 31, 2017) | |
2016 Occupancy: | 100.0% (December 31, 2016) | |
|
|
|
Financial Information | ||||||
Tranche | Cut-off Date Balance | Balance per Sq. Ft. Cut-off / Balloon | LTV Cut-off / Balloon | U/W DSCR NOI / NCF | U/W Debt Yield NOI / NCF | U/W Debt Yield at Balloon NOI / NCF |
Mortgage Loan | $33,500,000 | $444 / $444 | 46.9% / 46.9% | 2.52x / 2.34x | 9.7% / 9.0% | 9.7% / 9.0% |
(1) | The appraisal provided a “Hypothetical Market Value As Dark” of $59.5 million as of November 7, 2019, which assumes that Zendesk terminates its lease and vacates its premises, resulting in a loan to dark value of approximately 56.3%. |
(2) | Monthly deposits into the replacement reserve are waived as long as the debt yield as calculated in accordance with the loan documents is equal to or greater than 9.0%. To the extent that the Debt Yield is less than 9.0%, $1,259 is required to be deposited on each monthly due date into the replacement reserve. |
(3) | The increase from 2017 Net Operating Income through T-10 10/31/2019 Ann. Net Operating Income is primarily attributable to (i) annual base rent increases of approximately 3.0% in accordance with Zendesk’s lease and (ii) a tax reassessment at the 1019 Market property which resulted in an increase in taxes in 2017 with the reimbursement paid in 2018. |
THE INFORMATION IN THIS STRUCTURAL AND COLLATERAL TERM SHEET IS NOT COMPLETE AND MAY BE AMENDED PRIOR TO THE TIME OF SALE. THIS TERM SHEET IS NOT AN OFFER TO SELL THESE SECURITIES AND IT IS NOT A SOLICITATION OF AN OFFER TO BUY THESE SECURITIES IN ANY JURISDICTION WHERE THE OFFER OR SALE IS NOT PERMITTED.
140
1019 Market Street San Francisco, CA 94103 | Collateral Asset Summary – Loan No. 15 1019 Market | Cut-off Date Balance: Cut-off Date LTV: U/W NCF DSCR: U/W NOI Debt Yield: | $33,500,000 46.9% 2.34x 9.7% |
Sources and Uses | ||||||
Sources | Proceeds | % of Total |
| Uses | Proceeds | % of Total |
Mortgage Loan | $33,500,000 | 100.0% |
| Payoff Existing Debt | $19,359,731 | 57.8% |
|
|
|
| Return of Equity | 12,068,063 | 36.0% |
|
| % |
| Upfront Reserves | 1,877,080 | 5.6% |
|
|
|
| Closing Costs | 195,126 | 0.6% |
Total Sources | $33,500,000 | 100.0% |
| Total Uses | $33,500,000 | 100.0% |
The Borrower / Borrower Sponsor. The borrower is 1019 Market Street L.P., a single purpose entity and Delaware limited partnership structured to be a bankruptcy-remote entity with one independent director in its organizational structure. The borrower sponsor and the non-recourse carveout guarantor is DWS Grundbesitz GmbH, an affiliate of DWS Group GmbH & Co. KGaA (“DWS”) and the management company of the DWS Grundbesitz Global fund. The borrower sponsor’s non-recourse carveout guarantor liability is limited to only a subset of non-recourse carveouts. In addition, the loss recourse carveout liability of the borrower and the borrower sponsor is capped at 110.0% of the principal balance of the 1019 Market loan then outstanding. For additional information, see “Description of the Mortgage Pool—Non-Recourse Carveout Limitations” in the Preliminary Prospectus.
Founded in 1956, DWS is a global asset manager that serves clients including large institutions, governments, corporations, foundations and individual investors. DWS is a publicly traded company on the Frankfurt Stock Exchange (FRA: DWS). As of September 30, 2019, DWS had approximately €752.0 billion of assets under management and reported total revenues of approximately €560.0 million. DWS launched the Grundbesitz Global fund in 2000. The Grundbesitz Global fund is a German open ended real estate fund with approximately €3.6 billion of total assets under management as of January 17, 2020.
The Property. The 1019 Market property (the “1019 Market Property”) is a 75,523 sq. ft., seven story office building with ground floor retail located in the San Francisco, California central business district (the “San Francisco CBD”). The 1019 Market Property offers convenient access to public transportation including the Bay Area Rapid Transit System, a rapid transit rail which connects San Francisco’s CBD to Berkeley, Oakland, Fremont, Walnut Creek and other urban and suburban areas in California, as well as the San Francisco Municipal Transportation Agency bus lines and street cars.
The 1019 Market Property is designated as a Category II Significant Building under Article 11 of the Planning Code of the City of San Francisco, and contributes to the city’s Market Street Theater and Loft District, which is listed on the National Register. In addition, the 1019 Market Property is subject to a California Mills Act Historic Property Agreement which contemplated building rehabilitation work and continued maintenance. The rehabilitation work has been completed, and the next required maintenance will occur in 2023 and consist of painting and sealing various portions of the building exterior. If the building incurs damage of less than 50% of the historical property, the damaged area must be replaced and repaired.
The 1019 Market Property was built in 1909 and received a full interior renovation in 2014 including the addition of 400 work stations, 40 private offices and conference rooms, kitchen and several multi-functional areas. Additionally, the renovation focused on the replacement of all building systems, new elevator upgrades, new electrical and gas service, interior ADA and public area improvements, refurbishment of existing brick walls and restoration of the existing timber and steel structure.
As of September 1, 2019, the 1019 Market Property was 100.0% occupied by two tenants. The largest tenant, Zendesk (NYSE: ZEN) (72,933 sq. ft.; 96.6% of NRA; 96.6% of U/W Base Rent), occupies 72,933 sq. ft. of office space, which serves as Zendesk’s headquarters. Founded in 2007, Zendesk is a software development company that focuses on customer support software and customer relationship management platforms. Zendesk has approximately 3,000 global employees and 145,000 paid customer accounts across 160 customer countries and territories. As of September 30, 2019, Zendesk reported approximately $210.5 million in total revenue. Zendesk located to the 1019 Market Property in 2014, at which time the building received a full renovation including new building systems and amenities. The Zendesk lease expires in August 2022 with one, five year extension option remaining. Zendesk’s lease includes an approximately $1.8 million ($24.74 PSF) letter of credit (“LOC”). Following a default by Zendesk under its lease, the letter of credit will be drawn upon and contributed to the rollover reserve. Zendesk pays full service gross rent net of electric of $55.22 PSF with 3.0% annual rent escalations through the end of its lease. Zendesk’s rent is approximately 31.0% below the appraisal’s concluded market rent of $80.00. Zendesk has multiple offices located in the area and it has been reported that the tenant is in discussions to consolidate to one location in the future. The 1019 Market loan has been structured with an approximately $1.88 million upfront tenant improvement reserve, on-going annual collections of $1.00 PSF capped at approximately $4.9 million and a cash flow sweep into such tenant improvement reserve upon the occurrence the borrower failing to deliver to the lender, on or before the date that is 15 months prior to the expiration of the Zendesk lease, among other events (i) satisfactory evidence that Zendesk has renewed its lease in accordance with the terms set forth in the lease for a term of not less than five years and (ii) an updated tenant estoppel certificate from Zendesk confirming, among other things, (A) such renewal and the terms thereof, (B) the Zendesk is in physical occupancy of its space and paying full contractual rent, and (C) that there is no default by the borrower under the Zendesk lease.
The second largest tenant, The Chai Bar (2,590 sq. ft.; 3.4% of NRA; 3.4% of U/W Base Rent) occupies the ground floor retail space of the 1019 Market Property. Chai Bar’s lease expires in February 2025 with two, five year extension options.
THE INFORMATION IN THIS STRUCTURAL AND COLLATERAL TERM SHEET IS NOT COMPLETE AND MAY BE AMENDED PRIOR TO THE TIME OF SALE. THIS TERM SHEET IS NOT AN OFFER TO SELL THESE SECURITIES AND IT IS NOT A SOLICITATION OF AN OFFER TO BUY THESE SECURITIES IN ANY JURISDICTION WHERE THE OFFER OR SALE IS NOT PERMITTED.
141
1019 Market Street San Francisco, CA 94103 | Collateral Asset Summary – Loan No. 15 1019 Market | Cut-off Date Balance: Cut-off Date LTV: U/W NCF DSCR: U/W NOI Debt Yield: | $33,500,000 46.9% 2.34x 9.7% |
Tenant Summary(1) | ||||||
Tenant | Credit Rating (Moody’s/Fitch/S&P) | Net Rentable Area | % of Net Rentable Area | U/W Base Rent PSF | % of Total U/W Base Rent | Lease Expiration |
Zendesk | NR / NR / NR | 72,933 | 96.6% | $55.22 | 96.6% | 8/31/2022 |
The Chai Bar | NR / NR / NR | 2,590 | 3.4% | 54.02 | 3.4% | 2/28/2025 |
Total Occupied |
| 75,523 | 100.0% | $55.18 | 100.0% |
|
Vacant |
| 0 | 0.0% |
|
|
|
Total / Wtd. Avg. |
| 75,523 | 100.0% |
|
|
|
(1) | U/W Base Rent is based on the underwritten rent roll dated September 1, 2019 inclusive of contractual rent steps through September 2020. |
Lease Rollover Schedule(1) | ||||||||
Year | # of Leases Expiring | Total Expiring Sq. Ft. | % of Total Sq. Ft. Expiring | Cumulative Sq. Ft. Expiring | Cumulative % of Sq. Ft. Expiring | Annual U/W Base Rent PSF | % U/W Base Rent Rolling | Cumulative % of U/W Base Rent |
MTM | 0 | 0 | 0.0% | 0 | 0.0% | $0.00 | 0.0% | 0.0% |
2019 | 0 | 0 | 0.0% | 0 | 0.0% | $0.00 | 0.0% | 0.0% |
2020 | 0 | 0 | 0.0% | 0 | 0.0% | $0.00 | 0.0% | 0.0% |
2021 | 0 | 0 | 0.0% | 0 | 0.0% | $0.00 | 0.0% | 0.0% |
2022 | 1 | 72,933 | 96.6% | 72,933 | 96.6% | $55.22 | 96.6% | 96.6% |
2023 | 0 | 0 | 0.0% | 72,933 | 96.6% | $0.00 | 0.0% | 96.6% |
2024 | 0 | 0 | 0.0% | 72,933 | 96.6% | $0.00 | 0.0% | 96.6% |
2025 | 1 | 2,590 | 3.4% | 75,523 | 100.0% | $54.02 | 3.4% | 100.0% |
2026 | 0 | 0 | 0.0% | 75,523 | 100.0% | $0.00 | 0.0% | 100.0% |
2027 | 0 | 0 | 0.0% | 75,523 | 100.0% | $0.00 | 0.0% | 100.0% |
2028 | 0 | 0 | 0.0% | 75,523 | 100.0% | $0.00 | 0.0% | 100.0% |
2029 | 0 | 0 | 0.0% | 75,523 | 100.0% | $0.00 | 0.0% | 100.0% |
2030 and Thereafter | 0 | 0 | 0.0% | 75,523 | 100.0% | $0.00 | 0.0% | 100.0% |
Vacant | NAP | 0 | 0.0% | 75,523 | 100.0% | NAP | NAP |
|
Total / Wtd. Avg. | 2 | 75,523 | 100.0% |
|
| $55.18 | 100.0% |
|
| ||||||||
(1) | U/W Base Rent is based on the underwritten rent roll dated September 1, 2019 inclusive of contractual rent steps through September 2020. |
Cash Flow Analysis.
| Cash Flow Analysis | ||||||
| 2016 | 2017 | 2018 | T-10 10/31/2019 Ann. | U/W | U/W PSF | |
Base Rent(1) | $3,686,692 | $3,797,175 | $3,910,688 | $4,024,022 | $4,167,272 | $55.18 | |
Vacant Income | 0 | 0 | 0 | 0 | 0 | $0.00 | |
Gross Potential Rent | $3,686,692 | $3,797,175 | $3,910,688 | $4,024,022 | $4,167,272 | $55.18 | |
Total Reimbursements | 330,380 | 587,918 | 1,146,528 | 738,904 | 885,037 | $11.72 | |
Other Income | 5,544 | 9,533 | 14,427 | 14,673 | 0 | $0.00 | |
Less: Vacancy | 0 | 0 | 0 | 0 | (252,615) | ($3.34) | |
Effective Gross Income | $4,022,616 | $4,394,626 | $5,071,643 | $4,777,599 | $4,799,693 | $63.55 | |
Total Fixed Expenses | 430,870 | 776,870 | 665,280 | 661,078 | 716,511 | $9.49 | |
Total Operating Expenses | 699,509 | 717,808 | 772,840 | 826,561 | 848,991 | $11.24 | |
Net Operating Income(2) | $2,892,237 | $2,899,948 | $3,633,523 | $3,289,961 | $3,234,192 | $42.82 | |
TI/LC | 0 | 0 | 0 | 0 | 217,143 | $2.88 | |
Capital Expenditures | 0 | 0 | 0 | 0 | 15,105 | $0.20 | |
Net Cash Flow | $2,892,237 | $2,899,948 | $3,633,523 | $3,289,961 | $3,001,944 | $39.75 | |
|
|
|
|
|
|
|
|
(1) | U/W Base Rent is based on the underwritten rent roll dated September 1, 2019 inclusive of contractual rent steps through September 2020. |
(2) | The increase from 2017 Net Operating Income through T-10 10/31/2019 Ann. Net Operating Income is primarily attributable to (i) annual base rent increases of approximately 3.0% in accordance with Zendesk’s lease and (ii) a tax reassessment at the 1019 Market Property which resulted in an increase in taxes in 2017 with the reimbursement paid in 2018. |
THE INFORMATION IN THIS STRUCTURAL AND COLLATERAL TERM SHEET IS NOT COMPLETE AND MAY BE AMENDED PRIOR TO THE TIME OF SALE. THIS TERM SHEET IS NOT AN OFFER TO SELL THESE SECURITIES AND IT IS NOT A SOLICITATION OF AN OFFER TO BUY THESE SECURITIES IN ANY JURISDICTION WHERE THE OFFER OR SALE IS NOT PERMITTED.
142
STATEMENT REGARDING ASSUMPTIONS AS TO SECURITIES, PRICING ESTIMATES AND
OTHER INFORMATION
This material is for your information, and none of Deutsche Bank Securities Inc., J.P. Morgan Securities LLC, Citigroup Global Markets Inc., Academy Securities, Inc. and Drexel Hamilton, LLC or any other underwriter (the “Underwriters”) are soliciting any action based upon it. This material is not to be construed as an offer to sell or the solicitation of any offer to buy any security in any jurisdiction where such an offer or solicitation would be illegal.
Neither this document nor anything contained herein shall form the basis for any contract or commitment whatsoever. The information contained herein is preliminary as of the date hereof. These materials are subject to change, completion or amendment from time to time. The information contained herein will be superseded by similar information delivered to you as part of the preliminary prospectus relating to the Benchmark 2020-B16 Mortgage Trust Commercial Mortgage Pass-Through Certificates, Series 2020-B16 (the “Offering Document”). The information contained herein supersedes any such information previously delivered and should be reviewed only in conjunction with the entire Offering Document. All of the information contained herein is subject to the same limitations and qualifications contained in the Offering Document. The information contained herein does not contain all relevant information relating to the underlying mortgage loans or mortgaged properties. Such information is described elsewhere in the Offering Document. The information contained herein will be more fully described elsewhere in the Offering Document. The information contained herein should not be viewed as projections, forecasts, predictions or opinions with respect to value. Prior to making any investment decision, prospective investors are strongly urged to read the Offering Document its entirety. Neither the Securities and Exchange Commission nor any state securities commission has approved or disapproved of these securities or determined if this free writing prospectus is truthful or complete. Any representation to the contrary is a criminal offense.
The attached information contains certain tables and other statistical analyses (the “Computational Materials”) which have been prepared in reliance upon information furnished by the Mortgage Loan Sellers. Numerous assumptions were used in preparing the Computational Materials, which may or may not be reflected herein. As such, no assurance can be given as to the Computational Materials’ accuracy, appropriateness or completeness in any particular context; or as to whether the Computational Materials and/or the assumptions upon which they are based reflect present market conditions or future market performance. The Computational Materials should not be construed as either projections or predictions or as legal, tax, financial or accounting advice. You should consult your own counsel, accountant and other advisors as to the legal, tax, business, financial and related aspects of a purchase of these securities. Any weighted average lives, yields and principal payment periods shown in the Computational Materials are based on prepayment and/or loss assumptions, and changes in such prepayment and/or loss assumptions may dramatically affect such weighted average lives, yields and principal payment periods. In addition, it is possible that prepayments or losses on the underlying assets will occur at rates higher or lower than the rates shown in the attached Computational Materials. The specific characteristics of the securities may differ from those shown in the Computational Materials due to differences between the final underlying assets and the preliminary underlying assets used in preparing the Computational Materials. The principal amount and designation of any security described in the Computational Materials are subject to change prior to issuance. None of Underwriters or any of their respective affiliates makes any representation or warranty as to the actual rate or timing of payments or losses on any of the underlying assets or the payments or yield on the securities.
This document contains forward-looking statements. Those statements are subject to certain risks and uncertainties that could cause the success of collections and the actual cash flow generated to differ materially from the information set forth herein. While such information reflects projections prepared in good faith based upon methods and data that are believed to be reasonable and accurate as of the dates thereof, the depositor undertakes no obligation to revise these forward-looking statements to reflect subsequent events or circumstances. Individuals should not place undue reliance on forward-looking statements and are advised to make their own independent analysis and determination with respect to the forecasted periods, which reflect the issuer’s view only as of the date hereof.
IMPORTANT NOTICE RELATING TO AUTOMATICALLY GENERATED EMAIL DISCLAIMERS
Any legends, disclaimers or other notices that may appear at the bottom of the email communication to which this free writing prospectus is attached relating to (1) these materials not constituting an offer (or a solicitation of an offer), (2) no representation being made that these materials are accurate or complete and may not be updated or (3) these materials possibly being confidential, are not applicable to these materials and should be disregarded. Such legends, disclaimers or other notices have been automatically generated as a result of these materials having been sent via Bloomberg or another system.
THE INFORMATION IN THIS STRUCTURAL AND COLLATERAL TERM SHEET IS NOT COMPLETE AND MAY BE AMENDED PRIOR TO THE TIME OF SALE. THIS TERM SHEET IS NOT AN OFFER TO SELL THESE SECURITIES AND IT IS NOT A SOLICITATION OF AN OFFER TO BUY THESE SECURITIES IN ANY JURISDICTION WHERE THE OFFER OR SALE IS NOT PERMITTED.
143