| FREE WRITING PROSPECTUS | ||
| FILED PURSUANT TO RULE 433 | ||
| REGISTRATION FILE NO.: 333-226943-09 | ||
December 15, 2020
FREE WRITING PROSPECTUS
STRUCTURAL AND COLLATERAL TERM SHEET
$814,217,000
(Approximate Total Mortgage Pool Balance)
$673,917,000
(Approximate Offered Certificates)
BENCHMARK 2020-B22 |
Deutsche Mortgage & Asset Receiving Corporation
Depositor
German American Capital Corporation
JPMorgan Chase Bank, National Association
Citi Real Estate Funding Inc.
Goldman Sachs Mortgage Company
Sponsors and Mortgage Loan Sellers
| Deutsche Bank Securities | Citigroup | Goldman Sachs & Co. LLC | J.P. Morgan |
| Co-Lead Managers and Joint Bookrunners | |||
| Academy Securities | Drexel Hamilton | ||
| Co-Managers | |||
The depositor has filed a registration statement (including the prospectus) with the Securities and Exchange Commission (File No. 333-226943) for the offering to which this communication relates. Before you invest, you should read the prospectus in the registration statement and other documents the depositor has filed with the Securities and Exchange Commission for more complete information about the depositor, the issuing entity and this offering. You may get these documents for free by visiting EDGAR on the Securities and Exchange Commission website at www.sec.gov. Alternatively, the depositor or Deutsche Bank Securities Inc., any other underwriter, or any dealer participating in this offering will arrange to send you the prospectus if you request it by calling toll-free 1-800-503-4611 or by emailing: prospectus.cpdg@db.com. The offered certificates referred to in these materials, and the asset pool backing them, are subject to modification or revision (including the possibility that one or more classes of certificates may be split, combined or eliminated at any time prior to issuance or availability of a final prospectus) and are offered on a “when, as and if issued” basis. You understand that, when you are considering the purchase of these certificates, a contract of sale will come into being no sooner than the date on which the relevant class has been priced and we have verified the allocation of certificates to be made to you; any “indications of interest” expressed by you, and any “soft circles” generated by us, will not create binding contractual obligations for you or us. This free writing prospectus does not contain all information that is required to be included in the prospectus.
| Capitalized terms used but not defined herein have the meanings assigned to them in the Preliminary Prospectus expected to be dated December 15, 2020 relating to the offered certificates (hereinafter referred to as the “Preliminary Prospectus”). |
| KEY FEATURES OF SECURITIZATION |
| Offering Terms: | ||
| Co-Lead Managers and Joint Bookrunners: | Deutsche Bank Securities Inc., J.P. Morgan Securities LLC, Citigroup Global Markets Inc. and Goldman Sachs & Co. LLC | |
| Co-Managers: | Academy Securities, Inc. and Drexel Hamilton, LLC | |
| Sponsors and Mortgage Loan Sellers: | German American Capital Corporation* (“GACC”) (15.5%), JPMorgan Chase Bank, National Association (“JPMCB”) (39.5%), Citi Real Estate Funding Inc. (“CREFI”) (30.7%) and Goldman Sachs Mortgage Company (“GSMC”) (14.2%) *An indirect wholly owned subsidiary of Deutsche Bank AG | |
| Master Servicer: | Midland Loan Services, a Division of PNC Bank, National Association | |
| Operating Advisor: | Pentalpha Surveillance LLC | |
| Asset Representations Reviewer: | Pentalpha Surveillance LLC | |
| Special Servicer: | Rialto Capital Advisors, LLC | |
| Certificate Administrator: | Wells Fargo Bank, National Association | |
| Trustee: | Wells Fargo Bank, National Association | |
| Rating Agencies: | Fitch Ratings, Inc. (“Fitch”), Kroll Bond Rating Agency, LLC (“KBRA”), and Moody’s Investors Service, Inc. (“Moody’s”). | |
| Credit Risk Retention: | For a discussion on the manner in which the U.S. credit risk retention requirements are being satisfied by GACC, as retaining sponsor, see “Credit Risk Retention” in the Preliminary Prospectus. Note that this securitization transaction is not being structured to satisfy EU risk retention and due diligence requirements. | |
| Determination Date: | 11th day of each month, or if such 11th day is not a business day, the immediately following business day, commencing in January 2021. | |
| Distribution Date: | 4th business day following the Determination Date in each month, commencing in January 2021. | |
| Cut-off Date: | With respect to each mortgage loan, the later of the related payment date of such mortgage loan in December 2020 (or, in the case of any mortgage loan that has its first due date subsequent to December 2020, the date that would have been its due date in December 2020 under the terms of that mortgage loan if a monthly payment were scheduled to be due in that month) and the date of origination of such mortgage loan. Unless otherwise noted, all mortgage loan statistics are based on balances as of the Cut-off Date. | |
| Closing Date: | On or about December 31, 2020 | |
| Settlement Terms: | DTC, Euroclear and Clearstream, same day funds, with accrued interest. | |
| ERISA Eligible: | All of the Offered Certificates are expected to be ERISA eligible. | |
| SMMEA Eligible: | None of the Offered Certificates will be SMMEA eligible. | |
| Day Count: | 30/360 | |
| Tax Treatment: | REMIC | |
| Rated Final Distribution Date: | January 2054 | |
| Minimum Denominations: | $10,000 (for each class of offered principal balance certificates) and $100,000 (for each class of offered interest-only certificates) and in each case in multiples of $1 thereafter. | |
| Clean-up Call: | 1% (with certain exceptions described under “Pooling and Servicing Agreement—Termination; Retirement of Certificates” in the Preliminary Prospectus) | |
| Distribution of Collateral by Property Type |

THE INFORMATION IN THIS STRUCTURAL AND COLLATERAL TERM SHEET IS NOT COMPLETE AND MAY BE AMENDED PRIOR TO THE TIME OF SALE. THIS TERM SHEET IS NOT AN OFFER TO SELL THESE SECURITIES AND IT IS NOT A SOLICITATION OF AN OFFER TO BUY THESE SECURITIES IN ANY JURISDICTION WHERE THE OFFER OR SALE IS NOT PERMITTED.
2
| Overview of Mortgage Pool Characteristics |
| Mortgage Loan Sellers | Number of Mortgage Loans | Number of Mortgaged Properties | Aggregate Cut-off Date Balance | % of Initial Pool Balance | |
| German American Capital Corporation | 6 | 6 | $71,464,000 | 8.8% | |
| JPMorgan Chase Bank, National Association | 9 | 12 | $261,628,000 | 32.1% | |
| Citi Real Estate Funding Inc. | 11 | 16 | $210,225,000 | 25.8% | |
| Goldman Sachs Mortgage Company | 5 | 7 | $115,900,000 | 14.2% | |
| JPMorgan Chase Bank, National Association / German American Capital Corporation(1) | 1 | 1 | $80,000,000 | 9.8% | |
| Citi Real Estate Funding Inc. / German American Capital Corporation(2) | 1 | 2 | $75,000,000 | 9.2% | |
| Total: | 33 | 44 | $814,217,000 | 100.0% | |
Collateral Facts | |||||
| Initial Outstanding Pool Balance: | $814,217,000 | ||||
| Number of Mortgage Loans: | 33 | ||||
| Number of Mortgaged Properties: | 44 | ||||
| Average Mortgage Loan Cut-off Date Balance: | $24,673,242 | ||||
| Weighted Average Mortgage Rate: | 3.4390% | ||||
| Weighted Average Mortgage Loan Original Term to Maturity Date or ARD (months)(3): | 120 | ||||
| Weighted Average Mortgage Loan Remaining Term to Maturity Date or ARD (months)(3): | 118 | ||||
| Weighted Average Mortgage Loan Seasoning (months)(3): | 2 | ||||
| % of Mortgaged Properties Leased to a Single Tenant: | 13.7% | ||||
Credit Statistics(4) | |||||
| Weighted Average Mortgage Loan U/W NCF DSCR: | 2.95x | ||||
| Weighted Average Mortgage Loan Cut-off Date LTV(5): | 53.7% | ||||
| Weighted Average Mortgage Loan Maturity Date or ARD LTV(5): | 51.4% | ||||
| Weighted Average U/W NOI Debt Yield: | 11.4% | ||||
Amortization Overview | |||||
| % Mortgage Loans with Amortization through Maturity Date or ARD: | 9.3% | ||||
| % Mortgage Loans which pay Interest Only through Maturity or ARD Date: | 76.6% | ||||
| % Mortgage Loans which pay Interest Only followed by Amortization through Maturity Date or ARD: | 14.2% | ||||
| Weighted Average Remaining Amortization Term (months)(6): | 359 | ||||
Amortization Overview | |||||
| % Mortgage Loans with Upfront or Ongoing Tax Reserves: | 51.6% | ||||
| % Mortgage Loans with Upfront or Ongoing Insurance Reserves: | 34.5% | ||||
| % Mortgage Loans with Upfront or Ongoing Replacement Reserves(7): | 50.5% | ||||
| % Mortgage Loans with Upfront or Ongoing TI/LC Reserves(8): | 47.1% | ||||
| % Mortgage Loans with In Place Hard Lockboxes: | 75.7% | ||||
| % Mortgage Loans with Cash Traps Triggered at DSCR Levels ≥ 1.15x: | 59.4% | ||||
| % Mortgage Loans with Cash Traps Triggered at Debt Yield Levels ≥ 6.0%: | 40.6% | ||||
| Prepayment Provisions(9) | |||||
| % Mortgage Loans with Defeasance Only After a Lockout Period and Prior to an Open Period: | 55.3% | ||||
| % Mortgage Loans with Prepayment Only After a Lockout Period and Prior to an Open Period with a Yield Maintenance Charge: | 1.7% | ||||
| % Mortgage Loans with Prepayment Only After a Lockout Period and Prior to an Open Period with Defeasance or a Yield Maintenance Charge: | 27.4% | ||||
| % Mortgage Loans with Prepayment with Yield Maintenance Charge Prior to an Open Period: | 2.5% | ||||
| % Mortgage Loans with Prepayment with Defeasance or a Yield Maintenance Charge Prior to an Open Period: | 13.2% | ||||
| (1) | Includes the $80.0 million pari passu portion of The Grace Building mortgage loan, as to which JPMCB is acting as mortgage loan seller of the $60.0 million Note A-2-5, Note A-2-6 and Note A-2-7 and GACC is acting as the mortgage loan seller of the $20.0 million Note A-4-4. |
| (2) | Includes the $75.0 million pari passu portion of the MGM Grand & Mandalay Bay mortgage loan, as to which CREFI is acting as mortgage loan seller of the $40.0 million Note A-13-6 and GACC is acting as the mortgage loan seller of the $35.0 million Note A-15-7. |
| (3) | With respect to 11 mortgage loans (30.8%), under the terms of the related mortgage loan documents, the first payment date is in February 2021. However, due to the fact that the related mortgage loan seller will contribute an Initial Interest Deposit Amount to the Issuing Entity on the Closing Date to cover an amount that represents one-month’s interest that would have accrued with respect to the mortgage loan at the related Net Mortgage Rate with respect to a January 2021 payment date, such Mortgage Loan is being treated as having a First Due Date in January 2021, and the Original Term to Maturity Date or ARD, Remaining Term to Maturity Date or ARD and Loan Seasoning are shown in the Annex A-1 to reflect this. |
| (4) | The LTV, DSCR and Debt Yield calculations include any related pari passu companion loan(s) and exclude any related subordinate companion loan(s) and/or mezzanine loan(s). |
| (5) | With respect to one mortgage loan (0.9%) (801 Bedford Avenue), the Cut-off Date LTV and Maturity Date or ARD LTV have been calculated using a value other than the “As Is” appraised value. For additional information please see the footnotes to Annex A-1 in the Preliminary Prospectus. |
| (6) | Excludes mortgage loans which are interest only for the full loan term. |
| (7) | Includes FF&E reserves. |
| (8) | Represents the percent of the allocated Initial Outstanding Pool Balance of office, retail, industrial and mixed use properties only structured with TI/LC reserves. |
| (9) | Please see Annex A-1 of the Preliminary Prospectus for more information. |
THE INFORMATION IN THIS STRUCTURAL AND COLLATERAL TERM SHEET IS NOT COMPLETE AND MAY BE AMENDED PRIOR TO THE TIME OF SALE. THIS TERM SHEET IS NOT AN OFFER TO SELL THESE SECURITIES AND IT IS NOT A SOLICITATION OF AN OFFER TO BUY THESE SECURITIES IN ANY JURISDICTION WHERE THE OFFER OR SALE IS NOT PERMITTED.
3
Benchmark 2020-B22 Mortgage Trust
|
| STRUCTURE SUMMARY |
OFFERED CERTIFICATES
| Class(1) | Ratings (Moody’s/Fitch/KBRA) | Initial Certificate Balance or Notional | Initial Subordination | Weighted Average Life | Principal (months)(4) | Certificate Principal to Value Ratio(5) | Certificate Underwritten NOI Debt Yield(6) |
| Class A-1 | Aaa(sf)/AAAsf/AAA(sf) | $9,763,000 | 30.000%(7) | 3.09 | 1 – 61 | 37.6% | 16.3% |
| Class A-2 | Aaa(sf)/AAAsf/AAA(sf) | $3,086,000 | 30.000%(7) | 5.04 | 61 – 61 | 37.6% | 16.3% |
| Class A-SB | Aaa(sf)/AAAsf/AAA(sf) | $15,906,000 | 30.000%(7) | 7.24 | 61 – 111 | 37.6% | 16.3% |
| Class A-4 | Aaa(sf)/AAAsf/AAA(sf) | (8) | 30.000%(7) | (8) | (8) | 37.6% | 16.3% |
| Class A-5 | Aaa(sf)/AAAsf/AAA(sf) | (8) | 30.000%(7) | (8) | (8) | 37.6% | 16.3% |
| Class X-A(9) | Aa3(sf)/AAAsf/AAA(sf) | $611,069,000(10) | N/A | N/A | N/A | N/A | N/A |
| Class A-M | Aa3(sf)/AAAsf/AAA(sf) | $69,615,000 | 21.000% | 10.03 | 120 – 121 | 42.4% | 14.4% |
| Class B | NR/AA-sf/AA(sf) | $30,941,000 | 17.000% | 10.04 | 121 – 121 | 44.6% | 13.7% |
| Class C | NR/A-sf/A(sf) | $31,907,000 | 12.875% | 10.04 | 121 – 121 | 46.8% | 13.1% |
NON-OFFERED CERTIFICATES
| Class(1) | Ratings (Moody’s/Fitch/KBRA) | Initial Certificate Balance or Notional | Initial Subordination | Weighted Average Life | Principal (months)(4) | Certificate Principal to Value Ratio(5) | Certificate Underwritten NOI Debt Yield(6) |
| Class X-B(9) | NR/A-sf/AAA(sf) | $62,848,000(10) | N/A | N/A | N/A | N/A | N/A |
| Class X-D(9) | NR/BBB-sf/BBB-(sf) | $41,576,000(10) | N/A | N/A | N/A | N/A | N/A |
| Class X-F(9) | NR/BB-sf/NR | $22,238,000(10) | N/A | N/A | N/A | N/A | N/A |
| Class X-G(9) | NR/B-sf/NR | $7,735,000(10) | N/A | N/A | N/A | N/A | N/A |
| Class X-H(9) | NR/NR/NR | $28,040,150(10) | N/A | N/A | N/A | N/A | N/A |
| Class D | NR/BBBsf/BBB+(sf) | $22,238,000 | 10.000% | 10.04 | 121 – 121 | 48.3% | 12.7% |
| Class E | NR/BBB-sf/BBB-(sf) | $19,338,000 | 7.500% | 10.04 | 121 – 121 | 49.7% | 12.3% |
| Class F | NR/BB-sf/NR | $22,238,000 | 4.625% | 10.04 | 121 – 121 | 51.2% | 12.0% |
| Class G | NR/B-sf/NR | $7,735,000 | 3.625% | 10.04 | 121 – 121 | 51.8% | 11.8% |
| Class H | NR/NR/NR | $28,040,150 | 0.000% | 10.04 | 121 – 121 | 53.7% | 11.4% |
NON-OFFERED VERTICAL RISK RETENTION INTEREST
| Non-Offered Vertical Risk Retention Interest | Ratings (S&P/Fitch/KBRA) | Initial Balance | Initial Subordination | Weighted Average Life | Principal (months)(11) | Certificate Principal to Value Ratio | Certificate Underwritten NOI Debt Yield |
| VRR Interest(12)(13) | NR/NR/NR | $40,710,850 | N/A | 9.65 | 1 - 121 | N/A | N/A |
| (1) | The pass-through rates for the Class A-1, Class A-2, Class A-SB, Class A-4, Class A-5, Class A-M, Class B, Class C, Class D, Class E, Class F, Class G and Class H certificates (collectively, the “Principal Balance Certificates”) in each case, will be one of: (i) a fixed per annum rate, (ii) the weighted average of the net mortgage rates on the mortgage loans (in each case, adjusted, if necessary, to accrue on the basis of a 360-day year consisting of twelve 30-day months) as of their respective due dates in the month preceding the month in which such Distribution Date occurs (the “WAC Rate”), (iii) a rate equal to the lesser of a specified pass-through rate and the WAC Rate or (iv) the WAC Rate less a specified rate. |
| (2) | Approximate; subject to a permitted variance of plus or minus 5%. The Certificate Balance of the VRR Interest is not included in the Certificate Balance or Notional Amount of any Class of Certificates set forth under "Offered Certificates" or "Non-Offered Certificates" in the table above. |
| (3) | The initial subordination levels are calculated based on the initial Certificate Balance. The approximate initial credit support percentages shown in the table above do not take into account the VRR Interest. However, losses incurred on the mortgage loans will be allocated between the VRR Interest and the Principal Balance Certificates, pro rata in accordance with their respective outstanding Certificate Balances. See “Credit Risk Retention” and “Description of the Certificates” in the Preliminary Prospectus. |
| (4) | The weighted average life and principal window during which distributions of principal would be received as set forth in the table with respect to each class of Principal Balance Certificates are based on (i) modeling assumptions described in the Preliminary Prospectus and (ii) assumptions that there are no prepayments, modifications or losses in respect of the mortgage loans and there are no extensions or forbearances of maturity dates or anticipated repayment dates of the mortgage loans. The weighted average life and principal window of the Class A-4 and Class A-5 certificates are subject to change as described in footnote (8) below. |
| (5) | “Certificate Principal to Value Ratio” for any class of Principal Balance Certificates is calculated as the product of (a) the weighted average mortgage loan Cut-off Date LTV of the mortgage loans, multiplied by (b) a fraction, the numerator of which is the total initial Certificate Balance of the related class of Principal Balance Certificates and all other classes of Principal Balance Certificates, if any, that are senior to such class, and the denominator of which is the total initial Certificate Balance of all classes of Principal Balance Certificates. The Certificate Principal to Value Ratios of the Class A-1, Class A-2, Class A-SB, Class A-4 and Class A-5 certificates are calculated in the aggregate for those classes as if they were a single class. |
| (6) | “Certificate Underwritten NOI Debt Yield” for any class of Principal Balance Certificates is calculated as the product of (a) the weighted average Underwritten NOI Debt Yield for the mortgage loans, multiplied by (b) a fraction, the numerator of which is the total initial Certificate Balance of all classes of Principal Balance Certificates and the denominator of which is the total initial Certificate Balance of such class of Principal Balance Certificates and all other classes of Principal Balance Certificates, if any, that are senior to such class. The Underwritten NOI Debt Yields of the Class A-1, Class A-2, Class A-SB, Class A-4 and Class A-5 certificates are calculated in the aggregate for those classes as if they were a single class. |
| (7) | The initial subordination levels for the Class A-1, Class A-2, Class A-SB, Class A-4 and Class A-5 certificates are represented in the aggregate. |
| (8) | The exact initial Certificate Balances of the Class A-4 and Class A-5 certificates are unknown and will be determined based on the final pricing of those classes of certificates. However, the respective initial Certificate Balances, weighted average lives and principal windows of the Class A-4 and Class A-5 certificates are expected to be within the applicable ranges reflected in the following chart. The aggregate initial Certificate Balance of the Class A-4 and Class A-5 certificates is expected to be approximately $512,699,000, subject to a variance of plus or minus 5.0%. |
| Class of Certificates | Expected Range of Initial Certificate Balance | Expected Range of Weighted Avg. Life (years)(4) | Expected Range of Principal Window (months)(4) |
| Class A-4 | $0 - $256,000,000 | NAP - 9.45 | NAP / 111-120 |
| Class A-5 | $256,699,000 - $512,699,000 | 9.96 - 9.71 | 120-120 / 111-120 |
| (9) | As further described in the Preliminary Prospectus, the pass-through rate applicable to the Class X-A, Class X-B, Class X-D, Class X-F, Class X-G and Class X-H certificates (collectively, the “Class X Certificates”) for each Distribution Date will generally be equal to the excess of (i) the WAC Rate over (ii)(A) with respect to the Class X-A certificates, the weighted average of the pass-through rates of the Class A-1, Class A-2, Class A-SB, Class A-4, Class A-5 and Class A-M certificates (based on their respective Certificate Balances outstanding immediately prior to such Distribution Date), (B) with respect to the Class X-B certificates, the weighted average of the pass-through rates of the Class B and Class C certificates (based on their respective Certificate Balances outstanding immediately prior to such Distribution Date), (C) with respect to the Class X-D certificates, the weighted average of the pass-through rates of the Class D and Class E certificates (based on their respective Certificate Balances outstanding immediately prior to such Distribution Date), (D) with respect to the Class X-F certificates, the pass-through rate of the Class F certificates, (E) with respect to the Class X-G certificates, the pass-through rate of the Class G certificates and (F) with respect to the Class X-H certificates, the pass-through rate of the Class H certificates. |
| (10) | The Class X Certificates will not have Certificate Balances. None of the Class X Certificates will be entitled to distributions of principal. The interest accrual amounts on the Class X-A certificates will be calculated by reference to a notional amount equal to the aggregate Certificate Balances of the Class A-1, Class A-2, Class A-SB, Class A-4, Class A-5 and Class A-M certificates. The interest accrual amounts on the Class X-B certificates will be calculated by reference to a notional amount equal to the aggregate Certificate Balances of the Class B and Class C certificates. The interest accrual amounts on the Class X-D certificates will be calculated by reference to a notional amount equal to the aggregate Certificate Balances of the Class D and Class E certificates. The interest |
THE INFORMATION IN THIS STRUCTURAL AND COLLATERAL TERM SHEET IS NOT COMPLETE AND MAY BE AMENDED PRIOR TO THE TIME OF SALE. THIS TERM SHEET IS NOT AN OFFER TO SELL THESE SECURITIES AND IT IS NOT A SOLICITATION OF AN OFFER TO BUY THESE SECURITIES IN ANY JURISDICTION WHERE THE OFFER OR SALE IS NOT PERMITTED.
4
Benchmark 2020-B22 Mortgage Trust
|
| STRUCTURE SUMMARY |
| accrual amounts on the Class X-F certificates will be calculated by reference to a notional amount equal to the Certificate Balance of the Class F certificates. The interest accrual amounts on the Class X-G certificates will be calculated by reference to a notional amount equal to the Certificate Balance of the Class G certificates. The interest accrual amounts on the Class X-H certificates will be calculated by reference to a notional amount equal to the Certificate Balance of the Class H certificates. The notional amount of each class of Class X Certificates is subject to change depending upon the final pricing of the Principal Balance Certificates, as follows: (1) if as a result of such pricing the pass-through rate of any class of Principal Balance Certificates whose Certificate Balance comprises such notional amount is equal to the WAC Rate, the Certificate Balance of such class of Principal Balance Certificates may not be part of, and will reduce accordingly, such notional amount of such class of Class X Certificates (or, if as a result of such pricing the pass-through rate of such class of Class X Certificates is equal to zero, such class of Class X Certificates may not be issued on the Closing Date), and/or (2) if as a result of such pricing the pass-through rate of any class of Principal Balance Certificates that does not comprise such notional amount of such class of Class X Certificates is less than the WAC Rate, such class of Principal Balance Certificates may become a part of, and will increase accordingly, such notional amount of such class of Class X Certificates. |
| (11) | The weighted average life and principal window during which distributions of principal would be received as set forth in the foregoing table with respect to the VRR Interest (as defined below) are based on the assumptions set forth under “Yield and Maturity Considerations—Weighted Average Life” in the Preliminary Prospectus and on the assumptions that there are no prepayments, modifications or losses in respect of the mortgage loans and that there are no extensions or forbearances of maturity dates or anticipated repayment dates of the mortgage loans. |
| (12) | German American Capital Corporation, as the retaining sponsor, is expected to acquire from the depositor, on the Closing Date, an “eligible vertical interest” (as defined in Regulation RR) in the form of a single vertical security (the “VRR Interest”), representing approximately (but not less than) 5.00% of all amounts collected on the mortgage loans (net of expenses of the issuing entity) that are available for distribution on the non-VRR certificates and the VRR Interest. See “Credit Risk Retention” in the Preliminary Prospectus. The VRR Interest is a class of Certificates. |
| (13) | Although it does not have a specified pass-through rate (other than for tax reporting purposes), the effective interest rate for the VRR Interest will be the WAC rate. |
Class A-2 Principal Paydown(1) |
| Class | Mortgage Loan Seller | Mortgage Loan | Property Type | Cut-off Date Balance | Remaining Term to Maturity (Mos.) | Cut-off Date LTV Ratio | U/W NCF DSCR | U/W NOI Debt Yield | |
| A-2 | CREFI | Prime Storage Palm Desert(2) | Self Storage | $3,250,000 | 61 | 58.0% | 2.36x | 9.7% | |
| (1) | This table reflects the mortgage loans whose balloon payments will be applied to pay down the Class A-2 certificates, assuming (i) that none of the mortgage loans experience prepayments, defaults or losses, (ii) there are no extensions of maturity dates and (iii) each mortgage loan is paid in full on its stated maturity date. See “Yield and Maturity Considerations—Yield Considerations” in the Preliminary Prospectus. |
| (2) | With respect to the Prime Storage Palm Desert mortgage loan, under the terms of the related mortgage loan documents, the first payment date is in February 2021. However, due to the fact that the related mortgage loan seller will contribute an Initial Interest Deposit Amount to the Issuing Entity on the Closing Date to cover an amount that represents one-month’s interest that would have accrued with respect to the mortgage loan at the related Net Mortgage Rate with respect to a January 2021 payment date, such Mortgage Loan is being treated as having a First Due Date in January 2021, and the Original Term to Maturity Date or ARD, Remaining Term to Maturity Date or ARD and Loan Seasoning are shown in the Annex A-1 to reflect this. |
THE INFORMATION IN THIS STRUCTURAL AND COLLATERAL TERM SHEET IS NOT COMPLETE AND MAY BE AMENDED PRIOR TO THE TIME OF SALE. THIS TERM SHEET IS NOT AN OFFER TO SELL THESE SECURITIES AND IT IS NOT A SOLICITATION OF AN OFFER TO BUY THESE SECURITIES IN ANY JURISDICTION WHERE THE OFFER OR SALE IS NOT PERMITTED.
5
Benchmark 2020-B22 Mortgage Trust
|
| OVERVIEW OF MORTGAGE POOL CHARACTERISTICS |
| Ten Largest Mortgage Loans | |||||||||
| Mortgage Loan | Mortgage Loan Seller | City, State | Property Type | Mortgage Loan Cut-off Date | % of Initial Outstanding Pool Balance | Cut-off Date Balance per NRA/Room(1) | Cut-off Date LTV(1) | U/W NCF DSCR | U/W NOI Debt Yield(1) |
| The Grace Building | JPMCB/GACC | New York, NY | Office | $80,000,000 | 9.8% | $567 | 41.1% | 4.25x | 11.8% |
| MGM Grand & Mandalay Bay | CREFI/GACC | Las Vegas, NV | Hospitality | $75,000,000 | 9.2% | $167,645 | 35.5% | 4.95x | 17.9% |
| Elo Midtown Office Portfolio | CREFI | New York, NY | Office | $71,000,000 | 8.7% | $419 | 58.5% | 2.30x | 8.6% |
| Station Park & Station Park West | JPMCB | Farmington, UT | Mixed Use | $60,000,000 | 7.4% | $119 | 50.0% | 3.86x | 13.8% |
| Rugby Pittsburgh Portfolio | JPMCB | Various, PA | Office | $50,000,000 | 6.1% | $85 | 61.9% | 2.00x | 12.1% |
| Mountain View Village | JPMCB | Riverton, UT | Retail | $38,650,500 | 4.7% | $95 | 39.0% | 3.13x | 11.4% |
| 4 West 58th Street | JPMCB | New York, NY | Mixed Use | $32,500,000 | 4.0% | $1,496 | 69.4% | 1.94x | 7.4% |
| McClellan Business Park | GSMC | McClellan, CA | Mixed Use | $32,400,000 | 4.0% | $52 | 60.2% | 2.90x | 10.5% |
| 1088 Sansome | GACC | San Francisco, CA | Office | $32,250,000 | 4.0% | $522 | 59.7% | 2.73x | 9.1% |
| 711 Fifth Avenue | GSMC | New York, NY | Mixed Use | $30,000,000 | 3.7% | $1,603 | 54.5% | 2.90x | 9.4% |
| Total/Weighted Average | $501,800,500 | 61.6% | 50.8% | 3.31x | 11.8% | ||||
| (1) | The Cut-off Date Balance per NRA/Room, Cut-off Date LTV, U/W NCF DSCR after IO and U/W NOI Debt Yield calculations include any related pari passu companion loan(s) and exclude any related subordinate companion loan(s) and/or mezzanine loan(s). |
| Subordinate Debt Summary | |||||||||
| Mortgage Loan | Mortgage Loan Cut-off Date Balance | Pari Passu | Subordinate Debt Cut-off Date Balance | Trust U/W NCF DSCR | Total Debt U/W NCF DSCR(1) | Trust Cut-off Date LTV | Total Debt Cut-off Date LTV(1) | Trust U/W NOI Debt Yield | Total Debt U/W NOI Debt Yield(1) |
| The Grace Building | $80,000,000 | $803,000,000 | $367,000,000 | 4.25x | 3.00x | 41.1% | 58.1% | 11.8% | 8.3% |
| MGM Grand & Mandalay Bay | $75,000,000 | $1,559,200,000 | $1,365,800,000 | 4.95x | 2.70x | 35.5% | 65.2% | 17.9% | 9.7% |
| (1) | Total Debt U/W NCF DSCR, Total Debt Cut-off Date LTV and Total Debt U/W NOI Debt Yield calculations include any related pari passu companion loan(s), related subordinate companion loan(s) and/or related mezzanine loan(s). |
THE INFORMATION IN THIS STRUCTURAL AND COLLATERAL TERM SHEET IS NOT COMPLETE AND MAY BE AMENDED PRIOR TO THE TIME OF SALE. THIS TERM SHEET IS NOT AN OFFER TO SELL THESE SECURITIES AND IT IS NOT A SOLICITATION OF AN OFFER TO BUY THESE SECURITIES IN ANY JURISDICTION WHERE THE OFFER OR SALE IS NOT PERMITTED.
6
Benchmark 2020-B22 Mortgage Trust
|
| OVERVIEW OF MORTGAGE POOL CHARACTERISTICS |
| Companion Loan Summary |
| Loan No. | Mortgage Loan | Note(s) | Original Balance ($) | Cut-off Date Balance ($) | Holder of Note(1) | Lead Servicer for Whole Loan (Y/N) | Master Servicer Under Lead Securitization | Special Servicer Under Lead Securitization |
| 1 | The Grace Building | A-1-1, A-2-1, A-3-1, A-4-1 | $383,000,000 | $383,000,000 | GRACE 2020-GRCE | Yes | ||
| A-1-2 | $75,000,000 | $75,000,000 | BANK 2020-BNK29 | No | ||||
| A-1-3-1 | $60,000,000 | $60,000,000 | BANK 2020-BNK30(2) | No | ||||
| A-2-2, A-2-3, A-4-2 | $100,000,000 | $100,000,000 | Benchmark 2020-B21 | No | ||||
| A-2-5, A-2-6, A-2-7, A-4-4 | $80,000,000 | $80,000,000 | Benchmark 2020-B22 | No | ||||
| A-3-2, A-3-3, A-3-4, A-3-5 | $100,000,000 | $100,000,000 | Column Financial Inc. | No | ||||
| A-1-3-2 | $15,000,000 | $15,000,000 | Bank of America, N.A. | No | ||||
| A-4-3, A-4-5 | $40,000,000 | $40,000,000 | DBRI | No | ||||
| A-2-4 | $30,000,000 | $30,000,000 | JPMCB | No | ||||
| Total Senior Notes | $883,000,000 | $883,000,000 | ||||||
| B-1, B-2, B-3, B-4 | $367,000,000 | $367,000,000 | GRACE 2020-GRCE | Yes | Wells Fargo | Situs | ||
| Total | $1,250,000,000 | $1,250,000,000 | ||||||
| 2 | MGM Grand & Mandalay Bay | A-1, A-2, A-3, A-4 | $670,139 | $670,139 | BX 2020-VIVA | No | ||
| A-5, A-6, A-7, A-8 | $794,861 | $794,861 | BX 2020-VIV2 | No | ||||
| A-9, A-10, A-11, A-12 | $1,000,000 | $1,000,000 | BX 2020-VIV3 | No | ||||
| A-13-1, A-15-1 | $65,000,000 | $65,000,000 | Benchmark 2020-B18 | No | ||||
| A-13-2, A-15-3 | $80,000,000 | $80,000,000 | Benchmark 2020-B19 | No | ||||
| A-13-3, A-14-4, A-15-5, A-16-2 | $550,000,000 | $550,000,000 | BX 2020-VIV4 | No | ||||
| A-13-4, A-15-4 | $70,000,000 | $70,000,000 | Benchmark 2020-B20 | No | ||||
| A-13-5, A-15-6 | $75,000,000 | $75,000,000 | Benchmark 2020-B21 | No | ||||
| A-13-6, A-15-7 | $75,000,000 | $75,000,000 | Benchmark 2020-B22 | No | ||||
| A-14-1, A-16-1 | $69,500,000 | $69,500,000 | BBCMS 2020-C8 | No | ||||
| A-14-2, A-14-3 | $45,000,000 | $45,000,000 | WFCM 2020-C58(2) | No | ||||
| A-15-2 | $50,000,000 | $50,000,000 | DBJPM 2020-C9 | No | ||||
| A-13-7 | $65,000,000 | $65,000,000 | GSMS 2020-GSA2(2) | No | ||||
| A-13-8 | $99,360,667 | $99,360,667 | CREFI | No | ||||
| A-14-5 | $101,847,000 | $101,847,000 | Barclays Bank PLC | No | ||||
| A-15-8 | $94,680,333 | $94,680,333 | DBRI | No | ||||
| A-16-3 | $191,347,000 | $191,347,000 | SGFC | No | ||||
| Total Senior Notes | $1,634,200,000 | $1,634,200,000 | ||||||
| B-1-A, B-2-A, B-3-A, B-4-A, B-1-B, B-2-B, B-3-B, B-4-B | $329,861 | $329,861 | BX 2020-VIVA | No | ||||
| B-5-A, B-6-A, B-7-A, B-8-A, B-5-B, B-6-B, B-7-B, B-8-B | $374,355,139 | $374,355,139 | BX 2020-VIV2 | No | ||||
| B-9-A, B-10-A, B-11-A, B-12-A | $429,715,000 | $429,715,000 | BX 2020-VIV3 | No | ||||
| C-1, C-2, C-3, C-4 | $561,400,000 | $561,400,000 | BX 2020-VIVA | Yes | KeyBank | Situs | ||
| Total | $3,000,000,000 | $3,000,000,000 | ||||||
| 3 | Elo Midtown Office Portfolio | A-1 | $71,000,000 | $71,000,000 | Benchmark 2020-B22 | Yes | Midland | Rialto |
| A-2 | $70,000,000 | $70,000,000 | GSMS 2020-GSA2(2) | No | ||||
| Total | $141,000,000 | $141,000,000 | ||||||
| 4 | Station Park & Station Park West | A-1 | $60,000,000 | $60,000,000 | Benchmark 2020-B22 | Yes | Midland | Rialto |
| A-2 | $58,700,000 | $58,700,000 | JPMCB | No | ||||
| Total | $118,700,000 | $118,700,000 | ||||||
| 5 | Rugby Pittsburgh Portfolio | A-1 | $50,000,000 | $50,000,000 | Benchmark 2020-B22 | Yes | Midland | Rialto |
| A-2 | $40,000,000 | $40,000,000 | JPMCB | No | ||||
| Total | $90,000,000 | $90,000,000 | ||||||
| 7 | 4 West 58th Street | A-1 | $62,500,000 | $62,500,000 | Benchmark 2020-B20 | Yes | Midland | Midland |
| A-2 | $30,000,000 | $30,000,000 | Benchmark 2020-B21 | No | ||||
| A-3, A-4 | $32,500,000 | $32,500,000 | Benchmark 2020-B22 | No | ||||
| Total | $125,000,000 | $125,000,000 |
THE INFORMATION IN THIS STRUCTURAL AND COLLATERAL TERM SHEET IS NOT COMPLETE AND MAY BE AMENDED PRIOR TO THE TIME OF SALE. THIS TERM SHEET IS NOT AN OFFER TO SELL THESE SECURITIES AND IT IS NOT A SOLICITATION OF AN OFFER TO BUY THESE SECURITIES IN ANY JURISDICTION WHERE THE OFFER OR SALE IS NOT PERMITTED.
7
Benchmark 2020-B22 Mortgage Trust
|
| OVERVIEW OF MORTGAGE POOL CHARACTERISTICS |
| Loan No. | Mortgage Loan | Note(s) | Original Balance ($) | Cut-off Date Balance ($) | Holder of Note(1) | Lead Servicer for Whole Loan (Y/N) | Master Servicer Under Lead Securitization | Special Servicer Under Lead Securitization |
| 8 | McClellan Business Park | A-1 | $75,000,000 | $75,000,000 | BANK 2020-BNK30(3) | Yes | Wells Fargo | Greystone |
| A-2 | $69,000,000 | $69,000,000 | WFCM 2020-C58(2) | No | ||||
| A-3, A-4, A-5 | $106,600,000 | $106,600,000 | WFB | No | ||||
| A-6 | $75,000,000 | $75,000,000 | Benchmark 2020-B21 | No | ||||
| A-7, A-8 | $32,400,000 | $32,400,000 | Benchmark 2020-B22 | No | ||||
| Total | $358,000,000 | $358,000,000 | ||||||
| 10 | 711 Fifth Avenue | A-1-1, A-1-10 | $62,500,000 | $62,500,000 | GSMS 2020-GC47 | Yes | Wells Fargo | KeyBank |
| A-1-2 | $60,000,000 | $60,000,000 | Benchmark 2020-B21 | No | ||||
| A-1-3, A-1-16, A-1-17 | $54,000,000 | $54,000,000 | GS Bank | No | ||||
| A-1-4 | $40,000,000 | $40,000,000 | GSMS 2020-GSA2(2) | No | ||||
| A-1-5-A, A-1-5-C | $30,000,000 | $30,000,000 | Benchmark 2020-B22 | No | ||||
| A-1-5-B | $15,000,000 | $15,000,000 | Benchmark 2020-B20 | No | ||||
| A-1-6, A-1-7 | $40,000,000 | $40,000,000 | JPMDB 2020-COR7 | No | ||||
| A-1-8, A-1-9, A-1-13 | $45,000,000 | $45,000,000 | Benchmark 2020-B18 | No | ||||
| A-1-11, A-1-12, A-1-14 | $25,000,000 | $25,000,000 | DBJPM 2020-C9 | No | ||||
| A-1-15 | $10,000,000 | $10,000,000 | Benchmark 2020-B19 | No | ||||
| A-2-1 | $60,000,000 | $60,000,000 | BANK 2020-BNK28 | No | ||||
| A-2-2 | $43,000,000 | $43,000,000 | BANK 2020-BNK27 | No | ||||
| A-2-3-A | $25,500,000 | $25,500,000 | BANK 2020-BNK29 | No | ||||
| A-2-3-B | $15,000,000 | $15,000,000 | BANK 2020-BNK30(2) | No | ||||
| A-2-4 | $20,000,000 | $20,000,000 | BBCMS 2020-C8 | No | ||||
| Total | $545,000,000 | $545,000,000 | ||||||
| 13 | 32-42 Broadway | A-1 | $75,000,000 | $75,000,000 | Benchmark 2020-B21 | Yes | Midland | Midland |
| A-2-1 | $25,000,000 | $25,000,000 | GSMS 2020-GSA2(2) | No | ||||
| A-2-2 | $25,000,000 | $25,000,000 | Benchmark 2020-B22 | No | ||||
| Total | $125,000,000 | $125,000,000 | ||||||
| 15 | JW Marriott Nashville | A-1, A-2, A-7, A-8, A-9 | $110,000,000 | $110,000,000 | GS Bank | Yes | Future Securitization(4) | Future Securitization |
| A-3, A-6 | $35,000,000 | $35,000,000 | GSMS 2020-GSA2(2) | No | ||||
| A-4 | $20,000,000 | $20,000,000 | Benchmark 2020-B21 | No | ||||
| A-5 | $20,000,000 | $20,000,000 | Benchmark 2020-B22 | No | ||||
| Total | $185,000,000 | $185,000,000 | ||||||
| 16 | Hotel ZaZa Houston Museum District | A-1-1 | $20,000,000 | $20,000,000 | GSMS 2020-GSA2(2) | No | ||
| A-1-2, A-1-3, A-1-4, A-2-2 | $20,000,000 | $20,000,000 | Benchmark 2020-B22 | No | ||||
| A-2-1 | $20,000,000 | $20,000,000 | CREFI | Yes | Future Securitization(5) | Future Securitization | ||
| Total | $60,000,000 | $60,000,000 | ||||||
| 19 | Cabinetworks Portfolio | A-1 | $17,333,000 | $17,333,000 | GS Bank | Yes | Future Securitization(5) | Future Securitization |
| A-2 | $15,000,000 | $15,000,000 | GSMS 2020-GSA2(2) | No | ||||
| A-3 | $15,000,000 | $15,000,000 | Benchmark 2020-B22 | No | ||||
| Total | $47,333,000 | $47,333,000 |
| (1) | The identification of a securitization trust means that we have identified another securitization trust that has closed or as to which a preliminary prospectus (or preliminary offering circular) or final prospectus (or final offering circular) has printed that includes or is expected to include the identified Mortgage Note(s). |
| (2) | Each of the BANK 2020-BNK30 securitization transaction, the WFCM 2020-C58 securitization transaction and the GSMS 2020-GSA2 securitization transaction is expected to close prior to the Closing Date. |
| (3) | The related whole loan is currently serviced under the pooling and servicing agreement governing the Benchmark 2020 B21 securitization and is expected to be serviced under the BANK 2020-BNK30 securitization on and after the closing date of the BANK 2020-BNK30 securitization, which is expected to be December 22, 2020. |
| (4) | The related whole loan is currently serviced under the pooling and servicing agreement governing the Benchmark 2020-B21 transaction. From and after the securitization of the related controlling note, the related whole loan will be serviced under the related pooling and servicing agreement for such future securitization. |
| (5) | The related whole loan is expected to initially be serviced under the pooling and servicing agreement of the GSMS 2020-GSA2 transaction. The GSMS 2020-GSA2 securitization transaction is expected to close prior to the Closing Date. From and after the securitization of the related controlling note, the related whole loan will be serviced under the related pooling and servicing agreement for such future securitization. |
THE INFORMATION IN THIS STRUCTURAL AND COLLATERAL TERM SHEET IS NOT COMPLETE AND MAY BE AMENDED PRIOR TO THE TIME OF SALE. THIS TERM SHEET IS NOT AN OFFER TO SELL THESE SECURITIES AND IT IS NOT A SOLICITATION OF AN OFFER TO BUY THESE SECURITIES IN ANY JURISDICTION WHERE THE OFFER OR SALE IS NOT PERMITTED.
8
Benchmark 2020-B22 Mortgage Trust
|
| OVERVIEW OF MORTGAGE POOL CHARACTERISTICS |
| COVID-19 Updates | ||||||||||||||
| Loan No. | Property Name | Mortgage Loan Seller | Property Type | Information as of Date | First Payment Date(1) | November Service Payment Received (Y/N) | December Service Payment Received (Y/N) | Forbearance or Other Debt Service Relief Requested (Y/N) | Other Loan Modification Requested (Y/N) | Lease Modification or Rent Relief Requested (Y/N) | Occupied SF or Unit Count Making Full October Rent Payment (%) | UW October Base Rent Paid (%) | Occupied SF or Unit Count Making Full November Rent Payment (%) | UW November Base Rent Paid (%) |
| 1 | The Grace Building(2) | JPMCB/GACC | Office | 12/1/2020 | 1/6/2021 | NAP | NAP | No | No | Yes | 98.0% | 97.1% | 98.0% | 97.1% |
| 2 | MGM Grand & Mandalay Bay(3) | CREFI/GACC | Hospitality | 12/6/2020 | 4/5/2020 | Yes | Yes | No | No | No | 100.0% | 100.0% | 100.0% | 100.0% |
| 3 | Elo Midtown Office Portfolio(4) | CREFI | Office | 12/6/2020 | 1/6/2021 | NAP | NAP | No | No | No | 100.0% | 100.0% | 100.0% | 100.0% |
| 4 | Station Park & Station Park West(5) | JPMCB | Mixed Use | 12/1/2020 | 1/5/2021 | NAP | NAP | No | No | Yes | 83.5% | 83.6% | NAV | NAV |
| 5 | Rugby Pittsburgh Portfolio | JPMCB | Office | 12/1/2020 | 1/1/2021 | NAP | NAP | No | No | Yes | 100.0% | 100.0% | NAV | NAV |
| 6 | Mountain View Village(6) | JPMCB | Retail | 12/1/2020 | 1/5/2021 | NAP | NAP | No | No | Yes | 92.9% | 92.7% | 95.6% | 96.4% |
| 7 | 4 West 58th Street(7) | JPMCB | Mixed Use | 12/1/2020 | 4/1/2020 | Yes | Yes | No | Yes | Yes | 84.2% | 91.2% | NAV | NAV |
| 8 | McClellan Business Park(8) | GSMC | Mixed Use | 11/20/2020 | 1/11/2021 | NAP | NAP | No | No | Yes | 99.0% | 99.0% | 98.0% | 99.0% |
| 9 | 1088 Sansome | GACC | Office | 12/11/2020 | 1/6/2021 | NAP | NAP | No | No | No | 100.0% | 100.0% | 100.0% | 100.0% |
| 10 | 711 Fifth Avenue(9) | GSMC | Mixed Use | 12/1/2020 | 4/6/2020 | Yes | Yes | No | No | Yes | 100.0% | 100.0% | 100.0% | 100.0% |
| 11 | Amazon Port of Savannah | JPMCB | Industrial | 12/1/2020 | 1/1/2021 | NAP | NAP | No | No | No | 100.0% | 100.0% | 100.0% | 100.0% |
| 12 | 111 Kent Avenue | CREFI | Multifamily | 12/6/2020 | 1/6/2021 | NAP | NAP | No | No | No | 98.2% | 98.7% | 96.6% | 96.2% |
| 13 | 32-42 Broadway(10) | CREFI | Office | 12/6/2020 | 12/6/2020 | NAP | Yes | No | No | Yes | 98.5% | 98.5% | 76.1% | 76.1% |
| 14 | 27750 Entertainment Drive | CREFI | Office | 12/6/2020 | 1/6/2021 | NAP | NAP | No | No | No | 100.0% | 100.0% | 100.0% | 100.0% |
| 15 | JW Marriott Nashville(11) | GSMC | Hospitality | 11/30/2020 | 4/6/2020 | Yes | Yes | Yes | Yes | Yes | NAP | NAP | NAP | NAP |
| 16 | Hotel ZaZa Houston Museum District(12) | CREFI | Hospitality | 12/6/2020 | 4/6/2020 | Yes | Yes | No | Yes | No | 100.0% | 100.0% | 100.0% | 100.0% |
| 17 | Medici Office Park | GSMC | Office | 12/10/2020 | 1/6/2021 | NAP | NAP | No | No | No | 100.0% | 100.0% | 100.0% | 100.0% |
| 18 | 5 East 22nd Street | CREFI | Retail | 12/6/2020 | 1/6/2021 | NAP | NAP | No | No | Yes | 95.1% | 95.1% | 95.1% | 95.1% |
| 19 | Cabinetworks Portfolio(13) | GSMC | Industrial | 10/15/2020 | 12/6/2020 | NAP | Yes | No | No | No | 100.0% | 100.0% | 100.0% | 100.0% |
| 20 | 350 West Broadway | JPMCB | Mixed Use | 12/1/2020 | 1/1/2021 | NAP | NAP | No | No | No | 100.0% | 100.0% | 100.0% | 100.0% |
| 21 | Maplewood Commons | JPMCB | Retail | 12/1/2020 | 1/1/2021 | NAP | NAP | No | No | No | 100.0% | 100.0% | 100.0% | 100.0% |
| 22 | Mercury Plaza(14) | JPMCB | Retail | 12/1/2020 | 1/1/2021 | NAP | NAP | No | No | Yes | 95.2% | 96.3% | NAV | NAV |
| 23 | Pet Food Experts Industrial | GACC | Industrial | 12/9/2020 | 1/6/2021 | NAP | NAP | No | No | No | 100.0% | 100.0% | 100.0% | 100.0% |
| 24 | Frontier Self Storage | GACC | Self Storage | 12/11/2020 | 1/6/2021 | NAP | NAP | No | No | No | 100.0% | 100.0% | 100.0% | 100.0% |
| 25 | Arotech-FAAC Portfolio | JPMCB | Industrial | 12/1/2020 | 1/6/2021 | NAP | NAP | No | No | No | 100.0% | 100.0% | 100.0% | 100.0% |
| 26 | Storage Solutions Portfolio | CREFI | Self Storage | 12/6/2020 | 1/6/2021 | NAP | NAP | No | No | No | 100.0% | 100.0% | 100.0% | 100.0% |
| 27 | Reladyne Industrial(15) | GACC | Industrial | 12/10/2020 | 1/6/2021 | NAP | NAP | No | No | Yes | 100.0% | 100.0% | 100.0% | 100.0% |
| 28 | 801 Bedford Avenue | CREFI | Retail | 12/6/2020 | 1/6/2021 | NAP | NAP | No | No | No | 100.0% | 100.0% | 100.0% | 100.0% |
| 29 | SDC Annex | GACC | Office | 11/23/2020 | 1/6/2021 | NAP | NAP | No | No | No | 100.0% | 100.0% | 100.0% | 100.0% |
| 30 | CityLine All American Storage | CREFI | Mixed Use | 12/6/2020 | 1/6/2021 | NAP | NAP | No | No | No | 100.0% | 100.0% | 100.0% | 100.0% |
| 31 | 200 Centennial Avenue(16) | CREFI | Office | 12/6/2020 | 1/6/2021 | NAP | NAP | No | No | No | 100.0% | 98.0% | 100.0% | 98.0% |
| 32 | Alief Westwood Self Storage | GACC | Self Storage | 12/7/2020 | 1/6/2021 | NAP | NAP | No | No | No | 97.0% | 93.0% | 97.0% | 93.1% |
| 33 | Prime Storage Palm Desert | CREFI | Self Storage | 12/6/2020 | 1/6/2021 | NAP | NAP | No | No | No | 97.0% | 95.1% | 97.8% | 97.7% |
THE INFORMATION IN THIS STRUCTURAL AND COLLATERAL TERM SHEET IS NOT COMPLETE AND MAY BE AMENDED PRIOR TO THE TIME OF SALE. THIS TERM SHEET IS NOT AN OFFER TO SELL THESE SECURITIES AND IT IS NOT A SOLICITATION OF AN OFFER TO BUY THESE SECURITIES IN ANY JURISDICTION WHERE THE OFFER OR SALE IS NOT PERMITTED.
9
Benchmark 2020-B22 Mortgage Trust
|
| OVERVIEW OF MORTGAGE POOL CHARACTERISTICS |
Footnotes
| (1) | With respect to 11 mortgage loans (30.8%), under the terms of the related mortgage loan documents, the first payment date is in February 2021. However, due to the fact that the related mortgage loan seller will contribute an Initial Interest Deposit Amount to the Issuing Entity on the Closing Date to cover an amount that represents one-month’s interest that would have accrued with respect to the mortgage loan at the related Net Mortgage Rate with respect to a January 2021 payment date, such Mortgage Loan is being treated as having a First Due Date in January 2021, and the Original Term to Maturity Date or ARD, Remaining Term to Maturity Date or ARD and Loan Seasoning are shown in the Annex A-1 to reflect this. |
| (2) | The Grace Building – As a result of the COVID-19 pandemic, four retail tenants (2.0% of NRA and 2.9% of U/W Base Rent) have not made rent payments for the past several months. The borrower sponsor is in the process of negotiating rent deferrals with full rental payments anticipated to commence in late 2021 or early 2022. The parking tenant has not paid the required monthly rental payments since March and an event of default is continuing under the lease. The borrower sponsor is in the process of replacing the current operator and plans to employ a new operator under a management agreement. The borrower deposited $1,608,940 with the lender at origination for anticipated parking rent shortfalls. |
| (3) | MGM Grand & Mandalay Bay – Based on the adjusted September 2020 TTM EBITDAR of approximately $222.0 million and the initial master lease rent of $292.0 million, the MGM Grand & Mandalay Bay Whole Loan results in a September 2020 TTM EBITDAR-to rent coverage ratio of 0.76x. |
| (4) | Elo Midtown Office Portfolio – UW Base Rent Paid (%) for October and November are greater than 100.0% at the Elo Midtown Office Portfolio Properties as collections include the payback of rents that were previously deferred due to the COVID-19 pandemic. |
| (5) | Station Park & Station Park West – As a result of COVID-19, the borrower sponsor negotiated rent deferrals on a tenant-by-tenant basis and ultimately provided two months of deferred rent in April and May to 31 tenants totaling 293,362 sq. ft. and amounting to $909,200 of rent deferment. Leases for these tenants were amended such that the deferred rent will be recouped by the borrower sponsor via 12 equal installments in 2021. At origination, a $3,958,133 gap rent reserve was established, representing the aggregate amount of base rent for the succeeding 12-months for tenants who have not paid in-full base rent due pursuant to each such tenant’s underlying lease as of the origination date. Such amounts will not be released to the borrower until, among other conditions, (i) collections exceed 95% of the full rent payable from all tenants in place as of the origination date for a period of 12 consecutive months and (ii) the Station Park & Station Park West property is at least 80% occupied based on total square footage, provided no event of default or cash sweep event then exists. See the Station Park & Station Park West "COVID-19 Update" herein for additional information. |
| (6) | Mountain View Village – As a result of the COVID-19 pandemic, a total of 24 tenants requested some form of rent relief. The borrower sponsor negotiated on a tenant-by-tenant basis and ultimately provided two months of deferred rent in April and May to 11 tenants totaling 99,164 sq. ft. and amounting to $245,975 of rent deferment. Leases for these tenants were amended such that the deferred rent will be recouped by the borrower sponsor via 12 equal installments in 2021. At origination, a $712,926 gap rent reserve was established, representing the aggregate amount of base rent for the succeeding 12-months for tenants who have not paid in-full base rent due pursuant to each such tenant’s underlying lease as of the origination date. Such amounts will not be released to the borrower until, among other conditions, (i) collections exceed 95% of the full rent payable from all tenants in place as of the origination date for a period of 12 consecutive months and (ii) the Mountain View Village property is at least 80% occupied based on total square footage, provided no event of default or cash sweep event then exists. See the Mountain View Village "COVID-19 Update" herein for additional information. |
| (7) | 4 West 58th Street – The mortgaged property is fully open and operational. The largest tenant, Neiman Marcus, is current with respect to all outstanding contractual rent obligations. The second largest tenant, Netflix, took possession of its space in September 2020. Due to a delay in construction caused by NYC's stop construction order, the tenant’s rent commencement date was pushed back from January 2021 to March 2021. Of the remaining tenants (with no individual tenant representing greater than 4.2% of U/W Base Rent), several are in free rent and/or abatement periods, in some instances related to delayed rent commencement dates as a function of the COVID-19 pandemic. Please see the 4 West 58th Street “COVID-19 Tenant Summary” table for additional details. In certain instances, October figures are inclusive of tenants which have taken occupancy and are currently not paying rent. In connection with these tenants, a free rent reserve was established at origination and such tenants are being counted as current on contractual rental payments as they are within their applicable free rent periods. |
| (8) | McClellan Business Park - Six tenants, representing 5.7% of the NRA have requested rent relief. The borrower provided rent collections for October and November 2020. November information assumes all federal and state tenants, which pay rent in arrears, have made full payments. |
| (9) | 711 Fifth Avenue – Includes one tenant, representing 4.2% of the SF and 37.3% of UW Base Rent of the 711 Fifth Avenue property who paid its rent in accordance with an agreement to pay 50% abated rent for the months of April, May and June. The abated rent is expected to be paid back 50% by the end of 2020 and the remainder by the end of Q1 2021. |
| (10) | 32-42 Broadway – due to the granularity of the 32-42 Broadway property rent roll, the Occupied SF or Unit Count Making Full October and November Payment (%) was unable to be obtained and has been set to match the UW Base Rent Paid (%). |
| (11) | JW Marriott Nashville –In April 2020, the JW Marriott Nashville Whole Loan was modified to permit the use of FF&E reserve funds to pay debt service, and the borrower sponsor provided a guaranty for (i) debt service payments through October 2020, and (ii) taxes and insurance payments that the guarantor is liable for to the extent they are due and payable prior to the earlier to occur of (1) a conclusion of the JW Marriott Nashville trigger period or (2) the date on which the JW Marriott Nashville Whole Loan has been indefeasibly paid in full in cash. In October 2020, the JW Marriott Nashville Whole Loan was further modified to waive the requirement to fund the FF&E reserve until April 2021, waive the cash management debt yield trigger through the second quarter of 2022, and otherwise permanently decrease the debt yield trigger level from 10% to 7.5%, in exchange for the borrower funding an 18-month debt service reserve to be applied to monthly payments from October 2020 through March 2022. Certain FF&E reserve funds have been used to pay debt service; therefore, the JW Marriott Nashville Whole Loan is currently in a cash management trigger period. |
| (12) | Hotel ZaZa Houston Museum District – The Hotel ZaZa Houston Museum District loan was recently modified to create a $2,311,667 debt service reserve by converting approximately $945,384 in existing FF&E reserves as well as a $1,248,110 new cash contribution by the sponsor, and an additional deposit to be received from the borrower on the monthly payment date occurring in January 2021 of $118,173. The debt service reserve will only be released upon the Hotel ZaZa Houston Museum District property achieving a 9.5% net cash flow debt yield on a trailing 12 month basis for two consecutive quarters, with approximately $1.16 million being allocated back to FF&E reserve and approximately $1.16 million being remitted back to the borrower. The FF&E reserve monthly deposits will be waived for the 2021 calendar year, after which the FF&E reserve will follow the step-up structure of 2.50% in 2022, 3.25% in 2023, and 4.00% in 2024 and thereafter. Lastly, the debt yield cash management trigger will be temporarily waived until January 2023, however, cash management will still be enforced if an event of default occurs. |
| (13) | Cabinetworks Portfolio – Single tenant occupying 100.0% of NRA. The tenant pays rent quarterly and all rent through to December 31, 2020 has been paid. |
| (14) | Mercury Plaza – As a result of the COVID-19 pandemic, two tenants (28,504 sq. ft. and 24.0% of U/W Base Rent), requested some form of rent relief. Marshall's rent was forgiven for the months of May, June and July 2020. Marshall’s paid full monthly contractual rent in August 2020 and has remained current through November. In exchange for the rent forgiveness, Marshall's removed its co-tenancy tied to Burlington Coat Factory (not part of the collateral). Longhorn's rent was forgiven in full for May, June, July and August of 2020 and 50% for September and October of 2020. The estoppel noted that Longhorn paid full monthly contractual rent in November 2020. In exchange for the rent forgiveness, Long Horn Steakhouse executed an early 5-year renewal option during the COVID-19 pandemic, demonstrating its commitment to the mortgaged property. No other tenants were offered rental relief and the remaining tenancy has been current on rent throughout the pandemic. |
| (15) | Reladyne Industrial – The seller of the Reladyne Industrial mortgaged property agreed to defer the June and July rent payments for the sole tenant, Reladyne, which amount was repaid to the seller before the close of the sale of the Reladyne Industrial mortgaged property. Reladyne is current on all rent obligations and has not made any further requests for rent deferral or lease modifications. |
| (16) | 200 Centennial Avenue - Four tenants at the 200 Centennial Avenue Property, representing 11.8% of NRA and 10.0% of UW Base Rent, were granted a 20% rent reduction for a one-year period. |
THE INFORMATION IN THIS STRUCTURAL AND COLLATERAL TERM SHEET IS NOT COMPLETE AND MAY BE AMENDED PRIOR TO THE TIME OF SALE. THIS TERM SHEET IS NOT AN OFFER TO SELL THESE SECURITIES AND IT IS NOT A SOLICITATION OF AN OFFER TO BUY THESE SECURITIES IN ANY JURISDICTION WHERE THE OFFER OR SALE IS NOT PERMITTED.
10
Benchmark 2020-B22 Mortgage Trust
|
| OVERVIEW OF MORTGAGE POOL CHARACTERISTICS |
| Distribution of Cut-off Date Balances(1) | |||||||||||||||||||
| Weighted Averages | |||||||||||||||||||
| Range of Cut-off Date Balances | Number of Mortgage Loans | Aggregate Cut-off Date Balance | % of Initial Outstanding Pool Balance | Mortgage Rate | Stated Remaining Term (Mos.)(2) | U/W NCF DSCR | Cut-off Date LTV(3) | Maturity Date LTV(3) | |||||||||||
| $3,250,000 | - | $7,499,999 | 7 | $36,344,000 | 4.5% | 3.9162% | 115 | 1.83x | 59.6% | 53.8% | |||||||||
| $7,500,000 | - | $14,999,999 | 6 | $68,372,500 | 8.4% | 3.5201% | 121 | 2.57x | 59.6% | 56.2% | |||||||||
| $15,000,000 | - | $24,999,999 | 7 | $128,000,000 | 15.7% | 3.7054% | 117 | 2.41x | 58.1% | 50.8% | |||||||||
| $25,000,000 | - | $49,999,999 | 8 | $245,500,500 | 30.2% | 3.4181% | 118 | 2.64x | 56.4% | 56.4% | |||||||||
| $50,000,000 | - | $80,000,000 | 5 | $336,000,000 | 41.3% | 3.2847% | 118 | 3.59x | 48.2% | 46.9% | |||||||||
| Total/Weighted Average | 33 | $814,217,000 | 100.0% | 3.4390% | 118 | 2.95x | 53.7% | 51.4% | |||||||||||
| Distribution of Mortgage Rates(1) | |||||||||||||||||||
| Weighted Averages | |||||||||||||||||||
| Range of Mortgage Rates | Number of Mortgage Loans | Aggregate Cut-off Date Balance | % of Initial Outstanding Pool Balance | Mortgage Rate | Stated Remaining Term (Mos.)(2) | U/W NCF DSCR | Cut-off Date LTV(3) | Maturity Date LTV(3) | |||||||||||
| 2.6921% | - | 3.2999% | 7 | $210,750,000 | 25.9% | 2.9930% | 118 | 3.50x | 51.1% | 51.1% | |||||||||
| 3.3000% | - | 4.2499% | 22 | $556,660,500 | 68.4% | 3.5207% | 118 | 2.86x | 53.7% | 51.4% | |||||||||
| 4.2500% | - | 4.6000% | 4 | $46,806,500 | 5.7% | 4.4758% | 120 | 1.61x | 65.6% | 53.8% | |||||||||
| Total/Weighted Average | 33 | $814,217,000 | 100.0% | 3.4390% | 118 | 2.95x | 53.7% | 51.4% | |||||||||||
| Property Type Distribution(1)(4) |
| Weighted Averages | |||||||||||||||||||||||||||||||
| % of Initial | Stated | Maturity | |||||||||||||||||||||||||||||
| Number of | Aggregate | Outstanding | Cut-off Date | Remaining | Cut-off | Date or | |||||||||||||||||||||||||
| Mortgaged | Cut-off | Pool | Number of | Balance per # of | Mortgage | Term | U/W NCF | Date | ARD | ||||||||||||||||||||||
| Property Type | Properties | Date Balance | Balance | NRA/Units/Rooms | NRA/Units/Rooms | Rate | (Mos.)(2) | Occupancy | DSCR | LTV(3) | LTV(3) | ||||||||||||||||||||
| Office | 12 | $310,415,000 | 38.1 | % | 3,855,566 | $366 | 3.3435 | % | 120 | 92.9 | % | 2.71 | x | 54.9 | % | 51.3 | % | ||||||||||||||
| CBD | 6 | $208,250,000 | 25.6 | % | 2,476,664 | $478 | 3.1284 | % | 120 | 94.8 | % | 3.16 | x | 51.1 | % | 51.1 | % | ||||||||||||||
| Suburban | 5 | $96,500,000 | 11.9 | % | 1,353,434 | $133 | 3.7419 | % | 121 | 88.3 | % | 1.83 | x | 62.6 | % | 51.6 | % | ||||||||||||||
| Suburban Flex | 1 | $5,665,000 | 0.7 | % | 25,468 | $222 | 4.4640 | % | 120 | 100.0 | % | 1.41 | x | 60.3 | % | 53.9 | % | ||||||||||||||
| Mixed Use | 6 | $174,790,000 | 21.5 | % | 8,431,623 | $698 | 3.4195 | % | 117 | 88.7 | % | 2.89 | x | 57.6 | % | 56.2 | % | ||||||||||||||
| Office/Retail | 3 | $77,500,000 | 9.5 | % | 437,561 | $1,455 | 3.4866 | % | 113 | 90.9 | % | 2.21 | x | 62.3 | % | 59.7 | % | ||||||||||||||
| Retail/Office/Hospitality | 1 | $60,000,000 | 7.4 | % | 995,303 | $119 | 3.3770 | % | 120 | 85.9 | % | 3.86 | x | 50.0 | % | 50.0 | % | ||||||||||||||
| Industrial/Office/Multifamily/Retail/Other | 1 | $32,400,000 | 4.0 | % | 6,925,484 | $52 | 3.3090 | % | 120 | 86.8 | % | 2.90 | x | 60.2 | % | 60.2 | % | ||||||||||||||
| Self Storage/Office | 1 | $4,890,000 | 0.6 | % | 73,275 | $67 | 3.6100 | % | 120 | 99.1 | % | 1.78 | x | 60.0 | % | 51.4 | % | ||||||||||||||
| Hospitality | 4 | $115,000,000 | 14.1 | % | 10,596 | $203,279 | 3.5272 | % | 111 | 65.6 | % | 4.32 | x | 43.0 | % | 42.1 | % | ||||||||||||||
| Full Service | 4 | $115,000,000 | 14.1 | % | 10,596 | $203,279 | 3.5272 | % | 111 | 65.6 | % | 4.32 | x | 43.0 | % | 42.1 | % | ||||||||||||||
| Retail | 5 | $88,153,000 | 10.8 | % | 707,419 | $214 | 3.5318 | % | 120 | 88.4 | % | 2.98 | x | 45.0 | % | 43.3 | % | ||||||||||||||
| Anchored | 3 | $65,028,000 | 8.0 | % | 660,743 | $101 | 3.5083 | % | 120 | 84.3 | % | 2.84 | x | 46.4 | % | 44.1 | % | ||||||||||||||
| Unanchored | 2 | $23,125,000 | 2.8 | % | 46,676 | $533 | 3.5979 | % | 120 | 100.0 | % | 3.36 | x | 41.0 | % | 41.0 | % | ||||||||||||||
| Industrial | 9 | $72,885,000 | 9.0 | % | 2,149,944 | $129 | 3.4800 | % | 120 | 100.0 | % | 2.33 | x | 62.7 | % | 61.0 | % | ||||||||||||||
| Warehouse/Distribution | 2 | $40,335,000 | 5.0 | % | 314,651 | $191 | 3.5149 | % | 121 | 100.0 | % | 2.39 | x | 61.4 | % | 61.4 | % | ||||||||||||||
| Manufacturing | 3 | $15,000,000 | 1.8 | % | 1,528,894 | $31 | 3.3220 | % | 119 | 100.0 | % | 2.08 | x | 64.4 | % | 57.8 | % | ||||||||||||||
| R&D/Flex | 3 | $10,400,000 | 1.3 | % | 121,869 | $94 | 3.5760 | % | 120 | 100.0 | % | 2.86 | x | 63.8 | % | 63.8 | % | ||||||||||||||
| Warehouse/Manufacturing | 1 | $7,150,000 | 0.9 | % | 184,530 | $39 | 3.4750 | % | 121 | 100.0 | % | 1.74 | x | 65.0 | % | 61.2 | % | ||||||||||||||
| Self Storage | 7 | $26,974,000 | 3.3 | % | 431,962 | $79 | 3.5549 | % | 113 | 94.2 | % | 2.38 | x | 60.9 | % | 56.5 | % | ||||||||||||||
| Multifamily | 1 | $26,000,000 | 3.2 | % | 62 | $419,355 | 3.7700 | % | 120 | 93.5 | % | 2.44 | x | 57.3 | % | 57.3 | % | ||||||||||||||
| Mid Rise | 1 | $26,000,000 | 3.2 | % | 62 | $419,355 | 3.7700 | % | 120 | 93.5 | % | 2.44 | x | 57.3 | % | 57.3 | % | ||||||||||||||
| Total/Weighted Average | 44 | $814,217,000 | 100.0 | % | 3.4390 | % | 118 | 88.3 | % | 2.95 | x | 53.7 | % | 51.4 | % | ||||||||||||||||
| Geographic Distribution(1)(4) |
| Weighted Averages | ||||||||||||||||||||||
| Number of | % of Initial | Stated | Maturity Date | |||||||||||||||||||
| Mortgaged | Aggregate Cut-off | Outstanding | Remaining Term | U/W NCF | Cut-off Date | or ARD | ||||||||||||||||
| State/Location | Properties | Date Balance | Pool Balance | Mortgage Rate | (Mos.)(2) | DSCR | LTV(3) | LTV(3) | ||||||||||||||
| New York | 11 | $302,625,000 | 37.2 | % | 3.2954 | % | 118 | 2.92 | x | 52.8 | % | 52.2 | % | |||||||||
| New York City | 11 | $302,625,000 | 37.2 | % | 3.2954 | % | 118 | 2.92 | x | 52.8 | % | 52.2 | % | |||||||||
| California | 5 | $102,400,000 | 12.6 | % | 3.5801 | % | 119 | 2.53 | x | 63.0 | % | 59.8 | % | |||||||||
| Northern | 3 | $75,650,000 | 9.3 | % | 3.2456 | % | 121 | 2.86 | x | 59.9 | % | 59.9 | % | |||||||||
| Southern | 2 | $26,750,000 | 3.3 | % | 4.5259 | % | 113 | 1.60 | x | 71.5 | % | 59.4 | % | |||||||||
| Utah | 2 | $98,650,500 | 12.1 | % | 3.3770 | % | 120 | 3.57 | x | 45.7 | % | 45.7 | % | |||||||||
| Nevada | 2 | $75,000,000 | 9.2 | % | 3.5580 | % | 111 | 4.95 | x | 35.5 | % | 35.5 | % | |||||||||
| Pennsylvania | 3 | $61,635,000 | 7.6 | % | 3.3956 | % | 121 | 2.14 | x | 61.3 | % | 54.0 | % | |||||||||
| Other | 21 | $173,906,500 | 21.4 | % | 3.6050 | % | 118 | 2.34 | x | 59.4 | % | 54.5 | % | |||||||||
| Total/Weighted Average | 44 | $814,217,000 | 100.0 | % | 3.4390 | % | 118 | 2.95 | x | 53.7 | % | 51.4 | % | |||||||||
THE INFORMATION IN THIS STRUCTURAL AND COLLATERAL TERM SHEET IS NOT COMPLETE AND MAY BE AMENDED PRIOR TO THE TIME OF SALE. THIS TERM SHEET IS NOT AN OFFER TO SELL THESE SECURITIES AND IT IS NOT A SOLICITATION OF AN OFFER TO BUY THESE SECURITIES IN ANY JURISDICTION WHERE THE OFFER OR SALE IS NOT PERMITTED.
11
Benchmark 2020-B22 Mortgage Trust
|
| OVERVIEW OF MORTGAGE POOL CHARACTERISTICS |
| Distribution of Cut-off Date LTVs(1)(3) |
| Weighted Averages | ||||||||||||||||||||||||
| % of Initial | Stated | Maturity Date or | ||||||||||||||||||||||
| Number of | Aggregate Cut-off | Outstanding | Remaining Term | U/W NCF | Cut-off Date | ARD | ||||||||||||||||||
| Range of Cut-off Date LTVs | Mortgage Loans | Date Balance | Pool Balance | Mortgage Rate | (Mos.)(2) | DSCR | LTV(3) | LTV(3) | ||||||||||||||||
| 33.9% | - | 54.9% | 10 | $367,650,500 | 45.2 | % | 3.2803 | % | 117 | 3.71 | x | 44.0 | % | 43.0 | % | |||||||||
| 55.0% | - | 59.9% | 9 | $188,637,500 | 23.2 | % | 3.5190 | % | 120 | 2.48 | x | 58.4 | % | 57.6 | % | |||||||||
| 60.0% | - | 64.9% | 11 | $194,779,000 | 23.9 | % | 3.4794 | % | 119 | 2.38 | x | 61.9 | % | 57.1 | % | |||||||||
| 65.0% | - | 69.9% | 2 | $39,650,000 | 4.9 | % | 3.6430 | % | 113 | 1.90 | x | 68.6 | % | 67.9 | % | |||||||||
| 70.0% | - | 73.4% | 1 | $23,500,000 | 2.9 | % | 4.6000 | % | 120 | 1.50 | x | 73.4 | % | 59.6 | % | |||||||||
| Total/Weighted Average | 33 | $814,217,000 | 100.0 | % | 3.4390 | % | 118 | 2.95 | x | 53.7 | % | 51.4 | % | |||||||||||
| Distribution of Maturity Date or ARD LTVs(1)(3) | ||||||||||||||||||||||||
| Weighted Averages | ||||||||||||||||||||||||
| % of Initial | Stated | Maturity Date or | ||||||||||||||||||||||
| Range of Maturity Date or | Number of | Aggregate Cut-off | Outstanding | Remaining Ter | U/W NCF | Cut-off Date | ARD | |||||||||||||||||
| ARD LTVs | Mortgage Loans | Date Balance | Pool Balance | Mortgage Rate | m (Mos.)(2) | DSCR | LTV(3) | LTV(3) | ||||||||||||||||
| 33.9% | - | 49.9% | 9 | $281,528,000 | 34.6 | % | 3.3479 | % | 117 | 3.64 | x | 42.5 | % | 39.9 | % | |||||||||
| 50.0% | - | 54.9% | 8 | $188,279,000 | 23.1 | % | 3.4070 | % | 119 | 2.78 | x | 55.5 | % | 52.0 | % | |||||||||
| 55.0% | - | 59.9% | 10 | $213,260,000 | 26.2 | % | 3.5749 | % | 120 | 2.39 | x | 60.7 | % | 58.7 | % | |||||||||
| 60.0% | - | 69.4% | 6 | $131,150,000 | 16.1 | % | 3.4595 | % | 117 | 2.64 | x | 63.7 | % | 63.5 | % | |||||||||
| Total/Weighted Average | 33 | $814,217,000 | 100.0 | % | 3.4390 | % | 118 | 2.95 | x | 53.7 | % | 51.4 | % | |||||||||||
| Distribution of Underwritten NCF Debt Service Coverages(1) | ||||||||||||||||||||||||
| Weighted Averages | ||||||||||||||||||||||||
| % of Initial | Stated | Maturity Date or | ||||||||||||||||||||||
| Range of Underwritten NCF | Number of | Aggregate Cut-off | Outstanding | Remaining | U/W NCF | Cut-off Date | ARD | |||||||||||||||||
| Debt Service Coverages | Mortgage Loans | Date Balance | Pool Balance | Mortgage Rate | Term (Mos.)(2) | DSCR | LTV(3) | LTV(3) | ||||||||||||||||
| 1.41x | - | 1.49x | 2 | $20,665,000 | 2.5 | % | 3.9247 | % | 120 | 1.42 | x | 61.9 | % | 50.4 | % | |||||||||
| 1.50x | - | 1.74x | 4 | $44,110,000 | 5.4 | % | 4.1552 | % | 120 | 1.61 | x | 67.5 | % | 56.3 | % | |||||||||
| 1.75x | - | 2.49x | 13 | $294,606,500 | 36.2 | % | 3.6172 | % | 118 | 2.12 | x | 60.0 | % | 56.3 | % | |||||||||
| 2.50x | - | 3.49x | 9 | $203,835,500 | 25.0 | % | 3.2734 | % | 119 | 2.90 | x | 54.2 | % | 54.2 | % | |||||||||
| 3.50x | - | 4.95x | 5 | $251,000,000 | 30.8 | % | 3.1985 | % | 117 | 4.34 | x | 42.7 | % | 42.7 | % | |||||||||
| Total/Weighted Average | 33 | $814,217,000 | 100.0 | % | 3.4390 | % | 118 | 2.95 | x | 53.7 | % | 51.4 | % | |||||||||||
| Original Terms to Maturity or ARD(1)(2) | ||||||||||||||||||||||||
| Weighted Averages | ||||||||||||||||||||||||
| % of Initial | Stated | Maturity Date or | ||||||||||||||||||||||
| Original Terms | Number of | Aggregate Cut-off | Outstanding | Remaining | U/W NCF | Cut-off Date | ARD | |||||||||||||||||
| to Maturity or ARD | Mortgage Loans | Date Balance | Pool Balance | Mortgage Rate | Term (Mos.)(2) | DSCR | LTV(3) | LTV(3) | ||||||||||||||||
| 61 | - | 61 | 1 | $3,250,000 | 0.4 | % | 3.9900 | % | 61 | 2.36 | x | 58.0 | % | 58.0 | % | |||||||||
| 120 | - | 121 | 32 | $810,967,000 | 99.6 | % | 3.4368 | % | 118 | 2.96 | x | 53.7 | % | 51.4 | % | |||||||||
| Total/Weighted Average | 33 | $814,217,000 | 100.0 | % | 3.4390 | % | 118 | 2.95 | x | 53.7 | % | 51.4 | % | |||||||||||
| Distribution of Remaining Terms to Maturity or ARD(1)(2) | ||||||||||||||||||||||||
| Weighted Averages | ||||||||||||||||||||||||
| % of Initial | Stated | Maturity Date or | ||||||||||||||||||||||
| Range of Remaining Terms | Number of | Aggregate Cut-off | Outstanding | Remaining | U/W NCF | Cut-off Date | ARD | |||||||||||||||||
| to Maturity or ARD | Mortgage Loans | Date Balance | Pool Balance | Mortgage Rate | Term (Mos.)(2) | DSCR | LTV(3) | LTV(3) | ||||||||||||||||
| 61 | - | 61 | 1 | $3,250,000 | 0.4 | % | 3.9900 | % | 61 | 2.36 | x | 58.0 | % | 58.0 | % | |||||||||
| 111 | - | 111 | 5 | $177,500,000 | 21.8 | % | 3.4931 | % | 111 | 3.64 | x | 49.8 | % | 49.2 | % | |||||||||
| 119 | - | 121 | 27 | $633,467,000 | 77.8 | % | 3.4210 | % | 120 | 2.76 | x | 54.8 | % | 52.0 | % | |||||||||
| Total/Weighted Average | 33 | $814,217,000 | 100.0 | % | 3.4390 | % | 118 | 2.95 | x | 53.7 | % | 51.4 | % | |||||||||||
| Distribution of Underwritten NOI Debt Yields(1) | ||||||||||||||||||||||||
| Weighted Averages | ||||||||||||||||||||||||
| % of Initial | Stated | Maturity Date or | ||||||||||||||||||||||
| Range of Underwritten NOI | Number of | Aggregate Cut-off | Outstanding | Remaining | U/W NCF | Cut-off Date | ARD | |||||||||||||||||
| Debt Yields | Mortgage Loans | Date Balance | Pool Balance | Mortgage Rate | Term (Mos.)(2) | DSCR | LTV(3) | LTV(3) | ||||||||||||||||
| 7.4% | - | 8.9% | 6 | $159,990,000 | 19.6 | % | 3.6252 | % | 119 | 2.09 | x | 61.8 | % | 60.3 | % | |||||||||
| 9.0% | - | 9.9% | 10 | $178,745,000 | 22.0 | % | 3.5330 | % | 118 | 2.47 | x | 59.4 | % | 57.0 | % | |||||||||
| 10.0% | - | 12.4% | 11 | $279,982,000 | 34.4 | % | 3.2441 | % | 120 | 2.96 | x | 51.8 | % | 48.2 | % | |||||||||
| 12.5% | - | 14.9% | 4 | $100,500,000 | 12.3 | % | 3.4891 | % | 118 | 3.42 | x | 48.1 | % | 46.4 | % | |||||||||
| 15.0% | - | 17.9% | 2 | $95,000,000 | 11.7 | % | 3.4698 | % | 111 | 4.79 | x | 41.0 | % | 41.0 | % | |||||||||
| Total/Weighted Average | 33 | $814,217,000 | 100.0 | % | 3.4390 | % | 118 | 2.95 | x | 53.7 | % | 51.4 | % | |||||||||||
THE INFORMATION IN THIS STRUCTURAL AND COLLATERAL TERM SHEET IS NOT COMPLETE AND MAY BE AMENDED PRIOR TO THE TIME OF SALE. THIS TERM SHEET IS NOT AN OFFER TO SELL THESE SECURITIES AND IT IS NOT A SOLICITATION OF AN OFFER TO BUY THESE SECURITIES IN ANY JURISDICTION WHERE THE OFFER OR SALE IS NOT PERMITTED.
12
Benchmark 2020-B22 Mortgage Trust
|
| OVERVIEW OF MORTGAGE POOL CHARACTERISTICS |
| Amortization Types(1) |
| Weighted Averages | ||||||||||||||||||||||
| % of Initial | Stated | Maturity Date or | ||||||||||||||||||||
| Number of | Aggregate Cut-off | Outstanding | Remaining | U/W NCF | Cut-off Date | ARD | ||||||||||||||||
| Amortization Type | Mortgage Loans | Date Balance | Pool Balance | Mortgage Rate | Term (Mos.)(2) | DSCR | LTV(3) | LTV(3) | ||||||||||||||
| Interest Only | 19 | $548,410,500 | 67.4 | % | 3.3061 | % | 119 | 3.07 | x | 53.6 | % | 53.6 | % | |||||||||
| Interest Only, then Amortizing | 8 | $115,429,000 | 14.2 | % | 3.5820 | % | 119 | 1.94 | x | 60.7 | % | 53.1 | % | |||||||||
| Amortizing Balloon | 5 | $75,377,500 | 9.3 | % | 4.0685 | % | 120 | 1.63 | x | 61.6 | % | 48.9 | % | |||||||||
| Interest Only, then ARD | 1 | $75,000,000 | 9.2 | % | 3.5580 | % | 111 | 4.95 | x | 35.5 | % | 35.5 | % | |||||||||
| Total/Weighted Average | 33 | $814,217,000 | 100.0 | % | 3.4390 | % | 118 | 2.95 | x | 53.7 | % | 51.4 | % | |||||||||
| (1) | The U/W NCF DSCR, Cut-off Date LTV Ratio, Maturity Date or ARD LTV, Underwritten NOI Debt Yield and Cut-off Date Balance per # of NRA/Units/Rooms calculations include any related pari passu companion loan(s) and exclude any related subordinate companion loan(s) and/or mezzanine loan(s). |
| (2) | With respect to 11 mortgage loans (30.8%), under the terms of the related mortgage loan documents, the first payment date is in February 2021. However, due to the fact that the related mortgage loan seller will contribute an Initial Interest Deposit Amount to the Issuing Entity on the Closing Date to cover an amount that represents one-month’s interest that would have accrued with respect to the mortgage loan at the related Mortgage Rate with respect to a January 2021 payment date, such Mortgage Loan is being treated as having a First Due Date in January 2021, and the Original Term to Maturity Date or ARD, Remaining Term to Maturity Date or ARD and Loan Seasoning are shown in the Annex A-1 to reflect this. |
| (3) | With respect to one mortgage loan (0.9%) (801 Bedford Avenue), the Cut-off Date LTV and Maturity Date or ARD LTV have been calculated using a value other than the “As Is” appraised value. For additional information please see the footnotes to Annex A-1 in the Preliminary Prospectus. |
| (4) | Reflects allocated loan amount for properties securing multi-property Mortgage Loans. |
THE INFORMATION IN THIS STRUCTURAL AND COLLATERAL TERM SHEET IS NOT COMPLETE AND MAY BE AMENDED PRIOR TO THE TIME OF SALE. THIS TERM SHEET IS NOT AN OFFER TO SELL THESE SECURITIES AND IT IS NOT A SOLICITATION OF AN OFFER TO BUY THESE SECURITIES IN ANY JURISDICTION WHERE THE OFFER OR SALE IS NOT PERMITTED.
13
Benchmark 2020-B22 Mortgage Trust
|
| STRUCTURE OVERVIEW |
| Allocation between VRR Interest and the Non-VRR Certificates: | The aggregate amount available for distribution to holders of the Non-VRR Certificates and the VRR Interest on each Distribution Date will be: (i) the gross amount of interest, principal, yield maintenance charges and prepayment premiums collected with respect to the Mortgage Loans in the applicable one-month collection period (other than any excess interest accrued after the related anticipated repayment date on any mortgage loan with an anticipated repayment date), net of specified expenses of the issuing entity, including fees payable therefrom to, and losses, liabilities, costs and expenses reimbursable or indemnifiable therefrom to, the Master Servicer, the Special Servicer, the Certificate Administrator, the Trustee, the Operating Advisor, the Asset Representations Reviewer and CREFC®; and (ii) allocated to amounts available for distribution to the holders of the VRR Interest, on the one hand, and amounts available for distribution to the holders of the Certificates (other than the Class R certificates and the VRR Interest) (the “Non-VRR Certificates”), on the other hand. On each Distribution Date, the portion of such aggregate available funds allocable to: (a) the VRR Interest will be the product of such aggregate available funds multiplied by a fraction, expressed as a percentage, the numerator of which is the initial Certificate Balance of the VRR Interest, and the denominator of which is the sum of the aggregate initial Certificate Balance of the Principal Balance Certificates and the initial Certificate Balance of the VRR Interest (the “VRR Percentage”); and (b) the Non-VRR Certificates will at all times be the product of such aggregate available funds multiplied by the difference between 100% and the VRR Percentage (such difference, the “Non-VRR Percentage”). See “Credit Risk Retention” and “Description of the Certificates” in the Preliminary Prospectus. | |
| Principal Payments: | Payments in respect of the Non-VRR Percentage of principal on the Non-VRR Certificates (other than the Class S certificates) will be distributed, first, to the Class A-SB certificates, until the Certificate Balance of such class is reduced to the planned principal balance for the related Distribution Date set forth on Annex G to the Preliminary Prospectus, then, to the Class A-1, Class A-2, Class A-4, Class A-5, Class A-SB, Class A-M, Class B, Class C, Class D, Class E, Class F, Class G and Class H certificates, in that order, until the Certificate Balance of each such class is reduced to zero. Notwithstanding the foregoing, if the total Certificate Balance of the Class A-M, Class B, Class C, Class D, Class E, Class F, Class G and Class H certificates have been reduced to zero as a result of loss allocation, payments in respect of principal of the certificates will be distributed, first, to the Class A-1, Class A-2, Class A-SB, Class A-4 and Class A-5 certificates, on a pro rata basis, based on the Certificate Balance of each such class, then, to the extent of any recoveries on realized losses, to the Class A-M, Class B, Class C, Class D, Class E, Class F, Class G and Class H certificates, in that order, in each case until the Certificate Balance of each such class is reduced to zero (or previously allocated realized losses have been fully reimbursed).
Each class of Class X Certificates will not be entitled to receive distributions of principal; however, (i) the notional amount of the Class X-A certificates will be reduced by the aggregate amount of principal distributions and realized losses allocated to the Class A-1, Class A-2, Class A-SB, Class A-4, Class A-5 and Class A-M certificates; (ii) the notional amount of the Class X-B certificates will be reduced by the aggregate amount of principal distributions and realized losses allocated to the Class B and Class C certificates; (iii) the notional amount of the Class X-D certificates will be reduced by the aggregate amount of principal distributions and realized losses allocated to the Class D and Class E certificates; (iv) the notional amount of the Class X-F certificates will be reduced by the amount of principal distributions and realized losses allocated to the Class F certificates; (v) the notional amount of the Class X-G certificates will be reduced by the amount of principal distributions and realized losses allocated to the Class G certificates; and (vi) the notional amount of the Class X-H certificates will be reduced by the amount of principal distributions and realized losses allocated to the Class H certificates. | |
| Interest Payments: | On each Distribution Date, interest accrued for each class of Non-VRR Certificates at the applicable pass-through rate will be distributed in the following order of priority, to the extent of the Non-VRR Percentage of the aggregate available funds (exclusive of any portion thereof that represents the Non-VRR Percentage of any yield maintenance charges and prepayment premiums): first, to the Class A-1, Class A-2, Class A-SB, Class A-4, Class A-5, Class X-A, Class X-B, Class X-D, Class X-F, Class X-G and Class X-H certificates, on a pro rata basis, based on the accrued and unpaid interest on each such class and then, to the Class A-M, Class B, Class C, Class D, Class E, Class F, Class G and Class H certificates, in that order, in each case until the interest payable to each such class is paid in full. |
THE INFORMATION IN THIS STRUCTURAL AND COLLATERAL TERM SHEET IS NOT COMPLETE AND MAY BE AMENDED PRIOR TO THE TIME OF SALE. THIS TERM SHEET IS NOT AN OFFER TO SELL THESE SECURITIES AND IT IS NOT A SOLICITATION OF AN OFFER TO BUY THESE SECURITIES IN ANY JURISDICTION WHERE THE OFFER OR SALE IS NOT PERMITTED.
14
Benchmark 2020-B22 Mortgage Trust
|
| STRUCTURE OVERVIEW |
The pass-through rates applicable to the Class A-1, Class A-2, Class A-SB, Class A-4, Class A-5, Class A-M, Class B, Class C, Class D, Class E, Class F, Class G and Class H certificates for each Distribution Date will equal one of: (i) a fixed per annum rate, (ii) the WAC Rate, (iii) a rate equal to the lesser of a specified pass-through rate and the WAC Rate or (iv) the WAC Rate less a specified rate.
As further described in the Preliminary Prospectus, the pass-through rates applicable to the Class X Certificates for each Distribution Date will generally be equal to the excess of (i) the WAC Rate over (ii) (A) with respect to the Class X-A certificates, the weighted average of the pass-through rates of the Class A-1, Class A-2, Class A-SB, Class A-4, Class A-5 and Class A-M certificates (weighted based on their respective Certificate Balances outstanding immediately prior to that Distribution Date), (B) with respect to the Class X-B certificates, the weighted average of the pass-through rates of the Class B and Class C certificates (weighted based on their respective Certificate Balances outstanding immediately prior to that Distribution Date), (C) with respect to the Class X-D certificates, the weighted average of the pass-through rates of the Class D and Class E certificates (weighted based on their respective Certificate Balances outstanding immediately prior to that Distribution Date), (D) with respect to the Class X-F certificates, the pass-through rate of the Class F certificates, (E) with respect to the Class X-G certificates, the pass-through rate of the Class G certificates and (F) with respect to the Class X-H certificates, the pass-through rate of the Class H certificates. | ||
| Prepayment Interest Shortfalls: | Prepayment interest shortfalls will be allocated pro rata based on interest entitlements, in reduction of the interest otherwise payable with respect to each of the interest-bearing classes of certificates. | |
| Loss Allocation: | The Non-VRR Percentage of losses on the Mortgage Loans will be allocated to each class of Non-VRR Certificates entitled to principal in reverse alphabetical order starting with the Class H certificates through and including the Class A-M certificates and then to the Class A-1, Class A-2, Class A-SB, Class A-4 and Class A-5 certificates on a pro rata basis based on the Certificate Balance of each such class. The notional amount of any class of Class X Certificates will be reduced by the aggregate amount of realized losses allocated to the class(es) of certificates that are component(s) of the notional amount of such class of Class X Certificates.
| |
Prepayment Premiums:
| A percentage of the Non-VRR Percentage of all prepayment premiums (either fixed prepayment premiums or yield maintenance amounts) collected on the Mortgage Loans will be allocated to each of the Class A-1, Class A-2, Class A-SB, Class A-4, Class A-5, Class A-M, Class B, Class C, Class D and Class E certificates (the “YM P&I Certificates”) then entitled to principal distributions, which percentage will be equal to the product of (a) a fraction, not greater than one, the numerator of which is the amount of principal distributed to such class on such Distribution Date and the denominator of which is the total amount of principal distributed to the holders of the Class A-1, Class A-2, Class A-SB, Class A-4, Class A-5, Class A-M, Class B, Class C, Class D, Class E, Class F, Class G and Class H certificates on such Distribution Date, and (b) the Base Interest Fraction for the related principal prepayment and such class of certificates. The VRR Percentage of all prepayment premiums (either fixed prepayment premiums or yield maintenance amounts) will be distributed to the VRR Interest.
The “Base Interest Fraction” for any principal prepayment on any Mortgage Loan and for:
(A) any of the Class A-1 through Class E certificates with a Pass-Through Rate equal to either the WAC Rate or the WAC Rate less a specified rate, will be a fraction (not greater than one) (a) whose numerator is the greater of zero and the amount, if any, by which (i) the Pass-Through Rate on such class of certificates exceeds (ii) the yield rate (as provided by the master servicer) used in calculating the prepayment premium or yield maintenance charge, as applicable, with respect to such principal prepayment and (b) whose denominator is the amount, if any, by which (i) the Net Mortgage Rate on such Mortgage Loan during the related interest accrual period exceeds (ii) the yield rate (as provided by the master servicer) used in calculating the prepayment premium or yield maintenance charge, as applicable, with respect to such principal prepayment; provided, however, that if such yield rate is greater than or equal to the Net Mortgage Rate on such Mortgage Loan during the related interest accrual period, then the respective Base Interest Fraction will be zero; provided, further, that if such yield rate is greater than or equal to the Net Mortgage Rate on such Mortgage Loan during the related interest accrual period, but less than the Pass-Through Rate described in clause (a)(i) above, then the respective Base Interest Fraction will be one; and |
THE INFORMATION IN THIS STRUCTURAL AND COLLATERAL TERM SHEET IS NOT COMPLETE AND MAY BE AMENDED PRIOR TO THE TIME OF SALE. THIS TERM SHEET IS NOT AN OFFER TO SELL THESE SECURITIES AND IT IS NOT A SOLICITATION OF AN OFFER TO BUY THESE SECURITIES IN ANY JURISDICTION WHERE THE OFFER OR SALE IS NOT PERMITTED.
15
Benchmark 2020-B22 Mortgage Trust
|
| STRUCTURE OVERVIEW |
| (B) any of the Class A-1 through Class E certificates with a Pass-Through Rate equal to a fixed per annum rate, will be a fraction (not greater than one)(a) whose numerator is the greater of zero and the amount, if any, by which (i) the Pass-Through Rate on such class of certificates exceeds (ii) the yield rate (as provided by the master servicer) used in calculating the prepayment premium or yield maintenance charge, as applicable, with respect to such principal prepayment and (b) whose denominator is the amount, if any, by which (i) the Mortgage Rate on such Mortgage Loan (without regard to any increase in the interest rate of any ARD Loan after the related Anticipated Repayment Date, and net of the Administrative Cost Rate) during the related interest accrual period multiplied by 365/360 exceeds (ii) the yield rate (as provided by the master servicer) used in calculating the prepayment premium or yield maintenance charge, as applicable, with respect to such principal prepayment; provided, however, that if such yield rate is greater than or equal to the amount set forth in clause (b)(i) above, then the respective Base Interest Fraction will be zero; provided, further, that if such yield rate is greater than or equal to the amount set forth in clause (b)(i) above, but less than the Pass-Through Rate described in clause (a)(i) above, then the respective Base Interest Fraction will be one.
The remaining percentage of the Non-VRR Percentage of prepayment premiums will be allocated to the Class X-A, Class X-B and Class X-D certificates in the manner described in the Preliminary Prospectus. In general, this formula provides for an increase in the percentage of prepayment premiums allocated to the YM P&I Certificates then entitled to principal distributions relative to the Class X-A, Class X-B and Class X-D certificates as Discount Rates decrease and a decrease in the percentage allocated to such classes as Discount Rates rise.
| |
| Whole Loans: | The mortgaged properties identified on Annex A-1 to the Preliminary Prospectus as The Grace Building, MGM Grand & Mandalay Bay, Elo Midtown Office Portfolio, Station Park & Station Park West, Rugby Pittsburgh Portfolio, 4 West 58th Street, McClellan Business Park, 711 Fifth Avenue, 32-42 Broadway, JW Marriott Nashville, Hotel ZaZa Houston Museum District and Cabinetworks Portfolio each secure both a mortgage loan to be included in the trust fund and one or more other companion loans that will not be included in the trust fund, each of which will be pari passu or subordinate in right of payment with the mortgage loan included in the trust fund. We refer to each such group of related loans as a “whole loan”.
As of the Closing Date, the pari passu companion loans and the subordinate companion loans are expected to be held by the party identified in “—Companion Loan Summary” above and the table titled “Whole Loan Control Notes and Non-Control Notes” in “Description of the Mortgage Pool—The Whole Loans—General” in the Preliminary Prospectus.
| |
| Control Rights and Directing Holder: | With respect to any Serviced Mortgage Loan and any related Serviced Companion Loan, the Directing Holder will generally be entitled to direct the Special Servicer to take, or refrain from taking certain actions with respect to each Serviced Mortgage Loan and any related Serviced Companion Loans. Furthermore, the Directing Holder will also have the right to receive notice and consent to certain material actions that the Master Servicer and the Special Servicer proposes to take with respect to each Serviced Mortgage Loan and any related Serviced Companion Loans.
The “Directing Holder” will be, with respect to each Serviced Mortgage Loan, the certificateholder (or its representative) selected by more than 50% of the Controlling Class, by Certificate Balance, as determined by the certificate registrar from time to time.
It is expected that RREF IV Debt AIV, LP or its affiliate will be the initial Directing Holder with respect to each Serviced Mortgage Loan and any related Serviced Companion Loans.
For a description of the directing holder for each Non-Serviced Whole Loan, see “Description of the Mortgage Pool—The Whole Loans” and “Pooling and Servicing Agreement—The Directing Holder” in the Preliminary Prospectus.
| |
| Control Eligible Certificates: | Class G and Class H certificates.
| |
| Controlling Class: | The Controlling Class will be the most subordinate class of Control Eligible Certificates then outstanding that has an aggregate Certificate Balance, as notionally reduced by any cumulative appraisal reduction amounts allocable to such class, equal to at least 25% of the initial Certificate Balance of such class; provided that if at any time the Certificate Balances of all Control Eligible Certificates, as notionally reduced by any appraisal reduction amounts (but without regard to any collateral deficiency amounts) allocable to such classes, have been |
THE INFORMATION IN THIS STRUCTURAL AND COLLATERAL TERM SHEET IS NOT COMPLETE AND MAY BE AMENDED PRIOR TO THE TIME OF SALE. THIS TERM SHEET IS NOT AN OFFER TO SELL THESE SECURITIES AND IT IS NOT A SOLICITATION OF AN OFFER TO BUY THESE SECURITIES IN ANY JURISDICTION WHERE THE OFFER OR SALE IS NOT PERMITTED.
16
Benchmark 2020-B22 Mortgage Trust
|
| STRUCTURE OVERVIEW |
reduced to zero, then the “Controlling Class” will be the most subordinate class of Control Eligible Certificates that has an aggregate principal balance greater than zero; provided, further that if at any time the Certificate Balances of the Class A-1, Class A-2, Class A-SB, Class A-4, Class A-5, Class A-M, Class B, Class C, Class D, Class E and Class F certificates have been reduced to zero as a result of the allocation of principal payments on the Mortgage Loans, then the Controlling Class will be the most subordinate class of Control Eligible Certificates that has an aggregate Certificate Balance greater than zero (without regard to the application of appraisal reduction amounts or any collateral deficiency amounts to notionally reduce the Certificate Balance of such class).
The Controlling Class as of the Closing Date will be the Class H certificates. | ||
| Appraised-Out Class: | Any class of Control Eligible Certificates that has been determined, as a result of appraisal reduction amounts and collateral deficiency amounts allocable to such class, to no longer be the Controlling Class.
| |
| Remedies Available to Holders of an Appraised-Out Class: | Holders of the majority of any class of Control Eligible Certificates that is determined at any time of determination to no longer be the Controlling Class as a result of an allocation of appraisal reduction amounts and collateral deficiency amounts in respect of such class will have the right, at their sole expense, to require the Special Servicer to order a second appraisal for any Serviced Mortgage Loan for which an appraisal reduction event has occurred or as to which there exists a collateral deficiency amount. Upon receipt of the second appraisal, the Special Servicer will be required to send the appraisal to the Master Servicer, who will be required to recalculate the appraisal reduction amount or collateral deficiency amount based on the second appraisal, and if required by such recalculation, the Special Servicer will reinstate the Appraised-Out Class as the Controlling Class. The Holders of an Appraised-Out Class requesting a second appraisal will not be entitled to exercise any rights of the Controlling Class until such time, if any, as the class is reinstated as the Controlling Class.
| |
| Control Termination Event: | Will occur and be continuing with respect to any Mortgage Loan or Serviced Whole Loan when one or more of the following is true: (i) the Class G certificates have a Certificate Balance (taking into account the application of any cumulative appraisal reduction amounts and collateral deficiency amounts to notionally reduce the Certificate Balance of such class) being reduced to less than 25% of the initial Certificate Balance of that class or (ii) the holder of the Class G certificates is the majority Controlling Class Certificateholder and has irrevocably waived its right, in writing, to exercise any of the rights of the Controlling Class Certificateholder and such rights have not been reinstated to a successor controlling class certificateholder pursuant to the terms of the PSA; provided that no Control Termination Event resulting solely from the operation of clause (ii) will be deemed to have existed or be in continuance with respect to a successor holder of Class G certificates that has not irrevocably waived its right to exercise any of the rights of the Controlling Class Certificateholder; provided that a Control Termination Event will not be deemed to be continuing in the event the Certificate Balances of all Classes of Principal Balance Certificates other than the Control Eligible Certificates have been reduced to zero. With respect to an excluded loan related to the Directing Holder, a Control Termination Event will be deemed to exist. | |
During the continuance of a Control Termination Event, the Directing Holder will no longer have any control rights. The Directing Holder will no longer have the right to direct certain actions of the Special Servicer and will no longer have consent rights with respect to certain material actions that the Master Servicer or Special Servicer proposes to take with respect to a Serviced Mortgage Loan and any related Serviced Companion Loans.
During the continuance of a Control Termination Event, the Directing Holder will retain non-binding consultation rights with respect to certain material actions that the Special Servicer proposes to take with respect to a Serviced Mortgage Loan and any related Serviced Companion Loans. Such consultation rights will continue until the occurrence of a Consultation Termination Event. | ||
| Consultation Termination Event: | Will occur and be continuing with respect to any Mortgage Loan or Serviced Whole Loan when one or more of the following is true: (i) there is no class of Control Eligible Certificates that has a then-outstanding Certificate Balance equal to at least 25% of the initial Certificate Balance of that class, in each case, without regard to the application of any cumulative appraisal reduction amounts or (ii) the holder of the Class G certificates is the majority Controlling Class Certificateholder and has irrevocably waived its right, in writing, to exercise any of the rights of |
THE INFORMATION IN THIS STRUCTURAL AND COLLATERAL TERM SHEET IS NOT COMPLETE AND MAY BE AMENDED PRIOR TO THE TIME OF SALE. THIS TERM SHEET IS NOT AN OFFER TO SELL THESE SECURITIES AND IT IS NOT A SOLICITATION OF AN OFFER TO BUY THESE SECURITIES IN ANY JURISDICTION WHERE THE OFFER OR SALE IS NOT PERMITTED.
17
Benchmark 2020-B22 Mortgage Trust
|
| STRUCTURE OVERVIEW |
the Controlling Class Certificateholder and such rights have not been reinstated to a successor controlling class certificateholder pursuant to the terms of the PSA; provided that no Consultation Termination Event resulting solely from the operation of clause (ii) will be deemed to have existed or be in continuance with respect to a successor holder of Class G certificates that has not irrevocably waived its right to exercise any of the rights of the Controlling Class Certificateholder; provided that a Consultation Termination Event will not be deemed to be continuing in the event the Certificate Balances of all Classes of Principal Balance Certificates other than the Control Eligible Certificates have been reduced to zero. With respect to an excluded loan related to the Directing Holder, a Consultation Termination Event will be deemed to exist.
During the continuance of a Consultation Termination Event, the Directing Holder will have no rights under the PSA other than those rights that all Certificateholders have.
| ||
| Risk Retention Consultation Party: | The risk retention consultation party will have certain non-binding consultation rights with respect to certain material servicing actions. The holder of the VRR Interest will be entitled to appoint the risk retention consultation party. Deutsche Bank AG, New York Branch (a majority-owned affiliate of GACC) is expected to be appointed as the initial risk retention consultation party. | |
| Appointment and Replacement of Special Servicer: | The Directing Holder will appoint the initial Special Servicer with respect to each Serviced Mortgage Loan and any related Serviced Companion Loans as of the Closing Date. For so long as no Control Termination Event is continuing, the Directing Holder generally may replace the Special Servicer with respect to each Serviced Mortgage Loan and any related Serviced Companion Loans with or without cause at any time.
During the continuance of a Control Termination Event, the Directing Holder will no longer have the right to replace the Special Servicer and such replacement (other than with respect to the Non-Serviced Whole Loans) will occur based on a vote of holders of all voting eligible classes of certificates as described below. See “Description of the Mortgage Pool—The Whole Loans” and “Pooling and Servicing Agreement” in the Preliminary Prospectus for a description of the special servicer appointment and replacement rights with respect to Non-Serviced Whole Loans. | |
| Replacement of Special Servicer by Vote of Certificateholders: | Other than with respect to Non-Serviced Whole Loans, if a Control Termination Event is continuing, upon (i) the written direction of holders of certificates evidencing not less than 25% of the voting rights of all classes of Principal Balance Certificates and the VRR Interest (taking into account the application of appraisal reduction amounts to notionally reduce the Certificate Balances of classes to which such appraisal reduction amounts are allocable) and requesting a vote to replace the Special Servicer with a replacement special servicer, (ii) payment by such requesting holders to the Certificate Administrator of all reasonable fees and expenses to be incurred by the Certificate Administrator in connection with administering such vote and (iii) delivery by such holders to the Certificate Administrator and Trustee of written confirmations from each Rating Agency that the appointment of the replacement Special Servicer will not result in a downgrade of the certificates, the Certificate Administrator will be required to promptly post notice of such request on the Certificate Administrator’s website and concurrently provide written notice of such request by mail to all Certificateholders of such request and conduct the solicitation of votes of all certificates in such regard. Upon the written direction (within 180 days) of (i) holders of Principal Balance Certificates and the VRR Interest evidencing at least 66 2/3% of a Certificateholder Quorum or (ii) holders of Principal Balance Certificates and the VRR Interest evidencing more than 50% of the aggregate voting rights of Principal Balance Certificates and the VRR Interest outstanding that has not been reduced to less than 25% of its initial Certificate Balance through the application of appraisal reduction amounts and realized losses), the Trustee will immediately replace the Special Servicer with the replacement Special Servicer (other than with respect to Non-Serviced Whole Loans).
“Certificateholder Quorum” means, in connection with any solicitation of votes in connection with the replacement of the Special Servicer as described above or the Asset Representations Reviewer as described below, the holders of certificates evidencing at least 50% of the aggregate voting rights (taking into account other than with respect to the termination of the Asset Representations Reviewer, the application of any appraisal reduction amounts to notionally reduce the Certificate Balance of the certificates) of all Principal Balance Certificates and the VRR Interest, on an aggregate basis. |
THE INFORMATION IN THIS STRUCTURAL AND COLLATERAL TERM SHEET IS NOT COMPLETE AND MAY BE AMENDED PRIOR TO THE TIME OF SALE. THIS TERM SHEET IS NOT AN OFFER TO SELL THESE SECURITIES AND IT IS NOT A SOLICITATION OF AN OFFER TO BUY THESE SECURITIES IN ANY JURISDICTION WHERE THE OFFER OR SALE IS NOT PERMITTED.
18
Benchmark 2020-B22 Mortgage Trust
|
| STRUCTURE OVERVIEW |
During the continuance of a Control Termination Event, if the Operating Advisor determines, in its sole discretion exercised in good faith, that (1) the Special Servicer is not performing its duties as required under the PSA or is otherwise not acting in accordance with the Servicing Standard and (2) the replacement of the Special Servicer would be in the best interest of the Certificateholders as a collective whole, then the Operating Advisor will have the right to recommend the replacement of the Special Servicer. The Operating Advisor’s recommendation to replace the Special Servicer (other than with respect Non-Serviced Whole Loans) must be confirmed by a majority of a quorum of Certificateholders (which, for this purpose, is the Certificateholders that evidence at least 20% of the Voting Rights (taking into account the application of any appraisal reduction amounts to notionally reduce the respective Certificate Balances) of all Principal Balance Certificates and the VRR Interest on an aggregate basis within 180 days from the time such recommendation is posted to the Certificate Administrator website and is subject to the receipt of written confirmations from each Rating Agency that the appointment of the replacement Special Servicer will not result in a downgrade of the certificates.
See “Description of the Mortgage Pool—The Whole Loans” and “Pooling and Servicing Agreement” in the Preliminary Prospectus for a description of the special servicer appointment and replacement rights with respect to Non-Serviced Whole Loans. | ||
| Cap on Workout and Liquidation Fees: | The workout fees and liquidation fees payable to a Special Servicer under the PSA will be an amount equal to the lesser of: (1) 1.0% of each collection of interest and principal following a workout or liquidation, subject to a minimum of $25,000 and (2) $1,000,000 per workout or liquidation. All Modification Fees actually paid to the Special Servicer in connection with a workout or liquidation or in connection with any prior workout or partial liquidation that occurred within the prior 18 months will be deducted from the total workout fee (only after receipt by the Special Servicer of workout fees of $25,000) and/or liquidation fees payable (other than Modification Fees earned while the Mortgage Loan was not in special servicing). In addition, the total amount of workout and liquidation fees actually payable by the Issuing Entity under the PSA will be capped in the aggregate at $1,000,000 for each related Mortgage Loan. If a new special servicer begins servicing the related Mortgage Loan, all amounts paid to the prior special servicer will be disregarded for purposes of calculating the cap.
| |
| Special Servicer Compensation: | The special servicing fee will equal 0.25% per annum of the stated principal balance of the related specially serviced loan or REO property, as applicable, with a minimum monthly fee of $5,000. The Special Servicer and its affiliates will be prohibited from receiving or retaining any compensation or any other remuneration under the PSA (including, without limitation, in the form of commissions, brokerage fees, rebates, or as a result of any other fee-sharing arrangement) from any person (including, without limitation, the issuing entity, any borrower, any manager, any guarantor or indemnitor in respect of a Serviced Mortgage Loan and any related Serviced Companion Loans, and any purchaser of any Serviced Mortgage Loan and any related Serviced Companion Loan or REO Property) in connection with the disposition, workout or foreclosure of any Serviced Mortgage Loan and any related Serviced Companion Loans, the management or disposition of any REO Property, or the performance of any other special servicing duties under the PSA, other than as expressly permitted in the PSA and other than commercially reasonable treasury management fees, banking fees, property condition report fees, customary title agent fees and insurance commissions or fees received or retained by the Special Servicer or any of its Affiliates in connection with any services performed by such party with respect to any Mortgage Loan, Serviced Whole Loan or REO Property. Subject to certain limited exceptions, the Special Servicer will also be required to report any compensation or other remuneration the Special Servicer or its affiliates have received from any person and such information will be disclosed in the Certificateholders’ monthly distribution date statement.
| |
| Operating Advisor: | With respect to the Serviced Mortgage Loans and any related Serviced Companion Loans the Operating Advisor will have access to any final asset status report and all information available with respect to the transaction on the Certificate Administrator’s website and will have certain monitoring responsibilities on behalf of the entire trust. After the occurrence and during the continuance of a Control Termination Event, the Operating Advisor will have consultation rights with respect to certain major decisions.
The Operating Advisor will be subject to termination with respect to any Serviced Mortgage Loan and Serviced Whole Loan, if holders of at least 15% of the aggregate voting rights of the certificates (in connection with termination and replacement relating to the Mortgage Loans) vote |
THE INFORMATION IN THIS STRUCTURAL AND COLLATERAL TERM SHEET IS NOT COMPLETE AND MAY BE AMENDED PRIOR TO THE TIME OF SALE. THIS TERM SHEET IS NOT AN OFFER TO SELL THESE SECURITIES AND IT IS NOT A SOLICITATION OF AN OFFER TO BUY THESE SECURITIES IN ANY JURISDICTION WHERE THE OFFER OR SALE IS NOT PERMITTED.
19
Benchmark 2020-B22 Mortgage Trust
|
| STRUCTURE OVERVIEW |
to terminate and replace the Operating Advisor and such vote is approved by holders of more than 50% of the applicable voting rights that exercise their right to vote (in the case of each of such vote and approval, taking into account realized losses and the application of any appraisal reduction amounts to notionally reduce the Certificate Balance of the certificates), provided that holders of at least 50% of the applicable voting rights have exercised their right to vote. The holders initiating such vote will be responsible for the fees and expenses in connection with the vote and replacement.
The Operating Advisor will not have consultation rights in respect of Non-Serviced Mortgage Loans. | ||
| Asset Representations Reviewer: | The Asset Representations Reviewer will be required to review certain delinquent Mortgage Loans after a specified delinquency threshold has been exceeded and the required percentage of Certificateholders vote to direct a review of such delinquent Mortgage Loans. An asset review will occur when either (1) Mortgage Loans with an aggregate outstanding principal balance of 25% or more of the aggregate outstanding principal balance of all of the Mortgage Loans (including any REO loans (or a portion of any REO loan in the case of a whole loan)) held by the issuing entity as of the end of the applicable collection period are delinquent loans or (2)(A) prior to and including the second anniversary of the Closing Date, at least 10 Mortgage Loans are delinquent loans as of the end of the applicable collection period and the outstanding principal balance of such delinquent loans in the aggregate constitutes at least 15% of the aggregate outstanding principal balance of all of the Mortgage Loans (including any REO loans (or a portion of any REO loan in the case of a whole loan)) held by the issuing entity as of the end of the applicable collection period, or (B) after the second anniversary of the Closing Date, at least 15 Mortgage Loans are delinquent loans as of the end of the applicable collection period and the outstanding principal balance of such delinquent loans in the aggregate constitutes at least 20% of the aggregate outstanding principal balance of all of the Mortgage Loans (including any REO loans (or a portion of any REO loan in the case of a whole loan)) held by the issuing entity as of the end of the applicable collection period.
The Asset Representations Reviewer may be terminated and replaced without cause. Upon (i) the written direction of Certificateholders evidencing not less than 25% of the voting rights (taking into account realized losses, but without regard to the application of any appraisal reduction amounts to notionally reduce the Certificate Balance of the certificates) requesting a vote to terminate and replace the Asset Representations Reviewer with a proposed successor asset representations reviewer that is an eligible asset representations reviewer, and (ii) payment by such holders to the Certificate Administrator of the reasonable fees and expenses to be incurred by the Certificate Administrator in connection with administering such vote, the Certificate Administrator will promptly provide notice to all Certificateholders and the Asset Representations Reviewer of such request by posting such notice on its internet website, and by mailing such notice to all Certificateholders and the Asset Representations Reviewer. Upon the written direction of Certificateholders evidencing at least 75% of a Certificateholder Quorum, the Trustee will terminate all of the rights and obligations of the Asset Representations Reviewer under the PSA by written notice to the Asset Representations Reviewer, and the proposed successor Asset Representations Reviewer will be appointed. See “Pooling and Servicing Agreement—The Asset Representations Reviewer” in the Preliminary Prospectus.
| |
| Dispute Resolution Provisions: | Each Mortgage Loan Seller will be subject to the dispute resolution provisions set forth in the PSA to the extent those provisions are triggered with respect to any Mortgage Loan sold to the depositor by such Mortgage Loan Seller and such Mortgage Loan Seller will be obligated under the related mortgage loan purchase agreement to comply with all applicable provisions and to take part in any mediation or arbitration proceedings that may result.
Generally, in the event that a repurchase request as described in the Preliminary Prospectus is not “Resolved” within 180 days after the related Mortgage Loan Seller receives such Repurchase Request, then the enforcing servicer will be required to send a notice to the initial requesting Certificateholder (if any) indicating the enforcing servicer’s intended course of action with respect to the Repurchase Request. If (a) the enforcing servicer’s intended course of action with respect to the Repurchase Request does not involve pursuing further action to exercise rights against the related Mortgage Loan Seller with respect to the Repurchase Request and the initial requesting Certificateholder, if any, or any other Certificateholder or Certificate Owner wishes to exercise its right to refer the matter to mediation (including nonbinding arbitration) or arbitration, or (b) the enforcing servicer’s intended course of action is to pursue further action to exercise rights against the related Mortgage Loan Seller with respect to the Repurchase Request but the initial requesting Certificateholder, if any, or any |
THE INFORMATION IN THIS STRUCTURAL AND COLLATERAL TERM SHEET IS NOT COMPLETE AND MAY BE AMENDED PRIOR TO THE TIME OF SALE. THIS TERM SHEET IS NOT AN OFFER TO SELL THESE SECURITIES AND IT IS NOT A SOLICITATION OF AN OFFER TO BUY THESE SECURITIES IN ANY JURISDICTION WHERE THE OFFER OR SALE IS NOT PERMITTED.
20
Benchmark 2020-B22 Mortgage Trust
|
| STRUCTURE OVERVIEW |
other Certificateholder or Certificate Owner does not agree with the dispute resolution method selected by the enforcing servicer, then the initial requesting Certificateholder, if any, or such other Certificateholder or Certificate Owner may deliver a written notice to the enforcing servicer indicating its intent to exercise its right to refer the matter to either mediation or arbitration.
“Resolved” means, with respect to a Repurchase Request, (i) that the related material defect or material breach has been cured, (ii) the related Mortgage Loan has been repurchased in accordance with the related mortgage loan purchase agreement, (iii) a mortgage loan has been substituted for the related Mortgage Loan in accordance with the related mortgage loan purchase agreement, (iv) the applicable Mortgage Loan Seller made the loss of value payment, (v) a contractually binding agreement is entered into between the enforcing servicer, on behalf of the issuing entity, and the related Mortgage Loan Seller that settles the related Mortgage Loan Seller’s obligations under the related mortgage loan purchase agreement, or (vi) the related Mortgage Loan is no longer property of the issuing entity as a result of a sale or other disposition in accordance with the PSA. See “Pooling and Servicing Agreement—Dispute Resolution Provisions” in the Preliminary Prospectus.
| ||
| Liquidated Loan Waterfall: | On liquidation of any Mortgage Loan, all net liquidation proceeds will be applied according to the PSA, so that amounts allocated as a recovery of accrued and unpaid interest will not, in the first instance, include (a) any amount by which the interest portion of P&I Advances previously made was reduced as a result of appraisal reduction amounts and (b) Accrued AB Loan Interest. After the adjusted interest amount is so allocated, any remaining net liquidation proceeds will be allocated to pay principal on the Mortgage Loan until the unpaid principal amount of the Mortgage Loan has been reduced to zero. Any remaining liquidation proceeds would then be allocated as a recovery of (a) accrued and unpaid interest corresponding to the amount by which the interest portion of P&I Advances previously made was reduced as a result of appraisal reduction amounts and (b) any Accrued AB Loan Interest. |
THE INFORMATION IN THIS STRUCTURAL AND COLLATERAL TERM SHEET IS NOT COMPLETE AND MAY BE AMENDED PRIOR TO THE TIME OF SALE. THIS TERM SHEET IS NOT AN OFFER TO SELL THESE SECURITIES AND IT IS NOT A SOLICITATION OF AN OFFER TO BUY THESE SECURITIES IN ANY JURISDICTION WHERE THE OFFER OR SALE IS NOT PERMITTED.
21
1114 Avenue of the Americas New York, NY 10036 | Collateral Asset Summary – Loan No. 1 The Grace Building | Cut-off Date Balance: Cut-off Date LTV: U/W NCF DSCR: U/W NOI Debt Yield: | $80,000,000 41.1% 4.25x 11.8% |
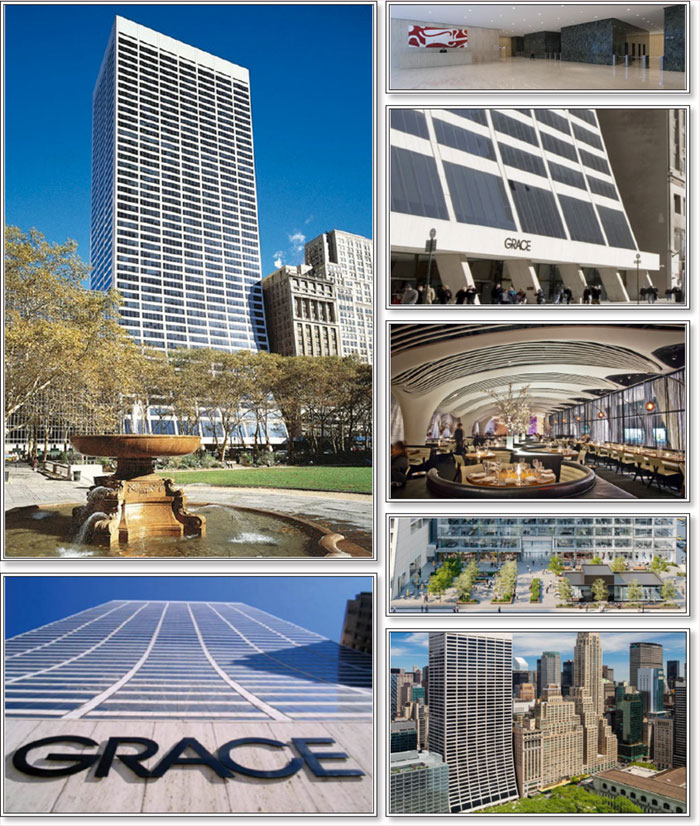
THE INFORMATION IN THIS STRUCTURAL AND COLLATERAL TERM SHEET IS NOT COMPLETE AND MAY BE AMENDED PRIOR TO THE TIME OF SALE. THIS TERM SHEET IS NOT AN OFFER TO SELL THESE SECURITIES AND IT IS NOT A SOLICITATION OF AN OFFER TO BUY THESE SECURITIES IN ANY JURISDICTION WHERE THE OFFER OR SALE IS NOT PERMITTED.
22
1114 Avenue of the Americas New York, NY 10036 | Collateral Asset Summary – Loan No. 1 The Grace Building | Cut-off Date Balance: Cut-off Date LTV: U/W NCF DSCR: U/W NOI Debt Yield: | $80,000,000 41.1% 4.25x 11.8% |
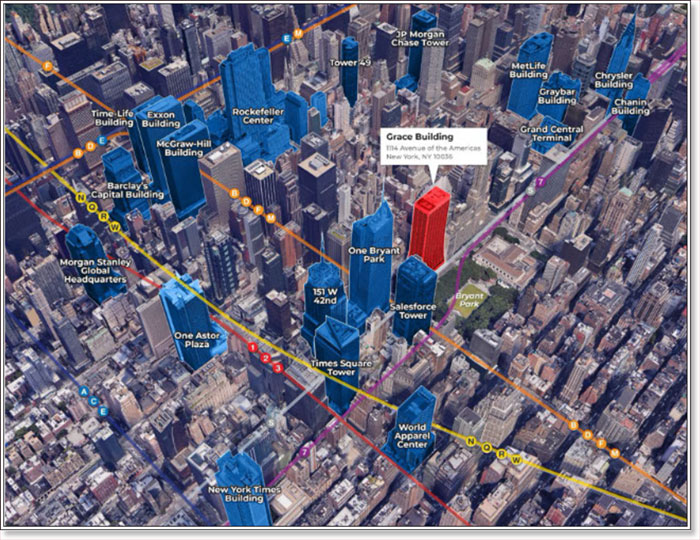
THE INFORMATION IN THIS STRUCTURAL AND COLLATERAL TERM SHEET IS NOT COMPLETE AND MAY BE AMENDED PRIOR TO THE TIME OF SALE. THIS TERM SHEET IS NOT AN OFFER TO SELL THESE SECURITIES AND IT IS NOT A SOLICITATION OF AN OFFER TO BUY THESE SECURITIES IN ANY JURISDICTION WHERE THE OFFER OR SALE IS NOT PERMITTED.
23
1114 Avenue of the Americas New York, NY 10036 | Collateral Asset Summary – Loan No. 1 The Grace Building | Cut-off Date Balance: Cut-off Date LTV: U/W NCF DSCR: U/W NOI Debt Yield: | $80,000,000 41.1% 4.25x 11.8% |
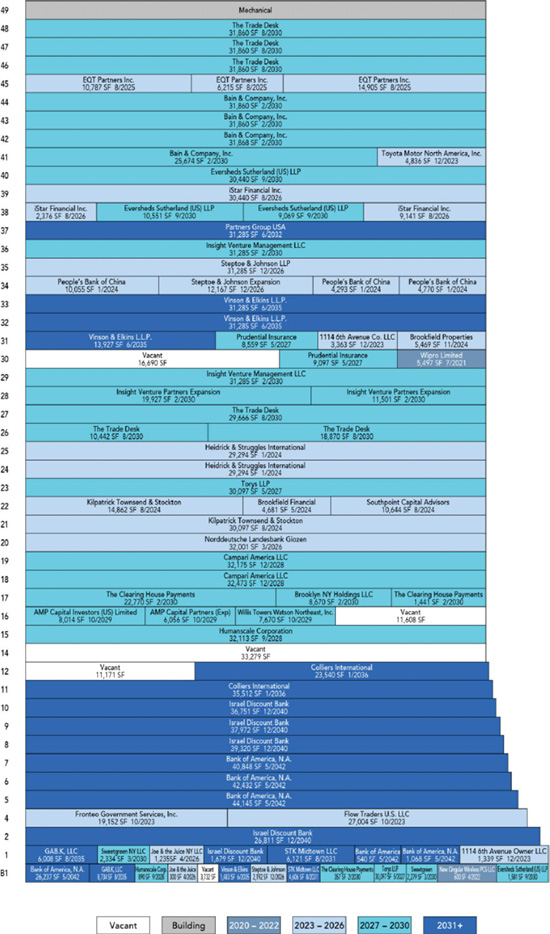
THE INFORMATION IN THIS STRUCTURAL AND COLLATERAL TERM SHEET IS NOT COMPLETE AND MAY BE AMENDED PRIOR TO THE TIME OF SALE. THIS TERM SHEET IS NOT AN OFFER TO SELL THESE SECURITIES AND IT IS NOT A SOLICITATION OF AN OFFER TO BUY THESE SECURITIES IN ANY JURISDICTION WHERE THE OFFER OR SALE IS NOT PERMITTED.
24
1114 Avenue of the Americas New York, NY 10036 | Collateral Asset Summary – Loan No. 1 The Grace Building | Cut-off Date Balance: Cut-off Date LTV: U/W NCF DSCR: U/W NOI Debt Yield: | $80,000,000 41.1% 4.25x 11.8% |
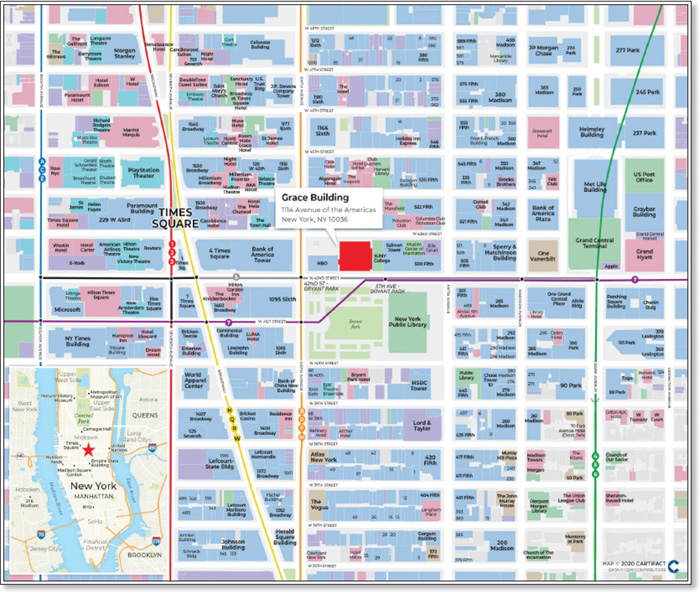
THE INFORMATION IN THIS STRUCTURAL AND COLLATERAL TERM SHEET IS NOT COMPLETE AND MAY BE AMENDED PRIOR TO THE TIME OF SALE. THIS TERM SHEET IS NOT AN OFFER TO SELL THESE SECURITIES AND IT IS NOT A SOLICITATION OF AN OFFER TO BUY THESE SECURITIES IN ANY JURISDICTION WHERE THE OFFER OR SALE IS NOT PERMITTED.
25
1114 Avenue of the Americas New York, NY 10036 | Collateral Asset Summary – Loan No. 1 The Grace Building | Cut-off Date Balance: Cut-off Date LTV: U/W NCF DSCR: U/W NOI Debt Yield: | $80,000,000 41.1% 4.25x 11.8% |
| Mortgage Loan Information | |
| Loan Sellers: | JPMCB/GACC |
| Loan Purpose: | Refinance |
Credit Assessment (Fitch/KBRA/Moody’s)(10): | A-sf / A+(sf) / Baa2(sf) |
| Borrower Sponsors(1): | Brookfield Office Properties Inc.; Swig Investment Company, LLC |
| Borrower(1): | 1114 6th Avenue Owner LLC |
| Original Balance(2): | $80,000,000 |
| Cut-off Date Balance(2): | $80,000,000 |
| % by Initial UPB: | 9.8% |
| Interest Rate: | 2.69210% |
| Payment Date: | 6th of each month |
| First Payment Date: | January 6, 2021 |
| Maturity Date: | December 6, 2030 |
| Amortization: | Interest Only |
| Additional Debt(2)(3): | $803,000,000 Pari Passu Debt; $367,000,000 Subordinate Debt; Future Mezzanine Debt Permitted |
| Call Protection(4): | L(24), DorYM1(89), O(7) |
| Lockbox / Cash Management: | Hard / Springing |
| Reserves(5) | |||
| Initial | Monthly | Cap | |
| Taxes: | $0 | Springing | NAP |
| Insurance: | $0 | Springing | NAP |
| Recurring Replacements: | $0 | Springing | NAP |
| TI/LC: | $56,172,399 | Springing | NAP |
| Free Rent: | $25,964,570 | $0 | NAP |
| Lobby/Elevator Work: | $5,970,240 | $0 | NAP |
| Parking Rent Shortfall: | $1,608,940 | $0 | NAP |
| Property Information | |
| Single Asset / Portfolio: | Single Asset |
| Property Type: | CBD Office |
| Collateral: | Fee Simple |
| Location: | New York, NY |
| Year Built / Renovated: | 1974 / 2018 |
| Total Sq. Ft.: | 1,556,972 |
| Property Management(6): | TRZ Holdings IV LLC |
| Underwritten NOI(7): | $104,293,717 |
| Underwritten NCF(7): | $102,347,502 |
| Appraised Value: | $2,150,000,000 |
| Appraisal Date: | September 8, 2020 |
| Historical NOI(8) | |
| Most Recent NOI: | $46,272,539 (T-12 September 30, 2020) |
| 2019 NOI: | $52,538,193 (December 31, 2019) |
| 2018 NOI: | $73,206,665 (December 31, 2018) |
| 2017 NOI: | $67,159,674 (December 31, 2017) |
| Historical Occupancy | |
| Most Recent Occupancy: | 94.8% (October 19, 2020) |
| 2019 Occupancy: | 91.0% (December 31, 2019) |
| 2018 Occupancy: | 97.6% (December 31, 2018) |
| 2017 Occupancy: | 94.7% (December 31, 2017) |
| Financial Information(2)(3)(9) | ||||||
| Tranche | Cut-off Date Balance | Balance per Sq. Ft. Cut-off / Balloon | LTV Cut-off / Balloon | U/W DSCR NOI / NCF | U/W Debt Yield NOI / NCF | U/W Debt Yield at Balloon NOI / NCF |
| Mortgage Loan | $80,000,000 | |||||
| Pari Passu Notes | 803,000,000 | |||||
| Total Senior Notes | $883,000,000 | $567 / $567 | 41.1% / 41.1% | 4.33x / 4.25x | 11.8% / 11.6% | 11.8% / 11.6% |
| B Notes | 367,000,000 | |||||
| Whole Loan | $1,250,000,000 | $803 / $803 | 58.1% / 58.1% | 3.06x / 3.00x | 8.3% / 8.2% | 8.3% / 8.2% |
| (1) | For a description of the borrower and the borrower sponsor see “The Borrower / Borrower Sponsor” herein. |
| (2) | Represents the principal balance of the non-controlling Notes A-2-5, A-2-6, A-2-7, and A-4-4 which will be included in the Benchmark 2020-B22 securitization trust. The Grace Building Whole Loan (as defined below), is evidenced by 21 pari passu senior promissory notes and four pari passu subordinate B notes, with an aggregate outstanding principal balance as of the Cut-off Date of $1.25 billion. For additional information, see “The Loan” herein. |
| (3) | See “Current Mezzanine or Secured Subordinate Indebtedness" herein. |
| (4) | Defeasance or prepayment of the Grace Building Whole Loan is permitted at any time after the earlier to occur of (a) the end of the two-year period commencing on the closing date of the securitization of the last portion of the Grace Building Whole Loan to be securitized and (b) November 17, 2023. The assumed prepayment lockout period of 24 payments is based on the closing date of this transaction in December 2020. |
| (5) | See “Initial and Ongoing Reserves” herein. |
| (6) | For a description of the property managers, see “Property Management” herein. |
| (7) | Underwritten NOI and Underwritten NCF are based on in-place rent roll as of October 2020 and are inclusive of contractual rent steps of $4,566,719 underwritten for various tenants through December 31, 2021. |
| (8) | The recent volatility in NOI at the Grace Building Property (as defined below) is a result of the replacement of some larger legacy tenants (including 4 of the 5 largest tenants) between 2016 and 2018 and the signing of new and renewal leases with respect to 950,000 sq. ft. of space. The cash flow declines in 2019 and TTM 9/30/2020 and the projected increase in UW cash flows are the result of this rollover and the rent abatements associated with the new leases. All outstanding landlord obligations ($56,172,399) and rent abatements ($25,964,570) were reserved at origination. |
| (9) | While the Grace Building Loan (as defined below) was originated after the emergence of the novel coronavirus pandemic and the economic disruption resulting from measures to combat the pandemic, the pandemic is an evolving situation and could impact the Grace Building Whole Loan more severely than assumed in the underwriting of the Grace Building Loan and could adversely affect the NOI, NCF and occupancy information, as well as the appraised value and the DSCR, LTV and Debt Yield metrics presented above. See “Risk Factors—Special Risks—Coronavirus Pandemic Has Adversely Affected the Global Economy and Will Likely Adversely Affect the Performance of the Mortgage Loans” in the Preliminary Prospectus. |
| (10) | Fitch, KBRA, and Moody’s provided the listed assessments for the Grace Building Loan in the context of its inclusion in the mortgage pool. |
THE INFORMATION IN THIS STRUCTURAL AND COLLATERAL TERM SHEET IS NOT COMPLETE AND MAY BE AMENDED PRIOR TO THE TIME OF SALE. THIS TERM SHEET IS NOT AN OFFER TO SELL THESE SECURITIES AND IT IS NOT A SOLICITATION OF AN OFFER TO BUY THESE SECURITIES IN ANY JURISDICTION WHERE THE OFFER OR SALE IS NOT PERMITTED.
26
1114 Avenue of the Americas New York, NY 10036 | Collateral Asset Summary – Loan No. 1 The Grace Building | Cut-off Date Balance: Cut-off Date LTV: U/W NCF DSCR: U/W NOI Debt Yield: | $80,000,000 41.1% 4.25x 11.8% |
The Loan. The Grace Building mortgage loan (the “Grace Building Loan”) is part of a whole loan (the “Grace Building Whole Loan”) secured by the borrower’s fee simple interest in an approximately 1.56 million sq. ft., LEED Class A Gold office building located in Midtown Manhattan, New York (the “Grace Building Property”). The Grace Building Whole Loan is evidenced by 21 pari passu senior promissory notes in the aggregate original principal amount of $883,000,000 (collectively, the “Grace Building Senior Notes”) and four pari passu subordinate promissory notes in the aggregate original principal amount of $367,000,000 (collectively, the “Grace Building Subordinate Notes”). The Grace Building Whole Loan was co-originated by Bank of America, N.A. (“BANA”), JPMorgan Chase Bank, National Association (“JPMCB”), Column Financial, Inc. (“CS”) and DBR Investments Co. Limited (“DBRI”). The Grace Building Loan is evidenced by the non-controlling promissory Notes A-2-5, A-2-6, and A-2-7 being contributed by JPMCB in the original principal amount of $60,000,000, and Note A-4-4 being contributed by GACC in the original principal amount of $20,000,000. As shown in the table below, eight promissory notes in the aggregate original principal amount of $750,000,000 were contributed to the GRACE 2020-GRCE securitization trust. The Grace Building Whole Loan will be serviced pursuant to the trust and servicing agreement for the GRACE 2020-GRCE securitization trust. The Grace Building Senior Notes other than those evidencing the Grace Building Loan are referred to herein as the “Grace Building Non-Serviced Pari Passu Companion Loans”. See “Description of the Mortgage Pool—The Whole Loans—The Non-Serviced AB Whole Loans—The Grace Building Whole Loan” and “Pooling and Servicing Agreement—Servicing of the Non-Serviced Mortgage Loans” in the Preliminary Prospectus.
| Whole Loan Summary | |||||
| Notes | Original Balance | Cut-off Date Balance | Note Holder | Controlling Piece | |
| A-1-1, A-2-1, A-3-1, A-4-1 | $383,000,000 | $383,000,000 | GRACE 2020-GRCE | Yes(1) | |
| A-1-2 | 75,000,000 | 75,000,000 | BANK 2020-BNK29 | No | |
| A-1-3-1 | 60,000,000 | 60,000,000 | BANK 2020-BNK30(2) | No | |
| A-1-3-2 | 15,000,000 | 15,000,000 | BANA(3) | No | |
| A-2-2, A-2-3, A-4-2 | 100,000,000 | 100,000,000 | Benchmark 2020-B21 | No | |
| A-2-4 | 30,000,000 | 30,000,000 | JPMCB(3) | No | |
| A-2-5, A-2-6, A-2-7, A-4-4 | 80,000,000 | 80,000,000 | Benchmark 2020-B22 | No | |
| A-3-2, A-3-3, A-3-4, A-3-5 | 100,000,000 | 100,000,000 | CS(3) | No | |
| A-4-3, A-4-5 | 40,000,000 | 40,000,000 | DBRI(3) | No | |
| Total Senior Notes | $883,000,000 | $883,000,000 | |||
| B-1, B-2, B-3, B-4(4) | $367,000,000 | $367,000,000 | GRACE 2020-GRCE | Yes(1) | |
| Whole Loan | $1,250,000,000 | $1,250,000,000 | |||
| (1) | Pursuant to the related co-lender agreement, the controlling holder will be the GRACE 2020-GRCE trust. See “Description of the Mortgage Pool—The Whole Loans—The Non-Serviced AB Whole Loans—The Grace Building Whole Loan” in the Preliminary Prospectus. |
| (2) | The BANK 2020-BNK30 transaction is expected to close on or about December 22, 2020. |
| (3) | Expected to be contributed to one or more future securitizations. |
| (4) | The Grace Building Subordinate Notes are subordinate in right of payment to the Grace Building Senior Notes. |
The Grace Building Whole Loan has a 120-month interest-only term. The Grace Building Senior Notes accrue interest at a fixed rate of approximately 2.69210% per annum and the Grace Building Subordinate Notes accrue interest at a fixed rate of approximately 2.69210% per annum. The proceeds of the Grace Building Whole Loan were used to pay off existing debt encumbering the Grace Building Property of approximately $905.4 million, return approximately $240.0 million of equity to the borrower sponsor, pay closing costs of approximately $14.9 million, and fund escrows of approximately $89.7 million.
| Sources and Uses | ||||||
| Sources | Proceeds | % of Total | Uses | Proceeds | % of Total | |
| Senior Notes | $883,000,000 | 70.6% | Loan Payoff(1) | $905,439,802 | 72.4% | |
| Subordinate Notes | 367,000,000 | 29.4 | Return of Equity | 239,965,013 | 19.2 | |
| Reserves | 89,716,149 | 7.2 | ||||
| Closing Costs | 14,879,035 | 1.2 | ||||
| Total Sources | $1,250,000,000 | 100.0% | Total Uses | $1,250,000,000 | 100.0% | |
| (1) | Loan payoff includes defeasance costs for previously securitized debt in the GRACE 2014-GRCE trust. |
The Borrower / Borrower Sponsors. The borrower is 1114 6th Avenue Owner LLC (the “Borrower”), a Delaware limited liability company that is structured to be bankruptcy-remote with at least one independent director. The Borrower is owned by a joint venture partnership between an affiliate of Swig Investment Company, LLC and 1114 6th Avenue Holdings LLC (controlled and majority indirectly owned by an affiliate of the borrower sponsor, Brookfield Office Properties Inc.).
The non-recourse carveout guarantors are BOP NYC OP LLC and Swig Investment Company, LLC. The full recourse obligations of the non-recourse carveout guarantors for bankruptcy related events are capped at 15% of the outstanding principal balance of the Grace Building Whole Loan.
BOP NYC OP LLC is a subsidiary of Brookfield Property Partners L.P., the public real estate vehicle of Brookfield Asset Management Inc. (NYSE: BAM) (“Brookfield Asset Management”). Brookfield Asset Management was founded in 1899 and is a global asset manager with a reported approximately $550 billion of assets under management, concentrated in property, infrastructure, renewable power, private equity and credit. Brookfield Asset Management has approximately 150,000 employees in over 100 offices in 30 different countries
THE INFORMATION IN THIS STRUCTURAL AND COLLATERAL TERM SHEET IS NOT COMPLETE AND MAY BE AMENDED PRIOR TO THE TIME OF SALE. THIS TERM SHEET IS NOT AN OFFER TO SELL THESE SECURITIES AND IT IS NOT A SOLICITATION OF AN OFFER TO BUY THESE SECURITIES IN ANY JURISDICTION WHERE THE OFFER OR SALE IS NOT PERMITTED.
27
1114 Avenue of the Americas New York, NY 10036 | Collateral Asset Summary – Loan No. 1 The Grace Building | Cut-off Date Balance: Cut-off Date LTV: U/W NCF DSCR: U/W NOI Debt Yield: | $80,000,000 41.1% 4.25x 11.8% |
and is one of the largest real estate fund managers in the world. Brookfield Property Partners L.P. is a large global real estate company, with approximately $86 billion in total assets. Brookfield Property Partners L.P. owns and operates properties in the world’s major markets, with a global portfolio that includes office, retail, multifamily, logistics, hospitality, self-storage, triple-net lease, manufactured housing and student housing assets.
Swig Investment Company, LLC is a San Francisco-based private real estate investment company with an 80-year history of development, ownership and management of commercial real estate properties in major markets throughout the United States. The company’s diversified portfolio includes over 9 million sq. ft. of office buildings in markets such as New York, San Francisco, and Southern California.
The Property. The Grace Building Property is a 1.56 million sq. ft., LEED Gold office tower located at Sixth Avenue and 42nd Street in Midtown Manhattan across from Bryant Park. The Grace Building Property was developed in 1974 by Swig Investment Company, LLC and designed by architect firm Skidmore, Owings & Merrill-partner Gordon Bunshaft. A notable aesthetic feature of the building is the concave vertical slopes of its north and south façades, which are similar to the Solow Building at 9 West 57th Street, another Bunshaft project. The Grace Building Property offers wide-open floor plates with walls of glass offering views of Bryant Park, the Hudson River and the city skyline. The Grace Building Property also includes an 188-space underground parking garage.
The Grace Building Property was 94.8% leased as of October 19, 2020 to a granular rent roll of over 35 tenants in various industries. Major tenants at the Grace Building Property include Bank of America, N.A., The Trade Desk and Israel Discount Bank. In addition to the office space, there is 30,877 sq. ft. (2.0% of NRA) of retail space, which is 95.0% occupied by two fine dining restaurants, STK and Gabriel Kruether, and two quick service restaurants, Sweetgreen and Joe & The Juice.
The Grace Building Property has maintained high occupancy levels with a 20-year physical occupancy average of approximately 94%. The Grace Building Property experienced significant tenant turnover from 2016-2018, as four of the five largest tenants, including HBO (Time Warner Inc.) and Cooley LLP (a large law firm), were replaced by other tenants on long-term leases. As a result of such replacement leases, the Grace Building Property has been able to stabilize at approximately 95% occupancy, in-line with its historical average.
Over 950,000 sq. ft. of new and renewed leases have been signed at the Grace Building Property since 2016. As a result, less than 16.0% of tenants by NRA have leases that expire in the next five years. Recent leasing activity includes 95,580 sq. ft. leased to The Trade Desk, 127,425 sq. ft. of expansion space leased to Bank of America, N.A., and 41,957 sq. ft. of renewal and expansion space leased to iStar Financial.
COVID-19 Update. The first debt service payment on the Grace Building Whole Loan is due in January 2021 and, as of November 17, 2020, the Grace Building Whole Loan is not subject to any forbearance, modification or debt service relief request. The Grace Building Property is open and operating, with 98.0% of tenants by occupied NRA and 97.1% of tenants by underwritten base rent having paid their full November 2020 rent payments. Four retail tenants (2.0% of NRA, 2.9% of underwritten rent) have not made rent payments for the last three months or more. The borrower sponsor is in the process of negotiating rent deferrals with such retail tenants, with full rental payments anticipated to commence in late 2021 or early 2022. The parking tenant has not paid the required monthly rental payments since March 2020 and an event of default is continuing under its lease. The borrower sponsor is in the process of replacing the current parking operator and plans to employ a new operator under a management agreement. The Borrower deposited with the lender $1,608,940 for anticipated parking rent shortfalls (see “—Escrows and Reserves” below). We cannot assure you the borrower sponsor will employ a new parking operator as anticipated or at all. See “Risk Factors—Special Risks—Coronavirus Pandemic Has Adversely Affected the Global Economy and Will Likely Adversely Affect the Performance of the Mortgage Loans” in the Preliminary Prospectus.
THE INFORMATION IN THIS STRUCTURAL AND COLLATERAL TERM SHEET IS NOT COMPLETE AND MAY BE AMENDED PRIOR TO THE TIME OF SALE. THIS TERM SHEET IS NOT AN OFFER TO SELL THESE SECURITIES AND IT IS NOT A SOLICITATION OF AN OFFER TO BUY THESE SECURITIES IN ANY JURISDICTION WHERE THE OFFER OR SALE IS NOT PERMITTED.
28
1114 Avenue of the Americas New York, NY 10036 | Collateral Asset Summary – Loan No. 1 The Grace Building | Cut-off Date Balance: Cut-off Date LTV: U/W NCF DSCR: U/W NOI Debt Yield: | $80,000,000 41.1% 4.25x 11.8% |
| Major Tenant Summary(1) | ||||||
| Tenant | Credit Rating (Moody's/Fitch/S&P)(2) | Net Rentable Area (Sq. Ft.) | % of Net Rentable Area | U/W Base Rent Per Sq. Ft.(3) | % of Total U/W Base Rent | Lease Expiration |
| Office Tenants | ||||||
| Bank of America, N.A. | A2 / A+ / A- | 155,270 | 10.0% | $81.42 | 9.0% | 5/31/2042 |
| The Trade Desk(4) | NR / NR / NR | 154,558 | 9.9% | $130.99 | 14.4% | 8/31/2030 |
| Israel Discount Bank(5) | NR / NR / BBB+ | 142,533 | 9.2% | $54.21 | 5.5% | 12/31/2040 |
| Bain & Company, Inc. | NR / NR / NR | 121,262 | 7.8% | $106.59 | 9.2% | 2/28/2030 |
| Insight Venture Management LLC | NR / NR / NR | 93,998 | 6.0% | $102.69 | 6.9% | 2/28/2030 |
| Total Major Office Tenants | 667,621 | 42.9% | $94.65 | 45.0% | ||
| Other Office and Storage Tenants | 779,378 | 50.1% | $93.94 | 52.1% | ||
| Retail Tenants | 29,338 | 1.9% | $137.74 | 2.9% | ||
| Total Occupied | 1,476,337 | 94.8% | $95.13 | 100.0% | ||
| Vacant Office and Storage | 79,096 | 5.1% | ||||
| Vacant Retail | 1,539 | 0.1% | ||||
| Total / Wtd. Avg. | 1,556,972 | 100.0% | ||||
| (1) | Based on the underwritten rent roll dated October 19, 2020. |
| (2) | In certain instances, ratings provided are those of the parent company of the entity shown, whether or not the parent company guarantees the lease. |
| (3) | As of the loan origination date, Bank of America, N.A., The Trade Desk, Bain & Company, Inc. and Insight Venture Management LLC are entitled to a total of $12,022,739 of free rent, which was fully reserved by the lender. |
| (4) | The Trade Desk has the right to terminate its lease solely as to the 26th and 27th floors effective as of the last day of the month in which the 7th anniversary of the commencement date for such floors occurs and with the payment of a termination fee. |
| (5) | Israel Discount Bank has (i) a one-time right to terminate its entire leased space, effective as of December 31, 2035, with 21 months’ prior written notice, and (ii) the right to terminate the lease with respect to the ground floor only, effective (at IDB’s option) on either the fifth anniversary or the tenth anniversary of the rent commencement date, with fifteen months’ prior written notice. |
| Lease Rollover Schedule(1)(2) | ||||||||
| Year | # of Leases Expiring | Total Expiring Sq. Ft. | % of Total Sq. Ft. Expiring | Cumulative Sq. Ft. Expiring | Cumulative % of Sq. Ft. Expiring | Annual U/W Base Rent per sq. ft. | % U/W Base Rent Rolling | Cumulative % of U/W Base Rent |
| MTM | 0 | 0 | 0.0% | 0 | 0.0% | $0.00 | 0.0% | 0.0% |
| 2021 | 1 | 5,497 | 0.4% | 5,497 | 0.4% | $75.00 | 0.3% | 0.3% |
| 2022 | 1 | 600 | 0.0% | 6,097 | 0.4% | $0.00 | 0.0% | 0.3% |
| 2023 | 5 | 55,694 | 3.6% | 61,791 | 4.0% | $71.66 | 2.8% | 3.1% |
| 2024 | 10 | 143,459 | 9.2% | 205,250 | 13.2% | $99.34 | 10.1% | 13.3% |
| 2025 | 3 | 31,907 | 2.0% | 237,157 | 15.2% | $118.01 | 2.7% | 16.0% |
| 2026 | 9 | 121,137 | 7.8% | 358,294 | 23.0% | $102.21 | 8.8% | 24.8% |
| 2027 | 3 | 47,753 | 3.1% | 406,047 | 26.1% | $85.66 | 2.9% | 27.7% |
| 2028 | 4 | 97,651 | 6.3% | 503,698 | 32.4% | $81.05 | 5.6% | 33.3% |
| 2029 | 3 | 21,740 | 1.4% | 525,438 | 33.7% | $101.28 | 1.6% | 34.9% |
| 2030 & Thereafter | 49 | 950,899 | 61.1% | 1,476,337 | 94.8% | $96.16 | 65.1% | 100.0% |
| Vacant | NAP | 80,635 | 5.2% | 1,556,972 | 100.0% | NAP | NAP | NAP |
| Total / Wtd. Avg. | 88 | 1,556,972 | 100.0% | $95.13 | 100.0% | |||
| (1) | Based on the underwritten rent roll dated October 19, 2020 and based on the approximate square footage occupied by each owned tenant. |
| (2) | Certain tenants may have lease termination options that are exercisable prior to the stated expiration date of the subject lease or leases which are not considered in the lease rollover schedule. |
Major Tenants. The largest tenant by underwritten rent is The Trade Desk (154,558 sq. ft., 9.9% of NRA, 14.4% of U/W Base Rent). The Trade Desk (NASDAQ: TTD) (“Trade Desk”) is a global technology company that markets a software platform used by digital advertising buyers to purchase data-driven digital advertising campaigns across various advertising formats and devices. Trade Desk currently has over 1,300 employees and a reported market capitalization of approximately $26.48 billion. Trade Desk currently leases a total of 154,558 sq. ft. on the 26th, 27th, 46th, 47th and 48th floors through August 31, 2030. The commencement date with respect to the 26th and 27th floors (the “Additional Premises Commencement Date”) will occur upon the earlier of (i) substantial completion of the work to be performed by the landlord and (ii) the date Trade Desk first takes possession of the space. Trade Desk has one five-year renewal option so long as Trade Desk is not in default or in bankruptcy and Trade Desk and its affiliates physically occupy at least 79% of the space.
Trade Desk’s annual base rent for the 46th, 47th and 48th floors is $139.00 per sq. ft. from August 10, 2020 through August 31, 2025, and then $148.00 per sq. ft. from September 1, 2025 through August 31, 2030. Trade Desk’s annual base rent for the 26th and 27th floors is $118.00 initially, and then $128.00 per sq. ft. after the fifth anniversary of the Additional Premises Commencement Date through August 31, 2030.
Trade Desk is currently in a free rent period through September 30, 2021. All free rent, in the amount of $5,799,503, was fully reserved at origination. Trade Desk is entitled to $7,770,283 for tenant improvements and leasing costs from the landlord, which amount was fully reserved at origination (see “—Escrows and Reserves” below). We cannot assure you Trade Desk will take possession or begin paying rent as expected or at all.
THE INFORMATION IN THIS STRUCTURAL AND COLLATERAL TERM SHEET IS NOT COMPLETE AND MAY BE AMENDED PRIOR TO THE TIME OF SALE. THIS TERM SHEET IS NOT AN OFFER TO SELL THESE SECURITIES AND IT IS NOT A SOLICITATION OF AN OFFER TO BUY THESE SECURITIES IN ANY JURISDICTION WHERE THE OFFER OR SALE IS NOT PERMITTED.
29
1114 Avenue of the Americas New York, NY 10036 | Collateral Asset Summary – Loan No. 1 The Grace Building | Cut-off Date Balance: Cut-off Date LTV: U/W NCF DSCR: U/W NOI Debt Yield: | $80,000,000 41.1% 4.25x 11.8% |
Trade Desk has the right to terminate the lease solely as to the 26th and 27th floors if the Additional Premises Commencement Date does not occur by May 31, 2021, as such date may be extended by force majeure (not to exceed 150 days in the aggregate). In addition, so long as Trade Desk is not in bankruptcy and no default is continuing, Trade Desk has a one-time right to terminate the lease with respect to one or both of the 26th and 27th floors, effective as of the last day of the month in which the seventh anniversary of the Additional Premises Commencement Date occurs. If Trade Desk has elected to terminate both the 26th and 27th floors, Trade Desk will be required to make a $6,700,000 termination payment. If Trade Desk has elected to terminate one floor, Trade Desk will be required to make a $3,350,000 termination payment. Notwithstanding the foregoing, no termination will be permitted if Trade Desk has exercised its right of first offer to lease certain additional space pursuant to its lease within the 24-month period immediately preceding the date on which Trade Desk sends a notice to effectuate such termination.
The second largest tenant by underwritten rent is Bain & Company, Inc. (121,262 sq. ft., 7.8% of NRA, 9.2% of U/W Base Rent). Bain & Company, Inc. (“Bain”) is an American global management consulting firm headquartered in Boston, Massachusetts. The firm provides advisory services to many large businesses, non-profit organizations and governments. Bain has 59 offices in 37 countries and more than 12,000 employees. Bain leases a portion of the 41st floor and the entire 42nd, 43rd and 44th floors through February 28, 2030. Bain has two five-year renewal options, with 18 months’ prior written notice; provided that Bain is not in default and is physically occupying at least the lesser of (x) two full floors of the building and (y) 66.66% of its space. Bain does not have any termination options.
Bain’s annual base rent for the 41st floor will be $133.00 per sq. ft. commencing on January 1, 2021, and will increase to $143.00 per sq. ft. on January 1, 2026. The annual base rent for the 42nd through 44th floors is currently $99.50 per sq. ft., and will increase to $106.00 per sq. ft. on March 1, 2025. Bain is entitled to $2,439,030 for tenant improvements related to its 41st floor expansion, which amount was fully reserved at origination (see “Escrows and Reserves”).
The third largest tenant by underwritten rent is Bank of America, N.A. (155,270 sq. ft., 10.0% of NRA, 9.0% of U/W Base Rent). Bank of America, N.A. (Moody’s/S&P/Fitch: A2/A-/A+) (NYSE: BAC) (“BANA”) is a multinational investment bank and financial services holding company headquartered in Charlotte, North Carolina, with central hubs in New York City, London, Hong Kong, Dallas and Toronto. BANA has expanded its footprint around Bryant Park with its New York headquarters at One Bryant Park and a recent expansion into 1100 Avenue of the Americas. BANA currently leases 155,270 sq. ft. of combined space on the 5th, 6th and 7th floors of the Grace Building Property, together with the building pavilion premises located on and beneath the plaza area of the 43rd Street side of the building through May 31, 2042. BANA has the option to renew its lease for up to four renewal terms for a maximum of 20 years, provided that BANA must occupy 100,000 sq. ft. in each of (i) the 5th, 6th and 7th floors and (ii) in the portion of the total premises (i.e. such floors plus the pavilion space) leased by it as to which BANA is exercising the renewal option. BANA is only permitted to exercise a renewal with respect to the pavilion premises if at least six full floors of office space under its lease at 1100 Avenue of the Americas is also simultaneously renewed. BANA does not have any termination options.
BANA’s annual base rent for the 5th, 6th and 7th floors is currently $79.00 per sq. ft. and its annual base rent for the pavilion premises is currently $92.50 per sq. ft.
BANA is currently in a free rent period, with a rent commencement date of February 1, 2021 for the 5th, 6th and 7th floors, and April 1, 2021 for the pavilion premises. All free rent, in the amount of $1,884,169, was fully reserved at origination. BANA is entitled to $8,840,109 for tenant improvements from the landlord, which amount was fully reserved at origination (see “Escrows and Reserves”).
The fourth largest tenant by underwritten rent is Israel Discount Bank (142,533 sq. ft., 9.2% of NRA, 5.5% of underwritten rent). Israel Discount Bank of New York (S&P: BBB+) (“IDB”) is an American multinational private bank, commercial bank and financial services company headquartered in New York City with locations in the United States, Latin America and Israel. Chartered by the State of New York and a member of the Federal Deposit Insurance Corporation, IDB reported $9.23 billion in total assets in 2018. IDB currently leases 142,533 sq. ft. of combined space on the ground, 2nd, 8th, 9th and 10th floors through December 31, 2040. IDB’s lease commencement date is the earlier to occur of: (i) the date of substantial completion of the work to be performed by the Borrower, but in no event earlier than January 1, 2021; and (ii) the date IDB first takes possession of the space. IDB has two five-year renewal options, with 21 months’ prior written notice, provided that IDB has not subleased more than 20% of its leased premises and IDB is leasing at least two full floors on the date it exercises the renewal option.
IDB’s annual base rent for the ground floor is $317.08 per sq. ft., which will increase to $352.08 per sq. ft., $392.08 per sq. ft. and $442.08 per sq. ft. every five years. IDB’s annual base rent for the 2nd, 8th, 9th and 10th floors is $51.08 per sq. ft., which will increase to $58.08 per sq. ft., $65.08 per sq. ft. and $72.08 per sq. ft. every five years.
IDB is currently in a free rent period, with an anticipated rent commencement date of January 1, 2021 and an anticipated commencement date for payment of operating expenses and real estate taxes of January 1, 2022. All free rent, in the amount of $5,546,495, was fully reserved at origination. IDB is entitled to $15,906,051 for tenant improvements and leasing commissions, which amount was fully reserved at origination (see “—Escrows and Reserves” below). We cannot assure you that the IDB lease will commence as expected or at all.
Subject to certain conditions set forth in the lease, IDB has (i) a one-time right to terminate its entire leased space, effective as of December 31, 2035, with 21 months’ prior written notice, and (ii) the right to terminate the lease with respect to the ground floor only,
THE INFORMATION IN THIS STRUCTURAL AND COLLATERAL TERM SHEET IS NOT COMPLETE AND MAY BE AMENDED PRIOR TO THE TIME OF SALE. THIS TERM SHEET IS NOT AN OFFER TO SELL THESE SECURITIES AND IT IS NOT A SOLICITATION OF AN OFFER TO BUY THESE SECURITIES IN ANY JURISDICTION WHERE THE OFFER OR SALE IS NOT PERMITTED.
30
1114 Avenue of the Americas New York, NY 10036 | Collateral Asset Summary – Loan No. 1 The Grace Building | Cut-off Date Balance: Cut-off Date LTV: U/W NCF DSCR: U/W NOI Debt Yield: | $80,000,000 41.1% 4.25x 11.8% |
effective (at IDB’s option) on either the fifth anniversary or the tenth anniversary of the rent commencement date, with 15 months’ prior written notice.
Environmental Matters. According to a Phase I environmental report dated September 22, 2020, there are no recognized environmental conditions or recommendations for further action at the Grace Building Property.
The Market. The Grace Building Property is located on the north side of Bryant Park at the corner of 42nd Street and 6th Avenue in the Sixth Avenue/Rockefeller Center submarket of the Midtown Manhattan office market. The Grace Building Property is accessible by multiple major mass transit stations in Manhattan, connecting to points across the tristate area. The 1-2-3, N-R-Q-W, 7 and B-D-F-M subway lines all stop within a block of the Grace Building Property providing access from Penn Station, the Upper West Side, and Queens. The S subway line provides a cross-town connection to Grand Central Station and the 4, 5, 6 subway line. Additionally, the Grace Building Property is three blocks from the Port Authority Bus terminal at 8th Avenue and 42nd Street.
The Sixth Avenue/Rockefeller Center area has recently experienced the signing of sizable new leases. Per a third-party market research report, in the second quarter of 2020, a large technology company signed a 232,000 sq. ft. lease at 151 West 42nd Street that was the largest new lease signed in the quarter. Other recent lease executions include Colliers relocating to the Grace Building Property for approximately 59,000 sq. ft. and TripleMint leasing 31,000 sq. ft. at 1500 Broadway. Following a wave of move-outs earlier in the annual cycle, relocations into the Sixth Avenue/Rockefeller Center submarket have pushed vacancies downward, and according to the appraisal, as of the second quarter of 2020, the Sixth Avenue/Rockefeller Center Class A office submarket had a vacancy rate of 4.4% and market rents of $87.02 per sq. ft. The average in-place office rent at the Grace Building Property is currently approximately $94 per sq. ft.
The appraisal identified 15 comparable office leases that had base rents ranging from $79.50 to $184.35 per sq. ft. with a weighted average of $124.41 per sq. ft. The appraiser concluded a net effective market rent of $100.34 per sq. ft. for the entire office component.
| Comparable Office Leases(1) | |||||||
| Property Name / Location | Year Built / Renovated | Stories | Tenant Name | Tenant Leased Space | Lease Date | Lease Term (years) | Base Rent per Sq. Ft. |
| Grace Building Property | 1974 / 2018 | 48 | Various | 1,476,337 | Various | Various | $92.04 |
| 452 Fifth Avenue New York, NY | 1984 / 2012 | 30 | Confidential | 16,428 | Sep-20 | 16.0 | $112.00 |
| 1140 Avenue of the Americas New York, NY | 1931 / 2010 | 22 | Citi National Bank | 65,430 | Sep-20 | 10.0 | $79.50 |
| 1 Vanderbilt Avenue New York, NY | 1968 | 50 | InTandem Capital Partners and Sagewind Capital LLC | 10,165 | Apr-20 | 8.0 | $107.00 |
| 1271 Avenue of the Americas New York, NY | 1971 | 54 | AIG Employee Services | 359,107 | Apr-20 | 16.5 | $97.45 |
| 1271 Avenue of the Americas New York, NY | 1971 | 54 | Greenhill & Co. | 77,622 | Apr-20 | 16.0 | $91.00 |
| 1155 Avenue of the Americas New York, NY | 1968 / 2019 | 40 | R3 | 17,246 | Mar-20 | 11.2 | $102.00 |
| 30 Hudson Yards, New York, NY | 2019 | 90 | Related | 84,792 | Mar-20 | 15.0 | $184.35 |
| 30 Hudson Yards, New York, NY | 2019 | 90 | 175,000 | Jan-20 | 16.3 | $156.38 | |
| 712 Fifth Avenue New York, NY | 1990 | 52 | TSG Consumer Partners, LLC | 9,800 | Jan-20 | 10.7 | $136.50 |
| 1271 Avenue of the Americas New York, NY | 1971 | 54 | Bessemer Trust Company | 236,631 | Jan-20 | 21.8 | $107.00 |
767 Fifth Avenue New York, NY | 1968 | 50 | Public Investment Fund of Saudi Arabia (PIF) | 41,000 | Jan-20 | 11.1 | $175.00 |
1 Vanderbilt Avenue New York, NY | 1968 | 50 | McDermott, Will & Emery | 15,703 | Dec-19 | 21.2 | $147.00 |
1 Vanderbilt Avenue New York, NY | 2020 | 67 | Oak Hill Advisors, L.P. | 45,954 | Oct-19 | 16.0 | $123.00 |
1095 Avenue of the Americas New York, NY | 1972 / 2008 | 42 | Stifel, Nicholaus & Co | 67,247 | Oct-20 | 10.7 | $103.00 |
1095 Avenue of the Americas New York, NY | 1972 / 2008 | 42 | China Construction Bank | 49,324 | Sep-19 | 11 | $145.00 |
| (1) | Source: Appraisal. |
THE INFORMATION IN THIS STRUCTURAL AND COLLATERAL TERM SHEET IS NOT COMPLETE AND MAY BE AMENDED PRIOR TO THE TIME OF SALE. THIS TERM SHEET IS NOT AN OFFER TO SELL THESE SECURITIES AND IT IS NOT A SOLICITATION OF AN OFFER TO BUY THESE SECURITIES IN ANY JURISDICTION WHERE THE OFFER OR SALE IS NOT PERMITTED.
31
1114 Avenue of the Americas New York, NY 10036 | Collateral Asset Summary – Loan No. 1 The Grace Building | Cut-off Date Balance: Cut-off Date LTV: U/W NCF DSCR: U/W NOI Debt Yield: | $80,000,000 41.1% 4.25x 11.8% |
Cash Flow Analysis.
| Cash Flow Analysis(1)(2) | ||||||
| 2017 | 2018 | 2019 | T-12 9/30/2020 | U/W | U/W PSF | |
| Base Rent(3) | $99,833,553 | $107,014,493 | $91,119,452 | $87,976,996 | $140,450,510 | $90.21 |
| Straight-Lined Rent(4) | 0 | 0 | 0 | 0 | 1,439,207 | $0.92 |
| Vacant Income(5) | 0 | 0 | 0 | 0 | 7,464,675 | $4.79 |
| Gross Potential Rent | $99,833,553 | $107,014,493 | $91,119,452 | $87,976,996 | $149,354,392 | $95.93 |
| Total Reimbursements | 10,212,232 | 12,529,407 | 8,566,979 | 6,267,900 | 12,766,325 | $8.20 |
| Gross Potential Income | $110,045,785 | $119,543,900 | $99,686,431 | $94,244,896 | $162,120,717 | $104.13 |
| Less: Vacancy(5) | 0 | 0 | 0 | 0 | (7,464,675) | ($4.79) |
| Other Income(6) | 3,209,878 | 3,195,652 | 3,230,812 | 2,759,133 | 2,956,947 | $1.90 |
| Effective Gross Income | $113,255,664 | $122,739,552 | $102,917,243 | $97,004,029 | $157,612,989 | $101.23 |
| Total Fixed Expenses | 26,516,164 | 28,386,384 | 30,273,753 | 31,869,978 | 33,383,205 | $21.44 |
| Total Operating Expenses | 19,579,826 | 21,146,504 | 20,105,297 | 18,861,512 | 19,936,067 | $12.80 |
| Total Expenses | $46,095,990 | $49,532,888 | $50,379,050 | 50,731,490 | $53,319,272 | $34.25 |
| Net Operating Income | $67,159,674 | $73,206,665 | $52,538,193 | $46,272,539 | $104,293,717 | $66.98 |
| TI/LC | 0 | 0 | 0 | 0 | 1,556,972 | $1.00 |
| Capital Expenditures | 0 | 0 | 0 | 0 | 389,243 | $0.25 |
| Net Cash Flow | $67,159,674 | $73,206,665 | $52,538,193 | $46,272,539 | $102,347,502 | $65.73 |
| (1) | Certain items such as interest expense, interest income, lease cancellation income, depreciation, amortization, debt service payments and any other non-recurring or non-operating items were excluded from the historical presentation and are not considered for the underwritten cash flow. |
| (2) | The recent volatility in cash flow and increase from 2019 Net Cash Flow to Underwritten Net Cash Flow at the Grace Building Property is a result of the replacement of some larger legacy tenants (including 4 of the 5 largest tenants) between 2016 and 2018 and the signing of new and renewal leases with respect to 950,000 sq. ft. of space. The cash flow declines in 2019 and the projected increase in UW cash flows are the result of this rollover and the rent abatements associated with the new leases. All outstanding landlord obligations ($56,172,399) and rent abatements ($25,964,570) were reserved at origination. |
| (3) | Underwritten Base Rent is based on the in-place rent roll as of October 2020 and includes contractual rent steps of $4,566,719 underwritten for various tenants through December 31, 2021. |
| (4) | Represents the straight line credit for investment grade tenants and tenants identified by a legal industry publication as among the 100 largest law firms through the lesser of the lease or loan term. |
| (5) | Underwritten Vacant Income and Vacancy represents an underwritten economic vacancy of 4.6%. The Grace Building Property is 94.8% occupied as of October 19, 2020. |
| (6) | Other Income consists of directly billed utilities and $1,608,941 of parking income. 1114 Sixth Parking LLC is the current tenant under a parking garage lease. The tenant has not paid the required monthly rental payments for several months and an event of default is continuing under its lease. The Borrower is actively pursuing the termination of the lease and replacement arrangement with a new parking manager. At loan origination, the Borrower deposited with the lender $1,608,940 for anticipated parking rent shortfalls. |
Property Management. The Grace Building Property is currently managed by TRZ Holdings IV LLC (an affiliate of the borrower sponsor) (“TRZ”) pursuant to a management agreement and sub-managed by Brookfield Properties (USA II) LLC (an affiliate of the borrower sponsor) pursuant to a sub-management agreement. Under the Grace Building Whole Loan documents, the Grace Building Property is required to be managed by TRZ and sub-managed by Brookfield Properties (USA II) LLC, respectively, or any qualified manager as defined in The Grace Building Whole Loan documents. The lender has the right to replace, or require the Borrower to replace, each of the property manager and the sub-property manager with a property manager or sub-property manager, as applicable, selected by the Borrower (or selected by the lender in the event of an event of default under the Grace Building Whole Loan documents) (i) during the continuance of an event of default under the Grace Building Whole Loan documents, (ii) during the continuance of a material default by the property manager under the management agreement or the sub-property manager under the sub-management agreement (after the expiration of any applicable notice and/or cure periods), or (iii) if the property manager or sub-property manager becomes bankrupt or insolvent.
Lockbox / Cash Management. The Grace Building Whole Loan is structured with a hard lockbox and springing cash management. Revenues from the Grace Building Property are required to be deposited into the lockbox account directly by tenants and any funds received by the Borrower and property manager within five business days of receipt. If no Trigger Period (as defined below) exists, funds in the lockbox account will be disbursed to the Borrower. During a Trigger Period, funds in the lockbox account are required to be swept on each business day to the lender-controlled cash management account and disbursed according to the Grace Building Whole Loan documents with excess cash held by the lender for so long as such Trigger Period continues, other than for disbursements to the borrower for (unless already paid) debt service due under the Grace Building Whole Loan, shortfalls in the required reserve accounts, deposit of the Low Cash Flow Period Threshold Collateral (as defined below), emergency and life safety expenses, approved operating expenses, and disbursements to the borrower to be distributed to its equity holders in an amount sufficient to satisfy the distribution requirements applicable to REITs and certain other uses as set forth in The Grace Building Whole Loan documents.
Initial and Ongoing Reserves. At loan origination, the Borrower deposited (i) $56,172,399 for outstanding landlord tenant improvement and leasing commission obligations due to various tenants; (ii) $25,964,570 for free rent owed to various tenants through June 2022 to be applied on each monthly payment date to simulate the payment of tenant rent; (iii) $5,970,240 for certain construction and improvement work related to the lobby and elevator cabs and systems; and (iv) $1,608,940 for anticipated parking rent shortfalls from the loan origination date through November 2021, 1/12 of which reserve will be applied to the Grace Building Whole Loan lockbox account on each monthly payment date for such period.
THE INFORMATION IN THIS STRUCTURAL AND COLLATERAL TERM SHEET IS NOT COMPLETE AND MAY BE AMENDED PRIOR TO THE TIME OF SALE. THIS TERM SHEET IS NOT AN OFFER TO SELL THESE SECURITIES AND IT IS NOT A SOLICITATION OF AN OFFER TO BUY THESE SECURITIES IN ANY JURISDICTION WHERE THE OFFER OR SALE IS NOT PERMITTED.
32
1114 Avenue of the Americas New York, NY 10036 | Collateral Asset Summary – Loan No. 1 The Grace Building | Cut-off Date Balance: Cut-off Date LTV: U/W NCF DSCR: U/W NOI Debt Yield: | $80,000,000 41.1% 4.25x 11.8% |
Real Estate Taxes. During a Trigger Period (as defined below), the Borrower is required to deposit monthly 1/12 of the annual estimated real estate taxes.
Insurance. During a Trigger Period, the Borrower is required to deposit monthly 1/12 of the annual estimated insurance premiums (unless the Grace Building Property is covered by a blanket policy).
Replacement Reserves. During a Trigger Period, the Borrower is required to deposit monthly $0.20 per sq. ft. per annum (initially $25,950) for capital expenditures.
TI/LC Reserves. During a Trigger Period, the Borrower is required to deposit monthly $1.50 per sq. ft. per annum (initially $194,622) for tenant improvements and leasing commissions.
A “Grace Building Trigger Period” means a period (i) commencing upon the occurrence of an event of default under the Grace Building Whole Loan or, if a mezzanine loan is then outstanding, under such mezzanine loan, and ending when the event of default has been cured; or (ii) beginning when the debt yield (including any mezzanine loan, if outstanding) (tested each fiscal quarter) is less than 6.00% for any two consecutive fiscal quarters, and ending when (x) the debt yield (including any mezzanine loan, if outstanding) (tested each fiscal quarter) is at least 6.00% for any two consecutive fiscal quarters or (y) the borrower has delivered cash or a letter of credit (the “Low Cash Flow Period Threshold Collateral”) in an amount which, when applied to the outstanding principal balance of the Grace Building Whole Loan (plus any mezzanine loan) would be sufficient to meet the debt yield requirement of 6.00%.
Current Mezzanine or Secured Subordinate Indebtedness. The Grace Building Property also secures the Grace Building Non-Serviced Pari Passu Companion Loans, which have an aggregate Cut-off Date principal balance of $803,000,000 and the Grace Building Subordinate Notes, which have an aggregate Cut-off Date principal balance of $367,000,000. The Grace Building Non-Serviced Pari Passu Companion Loans and the Grace Building Subordinate Notes accrue interest at the same rate as the Grace Building Mortgage Loan. The Grace Building Mortgage Loan and the Grace Building Non-Serviced Pari Passu Companion Loans are each pari passu in right of payment and together are senior in right of payment to the Grace Building Subordinate Notes. The holders of the Grace Building Mortgage Loan, the Grace Building Non-Serviced Pari Passu Companion Loans and the Grace Building Subordinate Notes have entered into a co-lender agreement which sets forth the allocation of collections on the Grace Building Whole Loan. See “Description of the Mortgage Pool—The Whole Loans—The Non-Serviced AB Whole Loans—The Grace Building Whole Loan” and “Pooling and Servicing Agreement—Servicing of the Non-Serviced Mortgage Loans” in the Preliminary Prospectus.
Future Mezzanine or Subordinate Indebtedness Permitted. An affiliate of the Borrower is permitted to incur future mezzanine debt (secured by a pledge of direct equity interests in the Borrower), provided that among other conditions: (i) no event of default is continuing; (ii) the principal amount of the mezzanine loan may not exceed an amount which, when combined with the Grace Building Whole Loan, results in (a) a loan-to-value ratio greater than 58.14% or (b) a debt yield less than 8.35%; (iii) the mezzanine loan is co-terminous with the Grace Building Whole Loan or is freely prepayable after the maturity date of the Grace Building Whole Loan; (iv) the mezzanine loan is interest-only; (v) an intercreditor agreement is executed that is acceptable to the lender and the rating agencies; and (vi) a rating agency confirmation is delivered by each rating agency rating securities backed by the Grace Building Whole Loan.
Partial Releases. None.
THE INFORMATION IN THIS STRUCTURAL AND COLLATERAL TERM SHEET IS NOT COMPLETE AND MAY BE AMENDED PRIOR TO THE TIME OF SALE. THIS TERM SHEET IS NOT AN OFFER TO SELL THESE SECURITIES AND IT IS NOT A SOLICITATION OF AN OFFER TO BUY THESE SECURITIES IN ANY JURISDICTION WHERE THE OFFER OR SALE IS NOT PERMITTED.
33
3799 & 3950 South Las Vegas Boulevard Las Vegas, NV Various | Collateral Asset Summary – Loan No. 2 MGM Grand & Mandalay Bay | Cut-off Date Balance: Cut-off Date LTV: U/W NCF DSCR: U/W NOI Debt Yield: | $75,000,000 35.5% 4.95x 17.9% |

THE INFORMATION IN THIS STRUCTURAL AND COLLATERAL TERM SHEET IS NOT COMPLETE AND MAY BE AMENDED PRIOR TO THE TIME OF SALE. THIS TERM SHEET IS NOT AN OFFER TO SELL THESE SECURITIES AND IT IS NOT A SOLICITATION OF AN OFFER TO BUY THESE SECURITIES IN ANY JURISDICTION WHERE THE OFFER OR SALE IS NOT PERMITTED.
34
3799 & 3950 South Las Vegas Boulevard Las Vegas, NV Various | Collateral Asset Summary – Loan No. 2 MGM Grand & Mandalay Bay | Cut-off Date Balance: Cut-off Date LTV: U/W NCF DSCR: U/W NOI Debt Yield: | $75,000,000 35.5% 4.95x 17.9% |
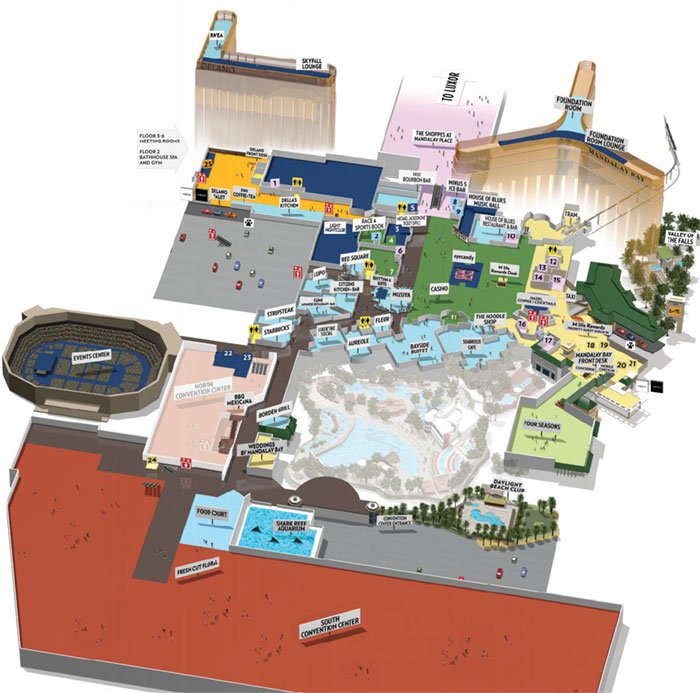
THE INFORMATION IN THIS STRUCTURAL AND COLLATERAL TERM SHEET IS NOT COMPLETE AND MAY BE AMENDED PRIOR TO THE TIME OF SALE. THIS TERM SHEET IS NOT AN OFFER TO SELL THESE SECURITIES AND IT IS NOT A SOLICITATION OF AN OFFER TO BUY THESE SECURITIES IN ANY JURISDICTION WHERE THE OFFER OR SALE IS NOT PERMITTED.
35
3799 & 3950 South Las Vegas Boulevard Las Vegas, NV Various | Collateral Asset Summary – Loan No. 2 MGM Grand & Mandalay Bay | Cut-off Date Balance: Cut-off Date LTV: U/W NCF DSCR: U/W NOI Debt Yield: | $75,000,000 35.5% 4.95x 17.9% |
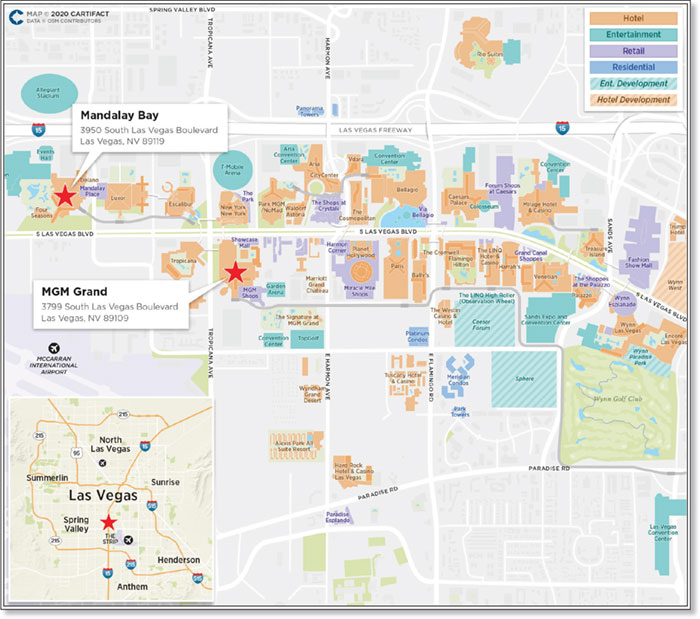
THE INFORMATION IN THIS STRUCTURAL AND COLLATERAL TERM SHEET IS NOT COMPLETE AND MAY BE AMENDED PRIOR TO THE TIME OF SALE. THIS TERM SHEET IS NOT AN OFFER TO SELL THESE SECURITIES AND IT IS NOT A SOLICITATION OF AN OFFER TO BUY THESE SECURITIES IN ANY JURISDICTION WHERE THE OFFER OR SALE IS NOT PERMITTED.
36
3799 & 3950 South Las Vegas Boulevard Las Vegas, NV Various | Collateral Asset Summary – Loan No. 2 MGM Grand & Mandalay Bay | Cut-off Date Balance: Cut-off Date LTV: U/W NCF DSCR: U/W NOI Debt Yield: | $75,000,000 35.5% 4.95x 17.9% |
| Mortgage Loan Information | |
| Loan Sellers(1): | CREFI/GACC |
| Loan Purpose(2): | Acquisition |
| Credit Assessment | |
| (Fitch/KBRA/Moody’s)(10): | BBB+sf / AA-(sf) / Aaa(sf) |
| Borrower Sponsors: | BREIT Operating Partnership L.P.; MGM Growth Properties Operating Partnership LP |
| Borrowers: | MGM Grand PropCo, LLC; Mandalay PropCo, LLC |
| Original Balance(3): | $75,000,000 |
| Cut-off Date Balance(3): | $75,000,000 |
| % by Initial UPB: | 9.2% |
| Interest Rate: | 3.55800% |
| Payment Date: | 5th of each month |
| First Payment Date: | April 5, 2020 |
| Anticipated Repayment Date(4): | March 5, 2030 |
| Final Maturity Date(4): | March 5, 2032 |
| Amortization: | Interest Only, ARD (to the extent of Excess Cash Flow) |
| Additional Debt(3): | $1,559,200,000 Pari Passu Debt; $804,400,000 B-Notes; $561,400,000 C-Notes; Future Mezzanine Debt Permitted |
| Call Protection(5): | YM0.5(33), DorYM0.5(80), O(7) |
| Lockbox / Cash Management: | Hard / Springing |
| Reserves(6) | |||
| Initial | Monthly | Cap | |
| Taxes: | $0 | Springing | NAP |
| Insurance: | $0 | Springing | NAP |
| FF&E: | $0 | Springing | NAP |
| Property Information | |
| Single Asset / Portfolio: | Portfolio of two properties |
| Property Type: | Full Service Hospitality |
| Collateral: | Fee Simple |
| Location: | Las Vegas, NV |
| Year Built / Renovated(7): | Various / NAP |
| Total Rooms(8): | 9,748 |
| Property Management: | Self-Managed |
| Underwritten NOI: | $520,080,353 |
| Underwritten NCF: | $487,305,761 |
| Appraised Value(9): | $4,600,000,000 |
| Appraisal Date(9): | January 10, 2020 |
| Historical NOI(2) | |
| Most Recent NOI: | $222,041,347 (T-12 September 30, 2020) |
| 2019 NOI: | $520,080,353 (December 31, 2019) |
| 2018 NOI: | $617,369,266 (December 31, 2018) |
| 2017 NOI: | $605,037,208 (December 31, 2017) |
| Historical Occupancy(8) | |
| Most Recent Occupancy: | 71.4% (September 30, 2020) |
| 2019 Occupancy: | 92.1% (December 31, 2019) |
| 2018 Occupancy: | 91.5% (December 31, 2018) |
| 2017 Occupancy: | 91.0% (December 31, 2017) |
| Financial Information(3) | ||||||
| Tranche | Cut-off Date Balance | Balance per Room Cut-off / Balloon(4) | LTV(2)(4)(9) Cut-off / Balloon | U/W DSCR(2) Master Lease Rent | U/W Debt Yield(2) Master Lease Rent | U/W Debt Yield at Balloon(2) Master Lease Rent |
| Mortgage Loan | $75,000,000 | |||||
| Pari Passu Notes | $1,559,200,000 | |||||
| Total A Notes | $1,634,200,000 | $167,645 / $167,645 | 35.5% / 35.5% | 4.95x | 17.9% | 17.9% |
| B Notes | $804,400,000 | |||||
| C Notes | $561,400,000 | |||||
| Whole Loan | $3,000,000,000 | $307,755 / $307,755 | 65.2% / 65.2% | 2.70x | 9.7% | 9.7% |
| (1) | The MGM Grand & Mandalay Bay Whole Loan (as defined below) was co-originated by Citi Real Estate Funding Inc. (“CREFI”), Barclays Capital Real Estate Inc. (“BCREI”), Deutsche Bank AG, New York Branch (“DBNY”) and Société Générale Financial Corporation (“SGFC”). CREFI will be contributing Note A-13-6 with an outstanding principal balance of $40,000,000 and GACC will be contributing Note A-15-7 with an outstanding principal balance of $35,000,000 to the Benchmark 2020-B22 securitization. |
| (2) | On January 14, 2020, MGM Growth Properties Operating Partnership LP (“MGP OP”), an affiliate of BREIT Operating Partnership L.P. (“BREIT OP”; and together with MGP OP, the “Sponsors”, as more particularly referred to as the “Borrower Sponsors”) and certain other parties entered into an agreement to, among other things, form a joint venture (50.1% indirectly owned by MGP OP and 49.9% indirectly owned by BREIT OP) (the “Joint Venture”) to acquire the MGM Grand & Mandalay Bay Properties (as defined below) for a purchase price of $4.60 billion ($471,892 per room). Contemporaneously with the acquisition, the MGM Grand & Mandalay Bay Borrowers (as defined below), as landlord entered into a 30-year triple-net master/operating lease (the “MGM/Mandalay Lease” or “Master Lease”) with two, 10-year renewal options with MGM Lessee II, LLC (“MGM Tenant”), a wholly owned subsidiary of MGM Resorts International (“MGM”). Financial and other information presented in this Term Sheet is presented on a “look through” basis, based on the rents and receipts of the MGM Grand & Mandalay Bay Properties. For so long as the MGM/Mandalay Lease is in effect, the MGM Grand & Mandalay Bay Borrowers will be entitled only to the rent due under the MGM/Mandalay Lease and not to the underlying rent and other income from the MGM Grand & Mandalay Bay Properties. The LTV Cut-off / Balloon, U/W DSCR Master Lease Rent, U/W Debt Yield Master Lease Rent and U/W Debt Yield at Balloon Master Lease Rent presented in the chart above are based on the initial MGM/Mandalay Lease annual rent of $292,000,000. The U/W NCF DSCR, U/W NCF Debt Yield and U/W NCF Debt Yield at Balloon for the MGM Grand & Mandalay Bay Senior Notes (based on the U/W NCF of $487.3 million) are 8.27x, 29.8% and 29.8%, respectively. Based on the September 2020 TTM adjusted EBITDAR of $222.0 million, the Mortgage Loan results in a DSCR of 2.05x (which is below the DSCR Threshold – See “Lockbox and Cash Management” herein for more detail. On May 1, 2020, MGM Resorts International reported in its first quarter Form 10-Q filing that, as a result of the temporary closure of its domestic properties (which includes the MGM Grand & Mandalay Bay Properties) following the outbreak of COVID-19, its domestic properties (which includes the MGM Grand & Mandalay Bay Properties) were effectively generating no revenue, and there were high levels of room and convention cancellation through the third quarter of 2020. On August 3, 2020, MGM reported in its second quarter Form 10-Q filing that, while throughout May, June and July 2020, it re-opened most of its properties with limited amenities and certain measures to mitigate the spread of COVID-19, such properties (which include the MGM Grand and Mandalay Bay Properties) may be subject to temporary, complete or partial shutdowns in the future. On November 3, 2020, MGM reported in its most recent third quarter Form 10-Q filing that throughout the second and third quarters of 2020, all of its properties reopened but are operating without certain amenities and subject to certain occupancy limitations and therefore are generating revenues that are significantly lower than historical results, and that it has seen and expects to continue to see weakened demand in light of consumer fears and general economic uncertainty, among other things. The September 2020 TTM financials presented above reflect the suspension of operations at (i) the MGM Grand Property from March 17, 2020 through June 3, 2020 and (ii) The Shoppes at Mandalay Bay Place and the Mandalay Bay resort from March 17, 2020 through June 24, 2020 and June 30, 2020, respectively, and the occupancy limitations imposed on the MGM Grand & Mandalay Bay Properties by the state of Nevada during the third quarter of 2020. Upon reopening, both MGM Grand & Mandalay Bay Properties were operating with limited amenities and certain COVID-19 mitigation procedures. The Lender UW presented above is based on 2019 financials, which reflects a full-year of uninterrupted operations at the MGM Grand & Mandalay Bay Properties. Please see the “Historical Performance” tables herein, and the footnotes thereto, for more detailed underwritten cash flow information. |
| (3) | The MGM Grand & Mandalay Bay Loan (as defined below) is part of the MGM Grand & Mandalay Bay Whole Loan (as defined below), which is comprised of (i) 36 pari passu senior promissory notes with an aggregate Cut-off Date balance of $1,634,200,000 (the “MGM Grand & Mandalay Bay Senior Notes,” and collectively, the “MGM Grand & Mandalay Bay Senior Loan”) and (ii) 24 promissory notes with an aggregate Cut-off Date balance of $1,365,800,000 consisting of multiple subordination levels, which are subordinate to the MGM Grand & Mandalay Bay Senior Notes (the “MGM Grand & Mandalay Bay Junior Notes”). The MGM Grand Property has an allocated mortgage loan amount (“ALA”) of $1,635,000,000 and the Mandalay Bay Property has an ALA equal to $1,365,000,000. |
| (4) | The MGM Grand & Mandalay Bay Whole Loan is structured with an Anticipated Repayment Date (“ARD”) of March 5, 2030 and a Final Maturity Date of March 5, 2032. After the ARD, the following structure will apply: (i) the interest rate will increase by 200 basis points over the greater of (x) 3.55800%, and (y) (1) the ARD Treasury Note Rate in effect on the ARD plus (2) 1.77000%, (ii) amounts in the Excess Cash Flow Reserve (as defined below) will be applied first to pay monthly additional interest amounts which, to the extent not paid (such amount not paid, together with accrued interest thereon at the Adjusted Interest Rate, the “Accrued Interest”), will be deferred and added to the principal balance of the MGM Grand & Mandalay Bay Whole Loan, and (iii) a full cash flow sweep to the extent of remaining amounts in the Excess Cash Flow Reserve will be applied to the principal of the MGM Grand & Mandalay Bay Whole Loan. The metrics presented in the Financial Information chart above for Balance per Room Cut-off / Balloon and LTV Cut-off / Balloon are calculated based on the ARD. |
THE INFORMATION IN THIS STRUCTURAL AND COLLATERAL TERM SHEET IS NOT COMPLETE AND MAY BE AMENDED PRIOR TO THE TIME OF SALE. THIS TERM SHEET IS NOT AN OFFER TO SELL THESE SECURITIES AND IT IS NOT A SOLICITATION OF AN OFFER TO BUY THESE SECURITIES IN ANY JURISDICTION WHERE THE OFFER OR SALE IS NOT PERMITTED.
37
3799 & 3950 South Las Vegas Boulevard Las Vegas, NV Various | Collateral Asset Summary – Loan No. 2 MGM Grand & Mandalay Bay | Cut-off Date Balance: Cut-off Date LTV: U/W NCF DSCR: U/W NOI Debt Yield: | $75,000,000 35.5% 4.95x 17.9% |
| (5) | The defeasance lockout period will be 33 payments beginning with and including the first payment date of April 5, 2020. The MGM Grand & Mandalay Bay Borrowers have the option to defease the MGM Grand & Mandalay Bay Whole Loan, in whole or in part, after the earlier to occur of (i) two years after the closing date of the securitization that includes the last note to be securitized and (ii) February 14, 2023. The MGM Grand & Mandalay Bay Whole Loan may be prepaid in whole or in part at any time, subject to payment of the applicable yield maintenance premium if such prepayment occurs prior to September 5, 2029 (provided no yield maintenance will be due in connection with mandatory prepayments arising out of any casualty, condemnation or in connection with a Special Release (as defined below) or a Default Release (as defined below). |
| (6) | See “Initial and Ongoing Reserves” herein. |
| (7) | The MGM Grand Property was built in 1993 and the Mandalay Bay Property was built in 1999. The MGM Grand Property has benefited from capital investment of approximately $480.0 million (approximately $96,000 per room) since 2010, $144.0 million of which was spent on a full rooms’ renovation from 2010 to 2013. Additionally, approximately $118.9 million was recently spent on an expansion and renovation of the convention center completed in December 2018, which is expected to expand the group business at the MGM Grand Property. The Mandalay Bay Property (including the Delano) underwent a substantial rooms’ renovation for approximately $159.7 million from 2012 to 2016 and, inclusive of the Four Seasons, has received a total of approximately $510.6 million (approximately $107,500 per room) of capital investment since 2010. |
| (8) | Size and Occupancy are based solely on the hotel at the MGM Grand & Mandalay Bay Properties. As of the trailing twelve months ending September 30, 2020, approximately 34.0% of revenues were generated by rooms, 17.5% of revenues were from gaming, 26.5% from food & beverage and 22.0% from other sources. |
| (9) | The Appraised Value of $4,600,000,000 as of January 10, 2020 set forth above is the appraised value solely with respect to real property at the MGM Grand & Mandalay Bay Properties, excluding personal property and intangible property attributable to the MGM Grand & Mandalay Bay Properties (the “Aggregate Real Property Appraised Value”). The appraisal also includes an “As Leased-Sale-Leaseback Appraised Value,” which is equal to the Aggregate Real Property Appraised Value. The Appraised Value of $7,352,600,000 (“Aggregate As-Is Appraised Value”) as of January 10, 2020, includes personal property and intangible property attributable to the MGM Grand & Mandalay Bay Properties. The personal property and intangible property relating to the MGM Grand & Mandalay Bay Properties is owned by the MGM Tenant or certain sublessees at the MGM Grand & Mandalay Bay Properties that are wholly owned subsidiaries of MGM (the “MGM/Mandalay Operating Subtenants”) (as more particularly provided in the Master Lease), which granted a security interest in certain property of the MGM Tenant and the MGM/Mandalay Operating Subtenants (with certain exclusions, including an exclusion for the intellectual property of MGM Tenant as more particularly described in the Master Lease); and provided that the FF&E is only transferred to the MGM Grand & Mandalay Bay Borrowers at no cost in the event of a termination of the Master Lease due to an event of default by the MGM Tenant thereunder) in favor of the MGM Grand & Mandalay Bay Borrowers, and such security interest was collaterally assigned by the MGM Grand & Mandalay Bay Borrowers to the mortgage lender. The LTV Cut-off / Balloon based on the Aggregate As-Is Appraised Value are 22.2% and 22.2%, respectively, based on the MGM Grand & Mandalay Bay Senior Loan. The LTV Cut-off / Balloon based on the Aggregate As-Is Appraised Value are 40.8% and 40.8%, respectively, based on the MGM Grand & Mandalay Bay Whole Loan. |
| (10) | Fitch, KBRA, and Moody’s provided the listed assessments for the MGM Grand & Mandalay Bay Loan in the context of its inclusion in the mortgage pool. |
The Loan. The MGM Grand & Mandalay Bay mortgage loan (the “MGM Grand & Mandalay Bay Loan”) is part of a fixed rate whole loan (the “MGM Grand & Mandalay Bay Whole Loan”), which is secured by the borrowers’ fee simple interests in the MGM Grand resort (the “MGM Grand Property”) and the Mandalay Bay resort (the “Mandalay Bay Property”) (together, the “MGM Grand & Mandalay Bay Properties”) located in Las Vegas, Nevada. The MGM Grand & Mandalay Bay Whole Loan is comprised of 60 promissory notes with an aggregate principal balance as of the Cut-off Date of $3.0 billion, two of which (Notes A-13-6 and A-15-7), with an outstanding principal balance as of the Cut-off Date of $75.0 million, will be included in the Benchmark 2020-B22 trust and constitute the MGM Grand & Mandalay Bay Loan, as detailed in the note summary table below. Only the MGM Grand & Mandalay Bay Loan will be included in the mortgage pool for the Benchmark 2020-B22 mortgage trust.
The relationship between the holders of the MGM Grand & Mandalay Bay Whole Loan will be governed by a co-lender agreement as described under “Description of the Mortgage Pool—The Whole Loans—The Non-Serviced AB Whole Loans—The MGM Grand & Mandalay Bay Whole Loan” and “Pooling and Servicing Agreement—Servicing of the Non-Serviced Mortgage Loans” in the Preliminary Prospectus.
THE INFORMATION IN THIS STRUCTURAL AND COLLATERAL TERM SHEET IS NOT COMPLETE AND MAY BE AMENDED PRIOR TO THE TIME OF SALE. THIS TERM SHEET IS NOT AN OFFER TO SELL THESE SECURITIES AND IT IS NOT A SOLICITATION OF AN OFFER TO BUY THESE SECURITIES IN ANY JURISDICTION WHERE THE OFFER OR SALE IS NOT PERMITTED.
38
3799 & 3950 South Las Vegas Boulevard Las Vegas, NV Various | Collateral Asset Summary – Loan No. 2 MGM Grand & Mandalay Bay | Cut-off Date Balance: Cut-off Date LTV: U/W NCF DSCR: U/W NOI Debt Yield: | $75,000,000 35.5% 4.95x 17.9% |
| Whole Loan Summary | ||||
| Note | Original Balance | Cut-off Date Balance | Note Holder | Controlling Piece |
| A-13-6, A-15-7 | $75,000,000 | $75,000,000 | Benchmark 2020-B22(1) | No |
| A-13-5, A-15-6 | $75,000,000 | $75,000,000 | Benchmark 2020-B21 | No |
| A-13-4, A-15-4 | $70,000,000 | $70,000,000 | Benchmark 2020-B20 | No |
| A-13-2, A-15-3 | $80,000,000 | $80,000,000 | Benchmark 2020-B19 | No |
| A-13-1, A-15-1 | $65,000,000 | $65,000,000 | Benchmark 2020-B18 | No |
| A-15-2 | $50,000,000 | $50,000,000 | DBJPM 2020-C9 | No |
| A-1, A-2, A-3, A-4 | $670,139 | $670,139 | BX 2020-VIVA | No |
| A-5, A-6, A-7, A-8 | $794,861 | $794,861 | BX 2020-VIV2 | No |
| A-9, A-10, A-11, A-12 | $1,000,000 | $1,000,000 | BX 2020-VIV3 | No |
| A-13-3, A-14-4, A-15-5, A-16-2 | $550,000,000 | $550,000,000 | BX 2020-VIV4 | No |
| A-14-1, A-16-1 | $69,500,000 | $69,500,000 | BBCMS 2020-C8 | No |
| A-14-2, A-14-3 | $45,000,000 | $45,000,000 | WFCM 2020-C58(2) | No |
| A-13-7 | $65,000,000 | $65,000,000 | GSMS 2020-GSA2(3) | No |
| A-13-8 | $99,360,667 | $99,360,667 | CREFI(4) | No |
| A-14-5 | $101,847,000 | $101,847,000 | Barclays Bank PLC(4) | No |
| A-15-8 | $94,680,333 | $94,680,333 | DBRI(4) | No |
| A-16-3 | $191,347,000 | $191,347,000 | SGFC(4) | No |
| Total Senior Notes | $1,634,200,000 | $1,634,200,000 | ||
| B-1-A, B-2-A, B-3-A, B-4-A, B-1-B, B-2-B, B-3-B, B-4-B(6) | $329,861 | $329,861 | BX 2020-VIVA | No |
| B-5-A, B-6-A, B-7-A, B-8-A, B-5-B, B-6-B, B-7-B, B-8-B(6) | $374,355,139 | $374,355,139 | BX 2020-VIV2 | No |
| B-9-A, B-10-A, B-11-A, B-12-A(6) | $429,715,000 | $429,715,000 | BX 2020-VIV3 | No |
| C-1, C-2, C-3, C-4(6) | $561,400,000 | $561,400,000 | BX 2020-VIVA | Yes(5) |
| Whole Loan | $3,000,000,000 | $3,000,000,000 | ||
| (1) | CREFI will be contributing Note A-13-6 which has an outstanding principal balance of $40,000,000 to the Benchmark 2020-B22 securitization. GACC will be contributing Note A-15-7 which has an outstanding principal balance of $35,000,000 to the Benchmark 2020-B22 securitization. |
| (2) | The WFCM 2020-C58 securitization transaction is expected to close prior to the Closing Date. |
| (3) | The GSMS 2020-GSA2 securitization transaction is expected to close prior to the Closing Date. |
| (4) | Expected to be contributed to one or more future securitization transactions. |
| (5) | The initial controlling note is Note C-1, so long as no related control appraisal period with respect to Note C-1 and the related pari passu C notes has occurred and is continuing. If and for so long as a control appraisal period has occurred and is continuing, then the controlling note will be as described under “Description of the Mortgage Pool—The Whole Loans—The Non-Serviced AB Whole Loans—The MGM Grand & Mandalay Bay Whole Loan” in the Preliminary Prospectus. |
| (6) | The MGM Grand & Mandalay Bay Junior Notes are subordinate to the MGM Grand & Mandalay Bay Senior Notes. |
The MGM Grand & Mandalay Bay Whole Loan has a 120-month interest-only term through the ARD of March 5, 2030. After the ARD, through and including March 5, 2032 (the “Maturity Date”), the following structure would apply: (i) the interest rate will increase by 200 basis points over the greater of (x) 3.55800%, and (y)(1) the ARD Treasury Note Rate in effect on the ARD (such new rate, the “Adjusted Interest Rate”) plus (2) 1.77000%, (ii) amounts in the Excess Cash Flow Reserve (as defined below) will be applied first to pay monthly additional interest amounts which, to the extent not paid, will be deferred (together with interest accrued thereon at the Adjusted Interest Rate) and added to the principal balance of the MGM Grand & Mandalay Bay Whole Loan, and (iii) a full cash flow sweep to the extent of remaining amounts in the Excess Cash Flow Reserve will be applied to principal of the MGM Grand & Mandalay Bay Whole Loan. For the period from the origination date through the ARD, the MGM Grand & Mandalay Bay Senior Notes and Junior Notes accrue at the rate of 3.55800% per annum. The MGM Grand & Mandalay Bay Whole Loan proceeds along with borrower sponsor equity were used to purchase the MGM Grand & Mandalay Bay Properties for $4.6 billion.
“ARD Treasury Note Rate” means the rate of interest per annum calculated by the linear interpolation of the yields, as reported in Federal Reserve Statistical Release H.15 Selected Interest Rates under the heading “U.S. Government Securities/Treasury Constant Maturities” for the business day ending immediately prior to the ARD, of “U.S. Government Securities/Treasury Constant Maturities” with maturity dates (one longer and one shorter) most nearly approximating the Maturity Date. In the event Federal Reserve Statistical Release H.15 Selected Interest Rates is no longer published or in the event Federal Reserve Statistical Release H.15 Selected Interest Rates no longer publishes “U.S. Government Securities/Treasury Constant Maturities”, the mortgage lender will select a comparable publication to determine such “U.S. Government Securities/Treasury Constant Maturities” and the applicable ARD Treasury Note Rate. The mortgage lender’s determination of the ARD Treasury Note Rate will be final absent manifest error.
Based on the contractual Master Lease rents in years 11 and 12 of $356 million and $363 million (rental payments fully guaranteed by MGM (Fitch: BB- / Moody’s: Ba3 / S&P: BB-), respectively, and a 5.55800% interest rate, the MGM Grand & Mandalay Bay Whole Loan would generate approximately $401 million of amortization in those two years (so long as the MGM Grand & Mandalay Bay Whole Loan remains outstanding during that period). The amortization will result in a year 12 loan-to-cost ratio of 56.3%, a debt yield of 20.0% (based on the year-end December 2019 EBITDAR) and a mortgage loan basis of approximately $266,572 per room.
Based on the Aggregate As-Is Appraised Value of approximately $7.35 billion as of January 10, 2020, the LTV Cut-off / Balloon for the MGM Grand & Mandalay Bay Senior Loan are 22.2% and 22.2%, respectively. Based on the Aggregate Real Property Appraised Value
THE INFORMATION IN THIS STRUCTURAL AND COLLATERAL TERM SHEET IS NOT COMPLETE AND MAY BE AMENDED PRIOR TO THE TIME OF SALE. THIS TERM SHEET IS NOT AN OFFER TO SELL THESE SECURITIES AND IT IS NOT A SOLICITATION OF AN OFFER TO BUY THESE SECURITIES IN ANY JURISDICTION WHERE THE OFFER OR SALE IS NOT PERMITTED.
39
3799 & 3950 South Las Vegas Boulevard Las Vegas, NV Various | Collateral Asset Summary – Loan No. 2 MGM Grand & Mandalay Bay | Cut-off Date Balance: Cut-off Date LTV: U/W NCF DSCR: U/W NOI Debt Yield: | $75,000,000 35.5% 4.95x 17.9% |
of $4.6 billion as of January 10, 2020, the LTV Cut-off / Balloon for the MGM Grand & Mandalay Bay Senior Loan are 35.5% and 35.5%, respectively.
| Sources and Uses | ||||||
| Sources | Proceeds | % of Total | Uses | Proceeds | % of Total | |
| Senior Notes | $1,634,200,000 | 35.4% | Purchase Price | $4,600,000,000 | 99.6% | |
| Junior Notes | 1,365,800,000 | 29.6 | Closing Costs | 17,792,163 | 0.4 | |
| Sponsor Equity(1) | 1,617,792,163 | 35.0 | ||||
| Total Sources | $4,617,792,163 | 100.0% | Total Uses | $4,617,792,163 | 100.0% | |
| (1) | Includes MGM’s approximately $80.0 million of retained equity interest in the MGM Grand & Mandalay Bay Properties after the sale-leaseback, by virtue of operating partnership units in MGP OP issued to MGM on the origination date of the MGM Grand & Mandalay Bay Whole Loan. |
The Borrowers / Borrower Sponsors. On January 14, 2020, MGM Growth Properties Operating Partnership LP (“MGP OP”), an affiliate of BREIT Operating Partnership L.P. (“BREIT OP” and together with MGP OP, the “Sponsors”, as more particularly referred to as the “Borrower Sponsors”), and certain other parties entered into an agreement to, among other things, form a joint venture (50.1% indirectly owned by MGP OP and 49.9% indirectly owned by BREIT OP) (the “Joint Venture”) to acquire the MGM Grand & Mandalay Bay Properties in Las Vegas for a purchase price of $4.60 billion ($471,892 per room). The borrowers under the MGM Grand & Mandalay Bay Whole Loan are MGM Grand PropCo, LLC and Mandalay PropCo, LLC (individually, a “MGM Grand & Mandalay Bay Borrower” and, collectively, the “MGM Grand & Mandalay Bay Borrowers” or the “Borrowers”), which are subsidiaries of the Joint Venture. The MGM Grand & Mandalay Bay Borrowers are Delaware limited liability companies and single purpose entities with two independent directors. Blackstone Real Estate Income Trust, Inc. (“BREIT”) is a non-traded real estate investment trust focused on investing in commercial real estate properties diversified by sector with an emphasis on providing investors with access to Blackstone���s institutional real estate investment platform. BREIT seeks to directly own stabilized income-generating United States commercial real estate across the key property types, including multifamily, industrial, retail, hotel, healthcare and office. BREIT is managed by an external advisor, BX REIT Advisors L.L.C., which is an affiliate of The Blackstone Group Inc. (“Blackstone”). Blackstone’s real estate investor capital under management totals approximately $174.0 billion as of September 30, 2020 and includes prime assets such as the Bellagio, Cosmopolitan Las Vegas, Hotel Del Coronado, Grand Wailea, Arizona Biltmore, Ritz Carlton Kapalua, and Turtle Bay Resort.
MGM Growth Properties LLC (“MGP”) is one of the leading publicly traded real estate investment trusts engaged in the acquisition, ownership and leasing of large-scale destination entertainment and leisure resorts. MGP currently owns a portfolio of properties, consisting of 12 premier destination resorts in Las Vegas and elsewhere across the United States, with over 27,400 rooms, as well as MGM Northfield Park in Northfield, OH, Empire Resort Casino in Yonkers, NY, and a retail and entertainment district, The Park, in Las Vegas.
MGP OP and BREIT OP (together, individually or collectively as the context may require, the “Guarantor”), are the non-recourse carveout guarantors on a several basis in proportion to each Guarantor’s Liability Percentage (as defined below). The Liability Percentage of each Guarantor will be automatically increased or decreased from time to time, as applicable, to the extent any direct and/or indirect equity interest in the Borrowers is transferred by one Guarantor (or its affiliates) to the other Guarantor (or its affiliates) with the transferring Guarantor’s Liability Percentage increasing by the amount of such transferred interests and the transferee Guarantor’s Liability Percentage decreasing by such amount. In no event will the Liability Percentage of the Guarantors in the aggregate be less than or greater than 100%. For the avoidance of doubt, transfers by a Guarantor (or its affiliates) to a third party that is not an affiliate of the other Guarantor will not result in an adjustment to the Liability Percentage of either Guarantor. For illustrative purposes, if BREIT OP transfers a 25% indirect equity interest in the Borrowers to a third party that is not an Affiliate of MGP OP and subsequently transfers a 10% indirect equity interest in the Borrowers to MGP OP, the adjustments required to be made as a result of such transfers will be: (i) a decrease of ten percentage points to BREIT OP’s Liability Percentage and (ii) an increase of ten percentage points to MGP OP’s Liability Percentage.
The Guarantor’s liability for full recourse events is capped at an amount equal to 10% of the aggregate outstanding principal balance of the MGM Grand & Mandalay Bay Whole Loan as of the date of the event. In addition, only the Borrowers are liable for breaches of environmental covenants; provided, however, that if the Borrowers fail to maintain an environmental insurance policy required under the MGM Grand & Mandalay Bay Whole Loan documents, the Guarantor is liable for losses other than (x) for any amounts in excess of the applicable coverage amounts under the environmental policy had the same been renewed, replaced or extended as required under the loan agreement and (y) for any amounts recovered under the environmental policy. In addition, recourse for transfers of the MGM Grand & Mandalay Bay Properties or controlling equity interests in the MGM Grand & Mandalay Bay Borrowers is loss recourse, rather than full recourse.
“Liability Percentage” means, initially, (x) with respect to BREIT OP, 49.9% and (y) with respect to MGP OP, 50.1%.
THE INFORMATION IN THIS STRUCTURAL AND COLLATERAL TERM SHEET IS NOT COMPLETE AND MAY BE AMENDED PRIOR TO THE TIME OF SALE. THIS TERM SHEET IS NOT AN OFFER TO SELL THESE SECURITIES AND IT IS NOT A SOLICITATION OF AN OFFER TO BUY THESE SECURITIES IN ANY JURISDICTION WHERE THE OFFER OR SALE IS NOT PERMITTED.
40
3799 & 3950 South Las Vegas Boulevard Las Vegas, NV Various | Collateral Asset Summary – Loan No. 2 MGM Grand & Mandalay Bay | Cut-off Date Balance: Cut-off Date LTV: U/W NCF DSCR: U/W NOI Debt Yield: | $75,000,000 35.5% 4.95x 17.9% |
The Properties.
MGM Grand (54.5% of Mortgage ALA and Master Lease Rent)
Built in 1993, the MGM Grand Property is a full-service luxury resort and casino property located on the Las Vegas Strip, situated between Tropicana Boulevard and Harmon Avenue. According to World Atlas, the MGM Grand Property is the third largest hotel in the world by room count. The MGM Grand Property is also a recipient of the AAA Four Diamond award. The MGM Grand Property covers approximately 101.9 acres and consists of 4,998 hotel rooms: 4,270 standard rooms, 554 suites, 88 luxury suites, 51 SKYLOFTS suites (excluding one additional office unit), 30 mansion villas (Mediterranean-themed villas targeted for high-end gamblers, celebrities and casino-invited guests on the strip) (the “Mansion Villas”) and four entourage rooms associated with the Mansion Villas. The MGM Grand Property contains approximately 177,268 square feet (“sq. ft.”) of casino space, featuring 1,553 slot machines and 128 gaming tables, over 748,000 sq. ft. of meeting space, 18 restaurants, an approximately 22,858 sq. ft. spa, four swimming pools and approximately 41,800 sq. ft. of rentable retail space (featuring 31 retailers). The MGM Grand Property is home to Cirque du Soleil’s “Kà”, an acrobatic theater production that has been in residence at the MGM Grand Property since October 2004. The MGM Grand Property also includes the David Copperfield Theatre, Hakkasan Nightclub and the MGM Grand Garden Arena, which has a seating capacity of over 16,000 and hosts premier concerts, award shows, sporting events including championship boxing, and other special events.
Room sizes range from 346 sq. ft. to 11,517 sq. ft. and offer one to four bedrooms. Standard room amenities include air conditioning, in-room dining service, minibar, telephone, hair dryer, in-room safe, and high-speed internet. SKYLOFTS at MGM Grand, a AAA Four-Diamond, Forbes Five Star hotel, occupies the top two floors of the main building. The hotel has 51 lofts ranging from 1,401 to 6,040 sq. ft. per loft. SKYLOFTS is also a member of The Leading Hotels of the World. The Mansion at the MGM Grand Property contains 30 Mansion Villas ranging from 2,358 to 11,517 sq. ft. per villa and $5,000 to $35,000 per night.
Since 2010, the MGM Grand Property has benefited from total capital investment of approximately $480.0 million (approximately $96,036 per room). Notable capital expenditures from this time period include an approximately $144.0 million full rooms renovation from 2010 to 2013 and a recent $118.9 million expansion and renovation of the conference center, which was completed in December 2018.
Mandalay Bay (45.5% of Mortgage ALA and Master Lease Rent)
Built in 1999, the Mandalay Bay Property is a full-service luxury resort and casino property located as the first major resort on the strip to greet visitors arriving by automobile from Southern California. The AAA Four Diamond award winning resort is a premier conference hotel in Las Vegas with approximately 2.2 million sq. ft. of convention, ballroom and meeting space, making it the fifth single largest event space in the United States. The Mandalay Bay Property is immediately across Interstate 15 from Allegiant Stadium, the new home stadium of the National Football League’s (“NFL”) Raiders, which was substantially completed in July 2020. The Raiders started the 2020 football season at the stadium and are hosting games, however, the stadium will remain closed to fans for the season due to the outbreak of COVID-19. The Mandalay Bay Property covers approximately 124.1 acres and consists of 4,750 hotel rooms. Also included within the Mandalay Bay Property are: (i) the Delano, which is an all-suite hotel tower within the complex and (ii) a Four Seasons hotel, each of which has its own lobby, restaurants and pool and spa. In addition to the significant meeting space, the Mandalay Bay Property contains approximately 152,159 sq. ft. of casino space, featuring approximately 1,232 slot machines and 71 gaming tables, 27 total restaurants, an approximately 30,000 sq. ft. spa, ten swimming pools and approximately 54,000 sq. ft. of rentable retail space featuring 41 retailers. The Mandalay Bay Property is also the home to Cirque du Soleil’s Michael Jackson “ONE”, which has been in residence at the Mandalay Bay Property in an approximately 1,805-seat showroom since 2013, an approximately 12,000-seat special events arena, the House of Blues (which features an arena seating up to 2,500 people) and the Shark Reef Aquarium. Additionally, Mandalay Bay Property’s expansive pool and beach area plays host to an array of evening open air concerts during the pool season, a large wave pool, and Moorea, a European-style “ultra” beach and Daylight Beach Club.
Room sizes range from 400 to 5,605 sq. ft. and the Mandalay Bay Property offers one- to four-bedroom rooms. Standard room amenities include air conditioning, in-room dining service, minibar, telephone, hair dryer, in-room safe, and high-speed internet. Floors 60–62 are designed as penthouse suites, with a penthouse lounge on level 62 for guests staying in the penthouses. Floors numbered 35–39 of the main hotel building are occupied by the five-star and AAA Four-Diamond Four Seasons Hotel Las Vegas. Located at the resort’s 43-story second tower, the Delano Las Vegas is comprised of 45 rooms and 1,072 suites. Each suite at the Delano is at least 725 sq. ft.
The Mandalay Bay Property (including the Delano) underwent a substantial rooms’ renovation of approximately $159.7 million (approximately $35,150 per room) from 2012 to 2016 and has received a total of approximately $510.6 million (approximately $107,485 per room) of capital investment since 2010.
Cirque du Soleil performances at the MGM Grand & Mandalay Bay Properties scheduled through December 31, 2020 have been cancelled. On June 29, 2020, Cirque du Soleil Entertainment Group (“Cirque”) announced that it and certain of its affiliated companies filed for protection from creditors under the Companies’ Creditors Arrangement Act (“CCAA”) in order to restructure its capital structure, which application was granted by the court. On July 16, 2020, Cirque announced that it entered into a new “stalking horse” purchase agreement with a group of existing first lien and second lien secured lenders pursuant to which such lenders would acquire substantially all of Cirque’s assets in settlement of Cirque’s first and second lien debt. Such purchase agreement was approved by the court on July 17, 2020, and served as the new “stalking horse” bid in a SISP supervised by the court and the court-appointed monitor. As of August
THE INFORMATION IN THIS STRUCTURAL AND COLLATERAL TERM SHEET IS NOT COMPLETE AND MAY BE AMENDED PRIOR TO THE TIME OF SALE. THIS TERM SHEET IS NOT AN OFFER TO SELL THESE SECURITIES AND IT IS NOT A SOLICITATION OF AN OFFER TO BUY THESE SECURITIES IN ANY JURISDICTION WHERE THE OFFER OR SALE IS NOT PERMITTED.
41
3799 & 3950 South Las Vegas Boulevard Las Vegas, NV Various | Collateral Asset Summary – Loan No. 2 MGM Grand & Mandalay Bay | Cut-off Date Balance: Cut-off Date LTV: U/W NCF DSCR: U/W NOI Debt Yield: | $75,000,000 35.5% 4.95x 17.9% |
18, 2020, it was reported that the lenders’ bid was the highest bid, which requires court approval to take effect. On October 20, 2020, it was further reported that the plan giving the lenders control and virtually all of the equity of Cirque was approved, and on November 24, 2020, Cirque announced the closing of the sale transaction with its secured lenders and its emergence from creditor protection under the CCAA in Canada and Chapter 15 in the United States.
COVID-19 Update. According to a press release issued on March 15, 2020, MGM announced that it would suspend operations at all of its Las Vegas properties, including the MGM Grand & Mandalay Bay Properties, until further notice, effective as of March 17, 2020, and that casino operations would close on March 16, 2020, followed by hotel operations on March 17, 2020. MGM cited COVID-19 as a pandemic that had intensified in the United States, requiring major collective action to slow its progression. MGM stated that it cancelled all reservations at its Las Vegas properties prior to May 21, 2020. MGM further reported that it incurred substantial operating losses in March 2020 and did not expect to see a material improvement until more is known regarding the duration and severity of the pandemic, including when MGM’s properties can reopen to the public. On May 1, 2020, MGM reported in its first quarter Form 10-Q filing that as a result of the government-mandated closure, its domestic properties (which includes the MGM Grand & Mandalay Bay Properties and several properties which are not part of the collateral for the MGM Grand & Mandalay Bay Whole Loan) were effectively generating no revenue. In addition, in its Form 10-Q filing, MGM Resorts International reported high levels of room and convention cancellation across its domestic properties through the third quarter of 2020 with some tentative re-bookings in the fourth quarter and into 2021. As of June 4, 2020, the MGM Grand was reopened, with limited amenities and certain COVID-19 mitigation procedures. MGM Resorts International reopened The Shoppes at Mandalay Bay Place on June 25, 2020 and the Mandalay Bay resort on July 1, 2020, both with limited amenities and certain COVID-19 mitigation procedures. On August 3, 2020, MGM reported in its second quarter Form 10-Q filing that, while throughout May, June and July 2020, it re-opened most of its properties with limited amenities and certain measures to mitigate the spread of COVID-19, such properties (which includes the MGM Grand and Mandalay Bay Properties) may be subject to temporary, complete or partial shutdowns in the future. On August 28, 2020, several news outlets reported that MGM is expected to lay off approximately 18,000 furloughed workers in the United States, more than one-quarter of its pre-COVID-19 pandemic U.S. workforce, due to the continued impact of the COVID-19 pandemic on MGM’s business. However, MGM permitted certain stage shows and performances to resume at select properties (including the MGM Grand) on or about November 6, 2020. On November 3, 2020, MGM reported in its most recent third quarter Form 10-Q filing that (i) throughout the second and third quarters of 2020, all of its properties reopened but are operating without certain amenities and subject to certain occupancy limitations and therefore are generating revenues that are significantly lower than historical results and (ii) although MGM has engaged in aggressive cost reduction efforts, it still has significant fixed and variable costs, which will adversely affect its profitability, and has seen and expects to continue to see weakened demand in light of continued domestic and international travel restrictions or warnings, restrictions on amenity use (such as gaming, restaurant and pool capacity limitations), consumer fears and reduced consumer discretionary spending, general economic uncertainty and increased rates of unemployment. As has been reported on MGM’s third quarter 2020 earnings call, MGM disclosed that it is evaluating plans to minimize mid-week Adjusted Property EBITDAR losses at its properties in light of its seasonal low period during the winter months, which could include reducing amenities at some of its properties and the closure of certain hotel towers. Effective as of November 30, 2020, MGM has temporarily closed the hotel tower operations at Mandalay Bay from Monday through Thursday each week. At this time, the casino, restaurants and certain other amenities at Mandalay Bay will remain open throughout the week. MGM does not expect the temporary closure to continue past December, however, MGM will continue to evaluate business levels to determine how long the closure will remain in effect. As of December 6, 2020, the MGM Grand & Mandalay Bay Properties continue to operate subject to the restrictions described above. The MGM Grand & Mandalay Bay Whole Loan is current through the December 2020 payment date and as of December 6, 2020, no loan modification or forbearance requests have been made. Additionally, October 2020 and November 2020 master lease payments have been made and there have been no lease modification requests. See “Risk Factors—Special Risks—Coronavirus Pandemic Has Adversely Affected the Global Economy and Will Likely Adversely Affect the Performance of the Mortgage Loans” in the Preliminary Prospectus.
Revenue Streams. The MGM Grand & Mandalay Bay Properties benefit from a diverse set of revenue streams with a substantial contribution from non-gaming sources (only 18.0% of combined year-end (“YE”) December 2019 revenues derived from casino) and offer nearly 2.8 million sq. ft. of combined meeting and convention space.
As of YE December 2019, the MGM Grand Property generated 77.8% of net revenues from rooms, food and beverage, retail, entertainment and other operations. The gaming segment contributed 22.2% of net revenue (approximately $257.9 million), representing a decline from the 2018 level of 29.8% of net revenue (of approximately $365.7 million). A portion of the decline can be attributed to a renovation of the Mansion Villas in 2019, which serve as the MGM Grand Property’s main attractant to high-end gamblers. Nearly all departments at the MGM Grand Property (including rooms, F&B, retail and entertainment) experienced continued growth in the YE December 2019 period despite the decline in casino revenue.
The Mandalay Bay Property has a much smaller casino department as a percentage of total net revenue (12.9% as of YE December 2019) than most casinos on the Las Vegas strip. The Mandalay Bay Property revenues are primarily driven by (i) the focus on group and convention business (according to the appraisal, the Mandalay Bay Property had a 2019 penetration factor of 134.8% for group business) and (ii) the fact that two of the three room types are operated as non-casino focused third party franchises (the Delano and Four Seasons). As of YE December 2019, 64.1% of total revenues at the Mandalay Bay Property were derived from rooms’ revenue (34.1%) and food & beverage revenue (30.0%).
THE INFORMATION IN THIS STRUCTURAL AND COLLATERAL TERM SHEET IS NOT COMPLETE AND MAY BE AMENDED PRIOR TO THE TIME OF SALE. THIS TERM SHEET IS NOT AN OFFER TO SELL THESE SECURITIES AND IT IS NOT A SOLICITATION OF AN OFFER TO BUY THESE SECURITIES IN ANY JURISDICTION WHERE THE OFFER OR SALE IS NOT PERMITTED.
42
3799 & 3950 South Las Vegas Boulevard Las Vegas, NV Various | Collateral Asset Summary – Loan No. 2 MGM Grand & Mandalay Bay | Cut-off Date Balance: Cut-off Date LTV: U/W NCF DSCR: U/W NOI Debt Yield: | $75,000,000 35.5% 4.95x 17.9% |
As of YE December 2019, the MGM Grand Property achieved occupancy, ADR and RevPAR of 91.4%, $190.29 and $173.85, respectively. As of YE December 2019, the Mandalay Bay Property achieved occupancy, ADR and RevPAR of 92.8%, $202.98 and $188.40, respectively.
| Historical Performance | ||||||||||||||||||
| EBITDAR ($ Millions)(1) | 2006 | 2007 | 2008 | 2009 | 2010 | 2011 | 2012 | 2013 | 2014 | 2015 | 2016 | 2017 | 2018 | 2019 | March 2020 TTM(1) | June 2020 TTM(1) | Sept. 2020 TTM(1) | UW |
| MGM Grand | $329 | $396 | $271 | $214 | $163 | $149 | $181 | $236 | $255 | $281 | $332 | $345 | $372 | $283 | $263 | $220 | $129 | $283 |
| Mandalay Bay | $282 | $291 | $251 | $160 | $125 | $169 | $147 | $167 | $176 | $204 | $237 | $260 | $246 | $237 | $224 | $161 | $93 | $237 |
| Total Collateral | $611 | $688 | $522 | $374 | $288 | $318 | $327 | $403 | $431 | $485 | $569 | $605 | $617 | $520 | $487 | $381 | $222 | $520 |
| Debt Yield(2) | 20.4% | 22.9% | 17.4% | 12.5% | 9.6% | 10.6% | 10.9% | 13.4% | 14.4% | 16.2% | 19.0% | 20.2% | 20.6% | 17.3% | 16.2% | 12.7% | 7.4% | 17.3% |
| Rent Coverage(3) | 2.1x | 2.4x | 1.8x | 1.3x | 1.0x | 1.1x | 1.1x | 1.4x | 1.5x | 1.7x | 1.9x | 2.1x | 2.1x | 1.8x | 1.7x | 1.3x | 0.8x | 1.8x |
| (1) | On May 1, 2020, MGM Resorts International reported in its first quarter Form 10-Q filing that, as a result of the temporary closure of its domestic properties (which includes the MGM Grand & Mandalay Bay Properties) following the outbreak of COVID-19, its domestic properties (which includes the MGM Grand & Mandalay Bay Properties) were effectively generating no revenue, and there were high levels of room and convention cancellation through the third quarter of 2020. The March 2020 TTM financials presented above reflect the suspension of operations at the Properties from March 17, 2020 through the end of the first calendar quarter of 2020. On August 3, 2020, MGM reported in its second quarter Form 10-Q filing that, while throughout May, June and July 2020, it re-opened most of its properties with limited amenities and certain measures to mitigate the spread of COVID-19, such properties (which include the MGM Grand and Mandalay Bay Properties) may be subject to temporary, complete or partial shutdowns in the future. On November 3, 2020, MGM reported in its most recent third quarter Form 10-Q filing that throughout the second and third quarters of 2020, all of its properties reopened but are operating without certain amenities and subject to certain occupancy limitations and therefore are generating revenues that are significantly lower than historical results, and that it has seen and expects to continue to see weakened demand in light of consumer fears and general economic uncertainty, among other things. The June 2020 TTM and September 2020 TTM financials presented above reflect the operations at the MGM Grand Property, which remained suspended until June 4, 2020, operations at The Shoppes at Mandalay Bay Place and the Mandalay Bay resort, which remained suspended through June 24, 2020 and June 30, 2020, respectively, and the occupancy limitations imposed on the MGM Grand & Mandalay Bay Properties by the state of Nevada during the third quarter of 2020. The $487 million presented above represents the adjusted March 2020 TTM EBITDAR, which takes into account an adjustment for a combined net extraordinary loss of approximately $20.6 million during the March 2020 TTM period (reflecting primarily operating losses during closure comprised mainly of employee payroll expenses and corporate allocations and net of a combined extraordinary gain of approximately $0.7 million related to a reversal of certain accrued benefit expenses) related to the temporary closure of the MGM Grand & Mandalay Bay Properties following the outbreak of COVID-19. The $381 million presented above represents the adjusted June 2020 TTM EBITDAR and the $222 million presented above represents the adjusted September 2020 TTM EBITDAR, each of which takes into account an adjustment for a combined net extraordinary loss of approximately $82.4 million during the respective TTM periods (reflecting primarily operating losses during closure comprised mainly of employee payroll expenses and corporate allocations and net of a combined extraordinary gain of approximately $0.7 million related to a reversal of certain accrued benefit expenses) related to the temporary closure of the MGM Grand & Mandalay Bay Properties following the outbreak of COVID-19. The Lender UW presented above is based on 2019 financials, which reflects a full year of uninterrupted operations at the MGM Grand & Mandalay Bay Properties. Please see “Historical and Underwritten Cash Flows” herein, and the footnotes thereto, for more detailed underwritten cash flow information. |
| (2) | Debt Yield metrics presented above are based on the MGM Grand & Mandalay Bay Whole Loan Cut-off Date balance of $3.0 billion and the EBITDAR of each respective time period. |
| (3) | Rent Coverage ratios presented above are based on the initial Master Lease Rent of $292.0 million and the EBITDAR of each respective time period. |
| Historical Performance – MGM Grand(1) | |||||||||||||||||
| 2006 | 2007 | 2008 | 2009 | 2010 | 2011 | 2012 | 2013 | 2014 | 2015 | 2016 | 2017 | 2018 | 2019 | March 2020 TTM(2) | June 2020 TTM(2) | Sept. 2020 TTM(2) | |
| RevPAR | $154 | $162 | $145 | $112 | $112 | $128 | $136 | $138 | $151 | $155 | $162 | $167 | $169 | $174 | $172 | $161 | $126 |
| Net Revenue ($ bns) | $1.19 | $1.32 | $1.22 | $1.09 | $1.03 | $1.05 | $1.07 | $1.15 | $1.21 | $1.16 | $1.15 | $1.18 | $1.23 | $1.16 | $1.10 | $0.87 | $0.66 |
| EBITDAR Margin | 28% | 30% | 22% | 20% | 16% | 14% | 17% | 21% | 21% | 24% | 29% | 29% | 30% | 24% | 24% | 25% | 20% |
| (1) | Any financial information contained in this Term Sheet for the MGM Grand Property which relates to any period prior to 2015 has not been recast to reflect the adoption of ASC 606 revenue recognition under GAAP and thus, any financial information provided for periods prior to 2015 may not be comparable to periods on or after 2015 with respect to which recasting has been applied. |
| (2) | The March 2020 TTM financials presented above reflect the suspension of operations at the MGM Grand & Mandalay Bay Properties from March 17, 2020 through the end of the first calendar quarter of 2020. On August 3, 2020, MGM reported in its second quarter Form 10-Q filing that, while throughout May, June and July 2020, it re-opened most of its properties with limited amenities and certain measures to mitigate the spread of COVID-19, such properties (which include the MGM Grand and Mandalay Bay Properties) may be subject to temporary, complete or partial shutdowns in the future, and that it has seen and expects to continue to see weakened demand in light of consumer fears and general economic uncertainty, among other things. The June 2020 TTM and September 2020 TTM financials presented above reflect the operations at the MGM Grand Property, which remained suspended until June 4, 2020, operations at The Shoppes at Mandalay Bay Place and the Mandalay Bay resort, which remained suspended through June 24, 2020 and June 30, 2020, respectively, and the occupancy limitations imposed on the MGM Grand & Mandalay Bay Properties by the state of Nevada during the third quarter of 2020. |
| Historical Performance – Mandalay Bay(1) | |||||||||||||||||
| 2006 | 2007 | 2008 | 2009 | 2010 | 2011 | 2012 | 2013 | 2014 | 2015 | 2016 | 2017 | 2018 | 2019 | March 2020 TTM(2) | June 2020 TTM(2) | Sept. 2020 TTM(2) | |
| RevPAR | $199 | $213 | $193 | $142 | $142 | $160 | $162 | $164 | $176 | $177 | $185 | $186 | $184 | $188 | $188 | $186 | $143 |
| Net Revenue ($ bns) | $0.99 | $1.02 | $0.95 | $0.79 | $0.78 | $0.84 | $0.78 | $0.86 | $0.95 | $0.94 | $0.97 | $0.98 | $0.97 | $0.94 | $0.90 | $0.67 | $0.49 |
| EBITDAR Margin | 29% | 28% | 26% | 20% | 16% | 20% | 19% | 19% | 19% | 22% | 24% | 27% | 25% | 25% | 25% | 24% | 19% |
| (1) | Any financial information contained in this Term Sheet for the Mandalay Bay Property which relates to any period prior to 2015 has not been recast to reflect the adoption of ASC 606 revenue recognition under GAAP and thus, any financial information provided for periods prior to 2015 may not be comparable to periods on or after 2015 with respect to which recasting has been applied. |
| (2) | The March 2020 TTM financials presented above reflect the suspension of operations at the MGM Grand & Mandalay Bay Properties from March 17, 2020 through the end of the first calendar quarter of 2020. On August 3, 2020, MGM reported in its second quarter Form 10-Q filing that, while throughout May, June and July 2020, it re-opened most of its properties with limited amenities and certain measures to mitigate the spread of COVID-19, such properties (which include the MGM Grand and Mandalay Bay Properties) may be subject to temporary, complete or partial shutdowns in the future, and that it has seen and expects to continue to see weakened demand in light of consumer fears and general economic uncertainty, among other things. The June 2020 TTM and September 2020 TTM financials presented above reflect the operations at the MGM Grand Property, which remained suspended until June 4, 2020, operations at The Shoppes at Mandalay Bay Place and the Mandalay Bay resort, which remained suspended through June 24, 2020 and June 30, 2020, respectively, and the occupancy limitations imposed on the MGM Grand & Mandalay Bay Properties by the state of Nevada during the third quarter of 2020. |
Master Lease. The MGM Grand & Mandalay Bay Properties are master-leased to MGM Lessee II, LLC (the “MGM Tenant”), a wholly-owned subsidiary of MGM under a 30-year, triple-net master and operating lease with two, 10-year renewal options. In turn, the MGM Tenant has subleased a portion of the MGM Grand & Mandalay Bay Properties to each of MGM Grand Hotel, LLC, a Nevada limited liability company (the “Grand Operating Subtenant”), Mandalay Bay, LLC, a Nevada limited liability company (the “Mandalay Bay Subtenant”) and Mandalay Place, LLC, a Nevada limited liability company (“Mandalay Place Subtenant”; and, together with Grand Operating Subtenant and Mandalay Bay Subtenant, individually or collectively as the context may require, together with any person to whom all or any portion of a Property is sublet by MGM Tenant pursuant to an MGM/Mandalay Operating sublease pursuant to the
THE INFORMATION IN THIS STRUCTURAL AND COLLATERAL TERM SHEET IS NOT COMPLETE AND MAY BE AMENDED PRIOR TO THE TIME OF SALE. THIS TERM SHEET IS NOT AN OFFER TO SELL THESE SECURITIES AND IT IS NOT A SOLICITATION OF AN OFFER TO BUY THESE SECURITIES IN ANY JURISDICTION WHERE THE OFFER OR SALE IS NOT PERMITTED.
43
3799 & 3950 South Las Vegas Boulevard Las Vegas, NV Various | Collateral Asset Summary – Loan No. 2 MGM Grand & Mandalay Bay | Cut-off Date Balance: Cut-off Date LTV: U/W NCF DSCR: U/W NOI Debt Yield: | $75,000,000 35.5% 4.95x 17.9% |
express terms and conditions of the MGM/Mandalay Lease, each an “MGM/Mandalay Operating Subtenant”). Each MGM/Mandalay Operating Subtenant executed a joinder to the MGM/Mandalay Lease for the purpose of (x) agreeing to be bound by the terms and provisions of the MGM/Mandalay Lease regarding the disposition of any portion of MGM Tenant’s Property owned by such MGM/Mandalay Operating Subtenant and (y) granting a security interest to the Borrowers in the portion of the MGM Tenant’s pledged property owned by such MGM/Mandalay Operating Subtenant and certain reserve funds under the MGM/Mandalay Lease. The MGM Tenant and each MGM/Mandalay Operating Subtenant is not a borrower or an obligor under the MGM Grand & Mandalay Bay Whole Loan documents.
Under the Master Lease, the MGM Tenant is required to pay to the Borrowers an initial lease rent of $292.0 million per annum ($159.0 million allocated to the MGM Grand Property and $133.0 million allocated to the Mandalay Bay Property, the “Master Lease Rent”), subject to annual increases of (i) 2.0% in years 2 through 15 of the initial lease term, and (ii) thereafter, the greater of 2.0% or CPI (CPI capped at 3.0%) for the remainder of the initial lease term. Additionally, MGM will be required to continue to invest in the MGM Grand & Mandalay Bay Properties, with (x) a minimum aggregate capital investment requirement of 3.5% of actual net revenues every five years (the first such period beginning January 1, 2020 and expiring December 31, 2024, and the second such period beginning January 1, 2021 and expiring December 31, 2025, and each five-year period thereafter on a rolling basis) in the aggregate for the MGM Grand & Mandalay Bay Properties (such amount not to be less than 2.5% of the actual net revenue of any individual Property) (collectively, the “Required CapEx”) and (y) a monthly reserve equal to 1.5% of actual net revenues which may be used for FF&E and on qualifying capital expenditures in satisfaction of the Required CapEx spend. Upon early termination of the Master Lease due to an event of default by MGM Tenant thereunder, the FF&E will be transferred to the Borrowers at no cost.
Beginning with the first full calendar quarter after the origination date for the MGM Grand & Mandalay Bay Whole Loan and continuing thereafter, if either (a) (x) EBITDAR to Rent Ratio (as defined in the Master Lease) for the prior four fiscal quarters is less than 1.60x and (y) MGM’s market cap is less than $6.0 billion or (b) (x) MGM is no longer publicly traded and listed on NYSE, AMEX or NASDAQ and (y) the EBITDAR to Rent Ratio for the prior four fiscal quarters is less than 2.0x, then MGM Tenant will be required to provide one or more letters of credit or fund a cash escrow in an aggregate amount equal to the following year’s rent (taking into account the applicable escalations). Based on the adjusted September 2020 TTM EBITDAR of approximately $222.0 million and the initial Master Lease rent of $292.0 million, the MGM Grand & Mandalay Bay Whole Loan results in a September 2020 TTM EBITDAR-to-rent coverage ratio of 0.76x.
No intellectual property is licensed to the Borrowers and the Borrowers have no option to purchase upon expiration of the Master Lease. Upon the expiration of the Master Lease term or earlier termination of Master Lease, MGM Tenant will be obligated to provide up to 18 months of transition services to permit the continuous and uninterrupted operation of the Property.
MGM (NYSE: MGM, rated Ba3/BB-/BB- by Moody’s, Fitch and S&P) guarantees to the Borrowers the payment and performance of all monetary obligations and certain other obligations of the MGM Tenant under the Master Lease. In addition to the lease guaranty, MGM (in such capacity, “Shortfall Collection Guarantor”) has executed a shortfall guaranty for the benefit of mortgage lender for the MGM Grand & Mandalay Bay Whole Loan, pursuant to which MGM has guaranteed to mortgage lender the unpaid portion of the initial principal amount of the MGM Grand & Mandalay Bay Whole Loan (without giving effect to any future amendments that may increase the principal balance) and all interest accrued and unpaid thereon. For the avoidance of doubt, the Shortfall Collection Guarantor does not guarantee any Accrued Interest or any additional principal as a result of any unpaid Accrued Interest after the ARD. Transfers of interests in MGM are not restricted under the MGM Grand & Mandalay Bay Whole Loan documents and any bankruptcy or other adverse event with respect to the Shortfall Collection Guarantor does not constitute a default under the MGM Grand & Mandalay Bay Whole Loan documents. Neither MGM nor its affiliates (including, without limitation, MGM Tenant) are considered an affiliate of the Borrowers for any purpose under the MGM Grand & Mandalay Bay Whole Loan documents so long as such person does not control Borrower. There is no continuing net worth requirement with respect to MGM in connection with the shortfall guaranty. As of the origination of the MGM Grand & Mandalay Bay Whole Loan, neither MGM nor MGM Tenant controlled the Borrowers.
As of December 31, 2019, MGM had a market capitalization of approximately $16.7 billion, full-year 2019 revenue of approximately $12.9 billion and consolidated, adjusted earnings before interest, taxes, depreciation and amortization (“EBITDA”) of approximately $3.0 billion. As of March 31, 2020, MGM reported revenue of approximately $2.3 billion for the first quarter of 2020. This represents a 29% decrease to the first quarter of 2019 which was primarily driven by MGM’s temporary suspension of its domestic and Macau casino operations related to the COVID-19 pandemic. MGM had $6.0 billion of cash and cash equivalents as of March 31, 2020, which included $1.8 billion at MGP and $381 million at MGM China. In addition, on April 23, 2020, MGM commenced a private offering of $750 million in aggregate principal amount of 6.75% coupon senior notes due in 2025, which further added to MGM’s cash position. As of June 30, 2020, MGM had a market capitalization of approximately $8.3 billion. As of September 30, 2020, MGM reported (i) revenue of approximately $1.1 billion for the third quarter of 2020 (of which approximately $481.4 million was derived from MGM’s Las Vegas Strip resorts), (ii) a total consolidated liquidity position of $7.8 billion (which includes MGM Resorts, MGM China and MGP and is comprised of cash and cash equivalents of approximately $4.6 billion and approximately $3.2 billion available under certain revolving credit facilities), (iii) an MGM Resorts liquidity position of approximately $4.5 billion (which excludes MGP OP and MGM China) and is comprised of cash and cash equivalents of approximately $3.5 billion and approximately $922 million available under its $1.5 billion revolving facility and (iv) a market capitalization of approximately $10.7 billion. Also as of September 30, 2020, MGM reported that it had $700.0 million remaining under its
THE INFORMATION IN THIS STRUCTURAL AND COLLATERAL TERM SHEET IS NOT COMPLETE AND MAY BE AMENDED PRIOR TO THE TIME OF SALE. THIS TERM SHEET IS NOT AN OFFER TO SELL THESE SECURITIES AND IT IS NOT A SOLICITATION OF AN OFFER TO BUY THESE SECURITIES IN ANY JURISDICTION WHERE THE OFFER OR SALE IS NOT PERMITTED.
44
3799 & 3950 South Las Vegas Boulevard Las Vegas, NV Various | Collateral Asset Summary – Loan No. 2 MGM Grand & Mandalay Bay | Cut-off Date Balance: Cut-off Date LTV: U/W NCF DSCR: U/W NOI Debt Yield: | $75,000,000 35.5% 4.95x 17.9% |
previously announced agreement with MGP OP to redeem for cash up to $1.4 billion of its MGP OP units and it does not have any debt maturing prior to 2022.
MGM Tenant is a casino owner-operator for 29 unique hotel offerings totaling over 44,000 rooms across Las Vegas, United States regional markets and Macau. MGM Tenant has managed the MGM Grand & Mandalay Bay Properties for more than 27 and 18 years, respectively.
Cash Flow Analysis.
| Cash Flow Analysis | ||||||||
| 2015 | 2016 | 2017 | 2018 | 2019 | September 2020 TTM | U/W | U/W Per Room(1) | |
| Occupancy | 92.5% | 92.4% | 91.0% | 91.5% | 92.1% | 71.4% | 92.1% | |
| ADR | $179.08 | $187.27 | $193.58 | $192.62 | $196.52 | $187.46 | $196.52 | |
| RevPAR | $165.56 | $172.97 | $176.24 | $176.18 | $180.94 | $133.76 | $180.94 | |
| Hotel Revenue | $576,193,751 | $611,611,719 | $621,671,255 | $619,356,266 | $635,408,160 | $347,024,422 | $635,408,160 | $65,183 |
| Casino Revenue | 461,726,103 | 438,253,825 | 459,676,698 | 492,001,712 | 379,532,959 | 264,556,936 | 379,532,959 | $38,934 |
| F&B Revenue | 578,021,518 | 598,992,505 | 608,876,978 | 604,859,218 | 629,566,379 | 283,966,048 | 629,566,379 | $64,584 |
| Other Revenue | 480,778,051 | 465,818,022 | 471,735,234 | 475,323,334 | 461,787,990 | 261,969,455 | 461,787,990(2) | $47,373 |
| Total Revenue | $2,096,719,423 | $2,114,676,071 | $2,161,960,165 | $2,191,540,530 | $2,106,295,488 | $1,157,516,861 | $2,106,295,488 | $216,075 |
| Hotel Expense | 230,915,708 | 235,477,994 | 249,304,637 | 255,303,612 | 265,201,312 | 176,427,144 | 265,201,312 | $27,206 |
| Casino Expense | 253,918,628 | 213,245,938 | 229,109,011 | 226,996,812 | 223,320,361 | 168,325,682 | 223,320,361 | $22,909 |
| F&B Expense | 428,952,166 | 429,128,035 | 433,970,578 | 437,033,184 | 449,487,794 | 231,438,278 | 449,487,794 | $46,111 |
| Other Expense | 349,547,741 | 323,328,025 | 322,504,168 | 316,078,620 | 304,747,043 | 174,051,892 | 304,747,043 | $31,263 |
| Total Departmental Expenses | $1,263,334,243 | $1,201,179,992 | $1,234,888,394 | $1,235,412,228 | $1,242,756,510 | $750,242,996 | $1,242,756,510 | $127,488 |
| Property Maintenance | 111,939,869 | 110,077,272 | 94,539,158 | 100,973,309 | 102,493,739 | 76,876,259 | 102,493,739 | $10,514 |
| Property Administration(3) | 174,627,810 | 172,200,235 | 166,262,013 | 167,553,605 | 170,530,197 | 130,757,309 | 170,530,197 | $17,494 |
| Marketing & Advertising | 38,202,199 | 39,405,548 | 39,688,932 | 45,724,651 | 42,793,494 | 28,683,995 | 42,793,494 | $4,390 |
| Total Undistributed Expenses | $324,769,878 | $321,683,055 | $300,490,103 | $314,251,565 | $315,817,430 | $236,317,563 | $315,817,430 | $32,398 |
| Management Fee | 0 | 0 | 0 | 0 | 0 | 0 | 0 | $0 |
| Real Estate Taxes | 16,605,853 | 16,929,584 | 15,852,622 | 17,309,478 | 18,451,931 | 19,252,702 | 18,451,931 | $1,893 |
| Insurance | 6,711,471 | 6,110,026 | 5,691,838 | 7,197,993 | 9,189,264 | 12,039,683 | 9,189,264 | $943 |
| Net Extraordinary Loss Add-Back | 0 | 0 | 0 | 0 | 0 | 82,377,430(4) | 0 | $0 |
| EBITDAR | $485,297,978 | $568,773,414 | $605,037,208 | $617,369,266 | $520,080,353 | $222,041,347(6) | $520,080,353 | $53,353 |
| FF&E(5) | 0 | 0 | 0 | 0 | 0 | 0 | 32,774,592 | 3,362 |
| Net Cash Flow | $485,297,978 | $568,773,414 | $605,037,208 | $617,369,266 | $520,080,353 | $222,041,347(6) | $487,305,761 | 49,990 |
| (1) | Based on 9,748 guest rooms. |
| (2) | The most recent available breakout of the Signature Condo-Hotel revenue as a component of Other Revenue was from the November 2019 trailing 12-month period. |
| (3) | 2018 Property Administration expense was adjusted for the Mandalay Bay Property to exclude $21.8 million of one-time business interruption proceeds related to the October 1, 2017 shooting at a country concert in Las Vegas. |
| (4) | Net Extraordinary Loss Add-Back represents a net combined extraordinary loss from the MGM Grand & Mandalay Bay Properties of approximately $82.4 million during the September 2020 TTM period (reflecting primarily operating losses during closure comprised mainly of employee payroll expenses and corporate allocations and net of a combined extraordinary gain of approximately $0.7 million related to a reversal of certain accrued benefit expenses) related to the temporary closure of the MGM Grand & Mandalay Bay Properties following the outbreak of COVID-19. The September 2020 TTM EBITDAR of approximately $222.0 million represents the combined adjusted EBITDAR as calculated per the Master Lease (after taking into account the extraordinary loss add-back for the September 2020 TTM period). |
| (5) | Underwritten FF&E is based on the 1.5% contractual FF&E reserve based on total net revenues (excluding net revenues associated with the Signature Condo-Hotel development at the MGM Grand Property for which FF&E is not reserved under the Master Lease). With respect to the Mandalay Bay Property, 5.0% FF&E Reserve was underwritten for the revenues associated with the closing date Four Seasons Management Agreement. |
| (6) | On May 1, 2020, MGM Resorts International reported in its first quarter Form 10-Q filing that, as a result of the temporary closure of its domestic properties (which includes the MGM Grand & Mandalay Bay Properties) following the outbreak of COVID-19, its domestic properties (which includes the MGM Grand & Mandalay Bay Properties) were effectively generating no revenue, and there were high levels of room and convention cancellation through the third quarter of 2020. On August 3, 2020, MGM reported in its second quarter Form 10-Q filing that, while throughout May, June and July 2020, it re-opened most of its properties with limited amenities and certain measures to mitigate the spread of COVID-19, such properties (which include the MGM Grand and Mandalay Bay Properties) may be subject to temporary, complete or partial shutdowns in the future. On November 3, 2020, MGM reported in its most recent third quarter Form 10-Q filing that throughout the second and third quarters of 2020, all of its properties reopened but are operating without certain amenities and subject to certain occupancy limitations and therefore are generating revenues that are significantly lower than historical results, and that it has seen and expects to continue to see weakened demand in light of consumer fears and general economic uncertainty, among other things. The September 2020 TTM financials presented above reflect the suspension of operations at (i) the MGM Grand Property from March 17, 2020 through June 3, 2020 and (ii) The Shoppes at Mandalay Bay Place and the Mandalay Bay resort from March 17, 2020 through June 24, 2020 and June 30, 2020, respectively, and the occupancy limitations imposed on the MGM Grand & Mandalay Bay Properties by the state of Nevada during the third quarter of 2020. Upon reopening, both MGM Grand & Mandalay Bay Properties were operating with limited amenities and certain COVID-19 mitigation procedures. The Lender UW presented above is based on 2019 financials, which reflects a full-year of uninterrupted operations at the MGM Grand & Mandalay Bay Properties. |
THE INFORMATION IN THIS STRUCTURAL AND COLLATERAL TERM SHEET IS NOT COMPLETE AND MAY BE AMENDED PRIOR TO THE TIME OF SALE. THIS TERM SHEET IS NOT AN OFFER TO SELL THESE SECURITIES AND IT IS NOT A SOLICITATION OF AN OFFER TO BUY THESE SECURITIES IN ANY JURISDICTION WHERE THE OFFER OR SALE IS NOT PERMITTED.
45
3799 & 3950 South Las Vegas Boulevard Las Vegas, NV Various | Collateral Asset Summary – Loan No. 2 MGM Grand & Mandalay Bay | Cut-off Date Balance: Cut-off Date LTV: U/W NCF DSCR: U/W NOI Debt Yield: | $75,000,000 35.5% 4.95x 17.9% |
Environmental Matters. According to the Phase I environmental report dated February 11, 2020, the environmental consultant identified underground storage tanks at the MGM Grand & Mandalay Bay Properties. Due to the presence of underground storage tanks, the MGM Grand & Mandalay Bay Borrowers purchased, and are required to maintain under the MGM Grand & Mandalay Bay Whole Loan agreement, an environmental insurance policy.
The Market. The MGM Grand & Mandalay Bay Properties are located on the Las Vegas Strip in the heart of Las Vegas, Nevada. Visitor volume and airport passenger traffic into the Las Vegas region have more than doubled from 1990 to 2019. In connection with the financial downturn in 2008 and 2009, the Las Vegas market generally experienced a contraction. During 2010, the market began to rebound and visitation has returned to or near peak levels. McCarran International Airport welcomed 51.5 million passengers in 2019 (surpassing the 2018 passenger count of approximately 49.6 million).
Since 2010, annual convention attendance in Las Vegas has grown by over 2 million people (4.0% CAGR). With an estimated local population of 2.3 million people as of 2019, an additional approximately 42.5 million tourists visiting the metropolitan Las Vegas area annually and recent investment in Las Vegas by major sports leagues, the amount of existing gaming activity has increased steadily since the 2009 trough. In Clark County, gaming revenue has increased approximately 17.2% through 2019 since the gaming revenue trough in 2009.
| Market Overview(1) | ||||||||||||
| Category | 1990 | 2009 | 2010 | 2011 | 2012 | 2013 | 2014 | 2015 | 2016 | 2017 | 2018 | 2019 |
| Visitor Volume (thousands) | 20,954 | 36,351 | 37,335 | 38,929 | 39,727 | 39,668 | 41,127 | 42,312 | 42,936 | 42,214 | 42,117 | 42,524 |
| YoY % Change | NAP | -3.0% | 2.7% | 4.3% | 2.1% | -0.1% | 3.7% | 2.9% | 1.5% | -1.7% | -0.2% | 1.0% |
| Clark County Gaming Revenues ($mm) | $4,104 | $8,838 | $8,909 | $9,223 | $9,400 | $9,674 | $9,554 | $9,618 | $9,714 | $9,979 | $10,250 | $10,355 |
| YoY % Change | NAP | -9.8% | 0.8% | 3.5% | 1.9% | 2.9% | -1.2% | 0.7% | 1.0% | 2.7% | 2.7% | 1.0% |
| Hotel / Motel Rooms Inventory | 73,730 | 148,941 | 148,935 | 150,161 | 150,481 | 150,593 | 150,544 | 149,213 | 149,339 | 148,896 | 149,158 | 149,422 |
| YoY % Change | NAP | 6.0% | 0.0% | 0.8% | 0.2% | 0.1% | 0.0% | -0.9% | 0.1% | -0.3% | 0.2% | 0.2% |
| Airport Passenger Traffic (thousands) | 19,090 | 40,469 | 39,757 | 41,481 | 41,668 | 41,857 | 42,885 | 45,319 | 47,368 | 48,430 | 49,645 | 51,538 |
| YoY % Change | NAP | -8.2% | -1.8% | 4.3% | 0.4% | 0.5% | 2.5% | 5.7% | 4.5% | 2.2% | 2.5% | 3.8% |
| Convention Attendance (thousands) | 1,742 | 4,492 | 4,473 | 4,865 | 4,944 | 5,107 | 5,195 | 5,891 | 6,311 | 6,646 | 6,502 | 6,649 |
| YoY % Change | NAP | -23.9% | -0.4% | 8.8% | 1.6% | 3.3% | 1.7% | 13.4% | 7.1% | 5.3% | -2.2% | 2.3% |
| (1) | Source: Las Vegas Convention and Visitors Authority. |
The Las Vegas Strip hotel average occupancy has been approximately 90% over the last three years. The Las Vegas Strip average 2019 occupancy was 90.4% and average 2018 occupancy was 89.5%. The Las Vegas Strip average 2019 ADR of $143.31 increased 3.3% relative to the average 2018 ADR of $138.71.
| Historical Occupancy, ADR, RevPAR – Competitive Set | |||||||||
| MGM Grand Resort(1) | Competitive Set(2)(3) | MGM Grand Penetration Factor(2) | |||||||
| Year | Occupancy | ADR | RevPAR | Occupancy | ADR | RevPAR | Occupancy | ADR | RevPAR |
| December 31, 2017 | 92.1% | $181.76 | $167.36 | 92.0% | $181.95 | $167.10 | 100.2% | 100.0% | 100.3% |
| December 31, 2018 | 92.7% | $182.10 | $168.76 | 93.0% | $187.63 | $173.66 | 100.1% | 97.4% | 97.6% |
| December 31, 2019 | 91.4% | $190.29 | $173.85 | 94.0% | $193.23 | $181.41 | 98.7% | 98.6% | 97.3% |
| (1) | Source: Historical operating statements. |
| (2) | Source: Appraisal. |
| (3) | Includes: The Mirage, New York New York, Luxor, Caesars, Planet Hollywood, and Venetian/Palazzo. |
THE INFORMATION IN THIS STRUCTURAL AND COLLATERAL TERM SHEET IS NOT COMPLETE AND MAY BE AMENDED PRIOR TO THE TIME OF SALE. THIS TERM SHEET IS NOT AN OFFER TO SELL THESE SECURITIES AND IT IS NOT A SOLICITATION OF AN OFFER TO BUY THESE SECURITIES IN ANY JURISDICTION WHERE THE OFFER OR SALE IS NOT PERMITTED.
46
3799 & 3950 South Las Vegas Boulevard Las Vegas, NV Various | Collateral Asset Summary – Loan No. 2 MGM Grand & Mandalay Bay | Cut-off Date Balance: Cut-off Date LTV: U/W NCF DSCR: U/W NOI Debt Yield: | $75,000,000 35.5% 4.95x 17.9% |
| Historical Occupancy, ADR, RevPAR – Competitive Set | |||||||||
| Mandalay Bay Resort(1) | Competitive Set(2)(3) | Mandalay Bay Penetration Factor(2) | |||||||
| Year | Occupancy | ADR | RevPAR | Occupancy | ADR | RevPAR | Occupancy | ADR | RevPAR |
| December 31, 2017 | 90.0% | $206.28 | $185.57 | 92.0% | $177.98 | $164.06 | 98.0% | 113.2% | 110.9% |
| December 31, 2018 | 90.2% | $203.96 | $183.96 | 93.0% | $183.94 | $171.13 | 97.4% | 109.2% | 106.4% |
| December 31, 2019 | 92.8% | $202.98 | $188.40 | 94.0% | $190.09 | $178.15 | 96.6% | 108.8% | 105.1% |
| (1) | Source: Historical operating statements. |
| (2) | Source: Appraisal. |
| (3) | Includes: The Mirage, New York New York, Luxor, Caesars, Planet Hollywood, and Venetian/Palazzo. |
Additional group business is expected to enter the market as a result of the delivery of Allegiant Stadium in July 2020 (across the street from the Mandalay Bay Property) which will serve as the home stadium for the Raiders NFL team. Non-gaming revenue in the Las Vegas market was approximately 65% of total revenue in 2019 compared to pre-recession levels of approximately 59% in 2007.
Each of the MGM Grand & Mandalay Bay Properties share the same competitive set. The primary competitive set for the MGM Grand & Mandalay Bay Properties consists of six hotels, which range in size from 2,024 to 7,117 rooms and collectively contain an aggregate 23,058 rooms. According to the appraisal, there are two mega resorts in the construction phase with planned delivery between 2021 and 2022. Resorts World Las Vegas is a 59-story Chinese-themed mega resort under construction the former Stardust Resort and Casino site on the northern Las Vegas Strip with scheduled delivery by summer of 2021 according to the appraisal. The Drew is a 735-foot tall, 75% completed mega casino resort scheduled to be delivered by 2022.
| Comparable Properties(1) | |||||||
| Property Name | No. of Rooms | Year Opened | Meeting Space (sq. ft.) | Casino Space (sq. ft.) | Estimated 2019 Occ. | Estimated 2019 ADR | Estimated 2019 RevPAR |
| MGM Grand(2) | 4,998 | 1993 | 748,325 | 177,268 | 91.4% | $190.29 | $173.85 |
| Mandalay Bay(2) | 4,750 | 1999 | 2,100,000 | 152,159 | 92.8% | $202.98 | $188.40 |
| The Mirage | 3,044 | 1989 | 170,000 | 94,000 | 94.6% | $178.00 | $168.39 |
| New York New York | 2,024 | 1997 | 30,500 | 81,000 | 95.5% | $151.00 | $144.21 |
| Luxor | 4,397 | 1993 | 20,000 | 120,000 | 95.0% | $119.00 | $113.05 |
| Caesar’s Palace | 3,976 | 1966 | 300,000 | 124,200 | 93.0% | $221.00 | $205.53 |
| Planet Hollywood | 2,500 | 2000 | 20,000 | 64,500 | 90.0% | $185.00 | $166.50 |
| Venetian/Palazzo | 7,117 | 1999 | 450,000 | 335,878 | 94.6% | $237.00 | $224.20 |
| (1) | Source: Appraisal, unless otherwise indicated. |
| (2) | Source: Underwriting and Borrower Sponsor provided information. |
Property Management. The MGM Grand & Mandalay Bay Properties are currently managed by the MGM Tenant and/or the applicable MGM/Mandalay Operating Subtenant, and there are no management agreements currently in effect with the Borrowers and, other than the management agreement with respect to the Four Seasons hotel and the management agreement with respect to certain signature hotel units (which, for the avoidance of doubt, are not part of the MGM Grand & Mandalay Bay Properties), for which management fees related thereto are included as part of the collateral, there are no management agreements currently in effect with respect to the MGM Grand & Mandalay Bay Properties.
Lockbox / Cash Management. The MGM Grand & Mandalay Bay Whole Loan is subject to a hard lockbox with springing cash management. Amounts on deposit in the lockbox account will be disbursed to the Borrower’s operating account in accordance with the clearing account agreement. After the occurrence and during the continuation of a MGM Grand & Mandalay Bay Trigger Period (as defined below), the Borrowers will establish a cash management account and, at least two times per week, the clearing account bank will sweep funds from the lockbox accounts into the cash management account in accordance with the clearing account agreement and the cash management bank will apply funds on deposit in the order of priority described in the MGM Grand & Mandalay Bay Whole Loan documents, with the remaining excess cash flow (the “Excess Cash Flow Reserve”) to be held as additional collateral for the MGM Grand & Mandalay Bay Whole Loan (and, after the ARD, all amounts in the Excess Cash Flow Reserve account will be used to pay the monthly additional interest amount and applied to the principal of the MGM Grand & Mandalay Bay Whole Loan).
A “MGM Grand & Mandalay Bay Trigger Period” means a period (A) commencing upon the occurrence of any of the following: (i) the Debt Service Coverage Ratio (“DSCR”) falling below 2.50x (the “DSCR Threshold”) for two consecutive quarters (a “DSCR Trigger”), (ii) the MGM Tenant is subject to a bankruptcy action (an “OpCo Bankruptcy”), (iii) an event of default under the MGM Grand & Mandalay Bay Whole Loan has occurred and is continuing (an “EOD Trigger”), (iv) an OpCo Trigger Event (as defined below) or (v) the Borrowers fail to repay the MGM Grand & Mandalay Bay Whole Loan in full on or before the ARD and (B) terminating upon (i) in the event of a DSCR Trigger, either such time that the DSCR exceeds the DSCR Threshold for two consecutive quarters or the Borrowers make voluntary prepayments of the MGM Grand & Mandalay Bay Whole Loan in accordance with the terms of the MGM Grand & Mandalay Bay Whole Loan documents in amounts necessary to achieve a DSCR greater than or equal to the DSCR Threshold (without any obligation to wait two consecutive quarters), (ii) in the event of an OpCo Bankruptcy, the assumption of the Master Lease in such bankruptcy proceeding or the replacement of the MGM Tenant as provided in the MGM Grand & Mandalay Bay Whole Loan documents
THE INFORMATION IN THIS STRUCTURAL AND COLLATERAL TERM SHEET IS NOT COMPLETE AND MAY BE AMENDED PRIOR TO THE TIME OF SALE. THIS TERM SHEET IS NOT AN OFFER TO SELL THESE SECURITIES AND IT IS NOT A SOLICITATION OF AN OFFER TO BUY THESE SECURITIES IN ANY JURISDICTION WHERE THE OFFER OR SALE IS NOT PERMITTED.
47
3799 & 3950 South Las Vegas Boulevard Las Vegas, NV Various | Collateral Asset Summary – Loan No. 2 MGM Grand & Mandalay Bay | Cut-off Date Balance: Cut-off Date LTV: U/W NCF DSCR: U/W NOI Debt Yield: | $75,000,000 35.5% 4.95x 17.9% |
(or in the event the Master Lease is terminated and not replaced, the DSCR is equal to or greater than the DSCR Threshold or the Borrowers make voluntary prepayments of the MGM Grand & Mandalay Bay Whole Loan in accordance with the terms of the MGM Grand & Mandalay Bay Whole Loan documents in amounts necessary to achieve a DSCR greater than or equal to the DSCR Threshold (without any obligation to wait two consecutive quarters)), (iii) in the event of an OpCo Trigger Period, any OpCo Trigger Event Cure (as defined below) and (iv) in the event of an EOD Trigger, no other events of default exist and are continuing and the mortgage lender will have accepted a cure by the Borrowers of such event of default. For the avoidance of doubt, in no instance will an MGM Grand & Mandalay Bay Trigger Period caused by the failure of the Borrowers to repay the MGM Grand & Mandalay Bay Whole Loan in full on or before the ARD be capable of being cured or deemed to expire.
An “OpCo Trigger Event” means the occurrence and continuance of all of the following conditions simultaneously: (i) an event of default under the Master Lease has occurred and is continuing; (ii) (x) the managing member of the Joint Venture is an affiliate of the Borrowers other than MGP or MGP OP that is controlled by MGP or MGP OP and (y) MGP OP is controlled by MGM and (iii) such managing member is permitted under the terms of the Joint Venture agreement to take any of the following actions without the consent of (x) BCORE Windmill Parent LLC (the member of the Joint Venture that is affiliated with BREIT OP) (a) granting any consent, approval or wavier or making any election under the Master Lease, Lease Guaranty or other related lease documents, (b) entering into any amendment, supplement or modification to the Master Lease, Lease Guaranty or other related lease documents, or (c) declaring an event of default under the Master Lease, Lease Guaranty or other related lease documents or (y) if applicable, a Qualified Transferee (as defined in the MGM Grand & Mandalay Bay Whole Loan documents) that is not an affiliate of MGM Tenant which owns a 15% or greater direct and/or indirect interest in the Borrowers.
“Lease Guaranty” means that certain Guaranty of Lease Documents dated as of February 14, 2020, made by MGM in favor of the Borrowers.
An “OpCo Trigger Event Cure” means, as applicable, (i) the Borrowers have provided evidence to the mortgage lender of the cure of the event of default under the Master Lease, (ii) the Borrowers have waived the event of default under the Master Lease, provided that such waiver was approved by the mortgage lender, or (iii) in the event that the event of default results in the termination of the Master Lease, either (a) (I) the Borrowers and MGM Tenant have entered into a new lease on terms and conditions substantially similar to those contained in the Master Lease as of the origination of the MGM Grand & Mandalay Bay Whole Loan and (II) the Master Lease opinion delivery requirements have been satisfied, or (b) after giving effect to the termination of the Master Lease the DSCR is equal to or greater than 2.50x for two consecutive quarters or the Borrowers make voluntary prepayments in accordance with the terms of the MGM Grand & Mandalay Bay Whole Loan documents in an amount necessary to achieve a DSCR equal to or greater than 2.50x.
Initial and Ongoing Reserves. At loan origination, the Borrowers were not required to deposit any initial reserves. For so long as the MGM Grand & Mandalay Bay Properties are subject to the Master Lease, there are no ongoing reserves required under the MGM Grand & Mandalay Bay Whole Loan documents.
Under the Master Lease, the MGM Tenant is obligated to make monthly deposits of 1.50% of net revenues at an eligible institution to be used for FF&E and qualifying capital expenditures (the “OpCo FF&E Reserve Account”). MGM Tenant granted the Borrowers a security interest in the OpCo FF&E Reserve Account, and the Borrowers collaterally assigned the Borrowers’ security interest in the OpCo FF&E Reserve Account to the mortgage lender.
Real Estate Taxes Reserve. For so long as the MGM Grand & Mandalay Bay Properties are subject to the Master Lease, no reserves for real estate taxes are required under the loan documents. If the MGM Grand & Mandalay Bay Properties are not subject to the Master Lease, solely if a MGM Grand & Mandalay Bay Trigger Period is in effect, the loan documents provide for ongoing monthly reserves for real estate taxes in an amount equal to 1/12 of the real estate taxes that the lender estimates will be payable during the next 12 months at least 30 days prior to their respective due dates. Notwithstanding the foregoing, the requirement for such monthly reserves will be reduced dollar for dollar by any taxes paid or reserved for by a brand manager or casino operator pursuant to a brand management or casino management agreement relating to the MGM Grand & Mandalay Bay Properties.
Insurance Reserve. For so long as the MGM Grand & Mandalay Bay Properties are subject to the Master Lease, no reserves for insurance premiums are required under the loan documents. If the MGM Grand & Mandalay Bay Properties are not subject to the Master Lease, solely if a MGM Grand & Mandalay Bay Trigger Period is in effect, the loan documents provide for ongoing monthly reserves for insurance premiums in an amount equal to 1/12 of the insurance premiums that the lender estimates will be payable for the renewal of the insurance policies at least 30 days prior to the expiration thereof. Notwithstanding the foregoing, the requirement for such monthly reserves will be reduced dollar for dollar by any insurance premiums paid or reserved for by a brand manager or casino operator pursuant to a brand management or casino management agreement relating to the MGM Grand & Mandalay Bay Properties. In addition, such monthly reserves will not be required so long as (i) no event of default is continuing, and (ii) the insurance coverage for the MGM Grand & Mandalay Bay Properties are included in a blanket policy reasonably acceptable to the lender.
Replacement Reserve. For so long as the MGM Grand & Mandalay Bay Properties are not subject to the Master Lease, (i) on each Payment Date during a MGM Grand & Mandalay Bay Trigger Period, the Borrowers will be required to make a deposit equal to (a) 4.0% of net revenue from guest rooms and Borrower-managed food and beverage operations and (b) 0.5% of all other net revenue (other than
THE INFORMATION IN THIS STRUCTURAL AND COLLATERAL TERM SHEET IS NOT COMPLETE AND MAY BE AMENDED PRIOR TO THE TIME OF SALE. THIS TERM SHEET IS NOT AN OFFER TO SELL THESE SECURITIES AND IT IS NOT A SOLICITATION OF AN OFFER TO BUY THESE SECURITIES IN ANY JURISDICTION WHERE THE OFFER OR SALE IS NOT PERMITTED.
48
3799 & 3950 South Las Vegas Boulevard Las Vegas, NV Various | Collateral Asset Summary – Loan No. 2 MGM Grand & Mandalay Bay | Cut-off Date Balance: Cut-off Date LTV: U/W NCF DSCR: U/W NOI Debt Yield: | $75,000,000 35.5% 4.95x 17.9% |
non-recurring items), in each case for the calendar month that is two months prior to the calendar month in which the applicable deposit to the replacement reserve fund is to be made (the sum of (a) and (b), the “Replacement Reserve Monthly Deposit”), and (ii) if a MGM Grand & Mandalay Bay Trigger Period does not exist, on the first payment date of each calendar quarter, an amount equal to the lesser of (x) the Replacement Reserve Current Year Lookback Deficiency and (y) the Replacement Reserve Five Year Lookback Deficiency (as defined below) (the lesser of (x) and (y), the “Replacement Reserve Quarterly Deposit”), provided that for so long as any individual Property is managed by (x) a brand manager pursuant to a brand management agreement and/or (y) a casino operator pursuant to a casino management agreement, the amounts required to be funded as a Replacement Reserve Monthly Deposit or a Replacement Reserve Quarterly Deposit will be reduced on a dollar-for-dollar basis by any amounts deposited into a manager account for replacements, PIP work or brand mandated work for the applicable calendar months as set forth in the annual budget and required pursuant to the terms of the brand management agreement and/or casino management agreement if the Borrowers deliver evidence reasonably satisfactory to the mortgage lender that such deposit has been made.
“Replacement Reserve Current Year Lookback Deficiency” means an amount equal to (x) the aggregate amount of Replacement Reserve Monthly Deposits which would have been funded from the beginning of the then calendar year to the date of determination had a MGM Grand & Mandalay Bay Trigger Period been in effect for the entirety of such period less (y) the sum of (1) the aggregate amount expended on replacements, PIP work and brand mandated work during such calendar year to date and (2) the aggregate amount funded into the Replacement Reserve Fund during such calendar year to date; provided, if the foregoing calculation results in a negative number, the Replacement Reserve Current Year Lookback Deficiency will be deemed to be zero.
“Replacement Reserve Five Year Lookback Deficiency” means (i) zero, with respect to any period before December 31, 2024, and (ii) from and after January 1, 2025, an amount equal to (x) 4.0% of net revenue from guest rooms and Borrower-managed food and beverage operations and 0.5% of all other net revenues (other than non-recurring items) during the Replacement Reserve Five Year Lookback Period (as defined below) less (y) the sum of (1) the aggregate amount expended on replacements, PIP work and brand mandated work during the Replacement Reserve Five Year Lookback Period (including amounts expended by MGM Tenant pursuant to the express terms and conditions of the Master Lease) and (2) the aggregate amounts funded into the Replacement Reserve Fund during such Replacement Reserve Five Year Lookback Period; provided, if the foregoing calculation results in a negative number, the Replacement Reserve Five Year Lookback Deficiency will be deemed to be zero.
“Replacement Reserve Five Year Lookback Period” means each five (5) year period (on a rolling basis) with the first period commencing on January 1, 2020 and expiring on December 31, 2024 and the second period commencing on January 1, 2021 and expiring on December 31, 2025.
Current Mezzanine or Subordinate Indebtedness. In addition to the MGM Grand & Mandalay Bay Loan, the MGM Grand & Mandalay Bay Properties also secure the MGM Grand & Mandalay Bay Senior Notes not included in the Benchmark 2020-B22 securitization trust, which have an aggregate Cut-off Date principal balance of $1,559,200,000, and the MGM Grand & Mandalay Bay Junior Notes (which have an aggregate Cut-off Date principal balance of $1,365,800,000). The MGM Grand & Mandalay Bay Senior Notes not included in the Benchmark 2020-B22 trust and the MGM Grand & Mandalay Bay Junior Notes accrue interest at the same rate as the MGM Grand & Mandalay Bay Loan. The MGM Grand & Mandalay Bay Loan is entitled to payments of interest and principal on a pro rata and pari passu basis with the MGM Grand & Mandalay Bay Senior Notes not included in the Benchmark 2020-B22 securitization trust. The MGM Grand & Mandalay Bay Loan and the MGM Grand & Mandalay Bay Senior Notes not included in the Benchmark 2020-B22 securitization trust are generally senior to the MGM Grand & Mandalay Bay Junior Notes.
Future Mezzanine or Subordinate Indebtedness Permitted. The MGM Grand & Mandalay Bay Borrowers have a one-time right to borrow a mezzanine loan subordinate to the MGM Grand & Mandalay Bay Whole Loan (“Mezzanine Loan”), subject to credit and legal criteria specified in the MGM Grand & Mandalay Bay Whole Loan documents, including, without limitation: (i) a combined maximum loan to value ratio (based on appraisals ordered by the lender in connection with the closing of the Mezzanine Loan and calculated based on the outstanding principal balance of the MGM Grand & Mandalay Bay Whole Loan and the initial principal amount of the Mezzanine Loan) of 67.0%, (ii) a debt service coverage ratio at the closing of the Mezzanine Loan at least equal to 4.81x, in each case, inclusive of the additional mezzanine debt and (iii) an intercreditor agreement reasonably satisfactory to the lender. The lender’s receipt of a rating agency confirmation will not be required in connection with the Mezzanine Loan.
Notwithstanding the foregoing, (1) during a MGM Grand & Mandalay Bay Trigger Period (and for so long as no event of default has occurred and is continuing), in the event that the Mezzanine Loan (or any portion thereof) is directly or indirectly or beneficially owned by the MGM Grand & Mandalay Bay Borrowers, mezzanine borrower or a “broad affiliate” (as defined in the MGM Grand & Mandalay Whole Loan documents) of the Borrowers or mezzanine borrower (an “Affiliated Mezzanine Lender”), in no instance will the Affiliated Mezzanine Lender be permitted to receive late charges, principal (other than the pro rata prepayment of the Mezzanine Loan upon the release of an individual Property or prepayment of the MGM Grand & Mandalay Bay Whole Loan in accordance with the terms and conditions of the MGM Grand & Mandalay Bay Whole Loan documents and the Mezzanine Loan documents) or interest at the default rate, even if an event of default has occurred and is continuing under the Mezzanine Loan and such Affiliated Mezzanine Lender will only be permitted to receive interest at the non-default rate on a monthly basis, (2) during a MGM Grand & Mandalay Bay Trigger Period (and for so long as no event of default has occurred and is continuing under the MGM Grand & Mandalay Bay Whole Loan documents), for so long as the whole Mezzanine Loan is not directly or indirectly or beneficially owned by an Affiliated Mezzanine Lender, the mezzanine lender will
THE INFORMATION IN THIS STRUCTURAL AND COLLATERAL TERM SHEET IS NOT COMPLETE AND MAY BE AMENDED PRIOR TO THE TIME OF SALE. THIS TERM SHEET IS NOT AN OFFER TO SELL THESE SECURITIES AND IT IS NOT A SOLICITATION OF AN OFFER TO BUY THESE SECURITIES IN ANY JURISDICTION WHERE THE OFFER OR SALE IS NOT PERMITTED.
49
3799 & 3950 South Las Vegas Boulevard Las Vegas, NV Various | Collateral Asset Summary – Loan No. 2 MGM Grand & Mandalay Bay | Cut-off Date Balance: Cut-off Date LTV: U/W NCF DSCR: U/W NOI Debt Yield: | $75,000,000 35.5% 4.95x 17.9% |
receive on a monthly basis interest at the non-default rate and, if an event of default has occurred and is continuing under the Mezzanine Loan, funds sufficient to pay any other amounts then due under the Mezzanine Loan and the Mezzanine Loan documents (other than the payment of the outstanding principal amount of the Mezzanine Loan on the maturity date of the Mezzanine Loan whether on the scheduled date for such payment or earlier due to an acceleration of the Mezzanine Loan) and (3) after the ARD, in no instance will any mezzanine lender be permitted to receive any payments whatsoever.
Partial Release. So long as no event of default has occurred and is continuing (other than as set forth below), the Borrowers may at any time release an individual Property from the MGM Grand & Mandalay Bay Whole Loan by prepaying the applicable Release Percentage (as defined below) of the ALA of the subject individual Property (including any yield maintenance premium, if required), and subject to the terms and conditions in the MGM Grand & Mandalay Bay Whole Loan documents, including, without limitation: (i) the DSCR after giving effect to such release is at least equal to 4.81x; (ii) continued compliance with the single purpose entity requirements contained in the MGM Grand & Mandalay Bay Whole Loan documents; (iii) payment to an agent or servicer of the then current and customary fee by such persons for such releases in an amount not to exceed $2,000.00 and any reasonable legal fees or other out-of-pocket costs incurred by the lender to effect the release and any applicable prepayment premiums (provided the legal fees may not exceed $10,000.00); (iv) payment of all recording charges, filing fees, taxes or other similar expenses payable in connection therewith; (v) if the MGM Grand & Mandalay Bay Whole Loan is securitized in a REMIC trust, compliance with applicable REMIC requirements relating to the REMIC 125% LTV test for release which may be satisfied by delivery of any of the following if permitted by REMIC requirements: an existing or updated appraisal, a broker’s price opinion or other written determination of value using a commercially reasonable valuation method, in each case satisfactory to the lender, but will be based solely on the value of real property and will exclude personal property and going-concern value; and (vi) if the Property is subject to the Master Lease, the Borrowers removing the released individual Property from the Master Lease and entering into a new triple-net lease with respect to the remaining individual Property on substantially the same terms as the Master Lease (collectively, the “Release Conditions”).
“Release Percentage” means, with respect to any individual Property, 105.0% until such time as the outstanding principal balance of the MGM Grand & Mandalay Bay Whole Loan is reduced to $2,250,000,000 (the “Release Percentage Threshold”), and 110.0% thereafter. In calculating the Release Amount for an individual Property, the Release Percentage may initially be 105% until the application of a portion of such prepayment would reach the Release Percentage Threshold and with respect to any remaining prepayment for such individual Property, the Release Percentage would be 110%.
Notwithstanding the foregoing, in the event that the DSCR following the release would not satisfy the DSCR requirement in clause (i) of the Release Conditions, and such release is in connection with an arms’ length transaction with an unrelated third party, the Borrowers will be permitted to release the proposed release Property and the amount that will be required to be prepaid (or defeased) in connection with such release will equal the greater of (I) the Release Percentage of the ALA for such individual Property, together with, to the extent the release does not occur in connection with a partial defeasance, any yield maintenance premium required (if any) and (II) the lesser of (x) 100.0% of the net sales proceeds for the sale of such individual Property (net of reasonable and customary closing costs associated with the sale of such individual Property) and (y) an amount necessary to, after giving effect to such release of the individual Property, achieve the DSCR requirement in the preceding paragraph.
The Borrowers may release any defaulting individual Property, without the payment of any yield maintenance premium, in order to cure a default or an event of default related to such individual Property, subject to the satisfaction of other terms and conditions in the MGM Grand & Mandalay Bay Whole Loan documents (including, without limitation, Release Conditions (other than clause (i))) (a “Default Release”). In addition, the Borrowers may release an individual Property (including to an affiliate) if the estimated net proceeds following any casualty or condemnation at such individual Property will be equal to or greater than (x) 25.0% of its allocated whole loan amount, or (y) 5.0% of its ALA (subject to the satisfaction of other terms and conditions in the MGM Grand & Mandalay Bay Whole Loan documents) upon satisfaction of clauses (iii), (iv) and (v) of the Release Conditions above and prepayment of the MGM Grand & Mandalay Bay Whole Loan in an amount equal to the net proceeds (up to an amount equal to the Release Percentage) for such individual Property (a “Special Release”).
THE INFORMATION IN THIS STRUCTURAL AND COLLATERAL TERM SHEET IS NOT COMPLETE AND MAY BE AMENDED PRIOR TO THE TIME OF SALE. THIS TERM SHEET IS NOT AN OFFER TO SELL THESE SECURITIES AND IT IS NOT A SOLICITATION OF AN OFFER TO BUY THESE SECURITIES IN ANY JURISDICTION WHERE THE OFFER OR SALE IS NOT PERMITTED.
50
(THIS PAGE INTENTIONALLY LEFT BLANK)
51
Various New York, NY 10036 | Collateral Asset Summary – Loan No. 3 Elo Midtown Office Portfolio | Cut-off Date Balance: Cut-off Date LTV: U/W NCF DSCR: U/W NOI Debt Yield: | $71,000,000 58.5% 2.30x 8.6% |
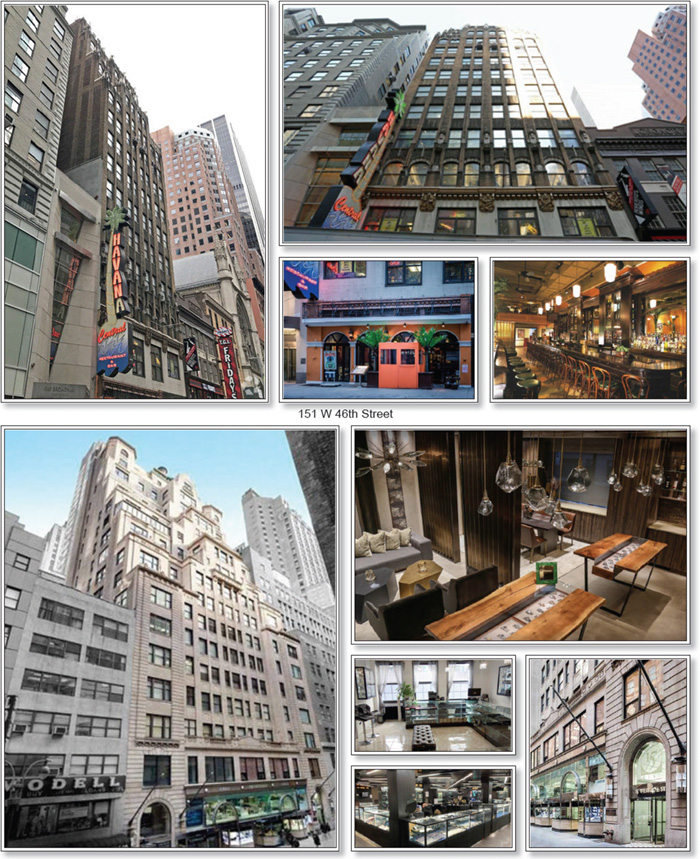
THE INFORMATION IN THIS STRUCTURAL AND COLLATERAL TERM SHEET IS NOT COMPLETE AND MAY BE AMENDED PRIOR TO THE TIME OF SALE. THIS TERM SHEET IS NOT AN OFFER TO SELL THESE SECURITIES AND IT IS NOT A SOLICITATION OF AN OFFER TO BUY THESE SECURITIES IN ANY JURISDICTION WHERE THE OFFER OR SALE IS NOT PERMITTED.
52
Various New York, NY 10036 | Collateral Asset Summary – Loan No. 3 Elo Midtown Office Portfolio | Cut-off Date Balance: Cut-off Date LTV: U/W NCF DSCR: U/W NOI Debt Yield: | $71,000,000 58.5% 2.30x 8.6% |
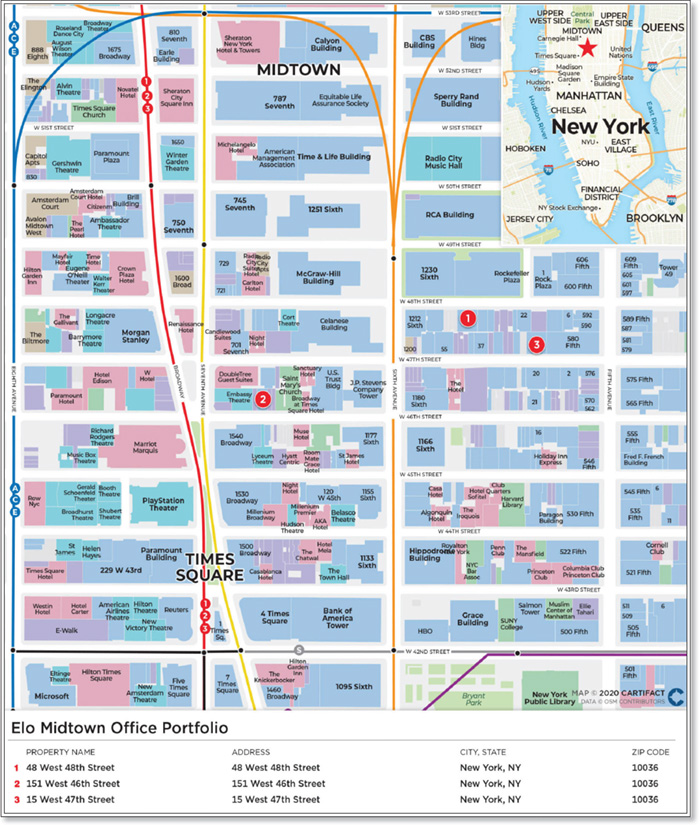
THE INFORMATION IN THIS STRUCTURAL AND COLLATERAL TERM SHEET IS NOT COMPLETE AND MAY BE AMENDED PRIOR TO THE TIME OF SALE. THIS TERM SHEET IS NOT AN OFFER TO SELL THESE SECURITIES AND IT IS NOT A SOLICITATION OF AN OFFER TO BUY THESE SECURITIES IN ANY JURISDICTION WHERE THE OFFER OR SALE IS NOT PERMITTED.
53
Various New York, NY 10036 | Collateral Asset Summary – Loan No. 3 Elo Midtown Office Portfolio | Cut-off Date Balance: Cut-off Date LTV: U/W NCF DSCR: U/W NOI Debt Yield: | $71,000,000 58.5% 2.30x 8.6% |
| Mortgage Loan Information | |
| Loan Seller: | CREFI |
| Loan Purpose: | Refinance/Acquisition |
| Borrower Sponsor: | Jack Elo |
| Borrowers: | Elo Equity LLC; Simco Realty LLC; Elo Group LLC |
| Original Balance(1): | $71,000,000 |
| Cut-off Date Balance(1): | $71,000,000 |
| % by Initial UPB: | 8.7% |
| Interest Rate: | 3.51000% |
| Payment Date: | 6th of each month |
| First Payment Date(2): | January 6, 2021 |
| Maturity Date: | January 6, 2031 |
| Amortization: | Interest Only |
| Additional Debt(1): | $70,000,000 Pari Passu Debt |
| Call Protection(2): | L(24), D(93), O(4) |
| Lockbox / Cash Management: | Soft / Springing |
| Reserves(3) | |||
| Initial | Monthly | Cap | |
| Taxes: | $0 | $490,582 | NAP |
| Insurance: | $0 | $5,716 | NAP |
| Replacement: | $0 | $5,605 | NAP |
| TI/LC: | $0 | $28,025 | NAP |
| Debt Service: | $2,508,919 | $0 | NAP |
| Property Information | |
| Single Asset / Portfolio: | Portfolio of three properties |
| Property Type: | CBD Office |
| Collateral: | Fee Simple |
| Location: | New York, NY |
| Year Built / Renovated: | 1926, 1928 / NAP |
| Total Sq. Ft.: | 336,302 |
| Property Management: | Self-Managed |
| Underwritten NOI: | $12,063,318 |
| Underwritten NCF: | $11,543,568 |
| Appraised Value: | $241,000,000 |
| Appraisal Date: | November 1, 2020 |
| Historical NOI | |
| Most Recent NOI: | $9,322,373 (T-12 October 31, 2020) |
| 2019 NOI: | $11,945,190 (December 31, 2019) |
| 2018 NOI: | $12,346,219 (December 31, 2018) |
| 2017 NOI: | $12,541,851 (December 31, 2017) |
| Historical Occupancy | |
| Most Recent Occupancy(4): | 95.3% (Various) |
| 2019 Occupancy: | 95.5% (December 31, 2019) |
| 2018 Occupancy: | 97.4% (December 31, 2018) |
| 2017 Occupancy: | 97.0% (December 31, 2017) |
| Financial Information(1) | ||||||
| Tranche | Cut-off Date Balance | Balance per Sq. Ft. Cut-off / Balloon | LTV Cut-off / Balloon | U/W DSCR NOI / NCF | U/W Debt Yield NOI / NCF | U/W Debt Yield at Balloon NOI / NCF |
| Mortgage Loan | $71,000,000 | |||||
| Pari Passu Note | $70,000,000 | |||||
| Whole Loan | $141,000,000 | $419 / $419 | 58.5% / 58.5% | 2.40x / 2.30x | 8.6% / 8.2% | 8.6% / 8.2% |
| (1) | The Cut-off Date Balance of $71,000,000 represents the outstanding principal balance of the controlling Note A-1, which is part of the Elo Midtown Office Portfolio Whole Loan (as defined below) consisting of two pari passu promissory notes with an aggregate original principal and Cut-off Date Balance of $141,000,000. |
| (2) | The first payment date for the Elo Midtown Office Portfolio Whole Loan is February 6, 2021. On the Closing Date, CREFI will deposit sufficient funds to pay the amount of interest that would be due with respect to a January 6, 2021 payment. Original term to maturity (months), original interest only period (months), and prepayment provisions are inclusive of the additional January 6, 2021 interest only-payment to be funded on the Closing Date. |
| (3) | See “—Initial and Ongoing Reserves” below. |
| (4) | Occupancy dates for 48 West 48th Street, 151 West 46th Street, and 15 West 47th Street are November 3, 2020, November 1, 2020, and November 5, 2020, respectively. |
THE INFORMATION IN THIS STRUCTURAL AND COLLATERAL TERM SHEET IS NOT COMPLETE AND MAY BE AMENDED PRIOR TO THE TIME OF SALE. THIS TERM SHEET IS NOT AN OFFER TO SELL THESE SECURITIES AND IT IS NOT A SOLICITATION OF AN OFFER TO BUY THESE SECURITIES IN ANY JURISDICTION WHERE THE OFFER OR SALE IS NOT PERMITTED.
54
Various New York, NY 10036 | Collateral Asset Summary – Loan No. 3 Elo Midtown Office Portfolio | Cut-off Date Balance: Cut-off Date LTV: U/W NCF DSCR: U/W NOI Debt Yield: | $71,000,000 58.5% 2.30x 8.6% |
The Loan. The Elo Midtown Office Portfolio mortgage loan (the “Elo Midtown Office Portfolio Loan”) is part of a whole loan (the “Elo Midtown Office Portfolio Whole Loan”), which is secured by each borrower’s fee simple interest in three office properties located in New York, New York (each, individually an “Elo Midtown Office Portfolio Property” and collectively, the “Elo Midtown Office Portfolio Properties”). The Elo Midtown Office Portfolio Whole Loan is comprised of two pari passu notes with an aggregate principal balance as of the Cut-off Date of $141.0 million. The controlling Note A-1, with an outstanding principal balance as of the Cut-off Date of $71.0 million, will be included in the Benchmark 2020-B22 trust and constitutes the Elo Midtown Office Portfolio Loan. The non-controlling Note A-2, with an outstanding principal balance as of the Cut-off Date of $70.0 million, is expected to be contributed to the GSMS 2020-GSA2 securitization trust. The relationship between the holders of the Elo Midtown Office Portfolio Whole Loan is governed by a co-lender agreement as described under “Description of the Mortgage Pool—The Whole Loans—The Serviced Pari Passu Whole Loans” in the Preliminary Prospectus. The Elo Midtown Office Portfolio Whole loan has an interest rate of 3.51000% and was originated by Citi Real Estate Funding Inc. (“CREFI”) on December 10, 2020.
The Elo Midtown Office Portfolio Whole Loan was utilized to refinance existing debt on the 48 West 48th Street and 151 West 46th Street properties, acquire the 15 West 47th Street property, fund reserves, and pay originations costs.
The table below summarizes the promissory notes that comprise the Elo Midtown Office Portfolio Whole Loan.
| Whole Loan Summary | ||||
| Note | Original Balance | Cut-off Date Balance | Note Holder | Controlling Piece |
| A-1 | $71,000,000 | $71,000,000 | Benchmark 2020-B22 | Yes |
| A-2 | $70,000,000 | $70,000,000 | GSMS 2020-GSA2(1) | No |
| Whole Loan | $141,000,000 | $141,000,000 | ||
| (1) | The GSMS 2020-GSA2 securitization transaction is expected to close prior to the Closing Date. |
| Sources and Uses | ||||||
| Sources | Proceeds | % of Total | Uses | Proceeds | % of Total | |
| Whole Loan | $141,000,000 | 92.4% | Purchase Price | $110,000,000 | 72.1% | |
| Borrower Sponsor Equity | 11,536,649 | 7.6 | Loan Payoff | 34,270,386 | 22.5 | |
| Origination Costs | 5,757,344 | 3.8 | ||||
| Reserves | 2,508,919 | 1.6 | ||||
| Total Sources | $152,536,649 | 100.0% | Total Uses | $152,536,649 | 100.0% | |
The Elo Midtown Office Portfolio Whole Loan has an initial term of 121 months and has a remaining term of 121 months as of the Cut-off Date. The Elo Midtown Office Portfolio Whole Loan requires interest only payments on each due date through the scheduled maturity date in January 2031. Voluntary prepayment of the Elo Midtown Office Portfolio Whole Loan is prohibited prior to the due date in October 2030. At any time after the earlier to occur of (a) December 10, 2023 and (b) the second anniversary of the closing date of the securitization into which the last of the Elo Midtown Office Portfolio notes are securitized, the Elo Midtown Office Portfolio Whole Loan may be defeased in full with direct, non-callable obligations of the United States of America.
The Borrower(s) / Borrower Sponsor. The borrowers are Elo Equity LLC, Simco Realty LLC, and Elo Group LLC (collectively, the “Elo Midtown Office Portfolio Borrower”). Legal counsel to the Elo Midtown Office Portfolio Borrower delivered a non-consolidation opinion in connection with the origination of the Elo Midtown Office Portfolio Whole Loan.
The borrower sponsor and non-recourse carve out guarantor is Jack Elo of the Elo Organization, an active and multi-generational owner and operator of office buildings in Midtown Manhattan.
The Properties. The Elo Midtown Office Portfolio Properties consist of three central business district office properties totaling 336,302 sq. ft. located in New York, New York. The Elo Midtown Office Portfolio Properties were 95.3% occupied as of the related November 2020 rent rolls. Occupancy dates for 48 West 48th Street, 151 West 46th Street, and 15 West 47th Street are November 3, 2020, November 1, 2020, and November 5, 2020, respectively. All three buildings are Class B office buildings with ground floor retail space.
The following table presents detailed information with respect to each of the Elo Midtown Office Portfolio Properties.
| Portfolio Summary | |||||||||
| Property Name | City, State | Property Type (Subtype) | Allocated Whole Loan Amount | Total Sq. Ft. | Year Built | As-Is Appraised Value | U/W Base Rent | Market | Occ. (%)(1) |
| 48 West 48th Street | New York, NY | Office (CBD) | $45,500,000 | 137,663 | 1926 | 79,000,000 | $5,863,906 | New York | 100.0% |
| 151 West 46th Street | New York, NY | Office (CBD) | $24,000,000 | 65,500 | 1928 | 42,000,000 | $2,966,892 | New York | 100.0% |
| 15 West 47th Street | New York, NY | Office (CBD) | $71,500,000 | 133,139 | 1926 | 120,000,000 | $8,667,132 | New York | 88.1% |
| Total / Wtd. Avg. | $141,000,000 | 336,302 | $241,000,000 | $17,497,930 | 95.3% | ||||
| (1) | Occupancy dates for 48 West 48th Street, 151 West 46th Street, and 15 West 47th Street are November 3, 2020, November 1, 2020, and November 5, 2020, respectively. |
THE INFORMATION IN THIS STRUCTURAL AND COLLATERAL TERM SHEET IS NOT COMPLETE AND MAY BE AMENDED PRIOR TO THE TIME OF SALE. THIS TERM SHEET IS NOT AN OFFER TO SELL THESE SECURITIES AND IT IS NOT A SOLICITATION OF AN OFFER TO BUY THESE SECURITIES IN ANY JURISDICTION WHERE THE OFFER OR SALE IS NOT PERMITTED.
55
Various New York, NY 10036 | Collateral Asset Summary – Loan No. 3 Elo Midtown Office Portfolio | Cut-off Date Balance: Cut-off Date LTV: U/W NCF DSCR: U/W NOI Debt Yield: | $71,000,000 58.5% 2.30x 8.6% |
The 48 West 48th Street property was constructed in 1926 and spans 137,663 sq. ft. across 16 stories on a 0.219-acre site. According to the appraisal, the property is located within the Diamond District and within close proximity to two of the top 10 largest jewelry exchanges in the world, where 90% of the jewelry, diamonds and precious stones in the United States originally transact. The property is 100% occupied by a diverse roster of office tenants and three retail tenants. The office component represents 119,830 sq. ft. (approximately 87.0% of net rentable area) and, per the appraisal, is typical for buildings within the Diamond District, where jewelry tenants seek space featuring small, functional suites. The largest office tenants based on net rentable square feet include Luccello, Inc. (5,100 sq. ft.), Ez Estate Llc (4,763 sq. ft.), Intercolor Inc. (4,069 sq. ft.), and Sunrise Jewelry Corp (3,973 sq. ft.). The retail component represents the remaining 17,833 sq. ft. of the building and is occupied by three ground floor tenants, with frontage along the south side of West 48th Street. The largest retail tenant, occupying 10,350 sq. ft., is Rockefeller Corp., a restaurant that serves custom salads and sandwiches, fruit juices, smoothies and other items.
The 151 West 46th Street property was constructed in 1928 and spans 65,500 sq. ft. across 15 stories on a 0.115-acre site. The property is 100% occupied by one retail tenant, 20 office tenants and one telecom tenant. According to the appraisal, the property features small, functional floor plates demised for both single and multi-tenant occupants. The five largest tenants, based on net rentable square feet in the building, occupy 5,000 sq. ft. each. One of the tenants, Havana Central- Ny 2, LLC, a Cuban-themed restaurant and bar, occupies the ground level retail space and recently extended its lease until December 2029 at $192.00 per sq. ft. The other four largest tenants in the building include Neiger LLP, City Casting Corp., Artevyl Kiab LLC, and T.O. Dey Corp.
The 15 West 47th Street property was constructed in 1926 and spans 133,139 sq. ft. across 18 stories on a 0.225-acre site. The property is 88.1% occupied by a diverse roster of office and retail tenants. The office space comprises 105,214 sq. ft. and the retail space comprises 27,925 sq. ft. The largest office tenants based on net rentable square feet include The Del Gatto Luxury Group LLC, Avi & Co. Ny Corp., and Diamond Services. According to the appraisal, the retail unit is comprised of a large arcade unit, which is 8,762 sq. ft. and contains approximately 35 different booths.
COVID-19 Update. As of December 6, 2020 the Elo Midtown Office Portfolio Properties are open and operating. At the onset of the COVID-19 pandemic, the borrower sponsor offered a one-time rent concession for one or two months on a tenant-by-tenant basis that was not required to be repaid at the 48 West 48th Street and 151 West 46th Street properties in order to maintain strong relationships with tenants. Tenants at the 15 West 47th Street property were given a similar rent deferral option but were required to pay back any deferred rent. According to the borrower sponsor, collections at the Elo Midtown Office Portfolio Properties were 122.7% and 110.1% for October and November 2020, respectively, which is inclusive of rent being paid back. As of December 6, 2020, the Elo Midtown Office Portfolio Loan is not subject to any modification or forbearance requests. The first payment date under the Elo Midtown Office Portfolio Whole Loan documents of the Elo Midtown Office Portfolio Whole Loan is February 6, 2021. See “Risk Factors—Special Risks—Coronavirus Pandemic Has Adversely Affected the Global Economy and Will Likely Adversely Affect the Performance of the Mortgage Loans” in the Preliminary Prospectus.
| Tenant Summary(1) | ||||||
| Tenant | Credit Rating (Moody’s/Fitch/S&P)(2) | Net Rentable Area (Sq. Ft.) | % of Net Rentable Area | U/W Base Rent Per Sq. Ft.(3) | % of Total U/W Base Rent(3) | Lease Expiration |
| Havana Central- Ny 2, LLC | NR / NR / NR | 5,000 | 1.5% | $197.76 | 5.5% | 12/31/2029 |
| Rockefeller Corp. | NR / NR / NR | 10,350 | 3.1% | $78.30 | 4.5% | 5/31/2030 |
| Ultimate Jewelry(4) | NR / NR / NR | 2,025 | 0.6% | $205.11 | 2.3% | Various |
| Stir Fry Cuisine Inc. | NR / NR / NR | 3,607 | 1.1% | $87.22 | 1.8% | 2/28/2026 |
| Diamond Fantasies Inc, Et. Al. | NR / NR / NR | 526 | 0.2% | $572.38 | 1.7% | 7/31/2025 |
| Avi & Co. Ny Corp. | NR / NR / NR | 4,697 | 1.4% | $59.23 | 1.5% | 8/31/2025 |
| Sashka & Company Inc. | NR / NR / NR | 2,500 | 0.7% | $97.77 | 1.4% | 9/30/2021 |
| Diamond Services(5) | NR / NR / NR | 3,884 | 1.2% | $61.97 | 1.3% | Various |
| Tian Fu Lou, Inc. | NR / NR / NR | 3,876 | 1.2% | $55.73 | 1.2% | 1/31/2026 |
| Luccello, Inc. | NR / NR / NR | 5,100 | 1.5% | $39.34 | 1.1% | 11/30/2026 |
| Ten Largest Tenants | 41,565 | 12.4% | $96.48 | 22.3% | ||
| Remaining Occupied | 278,850 | 82.9% | $49.99 | 77.7% | ||
| Total / Wtd. Avg. Occupied Collateral | 320,415 | 95.3% | $56.02 | 100.0% | ||
| Vacant | 15,887 | 4.7% | ||||
| Total | 336,302 | 100.0% | ||||
| (1) | Based on the underwritten rent rolls dated November 1, 2020, November 3, 2020, and November 5, 2020. |
| (2) | Certain ratings are those of the parent company whether or not the parent guarantees the lease. |
| (3) | U/W Base Rent Per Sq. Ft. and % of Total U/W Base Rent are inclusive of contractual rent steps through November 1, 2021. |
| (4) | Ultimate Jewelry leases 1,768 sq. ft. expiring on October 31, 2025 and 257 sq. ft. expiring on December 31, 2021. |
| (5) | Diamond Services leases 2,163 sq. ft. expiring on January 31, 2022 and 1,721 sq. ft. expiring on December 31, 2022. |
THE INFORMATION IN THIS STRUCTURAL AND COLLATERAL TERM SHEET IS NOT COMPLETE AND MAY BE AMENDED PRIOR TO THE TIME OF SALE. THIS TERM SHEET IS NOT AN OFFER TO SELL THESE SECURITIES AND IT IS NOT A SOLICITATION OF AN OFFER TO BUY THESE SECURITIES IN ANY JURISDICTION WHERE THE OFFER OR SALE IS NOT PERMITTED.
56
Various New York, NY 10036 | Collateral Asset Summary – Loan No. 3 Elo Midtown Office Portfolio | Cut-off Date Balance: Cut-off Date LTV: U/W NCF DSCR: U/W NOI Debt Yield: | $71,000,000 58.5% 2.30x 8.6% |
| Lease Rollover Schedule(1)(2) | ||||||||
| Year | # of Leases Expiring | Total Expiring Sq. Ft. | % of Total Sq. Ft. Expiring | Cumulative Sq. Ft. Expiring | Cumulative % of Sq. Ft. Expiring | Annual U/W Base Rent Per Sq. Ft.(3) | % U/W Base Rent Rolling(3) | Cumulative % of U/W Base Rent(3) |
| MTM | 15 | 6,832 | 2.0% | 6,832 | 2.0% | $99.80 | 3.8% | 3.8% |
| 2020 | 12 | 10,288 | 3.1% | 17,120 | 5.1% | $48.46 | 2.8% | 6.6% |
| 2021 | 72 | 64,340 | 19.1% | 81,460 | 24.2% | $48.18 | 17.3% | 23.8% |
| 2022 | 60 | 73,917 | 22.0% | 155,377 | 46.2% | $43.73 | 18.0% | 41.9% |
| 2023 | 44 | 43,886 | 13.0% | 199,263 | 59.3% | $49.00 | 12.0% | 53.8% |
| 2024 | 19 | 19,611 | 5.8% | 218,874 | 65.1% | $48.45 | 5.3% | 59.1% |
| 2025 | 58 | 56,408 | 16.8% | 275,282 | 81.9% | $75.70 | 23.8% | 82.9% |
| 2026 | 3 | 12,583 | 3.7% | 287,865 | 85.6% | $58.11 | 4.1% | 87.0% |
| 2027 | 1 | 2,500 | 0.7% | 290,365 | 86.3% | $39.34 | 0.5% | 87.5% |
| 2028 | 0 | 0 | 0.0% | 290,365 | 86.3% | $0.00 | 0.0% | 87.5% |
| 2029 | 2 | 10,000 | 3.0% | 300,365 | 89.3% | $113.28 | 6.3% | 93.8% |
| 2030 | 3 | 17,850 | 5.3% | 318,215 | 94.6% | $58.28 | 5.8% | 99.6% |
| 2031 & Thereafter | 1 | 2,200 | 0.7% | 320,415 | 95.3% | $29.45 | 0.4% | 100.0% |
| Vacant | NAP | 15,887 | 4.7% | 336,302 | 100.0% | NAP | NAP | NAP |
| Total / Wtd. Avg. | 290 | 336,302 | 100.0% | $56.02 | 100.0% | |||
| (1) | Certain tenants may have termination or contraction options (which may become exercisable prior to the originally stated expiration date of the tenant lease) that are not considered in the above Lease Rollover Schedule. |
| (2) | Based on the underwritten rent rolls dated November 1, 2020, November 3, 2020, and November 5, 2020. |
| (3) | Annual U/W Base Rent Per Sq. Ft., % U/W Base Rent Rolling and Cumulative % of U/W Base Rent are inclusive of contractual rent steps through November 1, 2021 |
Major Tenants. The top three tenants occupying the Elo Midtown Office Portfolio properties by U/W Base Rent are Havana Central- Ny 2, LLC (5,000 sq. ft.; 1.5% of net rentable area; 5.5% of U/W Base Rent), Rockefeller Corp. (10,350 sq. ft.; 3.1% of net rentable area; 4.5% of U/W Base Rent), and Ultimate Jewelry (2,025 sq. ft.; 0.6% of net rentable area; 2.3% of U/W Base Rent).
Havana Central- Ny 2, LLC (5,000 sq. ft.; 1.5% of net rentable area; 5.5% of U/W Base Rent). Havana Central- Ny 2, LLC (“Havana”) is a Cuban-themed restaurant and bar that occupies all of the grade level retail/restaurant space at 151 West 46th Street. Havana pays a gross rent per sq. ft. of approximately $200. Havana’s current lease contract expires in December of 2029 and does not have any extension options.
Rockefeller Corp. (10,350 sq. ft.; 3.1% of net rentable area; 4.5% of U/W Base Rent). Rockefeller Corp. operates as a fast casual eatery called “Delis 48”. The restaurant offers 24 hours 7 days a week catering to the dense employment base surrounding Rockefeller Center. Delis 48 offers custom salads and sandwiches, gourmet buffet, fruit juices, Asian-style dishes such as sushi and ramen, and spacious upstairs seating. Rockefeller Corp.’s current lease expires in May of 2030 and does not have any extension options.
Ultimate Jewelry (2,025 sq. ft.; 0.6% of net rentable area; 2.3% of U/W Base Rent). Ultimate Jewelry, d/b/a Ultimate Diamond (“Ultimate Diamond”), is a 3rd generation family-run and operated diamond and jewelry business dating back to 1959. Ultimate Jewelry currently occupies three different spaces at 15 West 47th Street with three separate leases. One of the leases, totaling 257 sq. ft., expires in December 2021 with no extension options. The other two leases, totaling 1,768 sq. ft., expire in October 2025 with no extension options.
Environmental Matters. According to Phase I environmental reports dated February 27, 2020 and October 28, 2020, there are no recognized environmental conditions or recommendations for further action at the Elo Midtown Office Portfolio Properties.
The Market. The Elo Midtown Office Portfolio Properties are located within the midtown Manhattan office market, which contains approximately 289 million sq. ft. of office space with availability rate of 14.6% and average asking rents of $83.20 as of the third quarter of 2020. The 15 West 47th Street property and the 48 West 48th Street property are located within the Sixth Avenue/Rockefeller Center submarket and the 151 West 46th Street property is located within the Times Square submarket.
According to the appraisal, the Sixth Avenue/Rockefeller Center submarket is generally bounded by 41st Street to 59th Street, Seventh Avenue to midblock Sixth – Fifth Avenue. According to the appraisal, the average asking rent in the third quarter of 2020 was $84.58 per sq. ft., a $0.83 per sq. ft. increase from the prior year’s average asking rent of $83.75. Vacancy rates for office space in the Sixth Avenue/Rockefeller Center submarket have increased 1.5% over the past year, from 4.6% to 6.1%.
Based on the appraisal, the Times Square office submarket is defined as 41st Street to 48th Street, Ninth Avenue to Seventh Avenue. According to the appraisal, the average asking rent in the third quarter of 2020 was $79.27 per sq. ft., a $4.09 per sq. ft. increase from the prior year’s asking rent. Vacancy rates for office space in the Times Square submarket have increased 1.0% over the past year, from 6.4% to 7.4%.
THE INFORMATION IN THIS STRUCTURAL AND COLLATERAL TERM SHEET IS NOT COMPLETE AND MAY BE AMENDED PRIOR TO THE TIME OF SALE. THIS TERM SHEET IS NOT AN OFFER TO SELL THESE SECURITIES AND IT IS NOT A SOLICITATION OF AN OFFER TO BUY THESE SECURITIES IN ANY JURISDICTION WHERE THE OFFER OR SALE IS NOT PERMITTED.
57
Various New York, NY 10036 | Collateral Asset Summary – Loan No. 3 Elo Midtown Office Portfolio | Cut-off Date Balance: Cut-off Date LTV: U/W NCF DSCR: U/W NOI Debt Yield: | $71,000,000 58.5% 2.30x 8.6% |
The following table presents certain information relating to the primary competition for the Elo Midtown Office Portfolio Properties.
| Comparable Office Buildings(1) | ||||
| Property Name | City, State | Net Rentable Area (Sq. Ft.) | Year Built | Occupancy |
| Elo Midtown Office Portfolio | New York, NY | 336,302(2) | 1926, 1928 | 95.3%(2) |
| 11 East 44th Street | New York, NY | 135,150 | 1927 | 94.3% |
| 34 West 44th Street | New York, NY | 190,000 | 1922 | 95.1% |
| 6 East 45th Street | New York, NY | 90,000 | 1930 | 94.9% |
| 2 West 45th Street | New York, NY | 100,000 | 1910 | 92.8% |
| 7 West 45th Street | New York, NY | 87,750 | 1913 | 98.1% |
| (1) | Source: Appraisal |
| (2) | Based on the underwritten rent rolls dated November 1, 2020, November 3, 2020, and November 5, 2020. |
Cash Flow Analysis.
| Cash Flow Analysis(1) | ||||||
| 2017 | 2018 | 2019 | T-12 10/31/2020(2) | U/W(2) | U/W PSF | |
| Base Rent | $16,827,267 | $16,958,175 | $17,172,852 | $15,543,967 | $17,497,930 | $52.03 |
| Rent Steps(3) | 0 | 0 | 0 | 0 | 452,710 | 1.35 |
| Vacant Income | 0 | 0 | 0 | 0 | 1,928,184 | 5.73 |
| Reimbursements | 2,221,080 | 2,147,137 | 2,008,175 | 1,550,685 | 1,858,048 | 5.52 |
| Vacancy & Credit Loss | 0 | 0 | 0 | (774,110) | (1,928,184) | (5.73) |
| Other Income | 208,207 | 196,271 | 174,570 | 100,790 | 100,790 | 0.30 |
| Effective Gross Income | $19,256,554 | $19,301,583 | $19,355,597 | $16,421,332 | $19,909,478 | $59.20 |
| Total Operating Expenses | 6,714,703 | 6,955,364 | 7,410,407 | 7,098,959 | 7,846,160 | $23.33 |
| Net Operating Income | $12,541,851 | $12,346,219 | $11,945,190 | $9,322,373 | $12,063,318 | $35.87 |
| TI/LC | 0 | 0 | 0 | 0 | 450,439 | 1.34 |
| Capital Expenditures | 0 | 0 | 0 | 0 | 69,310 | 0.21 |
| Net Cash Flow | $12,541,851 | $12,346,219 | $11,945,190 | $9,322,373 | $11,543,568 | $34.33 |
| (1) | Certain items such as interest expense, interest income, lease cancellation income, depreciation, amortization, debt service payments and any other non-recurring or non-operating items were excluded from the historical presentation and are not considered for the underwritten cash flow. |
| (2) | The increase in T-12 10/31/2020 Net Operating Income to U/W Net Operating Income can be attributed to the rent deferments given to tenants at the 48 West 48th Street and 151 West 46th Street properties by the borrower sponsor that were not required to be repaid, contractual rent steps, and potential income from vacant space. Historical Net Operating Income is in-line with Underwritten Net Operating Income. |
| (3) | Rent Steps of $452,710 underwritten for various tenants through November 1, 2021. |
Property Management. The Elo Midtown Office Portfolio Properties are self-managed.
Lockbox / Cash Management. The Elo Midtown Office Portfolio Whole Loan is structured with a soft lockbox and springing cash management. The Elo Midtown Office Portfolio Borrower is required, upon the occurrence of an Elo Midtown Office Portfolio Trigger Period (as defined below), to deliver a tenant direction letter to the existing tenants at the Elo Midtown Office Portfolio Properties, directing them to remit their rent checks directly to the lender-controlled lockbox. Prior to an Elo Midtown Office Portfolio Trigger Period, the Elo Midtown Office Portfolio Borrower is required to cause revenue received by the Elo Midtown Office Portfolio Borrower or any applicable property manager from the Elo Midtown Office Portfolio Properties to be deposited into such lockbox immediately upon receipt. All funds deposited into the lockbox are required to be transferred on each business day to or at the direction of the Elo Midtown Office Portfolio Borrower unless an Elo Midtown Office Portfolio Trigger Period exists. Upon the occurrence and during the continuance of an Elo Midtown Office Portfolio Trigger Period, all funds in the lockbox account are required to be swept on each business day to a cash management account under the control of the lender to be applied and disbursed in accordance with the Elo Midtown Office Portfolio Whole Loan documents, and all excess cash flow funds remaining in the cash management account after the application of such funds in accordance with the Elo Midtown Office Portfolio Whole Loan documents are required to be held by the lender in an excess cash flow reserve account as additional collateral for the Elo Midtown Office Portfolio Whole Loan. Upon the cure of the applicable Elo Midtown Office Portfolio Trigger Period, so long as no other Elo Midtown Office Portfolio Trigger Period exists, the lender is required to return any amounts remaining on deposit in the excess cash flow reserve account to the Elo Midtown Office Portfolio Borrower. Upon an event of default under the Elo Midtown Office Portfolio Whole Loan documents, the lender will apply funds to the debt in such priority as it may determine.
An “Elo Midtown Office Portfolio Trigger Period” means a period commencing upon the earliest to occur of (i) an event of default under the Elo Midtown Office Portfolio Whole Loan documents, (ii) the debt yield falling to 7.00% or below, and (iii) an Elo Midtown Office Portfolio Specified Tenant Trigger Period (as defined below), and expiring upon (a) with respect to clause (i) above, the cure (if applicable) of such event of default, (b) with respect to clause (ii) above, the debt yield being equal to or greater than 7.50% for two consecutive calendar quarters, and (c) with respect to clause (iii) above, such Elo Midtown Office Portfolio Specified Tenant Trigger Period ceasing to exist.
An “Elo Midtown Office Portfolio Specified Tenant” means as applicable, (i) Havana Central- Ny 2, LLC, (ii) Rockefeller Corp., (iii) as to each of the Elo Midtown Office Portfolio Properties (x) any tenant whose lease which, individually or when aggregated with all other
THE INFORMATION IN THIS STRUCTURAL AND COLLATERAL TERM SHEET IS NOT COMPLETE AND MAY BE AMENDED PRIOR TO THE TIME OF SALE. THIS TERM SHEET IS NOT AN OFFER TO SELL THESE SECURITIES AND IT IS NOT A SOLICITATION OF AN OFFER TO BUY THESE SECURITIES IN ANY JURISDICTION WHERE THE OFFER OR SALE IS NOT PERMITTED.
58
Various New York, NY 10036 | Collateral Asset Summary – Loan No. 3 Elo Midtown Office Portfolio | Cut-off Date Balance: Cut-off Date LTV: U/W NCF DSCR: U/W NOI Debt Yield: | $71,000,000 58.5% 2.30x 8.6% |
leases at the applicable property with the same tenant or its affiliate, either (A) accounts for 10.0% or more of the total rental income for the applicable property, or (B) demises 10.0% or more of the square feet of the applicable property’s gross leasable area, and (iv) any other lessee(s) of the Elo Midtown Office Portfolio Specified Tenant space, and any guarantor(s) of the applicable related Elo Midtown Office Portfolio Specified Tenant lease(s).
An “Elo Midtown Office Portfolio Specified Tenant Trigger Period” means a period (A) commencing upon the first to occur of (i) any Elo Midtown Office Portfolio Specified Tenant being in material non-monetary default under its lease beyond all applicable notice and grace periods, (ii) any Elo Midtown Office Portfolio Specified Tenant being in monetary default under its lease beyond all applicable notice and grace periods (provided, that, if such monetary default was solely the result of such Elo Midtown Office Portfolio Specified Tenant being restricted from the use and occupancy of its applicable Elo Midtown Office Portfolio Specified Tenant space due to its compliance with orders by a governmental authority as a result of the COVID-19 pandemic, then such monetary default has continued for the lesser of (x) three months or (y) the period commencing on the date such orders going into effect and expiring upon the date such order is lifted applicable governmental authority), (iii) any Elo Midtown Office Portfolio Specified Tenant failing to be in actual, physical possession of its Elo Midtown Office Portfolio Specified Tenant space (or applicable portion thereof), failing to be open for business during customary hours and/or “going dark” in its Elo Midtown Office Portfolio Specified Tenant space (or applicable portion thereof) for more than five consecutive business days, (iv) any Elo Midtown Office Portfolio Specified Tenant giving notice that it is terminating its lease for all of its Elo Midtown Office Portfolio Specified Tenant space or any portion of its Elo Midtown Office Portfolio Specified Tenant space equal to or greater than 15%, (v) any termination or cancellation of any Elo Midtown Office Portfolio Specified Tenant lease (including, without limitation, rejection in any bankruptcy or similar insolvency proceeding) and/or any Elo Midtown Office Portfolio Specified Tenant lease failing to otherwise be in full force and effect and (vi) any bankruptcy or similar insolvency of any Elo Midtown Office Portfolio Specified Tenant; and (B) expiring upon the first to occur of the lender’s receipt of evidence reasonably acceptable to the lender (including, without limitation, a duly executed estoppel certificate from the applicable Elo Midtown Office Portfolio Specified Tenant in form and substance acceptable to the lender, unless the applicable Elo Midtown Office Portfolio Specified Tenant refuses to deliver such an estoppel certificate and the Elo Midtown Office Portfolio Borrower has used commercially reasonable efforts to require delivery thereof) of (1) the satisfaction of the Elo Midtown Office Portfolio Specified Tenant Cure Conditions or (2) the Elo Midtown Office Portfolio Borrower leasing the entire Elo Midtown Office Portfolio Specified Tenant space (or applicable portion thereof) in accordance with the applicable terms and conditions of the Elo Midtown Office Portfolio Whole Loan documents, the applicable tenant under such lease being in actual, physical occupancy of, and open to the public for business in, the space demised under its lease and paying the full amount of the rent due under its lease. For the purposes of this definition, an Elo Midtown Office Portfolio Specified Tenant will not be deemed to have failed to be open for business and/or “gone dark” if such discontinuation is effectuated in order to comply with orders by a governmental authority which restrict the use and occupancy of the applicable Elo Midtown Office Portfolio Specified Tenant space as a result of the COVID-19 pandemic and the applicable Elo Midtown Office Portfolio Specified Tenant resumes operations in its Elo Midtown Office Portfolio Specified Tenant space within five business days after such restrictions are lifted. During the continuance of the COVID-19 pandemic, an Elo Midtown Office Portfolio Specified Tenant will be deemed to be operating in its respective space its premises is operational (i.e. with minimal staff coming in on an ongoing basis to perform necessary administrative functions) and available to the Elo Midtown Office Portfolio tenant’s employees for use on a voluntary basis.
An “Elo Midtown Office Portfolio Specified Tenant Cure Conditions” means each of the following, as applicable (i) the applicable Elo Midtown Office Portfolio Specified Tenant has cured all defaults under the applicable Elo Midtown Office Portfolio Specified Tenant lease, (ii) the applicable Elo Midtown Office Portfolio Specified Tenant is in actual, physical possession of the Elo Midtown Office Portfolio Specified Tenant space (or applicable portion thereof), is open for business during customary hours and not “dark” in the Elo Midtown Office Portfolio Specified Tenant space (or applicable portion thereof), (iii) the applicable Elo Midtown Office Portfolio Specified Tenant has revoked or rescinded all termination or cancellation notices with respect to the applicable Elo Midtown Office Portfolio Specified Tenant lease and has re-affirmed the applicable Elo Midtown Office Portfolio Specified Tenant lease as being in full force and effect, (iv) with respect to any applicable bankruptcy or insolvency proceedings involving the applicable Elo Midtown Office Portfolio Specified Tenant and/or the applicable Elo Midtown Office Portfolio Specified Tenant lease, the applicable Elo Midtown Office Portfolio Specified Tenant is no longer insolvent or subject to any bankruptcy or insolvency proceedings and has affirmed the applicable Elo Midtown Office Portfolio Specified Tenant lease pursuant to final, non-appealable order of a court of competent jurisdiction and (v) the applicable Elo Midtown Office Portfolio Specified Tenant is paying full, unabated rent under the applicable Elo Midtown Office Portfolio Specified Tenant lease.
Initial and Ongoing Reserves. At origination, the Elo Midtown Office Portfolio Borrower funded approximately $2,508,919 with respect to a debt service reserve.
Tax Reserve. On each monthly payment date, the Elo Midtown Office Portfolio Borrower is required to deposit reserves of 1/12 of the taxes that the lender estimates will be payable over the next-ensuing 12-month period (initially estimated to be approximately $490,582).
Insurance Reserve. On each monthly payment date, the Elo Midtown Office Portfolio Borrower is required to fund 1/12 of the
insurance premiums that the lender estimates will be payable for the renewal of coverage afforded by such policies with respect to the 15 West 47th Street property (estimated to be $5,716 monthly); provided that the insurance reserve with respect to the remaining Elo Midtown Office Portfolio Properties will be conditionally waived so long as the Elo Midtown Office Portfolio Borrower maintains a blanket policy meeting the requirements of the Elo Midtown Office Portfolio Whole Loan documents.
THE INFORMATION IN THIS STRUCTURAL AND COLLATERAL TERM SHEET IS NOT COMPLETE AND MAY BE AMENDED PRIOR TO THE TIME OF SALE. THIS TERM SHEET IS NOT AN OFFER TO SELL THESE SECURITIES AND IT IS NOT A SOLICITATION OF AN OFFER TO BUY THESE SECURITIES IN ANY JURISDICTION WHERE THE OFFER OR SALE IS NOT PERMITTED.
59
Various New York, NY 10036 | Collateral Asset Summary – Loan No. 3 Elo Midtown Office Portfolio | Cut-off Date Balance: Cut-off Date LTV: U/W NCF DSCR: U/W NOI Debt Yield: | $71,000,000 58.5% 2.30x 8.6% |
Replacement Reserve. On each monthly payment date, the Elo Midtown Office Portfolio Borrower is required to deposit approximately $5,605 into a replacement reserve for capital expenditures.
TI/LC Reserve. On each monthly payment date, the Elo Midtown Office Portfolio Borrower is required to make monthly deposits of approximately $28,025 into a TI/LC reserve account.
Current Mezzanine or Secured Subordinate Indebtedness. None.
Future Mezzanine or Secured Subordinate Indebtedness Permitted. None.
Partial Release. None.
THE INFORMATION IN THIS STRUCTURAL AND COLLATERAL TERM SHEET IS NOT COMPLETE AND MAY BE AMENDED PRIOR TO THE TIME OF SALE. THIS TERM SHEET IS NOT AN OFFER TO SELL THESE SECURITIES AND IT IS NOT A SOLICITATION OF AN OFFER TO BUY THESE SECURITIES IN ANY JURISDICTION WHERE THE OFFER OR SALE IS NOT PERMITTED.
60
(THIS PAGE INTENTIONALLY LEFT BLANK)
61
150 North Central Avenue and 1037 & 1070 West Park Lane Farmington, UT 84025 | Collateral Asset Summary – Loan No. 4 Station Park & Station Park West | Cut-off Date Balance: Cut-off Date LTV: U/W NCF DSCR: U/W NOI Debt Yield: | $60,000,000 50.0% 3.86x 13.8% |

THE INFORMATION IN THIS STRUCTURAL AND COLLATERAL TERM SHEET IS NOT COMPLETE AND MAY BE AMENDED PRIOR TO THE TIME OF SALE. THIS TERM SHEET IS NOT AN OFFER TO SELL THESE SECURITIES AND IT IS NOT A SOLICITATION OF AN OFFER TO BUY THESE SECURITIES IN ANY JURISDICTION WHERE THE OFFER OR SALE IS NOT PERMITTED.
62
150 North Central Avenue and 1037 & 1070 West Park Lane Farmington, UT 84025 | Collateral Asset Summary – Loan No. 4 Station Park & Station Park West | Cut-off Date Balance: Cut-off Date LTV: U/W NCF DSCR: U/W NOI Debt Yield: | $60,000,000 50.0% 3.86x 13.8% |
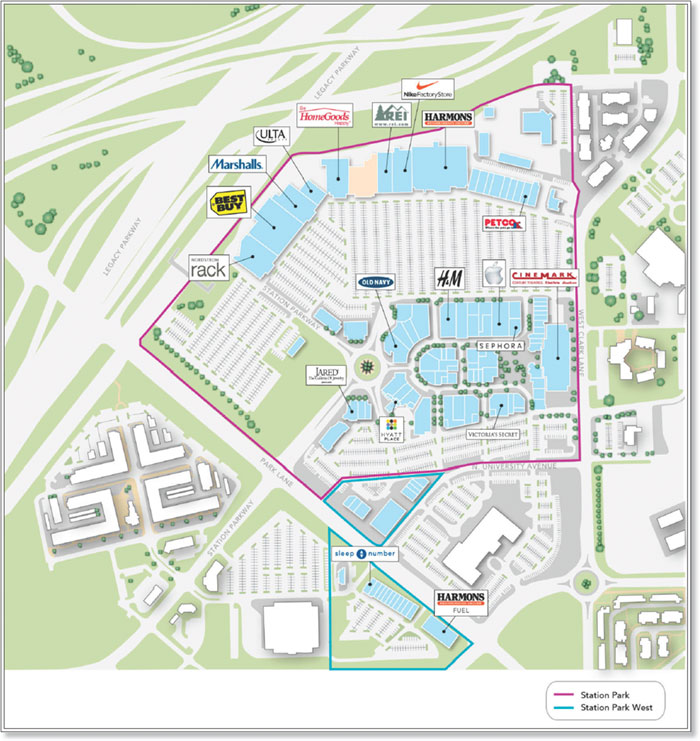
THE INFORMATION IN THIS STRUCTURAL AND COLLATERAL TERM SHEET IS NOT COMPLETE AND MAY BE AMENDED PRIOR TO THE TIME OF SALE. THIS TERM SHEET IS NOT AN OFFER TO SELL THESE SECURITIES AND IT IS NOT A SOLICITATION OF AN OFFER TO BUY THESE SECURITIES IN ANY JURISDICTION WHERE THE OFFER OR SALE IS NOT PERMITTED.
63
150 North Central Avenue and 1037 & 1070 West Park Lane Farmington, UT 84025 | Collateral Asset Summary – Loan No. 4 Station Park & Station Park West | Cut-off Date Balance: Cut-off Date LTV: U/W NCF DSCR: U/W NOI Debt Yield: | $60,000,000 50.0% 3.86x 13.8% |

THE INFORMATION IN THIS STRUCTURAL AND COLLATERAL TERM SHEET IS NOT COMPLETE AND MAY BE AMENDED PRIOR TO THE TIME OF SALE. THIS TERM SHEET IS NOT AN OFFER TO SELL THESE SECURITIES AND IT IS NOT A SOLICITATION OF AN OFFER TO BUY THESE SECURITIES IN ANY JURISDICTION WHERE THE OFFER OR SALE IS NOT PERMITTED.
64
150 North Central Avenue and 1037 & 1070 West Park Lane Farmington, UT 84025 | Collateral Asset Summary – Loan No. 4 Station Park & Station Park West | Cut-off Date Balance: Cut-off Date LTV: U/W NCF DSCR: U/W NOI Debt Yield: | $60,000,000 50.0% 3.86x 13.8% |
| Mortgage Loan Information | |
| Loan Seller: | JPMCB |
| Loan Purpose: | Refinance |
| Borrower Sponsors: | California State Teachers Retirement |
| System; CenterCal, LLC | |
| Borrowers: | Station Park CenterCal Owner, LLC; |
| Station Park Hotel CenterCal Owner, | |
| LLC | |
| Original Balance(1): | $60,000,000 |
| Cut-off Date Balance(1): | $60,000,000 |
| % by Initial UPB: | 7.4% |
| Interest Rate: | 3.37700% |
| Payment Date: | 5th of each month |
| First Payment Date: | January 5, 2021 |
| Maturity Date: | December 5, 2030 |
| Amortization: | Interest Only |
| Additional Debt(1): | $58,700,000 Pari Passu Debt |
| Call Protection(2): | L(24), DorYM1(92), O(4) |
| Lockbox / Cash Management: | Hard / Springing |
| Reserves(3) | |||||
| Initial | Monthly | Cap | |||
| Taxes: | $0 | Springing | NAP | ||
| Insurance: | $0 | Springing | NAP | ||
| Replacement: | $0 | Springing | $149,292 | ||
| TI/LC: | $0 | Springing | $1,990,606 | ||
| Gap Rent Reserve(4): | $3,958,133 | $0 | NAP | ||
| Key Money Reserve: | $248,000 | $0 | NAP | ||
| Property Information | ||
| Single Asset / Portfolio(5): | Single Asset | |
| Property Type: | Mixed Use – Retail/Office/Hospitality | |
| Collateral: | Fee Simple | |
| Location: | Farmington, UT | |
| Year Built / Renovated: | 2011-2018 / NAP | |
| Total Sq. Ft.(5): | 995,303 | |
| Property Management: | CenterCal Properties, LLC; Crescent | |
| Hotels & Resorts, LLC | ||
| Underwritten NOI(6)(7): | $16,341,736 | |
| Underwritten NCF(6)(7): | $15,694,789 | |
| Appraised Value(8): | $237,400,000 | |
| Appraisal Date(8): | October 2, 2020 | |
| Historical NOI(7) | ||
| Most Recent NOI(7): | $16,793,038 (T-12 October 31, 2020) | |
| 2019 NOI(7): | $13,159,791 (December 31, 2019) | |
| 2018 NOI: | $12,305,229 (December 31, 2018) | |
| 2017 NOI: | $12,826,107 (December 31, 2017) | |
| Historical Occupancy(7) | ||
| Most Recent Occupancy: | 85.9% (October 1, 2020) | |
| 2019 Occupancy: | 89.9% (December 31, 2019) | |
| 2018 Occupancy: | 79.2% (December 31, 2018) | |
| 2017 Occupancy: | 75.8% (December 31, 2017) | |
| Financial Information(1)(7) | ||||||
| Tranche | Cut-off Date Balance | Balance per Sq. Ft. Cut-off / Balloon(2) | LTV Cut-off / Balloon | U/W DSCR NOI / NCF | U/W Debt Yield NOI / NCF | U/W Debt Yield at Balloon NOI / NCF |
| Mortgage Loan | $60,000,000 | |||||
| Pari Passu Notes | 58,700,000 | |||||
| Whole Loan | $118,700,000 | $119 / $119 | 50.0% / 50.0% | 4.02x / 3.86x | 13.8% / 13.2% | 13.8% / 13.2% |
| (1) | The Station Park Loan (as defined below) consists of the controlling Note A-1 and is part of the Station Park Whole Loan (as defined below) evidenced by 2 pari passu notes with an aggregate outstanding principal balance as of the Cut-off Date of $118.7 million. For additional information, see “The Loan” herein. |
| (2) | The defeasance lockout period will be at least 24 payments beginning with and including the first payment date of January 5, 2021. The Borrowers (as defined below) have the option to defease the Station Park Whole Loan, in whole, at any time after the second anniversary of the securitization closing date of the last note to be securitized. The Station Park Whole Loan may be prepaid in whole or in part at any time on or after January 5, 2023, subject to payment of the applicable yield maintenance premium if such prepayment occurs prior to September 5, 2030. |
| (3) | Gap Rent Reserves represent the aggregate amount of base rent for the succeeding 12-months for tenants who have not paid in-full base rent due pursuant to each such tenant’s underlying lease as of the origination date. Such amounts will not be released to the borrower until, among other conditions, (i) collections exceed 95% of the full rent payable from all tenants in place as of the origination date for a period of 12 consecutive months and (ii) the Station Park Property is at least 80% occupied based on total square footage, provided no event of default or Station Park Cash Sweep Event (as defined below) then exists. |
| (4) | Total Sq. Ft. is exclusive of the Hyatt Place (defined below), which is comprised of a 108-room select-service hotel. |
| (5) | Underwritten NOI and Underwritten NCF are inclusive of (i) contractual rent steps through October 2021 and (ii) straight-line rent through the shorter of the loan and lease term for investment grade tenants, in aggregate totaling approximately $540,207. |
| (6) | While the Station Park Loan was originated after the emergence of the novel coronavirus pandemic and the economic disruption resulting from measures to combat the pandemic, the pandemic is an evolving situation and could impact the Station Park Loan more severely than assumed in the underwriting of the Station Park Loan and could adversely affect the NOI, NCF and occupancy information, as well as the appraised value and the DSCR, LTV and Debt Yield metrics presented above. See “Risk Factors— Special Risks—Coronavirus Pandemic Has Adversely Affected the Global Economy and Will Likely Adversely Affect the Performance of the Mortgage Loans” in the Preliminary Prospectus. |
| (7) | The increase in Most Recent NOI from 2019 NOI is primarily attributable to the commencement of seven new leases since December 2019 totaling 97,285 sq. ft. and accounting for 9.0% of U/W Base Rent. |
THE INFORMATION IN THIS STRUCTURAL AND COLLATERAL TERM SHEET IS NOT COMPLETE AND MAY BE AMENDED PRIOR TO THE TIME OF SALE. THIS TERM SHEET IS NOT AN OFFER TO SELL THESE SECURITIES AND IT IS NOT A SOLICITATION OF AN OFFER TO BUY THESE SECURITIES IN ANY JURISDICTION WHERE THE OFFER OR SALE IS NOT PERMITTED.
65
150 North Central Avenue and 1037 & 1070 West Park Lane Farmington, UT 84025 | Collateral Asset Summary – Loan No. 4 Station Park & Station Park West | Cut-off Date Balance: Cut-off Date LTV: U/W NCF DSCR: U/W NOI Debt Yield: | $60,000,000 50.0% 3.86x 13.8% |
The Loan. The Station Park mortgage loan (the “Station Park Loan”) is part of a whole loan that has an aggregate outstanding principal balance as of the Cut-off Date of $118.7 million (the “Station Park Whole Loan”), secured by the first mortgages encumbering the borrowers’ fee simple interest in a 995,303 sq. ft. mixed use, open air lifestyle center inclusive of a grocery anchored power center, Class A office space, a 108-room Hyatt Place hotel (“Hyatt Place”) , three retail strip buildings, a movie theatre and a gas station (the “Station Park Property”) located in Farmington, Utah. The Station Park Whole Loan is comprised of 2 pari passu notes with an aggregate original principal balance as of the Cut-off Date of $118.7 million, of which Note A-1, with an outstanding principal balance as of the Cut-off Date of $60.0 million, is being contributed to the Benchmark 2020-B22 trust and constitutes the Station Park Loan. The remaining note is expected to be contributed to one or more future securitization trusts.
The relationship between the holders of the Station Park Whole Loan will be governed by a co-lender agreement as described under “Description of the Mortgage Pool—The Whole Loans—The Serviced Pari Passu Whole Loans” in the Preliminary Prospectus.
| Whole Loan Summary(1) | ||||
| Note | Original Balance | Cut-off Date Balance | Note Holder | Controlling Piece |
| A-1 | $60,000,000 | $60,000,000 | Benchmark 2020-B22 | Yes |
| A-2 | $58,700,000 | $58,700,000 | JPMCB(1) | No |
| Whole Loan | $118,700,000 | $118,700,000 | ||
| (1) | The related note is currently held by JPMCB and is expected to be contributed to one or more future securitizations. |
The Station Park Whole Loan has a 120-month interest-only term and accrues interest at a fixed rate of 3.37700% per annum. The proceeds of the Station Park Whole Loan were used to pay closing costs, fund upfront reserves and return $113.4 million of equity to the Borrower Sponsors (as defined below). Prior to origination, the property was unencumbered.
| Sources and Uses | |||||||||
| Sources | Proceeds | % of Total | Uses | Proceeds | % of Total | ||||
| Whole Loan | $118,700,000 | 100.0% | Return of Equity | $113,406,092 | 95.5% | ||||
| Upfront Reserves | 4,206,133 | 3.5_ | |||||||
| Closing Costs | 1,087,775 | 0.9_ | |||||||
| Total Sources | $118,700,000 | 100.0% | Total Uses | $118,700,000 | 100.0% | ||||
The Borrowers / Borrower Sponsors. The borrowers are Station Park CenterCal Owner, LLC and Station Park Hotel CenterCal Owner, LLC (collectively, the “Borrowers”), each a Delaware limited liability company and single purpose entity with two independent directors. Legal counsel to the Borrower delivered a non-consolidation opinion in connection with the origination of the Station Park Loan. The Borrowers are indirectly owned or controlled by a joint venture between California State Teachers Retirement System (“CalSTRS”) and CenterCal, LLC (“CenterCal”) (collectively, the “Borrower Sponsors”). CalSTRS is the largest educator-only pension fund in the world, the second largest pension fund in the U.S. and as of October 31, 2020, had a market value of approximately $254.7 billion. As of October, 31, 2020, approximately 13.8% of CalSTRS’ portfolio was allocated to real estate, totaling approximately $35.2 billion of net asset value. CalSTRS was established by law in 1913 to provide retirement benefits to California’s public school educators from prekindergarten through community college. The organization provides retirement, disability and survivor benefits to California’s more than 965,000 public school educators and their families. CenterCal Properties, LLC, founded in 2004 by Fred Bruning and Jean Paul Wardy, is a full-service commercial real estate company in the business of investing, developing, leasing and managing its projects. CenterCal has over 120 employees in over 12 states across the Western United States. CenterCal excels in, and is best known for, creating destinations throughout the western United States with a unique strategy of “placemaking,” which emphasizes the importance of developing spaces with a sense of community.
There is no separate non-recourse carveout guarantor or environmental indemnitor, and the borrower is the sole party responsible for breaches or violations of the non-recourse carve-out provisions in the related Mortgage Loan documents, including the environmental indemnity. At loan origination, the Borrower Sponsors provided a secured lender environmental policy. See “Environmental Matters” below for additional information related to the environmental insurance.
THE INFORMATION IN THIS STRUCTURAL AND COLLATERAL TERM SHEET IS NOT COMPLETE AND MAY BE AMENDED PRIOR TO THE TIME OF SALE. THIS TERM SHEET IS NOT AN OFFER TO SELL THESE SECURITIES AND IT IS NOT A SOLICITATION OF AN OFFER TO BUY THESE SECURITIES IN ANY JURISDICTION WHERE THE OFFER OR SALE IS NOT PERMITTED.
66
150 North Central Avenue and 1037 & 1070 West Park Lane Farmington, UT 84025 | Collateral Asset Summary – Loan No. 4 Station Park & Station Park West | Cut-off Date Balance: Cut-off Date LTV: U/W NCF DSCR: U/W NOI Debt Yield: | $60,000,000 50.0% 3.86x 13.8% |
The Property.
| Tenant Summary(1)(2) | |||||||||
| Tenant | Property Type | Credit Rating (Moody's/Fitch/S&P)(3) | Net Rentable Area (Sq. Ft.) | % of Net Rentable Area | U/W Base Rent Per Sq. Ft.(4) | % of Total U/W Base Rent(4) | Lease Expiration | ||
| Harmons(5) | Retail | NR / NR / NR | 72,785 | 7.3% | $12.54 | 4.8% | 4/30/2031 | ||
| Cinemark | Retail | B3 / B+ / B | 53,624 | 5.4% | $16.50 | 4.7% | 7/31/2026 | ||
| Best Buy | Retail | Baa1 / NR / BBB | 50,455 | 5.1% | $11.89 | 3.2% | 3/31/2029 | ||
| Life Engineering(6) | Office | NR / NR / NR | 43,145 | 4.3% | $26.00 | 5.9% | 6/01/2026 | ||
| Vista Outdoor(7)(8) | Office | B2 / NR / B+ | 35,194 | 3.5% | $24.04 | 4.5% | 5/31/2026 | ||
| Nordstrom Rack | Retail | Baa3 / NR / BB+ | 29,603 | 3.0% | $14.50 | 2.3% | 11/30/2023 | ||
| UDO | Office | NR / NR / NR | 28,970 | 2.9% | $25.75 | 3.9% | 9/01/2025 | ||
| Marshalls | Retail | A2 / NR / A | 25,340 | 2.5% | $8.42 | 1.1% | 8/31/2021 | ||
| Homegoods | Retail | A2 / NR / A | 24,903 | 2.5% | $8.75 | 1.2% | 8/31/2021 | ||
| Lift at Station Park | Retail | NR / NR / NR | 24,750 | 2.5% | $17.37 | 2.3% | 1/31/2023 | ||
| Ten Largest Tenants | 388,769 | 39.1% | $16.47 | 33.8% | |||||
| Remaining Occupied Retail | 375,020 | 37.7% | $26.33 | 52.2% | |||||
| Remaining Occupied Office | 91,155 | 9.2% | $29.12 | 14.0% | |||||
| Total Occupied | 854,944 | 85.9% | $22.14 | 100.0% | |||||
| Vacant | 140,359 | 14.1% | |||||||
| Total / Wtd. Avg. | 995,303 | 100.0% | |||||||
| (1) | Based on the underwritten rent roll dated October 1, 2020, exclusive of Hyatt Place which is comprised of a 108-room select-service hotel. |
| (2) | Certain of the tenants have leases that provide for co-tenancy provisions. See “Description of the Mortgage Pool—Tenant Issues—Lease Expirations and Terminations” in the Preliminary Prospectus for additional information. |
| (3) | In certain instances, ratings provided are those of the parent company of the entity shown, whether or not the parent company guarantees the lease. |
| (4) | U/W Base Rent per Sq. Ft. and % of Total U/W Base Rent are inclusive of contractual rent steps through October 2021 accounting for approximately $540,207 in U/W Base Rent. |
| (5) | Net Rentable Area (Sq. Ft.) is inclusive of 3,396 sq. ft. attributable to Harmons Fuel Center with a lease expiration date in July 2026 accounting for $21.44 per sq. ft. in U/W Base Rent. |
| (6) | Pursuant to a sublease (the “Sublease”) executed on December 1, 2020, between Life Engineering, the fourth largest tenant at the Mortgaged Property, as subtenant, and Pluralsight, LLC, the current prime tenant whose lease expires on February 28, 2021, Life Engineering is subleasing its space from Pluralsight through February 28, 2021. According to the borrower, Life Engineering is in occupancy of a portion of the space under the Sublease. Life Engineering has executed a lease and will become a direct tenant under the new lease (the “New Lease”). The rent commencement date with respect to the New Lease will occur 90 days following delivery of the related space, which is anticipated to be on or before March 1, 2021. We cannot assure you that this tenant will take occupancy or begin paying rent as anticipated or at all. |
| (7) | Vista Outdoor (“Vista”) has a continuing option to terminate its lease with respect to all or a portion of its premises on and after June 1, 2023, with at least a nine months’ prior written notice and the payment of a termination fee. |
| (8) | Vista has entered into a sublease of its entire space with El Morro Holdings, Inc. (“El Morro”), as the subtenant. Pursuant to the sublease, in the event of a natural expiration of or an earlier termination of Vista’s current lease (the “Prime Lease”), the Prime Lease would be assigned over to El Morro, upon which event the term of the Prime Lease would be extended to May 31, 2028. |
| Lease Rollover Schedule(1) | ||||||||
| Year | # of Leases Expiring | Total Expiring Sq. Ft. | % of Total Sq. Ft. Expiring | Cumulative Sq. Ft. Expiring | Cumulative % of Sq. Ft. Expiring | U/W Base Rent per Sq. Ft.(2) | % U/W Base Rent Rolling(2) | Cumulative % of U/W Base Rent(2) |
| MTM | 4 | 1,650 | 0.2% | 1,650 | 0.2% | $54.34 | 0.5% | 0.5% |
| 2020 | 2 | 3,021 | 0.3% | 4,671 | 0.5% | $19.88 | 0.3% | 0.8% |
| 2021 | 12 | 74,271 | 7.5% | 78,942 | 7.9% | $14.81 | 5.8% | 6.6% |
| 2022 | 14 | 49,839 | 5.0% | 128,781 | 12.9% | $24.11 | 6.3% | 12.9% |
| 2023(3) | 21 | 138,471 | 13.9% | 267,252 | 26.9% | $21.37 | 15.6% | 28.6% |
| 2024 | 13 | 64,361 | 6.5% | 331,613 | 33.3% | $27.31 | 9.3% | 37.9% |
| 2025 | 14 | 88,473 | 8.9% | 420,086 | 42.2% | $29.72 | 13.9% | 51.8% |
| 2026(4) | 14 | 198,135 | 19.9% | 618,221 | 62.1% | $24.44 | 25.6% | 77.3% |
| 2027 | 4 | 7,705 | 0.8% | 625,926 | 62.9% | $28.03 | 1.1% | 78.5% |
| 2028 | 6 | 13,308 | 1.3% | 639,234 | 64.2% | $32.87 | 2.3% | 80.8% |
| 2029 | 8 | 93,682 | 9.4% | 732,916 | 73.6% | $18.95 | 9.4% | 90.2% |
| 2030 | 5 | 48,348 | 4.9% | 781,264 | 78.5% | $18.79 | 4.8% | 95.0% |
| 2031 & Thereafter | 2 | 73,680 | 7.4% | 854,944 | 85.9% | $12.96 | 5.0% | 100.0% |
| Vacant | NAP | 140,359 | 14.1% | 995,303 | 100.0% | NAP | NAP | NAP |
| Total / Wtd. Avg. | 119 | 995,303 | 100.0% | $22.14 | 100.0% | |||
| (1) | Based on the underwritten rent roll dated October 1, 2020, exclusive of Hyatt Place which is comprised of a 108-room select-service hotel. |
| (2) | U/W Base Rent per Sq. Ft., % U/W Base Rent Rolling and Cumulative % of U/W Base Rent are is inclusive of contractual rent steps through October 2021 accounting for approximately $540,207 in U/W Base Rent. |
| (3) | 2023 is inclusive of 11,173 sq. ft. attributable to Forever 21 which pays % in lieu and has no attributable underwritten base rent. |
| (4) | 2026 is inclusive of 43,145 sq. ft. attributable to Life Engineering which is not yet in occupancy or paying rent. The rent commencement date with respect to the Life Engineering lease will occur 90 days following delivery of the related space, which is anticipated to be on or before March 1, 2021. We cannot assure you that this tenant will take occupancy or begin paying rent as anticipated or at all. |
THE INFORMATION IN THIS STRUCTURAL AND COLLATERAL TERM SHEET IS NOT COMPLETE AND MAY BE AMENDED PRIOR TO THE TIME OF SALE. THIS TERM SHEET IS NOT AN OFFER TO SELL THESE SECURITIES AND IT IS NOT A SOLICITATION OF AN OFFER TO BUY THESE SECURITIES IN ANY JURISDICTION WHERE THE OFFER OR SALE IS NOT PERMITTED.
67
150 North Central Avenue and 1037 & 1070 West Park Lane Farmington, UT 84025 | Collateral Asset Summary – Loan No. 4 Station Park & Station Park West | Cut-off Date Balance: Cut-off Date LTV: U/W NCF DSCR: U/W NOI Debt Yield: | $60,000,000 50.0% 3.86x 13.8% |
The Station Park Property is a 995,303 sq. ft., Class A, mixed-use property comprised of two components, “Station Park” and “Station Park West”. Station Park is comprised of The Village, an open air lifestyle center consisting of upper level Class A office space, a movie theatre and a 108-room Hyatt Place franchise hotel. Additionally, Station Park consists of a separate grocery-anchored retail power center constructed in 2011 and anchored by Harmons Grocery (“Harmons”). In the aggregate, Station Park consists of 893,872 sq. ft. (exclusive of sq. ft. associated with Hyatt Place). The office space at Station Park consists of five, three-story buildings with ground floor retail and upper level office space constructed in phases between 2011 and 2016. The Station Park West component is located directly west of Station Park, across Park Lane Road. Station Park West is comprised of three unanchored multi-tenant retail strip buildings, a single-tenant office building and a fuel station, which is subject to a ground lease. In aggregate, Station Park West consists of 101,431 sq. ft. The three unanchored retail strip buildings were constructed between 2016 and 2018. The single-tenant office building was built in 2016 and consists of two stories that are 100.0% leased to Vista Outdoor through February 2026. Station Park West is also inclusive of three undeveloped pad sites totaling an estimated 16,315 sq. ft., all of which is included as collateral for the Station Park Whole Loan. The Station Park Property spans across approximately 67.3 acres and has 4,883 parking spaces (4.9 spaces per 1,000 sq. ft.).
The Borrower Sponsors acquired the Station Park site in 2007 and developed the Station Park Property in phases between 2011 and 2018 at an estimated total cost of approximately $232.5 million ($234 per sq. ft.). The Borrower Sponsors have since invested approximately $87.2 million in leasing costs and approximately $1.4 million in capital improvements, resulting in a total cost basis of approximately $321.1 million ($323 per sq. ft.). Since 2019, seven new leases have commenced totaling 86,684 sq. ft. of net rentable area at the Station Park Property. Despite the COVID-19 pandemic, the Borrower Sponsor has executed a ground lease with Quick Quack, accounting for an additional 3,600 sq. ft. at one of the undeveloped pad sites, which is expected to be improved with an express car wash. The Borrower Sponsor is also in advanced negotiations to lease one of the undeveloped pad sites to a national retailer. The Borrower Sponsors are focused on creating thoughtful projects that will endure lasting benefits to the communities they serve. The Borrower Sponsors continue to lease up the Station Park Property and invest resources to create a strong sense of community and family connection for the next generation of shopping experience, offering many reasons to visit the property for activities, entertainment and community events.
In aggregate, the Station Park Property consists of 995,303 sq. ft. and was 85.9% leased (excluding Hyatt Place) to over 100 tenants as of October 1, 2020. The Station Park Property office component is 100.0% leased to 18 tenants. The retail space within the Station Park Property accounts for approximately 80.1% of the net rentable area and is 82.4% leased to over 100 tenants. Approximately 71.6% of U/W Base Rent at the Station Park Property is attributable to retail tenants.
Hyatt Place is situated in the center of the Station Park Property and features 108 guestrooms, many of which offer surrounding mountain views. Hyatt Place is a three-story select-service hotel equipped with 1,580 sq. ft. of divisible meeting space, a pool and spa, a fitness center, a market and a breakfast bar. The Gallery Menu serves food to guests 24/7 and The Library, located just off the hotel lobby, offers mountain views from the attached outdoor deck. Hyatt Place has remained open and operational throughout the onset of the COVID-19 pandemic and reported room revenue of $2.7 million and NCF of $119,039 for TTM October 2020. Further, Hyatt Place reported occupancy, ADR, and RevPAR of 62.4%, $110.56 and $68.95 as of TTM September 2020, respectively.
| Hotel Performance(1) | ||||||||||
| TTM September 2018 | TTM September 2019 | TTM September 2020 | ||||||||
| Occ % | ADR | RevPAR | Occ % | ADR | RevPAR | Occ % | ADR | RevPAR | ||
| Hyatt Place | 77.0% | $118.07 | $90.87 | 77.8% | $117.30 | $91.24 | 62.4% | $110.56 | $68.95 | |
| Competitive Set | 72.0% | $99.34 | $71.53 | 71.9% | $100.65 | $72.36 | 54.0% | $90.35 | $48.78 | |
| Penetration Index | 106.9% | 118.9% | 127.0% | 108.2% | 116.5% | 126.1% | 115.5% | 122.4% | 141.3% | |
| (1) | Third party market research report. |
COVID-19 Update. As of December 1, 2020, the Station Park Whole Loan is not subject to any modification or forbearance request. The Borrower Sponsor negotiated rent deferrals on a tenant-by-tenant basis and ultimately provided two months of deferred rent in April and May to 31 tenants accounting for 293,362 sq. ft. (29.2% of NRA) and $909,200 of base rent. The leases for these tenants were amended such that the deferred rent will be recouped by the landlord via 12 equal installments in 2021. At origination, a $3,958,133 gap rent reserve was established, representing the aggregate amount of base rent for the succeeding 12-months for tenants who have not paid in-full base rent due pursuant to each such tenant’s underlying lease as of the origination date. Such amounts will not be released to the borrower until, among other conditions, (i) collections exceed 95% of the full rent payable from all tenants in place as of the origination date for a period of 12 consecutive months and (ii) the Station Park Property is at least 80% occupied based on total square footage, provided no event of default of Cash Sweep Event (as defined below) then exists. The first payment date of the Station Park Whole Loan is January 5, 2021. See “Risk Factors—Special Risks—Coronavirus Pandemic Has Adversely Affected the Global Economy and Will Likely Adversely Affect the Performance of the Mortgage Loans” in the Preliminary Prospectus. The chart below outlines collections throughout the COVID-19 pandemic.
THE INFORMATION IN THIS STRUCTURAL AND COLLATERAL TERM SHEET IS NOT COMPLETE AND MAY BE AMENDED PRIOR TO THE TIME OF SALE. THIS TERM SHEET IS NOT AN OFFER TO SELL THESE SECURITIES AND IT IS NOT A SOLICITATION OF AN OFFER TO BUY THESE SECURITIES IN ANY JURISDICTION WHERE THE OFFER OR SALE IS NOT PERMITTED.
68
150 North Central Avenue and 1037 & 1070 West Park Lane Farmington, UT 84025 | Collateral Asset Summary – Loan No. 4 Station Park & Station Park West | Cut-off Date Balance: Cut-off Date LTV: U/W NCF DSCR: U/W NOI Debt Yield: | $60,000,000 50.0% 3.86x 13.8% |
| COVID-19 Collections Summary(1) | |||||||
| April | May | June | July | August | September | October | |
| 67.2% | 57.5% | 72.9% | 82.2% | 82.4% | 82.1% | 83.6% | |
| (1) | Based on collections report provided by the Borrower. |
Major Tenants.
Harmons (72,785 sq. ft.; 7.3% of NRA; 4.8% of U/W Base Rent) was founded in 1932 and is a family owned and locally run grocer within the state of Utah. Harmon’s has 20 stores throughout the Wasatch Front and St. George’s area. The grocery store chain emphasizes sourcing from local companies and farms, and focuses on using higher-quality ingredients. In addition to selling groceries, Harmon’s operates post offices, coffee bars, offers full-time chefs and cooking classes, and employs pharmacists and dieticians across its locations. Harmon’s serves as the grocery-anchor within the power center at the Station Park Property. Harmon’s has been a tenant at the Station Park Property since April 2011. Harmons Fuel Station was built in 2019 and accounts for 3,396 sq. ft. at the Station Park Property. Harmons has four, five-year renewal options remaining. Harmon’s has no termination options remaining.
Cinemark (53,624 sq. ft.; 5.4% of NRA; 4.7% of U/W Base Rent) was founded in 1984 and is a leader in the motion picture exhibition industry with 533 theatres and 5,974 screens in the U.S. and Latin America as of September 30, 2020. Cinemark is headquartered in Plano, Texas and is the third largest circuit in the US with 331 theatres and 4,517 screens in 42 states across the United States. Cinemark is currently open and has been a tenant at the Station Park Property since August 2011. Cinemark has four, five-year renewal options remaining and no termination options.
Best Buy (50,455 sq. ft.; 5.1% of NRA; 3.2% of U/W Base Rent) was incorporated in 1966 and engages in consumer technology. Best Buy has operations in the United States, Canada and Mexico and operates 977 stores and 11 Best Buy outlet centers throughout the United States. For the fiscal year 2020, Best Buy reported domestic revenue of over $40.1 billion, a 2.1% increase from fiscal year 2019. Best Buy has been a tenant at the Station Park Property since October 2018 and has four, five-year renewal options. Best Buy has no termination options.
Environmental Matters. The Phase I environmental report dated March 31, 2020 recommended no further action at the Station Park component of the Station Park Property and the Phase I environmental report dated April 3, 2020 recommended no further action at the Station Park West component of the Station Park Property. At origination, the Borrower Sponsors provided a secured lender environmental policy from Ironshore Specialty Insurance Company with the lender as the named insured, with per incident and aggregate limits of $10,000,000 and a $50,000 per incident self-insured retention. The insurance premium was paid at origination.
The Market. The Station Park Property is located within the Ogden-Clearfield, UT Metropolitan Statistical Area (“MSA”), approximately 17 miles south of the Ogden Central Business District (“CBD”) and 15 miles north of the Salt Lake City CBD. The area includes a total of 326,231 employees and has a 7.0% unemployment rate. The top three industries in the area include manufacturing, health care/social assistance and retail trade. Primary access to the Station Park Property is provided by Interstate 15, which can be accessed from the Station Park Property and provides access to communities to the north and into Idaho, as well as Salt Lake City to the south. The Station Park Property benefits from nearby attractions including Lagoon Amusement Park, a privately-owned amusement park in Farmington with over 50 rides and 10 roller coasters, which is approximately 2 miles from the Station Park Property. Additionally, the University of Utah Health Center, an advanced medical facility of over 100,000 sq. ft., sits adjacent to the Station Park Property and specializes in primary, specialty and urgent care. The Station Park Property is also served by Farmington Station commuter rail landing and park and ride. The station is served by FrontRunner, the UTA’s commuter rail train that operates along the Wasatch Front with service from Ogden to the north through the Salt Lake City MSA and into Utah to the south. The Farmington Station has approximately 900 parking spaces. According to the appraisal, the estimated 2020 population within a one-, three- and five-mile radius of the Station Park Property was approximately 8,298, 39,468 and 76,624, respectively. The estimated 2020 average household income within the same radii was approximately $126,930, $132,124 and $122,898, respectively.
The Station Park Property is located in the Salt Lake retail market, which has over 36.8 million sq. ft. of retail space and a vacancy rate of 7.2%. As of the second quarter of 2020 there was 69,534 sq. ft. of net absorption and average NNN market rents were $18.19 per sq. ft., a 4.6% increase quarter-over-quarter. Despite uncertainty, new leasing activity in the Salt Lake retail market totaled 437,320 sq. ft. as of the second quarter of 2020, including 87,000 sq. ft. of vacant big-box space for retail use.
According to a third party market report, the Station Park Property is located in the Davis/Weber County office market, which consists of approximately 13.2 million square feet of office space. As of the second quarter of 2020, the overall market reported an occupancy rate of 93.2% with market rents averaging $17.73 per sq. ft.
THE INFORMATION IN THIS STRUCTURAL AND COLLATERAL TERM SHEET IS NOT COMPLETE AND MAY BE AMENDED PRIOR TO THE TIME OF SALE. THIS TERM SHEET IS NOT AN OFFER TO SELL THESE SECURITIES AND IT IS NOT A SOLICITATION OF AN OFFER TO BUY THESE SECURITIES IN ANY JURISDICTION WHERE THE OFFER OR SALE IS NOT PERMITTED.
69
150 North Central Avenue and 1037 & 1070 West Park Lane Farmington, UT 84025 | Collateral Asset Summary – Loan No. 4 Station Park & Station Park West | Cut-off Date Balance: Cut-off Date LTV: U/W NCF DSCR: U/W NOI Debt Yield: | $60,000,000 50.0% 3.86x 13.8% |
With respect to the Station Park component, the appraisal identified 24 comparable retail leases across six properties within the Salt Lake City MSA ranging in size from 960 sq. ft. to 21,008 sq. ft. with lease terms ranging between 5.0 and 15.0 years. The comparable tenants reported annual NNN rental rates ranging from $15.90 to $50.00 per sq. ft. with a weighted average rent of approximately $26.36 per sq. ft.
| Station Park - Competitive/Comparable Retail Properties(1) | ||||||||
| Appraiser’s Comparable Leases | ||||||||
| Property Name | Distance to Subject (miles) | Size (SF) | Year Built/ Renovated | Occupancy | Anchor/Major Tenants | Range of Lease Terms (Yrs) | Range of Base Rent PSF | |
| The Gateway | 15.0 | 647,724 | 2001 / 2018 | 70.0% | NAP | 5.0 – 15.0 | $20.00 - $30.00 | |
| Salt Lake City, UT | ||||||||
| Layton Pointe | 8.1 | 123,890 | 2005 | 90.0% | Bed Bath & Beyond; | 5.0 - 10.0 | $31.21 - $50.00 | |
| Layton, UT | Dress Barn; Ross | |||||||
| Family Center at Riverdale | 14.0 | 427,805 | 1995 / 2008 | 98.0% | Super Target; | 5.0 – 10.0 | $21.50 – 33.84 | |
| Riverdale, UT | Gordman’s; Best Buy; | |||||||
| Sportmans’ Warehouse; | ||||||||
Applebee’s; Jo-Ann Fabrics | ||||||||
| The Shoppes at Fort Union | 25.0 | 694,099 | 1980 / 2006 | 98.0% | Smith’s Food and | 10.0 – 10.7 | $30.00 - $44.00 | |
| Midvale, UT | Drug; Walmart; Petco | |||||||
| Bed Bath & Beyond; Ross; | ||||||||
| DSW Shoes, Michaels, | ||||||||
| The District | 29.0 | 906,300 | 2007 | 98.0% | Target; JC Penney; | $28.00 - $30.00 | ||
| South Jordan, UT | Ross; Sports Authority; | 5.0 | ||||||
| Petco; Hobby Lobby | ||||||||
| West Bountiful Commons I & II | 6.5 | 329,549 | 1993 | 99.0% | Costco; At Home; Office | 5.0 – 10.0 | $15.90 – 35.00 | |
| West Bountiful, UT | Depot; Petco | |||||||
| (1) | Source: Appraisal. |
With respect to the Station Park component, the appraisal identified 8 comparable office leases across four properties within the Salt Lake City MSA ranging in size from 2,395 sq. ft. to 19,327 sq. ft. with lease terms ranging between 3.1 and 10.0 years. The comparable tenants reported annual NNN rental rates ranging from $21.34 to $30.00 per sq. ft. with a weighted average rent of approximately $27.21 per sq. ft.
| Station Park - Competitive/Comparable Office Properties(1) | |||||||||||||
| Appraiser’s Comparable Leases | |||||||||||||
| Property Name | Distance to Subject (miles) | Size (SF) | Year Built/ Renovated | Occupancy | Lease Type | Range of Lease Terms (Yrs) | Range of Base Rent PSF | ||||||
| Parrish Crossing | 6.0 | NAP | 2020 | NAP | Full-Service | 10.0 | $26.20 - $26.27 | ||||||
| Centerville, UT | |||||||||||||
| Falcoln Hill | 12.5 | 73,912 | 2017 | 100.0% | Full-Service | 5.4 | $26.50 | ||||||
| Layton, UT | |||||||||||||
| Centerville Business Park | 5.5 | 131,183 | 2000 / 2014 | 100.0% | Full-Service | 3.1 – 8.5 | $21.34 - $22.54 | ||||||
| Centerville, UT | |||||||||||||
| Gateway 3 | 114,197 | 2001 | 78.0% | Full-Service/ | 5.0 – 5.4 | $28.00 - $30.00 | |||||||
| Salt Lake City, UT | Base Yr. Stop | ||||||||||||
| (1) | Source: Appraisal. |
THE INFORMATION IN THIS STRUCTURAL AND COLLATERAL TERM SHEET IS NOT COMPLETE AND MAY BE AMENDED PRIOR TO THE TIME OF SALE. THIS TERM SHEET IS NOT AN OFFER TO SELL THESE SECURITIES AND IT IS NOT A SOLICITATION OF AN OFFER TO BUY THESE SECURITIES IN ANY JURISDICTION WHERE THE OFFER OR SALE IS NOT PERMITTED.
70
150 North Central Avenue and 1037 & 1070 West Park Lane Farmington, UT 84025 | Collateral Asset Summary – Loan No. 4 Station Park & Station Park West | Cut-off Date Balance: Cut-off Date LTV: U/W NCF DSCR: U/W NOI Debt Yield: | $60,000,000 50.0% 3.86x 13.8% |
The following table presents certain information relating to the appraisal’s market rent conclusion for the Station Park component at the Station Park Property:
| Station Park - Summary of Appraisal’s Concluded Market Rent | |
| Market Rent PSF | |
| Power Center | |
| Anchors | $11.00 |
| Jr. Anchors greater than 20K sq. ft. | $14.00 |
| Jr. Anchors less than 20K sq. ft. | $18.00 |
| In-line | $25.00 |
| Village | |
| Greater than 10K sq. ft. | $18.00 |
| 4k to 8k sq. ft. | $30.00 |
| Less than 2k sq. ft. | $34.00 |
| Pavilion | $36.00 |
| Outparcel | $34.00 - $75.00 |
With respect to the Station Park West component, the appraisal identified 16 retail lease comparables across five properties within the Salt Lake City MSA ranging in size from 960 sq. ft. to 6,409 sq. ft. with lease terms ranging between 5.0 and 10.0 years. The comparable tenants reported annual NNN rental rates ranging from $21.50 to $50.00 per sq. ft. with a weighted average rent of approximately $32.74 per sq. ft.
| Station Park West - Competitive/Comparable Retail Properties(1) | ||||||||||
| Appraiser’s Comparable Leases | ||||||||||
| Property Name | Distance to Subject (miles) | Size (SF) | Year Built/ Renovated | Occupancy | Anchor/Major Tenants | Range of Lease Terms (Yrs) | Range of Base Rent PSF | |||
| Layton Pointe | 8.1 | 123,890 | 2005 | 90.0% | Bed Bath & Beyond; | 5.0 – 10.0 | $31.21 - $50.00 | |||
| Layton, UT | Dress Barn; Ross | |||||||||
| Family Center at Riverdale | 14.0 | 427,805 | 1995 / 2008 | 98.0% | Super Target; | 5.0 - 10.0 | $21.50 - $33.84 | |||
| Riverdale, UT | Gordman’s; Best | |||||||||
| Buy; Sportman’s | ||||||||||
Warehouse; Applebee’s; Jo-Ann Fabrics | ||||||||||
| Ogden Commons – Pads | 18.0 | 26,877 | 2010 / 2018 | 100.0% | Winco Foods; PetSmart; | 5.0 – 6.0 | $26.00 | |||
| Ogden, UT | Ross Dress For Less | |||||||||
| The Point – Pad D | 12.0 | 9,302 | 2018 | 100.0% | NAP | 5.0 – 10.0 | $24.50 - $27.80 | |||
| West Point, UT | ||||||||||
| Riverdale Town Center | 14.0 | 88,000 | 2017 | 90.0% | Hobby Lobby | 5.0 -10.0 | $35.00 - $39.00 | |||
| Riverdale, UT | ||||||||||
| (1) | Source: Appraisal. |
THE INFORMATION IN THIS STRUCTURAL AND COLLATERAL TERM SHEET IS NOT COMPLETE AND MAY BE AMENDED PRIOR TO THE TIME OF SALE. THIS TERM SHEET IS NOT AN OFFER TO SELL THESE SECURITIES AND IT IS NOT A SOLICITATION OF AN OFFER TO BUY THESE SECURITIES IN ANY JURISDICTION WHERE THE OFFER OR SALE IS NOT PERMITTED.
71
150 North Central Avenue and 1037 & 1070 West Park Lane Farmington, UT 84025 | Collateral Asset Summary – Loan No. 4 Station Park & Station Park West | Cut-off Date Balance: Cut-off Date LTV: U/W NCF DSCR: U/W NOI Debt Yield: | $60,000,000 50.0% 3.86x 13.8% |
Also with respect to the Station Park West component, the appraisal identified seven office lease comparables across four properties within the Salt Lake City MSA ranging in size from 2,055 sq. ft. to 15,221 sq. ft. with lease terms ranging between 5.0 and 10.0 years. The comparable tenants reported annual rental rates ranging from $14.50 to $26.67 per sq. ft. with a weighted average rent of approximately $24.13 per sq. ft.
| Station Park West - Competitive/Comparable Office Properties(1) | |||||||||||||
| Appraiser’s Comparable Leases | |||||||||||||
| Property Name | Distance to Subject (miles) | Size (SF) | Year Built/Renovated | Occupancy | Lease Type | Range of Lease Terms (Yrs) | Range of Base Rent PSF | ||||||
| Parrish Crossing | 6.0 | NAP | 2020 | NAP | Full-Service | 10.0 | $26.20 – $26.67 | ||||||
| Centerville, UT | |||||||||||||
| Farmington Tech Center | 1.7 | 33,000 | 2018 | 70.0% | Full-Service | 5.0 – 7.2 | $22.50 - $23.00 | ||||||
| Farmington, UT | |||||||||||||
| Legend Hills Tower 3 | 9.3 | 35,305 | 2006 | 100.0% | NNN | 5.2 | $14.50 | ||||||
| Clearfield, UT | |||||||||||||
Layton Grandview Corporate Center | 10.3 | 34,902 | 2000 | 91.0% | Full-Service Base Yr. Stop | 5.3 | $19.50 | ||||||
| Layton, UT | |||||||||||||
| (1) | Source: Appraisal. |
The following table presents certain information relating to the appraisal’s market rent conclusion for the Station Park West component at the Station Park Property:
| Summary of Appraisal’s Concluded Market Rent – Station Park West | ||
| Market Rent PSF | ||
| Retail/Shop Space | $30.00 - $38.00 | |
| Office | $26.00 | |
| Pad Site | $18.00 | |
Cash Flow Analysis.
| Cash Flow Analysis(1) | ||||||||||||
| 2017 | 2018 | 2019 | T-12 10/31/2020 | U/W | U/W PSF | |||||||
| Base Rent(2) | 16,155,521 | 15,841,457 | $17,287,499 | $19,031,461 | $18,931,275 | $19.02 | ||||||
| Straight-Line Rental Income | 0 | 0 | 0 | 0 | 12,287 | $0.01 | ||||||
| Vacant Income | 0 | 0 | 0 | 0 | 4,363,537 | $4.38 | ||||||
| Gross Potential Rent | $16,155,521 | $15,841,457 | $17,287,499 | $19,031,461 | $23,307,099 | $23.42 | ||||||
| Total Reimbursements | 4,121,300 | 3,925,959 | 4,891,000 | 5,952,865 | 5,533,010 | $5.56 | ||||||
| Hotel Income | 928,981 | 1,062,763 | 1,064,625 | 119,039 | 119,039 | $0.12 | ||||||
| Other Income | 251,849 | 778,340 | 525,684 | 308,757 | 308,757 | $0.31 | ||||||
| Gross Potential Income | $21,457,651 | $21,608,519 | $23,768,809 | $25,412,122 | $29,267,905 | $29.41 | ||||||
| Less: Vacancy & Credit Loss | 0 | 0 | 0 | 0 | (4,363,537) | $(4.38) | ||||||
| Effective Gross Income | $21,457,651 | $21,608,519 | $23,768,809 | $25,412,122 | $24,904,368 | $25.02 | ||||||
| Total Fixed Expenses(3) | 2,840,568 | 3,436,740 | 3,991,067 | 2,456,978 | 2,415,759 | $2.43 | ||||||
| Total Operating Expenses | 5,790,977 | 5,866,550 | 6,617,951 | 6,162,106 | 6,146,873 | $6.18 | ||||||
| Net Operating Income | $12,826,107 | $12,305,229 | $13,159,791 | $16,793,038 | $16,341,736 | $16.42 | ||||||
| TI/LC | 0 | 0 | 0 | 0 | 497,652 | $0.50 | ||||||
| Capital Expenditures | 0 | 0 | 0 | 0 | 149,295 | $0.15 | ||||||
| Net Cash Flow | $12,826,107 | $12,305,229 | $13,159,791 | $16,793,038 | $15,694,789 | $15.77 | ||||||
| (1) | Based on the underwritten rent roll dated October 1, 2020. |
| (2) | Base Rent is inclusive of contractual rent steps through October 2021. |
| (3) | The decrease in Total Fixed Expenses from T-12 10/31 2020 to U/W is primarily attributable to a permanent reduction in real estate taxes as a result of real estate tax reassessment at the Station park Property. |
Property Management. The Station Park Property is currently managed by CenterCal Properties, LLC, and, with respect to Hyatt Place, Crescent Hotels & Resorts, LLC, both Delaware limited liability companies. CenterCal Properties, LLC is an affiliate of the Borrower Sponsors.
Lockbox / Cash Management. The Station Park Whole Loan documents require a hard lockbox and springing cash management. The Borrowers were required at loan origination to deliver tenant direction letters to all tenants at the Station Park Property directing all tenants to remit rent checks directly to the lender-controlled lockbox. So long as no Cash Sweep Event is continuing, all funds deposited into the lockbox account are required to be transferred to or at the direction of the borrowers. During the continuance of a Cash Sweep Event, all
THE INFORMATION IN THIS STRUCTURAL AND COLLATERAL TERM SHEET IS NOT COMPLETE AND MAY BE AMENDED PRIOR TO THE TIME OF SALE. THIS TERM SHEET IS NOT AN OFFER TO SELL THESE SECURITIES AND IT IS NOT A SOLICITATION OF AN OFFER TO BUY THESE SECURITIES IN ANY JURISDICTION WHERE THE OFFER OR SALE IS NOT PERMITTED.
72
150 North Central Avenue and 1037 & 1070 West Park Lane Farmington, UT 84025 | Collateral Asset Summary – Loan No. 4 Station Park & Station Park West | Cut-off Date Balance: Cut-off Date LTV: U/W NCF DSCR: U/W NOI Debt Yield: | $60,000,000 50.0% 3.86x 13.8% |
funds on deposit in the lockbox account are required to be transferred to the cash management account each business day, at which point, following payment of taxes and insurance, debt service, required reserves and operating expenses, all funds are required to be deposited into the excess cash flow reserve, to be held by the lender as additional security for the Station Park Whole Loan and disbursed in accordance with the terms of the Station Park Whole Loan documents. During the continuance of an event of default, the lender may apply such funds in such order and priority as the lender determines. The lender has been granted a first priority security interest in the lockbox account and the cash management account.
A “Cash Sweep Event” will commence upon the occurrence of (i) an event of default, (ii) a bankruptcy action of the Borrowers or affiliated manager or (iii) the debt service coverage ratio based on the trailing three-month period immediately preceding the date of determination being less than 2.00x.
A “Cash Sweep Event” may be cured (a) with respect to clause (i) above, by the acceptance by the lender of a cure of such event of default; (b) with respect to clause (ii) above solely with respect to the affiliated manager, if the Borrower replaces the affiliated manager with a qualified manager (as fully described in the Station Park Whole Loan documents) under a replacement management agreement within 60 days; or (c) with respect to clause (iii) above, by the achievement of a debt service coverage ratio of 2.00x or greater for three consecutive months based upon the trailing three month period immediately preceding the determination date; provided, however, (1) no event of default will have occurred and be continuing, (2) a Cash Sweep Event may be cured no more than a total of five times during the term of the Station Park Whole Loan, and (3) a bankruptcy event caused by the Borrower may not be cured.
Initial and Ongoing Reserves. At origination, the Borrowers deposited (i) $248,000 into a key money reserve (“Key Money Reserve”) and (ii) $3,958,133 into a gap rent reserve (the “Gap Rent Reserve”). The Key Money Reserve represents the remaining unamortized portion of the key money as described in the franchise agreement for Hyatt Place. The Gap Rent Reserve represents the aggregate amount of base rent for the succeeding 12-month period for those tenants who have not paid in-full base rent due pursuant to each such tenant’s underlying lease as of the origination date. Such amounts will not be released to the borrower until, among other conditions, (i) collections exceed 95% of the full rent payable from all tenants in place as of the origination date for a period of 12 consecutive months and (ii) the Station Park Property is at least 80% occupied based on total square footage, provided no event of default or Cash Sweep Event then exists.
Real Estate Taxes and Insurance Reserves. On each payment date, the Borrowers are required to make monthly deposits of (i) taxes in an amount equal to 1/12 of the amount that the lender estimates will be necessary to pay taxes over the then succeeding 12-month period (provided that such reserve will be conditionally waived so long as no Reserve Trigger Period (as defined below) under the related loan documents has occurred and is continuing, the taxes are paid by the Borrowers and the Borrowers have provided satisfactory evidence upon request that taxes have been paid in accordance with the requirements of the Station Park Whole Loan documents) and (ii) insurance premiums in an amount equal to 1/12 of the amount that the lender estimates will be necessary to cover premiums over the then succeeding 12-month period (provided that such reserve will be conditionally waived so long as no Reserve Trigger Period under the related loan documents has occurred and is continuing, and the Station Park Property is insured by a policy (which may be a blanket policy) meeting the requirements of the Station Park Whole Loan documents).
Replacement Reserves. On each payment date during the continuance of a Reserve Trigger Event (as defined below) and continuing on a monthly basis during such Reserve Trigger Period, the Borrowers will be required to deposit approximately $12,441, subject to a cap equal to 12 times the required monthly deposit ($149,292).
TI/LC Reserve. On each payment date during the continuance of a Reserve Trigger Event and continuing on a monthly basis during such Reserve Trigger Period, the Borrowers will be required to deposit approximately $82,942 (1/12 of $1.00 per sq. ft.), subject to a cap equal to 24 times the required monthly deposit (approximately $1,990,606).
A “Reserve Trigger Period” means each period commencing on the occurrence of a Reserve Trigger Event and continuing until the earlier of (i) the payment date next occurring following the related Reserve Trigger Event Cure (as defined below) or (ii) until payment in full of all principal and interest on the Station Park Whole Loan and all other amounts payable under the Station Park Whole Loan Documents or defeasance of the Station Park Whole Loan in accordance with the terms and provisions of the Station Park Whole Loan documents.
A “Reserve Trigger Event” will commence upon the occurrence of (i) an event of default, (ii) a bankruptcy action of the Borrowers or affiliated manager or (iii) the debt service coverage ratio based on the trailing three-month period immediately preceding the date of determination being less than 2.00x.
A “Reserve Trigger Event Cure” means (a) with respect to clause (i) above, the acceptance by the lender of a cure of such event of default; (b) with respect to clause (ii) above solely with respect to the affiliated manager, if the Borrower replaces the affiliated manager with a qualified manager (as fully described in the Station Park Whole Loan documents) under a replacement management agreement
THE INFORMATION IN THIS STRUCTURAL AND COLLATERAL TERM SHEET IS NOT COMPLETE AND MAY BE AMENDED PRIOR TO THE TIME OF SALE. THIS TERM SHEET IS NOT AN OFFER TO SELL THESE SECURITIES AND IT IS NOT A SOLICITATION OF AN OFFER TO BUY THESE SECURITIES IN ANY JURISDICTION WHERE THE OFFER OR SALE IS NOT PERMITTED.
73
150 North Central Avenue and 1037 & 1070 West Park Lane Farmington, UT 84025 | Collateral Asset Summary – Loan No. 4 Station Park & Station Park West | Cut-off Date Balance: Cut-off Date LTV: U/W NCF DSCR: U/W NOI Debt Yield: | $60,000,000 50.0% 3.86x 13.8% |
within 60 days; or (c) with respect to clause (iii) above, the achievement of a debt service coverage ratio of 2.00x or greater for three consecutive months based upon the trailing three month period immediately preceding the determination date; provided, however, (1) no event of default will have occurred and continuing, (2) a Cash Sweep Event may be cured no more than a total of two times during the term of the Station Park Whole Loan, and (3) a bankruptcy event caused by the Borrower may not be cured.
Current Mezzanine or Subordinate Indebtedness. None.
Future Mezzanine or Subordinate Indebtedness Permitted. None.
Partial Release. None.
THE INFORMATION IN THIS STRUCTURAL AND COLLATERAL TERM SHEET IS NOT COMPLETE AND MAY BE AMENDED PRIOR TO THE TIME OF SALE. THIS TERM SHEET IS NOT AN OFFER TO SELL THESE SECURITIES AND IT IS NOT A SOLICITATION OF AN OFFER TO BUY THESE SECURITIES IN ANY JURISDICTION WHERE THE OFFER OR SALE IS NOT PERMITTED.
74
(THIS PAGE INTENTIONALLY LEFT BLANK)
75
| Various | Collateral Asset Summary – Loan No. 5 Rugby Pittsburgh Portfolio | Cut-off Date Balance: Cut-off Date LTV: U/W NCF DSCR: U/W NOI Debt Yield: | $50,000,000 61.9% 2.00x 12.1% |
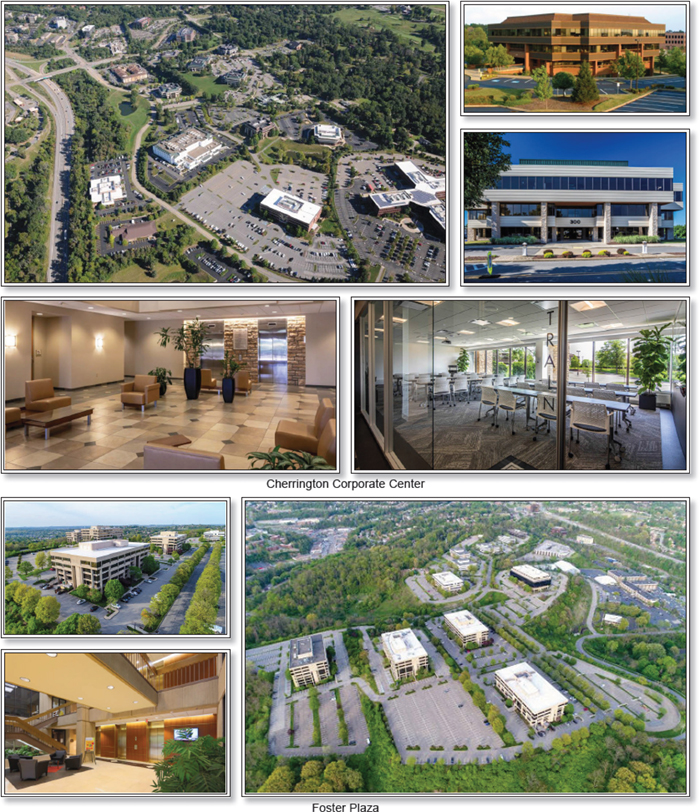
THE INFORMATION IN THIS STRUCTURAL AND COLLATERAL TERM SHEET IS NOT COMPLETE AND MAY BE AMENDED PRIOR TO THE TIME OF SALE. THIS TERM SHEET IS NOT AN OFFER TO SELL THESE SECURITIES AND IT IS NOT A SOLICITATION OF AN OFFER TO BUY THESE SECURITIES IN ANY JURISDICTION WHERE THE OFFER OR SALE IS NOT PERMITTED.
76
| Various | Collateral Asset Summary – Loan No. 5 Rugby Pittsburgh Portfolio | Cut-off Date Balance: Cut-off Date LTV: U/W NCF DSCR: U/W NOI Debt Yield: | $50,000,000 61.9% 2.00x 12.1% |

THE INFORMATION IN THIS STRUCTURAL AND COLLATERAL TERM SHEET IS NOT COMPLETE AND MAY BE AMENDED PRIOR TO THE TIME OF SALE. THIS TERM SHEET IS NOT AN OFFER TO SELL THESE SECURITIES AND IT IS NOT A SOLICITATION OF AN OFFER TO BUY THESE SECURITIES IN ANY JURISDICTION WHERE THE OFFER OR SALE IS NOT PERMITTED.
77
| Various | Collateral Asset Summary – Loan No. 5 Rugby Pittsburgh Portfolio | Cut-off Date Balance: Cut-off Date LTV: U/W NCF DSCR: U/W NOI Debt Yield: | $50,000,000 61.9% 2.00x 12.1% |

THE INFORMATION IN THIS STRUCTURAL AND COLLATERAL TERM SHEET IS NOT COMPLETE AND MAY BE AMENDED PRIOR TO THE TIME OF SALE. THIS TERM SHEET IS NOT AN OFFER TO SELL THESE SECURITIES AND IT IS NOT A SOLICITATION OF AN OFFER TO BUY THESE SECURITIES IN ANY JURISDICTION WHERE THE OFFER OR SALE IS NOT PERMITTED.
78
| Various | Collateral Asset Summary – Loan No. 5 Rugby Pittsburgh Portfolio | Cut-off Date Balance: Cut-off Date LTV: U/W NCF DSCR: U/W NOI Debt Yield: | $50,000,000 61.9% 2.00x 12.1% |
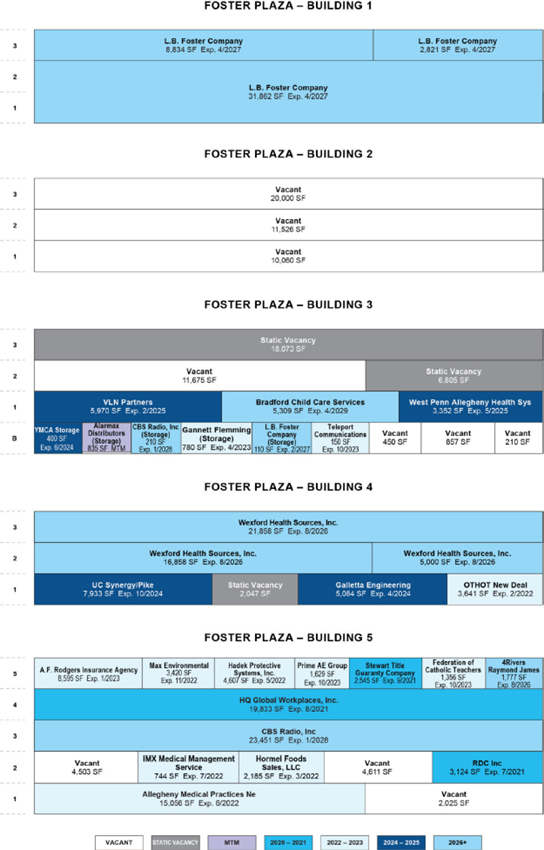
THE INFORMATION IN THIS STRUCTURAL AND COLLATERAL TERM SHEET IS NOT COMPLETE AND MAY BE AMENDED PRIOR TO THE TIME OF SALE. THIS TERM SHEET IS NOT AN OFFER TO SELL THESE SECURITIES AND IT IS NOT A SOLICITATION OF AN OFFER TO BUY THESE SECURITIES IN ANY JURISDICTION WHERE THE OFFER OR SALE IS NOT PERMITTED.
79
| Various | Collateral Asset Summary – Loan No. 5 Rugby Pittsburgh Portfolio | Cut-off Date Balance: Cut-off Date LTV: U/W NCF DSCR: U/W NOI Debt Yield: | $50,000,000 61.9% 2.00x 12.1% |
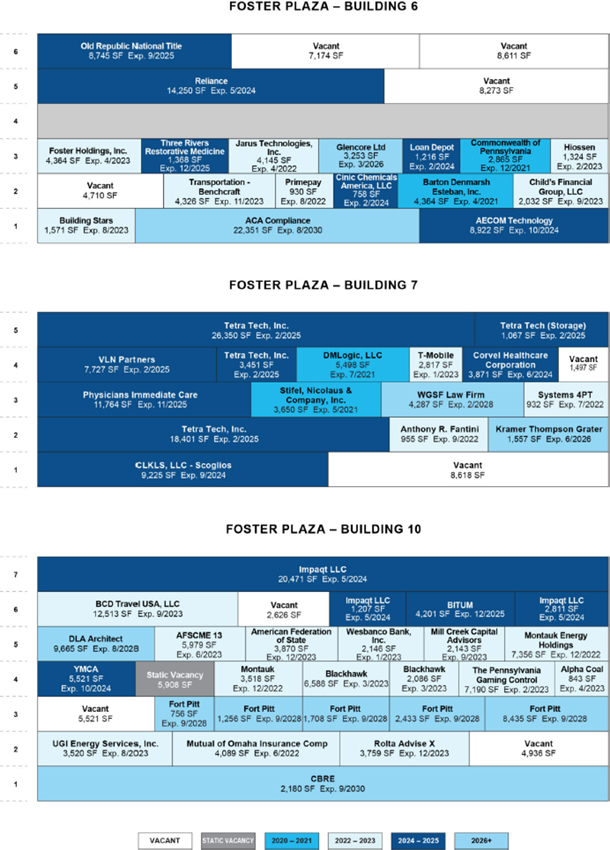
THE INFORMATION IN THIS STRUCTURAL AND COLLATERAL TERM SHEET IS NOT COMPLETE AND MAY BE AMENDED PRIOR TO THE TIME OF SALE. THIS TERM SHEET IS NOT AN OFFER TO SELL THESE SECURITIES AND IT IS NOT A SOLICITATION OF AN OFFER TO BUY THESE SECURITIES IN ANY JURISDICTION WHERE THE OFFER OR SALE IS NOT PERMITTED.
80
| Various | Collateral Asset Summary – Loan No. 5 Rugby Pittsburgh Portfolio | Cut-off Date Balance: Cut-off Date LTV: U/W NCF DSCR: U/W NOI Debt Yield: | $50,000,000 61.9% 2.00x 12.1% |

THE INFORMATION IN THIS STRUCTURAL AND COLLATERAL TERM SHEET IS NOT COMPLETE AND MAY BE AMENDED PRIOR TO THE TIME OF SALE. THIS TERM SHEET IS NOT AN OFFER TO SELL THESE SECURITIES AND IT IS NOT A SOLICITATION OF AN OFFER TO BUY THESE SECURITIES IN ANY JURISDICTION WHERE THE OFFER OR SALE IS NOT PERMITTED.
81
| Various | Collateral Asset Summary – Loan No. 5 Rugby Pittsburgh Portfolio | Cut-off Date Balance: Cut-off Date LTV: U/W NCF DSCR: U/W NOI Debt Yield: | $50,000,000 61.9% 2.00x 12.1% |
| Mortgage Loan Information | |
| Loan Seller: | JPMCB |
| Loan Purpose: | Refinance |
| Borrower Sponsor(1): | Rugby Realty |
| Borrowers(1): | Various |
| Original Balance(2): | $50,000,000 |
| Cut-off Date Balance(2): | $50,000,000 |
| % by Initial UPB: | 6.1% |
| Interest Rate: | 3.39200% |
| Payment Date: | 1st of each month |
| First Payment Date(3): | January 1, 2021 |
| Maturity Date: | January 1, 2031 |
| Amortization(3)(4): | Interest only for the first 37 months, then amortizing |
| Additional Debt(2): | $40,000,000 Pari Passu Debt |
| Call Protection(3)(5): | L(24), D(94), O(3) |
| Lockbox / Cash Management: | Hard / Springing |
| Reserves(9) | |||
| Initial | Monthly | Cap | |
| Taxes: | $976,237 | $81,353 | NAP |
| Insurance: | $0 | Springing | NAP |
| Replacement: | $17,611 | $17,611 | NAP |
| TI/LC: | $88,055 | $88,055 | $5,283,290 |
| Free Rent: | $2,230,699 | $0 | NAP |
| Outstanding TIs: | $1,255,653 | $0 | NAP |
| Outstanding CapEx: | $851,993 | $0 | NAP |
| Property Information | |
| Single Asset / Portfolio: | Portfolio of two office parks / 15 buildings |
| Property Type: | Suburban Office |
| Collateral: | Fee Simple |
| Location: | Various |
| Year Built / Renovated: | Various / NAP |
| Total Sq. Ft.(6): | 1,056,658 |
| Property Management: | C&F Management Enterprises, LLC |
| Underwritten NOI(7): | $10,855,693 |
| Underwritten NCF(7): | $9,587,703 |
| Appraised Value(7): | $145,300,000 |
| Appraisal Date: | Various |
| Historical NOI | |
| Most Recent NOI(8): | $10,097,088 (T-12 August 31, 2020) |
| 2019 NOI(8): | $8,725,882 (December 31, 2019) |
| 2018 NOI: | $8,006,562 (December 31, 2018) |
| 2017 NOI(10): | NAV |
| Historical Occupancy | |
| Most Recent Occupancy: | 82.0% (November 1, 2020) |
| 2019 Occupancy: | 72.7% (December 31, 2019) |
| 2018 Occupancy: | 73.0% (December 31, 2018) |
| 2017 Occupancy(10): | NAV |
| Financial Information(2)(7) | ||||||
| Tranche | Cut-off Date Balance | Balance per Sq. Ft. Cut-off / Balloon | LTV Cut-off / Balloon | U/W DSCR NOI / NCF | U/W Debt Yield NOI / NCF | U/W Debt Yield at Balloon NOI / NCF |
| Mortgage Loan | $50,000,000 | |||||
| Pari Passu Notes | 40,000,000 | |||||
| Whole Loan | $90,000,000 | $85 / $73 | 61.9% / 52.8% | 2.27x / 2.00x | 12.1% / 10.7% | 14.2% / 12.5% |
| (1) | For a description of the Rugby Pittsburgh Portfolio Borrowers (as defined below) and the borrower sponsors, see “The Borrowers / Borrower Sponsors” below. |
| (2) | The Rugby Pittsburgh Portfolio Loan (as defined below) consists of the controlling Note A-1 and is part of the Rugby Pittsburgh Portfolio Whole Loan (as defined below) evidenced by two pari passu notes with an aggregate outstanding principal balance as of the Cut-off Date of $90.0 million. For additional information, see “The Loan” below. |
| (3) | The first payment date for the Rugby Pittsburgh Portfolio Whole Loan is February 1, 2021. On the Closing Date, JPMCB will deposit sufficient funds to pay the amount of interest that would be due with respect to a January 1, 2021 payment. First Payment Date, Amortization period and Call Protection presented in the Mortgage Loan Information above are inclusive of the additional January 2021 interest payment to be deposited on the Closing Date. |
| (4) | The Rugby Pittsburgh Portfolio Whole Loan will be interest only for the first 37-months and will then amortize on a 30-year schedule for the remainder of the loan term. |
| (5) | The lockout period will be at least 24 payments beginning with and including the first payment date of January 1, 2021. The Borrowers have the option to (a) defease the Rugby Pittsburgh Portfolio Whole Loan on the date that is two years from the securitization of the last note to be securitized (the “Permitted Defeasance Date”) or (b) prepay the Rugby Pittsburgh Portfolio Whole Loan with the payment of a yield maintenance premium on February 1, 2024, if the Permitted Defeasance Date has not occurred. The assumed lockout period of 24 months is based on the expected closing date of the Benchmark 2020-B22 securitization in December 2020. The actual lockout period may be longer. |
| (6) | Total Sq. Ft. is comprised of 15 buildings across two office parks, the Foster Plaza office park and the Cherrington Corporate Center office park. Foster Plaza (as defined below) is comprised of eight buildings totaling 674,625 sq. ft. and Cherrington Corporate Center (as defined below) is comprised of seven buildings totaling 382,033 sq. ft. |
| (7) | While the Rugby Pittsburgh Portfolio Loan was originated after the emergence of the novel coronavirus pandemic and the economic disruption resulting from measures to combat the pandemic, the pandemic is an evolving situation and could impact the Rugby Pittsburgh Portfolio Loan more severely than assumed in the underwriting of the Rugby Pittsburgh Portfolio Loan and could adversely affect the NOI, NCF and occupancy information, as well as the appraised value and the DSCR, LTV and Debt Yield metrics presented above. See “Risk Factors—Special Risks—Coronavirus Pandemic Has Adversely Affected the Global Economy and Will Likely Adversely Affect the Performance of the Mortgage Loans” in the Preliminary Prospectus. |
| (8) | The increase in Most Recent NOI from 2019 NOI is primarily attributable to new leases executed in 2019 and 2020 accounting for approximately $4.4 million in U/W Base Rent. |
| (9) | See “Initial and Ongoing Reserves” below. |
| (10) | 2017 NOI and 2017 Occupancy are not available, as the Rugby Pittsburgh Portfolio Properties (as defined below) were acquired by the borrower sponsors in November 2017. |
THE INFORMATION IN THIS STRUCTURAL AND COLLATERAL TERM SHEET IS NOT COMPLETE AND MAY BE AMENDED PRIOR TO THE TIME OF SALE. THIS TERM SHEET IS NOT AN OFFER TO SELL THESE SECURITIES AND IT IS NOT A SOLICITATION OF AN OFFER TO BUY THESE SECURITIES IN ANY JURISDICTION WHERE THE OFFER OR SALE IS NOT PERMITTED.
82
| Various | Collateral Asset Summary – Loan No. 5 Rugby Pittsburgh Portfolio | Cut-off Date Balance: Cut-off Date LTV: U/W NCF DSCR: U/W NOI Debt Yield: | $50,000,000 61.9% 2.00x 12.1% |
The Loan. The Rugby Pittsburgh Portfolio mortgage loan (the “Rugby Pittsburgh Portfolio Loan”) is part of a whole loan (the “Rugby Pittsburgh Portfolio Whole Loan”) secured by a first mortgage encumbering the borrowers’ fee simple interest in a two property portfolio comprised of 15 Class A office buildings across two office parks—the Foster Plaza office park (“Foster Plaza”) and the Cherrington Corporate Center office park (“Cherrington Corporate Center”)—in the aggregate comprising 1,056,658 sq. ft., each located in the suburbs of Pittsburgh, Pennsylvania (the “Rugby Pittsburgh Portfolio Properties”). The Rugby Pittsburgh Portfolio Whole Loan is evidenced by two pari passu notes with an aggregate outstanding principal balance as of the Cut-off Date of $90.0 million. The Rugby Pittsburgh Portfolio Loan, which is evidenced by the controlling Note A-1, has an original principal balance and outstanding principal balance as of the Cut-off Date of $50.0 million and will be included in the Benchmark 2020-B22 trust.
The relationship between the holders of the Rugby Pittsburgh Portfolio Whole Loan is governed by a co-lender agreement as described under “Description of the Mortgage Pool—The Whole Loans—The Serviced Pari Passu Whole Loans” in the Preliminary Prospectus.
| Whole Loan Summary | ||||
| Note | Original Balance | Cut-off Date Balance | Note Holder | Controlling Piece |
| A-1 | $50,000,000 | $50,000,000 | Benchmark 2020-B22 | Yes |
| A-2 | 40,000,000 | 40,000,000 | JPMCB(1) | No |
| Whole Loan | $90,000,000 | $90,000,000 | ||
(1) The related note is currently held by JPMCB and is expected to be contributed to one or more future securitizations.
The Rugby Pittsburgh Portfolio Whole Loan has a 121-month term with interest only payments for the first 37-months and will amortize on a 30-year schedule thereafter. The Rugby Pittsburgh Portfolio Whole Loan accrues interest at a rate of 3.39200% per annum. The Rugby Pittsburgh Portfolio Whole Loan proceeds were used to refinance existing debt, return equity to the borrower sponsor, fund upfront reserves and pay closing costs. Based on the aggregate “As Is” appraised value of $145.3 million as of November 4, 2020 for Foster Plaza and November 5, 2020 for Cherrington Corporate Center, the Cut-off Date LTV Ratio is 61.9%.
| Sources and Uses | |||||||
| Sources | Proceeds | % of Total | Uses | Proceeds | % of Total | ||
| Whole Loan | $90,000,000 | 100.0% | Loan Payoff | $63,066,340 | 70.1% | ||
| Return of Equity | 20,302,566 | 22.6 | |||||
| Upfront Reserves | 5,420,248 | 6.0 | |||||
| Closing Costs | 1,210,846 | 1.3 | |||||
| Total Sources | $90,000,000 | 100.0% | Total Uses | $90,000,000 | 100.0% | ||
The Borrowers / Borrower Sponsors. The borrowers are 200 Cherrington Associates, LLC; 300 Cherrington Associates, LLC; 400 Cherrington Associates, LLC; 500 Cherrington Associates, LLC; 600 Cherrington Associates, LLC; 625 Cherrington Associates, LLC; 700 Cherrington Associates, LLC; Foster 1 Associates, LLC; Foster 2 Associates, LLC; Foster 3 Associates, LLC; Foster 4 Associates, LLC; Foster 5 Associates, LLC; Foster 6 Associates, LLC; Foster 7 Associates, LLC and Foster 10 Associates, LLC, each a Delaware limited liability company (collectively, the “Rugby Pittsburgh Portfolio Borrowers”). The borrower sponsors and non-recourse carveout guarantors are Aaron Stauber, Alan Ades, Maurice Ades, Robert Ades, and Daniel Stauber, all of whom serve as principals at Rugby Realty, a New Jersey-based private equity firm with approximately $1.0 billion of real estate owned throughout New York, New Jersey, Pennsylvania, Connecticut, Florida and Georgia. Rugby Realty is involved in all aspects of commercial real estate operations, including the purchase, development and management of a broad range of real estate holdings. As of December 2019, Rugby Realty owned more than 6.5 million sq. ft. of real estate valued at approximately $1.0 billion. Rugby Realty currently owns more than 5.0 million sq. ft. of office space valued in excess of $500 million in the Pittsburgh metropolitan statistical area. In addition to the Rugby Pittsburgh Portfolio Properties, the borrower sponsors currently own some of Pittsburgh’s most recognizable buildings, including the Frick Building, Gulf Tower, Koppers Building, 933 Penn Avenue, 2100 Wharton Street and the Ewart Building.
The Portfolio. The Rugby Pittsburgh Portfolio Properties consist of a two-property, 1,056,658 sq. ft. Class A office portfolio located in Pittsburgh and Coraopolis, Pennsylvania comprised of 15-buildings across two office parks: Foster Plaza (eight buildings; 674,625 sq. ft.) and Cherrington Corporate Center (seven buildings; 382,033 sq. ft.). The office buildings were constructed between 1975 and 1994. Collectively, the Rugby Pittsburgh Portfolio Properties are currently 82.0% occupied by a diverse tenant roster including approximately 97 unique tenants across a wide range of industries. There are several surface parking lots across the Rugby Pittsburgh Portfolio Properties containing a total of 5,882 parking spots, resulting in a parking ratio of approximately 4.33 spaces per 1,000 sq. ft. at Cherrington Corporate Center and 3.31 spaces per 1,000 sq. ft. at Foster Plaza.
Rugby Realty acquired the Rugby Pittsburgh Portfolio Properties in November 2017 for approximately $71.0 million (approximately $67 per sq. ft.), when the portfolio was 60% leased with a $7.0 million NOI and has since increased occupancy to 82.0%, resulting in an NOI of more than $10.1 million (an approximately 44% increase). Since acquiring the Rugby Pittsburgh Portfolio Properties, the borrower sponsors have implemented a $9.5 million capital improvement plan to revitalize each campus into a corporate destination for tenants
THE INFORMATION IN THIS STRUCTURAL AND COLLATERAL TERM SHEET IS NOT COMPLETE AND MAY BE AMENDED PRIOR TO THE TIME OF SALE. THIS TERM SHEET IS NOT AN OFFER TO SELL THESE SECURITIES AND IT IS NOT A SOLICITATION OF AN OFFER TO BUY THESE SECURITIES IN ANY JURISDICTION WHERE THE OFFER OR SALE IS NOT PERMITTED.
83
| Various | Collateral Asset Summary – Loan No. 5 Rugby Pittsburgh Portfolio | Cut-off Date Balance: Cut-off Date LTV: U/W NCF DSCR: U/W NOI Debt Yield: | $50,000,000 61.9% 2.00x 12.1% |
with modern renovations and amenity centers. Moreover, the portfolio has benefited from continued leasing momentum through the onset of the COVID-19 pandemic, executing 55,000 sq. ft. in new leases. Overall, approximately 18.8% of net rentable area and 19.7% of underwritten base rent is attributable to investment grade rated tenants including Chevron (rated AA by S&P), Waste Management of PA, Inc. (rated A- by S&P), Federal Express (rated BBB by S&P) and Atrium (rated AA- by S&P).
| Portfolio Summary | |||||||
| Property Name | City, State | Year Built | Net Rentable Area (Sq. Ft.) | Occupancy | Allocated Cut-Off Date Balance | % Allocated Cut-Off Date Balance | Appraised Value |
| Foster Plaza | Pittsburgh, PA | 1975 - 1987 | 674,625 | 77.6% | $30,488,644 | 61.0% | $88,600,000 |
| Cherrington Corporate Center | Coraopolis, PA | 1986 - 1994 | 382,033 | 89.8% | $19,511,356 | 39.0% | $56,700,000 |
| Total / Wtd. Avg. | 1,056,658 | 82.0% | $50,000,000 | 100.0% | $145,300,000 | ||
Foster Plaza. Foster Plaza is an eight-building, 674,625 sq. ft. office park located in the Parkway West Corridor Submarket of Pittsburgh, Pennsylvania. The buildings were constructed between 1975 and 1987. Foster Plaza has undergone approximately $6.25 million in renovations since acquisition, including the installation of an extensive 12,906 sq. ft. amenity center that includes a state-of-the-art event, conference, and training center, tenant lounges, a food hall and community space, as well as a game center. In addition, most common areas, bathrooms and elevators were refinished across both office parks. Older mechanical equipment and roofing was replaced, parking lots were resurfaced and exterior finishes were cleaned, as needed. Air purification systems were also added at the properties.
| Foster Plaza Tenant Summary(1) | ||||||
| Tenant | Credit Rating (Moody’s/Fitch/S&P)(2) | Net Rentable Area (Sq. Ft.) | % of Net Rentable Area | U/W Base Rent Per Sq. Ft.(3) | % of Total U/W Base Rent(3) | Lease Expiration |
| Tetra Tech, Inc.(4) | NR / NR / NR | 48,202 | 7.1% | $24.48 | 10.3% | 2/28/2025 |
| Wexford Health Sources, Inc.(5) | NR / NR / NR | 43,716 | 6.5% | $18.07 | 6.9% | 8/31/2026 |
| L.B. Foster Company | NR / NR / NR | 43,517 | 6.5% | $22.00 | 8.3% | 4/30/2027 |
| Impaqt LLC | NR / NR / NR | 24,489 | 3.6% | $22.89 | 4.9% | 5/31/2024 |
| CBS Radio, Inc | B2 / NR / B | 23,451 | 3.5% | $21.44 | 4.4% | 1/31/2028 |
| ACA Compliance(6) | NR / NR / NR | 22,351 | 3.3% | $26.00 | 5.1% | 8/31/2030 |
| HQ Global Workplaces, Inc. | NR / NR / NR | 19,833 | 2.9% | $23.00 | 4.0% | 8/31/2021 |
| Allegheny Medical Practices Ne | NR / NR / NR | 15,056 | 2.2% | $22.25 | 2.9% | 6/30/2022 |
| Fort Pitt | NR / NR / NR | 14,588 | 2.2% | $22.50 | 2.9% | 9/30/2028 |
| Reliance(7) | NR / NR / NR | 14,250 | 2.1% | $21.75 | 2.7% | 5/31/2024 |
| Ten Largest Tenants | 269,453 | 39.9% | $22.27 | 52.2% | ||
| Remaining Occupied | 250,904 | 37.2% | $21.77 | 47.5% | ||
| Storage | 3,402 | 0.5% | $9.71 | 0.3% | ||
| Total / Wtd. Avg. Occupied | 523,759 | 77.6% | $21.95 | 100.0% | ||
| Vacant | 150,866 | 22.4% | ||||
| Total | 674,625 | 100.0% | ||||
| (1) | Based on the underwritten rent roll dated November 1, 2020. |
| (2) | In certain instances, ratings provided are those of the parent company of the entity shown, whether or not the parent company guarantees the lease. |
| (3) | U/W Base Rent per Sq. Ft. and % of Total U/W Base Rent are inclusive of (i) contractual rent steps through November 2021 and (ii) straight line rent through the shorter of the loan and lease term for investment grade rated tenants. |
| (4) | Tetra Tech, Inc. has an additional 1,067 sq. ft. attributable to storage space accounting for $8.00 per sq. ft. in underwritten base rent. |
| (5) | Wexford Health Sources, Inc. has a one-time option to terminate its lease with respect to either (i) a portion of its second floor premises consisting of 5,000 rentable square feet or (ii) the entirety of its second floor premises, effective as of either (x) February 2022 or (y) February 2023, upon written notice by August 2021, or August 2022, and the payment of a termination fee. |
| (6) | ACA Compliance has a one-time option to terminate its lease as of August 2025 upon 12 months’ written notice and the payment of a termination fee. |
| (7) | Reliance has a one-time option to terminate its lease as of May 2022 upon written notice by August 2021 and the payment of a termination fee. |
THE INFORMATION IN THIS STRUCTURAL AND COLLATERAL TERM SHEET IS NOT COMPLETE AND MAY BE AMENDED PRIOR TO THE TIME OF SALE. THIS TERM SHEET IS NOT AN OFFER TO SELL THESE SECURITIES AND IT IS NOT A SOLICITATION OF AN OFFER TO BUY THESE SECURITIES IN ANY JURISDICTION WHERE THE OFFER OR SALE IS NOT PERMITTED.
84
| Various | Collateral Asset Summary – Loan No. 5 Rugby Pittsburgh Portfolio | Cut-off Date Balance: Cut-off Date LTV: U/W NCF DSCR: U/W NOI Debt Yield: | $50,000,000 61.9% 2.00x 12.1% |
| Foster Plaza Lease Rollover Schedule(1)(2) | ||||||||
| Year | # of Leases Expiring | Total Expiring Sq. Ft. | % of Total Sq. Ft. Expiring | Cumulative Sq. Ft. Expiring | Cumulative % of Sq. Ft. Expiring | Annual U/W Base Rent per Sq. Ft.(3) | % U/W Base Rent Rolling(3) | Cumulative % of U/W Base Rent |
| MTM & 2020 | 1 | 835 | 0.1% | 835 | 0.1% | $10.00 | 0.1% | 0.1% |
| 2021 | 7 | 41,879 | 6.2% | 42,714 | 6.3% | $22.37 | 8.2% | 8.2% |
| 2022 | 13 | 51,578 | 7.6% | 94,292 | 14.0% | $22.45 | 10.1% | 18.3% |
| 2023 | 21 | 79,431 | 11.8% | 173,723 | 25.8% | $22.63 | 15.6% | 33.9% |
| 2024 | 13 | 81,669 | 12.1% | 255,392 | 37.9% | $20.06 | 14.2% | 48.2% |
| 2025 | 9 | 92,396 | 13.7% | 347,788 | 51.6% | $23.52 | 18.9% | 67.1% |
| 2026 | 6 | 50,303 | 7.5% | 398,091 | 59.0% | $18.64 | 8.2% | 75.2% |
| 2027 | 4 | 43,627 | 6.5% | 441,718 | 65.5% | $21.97 | 8.3% | 83.6% |
| 2028 | 9 | 52,201 | 7.7% | 493,919 | 73.2% | $22.14 | 10.1% | 93.6% |
| 2029 | 1 | 5,309 | 0.8% | 499,228 | 74.0% | $18.21 | 0.8% | 94.5% |
| 2030 | 2 | 24,531 | 3.6% | 523,759 | 77.6% | $25.93 | 5.5% | 100.0% |
| 2031 and Thereafter | 0 | 0 | 0.0% | 523,759 | 77.6% | $0.00 | 0.0% | 100.0% |
| Vacant | NAP | 150,866 | 22.4% | 674,625 | 100.0% | NAP | NAP | NAP |
| Total / Wtd. Avg. | 86 | 674,625 | 100.0% | $21.95 | 100.0% | |||
| (1) | Based on the underwritten rent roll dated November 1, 2020. |
| (2) | Certain tenants may have termination or contraction options (which may become exercisable prior to the originally stated expiration date of the tenant lease) that are not considered in the above Lease Rollover Schedule. |
| (3) | Annual U/W Base Rent per Sq. Ft. and % U/W Base Rent Rolling are inclusive of (i) contractual rent steps through November 2021 and (ii) straight line rent through the shorter of the loan and lease term for investment grade rated tenants. |
Cherrington Corporate Center. Cherrington Corporate Center is a seven-building, 382,033 sq. ft. office park located in the Parkway West Submarket of Pittsburgh. The office park’s buildings were constructed between 1986 and 1994. Cherrington Corporate Center has undergone approximately $1.95 million in renovations since acquisition, including the installation of an extensive 7,524 sq. ft. of amenity space located on the first floor of one of the buildings, which has a state-of-the-art event, conference and training center, tenant lounges, a kitchen and community space, as well as a fitness center.
| Cherrington Corporate Center Tenant Summary(1) | ||||||
| Tenant | Credit Rating (Moody’s/Fitch/S&P)(2) | Net Rentable Area (Sq. Ft.) | % of Net Rentable Area | U/W Base Rent Per Sq. Ft.(3) | % of Total U/W Base Rent(3) | Lease Expiration |
| Chevron USA(4) | Aa2 / NR / AA | 120,000 | 31.4% | $23.65 | 36.0% | 8/31/2025 |
| Mortgage Connect(5) | NR / NR / NR | 66,713 | 17.5% | $22.48 | 19.0% | 3/31/2027 |
| Waste Management of PA, Inc.(6) | Baa1 / BBB+ / A- | 23,470 | 6.1% | $22.54 | 6.7% | 7/31/2028 |
| MS Consultants | NR / NR / NR | 12,452 | 3.3% | $21.50 | 3.4% | 10/31/2027 |
| Kinect Energy - ODE Acq | NR / NR / NR | 11,788 | 3.1% | $22.89 | 3.4% | 9/30/2024 |
| Mason Dixon Energy | NR / NR / NR | 10,165 | 2.7% | $24.50 | 3.2% | 4/30/2021 |
| Federal Express | Baa2 / NR / BBB | 10,105 | 2.6% | $22.29 | 2.9% | 11/30/2024 |
| Atrium | Aa3 / A+ / AA- | 9,604 | 2.5% | $22.50 | 2.7% | 4/30/2026 |
| VF Outdoor | A3 / NR / A | 9,164 | 2.4% | $23.67 | 2.8% | 6/30/2026 |
| Dermatology Assoc of W. Penn | NR / NR / NR | 7,617 | 2.0% | $25.50 | 2.5% | 12/31/2023 |
| Ten Largest Tenants | 281,078 | 73.6% | $23.14 | 82.6% | ||
| Remaining Occupied | 60,311 | 15.8% | $22.57 | 17.3% | ||
| Storage | 1,509 | 0.4% | $8.83 | 0.2% | ||
| Total / Wtd. Avg. Occupied | 342,898 | 89.8% | $22.98 | 100.0% | ||
| Vacant | 39,135 | 10.2% | ||||
| Total | 382,033 | 100.0% | ||||
| (1) | Based on the underwritten rent roll dated November 1, 2020. |
| (2) | In certain instances, ratings provided are those of the parent company of the entity shown, whether or not the parent company guarantees the lease. |
| (3) | U/W Base Rent per Sq. Ft. and % of Total U/W Base Rent are inclusive of (i) contractual rent steps through November 2021 and (ii) straight line rent through the shorter of the loan and lease term for investment grade rated tenants. |
| (4) | Chevron USA has a one-time option to terminate its lease with respect to either (i) the entirety of its premises or (ii) one or more contiguous floors effective as of August 2023 upon 12-months’ notice and payment of a termination fee. See “Major Tenants” herein for additional information. |
| (5) | Mortgage Connect has the right to terminate its lease with respect to the first floor, totaling 8,327 sq. ft. upon 120 days’ notice and the payment of a termination fee with such termination to be effective as of (i) April 30, 2025 or (ii) April 30, 2026. |
| (6) | Waste Management of PA has a one-time option to terminate its lease effective as of August 2023 upon 12-months’ written notice and payment of a termination fee. |
THE INFORMATION IN THIS STRUCTURAL AND COLLATERAL TERM SHEET IS NOT COMPLETE AND MAY BE AMENDED PRIOR TO THE TIME OF SALE. THIS TERM SHEET IS NOT AN OFFER TO SELL THESE SECURITIES AND IT IS NOT A SOLICITATION OF AN OFFER TO BUY THESE SECURITIES IN ANY JURISDICTION WHERE THE OFFER OR SALE IS NOT PERMITTED.
85
| Various | Collateral Asset Summary – Loan No. 5 Rugby Pittsburgh Portfolio | Cut-off Date Balance: Cut-off Date LTV: U/W NCF DSCR: U/W NOI Debt Yield: | $50,000,000 61.9% 2.00x 12.1% |
| Cherrington Corporate Center Lease Rollover Schedule(1)(2) | ||||||||
| Year | # of Leases Expiring | Total Expiring Sq. Ft. | % of Total Sq. Ft. Expiring | Cumulative Sq. Ft. Expiring | Cumulative % of Sq. Ft. Expiring | Annual U/W Base Rent per Sq. Ft.(3) | % U/W Base Rent Rolling(3) | Cumulative % of U/W Base Rent |
| MTM & 2020 | 0 | 0 | 0.0% | 0 | 0.0% | $0.00 | 0.0% | 0.0% |
| 2021 | 3 | 14,748 | 3.9% | 14,748 | 3.9% | $23.68 | 4.4% | 4.4% |
| 2022 | 2 | 8,181 | 2.1% | 22,929 | 6.0% | $23.52 | 2.4% | 6.9% |
| 2023 | 4 | 15,703 | 4.1% | 38,632 | 10.1% | $24.01 | 4.8% | 11.7% |
| 2024 | 5 | 28,091 | 7.4% | 66,723 | 17.5% | $22.64 | 8.1% | 19.7% |
| 2025 | 11 | 144,928 | 37.9% | 211,651 | 55.4% | $23.31 | 42.9% | 62.6% |
| 2026 | 3 | 23,132 | 6.1% | 234,783 | 61.5% | $23.06 | 6.8% | 69.4% |
| 2027 | 6 | 79,165 | 20.7% | 313,948 | 82.2% | $22.32 | 22.4% | 91.8% |
| 2028 | 3 | 27,259 | 7.1% | 341,207 | 89.3% | $22.17 | 7.7% | 99.5% |
| 2029 | 0 | 0 | 0.0% | 341,207 | 89.3% | $0.00 | 0.0% | 99.5% |
| 2030 | 0 | 0 | 0.0% | 341,207 | 89.3% | $0.00 | 0.0% | 99.5% |
| 2031 and Thereafter | 1 | 1,691 | 0.4% | 342,898 | 89.8% | $25.13 | 0.5% | 100.0% |
| Vacant | NAP | 39,135 | 10.2% | 382,033 | 100.0% | NAP | NAP | NAP |
| Total / Wtd. Avg. | 38 | 382,033 | 100.0% | $22.98 | 100.0% | |||
| (1) | Based on the underwritten rent roll dated November 1, 2020. |
| (2) | Certain tenants may have termination or contraction options (which may become exercisable prior to the originally stated expiration date of the tenant lease) that are not considered in the above Lease Rollover Schedule. |
| (3) | Annual U/W Base Rent per Sq. Ft. and % U/W Base Rent Rolling are inclusive of (i) contractual rent steps through November 2021 and (ii) straight line rent through the shorter of the loan and lease term for investment grade rated tenants. |
Major Tenants.
Chevron USA (“Chevron”) (120,000 sq. ft., 11.4% of NRA, 14.6% of U/W Base Rent) is an American multinational energy corporation primarily focused on the oil and gas sector. The company is engaged in all aspects of the oil and gas industry, including exploration, production, refining, marketing, and transportation, among others. Chevron has been a tenant at Cherrington Corporate Center since 2015 and, according to the borrower sponsor, has invested significant capital in the buildout of its space. This included secure card access turnstile systems at the entrances, a fitness center with a locker room and showers, a 5,000 sq. ft. training facility, a café and dining area, a 5,000 sq. ft. engineering file center, an outdoor patio and a 300 KW back-up generator. Additionally, Cherrington Corporate Center serves as Chevron’s Appalachian Gas Division Engineering Headquarters. Chevron recently signed a five-year renewal in September 2020, which provides for a termination option in August 2023 upon no less than 12 months’ prior written notice.
EQT Corp (rated Ba3 by Moody’s), the largest U.S. natural gas producer by volume, has entered into a definitive purchase and sale agreement with Chevron for its Appalachia gas assets and a pipeline stake. Upon such acquisition, it is possible EQT would extend the Chevron lease for an additional five year renewal and continue operating the space as its Appalachian Gas Division Engineering Headquarters. According to the borrower sponsor, they are currently in lease negotiations with a replacement tenant. We cannot assure you that the lease will be extended as expected or at all.
The Rugby Pittsburgh Portfolio Whole Loan is structured with a cash flow sweep in the event that, among other conditions, (a) Chevron fails to extend its lease for a five year term at expiration or the borrower sponsors fail to find an approved replacement tenant subject to certain leasing conditions or (b) the occurrence of certain tenant triggers, including Chevron terminating its lease, giving notice of termination or abandoning its premises. In either case, whether Chevron opts to terminate its lease or fails to renew 12-months prior to expiration, the Rugby Pittsburgh Portfolio Whole Loan is structured such that (holding all else equal) the lender will have collected approximately $4.8 million ($40 per sq. ft.) with respect to the Chevron leased space) upon Chevron vacating the property (absent an approved replacement tenant) to be held as additional collateral for the Rugby Pittsburgh Portfolio Whole Loan. See “Lockbox / Cash Management” herein for additional information.
Additionally, assuming Chevron vacates its leased space and the replacement lease is not executed, holding all else equal, the Rugby Portfolio Whole Loan results in a 2.21x and 1.42x interest-only and amortizing DSCR, respectively.
Mortgage Connect (66,713 sq. ft., 6.3% of NRA, 7.7% of U/W Base Rent) is a national provider of residential mortgage services, ranging from mortgage originations to mortgage default solutions. Mortgage Connect’s global headquarters is located less than 1.5 miles away from Cherrington Corporate Center. Mortgage Connect recently took occupancy of the 66,713 sq. ft. 600 Cherrington building in its entirety after executing a six-year lease expansion in November 2020 for the remaining 8,327 sq. ft. on the first floor.
Tetra Tech, Inc. (“Tetra Tech”) (49,269 sq. ft., 4.7% of NRA, 6.1% of U/W Base Rent) is a consulting and engineering firm focused on engineering program management and construction management services based out of Pasadena, California. Tetra Tech is primarily focused on projects related to water, the environment, infrastructure, resource management, energy and international development. The Tetra Tech leased space is among the six largest leased by Tetra Tech within the United States, and one of the three largest leased
THE INFORMATION IN THIS STRUCTURAL AND COLLATERAL TERM SHEET IS NOT COMPLETE AND MAY BE AMENDED PRIOR TO THE TIME OF SALE. THIS TERM SHEET IS NOT AN OFFER TO SELL THESE SECURITIES AND IT IS NOT A SOLICITATION OF AN OFFER TO BUY THESE SECURITIES IN ANY JURISDICTION WHERE THE OFFER OR SALE IS NOT PERMITTED.
86
| Various | Collateral Asset Summary – Loan No. 5 Rugby Pittsburgh Portfolio | Cut-off Date Balance: Cut-off Date LTV: U/W NCF DSCR: U/W NOI Debt Yield: | $50,000,000 61.9% 2.00x 12.1% |
spaces in the United States outside of the state of California. The space is occupied the Tetra Tech’s Government Services Group and Commercial/Industrial Services Group. Most recently, Tetra Tech executed a five-year renewal in April 2019, increasing in-place rent from $22.00 per sq. ft. to $24.00 per sq. ft. Tetra Tech has no remaining termination options.
COVID-19 Update. As of December 2020, 100.0% of the Rugby Pittsburgh Portfolio Properties are open and, according to the borrower sponsor, 35% of the tenants have returned to their office space. Additionally, the borrower sponsor has seen a 100.0% collection rate across the Rugby Pittsburgh Portfolio Properties throughout the COVID-19 pandemic. The first payment date of the Rugby Pittsburgh Portfolio Loan is February 1, 2021. As of December 1, 2020, the Rugby Pittsburgh Portfolio Whole Loan is not subject to any modification or forbearance request. . See “Risk Factors—Special Risks—Coronavirus Pandemic Has Adversely Affected the Global Economy and Will Likely Adversely Affect the Performance of the Mortgage Loans” in the Preliminary Prospectus.
Environmental Matters. According to the Phase I environmental reports dated November 6, 2020, there are no recognized environmental conditions or recommendations for further action at the Rugby Pittsburgh Portfolio Properties.
The Market. The Rugby Pittsburgh Portfolio Properties are located in the suburbs of Pittsburgh, Pennsylvania, and are part of the Pittsburgh office market. According to CoStar as of the fourth quarter of 2020, the Pittsburgh office market had a vacancy rate of 9.3% and asking rent of $21.14 per sq. ft. According to the appraisal, several prominent landmarks integral to the city of Pittsburgh also lie just outside, demarcating the Pittsburgh CBD, including PNC Park, the home of the Major League Baseball’s Pittsburgh Pirates, and Heinz Field, the home of the National Football League’s Pittsburgh Steelers, immediately north of the Pittsburgh CBD. Station Square, an upscale shopping area and tourist attraction, is opposite the CBD to the south. Immediately east of the Pittsburgh CBD is PPG Paint Arena, home of the Pittsburgh Penguins NHL hockey team.
Located in Moon Township of the Parkway West submarket, Cherrington Corporate Center is the closest suburban office park to Pittsburgh International Airport, approximately 7 miles away. Cherrington Corporate Center is accessed via I-376 and I-70. Cherrington Corporate Center benefits from the Shell Cracking Plant that is being built approximately 4 miles away. The facility is expected to be delivered in 2024 and is the only cracking plant in Pittsburgh. According to the appraisal, as of 2020, the population within a one-, three- and five-mile radius of Cherrington Corporate Center was 1,146, 27,354 and 69,854, respectively. Additionally, over the same time period, the average household income within a one-, three- and five-mile radius was $115,862, $101,007 and $109,244, respectively.
Located in the Green Tree Borough of the Parkway West submarket, Foster Plaza is the closest Class A suburban office park to Pittsburgh’s CBD, which is approximately 4 miles away. Foster Plaza is accessible via I-376, the primary highway in the Pittsburgh area, with the nearest exit less than one mile away. According to CoStar, as of the fourth quarter of 2020, the Green Tree Borough of the Parkway West submarket had a vacancy of 10.5% and an average asking rent of $21.21 per sq. ft. According to the appraisal, as of 2020, the population within a one-, three- and five-mile radius of Foster Plaza was 10,112, 107,969 and 284,367, respectively. Additionally, over the same time period, the average household income within a one-, three- and five-mile radius was $88,408, $81,729 and $81,848, respectively.
The Rugby Pittsburgh Portfolio Properties are located in the Parkway West submarket in the Pittsburgh office market. The appraisals identified seven office rent comparables for the Rugby Pittsburgh Portfolio Properties. Comparable properties were built between 1960 and 2004 and range in size from 175,012 to 935,817 sq. ft. Occupancy at the comparable properties ranges between 61% and 100%, with an average occupancy of approximately 83%. The appraisal’s concluded office market rents for Foster Plaza and Cherrington Corporate Center were $22.00 per sq. ft. and $22.50 per sq. ft., respectively, in-line with underwritten base rent at the respective Rugby Pittsburgh Portfolio Properties.
THE INFORMATION IN THIS STRUCTURAL AND COLLATERAL TERM SHEET IS NOT COMPLETE AND MAY BE AMENDED PRIOR TO THE TIME OF SALE. THIS TERM SHEET IS NOT AN OFFER TO SELL THESE SECURITIES AND IT IS NOT A SOLICITATION OF AN OFFER TO BUY THESE SECURITIES IN ANY JURISDICTION WHERE THE OFFER OR SALE IS NOT PERMITTED.
87
| Various | Collateral Asset Summary – Loan No. 5 Rugby Pittsburgh Portfolio | Cut-off Date Balance: Cut-off Date LTV: U/W NCF DSCR: U/W NOI Debt Yield: | $50,000,000 61.9% 2.00x 12.1% |
Cash Flow Analysis.
| Cash Flow Analysis | |||||
| 2018 | 2019 | TTM(1) | U/W | U/W per Sq. Ft. | |
| Base Rent(2)(3) | $18,004,702 | $17,606,794 | $17,973,327 | $19,375,809 | $18.34 |
| Vacant Income | 0 | 0 | 0 | 4,178,695 | 3.95 |
| Gross Potential Rent | $18,004,702 | $17,606,794 | $17,973,327 | $23,554,504 | $22.29 |
| Total Reimbursements | 111,676 | 100,098 | 93,212 | 87,214 | 0.08 |
| Net Rental Income | $18,116,378 | $17,706,892 | $18,066,539 | $23,641,718 | $22.37 |
| (Vacancy/Credit Loss) | 0 | 0 | 0 | (4,178,695) | (3.95) |
| Other Income | 227,001 | 281,495 | 211,407 | 211,407 | 0.20 |
| Effective Gross Income | $18,343,379 | $17,988,387 | $18,277,946 | $19,674,430 | $18.62 |
| Total Expenses | $10,336,817 | $9,262,505 | $8,180,858 | $8,818,737 | $8.35 |
| Net Operating Income | $8,006,562 | $8,725,882 | $10,097,088 | $10,855,693 | $10.27 |
| TI/LC | 0 | 0 | 0 | 1,056,658 | 1.00 |
| Replacement Reserves | 0 | 0 | 0 | 211,332 | 0.20 |
| Net Cash Flow | $8,006,562 | $8,725,882 | $10,097,088 | $9,587,703 | $9.07 |
| (1) | TTM column represents the trailing 12-month period ending August 31, 2020. |
| (2) | U/W Base Rent is inclusive of (i) contractual rent steps through November 2021 (ii) and (ii) straight line rent through the shorter of the loan and lease term for investment grade rated tenants. |
| (3) | The increase in U/W Base Rent from TTM Base Rent is primarily attributable to new leases executed in 2019 and 2020 accounting for approximately $4.4 million in U/W Base Rent. |
Property Management. The Rugby Pittsburgh Portfolio Properties are managed by C&F Management Enterprises, LLC, a Delaware limited liability company, which has entered into a property management agreement with CBRE, Inc., a Delaware corporation.
Lockbox / Cash Management. The Rugby Pittsburgh Portfolio Whole Loan is structured with a hard lockbox and springing cash management. The Rugby Pittsburgh Portfolio Borrowers were required at loan origination to deliver tenant direction letters instructing all tenants to deposit all rents and payments directly into a lender-controlled lockbox. All funds deposited into the lockbox are required to be transferred on each business day to or at the direction of the Rugby Pittsburgh Portfolio Borrowers unless a Cash Sweep Event (as defined below) has occurred and continues to exist. Upon the occurrence and during the continuance of a Cash Sweep Event, all funds in the lockbox account are required to be swept on each business day to a lender-controlled cash management account, to be applied and disbursed in accordance with the Rugby Pittsburgh Portfolio Whole Loan documents. During the continuance of a Cash Sweep Event, all excess cash flow funds remaining in the cash management account after the application of such funds in accordance with the Rugby Pittsburgh Portfolio Whole Loan documents are required to be held by the lender in an excess cash flow reserve account as additional collateral for the Rugby Pittsburgh Portfolio Whole Loan.
A “Cash Sweep Event” means the occurrence and continuation of (i) an event of default, (ii) any bankruptcy action of the Rugby Pittsburgh Portfolio Borrowers, the property manager or the property sub-manager, (iii) debt service coverage ratio based on the trailing three-month period immediately preceding the date of determination being less than 1.40x (on an amortizing basis) (a “DSCR Trigger Event”) or (iv) a Major Tenant Trigger Event (as defined below).
A Cash Sweep Event may be cured, with respect to (a) clause (i) above, the acceptance by the lender of a cure of such event of default, (b) clause (ii) above, solely with respect to the bankruptcy action of the property manager or the property sub-manager, if the Rugby Pittsburgh Portfolio Borrowers replace the property manager or the property sub-manager with a qualified manager (as defined in the Rugby Pittsburgh Portfolio Whole Loan documents) under a replacement management agreement within 60 days, (c) clause (iii) above, the achievement of a debt service coverage ratio based on the trailing three-month period immediately preceding the date of determination of not less than 1.45x, or (d) clause (iv) above, the achievement of a Major Tenant Trigger Event Cure (as defined below); provided, however, (1) no event of default will have occurred and be continuing under the Rugby Pittsburgh Portfolio Whole Loan documents, (2) a Cash Sweep Event may occur no more than a total of five times during the term of the Rugby Pittsburgh Portfolio Whole Loan (provided the foregoing limitation is not applicable to the Major Tenant Trigger Event or a DSCR Trigger Event), and (3) the Rugby Pittsburgh Portfolio Borrowers will have paid all of the lender’s reasonable expenses incurred in connection with such curing of a Cash Sweep Event. The Rugby Pittsburgh Portfolio Borrowers have no right to cure a bankruptcy action of a Rugby Pittsburgh Portfolio Borrower, unless such bankruptcy action was involuntary and not consented to or acquiesced in by such Rugby Pittsburgh Portfolio Borrower and the same is dismissed within 60 days after having been filed with no adverse consequences to the Rugby Pittsburgh Portfolio Properties.
A “Major Tenant Trigger Event” means the occurrence and continuation of (i) the debt yield for the Rugby Pittsburgh Portfolio Properties falling below 9.25% and (ii) if Chevron (a) exercises its option to terminate its lease or (b) has neither renewed nor exercised its option to extend its lease prior to the date that is 12 months prior to the then applicable expiration date under its lease.
A “Major Tenant Trigger Event Cure” means (i) the Rugby Pittsburgh Portfolio Borrowers replace Chevron with an approved major tenant replacement lease that satisfies the major tenant leasing conditions set forth in the Rugby Pittsburgh Portfolio Whole Loan documents,
THE INFORMATION IN THIS STRUCTURAL AND COLLATERAL TERM SHEET IS NOT COMPLETE AND MAY BE AMENDED PRIOR TO THE TIME OF SALE. THIS TERM SHEET IS NOT AN OFFER TO SELL THESE SECURITIES AND IT IS NOT A SOLICITATION OF AN OFFER TO BUY THESE SECURITIES IN ANY JURISDICTION WHERE THE OFFER OR SALE IS NOT PERMITTED.
88
| Various | Collateral Asset Summary – Loan No. 5 Rugby Pittsburgh Portfolio | Cut-off Date Balance: Cut-off Date LTV: U/W NCF DSCR: U/W NOI Debt Yield: | $50,000,000 61.9% 2.00x 12.1% |
(ii) the debt yield (excluding Chevron) is equal to or greater than 9.25% or (iii) the amount on deposit in the excess cash flow account incurred with respect to re-tenanting the major tenant premises is equal to the cap of $4,800,000.
Initial and Ongoing Reserves. At loan origination, the Rugby Pittsburgh Portfolio Borrowers deposited approximately (i) $2,230,699 into a free rent reserve, (ii) $976,237 into a real estate tax reserve, (iii) $17,611 into a replacement reserve, (iv) $88,055 into a TI/LC reserve, (v) $1,255,653 into an outstanding tenant improvements and leasing commissions reserve to cover outstanding tenant improvement obligations and leasing commissions for eight tenants and (vi) approximately $851,993 into an outstanding capex reserve.
Real Estate Taxes Reserves. On each monthly payment date, the Rugby Pittsburgh Portfolio Borrowers are required to deposit into a real estate tax reserve an amount equal to (i) 1/12th of the estimated annual real estate taxes, which currently equates to approximately $81,353 per month (approximately $0.08 per sq. ft.).
Insurance Reserves. On each monthly payment date, the Rugby Pittsburgh Portfolio Borrowers are required to deposit into an insurance reserve an amount equal to 1/12th of estimated insurance premiums. To the extent the Rugby Pittsburgh Portfolio Borrowers obtain and maintain a blanket insurance policy acceptable to the lender and no event of default has occurred and is continuing, the requirement for monthly deposits into the insurance reserve will be waived.
Replacements Reserve. The Rugby Pittsburgh Portfolio Borrowers are required to deposit into the replacement reserve, on a monthly basis, $17,611.
TI/LC Reserve. The Rugby Pittsburgh Portfolio Borrowers are required to deposit into the TI/LC reserve, on a monthly basis, $88,055, subject to a cap of $5,283,290.
Current Mezzanine or Subordinate Indebtedness. None.
Future Mezzanine or Subordinate Indebtedness Permitted. None.
Partial Release. Release of individual buildings is not permitted; however, the Rugby Pittsburgh Portfolio Whole Loan documents permit the release of certain vacant outparcels at the Rugby Pittsburgh Portfolio Properties (the “Release Outparcels”), subject to the satisfaction of certain conditions set forth in the Rugby Pittsburgh Portfolio Whole Loan documents, including, without limitation: (a) the related Release Outparcel is vacant, unimproved (except for surface parking) and non-income producing; (b) the related Release Outparcel may not be released and conveyed to an affiliate of the Rugby Pittsburgh Portfolio Borrowers; (c) the release of such Release Outparcel does not result in a material adverse effect or materially impair the operation, value or use of the Rugby Pittsburgh Portfolio Properties continuing to be subject to the lien of the mortgage after such release; (d) the Rugby Pittsburgh Portfolio Borrowers pay an amount equal to (i) with respect to the Release Outparcel identified as Outparcel A, the greater of (x) 100% of the net sales proceeds from the sale of Outparcel A and (y) 90% of the gross sales proceeds from such sale, but in no event less than $1,020,000 and (ii) with respect to the Release Outparcel identified as Outparcel B, 100% of the net sales proceeds from the sale of Outparcel B, but in no event less than 90% of the gross sales proceeds from such sale; and (e) satisfaction of customary REMIC conditions and, if necessary, delivery of a REMIC opinion. See “Description of the Mortgage Pool—Certain Terms of the Mortgage Loans—Partial Releases” in the Preliminary Prospectus for additional information.
THE INFORMATION IN THIS STRUCTURAL AND COLLATERAL TERM SHEET IS NOT COMPLETE AND MAY BE AMENDED PRIOR TO THE TIME OF SALE. THIS TERM SHEET IS NOT AN OFFER TO SELL THESE SECURITIES AND IT IS NOT A SOLICITATION OF AN OFFER TO BUY THESE SECURITIES IN ANY JURISDICTION WHERE THE OFFER OR SALE IS NOT PERMITTED.
89
| 4630 West 13400 South Riverton, UT 84103 | Collateral Asset Summary – Loan No. 6 Mountain View Village | Cut-off Date Balance: Cut-off Date LTV: U/W NCF DSCR: U/W NOI Debt Yield: | $38,650,500 39.0% 3.13x 11.4% |

THE INFORMATION IN THIS STRUCTURAL AND COLLATERAL TERM SHEET IS NOT COMPLETE AND MAY BE AMENDED PRIOR TO THE TIME OF SALE. THIS TERM SHEET IS NOT AN OFFER TO SELL THESE SECURITIES AND IT IS NOT A SOLICITATION OF AN OFFER TO BUY THESE SECURITIES IN ANY JURISDICTION WHERE THE OFFER OR SALE IS NOT PERMITTED.
90
| 4630 West 13400 South Riverton, UT 84103 | Collateral Asset Summary – Loan No. 6 Mountain View Village | Cut-off Date Balance: Cut-off Date LTV: U/W NCF DSCR: U/W NOI Debt Yield: | $38,650,500 39.0% 3.13x 11.4% |
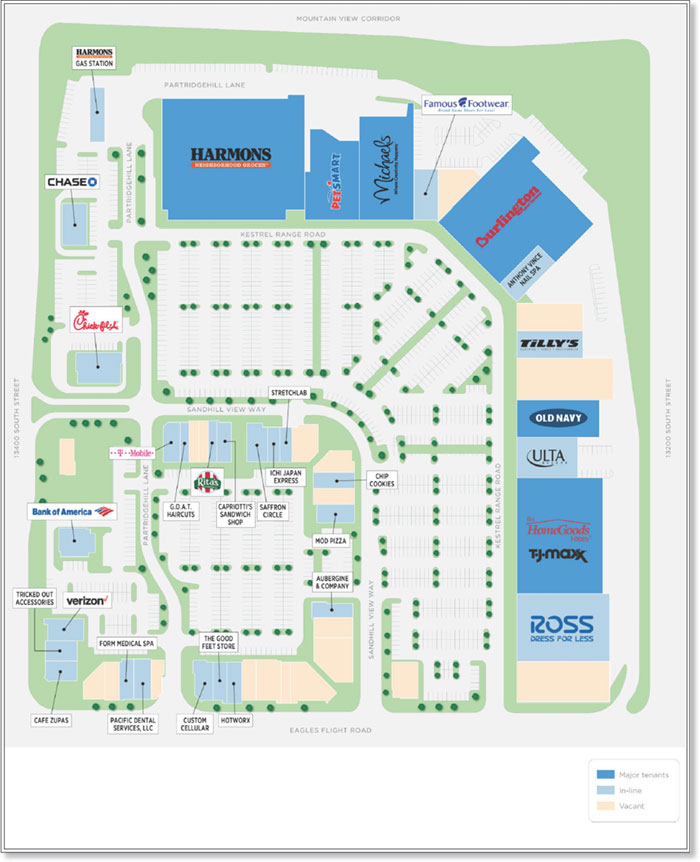
THE INFORMATION IN THIS STRUCTURAL AND COLLATERAL TERM SHEET IS NOT COMPLETE AND MAY BE AMENDED PRIOR TO THE TIME OF SALE. THIS TERM SHEET IS NOT AN OFFER TO SELL THESE SECURITIES AND IT IS NOT A SOLICITATION OF AN OFFER TO BUY THESE SECURITIES IN ANY JURISDICTION WHERE THE OFFER OR SALE IS NOT PERMITTED.
91
| 4630 West 13400 South Riverton, UT 84103 | Collateral Asset Summary – Loan No. 6 Mountain View Village | Cut-off Date Balance: Cut-off Date LTV: U/W NCF DSCR: U/W NOI Debt Yield: | $38,650,500 39.0% 3.13x 11.4% |
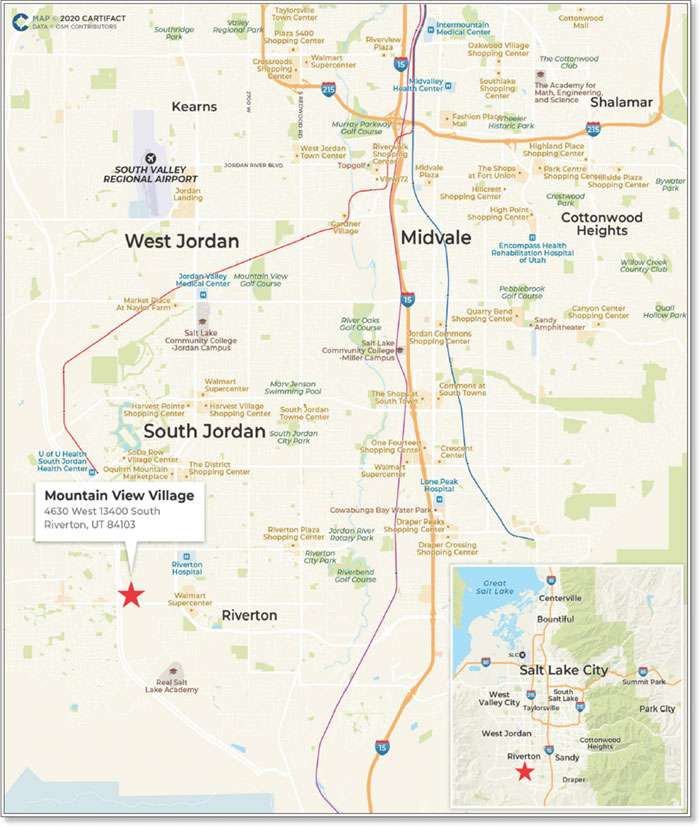
THE INFORMATION IN THIS STRUCTURAL AND COLLATERAL TERM SHEET IS NOT COMPLETE AND MAY BE AMENDED PRIOR TO THE TIME OF SALE. THIS TERM SHEET IS NOT AN OFFER TO SELL THESE SECURITIES AND IT IS NOT A SOLICITATION OF AN OFFER TO BUY THESE SECURITIES IN ANY JURISDICTION WHERE THE OFFER OR SALE IS NOT PERMITTED.
92
| 4630 West 13400 South Riverton, UT 84103 | Collateral Asset Summary – Loan No. 6 Mountain View Village | Cut-off Date Balance: Cut-off Date LTV: U/W NCF DSCR: U/W NOI Debt Yield: | $38,650,500 39.0% 3.13x 11.4% |
| Mortgage Loan Information | |
| Loan Seller: | JPMCB |
| Loan Purpose: | Refinance |
| Borrower Sponsors: | California State Teachers Retirement |
| System; CenterCal, LLC | |
| Borrower: | Riverton CenterCal Owner, LLC |
| Original Balance: | $38,650,500 |
| Cut-off Date Balance: | $38,650,500 |
| % by Initial UPB: | 4.7% |
| Interest Rate: | 3.37700% |
| Payment Date: | 5th of each month |
| First Payment Date: | January 5, 2021 |
| Maturity Date: | December 5, 2030 |
| Amortization: | Interest Only |
| Additional Debt: | None |
| Call Protection: | L(24), DorYM1(92), O(4) |
| Lockbox / Cash Management: | Hard / Springing |
| Reserves(5) | |||
| Initial | Monthly | Cap | |
| Taxes: | $0 | Springing | NAP |
| Insurance: | $0 | Springing | NAP |
| Replacement: | $0 | Springing | $61,044 |
| TI/LC: | $0 | Springing | $813,956 |
| Gap Rent(6): | $712,926 | $0 | NAP |
| Property Information | |
| Single Asset / Portfolio: | Single Asset |
| Property Type: | Anchored Retail |
| Collateral: | Fee Simple |
| Location: | Riverton, UT |
| Year Built / Renovated: | 2018-2019 / NAP |
| Total Sq. Ft.: | 406,978 |
| Property Management: | CenterCal Properties, LLC |
| Underwritten NOI(1)(2): | $4,404,355 |
| Underwritten NCF(1)(2): | $4,139,819 |
| Appraised Value(2): | $99,200,000 |
| Appraisal Date(2): | October 2, 2020 |
| Historical NOI | |
| Most Recent NOI(2): | $4,314,548 (T-12 October 31, 2020) |
| 2019 NOI(3): | $3,320,240 (December 31, 2019) |
| 2018 NOI(3): | $873,366 (December 31, 2018) |
| 2017 NOI(4): | NAP |
| Historical Occupancy | |
| Most Recent Occupancy(2): | 77.6% (October 1, 2020) |
| 2019 Occupancy: | 73.0% (December 31, 2019) |
| 2018 Occupancy: | 63.9% (December 31, 2018) |
| 2017 Occupancy(4): | NAP |
| Financial Information(2) | ||||||
| Tranche | Cut-off Date Balance | Balance per Sq. Ft. Cut-off / Balloon | LTV Cut-off / Balloon | U/W DSCR NOI / NCF | U/W Debt Yield NOI / NCF | U/W Debt Yield at Balloon NOI / NCF |
| Mortgage Loan | $38,650,500 | $95 / $95 | 39.0% / 39.0% | 3.33x / 3.13x | 11.4% / 10.7% | 11.4% / 10.7% |
| (1) | Underwritten NOI and Underwritten NCF are inclusive of contractual rent steps through October 2021 and straight-line rent for investment grade tenants totaling approximately $44,516. |
| (2) | While the Mountain View Village Loan (as defined below) was originated after the emergence of the novel coronavirus pandemic and the economic disruption resulting from measures to combat the pandemic, the pandemic is an evolving situation and could impact the Mountain View Village Loan more severely than assumed in the underwriting of the Mountain View Village Loan and could adversely affect the NOI, NCF and occupancy information, as well as the appraised value and the DSCR, LTV and Debt Yield metrics presented above. See “Risk Factors— Special Risks —Coronavirus Pandemic Has Adversely Affected the Global Economy and Will Likely Adversely Affect the Performance of the Mortgage Loans” in the Preliminary Prospectus. |
| (3) | The increase from 2018 NOI to 2019 NOI is attributable to the initial lease-up of the Mountain View Village Property (as defined below). |
| (4) | 2017 NOI and 2017 Occupancy figures are not available as the Mountain View Village Property was developed between 2018 and 2019. |
| (5) | For a full description of reserves, please see “Initial and Ongoing Reserves” herein. |
| (6) | Gap Rent Reserve represents the aggregate amount of base rent for the succeeding 12-months for tenants who have not paid in-full base rent due pursuant to each such tenant’s underlying lease as of the origination date. Such amounts will not be released to the borrower until, among other conditions, (i) collections exceed 95% of the full rent payable from all tenants in place as of the origination date for a period of 12 consecutive months and (ii) the Mountain View Village Property is at least 80% occupied based on total square footage, provided no event of default or Cash Sweep Event (as defined below) then exists. |
THE INFORMATION IN THIS STRUCTURAL AND COLLATERAL TERM SHEET IS NOT COMPLETE AND MAY BE AMENDED PRIOR TO THE TIME OF SALE. THIS TERM SHEET IS NOT AN OFFER TO SELL THESE SECURITIES AND IT IS NOT A SOLICITATION OF AN OFFER TO BUY THESE SECURITIES IN ANY JURISDICTION WHERE THE OFFER OR SALE IS NOT PERMITTED.
93
| 4630 West 13400 South Riverton, UT 84103 | Collateral Asset Summary – Loan No. 6 Mountain View Village | Cut-off Date Balance: Cut-off Date LTV: U/W NCF DSCR: U/W NOI Debt Yield: | $38,650,500 39.0% 3.13x 11.4% |
The Loan. The Mountain View Village mortgage loan (the “Mountain View Village Loan”) is secured by a first mortgage encumbering the borrower’s fee simple interest in a 406,978 sq. ft. grocery anchored retail center in Riverton, Utah (the “Mountain View Village Property”). The Mountain View Village Loan has an original principal balance and outstanding principal balance as of the Cut-off Date of $38,650,500.
The Mountain View Village Loan has a 120-month interest-only term and accrues interest at a rate of 3.37700% per annum. The proceeds of the Mountain View Village Loan and Borrower Sponsors’ equity of approximately $29.6 million will be used to pay off approximately $67.0 million of existing debt, pay closing costs and fund a 12-month upfront gap rent reserve.
| Sources and Uses | |||||
| Sources | Proceeds | % of Total | Uses | Proceeds | % of Total |
| Mortgage Loan | $38,650,500 | 56.6% | Loan Payoff | $66,995,169 | 98.1% |
| Borrower Sponsor Equity | 29,623,492 | 43.4 | Upfront Reserves | 712,926 | 1.0_ |
| Closing Costs | 565,897 | 0.8_ | |||
| Total Sources | $68,273,992 | 100.0% | Total Uses | $68,273,992 | 100.0% |
The Borrower / Borrower Sponsors. The borrower is Riverton CenterCal Owner, LLC (the “Borrower”), a Delaware limited liability company and single purpose entity with two independent directors. Legal counsel to the Borrower delivered a non-consolidation opinion in connection with the origination of the Mountain View Village Loan. The Borrower is indirectly owned or controlled by a joint venture between California State Teachers Retirement System (“CalSTRS”) and CenterCal, LLC (“CenterCal”) (collectively, the “Borrower Sponsors”). CalSTRS is the largest educator-only pension fund in the world, the second largest pension fund in the United States and as of October 31, 2020, had a market value of approximately $254.7 billion. As of October, 31, 2020, approximately 13.8% of CalSTRS’ portfolio was allocated to real estate, totaling approximately $35.2 billion of net asset value. CalSTRS was established by law in 1913 to provide retirement benefits to California’s public school educators from prekindergarten through community college. The organization provides retirement, disability and survivor benefits to California’s approximately 965,000 public school educators and their families. CenterCal Properties, LLC, founded in 2004 by Fred Bruning and Jean Paul Wardy, is a full-service commercial real estate company in the business of investing, developing, leasing and managing its projects. CenterCal has over 120 employees in over 12 offices across the western United States. CenterCal excels in, and is best known for, creating destinations throughout the western United States with a unique strategy of “placemaking,” which emphasizes the importance of developing spaces with a sense of community.
There is no separate non-recourse carveout guarantor or environmental indemnitor, and the borrower is the sole party responsible for breaches or violations of the nonrecourse carve-out provisions in the related mortgage loan documents, including the environmental indemnity. At loan origination, the Borrower Sponsors provided a secured lender environmental policy. See “Environmental Matters” below for additional information related to the environmental insurance.
THE INFORMATION IN THIS STRUCTURAL AND COLLATERAL TERM SHEET IS NOT COMPLETE AND MAY BE AMENDED PRIOR TO THE TIME OF SALE. THIS TERM SHEET IS NOT AN OFFER TO SELL THESE SECURITIES AND IT IS NOT A SOLICITATION OF AN OFFER TO BUY THESE SECURITIES IN ANY JURISDICTION WHERE THE OFFER OR SALE IS NOT PERMITTED.
94
| 4630 West 13400 South Riverton, UT 84103 | Collateral Asset Summary – Loan No. 6 Mountain View Village | Cut-off Date Balance: Cut-off Date LTV: U/W NCF DSCR: U/W NOI Debt Yield: | $38,650,500 39.0% 3.13x 11.4% |
The Property.
| Tenant Summary(1)(2) | |||||||||
| Tenant | Property Type | Credit Rating (Moody’s/Fitch/S&P)(3) | Net Rentable Area (Sq. Ft.) | % of Net Rentable Area | U/W Base Rent Per Sq. Ft.(4) | % of Total U/W Base Rent(4) | Lease Expiration | TTM October 2020 Sales PSF | TTM Occupancy Cost % |
| Harmons(5)(6) | Retail | NR / NR / NR | 81,641 | 20.1% | $10.86 | 17.1% | 8/31/2038 | $370 | 3.4% |
| T.J Maxx and Home Goods | Retail | A2 / NR / A | 42,500 | 10.4% | $11.50 | 9.5% | 6/30/2028 | NAV | NAV |
| Burlington Coat Factory | Retail | NR / B / BB | 40,000 | 9.8% | $10.00 | 7.7% | 2/28/2029 | NAV | NAV |
| Michaels Stores | Retail | NR / B / B | 22,843 | 5.6% | $16.00 | 7.1% | 2/29/2028 | NAV | NAV |
| Ross Dress for Less | Retail | A2 / NR / BBB+ | 22,004 | 5.4% | $13.50 | 5.7% | 2/28/2030 | NAV | NAV |
| PetSmart, Inc. | Retail | B1 / NR / B- | 18,020 | 4.4% | $20.00 | 7.0% | 6/30/2028 | NAV | NAV |
| Old Navy | Retail | Ba3 / NR / BB- | 12,511 | 3.1% | $17.00 | 4.1% | 6/30/2023 | $178 | 9.5% |
| Ulta | Retail | NR / NR / NR | 10,005 | 2.5% | $17.00 | 3.3% | 6/30/2028 | NAV | NAV |
| Tilly’s | Retail | NR / NR / NR | 6,666 | 1.6% | $20.00 | 2.6% | 1/31/2029 | $135 | 14.8% |
| Anthony Vince’ Nail Spa | Retail | NR / NR / NR | 5,061 | 1.2% | $26.01 | 2.5% | 2/28/2029 | $159 | 16.3% |
| Ten Largest Tenants | 261,251 | 64.2% | $13.19 | 66.6% | |||||
| Remaining Occupied | 54,682 | 13.4% | $31.55 | 33.4% | |||||
| Total Occupied | 315,933 | 77.6% | $16.37 | 100.0% | |||||
| Vacant | 91,045 | 22.4% | |||||||
| Total / Wtd. Avg. | 406,978 | 100.0% | |||||||
| (1) | Based on the underwritten rent roll dated October 1, 2020. |
| (2) | Certain of the tenants have leases that provide for co-tenancy provisions. See “Description of the Mortgage Pool—Tenant Issues—Lease Expirations and Terminations” in the Preliminary Prospectus for additional information. |
| (3) | In certain instances, ratings provided are those of the parent company of the entity shown, whether or not the parent company guarantees the lease. |
| (4) | U/W Base Rent per Sq. Ft. and % of Total U/W Base Rent are inclusive of contractual rent steps through October 2021. |
| (5) | Harmons Net Rentable Area (Sq. Ft.) is inclusive of 14,548 sq. ft. attributable to Harmons Fuel Station. |
| (6) | TTM October 2020 Sales PSF and TTM Occupancy Cost % is based on TTM October 2020 sales is not inclusive of 14,548 sq. ft. attributable to Harmon’s Fuel Station. |
| Lease Rollover Schedule(1) | ||||||||
| Year | # of Leases Expiring | Total Expiring Sq. Ft. | % of Total Sq. Ft. Expiring | Cumulative Sq. Ft. Expiring | Cumulative % of Sq. Ft. Expiring | Annual U/W Base Rent per Sq. Ft.(2) | % U/W Base Rent Rolling(2) | Cumulative % of U/W Base Rent(2) |
| MTM | 0 | 0 | 0.0% | 0 | 0.0% | $0.00 | 0.0% | 0.0% |
| 2020 | 0 | 0 | 0.0% | 0 | 0.0% | $0.00 | 0.0% | 0.0% |
| 2021 | 0 | 0 | 0.0% | 0 | 0.0% | $0.00 | 0.0% | 0.0% |
| 2022 | 0 | 0 | 0.0% | 0 | 0.0% | $0.00 | 0.0% | 0.0% |
| 2023 | 1 | 12,511 | 3.1% | 12,511 | 3.1% | $17.00 | 4.1% | 4.1% |
| 2024 | 2 | 2,647 | 0.7% | 15,158 | 3.7% | $38.94 | 2.0% | 6.1% |
| 2025 | 2 | 4,074 | 1.0% | 19,232 | 4.7% | $37.19 | 2.9% | 9.0% |
| 2026 | 0 | 0 | 0.0% | 19,232 | 4.7% | $0.00 | 0.0% | 9.0% |
| 2027 | 0 | 0 | 0.0% | 19,232 | 4.7% | $0.00 | 0.0% | 9.0% |
| 2028 | 11 | 110,390 | 27.1% | 129,622 | 31.8% | $18.05 | 38.5% | 47.6% |
| 2029(3) | 8 | 64,450 | 15.8% | 194,072 | 47.7% | $14.48 | 18.0% | 65.6% |
| 2030 | 4 | 28,194 | 6.9% | 222,266 | 54.6% | $17.83 | 9.7% | 75.3% |
| 2031 & Thereafter | 4 | 93,667 | 23.0% | 315,933 | 77.6% | $13.61 | 24.7% | 100.0% |
| Vacant | NAP | 91,045 | 22.4% | 406,978 | 100.0% | NAP | NAP | NAP |
| Total / Wtd. Avg. | 32 | 406,978 | 100.0% | $16.37 | 100.0% | |||
| (1) | Based on the underwritten rent roll dated October 1, 2020. |
| (2) | Annual U/W Base Rent per Sq. Ft., % U/W Base Rent Rolling and Cumulative % of U/W Base Rent are inclusive of contractual rent steps through October 2021. |
| (3) | 2029 is inclusive of 5,003 sq. ft. attributable to Famous Footwear, which pays % in lieu and has no attributable U/W Base Rent. |
The Mountain View Village Property is a Class A, grocery anchored retail power center located at 4630 West 13400 South with frontage along the Mountain View Corridor in Riverton, Utah. The Mountain View Village Property consists of 13, one-story buildings constructed in 2018 and 2019. The Mountain View Village Property contains 1,598 parking spaces for a ratio of 3.93 per 1,000 sq. ft. and is grocery anchored by Harmons. The Mountain View Village Property serves as a community center equipped with manicured landscaping, fire pits, fountains and outdoor seating.
The Mountain View Village Property was 77.6% leased to 32 diverse tenants as of October 1, 2020. The weighted average remaining lease term across the Mountain View Village Property is 10.5 years.
THE INFORMATION IN THIS STRUCTURAL AND COLLATERAL TERM SHEET IS NOT COMPLETE AND MAY BE AMENDED PRIOR TO THE TIME OF SALE. THIS TERM SHEET IS NOT AN OFFER TO SELL THESE SECURITIES AND IT IS NOT A SOLICITATION OF AN OFFER TO BUY THESE SECURITIES IN ANY JURISDICTION WHERE THE OFFER OR SALE IS NOT PERMITTED.
95
| 4630 West 13400 South Riverton, UT 84103 | Collateral Asset Summary – Loan No. 6 Mountain View Village | Cut-off Date Balance: Cut-off Date LTV: U/W NCF DSCR: U/W NOI Debt Yield: | $38,650,500 39.0% 3.13x 11.4% |
The Borrower Sponsors acquired the Mountain View Village site in 2017 and developed the Mountain View Village Property in 2018 and 2019 for a total cost of $81.7 million ($201 per sq. ft.). The Borrower Sponsors have since invested $23.3 million in leasing costs, resulting in a total cost basis of $105.0 million ($258 per sq. ft.). Despite the ongoing COVID-19 pandemic, seven leases totaling 51,369 sq. ft. have commenced at the Mountain View Village Property since January 2020 and the Borrower Sponsors are in advanced negotiations to lease additional sq. ft. to national retailers. The Borrower Sponsors are focused on creating an experience-driven, mixed-use destination in Riverton, Utah. While continuing to increase occupancy, the Borrower Sponsors anticipate leasing up the Mountain View Village Property with retail, restaurant, office, fitness, entertainment and residential offerings. Set within one of the fastest growing submarkets in the United States, the Borrower Sponsors plan to create a lifestyle center poised to attract, cater to and entertain guests from far beyond the immediate area.
COVID-19 Update. As of December 1, 2020, The Mountain View Village Property is fully open and operational. As of December 1, 2020, the Mountain View Village Property is not subject to any modification or forbearance requests. A total of 24 tenants requested some form of rent relief at the Mountain View Village Property. The Borrower Sponsors negotiated rent deferrals on a tenant-by-tenant basis and ultimately provided two months of deferred rent in April and May to 11 tenants at the Mountain View Village Property comprising 99,164 sq. ft. (24.4% of net rentable area) and totaling $245,075 in rent deferment. Leases for these tenants were amended such that the deferred rent will be recouped by the landlord via 12 equal installments in 2021. At origination, a $712,926 gap rent reserve was established, representing the aggregate amount of base rent for the succeeding 12-months for tenants who have not paid in-full base rent due pursuant to each such tenant’s underlying lease as of the origination date. Such amounts will not be released to the borrower until, among other conditions, (i) collections exceed 95% of the full rent payable from all tenants in place as of the origination date for a period of 12 consecutive months and (ii) the Mountain View Village Property is at least 80% occupied based on total square footage, provided no event of default or Cash Sweep Event then exists. The first payment date of the Mountain View Village Loan is January 5, 2021. See “Risk Factors—Special Risks—Coronavirus Pandemic Has Adversely Affected the Global Economy and Will Likely Adversely Affect the Performance of the Mortgage Loans” in the Preliminary Prospectus. The chart below outlines collections throughout the COVID-19 pandemic.
| COVID-19 Collections Summary(1) | |||||||
| April | May | June | July | August | September | October | November |
| 68.5% | 64.9% | 76.9% | 91.6% | 70.3% | 90.9% | 92.7% | 96.4% |
| (1) | Based on collections report provided by the Borrower. |
Major Tenants.
Harmons (81,641 sq. ft.; 20.1% of NRA; 17.1% of U/W Base Rent) was founded in 1932 and is a family owned and locally run grocer within the state of Utah. Harmons has 20 stores throughout the Wasatch Front and St. George’s area. The grocery store chain emphasizes sourcing from local companies and farms, and focuses on using higher-quality ingredients. In addition to selling groceries, Harmons operates post offices, coffee bars, offers full-time chefs and cooking classes, and employs pharmacists and dieticians across its locations. Harmons serves as the grocery-anchor within the power center and also includes 14,548 sq. ft. attributable to Harmons Fuel Station, the ground leased gas station at the Mountain View Village Property. From TTM October 2019 to TTM October 2020, sales per sq. ft. at the Mountain View Village Property increased from $173.74 per sq. ft. to $369.96 per sq. ft., a 112.9% year-over-year increase. Harmons has been a tenant at the Mountain View Village Property since August 2018 and has four, five-year renewal options remaining. Harmons has no termination options remaining.
T.J. Maxx and HomeGoods (42,500 sq. ft.; 10.4% of NRA; 9.5% of U/W Base Rent) are both subsidiaries of TJX Companies, Inc. a leading off-price apparel and home fashions retailer in the U.S. and worldwide. TJX Companies, Inc. has more than 4,500 stores across nine countries, four e-commerce sites, and employs approximately 286,000 associates. In 2019, TJX Companies, Inc. generated nearly $42 billion in sales and in 2020 it was ranked 80 in the 2020 Fortune 500 company listings. T.J. Maxx and HomeGoods have been at the property since June 2018 and have four, five-year renewal options. T.J. Maxx and HomeGoods have no termination options.
Burlington Coat Factory (40,000 sq. ft.; 9.8% of NRA; 7.7% of U/W Base Rent), also known as Burlington Stores, opened its first store in 1972 in Burlington, NJ where it offered off-price coats and outerwear and has since expanded its product assortment to include ladies’ sportswear, men’s active wear, children’s apparel, baby apparel, home goods, and beauty products. Burlington Stores is a Fortune 500 company with 769 stores in 45 states and Puerto Rico as of Q3 2020. In 2019, Burlington Stores generated $7.3 billion in revenue. Burlington Coat Factory has been at the Mountain View Village Property since August 2018 and has four, five-year renewal options. Burlington Coat Factory has no termination options.
Environmental Matters. The Phase I environmental report dated April 3, 2020 recommended no further action at the Mountain View Village Property. At origination, the Borrower Sponsors provided a secured lender environmental policy from Ironshore Specialty Insurance Company with the lender as the named insured, with per incident and aggregate limits of $10,000,000 and a $50,000 per incident self-insured retention. The insurance premium was paid at origination.
THE INFORMATION IN THIS STRUCTURAL AND COLLATERAL TERM SHEET IS NOT COMPLETE AND MAY BE AMENDED PRIOR TO THE TIME OF SALE. THIS TERM SHEET IS NOT AN OFFER TO SELL THESE SECURITIES AND IT IS NOT A SOLICITATION OF AN OFFER TO BUY THESE SECURITIES IN ANY JURISDICTION WHERE THE OFFER OR SALE IS NOT PERMITTED.
96
| 4630 West 13400 South Riverton, UT 84103 | Collateral Asset Summary – Loan No. 6 Mountain View Village | Cut-off Date Balance: Cut-off Date LTV: U/W NCF DSCR: U/W NOI Debt Yield: | $38,650,500 39.0% 3.13x 11.4% |
The Market. The Mountain View Village Property is located within the Salt Lake City retail market, approximately 15 miles south of the Salt Lake City Central Business District. The area includes over 625,000 employees and has a 2.6% unemployment rate. The top three industries within the area are health care/social assistance, manufacturing and educational services, which collectively represent approximately 31% of the population. The immediate surrounding area is a mixture of commercial and residential development, transitioning from agricultural use into large scale, master planned projects including the Mountain View Village Property. Development is generally along the Mountain View Corridor infrastructure project, a Utah Department of Transportation project that is expected to eventually consist of a 35-mile freeway from Interstate 80 in Salt Lake County to State Route 73 in Utah County. Primary access to the Mountain View Village Property is currently provided by Interstate 15 and Bangerter Highway to the east of the subject, as well as Mountain View Corridor located to the west. The Salt Lake City International Airport is approximately 21.0 miles north of the Mountain View Village Property. Per the appraisal, the population in the Salt Lake City, UT Metropolitan Statistical Area has increased by 168,243 since 2010, reflecting an annual increase of 1.6%. Population is projected to increase by an additional 101,493 by 2024 reflecting 1.6% annual population growth. According to the appraisal, the estimated 2020 population within a one-, three- and five-mile radius of the Mountain View Village Property was approximately 13,494, 98,020 and 179,726, respectively. The estimated 2020 average household income within the same radii was approximately $122,827, $128,329 and $130,645, respectively.
The Mountain View Village Property is located in the Salt Lake City retail market and Southwest retail submarket. According to the appraisal, the Salt Lake City retail market had a total inventory of 36.8 million sq. ft. and a vacancy rate of 7.2%. As of the second quarter of 2020, there was 69,534 sq. ft. of positive net absorption and average NNN asking rents were $18.19 per sq. ft. The Southwest retail submarket included 5.4 million sq. ft. with a total vacancy rate of 3.5% and average NNN asking rents of $18.01 per sq. ft.
The appraisal identified 27 comparable retail leases across seven properties within the Salt Lake City MSA ranging in size from 960 sq. ft. to 25,239 sq. ft. with terms ranging between 5.0 and 10.7 years. The comparable leases reported annual rental rates ranging between $13.50 and $44.00 per sq. ft. with a weighted average rent of approximately $22.06 per sq. ft.
| Competitive/Comparable Properties(1) | |||||||
| Appraiser’s Lease Comparables | |||||||
| Property Name | Distance to Subject (miles) | Size (SF) | Year Built/ Renovated | Occupancy | Anchor/Major Tenants | Range of Lease Terms (Yrs) | Range of Base Rent PSF |
| The Shoppes at Fort Union Midvale, UT | 11 | 694,099 | 1980 / 2006 | 98% | Smith’s Food and Drug; Walmart | 10.0 – 10.7 | $30.00 - $44.00 |
| The District South Jordan, UT | 5.4 | 906,300 | 2007 | 98% | Target; JC Penney; Ross; Petco; Hobby Lobby | 5.0 | $28.00 - $35.00 |
| Commons at South Towne Sandy, UT | 7.1 | 60,677 | 1994 | 100% | PetSmart; PGA Superstore | 10.0 | $16.42 – $30.00 |
| Highridge Strip Center South Jordan, UT | 2.8 | 15,051 | 2018 | 100% | NAP | 7.0 - 10.0 | $27.50 – $31.33 |
| West Bountiful Commons I & II West Bountiful, UT | 27 | 329,549 | 1993 | 99% | Costco; At Home; Office Depot; Petco | 5.0 - 10.0 | $15.90 – $35.00 |
| University Crossing Orem, UT | 23 | 213,440 | 1971 / 2015 | 92% | Burlington Coat Factory; Barnes & Noble; Nordstrom; Pier 1 Imports | 5.0 - 10.0 | $13.50 – $36.00 |
| Family Center at Riverdale Riverdale, UT | 46 | 427,805 | 1995 / 2008 | 98% | Super Target; Gordman’s; Sportsman’s Warehouse; Best Buy; Applebee’s | 5.0 - 10.0 | $21.50 – $33.84 |
| (1) | Source: Appraisal. |
THE INFORMATION IN THIS STRUCTURAL AND COLLATERAL TERM SHEET IS NOT COMPLETE AND MAY BE AMENDED PRIOR TO THE TIME OF SALE. THIS TERM SHEET IS NOT AN OFFER TO SELL THESE SECURITIES AND IT IS NOT A SOLICITATION OF AN OFFER TO BUY THESE SECURITIES IN ANY JURISDICTION WHERE THE OFFER OR SALE IS NOT PERMITTED.
97
| 4630 West 13400 South Riverton, UT 84103 | Collateral Asset Summary – Loan No. 6 Mountain View Village | Cut-off Date Balance: Cut-off Date LTV: U/W NCF DSCR: U/W NOI Debt Yield: | $38,650,500 39.0% 3.13x 11.4% |
The following table presents certain information relating to the appraisal’s market rent conclusion for the Mountain View Village Property:
| Summary of Appraisal’s Concluded Retail Market Rent | |
| Market Rent PSF | |
| Anchors | $12.00 |
| Jr. Anchors > 20K Sq. Ft. | $15.00 |
| Jr. Anchors < 20K Sq. Ft. | $17.00 |
| Large In-line | $21.00 |
| Shop Space | $30.00 - $38.00 |
Cash Flow Analysis.
| Cash Flow Analysis(1) | |||||
| 2018 | 2019 | T-12 10/30/2020 | U/W | U/W PSF | |
| Base Rent(2)(3) | $1,187,801 | $4,455,565 | $5,051,131 | $5,171,108 | $12.71 |
| Straight-Line Rental Income | 0 | 0 | 0 | 33,860 | $0.08 |
| Vacant Income | 0 | 0 | 0 | 2,287,068 | $5.62 |
| Gross Potential Rent | $1,187,801 | $4,455,565 | $5,051,131 | 7,492,037 | $18.41 |
| Total Reimbursements | 396,948 | 1,411,716 | 2,021,175 | 1,958,190 | $4.81 |
| Other Income | 5,477 | 17,686 | 40,061 | 40,061 | $0.10 |
| Gross Potential Income | $1,590,226 | $5,884,967 | $7,112,367 | 9,490,288 | $23.32 |
| Less: Vacancy & Credit Loss | 0 | 0 | 0 | (2,287,068) | ($5.62) |
| Effective Gross Income | $1,590,226 | $5,884,967 | $7,112,367 | 7,203,220 | $17.70 |
| Total Fixed Expenses | 210,919 | 1,084,091 | 1,161,378 | 1,159,699 | $2.85 |
| Total Operating Expenses | 505,941 | 1,480,636 | 1,636,440 | 1,639,166 | $4.03 |
| Net Operating Income | $873,366 | $3,320,240 | $4,314,548 | 4,404,355 | $10.82 |
| TI/LC | 0 | 0 | 0 | 203,489 | $0.50 |
| Capital Expenditures | 0 | 0 | 0 | 61,047 | $0.15 |
| Net Cash Flow | $873,366 | $3,320,240 | $4,314,548 | 4,139,819 | $10.17 |
| (1) | 2017 historical financials are not available as the Mountain View Village Property was constructed in 2018 and 2019. |
| (2) | The increase from 2018 NOI to 2019 NOI is primarily attributable to the initial lease-up of the Mountain View Village Property. |
| (3) | U/W Base Rent is inclusive of contractual rent steps through October 2021. |
Property Management. The Mountain View Village Property is currently managed by CenterCal Properties, LLC a Delaware limited liability company and affiliate of the Borrower Sponsors.
Lockbox / Cash Management. The Mountain View Village Loan documents require a hard lockbox and springing cash management. The Borrower was required at origination to deliver tenant direction letters to all tenants at the Mountain View Village Property directing all tenants to remit rent checks directly to a lender-controlled lockbox account. So long as no Cash Sweep Event is continuing, all funds deposited into the lockbox account are required to be transferred to or at the direction of the borrowers. During the continuance of a Cash Sweep Event, all funds on deposit in the lockbox account are required to be transferred to the cash management account each business day, at which point, following payment of taxes and insurance, debt service, required reserves and operating expenses, all funds are required to be deposited into the excess cash flow reserve, to be held by the lender as additional security for the Mountain View Village Loan and disbursed in accordance with the terms of the Mountain View Village Loan documents. During the continuance of an event of default, the lender may apply such funds in such order and priority as the lender determines. The lender has been granted a first priority security interest in the lockbox account and the cash management account.
A “Cash Sweep Event” means the occurrence of (i) an event of default, (ii) a bankruptcy action of the Borrower or affiliated manager or (iii) the debt service coverage ratio based on the trailing three-month period immediately preceding the date of determination being less than 2.00x (a “DSCR Trigger Event”).
A “Cash Sweep Event” may be cured (a) with respect to clause (i) above, by the acceptance by the lender of a cure of such event of default; (b) with respect to clause (ii) above solely with respect to the affiliated manager, if the Borrower replaces the affiliated manager with a qualified manager (as fully described in the Mountain View Village Loan documents) under a replacement management agreement within 60 days; or (c) with respect to clause (iii) above, by the achievement of a debt service coverage ratio of 2.00x or greater for three consecutive months based upon the trailing three month period immediately preceding the determination date; provided, however, (1) no event of default will have occurred and be continuing, (2) a Cash Sweep Event may be cured no more than a total of five times during the term of the Mountain View Village Loan, and (3) a bankruptcy event caused by the Borrower may not be cured.
THE INFORMATION IN THIS STRUCTURAL AND COLLATERAL TERM SHEET IS NOT COMPLETE AND MAY BE AMENDED PRIOR TO THE TIME OF SALE. THIS TERM SHEET IS NOT AN OFFER TO SELL THESE SECURITIES AND IT IS NOT A SOLICITATION OF AN OFFER TO BUY THESE SECURITIES IN ANY JURISDICTION WHERE THE OFFER OR SALE IS NOT PERMITTED.
98
| 4630 West 13400 South Riverton, UT 84103 | Collateral Asset Summary – Loan No. 6 Mountain View Village | Cut-off Date Balance: Cut-off Date LTV: U/W NCF DSCR: U/W NOI Debt Yield: | $38,650,500 39.0% 3.13x 11.4% |
Initial and Ongoing Reserves. At origination, the Borrower deposited approximately $712,926 into a gap rent reserve (the “Gap Rent Reserve”). The Gap Rent Reserve represents the aggregate amount of base rent for the succeeding 12-month period for those tenants who have not paid in-full base rent due pursuant to each such tenant’s underlying lease as of the origination date. Such amounts will not be released to the borrower until, among other conditions, (i) collections exceed 95% of the full rent payable from all tenants in place as of the origination date for a period of 12 consecutive months and (ii) the Mountain View Village Property is at least 80% occupied based on total square footage, provided no event of default or Cash Sweep Event then exists.
Real Estate Taxes and Insurance Reserves. On each payment date during the continuance of a Reserve Trigger Event (as defined below), the Borrower is required to make monthly deposits of: (i) a tax reserve in an amount equal to 1/12 of the amount that the lender estimates will be necessary to pay taxes over the then succeeding 12-month period and (ii) an insurance reserve in an amount equal to 1/12 of the amount that the lender estimates will be necessary to cover premiums over the then succeeding 12-month period (such reserve has been conditionally waived so long as no event of default under the related loan documents has occurred and is continuing, and the Mountain View Village Property is insured by a policy (which may be a blanket policy) meeting the requirements of the Mountain View Village Loan documents).
Replacement Reserves. On each payment date during the continuance of a Reserve Trigger Event, approximately $5,087, subject to a cap of an amount equal to 12 times the required monthly deposit (approximately $61,044).
TI/LC Reserve. On each payment date during the continuance of a Reserve Trigger Event, approximately $33,915 (1/12 of $1.00 per sq. ft.), subject to a cap of an amount equal to 24 times the required monthly deposit (approximately $813,956).
A “Reserve Trigger Period” means each period commencing on the occurrence of a Reserve Trigger Event (as defined below) and continuing until the earlier of (i) the payment date next occurring following the related Reserve Trigger Event Cure (as defined below) or (ii) until payment in full of all principal and interest on the Mountain View Village Loan and all other amounts payable under the Mountain View Village Loan documents or defeasance of the Mountain View Village Loan in accordance with the terms and provisions of the Mountain View Village Loan documents.
A “Reserve Trigger Event” will commence upon the occurrence of (i) an event of default, (ii) a bankruptcy action of the Borrower or affiliated manager or (iii) the debt service coverage ratio based on the trailing three-month period immediately preceding the date of determination being less than 2.00x.
A “Reserve Trigger Event Cure” means (a) with respect to clause (i) above, the acceptance by the lender of a cure of such event of default; (b) with respect to clause (ii) above solely with respect to the affiliated manager, if the Borrower replaces the affiliated manager with a qualified manager (as fully described in the Mountain View Village Loan documents) under a replacement management agreement within 60 days; or (c) with respect to clause (iii) above, the achievement of a debt service coverage ratio of 2.00x or greater for three consecutive months based upon the trailing three month period immediately preceding the determination date; provided, however, (1) no event of default will have occurred and continuing, (2) a Cash Sweep Event may be cured no more than a total of two times during the term of the Mountain View Village Loan, and (3) a bankruptcy event caused by the Borrower may not be cured.
Current Mezzanine or Subordinate Indebtedness. None.
Future Mezzanine or Subordinate Indebtedness Permitted. None.
Partial Release. None.
THE INFORMATION IN THIS STRUCTURAL AND COLLATERAL TERM SHEET IS NOT COMPLETE AND MAY BE AMENDED PRIOR TO THE TIME OF SALE. THIS TERM SHEET IS NOT AN OFFER TO SELL THESE SECURITIES AND IT IS NOT A SOLICITATION OF AN OFFER TO BUY THESE SECURITIES IN ANY JURISDICTION WHERE THE OFFER OR SALE IS NOT PERMITTED.
99
4 West 58th Street New York, NY 10019 | Collateral Asset Summary – Loan No. 7 4 West 58th Street | Cut-off Date Balance: Cut-off Date LTV: U/W NCF DSCR: U/W NOI Debt Yield: | $32,500,000 69.4% 1.94x 7.4% |

THE INFORMATION IN THIS STRUCTURAL AND COLLATERAL TERM SHEET IS NOT COMPLETE AND MAY BE AMENDED PRIOR TO THE TIME OF SALE. THIS TERM SHEET IS NOT AN OFFER TO SELL THESE SECURITIES AND IT IS NOT A SOLICITATION OF AN OFFER TO BUY THESE SECURITIES IN ANY JURISDICTION WHERE THE OFFER OR SALE IS NOT PERMITTED.
100
4 West 58th Street New York, NY 10019 | Collateral Asset Summary – Loan No. 7 4 West 58th Street | Cut-off Date Balance: Cut-off Date LTV: U/W NCF DSCR: U/W NOI Debt Yield: | $32,500,000 69.4% 1.94x 7.4% |

THE INFORMATION IN THIS STRUCTURAL AND COLLATERAL TERM SHEET IS NOT COMPLETE AND MAY BE AMENDED PRIOR TO THE TIME OF SALE. THIS TERM SHEET IS NOT AN OFFER TO SELL THESE SECURITIES AND IT IS NOT A SOLICITATION OF AN OFFER TO BUY THESE SECURITIES IN ANY JURISDICTION WHERE THE OFFER OR SALE IS NOT PERMITTED.
101
4 West 58th Street New York, NY 10019 | Collateral Asset Summary – Loan No. 7 4 West 58th Street | Cut-off Date Balance: Cut-off Date LTV: U/W NCF DSCR: U/W NOI Debt Yield: | $32,500,000 69.4% 1.94x 7.4% |

THE INFORMATION IN THIS STRUCTURAL AND COLLATERAL TERM SHEET IS NOT COMPLETE AND MAY BE AMENDED PRIOR TO THE TIME OF SALE. THIS TERM SHEET IS NOT AN OFFER TO SELL THESE SECURITIES AND IT IS NOT A SOLICITATION OF AN OFFER TO BUY THESE SECURITIES IN ANY JURISDICTION WHERE THE OFFER OR SALE IS NOT PERMITTED.
102
4 West 58th Street New York, NY 10019 | Collateral Asset Summary – Loan No. 7 4 West 58th Street | Cut-off Date Balance: Cut-off Date LTV: U/W NCF DSCR: U/W NOI Debt Yield: | $32,500,000 69.4% 1.94x 7.4% |
| Mortgage Loan Information | |
| Loan Seller: | JPMCB |
| Loan Purpose: | Recapitalization |
| Borrower Sponsor(1): | Estate of Sheldon H. Solow |
| Borrowers: | Ulysses Co. II, L.L.C.; Solow Building Company III, L.L.C. |
| Original Balance(2): | $32,500,000 |
| Cut-off Date Balance(2): | $32,500,000 |
| % by Initial UPB: | 4.0% |
| Interest Rate: | 3.68000% |
| Payment Date: | 1st of each month |
| First Payment Date: | April 1, 2020 |
| Maturity Date: | March 1, 2030 |
| Amortization: | Interest Only |
| Additional Debt: | $92,500,000 Pari Passu Debt; Future Mezzanine Debt Permitted |
| Call Protection: | L(33), D(81), O(6) |
| Lockbox / Cash Management: | Hard / Springing |
| Reserves(8) | |||
| Initial | Monthly | Cap | |
| Taxes: | $91,175 | $91,175 | NAP |
| Insurance: | $4,669 | $4,669 | NAP |
| Replacement: | $0 | $1,392 | $33,408 |
| TI/LC: | $7,811,435 | $13,932 | $835,920 |
| Free Rent / Gap Rent Reserve: | $5,799,156 | $0 | NAP |
| Excess Cash Flow Reserve(8): | $1,878,542 | NAP | NAP |
| Property Information | |
| Single Asset / Portfolio: | Single Asset |
| Property Type: | Mixed Use – Office/Retail |
| Collateral(3): | Fee Simple/Leasehold |
| Location: | New York, NY |
| Year Built / Renovated: | 1948 / 2016-2019 |
| Total Sq. Ft.: | 83,537 |
| Property Management: | Solow Management Corp. |
| Underwritten NOI(4)(5)(6): | $9,242,058 |
| Underwritten NCF(4)(5): | $9,059,948 |
| Appraised Value(5): | $180,000,000 |
| Appraisal Date(5): | February 1, 2020 |
| Historical NOI(6) | |
| Most Recent NOI: | $4,519,138 (T-12 June 30, 2020) |
| 2019 NOI: | $3,570,977 (December 31, 2019) |
| 2018 NOI: | $2,974,304 (December 31, 2018) |
| 2017 NOI: | $2,908,139 (December 31, 2017) |
| Historical Occupancy | |
| Most Recent Occupancy(7): | 100.0% (October 1, 2020) |
| 2019 Occupancy: | 76.7% (December 31, 2019) |
| 2018 Occupancy: | 73.2% (December 31, 2018) |
| 2017 Occupancy: | 79.6% (December 31, 2017) |
| Financial Information(2) | ||||||
| Tranche | Cut-off Date Balance | Balance per Sq. Ft. Cut-off / Balloon | LTV Cut-off / Balloon | U/W DSCR NOI / NCF | U/W Debt Yield NOI / NCF | U/W Debt Yield at Balloon NOI / NCF |
| Mortgage Loan | $32,500,000 | |||||
| Pari Passu Notes | 92,500,000 | |||||
| Whole Loan | $125,000,000 | $1,496 / $1,496 | 69.4% / 69.4% | 1.98x / 1.94x | 7.4% / 7.2% | 7.4% / 7.2% |
| (1) | The borrower sponsor and the non-recourse carveout guarantor, Sheldon H. Solow, passed away on November 17, 2020. For additional information, see “The Borrowers / Borrower Sponsors” section below. |
| (2) | The 4 West 58th Street Loan (as defined below) is part of a whole loan evidenced by four pari passu notes, with an aggregate outstanding principal balance as of the Cut-off Date of $125.0 million. For additional information, see “The Loan” herein. |
| (3) | The 4 West 58th Street Whole Loan (as defined below) is secured by both the fee simple interest and the leasehold interest owned by Ulysses Co. II, L.L.C. and Solow Building Company III, L.L.C., respectively, each a borrower under the 4 West 58th Street Whole Loan. |
| (4) | Underwritten figures are based on the underwritten rent roll dated as of October 1, 2020, which accounts for all executed leases (whether or not tenants are in occupancy and/or have commenced paying rent with rent steps underwritten through July 2021. For avoidance of doubt, no COVID-19 specific adjustments have been incorporated into the lender underwriting. |
| (5) | All NOI, NCF and occupancy information, as well as the appraised value, were determined prior to the emergence of the novel coronavirus pandemic, and the economic disruption resulting from measures to combat the pandemic, and all DSCR, LTV and Debt Yield metrics were calculated, and the 4 West 58th Street loan was underwritten, based on such prior information. See “Risk Factors—Special Risks—Coronavirus Pandemic Has Adversely Affected the Global Economy and Will Likely Adversely Affect the Performance of the Mortgage Loans” in the Preliminary Prospectus. |
| (6) | The increase in Underwritten NOI from 2018 NOI is primarily attributable to six of the nine tenants accounting for 40.8% of net rentable area and 65.8% of underwritten base rent executing leases between 2018 and July 2020. |
| (7) | Most Recent Occupancy and Underwritten NCF are inclusive of Netflix Inc., J2 Enterprises LTD., Northwell Health, Neistein Plastic Surgery PLLC and PP North America US Inc., all of which have executed their respective leases and/or taken possession of their space but are not yet in occupancy and/or paying rent. Netflix Inc. has taken possession of its space, is in the process of building out its space and is scheduled to commence paying rent in March 2021. J2 Enterprises LTD. is expected to complete its renovation in December 2020. Northwell Health and Neistein Plastic Surgery PLLC have taken possession of their space and began paying rent in December 2020. |
| (8) | For a full description of Escrows and Reserves, please refer to “Escrows and Reserves” below. The excess cash flow reserve is described in the “Lockbox/Cash Management” section below. |
THE INFORMATION IN THIS STRUCTURAL AND COLLATERAL TERM SHEET IS NOT COMPLETE AND MAY BE AMENDED PRIOR TO THE TIME OF SALE. THIS TERM SHEET IS NOT AN OFFER TO SELL THESE SECURITIES AND IT IS NOT A SOLICITATION OF AN OFFER TO BUY THESE SECURITIES IN ANY JURISDICTION WHERE THE OFFER OR SALE IS NOT PERMITTED.
103
4 West 58th Street New York, NY 10019 | Collateral Asset Summary – Loan No. 7 4 West 58th Street | Cut-off Date Balance: Cut-off Date LTV: U/W NCF DSCR: U/W NOI Debt Yield: | $32,500,000 69.4% 1.94x 7.4% |
The Loan. The 4 West 58th Street mortgage loan (the “4 West 58th Street Loan”) is part of a whole loan (the “4 West 58th Street Whole Loan”) and is secured by the 4 West 58th Street Borrower’s (as defined below) fee simple and leasehold interests in a 14-story, 83,537 sq. ft. mixed-use building in New York, New York (the “4 West 58th Street Property”). The 4 West 58th Street Whole Loan is evidenced by four pari passu promissory notes with an aggregate outstanding principal balance as of the Cut-off Date of $125.0 million. The non-controlling Notes A-3 and A-4, with an aggregate outstanding principal balance as of the Cut-off Date of $32.5 million, will be included in the Benchmark 2020-B22 trust and constitutes the 4 West 58th Street Loan. The remaining notes have been contributed to other securitization trusts. The controlling Note A-1, with an outstanding principal balance of $62.5 million, has been contributed to the Benchmark 2020-B20 trust. The relationship between the holders of the 4 West 58th Street Whole Loan is governed by a co-lender agreement as described under “Description of the Mortgage Pool—The Whole Loans—The Non-Serviced Pari Passu Whole Loans” and “Pooling and Servicing Agreement—Servicing of the Non-Serviced Mortgage Loans” in the Preliminary Prospectus.
| Whole Loan Summary | ||||
| Note | Original Balance | Cut-off Date Balance | Note Holder | Controlling Piece |
| A-1 | $62,500,000 | $62,500,000 | Benchmark 2020-B20 | Yes |
| A-2 | 30,000,000 | 30,000,000 | Benchmark 2020-B21 | No |
| A-3, A-4 | 32,500,000 | 32,500,000 | Benchmark 2020-B22 | No |
| Whole Loan | $125,000,000 | $125,000,000 | ||
The 4 West 58th Street Whole Loan has a 120-month interest-only term. The 4 West 58th Street Whole Loan accrues interest at a fixed rate of 3.68000% per annum. The proceeds of the 4 West 58th Street Whole Loan were used to return approximately $107.1 million of equity to the Borrowers, fund upfront reserves of approximately $13.7 million related to outstanding TI/LC reserves and an outstanding free rent reserve, and pay closing costs of approximately $4.2 million.
| Sources and Uses | ||||||
| Sources | Proceeds | % of Total | Uses | Proceeds | % of Total | |
| Whole Loan | $125,000,000 | 100.0% | Return of Equity | $107,093,482 | 85.7% | |
| Upfront Reserves | 13,706,435 | 11.0% | ||||
| Closing Costs | 4,200,083 | 3.4% | ||||
| Total Sources | $125,000,000 | 100.0% | Total Uses | $125,000,000 | 100.0% | |
The Borrowers / Borrower Sponsors. The borrowers are Ulysses Co. II, L.L.C. and Solow Building Company III, L.L.C., each a Delaware limited liability company (collectively, the “Borrowers”), with two independent directors in their organizational structures. The borrower sponsor and the non-recourse carveout guarantor, Sheldon H. Solow, passed away on November 17, 2020. The related guaranty agreement provides that all of the guarantor’s obligations under the guaranty (the “Guaranteed Obligations”) are binding upon the guarantor’s estate and legal representatives upon the guarantor’s death. The guaranty further provides that, after the guarantor’s death and until all of the Guaranteed Obligations have been paid in full and at all times following the guarantor’s estate’s first distribution of assets, the guarantor’s estate (a) is required to maintain (i) a net worth of not less than $125,000,000 (the “Net Worth Threshold”) and (ii) liquid assets of not less than $10,000,000 (the “Liquid Assets Threshold”), and (b) may not sell, pledge, mortgage or otherwise transfer any of its assets, or any interest therein, on terms materially less favorable than would be obtained in an arms-length transaction or if such transaction would cause the net worth or the liquidity of the guarantor’s estate to fall below the Net Worth Threshold and the Liquid Assets Threshold, respectively.
Sheldon H. Solow was the founder and CEO of Solow Building Company L.L.C. (“Solow Building Company”) and had been an owner and developer of residential and commercial properties in New York for over 50 years. Solow Building Company is a Manhattan-based real estate company specializing in design, construction and property management for commercial and residential properties. Founded in 1965, Solow Building Company has a real estate portfolio comprised of buildings throughout Manhattan. Sheldon H. Solow’s holdings included 9 West 57th Street, a 50-story black glass office tower with views of Central Park, which is located adjacent to the 4 West 58th Street Property. Mr. Solow’s residential portfolio included One and Two Sutton Place North and the Solow Townhouses in the Upper East Side.
The Property. The 4 West 58th Street Property is a 14-story, 83,537 square foot mixed-use building located in New York, New York. The 4 West 58th Street Property is located on 58th Street between 5th Avenue and 6th Avenue and is situated across from the Plaza, on the southwest corner of the Grand Army Plaza with unobstructed views of Central Park. The 4 West 58th Street Property is divided between 14 stories of office, retail and theater space located on the ground-floor. As of October 1, 2020, the 4 West 58th Street Property was 100.0% leased. Since 2016, the 4 West 58th Street Property has undergone approximately $16.9 million in renovations and upgrades between landlord work and tenant improvements, of which approximately $11.6 million was invested in the build-out of the Neiman Marcus space. In March of 2020, the Borrowers began a comprehensive base building renovation of the space previously occupied by the Paris Theater. During this time, $1.5 million of base building improvements were made by Borrowers for various improvements to HVAC systems, electrical equipment, sprinklers and safety equipment. The Borrowers delivered the space to Netflix in September of 2020, at which point Netflix began tenant specific buildout of its space. Netflix is expected to re-open in July 2021.
THE INFORMATION IN THIS STRUCTURAL AND COLLATERAL TERM SHEET IS NOT COMPLETE AND MAY BE AMENDED PRIOR TO THE TIME OF SALE. THIS TERM SHEET IS NOT AN OFFER TO SELL THESE SECURITIES AND IT IS NOT A SOLICITATION OF AN OFFER TO BUY THESE SECURITIES IN ANY JURISDICTION WHERE THE OFFER OR SALE IS NOT PERMITTED.
104
4 West 58th Street New York, NY 10019 | Collateral Asset Summary – Loan No. 7 4 West 58th Street | Cut-off Date Balance: Cut-off Date LTV: U/W NCF DSCR: U/W NOI Debt Yield: | $32,500,000 69.4% 1.94x 7.4% |
As of October 1, 2020, the 4 West 58th Street Property was 100.0% leased to a diverse roster of nine tenants. There are three designated retail tenants inclusive of the Netflix theater space and six office tenants. The tenants have a weighted average remaining lease term of approximately 10.75 years. Despite occupying approximately 23.8% of net rentable area, retail tenants account for approximately 52.9% of underwritten base rent which is largely driven by the Netflix rent. Since November of 2019, the Borrowers have completed 34,121 square feet of new leases at the 4 West 58th Street Property, of which 10,651 square feet is attributable to retail space and 23,470 square feet is attributable to office space. Each medical office tenant at the 4 West 58th Street Property occupies its own floor with views of Central Park.
COVID-19 Update. As of November 1, 2020, the 4 West 58th Street Property is open for operations. As of November 1, 2020, the 4 West 58th Street Whole Loan is not subject to any modification or forbearance requests. The table below outlines the current status with respect to all tenants at the 4 West 58th Street Property according to the borrower sponsor as of October 6, 2020. The 4 West 58th Street Whole Loan is current as of the November 2020 payment date. The 4 West 58th Street Whole Loan is current as of the December 2020 payment date. See “Risk Factors—Special Risks—Coronavirus Pandemic Has Adversely Affected the Global Economy and Will Likely Adversely Affect the Performance of the Mortgage Loans” in the Preliminary Prospectus.
| COVID-19 Tenant Summary | ||||
| Tenant | Net Rentable Area (Sq. Ft.) | % of Net Rentable Area | % of Total Annual U/W Base Rent(3) | Commentary |
| Neiman Marcus | 40,170 | 48.1% | 28.6% | Current. |
| Netflix | 10,651 | 12.8 | 47.3 | New Lease executed; Netflix took possession of the space in September 2020, rather than the anticipated date in July 2020 due to COVID-19; Rent commencement date delayed from January 2021 to March 2021. |
| J2 Enterprises | 6,121 | 7.3 | 3.3 | Restaurant renovation delayed due to COVID-19 expected to be completed in December 2020; Tenant is not currently paying rent and has requested rent forgiveness. |
| Northwell Health | 5,174 | 6.2 | 4.2 | Tenant is currently in occupancy with an expected rent commencement date in December 2020. |
| Union Sq. Dermatology | 5,174 | 6.2 | 4.1 | Current. |
| EBS Enterprises | 5,174 | 6.2 | 4.0 | Current. |
| Neistein Plastic Surgery PLLC | 3,974 | 4.8 | 3.1 | New lease, Tenant in occupancy; rent commencement date in December 2020. |
| Navaderm Partners(4) | 3,974 | 4.8 | 3.1 | Current. |
| PP North America US Inc.(5) | 3,125 | 3.7 | 2.4 | Tenant in occupancy; Tenant is not currently paying rent and has requested rent forgiveness. |
| Tenant Summary(1) | ||||||
| Tenant | Credit Rating (Moody's/Fitch/S&P)(2) | Net Rentable Area (Sq. Ft.) | % of Net Rentable Area | U/W Base Rent Per Sq. Ft.(3) | % of Total Annual U/W Base Rent(3) | Lease Expiration |
| Neiman Marcus | NR / NR / NR | 40,170 | 48.1% | $83.50 | 28.6% | 2/28/2033 |
| Netflix | Ba3 / NR / BB | 10,651 | 12.8 | $521.08 | 47.3 | 12/31/2030 |
| J2 Enterprises | NR / NR / NR | 6,121 | 7.3 | $62.69 | 3.3 | 7/31/2028 |
| Northwell Health | NR / NR / NR | 5,174 | 6.2 | $95.00 | 4.2 | 5/31/2030 |
| Union Sq. Dermatology | NR / NR / NR | 5,174 | 6.2 | $92.25 | 4.1 | 3/31/2035 |
| EBS Enterprises | NR / NR / NR | 5,174 | 6.2 | $90.00 | 4.0 | 1/31/2030 |
| Neistein Plastic Surgery PLLC | NR / NR / NR | 3,974 | 4.8 | $93.00 | 3.1 | 7/30/2030 |
| Navaderm Partners(4) | NR / NR / NR | 3,974 | 4.8 | $92.25 | 3.1 | 11/30/2029 |
| PP North America US Inc.(5) | NR / NR / NR | 3,125 | 3.7 | $88.50 | 2.4 | 9/30/2023 |
| Total / Wtd. Avg. | 83,537 | 100.0% | $140.48 | 100.0% | ||
| (1) | Based on the underwritten rent roll dated October 1, 2020. |
| (2) | In certain instances, ratings provided are those of the parent company of the entity shown, whether or not the parent company guarantees the lease. |
| (3) | U/W Base Rent Per Sq. Ft. and % of Total Annual U/W Base Rent are inclusive of contractual rent steps through July 2021. |
| (4) | Navaderm Partners has the right to terminate its lease on November 1, 2026, with nine months’ prior written notice and a termination fee equal to the unamortized amounts of brokerage commissions, rent abatements and landlord work costs related to such space. |
| (5) | PP North America is located on the 14th floor and would typically be utilized as office space but is currently utilized as retail/showroom space. |
THE INFORMATION IN THIS STRUCTURAL AND COLLATERAL TERM SHEET IS NOT COMPLETE AND MAY BE AMENDED PRIOR TO THE TIME OF SALE. THIS TERM SHEET IS NOT AN OFFER TO SELL THESE SECURITIES AND IT IS NOT A SOLICITATION OF AN OFFER TO BUY THESE SECURITIES IN ANY JURISDICTION WHERE THE OFFER OR SALE IS NOT PERMITTED.
105
4 West 58th Street New York, NY 10019 | Collateral Asset Summary – Loan No. 7 4 West 58th Street | Cut-off Date Balance: Cut-off Date LTV: U/W NCF DSCR: U/W NOI Debt Yield: | $32,500,000 69.4% 1.94x 7.4% |
| Lease Rollover Schedule(1)(2) | ||||||||
| Year | # of Leases Expiring | Total Expiring Sq. Ft. | % of Total Sq. Ft. Expiring | Cumulative Sq. Ft. Expiring | Cumulative % of Sq. Ft. Expiring | Annual U/W Base Rent Per Sq. Ft.(3) | % U/W Base Rent Rolling(3) | Cumulative % of U/W Base Rent(3) |
| 2020 & MTM | 0 | 0 | 0.0% | 0 | 0.0% | $0.00 | 0.0% | 0.0% |
| 2021 | 0 | 0 | 0.0% | 0 | 0.0% | $0.00 | 0.0% | 0.0% |
| 2022 | 0 | 0 | 0.0% | 0 | 0.0% | $0.00 | 0.0% | 0.0% |
| 2023 | 1 | 3,125 | 3.7% | 3,125 | 3.7% | $88.50 | 2.4% | 2.4% |
| 2024 | 0 | 0 | 0.0% | 3,125 | 3.7% | $0.00 | 0.0% | 2.4% |
| 2025 | 0 | 0 | 0.0% | 3,125 | 3.7% | $0.00 | 0.0% | 2.4% |
| 2026 | 0 | 0 | 0.0% | 3,125 | 3.7% | $0.00 | 0.0% | 2.4% |
| 2027 | 0 | 0 | 0.0% | 3,125 | 3.7% | $0.00 | 0.0% | 2.4% |
| 2028 | 1 | 6,121 | 7.3% | 9,246 | 11.1% | $62.69 | 3.3% | 5.6% |
| 2029 | 1 | 3,974 | 4.8% | 13,220 | 15.8% | $92.25 | 3.1% | 8.8% |
| 2030 & Thereafter | 6 | 70,317 | 84.2% | 83,537 | 100.0% | $152.29 | 91.2% | 100.0% |
| Vacant | 0 | 0 | 0.0% | 83,537 | 100.0% | NAP | NAP | NAP |
| Total / Wtd. Avg. | 9 | 83,537 | 100.0% | $140.48 | 100.0% | |||
| (1) | Based on the underwritten rent roll dated October 1, 2020. |
| (2) | Certain tenants may have termination or contraction options (which may become exercisable prior to the originally stated expiration date of the tenant lease) that are not considered in the above Lease Rollover Schedule. |
| (3) | U/W Base Rent Per Sq. Ft., % U/W Base Rent Rolling and Cumulative % of U/W Base Rent are inclusive of contractual rent steps through July 2021. |
Major Tenants. The Neiman Marcus Group LLC. (“Neiman Marcus”), (40,170 sq. ft.; 48.1% of NRA; 28.6% of U/W Base Rent) is the largest tenant at the 4 West 58th Street Property. Neiman Marcus is an American chain of luxury department stores owned by the Neiman Marcus Group, headquartered in Dallas, Texas. Founded in 1907, the retail company offers women's and men's apparel, handbags, shoes, cosmetics, jewelry, and home decoration products, serving customers worldwide. Neiman Marcus occupies space across six floors and has been at the property for almost four years. The property serves as an extension of its flagship Bergdorf Goodman store located on 5th Avenue and is interconnected to the store on five floors. Employees can walk seamlessly between the two buildings. Neiman Marcus utilizes the space for offices tailoring/alteration and excess inventory storage.
Neiman Marcus executed a lease in September of 2016, which expires in February of 2033. Neiman Marcus filed for bankruptcy under chapter 11 of the Bankruptcy Code on May 7, 2020 and subsequently emerged from bankruptcy on September 25, 2020. As part of the bankruptcy filing, Neiman Marcus assumed its lease at the 4 West 58th Street Property and is current with respect to all contractual rent obligations. When Neiman Marcus filed bankruptcy, this caused a Tenant Trigger Event (as defined below) pursuant to the terms set forth in the loan agreement and excess cash flow since May has been deposited in an excess cash flow reserve. The excess cash flow reserve account has a current balance as of December 1, 2020 of $1,878,542.
Netflix Inc. (“Netflix”) (10,651 sq. ft.; 12.8% of NRA; 47.3% of U/W Base Rent) is the second largest tenant at the 4 West 58th Street Property. Netflix is an internet subscription service company, providing movies and television episodes via the internet and mail. Founded in 1997, Netflix has become a leading internet streaming company, distributing movies and TV shows in a variety of genres and languages to over 167 million monthly paid subscribers in more than 190 countries as of January 2020. Netflix will keep the name Paris Theater and will utilize the space as an entertainment venue for movie screenings, grand openings and “red-carpet” events as well as media launches and theatrical releases of its movies.
The Netflix space was delivered to the tenant in September 2020 with a rent commencement date in March 2021. The Borrowers are performing $1.8 million in tenant improvements prior to rent commencement, which will leave the space vacant and demolished, allowing for Netflix to renovate the space. The initial rent on the space is approximately $5.5 million ($521.08 per sq. ft.) with a 10% increase in year six. The Netflix lease expires in December 2030 and has four, five-year renewal options at 110% of previous rent with the last and first month of the renewal term being abated.
J2 Enterprises LTD. (“J2 Enterprises”) (6,121 sq. ft.; 7.3% of NRA; 3.3% of U/W Base Rent) is the third largest tenant at the 4 West 58th Street Property. J2 Enterprises is an American restaurant business. J2 Enterprises is expected to open a 6,121 square foot restaurant at the 4 West 58th Street Property upon the completion of renovations. 604 square feet of storage space is in the basement and the remaining 5,517 square feet is on the mezzanine level. The J2 Enterprises lease expires in July 2028.
Northwell Health (5,174 sq. ft.; 6.2% of NRA; 4.2% of U/W Base Rent) is the fourth largest tenant at the 4 West 58th Street Property. Northwell Health is New York State’s largest health care provider and private employer, with 23 hospitals, nearly 800 outpatient facilities and more than 14,200 affiliated physicians. Northwell Health cares for over two million people annually in the New York metro area. Northwell Health has more than 74,000 employees – 18,500-plus nurses and 4,500 employed doctors, including members of Northwell Health Physician Partners. As of October 2020, Northwell Health had an annual operating budget of $13.5 billion that helps them service an area of nearly 11.0 million people.
THE INFORMATION IN THIS STRUCTURAL AND COLLATERAL TERM SHEET IS NOT COMPLETE AND MAY BE AMENDED PRIOR TO THE TIME OF SALE. THIS TERM SHEET IS NOT AN OFFER TO SELL THESE SECURITIES AND IT IS NOT A SOLICITATION OF AN OFFER TO BUY THESE SECURITIES IN ANY JURISDICTION WHERE THE OFFER OR SALE IS NOT PERMITTED.
106
4 West 58th Street New York, NY 10019 | Collateral Asset Summary – Loan No. 7 4 West 58th Street | Cut-off Date Balance: Cut-off Date LTV: U/W NCF DSCR: U/W NOI Debt Yield: | $32,500,000 69.4% 1.94x 7.4% |
Northwell Health signed a 10-year lease in March 2020 with a September 2020 commencement for 5,174 sq. ft. of space. The initial rent on the space is approximately $492,000 with 2.75% increases in rent every year thereafter. The Northwell Health lease expires in May 2030 and has one, five-year renewal option at 95% of the agreed upon fair market rental value on the first day of the renewal term.
Environmental Matters. According to a Phase I environmental report dated January 28, 2020, there are no recognized environmental conditions or recommendations for further action at the 4 West 58th Avenue Property, other than development and implementation of an asbestos operations and maintenance program.
The Market. The 4 West 58th Street Property is located in the heart of the Plaza District in Manhattan, New York in the Plaza District office submarket within the New York office market. The boundaries of the 4 West 58th Street Property’s immediate area are the Plaza Hotel and Central Park to the north, Midtown Manhattan to the south, Bergdorf Goodman to the east and 9 West 57th Street to the west. New York City’s largest employers include a diverse group of multinational corporations representing a variety of industries including healthcare, financial services, retail and education. Forty-six of the nation’s Fortune 500 corporations are headquartered in New York City including Verizon, J.P. Morgan Chase, Citigroup, MetLife, American International Group, Morgan Stanley, New York Life Insurance, Goldman Sachs Group, TIAA, American Express and Time Warner. According to CoStar, the estimated 2020 population within a one-, three- and five-mile radius of the 4 West 58th Street Property was 194,480, 1,311,499 and 2,780,233, respectively. Additionally, according to CoStar, the estimated 2020 median household income within a one-, three- and five-mile radius of the 4 West 58th Street Property was $129,370, $100,187 and $83,691, respectively.
According to CoStar, as of the third quarter of 2020, the New York office market consisted of approximately 945.7 million square feet of office space with an overall market vacancy of 9.5% and average market rents of approximately $58.32 per square foot. Tech tenants are a major driver of leasing activity as one of the few sectors still adding headcounts, as witnessed by notable expansions from companies in 2019. Approximately 66.6 million people visited New York City in 2019, while Central Park draws approximately 37.5 million visitors annually. The 4 West 58th Street Property also benefits from its proximity to the many transportation alternatives. There are 12 different subway lines that have stops in the area encompassed by Eighth Avenue, Fifth Avenue, 57th Street and Central Park South, including a shuttle train that provides access to Grand Central Terminal. Additionally, Penn Station is located approximately 1.6 miles away from the 4 West 58th Street property and LaGuardia Airport is approximately 6.7 miles away.
The 4 West 58th Street Property is located in the Plaza District office submarket in the New York office market. The Plaza District office submarket is the largest office submarket in the nation. According to CoStar, as of the third quarter of 2020, the Plaza District office submarket included over 89.5 million square feet of office space with a total vacancy rate of 11.3% and average market rents of $92.06 per square foot. The 4 West 58th Street Property is located adjacent to 9 West 57th Street, a 50-story black glass office tower owned by the borrower sponsor and has nearby access to Central Park. The submarket benefits from its geographically central location, highway access, proximity to LaGuardia Airport, John F. Kennedy Airport and Newark Airport, as well as various trains and highways.
The appraisal identified six comparable office leases across the Plaza District office submarket. Base rents at the comparable properties ranged from $87.38 to $97.40 per square foot with an average rent of approximately $92.40 per square foot. The appraisal identified six comparable medical office leases across the Plaza District office submarket. Base rents at the comparable properties ranged from $88.06 to $98.01 per square foot with an average rent of approximately $93.49 per square foot. The concluded market rent for the six office tenants at the 4 West 58th Street Property is $90.00 for office tenants and ranges from $95.00 to $105.00 for medical office tenants as detailed below, which is higher than the 4 West 58th Street Property’s underwritten in-place weighted average office rent of $86.81 per square foot.
| Appraisal Concluded Market Rent PSF(1) | ||||
| Tenant Type | Retail/Theater | Floors 3-8 | Floors 9-13 | PH |
| Office | NAP | $90.00 | $95.00 | $105.00 |
| Theater | $473.00 | NAP | NAP | NAP |
| Retail | $75.00 | NAP | NAP | NAP |
| (1) | Based on the Appraisal. |
THE INFORMATION IN THIS STRUCTURAL AND COLLATERAL TERM SHEET IS NOT COMPLETE AND MAY BE AMENDED PRIOR TO THE TIME OF SALE. THIS TERM SHEET IS NOT AN OFFER TO SELL THESE SECURITIES AND IT IS NOT A SOLICITATION OF AN OFFER TO BUY THESE SECURITIES IN ANY JURISDICTION WHERE THE OFFER OR SALE IS NOT PERMITTED.
107
4 West 58th Street New York, NY 10019 | Collateral Asset Summary – Loan No. 7 4 West 58th Street | Cut-off Date Balance: Cut-off Date LTV: U/W NCF DSCR: U/W NOI Debt Yield: | $32,500,000 69.4% 1.94x 7.4% |
Cash Flow Analysis.
| Cash Flow Analysis(1) | ||||||
| 2017 | 2018 | 2019 | TTM | U/W | U/W PSF | |
| Base Rent(2) | $4,427,725 | $4,152,921 | $5,462,283 | $6,926,217 | $11,735,176 | $140.48 |
| Vacant Income | 0 | 0 | 0 | 0 | 0 | 0 |
| Gross Potential Rent | $4,427,725 | $4,152,921 | $5,462,283 | $6,926,217 | $11,735,176 | $140.48 |
| CAM Reimbursements | 656,091 | 702,970 | 707,741 | 582,227 | 769,704 | 9.21 |
| Gross Potential Income | $5,083,816 | $4,855,891 | $6,170,024 | $7,508,445 | $12,504,880 | $149.69 |
| Less: Vacancy & Credit Loss | 0 | 0 | 0 | 0 | (625,244) | (7.48) |
| Other Income | (178,738) | 21,606 | (541,760) | 389,250 | 63,750 | 0.76 |
| Effective Gross Income | $4,905,078 | $4,877,497 | $5,628,265 | $7,897,694 | $11,943,386 | $142.97 |
| Total Operating Expenses | 1,996,939 | 1,903,193 | 2,057,287 | 3,378,556 | 2,701,328 | 32.34 |
| Net Operating Income(3) | $2,908,139 | $2,974,304 | $3,570,977 | $4,519,138 | $9,242,058 | $110.63 |
| TI/LC | 0 | 0 | 0 | 0 | 167,074 | 2.00 |
| Capital Expenditures | 0 | 0 | 0 | 0 | 15,037 | 0.18 |
| Net Cash Flow | $2,908,139 | $2,974,304 | $3,570,977 | $4,519,138 | $9,059,948 | $108.45 |
| (1) | Certain items such as straight line rent, interest expense, interest income, lease cancellation income, depreciation, amortization, debt service payments and any other non-recurring or non-operating items were excluded from the historical presentation and are not considered for the underwritten cash flow. |
| (2) | U/W Base Rent is inclusive of contractual rent steps through July 2021. |
| (3) | The increase in U/W Net Operating Income from 2018 Net Operating Income is primarily attributable to six of the nine tenants accounting for 40.8% of net rentable area and 65.8% of U/W Base Rent executing leases between 2018 and July 2020. |
Property Management. The 4 West 58th Street Property is managed by Solow Management Corp. (“Solow Manager”), a New York corporation, and an affiliate of the borrowers. Lender will have the right to require the Borrowers or Solow Manager to replace any, manager with (x) an unaffiliated qualified manager selected by the Borrowers or (y) another property manager chosen by the Borrowers and approved by lender (provided, that such approval may be conditioned upon the Borrowers delivering a rating agency confirmation as to such new property manager and management agreement) and/or terminate the management agreement upon the occurrence of any one or more of the following events: (i) at any time following the occurrence of an event of default and acceleration of the 4 West 58th Street Whole Loan, (ii) if the manager is in default under the management agreement in any material respect beyond any applicable notice and cure period, (iii) if the manager becomes insolvent or a debtor in any bankruptcy or insolvency proceeding, or (iv) if at any time the manager has engaged in any causable action, including but not limited to gross negligence, fraud, willful misconduct or misappropriation of funds.
Escrows and Reserves. At loan origination, the Borrowers deposited (i) approximately $91,175 into a real estate tax reserve, (ii) $4,669 into an insurance reserve, (iii) $7,811,435 into an outstanding TI/LC reserve, and (iv) $5,799,156 into an outstanding free rent reserve in connection with six leases.
Tax Reserve. The Borrowers are required to deposit into a real estate tax reserve, on a monthly basis, 1/12 of the estimated annual real estate taxes (which currently equates to $91,175).
Insurance Reserve. The Borrowers are required to deposit into an insurance reserve, on a monthly basis, 1/12 of estimated insurance premiums (which currently equates to $4,669).
TI/LC Reserve. The Borrowers are required to deposit into the TI/LC reserve, on a monthly basis, $13,932 ($2.00 per square foot per annum), subject to a cap of $835,920.
Replacement Reserve. The Borrowers are required to deposit into the replacement reserve, on a monthly basis, $1,392 (which is based on $0.20 per rentable square foot per annum), subject to a cap of $33,408.
Lockbox / Cash Management. The 4 West 58th Street Whole Loan is structured with a hard lockbox and springing cash management. The borrowers were required at origination to deliver tenant direction letters instructing all tenants to deposit rents into a lender controlled lockbox account. So long as no Trigger Period (as defined below) then exists, all funds deposited into the lockbox account are required to be transferred on each business day to or at the direction of the Borrowers. During the continuance of a Trigger Period, all funds on deposit in the lockbox account are required to be transferred to the cash management account on a daily basis, at which point, following payment of taxes and insurance, debt service, required reserves and operating expenses, all funds are required to be deposited into the excess cash flow reserve, to be held and disbursed in accordance with the terms of the loan documents. During the continuance of an event of default, the lender may apply such funds in such order and priority as the lender determines. The lender has been granted a first priority security interest in the cash management account. As a result of the bankruptcy action of Neiman Marcus in May 2020, the 4 West 58th Street Whole Loan is currently in a Trigger Period as detailed below. The excess cash flow reserve account has a current balance as of December 1, 2020 of $1,878,542.
THE INFORMATION IN THIS STRUCTURAL AND COLLATERAL TERM SHEET IS NOT COMPLETE AND MAY BE AMENDED PRIOR TO THE TIME OF SALE. THIS TERM SHEET IS NOT AN OFFER TO SELL THESE SECURITIES AND IT IS NOT A SOLICITATION OF AN OFFER TO BUY THESE SECURITIES IN ANY JURISDICTION WHERE THE OFFER OR SALE IS NOT PERMITTED.
108
4 West 58th Street New York, NY 10019 | Collateral Asset Summary – Loan No. 7 4 West 58th Street | Cut-off Date Balance: Cut-off Date LTV: U/W NCF DSCR: U/W NOI Debt Yield: | $32,500,000 69.4% 1.94x 7.4% |
With respect to the Tenant Trigger Event caused by Neiman Marcus’ bankruptcy filing, pursuant to a letter that the lender received on October 7, 2020, the borrowers challenged the Trigger Period remaining in effect, and expressed their view that Neiman Marcus effectuated a corporate restructuring by, inter alia, (i) filing new organizational documents, (ii) dissolving Neiman Marcus’ ownership interests, (iii) appointing new board members, and (iv) assuming the lease, resulting in the estate of Neiman Marcus being dissolved and Neiman Marcus emerging as a reorganized debtor. The borrowers further asserted that it has satisfied the Trigger Event Cure (as defined below) conditions, given that the reorganized entity (a) has a creditworthiness and financial standing superior to that of the pre-bankruptcy Neiman Marcus, (b) assumed the lease, and (c) is in occupancy of the premises, open for business, and paying full contractual rent, and, therefore, the Trigger Event is cured and amounts held in the excess cash flow reserve should be released to the borrowers. The lender disagrees with the borrowers’ position and has not terminated the Trigger Period or released amounts held in the excess cash flow reserve. However, we cannot assure you that the master servicer or the special servicer will not come to a different view and elect to discontinue the Trigger Event and release the funds currently held in the excess cash flow reserve account, or otherwise amend terms of the 4 West 58th Street Whole Loan documents in connection with any related action. In addition, we cannot assure you that the continued imposition of the cash flow sweep will not result in further actions by the borrowers, including litigation, to terminate the cash sweep and/or obtain the release of the funds held in the excess cash flow reserve. See “Description of the Mortgage Pool—Litigation and Other Considerations” for additional information.
“Trigger Period” means each period commencing on the occurrence of a Trigger Event and continuing until the earlier of (i) the payment date next occurring following the related Trigger Event Cure, or (ii) payment in full of all principal and interest on the 4 West 58th Street Whole Loan and all other amounts payable under the loan documents.
A “Trigger Event” means the occurrence of (i) an event of default, (ii) any bankruptcy action of the borrowers or property manager, (iii) a DSCR Trigger Event (as defined below) or (iv) a Tenant Trigger Event (as defined below).
A “DSCR Trigger Event” means the debt service coverage ratio of the 4 West 58th Street Whole Loan (as calculated in accordance with the loan documents) based on underwritten net cash flow on a trailing three-month basis as of the date of determination is less than 1.50x.
A “Tenant Trigger Event” means that (i) Neiman Marcus or Netflix goes dark or sublets, vacates or abandons 50% or more of the premises demised to Neiman Marcus or the premises demised to Netflix, as applicable, (ii) Neiman Marcus or Netflix defaults under their respective leases, beyond any notice and cure periods, (iii) a bankruptcy action of Neiman Marcus or Netflix occurs, or (iv) Netflix gives notice of non-renewal, notice of termination, or does not renew the Netflix lease prior to 18 months prior to the expiration date or renewal period required under the Netflix lease.
A “Trigger Event Cure” means if the Trigger Event is caused solely by (a) the occurrence of a DSCR Trigger Event, the achievement of the a debt service coverage ratio, as reasonably determined by the lender based on underwritten net cash flow on a trailing three-month basis, of at least 1.50x for two consecutive calendar quarters, (b) an event of default, the acceptance by the lender of a cure of such event of default (which cure the lender may reject or accept in its sole discretion), (c) the bankruptcy or insolvency of the property manager, the borrowers replacing such manager with a qualified manager (as fully described in the 4 West 58th Street Whole Loan documents) under a replacement management agreement in accordance with the terms under the 4 West 58th Street Whole Loan documents within 60 days or (d) a Tenant Trigger Event, the replacement of Neiman Marcus or Netflix, as applicable, with one or more replacement tenant(s) pursuant to one or more lease(s) entered into in accordance with the 4 West 58th Street Whole Loan documents; provided, however, that such Trigger Event Cure set forth in this definition will be subject to the following conditions: (i) all other Trigger Events that have occurred have been cured, (ii) the borrowers have paid all of the lender’s reasonable expenses incurred in connection with such Trigger Event Cure including reasonable attorneys’ fees and expenses and (iii) the borrowers have the right two (2) times in the aggregate to effect such Trigger Event Cure in any 12-month period. In no event will a Trigger Event Cure occur with respect to any Trigger Event caused in whole or in part by the bankruptcy or insolvency of the borrowers.
Future Mezzanine or Subordinate Indebtedness Permitted. Certain direct and indirect owners of the borrowers have the right to obtain a future mezzanine loan, provided, among other conditions listed in the 4 West 58th Street Whole Loan documents, (a) the loan-to-value ratio for the total debt inclusive of the 4 West 58th Street mezzanine loan is no greater than 69.4% and (b) the debt service coverage ratio for the total debt inclusive of the 4 West 58th Street Whole Loan is no less than 1.50x.
Partial Release. None.
THE INFORMATION IN THIS STRUCTURAL AND COLLATERAL TERM SHEET IS NOT COMPLETE AND MAY BE AMENDED PRIOR TO THE TIME OF SALE. THIS TERM SHEET IS NOT AN OFFER TO SELL THESE SECURITIES AND IT IS NOT A SOLICITATION OF AN OFFER TO BUY THESE SECURITIES IN ANY JURISDICTION WHERE THE OFFER OR SALE IS NOT PERMITTED.
109
3140 Peacekeeper Way McClellan, CA 95652 | Collateral Asset Summary – Loan No. 8 McClellan Business Park | Cut-off Date Balance: Cut-off Date LTV: U/W NCF DSCR: U/W NOI Debt Yield: | $32,400,000 60.2% 2.90x 10.5% |
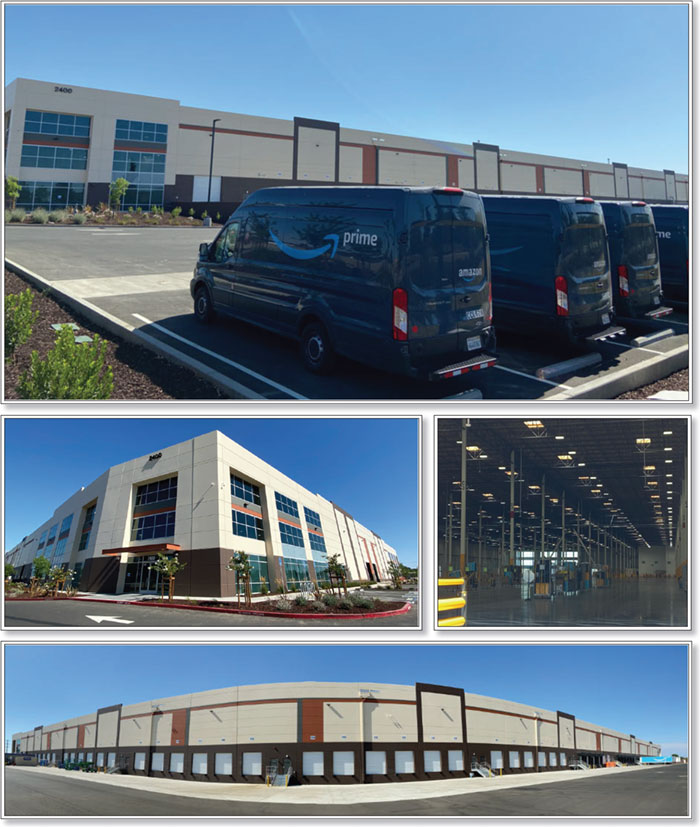
THE INFORMATION IN THIS STRUCTURAL AND COLLATERAL TERM SHEET IS NOT COMPLETE AND MAY BE AMENDED PRIOR TO THE TIME OF SALE. THIS TERM SHEET IS NOT AN OFFER TO SELL THESE SECURITIES AND IT IS NOT A SOLICITATION OF AN OFFER TO BUY THESE SECURITIES IN ANY JURISDICTION WHERE THE OFFER OR SALE IS NOT PERMITTED.
110
3140 Peacekeeper Way McClellan, CA 95652 | Collateral Asset Summary – Loan No. 8 McClellan Business Park | Cut-off Date Balance: Cut-off Date LTV: U/W NCF DSCR: U/W NOI Debt Yield: | $32,400,000 60.2% 2.90x 10.5% |

THE INFORMATION IN THIS STRUCTURAL AND COLLATERAL TERM SHEET IS NOT COMPLETE AND MAY BE AMENDED PRIOR TO THE TIME OF SALE. THIS TERM SHEET IS NOT AN OFFER TO SELL THESE SECURITIES AND IT IS NOT A SOLICITATION OF AN OFFER TO BUY THESE SECURITIES IN ANY JURISDICTION WHERE THE OFFER OR SALE IS NOT PERMITTED.
111
3140 Peacekeeper Way McClellan, CA 95652 | Collateral Asset Summary – Loan No. 8 McClellan Business Park | Cut-off Date Balance: Cut-off Date LTV: U/W NCF DSCR: U/W NOI Debt Yield: | $32,400,000 60.2% 2.90x 10.5% |
Mortgage Loan Information | |
| Loan Seller(1): | GSMC |
| Loan Purpose: | Refinance |
| Borrower Sponsor: | McClellan Business Park, LLC |
| Borrower: | McClellan Realty, LLC |
| Original Balance(2): | $32,400,000 |
| Cut-off Date Balance(2): | $32,400,000 |
| % by Initial UPB: | 4.0% |
| Interest Rate: | 3.30900% |
| Payment Date: | 11th of each month |
| First Payment Date: | January 11, 2021 |
| Maturity Date: | December 11, 2030 |
| Amortization: | Interest Only |
| Additional Debt(2): | $325,600,000 Pari Passu Debt |
| Call Protection(3): | YM(24), DorYM(89), O(7) |
| Lockbox / Cash Management: | Hard / Springing |
| Reserves(4) | |||
| Initial | Monthly | Cap | |
| Taxes: | $0 | Springing | NAP |
| Insurance: | $0 | Springing | NAP |
| Replacement: | $0 | Springing | $2,077,645 |
| TI/LC: | $0 | Springing | $6,925,484 |
| Existing TI/LC Obligations: | $5,482,591 | $0 | NAP |
| Development Agency Loan: | $689,614 | $0 | NAP |
| Rent Concession: | $18,717 | $0 | NAP |
| Property Information | |
| Single Asset / Portfolio: | Single Asset |
| Property Type: | Industrial/Office/Multifamily/Retail/Other |
| Collateral: | Fee Simple |
| Location: | McClellan, CA |
| Year Built / Renovated: | 1938-2019 / NAP |
| Total Sq. Ft.: | 6,925,484 |
| Property Management: | LDKV Management, Inc. |
| Underwritten NOI: | $37,628,413 |
| Underwritten NCF: | $34,858,219 |
| Appraised Value: | $595,000,000 |
| Appraisal Date: | September 15, 2020 |
| Historical NOI | |
| Most Recent NOI: | $29,593,816 (T-12 September 30, 2020) |
| 2019 NOI: | $27,579,910 (December 31, 2019) |
| 2018 NOI: | $24,924,493 (December 31, 2018) |
| 2017 NOI: | $21,645,209 (December 31, 2017) |
| Historical Occupancy | |
| Most Recent Occupancy: | 86.8% (September 15, 2020) |
| 2019 Occupancy: | 88.4% (December 31, 2019) |
| 2018 Occupancy: | 83.4% (December 31, 2018) |
| 2017 Occupancy: | 80.3% (December 31, 2017) |
| Financial Information(2) | ||||||
| Tranche | Cut-off Date Balance | Balance per Sq. Ft. Cut-off / Balloon | LTV Cut-off / Balloon | U/W DSCR NOI / NCF | U/W Debt Yield NOI / NCF | U/W Debt Yield at Balloon NOI / NCF |
| Mortgage Loan | $32,400,000 | |||||
| Pari Passu Notes | $325,600,000 | |||||
| Whole Loan | $358,000,000 | $52 / $52 | 60.2% / 60.2% | 3.13x / 2.90x | 10.5% / 9.7% | 10.5% / 9.7% |
| (1) | The McClellan Business Park Whole Loan (as defined below) was co-originated by Goldman Sachs Bank USA (“GSBI”) and Wells Fargo Bank, National Association (“WFB”). |
| (2) | The McClellan Business Park Whole Loan (as defined below) is part of a whole loan evidenced by eight pari passu notes having an aggregate outstanding principal balance as of the Cut-off Date of approximately $358.0 million. See “Whole Loan Summary” chart herein. |
| (3) | The McClellan Business Park Whole Loan may be prepaid in whole (but not in part) on or prior to May 11, 2030 with the payment of a yield maintenance premium. The defeasance lockout period will be at least 24 months. The borrower has the option to defease the McClellan Business Park Whole Loan in whole (but not in part) after the earlier to occur of (i) two years after the closing date of the securitization date of the securitization that includes the last note to be securitized and (ii) January 11, 2024. The assumed defeasance lockout period of 24 months is based on the expected closing date of the Benchmark 2020-B22 securitization in December 2020. The actual lockout period may be longer. Partial Release is permitted. See “Partial Release” herein. |
| (4) | See “Initial and Ongoing Reserves” herein. |
THE INFORMATION IN THIS STRUCTURAL AND COLLATERAL TERM SHEET IS NOT COMPLETE AND MAY BE AMENDED PRIOR TO THE TIME OF SALE. THIS TERM SHEET IS NOT AN OFFER TO SELL THESE SECURITIES AND IT IS NOT A SOLICITATION OF AN OFFER TO BUY THESE SECURITIES IN ANY JURISDICTION WHERE THE OFFER OR SALE IS NOT PERMITTED.
112
3140 Peacekeeper Way McClellan, CA 95652 | Collateral Asset Summary – Loan No. 8 McClellan Business Park | Cut-off Date Balance: Cut-off Date LTV: U/W NCF DSCR: U/W NOI Debt Yield: | $32,400,000 60.2% 2.90x 10.5% |
The Loan. The McClellan Business Park mortgage loan (the “McClellan Business Park Loan”) is part of a whole loan (the “McClellan Business Park Whole Loan”) which is secured by the borrower’s fee simple interest in a 6,925,484 sq. ft. mixed use property located in McClellan, California (the “McClellan Business Park Property”). The McClellan Business Park Whole is comprised of eight pari passu notes with an outstanding aggregate principal balance as of the Cut-off Date of $358,000,000. The McClellan Business Park Loan, which is evidenced by the non-controlling notes A-7 and A-8, has an aggregate principal balance of $32,400,000 as of the Cut-off Date.
The relationship between the holders of the McClellan Business Park Whole Loan will be governed by a co-lender agreement as described under “Description of the Mortgage Pool–The Whole Loans–The Non-Serviced Pari Passu Whole Loans” in the Preliminary Prospectus.
| Whole Loan Summary | ||||
| Note | Original Balance | Cut-off Date Balance | Note Holder | Controlling Piece |
| A-1 | $ 75,000,000 | $ 75,000,000 | BANK 2020-BNK30(1) | Yes |
| A-2 | 69,000,000 | 69,000,000 | WFCM 2020-C58(2) | No |
| A-3 | 50,600,000 | 50,600,000 | Wells Fargo Bank, National Association(3) | No |
| A-4 | 36,000,000 | 36,000,000 | Wells Fargo Bank, National Association (3) | No |
| A-5 | 20,000,000 | 20,000,000 | Wells Fargo Bank, National Association (3) | No |
| A-6 | 75,000,000 | 75,000,000 | Benchmark 2020-B21 | No |
| A-7, A-8 | 32,400,000 | 32,400,000 | Benchmark 2020-B22 | No |
| Whole Loan | $ 358,000,000 | $ 358,000,000 | ||
| (1) | The BANK 2020-BNK30 securitization transaction is expected to close prior to the Closing Date. |
| (2) | The WFCM 2020-C58 securitization transaction is expected to close prior to the Closing Date. |
| (3) | Expected to be contributed to one or more future securitization transactions. |
The McClellan Business Park Whole Loan has a 120-month interest-only term. The McClellan Business Park Whole Loan, which accrues interest at an interest rate of 3.30900% per annum, has an outstanding principal balance as of the Cut-Off Date of approximately $358.0 million. The proceeds of the McClellan Business Park Whole Loan were primarily used to refinance prior debt secured by the McClellan Business Park Property, fund upfront reserves, and cover closing costs. Based on the “market value as-is-bulk property” appraised value of $595.0 million as of the September 15, 2020 appraisal, the McClellan Business Park Whole Loan Cut-Off Date LTV Ratio is 60.2%.
The most recent prior financing of the McClellan Business Park Property was not included in a prior securitization transaction.
Sources and Uses | ||||||
| Sources | Proceeds | % of Total | Uses | Proceeds | % of Total | |
| Whole Loan | $358,000,000 | 100.0% | Loan Payoff | $344,200,000 | 96.1% | |
| Upfront Reserves | 6,190,922 | 1.7 | ||||
| Principal Equity Distribution | 4,859,078 | 1.4 | ||||
| Closing Costs | 2,750,000 | 0.8 | ||||
| Total Sources | $358,000,000 | 100.0% | Total Uses | $358,000,000 | 100.0% | |
The Borrower / Borrower Sponsor. The borrower for the McClellan Business Park Whole Loan is McClellan Realty, LLC, a Delaware limited liability company. Legal counsel delivered to the borrower a non-consolidation opinion in connection with the origination of the McClellan Business Park Whole Loan. The borrower sponsor and non-recourse carveout guarantor under the McClellan Business Park Whole Loan is McClellan Business Park, LLC.
The Property. The McClellan Business Park Property is part of McClellan Park, a large office and industrial park located west of Watt Avenue in an unincorporated area of Sacramento County, California. The McClellan Business Park Property includes 139 primary buildings totaling 6,925,484 sq. ft. of gross building area with a land size of 781 acres. The McClellan Business Park Property surrounds the 10,600-foot McClellan Airfield, which is an active public airstrip. McClellan Park was formerly McClellan Air Force Base, one of five main depots in the United States that provided repair and maintenance services to military aircraft. Since closing in July 2001, the borrower sponsor of McClellan Park has leased or sold over 7.0 million sq. ft. of commercial and industrial space.
The current owners of McClellan Park have converted McClellan Air Force Base into a business park. The redevelopment to date has included: approximately $100 million in infrastructure improvements; approximately $200 million in building and tenant improvements; the lease-up or sale of over 7.0 million sq. ft. of office and industrial space; the conversion of the visiting officers’ quarters and associated buildings into the Lions Gate Hotel and meeting space; establishment of McClellan Jet Services as the fixed-base operator of the airfield, providing maintenance and fueling services to support the airfield and the establishment of a Mello-Roos benefit district to provide a source of funds for infrastructure costs. The borrower sponsor has invested more than $585 million in the McClellan Business Park Property.
The McClellan Business Park Property contains over 175 tenants and is currently 86.8% occupied as of September 15, 2020. Major tenants at the McClellan Business Park Property include Amazon.com (“Amazon”) (6.0% NRA, 6.5% U/W Base Rent), Northrop Grumman Systems (3.9% NRA, 7.1% U/W Base Rent) and USDA Forest Services (2.0% NRA, 8.8% U/W Base Rent). The primary use of the
THE INFORMATION IN THIS STRUCTURAL AND COLLATERAL TERM SHEET IS NOT COMPLETE AND MAY BE AMENDED PRIOR TO THE TIME OF SALE. THIS TERM SHEET IS NOT AN OFFER TO SELL THESE SECURITIES AND IT IS NOT A SOLICITATION OF AN OFFER TO BUY THESE SECURITIES IN ANY JURISDICTION WHERE THE OFFER OR SALE IS NOT PERMITTED.
113
3140 Peacekeeper Way McClellan, CA 95652 | Collateral Asset Summary – Loan No. 8 McClellan Business Park | Cut-off Date Balance: Cut-off Date LTV: U/W NCF DSCR: U/W NOI Debt Yield: | $32,400,000 60.2% 2.90x 10.5% |
McClellan Business Park Property is for industrial purposes. The industrial usage includes the warehouse, manufacturing, research, and airfield (collectively, 81.5% NRA, 60.8% U/W Base Rent). The additional uses include office (14.7% NRA, 31.8% U/W Base Rent), residential (2.3% NRA, 5.0% U/W Base Rent), retail (1.5% NRA, 2.5% U/W Base Rent) and yard/rail (0.0% NRA; 0.0% U/W Base Rent).
| Property Summary(1) | |||
| Use Type | Net Rentable Sq. Ft. | % of Net Rentable Sq. Ft | Occupancy |
| Warehouse | 2,532,812 | 36.6% | 96.6% |
| Manufacturing | 1,660,684 | 24.0% | 91.6% |
| Research | 604,753 | 8.7% | 70.2% |
| Airfield | 843,221 | 12.2% | 78.6% |
| Total Industrial | 5,641,470 | 81.5% | 89.6% |
| Office | 1,020,349 | 14.7% | 72.5% |
| Residential | 157,254 | 2.3% | 71.8% |
| Retail | 103,291 | 1.5% | 93.8% |
| Yard / Rail | 3,120 | 0.0% | 100.0% |
| Total / Wtd. Avg. | 6,925,484 | 100.0% | 86.8% |
| (1) | Based on September 15, 2020 rent roll |
Industrial (81.5% of NRA; 60.8% of U/W Base Rent)
Totaling over 5.6 million sq. ft., representing 81.5% of NRA and 60.8% of U/W Base Rent, the industrial space at the McClellan Business Park Property includes warehouse, manufacturing, research, and airfield/hanger buildings.
Defense Microelectronics Activity, an advanced lab facility operating under the Department of Defense, also owns approximately 375,000 sq. ft. within the McClellan Business Park Property. Other industrial tenants include Northrop Grumman Systems and General Dynamics. In addition, the research buildings at the McClellan Business Park Property were originally designed for the United States Air Force.
Amazon (6.0% NRA; 6.5% U/W Base Rent), the largest tenant at the McClellan Business Park Property, recently signed a 10-year lease, with two five-year extension options, on a newly constructed 417,637 square foot distribution warehouse.
Northrop Grumman Systems (3.9% Property NRA; 7.1% U/W Base Rent) is an American global aerospace and defense technology company. With 90,000 employees and an annual revenue in excess of $30 billion, it is one of the world's largest weapons manufacturers and military technology providers. At the McClellan Business Park Property. Northrup Grumman Systems has the right to terminate a portion of its space with notice to the landlord and payment of a termination fee.
Office (14.7% of NRA; 31.8% of U/W Base Rent)
The office component of the McClellan Business Park Property includes buildings designated as office and recreational. There are 37 primary buildings totaling 1,020,349 sq. ft. These buildings range in size from 800 to 331,670 sq. ft., with the majority of buildings below 15,000 sq. ft. in size. The median size within this set of buildings is 7,606 sq. ft. Originally constructed from 1938 to 1992, many of the buildings have been renovated to various levels. Existing office tenants include a variety of larger and small public and private operations such as the USDA, Gateway Community Charters, and Faneuil, Inc.
Defense Microelectronics Activity is a technology partner to military program managers and an engineering liaison to all sectors of defense contractors and has both office and research space in the McClellan Business Park Property.
USDA Forest Service (2.0% NRA; 8.8% U/W Base Rent) is an agency of the U.S. Department of Agriculture that administers the nation's 154 national forests and 20 national grasslands. The Forest Service manages 193 million acres of land. USDA Forest Service has the right to terminate its lease with 90 days’ written notice to the landlord.
Gateway Community Charters (1.7% NRA; 3.1% U/W Base Rent) is a 501c3 nonprofit, public-benefit corporation that has aimed to create and manage high quality charter schools, which provide access to innovative, quality, standards-based educational opportunities for all students. Gateway Community Charters has been providing quality school choice options in the greater Sacramento region for over fifteen years.
Faneuil, Inc. (0.9% NRA; 3.0% U/W Base Rent) has specialized in designing, implementing, managing and operating multichannel customer care and back-office business processing solutions for government and commercial clients nationwide for over 25 years. Headquartered in Hampton, Virginia, Faneuil delivers broad support to several industries, including transportation and tolling, health and human services, utilities, state and municipal governments and commercial/retail services.
THE INFORMATION IN THIS STRUCTURAL AND COLLATERAL TERM SHEET IS NOT COMPLETE AND MAY BE AMENDED PRIOR TO THE TIME OF SALE. THIS TERM SHEET IS NOT AN OFFER TO SELL THESE SECURITIES AND IT IS NOT A SOLICITATION OF AN OFFER TO BUY THESE SECURITIES IN ANY JURISDICTION WHERE THE OFFER OR SALE IS NOT PERMITTED.
114
3140 Peacekeeper Way McClellan, CA 95652 | Collateral Asset Summary – Loan No. 8 McClellan Business Park | Cut-off Date Balance: Cut-off Date LTV: U/W NCF DSCR: U/W NOI Debt Yield: | $32,400,000 60.2% 2.90x 10.5% |
Residential (2.3% of NRA; 5.0% of U/W Base Rent)
The residential component at the McClellan Business Park Property includes seven primary buildings which include renovated and non-renovated dorm buildings. These buildings are consistent in size, ranging from 19,038 to 25,380 sq. ft. with a median of 24,000 sq. ft. The residential space is 71.8% occupied by two tenants, the USDA Forest Service and AmeriCorps, as of September 15, 2020.
Retail (1.5% of NRA; 2.5% of U/W Base Rent)
The retail portion of the McClellan Business Park is currently 93.8% leased and consists of 11 buildings totaling over 100,000 sq. ft. of improved retail space. The retail operations provide tenants amenities such as a gas station and restaurant as of September 15, 2020.
COVID-19 Update.
As of November 20, 2020 the McClellan Business Park Property is open with most tenants working remotely. Six tenants, representing approximately 5.7% of the sq. ft. have requested rent relief. According to the borrower sponsor, it collected approximately 99% of rent payments in October 2020 and 99.0% of rent payments in November 2020. The first payment date of the McClellan Business Park Whole Loan is January 11, 2021. As of December 6, 2020, the McClellan Business Park Loan is not subject to any modification or forbearance requests. See “Risk Factors—Special Risks—Coronavirus Pandemic Has Adversely Affected the Global Economy and Will Likely Adversely Affect the Performance of the Mortgage Loans” in the Preliminary Prospectus.
Tenant Summary.
| Tenant Summary(1) | ||||||
Tenant | Ratings (Moody’s/Fitch/S&P)(2) | Net Rentable Area (Sq. Ft.) | % of Net Rentable Area | U/W Base Rent Per Sq. Ft.(3) | % of Total U/W Base Rent(3) | Lease Expiration |
| USDA Forest Service(4) | Aaa / AAA / NR | 135,992 | 2.0% | $24.91 | 8.8% | 11/13/2022 |
| Northrop Grumman Systems(5) | Baa1 / BBB / BBB | 267,618 | 3.9% | $10.16 | 7.1% | 12/31/2021 |
| Amazon.com | NR / NR / NR | 417,637 | 6.0% | $6.00 | 6.5% | 6/30/2030 |
| Cal Fire(6) | NR / NR / NR | 153,429 | 2.2% | $8.33 | 3.3% | 11/30/2020 |
| Gateway Charters(7) | NR / NR / NR | 114,890 | 1.7% | $10.39 | 3.1% | 6/30/2028 |
| Faneuil, Inc. | NR / NR / NR | 64,800 | 0.9% | $17.84 | 3.0% | 5/9/2029 |
| Hydra Distribution | NR / NR / NR | 388,784 | 5.6% | $2.97 | 3.0% | 4/16/2025 |
| GSA(8) | NR / NR / NR | 132,035 | 1.9% | $8.03 | 2.8% | 5/6/2022 |
| Dome Printing | NR / NR / NR | 320,000 | 4.6% | $3.15 | 2.6% | 11/17/2033 |
| McClellan Jet Services(9) | NR / NR / NR | 280,839 | 4.1% | $3.56 | 2.6% | 9/12/2022 |
| Ten Largest Tenants | 2,276,024 | 32.9% | $7.23 | 42.7% | ||
| Other Tenants(10) | 3,732,433 | 53.9% | 5.92 | 557.3% | ||
| Total Occupied Space | 6,008,457 | 86.8% | $6.42 | 100.0% | ||
| Vacant | 917,027 | 13.2% | ||||
| Total | 6,925,484 | 100.0% | ||||
| (1) | Based on the September 15, 2020 rent roll. |
| (2) | Certain ratings are those of the parent company whether or not the parent guarantees the lease. |
| (3) | U/W Base Rent, U/W Base Rent $ per sq. ft. and % of Total U/W Base Rent are based on in-place rent in the underwritten rent roll dated September 15, 2020. |
| (4) | USDA Forest Service leases 132,699 sq. ft. expiring on November 13, 2022 and 3,293 sq. ft. expiring on May 31, 2021. USDA Forest Service has the right to terminate its lease within 90 days’ written notice to the landlord. |
| (5) | Northrop Grumman Systems leases 254,511 sq. ft. expiring on December 31, 2021, 4,857 sq. ft. expiring on July 31, 2022, and 8,250 sq. ft. expiring on November 30, 2022. Northrop Grumman Systems has the right to terminate a portion of its space (4,857 sq. ft.) with notice to the landlord and payment of a termination fee. |
| (6) | Cal Fire leases 91,325 sq. ft. expiring on November 30, 2020, 42,095 sq. ft. on a month-to-month basis, 18,253 sq. ft. expiring June 30, 2028 and 1,756 sq. ft. expiring November 30, 2021. |
| (7) | Gateway Charters leases 98,185 sq. ft. expiring on June 30, 2028, 15,105 sq. ft. expiring on October 16, 2027, and 1,600 sq. ft. expiring on June 30, 2021. |
| (8) | GSA leases 73,094 sq. ft. expiring on May 6, 2022, 36,223 sq. ft. expiring on September 6, 2021, 14,958 sq. ft. expiring on September 30, 2022, and 7,760 sq. ft. expiring on September 30, 2021. GSA has the right to terminate its lease with 30 days’ notice. |
| (9) | McClellan Jet Services has the right to terminate its lease with respect to a portion of its space (1,373 sq. ft.) effective at any time after November 30, 2023 with 30 days’ notice. |
| (10) | Includes two tenants, Siemens Industry, Inc. (65,785 sq. ft., $7.20 U/W Based Rent Per Sq. Ft.) and Veterans Affairs (10,000 sq. ft., $5.25 U/W Base Rent Per Sq. Ft.), who have leases starting in January 2021 and February 2021, respectively. |
THE INFORMATION IN THIS STRUCTURAL AND COLLATERAL TERM SHEET IS NOT COMPLETE AND MAY BE AMENDED PRIOR TO THE TIME OF SALE. THIS TERM SHEET IS NOT AN OFFER TO SELL THESE SECURITIES AND IT IS NOT A SOLICITATION OF AN OFFER TO BUY THESE SECURITIES IN ANY JURISDICTION WHERE THE OFFER OR SALE IS NOT PERMITTED.
115
3140 Peacekeeper Way McClellan, CA 95652 | Collateral Asset Summary – Loan No. 8 McClellan Business Park | Cut-off Date Balance: Cut-off Date LTV: U/W NCF DSCR: U/W NOI Debt Yield: | $32,400,000 60.2% 2.90x 10.5% |
| Lease Rollover Schedule(1)(2) | ||||||||
| Year | # of Leases Expiring | Total Expiring Sq. Ft. | % of Total Sq. Ft. Expiring | Cumulative Sq. Ft. Expiring | Cumulative % of Sq. Ft. Expiring | Annual U/W Base Rent Per Sq. Ft. | % U/W Base Rent | Cumulative % of U/W Base Rent |
| MTM | 15 | 75,533 | 1.1% | 75,533 | 1.1% | $6.41 | 1.3% | 1.3% |
| 2020 | 17 | 150,128 | 2.2 | 225,661 | 3.3% | $9.33 | 3.6 | 4.9% |
| 2021 | 94 | 896,269 | 12.9 | 1,121,930 | 16.2% | $8.25 | 19.2 | 24.1% |
| 2022 | 63 | 1,044,895 | 15.1 | 2,166,825 | 31.3% | $7.66 | 20.8 | 44.8% |
| 2023 | 35 | 783,580 | 11.3 | 2,950,405 | 42.6% | $4.88 | 9.9 | 54.8% |
| 2024 | 21 | 463,243 | 6.7 | 3,413,648 | 49.3% | $4.75 | 5.7 | 60.5% |
| 2025 | 26 | 791,251 | 11.4 | 4,204,899 | 60.7% | $5.24 | 10.8 | 71.2% |
| 2026 | 5 | 152,898 | 2.2 | 4,357,797 | 62.9% | $6.20 | 2.5 | 73.7% |
| 2027 | 21 | 601,568 | 8.7 | 4,959,365 | 71.6% | $4.85 | 7.6 | 81.2% |
| 2028 | 21 | 233,106 | 3.4 | 5,192,471 | 75.0% | $10.71 | 6.5 | 87.7% |
| 2029 | 3 | 64,800 | 0.9 | 5,257,271 | 75.9% | $17.84 | 3.0 | 90.7% |
| 2030 | 5 | 420,757 | 6.1 | 5,678,028 | 82.0% | $5.96 | 6.5 | 97.2% |
| 2031 & Thereafter | 13 | 330,429 | 4.8 | 6,008,457 | 86.8% | $3.26 | 2.8 | 100.0% |
| Vacant | 0 | 917,027 | 13.2 | 6,925,484 | 100.0% | NAP | NAP | NAP |
| Total / Wtd. Avg. | 339 | 6,925,484 | 100.0% | $6.42 | 100.0% | |||
| (1) | Based on the underwritten rent roll dated September 15, 2020. |
| (2) | Certain tenants have lease termination options that may become exercisable prior to the originally stated expiration date of the tenant lease that are not considered in the lease rollover schedule. |
Environmental Matters. According to the Phase I environmental reports dated between November 2, 2020 and November 6, 2020, the McClellan Business Park Property is a part of the former McClellan Air Force Base, which is on the National Priorities List (NPL) as a Superfund site due to impacts related to the long-term military operation of the McClellan Business Park Property. According to the related environmental reports, environmental impacts include, among other things, groundwater contamination from volatile organic compounds, 1,4-dioxane, metals, and perchlorate. The environmental reports identified such impacts, including the potential for vapor encroachment, as a site-wide recognized environmental condition. In addition, the Phase I ESAs identified two lot-specific recognized environmental conditions related to (i) perfluorooctane sulfonate concentrations exceeding U.S. Environmental Protection Agency screening criteria for drinking water at one parcel and (ii) impacts from the prior operations of a wastewater treatment plant, sludge drying beds, an underground oil-water separator, a 10,000-gallon oil storage tank and a pesticide/herbicide storage area on another parcel. Groundwater is at a depth of approximately 105 feet and all domestic water is provided to the region, including McClellan Park, by the local municipal water utility. The McClellan Business Park Property is subject to multiple local, state and federal restrictions and institutional controls, including, among other things, groundwater use restrictions, use restrictions, digging restrictions, interference restrictions and access restrictions. All existing and future uses of the McClellan Business Park Property consistent with such restrictions are permitted by local, state and federal agencies. According to the environmental reports, the United States Air Force is the responsible party of record and retains responsibility for subsequent discoveries of previously-unknown environmental conditions.
The Market. The McClellan Business Park Property is in the northern part of an unincorporated area of Sacramento County. The area is generally located northwest of Interstate 80, southwest of the unincorporated community of North Highlands and southeast of the unincorporated community of Rio Linda. The area is located approximately nine miles northeast of Sacramento’s central business district.
McClellan Business Park Market Summary. McClellan Business Park is in an unincorporated area of Sacramento County adjacent to the community of North Highlands. North Highlands is a mixed-use area, with retail uses surrounding Watt Avenue, industrial uses to the south, residential uses to the east of Watt Avenue, and residential and agricultural uses to the north of the McClellan Park area. The McClellan Business Park Property is located approximately 9 miles northeast of Downtown Sacramento. McClellan Park is recognized as its own submarket and tracked as such by the major brokerage houses due to its size. Land uses within McClellan Park include office, light industrial, heavy industrial, aviation-related, rail, and a portion of multifamily properties. One of the primary demand drivers for the submarket, particularly for the industrial users, is the McClellan Business Park Property’s adjacent position to the 10,600-foot McClellan Airfield. When the borrower sponsor entered into an agreement to acquire the McClellan Business Park Property in 2001 and began operating the property in 2000, McClellan Park had only two tenants totaling 90,000 sq. ft. of space with an estimated employment of 5,500. By the time the borrower sponsor acquired the property in late 2001 occupancy was in excess of 1,000,000 sq. ft. of space. Since then, employment has grown 300% to an estimated 18,000 to 20,000 today. Since 2001, the McClellan Business Park Property has leased and redeveloped in excess of 7.0 million sq. ft. of manufacturing, warehouse, and office space. From 2011 to the third quarter of 2020, asking rents in the McClellan Park submarket have increased at a compound annual growth rate of 5.1% and vacancy has decreased by 14.5%.
THE INFORMATION IN THIS STRUCTURAL AND COLLATERAL TERM SHEET IS NOT COMPLETE AND MAY BE AMENDED PRIOR TO THE TIME OF SALE. THIS TERM SHEET IS NOT AN OFFER TO SELL THESE SECURITIES AND IT IS NOT A SOLICITATION OF AN OFFER TO BUY THESE SECURITIES IN ANY JURISDICTION WHERE THE OFFER OR SALE IS NOT PERMITTED.
116
3140 Peacekeeper Way McClellan, CA 95652 | Collateral Asset Summary – Loan No. 8 McClellan Business Park | Cut-off Date Balance: Cut-off Date LTV: U/W NCF DSCR: U/W NOI Debt Yield: | $32,400,000 60.2% 2.90x 10.5% |
Cash Flow Analysis.
| Cash Flow Analysis(1) | |||||||
| 2017 | 2018 | 2019 | T-12 9/30/2020 | U/W | U/W PSF | ||
| Base Rent | $30,020,185 | $34,154,288 | $36,215,976 | $38,587,412 | $38,545,498 | $5.57 | |
| Rent Steps | 0 | 0 | 0 | 0 | 1,210,817 | 0.17 | |
| Rent Average Benefit | 0 | 0 | 0 | 0 | 585,214 | 0.08 | |
| TI Amortization | 0 | 0 | 0 | 0 | 535,080 | 0.08 | |
| Yard Rent | 0 | 0 | 0 | 0 | 4,145,429 | 0.60 | |
| Expense Reimbursements | 4,748,711 | 5,452,877 | 6,256,187 | 6,754,163 | 6,850,394 | 0.99 | |
| Other Income | 252,056 | 47,853 | 300,496 | 793,948 | 793,948 | 0.11 | |
| Effective Gross Income | $35,020,952 | $39,655,018 | $42,772,659 | $46,135,523 | $52,666,380 | $7.60 | |
| Total Operating Expenses | 13,375,743 | 14,730,525 | 15,192,749 | 16,541,707 | 15,037,967 | 2.17 | |
| Net Operating Income(2) | $21,645,209 | $24,924,493 | $27,579,910 | $29,593,816 | $37,628,413 | $5.43 | |
| TI/LC | 0 | 0 | 0 | 0 | 1,731,371 | 0.25 | |
| Capital Expenditures | 0 | 0 | 0 | 0 | 1,038,823 | 0.15 | |
| Net Cash Flow | $21,645,209 | $24,924,493 | $27,579,910 | $29,593,816 | $34,858,219 | $5.03 | |
| (1) | Certain items such as straight line rent, interest expense, interest income, lease cancellation income, depreciation, amortization, debt service, and any other non-recurring or non-operating items were excluded from the historical presentation and are not considered for the underwritten cash flow. |
| (2) | The increase from T-12 9/30/2020 Net Operating Income to U/W Net Operating Income is primarily attributable to (i) contractual rent steps through October 2021 and the straight line average of contractual rent step increments over the lease term for investment grade tenants, (ii) increase in rental rates on rolling leases, (iii) occupancy increases, including speculative lease up to Amazon of a newly built 400,000 sq. ft. last mile distribution center, and (iv) a management fee cap at $1,000,000. |
Property Management. The McClellan Business Park Property is currently managed by LDKV Management, Inc. Under the McClellan Business Park Whole Loan documents, the McClellan Business Park Property is required to be managed by LDKV Management, Inc. or another property management company approved by the lender, with respect to which, if required by the lender, a rating agency confirmation has been received and, to the extent the other manager is affiliated with the borrower or guarantor, delivery of a non-consolidation opinion. The lender has the right to require the borrower to replace the property manager (i) if the property manager files or is the subject of a petition in bankruptcy, (ii) during the continuance of an event of default under the McClellan Business Park Whole Loan documents, (iii) upon a change in control of the manager, (iv) during the continuance of an event of default by the property manager under the management agreement (after the expiration of any applicable notice and/or cure periods) or (v) for cause including but not limited to fraud, gross negligence, willful misconduct or misappropriation of funds by the property manager.
Lockbox / Cash Management. The McClellan Business Park Whole Loan is structured with a hard lockbox and springing cash management. The borrower is required to deliver tenant direction letters instructing all tenants to deposit rents into a lender-controlled lockbox account. In addition, the borrower is required to cause all cash revenues relating to the McClellan Business Park Property and all other money received by the borrower or the property manager with respect to the McClellan Business Park Property (other than tenant security deposits) to be deposited into such lockbox account or a lender-controlled cash management account within two business days of receipt thereof.
On each business day that no McClellan Business Park Cash Trap Event Period is continuing, all funds in the lockbox account are required to be swept into a borrower-controlled operating account. On each business day that a McClellan Business Park Cash Trap Event Period is continuing, all funds in the lockbox account are required to be swept into the cash management account.
A “McClellan Business Park Cash Trap Event Period” means each period (i) during the continuance of an event of default under the McClellan Business Park Whole Loan, or (ii) commencing when the debt yield (as calculated under the loan documents) is less than 7.0% at the end of any calendar quarter, and ending when the debt yield is equal to or greater than 7.0% at the end of any calendar quarter.
During the continuance of a McClellan Business Park Cash Trap Event Period (other than an event of default under the McClellan Business Park Whole Loan), all amounts on deposit in the cash management account after payment of debt service and required reserves are required to be deposited into an excess cash flow reserve account as additional collateral for the McClellan Business Park Whole Loan.
Initial and Ongoing Reserves. At origination, the borrower funded upfront reserves of (i) approximately $689,613.89 for the amount owed by the borrower under the development agency loan described below under “—Current Mezzanine or Subordinate Indebtedness,” (ii) approximately $18,717 for future rent credits, abatements or gap rent for certain existing leases and (iii) approximately $5,482,591 for existing tenant improvement and leasing commission obligations.
On each due date during the continuance of a McClellan Business Park Cash Trap Event Period, the borrower is required to fund (i) a tax reserve in an amount equal to one-twelfth of the property taxes that the lender estimates will be payable during the next ensuing 12 months, (ii) an insurance reserve in an amount equal to one-twelfth of the insurance premiums that the lender estimates will be payable for the renewal of any required insurance policies, unless the borrower is maintaining a blanket policy meeting the requirements of the
THE INFORMATION IN THIS STRUCTURAL AND COLLATERAL TERM SHEET IS NOT COMPLETE AND MAY BE AMENDED PRIOR TO THE TIME OF SALE. THIS TERM SHEET IS NOT AN OFFER TO SELL THESE SECURITIES AND IT IS NOT A SOLICITATION OF AN OFFER TO BUY THESE SECURITIES IN ANY JURISDICTION WHERE THE OFFER OR SALE IS NOT PERMITTED.
117
3140 Peacekeeper Way McClellan, CA 95652 | Collateral Asset Summary – Loan No. 8 McClellan Business Park | Cut-off Date Balance: Cut-off Date LTV: U/W NCF DSCR: U/W NOI Debt Yield: | $32,400,000 60.2% 2.90x 10.5% |
related loan documents, (iii) a replacement reserve in the amount of $86,568.55 (to be reduced to take into account the reduction of expenses in connection with a partial release), subject to a cap of $2,077,645.20, and (iv) a tenant improvements and leasing commission reserve in the amount of $288,561.83, subject to a cap of $6,925,484.
Condominium Conversion. Pursuant to the lease with the tenant Twin Rivers, in the event, among other conditions, the Twin Rivers tenant prepays its rent in full and the Twin Rivers tenant requests the release of its leased premises from the lien of the McClellan Business Park Whole Loan, the borrower may be required to (i) convert the building occupied by Twin Rivers to a commercial condominium and (ii) transfer to the Twin Rivers tenant ownership of its leased premises within the Twin Rivers building (the “Twin Rivers Condominium Unit”). As of origination, the Twin Rivers tenant has prepaid its rent in full but has not requested that the borrower perform a condominium conversion. Under the loan documents, the borrower is permitted to perform a condominium conversion of the Twin Rivers building, provided that, among other conditions, (i) the resulting condominium regime comprises two or more condominium units, one of which consists solely of the Twin Rivers Condominium Unit and (ii) any related condominium documents are subject to the approval of the lender, not to be unreasonably withheld. See “Description of the Mortgage Pool—Mortgage Pool Characteristics—Condominium and Other Shared Interests” in the Preliminary Prospectus.
Current Mezzanine or Subordinate Indebtedness. A portion of the McClellan Business Park Property is subject to a subordinate loan (the “Development Agency Loan”) obtained in connection with the development of the McClellan Business Park Property in 2011 in favor of the Sacramento County Successor Agency (the “Development Agency”) in the original principal amount of $1,000,000, of which an estimated $639,220.10 (as calculated by the Development Agency based on current leasing rates at the applicable portion of the McClellan Business Park Property) is outstanding, which amount may be forgiven if the borrower satisfies certain development and leasing criteria over the remaining term of the Development Agency Loan (provided that the borrower and the subordinate lender disagree as to what the criteria are for obtaining forgiveness and whether the borrower has yet satisfied such criteria with respect to the outstanding principal balance). All interest accrues at 4% simple interest under the Development Agency Loan, but all payments of interest or principal are deferred until the maturity date, which is March 1, 2023. At origination, the Development Agency entered into a subordination agreement pursuant to which the Development Agency expressly waived, relinquished and subordinated the lien of the Development Agency Loan in favor of the McClellan Business Park Loan. In connection with the Development Agency Loan, the borrower deposited $689,613.89 with the lender (the “Development Agency Loan Reserve Funds”) at origination, representing approximately 108% of the estimated amount owed by the borrower to the Development Agency. In the event that the Development Agency commences any enforcement action or commences the exercise of any remedies under the Development Agency Loan, the lender has the right, without the consent of the borrower, to disburse the Development Agency Loan Reserve Funds to the Development Agency for the payment of any outstanding debt owned by borrower to the Development Agency.
Future Mezzanine or Subordinate Indebtedness Permitted. None.
Partial Release. Provided no default or event of default under the McClellan Business Park Whole Loan is continuing, the borrower is permitted to obtain a release of one or more buildings (each, a “McClellan Business Park Release Parcel”) comprising a portion of the McClellan Business Park Property subject to the satisfaction of certain conditions, including, among others: (i) prepayment of the McClellan Business Park Whole Loan for a release price equal to (a) for the first 10% of the original principal balance of the McClellan Business Park Whole Loan being repaid, 110% of the allocated loan amount of the applicable McClellan Business Park Release Parcel(s) and (b) for the remaining collateral, 115% of the allocated loan amount of the applicable McClellan Business Park Release Parcel(s), in each instance together with any applicable yield maintenance premium, (ii) after giving effect to such release (a) the debt yield (as calculated under the McClellan Business Park Whole Loan documents), as of the date of such release, is equal to or greater than 10%, (b) at least 100 buildings remain subject to the lien of the McClellan Business Park Whole Loan and no building accounts, on a pro forma basis, for more than 10% of the remaining aggregated net cash flow (as calculated under the McClellan Business Park Whole Loan documents) and (c) at least 60% of the remaining rentable square feet is used for industrial purposes and (iii) satisfaction of customary REMIC requirements. Notwithstanding anything to the contrary in the foregoing, if the portion of the McClellan Business Park Property identified as Lot 83 (the “Twin Rivers Parcel”) is being released in connection with the borrower’s conversion of the Twin Rivers Parcel to a condominium (the “McClellan Business Park Condominium Conversion”), then the release price for the Twin Rivers Parcel will be equal to 100% of its allocated loan amount.
In addition, the McClellan Business Park Whole Loan documents permit the borrower to obtain the free release of certain non-income producing parcels (each, a “McClellan Business Park NIP Parcel”) that were attributed no value in underwriting, subject to satisfaction of certain conditions including, among others, that any such McClellan Business Park NIP Parcel is being released solely (i) to accommodate parcel/tax lot adjustments for potential development by an affiliate of the borrower or guarantor or (ii) for the sale of such McClellan Business Park NIP Parcel to a third party that is not an affiliate of the borrower or the guarantor. After the occurrence of the McClellan Business Park Condominium Conversion, the borrower may also obtain the free release of the premises within the Twin Rivers Parcel currently occupied by the tenant Twin Rivers, subject to the satisfaction of certain conditions set forth in the related loan documents.
THE INFORMATION IN THIS STRUCTURAL AND COLLATERAL TERM SHEET IS NOT COMPLETE AND MAY BE AMENDED PRIOR TO THE TIME OF SALE. THIS TERM SHEET IS NOT AN OFFER TO SELL THESE SECURITIES AND IT IS NOT A SOLICITATION OF AN OFFER TO BUY THESE SECURITIES IN ANY JURISDICTION WHERE THE OFFER OR SALE IS NOT PERMITTED.
118
(THIS PAGE INTENTIONALLY LEFT BLANK)
119
1088 Sansome Street San Francisco, CA 94111 | Collateral Asset Summary – Loan No. 9 1088 Sansome | Cut-off Date Balance: Cut-off Date LTV: U/W NCF DSCR: U/W NOI Debt Yield: | $32,250,000 59.7% 2.73x 9.1% |
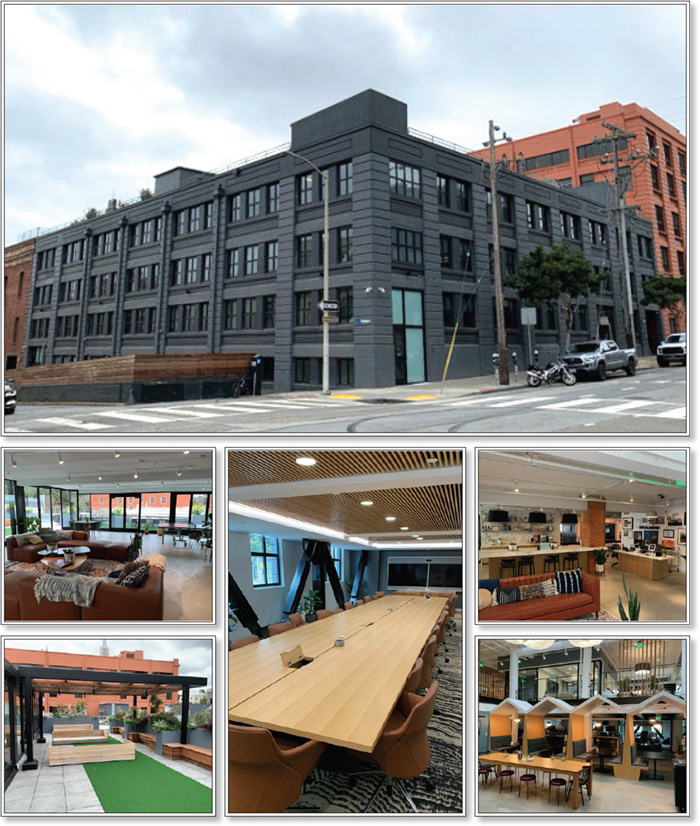
THE INFORMATION IN THIS STRUCTURAL AND COLLATERAL TERM SHEET IS NOT COMPLETE AND MAY BE AMENDED PRIOR TO THE TIME OF SALE. THIS TERM SHEET IS NOT AN OFFER TO SELL THESE SECURITIES AND IT IS NOT A SOLICITATION OF AN OFFER TO BUY THESE SECURITIES IN ANY JURISDICTION WHERE THE OFFER OR SALE IS NOT PERMITTED.
120
1088 Sansome Street San Francisco, CA 94111 | Collateral Asset Summary – Loan No. 9 1088 Sansome | Cut-off Date Balance: Cut-off Date LTV: U/W NCF DSCR: U/W NOI Debt Yield: | $32,250,000 59.7% 2.73x 9.1% |
THE INFORMATION IN THIS STRUCTURAL AND COLLATERAL TERM SHEET IS NOT COMPLETE AND MAY BE AMENDED PRIOR TO THE TIME OF SALE. THIS TERM SHEET IS NOT AN OFFER TO SELL THESE SECURITIES AND IT IS NOT A SOLICITATION OF AN OFFER TO BUY THESE SECURITIES IN ANY JURISDICTION WHERE THE OFFER OR SALE IS NOT PERMITTED.
121
1088 Sansome Street San Francisco, CA 94111 | Collateral Asset Summary – Loan No. 9 1088 Sansome | Cut-off Date Balance: Cut-off Date LTV: U/W NCF DSCR: U/W NOI Debt Yield: | $32,250,000 59.7% 2.73x 9.1% |
| Mortgage Loan Information | |
| Loan Seller: | GACC |
| Loan Purpose: | Refinance |
| Borrower Sponsors: | Angus McCarthy; Michael Moritz |
| Borrower: | 1088 Sansome St Property LLC |
| Original Balance: | $32,250,000 |
| Cut-off Date Balance: | $32,250,000 |
| % by Initial UPB: | 4.0% |
| Interest Rate: | 3.27600% |
| Payment Date: | 6th of each month |
| First Payment Date(1): | January 6, 2021 |
| Maturity Date: | January 6, 2031 |
| Amortization: | Interest Only |
| Additional Debt: | None |
| Call Protection: | L(24), D(92), O(5) |
| Lockbox / Cash Management: | Hard / Springing |
| Reserves | |||
| Initial | Monthly | Cap | |
| Taxes: | $0 | $35,954 | NAP |
| Insurance: | $4,421 | $1,474 | NAP |
| Replacement: | $0 | $1,030 | $24,727 |
| TI/LC: | $0 | Springing | NAP |
| Debt Service: | $250,000 | $0 | NAP |
| Property Information | |
| Single Asset / Portfolio: | Single Asset |
| Property Type: | CBD Office |
| Collateral: | Fee Simple |
| Location: | San Francisco, CA |
| Year Built / Renovated: | 1908 / 2017 |
| Total Sq. Ft.: | 61,817 |
| Property Management: | W2 Property Management, Inc. |
| Underwritten NOI: | $2,938,260 |
| Underwritten NCF: | $2,925,896 |
| Appraised Value: | $54,000,000 |
| Appraisal Date: | November 2, 2020 |
| Historical NOI(2) | |
| Most Recent NOI: | $2,916,696 (T-12 June 30, 2020) |
| 2019 NOI: | $2,569,024 (December 31, 2019) |
| 2018 NOI: | NAV |
| 2017 NOI: | NAV |
| Historical Occupancy(2) | |
| Most Recent Occupancy: | 100.0% (June 30, 2020) |
| 2019 Occupancy: | 100.0% (December 31, 2019) |
| 2018 Occupancy: | NAV |
| 2017 Occupancy: | NAV |
| Financial Information | ||||||
| Tranche | Cut-off Date Balance | Balance per Sq. Ft. Cut-off / Balloon | LTV Cut-off / Balloon | U/W DSCR NOI / NCF | U/W Debt Yield NOI / NCF | U/W Debt Yield at Balloon NOI / NCF |
| Mortgage Loan | $32,250,000 | $522 / $522 | 59.7% / 59.7% | 2.74x / 2.73x | 9.1% / 9.1% | 9.1% / 9.1% |
| (1) | The interest only period and First Payment Date presented in the Mortgage Loan Information above are inclusive of the additional January 2021 interest payment to be deposited on the Closing Date by German American Capital Corporation. The first payment date under the loan documents is February 6, 2021. |
| (2) | Historical financial information and occupancy for 2017 and 2018 are not available as the 1088 Sansome Property (as defined below) was undergoing a full seismic retrofit and interior renovation, which was completed at the end of 2017. The lease with Pattern Energy was signed in March 2018 and Pattern Energy took occupancy in September 2018. Big Wines took occupancy in January 2019. |
THE INFORMATION IN THIS STRUCTURAL AND COLLATERAL TERM SHEET IS NOT COMPLETE AND MAY BE AMENDED PRIOR TO THE TIME OF SALE. THIS TERM SHEET IS NOT AN OFFER TO SELL THESE SECURITIES AND IT IS NOT A SOLICITATION OF AN OFFER TO BUY THESE SECURITIES IN ANY JURISDICTION WHERE THE OFFER OR SALE IS NOT PERMITTED.
122
1088 Sansome Street San Francisco, CA 94111 | Collateral Asset Summary – Loan No. 9 1088 Sansome | Cut-off Date Balance: Cut-off Date LTV: U/W NCF DSCR: U/W NOI Debt Yield: | $32,250,000 59.7% 2.73x 9.1% |
The Loan. The 1088 Sansome mortgage loan (the “1088 Sansome Loan”) has an outstanding principal balance as of the Cut-off Date of $32,250,000. The 1088 Sansome Loan is secured by the borrower’s fee simple interest in a 61,817 sq. ft., Class B office building located in San Francisco, California (the “1088 Sansome Property”).
The 1088 Sansome Loan has a 121-month interest-only term and accrues interest at a rate of 3.27600% per annum. Proceeds of the 1088 Sansome Loan were primarily used to refinance existing debt, pay closing costs, fund upfront reserves and return approximately $6.3 million to the borrower sponsor. Based on the “As Is” appraised value of $54.0 million as of November 2, 2020, the Cut-off Date LTV Ratio is 59.7%. In addition, the appraisal concluded to an “As Dark” appraised value of $36.0 million as of November 2, 2020, which equates to a loan to dark value ratio of 89.6%.
| Sources and Uses | ||||||
| Sources | Proceeds | % of Total | Uses | Proceeds | % of Total | |
| Mortgage Loan | $32,250,000 | 100.0% | Loan Payoff | $24,716,247 | 76.6% | |
| Return of Equity | 6,335,788 | 19.6 | ||||
| Closing Costs | 943,543 | 2.9 | ||||
| Reserves | 254,421 | 0.8 | ||||
| Total Sources | $32,250,000 | 100.0% | Total Uses | $32,250,000 | 100.0% | |
The Borrower / Borrower Sponsor. The borrower is 1088 Sansome St Property LLC, a Delaware limited liability company and special purpose entity with one independent director in its organizational structure. The borrower sponsors and non-recourse carve-out guarantors are Angus McCarthy and Michael Moritz. The non-recourse carveout guarantors are liable on a joint and several basis; however, the guarantees are not cross-defaulted. See “Description of the Mortgage Pool—Non Recourse Carveout Limitations” in the Preliminary Prospectus.
Angus McCarthy is the founder of A. McCarthy Engineering, a San Francisco based developer specializing in residential and commercial office construction and renovations. Angus McCarthy was appointed to the San Francisco Department of Building Inspection’s seven-member citizen Building Inspection Commission (“BIC”) by former San Francisco Mayor Ed Lee in 2012. Today, Angus McCarthy serves as the BIC’s president and is responsible for overseeing building code enforcement efforts.
Michael Moritz is a Welsh venture capitalist and former journalist. Michael Moritz is currently the Chairman and managing partner of Sequoia Capital where he has worked since 1986. Sequoia Capital is a venture capital firm focused on energy, financials, enterprise, healthcare, internet and mobile startups. Michael Moritz represented Sequoia Capital in its investments in Google, Yahoo, PayPal, Flextronics, Kayak, Pure Digital, and Zappos.com, among other investments.
The Property.
| Tenant Summary(1) | ||||||
| Tenant | Credit Rating (Moody’s/Fitch/S&P)(2) | Net Rentable Area (Sq. Ft.) | % of Net Rentable Area | U/W Base Rent Per Sq. Ft. | % of Total U/W Base Rent | Lease Expiration |
| Pattern Energy(3) | Ba3 / NR / BB-(4) | 50,910 | 82.4% | $62.59 | 94.9% | 12/17/2028 |
| Big Wines(5)(6) | NR / NR / NR | 10,907 | 17.6 | $15.62 | 5.1 | 10/1/2029 |
| Total / Wtd. Avg. Occupied | 61,817 | 100.0% | $54.31 | 100.0% | ||
| Vacant | 0 | 0.0% | ||||
| Total | 61,817 | 100.0% | ||||
| (1) | Based on the underwritten rent roll dated December 3, 2020. |
| (2) | Certain ratings are those of the direct parent company whether or not the direct parent company guarantees the lease. |
| (3) | Pattern Energy has one option to renew at market rent for an additional five year period with notice between August 17, 2027 and December 17, 2027. |
| (4) | The ultimate parent company, Canada Pension Plan Investment Board (CPPIB), is rated Aaa / NR / AAA by Moody’s/Fitch/S&P. |
| (5) | Big Wines has one option to renew at market rent for an additional five year period with notice no less than nine months prior to the expiration of the initial term. |
| (6) | The U/W Base Rent per sq. ft. of $15.62 includes 1,445 sq. ft. of sub-basement space with no attributable contractual rent. The contractual base rent for the 9,462 sq. ft. of ground floor space is $18.02 per sq. ft. |
THE INFORMATION IN THIS STRUCTURAL AND COLLATERAL TERM SHEET IS NOT COMPLETE AND MAY BE AMENDED PRIOR TO THE TIME OF SALE. THIS TERM SHEET IS NOT AN OFFER TO SELL THESE SECURITIES AND IT IS NOT A SOLICITATION OF AN OFFER TO BUY THESE SECURITIES IN ANY JURISDICTION WHERE THE OFFER OR SALE IS NOT PERMITTED.
123
1088 Sansome Street San Francisco, CA 94111 | Collateral Asset Summary – Loan No. 9 1088 Sansome | Cut-off Date Balance: Cut-off Date LTV: U/W NCF DSCR: U/W NOI Debt Yield: | $32,250,000 59.7% 2.73x 9.1% |
| Lease Rollover Schedule(1) | ||||||||
| Year | # of Leases Expiring | Total Expiring Sq. Ft. | % of Total Sq. Ft. Expiring | Cumulative Sq. Ft. Expiring | Cumulative % of Sq. Ft. Expiring | Annual U/W Per Sq. Ft. | % U/W Base Rent Rolling | Cumulative % of U/W Base Rent |
| MTM & 2020 | 0 | 0 | 0.0% | 0 | 0.0% | $0.00 | 0.0% | 0.0% |
| 2021 | 0 | 0 | 0.0% | 0 | 0.0% | $0.00 | 0.0% | 0.0% |
| 2022 | 0 | 0 | 0.0% | 0 | 0.0% | $0.00 | 0.0% | 0.0% |
| 2023 | 0 | 0 | 0.0% | 0 | 0.0% | $0.00 | 0.0% | 0.0% |
| 2024 | 0 | 0 | 0.0% | 0 | 0.0% | $0.00 | 0.0% | 0.0% |
| 2025 | 0 | 0 | 0.0% | 0 | 0.0% | $0.00 | 0.0% | 0.0% |
| 2026 | 0 | 0 | 0.0% | 0 | 0.0% | $0.00 | 0.0% | 0.0% |
| 2027 | 0 | 0 | 0.0% | 0 | 0.0% | $0.00 | 0.0% | 0.0% |
| 2028 | 1 | 50,910 | 82.4% | 50,910 | 82.4% | $62.59 | 94.9% | 94.9% |
| 2029 | 1 | 10,907 | 17.6% | 61,817 | 100.0% | $15.62(2) | 5.1% | 100.0% |
| 2030 | 0 | 0 | 0.0% | 61,817 | 100.0% | $0.00 | 0.0% | 100.0% |
| 2031 & Thereafter | 0 | 0 | 0.0% | 61,817 | 100.0% | $0.00 | 0.0% | 100.0% |
| Vacant | NAP | 0 | 0.0% | 61,817 | 100.0% | NAP | NAP | NAP |
| Total / Wtd. Avg. | 2 | 61,817 | 100.0% | $54.31 | 100.0% | |||
| (1) | Based on the underwritten rent roll dated December 3, 2020. |
| (2) | The U/W Base Rent per sq. ft. of $15.62 includes 1,445 sq. ft. of sub-basement space with no attributable contractual rent. The contractual base rent for the 9,462 sq. ft. of ground floor space is $18.01 per sq. ft. |
The 1088 Sansome Property is a four-story, 61,817 sq. ft. Class B office building located in the North Waterfront/Jackson Square submarket of San Francisco, California. The borrower sponsors purchased the 1088 Sansome Property in 2014 for approximately $14.4 million and spent approximately $15.0 million on a full seismic retrofit, interior renovations, and tenant improvements, which were completed in 2017. The 1088 Sansome Property consists of four stories of office space and a roof deck totaling 50,910 sq. ft. that is fully leased to Pattern Energy and a partially above-grade basement totaling 10,907 sq. ft. that is leased to Big Wines. There is one entrance on Sansome Street with keycard access for Pattern Energy and one entrance on Green Street for Big Wines. The 1088 Sansome Property is located in a designated historic district in San Francisco.
COVID-19 Update. As of December 1, 2020, the 1088 Sansome Property is open, however most office tenant employees are working remotely. As of the November rent payment date, all tenants have paid rent in-full for November (and prior months), with the borrower having collected 100.0% of the underwritten base rent. As of December 8, 2020, neither of the two tenants has requested a lease modification or rent forbearance. The first payment date of the 1088 Sansome Loan is scheduled on February 6, 2021. As of December 8, 2020, the 1088 Sansome Loan is not subject to any modification or forbearance request. See “Risk Factors—Special Risks—Coronavirus Pandemic Has Adversely Affected the Global Economy and Will Likely Adversely Affect the Performance of the Mortgage Loans” in the Preliminary Prospectus.
Major Tenants.
Pattern Energy Group Services LP (“Pattern Energy”) (50,910 sq. ft.; 82.4% of net rentable area; 94.9% of U/W Base Rent) is a private renewable energy company and a wholly owned subsidiary of Pattern Energy Group, LP. Pattern Energy has an operational portfolio that includes 28 utility-scale renewable energy facilities in the United States, Canada and Japan. Pattern Energy is engaged in all project stages including resource analysis, site development, power marketing, finance, construction, facility operations and asset management. With a global footprint spanning the United States, Canada, Mexico, Chile and Japan, Pattern Energy has brought more than 5,000 megawatts of renewable power projects to market and has offices in San Francisco (at the 1088 Sansome Property), Houston, San Diego, Toronto, Mexico City, Santiago and Tokyo. The 1088 Sansome Property serves as the company’s global headquarters with approximately 228 employees at the location.
Pattern Energy completed a restructuring in 2020 to combine its operating and development businesses under one umbrella. A joint venture between the Canada Pension Plan Investment Board (CPPIB, Moody’s / S&P: Aaa / AAA), in addition to Riverstone Holdings LLC, and members of Pattern Energy’s management agreed to acquire Pattern Energy in an all-cash deal for $26.75 per share, implying a value of approximately $6.1 billion, including net debt. The transaction closed in the second quarter of 2020. Prior to the acquisition, Pattern Energy was previously listed on the NASDAQ (“PEGI”) and reported an adjusted EBITDA for year-end 2019 of approximately $359 million and a net loss in 2019 of approximately $107 million.
Pattern Energy signed a 10 year lease in March 2018 to occupy the entirety of the office portion and penthouse. Pattern Energy did not receive any tenant improvement allowance as its space was delivered in turnkey condition. Following taking possession of the space, Pattern Energy spent an additional $16.00 per sq. ft. to complete its build-out and equip the space with furniture, desks, and other office equipment. Pattern Energy currently has a base rent of $62.59 per sq. ft. with 3% annual rent escalations. According to the appraisal, Pattern Energy’s in-place base rent is approximately 13.9% below market rent. Pattern Energy has one, five-year renewal option with
THE INFORMATION IN THIS STRUCTURAL AND COLLATERAL TERM SHEET IS NOT COMPLETE AND MAY BE AMENDED PRIOR TO THE TIME OF SALE. THIS TERM SHEET IS NOT AN OFFER TO SELL THESE SECURITIES AND IT IS NOT A SOLICITATION OF AN OFFER TO BUY THESE SECURITIES IN ANY JURISDICTION WHERE THE OFFER OR SALE IS NOT PERMITTED.
124
1088 Sansome Street San Francisco, CA 94111 | Collateral Asset Summary – Loan No. 9 1088 Sansome | Cut-off Date Balance: Cut-off Date LTV: U/W NCF DSCR: U/W NOI Debt Yield: | $32,250,000 59.7% 2.73x 9.1% |
notice between August 2027 and December 2027 to be reset at fair market value with 3% annual rent escalations. Pattern Energy does not have any termination options, contraction options or free rent. Pattern Energy has a right of first offer to purchase the 1088 Sansome Property, which has been waived in connection with a foreclosure or deed-in-lieu thereof, and a subsequent sale by the lender or its designee, but would apply to any further transfers.
As a result of the COVID-19 global pandemic, the majority of Pattern Energy employees are working from home with only employees deemed essential allowed to return to the office. According to the borrower, Pattern Energy is planning to phase employees back into the office starting in February 2021 with the goal of having the remainder of its workforce return by the summer of 2021.
Big Wines (10,907 sq. ft.; 17.6% of net rentable area; 5.1% of U/W Base Rent) is a membership-based wine storage facility which also offers tasting classes and a wine bar for the general public. Big Wines offers 230 private temperature-controlled storage spaces that are available in a variety of sizes and memberships that range from monthly to multi-year. Big Wines also has a private room in addition to a large wine bar space where it hosts numerous events for both members and private groups. The storage component of Big Wines comprises approximately 90% of its business income. Big Wines does not have any termination options, contraction options or free rent.
As a result of the COVID-19 global pandemic, Big Wines was forced to suspend indoor wine tastings, however the core storage component of its business remained unaffected. Wine storage tenants are allowed to access their units on an appointment basis while following state and local COVID-19 safety protocols (i.e. limited capacity, face coverings, social distancing, etc.).
Environmental Matters. According to a Phase I environmental report dated November 2, 2020, there were no recommendations for further action at the 1088 Sansome Property other than the development of an asbestos operations and maintenance program. An asbestos operations and maintenance plan was obtained for the 1088 Sansome Property.
The Market. The 1088 Sansome Property is located in the North Waterfront/Jackson Square area of San Francisco, just north of the city’s financial district. The 1088 Sansome Property offers tenants a walkable location with access to restaurant and retail amenities along the Embarcadero and in the surrounding neighborhoods of Jackson Square and North Beach. The area includes many art galleries, boutique retailers, and dining options. Boutique brands such as Allbirds, Isabel Marant, Aesop, and Filson have all set up shop in the area. In addition to retail, some of San Francisco’s most recognized restaurants including Quince, Cotogna, Kokkari, and Bix call the area home. The location is also within walking distance to many forms of public transit, including MUNI light rail and bus lines, BART, Golden Gate Transit, and the SF Ferry, which services inbound commuters from both the North Bay and East Bay.
According to the appraisal, the North Waterfront submarket vacancy was 10.9% as of the second quarter of 2020. The submarket contains over 3.3 million sq. ft. of office space with an average overall asking rent of $82.89 per sq. ft.
The following chart displays six lease comparables for the office space. The office lease comparables’ rents range from $66.00 per sq. ft. to $88.00 per sq. ft.
| Comparable Office Leases(1) | |||||
| Property Name | Tenant Name | Tenant Leased Space | Lease Date | Lease Term (years) | Base Rent Per Sq. Ft. |
1088 Sansome San Francisco, CA | Pattern Energy | 50,910(2) | Mar-20(2) | 10.3(2) | $62.59(2) |
1725 Montgomery Street San Francisco, CA | Brightmark | 14,700 | Jul-20 | 7.0 | $68.00 |
450 Pacific Avenue San Francisco, CA | Keesal Young & Logan | 28,586 | Jun-20 | 3.0 | $88.00 |
945 Battery Street San Francisco, CA | Lightstep | 40,238 | Dec-19 | 5.2 | $80.00 |
55 Francisco Street San Francisco, CA | Endpoint Clinical | 20,000 | Oct-19 | 5.2 | $66.00 |
735 Battery Street San Francisco, CA | Samsung | 25,014 | May-19 | 7.0 | $68.00 |
170 Columbus San Francisco, CA | Project Affinity | 14,282 | Apr-19 | 5.0 | $66.00 |
| (1) | Based on the Appraisal. |
| (2) | Based on the underwritten rent roll as of December 3, 2020. |
THE INFORMATION IN THIS STRUCTURAL AND COLLATERAL TERM SHEET IS NOT COMPLETE AND MAY BE AMENDED PRIOR TO THE TIME OF SALE. THIS TERM SHEET IS NOT AN OFFER TO SELL THESE SECURITIES AND IT IS NOT A SOLICITATION OF AN OFFER TO BUY THESE SECURITIES IN ANY JURISDICTION WHERE THE OFFER OR SALE IS NOT PERMITTED.
125
1088 Sansome Street San Francisco, CA 94111 | Collateral Asset Summary – Loan No. 9 1088 Sansome | Cut-off Date Balance: Cut-off Date LTV: U/W NCF DSCR: U/W NOI Debt Yield: | $32,250,000 59.7% 2.73x 9.1% |
Cash Flow Analysis.
| Cash Flow Analysis(1)(2) | ||||
| 2019 | T-12 6/30/2020 | U/W | U/W PSF | |
| Base Rent | $3,096,786 | $3,276,857 | $3,357,015 | $54.31 |
| Rent Steps(3) | 0 | 0 | 99,432 | 1.61 |
| Gross Potential Rent | $3,096,786 | $3,276,857 | $3,456,447 | $55.91 |
| Total Reimbursements | 0 | 451,822 | 447,338 | 7.24 |
| Total Gross Income | 3,096,786 | 3,728,679 | 3,903,785 | $63.15 |
| Less: Vacancy | 0 | 0 | (195,189) | (3.16) |
| Effective Gross Income | $3,096,786 | $3,728,679 | $3,708,595 | $59.99 |
| Total Fixed Expenses | 385,558 | 449,208 | 448,617 | 7.26 |
| Total Operating Expenses | 142,204 | 362,776 | 321,719 | 5.20 |
| Net Operating Income | $2,569,024 | $2,916,696 | $2,938,260 | $47.53 |
| TI/LC | 0 | 0 | 0 | 0.00 |
| Capital Expenditures | 0 | 0 | 12,363 | 0.20 |
| Net Cash Flow | $2,569,024 | $2,916,696 | $2,925,896 | $47.33 |
| (1) | Based on the underwritten rent roll as of December 3, 2020. For avoidance of doubt, no COVID-19 specific adjustments have been incorporated in the lender U/W. |
| (2) | Historical financial information and occupancy for 2017 and 2018 are not available as the 1088 Sansome Property was undergoing a full seismic retrofit and interior renovation, which was completed at the end of 2017. The lease with Pattern Energy was signed in March 2018 and it took occupancy in September 2018. Big Wines took occupancy in January 2019. |
| (3) | Rent Steps includes contractual rent steps of $99,432 underwritten through September 2021. |
Property Management. The 1088 Sansome Property is currently managed by W2 Property Management, Inc.
Lockbox / Cash Management. The 1088 Sansome Loan is structured with a hard lockbox and springing cash management. The borrower is required to cause tenants to deposit rents directly into a lender-controlled lockbox account. In addition, the borrower and the property manager are required to deposit all rents and gross revenue from the 1088 Sansome Property into such lockbox account within one business day of receipt. If no 1088 Sansome Trigger Period exists, on a daily basis, all funds in the lockbox account are required to be swept into the borrower’s operating account. During a 1088 Sansome Trigger Period, sums on deposit in the lockbox account are required to be transferred on a daily basis to a lender-controlled cash management account to be applied to payment of all required monthly amounts (including, without limitation, taxes and insurance, debt service and required reserves) and approved property operating expenses, with any excess funds being held by the lender as additional collateral for the loan (or if there is a 1088 Sansome Major Tenant Sweep Event (as defined below), being deposited into the 1088 Sansome Lease Sweep Reserve (as defined below)).
A "1088 Sansome Trigger Period" will commence upon the occurrence of (i) an event of default (and will end if the lender has accepted a cure), (ii) if the debt service coverage ratio falls below 1.20x, as determined by the lender (and end if the debt service coverage ratio exceeds 1.25x for two consecutive quarters), (iii) a 1088 Sansome Major Tenant Sweep Event (and will end upon the termination thereof), or (iv) the disbursement of funds from the debt service reserve account (and will end if such funds have been reimbursed and certain other conditions are satisfied). For purposes of determining whether a 1088 Sansome Trigger Period occurs under clause (ii), the debt service coverage ratio will be measured quarterly; however if a Tenant Adjustment Event (as defined below) occurs, then the underwritten net cash flow used to calculate the debt service coverage ratio under the 1088 Sansome Loan may be immediately adjusted downward by the lender, and to the extent such adjustment results in a debt service coverage ratio below 1.20x, a 1088 Sansome Trigger Period will immediately commence under clause (ii).
A “Tenant Adjustment Event” means any of the following: (1) a tenant is not currently in occupancy and paying full, unabated rent, (2) a tenant is affiliated with the borrower or a non-recourse carveout guarantor, (3) a tenant is (X) in default beyond any applicable notice or cure period in the applicable lease or (Y) in bankruptcy, (4) a tenant is under a month-to-month lease, or (5) a tenant’s lease term is set to expire in the next two succeeding calendar quarters.
During the continuance of a 1088 Sansome Major Tenant Sweep Event, all excess funds are required to be swept into an account to be held as additional collateral for the 1088 Sansome Loan (the “1088 Sansome Lease Sweep Reserve”). Provided there is no event of default, the 1088 Sansome Lease Sweep Reserve will be made available to the borrower to pay for certain tenant improvements, leasing commissions and other costs incurred by the borrower in connection with the re-tenanting of the space covered by the applicable lease.
A “1088 Sansome Major Tenant Sweep Event” will commence (a) upon the earlier of (i) the date that is 12 months prior to the expiration of a 1088 Sansome Sweep Lease (defined below) or (ii) upon the date required under the 1088 Sansome Sweep Lease by which the 1088 Sansome Lease Sweep Tenant (as defined below) is required to give notice of its exercise of a renewal option thereunder (and such renewal has not been so exercised); (b) upon the early termination, early cancellation or early surrender of a 1088 Sansome Sweep Lease or upon the borrower’s receipt of notice by a 1088 Sansome Lease Sweep Tenant of its intent to effect an early termination, early cancellation or early surrender of its 1088 Sansome Sweep Lease; (c) if a 1088 Sansome Lease Sweep Tenant has ceased operating its business at the 1088 Sansome Property (i.e., “goes dark” other than a cessation of operations in some or all of its leased space in order
THE INFORMATION IN THIS STRUCTURAL AND COLLATERAL TERM SHEET IS NOT COMPLETE AND MAY BE AMENDED PRIOR TO THE TIME OF SALE. THIS TERM SHEET IS NOT AN OFFER TO SELL THESE SECURITIES AND IT IS NOT A SOLICITATION OF AN OFFER TO BUY THESE SECURITIES IN ANY JURISDICTION WHERE THE OFFER OR SALE IS NOT PERMITTED.
126
1088 Sansome Street San Francisco, CA 94111 | Collateral Asset Summary – Loan No. 9 1088 Sansome | Cut-off Date Balance: Cut-off Date LTV: U/W NCF DSCR: U/W NOI Debt Yield: | $32,250,000 59.7% 2.73x 9.1% |
to comply with governmental restrictions which restrict the use or occupancy of the 1088 Sansome Property as a result of, or otherwise in connection with, the COVID-19 pandemic or any other pandemic or epidemic, provided that the 1088 Sansome Lease Sweep Tenant resumes operations in its leased space within 90 days after such government restrictions are lifted) in a majority of its space; (d) upon a default under a 1088 Sansome Sweep Lease by a 1088 Sansome Lease Sweep Tenant beyond any applicable notice and cure period, (e) upon a bankruptcy or insolvency proceeding of a 1088 Sansome Lease Sweep Tenant or its parent (or Pattern Energy Operations LP) until either (i) the applicable insolvency proceeding has terminated and the applicable 1088 Sansome Sweep Lease has been affirmed, assumed or assigned in a manner reasonably satisfactory to the lender or (ii) the applicable 1088 Sansome Sweep Lease has been assumed and assigned to a third party in a manner reasonably satisfactory to the lender, or (f) upon a decline in the credit rating of the 1088 Sansome Lease Sweep Tenant (or its parent entity and/or Pattern Energy Operations LP) two notches below its current rating.
A 1088 Sansome Major Tenant Sweep Event will end once the applicable 1088 Sansome Major Tenant Sweep Event has been cured or the space demised under the 1088 Sansome Sweep Lease has been re-tenanted pursuant to one or more Qualified Leases (as defined below), or, if applicable, the applicable 1088 Sansome Sweep Lease has been renewed pursuant to its terms, and, in the lender’s judgment, sufficient funds have been accumulated in the 1088 Sansome Lease Sweep Reserve to cover all anticipated tenant improvements and leasing commissions and free and/or abated rent in connection therewith (and any debt service and operating shortfalls relating to the delay in the commencement of full rent payments) (the “1088 Sansome Lease Sweep Re-tenanting Costs”). A 1088 Sansome Major Tenant Sweep Event will also end on the date on which the following amounts have accumulated in the 1088 Sansome Lease Sweep Reserve: (x) $50.00 per sq. ft. with respect to any portion of the space demised under the applicable 1088 Sansome Sweep Lease that has not been re-tenanted and (y) to the extent a portion of the space demised under the applicable 1088 Sansome Sweep Lease has been re-tenanted pursuant to one or more Qualified Leases, in the lender’s judgment, sufficient funds to cover all anticipated 1088 Sansome Lease Sweep Re-tenanting Costs related to the space that has been re-tenanted.
A “1088 Sansome Sweep Lease” means the Pattern Energy lease and any replacement lease covering a majority of the space currently demised under such lease.
A "1088 Sansome Lease Sweep Tenant" means a tenant under a 1088 Sansome Sweep Lease or its direct or indirect parent company (if any) and/or any guarantor of such tenant's obligations under a 1088 Sansome Sweep Lease.
A "Qualified Lease" means either: (A) the original 1088 Sansome Sweep Lease, as extended in accordance with (i) the express renewal option set forth in such 1088 Sansome Sweep Lease or (ii) a modification of the 1088 Sansome Sweep Lease approved by the lender, or (B) a replacement lease (i) with a term that extends at least three years beyond the end of the loan term; (ii) entered into in accordance with the loan agreement and (iii) on market terms with respect to, among other things, base rent, additional rent and recoveries and tenant improvement allowances.
Initial and Ongoing Reserves. At origination, the borrower funded reserves of (i) approximately $4,421 into an insurance reserve, and (ii) $250,000 into a debt service reserve (equal to approximately three monthly debt service payments).
Ongoing TI/LC reserves are suspended so long as Pattern Energy is in place and paying rent, no 1088 Sansome Trigger Period is continuing and all obligations under the Pattern Energy lease related to tenant improvements and leasing commissions are satisfied. On each monthly payment date, the borrower is required to deposit (i) 1/12 of the estimated annual real estate taxes into a tax reserve (currently equivalent to approximately $35,954), (ii) 1/12 of the estimated annual insurance premiums into an insurance reserve (currently equivalent to approximately $1,474), (iii) approximately $1,030 related to capital improvements into a replacement reserve (capped at approximately $24,727), and (iv) if Pattern Energy is no longer in place and paying rent, a 1088 Sansome Trigger Period is continuing or all obligations under the Pattern Energy lease related to tenant improvements and leasing commissions are not satisfied, approximately $7,727 related to tenant improvements and leasing commissions into a TI/LC reserve. In addition, a 1088 Sansome Lease Sweep Reserve is required to be funded upon a 1088 Sansome Major Tenant Sweep Event, as described above under “Lockbox / Cash Management.”
Current Mezzanine or Subordinate Indebtedness. None.
Future Mezzanine or Subordinate Indebtedness Permitted. None.
Partial Release. None.
THE INFORMATION IN THIS STRUCTURAL AND COLLATERAL TERM SHEET IS NOT COMPLETE AND MAY BE AMENDED PRIOR TO THE TIME OF SALE. THIS TERM SHEET IS NOT AN OFFER TO SELL THESE SECURITIES AND IT IS NOT A SOLICITATION OF AN OFFER TO BUY THESE SECURITIES IN ANY JURISDICTION WHERE THE OFFER OR SALE IS NOT PERMITTED.
127
711 5th Avenue New York, NY 10022 | Collateral Asset Summary – Loan No. 10 711 Fifth Avenue | Cut-off Date Balance: Cut-off Date LTV: U/W NCF DSCR: U/W NOI Debt Yield: | $30,000,000 54.5% 2.90x 9.4% |
THE INFORMATION IN THIS STRUCTURAL AND COLLATERAL TERM SHEET IS NOT COMPLETE AND MAY BE AMENDED PRIOR TO THE TIME OF SALE. THIS TERM SHEET IS NOT AN OFFER TO SELL THESE SECURITIES AND IT IS NOT A SOLICITATION OF AN OFFER TO BUY THESE SECURITIES IN ANY JURISDICTION WHERE THE OFFER OR SALE IS NOT PERMITTED.
128
711 5th Avenue New York, NY 10022 | Collateral Asset Summary – Loan No. 10 711 Fifth Avenue | Cut-off Date Balance: Cut-off Date LTV: U/W NCF DSCR: U/W NOI Debt Yield: | $30,000,000 54.5% 2.90x 9.4% |

THE INFORMATION IN THIS STRUCTURAL AND COLLATERAL TERM SHEET IS NOT COMPLETE AND MAY BE AMENDED PRIOR TO THE TIME OF SALE. THIS TERM SHEET IS NOT AN OFFER TO SELL THESE SECURITIES AND IT IS NOT A SOLICITATION OF AN OFFER TO BUY THESE SECURITIES IN ANY JURISDICTION WHERE THE OFFER OR SALE IS NOT PERMITTED.
129
711 5th Avenue New York, NY 10022 | Collateral Asset Summary – Loan No. 10 711 Fifth Avenue | Cut-off Date Balance: Cut-off Date LTV: U/W NCF DSCR: U/W NOI Debt Yield: | $30,000,000 54.5% 2.90x 9.4% |

THE INFORMATION IN THIS STRUCTURAL AND COLLATERAL TERM SHEET IS NOT COMPLETE AND MAY BE AMENDED PRIOR TO THE TIME OF SALE. THIS TERM SHEET IS NOT AN OFFER TO SELL THESE SECURITIES AND IT IS NOT A SOLICITATION OF AN OFFER TO BUY THESE SECURITIES IN ANY JURISDICTION WHERE THE OFFER OR SALE IS NOT PERMITTED.
130
711 5th Avenue New York, NY 10022 | Collateral Asset Summary – Loan No. 10 711 Fifth Avenue | Cut-off Date Balance: Cut-off Date LTV: U/W NCF DSCR: U/W NOI Debt Yield: | $30,000,000 54.5% 2.90x 9.4% |
| Mortgage Loan Information | |
| Loan Seller(1): | GSMC |
| Loan Purpose: | Refinance |
| Borrower Sponsors: | Bayerische Versorgungskammer; Deutsche Finance America LLC; DF Deutsche Finance Holding AG; Hessen Lawyers Pension Fund |
| Borrower: | 711 Fifth Ave Principal Owner LLC |
| Original Balance(2): | $30,000,000 |
| Cut-off Date Balance(2): | $30,000,000 |
| % by Initial UPB: | 3.7% |
| Interest Rate: | 3.16000% |
| Payment Date: | 6th of each month |
| First Payment Date: | April 6, 2020 |
| Maturity Date: | March 6, 2030 |
| Amortization: | Interest Only |
| Additional Debt(2): | $515,000,000 Pari Passu Debt; Future Mezzanine Debt Permitted |
| Call Protection(3): | L(33), D(80), O(7) |
| Lockbox / Cash Management: | Hard / Springing |
| Reserves | |||
| Initial | Monthly | Cap | |
| Taxes: | $0 | Springing | NAP |
| Insurance: | $0 | Springing | NAP |
| Replacement: | $0 | Springing | $170,012 |
| TI/LC: | $0 | Springing | $1,020,072 |
| Other(4): | $3,048,024 | Springing | NAP |
| Property Information | |
| Single Asset / Portfolio: | Single Asset |
| Property Type: | Mixed Use – Office/Retail |
| Collateral: | Fee Simple |
| Location: | New York, NY |
| Year Built / Renovated: | 1927 / 2013-2019 |
| Total Sq. Ft.: | 340,024 |
| Property Management: | SHVO Property Management LLC and Jones Lang LaSalle Americas, Inc. |
| Underwritten NOI: | $51,304,783 |
| Underwritten NCF: | $50,675,427 |
| Appraised Value: | $1,000,000,000 |
| Appraisal Date: | January 23, 2020 |
| Historical NOI | |
| Most Recent NOI: | $47,288,255 (T-12 March 31, 2020) |
| 2019 NOI: | $48,596,349 (December 31, 2019) |
| 2018 NOI: | $44,088,566 (December 31, 2018) |
| 2017 NOI: | $45,365,518 (December 31, 2017) |
| Historical Occupancy | |
| Most Recent Occupancy: | 76.5% (January 31, 2020) |
| 2019 Occupancy(5): | 66.9% (December 31, 2019) |
| 2018 Occupancy(5): | 67.4% (December 31, 2018) |
| 2017 Occupancy(5): | 73.7% (December 31, 2017) |
| Financial Information(1)(2) | ||||||
| Tranche | Cut-off Date Balance | Balance per Sq. Ft. Cut-off / Balloon | LTV Cut-off / Balloon | U/W DSCR NOI / NCF | U/W Debt Yield NOI / NCF | U/W Debt Yield at Balloon NOI / NCF |
| Mortgage Loan | $30,000,000 | |||||
| Pari Passu Notes | $515,000,000 | |||||
| Whole Loan | $545,000,000 | $1,603 / $1,603 | 54.5% / 54.5% | 2.94x / 2.90x | 9.4% / 9.3% | 9.4% / 9.3% |
| (1) | The 711 Fifth Avenue Whole Loan (as defined below) was co-originated by Goldman Sachs Bank USA (“GSBI”) and Bank of America, N.A. (“BANA”). |
| (2) | The Cut-off Date Balance of $30,000,000 represents the non-controlling notes A-1-5-A and A-1-5-C, which are part of the 711 Fifth Avenue Whole Loan consisting of 24 pari passu promissory notes with an aggregate original principal balance of $545,000,000. |
| (3) | The defeasance lockout period, with respect to a defeasance of the 711 Fifth Avenue Whole Loan, will be at least 33 payment dates beginning with and including the first payment date of April 6, 2020. Defeasance of the 711 Fifth Avenue Whole Loan is permitted after the date that is the earlier of (i) two years from the closing date of the securitization that includes the last note to be securitized and (ii) March 6, 2023 (the “711 Fifth Avenue Lockout Period”). Prepayment in whole, but not in part (other than to cure a debt yield trigger), of the 711 Fifth Avenue Whole Loan is permitted on or after the payment date in September 2029 without the payment of a yield maintenance premium. |
| (4) | Other Initial Reserves include a Temporary Certificate of Occupancy Reserve ($2,000,000) and an Unfunded Obligations Reserve ($1,048,024.18). See “Initial and Ongoing Reserves” herein. The 711 Fifth Avenue Borrower (as defined below) obtained a new temporary certificate of occupancy in April 2020, and the $2,000,000 has been disbursed to the 711 Fifth Avenue Borrower. |
| (5) | Historical occupancy at the 711 Fifth Avenue Property (as defined below) was calculated on a physical basis. |
THE INFORMATION IN THIS STRUCTURAL AND COLLATERAL TERM SHEET IS NOT COMPLETE AND MAY BE AMENDED PRIOR TO THE TIME OF SALE. THIS TERM SHEET IS NOT AN OFFER TO SELL THESE SECURITIES AND IT IS NOT A SOLICITATION OF AN OFFER TO BUY THESE SECURITIES IN ANY JURISDICTION WHERE THE OFFER OR SALE IS NOT PERMITTED.
131
711 5th Avenue New York, NY 10022 | Collateral Asset Summary – Loan No. 10 711 Fifth Avenue | Cut-off Date Balance: Cut-off Date LTV: U/W NCF DSCR: U/W NOI Debt Yield: | $30,000,000 54.5% 2.90x 9.4% |
The Loan. The 711 Fifth Avenue mortgage loan (the “711 Fifth Avenue Loan”) is part of a whole loan (the “711 Fifth Avenue Whole Loan”) which is secured by the borrower’s fee simple interest in a 340,024 sq. ft., Class A, mixed use property in New York, New York (the “711 Fifth Avenue Property”). The 711 Fifth Avenue Whole Loan is comprised of 24 pari passu promissory notes with an outstanding aggregate principal balance as of the Cut-off Date of $545.0 million. The 711 Fifth Avenue Loan, which is evidenced by the non-controlling Notes A-1-5-A and A-1-5-C, has an aggregate original principal balance and outstanding principal balance as of the Cut-off Date of $30.0 million.
The relationship between the holders of the 711 Fifth Avenue Whole Loan will be governed by a co-lender agreement as described under “Description of the Mortgage Pool—The Whole Loans—The Non-Serviced Pari Passu Whole Loans” and “Pooling and Servicing Agreement—Servicing of the Non-Serviced Mortgage Loans” in the Preliminary Prospectus.
| Whole Loan Summary | ||||
| Note | Original Balance | Cut-off Date Balance | Note Holder | Controlling Piece |
| A-1-1 | $ 50,000,000 | $ 50,000,000 | GSMS 2020-GC47 | Yes |
| A-1-2 | 60,000,000 | 60,000,000 | Benchmark 2020-B21 | No |
| A-1-3 | 50,000,000 | 50,000,000 | GSBI(1) | No |
| A-1-4 | 40,000,000 | 40,000,000 | GSMS 2020-GSA2(2) | No |
| A-1-5-A | 25,000,000 | 25,000,000 | Benchmark 2020-B22 | No |
| A-1-5-B | 15,000,000 | 15,000,000 | Benchmark 2020-B20 | No |
| A-1-5-C | 5,000,000 | 5,000,000 | Benchmark 2020-B22 | No |
| A-1-6 | 20,000,000 | 20,000,000 | JPMDB 2020-COR7 | No |
| A-1-7 | 20,000,000 | 20,000,000 | JPMDB 2020-COR7 | No |
| A-1-8 | 20,000,000 | 20,000,000 | Benchmark 2020-B18 | No |
| A-1-9 | 20,000,000 | 20,000,000 | Benchmark 2020-B18 | No |
| A-1-10 | 12,500,000 | 12,500,000 | GSMS 2020-GC47 | No |
| A-1-11 | 10,000,000 | 10,000,000 | DBJPM 2020-C9 | No |
| A-1-12 | 10,000,000 | 10,000,000 | DBJPM 2020-C9 | No |
| A-1-13 | 5,000,000 | 5,000,000 | Benchmark 2020-B18 | No |
| A-1-14 | 5,000,000 | 5,000,000 | DBJPM 2020-C9 | No |
| A-1-15 | 10,000,000 | 10,000,000 | Benchmark 2020-B19 | No |
| A-1-16 | 2,500,000 | 2,500,000 | GSBI(1) | No |
| A-1-17 | 1,500,000 | 1,500,000 | GSBI(1) | No |
| A-2-1 | 60,000,000 | 60,000,000 | BANK 2020-BNK28 | No |
| A-2-2 | 43,000,000 | 43,000,000 | BANK 2020-BNK27 | No |
| A-2-3-A | 25,500,000 | 25,500,000 | BANK 2020-BNK29 | No |
| A-2-3-B | 15,000,000 | 15,000,000 | BANK 2020-BNK30(3) | No |
| A-2-4 | 20,000,000 | 20,000,000 | BBCMS 2020-C8 | No |
| Whole Loan | $ 545,000,000 | $ 545,000,000 | ||
| (1) | Expected to be contributed to one or more future securitizations. |
| (2) | The GSMS 2020-GSA2 securitization transaction is expected to close prior to the Closing Date. |
| (3) | The BANK 2020-BNK30 securitization transaction is expected to close prior to the Closing Date. |
The 711 Fifth Avenue Whole Loan has a 10-year interest-only term and accrues interest at a rate of 3.16000% per annum. The 711 Fifth Avenue Whole Loan was primarily used to repay the existing loan, fund upfront reserves, and pay closing costs. Based on the “As Is” appraised value of $1.00 billion as of January 23, 2020 and the Cut-off Date balance of the 711 Fifth Avenue Whole Loan, the Cut-off Date LTV Ratio is 54.5%.
| Sources and Uses | ||||||
| Sources | Proceeds | % of Total | Uses | Proceeds | % of Total | |
| Whole Loan | $545,000,000 | 90.0% | Loan Payoff | $598,153,683 | 98.8% | |
| Principal’s New Cash Contribution | 60,294,721 | 10.0 | Closing Costs | 4,093,014 | 0.7 | |
| Upfront Reserves | 3,048,024 | 0.5 | ||||
| Total Sources | $605,294,721 | 100.0% | Total Uses | $605,294,721 | 100.0% | |
The Borrower / Borrower Sponsors. The borrower is 711 Fifth Ave Principal Owner LLC, a Delaware limited liability company (the “711 Fifth Avenue Borrower”). Legal counsel to the 711 Fifth Avenue Borrower delivered a non-consolidation opinion in connection with the origination of the 711 Fifth Avenue Whole Loan. There is no nonrecourse carve-out guarantor or separate environmental indemnitor with respect to the 711 Fifth Avenue Whole Loan.
As of the 711 Fifth Avenue Whole Loan origination date, the borrower sponsors are one or more of (a) Bayerische Versorgungskammer (“BVK”), (b) Deutsche Finance America LLC and/or DF Deutsche Finance Holding AG (together, “DFA”) and/or (c) Hessen Lawyers Pension Fund. These entities collectively have acquired five other assets located in major cities. BVK, a public-law pension group in
THE INFORMATION IN THIS STRUCTURAL AND COLLATERAL TERM SHEET IS NOT COMPLETE AND MAY BE AMENDED PRIOR TO THE TIME OF SALE. THIS TERM SHEET IS NOT AN OFFER TO SELL THESE SECURITIES AND IT IS NOT A SOLICITATION OF AN OFFER TO BUY THESE SECURITIES IN ANY JURISDICTION WHERE THE OFFER OR SALE IS NOT PERMITTED.
132
711 5th Avenue New York, NY 10022 | Collateral Asset Summary – Loan No. 10 711 Fifth Avenue | Cut-off Date Balance: Cut-off Date LTV: U/W NCF DSCR: U/W NOI Debt Yield: | $30,000,000 54.5% 2.90x 9.4% |
Germany, managed 12 independent professional and municipal pension funds with a total of 2.3 million policyholders and pension recipients, €4.8 billion in annual contributions and reimbursement income, and approximately €3.4 billion in annual pension payments as of December 31, 2018. BVK managed a total investment volume of €77 billion by book value as of December 31, 2018. DFA, the American private equity arm of Deutsche Finance Group, was established in 2018 and has acquired 11 properties with a total capitalization of over $3.1 billion as of April 21, 2020. Hessen Lawyers Pension Fund is the pension fund for the German state of Hessen, with approximately €4.12 billion assets under management as of February 29, 2020.
The Property. The 711 Fifth Avenue property is an 18-story, 340,024 sq. ft. Class A mixed use building with an office component (levels four – 18; 286,226 sq. ft.) and a retail component (levels B – three; 53,798 sq. ft.) located in Midtown Manhattan on the corner of Fifth Avenue and East 55th Street. The 711 Fifth Avenue property was originally constructed in 1927 and has undergone various capital improvements from 2013 through mid-2019. Major capital improvements include a sixth floor corridor upgrade, 14th floor roof replacement, main roof replacement, fourth and ninth floor renovations, and elevator modernization. Based on the underwritten rent roll dated January 31, 2020, the 711 Fifth Avenue property is currently 76.5% leased (based on net rentable area (“NRA”)), to a diverse tenant roster including banking (SunTrust Banks), fashion (Ralph Lauren Retail Inc. (“Ralph Lauren”) and The Swatch Group Ltd. (“The Swatch Group”)), luxury goods (Loro Piana USA), and finance (Allen & Company LLC).
Office (84.2% of NRA; 21.5% of underwritten base rent)
The Class A office space at the 711 Fifth Avenue Property is currently 72.3% occupied by five tenants that collectively contribute 21.5% of underwritten base rent (inclusive of storage rent derived from office tenants). 84,516 sq. ft. of the office space (29.5% of Class A office NRA) at the 711 Fifth Avenue Property is leased to an investment grade-rated office tenant (SunTrust Banks).
The largest office tenant at the 711 Fifth Avenue Property, SunTrust Banks (A+ / A3 by Fitch/Moody’s), occupies 24.9% of the 711 Fifth Avenue Property’s NRA and accounts for 8.9% of underwritten base rent. The tenant has occupied space in the 711 Fifth Avenue Property since 2004 and has expanded several times. The tenant's primary businesses included deposits, lending, credit cards, and trust and investment services. Through its various subsidiaries, the SunTrust Banks provides corporate and investment banking, capital market services, mortgage banking, and wealth management.
The second largest office tenant at the 711 Fifth Avenue Property, Allen & Company, occupies 20.9% of the 711 Fifth Avenue Property’s NRA and accounts for 7.4% of underwritten base rent. The tenant has occupied space in the 711 Fifth Avenue Property since 1985 and has expanded several times. The 711 Fifth Avenue Property serves as Allen & Company LLC’s headquarters. Allen & Company LLC is a privately held boutique investment bank, which specializes in real estate, technology, media and entertainment.
The third largest office tenant at the 711 Fifth Avenue Property, Loro Piana USA, occupies 7.2% of the 711 Fifth Avenue Property’s NRA and accounts for 2.6% of underwritten base rent. The tenant has occupied space in the 711 Fifth Avenue Property since 2005. Loro Piana USA is an Italian fabrics and clothing company specializing in high-end, luxury cashmere and wool products.
Retail (15.6% of NRA; 78.5% of underwritten base rent)
The 53,798 sq. ft. of multi-level retail space at the 711 Fifth Avenue Property is currently anchored by Ralph Lauren (A2 / A- by Moody’s/S&P) (which has been dark but paying rent since April 2017) and The Swatch Group, which collectively contribute 78.5% of UW Base Rent (inclusive of storage/restaurant rent derived from retail tenants). Ralph Lauren is a wholly owned subsidiary of Ralph Lauren Corporation. Ralph Lauren, the largest retail tenant by UW Base Rent, leases 11.4% of NRA and accounts for 41.1% of UW Base Rent. The 711 Fifth Avenue Property served as Ralph Lauren’s former flagship; however, its space is now dark and available for sublease. Ralph Lauren continues to operate the Polo Bar (7,436 sq. ft. of the total Ralph Lauren 38,638 sq. ft.) at this location. According to a media report, the Ralph Lauren tenant has agreed to sublease its entire space to Mango, a Spanish retail chain, for $5 million per year. Pursuant to the terms of the lease and the loan documents, the tenant may not sublease the space to an unaffiliated third party without the consent of the 711 Fifth Avenue Borrower and the lender (in each case, which consent may not be unreasonably withheld, conditioned or delayed). It is not expected that any such sublease arrangement will relieve the Ralph Lauren tenant of its obligations under the lease (including the obligation to pay rent). We cannot assure you that such sublease will be executed or approved.
The Swatch Group is the second largest retail tenant at the 711 Fifth Avenue Property. The Swatch Group occupies 4.2% of the 711 Fifth Avenue Property’s NRA and accounts for 37.3% of UW Base Rent. The Swatch Group has occupied space in the 711 Fifth Avenue Property since 2011, and brands that are currently represented at the 711 Fifth Avenue Property include Omega and Breguet. The Swatch Group engages in the design, manufacture, and sale of finished watches, jewelry as well as watch movements and components. It operates through two segments, including Watches and Jewelry and Electronic Systems. The Watches and Jewelry segment designs, produces, and markets watches and jewelry. The Electronic Systems segment develops, manufactures, and sells electronic components and sports timing activities.
COVID-19 Update. As of December 1, 2020, the 711 Fifth Avenue Property is open; however, all retail tenants are closed (the Polo Bar is open for takeout and delivery) and most, if not all, office tenants are working remotely. One retail tenant, representing approximately
THE INFORMATION IN THIS STRUCTURAL AND COLLATERAL TERM SHEET IS NOT COMPLETE AND MAY BE AMENDED PRIOR TO THE TIME OF SALE. THIS TERM SHEET IS NOT AN OFFER TO SELL THESE SECURITIES AND IT IS NOT A SOLICITATION OF AN OFFER TO BUY THESE SECURITIES IN ANY JURISDICTION WHERE THE OFFER OR SALE IS NOT PERMITTED.
133
711 5th Avenue New York, NY 10022 | Collateral Asset Summary – Loan No. 10 711 Fifth Avenue | Cut-off Date Balance: Cut-off Date LTV: U/W NCF DSCR: U/W NOI Debt Yield: | $30,000,000 54.5% 2.90x 9.4% |
37% of the underwritten base rent, executed a rent deferral agreement as of May 18, 2020 with the 711 Fifth Avenue Borrower that provides for a 50% rent abatement for April, May and June 2020, with abated rent being required to be repaid as follows: 50% of the abated total amount to be repaid by the end of 2020 and the remaining 50% to be repaid by the end of March 2021. All of the tenants have paid their October 2020 and November 2020 rent in full. The 711 Fifth Avenue Whole Loan is current through the December 6, 2020 payment date. See “Risk Factors—Special Risks—Coronavirus Pandemic Has Adversely Affected the Global Economy and Will Likely Adversely Affect the Performance of the Mortgage Loans” in the Preliminary Prospectus.
| Tenant Summary(1) | ||||||
| Tenant | Ratings (Moody’s/Fitch/S&P)(2) | Net Rentable Area (Sq. Ft.) | % of Net Rentable Area | U/W Base Rent Per Sq. Ft.(3) | % of Total U/W Base Rent(3) | Lease Expiration |
| SunTrust Banks | A3 / A+ / NR | 84,516 | 24.9% | $70.09 | 8.9% | 4/30/2024 |
| Allen & Company | NR / NR / NR | 70,972 | 20.9 | $69.73 | 7.4% | 9/30/2033 |
| Ralph Lauren (4) | A2 / NR / A- | 38,638 | 11.4 | $712.36 | 41.1% | 6/30/2029 |
| Loro Piana USA | NR / NR / NR | 24,388 | 7.2 | $71.38 | 2.6% | 8/31/2025 |
| Sandler Capital | NR / NR / NR | 17,200 | 5.1 | $80.17 | 2.1% | 6/30/2027 |
| The Swatch Group | NR / NR / NR | 14,274 | 4.2 | $1,749.81 | 37.3% | 12/31/2029 |
| Catalyst Investors | NR / NR / NR | 6,034 | 1.8 | $67.00 | 0.6% | 11/30/2023 |
| Largest Owned Tenants | 256,022 | 75.3% | $261.29 | 100.0% | ||
| Remaining Occupied(5) | 3,935 | 1.2 | ||||
| Vacant | 80,067 | 23.5 | ||||
| Total | 340,024 | 100.0% | ||||
| (1) | Calculated based on the approximate square footage occupied by each tenant. |
| (2) | Certain ratings are those of the parent entity whether or not the parent entity guarantees the lease. |
| (3) | U/W Base Rent Per Sq. Ft. and % of Total U/W Base Rent are based on the underwritten rent roll dated January 31, 2020 which includes contractual rent steps through January 2021. |
| (4) | Currently, the Ralph Lauren spaces totaling 38,638 sq. ft. are now dark and available for sublease. The tenant continues to operate the Polo Bar space of 7,436 sq. ft. at the 711 Fifth Avenue Property, but the Polo Bar is only open for takeout and delivery. According to a media report, the Ralph Lauren tenant has agreed to sublease its entire space to Mango, a Spanish retail chain, for $5 million per year. Pursuant to the terms of the lease and the loan documents, the tenant may not sublease the space to an unaffiliated third party without the consent of the Borrower and the lender (in each case, which consent may not be unreasonably withheld, conditioned, or delayed). It is not expected that any such sublease arrangement will relieve the Ralph Lauren tenant of its obligation under the lease (including the obligation to pay rent). We cannot assure you that such sublease will be executed or approved. |
| (5) | Includes non-revenue spaces of 2,330 sq. ft. attributable to the property management office, 1,042 sq. ft. attributable to the building security office and 563 sq. ft. attributable to the porter locker room. |
| Lease Rollover Schedule(1)(2) | ||||||||
| Year | # of Leases Expiring | Total Expiring Sq. Ft. | % of Total Sq. Ft. Expiring | Cumulative Sq. Ft. Expiring | Cumulative % of Sq. Ft. Expiring | Annual U/W Per Sq. Ft. (3) | % U/W Rolling(3) | Cumulative % of U/W Base Rent(3) |
| MTM | 0 | 0 | 0.0% | 0 | 0.0% | $0.00 | 0.0% | 0.0% |
| 2020 | 0 | 0 | 0.0 | 0 | 0.0% | $0.00 | 0.0 | 0.0% |
| 2021 | 0 | 0 | 0.0 | 0 | 0.0% | $0.00 | 0.0 | 0.0% |
| 2022 | 0 | 0 | 0.0 | 0 | 0.0% | $0.00 | 0.0 | 0.0% |
| 2023 | 1 | 6,034 | 1.8 | 6,034 | 1.8% | $67.00 | 0.6 | 0.6% |
| 2024 | 6 | 84,516 | 24.9 | 90,550 | 26.6% | $70.09 | 8.9 | 9.5% |
| 2025 | 2 | 24,388 | 7.2 | 114,938 | 33.8% | $71.38 | 2.6 | 12.1% |
| 2026 | 0 | 0 | 0.0 | 114,938 | 33.8% | $0.00 | 0.0 | 12.1% |
| 2027 | 1 | 17,200 | 5.1 | 132,138 | 38.9% | $80.17 | 2.1 | 14.1% |
| 2028 | 0 | 0 | 0.0 | 132,138 | 38.9% | $0.00 | 0.0 | 14.1% |
| 2029 | 12 | 52,912 | 15.6 | 185,050 | 54.4% | $992.23 | 78.5 | 92.6% |
| 2030 | 0 | 0 | 0.0 | 185,050 | 54.4% | $0.00 | 0.0 | 92.6% |
| 2031 & Thereafter(4) | 8 | 74,907 | 22.0 | 259,957 | 76.5% | $66.06 | 7.4 | 100.0% |
| Vacant | NAP | 80,067 | 23.5 | 340,024 | 100.0% | NAP | NAP | NAP |
| Total / Wtd. Avg. | 30 | 340,024 | 100.0% | $261.29 | 100.0% | |||
| (1) | Calculated based on the approximate square footage occupied by each collateral tenant. |
| (2) | Certain tenants may have termination or contraction options (which may become exercisable prior to the originally stated expiration date of the tenant lease) that are not considered in the above Lease Rollover Schedule. |
| (3) | Annual U/W Base Rent Per Sq. Ft., % U/W Base Rent Rolling, and Cumulative % of U/W Base Rent are based on the underwritten rent roll dated January 31, 2020 and include contractual rent steps through January 2021. |
| (4) | Includes non-revenue spaces of 2,330 sq. ft. attributable to the property management office, 1,042 sq. ft. attributable to the building security office and 563 sq. ft. attributable to the porter locker room. |
Environmental Matters. The Phase I environmental report dated February 3, 2020 recommended no further action at 711 Fifth Avenue Property.
The Market. According to the appraisal, the 711 Fifth Avenue Property is located in the Midtown and the Upper Fifth Avenue retail submarket. The Plaza District office submarket is bounded by 65th Street to the north, the East River to the east, 47th Street to the south, and Avenue of the Americas to the west. The Plaza District is proximate to Central Park and has access to shopping along Fifth and Madison Avenues. The Plaza District office submarket is home to numerous national and multinational corporations and is dominated by financial (with hedge funds clustered along Madison Avenue) and legal tenants, with some media and fashion firms.
THE INFORMATION IN THIS STRUCTURAL AND COLLATERAL TERM SHEET IS NOT COMPLETE AND MAY BE AMENDED PRIOR TO THE TIME OF SALE. THIS TERM SHEET IS NOT AN OFFER TO SELL THESE SECURITIES AND IT IS NOT A SOLICITATION OF AN OFFER TO BUY THESE SECURITIES IN ANY JURISDICTION WHERE THE OFFER OR SALE IS NOT PERMITTED.
134
711 5th Avenue New York, NY 10022 | Collateral Asset Summary – Loan No. 10 711 Fifth Avenue | Cut-off Date Balance: Cut-off Date LTV: U/W NCF DSCR: U/W NOI Debt Yield: | $30,000,000 54.5% 2.90x 9.4% |
According to the appraisal, as of the fourth quarter of 2019, the Plaza District office submarket has an inventory of 26.7 million sq. ft. with a vacancy rate of 8.7% and an average asking rent of $114.07 per sq. ft. The Upper Fifth Avenue retail submarket is located between 42nd and 57th Streets, and this portion of Fifth Avenue is the most expensive area for retail space rents in Manhattan. The Upper Fifth Avenue retail submarket has historically drawn international travelers and occupants of nearby luxury hotels and condos. According to the appraisal, as of the fourth quarter of 2019, the Upper Fifth Avenue retail submarket has an average asking rent of $1,775.00 per sq. ft., with an availability rate of 24.3%.
The following table presents certain information relating to the primary competition for the 711 Fifth Avenue Property:
| Comparable Office Leases(1) | ||||||
| Property Name / Location | Year Built | Tenant Name | Tenant Leased Space | Lease Date | Lease Term (years) | Base Rent PSF |
711 Fifth Avenue(2) New York, NY | 1927 | SunTrust Banks | 22,832 | Mar-16 | 8.2 | $75.50 |
623 Fifth Avenue New York, NY | 1989 | NWI Management | 8,400 | Nov-19 | 3.3 | $80.00 |
510 Madison Avenue New York, NY | 2009/2012 | Castlelake, L.P. | 6,903 | Nov-19 | 7.3 | $124.00 |
745 Fifth Avenue New York, NY | 1929/1989 | Fremont Macanta | 7,067 | Jun-19 | 6.8 | $103.00 |
640 Fifth Avenue New York, NY | 1940/2003 | Hamlin Capital Management | 23,616 | Mar-19 | 10.0 | $75.17 |
640 Fifth Avenue New York, NY | 1940/2003 | Avolon Aerospace | 10,295 | Jan-19 | 10.0 | $92.99 |
645 Madison Avenue New York, NY | 1971/2005 | Rothman Orthopaedic Institute | 21,461 | Jan-19 | 10.9 | $88.00 |
725 Fifth Avenue New York, NY | 1983 | S.S. Steiner, Inc. | 6,875 | Jan-19 | 7.5 | $82.00 |
510 Madison Avenue New York, NY | 2009/2012 | Christian Dior, Inc. and Christian Dior Perfumes,LLC | 70,055 | Jan-19 | 5.0 | $74.50 |
712 Fifth Avenue New York, NY | 1990 | Wargo & Co. | 2,074 | Oct-18 | 7.7 | $105.00 |
725 Fifth Avenue New York, NY | 1983 | Marc Fisher | 9,924 | Jul-18 | 10.0 | $89.00 |
640 Fifth Avenue New York, NY | 1940/2003 | Klein Group | 9,458 | Jul-18 | 10.0 | $92.00 |
535 Madison Avenue New York, NY | 1982 | Walker & Dunlop, LLC | 5,450 | Jul-18 | 3.0 | $80.00 |
535 Madison Avenue New York, NY | 1982 | Melvin Capital | 14,765 | May-18 | 10.6 | $104.00 |
| (1) | Source: Appraisal. |
| (2) | Based on the underwritten rent roll as of January 31, 2020. |
| Comparable Retail Leases(1) | |||||
| Property Name / Location | Tenant Name | Tenant Leased Space | Lease Date | Lease Term (years) | Base Rent PSF |
711 Fifth Avenue(2) New York, NY | The Swatch Group | 14,274 | May-11 | 18.7 | $1,749.81 |
767 Fifth Avenue New York, NY | Christian Dior | 11,847 | Apr-19 | 4.0 | $666.84 |
730 Fifth Avenue New York, NY | Mikimoto | 4,505 | Feb-19 | 10.0 | $1,109.88 |
760 Madison Avenue New York, NY | Giorgio Armani | 19,780 | Jan-19 | 15.0 | $1,066.23 |
706 Madison Avenue New York, NY | Hermès | 47,000 | Jan-19 | 10.0 | $329.79 |
609 Fifth Avenue New York, NY | Puma | 23,917 | Feb-18 | 16.0 | $372.12 |
650 Fifth Avenue New York, NY | Nike | 69,214 | Mar-17 | 15.5 | $479.53 |
640 Fifth Avenue New York, NY | Dyson | 3,097 | Mar-17 | 10.0 | $2,660.64 |
640 Fifth Avenue New York, NY | Victoria's Secret | 63,779 | Apr-16 | 16.0 | $516.90 |
645 Fifth Avenue New York, NY | Longchamp | 2,000 | Feb-16 | 10.0 | $2,850.00 |
767 Fifth Avenue New York, NY | Under Armour | 53,500 | Feb-16 | 15.0 | $560.75 |
685 Fifth Avenue New York, NY | Stuart Weitzman | 3,481 | Feb-16 | 15.0 | $1,436.37 |
685 Fifth Avenue New York, NY | Coach | 24,541 | Jan-16 | 15.0 | $814.96 |
| (1) | Source: Appraisal. |
| (2) | Based on the underwritten rent roll as of January 31, 2020. |
THE INFORMATION IN THIS STRUCTURAL AND COLLATERAL TERM SHEET IS NOT COMPLETE AND MAY BE AMENDED PRIOR TO THE TIME OF SALE. THIS TERM SHEET IS NOT AN OFFER TO SELL THESE SECURITIES AND IT IS NOT A SOLICITATION OF AN OFFER TO BUY THESE SECURITIES IN ANY JURISDICTION WHERE THE OFFER OR SALE IS NOT PERMITTED.
135
711 5th Avenue New York, NY 10022 | Collateral Asset Summary – Loan No. 10 711 Fifth Avenue | Cut-off Date Balance: Cut-off Date LTV: U/W NCF DSCR: U/W NOI Debt Yield: | $30,000,000 54.5% 2.90x 9.4% |
Cash Flow Analysis.
| Cash Flow Analysis(1) | ||||||||
| 2016 | 2017 | 2018 | 2019 | T-12 3/31/2020 | U/W | U/W PSF | ||
| Base Rent | $50,709,002 | $59,133,963 | $58,947,171 | $64,979,130 | $64,530,557 | $66,896,764 | $196.74 | |
| Contractual Rent Steps(2) | 0 | 0 | 0 | 0 | 0 | 1,962,475 | 5.77 | |
| Vacant Income | 0 | 0 | 0 | 0 | 0 | 7,680,090 | 22.59 | |
| Reimbursements | 1,826,845 | 3,069,898 | 3,727,298 | 4,194,777 | 4,145,942 | 4,962,830 | 14.60 | |
| Vacancy & Credit Loss(3) | 0 | 0 | 0 | 0 | 0 | (7,680,090) | (22.59) | |
| Other Income | 307,215 | 519,693 | 364,227 | 389,683 | 383,754 | 371,484 | 1.09 | |
| Effective Gross Income | $52,843,062 | $62,723,555 | $63,038,695 | $69,563,590 | $69,060,254 | $74,193,553 | $218.20 | |
| Total Operating Expenses | 14,954,656 | 17,358,037 | 18,950,129 | 20,967,241 | 21,771,999 | 22,888,769 | 67.32 | |
| Net Operating Income | $37,888,406 | $45,365,518 | $44,088,566 | $48,596,349 | $47,288,255 | $51,304,783 | $150.89 | |
| TI/LC | 0 | 0 | 0 | 0 | 0 | 544,350 | 1.60 | |
| Capital Expenditures | 0 | 0 | 0 | 0 | 0 | 85,006 | 0.25 | |
| Net Cash Flow | $37,888,406 | $45,365,518 | $44,088,566 | $48,596,349 | $47,288,255 | $50,675,427 | $149.03 | |
| (1) | Certain items such as straight line rent, interest expense, interest income, lease cancellation income, depreciation, amortization, debt service payments and any other non-recurring or non-operating items were excluded from the historical presentation and are not considered for the underwritten cash flow. |
| (2) | Contractual Rent Steps include $1,962,475 underwritten for various tenants through January 31, 2021. |
| (3) | Underwritten Vacancy & Credit Loss Represents an underwritten economic vacancy of 9.4%. |
Property Management. The 711 Fifth Avenue Property is currently managed by SHVO Property Management LLC (an affiliate of the borrower sponsors) (“SHVO”), pursuant to a management agreement and sub-managed by Jones Lang LaSalle Americas, Inc. (“JLL”) pursuant to a sub-management agreement.
Lockbox / Cash Management. The 711 Fifth Avenue Whole Loan is structured with a hard lockbox and springing cash management. The 711 Fifth Avenue Borrower is required to direct all existing and future tenants of the 711 Fifth Avenue Property to directly deposit all rents into a clearing account controlled by the lender. Provided no 711 Trigger Period exists, the funds in the clearing account are required to be swept on a daily basis into a borrower operating account. During the continuance of a 711 Trigger Period (or an event of default at the lender’s election), the funds in the clearing account are required to be swept on a daily basis into a cash management account controlled by the lender and all amounts on deposit in the cash management account after payment of the monthly debt service, required reserves and budgeted operating expenses are required to be held as additional security for the 711 Fifth Avenue Whole Loan during the continuance of such 711 Trigger Period, except that if there exists no event of default and the only 711 Trigger Period then in existence is a Tenant Rollover Sweep and the applicable Tenant Rollover Sweep Equity Amount was deposited with the lender as required under the 711 Fifth Avenue Whole Loan documents, then all excess cash flow that would have been reserved is required to be released to the 711 Fifth Avenue Borrower.
A “711 Trigger Period” means each period that commences upon the first to occur of: (a) the debt yield, determined as of the first day of any fiscal quarter, is less than 7.0%, until the occurrence of a DY Cure Event (and if financial reports are not delivered to the lender as and when required under the 711 Fifth Avenue Whole Loan documents, a 711 Trigger Period will be deemed to have commenced and be ongoing, unless and until such reports are delivered and they indicate that, in fact, no 711 Trigger Period is ongoing); (b) there exists an event of default under any mezzanine loan until cured; (c) any major tenant leasing space that is rated investment grade is downgraded below investment grade (as determined by S&P or Moody’s), until the occurrence of a Downgraded Tenant Cure, (d) any major tenant that (i) terminates its lease, (ii) “goes dark”, unless such applicable lease is and continues to be guaranteed by an entity rated investment grade (as determined by S&P or Moody’s), (iii) vacates or provides indication of its intent to vacate all of its leased space (or any portion thereof), or (iv) fails to provide written notice to the 711 Fifth Avenue Borrower of its intent to renew its applicable lease 36 months prior to its then current lease expiration date, until the occurrence of a Tenant Rollover Sweep Cure, and (e) upon the earlier to occur of (x) the date that is 120 days following the origination date (if a new temporary or permanent certificate of occupancy has not yet been received by such date) as may be extended up to 60 days if the 711 Fifth Avenue Borrower is diligently and continuously pursuing obtaining a new temporary or permanent certificate of occupancy, (y) the date that the 711 Fifth Avenue Borrower ceases to diligently and continuously pursue obtaining a new temporary or permanent certificate of occupancy and (z) the date that the applicable governmental authority seeks an enforcement action affecting occupancy of the building or having a material adverse effect on 711 Fifth Avenue Borrower or the 711 Fifth Avenue Property as a result of the expired certificate of occupancy until the lender receives such new certificate of occupancy (such period prior to receipt of a new certificate of occupancy, a “TCO Renewal Failure”).
A “DY Cure Event” means (a) no event of default is continuing and (b) the achievement of a debt yield, determined as of the first day of each of two consecutive fiscal quarters thereafter, equal to or greater than 7.0% (which debt yield test may be satisfied at the 711 Fifth Avenue Borrower’s sole discretion (i) after the 711 Fifth Avenue Lockout Period, by either (x) making voluntary prepayments or (y) effectuating a partial defeasance, in amounts necessary to achieve the required debt yield or (ii) by depositing in a reserve account, as
THE INFORMATION IN THIS STRUCTURAL AND COLLATERAL TERM SHEET IS NOT COMPLETE AND MAY BE AMENDED PRIOR TO THE TIME OF SALE. THIS TERM SHEET IS NOT AN OFFER TO SELL THESE SECURITIES AND IT IS NOT A SOLICITATION OF AN OFFER TO BUY THESE SECURITIES IN ANY JURISDICTION WHERE THE OFFER OR SALE IS NOT PERMITTED.
136
711 5th Avenue New York, NY 10022 | Collateral Asset Summary – Loan No. 10 711 Fifth Avenue | Cut-off Date Balance: Cut-off Date LTV: U/W NCF DSCR: U/W NOI Debt Yield: | $30,000,000 54.5% 2.90x 9.4% |
additional collateral, cash or a letter of credit in an amount that when subtracted from the principal indebtedness of the 711 Fifth Avenue Whole Loan for purposes of calculating debt yield would result in a debt yield that equals or exceeds 7.0% (provided that the aggregate notional amount of all outstanding letters of credit delivered may at no time exceed 10% of the principal indebtedness of the 711 Fifth Avenue Whole Loan).
Additionally, provided no event of default under the 711 Fifth Avenue Whole Loan is continuing, the 711 Fifth Avenue Borrower has the right at any time from and after the expiration of the 711 Fifth Avenue Lockout Period (a) solely to effect a DY Cure Event to partially defease (with no corresponding release of collateral) and (b) to totally defease, the 711 Fifth Avenue Whole Loan in the amount necessary to either cause the achievement of a DY Cure Event as determined by the lender in its reasonable discretion or defease the 711 Fifth Avenue Whole Loan in whole, subject to the satisfaction of certain conditions, including, among others, delivery of defeasance collateral in an amount sufficient to make all payments of interest and principal due under the defeased note until the first due date in the prepayment period, a REMIC opinion and a rating agency confirmation.
Initial and Ongoing Reserves. At origination, the 711 Fifth Avenue Borrower funded (a) approximately $1,048,024 for outstanding free rent (including any rent credits) and (b) $2,000,000 for estimated costs in connection with obtaining a new temporary or permanent certificate of occupancy to replace the temporary certificate of occupancy that expired in November 2019. The 711 Fifth Avenue Borrower obtained a temporary certificate of occupancy that was effective as of March 24, 2020, and the $2,000,000 has been disbursed to the 711 Fifth Avenue Borrower.
Real Estate Taxes and Insurance Reserves. On each due date during the continuance of a 711 Trigger Period, the 711 Fifth Avenue Borrower will be required to fund (i) a tax and insurance reserve in an amount equal to 1/12 of the property taxes and insurance premiums that the lender reasonably estimates will be payable during the next ensuing 12 months; provided that reserves for insurance premiums will be waived if the 711 Fifth Avenue Property is covered by an acceptable blanket insurance policy.
TI/LC Reserve. On each due date during the continuance of a 711 Trigger Period, the 711 Fifth Avenue Borrower will be required to fund a tenant improvements and leasing commissions reserve in an amount equal to $42,503, capped at an amount equal to the greater of (x) the lender’s good faith estimate of all leasing commissions and tenant improvements to be performed during the next two years and (y) the aggregate amount of all outstanding leasing commissions and tenant improvements under leases then in effect, equal to $1,020,072.
Replacement Reserve. On each due date during the continuance of a 711 Trigger Period, the 711 Fifth Avenue Borrower will be required to fund a capital expenditure reserve in an amount equal to approximately $7,084 capped at an amount equal to the lender’s good faith estimate of capital expenses to be performed during the next two years equal to approximately $170,012.
Additionally, during the continuance of a Tenant Rollover Sweep, all excess cash (and any other amounts sufficient to result in a reserve amount for such month of at least $2,500,000) after payment of applicable debt service, budgeted operating expenses and other required reserves are required to be reserved in a tenant rollover reserve capped at the greater of (x) $7,500,000 and (y) all excess cash flow estimated by lender in its good faith that would have been deposited in such reserve account for the three-month period following the deposit of such funds (the “Tenant Rollover Sweep Equity Amount”). Additionally, during the continuance of a Downgraded Tenant Sweep (if no deposits are required to the tenant rollover reserve), all excess cash after payment of applicable debt service, budgeted operating expenses and other required reserves is required to be reserved in a tenant downgrade reserve. Additionally, during the continuance of a TCO Renewal Failure (if no deposits are required to the tenant rollover reserve or tenant downgrade reserve), (a) prior to March 6, 2021, $1,000,000 and (b) after March 6, 2021, all excess cash after payment of applicable debt service, budgeted operating expenses and other required reserves are required to be reserved in a tenant downgrade reserve.
A “Downgraded Tenant Sweep” will be continuing upon any tenant under a Major Lease (or with regard to Ralph Lauren, its highest rated parent entity, as applicable) that is rated investment grade is downgraded below investment grade (as determined by S&P and Moody’s), until the occurrence of a Downgraded Tenant Cure.
A “Downgraded Tenant Cure” means that the downgraded tenant is once more rated investment grade (as determined by S&P or Moody’s), or such space is relet in accordance with the 711 Fifth Avenue Whole Loan documents or an amount sufficient to pay unabated rent for 18 consecutive months then due under the applicable downgraded tenant’s lease (subject to reduction in accordance with the loan documents) has been deposited in the downgraded tenant reserve
A “Major Lease” means any of the leases with Ralph Lauren, The Swatch Group and any lease that when aggregated with all other leases at the 711 Fifth Avenue Property with the same or an affiliated tenant (assuming the exercise of all expansion rights and all preferential rights to lease additional space), is expected to demise more than 30% of the rentable square footage or account for 20% or more of the total rental income. Additionally, any lease with any purchase option, with a 711 Fifth Avenue Borrower affiliate or entered into during an event of default will also be considered a Major Lease.
A “Tenant Rollover Sweep” will exist if any tenant under a Major Lease (i) terminates their lease, (ii) goes “dark” (other than (a) Ralph Lauren if it has an investment grade rating or (b) is guaranteed by an entity rated investment grade (as determined by S&P or Moody’s),
THE INFORMATION IN THIS STRUCTURAL AND COLLATERAL TERM SHEET IS NOT COMPLETE AND MAY BE AMENDED PRIOR TO THE TIME OF SALE. THIS TERM SHEET IS NOT AN OFFER TO SELL THESE SECURITIES AND IT IS NOT A SOLICITATION OF AN OFFER TO BUY THESE SECURITIES IN ANY JURISDICTION WHERE THE OFFER OR SALE IS NOT PERMITTED.
137
711 5th Avenue New York, NY 10022 | Collateral Asset Summary – Loan No. 10 711 Fifth Avenue | Cut-off Date Balance: Cut-off Date LTV: U/W NCF DSCR: U/W NOI Debt Yield: | $30,000,000 54.5% 2.90x 9.4% |
(iii) vacates or provides indication of their intent to vacate all or any portion of their leased space or (iv) fails to provide written notice of their intent to renew such lease on the date that is 36 months prior to its then current lease expiration date.
A “Tenant Rollover Sweep Cure” means, as applicable (a) a tenant under a Major Lease renews its lease or enters into a new lease on substantially the same terms and conditions, is no longer “dark” or moves back into its space or revokes any prior notice of intent to vacate or (b) such space is relet in accordance with the terms of the 711 Fifth Avenue Whole Loan documents.
Current Mezzanine or Subordinate Indebtedness. None.
Future Mezzanine or Subordinate Indebtedness Permitted. A 100% direct or indirect owner of the 711 Fifth Avenue Borrower or any existing mezzanine borrower is permitted one time during the term of the 711 Fifth Avenue Whole Loan to obtain a mezzanine loan from a lender meeting certain requirements under the 711 Fifth Avenue Whole Loan documents secured by a pledge of the equity interests in the 711 Fifth Avenue Borrower, provided that, among other conditions: (a) the mezzanine loan is in an amount not to exceed the lesser of (i) $35,000,000 and (ii) an amount that, when added to the 711 Fifth Avenue Whole Loan will result in (A) a combined loan to “as is” appraised value ratio of the 711 Fifth Avenue Property of no more than 54.5%, (B) a combined debt service coverage ratio (based on the 711 Fifth Avenue Whole Loan and the proposed mezzanine loan) of greater than 2.80x and (C) the combined debt yield being equal to or greater than 8.98%; (b) the mezzanine loan is secured by an equity pledge encumbering direct and indirect ownership interests in the 711 Fifth Avenue Borrower (and not any collateral securing the 711 Fifth Avenue Whole Loan); (c) the mezzanine loan will be coterminous with the 711 Fifth Avenue Whole Loan; and (d) the mezzanine lender (i) is not an affiliate of the 711 Fifth Avenue Borrower and (ii) enters into an intercreditor agreement with the lender satisfactory in all respects to the lender in its reasonable discretion and any applicable rating agency. Additionally, such financing will be subject to receipt by the lender of rating agency confirmations from the applicable rating agencies.
Partial Release. None.
THE INFORMATION IN THIS STRUCTURAL AND COLLATERAL TERM SHEET IS NOT COMPLETE AND MAY BE AMENDED PRIOR TO THE TIME OF SALE. THIS TERM SHEET IS NOT AN OFFER TO SELL THESE SECURITIES AND IT IS NOT A SOLICITATION OF AN OFFER TO BUY THESE SECURITIES IN ANY JURISDICTION WHERE THE OFFER OR SALE IS NOT PERMITTED.
138
(THIS PAGE INTENTIONALLY LEFT BLANK)
139
1500 Crossgate Road Port Wentworth, GA 31407 | Collateral Asset Summary – Loan No. 11 Amazon Port of Savannah | Cut-off Date Balance: Cut-off Date LTV: U/W NCF DSCR: U/W NOI Debt Yield: | $28,700,000 62.4% 2.24x 8.1% |
| Mortgage Loan Information | |
| Loan Seller: | JPMCB |
| Loan Purpose: | Acquisition |
| Borrower Sponsors: | Inversiones en Iberia US Holdings LLC; Marcos Martinez Gavica |
| Borrower: | 1500 Crossgate LLC |
| Original Balance: | $28,700,000 |
| Cut-off Date Balance: | $28,700,000 |
| % by Initial UPB: | 3.5% |
| Interest Rate: | 3.55700% |
| Payment Date: | 1st of each month |
| First Payment Date(3): | January 1, 2021 |
| Maturity Date: | January 1, 2031 |
| Amortization: | Interest Only |
| Additional Debt: | None |
| Call Protection(3): | L(24), D(91), O(6) |
| Lockbox / Cash Management(6): | Springing / Springing |
| Reserves(6) | |||
| Initial | Monthly | Cap | |
| Taxes: | $137,888 | $45,963 | NAP |
| Insurance: | $0 | Springing | NAP |
| Replacement: | $0 | Springing | $50,000 |
| TI/LC: | $0 | Springing | $500,000 |
| Property Information | |
| Single Asset / Portfolio: | Single Asset |
| Property Type: | Warehouse/Distribution Industrial |
| Collateral: | Fee Simple |
| Location: | Port Wentworth, GA |
| Year Built / Renovated: | 2020 / NAP |
| Total Sq. Ft.: | 117,351 |
| Property Management: | Premier Leasing and Property Management Inc. |
| Underwritten NOI(1): | $2,334,835 |
| Underwritten NCF(1)(2): | $2,323,100 |
| Appraised Value(1)(4): | $46,000,000 |
| Appraisal Date: | October 13, 2020 |
| Historical NOI(1)(5) | |
| Most Recent NOI: | NAV |
| 2019 NOI: | NAV |
| 2018 NOI: | NAV |
| 2017 NOI: | NAV |
| Historical Occupancy(5) | |
| Most Recent Occupancy: | 100.0% (December 1, 2020) |
| 2019 Occupancy: | NAV |
| 2018 Occupancy: | NAV |
| 2017 Occupancy: | NAV |
| Financial Information | ||||||
| Tranche | Cut-off Date Balance | Balance per Sq. Ft. Cut-off / Balloon | LTV Cut-off / Balloon | U/W DSCR NOI / NCF | U/W Debt Yield NOI / NCF | U/W Debt Yield at Balloon NOI / NCF |
| Mortgage Loan | $28,700,000 | $245 / $245 | 62.4% / 62.4% | 2.26x / 2.24x | 8.1% / 8.1% | 8.1% / 8.1% |
| (1) | While the Amazon Port of Savannah loan was originated after the emergence of the novel coronavirus pandemic and the economic disruption resulting from measures to combat the pandemic, the pandemic is an evolving situation and could impact the Amazon Port of Savannah loan more severely than assumed in the underwriting of the Amazon Port of Savannah loan and could adversely affect the NOI, NCF and occupancy information, as well as the appraised value and the DSCR, LTV and Debt Yield metrics presented above. See “Risk Factors— Special Risks—Coronavirus Pandemic Has Adversely Affected the Global Economy and Will Likely Adversely Affect the Performance of the Mortgage Loans” in the Preliminary Prospectus. |
| (2) | Underwritten NCF is inclusive of straight-line rent over the term of the Amazon Port of Savannah loan term. |
| (3) | First Payment Date and Call Protection presented in the Mortgage Loan Information section above are inclusive of the additional January 2021 interest payment to be deposited by JPMCB on the Closing Date. |
| (4) | The appraiser determined an “As-Dark Value” of $30.9 million, which results in a 92.9% Loan-to-Dark Value ratio. |
| (5) | Historical financials and occupancy are not available, as the Amazon Port of Savannah Property (as defined below) was built in 2020. |
| (6) | The Amazon Port of Savannah loan is subject to an excess cash sweep (to be held as additional collateral for the loan) upon, among other conditions, (a) an event of default, (b) a bankruptcy action of the borrower or manager, (c) an Amazon DSCR Trigger Event (as defined below), (d) an Amazon Trigger Event (as defined below), (e) an Amazon Downgrade Trigger Event (as defined below) or (f) an Amazon Maturity Trigger Event (as defined below). See “Lockbox / Cash Management” herein. |
THE INFORMATION IN THIS STRUCTURAL AND COLLATERAL TERM SHEET IS NOT COMPLETE AND MAY BE AMENDED PRIOR TO THE TIME OF SALE. THIS TERM SHEET IS NOT AN OFFER TO SELL THESE SECURITIES AND IT IS NOT A SOLICITATION OF AN OFFER TO BUY THESE SECURITIES IN ANY JURISDICTION WHERE THE OFFER OR SALE IS NOT PERMITTED.
140
1500 Crossgate Road Port Wentworth, GA 31407 | Collateral Asset Summary – Loan No. 11 Amazon Port of Savannah | Cut-off Date Balance: Cut-off Date LTV: U/W NCF DSCR: U/W NOI Debt Yield: | $28,700,000 62.4% 2.24x 8.1% |
| Sources and Uses(1) | ||||||
| Sources | Proceeds | % of Total | Uses | Proceeds | % of Total | |
| Mortgage Loan | $28,700,000 | 62.2% | Purchase Price(1) | $45,593,515 | 98.8% | |
| Sponsor Equity | 17,440,058 | 37.8 | Closing Costs | 408,656 | 0.9 | |
| Upfront Reserves | 137,888 | 0.3 | ||||
| Total Sources | $46,140,058 | 100.0% | Total Uses | $46,140,058 | 100.0% | |
| (1) | The Amazon Port of Savannah Property was acquired by the borrower sponsors in an all cash transaction in September 2020. Sources and Uses presented above are reflective of the net result of the acquisition and recapitalization. |
The Borrower / Borrower Sponsors. The borrower is 1500 Crossgate LLC, a single purpose entity and Delaware limited liability company structured to be a bankruptcy-remote entity with one independent director in its organizational structure. Legal counsel to the borrower delivered a non-consolidation opinion in connection with the origination of the Amazon Port of Savannah loan. The borrower sponsors and nonrecourse carve-out guarantors are Inversiones en Iberia US Holdings LLC, a Delaware limited liability company, and Marcos Martinez Gavica. Inversiones en Iberia US Holdings LLC is managed by Marcos Martínez Gavica and Rodrigo Lozano. Marcos Martínez Gavia, the former Chairman of the Board of Santander Mexico, navigated Santander México’s placement of 24.9% of its capital in international markets, one of the most important transactions in the history of the Mexican stock market, which resulted in Santander México becoming the only financial institution in México with full registration on the Mexican Stock Exchange and on the New York Stock Exchange. Marcos Martínez Gavica was recently named Chairman of the Mexican Stock Exchange (BOLSA MEXICANA DE VALORES, S.A.B. DE C.V.).
The Property. The Amazon Port of Savannah property is a one-story, 117,351 sq. ft. single-tenant industrial distribution warehouse property located on an approximately 31.5-acre site in Port Wentworth, Georgia (the “Amazon Port of Savannah Property”). The Amazon Port of Savannah Property was built-to-suit for Amazon.com Services, Inc. (“Amazon”) in 2020 and currently serves as Amazon’s only planned last-mile distribution center in the Savannah market. The property benefits from its proximity to the Port of Savannah, which reaches nearly 80% of the U.S. population within a two-day drive. The Amazon Port of Savannah Property features concrete loading areas, asphalt paved parking (inclusive of significant parking for delivery vans on the north side of the tract), curbing, signage, landscaping, exterior lighting and more. The Amazon Port of Savannah Property was built with 100.0% climate control, in addition to 13 dock-high doors, six drive-in doors and clear heights of 36 ft. The Amazon Port of Savannah Property includes 1,067 surface parking spaces, resulting in a parking ratio of approximately 9.1 spaces per 1,000 sq. ft., of which 377 spaces are for automobiles and 690 spaces are for delivery van storage. The amount of parking is well suited to Amazon’s use as a last-mile fulfillment center for the Savannah MSA.
The Amazon Port of Savannah Property is currently 100.0% leased to Amazon.com Services Inc. (“Amazon”) through July 2032 with four, five-year extension options with a guarantee from Amazon parent company, Amazon.com, Inc. (“Amazon Parent”) (rated A2/A+/AA- by Moody’s/Fitch/S&P). Amazon is a subsidiary of the Amazon Parent, an American multinational technology company based in Seattle, Washington, which focuses on e-commerce, cloud computing, digital streaming, and artificial intelligence and operates primarily through three segments: North America, International and Amazon Web Services (AWS). Amazon Parent also manufactures and sells electronic devices. Amazon Parent reported 2019 annual net income of approximately $11.6 billion and revenue of greater than $280 billion, up approximately 20.5% from 2018. As of January 2020, Amazon Parent had over 110 active fulfillment centers in the United States and has over 1.0 million employees to date.
The Amazon Port of Savannah loan is subject to an excess cash sweep (as described below) beginning on October 1, 2029, among other conditions, resulting in a 15-month sweep prior to the maturity date of the Amazon Port of Savannah loan. Funds collected in connection with the sweep will be held as additional collateral for the Amazon Port of Savannah loan, effectively reducing the overall loan basis at maturity. In no event will excess cash flow swept in connection with the maturity be released to the borrower prior to repayment in-full of the Amazon Port of Savannah loan. See “Lockbox / Cash Management” below for additional detail.
COVID-19 Update. As of December 1, 2020, the Amazon Port of Savannah Property is open and operational with Amazon fully occupying its space and meeting all contractual rent obligations. As of December 1, 2020, the Amazon Port of Savannah loan is not subject to any modification or forbearance requests related to the COVID-19 pandemic. The first payment date of the Amazon Port of Savannah loan is January 1, 2021. See “Risk Factors—Special Risks—Coronavirus Pandemic Has Adversely Affected the Global Economy and Will Likely Adversely Affect the Performance of the Mortgage Loans” in the Preliminary Prospectus.
| Tenant Summary(1) | ||||||
| Tenant | Credit Rating (Moody's/Fitch/S&P)(2) | Net Rentable Area (Sq. Ft.) | % of Net Rentable Area | U/W Base Rent Per Sq. Ft.(3) | % of Total U/W Base Rent | Lease Expiration |
| Amazon | A2 / A+ / AA- | 117,351 | 100.0% | $20.69 | 100.0% | 7/31/2032 |
| Total Occupied | 117,351 | 100.0% | $20.69 | 100.0% | ||
| Vacant | 0 | 0.0% | ||||
| Total / Wtd. Avg. | 117,351 | 100.0% | ||||
| (1) | Based on the underwritten rent roll dated September 1, 2020. |
| (2) | In certain instances, ratings provided are those of the parent company of the entity shown, whether or not the parent company guarantees the lease. |
| (3) | U/W Base Rent Per Sq. Ft. is inclusive of straight-line rents over the term of the Amazon Port of Savannah loan term. |
THE INFORMATION IN THIS STRUCTURAL AND COLLATERAL TERM SHEET IS NOT COMPLETE AND MAY BE AMENDED PRIOR TO THE TIME OF SALE. THIS TERM SHEET IS NOT AN OFFER TO SELL THESE SECURITIES AND IT IS NOT A SOLICITATION OF AN OFFER TO BUY THESE SECURITIES IN ANY JURISDICTION WHERE THE OFFER OR SALE IS NOT PERMITTED.
141
1500 Crossgate Road Port Wentworth, GA 31407 | Collateral Asset Summary – Loan No. 11 Amazon Port of Savannah | Cut-off Date Balance: Cut-off Date LTV: U/W NCF DSCR: U/W NOI Debt Yield: | $28,700,000 62.4% 2.24x 8.1% |
| Lease Rollover Schedule(1) | ||||||||
| Year | # of Leases Expiring | Total Expiring Sq. Ft. | % of Total Sq. Ft. Expiring | Cumulative Sq. Ft. Expiring | Cumulative % of Sq. Ft. Expiring | Annual U/W Base Rent per Sq. Ft. | % U/W Base Rent Rolling | Cumulative % of U/W Base Rent |
| MTM & 2020 | 0 | 0 | 0.0% | 0 | 0.0% | $0.00 | 0.0% | 0.0% |
| 2021 | 0 | 0 | 0.0% | 0 | 0.0% | $0.00 | 0.0% | 0.0% |
| 2022 | 0 | 0 | 0.0% | 0 | 0.0% | $0.00 | 0.0% | 0.0% |
| 2023 | 0 | 0 | 0.0% | 0 | 0.0% | $0.00 | 0.0% | 0.0% |
| 2024 | 0 | 0 | 0.0% | 0 | 0.0% | $0.00 | 0.0% | 0.0% |
| 2025 | 0 | 0 | 0.0% | 0 | 0.0% | $0.00 | 0.0% | 0.0% |
| 2026 | 0 | 0 | 0.0% | 0 | 0.0% | $0.00 | 0.0% | 0.0% |
| 2027 | 0 | 0 | 0.0% | 0 | 0.0% | $0.00 | 0.0% | 0.0% |
| 2028 | 0 | 0 | 0.0% | 0 | 0.0% | $0.00 | 0.0% | 0.0% |
| 2029 | 0 | 0 | 0.0% | 0 | 0.0% | $0.00 | 0.0% | 0.0% |
| 2030 | 0 | 0 | 0.0% | 0 | 0.0% | $0.00 | 0.0% | 0.0% |
| 2031 & Thereafter | 1 | 117,351 | 100.0% | 117,351 | 100.0% | $20.69 | 100.0% | 100.0% |
| Vacant | NAP | 0 | 0.0% | 117,351 | 100.0% | NAP | NAP | NAP |
| Total / Wtd. Avg. | 1 | 117,351 | 100.0% | $20.69 | 100.0% | |||
| (1) | Based on the underwritten rent roll dated December 1, 2020. |
The Amazon Port of Savannah Property is located in Port Wentworth, Georgia on the north side of Crossgate Road, between GA Highway 21 and Jimmy DeLoach Parkway in close proximity to major transportation arteries including I-95 (4.0 miles) to the west and I-16 (6.5 miles) to the south in an area that is predominantly industrial in nature. In addition, the Amazon Port of Savannah Property is located seven miles northwest of downtown Savannah. According to the appraisal, the Savannah industrial market has maintained a near record-low vacancy rate of 3.3% as of Q2 2020, despite an overall market inventory increase. The below-average vacancy rate is attributed to a record-breaking year of throughput and the expansion at the Georgia Ports Authority (“GPA”). The GPA has implemented the Savannah Harbor Expansion Project, which is expected to deepen the channel to 47 feet, enabling the port to more effectively serve larger vessels and resulting in lower per-container costs. The port is expected to get an additional boost from the $127 million Mason Mega Rail Terminal, which is expected to increase the rail lift capacity to one million containers annually. The project will roughly double the port’s capacity, providing what is set to be the largest on-dock rail facility at any port in North America. The project is expected to be completed by year-end 2020. According to the appraisal, the overall population and average household income within the Savannah, Georgia core-based statistical area are currently 395,065 and $81,674, respectively.
The Amazon Port of Savannah Property is located within the Port Corridor industrial submarket of the Savannah industrial market. According to a third party market data provider, as of the third quarter of 2020, the Savannah industrial market consisted of approximately 78.9 million sq. ft. of industrial space with a total vacancy of 2.5%. Additionally, as of the third quarter of 2020, the Port Corridor industrial submarket consisted of approximately 23.8 million sq. ft. of industrial space with a total vacancy rate of 1.2%.
The appraisal identified eight industrial rent comparables, primarily comprised of build-to-suit Amazon and FedEx Ground facilities, located across the country. The comparable properties were built or are anticipated to be built between 2018 and 2021 and range in size between 112,138 sq. ft. and 955,844 sq. ft. The appraisal notes NNN rents ranging between $10.19 and $22.43 per sq. ft. with an average of $16.12 per sq. ft. The appraisal’s concluded industrial market rent for the Amazon Port of Savannah Property is $17.00 per sq. ft., noting the built-to-suit nature of the property and Amazon’s specifications are the primary driver of in-place rents.
| Cash Flow Analysis(1) | ||
| U/W | U/W Per Sq. Ft. | |
| Base Rent(2) | $2,427,784 | $20.69 |
| Vacant Income | 0 | 0.00 |
| Gross Potential Rent | $2,427,784 | $20.69 |
| Total Reimbursements | 670,516 | 5.71 |
| Gross Potential Income | $3,098,300 | $26.40 |
| Total Other Income | 0 | 0.00 |
| Vacancy | (92,949) | (0.79) |
| Effective Gross Income | $3,005,351 | $25.61 |
| Total Expenses | 670,516 | 5.71 |
| Net Operating Income | $2,334,835 | $19.90 |
| TI/LC | 0 | 0.00 |
| Replacement Reserves | 11,735 | 0.10 |
| Net Cash Flow | $2,323,100 | $19.80 |
| (1) | Historical financials are not available because the Amazon Port of Savannah Property was newly built in 2020. |
| (2) | U/W Base Rent is inclusive of approximately $225,257 attributable to straight-line rent underwritten over the term of the Amazon Port of Savannah loan term. |
THE INFORMATION IN THIS STRUCTURAL AND COLLATERAL TERM SHEET IS NOT COMPLETE AND MAY BE AMENDED PRIOR TO THE TIME OF SALE. THIS TERM SHEET IS NOT AN OFFER TO SELL THESE SECURITIES AND IT IS NOT A SOLICITATION OF AN OFFER TO BUY THESE SECURITIES IN ANY JURISDICTION WHERE THE OFFER OR SALE IS NOT PERMITTED.
142
1500 Crossgate Road Port Wentworth, GA 31407 | Collateral Asset Summary – Loan No. 11 Amazon Port of Savannah | Cut-off Date Balance: Cut-off Date LTV: U/W NCF DSCR: U/W NOI Debt Yield: | $28,700,000 62.4% 2.24x 8.1% |
Lockbox / Cash Management. The Amazon Port of Savannah loan is structured with a springing lockbox and springing cash management. During the continuance of an Amazon Cash Sweep Event (as defined below), the borrower will, or will cause the manager to, immediately deposit all revenue into the lockbox account. Such funds will be swept into a cash management account controlled by the lender and disbursed in accordance with the Amazon Port of Savannah loan documents. If an Amazon Cash Sweep Event is continuing, all excess cash flow after payment of debt service, required reserves and operating expenses will be held as additional collateral for the Amazon Port of Savannah loan. The lender has been granted a security interest in the cash management account. Upon occurrence of an Amazon Cash Sweep Event Cure (as defined below), the cash management account (as well as any related accounts) is required to be closed until another Amazon Cash Sweep Event occurs and amounts held in such account are required to be disbursed to the borrower.
An “Amazon Cash Sweep Event” means the occurrence of the following: (a) an event of default; (b) any bankruptcy action of the borrower or the property manager; (c) the debt service coverage ratio based on the trailing three-month period immediately preceding the date of such determination being less than 1.75x (an “Amazon DSCR Trigger Event”); (d) an Amazon Trigger Event (as defined below); (e) an Amazon Downgrade Trigger Event (as defined below); or (f) October 1, 2029 (the “Amazon Maturity Trigger Event”).
An “Amazon Cash Sweep Event Cure” means (i) with respect to clause (c) above, the achievement of a debt service coverage ratio of 1.80x or greater for two consecutive quarters based upon the trailing three-month periods immediately preceding the date of determination, (ii) with respect to clause (a) above, the acceptance by the lender of a cure of such event of default, (iii) with respect to clause (b) above solely with respect to the property manager, if the borrower replaces the property manager with a qualified manager (as described in the Amazon Port of Savannah loan documents) under an acceptable replacement management agreement within 60 days after such bankruptcy action, (iv) with respect to clause (d) above, if the borrower satisfies the Amazon Replacement Lease Criteria (as defined below), or (v) with respect to clause (e) above, the occurrence of an Amazon Downgrade Trigger Event Cure (as defined below); provided (1) no event of default has occurred and is continuing, (2) an Amazon Cash Sweep Event Cure following the occurrence of an event of default or a bankruptcy action of the property manager may occur no more than a total of five times in the aggregate during the term of the Amazon Port of Savannah loan, (3) an Amazon Cash Sweep Event Cure following the occurrence of an Amazon DSCR Trigger Event, an Amazon Trigger Event or an Amazon Downgrade Trigger Event may occur an unlimited number of times during the term of the Amazon Port of Savannah loan, (4) the borrower will have paid all of the lender’s reasonable expenses incurred in connection with such Amazon Cash Sweep Event Cure, including reasonable attorney’s fees and expenses, and (5) the borrower has no right to cure an Amazon Cash Sweep Event caused by (x) a bankruptcy action of the borrower or (y) an Amazon Maturity Trigger Event.
An “Amazon Trigger Event” means the occurrence of any of the following: (i) a bankruptcy action with respect to Amazon or Amazon Parent, (ii) Amazon “goes dark,” vacates or abandons its premises at the Amazon Port of Savannah Property in accordance with the Amazon Port of Savannah loan documents, (iii) Amazon terminates its lease, subleases or lists its premises for sublease (other than a sublease to an affiliate pursuant to the terms of the lease) or (iv) Amazon publicly announces its intention to do any of the items described in clauses (i), (ii) or (iii) above.
“Amazon Replacement Lease Criteria” means satisfaction of the certain conditions with respect to all of the space demised to Amazon under its lease, including, without limitation, the following: (a) the borrower has entered into one or more replacement leases for the space demised to Amazon, (b) each tenant replacing Amazon is in physical occupancy of the space covered by the applicable replacement lease, open for business and paying full contractual rent, and (c) the borrower provides the lender with, among other documents, a copy of each executed replacement lease, a tenant estoppel satisfactory to the lender, and an updated rent roll.
An “Amazon Downgrade Trigger Event” means the credit rating of Amazon Parent is either (a) withdrawn by two or more of S&P, Fitch and/or Moody’s or (b) downgraded to “BBB-” or less by S&P or Fitch or Baa3 or less by Moody’s.
An “Amazon Downgrade Trigger Event Cure” means (i) with respect to clause (a) above, the credit rating of Amazon Parent is reinstated by each rating agency that withdrew such rating and such reinstated rating is at least “BBB” by S&P or Fitch or “Baa2” by Moody’s, as applicable or (ii) with respect to clause (b) above, the credit rating of Amazon Parent is increased by the rating agency the downgraded such credit rating to at least “BBB” by S&P and Fitch and “Baa2” by Moody’s, as applicable.
THE INFORMATION IN THIS STRUCTURAL AND COLLATERAL TERM SHEET IS NOT COMPLETE AND MAY BE AMENDED PRIOR TO THE TIME OF SALE. THIS TERM SHEET IS NOT AN OFFER TO SELL THESE SECURITIES AND IT IS NOT A SOLICITATION OF AN OFFER TO BUY THESE SECURITIES IN ANY JURISDICTION WHERE THE OFFER OR SALE IS NOT PERMITTED.
143
111 Kent Avenue Brooklyn, NY 11249 | Collateral Asset Summary – Loan No. 12 111 Kent Avenue | Cut-off Date Balance: Cut-off Date LTV: U/W NCF DSCR: U/W NOI Debt Yield: | $26,000,000 57.3% 2.44x 9.4% |
| Mortgage Loan Information | |
| Loan Seller: | CREFI |
| Loan Purpose: | Acquisition |
| Borrower Sponsor: | Fei Ling Wong |
| Borrower: | 111 Kent LLC |
| Original Balance: | $26,000,000 |
| Cut-off Date Balance: | $26,000,000 |
| % by Initial UPB: | 3.2% |
| Interest Rate: | 3.77000% |
| Payment Date: | 6th of each month |
| First Payment Date: | January 6, 2021 |
| Maturity Date: | December 6, 2030 |
| Amortization: | Interest Only |
| Additional Debt: | None |
| Call Protection: | L(24), D(92), O(4) |
| Lockbox / Cash Management: | Springing / Springing |
| Reserves | |||
| Initial | Monthly | Cap | |
| Taxes: | $2,047 | $2,047 | NAP |
| Insurance: | $22,000 | $5,500 | NAP |
| Immediate Repairs: | $6,325 | $0 | NAP |
| Replacement: | $0 | $1,292 | NAP |
| Property Information | |
| Single Asset / Portfolio: | Single Asset |
| Property Type: | Mid Rise Multifamily |
| Collateral: | Fee Simple |
| Location: | Brooklyn, NY |
| Year Built / Renovated: | 2011 / NAP |
| Total Units: | 62 |
| Property Management: | Pinnacle City Living, LLC |
| Underwritten NOI: | $2,443,012 |
| Underwritten NCF: | $2,427,512 |
| Appraised Value: | $45,400,000 |
| Appraisal Date: | October 20, 2020 |
| Historical NOI | |
| Most Recent NOI: | $2,225,073 (T-12 September 30, 2020) |
| 2019 NOI(1): | NAV |
| 2018 NOI(1): | NAV |
| 2017 NOI(1): | NAV |
| Historical Occupancy | |
| Most Recent Occupancy: | 93.5% (November 17, 2020) |
| 2019 Occupancy(1): | NAV |
| 2018 Occupancy(1): | NAV |
| 2017 Occupancy(1): | NAV |
| Financial Information | ||||||
| Tranche | Cut-off Date Balance | Balance per Unit Cut-off / Balloon | LTV Cut-off / Balloon | U/W DSCR NOI / NCF | U/W Debt Yield NOI / NCF | U/W Debt Yield at Balloon NOI / NCF |
| Mortgage Loan | $26,000,000 | $419,355 / $419,355 | 57.3% / 57.3% | 2.46x / 2.44x | 9.4% / 9.3% | 9.4% / 9.3% |
| (1) | Historical NOI and Occupancy information is not available for the 111 Kent Avenue Property (as defined below) because the borrower sponsor acquired the property in August 2020. |
THE INFORMATION IN THIS STRUCTURAL AND COLLATERAL TERM SHEET IS NOT COMPLETE AND MAY BE AMENDED PRIOR TO THE TIME OF SALE. THIS TERM SHEET IS NOT AN OFFER TO SELL THESE SECURITIES AND IT IS NOT A SOLICITATION OF AN OFFER TO BUY THESE SECURITIES IN ANY JURISDICTION WHERE THE OFFER OR SALE IS NOT PERMITTED.
144
111 Kent Avenue Brooklyn, NY 11249 | Collateral Asset Summary – Loan No. 12 111 Kent Avenue | Cut-off Date Balance: Cut-off Date LTV: U/W NCF DSCR: U/W NOI Debt Yield: | $26,000,000 57.3% 2.44x 9.4% |
| Sources and Uses | ||||||
| Sources | Proceeds | % of Total | Uses | Proceeds | % of Total | |
| Mortgage Loan | $26,000,000 | 56.9% | Purchase Price | $45,340,000 | 99.4% | |
| Sponsor Equity | 19,665,210 | 43.1 | Closing Costs | 294,839 | 0.6 | |
| Upfront Reserves | 30,371 | 0.1 | ||||
| Total Sources | $45,665,210 | 100.0% | Total Uses | $45,665,210 | 100.0% | |
The Borrower / Borrower Sponsors. The borrower is 111 Kent LLC, a single purpose Delaware limited liability company structured to be bankruptcy remote with one independent director in its organizational structure. Legal counsel to the borrower delivered a non-consolidation opinion in connection with the origination of loan. The borrower sponsor is Fei Ling Wong and the nonrecourse carve-out guarantors are the Yihai United Development International Corporation and Fei Ling Wong, individually or collectively as the context may require.
Yihai Group, founded in 1989, is a vertically integrated private real estate operating company with expertise in development, investment management, property management, construction, leasing, and financing. Yihai is one of the largest owners, managers and developers in China with an aggregate gross asset and investment valuation of approximately $10 billion as of 2017, comprising over 86 million square feet of commercial operating properties and residential condo development. One of Yihai’s signature assets is Beijing Yihai Garden, a development and residential community with 52 buildings and 6,700 residential units located on the southwest side of Beijing, China. It is comprised of residential towers, k-12 schools, office, malls, parks, and clubhouses. Yihai Group has been dedicated to sustainable development, protecting the ecosystem, and making an environmental, social and economic impact on the urban community. Linda Wong is the Chairwoman of Yihai Group.
The Property. The 111 Kent Avenue property (the “111 Kent Avenue Property”) is a seven-story, class A, 62-unit, luxury rental building located at the corner of North 7th Street and Kent Avenue in the Williamsburg neighborhood of Brooklyn, New York. Built in 2011, the 111 Kent Avenue Property contains Bosch stainless-steel appliances, quartz counter tops, washer/ dryers in unit, and central air. Further, tenants enjoy an amenity package that includes a rooftop deck with a pool, a doorman, unobstructed views of Manhattan, a parking garage (22 spaces), storage units (39 units), bike storage (24 units), a state-of-the-art fitness center and yoga studio, and 9+ foot ceiling heights. The 62 units are currently 93.5% occupied as of the November 17, 2020 rent roll (4 vacancies).
The 111 Kent Avenue Property is located in the New York Metro submarket of the Kings County market. The 111 Kent Avenue Property is located four blocks from the Bedford Avenue subway station with service on the L train and is also located two blocks from the North Williamsburg ferry terminal. According to the appraisal, the median household income in a 0.25 mile, 0.5 mile, and 1 mile radius from the 111 Kent Avenue Property are $122,587, $117,557, and $78,214, respectively.
COVID-19 Update. As of December 6, 2020, the 111 Kent Avenue Property is open and operational. Collections at the 111 Kent Avenue Property for October and November 2020 were 98.7% and 96.2%, respectively. As of December 6, 2020, the 111 Kent Avenue loan is not subject to any modifications or forbearance requests. The first payment date of the 111 Kent Avenue loan is due on January 6, 2021. See “Risk Factors—Special Risks—Coronavirus Pandemic Has Adversely Affected the Global Economy and Will Likely Adversely Affect the Performance of the Mortgage Loans” in the Preliminary Prospectus.
| Multifamily Unit Mix(1)(2) | ||||||
| Unit Type | # of Units | % of Total Units | Occupancy | Average Unit Size (Sq. Ft.) | Average Monthly Rent Per Unit((3) | Average Rent PSF/Month(3) |
| Duplex Studio | 4 | 6.5% | 100.0% | 1,126 | $4,158 | $3.69 |
| 1BR | 25 | 40.3% | 88.0% | 851 | $3,857 | $4.46 |
| 2BR | 27 | 43.5% | 96.3% | 1,112 | $5,562 | $5.00 |
| 3BR | 2 | 3.2% | 100.0% | 1,390 | $7,265 | $5.23 |
| 2BR – Top Floor | 2 | 3.2% | 100.0% | 1,224 | $7,645 | $6.25 |
| 3BR – Top Floor | 2 | 3.2% | 100.0% | 1,818 | $10,747 | $5.91 |
| Total / Wtd. Avg. | 62 | 100.0% | 93.5% | 1,043 | $5,128 | $4.79 |
| (1) | Based on the underwritten rent roll dated November 17, 2020. |
| (2) | Occupancy, Average Unit Size (Sq. Ft.) and Average Monthly In-Place Rents represent a weighted average of the various unit type layouts. |
| (3) | Excludes vacant units. |
THE INFORMATION IN THIS STRUCTURAL AND COLLATERAL TERM SHEET IS NOT COMPLETE AND MAY BE AMENDED PRIOR TO THE TIME OF SALE. THIS TERM SHEET IS NOT AN OFFER TO SELL THESE SECURITIES AND IT IS NOT A SOLICITATION OF AN OFFER TO BUY THESE SECURITIES IN ANY JURISDICTION WHERE THE OFFER OR SALE IS NOT PERMITTED.
145
111 Kent Avenue Brooklyn, NY 11249 | Collateral Asset Summary – Loan No. 12 111 Kent Avenue | Cut-off Date Balance: Cut-off Date LTV: U/W NCF DSCR: U/W NOI Debt Yield: | $26,000,000 57.3% 2.44x 9.4% |
Cash Flow Analysis.
| Cash Flow Analysis | |||
| T-12 9/30/2020 | U/W | U/W Per Unit | |
| Gross Potential Rent | $3,836,149 | $3,779,613 | $60,962 |
| Vacancy | (622,574) | (426,038) | (6,872) |
| Other Loss | (0) | (0) | 0 |
| Net Rental Income | $3,213,575 | $3,353,575 | $54,090 |
| Other Income(1) | 77,335 | 95,334 | 1,538 |
| Effective Gross Income | $3,290,910 | $3,448,909 | $55,628 |
| Real Estate Taxes | 25,169 | 23,651 | 381 |
| Insurance | 40,403 | 62,856 | 1,014 |
| Management Fee | 98,727 | 103,467 | 1,669 |
| Other Expenses | 901,537 | 815,922 | 13,160 |
| Total Expenses | $1,065,837 | $1,005,897 | $16,224 |
| Net Operating Income | $2,225,073 | $2,443,012 | $39,403 |
| Replacement Reserves | 0 | 15,500 | 250 |
| Net Cash Flow | $2,225,073 | $2,427,512 | $39,153 |
| (1) | Other Income includes income from parking, storage, and miscellaneous |
THE INFORMATION IN THIS STRUCTURAL AND COLLATERAL TERM SHEET IS NOT COMPLETE AND MAY BE AMENDED PRIOR TO THE TIME OF SALE. THIS TERM SHEET IS NOT AN OFFER TO SELL THESE SECURITIES AND IT IS NOT A SOLICITATION OF AN OFFER TO BUY THESE SECURITIES IN ANY JURISDICTION WHERE THE OFFER OR SALE IS NOT PERMITTED.
146
(THIS PAGE INTENTIONALLY LEFT BLANK)
147
32-42 Broadway New York, NY 10004 | Collateral Asset Summary – Loan No. 13 32-42 Broadway | Cut-off Date Balance: Cut-off Date LTV: U/W NCF DSCR: U/W NOI Debt Yield: | $25,000,000 51.4% 2.66x 9.8% |
| Mortgage Loan Information | |
| Loan Seller: | CREFI |
| Loan Purpose: | Refinance |
| Borrower Sponsors: | Eli Schron; Mark Schron; Avi Schron |
| Borrower: | 32-42 Broadway Owner LLC |
| Original Balance: | $25,000,000 |
| Cut-off Date Balance(1): | $25,000,000 |
| % by Initial UPB(1): | 3.1% |
| Interest Rate: | 3.25000% |
| Payment Date: | 6th of each month |
| First Payment Date: | December 6, 2020 |
| Maturity Date: | November 6, 2030 |
| Amortization: | Interest Only |
| Additional Debt(1): | $100,000,000 Pari Passu Debt |
| Call Protection: | L(25), D(91), O(4) |
| Lockbox / Cash Management: | Hard / Springing |
| Reserves | |||
| Initial | Monthly | Cap | |
| Taxes: | $0 | $393,685 | NAP |
| Insurance: | $0 | Springing | NAP |
| Replacement: | $0 | $30,425 | NAP |
| TI/LC(2): | $3,000,000 | Springing | $3,000,000 |
| Required Repairs: | $32,450 | $0 | NAP |
| Unfunded Obligations: | $131,038 | $0 | NAP |
| Debt Service: | $4,062,500 | $0 | NAP |
| Property Information | |
| Single Asset / Portfolio: | Single Asset |
| Property Type: | CBD Office |
| Collateral: | Fee Simple |
| Location: | New York, NY |
| Year Built / Renovated: | 1898, 1904 / 2019 |
| Total Sq. Ft.: | 521,573 |
| Property Management: | Cammeby’s Management Company, LLC |
| Underwritten NOI: | $12,296,389 |
| Underwritten NCF: | $10,952,043 |
| Appraised Value: | $243,000,000 |
| Appraisal Date: | August 28, 2020 |
| Historical NOI | |
| Most Recent NOI: | $12,766,564 (T-12 June 30, 2020) |
| 2019 NOI: | $11,894,826 (December 31, 2019) |
| 2018 NOI: | $11,521,849 (December 31, 2018) |
| 2017 NOI: | $10,777,353 (December 31, 2017) |
| Historical Occupancy | |
| Most Recent Occupancy: | 90.5% (September 1, 2020) |
| 2019 Occupancy: | 97.3% (December 31, 2019) |
| 2018 Occupancy: | 96.1% (December 31, 2018) |
| 2017 Occupancy: | 96.0% (December 31, 2017) |
| Financial Information(1) | ||||||
| Tranche | Cut-off Date Balance | Balance per Sq. Ft. Cut-off / Balloon | LTV Cut-off / Balloon | U/W DSCR NOI / NCF | U/W Debt Yield NOI / NCF | U/W Debt Yield at Balloon NOI / NCF |
| Mortgage Loan | $25,000,000 | |||||
| Pari Passu Notes | 100,000,000 | |||||
| Whole Loan | $125,000,000 | $240 / $240 | 51.4% / 51.4% | 2.99x / 2.66x | 9.8% / 8.8% | 9.8% / 8.8% |
| (1) | The 32-42 Broadway loan consists of the non-controlling Note A-2-2 and is part of the 32-42 Broadway whole loan evidenced by three pari passu notes with an aggregate outstanding principal balance as of the Cut-off Date of $125.0 million. |
| (2) | On each due date, if the balance in the TI/LC Reserve falls below $1,500,000, the 32-42 Broadway borrower is required to make monthly deposits of approximately $65,197 until the balance in the TI/LC Reserve reaches $3,000,000. |
THE INFORMATION IN THIS STRUCTURAL AND COLLATERAL TERM SHEET IS NOT COMPLETE AND MAY BE AMENDED PRIOR TO THE TIME OF SALE. THIS TERM SHEET IS NOT AN OFFER TO SELL THESE SECURITIES AND IT IS NOT A SOLICITATION OF AN OFFER TO BUY THESE SECURITIES IN ANY JURISDICTION WHERE THE OFFER OR SALE IS NOT PERMITTED.
148
32-42 Broadway New York, NY 10004 | Collateral Asset Summary – Loan No. 13 32-42 Broadway | Cut-off Date Balance: Cut-off Date LTV: U/W NCF DSCR: U/W NOI Debt Yield: | $25,000,000 51.4% 2.66x 9.8% |
| Whole Loan Summary | ||||
| Note | Original Balance | Cut-off Date Balance | Note Holder | Controlling Piece |
| A-1 | $75,000,000 | $75,000,000 | Benchmark 2020-B21 | Yes |
| A-2-1 | 25,000,000 | 25,000,000 | GSMS 2020-GSA2(1) | No |
| A-2-2 | 25,000,000 | 25,000,000 | Benchmark 2020-B22 | No |
| Total | $125,000,000 | $125,000,000 | ||
| (1) | The GSMS 2020-GSA2 securitization transaction is expected to close prior to the Closing Date. |
| Sources and Uses | ||||||
| Sources | Proceeds | % of Total | Uses | Proceeds | % of Total | |
| Whole Loan | $125,000,000 | 98.4% | Loan Payoff | $115,986,003 | 91.3% | |
| Borrower Sponsor Equity | 2,050,134 | 1.6 | Upfront Reserves | 7,225,988 | 5.7 | |
| Closing Costs | 3,838,143 | 3.0 | ||||
| Total Sources | $127,050,134 | 100.0% | Total Uses | $127,050,134 | 100.0% | |
The Borrower / Borrower Sponsor. The borrower is 32-42 Broadway Owner LLC, a Delaware limited liability company and single purpose entity with two independent directors. Legal counsel to the borrower delivered a non-consolidation opinion in connection with the origination of the 32-42 Broadway whole loan.
The borrower sponsors and non-recourse carve-out guarantors are Eli Schron, Mark Schron, and Avi Schron, the three sons of Rubin Schron who founded Cammeby’s International. Rubin Schron has been in the real estate business for nearly 40 years. As of 2019, Cammeby’s / the Schron brothers own interests in more than 31,000 residential units primarily in New York, New Jersey, Pennsylvania and Connecticut, 145 nursing home units and approximately 15 million sq. ft. of commercial and industrial space with a combined market value of approximately $3 billion. The entirety of the borrower sponsor’s commercial portfolio is located in New York, NY, with the exception of one large industrial park in New Jersey.
The Property. The 32-42 Broadway property (the “32-42 Broadway Property”) consists of two interconnecting 18 and 21-story Class B office buildings, plus a lower level and penthouse, located at 32-42 Broadway, in New York, New York. The 32 Broadway building is an 18-story Class B office building, plus lower level and penthouse, which was constructed in 1898. The 32 Broadway building consists of 128,945 sq. ft. of net rentable area, which is leased to two retail and 53 office tenants. The 42 Broadway building is a 21-story Class B office building, plus lower level, which was constructed in 1904. It consists of 392,628 sq. ft. of net rentable area, which is leased to four retail and 33 office tenants. Based on the underwritten rent roll dated September 1, 2020, the 32-42 Broadway Property is 90.5% leased.
Office (97.1% of net rentable area; 89.9% of U/W base rent)
The largest office tenant at the 32-42 Broadway Property, City of NY Department of Consumer Affairs, occupies 16.4% of the 32-42 Broadway Property’s net rentable area and accounts for 15.4% of U/W base rent. The tenant has occupied space at the 32-42 Broadway Property since 2013. City of NY Department of Consumer Affairs (now referred to as the City of NY Department of Consumer and Worker Protection) licenses more than 75,000 businesses in more than 50 industries and enforces consumer protection, licensing, and workplace laws. The Department of Consumer Affairs (“DCA”) protects the marketplace from predatory practices to create a culture of compliance. The DCA also conducts research and advocates for public policy that furthers its work to support New York City’s communities.
The second largest office tenant at the 32-42 Broadway Property, the City of NY Board of Elections, occupies 10.1% of the 32-42 Broadway Property’s net rentable area and accounts for 10.6% of U/W base rent. The tenant has occupied space at the 32-42 Broadway Property since 2011. The Board of Elections is an administrative body of 10 commissioners, two from each borough upon recommendation by both political parties and then appointed by the city council for a term of four years. The commissioners appoint a bipartisan staff to oversee the daily activities of its main and five borough offices of New York City.
The third largest office tenant at the 32-42 Broadway Property, Magilla Entertainment, LLC, occupies 6.3% of the 32-42 Broadway Property’s net rentable area and accounts for 7.0% of U/W base rent. The tenant has occupied space at the 32-42 Broadway Property since 2012. Magilla Entertainment, LLC is one of the nation’s largest independently owned production companies in non-scripted television. Magilla Entertainment, LLC has a portfolio of over 45 separate and unique series including shows such as Discovery’s Moonshiners and Diesel Brothers, TLC’s Long Island Medium, HGTV’s Beach Front Bargain Hunt franchise, and History Channel’s American Ripper, three-part mini-series –Cars That Made America and one-hour documentary –Rise Up: The Movement That Changed America.
Retail (2.9% of net rentable area; 10.1% of U/W base rent)
The retail space at the 32-42 Broadway Property is comprised of approximately 2.9% of the total net rentable area and the retail space is 73.9% leased to JP Morgan Chase Bank, NA (5,044 sq. ft.), GFG Broadway, LLC (3,366 sq. ft.), Bento Nouveau, Inc. (1,000 sq. ft.), 42 Broadway Coffee & Bakery, LLC (800 sq. ft.), 42 Broadway News, LLC (650 sq. ft.) and Blue Chip Haircutters, LLC (450 sq. ft.).
THE INFORMATION IN THIS STRUCTURAL AND COLLATERAL TERM SHEET IS NOT COMPLETE AND MAY BE AMENDED PRIOR TO THE TIME OF SALE. THIS TERM SHEET IS NOT AN OFFER TO SELL THESE SECURITIES AND IT IS NOT A SOLICITATION OF AN OFFER TO BUY THESE SECURITIES IN ANY JURISDICTION WHERE THE OFFER OR SALE IS NOT PERMITTED.
149
32-42 Broadway New York, NY 10004 | Collateral Asset Summary – Loan No. 13 32-42 Broadway | Cut-off Date Balance: Cut-off Date LTV: U/W NCF DSCR: U/W NOI Debt Yield: | $25,000,000 51.4% 2.66x 9.8% |
COVID-19 Update. As of December 6, 2020, the 32-42 Broadway Property is open and operational. At the onset of the COVID-19 pandemic, the borrower sponsor executed rent deferment agreements with certain tenants, most of which have now expired, and no major tenants have rent deferrals. September 2020 rent collections at the 32-42 Broadway Property were 105.6% of underwritten base rent, which includes payback of rents that were previously deferred. October 2020 rent collections at the 32-42 Broadway Property were 98.5% of underwritten base rent. November 2020 rent collections at the 32-42 Broadway Property were 76.1% of underwritten base rent. As of December 6, 2020, the 32-42 Broadway loan is not subject to any modifications or forbearance requests. The 32-42 Broadway loan is current on payments through December 6, 2020. See “Risk Factors—Special Risks—Coronavirus Pandemic Has Adversely Affected the Global Economy and Will Likely Adversely Affect the Performance of the Mortgage Loans” in the Preliminary Prospectus.
| Tenant Summary(1) | ||||||||||
| Tenant | Credit Rating (Moody’s/Fitch/S&P) | Net Rentable Area (Sq. Ft.) | % of Net Rentable Area | U/W Base Rent Per Sq. Ft. | % of Total U/W Base Rent | Lease Expiration | ||||
| City of NY Dept of Consumer Affairs(2) | NR / NR / NR | 85,573 | 16.4 | % | $33.67 | 15.4% | 7/31/2027 | |||
| City of NY Board of Elections(3) | NR / NR / NR | 52,618 | 10.1 | $37.82 | 10.6% | 2/6/2022 | ||||
| Magilla Entertainment, LLC(4) | NR / NR / NR | 33,106 | 6.3 | $39.47 | 7.0% | 9/15/2024 | ||||
| Premier Home Health Care Services, Inc. | NR / NR / NR | 18,000 | 3.5 | $39.39 | 3.8% | 1/31/2023 | ||||
| Agudath Israel of America(5) | NR / NR / NR | 17,000 | 3.3 | $27.04 | 2.5% | 1/31/2026 | ||||
| Downtown Turn Key Office Suites, LLC | NR / NR / NR | 11,000 | 2.1 | $33.43 | 2.0% | 8/5/2024 | ||||
| Community Resource Exchange,Inc. | NR / NR / NR | 10,108 | 1.9 | $5.94 | 0.3% | 8/6/2020 | ||||
| Total World Domination,Inc. d/b/a Engine Room Audio | NR / NR / NR | 9,000 | 1.7 | $42.00 | 2.0% | 6/24/2021 | ||||
| Largest Tenant | 236,405 | 45.3 | % | $34.48 | 43.6% | |||||
| Remaining Occupied | 235,592 | 45.2 | $44.81 | 56.4 | ||||||
| Total / Wtd. Avg. Occupied Collateral | 471,997 | 90.5 | % | $39.64 | 100.0% | |||||
| Vacant | 49,576 | 9.5 | ||||||||
| Total | 521,573 | 100.0 | % | |||||||
| (1) | Based on the underwritten rent roll dated September 1, 2020. |
| (2) | City of NY Dept of Consumer Affairs has a one-time right to terminate its lease in whole or in part on a full floor or full floors basis, effective on either October 14, 2023 or October 14, 2026 upon 12 months’ written notice for 75,264 sq. ft. of its space at the 32-42 Broadway Property. The City of NY Dept of Consumer Affairs is required to pay a termination fee equal to the sum of the unamortized rent value of the abatement period and the total cost of the work. |
| (3) | City of NY Board of Elections has a one-time right to terminate the expansion space on April 22, 2021 upon at least 12 months’ notice, provided that City of NY Board of Elections has terminated the entire 6th and/or 7th floor of the existing lease. |
| (4) | Magilla Entertainment, LLC’s space at the 32-42 Broadway Property includes a month-to-month lease on storage space. The month-to-month lease can be terminated by either the tenant or the borrower on no less than 10 days and no more than 30 days’ prior written notice. The month-to-month space makes up 0.1% of U/W Base Rent. |
| (5) | Agudath Israel of America’s space at the 32-42 Broadway Property includes a month-to-month lease on an exercise room. The month-to-month space makes up approximately 0.01% of U/W Base Rent. |
| Lease Rollover Schedule(1)(2) | ||||||||
| Year | # of Leases Expiring | Total Expiring Sq. Ft. | % of Total Sq. Ft. Expiring | Cumulative Sq. Ft. Expiring | Cumulative % of Sq. Ft. Expiring | Annual U/W Base Rent Per Sq. Ft. | % U/W Base Rent Rolling | Cumulative % of U/W Base Rent |
| MTM | 8 | 5,345 | 1.0% | 5,345 | 1.0% | $42.25 | 1.2% | 1.2% |
| 2020 | 2 | 10,168 | 1.9% | 15,513 | 3.0% | $6.08 | 0.3% | 1.5% |
| 2021 | 21 | 57,009 | 10.9% | 72,522 | 13.9% | $38.58 | 11.8% | 13.3% |
| 2022 | 13 | 72,039 | 13.8% | 144,561 | 27.7% | $37.21 | 14.3% | 27.6% |
| 2023 | 10 | 35,625 | 6.8% | 180,186 | 34.5% | $40.73 | 7.8% | 35.4% |
| 2024 | 13 | 75,977 | 14.6% | 256,163 | 49.1% | $37.01 | 15.0% | 50.4% |
| 2025 | 9 | 26,326 | 5.0% | 282,489 | 54.2% | $69.20 | 9.7% | 60.1% |
| 2026 | 8 | 36,175 | 6.9% | 318,664 | 61.1% | $34.74 | 6.7% | 66.9% |
| 2027 | 8 | 110,062 | 21.1% | 428,726 | 82.2% | $35.08 | 20.6% | 87.5% |
| 2028 | 3 | 16,515 | 3.2% | 445,241 | 85.4% | $40.90 | 3.6% | 91.1% |
| 2029 | 4 | 14,966 | 2.9% | 460,207 | 88.2% | $81.32 | 6.5% | 97.6% |
| 2030 | 1 | 4,290 | 0.8% | 464,497 | 89.1% | $38.00 | 0.9% | 98.5% |
| 2031 & Thereafter | 2 | 7,500 | 1.4% | 471,997 | 90.5% | $37.87 | 1.5% | 100.0% |
| Vacant | NAP | 49,576 | 9.5% | 521,573 | 100.0% | NAP | NAP | NAP |
| Total / Wtd. Avg. | 102 | 521,573 | 100.0% | $39.64 | 100.0% | |||
| (1) | Based on the underwritten rent roll dated September 1, 2020. |
| (2) | Certain tenants may have termination or contraction options (which may become exercisable prior to the originally stated expiration date of the tenant lease) that are not considered in the above Lease Expiration Schedule. |
THE INFORMATION IN THIS STRUCTURAL AND COLLATERAL TERM SHEET IS NOT COMPLETE AND MAY BE AMENDED PRIOR TO THE TIME OF SALE. THIS TERM SHEET IS NOT AN OFFER TO SELL THESE SECURITIES AND IT IS NOT A SOLICITATION OF AN OFFER TO BUY THESE SECURITIES IN ANY JURISDICTION WHERE THE OFFER OR SALE IS NOT PERMITTED.
150
32-42 Broadway New York, NY 10004 | Collateral Asset Summary – Loan No. 13 32-42 Broadway | Cut-off Date Balance: Cut-off Date LTV: U/W NCF DSCR: U/W NOI Debt Yield: | $25,000,000 51.4% 2.66x 9.8% |
Cash Flow Analysis.
| Cash Flow Analysis(1) | ||||||
| 2017 | 2018 | 2019 | T-12 6/30/2020 | U/W | U/W Per Sq. Ft. | |
| Base Rent(2) | $18,521,528 | $19,136,347 | $19,705,031 | $20,004,281 | $18,709,426 | $35.87 |
| Rent Steps(3) | 0 | 0 | 0 | 0 | 725,040 | 1.39 |
| Potential Income From Vacant Space | 0 | 0 | 0 | 0 | 2,747,098 | 5.27 |
| Reimbursements | 1,117,080 | 1,276,511 | 1,484,585 | 1,536,557 | 1,627,108 | 3.12 |
| Gross Potential Rent | $19,638,608 | $20,412,858 | $21,189,616 | $21,540,838 | $23,808,672 | $45.65 |
| Vacancy & Credit Loss | (511,890) | (235,636) | (222,100) | (261,932) | (2,747,098) | (5.27) |
| Other Income | 2,087,459 | 2,136,205 | 2,052,795 | 2,264,915 | 2,107,632 | 4.04 |
| Effective Gross Income | $21,214,177 | $22,313,427 | $23,020,311 | $23,543,821 | $23,169,206 | $44.42 |
| Total Operating Expenses | 10,436,824 | 10,791,578 | 11,125,485 | 10,777,257 | 10,872,817 | 20.85 |
| Net Operating Income | $10,777,353 | $11,521,849 | $11,894,826 | $12,766,564 | $12,296,389 | $23.58 |
| TI/LC | 0 | 0 | 0 | 0 | 979,245 | 1.88 |
| Capital Expenditures | 0 | 0 | 0 | 0 | 365,101 | 0.70 |
| Net Cash Flow | $10,777,353 | $11,521,849 | $11,894,826 | $12,766,564 | $10,952,043 | $21.00 |
| (1) | Certain items such as interest expense, interest income, lease cancellation income, depreciation, amortization, debt service payments and any other non-recurring or non-operating items were excluded from the historical presentation and are not considered for the underwritten cash flow. |
| (2) | U/W Base Rent is based on the underwritten rent roll dated September 1, 2020. |
| (3) | Rent Steps include $725,040 underwritten for various tenants through October 31, 2021 |
THE INFORMATION IN THIS STRUCTURAL AND COLLATERAL TERM SHEET IS NOT COMPLETE AND MAY BE AMENDED PRIOR TO THE TIME OF SALE. THIS TERM SHEET IS NOT AN OFFER TO SELL THESE SECURITIES AND IT IS NOT A SOLICITATION OF AN OFFER TO BUY THESE SECURITIES IN ANY JURISDICTION WHERE THE OFFER OR SALE IS NOT PERMITTED.
151
27750 Entertainment Drive Valencia, CA 91355 | Collateral Asset Summary – Loan No. 14 27750 Entertainment Drive | Cut-off Date Balance: Cut-off Date LTV: U/W NCF DSCR: U/W NOI Debt Yield: | $23,500,000 73.4% 1.50x 9.7% |
| Mortgage Loan Information | |
| Loan Seller: | CREFI |
| Loan Purpose: | Refinance |
| Borrower Sponsor: | Rustin Kretz |
| Borrower: | Scorpion Real Estate LLC |
| Original Balance: | $23,500,000 |
| Cut-off Date Balance: | $23,500,000 |
| % by Initial UPB: | 2.9% |
| Interest Rate: | 4.60000% |
| Payment Date: | 6th of each month |
| First Payment Date: | January 6, 2021 |
| Maturity Date: | December 6, 2030 |
| Amortization: | 360 Months |
| Additional Debt: | None |
| Call Protection: | L(24), D(92), O(4) |
| Lockbox / Cash Management: | Hard / In Place |
| Reserves | |||
| Initial | Monthly | Cap | |
| Taxes: | $110,289 | $55,144 | NAP |
| Insurance: | $37,582 | $5,369 | NAP |
| Replacement: | $0 | $1,640 | NAP |
| TI/LC(1): | $0 | Springing | NAP |
| Property Information | |
| Single Asset / Portfolio: | Single Asset |
| Property Type: | Suburban Office |
| Collateral: | Fee Simple |
| Location: | Valencia, CA |
| Year Built / Renovated: | 2017 / NAP |
| Total Sq. Ft.: | 98,388 |
| Property Management: | Self-Managed |
| Underwritten NOI: | $2,283,740 |
| Underwritten NCF: | $2,165,675 |
| Appraised Value: | $32,000,000 |
| Appraisal Date: | July 2, 2020 |
| Historical NOI | |
| Most Recent NOI: | $1,880,707 (T-12 June 30, 2020) |
| 2019 NOI: | $2,151,403 (December 31, 2019) |
| 2018 NOI: | $1,788,817 (December 31, 2018) |
| 2017 NOI: | NAV |
| Historical Occupancy | |
| Most Recent Occupancy: | 100.0% (December 6, 2020) |
| 2019 Occupancy: | 100.0% (December 31, 2019) |
| 2018 Occupancy: | 100.0% (December 31, 2018) |
| 2017 Occupancy: | NAV |
| Financial Information | ||||||
| Tranche | Cut-off Date Balance | Balance per Sq. Ft. Cut-off / Balloon | LTV Cut-off / Balloon | U/W DSCR NOI / NCF | U/W Debt Yield NOI / NCF | U/W Debt Yield at Balloon NOI / NCF |
| Mortgage Loan | $23,500,000 | $239 / $194 | 73.4% / 59.6% | 1.58x / 1.50x | 9.7% / 9.2% | 12.0% / 11.4% |
| (1) | On each monthly payment date, the borrower will be required to deposit $8,199 into the TI/LC reserve if the following conditions are not met: (i) no event of default has occurred and is continuing, (ii) no trigger period has occurred and is continuing, (iii) the Scorpion Enterprises, LP lease is in full force and effect with no defaults thereunder, (iv) Scorpion Enterprises, LP is not bankrupt or insolvent, (v) Scorpion Enterprises, LP has not expressed its intention in writing to terminate, cancel or default under the Scorpion Enterprises, LP lease (including, without limitation, in connection with any rejection in any bankruptcy or similar insolvency proceeding). |
THE INFORMATION IN THIS STRUCTURAL AND COLLATERAL TERM SHEET IS NOT COMPLETE AND MAY BE AMENDED PRIOR TO THE TIME OF SALE. THIS TERM SHEET IS NOT AN OFFER TO SELL THESE SECURITIES AND IT IS NOT A SOLICITATION OF AN OFFER TO BUY THESE SECURITIES IN ANY JURISDICTION WHERE THE OFFER OR SALE IS NOT PERMITTED.
152
27750 Entertainment Drive Valencia, CA 91355 | Collateral Asset Summary – Loan No. 14 27750 Entertainment Drive | Cut-off Date Balance: Cut-off Date LTV: U/W NCF DSCR: U/W NOI Debt Yield: | $23,500,000 73.4% 1.50x 9.7% |
| Sources and Uses | ||||||
| Sources | Proceeds | % of Total | Uses | Proceeds | % of Total | |
| Mortgage Loan | $23,500,000 | 94.2% | Loan Payoff | $24,125,523 | 96.7% | |
| Borrower Sponsor Equity | 1,455,024 | 5.8 | Closing Costs | 681,630 | 2.7 | |
| Upfront Reserves | 147,871 | 0.6 | ||||
| Total Sources | $24,955,024 | 100.0% | Total Uses | $24,955,024 | 100.0% | |
The Borrower / Borrower Sponsor. The borrower is Scorpion Real Estate LLC, a California limited liability company and single purpose entity with one independent director. Legal counsel to the borrower delivered a non-consolidation opinion in connection with the origination of the 27750 Entertainment Drive mortgage loan.
The borrower sponsor and non-recourse carveout guarantor is Rustin Kretz. Rustin Kretz is the founder and CEO of Scorpion Enterprises, LP and owns 100% of the borrower.
The Property. The 27750 Entertainment Drive property (the “27750 Entertainment Drive Property”) consists of a 98,388 sq. ft., four-story office building situated on a 6.4-acre parcel in Valencia, California. The 27750 Entertainment Drive Property was built in 2017 and includes amenities such as an on-site gym, basketball court, locker rooms, café, cafeteria including commercial kitchen, multiple break rooms, and an outdoor patio/seating area. The 27750 Entertainment Drive Property provides 376 surface parking spaces at a ratio of 3.82 spaces per 1,000 sq. ft. of gross floor area. The 27750 Entertainment Drive Property is 100.0% leased to one tenant, Scorpion Enterprises, LP, who utilizes the property as its headquarters.
Scorpion Enterprises, LP (“Scorpion”) is a digital marketing, technology and branding company. The borrower sponsor, Rustin Kretz, is the founder and CEO of Scorpion. In connection with the financing, Scorpion entered into a new, 15-year lease with no outs or termination options, at a rental rate of $29.00 per sq. ft. NNN. The 27750 Entertainment Drive Property was built-to-suit for Scorpion in 2017.
COVID-19 Update. The 27750 Entertainment Drive Property is currently closed in compliance with local regulations. The tenant continues to occupy 100.0% of the 27750 Entertainment Drive Property and all employees are working from home. As of December 6, 2020, the tenant is current on rent and is not requesting deferred rent or lease modifications. As of December 6, 2020, the 27750 Entertainment Drive loan is not subject to any modifications or forbearance requests. The first payment date of the 27750 Entertainment Drive loan is due on January 6, 2021. See “Risk Factors—Special Risks—Coronavirus Pandemic Has Adversely Affected the Global Economy and Will Likely Adversely Affect the Performance of the Mortgage Loans” in the Preliminary Prospectus.
| Tenant Summary(1) | ||||||
| Tenant | Credit Rating (Moody’s/Fitch/S&P)(2) | Net Rentable Area (Sq. Ft.) | % of Net Rentable Area | U/W Base Rent Per Sq. Ft. | % of Total U/W Base Rent | Lease Expiration |
| Scorpion Enterprises, LP | NR / NR / NR | 98,388 | 100.0% | $29.00 | 100.0% | 11/30/2035 |
| Largest Tenant | 98,388 | 100.0% | $29.00 | 100.0% | ||
| Remaining Occupied | 0 | 0.0 | $0.00 | 0.0 | ||
| Total / Wtd. Avg. Occupied Collateral | 98,388 | 100.0% | $29.00 | 100.0% | ||
| Vacant | 0 | 0.0 | ||||
| Total | 98,388 | 100.0% | ||||
| (1) | Based on the underwritten rent roll as of December 6, 2020. |
| (2) | Certain ratings are those of the parent company whether or not the parent guarantees the lease. |
THE INFORMATION IN THIS STRUCTURAL AND COLLATERAL TERM SHEET IS NOT COMPLETE AND MAY BE AMENDED PRIOR TO THE TIME OF SALE. THIS TERM SHEET IS NOT AN OFFER TO SELL THESE SECURITIES AND IT IS NOT A SOLICITATION OF AN OFFER TO BUY THESE SECURITIES IN ANY JURISDICTION WHERE THE OFFER OR SALE IS NOT PERMITTED.
153
27750 Entertainment Drive Valencia, CA 91355 | Collateral Asset Summary – Loan No. 14 27750 Entertainment Drive | Cut-off Date Balance: Cut-off Date LTV: U/W NCF DSCR: U/W NOI Debt Yield: | $23,500,000 73.4% 1.50x 9.7% |
| Lease Rollover Schedule(1) | ||||||||
| Year | # of Leases Expiring | Total Expiring Sq. Ft. | % of Total Sq. Ft. Expiring | Cumulative Sq. Ft. Expiring | Cumulative % of Sq. Ft. Expiring | Annual U/W Base Rent Per Sq. Ft. | % U/W Base Rent Rolling | Cumulative % of U/W Base Rent |
| MTM | 0 | 0 | 0.0% | 0 | 0.0% | $0.00 | 0.0% | 0.0% |
| 2020 | 0 | 0 | 0.0% | 0 | 0.0% | $0.00 | 0.0% | 0.0% |
| 2021 | 0 | 0 | 0.0% | 0 | 0.0% | $0.00 | 0.0% | 0.0% |
| 2022 | 0 | 0 | 0.0% | 0 | 0.0% | $0.00 | 0.0% | 0.0% |
| 2023 | 0 | 0 | 0.0% | 0 | 0.0% | $0.00 | 0.0% | 0.0% |
| 2024 | 0 | 0 | 0.0% | 0 | 0.0% | $0.00 | 0.0% | 0.0% |
| 2025 | 0 | 0 | 0.0% | 0 | 0.0% | $0.00 | 0.0% | 0.0% |
| 2026 | 0 | 0 | 0.0% | 0 | 0.0% | $0.00 | 0.0% | 0.0% |
| 2027 | 0 | 0 | 0.0% | 0 | 0.0% | $0.00 | 0.0% | 0.0% |
| 2028 | 0 | 0 | 0.0% | 0 | 0.0% | $0.00 | 0.0% | 0.0% |
| 2029 | 0 | 0 | 0.0% | 0 | 0.0% | $0.00 | 0.0% | 0.0% |
| 2030 | 0 | 0 | 0.0% | 0 | 0.0% | $0.00 | 0.0% | 0.0% |
| 2031 & Thereafter | 1 | 98,388 | 100.0% | 98,388 | 100.0% | $29.00 | 100.0% | 100.0% |
| Vacant | NAP | 0 | 0.0% | 98,388 | 100.0% | NAP | NAP | NAP |
| Total / Wtd. Avg. | 1 | 98,388 | 100.0% | $29.00 | 100.0% | |||
| (1) | Based on the underwritten rent roll as of December 6, 2020. |
Cash Flow Analysis.
| Cash Flow Analysis(1) | ||||||
| 2018 | 2019 | T-12 6/30/2020 | U/W | U/W PSF | ||
| Base Rent(2) | $2,306,760 | $2,306,760 | $2,306,760 | $2,853,252 | $29.00 | |
| Vacant Income | 0 | 0 | 0 | 0 | 0.00 | |
| Reimbursements | 477,558 | 962,921 | 739,256 | 1,147,865 | 11.67 | |
| Mark-to-Market Adjustment | 0 | 0 | 0 | (388,901) | (3.95) | |
| Vacancy & Credit Loss | 0 | 0 | 0 | (180,611) | (1.84) | |
| Other Income | 0 | 0 | 0 | 0 | 0.00 | |
| Effective Gross Income | $2,784,318 | $3,269,791 | $3,046,126 | $3,431,605 | $34.88 | |
| Total Operating Expenses | 995,501 | 1,118,388 | 1,165,419 | 1,147,865 | 11.67 | |
| Net Operating Income | $1,788,817 | $2,151,403 | $1,880,707 | $2,283,740 | $23.21 | |
| TI/LC | 0 | 0 | 0 | 98,388 | 1.00 | |
| Capital Expenditures | 0 | 0 | 0 | 19,678 | 0.20 | |
| Net Cash Flow | $1,788,817 | $2,151,403 | $1,880,707 | $2,165,675 | $22.01 | |
| (1) | Certain items such as interest expense, interest income, lease cancellation income, depreciation, amortization, debt service payments and any other non-recurring or non-operating items were excluded from the historical presentation and are not considered for the underwritten cash flow. |
| (2) | U/W Base Rent is based on the underwritten rent roll as of December 6, 2020. No rent steps have been underwritten. |
THE INFORMATION IN THIS STRUCTURAL AND COLLATERAL TERM SHEET IS NOT COMPLETE AND MAY BE AMENDED PRIOR TO THE TIME OF SALE. THIS TERM SHEET IS NOT AN OFFER TO SELL THESE SECURITIES AND IT IS NOT A SOLICITATION OF AN OFFER TO BUY THESE SECURITIES IN ANY JURISDICTION WHERE THE OFFER OR SALE IS NOT PERMITTED.
154
201 8th Avenue South Nashville, TN 37203 | Collateral Asset Summary – Loan No. 15 JW Marriott Nashville | Cut-off Date Balance: Cut-off Date LTV: U/W NCF DSCR: U/W NOI Debt Yield: | $20,000,000 61.5% 4.17x 15.3% |
| Mortgage Loan Information | |
| Loan Seller: | GSMC |
| Loan Purpose: | Refinance |
| Borrower Sponsor: | Jacquelyn Soffer |
| Borrower: | 8th & Demonbreun Hotel LP |
| Original Balance(1): | $20,000,000 |
| Cut-off Date Balance(1): | $20,000,000 |
| % by Initial UPB: | 2.5% |
| Interest Rate: | 3.13900% |
| Payment Date: | 6th of each month |
| First Payment Date: | April 6, 2020 |
| Maturity Date: | March 6, 2030 |
| Amortization: | Interest Only |
| Additional Debt(1): | $165,000,000 Pari Passu Debt |
| Call Protection(2): | L(33), D(80), O(7) |
| Lockbox / Cash Management: | Hard / Springing |
| Reserves | |||
| Initial | Monthly | Cap | |
| Taxes: | $0 | Springing(3) | NAP |
| Insurance: | $0 | Springing(3) | NAP |
| Replacement: | $1,875,692 | Springing(4) | NAP |
| Debt Service Reserve: | $8,831,707(5) | $0 | NAP |
| Property Information | |
| Single Asset / Portfolio: | Single Asset |
| Property Type: | Full Service Hospitality |
| Collateral: | Fee Simple / Leasehold |
| Location: | Nashville, TN |
| Year Built / Renovated: | 2018 / NAP |
| Total Rooms: | 533 |
| Property Management: | TB All Fees Operating LP |
| Underwritten NOI: | $28,345,145 |
| Underwritten NCF: | $24,567,151 |
| Appraised Value: | $301,000,000 |
| Appraisal Date: | November 10, 2020 |
| Historical NOI | |
| Most Recent NOI: | $7,783,401 (TTM September 30, 2020) |
| 2019 NOI: | $28,553,670 (December 31, 2019) |
| 2018 NOI(6): | NAV |
| 2017 NOI(6): | NAV |
| Historical Occupancy | |
| Most Recent Occupancy: | 44.1% (TTM September 30, 2020) |
| 2019 Occupancy: | 85.5% (December 31, 2019) |
| 2018 Occupancy(6): | NAV |
| 2017 Occupancy(6): | NAV |
| Financial Information(1) | ||||||
| Tranche | Cut-off Date Balance | Balance per Room Cut-off / Balloon | LTV Cut-off / Balloon | U/W DSCR NOI / NCF | U/W Debt Yield NOI / NCF | U/W Debt Yield at Balloon NOI / NCF |
| Mortgage Loan | $20,000,000 | |||||
| Pari Passu Notes | 165,000,000 | |||||
| Whole Loan | $185,000,000 | $347,092 / $347,092 | 61.5% / 61.5% | 4.81x / 4.17x | 15.3% / 13.3% | 15.3% / 13.3% |
| (1) | The JW Marriott Nashville loan consists of the non-controlling Note A-5 (the “JW Marriott Nashville Loan”) and is part of a whole loan evidenced by nine pari passu promissory notes having an aggregate outstanding principal balance as of the Cut-off Date of approximately $185.0 million (the “JW Marriott Nashville Whole Loan”). See “Whole Loan Summary” chart herein. |
| (2) | The lockout period will be at least 33 payments beginning with and including the first payment date of April 6, 2020. The borrower has the option to defease the full $185.0 million JW Marriott Nashville Whole Loan after the earlier to occur of (i) two years after the closing date of the securitization that includes the last note to be securitized and (ii) March 6, 2023. The lockout period of 33 payments is based on the expected Benchmark 2020-B22 transaction closing date occurring in December 2020. The actual lockout period may be longer. |
| (3) | On each due date during the continuance of a JW Marriott Nashville Trigger Period (pursuant to clause (i) or (iii) of such definition), the borrower is required to fund a property tax and insurance reserve in an amount equal to one-twelfth of the amount of property taxes and insurance premiums that the lender reasonably estimates will be payable during the next 12 ensuing months. A “JW Marriott Nashville Trigger Period” means any period (i) commencing when the debt yield (as calculated under the loan documents), determined as of the conclusion of the second of any two consecutive fiscal quarters ending upon or following the conclusion of the second fiscal quarter of 2022, is less than 7.5%, and ending when the debt yield, determined as of the conclusion of the second of any two consecutive fiscal quarters thereafter, is equal to or greater than 7.5%; (ii) commencing upon the date of any withdrawal from the FF&E reserve in order to pay debt service, and ending on the later of the date upon which (a) the borrower has replenished the FF&E reserve for any amounts previously withdrawn to pay debt service, and (b) withdrawals from the FF&E reserve to pay debt service are no longer permitted under the loan documents; and (iii) commencing when the borrower fails to deliver required quarterly or annual financial reports and ending when such reports are delivered and indicate that no other JW Marriott Nashville Trigger Period is ongoing. |
| (4) | On each due date beginning in April 2021, the borrower is required to fund a replacement reserve in an amount equal to (i) from the due date in April 2021 up to and including the due date in July 2023, 3.0% of gross revenues and (ii) from and after the due date in August 2023, 4.0% of gross revenues. The borrower may use amounts in the replacement reserve to make debt service payments on the JW Marriott Nashville Whole Loan, up to an amount of $1,876,087. The borrower will be required to replenish the replacement reserve for any amounts previously withdrawn to pay debt service. |
| (5) | On October 6, 2020, the borrower funded a debt service reserve in an amount equal to $8,831,707. On each due date from (and including) October 2020 through (and including) March 2022, the lender is required to apply funds from the debt service reserve to make debt service payments under the JW Marriott Nashville Whole Loan. |
| (6) | The JW Marriott Nashville Property (as defined below) was built in 2018, therefore historical information is unavailable. |
THE INFORMATION IN THIS STRUCTURAL AND COLLATERAL TERM SHEET IS NOT COMPLETE AND MAY BE AMENDED PRIOR TO THE TIME OF SALE. THIS TERM SHEET IS NOT AN OFFER TO SELL THESE SECURITIES AND IT IS NOT A SOLICITATION OF AN OFFER TO BUY THESE SECURITIES IN ANY JURISDICTION WHERE THE OFFER OR SALE IS NOT PERMITTED.
155
201 8th Avenue South Nashville, TN 37203 | Collateral Asset Summary – Loan No. 15 JW Marriott Nashville | Cut-off Date Balance: Cut-off Date LTV: U/W NCF DSCR: U/W NOI Debt Yield: | $20,000,000 61.5% 4.17x 15.3% |
| Whole Loan Summary | ||||
| Note | Original Balance | Cut-off Date Balance | Note Holder | Controlling Piece |
| A-1 | $50,000,000 | $50,000,000 | GSBI | Yes(1) |
| A-2 | 40,000,000 | 40,000,000 | GSBI | No |
| A-3 | 25,000,000 | 25,000,000 | GSMS 2020-GSA2(2) | No |
| A-4 | 20,000,000 | 20,000,000 | Benchmark 2020-B21 | No(1) |
| A-5 | 20,000,000 | 20,000,000 | Benchmark 2020-B22 | No |
| A-6 | 10,000,000 | 10,000,000 | GSMS 2020-GSA2(2) | No |
| A-7 | 10,000,000 | 10,000,000 | GSBI | No |
| A-8 | 5,000,000 | 5,000,000 | GSBI | No |
| A-9 | 5,000,000 | 5,000,000 | GSBI | No |
| Total | $185,000,000 | $185,000,000 | ||
| (1) | The JW Marriott Nashville Whole Loan is serviced under the pooling and servicing agreement governing the Benchmark 2020-B21 securitization. From and after the securitization of the controlling Note A-1 held by Goldman Sachs Bank USA (“GSBI”), the JW Marriott Whole Loan will be serviced under the pooling and servicing agreement governing such securitization. |
| (2) | The GSMS 2020-GSA2 securitization transaction is expected to close prior to the Closing Date. |
The JW Marriott Nashville Whole Loan, which accrues interest at an interest rate of 3.13900% per annum, has an outstanding principal balance as of the Cut-Off Date of approximately $20.0 million. The JW Marriott Nashville Whole Loan had an initial term of 120 months and has a remaining term of 111 months. The proceeds of The JW Marriott Nashville Whole Loan were primarily used to refinance, fund upfront reserves, and cover origination costs. Based on the “as-is” appraised value of $301.0 million as of the November 10, 2020 appraisal, the JW Marriott Nashville Whole Loan Cut-Off Date LTV Ratio is 61.5%.
The most recent prior financing of The JW Marriott Nashville Property was not included in a prior securitization transaction.
| Sources and Uses | ||||||
| Sources | Proceeds | % of Total | Uses | Proceeds | % of Total | |
| Whole Loan | $185,000,000 | 97.4% | Loan Payoff | $184,529,539 | 97.1% | |
| Principal’s New Cash Contribution | 5,002,002 | 2.6 | Closing Costs | 3,596,771 | 1.9 | |
| Reserves | 1,875,692 | 1.0 | ||||
| Total Sources | $190,002,002 | 100.0% | Total Uses | $190,002,002 | 100.0% | |
The Borrower / Borrower Sponsor. The borrower is 8th & Demonbreun Hotel LP, a Delaware limited partnership. Legal counsel to the borrower delivered a non-consolidation opinion in connection with the origination of the JW Marriott Nashville Whole Loan. The borrower sponsor and non-recourse carveout guarantor under the JW Marriott Nashville Whole Loan is Jacquelyn Soffer.
The Property. The JW Marriott Nashville Property, located in downtown Nashville, is a full service lodging facility built in 2018 (the “JW Marriott Nashville Property”). The JW Marriott Nashville Property encompasses approximately 2.72 acres, consisting of the borrower’s fee interest in a 33-story, 533-room hotel (the “Hotel Parcel”) and leasehold interest in a portion of a 300 space parking garage. The JW Marriott Nashville Property offers amenities including multiple food/beverage outlets, an outdoor pool and amenities deck, fitness center, spa, business center, concierge lounge, retail store, sundry shop, and approximately 50,000 sq. ft. of meeting space. Guestrooms range from one to two bedrooms. Standard room amenities include a flat-panel television, high-speed internet, and a lounge chair/loveseat. The guest bathrooms are finished with marble tile flooring, granite vanity countertops, and a glass enclosed walk-in shower. Luxury suites are also available with additional amenities. The lobby level includes the Stompin Grounds Restaurant and Market as well as the Cumberland Bar. The Cabana Club is a poolside bar and grill. The JW Marriott Nashville Property carries the JW Marriott flag under a franchise agreement that expires on July 1, 2048.
COVID-19 Update. After January and February 2020, the JW Marriott Nashville Property operated at a 37.4% occupancy and $293 ADR in March 2020. The JW Marriott Nashville Property generated an NCF of $78,666 in March 2020. The JW Marriott Nashville Property was closed from April 8, 2020 to June 14, 2020.
In April 2020, the JW Marriott Nashville Whole Loan was modified to permit the use of FF&E reserve funds to pay debt service, and the borrower sponsor provided a guaranty for (i) debt service payments through October 2020, and (ii) taxes and insurance payments that the guarantor is liable for to the extent they are due and payable prior to the earlier to occur of (1) a conclusion of the JW Marriott Nashville Trigger Period (as defined above) or (2) the date on which the JW Marriott Nashville Whole Loan has been indefeasibly paid in full in cash. In October 2020, the JW Marriott Nashville Whole Loan was further modified to waive the requirement to fund the FF&E reserve until April 2021, waive the cash management debt yield trigger through the second quarter of 2022, and otherwise permanently decrease the debt yield trigger level from 10% to 7.5%, in exchange for the borrower funding an 18-month debt service reserve to be applied to monthly payments from October 2020 through March 2022.
THE INFORMATION IN THIS STRUCTURAL AND COLLATERAL TERM SHEET IS NOT COMPLETE AND MAY BE AMENDED PRIOR TO THE TIME OF SALE. THIS TERM SHEET IS NOT AN OFFER TO SELL THESE SECURITIES AND IT IS NOT A SOLICITATION OF AN OFFER TO BUY THESE SECURITIES IN ANY JURISDICTION WHERE THE OFFER OR SALE IS NOT PERMITTED.
156
201 8th Avenue South Nashville, TN 37203 | Collateral Asset Summary – Loan No. 15 JW Marriott Nashville | Cut-off Date Balance: Cut-off Date LTV: U/W NCF DSCR: U/W NOI Debt Yield: | $20,000,000 61.5% 4.17x 15.3% |
The JW Marriott Nashville Property re-opened on June 15, 2020. However, on July 3, 2020 the Nashville mayor shut down bars through July 2020 given a rise in the infection rate. This resulted in the JW Marriott Nashville Property losing 400 leisure room nights for July and August 2020 and achieving an 18% occupancy rate for July and 20% occupancy rate for August 2020 at a rate of $211 and $203 respectively. See “Risk Factors—Special Risks—Coronavirus Pandemic Has Adversely Affected the Global Economy and Will Likely Adversely Affect the Performance of the Mortgage Loans” in the Preliminary Prospectus.
Cash Flow Analysis.
| Cash Flow Analysis(1) | |||||
| 2019 | January 2020 TTM | September 2020 TTM | U/W | U/W Per Room | |
| Occupancy | 85.5% | 85.8% | 44.1% | 85.8% | |
| ADR | $294.74 | $295.53 | $277.42 | $295.53 | |
| RevPAR | $251.86 | $253.69 | $122.29 | $253.69 | |
| Room Revenue | $48,994,085 | $49,350,453 | $23,790,872 | $49,350,452 | $92,590 |
| Food & Beverage Revenue | 38,988,924 | 39,009,534 | 19,749,159 | 39,009,533 | $73,189 |
| Other Operating Dept Revenue | 3,998,700 | 4,020,501 | 2,242,056 | 4,020,500 | $7,543 |
| Other Revenue(2) | 1,695,488 | 2,069,358 | 2,463,134 | 2,069,357 | $3,882 |
| Total Revenue | $93,677,197 | $94,449,846 | $48,245,221 | $94,449,843 | $177,204 |
| Room Expense | 9,809,498 | 9,923,487 | 5,385,294 | 9,923,487 | $18,618 |
| Food & Beverage Expense | 25,687,127 | 25,675,660 | 14,055,996 | 25,675,660 | $48,172 |
| Other Expense | 1,766,043 | 1,758,953 | 1,171,880 | 1,758,953 | $3,300 |
| Total Departmental Expenses | $37,262,668 | $37,358,100 | $20,613,170 | $37,358,100 | $70,090 |
| Total General/Unallocated Expense | 22,958,526 | 23,125,488 | 15,191,639 | 22,986,367 | $43,126 |
| Total Fixed Expense | 4,902,333 | 4,868,375 | 4,657,010 | 5,760,230 | $10,807 |
| Total Expenses | $65,123,527 | $65,351,963 | $40,461,820 | $66,104,698 | $124,024 |
| Net Operating Income(3) | 28,553,670 | 29,097,883 | 7,783,401 | 28,345,145 | 53,180 |
| FF&E | 1,420,973 | 1,475,927 | 852,165 | 3,777,994 | 7,088 |
| Net Cash Flow | $27,132,697 | $27,621,956 | $6,931,237 | $24,567,151 | $46,092 |
| (1) | Certain items such as straight line rent, interest expense, interest income, depreciation, amortization, debt service payments and any other non-recurring or non-operating items were excluded from the historical presentation and are not considered for the underwritten cash flow. |
| (2) | Other revenue includes guaranteed no shows, miscellaneous room revenue, and early / late departure fees. |
| (3) | The increase in UW Net Operating Income is primarily attributable to the JW Marriott Nashville Property’s closure from April 8, 2020 to June 14, 2020. See “-COVID-19 Update”. We cannot assure you the JW Marriott Nashville Property will revert to pre-COVID performance as expected or at all. |
THE INFORMATION IN THIS STRUCTURAL AND COLLATERAL TERM SHEET IS NOT COMPLETE AND MAY BE AMENDED PRIOR TO THE TIME OF SALE. THIS TERM SHEET IS NOT AN OFFER TO SELL THESE SECURITIES AND IT IS NOT A SOLICITATION OF AN OFFER TO BUY THESE SECURITIES IN ANY JURISDICTION WHERE THE OFFER OR SALE IS NOT PERMITTED.
157
STATEMENT REGARDING ASSUMPTIONS AS TO SECURITIES, PRICING ESTIMATES AND
OTHER INFORMATION
This material is for your information, and none of Deutsche Bank Securities Inc., J.P. Morgan Securities LLC, Citigroup Global Markets Inc., Goldman Sachs & Co. LLC, Academy Securities, Inc. and Drexel Hamilton, LLC or any other underwriter (the “Underwriters”) are soliciting any action based upon it. This material is not to be construed as an offer to sell or the solicitation of any offer to buy any security in any jurisdiction where such an offer or solicitation would be illegal.
Neither this document nor anything contained herein shall form the basis for any contract or commitment whatsoever. The information contained herein is preliminary as of the date hereof. These materials are subject to change, completion or amendment from time to time. The information contained herein will be superseded by similar information delivered to you as part of the preliminary prospectus relating to the Benchmark 2020-B22 Mortgage Trust Commercial Mortgage Pass-Through Certificates, Series 2020-B22 (the "Offering Document"). The information contained herein supersedes any such information previously delivered and should be reviewed only in conjunction with the entire Offering Document. All of the information contained herein is subject to the same limitations and qualifications contained in the Offering Document. The information contained herein does not contain all relevant information relating to the underlying mortgage loans or mortgaged properties. Such information is described elsewhere in the Offering Document. The information contained herein will be more fully described elsewhere in the Offering Document. The information contained herein should not be viewed as projections, forecasts, predictions or opinions with respect to value. Prior to making any investment decision, prospective investors are strongly urged to read the Offering Document its entirety. Neither the Securities and Exchange Commission nor any state securities commission has approved or disapproved of these securities or determined if this free writing prospectus is truthful or complete. Any representation to the contrary is a criminal offense.
The attached information contains certain tables and other statistical analyses (the “Computational Materials”) which have been prepared in reliance upon information furnished by the Mortgage Loan Sellers. Numerous assumptions were used in preparing the Computational Materials, which may or may not be reflected herein. As such, no assurance can be given as to the Computational Materials’ accuracy, appropriateness or completeness in any particular context; or as to whether the Computational Materials and/or the assumptions upon which they are based reflect present market conditions or future market performance. The Computational Materials should not be construed as either projections or predictions or as legal, tax, financial or accounting advice. You should consult your own counsel, accountant and other advisors as to the legal, tax, business, financial and related aspects of a purchase of these securities. Any weighted average lives, yields and principal payment periods shown in the Computational Materials are based on prepayment and/or loss assumptions, and changes in such prepayment and/or loss assumptions may dramatically affect such weighted average lives, yields and principal payment periods. In addition, it is possible that prepayments or losses on the underlying assets will occur at rates higher or lower than the rates shown in the attached Computational Materials. The specific characteristics of the securities may differ from those shown in the Computational Materials due to differences between the final underlying assets and the preliminary underlying assets used in preparing the Computational Materials. The principal amount and designation of any security described in the Computational Materials are subject to change prior to issuance. None of Underwriters or any of their respective affiliates makes any representation or warranty as to the actual rate or timing of payments or losses on any of the underlying assets or the payments or yield on the securities.
This document contains forward-looking statements. Those statements are subject to certain risks and uncertainties that could cause the success of collections and the actual cash flow generated to differ materially from the information set forth herein. While such information reflects projections prepared in good faith based upon methods and data that are believed to be reasonable and accurate as of the dates thereof, the depositor undertakes no obligation to revise these forward-looking statements to reflect subsequent events or circumstances. Individuals should not place undue reliance on forward-looking statements and are advised to make their own independent analysis and determination with respect to the forecasted periods, which reflect the issuer’s view only as of the date hereof.
IMPORTANT NOTICE RELATING TO AUTOMATICALLY GENERATED EMAIL DISCLAIMERS
Any legends, disclaimers or other notices that may appear at the bottom of the email communication to which this free writing prospectus is attached relating to (1) these materials not constituting an offer (or a solicitation of an offer), (2) no representation being made that these materials are accurate or complete and may not be updated or (3) these materials possibly being confidential, are not applicable to these materials and should be disregarded. Such legends, disclaimers or other notices have been automatically generated as a result of these materials having been sent via Bloomberg or another system.
THE INFORMATION IN THIS STRUCTURAL AND COLLATERAL TERM SHEET IS NOT COMPLETE AND MAY BE AMENDED PRIOR TO THE TIME OF SALE. THIS TERM SHEET IS NOT AN OFFER TO SELL THESE SECURITIES AND IT IS NOT A SOLICITATION OF AN OFFER TO BUY THESE SECURITIES IN ANY JURISDICTION WHERE THE OFFER OR SALE IS NOT PERMITTED.
158