Exhibit 99.2
ANSYS, INC. FOURTH QUARTER AND FY 2015
EARNINGS ANNOUNCEMENT
PREPARED REMARKS
February 25, 2016
ANSYS is providing a copy of its prepared remarks in combination with its earnings announcement. These remarks are offered to provide stockholders and analysts with additional time and detail for analyzing our Q4 and FY 2015 results in advance of our quarterly conference call. As previously announced, the conference call will begin today, February 25, 2016, at 10:30 a.m. Eastern Time and will include only brief overview comments followed by questions and answers. These prepared remarks will not be read on the call.
To access the live broadcast, please visit the Investor Relations section of ANSYS’ website at http://investors.ansys.com and click on events & presentations, then webcasts. The call can also be heard by dialing (866) 652-5200 (US) or (412) 317-6060 (CAN & INT’L) at least five minutes prior to the call and referencing conference code 10079946. A replay will be available within two hours of the call’s completion at http://investors.ansys.com or at (877) 344-7529 (US), (855) 669-9658 (CAN) or (412) 317-0088 (INT’L) and referencing the access code 10079946.
NON-GAAP SUPPLEMENTAL INFORMATION
In addition to our GAAP information, ANSYS has historically provided non-GAAP supplemental information. Our reasons for providing this information are described later in this document, as well as in our Q4 2015 earnings press release, which can be found on our website in the press release section. Reconciliations of GAAP to non-GAAP information are also provided. In line with our historical practice, the financial information below is presented on a supplemental, non-GAAP basis unless otherwise indicated.
FOURTH QUARTER AND FY 2015 OVERVIEW
The fourth quarter financial results performed within our Q4 guidance range for revenue and above the range for earnings. Other areas of strength in the quarter included record cash flows, a year-end record deferred revenue and backlog balance of $504 million and an industry-leading non-GAAP operating margin of 47.5%. We reported consolidated non-GAAP revenue of $252.0 million, an increase of 4% in constant currency and at the low end of our expectations. For the fourth quarter, lease license revenue grew 7%, perpetual licenses decreased 8% and maintenance revenue grew 13%, all in constant currency. We also achieved non-GAAP EPS of $0.91 in the fourth quarter. The perpetual license and overall revenue growth rates were adversely affected by the deferred recognition of perpetual license revenue, dominated by approximately $6 million from a single customer sale during the fourth quarter. This was compounded by weaker performance in our Asia-Pacific business which tends to have a higher proportion of perpetual licenses.
For the full year, consolidated revenue increased 7% in constant currency to $944.5 million and we reported diluted EPS of $3.42, which was within the guidance range that we initially provided in February 2015. Our financial performance for FY 2015 included total cash flows from operations of $367.5 million that substantially funded several acquisitions, as well as the repurchase of 3.8 million shares of stock.
The following are notable highlights from Q4 and FY 2015:
| · | | Our perpetual license revenue decreased 8% for Q4 and grew 3% for FY 2015 in constant currency. Our lease license revenue grew 7% in Q4 and 5% in FY 2015, both in constant currency, while our maintenance revenue grew 13% in constant currency for each of Q4 and FY 2015. Both lease licenses and maintenance contributed to our recurring revenue base continuing to remain strong at 70% of Q4 revenue and 72% of FY 2015 revenue. There was continued progress in enterprise portfolio sales efforts, cross-selling and customer engagement activities which contributed to building the deferred revenue and backlog balance to $504.0 million at December 31, 2015, as well as the overall sales pipeline for Q1 2016 and beyond. |
| · | | The fourth quarter perpetual license and overall growth rates were adversely affected by a perpetual license sale in excess of $6 million from a single customer that is being recognized over a 26-month period as a result of the absence of vendor-specific objective evidence of fair value on other deliverables in the arrangement. |
| · | | During Q4 2015, we had 34 customers with orders in excess of $1 million, including one customer with orders in excess of $25 million. In Q4 of 2014, we had 35 customers with orders in excess of $1 million. For fiscal year 2015 we had 130 customers with orders in excess of $1 million, as compared to 122 customers with orders in excess of $1 million in 2014. |
| · | | As we stated throughout the year, we have made, and will continue to make, changes in and investments across many aspects of our business. These investments will continue to be balanced against the ongoing macroeconomic realities facing both ANSYS and our customers. The non-GAAP operating margins for the fourth quarter and FY 2015 were 47.5% in both periods. |
| · | | During the fourth quarter, we repurchased approximately 1.0 million shares of common stock at an average price of $91.49 per share. During FY 2015, we repurchased approximately 3.8 million shares at an average price of $88.16 per share. During FY 2014, we repurchased a total of 3.0 million shares at an average price of $78.54. |
| · | | Total headcount on December 31, 2015 was approximately 2,770, a net increase of approximately 10 FTE’s as compared to September 30, 2015 and a net increase of approximately 55 FTE’s as compared to December 31, 2014. Total headcount reflects the addition of new hires as well as employees from acquisitions completed in 2015. |
| · | | Our direct and indirect businesses contributed 76% and 24% of revenue, respectively, for both Q4 and FY 2015. |
| · | | In December 2015, the Company released a version of ANSYS SpaceClaim™ with new features to empower users to quickly and easily manipulate 3-D models across the entire product development cycle. This will decrease the time needed to reverse-engineer parts or prepare models for 3-D printing. At the same time, ANSYS FENSAP-ICE™ and ANSYS FENSAP-ICE Turbo™ were launched with comprehensive state-of-the-art capabilities for aircraft icing simulation. These releases provide integration with ANSYS CFX® and enable aerospace engineers to predict inflight icing for aircraft, engines, probes and components more efficiently and accurately. |

The ANSYS IR App – now available for download on iTunes and Google Play. Want to keep track of your investment in ANSYS? Receive real-time updates when new press releases, SEC filings, events and other content are posted? Then download the ANSYS IR App for free today and you will be able to access all of this content and more online or offline – great for when you are traveling or out of the office.
DEFERRED REVENUE AND BACKLOG
| (in thousands) | | December 31,
2015 | | September 30,
2015 | | December 31,
2014 | | September 30,
2014 |
| Current Deferred Revenue | | $ | 364,644 | | | $ | 319,705 | | | $ | 332,664 | | | $ | 301,026 | |
| Current Backlog | | | 47,015 | | | | 43,701 | | | | 41,390 | | | | 46,213 | |
| Total Current Deferred Revenue and Backlog | | $ | 411,659 | | | $ | 363,406 | | | $ | 374,054 | | | $ | 347,239 | |
| | | | | | | | | | | | | | | | | |
| Long-Term Deferred Revenue | | $ | 15,096 | | | $ | 14,480 | | | $ | 12,641 | | | $ | 13,292 | |
| Long-Term Backlog | | | 77,275 | | | | 58,315 | | | | 81,595 | | | | 72,930 | |
| Total Long-Term Deferred Revenue and Backlog | | $ | 92,371 | | | $ | 72,795 | | | $ | 94,236 | | | $ | 86,222 | |
| | | | | | | | | | | | | | | | | |
| Total Deferred Revenue and Backlog | | $ | 504,030 | | | $ | 436,201 | | | $ | 468,290 | | | $ | 433,461 | |
As a result of the fair value provisions applicable to the accounting for business combinations, the Company typically records acquired deferred revenue at an amount that is lower than the historical carrying value. The impact of this adjustment on GAAP revenue was $0.4 million and $1.7 million for Q4 2015 and FY 2015, respectively. The expected impact of this adjustment on GAAP revenue is insignificant for both Q1 2016 and for FY 2016.
NON-GAAP REVENUE
| ANSYS, Inc. |
| Q4 2015 vs. Q4 2014 REVENUE COMPARISON |
| (Unaudited) |
| ($ in thousands) | | Non-GAAP Revenue | | |
| | | Q4 2015 | | % of
Total | | Q4 2014 | | % of
Total | | Q4 15 vs.
Q4 14 %
Growth | | Q4 15 vs. Q4 14 %
GROWTH in
CONSTANT
CURRENCY |
| | | | | | | | | | | | | |
| Total Lease | | $81,848 | | 32.5% | | $80,284 | | 31.4% | | 1.9% | | 6.5% |
| | | | | | | | | | | | | |
| Total Perpetual | | $67,856 | | 26.9% | | $77,928 | | 30.5% | | -12.9% | | -8.5% |
| | | | | | | | | | | | | |
| Total Maintenance | | $95,184 | | 37.8% | | $89,427 | | 35.0% | | 6.4% | | 12.9% |
| | | | | | | | | | | | | |
| Total Service | | $7,119 | | 2.8% | | $7,850 | | 3.1% | | -9.3% | | -3.5% |
| | | | | | | | | | | | | |
| Total Q4 | | $252,007 | | 100.0% | | $255,489 | | 100.0% | | -1.4% | | 3.9% |
| ANSYS, Inc. |
| 2015 YTD vs. 2014 YTD REVENUE COMPARISON |
| (Unaudited) |
| ($ in thousands) | | Non-GAAP Revenue | | |
| | | 2015 YTD | | % of
Total | | 2014 YTD | | % of
Total | | 2015 YTD vs.
2014 YTD
% Growth | | 2015 YTD vs.
2014 YTD
% GROWTH in
CONSTANT
CURRENCY |
| | | | | | | | | | | | | |
| Total Lease | | $317,038 | | 33.6% | | $320,100 | | 34.0% | | -1.0% | | 5.4% |
| | | | | | | | | | | | | |
| Total Perpetual | | $239,205 | | 25.3% | | $247,793 | | 26.3% | | -3.5% | | 3.1% |
| | | | | | | | | | | | | |
| Total Maintenance | | $365,147 | | 38.7% | | $348,582 | | 37.0% | | 4.8% | | 12.6% |
| | | | | | | | | | | | | |
| Total Service | | $23,088 | | 2.4% | | $24,967 | | 2.7% | | -7.5% | | 0.2% |
| | | | | | | | | | | | | |
| YTD | | $944,478 | | 100.0% | | $941,442 | | 100.0% | | 0.3% | | 7.3% |
In constant currency, total consolidated non-GAAP revenue increased 4% in Q4 2015 and increased 7% for FY 2015. We reported increases in our lease revenue in both Q4 and FY 2015, up 7% and 5% respectively, in constant currency. Perpetual licenses in Q4 decreased 8% and for FY 2015 were up 3% in constant currency, respectively. Our maintenance business continued to grow 13% for both Q4 and FY 2015, and our overall maintenance renewal rates continued to be strong.
NON-GAAP GEOGRAPHIC HIGHLIGHTS
| |
ANSYS, Inc. Q4 2015 vs. Q4 2014 GEOGRAPHIC COMPARISON |
| (Unaudited) |
| ($ in thousands) | | Non-GAAP Revenue | | |
| | | Q4 2015 | | % of
Total | | Q4 2014 | | % of
Total | | Q4 15 vs.
Q4 14
% Growth | | Q4 15 vs. Q4 14 %
GROWTH in
CONSTANT
CURRENCY |
| | | | | |
| North America | | $95,854 | | 38.0% | | $91,322 | | 35.7% | | 5.0% | | 5.4% |
| | | | | | | | | | | | | |
| Germany | | $25,476 | | 10.1% | | $26,449 | | 10.4% | | -3.7% | | 9.8% |
| United Kingdom | | $10,609 | | 4.2% | | $11,953 | | 4.7% | | -11.2% | | -7.1% |
| Other Europe | | $42,199 | | 16.7% | | $48,252 | | 18.9% | | -12.5% | | -0.7% |
| Total Europe | | $78,284 | | 31.1% | | $86,654 | | 33.9% | | -9.7% | | 1.6% |
| | | | | | | | | | | | | |
| Japan | | $26,810 | | 10.6% | | $26,353 | | 10.3% | | 1.7% | | 8.8% |
| Other Gen. Int'l Area | | $51,059 | | 20.3% | | $51,160 | | 20.0% | | -0.2% | | 2.5% |
| Total Gen. Int'l Area | | $77,869 | | 30.9% | | $77,513 | | 30.3% | | 0.5% | | 4.6% |
| | | | | | | | | | | | | |
| Total Q4 | | $252,007 | | 100.0% | | $255,489 | | 100.0% | | -1.4% | | 3.9% |
| ANSYS, Inc. |
| 2015 YTD vs. 2014 YTD GEOGRAPHIC COMPARISON |
| (Unaudited) |
| ($ in thousands) | | Non-GAAP Revenue | | |
| | | 2015 YTD | | % of
Total | | 2014 YTD | | % of
Total | | 2015 YTD vs.
2014 YTD
% Growth | | 2015 YTD vs.
2014 YTD
% GROWTH in
CONSTANT
CURRENCY |
| North America | | $368,435 | | 39.0% | | $335,866 | | 35.7% | | 9.7% | | 10.1% |
| | | | | | | | | | | | | |
| Germany | | $94,610 | | 10.0% | | $99,996 | | 10.6% | | -5.4% | | 11.1% |
| United Kingdom | | $39,238 | | 4.2% | | $43,275 | | 4.6% | | -9.3% | | -2.5% |
| Other Europe | | $156,548 | | 16.6% | | $176,586 | | 18.8% | | -11.3% | | 3.2% |
| Total Europe | | $290,396 | | 30.7% | | $319,857 | | 34.0% | | -9.2% | | 4.9% |
| | | | | | | | | | | | | |
| Japan | | $104,463 | | 11.1% | | $109,521 | | 11.6% | | -4.6% | | 8.7% |
| Other Gen. Int'l Area | | $181,184 | | 19.2% | | $176,198 | | 18.7% | | 2.8% | | 5.6% |
| Total Gen. Int'l Area | | $285,647 | | 30.2% | | $285,719 | | 30.3% | | 0.0% | | 6.8% |
| | | | | | | | | | | | | |
| YTD | | $944,478 | | 100.0% | | $941,442 | | 100.0% | | 0.3% | | 7.3% |
North America revenue grew 5% and 10% in constant currency for Q4 2015 and FY 2015, respectively. The Q4 2015 growth rate compares to a strong comparable in last year’s Q4 in which North America grew 12%. Of particular note for the year is the outstanding performance of the electronics and high-tech segment. The market-unique solution that ANSYS offers for a complete chip-package-system workflow, backed up by a broad solution portfolio and coupled with increasing market investments to support the Internet of Things trend resulted in a number of sales to customers in the high-tech industry.Outside of high-tech, strong performance continued in aerospace and defense, as well as automotive, as companies continued to rely on ANSYS technology to meet the needs of energy and fuel efficiency, safety and comfort, and the delivery of more innovative products in a more cost-effective way in the face of evolving competition and customer requirements. The impact of low oil prices continues to weigh on ANSYS’ North American energy and energy-related customers as they hold back on investment, reduce workforce and consider consolidation and realignment in the face of the new economic reality. This trend has also had a negative impact on the industrial equipment suppliers to the oil and gas industry and, consequently, ANSYS associated revenues from these sectors. The consolidation in the semiconductor segment, particularly among the large chip manufacturers, continues to elongate sales cycles and impact growth in our semiconductor business.
Sales hiring, pipeline building and customer engagement activities in North America remain strong as demand for innovation continues to drive simulation investments across a broad array of industries. Additionally, as we have been discussing throughout the course of the year, we continued to see increased interest from some of our long-standing and leading customers to expand their enterprise deployments of ANSYS’ platform and technologies. This is being driven by their own internal initiatives to accelerate the pace of innovation and productivity, while also looking to reduce overall spend through vendor consolidation efforts. North America had the largest number of these enterprise expansion deals in 2015. These deals also contributed to the growth in deferred revenue and backlog.
Europe continued to show progress and overall revenue growth for both Q4 and FY 2015, albeit with continued mixed results and pockets of lingering economic and geo-political issues. Europe as a whole delivered 2% and 5% constant currency revenue growth for Q4 and FY 2015, respectively. Germany continued to lead the region and delivered double-digit, constant currency revenue growth of 10% for Q4 and 11% for FY 2015. We saw growth and steady progress in countries such as Italy, Spain and the Netherlands. However, our performance in Europe continued to be adversely impacted in the fourth quarter as a result of weakness in markets such as the UK, France, Sweden and Russia. Overall, channel partner performance in both new business production and renewals improved in the fourth quarter.
Sales hiring and continued pipeline building continue to be major areas of focus in Europe. Qualitatively, the ANSYS industry performance trends for the quarter were similar to those described for North America. However, the impact of the low oil price has been felt less in ANSYS revenues in the energy industry, as reductions in oil and gas revenue in the UK and Nordic were more than offset by gains elsewhere in off-shore renewables, nuclear and power generation. While it is not anticipated that the recent automotive emissions scandal will materially impact ANSYS license and maintenance revenue, it could have a near term negative impact on our consulting revenue. This is just one of many real-world realties that highlight the increasing difficulty companies are facing to meet regulatory standards and over time will tend to increase their reliance on simulation-based approaches as they struggle to deal with these growing challenges.
The results in our General International Area (GIA) continued to demonstrate sustainable progress in Japan, our largest international market, which delivered 9% revenue growth in constant currency in both Q4 and FY 2015. China also contributed double-digit growth in the fourth quarter. Overall, the region delivered constant currency growth of 5% for Q4 and 7% for FY 2015.The Q4 growth was adversely impacted by struggles in our business in South Korea and Brazil. Additionally, as we have previously mentioned, business momentum in the Chinese state-owned enterprises has been notably slower throughout 2015. The channel partner performance, particularly on the new business front, was weakest in GIA for both the fourth quarter and the year.In the high-tech and electronics industries, revenues grew but at a slower pace than other regions, as intra- and inter-region competition impacted the performance of major companies. In the automotive industry, the Chinese economic situation impacted the off-road segment negatively. The energy segment performed relatively well due to ANSYS having a lower reliance on oil and gas revenues in this region and being buoyed by increased investments in renewables and nuclear. In the industrial equipment industry, continued focus on power generation also had a positive impact. Our primary focus as we head into 2016 will be on improving direct sales execution and productivity, as well as the new business production of our growing channel partner network in the region.
TECHNOLOGY UPDATES

Here are some of the reasons why we’re so excited about this new release:
ANSYS 17.0 delivers the most comprehensive set of physics features that we’ve released in our 45-year history. It provides engineering simulation solutions to teams across all disciplines, including structures, fluids, electronics, embedded software and systems engineering. Beyond just adding features, we’ve improved performance by a full order of magnitude, giving the customer 10x the productivity, 10x greater insight into the product design and 10x the performance to design and innovate more quickly and efficiently than ever.
Increasing Your Productivity by 10x with ANSYS 17
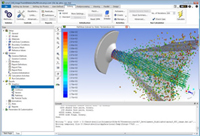
ANSYS 17.0 delivers solutions faster so that engineers can make better design decisions earlier in the product development cycle. We’ve made improvements across the entire workflow, from modeling to post-processing, radically accelerating results without compromising accuracy. In the fluids product line, there is a dramatic improvement in usability and interactivity. New ribbon-style toolbars and other improvements make navigation more intuitive, faster and reduce the number of mouse clicks necessary to perform a task. For those new to our software, they can jump in and become productive quickly. For the more experienced, there are new tools and options that expand the analysis capabilities.
When it comes to preparing geometry for analysis, ANSYS SpaceClaim Direct Modeler is already more efficient and faster than traditional CAD tools. With ANSYS 17.0, engineers will speed up their time to CAE even further, with improved performance for importing complex models and more tools for faster geometry creation and editing.
We’ve also expanded our ANSYS SCADE model-based, embedded software development and simulation environment. ANSYS 17.0 enables software engineers to be more productive with developing, testing and certifying embedded software. New industry-specific vertical solutions take full benefit from the openness and flexibility of the platform to facilitate OEM-supplier interactions while adhering to industry standards, such as ARINC 664/653, FACE and AUTOSAR.
 The chip-package-system design workflow for electronics is more tightly integrated and automated, and now includes across-the-board performance improvements for power integrity, signal integrity and EMI analyses. High-performance computing improvements over the past two releases give 20-60x performance gains for package and board simulation. In addition, a thermal analysis is now integrated and automated in ANSYS SIWave. Package engineers no longer need to use (or learn) a separate electronics cooling application — they can get robust and accurate thermal results in less than two minutes with just a few mouse clicks, a productivity improvement of over 100x!
ANSYS 17 – 10x Greater Insight
An increasingly rich suite of models and better post-processing gives engineering teams greater insight into their designs and real-world performance of their products.
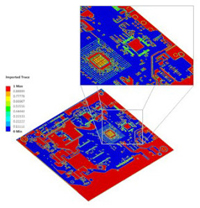
Mechanical engineers can now accurately model the multitude of layers and traces in a printed circuit board, a task that was previously impractical due to the size and complexity of the meshing. With ANSYS 17, ECAD geometry can now be directly imported, along with the metal trace data, to create a mesh with lower element counts to predict stress, deformation and fatigue caused by high-power densities. These capabilities enable you to design PCB layouts and thermal management strategies for more reliable electronic components.
System-level simulations involving mechanical and fluidic systems have also advanced in ANSYS 17.0. In this release, we have introduced native support for the industry-standard system modeling language, Modelica®. This language gives access to hundreds of additional mechanical and fluid component models in addition to the rich library for power electronics models already provided by our software. At the same time, advancements in the platform enable system engineers to more easily incorporate high-fidelity 3-D results into system-level models to verify that detailed component changes meet system-level requirements.
ANSYS 17 – 10x the Performance
 Of course, ANSYS continues to maintain its leadership in parallel performance. Our HPC architecture leverages the latest processor technologies. Simulations that once took weeks of computational time can now be solved in days or even hours. HPC for the structures suite has benefited from a number of performance advancements and can now address highly complex models with scaling up to 1,000 cores. By adding an HPC Workpack, structural analysts can increase their simulation throughput by 10x, and it doesn’t require a massive investment in hardware either— this power can be harnessed on most IT configurations, from desktops to cloud environments. Meanwhile, ANSYS Fluent smashed the previous world record by scaling up to 129,000 cores at 90 percent efficiency. Of course, ANSYS continues to maintain its leadership in parallel performance. Our HPC architecture leverages the latest processor technologies. Simulations that once took weeks of computational time can now be solved in days or even hours. HPC for the structures suite has benefited from a number of performance advancements and can now address highly complex models with scaling up to 1,000 cores. By adding an HPC Workpack, structural analysts can increase their simulation throughput by 10x, and it doesn’t require a massive investment in hardware either— this power can be harnessed on most IT configurations, from desktops to cloud environments. Meanwhile, ANSYS Fluent smashed the previous world record by scaling up to 129,000 cores at 90 percent efficiency.
|
| Automated 3-D Assembly |

ANSYS 2016 Investor Day
Thursday, June 2, 2016
9 AM - 4:15 PM |
Be sure to join us for the cocktail reception on June 1 from 6-8 pm
Hyatt Regency Pittsburgh International Airport
Hotel reservation deadline - Monday, May 16, 2016
Reserve your room today.
More detail on presenters and agenda to follow. | 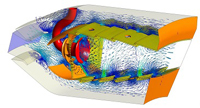 |
© 2016 ANSYS, Inc. All Rights Reserved.
2600 ANSYS Drive Canonsburg, PA 15317.
Trademark Statement |
INCOME STATEMENT HIGHLIGHTS
Q4 2015 MARGINS AND OUTLOOK: The respective non-GAAP gross and operating margins were 89.5% and 47.5% for
the fourth quarter, and 88.8% and 47.5% for FY 2015.
Looking ahead into Q1 2016, we are targeting a non-GAAP gross profit margin of approximately 88% - 89% and a non-GAAP operating margin of approximately 45%. Our current outlook for FY 2016 assumes a non-GAAP gross profit margin of 88% - 89% and a non-GAAP operating margin of 47% - 48%.
Q4 2015 TAX RATE AND OUTLOOK:Our Q4 non-GAAP effective tax rate was 31.6% and our GAAP rate was 30.4%. Our 2015 non-GAAP effective tax rate was 30.6% and the 2015 GAAP rate was 29.2%. The Q4 2015 tax rate was lower than the Company’s guidance as a result of the reinstatement of the U.S. research and development tax credit. The reinstatement resulted in approximately $2.6 million, or $0.03 diluted EPS, in incremental benefit.
Looking ahead into Q1 2016, we are currently forecasting an effective tax rate of approximately 32.8% - 33.8%. For FY 2016,
we are expecting an effective tax rate of approximately 32.0% - 33.0%. The 2016 effective tax rate exceeds that of 2015
primarily as a result of the expiration of a $3.1 million quarterly tax benefit associated with the Company’s restructuring of its
Japan subsidiaries in 2010.
BALANCE SHEET AND CASH FLOW HIGHLIGHTS
| · | Cash and short-term investments totaled $785 million as of December 31, 2015, of which 69% is held domestically. |
| | · | Cash flows from operations were $109 million for the fourth quarter of 2015, representing an increase of 18%. Operating cash flows for FY 2015 were $368 million and decreased 5% as compared to the prior year as a result of a stronger U.S. Dollar and an income tax refund of approximately $27 million in the first quarter of 2014 that did not recur in 2015. |
| | · | Consolidated net DSO of 35 days, an improvement of three days as compared to the prior year quarter. |
| | · | Capital expenditures totaled $5.4 million for the fourth quarter and $16.1 million for FY 2015. |
| | · | We are currently planning on total 2016 capital expenditures in the range of $20 - $25 million. |
SHARE COUNT AND SHARE REPURCHASE
We had 90.5 million fully diluted weighted average shares outstanding in Q4. We repurchased approximately 1.0 million shares during Q4 at an average price of $91.49 per share. During FY 2015, we repurchased approximately 3.8 million shares at an average price of $88.16.As of December 31, 2015, the Company had 2.1 million shares remaining in its authorized share repurchase program. In February 2016, the Company’s Board of Directors increased the authorized share repurchase program to 5.0 million shares.
We are currently expecting approximately 90 – 91 million fully diluted shares outstanding in Q1 2016 and approximately 90 million outstanding for FY 2016.
STOCK-BASED COMPENSATION EXPENSE
ANSYS, Inc.
STOCK-BASED COMPENSATION EXPENSE BREAKDOWN
| ($ in thousands) | | Three Months Ended | | Year-to-Date |
| | | | 12/31/2015 | | | | 12/31/2014 | | | | 12/31/2015 | | | | 12/31/2014 | |
| Cost of sales: | | | | | | | | | | | | | | | | |
| Software Licenses | | $ | 196 | | | $ | 487 | | | $ | 745 | | | $ | 1,776 | |
| Maintenance & Service | | | 436 | | | | 448 | | | | 1,868 | | | | 2,035 | |
| | | | | | | | | | | | | | | | | |
| Operating expenses: | | | | | | | | | | | | | | | | |
| SG&A | | | 4,115 | | | | 4,307 | | | | 17,153 | | | | 17,073 | |
| R&D | | | 3,473 | | | | 4,036 | | | | 14,185 | | | | 15,977 | |
| | | | | | | | | | | | | | | | | |
| Total Expense Before Taxes | | $ | 8,220 | | | $ | 9,278 | | | $ | 33,951 | | | $ | 36,861 | |
| Related Income Tax Benefits | | | (3,202 | ) | | | (3,224 | ) | | | (11,656 | ) | | | (10,927 | ) |
| Expense, net of taxes | | $ | 5,018 | | | $ | 6,054 | | | $ | 22,295 | | | $ | 25,934 | |
| | | | | | | | | | | | | | | | | |
CURRENCY
CURRENCY IMPACT COMPARED TO Q4 2014 and FY 2014: The 2015 fourth quarter revenue and operating income were unfavorably impacted by currency fluctuations of $13.4 million and $8.2 million, respectively. The FY 2015 revenue and operating income were unfavorably impacted by currency fluctuations of $66.0 million and $39.3 million, respectively.
CURRENCY OUTLOOK:The Company’s results have been, and will continue to be, impacted by currency fluctuations, particularly by rate movements in the Euro, British Pound and Japanese Yen. In our current outlook, we are establishing our currency rate assumptions for Q1 2016 at 1.10 - 1.13 for the Euro, 1.41 - 1.44 for the British Pound and 114 – 117 for the Japanese Yen. For FY 2016, our currency rate assumptions have been adjusted to include 1.10 – 1.13 for the Euro, 1.41 – 1.44 for the British Pound and 113 - 116 for the Japanese Yen. These rates compare to those provided with our previous FY 2016 guidance of 1.09 - 1.12 for the Euro, 1.52 - 1.55 for the British Pound and 119 - 122 for the Japanese Yen.
OUTLOOK
Q1 and FY 2016 OUTLOOK:
Based on our current sales visibility, the assumption of a continuation of a similar business climate to that we experienced in the fourth quarter along with a recent increase in economic uncertainty and market volatility, and updates to our previous currency rate assumptions, we are providing our initial outlook for Q1 2016. We are currently forecasting GAAP and non-GAAP revenue in the range of $224.0 - $232.0 million, non-GAAP diluted EPS in the range of $0.74 - $0.77 and GAAP diluted EPS in the range of $0.57 - $0.62.
We are updating our previous outlook for the full year of 2016 to reflect the increasing uncertainty and market volatility that is impacting both our customers and our business in the foreseeable future. Our updated outlook includes GAAP and non-GAAP revenue in the range of $995 million - $1,030 million ($1.03 billion). Our non-GAAP diluted EPS outlook for FY 2016 is in the range of $3.53 - $3.69, and we expect GAAP diluted EPS in the range of $2.86 - $3.05.
This outlook factors in updated currency rate assumptions, planned increases in sales capacity and other headcount additions, and our current visibility around sales pipelines and forecasts. However, as we have said in the past, and will continue to reiterate, there are many things that we have no control over, including the macro-economic environment, customer sentiment and procurement patterns, government and tax policies, and currency rate volatility. We do, however, have the benefit of a solid, repeatable business base; a diversified, geographic and industry footprint; and a world-class customer base that have helped us to succeed through uncertainties and volatility that have arisen in the past.
CLOSING COMMENTS
As we proceed through 2016, the emphasis will be a continued focus on execution and technological differentiation. Customer acceptance of our vision and unique value proposition, coupled with the investments we are making in the business and in the expansion of our systems approach to simulation, make us very optimistic about our long-term opportunity. We continue to be propelled by a strong combination of a solid business model, loyal customers, dedicated channel partners, great technology and talented, committed employees across the globe.
FORWARD-LOOKING STATEMENTS AND RISK FACTORS
Information provided by the Company or its spokespersons, including the above statements and any others in this document that refer to plans and expectations for the first quarter of 2016, FY 2016 and the future are forward-looking statements. The Company cautions investors that its performance (and, therefore, any forward-looking statement) is subject to risks and uncertainties. A detailed discussion of these risks and other factors that could affect ANSYS’ results is included in ANSYS’ SEC filings, including the report on Form 10-K for the year ended December 31, 2015, filed on February 25, 2016.
RECONCILIATION OF GAAP TO NON-GAAP MEASURES
ANSYS, INC. AND SUBSIDIARIES
Reconciliation of Non-GAAP Measures
(Unaudited)
(in thousands, except percentages and per share data)
| | | Three Months Ended |
| | | December 31, 2015 | | December 31, 2014 |
| | | As Reported | | Adjustments | | Non-
GAAP
Results | | As Reported | | Adjustments | | Non-
GAAP
Results |
| | | | | | | | | | | | | |
| Total revenue | | $ | 251,647 | | | | $ 360 (1) | | | $ | 252,007 | | | $ | 254,375 | | | | $ 1,114 (4) | | | $ | 255,489 | |
| Operating income | | | 96,943 | | | | 22,780 (2) | | | | 119,723 | | | | 94,048 | | | | 25,973 (5) | | | | 120,021 | |
| Operating profit margin | | | 38.5 | % | | | | | | | 47.5 | % | | | 37.0 | % | | | | | | | 47.0 | % |
| Net income | | $ | 68,021 | | | | $14,396 (3) | | | $ | 82,417 | | | $ | 69,633 | | | | $16,656 (6) | | | $ | 86,289 | |
| Earnings per share – diluted: | | | | | | | | | | | | | | | | | | | | | | | | |
| Diluted earnings per share | | $ | 0.75 | | | | | | | $ | 0.91 | | | $ | 0.74 | | | | | | | $ | 0.92 | |
| Weighted average shares - diluted | | | 90,549 | | | | | | | | 90,549 | | | | 93,584 | | | | | | | | 93,584 | |
| (1) | Amount represents the revenue not reported during the period as a result of the acquisition accounting adjustment associated with accounting for deferred revenue in business combinations. |
| (2) | Amount represents $14.2 million of amortization expense associated with intangible assets acquired in business combinations, $8.2 million of stock-based compensation expense and the $0.4 million adjustment to revenue as reflected in (1) above. |
| (3) | Amount represents the impact of the adjustments to operating income referred to in (2) above, adjusted for the related income tax impact of $8.4 million. |
| (4) | Amount represents the revenue not reported during the period as a result of the acquisition accounting adjustment associated with accounting for deferred revenue in business combinations. |
| (5) | Amount represents $15.5 million of amortization expense associated with intangible assets acquired in business combinations, $9.3 million of stock-based compensation expense, the $1.1 million adjustment to revenue as reflected in (4) above and $0.1 million of transaction expenses related to business combinations. |
| (6) | Amount represents the impact of the adjustments to operating income referred to in (5) above, adjusted for the related income tax impact of $9.3 million. |
ANSYS, INC. AND SUBSIDIARIES
Reconciliation of Non-GAAP Measures
(Unaudited)
(in thousands, except percentages and per share data)
| | | Twelve Months Ended |
| | | December 31, 2015 | | December 31, 2014 |
| | | As Reported | | Adjustments | | Non-
GAAP
Results | | As Reported | | Adjustments | | Non-
GAAP
Results |
| | | | | | | | | | | | | |
| Total revenue | | $ | 942,753 | | | | $ 1,725 (1) | | | $ | 944,478 | | | $ | 936,021 | | | | $ 5,421 (4) | | | $ | 941,442 | |
| Operating income | | | 353,679 | | | | 94,665 (2) | | | | 448,344 | | | | 347,450 | | | | 104,403 (5) | | | | 451,853 | |
| Operating profit margin | | | 37.5 | % | | | | | | | 47.5 | % | | | 37.1 | % | | | | | | | 48.0 | % |
| Net income | | $ | 252,521 | | | | $60,854 (3) | | | $ | 313,375 | | | $ | 254,690 | | | | $68,719 (6) | | | $ | 323,409 | |
| Earnings per share – diluted: | | | | | | | | | | | | | | | | | | | | | | | | |
| Diluted earnings per share | | $ | 2.76 | | | | | | | $ | 3.42 | | | $ | 2.70 | | | | | | | $ | 3.43 | |
| Weighted average shares - diluted | | | 91,502 | | | | | | | | 91,502 | | | | 94,194 | | | | | | | | 94,194 | |
| (1) | Amount represents the revenue not reported during the period as a result of the acquisition accounting adjustment associated with accounting for deferred revenue in business combinations. |
| (2) | Amount represents $58.1 million of amortization expense associated with intangible assets acquired in business combinations, $34.0 million of stock-based compensation expense, the $1.7 million adjustment to revenue as reflected in (1) above and $0.8 million of transaction expenses related to business combinations. |
| (3) | Amount represents the impact of the adjustments to operating income referred to in (2) above, adjusted for the related income tax impact of $33.8 million. |
| (4) | Amount represents the revenue not reported during the period as a result of the acquisition accounting adjustment associated with accounting for deferred revenue in business combinations. |
| (5) | Amount represents $61.0 million of amortization expense associated with intangible assets acquired in business combinations, $36.9 million of stock-based compensation expense, the $5.4 million adjustment to revenue as reflected in (4) above and $1.1 million of transaction expenses related to business combinations. |
| (6) | Amount represents the impact of the adjustments to operating income referred to in (5) above, adjusted for the related income tax impact of $35.7 million. |
USE OF NON-GAAP MEASURES
The Company provides non-GAAP revenue, non-GAAP operating income, non-GAAP operating profit margin, non-GAAP net income and non-GAAP diluted earnings per share as supplemental measures to GAAP regarding the Company's operational performance. These financial measures exclude the impact of certain items and, therefore, have not been calculated in accordance with GAAP. A detailed explanation of each of the adjustments to such financial measures is described below. This press release also contains a reconciliation of each of these non-GAAP financial measures to its most comparable GAAP financial measure.
Management uses non-GAAP financial measures (a) to evaluate the Company's historical and prospective financial performance as well as its performance relative to its competitors, (b) to set internal sales targets and spending budgets, (c) to allocate resources, (d) to measure operational profitability and the accuracy of forecasting, (e) to assess financial discipline over operational expenditures and (f) as an important factor in determining variable compensation for management and its employees. In addition, many financial analysts that follow the Company focus on and publish both historical results and future projections based on non-GAAP financial measures. The Company believes that it is in the best interest of its investors to provide this information to analysts so that they accurately report the non-GAAP financial information. Moreover, investors have historically requested, and the Company has historically reported, these non-GAAP financial measures as a means of providing consistent and comparable information with past reports of financial results.
While management believes that these non-GAAP financial measures provide useful supplemental information to investors, there are limitations associated with the use of these non-GAAP financial measures. These non-GAAP financial measures are not prepared in accordance with GAAP, are not reported by all of the Company's competitors and may not be directly comparable to similarly titled measures of the Company's competitors due to potential differences in the exact method of calculation. The Company compensates for these limitations by using these non-GAAP financial measures as supplements to GAAP financial measures and by reviewing the reconciliations of the non-GAAP financial measures to their most comparable GAAP financial measures.
The adjustments to these non-GAAP financial measures, and the basis for such adjustments, are outlined below:
Acquisition accounting for deferred revenue and its related tax impact. Historically, the Company has consummated acquisitions in order to support its strategic and other business objectives. In accordance with the fair value provisions applicable to the accounting for business combinations, acquired deferred revenue is often recorded on the opening balance sheet at an amount that is lower than the historical carrying value. Although this acquisition accounting requirement has no impact on the Company's business or cash flow, it adversely impacts the Company's reported GAAP revenue in the reporting periods following an acquisition. In order to provide investors with financial information that facilitates comparison of both historical and future results, the Company provides non-GAAP financial measures which exclude the impact of the acquisition accounting adjustment. The Company believes that this non-GAAP financial adjustment is useful to investors because it allows investors to (a) evaluate the effectiveness of the methodology and information used by management in its financial and operational decision-making and (b) compare past and future reports of financial results of the Company as the revenue reduction related to acquired deferred revenue will not recur when related annual lease licenses and software maintenance contracts are renewed in future periods.
Amortization of intangible assets from acquisitions and its related tax impact. The Company incurs amortization of intangible assets, included in its GAAP presentation of amortization expense, related to various acquisitions it has made. Management excludes these expenses and their related tax impact for the purpose of calculating non-GAAP operating income, non-GAAP operating profit margin, non-GAAP net income and non-GAAP diluted earnings per share when it evaluates the continuing operational performance of the Company because these costs are fixed at the time of an acquisition, are then amortized over a period of several years after the acquisition and generally cannot be changed or influenced by management after the acquisition. Accordingly, management does not consider these expenses for purposes of evaluating the performance of the Company during the applicable time period after the acquisition, and it excludes such expenses when making decisions to allocate resources. The Company believes that these non-GAAP financial measures are useful to investors because they allow investors to (a) evaluate the effectiveness of the methodology and information used by management in its financial and operational decision-making and (b) compare past reports of financial results of the Company as the Company has historically reported these non-GAAP financial measures.
Stock-based compensation expense and its related tax impact. The Company incurs expense related to stock-based compensation included in its GAAP presentation of cost of software licenses, cost of maintenance and service; research and development expense; and selling, general and administrative expense. Although stock-based compensation is an expense of the Company and viewed as a form of compensation, management excludes these expenses for the purpose of calculating non-GAAP operating income, non-GAAP operating profit margin, non-GAAP net income and non-GAAP diluted earnings per share when it evaluates the continuing operational performance of the Company. Specifically, the Company excludes stock-based compensation during its annual budgeting process and its quarterly and annual assessments of the Company's and management's performance. The annual budgeting process is the primary mechanism whereby the Company allocates resources to various initiatives and operational requirements. Additionally, the annual review by the board of directors during which it compares the Company's historical business model and profitability to the planned business model and profitability for the forthcoming year excludes the impact of stock-based compensation. In evaluating the performance of senior management and department managers, charges related to stock-based compensation are excluded from expenditure and profitability results. In fact, the Company records stock-based compensation expense into a stand-alone cost center for which no single operational manager is responsible or accountable. In this way, management is able to review, on a period-to-period basis, each manager's performance and assess financial discipline over operational expenditures without the effect of stock-based compensation. The Company believes that these non-GAAP financial measures are useful to investors because they allow investors to (a) evaluate the Company's operating results and the effectiveness of the methodology used by management to review the its operating results, and (b) review historical comparability in its financial reporting, as well as comparability with competitors' operating results.
Transaction costs related to business combinations. The Company incurs expenses for professional services rendered in connection with business combinations, which are included in its GAAP presentation of selling, general and administrative expense. These expenses are generally not tax-deductible. Management excludes these acquisition-related transaction expenses for the purpose of calculating non-GAAP operating income, non-GAAP operating profit margin, non-GAAP net income and non-GAAP diluted earnings per share when it evaluates the continuing operational performance of the Company, as it generally would not have otherwise incurred these expenses in the periods presented as a part of its continuing operations. The Company believes that these non-GAAP financial measures are useful to investors because they allow investors to (a) evaluate the Company's operating results and the effectiveness of the methodology used by management to review the Company's operating results, and (b) review historical comparability in the Company’s financial reporting, as well as comparability with competitors' operating results.
Non-GAAP financial measures are not in accordance with, or an alternative for, GAAP in the United States. The Company's non-GAAP financial measures are not meant to be considered in isolation or as a substitute for comparable GAAP financial measures, and should be read only in conjunction with the Company's consolidated financial statements prepared in accordance with GAAP.
Pursuant to the requirements of Regulation G, the Company has provided a reconciliation of the non-GAAP financial measures to the most directly comparable GAAP financial measures as listed below:
| GAAP Reporting Measure | Non-GAAP Reporting Measure |
| Revenue | Non-GAAP Revenue |
| Operating Income | Non-GAAP Operating Income |
| Operating Profit Margin | Non-GAAP Operating Profit Margin |
| Net Income | Non-GAAP Net Income |
| Diluted Earnings Per Share | Non-GAAP Diluted Earnings Per Share |
IR Contact:
Annette N. Arribas, CTP
(724) 820-3700
annette.arribas@ansys.com
15 | Page