Exhibit 99.1
|
BJ’S RESTAURANTS, INC.
February 27, 2014 – Analyst Day
BJ’s
One for all.
|
Safe
Harbor
BJ’S Restaurants, Inc.
At BJ’s, we’re pursuing AMAZING for one and all.
Certain statements in the following presentation and all other statements that are not purely historical
cons tute“forward-- looking” statements for purposes of the Securi es Act of 1933 and the Securi es and
Exchange Act of 1934, as amended, and are intended to be covered by the safe harbors created thereby.
Such statements include, but are not limited to, those regarding expected comparable restaurant sales and
margin growth in future periods, total poten al domes c capacity, the success of varioussales-- building and
produc vity ini a ves, future guest traffic trends, construc on cost savings ini a ves and the number and
ming of new restaurants expected to be opened in future periods. These“forward-- looking” statements
involve known and unknown risks, uncertain es and other factors which may cause actual results to be
materially different from those projected or an cipated. Factors that might cause such differences include,
but are not limited to: (i) our ability to manage an increasing number of new restaurant openings, (ii)
construc on delays, (iii) labor shortages, (iv) increase in minimum wage and other employment related costs,
including the poten al impact of the Pa ent Protec on and Affordable Care Act on our opera ons, (v) the
effect of credit and equity market disrup ons on our ability to finance our con nued expansion on
acceptable terms, (vi) food quality and health concerns, (vii) factors that impact California, where 64 of our
current 147 restaurants are located, (viii) restaurant and brewery industry compe on, (ix) impact of certain
brewery business considera ons, including without limita on, dependence upon suppliers, third party
contractors and related hazards, (x) consumer spending trends in general for casual dining occasions, (xi)
poten al uninsured losses and liabili es due to limita ons on insurance coverage, (xii) fluctua ng commodity
costs and availability of food in general and certain raw materials related to the brewing of our handcra ed
beers and energy, (xiii) trademark andservice-- mark risks, (xiv) government regula ons and licensing costs,
(xv) beer and liquor regula ons, (xvi) loss of key personnel, (xvii) inability to secure acceptable sites, (xviii)
legal proceedings, (xix) other general economic and regulatory condi ons and requirements, (xx) the success
of our keysales-- building and related operational ini atives, and (xxi) numerous other matiers discussed in
the Company’s filings with the Securi es and Exchange Commission, including its recent reports on Forms10--
K,10-- Q and8-- K. The“forward-- looking” statements contained in this presenta on are based on current
assumptions and expecta ons and BJ’s Restaurants, Inc. undertakes no obligation to update or alter its
“forward-- looking” statements whether as a result of new information, future events or otherwise.
2 |
|
|
Welcome
&
Overview
Greg
Trojan
President
&
Chief
Executive Officer
3 |
|
BJ’S Restaurants, Inc.
At BJ’s, we’re pursuing AMAZING for one and all
|
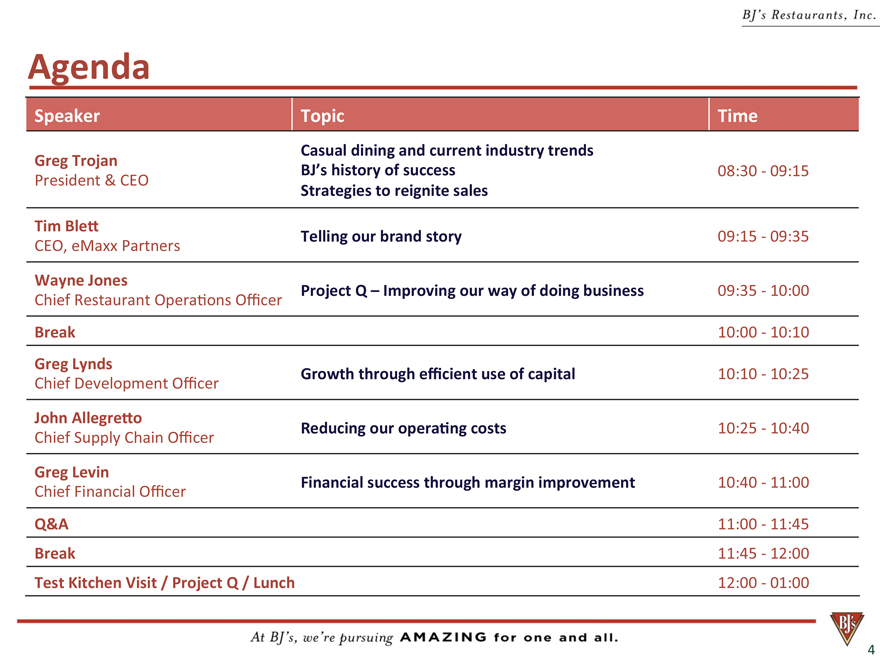
Agenda Speaker Topic Time
Casual dining and currentindustry trends Greg Trojan BJ’s history of success 08:30
09:15 President & CEO Strategies to reignite sales Tim Ble CEO, eMaxx Partners Telling our brand story 09:15--? 09:35 Wayne Jones Chief Restaurant Opera ons
OFFcer Project Q
– Improving our way of
doing
business
09:35
10:00
Break 10:00 10:10 Greg Lynds Chief Development Offcer Growth through
eccient use of capital
10:10
10:25
John
Allegre o
Chief
Supply
Chain
Officer
Reducing
our
opera ng
costs
10:25
--
10:40
Greg
Levin
Chief
Financial
Officer
Financial
success
through
margin
improvement
10:40
-
11:00
Q&A
11:00
11:45
Break
11:45
--
12:00
Test
Kitchen
Visit
/
Project
Q
/
Lunch
12:00--? 01:00
4 |
| BJ’S Restaurants, Inc. At BJ’s, we’re pursuing AMAZING for one and all |
|
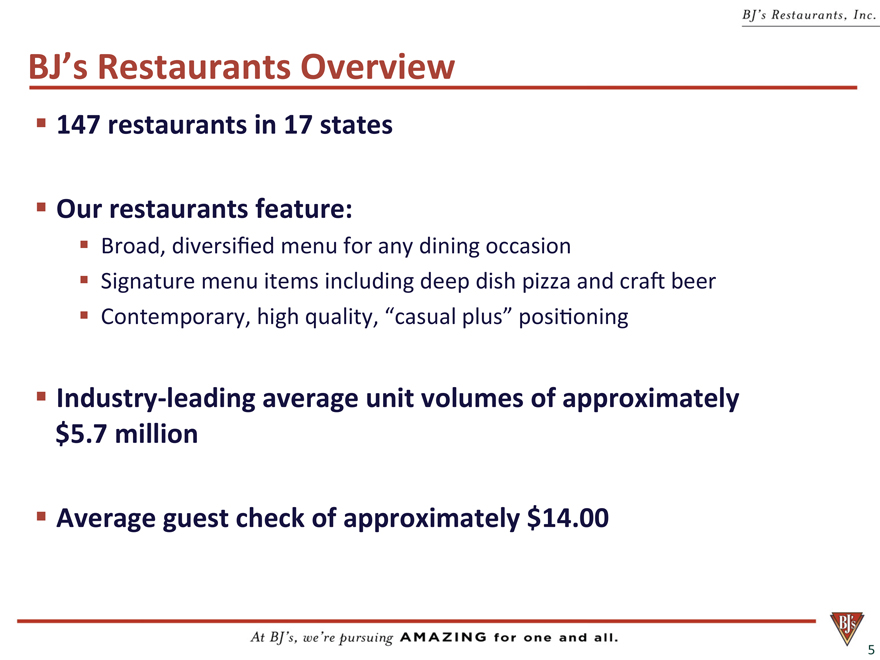
BJ’s
Restaurants
Overview
147
restaurants
in
17
states
Our
restaurants
feature:
Broad,
diversi?ed
menu
for
any
dining
occasion
Signature
menu
items
including
deep
dish
pizza
and
craft
beer
Contemporary, high
quality,
“casual
plus”
positioning
Industry--?leading
average
unit
volumes of approximately
$5.7 million
Average
guest
check
of
approximately
$14.00
5 |
|
BJ’S Restaurants, Inc.
At BJ’s, we’re pursuing AMAZING for one and all
|

Current
Footprint
TOTAL
–
147
4 |
|
3 |
|
5 |
|
5 |
| 1 |
1 |
| 4 |
2 |
| 2 |
64 1
1 |
| 3 6 29 |
1 |
|
15
6 |
|
BJ’S Restaurants, Inc.
At BJ’s, we’re pursuing AMAZING for one and all
|
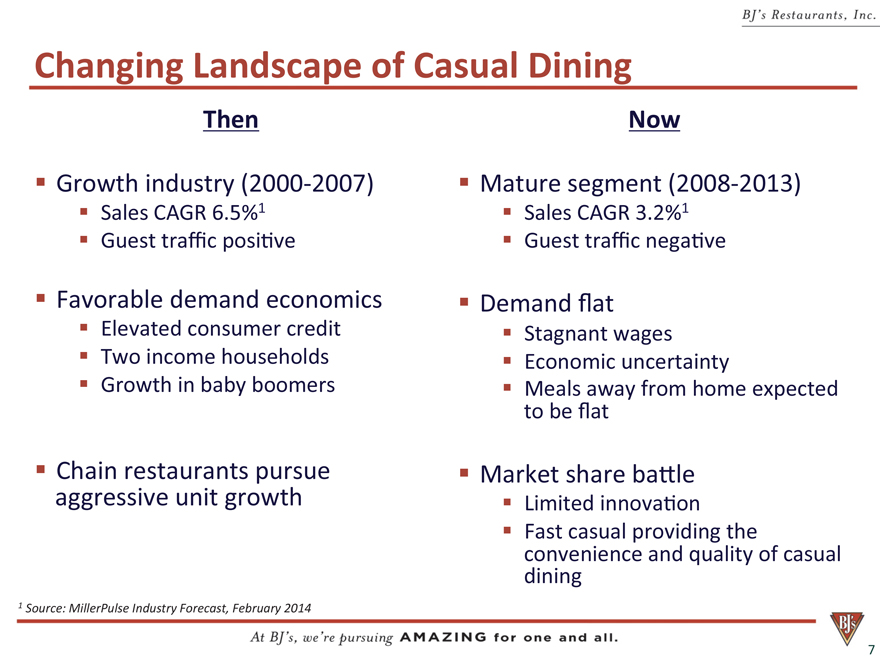
Changing
Landscape
of
Casual
Dining
Then
Growth
industry
(2000--?2007)
Mature
segment
(2008--?2013)
Sales
CAGR
6.5%1
Sales
CAGR
3.2%1 Guest tra?c positive Guest tra?c negative Favorable demand economics Demand ?at Elevated consumer credit Stagnant
wages Two income households Economic uncertainty Growth in baby boomers Meals away from home expected to be
?at Chain restaurants pursue Market share battle aggressive unit growth Limited
innovation
Fast
casual
providing
the
convenience
and
quality
of
casual
dining
1 |
|
Source:
MillerPulse
Industry
Forecast,
February
2014
7 |
|
BJ’S Restaurants, Inc.
At BJ’s, we’re pursuing AMAZING for one and all
|
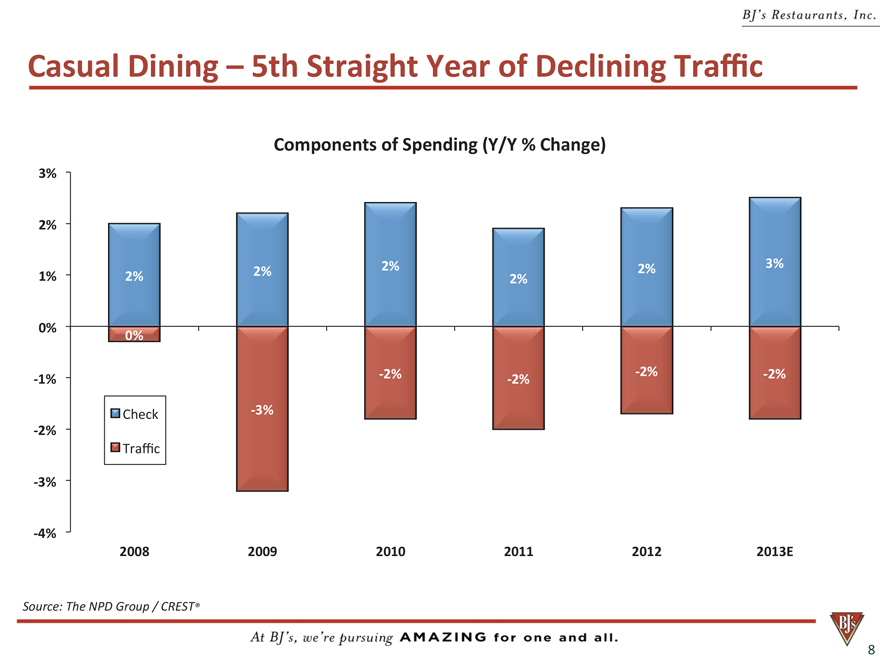
Casual
Dining
–
5th
Straight
Year
of
Declining Traffic Components of Spending (Y/Y % Change) 3% 2% 2% 2% 2% 3% 1% 2% 2% 0% 0%--?1%--?2%--?2%--?2%
--?2% Check--?3%--?2% Tra?c--?3%--?4% 2008 2009 2010 2011 2012 2013E Source:
The
NPD
Group
/
CREST®
8 |
|
BJ’S Restaurants, Inc.
At BJ’s, we’re pursuing AMAZING for one and all
|
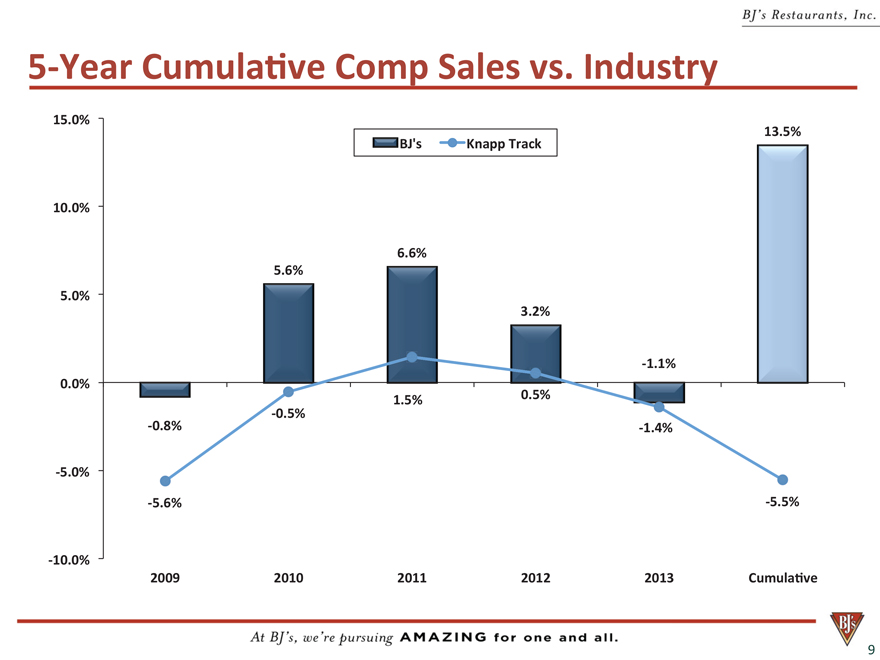
5--?Year
Cumulative
Comp
Sales
vs.
Industry
15.0%
13.5%
BJ’s
Knapp
Track
10.0%
6.6%
5.6%
5.0%
3.2%
--?1.1%
0.0%
1.5%
0.5%
--?0.5%
--?0.8%
--?1.4%
--?5.0%
--?5.6%
--?5.5%
--?10.0%
2009
2010
2011
2012
2013
Cumulative
9
BJ’S Restaurants, Inc.
At BJ’s, we’re pursuing AMAZING for one and all
|
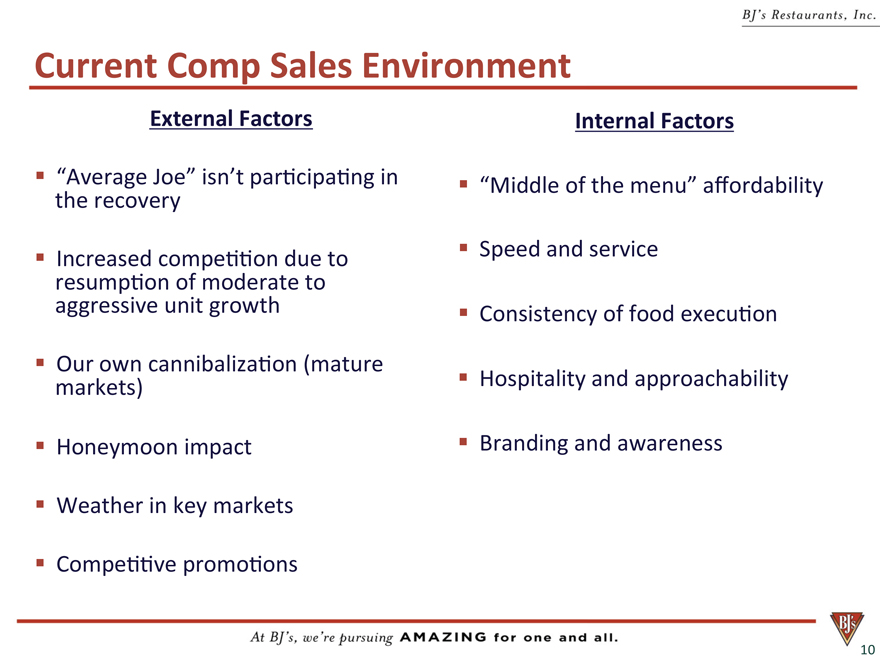
Current
Comp
Sales
Environment
External
Factors
Internal
Factors
“Average Joe” isn’t par cipa n in “Middle of the menu” affordability the recovery Increased competition
due
to
Speed
and
service
resumption
of
moderate
to
aggressive
unit
growth
Consistency
of
food
execution
Our
own
cannibaliza on
(mature
markets)
Hospitality
and
approachability
Honeymoon
impact
Branding
and
awareness
Weather
in
key
markets
Competitive
promoons
10
BJ’S Restaurants, Inc.
At BJ’s, we’re pursuing AMAZING for one and all
|
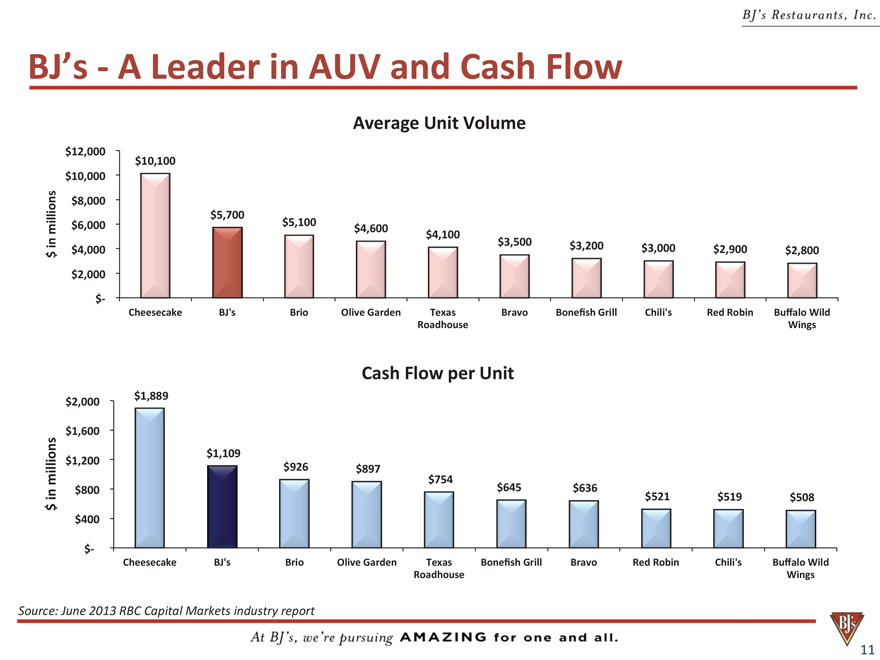
BJ’s
A
Leader
in
AUV
and
Cash
Flow
Average
Unit
Volume
$12,000 $10,100 $10,000 $8,000 millions $5,700 in $6,000 $5,100 $4,600 $4,100
$3,500 $3,200
$4,000 $3,000 $2,900 $2,800 $
$2,000$--
Cheesecake BJ’s Brio Olive Garden Texas Bravo Bonefish Grill Chili’s Red Robin Buffalo Wild Roadhouse Wings
Cash Flow per Unit
$1,889 $2,000
$1,600
$1,109 $1,200 millions $926 $897 in $754
$800 $645 $636
$521 $519 $508
$
$400
$--
Cheesecake BJ’s Brio Olive Garden Texas Bonefish Grill Bravo Red Robin Chili’s Buffalo Wild Roadhouse Wings
Source:
June
2013
RBC
Capital
Markets
industry
report
11
BJ’S Restaurants, Inc.
At BJ’s, we’re pursuing AMAZING for one and all
|
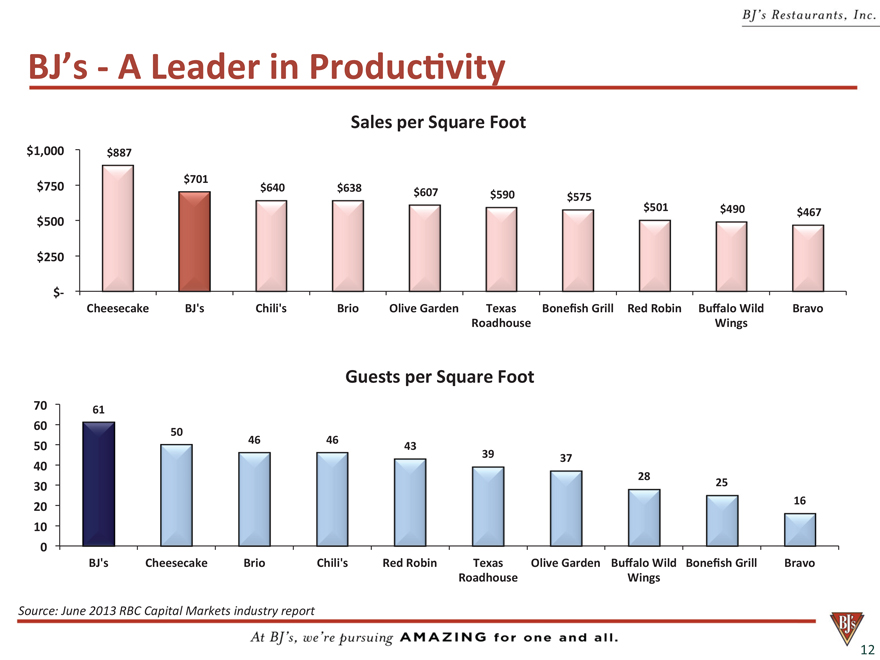
BJ’s
--?
A
Leader in Productivity Sales per Square Foot $1,000 $887 $701 $750 $640 $638 $607 $590 $575 $501 $490 $467 $500 $250
\$--? Cheesecake BJ’s Chili’s Brio Olive Garden Texas Bone?sh Grill Red Robin Bu?alo Wild Bravo Roadhouse Wings Guests per Square Foot 70 61 60 50 46 46 50 43 40 39 37 28 30 25
20
16
10
0
BJ’s
Cheesecake
Brio
Chili’s
Red
Robin
Texas
Olive
Garden
Bu?alo
Wild
Bone?sh
Grill
Bravo
Roadhouse
Wings
Source:
June
2013
RBC
Capital
Markets
industry
report
12
BJ’S Restaurants, Inc.
At BJ’s, we’re pursuing AMAZING for one and all
|
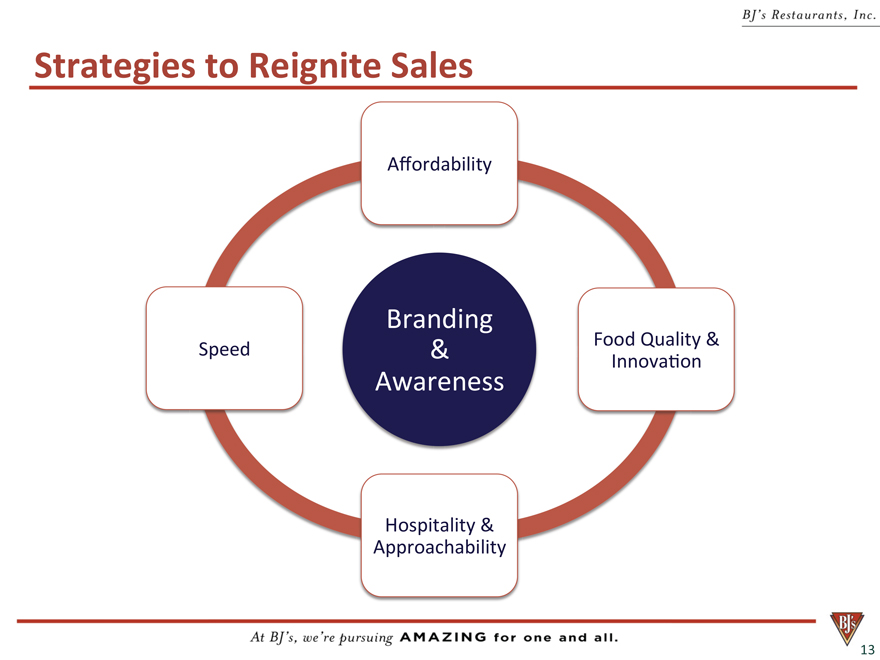
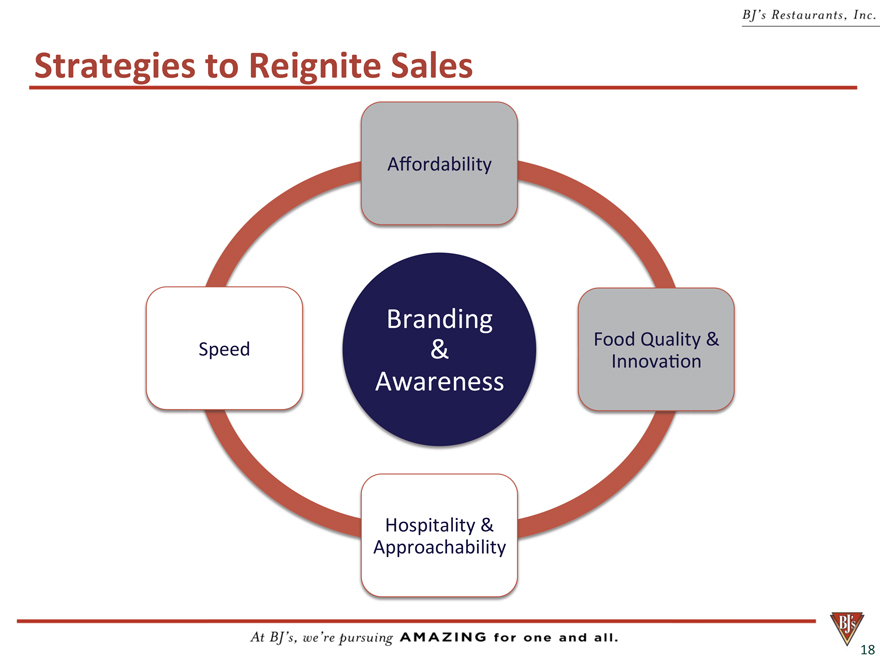
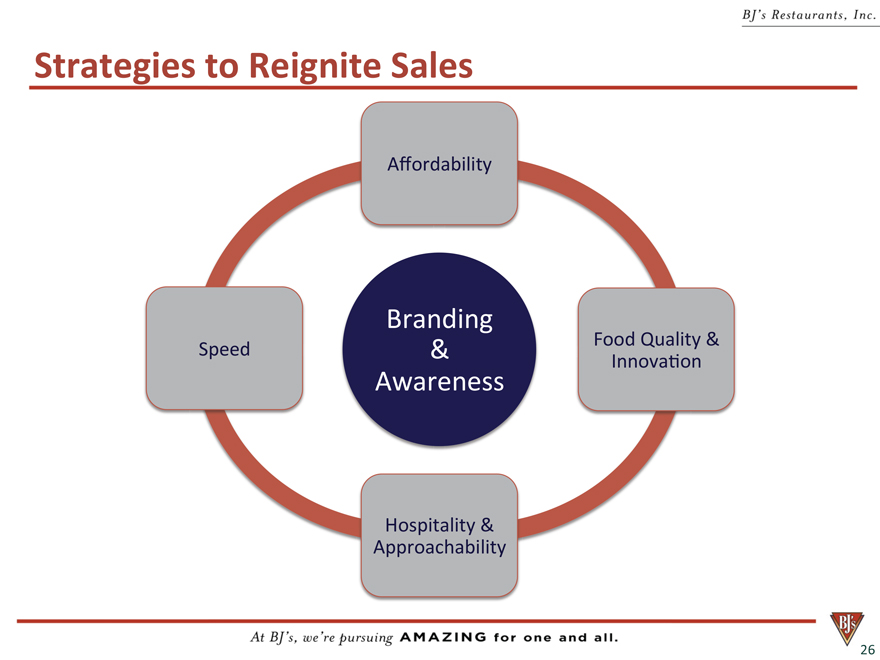
Strategies
to
Reignite
Sales
A?ordability
Speed
Branding
&
Awareness
Food
Quality
&
Innovation Hospitality
&
Approachability
13
BJ’S Restaurants, Inc.
At BJ’s, we’re pursuing AMAZING for one and all
|
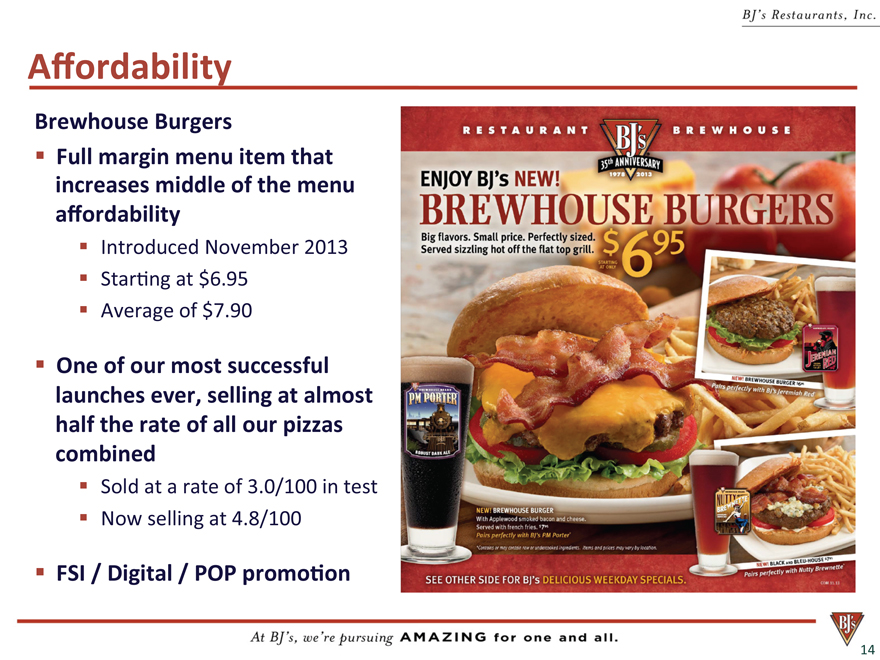
Affordability
Brewhouse
Burgers
Full
margin
menu
item
that
increases
middle
of
the menu a?ordability Introduced November 2013 Starting
at $6.95 Average of $7.90 One of our most successful launches ever, selling at almost half the rate
of
all
our
pizzas
combined
Sold
at
a
rate
of
3.0/100
in
test
Now
selling
at
4.8/100
FSI
/
Digital
/
POP
promotion
14
BJ’S Restaurants, Inc.
At BJ’s, we’re pursuing AMAZING for one and all
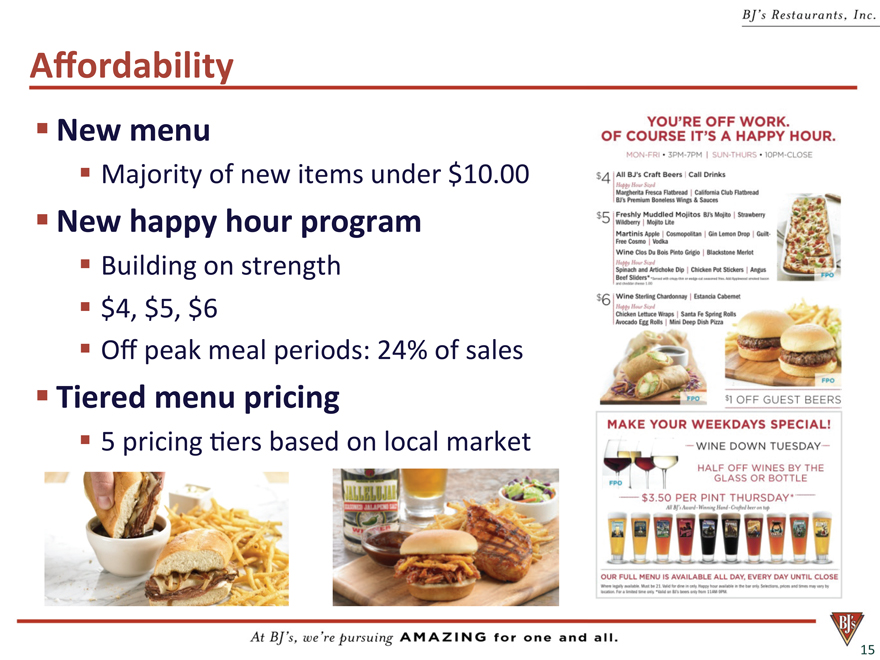
Affordability
New
menu
Majority
|
of
new
items
under
$10.00
New
happy
hour
program
Building
on
strength
$4,
$5,
$6
O?
peak
meal
periods:
24%
of
sales
Tiered
menu
pricing
5 |
|
pricing
tiers
based
on
local
market
15
BJ’S Restaurants, Inc.
At BJ’s, we’re pursuing AMAZING for one and all
|
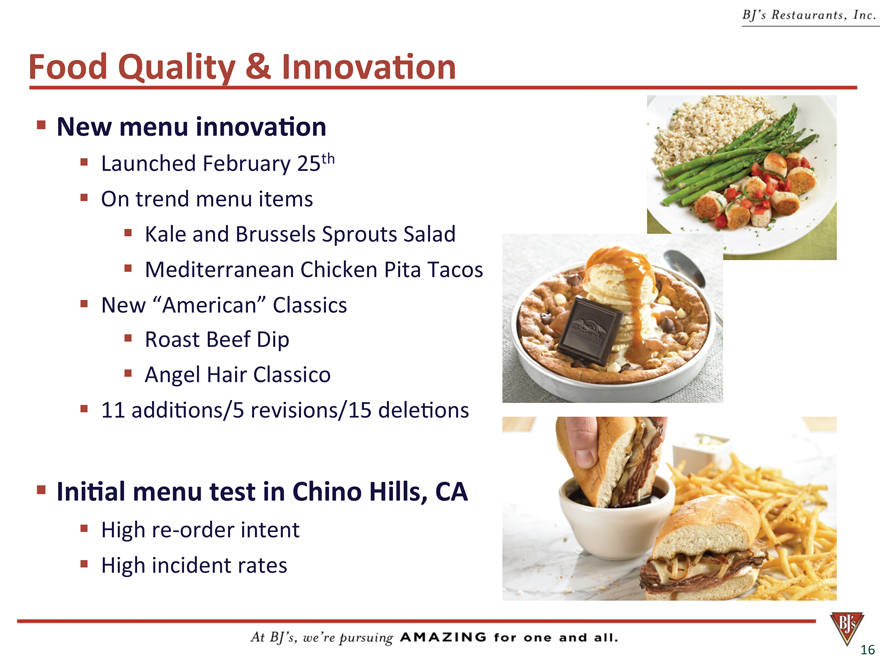
Food
Quality
&
Innovation
New
menu
innovation
Launched
February 25th On trend menu items Kale and Brussels
Sprouts
Salad
Mediterranean
Chicken
Pita
Tacos
New
“American”
Classics
Roast
Beef
Dip
Angel
Hair
Classico
11
additions/5
revisions/15
deletions
Initial
menu
test
in
Chino
Hills,
CA
High
re--?order
intent
High
incident
rates
16
BJ’S Restaurants, Inc.
At BJ’s, we’re pursuing AMAZING for one and all
|
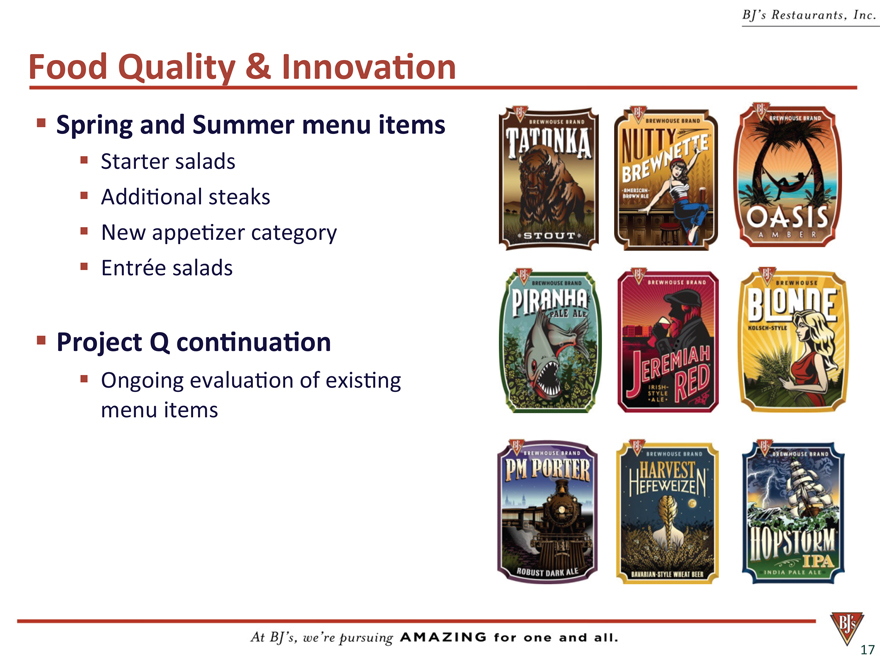
Food Quality & Innovation
Spring
and
Summer
menu
items
Starter
salads
Additional
steaks
New
appetizer
category
Entrée
salads
Project
Q
continuation
Ongoing
evaluation
of
existing
menu
items
17
BJ’S Restaurants, Inc.
At BJ’s, we’re pursuing AMAZING for one and all
|
Strategies
to
Reignite
Sales
A?ordability
Branding
Food
Quality
&
Speed
&
Innovation
Awareness
Hospitality
&
Approachability
18
BJ’S Restaurants, Inc.
At BJ’s, we’re pursuing AMAZING for one and all
|
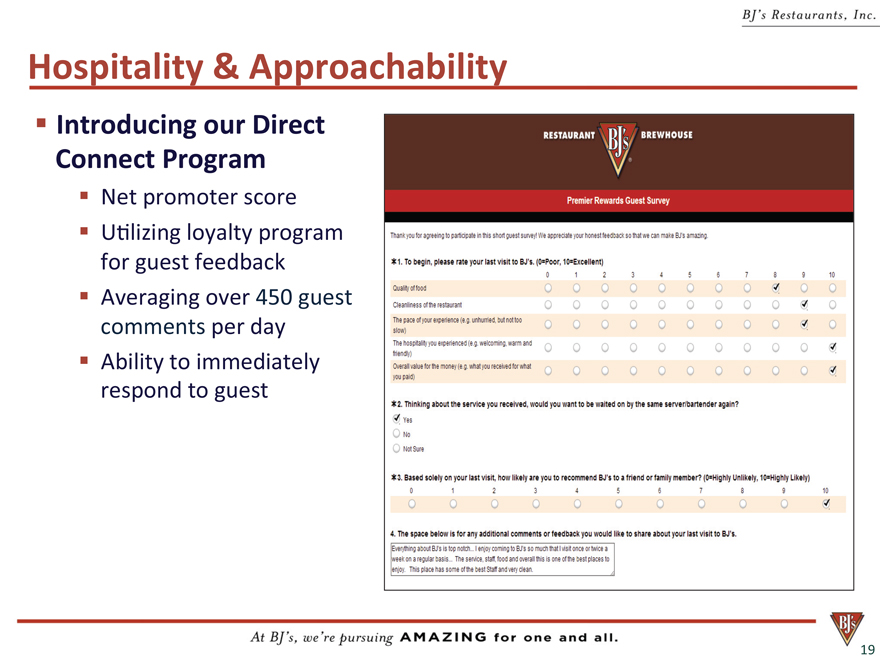
Hospitality & Approachability
Introducing
our
Direct
Connect
Program
Net
promoter
score
Utilizing
loyalty
program
for
guest
feedback
Averaging
over
450
guest
comments
per
day
Ability
to
immediately
respond
to
guest
19
BJ’S Restaurants, Inc.
At BJ’s, we’re pursuing AMAZING for one and all
|
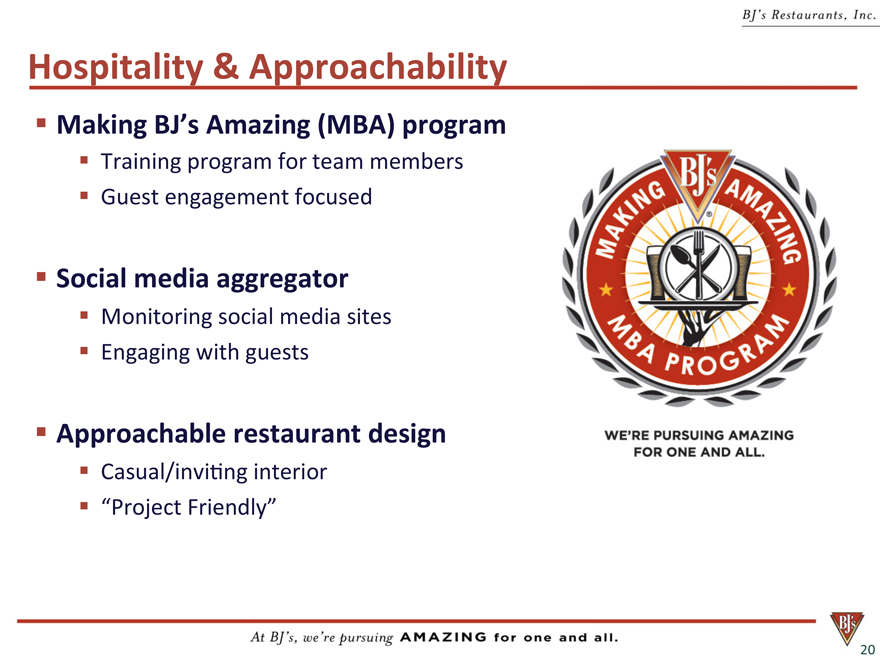
Hospitality
&
Approachability
Making
BJ’s
Amazing
(MBA)
program
Training
program
for
team
members
Guest
engagement
focused
Social
media
aggregator
Monitoring
social
media
sites
Engaging
with
guests
Approachable
restaurant
design
Casual/inviting
interior
“Project
Friendly”
20
BJ’S Restaurants, Inc.
At BJ’s, we’re pursuing AMAZING for one and all
|
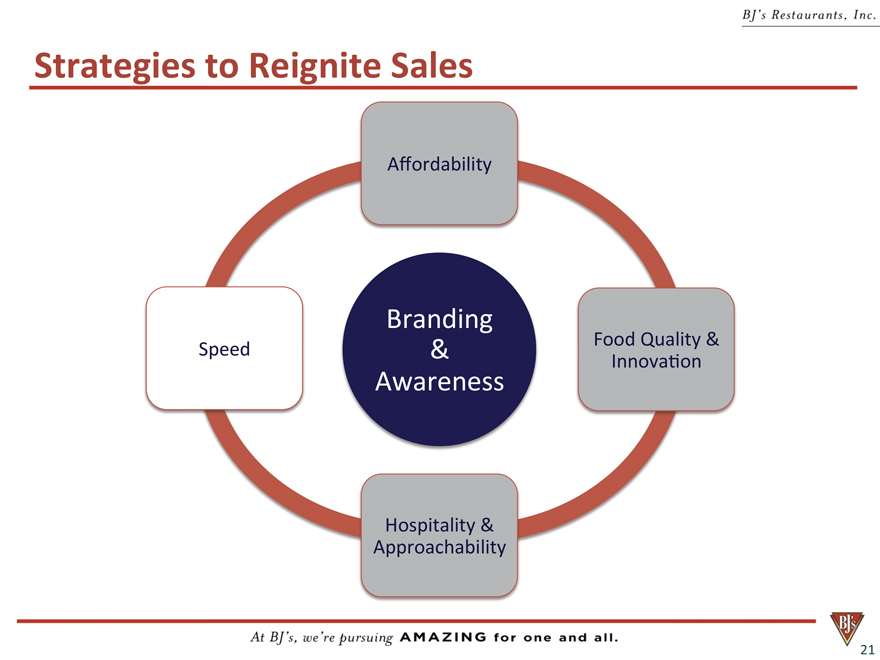
Strategies
to
Reignite
Sales
A?ordability
Branding
Food
Quality
&
Speed
&
Innovation
Awareness
Hospitality
&
Approachability
21
BJ’S Restaurants, Inc.
At BJ’s, we’re pursuing AMAZING for one and all
|
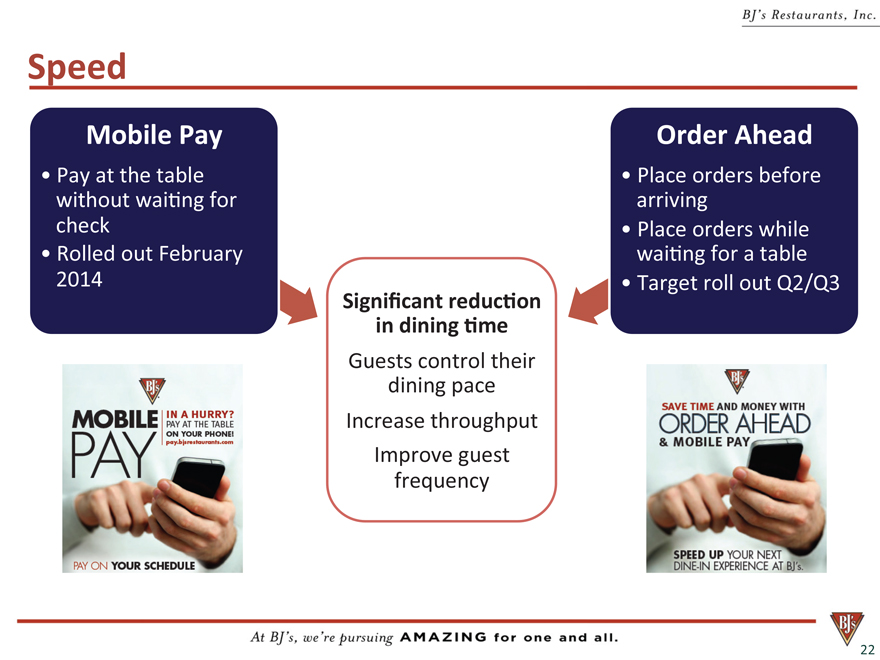
Speed
Mobile
Pay
Order
Ahead
Pay
at
the
table
Place
orders
before
without
waiting
for
arriving
check
Place
orders
while
Rolled
out
February waiting for a 2014 Target
roll
out
reduc on
in
dining
me
Guests
control
their
dining
pace
Increase
throughput
Improve
guest
frequency
22
BJ’S Restaurants, Inc.
At BJ’s, we’re pursuing AMAZING for one and all
|
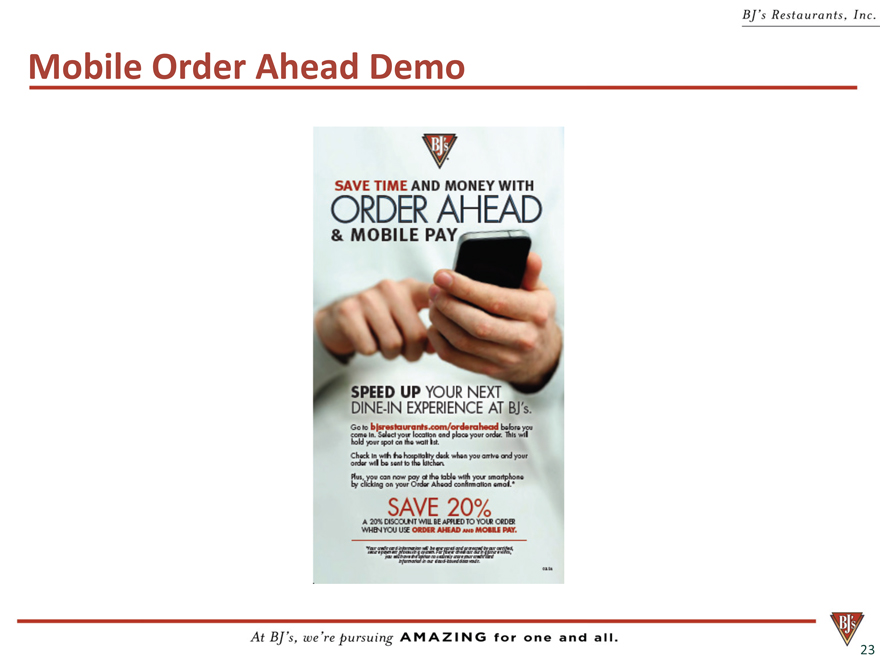
Mobile
Order
Ahead
Demo
23
BJ’S Restaurants, Inc.
At BJ’s, we’re pursuing AMAZING for one and all
|
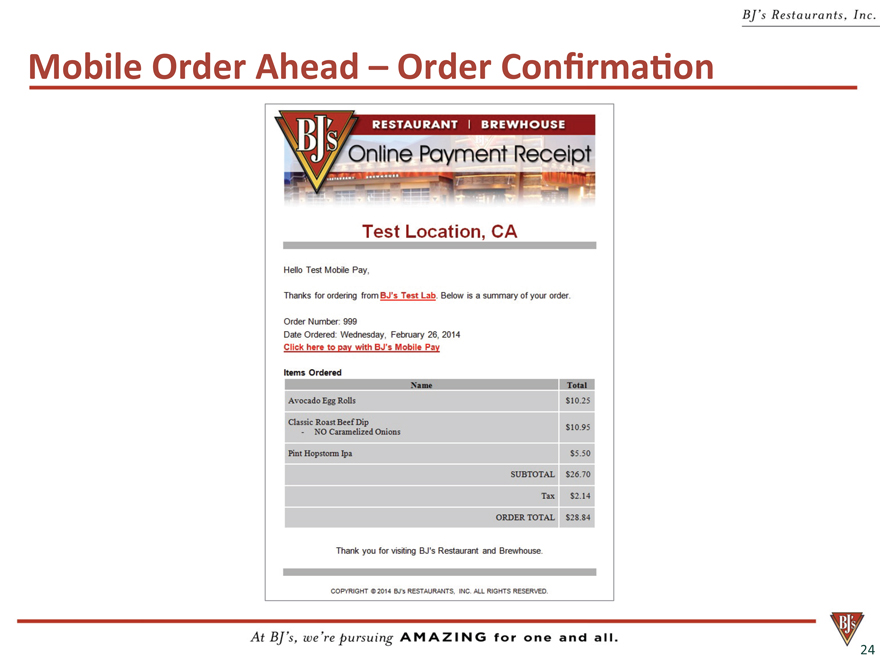
Mobile
Order
Ahead
–
Order
Confirmation
24
BJ’S Restaurants, Inc.
At BJ’s, we’re pursuing AMAZING for one and all
|
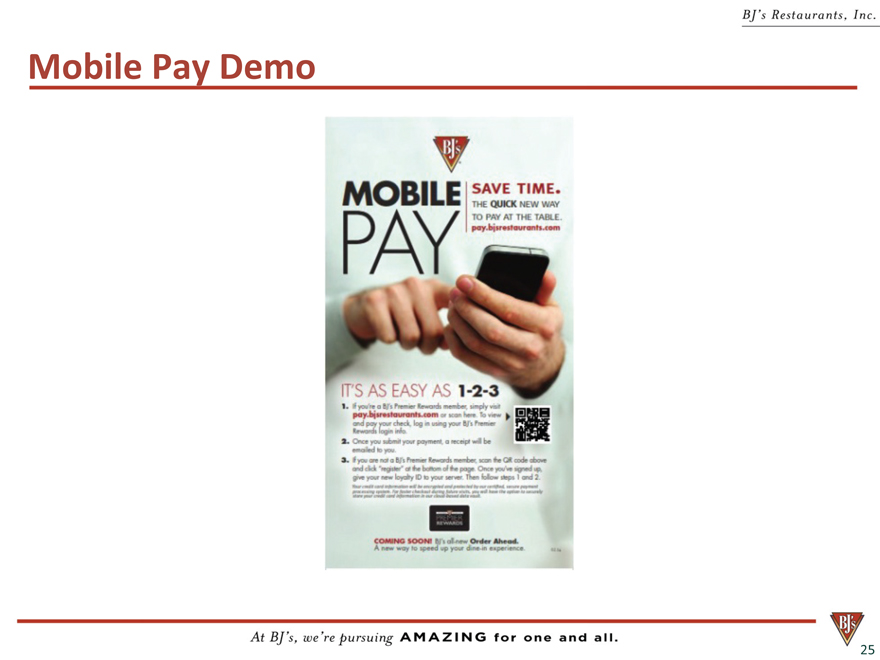
Mobile
Pay
Demo
25
BJ’S Restaurants, Inc.
At BJ’s, we’re pursuing AMAZING for one and all
|
Strategies
to
Reignite
Sales
A?ordability
Branding
Food
Quality
&
Speed
&
Innovation
Awareness
Hospitality
&
Approachability
26
BJ’S Restaurants, Inc.
At BJ’s, we’re pursuing AMAZING for one and all
|
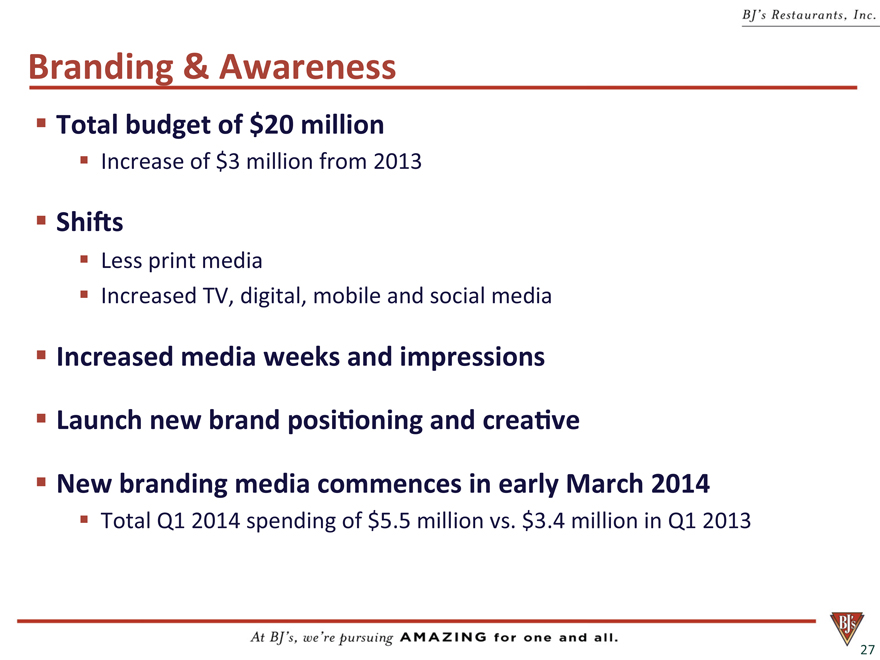
Branding
&
Awareness
Total
budget
of
$20
million
Increase
of
$3
million
from
2013
Shis Less print media Increased TV, digital, mobile and social media Increased media weeks and
impressions
Launch
new
brand
posioning
and
creative
New
branding
media
commences
in
early
March
2014
Total
Q1
2014
spending
of
$5.5
million
vs.
$3.4
million
in
Q1
2013
27
BJ’S Restaurants, Inc.
At BJ’s, we’re pursuing AMAZING for one and all
|
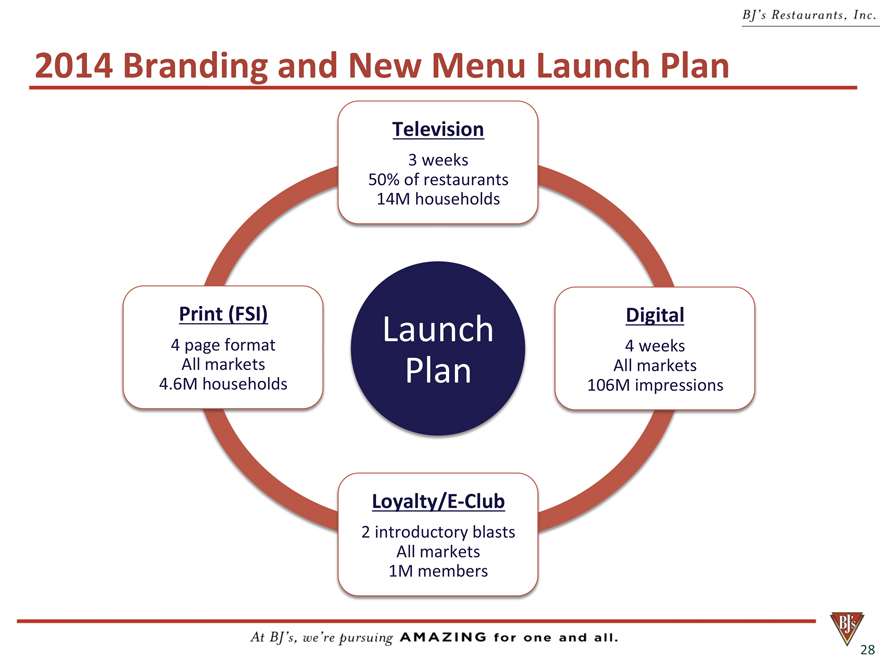
2014
Branding
and
New
Menu
Launch
Plan
Television
3 |
|
weeks
50%
of
restaurants
14M
households
(FSI)
Launch
Digital
4 |
|
page
format
4
weeks
All
markets
Plan
All
markets
4.6M
households
106M
impressions
Loyalty/E--?Club
2 |
|
introductory
blasts
All
markets
1M
members
28
BJ’S Restaurants, Inc.
At BJ’s, we’re pursuing AMAZING for one and all
|
Telling
Our
Brand
Story
Tim
Blett
CEO,
eMaxx
Partners
29
BJ’S Restaurants, Inc.
At BJ’s, we’re pursuing AMAZING for one and all
|
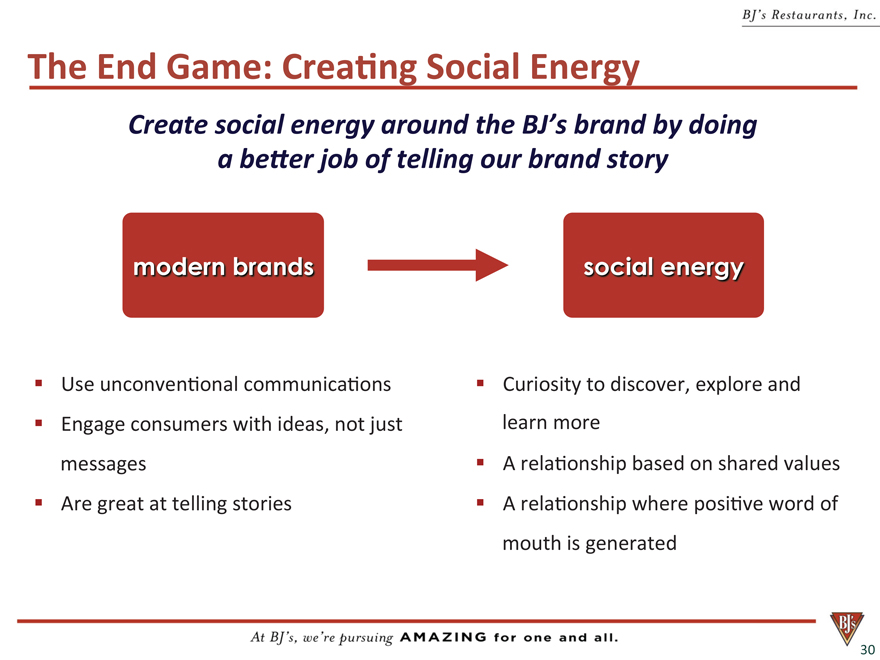
The
End
Game:
Creang
Social
Energy
Create social energy around the BJ’s brand by doing
a better job of telling our brand story
modern brands
social energy
Use
unconventional
communications
?Engage
consumers
with ideas, not just messages ?Are great at telling stories Curiosity to discover, explore and
learn
more
A
relationship
based
on
shared
values
A
relationship
where
positive
word
of
mouth
is
generated
30
BJ’S Restaurants, Inc.
At BJ’s, we’re pursuing AMAZING for one and all
|
Brand
Immersion
&
Research
Methodology
BJ’s
team
member
survey
Executive
leadership
interviews
Premier
rewards
survey
Awareness,
Trial
&
Usage
survey
(2013)
Social
media
&
online
audit
31
BJ’S Restaurants, Inc.
At BJ’s, we’re pursuing AMAZING for one and all
|
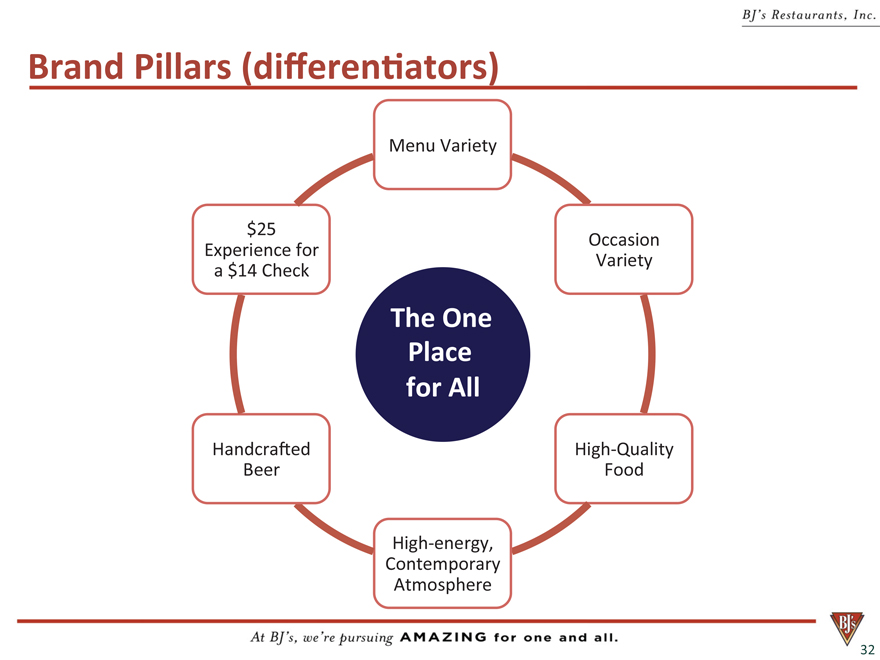
Brand
Pillars
(di?erentiators)
Menu
Variety
$25
Occasion
Experience
for
Variety
a
$14
Check
The
One
Place
for
All
Handcrafted
High--?Quality
Beer
Food
High--?energy,
Contemporary
Atmosphere
32
BJ’S Restaurants, Inc.
At BJ’s, we’re pursuing AMAZING for one and all
|
Our brand
Promise
33
BJ’S Restaurants, Inc.
At BJ’s, we’re pursuing AMAZING for one and all
|
One simple
PHRASE
34
BJ’S Restaurants, Inc.
At BJ’s, we’re pursuing AMAZING for one and all
|

One for all
35
BJ’S Restaurants, Inc.
At BJ’s, we’re pursuing AMAZING for one and all
|
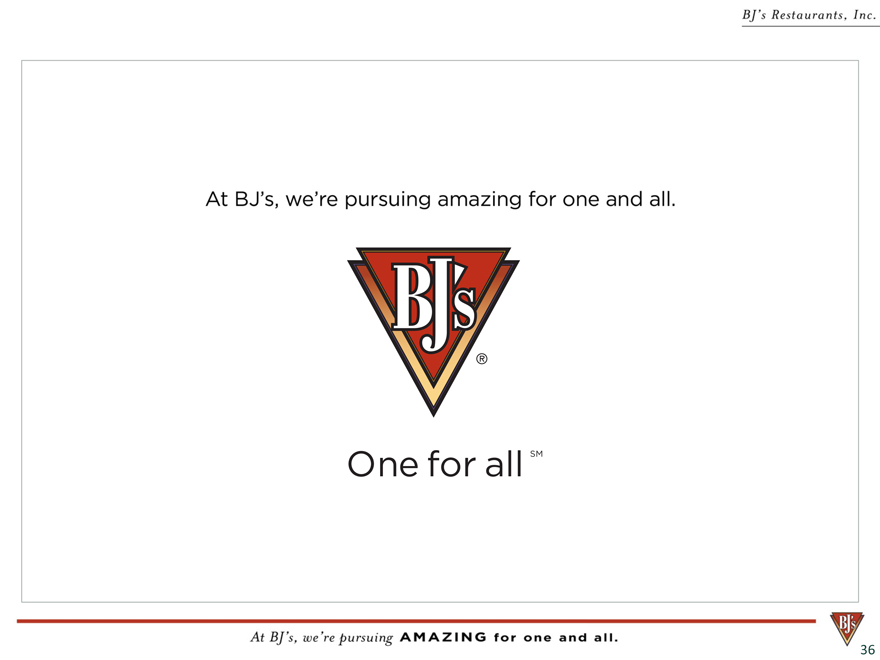
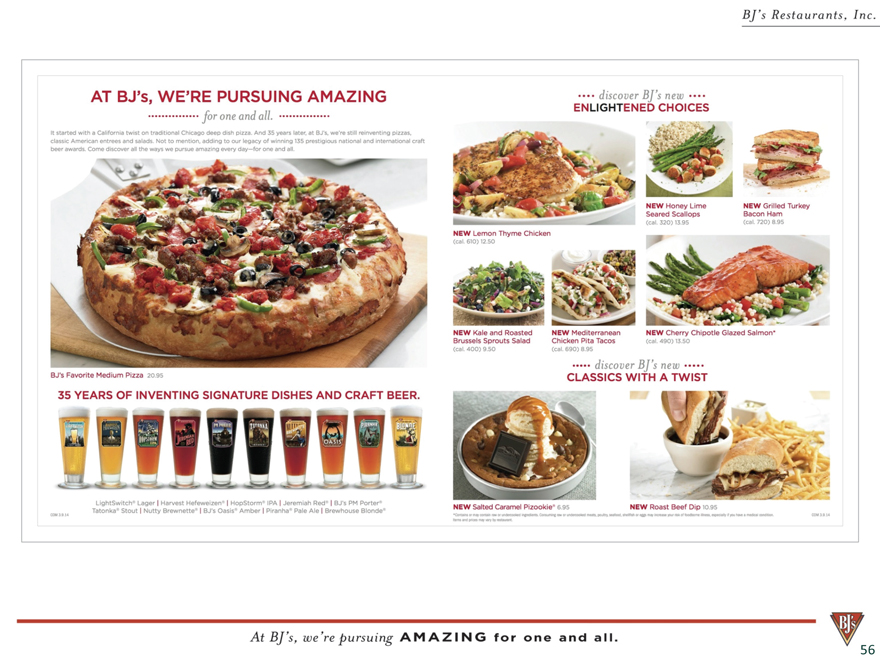
At BJ’s, we’re pursuing amazing for one and all
One for all SM
36
BJ’S Restaurants, Inc.
At BJ’s, we’re pursuing AMAZING for one and all
|
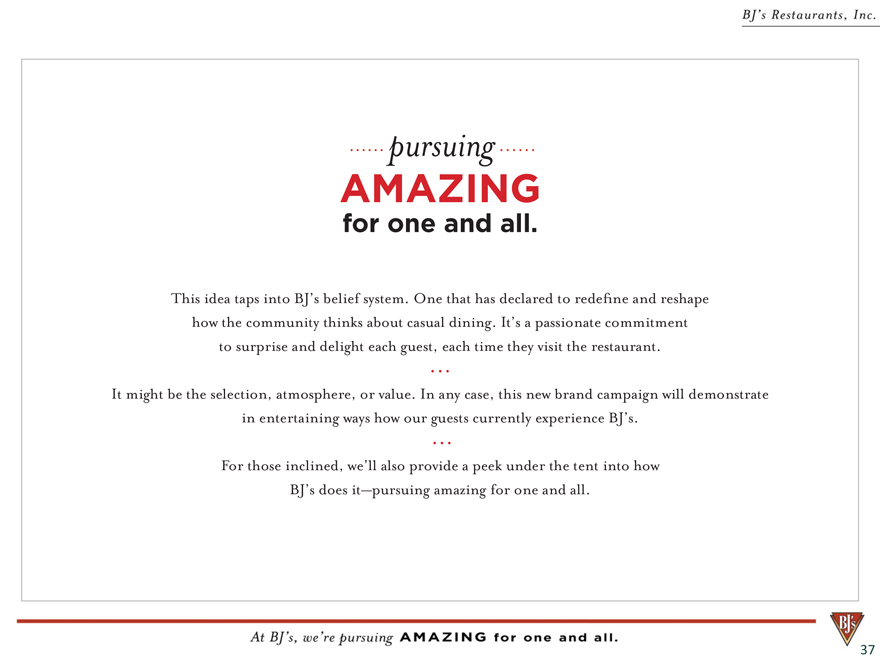
This idea taps into BJ’s belief system. One that has declared to redefine and reshape how the community thinks about casual dining. It’s a passionate commitment to surprise and delight each guest, each time they visit the restaurant.
It might be the selection, atmosphere, or value. In any case, this new brand campaign will demonstrate in entertaining ways how our guests currently experience BJ’s.
For those inclined, we’ll also provide a peek under the tent into how BJ’s does it—pursuing amazing for one and all.
Pursuing AMAZING for one and all
37
BJ’S Restaurants, Inc.
At BJ’s, we’re pursuing AMAZING for one and all
|
38
BJ’S Restaurants, Inc.
At BJ’s, we’re pursuing AMAZING for one and all
|
39
BJ’S Restaurants, Inc.
At BJ’s, we’re pursuing AMAZING for one and all
|
All the SERVICE
40
BJ’S Restaurants, Inc.
At BJ’s, we’re pursuing AMAZING for one and all
|
all the
SKILLS
41
BJ’S Restaurants, Inc.
At BJ’s, we’re pursuing AMAZING for one and all
|
All the ways YOU MAKE BJ’S AMAZING
42
BJ’S Restaurants, Inc.
At BJ’s, we’re pursuing AMAZING for one and all
|
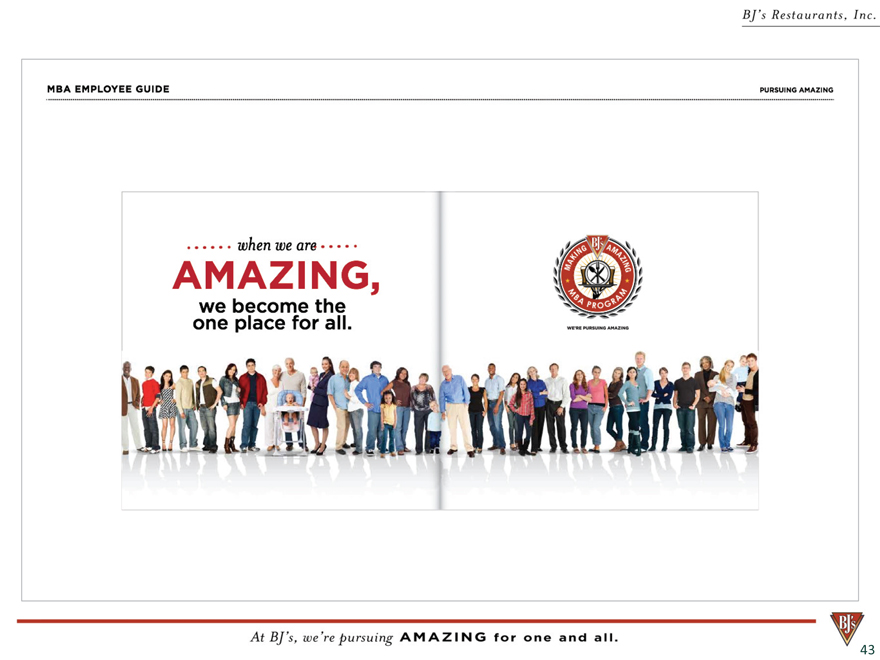
When we are AMAZING, we become the one place for all.
43
BJ’S Restaurants, Inc.
At BJ’s, we’re pursuing AMAZING for one and all
|
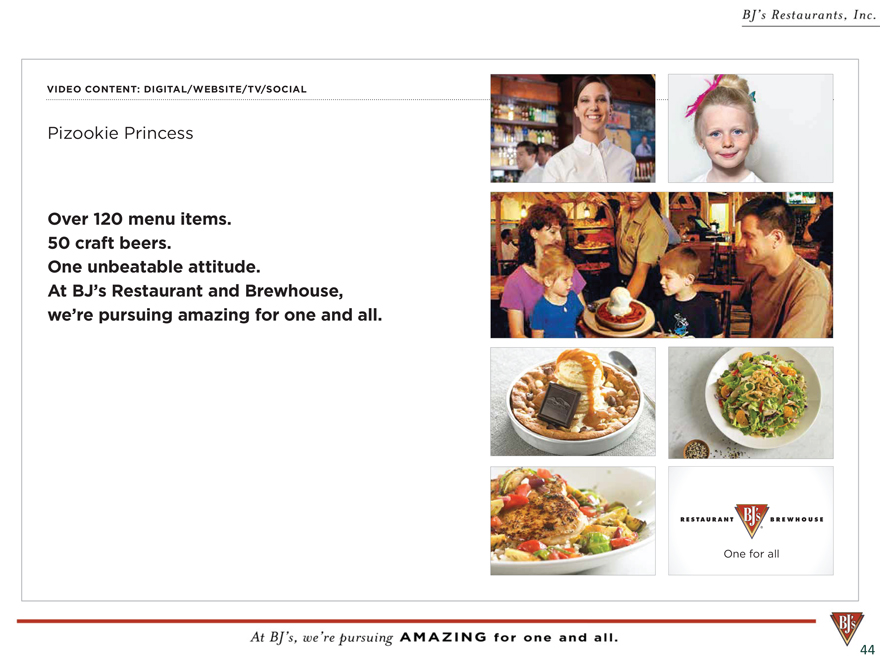
Over 120 menu items. 50 craft beers.
One unbeatable attitude.
At BJ’s Restaurant and Brewhouse, we’re pursuing amazing for one and all.
One for all
44
VIDEO CONTENT: DIGITAL/WEBSITE/TV/SOCIAL
Pizookie Princess
BJ’S Restaurants, Inc.
At BJ’s, we’re pursuing AMAZING for one and all
|
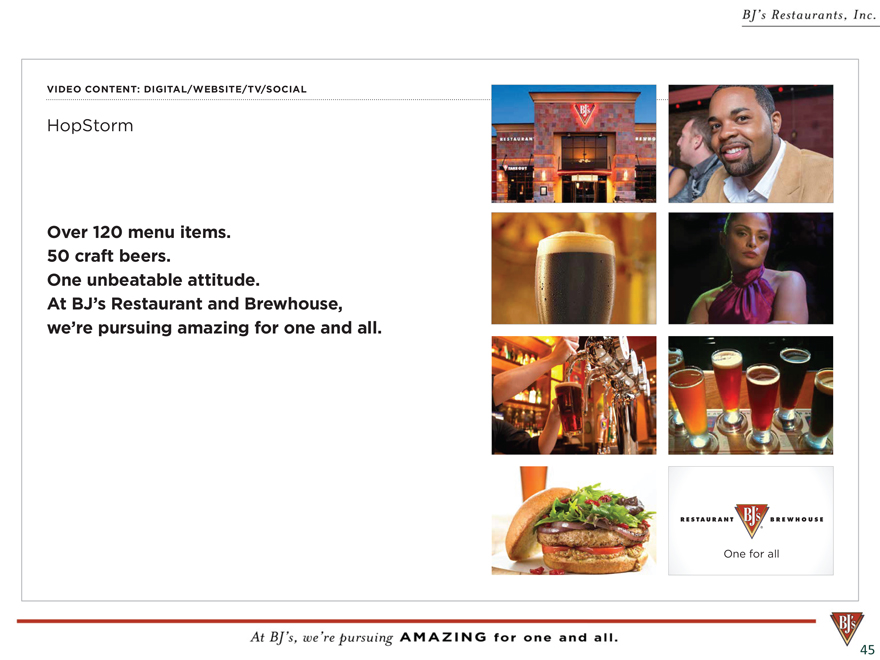
Over 120 menu items. 50 craft beers.
One unbeatable attitude.
At BJ’s Restaurant and Brewhouse, we’re pursuing amazing for one and all.
VIDEO CONTENT: DIGITAL/WEBSITE/TV/SOCIAL
HopStorm
45
BJ’S Restaurants, Inc.
At BJ’s, we’re pursuing AMAZING for one and all
|

46
BJ’S Restaurants, Inc.
At BJ’s, we’re pursuing AMAZING for one and all
|

47
BJ’S Restaurants, Inc.
At BJ’s, we’re pursuing AMAZING for one and all
|
48
BJ’S Restaurants, Inc.
At BJ’s, we’re pursuing AMAZING for one and all
|

49
BJ’S Restaurants, Inc.
At BJ’s, we’re pursuing AMAZING for one and all
|

50
BJ’S Restaurants, Inc.
At BJ’s, we’re pursuing AMAZING for one and all
|
BJ’S Restaurants, Inc.
At BJ’s, we’re pursuing AMAZING for one and all
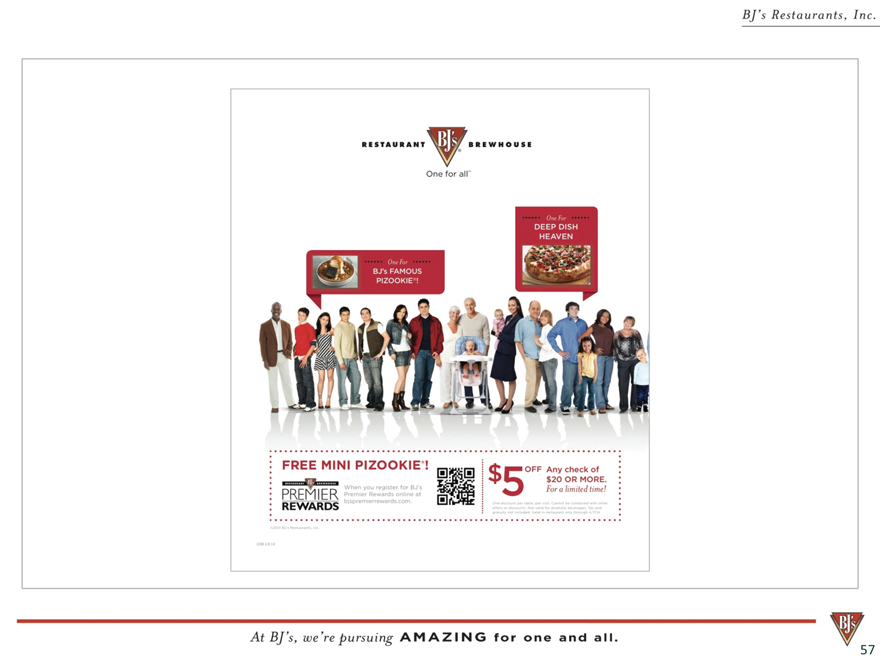
One for all
Join in the pursuit of amazing
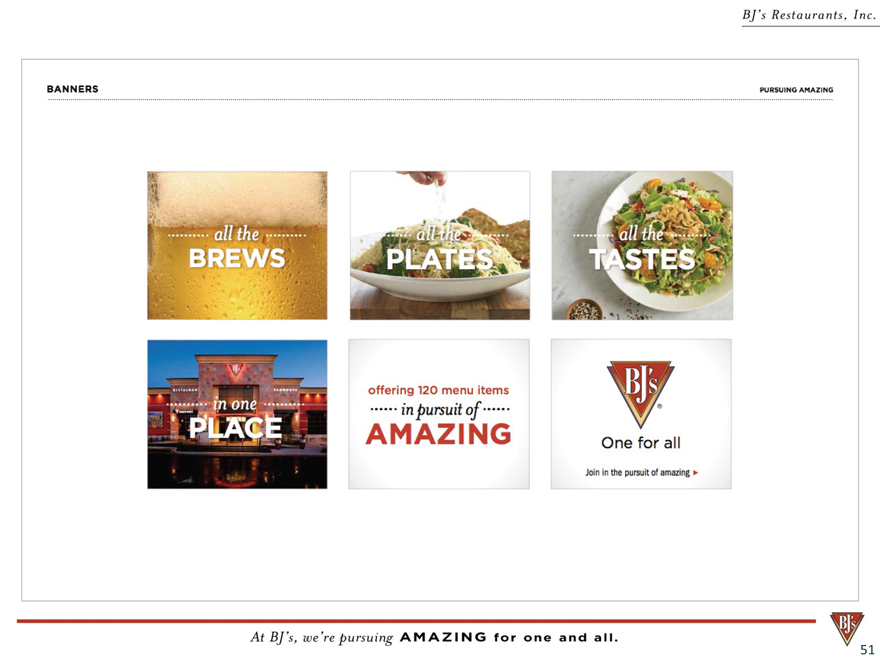
Offering 120 menu items in pursuit of AMAZING
BANNERS PURSUING AMAZING
51
|
BJ’S Restaurants, Inc.
At BJ’s, we’re pursuing AMAZING for one and all
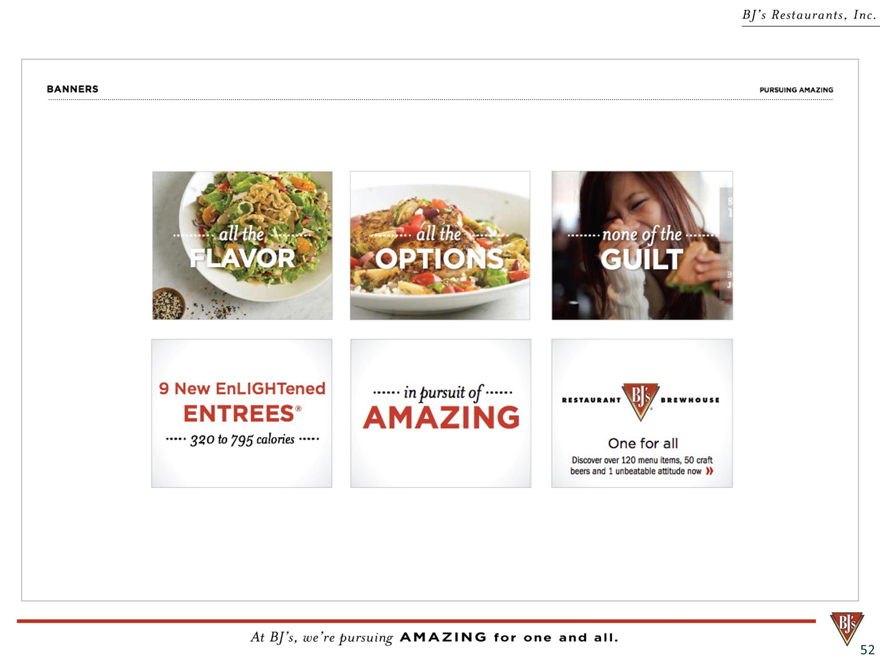
BANNERS PURSUING AMAZING
One for all Discover over 120 menu items, 50 craft beers and 1 unbeatable attitude now
52
|
BJ’S Restaurants, Inc.
At BJ’s, we’re pursuing AMAZING for one and all
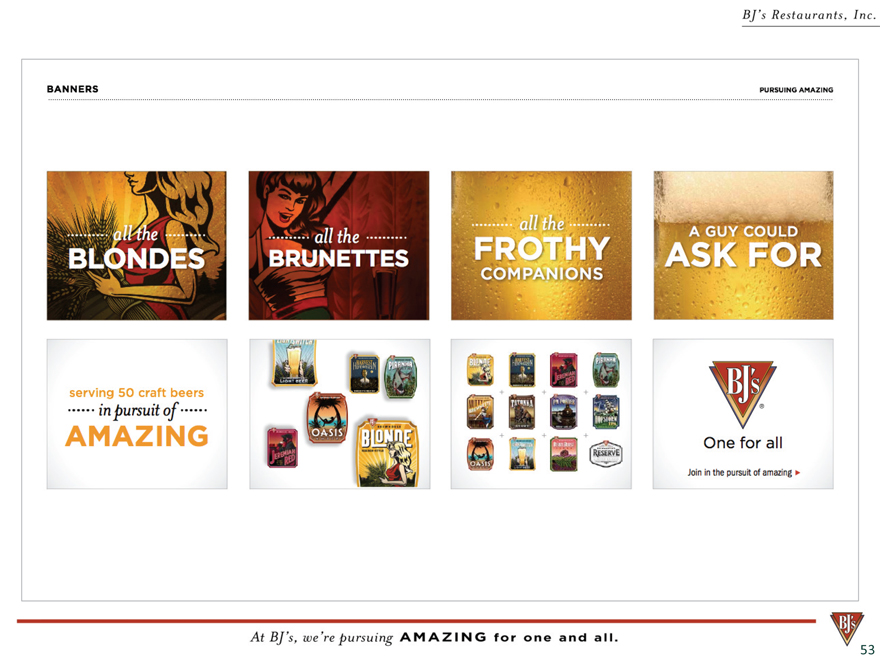
BANNERS PURSUING AMAZING
One for all join in the pursuit of amazing
53
|
BJ’S Restaurants, Inc.
At BJ’s, we’re pursuing AMAZING for one and all
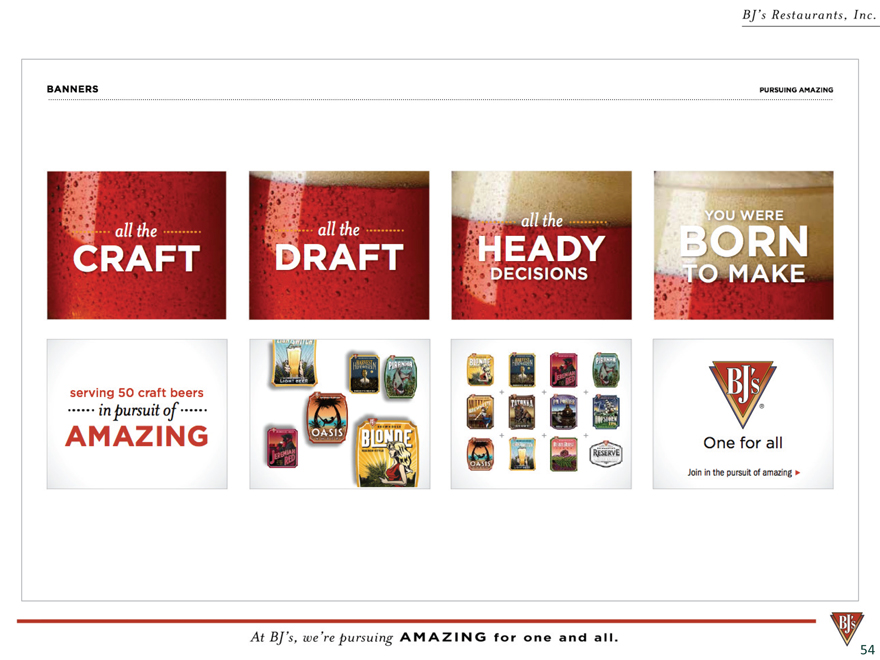
BANNERS PURSUING AMAZING
One for all join in the pursuit of amazing
54
|
BJ’S Restaurants, Inc.
At BJ’s, we’re pursuing AMAZING for one and all
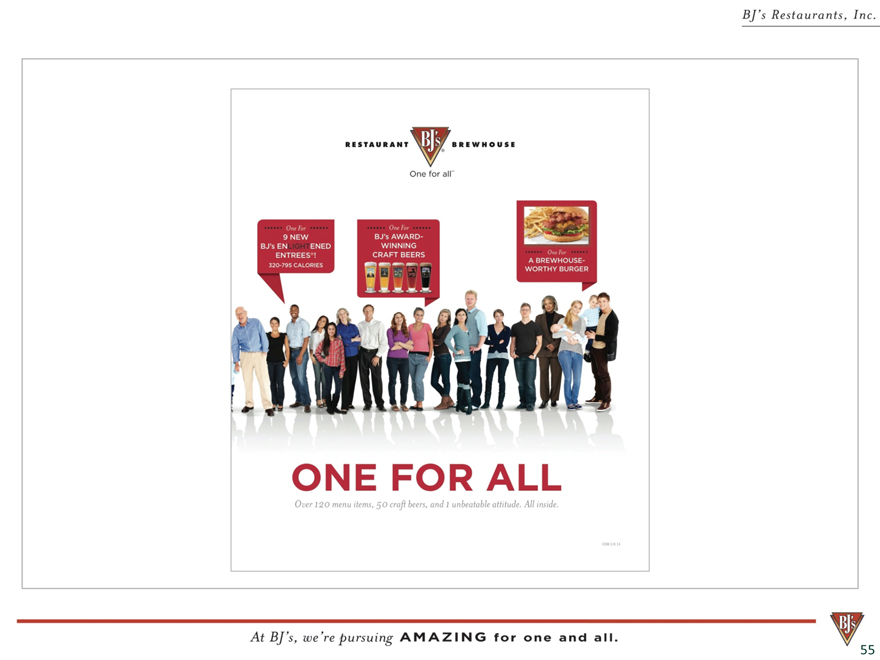
ONE FOR ALL
Over 120 menu item, 50 craft beers, and 1 unbeatable attitude. All inside.
55
|
BJ’S Restaurants, Inc.
At BJ’s, we’re pursuing AMAZING for one and all
56
|
BJ’S Restaurants, Inc.
At BJ’s, we’re pursuing AMAZING for one and all
57
|
Brand Essence Video
BJ’S Restaurants, Inc.
At BJ’s, we’re pursuing AMAZING for one and all
58
|
Project
Q
–
Improving
our
Way
of
Doing
Business
Wayne
Jones
EVP,
Chief
Restaurant
Operations
Ocer
To
develop
the
optimal
menu,
recipes,
kitchen
processes
and
sourcing
decisions
which
enable
us
to
maximize
our
ability
to
consistently
deliver
quality
and craveable BJ’s food and beverages BJ’S Restaurants, Inc. At BJ’s, we’re pursuing AMAZING for one and all
59
|
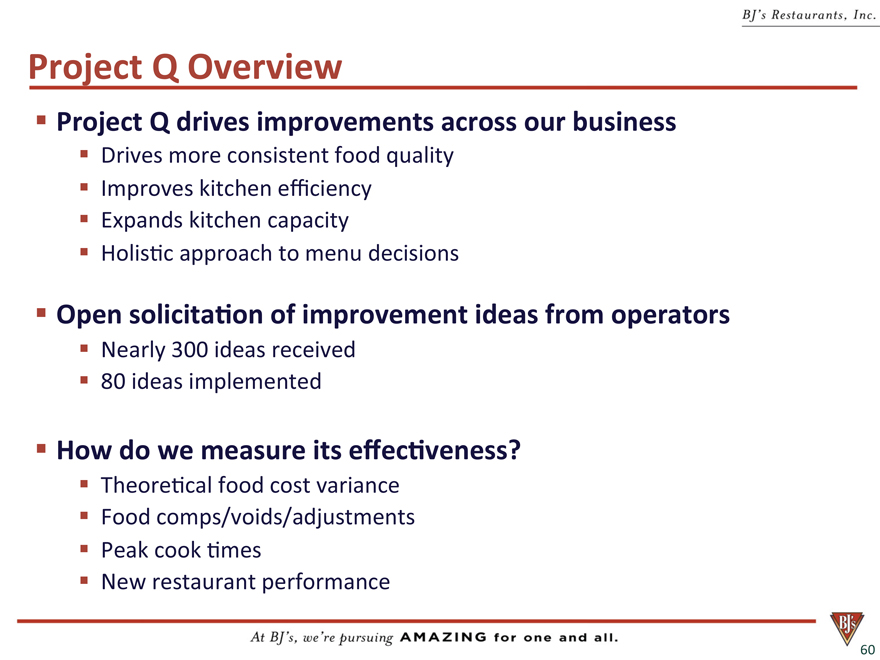
Project
Q
Overview
Project Q drives improvements across our business
Drives more consistent food quality
Improves kitchen efficiency
Expands kitchen capacity
Holis c approach to menu decisions
Open solicitation of improvement ideas from operators
Nearly 300 ideas received
80 ideas implemented
How do we measure its effectiveness
Theore cal food cost variance
Food comps/voids/adjustments
Peak cook mes
New restaurant performance BJ’S Restaurants, Inc.
At BJ’s, we’re pursuing AMAZING for one and all
60
|
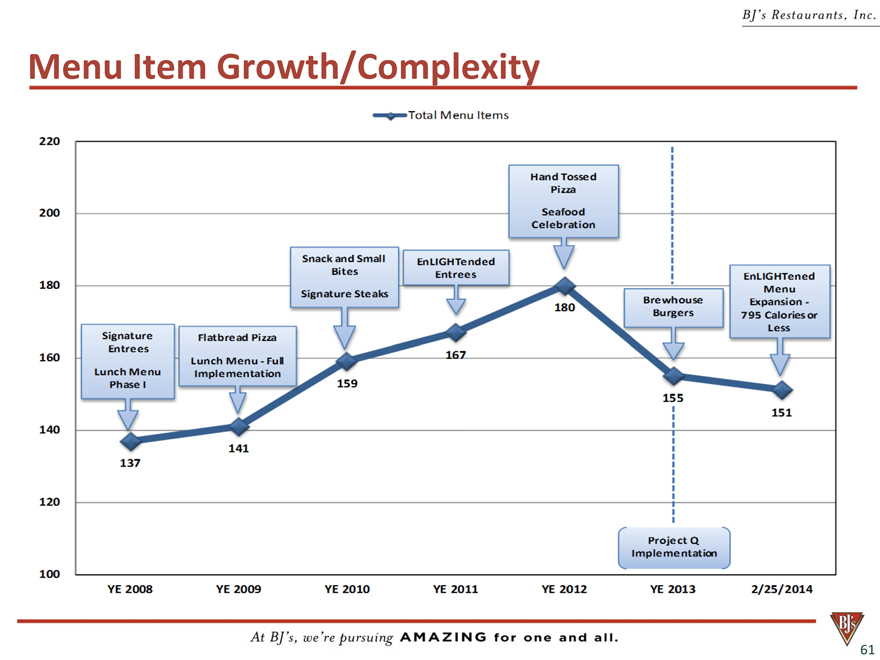
Menu
Item
Growth/Complexity
BJ’S Restaurants, Inc.
At BJ’s, we’re pursuing AMAZING for one and all
61
|
BJ’S Restaurants, Inc.
At BJ’s, we’re pursuing AMAZING for one and all
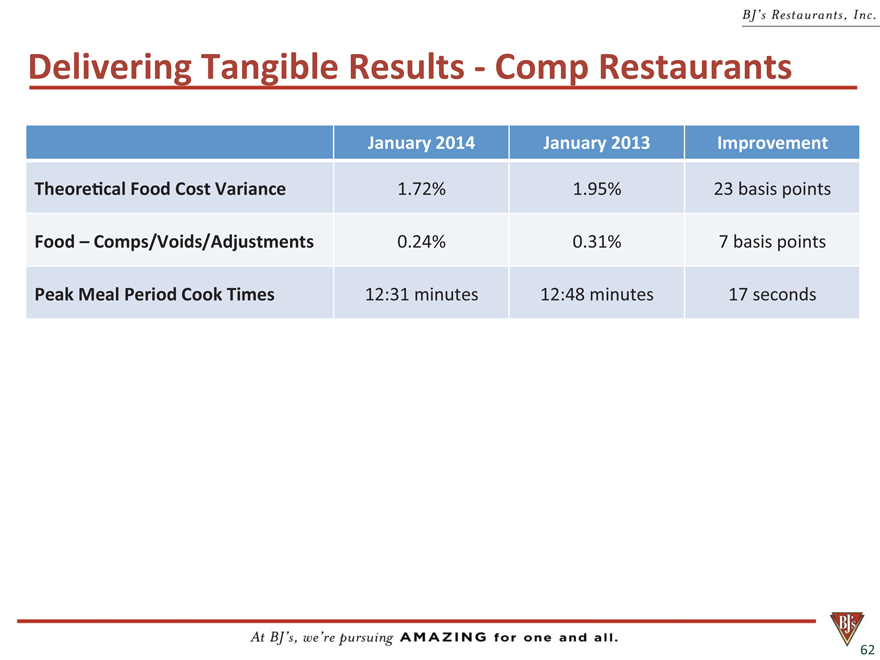
Delivering
Tangible
Results
--?
Comp
Restaurants
January
2014
January
2013
Improvement
Theoretical
Food
Cost
Variance
1.72%
1.95%
23
basis
points
Food
–
Comps/Voids/Adjustments
0.24%
0.31%
7
basis
points
Peak
Meal
Period
Cook
Times
12:31
minutes
12:48 minutes
17 seconds
62
|
BJ’S Restaurants, Inc.
At BJ’s, we’re pursuing AMAZING for one and all
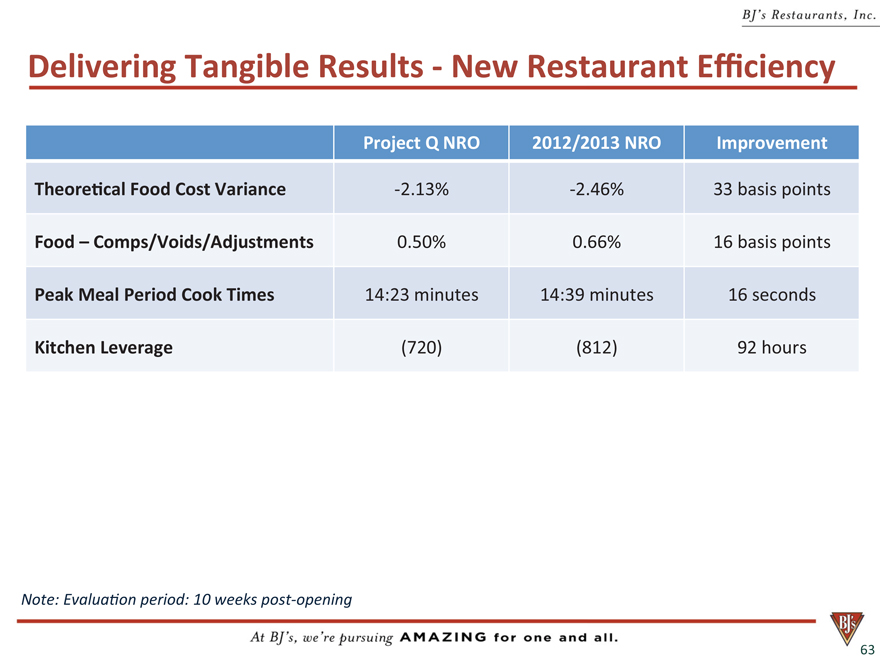
Delivering
Tangible
Results
--
New
Restaurant
Eciency
Project
Q
NRO
2012/2013
NRO
Improvement
Theoretical
Food
Cost
Variance
--2.13%
--2.46%
33
basis
points
Food
–
0.50% 0.66% 16 basis
points
Peak
Meal
Period
Cook
Times
14:23
minutes
14:39
minutes
16 Kichen Leverage (720) (812) 92 hours 63 Note: Evaluation period: 10
weeks
post--opening
|
BJ’S Restaurants, Inc.
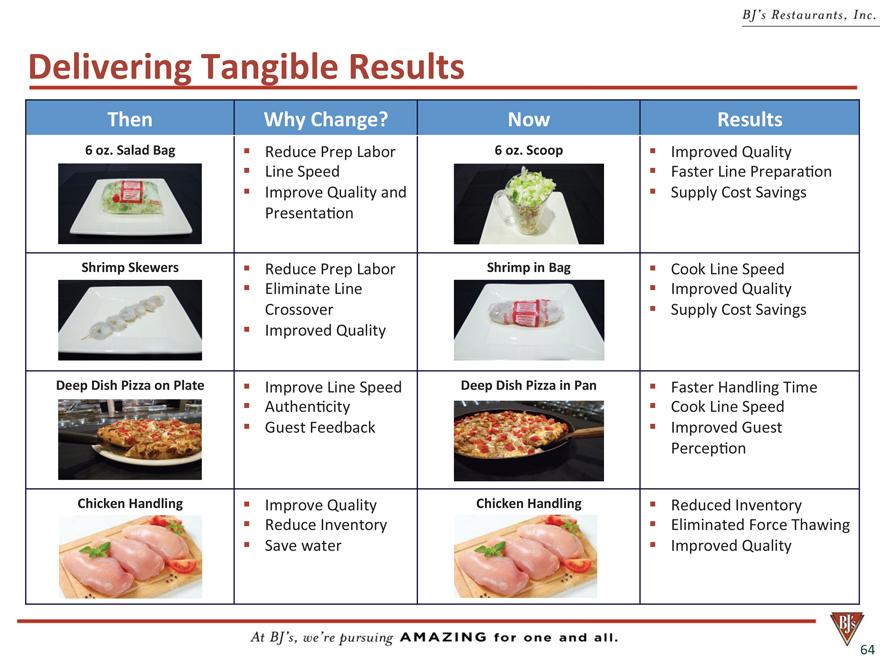
At BJ’s, we’re pursuing AMAZING for one and all Delivering Tangible Results Then Why Change?
Now Results 6 oz. Salad Bag Reduce Prep Labor 6 oz. Scoop Improved Quality Line Speed Faster Line Prepara on Improve
Quality and Supply Cost Savings Presenta on Shrimp Skewers Reduce Prep Labor Shrimp in Bag Cook
Line Speed Eliminate Line Improved Quality Crossover Supply Cost Savings Improved Quality Deep Dish Pizza
on
Plate
Improve
Line
Speed
Deep
Dish
Pizza
in
Pan
Faster
Handling
Time
Authen city
Cook
Line
Speed
Guest
Feedback
Improved
Guest
Perception
Chicken
Handling
Improve
Quality
Chicken
Handling
Reduced
Inventory
Reduce
Inventory Eliminated Force Thawing Save water
Improved
Quality
64
|
BJ’S Restaurants, Inc.
At BJ’s, we’re pursuing AMAZING for one and all
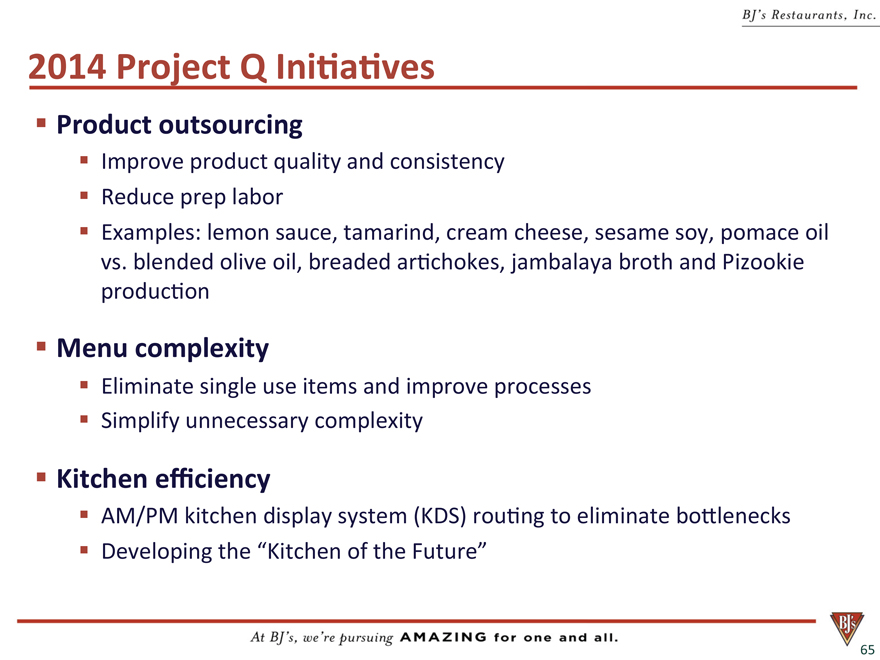
2014
Project
Q
Initiatives
Product
outsourcing
Improve
product
quality
and
consistency
Reduce
prep
labor
Examples:
lemon
sauce,
tamarind, cream cheese, sesame soy, pomace oil vs. blended olive oil,
breaded arti chokes, jambalaya broth and Pizookie production Menu complexity Eliminate single use items and improve processes
Simplify unnecessary complexity Kitchen
e?ciency
AM/PM
kitchen
display
system
(KDS)
routing
to
eliminate
bottlenecks
Developing
the
“Kitchen
of
the
Future”
65
|

BJ’S Restaurants, Inc.
At BJ’s, we’re pursuing AMAZING for one and all
Break
10:00
–
10:10
66
|

Growth
Through
E?cient
Use
of
Capital
Greg
Lynds
Executive
VP
&
Chief
Development
O?cer
BJ’S Restaurants, Inc.
At BJ’s, we’re pursuing AMAZING for one and all
67
|
BJ’S Restaurants, Inc.
At BJ’s, we’re pursuing AMAZING for one and all
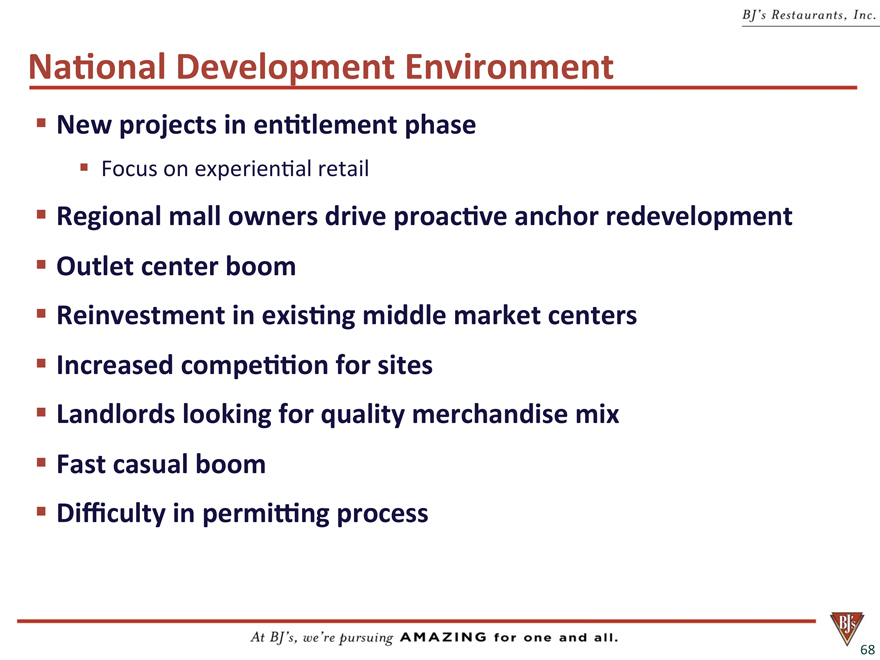
National
Development
Environment
New
projects
in
entitlement
phase
Focus
on
experiential
retail
Regional
mall
owners
drive
proactive
anchor
redevelopment
Outlet
center
boom
Reinvestment
in
existing
middle
market
centers
Increased
competition
for sites
Landlords
looking for quality merchandise
mix
Fast casual
boom Diculty in permiting
process
68
|
BJ’S Restaurants, Inc.
At BJ’s, we’re pursuing AMAZING for one and all
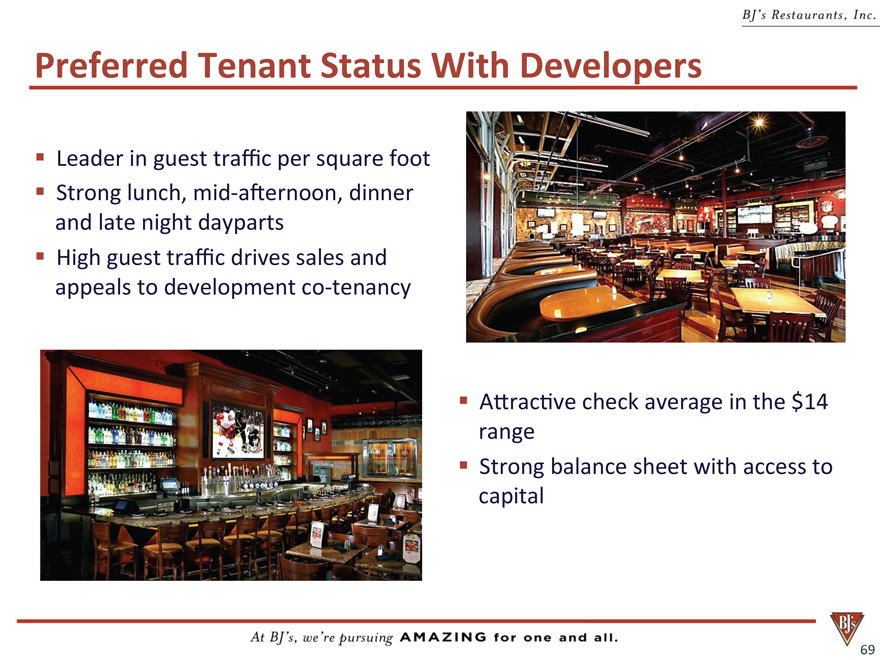
Preferred
Tenant
Status
With
Developers
Leader in guest traffic per square foot Strong lunch,mid-- afternoon, dinner and late night dayparts High guest traffic drives sales and appeals to developmentco-- tenancy Attractive
check
average
in
the
$14
range
Strong
balance
sheet
with
access
to
capital
69
|
BJ’S Restaurants, Inc.
At BJ’s, we’re pursuing AMAZING for one and all
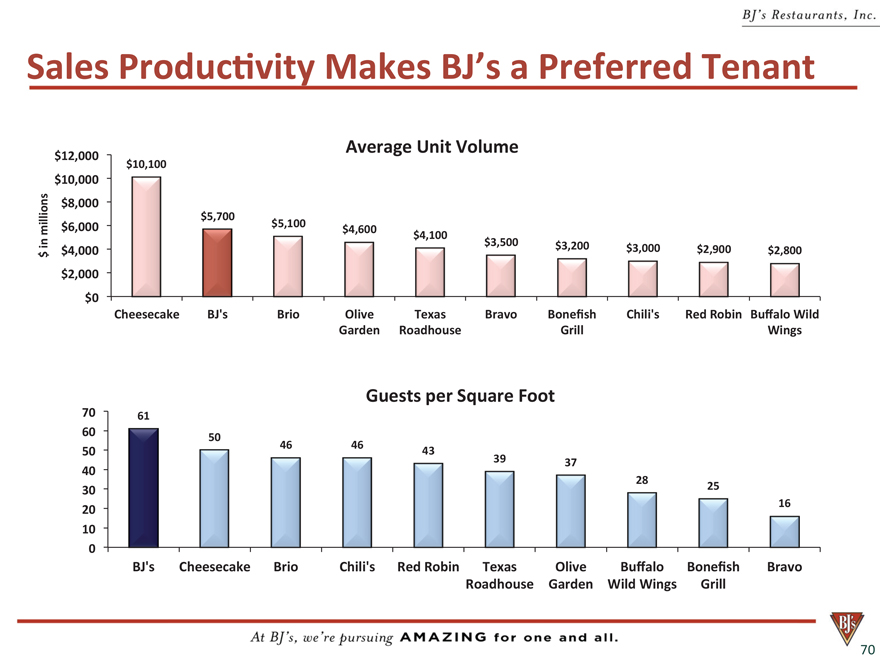
Sales
Productivity
Makes
BJ’s
a
Preferred
Tenant
Average
Unit
Volume
$12,000 $10,100 $10,000 $8,000 millions $5,700 in $6,000 $5,100 $4,600 $4,100 $3,500 $3,200
$3,000 $4,000 $2,900 $2,800 $ $2,000 $0 Cheesecake BJ’s Brio Olive
Texas
Bravo
Bonefish Chili’s Red Robin Buffalo Wild Garden Roadhouse Grill
Wings
Guests
per
Square
Foot 70 61 60 50 46 46 50 43 40 39 37 28 30 25
20 16 10 0
BJ’s
Cheesecake
Brio
Chili’s
Red
Robin
Texas
Olive
Bualo
Bonesh
Bravo
Roadhouse
Garden
Wild
Wings
Grill
70
|
BJ’S Restaurants, Inc.
At BJ’s, we’re pursuing AMAZING for one and all
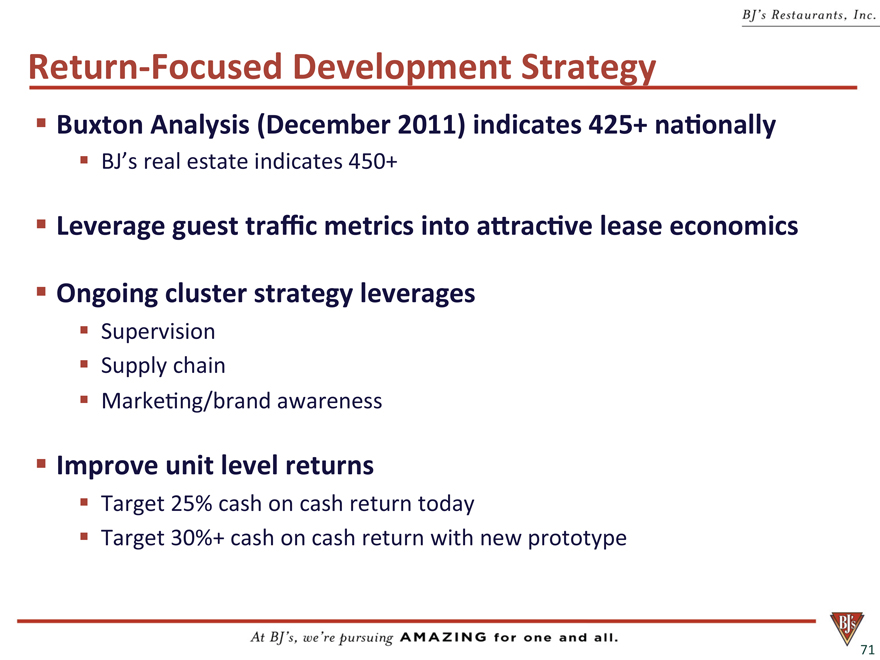
Return Focused
Development
Strategy
Buxton
Analysis
(December
2011)
indicates
425+
nationally
BJ’s
real
estate
indicates
450+
Leverage guest tra?c metrics into aractive lease economics Ongoing cluster strategy leverages Supervision Supply
chain
Marketing/brand
awareness
Improve
unit
level
returns
Target
25%
cash
on
cash
return
today
Target
30%+
cash
on
cash
return
with
new
prototype
71
|
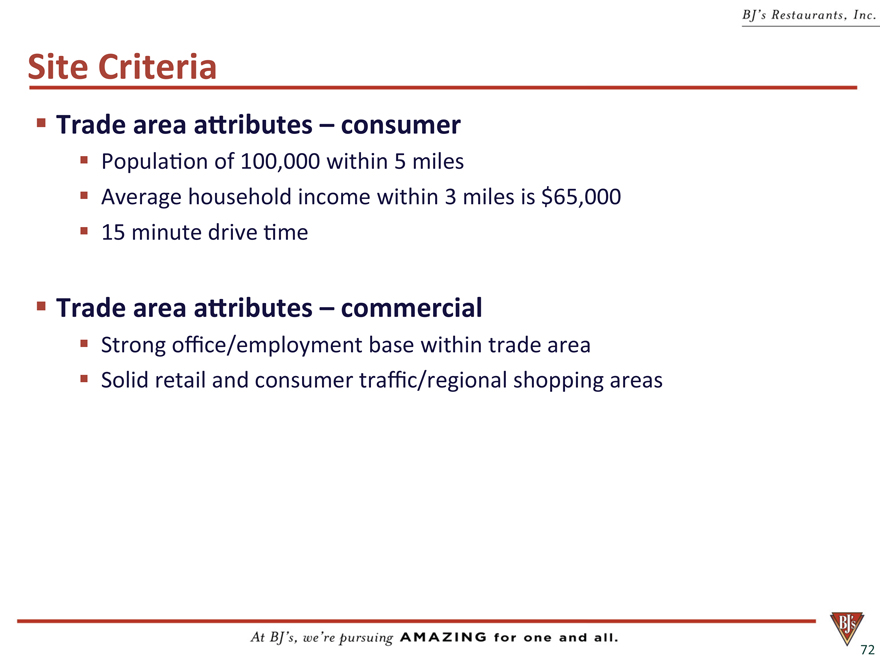
Site
Criteria
Trade
area
attributes
–
consumer
Population
of
100,000
within
5 |
|
miles
Average
household
income
within
3 |
|
miles
is
$65,000
15
minute
drive
me
? Trade
area
a ributes
–
commercial
? Strong
o?ce/employment
base
within
trade
area
? Solid
retail
and
consumer
tra?c/regional
shopping
areas
72
BJ’S Restaurants, Inc.
At BJ’s, we’re pursuing AMAZING for one and all
|

Runway
for
Growth
Significantly less penetrated than comparable casual dining restaurants
Number
of
Restaurant
Locations
2,000
Number
of
Restaurant
Loca ons
1,860
1,800
1,600
1,400
1,266
1,200
1,000
990
822
770
800
678
600
462
406
400
200
147
0
BJ’s
Texas
RH
Red
Robin
Red
Lobster
Outback
Olive
Garden
Bu?alo
Wild
Chili’s
Applebee’s
Wings
73
BJ’S Restaurants, Inc.
At BJ’s, we’re pursuing AMAZING for one and all
|
BJ’S Restaurants, Inc.
At BJ’s, we’re pursuing AMAZING for one and all
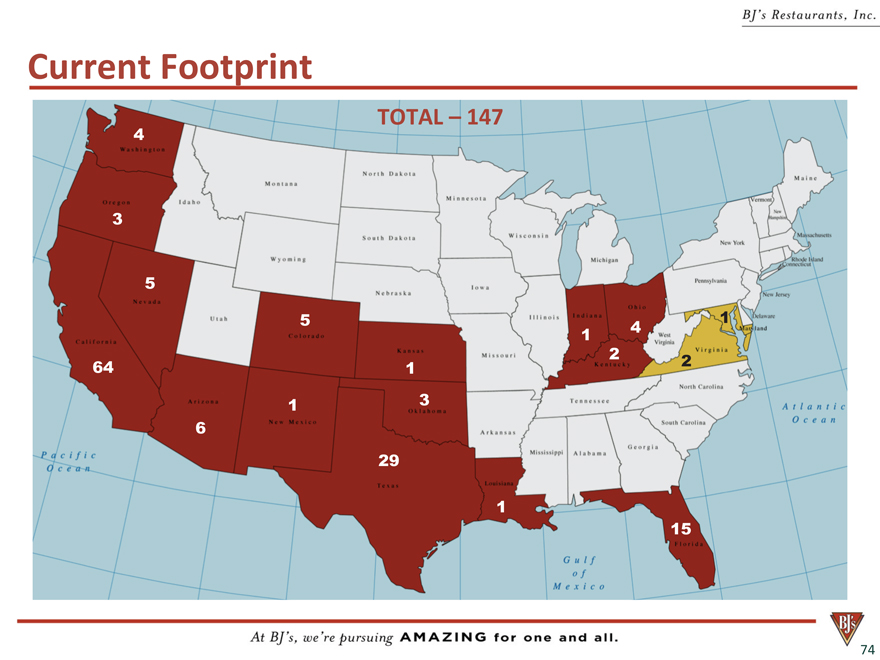
Current Footprint
TOTAL
–
147
4 |
|
3 |
|
5 |
|
5 |
| 1 |
1 |
| 4 |
2 |
| 2 |
64 1
1 |
| 3 6 29 |
1 |
|
15
74
|
BJ’S Restaurants, Inc.
At BJ’s, we’re pursuing AMAZING for one and all
Factors
for
New
Market
Penetra on
? Sales
poten al
? Retail
and
other
restaurant
sales
? Demographic
profile
–
popula on,
income,
day me
? Macroeconomic
factors
? Employment
growth
? Population
growth
? Other
factors
? Minimum
wage
and
operating
cost
environment
? Construction
costs
? Supply
chain
? Buxton
analysis
of
trade
areas
75
|
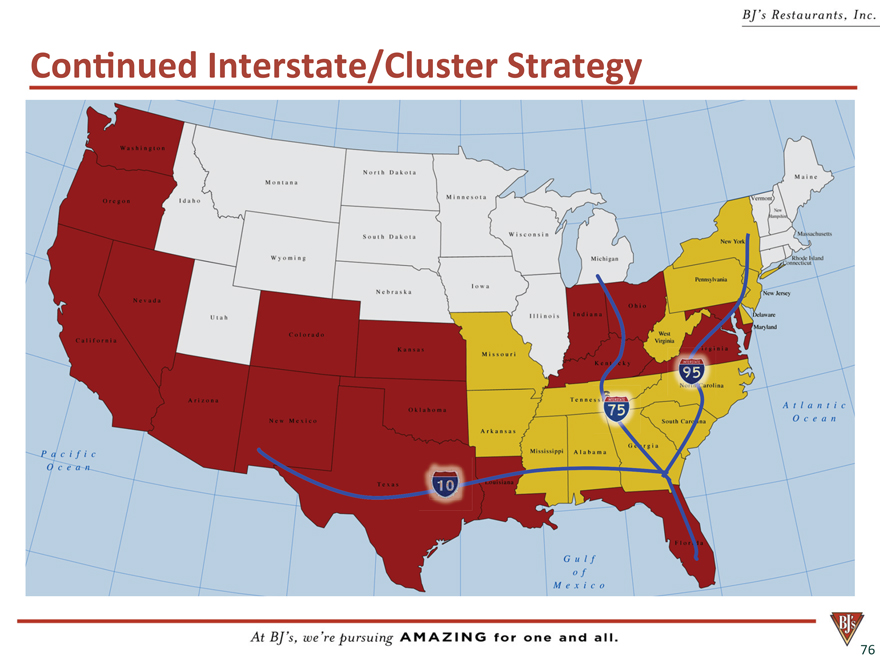
Continued Interstate/Cluster Strategy
BJ’S Restaurants, Inc.
At BJ’s, we’re pursuing AMAZING for one and all
76
|
BJ’S Restaurants, Inc.
At BJ’s, we’re pursuing AMAZING for one and all
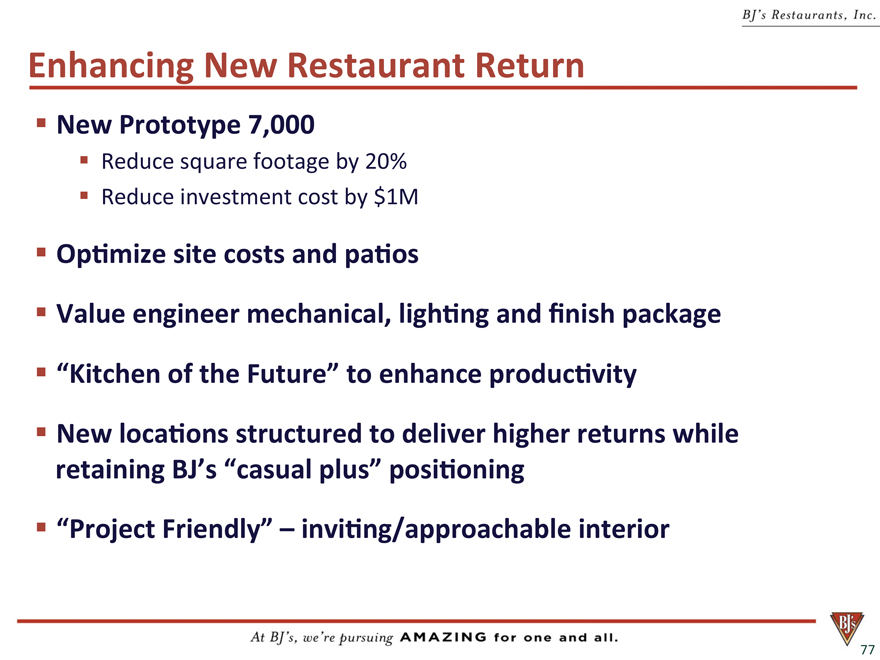
Enhancing
New
Restaurant
Return ? New Prototype 7,000 ? Reduce square footage by 20% ? Reduce investment cost by
$1M
? Optimize
site
costs
and
patios
? Value
engineer
mechanical,
lighting
and
?nish
package
? “Kitchen
of
the
Future”
to
enhance
produc vity
? New
loca ons
structured
to
deliver
higher
returns
while
retaining
BJ’s
“casual
plus”
posio ning
? “Project
Friendly”
–
invi ng/approachable
interior
77
|
BJ’S Restaurants, Inc.
At BJ’s, we’re pursuing AMAZING for one and all
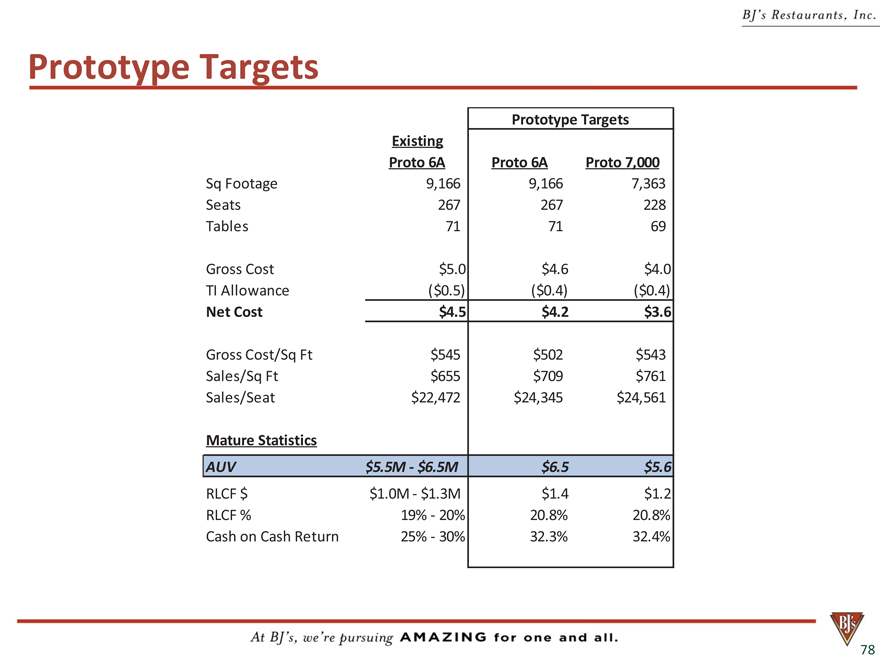
Prototype Targets Prototype Targets Existing Proto 6A Proto 6A Proto 7,000 Sq Footage 9,166 9,166 7,363
Seats 267 267 228 Tables 71 71 69 Gross Cost $ 5. 0 $ 4. 6 $ 4. 0 TI Allowance ($0.5) ($0.4) ($0.4) Net Cost $ 4. 5
$ 4. 2 $ 3. 6 Gross
Cost/Sq
Ft $545 $502 $543
Sales/Sq
Ft $655 $709 $761
Sales/Seat $22,472 $24,345 $24,561
Mature
Statistics
AUV $5.5M
--?
$6.5M
$
6.5
$
5.6
RLCF
$ $1.0M
--?
$1.3M
$
1.
4 |
|
$
1.
2 |
|
RLCF
% 19%
--?
20% 20.8% 20.8%
Cash
on
Cash
Return 25%
--?
30% 32.3% 32.4%
78
|
BJ’S Restaurants, Inc.
At BJ’s, we’re pursuing AMAZING for one and all
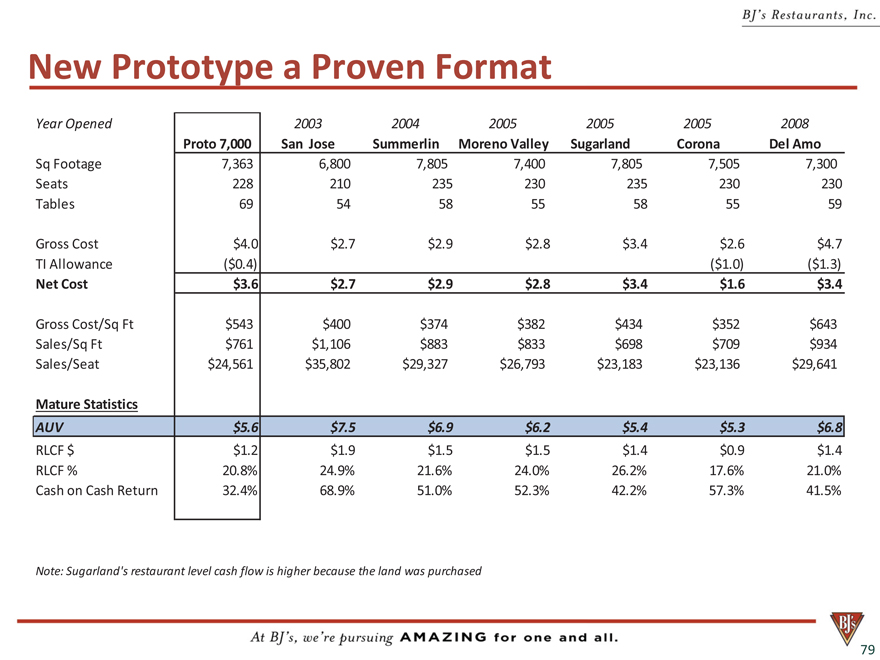
New
Prototype
a
Proven
Format
Year
Opened 2003 2004 2005 2005 2005 2008
Proto
7,000 San Jose Summerlin Moreno Valley Sugarland Corona Del Amo Sq Footage 7,363 6,800 7,805 7,400 7,805 7,505 7,300 Seats 228 210235
230 235 230 230 Tables 69 54 58 55 58 55 59 Gross Cost $ 4.0 $ 2.7 $ 2.9 $ 2.8 $ 3.4 $ 2.6 $ 4.7 TI Allowance ($0.4) ($1.0) ($1.3) Net Cost $ 3.6 $ 2.7 $ 2.9 $ 2.8 $ 3.4 $ 1.6 $ 3.4 Gross Cost/Sq Ft $543 $400 $374 $382 $434 $352 $643 Sales/Sq Ft $761 $1,106
$883 $833 $698 $709 $934
Sales/Seat $24,561 $35,802 $29,327 $26,793 $23,183 $23,136 $29,641 Mature Statistics AUV 6 $ 7. 5 $ 6. 9 $ 6. 2 $ 5. 4 $ 5.
3 $ 6. 8 RLCF $ $ 1.2 $ 1.9
$
1.5
$
1.5
$
1.4
$
0.9
$
1.4
RLCF
% 20.8% 24.9% 21.6% 24.0% 26.2% 17.6% 21.0%
Cash
on
Cash
Return 32.4% 68.9% 51.0% 52.3% 42.2% 57.3% 41.5%
Note:
Sugarland’s
restaurant
level
cash
flow
is
higher
because
the
land
was
purchased
79
|
BJ’S Restaurants, Inc.
At BJ’s, we’re pursuing AMAZING for one and all
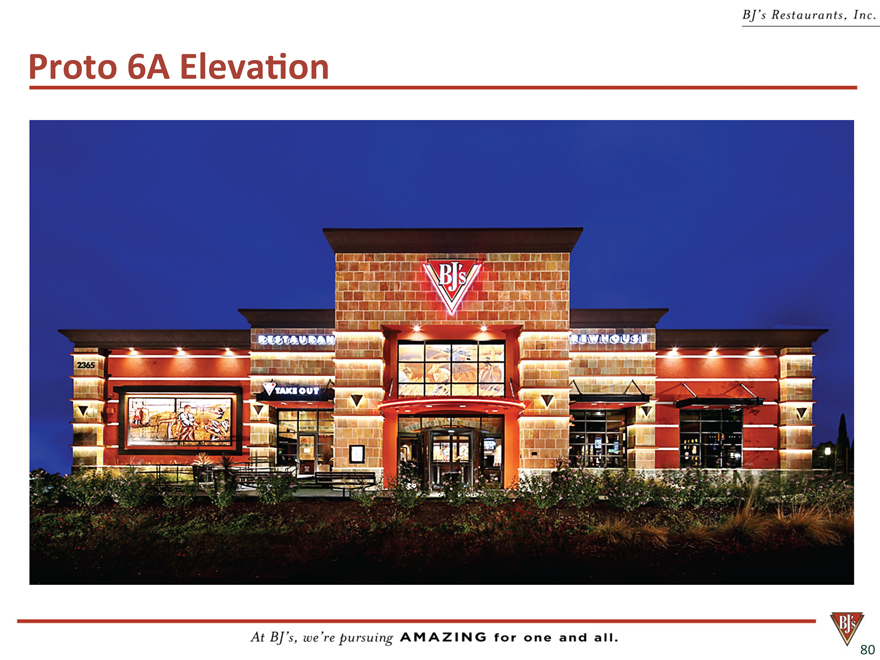
Proto
6A
Elevati
On
80
|
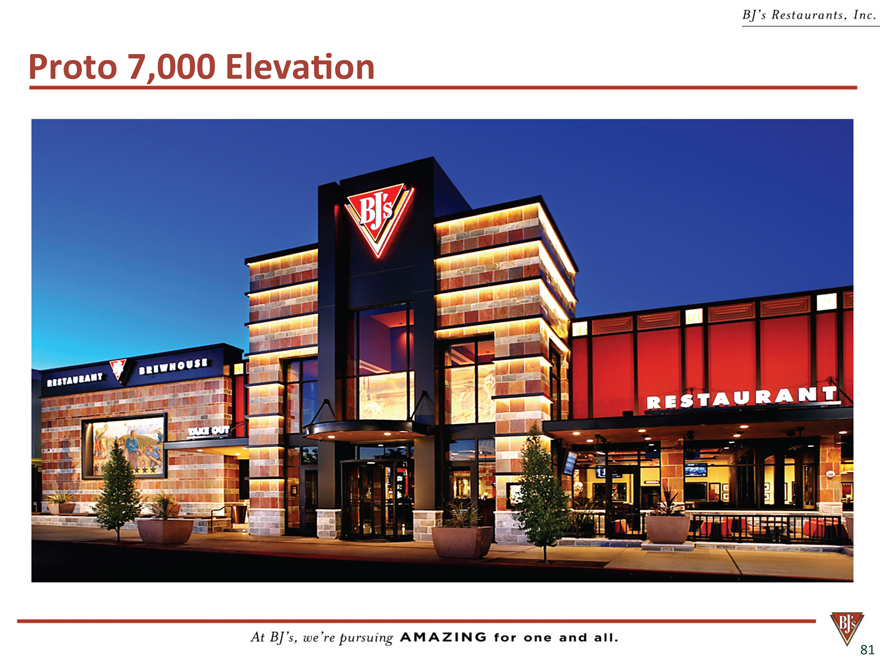
Proto
7,000
Elevation
BJ’S Restaurants, Inc.
At BJ’s, we’re pursuing AMAZING for one and all
81
|
BJ’S Restaurants, Inc.
At BJ’s, we’re pursuing AMAZING for one and all
Reducing
Our
Operating
Costs
John
Allegretto
Chief
Supply
Chain
O?cer
82
|

BJ’S Restaurants, Inc.
At BJ’s, we’re pursuing AMAZING for one and all
Cost
Savings
Plan
–
Operating/Occupancy
Costs
Operan g/Occupancy
Costs
Cost
savings ini a ves (per Restaurant Week) designed to o?set e?ective $25,000 in?ation of approximately 1.7% $20,000 $15,000 Approximately $1,000 per operating week savings by $10,000 2016 § $76M annually based on $5,000 current
operating
weeks
$--?
2010
2011
2012
2013
2016
Without
Savings
Plan
With
Savings
Plan
83
Note:
Excludes
marketing
Note:
2011
includes
53
weeks
|
BJ’S Restaurants, Inc.
At BJ’s, we’re pursuing AMAZING for one and all
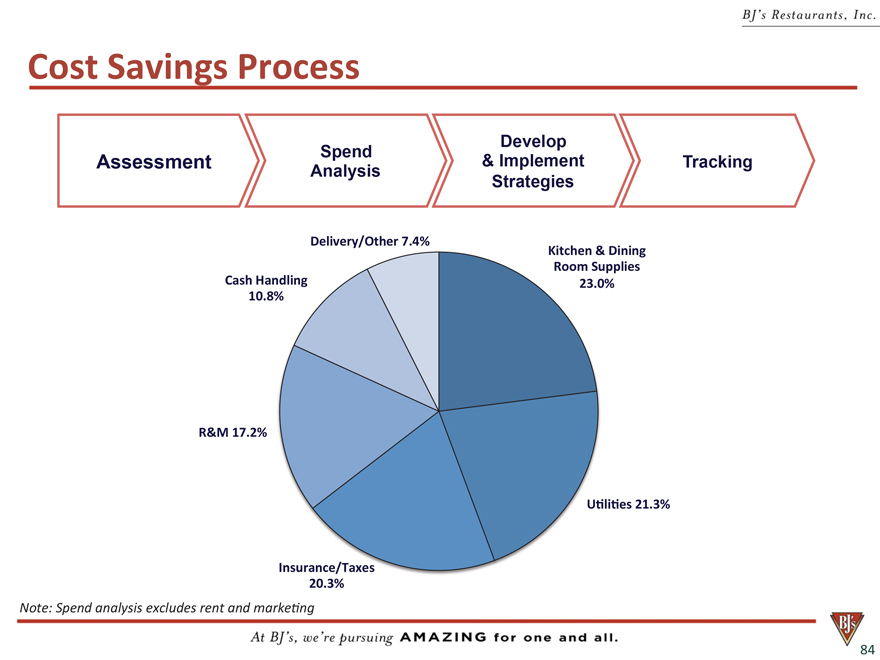
Cost
Savings
Process
Develop Spend
Assessment & Implement Tracking Analysis Strategies
Delivery/Other
7.4%
Delivery/Other
7.4%
Kitchen
&
Dining
Room
Supplies
Cash
Handling
23.0%
10.8%
R&M
17.2%
U li es
21.3%
Insurance/Taxes
20.3%
Note:
Spend
analysis
excludes
rent
and
marketing
84
|
BJ’S Restaurants, Inc.
At BJ’s, we’re pursuing AMAZING for one and all
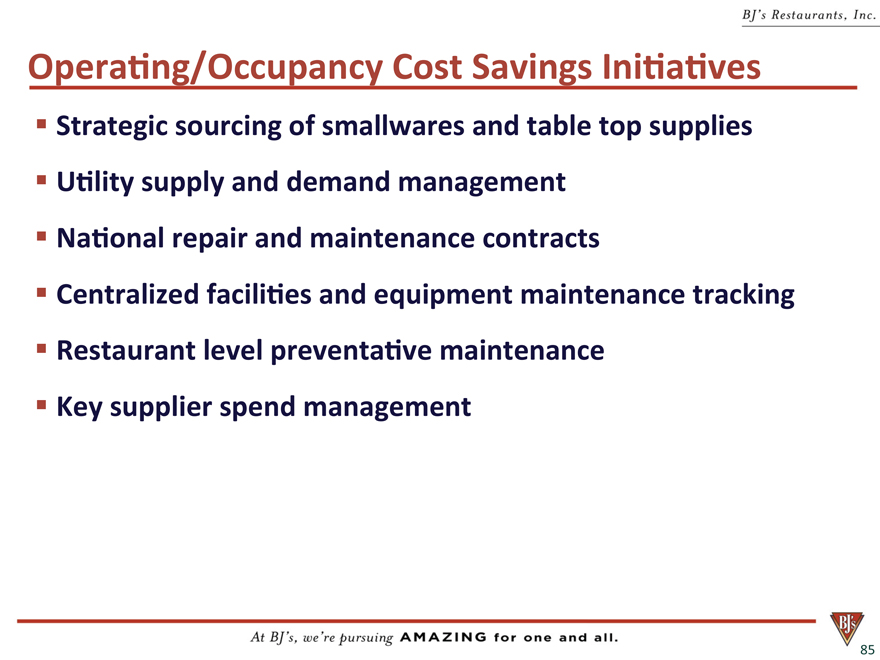
Operating/Occupancy
Cost
Savings
Initiatives
Strategic
sourcing
of
smallwares
and
table
top
supplies
U lity
supply
and
demand
management
National
repair
and
maintenance
contracts
Centralized
facilities
and
equipment
maintenance
tracking
Restaurant
level
preventative
maintenance
Key
supplier
spend
management
85
|
BJ’S Restaurants, Inc.
At BJ’s, we’re pursuing AMAZING for one and all
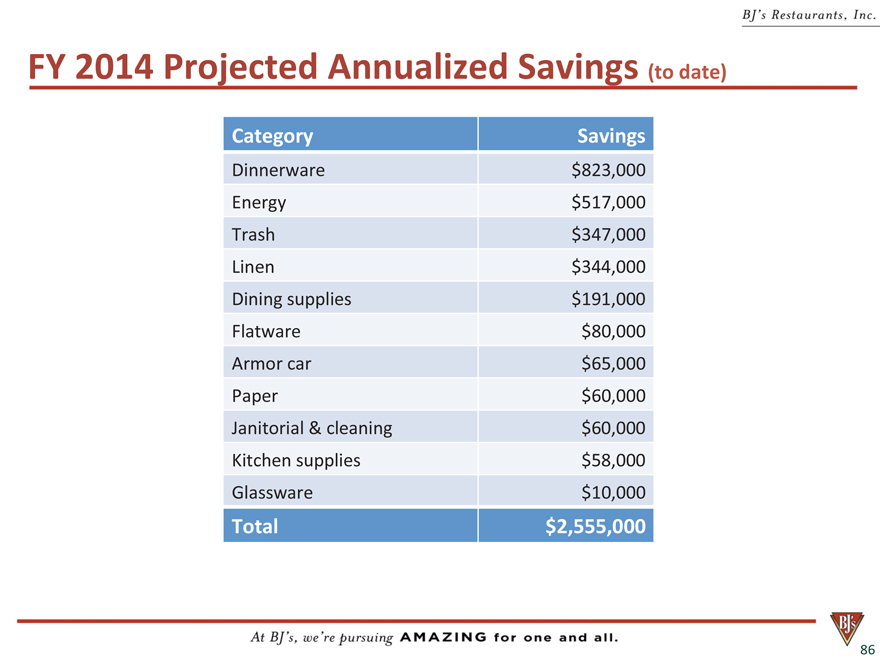
FY
2014
Projected
Annualized
Savings
(to
date)
Category
Savings
Dinnerware
$823,000
Energy
$517,000
Trash
$347,000
Linen
$344,000
Dining
supplies
$191,000
Flatware
$80,000
Armor
car
$65,000
Paper
$60,000
Janitorial
&
cleaning
$60,000
Kitchen
supplies
$58,000
Glassware
$10,000
Total
$2,555,000
86
|
BJ’S Restaurants, Inc.
At BJ’s, we’re pursuing AMAZING for one and all
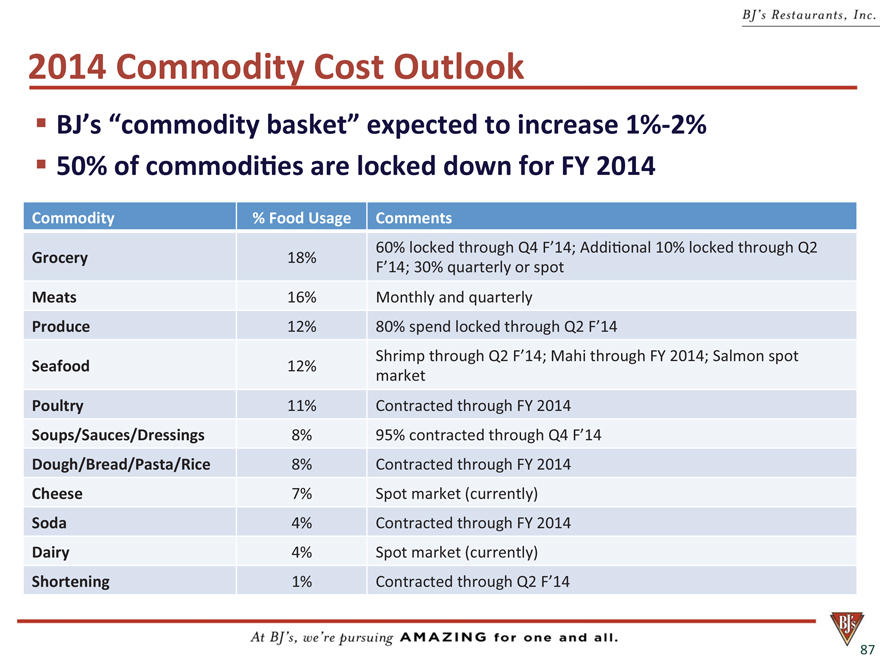
2014
Commodity
Cost Outlook BJ’s “commodity basket” expected to increase1%--?2% 50% of commodities are locked down
for FY 2014 Commodity % Food Usage Comments 60% locked through Q4 F’14; Addi onal 10% locked through Q2 Grocery 18% F’14; 30% quarterly
or
spot
Meats
16%
Monthly
and quarterly Produce 12% 80% spend locked through Q2 F’14 Shrimp through Q2 F’14; Mahi through FY 2014; Salmon spot Seafood 12%
market Poultry 11% Contracted through FY 2014 Soups/Sauces/Dressings 8% 95% contracted through
Q4
F’14
Dough/Bread/Pasta/Rice
8%
Contracted
through
FY
2014
Cheese
7%
Spot
market
(currently)
Soda
4%
Contracted
through
FY
2014
Dairy
4%
Spot
market
(currently)
Shortening
1%
Contracted
through
Q2
F’14
87
|
BJ’S Restaurants, Inc.
At BJ’s, we’re pursuing AMAZING for one and all
Financial
Success
through
Margin
Improvement
Greg
Levin
Executive
VP,
Chief
Financial
O?cer
and
Secretary
88
|
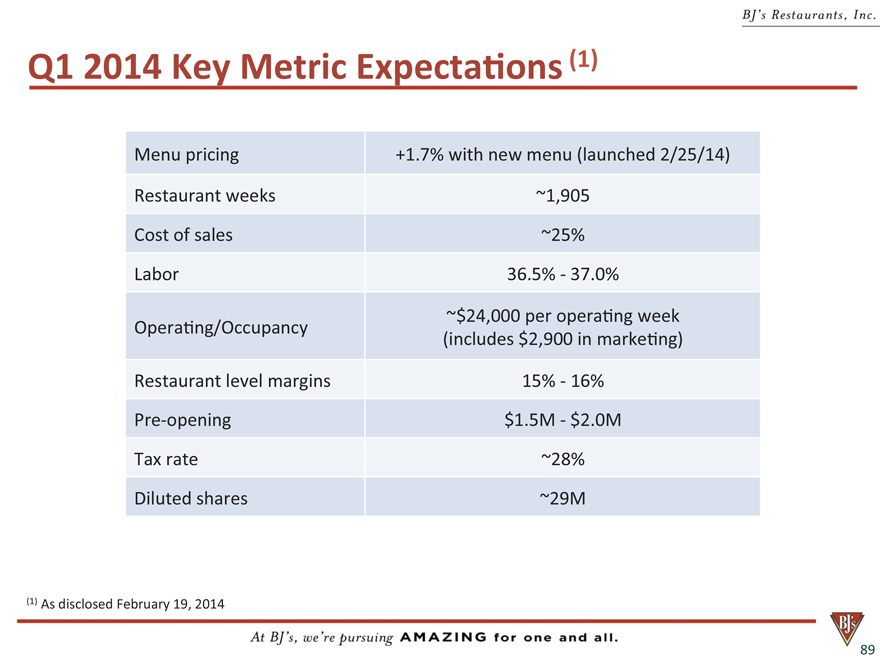
Q1
2014
Key
Metric
Expectations
(1)
Menu pricing +1.7% with new menu (launched2/25/14) Restaurant weeks ~1,905 Cost of
sales
~25%
Labor
36.5%
--?
37.0%
~$24,000
per
operating
week
Opera ng/Occupancy
(includes
$2,900
in
marketing)
Restaurant
level
margins
15%
--?
16%
Pre--?opening
$1.5M
--?
$2.0M
Tax
rate
~28%
Diluted
shares
~29M
BJ’S Restaurants, Inc.
At BJ’s, we’re pursuing AMAZING for one and all
(1) |
|
As
disclosed
February
19,
2014
89
|
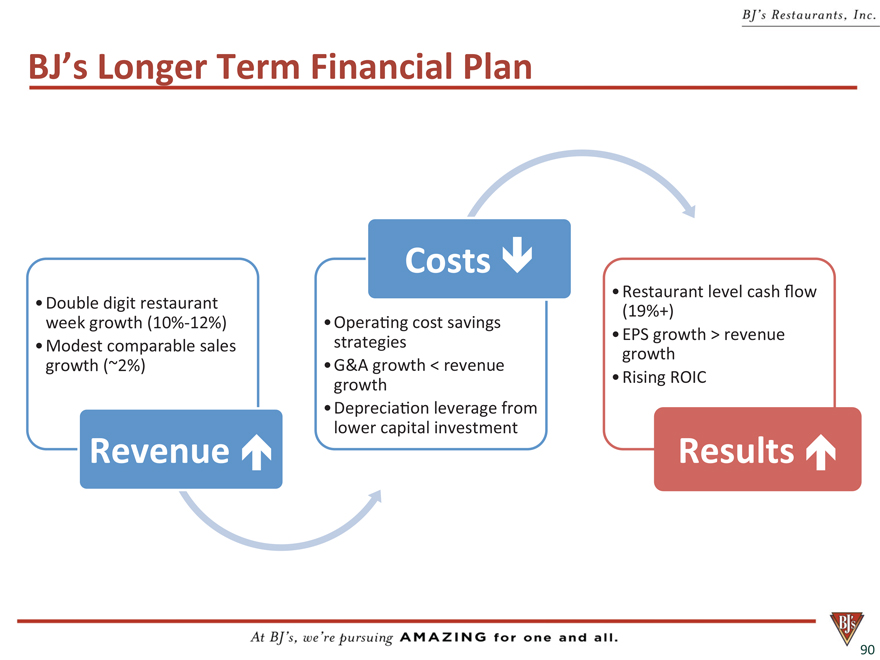
BJ’s
Longer
Term
Financial
Plan
BJ’S Restaurants, Inc.
At BJ’s, we’re pursuing AMAZING for one and all
Costs Restaurant level cash now Double digit restaurant (19%+) week growth(10%--?12%) Opera ng cost
savings
Modest
comparable
sales
strategies
EPS
growth
growth
>
revenue
growth
(~2%)
G&A
growth
<
revenue
growth
Rising
ROIC
Deprecia on
leverage
from
lower
capital
investment
Revenue
é
Results
é
90
|
BJ’S Restaurants, Inc.
At BJ’s, we’re pursuing AMAZING for one and all
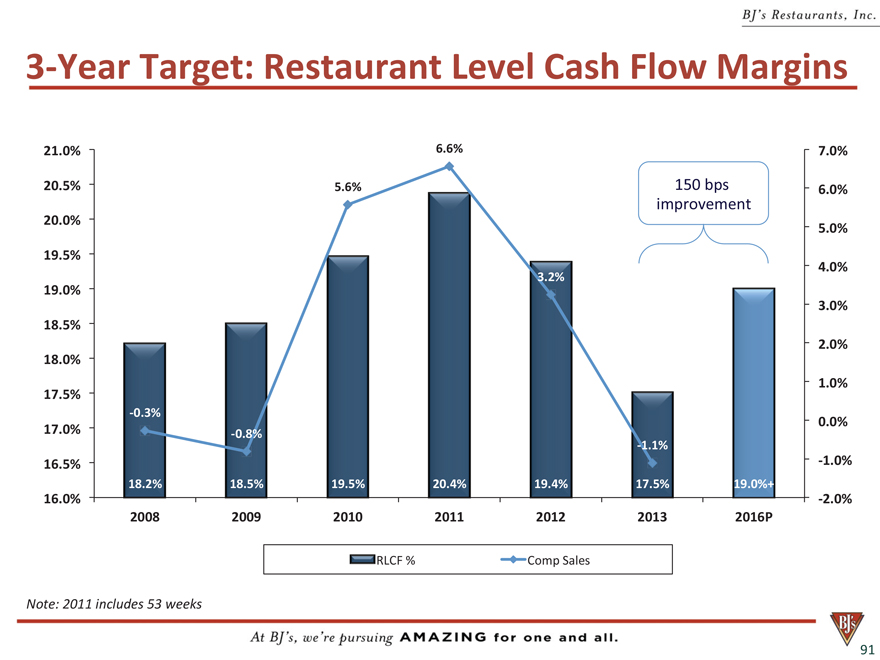
3--?Year
Target:
Restaurant
Level
Cash Flow Margins 21.0% 6.6% 7.0% 20.5% 5.6% 150 bps 6.0% improvement 20.0% 5.0% 19.5% 4.0% 19.0% 3.2% 3.0% 18.5%
2.0%
18.0%
1.0%
17.5%
--?0.3%
0.0%
17.0%
--?0.8%
--?1.1%
16.5%
--?1.0%
18.2%
18.5%
19.5%
20.4%
19.4%
17.5%
19.0%+
16.0%
--?2.0%
2008
2009
2010
2011
2012
2013
2016P
RLCF
%
Comp
Sales
Note:
2011
includes
53
weeks
91
BJ’S Restaurants, Inc.
At BJ’s, we’re pursuing AMAZING for one and all
|

BJ’S Restaurants, Inc.
At BJ’s, we’re pursuing AMAZING for one and all
3--?Year
Target:
Adjusted
Opera ng
Income
Margin
230
bps
8.0%
improvement
7.3%
7.0%
6.1%
6.0%
6.0%+
6.0%
5.0%
4.7%
3.8%
4.0%
3.7%
3.0%
2.0%
1.0%
0.0%
2008
2009
2010
2011
2012
2013
2016P
Note:
2011
includes
53
weeks
92
|
BJ’S Restaurants, Inc.
At BJ’s, we’re pursuing AMAZING for one and all
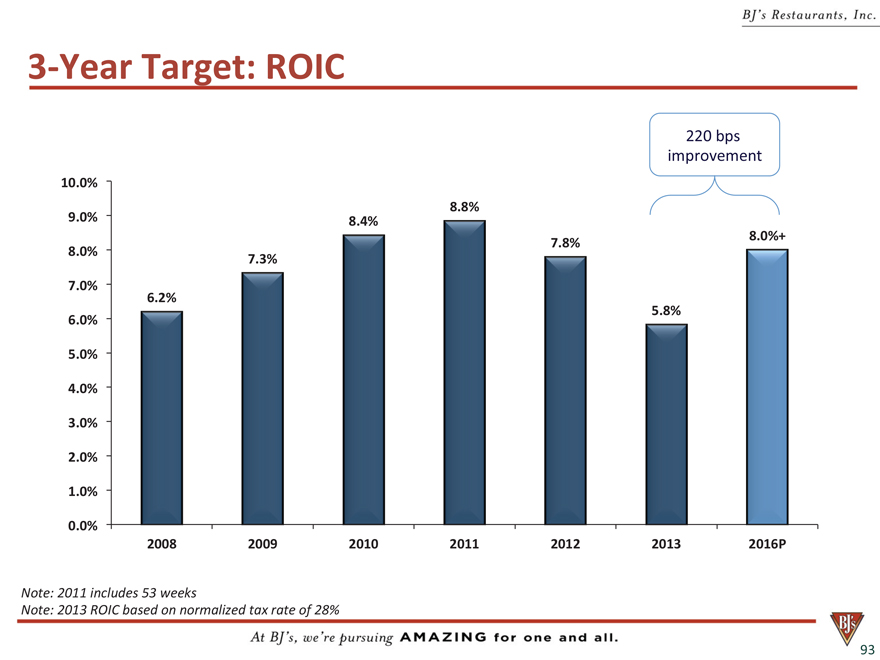
3--?Year
Target:
ROIC
220
bps
improvement
10.0% 8.8% 9.0% 8.4% 7.8% 8.0% 8.0% 7.3% 7.0% 6.2% 5.8% 6.0%
5.0%
4.0%
3.0%
2.0%
1.0%
0.0%
2008
2009
2010
2011
2012
2013
2016P
Note:
2011
includes
53
weeks
Note:
2013
ROIC
based
on
normalized
tax
rate
of
28%
93
|
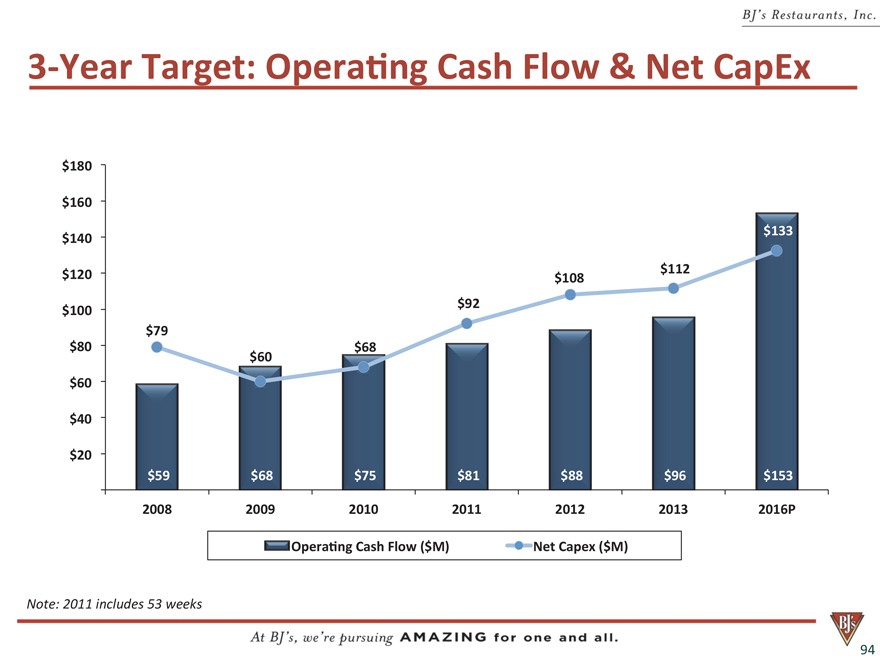
3--?Year
Target:
Operating
Cash
Flow
&
Net
CapEx
$180
$160
$133 $140 $120 $112 $108 $92 $100 $79 $80 $68 $60 $60
$40
$20
$59 $68 $75 $81 $88 $96 $153 2008 2009 2010 2011 2012 2013 2016P Operating Cash Flow ($M) Net Capex ($M) Note:
2011
includes
53
weeks
94
|
Current
Balance
Sheet
and
Capital
Structure
Balance
sheet
as
of
December 31, 2013 Cash
and investments of $33 million Total assets of $620 million No funded debt Stockholders’ equity of $401 million 2014 CapEx Approximately $105 million gross and $93 million net Available
credit
line
$75
million
(for
LCs
and
backstop
liquidity)
Es mated
$15M--?$20M
in
owned
proper es
that
can
be
mone zed
Financial
strength
and
?exibility
to
pivot
capital
priori es
to
op mize
shareholder
value
95
|
Q&A
Greg
Trojan
Tim
Blett
Wayne
Jones
Greg
Lynds
John
Allegretto
Greg
Levin
96
|
Lunch
Join
us
in
our
test
kitchen
at
12:00pm
for
a
look
at
Project
Q
in
ac on
and
a
lunch
tasting
featuring
some
of
our
new
and
test
menu
items
97
|
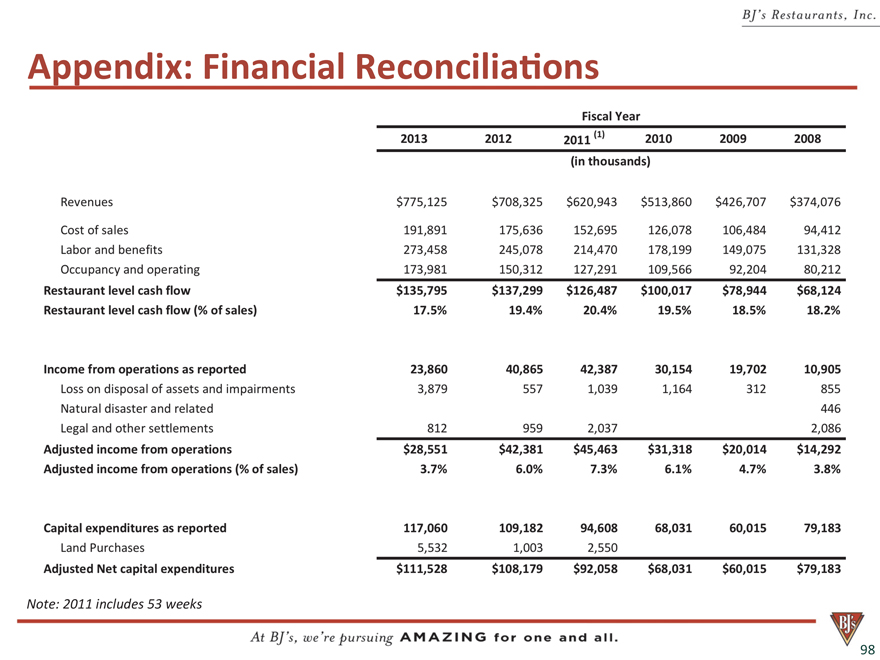
Appendix:
Financial
Reconciliatins
Note:
2011
includes
53
weeks
98