Exhibit 99.2
MD&A Management’s Discussion and Analysis | | | | This management’s discussion and analysis (MD&A) contains information to help you understand our business and financial performance. Information is as of March 1, 2019. This MD&A focuses on our Consolidated Financial Statements and Notes and includes a discussion of known risks and uncertainties relating to our business and the oilfield services sector. You should read this MD&A with the accompanying audited Consolidated Financial Statements and Notes, which have been prepared in accordance with International Financial Reporting Standards (IFRS) and with the information in Cautionary Statement About Forward-Looking Information and Statements on page 2. The terms we, us, our, Precision Drilling and Precision mean Precision Drilling Corporation and our subsidiaries and include any partnerships that we are part. All amounts are in Canadian dollars unless otherwise stated. |
| | | |
| | Precision Drilling Corporation 2018 | |
| | | |
1 | Management’s Discussion and Analysis |
CAUTIONARY STATEMENT ABOUT FORWARD-LOOKING INFORMATION AND STATEMENTS
We disclose forward-looking information to help current and prospective investors understand our future prospects.
Certain statements contained in this MD&A, including statements that contain words such as could, should, can, anticipate, estimate, intend, plan, expect, believe, will, may, continue, project, potential and similar expressions and statements relating to matters that are not historical facts constitute forward-looking information within the meaning of applicable Canadian securities legislation and forward-looking statements within the meaning of the safe harbor provisions of the United States Private Securities Litigation Reform Act of 1995 (collectively, forward-looking information and statements).
Our forward-looking information and statements in this MD&A include, but are not limited to, the following:
| ▪ | our outlook on oil and natural gas prices |
| ▪ | our expectations about drilling activity in North America and the demand for drilling rigs |
| ▪ | our capital expenditure plans for 2019 |
| ▪ | our 2019 strategic priorities |
| ▪ | the potential impact liquefied natural gas export development could have on North American drilling activity |
| ▪ | our expectations that new or newer rigs will enter the markets we currently operate in |
| ▪ | our ability to remain compliant with our senior secured credit facility financial debt covenants. |
The forward-looking information and statements are based on certain assumptions and analysis made by Precision in light of our experience and our perception of historical trends, current conditions and expected future developments as well as other factors we believe are appropriate in the circumstances. These include, among other things:
| ▪ | our ability to react to customer spending plans as a result of changes in oil and natural gas prices |
| ▪ | the status of current negotiations with our customers and vendors |
| ▪ | customer focus on safety performance |
| ▪ | existing term contracts are neither renewed or terminated prematurely |
| ▪ | continued market demand for drilling rigs |
| ▪ | our ability to deliver rigs to customers on a timely basis |
| ▪ | the general stability of the economic and political environment in the jurisdictions we operate in |
| ▪ | the impact of an increase/decrease in capital spending. |
Undue reliance should not be placed on forward-looking information and statements. Whether actual results, performance or achievements will conform to our expectations and predictions is subject to a number of known and unknown risks and uncertainties which could cause actual results to differ materially from our expectations. Such risks and uncertainties include, but are not limited to:
| ▪ | volatility in the price and demand for oil and natural gas |
| ▪ | fluctuations in the level of oil and natural gas exploration and development activities |
| ▪ | fluctuations in the demand for contract drilling, directional drilling, well servicing and ancillary oilfield services |
| ▪ | our customers’ inability to obtain adequate credit or financing to support their drilling and production activity |
| ▪ | changes in drilling and well servicing technology, which could reduce demand for certain rigs or put us at a competitive advantage |
| ▪ | shortages, delays and interruptions in the delivery of equipment supplies and other key inputs |
| ▪ | liquidity of the capital markets to fund customer drilling programs |
| ▪ | availability of cash flow, debt and equity sources to fund our capital and operating requirements, as needed |
| ▪ | the impact of weather and seasonal conditions on operations and facilities |
| ▪ | competitive operating risks inherent in contract drilling, directional drilling, well servicing and ancillary oilfield services |
| ▪ | ability to improve our rig technology to improve drilling efficiency |
| ▪ | general economic, market or business conditions |
| ▪ | the availability of qualified personnel and management |
| ▪ | a decline in our safety performance which could result in lower demand for our services |
| ▪ | changes in laws or regulations, including changes in environmental laws and regulations such as increased regulation of hydraulic fracturing or restrictions on the burning of fossil fuels and greenhouse gas emissions, which could have an adverse impact on the demand for oil and natural gas |
| ▪ | terrorism, social, civil and political unrest in the foreign jurisdictions where we operate |
Precision Drilling Corporation 2018 Annual Report | 2 |
| ▪ | fluctuations in foreign exchange, interest rates and tax rates, and |
| ▪ | other unforeseen conditions which could impact the use of services supplied by Precision and our ability to respond to such conditions. |
Readers are cautioned that the foregoing list of risk factors is not exhaustive. You can find more information about these and other factors that could affect our business, operations or financial results in reports on file with securities regulatory authorities from time to time, including but not limited to our annual information form (AIF) for the year ended December 31, 2018, which you can find in our profile on SEDAR (www.sedar.com) or in our profile on EDGAR ( www.sec.gov).
All of the forward-looking information and statements made in this MD&A are expressly qualified by these cautionary statements. There can be no assurance that actual results or developments that we anticipate will be realized. We caution you not to place undue reliance on forward-looking information and statements. The forward-looking information and statements made in this MD&A are made as of the date hereof. We will not necessarily update or revise this forward-looking information as a result of new information, future events or otherwise, unless we are required to by securities law.
NON-GAAP MEASURES
In this MD&A, we reference additional generally accepted accounting principles (GAAP) measures that are not defined terms under IFRS to assess performance because we believe they provide useful supplemental information to investors.
Adjusted EBITDA
We believe that adjusted EBITDA (earnings before income taxes, loss or gain on redemption and repurchase of unsecured senior notes, finance charges, foreign exchange, impairment of property, plant and equipment, impairment of goodwill and depreciation and amortization), as reported in our Consolidated Statement of Loss, is a useful measure, because it gives an indication of the results from our principal business activities prior to consideration of how our activities are financed and the impact of foreign exchange, taxation and depreciation and amortization charges.
Covenant EBITDA
Covenant EBITDA, as defined in our Senior Credit Facility agreement, is used in determining the Corporation’s compliance with its covenants. Covenant EBITDA differs from Adjusted EBITDA by the exclusion of bad debt expense, restructuring costs and certain foreign exchange amounts.
Operating Loss
We believe that operating loss is a useful measure because it provides an indication of the results of our principal business activities before consideration of how those activities are financed and the impact of foreign exchange and taxation. Operating loss is calculated as follows:
Year ended December 31 (thousands of dollars) | | 2018 | | | 2017 | | | 2016 | |
Revenue | | | 1,541,189 | | | | 1,321,224 | | | | 951,411 | |
Expenses: | | | | | | | | | | | | |
Operating | | | 1,067,871 | | | | 926,171 | | | | 607,295 | |
General and administrative | | | 112,387 | | | | 90,072 | | | | 110,287 | |
Restructuring | | | - | | | | - | | | | 5,754 | |
Other recoveries | | | (14,200 | ) | | | - | | | | - | |
Depreciation and amortization | | | 365,660 | | | | 377,746 | | | | 391,659 | |
Impairment of goodwill | | | 207,544 | | | | - | | | | - | |
Impairment of property, plant and equipment | | | - | | | | 15,313 | | | | - | |
Gain on re-measurement of property, plant and equipment | | | - | | | | - | | | | (7,605 | ) |
Operating loss | | | (198,073 | ) | | | (88,078 | ) | | | (155,979 | ) |
Foreign exchange | | | 4,017 | | | | (2,970 | ) | | | 6,008 | |
Finance charges | | | 127,178 | | | | 137,928 | | | | 146,360 | |
Loss (gain) on redemption and repurchase of unsecured senior notes | | | (5,672 | ) | | | 9,021 | | | | 239 | |
Income taxes | | | (29,326 | ) | | | (100,021 | ) | | | (153,031 | ) |
Net loss | | | (294,270 | ) | | | (132,036 | ) | | | (155,555 | ) |
| |
3 | Management’s Discussion and Analysis |
Funds Provided by (Used In) Operations
We believe that funds provided by (used in) operations, as reported in our Consolidated Statements of Cash Flow, is a useful measure because it provides an indication of the funds our principal business activities generate prior to consideration of working capital, which is primarily made up of highly liquid balances.
Working Capital
We define working capital as current assets less current liabilities as reported in our Consolidated Statement of Financial Position.
Precision Drilling Corporation 2018 Annual Report | 4 |
| | | | | |
| About Precision | | Management’s Discussion and Analysis | | |
| | | | | |
Precision Drilling Corporation provides onshore drilling and completion and production services to exploration and production companies in the oil and natural gas industry.
Headquartered in Calgary, Alberta, Canada, we are a large oilfield services company with broad geographic scope in North America. We also have operations in the Middle East. Our common shares trade on the Toronto Stock Exchange, under the symbol PD, and on the New York Stock Exchange, under the symbol PDS. | | Vision Our vision is to be globally recognized as the High Performance, High Value provider of land drilling services. You can read about our strategic priorities for 2019 on page 24. |
COMPETITIVE ADVANTAGE
From our founding as a private oilfield drilling contractor in the 1950s, Precision has grown to become one of the most active drillers in North America. Our competitive advantage is underpinned by five distinguishing features:
| ▪ | a competitive operating model that drives efficiency, quality and cost discipline |
| ▪ | a culture focused on safety and performance |
| ▪ | size and scale of operations that provide higher margins and better service capabilities |
| ▪ | high quality standardized equipment and control system with process automation control and advanced digital backbone systems to deliver efficient, consistent and safe drilling services, and |
| ▪ | a capital structure that provides long-term stability, flexibility and liquidity that allows us to take advantage of business cycle opportunities. |
CORPORATE GOVERNANCE
At Precision, we believe that a transparent culture of corporate governance and ethical behaviour in decision-making is fundamental to the way we do business.
We have a diverse and experienced Board of Directors (Board). Our directors have a history of achievement and an effective mix of skills, knowledge, and business experience. The directors oversee the conduct of our business, provide oversight in support of future operations and monitor regulatory developments and governance best practices in Canada and the U.S. Our Board also reviews our governance charters, guidelines, policies and procedures to make sure they are appropriate and that we maintain high governance standards.
Our Board has established three standing committees, comprised of independent directors, to help it carry out its responsibilities effectively:
| ▪ | Corporate Governance, Nominating and Risk Committee, and |
| ▪ | Human Resources and Compensation Committee. |
The Board may also create special ad hoc committees from time to time to deal with important matters that arise.
You can find more information about our approach to governance in our management information circular, available on our website (www.precisiondrilling.com).
| |
5 | Management’s Discussion and Analysis |
TWO BUSINESS SEGMENTS
We operate our business in two segments, supported by vertically integrated business support systems.
Precision Drilling Corporation |
| | | | | | | | | | | | | | | | |
| | | | | | | | | | | | | | | | |
| Contract Drilling Services | | | | Completion and Production Services |
| | | | | | | | | | | | | | | | |
| ● | Drilling rig operations | | | | | ● | Canada and U.S. |
| | – | Canada | | | | | | | | | – | Service rigs | | | |
| | – | U.S. | | | | | | | | | | | | | |
| | – | International | | | | | | | | ● | Canada |
| ● | Directional drilling operations | | | | | – | Snubbing | | | |
| | – | Canada | | | | | | | | | – | Camps and catering | | | |
| | – | U.S. | | | | | | | | | – | Equipment Rentals | | | |
| | | | | | | | | | | | | | | | |
| | | | | | | | | | | | | | | | |
| | | | | | | | | | | | | | | | |
| | | | | | | | | | | | | | | | |
| Business support systems | | | | | | | | | | |
| | | | | | | | | | | | | | | | |
| ● | Sales and marketing | ● | Procurement and distribution | ● | Manufacturing | ● | Equipment maintenance and certification | ● | Engineering | |
| | | | | | | | | | | | | | | | |
| | | | | | | | | | | | | | | | |
| | | | | | | | | | | | | | | | |
| Corporate support | | | | | | | | |
| | | | | | | | | | | | | | | | |
| ● | Information systems | ● | Health, safety and environment | ● | Human resources | ● | Finance | ● | Legal and enterprise risk management |
| | | | | | | | | | | | | | | | |
Precision Drilling Corporation 2018 Annual Report | 6 |
Contract Drilling Services
We provide onshore drilling services to exploration and production companies in the oil and natural gas industry, operating in Canada, the U.S. and internationally.
We are a large, multi-basin oilfield operator servicing approximately 26% of the active land drilling market in Canada and 7% of the active U.S. market. We also have an international presence with operations in the Middle East and Mexico.
At December 31, 2018, our Contract Drilling Services segment consisted of:
| ▪ | 236 land drilling rigs, including: |
| – | 2 in the Kurdistan region of Iraq |
| – | 1 in the country of Georgia |
| ▪ | directional drilling services in Canada and the U.S. |
| ▪ | engineering, manufacturing and repair services, primarily for Precision’s operations |
| ▪ | centralized procurement, inventory and distribution of consumable supplies for our global operations |
| ▪ | 18 Canadian and four U.S. land drilling rigs designated as held for sale . |
At December 31, 2018, we had 236 Super Series drilling rigs. Our Super Series rigs are highly mobile and mechanized, which make them safer and more efficient in drilling directional and horizontal wells than older generation drilling rigs. Our Super Series rigs have a broad range of features to meet a diverse range of customer needs with a focus on high efficiency development drilling applications, from drilling shallow- to medium-depth wells to deeper, extended reach horizontal well bores and all depths of conventional wells. Available features include alternating current (AC) power, digital control systems, integrated top drive, omni-directional pad walking systems for multi-pad well drilling, highly mechanized pipe handling, and high capacity mud pumps.
| |
7 | Management’s Discussion and Analysis |
Completion and Production Services
We provide well completion, workover, abandonment, and re-entry preparation services, as well as snubbing units for pressure control services and equipment rentals to oil and natural gas exploration and production companies in Canada and the U.S.
On an operating hour basis in 2018, we serviced approximately 12% of the well completion and workover service rig market demand in Canada and less than 1% in the U.S.
At December 31, 2018, our Completion and Production Services segment consisted of:
| ∎ | 198 well completion and workover service rigs, including: |
| ∎ | 12 snubbing units in Canada |
| ∎ | approximately 1,700 oilfield rental items, including surface storage, small-flow wastewater treatment, power generation, and solids control equipment, primarily in Canada |
| ∎ | 132 wellsite accommodation units in Canada |
| ∎ | 43 drill camps and four base camps in Canada |
| ∎ | 10 large-flow wastewater treatment units, 22 pumphouses and eight potable water production units in Canada. |
Precision Drilling Corporation 2018 Annual Report | 8 |
| | | | | |
| 2018 Highlights and Outlook | | Management’s Discussion and Analysis | | |
| | | | | |
Adjusted EBITDA, funds provided by operations and working capital are Non-GAAP measures. See page 3 for more information.
Financial Highlights
Year ended December 31 (thousands of dollars, except where noted) | | 2018 | | | % increase/ (decrease) | | | 2017 | | | % increase/ (decrease) | | | 2016 | | | % increase/ (decrease) | |
Revenue | | | 1,541,189 | | | | 16.6 | | | | 1,321,224 | | | | 31.7 | | | | 1,003,233 | | | | (38.6 | ) |
Adjusted EBITDA | | | 375,131 | | | | 23.0 | | | | 304,981 | | | | 33.7 | | | | 228,075 | | | | (51.9 | ) |
Adjusted EBITDA % of revenue | | | 24.3 | % | | | | | | | 23.1 | % | | | | | | | 22.7 | % | | | | |
Net loss | | | (294,270 | ) | | | 122.9 | | | | (132,036 | ) | | | (15.1 | ) | | | (155,555 | ) | | | (57.2 | ) |
Cash provided by operations | | | 293,334 | | | | 151.7 | | | | 116,555 | | | | (4.9 | ) | | | 122,508 | | | | (76.3 | ) |
Funds provided by operations | | | 311,214 | | | | 69.2 | | | | 183,935 | | | | 74.6 | | | | 105,375 | | | | (70.5 | ) |
Investing activities | | | | | | | | | | | | | | | | | | | | | | | | |
Capital spending | | | | | | | | | | | | | | | | | | | | | | | | |
Expansion | | | 35,444 | | | | 196.7 | | | | 11,946 | | | | (92.0 | ) | | | 148,887 | | | | (58.8 | ) |
Upgrade | | | 30,757 | | | | (17.1 | ) | | | 37,086 | | | | 86.7 | | | | 19,862 | | | | (59.0 | ) |
Maintenance and infrastructure | | | 48,375 | | | | 87.6 | | | | 25,791 | | | | (25.7 | ) | | | 34,723 | | | | (28.8 | ) |
Intangibles | | | 11,567 | | | | (50.1 | ) | | | 23,179 | | | n/m | | | | — | | | | — | |
Proceeds on sale | | | (24,457 | ) | | | 64.8 | | | | (14,841 | ) | | | 89.3 | | | | (7,840 | ) | | | (19.9 | ) |
Net capital spending | | | 101,686 | | | | 22.3 | | | | 83,161 | | | | (57.5 | ) | | | 195,632 | | | | (56.4 | ) |
Business acquisition | | | — | | | | — | | | | — | | | (100.0 | ) | | | 12,200 | | | n/m | |
Loss per share ($) | | | | | | | | | | | | | | | | | | | | | | | | |
Basic and diluted | | | (1.00 | ) | | | 122.2 | | | | (0.45 | ) | | | (15.1 | ) | | | (0.53 | ) | | | (57.3 | ) |
n/m – calculation not meaningful.
Operating Highlights
Year ended December 31 | | 2018 | | | % increase/ (decrease) | | | 2017 | | | % increase/ (decrease) | | | 2016 | | | % increase/ (decrease) | |
Contract drilling rig fleet | | | 236 | | | | (7.8 | ) | | | 256 | | | | 0.4 | | | | 255 | | | | 1.6 | |
Drilling rig utilization days | | | | | | | | | | | | | | | | | | | | | | | | |
Canada | | | 18,617 | | | | (1.4 | ) | | | 18,883 | | | | 48.4 | | | | 12,722 | | | | (26.2 | ) |
U.S. | | | 26,714 | | | | 30.4 | | | | 20,479 | | | | 80.5 | | | | 11,343 | | | | (46.4 | ) |
International | | | 2,920 | | | | - | | | | 2,920 | | | | 4.8 | | | | 2,786 | | | | (31.8 | ) |
Revenue per utilization day | | | | | | | | | | | | | | | | | | | | | | | | |
Canada (Cdn$) | | | 21,644 | | | | 2.4 | | | | 21,143 | | | | (13.7 | ) | | | 24,509 | | | | (9.1 | ) |
U.S. (US$) | | | 21,864 | | | | 10.1 | | | | 19,861 | | | | (24.0 | ) | | | 26,145 | | | | (2.2 | ) |
International (US$) | | | 50,469 | | | | 0.5 | | | | 50,240 | | | | 9.8 | | | | 45,753 | | | | 5.2 | |
Operating cost per utilization day | | | | | | | | | | | | | | | | | | | | | | | | |
Canada (Cdn$) | | | 14,493 | | | | 10.3 | | | | 13,140 | | | | (7.8 | ) | | | 14,258 | | | | (4.2 | ) |
U.S. (US$) | | | 14,337 | | | | 3.5 | | | | 13,846 | | | | (10.9 | ) | | | 15,547 | | | | (0.5 | ) |
| | | | | | | | | | | | | | | | | | | | | | | | |
Service rig fleet | | | 210 | | | | - | | | | 210 | | | | 1.4 | | | | 207 | | | | 27.0 | |
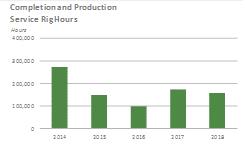
Service rig operating hours | | | 157,467 | | | | (8.9 | ) | | | 172,848 | | | | 73.8 | | | | 99,451 | | | | (33.5 | ) |
Revenue per operating hour (Cdn$) | | | 709 | | | | 11.3 | | | | 637 | | | | (1.4 | ) | | | 646 | | | | (17.6 | ) |
| |
9 | Management’s Discussion and Analysis |
Financial Position and Ratios
(thousands of dollars, except ratios) | | December 31, 2018 | | | December 31, 2017 | | | December 31, 2016 | |
Working capital(1) | | | 240,539 | | | | 232,121 | | | | 230,874 | |
Working capital ratio | | | 1.9 | | | | 2.1 | | | | 2.0 | |
Long-term debt | | | 1,706,253 | | | | 1,730,437 | | | | 1,906,934 | |
Total long-term financial liabilities | | | 1,723,350 | | | | 1,754,059 | | | | 1,946,742 | |
Total assets | | | 3,636,043 | | | | 3,892,931 | | | | 4,324,214 | |
Enterprise value(2) | | | 2,305,890 | | | | 2,782,596 | | | | 3,937,737 | |
Long-term debt to long-term debt plus equity(3) | | | 0.5 | | | | 0.5 | | | | 0.5 | |
Long-term debt to cash provided by operations | | | 5.8 | | | | 14.8 | | | | 15.6 | |
Long-term debt to enterprise value | | | 0.7 | | | | 0.6 | | | | 0.5 | |
(1) | See NON-GAAP MEASURES on page 3 of this report. |
(2) | Share price multiplied by the number of shares outstanding plus long-term debt minus cash. See page 39 for more information. |
(3) | Net of unamortized debt issue costs. |
2018 OVERVIEW
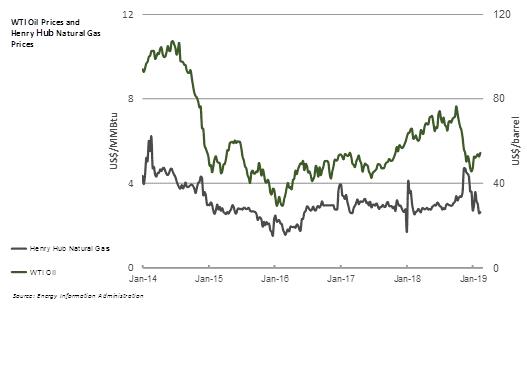
While global commodity prices strengthened in 2018, the year was beleaguered with extreme volatility, particularly in the Canadian market. In the U.S., West Texas Intermediate (WTI) oil prices averaged US$65 per barrel and Henry Hub natural gas prices averaged US$3.07 per MMBtu, levels supportive of unconventional resource development. However, a volatile and uncertain oil price outlook and renewed focus on free cash flow has encouraged conservatism in customer spending. In Canada, acute pipeline takeaway shortfalls and growing uncertainty in regulatory policy caused immense pressure on regional commodity prices and subsequent activity levels, particularly towards the end of the year. In early December the Alberta government instituted mandatory oil production curtailments as a vehicle to address regional oil price differentials relative to WTI oil prices.
For the year ended December 31, 2018, our net loss was $294 million, or $1.00 per diluted share, compared with a net loss of $132 million, or $0.45 per diluted share in 2017. During 2018 we incurred a goodwill impairment charge of $208 million related to our Canada contract drilling and U.S. directional drilling businesses, that after tax, increased our net loss by $199 million and net loss per diluted share by $0.68.
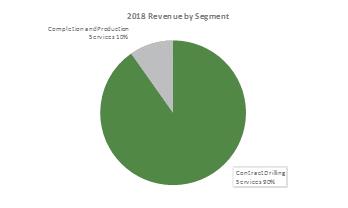
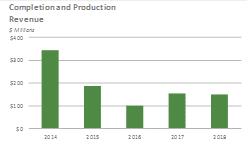
Revenue in 2018 was $1,541 million, or 17% higher than in 2017, mainly due to higher activity and day rates in our U.S. contract drilling operations. Contract Drilling Services revenue was up 19%, while Completion and Production Services revenue was down 2%. Our U.S. drilling activity increased 30% in 2018 while Canadian and international drilling activity remained consistent with 2017.
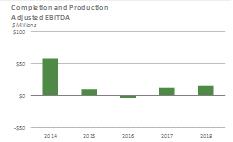
Adjusted EBITDA in 2018 was $375 million, or 23% higher than in 2017. Our Adjusted EBITDA margin was 24%, slightly higher than 2017. Adjusted EBITDA improved in 2018 primarily due to increased U.S. drilling activity and day rates. Adjusted EBITDA as a percentage of segment revenue for the year in our Contract Drilling Services segment was 30%, compared with 29% in the prior year, while Adjusted EBITDA as a percentage of segment revenue from our Completion and Production Services segment was 10%, compared to 8% in 2017. The improved percentages achieved in our Completion and Production Services segment were the result of improved day rates. Our portfolio of term customer contracts, a scalable operating cost structure, and economies achieved through vertical integration of the supply chain help us manage our Adjusted EBITDA percentages.
Capital expenditures for the purchase of property, plant and equipment were $126 million in 2018, an increase of $28 million over 2017. Capital spending for 2018 included $66 million for upgrade and expansion capital, $48 million for the maintenance of existing assets and infrastructure and $12 million for intangibles related to a new enterprise-wide resource planning (ERP) system.
In 2018 we continued to invest in our fleet adding two new-build drilling rigs in the U.S., completing 31 rig upgrades, and commencing the build of our sixth Kuwait rig, all of which were backed by long-term contracts and within a constrained expansion and upgrade capital spend of approximately $66 million.
Under IFRS, we are required to assess the carrying value of assets in our cash-generating units (CGUs) containing goodwill annually and when indicators of impairment exist. Due to the decrease in oil and natural gas well drilling in Canada and the outlook for activity in Canada and in our directional drilling division in the U.S., we recognized a $208 million goodwill impairment charge. The impairment charge represents the full amount of goodwill attributable to our Canadian contract drilling operation and our U.S. directional drilling operations.
During the year we redeemed US$80 million and repurchased and cancelled US$3 million of our 6.5% unsecured senior notes due 2021 and repurchased and cancelled US$49 million principal amount of our 5.25% unsecured senior notes due 2024.
Precision Drilling Corporation 2018 Annual Report | 10 |
OUTLOOK
Contracts
Term customer contracts provide a base level of activity and revenue. As of March 1, 2019, we had term contracts in place for an average of 54 rigs: six in Canada, 40 in the U.S. and eight internationally for 2019. In Canada, term contracted rigs normally generate 250 utilization days per rig year because of the seasonal nature of wellsite access. In most regions in the U.S. and internationally term contracts normally generate | | In 2018, approximately 49% of our total contract drilling revenue was generated from rigs under term contracts. |
365 utilization days per rig year. In 2018, we had an average of 63 drilling rigs working under term contracts and revenue from these contracts was approximately 49% of our total contract drilling revenue for the year.
Pricing, Demand and Utilization
Volatility in global crude prices remained a key theme throughout 2018, particularly towards the end of the year with concerns over the health of the global economy, ongoing trade wars, varying degrees of OPEC and non-OPEC production cuts and continued growth in U.S. production driving uncertainty in supply and demand fundamentals. The WTI oil price closed the year at US$45.41 per barrel. Since then, WTI has hovered in the mid-US$50’s per barrel range and closed at US$55.80 per barrel on March 1, 2019. A similar phenomenon played out in other grades of crude such as Western Canada Select (WCS) and Permian regional pricing whereby mid-to late 2018 differentials widened to extreme levels largely as a result of takeaway capacity constraints in each respective market. Year-to-date in 2019 differentials have narrowed and are expected to revert to more normalized levels in the Permian with incremental takeaway capacity added mid-year, while in Canada WCS differentials are expected to remain volatile but show greater stability with the province of Alberta having instituted production constraints at the end of 2018 in addition to incremental rail capacity and potential increased pipeline takeaway capacity.
Natural gas prices have remained relatively rangebound by historical standards as growth in associated gas from unconventional oil development, higher than average storage levels, infrastructure constraints and the lack of a fully developed export market from North America continue to cap pricing. Natural gas prices in the U.S., referenced by the Henry Hub price on the New York Mercantile Exchange (NYMEX), averaged US$3.07 per MMBtu in 2018, and closed the year at US$2.94 per MMBtu. In Canada, the AECO natural gas benchmark experienced price weakness and volatility in 2018 particularly in the summer months driven by plant maintenance, pipeline shut-ins, and challenges exporting natural gas as a Canadian LNG export industry has not been developed leaving a well-supplied U.S. market as the only export option for Canadian natural gas. Differences between NYMEX (U.S.) prices and AECO (Canada) prices are expected to continue if Canadian export markets remained challenged.
The rig count at March 1, 2019 was 30% lower in Canada than it was a year ago while the year-to-date rig count has averaged 48% less than 2018. Activity for the remainder of the year is expected to be determined by the strength in commodity prices and the resulting oil and natural gas customer budgets.
In the U.S., strengthening crude prices have resulted in increased drilling activity and demand for our rigs. As a result, spot market pricing and activity each increased throughout 2018 and have improved further year-to-date in 2019. As of March 1, 2019, the rig count was 5% higher than the same time last year and has averaged 10% higher year-to-date compared to 2018. Activity levels for the remainder of 2019 are expected to be dependent on commodity prices and resulting customer budgets.
The Canadian to U.S. dollar exchange rate averaged US$0.7712 (Cdn$/US$1.2966) for 2018 and closed the year at US$0.7325 (Cdn$/US$1.36521). The lower Canadian dollar relative to the U.S. dollar serves to partially offset the impact of lower U.S. dollar-denominated crude oil and natural gas prices for Canadian exploration and production companies. Year to date, the Canadian dollar has strengthened against the U.S. dollar and as of March 1, 2019, the Canadian dollar closed at US$0.7518.
International
We currently have eight rigs working on term contracts with five in Kuwait and three in the Kingdom of Saudi Arabia. During 2018, we announced the award of one new-build ST-3000 drilling rig in Kuwait under a five year take-or-pay contract with an optional one-year extension. We expect the sixth rig to commence drilling operations in the third quarter of 2019.
| |
11 | Management’s Discussion and Analysis |
Upgrading the Fleet
The industry trend toward more complex drilling programs has accelerated the retirement of older generation, less capable rigs. Over the past several years, we and some of our competitors have been upgrading the drilling rig fleet by building new rigs, upgrading existing rigs, and decommissioning lower capacity rigs. We believe this retooling of the industry-wide fleet has been making legacy rigs virtually obsolete in North America.
With the completion of our new-build rig program and upgrades of existing rigs, our fleet consisted of 236 Super Series rigs and 22 rigs identified and held for sale as at December 31, 2018.
Capital Spending
Capital spending in 2019 is expected to be $169 million and includes $53 million for sustaining and infrastructure and $116 million for upgrade and expansion, approximately $68 million of which relates to the completion of our sixth new-build rig in Kuwait. We expect that the $169 million will be split $161 million in the Contract Drilling Services segment, $6 million in the Completion and Production Services segment and $2 million to the Corporate segment.
Precision Drilling Corporation 2018 Annual Report | 12 |


| |
13 | Management’s Discussion and Analysis |
| | | | | |
| Understanding Our Business Drivers | | Management’s Discussion and Analysis | | |
| | | | | |
THE ENERGY INDUSTRY
Precision operates in the energy services business, which is an inherently challenging cyclical sector of the energy industry. We depend on oil and natural gas exploration and production companies to contract our services as part of their exploration and development activities. The economics of their businesses are dictated by the current and expected future margin between their finding and development costs and the eventual market price for the commodities they produce: crude oil, natural gas, and natural gas liquids.
Conventional / Unconventional wells
Oil and natural gas reservoirs can be conventional, where a vertical well is drilled into a highly pressurized reservoir allowing the oil and natural gas to flow freely shortly after completing the drilling process. Unconventional reservoirs are exploited by drilling a vertical section of a well followed by a horizontal section to access a large portion of the oil or natural gas formation. These “unconventional” or “shale” reservoirs are typically lower pressure and require extra stimulation to generate production. The practice of “hydraulic fracturing” follows the unconventional drilling process with high horsepower equipment pumping water and proppant down a wellbore at high pressure to frack the rock, releasing hydrocarbons. The vast majority of the wells we drill in North America are unconventional. We are not involved in the hydraulic fracturing of a well.
Commodity Prices
Cash flow to fund exploration and development is dependent on commodity prices: higher prices increase cash flow and encourage investment and when prices decline, the opposite is true.
Oil can be transported relatively easily, so it is generally priced in a global market that is influenced by an array of economic and political factors. Higher oil prices typically result in stronger demand for drilling services with funding for drilling programs directed toward the most economically attractive drilling opportunities. As the volume of unconventional oil development has dramatically increased over the past decade, generating efficiencies through industrialized processes, more capital has been directed toward unconventional oil development in North America, reflecting the region’s competitiveness globally.
Natural gas and natural gas liquids continue to be priced more regionally. In North America, natural gas demand largely depends on the weather. Colder winter temperatures, and to a lesser extent, warmer summer temperatures, result in greater natural gas demand. Other demand drivers, such as natural gas fired power generation, industrial applications, and transportation, have shown positive growth over the past several years driven by a preference for natural gas over coal, and lower prices. The planned liquefied natural gas (LNG) export from Canada and continued development in the U.S. could serve as a catalyst for natural gas directed drilling activity over the medium to long term.
The key natural gas price driver continues to be increased production from unconventional shale gas drilling. Since the winter of 2014, pricing for natural gas in North America has generally been depressed, as supplies of unconventional natural gas have increased, and current inventory levels are viewed as adequate to keep North American markets well supplied.
Precision Drilling Corporation 2018 Annual Report | 14 |
Average Oil and Natural Gas Prices
| | 2018 | | | 2017 | | | 2016 | |
Oil | | | | | | | | | | | | |
WTI (US$ per barrel) | | | 64.88 | | | | 50.95 | | | | 43.30 | |
Natural gas | | | | | | | | | | | | |
Canada | | | | | | | | | | | | |
AECO ($ per MMBtu) | | | 1.49 | | | | 2.16 | | | | 2.14 | |
U.S. | | | | | | | | | | | | |
Henry Hub (US$ per MMBtu) | | | 3.12 | | | | 2.98 | | | | 2.48 | |
Source: WTI and Henry; Hub Energy Information Administration, AECO; Gas Alberta Inc. | | | | | | | | | | | | |
New Technology
North American exploration and production companies, which comprise the majority of our customer base, have been adapting to a lower commodity price environment and are increasingly focused on drilling and completion efficiency. Most of these companies have adopted large-scale industrialization techniques, utilizing multi-well pads and high-efficiency downhole and surface drilling systems to improve efficiency. Over the past several years, drilling rig enhancements have focused on equipment upgrades, such as walking systems, AC controls and increased fluid pumping capacity. More recently, customer focus has been shifting to rig automation technologies to deliver increased efficiency, consistency and predictability of results, which customers desire in their development-style drilling programs. Exploration and production companies have an increasing appetite for these technologies as they provide an opportunity to push the limits of efficiency and consistency, common in industrialized processes.
Our technology strategy is well-aligned with customer efficiency objectives. We leverage our existing base of AC control systems installed on over 100 of our Super Series drilling rigs. These standardized control systems enable us to reliably mass deploy advanced software systems capable of delivering leading-edge digital automation, significantly boosting efficiency of the well construction process. Our technology strategy is centered around partnering with industry experts which allows us to deliver an
| |
15 | Management’s Discussion and Analysis |
extensive suite of offerings to our customers with minimal research and development capital. Our digital technology strategy is currently focused on four fundamentals:
1. | Standardized Control System Platform |
We leverage our standardized rig equipment and control system to deploy a fully integrated Process Automation Control system (PAC), which allows us to consistently implement best practices to eliminate human variance and human error, resulting in significantly improved drilling efficiency. In addition to built-in process automation routines, PAC also hosts Precision Drilling Apps (PD Apps), which leverage advanced algorithms and exploitation of various machine learning techniques to improve complex drilling processes. The standard platform is encouraging innovation in the drilling app space by attracting innovative solutions from customers and third parties inside and outside the oil and gas industry. We installed our first PAC system in late 2016 and currently have 31 PAC systems deployed in the field and more than 15 PD Apps in the trial phase or in development, making Precision an industry leader in automation technology.
2. | Data Collection and Analytics |
Our digital rig control systems with PAC are now generating well above 1 GB/min of data, versus a limited number of data channels from traditional Electronic Data Recorders, knowns as EDR systems. We have a robust data analytics strategy with a dedicated analytics team (PD Analytics) focused on improving rig performance and financial returns through commercialization of performance data.
3. | Digitally Enabled Services |
Our advanced digital infrastructure helps automate repetitive tasks for the driller, freeing up time for the driller to address more value-added responsibilities. For example, we have introduced our Directional Guidance System (DGS) aiming to either replace directional drillers on the wellsite through an advanced algorithm delivered through a PD App and remote support. To date, we have successfully drilled more than 200 wells using this technology and believe these types of solutions will eventually become industry standard.
4. | Leading-Edge Corporate-Wide Data Systems and Technology Culture |
In 2018, we successfully implemented the latest version of SAP S/4HANA to fully realize the benefits of the system’s integration with our digital service delivery platform. This robust SAP enterprise system is built to support the increased data flows from the field, provided by our PAC systems. Precision committed to a digital technology strategy nearly three years ago, enabling us to build a strong digital mindset within the company at all levels.
Our combination of High Performance standardized rig fleet, integrated PAC system, PD Apps and PD Analytics position us to help our customers achieve their efficiency goals and generate strong returns for our shareholders through service differentiation.
Precision Drilling Corporation 2018 Annual Report | 16 |
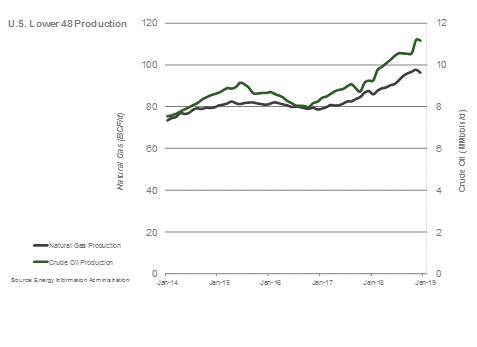
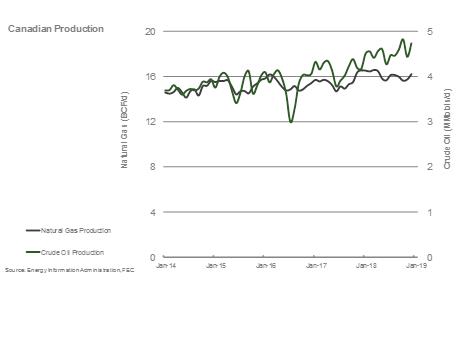
Natural gas production in Canada has been flat because of lower natural gas directed drilling due to pricing pressure and Canada’s lack of an export market other than the U.S.
| |
17 | Management’s Discussion and Analysis |
Drilling Activity
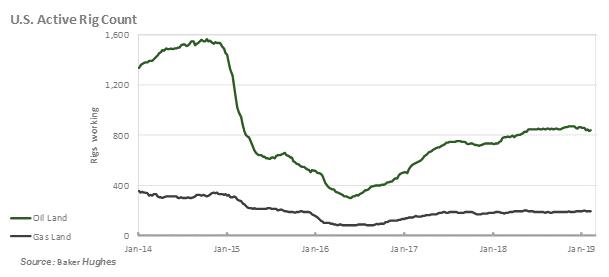
Following a decline in activity in 2015 and 2016, the North American land drilling market showed increased activity levels in 2017 and 2018, particularly in the U.S., as customer demand improved with higher oil prices.
In 2018, the industry drilled 6,781 wells in western Canada, compared with 6,959 in 2017 and 3,963 in 2016. Total industry drilling operating days were 64,491 in 2018 compared with 66,138 in 2017 and 42,391 in 2016. Average industry drilling operating days per well was 9.5, the same as in 2017 and slightly lower than 10.7 in 2016. From 2017 to 2018 the average depth of a well increased 4% compared with an increase of 5% from 2016 to 2017.
In 2018 approximately 19,300 wells were started onshore in the U.S., compared with approximately 15,800 in 2017 and 11,200 in 2016.
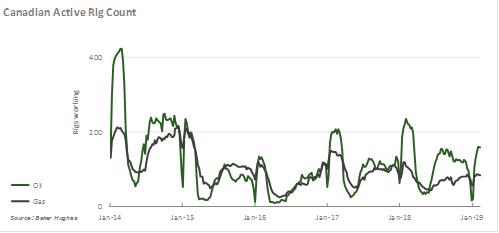
In Canada, there has been relative strength in natural gas liquids and light tight oil drilling activity in the deeper basins of northwestern Alberta and northeastern British Columbia, while in the U.S. the bias towards oil-directed drilling continues. In 2018, approximately 63% of the Canadian industry’s active rigs and 81% of the U.S. industry’s active rigs were drilling for oil targets, compared with 53% for Canada and 80% for the U.S. in 2017.
The graphs below show the shift in drilling activity to oil targets since 2014, in both the U.S. and Canada. The Canadian drilling rig activity graph also shows how Canadian drilling activity fluctuates with the seasons, a market dynamic that generally is not present in the U.S.
Precision Drilling Corporation 2018 Annual Report | 18 |
A COMPETITIVE OPERATING MODEL
The contract drilling business is highly competitive, with many industry participants. We compete for drilling contracts that are often awarded in a competitive bid process. We believe potential customers focus on pricing and rig availability when selecting a drilling contractor, but also consider many other things, including drilling capabilities, condition of rigs, quality of rig crews, breadth of service, technology offering, and safety record, among others.
Providing High Performance, High Value services to our customers is the core of our competitive strategy. We deliver High Performance through passionate people supported by quality business systems, drilling technology, equipment and infrastructure designed to optimize results and reduce risks. We create High Value by operating safely and sustainably, lowering our customers’ risks and costs while improving efficiency, developing our people, and generating superior financial returns for our investors.
Operating Efficiency
We keep customer well costs down by maximizing the efficiency of operations in several ways:
| ∎ | using innovative and advanced drilling technology that is efficient and reduces costs |
| ∎ | having equipment that is geographically dispersed, reliable and well maintained |
| ∎ | monitoring our equipment to minimize mechanical downtime |
| ∎ | managing operations effectively to keep non-productive time to a minimum |
| ∎ | staffing our rigs with well-trained crews with performance measured against defined competencies, and |
| ∎ | compensating our executives and eligible employees based on performance against safety, operational, employee retention, and financial measures. |
Efficient, Cost-Reducing Technologies
We focus on providing efficient, cost-reducing drilling technologies. Design innovations and technology improvements, such as multi-well pad capability and rapid mobility between wells, capture incremental time savings during the drilling process.
Precision has invested over $3 billion in its drilling rig fleet since 2010, adding over 120 Super Series drilling rigs during the period. With one of the newest and most technically capable fleets in North America and the Middle East, Precision’s Super Series rigs have been designed for industrial-style drilling: highly efficient; mobile; safe; controllable; upgradable; and able to act as a platform for technology delivery to the well location. Precision has completed several relatively low dollar cost upgrades over the past several years including additions of walking systems, higher pressure and capacity mud pumps, increased setback capacity and PAC technology. Precision’s Super Series drilling rig fleet has the features needed to meet essentially all the industrial-style drilling requirements of our customers in North America and deep, high-pressure drilling projects internationally.
| |
19 | Management’s Discussion and Analysis |
Broad Geographic Footprint
Geographic proximity and fleet versatility support the High Performance, High Value services we provide to our customers. Our large fleet of rigs is strategically deployed across the most active drilling regions in North America, including all major unconventional oil and natural gas basins.
Managing Downtime
Minimizing downtime is a key operating metric for us and our customers. Reliable and well-maintained equipment minimizes downtime and non-productive time during operations. We manage mechanical downtime through preventative maintenance programs, detailed inspection processes, an extensive fleet of strategically-located spare equipment, and an in-house supply chain. We minimize non-productive time (to move, rig-up and rig-out) by utilizing walking systems, reducing the number of move loads per rig, and using mechanized equipment for safer and quicker rig component connections.
Tracking Our Results
We unitize key financial information per day and per hour and compare these measures to established benchmarks and past performance. We evaluate the relative strength of our financial position by monitoring our working capital, debt ratios, and returns on capital employed. We track industry statistics to evaluate our performance against competitors.
We reward executives and eligible employees through incentive compensation plans for performance against the following measures:
| ∎ | safety performance – total recordable incident rate per 200,000 man-hours, recordable free facilities and “Triple Target Zero” days (defined on page 22 under ‘Safe Operations’). Measured against prior year performance and current year industry performance in Canada and the U.S. |
| ∎ | operational performance – rig down time for repair as measured by time not billed to the customer. Measured against a predetermined target of available billable time |
| ∎ | key field employee retention – senior field employee retention rates. Measured against predetermined target rates of retention |
| ∎ | strategic initiatives – achieving strategic operational goals. Measured against predetermined target metrics |
| ∎ | financial performance – Adjusted EBITDA, adjusted cash flow, return on capital employed and debt reduction. Measured against predetermined targets |
| ∎ | investment returns – total shareholder return performance (including dividends) against a group of industry peers, over a three-year period. The peer group consists of a predetermined group of companies with similar business operations that we compete with for investors. |
Top Tier Service
We pride ourselves on providing quality equipment operated by experienced and well-trained crews. We also strive to align our capabilities with evolving technical requirements associated with more complex well bore programs.
High Performance Rig Fleet
Our fleet of drilling rigs is well positioned to address the unconventional drilling programs of our customers. The vast majority of our drilling rigs have been designed or significantly upgraded to drill horizontal wells. With a breadth of horsepower types and drilling depth capabilities, our large fleet can address every type of onshore unconventional and conventional oil and natural gas drilling opportunity in North America.
Our service rigs provide completion, workover, abandonment, well maintenance, high pressure operations and critical sour gas well work, and well re-entry preparation across the Western Canada Sedimentary Basin and in the northern U.S. Service rigs are supported by four field locations in Alberta, two in Saskatchewan, and one each in Manitoba, British Columbia and North Dakota.
Snubbing units complement traditional natural gas well servicing by allowing customers to work on wells while they are pressurized and production has been suspended. We have two kinds of snubbing units: rig-assist and self-contained. Self-contained units do not require a service rig on site and are capable of snubbing and performing many other well servicing procedures. Included in our self-contained units are three patented L-frame units, which are more efficient in the rig up and rig out process than standard self-contained units.
Precision Drilling Corporation 2018 Annual Report | 20 |
Upgrade Opportunities
We leverage our internal manufacturing and repair capabilities and inventory of quality rigs to address market demand through upgraded drilling rigs. For drilling rigs, the upgrade is typically performed at the request of a customer and includes a term contract. Historically, certain upgrades have resulted in a change in tier classification.
Ancillary Equipment and Services
An inventory of equipment (top drives, loaders, boilers, tubulars, and well control equipment) supports our fleet of drilling and service rigs. We also maintain an inventory of key rig components to minimize downtime due to equipment failure.
We benefit from internal services for equipment certifications and component manufacturing from our manufacturing division in Canada and for standardization and distribution of consumable oilfield products through our procurement divisions in Canada and the U.S.
Precision Rentals provides specialized equipment and wellsite accommodations to customers on a rental basis. Precision Camp Services provides food and accommodation to personnel working at the wellsite, typically in remote locations in Western Canada.
Technical Centres
We operate two contract drilling technical centres, one in Nisku, Alberta and one in Houston, Texas. We also operate one completion and production services technical centre in Red Deer, Alberta. These centres accommodate our technical service and field training groups and enable us to consolidate support and training for our operations. Both of our contract drilling technical centres include fully functioning training rigs with the latest drilling technologies. In addition, our Houston facility accommodates our rig manufacturing group.
People Having an experienced, high performance crew is a competitive strength and highly valued by our customers. There are often shortages of industry manpower in peak operating periods. We rely heavily on our safety record, investment in employee development, comprehensive employee training, competency development, and reputation to attract | | Toughnecks (www.toughnecks.com) has been a highly successful field recruiting program for us since we introduced it in 2008. |
and retain employees. Our people strategies focus on initiatives that provide a safe and productive work environment, opportunity for advancement, and added wage security. We have centralized personnel, orientation, and training programs in Canada and the U.S. Our people strategies have enabled us to deliver quality field crews at all points in the industry cycle.
Systems
In 2017 we commenced an upgrade to our ERP system that was completed in the second quarter of 2018. The upgraded system fully integrates our drilling rigs with our field facilities and corporate offices increasing operating efficiencies and positioning the organization to better handle the increased data flows associated with our business. All our divisions operate using standardized business processes across marketing, equipment maintenance, procurement, manufacturing, HSE, inventory control, engineering, finance, payroll and human resources.
We continue to invest in information systems that provide competitive advantages. Electronic links between field and financial systems provide accuracy and timely processing. This repository of rig data improves response time to customer inquiries. Rig manufacturing projects also benefit from scheduling and budgeting tools, which identify and help leverage economies of scale as construction demands increase.
| |
21 | Management’s Discussion and Analysis |
Safe Operations
Safety, environmental stewardship and employee health are critical for us and for our customers and are the foundation of our culture.
Safety performance is a fundamental contributor to operating performance and the financial results we generate for our shareholders. We track safety using three separate metrics: ∎ Total Recordable Incident Rate ∎ Facilities Recordable Free ∎ Triple Target Zero Days. | | Target Zero The health and safety of our employees is a core value at Precision, and daily we work to set the standard for safety in our industry. |
Total Recordable Incident Rate (TRIR) is an industry standard and benchmarks our success and isolates areas for improvement. We have taken it to another level by tracking and measuring all injuries, regardless of severity, because they are leading indicators for the potential for more serious events. In 2018, 96% of our drilling rigs and 99% of our service rigs achieved Recordable Free Facilities. Facilities recordable free includes all of our rigs, operating centres and offices and measures how many of our facilities do not have a recordable incident during the year. In addition, we have a goal of achieving “Triple Target Zero” every day. A Triple Target Zero day is a day when we have no high potential work-related vehicle incidents, no recordable injuries and no reportable spills. For 2018 we achieved 288 Triple Target Zero days.
We foster our safety culture through strong leadership, technical and compliance training, and proven support systems. Every day, we invest in our employees to prepare them for any and every situation on the rig. Our Technical Support Centre training facilities are located in Houston, Texas, and Nisku, Alberta, where more than 6,100 employees were trained in 2018 on our culture, rig personnel and responsibilities, tools and equipment, safety and environmental protocol and procedures, leadership and team-building.
We continuously review our rig designs and components and use advanced technology to operate safely, improve the life cycle, maintain operational efficiency, reduce energy use, and maintain our energy and resources. In 2018, 20% of our fleet was configured to be powered by natural gas, which is cleaner-burning than diesel and therefore reduces our, and our customer’s, carbon footprint. Our pad-capable rig fleet has also helped our customers reduce their overall operating footprint by enabling them to drill multiple wells on a single well pad location.
Precision Drilling Corporation 2018 Annual Report | 22 |
AN EFFECTIVE STRATEGY
Precision’s vision is to be globally recognized as the High Performance, High Value provider of land drilling services. We work toward this vision by defining and measuring our results against strategic priorities we establish at the beginning of every year.
2018 Strategic Priorities | | 2018 Results |
Commercial deployment of Process Automation Controls and Directional Guidance Systems on a wide scale. | | Added ten Process Automation Control (PAC) systems with a total of 31 systems deployed in the field at year-end, a 50% increase in installed base during 2018. Equipped both training rigs in Nisku and Houston with PAC technology. Drilled 365 wells in 2018 utilizing PAC technology and drilled 119 wells utilizing its directional guidance system, over half of which were drilled without any directional drillers on location. By year-end, Precision, its partners, customers and several third parties had 15 drilling performance applications under development with several Apps in field trials. Completed ERP system upgrade to position the organization to better handle increased data flows. |
Enhance financial performance through higher utilization and improved margins. | | Consolidated utilization days increased 14% year-over-year. U.S. Drilling margins up 25%, Canadian Drilling margins up 4% and International Drilling margins remained stable. Achieved highest market share on record for Precision in the U.S. of over 7.5%. |
Reduce debt by generating free cash flow while continuing to fund only the most attractive investment opportunities. •Target $75 million to $125 million debt repayment in 2018. •Target $300 million to $500 million debt repayment by year-end 2021. | | Generated $311 million in funds provided by operations (Non-GAAP measure – see page 3 for more information) representing a 69% increase year-over-year. Precision’s 2018 debt repayments totaled $174 million, $49 million higher than the top end of Precision’s target 2018 debt repayment range. In conjunction with debt repayments, Precision grew its cash balance by $32 million throughout the year. Completed two new-build rigs in the U.S. market while continuing rig upgrade program (not exceeding $3 million in upgrade cost per rig). Precision also began construction of its sixth new-build rig in Kuwait. Capital expenditures totaled $126 million, $9 million less than planned spending. Net capital expenditures totaled $102 million with $24 million of proceeds on sale of property, plant and equipment. |
| |
23 | Management’s Discussion and Analysis |
Our Corporate and Competitive Strategies are designed to optimize resource allocation and differentiate us from the competition, generating value for investors. Unconventional drilling is the primary opportunity in the North American marketplace. Unconventional resource development requires the most efficient and technically capable drilling rigs and other highly developed services that facilitate the drilling of reliable, predictable and repeatable horizontal wells. Customer adoption of large-scale industrialization techniques and high efficiency rig systems continues to increase and Precision’s Super Series rig fleet and High Performance, High Value strategy positions the Company to benefit from that trend. The completion and production work associated with unconventional wells provides the most profitable growth opportunities for our Completion and Production Services segment.
Strategic Priorities for 2019
• | Generate strong free cash flow and utilize $100 million to $150 million to reduce debt in 2019; increased long-term debt reduction targets to $400 million to $600 million by year-end 2021 (inclusive of 2018 debt repayments). |
• | Maximize financial results by leveraging our High Performance, High Value Super Series rig fleet and scale with disciplined cost management. |
• | Full scale commercialization and implementation of our Process Automation Control platform, PD Apps and PD Analytics. |
Precision Drilling Corporation 2018 Annual Report | 24 |
| | | | | |
| 2018 Results | | Management’s Discussion and Analysis | | |
| | | | | |
Adjusted EBITDA and operating loss are Non-GAAP measures. See page 3 for more information.
Consolidated Statements of Loss Summary
Year ended December 31 (thousands of dollars) | | 2018 | | | 2017 | | | 2016 | |
Revenue | | | | | | | | | | | | |
Contract Drilling Services | | | 1,396,492 | | | | 1,173,930 | | | | 907,821 | |
Completion and Production Services | | | 150,760 | | | | 154,146 | | | | 100,049 | |
Inter-segment elimination | | | (6,063 | ) | | | (6,852 | ) | | | (4,637 | ) |
| | | 1,541,189 | | | | 1,321,224 | | | | 1,003,233 | |
Adjusted EBITDA(1) | | | | | | | | | | | | |
Contract Drilling Services | | | 412,134 | | | | 342,970 | | | | 296,651 | |
Completion and Production Services | | | 14,881 | | | | 11,888 | | | | (3,649 | ) |
Corporate and Other | | | (51,884 | ) | | | (49,877 | ) | | | (64,927 | ) |
| | | 375,131 | | | | 304,981 | | | | 228,075 | |
Depreciation and amortization | | | 365,660 | | | | 377,746 | | | | 391,659 | |
Impairment of goodwill | | | 207,544 | | | | — | | | | — | |
Impairment of property, plant and equipment | | | — | | | | 15,313 | | | | — | |
Gain on re-measurement of property, plant and equipment | | | — | | | | — | | | | (7,605 | ) |
Foreign exchange | | | 4,017 | | | | (2,970 | ) | | | 6,008 | |
Finance charges | | | 127,178 | | | | 137,928 | | | | 146,360 | |
Loss (gain) on redemption and repurchase of unsecured senior notes | | | (5,672 | ) | | | 9,021 | | | | 239 | |
Loss before income taxes | | | (323,596 | ) | | | (232,057 | ) | | | (308,586 | ) |
Income taxes | | | (29,326 | ) | | | (100,021 | ) | | | (153,031 | ) |
Net loss | | | (294,270 | ) | | | (132,036 | ) | | | (155,555 | ) |
(1) | See Non-GAAP Measures on page 3 of this report. |
Results by Geographic Segment
Year ended December 31 (thousands of dollars) | | 2018 | | | 2017 | | | 2016 | |
Revenue | | | | | | | | | | | | |
Canada | | | 571,640 | | | | 578,817 | | | | 418,030 | |
U.S. | | | 797,217 | | | | 568,573 | | | | 426,546 | |
International | | | 191,131 | | | | 190,401 | | | | 169,286 | |
Inter-segment elimination | | | (18,799 | ) | | | (16,567 | ) | | | (10,629 | ) |
| | | 1,541,189 | | | | 1,321,224 | | | | 1,003,233 | |
Total assets | | | | | | | | | | | | |
Canada | | | 1,269,542 | | | | 1,631,838 | | | | 1,738,853 | |
U.S. | | | 1,772,850 | | | | 1,666,368 | | | | 1,861,908 | |
International | | | 593,651 | | | | 594,725 | | | | 723,453 | |
| | | 3,636,043 | | | | 3,892,931 | | | | 4,324,214 | |
| |
25 | Management’s Discussion and Analysis |
2018 COMPARED WITH 2017
Net loss in 2018 was $294 million, or $1.00 per diluted share, compared with net loss of $132 million, or $0.45 per diluted share, in 2017. The higher net loss in 2018 was primarily the result of a $208 million goodwill impairment charge offset by higher U.S. activity and average day rates.
Revenue was $1,541 million (17% higher than 2017) because of higher U.S. activity and improved day rates.
Adjusted EBITDA in 2018 was $375 million (23% higher than 2017), mainly because of the increase in U.S. activity. Activity, as measured by drilling utilization days, increased 30% in the U.S. while remaining relatively constant in Canada and internationally compared with 2017.
Impairment
Under IFRS, we are required to assess the carrying value of assets in our CGUs containing goodwill annually and when indicators of impairment exist. Due to the decrease in oil and natural gas well drilling in Canada and the outlook for activity in Canada and in our directional drilling division in the U.S., we recognized a $208 million goodwill impairment charge. The impairment charge represents the full amount of goodwill attributable to our Canadian contract drilling and U.S. directional drilling operations.
Because of no activity in Mexico in 2017, we completed an impairment test for our Mexico contract drilling CGU as of December 31, 2017. As a result of this test it was determined that property, plant and equipment in our Mexico contract drilling business was impaired by US$12 million.
Foreign Exchange
We recognized a foreign exchange loss of $4 million in 2018 (2017 – $3 million gain) due to the devaluation of the Canadian dollar against the U.S. dollar and this affected the net U.S. dollar denominated monetary position in our Canadian dollar-based companies.
Finance Charges
Finance charges were $127 million, a decrease of $11 million compared with 2017 primarily due to a reduction in interest expense related to debt retired in 2017 and mid-2018 partially offset by higher interest income earned in the comparative period.
Gain on Redemption and Repurchase of Unsecured Senior Notes
During the year we redeemed US$80 million and repurchased and cancelled US$3 million of our 6.5% unsecured senior notes due 2021 and repurchased and cancelled US$49 million principal amount of our 5.25% unsecured senior notes due 2024 resulting in a net gain of $6 million. In comparison, during 2017, we redeemed and/or repurchased and cancelled US$442 million of our previously outstanding senior notes incurring a loss of $9 million.
Income Taxes
Income taxes were a recovery of $29 million, $71 million lower than the $100 million recovery booked in 2017. The reduced recovery in 2018 compared with 2017 was mainly due to a smaller loss prior to the non-taxable portion of the goodwill impairment.
Precision Drilling Corporation 2018 Annual Report | 26 |
2017 COMPARED WITH 2016
Net loss in 2017 was $132 million, or $0.45 per diluted share, compared with net loss of $156 million, or $0.53 per diluted share, in 2016. The reduction of net loss in 2017 was primarily the result of improved activity levels compared to 2016.
Revenue was $1,321 million (32% higher than 2016) because of higher activity in all our operations.
Adjusted EBITDA in 2017 was $305 million (34% higher than 2016), mainly because activity levels were higher in all our operations. Activity, as measured by drilling utilization days, increased 48% in Canada, 81% in the U.S., and 5% internationally compared with 2016.
Impairment
Under IFRS, we are required to assess the carrying value of assets in our CGUs containing goodwill annually and when indicators of impairment exist. Because of no activity in Mexico in 2017, we completed an impairment test for our Mexico contract drilling CGU as of December 31, 2017. The test involves determining a value in use based on a multi-year discounted cash flow using assumptions on expected future results. The resulting value in use is then compared to the carrying value of the CGU. As a result of this test it was determined that property, plant and equipment in our Mexico contract drilling business was impaired by US$12 million.
Foreign Exchange
We recognized a foreign exchange gain of $3 million in 2017 (2016 – $6 million loss) because the Canadian dollar strengthened in value against the U.S. dollar and this affected the net U.S. dollar denominated monetary position in our Canadian dollar-based companies.
Finance Charges
Finance charges were $138 million, a decrease of $8 million compared with 2016. The decrease is the result of a stronger Canadian dollar on our U.S. dollar denominated interest expense and a reduction in interest expense related to debt retired during the past two years.
Loss on Redemption and Repurchase of Unsecured Senior Notes
During 2017, we redeemed and/or repurchased and cancelled US$442 million of our previously outstanding senior notes incurring a loss of $9 million. In 2016, we redeemed and/or repurchased and cancelled $200 million and US$360 million of our previously outstanding Canadian and U.S. senior notes, respectively, incurring a slight loss.
Income Taxes
Income taxes were a recovery of $100 million, $53 million lower than the $153 million recovery booked in 2016 mainly due to a smaller loss in 2017 compared with 2016 and from the fourth quarter tax reform implemented in the U.S. reducing tax rates which reduced the benefit of our U.S. losses carried forward.
| |
27 | Management’s Discussion and Analysis |
Segmented Results
CONTRACT DRILLING SERVICES
Financial Results
Adjusted EBITDA and operating loss are Non-GAAP measures. See page 3 for more information.
Year ended December 31 (thousands of dollars, except where noted) | | 2018 | | | % of revenue | | | 2017 | | | % of revenue | | | 2016 | | | % of revenue | |
Revenue | | | 1,396,492 | | | | | | | | 1,173,930 | | | | | | | | 907,821 | | | | | |
Expenses | | | | | | | | | | | | | | | | | | | | | | | | |
Operating | | | 945,203 | | | | 67.7 | | | | 798,655 | | | | 68.0 | | | | 574,104 | | | | 63.2 | |
General and administrative | | | 39,155 | | | | 2.8 | | | | 32,305 | | | | 2.8 | | | | 34,026 | | | | 3.7 | |
Restructuring | | | — | | | | — | | | | — | | | | — | | | | 3,040 | | | | 0.3 | |
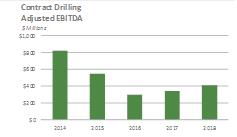
Adjusted EBITDA (1) | | | 412,134 | | | | 29.5 | | | | 342,970 | | | | 29.2 | | | | 296,651 | | | | 32.7 | |
Depreciation and amortization | | | 334,555 | | | | 24.0 | | | | 334,587 | | | | 28.5 | | | | 348,005 | | | | 38.3 | |
Impairment of goodwill | | | 207,544 | | | | 14.9 | | | | — | | | | — | | | | — | | | | — | |
Impairment of property, plant and equipment | | | — | | | | — | | | | 15,313 | | | | 1.3 | | | | — | | | | — | |
Operating loss (1) | | | (129,965 | ) | | | (9.3 | ) | | | (6,930 | ) | | | (0.6 | ) | | | (51,354 | ) | | | (5.7 | ) |
| (1) | See Non-GAAP measures on page 3 of this report. |
2018 Compared with 2017
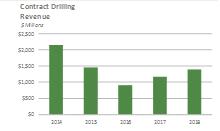
Revenue from Contract Drilling Services was $1,396 million, 19% higher than 2017, mainly because of higher activity in our U.S. contract drilling operations and higher average day rates in each of our contract drilling operations.
In 2018, total shortfall payments in Canada and idle but contracted revenue in the U.S. were $12 million and US$0.6 million, compared with $31 million and US$6 million, respectively in 2017.
Operating expenses in 2018 were 68% of revenue and is consistent with the prior year. On a per utilization day basis, operating costs for the drilling rig division in Canada were higher than the prior year period due to timing of equipment certifications and equipment maintenance costs. In the U.S., operating costs on a per day basis were higher than the prior year period primarily due to expenses recovered through the day rate and higher turnkey activity. General and administrative expenses for 2018 were higher due to the devaluation of the Canadian dollar on our U.S. dollar denominated costs.
Our 2018 operating loss was $130 million as compared to an operating loss of $7 million in the comparable prior year period. Operating loss in 2018 increased as a result of goodwill impairment charges of $208 million offset by an increase in drilling activity in our U.S. drilling operations and improved day rates in each of our drilling operations. Our 2017 operating results include an impairment of property, plant and equipment charge of $15 million related to certain drilling rigs and spare equipment. Excluding the impairment of goodwill and property, plant and equipment impairment, operating earnings would have been $78 million in 2018 and $8 million in 2017.
Our total depreciation expense was consistent year over year.
Capital expenditures in 2018 for our Contract Drilling segment were $108 million:
| ∎ | $35 million – to expand our asset base |
| ∎ | $31 million – to upgrade existing equipment |
| ∎ | $42 million – on maintenance and infrastructure. |
Precision Drilling Corporation 2018 Annual Report | 28 |
Operating Statistics
Year ended December 31 | | 2018 | | | % increase/ (decrease) | | | 2017 | | | % increase/ (decrease) | | | 2016 | | | % increase/ (decrease) | |
Number of drilling rigs (year-end) | | | 236 | | | | (7.8 | ) | | | 256 | | | | 0.4 | | | | 255 | | | | 1.6 | |
Drilling utilization days (operating and moving) | | | | | | | | | | | | | | | | | | | | | | | | |
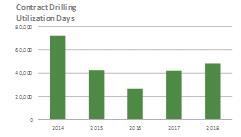
Canada | | | 18,617 | | | | (1.4 | ) | | | 18,883 | | | | 48.4 | | | | 12,722 | | | | (26.2 | ) |
U.S. | | | 26,714 | | | | 30.4 | | | | 20,479 | | | | 80.5 | | | | 11,343 | | | | (46.4 | ) |
International | | | 2,920 | | | | - | | | | 2,920 | | | | 4.8 | | | | 2,786 | | | | (31.8 | ) |
Drilling revenue per utilization day | | | | | | | | | | | | | | | | | | | | | | | | |
Canada (Cdn$) | | | 21,644 | | | | 2.4 | | | | 21,143 | | | | (13.7 | ) | | | 24,509 | | | | (9.1 | ) |
U.S. (US$) | | | 21,864 | | | | 10.1 | | | | 19,861 | | | | (24.0 | ) | | | 26,145 | | | | (2.2 | ) |
International (US$) | | | 50,469 | | | | 0.5 | | | | 50,240 | | | | 9.8 | | | | 45,753 | | | | 5.2 | |
Drilling statistics (Canadian operations only) | | | | | | | | | | | | | | | | | | | | | | | | |
Wells drilled | | | 1,663 | | | | (3.8 | ) | | | 1,729 | | | | 79.7 | | | | 962 | | | | (28.8 | ) |
Average days per well | | | 9.9 | | | | 2.1 | | | | 9.7 | | | | (17.1 | ) | | | 11.7 | | | | 2.6 | |
Metres drilled (hundreds) | | | 4,694 | | | | 2.1 | | | | 4,597 | | | | 80.4 | | | | 2,548 | | | | (21.0 | ) |
Average metres per well | | | 2,823 | | | | 6.2 | | | | 2,659 | | | | 0.4 | | | | 2,649 | | | | 11.0 | |
Canadian Drilling
Revenue from Canadian drilling was $403 million, 1% lower than 2017. Drilling rig activity, as measured by utilization days, was down slightly by 1% while average day rates were up 2%.
Adjusted EBITDA was $124 million, 13% lower than 2017, because of lower drilling activity offset by higher average day rates.
Depreciation expense for the year was $112 million, in-line with 2017.
Drilling Statistics – Canada
In 2018, we transferred one drilling rig from Canada to the U.S. and identified 18 drilling rigs to be held for sale, bringing our Canadian 2018 year-end net rig count to 117 (2017 –136).
The industry drilling rig fleet has decreased as there were approximately 592 rigs at the end of 2018 compared with 627 at the end of 2017. Our operating day utilization was 34% (2017 – 34%), compared with industry utilization of 29% (2017 – 29%).
U.S. Drilling
Revenue from U.S. drilling was US$584 million, 43% higher than 2017. Drilling rig activity, as measured by utilization days, was up 30% while average revenue per day was up 10%.
Adjusted EBITDA was US$180 million, 70% higher than 2017, mainly because of higher activity and average day rates offset by lower idle but contracted revenue.
Depreciation expense for the year was US$120 million, US$1 million lower than 2017 because of a lower capital asset base.
Drilling Statistics – U.S.
In 2018, we completed two new-build rigs, transferred one rig from Canada and identified four drilling rigs to be held for sale, leaving our U.S. year-end net rig count at 102. In 2018, we averaged 73 rigs working, an 30% increase from 56 rigs in 2017. The industry drilling fleet increased as well, averaging 1,014 active land rigs in 2018, up 18% from 856 rigs in 2017.
Our average day rates in the U.S. increased 10% in 2018 as legacy contracts expired and newly contracted rigs were at higher day rates. Revenue from idle but contracted rigs was US$0.6 million in 2018, a reduction of $6 million from the prior year period.
| |
29 | Management’s Discussion and Analysis |
Turnkey utilization days increased 161% over 2017 and accounted for approximately 2% of our revenue compared with 2% in 2017.
Drilling Statistics – U.S.
| | 2018 | | | 2017 | | | 2016 | |
| | Precision | | | Industry (1) | | | Precision | | | Industry (1) | | | Precision | | | Industry (1) | |
Average number of active land rigs for quarters ended: | | | | | | | | | | | | | | | | | | | | | | | | |
March 31 | | | 64 | | | | 951 | | | | 47 | | | | 722 | | | | 32 | | | | 516 | |
June 30 | | | 72 | | | | 1,021 | | | | 59 | | | | 874 | | | | 24 | | | | 397 | |
September 30 | | | 76 | | | | 1,032 | | | | 61 | | | | 927 | | | | 29 | | | | 465 | |
December 31 | | | 80 | | | | 1,050 | | | | 58 | | | | 902 | | | | 39 | | | | 567 | |
Annual average | | | 73 | | | | 1,014 | | | | 56 | | | | 856 | | | | 31 | | | | 486 | |
COMPLETION AND PRODUCTION SERVICES
Financial Results
Adjusted EBITDA and operating loss are Non-GAAP measures. See page 3 for more information.
Year ended December 31 (thousands of dollars, except where noted) | | 2018 | | | % of revenue | | | 2017 | | | % of revenue | | | 2016 | | | % of revenue | |
Revenue | | | 150,760 | | | | | | | | 154,146 | | | | | | | | 100,049 | | | | | |
Expenses | | | | | | | | | | | | | | | | | | | | | | | | |
Operating | | | 128,731 | | | | 85.4 | | | | 134,368 | | | | 87.2 | | | | 92,248 | | | | 93.0 | |
General and administrative | | | 7,148 | | | | 4.7 | | | | 7,890 | | | | 5.1 | | | | 9,429 | | | | 8.6 | |
Restructuring | | | — | | | | — | | | | — | | | | — | | | | 2,021 | | | | 2.0 | |
Adjusted EBITDA (1) | | | 14,881 | | | | 9.9 | | | | 11,888 | | | | 7.7 | | | | (3,649 | ) | | | (3.6 | ) |
Depreciation and amortization | | | 23,879 | | | | 15.8 | | | | 29,638 | | | | 19.2 | | | | 29,272 | | | | 29.3 | |
Gain on re-measurement of property, plant and equipment | | | — | | | | — | | | | — | | | | — | | | | (7,605 | ) | | n/m | |
Operating loss (1) | | | (8,998 | ) | | | (6.0 | ) | | | (17,750 | ) | | | (11.5 | ) | | | (25,316 | ) | | | (25.3 | ) |
| (1) | See Non-GAAP Measures on page 3 of this report. |
n/m – calculation not meaningful.
Revenue from Completion and Production Services was $151 million in 2018, 2% lower than 2017, mainly because of lower activity across all our product lines.
Operating loss was $9 million in 2018, compared with an operating loss of $18 million in 2017. The decrease in our operating loss in 2018 was primarily due to higher average day rates and improved cost recoveries offset by lower service rig operating hours.
Operating expenses were 85% of revenue, 2% points lower than 2017, mainly because of improved cost recoveries.
Depreciation in 2018 decreased by 19% as a higher proportion of the segment’s capital asset base became fully depreciated.
Capital expenditures in 2018 for our Completions and Production segment were $5 million, comprised mainly of maintenance capital.
Revenue from Precision Well Servicing in Canada was $99 million, up $1 million from 2017 as average revenue rates increased by 12% offset by a reduction in activity of 10% versus the prior year.
Revenue from our U.S. based completion and production businesses was US$10 million, 15% lower than 2017. The decrease was the result of lower activity partially offset by higher average rates.
Revenue from Precision Rentals was $19 million, 17% lower than 2017. The decrease was due to lower activity and average revenue rates.
Precision Drilling Corporation 2018 Annual Report | 30 |
Revenue from Precision Camp Services was $15 million, 15% higher than 2017, because of an increase in camp activity, partially offset by lower average revenue rates. Precision operated four base camps and 43 drill camps during 2018.
Operating Results
Year ended December 31 | | 2018 | | | % increase/ (decrease) | | | 2017 | | | % increase/ (decrease) | | | 2016 | | | % increase/ (decrease) | |
Number of service rigs (end of year) | | | 210 | | | | - | | | | 210 | | | | 1.4 | | | | 207 | | | | (27.0 | ) |
Service rig operating hours | | | 157,467 | | | | (8.9 | ) | | | 172,848 | | | | 73.8 | | | | 99,451 | | | | (33.5 | ) |
Revenue per operating hour | | | 709 | | | | 11.3 | | | | 637 | | | | (1.4 | ) | | | 646 | | | | (17.6 | ) |
Our service operating hours fell by 9% in the current year while our revenue per operating hour increased by 11% over the comparable prior year period. In December 2016, we acquired 48 well service rigs for consideration of $12 million and our coil tubing assets and associated equipment.
CORPORATE AND OTHER
Financial Results
Adjusted EBITDA and operating loss are Non-GAAP measures. See page 3 for more information.
Year ended December 31 (thousands of dollars, except where noted) | | 2018 | | | 2017 | | | 2016 | |
Revenue | | | — | | | | — | | | | — | |
Expenses | | | | | | | | | | | | |
Operating | | | — | | | | — | | | | — | |
General and administrative | | | 66,084 | | | | 49,877 | | | | 64,234 | |
Other recoveries | | | (14,200 | ) | | | — | | | | — | |
Restructuring | | | — | | | | — | | | | 693 | |
Adjusted EBITDA(1) | | | (51,884 | ) | | | (49,877 | ) | | | (64,927 | ) |
Depreciation and amortization | | | 7,226 | | | | 13,521 | | | | 14,382 | |
Operating loss(1) | | | (59,110 | ) | | | (63,398 | ) | | | (79,309 | ) |
(1) | See Non-GAAP Measures on page 3 of this report. |
Our Corporate and Other segment contains support functions that provide assistance to our business segments. It includes costs incurred in corporate groups in both Canada and the U.S.
Corporate general and administrative expenses were $66 million in 2018, $16 million more than 2017. The increase is mainly related to higher foreign exchange translation on our U.S. dollar based costs and higher share-based incentive compensation expenses. In 2018, corporate general and administrative costs were 4.3% of consolidated revenue compared with 3.8% in 2017 and 6.4% in 2016.
During 2018 we terminated an arrangement agreement to acquire an oil and natural gas drilling contractor. Subsequent to the termination a transaction fee was paid to us which, net of transaction costs, amounted to $14 million.
Capital expenditures in 2018 for our Corporate and Other segment were $13 million, primarily related to a new ERP system.
QUARTERLY FINANCIAL RESULTS
Adjusted EBITDA and funds provided by (used in) operations are Non-GAAP measures. See page 3 for more information.
2018 – Quarters Ended (thousands of dollars, except per share amounts) | | March 31 | | | June 30 | | | September 30 | | | December 31 | |
Revenue | | | 401,006 | | | | 330,716 | | | | 382,457 | | | | 427,010 | |
Adjusted EBITDA(1) | | | 97,469 | | | | 62,182 | | | | 80,988 | | | | 134,492 | |
Net loss | | | (18,077 | ) | | | (47,217 | ) | | | (30,648 | ) | | | (198,328 | ) |
per basic and diluted share | | | (0.06 | ) | | | (0.16 | ) | | | (0.10 | ) | | | (0.68 | ) |
Funds provided by operations(1) | | | 104,026 | | | | 50,225 | | | | 64,368 | | | | 92,595 | |
Cash provided by operations | | | 38,189 | | | | 129,695 | | | | 31,961 | | | | 93,489 | |
| |
31 | Management’s Discussion and Analysis |
(1) | See Non-GAAP measures on page 3 of this report. |
2017 – Quarters Ended (thousands of dollars, except per share amounts) | | March 31 | | | June 30 | | | September 30 | | | December 31 | |
Revenue | | | 368,673 | | | | 290,860 | | | | 314,504 | | | | 347,187 | |
Adjusted EBITDA(1) | | | 84,308 | | | | 56,520 | | | | 73,239 | | | | 90,914 | |
Net loss | | | (22,614 | ) | | | (36,130 | ) | | | (26,287 | ) | | | (47,005 | ) |
per basic and diluted share | | | (0.08 | ) | | | (0.12 | ) | | | (0.09 | ) | | | (0.16 | ) |
Funds provided by (used in) operations(1) | | | 85,659 | | | | (15,187 | ) | | | 85,140 | | | | 28,323 | |
Cash provided by operations | | | 33,770 | | | | 2,739 | | | | 56,757 | | | | 23,289 | |
(1) | See Non-GAAP measures on page 3 of this report. |
Seasonality
Drilling and well servicing activity is affected by seasonal weather patterns and ground conditions. In northern Canada, some drilling sites can only be accessed in the winter once the terrain is frozen, which is usually late in the fourth quarter. As a result activity peaks in the winter, in the fourth and first quarters. In the spring, wet weather and the spring thaw in Canada and the northern U.S. make the ground unstable. Government road bans restrict the movement of rigs and other heavy equipment, reducing activity in the second quarter. This leads to quarterly fluctuations in operating results and working capital requirements.
Fourth Quarter 2018 Compared with Fourth Quarter 2017
In the fourth quarter of 2018, we recorded a net loss of $198 million, or net loss per diluted share of $0.68, compared with a net loss of $47 million, or a net loss of $0.16 per diluted share, in the fourth quarter of 2017. During the quarter we incurred goodwill impairment charges totaling $208 million that, after-tax, reduced net earnings by $199 million and net earnings per diluted share by $0.68. Excluding the impact of the goodwill impairment net earnings would have been $1 million ($0.00 per share).
Revenue in the fourth quarter was $427 million or 23% higher than the fourth quarter of 2017, mainly due to increased activity and day rates in our U.S. contract drilling business. Compared with the fourth quarter of 2017 our activity, as measured by drilling rig utilization days, increased by 36% in the U.S., decreased 9% in Canada and remained consistent internationally. Revenue from our Contract Drilling Services segment increased by 27% and Completion and Production Services segment decreased 10% over the comparative prior year period.
Adjusted EBITDA this quarter was $134 million, an increase of $44 million from the fourth quarter of 2017. Our Adjusted EBITDA as a percentage of revenue was 31% this quarter, compared with 26% in the fourth quarter of 2017. Adjusted EBITDA as a percent of revenue in the fourth quarter of 2018 was positively impacted by higher activity and day rates in the U.S., the receipt of a transaction fee and lower share-based incentive compensation partially offset by lower activity in our Canada contract drilling operations versus 2017.
As a percentage of revenue, operating costs were 67% in the fourth quarter of 2018 and was consistent with the same quarter of 2017. Our portfolio of term customer contracts and a highly variable operating cost structure, helped us manage our Adjusted EBITDA margin.
Contract Drilling Services
Revenue from Contract Drilling Services was $392 million this quarter, or 27% higher than the fourth quarter of 2017, while adjusted EBITDA increased by 22% to $122 million. The increase in revenue was primarily due to higher utilization days as well as higher spot market rates in the U.S. During the quarter we recognized $1 million in shortfall payments in our Canadian contract drilling business compared with $13 million in the prior year comparative period. In the U.S. we recognized turnkey revenue of US$11 million compared with US$3 million in the comparative period and we recognized US$0.3 million in idle but contracted rig revenue compared with US$1 million in the comparative quarter of 2017.
Drilling rig utilization days in Canada (drilling days plus move days) were 4,517 during the fourth quarter of 2018, a decrease of 9% compared to 2017 primarily due to decreased industry activity brought on by lower commodity prices and takeaway capacity challenges in Canada. Drilling rig utilization days in the U.S. were 7,318, or 36% higher than the same quarter of 2017 as our U.S. activity was up with higher industry activity. Drilling rig utilization days in our international business were 736, in-line with the same quarter of 2017.
Compared with the same quarter in 2017, drilling rig revenue per utilization day in Canada decreased 3% as lower shortfall revenue in the current quarter was partially offset by increases in spot market rates and higher expenses recovered through the
Precision Drilling Corporation 2018 Annual Report | 32 |
day rate compared with the prior period. Drilling rig revenue per utilization day for the quarter in the U.S. was up 16% compared to the prior year as we realized higher average day rates and turnkey revenue. International revenue per utilization day for the quarter was up by 3% compared with the prior year comparative period due to fewer rig moves.
In Canada, 15% of our utilization days in the quarter were generated from rigs under term contract, compared with 13% in the fourth quarter of 2017. In the U.S., 62% of utilization days were generated from rigs under term contract as compared with 55% in the fourth quarter of 2017.
Operating costs were 66% of revenue for the quarter, one percentage point higher than the prior year period. On a per utilization day basis, operating costs for the drilling rig division in Canada were higher than the prior year period due to timing of equipment certifications and equipment maintenance costs and higher expenses recovered through the day rate. In the U.S., operating costs for the quarter on a per day basis were higher than the prior year period primarily due to expenses recovered through the day rate and higher turnkey activity.
Depreciation expense in the quarter was $13 million higher than the prior year comparative period due to the recognition of accelerated depreciation on excess spare equipment.
Completion and Production Services
Revenue from Completion and Production Services was down $4 million or 10% compared with the fourth quarter of 2017 due to lower activity in our Canadian businesses. Our service rig operating hours in the quarter were down 19% from the fourth quarter of 2017 while rates increased an average of 17%. Approximately 81% of our fourth quarter Canadian service rig activity was oil related.
During the quarter, Completion and Production Services generated 90% of its revenue from Canadian operations and 10% from U.S. operations compared with the fourth quarter of 2017 where 92% of revenue was generated in Canada and 8% in the U.S.
Average service rig revenue per operating hour in the quarter was $753 or $109 higher than the fourth quarter of 2017. The increase was primarily the result of increased costs passed through to the customer and rig mix.
Adjusted EBITDA was higher than the fourth quarter of 2017 primarily because of higher average rates and improved cost structure, partially offset by lower activity.
Operating costs as a percentage of revenue was 78% compared with the prior year comparative quarter of 88%.
Depreciation expense in the quarter was $3 million lower than the prior year comparative period due to the recognition of gains on disposal of capital assets in the current year compared with losses on disposal in the prior year.
Corporate and Other
Our Corporate and Other segment provides support functions to our operating segments. The Corporate and Other segment had an adjusted EBITDA (see “NON-GAAP MEASURES”) of $5 million, a $17 million increase compared with the fourth quarter of 2017 primarily due to lower share-based incentive compensation and the receipt of the transaction termination fee partially offset by costs associated with our unsuccessful arrangement agreement.
Net financial charges for the quarter were $32 million, a decrease of $6 million compared with the fourth quarter of 2017 primarily because of debt retired in 2017 and mid-2018 partially offset by a weaker Canadian dollar on our U.S. dollar denominated interest expense.
During the quarter we redeemed US$30 million of our 6.5% unsecured senior notes due 2021 and repurchased and cancelled US$44 million principal amount of our 5.25% unsecured senior notes due 2024 resulting in a net gain of $7 million.
Income tax expense for the quarter was a recovery of $2 million compared with a recovery of $17 million in the same quarter in 2017. The tax recovery in 2018 decreased primarily due to a smaller loss prior to the non-taxable portion of the goodwill impairment compared with the prior year quarter.
Capital expenditures were $30 million in the fourth quarter compared with $25 million in the fourth quarter of 2017. Spending in the fourth quarter of 2018 included:
| ∎ | $11 million – to expand and upgrade our asset base |
| ∎ | $18 million – on maintenance and infrastructure |
| ∎ | $1 million – on intangibles. |
| |
33 | Management’s Discussion and Analysis |
| | | | | |
| Financial Condition | | Management’s Discussion and Analysis | | |
| | | | | |
The oilfield services business is inherently cyclical. To manage this variability, we focus on maintaining a strong balance sheet so we have the financial flexibility we need to continue to manage our capital expenditures and cash flows, no matter where we are in the business cycle.
We apply a disciplined approach to managing and tracking the results of our operations to keep costs down. We maintain a scalable cost structure so we can be responsive to changing competition and market demand. We also invest in our fleet to make sure we remain competitive. Our maintenance capital expenditures are tightly governed by and highly responsive to activity levels with additional cost savings leverage provided through our internal manufacturing and supply divisions. Term contracts on expansion capital for new-build rig programs help provide more certainty of future revenues and return on our growth capital investments.
LIQUIDITY
During the year we redeemed US$80 million and repurchased and cancelled US$3 million of our 6.5% unsecured senior notes due 2021 and repurchased and cancelled US$49 million principal amount of our 5.25% unsecured senior notes due 2024. On November 30, 2018 we agreed with our lenders to a one-year maturity extension of our Senior Credit Facility to November 2022.
In 2017, we issued US$400 million of 7.125% senior notes due in 2026 in a private offering, repurchased pursuant to an early tender offer US$310 million of our 6.625% unsecured senior notes due 2020 and US$70 million of our 6.5% unsecured senior notes due 2021 and redeemed our remaining outstanding 6.625% unsecured senior notes due 2020.
On November 21, 2017 we agreed with our lenders to the following amendments to our Senior Credit Facility:
| ∎ | reduce the Covenant EBITDA (as defined in the debt agreement) (See Non-GAAP Measures on page 3 of this report) to interest expense coverage ratio to greater than or equal to 2.0:1 for the periods ending June 30, September 30, December 31, 2018 and March 31, 2019 reverting to 2.5:1 thereafter |
| ∎ | reduced the size of the facility to US$500 million |
| ∎ | amend certain negative covenants, to among other things, permit the redemption and repurchase of junior debt on a permanent basis subject to a pro forma senior net leverage covenant test of less than or equal to 1.75:1 |
| ∎ | add a new covenant that permits distributions post the covenant relief period subject to a pro forma senior net leverage covenant of less than or equal to 1.75:1. |
On January 20, 2017 we agreed with our lenders to the following amendments to our Senior Credit Facility:
| ∎ | reduce the Covenant EBITDA (as defined in the debt agreement) to interest expense coverage ratio to greater than or equal to 1.25:1 for the periods ending March 31, June 30 and September 30, 2017. For the periods ending December 31, 2017 and March 31, 2018 the ratio is 1.5:1 reverting to 2.5:1 thereafter |
| ∎ | reduce the size of the facility to US$525 million. |
As of December 31, 2018, our liquidity was supported by a cash balance of $97 million, our Senior Credit Facility of US$500 million, operating facilities totaling approximately $60 million, and a US$30 million secured facility for letters of credit. Our ability to draw on our Senior Credit Facility is governed by financial covenants. See Capital Structure – Covenants on page 37.
We expect that cash provided by operations and our sources of financing, including our Senior Credit Facility, will be sufficient to meet our debt obligations and to fund future capital expenditures.
Precision Drilling Corporation 2018 Annual Report | 34 |
At December 31, 2018, excluding letters of credit, we had approximately $1,729 million (2017 – $1,822 million) outstanding under our secured and unsecured credit facilities and $23 million in unamortized debt issue costs. Our Senior Credit Facility includes financial ratio covenants that are tested quarterly. | | Key Ratios We ended 2018 with a long-term debt to long-term debt plus equity ratio of 0.5, and a ratio of long-term debt to cash provided by operations of 5.8. |
We ended 2018 with a long-term debt to long-term debt plus equity ratio of 0.5 (2017 – 0.5) and a ratio of long-term debt to cash provided by operations of 5.8 (2017 – 14.8).
The current blended cash interest cost of our debt is approximately 6.7%.
Ratios and Key Financial Indicators
We evaluate the relative strength of our financial position by monitoring our working capital, debt ratios and liquidity.
We also monitor returns on capital, and we link our executives’ incentive compensation to the returns to our shareholders relative to the shareholder returns of our peers.
Financial Position and Ratios
(in thousands of dollars, except ratios) | | December 31, 2018 | | | December 31, 2017 | | | December 31, 2016 | |
Working capital(1) | | | 240,539 | | | | 232,121 | | | | 230,874 | |
Working capital ratio | | | 1.9 | | | | 2.1 | | | | 2.0 | |
Long-term debt | | | 1,706,253 | | | | 1,730,437 | | | | 1,906,934 | |
Total long-term financial liabilities | | | 1,723,350 | | | | 1,754,059 | | | | 1,946,742 | |
Total assets | | | 3,636,043 | | | | 3,892,931 | | | | 4,324,214 | |
Enterprise value (see table on page 39) | | | 2,305,890 | | | | 2,782,596 | | | | 3,937,737 | |
Long-term debt to long-term debt plus equity | | | 0.5 | | | | 0.5 | | | | 0.5 | |
Long-term debt to cash provided by operations | | | 5.8 | | | | 14.8 | | | | 15.6 | |
Long-term debt to Adjusted EBITDA | | | 4.5 | | | | 5.7 | | | | 8.4 | |
Long-term debt to enterprise value | | | 0.7 | | | | 0.6 | | | | 0.5 | |
(1) | See Non-GAAP measures on page 3 of this report. |
Credit Rating
Credit ratings affect our ability to obtain short and long-term financing, the cost of this financing, and our ability to engage in certain business activities cost-effectively.
At March 1, 2019 | | Moody’s | | S&P | | Fitch |
Corporate credit rating | | B2 | | BB- | | B+ |
Senior Credit Facility rating | | Not rated | | Not rated | | BB+ |
Senior unsecured credit rating | | B3 | | BB- | | BB- |
CAPITAL MANAGEMENT
To maintain and grow our business, we invest in growth, upgrade and sustaining capital. We base expansion and upgrade capital decisions on return on capital employed and payback, and we mitigate the risk that we may not be able to fully recover our capital by requiring two- to five-year term contracts for new-build rigs.
We base our maintenance capital decisions on actual activity levels, using key financial indicators that we express as per operating day or per operating hour. Sourcing internally (through our manufacturing and supply divisions) helps keep our maintenance capital costs as low as possible.
| |
35 | Management’s Discussion and Analysis |
Foreign Exchange Risk
Our U.S. and international operations have revenue, expenses, assets and liabilities denominated in currencies other than the Canadian dollar (mostly in U.S. dollars and currencies that are pegged to the U.S. dollar). This means that changes in currency exchange rates can materially affect our income statement, balance sheet and statement of cash flow. We manage this risk by matching the currency of our debt obligations with the currency of cash flows generated by the operations that the debt supports.
Hedge of Investments in Foreign Operations
We utilize foreign currency long-term debt to hedge our exposure to changes in the carrying values of our net investment in certain foreign operations as a result of changes in foreign exchange rates.
During 2018, we designated all of our U.S. dollar senior notes as a net investment hedge in our U.S. dollar denominated foreign operations.
To be accounted for as a hedge, the foreign currency denominated long-term debt must be designated and documented as such and must be effective at inception and on an ongoing basis. We recognize the effective amount of this hedge (net of tax) in other comprehensive income. We recognize ineffective amounts in earnings.
SOURCES AND USES OF CASH
At December 31 (thousands of dollars) | | 2018 | | | 2017 | | | 2016 | |
Cash from operations | | | 293,334 | | | | 116,555 | | | | 122,508 | |
Cash used in investing | | | (100,794 | ) | | | (91,150 | ) | | | (213,925 | ) |
Surplus (deficit) | | | 192,540 | | | | 25,405 | | | | (91,417 | ) |
Cash used in financing | | | (169,085 | ) | | | (73,784 | ) | | | (218,324 | ) |
Effect of exchange rate changes on cash | | | 8,090 | | | | (2,245 | ) | | | (19,313 | ) |
Net cash provided (used) | | | 31,545 | | | | (50,624 | ) | | | (329,054 | ) |
Cash from Operations
In 2018, we generated cash from operations of $293 million compared with $117 million in 2017. The increase is primarily the result of lower interest payments on our long-term debt and higher cash tax recoveries.
Investing Activity
We made growth and sustaining capital investments of $126 million in 2018:
| ∎ | $66 million on upgrade and expansion capital |
| ∎ | $48 million on maintenance and infrastructure capital |
| ∎ | $12 million on intangibles. |
The $126 million in capital expenditures in 2018 was split between segments as follows:
| ∎ | $108 million in Contract Drilling Services |
| ∎ | $5 million in Completion and Production Services |
| ∎ | $13 million in Corporate and Other. |
Expansion and upgrade capital includes the cost of long-lead items purchased for our capital inventory, such as integrated top drives, drill pipe, control systems, engines and other items we can use to complete new-build projects or upgrade our rigs in North America and internationally.
We sold underutilized capital assets for proceeds of $24 million in 2018 compared with $15 million in 2017.
Financing Activity
As discussed on page 34, during the year, we redeemed US$80 million and repurchased and cancelled US$3 million of our 6.5% unsecured senior notes due 2021, repurchased and cancelled US$49 million principal amount of our 5.25% unsecured senior notes due 2024 and extended the maturity date of our Senior Credit Facility to November 21, 2022.
Precision Drilling Corporation 2018 Annual Report | 36 |
During 2017, we issued US$400 million of senior notes, redeemed US$62 million of senior notes and repurchased and cancelled US$380 million of senior notes.
As of December 31, 2018, our operating facility of $40 million with Royal Bank of Canada was undrawn except for $28 million in outstanding letters of credit; our operating facility of US$15 million with Wells Fargo remained undrawn; and our demand facility for letters of credit of US$30 million with HSBC Canada had US$28 million available.
CAPITAL STRUCTURE
Debt
As of December 31, 2018, we had a cash balance of $97 million, available capacity under our secured facilities of $715 million and $1,729 million outstanding under our senior unsecured notes.
Amount | | Availability | | Used for | | Maturity |
Senior facility (secured) | | | | | | |
US$500 million (extendible, revolving term credit facility with US$250 million(1) accordion feature) | | Undrawn, except US$28 million in outstanding letters of credit | | General corporate purposes | | November 21, 2022 |
Operating facilities (secured) | | | | | | |
$40 million | | Undrawn, except $28 million in outstanding letters of credit | | Letters of credit and general corporate purposes | | |
US$15 million | | Undrawn | | Short term working capital requirements | | |
Demand letter of credit facility (secured) | | | | | | |
US$30 million | | Undrawn, except US$2 million in outstanding letters of credit | | Letters of credit | | |
Senior notes (unsecured) | | | | | | |
US$166 million – 6.5% | | Fully drawn | | Capital expenditures and general corporate purposes | | December 15, 2021 |
US$350 million – 7.75% | | Fully drawn | | Debt redemption and repurchases | | December 15, 2023 |
US$351 million – 5.25% | | Fully drawn | | Capital expenditures and general corporate purposes | | November 15, 2024 |
US$400 million – 7.125% | | Fully drawn | | Debt redemption and repurchases | | January 15, 2026 |
(1) | Increases to US$300 million at the end of the covenant relief period of March 31, 2019. |
Covenants
Senior Credit Facility
The Senior Credit Facility requires that we comply with certain financial covenants including a leverage ratio of consolidated senior debt to earnings before interest, taxes, depreciation and amortization as defined in the agreement (Covenant EBITDA) of less than or equal to 2.5:1. For purposes of calculating the leverage ratio, consolidated senior debt only includes secured indebtedness. Covenant EBITDA as defined in our Senior Credit Facility agreement differs from Adjusted EBITDA as defined under Non-GAAP Measures by the exclusion of bad debt expense and certain foreign exchange amounts. As of December 31, 2018, our consolidated senior debt to Covenant EBITDA ratio was negative 0.16:1.
Under the Senior Credit Facility, we are required to maintain a Covenant EBITDA coverage ratio, calculated as Covenant EBITDA to interest expense for the most recent four consecutive fiscal quarters, of greater than or equal to 1.5:1, which, after the November 2017 amendment increased to 2.0:1 for the periods June 30, September 30, December 31, 2018 and March 31, 2019 and reverts to 2.5:1 for periods ending after March 31, 2019 until the maturity date of the facility. As of December 31, 2018, our Covenant EBITDA coverage ratio was 3.31:1.
The Senior Credit Facility prevents us from making distributions prior to April 1, 2019, after which, distributions are subject to a pro forma senior net leverage covenant of less than or equal to 1.75:1. The Senior Credit Facility also limits the redemption and repurchase of junior debt subject to a pro forma senior net leverage covenant test of less than or equal to 1.75:1.
| |
37 | Management’s Discussion and Analysis |
In addition, the Senior Credit Facility contains certain covenants that place restrictions on our ability to incur or assume additional indebtedness; dispose of assets; pay dividends, share redemptions or other distributions; change our primary business; incur liens on assets; engage in transactions with affiliates; enter into mergers, consolidations or amalgamations; and enter into speculative swap agreements.
At December 31, 2018, we were in compliance with the covenants of the Senior Credit Facility.
Senior Notes
The senior notes require that we comply with certain covenants including an incurrence based consolidated interest coverage ratio test, as defined in the senior note agreements, of greater than or equal to 2.0:1 for the most recent four consecutive fiscal quarters. In the event that our consolidated interest coverage ratio is less than 2.0:1 for the most recent four consecutive fiscal quarters the senior notes restrict our ability to incur additional indebtedness, except as permitted under the agreements, until such time as we are in compliance with the ratio test but would not restrict our access to available funds under the Senior Credit Facility or refinance our existing debt. Furthermore, it does not give rise to any cross-covenant violations, give the lenders the right to demand repayment of any outstanding portion of the senior notes prior to the stated maturity dates, or provide any other forms of recourse to the lenders. As of December 31, 2018, our senior notes consolidated interest coverage ratio was 2.8:1.
The senior notes contain a restricted payments covenant that limits our ability to make payments in the nature of dividends, distributions and repurchases from shareholders. The restricted payments basket grows from a starting point of October 1, 2010 for the 2021 and 2024 Senior Notes, from October 1, 2016 for the 2023 Senior Note and October 1, 2017 for the 2026 Senior Note by, among other things, 50% of cumulative consolidated net earnings, and decreases by 100% of cumulative consolidated net losses as defined in the note agreements, and cumulative payments made to shareholders. Based on our consolidated financial results for the period ended December 31, 2015, the governing net restricted payments basket under the senior notes was negative $152 million prohibiting us from making any further dividend payments for dividends declared on or after December 31, 2015 until the restricted payments baskets become positive. As a result, Precision suspended our dividend on February 11, 2016.
Based on our consolidated financial results for the period ended December 31, 2018, the governing net restricted payments basket was negative $496 million.
For further information, please see the senior note indentures which are available on SEDAR and EDGAR.
In addition, the senior notes contain certain covenants that limit our ability, and the ability of certain subsidiaries, to incur additional indebtedness and issue preferred shares; create liens; create or permit to exist restrictions on our ability or certain subsidiaries to make certain payments and distributions; engage in amalgamations, mergers or consolidations; make certain dispositions and engage in transactions with affiliates.
Shelf Registration
In August 2016, we completed the filing of a short form base shelf prospectus with the securities regulatory authorities in each of the provinces of Canada and a corresponding registration statement in the U.S., for the offering of up to $1 billion of common shares, preferred shares, debt securities, warrants, subscription receipts or units (the Securities). The Securities may be offered from time to time during the 25-month period for which the short form base shelf prospectus remains valid. During 2018, the shelf registration period lapsed and was not renewed.
Contractual Obligations
Our contractual obligations include both financial obligations (long-term debt and interest) and non-financial obligations (new-build rig commitments, operating leases, and equity-based compensation for key executives and officers).
Precision Drilling Corporation 2018 Annual Report | 38 |
The table below shows the amounts of these obligations and when payments are due for each.
At December 31, 2018 (thousands of dollars) | | Payments due (by period) | |
| | Less than 1 year | | | 1-3 years | | | 4-5 years | | | More than 5 years | | | Total | |
Long-term debt(1) | | | — | | | | 226,113 | | | | 477,823 | | | | 1,025,415 | | | | 1,729,351 | |
Interest on long-term debt(1) | | | 115,802 | | | | 230,992 | | | | 200,667 | | | | 101,457 | | | | 648,918 | |
Purchase of property, plant and equipment(1)(2) | | | 88,046 | | | | 91,797 | | | | — | | | | — | | | | 179,843 | |
Operating leases(1) | | | 13,496 | | | | 20,418 | | | | 16,221 | | | | 17,797 | | | | 67,932 | |
Contractual incentive plans(1)(3) | | | 6,221 | | | | 10,439 | | | | — | | | | — | | | | 16,660 | |
Total | | | 223,565 | | | | 579,760 | | | | 694,711 | | | | 1,144,669 | | | | 2,642,705 | |
(1) | U.S. dollar denominated balances are translated at the period end exchange rate of Cdn$1.00 equals US$0.7325. |
(2) | The balance relates primarily to the costs of rig equipment with a flexible delivery schedule wherein we can take delivery of the equipment between 2019 and 2021 at our discretion. |
(3) | Includes amounts we have not yet accrued but are likely to pay at the end of the contract term. Our long-term incentive plans compensate officers and key employees through cash payments when their awards vest. Equity-based compensation amounts are shown based on the five-day weighted average share price on the TSX of $2.36 at December 31, 2018. |
Shareholders Capital
| | March 1, 2019 | | | December 31, 2018 | | | December 31, 2017 | | | December 31, 2016 | |
Shares outstanding | | | 293,781,836 | | | | 293,781,836 | | | | 293,238,858 | | | | 293,238,858 | |
Deferred shares outstanding | | | 93,173 | | | | 93,173 | | | | 195,743 | | | | 195,743 | |
Share options outstanding | | | 10,441,601 | | | | 10,799,006 | | | | 10,458,981 | | | | 11,525,742 | |
You can find more information about our capital structure in our AIF, available on our website and on SEDAR.
Common Shares
Our articles of amalgamation allow us to issue an unlimited number of common shares.
In the fourth quarter of 2012, we introduced a quarterly dividend program. The dividend program was suspended in the first quarter of 2016. See Covenants – Senior Notes on page 38 for more information.
Preferred Shares
We can issue preferred shares in one or more series. The number of preferred shares that may be authorized for issue at any time cannot exceed more than half of the number of issued and outstanding common shares. We currently have no preferred shares issued.
Enterprise Value
(thousands of dollars, except shares outstanding and per share amounts) | | December 31, 2018 | | | December 31, 2017 | | | December 31, 2016 | |
Shares outstanding | | | 293,781,836 | | | | 293,238,858 | | | | 293,238,858 | |
Year-end share price on the TSX | | | 2.37 | | | | 3.81 | | | | 7.32 | |
Shares at market | | | 696,263 | | | | 1,117,240 | | | | 2,146,508 | |
Long-term debt | | | 1,706,253 | | | | 1,730,437 | | | | 1,906,934 | |
Less cash | | | (96,626 | ) | | | (65,081 | ) | | | (115,705 | ) |
Enterprise value | | | 2,305,890 | | | | 2,782,596 | | | | 3,937,737 | |
| |
39 | Management’s Discussion and Analysis |
| | | | | |
| Accounting Policies and Estimates | | Management’s Discussion and Analysis | | |
| | | | | |
CRITICAL ACCOUNTING ESTIMATES AND JUDGEMENTS
Because of the nature of our business, we are required to make estimates about the future that affect the reported amounts of assets, liabilities, revenues and expenses, and the disclosure of contingent liabilities. Estimates are based on our past experience, our best judgment and assumptions we think are reasonable.
Our significant accounting policies are described in Note 3 to the Consolidated Financial Statements. We believe the following are the most difficult, subjective or complex judgments, and are the most critical to how we report our financial position and results of operations:
| ∎ | impairment of long-lived assets |
| ∎ | depreciation and amortization |
Impairment of Long-Lived Assets
Long-lived assets, which include property, plant and equipment, intangibles and goodwill, comprise the majority of our assets. The carrying value of these assets is reviewed for impairment periodically or whenever events or changes in circumstances indicate that their carrying amounts may not be recoverable. For property, plant and equipment, this requires us to forecast future cash flows to be derived from the utilization of these assets based on assumptions about future business conditions and technological developments. Significant, unanticipated changes to these assumptions could require a provision for impairment in the future.
For goodwill, we conduct impairment tests annually in the fourth quarter or whenever there is a change in circumstance that indicates that the carrying value may not be recoverable. The recoverability of goodwill requires a calculation of the recoverable amount of the CGU or groups of CGUs to which goodwill has been allocated. A CGU is the smallest identifiable group of assets that generates cash inflows that are largely independent of the cash inflows from other assets or groups of assets. Judgment is required in the aggregation of assets into CGUs. The recoverability calculation requires an estimation of the future cash flows from the CGU or group of CGUs, and judgment is required in projecting cash flows and selecting the appropriate discount rate. We use observable market data inputs to develop a discount rate that we believe approximates the discount rate from market participants.
In deriving the underlying projected cash flows, assumptions must also be made about future drilling activity, margins and market conditions over the long-term life of the assets or CGUs. We cannot predict if an event that triggers impairment will occur, when it will occur or how it will occur, or how it will affect reported asset amounts. Although we believe the estimates are reasonable and consistent with current conditions, internal planning, and expected future operations, such estimations are subject to significant uncertainty and judgment.
Depreciation and Amortization
Our property, plant and equipment and intangible assets are depreciated and amortized based on estimates of useful lives and salvage values. These estimates consider data and information from various sources, including vendors, industry practice, and our own historical experience, and may change as more experience is gained, market conditions shift, or new technological advancements are made.
Determination of which parts of the drilling rig equipment represent a significant cost relative to the entire rig and identifying the consumption patterns along with the useful lives of these significant parts are matters of judgment. This determination can be complex and subject to differing interpretations and views, particularly when rig equipment comprises individual components for which different depreciation methods or rates are appropriate.
Precision Drilling Corporation 2018 Annual Report | 40 |
Income Taxes
Uncertainties exist with respect to the interpretation of complex tax regulations, changes in tax laws, and the amount and timing of future taxable income. Differences arising between the actual results and the assumptions made, or future changes to such assumptions, could necessitate future adjustments to taxable income and expenses already recorded. We establish provisions, based on reasonable estimates, for possible consequences of audits by the tax authorities of the respective countries in which we operate. The amount of such provisions is based on various factors, such as experience of previous tax audits and differing interpretations of tax regulations by the taxable entity and the responsible tax authority.
AMENDMENTS TO ACCOUNTING STANDARDS ADOPTED JANUARY 1, 2018
We applied the following mandatorily effective amendments to IFRSs in the current year. Outside of additional disclosure requirements, these amendments had no impact on the amounts recorded in our financial statements.
IFRS 9, Financial Instruments
IFRS 9 replaced IAS 39 Financial Instruments, Recognition and Measurement. IFRS 9 contains three principal classification categories for financial assets: measured at amortized cost, fair value through other comprehensive income and fair value through profit or loss. The classification of financial assets under IFRS 9 is generally based on the business model in which a financial asset is managed and the characteristics of its contractual cash flows. IFRS 9 eliminates the previous IAS 39 categories of held to maturity, loans and receivables and available for sale. Under IFRS 9, derivatives embedded in contracts where the host is a financial asset under the standard are never separated. Instead the hybrid financial instrument as a whole is assessed for classification.
Under the new standard, Precision’s accounts receivable, accounts payable and accrued liabilities and long-term debt have been classified and measured at amortized cost.
IFRS 9 replaced the incurred loss model of IAS 39 with an expected credit loss model. The loss allowance to be recorded against trade receivables is measured as the lifetime expected credit losses. Due to low historical default rates, there was no material adjustment to the credit loss allowance.
IFRS 15, Revenue from Contracts with Customers
IFRS 15 established a single comprehensive model to address how and when to recognize revenue as well as requiring entities to provide users of financial statements with more informative, relevant disclosures in order to understand the nature, amount, timing and uncertainty of revenue and cash flows arising from contracts with customers. It replaced existing revenue recognition guidance including IAS 18 Revenue and IAS 11 Construction Contracts.
The standard provides a principle based five-step model to be applied to all contracts with customers. This five-step model involves identifying the contract(s) with a customer; identifying the performance obligations in the contract; determining the transaction price; allocating the transaction price to the performance obligations in the contract; and recognizing revenue when (or as) the entity satisfies performance obligations.
During its initial application of IFRS 15, the Corporation did not apply any of the available practical expedients. The application of IFRS 15 did not result in a material impact to the Corporation’s consolidated financial statements. For additional information about the Corporation’s accounting policies with respect to revenue recognition, see Note 3(j) in our Consolidated Financial Statements.
ACCOUNTING STANDARDS, INTERPRETATIONS AND AMENDMENTS TO EXISTING STANDARDS NOT YET EFFECTIVE
IFRS 16, Leases
On January 1, 2019, Precision will adopt IFRS 16 - Leases. This standard introduces a single, on-balance sheet lease accounting model for lessees and requires a lessee to recognize a right-of-use asset representing its right to direct the use of the underlying asset as well as a lease liability representing its obligation to make future lease payments. IFRS 16 will also cause expenses to be higher at the beginning and lower towards the end of a lease, even when payments are consistent throughout the term. The standard includes recognition exemptions for short-term leases and leases of low-value items. Lessor accounting remains similar to the current standard in which lessors continue to classify leases as either finance or operating leases.
| |
41 | Management’s Discussion and Analysis |
IFRS 16 will replace existing lease guidance, including IAS 17 Leases, IFRIC 4 Determining whether an Arrangement contains a Lease, SIC-15 Operating Leases – Incentives and SIC-27 Evaluating the Substance of Transactions Involving the Legal Form of a Lease.
Precision has completed its review of the existing contracts that are currently classified as leases under the existing standard, or that could be classified as leases under IFRS 16, in order to identify the contracts that will be impacted by the new standard from the perspective of both a lessor and a lessee. Management has also estimated the impact that the initial application of IFRS 16 will have on its consolidated financial statements, as described below. The actual impact of adopting the standard on January 1, 2019 may differ from what is described below as Precision’s accounting policies, including the election to apply certain practical expedients, are subject to change until presented in its first published financial statements after the date of initial application.
Leases in which Precision is a lessee
Precision will recognize right-of-use assets and lease liabilities for its real estate, vehicle, office equipment and other contracts that are currently classified as operating leases. The nature of expenses related to those leases will change as Precision will depreciate the right-of-use assets and recognize interest expense on its lease liabilities. Under the existing standard, Precision recognizes operating lease expenses on a straight-line basis over the term of the lease in either operating or general and administrative expense and recognizes assets and liabilities only to the extent there was a timing difference between the payment date and the recognition of the expense.
Based on the information currently available, Precision estimates that it will recognize lease liabilities and corresponding right-of-use assets of approximately $60 million - $70 million on January 1, 2019 related to contracts where it is the lessee. Precision does not expect a material adjustment to the opening balance of retained earnings on January 1, 2019 upon the initial application of IFRS 16. The actual impact of adopting the standard on January 1, 2019 may differ from these estimates as the Corporation continues to review its calculations and may refine certain inputs therein, such as the discount rate and lease term.
Leases in which Precision is a lessor
Precision evaluated its drilling rigs under term contracts longer than one year and determined that these meet the definition of a lease under IFRS 16. Precision expects to classify these as operating leases, and accordingly, will recognize lease income over the term of the respective drilling contract. This is not expected to give rise to differences in the recognition or measurement of revenues from these contracts as compared to Precision’s existing accounting policies.
Precision reassessed the classification of its real estate sub-leases in which it is a lessor. These are classified as an operating lease under the existing lease standard and management does not expect to reclassify these as finance leases.
Transition
There are two methods by which the new standard may be adopted: (1) a full retrospective approach with a restatement of all prior periods presented, or (2) a modified retrospective approach with a cumulative-effect adjustment recognized in opening retained earnings as of the date of adoption, with no restatement of comparative information. Precision will apply IFRS 16 initially on January 1, 2019, using the modified retrospective approach.
When applying a modified retrospective approach to leases previously classified as operating leases under IAS 17, the lessee can elect, on a lease-by-lease basis, whether to apply a number of practical expedients on transition. On initial adoption of the new standard, the Corporation intends to use the following practical expedients, where applicable:
| ∎ | not applying the requirements of the standard to short-term leases |
| ∎ | treat existing operating leases with a remaining term of less than 12 months at January 1, 2019 as short-term leases |
| ∎ | not applying the requirements of the standard to low-value leases, and |
| ∎ | applying a single discount rate to a portfolio of leases with reasonably similar characteristics. |
As a result of the adoption of the new standard, Precision will be required to include significant disclosures in the consolidated financial statements based on the prescribed requirements. These new disclosures will include information regarding the judgments used in determining discount rates and terms of leases including optional renewal periods. The Corporation will include the required disclosures in its 2019 first quarter condensed consolidated interim financial statements.
IFRIC 23, Uncertainty over Income Tax Treatments
IFRIC 23 clarifies the accounting for uncertainties in income taxes. The interpretation requires the entity to use the most likely amount or the expected value of the tax treatment if it concludes that it is not probable that a particular tax treatment will be accepted. It requires an entity to assume that a taxation authority with the right to examine any amounts reported to it will examine those amounts and will have full knowledge of all relevant information when doing so.
Precision Drilling Corporation 2018 Annual Report | 42 |
IFRIC 23 is effective for annual reporting periods beginning on or after January 1, 2019. The requirements are applied by recognizing the cumulative effect of initially applying them in retained earnings, or in other appropriate components of equity, at the start of the reporting period in which an entity first applies them, without adjusting comparative information. Full retrospective application is permitted, if an entity can do so without using hindsight.
Precision has reviewed its initial application of IFRIC 23 and determined it will not have a material impact on the consolidated financial statements. The actual impact of adopting the standard on January 1, 2019 may differ as Precision’s accounting policies are subject to change until presented in its first published financial statements after the date of initial application.
| |
43 | Management’s Discussion and Analysis |
| | | | | |
| Risks in Our Business | | Management’s Discussion and Analysis | | |
| | | | | |
Our key business risks are summarized below. Additional information and other risks in our business are discussed in our AIF, available on our website (www.precisiondrilling.com).
Our enterprise risk management framework operates at the business and functional levels and is designed to identify, evaluate, and mitigate risks within each of the risk categories below. It leverages the risk framework in each of our businesses, which includes our risk policies, guidelines and review mechanisms.
Our businesses routinely encounter and manage risks, some of which may cause our future results to be different, sometimes materially different, than what we presently anticipate. We describe certain important strategic, operational, financial, and legal and compliance risks. Our response to development in those risk areas and our reactions to material future developments will affect our future results.
Our operations depend on the price of oil and natural gas, which have been subject to increased volatility in recent years, and the exploration and development activities of oil and natural gas exploration companies
We sell our services to oil and natural gas exploration and production companies. Macroeconomic and geopolitical factors associated with oil and natural gas supply and demand are the primary factors driving pricing and profitability in the oilfield services industry. Generally, we experience high demand for our services when commodity prices are relatively high and the opposite is true when commodity prices are relatively low, as is currently the case. The volatility of crude oil and natural gas prices accounts for much of the cyclical nature of the oilfield services business and in recent years, increased volatility has led to greater uncertainty in the demand for our services.
The markets for oil and natural gas are separate and distinct. Oil is a global commodity with a vast distribution network, although the differential between benchmarks such as West Texas Intermediate, Western Canadian Select, and European Brent crude oil can fluctuate. As in all markets, when supply, demand, inability to access domestic or export markets and other factors change, so can the spreads between benchmarks. The most economical way to transport natural gas is in its gaseous state by pipeline, and the natural gas market depends on pipeline infrastructure and regional supply and demand. However, developments in the transportation of liquefied natural gas in ocean going tanker ships have introduced an element of globalization to the natural gas market.
Worldwide military, political and economic events, such as conflict in the Middle East, expectations for global economic growth, trade disputes, or initiatives by OPEC and other major petroleum exporting countries, can affect supply and demand for oil and natural gas. Weather conditions, governmental regulation (in Canada and elsewhere), levels of consumer demand, the availability and pricing of alternate sources of energy (including renewal energy initiatives), the availability of pipeline capacity and other transportation for oil and natural gas, U.S. and Canadian oil and natural gas storage levels, and other factors beyond our control can also affect the supply of and demand for oil and natural gas and lead to future price volatility.
The North American land drilling industry has been in a downturn relative to activity levels experienced prior to 2015, a result of lower commodity prices restricting customer spending and decreasing drilling demand. In 2018, approximately 19,300 wells were started onshore in the U.S., compared to approximately 43,700 in 2014. In 2018, the industry drilled 6,781 wells in western Canada, compared to 10,942 in 2014. According to industry sources, the U.S. average active land drilling rig count was up approximately 18% in 2018, compared to 2017, and the Canadian average active land drilling rig count was down approximately 7% during the same period. However, oil and natural gas prices remained volatile throughout 2018 and could continue at these relatively low levels or lower levels for the foreseeable future. Prices have been negatively affected since late 2014 by a combination of factors, including increased production, the decisions of OPEC and Russia and a strengthening in the U.S. dollar relative to most other currencies. These factors have adversely affected, and could continue to adversely affect, the price of oil and natural gas, which would adversely affect the level of capital spending by our customers and in turn could have a material and adverse effect on our results of operations.
As a result of the continued pressure on commodity prices, many of our customers have reduced spending budgets compared to periods prior to the downturn, and further reductions in commodity prices or prices remaining at current levels for a prolonged period may result in further reductions in capital budgets in the future, which could result in cancelled, delayed or reduced drilling programs by our customers and a corresponding decline in demand for our services. Moreover, the prolonged reduction in oil
Precision Drilling Corporation 2018 Annual Report | 44 |
and natural gas prices has depressed, and may continue to depress, and the availability and pricing of alternative sources of energy and technological advances may depress, the overall level of exploration and production activity, resulting in corresponding decline in the demand for our services. In late 2018 and into 2019, as a result of oil and natural gas price volatility and regulatory uncertainty, some of our Canadian customers have delayed announcing their 2019 capital budgets, which has created some uncertainty in the level of demand for our services in Canada.
If a reduction in exploration and development activities, whether resulting from changes in oil and natural gas prices and reductions in capital budgets described above or otherwise, continues or worsens, it could materially and adversely affect us further by:
| ▪ | negatively impacting our revenue, cash flow, profitability and financial condition |
| ▪ | restricting our ability to make capital expenditures compared to periods prior to the downturn and our ability to meet future contracted deliveries of new-build rigs |
| ▪ | affecting the existing fair market value of our rig fleet, which in turn could trigger a write-down for accounting purposes |
| ▪ | our customers negotiating, terminating, or failing to honour their drilling contracts with us |
| ▪ | making our Senior Credit Facility financial covenants more difficult to attain, and |
| ▪ | negatively impacting our ability to maintain or increase our borrowing capacity, our ability to obtain additional capital to finance our business and our ability to achieve our debt reduction targets. |
There is no assurance that demands for our services or conditions in the oil and natural gas and oilfield services sector will not decline in the future, and a significant decline in demand could have a material adverse effect on our financial condition.
Additionally, we have accounts receivable with customers in the oil and natural gas industry and their revenues may be affected by fluctuations in commodity prices. Our ability to collect receivables may be adversely affected by any prolonged weakness in oil and natural gas prices.
Pipeline constraints in western Canada have an adverse effect on the demand for our services in Canada
In western Canada, delays and/or the inability to obtain necessary regulatory approvals for pipeline projects that would provide additional transportation capacity and access to refinery capacity for our customers has led to downward price pressure on oil and natural gas produced in western Canada, which has depressed, and may continue to depress, the overall exploration and production activity of our customers. Additionally, this regulatory uncertainty in Canada has impacted some of our customers’ ability to obtain financing, which has also depressed overall exploration and production activity. These factors result in a corresponding decline in the demand for our services that could have a material adverse effect on our revenue, cash flow, and profitability.
In December 2018, the Province of Alberta introduced mandatory curtailment on heavy oil production within the Province of Alberta, which has resulted in reduced differentials between WTI pricing and Western Canada Select Pricing; however, with a limited line of sight to new pipeline additions, customer spending in Canada is expected to be down significantly in the first half of the year with the potential for increased activity later in the year.
Intense price competition and the cyclical nature of the contract drilling industry could have an adverse effect on revenue and profitability
The contract drilling business is highly competitive with many industry participants. We compete for drilling contracts that are usually awarded based on competitive bids. We believe pricing and rig availability are the primary factors potential customers consider when selecting a drilling contractor. We believe other factors are also important, such as the drilling capabilities and condition of drilling rigs, the quality of service and experience of rig crews, the safety record of the contractor and the particular drilling rig, the offering of ancillary services, the ability to provide drilling equipment that is adaptable to and having personnel familiar with new technologies and drilling techniques, and rig mobility and efficiency.
Historically, contract drilling has been cyclical with periods of low demand, excess rig supply and low day rates, followed by periods of high demand, short rig supply and increasing day rates. Periods of excess drilling rig supply intensify the competition and often result in rigs being idle. There are numerous contract drilling companies in the markets where we operate, and an oversupply of drilling rigs can cause greater price competition. Contract drilling companies compete primarily on a regional basis, and the intensity of competition can vary significantly from region to region at any particular time. If demand for drilling services is better in a region where we operate, our competitors might respond by moving suitable drilling rigs in from other regions, reactivating previously stacked rigs or purchasing new drilling rigs. An influx of drilling rigs into a market from any source could rapidly intensify competition and make any improvement in the demand for our drilling rigs short-lived, which could in turn have a material adverse effect on our revenue, cash flow and earnings.
| |
45 | Management’s Discussion and Analysis |
Our business results and the strength of our financial position are affected by our ability to strategically manage our capital expenditure program in a manner consistent with industry cycles and fluctuations in the demand for contract drilling services. If we do not effectively manage our capital expenditures or respond to market signals relating to the supply or demand for contract drilling and oilfield services, it could have a material adverse effect on our revenue, operations and financial condition.
New capital expenditures in the contract drilling industry expose us to the risk of oversupply of equipment
Periods of high demand often lead to higher capital expenditures on drilling rigs and other oilfield services equipment. The number of newer drilling rigs competing for work in markets where we operate has increased as the industry has added new and upgraded rigs. The industry supply of drilling rigs may exceed actual demand because of the relatively long-life span of oilfield services equipment as well as the typically long time from when a decision is made to upgrade or build new equipment to when the equipment is built and placed into service. Excess supply resulting from industry-wide capital expenditures could lead to lower demand for term drilling contracts and for our equipment and services. The additional supply of drilling rigs has intensified price competition in the past and could continue to do so. This could lead to lower day rates in the oilfield services industry generally and lower utilization of existing rigs. If any of these factors materialize, it would have an adverse effect on our revenue, cash flow, earnings and asset valuation.
We require sufficient cash flows to service and repay our debt
We will need sufficient cash flows in the future to service and repay our debt. Our ability to generate cash in the future is affected to some extent by general economic, financial, competitive and other factors that may be beyond our control. If we need to borrow funds in the future to service our debt, our ability will depend on covenants in the Senior Credit Facility, the 2021 Note Indenture, the 2023 Note Indenture, the 2024 Note Indenture, the 2026 Note indenture and other debt agreements we may have in the future, and on our credit ratings. We may not be able to access sufficient amounts under the Senior Credit Facility or from the capital markets in the future to pay our obligations as they mature, or to fund other liquidity requirements. If we are not able to borrow a sufficient amount or generate enough cash flow from operations to service and repay our debt, we will need to refinance our debt or we will be in default, and we could be forced to reduce or delay investments and capital expenditures or dispose of material assets or issue equity. We may not be able to refinance or arrange alternative measures on favourable terms or at all. If we are unable to service, repay or refinance our debt, it could have a negative impact on our financial condition and results of operations.
Repaying our debt depends on our guarantor subsidiaries generating cash flow and making it available to us by dividend, debt repayment or otherwise. Our guarantor subsidiaries may not be able to, or may not be permitted to, make distributions to allow us to make payments on our debt. Each guarantor subsidiary is a distinct legal entity, and, under certain circumstances, legal and contractual restrictions may limit our ability to obtain cash from the subsidiaries. While the agreements governing certain existing debt limits the ability of our subsidiaries to incur consensual restrictions on their ability to pay dividends or make other intercompany payments to us, these limitations are subject to qualifications and exceptions.
A substantial portion of our operations is carried out through subsidiaries, and some of them are not guarantors of our debt. The assets of the non-guarantor subsidiaries represent approximately 15% of Precision’s consolidated assets. These subsidiaries do not have any obligation to pay amounts due on the debt or to make funds available for that purpose.
If we do not receive dividends from our guarantor subsidiaries, we may be unable to make the required principal and interest payments, which could have a material adverse effect on our financial position and results of operations.
Customers’ inability to obtain credit/financing could lead to lower demand for our services
Many of our customers require reasonable access to credit facilities and debt capital markets to finance their oil and natural gas drilling activity. If the availability of credit to our customers is reduced, they may reduce their drilling and production expenditures, thereby decreasing demand for our products and services. In Canada, the Supreme Court of Canada’s 2019 Redwater decision (Orphan Well Association v. Grant Thornton Ltd., which held that abandonment and reclamation obligations of a bankrupt debtor were binding on the debtor’s trustee) may increase the cost of capital for our Canadian customers and could impact the availability for credit for those customers while secured lenders assess the impact of the decision. A reduction in spending by our customers could adversely affect our operating results and financial condition as described further under – “Our operations depend on the price of oil and natural gas, which have been subject to increase volatility in recent years, and the exploration and development activities of oil and natural gas exploration companies” on page 44.
Precision Drilling Corporation 2018 Annual Report | 46 |
Our debt facilities contain restrictive covenants
The Senior Credit Facility, the 2021 Note Indenture, the 2023 Note Indenture, the 2024 Note Indenture and the 2026 Note indenture contain a number of covenants which, among other things, restrict us and some of our subsidiaries from conducting certain activities (see Capital Structure – Covenants – Senior Notes on page 38). In the event Consolidated Interest Coverage Ratio (as defined in our four senior note indentures) is less than 2.0:1 for the most recent four consecutive fiscal quarters, the senior note indentures restrict our ability to incur additional indebtedness. As at December 31, 2018, our Consolidated Interest Coverage Ratio, as calculated per our senior note indentures, was 2.8:1.
In addition, we must satisfy and maintain certain financial ratio tests under the Senior Credit Facility (see Capital Structure – Senior Credit Facility on page 37). Events beyond our control could affect our ability to meet these tests in the future. If we breach any of the covenants, it could result in a default under the Senior Credit Facility or any of the note indentures. If there is a default under our Senior Credit Facility, the applicable lenders could decide to declare all amounts outstanding under the Senior Credit Facility or any of the note indentures to be due and payable immediately and terminate any commitments to extend further credit. If there is an acceleration by the lenders and the accelerated amounts exceed a specific threshold, the applicable noteholders could decide to declare all amounts outstanding under any of the note indentures to be due and payable immediately.
At December 31, 2018, we were in compliance with the covenants of the Senior Credit Facility.
Uncertainty in Trade Relations
Ratification of the United States-Mexico-Canada Agreement (USMCA) deal to replace the North American Free Trade Agreement (NAFTA) may be delayed or prevented in the U.S. House of Representatives following the U.S. mid-term elections. Changes that could have had an impact on the oil and natural gas industry were not included in the USMCA; however, as the final terms and ratification of the USMCA remain uncertain, it is currently unclear how this agreement may affect the U.S., Mexico and Canada and what effects the final terms will have on our operations. In addition, implementation by the U.S. of new legislative or regulatory regimes or tariffs could impose additional costs on us, decrease U.S., Mexico or Canadian demand for our services or otherwise negatively impact us or our customers, which may have a material adverse effect on our business, financial condition and operations.
Risks and uncertainties associated with our international operations can negatively affect our business
We conduct some of our business in the Middle East. Our growth plans contemplate establishing operations in other international regions, including countries where the political and economic systems may be less stable than in Canada or the U.S.
Our international operations are subject to risks normally associated with conducting business in foreign countries, including, but not limited to, the following:
| ▪ | an uncertain political and economic environment |
| ▪ | the loss of revenue, property and equipment as a result of expropriation, confiscation, nationalization, contract deprivation and force majeure |
| ▪ | war, terrorist acts or threats, civil insurrection and geopolitical and other political risks |
| ▪ | fluctuations in foreign currency and exchange controls |
| ▪ | restrictions on the repatriation of income or capital |
| ▪ | increases in duties, taxes and governmental royalties |
| ▪ | renegotiation of contracts with governmental entities |
| ▪ | changes in laws and policies governing operations of companies |
| ▪ | compliance with anti-corruption and anti-bribery legislation in Canada, the U.S. and other countries, and |
| ▪ | trade restrictions or embargoes imposed by the U.S. or other countries. |
If there is a dispute relating to our international operations, we may be subject to the exclusive jurisdiction of foreign courts or may not be able to subject foreign persons to the jurisdiction of a court in Canada or the U.S.
| |
47 | Management’s Discussion and Analysis |
Government-owned petroleum companies located in some of the countries where we operate now or in the future may have policies, or may be subject to governmental policies, that give preference to the purchase of goods and services from companies that are majority-owned by local nationals. As such, we may rely on joint ventures, license arrangements and other business combinations with local nationals in these countries, which may expose us to certain counterparty risks, including the failure of local nationals to meet contractual obligations or comply with local or international laws that apply to us.
In the international markets where we operate, we are subject to various laws and regulations that govern the operation and taxation of our businesses and the import and export of our equipment from country to country. There may be uncertainty about how these laws and regulations are imposed, applied or interpreted, and they could be subject to change. Since we derive a portion of our revenues from subsidiaries outside of Canada and the U.S., the subsidiaries paying dividends or making other cash payments or advances may be restricted from transferring funds in or out of the respective countries, or face exchange controls or taxes on any payments or advances. We have organized our foreign operations partly based on certain assumptions about various tax laws (including capital gains and withholding taxes), foreign currency exchange, and capital repatriation laws and other relevant laws of a variety of foreign jurisdictions. We believe these assumptions are reasonable; however, there is no assurance that foreign taxing or other authorities will reach the same conclusion. If these foreign jurisdictions change or modify the laws, we could suffer adverse tax and financial consequences.
While we have developed policies and procedures designed to achieve compliance with applicable international laws, we could be exposed to potential claims, economic sanctions or other restrictions for alleged or actual violations of international laws related to our international operations, including anti-corruption and anti-bribery legislation, trade laws and trade sanctions. The Canadian government, the U.S. Department of Justice, the Securities and Exchange Commission (SEC), the U.S. Office of Foreign Assets Control and similar agencies and authorities in other jurisdictions have a broad range of civil and criminal penalties they may seek to impose against corporations and individuals for such violations, including injunctive relief, disgorgement, fines, penalties and modifications to business practices and compliance programs, among other things. While we cannot accurately predict the impact of any of these factors, if any of those risks materialize, it could have a material adverse effect on our reputation, business, financial condition, results of operations and cash flow.
Our and our customer’s operations are subject to numerous environmental laws, regulations and guidelines
Our operations are affected by numerous laws, regulations and guidelines relating to the protection of the environment, including those governing the management, transportation and disposal of hazardous substances and other waste materials. These include those relating to spills, releases and discharges of hazardous substances or other waste materials into the environment, requiring removal or remediation of pollutants or contaminants, and imposing civil and criminal penalties for violations. Some of these apply to our operations and authorize the recovery of damages by the government, injunctive relief, and the imposition of stop, control, remediation and abandonment orders. In addition, our land drilling operations may be conducted in or near ecologically sensitive areas, such as wetlands that are subject to special protective measures, which may expose us to additional operating costs and liabilities for noncompliance with certain laws. Some environmental laws and regulations may impose strict and, in certain cases joint and several, liability. This means that in some situations we could be exposed to liability as a result of conduct that was lawful at the time it occurred, or conditions caused by prior operators or other third parties, including any liability related to offsite treatment or disposal facilities. The costs arising from compliance with these laws, regulations and guidelines may be material.
Major projects which would benefit our customers, such as new pipelines and other facilities, may be inhibited, delayed or stopped by a variety of factors, including inability to obtain regulatory or governmental approvals or public opposition.
We maintain liability insurance, including insurance for certain environmental claims, but coverage is limited and some of our policies exclude coverage for damages resulting from environmental contamination. We cannot assure that insurance will continue to be available to us on commercially reasonable terms, that the possible types of liabilities that we may incur will be covered by insurance, or that the dollar amount of the liabilities will not exceed our policy limits. Even a partially uninsured claim, if successful and of sufficient magnitude, could have a material adverse effect on our business, financial condition, results of operations and future prospects.
Environment regulations could have a significant impact on the energy industry
The subject of energy and the environment has created intense public debate around the world in recent years. Debate is likely to continue for the foreseeable future and could potentially have a significant impact on all aspects of the economy. The trend in environmental regulation has been to impose more restrictions and limitations on activities that may impact the environment. Any regulatory changes that impose additional environmental restrictions or requirements on us, or our customers, could increase our operating costs and potentially lead to lower demand for our services and have an adverse effect on us. For example, there is growing concern about the apparent connection between the burning of fossil fuels and climate change. Laws,
Precision Drilling Corporation 2018 Annual Report | 48 |
regulations or treaties concerning climate change or greenhouse gas emissions can have an adverse impact on the demand for oil and natural gas, which could have a material adverse effect on us.
Governments in Canada and the U.S. are also considering more stringent regulation or restriction of hydraulic fracturing, a technology used by most of our customers that involves the injection of water, sand and chemicals under pressure into rock formations to stimulate oil and natural gas production.
Increasing regulatory restrictions could have a negative impact on the exploration of unconventional energy resources, which are only commercially viable with the use of hydraulic fracturing. Laws relating to hydraulic fracturing are in various stages of development at levels of governments in markets where we operate and the outcome of these developments and their effect on the regulatory landscape and the contract drilling industry is uncertain. Hydraulic fracturing laws or regulations that cause a decrease in the completion of new oil and natural gas wells and an associated decrease in demand for our services could have a material adverse effect on our operations and financial results.
Poor safety performance could lead to lower demand for our services
Standards for accident prevention in the oil and natural gas industry are governed by service company safety policies and procedures, accepted industry safety practices, customer-specific safety requirements, and health and safety legislation. Safety is a key factor that customers consider when selecting an oilfield services company. A decline in our safety performance could result in lower demand for services, and this could have a material adverse effect on our revenue, cash flow and earnings.
We are subject to various health and safety laws, rules, legislation and guidelines which can impose material liability, increase our costs or lead to lower demand for our services.
Relying on third-party suppliers has risks
We source certain key rig components, raw materials, equipment and component parts from a variety of suppliers in Canada, the U.S. and internationally. We also outsource some or all construction services for drilling and service rigs, including new-build rigs, as part of our capital expenditure programs. We maintain relationships with several key suppliers and contractors and an inventory of key components, materials, equipment and parts. We also place advance orders for components that have long lead times. We may, however, experience cost increases, delays in delivery due to strong activity or financial hardship of suppliers or contractors, or other unforeseen circumstances relating to third parties. If our current or alternate suppliers are unable to deliver the necessary components, materials, equipment, parts and services we require for our businesses, including the construction of new-build drilling rigs, it can delay service to our customers and have a material adverse effect on our revenue, cash flow and earnings.
Acquisitions entail numerous risks and may disrupt our business or distract management
We consider and evaluate acquisitions of, or significant investments in, complementary businesses and assets as part of our business strategy. Acquisitions involve numerous risks, including unanticipated costs and liabilities, difficulty in integrating the operations and assets of the acquired business, the ability to properly access and maintain an effective internal control environment over an acquired company to comply with public reporting requirements, potential loss of key employees and customers of the acquired companies, and an increase in our expenses and working capital requirements. Any acquisition could have a material adverse effect on our operating results, financial condition or the price of our securities.
We may incur substantial debt to finance future acquisitions and also may issue equity securities or convertible securities for acquisitions. Debt service requirements could be a burden on our results of operations and financial condition. We would also be required to meet certain conditions to borrow money to fund future acquisitions. Acquisitions could also divert the attention of management and other employees from our day-to-day operations and the development of new business opportunities. Even if we are successful in integrating future acquisitions into our operations, we may not derive the benefits such as operational or administrative synergies we expect from acquisitions, which may result in us committing capital resources and not receiving the expected returns. In addition, we may not be able to continue to identify attractive acquisition opportunities or successfully acquire identified targets.
New technology could reduce demand for certain rigs or put us at a competitive disadvantage
Complex drilling programs for the exploration and development of conventional and unconventional oil and natural gas reserves demand high performance drilling rigs. The ability of drilling rig service providers to meet this demand depends on continuous improvement of existing rig technology, such as drive systems, control systems, automation, mud systems and top drives, to improve drilling efficiency. Our ability to deliver equipment and services that meet customer demand is essential to our continued success. We cannot guarantee that our rig technology will continue to meet the needs of our customers, especially as rigs age
| |
49 | Management’s Discussion and Analysis |
and technology advances, or that our competitors will not develop technological improvements that are more advantageous, timely, or cost effective.
Our operations face risks of interruption and casualty losses
Our operations face many hazards inherent in the drilling and well servicing industries, including blowouts, cratering, explosions, fires, loss of well control, loss of hole, reservoir damage, loss of directional control, damaged or lost equipment, and damage or loss from inclement weather or natural disasters. Any of these hazards could result in personal injury or death, damage to or destruction of equipment and facilities, suspension of operations, environmental damage, damage to the property of others, and damage to producing or potentially productive oil and natural gas formations that we drill through.
Generally, drilling and service rig contracts separate the responsibilities of a drilling or service rig company and the customer, and we try to obtain indemnification from our customers by contract for some of these risks even though we also have insurance coverage to protect us. We cannot assure, however, that any insurance or indemnification agreements will adequately protect us against liability from all the consequences described above. If there is an event that is not fully insured or indemnified against, or a customer or insurer does not meet its indemnification or insurance obligations, it could result in substantial losses. In addition, we may not be able to get insurance to cover any or all these risks, or the coverage may not be adequate. Insurance premiums or other costs may rise significantly in the future, making the insurance prohibitively expensive or uneconomic. Significant events, including terrorist attacks in the U.S., severe hurricane damage and well blowout damage in the U.S. Gulf Coast region, have resulted in significantly higher insurance costs, deductibles and coverage restrictions. When we renew our insurance, we may decide to self-insure at higher levels and assume increased risk in order to reduce costs associated with higher insurance premiums.
Business in our industry is seasonal and highly variable
Seasonal weather patterns in Canada and the northern U.S. affect activity in the oilfield services industry. During the spring months, wet weather and the spring thaw make the ground unstable, so municipalities and counties and provincial and state transportation departments enforce road bans that restrict the movement of rigs and other heavy equipment. This reduces activity and highlights the importance of the location of our equipment prior to the imposition of the road bans. The timing and length of road bans depend on weather conditions leading to the spring thaw and during the thawing period.
Additionally, certain oil and natural gas producing areas are located in parts of western Canada that are only accessible during the winter months because the ground surrounding or containing the drilling sites in these areas consists of terrain known as muskeg. Rigs and other necessary equipment cannot cross this terrain to reach the drilling site until the muskeg freezes. Moreover, once the rigs and other equipment have been moved to a drilling site, they may become stranded or be unable to move to another site if the muskeg thaws unexpectedly. Our business activity depends, at least in part, on the severity and duration of the winter season.
Global climate change could impact the timing and length of the spring thaw and the period in which the muskeg freezes and thaws and it could impact the severity of winter, which could adversely affect our business and operating results. Furthermore, extreme climate conditions that could result in natural disasters such as flooding or forest fires, may result in delays or cancellation of some of our customer’s operations, which could adversely affect our operating results. We cannot; however, estimate the degree to which climate change and extreme climate conditions could impact our business and operating results.
Our operations are subject to foreign exchange risk
Our U.S. and international operations have revenue, expenses, assets and liabilities denominated in currencies other than the Canadian dollar and are mostly in U.S. dollars and currencies that are pegged to the U.S. dollar. This means that currency exchange rates can affect our income statement, balance sheet and statement of cash flow.
Translation into Canadian Dollars
When preparing our consolidated financial statements, we translate the financial statements for foreign operations that do not have a Canadian dollar functional currency into Canadian dollars. We translate assets and liabilities at exchange rates in effect at the period end date. We translate revenues and expenses using average exchange rates for the month of the transaction. We initially recognize gains or losses from these translation adjustments in other comprehensive income and reclassify them from equity to net earnings on disposal or partial disposal of the foreign operation. Changes in currency exchange rates could materially increase or decrease our foreign currency-denominated net assets, which would increase or decrease shareholders’ equity. Changes in currency exchange rates will affect the amount of revenues and expenses we record for our U.S. and
Precision Drilling Corporation 2018 Annual Report | 50 |
international operations, which will increase or decrease our net earnings. If the Canadian dollar strengthens against the U.S. dollar, the net earnings we record in Canadian dollars from our U.S. and international operations will be lower.
Transaction exposure
We have long-term debt denominated in U.S. dollars. We have designated our U.S. dollar denominated unsecured senior notes as a hedge against the net asset position of our U.S. and foreign operations. This debt is converted at the exchange rate in effect at the period end dates with the resulting gains or losses included in the statement of comprehensive income. If the Canadian dollar strengthens against the U.S. dollar, we will incur a foreign exchange gain from the translation of this debt. Similarly, if the Canadian dollar weakens against the U.S. dollar, we will incur a foreign exchange loss from the translation of this debt. The vast majority of our international operations are transacted in U.S. dollars or U.S. dollar-pegged currencies. Transactions for our Canadian operations are primarily transacted in Canadian dollars. We occasionally purchase goods and supplies in U.S. dollars for our Canadian operations, and we maintain U.S. dollar cash in our Canadian operations.
We may be unable to access additional financing
We may need to obtain additional debt or equity financing in the future to support ongoing operations, undertake capital expenditures, repay existing or future debt (including the Senior Credit Facility, the 2021 Notes, the 2023 Notes, the 2024 Notes and the 2026 Notes), or pursue acquisitions or other business combination transactions. Volatility or uncertainty in the credit markets may increase costs associated with issuing debt or equity, and there is no assurance that we will be able to access additional financing when we need it, or on terms we find acceptable or favourable. If we are unable to obtain financing to support ongoing operations or to fund capital expenditures, acquisitions, debt repayments, or other business combination transactions, it could limit growth and may have a material adverse effect on our revenue, cash flow and profitability.
Increasing Interest Rates may increase our cost of borrowing
Both the Bank of Canada and the United States Federal Reserve increased their benchmark interest rates in 2018, and commentary suggests that there may be additional increases in 2019. These rate increases may have an impact on our cost of borrowing under our Senior Credit Facility and any debt financing we may negotiate. On July 27, 2017, the U.K. Financial Conduct Authority announced that it intends to stop compelling banks to submit LIBOR rates after 2021. The elimination of LIBOR or any other changes or reforms to the determination or supervision of LIBOR could have an adverse impact on the market for or value of any LIBOR-linked securities, loans, and other financial obligations or extensions of credit held by or due to us.
Risks associated with turnkey drilling operations could adversely affect our business
We earn some of our revenue from turnkey drilling contracts. We expect that turnkey drilling will continue to be part of our service offering; however, turnkey contracts pose substantially more risk than wells drilled on a daywork basis. Under a typical turnkey drilling contract, we agree to drill a well for a customer to a specified depth and under specified conditions for a fixed price. We typically provide technical expertise and engineering services, as well as most of the equipment required for the drilling of turnkey wells and use subcontractors for related services. We typically do not receive progress payments and are entitled to payment by the customer only after we have met the full terms of the drilling contract. We sometimes encounter difficulties on wells and incur unanticipated costs, and not all the costs are covered by insurance. As a result, under turnkey contracts we assume most of the risks associated with drilling operations that are generally assumed by customers under a daywork contract. Operating cost overruns or operational difficulties on turnkey jobs could have a material adverse effect on our financial position and results of operations.
There are risks associated with increased capital expenditures
The timing and amount of capital expenditures we incur will directly affect the amount of cash available to us. The cost of equipment generally escalates as a result of high input costs during periods of high demand for our drilling rigs and oilfield services equipment and other factors. There is no assurance that we will be able to recover higher capital costs through rate increases to our customers.
A successful challenge by the tax authorities of expense deductions could negatively affect the value of our common shares
Taxation authorities may not agree with the classification of expenses we or our subsidiaries have claimed, or they may challenge the amount of interest expense deducted. If the taxation authorities successfully challenge our classifications or deductions, it could have a material adverse effect on our return to shareholders.
| |
51 | Management’s Discussion and Analysis |
Losing key management could reduce our competitiveness and prospects for future success
Our future success and growth depend partly on the expertise and experience of our key management. There is no assurance that we will be able to retain key management. Losing these individuals could have a material adverse effect on our operations and financial condition.
Our assessment of goodwill or capital assets for impairment may result in a non-cash charge against our consolidated net income
We are required to assess our goodwill balance for impairment at least annually, and our capital assets balance for impairment when certain internal and external factors indicate the need for further analysis. We calculate impairment based on management’s estimates and assumptions. We may consider several factors, including any declines in our share price and market capitalization, lower future cash flow and earnings estimates, significantly reduced or depressed markets in our industry, and general economic conditions, among other things. Any impairment write-down to goodwill or capital assets would result in a non-cash charge against net earnings, and it could be material.
After recording a goodwill impairment charge for $208 million in the fourth quarter of 2018, we no longer have a goodwill balance.
Our credit ratings may change
Credit ratings affect our financing costs, liquidity and operations over the long term and are intended as an independent measure of the credit quality of long-term debt. Credit ratings affect our ability to obtain short and long-term financing and the cost of this financing, and our ability to engage in certain business activities cost-effectively.
If a rating agency reduces its current rating on our debt, or downgrades us, or we experience a negative change in our ratings outlook, it could have an adverse effect on our financing costs and access to liquidity and capital.
The price of our common shares can fluctuate
Several factors can cause volatility in our share price, including increases or decreases in revenue or earnings, changes in revenue or earnings estimates by the investment community, failure to meet analysts’ expectations, changes in credit ratings, and speculation in the media or investment community about our financial condition or results of operations. General market conditions and Canadian, U.S. or international economic factors and political events unrelated to our performance may also affect the price of our common shares. Investors should therefore not rely on past performance of our common shares to predict the future performance of our common shares or financial results.
Selling additional common shares could affect share value
We may issue additional common shares in the future to fund our needs or those of other entities owned directly or indirectly by us, as authorized by the Board. We do not need shareholder approval to issue additional common shares, except as may be required by applicable stock exchange rules, and shareholders do not have any pre-emptive rights related to share issues (see Capital Structure on page 37).
Any difficulty in retaining, replacing, or adding personnel could adversely affect our business
Our ability to provide reliable services depends on the availability of well-trained, experienced crews to operate our field equipment. We must also balance our need to maintain a skilled workforce with cost structures that fluctuate with activity levels. We retain the most experienced employees during periods of low utilization by having them fill lower level positions on field crews. Many of our businesses experience manpower shortages in peak operating periods, and we may experience more severe shortages if the industry adds more rigs, oilfield services companies expand, and new companies enter the business.
We may not be able to find enough skilled labour to meet our needs, and this could limit growth. We may also have difficulty finding enough skilled and unskilled labour in the future if demand for our services increases. Shortages of qualified personnel have occurred in the past during periods of high demand. The demand for qualified rig personnel generally increases with stronger demand for land drilling services and as new and refurbished rigs are brought into service. Increased demand typically leads to higher wages that may or may not be reflected in any increases in service rates.
Other factors can also affect our ability to find enough workers to meet our needs. Our business requires skilled workers who can perform physically demanding work. Volatility in oil and natural gas activity and the demanding nature of the work, however, may prompt workers to pursue other kinds of jobs that offer a more desirable work environment and wages competitive to ours. Our success depends on our ability to continue to employ and retain skilled technical personnel and qualified rig personnel. If we are unable to, it could have a material adverse effect on our operations.
Precision Drilling Corporation 2018 Annual Report | 52 |
Our business is subject to cybersecurity risks
We rely heavily on information technology systems and other digital systems for operating our business. Threats to information technology systems associated with cybersecurity risks and cyber incidents or attacks continue to grow and are increased by the growing complexity of our information technology systems. Cybersecurity attacks could include, but are not limited to, malicious software, attempts to gain unauthorized access to data and the unauthorized release, corruption or loss of data and personal information, account takeovers, and other electronic security breaches that could lead to disruptions in our critical systems. Other cyber incidents may occur as a result of natural disasters, telecommunication failure, utility outages, human error, design defects, and unexpected complications with technology upgrades. Risks associated with these attacks and other incidents include, among other things, loss of intellectual property, reputational harm, leaked information, improper use of our assets, disruption of our and our customers’ business operations and safety procedures, loss or damage to our data delivery systems, unauthorized disclosure of personal information which could result in administrative penalties and increased costs to prevent, respond to or mitigate cybersecurity events. Although we use various procedures and controls to mitigate our exposure to such risk, including cybersecurity risk assessments that are reviewed by our Corporate Governance, Nominating and Risk Committee, cyber security awareness programs for our employees, continuous monitoring of our information technology systems for threats, and insurance that may cover losses incurred as a result of certain cyber security attacks or incidents, cybersecurity attacks and other incidents are evolving and unpredictable. The occurrence of such an attack or incident could go unnoticed for a period of time. Any such attack or incident could have a material adverse effect on our business, financial condition and results of operations.
Our business could be negatively affected as a result of actions of activist shareholders and some institutional investors may be discouraged from investing in the industry we operate in
Activist shareholders could advocate for changes to our corporate governance, operational practices and strategic direction, which could have an adverse effect on our reputation, business and future operations. In recent years, publicly-traded companies have been increasingly subject to demands from activist shareholders advocating for changes to corporate governance practices, such as executive compensation practices, social issues, or for certain corporate actions or reorganizations. There can be no assurances that activist shareholders won’t publicly advocate for us to make certain corporate governance changes or engage in certain corporate actions. Responding to challenges from activist shareholders, such as proxy contests, media campaigns or other activities, could be costly and time consuming and could have an adverse effect on our reputation and divert the attention and resources of management and our Board, which could have an adverse effect on our business and operational results. Additionally, shareholder activism could create uncertainty about future strategic direction, resulting in loss of future business opportunities, which could adversely affect our business, future operations, profitability and our ability to attract and retain qualified personnel.
In addition to risks associated with activist shareholders, some institutional investors are placing an increased emphasis on ESG factors when allocating their capital. These investors may be seeking enhanced ESG disclosures or may implement policies that discourage investment in the hydrocarbon industry. To the extent that certain institutions implement policies that discourage investments in our industry, it could have an adverse effect on our financing costs and access to liquidity and capital.
As a foreign private issuer in the U.S., we may file less information with the SEC than a company incorporated in the U.S.
As a foreign private issuer, we are exempt from certain rules under the United States Exchange Act of 1934 (the Exchange Act) that impose disclosure requirements, as well as procedural requirements, for proxy solicitations under Section 14 of the Exchange Act. Our directors, officers and principal shareholders are also exempt from the reporting and short-swing profit recovery provisions of Section 16 of the Exchange Act. We are not required to file periodic reports and financial statements with the SEC as frequently or as promptly as U.S. companies whose securities are registered under the Exchange Act, nor are we generally required to comply with Regulation FD, which restricts the selective disclosure of material non-public information. As a result, there may be less publicly available information about us than U.S. public companies and this information may not be provided as promptly. In addition, we are permitted, under a multi-jurisdictional disclosure system adopted by the U.S. and Canada, to prepare our disclosure documents in accordance with Canadian disclosure requirements, including preparing our financial statements in accordance with International Financial Reporting Standards (IFRS), which differs in some respects from U.S. GAAP. We are required to assess our foreign private issuer status under U.S. securities laws annually at the end of the second quarter. If we were to lose our status as a foreign private issuer under U.S. securities laws, we would be required to fully comply with U.S. securities and accounting requirements.
We have retained liabilities from prior reorganizations
We have retained all liabilities of our predecessor companies, including liabilities relating to corporate and income tax matters.
| |
53 | Management’s Discussion and Analysis |
We may become a passive foreign investment company, which could result in adverse U.S. tax consequences to U.S. investors
Management does not believe that we are or will be treated as a passive foreign investment company (PFIC) for U.S. tax purposes. However, because PFIC status is determined annually and will depend on the composition of our income and assets from time to time, it is possible that we could be considered a PFIC in the future. This could result in adverse U.S. tax consequences to a U.S. investor. In particular, a U.S. investor would be subject to U.S. federal income tax at ordinary income rates, plus a possible interest charge, for any gain derived from a disposition of common shares, as well as certain distributions by us. In addition, a step-up in the tax basis of our common shares would not be available if an individual holder dies.
An investor who acquires 10% or more of our common shares may be subject to taxation under the controlled foreign corporation (CFC) rules.
Under certain circumstances, a U.S. person who directly or indirectly owns 10% or more of the voting power of a foreign corporation that is a CFC (generally, a foreign corporation where 10% of the U.S. shareholders own more than 50% of the voting power or value of the stock of the foreign corporation) for 30 straight days or more during a taxable year and who holds any shares of the foreign corporation on the last day of the corporation’s tax year must include in gross income for U.S. federal income tax purposes its pro rata share of certain income of the CFC even if the share is not distributed to the person. We are not currently a CFC, but this could change in the future.
Precision Drilling Corporation 2018 Annual Report | 54 |
| | | | | |
| Evaluation of Controls and Procedures | | Management’s Discussion and Analysis | | |
| | | | | |
Internal Control over Financial Reporting
We maintain internal control over financial reporting that is designed to provide reasonable assurance regarding the reliability of financial reporting and the preparation of financial statements for external purposes in accordance with IFRS.
Management is responsible for establishing and maintaining adequate internal control over financial reporting, as defined in Rules 13a – 15(f) and 15d – 15(f) under the United States Securities Exchange Act of 1934, as amended (the Exchange Act) and under National Instrument 52-109 Certification of Disclosure in Issuer’s Annual and Interim Filings (NI 52-109).
Management, including the Chief Executive Officer (CEO) and the Chief Financial Officer (CFO), has conducted an evaluation of our internal control over financial reporting based on criteria established in Internal Control – Integrated Framework (2013) issued by the Committee of Sponsoring Organizations of the Treadway Commission (COSO 2013).
There were no changes in our internal control over financial reporting in 2018 that have materially affected or are reasonably likely to materially affect our internal control over financial reporting. Based on management’s assessment as of December 31, 2018, management has concluded that our internal control over financial reporting is effective.
The effectiveness of internal control over financial reporting as of December 31, 2018 was audited by KPMG LLP, an independent registered public accounting firm, as stated in their Report of Independent Registered Public Accounting Firm, which is included in this annual report.
Due to its inherent limitations, internal control over financial reporting is not intended to provide absolute assurance that a misstatement of our financial statements would be prevented or detected. Further, the evaluation of the effectiveness of internal control over financial reporting was made as of a specific date, and continued effectiveness in future periods is subject to the risks that controls may become inadequate.
Disclosure Controls and Procedures
We maintain disclosure controls and procedures designed to provide reasonable assurance that information required to be disclosed in our interim and annual filings is reviewed, recognized and disclosed accurately and in the appropriate time period.
Management, including the CEO and CFO, carried out an evaluation, as of December 31, 2018, of the effectiveness of the design and operation of Precision’s disclosure controls and procedures, as defined in Rule 13a – 15(e) and 15d – 15(e) under the Exchange Act and NI 52-109. Based on that evaluation, the CEO and CFO have concluded that the design and operation of Precision’s disclosure controls and procedures were effective to ensure that information required to be disclosed in the reports we file or submit under the Exchange Act or Canadian securities legislation is recorded, processed, summarized and reported within the time periods specified in the rules and forms therein.
It should be noted that while the CEO and CFO believe that our disclosure controls and procedures provide a reasonable level of assurance that they are effective, they do not expect that these disclosure controls and procedures will prevent all errors and fraud. A control system, no matter how well conceived or operated, can provide only reasonable, not absolute, assurance that the objectives of the control system are met.
| |
55 | Management’s Discussion and Analysis |