Exhibit 99.2
MD&A Management’s Discussion and Analysis | | | | This management’s discussion and analysis (MD&A) contains information to help you understand our business and financial performance. Information is as of March 6, 2020. This MD&A focuses on our Consolidated Financial Statements and Notes and includes a discussion of known risks and uncertainties relating to our business and the oilfield services sector. You should read this MD&A with the accompanying audited Consolidated Financial Statements and Notes, which have been prepared in accordance with International Financial Reporting Standards (IFRS) and with the information in Cautionary Statement About Forward-Looking Information and Statements on page 62. The terms we, us, our, Precision Drilling, Precision, and the Corporation mean Precision Drilling Corporation and our subsidiaries and include any partnerships that we are part. All amounts are in Canadian dollars unless otherwise stated. |
| | | |
| | Precision Drilling Corporation 2019 | |
| | | |
1 | Management’s Discussion and Analysis |
Precision Drilling Corporation provides onshore drilling and completion and production services to exploration and production companies in the oil and natural gas industry.
Headquartered in Calgary, Alberta, Canada, we are a large oilfield services company with broad geographic scope in North America. We also have operations in the Middle East. Our common shares trade on the Toronto Stock Exchange, under the symbol PD, and on the New York Stock Exchange, under the symbol PDS. | | Vision Our vision is to be globally recognized as the High Performance, High Value provider of land drilling services. You can read about our strategic priorities for 2020 on page 29. |
COMPETITIVE ADVANTAGE
From our founding as a private oilfield drilling contractor in the 1950s, Precision has grown to become one of the most active drillers in North America. Our competitive advantage is underpinned by five distinguishing features:
| ▪ | a competitive operating model that drives efficiency, quality and cost discipline |
| ▪ | a culture focused on corporate responsibility, safety and field performance |
| ▪ | size and scale of operations that provide higher margins and better service capabilities |
| ▪ | high quality standardized equipment and control systems with process automation control and advanced digital backbone systems to deliver efficient, consistent and safe drilling services |
| ▪ | a high-quality drilling rig fleet, with AC rigs capable of supporting our AlphaAutomation technology to deliver consistent, repeatable, high-quality wellbores while improving safety, performance and operational efficiency, and |
| ▪ | a capital structure that provides long-term stability, flexibility and liquidity that allows us to take advantage of business cycle opportunities. |
CORPORATE GOVERNANCE
At Precision, we believe that a transparent culture of corporate governance and ethical behaviour in decision-making is fundamental to the way we do business.
We have a diverse and experienced Board of Directors (Board). Our directors have a history of achievement and an effective mix of skills, knowledge, and business experience. The directors oversee the conduct of our business, provide oversight in support of future operations and monitor regulatory developments and governance best practices in Canada, the U.S. and internationally. Our Board also reviews our governance charters, guidelines, policies and procedures to make sure they are appropriate and that we maintain high governance standards.
Our Board has established three standing committees, comprised of independent directors, to help carry out its responsibilities effectively:
| ▪ | Corporate Governance, Nominating and Risk Committee (CGNRC), and |
| ▪ | Human Resources and Compensation Committee (HRCC). |
The Board may also create special ad hoc committees from time to time to deal with important matters that arise.
You can find more information about our approach to governance in our management information circular, available on our website (www.precisiondrilling.com).
| |
Precision Drilling Corporation 2019 Annual Report | 2 |
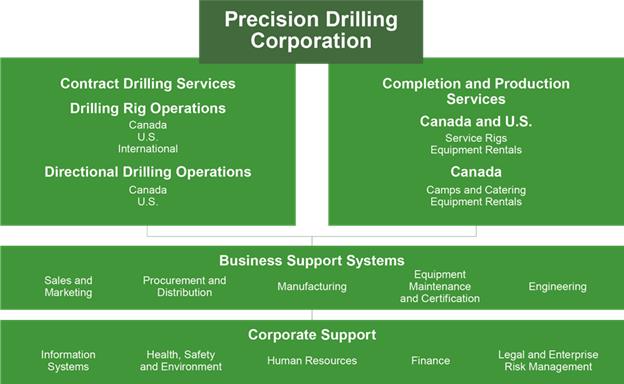
BUSINESS SEGMENTS
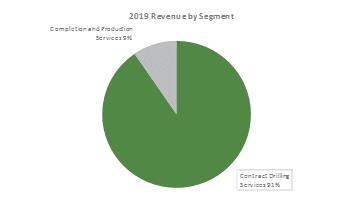
We operate our business in two segments, supported by vertically integrated business and corporate support systems.
3 | Management’s Discussion and Analysis |
Contract Drilling Services
We provide onshore drilling services to exploration and production companies in the oil and natural gas industry, operating in Canada, the U.S. and internationally.
We are a large, multi-basin oilfield operator servicing approximately 28% of the active land drilling market in Canada and 8% of the active U.S. market. We also have an international presence with operations in the Middle East.
At December 31, 2019, our Contract Drilling Services segment consisted of:
| ▪ | 226 land drilling rigs, including: |
| – | 2 in the Kurdistan region of Iraq |
| – | 1 in the country of Georgia |
| ▪ | directional drilling services in Canada and the U.S. |
| ▪ | engineering, manufacturing and repair services, primarily for Precision’s operations |
| ▪ | centralized procurement, inventory and distribution of consumable supplies for our global operations. |
At December 31, 2019, we had 226 Super Series drilling rigs. Our Super Series rigs are highly mobile and mechanized, which make them safer and more efficient in drilling directional and horizontal wells than older generation drilling rigs. Our Super Series rigs have a broad range of features to meet a diverse range of customer needs with a focus on high efficiency development drilling applications, from drilling shallow- to medium-depth wells to deeper, extended reach horizontal well bores and all depths of conventional wells. Available features include alternating current (AC) power, digital control systems, integrated top drives, omni-directional pad walking systems for multi-pad well drilling, highly mechanized pipe handling, and high capacity mud pumps.
| |
Precision Drilling Corporation 2019 Annual Report | 4 |
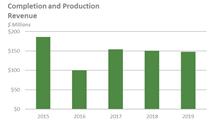
Completion and Production Services
We provide well completion, workover, abandonment, re-entry preparation services and equipment rentals to oil and natural gas exploration and production companies in Canada and the U.S. In addition, we provide camp and catering services in Canada.
On an operating hour basis in 2019, we serviced approximately 11% of the well completion and workover service rig market demand in Canada and less than 1% in the U.S.
At December 31, 2019, our Completion and Production Services segment consisted of:
| ▪ | 123 well completion and workover service rigs, including: |
| ▪ | approximately 1,700 oilfield rental items, including surface storage, small-flow water treatment, power generation, and solids control equipment, primarily in Canada |
| ▪ | 132 wellsite accommodation units in Canada |
| ▪ | 42 drill camps and four base camps in Canada. |
In 2019, 75 service rigs were not registered with the industry association and 12 snubbing units were sold.
5 | Management’s Discussion and Analysis |
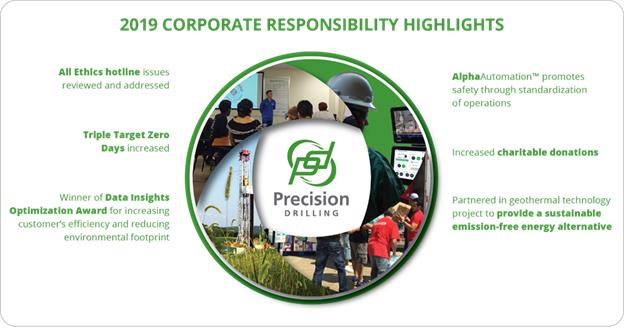
Corporate Responsibility is integral to Precision’s vision, mission, and competitive strategy because we believe that operating a sustainable and responsible company is critical to our long-term success. We believe our Corporate Responsibility approach and initiatives drive business execution and create a competitive advantage. Precision’s High Performance, High Value competitive strategy is supported by and reliant upon safety performance, environmental stewardship, employee well-being and training, and community involvement. Our employees, investors and customers reward our commitment to Corporate Responsibility and recognize that it provides us the ability to attract talent, capital and a premium for our services.
Our High Performance, High Value service offering is made possible through optimized rig designs and efficient processes, enhancing our ability to drill wells safer and faster, while producing high quality well bores and lowering costs for our customers. Our ability to produce these results safely, predictably and repeatably minimizes our environmental impact and drives revenues for our core business.
Our operating cost structure benefits from our commitment to Corporate Responsibility. The costs of creating spill prevention processes and effective engineering designs are lower than the costs of fluid spill clean-up. The costs associated with establishing world-class safety processes are lower than work related injury costs. Providing comprehensive training for our personnel allows us to retain top talent and enhance operational execution. Our investment in rig technology and advanced digital automation capabilities reduce energy consumption and GHG emissions, lowering the operating costs for both Precision and our customers. Our focused social and community involvement initiatives enhance our corporate brand, minimize the potential impact of unforeseen business interruptions and serve to enhance our retention and recruitment processes by allowing us to choose from the best of the best to join Precision. The strong alignment of Corporate Responsibility with our High Performance, High Value competitive strategy lowers our operating costs and enhances profitability, while operating in an ethical and environmentally responsible way.
Corporate Responsibility influences every aspect of our business. We have a long track record of achieving and sustaining substantial improvements in critical Corporate Responsibility categories. We are committed to continue tracking, improving and reporting on our Corporate Responsibility metrics.
In 2019, we continued to deliver on our multi-year Corporate Responsibility reporting strategy by significantly increasing communication and visibility regarding Precision’s environmental, social and governance (ESG) practices.
| |
Precision Drilling Corporation 2019 Annual Report | 6 |
Last year, we completed several strategic initiatives to advance our Corporate Responsibility communication, including completing an internal assessment based on an industry standard framework as set forth by the International Petroleum Industry Environmental Conservation Association, the American Petroleum Institute and the International Association of Oil and Gas Producers. This assessment allowed us to evaluate the key aspects of our Corporate Responsibility strategy that we believe are most significant to our internal and external stakeholders and with those stakeholders in mind, we subsequently developed and accomplished the following initiatives in 2019:
| ▪ | integrated sustainability into the mandate of the CGNRC |
| ▪ | verified and updated Chemical Inventories, Spill Prevention and Countermeasures plans, and Storm Water Pollution Prevention Plans |
| ▪ | completed an environmental assessment of our Houston Technical Support Centre |
| ▪ | developed a more strategic and purposeful approach to company communications by creating opportunities for voluntary disclosure through existing business processes, our website and annual disclosure documents, ensuring both quality of disclosure and cost neutrality |
| ▪ | updated our Crisis and Emergency Response Plans, conducted global drills, and media training to enhance emergency preparedness and enable attendees to participate in practical exercises that incorporate best practices for crisis management, techniques from global experts and expertise from within our organization |
| ▪ | integrated voluntary disclosure data into mandatory financial disclosure forms |
| ▪ | increased transparent communication with key investors; strengthening our corporate reputation for openness to dialogue on ESG issues, and |
| ▪ | completed a fulsome assessment of our Health, Safety and Environment Management System in order to ensure alignment with regulatory, industry best practice and customer requirements. |
We continue to actively solicit feedback from both external and internal stakeholders in order to enhance our Corporate Responsibility strategy. Our recent letter to shareholders contains a section specifically requesting feedback regarding sustainability. Feedback received will be integrated into our 2020 Corporate Responsibility Strategy. This year, our corporate strategy will also include an ESG component in order to align our priorities with our Corporate Responsibility plan. We have also linked executive compensation targets to key corporate sustainability goals. Historically we incorporated ESG into our short-term incentive plan (STIP) scorecard through our safety metrics of Total Recordable Incident Rate (TRIR), Percentage of Facilities Recordable Free, and Triple Target Zero (see Health, Safety and Environment on page 8). In 2020, we expanded ESG in our STIP scorecard by including a new Strategic Environmental Initiatives metric to measure management’s advancement of our multi-year Corporate Responsibility Strategy.
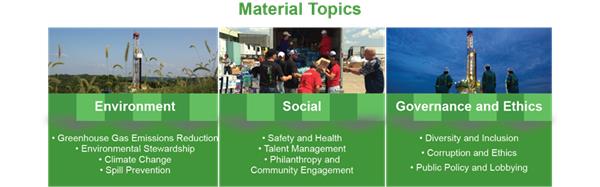
Materiality Assessment
In 2017, we completed a comprehensive materiality assessment to understand and focus our sustainability priorities as a company (Materiality Assessment). Under the guidance of a highly-experienced independent consultant, we engaged with internal stakeholders to review multiple sustainability topics through facilitated sessions in order to identify those material to Precision and to our stakeholders.
In 2019 we updated our Materiality Assessment using data-driven analytics, which involved benchmarking against our peers, reviewing mandatory regulations and voluntary standards, and examining news and social media to develop a detailed external view of current sustainability topics. We also focused on areas that we consider to be foundational to our sustainability practices, including safety, ethics, governance, stakeholder engagement, and diversity and inclusion.
Based on this review, an evaluation of our business risks, the applicability, and the potential for Precision to impact the issue, our 2019 Materiality Assessment identified the following focus areas as the most significant priorities to our business.
7 | Management’s Discussion and Analysis |
Management and the Board of Directors review our sustainability strategy annually at the Board Strategic Session. Every quarter our Safety and Corporate responsibility Council and our CGNRC also reviews and discusses updates on our sustainability efforts.
Health, Safety and Environment (HSE)
Precision strives to lead and set the standard for HSE in our industry. One of our core values addresses protecting our people, the environment, customers, and our neighbors. We deliver state-of-the-art technologies, a highly skilled and technically competent workforce, and a culture that stresses having a plan for every job we perform and that we follow that plan every time; this is the Precision way. We ensure our employees are kept updated on all new industry standards by actively participating in industry associations and delivering comprehensive training to our employees. Last year our employees participated in over 75 industry associations events and attended over 1,700 hours of continuous learning within these organizations.
Precision Management System
Our Global Quality Health, Safety and Environmental Management System (HSE Management System) is tightly integrated into our culture to ensure standardization, consistency, and repeatability throughout our field operations. Our Key Beliefs, Target Zero Rules and HSE Fundamentals are our guiding principles and serve as the foundational core of our service delivery model. Our HSE Fundamentals are Hazard and Risk Assessment, Stop Work, Step Back, Incident Investigation, Observations and Competent and Fit Workforce. We have oversight and Board of Directors’ engagement through our Safety and Corporate Responsibility Council; continuously reviewing, monitoring, and making recommendations to strengthen our standards, policies, and procedures.
Precision fosters our safety culture through visible leadership, competency and regulatory training, and proven management systems. Our commitment to provide comprehensive training and development to our people can be seen through the significant investment we have made in our Technical Support Centre training facilities located in Houston, Texas, and Nisku, Alberta. In 2019, over 5,488 employees were trained at these facilities on Precision’s culture, rig roles and responsibilities, well control, tools and equipment, HSE standards, leadership, and communication.
Environment and Climate Change Stewardship
We recognize climate change is an important global issue and actively monitor developments that have the potential to affect our business. Our ability to reduce our carbon footprint at drilling sites is tied to our customers, as they are responsible for controlling, measuring and reporting on usage of greenhouse emissions. However, we recognize that our position as a global technology leader in our industry uniquely situates us to address climate change with technologies that can assist our customers in both increasing their operational performance while simultaneously reducing environmental impact. By continuously investing in our rig technology to make our operations safer, more reliable and efficient, we help our customers reduce or eliminate emissions, reduce water usage, improve chemistry applications and increase oil and natural gas production all while using fewer resources. Our modern rig fleet and digital enablement strategy allow our customers to rely on real time data driven insights and automation in order to make faster and smarter decisions. This digital transformation limits energy use, while maximizing output and productivity throughout the entire drilling process. We have standardized our operating procedures and continually explore new innovative technologies to maximize our overall performance, which minimizes waste and our environmental footprint, including reduced greenhouse gas emissions.
Our customers aggregate and report on-site fuel usage with respect to greenhouse gas emissions and we have significantly invested in technologies allowing them to minimize environmental impact. These alternatives include:
| ▪ | enhancing drilling technologies to generate improved drilling efficiencies, allowing us to drill wells faster and move in and out of a location more rapidly |
| ▪ | scaling our AlphaAutomation offering (34 systems currently deployed in the field) to significantly improve operational efficiency and reduce overall drilling times |
| ▪ | utilizing AlphaApps (15, either active or in development) to further enhance drilling efficiencies and reduce fuel usage on site |
| ▪ | utilizing bi-fuel systems (29 in Canada, 20 in the U.S.) to reduce diesel consumption and greenhouse gas emissions |
| ▪ | utilizing natural gas engines (approximately 25% of our North American fleet) that burn lower carbon fuel |
| ▪ | designing and building our rigs to employ pad walking systems to reduce our environmental footprint by improving drilling efficiencies |
| ▪ | working with our customers to effectively utilize our products and services to help them reduce their greenhouse gas emissions in the development of their hydrocarbon resources |
| ▪ | including climate strategy in our internal research and development of products |
| ▪ | working with educational institutions and other corporations to further develop sustainable solutions in the industry |
| ▪ | working with our customers on solutions to mitigate noise pollution in and around highly populated areas, and |
| ▪ | utilizing industry best practice processes to ensure spill prevention. |
| |
Precision Drilling Corporation 2019 Annual Report | 8 |
Research and Development
In collaboration with the University of Calgary’s Schulich School of Engineering, we jointly submitted a Collaborative Research and Development Grant application under the Natural Sciences and Engineering Research Council’s (NSERC) University-Industry Program. NSERC awarded funding for the project which involves development of sensing and control systems to be utilized in closed loop automated drilling systems. To further the project, Precision entered into a Research Agreement with the University of Calgary which aims to increase efficiencies in the drilling process and reduce environmental footprint. The project commenced in 2019 and is scheduled for completion in 2021.
We also support development of alternative energy sources. We partnered with Eavor Technologies Inc. and Shell International Exploration and Production and as part of our partnership agreement, Shell and Precision provided technical expertise towards the design of drilling, completion, and construction of geothermal wells and a technological demonstration facility in Alberta. Precision provided the drilling expertise for the pilot program in which we drilled two deep wells were connected horizontally. Once implemented, the system will pump water between the two connected wells and harness heat from the planet’s core. This is a solution that, unlike wind and solar, builds upon our expertise in drilling and uses already created energy infrastructure to produce steady and dependable heat and electrical power without emissions of any kind. In this process there are no greenhouse gas emissions, limited water use, and no produced brine or solids. Geothermal technology provides an opportunity for Precision to utilize its existing rig fleet in the drilling of new geothermal wells. This proposed geothermal recovery technology could one day provide a sustainable emission-free energy alternative to the world.
Performance Indicators
Our HSE key performance indicators measure injury-free performance, safe driving behavior, and environmental impact. We have Health, Safety and Environmental goals devoted to achieving what we call “Triple Target Zero Days”, our internal scorecard that recognizes injury-free performance, safe driving behavior and “zero spills” that could impact the environment. Precision’s 2019 safety performance was at the top quartile of the land drilling industry, as measured by Total Recordable Incident Rate (TRIR), an industry standard metric for safety performance and benchmarking. The comparative data was provided by our industry associations (International Association of Drilling Contractors and Canadian Association of Drilling Contractors). | | 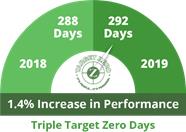
|
Our HSE Management Systems at Work
Throughout 2018 and 2019, we performed a comprehensive assessment and realignment of our HSE Management System; analyzing regulations in the countries and regions in which we work, industry best practices, and internal Precision standards. From our HSE Management System, Precision created a Safe Operations Verification work-flow process to ensure that all the core HSE elements are planned for, verified, and reviewed for every job every time – every job we do has a plan and we follow the plan every time. We realized our investigation methodology and associated processes to incorporate fundamental elements of human performance.
In 2019, Precision added an HSE Assurance Program that is integrated with our existing highly professional and skilled HSE team. This team is responsible for testing the effectiveness and implementation of our HSE Management System. This highly skilled and experienced team of professionals created a protocol that integrates the elements of International Standards Organization auditing, Canada Certificate of Recognition auditing, key elements of behavior-based safety, and the fundamentals of human performance.
Crisis and Emergency Preparedness
In 2019, we developed and implemented workplace violence prevention and response plans, disaster relocation plans, and delivered comprehensive crisis media training for our company spokespersons. To validate our effectiveness, we conduct global training and tabletop drills annually to prepare our employees and the leadership team for various emergency scenarios.
Our long-standing Disaster Recovery and Business Continuity Plans are continually tested, reviewed, and updated. In 2019, we completed several IT infrastructure tests, such as a Disaster Recovery Test, a Penetration Test on Precision’s internal and external network, a Digital Footprint Assessment, a Cloud Access Security Broker, and an Information Management & Data Privacy Test. No material issues were identified as a result of these tests.
Corporate Governance, Ethics & Compliance
Our principles for sustainability are built on a foundation of ethics and integrity. Precision is committed to ethical behavior through the oversight provided by our Board, our Code of Business Conduct (the Code), our employment policies and practices and our internal audit function. Our internal audit function reports directly to the Audit Committee of the Board.
9 | Management’s Discussion and Analysis |
Corporate Governance
Our Corporate Governance Guidelines are reviewed annually and serve as a guidepost for the Board. Topics pertaining to corporate citizenship, governance and sustainability are routinely reviewed at meetings of the Board and its committees.
The Board provides comprehensive oversight of the management and governance of Precision. During 2019, our Board had nine members. All directors stand for election at our annual meeting of shareholders. The CGNRC performs an annual evaluation of Precision’s director criteria, Board diversity profiles, skills and experience. This committee also performs assessments of the Board, committees and individual directors.
Diversity and Inclusion
We believe in building a team of exceptional employees who bring a wide range of ideas, perspectives, skills and cultures to our company. Precision has made a commitment to be a workplace free from discrimination, harassment, workplace violence and retaliation. Our diversity and inclusion policy prohibits discrimination of any kind and promotes diversity and inclusivity among our employees, management team and board members.
We adopted a diversity and inclusion policy in 2015 that considers gender, race and other factors with the objective of promoting diversity and inclusion among our employees, management team and the Board to foster an environment where we can draw on the widest range of knowledge, skills, perspectives and experience. As a company with operations in several countries, we place high importance on ensuring that we have a diverse Board and management team.
We aim to create a workplace free from discrimination by posting gender-neutral job listings for positions throughout the organization. We encourage all employees or individuals, who meet the criteria (irrespective of gender) to apply for all positions.
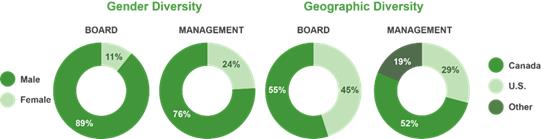
Board Diversity
When recruiting new directors, the CGNRC considers candidates on merit. It considers our vision and business strategy, the skills and competencies of the current directors, any gaps in Board skills, and the attributes, knowledge and experience new directors should have to best enhance our business plan and strategies. The CGNRC also considers diversity as part of this process, including the level of female representation on the Board. When assessing Board composition or identifying suitable candidates for appointment to the Board, the CGNRC will include a slate of minority candidates for all open Board seats.
We have not adopted targets for female directors because we believe merit of the candidate and needs of the organization must remain paramount. We believe our process of reviewing candidates on a variety of factors is more appropriate because it includes gender as well as ethnicity, geographic location and other experience. However, last year we amended our diversity policy to ensure qualified female candidates are included for all open Board positions.
In the last five years, two of five of our new directors have been women. We are firmly committed to gender diversity and are mindful of the need to pursue qualified female candidates. The CGNRC ensures the list of potential director candidates includes qualified women, but the Board’s decision to appoint or nominate a director is based on qualifications of candidates and the particular needs of the Board at that time. The Board believes it must also have the flexibility to add qualified board members when they become available, and this may mean appointing female or male directors, as appropriate.
Management Diversity
Increasing diversity at the management level is essential to maintaining our competitive advantage and is a factor in managing our talent pool and making strategic hires.
The executive leadership team reviews the talent pool regularly and considers the individual’s development, industry experience, background, race, gender and other factors before recommending executive appointments to the Board for approval. The Board also considers the representation of women and geographic diversity, amongst other factors, in executive positions when reviewing the management succession plan and approving executive appointments. We do not have specific gender targets as we believe merit of the candidate and needs of the organization must be paramount.
| |
Precision Drilling Corporation 2019 Annual Report | 10 |
Reporting and Accountability
The human resources department reviews the structure, size, pay equity and composition of our workforce annually and prepares a report for the Chief Administrative Officer and the CEO. Similarly, the executive leadership team meets regularly to assess its optimum composition, and annually provides a report to the CGNRC.
The CGNRC also monitors Board diversity and prepares an annual report for the Board that includes information about factors to consider when recruiting new directors.
Clawbacks
Our senior leadership team is held accountable for their decisions. As such, we have designed our compensation program so any consequences stemming from our policies, employment agreements and incentive plans align with Precision’s best interests.
Our Clawback Policy entitles us to recoup some or all incentive compensation awarded or paid to our senior leadership team, including our CEO, both past and present, if:
| ▪ | there was a restatement of our financial statements for a fiscal year or fiscal quarter when they were with Precision; |
| ▪ | there was an error in calculating executive compensation during their time with Precision; or |
| ▪ | the member of the senior leadership team engaged in misconduct, including fraud, non-compliance with applicable laws and any act or omission that would entitle an employee to be terminated for cause. |
The Policy applies to all forms of incentive awards including bonuses, restricted share units, performance share units and stock options.
Business Ethics
We believe ethical behavior is fundamental to the way we do business. Our Code of Business Conduct and Ethics ensures every director, executive officer, manager, employee, and contractor represents Precision’s values. The full text of the Code is available at www.precisiondrilling.com.
We have a robust, proven corporate governance system that is effective in ensuring a transparent culture. It allows for ethical issues to be reported, assessed and resolved in a timely manner. This system employs a strong body of policies, enforcement mechanisms and a closed-loop resolution process of issues that are reported.
The Code addresses the following key areas, among others:
▪ financial reporting and accountability ▪ maintaining confidentiality ▪ avoiding conflicts of interest ▪ complying with laws ▪ safeguarding corporate assets ▪ reporting illegal or unethical behavior | | ▪ fair dealing ▪ disclosure ▪ anti-retaliation ▪ data and privacy security ▪ bribery and corruption ▪ harassment and discrimination |
|
Every director, executive officer, manager, and employee must annually acknowledge that they have read, understood and will abide by the Code. Each member of the senior management team must also certify quarterly whether they are aware of any breaches of the Code. In-person and online training is provided annually to all permanent employees and covers an array of topics related to business conduct and ethics.
A hotline is available for anyone within or outside of Precision to confidentially and anonymously report any suspected illegal or unethical conduct or breach of our policies. With the oversight of the Audit and HRCC Committees, there were no ethics incidents in 2019 that required disclosure and 100% of the issues reported through the hotline were reviewed and resolved. An independent third party operates the hotline and notifies the Audit Committee Chair immediately upon receiving a complaint. Reports are reviewed by our legal, internal audit and human resources groups, investigated by the appropriate department based on the allegation, and reported quarterly to the Audit Committee, or the HRCC, depending on the nature of the allegation.
Precision respects Human Rights as a fundamental value. Our objective is to promote Human Rights throughout our organization, our customers, operations, and entities with which we do business. Our Compliance Department is responsible for the execution and maintenance of our Human Rights policy detailed in the Code. Our policies aim to help identify and prevent any threats to Human Rights. If a breach is identified, we work diligently to ensure a fair and impartial remediation.
Anti-Bribery and Anti-Corruption
We recognize that we operate in some countries with a low ranking on the Corruption Perception Index, as compiled by Transparency International. Precision has an Anti-Bribery and Anti-Corruption Policy that sets out the Corporation’s standards for detecting and preventing corruption. Our Compliance Department provides mandatory, comprehensive training annually on issues dealing with bribery and corruption for key groups of employees. Additionally, in-person training is delivered throughout
11 | Management’s Discussion and Analysis |
the organization and scheduled as needed. There have been no internal or external investigations regarding non-compliance with anti-bribery and corruption laws or our policies and there are currently none underway. Our Compliance Department continually monitors intermediaries through internal reviews and assistance from a third-party vendor. Our due diligence procedures generate a risk score for intermediaries. Based on the results, due diligence recommendations are completed and monitored through an intermediary database.
International Trade – Sanctions
Our international trade policies are designed to ensure compliance with applicable laws and regulations governing the export and import of Precision’s products, services, software, and technology to areas where we conduct or plan to conduct business. In 2019, we conducted a comprehensive assessment of our international trade policies and refreshed our international trade manual.
Precision complies with all export control, sanctions, and hiring, of the countries where we operate, including Canada and the U.S. Precision also complies with the anti-boycott laws of the U.S.
While Precision’s products, services, software, and technology are generally not military in nature, some purely commercial or civilian items are regulated because they have a “dual-use,” meaning they could be used for a military, weapons proliferation, or other nefarious use even though we and our business partners do not use them for such purposes. Therefore, Precision ensures that no such items are exported without the required authorization.
It is our general policy that no U.S. incorporated or U.S. based affiliate of Precision, no non-U.S. entity subject to U.S. jurisdiction (including foreign entities owned or controlled by a U.S. party), no U.S. citizen or resident employee wherever located, or no non-U.S. employee or resident while acting in the United States, may participate in, approve, facilitate, assist, advise on, or support any transaction involving countries sanctioned by the U.S. government (e.g., Cuba, Iran, Syria); companies organized in, or owned or controlled by the governments of those countries; or sanctioned parties.
Insider Trading
Our Insider Trading Policy applies to all directors, executive officers, managers, and employees. Reviewed annually by the CGNRC, the Policy:
| ▪ | sets out our obligations to stock exchanges, regulators and investors |
| ▪ | prohibits “tipping” or the purchase or sale of Precision shares while in possession of undisclosed material information |
| ▪ | establishes a regular black-out calendar |
| ▪ | prohibits short-term trades, purchases on margin, short sales, trading in derivatives, or hedging the value of Precision shares through specific financial instruments |
| ▪ | requires insiders to pre-clear trades of Precision shares, and |
| ▪ | prohibits insiders from participating in equity monetization transactions involving any unvested equity awards under our long-term incentive plans or Precision shares that constitute part or all our terms for meeting our minimum share ownership guidelines. |
Privacy
Precision has a Privacy Policy and our organization respects and is committed to protecting the privacy and security of all personal information collected by Precision. We recognize the importance of having effective privacy protections in place and are committed to complying with applicable privacy laws and regulations in our various jurisdictions, supplemented by our internal policies and standards.
Our Chief Privacy Officer (CPO) is responsible for ensuring our internal policies are implemented and maintained. The CPO ensures the appropriate personnel understand our Privacy Policy and provides all necessary guidance to assist with implementing and monitoring of the Privacy Policy.
Our Privacy Policy details what personal information is, how we collect, share, use and protect this information, and how employees can exercise their privacy rights. We process personal information for the purposes set out in our Privacy Policy and if we need to process personal information for other purposes, we provide notice to the employee and, if required by law, seek their consent. In 2019 we updated our Privacy Policy to ensure compliance with various regulations and provided privacy training to all corporate employees.
We have implemented appropriate physical, technical and organizational security measures to secure personal information against accidental loss and unauthorized access, use, alteration or disclosure. In addition, we limit access to personal information to those employees, agents, contractors and other third parties that have a legitimate business need for such access. Each department is responsible for the security of information in its custody and implement measures to keep such information safe.
Avoiding Conflicts of Interest
The Board is committed to making decisions in the best interests of Precision and considers the interests of our shareholders, securityholders, customers, employees, suppliers, communities where we operate, the environment, governments, regulators and the general public.
| |
Precision Drilling Corporation 2019 Annual Report | 12 |
From time to time, directors will face potential conflicts of interest related to our business. Some directors may hold management or director positions with customers or with other oilfield services providers that may be in direct competition with us. Some may also be involved with entities that periodically provide financing or make equity investments in companies that compete with us. Any conflicts are subject to the procedures and remedies set out under the Business Corporations Act (Alberta). If directors find themselves in a conflict of interest, they advise the Chairman of the Board, abstain from participating in any discussions and voting on the matter or excuse themselves from the meeting.
Our employees are also required to disclose any potential conflicts of interest. The conflicts disclosed are reviewed by our Audit and Compliance departments and resolved in accordance with the Code.
Public Policy & Lobbying
Precision is politically neutral and does not engage in political activities or make political contributions. We may not use company funds or assets for political purposes. However, we are active members of various associations that conduct lobbying on behalf of the oil and natural gas industry, and we allow lobbying on behalf of Precision’s interests, in accordance with all federal and provincial regulations. The CEO must approve all such requests for financial support for these associations.
Our employees are required to inform the Chief Compliance Officer of any company communication with government officials, including elected officials and bureaucratic staff. However, this does not include dealings with regulators on ordinary matters (the Alberta Energy Regulator, Occupational Health & Safety officials and other regulators in Canada, the U.S. or internationally that interact with Precision in the ordinary course of business), unless their actions raise questions under our policies.
Talent Management
We strive to have high-performing, passionate people throughout every level of our company. We have implemented systems and processes that help us execute our talent management strategy to maintain a well-trained, highly competent and capable talent pool, both in the field and corporate positions with a broad range of business experience throughout market cycles.
In 2019, we further enhanced the Precision Drilling University Resource Centre (PD University), a central online hub where employees can access competencies, training resources, and development programs. PD University is divided into two segments: the School of Toughnecks and the School of Leadership. The School of Toughnecks focuses on the development and dissemination of training to develop the best crews in the industry, ensuring that our field employees have the skills, knowledge and abilities they need to deliver our High Performance commitment. The School of Leadership is focused on developing new and experienced leaders. The curriculum is designed and delivered by our executives with support from our organizational development and learning professionals. | | 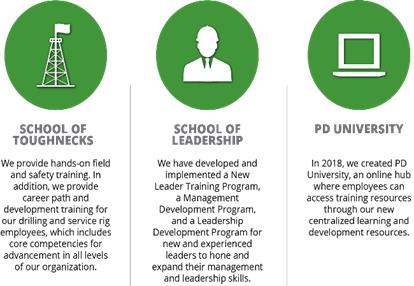
|
Our proactive talent management strategy helps us maintain a strong, agile workforce when the industry experiences manpower shortages during peak operating periods. In 2019, we onboarded over 1,191 new employees. Between Precision’s technical centres and traveling field coaches, we have trained 5,488 employees and performed approximately 3,560 rig-based competency assessments.
Our talent management strategy enables Precision to:
| ▪ | retain experienced field personnel during market cycles |
| ▪ | support targeted recruitment initiatives, and |
| ▪ | reward the achievement of our short-term and long-term strategic objectives. |
13 | Management’s Discussion and Analysis |
As part of our employee engagement strategies, we offer company-supported social activities to promote collaboration, work-life balance and interaction with the families of our employees. We also hold annal wellness campaigns to support the health and well-being of our employees and hold ticket draws to concerts, sporting events, and other entertainment to provide employees with social opportunity incentives.
High School and University Internship Programs
| | |
Precision continues to initiate high school industry exposure efforts to broaden students’ technical education and familiarity through Career Days, STEM Day projects and manages a comprehensive summer internship program. In 2019, we hosted 59 interns from 30 universities working in Canada and the U.S with nationalities represented from North and South America, Western and Southern Africa, Southeast Asia, and Northern Europe. We believe our summer internship program provides an important talent pool for our permanent hires and provides participants with practical experience that cannot be obtained in the classroom and is an excellent entry into the oil and natural gas industry. | | 
|
Philanthropy & Community Engagement
We are proud to invest in causes that are important to our employees, customers and the communities where we operate. Throughout 2019, our corporate giving program contributed to several exceptional health and human services organizations and youth programs. | | 
|
For nearly 30 years, one of our proudest partnerships in Canada has been with the Shock Trauma Air Rescue Services (STARS) Foundation which provides rapid and specialized emergency care and transportation for critically ill and injured patients. STARS operate 24/7 bases in Calgary, Edmonton, Grande Prairie, Regina, Saskatoon and Winnipeg which are well aligned to provide critical support to remote field operations and employees both on and off the job residing across Western Canada.
In 2019 we continued our multi-year partnership with the Heritage Park Society of Calgary to support the Natural Resources Project, “Keeping Alberta’s Story Alive”. The Heritage Park Society restores, builds and creates programs in the Natural Resources Area for the education of nearly 700,000 attendees and students at Heritage Park. Additionally, we have continued our longstanding partnership with the Heart and Stroke Foundation of Canada supporting the Jump-Rope-For-Heart program which impacts over one million children annually in 4,000 schools across Canada. This program focuses on promoting health, saving lives and enhancing recovery and provides funding to support medical breakthroughs that tangibly improve Canadians’ heart and brain health.
In 2019, we partnered with the University of Calgary in sponsoring their 2019 Drillbotics team at the SPE Drilling Systems Automation Technical Section’s International Student Competition. Students receive hands-on manufacturing and programming experience through this competition to design a drilling rig and related equipment to autonomously drill a vertical well as quickly as possible while maintaining borehole quality and integrity of the drilling rig and drill string. We also sponsored the 2019 University of Calgary Chancellor’s Ride which provides scholarships to students drawn from the best and brightest across the country advancing excellence in research at the undergraduate level. | | 
|
| |
Precision Drilling Corporation 2019 Annual Report | 14 |
A few of our other financial commitments in 2019 included: | | |
▪ Girls, Inc. of Greater Houston to advocate on behalf of girls and deliver life-changing programs and experiences ▪ Children’s Fund Inc. to support children focused charities in Texas with small budgets, minimal fund-raising ability, small administrative departments, lack of government or other charity support, and lack of exposure to the business community to help them grow and succeed ▪ Good Samaritan Community Services to support the Good Sam Sonora Summer Camp, a summer youth enrichment program located in South Texas ▪ Spindletop Charities of Houston to provide aid programs targeting child abuse prevention, pediatric medical research, drug and alcohol abuse prevention and rehabilitation, education and scholarships, school safety, therapeutic services and after-school programs, and family health ▪ Texas Children’s Hospital to provide world-class care to every child who comes to them for help no matter the financial circumstances ▪ Kids Cancer Care Foundation of Alberta to provide programs to meet the needs of the whole family at each stage of the cancer journey, from diagnosis through treatment and beyond ▪ Unlocking Potential Foundation of Calgary to provide unparalleled education and community outreach programs to equip individuals with the knowledge and skills to deal with issues and live life to its’ fullestFraser Institute to improve the quality of life for Canadians, their families, and future generations by studying, measuring, and broadly communicating the effects of government policies, entrepreneurship, and choice on their well-being ▪ Calgary Urban Project Society to support their program of over 8,000 vulnerable Calgarians to improve their quality of life through housing, development and emotional support programs ▪ Canada: Powered by Women a national initiative to empower and mobilize women voters across Canada, and ▪ KidSport to support children to remove the financial barriers that prevent them from playing organized sport in 166 communities across Canada. | | 
|
|
|
|
|
|
|
15 | Management’s Discussion and Analysis |
Volunteering in the Community
We understand the value of volunteering our time and have a desire to do more in the communities where we work. We continue to find new ways to obtain and attract new talent and establish a more purpose-driven and engaged workforce. We encourage our employees to participate in company-sponsored volunteer opportunities. In 2019, approximately 593 employees volunteered over 1,700 hours of time towards numerous organizations aligned with our giving philosophy.
A few of our high impact initiatives in 2019 included: | |
▪ donation drives for the Houston Food Bank and the Calgary Foodbank to provide nutritious food to school-aged children at-risk of hunger and to families and individuals facing crisis ▪ completed the annual spring clean-up at Camp Kindle for the Kids Cancer Foundation of Alberta to create camp experiences for children with cancer ▪ participated in the MS150, an annual bike ride from Houston to Austin raising funds for the National Multiple Sclerosis Society ▪ held blood drives for Calgary Blood Services to ensure life-saving blood products are delivered to hundreds of people across the country each day ▪ prepared meals and donated funds to Inn from the Cold in Calgary for shelter residents ▪ held an annual hockey tournament for employees and customers in Calgary with proceeds donated to the Highbanks Society to provide affordable housing and a nurturing community where young families can learn and grow ▪ held clothing drives to obtain lightly used professional wear to support people in need who are re-entering the work force after homelessness and addiction struggles through the Calgary Dreams Centre ▪ donated over 200 children’s toys, toiletries, and educational items as well as help fund the bussing to deliver gifts to underprivileged children through the Magic of Christmas so they can enjoy the holiday season ▪ donated over 600 items to the Ronald McDonald House of Houston including pantry items, toiletries and gift cards ▪ prepared soup with the Soup Sisters program in Calgary for delivery to the Awo Taan Healing Lodge which provides services and programs to women and children from all cultures, who have suffered from family violence and all forms of abuse, in a uniquely Aboriginal atmosphere ▪ donated school supplies and assembled backpacks for children through the Calgary Board of Education and the Houston YMCA, and ▪ Houston office staff assembled and delivered bikes and skateboards for underprivileged children. | 
|
Scholarship Program
Precision recognizes the value of post-secondary education and supports the children of our employees in their efforts to further their education. Precision has a long-standing scholarship program to assist children of employees who plan to continue their educational journey in college or vocational school programs. Precision partners with Scholarship America to administer the application process and all scholarships are granted without regard to race, color, creed, religion, sexual orientation, age, gender, disability, or national origin. In 2019, scholarships were provided to the children of 30 of our employees. Precision also recognizes the legacy of numerous long-serving employees who have retired from the company by funding annual scholarships with several education institutions across North America in the name of the retiree.
We have also been a long-standing contributor to the Houston Livestock Show and Rodeo scholarship program. As one of the largest scholarship providers in the U.S., the Rodeo has presented more than 19,000 scholarships valued at $230 million since 1957.
Corporate Culture
We believe our greatest asset is our people and we are committed to providing a work environment where employees feel respected, satisfied and appreciated. We understand the importance of building a culture that will not only make our company stand out from others but will also give us a competitive advantage. Our Board champions and holds management accountable for our highly collaborative culture through active oversight and input on initiatives driven by management. In 2019, through a series of training sessions, operational meetings and townhalls, we asked our employees in the field and our offices to provide insights about our culture. Over 1,000 employees participated in this process, which resulted in the identification of key focus areas to continue to foster and grow Precision’s positive culture in 2020.
Feedback
We believe in building a feedback rich culture and encourage ongoing engagement with our employees, shareholders and other stakeholders. Please contact us at investorrelations@precisiondrilling.com with your feedback.
| |
Precision Drilling Corporation 2019 Annual Report | 16 |
| | | | | |
| 2019 HIGHLIGHTS AND OUTLOOK | | | | |
| | | | | |
Adjusted EBITDA, operating earnings (loss), funds provided by (used in) operations and working capital are Non-GAAP measures. See page 64 for more information.
Financial Highlights
Year ended December 31 (in thousands of dollars, except where noted) | | 2019 | | | % increase/ (decrease) | | | 2018 | | | % increase/ (decrease) | | | 2017 | | | % increase/ (decrease) | | |
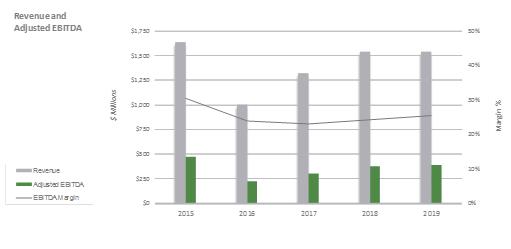
Revenue | | | 1,541,320 | | | | 0.0 | | | | 1,541,189 | | | | 16.6 | | | | 1,321,224 | | | | 31.7 | | |
Adjusted EBITDA | | | 391,905 | | | | 4.5 | | | | 375,131 | | | | 23.0 | | | | 304,981 | | | | 33.7 | | |
Adjusted EBITDA % of revenue | | | 25.4 | % | | | | | | | 24.3 | % | | | | | | | 23.1 | % | | | | | |
Net earnings (loss) | | | 6,618 | | | | (102.2 | ) | | | (294,270 | ) | | | 122.9 | | | | (132,036 | ) | | | (15.1 | ) | |
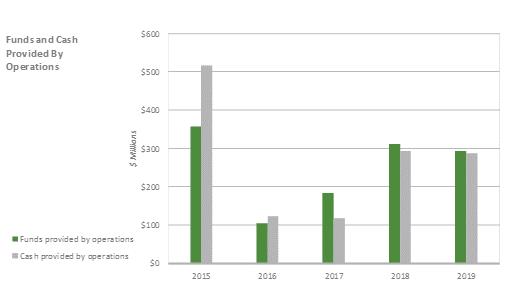
Cash provided by operations | | | 288,159 | | | | (1.8 | ) | | | 293,334 | | | | 151.7 | | | | 116,555 | | | | (4.9 | ) | |
Funds provided by operations | | | 292,652 | | | | (6.0 | ) | | | 311,214 | | | | 69.2 | | | | 183,935 | | | | 74.6 | | |
Investing activities | | | | | | | | | | | | | | | | | | | | | | | | | |
Capital spending | | | | | | | | | | | | | | | | | | | | | | | | | |
Expansion | | | 108,064 | | | | 204.9 | | | | 35,444 | | | | 196.7 | | | | 11,946 | | | | (92.0 | ) | |
Upgrade | | | 12,846 | | | | (58.2 | ) | | | 30,757 | | | | (17.1 | ) | | | 37,086 | | | | 86.7 | | |
Maintenance and infrastructure | | | 38,976 | | | | (19.4 | ) | | | 48,375 | | | | 87.6 | | | | 25,791 | | | | (25.7 | ) | |
Intangibles | | | 808 | | | | (93.0 | ) | | | 11,567 | | | | (50.1 | ) | | | 23,179 | | | n/m | | |
Proceeds on sale | | | (90,768 | ) | | | 271.1 | | | | (24,457 | ) | | | 64.8 | | | | (14,841 | ) | | | 89.3 | | |
Net capital spending | | | 69,926 | | | | (31.2 | ) | | | 101,686 | | | | 22.3 | | | | 83,161 | | | | (57.5 | ) | |
Earnings (loss) per share ($) | | | | | | | | | | | | | | | | | | | | | | | | | |
Basic | | | 0.02 | | | | (102.3 | ) | | | (1.00 | ) | | | 122.2 | | | | (0.45 | ) | | | (15.1 | ) | |
Diluted | | | 0.02 | | | | (102.3 | ) | | | (1.00 | ) | | | 122.2 | | | | (0.45 | ) | | | (15.1 | ) | |
n/m – calculation not meaningful.
Operating Highlights
Year ended December 31 | | 2019 | | | % increase/ (decrease) | | | 2018 | | | % increase/ (decrease) | | | 2017 | | | % increase/ (decrease) | |
Contract drilling rig fleet | | | 226 | | | | (4.2 | ) | | | 236 | | | | (7.8 | ) | | | 256 | | | | 0.4 | |
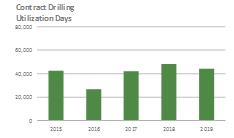
Drilling rig utilization days | | | | | | | | | | | | | | | | | | | | | | | | |
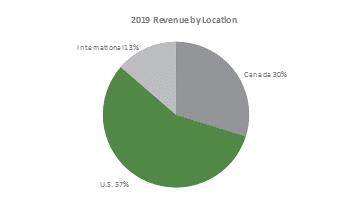
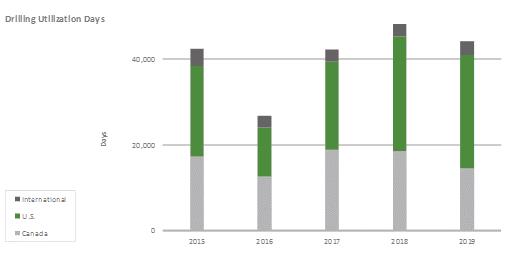
U.S. | | | 26,544 | | | | (0.6 | ) | | | 26,714 | | | | 30.4 | | | | 20,479 | | | | 80.5 | |
Canada | | | 14,498 | | | | (22.1 | ) | | | 18,617 | | | | (1.4 | ) | | | 18,883 | | | | 48.4 | |
International | | | 3,093 | | | | 5.9 | | | | 2,920 | | | | — | | | | 2,920 | | | | 4.8 | |
Revenue per utilization day | | | | | | | | | | | | | | | | | | | | | | | | |
U.S. (US$) | | | 23,397 | | | | 7.0 | | | | 21,864 | | | | 10.1 | | | | 19,861 | | | | (24.0 | ) |
Canada (Cdn$) | | | 21,569 | | | | (0.3 | ) | | | 21,644 | | | | 2.4 | | | | 21,143 | | | | (13.7 | ) |
International (US$) | | | 51,360 | | | | 1.8 | | | | 50,469 | | | | 0.5 | | | | 50,240 | | | | 9.8 | |
Operating cost per utilization day | | | | | | | | | | | | | | | | | | | | | | | | |
U.S. (US$) | | | 14,447 | | | | 0.8 | | | | 14,337 | | | | 3.5 | | | | 13,846 | | | | (10.9 | ) |
Canada (Cdn$) | | | 15,240 | | | | 5.2 | | | | 14,493 | | | | 10.3 | | | | 13,140 | | | | (7.8 | ) |
| | | | | | | | | | | | | | | | | | | | | | | | |
Service rig fleet | | | 123 | | | | (41.4 | ) | | | 210 | | | | — | | | | 210 | | | | 1.4 | |
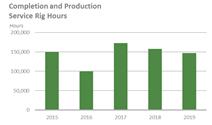
Service rig operating hours | | | 147,154 | | | | (6.5 | ) | | | 157,467 | | | | (8.9 | ) | | | 172,848 | | | | 73.8 | |
Revenue per operating hour (Cdn$) | | | 739 | | | | 4.2 | | | | 709 | | | | 11.3 | | | | 637 | | | | (1.4 | ) |
17 | Management’s Discussion and Analysis |
Financial Position and Ratios
(in thousands of dollars, except ratios) | | December 31, 2019 | | | December 31, 2018 | | | December 31, 2017 | |
Working capital(1) | | | 201,696 | | | | 240,539 | | | | 232,121 | |
Working capital ratio | | | 1.9 | | | | 1.9 | | | | 2.1 | |
Long-term debt | | | 1,427,181 | | | | 1,706,253 | | | | 1,730,437 | |
Total long-term financial liabilities | | | 1,500,950 | | | | 1,723,350 | | | | 1,754,059 | |
Total assets | | | 3,269,840 | | | | 3,636,043 | | | | 3,892,931 | |
Enterprise value(2) | | | 1,854,393 | | | | 2,305,890 | | | | 2,782,596 | |
Long-term debt to long-term debt plus equity(3) | | | 0.5 | | | | 0.5 | | | | 0.5 | |
Long-term debt to cash provided by operations | | | 5.0 | | | | 5.8 | | | | 14.8 | |
Long-term debt to enterprise value | | | 0.8 | | | | 0.7 | | | | 0.6 | |
(1) | See NON-GAAP MEASURES on page 64 of this report. |
(2) | Share price multiplied by the number of shares outstanding plus long-term debt minus cash. See page 45 for more information. |
(3) | Net of unamortized debt issue costs. |
2019 OVERVIEW
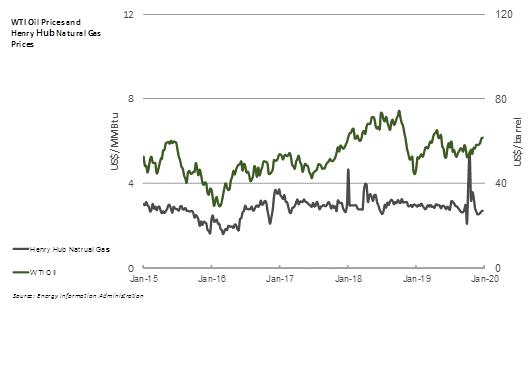
2019 was highlighted with extreme volatility, particularly in the Canadian market. In the U.S., WTI averaged US$57.07 per barrel and Henry Hub natural gas prices averaged US$2.56 per MMBtu, levels supporting unconventional resource development. The volatile and uncertain outlook on oil prices and stringent focus on free cash flow have encouraged conservatism in customer spending, leading to a significant industry decrease in rig count late in the year. In Canada, acute pipeline takeaway shortfalls and continued uncertainty in regulatory policy caused immense pressure on regional commodity prices and subsequent activity levels, particularly at the beginning of the year.
For the year ended December 31, 2019, our net earnings were $7 million, or $0.02 per diluted share, compared with a net loss of $294 million, or $1.00 per diluted share in 2018. During 2019, we decommissioned drillings rigs recognizing a loss on asset decommissioning of $20 million, that after tax, decreased our net earnings by $15 million and net earnings per diluted share by $0.05. In 2018 we incurred goodwill impairment charges that reduced after-tax net earnings by $199 million or net earnings per diluted share of $0.68.
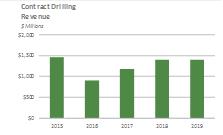
Revenue in 2019 was $1,541 million, consistent with 2018. Contract Drilling Services revenue was consistent with 2018, while Completion and Production Services revenue was down 2%. As compared to 2018, our U.S. drilling activity decreased slightly, Canadian activity decreased 22% and international activity grew 6% from the addition of our sixth drilling rig in Kuwait.
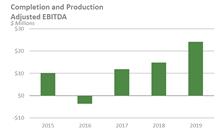
Adjusted EBITDA in 2019 was $392 million, or 4% higher than in 2018. Our Adjusted EBITDA margin was 25%, slightly higher than 2018. Our higher Adjusted EBITDA in 2019 was primarily due to increased U.S. and international day rates, higher international activity, improved operating margins and lower general and administrative costs, partially offset by lower activity in the U.S. and Canada. Adjusted EBITDA as a percentage of segment revenue for the year in our Contract Drilling Services segment was 31%, compared with 30% in the prior year, while Adjusted EBITDA as a percentage of segment revenue from our Completion and Production Services segment was 16%, compared to 10% in 2018. Our improved Adjusted EBITDA margins in our Completion and Production Services segment were primarily the result of improved service rig rates and operating cost savings initiatives. Our portfolio of term customer contracts, a scalable operating cost structure, and economies achieved through vertical integration of the supply chain help us manage our Adjusted EBITDA percentages.
Capital expenditures for the purchase of property, plant and equipment and intangible assets were $161 million in 2019, an increase of $35 million over 2018. Capital spending for 2019 included $121 million for upgrade and expansion capital, $40 million for the maintenance of existing assets, infrastructure and intangibles. In 2019 we continued to invest in our fleet adding one new-build drilling rig in the U.S. and completed our sixth Kuwait rig, both of which were backed by long-term contracts.
We decommissioned certain drilling and ancillary equipment that no longer met our High Performance technology standards and recognized a loss on asset decommissioning of $20 million.
During 2019, we repurchased and cancelled US$30 million of the 7.125% unsecured senior notes due 2026, US$5 million of the 7.75% unsecured senior notes due 2023 and US$43 million of the 5.25% unsecured senior notes due 2024. In addition, we redeemed US$75 million principal amount of our 6.50% unsecured senior notes due 2021. Subsequent to December 31, 2019, Precision redeemed US$25 million principal amount of the 6.50% unsecured senior notes due 2021 for an aggregate purchase price of US$25 million and repurchased and cancelled US$2 million of the 7.125% unsecured senior notes due 2026 and US$5 million of the 5.25% unsecured senior notes due 2024. In addition, we repurchased and cancelled 3 million common shares under our normal course issuer bid for $5 million subsequent to year end.
| |
Precision Drilling Corporation 2019 Annual Report | 18 |
OUTLOOK
Contracts
Term customer contracts provide a base level of activity and revenue. As of March 6, 2020, we had term contracts in place for an average of 42 rigs: 30 in the U.S., five in Canada and seven internationally for 2020. In most regions in the U.S. and internationally, term contracts normally generate 365 utilization days per rig year. In Canada, term contracted rigs normally generate 250 utilization days per rig year because of the seasonal nature of wellsite access. | | In 2019, approximately 59% of our total contract drilling revenue was generated from rigs under term contracts. |
In 2019, we had an average of 64 drilling rigs working under term contracts with revenue from these contracts representing approximately 59% of our total contract drilling revenue for the year.
Pricing, Demand and Utilization
The volatile and uncertain outlook on oil prices and stringent focus on free cash flow have encouraged conservatism in customer spending, leading to a significant industry decrease in rig count late in the year. In Canada, acute pipeline takeaway shortfalls and continued uncertainty in regulatory policy caused immense pressure on regional commodity prices and subsequent activity levels, particularly at the beginning of the year.
In the U.S., customer focus on free cash flow continues to encourage conservatism in customer spending, leading to a significant industry decrease in rig counts late in 2019 and into 2020. As of February 28, 2020, the rig count was 24% lower than the same time last year and has averaged 26% lower year-to-date compared to 2019. Our U.S. activity levels for the remainder of 2020 are expected to be dependent on commodity prices and resulting customer budgets.
The industry rig count at February 28, 2020 was 14% higher in Canada than it was a year ago while the year-to-date rig count has averaged 10% higher than 2019. Our Canadian activity for the remainder of the year is expected to be determined by the strength in commodity prices and the resulting customer budgets.
International
We currently have eight rigs working on term contracts with five in Kuwait and three in the Kingdom of Saudi Arabia. During 2019, our new-build ST-3000 drilling rig began drilling operations in Kuwait under a five year take-or-pay contract with an optional one-year extension. In December 2019 our workover rig in Kuwait came off contract and we are currently bidding this rig for a contract in the region. During the year we extended the contracts for two of our Saudi Arabia rigs that were expiring for an additional three-year term.
High Performance Rig Fleet
The industry trend toward more complex drilling programs has accelerated the retirement of older generation, less capable rigs. Over the past several years, we and some of our competitors have been upgrading the drilling rig fleet by building new rigs, upgrading existing rigs, and decommissioning lower capacity rigs. We believe this retooling of the industry-wide fleet has made legacy rigs virtually obsolete in North America. During the year we added two new-build Super Series rigs and upgraded an SCR rig to a Super Series rig. In addition, we decommissioned seven rigs in Canada that no longer met our High Performance technology standards and 22 rigs that we had previously identified as held for sale.
With the completion of our new-build rig program, upgrades of existing rigs and the decommissioning of legacy rigs, our fleet consisted of 226 Super Series rigs at December 31, 2019.
Capital Spending
Capital spending in 2020 is expected to be $95 million and includes $58 million for sustaining, infrastructure and intangibles and $37 million for upgrade and expansion. We expect our spending to be split $86 million in the Contract Drilling Services segment, $7 million in the Completion and Production Services segment and $2 million in the Corporate segment.
19 | Management’s Discussion and Analysis |
| |
Precision Drilling Corporation 2019 Annual Report | 20 |
| | | | | |
| UNDERSTANDING OUR BUSINESS DRIVERS | | | | |
| | | | | |
THE ENERGY INDUSTRY
Precision operates in the energy services business, which is an inherently challenging cyclical sector of the energy industry. We depend on oil and natural gas exploration and production companies to contract our services as part of their exploration and development activities. The economics of their businesses are dictated by the current and expected future margin between their finding and development costs and the eventual market price for the commodities they produce: crude oil, natural gas, and natural gas liquids.
Conventional / Unconventional Wells
Oil and natural gas reservoirs can be conventional, where a vertical well is drilled into a highly pressurized reservoir allowing the oil and natural gas to flow freely shortly after completing the drilling process. Unconventional reservoirs are exploited by drilling a vertical section of a well followed by a horizontal section to access a large portion of the oil or natural gas formation. These “unconventional” or “shale” reservoirs are typically lower pressure and require extra stimulation to generate production. The practice of “hydraulic fracturing” follows the unconventional drilling process with high horsepower equipment pumping water and proppant down a wellbore at high pressure to frack the rock, releasing hydrocarbons. The vast majority of the wells we drill in North America are unconventional. We are not involved in the hydraulic fracturing of a well.
Commodity Prices
Cash flow to fund exploration and development is dependent on commodity prices: higher prices increase cash flow and encourage investment and when prices decline, the opposite is true.
Oil can be transported relatively easily, so it is generally priced in a global market that is influenced by an array of economic and political factors. Higher oil prices typically result in stronger demand for drilling services with funding for drilling programs directed toward the most economically attractive drilling opportunities. As the volume of unconventional oil development has dramatically increased over the past decade, generating efficiencies through industrialized processes, more capital has been directed toward unconventional oil development in North America, reflecting the region’s competitiveness globally.
Natural gas and natural gas liquids continue to be priced more regionally. In North America, natural gas demand largely depends on the weather. Colder winter temperatures, and to a lesser extent, warmer summer temperatures, result in greater natural gas demand. Other demand drivers, such as natural gas fired power generation, industrial applications, and transportation, have shown positive growth over the past several years driven by a preference for natural gas over coal, and lower prices. The planned liquefied natural gas (LNG) export from Canada and continued development in the U.S. could serve as a catalyst for natural gas directed drilling activity over the medium to long term.
The key natural gas price driver continues to be increased production from unconventional shale gas drilling. Since the winter of 2014, pricing for natural gas in North America has generally been depressed, as supplies of unconventional natural gas have increased, and current inventory levels are viewed as adequate to keep North American markets well supplied.
21 | Management’s Discussion and Analysis |
Average Oil and Natural Gas Prices
| | 2019 | | | 2018 | | | 2017 | |
Oil | | | | | | | | | | | | |
West Texas Intermediate (per barrel) (US$) | | | 57.07 | | | | 64.88 | | | | 50.95 | |
Western Canadian Select (per barrel) (US$) | | | 44.28 | | | | 38.46 | | | | 38.97 | |
| | | | | | | | | | | | |
Natural gas | | | | | | | | | | | | |
U.S. | | | | | | | | | | | | |
Henry Hub (per MMBtu) (US$) | | | 2.56 | | | | 3.12 | | | | 2.98 | |
Canada | | | | | | | | | | | | |
AECO (per MMBtu) (Cdn$) | | | 1.77 | | | | 1.49 | | | | 2.16 | |
Source: WTI and Henry; Hub Energy Information Administration, AECO; Gas Alberta Inc. | | | | | | | | | | | | |
New Technology
North American exploration and production companies, which comprise the majority of our customer base, have been adapting to a lower commodity price environment and are increasingly focused on drilling and completion efficiency. Most of these companies have adopted large-scale industrialization techniques, utilizing multi-well pads and high-efficiency downhole and surface drilling systems to improve efficiency. Over the past several years, drilling rig enhancements have focused on equipment upgrades, such as walking systems, AC controls and increased fluid pumping capacity. More recently, customer focus has been shifting to rig automation technologies to deliver increased efficiency, consistency and predictability of results, which customers desire in their development-style drilling programs. Exploration and production companies have an increasing appetite for these technologies as they provide an opportunity to push the limits of efficiency and consistency, common in industrialized processes.
| |
Precision Drilling Corporation 2019 Annual Report | 22 |
Our technology strategy is well-aligned with customer efficiency objectives. We leverage our existing base of AC control systems installed on the majority of our Super Series drilling rigs. These standardized control systems enable us to reliably mass deploy advanced software systems capable of delivering leading-edge digital automation, significantly boosting efficiency of the well construction process. Our technology strategy is centered around partnering with industry experts which allows us to deliver an extensive suite of offerings to our customers with minimal research and development capital. Our digital technology strategy is currently focused on four fundamentals:
1. | Standardized Control System Platform |
We leverage our standardized rig equipment and control system to deploy our fully integrated AlphaAutomation system, which allows us to consistently implement best practices to eliminate human variance and human error, resulting in significantly improved drilling efficiency. In addition to built-in process automation routines, AlphaAutomation also hosts Precision Drilling Apps (AlphaApps), which leverage advanced algorithms and exploitation of various machine learning techniques to improve complex down-hole drilling processes. The standard platform is encouraging innovation in the drilling app space by attracting innovative solutions from customers and third parties inside and outside the oil and natural gas industry. We installed our first AlphaAutomation system in late 2016 and currently have 34 AlphaAutomation systems deployed in the field and more than 15 AlphaApps either commercialized or in final stages of development, making Precision an industry leader in automation technology. We intend to deploy an additional 24 AlphaAutomation systems in North America in 2020.
2. | Data Collection and Analytics |
Our digital rig control systems with AlphaAutomation are now generating well above 1 GB/min of data, versus a limited number of data channels from traditional Electronic Data Recorders, knowns as EDR systems. We have a robust data analytics strategy with a dedicated analytics team (AlphaAnalytics) focused on improving rig performance and financial returns through commercialization of performance data.
3. | Digitally Enabled Services |
Our advanced digital infrastructure helps automate repetitive tasks for the driller, freeing up time for the driller to address more value-added responsibilities. For example, we are leveraging our Directional Guidance System (DGS) aiming to replace directional drillers on the wellsite through an advanced algorithm delivered through an AlphaApp and remote support.
4. | Leading-Edge Corporate-Wide Data Systems and Technology Culture |
In 2018, we successfully implemented the latest version of SAP S/4HANA to fully realize the benefits of the system’s integration with our digital service delivery platform. This robust SAP enterprise resource planning (ERP) system is built to support the increased data flows from the field, provided by our AlphaAutomation systems. Precision committed to a digital technology strategy nearly three years ago, enabling us to build a strong digital mindset within the company at all levels.
23 | Management’s Discussion and Analysis |
Our combination of High Performance standardized rig fleet, integrated AlphaAutomation system, AlphaApps and AlphaAnalytics position us to help our customers achieve their efficiency goals and generate strong returns for our shareholders through service differentiation.
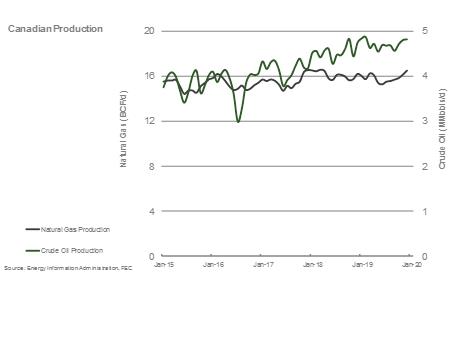
Natural gas production in Canada has been relatively flat because of lower natural gas directed drilling due to pricing pressure and Canada’s lack of an export market other than the U.S.
| |
Precision Drilling Corporation 2019 Annual Report | 24 |
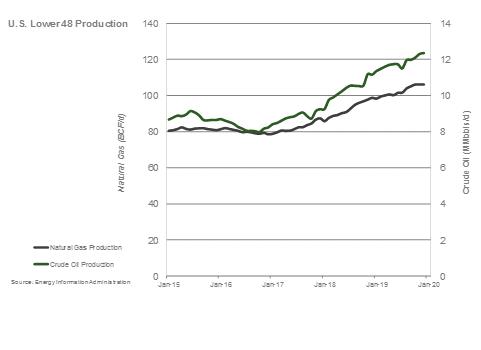
Drilling Activity
In 2019 approximately 18,000 wells were started onshore in the U.S., compared with approximately 19,300 in 2018 and 15,800 in 2017.
The industry drilled 4,679 wells in western Canada in 2019, compared with 6,781 in 2018 and 6,959 in 2017. Total industry drilling operating days were 45,334 in 2019 compared with 64,491 in 2018 and 66,138 in 2017. For Canada, lower customer spending in 2019 was due to widened differentials as a result of takeaway capacity constraints.
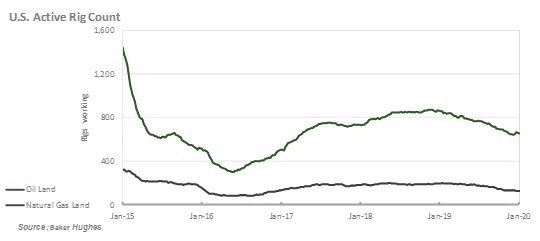
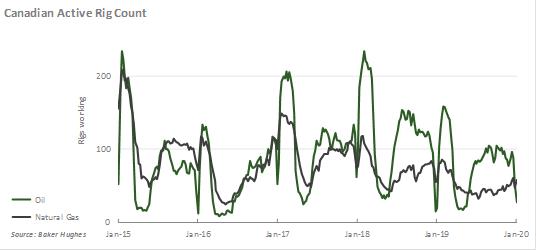
In Canada, there has been relative strength in natural gas liquids and tight light oil drilling activity in the deeper basins of northwestern Alberta and northeastern British Columbia, while in the U.S. the bias continues to be towards oil-directed drilling continues.
The graphs below show the shift in drilling activity to oil targets since 2017, in both the U.S. and Canada. The Canadian drilling rig activity graph also shows how Canadian drilling activity fluctuates with the seasons, a market dynamic that generally is not present in the U.S.
25 | Management’s Discussion and Analysis |
A COMPETITIVE OPERATING MODEL
The contract drilling business is highly competitive, with many industry participants. We compete for drilling contracts that are often awarded in a competitive bid process. We believe potential customers focus on pricing and rig availability when selecting a drilling contractor, but also consider many other things, including drilling capabilities, condition of rigs, quality of rig crews, breadth of service, technology offering, and safety record, among others.
Providing High Performance, High Value services to our customers is the core of our competitive strategy. We deliver High Performance through passionate people supported by quality business systems, drilling technology, equipment and infrastructure designed to optimize results and reduce risks. We create High Value by operating safely and sustainably, lowering our customers’ risks and costs while improving efficiency, developing our people, and generating superior financial returns for our investors.
Operating Efficiency
We keep customer well costs down by maximizing the efficiency of operations in several ways:
| ▪ | using innovative and advanced drilling technology that is efficient and reduces costs |
| ▪ | having equipment that is geographically dispersed, reliable and well maintained |
| ▪ | monitoring our equipment to minimize mechanical downtime |
| ▪ | managing operations effectively to keep non-productive time to a minimum |
| ▪ | staffing our rigs with well-trained crews with performance measured against defined competencies, and |
| ▪ | incentivizing our executives and eligible employees based on performance against safety, operational, employee retention, and financial measures. |
Efficient, Cost-Reducing Technologies
We focus on providing efficient, cost-reducing drilling technologies. Design innovations and technology improvements, such as multi-well pad capability and rapid mobility between wells, capture incremental time savings during the drilling process.
Precision has invested over $3 billion in its drilling rig fleet since 2010, adding over 120 Super Series drilling rigs during this period. With one of the newest and most technically capable fleets in North America and the Middle East, Precision’s Super Series rigs have been designed for industrial-style drilling: highly efficient; mobile; safe; controllable; upgradable; and able to act as a platform for technology delivery to the well location. Precision has completed several relatively low dollar cost upgrades over the past several years including additions of walking systems, higher pressure and capacity mud pumps, increased setback capacity and AlphaAutomation technology. Precision’s Super Series drilling rig fleet has the features needed to meet essentially all the industrial-style drilling requirements of our customers in North America and deep, high-pressure drilling projects internationally.
Broad Geographic Footprint
Geographic proximity and fleet versatility support the High Performance, High Value services we provide to our customers. Our large fleet of rigs is strategically deployed across the most active drilling regions in North America, including all major unconventional oil and natural gas basins.
Managing Downtime
Minimizing downtime is a key operating metric for us and our customers. Reliable and well-maintained equipment minimizes downtime and non-productive time during operations. We manage mechanical downtime through preventative maintenance programs, detailed inspection processes, an extensive fleet of strategically-located spare equipment, and an in-house supply chain. We minimize non-productive time (to move, rig-up and rig-out) by utilizing walking systems, reducing the number of move loads per rig, and using mechanized equipment for safer and quicker rig component connections.
Tracking Our Results
We unitize key financial information per day and per hour and compare these measures to established benchmarks and past performance. We evaluate the relative strength of our financial position by monitoring our working capital, debt ratios, and returns on capital employed. We track industry statistics to evaluate our performance against competitors.
We reward executives and eligible employees through incentive compensation plans for performance against the following measures:
| ▪ | safety performance – total recordable incident rate per 200,000 man-hours, recordable free facilities and “Triple Target Zero” days (defined on page 27 under ‘Safe Operations’). Measured against prior year performance and current year industry performance in Canada and the U.S. |
| ▪ | operational performance – rig down time for repair as measured by time not billed to the customer. Measured against a predetermined target of available billable time |
| |
Precision Drilling Corporation 2019 Annual Report | 26 |
| ▪ | key field employee retention – senior field employee retention rates. Measured against predetermined target rates of retention |
| ▪ | strategic initiatives – achieving strategic operational goals. Measured against predetermined target metrics |
| ▪ | financial performance – Adjusted EBITDA, adjusted cash flow, return on capital employed and debt reduction. Measured against predetermined targets |
| ▪ | investment returns – total shareholder return performance (including dividends) against a group of industry peers, over a three-year period. The peer group consists of a predetermined group of companies with similar business operations that we compete with for investors. |
Top Tier Service
We pride ourselves on providing quality equipment operated by experienced and well-trained crews. We also strive to align our capabilities with evolving technical requirements associated with more complex well bore programs.
High Performance Rig Fleet
Our fleet of drilling rigs is well positioned to address the unconventional drilling programs of our customers. The vast majority of our drilling rigs have been designed or significantly upgraded to drill horizontal wells. With a breadth of horsepower types and drilling depth capabilities, our large fleet can address every type of onshore unconventional and conventional oil and natural gas drilling opportunity in North America.
Our service rigs provide completion, workover, abandonment, well maintenance, high pressure operations and critical sour gas well work, and well re-entry preparation across the Western Canada Sedimentary Basin and in the northern U.S. Service rigs are supported by four field locations in Alberta, two in Saskatchewan, and one each in Manitoba, British Columbia and North Dakota.
Upgrade Opportunities
We leverage our internal manufacturing and repair capabilities and inventory of quality rigs to address market demand through upgraded drilling rigs. Upgrades are typically performed at the request of a customer and includes a term contract. Historically, certain upgrades have resulted in a change in classification to Super Series.
Ancillary Equipment and Services
An inventory of equipment (top drives, loaders, boilers, tubulars, and well control equipment) supports our fleet of drilling and service rigs. We also maintain an inventory of key rig components to minimize downtime due to equipment failure.
We benefit from internal services for equipment certifications and component manufacturing from our manufacturing division in Canada and for standardization and distribution of consumable oilfield products through our procurement divisions in Canada and the U.S.
Precision Rentals provides specialized equipment and wellsite accommodations to customers on a rental basis. Precision Camp Services provides food and accommodation to personnel working at the wellsite, typically in remote locations in Western Canada.
Technical Centres
We operate two contract drilling technical centres, one in Nisku, Alberta and one in Houston, Texas. We also operate one completion and production services technical centre in Red Deer, Alberta. These centres accommodate our technical service and field training groups and enable us to consolidate support and training for our operations. Both of our contract drilling technical centres include fully functioning training rigs with the latest drilling technologies. In addition, our Houston facility accommodates our rig manufacturing group.
People Having an experienced, high performance crew is a competitive strength and highly valued by our customers. There are often shortages of industry manpower in peak operating periods. We rely heavily on our safety record, investment in employee development, comprehensive employee training, competency development, and reputation to attract | | Toughnecks (www.toughnecks.com) has been a highly successful field recruiting program for us since we introduced it in 2008. |
and retain employees. Our people strategies focus on initiatives that provide a safe and productive work environment, opportunity for advancement, and added wage security. We have centralized personnel, orientation, and training programs in Canada and the U.S. Our people strategies have enabled us to deliver quality field crews at all points in the industry cycle.
27 | Management’s Discussion and Analysis |
Systems
In 2018 we upgraded our ERP system to fully integrate our drilling rigs with our field facilities and corporate offices increasing operating efficiencies and positioning the organization to better handle the increased data flows associated with our business. All our divisions operate using standardized business processes across marketing, equipment maintenance, procurement, manufacturing, HSE, inventory control, engineering, finance, payroll and human resources.
We continue to invest in information systems that provide competitive advantages. Electronic links between field and financial systems provide accuracy and timely processing. This repository of rig data improves response time to customer inquiries. Rig manufacturing projects also benefit from scheduling and budgeting tools, which identify and help leverage economies of scale as construction demands increase.
Safe Operations
Safety, environmental stewardship and employee health are critical for us and for our customers and are the foundation of our culture.
Safety performance is a fundamental contributor to operating performance and the financial results we generate for our shareholders. We track safety using three separate metrics: ▪ Total Recordable Incident Rate ▪ Facilities Recordable Free ▪ Triple Target Zero Days. | | Target Zero The health and safety of our employees is a core value at Precision, and daily we work to set the standard for safety in our industry. |
Total Recordable Incident Rate (TRIR) is an industry standard and benchmarks our success and isolates areas for improvement. We have taken it to another level by tracking and measuring all injuries, regardless of severity, because they are leading indicators for the potential for more serious events. In 2019, 87% of our drilling rigs and 93% of our service rigs achieved facilities recordable free. Facilities recordable free includes all of our rigs, operating centres and offices and measures how many of our facilities do not have a recordable incident during the year. In addition, we have a goal of achieving “Triple Target Zero” every day. A Triple Target Zero day is a day when we have no high potential work-related vehicle incidents, no recordable injuries and no reportable spills. For 2019 we achieved 292 Triple Target Zero days.
We foster our safety culture through strong leadership, technical and compliance training, and proven support systems. Every day, we invest in our field employees to prepare them for any and every situation on the rig. Our Technical Support Centre training facilities are located in Houston, Texas, and Nisku, Alberta, where more than 5,488 employees were trained in 2019 on our culture, rig personnel and responsibilities, tools and equipment, safety and environmental protocol and procedures, leadership and team-building.
We continuously review our rig designs and components and use advanced technology to operate safely, improve the life cycle, maintain operational efficiency, reduce energy use, and maintain our energy and resources. In 2019, 20% of our fleet was configured to be powered by natural gas, which is cleaner-burning than diesel and therefore reduces our customer’s emissions footprint. Our pad-capable rig fleet has also helped our customers reduce their overall operating footprint by enabling them to drill multiple wells on a single well pad location.
| |
Precision Drilling Corporation 2019 Annual Report | 28 |
AN EFFECTIVE STRATEGY
Precision’s vision is to be globally recognized as the High Performance, High Value provider of land drilling services. We work toward this vision by defining and measuring our results against strategic priorities we establish at the beginning of every year.
2019 Strategic Priorities | | 2019 Results |
Generate strong free cash flow and utilize $200 million to reduce debt in 2019 | | By mid-year Precision increased its 2019 debt repayment target to $200 million. We ended the year with a total of $205 million of debt reduction, exceeding the high end of our original targeted range by $55 million. Including 2018 repayments, have reduced debt by $380 million, nearing the low end of our long-term $400 million to $600 million targeted range just two years into the four-year plan. Significant cash generation has provided financial flexibility to utilize our Normal Course Issuer Bid to repurchase and cancel 16 million shares for $26 million. Ended the year with a reported cash balance of $75 million and completed a one-year extension of our US$500 million Senior Credit Facility, now maturing November 2023. Divested non-core assets for cash proceeds of $91 million. Reduced G&A expenses. Anticipating 2020 general and administrative cost run-rate to be less than $90 million before share-based expenses. Reduced interest expense from 2019 debt repayments with annual interest savings in 2020 expected to be approximately $13 million. |
Maximize financial results by leveraging our High Performance, High Value Super Series rig fleet and scale with disciplined cost management | | Based on average daily land drilling rigs working, sustained highest market share on record in the U.S. and Canada averaging 8% and 28%, respectively, in 2019. U.S. contract drilling margins (revenue less operating costs) were up 19% compared to prior year. Generated strong cash flow in Canada and international margins remained stable. Reported significant improvement in our Completion and Production Services segment, posting a 62% increase in Adjusted EBITDA compared to prior year. Revenue was $1,541 million which was in line with 2018 as stable activity and improved day rates in the U.S. were offset by lower activity and day rates in Canada. Adjusted EBITDA in 2019 was $392 million, 5% higher than 2018 despite a significant decrease in industry activity in the Canadian market. |
Full scale commercialization and implementation of our AlphaAutomation platform, AlphaApps and AlphaAnalytics | | Ended the year with 32 AlphaAutomation systems deployed in the field and on both of our training rigs located in Nisku, Alberta and Houston, Texas. Achieved full commercialization of AlphaAutomation in November, with systems deployed achieving over 90% utilization and earning commercial rates. Drilled over 1,100 wells since roll-out of AlphaAutomation technology, which includes more than 600 wells drilled in 2019. At year-end, Precision had 15 drilling AlphaApps either commercialized or in final stages of development. |
29 | Management’s Discussion and Analysis |
Our Corporate and Competitive Strategies are designed to optimize resource allocation and differentiate us from the competition, generating value for investors. Unconventional drilling is the primary opportunity in the North American marketplace. Unconventional resource development requires the most efficient and technically capable drilling rigs and other highly developed services that facilitate the drilling of reliable, predictable and repeatable horizontal wells. Customer adoption of large-scale industrialization techniques and high efficiency rig systems continues to increase and Precision’s Super Series rig fleet, High Performance, High Value strategy and Alpha Technologies offering, positions us to benefit from that trend. The completion and production work associated with unconventional wells provides the most profitable growth opportunities for our Completion and Production Services segment.
Strategic Priorities for 2020
| ▪ | Generate strong free cash flow and reduce debt by $100 million to $150 million in 2020 and by $700 million between 2018 and 2022. |
| ▪ | Demonstrate operational excellence in all aspects of our business including operational, financial and ESG (environmental, social and governance) metrics. |
| ▪ | Leverage our Alpha Technology platform as a competitive differentiator and source of financial returns for Precision. |
| |
Precision Drilling Corporation 2019 Annual Report | 30 |
Adjusted EBITDA, operating earnings (loss), funds provided by (used in) operations and working capital are Non-GAAP measures. See page 64 for more information.
Consolidated Statements of Net Earnings (Loss) Summary
Year ended December 31 (in thousands of dollars) | | 2019 | | | 2018 | | | 2017 | |
Revenue | | | | | | | | | | | | |
Contract Drilling Services | | | 1,399,068 | | | | 1,396,492 | | | | 1,173,930 | |
Completion and Production Services | | | 147,829 | | | | 150,760 | | | | 154,146 | |
Inter-segment elimination | | | (5,577 | ) | | | (6,063 | ) | | | (6,852 | ) |
| | | 1,541,320 | | | | 1,541,189 | | | | 1,321,224 | |
Adjusted EBITDA | | | | | | | | | | | | |
Contract Drilling Services | | | 429,483 | | | | 412,134 | | | | 342,970 | |
Completion and Production Services | | | 24,155 | | | | 14,881 | | | | 11,888 | |
Corporate and Other | | | (61,733 | ) | | | (51,884 | ) | | | (49,877 | ) |
| | | 391,905 | | | | 375,131 | | | | 304,981 | |
Depreciation and amortization | | | 333,616 | | | | 377,044 | | | | 384,096 | |
Gain on asset disposals | | | (50,741 | ) | | | (11,384 | ) | | | (6,350 | ) |
Loss on asset decommissioning | | | 20,263 | | | | — | | | | — | |
Impairment (reversal of impairment) of property, plant and equipment | | | (5,810 | ) | | | — | | | | 15,313 | |
Impairment of goodwill | | | — | | | | 207,544 | | | | — | |
Foreign exchange | | | (8,722 | ) | | | 4,017 | | | | (2,970 | ) |
Finance charges | | | 118,453 | | | | 127,178 | | | | 137,928 | |
Loss (gain) on redemption and repurchase of unsecured senior notes | | | (6,815 | ) | | | (5,672 | ) | | | 9,021 | |
Loss before income tax | | | (8,339 | ) | | | (323,596 | ) | | | (232,057 | ) |
Income taxes | | | (14,957 | ) | | | (29,326 | ) | | | (100,021 | ) |
Net earnings (loss) | | | 6,618 | | | | (294,270 | ) | | | (132,036 | ) |
Results by Geographic Segment
Year ended December 31 (in thousands of dollars) | | 2019 | | | 2018 | | | 2017 | |
Revenue | | | | | | | | | | | | |
U.S. | | | 871,651 | | | | 791,312 | | | | 568,573 | |
Canada | | | 459,377 | | | | 558,746 | | | | 562,250 | |
International | | | 210,292 | | | | 191,131 | | | | 190,401 | |
| | | 1,541,320 | | | | 1,541,189 | | | | 1,321,224 | |
Total assets | | | | | | | | | | | | |
U.S. | | | 1,560,523 | | | | 1,772,850 | | | | 1,666,368 | |
Canada | | | 1,133,591 | | | | 1,269,542 | | | | 1,631,838 | |
International | | | 575,726 | | | | 593,651 | | | | 594,725 | |
| | | 3,269,840 | | | | 3,636,043 | | | | 3,892,931 | |
31 | Management’s Discussion and Analysis |
2019 COMPARED WITH 2018
Net earnings in 2019 was $7 million, or $0.02 per diluted share, compared with a net loss of $294 million, or negative $1.00 per diluted share, in 2018. The higher net earnings were primarily the result of higher operating margins in our U.S. contract drilling business, lower G&A costs, lower finance charges because of our reduced debt, a current year foreign exchange gain and a 2018 goodwill impairment charge that after-tax reduced net earnings by $199 million, partially offset by lower activity in Canada and the receipt of a transaction termination fee in 2018.
Revenue was $1,541 million (consistent with 2018) because of higher international activity and improved U.S. and international day rates, offset by lower U.S. and Canadian activity and lower day rates in Canada.
Adjusted EBITDA in 2019 was $392 million (5% higher than in 2018). Our higher Adjusted EBITDA in 2019 was primarily due to increased U.S. and international day rates, higher international activity, improved operating margins and lower general and administrative costs, partially offset by lower activity in the U.S. and Canada.
Impairment
Under IFRS, we are required to assess the carrying value of assets in our CGUs containing goodwill annually and when indicators of impairment exist. As a result of the goodwill impairments recognized in 2018, at December 31, 2019, we no longer have any CGUs that contain goodwill. We did not identify an indication of impairment within the Corporation’s CGUs as at December 31, 2019. Accordingly, no impairment tests were performed.
In the second quarter of 2019, Precision concluded the sale of its Mexico-based drilling rigs and ancillary equipment, contained within its Contract Drilling Services segment, for total proceeds of US$48 million. Precision recognized a gain on asset disposal of US$24 million and reversed US$4 million of previous impairment charges.
In 2018, due to the decrease in oil and natural gas well drilling in Canada and the outlook for activity in Canada and in our directional drilling division in the U.S., we recognized a $208 million goodwill impairment charge. The impairment charge represents the full amount of goodwill attributable to our Canadian contract drilling and U.S. directional drilling operations.
Foreign Exchange
We recognized a foreign exchange gain of $9 million in 2019 (2018 – $4 million loss) due to the strengthening of the Canadian dollar against the U.S. dollar and this affected the net U.S. dollar denominated monetary position in our Canadian dollar-based companies and the translation of our U.S. denominated intercompany payables.
Finance Charges
Finance charges were $118 million, a decrease of $9 million compared with 2018 primarily due to a reduction in interest expense related to debt retired in 2018 and 2019, partially offset by the impact of the weakening of the Canadian dollar on our U.S. dollar denominated interest and lease accretion charges resulting from the adoption of IFRS 16 on January 1, 2019.
Gain on Redemption and Repurchase of Unsecured Senior Notes
During 2019, Precision repurchased and cancelled US$30 million of the 7.125% unsecured senior notes due 2026, US$5 million of the 7.75% unsecured senior notes due 2023 and US$43 million of the 5.25% unsecured senior notes due 2024. In addition, Precision redeemed US$75 million principal amount of its 6.50% unsecured senior notes due 2021. We recognized a gain on the repurchase and redemption of unsecured senior notes of $7 million. In comparison, during 2018, we redeemed and/or repurchased and cancelled US$132 million of our previously outstanding unsecured senior notes resulting in a gain of $6 million.
Income Taxes
In 2019, we recognized an income tax recovery of $15 million as compared to $30 million in 2018. The reduced recovery in 2019 compared with 2018 was mainly due to a smaller loss in 2019, prior to the non-taxable portion of the goodwill impairment recorded in 2018.
| |
Precision Drilling Corporation 2019 Annual Report | 32 |
2018 COMPARED WITH 2017
Net loss in 2018 was $294 million, or $1.00 per diluted share, compared with a net loss of $132 million, or $0.45 per diluted share, in 2017. The higher net loss in 2018 was primarily the result of a $208 million goodwill impairment charge offset by higher U.S. activity and average day rates.
Revenue was $1,541 million (17% higher than 2017) because of higher U.S. activity and improved day rates.
Adjusted EBITDA in 2018 was $375 million (23% higher than 2017), mainly because of the increase in U.S. activity. Activity, as measured by drilling utilization days, increased 30% in the U.S. while remaining relatively constant in Canada and internationally compared with 2017.
Impairment
Under IFRS, we are required to assess the carrying value of assets in our CGUs containing goodwill annually and when indicators of impairment exist. Due to the decrease in oil and natural gas well drilling in Canada and the outlook for activity in Canada and in our directional drilling division in the U.S., we recognized a $208 million goodwill impairment charge. The impairment charge represents the full amount of goodwill attributable to our Canadian contract drilling and U.S. directional drilling operations.
Because of no activity in Mexico in 2017, we completed an impairment test for our Mexico contract drilling CGU as of December 31, 2017. As a result of this test it was determined that property, plant and equipment in our Mexico contract drilling business was impaired by US$12 million.
Foreign Exchange
We recognized a foreign exchange loss of $4 million in 2018 (2017 – $3 million gain) due to the weakening of the Canadian dollar against the U.S. dollar and this affected the net U.S. dollar denominated monetary position in our Canadian dollar-based companies.
Finance Charges
Finance charges were $127 million, a decrease of $11 million compared with 2017 primarily due to a reduction in interest expense related to debt retired in 2017 and mid-2018 partially offset by higher interest income earned in the comparative period.
Gain on Redemption and Repurchase of Unsecured Senior Notes
During the year we redeemed US$80 million and repurchased and cancelled US$3 million principal amount of our 6.5% unsecured senior notes due 2021 and repurchased and cancelled US$49 million of our 5.25% unsecured senior notes due 2024 resulting in a net gain of $6 million. In comparison, during 2017, we redeemed and/or repurchased and cancelled US$442 million of our previously outstanding unsecured senior notes incurring a loss of $9 million.
Income Taxes
Income taxes were a recovery of $29 million, $71 million lower than the $100 million recovery booked in 2017. The reduced recovery in 2018 compared with 2017 was mainly due to a smaller loss prior to the non-taxable portion of the goodwill impairment.
33 | Management’s Discussion and Analysis |
SEGMENTED RESULTS
CONTRACT DRILLING SERVICES
Financial Results
Adjusted EBITDA, operating earnings (loss), funds provided by (used in) operations and working capital are Non-GAAP measures. See page 64 for more information.
Year ended December 31 (in thousands of dollars, except where noted) | | 2019 | | | % of revenue | | | 2018 | | | % of revenue | | | 2017 | | | % of revenue | |
Revenue | | | 1,399,068 | | | | | | | | 1,396,492 | | | | | | | | 1,173,930 | | | | | |
Expenses | | | | | | | | | | | | | | | | | | | | | | | | |
Operating | | | 927,612 | | | | 66.3 | | | | 945,203 | | | | 67.7 | | | | 798,655 | | | | 68.0 | |
General and administrative | | | 38,927 | | | | 2.8 | | | | 39,155 | | | | 2.8 | | | | 32,305 | | | | 2.8 | |
Restructuring | | | 3,046 | | | | 0.2 | | | | — | | | | — | | | | — | | | | — | |
Adjusted EBITDA | | | 429,483 | | | | 30.7 | | | | 412,134 | | | | 29.5 | | | | 342,970 | | | | 29.2 | |
Depreciation and amortization | | | 300,882 | | | | 21.5 | | | | 341,712 | | | | 24.5 | | | | 341,470 | | | | 29.1 | |
Gain on asset disposals | | | (46,849 | ) | | | (3.3 | ) | | | (7,157 | ) | | | (0.5 | ) | | | (6,883 | ) | | | (0.6 | ) |
Loss on asset decommissioning | | | 20,263 | | | | 1.4 | | | | — | | | | — | | | | — | | | | — | |
Impairment (reversal of impairment) of property, plant and equipment | | | (5,810 | ) | | | (0.4 | ) | | | — | | | | — | | | | 15,313 | | | | 1.3 | |
Impairment of goodwill | | | — | | | | — | | | | 207,544 | | | | 14.9 | | | | — | | | | — | |
Operating earnings (loss) | | | 160,997 | | | | 11.5 | | | | (129,965 | ) | | | (9.3 | ) | | | (6,930 | ) | | | (0.6 | ) |
2019 Compared with 2018
Revenue from Contract Drilling Services was $1,399 million, slightly higher than 2018, mainly because of higher day rates in our U.S. and international contract drilling operations partially offset by lower activity in our Canadian contract drilling operations.
In 2019, we recognized idle but contracted rig revenue in the U.S. of US$4 million and shortfall payments in Canada of $4 million, compared to US$1 million and $12 million, respectively in 2018.
Operating expenses in 2019 were 66% of revenue, 1% lower than the prior year. On a per utilization day basis, in the U.S., operating costs were slightly higher than the prior year primarily due to higher repair and maintenance costs and expenses recovered through the day rate, partially offset by lower turnkey activity. Operating costs on a per day basis for the drilling rig division in Canada were higher than the prior year period due to larger crew formations, higher repair and maintenance costs and fixed costs spread over lower activity. General and administrative expenses for 2019 were lower due to our continued cost savings initiatives and the impact of IFRS 16 on lease-related charges, partially offset by the weakening of the Canadian dollar against the U.S. dollar on our U.S. dollar denominated costs and higher share-based compensation charges.
Our 2019 operating earnings were $161 million as compared to an operating loss of $130 million in the prior year. Operating earnings increased in 2019 as a result of lower asset decommissioning and impairment-related charges, depreciation and amortization and higher gains from asset disposals. During 2019, we decommissioned drilling rigs resulting in a loss on decommissioning of $20 million and sold our Mexico-based drilling rigs and ancillary equipment recognizing a gain on asset disposal of US$24 million and reversal of impairment of US$4 million. Our 2018 operating results include an impairment of goodwill charge of $207 million. Excluding the impact of asset decommissioning and impairment-related charges, operating earnings would have been $175 million in 2019 and $78 million in 2018.
Our depreciation expense for 2019 was lower by 12% compared with the prior year due to asset sales and assets becoming fully depreciated.
Capital expenditures in 2019 for our Contract Drilling segment were $154 million:
| ▪ | $108 million – to expand our asset base |
| ▪ | $13 million – to upgrade existing equipment |
| ▪ | $33 million – on maintenance and infrastructure. |
| |
Precision Drilling Corporation 2019 Annual Report | 34 |
Operating Statistics
Year ended December 31 | | 2019 | | | % increase/ (decrease) | | | 2018 | | | % increase/ (decrease) | | | 2017 | | | % increase/ (decrease) | |
Number of drilling rigs (year-end) | | | 226 | | | | (4.2 | ) | | | 236 | | | | (7.8 | ) | | | 256 | | | | 0.4 | |
Drilling utilization days (operating and moving) | | | | | | | | | | | | | | | | | | | | | | | | |
U.S. | | | 26,544 | | | | (0.6 | ) | | | 26,714 | | | | 30.4 | | | | 20,479 | | | | 80.5 | |
Canada | | | 14,498 | | | | (22.1 | ) | | | 18,617 | | | | (1.4 | ) | | | 18,883 | | | | 48.4 | |
International | | | 3,093 | | | | 5.9 | | | | 2,920 | | | | — | | | | 2,920 | | | | 4.8 | |
Drilling revenue per utilization day | | | | | | | | | | | | | | | | | | | | | | | | |
U.S. | | | 23,397 | | | | 7.0 | | | | 21,864 | | | | 10.1 | | | | 19,861 | | | | (24.0 | ) |
Canada | | | 21,569 | | | | (0.3 | ) | | | 21,644 | | | | 2.4 | | | | 21,143 | | | | (13.7 | ) |
International | | | 51,360 | | | | 1.8 | | | | 50,469 | | | | 0.5 | | | | 50,240 | | | | 9.8 | |
Drilling statistics (Canadian operations only) | | | | | | | | | | | | | | | | | | | | | | | | |
Wells drilled | | | 1,314 | | | | (21.0 | ) | | | 1,663 | | | | (3.8 | ) | | | 1,729 | | | | 79.7 | |
Average days per well | | | 9.8 | | | | (1.0 | ) | | | 9.9 | | | | 2.1 | | | | 9.7 | | | | (17.1 | ) |
Metres drilled (hundreds) | | | 3,968 | | | | (15.5 | ) | | | 4,694 | | | | 2.1 | | | | 4,597 | | | | 80.4 | |
Average metres per well | | | 3,020 | | | | 7.0 | | | | 2,823 | | | | 6.2 | | | | 2,659 | | | | 0.4 | |
U.S. Drilling
Revenue from U.S. drilling was US$621 million, 6% higher than 2018. Drilling rig activity, as measured by utilization days, was down slightly from 2018 while average revenue per day was up 7%.
Adjusted EBITDA was US$214 million, 19% higher than 2018, mainly because of higher average day rates, idle but contracted revenue and increased expense recoveries, partially offset by turnkey activity.
Depreciation expense for the year was US$112 million, US$8 million lower than 2018 because of a lower capital asset base.
Drilling Statistics – U.S.
In 2019, we completed one new-build rig and transferred one rig from Canada, bringing our U.S. year-end rig count to 104. We averaged 73 rigs working in 2019, consistent with 2018 despite lower industry activity. In 2019, the average number of active land rigs for the industry was 921, down 9% from 1,014 rigs in 2018.
Our average day rates in the U.S. increased 7% in 2019 as legacy contracts expired and newly contracted rigs were at higher day rates and well to well day rates improved. Revenue from idle but contracted rigs was US$4 million in 2019, an increase of US$3 million from the prior year period.
Turnkey utilization days decreased 92% from 2018 and accounted for less than 1% of our revenue compared with 2% in 2018.
Drilling Statistics – U.S.
| | 2019 | | | 2018 | | | 2017 | |
| | Precision | | | Industry (1) | | | Precision | | | Industry (1) | | | Precision | | | Industry (1) | |
Average number of active land rigs for quarters ended: | | | | | | | | | | | | | | | | | | | | | | | | |
March 31 | | | 79 | | | | 1,023 | | | | 64 | | | | 951 | | | | 47 | | | | 722 | |
June 30 | | | 77 | | | | 967 | | | | 72 | | | | 1,021 | | | | 59 | | | | 874 | |
September 30 | | | 72 | | | | 896 | | | | 76 | | | | 1,032 | | | | 61 | | | | 927 | |
December 31 | | | 63 | | | | 798 | | | | 80 | | | | 1,050 | | | | 58 | | | | 902 | |
Annual average | | | 73 | | | | 921 | | | | 73 | | | | 1,014 | | | | 56 | | | | 856 | |
35 | Management’s Discussion and Analysis |
Canadian Drilling
Revenue from Canadian drilling was $313 million, 22% lower than 2018. Drilling rig activity, as measured by utilization days, was down by 22% while average day rates were slightly lower than 2018.
Adjusted EBITDA was $82 million, 34% lower than 2018, because of lower drilling activity and lower average day rates.
Depreciation expense for the year was $110 million, 2% lower than 2018 because of a lower capital asset base.
Drilling Statistics – Canada
During 2019, we transferred one drilling rig to the U.S. and decommissioned 7 rigs, bringing our Canadian year-end rig count to 109.
The industry drilling rig fleet decreased as there were approximately 517 rigs at the end of 2019 compared with 574 at the end of 2018. Our operating day utilization was 31% (2018 – 34%), compared with industry utilization of 22% (2018 – 29%).
COMPLETION AND PRODUCTION SERVICES
Financial Results
Adjusted EBITDA, operating earnings (loss), funds provided by (used in) operations and working capital are Non-GAAP measures. See page 64 for more information.
Year ended December 31 (in thousands of dollars, except where noted) | | 2019 | | | % of revenue | | | 2018 | | | % of revenue | | | 2017 | | | % of revenue | |
Revenue | | | 147,829 | | | | | | | | 150,760 | | | | | | | | 154,146 | | | | | |
Expenses | | | | | | | | | | | | | | | | | | | | | | | | |
Operating | | | 116,932 | | | | 79.1 | | | | 128,124 | | | | 85.0 | | | | 134,368 | | | | 87.2 | |
General and administrative | | | 6,285 | | | | 4.3 | | | | 6,591 | | | | 4.4 | | | | 7,890 | | | | 5.1 | |
Restructuring | | | 457 | | | | 0.3 | | | | 1,164 | | | | 0.8 | | | | — | | | | — | |
Adjusted EBITDA | | | 24,155 | | | | 16.3 | | | | 14,881 | | | | 9.9 | | | | 11,888 | | | | 7.7 | |
Depreciation and amortization | | | 17,881 | | | | 12.1 | | | | 22,801 | | | | 15.1 | | | | 29,136 | | | | 18.9 | |
Loss (gain) on asset disposals | | | (3,767 | ) | | | (2.5 | ) | | | 1,078 | | | | 0.7 | | | | 502 | | | | 0.3 | |
Operating earnings (loss) | | | 10,041 | | | | 6.8 | | | | (8,998 | ) | | | (6.0 | ) | | | (17,750 | ) | | | (11.5 | ) |
2019 Compared with 2018
Revenue from Completion and Production Services was $148 million in 2019, 2% lower than 2018, mainly because of lower activity in our well service and rental divisions and impact of the disposal of our snubbing units and water treatment assets partially offset by higher well service rates in Canada and the U.S.
Operating expenses were 79% of revenue, 6% lower than 2018, mainly because of our improved cost structure.
Operating earnings were $10 million in 2019, compared with an operating loss of $9 million in 2018. The increased operating earnings in 2019 was primarily due to higher average day rates and improved cost recoveries offset by lower service rig operating hours.
Depreciation in 2019 decreased by 22% as a result of the disposal of snubbing units and water treatment assets and a higher proportion of the segment’s capital asset base became fully depreciated.
During 2019, we disposed of certain snubbing units and related equipment, recognizing a gain on disposal of $3 million.
Capital expenditures in 2019 for our Completion and Production Services segment were $5 million, comprised mainly of maintenance capital.
Revenue from Precision Well Servicing in Canada was $89 million, down $10 million from 2018 due to the disposal of our snubbing units in 2019 and a 9% reduction in activity excluding snubbing, partially offset by a 5% increase in average revenue rates excluding snubbing versus the prior year.
Revenue from our U.S. based completion and production business was US$15 million, 51% higher than 2018. The increase was the result of higher activity and average rates.
Revenue from Precision Rentals was $16 million, 13% lower than 2018. The decrease was due to lower activity and average revenue rates.
Revenue from Precision Camp Services was $23 million, 46% higher than 2018, because of an increase in camp activity and higher average revenue rates. Precision operated four base camps and 42 drill camps during 2019.
| |
Precision Drilling Corporation 2019 Annual Report | 36 |
Operating Statistics
Year ended December 31 | | 2019 | | | % increase/ (decrease) | | | 2018 | | | % increase/ (decrease) | | | 2017 | | | % increase/ (decrease) | |
Number of service rigs (end of year) | | | 123 | | | | (41.4 | ) | | | 210 | | | | — | | | | 210 | | | | 1.4 | |
Service rig operating hours | | | 147,154 | | | | (6.5 | ) | | | 157,467 | | | | (8.9 | ) | | | 172,848 | | | | 73.8 | |
Revenue per operating hour | | | 739 | | | | 4.2 | | | | 709 | | | | 11.3 | | | | 637 | | | | (1.4 | ) |
In 2019, 75 service rigs were not registered with the industry association and 12 snubbing units were sold.
Our service operating hours fell by 7% in the current year while our revenue per operating hour increased by 4% over the comparable prior year period.
CORPORATE AND OTHER
Financial Results
Adjusted EBITDA, operating earnings (loss), funds provided by (used in) operations and working capital are Non-GAAP measures. See page 64 for more information.
Year ended December 31 (in thousands of dollars, except where noted) | | 2019 | | | 2018 | | | 2017 | |
Revenue | | | — | | | | — | | | | — | |
Expenses | | | | | | | | | | | | |
Operating | | | — | | | | — | | | | — | |
General and administrative | | | 58,798 | | | | 66,084 | | | | 49,877 | |
Restructuring | | | 2,935 | | | | — | | | | — | |
Other recoveries | | | — | | | | (14,200 | ) | | | — | |
Adjusted EBITDA | | | (61,733 | ) | | | (51,884 | ) | | | (49,877 | ) |
Depreciation and amortization | | | 14,853 | | | | 12,531 | | | | 13,490 | |
Loss (gain) on asset disposals | | | (125 | ) | | | (5,305 | ) | | | 31 | |
Operating loss | | | (76,461 | ) | | | (59,110 | ) | | | (63,398 | ) |
2019 Compared with 2018
Our Corporate and Other segment contains support functions that provide assistance to our business segments. It includes costs incurred in corporate groups in both Canada and the U.S.
Corporate general and administrative expenses were $59 million in 2019, $7 million lower than 2018. The decrease was mainly related to our efforts to realign our cost structure including the reduction of fixed overhead costs and the impact of IFRS 16 on our lease-related charges, partially offset by higher foreign exchange translation on our U.S. dollar based costs and higher share-based incentive compensation expenses. In 2019, corporate general and administrative costs were 3.8% of consolidated revenue compared with 4.3% in 2018 and 3.8% in 2017.
During the year, we recognized $3 million in restructuring costs relating to severance costs as we continued to align our cost structure with our reduced activity levels.
During 2018, we terminated an arrangement agreement to acquire an oilfield services drilling contractor. Subsequent to the termination a transaction fee was paid to us which, net of transaction costs, amounted to $14 million.
Capital expenditures in 2019 for our Corporate and Other segment were $1 million, primarily related to infrastructure.
37 | Management’s Discussion and Analysis |
QUARTERLY FINANCIAL RESULTS
Adjusted EBITDA, operating earnings (loss), funds provided by (used in) operations and working capital are Non-GAAP measures. See page 64 for more information.
2019 – Quarters Ended (in thousands of dollars, except per share amounts) | | March 31 | | | June 30 | | | September 30 | | | December 31 | |
Revenue | | | 434,043 | | | | 359,424 | | | | 375,552 | | | | 372,301 | |
Adjusted EBITDA | | | 107,967 | | | | 81,037 | | | | 97,895 | | | | 105,006 | |
Net earnings (loss) | | | 25,014 | | | | (13,801 | ) | | | (3,534 | ) | | | (1,061 | ) |
per basic share | | | 0.09 | | | | (0.05 | ) | | | (0.01 | ) | | | (0.00 | ) |
per diluted share | | | 0.08 | | | | (0.05 | ) | | | (0.01 | ) | | | (0.00 | ) |
Funds provided by operations | | | 95,993 | | | | 40,950 | | | | 79,930 | | | | 75,779 | |
Cash provided by operations | | | 40,587 | | | | 106,035 | | | | 66,556 | | | | 74,981 | |
2018 – Quarters Ended (in thousands of dollars, except per share amounts) | | March 31 | | | June 30 | | | September 30 | | | December 31 | |
Revenue | | | 401,006 | | | | 330,716 | | | | 382,457 | | | | 427,010 | |
Adjusted EBITDA | | | 97,469 | | | | 62,182 | | | | 80,988 | | | | 134,492 | |
Net loss | | | (18,077 | ) | | | (47,217 | ) | | | (30,648 | ) | | | (198,328 | ) |
per basic share | | | (0.06 | ) | | | (0.16 | ) | | | (0.10 | ) | | | (0.68 | ) |
per diluted share | | | (0.06 | ) | | | (0.16 | ) | | | (0.10 | ) | | | (0.68 | ) |
Funds provided by operations | | | 104,026 | | | | 50,225 | | | | 64,368 | | | | 92,595 | |
Cash provided by operations | | | 38,189 | | | | 129,695 | | | | 31,961 | | | | 93,489 | |
Seasonality
Drilling and well servicing activity is affected by seasonal weather patterns and ground conditions. In northern Canada, some drilling sites can only be accessed in the winter once the terrain is frozen, which is usually late in the fourth quarter. As a result, activity peaks in the winter, in the fourth and first quarters. In the spring, wet weather and the spring thaw in Canada and the northern U.S. make the ground unstable. Government road bans restrict the movement of rigs and other heavy equipment, reducing activity in the second quarter. This leads to quarterly fluctuations in operating results and working capital requirements.
Fourth Quarter 2019 Compared with Fourth Quarter 2018
In the fourth quarter of 2019, we recorded a net loss of $1 million or $0.00 per diluted share compared to a net loss of $198 million or $0.68 per diluted share in the fourth quarter of 2018. During the quarter, we incurred a loss on asset decommissioning of $20 million that, after tax, reduced net earnings by $15 million or $0.05 per diluted share. In the fourth quarter of 2018, we recognized goodwill impairment charges totaling $208 million that, after-tax, reduced net earnings by $199 million or $0.68 per diluted share. Excluding the impact of asset decommissioning and goodwill impairment, our 2019 net earnings would have been $14 million ($0.05 per diluted share) as compared to 2018 net earnings of $1 million ($0.00 per diluted share).
Revenue in the fourth quarter was $372 million or 13% lower than the fourth quarter of 2018, mainly due to lower activity in the U.S. and Canada, partially offset by higher average day rates in the U.S. and higher international activity. Compared with the fourth quarter of 2018, our drilling activity decreased 21% in the U.S., 13% in Canada and grew 11% internationally. Our 2019 fourth quarter revenue from our Contract Drilling Services and Completion and Production Services segments decreased 14% and 5%, respectively, from the comparable 2018 quarter.
Adjusted EBITDA was $105 million, a decrease of $29 million from the fourth quarter of 2018. Our lower Adjusted EBITDA in 2019 was primarily due to reduced U.S. and Canadian activity, higher share-based incentive compensation expense and the non-recurring receipt of the transaction termination fee in the fourth quarter of 2018.
As a percentage of revenue, operating costs were 65% in the fourth quarter of 2019, 2% lower than the same quarter of 2018. Our portfolio of term customer contracts and a highly variable operating cost structure helped us manage our Adjusted EBITDA margin.
Contract Drilling Services
Revenue from Contract Drilling Services for the fourth quarter of 2019 was $339 million, $53 million lower than the fourth quarter of 2018, while Adjusted EBITDA decreased 9% to $113 million. The lower revenue in 2019 was primarily due to lower utilization days in the U.S. and Canada, partially offset by higher international activity and U.S. pricing. During the quarter, we had US$3 million of revenue from each of idle but contracted rigs and turnkey projects as compared with fourth quarter 2018 idle but contracted rig and turnkey revenue of US$0.3 million and US$11 million, respectively.
| |
Precision Drilling Corporation 2019 Annual Report | 38 |
Drilling rig utilization days (drilling days plus move days) in the U.S. and Canada were down in the fourth quarter of 2019 as compared to 2018. In the U.S., we had 5,814 drilling rig utilization days, 21% lower than the same quarter of 2018. Canada had 3,919 days in the quarter, a decrease of 13% compared to 2018. The reduced activity in both regions was consistent with lower industry activity. Drilling rig utilization days in our international business was 818, 11% higher than the same quarter of 2018, as we deployed our sixth Kuwait rig in the third quarter of 2019.
Revenue per utilization day in the U.S. increased in the fourth quarter of 2019 to US$23,949 from US$23,369 in the prior year quarter. The increase was the result of higher day rates, idle but contracted rig revenue and rig technology revenue, partially offset by lower turnkey activity. In Canada, average revenue per utilization day for contract drilling rigs was $22,182 compared with $22,802 in the fourth quarter of 2018. The lower average revenue per utilization day in the fourth quarter of 2019 was primarily due to lower rates from a higher proportion of Super Singles in our rig mix and lower shortfall payments, partially offset by higher technology revenue. We did not receive shortfall payments in the fourth quarter of 2019 as compared to $1 million in the 2018 quarter. Average revenue per utilization day in our international contract drilling business was US$52,283 compared with US$51,982 in the respective prior year quarter. The higher average rate in 2019 was primarily due to day rate increases from the renewal and extension of drilling contracts and the deployment of the sixth Kuwait rig, partially offset by lower amortization of the initial upfront mobilization revenue on initial contracts. Directional drilling services realized revenue of $9 million in the fourth quarter of 2019, consistent with 2018.
In the U.S., 66% of utilization days were generated from rigs under term contract as compared with 70% in the fourth quarter of 2018. In Canada, 9% of our utilization days in the quarter were generated from rigs under term contract, compared with 15% in the fourth quarter of 2018.
Operating costs were 64% of revenue for the quarter, 2% lower than the prior year quarter. Our U.S. operating costs on a per day basis decreased to US$14,073 in the fourth quarter of 2019 compared with US$15,042 in 2018. The decrease was mainly due to lower turnkey activity, the impact from the reversal of prior period provisions and the componentization of rig recertification costs. Excluding the impact of the provision reversals and componentization of recertification costs, our operating costs on a per day basis for the quarter were US$14,974. Average operating costs per utilization day for drilling rigs in Canada decreased to $14,791 compared with the prior year quarter of $15,115. The decrease was mainly caused by the impact of lower repair and maintenance costs due to the componentization of rig recertification costs. Excluding the impact of componentization of recertifications, our operating costs on a per day basis for the quarter were $15,044.
Depreciation expense in the quarter was 26% lower than the fourth quarter of 2018. The lower 2019 expense was primarily due to asset sales, assets becoming fully depreciated and non-recurring accelerated depreciation of excess spare equipment recorded in the fourth quarter of 2018. In 2019, we recognized a loss on the decommissioning of drilling rigs and ancillary equipment of $20 million.
In the fourth quarter of 2019, through the completion of normal course business operations, we sold used assets resulting in a gain on asset disposals of $4 million as compared to $3 million in the comparable 2018 quarter.
Completion and Production Services
Revenue from Completion and Production Services decreased $2 million compared with the fourth quarter of 2018 due to lower activity in our rental and camp and catering divisions and the impact of the disposal of our snubbing units and water treatment assets partially offset by higher well service activity in Canada and the U.S. Our service rig operating hours in the quarter were up 11% from the fourth quarter of 2018 while average service rig revenue per operating hour decreased slightly to $746. Excluding the impact of snubbing assets, which were disposed in the first quarter, our fourth quarter 2019 service activity and rates increased 20% and 5%, respectively, over the comparative 2018 period. Approximately 78% of our fourth quarter Canadian service rig activity was oil related.
Adjusted EBITDA of $6 million in the fourth quarter of 2019 was 11% lower than the 2018 quarter primarily due to lower activity in our non-well servicing divisions and the impact of asset disposals, partially offset by higher well service activity and lower costs resulting from our cost control measures.
During the fourth quarter, the segment generated 81% of its revenue from Canadian operations and 19% from U.S. operations compared with 90% from Canada and 10% in the U.S. in the 2018 quarter.
Operating costs as a percentage of revenue was 77% compared with the prior year comparative quarter of 78%. The reduction of operating costs as a percentage of revenue was primarily the result of a higher proportion of 24-hour well service work and continued cost control.
Depreciation expense in the quarter was 20% lower than the prior year comparative period. The decrease in depreciation expense was primarily due to a lower capital asset base resulting from the disposition of snubbing units and water treatment assets and assets becoming fully depreciated.
39 | Management’s Discussion and Analysis |
Corporate and Other
Our Corporate and Other segment provides support functions to our operating segments. The Corporate and Other segment had negative Adjusted EBITDA of $14 million compared with Adjusted EBITDA of $5 million in the comparative 2018 quarter. The lower Adjusted EBITDA in 2019 was primarily the result of higher share-based incentive compensation in the current quarter and the non-recurring receipt of the transaction termination fee in the fourth quarter of 2018.
Net finance charges were $28 million, a decrease of $4 million compared with the fourth quarter of 2018, primarily due to a reduction in interest expense related to the debt retired in 2018 and 2019, partially offset by $1 million of lease accretion charges resulting from the adoption of IFRS 16 on January 1, 2019.
During the quarter, we repurchased and cancelled US$4 million of the 7.125% unsecured senior notes due 2026, US$5 million of the 7.75% unsecured senior notes due 2023 and US$11 million of the 5.25% unsecured senior notes due 2024. In addition, we redeemed US$25 million principal amount of our 6.50% unsecured senior notes due 2021. Our debt reduction resulted in a net gain of $3 million.
Income tax recovery for the quarter was $12 million compared with $2 million in the same quarter in 2018. In 2019, the Province of Alberta announced various reductions to corporate income tax rates, that when fully implemented over the next three years will decrease the provincial corporate income tax rate from 12% to 8% by 2022. The increase in the income tax recovery for the quarter is mainly due to a larger fourth quarter loss prior to the non-taxable portion of the goodwill impairment in 2018; adjustments for prior period taxes; the reversal of unrecognized tax benefits; and U.S. tax reform legislation clarification enacted in December 2019, offset by a reduction in the benefit from the Alberta income tax rate reductions.
Capital expenditures were $1 million in the fourth quarter of 2019 were primarily related to infrastructure.
| |
Precision Drilling Corporation 2019 Annual Report | 40 |
The oilfield services business is inherently cyclical. To manage this variability, we focus on maintaining a strong balance sheet so we have the financial flexibility we need to continue to manage our capital expenditures and cash flows, no matter where we are in the business cycle.
We apply a disciplined approach to managing and tracking the results of our operations to keep costs down. We maintain a scalable cost structure so we can be responsive to changing competition and market demand. We also invest in our fleet to make sure we remain competitive. Our maintenance capital expenditures are tightly governed by and highly responsive to activity levels with additional cost savings leverage provided through our internal manufacturing and supply divisions. Term contracts on expansion capital for new-build rig programs help provide more certainty of future revenues and return on our growth capital investments.
LIQUIDITY
During the year we repurchased and cancelled US$30 million of the 7.125% unsecured senior notes due 2026, US$5 million of the 7.75% unsecured senior notes due 2023 and US$43 million of the 5.25% unsecured senior notes due 2024. We redeemed US$75 million principal amount of our 6.50% unsecured senior notes due 2021. We extended the maturity date of our Senior Credit Facility to November 21, 2023. Subsequent to December 31, 2019, Precision redeemed US$25 million principal amount of the 6.50% unsecured senior notes due 2021 for an aggregate purchase price of US$25 million and repurchased and cancelled US$2 million of the 7.125% unsecured senior notes due 2026 and US$5 million of the 5.25% unsecured senior notes due 2024.
In 2018, we redeemed US$80 million and repurchased and cancelled US$3 million principal amount of our 6.5% unsecured senior notes due 2021 and repurchased and cancelled US$49 million of our 5.25% unsecured senior notes due 2024.
As of December 31, 2019, our liquidity was supported by a cash balance of $75 million, our Senior Credit Facility of US$500 million, operating facilities totaling approximately $60 million, and a US$30 million secured facility for letters of credit. Our ability to draw on our Senior Credit Facility is governed by financial covenants. See Capital Structure – Covenants on page 43.
At December 31, 2019, our operating facility of $40 million with Royal Bank of Canada was undrawn except for $26 million in outstanding letters of credit; our operating facility of US$15 million with Wells Fargo remained undrawn; and our demand facility for letters of credit of US$30 million with HSBC Canada had US$28 million available.
We expect that cash provided by operations and our sources of financing, including our Senior Credit Facility, will be sufficient to meet our debt obligations and to fund future capital expenditures.
At December 31, 2019, excluding letters of credit, we had approximately $1,445 million (2018 – $1,729 million) outstanding under our secured and unsecured credit facilities and $18 million in unamortized debt issue costs. Our Senior Credit Facility includes financial ratio covenants that are tested quarterly. | | Key Ratios We ended 2019 with a long-term debt to long-term debt plus equity ratio of 0.5, and a ratio of long-term debt to cash provided by operations of 5.0. |
We ended 2019 with a long-term debt to long-term debt plus equity ratio of 0.5 (2018 – 0.5) and a ratio of long-term debt to cash provided by operations of 5.0 (2018 – 5.8).
The current blended cash interest cost of our debt is approximately 6.8%.
Ratios and Key Financial Indicators
We evaluate the relative strength of our financial position by monitoring our working capital, debt ratios and liquidity.
We also monitor returns on capital, and we link our executives’ incentive compensation to the returns to our shareholders relative to the shareholder returns of our peers.
41 | Management’s Discussion and Analysis |
Financial Position and Ratios
(in thousands of dollars, except ratios) | | December 31, 2019 | | | December 31, 2018 | | | December 31, 2017 | |
Working capital(1) | | | 201,696 | | | | 240,539 | | | | 232,121 | |
Working capital ratio | | | 1.9 | | | | 1.9 | | | | 2.1 | |
Long-term debt | | | 1,427,181 | | | | 1,706,253 | | | | 1,730,437 | |
Total long-term financial liabilities | | | 1,500,950 | | | | 1,723,350 | | | | 1,754,059 | |
Total assets | | | 3,269,840 | | | | 3,636,043 | | | | 3,892,931 | |
Enterprise value (see table on page 45) | | | 1,854,393 | | | | 2,305,890 | | | | 2,782,596 | |
Long-term debt to long-term debt plus equity | | | 0.5 | | | | 0.5 | | | | 0.5 | |
Long-term debt to cash provided by operations | | | 5.0 | | | | 5.8 | | | | 14.8 | |
Long-term debt to Adjusted EBITDA | | | 3.6 | | | | 4.5 | | | | 5.7 | |
Long-term debt to enterprise value | | | 0.8 | | | | 0.7 | | | | 0.6 | |
(1) | See Non-GAAP measures on page 64 of this report. |
Credit Rating
Credit ratings affect our ability to obtain short and long-term financing, the cost of this financing, and our ability to engage in certain business activities cost-effectively.
At March 6, 2020 | | Moody’s | | S&P | | Fitch |
Corporate credit rating | | B1 | | BB- | | B+ |
Senior Credit Facility rating | | Not rated | | Not rated | | BB+ |
Senior unsecured credit rating | | B2 | | BB- | | BB- |
CAPITAL MANAGEMENT
To maintain and grow our business, we invest in growth, upgrade and sustaining capital. We base expansion and upgrade capital decisions on return on capital employed and payback, and we mitigate the risk that we may not be able to fully recover our capital by requiring two- to five-year term contracts for new-build rigs.
We base our maintenance capital decisions on actual activity levels, using key financial indicators that we express as per operating day or per operating hour. Sourcing internally (through our manufacturing and supply divisions) helps keep our maintenance capital costs as low as possible.
Foreign Exchange Risk
Our U.S. and international operations have revenue, expenses, assets and liabilities denominated in currencies other than the Canadian dollar (mostly in U.S. dollars and currencies that are pegged to the U.S. dollar). This means that changes in currency exchange rates can materially affect our income statement, balance sheet and statement of cash flow. We manage this risk by matching the currency of our debt obligations with the currency of cash flows generated by the operations that the debt supports.
Hedge of Investments in Foreign Operations
We utilize foreign currency long-term debt to hedge our exposure to changes in the carrying values of our net investment in certain foreign operations as a result of changes in foreign exchange rates.
During 2019, we designated all of our U.S. dollar unsecured senior notes as a net investment hedge in our U.S. dollar denominated foreign operations.
To be accounted for as a hedge, the foreign currency denominated long-term debt must be designated and documented as such and must be effective at inception and on an ongoing basis. We recognize the effective amount of this hedge (net of tax) in other comprehensive income. We recognize ineffective amounts in earnings.
| |
Precision Drilling Corporation 2019 Annual Report | 42 |
SOURCES AND USES OF CASH
At December 31 (in thousands of dollars) | | 2019 | | | 2018 | | | 2017 | |
Cash from operations | | | 288,159 | | | | 293,334 | | | | 116,555 | |
Cash used in investing | | | (74,500 | ) | | | (100,794 | ) | | | (91,150 | ) |
Surplus (deficit) | | | 213,659 | | | | 192,540 | | | | 25,405 | |
Cash used in financing | | | (231,814 | ) | | | (169,085 | ) | | | (73,784 | ) |
Effect of exchange rate changes on cash | | | (3,770 | ) | | | 8,090 | | | | (2,245 | ) |
Net cash used | | | (21,925 | ) | | | 31,545 | | | | (50,624 | ) |
Cash from Operations
In 2019, we generated cash from operations of $288 million compared with $293 million in 2018. The decrease is primarily the result of higher interest payments on our long-term debt because of deferral of a payment in 2019 partially offset by improved margins in the current year.
Investing Activity
We made growth and sustaining capital investments of $161 million in 2019:
| ▪ | $121 million on upgrade and expansion capital |
| ▪ | $40 million on maintenance, infrastructure capital and intangibles. |
The $161 million in capital expenditures in 2019 was split between segments as follows:
| ▪ | $154 million in Contract Drilling Services |
| ▪ | $5 million in Completion and Production Services |
| ▪ | $2 million in Corporate and Other. |
Expansion and upgrade capital includes the cost of long-lead items purchased for our capital inventory, such as integrated top drives, drill pipe, control systems, engines and other items we can use to complete new-build projects or upgrade our rigs in North America and internationally.
We sold underutilized capital assets for proceeds of $91 million in 2019 compared with $24 million in 2018.
CAPITAL STRUCTURE
Debt
As of December 31, 2019, we had a cash balance of $75 million, available capacity under our secured facilities of $645 million and $1,445 million outstanding under our unsecured senior notes.
Amount | | Availability | | Used for | | Maturity |
Senior credit facility (secured) | | | | | | |
US$500 million (extendible, revolving term credit facility with US$300 million accordion feature) | | Undrawn, except US$25 million in outstanding letters of credit | | General corporate purposes | | November 21, 2023 |
Operating facilities (secured) | | | | | | |
$40 million | | Undrawn, except $26 million in outstanding letters of credit | | Letters of credit and general corporate purposes | | |
US$15 million | | Undrawn | | Short term working capital requirements | | |
Demand letter of credit facility (secured) | | | | | | |
US$30 million | | Undrawn, except US$2 million in outstanding letters of credit | | Letters of credit | | |
Unsecured senior notes (unsecured) | | | | | | |
US$91 million – 6.5% | | Fully drawn | | Capital expenditures and general corporate purposes | | December 15, 2021 |
US$345 million – 7.75% | | Fully drawn | | Debt redemption and repurchases | | December 15, 2023 |
US$308 million – 5.25% | | Fully drawn | | Capital expenditures and general corporate purposes | | November 15, 2024 |
US$370 million – 7.125% | | Fully drawn | | Debt redemption and repurchases | | January 15, 2026 |
43 | Management’s Discussion and Analysis |
Covenants
Following is a listing of our currently applicable covenants and the calculations as of December 31, 2019:
| | Covenant | | At December 31, 2019 | |
Senior Credit Facility | | | | | | |
Consolidated senior debt to consolidated Covenant EBITDA(1) | | ≤ 2.50 | | | 0.00 | |
Consolidated Covenant EBITDA to consolidated interest expense | | ≥ 2.50 | | | 3.39 | |
| | | | | | |
Unsecured Senior Notes | | | | | | |
Consolidated interest coverage ratio | | ≥ 2.00 | | | 3.30 | |
(1) For purposes of calculating the leverage ratio consolidated senior debt only includes secured indebtedness.
At December 31, 2019, we were in compliance with the covenants of our Senior Credit Facility and unsecured senior notes.
Senior Credit Facility
The Senior Credit Facility requires that we comply with certain financial covenants including a leverage ratio of consolidated senior debt to earnings before interest, taxes, depreciation and amortization as defined in the agreement (Covenant EBITDA, see Non-GAAP measures on page 64 of this report) of less than or equal to 2.5:1. For purposes of calculating the leverage ratio, consolidated senior debt only includes secured indebtedness. Covenant EBITDA as defined in our Senior Credit Facility agreement differs from Adjusted EBITDA as defined under Non-GAAP Measures by the exclusion of bad debt expense, restructuring costs, certain foreign exchange amounts and with the adoption of the new lease standard IFRS 16 – Leases, the deduction of cash lease payments incurred after December 31, 2018.
Under the Senior Credit Facility, we are required to maintain a Covenant EBITDA to consolidated interest expense ratio for the most recent four consecutive fiscal quarters, of greater than or equal to 2.5:1.
The Senior Credit Facility limits distributions subject to a pro forma senior net leverage covenant of less than or equal to 1.75:1. The Senior Credit Facility also limits the redemption and repurchase of junior debt subject to a pro forma senior net leverage covenant test of less than or equal to 1.75:1.
In addition, the Senior Credit Facility contains certain covenants that place restrictions on our ability to incur or assume additional indebtedness; dispose of assets; pay dividends, share redemptions or other distributions; change our primary business; incur liens on assets; engage in transactions with affiliates; enter into mergers, consolidations or amalgamations; and enter into speculative swap agreements.
Unsecured Senior Notes
The unsecured senior notes require that we comply with restrictive and financial covenants including an incurrence based consolidated interest coverage ratio test of consolidated cash flow, as defined in the unsecured senior note agreements, to consolidated interest expense of greater than 2.0:1 for the most recent four consecutive fiscal quarters. In the event our consolidated interest coverage ratio is less than 2.0:1 for the most recent four consecutive fiscal quarters, the unsecured senior notes restrict our ability to incur additional indebtedness.
The unsecured senior notes contain a restricted payment covenant that limits our ability to make payments in the nature of dividends, distributions and for repurchases from shareholders. This restricted payment basket grows from a starting point of October 1, 2010 for the 2021 and 2024 unsecured senior notes, from October 1, 2016 for the 2023 unsecured senior notes and October 1, 2017 for the 2026 unsecured senior notes by, among other things, 50% of consolidated cumulative net earnings and decreases by 100% of consolidated cumulative net losses, as defined in the note agreements, and payments made to shareholders. Beginning with the December 31, 2015 calculation the governing net restricted payments basket was negative which limits our ability to declare and make dividend payments and share repurchases until such time as the restricted payments baskets once again become positive.
Based on our consolidated financial results for the period ended December 31, 2019, the governing net restricted payments basket was negative $517 million.
For further information, please see the unsecured senior note indentures which are available on SEDAR and EDGAR.
Contractual Obligations
Our contractual obligations include both financial obligations (long-term debt and interest) and non-financial obligations (new-build rig commitments, operating leases, and equity-based compensation for key executives and officers).
| |
Precision Drilling Corporation 2019 Annual Report | 44 |
The table below shows the amounts of these obligations and when payments are due for each.
| | Payments due (by period) | |
At December 31, 2019 (in thousands of dollars) | | Less than 1 year | | | 1-3 years | | | 4-5 years | | | More than 5 years | | | Total | |
Long-term debt(1) | | | 32,463 | | | | 85,215 | | | | 847,337 | | | | 480,112 | | | | 1,445,127 | |
Interest on long-term debt(1) | | | 95,427 | | | | 185,084 | | | | 141,004 | | | | 35,633 | | | | 457,148 | |
Purchase of property, plant and equipment(1)(2) | | | 24,858 | | | | 87,716 | | | | — | | | | — | | | | 112,574 | |
Operating leases(1) | | | 11,954 | | | | 21,728 | | | | 11,838 | | | | 11,117 | | | | 56,637 | |
Contractual incentive plans(1)(3) | | | 5,130 | | | | 12,675 | | | | — | | | | — | | | | 17,805 | |
Total | | | 169,832 | | | | 392,418 | | | | 1,000,179 | | | | 526,862 | | | | 2,089,291 | |
(1) | U.S. dollar denominated balances are translated at the period end exchange rate of Cdn$1.00 equals US$0.7701. |
(2) | The balance relates primarily to the costs of rig equipment with a flexible delivery schedule wherein we can take delivery of the equipment between 2020 and 2022 at our discretion. |
(3) | Includes amounts we have not yet accrued but are likely to pay at the end of the contract term. Our long-term incentive plans compensate officers and key employees through cash payments when their awards vest. Equity-based compensation amounts are shown based on the five-day weighted average share price on the TSX of $1.86 at December 31, 2019. |
Shareholders Capital
| | March 6, 2020 | | | December 31, 2019 | | | December 31, 2018 | | | December 31, 2017 | |
Shares outstanding | | | 272,099,037 | | | | 277,299,804 | | | | 293,781,836 | | | | 293,238,858 | |
Deferred shares outstanding | | | 93,173 | | | | 93,173 | | | | 93,173 | | | | 195,743 | |
Share options outstanding | | | 9,184,484 | | | | 10,384,634 | | | | 10,799,006 | | | | 10,458,981 | |
You can find more information about our capital structure in our Annual Information Form, available on our website and on SEDAR.
Common Shares
Our articles of amalgamation allow us to issue an unlimited number of common shares.
In the fourth quarter of 2012, we introduced a quarterly dividend program. The dividend program was suspended in the first quarter of 2016. See Unsecured Senior Notes on page 43 for more information.
Preferred Shares
We can issue preferred shares in one or more series. The number of preferred shares that may be authorized for issue at any time cannot exceed more than half of the number of issued and outstanding common shares. We currently have no preferred shares issued.
Enterprise Value
(thousands of dollars, except shares outstanding and per share amounts) | | December 31, 2019 | | | December 31, 2018 | | | December 31, 2017 | |
Shares outstanding | | | 277,299,804 | | | | 293,781,836 | | | | 293,238,858 | |
Year-end share price on the TSX | | | 1.81 | | | | 2.37 | | | | 3.81 | |
Shares at market | | | 501,913 | | | | 696,263 | | | | 1,117,240 | |
Long-term debt | | | 1,427,181 | | | | 1,706,253 | | | | 1,730,437 | |
Less cash | | | (74,701 | ) | | | (96,626 | ) | | | (65,081 | ) |
Enterprise value | | | 1,854,393 | | | | 2,305,890 | | | | 2,782,596 | |
45 | Management’s Discussion and Analysis |
| | | | | |
| ACCOUNTING POLICIES AND ESTIMATES | | | | |
| | | | | |
CRITICAL ACCOUNTING ESTIMATES AND JUDGEMENTS
Because of the nature of our business, we are required to make estimates about the future that affect the reported amounts of assets, liabilities, revenues and expenses, and the disclosure of contingent liabilities. Estimates are based on our past experience, our best judgment and assumptions we think are reasonable.
Our significant accounting policies are described in Note 3 to the Consolidated Financial Statements. We believe the following are the most difficult, subjective or complex judgments, and are the most critical to how we report our financial position and results of operations:
| ▪ | impairment of long-lived assets |
| ▪ | depreciation and amortization |
Impairment of Long-Lived Assets
Long-lived assets, which include property, plant and equipment, intangibles and goodwill, comprise the majority of our assets. The carrying value of these assets is reviewed for impairment periodically or whenever events or changes in circumstances indicate that their carrying amounts may not be recoverable. For property, plant and equipment, this requires us to forecast future cash flows to be derived from the utilization of these assets based on assumptions about future business conditions and technological developments. Significant, unanticipated changes to these assumptions could require a provision for impairment in the future.
For goodwill, we conduct impairment tests annually in the fourth quarter or whenever there is a change in circumstance that indicates that the carrying value may not be recoverable. The recoverability of goodwill requires a calculation of the recoverable amount of the CGU or groups of CGUs to which goodwill has been allocated. A CGU is the smallest identifiable group of assets that generates cash inflows that are largely independent of the cash inflows from other assets or groups of assets. Judgment is required in the aggregation of assets into CGUs. The recoverability calculation requires an estimation of the future cash flows from the CGU or group of CGUs, and judgment is required in projecting cash flows and selecting the appropriate discount rate. We use observable market data inputs to develop a discount rate that we believe approximates the discount rate from market participants.
In deriving the underlying projected cash flows, assumptions must also be made about future drilling activity, margins and market conditions over the long-term life of the assets or CGUs. We cannot predict if an event that triggers impairment will occur, when it will occur or how it will occur, or how it will affect reported asset amounts. Although we believe the estimates are reasonable and consistent with current conditions, internal planning, and expected future operations, such estimations are subject to significant uncertainty and judgment.
Depreciation and Amortization
Our property, plant and equipment and intangible assets are depreciated and amortized based on estimates of useful lives and salvage values. These estimates consider data and information from various sources, including vendors, industry practice, and our own historical experience, and may change as more experience is gained, market conditions shift, or new technological advancements are made.
Determination of which parts of the drilling rig equipment represent a significant cost relative to the entire rig and identifying the consumption patterns along with the useful lives of these significant parts are matters of judgment. This determination can be complex and subject to differing interpretations and views, particularly when rig equipment comprises individual components for which different depreciation methods or rates are appropriate.
Income Taxes
Uncertainties exist with respect to the interpretation of complex tax regulations, changes in tax laws, and the amount and timing of future taxable income. Differences arising between the actual results and the assumptions made, or future changes to such assumptions, could necessitate future adjustments to taxable income and expenses already recorded. We establish provisions, based on reasonable estimates, for possible consequences of audits by the tax authorities of the respective countries in which we operate. The amount of such provisions is based on various factors, such as experience of previous tax audits and differing interpretations of tax regulations by the taxable entity and the responsible tax authority.
| |
Precision Drilling Corporation 2019 Annual Report | 46 |
AMENDMENTS TO ACCOUNTING STANDARDS ADOPTED JANUARY 1, 2019
We applied the following mandatorily effective amendments to IFRS in the current year. Outside of additional disclosure requirements, the impact to our consolidated financial statements have been described below.
IFRS 16, Leases
IFRS 16 introduced a single, on-balance sheet lease accounting model for lessees and requires a lessee to recognize a right of use asset representing its right to direct the use of the underlying asset as well as a lease obligation representing the Corporation’s obligation to make future lease payments. Lessor accounting remained similar to the current standard in which lessors classify leases as either finance or operating leases.
On January 1, 2019, Precision adopted IFRS 16 using the modified retrospective approach. Under this approach, comparative information has not been restated and continues to be reported under IAS 17 and related interpretations. The adopted accounting policies and impact of applying IFRS 16 are disclosed below.
At inception, Precision assesses whether its contracts contain a lease. A contract contains a lease if it conveys the right to control the use of an identified asset for a period of time in exchange for consideration. The assessment of whether a contract conveys the right to control the use of an identified asset considers whether:
| ▪ | the contract involves the use of an identified asset and the substantive substitution rights of the supplier. If the supplier has a substantive substitution right, then the asset is not identified; |
| ▪ | the lessee’s right to obtain substantially all of the economic benefits from the use of the asset; and |
| ▪ | the lessee’s right to direct the use of the asset, including decision-making to change how and for what purpose the asset is used. |
At inception or on reassessment of a contract that contains a lease component, Precision allocates the consideration in the contract to each lease component on the basis of their relative stand-alone prices.
Leases in which Precision is a lessee
Precision recognizes a right of use asset and corresponding lease obligation at the lease commencement date. The right of use asset is initially measured at cost, which comprises the initial amount of the lease obligation adjusted for lease payments made on or before commencement date, incurred initial direct costs, estimated site retirement costs and any lease incentives received.
The right of use asset is subsequently depreciated using the straight-line method from the commencement date to the earlier of the end of the useful life of the right of use asset or the end of the lease term. The estimated useful lives of right of use assets are consistent with those of property, plant and equipment. In addition, the right of use asset is reduced by impairment losses, if any, and adjusted for certain remeasurements of the lease obligation.
The lease obligation is initially measured at the present value of the minimum lease payments not paid at commencement date, discounted using the interest rate implicit in the lease or, if that rate cannot be readily determined, Precision’s incremental borrowing rate. Generally, Precision uses its incremental borrowing rate as the discount rate for those leases in which it is the lessee.
Lease payments included in the measurement of the lease obligation comprise the following:
| ▪ | fixed payments, including in-substance fixed payments; |
| ▪ | variable lease payments that depend on an index or a rate, initially measured using the index or rate as at the commencement date; |
| ▪ | amounts expected to be payable under a residual value guarantee; and |
| ▪ | the exercise price under a purchase option that Precision is reasonably certain to exercise, lease payments in an optional renewal period if Precision is reasonably certain to exercise an extension option, and penalties for early termination of a lease unless Precision is reasonably certain not to terminate early. |
The lease obligation is measured at amortized cost using the effective interest method. The measurement of lease obligations require the use of certain estimates and assumptions including discount rates, exercise of lease term extension options, and escalating lease rates. It is remeasured when there is a change in:
| ▪ | future lease payments arising from a change in an index or rate; |
| ▪ | the estimated amount expected to be payable under a residual value guarantee; or |
| ▪ | the assessment of whether Precision will exercise a purchase, extension or termination option. |
When the lease obligation is remeasured in this way, a corresponding adjustment is made to the carrying amount of the right of use asset, or is recorded in profit or loss if the carrying amount of the right of use asset has been reduced to zero.
Leases in which Precision is a lessor
When Precision acts as a lessor, at inception, Precision evaluates the classification as either a finance or operating lease.
47 | Management’s Discussion and Analysis |
To classify each lease, Precision makes an overall assessment of whether the lease transfers substantially all of the risks and rewards incidental to ownership of the underlying asset. If this is the case, then the lease is a finance lease; if not, then it is an operating lease.
When acting as a sub-lessor, Precision accounts for its interests in the head lease and the sub-lease separately. It assesses the lease classification of a sub-lease with reference to the right of use asset arising from the head lease, not with reference to the underlying asset. If a head lease is a short-term lease then Precision classifies the sub-lease as an operating lease.
If an arrangement contains lease and non-lease components, Precision applies IFRS 15 to allocate the consideration in the contract. Precision recognizes lease payments received under operating leases for drilling rigs as income on a systematic basis, drilling days, over the lease term as part of revenue.
The accounting policies applicable to Precision as a lessor in the comparative period were not different from IFRS 16. However, when Precision was an intermediate lessor the sub-leases were classified with reference to the underlying asset.
Transition
Precision adopted IFRS 16 on January 1, 2019 using the modified retrospective method of adoption. When applying the modified retrospective approach to leases previously classified as operating leases under IAS 17 and related interpretations, the lessee can elect, on a lease-by-lease basis, whether to apply a number of practical expedients on transition. On initial adoption of the new standard, Precision elected to use the following practical expedients, where applicable, to:
| ▪ | grandfather the assessment of which contracts contained leases under IFRS 16 to only those previously identified as leases under IAS 17 and related interpretations; |
| ▪ | not apply the requirements of the standard to short-term and low-value leases; |
| ▪ | treat existing operating leases with a remaining term of less than 12 months at January 1, 2019 as short-term leases; and |
| ▪ | apply a single discount rate to a portfolio of leases with reasonably similar characteristics. |
In addition, at the date of initial application, for those leases previously classified as an operating lease under IAS 17, Management elected to recognize and measure the respective right of use assets at the amount equal to the lease obligation, adjusted for any prepaid or accrued lease payment immediately before the date of initial application. The opening balance sheet adjustment in relation to these leases was:
| | January 1, 2019 | |
Right of use asset | | $ | 73,464 | |
Accounts payables and accrued liabilities | | | (2,800 | ) |
Lease obligation | | | (73,464 | ) |
Deficit | | | 2,800 | |
When measuring certain lease obligations at the date of transition, minimum lease payments were discounted using Precision’s incremental borrowing rate. The weighted average of the incremental borrowing rates applied was 6.1%. At the date of transition, Precision derecognized $3 million of its deferred base rent balance which was established to straight-line amortize escalating corporate office rent expenses over the term of the lease.
In the comparative period, Precision classified its leases that transferred substantially all the risks and rewards of ownership as finance leases. These leased assets were measured initially at an amount equal to the lower of their fair value and the present value of the minimum lease payments, excluding any contingent payments. Subsequently, these assets were accounted for in accordance with the applicable accounting policy respective to that asset.
Assets held under other leases were classified as operating leases and were not recognized on the consolidated statement of financial position. Payments made under operating leases were recognized in profit or loss on a straight-line basis over the term of the lease. Lease incentives received were recognized as an integral part of the total lease expense, over the term of the lease.
IFRIC 23, Uncertainty over Income Tax Treatments
IFRIC 23 clarifies the accounting for uncertainties in income taxes. The interpretation requires the entity to use the most likely amount or the expected value of the income tax treatment if it concludes that it is not probable that a particular income tax treatment will be accepted. It requires an entity to assume that a taxation authority with the right to examine any amounts reported to it will examine those amounts and will have full knowledge of all relevant information when doing so. Using the modified retrospective method of adoption, Precision initially applied IFRIC 23 on January 1, 2019 and it did not have a material impact on the consolidated financial statements.
| |
Precision Drilling Corporation 2019 Annual Report | 48 |
Our enterprise risk management framework operates at the business and functional levels and is designed to identify, evaluate and mitigate risks within each of the risk categories below. It leverages the risk framework in each of our businesses, which includes Precision’s policies, guidelines and review mechanisms.
Our businesses routinely encounter and manage risks, some of which may cause our future results to be different, and sometimes materially different than what we presently anticipate. We describe certain important strategic, operational, financial, legal and compliance risks. Our response to developments in those risk areas and our reactions to material future developments will affect our future results.
Our operations depend on the price of oil and natural gas, which have been subject to increased volatility in recent years, and the exploration and development activities of oil and natural gas exploration companies
We sell our services to oil and natural gas exploration and production companies. Macroeconomic and geopolitical factors associated with oil and natural gas supply and demand are the primary factors driving pricing and profitability in the oilfield services industry. Generally, we experience high demand for our services when commodity prices are relatively high and the opposite is true when commodity prices are relatively low, as is currently the case. The volatility of crude oil and natural gas prices accounts for much of the cyclical nature of the oilfield services business and in recent years, increased volatility has led to greater uncertainty in the demand for our services.
The markets for oil and natural gas are separate and distinct. Oil is a global commodity with a vast distribution network, although the differential between benchmarks such as West Texas Intermediate, Western Canadian Select, and European Brent crude oil can fluctuate. As in all markets, when supply, demand, inability to access domestic or export markets and other factors change, so can the spreads between benchmarks. The most economical way to transport natural gas is in its gaseous state by pipeline, and the natural gas market depends on pipeline infrastructure and regional supply and demand. However, developments in the transportation of liquefied natural gas in ocean going tanker ships introduced an element of globalization to the natural gas market.
Worldwide military, political and economic events, such as conflict in the Middle East, expectations for global economic growth, trade disputes, or initiatives by OPEC and other major petroleum exporting countries, can affect supply and demand for oil and natural gas. Weather conditions, governmental regulation (in Canada and elsewhere), levels of consumer demand, the availability and pricing of alternate sources of energy (including renewable energy initiatives), the availability of pipeline capacity and other transportation for oil and natural gas, global oil and natural gas storage levels, and other factors beyond our control can also affect the supply of and demand for oil and natural gas and lead to future price volatility.
The North American land drilling industry has been in a downturn relative to activity levels experienced prior to 2015, a result of lower commodity prices restricting customer spending and decreasing drilling demand. In 2019, approximately 18,000 wells were started onshore in the U.S., compared to approximately 43,700 in 2014. In 2019, the industry drilled 4,679 wells in western Canada, compared to 10,942 in 2014. According to industry sources, the U.S. average active land drilling rig count was down approximately 9% in 2019, compared to 2018, and the Canadian average active land drilling rig count was down approximately 29% during the same period. However, oil and natural gas prices remained volatile throughout 2019 and could continue at these relatively low levels or lower levels for the foreseeable future. Prices have been negatively affected since late 2014 by a combination of factors, including increased production, the decisions of OPEC and Russia and a strengthening in the U.S. dollar relative to most other currencies. These factors have adversely affected, and could continue to adversely affect, the price of oil and natural gas, which would adversely affect the level of capital spending by our customers and in turn could have a material adverse effect on our business, financial condition, results of operations and cash flow.
As a result of the continued pressure on commodity prices, many of our customers have reduced spending budgets compared to periods prior to the downturn. Reductions in commodity prices or factors that impact the supply and demand for oil and natural gas and lead to price volatility may result in further reductions in capital budgets in the future, which could result in cancelled, delayed or reduced drilling programs by our customers and a corresponding decline in demand for our services. Moreover, the prolonged reduction in oil and natural gas prices has depressed, and may continue to depress, the overall level of exploration and production activity, resulting in a corresponding decline in the demand for our services. Additionally, the availability and pricing of alternative sources of energy, a potential shift to lower carbon intensive energy sources or a shift to a lower carbon economy, and technological advances may also depress the overall level of exploration and production activity, similarly impacting the demand for our services.
If a reduction in exploration and development activities, whether resulting from changes in oil and natural gas prices or reductions in capital budgets as described above or otherwise, continues or worsens, it could materially and adversely affect us further by:
| ▪ | negatively impacting our revenue, cash flow, profitability and financial condition |
| ▪ | restricting our ability to make capital expenditures compared to periods prior to the downturn and our ability to meet future contracted deliveries of new-build rigs |
49 | Management’s Discussion and Analysis |
| ▪ | affecting the existing fair market value of our rig fleet, which in turn could trigger a write-down for accounting purposes |
| ▪ | our customers negotiating, terminating, or failing to honour their drilling contracts with us |
| ▪ | making our Senior Credit Facility financial covenants more difficult to attain, and |
| ▪ | negatively impacting our ability to maintain or increase our borrowing capacity, our ability to obtain additional capital to finance our business and our ability to achieve our debt reduction targets. |
There is no assurance that demands for our services or conditions in the oil and natural gas and oilfield services sector will not decline in the future, and a significant decline in demand could have a material adverse effect on our business, financial condition, results of operations and cash flow.
Additionally, we have accounts receivable with customers in the oil and natural gas industry and their revenues may be affected by fluctuations in commodity prices. Our ability to collect receivables may be adversely affected by any prolonged weakness in oil and natural gas prices.
Pipeline constraints in western Canada have an adverse effect on the demand for our services in Canada
In western Canada, delays and/or the inability to obtain necessary regulatory approvals for pipeline projects that would provide additional transportation capacity and access to refinery capacity for our customers has led to downward price pressure on oil and natural gas produced in western Canada, which has depressed, and may continue to depress, the overall exploration and production activity of our customers. Construction has commenced on the Trans Mountain and Coastal Gaslink pipelines in Western Canada; however, both projects may face further regulatory delays or disruptions. The regulatory uncertainty in Canada has impacted some of our customers’ ability to obtain financing, which has also depressed overall exploration and production activity.
In December 2018, the Province of Alberta introduced mandatory curtailment on heavy oil production within the Province of Alberta, which has resulted in reduced differentials between WTI pricing and Western Canada Select Pricing; however, with limited certainty of timing for new pipeline additions, customer spending in Canada may remain at relatively depressed levels.
These factors could result in a corresponding decline in the demand for our services that could have a material adverse effect on our business, financial condition, results of operations and cash flow.
Intense price competition and the cyclical nature of the contract drilling industry could have an adverse effect on revenue and profitability
The contract drilling business is highly competitive with many industry participants. We compete for drilling contracts that are usually awarded based on competitive bids. We believe pricing and rig availability are the primary factors potential customers consider when selecting a drilling contractor. We believe other factors are also important, such as the drilling capabilities and condition of drilling rigs, the quality of service and experience of rig crews, the safety record of the contractor, the offering of ancillary services, the ability to provide drilling equipment that is adaptable, having personnel familiar with new technologies and drilling techniques, and rig mobility and efficiency.
Historically, contract drilling has been cyclical with periods of low demand, excess rig supply and low day rates, followed by periods of high demand, short rig supply and increasing day rates. Periods of excess drilling rig supply intensify the competition and often result in rigs being idle. There are numerous contract drilling companies in the markets where we operate, and an oversupply of drilling rigs can cause greater price competition. Contract drilling companies compete primarily on a regional basis, and the intensity of competition can vary significantly from region to region at any particular time. If demand for drilling services is better in a region where we operate, our competitors might respond by moving suitable drilling rigs in from other regions, reactivating previously stacked rigs or purchasing new drilling rigs. An influx of drilling rigs into a market from any source could rapidly intensify competition and make any improvement in the demand for our drilling rigs short-lived, which could in turn have a material adverse effect on our business, financial condition, results of operations and cash flow.
Our business results and the strength of our financial position are affected by our ability to strategically manage our capital expenditure program in a manner consistent with industry cycles and fluctuations in the demand for contract drilling services. If we do not effectively manage our capital expenditures or respond to market signals relating to the supply or demand for contract drilling and oilfield services, it could have a material adverse effect on our business, financial condition, results of operations and cash flow.
New capital expenditures in the contract drilling industry expose us to the risk of oversupply of equipment
Periods of high demand often lead to higher capital expenditures on drilling rigs and other oilfield services equipment. The number of newer drilling rigs competing for work in markets where we operate has increased as the industry has added new and upgraded rigs. The industry supply of drilling rigs may exceed actual demand because of the relatively long-life span of oilfield services equipment as well as the typically long time from when a decision is made to upgrade or build new equipment to when the equipment is built and placed into service. Excess supply resulting from industry-wide capital expenditures could lead to lower demand for term drilling contracts and for our equipment and services. The additional supply of drilling rigs has intensified price competition in the past and could continue to do so. This could lead to lower day rates in the oilfield services industry generally and lower utilization of existing rigs. If any of these factors materialize, it could have a material adverse effect on our business, financial condition, results of operations and cash flow.
| |
Precision Drilling Corporation 2019 Annual Report | 50 |
We require sufficient cash flows to service and repay our debt
We will need sufficient cash flows in the future to service and repay our debt. Our ability to generate cash in the future is affected to some extent by general economic, financial, competitive and other factors that may be beyond our control. If we need to borrow funds in the future to service our debt, our ability will depend on covenants in our Senior Credit Facility and the indentures associated with the unsecured senior 2021, 2023, 2024 and 2026 notes (the Senior Note Indentures) and other debt agreements we may have in the future, and on our credit ratings. We may not be able to access sufficient amounts under the Senior Credit Facility or from the capital markets in the future to pay our obligations as they mature, or to fund other liquidity requirements. If we are not able to borrow a sufficient amount or generate enough cash flow from operations to service and repay our debt, we will need to refinance our debt or we will be in default, and we could be forced to reduce or delay investments and capital expenditures or dispose of material assets or issue equity. We may not be able to refinance or arrange alternative measures on favourable terms or at all. If we are unable to service, repay or refinance our debt, it could have a negative impact on our business, financial condition, results of operations and cash flow.
Repaying our debt depends on our guarantor subsidiaries generating cash flow and making it available to us by dividend, debt repayment or otherwise. Our guarantor subsidiaries may not be able to, or may not be permitted to, make distributions to allow us to make payments on our debt. Each guarantor subsidiary is a distinct legal entity, and, under certain circumstances, legal and contractual restrictions may limit our ability to obtain cash from the subsidiaries. While the agreements governing certain existing debt limits the ability of our subsidiaries to incur consensual restrictions on their ability to pay dividends or make other intercompany payments to us, these limitations are subject to qualifications and exceptions.
A substantial portion of our operations are carried out through subsidiaries, and some of them are not guarantors of our debt. The assets of the non-guarantor subsidiaries represent approximately 18% of Precision’s consolidated assets. These subsidiaries do not have any obligation to pay amounts due on the debt or to make funds available for that purpose.
If we do not receive funds from our guarantor subsidiaries, we may be unable to make the required principal and interest payments, which could have a material adverse effect on our business, financial condition, results of operations and cash flow.
Customers’ inability to obtain credit/financing could lead to lower demand for our services
Many of our customers require reasonable access to credit facilities and debt capital markets to finance their oil and natural gas drilling activity. If the availability of credit to our customers is reduced, they may reduce their drilling and production expenditures, thereby decreasing demand for our products and services. In Canada, the Supreme Court of Canada’s 2019 Redwater decision (Orphan Well Association v. Grant Thornton Ltd., which held that abandonment and reclamation obligations of a bankrupt debtor were binding on the debtor’s trustee) may increase the cost of capital for our Canadian customers and could impact the availability of credit for those customers. A reduction in spending by our customers could have a material adverse effect on our business, financial condition, results of operations and cash flow as described further under – “Our operations depend on the price of oil and natural gas, which have been subject to increased volatility in recent years, and the exploration and development activities of oil and natural gas exploration companies” on page 49.
Our debt facilities contain restrictive covenants
The Senior Credit Facility and the Senior Note Indentures contain a number of covenants which, among other things, restrict us and some of our subsidiaries from conducting certain activities (see Capital Structure – Debt – Unsecured Senior Notes on page 43). In the event our Consolidated Interest Coverage Ratio (as defined in our four senior note indentures) is less than 2.0:1 for the most recent four consecutive fiscal quarters, the senior note indentures restrict our ability to incur additional indebtedness. As at December 31, 2019, our Consolidated Interest Coverage Ratio, as calculated per our senior note indentures, was 3.30:1.
In addition, we must satisfy and maintain certain financial ratio tests under the Senior Credit Facility (see Capital Structure – Debt on page 42). Events beyond our control could affect our ability to meet these tests in the future. If we breach any of the covenants, it could result in a default under the Senior Credit Facility or any of the Senior Note Indentures. If there is a default under our Senior Credit Facility, the applicable lenders could decide to declare all amounts outstanding under the Senior Credit Facility or any of the Senior Note Indentures to be due and payable immediately and terminate any commitments to extend further credit. If there is an acceleration by the lenders and the accelerated amounts exceed a specific threshold, the applicable noteholders could decide to declare all amounts outstanding under any of the Senior Note Indentures to be due and payable immediately.
At December 31, 2019, we were in compliance with the covenants of our Senior Credit Facility.
Uncertainty in Trade Relations
Implementation by the U.S. of new legislative or regulatory regimes or tariffs could impose additional costs on us, decrease U.S., Mexico or Canadian demand for our services or otherwise negatively impact us or our customers, which may have a material adverse effect on our business, financial condition, results of operations and cash flow. A revised U.S.-Mexico-Canada Agreement (USMCA) deal to replace the North American Free Trade Agreement (NAFTA) has recently been ratified in the U.S. and Mexico and the process to ratify has commenced in Canada. Changes that could have had an impact on the oil and natural gas industry were not included in the revised USMCA; however, it is currently unclear how this agreement may affect the U.S., Mexico and Canada and what effects USMCA will have on our operations.
51 | Management’s Discussion and Analysis |
Risks and uncertainties associated with our international operations can negatively affect our business
We conduct some of our business in the Middle East. Our growth plans contemplate establishing operations in other international regions, including countries where the political and economic systems may be less stable than in Canada or the United States.
Our international operations are subject to risks normally associated with conducting business in foreign countries, including, but not limited to, the following:
| ▪ | an uncertain political and economic environment |
| ▪ | the loss of revenue, property and equipment as a result of expropriation, confiscation, nationalization, contract deprivation and force majeure |
| ▪ | war, terrorist acts or threats, civil insurrection and geopolitical and other political risks |
| ▪ | fluctuations in foreign currency and exchange controls |
| ▪ | restrictions on the repatriation of income or capital |
| ▪ | increases in duties, taxes and governmental royalties |
| ▪ | renegotiation of contracts with governmental entities |
| ▪ | changes in laws and policies governing operations of companies |
| ▪ | compliance with anti-corruption and anti-bribery legislation in Canada, the U.S. and other countries |
| ▪ | trade restrictions or embargoes imposed by the U.S. or other countries. |
If there is a dispute relating to our international operations, we may be subject to the exclusive jurisdiction of foreign courts or may not be able to subject foreign persons to the jurisdiction of a court in Canada or the U.S.
Government-owned petroleum companies located in some of the countries where we operate now or in the future may have policies, or may be subject to governmental policies, that give preference to the purchase of goods and services from companies that are majority-owned by local nationals. As such, we may rely on joint ventures, license arrangements and other business combinations with local nationals in these countries, which may expose us to certain counterparty risks, including the failure of local nationals to meet contractual obligations or comply with local or international laws that apply to us.
In the international markets where we operate, we are subject to various laws and regulations that govern the operation and taxation of our businesses and the import and export of our equipment from country to country. There may be uncertainty about how these laws and regulations are imposed, applied or interpreted, and they could be subject to change. Since we derive a portion of our revenues from subsidiaries outside of Canada and the U.S., the subsidiaries paying dividends or making other cash payments or advances may be restricted from transferring funds in or out of the respective countries, or face exchange controls or taxes on any payments or advances. We have organized our foreign operations partly based on certain assumptions about various tax laws (including capital gains and withholding taxes), foreign currency exchange, and capital repatriation laws and other relevant laws of a variety of foreign jurisdictions. We believe these assumptions are reasonable; however, there is no assurance that foreign taxing or other authorities will reach the same conclusion. If these foreign jurisdictions change or modify the laws, we could suffer adverse tax and financial consequences.
We are subject to compliance with the United States Foreign Corrupt Practices Act (FCPA) and the Corruption of Foreign Public Official Act (Canada) (CFPOA), which generally prohibit companies from making improper payments to foreign government officials for the purpose of obtaining business. While we have developed policies and procedures designed to achieve compliance with the FCPA, CFPOA and other applicable international laws, we could be exposed to potential claims, economic sanctions or other restrictions for alleged or actual violations of international laws related to our international operations, including anti-corruption and anti-bribery legislation, trade laws and trade sanctions. The Canadian government, the U.S. Department of Justice, the Securities and Exchange Commission (SEC), the U.S. Office of Foreign Assets Control and similar agencies and authorities in other jurisdictions have a broad range of civil and criminal penalties they may seek to impose against corporations and individuals for such violations, including injunctive relief, disgorgement, fines, penalties and modifications to business practices and compliance programs, among other things. While we cannot accurately predict the impact of any of these factors, if any of those risks materialize, it could have a material adverse effect on our reputation, business, financial condition, results of operations and cash flow.
Our and our customer’s operations are subject to numerous environmental laws, regulations and guidelines
Our operations are affected by numerous laws, regulations and guidelines relating to the protection of the environment, including those governing the management, transportation and disposal of hazardous substances and other waste materials. These include those relating to spills, releases and discharges of hazardous substances or other waste materials into the environment, requiring removal or remediation of pollutants or contaminants, and imposing civil and criminal penalties for violations. Some of these apply to our operations and authorize the recovery of damages by the government, injunctive relief, and the imposition of stop, control, remediation and abandonment orders. In addition, our land drilling operations may be conducted in or near
| |
Precision Drilling Corporation 2019 Annual Report | 52 |
ecologically sensitive areas, such as wetlands that are subject to special protective measures, which may expose us to additional operating costs and liabilities for noncompliance with certain laws. Some environmental laws and regulations may impose strict and, in certain cases joint and several, liability. This means that in some situations we could be exposed to liability as a result of conduct that was lawful at the time it occurred, or conditions caused by prior operators or other third parties, including any liability related to offsite treatment or disposal facilities. The costs arising from compliance with these laws, regulations and guidelines may be material.
Major projects which would benefit our customers, such as new pipelines and other facilities, may be inhibited, delayed or stopped by a variety of factors, including inability to obtain regulatory or governmental approvals or public opposition.
We maintain liability insurance, including insurance for certain environmental claims, but coverage is limited and some of our policies exclude coverage for damages resulting from environmental contamination. We cannot assure that insurance will continue to be available to us on commercially reasonable terms, that the possible types of liabilities that we may incur will be covered by insurance, or that the dollar amount of the liabilities will not exceed our policy limits. Even a partially uninsured claim, if successful and of sufficient magnitude, could have a material adverse effect on our business, financial condition, results of operations and cash flow.
Environment regulations could have a significant impact on the energy industry
The subject of energy and the environment has created intense public debate around the world in recent years. Debate is likely to continue for the foreseeable future and could potentially have a significant impact on all aspects of the economy. The trend in environmental regulation has been to impose more restrictions and limitations on activities that may impact the environment. Any regulatory changes that impose additional environmental restrictions or requirements on us, or our customers, could increase our operating costs and potentially lead to lower demand for our services and have an adverse effect. Laws, regulations or treaties concerning climate change or greenhouse gas emissions, including incentives to conserve energy or use alternate sources of energy, can have an adverse impact on the demand for oil and natural gas, which could have a material adverse effect on us. Such laws, regulations or treatises are evolving and it is difficult to estimate with certainty the impact they will have on our business.
Governments in Canada and the U.S. are also considering more stringent regulation or restriction of hydraulic fracturing, a technology used by most of our customers that involves the injection of water, sand and chemicals under pressure into rock formations to stimulate oil and natural gas production. Increasing regulatory restrictions could have a negative impact on the exploration of unconventional energy resources, which are only commercially viable with the use of hydraulic fracturing. Laws relating to hydraulic fracturing are in various stages of development at levels of governments in markets where we operate and the outcome of these developments and their effect on the regulatory landscape and the contract drilling industry is uncertain. Hydraulic fracturing laws or regulations that cause a decrease in the completion of new oil and natural gas wells and an associated decrease in demand for our services could have a material adverse effect on our business, financial condition, results of operations and cash flow.
Poor safety performance could lead to lower demand for our services
Standards for accident prevention in the oil and natural gas industry are governed by service company safety policies and procedures, accepted industry safety practices, customer-specific safety requirements, and health and safety legislation. Safety is a key factor that customers consider when selecting an oilfield services company. A decline in our safety performance could result in lower demand for services, and this could have a material adverse effect on our business, financial condition, results of operations and cash flow.
We are subject to various health and safety laws, rules, legislation and guidelines which can impose material liability, increase our costs or lead to lower demand for our services.
Relying on third-party suppliers has risks and shortages in supply of equipment could adversely impact our business
We source certain key rig components, raw materials, equipment and component parts from a variety of suppliers in Canada, the U.S. and internationally. We also outsource some or all construction services for drilling and service rigs, including new-build rigs, as part of our capital expenditure programs. We maintain relationships with several key suppliers and contractors and an inventory of key components, materials, equipment and parts. We also place advance orders for components that have long lead times. We may, however, experience cost increases, delays in delivery due to strong activity or financial hardship of suppliers or contractors, or other unforeseen circumstances relating to third parties. In times of increased demand for drilling services, there may be shortages of components, materials, equipment, parts and services required for our business. If our current or alternate suppliers are unable to deliver the necessary components, materials, equipment, parts and services we require for our businesses, including the construction of new-build drilling rigs, it can delay service to our customers and have a material adverse effect on our business, financial condition, results of operations and cash flow.
53 | Management’s Discussion and Analysis |
The loss of one or more of our larger customers could have a material adverse effect on our business and our current backlog of contract drilling revenue may decline
In 2019, approximately 39% of our revenue was received from our 10 largest drilling customers and approximately 20% of our revenue was received from our three largest drilling customers. The loss of one or more of our larger customers could have a material adverse effect on our business, financial condition, results of operations and cash flow. In addition, financial difficulties experienced by customers could adversely impact their demand for our services and cause them to request amendments to our contracts with them. Further, consolidation among oil and natural gas exploration and production companies may reduce the number of available customers.
Our fixed-term drilling contracts generally provide our customers with an ability to terminate the contracts at their election, with an early termination payment to us if the contract is terminated prior to the expiration of the fixed term. During depressed market conditions or otherwise, customers may be unable to satisfy their contractual obligations or may seek to terminate or renegotiate or otherwise fail to honor their contractual obligations. In addition, we may not be able to perform under these contracts due to events beyond our control, and our customers may seek to terminate or renegotiate our contracts for various reasons, without paying an early termination payment. As a result, we may not realize all of our contract drilling backlog. In addition, the termination or renegotiation of fixed-term contracts without the receipt of early termination payments could have a material adverse effect on our business, financial condition, results of operations and cash flows. Our contract drilling backlog may decline, as fixed-term drilling contract coverage over time may not be offset by new or renegotiated contracts or may be reduced by price adjustments to existing contracts, including as a result of the decline in the price of oil and natural gas, capital spending reductions by our customers or other factors.
Acquisitions entail numerous risks and may disrupt our business or distract management
We consider and evaluate acquisitions of, or significant investments in, complementary businesses and assets as part of our business strategy. Acquisitions involve numerous risks, including unanticipated costs and liabilities, difficulty in integrating the operations and assets of the acquired business, the ability to properly access and maintain an effective internal control environment over an acquired company to comply with public reporting requirements, potential loss of key employees and customers of the acquired companies, and an increase in our expenses and working capital requirements. Any acquisition could have a material adverse effect on our business, financial condition, results of operations and cash flow.
We may incur substantial debt to finance future acquisitions and also may issue equity securities or convertible securities for acquisitions. Debt service requirements could be a burden on our results of operations and financial condition. We would also be required to meet certain conditions to borrow money to fund future acquisitions. Acquisitions could also divert the attention of management and other employees from our day-to-day operations and the development of new business opportunities. Even if we are successful in integrating future acquisitions into our operations, we may not derive the benefits such as operational or administrative synergies we expect from acquisitions, which may result in us committing capital resources and not receiving the expected returns. In addition, we may not be able to continue to identify attractive acquisition opportunities or successfully acquire identified targets.
New technology could reduce demand for certain rigs or put us at a competitive disadvantage
Complex drilling programs for the exploration and development of conventional and unconventional oil and natural gas reserves demand high performance drilling rigs. The ability of drilling rig service providers to meet this demand depends on continuous improvement of existing rig technology, such as drive systems, control systems, automation, mud systems and top drives, to improve drilling efficiency. Our ability to deliver equipment and services that meet customer demand is essential to our continued success. We cannot guarantee that our rig technology will continue to meet the needs of our customers, especially as rigs age and technology advances, or that our competitors will not develop technological improvements that are more advantageous, timely, or cost effective.
Our operations face risks of interruption and casualty losses
Our operations face many hazards inherent in the drilling and well servicing industries, including blowouts, cratering, explosions, fires, loss of well control, loss of hole, reservoir damage, loss of directional control, damaged or lost equipment, and damage or loss from inclement weather or natural disasters. Any of these hazards could result in personal injury or death, damage to or destruction of equipment and facilities, suspension of operations, environmental damage, damage to the property of others, and damage to producing or potentially productive oil and natural gas formations that we drill through, which could have a material adverse effect on our business, financial condition, results of operations and cash flow. Additionally, unexpected events such as unplanned power outages, natural disasters, supply disruptions, pandemic illness or other unforeseeable circumstances could have a material adverse effect on our business, financial condition, results of operations and cash flow.
Our worldwide operations could be disrupted by terrorism, acts of war, earthquakes, telecommunications failures, power or water shortages, tsunamis, floods, hurricanes, typhoons, fires, extreme weather conditions (whether as a result of climate change or otherwise), medical epidemics or pandemics and other natural or manmade disasters or catastrophic events, for some of which we may be self-insured. The occurrence of any of these business disruptions could result in difficulties in transporting our crews, hiring or managing personnel as well as other significant losses, that may adversely affect our business, financial conditions, results of operations and cash flow, and require substantial expenditures and recovery time in order to fully resume operations.
| |
Precision Drilling Corporation 2019 Annual Report | 54 |
Generally, drilling and service rig contracts separate the responsibilities of a drilling or service rig company and the customer, and we try to obtain indemnification from our customers by contract for some of these risks even though we also have insurance coverage to protect us. We cannot assure, however, that any insurance or indemnification agreements will adequately protect us against liability from all the consequences described above. If there is an event that is not fully insured or indemnified against, or a customer or insurer does not meet its indemnification or insurance obligations, it could result in substantial losses. In addition, we may not be able to get insurance to cover any or all these risks, or the coverage may not be adequate. Insurance premiums or other costs may rise significantly in the future, making the insurance prohibitively expensive or uneconomic. Significant events, including terrorist attacks in the U.S., wildfires, severe hurricane damage and well blowout damage in the U.S. Gulf Coast region, have resulted in significantly higher insurance costs, deductibles and coverage restrictions. When we renew our insurance, we may decide to self-insure at higher levels and assume increased risk in order to reduce costs associated with higher insurance premiums.
Business in our industry is seasonal and highly variable
Seasonal weather patterns in Canada and the northern U.S. affect activity in the oilfield services industry. During the spring months, wet weather and the spring thaw make the ground unstable, so municipalities and counties and provincial and state transportation departments enforce road bans that restrict the movement of rigs and other heavy equipment. This reduces activity and highlights the importance of the location of our equipment prior to the imposition of the road bans. The timing and length of road bans depend on weather conditions leading to the spring thaw and during the thawing period.
Additionally, certain oil and natural gas producing areas are located in parts of western Canada that are only accessible during the winter months because the ground surrounding or containing the drilling sites in these areas consists of terrain known as muskeg. Rigs and other necessary equipment cannot cross this terrain to reach the drilling site until the muskeg freezes. Moreover, once the rigs and other equipment have been moved to a drilling site, they may become stranded or be unable to move to another site if the muskeg thaws unexpectedly. Our business activity depends, at least in part, on the severity and duration of the winter season.
Global climate change could impact the timing and length of the spring thaw and the period in which the muskeg freezes and thaws and it could impact the severity of winter, which could adversely affect our business and operating results. We cannot, however, estimate the degree to which climate change and extreme climate conditions could impact our business and operating results.
Litigation and legal claims could have an adverse impact on our business
We may be subject to legal proceedings and governmental investigations from time to time related to our business and operations. Lawsuits or claims against us could have a material adverse effect on our business, financial condition, results of operations and cash flow. While we maintain insurance that may cover the cost of certain litigation or have indemnity provisions in our favor, we cannot assure that any insurance or indemnification agreement will cover the cost of theses liabilities, thus litigation or claims could negatively impact our business, reputation, financial condition and cash flow.
Unionization efforts and labor regulations could materially increase our costs or limit our flexibility
Efforts may be made from time to time to unionize portions of our workforce. We may be subject to strikes or work stoppages and other labor disruptions in connection with unionization efforts or renegotiation of existing contracts with unions. Unionization efforts, if successful, new collective bargaining agreements or work stoppages could materially increase our labor costs, reduce our revenues and adversely impact our operations and cash flow.
Effects of climate change, including physical and regulatory impacts, could have a negative impact on our business
The effects of climate change, including physical and regulatory impacts, could have a negative impact on our operations and the demand for oil and natural gas. There is growing concern about the apparent connection between the burning of fossil fuels and climate change. Laws, regulations or treaties concerning climate change or greenhouse gas emissions, including incentives to conserve energy or use alternate sources of energy, can have an adverse impact on the demand for oil and natural gas, which could have a material adverse effect on us.
As discussed above, under “Business in our industry is seasonal and highly variable”, weather patterns in Canada and the northern U.S. affect activity in the oilfield services industry. Global climate change could impact the timing and length of the spring thaw and the period in which the muskeg freezes and thaws and could impact the severity of winter, which could have a material adverse affect on our business and operating results. Furthermore, extreme climate conditions that could result in natural disasters such as flooding or forest fires, may result in delays or cancellation of some of our customer’s operations or could increase our operating costs (such as insurance costs), which could have a material adverse affect on our business and operating results. We cannot, however, estimate the degree to which climate change and extreme climate conditions could impact our business and operating results.
55 | Management’s Discussion and Analysis |
Canada and the U.S. are signatories to the Paris Agreement drafted at the United Nations Framework Convention on Climate Change in December 2015. The goals of the Paris Agreement are to prevent global temperature rise from exceeding 2 degrees Celsius above pre-industrial levels and to pursue efforts to limit the temperature increase to 1.5 degrees Celsius above pre-industrial levels. On August 4, 2017, the U.S. submitted formal notice of intention to withdraw from the Paris Agreement; however, under the terms of the Paris Agreement, the U.S. will remain a party until approximately August 2020. It is uncertain whether the U.S. will adhere to the exit process and/or enter into separately negotiated agreements related to climate change. In Canada, in connection with its commitments under the Paris Agreement, the federal government developed the Pan-Canadian Framework on Clean Growth and Climate Change in 2016 (the “PCF”). The PCF requires all provinces and territories to have a carbon price of $20 per tonne in 2019 and rising by $10 per year to $50 per tonne in 2022. Provinces and territories can implement either an explicit price-based system (such as the systems implemented in British Columbia and Alberta) or a cap and trade system. Saskatchewan remains the only Canadian jurisdiction that has not joined the national plan set out in the PCF. Saskatchewan released its own output-based performance standards approach, which is applied only to certain large industrial facilities. The proposed system in Saskatchewan only partially meets the PCF standards, therefore the federal carbon pollution pricing system will apply in Saskatchewan to sources not covered by Saskatchewan’s system. It is not possible at this time to predict the effect of the Paris Agreement and climate change-related legislation in Canada and the U.S. or whether additional climate-change legislation, regulations or other measures will be adopted at the federal, state, provincial or local levels in Canada and the U.S. However, further efforts by governments and non-governmental organizations to reduce greenhouse gas emissions appear likely, which may reduce demand for oil and natural gas.
In addition to physical and regulatory effects of climate change on our business, an increasing focus on reduction of greenhouse gas emissions and a potential shift to lower carbon intensive energy sources or a shift to a lower carbon economy may depress the overall level of exploration and production activity, impacting the demand for our services. Certain investors may discourage investments into the hydrocarbon industry. To the extent that certain institutions implement policies that discourage investments in our industry, it could have an adverse effect on our financing costs and our access to liquidity and capital. Additionally, if our reputation is diminished as a result of the industry we operate in or service, it could result in increased operating or regulatory costs, lower shareholder confidence or loss of public support for our business.
Disease Outbreak may impact our business
A local, regional, national or international outbreak of a contagious disease, such as COVID-19, could have an adverse effect on local economies and potentially the global economy, which may adversely impact the price of and demand for oil and gas (and correspondingly, decrease the demand for our services, which could have a material adverse effect on our business, financial condition, results of operations and cash flows). Additionally, such an outbreak, if uncontrolled, may result in temporary shortages of staff to the extent our work force is impacted, which may have a material adverse effect on our business.
Our operations are subject to foreign exchange risk
Our U.S. and international operations have revenue, expenses, assets and liabilities denominated in currencies other than the Canadian dollar and are mostly in U.S. dollars and currencies that are pegged to the U.S. dollar. This means that currency exchange rates can affect our income statement, balance sheet and statement of cash flow.
Translation into Canadian Dollars
When preparing our consolidated financial statements, we translate the financial statements for foreign operations that do not have a Canadian dollar functional currency into Canadian dollars. We translate assets and liabilities at exchange rates in effect at the period end date. We translate revenues and expenses using average exchange rates for the month of the transaction. We initially recognize gains or losses from these translation adjustments in other comprehensive income and reclassify them from equity to net earnings on disposal or partial disposal of the foreign operation. Changes in currency exchange rates could materially increase or decrease our foreign currency-denominated net assets, which would increase or decrease shareholders’ equity. Changes in currency exchange rates will affect the amount of revenues and expenses we record for our U.S. and international operations, which will increase or decrease our net earnings. If the Canadian dollar strengthens against the U.S. dollar, the net earnings we record in Canadian dollars from our U.S. and international operations will be lower.
Transaction exposure
We have long-term debt denominated in U.S. dollars. We have designated our U.S. dollar denominated unsecured senior notes as a hedge against the net asset position of our U.S. and foreign operations. This debt is converted at the exchange rate in effect at the period end dates with the resulting gains or losses included in the statement of comprehensive income. If the Canadian dollar strengthens against the U.S. dollar, we will incur a foreign exchange gain from the translation of this debt. Similarly, if the Canadian dollar weakens against the U.S. dollar, we will incur a foreign exchange loss from the translation of this debt. The vast majority of our international operations are transacted in U.S. dollars or U.S. dollar-pegged currencies. Transactions for our Canadian operations are primarily transacted in Canadian dollars. We occasionally purchase goods and supplies in U.S. dollars for our Canadian operations, and we maintain U.S. dollar cash in our Canadian operations.
| |
Precision Drilling Corporation 2019 Annual Report | 56 |
We may be unable to access additional financing
We may need to obtain additional debt or equity financing in the future to support ongoing operations, undertake capital expenditures, repay existing or future debt including the Senior Credit Facility and the Senior Note Indentures, or pursue acquisitions or other business combination transactions. Volatility or uncertainty in the credit markets may increase costs associated with issuing debt or equity, and there is no assurance that we will be able to access additional financing when we need it, or on terms we find acceptable or favourable. Such volatility and uncertainty may be adversely impacted by potential negative perception of investing in the hydrocarbon industry. If we are unable to obtain financing to support ongoing operations or to fund capital expenditures, acquisitions, debt repayments, or other business combination transactions, it could limit growth and may have a material adverse effect on our business, financial condition, results of operations, and cash flow.
Increasing Interest Rates may increase our cost of borrowing
Increases to the Canadian or United States benchmark interest rates may have an impact on our cost of borrowing under our Senior Credit Facility and any debt financing we may negotiate. On July 27, 2017, the U.K. Financial Conduct Authority announced that it intends to stop compelling banks to submit LIBOR rates after 2021. The elimination of LIBOR or any other changes or reforms to the determination or supervision of LIBOR could have an adverse impact on the market for or value of any LIBOR-linked securities, loans, and other financial obligations or extensions of credit held by or due to us.
Risks associated with turnkey drilling operations could adversely affect our business
We earn some of our revenue from turnkey drilling contracts. We expect that turnkey drilling will continue to be part of our service offering; however, turnkey contracts pose substantially more risk than wells drilled on a daywork basis. Under a typical turnkey drilling contract, we agree to drill a well for a customer to a specified depth and under specified conditions for a fixed price. We typically provide technical expertise and engineering services, as well as most of the equipment required for the drilling of turnkey wells and use subcontractors for related services. We typically do not receive progress payments and are entitled to payment by the customer only after we have met the full terms of the drilling contract. We sometimes encounter difficulties on wells and incur unanticipated costs, and not all the costs are covered by insurance. As a result, under turnkey contracts we assume most of the risks associated with drilling operations that are generally assumed by customers under a daywork contract. Operating cost overruns or operational difficulties on turnkey jobs could have a material adverse effect on our business, financial condition, results of operations and cash flow.
There are risks associated with increased capital expenditures
The timing and amount of capital expenditures we incur will directly affect the amount of cash available to us. The cost of equipment generally escalates as a result of high input costs during periods of high demand for our drilling rigs and oilfield services equipment and other factors. There is no assurance that we will be able to recover higher capital costs through rate increases to our customers.
A successful challenge by the tax authorities of expense deductions could negatively affect the value of our common shares
Taxation authorities may not agree with the classification of expenses we or our subsidiaries have claimed, or they may challenge the amount of interest expense deducted. If the taxation authorities successfully challenge our classifications or deductions, it could have a material adverse effect on our business financial condition, results of operations and cash flow.
Losing key management could reduce our competitiveness and prospects for future success
Our future success and growth depend partly on the expertise and experience of our key management. There is no assurance that we will be able to retain key management. Losing these individuals could have a material adverse effect on our business, financial condition, results of operations and cash flow.
Our assessment of goodwill or capital assets for impairment may result in a non-cash charge against our consolidated net income
We are required to assess our goodwill balance for impairment at least annually, and our capital assets balance for impairment when certain internal and external factors indicate the need for further analysis. We calculate impairment based on management’s estimates and assumptions. We may consider several factors, including any declines in our share price and market capitalization, lower future cash flow and earnings estimates, significantly reduced or depressed markets in our industry, and general economic conditions, among other things. Any impairment write-down to goodwill or capital assets would result in a non-cash charge against net earnings, and it could be material.
After recording a goodwill impairment charge for $208 million in the fourth quarter of 2018, we no longer have a goodwill balance.
57 | Management’s Discussion and Analysis |
Our credit ratings may change
Credit ratings affect our financing costs, liquidity and operations over the long term and are intended as an independent measure of the credit quality of long-term debt. Credit ratings affect our ability to obtain short and long-term financing and the cost of this financing, and our ability to engage in certain business activities cost-effectively.
If a rating agency reduces its current rating on our debt, or downgrades us, or we experience a negative change in our ratings outlook, it could have an adverse effect on our financing costs and access to liquidity and capital.
The price of our common shares can fluctuate
Several factors can cause volatility in our share price, including increases or decreases in revenue or earnings, changes in revenue or earnings estimates by the investment community, failure to meet analysts’ expectations, changes in credit ratings, and speculation in the media or investment community about our financial condition or results of operations. General market conditions, the perception of the industry we operate in and service and Canadian, U.S. or international economic and social factors and political events unrelated to our performance may also affect the price of our common shares. Investors should therefore not rely on past performance of our common shares to predict the future performance of our common shares or financial results. At times when our share price is relatively low, we may be subject to takeover attempts by certain companies or institutions acting opportunistically.
While there is currently an active trading market for our shares in both the United States and Canada, we cannot guarantee that an active trading market will be sustained in either country. There could cease to be an active trading market due to, among other factors, minimum listing requirements of stock exchanges. If an active trading market in our shares is not sustained, the trading liquidity of our shares will be limited and the market value of our shares may be reduced. The removal of our shares from stock exchanges due to the failure to maintain minimum listing requirements may have an adverse impact on the value of our shares.
Selling additional common shares could affect share value
While we implemented a normal course issuer bid under which we may acquire our own common shares, in the future we may issue additional common shares to fund our needs or those of other entities owned directly or indirectly by us, as authorized by the Board. We do not need shareholder approval to issue additional common shares, except as may be required by applicable stock exchange rules, and shareholders do not have any pre-emptive rights related to share issues (see Capital Structure on page 42).
Any difficulty in retaining, replacing, or adding personnel could adversely affect our business
Our ability to provide reliable services depends on the availability of well-trained, experienced crews to operate our field equipment. We must also balance our need to maintain a skilled workforce with cost structures that fluctuate with activity levels. We retain the most experienced employees during periods of low utilization by having them fill lower level positions on field crews. Many of our businesses experience manpower shortages in peak operating periods, and we may experience more severe shortages if the industry adds more rigs, oilfield services companies expand, and new companies enter the business.
We may not be able to find enough skilled labour to meet our needs, and this could limit growth. We may also have difficulty finding enough skilled and unskilled labour in the future if demand for our services increases. Shortages of qualified personnel have occurred in the past during periods of high demand. The demand for qualified rig personnel generally increases with stronger demand for land drilling services and as new and refurbished rigs are brought into service. Increased demand typically leads to higher wages that may or may not be reflected in any increases in service rates.
Other factors can also affect our ability to find enough workers to meet our needs. Our business requires skilled workers who can perform physically demanding work. Volatility in oil and natural gas activity and the demanding nature of the work, however, may prompt workers to pursue other kinds of jobs that offer a more desirable work environment and wages competitive to ours. Our success depends on our ability to continue to employ and retain skilled technical personnel and qualified rig personnel. If we are unable to, it could have a material adverse effect on our business, financial condition, results of operations and cash flow.
Our business is subject to cybersecurity risks
We rely heavily on information technology systems and other digital systems for operating our business. Threats to information technology systems associated with cybersecurity risks and cyber incidents or attacks continue to grow and are increased by the growing complexity of our information technology systems. Cybersecurity attacks could include, but are not limited to, malicious software, attempts to gain unauthorized access to data and the unauthorized release, corruption or loss of data and personal information, account takeovers, and other electronic security breaches that could lead to disruptions in our critical systems. Other cyber incidents may occur as a result of natural disasters, telecommunication failure, utility outages, human error, design defects, and unexpected complications with technology upgrades. Risks associated with these attacks and other incidents include, among other things, loss of intellectual property, reputational harm, leaked information, improper use of our assets, disruption of our and our customers’ business operations and safety procedures, loss or damage to our data delivery systems, unauthorized disclosure of personal information which could result in administrative penalties and increased costs to
| |
Precision Drilling Corporation 2019 Annual Report | 58 |
prevent, respond to or mitigate cybersecurity events. Although we use various procedures and controls to mitigate our exposure to such risk, including cybersecurity risk assessments that are reviewed by our CGNRC, cyber security awareness programs for our employees, continuous monitoring of our information technology systems for threats, and insurance that may cover losses incurred as a result of certain cyber security attacks or incidents, cybersecurity attacks and other incidents are evolving and unpredictable. The occurrence of such an attack or incident could go unnoticed for a period of time. Any such attack or incident could have a material adverse effect on our business, financial condition results of operations and cash flow.
Our business could be negatively affected as a result of actions of activist shareholders and some institutional investors may be discouraged from investing in the industry we operate in
Activist shareholders could advocate for changes to our corporate governance, operational practices and strategic direction, which could have an adverse effect on our reputation, business and future operations. In recent years, publicly traded companies have been increasingly subject to demands from activist shareholders advocating for changes to corporate governance practices, such as executive compensation practices, social issues, or for certain corporate actions or reorganizations. There can be no assurances that activist shareholders won’t publicly advocate for us to make certain corporate governance changes or engage in certain corporate actions. Responding to challenges from activist shareholders, such as proxy contests, media campaigns or other activities, could be costly and time consuming and could have an adverse effect on our reputation and divert the attention and resources of management and our Board, which could have an adverse effect on our business and operational results. Additionally, shareholder activism could create uncertainty about future strategic direction, resulting in loss of future business opportunities, which could adversely affect our business, future operations, profitability and our ability to attract and retain qualified personnel.
In addition to risks associated with activist shareholders, some institutional investors are placing an increased emphasis on ESG factors when allocating their capital. These investors may be seeking enhanced ESG disclosures or may implement policies that discourage investment in the hydrocarbon industry. To the extent that certain institutions implement policies that discourage investments in our industry, it could have an adverse effect on our financing costs and access to liquidity and capital. Additionally, if our reputation is diminished as a result of the industry we operate in or service, it could result in increased operation or regulatory costs, lower shareholder confidence or loss of public support for our business.
As a foreign private issuer in the U.S., we may file less information with the SEC than a company incorporated in the U.S.
As a foreign private issuer, we are exempt from certain rules under the United States Exchange Act of 1934 (the Exchange Act) that impose disclosure requirements, as well as procedural requirements, for proxy solicitations under Section 14 of the Exchange Act. Our directors, officers and principal shareholders are also exempt from the reporting and short-swing profit recovery provisions of Section 16 of the Exchange Act. We are not required to file periodic reports and financial statements with the SEC as frequently or as promptly as U.S. companies whose securities are registered under the Exchange Act, nor are we generally required to comply with Regulation FD, which restricts the selective disclosure of material non-public information. As a result, there may be less publicly available information about us than U.S. public companies and this information may not be provided as promptly. In addition, we are permitted, under a multi-jurisdictional disclosure system adopted by the U.S. and Canada, to prepare our disclosure documents in accordance with Canadian disclosure requirements, including preparing our financial statements in accordance with International Financial Reporting Standards (IFRS), which differs in some respects from U.S. GAAP. We are required to assess our foreign private issuer status under U.S. securities laws annually at the end of the second quarter. If we were to lose our status as a foreign private issuer under U.S. securities laws, we would be required to fully comply with U.S. securities and accounting requirements.
We have retained liabilities from prior reorganizations
We have retained all liabilities of our predecessor companies, including liabilities relating to corporate and income tax matters.
59 | Management’s Discussion and Analysis |
We may become a passive foreign investment company, which could result in adverse U.S. tax consequences to U.S. investors
Management does not believe that we are or will be treated as a passive foreign investment company (PFIC) for U.S. tax purposes. However, because PFIC status is determined annually and will depend on the composition of our income and assets from time to time, it is possible that we could be considered a PFIC in the future. This could result in adverse U.S. tax consequences to a U.S. investor. In particular, a U.S. investor would be subject to U.S. federal income tax at ordinary income rates, plus a possible interest charge, for any gain derived from a disposition of common shares, as well as certain distributions by us. In addition, a step-up in the tax basis of our common shares would not be available if an individual holder dies.
An investor who acquires 10% or more of our common shares may be subject to taxation under the controlled foreign corporation (CFC) rules.
Under certain circumstances, a U.S. person who directly or indirectly owns 10% or more of the voting power of a foreign corporation that is a CFC (generally, a foreign corporation where 10% or more U.S. shareholders own more than 50% of the voting power or value of the stock of the foreign corporation) for 30 straight days or more during a taxable year and who holds any shares of the foreign corporation on the last day of the corporation’s tax year must include in gross income for U.S. federal income tax purposes its pro rata share of certain income of the CFC even if the income is not distributed to the person. We are not currently a CFC, but this could change in the future.
| |
Precision Drilling Corporation 2019 Annual Report | 60 |
| | | | | |
| EVALUATION OF CONTROLS AND PROCEDURES | | | | |
| | | | | |
Internal Control over Financial Reporting
We maintain internal control over financial reporting that is designed to provide reasonable assurance regarding the reliability of financial reporting and the preparation of financial statements for external purposes in accordance with IFRS.
Management is responsible for establishing and maintaining adequate internal control over financial reporting, as defined in Rules 13a – 15(f) and 15d – 15(f) under the United States Securities Exchange Act of 1934, as amended (the Exchange Act) and under National Instrument 52-109 Certification of Disclosure in Issuer’s Annual and Interim Filings (NI 52-109).
Management, including the Chief Executive Officer (CEO) and the Chief Financial Officer (CFO), has conducted an evaluation of our internal control over financial reporting based on criteria established in Internal Control – Integrated Framework (2013) issued by the Committee of Sponsoring Organizations of the Treadway Commission (COSO 2013).
There were no changes in our internal control over financial reporting in 2019 that have materially affected or are reasonably likely to materially affect our internal control over financial reporting. Based on management’s assessment as of December 31, 2019, management has concluded that our internal control over financial reporting is effective.
The effectiveness of internal control over financial reporting as of December 31, 2019 was audited by KPMG LLP, an independent registered public accounting firm, as stated in their Report of Independent Registered Public Accounting Firm, which is included in this annual report.
Due to its inherent limitations, internal control over financial reporting is not intended to provide absolute assurance that a misstatement of our financial statements would be prevented or detected. Further, the evaluation of the effectiveness of internal control over financial reporting was made as of a specific date, and continued effectiveness in future periods is subject to the risks that controls may become inadequate.
Disclosure Controls and Procedures
We maintain disclosure controls and procedures designed to provide reasonable assurance that information required to be disclosed in our interim and annual filings is reviewed, recognized and disclosed accurately and in the appropriate time period.
Management, including the CEO and CFO, carried out an evaluation, as of December 31, 2019, of the effectiveness of the design and operation of Precision’s disclosure controls and procedures, as defined in Rule 13a – 15(e) and 15d – 15(e) under the Exchange Act and NI 52-109. Based on that evaluation, the CEO and CFO have concluded that the design and operation of Precision’s disclosure controls and procedures were effective to ensure that information required to be disclosed in the reports we file or submit under the Exchange Act or Canadian securities legislation is recorded, processed, summarized and reported within the time periods specified in the rules and forms therein.
It should be noted that while the CEO and CFO believe that our disclosure controls and procedures provide a reasonable level of assurance that they are effective, they do not expect that these disclosure controls and procedures will prevent all errors and fraud. A control system, no matter how well conceived or operated, can provide only reasonable, not absolute, assurance that the objectives of the control system are met.
61 | Management’s Discussion and Analysis |
CAUTIONARY STATEMENT ABOUT FORWARD-LOOKING INFORMATION AND STATEMENTS
We disclose forward-looking information to help current and prospective investors understand our future prospects.
Certain statements contained in this MD&A, including statements that contain words such as could, should, can, anticipate, estimate, intend, plan, expect, believe, will, may, continue, project, potential and similar expressions and statements relating to matters that are not historical facts constitute forward-looking information within the meaning of applicable Canadian securities legislation and forward-looking statements within the meaning of the safe harbor provisions of the United States Private Securities Litigation Reform Act of 1995 (collectively, forward-looking information and statements).
Our forward-looking information and statements in this MD&A include, but are not limited to, the following:
| ▪ | our outlook on oil and natural gas prices |
| ▪ | our expectations about drilling activity in North America and the demand for drilling rigs |
| ▪ | our capital expenditure plans for 2020 |
| ▪ | our 2020 strategic priorities |
| ▪ | the potential impact liquefied natural gas export development could have on North American drilling activity |
| ▪ | our expectations that new or newer rigs will enter the markets we currently operate in |
| ▪ | our ability to remain compliant with our senior secured credit facility financial debt covenants |
| ▪ | our reduction in general and administrative expenses anticipated in 2020, and |
| ▪ | our reduced annualized interest expense for 2020. |
The forward-looking information and statements are based on certain assumptions and analysis made by Precision in light of our experience and our perception of historical trends, current conditions and expected future developments as well as other factors we believe are appropriate in the circumstances. These include, among other things:
| ▪ | our ability to react to customer spending plans as a result of changes in oil and natural gas prices |
| ▪ | the status of current negotiations with our customers and vendors |
| ▪ | customer focus on safety performance |
| ▪ | existing term contracts are neither renewed or terminated prematurely |
| ▪ | continued market demand for drilling rigs |
| ▪ | our ability to deliver rigs to customers on a timely basis |
| ▪ | the general stability of the economic and political environment in the jurisdictions in which we operate, and |
| ▪ | the impact of an increase/decrease in capital spending. |
Undue reliance should not be placed on forward-looking information and statements. Whether actual results, performance or achievements will conform to our expectations and predictions is subject to a number of known and unknown risks and uncertainties which could cause actual results to differ materially from our expectations. Such risks and uncertainties include, but are not limited to:
| ▪ | volatility in the price and demand for oil and natural gas |
| ▪ | fluctuations in the level of oil and natural gas exploration and development activities |
| ▪ | fluctuations in the demand for contract drilling, directional drilling, well servicing and ancillary oilfield services |
| ▪ | our customers’ inability to obtain adequate credit or financing to support their drilling and production activity |
| ▪ | changes in drilling and well servicing technology, which could reduce demand for certain rigs or put us at a competitive advantage |
| ▪ | shortages, delays and interruptions in the delivery of equipment supplies and other key inputs |
| ▪ | liquidity of the capital markets to fund customer drilling programs |
| ▪ | availability of cash flow, debt and equity sources to fund our capital and operating requirements, as needed |
| ▪ | the impact of weather and seasonal conditions on operations and facilities |
| ▪ | competitive operating risks inherent in contract drilling, directional drilling, well servicing and ancillary oilfield services |
| ▪ | ability to improve our rig technology to improve drilling efficiency |
| ▪ | general economic, market or business conditions |
| ▪ | the availability of qualified personnel and management |
| ▪ | a decline in our safety performance which could result in lower demand for our services |
| |
Precision Drilling Corporation 2019 Annual Report | 62 |
| ▪ | changes in laws or regulations, including changes in environmental laws and regulations such as increased regulation of hydraulic fracturing or restrictions on the burning of fossil fuels and greenhouse gas emissions, which could have an adverse impact on the demand for oil and natural gas |
| ▪ | terrorism, social, civil and political unrest in the foreign jurisdictions where we operate |
| ▪ | fluctuations in foreign exchange, interest rates and tax rates, and |
| ▪ | other unforeseen conditions which could impact the use of services supplied by Precision and our ability to respond to such conditions. |
Readers are cautioned that the foregoing list of risk factors is not exhaustive. You can find more information about these and other factors that could affect our business, operations or financial results in reports on file with securities regulatory authorities from time to time, including but not limited to our annual information form (AIF) for the year ended December 31, 2019, which you can find in our profile on SEDAR (www.sedar.com) or in our profile on EDGAR ( www.sec.gov).
All of the forward-looking information and statements made in this MD&A are expressly qualified by these cautionary statements. There can be no assurance that actual results or developments that we anticipate will be realized. We caution you not to place undue reliance on forward-looking information and statements. The forward-looking information and statements made in this MD&A are made as of the date hereof. We will not necessarily update or revise this forward-looking information as a result of new information, future events or otherwise, unless we are required to by securities law.
63 | Management’s Discussion and Analysis |
NON-GAAP MEASURES
In this MD&A, we reference additional generally accepted accounting principles (GAAP) measures that are not defined terms under IFRS to assess performance because we believe they provide useful supplemental information to investors.
Adjusted EBITDA
We believe that adjusted EBITDA (earnings before income taxes, loss (gain) on redemption and repurchase of unsecured senior notes, finance charges, foreign exchange, impairment of goodwill, impairment (reversal of impairment) of property, plant and equipment, loss on asset decommissioning, gain on asset disposals and depreciation and amortization), as reported in our Consolidated Statement of Net Earnings (Loss), is a useful measure, because it gives an indication of the results from our principal business activities prior to consideration of how our activities are financed and the impact of foreign exchange, taxation and depreciation and amortization charges.
Covenant EBITDA
Covenant EBITDA, as defined in our senior credit facility agreement, is used in determining the Corporation’s compliance with its covenants. Covenant EBITDA differs from Adjusted EBITDA by the exclusion of bad debt expense, restructuring costs, certain foreign exchange amounts and with the adoption of the new lease standard IFRS 16 - Leases, the deduction of cash lease payments incurred after December 31, 2018.
Operating Earnings (Loss)
We believe that operating earnings (loss) is a useful measure because it provides an indication of the results of our principal business activities before consideration of how those activities are financed and the impact of foreign exchange and taxation. Operating earnings (loss) is calculated as follows:
Year ended December 31 (in thousands of dollars) | | 2019 | | | 2018 | | | 2017 | |
Revenue | | | 1,541,320 | | | | 1,541,189 | | | | 1,321,224 | |
Expenses: | | | | | | | | | | | | |
Operating | | | 1,038,967 | | | | 1,067,264 | | | | 926,171 | |
General and administrative | | | 104,010 | | | | 111,830 | | | | 90,072 | |
Restructuring | | | 6,438 | | | | 1,164 | | | | — | |
Other recoveries | | | — | | | | (14,200 | ) | | | — | |
Depreciation and amortization | | | 333,616 | | | | 377,044 | | | | 384,096 | |
Gain on asset disposals | | | (50,741 | ) | | | (11,384 | ) | | | (6,350 | ) |
Loss on asset decommissioning | | | 20,263 | | | | — | | | | — | |
Impairment (reversal of impairment) of property, plant and equipment | | | (5,810 | ) | | | — | | | | 15,313 | |
Impairment of goodwill | | | — | | | | 207,544 | | | | — | |
Operating earnings (loss) | | | 94,577 | | | | (198,073 | ) | | | (88,078 | ) |
Foreign exchange | | | (8,722 | ) | | | 4,017 | | | | (2,970 | ) |
Finance charges | | | 118,453 | | | | 127,178 | | | | 137,928 | |
Loss (gain) on redemption and repurchase of unsecured senior notes | | | (6,815 | ) | | | (5,672 | ) | | | 9,021 | |
Income taxes | | | (14,957 | ) | | | (29,326 | ) | | | (100,021 | ) |
Net earnings (loss) | | | 6,618 | | | | (294,270 | ) | | | (132,036 | ) |
Funds Provided by (Used In) Operations
We believe that funds provided by (used in) operations, as reported in our Consolidated Statements of Cash Flow, is a useful measure because it provides an indication of the funds our principal business activities generate prior to consideration of working capital, which is primarily made up of highly liquid balances.
Working Capital
We define working capital as current assets less current liabilities as reported in our Consolidated Statement of Financial Position.
| |
Precision Drilling Corporation 2019 Annual Report | 64 |