| FREE WRITING PROSPECTUS | ||
| FILED PURSUANT TO RULE 433 | ||
| REGISTRATION FILE NO.: 333-190246-11 | ||
| Dated December 5, 2014 | JPMBB 2014-C26 |
Free Writing Prospectus Structural and Collateral Term Sheet | ||
JPMBB 2014-C26 | ||
$1,449,606,872 (Approximate Mortgage Pool Balance) | ||
$1,224,918,000 (Approximate Offered Certificates) | ||
J.P. Morgan Chase Commercial Mortgage Securities Corp. Depositor | ||
| | ||
COMMERCIAL MORTGAGE PASS-THROUGH CERTIFICATES SERIES 2014-C26 | ||
| | ||
JPMorgan Chase Bank, National Association Column Financial, Inc. Barclays Bank PLC Redwood Commercial Mortgage Corporation General Electric Capital Corporation RAIT Funding, LLC Mortgage Loan Sellers | ||
J.P. Morgan Co-Lead Manager and Joint Bookrunner | Barclays Co-Lead Manager and Joint Bookrunner | Credit Suisse Co-Lead Manager and Joint Bookrunner |
Drexel Hamilton Co-Manager | ||
THE INFORMATION IN THIS STRUCTURAL AND COLLATERAL TERM SHEET IS NOT COMPLETE AND MAY BE AMENDED PRIOR TO THE TIME OF SALE. THIS TERM SHEET IS NOT AN OFFER TO SELL THESE SECURITIES AND IT IS NOT A SOLICITATION OF AN OFFER TO BUY THESE SECURITIES IN ANY JURISDICTION WHERE THE OFFER OR SALE IS NOT PERMITTED.
| Dated December 5, 2014 | JPMBB 2014-C26 |
This material is for your information, and none of J.P. Morgan Securities LLC (“JPMS”), Barclays Capital Inc. (“Barclays”), Credit Suisse Securities (USA) LLC (“Credit Suisse”) and Drexel Hamilton, LLC (“Drexel”) (each individually, an “Underwriter”, and together, the ‘‘Underwriters’’) is soliciting any action based upon it. This material is not to be construed as an offer to sell or the solicitation of any offer to buy any security in any jurisdiction where such an offer or solicitation would be illegal.
The Depositor has filed a registration statement (including a prospectus) with the SEC (SEC File no. 333-190246) for the offering to which this free writing prospectus relates. Before you invest, you should read the prospectus in the registration statement and other documents the Depositor has filed with the SEC for more complete information about the Depositor, the issuing trust and this offering. You may get these documents for free by visiting EDGAR on the SEC Web site at www.sec.gov. Alternatively, the Depositor or any Underwriter or any dealer participating in the offering will arrange to send you the prospectus if you request it by calling 1 (866) 400-7834 or by emailing cmbs-prospectus@jpmorgan.com.
Neither this document nor anything contained in this document shall form the basis for any contract or commitment whatsoever. The information contained in this document is preliminary as of the date of this document, supersedes any previous such information delivered to you and will be superseded by any such information subsequently delivered prior to the time of sale. These materials are subject to change, completion or amendment from time to time.
The attached information contains certain tables and other statistical analyses (the “Computational Materials”) that have been prepared in reliance upon information furnished by the Mortgage Loan Sellers. Numerous assumptions were used in preparing the Computational Materials, which may or may not be reflected in this document. The Computational Materials should not be construed as either projections or predictions or as legal, tax, financial or accounting advice. You should consult your own counsel, accountant and other advisors as to the legal, tax, business, financial and related aspects of a purchase of these certificates. Any weighted average lives, yields and principal payment periods shown in the Computational Materials are based on prepayment and/or loss assumptions, and changes in such prepayment and/or loss assumptions may dramatically affect such weighted average lives, yields and principal payment periods. In addition, it is possible that prepayments or losses on the underlying assets will occur at rates higher or lower than the rates shown in the Computational Materials. The specific characteristics of the certificates may differ from those shown in the Computational Materials due to differences between the final underlying assets and the preliminary underlying assets used in preparing the Computational Materials. The principal amount and designation of any certificate described in the Computational Materials are subject to change prior to issuance. None of the Underwriters nor any of their respective affiliates make any representation or warranty as to the actual rate or timing of payments or losses on any of the underlying assets or the payments or yield on the certificates.
This information is based upon management forecasts and reflects prevailing conditions and management’s views as of this date, all of which are subject to change.
This document contains forward-looking statements. Those statements are subject to certain risks and uncertainties that could cause the success of collections and the actual cash flow generated to differ materially from the information set forth in this document. While such information reflects projections prepared in good faith based upon methods and data that are believed to be reasonable and accurate as of their dates, the issuer undertakes no obligation to revise these forward-looking statements to reflect subsequent events or circumstances. Investors should not place undue reliance on forward-looking statements and are advised to make their own independent analysis and determination with respect to the forecasted periods, which reflect the issuer’s view only as of the date of this document.
J.P. Morgan is the marketing name for the investment banking businesses of JPMorgan Chase & Co. and its subsidiaries worldwide. Securities, syndicated loan arranging, financial advisory and other investment banking activities are performed by JPMS and its securities affiliates, and lending, derivatives and other commercial banking activities are performed by JPMorgan Chase Bank, National Association and its banking affiliates. JPMS is a member of SIPC and the NYSE.
THE CERTIFICATES REFERRED TO IN THESE MATERIALS ARE SUBJECT TO MODIFICATION OR REVISION (INCLUDING THE POSSIBILITY THAT ONE OR MORE CLASSES OF CERTIFICATES MAY BE SPLIT, COMBINED OR ELIMINATED AT ANY TIME PRIOR TO ISSUANCE OR AVAILABILITY OF A FINAL PROSPECTUS) AND ARE OFFERED ON A “WHEN, AS AND IF ISSUED” BASIS. PROSPECTIVE INVESTORS SHOULD UNDERSTAND THAT, WHEN CONSIDERING THE PURCHASE OF THESE CERTIFICATES, A CONTRACT OF SALE WILL COME INTO BEING NO SOONER THAN THE DATE ON WHICH THE RELEVANT CLASS OF CERTIFICATES HAS BEEN PRICED AND THE UNDERWRITERS HAVE CONFIRMED THE ALLOCATION OF CERTIFICATES TO BE MADE TO INVESTORS; ANY “INDICATIONS OF INTEREST” EXPRESSED BY ANY PROSPECTIVE INVESTOR, AND ANY “SOFT CIRCLES” GENERATED BY THE UNDERWRITERS, WILL NOT CREATE BINDING CONTRACTUAL OBLIGATIONS FOR SUCH PROSPECTIVE INVESTORS, ON THE ONE HAND, OR THE UNDERWRITERS, THE DEPOSITOR OR ANY OF THEIR RESPECTIVE AGENTS OR AFFILIATES, ON THE OTHER HAND.
AS A RESULT OF THE FOREGOING, A PROSPECTIVE INVESTOR MAY COMMIT TO PURCHASE CERTIFICATES THAT HAVE CHARACTERISTICS THAT MAY CHANGE, AND EACH PROSPECTIVE INVESTOR IS ADVISED THAT ALL OR A PORTION OF THE CERTIFICATES REFERRED TO IN THESE MATERIALS MAY BE ISSUED WITHOUT ALL OR CERTAIN OF THE CHARACTERISTICS DESCRIBED IN THESE MATERIALS. EACH UNDERWRITER’S OBLIGATION TO SELL CERTIFICATES TO ANY PROSPECTIVE INVESTOR IS CONDITIONED ON THE CERTIFICATES AND THE TRANSACTION HAVING THE CHARACTERISTICS DESCRIBED IN THESE MATERIALS. IF THE UNDERWRITERS DETERMINE THAT A CONDITION IS NOT SATISFIED IN ANY MATERIAL RESPECT, SUCH PROSPECTIVE INVESTOR WILL BE NOTIFIED, AND NEITHER THE DEPOSITOR NOR THE UNDERWRITERS WILL HAVE ANY OBLIGATION TO SUCH PROSPECTIVE INVESTOR TO DELIVER ANY PORTION OF THE CERTIFICATES THAT SUCH PROSPECTIVE INVESTOR HAS COMMITTED TO PURCHASE, AND THERE WILL BE NO LIABILITY OR OBLIGATION BETWEEN THE UNDERWRITERS, THE DEPOSITOR OR ANY OF THEIR RESPECTIVE AGENTS OR AFFILIATES, ON THE ONE HAND, AND SUCH PROSPECTIVE INVESTOR, ON THE OTHER HAND, AS A CONSEQUENCE OF THE NON-DELIVERY.
THE UNDERWRITERS MAY FROM TIME TO TIME PERFORM INVESTMENT BANKING SERVICES FOR, OR SOLICIT INVESTMENT BANKING BUSINESS FROM, ANY COMPANY NAMED IN THESE MATERIALS. THE UNDERWRITERS AND/OR THEIR AFFILIATES OR RESPECTIVE EMPLOYEES MAY FROM TIME TO TIME HAVE A LONG OR SHORT POSITION IN ANY CERTIFICATE OR CONTRACT DISCUSSED IN THESE MATERIALS.
THE INFORMATION IN THIS STRUCTURAL AND COLLATERAL TERM SHEET IS NOT COMPLETE AND MAY BE AMENDED PRIOR TO THE TIME OF SALE. THIS TERM SHEET IS NOT AN OFFER TO SELL THESE SECURITIES AND IT IS NOT A SOLICITATION OF AN OFFER TO BUY THESE SECURITIES IN ANY JURISDICTION WHERE THE OFFER OR SALE IS NOT PERMITTED.
 |  |  |
| 1 of 133 |
| Structural and Collateral Term Sheet | JPMBB 2014-C26 |
| Indicative Capital Structure |
Publicly Offered Certificates
| Class | Expected Ratings (Moody’s / DRBS / Kroll) | Approximate Initial Certificate Balance or Notional Amount(1) | Approximate Initial Credit Support(2) | Expected Weighted Avg. Life (years)(3) | Expected Principal Window(3) | Certificate Principal to Value Ratio(4) | Underwritten NOI Debt Yield(5) | |||||
| A-1 | Aaa(sf) / AAA(sf) / AAA(sf) | $59,050,000 | 30.000% | 3.02 | 1/15-10/19 | 47.0% | 14.7% | |||||
| A-2 | Aaa(sf) / AAA(sf) / AAA(sf) | $211,650,000 | 30.000% | 4.89 | 10/19-1/20 | 47.0% | 14.7% | |||||
| A-3 | Aaa(sf) / AAA(sf) / AAA(sf) | $300,000,000 | 30.000% | 9.77 | 7/24-11/24 | 47.0% | 14.7% | |||||
| A-4 | Aaa(sf) / AAA(sf) / AAA(sf) | $337,579,000 | 30.000% | 9.89 | 11/24-12/24 | 47.0% | 14.7% | |||||
| A-SB | Aaa(sf) / AAA(sf) / AAA(sf) | $106,446,000 | 30.000% | 7.30 | 10/19-7/24 | 47.0% | 14.7% | |||||
| X-A | Aa1(sf) / AAA(sf) / AAA(sf) | $1,108,949,000(6) | N/A | N/A | N/A | N/A | N/A | |||||
| X-B | Aa3(sf) / AAA(sf) / AAA(sf) | $67,045,000(6) | N/A | N/A | N/A | N/A | N/A | |||||
A-S(7)(8) | Aa1(sf) / AAA(sf) / AAA(sf) | $94,224,000 | 23.500% | 9.96 | 12/24-12/24 | 51.4% | 13.5% | |||||
B(7)(8) | Aa3(sf) / AA(sf) / AA(sf) | $67,045,000 | 18.875% | 9.96 | 12/24-12/24 | 54.5% | 12.7% | |||||
C(7)(8) | A3(sf) / A(high)(sf) / A(sf) | $48,924,000 | 15.500% | 9.96 | 12/24-12/24 | 56.8% | 12.2% | |||||
EC(7)(8)(9) | A1(sf) / A(high)(sf) / A(sf) | $210,193,000 | 15.500% | 9.96 | 12/24-12/24 | 56.8% | 12.2% | |||||
Privately Offered Certificates(10) |
| Class | Expected Ratings (Moody’s / DBRS / Kroll) | Approximate Initial Certificate Balance or Notional Amount(1) | Approximate Initial Credit Support(2) | Expected Weighted Avg. Life (years)(3) | Expected Principal Window(3) | Certificate Principal to Value Ratio(4) | Underwritten NOI Debt Yield(5) | |||||
| X-C | A3(sf) / AAA(sf) / AAA(sf) | $48,924,000(6) | N/A | N/A | N/A | N/A | N/A | |||||
| X-D | NR / AAA(sf) / BBB-(sf) | $106,908,000(6) | N/A | N/A | N/A | N/A | N/A | |||||
| X-E | NR / AAA(sf) / BB(sf) | $34,428,000(6) | N/A | N/A | N/A | N/A | N/A | |||||
| X-F | NR / AAA(sf) / B(sf) | $25,369,000(6) | N/A | N/A | N/A | N/A | N/A | |||||
| X-NR | NR / AAA(sf) / NR | $57,983,872(6) | N/A | N/A | N/A | N/A | N/A | |||||
| D | NR / BBB(low)(sf) / BBB-(sf) | $106,908,000 | 8.125% | 9.96 | 12/24-12/24 | 61.7% | 11.2% | |||||
| E | NR / BB(sf) / BB(sf) | $34,428,000 | 5.750% | 9.96 | 12/24-12/24 | 63.3% | 10.9% | |||||
| F | NR / B(sf) / B(sf) | $25,369,000 | 4.000% | 9.96 | 12/24-1/25 | 64.5% | 10.7% | |||||
| NR | NR / NR / NR | $57,983,872 | 0.000% | 10.04 | 1/25-1/25 | 67.2% | 10.3% | |||||
Privately Offered Loan-Specific Certificates
| Class | Expected Ratings (Moody’s / DBRS / Kroll) | Approximate Initial Certificate Balance(1) | Approximate Initial Credit Support(2) | Expected Weighted Avg. Life (years)(3) | Expected Principal Window(3) | Certificate Principal to Value Ratio(4) | Underwritten NOI Debt Yield(5) | |||||
HOW(11) | NR / NR / NR | $10,000,000 | 0.000% | 9.71 | 9/24-9/24 | N/A | N/A | |||||
| (1) | In the case of each such Class, subject to a permitted variance of plus or minus 5%. |
| (2) | The credit support percentages set forth for Class A-1, Class A-2, Class A-3, Class A-4, and Class A-SB Certificates represent the approximate initial credit support for the Class A-1, Class A-2, Class A-3, Class A-4 and Class A-SB Certificates in the aggregate. The credit support percentage for each of the Publicly Offered Certificates and the Privately Offered Certificates does not include the HOW Trust Subordinate Companion Loan. |
| (3) | Assumes 0% CPR / 0% CDR and a December 29, 2014 closing date. Based on modeling assumptions as described in the Free Writing Prospectus dated December 5, 2014 (the “Free Writing Prospectus”). |
| (4) | The “Certificate Principal to Value Ratio” for any Class (other than the Class A-1, Class A-2, Class A-3, Class A-4 and Class A-SB Certificates) is calculated as the product of (a) the weighted average Cut-off Date LTV Ratio for the mortgage loans, multiplied by (b) a fraction, the numerator of which is the total initial Certificate Balance of such Class of Certificates and all Classes of Principal Balance Certificates senior to such Class of Certificates and the denominator of which is the total initial Certificate Balance of all of the Principal Balance Certificates. The Class A-1, Class A-2, Class A-3, Class A-4 and Class A-SB Certificate Principal to Value Ratios are calculated in the aggregate for those Classes as if they were a single Class. Investors should note, however, that excess mortgaged property value associated with a mortgage loan will not be available to offset losses on any other mortgage loan. |
| (5) | The “Underwritten NOI Debt Yield” for any Class (other than the Class A-1, Class A-2, Class A-3, Class A-4 and Class A-SB Certificates) is calculated as the product of (a) the weighted average UW NOI Debt Yield for the mortgage loans and (b) the total initial Certificate Balance of all of the Classes of Principal Balance Certificates divided by the total initial Certificate Balance for such Class and all Classes of Principal Balance Certificates senior to such Class of Certificates. The Underwritten NOI Debt Yield for each of the Class A-1, Class A-2, Class A-3, Class A-4 and Class A-SB Certificates is calculated in the aggregate for those Classes as if they were a single Class. Investors should note, however, that net operating income from any mortgaged property supports only the related mortgage loan and will not be available to support any other mortgage loan. |
| (6) | The Class X-A, Class X-B, Class X-C, Class X-D, Class X-E, Class X-F and Class X-NR Notional Amounts are defined in the Free Writing Prospectus. |
| (7) | A holder of Class A-S, Class B and Class C Certificates (the “Exchangeable Certificates”) may exchange such Classes of Certificates (on an aggregate basis) for a related amount of Class EC Certificates, and Class EC Certificates may be exchanged for a ratable portion of each class of Exchangeable Certificates. |
| (8) | The initial Certificate Balance of a Class of Exchangeable Certificates represents the principal balance of such Class without giving effect to any exchange. The initial Certificate Balance of the Class EC Certificates is equal to the aggregate of the initial Certificate Balances of the Exchangeable Certificates and represents the maximum principal balance of such Class that could be issued in an exchange. See “Exchangeable Certificates and the Class EC Certificates” below. |
| (9) | Although the Class EC Certificates are listed below the Class C Certificates in the chart, the Class EC Certificates’ payment entitlements and subordination priority will be a result of the payment entitlements and subordination priority at each level of the related component classes of Class A-S, Class B and Class C Certificates. For purposes of determining the Approximate Initial Credit Support, Certificate Principal to Value Ratio and Underwritten NOI Debt Yield for Class EC Certificates, the calculation is based on the aggregate initial Certificate Balance of Class A-S, Class B and Class C Certificates as if they were a single class. |
| (10) | The Class R Certificates are not shown above. |
| (11) | The 543 Howard mortgage loan, which equals approximately $30.8 million (the “543 Howard Mortgage Loan”), is secured by the same mortgage instrument on the same related mortgaged property as the HOW Trust Subordinate Companion Loan with a principal balance of $10.0 million (the “HOW Trust Subordinate Companion Loan”, together with the 543 Howard Mortgage Loan, the “543 Howard Whole Loan”). The Class HOW certificates will only receive distributions from, and will only incur losses with respect to, the HOW Trust Subordinate Companion Loan. Such class will share in losses and shortfalls on the 543 Howard Whole Loan only. |
THE INFORMATION IN THIS STRUCTURAL AND COLLATERAL TERM SHEET IS NOT COMPLETE AND MAY BE AMENDED PRIOR TO THE TIME OF SALE. THIS TERM SHEET IS NOT AN OFFER TO SELL THESE SECURITIES AND IT IS NOT A SOLICITATION OF AN OFFER TO BUY THESE SECURITIES IN ANY JURISDICTION WHERE THE OFFER OR SALE IS NOT PERMITTED.
| | |
| 2 of 133 |
| Structural and Collateral Term Sheet | JPMBB 2014-C26 |
| Summary of Transaction Terms |
| Securities Offered: | $1,224,918,000 monthly pay, multi-class, commercial mortgage REMIC Pass-Through Certificates. |
Co-Lead Managers and Joint Bookrunners: | J.P. Morgan Securities LLC, Barclays Capital Inc. and Credit Suisse Securities (USA) LLC. |
| Co-Manager: | Drexel Hamilton, LLC |
| Mortgage Loan Sellers: | JPMorgan Chase Bank, National Association (“JPMCB”) (36.9%), Column Financial, Inc. (“CFI”) (21.0%), Barclays Bank PLC (“Barclays”) (18.9%), Redwood Commercial Mortgage Corporation (“Redwood”) (10.9%), General Electric Capital Corporation (“GECC”) (7.1%), and RAIT Funding, LLC (“RAIT”) (5.1%). |
| Master Servicer: | Midland Loan Services, a Division of PNC Bank, National Association (“Midland”). |
| Special Servicer: | Midland Loan Services, a Division of PNC Bank, National Association. |
| Directing Certificateholder: | Blackrock Realty Advisors, Inc. on behalf of one or more managed funds or accounts. |
| Trustee: | Wells Fargo Bank, National Association. |
| Certificate Administrator: | Wells Fargo Bank, National Association. |
| Senior Trust Advisor: | Pentalpha Surveillance LLC. |
| Rating Agencies: | Moody’s Investors Service, Inc. (“Moody’s”), DBRS, Inc. (“DBRS”) and Kroll Bond Rating Agency, Inc. (“KBRA”). |
| Pricing Date: | On or about December 17, 2014. |
| Closing Date: | On or about December 29, 2014. |
| Cut-off Date: | With respect to each mortgage loan, the related due date in December 2014, or with respect to any mortgage loan that has its first due date in January 2015 or February 2015, the date that would otherwise have been the related due date in December 2014. |
| Distribution Date: | The 4th business day after the Determination Date in each month, commencing in January 2015. |
| Determination Date: | 11th day of each month, or if the 11th day is not a business day, the next succeeding business day, commencing in January 2015. |
| Assumed Final Distribution Date: | The Distribution Date in January 2025, which is the latest anticipated repayment date of the Certificates. |
| Rated Final Distribution Date: | The Distribution Date in January 2048. |
| Tax Treatment: | The Publicly Offered Certificates are expected to be treated as REMIC regular interests for U.S. federal income tax purposes. |
| Form of Offering: | The Class A-1, Class A-2, Class A-3, Class A-4, Class A-SB, Class X-A, Class X-B, Class A-S, Class B, Class C and Class EC Certificates will be offered publicly (the “Publicly Offered Certificates”). The Class X-C, Class X-D, Class X-E, Class X-F, Class X-NR, Class D, Class E, Class F, Class NR, Class HOW and Class R Certificates (the “Privately Offered Certificates”) will be offered domestically to Qualified Institutional Buyers and (other than with respect to the Class HOW Certificates) to Institutional Accredited Investors and to institutions that are not U.S. Persons pursuant to Regulation S. |
| SMMEA Status: | The Certificates will not constitute “mortgage related securities” for purposes of SMMEA. |
| ERISA: | The Publicly Offered Certificates are expected to be ERISA eligible. |
| Optional Termination: | 1.0% clean-up call. |
| Minimum Denominations: | The Publicly Offered Certificates (other than the Class X-A and Class X-B Certificates) will be issued in minimum denominations of $10,000 and integral multiples of $1 in excess of $10,000. The Class X-A and Class X-B Certificates will be issued in minimum denominations of $1,000,000 and in integral multiples of $1 in excess of $1,000,000. |
| Settlement Terms: | DTC, Euroclear and Clearstream Banking. |
| Analytics: | The transaction is expected to be modeled by Intex Solutions, Inc. and Trepp, LLC and is expected to be available on Bloomberg L.P., Blackrock Financial Management Inc., Interactive Data Corporation and Markit. |
| Risk Factors: | THE CERTIFICATES INVOLVE CERTAIN RISKS AND MAY NOT BE SUITABLE FOR ALL INVESTORS. SEE THE “RISK FACTORS” SECTION OF THE FREE WRITING PROSPECTUS. |
THE INFORMATION IN THIS STRUCTURAL AND COLLATERAL TERM SHEET IS NOT COMPLETE AND MAY BE AMENDED PRIOR TO THE TIME OF SALE. THIS TERM SHEET IS NOT AN OFFER TO SELL THESE SECURITIES AND IT IS NOT A SOLICITATION OF AN OFFER TO BUY THESE SECURITIES IN ANY JURISDICTION WHERE THE OFFER OR SALE IS NOT PERMITTED.
| | |
| 3 of 133 |
| Structural and Collateral Term Sheet | JPMBB 2014-C26 |
Collateral Characteristics |
| Loan Pool | ||
Initial Pool Balance (“IPB”): | $1,449,606,872 | |
| Number of Mortgage Loans: | 69 | |
| Number of Mortgaged Properties: | 93 | |
| Average Cut-off Date Balance per Mortgage Loan: | $21,008,795 | |
| Weighted Average Current Mortgage Rate: | 4.44151% | |
| 10 Largest Mortgage Loans as % of IPB: | 37.6% | |
Weighted Average Remaining Term to Maturity(1)(2): | 110 months | |
| Weighted Average Seasoning: | 1 month | |
| Credit Statistics | ||
Weighted Average UW NCF DSCR(3)(4): | 1.69x | |
Weighted Average UW NOI Debt Yield(3): | 10.3% | |
Weighted Average Cut-off Date Loan-to-Value Ratio (“LTV”)(3)(5): | 67.2% | |
Weighted Average Maturity Date LTV(1)(3)(5): | 58.9% | |
| Other Statistics | ||
| % of Mortgage Loans with Additional Debt: | 24.9% | |
| % of Mortgaged Properties with Single Tenants: | 6.6% | |
| Amortization | ||
Weighted Average Original Amortization Term(6): | 354 months | |
Weighted Average Remaining Amortization Term(6): | 354 months | |
| % of Mortgage Loans with Partial Interest-Only followed by Amortizing Balloon: | 63.4% | |
| % of Mortgage Loans with Amortizing Balloon: | 20.9% | |
| % of Mortgage Loans with Interest-Only: | 11.2% | |
| % of Mortgage Loans with Partial Interest-Only followed by Amortizing Balloon followed by ARD-Structure: | 2.6% | |
| % of Mortgage Loans with Interest-Only followed by ARD-Structure: | 1.3% | |
| % of Mortgage Loans with Amortizing Balloon followed by ARD-Structure | 0.6% | |
Cash Management(7) | ||
| % of Mortgage Loans with In-Place, CMA Lockboxes: | 45.1% | |
| % of Mortgage Loans with In-Place, Hard Lockboxes: | 31.5% | |
| % of Mortgage Loans with Springing Lockboxes: | 18.5% | |
| % of Mortgage Loans with No Lockbox: | 3.0% | |
| % of Mortgage Loans with In-Place, Soft Lockboxes: | 1.8% | |
| Reserves | ||
| % of Mortgage Loans Requiring Monthly Tax Reserves: | 78.5% | |
| % of Mortgage Loans Requiring Monthly Insurance Reserves: | 38.4% | |
% of Mortgage Loans Requiring Monthly CapEx Reserves(8): | 62.7% | |
% of Mortgage Loans Requiring Monthly TI/LC Reserves(9): | 60.5% | |
| (1) | In the case of Loan Nos. 11, 29 and 46 each with an anticipated repayment date, as of the related anticipated repayment date. |
| (2) | In the case of Loan Nos. 2 and 29, the first payment dates for the loans are February 1, 2015. On the Closing Date, JPMCB will deposit sufficient funds to pay the interest associated with the interest due for the January 2015 payment for the related loans. Information presented in this term sheet reflects the loans’ contractual loan terms. |
| (3) | In the case of Loan Nos. 1, 6, 8 and 26, the UW NCF DSCR, UW NOI Debt Yield, Cut-off Date LTV and Maturity Date LTV calculations include the related Pari Passu Companion Loan. In the case of Loan No. 20, the UW NCF DSCR, UW NOI Debt Yield, Cut-off Date LTV and Maturity Date LTV calculations exclude the HOW Trust Subordinate Companion Loan. |
| (4) | In the case of Loan No. 20, the UW NCF DSCR is calculated using the average of principal and interest payments over the first 12 months following the cut-off date based on the principal payment schedule provided on Annex F of the Free Writing Prospectus. In the case of Loan No. 45, the UW NCF DSCR is calculated using the average of principal and interest payments over the first 12 months following the initial interest only period based on the principal payment schedule provided on Annex G of the Free Writing Prospectus. |
| (5) | In the case of Loan Nos. 14, 28, 52 and 65 the Cut-off Date LTV and the Maturity Date LTV are calculated based upon a hypothetical ”as-stabilized,” “as-renovated” or “as-complete” appraised value based on certain assumptions. Refer to “Description of the Mortgage Pool – Assessments of Property Value and Condition” in the Free Writing Prospectus for additional details. |
| (6) | Excludes six mortgage loans that are interest-only for the entire term or until the anticipated repayment date, as applicable. |
| (7) | For a detailed description of Cash Management, refer to “Description of the Mortgage Pool – Lockbox Accounts” in the Free Writing Prospectus. |
| (8) | CapEx Reserves include FF&E reserves for hotel properties. |
| (9) | Calculated only with respect to Cut-off Date Balance of mortgage loans secured by retail, industrial, office and mixed use properties. |
THE INFORMATION IN THIS STRUCTURAL AND COLLATERAL TERM SHEET IS NOT COMPLETE AND MAY BE AMENDED PRIOR TO THE TIME OF SALE. THIS TERM SHEET IS NOT AN OFFER TO SELL THESE SECURITIES AND IT IS NOT A SOLICITATION OF AN OFFER TO BUY THESE SECURITIES IN ANY JURISDICTION WHERE THE OFFER OR SALE IS NOT PERMITTED.
| | |
| 4 of 133 |
| Structural and Collateral Term Sheet | JPMBB 2014-C26 |
Collateral Characteristics |
Mortgage Loan Seller | Number of Mortgage Loans | Number of Mortgaged Properties | Aggregate Cut-off Date Balance | % of IPB | |
| JPMCB | 19 | 37 | $535,590,750 | 36.9 | % |
| Column | 12 | 18 | 304,654,404 | 21.0 | |
| Barclays | 12 | 12 | 273,628,152 | 18.9 | |
| RCMC | 10 | 10 | 158,546,099 | 10.9 | |
| GECC | 8 | 8 | 103,096,851 | 7.1 | |
| RAIT | 8 | 8 | 74,090,617 | 5.1 | |
| Total: | 69 | 93 | $1,449,606,872 | 100.0 | % |
| Ten Largest Mortgage Loans |
| No. | Loan Name | Mortgage Loan Seller | No. of Prop. | Cut-off Date Balance | % of IPB | SF/ Rooms | Property Type | UW NCF DSCR(1) | UW NOI Debt Yield(1) | Cut-off Date LTV(1) | Maturity Date LTV(1) | |
| 1 | 500 Fifth Avenue | Column | 1 | $100,000,000 | 6.9% | 712,791 | Office | 3.37x | 13.7% | 33.3% | 33.3% | |
| 2 | 1515 Market | JPMCB | 1 | $63,750,000 | 4.4% | 502,213 | Office | 1.50x | 10.3% | 73.3% | 66.8% | |
| 3 | Wells Fargo Center Tampa | JPMCB | 1 | $59,800,000 | 4.1% | 389,524 | Office | 1.33x | 9.0% | 76.7% | 70.4% | |
| 4 | Heron Lakes | JPMCB | 1 | $52,000,000 | 3.6% | 314,504 | Office | 1.36x | 9.3% | 73.2% | 62.5% | |
| 5 | Shaner Hotels Limited Service Portfolio | JPMCB | 7 | $49,750,000 | 3.4% | 732 | Hotel | 1.75x | 10.7% | 68.9% | 58.8% | |
| 6 | St. Louis Premium Outlets | Column | 1 | $47,500,000 | 3.3% | 351,462 | Retail | 1.41x | 8.6% | 71.6% | 65.1% | |
| 7 | Centergy One | GECC | 1 | $45,750,000 | 3.2% | 253,435 | Office | 1.29x | 8.9% | 75.0% | 64.2% | |
| 8 | The Outlet Shoppes of the Bluegrass | JPMCB | 1 | $45,000,000 | 3.1% | 374,683 | Retail | 1.83x | 11.3% | 63.0% | 49.7% | |
| 9 | United Healthcare Office | Barclays | 1 | $42,000,000 | 2.9% | 204,123 | Office | 2.02x | 9.8% | 70.0% | 70.0% | |
| 10 | 117 Kendrick Street | JPMCB | 1 | $39,560,000 | 2.7% | 212,846 | Office | 1.33x | 8.7% | 74.6% | 68.1% | |
| Top 3 Total/Weighted Average | 3 | $223,550,000 | 15.4% | 2.29x | 11.5% | 56.3% | 52.8% | |||||
| Top 5 Total/Weighted Average | 11 | $325,300,000 | 22.4% | 2.06x | 11.0% | 60.9% | 55.3% | |||||
| Top 10 Total/Weighted Average | 16 | $545,110,000 | 37.6% | 1.86x | 10.4% | 64.9% | 58.5% | |||||
| (1) | In the case of Loan Nos. 1, 6 and 8, the UW NCF DSCR, UW NOI Debt Yield, Cut-off Date LTV and Maturity Date LTV calculations include the related Pari Passu Companion Loan. |
| Pari Passu Note Loan Summary | ||||||||||||||
No. | Loan Name | Trust Cut- off Date Balance | Pari Passu Loan Cut- off Date Balance | Total Mortgage Loan Cut- off Date Balance | Controlling Pooling & Servicing Agreement | Master Servicer | Special Servicer | Voting Rights | ||||||
| 1 | 500 Fifth Avenue | $100,000,000 | $100,000,000 | $200,000,000 | JPMBB 2014-C26 | Midland | Midland | JPMBB 2014-C26 | ||||||
| 6 | St. Louis Premium Outlets | $47,500,000 | $47,500,000 | $95,000,000 | JPMBB 2014-C26 | Midland | Midland | JPMBB 2014-C26 | ||||||
| 8 | The Outlet Shoppes of the Bluegrass | $45,000,000 | $32,500,000 | $77,500,000 | JPMBB 2014-C26 | Midland | Midland | JPMBB 2014-C26 | ||||||
| 26 | Florida Multifamily Portfolio | $22,300,000 | $35,000,000 | $57,300,000 | JPMBB 2014-C25 | Wells Fargo | Rialto | JPMBB 2014-C25 | ||||||
THE INFORMATION IN THIS STRUCTURAL AND COLLATERAL TERM SHEET IS NOT COMPLETE AND MAY BE AMENDED PRIOR TO THE TIME OF SALE. THIS TERM SHEET IS NOT AN OFFER TO SELL THESE SECURITIES AND IT IS NOT A SOLICITATION OF AN OFFER TO BUY THESE SECURITIES IN ANY JURISDICTION WHERE THE OFFER OR SALE IS NOT PERMITTED.
| | |
| 5 of 133 |
| Structural and Collateral Term Sheet | JPMBB 2014-C26 |
Collateral Characteristics |
Additional Debt Summary(1) |
No. | Loan Name | Trust Cut-off Date Balance | Subordinate Debt Cut-off Date Balance | Total Debt Cut-off Date Balance | Mortgage Loan UW NCF DSCR | Total Debt UW NCF DSCR | Mortgage Loan Cut-off Date LTV | Total Debt Cut-off Date LTV | Mortgage Loan UW NOI Debt Yield | Total Debt UW NOI Debt Yield | ||||||||||||
| 2 | 1515 Market | $63,750,000 | $8,500,000 | $72,250,000 | 1.50x | 1.22x | 73.3% | 83.0% | 10.3% | 9.1% | ||||||||||||
| 4 | Heron Lakes | $52,000,000 | $7,000,000 | $59,000,000 | 1.36x | 1.11x | 73.2% | 83.1% | 9.3% | 8.2% | ||||||||||||
| 5 | Shaner Hotels Limited Service Portfolio | $49,750,000 | $8,050,000 | $57,800,000 | 1.75x | 1.38x | 68.9% | 80.0% | 10.7% | 9.2% | ||||||||||||
| 9 | United Healthcare Office | $42,000,000 | $9,000,000 | $51,000,000 | 2.02x | 1.37x | 70.0% | 85.0% | 9.8% | 8.1% | ||||||||||||
| 20 | 543 Howard(2) | $30,798,301 | $10,000,000 | $40,798,301 | 1.44x | 1.19x | 56.2% | 74.4% | 11.4% | 8.6% | ||||||||||||
| 22 | Marriott Fort Lauderdale | $25,950,000 | $4,000,000 | $29,950,000 | 1.64x | 1.31x | 63.0% | 72.7% | 10.1% | 8.8% | ||||||||||||
| 24 | Eagle View Apartments | $24,000,000 | $3,200,000 | $27,200,000 | 1.50x | 1.22x | 72.7% | 82.4% | 9.3% | 8.2% | ||||||||||||
| 26 | Florida Multifamily Portfolio(3) | $22,300,000 | $12,000,000 | $34,300,000 | 1.84x | 1.34x | 66.1% | 80.0% | 12.8% | 10.6% | ||||||||||||
| 31 | Renaissance Boca Raton | $18,450,000 | $4,000,000 | $22,450,000 | 1.72x | 1.27x | 59.3% | 72.2% | 10.6% | 8.7% | ||||||||||||
| 39 | Eastwood Village Shopping Center | $12,900,000 | $1,600,000 | $14,500,000 | 1.72x | 1.41x | 74.8% | 84.1% | 11.4% | 10.1% | ||||||||||||
| 42 | 10 New Road | $9,750,000 | $1,370,000 | $11,120,000 | 1.76x | 1.41x | 72.2% | 82.4% | 11.6% | 10.2% | ||||||||||||
| 45 | Hampshire Park Apartments(4) | $9,000,000 | $900,000 | $9,900,000 | 1.52x | 1.27x | 76.8% | 84.4% | 9.6% | 8.8% | ||||||||||||
| (1) | In the case of Loan Nos. 2, 4, 5, 9, 22, 24, 26, 31, 39, 42 and 45, subordinate debt represents mezzanine loans. In the case of Loan No. 20, subordinate debt represents a B-Note. |
| (2) | In the case of Loan No. 20, the Mortgage Loan UW NCF DSCR and Total Debt UW NCF DSCR are calculated using the average of principal and interest payments over the first 12 months following the cut-off date based on the principal payment schedule provided on Annex F of the Free Writing Prospectus. |
| (3) | In the case of Loan No. 26, Mortgage Loan UW NCF DSCR, Mortgage Loan UW NOI Debt Yield and Mortgage Loan Cut-off Date LTV calculations include the related Pari Passu Companion Loan. |
| (4) | In the case of Loan No. 45, the Mortgage Loan UW NCF DSCR and Total Debt UW NCF DSCR are calculated using the average of principal and interest payments over the first 12 months following the initial interest only period based on the principal payment schedule provided on Annex G of the Free Writing Prospectus. |
| HOW Trust Subordinate Companion Loan Summary |
| HOW Subordinate | Mortgage | Mortgage | Whole | Mortgage | |||||||
| Mortgage | Companion | Whole | Loan | Whole | Loan | Loan | Loan | Whole | |||
| Loan | Loan | Loan | UW | Loan | Cut-off | Cut-off | UW NOI | Loan | |||
| Cut-off Date | Cut-off Date | Cut-off Date | NCF | UW NCF | Date | Date | Debt | UW NOI | |||
| No. | Loan Name | Balance | Balance | Balance | DSCR | DSCR | LTV | LTV | Yield | Debt Yield | |
| 20 | 543 Howard (1)(2) | $30,798,301 | $10,000,000 | $40,798,301 | 1.44x | 1.19x | 56.2% | 74.4% | 11.4% | 8.6% |
| (1) | The Class HOW Certificates, which are backed by the HOW Trust Subordinate Companion Loan, are expected to be sold to Redwood Commercial Mortgage Corporation or its affiliates. |
| (2) | In the case of Loan No. 20, the Mortgage Loan UW NCF DSCR and Whole Loan UW NCF DSCR are calculated using the average of principal and interest payments over the first 12 months following the cut-off date based on the principal payment schedule provided on Annex F of the Free Writing Prospectus. |
THE INFORMATION IN THIS STRUCTURAL AND COLLATERAL TERM SHEET IS NOT COMPLETE AND MAY BE AMENDED PRIOR TO THE TIME OF SALE. THIS TERM SHEET IS NOT AN OFFER TO SELL THESE SECURITIES AND IT IS NOT A SOLICITATION OF AN OFFER TO BUY THESE SECURITIES IN ANY JURISDICTION WHERE THE OFFER OR SALE IS NOT PERMITTED.
| | |
| 6 of 133 |
| Structural and Collateral Term Sheet | JPMBB 2014-C26 | |
| Collateral Characteristics | ||
Mortgaged Properties by Type(1) |
| Weighted Average | ||||||||||||||||
| Property Type | Property Subtype | Number of Properties | Cut-off Date Principal Balance | % of IPB | Occupancy | UW NCF DSCR(2)(3) | UW NOI DY(2) | Cut-off Date LTV(2)(4) | Maturity Date LTV(2)(4)(5) | |||||||
| Office | CBD | 9 | $368,413,301 | 25.4% | 93.7% | 2.08x | 11.2% | 59.4% | 53.1% | |||||||
| Suburban | 10 | 253,917,871 | 17.5 | 97.2% | 1.52x | 9.8% | 71.9% | 64.8% | ||||||||
| Medical | 1 | 8,720,789 | 0.6 | 100.0% | 1.50x | 10.5% | 69.8% | 51.9% | ||||||||
| Subtotal: | 20 | $631,051,961 | 43.5% | 95.2% | 1.85x | 10.6% | 64.6% | 57.8% | ||||||||
| Multifamily | Garden | 27 | $175,358,986 | 12.1% | 94.7% | 1.40x | 9.2% | 75.2% | 65.7% | |||||||
| High Rise | 2 | 57,453,152 | 4.0 | 94.1% | 1.58x | 10.2% | 60.2% | 52.9% | ||||||||
| Student | 2 | 10,650,000 | 0.7 | 98.9% | 1.34x | 8.4% | 72.5% | 62.1% | ||||||||
| Subtotal: | 31 | $243,462,138 | 16.8% | 94.8% | 1.44x | 9.4% | 71.6% | 62.5% | ||||||||
| Hotel | Full Service | 4 | $114,400,000 | 7.9% | 76.2% | 1.71x | 10.6% | 66.7% | 57.8% | |||||||
| Limited Service | 10 | 89,455,000 | 6.2 | 73.2% | 1.66x | 10.5% | 69.4% | 57.0% | ||||||||
| Extended Stay | 3 | 31,970,000 | 2.2 | 81.3% | 1.77x | 10.9% | 68.7% | 60.7% | ||||||||
| Subtotal: | 17 | $235,825,000 | 16.3% | 75.8% | 1.70x | 10.6% | 68.0% | 57.9% | ||||||||
| Retail | Anchored | 6 | $98,238,691 | 6.8% | 94.4% | 1.41x | 9.3% | 69.6% | 60.6% | |||||||
| Outlet Center | 2 | 92,500,000 | 6.4 | 98.8% | 1.61x | 9.9% | 67.4% | 57.1% | ||||||||
| Shadow Anchored | 2 | 21,627,000 | 1.5 | 92.8% | 1.85x | 11.9% | 70.4% | 60.7% | ||||||||
| Unanchored | 2 | 10,590,108 | 0.7 | 90.6% | 1.49x | 9.8% | 68.1% | 58.0% | ||||||||
| Single Tenant | 1 | 3,096,114 | 0.2 | 100.0% | 1.40x | 8.9% | 64.5% | 52.7% | ||||||||
| Subtotal: | 13 | $226,051,914 | 15.6% | 96.0% | 1.54x | 9.8% | 68.6% | 59.2% | ||||||||
| Industrial | Flex | 3 | $33,590,738 | 2.3% | 84.9% | 1.53x | 10.5% | 69.7% | 62.5% | |||||||
| Warehouse | 2 | 15,978,750 | 1.1 | 96.8% | 1.99x | 11.4% | 66.2% | 59.6% | ||||||||
| Subtotal: | 5 | $49,569,488 | 3.4% | 88.7% | 1.68x | 10.8% | 68.6% | 61.6% | ||||||||
| Manufactured Housing | Manufactured Housing | 5 | $35,446,371 | 2.4% | 87.4% | 1.65x | 10.4% | 70.5% | 57.6% | |||||||
| Mixed Use | Industrial/Office | 1 | $20,000,000 | 1.4% | 100.0% | 1.73x | 10.7% | 61.0% | 54.3% | |||||||
| Self Storage | Self Storage | 1 | $8,200,000 | 0.6% | 84.2% | 1.57x | 9.4% | 63.6% | 52.6% | |||||||
| Total / Weighted Average: | 93 | $1,449,606,872 | 100.0% | 91.7% | 1.69x | 10.3% | 67.2% | 58.9% | ||||||||
| (1) | Because this table presents information relating to the mortgaged properties and not mortgage loans, the information for mortgage loans secured by more than one mortgaged property is based on allocated loan amounts. |
| (2) | In the case of Loan Nos. 1, 6, 8 and 26, the UW NCF DSCR, UW NOI Debt Yield, Cut-off Date LTV and Maturity Date LTV calculations include the related Pari Passu Companion Loan. In the case of Loan No. 20, the UW NCF DSCR, UW NOI Debt Yield, Cut-off Date LTV and Maturity Date LTV calculations exclude the HOW Trust Subordinate Companion Loan. |
| (3) | In the case of Loan No. 20, the UW NCF DSCR is calculated using the average of principal and interest payments over the first 12 months following the cut-off date based on the principal payment schedule provided on Annex F of the Free Writing Prospectus. In the case of Loan No. 45, the UW NCF DSCR is calculated using the average of principal and interest payments over the first 12 months following the initial interest only period based on the principal payment schedule provided on Annex G of the Free Writing Prospectus. |
| (4) | In the case of Loan Nos. 14, 28, 52 and 65 the Cut-off Date LTV and the Maturity Date LTV are calculated based upon a hypothetical “as-stabilized,” “as-renovated” or “as-complete” appraised value based on certain assumptions. Refer to “Description of the Mortgage Pool – Assessments of Property Value and Condition” in the Free Writing Prospectus for additional details. |
| (5) | In the case of Loan Nos. 11, 29 and 46, each of which has an anticipated repayment date, Maturity Date LTV is as of the related anticipated repayment date. |
THE INFORMATION IN THIS STRUCTURAL AND COLLATERAL TERM SHEET IS NOT COMPLETE AND MAY BE AMENDED PRIOR TO THE TIME OF SALE. THIS TERM SHEET IS NOT AN OFFER TO SELL THESE SECURITIES AND IT IS NOT A SOLICITATION OF AN OFFER TO BUY THESE SECURITIES IN ANY JURISDICTION WHERE THE OFFER OR SALE IS NOT PERMITTED.
| | |
| 7 of 133 |
| Structural and Collateral Term Sheet | JPMBB 2014-C26 | |
| Collateral Characteristics | ||
Mortgaged Properties by Location(1) | |||||||||||||||
Weighted Average | |||||||||||||||
State | Number of Properties | Cut-off Date Principal Balance | % of IPB | Occupancy | UW NCF DSCR(2)(3) | UW NOI DY(2) | Cut-off Date LTV(2)(4) | Maturity Date LTV(2)(4)(5) | |||||||
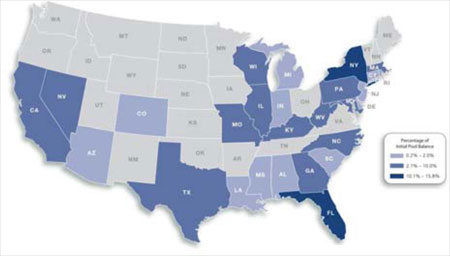
| Florida | 25 | $228,362,793 | 15.8% | 85.3% | 1.60x | 10.2% | 69.1% | 60.4% | |||||||
| New York | 4 | 166,825,000 | 11.5 | 92.6% | 2.61x | 12.2% | 47.5% | 44.2% | |||||||
| Texas | 7 | 131,495,310 | 9.1 | 91.5% | 1.36x | 9.1% | 72.2% | 63.9% | |||||||
| Massachusetts | 4 | 91,060,000 | 6.3 | 92.2% | 1.40x | 9.9% | 72.9% | 67.4% | |||||||
| Georgia | 5 | 88,376,381 | 6.1 | 92.0% | 1.48x | 9.7% | 71.2% | 61.5% | |||||||
| California | 6 | 83,438,409 | 5.8 | 98.8% | 2.01x | 11.5% | 55.7% | 45.6% | |||||||
| Kentucky | 2 | 79,000,000 | 5.4 | 84.0% | 1.71x | 10.9% | 69.9% | 57.9% | |||||||
| Pennsylvania | 3 | 75,206,888 | 5.2 | 86.7% | 1.52x | 10.3% | 72.7% | 65.5% | |||||||
| Illinois | 5 | 70,838,601 | 4.9 | 94.4% | 1.59x | 10.9% | 70.2% | 58.5% | |||||||
| North Carolina | 6 | 56,438,986 | 3.9 | 94.4% | 1.19x | 8.0% | 79.6% | 68.4% | |||||||
| Missouri | 1 | 47,500,000 | 3.3 | 100.0% | 1.41x | 8.6% | 71.6% | 65.1% | |||||||
| Maryland | 2 | 45,938,078 | 3.2 | 93.9% | 1.74x | 10.9% | 55.2% | 44.5% | |||||||
| Nevada | 2 | 44,070,000 | 3.0 | 99.9% | 1.99x | 9.8% | 69.8% | 69.4% | |||||||
| Wisconsin | 1 | 38,100,000 | 2.6 | 95.9% | 1.33x | 8.9% | 72.2% | 61.9% | |||||||
| West Virginia | 2 | 33,640,000 | 2.3 | 91.0% | 1.57x | 9.7% | 71.6% | 59.9% | |||||||
| Colorado | 2 | 24,838,691 | 1.7 | 94.8% | 1.38x | 8.9% | 68.2% | 60.8% | |||||||
| Connecticut | 1 | 24,000,000 | 1.7 | 100.0% | 1.28x | 8.6% | 74.3% | 63.9% | |||||||
| Indiana | 3 | 22,598,750 | 1.6 | 92.6% | 1.73x | 9.9% | 70.1% | 63.3% | |||||||
| South Carolina | 2 | 22,400,000 | 1.5 | 96.2% | 1.57x | 9.0% | 76.4% | 69.1% | |||||||
| New Jersey | 2 | 18,782,871 | 1.3 | 82.5% | 1.57x | 10.6% | 67.6% | 49.9% | |||||||
| Alabama | 1 | 12,900,000 | 0.9 | 97.9% | 1.72x | 11.4% | 74.8% | 63.5% | |||||||
| Delaware | 1 | 9,750,000 | 0.7 | 81.3% | 2.37x | 14.4% | 75.0% | 60.6% | |||||||
| Rhode Island | 1 | 9,750,000 | 0.7 | 94.7% | 1.76x | 11.6% | 72.2% | 61.3% | |||||||
| Michigan | 1 | 8,350,000 | 0.6 | 96.0% | 1.84x | 13.3% | 57.6% | 48.2% | |||||||
| Arizona | 2 | 6,896,114 | 0.5 | 95.9% | 1.43x | 9.3% | 71.3% | 59.9% | |||||||
| Louisiana | 1 | 5,700,000 | 0.4 | 87.2% | 3.06x | 15.4% | 55.9% | 55.9% | |||||||
| Mississippi | 1 | 3,350,000 | 0.2 | 98.6% | 1.48x | 9.6% | 71.3% | 58.3% | |||||||
| Total / Weighted Average: | 93 | $1,449,606,872 | 100.0% | 91.7% | 1.69x | 10.3% | 67.2% | 58.9% | |||||||
| (1) | Because this table presents information relating to the mortgaged properties and not mortgage loans, the information for mortgage loans secured by more than one mortgaged property is based on allocated loan amounts. |
| (2) | In the case of Loan Nos. 1, 6, 8 and 26, the UW NCF DSCR, UW NOI Debt Yield, Cut-off Date LTV and Maturity Date LTV calculations include the related Pari Passu Companion Loan. In the case of Loan No. 20, the UW NCF DSCR, UW NOI Debt Yield, Cut-off Date LTV and Maturity Date LTV calculations exclude the HOW Trust Subordinate Companion Loan. |
| (3) | In the case of Loan No. 20, the UW NCF DSCR is calculated using the average of principal and interest payments over the first 12 months following the cut-off date based on the principal payment schedule provided on Annex F of the Free Writing Prospectus. In the case of Loan No. 45, the UW NCF DSCR is calculated using the average of principal and interest payments over the first 12 months following the initial interest only period based on the principal payment schedule provided on Annex G of the Free Writing Prospectus. |
| (4) | In the case of Loan Nos. 14, 28, 52 and 65 the Cut-off Date LTV and the Maturity Date LTV are calculated based upon a hypothetical ”as-stabilized,” “as-renovated” or “as-complete” appraised value based on certain assumptions. Refer to “Description of the Mortgage Pool – Assessments of Property Value and Condition” in the Free Writing Prospectus for additional details. |
| (5) | In the case of Loan Nos. 11, 29 and 46, each of which has an anticipated repayment date, Maturity Date LTV is as of the related anticipated repayment date. |
THE INFORMATION IN THIS STRUCTURAL AND COLLATERAL TERM SHEET IS NOT COMPLETE AND MAY BE AMENDED PRIOR TO THE TIME OF SALE. THIS TERM SHEET IS NOT AN OFFER TO SELL THESE SECURITIES AND IT IS NOT A SOLICITATION OF AN OFFER TO BUY THESE SECURITIES IN ANY JURISDICTION WHERE THE OFFER OR SALE IS NOT PERMITTED.
| | |
| 8 of 133 |
| Structural and Collateral Term Sheet | JPMBB 2014-C26 | |
| Collateral Characteristics | ||
| Cut-off Date Principal Balance |
Weighted Average | |||||||||||||||||||||
| Range of Principal Balances | Number of Loans | Cut-off Date Principal Balance | % of IPB | Mortgage Rate | Remaining Loan Term(1)(5) | UW NCF DSCR(2)(3) | UW NOI DY(2) | Cut-off Date LTV(2)(4) | Maturity Date LTV(1)(2)(4) | ||||||||||||
| $2,070,000 | - | $9,999,999 | 28 | $169,031,642 | 11.7% | 4.52795% | 115 | 1.68x | 10.6% | 68.8% | 59.1% | ||||||||||
| $10,000,000 | - | $19,999,999 | 14 | 213,169,792 | 14.7 | 4.44804% | 99 | 1.76x | 10.6% | 66.6% | 57.5% | ||||||||||
| $20,000,000 | - | $24,999,999 | 5 | 114,300,000 | 7.9 | 4.52902% | 119 | 1.55x | 10.4% | 69.7% | 60.9% | ||||||||||
| $25,000,000 | - | $49,999,999 | 18 | 677,555,439 | 46.7 | 4.51513% | 112 | 1.53x | 9.8% | 69.6% | 60.6% | ||||||||||
| $50,000,000 | - | $100,000,000 | 4 | 275,550,000 | 19.0 | 4.16613% | 106 | 2.12x | 11.1% | 59.5% | 54.6% | ||||||||||
| Total / Weighted Average: | 69 | $1,449,606,872 | 100.0% | 4.44151% | 110 | 1.69x | 10.3% | 67.2% | 58.9% | ||||||||||||
| Mortgage Interest Rates |
Weighted Average | |||||||||||||||||||||
Range of Mortgage Interest Rates | Number of Loans | Cut-off Date Principal Balance | % of IPB | Mortgage Rate | Remaining Loan Term(1)(5) | UW NCF DSCR(2)(3) | UW NOI DY(2) | Cut-off Date LTV(2)(4) | Maturity Date LTV(1)(2)(4) | ||||||||||||
| 3.55000% | - | 4.40000% | 19 | $527,863,469 | 36.4% | 4.08270% | 116 | 2.03x | 11.1% | 61.1% | 54.6% | ||||||||||
| 4.40001% | - | 4.60000% | 23 | 472,673,628 | 32.6 | 4.48442% | 116 | 1.51x | 9.8% | 70.5% | 60.8% | ||||||||||
| 4.60001% | - | 4.80000% | 17 | 309,463,775 | 21.3 | 4.69883% | 93 | 1.53x | 9.7% | 70.3% | 62.3% | ||||||||||
| 4.80001% | - | 5.00000% | 8 | 67,356,001 | 4.6 | 4.94082% | 118 | 1.42x | 10.4% | 66.0% | 50.5% | ||||||||||
| 5.00001% | - | 5.22000% | 2 | 72,250,000 | 5.0 | 5.21471% | 87 | 1.40x | 9.5% | 76.9% | 70.4% | ||||||||||
| Total / Weighted Average: | 69 | $1,449,606,872 | 100.0% | 4.44151% | 110 | 1.69x | 10.3% | 67.2% | 58.9% | ||||||||||||
Original Term to Maturity/ARD in Months(1)(5) |
Weighted Average | ||||||||||||||||||
Original Term to Maturity/ARD in Months(5) | Number of Loans | Cut-off Date Principal Balance | % of IPB | Mortgage Rate | Remaining Loan Term(1)(5) | UW NCF DSCR(2)(3) | UW NOI DY(2) | Cut-off Date LTV(2)(4) | Maturity Date LTV(1)(2)(4) | |||||||||
| 60 | 9 | $221,338,691 | 15.3% | 4.65049% | 59 | 1.72x | 9.9% | 69.3% | 66.1% | |||||||||
| 120 | 60 | 1,228,268,181 | 84.7 | 4.40385% | 119 | 1.69x | 10.3% | 66.8% | 57.6% | |||||||||
| Total / Weighted Average: | 69 | $1,449,606,872 | 100.0% | 4.44151% | 110 | 1.69x | 10.3% | 67.2% | 58.9% | |||||||||
Remaining Term to Maturity/ARD in Months(1)(5) |
Weighted Average | ||||||||||||||||||||
Remaining Term to Maturity/ARD in Months(5) | Number of Loans | Cut-off Date Principal Balance | % of IPB | Mortgage Rate | Remaining Loan Term(1)(5) | UW NCF DSCR(2)(3) | UW NOI DY(2) | Cut-off Date LTV(2)(4) | Maturity Date LTV(1)(2)(4) | |||||||||||
| 58 | - | 60 | 9 | $221,338,691 | 15.3% | 4.65049% | 59 | 1.72x | 9.9% | 69.3% | 66.1% | |||||||||
| 61 | - | 120 | 60 | 1,228,268,181 | 84.7 | 4.40385% | 119 | 1.69x | 10.3% | 66.8% | 57.6% | |||||||||
| Total / Weighted Average: | 69 | $1,449,606,872 | 100.0% | 4.44151% | 110 | 1.69x | 10.3% | 67.2% | 58.9% | |||||||||||
| (1) | In the case of Loan Nos. 11, 29 and 46, each of which has an anticipated repayment date, Remaining Loan Term, Original Term To Maturity/ARD, Remaining Term to Maturity/ARD and Maturity Date LTV are as of the related anticipated repayment date. |
| (2) | In the case of Loan Nos. 1, 6, 8 and 26, the UW NCF DSCR, UW NOI Debt Yield, Cut-off Date LTV and Maturity Date LTV calculations include the related Pari Passu Companion Loan. In the case of Loan No. 20, the UW NCF DSCR, UW NOI Debt Yield, Cut-off Date LTV and Maturity Date LTV calculations exclude the HOW Trust Subordinate Companion Loan. |
| (3) | In the case of Loan No. 20, the UW NCF DSCR is calculated using the average of principal and interest payments over the first 12 months following the cut-off date based on the principal payment schedule provided on Annex F of the Free Writing Prospectus. In the case of Loan No. 45, the UW NCF DSCR is calculated using the average of principal and interest payments over the first 12 months following the initial interest only period based on the principal payment schedule provided on Annex G of the Free Writing Prospectus. |
| (4) | In the case of Loan Nos. 14, 28, 52 and 65 the Cut-off Date LTV and the Maturity Date LTV are calculated based upon a hypothetical “as-stabilized,” “as-renovated” or “as-complete” appraised value based on certain assumptions. Refer to “Description of the Mortgage Pool – Assessments of Property Value and Condition” in the Free Writing Prospectus for additional details. |
| (5) | In the case of Loan Nos. 2 and 29, the the first payment dates for the loans are February 1, 2015. On the Closing Date, JPMCB will deposit sufficient funds to pay the interest due for the January 2015 payment for the related loans. Information presented in this term sheet reflects the loans’ contractual loan terms. |
THE INFORMATION IN THIS STRUCTURAL AND COLLATERAL TERM SHEET IS NOT COMPLETE AND MAY BE AMENDED PRIOR TO THE TIME OF SALE. THIS TERM SHEET IS NOT AN OFFER TO SELL THESE SECURITIES AND IT IS NOT A SOLICITATION OF AN OFFER TO BUY THESE SECURITIES IN ANY JURISDICTION WHERE THE OFFER OR SALE IS NOT PERMITTED.
| | |
| 9 of 133 |
| Structural and Collateral Term Sheet | JPMBB 2014-C26 | |
| Collateral Characteristics | ||
| Original Amortization Term in Months |
Weighted Average | ||||||||||||||||||
Original Amortization Term in Months | Number of Loans | Cut-off Date Principal Balance | % of IPB | Mortgage Rate | Remaining Loan Term(1)(5) | UW NCF DSCR(2)(3) | UW NOI DY(2) | Cut-off Date LTV(2)(4) | Maturity Date LTV(1)(2)(4) | |||||||||
| Interest Only | 6 | $180,988,750 | 12.5% | 3.91119% | 96 | 2.99x | 12.7% | 45.6% | 45.6% | |||||||||
| 300 | 6 | 77,906,961 | 5.4 | 4.84410% | 118 | 1.47x | 10.7% | 65.1% | 47.6% | |||||||||
| 324 | 2 | 71,078,986 | 4.9 | 4.41100% | 119 | 1.19x | 8.0% | 79.7% | 68.5% | |||||||||
| 360 | 55 | 1,119,632,176 | 77.2 | 4.50116% | 111 | 1.53x | 10.0% | 70.0% | 61.2% | |||||||||
| Total / Weighted Average: | 69 | $1,449,606,872 | 100.0% | 4.44151% | 110 | 1.69x | 10.3% | 67.2% | 58.9% | |||||||||
| Remaining Amortization Term in Months |
Weighted Average | ||||||||||||||||||||
Remaining Amortization Term in Months | Number of Loans | Cut-off Date Principal Balance | % of IPB | Mortgage Rate | Remaining Loan Term(1)(5) | UW NCF DSCR(2)(3) | UW NOI DY(2) | Cut-off Date LTV(2)(4) | Maturity Date LTV(1)(2)(4) | |||||||||||
| Interest Only | 6 | $180,988,750 | 12.5% | 3.91119% | 96 | 2.99x | 12.7% | 45.6% | 45.6% | |||||||||||
| 297 | - | 299 | 3 | 44,501,961 | 3.1 | 4.91742% | 117 | 1.49x | 11.3% | 59.7% | 41.6% | |||||||||
| 300 | - | 360 | 60 | 1,224,116,162 | 84.4 | 4.50262% | 112 | 1.51x | 9.9% | 70.6% | 61.4% | |||||||||
| Total / Weighted Average: | 69 | $1,449,606,872 | 100.0% | 4.44151% | 110 | 1.69x | 10.3% | 67.2% | 58.9% | |||||||||||
| Amortization Types |
Weighted Average | ||||||||||||||||||
| Amortization Types | Number of Loans | Cut-off Date Principal Balance | % of IPB | Mortgage Rate | Remaining Loan Term(1)(5) | UW NCF DSCR(2)(3) | UW NOI DY(2) | Cut-off Date LTV(2)(4) | Maturity Date LTV(1)(2)(4) | |||||||||
| IO-Balloon | 40 | $918,625,986 | 63.4% | 4.47758% | 117 | 1.49x | 9.8% | 71.4% | 62.4% | |||||||||
| Balloon | 21 | 303,021,347 | 20.9 | 4.54189% | 103 | 1.59x | 10.5% | 66.3% | 54.5% | |||||||||
| Interest Only | 5 | 161,688,750 | 11.2 | 3.95430% | 100 | 2.92x | 12.5% | 46.3% | 46.3% | |||||||||
| ARD-IO-Balloon | 1 | 38,250,000 | 2.6 | 5.21000% | 58 | 1.25x | 8.7% | 75.0% | 71.8% | |||||||||
| ARD-Interest Only | 1 | 19,300,000 | 1.3 | 3.55000% | 60 | 3.61x | 13.9% | 40.0% | 40.0% | |||||||||
| ARD-Balloon | 1 | 8,720,789 | 0.6 | 4.79000% | 118 | 1.50x | 10.5% | 69.8% | 51.9% | |||||||||
| Total / Weighted Average: | 69 | $1,449,606,872 | 100.0% | 4.44151% | 110 | 1.69x | 10.3% | 67.2% | 58.9% | |||||||||
Underwritten Net Cash Flow Debt Service Coverage Ratios(2)(3) |
Weighted Average | ||||||||||||||||||||
| Underwritten Net Cash Flow Debt Service Coverage Ratios | Number of Loans | Cut-off Date Principal Balance | % of IPB | Mortgage Rate | Remaining Loan Term(1)(5) | UW NCF DSCR(2)(3) | UW NOI DY(2) | Cut-off Date LTV(2)(4) | Maturity Date LTV(1)(2)(4) | |||||||||||
| 1.19x | - | 1.36x | 13 | $365,334,565 | 25.2% | 4.64287% | 100 | 1.28x | 8.6% | 75.5% | 67.0% | |||||||||
| 1.36x | - | 1.44x | 12 | 240,044,415 | 16.6 | 4.49510% | 117 | 1.41x | 9.7% | 69.7% | 59.7% | |||||||||
| 1.46x | - | 1.54x | 17 | 255,531,709 | 17.6 | 4.43171% | 112 | 1.51x | 10.2% | 70.9% | 62.0% | |||||||||
| 1.56x | - | 1.64x | 6 | 95,708,029 | 6.6 | 4.73208% | 119 | 1.59x | 10.1% | 71.0% | 60.0% | |||||||||
| 1.66x | - | 1.79x | 8 | 162,286,023 | 11.2 | 4.43931% | 119 | 1.75x | 10.9% | 62.8% | 52.9% | |||||||||
| 1.81x | - | 2.00x | 6 | 139,963,381 | 9.7 | 4.32749% | 119 | 1.87x | 11.9% | 64.1% | 53.8% | |||||||||
| 2.01x | - | 3.61x | 7 | 190,738,750 | 13.2 | 3.94129% | 97 | 2.96x | 12.8% | 47.1% | 46.4% | |||||||||
| Total / Weighted Average: | 69 | $1,449,606,872 | 100.0% | 4.44151% | 110 | 1.69x | 10.3% | 67.2% | 58.9% | |||||||||||
| (1) | In the case of Loan Nos. 11, 29 and 46, each of which has an anticipated repayment date, Remaining Loan Term, Original Term To Maturity/ARD, Remaining Term to Maturity/ARD and Maturity Date LTV are as of the related anticipated repayment date. |
| (2) | In the case of Loan Nos. 1, 6, 8 and 26, the UW NCF DSCR, UW NOI Debt Yield, Cut-off Date LTV and Maturity Date LTV calculations include the related Pari Passu Companion Loan. In the case of Loan No. 20, the UW NCF DSCR, UW NOI Debt Yield, Cut-off Date LTV and Maturity Date LTV calculations exclude the HOW Trust Subordinate Companion Loan. |
| (3) | In the case of Loan No. 20, the UW NCF DSCR is calculated using the average of principal and interest payments over the first 12 months following the cut-off date based on the principal payment schedule provided on Annex F of the Free Writing Prospectus. In the case of Loan No. 45, the UW NCF DSCR is calculated using the average of principal and interest payments over the first 12 months following the initial interest only period based on the principal payment schedule provided on Annex G of the Free Writing Prospectus. |
| (4) | In the case of Loan Nos. 14, 28, 52 and 65 the Cut-off Date LTV and the Maturity Date LTV are calculated based upon a hypothetical “as-stabilized,” “as-renovated” or “as-complete” appraised value based on certain assumptions. Refer to “Description of the Mortgage Pool – Assessments of Property Value and Condition” in the Free Writing Prospectus for additional details. |
| (5) | In the case of Loan Nos. 2 and 29, the the first payment dates for the loans are February 1, 2015. On the Closing Date, JPMCB will deposit sufficient funds to pay the interest due for the January 2015 payment for the related loans. Information presented in this term sheet reflects the loans’ contractual loan terms. |
THE INFORMATION IN THIS STRUCTURAL AND COLLATERAL TERM SHEET IS NOT COMPLETE AND MAY BE AMENDED PRIOR TO THE TIME OF SALE. THIS TERM SHEET IS NOT AN OFFER TO SELL THESE SECURITIES AND IT IS NOT A SOLICITATION OF AN OFFER TO BUY THESE SECURITIES IN ANY JURISDICTION WHERE THE OFFER OR SALE IS NOT PERMITTED.
| | |
| 10 of 133 |
| Structural and Collateral Term Sheet | JPMBB 2014-C26 | |
| Collateral Characteristics | ||
LTV Ratios as of the Cut-off Date(2)(4) |
Weighted Average | ||||||||||||||||||||
| Range of Cut-off Date LTVs | Number of Loans | Cut-off Date Principal Balance | % of IPB | Mortgage Rate | Remaining Loan Term(1)(5) | UW NCF DSCR(2)(3) | UW NOI DY(2) | Cut-off Date LTV(2)(4) | Maturity Date LTV(1)(2)(4) | |||||||||||
| 33.3% | - | 59.9% | 9 | $235,280,203 | 16.2% | 4.07079% | 112 | 2.61x | 12.6% | 44.8% | 39.3% | |||||||||
| 60.0% | - | 64.9% | 10 | 170,778,985 | 11.8 | 4.35687% | 115 | 1.73x | 10.7% | 62.4% | 52.9% | |||||||||
| 65.0% | - | 69.9% | 13 | 185,719,979 | 12.8 | 4.55479% | 113 | 1.65x | 10.6% | 68.3% | 58.7% | |||||||||
| 70.0% | - | 75.0% | 26 | 552,393,720 | 38.1 | 4.42132% | 112 | 1.50x | 9.7% | 72.3% | 64.1% | |||||||||
| 75.0% | - | 80.0% | 11 | 305,433,986 | 21.1 | 4.74205% | 100 | 1.35x | 9.0% | 77.1% | 67.9% | |||||||||
| Total / Weighted Average: | 69 | $1,449,606,872 | 100.0% | 4.44151% | 110 | 1.69x | 10.3% | 67.2% | 58.9% | |||||||||||
LTV Ratios as of the Maturity Date(1)(2)(4) |
Weighted Average | ||||||||||||||||||||
Range of Maturity Date/ARD LTVs | Number of Loans | Cut-off Date Principal Balance | % of IPB | Mortgage Rate | Remaining Loan Term(1)(5) | UW NCF DSCR(2)(3) | UW NOI DY(2) | Cut-off Date LTV(2)(4) | Maturity Date LTV(1)(2)(4) | |||||||||||
| 33.3% | - | 44.9% | 4 | $185,051,453 | 12.8% | 3.96998% | 112 | 2.78x | 12.8% | 41.1% | 36.1% | |||||||||
| 45.0% | - | 49.9% | 5 | 75,032,871 | 5.2 | 4.25810% | 120 | 1.80x | 11.4% | 61.9% | 48.9% | |||||||||
| 50.0% | - | 54.9% | 8 | 134,216,903 | 9.3 | 4.49533% | 120 | 1.70x | 10.6% | 62.9% | 52.9% | |||||||||
| 55.0% | - | 59.9% | 19 | 245,440,968 | 16.9 | 4.45672% | 114 | 1.65x | 10.5% | 67.6% | 58.2% | |||||||||
| 60.0% | - | 65.0% | 16 | 305,940,691 | 21.1 | 4.56796% | 116 | 1.44x | 9.5% | 73.5% | 62.8% | |||||||||
| 65.0% | - | 71.8% | 17 | 503,923,986 | 34.8 | 4.54347% | 100 | 1.45x | 9.4% | 74.6% | 68.2% | |||||||||
| Total / Weighted Average: | 69 | $1,449,606,872 | 100.0% | 4.44151% | 110 | 1.69x | 10.3% | 67.2% | 58.9% | |||||||||||
| Prepayment Protection |
Weighted Average | ||||||||||||||||||
Prepayment Protection | Number of Loans | Cut-off Date Principal Balance | % of IPB | Mortgage Rate | Remaining Loan Term(1)(5) | UW NCF DSCR(2)(3) | UW NOI DY(2) | Cut-off Date LTV(2)(4) | Maturity Date LTV(1)(2)(4) | |||||||||
Defeasance | 48 | $965,936,122 | 66.6% | 4.44050% | 111 | 1.72x | 10.3% | 65.9% | 57.4% | |||||||||
Yield Maintenance | 21 | 483,670,750 | 33.4 | 4.44354% | 107 | 1.64x | 10.3% | 69.8% | 61.8% | |||||||||
Total / Weighted Average: | 69 | $1,449,606,872 | 100.0% | 4.44151% | 110 | 1.69x | 10.3% | 67.2% | 58.9% | |||||||||
| Loan Purpose |
Weighted Average | ||||||||||||||||||
| Loan Purpose | Number of Loans | Cut-off Date Principal Balance | % of IPB | Mortgage Rate | Remaining Loan Term(1)(5) | UW NCF DSCR(2)(3) | UW NOI DY(2) | Cut-off Date LTV(2)(4) | Maturity Date LTV(1)(2)(4) | |||||||||
| Refinance | 45 | $963,702,008 | 66.5% | 4.41378% | 111 | 1.74x | 10.3% | 65.5% | 56.7% | |||||||||
| Acquisition | 24 | 485,904,864 | 33.5 | 4.49653% | 107 | 1.61x | 10.2% | 70.6% | 63.1% | |||||||||
| Total / Weighted Average: | 69 | $1,449,606,872 | 100.0% | 4.44151% | 110 | 1.69x | 10.3% | 67.2% | 58.9% | |||||||||
| (1) | In the case of Loan Nos. 11, 29 and 46, each of which has an anticipated repayment date, Remaining Loan Term, Original Term To Maturity/ARD, Remaining Term to Maturity/ARD and Maturity Date LTV are as of the related anticipated repayment date. |
| (2) | In the case of Loan Nos. 1, 6, 8 and 26, the UW NCF DSCR, UW NOI Debt Yield, Cut-off Date LTV and Maturity Date LTV calculations include the related Pari Passu Companion Loan. In the case of Loan No. 20, the UW NCF DSCR, UW NOI Debt Yield, Cut-off Date LTV and Maturity Date LTV calculations exclude the HOW Trust Subordinate Companion Loan. |
| (3) In the case of Loan No. 20, the UW NCF DSCR is calculated using the average of principal and interest payments over the first 12 months following the cut-off date based on the principal payment schedule provided on Annex F of the Free Writing Prospectus. In the case of Loan No. 45, the UW NCF DSCR is calculated using the average of principal and interest payments over the first 12 months following the initial interest only period based on the principal payment schedule provided on Annex G of the Free Writing Prospectus. |
| (4) | In the case of Loan Nos. 14, 28, 52 and 65 the Cut-off Date LTV and the Maturity Date LTV are calculated based upon a hypothetical “as-stabilized,” “as-renovated” or “as-complete” appraised value based on certain assumptions. Refer to “Description of the Mortgage Pool – Assessments of Property Value and Condition” in the Free Writing Prospectus for additional details. |
| (5) | In the case of Loan Nos. 2 and 29, the the first payment dates for the loans are February 1, 2015. On the Closing Date, JPMCB will deposit sufficient funds to pay the interest due for the January 2015 payment for the related loans. Information presented in this term sheet reflects the loans’ contractual loan terms. |
THE INFORMATION IN THIS STRUCTURAL AND COLLATERAL TERM SHEET IS NOT COMPLETE AND MAY BE AMENDED PRIOR TO THE TIME OF SALE. THIS TERM SHEET IS NOT AN OFFER TO SELL THESE SECURITIES AND IT IS NOT A SOLICITATION OF AN OFFER TO BUY THESE SECURITIES IN ANY JURISDICTION WHERE THE OFFER OR SALE IS NOT PERMITTED.
| | |
| 11 of 133 |
| Structural and Collateral Term Sheet | JPMBB 2014-C26 | |
| Collateral Characteristics | ||
Previous Securitization History(1) |
| No. | Loan Name | Location | Property Type | Previous Securitization |
| 2 | 1515 Market | Philadelphia, PA | Office | JPMCC 2007-LDPX |
| 4 | Heron Lakes | Houston, TX | Office | JPMCC 2013-FL3 |
| 5.01 | Holiday Inn Express - Charleston | Charleston, WV | Hotel | GSMS 2006-GG6 |
| 7 | Centergy One | Atlanta, GA | Office | CSFB 2005-C5 |
| 9 | United Healthcare Office | Las Vegas, NV | Office | WBCMT 2006-C27 |
| 13.01 | Gable Oaks | Rockhill, SC | Multifamily | CSMC 2007-C5 |
| 13.02 | Sharon Pointe | Charlotte, NC | Multifamily | CSMC 2008-C1 |
| 13.03 | Woodbrook | Monroe, NC | Multifamily | CSMC 2007-C5 |
| 18.01 | Huntersville Apartments | Huntersville, NC | Multifamily | CSMC 2007-C5 |
| 18.02 | Wexford Apartments | Charlotte, NC | Multifamily | CSMC 2008-C1 |
| 18.03 | Davidson Apartments | Concord, NC | Multifamily | CSMC 2007-C5 |
| 18.04 | Marion Ridge Apartments | Shelby, NC | Multifamily | CSMC 2008-C1 |
| 22 | Marriott Fort Lauderdale | Fort Lauderdale, FL | Hotel | CSFB 2005-C5 |
| 25 | Newington Commons | Newington, CT | Retail | MSC 2005-HQ6 |
| 28 | Westview Apartments | Lewisville, TX | Multifamily | FREMF 2013-KF02 |
| 31 | Renaissance Boca Raton | Boca Raton, FL | Hotel | CSFB 2005-C5 |
| 32 | Broadway Marketplace - Parcel 2,3,4 | Denver, CO | Retail | JPMCC 2004-C3 |
| 35 | Hilton Garden Inn Tampa Riverview | Riverview, FL | Hotel | S2H 2012-LV1 |
| 46 | 100 Provena Way | Bourbonnais, IL | Office | WBCMT 2006-C24 |
| 47 | Forest Cove | Ann Arbor, MI | Office | GCCFC 2004-GG1 |
| 49 | Summer Chase | Little River, SC | Multifamily | GECMC 2005-C1 |
| 50 | Walden Park Shopping Center | Austin, TX | Retail | GCCFC 2005-GG3 |
| 53 | Mill Creek Crossing | Buford, GA | Retail | FDIC 2012-C1 |
| 54 | Cypress Pointe | Redding, CA | Retail | BSCMS 2005-T18 |
| 58 | 3445 North Causeway | Metairie, LA | Office | BACM 2006-4 |
| 60 | 701 Martinsville | Liberty Corner, NJ | Office | MSC 2005-HQ5 |
| 67 | Mobile Gardens MHC | Mission, TX | Manufactured Housing | WBCMT 2007-C31 |
| (1) | The table above represents the properties for which the previously existing debt was most recently securitized, based on information provided by the related borrower or obtained through searches of a third-party database. |
THE INFORMATION IN THIS STRUCTURAL AND COLLATERAL TERM SHEET IS NOT COMPLETE AND MAY BE AMENDED PRIOR TO THE TIME OF SALE. THIS TERM SHEET IS NOT AN OFFER TO SELL THESE SECURITIES AND IT IS NOT A SOLICITATION OF AN OFFER TO BUY THESE SECURITIES IN ANY JURISDICTION WHERE THE OFFER OR SALE IS NOT PERMITTED.
| | |
| 12 of 133 |
| Structural and Collateral Term Sheet | JPMBB 2014-C26 |
Class A-2(1) |
No. | Loan Name | Location | Cut-off Date Balance | % of IPB | Maturity/ARD Balance | % of Certificate Class(2) | Original Loan Term | Remaining Loan Term | UW NCF DSCR | UW NOI Debt Yield | Cut-off Date LTV Ratio | Maturity Date/ARD LTV Ratio | |||||||||
| 3 | Wells Fargo Center Tampa | Tampa, FL | $59,800,000 | 4.1% | $54,914,163 | 25.9% | 60 | 60 | 1.33x | 9.0% | 76.7% | 70.4% | |||||||||
| 9 | United Healthcare Office | Las Vegas, NV | 42,000,000 | 2.9 | 42,000,000 | 19.8 | 60 | 58 | 2.02x | 9.8% | 70.0% | 70.0% | |||||||||
| 11 | The View & Legends | Dallas, TX | 38,250,000 | 2.6 | 36,619,487 | 17.3 | 60 | 58 | 1.25x | 8.7% | 75.0% | 71.8% | |||||||||
| 29 | 1019 Market Street | San Francisco, CA | 19,300,000 | 1.3 | 19,300,000 | 9.1 | 60 | 60 | 3.61x | 13.9% | 40.0% | 40.0% | |||||||||
| 30 | Fordham Road Business Park | Wilmington, MA | 18,500,000 | 1.3 | 17,911,899 | 8.5 | 60 | 59 | 1.51x | 10.7% | 69.8% | 67.6% | |||||||||
| 32 | Broadway Marketplace - Parcel 2,3,4 | Denver, CO | 16,638,691 | 1.1 | 15,283,737 | 7.2 | 60 | 59 | 1.29x | 8.6% | 70.5% | 64.8% | |||||||||
| 33 | Staybridge Suites Savannah Historic District | Savannah, GA | 14,850,000 | 1.0 | 14,152,798 | 6.7 | 60 | 59 | 1.53x | 9.5% | 62.4% | 59.5% | |||||||||
| 55 | American Water Works | Pensacola, FL | 6,300,000 | 0.4 | 5,769,609 | 2.7 | 60 | 60 | 1.41x | 9.8% | 74.6% | 68.4% | |||||||||
| 58 | 3445 North Causeway | Metairie, LA | 5,700,000 | 0.4 | 5,700,000 | 2.7 | 60 | 60 | 3.06x | 15.4% | 55.9% | 55.9% | |||||||||
| Total / Weighted Average: | $221,338,691 | 15.3% | $211,651,694 | 100.0% | 60 | 59 | 1.72x | 9.9% | 69.3% | 66.1% | |||||||||||
| (1) | The table above presents the mortgage loans whose balloon payments would be applied to pay down the principal balance of the Class A-2 Certificates, assuming a 0% CPR and applying the “Modeling Assumptions” described in the Free Writing Prospectus, including the assumptions that (i) none of the mortgage loans in the pool experience prepayments, defaults or losses; (ii) there are no extensions of maturity dates of any mortgage loans in the pool; and (iii) each mortgage loan in the pool is paid in full on its stated maturity date or anticipated repayment date, as applicable. Each class of Certificates, including the Class A-2 Certificates, evidences undivided ownership interests in the entire pool of mortgage loans. Debt service coverage ratio, debt yield and loan-to-value ratio information does not take into account subordinate debt (whether or not secured by the mortgaged property), if any, that is allowed under the terms of any mortgage loan. See Annex A-1 to the Free Writing Prospectus. |
| (2) | Reflects the percentage equal to the Maturity/ARD Balance divided by the initial Class A-2 Certificate Balance. |
THE INFORMATION IN THIS STRUCTURAL AND COLLATERAL TERM SHEET IS NOT COMPLETE AND MAY BE AMENDED PRIOR TO THE TIME OF SALE. THIS TERM SHEET IS NOT AN OFFER TO SELL THESE SECURITIES AND IT IS NOT A SOLICITATION OF AN OFFER TO BUY THESE SECURITIES IN ANY JURISDICTION WHERE THE OFFER OR SALE IS NOT PERMITTED.
| | |
| 13 of 133 |
| Structural and Collateral Term Sheet | JPMBB 2014-C26 |
| Structural Overview |
| ■ | Accrual: | Each Class of Certificates (other than the Class HOW and Class R Certificates) will accrue interest on a 30/360 basis. Interest on the Class HOW Certificates will be calculated on an Actual/360 Basis. The Class R Certificates will not accrue interest. On each Distribution Date, any excess interest collected in respect of any mortgage loan in the trust with an anticipated repayment date during the related due period will be distributed to the holders of the Class NR Certificates. | |
| ■ | Distribution of Interest: | On each Distribution Date, accrued interest for each Class of Certificates (other than the Class HOW and Class R Certificates) at the applicable pass-through rate will be distributed in the following order of priority to the extent of available funds: first, to the Class A-1, Class A-2, Class A-3, Class A-4, Class A-SB, Class X-A, Class X-B, Class X-C, Class X-D, Class X-E, Class X-F and Class X-NR Certificates, on a pro rata basis, based on the interest entitlement for each such Class on such date, and then to the Class A-S, Class B, Class C, Class D, Class E, Class F and Class NR Certificates, in that order, in each case until the interest entitlement for such date payable to each such Class is paid in full. | |
| Payments of interest collected on the 543 Howard Whole Loan will be allocated first to the 543 Howard Mortgage Loan and then to the HOW Trust Subordinate Companion Loan (as defined below). Interest allocated to the HOW Trust Subordinate Companion Loan will only be available to make distributions and pay other amounts in respect of the Class HOW Certificates, as applicable. | |||
The pass-through rate applicable to the Class A-1, Class A-2, Class A-3, Class A-4, Class A-SB, Class A-S, Class B, Class C, Class D, Class E, Class F and Class NR certificates on each Distribution Date will be a per annum rate equal to one of (i) a fixed rate, (ii) the weighted average of the net mortgage rates on the mortgage loans (in each case adjusted, if necessary, to accrue on the basis of a 360-day year consisting of twelve 30-day months), (iii) the lesser of a specified fixed pass-through rate and the rate described in clause (ii) above or (iv) the rate described in clause (ii) above less a specified percentage. | |||
| The pass-through rate for the Class X-A Certificates for any Distribution Date will equal the excess, if any, of (a) the weighted average of the net mortgage rates on the mortgage loans (in each case adjusted, if necessary, to accrue on the basis of a 360-day year consisting of twelve 30-day months), over (b) the weighted average of the pass-through rates on the Class A-1, Class A-2, Class A-3, Class A-4, Class A-SB and Class A-S Certificates, weighted on the basis of their respective Certificate Balances immediately prior to that Distribution Date and calculated without giving effect to any exchange and conversion of any Class A-S Certificates for Class EC Certificates. | |||
| The pass-through rate for the Class X-B Certificates for any Distribution Date will equal the excess, if any, of (a) the weighted average of the net mortgage rates on the mortgage loans (in each case adjusted, if necessary, to accrue on the basis of a 360-day year consisting of twelve 30-day months), over (b) the pass-through rate of the Class B Certificates for that Distribution Date. | |||
| The pass-through rate for the Class X-C certificates for any distribution date will equal the excess, if any, of (a) the weighted average of the net mortgage rates on the mortgage loans (in each case adjusted, if necessary, to accrue on the basis of a 360-day year consisting of twelve 30-day months), over (b) the pass-through rate of the Class C certificates for that distribution date. | |||
| The pass-through rate for the Class X-D Certificates for any Distribution Date will equal the excess, if any, of (a) the weighted average of the net mortgage rates on the mortgage loans (in each case adjusted, if necessary, to accrue on the basis of a 360-day year consisting of twelve 30-day months), over (b) the pass-through rate of the Class D Certificates for that Distribution Date. |
THE INFORMATION IN THIS STRUCTURAL AND COLLATERAL TERM SHEET IS NOT COMPLETE AND MAY BE AMENDED PRIOR TO THE TIME OF SALE. THIS TERM SHEET IS NOT AN OFFER TO SELL THESE SECURITIES AND IT IS NOT A SOLICITATION OF AN OFFER TO BUY THESE SECURITIES IN ANY JURISDICTION WHERE THE OFFER OR SALE IS NOT PERMITTED.
| | |
| 14 of 133 |
| Structural and Collateral Term Sheet | JPMBB 2014-C26 |
| Structural Overview |
| The pass-through rate for the Class X-E Certificates for any Distribution Date will equal the excess, if any, of (a) the weighted average of the net mortgage rates on the mortgage loans (in each case adjusted, if necessary, to accrue on the basis of a 360-day year consisting of twelve 30-day months), over (b) the pass-through rate of the Class E Certificates for that Distribution Date. | |||
| The pass-through rate for the Class X-F Certificates for any Distribution Date will equal the excess, if any, of (a) the weighted average of the net mortgage rates on the mortgage loans (in each case adjusted, if necessary, to accrue on the basis of a 360-day year consisting of twelve 30-day months), over (b) the pass-through rate of the Class F Certificates for that Distribution Date. | |||
| The pass-through rate for the Class X-NR certificates for any distribution date will equal the excess, if any, of (a) the weighted average of the net mortgage rates on the mortgage loans (in each case adjusted, if necessary, to accrue on the basis of a 360-day year consisting of twelve 30-day months), over (b) the pass-through rate of the Class NR certificates for that distribution date. | |||
| The Class EC Certificates will not have a pass-through rate, but will be entitled to receive the sum of the interest otherwise distributable on the portion of Exchangeable Certificates that have been converted in an exchange for such Class EC Certificates. | |||
| On each Distribution Date, any excess interest collected in respect of any mortgage loan in the trust with an anticipated repayment date during the related due period will be distributed to the holders of the Class NR Certificates. | |||
See “Description of the Certificates—Distributions” in the Free Writing Prospectus. | |||
| ■ | Distribution of Principal: | On any Distribution Date prior to the Cross-Over Date, payments in respect of principal of the Certificates will be distributed first, to the Class A-SB Certificates until the Certificate Balance of the Class A-SB Certificates is reduced to the planned principal balance for the related Distribution Date set forth in Annex E to the Free Writing Prospectus, second, to the Class A-1 Certificates, until the Certificate Balance of such Class is reduced to zero, third, to the Class A-2 Certificates, until the Certificate Balance of such Class is reduced to zero, fourth, to the Class A-3 Certificates, until the Certificate Balance of such Class is reduced to zero, fifth, to the Class A-4 Certificates, until the Certificate Balance of such Class is reduced to zero, sixth, to the Class A-SB Certificates, until the Certificate Balance of such Class is reduced to zero and then to the Class A-S, Class B, Class C, Class D, Class E, Class F and Class NR Certificates, in that order, until the Certificate Balance of each such Class is reduced to zero. | |
On any Distribution Date on or after the Cross-Over Date, payments in respect of principal of the Certificates will be distributed first, to the Class A-1, Class A-2, Class A-3, Class A-4 and Class A-SB Certificates, on a pro rata basis, based on the Certificate Balance of each such Class until the Certificate Balance of each such Class is reduced to zero and then, to the Class A-S, Class B, Class C, Class D, Class E, Class F and Class NR Certificates, in that order, until the Certificate Balance of each such Class is reduced to zero. | |||
The “Cross-Over Date” means the Distribution Date on which the aggregate Certificate Balances of the Class A-S, Class B, Class C, Class D, Class E, Class F and Class NR Certificates (without giving effect to any exchange of the Exchangeable Certificates for Class EC Certificates) have been reduced to zero (after taking into account any allocation of realized losses on the mortgage loans (exclusive of any related companion loan and with respect to the 543 Howard Whole Loan, exclusive of the HOW Trust Subordinate Companion Loan) to such Classes on or prior to such date). If Exchangeable Certificates are converted in an exchange for Class EC Certificates, all principal that would otherwise be distributable to such converted Exchangeable Certificates will be distributed to such Class EC Certificates. | |||
The Class X-A, Class X-B, Class X-C, Class X-D, Class X-E, Class X-F and Class X-NR Certificates (the “Class X Certificates”) will not be entitled to receive distributions of |
THE INFORMATION IN THIS STRUCTURAL AND COLLATERAL TERM SHEET IS NOT COMPLETE AND MAY BE AMENDED PRIOR TO THE TIME OF SALE. THIS TERM SHEET IS NOT AN OFFER TO SELL THESE SECURITIES AND IT IS NOT A SOLICITATION OF AN OFFER TO BUY THESE SECURITIES IN ANY JURISDICTION WHERE THE OFFER OR SALE IS NOT PERMITTED.
| | |
| 15 of 133 |
| Structural and Collateral Term Sheet | JPMBB 2014-C26 |
| Structural Overview |
| principal; however, the notional amount of the Class X-A Certificates will be reduced by the aggregate amount of principal distributions, realized losses and trust fund expenses allocated to Certificates that are components of the Class X-A Certificates’ notional amount (the Certificate Balances of the Class A-1, Class A-2, Class A-3, Class A-4, Class A-SB and Class A-S Certificates (determined without giving effect to any exchange and conversion of any Class A-S Certificates for Class EC Certificates)), the notional amount of the Class X-B Certificates will be reduced by the aggregate amount of principal distributions, realized losses and trust fund expenses allocated to Certificates that are components of the Class X-B Certificates’ notional amount (the Certificate Balance of the Class B Certificates (determined without giving effect to any exchange and conversion of any Class B Certificates for Class EC Certificates)), the notional amount of the Class X-C Certificates will be reduced by the aggregate amount of principal distributions, realized losses and trust fund expenses allocated to Certificates that are components of the Class X-C Certificates’ notional amount (the Certificate Balance of the Class C Certificates (determined without giving effect to any exchange and conversion of any Class C Certificates for Class EC Certificates)), the notional amount of the Class X-D Certificates will be reduced by the aggregate amount of principal distributions, realized losses and trust fund expenses allocated to the Certificates that are components of the Class X-D Certificates’ notional amount (the Certificate Balance of the Class D Certificates), the notional amount of the Class X-E Certificates will be reduced by the aggregate amount of principal distributions, realized losses and trust fund expenses allocated to the Certificates that are components of the Class X-E Certificates’ notional amount (the Certificate Balance of the Class E Certificates), the notional amount of the Class X-F Certificates will be reduced by the aggregate amount of principal distributions, realized losses and trust fund expenses allocated to the Certificates that are components of the Class X-F Certificates’ notional amount (the Certificate Balance of the Class F Certificates) and the notional amount of the Class X-NR Certificates will be reduced by the aggregate amount of principal distribution, realized losses and trust fund expenses allocated to the Certificates that are components of the Class X-NR Certificates’ notional amount (the Certificate Balance of the Class NR Certificates). | |||
| On each Distribution Date, the Class HOW Certificates will be entitled to distributions of principal in reduction of its Certificate Balance to the extent of the amounts distributed to the HOW Trust Subordinate Companion Loan in respect of principal for such Distribution Date. | |||
| ■ | Exchangeable Certificates and the Class EC Certificates: | A holder of Class A-S, Class B and Class C Certificates (the “Exchangeable Certificates”) may exchange and convert such Classes of Certificates (on an aggregate basis) for a related amount of Class EC Certificates, and Class EC Certificates may be exchanged and converted for a ratable portion of each Class of Exchangeable Certificates. | |
| The initial Certificate Balance of a Class of Exchangeable Certificates represents the principal balance of such Class without giving effect to any exchange and conversion for Class EC Certificates. The initial Certificate Balance of the Class EC Certificates is equal to the aggregate of the initial Certificate Balances of the Exchangeable Certificates and represents the maximum principal balance of such Class that could be issued in an exchange. In the event that no Exchangeable Certificates are exchanged and converted for Class EC Certificates, the Class EC Certificate Balance would be equal to zero. Any exchange of (a) a portion of the Exchangeable Certificates will result in a conversion and reduction, on a dollar-for-dollar basis, of a proportionate share of each related component Class of the Exchangeable Certificates and an increase, on a dollar-for-dollar basis, of the Certificate Balance of the Class EC Certificates, and (b) any amount of the Class EC Certificates will result in a conversion and reduction, on a dollar-for-dollar basis, of the Certificate Balance of the Class EC Certificates and an increase, on a dollar-for-dollar basis, of a proportionate share of the related Certificate Balances of each Class of Certificates that are components of the Exchangeable Certificates. |
THE INFORMATION IN THIS STRUCTURAL AND COLLATERAL TERM SHEET IS NOT COMPLETE AND MAY BE AMENDED PRIOR TO THE TIME OF SALE. THIS TERM SHEET IS NOT AN OFFER TO SELL THESE SECURITIES AND IT IS NOT A SOLICITATION OF AN OFFER TO BUY THESE SECURITIES IN ANY JURISDICTION WHERE THE OFFER OR SALE IS NOT PERMITTED.
| | |
| 16 of 133 |
| Structural and Collateral Term Sheet | JPMBB 2014-C26 |
| Structural Overview |
| The Class EC Certificates will not have a pass-through rate, but will be entitled to receive the sum of the interest otherwise distributable on the portion of Exchangeable Certificates that have been exchanged and converted for such Class EC Certificates. | |||||||
| If an exchange and conversion has occurred, the Class EC Certificates received in such exchange will be entitled to receive on each Distribution Date distributions equal to the aggregate amount of Interest Distribution Amounts, Accrued Interest From Recoveries, distributions of principal, Yield Maintenance Charges and reimbursements of Collateral Support Deficits that would be distributable to the Exchangeable Certificates that were exchanged and converted for such Class EC Certificates. | |||||||
| If an exchange and conversion has occurred, the Class EC Certificates received in such exchange and conversion will be allocated the aggregate amount of Collateral Support Deficits, Net Prepayment Interest Shortfalls and other interest shortfalls (including those resulting from Appraisal Reduction Events) that would be allocated to the Exchangeable Certificates that were exchanged and converted for such Class EC Certificates. | |||||||
| ■ | Yield Maintenance / Fixed Penalty Allocation: | For purposes of the distribution of Yield Maintenance Charges on any Distribution Date, Yield Maintenance Charges collected in respect of the mortgage loans (or, in the case of the 543 Howard Whole Loan to the extent collected and allocated to the 543 Howard Mortgage Loan) will first be allocated pro rata between four groups (based on the amount of principal distributed to the Principal Balance Certificates in each group), consisting of (a) the Class A-1, Class A-2, Class A-3, Class A-4, Class A-SB, Class X-A and Class A-S Certificates (calculated without giving effect to any exchange and conversion of Class A-S Certificates for Class EC Certificates), on the one hand (“YM Group A”), (b) the Class B and Class X-B Certificates (calculated without giving effect to any exchange and conversion of Class B Certificates for Class EC Certificates) (“YM Group B”), (c) the Class C and Class X-C Certificates (calculated without giving effect to any exchange and conversion of Class C Certificates for Class EC Certificates) (“YM Group C”) and (d) the Class D and Class X-D Certificates (“YM Group D”). As among the Classes of Certificates in each YM Group, each Class of Certificates entitled to distributions of principal will receive an amount calculated generally in accordance with the following formula and as more specifically described in the Free Writing Prospectus, with any remaining Yield Maintenance Charges on such Distribution Date being distributed to the class of Class X Certificates in such YM Group. | |||||
| YM Charge | x | Principal Paid to Class | x | (Pass-Through Rate on Class – Discount Rate) | |||
| Total Principal Paid | (Mortgage Rate on Loan – Discount Rate) | ||||||
| No Yield Maintenance Charges will be distributed to the Class X-E, Class X-F, Class X-NR, Class E, Class F, Class NR or Class R Certificates. Once the Certificate Balances of the Class A-1, Class A-2, Class A-3, Class A-4, Class A-SB, Class A-S, Class B, Class C and Class D Certificates have been reduced to zero, all Yield Maintenance Charges will be distributed to the holders of the Class X-C Certificates, regardless of whether the notional amount of such Class of Certificates has been reduced to zero. | |||||||
| Yield Maintenance Charges allocable to the HOW Trust Subordinate Companion Loan will be distributable to the Class HOW Certificates. | |||||||
| If Exchangeable Certificates are converted in an exchange for Class EC Certificates, any Yield Maintenance Charges that otherwise would have been distributable to such Exchangeable Certificates had they not been converted will be distributed to the Class EC Certificates. | |||||||
| ■ | Realized Losses: | Realized losses on the mortgage loans (exclusive of losses on any related companion loan and losses allocated to the HOW Trust Subordinate Companion Loan) will be allocated first to the Class NR, Class F, Class E, Class D, Class C, Class B and Class A-S Certificates, in that order, in each case until the Certificate Balance of each such Class has been reduced to zero, and then, to the Class A-1, Class A-2, Class A-3, Class A-4 and Class A-SB Certificates, on a pro rata basis, based on the Certificate Balance of each | |||||
THE INFORMATION IN THIS STRUCTURAL AND COLLATERAL TERM SHEET IS NOT COMPLETE AND MAY BE AMENDED PRIOR TO THE TIME OF SALE. THIS TERM SHEET IS NOT AN OFFER TO SELL THESE SECURITIES AND IT IS NOT A SOLICITATION OF AN OFFER TO BUY THESE SECURITIES IN ANY JURISDICTION WHERE THE OFFER OR SALE IS NOT PERMITTED.
| | |
| 17 of 133 |
| Structural and Collateral Term Sheet | JPMBB 2014-C26 |
| Structural Overview |
| such class, until the Certificate Balance of each such class has been reduced to zero. The notional amount of the Class X-A, Class X-B, Class X-C, Class X-D, Class X-E, Class X-F and Class X-NR Certificates will be reduced by the aggregate amount of realized losses allocated to Certificates that are components of the notional amounts of the Class X-A, Class X-B, Class X-C, Class X-D, Class X-E, Class X-F and Class X-NR Certificates, respectively. | |||||||
Realized losses on each pari passu whole loan will be allocated pro rata, between the related mortgage loan and the related pari passu Companion Loan, based upon their respective Stated Principal Balances. Realized losses on the 543 Howard Whole Loan will be allocated first, to the HOW Trust Subordinate Companion Loan and then, to the related mortgage loan. | |||||||
| The Class EC Certificates will be allocated the realized losses and other shortfalls otherwise allocable to the Class A-S, Class B and Class C Certificates that are converted in an exchange for such Class EC Certificates. | |||||||
| ■ | Interest Shortfalls: | A shortfall with respect to the amount of available funds distributable in respect of interest can result from, among other sources: (a) delinquencies and defaults by borrowers; (b) shortfalls resulting from the application of Appraisal Reductions to reduce P&I Advances; (c) shortfalls resulting from interest on Advances made by the Master Servicer or the Trustee; (d) shortfalls resulting from the payment of Special Servicing Fees and other additional compensation that the Special Servicer is entitled to receive; (e) shortfalls resulting from extraordinary expenses of the trust, including indemnification payments payable to the Depositor, the Master Servicer, the Special Servicer, the Certificate Administrator, the Trustee or the Senior Trust Advisor; (f) shortfalls resulting from a modification of a mortgage loan’s interest rate or principal balance; and (g) shortfalls resulting from other unanticipated or default-related expenses of the trust. Any such shortfalls that decrease the amount of available funds distributable in respect of interest to the Certificateholders will reduce distributions to the classes of Certificates (other than the Class R Certificates) beginning with those with the lowest payment priorities, in reverse sequential order. See “Description of the Certificates—Distributions—Priority” in the Free Writing Prospectus. | |||||
| ■ | Appraisal Reductions: | With respect to mortgage loans serviced under the Pooling and Servicing Agreement, upon the occurrence of certain trigger events with respect to a mortgage loan, which are generally tied to certain events of default under the related mortgage loan documents, the Special Servicer will be obligated to obtain an appraisal of the related mortgaged property and the Master Servicer will calculate the Appraisal Reduction amount. The “Appraisal Reduction” amount is generally the amount by which the current principal balance of the related mortgage loan or whole loan, plus outstanding advances, real estate taxes, unpaid servicing fees and certain similar amounts exceeds 90% of the appraised value of the related mortgaged property, plus the amount of any escrows and letters of credit. | |||||
| With respect to the Florida Multifamily Portfolio mortgage loan, any Appraisal Reduction will be similarly determined pursuant to the pooling and servicing agreement under which it is serviced. | |||||||
| In general, the Appraisal Reduction amounts that are allocated to the mortgage loans (exclusive of amounts allocated to a Companion Loan (defined below)) are notionally allocated to reduce, in reverse sequential order, the Certificate Balance of each Class of Certificates (other than the Class A-1, Class A-2, Class A-3, Class A-4 and Class A-SB Certificates) beginning with the Class NR Certificates for certain purposes, including certain voting rights and the determination of the controlling class. | |||||||
With respect to each pari passu whole loan, the Appraisal Reduction amount is notionally allocated pro rata, between the related mortgage loan and the related pari passu Companion Loan, based upon their respective Stated Principal Balances. The Appraisal Reduction Amount with respect to the 543 Howard Whole Loan is notionally allocated first to the HOW Trust Subordinate Companion Loan (until the principal balance of the HOW | |||||||
THE INFORMATION IN THIS STRUCTURAL AND COLLATERAL TERM SHEET IS NOT COMPLETE AND MAY BE AMENDED PRIOR TO THE TIME OF SALE. THIS TERM SHEET IS NOT AN OFFER TO SELL THESE SECURITIES AND IT IS NOT A SOLICITATION OF AN OFFER TO BUY THESE SECURITIES IN ANY JURISDICTION WHERE THE OFFER OR SALE IS NOT PERMITTED.
| | |
| 18 of 133 |
| Structural and Collateral Term Sheet | JPMBB 2014-C26 |
| Structural Overview |
| Trust Subordinate Companion Loan is notionally reduced to zero by such Appraisal Reductions) and then to the related mortgage loan. | |||||||
| ■ | Appraisal Reduced Interest: | Accrued and unpaid interest at the related Mortgage Rate for a mortgage loan that is not advanced by the Master Servicer or the Trustee as backup master servicer due to the application of Appraisal Reduction amounts to such mortgage loan. | |||||
| ■ | Master Servicer Advances: | The Master Servicer will be required to advance certain delinquent scheduled mortgage loan payments of principal and interest and certain property protection advances, in each case, to the extent the Master Servicer deems such advances to be recoverable. At any time that an Appraisal Reduction amount exists, the amount that would otherwise be required to be advanced by the Master Servicer in respect of delinquent payments of interest on the mortgage loan will be reduced to equal the product of (x) the interest portion of the amount that would be advanced without regard to any Appraisal Reduction and (y) a fraction, the numerator of which is the then-outstanding principal balance of the mortgage loan minus the Appraisal Reduction amount and the denominator of which is the then-outstanding principal balance of the mortgage loan. The Master Servicer will not make any principal or interest advances with respect to the HOW Trust Subordinate Companion Loan. | |||||
| ■ | Whole Loans: | Four mortgage loans are each evidenced by a separate note and are each, together with an additional companion loan (each a “Companion Loan” and collectively with the related mortgage loan, a “Whole Loan”), secured by the same mortgage(s) on the related mortgaged property or portfolio of related mortgaged properties. Each such mortgage loan and its related Companion Loan are subject to an intercreditor agreement. None of these Companion Loans will be part of the trust. | |||||
In the case of all of these Whole Loans, referred to as the “500 Fifth Avenue Whole Loan”, the “St. Louis Premium Outlets Whole Loan”, “The Outlet Shoppes of the Bluegrass Whole Loan” and the “Florida Multifamily Portfolio Whole Loan”, a related Companion Loan is pari passu with the related mortgage loan (these Companion Loans are also referred to as the “Pari Passu Companion Loans”). The 500 Fifth Avenue Pari Passu Companion Loan, the St. Louis Premium Outlets Pari Passu Companion Loan and The Outlet Shoppes of the Bluegrass Pari Passu Companion Loan are referred to as “Serviced Companion Loans”. | |||||||
The 500 Fifth Avenue Whole Loan, the St. Louis Premium Outlets Whole Loan and The Outlet Shoppes of the Bluegrass Whole Loan (the “Serviced Whole Loans”) will be serviced under the pooling and servicing agreement for the JPMBB 2014-C26 transaction (the “Pooling and Servicing Agreement”). | |||||||
The Florida Multifamily Portfolio Whole Loan will be serviced pursuant to another pooling and servicing agreement as described under “Description of the Mortgage Pool—The Whole Loans—The Florida Multifamily Portfolio Whole Loan” in the Free Writing Prospectus. | |||||||
| ■ | HOW Trust Subordinate Companion Loan : | One mortgage loan referred to as the “543 Howard Mortgage Loan” is evidenced by a note, and such mortgage loan, together with a related trust subordinate companion loan (the “HOW Trust Subordinate Companion Loan”), are secured by a single mortgage or deed of trust on the related mortgaged property and are subject to an intercreditor agreement. Together, the 543 Howard Mortgage Loan and the HOW Trust Subordinate Companion Loan are referred to herein as the “543 Howard Whole Loan” or the “543 Howard Whole Loan”. The HOW Trust Subordinate Companion Loan is also part of the trust. The Class HOW Certificates will only receive distributions from, and will only incur losses with respect to, the HOW Trust Subordinate Companion Loan that are allocable to them pursuant to the related intercreditor agreement from the 543 Howard Whole Loan. | |||||
THE INFORMATION IN THIS STRUCTURAL AND COLLATERAL TERM SHEET IS NOT COMPLETE AND MAY BE AMENDED PRIOR TO THE TIME OF SALE. THIS TERM SHEET IS NOT AN OFFER TO SELL THESE SECURITIES AND IT IS NOT A SOLICITATION OF AN OFFER TO BUY THESE SECURITIES IN ANY JURISDICTION WHERE THE OFFER OR SALE IS NOT PERMITTED.
| | |
| 19 of 133 |
| Structural and Collateral Term Sheet | JPMBB 2014-C26 |
| Structural Overview |
| ■ | Liquidated Loan Waterfall: | On liquidation of any mortgage loan, all net liquidation proceeds (or, with respect to the 543 Howard Whole Loan, liquidation proceeds allocated to the 543 Howard Mortgage Loan) related to the mortgage loan (but not any related Companion Loan) will be applied so that amounts allocated as a recovery of accrued and unpaid interest will not, in the first instance, include any Appraisal Reduced Interest. After the adjusted interest amount is so allocated, any remaining liquidation proceeds will be allocated to offset certain advances and to pay principal on the mortgage loan until the unpaid principal amount of the mortgage loan has been reduced to zero. Any remaining liquidation proceeds will then be allocated to pay Appraisal Reduced Interest. Any liquidation proceeds in respect of each such mortgage loan in excess of the related outstanding balance will first be applied to offset any interest shortfalls allocated to the Certificates (other than the Class X Certificates), in sequential order, and then to offset any realized losses allocated to the Certificates (other than the Class X Certificates), in sequential order. Any liquidation proceeds remaining after such applications will be distributed to the Class R Certificates. | |||||
| ■ | Sale of Defaulted Mortgage Loans and REO Properties: | The Special Servicer may offer to sell or may offer to purchase any defaulted mortgage loan or REO property, if the Special Servicer determines that no satisfactory arrangements can be made for collection of delinquent payments and the sale would be in the best economic interests of the trust (or in the case of any Whole Loan, the trust and the holder of the related Pari Passu Companion Loan or the HOW Trust Subordinate Companion Loan, as a collective whole taking into account the pari passu or subordination nature of any Pari Passu Companion Loan or the HOW Trust Subordinate Companion Loan, as applicable), on a net present value basis. The Special Servicer is required to accept the highest offer for any defaulted mortgage loan or REO property in an amount at least equal to par plus accrued interest plus all other outstanding amounts due under such mortgage loan and any outstanding expenses of the trust relating to such mortgage loan (the “Defaulted Loan Purchase Price”) except as described in the Free Writing Prospectus. | |||||
| With respect to each Serviced Whole Loan, any such sale of the related defaulted mortgage loan will also include the related Pari Passu Companion Loan, if any, and the prices will be adjusted accordingly. | |||||||
| In connection with such sale and fair value determination, within 30 days of a mortgage loan becoming a specially serviced mortgage loan, the Special Servicer is required to order an appraisal and, within 30 days of receipt of such appraisal, is required to determine the fair value of such defaulted mortgage loan in accordance with the applicable servicing standard. If, however, the Special Servicer is already in the process of obtaining an appraisal with respect to the related mortgaged property, the Special Servicer is required to make its fair value determination as soon as reasonably practicable (but in any event within 30 days) after its receipt of such appraisal. Additionally, with respect to the mortgage loans that have mezzanine debt (whether in existence now or permitted in the future) or the HOW Trust Subordinate Companion Loan, the mezzanine lenders or the holders of the Class HOW Certificates as holders of the beneficial interest in the HOW Trust Subordinate Companion Loan, may have the option to purchase the related mortgage loan after certain events of default under such mortgage loan. | |||||||
| The Directing Certificateholder will not have a right of first refusal to purchase a defaulted mortgage loan. | |||||||
| If the Special Servicer does not receive an offer at least equal to the Defaulted Loan Purchase Price, the Special Servicer may purchase the defaulted mortgage loan or REO property at the Defaulted Loan Purchase Price. If the Special Servicer does not elect to purchase the defaulted mortgage loan or REO property at the Defaulted Loan Purchase Price, the Special Servicer is required to accept the highest offer received from any person that is determined to be a fair price (supported by an appraisal required to be obtained by the Special Servicer within 30 days of a mortgage loan becoming a specially serviced mortgage loan) for such defaulted mortgage loan or REO property, if the highest offeror is a person other than the Depositor, the Master Servicer, the Special Servicer, the | |||||||
THE INFORMATION IN THIS STRUCTURAL AND COLLATERAL TERM SHEET IS NOT COMPLETE AND MAY BE AMENDED PRIOR TO THE TIME OF SALE. THIS TERM SHEET IS NOT AN OFFER TO SELL THESE SECURITIES AND IT IS NOT A SOLICITATION OF AN OFFER TO BUY THESE SECURITIES IN ANY JURISDICTION WHERE THE OFFER OR SALE IS NOT PERMITTED.
| | |
| 20 of 133 |
| Structural and Collateral Term Sheet | JPMBB 2014-C26 |
| Structural Overview |
| Certificate Administrator, the Trustee, the Senior Trust Advisor, any borrower, any manager of a mortgaged property, any independent contractor engaged by the Special Servicer, a holder of any related Pari Passu Companion Loan, a holder of Class HOW Certificates (but only with respect to the related mortgage loan) or mezzanine loan (but only with respect to the related mortgage loan), or any known affiliate of any such person (each, an “Interested Person”). If the highest offer is made by an Interested Person, the Trustee must approve the purchase of the defaulted mortgage loan or REO property based upon its determination of the fair price for the defaulted mortgage loan or REO property (based upon updated appraisals received by the Trustee) and the Trustee may conclusively rely on the opinion of an independent appraiser or other independent expert retained by the Trustee in connection with making such determination. Neither the Trustee nor any of its affiliates may make an offer for or purchase any specially serviced mortgage loan or REO property. | |||||||
If the Special Servicer does not receive any offers that are at least equal to the Defaulted Loan Purchase Price, the Special Servicer is not required to accept the highest offer and may accept a lower offer for a defaulted mortgage loan or REO property if the Special Servicer determines, in accordance with the servicing standard, that a rejection of such offer would be in the best interests of the Certificateholders and, with respect to a Serviced Whole Loan, the related holder of the related Pari Passu Companion Loan, or, with respect to the 543 Howard Whole Loan, the holder of the Class HOW Certificates, as applicable, and in either case, as a collective whole (taking into account the subordinate or pari passu nature of any Companion Loan or HOW Trust Subordinate Companion Loan, as applicable), so long as such lower offer was not made by the Special Servicer or any of its affiliates. | |||||||
| If title to any mortgaged property is acquired by the trust fund, the Special Servicer will be required to sell such mortgaged property prior to the close of the third calendar year beginning after the year of acquisition, unless (a) the IRS grants or has not denied an extension of time to sell such mortgaged property or (b) the Trustee, the Certificate Administrator and the Master Servicer receive an opinion of independent counsel to the effect that the holding of the property by the trust fund longer than the above-referenced three-year period will not result in the imposition of a tax on any REMIC of the trust fund or cause any REMIC of the trust fund to fail to qualify as a REMIC. | |||||||
| The foregoing applies to mortgage loans serviced under the Pooling and Servicing Agreement. With respect to the Florida Multifamily Portfolio Whole Loan, if the special servicer under the pooling and servicing agreement determines to sell the related Pari Passu Companion Loan as described above, then the special servicer will be required to sell the Whole Loan, including the mortgage loan included in the JPMBB 2014-C26 Trust and the related Pari Passu Companion Loan, as a single loan. In connection with any such sale, the then-applicable special servicer will be required to follow procedures substantially similar to those set forth above. | |||||||
| ■ | Control Eligible Certificates: | Classes E, F and NR. | |||||
| ■ | Control Rights: | The Control Eligible Certificates will have certain control rights attached to them. The “Directing Certificateholder” will be the Controlling Class Certificateholder (or its representative) selected by more than 50% of the Controlling Class Certificateholders; provided, however, that (1) absent that selection, (2) until a Directing Certificateholder is so selected or (3) upon receipt of a notice from a majority of the Controlling Class Certificateholders that a Directing Certificateholder is no longer designated, the Controlling Class Certificateholder that owns the largest aggregate Certificate Balance of the Controlling Class (or its representative) will be the Directing Certificateholder; provided, however, that in the case of this clause (3), in the event no one holder owns the largest aggregate Certificate Balance of the Controlling Class, then there will be no Directing Certificateholder until appointed in accordance with the terms of the Pooling and Servicing Agreement. The Directing Certificateholder will be entitled to direct the Special Servicer to take, or refrain from taking certain actions with respect to a mortgage loan. Furthermore, | |||||
THE INFORMATION IN THIS STRUCTURAL AND COLLATERAL TERM SHEET IS NOT COMPLETE AND MAY BE AMENDED PRIOR TO THE TIME OF SALE. THIS TERM SHEET IS NOT AN OFFER TO SELL THESE SECURITIES AND IT IS NOT A SOLICITATION OF AN OFFER TO BUY THESE SECURITIES IN ANY JURISDICTION WHERE THE OFFER OR SALE IS NOT PERMITTED.
| | |
| 21 of 133 |
| Structural and Collateral Term Sheet | JPMBB 2014-C26 |
| Structural Overview |
| the Directing Certificateholder will also have the right to receive notice and provide consent with respect to certain material actions that the Master Servicer and the Special Servicer plan on taking with respect to a mortgage loan. With respect to any mortgage loan that has, or may in the future have, mezzanine debt, pursuant to the related intercreditor agreement, the related mezzanine lender may have certain consent rights with respect to certain modifications related to such mortgage loan. In addition, pursuant to the related intercreditor agreements and the pooling and servicing agreement, the HOW Trust Subordinate Companion Loan holder will have certain direction, consent and consultation rights with respect to the related mortgage loan. The rights of the Directing Certificateholder prior to a control appraisal event (as defined in the related intercreditor agreement) are subject to the rights of the HOW Trust Subordinate Companion Loan holder’s rights under the related intercreditor agreement. In addition, the holder of the HOW Trust Subordinate Companion Loan will have certain rights to cure defaults under the related mortgage loan, and in certain circumstances, to purchase the related defaulted mortgage loan. | |||||||
| With respect to the Florida Multifamily Portfolio mortgage loan, direction, consent and consultation rights with respect to the related Whole Loan will be exercised by the directing certificateholder or controlling class representative under the applicable pooling and servicing agreement. | |||||||
| With respect to the 500 Fifth Avenue Whole Loan, the St. Louis Premium Outlets Whole Loan and The Outlet Shoppes of the Bluegrass Whole Loan, direction, consent and consultation rights with respect to the related Whole Loan are subject to certain consultation rights of the holder of the related Pari Passu Companion Loan pursuant to the related intercreditor agreement. | |||||||
| ■ | Directing Certificateholder: | Blackrock Realty Advisors, Inc. on behalf of one or more managed funds or accounts is expected to be appointed the initial directing certificateholder. | |||||
| ■ | Controlling Class: | The “Controlling Class” will at any time of determination be the most subordinate Class of Control Eligible Certificates then outstanding that has an aggregate Certificate Balance, as notionally reduced by any Appraisal Reduction amounts allocable to such Class, equal to no less than 25% of the initial Certificate Balance for such Class. | |||||
| The Controlling Class as of the Closing Date will be the Class NR Certificates. | |||||||
| ■ | Control Event: | A “Control Event” will occur when (i) the Certificate Balance of the Class E Certificates (taking into account the application of Appraisal Reductions to notionally reduce the Certificate Balance of the Class E Certificates) has been reduced to less than 25% of the initial Certificate Balance of such Class as of the Closing Date or (ii) a holder of the Class E Certificates becomes the majority holder of the Controlling Class (the “Controlling Class Certificateholder”) and irrevocably waives its right to exercise any rights of the Controlling Class Certificateholder and such rights have not been reinstated to a successor Controlling Class Certificateholder. | |||||
| Upon the occurrence and during the continuance of a Control Event, the Controlling Class will no longer have any control rights. After the occurrence and during the continuance of a Control Event, the Directing Certificateholder will relinquish its right to direct certain actions of the Special Servicer and will no longer have consent rights with respect to certain actions that the Master Servicer or the Special Servicer plan on taking with respect to a mortgage loan. Following the occurrence and during the continuance of a Control Event, the Directing Certificateholder will retain consultation rights with the Special Servicer with respect to certain material actions that the Special Servicer plans on taking with respect to a mortgage loan. Such consultation rights will continue until the occurrence of a Consultation Termination Event. | |||||||
THE INFORMATION IN THIS STRUCTURAL AND COLLATERAL TERM SHEET IS NOT COMPLETE AND MAY BE AMENDED PRIOR TO THE TIME OF SALE. THIS TERM SHEET IS NOT AN OFFER TO SELL THESE SECURITIES AND IT IS NOT A SOLICITATION OF AN OFFER TO BUY THESE SECURITIES IN ANY JURISDICTION WHERE THE OFFER OR SALE IS NOT PERMITTED.
| | |
| 22 of 133 |
| Structural and Collateral Term Sheet | JPMBB 2014-C26 |
| Structural Overview |
| ■ | Consultation Termination Event: | A Consultation Termination Event will occur (i) when, without regard to the application of any Appraisal Reduction amount (i.e., giving effect to principal reductions through principal payments and realized losses only), there is no Class of Control Eligible Certificates that satisfies the requirement of a Controlling Class or (ii) during such time as the Class E Certificates are the most subordinate class among the Control Eligible Certificates that have a then-outstanding Principal Balance, net of Appraisal Reductions, at least equal to 25% of the initial Certificate Balance of such Class, and the then-Controlling Class Certificateholder has irrevocably waived its right to appoint a Directing Certificateholder and to exercise any of the rights of the Controlling Class Certificateholder and such rights have not been reinstated. | |||||
| Upon the occurrence of a Consultation Termination Event, there will be no Class of Certificates that will act as the Controlling Class. After the occurrence of a Consultation Termination Event, the Directing Certificateholder will have no rights under the Pooling and Servicing Agreement, other than those rights generally available to all Certificateholders. | |||||||
| ■ | Appraised-Out Class: | A Class of Control Eligible Certificates that has been determined, as a result of Appraisal Reduction amounts allocable to such Class, to no longer be the Controlling Class. | |||||
| ■ | Remedies Available to Holders of an Appraised-Out Class: | Holders of the majority of any Class of Control Eligible Certificates that are determined at any date of determination to no longer be the Controlling Class as a result of an Appraisal Reduction allocable to such class will have the right, at their sole expense, to require the Special Servicer to order a second appraisal report from an MAI appraiser (selected by the Special Servicer) for any mortgage loan that results in the Class becoming an Appraised-Out Class. | |||||
| Upon receipt of that second appraisal, the Special Servicer will be required to determine, in accordance with the Servicing Standard, whether, based on its assessment of the second appraisal, any recalculation of the Appraisal Reduction amount is warranted, and if so warranted, the Special Servicer is required to recalculate the Appraisal Reduction amount based on the second appraisal and if required by such recalculation, the Appraised-Out Class will be reinstated as the Controlling Class. The holders of an Appraised-Out Class requesting a second appraisal are not permitted to exercise any control or consent rights of the Controlling Class until such time, if any, as the Class is reinstated as the Controlling Class. | |||||||
| ■ | Senior Trust Advisor: | The Senior Trust Advisor will initially be Pentalpha Surveillance LLC. The Senior Trust Advisor will have certain review and consultation rights relating to the performance of the Special Servicer and with respect to its actions taken in connection with the resolution and/or liquidation of specially serviced mortgage loans. The Senior Trust Advisor will generally be responsible for reviewing the Special Servicer’s operational practices with respect to the resolution and liquidation of specially serviced mortgage loans. In addition, after the occurrence and during the continuance of a Control Event, the Senior Trust Advisor will have certain consultation rights with respect to the specially serviced mortgage loans except with respect to the 543 Howard Whole Loan unless a control appraisal period with respect to the HOW Trust Subordinate Companion Loan has occurred and is continuing. The Senior Trust Advisor will generally have no obligations or consultation rights under the Pooling and Servicing Agreement with respect to the Florida Multifamily Portfolio Whole Loan. However, Pentalpha Surveillance LLC is also the senior trust advisor under the JPMBB Commercial Mortgage Securities Trust 2014-C25 pooling and servicing agreement and, in such capacity, will have certain obligations and consultation rights with respect to the Florida Multifamily Portfolio Whole Loan that are substantially similar to those of the senior trust advisor under the Pooling and Servicing Agreement. | |||||
THE INFORMATION IN THIS STRUCTURAL AND COLLATERAL TERM SHEET IS NOT COMPLETE AND MAY BE AMENDED PRIOR TO THE TIME OF SALE. THIS TERM SHEET IS NOT AN OFFER TO SELL THESE SECURITIES AND IT IS NOT A SOLICITATION OF AN OFFER TO BUY THESE SECURITIES IN ANY JURISDICTION WHERE THE OFFER OR SALE IS NOT PERMITTED.
| | |
| 23 of 133 |
| Structural and Collateral Term Sheet | JPMBB 2014-C26 |
| Structural Overview |
| The Senior Trust Advisor will be responsible for: | ||||
| ● | after the occurrence and during the continuance of a Control Event, consulting with the Special Servicer with respect to each asset status report prepared by the Special Servicer and recommending proposed alternative courses of action. | |||
| ● | after the occurrence and during the continuance of a Control Event, preparing an annual report addressing the Senior Trust Advisor’s overall findings and determinations and setting forth its assessment of the Special Servicer’s performance of its duties under the Pooling and Servicing Agreement on a platform-level basis with respect to the resolution and liquidation of specially serviced mortgage loans that the Special Servicer is responsible for servicing under the Pooling and Servicing Agreement. As used above, “platform-level basis” refers to the Special Servicer’s performance of its duties as they relate to the resolution and liquidation of specially serviced mortgage loans, taking into account the Special Servicer’s specific duties under the Pooling and Servicing Agreement as well as the extent to which those duties were performed in accordance with the servicing standard, with due consideration to (and as limited by) the Senior Trust Advisor’s review of any assessment of compliance report, attestation report, asset status report and other information delivered to the Senior Trust Advisor by the Special Servicer with respect to the specially serviced mortgage loans (other than any communications between the Directing Certificateholder and the Special Servicer that would be privileged information). The annual report will be based on the Senior Trust Advisor’s knowledge of the Special Servicer’s actions taken during the applicable calendar year with respect to the resolution or liquidation of specially serviced mortgage loans that the Special Servicer is responsible for servicing under the Pooling and Servicing Agreement, including knowledge obtained in connection with the Senior Trust Advisor’s review of each asset status report prepared by the Special Servicer. | |||
| ● | prior to the occurrence and continuance of a Control Event, the Special Servicer will forward any Appraisal Reduction and net present value calculations used in the Special Servicer’s determination of what course of action to take in connection with the workout or liquidation of a specially serviced mortgage loan to the Senior Trust Advisor after such calculations have been finalized. The Senior Trust Advisor will be required to review such calculations but will not opine on or take any affirmative action with respect to such Appraisal Reduction calculations and/or net present value calculations. | |||
| ● | after the occurrence and during the continuance of a Control Event, recalculating and verifying, on a limited basis, the accuracy of mathematical calculations and the corresponding application of the non-discretionary portion of the applicable formulas utilized in connection with any Appraisal Reduction or net present value calculations performed by the Special Servicer. In the event the Senior Trust Advisor does not agree with the mathematical calculations or the application of the non-discretionary portion of the applicable formulas required to be utilized for such calculation, the Senior Trust Advisor and the Special Servicer will consult with each other in order to resolve any disagreement. Any disagreement with respect to such calculations that the Senior Trust Advisor and the Special Servicer are unable to resolve will be determined by the Certificate Administrator. | |||
In addition, the Senior Trust Advisor is required to promptly review all information available to Privileged Persons (as defined in the Free Writing Prospectus) on the Certificate Administrator’s website related to specially serviced mortgage loans and certain information available to Privileged Persons on the Certificate Administrator’s website related to mortgage loans included on the monthly CREFC® servicer watch list report, each final asset status report delivered to the Senior Trust Advisor by the Special Servicer and each assessment of compliance report and attestation report prepared by the Special Servicer in order to maintain its familiarity with the mortgage loans and the performance of the Special Servicer under the Pooling and Servicing Agreement. | ||||
THE INFORMATION IN THIS STRUCTURAL AND COLLATERAL TERM SHEET IS NOT COMPLETE AND MAY BE AMENDED PRIOR TO THE TIME OF SALE. THIS TERM SHEET IS NOT AN OFFER TO SELL THESE SECURITIES AND IT IS NOT A SOLICITATION OF AN OFFER TO BUY THESE SECURITIES IN ANY JURISDICTION WHERE THE OFFER OR SALE IS NOT PERMITTED.
| | |
| 24 of 133 |
| Structural and Collateral Term Sheet | JPMBB 2014-C26 |
| Structural Overview |
| After the occurrence and during the continuance of a Control Event, the Senior Trust Advisor will also consult with the Special Servicer in connection with certain major decisions and propose possible alternative courses of action. | ||||
| In addition, after the occurrence of a Consultation Termination Event, if the Senior Trust Advisor determines that the Special Servicer is not performing its duties as required under the Pooling and Servicing Agreement or is otherwise not acting in accordance with the Servicing Standard, the Senior Trust Advisor will have the right to recommend the replacement of the Special Servicer and will submit its formal recommendation to the Trustee and the Certificate Administrator (along with its rationale, its proposed replacement special servicer and other relevant information justifying its recommendation). | ||||
| The Senior Trust Advisor’s recommendation to replace the Special Servicer must be confirmed by an affirmative vote of holders of Certificates evidencing at least a majority of the aggregate notional balance of all Classes of Certificates entitled to principal distributions (taking into account the application of any Appraisal Reduction amounts to notionally reduce the Certificate Balances of the Classes to which such Appraisal Reduction amounts are allocable). In the event the holders of such Certificates elect to remove and replace the Special Servicer, the Certificate Administrator will be required to obtain a rating agency confirmation from each of the rating agencies at that time. | ||||
| ■ | Replacement of Senior Trust Advisor: | The Senior Trust Advisor may be terminated or removed under certain circumstances and a replacement Senior Trust Advisor appointed as described in the Free Writing Prospectus. | ||
| Any replacement Senior Trust Advisor (or the personnel responsible for supervising the obligations of the replacement Senior Trust Advisor) must (A) (i) be regularly engaged in the business of analyzing and advising clients in commercial mortgage-backed securities matters and have at least 5 years of experience in collateral analysis and loss projections and (ii) have at least 5 years of experience in commercial real estate asset management and experience in the workout and management of distressed commercial real estate assets or (B) be an institution that is a special servicer, senior trust advisor or operating advisor on a rated CMBS transaction, but has not been a special servicer or a senior trust advisor on a transaction that a rating agency has downgraded, qualified or withdrawn its ratings citing servicing concerns with the special servicer or a senior trust advisor as the sole or a material factor in such rating action. Any Senior Trust Advisor is prohibited from making an investment in any class of certificates in the Trust as described in the Free Writing Prospectus. | ||||
| ■ | Appointment and Replacement of Special Servicer: | The Directing Certificateholder will appoint the initial Special Servicer as of the Closing Date. Prior to the occurrence and continuance of a Control Event and the Special Servicer may generally be replaced at any time by the Directing Certificateholder. | ||
| Upon the occurrence and during the continuance of a Control Event, the Directing Certificateholder will no longer have the right to replace the Special Servicer and such replacement will occur based on a vote of holders of all voting eligible Classes of Certificates as described below. | ||||
| After the occurrence of a Consultation Termination Event, the Senior Trust Advisor may also recommend the replacement of the Special Servicer as described above. The holder of the HOW Trust Subordinate Companion Loan will have the right, prior to the occurrence of an AB Control Appraisal Period (as defined in the Free Writing Prospectus), to replace the Special Servicer solely with respect to the 543 Howard Whole Loan. | ||||
| Notwithstanding the foregoing, the Senior Trust Advisor will not be permitted to recommend the replacement of the Special Servicer with respect to the 543 Howard Whole Loan so long as the holder of the HOW Trust Subordinate Companion Loan is not subject to a HOW Control Appraisal Period under the intercreditor agreement. | ||||
THE INFORMATION IN THIS STRUCTURAL AND COLLATERAL TERM SHEET IS NOT COMPLETE AND MAY BE AMENDED PRIOR TO THE TIME OF SALE. THIS TERM SHEET IS NOT AN OFFER TO SELL THESE SECURITIES AND IT IS NOT A SOLICITATION OF AN OFFER TO BUY THESE SECURITIES IN ANY JURISDICTION WHERE THE OFFER OR SALE IS NOT PERMITTED.
| | |
| 25 of 133 |
| Structural and Collateral Term Sheet | JPMBB 2014-C26 |
| Structural Overview |
| ■ | Replacement of Special Servicer by Vote of Certificateholders: | After the occurrence and during the continuance of a Control Event and upon (a) the written direction of holders of Certificates evidencing not less than 25% of the aggregate notional balance of all Classes of Certificates entitled to principal (taking into account the application of Appraisal Reduction amounts to notionally reduce the Certificate Balances of Classes to which such Appraisal Reduction amounts are allocable) requesting a vote to replace the Special Servicer with a replacement special servicer, (b) payment by such requesting holders to the Certificate Administrator of all reasonable fees and expenses to be incurred by the Certificate Administrator in connection with administering such vote and (c) delivery by such holders to the Certificate Administrator and the Trustee of written confirmations from each Rating Agency that the appointment of such replacement special servicer will not result in a downgrade, withdrawal or qualification of the Certificates (which confirmations will be obtained at the expense of such holders), the Certificate Administrator will be required to promptly post such notice on its Internet website, and by mail conduct the solicitation of votes of all Certificates in such regard, which such vote must occur within 180 days of the posting of such notice. Upon the written direction of holders of at least 75% of a Certificateholder Quorum, the Trustee will immediately replace the Special Servicer with the replacement special servicer. | ||
A “Certificateholder Quorum” means, in connection with any solicitation of votes in connection with the replacement of the Special Servicer described above, the holders of Certificates evidencing at least 75% of the aggregate voting rights (taking into account the application of realized losses and the application of any Appraisal Reductions to notionally reduce the Certificate Balance of the Certificates) of all Classes of Certificates entitled to principal on an aggregate basis. | ||||
| The holders of the Class HOW Certificates will have the right, prior to the occurrence of a HOW Control Appraisal Period, to replace the special servicer solely with respect to the 543 Howard Whole Loan. | ||||
With respect to each of the 500 Fifth Avenue Whole Loan, the St. Louis Premium Outlets Whole Loan and The Outlet Shoppes of the Bluegrass Whole Loan, the holders of the related Pari Passu Companion Loan, under certain circumstances following a servicer termination event with respect to the special servicer, will be entitled to direct the trustee (and the trustee will be required) to terminate the special servicer solely with respect to such Whole Loan. A replacement special servicer will be selected by the trustee or, prior to a Control Event, by the Directing Certificateholder; provided, however, that any successor special servicer appointed to replace the Special Servicer with respect to such Whole Loan can generally not be the person (or its affiliate) that was terminated at the direction of the holder of the related Pari Passu Companion Loan. | ||||
With respect to the Florida Multifamily Portfolio Whole Loan, the JPMBB 2014-C26 trust as holder of the related mortgage loan has similar termination rights in the event of a servicer termination event with respect to the special servicer under the applicable pooling and servicing agreement as described above, which may be exercised by the Directing Certificateholder prior to the Control Event, however, the successor special servicer will be selected pursuant to the applicable pooling and servicing agreement by the related directing holder prior to a control event under such pooling and servicing agreement. The Master Servicer and Special Servicer are entitled to certain fees in connection with the servicing and administration of the mortgage loans as more fully described in “Transaction Parties–Servicing and Other Compensation and Payment of Expenses” in the Free Writing Prospectus. | ||||
THE INFORMATION IN THIS STRUCTURAL AND COLLATERAL TERM SHEET IS NOT COMPLETE AND MAY BE AMENDED PRIOR TO THE TIME OF SALE. THIS TERM SHEET IS NOT AN OFFER TO SELL THESE SECURITIES AND IT IS NOT A SOLICITATION OF AN OFFER TO BUY THESE SECURITIES IN ANY JURISDICTION WHERE THE OFFER OR SALE IS NOT PERMITTED.
| | |
| 26 of 133 |
| Structural and Collateral Term Sheet | JPMBB 2014-C26 |
| Structural Overview |
| ■ | Master Servicer and Special Servicer Compensation: | The Master Servicer is entitled to a fee (the “Servicing Fee”) payable monthly from interest received in respect of each mortgage loan and REO loan (including specially serviced mortgage loans, Serviced Companion Loan and the HOW Trust Subordinate Companion Loan) that will accrue at the related servicing fee rate described in the Free Writing Prospectus. The Special Servicer is also entitled to a fee (the “Special Servicing Fee”) with respect to each specially serviced mortgage loan and REO loan at the special servicing fee rate described in the Free Writing Prospectus. | ||
| In addition to the Servicing Fee, Special Servicing Fee and certain other fees described below, the Master Servicer and Special Servicer are entitled to retain and share certain additional servicing compensation, including assumption application fees, assumption fees, defeasance fees and certain Excess Modification Fees and consent fees with respect to the mortgage loans. The Special Servicer may also be entitled to either a Workout Fee or Liquidation Fee, but not both, from recoveries in respect of any particular mortgage loan. | ||||
An “Excess Modification Fee” with respect to any mortgage loan (other than the non-serviced mortgage loan), Serviced Whole Loan or 543 Howard Whole Loan is the sum of (A) the excess of (i) any and all Modification Fees with respect to a mortgage loan, Serviced Whole Loan or 543 Howard Whole Loan over (ii) all unpaid or unreimbursed additional expenses described in the Free Writing Prospectus (excluding Special Servicing Fees, Workout Fees and Liquidation Fees) outstanding with respect to the related mortgage loan, Serviced Whole Loan or 543 Howard Whole Loan, as applicable, and reimbursed from such Modification Fees and (B) expenses previously paid or reimbursed from Modification Fees as described in clause (A), which expenses have subsequently been recovered from the related borrower or otherwise. | ||||
With respect to the Master Servicer and Special Servicer, the Excess Modification Fees collected and earned by such servicer from the related borrower (taken in the aggregate with any other Excess Modification Fees collected and earned by such servicer from the related borrower within the prior 12 months of the collection of the current Excess Modification Fees) will be subject to a cap of 1.00% of the outstanding principal balance of the related mortgage loan, Serviced Whole Loan or HOW Trust Subordinate Companion Loan on the closing date of the related modification, extension, waiver or amendment. A “Modification Fee” with respect to any mortgage loan (other than the non-serviced mortgage loan), Serviced Whole Loan or HOW Trust Subordinate Companion Loan is generally any fee with respect to a modification, extension, waiver or amendment of any mortgage loan, Serviced Whole Loan or HOW Trust Subordinate Companion Loan. | ||||
A “Workout Fee” will generally be payable with respect to each corrected mortgage loan (as more specifically described in the Free Writing Prospectus) and will be calculated at a rate of 1.00% of payments of principal and interest on the respective mortgage loan for so long as it remains a corrected mortgage loan. After receipt by the Special Servicer of Workout Fees with respect to a corrected mortgage loan in an amount equal to $25,000, any Workout Fees in excess of such amount will be reduced by the Excess Modification Fee Amount; provided that in the event the Workout Fee, collected over the course of such workout, calculated at the Workout Fee Rate is less than $25,000, then the Special Servicer will be entitled to an amount from the final payment on the related corrected mortgage loan that would result in the total Workout Fees payable to the Special Servicer in respect of that corrected mortgage loan to be $25,000. | ||||
The “Excess Modification Fee Amount” for any corrected mortgage loan is an amount equal to any Excess Modification Fees paid by or on behalf of the related borrower with respect to the related mortgage loan (including the related Companion Loan or HOW Trust Subordinate Companion Loan) and received and retained by the Master Servicer or the Special Servicer, as applicable, as additional servicing compensation within the prior 12 months of the related modification, waiver, extension or amendment resulting in the mortgage loan or REO loan being a corrected mortgage loan, but only to the extent those fees have not previously been deducted from a Workout Fee or Liquidation Fee. | ||||
THE INFORMATION IN THIS STRUCTURAL AND COLLATERAL TERM SHEET IS NOT COMPLETE AND MAY BE AMENDED PRIOR TO THE TIME OF SALE. THIS TERM SHEET IS NOT AN OFFER TO SELL THESE SECURITIES AND IT IS NOT A SOLICITATION OF AN OFFER TO BUY THESE SECURITIES IN ANY JURISDICTION WHERE THE OFFER OR SALE IS NOT PERMITTED.
| | |
| 27 of 133 |
| Structural and Collateral Term Sheet | JPMBB 2014-C26 |
| Structural Overview |
A “Liquidation Fee” will generally be payable with respect to each specially serviced mortgage loan or REO property as to which the Special Servicer obtains a full or partial recovery of the related asset. The Liquidation Fee for each specially serviced mortgage loan will be payable at a rate of 1.00% of the liquidation proceeds; provided, however, that no Liquidation Fee will be less than $25,000. | ||||
| The Liquidation Fees will be reduced by the amount of any Excess Modification Fees received by the Special Servicer with respect to the related mortgage loan (including a Companion Loan or the HOW Trust Subordinate Companion Loan) or REO property as additional compensation within the prior 12 months, but only to the extent those fees have not previously been deducted from a Workout Fee or Liquidation Fee. | ||||
| Similar fees to those described above will be payable to the special servicer for the Florida Multifamily Portfolio Whole Loan under the applicable pooling and servicing agreement. | ||||
| Subject to certain limited exceptions, in connection with its duties under the Pooling and Servicing Agreement, the Special Servicer and its affiliates are prohibited from receiving or retaining any compensation (other than compensation specifically provided for under the Pooling and Servicing Agreement) from anyone in connection with the disposition, workout or foreclosure of any mortgage loan, the management or disposition of any REO property, or the performance of any other special servicing duties under the Pooling and Servicing Agreement. In the event the Special Servicer does receive any such compensation, it will be required to disclose those fees to the Certificate Administrator who will include it as part of the statement to Certificateholders. | ||||
| In addition, no liquidation fee will be payable to the Special Servicer if a mortgage loan becomes a specially serviced mortgage loan only because of a maturity default and the related liquidation proceeds are received within 90 days following the stated maturity date as a result of the related mortgage loan being refinanced or otherwise repaid in full. | ||||
| ■ | Deal Website: | The Certificate Administrator will maintain a deal website to which certain persons will have access to certain information including, but not limited to the following, which will be posted: | ||
| ■ | special notices | |||
| ■ | summaries of asset status reports | |||
| ■ | appraisals in connection with Appraisal Reductions plus any second appraisals ordered | |||
| ■ | an “Investor Q&A Forum” | |||
| ■ | a voluntary investor registry | |||
| ■ | SEC EDGAR filings | |||
THE INFORMATION IN THIS STRUCTURAL AND COLLATERAL TERM SHEET IS NOT COMPLETE AND MAY BE AMENDED PRIOR TO THE TIME OF SALE. THIS TERM SHEET IS NOT AN OFFER TO SELL THESE SECURITIES AND IT IS NOT A SOLICITATION OF AN OFFER TO BUY THESE SECURITIES IN ANY JURISDICTION WHERE THE OFFER OR SALE IS NOT PERMITTED.
| | |
| 28 of 133 |
| Structural and Collateral Term Sheet | JPMBB 2014-C26 |
| 500 Fifth Avenue |
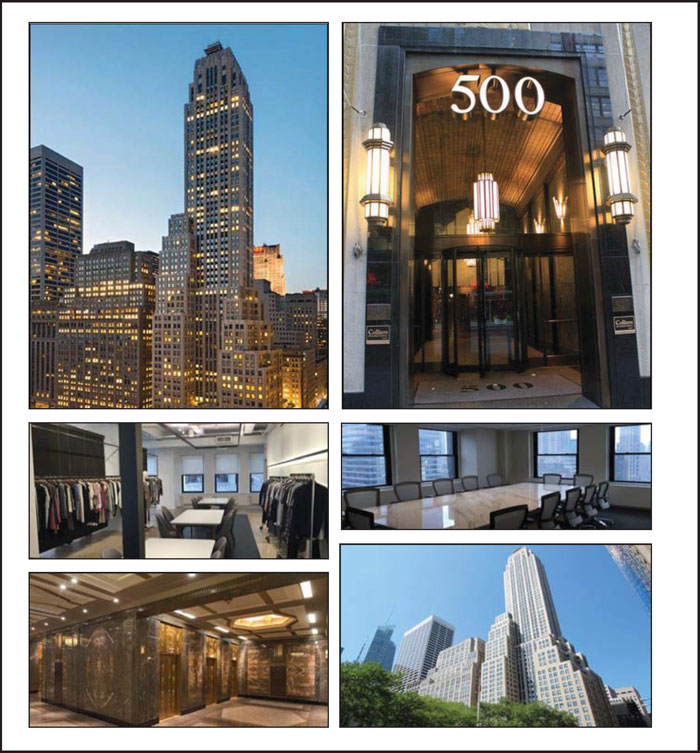
THE INFORMATION IN THIS STRUCTURAL AND COLLATERAL TERM SHEET IS NOT COMPLETE AND MAY BE AMENDED PRIOR TO THE TIME OF SALE. THIS TERM SHEET IS NOT AN OFFER TO SELL THESE SECURITIES AND IT IS NOT A SOLICITATION OF AN OFFER TO BUY THESE SECURITIES IN ANY JURISDICTION WHERE THE OFFER OR SALE IS NOT PERMITTED.
| | |
| 29 of 133 |
| Structural and Collateral Term Sheet | JPMBB 2014-C26 |
| 500 Fifth Avenue |
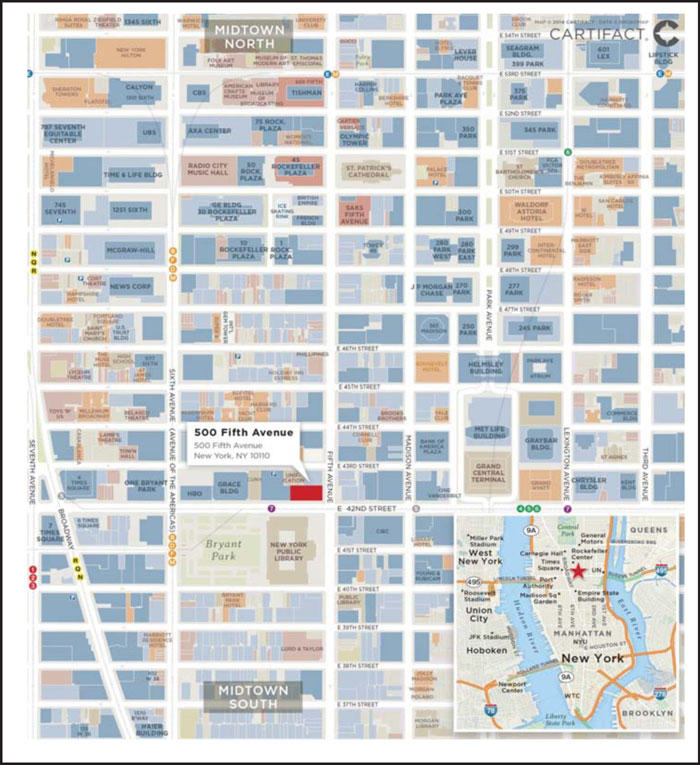
THE INFORMATION IN THIS STRUCTURAL AND COLLATERAL TERM SHEET IS NOT COMPLETE AND MAY BE AMENDED PRIOR TO THE TIME OF SALE. THIS TERM SHEET IS NOT AN OFFER TO SELL THESE SECURITIES AND IT IS NOT A SOLICITATION OF AN OFFER TO BUY THESE SECURITIES IN ANY JURISDICTION WHERE THE OFFER OR SALE IS NOT PERMITTED.
| | |
| 30 of 133 |
| Structural and Collateral Term Sheet | JPMBB 2014-C26 |
| 500 Fifth Avenue |
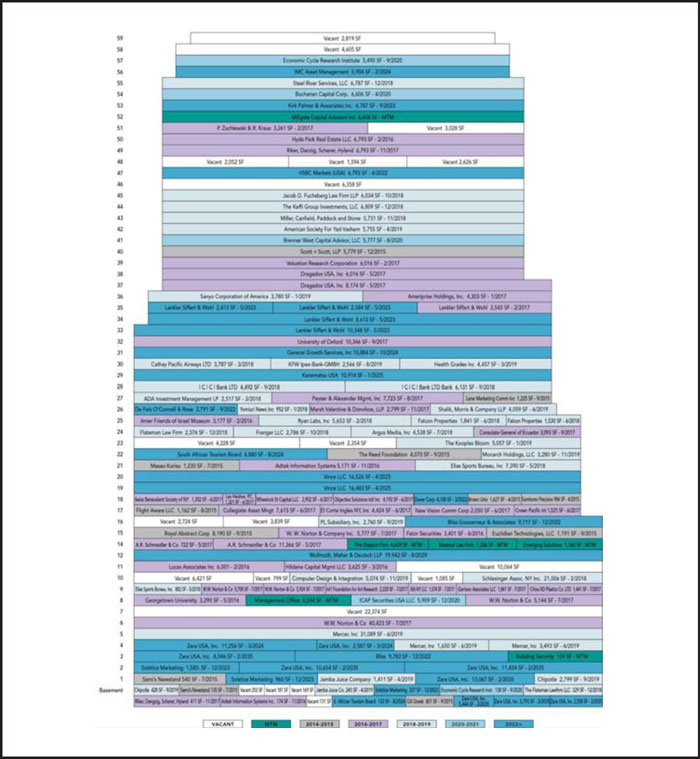
THE INFORMATION IN THIS STRUCTURAL AND COLLATERAL TERM SHEET IS NOT COMPLETE AND MAY BE AMENDED PRIOR TO THE TIME OF SALE. THIS TERM SHEET IS NOT AN OFFER TO SELL THESE SECURITIES AND IT IS NOT A SOLICITATION OF AN OFFER TO BUY THESE SECURITIES IN ANY JURISDICTION WHERE THE OFFER OR SALE IS NOT PERMITTED.
| | |
| 31 of 133 |
| Structural and Collateral Term Sheet | JPMBB 2014-C26 |
| 500 Fifth Avenue |
| Mortgage Loan Information | Property Information | |||
| Mortgage Loan Seller: | Column | Single Asset / Portfolio: | Single Asset | |
Original Principal Balance(1): | $100,000,000 | Title: | Fee | |
Cut-off Date Principal Balance(1): | $100,000,000 | Property Type - Subtype: | Office - CBD | |
| % of Pool by IPB: | 6.9% | Net Rentable Area (SF): | 712,791 | |
| Loan Purpose: | Refinance | Location: | New York, NY | |
| Borrower: | 500 Fifth Avenue (New York) LLC | Year Built / Renovated: | 1931 / 2012 | |
| Sponsor: | 500 Holdings, Inc. | Occupancy: | 92.3% | |
| Interest Rate: | 3.58000% | Occupancy Date: | 10/1/2014 | |
| Note Date: | 10/3/2014 | Number of Tenants: | 94 | |
| Maturity Date: | 10/6/2024 | 2011 NOI: | $21,383,626 | |
| Interest-only Period: | 120 months | 2012 NOI: | $21,014,691 | |
| Original Term: | 120 months | 2013 NOI: | $19,461,901 | |
| Original Amortization: | None | TTM NOI (as of 7/2014)(2): | $18,808,084 | |
| Amortization Type: | Interest Only | UW Economic Occupancy: | 92.5% | |
Call Protection(3): | L(26),Def(89),O(5) | UW Revenues: | $48,087,824 | |
| Lockbox: | CMA | UW Expenses: | $20,697,525 | |
| Additional Debt: | Yes | UW NOI(2): | $27,390,298 | |
| Additional Debt Balance: | $100,000,000 | UW NCF: | $24,433,310 | |
| Additional Debt Type: | Pari Passu | Appraised Value / Per SF: | $600,000,000 / $842 | |
| Appraisal Date: | 8/13/2014 | |||
Escrows and Reserves(4) | Financial Information(1) | |||||
| Initial | Monthly | Initial Cap | Cut-off Date Loan / SF: | $281 | ||
| Taxes: | $0 | Springing | N/A | Maturity Date Loan / SF: | $281 | |
| Insurance: | $0 | Springing | N/A | Cut-off Date LTV: | 33.3% | |
| Replacement Reserves: | $0 | Springing | N/A | Maturity Date LTV: | 33.3% | |
| TI/LC: | $0 | Springing | N/A | UW NCF DSCR: | 3.37x | |
| Other: | $16,029,253 | $0 | N/A | UW NOI Debt Yield: | 13.7% | |
| Sources and Uses |
| Sources | Proceeds | % of Total | Uses | Proceeds | % of Total | |
Mortgage Loan(1) | $200,000,000 | 100.0% | Payoff Existing Debt | $105,854,644 | 52.9% | |
| Return of Equity | 74,395,810 | 37.2 | ||||
| Upfront Reserves | 16,029,253 | 8.0 | ||||
| Closing Costs | 3,720,293 | 1.9 | ||||
| Total Sources | $200,000,000 | 100.0% | Total Uses | $200,000,000 | 100.0% |
| (1) | 500 Fifth Avenue is part of a loan evidenced by two pari passu notes with an aggregate original principal balance of $200.0 million. The Financial Information presented in the chart above reflects the Cut-off Date balance of the $200.0 million 500 Fifth Avenue Whole Loan. |
| (2) | The increase in UW NOI from TTM NOI is primarily the result of five new or renewed leases to tenants expanding or relocating within the building, representing approximately 111,686 square feet and $7,633,820 of annual rent with lease commencement dates ranging from February 1, 2014 through February 1, 2015. Additionally, the UW NOI includes $895,565 in rent steps through October 31, 2015. |
| (3) | The lockout period will be at least 26 payment dates beginning with and including the first payment date of November 6, 2014. Defeasance of the full $200.0 million 500 Fifth Avenue Whole Loan is permitted after the date that is the earlier of (i) two years after the securitization of the last pari passu note to be securitized, and (ii) three years after the closing date. |
| (4) | For a full description of Escrows and Reserves, please refer to “Escrows and Reserves” below. |
THE INFORMATION IN THIS STRUCTURAL AND COLLATERAL TERM SHEET IS NOT COMPLETE AND MAY BE AMENDED PRIOR TO THE TIME OF SALE. THIS TERM SHEET IS NOT AN OFFER TO SELL THESE SECURITIES AND IT IS NOT A SOLICITATION OF AN OFFER TO BUY THESE SECURITIES IN ANY JURISDICTION WHERE THE OFFER OR SALE IS NOT PERMITTED.
| | |
| 32 of 133 |
| Structural and Collateral Term Sheet | JPMBB 2014-C26 |
| 500 Fifth Avenue |
The Loan. The 500 Fifth Avenue loan is secured by a first mortgage lien on a 59-story, 712,791 square foot office building located in midtown Manhattan. The whole loan has an outstanding principal balance of $200.0 million (the “500 Fifth Avenue Whole Loan”), which is comprised of two pari passu notes, Note A-1 and Note A-2. Note A-1 has an outstanding principal balance as of the Cut-off Date of $100.0 million and is being contributed to the JPMBB 2014-C26 Trust. Note A-2, with an outstanding principal balance as of the Cut-off Date of $100.0 million, is currently held by Column and is expected to be contributed to a future securitized trust. The holder of Note A-1 (the “Controlling Noteholder”) will be the trustee of the JPMBB 2014-C26 Trust. The trustee of the JPMBB 2014-C26 Trust (or, prior to the occurrence and continuance of a Control Event, the Directing Certificateholder) will be entitled to exercise all of the rights of the Controlling Noteholder with respect to the 500 Fifth Avenue Whole Loan; however, the holder of Note A-2 will be entitled, under certain circumstances, to consult with respect to certain major decisions. The loan has a 10-year term and is interest-only for the term of the loan.
The Borrower. The borrowing entity for the 500 Fifth Avenue Whole Loan is 500 Fifth Avenue (New York) LLC, a Delaware limited liability company and special purpose entity.
The Sponsor. The loan sponsor and nonrecourse carve-out guarantor of the mortgage loan is 500 Holdings, Inc. which owns four commercial properties in addition to the property in New York, California and Illinois. The loan sponsor is ultimately controlled and owned by Moises Cosio Espinosa, a Mexican-born businessman and member of a prominent Mexican family with a long history in the investment and banking sectors.
The Property. 500 Fifth Avenue is a 59-story office building located in midtown Manhattan. The property was constructed in 1931, renovated in 2012 and consists of primarily office space with a retail component. The property offers unobstructed southerly views from the second floor up, over New York’s Bryant Park and the New York City Public Library and also offers unobstructed easterly and westerly views from the mid and tower floors. The ground floor features the main entrance on Fifth Avenue and retail spaces along West 42nd Street and Fifth Avenue. The property’s office space is located on floors three through 59. In the last 10 years, in excess of $12.0 million has been spent on capital items, including a lobby renovation (2005 - 2009), a retail restack expanding retail use to the basement and third floors (underway), standpipe to sprinkler conversion (2006 - 2012), winterization of the cooling tower (2011 - 2012), common corridor (2005 - 2012), restroom renovations (2005 - 2006), electrical riser installation (2006 - 2007), and a class E system upgrade (2010).
As of October 1, 2014, the property was 92.3% leased by 94 tenants representing apparel manufacturing and sales, publishing, legal, financial services and technology sectors. The largest tenant at the property, Zara USA, Inc. (“Zara”), leases 10.2% of the net rentable area with 13,843 square feet expiring in March 2024 and 58,701 square feet expiring in February 2035. Zara leases portions of four floors and the basement at the property, which comprises traditional office (portions of third and fourth floors), retail (basement to third floor), and traditional office which serves as its United States corporate office for Zara’s parent, Inditex (MSE: ITX). Zara currently has a presence in 88 countries with 2,000 stores. The tenant originally took occupancy in 2008 and has expanded its presence over the years to its current square footage of 72,544 square feet. The Zara space is currently being built out on the ground floor and lower level by the tenant with an anticipated opening in February 2015. The tenant has a five year renewal option for both the retail and office space at the greater of 95% of fair market value and the current rent. The second largest tenant, W.W. Norton & Co., leases 64,668 square feet (9.1% of net rentable area) through July 2017 and has no remaining renewal or termination rights. W.W. Norton & Co. is an international publishing firm which has been in operation for over 90 years. The firm originally took occupancy in 1973 and currently occupies space on five floors. The third largest tenant, Mercer, Inc. leases 36,232 square feet (5.1% of net rentable area) through June 2019. The company, which is a wholly owned subsidiary of Marsh & McLennan Companies, is a global consulting firm specializing in talent, health, retirement and investment services.
The property is located within the Midtown office market containing approximately 241.5 million square feet, representing the largest office market inventory in Manhattan. As of the second quarter 2014, the Midtown market reported an overall vacancy rate of 11.0%, and an overall average market rent of $70.82 per square foot, representing an increase of 1.1% over the prior quarter and increase of 3.8% over the prior year. More specifically, the property is located in the Grand Central submarket. The Grand Central submarket contains approximately 44.0 million square feet of office space and represents the largest office inventory within the Midtown market. As of the second quarter 2014, the submarket reported an overall vacancy rate of 13.6% and reported an overall average submarket rent of $61.85 per square foot, almost 6% higher than a year ago. The appraisal identified seven buildings which are directly competitive with the property. As identified by the appraisal, asking rents ranged between $50.00 and $85.00 per square foot and direct occupancy averaged 92.6% compared to rents at the property of $58.00 per square foot to $95.00 per square foot depending on the floor and current occupancy of 92.3%. No new construction is currently under construction within the submarket.
THE INFORMATION IN THIS STRUCTURAL AND COLLATERAL TERM SHEET IS NOT COMPLETE AND MAY BE AMENDED PRIOR TO THE TIME OF SALE. THIS TERM SHEET IS NOT AN OFFER TO SELL THESE SECURITIES AND IT IS NOT A SOLICITATION OF AN OFFER TO BUY THESE SECURITIES IN ANY JURISDICTION WHERE THE OFFER OR SALE IS NOT PERMITTED.
| | |
| 33 of 133 |
| Structural and Collateral Term Sheet | JPMBB 2014-C26 |
| 500 Fifth Avenue |
Historical and Current Occupancy(1) |
2011 | 2012 | 2013 | Current(2) |
| N/A | 87.7% | 87.4% | 92.3% |
| (1) | Historical Occupancies are as of December 31 of each respective year. 2011 occupancy was not provided by the borrower. |
| (2) | Current Occupancy is as of October 1, 2014. |
| Recent Leasing Activity | |||||||
Tenant Name | New / Renewal / Relocation Leases | Net Rentable Area | Lease Date | Term (years) | Base Rent PSF | Annual Rent | |
| Vince LLC | New / Renewal | 33,009 | 04/01/2014 | 10.0 | $59.00 | $1,947,531 | |
| Zara USA, Inc.(office expansion) | Expansion | 13,067 | 08/01/2014 | 21.0 | $151.40 | 1,978,332 | |
| Zara USA, Inc. (office expansion) | Expansion | 9,783 | 02/01/2015 | 20.0 | $35.34 | 345,731 | |
| Zara USA, Inc. (basement expansion) | Expansion | 2,558 | 07/01/2014 | 20.6 | $197.11 | 504,207 | |
| Kanematsu | New | 10,914 | 07/01/2014 | 10.0 | $63.50 | 693,039 | |
| Bliss PR | Relocation | 9,783 | 12/01/2014 | 7.8 | $50.01 | 489,248 | |
| W.W. Norton & Co. | Expansion | 5,779 | 09/01/2014 | 2.9 | $53.00 | 306,287 | |
| Computer Design & Integration LLC | Relocation | 5,356 | 10/15/2014 | 5.2 | $55.50 | 277,500 | |
| Wolmuth Maher & Deutsch LLP | Expansion | 4,923 | 01/01/2015 | 15.7 | $50.00 | 246,150 | |
| South African Tourism Board | Relocation | 4,880 | 04/01/2014 | 10.4 | $48.00 | 234,240 | |
| The Reed Foundation | Renewal / Relocation | 4,070 | 10/01/2014 | 1.0 | $81.98 | 333,659 | |
| Lankler Siffert & Wohl | Relocation | 3,544 | 02/01/2014 | 3.0 | $20.02 | 70,951 | |
| KFW-Ipex-Bank GmbH | Renewal / Relocation | 2,566 | 03/01/2014 | 5.5 | $51.75 | 132,791 | |
| The Swiss Benevolent Society | Renewal | 1,454 | 07/01/2014 | 3.0 | $51.00 | 74,154 | |
| Total | 111,686 | $7,633,820 | |||||
Tenant Summary(1) | |||||
| Tenant | Ratings(2) Moody’s/S&P/Fitch | Net Rentable Area (SF) | % of Total NRA | Base Rent PSF | Lease Expiration Date |
Zara USA, Inc.(3) | NA / NA / NA | 72,544 | 10.2% | $137.66 | 02/28/2035 |
| W.W. Norton & Co. | NA / NA / NA | 64,668 | 9.1% | $45.19 | 07/31/2017 |
Mercer, Inc.(4) | Baa1 /A- / BBB+ | 36,232 | 5.1% | $41.34 | 06/14/2019 |
Vince LLC(5) | NA / NA / NA | 33,009 | 4.6% | $59.00 | 04/30/2025 |
Lankler Siffert & Wohl(6) | NA / NA / NA | 27,500 | 3.9% | $53.78 | 05/31/2023 |
| Schlesinger Assoc, N.Y. Inc. | NA / NA / NA | 21,006 | 2.9% | $66.07 | 02/28/2018 |
| Wollmuth, Maher & Deutsch LLP | NA / NA / NA | 19,942 | 2.8% | $50.70 | 08/31/2029 |
| Dragados USA Inc | NA / NA / NA | 14,190 | 2.0% | $72.77 | 05/31/2017 |
| A.R. Schmeidler & Co. Inc. | NA / NA / NA | 12,088 | 1.7% | $55.76 | 05/31/2017 |
| Kanematsu USA Inc. | NA / NA / NA | 10,914 | 1.5% | $63.50 | 01/31/2025 |
| (1) | Based on the underwritten rent roll. |
| (2) | Ratings provided are for the parent company of the entity listed in the “Tenant” field whether or not the parent company guarantees the lease. |
| (3) | Zara USA, Inc. has multiple leases at the property and the expiration date listed above reflects the expiration date of the largest space that the tenant occupies. In total, Zara USA, Inc. has 58,701 square feet expiring in February 2035 and 13,843 square feet expiring in March 2024. Currently, the borrower has not received a fully executed certificate of occupancy which would allow Zara USA, Inc. to occupy the space being renovated upon its completion. Additionally, the tenant has received a six-month abatement of monthly rent for the six-month period ending February 10, 2015. |
| (4) | Mercer, Inc. is currently subleasing 5,143 square feet to W.W. Norton & Co. and has the remainder of its space on the market for sublease. |
| (5) | Vince LLC has the right to terminate its lease in April 2022 with 12 months’ notice and the payment of a termination fee. |
| (6) | Lankler Siffert & Wohl has multiple leases at the property and the expiration date listed above reflects the expiration date of the largest space that the tenant occupies. Lankler Siffert & Wohl has 3,543 square feet expiring in February 2017 and 23,957 square feet expiring in May 2023. |
THE INFORMATION IN THIS STRUCTURAL AND COLLATERAL TERM SHEET IS NOT COMPLETE AND MAY BE AMENDED PRIOR TO THE TIME OF SALE. THIS TERM SHEET IS NOT AN OFFER TO SELL THESE SECURITIES AND IT IS NOT A SOLICITATION OF AN OFFER TO BUY THESE SECURITIES IN ANY JURISDICTION WHERE THE OFFER OR SALE IS NOT PERMITTED.
| | |
| 34 of 133 |
| Structural and Collateral Term Sheet | JPMBB 2014-C26 |
| 500 Fifth Avenue |
Lease Rollover Schedule (1) | |||||||||||
Year | Number of Leases Expiring | Net Rentable Area Expiring | % of NRA Expiring | Base Rent Expiring | % of Base Rent Expiring | Cumulative Net Rentable Area Expiring | Cumulative % of NRA Expiring | Cumulative Base Rent Expiring | Cumulative % of Base Rent Expiring | ||
| Vacant | NAP | 54,845 | 7.7 | % | NAP | NAP | 54,845 | 7.7% | NAP | NAP | |
2014 & MTM(2) | 9 | 29,477 | 4.1 | $1,603,456 | 3.6% | 84,322 | 11.8% | $1,603,456 | 3.6% | ||
| 2015 | 11 | 25,124 | 3.5 | 1,313,202 | 2.9 | 109,446 | 15.4% | $2,916,658 | 6.5% | ||
| 2016 | 7 | 31,632 | 4.4 | 1,817,187 | 4.1 | 141,078 | 19.8% | $4,733,845 | 10.6% | ||
| 2017 | 24 | 172,956 | 24.3 | 9,386,454 | 21.0 | 314,034 | 44.1% | $14,120,299 | 31.6% | ||
| 2018 | 15 | 91,571 | 12.8 | 6,213,719 | 13.9 | 405,605 | 56.9% | $20,334,018 | 45.5% | ||
| 2019 | 9 | 66,361 | 9.3 | 3,891,754 | 8.7 | 471,966 | 66.2% | $24,225,772 | 54.2% | ||
| 2020 | 4 | 24,438 | 3.4 | 1,646,133 | 3.7 | 496,404 | 69.6% | $25,871,905 | 57.9% | ||
| 2021 | 0 | 0 | 0.0 | 0 | 0.0 | 496,404 | 69.6% | $25,871,905 | 57.9% | ||
| 2022 | 4 | 24,893 | 3.5 | 1,435,895 | 3.2 | 521,297 | 73.1% | $27,307,800 | 61.1% | ||
| 2023 | 3 | 33,284 | 4.7 | 2,414,024 | 5.4 | 554,581 | 77.8% | $29,721,824 | 66.5% | ||
| 2024 | 4 | 35,644 | 5.0 | 2,068,147 | 4.6 | 590,225 | 82.8% | $31,789,971 | 71.1% | ||
| 2025 & Beyond | 4 | 122,566 | 17.2 | 12,925,963 | 28.9 | 712,791 | 100.0% | $44,715,934 | 100.0% | ||
| Total | 94 | 712,791 | 100.0 | % | $44,715,934 | 100.0% | |||||
| (1) | Based on the underwritten rent roll. |
| (2) | Includes the building’s security and management offices. |
Operating History and Underwritten Net Cash Flow(1) | |||||||
| 2012 | 2013 | TTM(2) | Underwritten | Per Square Foot | %(3) | ||
Rents in Place(4) | $35,585,996 | $34,840,348 | $34,484,013 | $44,715,934 | $62.73 | 86.5% | |
| Vacant Income | 0 | 0 | 0 | 3,680,279 | 5.16 | 7.1 | |
| Gross Potential Rent | $35,585,996 | $34,840,348 | $34,484,013 | $48,396,213 | $67.90 | 93.7% | |
| Total Reimbursements | 2,673,958 | 3,019,339 | 2,987,719 | 3,276,638 | 4.6 | 6.3 | |
| Net Rental Income | $38,259,954 | $37,859,687 | $37,471,732 | $51,672,851 | $72.49 | 100.0% | |
| (Vacancy/Credit Loss) | 0 | (60,687) | (86,621) | (3,899,013) | (5.47) | (7.5) | |
| Other Income | 416,722 | 330,508 | 194,725 | 313,985 | 0.44 | 0.6 | |
| Effective Gross Income | $38,676,676 | $38,129,508 | $37,579,836 | $48,087,824 | $67.46 | 93.1% | |
| Total Expenses | $17,661,985 | $18,667,607 | $18,771,752 | $20,697,525 | $29.04 | 43.0% | |
Net Operating Income(5) | $21,014,691 | $19,461,901 | $18,808,084 | $27,390,298 | $38.43 | 57.0% | |
| Total TI/LC, Capex/RR | 0 | 0 | 0 | 2,956,988 | 4.15 | 6.1 | |
| Net Cash Flow | $21,014,691 | $19,461,901 | $18,808,084 | $24,433,310 | $34.28 | 50.8% | |
| (1) | A detailed operating statement for 2011 was not provided by the borrower. |
| (2) | TTM column represents the trailing twelve months ending July 31, 2014. |
| (3) | Percentage column represents percent of Net Rental Income for all revenue lines and represents percent of Effective Gross Income for the remainder of fields. |
| (4) | Underwritten rents in-place, include $895,565 in contractual rent steps through October 31, 2015. |
| (5) | The increase in UW NOI from TTM NOI is primarily the result of five new or renewed leases to tenants expanding or relocating within the building, representing approximately 111,686 square feet and $7,633,820 of annual rent with lease commencement dates ranging from February 1, 2014 through February 1, 2015. |
Property Management. The property is managed by Cushman & Wakefield under an agreement that automatically renews annually unless terminated by either party in writing.
THE INFORMATION IN THIS STRUCTURAL AND COLLATERAL TERM SHEET IS NOT COMPLETE AND MAY BE AMENDED PRIOR TO THE TIME OF SALE. THIS TERM SHEET IS NOT AN OFFER TO SELL THESE SECURITIES AND IT IS NOT A SOLICITATION OF AN OFFER TO BUY THESE SECURITIES IN ANY JURISDICTION WHERE THE OFFER OR SALE IS NOT PERMITTED.
| | |
| 35 of 133 |
| Structural and Collateral Term Sheet | JPMBB 2014-C26 |
| 500 Fifth Avenue |
Escrows and Reserves. At origination, the borrower deposited into escrow approximately $16,028,841 for unfunded obligations, and required repairs of $413. The unfunded obligations reserve covers unfunded tenant improvements of $7,153,458, façade repairs of $4,021,131, rent abatements for existing tenants of $3,094,077, building improvements in progress of $1,393,384 and unfunded leasing commissions of $366,791.
Tax Escrows - The requirement for the borrower to make monthly deposits to the tax escrow is waived so long as no Cash Sweep Period exists.
Insurance Escrows - The requirement for the borrower to make monthly deposits to the insurance escrow is waived so long as no Cash Sweep Period exists.
Replacement Reserves - The requirement for the borrower to make monthly deposits to the replacement reserve escrow is waived so long as no Cash Sweep Period exists.
TI/LC Reserves - The requirement for the borrower to make monthly deposits to the TI/LC escrow is waived so long as no Cash Sweep Period exists. During the existence of a Cash Sweep Period, the borrower shall pay to the lender on each monthly payment date the sum of $229,649 (approximately $3.86 per square foot annually), which amounts shall be deposited with and held by lender for tenant improvement and leasing commission obligations.
Lockbox / Cash Management. The 500 Fifth Avenue Whole Loan is structured with a CMA lockbox. The borrower and property manager are required to direct tenants to deposit all rents directly to the lockbox account. All funds in the lockbox account shall be remitted to the borrower on a daily basis in the absence of a Cash Sweep Period. During the continuance of a Cash Sweep Period, all excess cash flow after payment of debt service, required reserves and operating expenses will be held as additional collateral for the loan.
A “Cash Sweep Period” means, subject to termination in accordance with the related loan documents, the period commencing upon the earliest of (i) the occurrence of an event of default, (ii) the debt yield on a trailing twelve-month basis falls below 7.0%, or (iii) any bankruptcy action of the borrower or manager.
THE INFORMATION IN THIS STRUCTURAL AND COLLATERAL TERM SHEET IS NOT COMPLETE AND MAY BE AMENDED PRIOR TO THE TIME OF SALE. THIS TERM SHEET IS NOT AN OFFER TO SELL THESE SECURITIES AND IT IS NOT A SOLICITATION OF AN OFFER TO BUY THESE SECURITIES IN ANY JURISDICTION WHERE THE OFFER OR SALE IS NOT PERMITTED.
| | |
| 36 of 133 |
| Structural and Collateral Term Sheet | JPMBB 2014-C26 |
1515 Market |
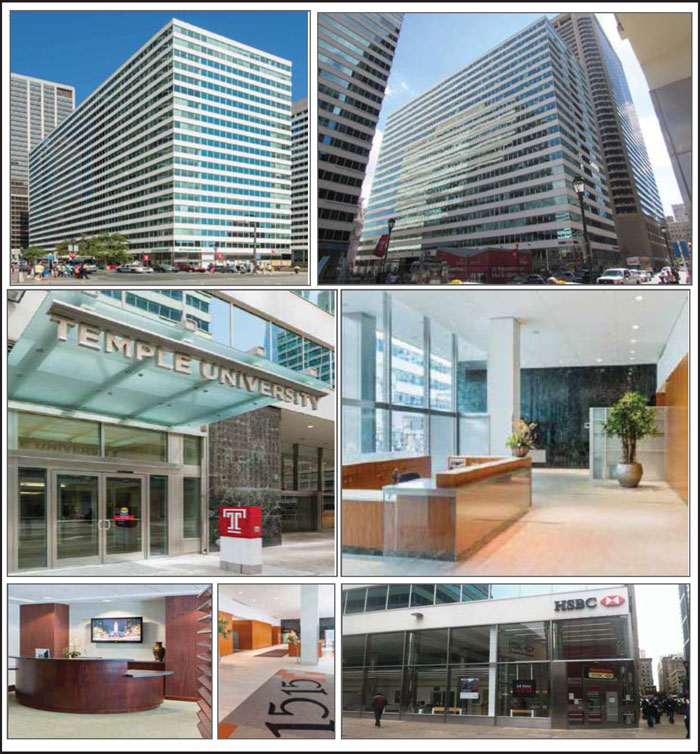
THE INFORMATION IN THIS STRUCTURAL AND COLLATERAL TERM SHEET IS NOT COMPLETE AND MAY BE AMENDED PRIOR TO THE TIME OF SALE. THIS TERM SHEET IS NOT AN OFFER TO SELL THESE SECURITIES AND IT IS NOT A SOLICITATION OF AN OFFER TO BUY THESE SECURITIES IN ANY JURISDICTION WHERE THE OFFER OR SALE IS NOT PERMITTED.
| | |
| 37 of 133 |
| Structural and Collateral Term Sheet | JPMBB 2014-C26 |
1515 Market |
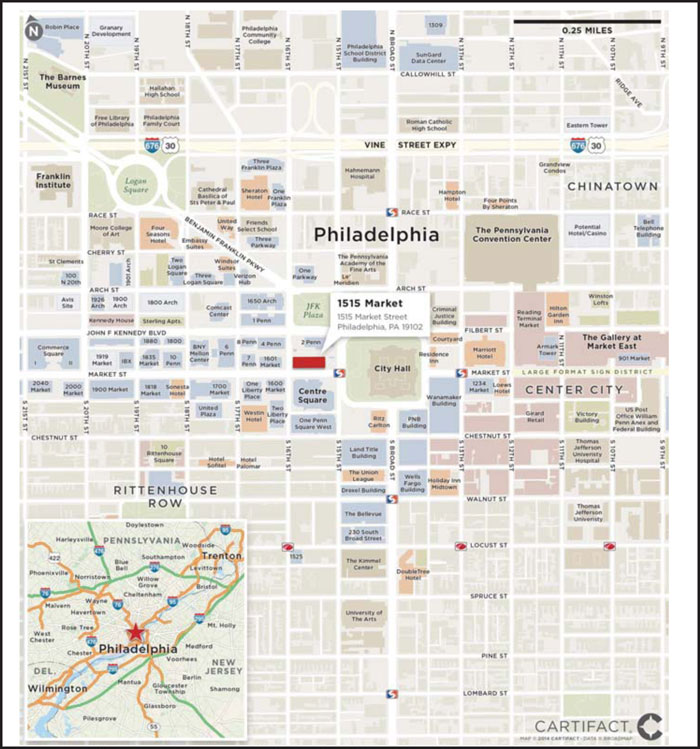
THE INFORMATION IN THIS STRUCTURAL AND COLLATERAL TERM SHEET IS NOT COMPLETE AND MAY BE AMENDED PRIOR TO THE TIME OF SALE. THIS TERM SHEET IS NOT AN OFFER TO SELL THESE SECURITIES AND IT IS NOT A SOLICITATION OF AN OFFER TO BUY THESE SECURITIES IN ANY JURISDICTION WHERE THE OFFER OR SALE IS NOT PERMITTED.
| | |
| 38 of 133 |
| Structural and Collateral Term Sheet | JPMBB 2014-C26 |
1515 Market |
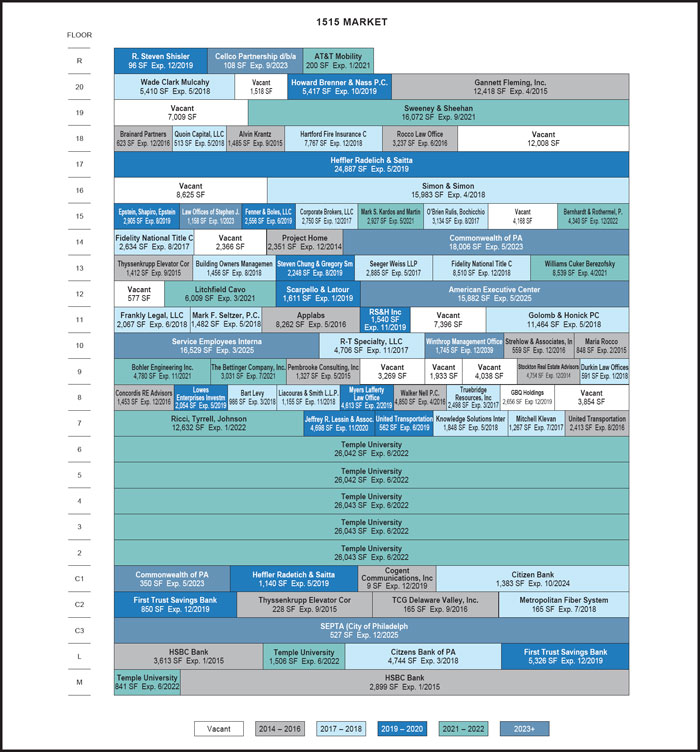
THE INFORMATION IN THIS STRUCTURAL AND COLLATERAL TERM SHEET IS NOT COMPLETE AND MAY BE AMENDED PRIOR TO THE TIME OF SALE. THIS TERM SHEET IS NOT AN OFFER TO SELL THESE SECURITIES AND IT IS NOT A SOLICITATION OF AN OFFER TO BUY THESE SECURITIES IN ANY JURISDICTION WHERE THE OFFER OR SALE IS NOT PERMITTED.
| | |
| 39 of 133 |
| Structural and Collateral Term Sheet | JPMBB 2014-C26 |
1515 Market |
| Mortgage Loan Information | Property Information | |||
| Mortgage Loan Seller: | JPMCB | Single Asset / Portfolio: | Single Asset | |
| Original Principal Balance: | $63,750,000 | Title: | Fee | |
| Cut-off Date Principal Balance: | $63,750,000 | Property Type - Subtype: | Office - CBD | |
| % of Pool by IPB: | 4.4% | Net Rentable Area (SF): | 502,213 | |
| Loan Purpose: | Acquisition | Location: | Philadelphia, PA | |
| Borrower: | BRI 1866 1515 Market, LP | Year Built / Renovated: | 1960 / 2007 | |
Sponsors(1): | Various | Occupancy: | 88.7% | |
| Interest Rate: | 4.30450% | Occupancy Date: | 11/20/2014 | |
| Note Date: | 12/2/2014 | Number of Tenants: | 73 | |
| Maturity Date: | 1/1/2025 | 2011 NOI: | $6,073,294 | |
Interest-only Period(2): | 61 months | 2012 NOI: | $4,807,093 | |
Original Term(2): | 121 months | 2013 NOI(3): | $4,090,220 | |
| Original Amortization: | 360 months | TTM NOI (as of 10/2014): | $4,878,882 | |
| Amortization Type: | IO-Balloon | UW Economic Occupancy: | 89.3% | |
| Call Protection: | L(26),Grtr1%orYM(92),O(3) | UW Revenues: | $12,069,378 | |
| Lockbox: | Hard | UW Expenses: | $5,487,872 | |
| Additional Debt: | Yes | UW NOI(3): | $6,581,505 | |
| Additional Debt Balance: | $8,500,000 | UW NCF: | $5,673,534 | |
| Additional Debt Type: | Mezzanine Loan | Appraised Value / Per SF: | $87,000,000 / $173 | |
| Appraisal Date: | 10/31/2014 | |||
Escrows and Reserves(4) | Financial Information | ||||||
| Initial | Monthly | Initial Cap | Cut-off Date Loan / SF: | $127 | |||
| Taxes: | $911,434 | $91,144 | N/A | Maturity Date Loan / SF: | $116 | ||
| Insurance: | $0 | Springing | N/A | Cut-off Date LTV: | 73.3% | ||
| Replacement Reserves: | $8,371 | $8,371 | N/A | Maturity Date LTV: | 66.8% | ||
| TI/LC: | $54,167 | $54,167 | $3,750,000 | UW NCF DSCR: | 1.50x | ||
| Other: | $2,807,354 | Springing | N/A | UW NOI Debt Yield: | 10.3% | ||
| Sources and Uses | ||||||
| Sources | Proceeds | % of Total | Uses | Proceeds | % of Total | |
| Mortgage Loan | $63,750,000 | 72.7% | Net Purchase Price(5) | $81,087,385 | 92.4% | |
| Mezzanine Loan | 8,500,000 | 9.7 | Upfront Reserves | 3,781,326 | 4.3 | |
| Sponsor Equity | 15,483,167 | 17.6 | Closing Costs | 2,864,456 | 3.3 | |
| Total Sources | $87,733,167 | 100.0% | Total Uses | $87,733,167 | 100.0% | |
| (1) | For a full description of the Sponsors, please refer to “The Sponsors” below. |
| (2) | The first payment date for the loan according to the mortgage loan documents is February 1, 2015. At securitization, funds sufficient to pay the interest associated with the loan on the Distribution Date in January 2015 will be deposited into the trust. Consequently, the mortgage loan term has been adjusted to reflect the additional payment of interest that the trust will receive on behalf of the mortgage loan. |
| (3) | The increase in 2013 NOI to UW NOI can be attributed to lease-up at the property, with occupancy increasing from 76.0% as of December 31, 2013 to 88.7% as of November 20, 2014. |
| (4) | For a full description of Escrows and Reserves, please refer to “Escrows and Reserves” below. |
| (5) | The Sponsors purchased the property for $85,000,000. The Net Purchase Price of $81,087,385 is $3,912,615 lower due to adjustments for real estate taxes, rent credits, outstanding tenant improvements, outstanding rent abatements, security deposits and other credits. |
THE INFORMATION IN THIS STRUCTURAL AND COLLATERAL TERM SHEET IS NOT COMPLETE AND MAY BE AMENDED PRIOR TO THE TIME OF SALE. THIS TERM SHEET IS NOT AN OFFER TO SELL THESE SECURITIES AND IT IS NOT A SOLICITATION OF AN OFFER TO BUY THESE SECURITIES IN ANY JURISDICTION WHERE THE OFFER OR SALE IS NOT PERMITTED.
| | |
| 40 of 133 |
| Structural and Collateral Term Sheet | JPMBB 2014-C26 |
1515 Market |
The Loan. The 1515 Market loan has an outstanding principal balance of $63.75 million and is secured by a first mortgage lien on a Class A office building located in Philadelphia, Pennsylvania. The loan has a 10-year term and, subsequent to a five-year interest-only period, will amortize on a 30-year schedule.
The Borrower. The borrowing entity for the loan is BRI 1866 1515 Market, LP, a Delaware limited partnership and special purpose entity.
The Sponsors. The loan sponsors and nonrecourse carve-out guarantors are Accesso Investment Properties V, LLLP and Accesso Investment Properties V (US), LLLP, which are both Florida limited liability limited partnerships. The loan sponsors are affiliated with Accesso Partners LLC, formerly known as Beacon Investment Properties. Accesso Partners LLC is a real estate investment and property development group that was founded in 2003 and is based in Hallandale Beach, Florida. Accesso Partners LLC currently has a portfolio of 31 properties totaling approximately 7.8 million square feet.
The loan sponsors acquired the property from Winthrop Realty Trust for approximately $85.0 million. Prior to Winthrop Realty Trust’s ownership the property was owned by a joint venture between CBRE Realty Finance and Stockton Partners of New York, which had purchased the building in 2007 for approximately $75.0 million. As part of the acquisition, a $70.0 million loan was put in place that was subsequently securitized in the JPMCC 2007-LDPX transaction. The loan faced a number of near-term lease maturities, complicating its ability to refinance the mortgage and in April 2011 was placed into special servicing as the previous owner pursued a loan modification. The loan modification failed to close and due to strong interest in the building the special servicer conducted a note sale in September 2012. Winthrop Realty Trust acquired the note from the JPMCC 2007-LDPX Trust for approximately $56.85 million (81.2% of par) resulting in a loss to the JPMCC 2007-LDPX Trust. At the time of the note purchase, the occupancy was approximately 76.0%
The Property. 1515 Market is a Class A office building located at the corner of Market Street and 15th Street in Philadelphia’s central business district. The 20-story property was constructed in 1960, renovated in 2007 and totals 502,213 square feet.
As of November 20, 2014, the property is approximately 88.7% leased by 73 tenants. The largest tenant at the property, Temple University, leases 130,213 square feet (25.9% of the net rentable area) through June 2022. Temple University is the fourth largest provider of professional post-secondary education in the United States. Temple University utilizes its space at the property as its “downtown campus”, an annex to its primary campus which is located two miles north. This location caters primarily to adults/full time employees that are pursuing a graduate degree. The tenant has its own separate entrance with security and elevator lobby. Temple University has been a tenant since 2000 and in 2012 executed an early ten year lease extension through June 2022. In September 2014, Temple University agreed to lease an additional 2,347 square feet of ground floor space which will have a bookstore and outdoor café. The second largest tenant at the property, Heffler Radetich & Saitta, leases 26,027 square feet (5.2% of the net rentable area) through May 2019. Heffler Radetich & Saitta has been a tenant at the property since 2000, when it originally occupied approximately 19,752 square feet, and has subsequently expanded multiple times to its current 26,027 square feet. Heffler Radetich & Saitta is a full-service certified public accounting and consulting firm. The firm is ranked by the Philadelphia Business Journal as the 19th largest CPA firm in Pennsylvania, New Jersey and Delaware. The third largest tenant at the property, the Commonwealth of PA, leases 18,356 square feet (3.7% of the net rentable area) through May 2023. The Commonwealth of PA has been a tenant at the property since 1986 and most recently in September 2013 extended the term of its lease for ten years to its expiration in May 2023. The Commonwealth of PA represents the government of the Commonwealth of Pennsylvania and currently uses the space for administrative offices supporting the Pennsylvania court system. No other tenant accounts for more then 3.3% of the net rentable area.
The property is located adjacent to both City Hall and Dilworth Park which recently re-opened following the completion of an approximately $70.0 million renovation project and now is an integrated transit/public space with a fountain/ice skating rink, café and areas for markets, concerts and other open-air activities. In addition, the property is part of and has direct weather protected access to the subterranean retail and regional train complex known as Suburban Station. Tenants and visitors are sheltered from weather and vehicular traffic as the property’s lobby offers direct access to the Southeastern Pennsylvania Transportation Authority’s (“SEPTA”) regional rail, Suburban Station’s concourse retail, surface trolleys as well as the Market-Frankford and Broad Street subway lines.
1515 Market is located in the Market West submarket of the Philadelphia central business district which is considered the city’s primary office district. According to the appraisal, the Market West corridor is located between 15th and 21st streets from Market to Arch streets. As of the third quarter of 2014 the Market West office market is comprised of approximately 29.9 million square feet and reported overall occupancy of 84.4% with asking rents of $29.77 per square foot. The appraisal identified six office properties that serve as a competitive set for the property. The properties in the competitive set range from 235,000 square feet to 686,503 square feet with a weighted average vacancy rate of 18.8% and asking rents of $22.50 to $27.00 per square foot.
THE INFORMATION IN THIS STRUCTURAL AND COLLATERAL TERM SHEET IS NOT COMPLETE AND MAY BE AMENDED PRIOR TO THE TIME OF SALE. THIS TERM SHEET IS NOT AN OFFER TO SELL THESE SECURITIES AND IT IS NOT A SOLICITATION OF AN OFFER TO BUY THESE SECURITIES IN ANY JURISDICTION WHERE THE OFFER OR SALE IS NOT PERMITTED.
| | |
| 41 of 133 |
| Structural and Collateral Term Sheet | JPMBB 2014-C26 |
1515 Market |
Historical and Current Occupancy(1) | |||
| 2011 | 2012 | 2013 | Current(2) |
| 84.0% | 76.4% | 76.0% | 88.7% |
| (1) | Historical Occupancies are as of December 31 of each respective year. |
| (2) | Current Occupancy is as of November 20, 2014. |
Tenant Summary(1) | |||||
| Tenant | Ratings(2) Moody’s/S&P/Fitch | Net Rentable Area (SF) | % of Total NRA | Base Rent PSF | Lease Expiration Date |
| Temple University | NA / NA / NA | 130,213 | 25.9% | $25.50 | 6/30/2022 |
| Heffler Radetich & Saitta | NA / NA / NA | 26,027 | 5.2% | $24.39 | 5/31/2019 |
Commonwealth of PA(3) | NA / NA / AA- | 18,356 | 3.7% | $25.73 | 5/31/2023 |
| Service Employees International Union | A2 / NA / NA | 16,529 | 3.3% | $21.00 | 3/31/2025 |
| Sweeney & Sheehan | NA / NA / NA | 16,072 | 3.2% | $25.50 | 9/30/2021 |
| Simon & Simon PC | NA / NA / NA | 15,983 | 3.2% | $24.00 | 4/30/2018 |
| American Executive Center | NA / NA / NA | 15,822 | 3.2% | $23.25 | 5/31/2025 |
| Ricci, Tyrrell, Johnson, | NA / NA / NA | 13,632 | 2.7% | $21.00 | 1/31/2022 |
| Gannett Fleming, Inc. | NA / A / NA | 12,418 | 2.5% | $26.59 | 4/30/2015 |
| Golomb & Honick PC | NA / NA / NA | 11,464 | 2.3% | $27.66 | 5/31/2018 |
| (1) | Based on the underwritten rent roll. |
| (2) | Ratings provided are for the parent company of the entity listed in the “Tenant” field whether or not the parent company guarantee the lease. |
| (3) | Commonwealth of PA is only obligated to pay rent to the extent it has received appropriations from the state government. |
Lease Rollover Schedule(1) | |||||||||||||||||
| Year | Number of Leases Expiring | Net Rentable Area Expiring | % of NRA Expiring | Base Rent Expiring | % of Base Rent Expiring | Cumulative Net Rentable Area Expiring | Cumulative % of NRA Expiring | Cumulative Base Rent Expiring | Cumulative % of Base Rent Expiring | ||||||||
| Vacant | NAP | 56,761 | 11.3 | % | NAP | NAP | 56,761 | 11.3% | NAP | NAP | |||||||
| 2014 & MTM | 2 | 7,105 | 1.4 | $29,975 | 0.3 | % | 63,866 | 12.7% | $29,975 | 0.3% | |||||||
| 2015 | 6 | 24,230 | 4.8 | 697,706 | 6.0 | 88,096 | 17.5% | $727,681 | 6.2% | ||||||||
| 2016 | 8 | 21,562 | 4.3 | 567,066 | 4.9 | 109,658 | 21.8% | $1,294,747 | 11.1% | ||||||||
| 2017 | 8 | 19,875 | 4.0 | 500,159 | 4.3 | 129,533 | 25.8% | $1,794,906 | 15.4% | ||||||||
| 2018 | 15 | 64,141 | 12.8 | 1,804,565 | 15.5 | 193,674 | 38.6% | $3,599,471 | 30.8% | ||||||||
| 2019 | 14 | 58,470 | 11.6 | 1,849,996 | 15.8 | 252,144 | 50.2% | $5,449,466 | 46.7% | ||||||||
| 2020 | 1 | 4,698 | 0.9 | 115,101 | 1.0 | 256,842 | 51.1% | $5,564,567 | 47.6% | ||||||||
| 2021 | 7 | 41,558 | 8.3 | 1,084,078 | 9.3 | 298,400 | 59.4% | $6,648,645 | 56.9% | ||||||||
| 2022 | 3 | 148,185 | 29.5 | 3,719,544 | 31.9 | 446,585 | 88.9% | $10,368,189 | 88.8% | ||||||||
| 2023 | 4 | 19,622 | 3.9 | 501,048 | 4.3 | 466,207 | 92.8% | $10,869,237 | 93.1% | ||||||||
| 2024 | 1 | 1,383 | 0.3 | 89,597 | 0.8 | 467,590 | 93.1% | $10,958,834 | 93.8% | ||||||||
| 2025 & Beyond | 4 | 34,623 | 6.9 | 719,187 | 6.2 | 502,213 | 100.0% | $11,678,020 | 100.0% | ||||||||
| Total | 73 | 502,213 | 100.0 | % | $11,678,020 | 100.0 | % | ||||||||||
| (1) | Based on the underwritten rent roll. |
THE INFORMATION IN THIS STRUCTURAL AND COLLATERAL TERM SHEET IS NOT COMPLETE AND MAY BE AMENDED PRIOR TO THE TIME OF SALE. THIS TERM SHEET IS NOT AN OFFER TO SELL THESE SECURITIES AND IT IS NOT A SOLICITATION OF AN OFFER TO BUY THESE SECURITIES IN ANY JURISDICTION WHERE THE OFFER OR SALE IS NOT PERMITTED.
| | |
| 42 of 133 |
| Structural and Collateral Term Sheet | JPMBB 2014-C26 |
1515 Market |
| Operating History and Underwritten Net Cash Flow | ||||||||
| 2011 | 2012 | 2013 | TTM(1) | Underwritten | Per Square Foot | %(2) | ||
Rents in Place(3) | $10,742,096 | $9,858,321 | $8,976,675 | $9,776,056 | $11,678,020 | $23.25 | 86.4% | |
| Vacant Income | 0 | 0 | 0 | 0 | 1,404,706 | 2.80 | 10.4 | |
| Gross Potential Rent | $10,742,096 | $9,858,321 | $8,976,675 | $9,776,056 | $13,082,726 | $26.05 | 96.8% | |
| Total Reimbursements | 936,295 | 380,523 | 580,668 | 525,978 | 438,432 | 0.87 | 3.2 | |
| Net Rental Income | $11,678,391 | $10,238,844 | $9,557,344 | $10,302,034 | $13,521,158 | $26.92 | 100.0% | |
| (Vacancy/Credit Loss) | 0 | 0 | 0 | 0 | (1,451,780) | (2.89) | (10.7) | |
| Other Income | 342,415 | 269,333 | 52,260 | 139,511 | 0 | 0.00 | 0.0 | |
| Effective Gross Income | $12,020,806 | $10,508,177 | $9,609,604 | $10,441,545 | $12,069,378 | $24.03 | 89.3% | |
| Total Expenses | $5,947,512 | $5,701,084 | $5,519,383 | $5,562,663 | $5,487,872 | $10.93 | 45.5% | |
| Net Operating Income | $6,073,294 | $4,807,093 | $4,090,220 | $4,878,882 | $6,581,505 | $13.11 | 54.5% | |
| Total TI/LC, Capex/RR | 0 | 0 | 0 | 0 | 907,972 | 1.81 | 7.5 | |
| Net Cash Flow | $6,073,294 | $4,807,093 | $4,090,220 | $4,878,882 | $5,673,534 | $11.30 | 47.0% | |
| (1) | TTM column represents the trailing twelve months ending October 31, 2014. |
| (2) | Percentage column represents percent of Net Rental Income for all revenue lines and represents percent of Effective Gross Income for the remainder of fields. |
| (3) | The increase in 2013 Rents in Place to the Underwritten Rents in Place can be attributed to lease-up at the property, with occupancy increasing from 76.0% as of December 31, 2013 to 88.7% as of November 20, 2014. |
Property Management. The property is managed by Accesso Services, LLC, an affiliate of the sponsor.
Escrows and Reserves. At origination, the borrower deposited into escrow approximately $1,934,290 for outstanding tenant improvement and leasing commissions associated with 12 tenants, $911,434 for real estate taxes, $660,314 for free rent, $212,750 for deferred maintenance, $54,167 for tenant improvement and leasing commissions and $8,371 for replacement reserves.
Tax Escrows - On a monthly basis, the borrower is required to escrow 1/12 of the annual estimated tax payments, which currently equates to $91,144.
Insurance Escrows - The requirement for the borrower to make monthly deposits into the insurance escrow is waived so long as no event of default exists and either the borrower provides satisfactory evidence that the property is insured under an approved blanket policy in accordance with the loan documents or the property maintains a debt service coverage ratio as calculated in the loan documents greater than 1.25x.
Replacement Reserves - On a monthly basis, the borrower is required to escrow $8,371 (approximately $0.20 per square foot annually) for replacement reserves.
TI/LC Reserves - On a monthly basis, the borrower is required to escrow $54,167 (approximately $1.29 per square foot annually) for future tenant improvements and leasing commissions. The reserve is subject to a cap of $3.75 million (approximately $7.47 per square foot).
Lockbox / Cash Management. The loan is structured with a hard lockbox and in-place cash management. The borrower or manager were required to send tenant direction letters to all tenants instructing them to deposit all rents and payments into the lockbox account controlled by the lender. All funds in the lockbox account are swept daily to a cash management account under the control of the lender and disbursed during each interest period during the term of the loan in accordance with the loan documents. To the extent that (i) there is an event of default under the loan documents, (ii) the debt service coverage ratio (including the mezzanine loan) as calculated in the loan documents based on a trailing three month period falls below 1.10x, (iii) the borrower or property manager becomes the subject of a bankruptcy, insolvency or similar action or (iv) a Temple University Trigger Event occurs, then all excess cash flow after payment of debt service, required reserves and operating expenses will be held as additional collateral for the loan.
A “Temple University Trigger Event” means: (i) any bankruptcy action with respect to Temple University, (ii) Temple University goes dark, vacates or abandons its space at the property, (iii) Temple University terminates its lease or (iv) Temple University fails to renew its lease for a minimum of five years on or before 12 months prior to its current lease expiration date in June 2022.
THE INFORMATION IN THIS STRUCTURAL AND COLLATERAL TERM SHEET IS NOT COMPLETE AND MAY BE AMENDED PRIOR TO THE TIME OF SALE. THIS TERM SHEET IS NOT AN OFFER TO SELL THESE SECURITIES AND IT IS NOT A SOLICITATION OF AN OFFER TO BUY THESE SECURITIES IN ANY JURISDICTION WHERE THE OFFER OR SALE IS NOT PERMITTED.
| | |
| 43 of 133 |
| Structural and Collateral Term Sheet | JPMBB 2014-C26 |
1515 Market |
Additional Mezzanine Debt. JPMCB provided the loan sponsors with a $8.5 million mezzanine loan that is secured by the loan sponsor’s equity interest in the borrower. The mezzanine loan has an anticipated repayment date of June 29, 2015 and a final maturity date of January 1, 2025. The mezzanine loan is interest-only for the term of the loan and has an initial interest rate of 10.00000%. If the mezzanine loan has not been repaid prior to the anticipated repayment date, after the anticipated repayment date, the interest rate will be 12.00000% and all excess cash flow will be swept and utilized to pay down the outstanding mezzanine loan balance (subject to the waterfall set forth in the cash management agreement). Including the mezzanine loan, the Cut-off Date LTV is 83.0%, the UW NCF DSCR is 1.22x based on the current mezzanine loan interest rate of 10.00000% and the amortizing mortgage loan debt service. Based on the mezzanine loan interest rate converting to 12.00000% and the amortizing mortgage loan debt service payment, the UW NCF DSCR is 1.18x. The mortgage and mezzanine lenders have entered into an intercreditor agreement.
THE INFORMATION IN THIS STRUCTURAL AND COLLATERAL TERM SHEET IS NOT COMPLETE AND MAY BE AMENDED PRIOR TO THE TIME OF SALE. THIS TERM SHEET IS NOT AN OFFER TO SELL THESE SECURITIES AND IT IS NOT A SOLICITATION OF AN OFFER TO BUY THESE SECURITIES IN ANY JURISDICTION WHERE THE OFFER OR SALE IS NOT PERMITTED.
| | |
| 44 of 133 |
| Structural and Collateral Term Sheet | JPMBB 2014-C26 | |
| Wells Fargo Center Tampa | ||
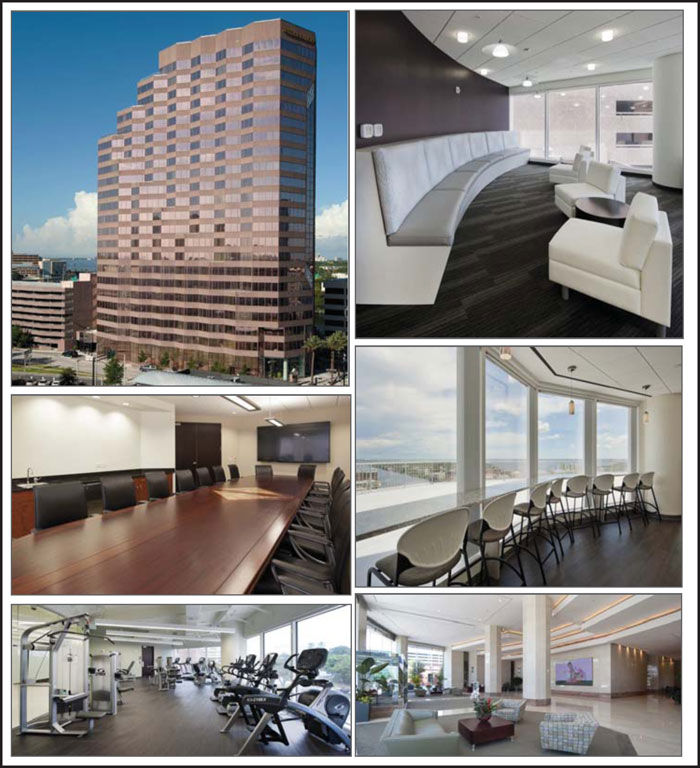
THE INFORMATION IN THIS STRUCTURAL AND COLLATERAL TERM SHEET IS NOT COMPLETE AND MAY BE AMENDED PRIOR TO THE TIME OF SALE. THIS TERM SHEET IS NOT AN OFFER TO SELL THESE SECURITIES AND IT IS NOT A SOLICITATION OF AN OFFER TO BUY THESE SECURITIES IN ANY JURISDICTION WHERE THE OFFER OR SALE IS NOT PERMITTED.
| | |
| 45 of 133 |
| Structural and Collateral Term Sheet | JPMBB 2014-C26 | |
| Wells Fargo Center Tampa | ||
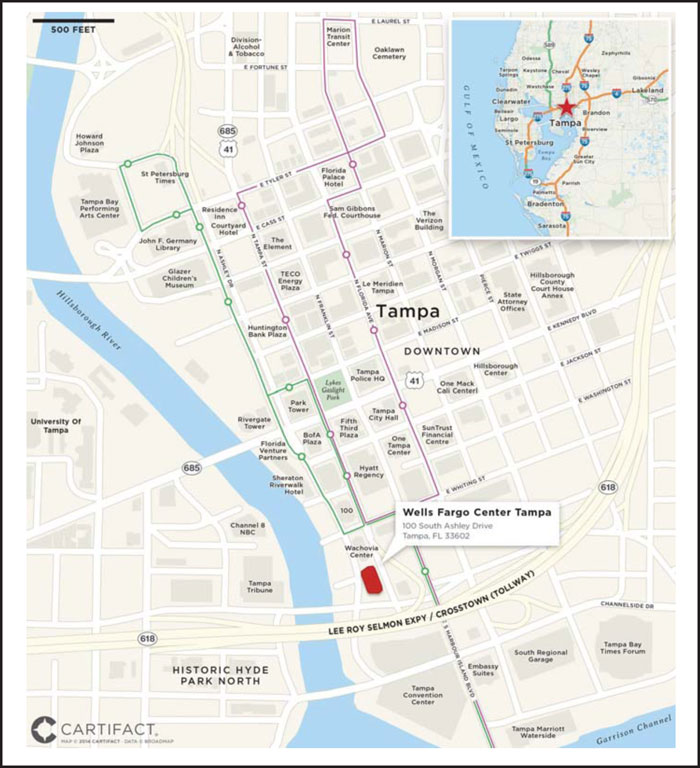
THE INFORMATION IN THIS STRUCTURAL AND COLLATERAL TERM SHEET IS NOT COMPLETE AND MAY BE AMENDED PRIOR TO THE TIME OF SALE. THIS TERM SHEET IS NOT AN OFFER TO SELL THESE SECURITIES AND IT IS NOT A SOLICITATION OF AN OFFER TO BUY THESE SECURITIES IN ANY JURISDICTION WHERE THE OFFER OR SALE IS NOT PERMITTED.
| | |
| 46 of 133 |
| Structural and Collateral Term Sheet | JPMBB 2014-C26 | |
| Wells Fargo Center Tampa | ||
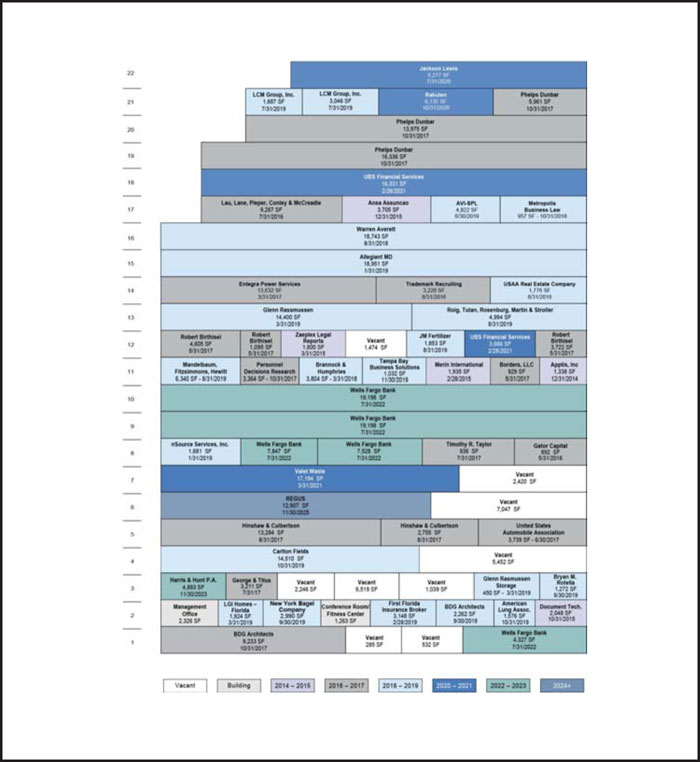
THE INFORMATION IN THIS STRUCTURAL AND COLLATERAL TERM SHEET IS NOT COMPLETE AND MAY BE AMENDED PRIOR TO THE TIME OF SALE. THIS TERM SHEET IS NOT AN OFFER TO SELL THESE SECURITIES AND IT IS NOT A SOLICITATION OF AN OFFER TO BUY THESE SECURITIES IN ANY JURISDICTION WHERE THE OFFER OR SALE IS NOT PERMITTED.
| | |
| 47 of 133 |
| Structural and Collateral Term Sheet | JPMBB 2014-C26 | |
| Wells Fargo Center Tampa | ||
| Mortgage Loan Information | Property Information | |||
| Mortgage Loan Seller: | JPMCB | Single Asset / Portfolio: | Single Asset | |
| Original Principal Balance: | $59,800,000 | Title: | Fee | |
| Cut-off Date Principal Balance: | $59,800,000 | Property Type - Subtype: | Office - CBD | |
| % of Pool by IPB: | 4.1% | Net Rentable Area (SF): | 389,524 | |
| Loan Purpose: | Acquisition | Location: | Tampa, FL | |
| Borrower: | 100 South Ashley Property Owner, LLC | Year Built / Renovated: | 1985 / 2013 | |
| Sponsor: | Greenfield Acquisition Partners VII, L.P. | Occupancy: | 93.1% | |
| Interest Rate: | 4.72150% | Occupancy Date: | 11/1/2014 | |
| Note Date: | 11/25/2014 | Number of Tenants: | 51 | |
| Maturity Date: | 12/1/2019 | 2011 NOI: | $2,756,369 | |
| Interest-only Period: | None | 2012 NOI(1): | $2,341,719 | |
| Original Term: | 60 months | 2013 NOI(1): | $2,918,702 | |
| Original Amortization: | 360 months | TTM NOI (as of 9/2014)(1)(2) : | $3,176,544 | |
| Amortization Type: | Balloon | UW Economic Occupancy: | 91.4% | |
| Call Protection: | L(24),Grtr1%orYM(12),O(24) | UW Revenues: | $9,349,535 | |
| Lockbox: | Hard | UW Expenses: | $3,965,225 | |
| Additional Debt: | N/A | UW NOI(2): | $5,384,310 | |
| Additional Debt Balance: | N/A | UW NCF: | $4,958,329 | |
| Additional Debt Type: | N/A | Appraised Value / Per SF: | $78,000,000 / $200 | |
| Appraisal Date: | 10/29/2014 | |||
Escrows and Reserves(3) | Financial Information | |||||
| Initial | Monthly | Initial Cap | Cut-off Date Loan / SF: | $154 | ||
| Taxes: | $116,465 | $116,465 | N/A | Maturity Date Loan / SF: | $141 | |
| Insurance: | $0 | Springing | N/A | Cut-off Date LTV: | 76.7% | |
| Replacement Reserves: | $800,000 | $4,870 | N/A | Maturity Date LTV: | 70.4% | |
| TI/LC: | $40,576 | $40,576 | N/A | UW NCF DSCR: | 1.33x | |
| Other: | $2,070,300 | $0 | N/A | UW NOI Debt Yield: | 9.0% | |
| Sources and Uses | ||||||||||
| Sources | Proceeds | % of Total | Uses | Proceeds | % of Total | |||||
| Mortgage Loan | $59,800,000 | 72.9 | % | Purchase Price | $78,000,000 | 95.1 | % | |||
| Sponsor Equity | 22,204,601 | 27.1 | Upfront Reserves | 3,027,341 | 3.7 | |||||
| Closing Costs | 977,260 | 1.2 | ||||||||
| Total Sources | $82,004,601 | 100.0 | % | Total Uses | $82,004,601 | 100.0 | % | |||
| (1) | Increases in historical NOI can be attributed to lease-up at the property, with occupancy increasing from 72.5% in 2011 to 75.1% in 2012, 86.3% in 2013 and to the current occupancy of 93.1% as of November 1, 2014. |
| (2) | The increase in UW NOI from TTM NOI is primarily the result of contractual rent increases through December 2015 and 26,132 square feet of newly executed leases since September 2014 that account for approximately $653,300 of annual rent. |
| (3) | For a full description of Escrows and Reserves, please refer to “Escrows and Reserves” below. |
The Loan. The Wells Fargo Center Tampa loan is secured by a first mortgage lien on a 22-story, 389,524 square foot office building located in the central business district of Tampa, Florida. The loan has an outstanding principal balance of $59.8 million, has a five-year term and amortizes on a 30-year schedule for the entire term of the loan.
The Borrower. The borrowing entity for the Wells Fargo Center Tampa loan is 100 South Ashley Property Owner, LLC, a Delaware limited liability company and special purpose entity.
THE INFORMATION IN THIS STRUCTURAL AND COLLATERAL TERM SHEET IS NOT COMPLETE AND MAY BE AMENDED PRIOR TO THE TIME OF SALE. THIS TERM SHEET IS NOT AN OFFER TO SELL THESE SECURITIES AND IT IS NOT A SOLICITATION OF AN OFFER TO BUY THESE SECURITIES IN ANY JURISDICTION WHERE THE OFFER OR SALE IS NOT PERMITTED.
| | |
| 48 of 133 |
| Structural and Collateral Term Sheet | JPMBB 2014-C26 | |
| Wells Fargo Center Tampa | ||
The Sponsor. The loan sponsor and nonrecourse carve-out guarantor is Greenfield Acquisition Partners VII, L.P. The loan sponsor is an affiliate of Greenfield Partners, which was established in 1997 by Eugene A. Gorab and is a real estate acquisition, development, asset management and finance company. The firm manages capital on behalf of its principals and limited partners, and has since inception secured capital commitments in excess of $4.0 billion across a series of discretionary investment vehicles. The company’s limited partners include state and corporate pension plans, university endowments, private foundations and high net worth individuals.
The Property. Wells Fargo Center Tampa is a Class A office building located on South Ashley Drive and occupies one city block between East Brorein Street and East Whiting Street in the central business district of Tampa, Florida. The property was constructed in 1985 and renovated in 2013. The 22-story property totals 389,524 square feet and consists primarily of office space with a small retail component which includes a Wells Fargo Bank branch. The property features amenities that include a fitness center, café, full service bank branch, conference center and complimentary shuttle service. The property also features an attached nine-story parking garage with 505 spaces, which provides for a parking ratio of 1.3 per 1,000 square feet. Prior to the acquisition, the previous owner spent over $6.0 million in upgrades and renovations. The renovations included modernizing of systems, telecommunications infrastructure and multi-tenant corridors. The corridor renovations include new lighting, new carpeting and bathroom upgrades. Upgrades to the property amenities include a new restaurant, a high-end fitness center and an upgrade to the parking garage. Additionally, the property obtained LEED Gold status.
As of November 1, 2014, the property was 93.1% leased by 51 tenants. The largest tenant at the property, Wells Fargo Bank (“Wells Fargo”), leases 14.9% of the net rentable area through July 2022 and has two five-year extension options remaining. Wells Fargo has been a tenant at the property since 1994 and in August 2012 extended the term of their lease through their current expiration of July 2022. Wells Fargo is rated A2/A+/AA- by Moody’s, S&P and Fitch, respectively. The property is Wells Fargo’s Tampa headquarters and is home to the wholesale banking unit which includes investment banking and capital markets, securities investment, commercial real estate and capital finance. Wells Fargo is a nationwide, diversified financial services company with $1.6 trillion in assets. At the end of third quarter 2014, Wells Fargo ranked fourth in assets among U.S. banks and was the world’s most valuable bank by market capitalization. The second largest tenant, Phelps Dunbar, leases 9.3% of the net rentable area through October 2017 and has two five-year extension options remaining. Phelps Dunbar is a regional law firm of more than 270 attorneys with offices positioned along the Gulf Coast from Houston to Tampa and has been a tenant at the property since 2006. The third largest tenant, UBS Financial Services, leases 5.1% of the net rentable area through February 2021 and has one five-year extension option remaining. UBS Financial Services is rated A2/A/A by Moody’s, S&P and Fitch and has been at the property since 1986 and is part of UBS’s Wealth Management Americas segment. UBS Wealth Management offers an array of investment products and services to affluent clients with more than $250,000 of investable assets. UBS Financial Services has a network of 7,000 financial advisors across the U.S., Puerto Rico and Canada serving more than two million customers. It has more than $600 billion of assets under management.
The property is located on South Ashley Drive and occupies one city block between East Brorein Street and East Whiting Street in the central business district of Tampa, Florida. Given the property’s central location, it is within walking distance of the Tampa Riverwalk, Tampa Convention Center and many of the amenities of downtown Tampa. At 22-stories, the property offers expansive views overlooking Hillsborough Bay, the Hillsborough River and the downtown Tampa skyline.
According to the appraisal, the overall Tampa-St. Petersburg-Clearwater office market consists of approximately 45.2 million square feet with an overall vacancy rate of 16.1% and a weighted average Class A rent of $23.63 per square foot as of first quarter 2014. Wells Fargo Center Tampa is located in the Tampa central business district office submarket which consists of approximately 6.4 million square feet with an overall vacancy rate of 13.2% and a weighted average Class A rent of $24.08 per square foot as of first quarter 2014. The Tampa central business district submarket is identified as one of the more desirable submarkets within the overall Tampa market. Overall vacancy in the central business district submarket has decreased by 2.1% between first quarter 2013 and first quarter 2014. The appraisal identified recent leases at five directly competitive properties built between 1981 and 1992 and ranging in size from 281,187 to 762,062 square feet. The rents at the comparable properties ranged from $22.00 to $27.50 per square foot. The appraisal’s conclusion of market rent for the property ranged from $24.50 to $26.00 per square foot depending on location and quality of space within the property. Using this conclusion of market rent, the appraisal determined that rents at the property are approximately 12.95% below market.
Historical and Current Occupancy(1) | ||||
2010 | 2011 | 2012 | 2013 | Current(2) |
| 69.8% | 72.5% | 75.1% | 86.3% | 93.1% |
| (1) | Historical Occupancies are as of December 31 of each respective year. |
| (2) | Current Occupancy is as of November 1, 2014. |
THE INFORMATION IN THIS STRUCTURAL AND COLLATERAL TERM SHEET IS NOT COMPLETE AND MAY BE AMENDED PRIOR TO THE TIME OF SALE. THIS TERM SHEET IS NOT AN OFFER TO SELL THESE SECURITIES AND IT IS NOT A SOLICITATION OF AN OFFER TO BUY THESE SECURITIES IN ANY JURISDICTION WHERE THE OFFER OR SALE IS NOT PERMITTED.
| | |
| 49 of 133 |
| Structural and Collateral Term Sheet | JPMBB 2014-C26 | |
| Wells Fargo Center Tampa | ||
Tenant Summary(1) | |||||||
| Tenant | Ratings(2) Moody’s/S&P/Fitch | Net Rentable Area (SF) | % of Total NRA | Base Rent PSF | Lease Expiration Date | ||
| Wells Fargo Bank | A2 / A+ / AA- | 58,098 | 14.9% | $21.85 | 7/31/2022 | ||
| Phelps Dunbar | N/A / N/A / N/A | 36,272 | 9.3% | $24.39 | 10/31/2017 | ||
| UBS Financial Services | A2 / A / A | 19,997 | 5.1% | $25.00 | 2/28/2021 | ||
| Allegiant MD | N/A / N/A / N/A | 18,951 | 4.9% | $21.38 | 1/31/2019 | ||
| Warren Averett | N/A / N/A / N/A | 18,743 | 4.8% | $24.78 | 8/31/2018 | ||
| Valet Waste | N/A / N/A / N/A | 17,194 | 4.4% | $21.50 | 3/31/2021 | ||
| Hinshaw & Culbertson | N/A / N/A / N/A | 16,039 | 4.1% | $24.76 | 8/31/2017 | ||
| Carlton Fields | N/A / N/A / N/A | 14,510 | 3.7% | $19.94 | 10/31/2019 | ||
| Glenn Rasmussen | N/A / N/A / N/A | 14,400 | 3.7% | $22.28 | 3/31/2019 | ||
| Entegra Power Services | N/A / N/A / N/A | 13,632 | 3.5% | $21.67 | 3/31/2017 | ||
| (1) | Based on the underwritten rent roll. |
| (2) | Ratings provided are for the parent company of the entity listed in the “Tenant” field whether or not the parent company guarantees the lease. |
Lease Rollover Schedule(1) | ||||||||||||||||
Year | Number of Leases Expiring | Net Rentable Area Expiring | % of NRA Expiring | Base Rent Expiring | % of Base Rent Expiring | Cumulative Net Rentable Area Expiring | Cumulative % of NRA Expiring | Cumulative Base Rent Expiring | Cumulative % of Base Rent Expiring | |||||||
| Vacant | NAP | 27,014 | 6.9% | NAP | NAP | 27,014 | 6.9% | NAP | NAP | |||||||
| 2014 & MTM | 1 | 1,338 | 0.3 | $28,259 | 0.3% | 28,352 | 7.3% | $28,259 | 0.3% | |||||||
| 2015 | 4 | 9,488 | 2.4 | 204,263 | 2.5 | 37,840 | 9.7% | $232,522 | 2.9% | |||||||
| 2016 | 5 | 13,399 | 3.4 | 317,234 | 3.9 | 51,239 | 13.2% | $549,755 | 6.8% | |||||||
| 2017 | 11 | 96,777 | 24.8 | 2,250,959 | 27.8 | 148,016 | 38.0% | $2,800,714 | 34.6% | |||||||
| 2018 | 5 | 27,542 | 7.1 | 651,163 | 8.0 | 175,558 | 45.1% | $3,451,877 | 42.7% | |||||||
| 2019 | 15 | 84,876 | 21.8 | 1,807,801 | 22.3 | 260,434 | 66.9% | $5,259,679 | 65.0% | |||||||
| 2020 | 2 | 12,412 | 3.2 | 306,534 | 3.8 | 272,846 | 70.0% | $5,566,212 | 68.8% | |||||||
| 2021 | 2 | 37,191 | 9.5 | 869,596 | 10.7 | 310,037 | 79.6% | $6,435,808 | 79.5% | |||||||
| 2022 | 1 | 58,098 | 14.9 | 1,270,987 | 15.7 | 368,135 | 94.5% | $7,706,795 | 95.2% | |||||||
| 2023 | 2 | 4,893 | 1.3 | 108,749 | 1.3 | 373,028 | 95.8% | $7,815,544 | 96.6% | |||||||
| 2024 | 0 | 0 | 0.0 | 0 | 0.0 | 373,028 | 95.8% | $7,815,544 | 96.6% | |||||||
| 2025 & Beyond | 3 | 16,496 | 4.2 | 277,501 | 3.4 | 389,524 | 100.0% | $8,093,045 | 100.0% | |||||||
| Total | 51 | 389,524 | 100.0% | $8,093,045 | 100.0% | |||||||||||
| (1) | Based on the underwritten rent roll. |
THE INFORMATION IN THIS STRUCTURAL AND COLLATERAL TERM SHEET IS NOT COMPLETE AND MAY BE AMENDED PRIOR TO THE TIME OF SALE. THIS TERM SHEET IS NOT AN OFFER TO SELL THESE SECURITIES AND IT IS NOT A SOLICITATION OF AN OFFER TO BUY THESE SECURITIES IN ANY JURISDICTION WHERE THE OFFER OR SALE IS NOT PERMITTED.
| | |
| 50 of 133 |
| Structural and Collateral Term Sheet | JPMBB 2014-C26 | |
| Wells Fargo Center Tampa | ||
Operating History and Underwritten Net Cash Flow | |||||||||||
2011 | 2012 | 2013 | TTM(1) | Underwritten | Per Square Foot | %(2) | |||||
Rents in Place(3)(4)(5) | $5,291,377 | $5,166,622 | $5,876,099 | $6,036,722 | $8,093,045 | $20.78 | 87.7% | ||||
| Vacant Income | 0 | 0 | 0 | 0 | 666,172 | 1.71 | 7.2 | ||||
| Gross Potential Rent | $5,291,377 | $5,166,622 | $5,876,099 | $6,036,722 | $8,759,217 | $22.49 | 95.0% | ||||
| Total Reimbursements | 234,534 | 171,889 | 103,483 | 240,453 | 465,285 | 1.19 | 5.0 | ||||
| Net Rental Income | $5,525,911 | $5,338,511 | $5,979,582 | $6,277,175 | $9,224,502 | $23.68 | 100.0% | ||||
| (Vacancy/Credit Loss) | 0 | 0 | 0 | 0 | (792,967) | (2.04) | (8.6) | ||||
| Parking Income | 628,880 | 618,316 | 644,247 | 725,508 | 918,000 | 2.36 | 10.0 | ||||
| Effective Gross Income | $6,154,791 | $5,956,827 | $6,623,829 | $7,002,682 | $9,349,535 | $24.00 | 101.4% | ||||
| Total Expenses | $3,398,422 | $3,615,108 | $3,705,127 | $3,826,138 | $3,965,225 | $10.18 | 42.4% | ||||
| Net Operating Income | $2,756,369 | $2,341,719 | $2,918,702 | $3,176,544 | $5,384,310 | $13.82 | 57.6% | ||||
| Total TI/LC, Capex/RR | 0 | 0 | 0 | 0 | 425,981 | 1.09 | 4.6 | ||||
| Net Cash Flow | $2,756,369 | $2,341,719 | $2,918,702 | $3,176,544 | $4,958,329 | $12.73 | 53.0% | ||||
| (1) | TTM column represents the trailing twelve-month period ending on September 30, 2014. |
| (2) | Percentage column represents percent of Net Rental Income for all revenue lines and represents percent of Effective Gross Income for the remainder of fields. |
| (3) | The increase in 2013 Rents in Place from 2012 Rents in Place is primarily the result of approximately 47,898 square feet of leasing activity at the property in 2013. Occupancy increased from 75.1% in 2012 to 86.3% in 2013. |
| (4) | The increase in TTM Rents in Place from 2013 Rents in Place is primarily the result of a new lease to Valet Waste for 17,194 square feet. |
| (5) | The increase in Underwritten Rents in Place from TTM Rents in Place is primarily the result of 26,132 square feet of newly executed leases since September 2014 that account for approximately $653,300 of annual rent and contractual rent increases through December 2015. |
Property Management. The property is managed by Tower Realty Asset Management, Inc., an affiliate of Tower Realty Partners, a privately held commercial real estate investment firm focusing on value-added opportunities throughout Florida. The company owns and operates over three million square feet of office and retail space throughout Florida.
Escrows and Reserves. At origination, the borrower deposited into escrow approximately $819,185 for a free rent reserve relating to 12 tenants, $800,000 for general replacement reserves, $759,484 for capital expenditure relating to modernization of the elevator system, $491,631 for outstanding tenant improvement and leasing commissions, $116,465 for real estate taxes and $40,576 for future tenant improvement and leasing commissions.
Tax Escrows - On a monthly basis, the borrower is required to escrow 1/12 of the annual estimated tax payments, which currently equates to $116,465.
Insurance Escrows - The requirement for the borrower to make monthly deposits into the insurance escrow is waived so long as (i) no event of default exists and (ii) the borrower provides satisfactory evidence that the property is insured under an approved blanket policy in accordance with the loan documents.
Replacement Reserves - On a monthly basis, the borrower is required to escrow $4,870 (approximately $0.15 per square foot annually) for replacement reserves.
TI/LC Reserves - On a monthly basis, the borrower is required to deposit $40,576 (approximately $1.25 per square foot annually) into the TI/LC escrow.
Lockbox / Cash Management. The loan is structured with a hard lockbox and in-place cash management. The borrower was required to send tenant direction letters to all tenants instructing them to deposit all rents and payments into the lockbox account controlled by the lender. All rents will be swept daily to a segregated cash management account and disbursed during each interest period in accordance with the loan documents. The lender will have a first priority security interest in the cash management account. Upon the occurrence and during the continuance of a Cash Sweep Event, all funds deposited into the cash management account after payment of debt service, required reserves and budgeted operating expenses will be held as additional security for the loan.
A “Cash Sweep Event” means: (i) the occurrence and continuance of an event of default, (ii) any bankruptcy action of the borrower, its principal or manager or (iii) the debt service coverage ratio as calculated in the loan documents based on the trailing three-month period falls below 1.10x.
THE INFORMATION IN THIS STRUCTURAL AND COLLATERAL TERM SHEET IS NOT COMPLETE AND MAY BE AMENDED PRIOR TO THE TIME OF SALE. THIS TERM SHEET IS NOT AN OFFER TO SELL THESE SECURITIES AND IT IS NOT A SOLICITATION OF AN OFFER TO BUY THESE SECURITIES IN ANY JURISDICTION WHERE THE OFFER OR SALE IS NOT PERMITTED.
| | |
| 51 of 133 |
| Structural and Collateral Term Sheet | JPMBB 2014-C26 |
[THIS PAGE INTENTIONALLY LEFT BLANK]
THE INFORMATION IN THIS STRUCTURAL AND COLLATERAL TERM SHEET IS NOT COMPLETE AND MAY BE AMENDED PRIOR TO THE TIME OF SALE. THIS TERM SHEET IS NOT AN OFFER TO SELL THESE SECURITIES AND IT IS NOT A SOLICITATION OF AN OFFER TO BUY THESE SECURITIES IN ANY JURISDICTION WHERE THE OFFER OR SALE IS NOT PERMITTED.
| | |
| 52 of 133 |
| Structural and Collateral Term Sheet | JPMBB 2014-C26 |
Heron Lakes |
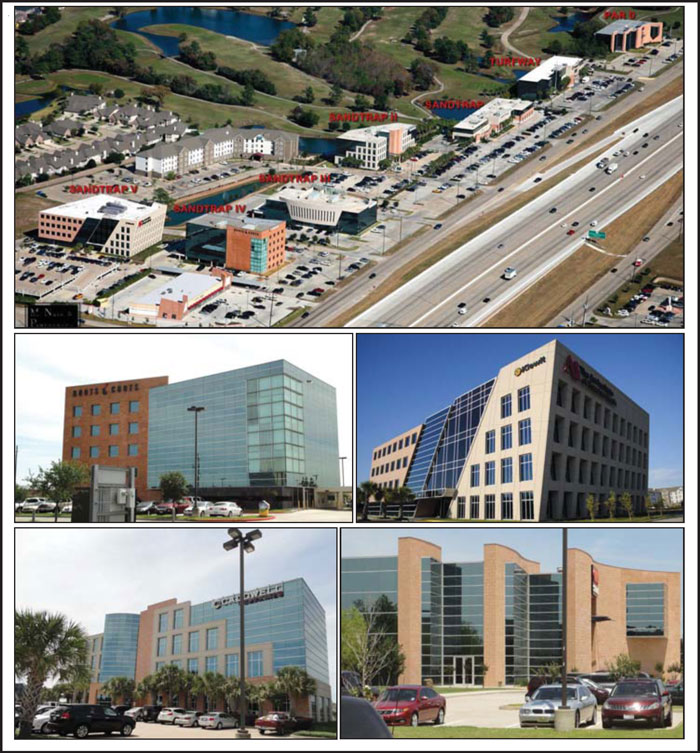
THE INFORMATION IN THIS STRUCTURAL AND COLLATERAL TERM SHEET IS NOT COMPLETE AND MAY BE AMENDED PRIOR TO THE TIME OF SALE. THIS TERM SHEET IS NOT AN OFFER TO SELL THESE SECURITIES AND IT IS NOT A SOLICITATION OF AN OFFER TO BUY THESE SECURITIES IN ANY JURISDICTION WHERE THE OFFER OR SALE IS NOT PERMITTED.
| | |
| 53 of 133 |
| Structural and Collateral Term Sheet | JPMBB 2014-C26 |
Heron Lakes |
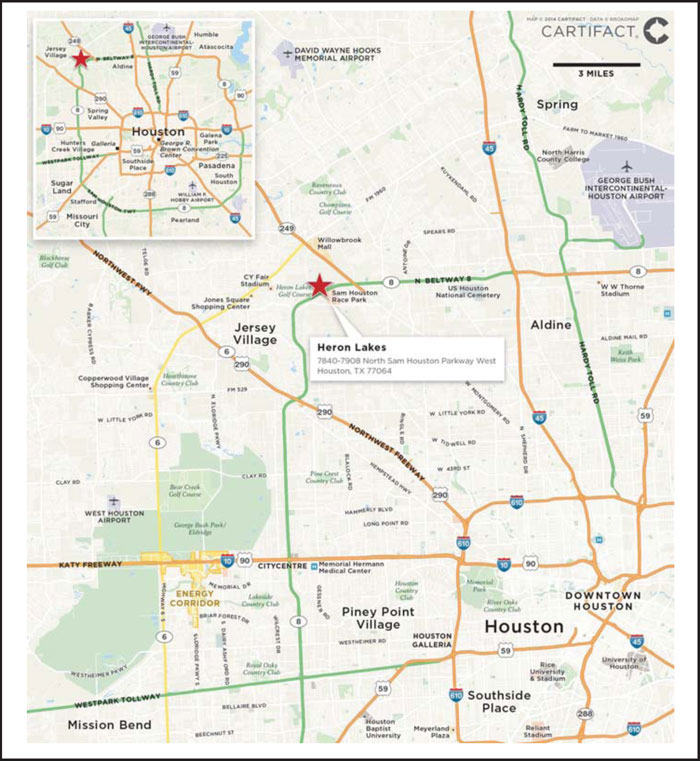
THE INFORMATION IN THIS STRUCTURAL AND COLLATERAL TERM SHEET IS NOT COMPLETE AND MAY BE AMENDED PRIOR TO THE TIME OF SALE. THIS TERM SHEET IS NOT AN OFFER TO SELL THESE SECURITIES AND IT IS NOT A SOLICITATION OF AN OFFER TO BUY THESE SECURITIES IN ANY JURISDICTION WHERE THE OFFER OR SALE IS NOT PERMITTED.
| | |
| 54 of 133 |
| Structural and Collateral Term Sheet | JPMBB 2014-C26 |
Heron Lakes |
| Mortgage Loan Information | Property Information | |||
| Mortgage Loan Seller: | JPMCB | Single Asset / Portfolio: | Single Asset | |
| Original Principal Balance: | $52,000,000 | Title: | Fee | |
| Cut-off Date Principal Balance: | $52,000,000 | Property Type - Subtype: | Office - Suburban | |
| % of Pool by IPB: | 3.6% | Net Rentable Area (SF): | 314,504 | |
| Loan Purpose: | Refinance | Location: | Houston, TX | |
| Borrower: | L REIT, Ltd. | Year Built / Renovated: | 2001-2008 / N/A | |
| Sponsor: | Mohammad Nasr | Occupancy(1)(2): | 98.2% | |
| Interest Rate: | 4.48500% | Occupancy Date: | 12/1/2014 | |
| Note Date: | 11/14/2014 | Number of Tenants: | 37 | |
| Maturity Date: | 12/1/2024 | 2011 NOI: | $4,506,692 | |
| Interest-only Period: | 24 months | 2012 NOI: | $4,560,844 | |
| Original Term: | 120 months | 2013 NOI: | $4,506,964 | |
| Original Amortization: | 360 months | TTM NOI (as of 9/2014): | $4,704,666 | |
| Amortization Type: | IO-Balloon | UW Economic Occupancy: | 95.0% | |
| Call Protection: | L(25),Grtr1%orYM(91),O(4) | UW Revenues(2): | $7,968,098 | |
| Lockbox: | Hard | UW Expenses: | $3,137,765 | |
| Additional Debt: | Yes | UW NOI: | $4,830,334 | |
| Additional Debt Balance: | $7,000,000 | UW NCF: | $4,288,295 | |
| Additional Debt Type: | Mezzanine Loan | Appraised Value / Per SF: | $71,000,000 / $226 | |
| Appraisal Date: | 11/1/2014 | |||
Escrows and Reserves(3) | Financial Information | |||||
| Initial | Monthly | Initial Cap | Cut-off Date Loan / SF: | $165 | ||
| Taxes: | $94,445 | $94,445 | N/A | Maturity Date Loan / SF: | $141 | |
| Insurance: | $9,479 | Springing | N/A | Cut-off Date LTV: | 73.2% | |
| Replacement Reserves: | $5,250 | $5,250 | N/A | Maturity Date LTV: | 62.5% | |
| TI/LC: | $39,375 | $39,375 | $1,890,000 | UW NCF DSCR: | 1.36x | |
| Other: | $5,135,169 | $0 | N/A | UW NOI Debt Yield: | 9.3% | |
| Sources and Uses | ||||||
| Sources | Proceeds | % of Total | Uses | Proceeds | % of Total | |
| Mortgage Loan | $52,000,000 | 88.1% | Payoff Existing Debt | $48,672,135 | 82.5% | |
| Mezzanine Loan | 7,000,000 | 11.9 | Upfront Reserves | 5,283,718 | 9.0 | |
| Closing Costs | 2,538,285 | 4.3 | ||||
| Return of Equity | 2,505,862 | 4.2 | ||||
| Total Sources | $59,000,000 | 100.0% | Total Uses | $59,000,000 | 100.0% | |
| (1) | Occupancy includes Logan International (14,482 square feet), Global Drilling Support (9,865 square feet) and American International Relocation Services (7,775 square feet), which have executed leases but are not expected to take occupancy until February 2015, January 2015 and February 2015, respectively. |
| (2) | Occupancy and UW Revenues include three tenants that are affiliated with the sponsor. These tenants account for approximately 4.0% of the net rentable area and 3.2% of the underwritten rents. |
| (3) | For a full description of Escrows and Reserves, please refer to “Escrows and Reserves” below. |
The Loan. The Heron Lakes loan has an outstanding principal balance of $52.0 million and is secured by a first mortgage lien on seven Class A office buildings located in Houston, Texas. The loan has a 10-year term and subsequent to a two-year interest-only period, will amortize on a 30-year schedule. The previously existing debt consisted of a $26.0 million mortgage loan that was securitized in the JPMCC 2013-FL3 transaction, together with a $25.0 million mezzanine loan.
The Borrower. The borrowing entity for the loan is L REIT, Ltd., a Texas limited partnership and special purpose entity.
THE INFORMATION IN THIS STRUCTURAL AND COLLATERAL TERM SHEET IS NOT COMPLETE AND MAY BE AMENDED PRIOR TO THE TIME OF SALE. THIS TERM SHEET IS NOT AN OFFER TO SELL THESE SECURITIES AND IT IS NOT A SOLICITATION OF AN OFFER TO BUY THESE SECURITIES IN ANY JURISDICTION WHERE THE OFFER OR SALE IS NOT PERMITTED.
| | |
| 55 of 133 |
| Structural and Collateral Term Sheet | JPMBB 2014-C26 |
Heron Lakes |
The Sponsor. The loan sponsor and nonrecourse carve-out guarantor is Mohammad Nasr. Mr. Nasr is the principal of a Houston based architectural and real estate development firm that has experience in over 24 projects across the United States comprising over 5.0 million square feet. Mr. Nasr developed the property between 2001 and 2008 for a total cost of approximately $73.0 million and has a current basis of approximately $74.3 million.
The Property. The property consists of seven Class A/B office buildings containing approximately 314,504 square feet located in Houston, Texas. The seven buildings were developed between 2001 and 2008 and are situated across 14.4 acres with frontage along Beltway 8 (Sam Houston Parkway), approximately 13 miles north of the Houston central business district. The buildings range from two to five stories and from approximately 35,000 square feet to 75,000 square feet.
As of December 1, 2014, the property was approximately 98.2% leased by 37 tenants. The tenants at the property operate in a variety of industries including oil and gas services, energy, technology, education, communications and banking. The largest tenant at the property, Boots & Coots, leases 34,052 square feet (10.8% of the net rentable area) through July 2017. Boots & Coots is a subsidiary of Halliburton and provides services to the oil and gas industry. The second largest tenant at the property, Intergraph, leases 29,581 square feet (9.4% of the net rentable area) through June 2020. Intergraph is a provider of engineering and geospatial software. In December 2012, Intergraph expanded by 21,040 square feet to its current total of 29,581 square feet and extended the term of its lease from May 2014 to June 2020. The third largest tenant at the property, Icon Bank, leases 22,029 square feet (7.0% of the net rentable area) and is headquartered at the property. Of the total space Icon Bank leases, 12,548 square feet are expiring in February 2017 and 9,481 square feet are expiring in February 2020. Icon Bank has been a tenant at the property since 2007 and has expanded multiple times, most recently in October 2014 by an additional 5,695 square feet. Icon Bank is a Texas based full-service bank with seven offices located in the state. As of the second quarter of 2014, the bank reported assets of approximately $597.1 million, up from approximately $481.5 million the previous year.
When the Heron Lakes loan was previously securitized in the JPMCC 2013-FL3 transaction, the third largest tenant at the time was the University of Phoenix, which occupied 24,749 square feet on a lease through December 2014. The University of Phoenix vacated the property in early 2014 but continued to fulfill its obligations under the lease until November 2014, when the tenant and loan sponsor agreed to terminate the lease early. The University of Phoenix space is being backfilled by Global Drilling Support, American International Relocation Services and Coperion. All three tenants have executed leases but Global Drilling Support and American International Relocation Services are not expected to take occupancy of their respective spaces until January 2015 and February 2015, respectively.
Located off of Sam Houston Parkway and North Gessner Road, the property represents the office component of the master-planned Heron Lakes Estates, which includes residential units, the 18-hole Heron Lakes Golf Course, and a Staybridge Suites hotel (none of which are part of the collateral). Nearby amenities for the residents of the community include Willowbrook Mall and the Sam Houston Race Park. Bush Intercontinental Airport is approximately 15 miles east/northeast of the property. The property has nearby access to Beltway 8, the FM 1960 highway and State Highway 249, which are the main thorough-fares in the area going east/west and north/south.
Heron Lakes is located in the FM 1960 submarket, northwest of the Houston central business district office market. According to the appraisal, as of the second quarter of 2014 the FM 1960 office market was comprised of approximately 6.2 million square feet, of which 2.04 million square feet is Class A. The Class A vacancy rate for the FM 1960 submarket as of the second quarter of 2014 was 6.9%, down from 11.8% at the end of 2012. Class A asking rents as of the second quarter of 2014 were $29.38 per square foot, up from $24.57 at the end of 2012. The appraiser stated that Heron Lakes lies within a stronger micromarket within the FM 1960 submarket, primarily due to its recent construction and frontage along Beltway 8. The appraisal identified five office properties that serve as a competitive set for the property. The properties in the competitive set range from 48,139 square feet to 159,175 square feet and were constructed between 2007 and 2009. The competitive set has a rental range of $17.50 to $21.50 per square foot NNN with a weighted average vacancy rate of 2.6%.
THE INFORMATION IN THIS STRUCTURAL AND COLLATERAL TERM SHEET IS NOT COMPLETE AND MAY BE AMENDED PRIOR TO THE TIME OF SALE. THIS TERM SHEET IS NOT AN OFFER TO SELL THESE SECURITIES AND IT IS NOT A SOLICITATION OF AN OFFER TO BUY THESE SECURITIES IN ANY JURISDICTION WHERE THE OFFER OR SALE IS NOT PERMITTED.
| | |
| 56 of 133 |
| Structural and Collateral Term Sheet | JPMBB 2014-C26 |
Heron Lakes |
Historical and Current Occupancy(1) | ||||
| 2010 | 2011 | 2012 | 2013 | Current(2)(3) |
| 96.0% | 94.8% | 90.0% | 95.3% | 98.2% |
| (1) | Historical Occupancies are as of December 31 of each respective year. |
| (2) | Current Occupancy is as of December 1, 2014. |
| (3) | Current Occupancy includes Logan International (14,482 square feet), Global Drilling Support (9,865 square feet) and American International Relocation Services (7,775 square feet), which have executed leases but are not expected to take occupancy until February 2015, January 2015 and February 2015, respectively. |
Tenant Summary(1) | |||||
| Tenant | Ratings(2) Moody’s/S&P/Fitch | Net Rentable Area (SF) | % of Total NRA | Base Rent PSF | Lease Expiration Date |
| Boots & Coots | A2 / A / A- | 34,052 | 10.8% | $25.01 | 7/31/2017 |
| Intergraph | NA / NA / NA | 29,581 | 9.4% | $25.05 | 6/30/2020 |
Icon Bank(3)(4) | NA / NA / NA | 22,029 | 7.0% | $20.44 | 2/28/2017 |
| Kiewit | NA / NA / NA | 21,923 | 7.0% | $26.95 | 6/30/2019 |
Art Institute(4) | NA / NA / NA | 20,711 | 6.6% | $19.50 | 6/30/2019 |
| Energy Solution | NA / NA / NA | 16,447 | 5.2% | $25.00 | 4/30/2016 |
| Accudata | NA / NA / NA | 14,885 | 4.7% | $24.87 | 6/30/2016 |
Logan International(4) | NA / NA / NA | 14,482 | 4.6% | $17.00 | 1/31/2025 |
| Caldwell Watson Real Estate Group | NA / NA / NA | 13,692 | 4.4% | $23.67 | 12/31/2019 |
Global Drilling Support(4) | NA / NA / NA | 9,865 | 3.1% | $17.50 | 12/31/2019 |
| (1) | Based on the underwritten rent roll. |
| (2) | Ratings provided are for the parent company of the entity listed in the “Tenant” field whether or not the parent company guarantees the lease. |
| (3) | Icon Bank has multiple leases at the property and the expiration date listed above reflects the expiration date of the largest space they occupy. In total, 12,548 square feet are expiring in February 2017 and 9,481 square feet are expiring in February 2020. |
| (4) | The Base Rent PSF for Icon Bank, Art Institute, Logan International and Global Drilling Support are lower then other tenants in the above chart because the leases are NNN while other tenants have gross leases. The loan sponsor has made a recent effort to convert new or renewal leases from gross to NNN. |
Lease Rollover Schedule(1) | |||||||||
| Year | Number of Leases Expiring | Net Rentable Area Expiring | % of NRA Expiring | Base Rent Expiring | % of Base Rent Expiring | Cumulative Net Rentable Area Expiring | Cumulative % of NRA Expiring | Cumulative Base Rent Expiring | Cumulative % of Base Rent Expiring |
| Vacant | NAP | 5,563 | 1.8% | NAP | NAP | 5,563 | 1.8% | NAP | NAP |
| 2014 & MTM | 1 | 411 | 0.1 | $0 | 0.0% | 5,974 | 1.9% | $0 | 0.0% |
| 2015 | 2 | 15,266 | 4.9 | 378,711 | 5.5 | 21,240 | 6.8% | $378,711 | 5.5% |
| 2016 | 8 | 60,688 | 19.3 | 1,491,556 | 21.7 | 81,928 | 26.0% | $1,870,267 | 27.2% |
| 2017 | 5 | 56,737 | 18.0 | 1,331,678 | 19.4 | 138,665 | 44.1% | $3,201,944 | 46.5% |
| 2018 | 4 | 14,889 | 4.7 | 296,198 | 4.3 | 153,554 | 48.8% | $3,498,142 | 50.8% |
| 2019 | 7 | 76,072 | 24.2 | 1,659,426 | 24.1 | 229,626 | 73.0% | $5,157,567 | 74.9% |
| 2020 | 5 | 53,834 | 17.1 | 1,174,233 | 17.1 | 283,460 | 90.1% | $6,331,800 | 92.0% |
| 2021 | 0 | 0 | 0.0 | 0 | 0.0 | 283,460 | 90.1% | $6,331,800 | 92.0% |
| 2022 | 1 | 2,444 | 0.8 | 41,548 | 0.6 | 285,904 | 90.9% | $6,373,348 | 92.6% |
| 2023 | 0 | 0 | 0.0 | 0 | 0.0 | 285,904 | 90.9% | $6,373,348 | 92.6% |
| 2024 | 0 | 0 | 0.0 | 0 | 0.0 | 285,904 | 90.9% | $6,373,348 | 92.6% |
| 2025 & Beyond | 4 | 28,600 | 9.1 | 508,026 | 7.4 | 314,504 | 100.0% | $6,881,374 | 100.0% |
| Total | 37 | 314,504 | 100.0% | $6,881,374 | 100.0% | ||||
(1) | Based on the underwritten rent roll. |
THE INFORMATION IN THIS STRUCTURAL AND COLLATERAL TERM SHEET IS NOT COMPLETE AND MAY BE AMENDED PRIOR TO THE TIME OF SALE. THIS TERM SHEET IS NOT AN OFFER TO SELL THESE SECURITIES AND IT IS NOT A SOLICITATION OF AN OFFER TO BUY THESE SECURITIES IN ANY JURISDICTION WHERE THE OFFER OR SALE IS NOT PERMITTED.
| | |
| 57 of 133 |
| Structural and Collateral Term Sheet | JPMBB 2014-C26 |
Heron Lakes |
| Operating History and Underwritten Net Cash Flow | ||||||||
| 2011 | 2012 | 2013 | TTM(1) | Underwritten | Per Square Foot | %(2) | ||
| Rents in Place | $7,031,517 | $7,260,348 | $7,284,620 | $7,713,318 | $6,881,374 | $21.88 | 82.3% | |
| Vacant Income | 0 | 0 | 0 | 0 | 101,525 | 0.32 | 1.2 | |
| Gross Potential Rent | $7,031,517 | $7,260,348 | $7,284,620 | $7,713,318 | $6,982,899 | $22.20 | 83.5% | |
Total Reimbursements(3) | 0 | 0 | 0 | 0 | 1,375,100 | 4.37 | 16.5 | |
| Net Rental Income | $7,031,517 | $7,260,348 | $7,284,620 | $7,713,318 | $8,357,998 | $26.58 | 100.0% | |
| (Vacancy/Credit Loss) | 0 | 0 | 0 | 0 | (417,900) | (1.33) | (5.0) | |
| Other Income | 0 | 0 | 0 | 0 | 28,000 | 0.09 | 0.3 | |
| Effective Gross Income | $7,031,517 | $7,260,348 | $7,284,620 | $7,713,318 | $7,968,098 | $25.34 | 95.3% | |
| Total Expenses | $2,524,825 | $2,699,504 | $2,777,656 | $3,008,652 | $3,137,765 | $9.98 | 39.4% | |
| Net Operating Income | $4,506,692 | $4,560,844 | $4,506,964 | $4,704,666 | $4,830,334 | $15.36 | 60.6% | |
| Total TI/LC, Capex/RR | 0 | 0 | 0 | 0 | 542,039 | 1.72 | 6.8 | |
| Net Cash Flow | $4,506,692 | $4,560,844 | $4,506,964 | $4,704,666 | $4,288,295 | $13.64 | 53.8% | |
| (1) | TTM column represents the trailing twelve months ending September 30, 2014. |
| (2) | Percentage column represents percent of Net Rental Income for all revenue lines and represents percent of Effective Gross Income for the remainder of fields. |
| (3) | The increase in TTM and Underwritten Total Reimbursements is due to the loan sponsor’s recent efforts to convert new or renewal leases from gross to NNN. |
Property Management. The property is managed by Hollister Property, Inc., an affiliate of the loan sponsor.
Escrows and Reserves. At origination, the borrower deposited into escrow approximately $4,000,000 for a Logan International reserve as described below, $1,087,669 for an outstanding leasing costs and free rent reserve as described below, $94,445 for real estate taxes, $47,500 for deferred maintenance, $39,375 for tenant improvements and leasing commissions, $9,479 for insurance and $5,250 for replacement reserves.
Tax Escrows - On a monthly basis, the borrower is required to escrow 1/12 of the annual estimated tax payments, which currently equates to $94,445.
Insurance Escrows - The requirement for the borrower to make monthly deposits into the insurance escrow is waived so long as (i) no event of default exists and (ii) the borrower provides satisfactory evidence that the property is insured under an approved blanket policy in accordance with the loan documents.
Replacement Reserves - On a monthly basis, the borrower is required to escrow $5,250 (approximately $0.20 per square foot annually) for replacement reserves.
TI/LC Reserves - On a monthly basis, the borrower is required to escrow $39,375 (approximately $1.50 per square foot annually) for future tenant improvements and leasing commissions. The reserve is subject to a cap of $1.89 million (approximately $6.01 per square foot). The borrower is required to deposit all fees into the TI/LC reserve in connection with any tenant exercising any termination or partial termination or contraction rights.
Outstanding Leasing Costs Reserves - At closing, the borrower deposited into escrow $1,087,669 for outstanding leasing costs. Of such funds, $890,570 will be used for outstanding tenant improvement and leasing commission obligations under leases in effect at closing and $197,099 will be used for free rent, rent abatements and tenant reimbursements under such existing leases.
Logan International Reserve - At closing, the borrower deposited into escrow $4,000,000 which shall be disbursed when Logan International (or one or more tenants acceptable to the lender) is in possession of its space, open for business and is paying full rent without offset, free rent or abatements and all landlord and tenant improvement and leasing commission obligations have been satisfied. The Logan International lease is expected to commence in February 2015 and is structured with four months of abated rent.
THE INFORMATION IN THIS STRUCTURAL AND COLLATERAL TERM SHEET IS NOT COMPLETE AND MAY BE AMENDED PRIOR TO THE TIME OF SALE. THIS TERM SHEET IS NOT AN OFFER TO SELL THESE SECURITIES AND IT IS NOT A SOLICITATION OF AN OFFER TO BUY THESE SECURITIES IN ANY JURISDICTION WHERE THE OFFER OR SALE IS NOT PERMITTED.
| | |
| 58 of 133 |
| Structural and Collateral Term Sheet | JPMBB 2014-C26 |
Heron Lakes |
Lockbox / Cash Management. The loan is structured with a hard lockbox and in-place cash management. The borrower or manager were required to send tenant direction letters to all tenants instructing them to deposit all rents and payments into the lockbox account controlled by the lender. All funds in the lockbox account are swept daily to a cash management account under the control of the lender and disbursed during each interest period during the term of the loan in accordance with the loan documents. To the extent that (i) there is an event of default under the loan documents, (ii) the debt service coverage ratio (including the mezzanine loan) as calculated in the loan documents based on a trailing three-month period falls below 1.05x for the period beginning on December 1, 2014 and ending on November 30, 2015 and 1.10x at any time thereafter or (iii) the borrower or property manager becomes the subject of a bankruptcy, insolvency or similar action, then all excess cash flow after payment of debt service, required reserves and operating expenses will be held as additional collateral for the loan.
Release of Individual Properties. None.
Additional Mezzanine Debt. A mezzanine loan of $7.0 million secured by the equity interests in the borrower was provided by JPMCB. The mezzanine loan has a coterminous maturity with the mortgage loan. The mezzanine loan makes interest only payments throughout the term of the loan and has a 10.10000% coupon. Including the mezzanine loan, the Cut-off Date LTV is 83.1%, the UW NCF DSCR is 1.11x (calculated based on amortizing debt service payments for the Mortgage Loan) and the UW NOI Debt Yield is 8.2%. The mortgage and mezzanine lenders have entered into an intercreditor agreement.
THE INFORMATION IN THIS STRUCTURAL AND COLLATERAL TERM SHEET IS NOT COMPLETE AND MAY BE AMENDED PRIOR TO THE TIME OF SALE. THIS TERM SHEET IS NOT AN OFFER TO SELL THESE SECURITIES AND IT IS NOT A SOLICITATION OF AN OFFER TO BUY THESE SECURITIES IN ANY JURISDICTION WHERE THE OFFER OR SALE IS NOT PERMITTED.
| | |
| 59 of 133 |
| Structural and Collateral Term Sheet | JPMBB 2014-C26 |
[THIS PAGE INTENTIONALLY LEFT BLANK]
THE INFORMATION IN THIS STRUCTURAL AND COLLATERAL TERM SHEET IS NOT COMPLETE AND MAY BE AMENDED PRIOR TO THE TIME OF SALE. THIS TERM SHEET IS NOT AN OFFER TO SELL THESE SECURITIES AND IT IS NOT A SOLICITATION OF AN OFFER TO BUY THESE SECURITIES IN ANY JURISDICTION WHERE THE OFFER OR SALE IS NOT PERMITTED.
| | |
| 60 of 133 |
| Structural and Collateral Term Sheet | JPMBB 2014-C26 | |
| Shaner Hotels Limited Service Portfolio | ||
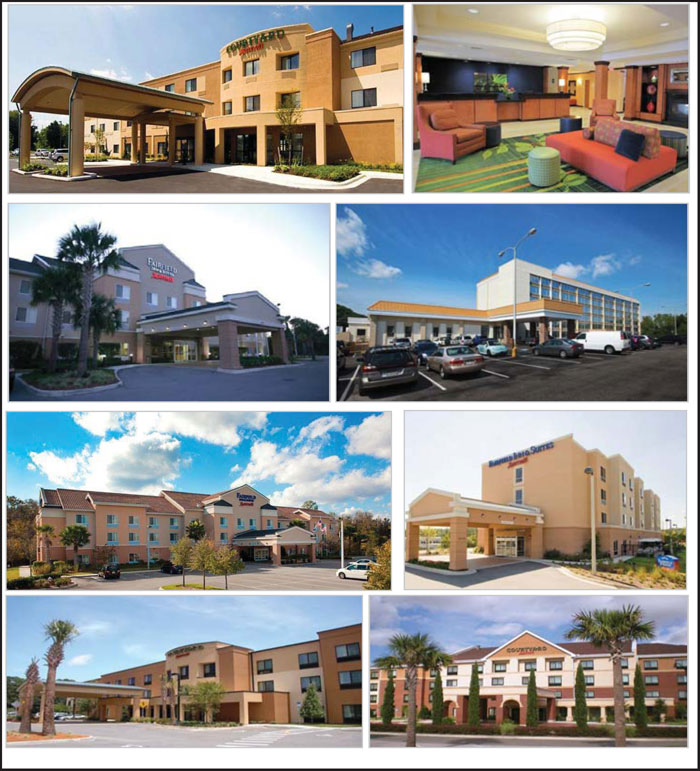
THE INFORMATION IN THIS STRUCTURAL AND COLLATERAL TERM SHEET IS NOT COMPLETE AND MAY BE AMENDED PRIOR TO THE TIME OF SALE. THIS TERM SHEET IS NOT AN OFFER TO SELL THESE SECURITIES AND IT IS NOT A SOLICITATION OF AN OFFER TO BUY THESE SECURITIES IN ANY JURISDICTION WHERE THE OFFER OR SALE IS NOT PERMITTED.
| | |
| 61 of 133 |
| Structural and Collateral Term Sheet | JPMBB 2014-C26 | |
| Shaner Hotels Limited Service Portfolio | ||
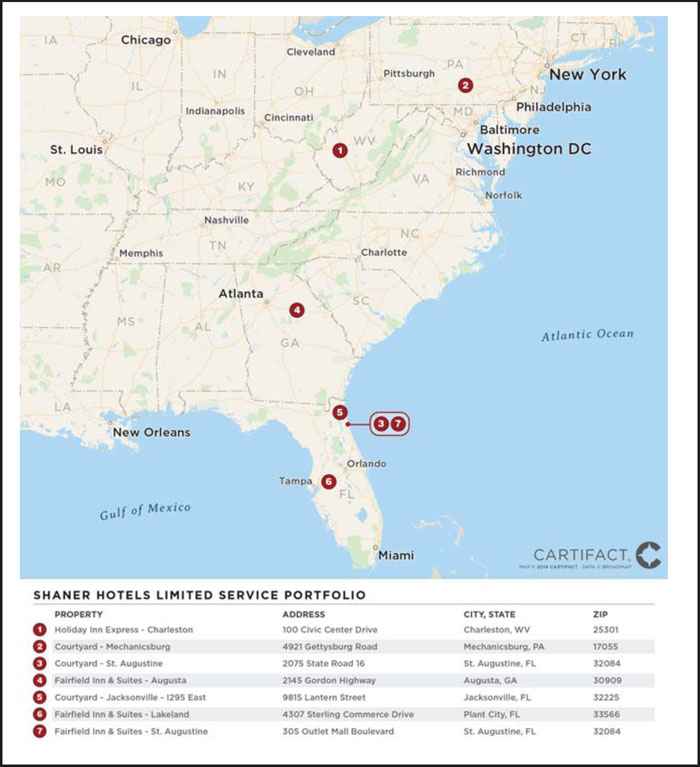
THE INFORMATION IN THIS STRUCTURAL AND COLLATERAL TERM SHEET IS NOT COMPLETE AND MAY BE AMENDED PRIOR TO THE TIME OF SALE. THIS TERM SHEET IS NOT AN OFFER TO SELL THESE SECURITIES AND IT IS NOT A SOLICITATION OF AN OFFER TO BUY THESE SECURITIES IN ANY JURISDICTION WHERE THE OFFER OR SALE IS NOT PERMITTED.
| | |
| 62 of 133 |
| Structural and Collateral Term Sheet | JPMBB 2014-C26 | |
| Shaner Hotels Limited Service Portfolio | ||
| Mortgage Loan Information | Property Information | |||
| Mortgage Loan Seller: | JPMCB | Single Asset / Portfolio: | Portfolio | |
| Original Principal Balance: | $49,750,000 | Title: | Fee / Leasehold | |
| Cut-off Date Principal Balance: | $49,750,000 | Property Type - Subtype: | Hotel - Limited Service | |
| % of Pool by IPB: | 3.4% | Net Rentable Area (Rooms): | 732 | |
| Loan Purpose: | Refinance | Location: | Various | |
Borrowers(1): | Various | Year Built / Renovated: | Various / Various | |
| Sponsor: | Lance T. Shaner | Occupancy / ADR / RevPAR: | 73.4% / $96.93 / $71.11 | |
| Interest Rate: | 4.52700% | Occupancy / ADR / RevPAR Date: | 8/31/2014 | |
| Note Date: | 10/31/2014 | Number of Tenants: | N/A | |
| Maturity Date: | 11/1/2024 | 2011 NOI: | $3,168,150 | |
| Interest-only Period: | 24 months | 2012 NOI: | $4,116,135 | |
| Original Term: | 120 months | 2013 NOI: | $4,673,646 | |
| Original Amortization: | 360 months | TTM NOI (as of 8/2014): | $5,342,856 | |
| Amortization Type: | IO-Balloon | UW Occupancy / ADR / RevPAR: | 73.4% / $96.93 / $71.11 | |
| Call Protection: | L(25),Def(91),O(4) | UW Revenues: | $20,021,078 | |
| Lockbox: | Hard | UW Expenses: | $14,708,924 | |
| Additional Debt: | Yes | UW NOI: | $5,312,154 | |
| Additional Debt Balance: | $8,050,000 | UW NCF: | $5,312,154 | |
| Additional Debt Type: | Mezzanine Loan | Appraised Value / Per Room: | $72,250,000 / $98,702 | |
| Appraisal Date: | 9/1/2014 | |||
Escrows and Reserves(2) | Financial Information | |||||
| Initial | Monthly | Initial Cap | Cut-off Date Loan / Room: | $67,964 | ||
| Taxes: | $313,522 | $47,334 | N/A | Maturity Date Loan / Room: | $58,084 | |
| Insurance: | $127,795 | $21,303 | N/A | Cut-off Date LTV: | 68.9% | |
| FF&E Reserves: | $0 | 4% of Gross Revenues | N/A | Maturity Date LTV: | 58.8% | |
| TI/LC: | $0 | $0 | N/A | UW NCF DSCR: | 1.75x | |
| Other: | $358,224 | $210,732 | N/A | UW NOI Debt Yield: | 10.7% | |
| Sources and Uses | ||||||||||
| Sources | Proceeds | % of Total | Uses | Proceeds | % of Total | |||||
Mortgage Loan | $49,750,000 | 86.1% | Payoff Existing Debt | $42,367,985 | 73.3 | % | ||||
Mezzanine Loan | 8,050,000 | 13.9 | Return of Equity | 13,369,180 | 23.1 | |||||
Closing Costs | 1,263,294 | 2.2 | ||||||||
| Upfront Reserves | 799,541 | 1.4 | ||||||||
| Total Sources | $57,800,000 | 100.0% | Total Uses | $57,800,000 | 100.0 | % | ||||
| (1) | For a full description of the borrowers, please refer to “The Borrowers” below. |
| (2) | For a full description of Escrows and Reserves, please refer to “Escrows and Reserves” below. |
The Loan. The Shaner Hotels Limited Service Portfolio loan has an outstanding principal balance of $49.75 million and is secured by a first mortgage lien on the fee or leasehold interests in seven limited service hotels totaling 732 rooms located in Florida, West Virginia, Pennsylvania and Georgia. The loan has a 10-year term, and subsequent to a two-year interest-only period, will amortize on a 30-year schedule.
The Borrowers. The borrowing entities for the loan are Shaner Select Services Hotels II, LLC, Shaner Select Services Hotels III, LLC, Shaner Select Services Hotels IV, LLC, Shaner Select Services Hotels V, LLC, Shaner Select Services Hotels VI, LLC, Shaner Augusta 141 LLC and Shaner Charleston LLC, each a Delaware limited liability company and a special purpose entity.
THE INFORMATION IN THIS STRUCTURAL AND COLLATERAL TERM SHEET IS NOT COMPLETE AND MAY BE AMENDED PRIOR TO THE TIME OF SALE. THIS TERM SHEET IS NOT AN OFFER TO SELL THESE SECURITIES AND IT IS NOT A SOLICITATION OF AN OFFER TO BUY THESE SECURITIES IN ANY JURISDICTION WHERE THE OFFER OR SALE IS NOT PERMITTED.
| | |
| 63 of 133 |
| Structural and Collateral Term Sheet | JPMBB 2014-C26 | |
| Shaner Hotels Limited Service Portfolio | ||
The Sponsor. The loan sponsor and nonrecourse carve-out guarantor is Lance T. Shaner, chairman and CEO of Shaner Hotel Group (“Shaner”). Shaner, a leading owner-operator in the hospitality industry, owns or manages 40 hotel properties in 17 states and two countries with gross revenues in excess of $150.0 million. Shaner’s hotels comprise 16 different brands, and Shaner employs approximately 2,700 people.
The Portfolio. The collateral consists of seven limited service hotels totaling 732 rooms located in Florida, West Virginia, Pennsylvania and Georgia. The portfolio is comprised of three Courtyards (286 rooms, 45.9% of UW NCF), three Fairfield Inn & Suites (251 rooms, 37.7% of UW NCF) and one Holiday Inn Express (195 rooms, 16.4% of UW NCF).
| Portfolio Summary | ||||||||||||||||
| Property | Location | Rooms | Year Built / Renovated | Cut-off Date Allocated Loan Amount | % of Allocated Loan Amount | Appraised Value | Underwritten Net Cash Flow | % of Underwritten Net Cash Flow | ||||||||
| Holiday Inn Express - Charleston | Charleston, WV | 195 | 1978 / 2013 | $9,640,000 | 19.4% | $14,000,000 | $869,912 | 16.4% | ||||||||
| Courtyard - Mechanicsburg | Mechanicsburg, PA | 91 | 2007 / NA | 8,950,000 | 18.0 | 13,000,000 | 942,585 | 17.7 | ||||||||
| Courtyard - St. Augustine | St. Augustine, FL | 98 | 2009 / NA | 7,400,000 | 14.9 | 10,750,000 | 901,029 | 17.0 | ||||||||
| Fairfield Inn & Suites - Augusta | Augusta, GA | 82 | 2009 / NA | 7,230,000 | 14.5 | 10,500,000 | 834,651 | 15.7 | ||||||||
| Courtyard - Jacksonville - I295 East | Jacksonville, FL | 97 | 2009 / NA | 6,370,000 | 12.8 | 9,250,000 | 595,718 | 11.2 | ||||||||
| Fairfield Inn & Suites - Lakeland | Plant City, FL | 87 | 2008 / NA | 5,510,000 | 11.1 | 8,000,000 | 599,388 | 11.3 | ||||||||
| Fairfield Inn & Suites - St. Augustine | St. Augustine, FL | 82 | 2009 / NA | 4,650,000 | 9.3 | 6,750,000 | 568,871 | 10.7 | ||||||||
| Total | 732 | $49,750,000 | 100.0% | $72,250,000 | $5,312,154 | 100.0% | ||||||||||
| Geographic Summary | ||||||||||||||||
| State | # of Properties | Cut-off Date Allocated Loan Amount | % of Allocated Loan Amount | # of Rooms | % of Rooms | Appraised Value | % of Appraised Value | Underwritten Net Cash Flow | % of Underwritten Net Cash Flow | |||||||
| Florida | 4 | $23,930,000 | 48.1% | 364 | 49.7% | $34,750,000 | 48.1% | $2,665,006 | 50.2% | |||||||
| West Virginia | 1 | 9,640,000 | 19.4 | 195 | 26.6 | 14,000,000 | 19.4 | 869,912 | 16.4 | |||||||
| Pennsylvania | 1 | 8,950,000 | 18.0 | 91 | 12.4 | 13,000,000 | 18.0 | 942,585 | 17.7 | |||||||
| Georgia | 1 | 7,230,000 | 14.5 | 82 | 11.2 | 10,500,000 | 14.5 | 834,651 | 15.7 | |||||||
| Total | 7 | $49,750,000 | 100.0% | 732 | 100.0% | $72,250,000 | 100.0% | $5,312,154 | 100.0% | |||||||
| Brand Summary | ||||||||||||||||
| Flag | # of Properties | Cut-off Date Allocated Loan Amount | % of Allocated Loan Amount | # of Rooms | % of Rooms | Appraised Value | % of Appraised Value | Underwritten Net Cash Flow | % of Underwritten Net Cash Flow | |||||||
| Courtyard | 3 | $22,720,000 | 45.7% | 286 | 39.1% | $33,000,000 | 45.7% | $2,439,332 | 45.9% | |||||||
| Fairfield Inn & Suites | 3 | 17,390,000 | 35.0 | 251 | 34.3 | 25,250,000 | 34.9 | 2,002,910 | 37.7 | |||||||
| Holiday Inn Express | 1 | 9,640,000 | 19.4 | 195 | 26.6 | 14,000,000 | 19.4 | 869,912 | 16.4 | |||||||
| Total | 7 | $49,750,000 | 100.0% | 732 | 100.0% | $72,250,000 | 100.0% | $5,312,154 | 100.0% | |||||||
THE INFORMATION IN THIS STRUCTURAL AND COLLATERAL TERM SHEET IS NOT COMPLETE AND MAY BE AMENDED PRIOR TO THE TIME OF SALE. THIS TERM SHEET IS NOT AN OFFER TO SELL THESE SECURITIES AND IT IS NOT A SOLICITATION OF AN OFFER TO BUY THESE SECURITIES IN ANY JURISDICTION WHERE THE OFFER OR SALE IS NOT PERMITTED.
| | |
| 64 of 133 |
| Structural and Collateral Term Sheet | JPMBB 2014-C26 | |
| Shaner Hotels Limited Service Portfolio | ||
Historical Occupancy, ADR and RevPAR(1) | ||||||||||||||
| Occupancy | ADR | RevPAR | ||||||||||||
| Property | 2011 | 2012 | 2013 | TTM(2) | 2011 | 2012 | 2013 | TTM(2) | 2011 | 2012 | 2013 | TTM(2) | ||
Holiday Inn Express – Charleston(3) | 69.4% | 69.1% | 69.3% | 68.6% | $82.34 | $85.82 | $85.64 | $86.82 | $57.13 | $59.32 | $59.33 | $59.53 | ||
| Courtyard - Mechanicsburg | 74.5% | 76.4% | 75.0% | 75.8% | $109.85 | $110.15 | $114.72 | $115.32 | $81.84 | $84.19 | $86.00 | $87.47 | ||
| Courtyard - St. Augustine | 63.8% | 71.0% | 73.8% | 76.5% | $87.28 | $92.27 | $95.10 | $99.56 | $55.65 | $65.55 | $70.17 | $76.17 | ||
Fairfield Inn & Suites – Augusta(4) | 75.8% | 74.1% | 70.5% | 72.3% | $95.55 | $100.14 | $107.29 | $108.78 | $72.39 | $74.24 | $75.59 | $78.64 | ||
| Courtyard - Jacksonville - I295 East | 66.6% | 78.8% | 72.9% | 74.0% | $85.07 | $79.96 | $82.17 | $90.33 | $56.62 | $63.00 | $59.86 | $66.82 | ||
| Fairfield Inn & Suites - Lakeland | 63.2% | 66.5% | 69.5% | 72.1% | $82.63 | $90.91 | $91.67 | $96.70 | $52.23 | $60.46 | $63.75 | $69.68 | ||
| Fairfield Inn & Suites - St. Augustine | 65.0% | 70.8% | 77.2% | 80.0% | $78.21 | $82.26 | $87.21 | $91.94 | $50.85 | $58.22 | $67.35 | $73.55 | ||
Weighted Average(5) | 68.4% | 72.0% | 72.1% | 73.4% | $88.27 | $90.85 | $93.48 | $96.93 | $60.36 | $65.42 | $67.41 | $71.11 | ||
| (1) | Based on operating statements provided by the borrowers. |
| (2) | TTM as of August 31, 2014. |
| (3) | In the TTM period, the Holiday Inn Express - Charleston’s competitive set was adjusted to include a 94 room Wingate By Wyndham Charleston and a 64 room Country Inn & Suites Charleston South and the removal of the 225 room Ramada Charleston Downtown. |
| (4) | Beginning in December 2013, the Fairfield Inn & Suites - Augustas’s competitive set was expanded to include a newly constructed 88 room Hampton Inn Augusta Gordon Highway. |
| (5) | Weighted by room count. |
Historical Occupancy, ADR and RevPAR Penetration Rates(1) | |||||||||||||||||||||||
| Occupancy | ADR | RevPAR | |||||||||||||||||||||
| Property | 2010 | 2011 | 2012 | 2013 | TTM(2) | 2010 | 2011 | 2012 | 2013 | TTM(2) | 2010 | 2011 | 2012 | 2013 | TTM(2) | ||||||||
| Holiday Inn Express - Charleston | 117.2% | 135.7% | 114.1% | 131.5% | 107.6% | 100.0% | 97.4% | 97.4% | 89.2% | 88.0% | 117.2% | 132.2% | 111.1% | 117.3% | 94.6% | ||||||||
| Courtyard - Mechanicsburg | 117.7% | 119.4% | 120.1% | 120.4% | 118.4% | 114.0% | 118.1% | 116.8% | 117.7% | 118.5% | 134.3% | 141.0% | 140.3% | 141.8% | 140.4% | ||||||||
| Courtyard - St. Augustine | 103.5% | 112.3% | 119.9% | 116.6% | 120.5% | 102.8% | 105.4% | 104.7% | 101.6% | 100.1% | 106.4% | 118.3% | 125.5% | 118.4% | 120.6% | ||||||||
| Fairfield Inn & Suites - Augusta | 118.5% | 118.4% | 116.8% | 115.7% | 107.7% | 112.0% | 118.3% | 121.9% | 128.8% | 125.2% | 132.7% | 140.1% | 142.3% | 149.0% | 134.8% | ||||||||
| Courtyard - Jacksonville - I295 East | 112.0% | 117.7% | 126.6% | 114.7% | 114.8% | 124.0% | 121.7% | 112.0% | 114.1% | 110.5% | 138.9% | 143.2% | 141.8% | 130.9% | 126.9% | ||||||||
| Fairfield Inn & Suites - Lakeland | 112.2% | 114.4% | 117.2% | 114.3% | 116.4% | 92.1% | 95.0% | 99.9% | 96.5% | 93.5% | 103.4% | 108.8% | 117.1% | 110.3% | 108.9% | ||||||||
| Fairfield Inn & Suites - St. Augustine | 93.0% | 107.5% | 110.1% | 111.5% | 115.6% | 104.5% | 104.5% | 103.4% | 103.6% | 101.8% | 97.1% | 112.4% | 113.9% | 115.4% | 117.7% | ||||||||
Weighted Average(3) | 111.6% | 120.5% | 117.5% | 119.9% | 113.6% | 106.2% | 107.1% | 106.4% | 104.6% | 102.8% | 118.6% | 128.8% | 125.2% | 124.8% | 116.8% | ||||||||
| (1) | 2010, 2011 and 2012 Penetration Factors are per the 2012 STR report. 2013 and TTM Penetration Factors are per the 2013 and TTM August 2014 STR reports, respectively. |
| (2) | TTM is as of August 31, 2014. |
| (3) | Weighted by room count. |
Holiday Inn Express - Charleston (Charleston, WV). The Holiday Inn Express - Charleston is a six-story, limited service hotel situated on a 2.08 acre site on Civic Centre Drive, off of Route 60 and Interstate 64 in Charleston, West Virginia. The property, which was constructed as a Sheraton, was built in 1978 and is comprised of 195 guest rooms of various layouts. The Holiday Inn Express - Charleston features a business center, fitness center, breakfast room and approximately 2,383 square feet of meeting space. Between 2011 and 2013, the loan sponsor invested approximately $3.7 million (approximately $18,813 per room) in capital expenditures. The property is located in Charleston, the capital of West Virginia and the state’s primary business center. The city of Charleston had an average household income of $47,582 and an estimated total population of 50,821 residents as of 2013 according to the U.S. Census. According to the appraisal, in 2013 the property generated approximately 60% of its room nights from commercial business, 22% from leisure business and 18% from meeting and group business. The primary competitive set for the property consists of six hotels, which range in size from 84 to 176 rooms. Per the appraisal, there is one new hotel project under construction in the Charleston market at this time: a 110-room Courtyard by Marriott which is scheduled to open in the fourth quarter of 2014 and is located approximately 0.2 miles from the subject property.
Courtyard - Mechanicsburg (Mechanicsburg, PA). The Courtyard - Mechanicsburg is a three-story, limited service hotel situated on a 6.29 acre site, on Gettysburg Road in Mechanicsburg, Pennsylvania. The property was built in 2007 and is comprised of 91 guest rooms of various layouts. The Courtyard - Mechanicsburg features an indoor pool, a business center, fitness center, café and 635 square feet of meeting space. The property is located in Mechanicsburg, home to a number of major corporations including Rite Aid, Acosta and Ahold USA, among others. Mechanicsburg is approximately eight miles southwest of the state capitol of Harrisburg and 20 miles from Hershey, home of Hershey Chocolate and Hershey Park. The Harrisburg-Carlisle metropolitan statistical area had a median household income of approximately $55,300 and an estimated total population of approximately 557,700 residents as of 2013 according to a report by Moody’s Analytics. According to the appraisal, in 2013 the property generated approximately 60% of its room nights from commercial business, 25% from meeting and group business and 15% from leisure business. The primary competitive set
THE INFORMATION IN THIS STRUCTURAL AND COLLATERAL TERM SHEET IS NOT COMPLETE AND MAY BE AMENDED PRIOR TO THE TIME OF SALE. THIS TERM SHEET IS NOT AN OFFER TO SELL THESE SECURITIES AND IT IS NOT A SOLICITATION OF AN OFFER TO BUY THESE SECURITIES IN ANY JURISDICTION WHERE THE OFFER OR SALE IS NOT PERMITTED.
| | |
| 65 of 133 |
| Structural and Collateral Term Sheet | JPMBB 2014-C26 | |
| Shaner Hotels Limited Service Portfolio | ||
for the property consists of seven hotels, which range in size from 64 to 219 rooms. Per the appraisal, there is one new hotel project currently under construction in the Mechanicsburg market: a 120-room Towneplace Suites by Marriott which is scheduled to open in the fourth quarter of 2014 and is located approximately 0.9 miles from the subject property. Approximately $1.6 million is expected to be spent in conjunction with the hotel’s property improvement plan over the next two years.
Courtyard - St. Augustine (St. Augustine, FL). The Courtyard - St. Augustine is a three-story, limited service hotel situated on a 2.75 acre site in the historic city of St. Augustine, Florida and near the World Golf Village. The property was built in 2009 and is comprised of 98 guest rooms of various layouts. The Courtyard - St. Augustine features an outdoor pool, bistro, business center, fitness center, lounge and approximately 638 square feet of meeting space. St. Augustine is the oldest continuously occupied European settlement in the United States, featuring an array of historical monuments and sites, as well as access to a number of popular beaches. The hotel is also located near the World Golf Village, a golf resort created by the PGA Tour which showcases the World Golf Hall of Fame and features two championship golf courses. The Courtyard - St. Augustine is located in the Jacksonville metropolitan statistical area, which had a per capita income of $42,356 and an estimated total population of approximately 1.4 million residents as of 2013 according to a report by Moody’s Analytics. According to the appraisal, in 2013 the property generated approximately 45% of its room nights from leisure business, 43% from commercial business and 12% from meeting and group business. The primary competitive set for the property consists of seven hotels, which range in size from 54 to 162 rooms. Per the appraisal, there are two new hotel projects under construction in the St. Augustine market at this time: a 95-room DoubleTree by Hilton which is scheduled to open in December 2014 and a 200-room Courtyard by Marriott expected to open in October 2015.
Fairfield Inn & Suites - Augusta (Augusta, GA). The Fairfield Inn & Suites - Augusta is a four-story, limited service hotel situated on a 2.12 acre site near Fort Gordon, a U.S. Army military base which is home to the U.S. Army Signal Corps and Signal Center, in Augusta, Georgia. The property was built in 2009 and is comprised of 82 guest rooms of various layouts. The Fairfield Inn & Suites - Augusta features an indoor pool, a fitness center and breakfast area. Since 2009, the loan sponsor has invested $87,344 (approximately $1,065 per room) in capital expenditures. Approximately $25,910 in capital expenditures was budgeted for 2014. The property is located in Augusta, the third largest city in the state of Georgia and an important hub for the medical, biotechnology, military and nuclear power industries. Augusta is also home to Augusta National Golf Club, the annual host to the Masters Tournament. The Augusta-Richmond County metropolitan statistical area had a median household income of approximately $45,000 and an estimated total population of approximately 572,500 residents as of 2013 according to a report by Moody’s Analytics. According to the appraisal, in 2013 the property generated approximately 60% of its room nights from commercial business, 20% from meeting and group business and 20% from leisure business. The primary competitive set for the property consists of five hotels, which range in size from 61 to 150 rooms. Per the appraisal, there is one new hotel project under construction in the Augusta market at this time: a 124-room Residence Inn which is scheduled to open in March 2015. A 90-room SpringHill Suites is also under consideration, although no construction schedule has yet been set.
Courtyard - Jacksonville - I295 East (Jacksonville, FL). The Courtyard - Jacksonville - I295 East is a four-story, limited service hotel situated on a 2.50 acre site between downtown Jacksonville and the Naval Station Mayport. The property was built in 2009 and is comprised of 97 guest rooms of various layouts. The Courtyard - Jacksonville - I295 East features an outdoor pool, bistro, business center, fitness center, lounge and approximately 700 square feet of meeting space. Jacksonville is Florida’s most populous city and an important financial and insurance center, as well as home to two naval bases, several hospitals and medical facilities and the NFL’s Jacksonville Jaguars. Jacksonville is also a popular tourist destination due to its proximity to a number of beaches and golf courses. The Jacksonville metropolitan statistical area had a per capita income of $42,356 and an estimated total population of approximately 1.4 million residents as of 2013 according to a report by Moody’s Analytics. According to the appraisal, in 2013 the property generated approximately 50% of its room nights from commercial business, 35% from leisure business and 15% from meeting and group business. The primary competitive set for the property consists of four hotels, which range in size from 73 to 112 rooms. Per the appraisal, there are no new hotel projects currently under construction in the Jacksonville market.
Fairfield Inn & Suites - Lakeland (Plant City, FL). The Fairfield Inn & Suites - Lakeland is a three-story, limited service hotel situated on a 2.65 acre site in Plant City, Florida. The property was built in 2008 and is comprised of 87 guest rooms of various layouts. The Fairfield Inn & Suites - Lakeland features an outdoor pool, a fitness center, business center and breakfast area. The property is located in Plant City, within the Tampa metropolitan statistical area and approximately 22 miles east of the Tampa central business district. Local attractions include LEGOLAND, alligator nature tours, Lakeland Center (home to the Lakeland Raiders of the Xtreme Indoor Football League) and Sun ‘N Fun, a non-profit promoting aviation education and known for its annual weeklong airshow. The Tampa metropolitan statistical area had per capita income of $41,412 and an estimated total population of approximately 2.8 million residents as of 2013 according to a report by Moody’s Analytics. According to the appraisal, in 2013 the property generated approximately 55% of its room nights from commercial business, 25% from leisure business and 20% from meeting and group business. The primary competitive set for the property consists of five hotels, which range in size from 60 to 119 rooms. Per the appraisal, there are no new hotel projects currently under construction in the property’s submarket. Minor upgrades totaling approximately $200,000 (approximately $2,299 per room) are expected to be completed within the next year.
THE INFORMATION IN THIS STRUCTURAL AND COLLATERAL TERM SHEET IS NOT COMPLETE AND MAY BE AMENDED PRIOR TO THE TIME OF SALE. THIS TERM SHEET IS NOT AN OFFER TO SELL THESE SECURITIES AND IT IS NOT A SOLICITATION OF AN OFFER TO BUY THESE SECURITIES IN ANY JURISDICTION WHERE THE OFFER OR SALE IS NOT PERMITTED.
| | |
| 66 of 133 |
| Structural and Collateral Term Sheet | JPMBB 2014-C26 | |
| Shaner Hotels Limited Service Portfolio | ||
Fairfield Inn & Suites - St. Augustine (St. Augustine, FL). The Fairfield Inn & Suites - St. Augustine is a three-story, limited service hotel situated on a 2.57 acre site in the historic city of St. Augustine, Florida and near the World Golf Village. The property was built in 2009 and is comprised of 82 guest rooms of various layouts. The Fairfield Inn & Suites - St. Augustine features an outdoor pool, a fitness center, business center and breakfast area. St. Augustine is the oldest continuously occupied European settlement in the United States, featuring an array of historical monuments and sites, as well as access to a number of popular beaches. The hotel is also located near the World Golf Village, a golf resort created by the PGA Tour which showcases the World Golf Hall of Fame and features two championship golf courses. The Fairfield Inn & Suites - St. Augustine is located in the Jacksonville metropolitan statistical area, which had a per capita income of $42,356 and an estimated total population of approximately 1.4 million residents as of 2013 according to a report by Moody’s Analytics. According to the appraisal, in 2013 the property generated approximately 45% of its room nights from leisure business, 35% from meeting and group business and 20% from commercial business. The primary competitive set for the property consists of seven hotels, which range in size from 48 to 108 rooms. Per the appraisal, there are two new hotel projects under construction in the St. Augustine market at this time: a 95-room DoubleTree by Hilton which is scheduled to open in December 2014 and a 200-room Courtyard by Marriott expected to open in October 2015.
Operating History and Underwritten Net Cash Flow | |||||||
| 2011 | 2012 | 2013 | TTM(1) | Underwritten | Per Room(2) | % of Total Revenue(3) | |
| Occupancy | 68.4% | 72.0% | 72.1% | 73.4% | 73.4% | ||
| ADR | $88.27 | $90.85 | $93.48 | $96.93 | $96.93 | ||
| RevPAR | $60.36 | $65.42 | $67.41 | $71.11 | $71.11 | ||
| Room Revenue | $16,127,001 | 17,525,957 | $18,011,014 | $18,999,996 | $18,999,996 | $25,956 | 94.9% |
| Other Department Revenues | 698,552 | 930,219 | 962,817 | 1,021,082 | 1,021,082 | 1,395 | 5.1 |
| Total Revenue | $16,825,553 | $18,456,176 | $18,973,831 | $20,021,078 | $20,021,078 | $27,351 | 100.0% |
| Room Expense | $4,941,269 | $5,143,913 | $5,104,454 | $5,256,127 | $5,256,127 | $7,181 | 27.7% |
| Other Departmental Expenses | 743,120 | 818,191 | 807,254 | 849,592 | 849,592 | 1,161 | 83.2 |
| Departmental Expenses | $5,684,389 | $5,962,104 | $5,911,708 | $6,105,719 | $6,105,719 | $8,341 | 30.5% |
| Departmental Profit | $11,141,164 | $12,494,072 | $13,062,123 | $13,915,359 | $13,915,359 | $19,010 | 69.5% |
| Operating Expenses | $4,561,369 | $4,590,461 | $4,586,941 | $4,649,020 | $4,649,020 | $6,351 | 23.2% |
| Gross Operating Profit | $6,579,795 | $7,903,611 | $8,475,182 | $9,266,339 | $9,266,339 | $12,659 | 46.3% |
Management Fees(4) | $504,767 | $553,685 | $569,215 | $600,632 | $600,632 | $821 | 3.0% |
| Franchise Fees | 1,267,731 | 1,449,379 | 1,506,604 | 1,537,743 | 1,537,743 | 2,101 | 7.7 |
| Property Taxes | 502,330 | 583,365 | 514,670 | 529,640 | 558,235 | 763 | 2.8 |
| Property Insurance | 292,795 | 291,800 | 279,612 | 287,134 | 284,250 | 388 | 1.4 |
| Ground Lease | 171,000 | 171,000 | 172,482 | 167,491 | 172,482 | 236 | 0.9 |
FF&E(5) | 673,022 | 738,247 | 758,953 | 800,843 | 800,843 | 1,094 | 4.0 |
| Total Other Expenses | $3,411,645 | $3,787,476 | $3,801,536 | $3,923,483 | $3,954,185 | $5,402 | 19.8% |
| Net Operating Income | $3,168,150 | $4,116,135 | $4,673,646 | $5,342,856 | $5,312,154 | $7,257 | 26.5% |
| Net Cash Flow | $3,168,150 | $4,116,135 | $4,673,646 | $5,342,856 | $5,312,154 | $7,257 | 26.5% |
| (1) | The TTM column represents the trailing twelve-month period ending on August 31, 2014. |
| (2) | Per Room values are based on 732 guest rooms. |
| (3) | % of Total Revenue column for Room Expense and Other Departmental Expenses is based on their corresponding revenue line item. |
| (4) | Historical Management Fees were adjusted to 3.0% of Total Revenue. |
| (5) | Historical FF&E was adjusted to 4.0% of Total Revenue. |
THE INFORMATION IN THIS STRUCTURAL AND COLLATERAL TERM SHEET IS NOT COMPLETE AND MAY BE AMENDED PRIOR TO THE TIME OF SALE. THIS TERM SHEET IS NOT AN OFFER TO SELL THESE SECURITIES AND IT IS NOT A SOLICITATION OF AN OFFER TO BUY THESE SECURITIES IN ANY JURISDICTION WHERE THE OFFER OR SALE IS NOT PERMITTED.
| | |
| 67 of 133 |
| Structural and Collateral Term Sheet | JPMBB 2014-C26 | |
| Shaner Hotels Limited Service Portfolio | ||
Property Management. The portfolio is managed by Shaner Hotel Holdings Limited Partnership, an affiliate of the loan sponsor.
Franchise Agreements. Shaner has franchise agreements with Marriott International, Inc. for six of the seven properties in the portfolio and with Holiday Hospitality Franchising, Inc. for the Holiday Inn Express - Charleston property.
Marriott Properties. Courtyard - Mechanicsburg, Courtyard - St. Augustine, Fairfield Inn & Suites - Augusta, Courtyard - Jacksonville - I295 East, Fairfield Inn & Suites - Lakeland and Fairfield Inn & Suites - St. Augustine each have franchise agreements in place with Marriott International, Inc. Courtyard - Mechanicsburg pays a franchise fee of 5.0% of gross room sales and a marketing fee of 2.0% of gross room sales. Courtyard - St. Augustine and Courtyard - Jacksonville - I295 East each pay a franchise fee of 5.5% of gross room sales and a marketing fee of 2.0% of gross room sales. Fairfield Inn & Suites - Augusta, Fairfield Inn & Suites - Lakeland and Fairfield Inn & Suites - St. Augustine each pay a franchise fee of 4.5% of gross room sales and a marketing fee of 2.5% of gross room sales.
Holiday Inn Property. The Holiday Inn Express - Charleston pays a franchise fee of 6.0% of gross room sales and a services contribution fee of 3.0% of gross room sales. Additionally, the hotel is subject to a monthly technology fee of $11.91 per room, subject to periodic increases.
| Franchise Agreement Summary | |||
| Property | Flag | Franchise Fee (% of gross room revenue)(1) | Expiration Date |
| Holiday Inn Express - Charleston | Holiday Hospitality Franchising, Inc. | 9.0% | March 2020 |
| Courtyard - Mechanicsburg | Marriott International, Inc. | 7.0% | October 2026 |
| Courtyard - St. Augustine | Marriott International, Inc. | 7.5% | April 2028 |
| Fairfield Inn & Suites - Augusta | Marriott International, Inc. | 7.0% | January 2028 |
| Courtyard - Jacksonville - I295 East | Marriott International, Inc. | 7.5% | April 2029 |
| Fairfield Inn & Suites - Lakeland | Marriott International, Inc. | 7.0% | January 2028 |
| Fairfield Inn & Suites - St. Augustine | Marriott International, Inc. | 7.0% | December 2028 |
| (1) | Includes marketing fees due under the franchise agreements. |
Ground Lease. The Holiday Inn Express - Charleston property is subject to two ground leases which commenced in 1973 and expire on August 31, 2023. The ground lease on the hotel has five additional 10-year extensions remaining and the ground lease on the parking lot has two additional five-year extensions remaining. The current total ground rent payment for the hotel ground lease consists of base rent of $60,000 per year, plus additional rent equal to 5% of gross room sales in excess of $2.2 million, subject to a cap of $3.2 million (which increases by $200,000 for each additional renewal period). The current total ground rent payment for the parking ground lease is $71,000 annually, which is adjusted during each renewal period in accordance with the Consumer Price Index (with a minimum rent of $84,000 for each renewal period).
Escrows and Reserves. At origination, the borrowers were required to deposit into escrow $313,522 for real estate taxes, $275,000 for a PIP reserve, $127,795 for insurance premiums, $82,399 for a ground rent reserve and $825 for deferred maintenance.
Tax Escrows - The borrowers are required to escrow 1/12 of the annual estimated tax payments monthly, which currently equates to $47,334.
Insurance Escrows - The borrowers are required to escrow 1/12 of the annual estimated insurance premiums monthly, which currently equates to $21,303.
FF&E Reserve - On a monthly basis, the borrowers are required to deposit 1/12 of an amount equal to 4.0% of gross revenues from the hotel for the calendar month two months prior to such payment date for FF&E.
PIP Reserve - On the payment date occurring in December 2014 and on each payment date through and including the payment date in May 2015, the borrowers are required to escrow $195,000 for certain PIP expenses.
Ground Lease Reserve - On a monthly basis, the borrowers are required to escrow $15,732 for ground rent.
THE INFORMATION IN THIS STRUCTURAL AND COLLATERAL TERM SHEET IS NOT COMPLETE AND MAY BE AMENDED PRIOR TO THE TIME OF SALE. THIS TERM SHEET IS NOT AN OFFER TO SELL THESE SECURITIES AND IT IS NOT A SOLICITATION OF AN OFFER TO BUY THESE SECURITIES IN ANY JURISDICTION WHERE THE OFFER OR SALE IS NOT PERMITTED.
| | |
| 68 of 133 |
| Structural and Collateral Term Sheet | JPMBB 2014-C26 | |
| Shaner Hotels Limited Service Portfolio | ||
Lockbox / Cash Management. The loan is structured with a hard lockbox and in-place cash management. At origination, the borrowers and manager were required to direct credit card companies to deliver all receipts directly into the lockbox account. All funds in the lockbox account are swept daily to a segregated cash management account under the control of the lender and disbursed during each interest period in accordance with the loan documents. To the extent there is a Cash Sweep Event (as defined below), all excess cash flow after payment of the debt service, required reserves and operating expenses will be held as additional collateral for the loan. The lender will have a first priority security interest in the cash management account.
A “Cash Sweep Event” means the occurrence of: (i) an event of default, (ii) either any borrower or property manager becomes the subject of a bankruptcy, insolvency or similar action, (iii) the debt service coverage ratio as calculated in the loan documents based on the trailing twelve months falls below 1.15x or (iv) any franchise agreement or replacement franchise agreement is terminated or not renewed, extended or replaced on or prior to the date that is 12 months prior to the termination or expiration date of such franchise agreement either (i) subject to and in compliance with the terms of any such franchise agreement, or (ii) on terms and conditions acceptable to lender, in each case within 30 days of such termination or expiration.
Additional Debt. The $8.05 million mezzanine loan is secured by the direct equity interests in the borrowers and is coterminous with the mortgage loan. The mezzanine loan is interest-only for the term of the loan and has a 10.00000% coupon. Including the mezzanine loan, the Cut-off Date LTV is 80.0%, the UW NCF DSCR is 1.38x and the UW NOI Debt Yield is 9.2%. The lenders have entered into an intercreditor agreement. The mezzanine loan is cross-collateralized and cross-defaulted with three other mezzanine loans related to mortgage loans, which are not included in the pool, through guaranties and pledge agreements signed by the various mezzanine loan borrowers. The total amount of mezzanine debt including the cross-collateralized and cross-defaulted loans is approximately $31.6 million.
THE INFORMATION IN THIS STRUCTURAL AND COLLATERAL TERM SHEET IS NOT COMPLETE AND MAY BE AMENDED PRIOR TO THE TIME OF SALE. THIS TERM SHEET IS NOT AN OFFER TO SELL THESE SECURITIES AND IT IS NOT A SOLICITATION OF AN OFFER TO BUY THESE SECURITIES IN ANY JURISDICTION WHERE THE OFFER OR SALE IS NOT PERMITTED.
| | |
| 69 of 133 |
| Structural and Collateral Term Sheet | JPMBB 2014-C26 |
[THIS PAGE INTENTIONALLY LEFT BLANK]
THE INFORMATION IN THIS STRUCTURAL AND COLLATERAL TERM SHEET IS NOT COMPLETE AND MAY BE AMENDED PRIOR TO THE TIME OF SALE. THIS TERM SHEET IS NOT AN OFFER TO SELL THESE SECURITIES AND IT IS NOT A SOLICITATION OF AN OFFER TO BUY THESE SECURITIES IN ANY JURISDICTION WHERE THE OFFER OR SALE IS NOT PERMITTED.
| | |
| 70 of 133 |
| Structural and Collateral Term Sheet | JPMBB 2014-C26 |
| St. Louis Premium Outlets | |
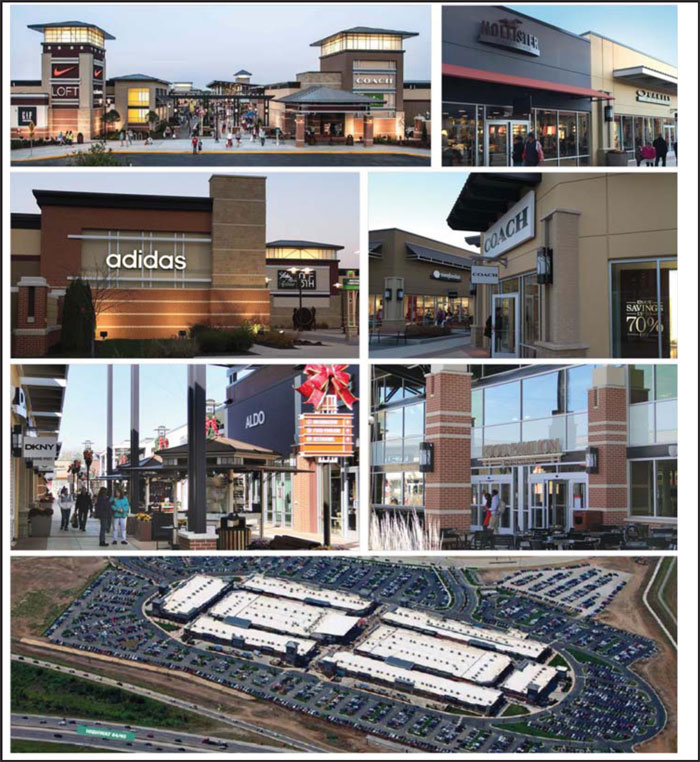
THE INFORMATION IN THIS STRUCTURAL AND COLLATERAL TERM SHEET IS NOT COMPLETE AND MAY BE AMENDED PRIOR TO THE TIME OF SALE. THIS TERM SHEET IS NOT AN OFFER TO SELL THESE SECURITIES AND IT IS NOT A SOLICITATION OF AN OFFER TO BUY THESE SECURITIES IN ANY JURISDICTION WHERE THE OFFER OR SALE IS NOT PERMITTED.
| | |
| 71 of 133 |
| Structural and Collateral Term Sheet | JPMBB 2014-C26 |
| St. Louis Premium Outlets | |
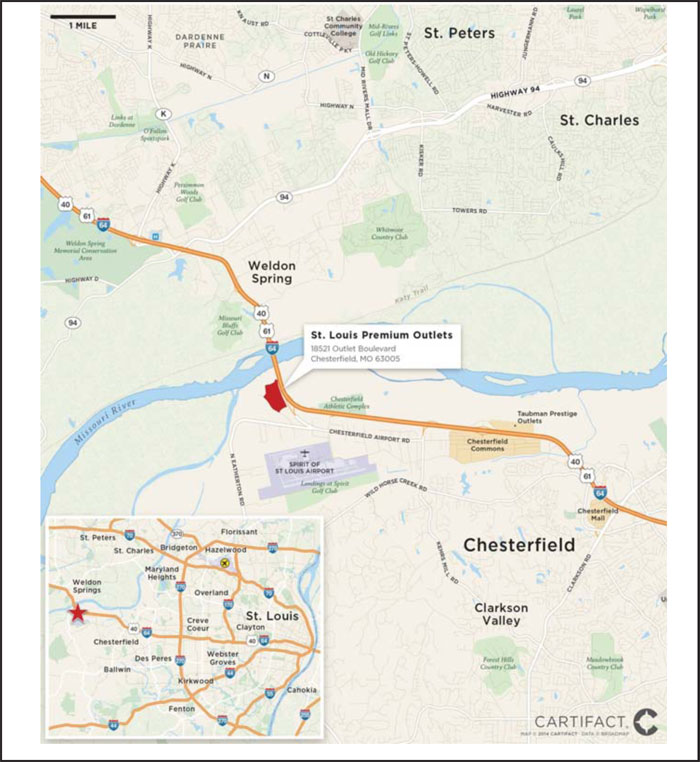
THE INFORMATION IN THIS STRUCTURAL AND COLLATERAL TERM SHEET IS NOT COMPLETE AND MAY BE AMENDED PRIOR TO THE TIME OF SALE. THIS TERM SHEET IS NOT AN OFFER TO SELL THESE SECURITIES AND IT IS NOT A SOLICITATION OF AN OFFER TO BUY THESE SECURITIES IN ANY JURISDICTION WHERE THE OFFER OR SALE IS NOT PERMITTED.
| | |
| 72 of 133 |
| Structural and Collateral Term Sheet | JPMBB 2014-C26 |
| St. Louis Premium Outlets | |
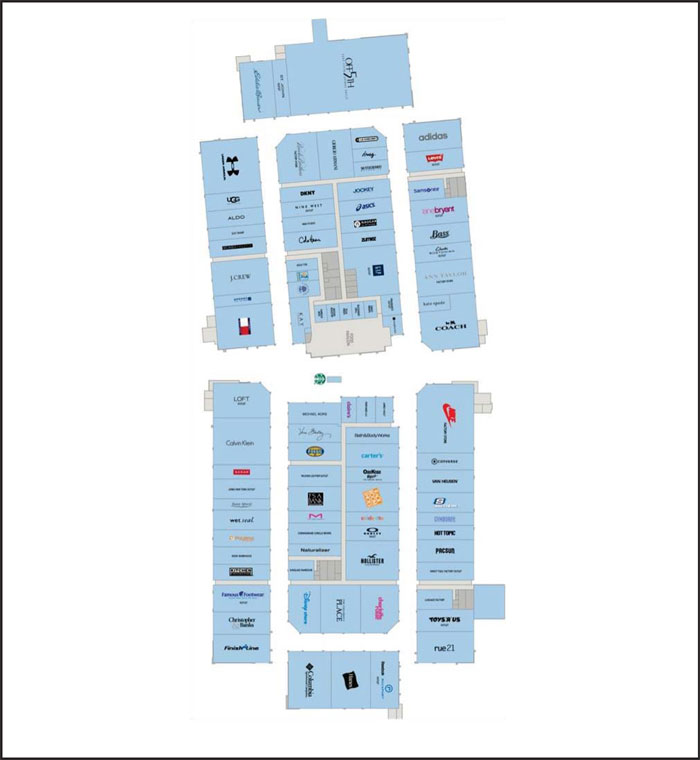
THE INFORMATION IN THIS STRUCTURAL AND COLLATERAL TERM SHEET IS NOT COMPLETE AND MAY BE AMENDED PRIOR TO THE TIME OF SALE. THIS TERM SHEET IS NOT AN OFFER TO SELL THESE SECURITIES AND IT IS NOT A SOLICITATION OF AN OFFER TO BUY THESE SECURITIES IN ANY JURISDICTION WHERE THE OFFER OR SALE IS NOT PERMITTED.
| | |
| 73 of 133 |
| Structural and Collateral Term Sheet | JPMBB 2014-C26 |
| St. Louis Premium Outlets | |
| Mortgage Loan Information | Property Information | |||
| Mortgage Loan Seller: | Column | Single Asset / Portfolio: | Single Asset | |
Original Principal Balance(1): | $47,500,000 | Title: | Fee | |
Cut-off Date Principal Balance(1): | $47,500,000 | Property Type - Subtype: | Retail – Outlet Center | |
| % of Pool by IPB: | 3.3% | Net Rentable Area (SF): | 351,462 | |
| Loan Purpose: | Refinance | Location: | Chesterfield, MO | |
| Borrower: | St. Louis Premium Outlets, LLC | Year Built / Renovated: | 2013 / N/A | |
| Sponsor: | Simon/Woodmont Development, LLC | Occupancy: | 100.0% | |
| Interest Rate: | 4.06100% | Occupancy Date: | 7/8/2014 | |
| Note Date: | 9/11/2014 | Number of Tenants: | 95 | |
| Maturity Date: | 10/6/2024 | 2011 NOI(2): | N/A | |
| Interest-only Period: | 60 months | 2012 NOI(2): | N/A | |
| Original Term: | 120 months | 2013 NOI(2): | N/A | |
| Original Amortization: | 360 months | TTM NOI (as of 6/2014)(3): | $8,919,605 | |
| Amortization Type: | IO-Balloon | UW Economic Occupancy: | 95.0% | |
Call Protection(4): | L(26),Def(87),O(7) | UW Revenues: | $14,361,102 | |
| Lockbox: | CMA | UW Expenses: | $6,213,688 | |
| Additional Debt: | Yes | UW NOI: | $8,147,414 | |
| Additional Debt Balance: | $47,500,000 | UW NCF: | $7,725,659 | |
| Additional Debt Type: | Pari Passu | Appraised Value / Per SF: | $132,600,000 / $377 | |
| Appraisal Date: | 8/18/2014 | |||
Escrows and Reserves(5) | Financial Information(1) | ||||||
| Initial | Monthly | Initial Cap | Cut-off Date Loan / SF: | $270 | |||
| Taxes: | $0 | Springing | N/A | Maturity Date Loan / SF: | $246 | ||
| Insurance: | $0 | Springing | N/A | Cut-off Date LTV: | 71.6% | ||
| Replacement Reserves: | $0 | Springing | $210,877 | Maturity Date LTV: | 65.1% | ||
| TI/LC: | $0 | Springing | $1,054,386 | UW NCF DSCR: | 1.41x | ||
| Other: | $0 | $0 | N/A | UW NOI Debt Yield: | 8.6% | ||
| Sources and Uses | |||||||
| Sources | Proceeds | % of Total | Uses | Proceeds | % of Total | |||||
Mortgage Loan(1) | $95,000,000 | 100.0 | % | Return of Equity | $93,890,499 | 98.8 | % | |||
| Closing Costs | 1,109,501 | 1.2 | ||||||||
| Total Sources | $95,000,000 | 100.0 | % | Total Uses | $95,000,000 | 100.0 | % |
| (1) | The St. Louis Premium Outlets is part of a loan evidenced by two pari passu notes with an aggregate original principal balance of $95.0 million. The Financial Information presented in the chart above reflects the Cut-off Date balance of the $95.0 million St. Louis Premium Outlets Whole Loan. |
| (2) | The property was recently constructed in 2013. Therefore, 2011, 2012 and 2013 NOI are not available. |
| (3) | Represents trailing 10 months ending June 30, 2014 as an annualized figure. |
| (4) | The lockout period will be at least 26 payment dates beginning with and including the first payment date of November 6, 2014. Defeasance of the full $95.0 million St. Louis Premium Outlets Whole Loan is permitted after the date that is the earlier of (i) two years after the securitization of the last pari passu note to be securitized and (ii) October 6, 2018. |
| (5) | For a full description of Escrows and Reserves, please refer to “Escrows and Reserves” below. |
THE INFORMATION IN THIS STRUCTURAL AND COLLATERAL TERM SHEET IS NOT COMPLETE AND MAY BE AMENDED PRIOR TO THE TIME OF SALE. THIS TERM SHEET IS NOT AN OFFER TO SELL THESE SECURITIES AND IT IS NOT A SOLICITATION OF AN OFFER TO BUY THESE SECURITIES IN ANY JURISDICTION WHERE THE OFFER OR SALE IS NOT PERMITTED.
| | |
| 74 of 133 |
| Structural and Collateral Term Sheet | JPMBB 2014-C26 |
| St. Louis Premium Outlets | |
The Loan. The St. Louis Premium Outlets loan is secured by a first mortgage lien on a 351,462 square foot outlet center that opened in 2013 and is located in Chesterfield, Missouri, approximately 21 miles west of St. Louis, Missouri. The whole loan has an outstanding principal balance of $95.0 million (the “St. Louis Premium Outlets Whole Loan”), which is comprised of two pari passu notes, Note A-1 and Note A-2. Note A-1 has an outstanding principal balance as of the Cut-off Date of $47.5 million and is being contributed to the JPMBB 2014-C26 Trust. Note A-2, with an outstanding principal balance as of the Cut-off Date of $47.5 million, is currently held by Column Financial, Inc. and is expected to be contributed to a future securitized trust. The holder of Note A-1 (the “Controlling Noteholder”) will be the trustee of the JPMBB 2014-C26 Trust. The trustee of the JPMBB 2014-C26 Trust (or, prior to the occurrence and continuance of a Control Event, the Directing Certificateholder) will be entitled to exercise all of the rights of the Controlling Noteholder with respect to the St. Louis Premium Outlets Whole Loan; however, the holder of the Note A-2 will be entitled, under certain circumstances, to consult with respect to certain major decisions. The loan has a 10-year term, and subsequent to a five-year interest-only period, will amortize on a 30-year schedule.
The Borrower. The borrowing entity is St. Louis Premium Outlets, LLC, a Delaware limited liability company and special purpose entity.
The Sponsor. The loan’s sponsor is Simon/Woodmont Development, LLC, a Delaware limited liability company. The sponsor is a joint venture between Simon Property Group, LP and The Woodmont Company. Simon Property Group, LP (“Simon”) is a wholly owned subsidiary of Simon Property Group Inc., a publicly traded REIT (NYSE: SPG, S&P: A, Fitch A, Moody’s: A3) that is focused on retail property ownership and management. The company is the largest publicly traded owner, operator and developer of retail assets. As of September 30, 2014, the company operated 208 income-producing properties located in 37 states and Puerto Rico.
The Woodmont Company is a full-service real estate firm headquartered in Fort Worth, Texas with over 31 years of experience in commercial real estate. The company specializes in every aspect of commercial real estate, including development, asset management, tenant representation, brokerage, construction supervision and investment sales.
The St. Louis Premium Outlets Whole Loan will be recourse to the sponsor pursuant to standard carve-outs; however, the guaranty provides that Simon’s liability shall not exceed $19.0 million in the aggregate, plus all of the reasonable out-of-pocket costs and expenses (including court costs and reasonable attorneys’ fees) incurred by lender in the enforcement of the guaranty or the preservation of lender’s rights thereunder.
The Property. St. Louis Premium Outlets is a one-story outlet center located in Chesterfield, Missouri. The improvements were constructed in 2013 and are located on a 31.73-acre site bounded by Monarch Chesterfield Levee Trail to the north and west, I-64 to the east, and Outlet Boulevard to the south in Chesterfield, Missouri, just west of St. Louis, in the St. Louis metropolitan statistical area. The total net rentable area of the property is 351,462 square feet including an approximately 3,300 square feet, centralized, enclosed food court with five tenant spaces. The property contains a total of approximately 2,038 surface parking spaces (5.80 spaces per 1,000 square feet). Access to the neighborhood is provided by I-64/Hwy 40, which is accessible immediately east of the property and provides a direct route to St. Louis, Missouri.
As of July 8, 2014, the property was 100.0% leased by 95 tenants. The property is anchored by Saks Fifth Avenue Off 5th, (27,996 square feet, 8.0% of net rentable area) and Nike Factory Store (12,000 square feet, 3.4% of net rentable area). In addition to its anchors, the property’s in-line tenants generally consist of national and international retailers such as Under Armour, Calvin Klein, Coach and Columbia Sportswear Co. Gross mall sales for all tenants that reported as of opening in August 22, 2013 through May 30, 2014 annualized were approximately $134 million. In-line sales per square foot for comparable stores less than 10,000 square feet were approximately $373 per square foot for the trailing twelve months ended September 30, 2014.
The Market. The property is located within the St. Louis retail market, MO-IL metropolitan statistical area (“St. Louis MSA”), which is situated at the confluence of the Missouri and Mississippi Rivers. According to the appraisal, the metro area contains 2.8 million residents and 28,453,000 square feet of space. The property lies within the St. Louis Central submarket, the largest submarket of St. Louis, with 8,788,000 square feet of retail space comprising 30.9% of the larger market’s total inventory. As of second quarter 2014, the overall vacancy rate for the market was 12.3% with the average asking rental rate for all types of space in the region at $14.95 per square foot. For the same period, the St. Louis Central submarket had a vacancy rate of 13.5% and an average asking rent of $17.87 per square foot. According to the appraisal, the primary trade area within a 10-mile radius contained approximately 331,501 residents with an average household income of approximately $106,450, which exceeds that of the state and country. According to the appraisal, the secondary trade area within a 15-mile radius contained approximately 741,740 residents with an average household income of $93,831.
THE INFORMATION IN THIS STRUCTURAL AND COLLATERAL TERM SHEET IS NOT COMPLETE AND MAY BE AMENDED PRIOR TO THE TIME OF SALE. THIS TERM SHEET IS NOT AN OFFER TO SELL THESE SECURITIES AND IT IS NOT A SOLICITATION OF AN OFFER TO BUY THESE SECURITIES IN ANY JURISDICTION WHERE THE OFFER OR SALE IS NOT PERMITTED.
| | |
| 75 of 133 |
| Structural and Collateral Term Sheet | JPMBB 2014-C26 |
| St. Louis Premium Outlets | |
Competitive Set Summary(1) | ||||||||||||
| Property | Year Built / Renovated | Total GLA (square feet) | Est. Sales PSF | Est. Occ. | Proximity (miles) | Anchor Tenants | ||||||
| Taubman Prestige Outlets | 2013 / N/A | 450,000 | N/A | 70% | 3.7 | The Bedroom Store, Restoration Hardware, Abercrombie & Fitch | ||||||
| St. Louis Outlets | 2003 / 2007 | 1,183,581 | $205 | 67% | 15.1 | Cabela’s, Regal Cinemas, Burlington Coat Factory | ||||||
| St. Louis Galleria | 1986 / 2011 | 1,179,486 | $550 | 97% | 16.9 | Macy’s, Dillard’s, Nordstrom | ||||||
| West County Center | 2002 / N/A | 1,209,799 | $350 | 99% | 12.7 | Nordstrom, JC Penney, Macy’s, Dicks Sporting Goods | ||||||
| Chesterfield Mall | 1976 / 2006 | 1,301,776 | $275 | 80% | 14.0 | Macy’s, Dillards, Sears, AMC Theaters | ||||||
| Plaza Frontenac | 1974 / 2013 | 483,810 | $540 | 97% | 5.3 | Neiman Marcus, Saks Fifth Avenue | ||||||
| (1) | Per the appraisal. |
Historical and Current Occupancy(1) | |||||||
| 2011 | 2012 | 2013 | Current(2) | ||||
| N/A | N/A | 100.0% | 100.0% | ||||
| (1) | Historical Occupancies are as of December 31 of each respective year. The property was constructed in 2013. | ||||||
(2) | Current Occupancy is as of July 8, 2014. | ||||||
Sales and Occupancy Costs(1) | |||||||||
| 2011 | 2012 | 2013 | TTM(2) | ||||||
| Sales PSF | N/A | N/A | N/A | $373 | |||||
| Occupancy Costs | N/A | N/A | N/A | 14.6 | % | ||||
| (1) | Sales PSF and Occupancy Costs are for in-line tenants that occupy less than 10,000 square feet. |
| (2) | TTM Sales per square foot and Occupancy Costs are as of the trailing twelve months ending September 30, 2014. |
Tenant Summary(1) | ||||||||||||||||||||
| Tenant | Ratings(2) Moody’s/S&P/Fitch | Net Rentable Area (SF) | % of Total NRA | Base Rent PSF | Sales PSF(3) | Occupancy Costs(3) | Lease Expiration Date | |||||||||||||
Saks Fifth Avenue Off 5th | B1 / B+ / NA | 27,996 | 8.0% | $14.00 | $171.82 | 10.5% | 8/31/2023 | |||||||||||||
| Nike Factory Store | A1 / AA- / NA | 12,000 | 3.4% | $18.00 | NAV | NAV | 1/31/2019 | |||||||||||||
| Under Armour | NA / NA / NA | 9,331 | 2.7% | $25.00 | $791.90 | 6.7% | 8/31/2023 | |||||||||||||
Calvin Klein(4) | Ba1 / BB+ / NA | 8,304 | 2.4% | $0.00 | $198.43 | 15.9% | 4/30/2019 | |||||||||||||
Coach(4) | NA / NA / NA | 8,000 | 2.3% | $0.00 | $1,160.65 | 7.2% | 1/31/2024 | |||||||||||||
| Columbia Sportswear Co. | NA / NA / NA | 7,597 | 2.2% | $22.00 | $348.77 | 10.7% | 1/31/2024 | |||||||||||||
| Tommy Hilfiger | Ba1 / BB+ / NA | 7,452 | 2.1% | $20.00 | $315.13 | 11.3% | 8/31/2018 | |||||||||||||
| Gap Outlet | Baa3 / BBB- / BBB- | 7,175 | 2.0% | $15.00 | $547.44 | 7.5% | 1/31/2019 | |||||||||||||
| Hanesbrands | Ba2 / BB / NA | 7,000 | 2.0% | $20.00 | $119.92 | 30.3% | 8/31/2023 | |||||||||||||
| Hollister Co. | NA / NA / NA | 6,500 | 1.8% | $25.00 | $168.49 | 24.1% | 11/30/2023 | |||||||||||||
| (1) | Based on the underwritten rent roll. |
| (2) | Ratings provided are for the parent company of the entity listed in the “Tenant” field whether or not the parent company guarantees the lease. |
| (3) | Sales PSF and Occupancy Costs are for the trailing-twelve months as of September 30, 2014. Nike Factory Store is a non-reporting tenant. |
| (4) | Calvin Klein and Coach pay percentage in lieu rent. |
THE INFORMATION IN THIS STRUCTURAL AND COLLATERAL TERM SHEET IS NOT COMPLETE AND MAY BE AMENDED PRIOR TO THE TIME OF SALE. THIS TERM SHEET IS NOT AN OFFER TO SELL THESE SECURITIES AND IT IS NOT A SOLICITATION OF AN OFFER TO BUY THESE SECURITIES IN ANY JURISDICTION WHERE THE OFFER OR SALE IS NOT PERMITTED.
| | |
| 76 of 133 |
| Structural and Collateral Term Sheet | JPMBB 2014-C26 |
| St. Louis Premium Outlets | |
Currently, 71 tenants at the property have termination options based on certain levels of sales thresholds, which are generally exercisable between 2016 and 2020. In addition, two tenants, Saks Fifth Avenue Off 5th and Calvin Klein have on-going co-tenancy provisions that require at least 70% and 75%, respectively, of the floor space of the shopping center be leased and open for business, which if not met may result in a right to terminate their respective lease.
Percent-in-lieu Rent Schedule | ||||||||||||
T-12(1) | T-12 Estimated | Underwritten | ||||||||||
| Tenant | Total Sales | Sales PSF | PIL | PIL Rent(1) | Rent (2) | |||||||
| Calvin Klein | $1,647,763 | $198 | 6% | $98,866 | $130,479 | |||||||
| Coach | 9,285,200 | $1,161 | 3% | 278,556 | 360,043 | |||||||
| J. Crew Factory Store | 4,083,060 | $681 | 5% | 204,153 | 211,425 | |||||||
| The Children’s Place | 1,169,160 | $195 | 6% | 70,150 | 74,909 | |||||||
| Giorgio Armani | 701,032 | $137 | 5% | 35,052 | 44,268 | |||||||
| Bath & Body Works | 1,627,344 | $603 | 8% | 130,188 | 127,380 | |||||||
| St. John | 909,846 | $362 | 6% | 54,591 | 60,814 | |||||||
| Totals | $19,423,405 | $503 | $871,554 | $1,009,318 | ||||||||
| (1) | Based on trailing 12 months ending September 30, 2014. |
| (2) | Based on estimates provided by the loan sponsors given their experience managing certain of these tenants and other similar tenants at outlet centers within the loan sponsors’ portfolio. |
Lease Rollover Schedule(1) | |||||||||||||||||||||||||
Year | Number of Leases Expiring | Net Rentable Area Expiring | % of NRA Expiring | Base Rent Expiring | % of Base Rent Expiring | Cumulative Net Rentable Area Expiring | Cumulative % of NRA Expiring | Cumulative Base Rent Expiring | Cumulative % of Base Rent Expiring | ||||||||||||||||
| Vacant | NAP | 0 | 0.0 | % | NAP | NAP | 0 | 0.0% | NAP | NAP | |||||||||||||||
| 2014 & MTM | 2 | 8,176 | 2.3 | $30,000 | 0.4 | % | 8,176 | 2.3% | $30,000 | 0.4% | |||||||||||||||
| 2015 | 0 | 0 | 0.0 | 0 | 0.0 | 8,176 | 2.3% | $30,000 | 0.4% | ||||||||||||||||
| 2016 | 0 | 0 | 0.0 | 0 | 0.0 | 8,176 | 2.3% | $30,000 | 0.4% | ||||||||||||||||
| 2017 | 0 | 0 | 0.0 | 0 | 0.0 | 8,176 | 2.3% | $30,000 | 0.4% | ||||||||||||||||
| 2018 | 10 | 29,644 | 8.4 | 728,481 | 10.1 | 37,820 | 10.8% | $758,481 | 10.5% | ||||||||||||||||
2019(2) | 5 | 33479 | 9.5 | 467,625 | 6.5 | 71,299 | 20.3% | $1,226,106 | 17.0% | ||||||||||||||||
| 2020 | 1 | 2,800 | 0.8 | 64,400 | 0.9 | 74,099 | 21.1% | $1,290,506 | 17.9% | ||||||||||||||||
| 2021 | 0 | 0 | 0.0 | 0 | 0.0 | 74,099 | 21.1% | $1,290,506 | 17.9% | ||||||||||||||||
| 2022 | 0 | 0 | 0.0 | 0 | 0.0 | 74,099 | 21.1% | $1,290,506 | 17.9% | ||||||||||||||||
| 2023 | 63 | 212,888 | 60.6 | 4,963,664 | 68.7 | 286,987 | 81.7% | $6,254,170 | 86.6% | ||||||||||||||||
2024(2) | 14 | 64475 | 18.3 | 971,210 | 13.4 | 351,462 | 100.0% | $7,225,380 | 100.0% | ||||||||||||||||
| 2025 & Beyond | 0 | 0 | 0.0 | 0 | 0.0 | 351,462 | 100.0% | $7,225,380 | 100.0% | ||||||||||||||||
| Total | 95 | 351,462 | 100.0 | % | $7,225,380 | 100.0 | % | ||||||||||||||||||
| (1) | Based on the underwritten rent roll. |
| (2) | Excludes percentage rent from the Calvin Klein and Coach tenants. |
THE INFORMATION IN THIS STRUCTURAL AND COLLATERAL TERM SHEET IS NOT COMPLETE AND MAY BE AMENDED PRIOR TO THE TIME OF SALE. THIS TERM SHEET IS NOT AN OFFER TO SELL THESE SECURITIES AND IT IS NOT A SOLICITATION OF AN OFFER TO BUY THESE SECURITIES IN ANY JURISDICTION WHERE THE OFFER OR SALE IS NOT PERMITTED.
| | |
| 77 of 133 |
| Structural and Collateral Term Sheet | JPMBB 2014-C26 |
| St. Louis Premium Outlets | |
Operating History and Underwritten Net Cash Flow | ||||
TTM(1) | Underwritten | Per Square Foot | %(2) | |
| Rents in Place | $7,329,294 | $7,225,380 | $20.56 | 48.3% |
Percentage & Other Rent(3) | 2,322,503 | 2,973,031 | 8.46 | 19.9 |
| Vacant Income | 0 | 0 | 0.00 | 0.0 |
| Gross Potential Rent | $9,651,797 | $10,198,411 | $29.02 | 68.1% |
| Total Reimbursements | 5,611,757 | 4,773,594 | 13.58 | 31.9 |
| Net Rental Income | $15,263,554 | $14,972,005 | $42.60 | 100.0% |
| (Vacancy/Credit Loss) | 0 | (748,600) | (2.13) | (5.0) |
| Other Income | 253,190 | 137,698 | 0.39 | 0.9 |
| Effective Gross Income | $15,516,744 | $14,361,102 | $40.86 | 95.9% |
| Total Expenses | $6,597,139 | $6,213,688 | $17.68 | 43.3% |
| Net Operating Income | $8,919,605 | $8,147,414 | $23.18 | 56.7% |
| Total TI/LC, Capex/RR | 0 | 421,754 | 1.20 | 2.9 |
| Net Cash Flow | $8,919,605 | $7,725,659 | $21.98 | 53.8% |
| (1) | Represents trailing 10 months ending June 30, 2014 annualized. |
| (2) | Percentage column represents percent of Net Rental Income for all revenue lines and represents percent of Effective Gross Income for the remainder of fields. |
| (3) | Based on estimates of percentage, overage and certain other additional rent (including items such as cart, kiosk, ATM, etc.) provided by the loan sponsors given their experience managing other outlet centers within the loan sponsors’ portfolio. |
Property Management. The property is managed by Simon Management Associates II, LLC, an affiliate of the loan sponsor.
Escrows and Reserve. No upfront escrows were taken at origination.
Tax Escrows - Lender shall not require an escrow for taxes provided that (i) taxes are actually paid prior to the assessment of any penalty for late payment and prior to the date that such taxes are considered delinquent, (ii) upon request, the borrower provides reasonably satisfactory evidence that taxes have been paid prior to the assessment of any penalty for late payment and prior to the date that such taxes are considered delinquent, (iii) no event of default has occurred and is continuing (iv) no DSCR Reserve Trigger Period is continuing.
Insurance Escrows - Lender shall not require an escrow for insurance provided that (i) no event of default has occurred and (ii) the borrower provides lender with satisfactory evidence (as determined by lender) that the property is insured in accordance with the loan documents pursuant to a blanket insurance policy acceptable to lender.
Replacement Reserve - Commencing at closing and continuing on a monthly basis thereafter, an escrow for replacement reserves equal to $5,858 (approximately $0.20 per square foot annually) will be required to be deposited with the lender; provided, however, that the amount on deposit in such reserve shall be capped at $210,877 (approximately $0.60 per square foot); provided further, however, that such amounts are subject to increase based on a higher amount recommended by a property condition report. Notwithstanding the foregoing, the lender shall not require an escrow for replacement reserves provided that (i) no event of default has occurred, and (ii) no DSCR Reserve Trigger Period is continuing.
Tenant Rollover Reserve - Commencing at closing and continuing on a monthly basis thereafter, the borrower shall deposit $29,289 (approximately $1.00 per square foot annually) into such escrow; provided, however, that the amount on deposit in such reserve shall be capped at $1,054,386 (approximately $3.00 per square foot). Notwithstanding the foregoing, lender shall not require an escrow for tenant improvements and leasing commission costs provided that (i) no event of default has occurred, and (ii) no DSCR Reserve Trigger Period is continuing.
“DSCR Reserve Trigger Period” means the debt service coverage ratio (as defined in the loan documents) calculated on a trailing four quarter basis is less than (i) 1.75x for two consecutive quarters on an interest only basis prior to November 6, 2019 and (ii) 1.15x for two consecutive quarters on an amortizing basis beginning November 6, 2019.
THE INFORMATION IN THIS STRUCTURAL AND COLLATERAL TERM SHEET IS NOT COMPLETE AND MAY BE AMENDED PRIOR TO THE TIME OF SALE. THIS TERM SHEET IS NOT AN OFFER TO SELL THESE SECURITIES AND IT IS NOT A SOLICITATION OF AN OFFER TO BUY THESE SECURITIES IN ANY JURISDICTION WHERE THE OFFER OR SALE IS NOT PERMITTED.
| | |
| 78 of 133 |
| Structural and Collateral Term Sheet | JPMBB 2014-C26 |
| St. Louis Premium Outlets | |
Lockbox / Cash Management. The loan is structured with a CMA lockbox. The borrower was required to send tenant direction letters to tenants instructing them to deposit all rents and payments into the lockbox account controlled by the lender. All funds in the lockbox account are swept on each Wednesday (or more frequently if required by the borrower in accordance with the lockbox agreement) to a cash management account under the control of the lender and disbursed during each interest period of the term of the loan in accordance with the loan documents. If (i) a DSCR Reserve Trigger Period occurs, (ii) there is an event of default under the loan documents, or (iii) the borrower or the property manager becomes the subject of a bankruptcy, borrower shall have no rights to make withdrawals from the lockbox account.
THE INFORMATION IN THIS STRUCTURAL AND COLLATERAL TERM SHEET IS NOT COMPLETE AND MAY BE AMENDED PRIOR TO THE TIME OF SALE. THIS TERM SHEET IS NOT AN OFFER TO SELL THESE SECURITIES AND IT IS NOT A SOLICITATION OF AN OFFER TO BUY THESE SECURITIES IN ANY JURISDICTION WHERE THE OFFER OR SALE IS NOT PERMITTED.
| | |
| 79 of 133 |
| Structural and Collateral Term Sheet | JPMBB 2014-C26 |
[THIS PAGE INTENTIONALLY LEFT BLANK]
THE INFORMATION IN THIS STRUCTURAL AND COLLATERAL TERM SHEET IS NOT COMPLETE AND MAY BE AMENDED PRIOR TO THE TIME OF SALE. THIS TERM SHEET IS NOT AN OFFER TO SELL THESE SECURITIES AND IT IS NOT A SOLICITATION OF AN OFFER TO BUY THESE SECURITIES IN ANY JURISDICTION WHERE THE OFFER OR SALE IS NOT PERMITTED.
| | |
| 80 of 133 |
| Structural and Collateral Term Sheet | JPMBB 2014-C26 |
Centergy One |
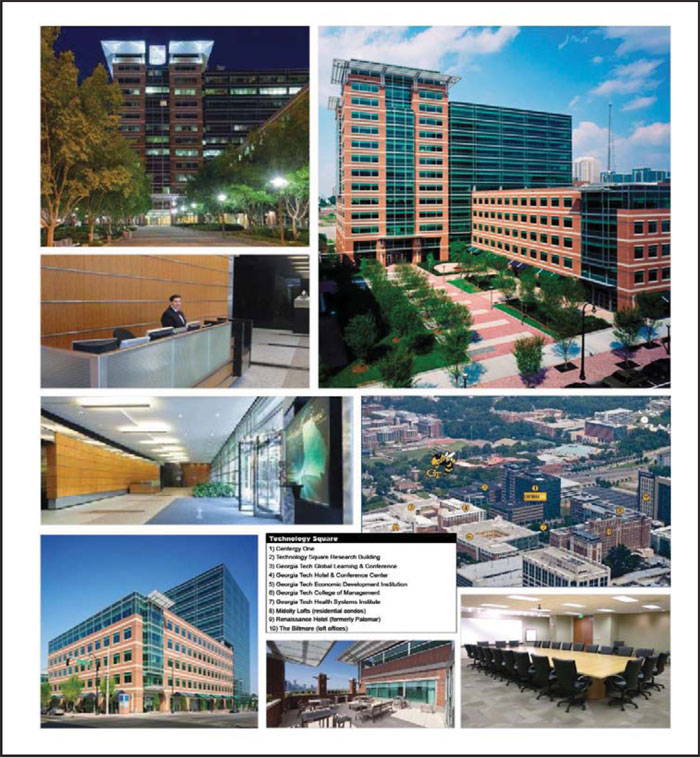
THE INFORMATION IN THIS STRUCTURAL AND COLLATERAL TERM SHEET IS NOT COMPLETE AND MAY BE AMENDED PRIOR TO THE TIME OF SALE. THIS TERM SHEET IS NOT AN OFFER TO SELL THESE SECURITIES AND IT IS NOT A SOLICITATION OF AN OFFER TO BUY THESE SECURITIES IN ANY JURISDICTION WHERE THE OFFER OR SALE IS NOT PERMITTED.
| | |
| 81 of 133 |
| Structural and Collateral Term Sheet | JPMBB 2014-C26 |
Centergy One |
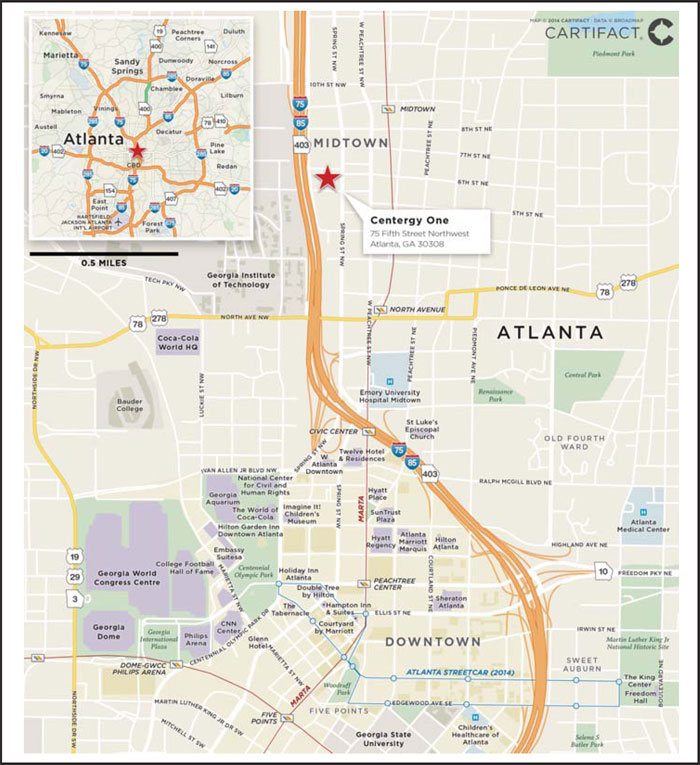
THE INFORMATION IN THIS STRUCTURAL AND COLLATERAL TERM SHEET IS NOT COMPLETE AND MAY BE AMENDED PRIOR TO THE TIME OF SALE. THIS TERM SHEET IS NOT AN OFFER TO SELL THESE SECURITIES AND IT IS NOT A SOLICITATION OF AN OFFER TO BUY THESE SECURITIES IN ANY JURISDICTION WHERE THE OFFER OR SALE IS NOT PERMITTED.
| | |
| 82 of 133 |
| Structural and Collateral Term Sheet | JPMBB 2014-C26 |
Centergy One |
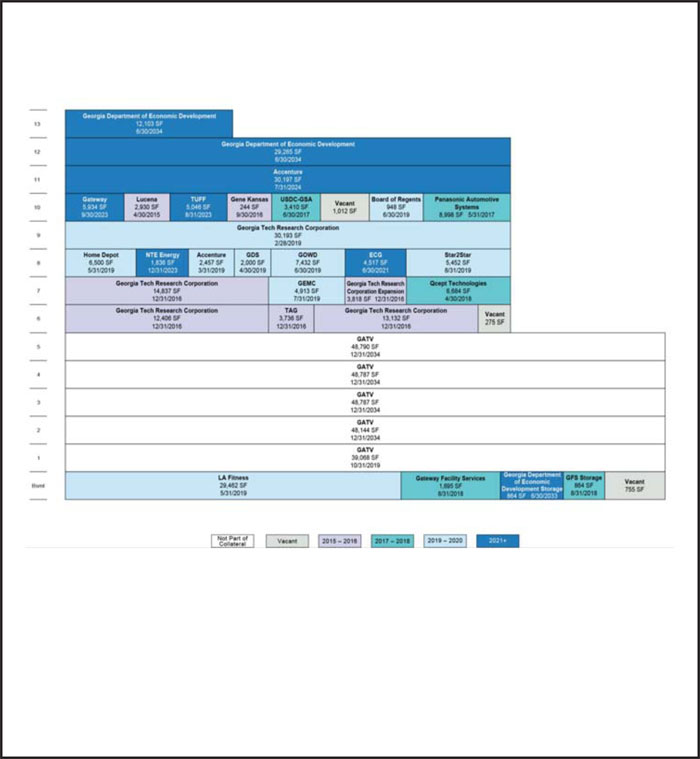
THE INFORMATION IN THIS STRUCTURAL AND COLLATERAL TERM SHEET IS NOT COMPLETE AND MAY BE AMENDED PRIOR TO THE TIME OF SALE. THIS TERM SHEET IS NOT AN OFFER TO SELL THESE SECURITIES AND IT IS NOT A SOLICITATION OF AN OFFER TO BUY THESE SECURITIES IN ANY JURISDICTION WHERE THE OFFER OR SALE IS NOT PERMITTED.
| | |
| 83 of 133 |
| Structural and Collateral Term Sheet | JPMBB 2014-C26 |
Centergy One |
| Mortgage Loan Information | Property Information | |||
| Mortgage Loan Seller: | GECC | Single Asset / Portfolio: | Single Asset | |
| Original Principal Balance: | $45,750,000 | Title: | Fee | |
| Cut-off Date Principal Balance: | $45,750,000 | Property Type - Subtype: | Office - CBD | |
| % of Pool by IPB: | 3.2% | Net Rentable Area (SF): | 253,435 | |
| Loan Purpose: | Refinance | Location: | Atlanta, GA | |
| Borrower: | Centergy One Associates, LLC | Year Built / Renovated: | 2003 / N/A | |
| Sponsors: | David Richard Tyndall and Marvin McKemie Reese | Occupancy: | 99.2% | |
| Occupancy Date: | 10/1/2014 | |||
| Interest Rate: | 4.60000% | Number of Tenants: | 22 | |
| Note Date: | 11/13/2014 | 2011 NOI: | $4,909,704 | |
| Maturity Date: | 12/1/2024 | 2012 NOI: | $3,844,700 | |
| Interest-only Period: | 24 months | 2013 NOI: | $3,895,078 | |
| Original Term: | 120 months | TTM NOI (as of 9/2014): | $4,242,972 | |
| Original Amortization: | 360 months | UW Economic Occupancy: | 96.2% | |
| Amortization Type: | IO-Balloon | UW Revenues: | $6,943,759 | |
| Call Protection: | L(24),Def(93),O(3) | UW Expenses: | $2,883,369 | |
| Lockbox: | Hard | UW NOI: | $4,060,390 | |
| Additional Debt: | N/A | UW NCF: | $3,642,223 | |
| Additional Debt Balance: | N/A | Appraised Value / Per SF: | $61,000,000 / $241 | |
| Additional Debt Type: | N/A | Appraisal Date: | 10/13/2014 | |
Escrows and Reserves(1) | Financial Information | ||||||
| Initial | Monthly | Initial Cap | Cut-off Date Loan / SF: | $181 | |||
| Taxes: | $223,837 | $74,612 | N/A | Maturity Date Loan / SF: | $155 | ||
| Insurance: | $38,125 | $5,446 | N/A | Cut-off Date LTV: | 75.0% | ||
| Replacement Reserves: | $0 | $4,224 | $150,000 | Maturity Date LTV: | 64.2% | ||
| TI/LC: | $1,463,271 | $31,679 | $1,140,000 | UW NCF DSCR: | 1.29x | ||
| Other: | $155,183 | $0 | N/A | UW NOI Debt Yield: | 8.9% | ||
| Sources and Uses | |||||||
| Sources | Proceeds | % of Total | Uses | Proceeds | % of Total | ||
| Mortgage Loan | $45,750,000 | 100.0% | Payoff Existing Debt | $35,634,900 | 77.9% | ||
| Return of Equity | 7,196,685 | 15.7 | |||||
| Upfront Reserves | 1,880,416 | 4.1 | |||||
| Closing Costs | 1,037,999 | 2.3 | |||||
| Total Sources | $45,750,000 | 100.0% | Total Uses | $45,750,000 | 100.0% | ||
| (1) | For a full description of Escrows and Reserves, please refer to “Escrows and Reserves” below. |
The Loan. The Centergy One loan has an outstanding balance of $45.75 million and is secured by a first mortgage lien on the borrower’s fee interest in nine units (253,435 square feet) of a 14-unit condominium regime (the “Century One Property”) comprising a 13-story, 487,011 square foot, Class A office building located in Atlanta, Georgia (the “Centergy One Building”). The loan has a 10-year term, and subsequent to a two-year interest-only period, will amortize on a 30-year schedule.
The Borrower. The borrowing entity for the Centergy One loan is Centergy One Associates, LLC, a Georgia limited liability company and single purpose entity. The borrower has a 52% voting interest in the owners’ association and the right to appoint two of three directors of the condominium association. Certain actions of the owners’ association require either a supra-majority or other mortgage holders’ consent (thus being outside the borrower’s affirmative control), including (i) amendment or termination of the condominium regime, (ii) restoration following casualty, (iii) filing of actions to enforce condominium documents, but otherwise the borrower has effective operational control over the condominium association.
THE INFORMATION IN THIS STRUCTURAL AND COLLATERAL TERM SHEET IS NOT COMPLETE AND MAY BE AMENDED PRIOR TO THE TIME OF SALE. THIS TERM SHEET IS NOT AN OFFER TO SELL THESE SECURITIES AND IT IS NOT A SOLICITATION OF AN OFFER TO BUY THESE SECURITIES IN ANY JURISDICTION WHERE THE OFFER OR SALE IS NOT PERMITTED.
| | |
| 84 of 133 |
| Structural and Collateral Term Sheet | JPMBB 2014-C26 |
Centergy One |
The Sponsor. The loan sponsors and nonrecourse carve-out guarantors are David Richard Tyndall and Marvin McKemie Reese. David Richard Tyndall and Marvin McKemie Reese are the indemnitors and managers of the borrower. They are cofounders of Gateway Development Services, Inc.
The Property. The Centergy One Property consists of floors 6 through 13 and the basement/retail level of the Centergy One Building. Centergy One Building lies within the Technology Square mixed use district. The Centergy One Building is a Class A, LEED-Silver certified office building located in Atlanta, Georgia located on approximately 1.23 acres. The 13-story steel and poured concrete tower was built in 2003. It is currently undergoing a roof replacement for which a reserve was required at closing. The Century One Property shares a 1,493-space parking deck via a lease that provides for 537 spaces or 2.12 spaces per 1,000 square feet of net rentable area.
As of October 1, 2014, the Centergy One Property was 99.2% leased to 22 tenants. Approximately 67.9% of the net rentable area is leased to credit tenants (see tenant summary table below). The Century One Property has had an average occupancy of 92.0% over the past 10 years. The largest tenant is Georgia Tech Research Corporation (“GTRC”), GTRC leases 29.4% of the net rentable area through December 2016 and February 2019. GTRC is a state chartered not-for-profit corporation whose activities primarily support Georgia Institute of Technology, a unit of the University System of Georgia (an organizational unit of the State of Georgia). The second largest tenant, Georgia Department of Economic Development (“GDEcD”) leases 16.7% of the net rentable area through June 30, 2015 with annual renewals through 2034. GDEcD is a department of the State of Georgia. It serves as the state’s sales and marketing arm and is the lead agency for attracting new business investment, encouraging the expansion of existing industry and small businesses, locating new markets for Georgia products, attracting tourists to Georgia, and promoting the state as a location for film, music, and digital entertainment projects, as well as planning and mobilizing state resources for economic development. The third largest tenant, Accenture leases 12.9% of the net rentable area through March 2019 and July 2024. Accenture provides management consulting, technology, and outsourcing services and has more than 305,000 employees and offices and operations in more than 200 cities in 56 countries. The company had net revenues of $30 billion for fiscal year 2014, and is rated A1 by Moody’s and A+ by S&P (investment grade). The tenant has been at the property since 2004 and recently in August 2014 renewed its existing lease and in April 2014 expanded into an additional 2,457 square feet.
The Centergy One Building is located in the Midtown submarket and within Georgia Tech University’s Technology Square research park. The Technology Square is an eight building complex and opened in 2003. The $380.0 million project totaling 1.4 million square feet encompasses education, research, hospitality, office and retail creating a new urban “main street” for the campus and Midtown Atlanta. The research park is home to the Scheller College of Business, Georgia Tech Hotel & Conference Center, the Global Learning Center, the Economic Development Institute, and the Barnes & Noble campus bookstore. The development has turned the area into a high tech corridor. Specifically, the Century One Building is located at the northwest corner of the intersection of Fifth Street Northwest and Spring Street Northwest, with frontage on both streets. The neighborhood is urban in character. Access is excellent, with good accessibility form Interstates 75 and 85. There are two MARTA stations located within walking distance to the property and multiple Cobb Community Transit bus stops located one block east of the property along West Peachtree Street. The Georgia Tech trolley has a stop directly in front of the property.
According to the appraisal, the Midtown Atlanta office submarket’s Class A sector consisted of 35 projects with 14,900,264 square feet of office space at the end of second quarter 2014. Additionally, there were 40 owner-occupied office buildings within this market containing roughly 2,679,420 square feet of space. Class A projects within Midtown Atlanta reported a second quarter 2014 vacancy rate of 16.9%, down from the 18.3% reported at the end of first quarter 2014. Year-to-date net absorption within the Class A sector totals positive 260,241 square feet. Quoted rates for available space within this sector of the market averaged $26.06 per square foot.
Historical and Current Occupancy(1) | |||
| 2011 | 2012 | 2013 | Current(2) |
| 100.0% | 93.7% | 94.4% | 99.2% |
| (1) | Historical Occupancies are the average of each respective year. |
| (2) | Current Occupancy is as of October 1, 2014 rent roll. |
THE INFORMATION IN THIS STRUCTURAL AND COLLATERAL TERM SHEET IS NOT COMPLETE AND MAY BE AMENDED PRIOR TO THE TIME OF SALE. THIS TERM SHEET IS NOT AN OFFER TO SELL THESE SECURITIES AND IT IS NOT A SOLICITATION OF AN OFFER TO BUY THESE SECURITIES IN ANY JURISDICTION WHERE THE OFFER OR SALE IS NOT PERMITTED.
| | |
| 85 of 133 |
| Structural and Collateral Term Sheet | JPMBB 2014-C26 |
Centergy One |
Tenant Summary(1) | |||||
| Tenant | Ratings(2) Moody’s/S&P/Fitch | Net Rentable Area (SF) | % of Total NRA | Base Rent PSF | Lease Expiration Date |
Georgia Tech Research Corporation(4) | Aaa / AAA / NA(3) | 74,386 | 29.4% | $26.00 | 12/31/2016 |
Georgia Dept. of Econ. Development(5)(6) | Aaa / AAA / NA(3) | 42,232 | 16.7% | $22.27 | 6/30/2034 |
Accenture(7)(8) | A1 / A+ / A+ | 32,654 | 12.9% | $27.74 | 7/31/2024 |
| LA Fitness | NA / NA / NA | 29,462 | 11.6% | $22.38 | 5/31/2019 |
| Panasonic Automotive Systems | Baa2 / BBB+ / BBB- | 8,998 | 3.6% | $31.21 | 5/31/2017 |
| Governor’s Office of Workforce Development | Aaa / AAA / NA(3) | 7,432 | 2.9% | $27.50 | 6/30/2019 |
| Qcept Technologies, Inc. | NA / NA / NA | 6,684 | 2.6% | $30.81 | 4/30/2018 |
| Home Depot | A2 / A / A- | 6,500 | 2.6% | $31.00 | 5/31/2019 |
| Gateway Development | NA / NA / NA | 5,934 | 2.3% | $30.75 | 9/30/2023 |
| Star2Star | NA / NA / NA | 5,452 | 2.2% | $31.00 | 8/31/2019 |
| (1) | Based on the underwritten rent roll. |
| (2) | Ratings provided are for the parent company of the entity listed in the “Tenant” field whether or not the parent company guarantees the lease. |
| (3) | State of Georgia General Obligation Bond Ratings. |
| (4) | Georgia Tech Research Corporation leases 44,193 square feet expiring December 2016 and 30,193 square feet expiring February 2019. |
| (5) | Georgia Department of Economic Development lease 864 square feet expiring June 2033 and 41,368 square feet expiring June 2034. |
| (6) | Georgia Department of Economic Development has an annual renewal clause in their lease. |
| (7) | Accenture leases 2,457 square feet expiring March 2019 and 30,197 square feet expiring July 2024. |
| (8) | Accenture has a 50% rent abatement for 30,197 square feet of its total square feet at the property through June 30, 2015. The borrower reserved $118,800 at origination in connection with such rent abatement. |
Lease Rollover Schedule(1) | |||||||||||
| Year | Number of Leases Expiring | Net Rentable Area Expiring | % of NRA Expiring | Base Rent Expiring | % of Base Rent Expiring | Cumulative Net Rentable Area Expiring | Cumulative % of NRA Expiring | Cumulative Base Rent Expiring | Cumulative % of Base Rent Expiring | ||
| Vacant | NAP | 2,042 | 0.8 | % | NAP | NAP | 2,042 | 0.8% | NAP | NAP | |
| 2014 & MTM | 0 | 0 | 0.0 | $0 | 0.0 | % | 2,042 | 0.8% | $0 | 0.0% | |
| 2015 | 1 | 2,930 | 1.2 | 58,600 | 0.9 | 4,972 | 2.0% | $58,600 | 0.9% | ||
| 2016 | 3 | 48,173 | 19.0 | 1,270,474 | 19.3 | 53,145 | 21.0% | $1,329,073 | 20.2% | ||
| 2017 | 2 | 12,408 | 4.9 | 389,504 | 5.9 | 65,553 | 25.9% | $1,718,577 | 26.1% | ||
| 2018 | 3 | 8,763 | 3.5 | 244,433 | 3.7 | 74,316 | 29.3% | $1,963,010 | 29.8% | ||
| 2019 | 9 | 89,357 | 35.3 | 2,334,952 | 35.5 | 163,673 | 64.6% | $4,297,962 | 65.3% | ||
| 2020 | 0 | 0 | 0.0 | 0 | 0.0 | 163,673 | 64.6% | $4,297,962 | 65.3% | ||
| 2021 | 1 | 4,517 | 1.8 | 128,735 | 2.0 | 168,190 | 66.4% | $4,426,698 | 67.2% | ||
| 2022 | 0 | 0 | 0.0 | 0 | 0.0 | 168,190 | 66.4% | $4,426,698 | 67.2% | ||
| 2023 | 3 | 12,816 | 5.1 | 391,650 | 5.9 | 181,006 | 71.4% | $4,818,348 | 73.2% | ||
| 2024 | 1 | 30,197 | 11.9 | 824,378 | 12.5 | 211,203 | 83.3% | $5,642,725 | 85.7% | ||
| 2025 & Beyond | 2 | 42,232 | 16.7 | 940,632 | 14.3 | 253,435 | 100.0% | $6,583,357 | 100.0% | ||
| Total | 25 | 253,435 | 100.0 | % | $6,583,358 | 100.0 | % | ||||
| (1) | Based on the underwritten rent roll. |
THE INFORMATION IN THIS STRUCTURAL AND COLLATERAL TERM SHEET IS NOT COMPLETE AND MAY BE AMENDED PRIOR TO THE TIME OF SALE. THIS TERM SHEET IS NOT AN OFFER TO SELL THESE SECURITIES AND IT IS NOT A SOLICITATION OF AN OFFER TO BUY THESE SECURITIES IN ANY JURISDICTION WHERE THE OFFER OR SALE IS NOT PERMITTED.
| | |
| 86 of 133 |
| Structural and Collateral Term Sheet | JPMBB 2014-C26 |
Centergy One |
| Operating History and Underwritten Net Cash Flow | ||||||||
| 2011 | 2012 | 2013 | TTM (1) | Underwritten | Per Square Foot | %(2) | ||
Rents in Place(3) | $6,525,514 | $6,401,850 | $6,337,233 | $6,174,391 | $6,583,358 | $25.98 | 91.5 | % |
| Vacant Income | 0 | 0 | 0 | 0 | 61,260 | 0.24 | 0.9 | |
| Gross Potential Rent | $6,525,514 | $6,401,850 | $6,337,233 | $6,174,391 | $6,644,618 | $26.22 | 92.3 | % |
| Total Reimbursements | 692,592 | 390,847 | 532,983 | 453,171 | 552,294 | 2.18 | 7.7 | |
| Net Rental Income | $7,218,106 | $6,792,697 | $6,870,216 | $6,627,562 | $7,196,912 | $28.40 | 100.0 | % |
| (Vacancy/Credit Loss) | (8,816) | (112,475) | (4,883) | (771,247) | (253,153) | (1.00) | (3.5 | ) |
Other Income(3) | 413,753 | 129,545 | 1,704 | 1,334,404 | 0 | 0.00 | 0.0 | |
| Effective Gross Income | $7,623,043 | $6,809,767 | $6,867,037 | $7,190,718 | $6,943,759 | $27.40 | 96.5 | % |
| Total Expenses | $2,713,339 | $2,965,067 | $2,971,958 | $2,947,746 | $2,883,369 | $11.38 | 41.5 | % |
| Net Operating Income | $4,909,704 | $3,844,700 | $3,895,078 | $4,242,972 | $4,060,390 | $16.02 | 58.5 | % |
| Total TI/LC, Capex/RR | 0 | 0 | 0 | 0 | 418,168 | 1.65 | 6.0 | |
| Net Cash Flow | $4,909,704 | $3,844,700 | $3,895,078 | $4,242,972 | $3,642,223 | $14.37 | 52.5 | % |
| (1) | The TTM column represents the trailing twelve months ending September 30, 2014. |
| (2) | Percentage column represents percent of Net Rental Income for all revenue lines and represents percent of Effective Gross Income for the remainder of fields. |
| (3) | The early termination of PNC accounts for the unusually high Other Income in the TTM numbers (termination fees), and the lower Rents in Place. Underwritten Rents in Place are higher than TTM due to new leases signed. |
Property Management. The property is managed by Gateway Facility Services, LLC.
Escrows & Reserves. At origination the borrower deposited into escrow $1,463,271 for tenant improvements, free rent, and leasing commissions, $223,837 for real estate taxes, $155,183 for immediate repairs, and $38,125 for insurance.
Tax Escrows - On a monthly basis, the borrower is required to escrow 1/12 of the annual estimated tax payments, which currently equates to $74,612.
Insurance Escrows - On a monthly basis, the borrower is required to escrow 1/12 of the annual estimated insurance premium, which currently equates to $5,446.
Replacement Reserves - On a monthly basis, the borrower is required to escrow $4,224 (approximately $0.20 per square foot annually) for replacement reserves. The reserve is subject to a cap of $150,000 (approximately $0.59 per square foot).
TI/LC Reserves - On a monthly basis, the borrower is required to escrow approximately $31,679 (approximately $1.50 per square foot annually), for TI/LC reserves. The reserve is subject to a cap of $1,140,000 (approximately $4.50 per square foot).
Lease Termination Reserve - Upon any lease termination, all termination fees shall be deposited into a lease termination reserve and shall be used to pay TI/LC costs associated with re-leasing these spaces.
Lockbox / Cash Management. The loan is structured with a hard lockbox and in-place cash management. The borrower was required to send tenant direction letters to tenants instructing them to deposit all rents and payments into the lockbox account controlled by the lender. All funds in the lockbox account are swept to a cash management account under the control of the lender and disbursed during each interest period of the term of the loan in accordance with the loan documents. To the extent that an event of default occurs, all excess cash flow after payment of debt service, required reserves and operating expenses will be held as additional collateral for the loan.
[THIS PAGE INTENTIONALLY LEFT BLANK]
THE INFORMATION IN THIS STRUCTURAL AND COLLATERAL TERM SHEET IS NOT COMPLETE AND MAY BE AMENDED PRIOR TO THE TIME OF SALE. THIS TERM SHEET IS NOT AN OFFER TO SELL THESE SECURITIES AND IT IS NOT A SOLICITATION OF AN OFFER TO BUY THESE SECURITIES IN ANY JURISDICTION WHERE THE OFFER OR SALE IS NOT PERMITTED.
| | |
| 87 of 133 |
| Structural and Collateral Term Sheet | JPMBB 2014-C26 |
THE INFORMATION IN THIS STRUCTURAL AND COLLATERAL TERM SHEET IS NOT COMPLETE AND MAY BE AMENDED PRIOR TO THE TIME OF SALE. THIS TERM SHEET IS NOT AN OFFER TO SELL THESE SECURITIES AND IT IS NOT A SOLICITATION OF AN OFFER TO BUY THESE SECURITIES IN ANY JURISDICTION WHERE THE OFFER OR SALE IS NOT PERMITTED.
| | |
| 88 of 133 |
| Structural and Collateral Term Sheet | JPMBB 2014-C26 |
The Outlet Shoppes of the Bluegrass |
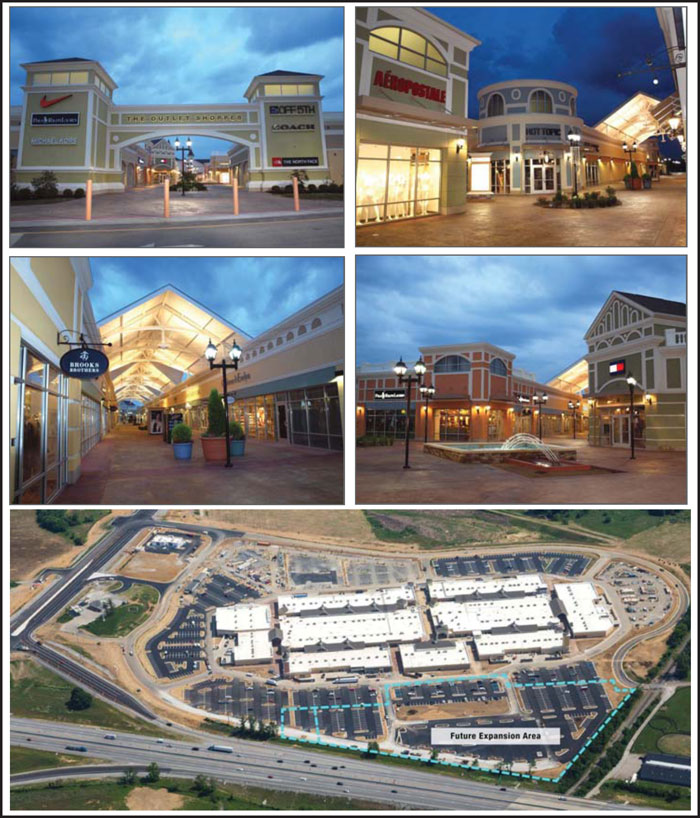
THE INFORMATION IN THIS STRUCTURAL AND COLLATERAL TERM SHEET IS NOT COMPLETE AND MAY BE AMENDED PRIOR TO THE TIME OF SALE. THIS TERM SHEET IS NOT AN OFFER TO SELL THESE SECURITIES AND IT IS NOT A SOLICITATION OF AN OFFER TO BUY THESE SECURITIES IN ANY JURISDICTION WHERE THE OFFER OR SALE IS NOT PERMITTED.
| | |
| 89 of 133 |
| Structural and Collateral Term Sheet | JPMBB 2014-C26 |
The Outlet Shoppes of the Bluegrass |

THE INFORMATION IN THIS STRUCTURAL AND COLLATERAL TERM SHEET IS NOT COMPLETE AND MAY BE AMENDED PRIOR TO THE TIME OF SALE. THIS TERM SHEET IS NOT AN OFFER TO SELL THESE SECURITIES AND IT IS NOT A SOLICITATION OF AN OFFER TO BUY THESE SECURITIES IN ANY JURISDICTION WHERE THE OFFER OR SALE IS NOT PERMITTED.
| | |
| 90 of 133 |
| Structural and Collateral Term Sheet | JPMBB 2014-C26 |
The Outlet Shoppes of the Bluegrass |
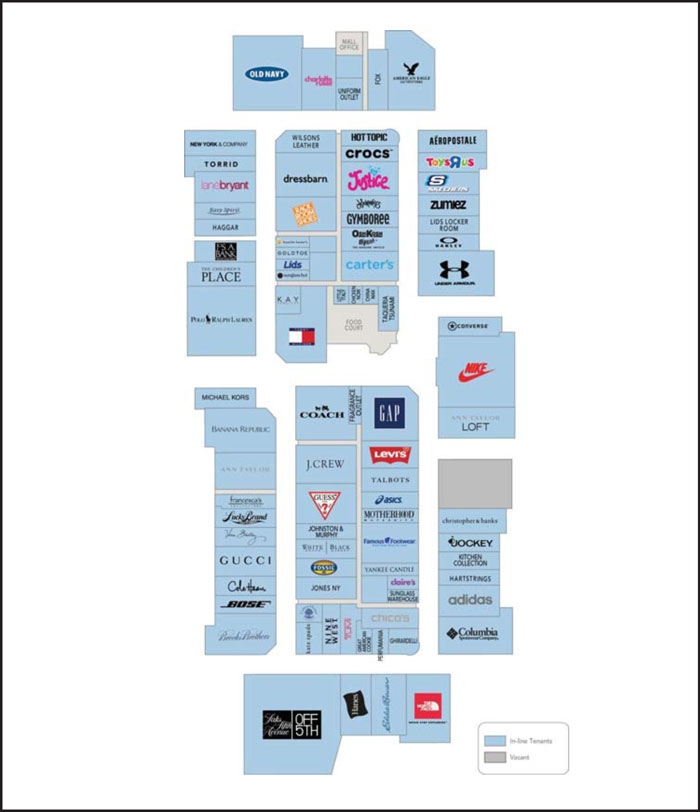
THE INFORMATION IN THIS STRUCTURAL AND COLLATERAL TERM SHEET IS NOT COMPLETE AND MAY BE AMENDED PRIOR TO THE TIME OF SALE. THIS TERM SHEET IS NOT AN OFFER TO SELL THESE SECURITIES AND IT IS NOT A SOLICITATION OF AN OFFER TO BUY THESE SECURITIES IN ANY JURISDICTION WHERE THE OFFER OR SALE IS NOT PERMITTED.
| | |
| 91 of 133 |
| Structural and Collateral Term Sheet | JPMBB 2014-C26 |
The Outlet Shoppes of the Bluegrass |
| Mortgage Loan Information | Property Information | |||
| Mortgage Loan Seller: | JPMCB | Single Asset / Portfolio: | Single Asset | |
Original Principal Balance(1): | $45,000,000 | Title: | Fee | |
Cut-off Date Principal Balance(1): | $45,000,000 | Property Type - Subtype: | Retail – Outlet Center | |
| % of Pool by IPB: | 3.1% | Net Rentable Area (SF): | 374,683 | |
| Loan Purpose: | Refinance | Location: | Simpsonville, KY | |
| Borrower: | Bluegrass Outlet Shoppes CMBS, | Year Built / Renovated: | 2014 / N/A | |
| LLC | Occupancy: | 97.5% | ||
Sponsors(2): | Various | Occupancy Date: | 10/1/2014 | |
| Interest Rate: | 4.04500% | Number of Tenants: | 88 | |
| Note Date: | 11/24/2014 | 2011 NOI(3): | N/A | |
| Maturity Date: | 12/1/2024 | 2012 NOI(3): | N/A | |
| Interest-only Period: | None | 2013 NOI(3): | N/A | |
| Original Term: | 120 months | TTM NOI(3): | N/A | |
| Original Amortization: | 360 months | UW Economic Occupancy: | 97.5% | |
| Amortization Type: | Balloon | UW Revenues: | $12,708,777 | |
| Call Protection: | L(25),Grtr1%orYM(91),O(4) | UW Expenses: | $3,976,907 | |
| Lockbox: | CMA | UW NOI: | $8,731,870 | |
| Additional Debt: | Yes | UW NCF: | $8,169,433 | |
| Additional Debt Balance: | $32,500,000 | Appraised Value / Per SF: | $123,000,000 / $328 | |
| Additional Debt Type: | Pari Passu | Appraisal Date: | 11/2/2014 | |
Escrows and Reserves(4) | Financial Information(1) | ||||||
| Initial | Monthly | Initial Cap | Cut-off Date Loan / SF: | $207 | |||
| Taxes: | $124,895 | $62,448 | N/A | Maturity Date Loan / SF: | $163 | ||
| Insurance: | $0 | Springing | N/A | Cut-off Date LTV: | 63.0% | ||
| Replacement Reserves: | $0 | Springing | $150,000 | Maturity Date LTV: | 49.7% | ||
| TI/LC: | $0 | Springing | N/A | UW NCF DSCR: | 1.83x | ||
| Other: | $6,958,372 | $0 | N/A | UW NOI Debt Yield: | 11.3% | ||
| Sources and Uses | ||||||
| Sources | Proceeds | % of Total | Uses | Proceeds | % of Total | |
Mortgage Loan(1) | $77,500,000 | 100.0% | Payoff Existing Debt | $47,988,196 | 61.9% | |
| Return of Equity | 19,330,251 | 24.9 | ||||
| Upfront Reserves | 7,083,267 | 9.1 | ||||
| Closing Costs | 3,098,287 | 4.0 | ||||
| Total Sources | $77,500,000 | 100.0% | Total Uses | $77,500,000 | 100.0% | |
| (1) | The Outlet Shoppes of the Bluegrass is part of a loan evidenced by two pari passu notes with an aggregate original principal balance of $77.5 million. The Financial Information presented in the chart above reflects the Cut-off Date balance of the $77.5 million The Outlet Shoppes of the Bluegrass Whole Loan. |
| (2) | For a full description of the loan sponsors, please refer to “The Sponsors” below. |
| (3) | Historical NOI is not available because the property was built in 2014. |
| (4) | For a full description of Escrows and Reserves, please refer to “Escrows and Reserves” below. |
The Loan. The Outlet Shoppes of the Bluegrass loan is secured by a first mortgage lien on a 374,683 square foot regional outlet mall located in Simpsonville, Kentucky. The whole loan has an outstanding principal balance of $77.5 million (“The Outlet Shoppes of the Bluegrass Whole Loan”), which is comprised of two pari passu notes, Note A-1 and Note A-2. Note A-1 has an outstanding principal balance as of the Cut-off Date of $45.0 million and is being contributed to the JPMBB 2014-C26 Trust. Note A-2 has an outstanding principal balance as of the Cut-off Date of $32.5 million and is expected to be contributed to a future securitization trust. The holder of Note A-1 (the “Controlling Noteholder”) will be the trustee of the JPMBB 2014-C26 Trust. The trustee of the JPMBB 2014-C26 Trust (or, prior to the occurrence and continuance of a Control Event under the pooling and servicing agreement, the Directing Certificateholder) will be entitled to exercise all of the rights of the Controlling Noteholder with respect to The Outlet Shoppes of the Bluegrass Whole Loan; however, the holder of Note A-2 will be entitled, under certain circumstances, to consult with respect to certain major decisions. The Outlet Shoppes of the Bluegrass Whole Loan has a 10-year term and amortizes on a 30-year schedule.
THE INFORMATION IN THIS STRUCTURAL AND COLLATERAL TERM SHEET IS NOT COMPLETE AND MAY BE AMENDED PRIOR TO THE TIME OF SALE. THIS TERM SHEET IS NOT AN OFFER TO SELL THESE SECURITIES AND IT IS NOT A SOLICITATION OF AN OFFER TO BUY THESE SECURITIES IN ANY JURISDICTION WHERE THE OFFER OR SALE IS NOT PERMITTED.
| | |
| 92 of 133 |
| Structural and Collateral Term Sheet | JPMBB 2014-C26 |
The Outlet Shoppes of the Bluegrass |
The Borrower. The borrowing entity for The Outlet Shoppes of the Bluegrass Whole Loan is Bluegrass Outlet Shoppes CMBS, LLC, a Delaware limited liability company and special purpose entity.
The Sponsor. The loan sponsor is a joint venture between CBL & Associates Limited Partnership (“CBL”) and Horizon Group Properties, L.P. (“Horizon”). CBL was founded in 1978 and is headquartered in Chattanooga, Tennessee. CBL (NYSE: CBL, rated Baa3/BBB- by Moody’s and Fitch) is one of the largest REITs in the United States. As of December 31, 2013, CBL owned controlling interests in 75 regional malls or outlet centers. Horizon is a publicly traded REIT founded in 1998 and headquartered in Rosemont, Illinois. The firm engages in the ownership, operation, and development of shopping centers in the United States. The loan sponsor has a current basis in the property of approximately $79.9 million.
The Property. The Outlet Shoppes of the Bluegrass is a 374,683 square foot one-level regional mall located in Simpsonville, Kentucky. The property recently opened in July 2014 and is located on approximately 36.1 acres. The property is anchored by Saks Fifth Avenue Off 5th (24,558 square feet) which is the only Saks Fifth Avenue Off 5th in the state. The property also includes several smaller anchors including Nike (14,355 square feet), Old Navy (13,266 square feet) and Polo Ralph Lauren (12,317 square feet), as well as several high-end tenants including Coach and Gucci. The Gucci store is the only one in the state. The property has approximately 1,885 parking spaces which are included in the collateral, resulting in a parking ratio of approximately 5.03 spaces per 1,000 square feet of net rentable area.
The property opened in July 2014 at 95.0% occupancy and subsequently signed new leases with Gucci, Kate Spade and Tumi bringing occupancy up to 97.5% by October 1, 2014. In addition to its anchors, the property’s in-line tenants generally consist of national tenants such as American Eagle, Under Armour, Tommy Hilfiger, Gap and Banana Republic.
The Outlet Shoppes of the Bluegrass is the only premium outlet center in Kentucky and is located in Simpsonville which is between Louisville and Lexington on Interstate 64. Simpsonville is located in the Louisville metropolitan statistical area and is approximately 22 miles east of the Louisville central business district and approximately 55 miles west of Lexington. The property’s central location allows the center to draw from both markets. In addition, there are 50,000 college students located within a 40-mile radius. Regional access to the area is provided by Interstates 64, 65, and 71 and according to the appraisal benefits from an average traffic count of 68,000 cars per day. According to the appraisal, the primary trade area within a 40-mile radius contained approximately 1,418,229 people, with a median household income of $66,083, in 2014. The properties secondary trade area spans up to a 50-mile radius and contains approximately 2,000,742 people with a median household income of $65,226. The appraisal concluded that market rents were generally in-line with the rents in-place at the property of $24.08 per square foot. According to the appraisal, the property’s primary and secondary competition consists of the six properties detailed in the table below. The closest outlet center is 83 miles from the property.
Competitive Set Summary(1) | |||||
| Property | Year Built / Renovated | Total GLA | Est. Occ. | Proximity (miles) | Anchor Tenants |
| The Paddock Shops | 2001 / N/A | 365,302 | 98% | 13.9 | Old Navy, Ulta, BB&B, Earth Fair, Office Depot |
| Springhurst Towne Center | 1997 / N/A | 798,035 | 95% | 12.6 | Meijer, Target, Kohl’s, Dick’s, TJ Maxx |
| Shelbyville Road Plaza | 1954 / 2007 | 388,803 | 90% | 15.4 | Ross, Nordstrom’s, Feeder’s Supply, Nike, Guitar Center |
| Plaza at Fayette | 2006 / N/A | 216,841 | 99% | 47.2 | Old Navy, Kirkland’s, Gordman’s, Cinamark, Guitar Center |
| Cincinnati Premium Outlets | 2009 / N/A | 425,000 | 100% | 100.0 | Gap Brands, Adidas, Reebok, Saks, Nike |
| Edinburgh Premium Outlets | 1989 / 1994 | 377,772 | 100% | 83.0 | Hilfiger, Dress Barn, Gap Brands, Rue21, Nike, VF |
| (1) | Per the appraisal. |
Historical and Current Occupancy(1) | |||
| 2011 | 2012 | 2013 | Current(2) |
| N/A | N/A | N/A | 97.5% |
| (1) | 2011, 2012 and 2013 Occupancy figures are not available because the property opened in 2014. |
| (2) | Current Occupancy is as of October 1, 2014. |
THE INFORMATION IN THIS STRUCTURAL AND COLLATERAL TERM SHEET IS NOT COMPLETE AND MAY BE AMENDED PRIOR TO THE TIME OF SALE. THIS TERM SHEET IS NOT AN OFFER TO SELL THESE SECURITIES AND IT IS NOT A SOLICITATION OF AN OFFER TO BUY THESE SECURITIES IN ANY JURISDICTION WHERE THE OFFER OR SALE IS NOT PERMITTED.
| | |
| 93 of 133 |
| Structural and Collateral Term Sheet | JPMBB 2014-C26 |
The Outlet Shoppes of the Bluegrass |
According to the loan sponsors, in August and September, 85 tenants that reported sales at the property achieved combined sales of $30.7 million. Assuming a 20% “grand opening haircut” and the loan sponsors’ estimates of sales dispersion by month, tenants would achieve total sales of approximately $158 million or $444 per square foot. The sensitivity chart below offers projections based upon a range of haircuts to the estimated sales extrapolated from the first two months. Sixty-seven tenants at the property have termination options based on sales thresholds, which are generally exercisable between 2017 and 2020.
| Preliminary Sales Sensitivity | |||
| Grand Opening Haircut | Estimated Total Sales(1) | Sales PSF | Occupancy Cost |
0%(2) | $197,722,444 | $555 | 5.8% |
| 10% | $177,950,199 | $499 | 6.4% |
| 20% | $158,177,955 | $444 | 7.2% |
| 30% | $138,405,711 | $388 | 8.3% |
| (1) | Estimated Total Sales were calculated based on the August 2014 and September 2014 sales only, taking into account the projected sales distribution at the property. Because the Estimated Total Sales were based on a limited number of months of sales data, the actual sales at the property during a 12 month period may be materially lower than the estimate. Additionally, the Estimated Total Sales were calculated taking into account an estimate of the monthly distribution of total sales during a calendar year. The actual sales distribution at the property during any calendar year may be materially different from the monthly sales distribution used in determining the Estimated Total Sales. |
| (2) | Assumes reported sales for 85 tenants of $30.7 million are annualized at the seasonal weights estimated by the loan sponsors with no adjustments. |
Tenant Summary(1) | |||||
| Tenant | Ratings(2) Moody’s/S&P/Fitch | Net Rentable Area (SF) | % of Total NRA | Base Rent PSF | Lease Expiration Date |
Saks Fifth Avenue Off 5th(3)(4) | B1 / B+ / NA | 24,558 | 6.6% | $9.00 | 7/31/2024 |
| Nike | A1 / AA- / NA | 14,355 | 3.8% | $21.00 | 1/31/2020 |
| Old Navy | Baa3 / BBB- / BBB- | 13,266 | 3.5% | $17.50 | 7/31/2019 |
Polo Ralph Lauren(3)(5) | A3 / A / NA | 12,317 | 3.3% | $16.67 | 1/31/2025 |
| American Eagle | NA / NA / NA | 9,194 | 2.5% | $21.42 | 1/31/2020 |
Under Armour(6) | NA / NA / NA | 8,847 | 2.4% | $23.18 | 7/31/2019 |
Tommy Hilfiger(7) | Ba3 / BB+ / NA | 8,039 | 2.1% | $22.00 | 8/31/2019 |
| Gap | Baa3 / BBB- / BBB- | 7,836 | 2.1% | $18.95 | 7/31/2019 |
| Banana Republic | Baa3 / BBB- / BBB- | 7,729 | 2.1% | $19.00 | 7/31/2019 |
Coach(3)(8) | NA / NA / NA | 7,651 | 2.0% | $39.21 | 1/31/2025 |
| (1) | Based on the underwritten rent roll. |
| (2) | Ratings provided are for the parent company of the entity listed in the “Tenant” field whether or not the parent company guarantees the lease. |
| (3) | Tenant pays percent-in-lieu for entire lease term. PIL is based on the minimum PIL payment per the leases or estimated sales provided by the borrower and these tenants will pay PIL for their entire lease terms. |
| (4) | If gross sales for the fifth lease year are less than $7.0 million, the tenant will have the right to terminate the lease with 90 days’ notice. |
| (5) | If gross sales for the fifth lease year are less than or equal to $500 per square foot, the tenant will have the right to terminate the lease with 60 days’ notice. |
| (6) | If gross sales for the third lease year are less than $2.0 million, the tenant will have the right to terminate the lease with 60 days’ notice. |
| (7) | If gross sales for the third lease year are less than approximately $2.2 million, the tenant will have the right to terminate the lease with 90 days’ notice. |
| (8) | If gross sales for the fourth lease year are less than $5.0 million, the tenant will have the right to terminate the lease with 90 days’ notice. |
THE INFORMATION IN THIS STRUCTURAL AND COLLATERAL TERM SHEET IS NOT COMPLETE AND MAY BE AMENDED PRIOR TO THE TIME OF SALE. THIS TERM SHEET IS NOT AN OFFER TO SELL THESE SECURITIES AND IT IS NOT A SOLICITATION OF AN OFFER TO BUY THESE SECURITIES IN ANY JURISDICTION WHERE THE OFFER OR SALE IS NOT PERMITTED.
| | |
| 94 of 133 |
| Structural and Collateral Term Sheet | JPMBB 2014-C26 |
The Outlet Shoppes of the Bluegrass |
| Percent-in-lieu Rent Schedule | ||||
Tenant | Estimated Year One Sales(1) | Estimated Sales PSF(1) | PIL | Underwritten Rent |
| Gucci | $7,500,300 | $1,604 | 5.00% | $375,015 |
| Coach | 10,000,000 | $1,307 | 3.00% | 300,000 |
| Saks Fifth Avenue Off 5th | 6,314,914 | $257 | 3.50% | 221,022 |
Polo Ralph Lauren(2) | 7,184,933 | $583 | 3.00% | 205,284 |
| Total | $31,000,147 | $1,101,321 | ||
| (1) | Based on estimates provided by the loan sponsors given experience managing other outlet centers as well as discussions with leasing agents. |
| (2) | Polo Ralph Lauren will pay 3.00% percent-in-lieu rent if sales are below $500 PSF; 2.00% percent-in-lieu rent if sales are between $500 PSF and $1,000 PSF and 1.00% percent-in-lieu rent if sales are in excess of $1,000 PSF. |
Of the 88 tenants, 73 tenants representing 336,589 square feet have co-tenancy provisions. These provisions generally require a minimum occupancy at the property ranging from 65.0%-85.0%. Twenty-eight of these tenants representing 150,425 square feet require that key tenants remain at the property which generally include Sak’s Fifth Avenue Off 5th, Coach, Nike and Tommy Hilfiger. If these co-tenancy clauses are not met, these tenants begin paying alternate rent which is a percentage of gross sales generally ranging from 1.0% to 50.0%.
Lease Rollover Schedule(1) | ||||||||||||
| Year | Number of Leases Expiring | Net Rentable Area Expiring | % of NRA Expiring | Base Rent Expiring | % of Base Rent Expiring | Cumulative Net Rentable Area Expiring | Cumulative % of NRA Expiring | Cumulative Base Rent Expiring | Cumulative % of Base Rent Expiring | |||
| Vacant | NAP | 9,315 | 2.5 | % | NAP | NAP | 9,315 | 2.5% | NAP | NAP | ||
| 2014 | 0 | 0 | 0.0 | $0 | 0.0 | % | 9,315 | 2.5% | $0 | 0.0% | ||
| 2015 | 1 | 3,402 | 0.9 | 85,050 | 0.9 | 12,717 | 3.4% | $85,050 | 0.9% | |||
| 2016 | 0 | 0 | 0.0 | 0 | 0.0 | 12,717 | 3.4% | $85,050 | 0.9% | |||
| 2017 | 1 | 2,073 | 0.6 | 55,000 | 0.6 | 14,790 | 3.9% | $140,050 | 1.6% | |||
| 2018 | 0 | 0 | 0.0 | 0 | 0.0 | 14,790 | 3.9% | $140,050 | 1.6% | |||
| 2019 | 14 | 69,430 | 18.5 | 1,550,739 | 17.2 | 84,220 | 22.5% | $1,690,789 | 18.7% | |||
| 2020 | 11 | 54,686 | 14.6 | 1,512,189 | 16.8 | 138,906 | 37.1% | $3,202,979 | 35.5% | |||
| 2021 | 0 | 0 | 0.0 | 0 | 0.0 | 138,906 | 37.1% | $3,202,979 | 35.5% | |||
| 2022 | 0 | 0 | 0.0 | 0 | 0.0 | 138,906 | 37.1% | $3,202,979 | 35.5% | |||
| 2023 | 0 | 0 | 0.0 | 0 | 0.0 | 138,906 | 37.1% | $3,202,979 | 35.5% | |||
| 2024 | 39 | 137,130 | 36.6 | 3,416,882 | 37.9 | 276,036 | 73.7% | $6,619,861 | 73.4% | |||
| 2025 & Beyond | 22 | 98,647 | 26.3 | 2,403,626 | 26.6 | 374,683 | 100.0% | $9,023,487 | 100.0% | |||
| Total | 88 | 374,683 | 100.0 | % | $9,023,487 | 100.0 | % | |||||
| (1) | Based on the underwritten rent roll. |
THE INFORMATION IN THIS STRUCTURAL AND COLLATERAL TERM SHEET IS NOT COMPLETE AND MAY BE AMENDED PRIOR TO THE TIME OF SALE. THIS TERM SHEET IS NOT AN OFFER TO SELL THESE SECURITIES AND IT IS NOT A SOLICITATION OF AN OFFER TO BUY THESE SECURITIES IN ANY JURISDICTION WHERE THE OFFER OR SALE IS NOT PERMITTED.
| | |
| 95 of 133 |
| Structural and Collateral Term Sheet | JPMBB 2014-C26 |
The Outlet Shoppes of the Bluegrass |
Underwritten Net Cash Flow | ||||
| Underwritten | Per Square Foot | %(1) | ||
Rents in Place(2) | $9,023,487 | $24.08 | 75.3% | |
| Vacant Income | 204,930 | 0.55 | 1.7 | |
| Gross Potential Rent | $9,228,417 | $24.63 | 77.0% | |
| Total Reimbursements | 2,749,646 | 7.34 | 23.0 | |
| Net Rental Income | $11,978,063 | $31.97 | 100.0% | |
| (Vacancy/Credit Loss) | (298,657) | (0.80) | (2.5) | |
Other Income(3) | 1,029,371 | 2.75 | 8.6 | |
| Effective Gross Income | $12,708,777 | $33.92 | 106.1% | |
| Total Expenses | $3,976,907 | $10.61 | 31.3% | |
| Net Operating Income | $8,731,870 | $23.30 | 68.7% | |
| Total TI/LC, Capex/RR | 562,437 | 1.50 | 4.4 | |
| Net Cash Flow | $8,169,433 | $21.80 | 64.3% | |
(1) Percentage column represents percent of Net Rental Income for all revenue lines and represents percent of Effective Gross Income for the remainder of fields. |
(2) Underwritten Rents in Place are based on October 1, 2014 rent roll, with underwritten rent bumps totaling $40,927 through November 2015. Four tenants pay PIL, which comprises approximately $1.1 million of Underwritten Rents in Place based on estimated sales of approximately $31.0 million. PIL tenants include Saks Fifth Avenue Off 5th, Coach, Gucci and Polo Ralph Lauren. |
(3) Other income primarily includes tenant marketing income including signage and branding income. |
Property Management. The property is managed by Horizon Group Properties, L.P., an affiliate of one of the loan sponsors.
Escrows and Reserves. At origination, the borrower deposited into escrow approximately $7.0 million for outstanding tenant improvement and leasing commissions associated with 62 tenants and $124,895 for real estate taxes.
Tax Escrows - On a monthly basis, the borrower is required to escrow 1/12 of the annual estimated tax payments, which currently
equates to $62,448.
Insurance Escrows - The requirement for the borrower to make monthly deposits to the insurance escrow is waived so long as no event of default or Cash Sweep Event exists and so long as the borrower provides satisfactory evidence that the property is insured under an acceptable blanket policy.
Replacement Reserves - The requirement for the borrower to make monthly deposits to the replacement reserve is waived through September 30, 2015 so long as no event of default exists. At any time after September 30, 2015, the requirement for the borrower to make monthly deposits to the replacement reserve is waived so long as the debt service coverage ratio as calculated in the loan documents based on the trailing twelve months does not fall below 1.30x for the two consecutive calendar quarters preceding the date of determination (a “Replacement Reserve DSCR Trigger”) and no event of default exists. Following the occurrence and during the continuance of a Replacement Reserve DSCR Trigger or an event of default, the borrower is required to deposit $6,250 per month (approximately $0.20 per square foot annually) for replacement reserves. The reserve is subject to a cap of $150,000 (approximately $0.40 per square foot).
TI/LC Reserves - On a monthly basis commencing on December 1, 2017, the borrower is required to escrow $43,123 (approximately $1.38 per square foot annually) for tenant improvements and leasing commissions.
Lockbox / Cash Management. The loan is structured with a CMA lockbox. The borrower and/or manager was required to send tenant direction letters to all tenants instructing them to deposit all rents and payments into the lockbox account controlled by the lender. The funds are then returned to an account controlled by the borrower until the occurrence of a Cash Sweep Event. During the continuance of a Cash Sweep Event, all rents will be swept daily to a segregated cash management account and held in trust and for the benefit of the lender. The lender will have a first priority security interest in the cash management account. Upon the occurrence and during the continuance of a Cash Sweep Event, all excess cash after payment of debt service, required reserves and budgeted operating expenses will be held as additional security for the loan.
A “Cash Sweep Event” means: (i) the occurrence and continuance of an event of default, (ii) any bankruptcy action of the borrower or manager or (iii) the debt service coverage ratio as calculated in the loan documents based on the trailing twelve months falls below 1.20x.
THE INFORMATION IN THIS STRUCTURAL AND COLLATERAL TERM SHEET IS NOT COMPLETE AND MAY BE AMENDED PRIOR TO THE TIME OF SALE. THIS TERM SHEET IS NOT AN OFFER TO SELL THESE SECURITIES AND IT IS NOT A SOLICITATION OF AN OFFER TO BUY THESE SECURITIES IN ANY JURISDICTION WHERE THE OFFER OR SALE IS NOT PERMITTED.
| | |
| 96 of 133 |
| Structural and Collateral Term Sheet | JPMBB 2014-C26 |
The Outlet Shoppes of the Bluegrass |
Release of Outparcels. At any time during the term of the loan, the borrower is permitted to release an unimproved release parcel in accordance with certain terms and conditions set forth in the loan documents.
Phase II Development. The area surrounding the shopping center can accommodate additional improvements that will not be included as collateral for the loan. According to the loan sponsors, 57,800 square feet of space is planned to be built adjacent to the shopping center. Leasing is currently underway and tenants will include complementary retail stores and restaurants. Construction is estimated to commence in the first quarter of 2015 and will be built on land that is not part of the collateral for the loan. There is also an outparcel containing 0.3 acres that may be developed which is not part of the collateral for the loan. There is currently no development activity with respect to the outparcel. The appraiser has allocated no value to either of these parcels or their related development potential.
THE INFORMATION IN THIS STRUCTURAL AND COLLATERAL TERM SHEET IS NOT COMPLETE AND MAY BE AMENDED PRIOR TO THE TIME OF SALE. THIS TERM SHEET IS NOT AN OFFER TO SELL THESE SECURITIES AND IT IS NOT A SOLICITATION OF AN OFFER TO BUY THESE SECURITIES IN ANY JURISDICTION WHERE THE OFFER OR SALE IS NOT PERMITTED.
| | |
| 97 of 133 |
| Structural and Collateral Term Sheet | JPMBB 2014-C26 |
[THIS PAGE INTENTIONALLY LEFT BLANK]
THE INFORMATION IN THIS STRUCTURAL AND COLLATERAL TERM SHEET IS NOT COMPLETE AND MAY BE AMENDED PRIOR TO THE TIME OF SALE. THIS TERM SHEET IS NOT AN OFFER TO SELL THESE SECURITIES AND IT IS NOT A SOLICITATION OF AN OFFER TO BUY THESE SECURITIES IN ANY JURISDICTION WHERE THE OFFER OR SALE IS NOT PERMITTED.
| | |
| 98 of 133 |
| Structural and Collateral Term Sheet | JPMBB 2014-C26 | |
| United Healthcare Office | ||
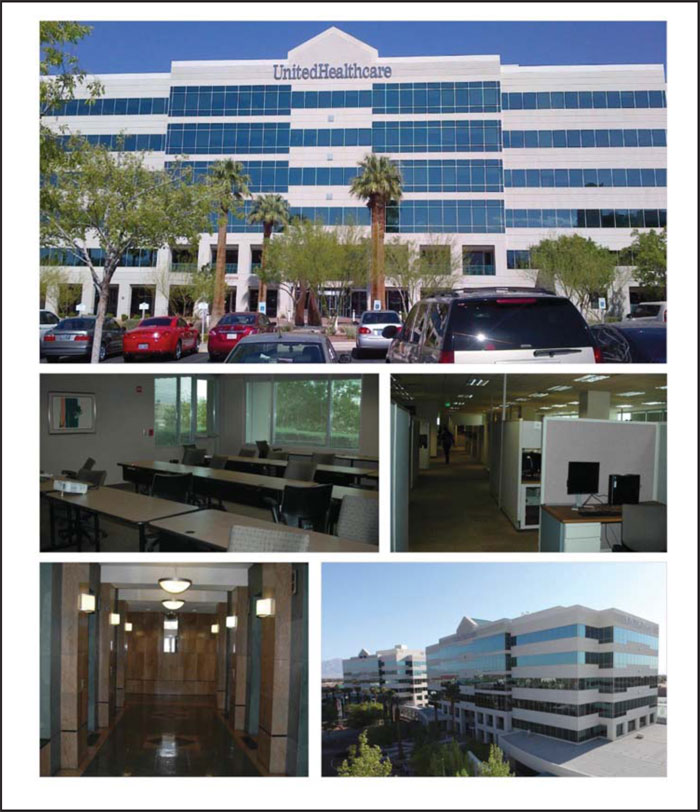
THE INFORMATION IN THIS STRUCTURAL AND COLLATERAL TERM SHEET IS NOT COMPLETE AND MAY BE AMENDED PRIOR TO THE TIME OF SALE. THIS TERM SHEET IS NOT AN OFFER TO SELL THESE SECURITIES AND IT IS NOT A SOLICITATION OF AN OFFER TO BUY THESE SECURITIES IN ANY JURISDICTION WHERE THE OFFER OR SALE IS NOT PERMITTED.
| | |
| 99 of 133 |
| Structural and Collateral Term Sheet | JPMBB 2014-C26 | |
| United Healthcare Office | ||
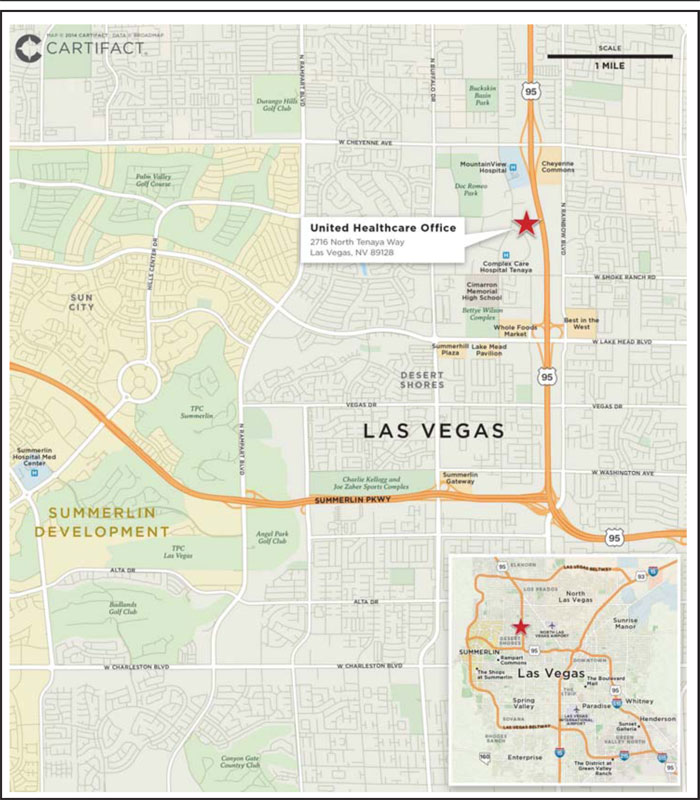
THE INFORMATION IN THIS STRUCTURAL AND COLLATERAL TERM SHEET IS NOT COMPLETE AND MAY BE AMENDED PRIOR TO THE TIME OF SALE. THIS TERM SHEET IS NOT AN OFFER TO SELL THESE SECURITIES AND IT IS NOT A SOLICITATION OF AN OFFER TO BUY THESE SECURITIES IN ANY JURISDICTION WHERE THE OFFER OR SALE IS NOT PERMITTED.
| | |
| 100 of 133 |
| Structural and Collateral Term Sheet | JPMBB 2014-C26 | |
| United Healthcare Office | ||
| Mortgage Loan Information | Property Information | |||
| Mortgage Loan Seller: | Barclays | Single Asset / Portfolio: | Single Asset | |
| Original Principal Balance: | $42,000,000 | Title: | Fee | |
| Cut-off Date Principal Balance: | $42,000,000 | Property Type - Subtype: | Office - Suburban | |
| % of Pool by IPB: | 2.9% | Net Rentable Area (SF): | 204,123 | |
| Loan Purpose: | Refinance | Location: | Las Vegas, NV | |
| Borrower: | 2716 N. Tenaya Loan 1, LLC | Year Built / Renovated: | 1998 / N/A | |
| Sponsor: | Lloyd W. Kendall, Jr. | Occupancy: | 100.0% | |
| Interest Rate: | 4.74186% | Occupancy Date: | 12/6/2014 | |
| Note Date: | 10/1/2014 | Number of Tenants: | 1 | |
| Maturity Date: | 10/6/2019 | 2011 NOI(1)(2): | N/A | |
| Interest-only Period: | 60 months | 2012 NOI(1)(2): | N/A | |
| Original Term: | 60 months | 2013 NOI(1): | $5,689,966 | |
| Original Amortization: | None | TTM NOI (as of 6/2014)(1): | $5,738,737 | |
| Amortization Type: | Interest Only | UW Economic Occupancy: | 100.0% | |
| Call Protection: | L(26),Def(27),O(7) | UW Revenues: | $4,209,843 | |
| Lockbox: | Hard | UW Expenses: | $84,197 | |
| Additional Debt: | Yes | UW NOI(1): | $4,125,646 | |
| Additional Debt Balance: | $9,000,000 | UW NCF: | $4,088,904 | |
| Additional Debt Type: | Mezzanine Loan | Appraised Value / Per SF: | $60,000,000 / $294 | |
| Appraisal Date: | 7/9/2014 | |||
Escrows and Reserves(3) | Financial Information | |||||
| Initial | Monthly | Initial Cap | Cut-off Date Loan / SF: | $206 | ||
| Taxes: | $0 | Springing | N/A | Maturity Date Loan / SF: | $206 | |
| Insurance: | $0 | Springing | N/A | Cut-off Date LTV: | 70.0% | |
| Replacement Reserves: | $0 | $0 | N/A | Maturity Date LTV: | 70.0% | |
| TI/LC: | $0 | $0 | N/A | UW NCF DSCR: | 2.02x | |
| Other: | $0 | $0 | N/A | UW NOI Debt Yield: | 9.8% | |
| Sources and Uses | ||||||
| Sources | Proceeds | % of Total | Uses | Proceeds | % of Total | |
| Mortgage Loan | $42,000,000 | 82.4% | Loan Payoff | $47,182,899 | 92.5% | |
| Mezzanine Loan | 9,000,000 | 17.6 | United Healthcare Payment(4) | 3,316,999 | 6.5 | |
| Closing Costs | 497,933 | 1.0 | ||||
| Return of Equity | 2,169 | 0.0 | ||||
| Total Sources | $51,000,000 | 100.0% | Total Uses | $51,000,000 | 100.0% | |
| (1) | UW NOI is less than historical figures as a result of a new lease executed in July 2014 with United Healthcare Services, Inc. (“UHS”) for a rental rate below its previous rental rate. Based on the previous lease executed by Sierra Healthcare Services, Inc. in December 2000 and assumed by UHS in 2008, UHS’s monthly base rents for 2011, 2012, 2013 and 2014 were $434,304, $440,818, $447,431 and $454,142, respectively. Based on the new 11.5-year lease, UHS’s current monthly base rent is $331,700 and will increase 3.0% annually beginning in January 2016. The underwritten monthly base rent equals $350,820, which reflects the straight line average base rent over the five-year loan term. |
| (2) | 2011 NOI and 2012 NOI are not available as the property and previous loan went into court appointed receivership in August 2011. Please refer to “Maturity Default” below. The 2011 and 2012 monthly base rents under the previous NNN lease were $434,304 and $440,818, which equate to annual rents of $5,211,648 and $5,289,816, respectively. |
| (3) | For a full description of Escrows and Reserves, please refer to “Escrows and Reserves” below. |
| (4) | The UHS lease is structured with a 10-month free rent period between October 2014 and July 2015. According to the lease, and at the borrower’s option, the borrower was entitled to elect to pay UHS any outstanding free rent amounts in lieu of the tenant continuing to receive free rent. At loan origination, the borrower elected to pay UHS $3,316,999, which represents the outstanding free rent due under the lease. UHS no longer has a free rent period and is currently paying rent of $331,700 per month. |
The Loan. The United Healthcare Office loan has an outstanding principal balance of $42.0 million and is secured by a first mortgage lien on the borrower’s fee interest in a six-story, Class A, 204,123 square foot office building located in Las Vegas, Nevada. The loan has a five-year term and is interest only for the term of the loan. The previously existing debt was securitized in WBCMT 2006-C27.
THE INFORMATION IN THIS STRUCTURAL AND COLLATERAL TERM SHEET IS NOT COMPLETE AND MAY BE AMENDED PRIOR TO THE TIME OF SALE. THIS TERM SHEET IS NOT AN OFFER TO SELL THESE SECURITIES AND IT IS NOT A SOLICITATION OF AN OFFER TO BUY THESE SECURITIES IN ANY JURISDICTION WHERE THE OFFER OR SALE IS NOT PERMITTED.
| | |
| 101 of 133 |
| Structural and Collateral Term Sheet | JPMBB 2014-C26 | |
| United Healthcare Office | ||
The Borrower. The borrowing entity for the United Healthcare Office loan is 2716 N. Tenaya Loan 1, LLC, a Delaware limited liability company and special purpose entity.
The Sponsor. The loan sponsor and non-recourse carve-out guarantor is Lloyd W. Kendall, Jr., an affiliate of Breakwater Equity Partners. The original borrowing entity purchased the property in 2006 for $73.0 million and after accounting for closing costs and upfront reserves, will have approximately $22.0 million of equity remaining. An affiliate of Breakwater Equity Partners is the managing member of the new borrowing entity. Breakwater Equity Partners is a commercial real estate consulting firm. Lloyd W. Kendall, Jr. has ownership interests in three other commercial properties which are collectively valued at approximately $133.3 million.
The Property. United Healthcare Office is a six-story, 204,123 square foot, Class A office property located in Las Vegas, Nevada, approximately six miles northwest of the Las Vegas central business district and eight miles northwest of the Las Vegas Strip. The property was built in 1998 and includes a five-story parking garage with 727 spaces and 182 surface spaces, resulting in a parking ratio of 4.5 spaces per 1,000 square feet, which is greater than the property’s primary competition. Building amenities include two auditoriums, several conference rooms, a library, an executive dining room, employee cafeteria and beauty salon.
As of December 6, 2014, the property was 100.0% occupied by a single tenant, UHS. Since 2000, the property has been 100.0% occupied by UHS or Sierra Health Services, Inc. (acquired by United Health Group in 2008). The property serves as the main administrative office for the UHS’s west coast operations and houses a total of 800 employees. According to the borrower, the tenant is consolidating employees from another office location into the property.
On July 15, 2014, UHS signed a new lease with 11.5-year term through December 31, 2025, approximately six years and three months past the loan’s maturity date. The lease includes three five-year extension options, resulting in a fully extended maturity date of December 31, 2040. The lease is triple net with the tenant being responsible for all operating and building maintenance expenses. According to the appraisal, the tenant’s current rental rate of $19.50 per square foot is in-line with market rental rates. If UHS exercises the extension options, the rental rate would be 95% of the then current market rental rate and would increase 3.0% annually.
United Health Group, UHS’s parent company, is based in Minnetonka, Minnesota and is rated A3, A+ and A- by Moody’s, S&P and Fitch, respectively. In 2008, United Health Group acquired Sierra Health Services, Inc., who previously occupied the property. United Health Group provides affordable health plans, quality patient care and advanced technology in order to help people achieve optimal health. The company features an array of medical services and specialties such as, cardiology, endocrinology, gastroenterology, neurology, podiatry, rheumatology, pain management and on-site urgent care services. United Health Group serves more than 85 million individuals worldwide, covering all 50 states and more than 125 countries around the world. As of year-end 2013, total revenues were approximately $122.5 billion and annualizing June 2014 total revenues equal approximately $128.6 billion. UHS accounts for a substantial portion of United Health Group’s assets. The subsidiaries held by UHS include the individual state insurance holding companies of United Health Group.
The United Healthcare Office property is located immediately west of Highway 95, approximately six miles northwest of the Las Vegas central business district, approximately eight miles northwest of the Las Vegas Strip and approximately 15 miles north of McCarran International Airport. The property is also less than a mile away from Mountain View Hospital and less than five miles away from Summerlin Hospital Medical Center. US Highway 95 is located next to the property and provides access to Phoenix, Arizona to the southeast and Reno, Nevada to the northwest. Additionally, the property has regional access to US Highway 93 and Interstates 215, 15 and 515. Approximately six miles southeast of the property, US Highway 95 intersects Interstate 15. Travel time from the property to the Las Vegas central business district is approximately 20 minutes while travel to McCarran International Airport is approximately 30 minutes. The neighborhood in which the building is located consists of a mixture of residential developments, several retail centers, small strip centers and a mixture of Class A and Class B office buildings.
According to the appraisal, the property is located in the Northwest submarket of the Las Vegas market. As of the first quarter of 2014, there was no new construction of office buildings or Class A office buildings in the Northwest submarket. Furthermore, more than 11,000 square feet of office space was absorbed in the Northwest submarket and approximately 2,000 square feet of Class A office space was absorbed in the Northwest submarket. Per the appraisal, as of the first quarter of 2014, average occupancy for office properties within the Las Vegas market was 77.5%, whereas average occupancy was 66.6% within the Northwest submarket. Comparable office rentals near the property have occupancy rates ranging from 31.0% to 82.0%.
Historical and Current Occupancy(1)(2) | |||
| 2011 | 2012 | 2013 | Current(3) |
| 100.0% | 100.0% | 100.0% | 100.0% |
| (1) | Historical Occupancies are as of December 31 of each respective year. |
| (2) | The property has been 100% occupied since 2000. |
| (3) | Current Occupancy is as of December 6, 2014. |
THE INFORMATION IN THIS STRUCTURAL AND COLLATERAL TERM SHEET IS NOT COMPLETE AND MAY BE AMENDED PRIOR TO THE TIME OF SALE. THIS TERM SHEET IS NOT AN OFFER TO SELL THESE SECURITIES AND IT IS NOT A SOLICITATION OF AN OFFER TO BUY THESE SECURITIES IN ANY JURISDICTION WHERE THE OFFER OR SALE IS NOT PERMITTED.
| | |
| 102 of 133 |
| Structural and Collateral Term Sheet | JPMBB 2014-C26 | |
| United Healthcare Office | ||
Tenant Summary(1) | ||||||||||
| Tenant | Ratings(2) Moody’s/S&P/Fitch | Net Rentable Area (SF) | % of Total NRA | UW Base Rent PSF(3) | Lease Expiration Date | |||||
| United Healthcare Services, Inc. | A3 / A+ / A- | 204,123 | 100.0% | $20.62 | 12/31/2025 | |||||
| (1) | Based on the underwritten rent roll. |
| (2) | Ratings provided are for the parent company of the entity listed in the “Tenant” field whether or not the parent company guarantees the lease. |
| (3) | UW Base Rent PSF is underwritten on a straight-line basis and represents the five-year average over the five-year loan term. |
Lease Rollover Schedule(1) | |||||||||||||||||
| Year | Number of Leases Expiring | Net Rentable Area Expiring | % of NRA Expiring | Base Rent Expiring | % of Base Rent Expiring | Cumulative Net Rentable Area Expiring | Cumulative % of NRA Expiring | Cumulative Base Rent Expiring | Cumulative % of Base Rent Expiring | ||||||||
| Vacant | NAP | 0 | 0.0% | NAP | NAP | 0 | 0.0% | NAP | NAP | ||||||||
| 2014 & MTM | 0 | 0 | 0.0 | $0 | 0.0% | 0 | 0.0% | $0 | 0.0% | ||||||||
| 2015 | 0 | 0 | 0.0 | 0 | 0.0 | 0 | 0.0% | $0 | 0.0% | ||||||||
| 2016 | 0 | 0 | 0.0 | 0 | 0.0 | 0 | 0.0% | $0 | 0.0% | ||||||||
| 2017 | 0 | 0 | 0.0 | 0 | 0.0 | 0 | 0.0% | $0 | 0.0% | ||||||||
| 2018 | 0 | 0 | 0.0 | 0 | 0.0 | 0 | 0.0% | $0 | 0.0% | ||||||||
| 2019 | 0 | 0 | 0.0 | 0 | 0.0 | 0 | 0.0% | $0 | 0.0% | ||||||||
| 2020 | 0 | 0 | 0.0 | 0 | 0.0 | 0 | 0.0% | $0 | 0.0% | ||||||||
| 2021 | 0 | 0 | 0.0 | 0 | 0.0 | 0 | 0.0% | $0 | 0.0% | ||||||||
| 2022 | 0 | 0 | 0.0 | 0 | 0.0 | 0 | 0.0% | $0 | 0.0% | ||||||||
| 2023 | 0 | 0 | 0.0 | 0 | 0.0 | 0 | 0.0% | $0 | 0.0% | ||||||||
| 2024 | 0 | 0 | 0.0 | 0 | 0.0 | 0 | 0.0% | $0 | 0.0% | ||||||||
| 2025 & Beyond | 1 | 204,123 | 100.0 | 4,209,843 | 100.0 | 204,123 | 100.0% | $4,209,843 | 100.0% | ||||||||
| Total | 1 | 204,123 | 100.0% | $4,209,843 | 100.0% | ||||||||||||
| (1) | Based on the underwritten rent roll. |
Operating History and Underwritten Net Cash Flow(1) | ||||||||||
| 2013 | TTM(2) | Underwritten | Per Square Foot | %(3) | ||||||
Rents in Place(4) | $5,817,297 | $5,857,563 | $4,209,843 | $20.62 | 100.0% | |||||
| Vacant Income | 0 | 0 | 0 | 0 | 0.0 | |||||
| Gross Potential Rent | $5,817,297 | $5,857,563 | $4,209,843 | $20.62 | 100.0% | |||||
| Total Reimbursements | 0 | 0 | 0 | 0 | 0.0 | |||||
| Net Rental Income | $5,817,297 | $5,857,563 | $4,209,843 | $20.62 | 100.0% | |||||
| (Vacancy/Credit Loss) | 0 | 0 | 0 | 0 | 0.0 | |||||
| Effective Gross Income | $5,817,297 | $5,857,563 | $4,209,843 | $20.62 | 100.0% | |||||
| Total Expenses | $127,330 | $118,826 | $84,197 | $0.41 | 2.0% | |||||
| Net Operating Income | $5,689,966 | $5,738,737 | $4,125,646 | $20.21 | 98.0% | |||||
| Total Capex/RR | 0 | 0 | 36,742 | 0.18 | 0.9 | |||||
| Net Cash Flow | $5,689,966 | $5,738,737 | $4,088,904 | $20.03 | 97.1% | |||||
| (1) | 2011 NOI and 2012 NOI are not available as the property and previous loan went into court appointed receivership in August 2011. Please refer to “Maturity Default” below. The 2011 and 2012 monthly base rents under the previous NNN lease were $434,304 and $440,818 which equate to annual rents of $5,211,648 and $5,289,816, respectively. |
| (2) | TTM column represents the trailing twelve-month period ending on June 30, 2014. |
| (3) | Percentage column represents percent of Net Rental Income for all revenue lines and represents percent of Effective Gross Income for the remainder of fields. |
| (4) | UW Rents in Place is less than historical figures as a result of a new lease executed in July 2014 with UHS for a rental rate below its previous rental rate. Based on the previous lease executed by Sierra Healthcare Services, Inc. in December 2000 and assumed by UHS in 2008, UHS’s monthly base rents for 2011, 2012, 2013 and 2014 were $434,304, $440,818, $447,431 and $454,142, respectively. Based on the new 11.5-year, lease, UHS’s current monthly base rent is $331,700 and will increase 3.0% annually beginning in January 2016. The underwritten monthly base rent equals $350,820 which reflects the straight line average base rent over the five-year loan term. |
THE INFORMATION IN THIS STRUCTURAL AND COLLATERAL TERM SHEET IS NOT COMPLETE AND MAY BE AMENDED PRIOR TO THE TIME OF SALE. THIS TERM SHEET IS NOT AN OFFER TO SELL THESE SECURITIES AND IT IS NOT A SOLICITATION OF AN OFFER TO BUY THESE SECURITIES IN ANY JURISDICTION WHERE THE OFFER OR SALE IS NOT PERMITTED.
| | |
| 103 of 133 |
| Structural and Collateral Term Sheet | JPMBB 2014-C26 | |
| United Healthcare Office | ||
Property Management. The property is managed by Clear Vista Management, LLC, a Nevada limited liability company.
Escrows and Reserves. At origination, the borrower was not required to deposit funds into escrow.
Tax Escrows - On a monthly basis, the borrower is required to escrow 1/12 of the annual estimated tax payments; however, these are waived for so long as UHS pays for taxes and evidence of such is provided to the lender within five days of written request.
Insurance Escrows - On a monthly basis, the borrower is required to escrow 1/12 of the annual estimated insurance premiums payments; however, these are waived for so long as UHS pays for insurance and evidence of such is provided to lender within five days of written request.
Lockbox / Cash Management. The loan is structured with a hard lockbox and in-place cash management. The borrower was required to send tenant direction letters to tenants instructing them to deposit all rents and payments directly to the lockbox account controlled by the lender. All funds in the lockbox account are swept daily to a cash management account under the control of the lender and disbursed during each monthly payment date of the term of the loan in accordance with the loan documents. To the extent that there is a Triggering Event, all excess cash flow after payment of debt service, required reserves and operating expenses will be held as additional collateral for the loan.
A “Triggering Event” means the period commencing upon the earlier of: (i) an event of default or a mezzanine event of default, (ii) the debt service coverage ratio falling below 1.20x, (iii) United Healthcare Services, Inc. filing for bankruptcy, (iv) United Health Group’s long term unsecured debt being downgraded (as determined by any rating agency rating such debt) below the rating as of the origination date and (v) United Healthcare Services, Inc. going dark, vacating or ceasing operations at the property.
Maturity Default. United Healthcare Office was previously securitized in the WBCMT 2006-C27 transaction with an original balance of $50.75 million. The property was held in a court appointed receivership as a result of a maturity default in August 2011. According to the loan sponsor, the borrower was awaiting the UHS’s lease renewal and the recovery of the real estate market in order to refinance. In July 2014, UHS signed a new lease through December 31, 2025 with an 11.5-year term. In 2012, the owners hired Breakwater Equity Partners to assist in extending and refinancing the loan. An affiliate of Breakwater Equity Partners, Lloyd W. Kendall, Jr., is the non-recourse carve-out guarantor for the loan. An affiliate of Breakwater Equity Partners is the managing member of the new borrowing entity. In February, May and July 2014, the borrower made three principal payments from excess property cash escrows worth approximately $5.5 million, reducing the previous loan’s outstanding principal balance to approximately $45.3 million. At loan origination, a majority of proceeds from the mortgage and mezzanine loans were used by the borrower to pay off the previous loan’s $45.3 million outstanding principal balance, pay $3.3 million to United Healthcare Services, Inc. in lieu of a free rent period, pay default interest on the previous loan of approximately $1.6 million and pay approximately $642,000 of interest due on the previous loan. Approximately $4.9 million in default interest was forgiven by the special servicer.
Additional Debt. The $9.0 million mezzanine loan is secured by the direct equity interests in the borrower and is coterminous with the mortgage loan. The mezzanine loan is interest-only for the term of the loan and has a 10.50000% coupon. Including the mezzanine loan, the Cut-off Date LTV is 85.0%, the UW NCF DSCR is 1.37x and the UW NOI Debt Yield is 8.10%. The lenders have entered into an intercreditor agreement.
THE INFORMATION IN THIS STRUCTURAL AND COLLATERAL TERM SHEET IS NOT COMPLETE AND MAY BE AMENDED PRIOR TO THE TIME OF SALE. THIS TERM SHEET IS NOT AN OFFER TO SELL THESE SECURITIES AND IT IS NOT A SOLICITATION OF AN OFFER TO BUY THESE SECURITIES IN ANY JURISDICTION WHERE THE OFFER OR SALE IS NOT PERMITTED.
| | |
| 104 of 133 |
| Structural and Collateral Term Sheet | JPMBB 2014-C26 | |
| 117 Kendrick Street | ||

THE INFORMATION IN THIS STRUCTURAL AND COLLATERAL TERM SHEET IS NOT COMPLETE AND MAY BE AMENDED PRIOR TO THE TIME OF SALE. THIS TERM SHEET IS NOT AN OFFER TO SELL THESE SECURITIES AND IT IS NOT A SOLICITATION OF AN OFFER TO BUY THESE SECURITIES IN ANY JURISDICTION WHERE THE OFFER OR SALE IS NOT PERMITTED.
| | |
| 105 of 133 |
| Structural and Collateral Term Sheet | JPMBB 2014-C26 | |
| 117 Kendrick Street | ||
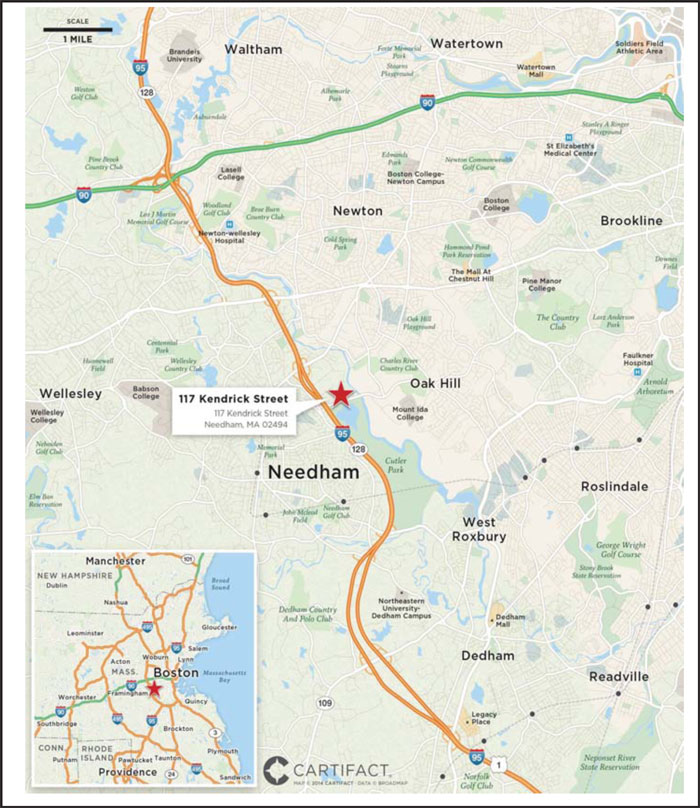
THE INFORMATION IN THIS STRUCTURAL AND COLLATERAL TERM SHEET IS NOT COMPLETE AND MAY BE AMENDED PRIOR TO THE TIME OF SALE. THIS TERM SHEET IS NOT AN OFFER TO SELL THESE SECURITIES AND IT IS NOT A SOLICITATION OF AN OFFER TO BUY THESE SECURITIES IN ANY JURISDICTION WHERE THE OFFER OR SALE IS NOT PERMITTED.
| | |
| 106 of 133 |
| Structural and Collateral Term Sheet | JPMBB 2014-C26 | |
| 117 Kendrick Street | ||
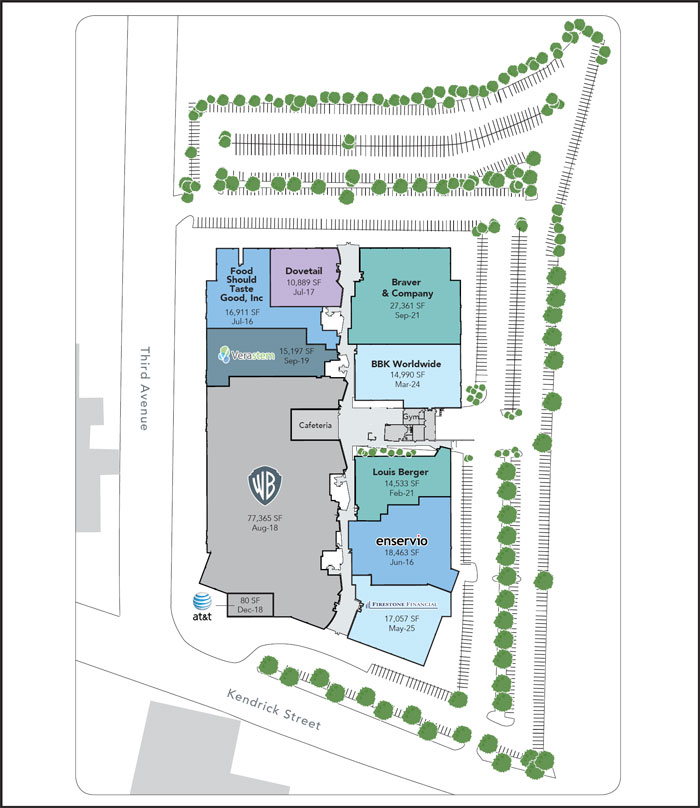
THE INFORMATION IN THIS STRUCTURAL AND COLLATERAL TERM SHEET IS NOT COMPLETE AND MAY BE AMENDED PRIOR TO THE TIME OF SALE. THIS TERM SHEET IS NOT AN OFFER TO SELL THESE SECURITIES AND IT IS NOT A SOLICITATION OF AN OFFER TO BUY THESE SECURITIES IN ANY JURISDICTION WHERE THE OFFER OR SALE IS NOT PERMITTED.
| | |
| 107 of 133 |
| Structural and Collateral Term Sheet | JPMBB 2014-C26 | |
| 117 Kendrick Street | ||
| Mortgage Loan Information | Property Information | |||
| Mortgage Loan Seller: | JPMCB | Single Asset / Portfolio: | Single Asset | |
| Original Principal Balance: | $39,560,000 | Title: | Fee | |
| Cut-off Date Principal Balance: | $39,560,000 | Property Type - Subtype: | Office - Suburban | |
| % of Pool by IPB: | 2.7% | Net Rentable Area (SF): | 212,846 | |
| Loan Purpose: | Acquisition | Location: | Needham, MA | |
| Borrower: | 117 Kendrick DE, LLC | Year Built / Renovated: | 1955 / 2001 | |
| Sponsor: | BRI 3 Holdings, LLC | Occupancy: | 100.0% | |
| Interest Rate: | 4.30000% | Occupancy Date: | 11/1/2014 | |
| Note Date: | 12/1/2014 | Number of Tenants: | 10 | |
| Maturity Date: | 12/1/2024 | 2011 NOI(1): | $23,245 | |
| Interest-only Period: | 60 months | 2012 NOI(1): | $1,843,603 | |
| Original Term: | 120 months | 2013 NOI: | $2,644,292 | |
| Original Amortization: | 360 months | TTM NOI (as of 10/2014)(2): | $2,591,611 | |
| Amortization Type: | IO-Balloon | UW Economic Occupancy: | 94.1% | |
| Call Protection: | L(13),Grtr1%orYM(94),O(13) | UW Revenues(2): | $5,493,570 | |
| Lockbox: | CMA | UW Expenses: | $2,037,084 | |
| Additional Debt: | N/A | UW NOI(2): | $3,456,486 | |
| Additional Debt Balance: | N/A | UW NCF: | $3,126,575 | |
| Additional Debt Type: | N/A | Appraised Value / Per SF: | $53,000,000 / $249 | |
| Appraisal Date: | 9/26/2014 | |||
Escrows and Reserves(3) | Financial Information | |||||||
| Initial | Monthly | Initial Cap | Cut-off Date Loan / SF: | $186 | ||||
| Taxes: | $0 | Springing | N/A | Maturity Date Loan / SF: | $170 | |||
| Insurance: | $0 | Springing | N/A | Cut-off Date LTV: | 74.6% | |||
| Replacement Reserves: | $3,540 | $3,540 | N/A | Maturity Date LTV: | 68.1% | |||
| TI/LC: | $0 | Springing | N/A | UW NCF DSCR: | 1.33x | |||
| Other: | $575,126 | $0 | N/A | UW NOI Debt Yield: | 8.7% | |||
| Sources and Uses | ||||||||
| Sources | Proceeds | % of Total | Uses | Proceeds | % of Total | |||
| Mortgage Loan | $39,560,000 | 73.9% | Purchase Price | $52,750,000 | 98.5% | |||
| Sponsor Equity | 13,973,505 | 26.1 | Upfront Reserves | 578,666 | 1.1 | |||
| Closing Costs | 204,839 | 0.4 | ||||||
| Total Sources | $53,533,505 | 100.0% | Total Uses | $53,533,505 | 100.0% | |||
| (1) | The increase from 2011 NOI to 2012 NOI is primarily due to increased leasing activity and the burn off of free rent concessions. |
| (2) | The increase from TTM NOI to UW NOI is primarily due to underwriting two newly executed leases for Firestone Financial and Verastem, which account for $989,896 of UW Revenues, as well as underwriting contractual rent steps through October 2015. |
| (3) | For a full description of Escrows and Reserves, please refer to “Escrows and Reserves” below. |
The Loan. The 117 Kendrick Street loan has an outstanding principal balance of $39.56 million and is secured by a first mortgage lien on a 212,846 square foot office building located in Needham, Massachussetts. The loan has a 10-year term, and subsequent to a five-year interest-only period, will amortize on a 30-year schedule.
The Borrower. The borrowing entity for the 117 Kendrick Street loan is 117 Kendrick DE, LLC, a Delaware limited liability company and special purpose entity.
THE INFORMATION IN THIS STRUCTURAL AND COLLATERAL TERM SHEET IS NOT COMPLETE AND MAY BE AMENDED PRIOR TO THE TIME OF SALE. THIS TERM SHEET IS NOT AN OFFER TO SELL THESE SECURITIES AND IT IS NOT A SOLICITATION OF AN OFFER TO BUY THESE SECURITIES IN ANY JURISDICTION WHERE THE OFFER OR SALE IS NOT PERMITTED.
| | |
| 108 of 133 |
| Structural and Collateral Term Sheet | JPMBB 2014-C26 | |
| 117 Kendrick Street | ||
The Sponsor. The loan sponsor is BRI 3 Holdings, LLC, an affiliate of The Bulfinch Companies, Inc. The Bulfinch Companies, Inc. is an entrepreneurial commercial real estate firm specializing in the development, acquisition and management of properties in the Greater Boston area and is headquartered in Needham, Massachusetts. The Bulfinch Companies, Inc.’s current portfolio includes nearly 3.0 million square feet of office, medical office, biotechnology and R&D space with a market value approaching $1.0 billion. The sponsor purchased the property from affiliates of Intercontinental Real Estate Corporation for $52.75 million.
The Property. 117 Kendrick Street is a single-story, 212,846 square foot Class A office building situated on approximately 12.1 acres in Needham, Massachusetts. The property was constructed as an industrial building in 1955 and renovated and repurposed for office use in 2001. The building’s interior was transformed with two mirroring lobbies connected by a “Main Street” style corridor. The renovation included the creation of a full-service cafeteria and fitness center as well as all new mechanical and building systems in order to reposition the building for office lease-up. Other on-site amenities include a childcare center and shuttle service to the MBTA Green Line.
As of November 1, 2014, the property was 100.0% occupied by 10 tenants. The largest tenant is Warner Brothers Entertainment Inc. (“Warner”), which occupies 36.3% of the net rentable area until August 2018 with two, five-year renewal options remaining. Warner operates its Turbine gaming division, which it acquired in 2010, at the property. The Turbine division is a computer game developer specializing in 3D massively multiplayer online role-playing games including The Lord of the Rings Online and Dungeons & Dragons Online. The second largest tenant is Braver & Company, which occupies 12.9% of the net rentable area through September 2021 and has two, five-year renewal options outstanding. Braver & Company is a national accounting and advisory firm that offers accounting, tax, assurance, business and consulting services to family-owned and privately held businesses as well as to not-for-profit and governmental organizations. The third largest tenant is Enservio, which occupies 8.7% of the net rentable area through June 2016 and has one, five-year renewal option outstanding. Enservio offers software and services across the entire value chain of contents claim processing, from on-site inventory capture and forensic reconstruction of non-restorable contents to transcription, desk appraisal, contents valuation services, payment, replacement and reporting. All of the tenants at the property have outstanding renewal options.
117 Kendrick Street is located approximately 10 miles west of Boston in Needham, Massachusetts. It is located one mile from Route 128 and four miles south of Massachusetts Turnpike. The property is situated in Needham Crossing, an approximately 3.0 million square foot business park that contains over ten buildings, the majority of which were originally used for industrial purposes. Needham Crossing is undergoing a transformation from a manufacturing and industrial park to an office and mixed-use district. This transformation has been spurred by the town of Needham which has worked with developers to replace obsolete industrial buildings with new office buildings. Notable tenants in this business park include Coca-Cola, Federal Express, General Dynamics and Gillette. 117 Kendrick Street is located on the banks of the Charles River with frontage along Cutler Park Reservation, a 700-acre, state-maintained reservation that has trails and picnic areas adjacent to the property. The property is also adjacent to the newly-launched N2 Innovation Corridor, just off of Route 128. The development initiative will be anchored by TripAdvisor’s new 290,000 square foot headquarters and is being developed with the goal of making Needham and Newton an attractive area for technology companies, start-ups and other innovators. According to CoStar, the property is considered to be part of the Route 128 West submarket within the Boston office market. The Route 128 West Class A office market contained an inventory of approximately 15.6 million square feet of office space with a reported vacancy rate of 8.6% and average asking rents of $33.56 per square foot as of the third quarter of 2014.
Historical and Current Occupancy(1) | |||
| 2011 | 2012 | 2013 | Current(2) |
| 75.3% | 83.9% | 85.9% | 100.0% |
| (1) | Historical Occupancies are as of December 31 of each respective year. |
| (2) | Current Occupancy is as of November 1, 2014. |
THE INFORMATION IN THIS STRUCTURAL AND COLLATERAL TERM SHEET IS NOT COMPLETE AND MAY BE AMENDED PRIOR TO THE TIME OF SALE. THIS TERM SHEET IS NOT AN OFFER TO SELL THESE SECURITIES AND IT IS NOT A SOLICITATION OF AN OFFER TO BUY THESE SECURITIES IN ANY JURISDICTION WHERE THE OFFER OR SALE IS NOT PERMITTED.
| | |
| 109 of 133 |
| Structural and Collateral Term Sheet | JPMBB 2014-C26 | |
| 117 Kendrick Street | ||
Tenant Summary(1) | |||||
| Tenant | Ratings(2) Moody’s/S&P/Fitch | Net Rentable Area (SF) | % of Total NRA | Base Rent PSF | Lease Expiration Date |
Warner(3) | Baa2 / BBB / BBB+ | 77,365 | 36.3% | $27.00 | 8/8/2018 |
| Braver & Company | NA / NA / NA | 27,361 | 12.9% | $25.65 | 9/30/2021 |
| Enservio | NA / NA / NA | 18,463 | 8.7% | $24.00 | 6/30/2016 |
Firestone Financial(4) | NA / NA / NA | 17,057 | 8.0% | $28.25 | 5/31/2025 |
Food Should Taste Good, Inc(5) | A3 / BBB+ / BBB+ | 16,911 | 7.9% | $26.75 | 7/31/2016 |
| Verastem | NA / NA / NA | 15,197 | 7.1% | $33.43 | 9/30/2019 |
| BBK | NA / NA / NA | 14,990 | 7.0% | $25.75 | 3/31/2024 |
Louis Berger(6) | NA / NA / NA | 14,533 | 6.8% | $24.78 | 2/28/2021 |
| Dovetail Partners | NA / NA / NA | 10,889 | 5.1% | $27.00 | 7/31/2017 |
| AT&T Communications | A3 / A- / A | 80 | 0.0% | $40.10 | 12/31/2018 |
| (1) | Based on the underwritten rent roll. |
| (2) | Ratings provided are for the parent company of the entity listed in the “Tenant” field whether or not the parent company guarantees the lease. |
| (3) | Warner has the right to terminate its lease on or after August 31, 2016 with 12 months’ notice and a payment of a termination fee. Warner’s current lease expires in August 2018 and offers two, five-year renewal options. |
| (4) | Firestone Financial has a newly executed lease and commences paying rent on May 1, 2015. At origination of the loan, $180,050 was escrowed to cover rent due until the tenant is paying full rent. |
| (5) | Food Should Taste Good, Inc subleases its entire space to Euro-Pro Operating LLC. |
| (6) | Louis Berger has the right to terminate its lease on or after February 28, 2018, with six months’ notice and a payment of a termination fee. Louis Berger’s current lease expires in February 2021 and offers one five-year renewal option. |
Lease Rollover Schedule(1) | |||||||||||
| Year | Number of Leases Expiring | Net Rentable Area Expiring | % of NRA Expiring | Base Rent Expiring | % of Base Rent Expiring | Cumulative Net Rentable Area Expiring | Cumulative % of NRA Expiring | Cumulative Base Rent Expiring | Cumulative % of Base Rent Expiring | ||
| Vacant | NAP | 0 | 0.0% | NAP | NAP | 0 | 0.0% | NAP | NAP | ||
| 2014 & MTM | 0 | 0 | 0.0 | $0 | 0.0% | 0 | 0.0% | $0 | 0.0% | ||
| 2015 | 0 | 0 | 0.0 | 0 | 0.0 | 0 | 0.0% | $0 | 0.0% | ||
| 2016 | 2 | 35,374 | 16.6 | 895,481 | 15.7 | 35,374 | 16.6% | $895,481 | 15.7% | ||
| 2017 | 1 | 10,889 | 5.1 | 294,003 | 5.1 | 46,263 | 21.7% | $1,189,484 | 20.8% | ||
| 2018 | 2 | 77,445 | 36.4 | 2,092,063 | 36.6 | 123,708 | 58.1% | $3,281,547 | 57.4% | ||
| 2019 | 1 | 15,197 | 7.1 | 508,036 | 8.9 | 138,905 | 65.3% | $3,789,583 | 66.3% | ||
| 2020 | 0 | 0 | 0.0 | 0 | 0.0 | 138,905 | 65.3% | $3,789,583 | 66.3% | ||
| 2021 | 2 | 41,894 | 19.7 | 1,061,996 | 18.6 | 180,799 | 84.9% | $4,851,579 | 84.8% | ||
| 2022 | 0 | 0 | 0.0 | 0 | 0.0 | 180,799 | 84.9% | $4,851,579 | 84.8% | ||
| 2023 | 0 | 0 | 0.0 | 0 | 0.0 | 180,799 | 84.9% | $4,851,579 | 84.8% | ||
| 2024 | 1 | 14,990 | 7.0 | 385,993 | 6.7 | 195,789 | 92.0% | $5,237,572 | 91.6% | ||
| 2025 & Beyond | 1 | 17,057 | 8.0 | 481,860 | 8.4 | 212,846 | 100.0% | $5,719,432 | 100.0% | ||
| Total | 10 | 212,846 | 100.0% | $5,719,432 | 100.0% | ||||||
(1) | Based on the underwritten rent roll. |
THE INFORMATION IN THIS STRUCTURAL AND COLLATERAL TERM SHEET IS NOT COMPLETE AND MAY BE AMENDED PRIOR TO THE TIME OF SALE. THIS TERM SHEET IS NOT AN OFFER TO SELL THESE SECURITIES AND IT IS NOT A SOLICITATION OF AN OFFER TO BUY THESE SECURITIES IN ANY JURISDICTION WHERE THE OFFER OR SALE IS NOT PERMITTED.
| | |
| 110 of 133 |
| Structural and Collateral Term Sheet | JPMBB 2014-C26 | |
| 117 Kendrick Street | ||
| Operating History and Underwritten Net Cash Flow | |||||||
| 2011 | 2012 | 2013 | TTM(1) | Underwritten | Per Square Foot | %(2) | |
Rents in Place(3)(4) | $2,748,274 | $3,774,852 | $4,508,538 | $4,731,145 | $5,719,432 | $26.87 | 98.1% |
| Vacant Income | 0 | 0 | 0 | 0 | 0 | 0.00 | 0.0 |
| Gross Potential Rent | $2,748,274 | $3,774,852 | $4,508,538 | $4,731,145 | $5,719,432 | $26.87 | 98.1% |
| Total Reimbursements | 39,025 | 12,973 | 36,182 | 34,001 | 109,108 | 0.51 | 1.9 |
| Net Rental Income | $2,787,298 | $3,787,825 | $4,544,720 | $4,765,146 | $5,828,540 | $27.38 | 100.0% |
| (Vacancy/Credit Loss) | (763,244) | (252,532) | (243,835) | (285,185) | (340,970) | (1.60) | (5.9) |
| Other Income | 18,820 | 0 | 3,000 | 13,500 | 6,000 | 0.03 | 0.1 |
| Effective Gross Income | $2,042,874 | $3,535,293 | $4,303,885 | $4,493,461 | $5,493,570 | $25.81 | 94.3% |
| Total Expenses | $2,019,629 | $1,691,690 | $1,659,593 | $1,901,851 | $2,037,084 | $9.57 | 37.1% |
Net Operating Income(3)(4) | $23,245 | $1,843,603 | $2,644,292 | $2,591,611 | $3,456,486 | $16.24 | 62.9% |
| Total TI/LC, Capex/RR | 0 | 0 | 0 | 0 | 329,911 | 1.55 | 6.0 |
| Net Cash Flow | $23,245 | $1,843,603 | $2,644,292 | $2,591,611 | $3,126,575 | $14.69 | 56.9% |
| (1) | TTM column represents the trailing twelve months ending on October 31, 2014. |
| (2) | % column represents percent of Net Rental Income for all revenue lines and represents percent of Effective Gross Income for the remainder of fields. |
| (3) | The increase from 2011 NOI to 2012 NOI is primarily due to increased leasing activity and the burn off of free rent concessions. |
| (4) | The increase from TTM NOI to UW NOI is primarily due to underwriting two newly executed leases for Firestone Financial and Verastem, which account for $989,896 of UW Revenues, as well as underwriting contractual rent steps through October 2015. |
Property Management. The property is managed by The Bulfinch Companies, Inc.
Escrows and Reserves. At origination, the borrower deposited into escrow $195,771 for a one month debt service reserve, $188,342 for a free rent reserve associated with Firestone Financial and BBK, approximately $150,450 for outstanding tenant improvements and leasing commissions associated with Verastem, $40,563 for immediate repairs and $3,540 for replacement reserves.
Tax Escrows - The requirement for the borrower to make monthly deposits into the tax escrow is waived so long as (i) no event of default exists, (ii) no Warner Trigger Event has occurred or is occurring and (iii) the borrower does not become delinquent on taxes or fails to provide the lender with satisfactory evidence that taxes have not become delinquent upon request.
A “Warner Trigger Event” means the borrower’s failure to renew the Warner lease or enter into an amendment to extend the term of the lease for at least five years beyond the current lease expiration in August 2018 on or before the date that is nine months prior to the Warner lease expiration date. A Warner Trigger Event will not commence if the borrower provides a Warner security payment as defined in the loan documents on or before the date that is nine months prior to the Warner lease expiration date.
Insurance Escrows - The requirement for the borrower to make monthly deposits into the insurance escrow is waived so long as (i) no event of default exists and (ii) the borrower provides satisfactory evidence that the property is insured under an approved blanket policy in accordance with the loan documents.
Replacement Reserves - On a monthly basis, the borrower is required to escrow $3,540 (approximately $0.20 per square foot annually) for replacement reserves.
TI/LC Reserves - The requirement of the borrower to make monthly deposits into the TI/LC reserve is waived so long as no DSCR Reserve Trigger Period, as defined below, is existing. During the continuance of a DSCR Reserve Trigger Period, the borrower is required to deposit $20,400 per month (approximately $1.15 per square foot annually) for TI/LC reserves.
A “DSCR Reserve Trigger Period” means the debt service coverage ratio as calculated in the loan documents based on the trailing twelve-month period falls below 1.10x.
Lockbox / Cash Management. The loan is structured with a CMA lockbox. The borrower and property manager were required to deliver tenant direction letters to all tenants instructing them to deposit all revenues directly into the lockbox account controlled by the lender. All funds in the lockbox account are returned to an account controlled by the borrower until the occurrence of an event of default or a Warner Trigger Event. During an event of default or a Warner Trigger Event, all funds on deposit in the lockbox account will be swept on a daily basis to a cash management account and all excess cash flow after payment of debt service, required reserves and operating expenses are required to be held as additional collateral for the loan.
THE INFORMATION IN THIS STRUCTURAL AND COLLATERAL TERM SHEET IS NOT COMPLETE AND MAY BE AMENDED PRIOR TO THE TIME OF SALE. THIS TERM SHEET IS NOT AN OFFER TO SELL THESE SECURITIES AND IT IS NOT A SOLICITATION OF AN OFFER TO BUY THESE SECURITIES IN ANY JURISDICTION WHERE THE OFFER OR SALE IS NOT PERMITTED.
| | |
| 111 of 133 |
| Structural and Collateral Term Sheet | JPMBB 2014-C26 |
[THIS PAGE INTENTIONALLY LEFT BLANK]
THE INFORMATION IN THIS STRUCTURAL AND COLLATERAL TERM SHEET IS NOT COMPLETE AND MAY BE AMENDED PRIOR TO THE TIME OF SALE. THIS TERM SHEET IS NOT AN OFFER TO SELL THESE SECURITIES AND IT IS NOT A SOLICITATION OF AN OFFER TO BUY THESE SECURITIES IN ANY JURISDICTION WHERE THE OFFER OR SALE IS NOT PERMITTED.
| | |
| 112 of 133 |
| Structural and Collateral Term Sheet | JPMBB 2014-C26 |
The View & Legends |
| Mortgage Loan Information | Property Information | |||
| Mortgage Loan Seller: | Column | Single Asset / Portfolio: | Portfolio | |
| Original Principal Balance: | $38,250,000 | Title: | Fee | |
| Cut-off Date Principal Balance: | $38,250,000 | Property Type - Subtype: | Multifamily - Various | |
| % of Pool by IPB: | 2.6% | Net Rentable Area (Units): | 655 | |
| Loan Purpose: | Refinance | Location: | Dallas, TX | |
Borrowers(1): | Various | Year Built / Renovated: | Various / 2013 | |
Sponsors(2): | Various | Occupancy: | 90.8% | |
| Interest Rate: | 5.21000% | Occupancy Date: | 10/16/2014 | |
| Note Date: | 9/24/2014 | Number of Tenants: | N/A | |
Anticipated Repayment Date(3): | 10/6/2019 | 2011 NOI(4): | N/A | |
| Interest-only Period: | 24 months | 2012 NOI(4): | N/A | |
Original Term(5): | 60 months | 2013 NOI: | $1,778,671 | |
| Original Amortization: | 360 months | TTM NOI (as of 7/2014)(6): | $2,563,938 | |
| Amortization Type: | ARD-IO-Balloon | UW Economic Occupancy: | 88.8% | |
| Call Protection: | L(26),Def(27),O(7) | UW Revenues: | $6,135,171 | |
| Lockbox: | Springing | UW Expenses: | $2,805,343 | |
| Additional Debt: | N/A | UW NOI(6): | $3,329,828 | |
| Additional Debt Balance: | N/A | UW NCF: | $3,164,583 | |
| Additional Debt Type: | N/A | Appraised Value / Per Unit: | $51,000,000 / $77,863 | |
| Appraisal Date: | 8/4/2014 | |||
| Escrows and Reserves | Financial Information | |||||
| Initial | Monthly | Initial Cap | Cut-off Date Loan / Unit: | $58,397 | ||
| Taxes: | $368,920 | $40,991 | N/A | Maturity Date Loan / Unit: | $55,908 | |
| Insurance: | $87,689 | $17,538 | N/A | Cut-off Date LTV: | 75.0% | |
| Replacement Reserves: | $13,770 | $13,770 | N/A | Maturity Date LTV: | 71.8% | |
| TI/LC: | $0 | $0 | N/A | UW NCF DSCR: | 1.25x | |
Other (7): | $52,951 | $0 | N/A | UW NOI Debt Yield: | 8.7% | |
| Sources and Uses | |||||||
| Sources | Proceeds | % of Total | Uses | Proceeds | % of Total | ||
| Mortgage Loan | $38,250,000 | 100.0% | Payoff Existing Debt | $26,500,000 | 69.3 | % | |
| Return of Equity | 10,795,041 | 28.2 | |||||
| Upfront Reserves | 523,330 | 1.4 | |||||
| Closing Costs | 431,629 | 1.1 | |||||
| Total Sources | $38,250,000 | 100.0% | Total Uses | $38,250,000 | 100.0 | % | |
| (1) | The borrowing entites for the loan are The View DFW 4 Two LLC and Legends DFW 4 Two LLC. |
| (2) | The sponsors for the entities are Charles F. Hill, Edward P. Lorin, The Hill Family Living Trust and The Lorin Family Trust. |
| (3) | The loan is structured with an anticipated repayment date (“ARD”) of October 6, 2019. In the event that the loan is not paid off on or before the ARD, the borrower is required to make monthly payments to the lender of principal and interest in the amount of the monthly debt service payment and interest will accrue at an interest rate (“Revised Note Rate”) that will be equal to the greater of (i) 3.0% plus the initial interest rate and (ii) 3.0% plus the then-current five-year treasury rate plus the five year swap spread determined on the ARD Date. The payment of interest in excess of interest at the initial interest rate will be deferred until the principal balance is paid in full. The Revised Note Rate may not exceed 8.5%. The final maturity date of the loan is October 6, 2024. |
| (4) | The properties were acquired in November 2012. Due to the timing of the acquisitions of the properties and the lack of information provided by the previous owners as part of the acquisitions, consolidated historical financials are not available prior to the twelve-month period ending December 31, 2013. |
| (5) | Represents the Original Term to the ARD. |
| (6) | Increase from TTM NOI to UW NOI is due to improving occupancy and an increase in rent at all properties in July 2014. |
| (7) | Initial Other Escrows and Reserves includes $52,951 for deferred maintenance. |
THE INFORMATION IN THIS STRUCTURAL AND COLLATERAL TERM SHEET IS NOT COMPLETE AND MAY BE AMENDED PRIOR TO THE TIME OF SALE. THIS TERM SHEET IS NOT AN OFFER TO SELL THESE SECURITIES AND IT IS NOT A SOLICITATION OF AN OFFER TO BUY THESE SECURITIES IN ANY JURISDICTION WHERE THE OFFER OR SALE IS NOT PERMITTED.
| | |
| 113 of 133 |
| Structural and Collateral Term Sheet | JPMBB 2014-C26 |
The View & Legends |
The Loan. The View & Legends loan has an outstanding principal balance of $38.25 million and is secured by a first mortgage lien on two Class B multifamily properties totaling 655 units located in Dallas, Texas. The properties include the View at Kessler Park (299 units) and the Legends on Lake Highlands (356 units). The loan is structured with an ARD of October 6, 2019 and a final maturity date of October 6, 2024, and subsequent to a two-year interest only period, will amortize on a 30-year schedule. The sponsors of the borrowers and the non-recourse carve-out guarantors are Charles F. Hill, Edward P. Lorin, The Hill Family Living Trust and The Lorin Family Trust. Mr. Hill and Mr. Lorin have over 40 years of combined experience and in 2007 co-founded Strategic Realty Capital (“SRC”) to focus on the acquisition and repositioning of distressed multifamily properties. Strategic Realty Capital and affiliate companies currently own over 10,000 units.
The Properties. The properties were acquired by the borrower in November 2012, after which they underwent significant renovations that lasted through most of 2013. During this year, the properties’ occupancy dipped in an attempt to upgrade the tenant base and re-brand the properties. With this strategy, the properties offered higher concessions to keep occupancy from dropping further, and incurred some higher expenses. The properties began increasing rental rates and has experienced increasing occupancy since the completion of the renovations in late 2013.
The View at Kessler Park is a 299-unit, Class B, high-rise style apartment community located at 2511 Wedglea Drive in Dallas, Texas. The property was originally built in 1964 and renovated in 2013. The property is improved with one, 11-story residential building and a three-story parking garage. Property amenities include a swimming pool, a pet park, picnic areas, laundry facilities on each floor, media room, game room, fitness center, business center, and an access gate. The property also has four office spaces containing a total of 2,178 square feet that are currently vacant and are being marketed for lease. A newly renovated bistro/café located on the first floor currently serves coffee to residents but is anticipated to be a full-service restaurant for resident use only. Open parking is provided for 144 vehicles and the three-story parking garage has 442 spaces for a total of 586 parking spaces, equating to 1.96 spaces per unit.
Legends on Lake Highlands is a 356-unit, Class B, garden-style apartment community located at 11201 East Lake Highlands Drive in Dallas, Texas. The property was originally developed in two phases between 1971 and 1979 and renovated by the borrower in 2013. The phases are located on non-contiguous parcels separated by Lake Highlands Circle, an interior roadway providing access to the property from East Lake Highlands Drive. The property is improved with 27 two-story residential buildings and one single story office/clubhouse building. Property amenities consist of two outdoor swimming pools, laundry facilities, a clubhouse, a fitness center, security gates, Wi-Fi access and a pet park. Open surface parking is provided for 518 vehicles (1.46 parking spaces per unit).
The Market. The properties are located in the City of Dallas, Texas within the Dallas/Fort Worth Consolidated Metropolitan Statistical Area (“CMSA”). According to the appraisal, as of the second quarter of 2014, the Dallas apartment market reported a total inventory of 499,214 units with annual completion of 12,000 units and absorption of 13,163 units. The market had an overall occupancy of 94.6% and an effective rent per unit of $918. The appraisal identified the View at Kessler Park as being located in the Oak Cliff submarket which contained 15,423 units as of the second quarter of 2014, which equates to approximately 3.1% of the Dallas apartment market. Current average occupancy in the submarket is 92.2% with an average monthly rent is $759 per unit compared to 90.0% and $893 per unit, respectively, at the subject property as of October 16, 2014. The appraisal identified a competitive set including five properties built between 2001 and 2012, with occupancy ranging from 92.0% to 98.0% and average monthly rent per unit ranging from $910 to $1,318.
According to the appraisal, Legends on Lake Highlands is located within the East Dallas submarket. As of second quarter 2014, the submarket reported a total inventory of 21,275 units, which equates to approximately 4.3% of the Dallas apartment market. Average occupancy within the submarket was 93.7% as of the second quarter of 2014, representing a 30 bps increase over the last 12 months. Monthly rental rates averaged $1,109 per unit in the second quarter of 2014. The property has a current occupancy of 91.6% as of October 16, 2014 and a monthly market rent per unit of $685. The appraisal identified five comparable properties built between 1968 and 1985, with occupancy ranging from 90.0% to 95.0% and average monthly rent per unit ranging from $648 to to $765.
THE INFORMATION IN THIS STRUCTURAL AND COLLATERAL TERM SHEET IS NOT COMPLETE AND MAY BE AMENDED PRIOR TO THE TIME OF SALE. THIS TERM SHEET IS NOT AN OFFER TO SELL THESE SECURITIES AND IT IS NOT A SOLICITATION OF AN OFFER TO BUY THESE SECURITIES IN ANY JURISDICTION WHERE THE OFFER OR SALE IS NOT PERMITTED.
| | |
| 114 of 133 |
| Structural and Collateral Term Sheet | JPMBB 2014-C26 |
The View & Legends |
View at Kessler Park - Multifamily Unit Mix(1) | |||||||||
Unit Type (Bed / Bath) | # of Units | % of Total | Occupied Units | Occupancy | Average Unit Size (Square Feet) | Average Monthly Rental Rate(2) | Average Monthly Rental Rate PSF(2) | Monthly Market Rental Rate(3)(4) | Monthly Market Rental Rate PSF(3)(4) |
| 0x1 | 35 | 11.7% | 30 | 85.7% | 377 | $612 | $1.62 | $701 | $1.86 |
| 0x1 | 49 | 16.4 | 48 | 98.0% | 393 | $646 | $1.64 | $697 | $1.77 |
| 1x1 | 35 | 11.7 | 30 | 85.7% | 689 | $811 | $1.18 | $872 | $1.27 |
| 1x1 | 61 | 20.4 | 53 | 86.9% | 713 | $840 | $1.18 | $882 | $1.24 |
| 1x1 | 10 | 3.3 | 7 | 70.0% | 724 | $838 | $1.16 | $907 | $1.25 |
| 1x1 | 20 | 6.7 | 19 | 95.0% | 773 | $881 | $1.14 | $911 | $1.18 |
| 2x1 | 49 | 16.4 | 47 | 95.9% | 821 | $918 | $1.12 | $965 | $1.18 |
| 2x2 | 27 | 9.0 | 25 | 92.6% | 1,066 | $1,101 | $1.03 | $1,170 | $1.10 |
| 3x2 | 13 | 4.3 | 10 | 76.9% | 1,214 | $1,291 | $1.06 | $1,364 | $1.12 |
| Total/Wtd. Avg. | 299 | 100.0% | 269 | 90.0% | 694 | $834 | $1.20 | $893 | $1.29 |
(1) | Based on the rent roll dated October 16, 2014. |
| (2) | Average Monthly Rental Rate and Average Monthly Rental Rate PSF are based on the weighted average occupied rents. |
| (3) | Market rents are based on the appraiser’s concluded market rents. |
| (4) | Monthly Market Rental Rate and Monthly Market Rental Rate PSF are based on all units. |
Legends on Lake Highlands - Multifamily Unit Mix(1) | |||||||||
Unit Type (Bed / Bath) | # of Units | % of Total | Occupied Units | Occupancy | Average Unit Size (Square Feet) | Average Monthly Rental Rate(2) | Average Monthly Rental Rate PSF(2) | Monthly Market Rental Rate(3)(4) | Monthly Market Rental Rate PSF(3)(4) |
| 0x1 | 8 | 2.3% | 8 | 100.0% | 529 | $514 | $0.97 | $520 | $0.98 |
| 1x1 | 48 | 13.5 | 48 | 100.0% | 550 | $551 | $1.00 | $562 | $1.02 |
| 1x1 | 88 | 24.7 | 84 | 95.5% | 650 | $633 | $0.97 | $640 | $0.98 |
| 1x1 | 36 | 10.1 | 32 | 88.9% | 660 | $581 | $0.88 | $588 | $0.89 |
| 1x1 | 20 | 5.6 | 19 | 95.0% | 721 | $618 | $0.86 | $630 | $0.87 |
| 2x1 | 40 | 11.2 | 36 | 90.0% | 820 | $702 | $0.86 | $708 | $0.86 |
| 2x1 | 24 | 6.7 | 22 | 91.7% | 900 | $724 | $0.80 | $738 | $0.82 |
| 2x2 | 56 | 15.7 | 47 | 83.9% | 950 | $835 | $0.88 | $848 | $0.89 |
| 2x2 | 24 | 6.7 | 23 | 95.8% | 978 | $762 | $0.78 | $785 | $0.80 |
| 2x2 | 12 | 3.4 | 7 | 58.3% | 1,029 | $843 | $0.82 | $858 | $0.83 |
| Total/Wtd. Avg. | 356 | 100.0% | 326 | 91.6% | 748 | $669 | $0.89 | $685 | $0.92 |
(1) | Based on the rent roll dated October 16, 2014. |
| (2) | Average Monthly Rental Rate and Average Monthly Rental Rate PSF are determined by the weighted average of occupied units. |
| (3) | Market rents are based on the appraiser’s concluded market rents. |
| (4) | Monthly Market Rental Rate and Monthly Market Rental Rate PSF are based on all units. |
THE INFORMATION IN THIS STRUCTURAL AND COLLATERAL TERM SHEET IS NOT COMPLETE AND MAY BE AMENDED PRIOR TO THE TIME OF SALE. THIS TERM SHEET IS NOT AN OFFER TO SELL THESE SECURITIES AND IT IS NOT A SOLICITATION OF AN OFFER TO BUY THESE SECURITIES IN ANY JURISDICTION WHERE THE OFFER OR SALE IS NOT PERMITTED.
| | |
| 115 of 133 |
| Structural and Collateral Term Sheet | JPMBB 2014-C26 |
The View & Legends |
Operating History and Underwritten Net Cash Flow | ||||||
| 2013 | TTM(1) | Underwritten | Per Unit | % (2) | ||
Rents in Place(3) | $5,259,008 | $5,553,843 | $5,307,477 | $8,103 | 89.8 | % |
| Vacant Income | 0 | 0 | 602,028 | 919 | 10.2 | |
| Gross Potential Rent | $5,259,008 | $5,553,843 | $5,909,505 | $9,022 | 100.0 | % |
| (Vacancy and Credit Loss) | (1,304,608) | (850,988) | (661,099) | (1,009) | (11.2 | ) |
| Other Income | 591,682 | 791,742 | 886,765 | 1,354 | 15.0 | |
| Effective Gross Income | $4,546,082 | $5,494,597 | $6,135,171 | $9,367 | 103.8 | % |
| Total Expenses | $2,767,411 | $2,930,659 | $2,805,343 | $4,283 | 45.7 | % |
| Net Operating Income | $1,778,671 | $2,563,938 | $3,329,828 | $5,084 | 54.3 | % |
| Replacement Reserves | 0 | 0 | 165,245 | 252 | 2.7 | |
| Non-Recurring Item | 51,144 | 59,360 | 0 | 0 | 0.0 | |
| Net Cash Flow | $1,727,527 | $2,504,578 | $3,164,583 | $4,831 | 51.6 | % |
Occupancy(4) | 90.7% | 90.8% | 88.8% | |||
(1) | TTM column represents the trailing twelve-month period ending on July 31, 2014. |
(2) | Percentage column represents percent of Gross Potential Rent for all revenue lines and represents percent of Effective Gross Income for the remainder of fields. |
(3) | Based on the rent roll dated September 3, 2014 with vacant units grossed up at the appraiser’s market rents. |
(4) | TTM occupancy is as of October 16, 2014. |
THE INFORMATION IN THIS STRUCTURAL AND COLLATERAL TERM SHEET IS NOT COMPLETE AND MAY BE AMENDED PRIOR TO THE TIME OF SALE. THIS TERM SHEET IS NOT AN OFFER TO SELL THESE SECURITIES AND IT IS NOT A SOLICITATION OF AN OFFER TO BUY THESE SECURITIES IN ANY JURISDICTION WHERE THE OFFER OR SALE IS NOT PERMITTED.
| | |
| 116 of 133 |
| Structural and Collateral Term Sheet | JPMBB 2014-C26 |
Arbor Gate |
| Mortgage Loan Information | Property Information | |||
| Mortgage Loan Seller: | RCMC | Single Asset / Portfolio: | Single Asset | |
| Original Principal Balance: | $38,100,000 | Title: | Fee | |
| Cut-off Date Principal Balance: | $38,100,000 | Property Type - Subtype: | Office - Suburban | |
| % of Pool by IPB: | 2.6% | Net Rentable Area (SF): | 216,612 | |
| Loan Purpose: | Refinance | Location: | Madison, WI | |
| Borrower: | Arbor Gate Development, LLC | Year Built / Renovated: | 2008 / N/A | |
| Sponsors: | Patrick J. Baxter and Bradley L. Hutter | Occupancy: | 95.9% | |
| Interest Rate: | 4.64000% | Occupancy Date: | 10/1/2014 | |
| Note Date: | 11/7/2014 | Number of Tenants: | 20 | |
| Maturity Date: | 12/5/2024 | 2011 NOI(1): | $2,095,415 | |
| Interest-only Period: | 24 months | 2012 NOI(1): | $2,799,918 | |
| Original Term: | 120 months | 2013 NOI(1): | $2,933,963 | |
| Original Amortization: | 360 months | TTM NOI (as of 8/2014)(1): | $3,048,491 | |
| Amortization Type: | IO-Balloon | UW Economic Occupancy: | 95.0% | |
| Call Protection: | L(24),Def(92),O(4) | UW Revenues: | $5,232,445 | |
| Lockbox: | CMA | UW Expenses: | $1,838,775 | |
Additional Debt(2): | N/A | UW NOI(1): | $3,393,669 | |
Additional Debt Balance(2): | N/A | UW NCF: | $3,133,735 | |
Additional Debt Type(2): | N/A | Appraised Value / Per SF(3): | $52,740,000 / $243 | |
| Appraisal Date: | 8/25/2014 | |||
| Escrows and Reserves | Financial Information | ||||||
| Initial | Monthly | Initial Cap | Cut-off Date Loan / SF: | $176 | |||
| Taxes: | $287,705 | $47,775 | N/A | Maturity Date Loan / SF: | $151 | ||
| Insurance: | $0 | Springing | N/A | Cut-off Date LTV: | 72.2% | ||
| Replacement Reserves: | $0 | $3,610 | N/A | Maturity Date LTV: | 61.9% | ||
| TI/LC: | $0 | $46,659 | $600,000 | UW NCF DSCR: | 1.33x | ||
Other(4): | $100,000 | $0 | N/A | UW NOI Debt Yield: | 8.9% | ||
| Sources and Uses | |||||||
| Sources | Proceeds | % of Total | Uses | Proceeds | % of Total | ||
| Mortgage Loan | $38,100,000 | 95.9% | Payoff Existing Debt | $38,885,834 | 97.9% | ||
| Sponsor Equity | 1,620,986 | 4.1 | Closing Costs | 447,447 | 1.1 | ||
| Upfront Reserves | 387,705 | 1.0 | |||||
| Total Sources | $39,720,986 | 100.0% | Total Uses | $39,720,986 | 100.0% | ||
| (1) | Increases in historical NOI can be attributed to lease-up at the property, with occupancy increasing from 70.6% in 2010 to 85.8% in 2011, 87.2% in 2012, 94.4% in 2013 and to the current occupancy of 95.9% as of October 1, 2014. In addition, the UW NOI includes approximately $50,909 of contractual rent bumps occurring through October 1, 2015. |
| (2) | At closing, a TIF Loan secured by the property in the amount of approximately $900,116 will be outstanding. Please refer to the “Additional Debt” section below for more information. |
| (3) | The Appraised Value includes 24,287 square feet of excess land that is currently being utilized for additional parking and which was valued at $240,000. |
| (4) | The Initial Other Escrows and Reserves is comprised of a $100,000 rent concession provided to the tenant Dean Health Systems. |
THE INFORMATION IN THIS STRUCTURAL AND COLLATERAL TERM SHEET IS NOT COMPLETE AND MAY BE AMENDED PRIOR TO THE TIME OF SALE. THIS TERM SHEET IS NOT AN OFFER TO SELL THESE SECURITIES AND IT IS NOT A SOLICITATION OF AN OFFER TO BUY THESE SECURITIES IN ANY JURISDICTION WHERE THE OFFER OR SALE IS NOT PERMITTED.
| | |
| 117 of 133 |
| Structural and Collateral Term Sheet | JPMBB 2014-C26 |
Arbor Gate |
The Loan. The Arbor Gate loan has an outstanding principal balance of $38.1 million and is secured by a first mortgage lien on the borrower’s fee interest in the Arbor Gate property, which is comprised of two adjacent Class A office buildings, an attached five-story parking structure, a daycare center and an excess land parcel used for overflow parking that are located in Madison, Wisconsin. The loan has a 10-year term and subsequent to a two-year interest only period, will amortize on a 30-year schedule. The loan sponsors and nonrecourse carve-out guarantors are Patrick J. Baxter and Bradley L. Hutter who developed the property in 2008 for a total cost basis of approximately $53.6 million.
The Property. The Arbor Gate property is comprised of two Class A, six‐story office buildings with 208,812 square feet of net rentable area including ground floor retail, an attached five-story parking garage containing 544 parking spaces, a single-story, 7,800 square foot office building that is used as a daycare facility and an excess land parcel currently utilized for overflow parking with 291 striped spaces. In total, the property contains 835 parking spaces (approximately 4.0 spaces per 1,000 square feet). The office buildings are adjoined by a three-level pedestrian skyway and the upper floors feature views of the University of Wisconsin Arboretum and the capitol building in downtown Madison.
As of October 1, 2014, the property was 95.9% occupied by 20 tenants. The largest tenant, Wipfli, LLP (“Wipfli”), was established in Wausau, Wisconsin in 1930 and since that time the firm has become one of the largest CPA and consulting firms in the United States with 24 offices across Wisconsin, Minnesota, Illinois, Washington and India. The firm is also an integral part of PKF North America, one of the largest global accounting networks in the world. Wipfli’s lease commenced in December 2008 and it occupies 40,052 square feet, approximately 18.5% of total net rentable area, through December 2023. The second largest tenant, Navitus Health Solutions (“Navitus”), is a Madison, Wisconsin-based pharmacy benefit management company that was founded in 2003 by Dean Health Plan and its partners. Dean Health Plan is owned by SSM Health Care, a non‐profit Catholic health system that includes St. Mary’s Hospital in Madison, and Dean Health System, a multi‐specialty practice that owns and operates clinics and medical facilities in 22 counties in southern Wisconsin. Navitus’ corporate headquarters are located at the property under a lease that expires in September 2018. The third largest tenant, Meriter Wisconsin Heart, was formed in 2011 through Meriter Health Services’ acquisition of Wisconsin Heart and Vascular Institute. At the time, Wisconsin Heart and Cardiovascular Institute was a group of 16 cardiologists, vascular surgeons and mid-level providers that had moved to the property from Meriter Hospital in 2008. Meriter Wisconsin Heart occupies 29,000 square feet that expires December 2023.
The Market. Arbor Gate is located in Madison, Wisconsin, the capitol and second largest city within the state, with a 2010 population of 231,453. The property is located within the South Central submarket, approximately four miles south of the Madison central business district. According to the appraisal, the property is prominent asset in this submarket with a recognizable location given its height and construction quality along the Beltline Highway, a major east-west thoroughfare in the southern bounds of the Madison area. Additionally, the property benefits from its proximity to the largest hospital campuses in Madison, including: University of Wisconsin, Meriter Hospital and St. Mary’s Hospital.
According to the appraisal, as of the second quarter of 2014, the vacancy rate in the Madison market was 10.2% while the South Central submarket was approximately 4.6% vacant, with an average vacancy rate of 7.4% over the past five years. The property’s competitive set for the office space has a vacancy rate of 9.5% and average adjusted lease rate of $19.51 per square foot. The property’s competitive set for retail space has a vacancy rate of 11.4% and an average lease rate of $21.22 per square foot. According to the appraisal, there has been no new construction in the submarket from 2010 through 2013 and there are few development sites available.
THE INFORMATION IN THIS STRUCTURAL AND COLLATERAL TERM SHEET IS NOT COMPLETE AND MAY BE AMENDED PRIOR TO THE TIME OF SALE. THIS TERM SHEET IS NOT AN OFFER TO SELL THESE SECURITIES AND IT IS NOT A SOLICITATION OF AN OFFER TO BUY THESE SECURITIES IN ANY JURISDICTION WHERE THE OFFER OR SALE IS NOT PERMITTED.
| | |
| 118 of 133 |
| Structural and Collateral Term Sheet | JPMBB 2014-C26 |
Arbor Gate |
The property’s top 10 tenants account for 184,965 square feet of the total space, or 85.4% of the total net rentable area.
Tenant Summary(1) | |||||
| Tenant | Ratings(2) Moody’s/S&P/Fitch | Net Rentable Area (SF) | % of Total NRA | UW Base Rent PSF | Lease Expiration Date |
| Wipfli, LLP | NA / NA / NA | 40,052 | 18.5% | $19.75 | 12/1/2023 |
| Navitus Health Solutions | NA / NA / NA | 38,717 | 17.9% | $23.65 | 9/30/2018 |
| Meriter Wisconsin Heart | NA / NA / NA | 29,000 | 13.4% | $17.83 | 12/1/2023 |
Dean Heath System(3) | NA / NA / NA | 18,934 | 8.7% | $19.72 | 4/30/2021 |
| Social Security Administration (ODAR) | Aaa / AA+ / AAA | 16,265 | 7.5% | $22.53 | 8/31/2020 |
| Singlewire Software | NA / NA / NA | 11,390 | 5.3% | $20.40 | 4/30/2016 |
| Meriter Hospital, Inc. | NA / NA / NA | 9,706 | 4.5% | $21.46 | 10/1/2018 |
Arbor Gate Hospitality(4) | NA / NA / NA | 8,944 | 4.1% | $23.73 | 10/31/2019 |
| Dane County Parent Council | NA / NA / NA | 7,800 | 3.6% | $10.95 | 7/31/2024 |
| The Egg & I | NA / NA / NA | 4,157 | 1.9% | $18.50 | 7/31/2021 |
| (1) | Based on the underwritten rent roll. |
| (2) | Ratings provided are for the parent company of the entity listed in the “Tenant” field whether or not the parent company guarantees the lease. |
| (3) | Dean Health System has the right to terminate the lease with said termination effective on April 30, 2018 with six months’ notice at any time during the month of October 2017. |
| (4) | Arbor Gate Hospitality occupies 8,944 square feet at the property of which 7,637 square feet expires on October 31, 2019 and 1,307 square feet expires on December 31, 2019. |
Operating History and Underwritten Net Cash Flow | |||||||
| 2011 | 2012 | 2013 | TTM(1) | Underwritten | Per Square Foot | %(2) | |
| Rents In Place | $3,276,759 | $3,667,267 | $3,777,160 | $4,022,369 | $4,205,240 | $19.41 | 76.6% |
| Vacant Income | 0 | 0 | 0 | 0 | 167,941 | 0.78 | 3.1 |
| Gross Potential Rent | $3,276,759 | $3,667,267 | $3,777,160 | $4,022,369 | $4,373,181 | $20.19 | 79.6% |
| Total Reimbursements | 844,283 | 1,031,803 | 1,035,504 | 1,011,168 | 1,119,268 | 5.17 | 20.4 |
| Concessions | (393,163) | (208,989) | (162,284) | (176,826) | 0 | 0.00 | 0.0 |
| Net Rental Income | $3,727,879 | $4,490,081 | $4,650,380 | $4,856,711 | 5,492,449 | $25.36 | 100.0% |
| (Vacancy/Credit Loss) | 0 | 0 | 0 | 0 | (274,622) | (1.27) | (5.0) |
| Other Income | 4,105 | 1,760 | 2,933 | 8,918 | 14,618 | 0.07 | 0.3 |
| Effective Gross Income | $3,731,983 | $4,491,841 | $4,653,313 | $4,865,629 | $5,232,445 | $24.16 | 95.3% |
| Total Expenses | $1,636,568 | $1,691,924 | $1,719,350 | $1,817,138 | $1,838,775 | $8.49 | 35.1% |
Net Operating Income(3) | $2,095,415 | $2,799,918 | $2,933,963 | $3,048,491 | $3,393,669 | $15.67 | 64.9% |
| Total TI/LC, Capex/RR | 0 | 0 | 0 | 0 | 259,934 | 1.20 | 5.0 |
| Net Cash Flow | $2,095,415 | $2,799,918 | $2,933,963 | $3,048,491 | $3,133,735 | $14.47 | 59.9% |
Occupancy(4) | 85.8% | 87.2% | 94.4% | 95.9% | 95.0% | ||
| (1) | TTM column represents the trailing twelve month period ending on August 31, 2014. |
| (2) | Percentage column represents percent of Net Rental Income for all revenue lines and represents percent of Effective Gross Income for the remainder of fields. |
| (3) | Increases in historical Net Operating Income can be attributed to lease-up at the property, with occupancy increasing from 70.6% in 2010 to 85.8% in 2011, 87.2% in 2012, 94.4% in 2013 and to the current occupancy of 95.9% as of October 1, 2014. In addition, the UW NOI includes approximately $50,909 of contractual rent bumps occurring through October 1, 2015. |
| (4) | Historical Occupancies are as of December 31 of each respective year. TTM Occupancy is as of October 1, 2014. |
Additional Debt. The property is subject to a subordinate mortgage in the original principal amount of $2,700,000 (the “TIF Loan”), which loan was originated in connection with a tax increment financing arrangement. In connection with the tax increment financing arrangement, the TIF Loan is to be repaid by increased property tax revenues resulting from improvements financed by the TIF Loan. The TIF Loan requires a minimum pay down of $400,000 per year; however, the incremental taxes paid currently exceed this threshold. The current loan balance of the TIF Loan is approximately $900,116.
THE INFORMATION IN THIS STRUCTURAL AND COLLATERAL TERM SHEET IS NOT COMPLETE AND MAY BE AMENDED PRIOR TO THE TIME OF SALE. THIS TERM SHEET IS NOT AN OFFER TO SELL THESE SECURITIES AND IT IS NOT A SOLICITATION OF AN OFFER TO BUY THESE SECURITIES IN ANY JURISDICTION WHERE THE OFFER OR SALE IS NOT PERMITTED.
| | |
| 119 of 133 |
| Structural and Collateral Term Sheet | JPMBB 2014-C26 |
[THIS PAGE INTENTIONALLY LEFT BLANK]
THE INFORMATION IN THIS STRUCTURAL AND COLLATERAL TERM SHEET IS NOT COMPLETE AND MAY BE AMENDED PRIOR TO THE TIME OF SALE. THIS TERM SHEET IS NOT AN OFFER TO SELL THESE SECURITIES AND IT IS NOT A SOLICITATION OF AN OFFER TO BUY THESE SECURITIES IN ANY JURISDICTION WHERE THE OFFER OR SALE IS NOT PERMITTED.
| | |
| 120 of 133 |
| Structural and Collateral Term Sheet | JPMBB 2014-C26 | |
| Threshold Multifamily Portfolio II | ||
| Mortgage Loan Information | Property Information | |||
| Mortgage Loan Seller: | Column | Single Asset / Portfolio: | Portfolio | |
| Original Principal Balance: | $38,040,000 | Title: | Fee | |
| Cut-off Date Principal Balance: | $38,040,000 | Property Type - Subtype: | Multifamily - Garden | |
| % of Pool by IPB: | 2.6% | Net Rentable Area (Units): | 610 | |
| Loan Purpose: | Refinance | Location: | Various | |
Borrowers(1): | Various | Year Built / Renovated: | Various / N/A | |
| Sponsor: | Brian A. Martin | Occupancy: | 95.1% | |
| Interest Rate: | 4.41100% | Occupancy Date: | 9/1/2014 | |
| Note Date: | 10/10/2014 | Number of Tenants: | N/A | |
| Maturity Date: | 11/6/2024 | 2011 NOI: | $2,028,572 | |
| Interest-only Period: | 42 months | 2012 NOI: | $2,433,494 | |
| Original Term: | 120 months | 2013 NOI: | $2,631,935 | |
| Original Amortization: | 324 months | TTM NOI (as of 8/2014)(2): | $2,921,449 | |
| Amortization Type: | IO-Balloon | UW Economic Occupancy: | 93.1% | |
| Call Protection: | L(25),Def(88),O(7) | UW Revenues: | $5,138,581 | |
| Lockbox: | Springing | UW Expenses: | $2,103,609 | |
| Additional Debt: | N/A | UW NOI(2): | $3,034,971 | |
| Additional Debt Balance: | N/A | UW NCF: | $2,882,471 | |
| Additional Debt Type: | N/A | Appraised Value / Per Unit(3): | $47,550,000 / $77,951 | |
| Appraisal Date: | 7/28/2014 | |||
| Escrows and Reserves | Financial Information | |||||||
| Initial | Monthly | Initial Cap | Cut-off Date Loan / Unit: | $62,361 | ||||
| Taxes: | $392,471 | $35,679 | N/A | Maturity Date Loan / Unit: | $53,608 | |||
| Insurance: | $65,347 | $7,261 | N/A | Cut-off Date LTV: | 80.0% | |||
| Replacement Reserves: | $0 | $12,902 | N/A | Maturity Date LTV: | 68.8% | |||
| TI/LC: | $0 | $0 | N/A | UW NCF DSCR: | 1.19x | |||
Other(4): | $75,675 | $0 | N/A | UW NOI Debt Yield: | 8.0% | |||
| Sources and Uses | ||||||
| Sources | Proceeds | % of Total | Uses | Proceeds | % of Total | |
| Mortgage Loan | $38,040,000 | 100.0% | Payoff Existing Debt | $30,560,987 | 80.3% | |
| Return of Equity | 6,718,077 | 17.7 | ||||
| Upfront Reserves | 533,492 | 1.4 | ||||
| Closing Costs | 227,443 | 0.6 | ||||
| Total Sources | $38,040,000 | 100.0% | Total Uses | $38,040,000 | 100.0% | |
| (1) | The borrowing entities for the loan are BMA Rock Hill Apartments, LLC, BMA North Sharon Amity Apartments, LLC, and BMA Monroe III Apartments, LLC. |
| (2) | Increase from TTM NOI to UW NOI is due to improving occupancy and an increase in rent at all properties in July 2014. |
| (3) | In addition to the individual property valuations, the appraisal also valued the mortgaged properties for purposes of a bulk sale as a portfolio at $49,531,257 ($81,199 per unit), as of October 1, 2014. The above presented value is the sum of individual property values. |
| (4) | Initial Other reserves represents deferred maintenance of $75,675. |
THE INFORMATION IN THIS STRUCTURAL AND COLLATERAL TERM SHEET IS NOT COMPLETE AND MAY BE AMENDED PRIOR TO THE TIME OF SALE. THIS TERM SHEET IS NOT AN OFFER TO SELL THESE SECURITIES AND IT IS NOT A SOLICITATION OF AN OFFER TO BUY THESE SECURITIES IN ANY JURISDICTION WHERE THE OFFER OR SALE IS NOT PERMITTED.
| | |
| 121 of 133 |
| Structural and Collateral Term Sheet | JPMBB 2014-C26 | |
| Threshold Multifamily Portfolio II | ||
The Loan. The Threshold Multifamily Portfolio II loan has an outstanding principal balance of $38.04 million and is secured by a first mortgage lien on three multifamily properties totaling 610 units. The loan has a 10-year term and, subsequent to a 42-month interest-only period, will amortize on a 27-year schedule. The loan sponsor and nonrecourse carve-out guarantor of the mortgage loan is Brian A. Martin. Mr. Martin is the President of Threshold Capital, which he founded in 2004. Threshold Capital is a real estate investment firm specializing in the acquisition, renovation and operation of multifamily communities. Threshold Capital’s real estate portfolio is currently valued at $375 million and includes 40 multifamily properties in the Southern United States.
The Properties. The three properties include: (i) Gable Oaks, a 252-unit garden-style multifamily property located in Rockhill, South Carolina; (ii) Sharon Pointe, a 190-unit garden-style multifamily property located in Charlotte, North Carolina and (iii) Woodbrook, a 168-unit garden-style multifamily property located in Monroe, North Carolina.
Gable Oaks. The Gable Oaks property is a 252-unit garden-style multifamily development which was completed in 1997 and as of September 1, 2014 was 96.4% occupied. Amenities at the property include an on-site leasing office, clubhouse, fitness room, laundry room and a swimming pool. The apartments feature carpeting and vinyl tile flooring, standard kitchen appliances, washer/dryer connections (two and three bedroom units only) and a patio/balcony. The studio units are leased fully furnished, with a murphy bed, sofa, chair, end table, two bar stools and a microwave. The property has 452 parking spaces, which results in a parking ratio of approximately 1.79 spaces per unit.
Sharon Pointe. The Sharon Pointe property is a 190-unit garden-style multifamily development which was completed in 2001 and as of September 1, 2014 was 93.2% occupied. Amenities at the property include an on-site leasing office, clubhouse, fitness center, laundry room, and a swimming pool. The apartments feature carpeting and vinyl tile flooring, standard kitchen appliances, ceiling fans, washer/dryer connections (two and three bedroom units only) and a patio/balcony. The studio units are leased fully furnished, with a murphy bed, sofa, chair, end table, two bar stools and a microwave. The property has 280 parking spaces, which results in parking ratio approximately 1.47 parking spaces per unit.
Woodbrook. The Woodbrook property is a 168-unit garden-style multifamily development which was completed in 1997 and as of September 1, 2014 was 95.2% occupied. Amenities at the property include an on-site leasing office, clubhouse, fitness center, laundry room, basketball court and a swimming pool. The apartments feature carpeting and vinyl tile flooring, standard kitchen appliances, ceiling fans, washer/dryer connections (two and three bedroom units only) and a patio/balcony. The studio units are leased fully furnished, with a murphy bed, sofa, chair, end table, two bar stools and a microwave. The property has 361 parking spaces, which results in parking ratio approximately 2.15 parking spaces per unit.
The Markets. Gable Oaks. The Gable Oaks property is located in Rockhill, South Carolina, approximately 20 miles south of the Charlotte central business district (“CBD”). The major retail development near the property is the Rockhill Galleria, a regional mall that is located approximately three miles south of the property. The neighborhood is also home to two colleges, York Technical College and Winthrop University, each located within 3.5 miles. York Technical College enrolls approximately 6,000 students and Winthrop University enrolls over 5,000 undergraduates and 1,100 graduate students. According to the appraisal, the Gable Oaks property is located within the North Pineville apartment submarket. As of the first quarter of 2014, the North Pineville submarket’s 1990-1999 built apartment properties reported an occupancy of 95.0% and comparable properties had an average occupancy of 96.2%. The average monthly market rent of the property’s submarket is $833 per unit and the market rent for the property’s age group is $831 per unit. The appraisal’s competitive set has an average monthly market rent of $705 per unit ($0.75 per square foot).
Sharon Pointe. The Sharon Pointe property is located in Charlotte, North Carolina approximately seven miles east of the Charlotte CBD. The major retail developments near the property include Compare Foods Supermarket, located adjacent to the north of the property. Hickory Grove Market Shopping Center is located within proximity to the east of the property. Eastland Mall is located approximately two miles south of the property along Central Avenue. The regional mall is anchored by Dillard’s, Burlington Coat Factory, and Sears. There is a transit system stop approximately one block from the property. According to the appraisal, the property is located within the North Tryon Street apartment submarket. As of the first quarter of 2014, the North Tryon Street submarket’s 2000-2009 built apartment properties reported an occupancy of 95.6% and comparable properties had an average occupancy of 95.5%. The average monthly market rent of the property’s submarket is $671 per unit and the market rent for property’s age group properties is $884 per unit. The appraisal’s competitive set has an average monthly market rent of $670 per unit ($0.83 per square foot).
THE INFORMATION IN THIS STRUCTURAL AND COLLATERAL TERM SHEET IS NOT COMPLETE AND MAY BE AMENDED PRIOR TO THE TIME OF SALE. THIS TERM SHEET IS NOT AN OFFER TO SELL THESE SECURITIES AND IT IS NOT A SOLICITATION OF AN OFFER TO BUY THESE SECURITIES IN ANY JURISDICTION WHERE THE OFFER OR SALE IS NOT PERMITTED.
| | |
| 122 of 133 |
| Structural and Collateral Term Sheet | JPMBB 2014-C26 | |
| Threshold Multifamily Portfolio II | ||
Woodbrook. The Woodbrook property is located in the northern portion of Monroe, North Carolina, approximately five miles northeast of the Monroe CBD. Harris Teeter, Food Lion, and Bi-Lo supermarkets are located approximately 2.5 to three miles from the property. Wal-Mart Supercenter, Lowe’s, and CVS are located approximately two miles east of the property along Roosevelt Boulevard. Big-K Mart and Monroe Mall (anchors include JCPenney, Belk, Sears, and Peebles) are located approximately 2.5 miles east of the property along Roosevelt Boulevard. There is a Park N Ride stop approximately 2.5 miles east of the property along Roosevelt Boulevard. According to the appraisal, the property is located within the Carmel apartment submarket. As of the first quarter 2014, the Carmel submarket’s 1990-1999 built apartment properties reported an occupancy of 95.4% and comparable properties had an average occupancy of 97.6%. The average monthly market rent of the property’s submarket is $1,014 per unit and the market rent for property’s age group properties is $1,064 per unit. The appraisal’s competitive set has an average monthly market rent of $735 per unit ($0.87 per square foot).
Gable Oaks Unit Mix(1) | |||||||||
| Unit Type | # of Units | % of Total | Occupied Units | Occupancy | Average Unit Size (SF) | Monthly In-Place Rents(2) | Monthly In-Place Rent PSF (2) | Monthly Market Rent(3) | Monthly Market Rent PSF |
| Studio | 21 | 8.3% | 21 | 100.0% | 336 | $526 | $1.56 | $545 | $1.62 |
| 1 Bedroom | 63 | 25.0 | 62 | 98.4% | 520 | $544 | $1.05 | $565 | $1.09 |
| 2 / 1 Bedroom | 13 | 5.2 | 13 | 100.0% | 864 | $636 | $0.74 | $670 | $0.78 |
| 2 / 2 Bedroom | 107 | 42.5 | 103 | 96.3% | 864 | $663 | $0.77 | $694 | $0.80 |
| 3 Bedroom | 48 | 19.0 | 44 | 91.7% | 1,080 | $769 | $0.71 | $804 | $0.74 |
| Total / Wtd. Avg. | 252 | 100.0% | 243 | 96.4% | 775 | $641 | $0.89 | $669 | $0.93 |
(1) Based on the underwritten rent roll.
(2) Average monthly rental rate per unit and PSF are determined by weighted average on occupied units.
(3) Market Rents are sourced from the borrower rent roll dated September 1, 2014.
Sharon Pointe Unit Mix(1) | |||||||||
| Unit Type | # of Units | % of Total | Occupied Units | Occupancy | Average Unit Size (SF) | Monthly In-Place Rents(2) | Monthly In- Place Rent PSF (2) | Monthly Market Rent(3) | Monthly Market Rent PSF |
| Studio | 24 | 12.6% | 24 | 100.0% | 440 | $540 | $1.23 | $555 | $1.26 |
| 1 Bedroom | 14 | 7.4 | 13 | 92.9% | 544 | $612 | $1.13 | $625 | $1.15 |
| 2 / 2 Bedroom | 120 | 63.2 | 112 | 93.3% | 844 | $694 | $0.82 | $715 | $0.85 |
| 3 Bedroom | 32 | 16.8 | 28 | 87.5% | 1,080 | $848 | $0.79 | $840 | $0.78 |
| Total / Wtd. Avg. | 190 | 100.0% | 177 | 93.2% | 811 | $695 | $0.89 | $709 | $0.91 |
(1) Based on the underwritten rent roll.
(2) Average monthly rental rate per unit and PSF are determined by weighted average on occupied units.
(3) Market Rents are sourced from the borrower rent roll dated September 1, 2014.
Woodbrook Unit Mix(1) | |||||||||
| Unit Type | # of Units | % of Total | Occupied Units | Occupancy | Average Unit Size (SF) | Monthly In-Place Rents(2) | Monthly In- Place Rent PSF (2) | Monthly Market Rent(3) | Monthly Market Rent PSF |
| Studio | 18 | 10.7% | 18 | 100.0% | 336 | $600 | $1.78 | $615 | $1.83 |
| 1 Bedroom | 21 | 12.5 | 20 | 95.2% | 600 | $601 | $1.00 | $625 | $1.04 |
| 2 / 1 Bedroom | 10 | 6.0 | 9 | 90.0% | 868 | $666 | $0.77 | $690 | $0.79 |
| 2 / 2 Bedroom | 95 | 56.5 | 91 | 95.8% | 868 | $732 | $0.84 | $755 | $0.87 |
| 3 Bedroom | 24 | 14.3 | 22 | 91.7% | 1,040 | $832 | $0.80 | $860 | $0.83 |
| Total / Wtd. Avg. | 168 | 100.0% | 160 | 95.2% | 802 | $712 | $0.95 | $735 | $0.98 |
(1) Based on the underwritten rent roll.
(2) Average monthly rental rate per unit and PSF are determined by weighted average on occupied units.
(3) Market Rents are sourced from the borrower rent roll dated September 1, 2014.
THE INFORMATION IN THIS STRUCTURAL AND COLLATERAL TERM SHEET IS NOT COMPLETE AND MAY BE AMENDED PRIOR TO THE TIME OF SALE. THIS TERM SHEET IS NOT AN OFFER TO SELL THESE SECURITIES AND IT IS NOT A SOLICITATION OF AN OFFER TO BUY THESE SECURITIES IN ANY JURISDICTION WHERE THE OFFER OR SALE IS NOT PERMITTED.
| | |
| 123 of 133 |
| Structural and Collateral Term Sheet | JPMBB 2014-C26 | |
| Threshold Multifamily Portfolio II | ||
Operating History and Underwritten Net Cash Flow(1) | |||||||
| 2012 | 2013 | TTM(2) | Underwritten | Per Unit | %(3) | ||
Rents in Place(4) | $4,568,938 | $4,745,701 | $4,854,816 | $4,956,527 | $8,125 | 100.0 | % |
| Vacant Income | 0 | 0 | 0 | 0 | 0 | 0.0 | |
| Gross Potential Rent | $4,568,938 | $4,745,701 | $4,854,816 | $4,956,527 | $8,125 | 100.0 | % |
| Total Reimbursements | 0 | 0 | 0 | 0 | 0 | 0.0 | |
| Net Rental Income | $4,568,938 | $4,745,701 | $4,854,816 | $4,956,527 | $8,125 | 100.0 | % |
(Vacancy and Credit Loss)(5) | (498,850) | (436,309) | (335,393) | (342,307) | (561) | (6.9 | ) |
| Other Income | 393,271 | 416,209 | 485,940 | 524,361 | 860 | 10.6 | |
| Effective Gross Income | $4,463,359 | $4,725,601 | $5,005,363 | $5,138,581 | $8,424 | 103.7 | % |
| Total Expenses | $2,029,865 | $2,093,666 | $2,083,914 | $2,103,610 | $3,449 | 40.9 | % |
| Net Operating Income | $2,433,494 | $2,631,935 | $2,921,449 | $3,034,971 | $4,975 | 59.1 | % |
| Total TI/LC, Capex/RR | 115,070 | 114,550 | 116,517 | 152,500 | 250 | 3.0 | |
| Net Cash Flow | $2,318,424 | $2,517,385 | $2,804,932 | $2,882,471 | $4,725 | 56.1 | % |
Occupancy(6) | 91.4% | 94.7% | 95.1% | 93.1% | |||
| (1) | A detailed operating statement for 2011 was not provided by the borrower. |
| (2) | The TTM column represents the trailing twelve months ending August 31, 2014. |
| (3) | Percentage column represents percent of Net Rental Income for all revenue lines and represents percent of Effective Gross Income for the remainder of fields. |
| (4) | Underwritten Rents in Place are based on the September 1, 2014 rent roll. |
| (5) | Vacancy and Credit Loss in the TTM period represent employee discount, vacancy loss, loss from non revenue units, concessions and uncollectible rents as of September 1, 2014. |
| (6) | Historical Occupancies are as of December 31 of each year. TTM occupancy is as of September 1, 2014. Underwritten Occupancy represents economic occupancy. |
Release of Individual Properties. After the lockout period, the borrower is permitted to obtain the release of any individual property in connection with a partial defeasance of the loan, subject to the satisfaction of certain conditions, including, but not limited to the following: (i) partial defeasance of a principal amount equal to the greater of (a) 100% of the net sales proceeds with respect to such property and (b) 125% of the aggregate of the allocated loan amount for such property, (ii) after giving effect to such sale and defeasance, the debt service coverage ratio of the properties then remaining shall be no less than the greater of (a) the debt service coverage ratio immediately preceding such sale and (b) 1.20x, and (iii) after giving effect to such sale and defeasance, the loan to value ratio of the properties then remaining shall be no more than the lesser of (a) the loan to value ratio immediately preceding such sale and (b) 80%.
THE INFORMATION IN THIS STRUCTURAL AND COLLATERAL TERM SHEET IS NOT COMPLETE AND MAY BE AMENDED PRIOR TO THE TIME OF SALE. THIS TERM SHEET IS NOT AN OFFER TO SELL THESE SECURITIES AND IT IS NOT A SOLICITATION OF AN OFFER TO BUY THESE SECURITIES IN ANY JURISDICTION WHERE THE OFFER OR SALE IS NOT PERMITTED.
| | |
| 124 of 133 |
| Structural and Collateral Term Sheet | JPMBB 2014-C26 |
| Columbia Centre I & II | |
| Mortgage Loan Information | Property Information | |||
| Mortgage Loan Seller: | JPMCB | Single Asset / Portfolio: | Single Asset | |
| Original Principal Balance: | $37,240,000 | Title: | Fee / Leasehold | |
| Cut-off Date Principal Balance: | $37,240,000 | Property Type - Subtype: | Office - CBD | |
| % of Pool by IPB: | 2.6% | Net Rentable Area (SF): | 370,775 | |
| Loan Purpose: | Acquisition | Location: | Rosemont, IL | |
| Borrower: | Adventus US Realty #6 LP | Year Built / Renovated: | 1986, 1988 / 2011 | |
| Sponsor: | Adventus Holdings LP | Occupancy(1): | 92.0% | |
| Interest Rate: | 4.22000% | Occupancy Date: | 10/8/2014 | |
| Note Date: | 10/15/2014 | Number of Tenants: | 44 | |
| Maturity Date: | 11/1/2024 | 2011 NOI: | N/A | |
| Interest-only Period: | 24 months | 2012 NOI: | $1,284,650 | |
| Original Term: | 120 months | 2013 NOI: | $1,972,820 | |
| Original Amortization: | 360 months | TTM NOI (as of 7/2014)(2): | $2,282,574 | |
| Amortization Type: | IO-Balloon | UW Economic Occupancy: | 87.5% | |
| Call Protection: | L(25),Def(92),O(3) | UW Revenues: | $7,827,712 | |
| Lockbox: | CMA | UW Expenses: | $3,956,005 | |
| Additional Debt: | N/A | UW NOI(1)(2): | $3,871,707 | |
| Additional Debt Balance: | N/A | UW NCF(1): | $3,290,555 | |
| Additional Debt Type: | N/A | Appraised Value / Per SF(3): | $53,200,000 / $143 | |
| Appraisal Date: | 8/14/2014 | |||
| Escrows and Reserves | Financial Information | |||||||
| Initial | Monthly | Initial Cap | Cut-off Date Loan / SF: | $100 | ||||
| Taxes: | $371,332 | $92,779 | N/A | Maturity Date Loan / SF: | $85 | |||
| Insurance: | $0 | Springing | N/A | Cut-off Date LTV(3): | 70.0% | |||
| Replacement Reserves: | $8,651 | $8,651 | N/A | Maturity Date LTV(3): | 59.3% | |||
TI/LC(3): | $54,071 | $54,071 | $1,946,569 | UW NCF DSCR: | 1.50x | |||
Other(3)(4): | $1,014,048 | $27,124 | N/A | UW NOI Debt Yield: | 10.4% | |||
| Sources and Uses | ||||||||
| Sources | Proceeds | % of Total | Uses | Proceeds | % of Total | |||
| Mortgage Loan | $37,240,000 | 69.3% | Purchase Price | $52,136,000 | 97.0% | |||
| Sponsor Equity | 16,527,255 | 30.7 | Upfront Reserves | 1,448,102 | 2.7 | |||
| Closing Costs | 183,153 | 0.3 | ||||||
| Total Sources: | $53,767,255 | 100.0% | Total Uses: | $53,767,255 | 100.0% | |||
| (1) | Occupancy, UW NOI and UW NCF include PERQ/HCI LLC (WPP), which has executed a lease but is not yet in occupancy or paying rent. |
| (2) | The increase from TTM NOI to UW NOI is primarily due to increased leasing activity and underwriting contractual rent escalations through September 2015. |
| (3) | Appraised Value / Per SF, Cut-off Date LTV and Maturity Date LTV reflect the “Hypothetical Market Value As Is” of $53.2 million, which assumes that all rent concessions, tenant improvement allowances, and leasing commissions for all existing leases have been paid. At origination, the borrower was required to escrow $54,071 for tenant improvements and $1,014,048 for free rent under the leases, and the borrower is also required to escrow $27,124 on each payment date in December 2014 and January and February 2015 for additional rent abatements. The “as-is” appraised value of $50.6 million would result in a Cut-off Date LTV and Maturity Date LTV of 73.6% and 62.4%, respectively. |
| (4) | Initial Other Escrows and Reserves consist of a free rent reserve related to tenants, PERQ/HCI LLC (WPP), Randa Accessories, Resolution Life Inc., Foresite Realty Management, Pasona, Celerity and Coty, Inc. Monthly Other Escrows and Reserves represents a monthly deposit for rent abatements which the borrower is required to make on the payment dates in December 2014 and January and February 2015. |
The Loan. The Columbia Centre I & II loan has an outstanding principal balance of $37.24 million and is secured by a first mortgage lien on two Class A office buildings totaling 370,775 square feet in Rosemont, Illinois. The loan has a 10-year term, and subsequent to a two-year interest-only period, will amortize on a 30-year schedule. The loan sponsor is Adventus Holdings LP (“Adventus”), a full service private REIT founded and based in Vancouver, Canada. The firm was founded by a group of former PricewaterhouseCoopers executives, including Rod Johnston and Brad Newell. Adventus is focused on acquiring and managing a portfolio of core properties in
THE INFORMATION IN THIS STRUCTURAL AND COLLATERAL TERM SHEET IS NOT COMPLETE AND MAY BE AMENDED PRIOR TO THE TIME OF SALE. THIS TERM SHEET IS NOT AN OFFER TO SELL THESE SECURITIES AND IT IS NOT A SOLICITATION OF AN OFFER TO BUY THESE SECURITIES IN ANY JURISDICTION WHERE THE OFFER OR SALE IS NOT PERMITTED.
| | |
| 125 of 133 |
| Structural and Collateral Term Sheet | JPMBB 2014-C26 |
| Columbia Centre I & II | |
the $10.0 to $50.0 million range, with a primary focus on suburban office properties in Chicago, Illinois. To date, Adventus has acquired five properties and has a commercial real estate portfolio valued at approximately $141.1 million, consisting of approximately 1.5 million square feet. The loan sponsor acquired the property from a joint-venture between White Oak Realty and Angelo Gordon for approximately $52.1 million. The borrowing entity for the Columbia Centre I & II loan is Adventus US Realty #6 LP, a Delaware limited partnership and special purpose entity.
The Property. Columbia Centre I & II are two class A office buildings totaling 370,775 square feet in Rosemont, Illinois. Columbia Centre I was built in 1986 and consists of a nine-story office tower and a five-level parking structure totaling 829 spaces. Columbia Centre II consists of a seven-story office tower with an adjacent four-story 437-space parking garage. The building was completed in 1988 as the second phase of the Columbia Centre office complex. Both office towers are designed with large setbacks, creating accessible terraces for the office tenants. Property amenities include a newly built 6,000 square foot fitness center, an on-site deli, a complimentary shuttle service to and from the CTA Blue Line Rosemont train station and 24/7 key card access and security cameras. Columbia Centre I & II were acquired by the seller in 2011, and according to the borrower, since 2011, there has been approximately $10.2 million invested in capital expenditures and re-leasing costs in order to renovate the common areas and re-tenant the space. The extensive renovations to reposition the property have brought overall occupancy from 67.6% in early 2011 to 92.0% as of October 8, 2014.
As of October 8, 2014, the property was 92.0% occupied by 44 tenants. The largest tenant is Randa Accessories, which occupies 8.9% of the property’s net rentable area on a lease through February 2022. Randa Accessories is the leading manufacturer, distributor and marketer of lifestyle accessories including belts, wallets, neckwear, small leather goods, luggage, business cases and jewelry for men, women and children. The company was founded in 1910 and provides its goods through over 10,000 retailers on five continents. The company has licensing agreements to make accessories for companies including Nautica, Diane von Furstenberg, Kenneth Cole, Guess, Tommy Hilfiger, Columbia Sportswear, Tumi and Anne Klein, along with retailers including Macy’s, Nordstrom and Sears. Randa Accessories utilizes its space at Columbia Centre I as its regional headquarters housing executive, marketing and accounting personnel. Randa Accessories originally executed a lease for 26,565 square feet in 2010, with a 6,253 square foot expansion in November 2013. The second largest tenant is Resolution Life Inc., which occupies 7.1% of the net rentable area through December 2024. Resolution Life Inc. is a U.S. based life insurance company that was founded in 2004 and is headquartered in London, England. In July 2013, Resolution Life Inc. acquired the Lincoln Benefit Life Company for $600 million. After the acquisition the company moved its headquarters to Rosemont, Illinois. In 2014, the parent company, Resolution Limited, changed its name to Friends Life. The company is traded on the London Stock Exchange under the ticker symbol, FLG and, as of August 2014, the company reported a market capitalization of $4.31 billion. The third largest tenant is HQ Global Workplaces LLC, which occupies 6.5% of the property’s net rentable area through September 2019. HQ Global Workplaces LLC is a division of the Regus Business Centre Corporation, which is a provider of workplace solutions. In 2004 Regus acquired HQ Global Workplaces LLC, the United States’ leading business center operator.
The Market. Columbia Centre I & II are located in Rosemont, Illinois, a suburb that is approximately 16 miles away from downtown Chicago. The property is located approximately two miles from the Chicago O’Hare International Airport and is accessible from both Interstate 294 and Interstate 90. The property is located in the heart of Rosemont’s recently developed entertainment, dining and shopping district anchored by the adjacent MB Financial Park. The master-planned community was opened in 2012 and is home to 12 retail & entertainment venues offering upscale international cuisine, live music, comedy, state-of-the-art theatre, bowling and seasonal events. The property is located less than two blocks from the Donald E. Stephens Convention Center and the newly opened Fashions Outlets of Chicago, half a mile from the entertainment venue the Park at Rosemont and approximately two miles from the Rivers Casino. The Donald E. Stephens Convention Center is the tenth largest convention facility in the nation and the Fashion Outlets of Chicago, which opened in August 2013, is a 530,000 square foot shopping center that consists of over 130 stores.
Columbia Centre I & II are located in the town of Rosemont in Cook County in northeastern Illinois. The property is located in the O’Hare submarket of the Chicago metro area. O’Hare is the only major suburban office submarket to feature a Chicago Transit Authority train line with direct access to Chicago’s central business district. The Rosemont Blue Line stop, which is located less than half a mile from the property, provides direct service between Chicago O’Hare International Airport and downtown Chicago. The property also provides a shuttle for tenants with service in the mornings and evenings to the CTA Blue Line. The O’Hare submarket had an office inventory of approximately 13.7 million square feet of which approximately 6.5 million square feet is Class A office space as of second quarter 2014. The O’Hare Class A office space had an estimated vacancy rate of 24.6% and average asking rents of $28.10 per square foot as of the second quarter of 2014. However, within the O’Hare submarket, the appraiser identified a subset of 10 directly competitive properties built between 1984 and 2010 and ranging from 121,117 square feet to 380,360 square feet that have a weighted average vacancy rate of 7.5% and average asking rents of $18.31 per square foot. Based on this peer group, the appraiser concluded a vacancy rate of 7.5% for Columbia Centre I & II. The property has a primary trade area consisting of a three-mile radius that contains an estimated 103,709 people with an estimated average household income of $40,814 for 2014.
THE INFORMATION IN THIS STRUCTURAL AND COLLATERAL TERM SHEET IS NOT COMPLETE AND MAY BE AMENDED PRIOR TO THE TIME OF SALE. THIS TERM SHEET IS NOT AN OFFER TO SELL THESE SECURITIES AND IT IS NOT A SOLICITATION OF AN OFFER TO BUY THESE SECURITIES IN ANY JURISDICTION WHERE THE OFFER OR SALE IS NOT PERMITTED.
| | |
| 126 of 133 |
| Structural and Collateral Term Sheet | JPMBB 2014-C26 |
| Columbia Centre I & II | |
Tenant Summary(1) | |||||
| Tenant | Ratings(2) Moody’s/S&P/Fitch | Net Rentable Area (SF) | % of Total NRA | Base Rent PSF | Lease Expiration Date |
Randa Accessories(3) | NA / NA / NA | 32,818 | 8.9% | $12.49 | 2/28/2022 |
Resolution Life Inc.(4) | NA / NA / NA | 26,369 | 7.1% | $13.50 | 12/31/2024 |
HQ Global Workplaces LLC(5) | NA / NA / NA | 24,225 | 6.5% | $15.75 | 9/30/2019 |
| Rail Europe Inc. | NA / NA / NA | 23,385 | 6.3% | $13.20 | 5/31/2017 |
| AFCO Credit Corporation | NA / NA / NA | 17,800 | 4.8% | $12.00 | 7/31/2016 |
Sprint Communications Company(6) | B1 / BB- / B+ | 12,895 | 3.5% | $13.00 | 7/31/2017 |
| General Services Administration | NA / NA / NA | 12,580 | 3.4% | $25.75 | 4/30/2019 |
| PERQ/HCI LLC (WPP) | NA / NA / NA | 12,073 | 3.3% | $14.00 | 7/31/2022 |
Tecta America Corp.(7) | NA / NA / NA | 11,782 | 3.2% | $12.00 | 9/30/2023 |
Lee & Associates of Illinois(8) | NA / NA / NA | 11,396 | 3.1% | $14.00 | 6/30/2023 |
| (1) | Based on the underwritten rent roll. |
| (2) | Ratings provided are for the parent company of the entity listed in the “Tenant” field whether or not the parent company guarantees the lease. |
| (3) | Randa Accessories has the right to terminate its lease on or after December 31, 2020, with 12 months’ notice and a payment of a termination fee. Randa Accessories originally executed a lease for 26,565 square feet in 2010 and executed a 6,253 square foot expansion in November 2013. |
| (4) | Resolution Life Inc. has the right to terminate its lease on May 31, 2020 or May 31, 2022 with nine months’ notice and payment of a termination fee. |
| (5) | HQ Global Workplaces LLC has the right to terminate its lease on or after September 30, 2016, with 10 months’ notice and payment of a termination fee. |
| (6) | Sprint Communications Company has the right to terminate its lease on or after July 31, 2015, with 10 months’ notice and a payment of a termination fee. |
| (7) | Tecta America Corp. has the right to terminate its lease for 11,872 square feet as of September 30, 2020 with 12 months’ written notice and the payment of a termination fee. With regards to the 95 square feet of storage space, either party may terminate the storage lease on the last day of any calendar month with 30 days’ prior notice. |
| (8) | Lee & Associates of Illinois has the right to terminate its lease on or after June 30, 2020, with nine months’ prior notice and payment of a termination fee. |
Operating History and Underwritten Net Cash Flow | ||||||
| 2012 | 2013 | TTM(1) | Underwritten(1) | Per Square Foot | %(2) | |
| Rents in Place | $2,986,743 | $3,496,864 | $3,480,970 | $4,696,321 | $12.67 | 52.5% |
| Vacant Income | 0 | 0 | 0 | 417,424 | 1.13 | 4.7 |
| Gross Potential Rent | $2,986,743 | $3,496,864 | $3,480,970 | $5,113,745 | $13.79 | 57.2% |
| Total Reimbursements | 1,635,391 | 2,128,170 | 2,609,343 | 3,832,211 | 10.34 | 42.8 |
| Net Rental Income | $4,622,134 | $5,625,034 | $6,090,313 | $8,945,957 | $24.13 | 100.0% |
| (Vacancy/Credit Loss) | 0 | 0 | 0 | (1,118,245) | (3.02) | (12.5) |
| Other Income | 0 | 0 | 0 | 0 | 0.00 | 0.0 |
| Effective Gross Income | $4,622,134 | $5,625,034 | $6,090,313 | $7,827,712 | $21.11 | 87.5% |
| Total Expenses | $3,337,484 | $3,652,214 | $3,807,739 | $3,956,005 | $10.67 | 50.5% |
| Net Operating Income | $1,284,650 | $1,972,820 | $2,282,574 | $3,871,707 | $10.44 | 49.5% |
| Total TI/LC, Capex/RR | 0 | 0 | 0 | 581,151 | 1.57 | 7.4 |
| Net Cash Flow | $1,284,650 | $1,972,820 | $2,282,574 | $3,290,555 | $8.87 | 42.0% |
Occupancy(3) | 78.6% | 74.1% | 92.0% | 87.5% | ||
| (1) | TTM column represents the trailing twelve month period ending on July 31, 2014. Increase from TTM Net Operating Income to UW Net Operating Income is primarily due to increased leasing activity and underwriting contractual rent escalations through September 2015. |
| (2) | Percentage column represents percent of Net Rental Income for all revenue lines and represents percent of Effective Gross Income for the remainder of fields. |
| (3) | Historical Occupancies are as of December 31 of each year. TTM Occupancy is as of October 8, 2014. Underwritten Occupancy represents economic occupancy. |
Ground Lease. There is a small portion of the property which consists of eight parking spaces that is subject to a ground lease. The ground lease commenced on September 12, 1966 and will expire on September 12, 2016. Upon expiration, the ground leased portion of the property will be released from the collateral for the loan.
THE INFORMATION IN THIS STRUCTURAL AND COLLATERAL TERM SHEET IS NOT COMPLETE AND MAY BE AMENDED PRIOR TO THE TIME OF SALE. THIS TERM SHEET IS NOT AN OFFER TO SELL THESE SECURITIES AND IT IS NOT A SOLICITATION OF AN OFFER TO BUY THESE SECURITIES IN ANY JURISDICTION WHERE THE OFFER OR SALE IS NOT PERMITTED.
| | |
| 127 of 133 |
| Structural and Collateral Term Sheet | JPMBB 2014-C26 |
[THIS PAGE INTENTIONALLY LEFT BLANK]
THE INFORMATION IN THIS STRUCTURAL AND COLLATERAL TERM SHEET IS NOT COMPLETE AND MAY BE AMENDED PRIOR TO THE TIME OF SALE. THIS TERM SHEET IS NOT AN OFFER TO SELL THESE SECURITIES AND IT IS NOT A SOLICITATION OF AN OFFER TO BUY THESE SECURITIES IN ANY JURISDICTION WHERE THE OFFER OR SALE IS NOT PERMITTED.
| | |
| 128 of 133 |
| Structural and Collateral Term Sheet | JPMBB 2014-C26 |
| Holiday Inn & Suites Across from Universal Studios | |
200
| Mortgage Loan Information | Property Information | |||
| Mortgage Loan Seller: | Barclays | Single Asset / Portfolio: | Single Asset | |
| Original Principal Balance: | $36,000,000 | Title(1): | Fee | |
| Cut-off Date Principal Balance: | $36,000,000 | Property Type - Subtype: | Hotel - Full Service | |
| % of Pool by IPB: | 2.5% | Net Rentable Area (Rooms): | 390 | |
| Loan Purpose: | Refinance | Location: | Orlando, FL | |
| Borrower: | Orlando Hotel Associates LLC | Year Built / Renovated: | 1971 / 2010-2011 | |
| Sponsor: | Allan V. Rose | Occupancy / ADR / RevPAR: | 88.1% / $78.83 / $69.47 | |
| Interest Rate: | 4.40000% | Occupancy / ADR / RevPAR Date: | 9/30/2014 | |
| Note Date: | 11/13/2014 | Number of Tenants(2): | N/A | |
| Maturity Date: | 12/6/2024 | 2011 NOI(3): | $2,320,225 | |
| Interest-only Period: | 36 months | 2012 NOI(3): | $3,602,155 | |
| Original Term: | 120 months | 2013 NOI: | $4,113,707 | |
| Original Amortization: | 360 months | TTM NOI (as of 9/2014): | $4,100,760 | |
| Amortization Type: | IO-Balloon | UW Occupancy / ADR / RevPAR: | 86.0% / $80.78 / $69.47 | |
| Call Protection: | L(24),Def(92),O(4) | UW Revenues: | $11,405,801 | |
| Lockbox: | CMA | UW Expenses: | $7,302,653 | |
| Additional Debt: | N/A | UW NOI: | $4,103,148 | |
| Additional Debt Balance: | N/A | UW NCF: | $4,103,148 | |
| Additional Debt Type: | N/A | Appraised Value / Per Room: | $58,600,000 / $150,256 | |
| Appraisal Date: | 10/2/2014 | |||
| Escrows and Reserves | Financial Information | |||||||
| Initial | Monthly | Initial Cap | Cut-off Date Loan / Room: | $92,308 | ||||
| Taxes: | $0 | $24,175 | N/A | Maturity Date Loan / Room: | $80,615 | |||
| Insurance: | $0 | Springing | N/A | Cut-off Date LTV: | 61.4% | |||
| FF&E Reserves: | $0 | 4% of Gross Revenues | N/A | Maturity Date LTV: | 53.7% | |||
| TI/LC: | $0 | $0 | N/A | UW NCF DSCR: | 1.90x | |||
Other(4): | $250,000 | $0 | N/A | UW NOI Debt Yield: | 11.4% | |||
| Sources and Uses | ||||||||
| Sources | Proceeds | % of Total | Uses | Proceeds | % of Total | |||
| Mortgage Loan | $36,000,000 | 100.0% | Payoff Existing Debt | $24,002,597 | 66.7% | |||
| Return of Equity | 10,803,493 | 30.0 | ||||||
| Closing Costs | 943,910 | 2.6 | ||||||
| Upfront Reserves | 250,000 | 0.7 | ||||||
| Total Sources | $36,000,000 | 100.0% | Total Uses | $36,000,000 | 100.0% | |||
| (1) | The loan is secured by the first mortgage on both the fee and leasehold interests in the property as the loan sponsor, Allan V. Rose, is the ground lessor. |
| (2) | The hotel’s restaurant is occupied by TGI Friday’s, which provides room service. |
| (3) | The increase in 2012 NOI from 2011 NOI is primarily a result of the property undergoing extensive room renovations in 2010 and 2011; as such approximately 42.7% of the available rooms were offline in 2011. |
| (4) | The Initial Other Escrows and Reserves include $250,000 for a property improvement plan (“PIP”) reserve, which is in excess of the engineering and management estimates. By May 26, 2015, the borrower is required to have completed the remaining PIP work, which includes improvements to the parking lot, guest rooms, public spaces and other hotel amenities. |
The Loan. The Holiday Inn & Suites Across from Universal Studios loan has an outstanding principal balance of $36.0 million and is secured by a first mortgage lien on the fee and leasehold interests in a 10-story 390-room full service hotel located in Orlando, Florida. The loan has a 10-year term and, subsequent to a three-year interest-only period, will amortize on a 30-year schedule.
THE INFORMATION IN THIS STRUCTURAL AND COLLATERAL TERM SHEET IS NOT COMPLETE AND MAY BE AMENDED PRIOR TO THE TIME OF SALE. THIS TERM SHEET IS NOT AN OFFER TO SELL THESE SECURITIES AND IT IS NOT A SOLICITATION OF AN OFFER TO BUY THESE SECURITIES IN ANY JURISDICTION WHERE THE OFFER OR SALE IS NOT PERMITTED.
| | |
| 129 of 133 |
| Structural and Collateral Term Sheet | JPMBB 2014-C26 |
| Holiday Inn & Suites Across from Universal Studios | |
The Sponsor. The loan sponsor and nonrecourse carve-out guarantor is Allan V. Rose, the owner and chief executive officer of AVR Realty Company (“AVR”), a privately-held real estate development and management company. Over the past 45 years, AVR has built, acquired and developed more than 30 million square feet of office complexes, shopping centers, corporate and industrial parks, apartment complexes, residential communities and hotels. The borrower has a total cost basis of approximately $45.4 million and approximately $9.4 million of equity remaining in the property.
The Property. The Holiday Inn & Suites Across from Universal Studios loan is secured by the fee and leasehold interests in a 10-story, 390-guestroom, full service hotel located in Orlando, Florida. The property is situated across the street from Universal Studios and Universal Islands of Adventure, at the intersection of Major Boulevard and South Kirkman Road. In 2010 and 2011 the hotel underwent a property improvement plan incorporating approximately $11.5 million ($29,578 per key) in extensive renovations to the lobby, guestrooms, ballrooms, corridors, elevators and building exteriors and façade. An additional $0.5 million in upgrades to the HVAC, ADA accessibility facilities and property management systems took place from 2012 through 2014.
Amenities at the property include two ballrooms with three meeting rooms, a penthouse, adult and children’s swimming pools, a fitness center, a business center and a laundry room. Of the 390 guestrooms available, there are 27 guestrooms with king-sized beds, 229 guestrooms with double beds, 95 one-bedroom suites and 39 two-bedroom suites. There are 427 parking spaces resulting in a ratio of approximately 1.1 parking spaces for every guestroom. Holiday Inn & Suites Across from Universal Studios provides complimentary scheduled transportation to Universal Studios, Wet ’n Wild Orlando, Sea World, Aquatica and Disney. Additionally, the property offers discounted tickets to many of the area’s attractions.
The property also benefits from having a TGI Friday’s (“TGIF”) restaurant located inside the hotel. The approximately 8,800 square foot restaurant is able to seat 200 to 300 people and provides a breakfast buffet, lunch, dinner and room service to hotel guests. TGIF has been at the property since 1998 and recently extended their lease through December 2018 and has six five-year extension options remaining. The restaurant pays fixed rent of $199,650, $25,000 in CAM and real estate tax reimbursements and 6.0% percentage rent on gross sales over $2.5 million. Between 2012 and 2014, with 2014 annualized for the first two quarters, TGIF has paid an average of $170,295 in overage rent yearly. TGIF total sales were $5,479,954 and $6,092,403 in 2012 and 2013, respectively.
The property is located in the Orlando-Deltona-Daytona Beach, Florida combined statistical area, in close proximity to numerous tourist attractions such as Universal Studios, Walt Disney World, SeaWorld Adventure Park, Discovery Cove and Wet ’n Wild Orlando. The property is located across the street from Universal Studios, The Wizarding World of Harry Potter and Universal’s Islands of Adventure. Simon Property Group’s Orlando Premium Outlets is located across Interstate 4, and features national tenants such as Nike Factory Store, Saks Fifth Avenue Off 5th, Barneys New York Warehouse, Polo Ralph Lauren Factory Store, Forever 21, Fendi, J. Crew and Ferragamo, among others. I-Drive 360, a $200 million entertainment center, is under construction less than 3.0 miles away and is expected to open in the spring of 2015. I-Drive 360 will include a 425-foot observation wheel, Madame Tussaud’s Wax Museum and the Sea Life Aquarium. Additionally, Disney has announced plans to transform Downtown Disney, creating additional demand generators.
According to the appraisal, the property generated approximately 75% of its room nights from leisure, 15% from commercial and 10% from meeting and group business. Annually, there are approximately 60 million tourists who visit the Orlando market. In 2013, there were 59 million people who visited Orlando, up 3.0% from 2012.
Historical Occupancy, ADR, RevPAR | |||||||||
Competitive Set(1) | Holiday Inn & Suites Across from Universal Studios(2) | Penetration Factor(3) | |||||||
| Year | Occupancy | ADR | RevPAR | Occupancy | ADR | RevPAR | Occupancy | ADR | RevPAR |
| 2011 | 66.7% | $70.43 | $46.98 | 73.3% | $88.69 | $64.97 | 109.9% | 125.9% | 138.3% |
| 2012 | 72.3% | $69.98 | $50.63 | 68.8% | $81.43 | $56.06 | 95.1% | 116.4% | 110.7% |
| 2013 | 73.7% | $71.52 | $52.72 | 81.3% | $76.84 | $62.50 | 110.3% | 107.4% | 118.6% |
TTM(4) | 80.6% | $74.29 | $59.87 | 86.6% | $79.23 | $68.58 | 107.4% | 106.7% | 114.5% |
| (1) | Data provided by Smith Travel Research. Competitive set contains the following properties: International Palms Resort Orlando I Drive, DoubleTree by Hilton Universal Orlando, Four Points Studio City, Best Western Orlando Gateway Hotel, Holiday Inn Express Universal Studio and Hyatt Place Orlando Universal. |
| (2) | Based on operating statements provided by the borrower. |
| (3) | Penetration Factor is calculated based on data provided by Smith Travel Research and the appraisal for the competitive set and based on operating statements provided by the borrower for the property. |
| (4) | TTM represents the trailing twelve-month period ending on August 31, 2014. |
THE INFORMATION IN THIS STRUCTURAL AND COLLATERAL TERM SHEET IS NOT COMPLETE AND MAY BE AMENDED PRIOR TO THE TIME OF SALE. THIS TERM SHEET IS NOT AN OFFER TO SELL THESE SECURITIES AND IT IS NOT A SOLICITATION OF AN OFFER TO BUY THESE SECURITIES IN ANY JURISDICTION WHERE THE OFFER OR SALE IS NOT PERMITTED.
| | |
| 130 of 133 |
| Structural and Collateral Term Sheet | JPMBB 2014-C26 |
| Holiday Inn & Suites Across from Universal Studios | |
Competitive Hotels Profile(1) | ||||||||
2013 Estimated Market Mix | 2013 Estimated Operating Statistics | |||||||
| Property | Rooms | Year Built | Commercial | Meeting & Group | Leisure | Occupancy | ADR | RevPAR |
| Holiday Inn & Suites Across from Universal Studios | 390 | 1971 | 15% | 10% | 75% | 81.3% | $76.84 | $62.50 |
| DoubleTree by Hilton Universal Orlando | 742 | 1972 | 20% | 25% | 55% | 74% | $90.00 | $66.60 |
| Hyatt Place Orlando Universal | 150 | 2000 | 20% | 20% | 60% | 84% | $95.00 | $79.80 |
| Four Points Studio City | 301 | 1979 | 15% | 15% | 70% | 78% | $74.00 | $57.72 |
| Holiday Inn Express Universal Studio | 196 | 2000 | 20% | 15% | 65% | 70% | $82.00 | $57.40 |
Total(2) | 1,389 | |||||||
| (1) | Per the appraisal. |
| (2) | Excludes the subject property. |
Operating History and Underwritten Net Cash Flow | |||||||
2011(1) | 2012(1) | 2013 | TTM(2) | Underwritten | Per Room(3) | % of Total Revenue(4) | |
| Occupancy | 73.3% | 68.8% | 81.3% | 88.1% | 86.0% | ||
| ADR | $88.69 | $81.43 | $76.84 | $78.83 | $80.78 | ||
| RevPAR | $64.97 | $56.06 | $62.50 | $69.47 | $69.47 | ||
| Room Revenue | $5,311,479 | $8,001,820 | $8,897,098 | $9,889,434 | $9,889,434 | $25,358 | 86.7% |
| Food & Beverage Revenue | 476,020 | 529,427 | 554,708 | 584,298 | 584,298 | 1498 | 5.1 |
| Telephone Revenue | 3,547 | 2,329 | 3,294 | 1,992 | 1,992 | 5 | 0.0 |
Other Departmental Revenues(5) | 698,393 | 796,055 | 928,257 | 930,078 | 930,078 | 2,385 | 8.2 |
| Total Revenue | $6,489,439 | $9,329,631 | $10,383,357 | $11,405,801 | $11,405,801 | $29,246 | 100.0% |
| Room Expense | $1,138,501 | $1,854,981 | $2,156,029 | $2,382,034 | $2,382,034 | $6,108 | 24.1% |
| Food & Beverage Expense | 239,668 | 279,898 | 307,165 | 320,181 | 320,181 | 821 | 54.8 |
| Telephone Expense | 36,982 | 41,546 | 43,417 | 47,685 | 47,685 | 122 | 2,394.3 |
| Other Departmental Expenses | 38,299 | 46,246 | 42,941 | 44,813 | 44,813 | 115 | 4.8 |
| Departmental Expenses | $1,453,450 | $2,222,671 | $2,549,552 | $2,794,713 | $2,794,713 | $7,166 | 24.5% |
| Departmental Profit | $5,035,989 | $7,106,960 | $7,833,805 | $8,611,088 | $8,611,088 | $22,080 | 75.5% |
| Operating Expenses | $2,390,820 | $3,146,900 | $3,315,691 | $3,646,355 | $3,646,355 | $9,350 | 32.0% |
| Gross Operating Profit | $2,645,169 | $3,960,060 | $4,518,114 | $4,964,733 | $4,964,733 | $12,730 | 43.5% |
| Fixed Expenses | $324,944 | $357,905 | $404,406 | $407,741 | $405,353 | $1,039 | 3.6% |
| FF&E | 0 | 0 | 0 | 456,232 | 456,232 | 1,170 | 4.0 |
| Total Other Expenses | $324,944 | $357,905 | $404,406 | $863,973 | $861,585 | $2,209 | 7.6% |
| Net Operating Income | $2,320,225 | $3,602,155 | $4,113,707 | $4,100,760 | $4,103,148 | $10,521 | 36.0% |
| Net Cash Flow | $2,320,225 | $3,602,155 | $4,113,707 | $4,100,760 | $4,103,148 | $10,521 | 36.0% |
| (1) | The increase in 2012 NOI from 2011 NOI is primarily a result of the property undergoing extensive room renovations in 2010 and 2011; as such approximately 42.7% of the available rooms were offline in 2011. |
| (2) | TTM column represents the trailing twelve-month period ending on September 30, 2014. |
| (3) | Per Room values based on 390 guestrooms. |
| (4) | % of Total Revenue column for Room Expense, Food & Beverage Expense, Telephone Expense and Other Departmental Expenses is based on their corresponding revenue line item. |
| (5) | Other Departmental Revenues are partially comprised of TGIF’s rent, inclusive of fixed rent and percentage rent. |
THE INFORMATION IN THIS STRUCTURAL AND COLLATERAL TERM SHEET IS NOT COMPLETE AND MAY BE AMENDED PRIOR TO THE TIME OF SALE. THIS TERM SHEET IS NOT AN OFFER TO SELL THESE SECURITIES AND IT IS NOT A SOLICITATION OF AN OFFER TO BUY THESE SECURITIES IN ANY JURISDICTION WHERE THE OFFER OR SALE IS NOT PERMITTED.
| | |
| 131 of 133 |
| Structural and Collateral Term Sheet | JPMBB 2014-C26 |
| Holiday Inn & Suites Across from Universal Studios | |
Franchise Agreement. The Holiday Inn & Suites Across from Universal Studios property has a 15-year franchise agreement with Holiday Hospitality Franchising, Inc., an affiliate of InterContinental Hotels Group for use of the Holiday Inn flag through September 30, 2024, with no extension options. The agreement provides for a contractual franchise fee equal to 5.0% of room revenue and may increase by an amount not to exceed 1.0% of room revenue. The franchise agreement also provides for a marketing fee equal to 2.5% of room revenue. If the franchise agreement is not renewed upon terms acceptable to the lender or if the franchise agreement has not been replaced with a replacement franchise agreement acceptable to the lender, cash flow will be swept twelve months prior to the current expiration date of the franchise agreement.
THE INFORMATION IN THIS STRUCTURAL AND COLLATERAL TERM SHEET IS NOT COMPLETE AND MAY BE AMENDED PRIOR TO THE TIME OF SALE. THIS TERM SHEET IS NOT AN OFFER TO SELL THESE SECURITIES AND IT IS NOT A SOLICITATION OF AN OFFER TO BUY THESE SECURITIES IN ANY JURISDICTION WHERE THE OFFER OR SALE IS NOT PERMITTED.
| | |
| 132 of 133 |
| Structural and Collateral Term Sheet | JPMBB 2014-C26 |
Contacts | |
| J.P. Morgan CMBS Capital Markets & Banking | ||
Kunal Singh Executive Director | kunal.k.singh@jpmorgan.com | (212) 834-5467 |
Brad Horn Vice President | bradley.j.horn@jpmporgan.com | (212) 834-9708 |
| J.P. Morgan CMBS Trading | ||
Andy Taylor Managing Director | andrew.b.taylor@jpmorgan.com | (212) 834-3813 |
Avinash Sharma Vice President | avinash.sharma@jpmorgan.com | (212) 272-6108 |
| J.P. Morgan Securitized Products Syndicate | ||
Andy Cherna Managing Director | andy.cherna@jpmorgan.com | (212) 834-4154 |
Mick Wiedrick Executive Director | mick.k.wiedrick@jpmorgan.com | (212) 834-4154 |
| Barclays CMBS Capital Markets & Banking | ||
Daniel Vinson Managing Director | daniel.vinson@barclays.com | (212) 528-8224 |
Luke Adovasio Vice President | luke.adovasio@barclays.com | (212) 526-5248 |
| Barclays CMBS Trading | ||
Max Baker Director | max.baker@barclays.com | (212) 412-2084 |
David Kung Director | david.kung@barclays.com | (212) 528-7970 |
| Barclays Securitized Products Syndicate | ||
Brian Wiele Managing Director | brian.wiele@barclays.com | (212) 412-5780 |
Kenneth Rosenberg Director | kenneth.rosenberg@barclays.com | (212) 412-5780 |
| Credit Suisse CMBS Capital Markets & Banking | ||
Chuck Lee Director | chuck.lee@credit-suisse.com | (212) 538-1807 |
Michael Brunner Director | michael.j.brunner@credit-suisse.com | (212) 325-0230 |
| Credit Suisse CMBS Trading | ||
Chris Callahan Managing Director | chris.callahan@credit-suisse.com | (212) 325-4240 |
Matt Masso Director | matthew.masso@credit-suisse.com | (212) 325-4240 |
| Credit Suisse Securitized Products Syndicate | ||
Craig Leonard Managing Director | craig.leonard@credit-suisse.com | (212) 325-8549 |
Roger Tedesco Director | roger.tedesco@credit-suisse.com | (212) 325-8549 |
THE INFORMATION IN THIS STRUCTURAL AND COLLATERAL TERM SHEET IS NOT COMPLETE AND MAY BE AMENDED PRIOR TO THE TIME OF SALE. THIS TERM SHEET IS NOT AN OFFER TO SELL THESE SECURITIES AND IT IS NOT A SOLICITATION OF AN OFFER TO BUY THESE SECURITIES IN ANY JURISDICTION WHERE THE OFFER OR SALE IS NOT PERMITTED.
| | |
| 133 of 133 |