JP Morgan Chase Commercial Mortgage Securities
Filed: 23 Jul 18, 12:00am
| FREE WRITING PROSPECTUS | ||
| FILED PURSUANT TO RULE 433 | ||
| REGISTRATION FILE NO.: 333-206361-15 | ||
| July [20], 2018 | Benchmark 2018-B5 |
Free Writing Prospectus Structural and Collateral Term Sheet |
BENCHMARK 2018-B5
|
This material is for your information, and none of J.P. Morgan Securities LLC (“JPMS”), Deutsche Bank Securities Inc., Citigroup Global Markets Inc., Drexel Hamilton, LLC and Academy Securities, Inc., (each individually, an “Underwriter”, and together, the ‘‘Underwriters’’) are soliciting any action based upon it. This material is not to be construed as an offer to sell or the solicitation of any offer to buy any security in any jurisdiction where such an offer or solicitation would be illegal.
The depositor has filed a registration statement (including a prospectus) with the SEC (SEC File No. 333-206361) for the offering to which this free writing prospectus relates. Before you invest, you should read the prospectus in the registration statement and other documents the depositor has filed with the SEC for more complete information about the depositor, the issuing entity and this offering. You may get these documents for free by visiting EDGAR on the SEC Web site at www.sec.gov. Alternatively, the depositor, any underwriter or any dealer participating in the offering will arrange to send you the prospectus if you request it by calling (800) 408-1016 or by emailing the ABS Syndicate Desk atabs_synd@jpmorgan.com.
THE SECURITIES TO WHICH THIS INFORMATION RELATES WILL BE MORE FULLY DESCRIBED IN A PROSPECTUS (THE “PROSPECTUS”), WHICH IS NOT YET AVAILABLE. THE PROSPECTUS WILL CONTAIN MATERIAL INFORMATION THAT IS NOT CONTAINED IN THESE MATERIALS (INCLUDING WITHOUT LIMITATION A DETAILED DISCUSSION OF RISKS ASSOCIATED WITH AN INVESTMENT IN THE CERTIFICATES, UNDER THE HEADING“RISK FACTORS”IN THE PROSPECTUS).
Neither this document nor anything contained in this document shall form the basis for any contract or commitment whatsoever. The information contained in this document is preliminary as of the date of this document, supersedes any previous such information delivered to you and will be superseded by any such information subsequently delivered prior to the time of sale. These materials are subject to change, completion or amendment from time to time. This information is based upon management forecasts and reflects prevailing conditions and management’s views as of this date, all of which are subject to change.
J.P. Morgan is the marketing name for the investment banking businesses of JPMorgan Chase & Co. and its subsidiaries worldwide. Securities, syndicated loan arranging, financial advisory and other investment banking activities are performed by JPMS and its securities affiliates, and lending, derivatives and other commercial banking activities are performed by JPMorgan Chase Bank, National Association and its banking affiliates. JPMS is a member of SIPC and the NYSE.
THE UNDERWRITERS MAY FROM TIME TO TIME PERFORM INVESTMENT BANKING SERVICES FOR, OR SOLICIT INVESTMENT BANKING BUSINESS FROM, ANY COMPANY NAMED IN THESE MATERIALS. THE UNDERWRITERS AND/OR THEIR AFFILIATES OR RESPECTIVE EMPLOYEES MAY FROM TIME TO TIME HAVE A LONG OR SHORT POSITION IN ANY CERTIFICATE OR CONTRACT DISCUSSED IN THESE MATERIALS. |
THE INFORMATION IN THIS STRUCTURAL AND COLLATERAL TERM SHEET IS NOT COMPLETE AND MAY BE AMENDED PRIOR TO THE TIME OF SALE. THIS TERM SHEET IS NOT AN OFFER TO SELL THESE SECURITIES AND IT IS NOT A SOLICITATION OF AN OFFER TO BUY THESE SECURITIES IN ANY JURISDICTION WHERE THE OFFER OR SALE IS NOT PERMITTED.
| July [20], 2018 | Benchmark 2018-B5 |
THE REPUBLIC OF KOREA
THIS PROSPECTUS IS NOT, AND UNDER NO CIRCUMSTANCES IS THIS PROSPECTUS TO BE CONSTRUED AS, A PUBLIC OFFERING OF SECURITIES IN KOREA. NEITHER THE ISSUER NOR ANY OF ITS AGENTS MAKE ANY REPRESENTATION WITH RESPECT TO THE ELIGIBILITY OF ANY RECIPIENTS OF THIS PROSPECTUS TO ACQUIRE THE OFFERED CERTIFICATES UNDER THE LAWS OF KOREA, INCLUDING, BUT WITHOUT LIMITATION, THE FOREIGN EXCHANGE TRANSACTION LAW AND REGULATIONS THEREUNDER (THE “FETL”). THE OFFERED CERTIFICATES HAVE NOT BEEN REGISTERED WITH THE FINANCIAL SERVICES COMMISSION OF KOREA FOR PUBLIC OFFERING IN KOREA, AND NONE OF THE OFFERED CERTIFICATES MAY BE OFFERED, SOLD OR DELIVERED, DIRECTLY OR INDIRECTLY, OR OFFERED OR SOLD TO ANY PERSON FOR RE-OFFERING OR RESALE, DIRECTLY OR INDIRECTLY IN KOREA OR TO ANY RESIDENT OF KOREA EXCEPT PURSUANT TO THE FINANCIAL INVESTMENT SERVICES AND CAPITAL MARKETS ACT AND THE DECREES AND REGULATIONS THEREUNDER (THE “FSCMA”), THE FETL AND ANY OTHER APPLICABLE LAWS, REGULATIONS AND MINISTERIAL GUIDELINES IN KOREA. WITHOUT PREJUDICE TO THE FOREGOING, THE NUMBER OF OFFERED CERTIFICATES OFFERED IN KOREA OR TO A RESIDENT OF KOREA SHALL BE LESS THAN FIFTY AND FOR A PERIOD OF ONE YEAR FROM THE ISSUE DATE OF THE OFFERED CERTIFICATES, NONE OF THE OFFERED CERTIFICATES MAY BE DIVIDED RESULTING IN AN INCREASED NUMBER OF OFFERED CERTIFICATES. FURTHERMORE, THE OFFERED CERTIFICATES MAY NOT BE RESOLD TO KOREAN RESIDENTS UNLESS THE PURCHASER OF THE OFFERED CERTIFICATES COMPLIES WITH ALL APPLICABLE REGULATORY REQUIREMENTS (INCLUDING, BUT NOT LIMITED TO, GOVERNMENT REPORTING APPROVAL REQUIREMENTS UNDER THE FETL AND ITS SUBORDINATE DECREES AND REGULATIONS) IN CONNECTION WITH THE PURCHASE OF THE OFFERED CERTIFICATES.
JAPAN
THE OFFERED CERTIFICATES HAVE NOT BEEN AND WILL NOT BE REGISTERED UNDER THE FINANCIAL INSTRUMENTS AND EXCHANGE LAW OF JAPAN, AS AMENDED (THE “FIEL”), AND DISCLOSURE UNDER THE FIEL HAS NOT BEEN AND WILL NOT BE MADE WITH RESPECT TO THE OFFERED CERTIFICATES. ACCORDINGLY, EACH UNDERWRITER HAS REPRESENTED AND AGREED THAT IT HAS NOT, DIRECTLY OR INDIRECTLY, OFFERED OR SOLD AND WILL NOT, DIRECTLY OR INDIRECTLY, OFFER OR SELL ANY OFFERED CERTIFICATES IN JAPAN OR TO, OR FOR THE BENEFIT OF, ANY RESIDENT OF JAPAN (WHICH TERM AS USED IN THIS PROSPECTUS MEANS ANY PERSON RESIDENT IN JAPAN, INCLUDING ANY CORPORATION OR OTHER ENTITY ORGANIZED UNDER THE LAWS OF JAPAN) OR TO OTHERS FOR REOFFERING OR RE-SALE, DIRECTLY OR INDIRECTLY, IN JAPAN OR TO, OR FOR THE BENEFIT OF, ANY RESIDENT OF JAPAN EXCEPT PURSUANT TO AN EXEMPTION FROM THE REGISTRATION REQUIREMENTS OF, AND OTHERWISE IN COMPLIANCE WITH, THE FIEL AND OTHER RELEVANT LAWS, REGULATIONS AND MINISTERIAL GUIDELINES OF JAPAN. AS PART OF THIS OFFERING OF THE OFFERED CERTIFICATES, THE UNDERWRITERS MAY OFFER THE OFFERED CERTIFICATES IN JAPAN TO UP TO 49 OFFEREES IN ACCORDANCE WITH THE ABOVE PROVISIONS.
THE INFORMATION IN THIS STRUCTURAL AND COLLATERAL TERM SHEET IS NOT COMPLETE AND MAY BE AMENDED PRIOR TO THE TIME OF SALE. THIS TERM SHEET IS NOT AN OFFER TO SELL THESE SECURITIES AND IT IS NOT A SOLICITATION OF AN OFFER TO BUY THESE SECURITIES IN ANY JURISDICTION WHERE THE OFFER OR SALE IS NOT PERMITTED.
2 of 130
| Structural and Collateral Term Sheet | Benchmark 2018-B5 | |
| Collateral Characteristics | ||
| Loan Pool | ||
| Initial Pool Balance (“IPB”): | $1,039,132,161 | |
| Number of Mortgage Loans: | 55 | |
| Number of Mortgaged Properties: | 219 | |
| Average Cut-off Date Balance per Mortgage Loan: | $18,893,312 | |
| Weighted Average Current Mortgage Rate: | 4.63043% | |
| 10 Largest Mortgage Loans as % of IPB: | 48.5% | |
| Weighted Average Remaining Term to Maturity(1): | 107 months | |
| Weighted Average Seasoning: | 1 months | |
| Credit Statistics | ||
| Weighted Average UW NCF DSCR(2): | 2.18x | |
| Weighted Average UW NOI Debt Yield(2): | 11.3% | |
| Weighted Average Cut-off Date Loan-to-Value Ratio (“LTV”)(2)(3): | 56.7% | |
| Weighted Average Maturity Date LTV(1)(2)(3): | 52.7% | |
| Other Statistics | ||
| % of Mortgage Loans with Additional Debt: | 30.7% | |
| % of Mortgaged Properties with Single Tenants: | 16.6% | |
| Amortization | ||
| Weighted Average Original Amortization Term(4): | 343 months | |
| Weighted Average Remaining Amortization Term(4): | 343 months | |
| % of Mortgage Loans with Interest-Only: | 59.0% | |
| % of Mortgage Loans with Partial Interest-Only followed by Amortizing Balloon: | 19.9% | |
| % of Mortgage Loans with Amortizing Balloon: | 17.2% | |
| % of Mortgage Loans with Interest-Only followed by ARD structure: | 3.8% | |
| Lockbox / Cash Management(5) | ||
| % of Mortgage Loans with In-Place, Hard Lockboxes: | 47.4% | |
| % of Mortgage Loans with Springing Lockboxes: | 35.6% | |
| % of Mortgage Loans with Hard; Master Lease Rents (Soft Springing): | 9.9% | |
| % of Mortgage Loans with In-Place, Soft Lockboxes: | 6.2% | |
| % of Mortgage Loans with Soft Springing Lockboxes: | 0.9% | |
| % of Mortgage Loans with Springing Cash Management: | 81.0% | |
| % of Mortgage Loans with In-Place Cash Management: | 19.0% | |
| Reserves | ||
| % of Mortgage Loans Requiring Monthly Tax Reserves: | 77.2% | |
| % of Mortgage Loans Requiring Monthly Insurance Reserves: | 26.9% | |
| % of Mortgage Loans Requiring Monthly CapEx Reserves(6): | 68.4% | |
| % of Mortgage Loans Requiring Monthly TI/LC Reserves(7): | 34.6% | |
| (1) | In the case of Loan No. 8, with an anticipated repayment date, Remaining Term to Maturity and Maturity Date LTV are calculated as of the related anticipated repayment date. |
| (2) | In the case of Loan Nos. 1, 4, 7, 8, 14, 18 and 19, the UW NCF DSCR, UW NOI Debt Yield, Cut-off Date LTV and Maturity Date LTV calculations include the related Pari Passu Companion Loan(s). In the case of Loan Nos. 1, 3, 4, 7, 8 and 10, the UW NCF DSCR, UW NOI Debt Yield, Cut-off Date LTV and Maturity Date LTV calculations exclude the related Subordinate Companion Loan(s) and/or related mezzanine loan(s). In the case of (i) Loan Nos. 23 and 24 and (ii) Loan Nos. 26 and 27, the loans in each such group are cross-collateralized and cross-defaulted with each other. As such, the calculations are based on the aggregate Cut-off Date Principal Balances, Maturity Date Principal Balances, UW NOI, UW NCF and Debt Service of the related group of those mortgage loans. |
| (3) | In the case of Loan Nos. 3, 7, 8, 10, 11, 14, 28, 37, 38, 40 and 43 the Cut-off Date LTV and the Maturity Date LTV are calculated by using an appraised value based on certain hypothetical assumptions. Refer to “Description of the Mortgage Pool—Assessments of Property Value and Condition” and “—Appraised Value” in the Preliminary Prospectus for additional details. |
| (4) | Excludes 24 mortgage loans that are interest-only for the entire term or until the related anticipated repayment date. |
| (5) | For a more detailed description of Lockbox / Cash Management, refer to “Description of the Mortgage Pool—Certain Terms of the Mortgage Loans—Mortgaged Property Accounts” in the Preliminary Prospectus. |
| (6) | CapEx Reserves include FF&E reserves for hotel properties. |
| (7) | Calculated only with respect to the Cut-off Date Balance of mortgage loans secured or partially secured by office, retail, flex and industrial properties. |
THE INFORMATION IN THIS STRUCTURAL AND COLLATERAL TERM SHEET IS NOT COMPLETE AND MAY BE AMENDED PRIOR TO THE TIME OF SALE. THIS TERM SHEET IS NOT AN OFFER TO SELL THESE SECURITIES AND IT IS NOT A SOLICITATION OF AN OFFER TO BUY THESE SECURITIES IN ANY JURISDICTION WHERE THE OFFER OR SALE IS NOT PERMITTED.
 |  |  |
3 of 130
| Structural and Collateral Term Sheet | Benchmark 2018-B5 | |
| Collateral Characteristics | ||
Mortgage Loan Seller | Number of | Number of | Aggregate | % of |
| JPMCB | 15 | 161 | $327,038,577 | 31.5% |
| CREFI | 23 | 38 | 347,680,896 | 33.5 |
| GACC(1) | 16 | 19 | 261,412,687 | 25.2 |
| JPMCB/GACC(2) | 1 | 1 | 103,000,000 | 9.9 |
| Total: | 55 | 219 | $1,039,132,161 | 100.0% |
| (1) | All of the loans for which GACC is the Mortgage Loan Seller were originated by Deutsche Bank, AG, New York Branch (“DBNY”) (an affiliate of GACC). In the case of Loan No. 8, the whole loan was co-originated by Barclays and DBNY. |
| (2) | In the case of Loan No. 1, the whole loan was co-originated by Wells Fargo Bank, National Association, Morgan Stanley Bank, National Association, JPMCB and DBNY. JPMCB will contribute the promissory note A-2-A-1 with a Cut-off Date Balance of $65,000,000 and DBNY will contribute the promissory note A-2-B-2-A with a Cut-off Date Balance of $38,000,000 to this securitization. |
| Ten Largest Mortgage Loans | ||||||||||||
| No. | Loan Name | Mortgage Loan Seller | No. of Prop. | Cut-off Date Balance | % of IPB | SF / Rooms | Property Type | UW NCF DSCR(1) | UW NOI Debt Yield(1) | Cut-off Date LTV(1)(2) | Maturity Date LTV(1)(2)(3) | |
| 1 | Aventura Mall | JPMCB/GACC | 1 | $103,000,000 | 9.9% | 1,217,508 | Retail | 2.58x | 11.0% | 40.8% | 40.8% | |
| 2 | NY & CT NNN Portfolio | CREFI | 9 | $57,375,000 | 5.5% | 70,333 | Retail | 1.61x | 8.3% | 61.2% | 61.2% | |
| 3 | eBay North First Commons | GACC | 1 | $51,000,000 | 4.9% | 250,056 | Office | 5.13x | 13.8% | 38.1% | 38.1% | |
| 4 | Workspace | JPMCB | 147 | $50,000,000 | 4.8% | 9,884,763 | Various | 3.60x | 21.6% | 35.4% | 35.4% | |
| 5 | Renaissance Tampa International Plaza Hotel | JPMCB | 1 | $44,200,000 | 4.3% | 293 | Hotel | 3.00x | 13.9% | 63.9% | 63.9% | |
| 6 | 660 Columbus Avenue | JPMCB | 1 | $43,500,000 | 4.2% | 65,936 | Retail | 1.36x | 6.7% | 62.7% | 62.7% | |
| 7 | Aon Center | JPMCB | 1 | $43,000,000 | 4.1% | 2,777,240 | Office | 3.03x | 15.5% | 40.3% | 40.3% | |
| 8 | 181 Fremont Street | GACC | 1 | $40,000,000 | 3.8% | 436,332 | Office | 3.14x | 11.8% | 39.6% | 39.6% | |
| 9 | Nassau Shopping Center | CREFI | 1 | $40,000,000 | 3.8% | 291,146 | Retail | 2.24x | 10.9% | 54.8% | 54.8% | |
| 10 | Embassy Suites Kennesaw | JPMCB | 1 | $31,968,577 | 3.1% | 192 | Hotel | 1.81x | 12.1% | 64.6% | 53.7% | |
| Top 3 Total/Weighted Average | 11 | $211,375,000 | 20.3% | 2.93x | 10.9% | 45.7% | 45.7% | |||||
| Top 5 Total/Weighted Average | 159 | $305,575,000 | 29.4% | 3.05x | 13.1% | 46.6% | 46.6% | |||||
| Top 10 Total/Weighted Average | 164 | $504,043,577 | 48.5% | 2.77x | 12.4% | 48.7% | 48.0% | |||||
| (1) | In the case of Loan Nos. 1, 4, 7 and 8, the UW NCF DSCR, UW NOI Debt Yield, Cut-off Date LTV and Maturity Date LTV calculations include the related Pari Passu Companion Loan(s). In the case of Loan Nos. 1, 3, 4, 7, 8 and 10, the UW NCF DSCR, UW NOI Debt Yield, Cut-off Date LTV and Maturity Date LTV calculations exclude the related Subordinate Companion Loan(s) and/or related mezzanine loan(s). |
| (2) | In the case of Loan Nos. 3, 7, 8 and 10 the Cut-off Date LTV and the Maturity Date LTV are calculated by using an appraised value based on certain hypothetical assumptions. Refer to “Description of the Mortgage Pool—Assessments of Property Value and Condition” and “—Appraised Value” in the Preliminary Prospectus for additional details. |
| (3) | In the case of Loan No. 8, with an anticipated repayment date, Maturity Date LTV is calculated as of the related anticipated repayment date. |
THE INFORMATION IN THIS STRUCTURAL AND COLLATERAL TERM SHEET IS NOT COMPLETE AND MAY BE AMENDED PRIOR TO THE TIME OF SALE. THIS TERM SHEET IS NOT AN OFFER TO SELL THESE SECURITIES AND IT IS NOT A SOLICITATION OF AN OFFER TO BUY THESE SECURITIES IN ANY JURISDICTION WHERE THE OFFER OR SALE IS NOT PERMITTED.
| | | |
4 of 130
| Structural and Collateral Term Sheet | Benchmark 2018-B5 | |
| Collateral Characteristics | ||
| Pari Passu Companion Loan Summary |
| Loan No. | Mortgage Loan | Note(s) | Original Balance ($) | Cut-off Date Balance ($) | Holder of Note | Lead Servicer for Whole Loan (Y/N) | Master Servicer Under Lead Securitization | Special Servicer Under Lead Securitization |
| 1 | Aventura Mall | A-1-A, A-1-B, A-1-C, A-1-D | $406,700,000 | $406,700,000 | Aventura Mall Trust 2018-AVM | Yes | Wells Fargo | CWCapital |
| A-2-A-1, A-2-B-3 | $115,000,000 | $115,000,000 | Benchmark 2018-B4 | No | ||||
| A-2-A-2, A-2-B-2-A | $103,000,000 | $103,000,000 | Benchmark 2018-B5 | No | ||||
| A-2-A-3, A-2-A-4, A-2-A-5 | $205,000,000 | $205,000,000 | JPMCB | No | ||||
A-2-B-1, A-2-B-2-B, A-2-B-2-C, A-2-B-4, A-2-B-5 | $142,000,000 | $142,000,000 | DBNY | No | ||||
| A-2-C-1, A-2-C-2, A-2-C-3, A-2-C-4, A-2-C-5 | $220,000,000 | $220,000,000 | Morgan Stanley Mortgage Capital holdings, Inc. | No | ||||
| A-2-D-1, A-2-D-2, A-2-D-3, A-2-D-4, A-2-D-5 | $220,000,000 | $220,000,000 | Wells Fargo Bank, National Association | No | ||||
| B-1, B-2, B-3, B-4(1) | $343,300,000 | $343,300,000 | Aventura Mall Trust 2018-AVM | Yes | ||||
| Total | $1,750,000,000 | $1,750,000,000 | ||||||
| 4 | Workspace | A-1, A-2, A-3, A-4 | $548,200,000 | $548,200,000 | JPMCB 2018-WPT(2) | Yes | Wells Fargo | CWCapital |
| A-5, A-6 | $50,000,000 | $50,000,000 | Benchmark 2018-B5 | No | ||||
| A-7, A-8, A-9, A-10 | $120,000,000 | $120,000,000 | JPMCB | No | ||||
| B-1, B-2(1) | $556,800,000 | $556,800,000 | JPMCB 2018-WPT(2) | No | ||||
| Total | $1,275,000,000 | 1,275,000,000 | ||||||
| 7 | Aon Center | A-1 | $50,000,000 | $50,000,000 | Benchmark 2018-B4 | No | Wells Fargo | CWCapital |
| A-2 | $43,000,000 | $43,000,000 | Benchmark 2018-B5 | No | ||||
| A-3 | $43,000,000 | $43,000,000 | JPMCB | No | ||||
| A-4 | $214,000,000 | $214,000,000 | JPMCC 2018-AON | Yes | ||||
| B(1) | $186,000,000 | $186,000,000 | JPMCC 2018-AON | No | ||||
| Total | $536,000,000 | $536,000,000 | ||||||
| 8 | 181 Fremont Street | A-1, A-4 | $80,000,000 | $80,000,000 | Benchmark 2018-B4 | Yes | Wells Fargo | CWCapital |
| A-2 | $58,000,000 | $58,000,000 | BANK 2018-BNK12 | No | ||||
| A-3 | $22,000,000 | $22,000,000 | Wells Fargo, National Association | No | ||||
| A-5 | $40,000,000 | $40,000,000 | Benchmark 2018-B5 | No | ||||
| A-6-1 | $30,000,000 | $30,000,000 | WFCM 2018-C44 | No | ||||
| A-6-2 | $20,000,000 | $20,000,000 | WFCM 2018-C45 | No | ||||
| Total | $250,000,000 | $250,000,000 | ||||||
| 14 | Overland Park XChange | A-1 | $25,000,000 | $25,000,000 | Benchmark 2018-B5 | (3) | Wells Fargo | Midland Loan Services |
| A-2 | $53,000,000 | $53,000,000 | JPMCB | (3) | ||||
| Total | $78,000,000 | $78,000,000 | ||||||
18
| Radisson Blu Aqua Hotel
| A-1 | $44,000,000 | $44,000,000 | Benchmark 2018-B1 | Yes | Wells Fargo | Park Birdge Lender Services |
| A-2 | $20,000,000 | $20,000,000 | Benchmark 2018-B5 | No | ||||
| Total | $64,000,000 | $64,000,000 | ||||||
| 19 | Westbrook Corporate Center | A-1 | $40,000,000 | $39,906,555 | Benchmark 2018-B4 | Yes | Wells Fargo | CWCapital |
| A-2 | $40,000,000 | $39,906,555 | MSC 2018-H3 | No | ||||
| A-3 | $19,000,000 | $18,955,614 | Benchmark 2018-B5 | No | ||||
| Total | $99,000,000 | $98,768,724 | No |
| (1) | Each note represents a subordinate companion loan. |
| (2) | The JPMCC 2018-WPT transaction is expected to close on July 31, 2018. |
| (3) | The Overland Park XChange Whole Loan will be serviced under the pooling and servicing agreement for the Benchmark 2018-B5 transaction until such time as Note A-2 has been securitized, at which point such Whole Loan will be serviced under the pooling and servicing agreement related to such securitization |
THE INFORMATION IN THIS STRUCTURAL AND COLLATERAL TERM SHEET IS NOT COMPLETE AND MAY BE AMENDED PRIOR TO THE TIME OF SALE. THIS TERM SHEET IS NOT AN OFFER TO SELL THESE SECURITIES AND IT IS NOT A SOLICITATION OF AN OFFER TO BUY THESE SECURITIES IN ANY JURISDICTION WHERE THE OFFER OR SALE IS NOT PERMITTED.
| | | |
5 of 130
| Structural and Collateral Term Sheet | Benchmark 2018-B5 | |
| Collateral Characteristics | ||
| Additional Debt Summary |
No. | Loan Name | Trust | Subordinate Debt Cut-off Date Balance(1) | Total Debt Cut-off Date Balance | Mortgage Loan UW NCF DSCR(2) | Total Debt UW NCF DSCR | Mortgage Loan | Total Debt Cut-off Date LTV(3) | Mortgage Loan UW NOI Debt Yield(2) | Total Debt UW NOI Debt Yield |
| 1 | Aventura Mall | $103,000,000 | $343,300,000 | $1,750,000,000 | 2.58x | 2.07x | 40.8% | 50.7% | 11.0% | 8.8% |
| 3 | eBay North First Commons | $51,000,000 | $37,125,000 | $88,125,000 | 5.13x | 2.13x | 38.1% | 65.9% | 13.8% | 8.0% |
| 4 | Workspace | $50,000,000 | $696,000,000 | $1,275,000,000 | 3.60x | 1.63x | 35.4% | 78.0% | 21.6% | 9.8% |
| 7 | Aon Center | $43,000,000 | $327,500,000 | $677,500,000 | 3.03x | 1.42x | 40.3% | 80.0% | 15.5% | 7.8% |
| 8 | 181 Fremont Street | $40,000,000 | $225,000,000 | $475,000,000 | 3.14x | 1.38x | 39.6% | 75.2% | 11.8% | 6.2% |
| 10 | Embassy Suites Kennesaw | $31,968,577 | $4,000,000 | $35,968,577 | 1.81x | 1.51x | 64.6% | 72.7% | 12.1% | 10.8% |
| (1) | In the case of Loan Nos. 1, 3 and 4 Subordinate Debt Cut-off Date Balance represents one or more Subordinate Companion Loans. In the case of Loan Nos. 7, Subordinate Debt Cut-off Date Balance represents one or more Subordinate Companion Loans and one or more mezzanine loans. In the case of Loan Nos. 8 and 10, Subordinate Debt Cut-off Date Balance represents one or more mezzanine loans. |
| (2) | In the case of Loan Nos. 1, 4, 7 and 8 the UW NCF DSCR, UW NOI Debt Yield, Cut-off Date LTV and Maturity Date LTV calculations include the related Pari Passu Companion Loan(s). In the case of Loan Nos. 1, 3, 4, 7, 8 and 10, the UW NCF DSCR, UW NOI Debt Yield, Cut-off Date LTV and Maturity Date LTV calculations exclude the related Subordinate Companion Loan(s) and/or related mezzanine loan(s). |
| (3) | In the case of Loan Nos. 3, 7, 8 and 10 the Cut-off Date LTV and the Maturity Date LTV are calculated by using an appraised value based on certain hypothetical assumptions. Refer to “Description of the Mortgage Pool—Assessments of Property Value and Condition” and “—Appraised Value” in the Preliminary Prospectus for additional details. |
THE INFORMATION IN THIS STRUCTURAL AND COLLATERAL TERM SHEET IS NOT COMPLETE AND MAY BE AMENDED PRIOR TO THE TIME OF SALE. THIS TERM SHEET IS NOT AN OFFER TO SELL THESE SECURITIES AND IT IS NOT A SOLICITATION OF AN OFFER TO BUY THESE SECURITIES IN ANY JURISDICTION WHERE THE OFFER OR SALE IS NOT PERMITTED.
| | | |
6 of 130
| Structural and Collateral Term Sheet | Benchmark 2018-B5 | |
| Collateral Characteristics | ||
| Mortgaged Properties by Type(1) |
| Weighted Average | |||||||||
| Property Type | Property Subtype | Number of Properties | Cut-off Date Principal Balance | % of IPB | Occupancy | UW NCF DSCR(2) | UW NOI Debt Yield(2) | Cut-off Date LTV(2)(3) | Maturity Date LTV(2)(3)(4) |
| Retail | Anchored | 6 | $128,344,000 | 12.4% | 98.4% | 1.85x | 9.5% | 61.1% | 60.1% |
| Super Regional Mall | 1 | 103,000,000 | 9.9 | 92.8% | 2.58x | 11.0% | 40.8% | 40.8% | |
| Unanchored | 10 | 52,881,679 | 5.1 | 99.0% | 1.60x | 9.1% | 63.4% | 59.8% | |
| Freestanding | 9 | 50,543,672 | 4.9 | 100.0% | 1.53x | 8.4% | 61.4% | 59.5% | |
| Shadow Anchored | 1 | 14,200,000 | 1.4 | 100.0% | 1.33x | 9.3% | 74.7% | 63.1% | |
| Subtotal: | 27 | $348,969,351 | 33.6% | 97.1% | 1.96x | 9.7% | 56.1% | 54.4% | |
| Office | Suburban | 92 | $154,310,729 | 14.8% | 94.0% | 3.34x | 14.4% | 50.4% | 48.4% |
| CBD | 4 | 138,952,526 | 13.4 | 87.9% | 2.62x | 13.1% | 44.8% | 41.0% | |
| Medical | 3 | 13,278,863 | 1.3 | 92.4% | 1.34x | 9.2% | 69.5% | 62.6% | |
| Subtotal: | 99 | $306,542,118 | 29.5% | 91.2% | 2.93x | 13.6% | 48.7% | 45.7% | |
| Hotel | Full Service | 3 | $96,168,577 | 9.3% | 81.0% | 2.38x | 12.3% | 62.2% | 58.6% |
| Limited Service | 4 | 37,156,213 | 3.6 | 72.3% | 1.60x | 12.6% | 64.4% | 47.1% | |
| Select Service | 2 | 26,197,520 | 2.5 | 88.4% | 1.86x | 14.8% | 57.3% | 38.9% | |
| Extended Stay | 1 | 13,500,000 | 1.3 | 80.3% | 1.89x | 12.1% | 67.5% | 57.0% | |
| Subtotal: | 10 | $173,022,309 | 16.7% | 80.2% | 2.10x | 12.7% | 62.3% | 53.0% | |
| Multifamily | Garden | 6 | $91,199,630 | 8.8% | 95.7% | 1.32x | 8.8% | 69.1% | 63.0% |
| Mid-rise | 5 | 41,500,000 | 4.0 | 96.2% | 1.53x | 7.8% | 59.2% | 59.2% | |
| Subtotal: | 11 | $132,699,630 | 12.8% | 95.9% | 1.39x | 8.4% | 66.0% | 61.8% | |
| Self Storage | Self Storage | 10 | $48,190,250 | 4.6% | 84.8% | 1.39x | 8.8% | 67.8% | 61.6% |
| Subtotal: | 10 | $48,190,250 | 4.6% | 84.8% | 1.39x | 8.8% | 67.8% | 61.6% | |
| Industrial | Flex | 1 | $7,387,385 | 0.7% | 100.0% | 1.45x | 10.0% | 73.1% | 59.8% |
| Warehouse | 1 | 5,997,679 | 0.6 | 100.0% | 1.45x | 10.0% | 73.1% | 59.8% | |
| Warehouse/Distribution | 1 | 2,700,000 | 0.3 | 100.0% | 1.84x | 9.2% | 63.1% | 63.1% | |
| Subtotal: | 3 | $16,085,064 | 1.5% | 100.0% | 1.52x | 9.9% | 71.4% | 60.4% | |
| Flex | Office/Industrial | 58 | $13,385,156 | 1.3% | 93.3% | 3.60x | 21.6% | 35.4% | 35.4% |
| Industrial | 1 | 238,281 | 0.0 | 72.7% | 3.60x | 21.6% | 35.4% | 35.4% | |
| Subtotal: | 59 | $13,623,438 | 1.3% | 92.9% | 3.60x | 21.6% | 35.4% | 35.4% | |
| Total / Weighted Average: | 219 | $1,039,132,161 | 100.0% | 91.8% | 2.18x | 11.3% | 56.7% | 52.7% | |
| (1) | Because this table presents information relating to the mortgaged properties and not mortgage loans, the information for mortgage loans secured by more than one mortgaged property is based on allocated loan amounts. |
| (2) | In the case of Loan Nos. 1, 4, 7, 8, 14, 18 and 19, the UW NCF DSCR, UW NOI Debt Yield, Cut-off Date LTV and Maturity Date LTV calculations include the related Pari Passu Companion Loan(s). In the case of Loan Nos. 1, 3, 4, 7, 8 and 10, the UW NCF DSCR, UW NOI Debt Yield, Cut-off Date LTV and Maturity Date LTV calculations exclude the related Subordinate Companion Loan(s) and/or related mezzanine loan(s). In the case of (i) Loan Nos. 23 and 24 and (ii) Loan Nos. 26 and 27, the loans in each such group are cross-collateralized and cross-defaulted with each other. As such, the calculations are based on the aggregate Cut-off Date Principal Balances, Maturity Date Principal Balances, UW NOI, UW NCF and Debt Service of the related group of those mortgage loans. |
| (3) | In the case of Loan Nos. 3, 7, 8, 10, 11, 14, 28, 37, 38, 40 and 43 the Cut-off Date LTV and the Maturity Date LTV are calculated by using an appraised value based on certain hypothetical assumptions. Refer to “Description of the Mortgage Pool—Assessments of Property Value and Condition” and “—Appraised Value” in the Preliminary Prospectus for additional details. |
| (4) | In the case of Loan No. 8, with an anticipated repayment date, Maturity Date LTV is calculated as of the related anticipated repayment date. |
THE INFORMATION IN THIS STRUCTURAL AND COLLATERAL TERM SHEET IS NOT COMPLETE AND MAY BE AMENDED PRIOR TO THE TIME OF SALE. THIS TERM SHEET IS NOT AN OFFER TO SELL THESE SECURITIES AND IT IS NOT A SOLICITATION OF AN OFFER TO BUY THESE SECURITIES IN ANY JURISDICTION WHERE THE OFFER OR SALE IS NOT PERMITTED.
| | | |
7 of 130
| Structural and Collateral Term Sheet | Benchmark 2018-B5 | |
| Collateral Characteristics | ||
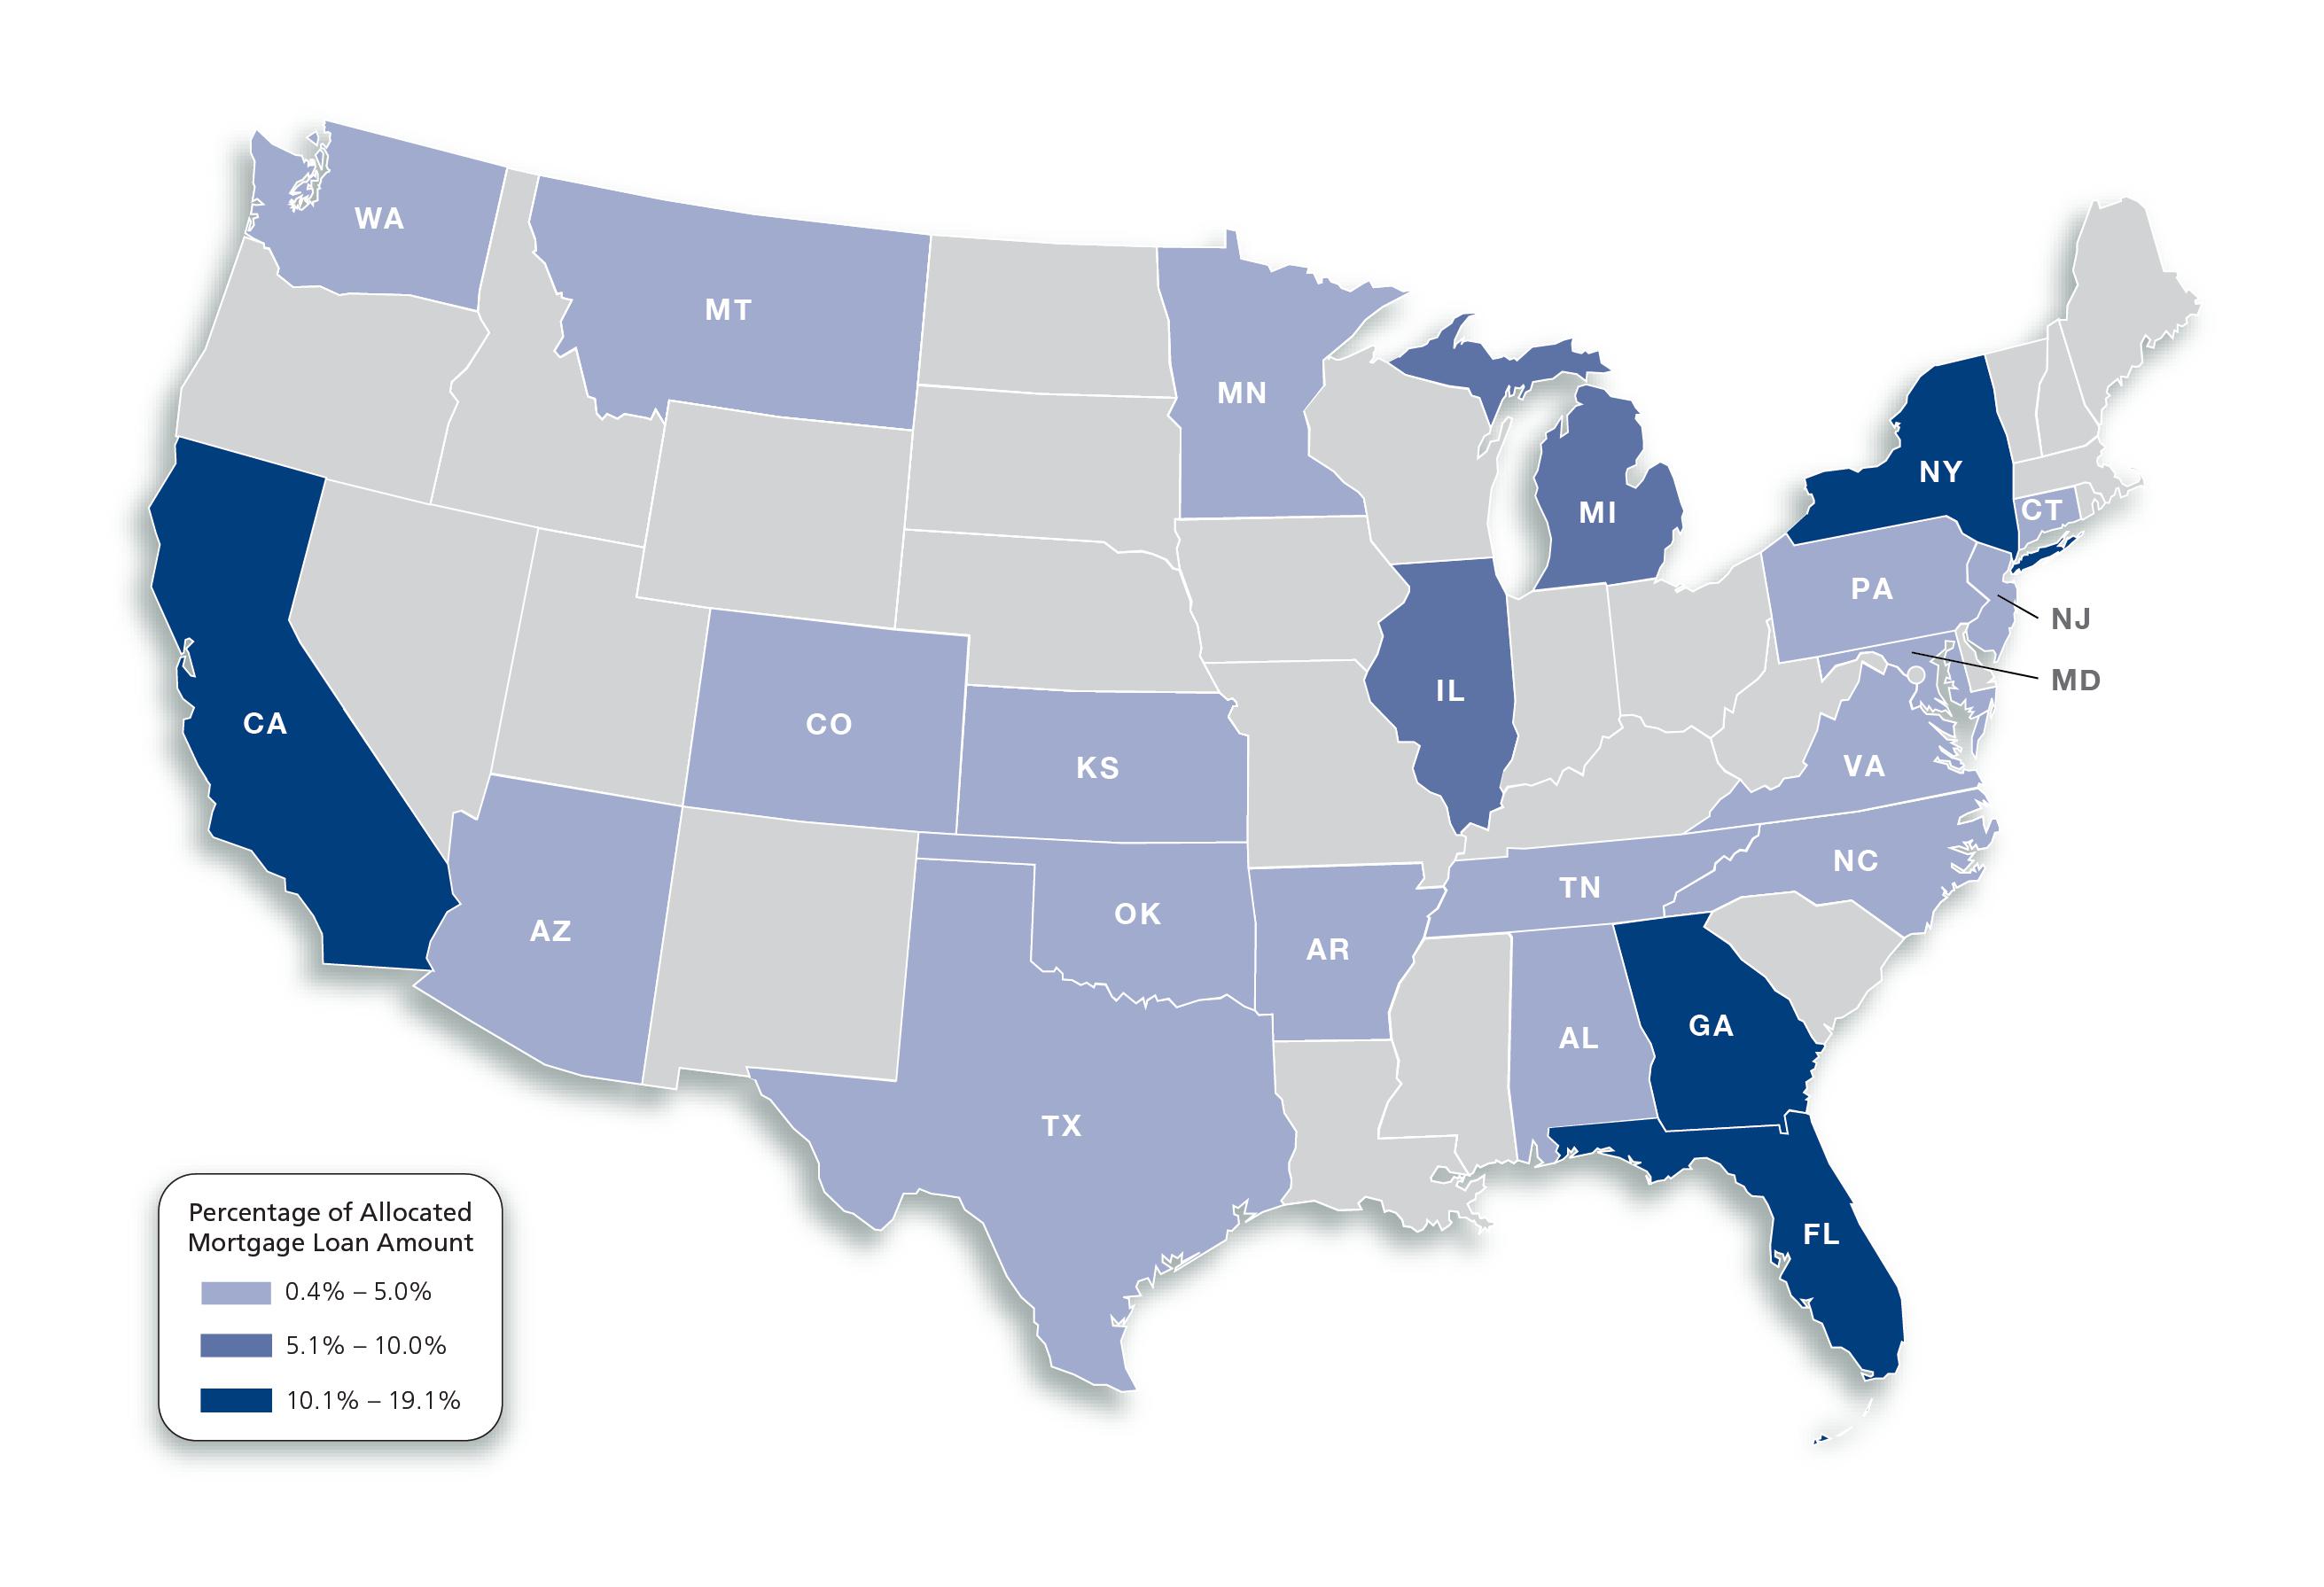
| Mortgaged Properties by Location(1) | ||||||||
Weighted Average | ||||||||
State | Number of Properties | Cut-off Date Principal Balance | % of IPB | Occupancy | UW NCF DSCR(2) | UW NOI Debt Yield(2) | Cut-off Date LTV(2)(3) | Maturity Date LTV(2)(3)(4) |
| New York | 16 | $198,475,000 | 19.1% | 96.8% | 1.80x | 8.9% | 55.8% | 55.8% |
| Florida | 50 | 194,001,766 | 18.7 | 90.0% | 2.66x | 12.6% | 49.6% | 49.3% |
| California | 6 | 133,326,269 | 12.8 | 99.4% | 3.43x | 12.4% | 46.4% | 43.1% |
| Georgia | 12 | 105,101,892 | 10.1 | 84.1% | 1.60x | 11.4% | 65.2% | 52.1% |
| Illinois | 6 | 97,918,476 | 9.4 | 86.5% | 2.25x | 12.4% | 53.6% | 49.9% |
| Michigan | 5 | 62,319,072 | 6.0 | 93.3% | 1.36x | 9.0% | 69.8% | 63.9% |
| Washington | 2 | 32,476,000 | 3.1 | 92.5% | 1.34x | 7.9% | 63.4% | 59.7% |
| Oklahoma | 1 | 29,952,526 | 2.9 | 80.1% | 1.35x | 11.8% | 70.1% | 52.3% |
| Kansas | 1 | 25,000,000 | 2.4 | 90.1% | 2.10x | 10.9% | 65.2% | 66.3% |
| Connecticut | 2 | 22,400,000 | 2.2 | 100.0% | 1.68x | 8.5% | 63.8% | 63.8% |
| Pennsylvania | 69 | 20,126,563 | 1.9 | 88.0% | 3.60x | 21.6% | 35.4% | 35.4% |
| Tennessee | 3 | 17,035,064 | 1.6 | 100.0% | 1.41x | 9.6% | 71.9% | 60.3% |
| Texas | 3 | 15,660,928 | 1.5 | 93.0% | 1.46x | 9.7% | 67.9% | 58.8% |
| North Carolina | 1 | 13,500,000 | 1.3 | 80.3% | 1.89x | 12.1% | 67.5% | 57.0% |
| Maryland | 1 | 10,610,000 | 1.0 | 97.5% | 2.41x | 11.9% | 62.8% | 62.8% |
| Alabama | 2 | 10,283,725 | 1.0 | 99.6% | 1.52x | 10.6% | 71.8% | 60.3% |
| Virginia | 2 | 10,146,208 | 1.0 | 76.7% | 1.55x | 11.5% | 66.5% | 55.4% |
| Colorado | 1 | 9,660,000 | 0.9 | 73.7% | 1.80x | 11.6% | 67.1% | 56.6% |
| Montana | 1 | 7,200,000 | 0.7 | 98.3% | 1.25x | 8.3% | 71.8% | 63.7% |
| Arkansas | 1 | 6,925,000 | 0.7 | 85.3% | 1.32x | 8.7% | 71.0% | 63.0% |
| Minnesota | 19 | 6,489,844 | 0.6 | 88.9% | 3.60x | 21.6% | 35.4% | 35.4% |
| Arizona | 14 | 6,473,828 | 0.6 | 94.8% | 3.60x | 21.6% | 35.4% | 35.4% |
| New Jersey | 1 | 4,050,000 | 0.4 | 100.0% | 1.51x | 8.1% | 67.5% | 67.5% |
| Total / Weighted Average: | 219 | $1,039,132,161 | 100.0% | 91.8% | 2.18x | 11.3% | 56.7% | 52.7% |
| (1) | Because this table presents information relating to the mortgaged properties and not mortgage loans, the information for mortgage loans secured by more than one mortgaged property is based on allocated loan amounts. |
| (2) | In the case of Loan Nos. 1, 4, 7, 8, 14, 18 and 19, the UW NCF DSCR, UW NOI Debt Yield, Cut-off Date LTV and Maturity Date LTV calculations include the related Pari Passu Companion Loan(s). In the case of Loan Nos. 1, 3, 4, 7, 8 and 10, the UW NCF DSCR, UW NOI Debt Yield, Cut-off Date LTV and Maturity Date LTV calculations exclude the related Subordinate Companion Loan(s) and/or related mezzanine loan(s). In the case of (i) Loan Nos. 23 and 24 and (ii) Loan Nos. 26 and 27, the loans in each such group are cross-collateralized and cross-defaulted with each other. As such, the calculations are based on the aggregate Cut-off Date Principal Balances, Maturity Date Principal Balances, UW NOI, UW NCF and Debt Service of the related group of those mortgage loans. |
| (3) | In the case of Loan Nos. 3, 7, 8, 10, 11, 14, 28, 37, 38, 40 and 43 the Cut-off Date LTV and the Maturity Date LTV are calculated by using an appraised value based on certain hypothetical assumptions. Refer to “Description of the Mortgage Pool—Assessments of Property Value and Condition” and “—Appraised Value” in the Preliminary Prospectus for additional details. |
| (4) | In the case of Loan No. 8, with an anticipated repayment date, Maturity Date LTV is calculated as of the related anticipated repayment date. |
THE INFORMATION IN THIS STRUCTURAL AND COLLATERAL TERM SHEET IS NOT COMPLETE AND MAY BE AMENDED PRIOR TO THE TIME OF SALE. THIS TERM SHEET IS NOT AN OFFER TO SELL THESE SECURITIES AND IT IS NOT A SOLICITATION OF AN OFFER TO BUY THESE SECURITIES IN ANY JURISDICTION WHERE THE OFFER OR SALE IS NOT PERMITTED.
| | | |
8 of 130
| Structural and Collateral Term Sheet | Benchmark 2018-B5 | |
| Collateral Characteristics | ||
| Cut-off Date Principal Balance |
Weighted Average | |||||||||||
| Range of Cut-off Date Principal Balances | Number of Loans | Cut-off Date Principal Balance | % of IPB | Mortgage Rate | Remaining Loan Term(1) | UW NCF DSCR(2)(3) | UW NOI DY(2) | Cut-off Date LTV(2)(4) | Maturity Date LTV(1)(2)(3) | ||
| $2,607,349 | - | $9,999,999 | 25 | $165,754,209 | 16.0% | 5.00424% | 117 | 1.50x | 9.2% | 65.6% | 59.6% |
| $10,000,000 | - | $19,999,999 | 12 | 168,556,947 | 16.2 | 4.89324% | 119 | 1.72x | 10.8% | 66.6% | 59.6% |
| $20,000,000 | - | $24,999,999 | 4 | 87,900,000 | 8.5 | 4.77866% | 116 | 1.44x | 8.6% | 65.2% | 61.0% |
| $25,000,000 | - | $49,999,999 | 10 | 355,546,005 | 34.2 | 4.56758% | 104 | 2.26x | 11.9% | 55.3% | 50.8% |
| $50,000,000 | - | $103,000,000 | 4 | 261,375,000 | 25.2 | 4.25954% | 96 | 3.06x | 13.0% | 43.7% | 43.7% |
| Total / Weighted Average: | 55 | $1,039,132,161 | 100.0% | 4.63043% | 107 | 2.18x | 11.3% | 56.7% | 52.7% | ||
| Mortgage Interest Rates |
Weighted Average | |||||||||||
| Range of Mortgage Interest Rates | Number of Loans | Cut-off Date Principal Balance | % of IPB | Mortgage Rate | Remaining Loan Term(1) | UW NCF DSCR(2) | UW NOI DY(2) | Cut-off Date LTV(2)(3) | Maturity Date LTV(1)(2)(3) | ||
| 2.63768% | - | 3.99999% | 2 | $91,000,000 | 8.8% | 3.10842% | 83 | 4.26x | 12.9% | 38.8% | 38.8% |
| 4.00000% | - | 4.49999% | 4 | 182,976,269 | 17.6 | 4.22362% | 119 | 2.48x | 11.6% | 43.4% | 42.4% |
| 4.50000% | - | 4.99999% | 33 | 576,406,024 | 55.5 | 4.79108% | 110 | 1.81x | 10.4% | 63.0% | 58.0% |
| 5.00000% | - | 5.45000% | 16 | 188,749,868 | 18.2 | 5.26799% | 101 | 2.04x | 12.9% | 59.1% | 53.3% |
| Total / Weighted Average: | 55 | $1,039,132,161 | 100.0% | 4.63043% | 107 | 2.18x | 11.3% | 56.7% | 52.7% | ||
| Original Term to Maturity in Months |
Weighted Average | |||||||||
| Original Term to Maturity in Months | Number of Loans | Cut-off Date Principal Balance | % of IPB | Mortgage Rate | Remaining Loan Term(1) | UW NCF DSCR(2) | UW NOI DY(2) | Cut-off Date LTV(2)(3) | Maturity Date LTV(1)(2)(3) |
| 60 | 4 | $145,500,000 | 14.0% | 3.94715% | 58 | 3.67x | 14.1% | 48.3% | 48.1% |
| 61 | 1 | 50,000,000 | 4.8 | 5.37200% | 59 | 3.60x | 21.6% | 35.4% | 35.4% |
| 120 | 50 | 843,632,161 | 81.2 | 4.70433% | 119 | 1.84x | 10.2% | 59.4% | 54.5% |
| Total / Weighted Average: | 55 | $1,039,132,161 | 100.0% | 4.63043% | 107 | 2.18x | 11.3% | 56.7% | 52.7% |
| Remaining Term to Maturity in Months | |||||||||
| Weighted Average | |||||||||||
| Range of Remaining Term to Maturity in Months | Number of Loans | Cut-off Date Principal Balance | % of IPB | Mortgage Rate | Remaining Loan Term(1) | UW NCF DSCR(2) | UW NOI DY(2) | Cut-off Date LTV(2)(3) | Maturity Date LTV(1)(2)(3) | ||
| 58 | - | 84 | 5 | $195,500,000 | 18.8% | 4.31156% | 59 | 3.65x | 16.0% | 45.0% | 44.9% |
| 85 | - | 119 | 39 | 683,132,161 | 65.7 | 4.66938% | 118 | 1.92x | 10.8% | 58.8% | 52.9% |
| 120 | - | 120 | 11 | 160,500,000 | 15.4 | 4.85308% | 120 | 1.50x | 7.8% | 62.1% | 61.3% |
| Total / Weighted Average: | 55 | $1,039,132,161 | 100.0% | 4.63043% | 107 | 2.18x | 11.3% | 56.7% | 52.7% | ||
| (1) | In the case of Loan No. 8, with an anticipated repayment date, Remaining Term to Maturity and Maturity Date LTV are calculated as of the related anticipated repayment date. |
| (2) | In the case of Loan Nos. 1, 4, 7, 8, 14, 18 and 19, the UW NCF DSCR, UW NOI Debt Yield, Cut-off Date LTV and Maturity Date LTV calculations include the related Pari Passu Companion Loan(s). In the case of Loan Nos. 1, 3, 4, 7, 8 and 10, the UW NCF DSCR, UW NOI Debt Yield, Cut-off Date LTV and Maturity Date LTV calculations exclude the related Subordinate Companion Loan(s) and/or related mezzanine loan(s). In the case of (i) Loan Nos. 23 and 24 and (ii) Loan Nos. 26 and 27, the loans in each such group are cross-collateralized and cross-defaulted with each other. As such, the calculations are based on the aggregate Cut-off Date Principal Balances, Maturity Date Principal Balances, UW NOI, UW NCF and Debt Service of the related group of those mortgage loans. |
| (3) | In the case of Loan Nos. 3, 7, 8, 10, 11, 14, 28, 37, 38, 40 and 43 the Cut-off Date LTV and the Maturity Date LTV are calculated by using an appraised value based on certain hypothetical assumptions. Refer to “Description of the Mortgage Pool—Assessments of Property Value and Condition” and “—Appraised Value” in the Preliminary Prospectus for additional details. |
THE INFORMATION IN THIS STRUCTURAL AND COLLATERAL TERM SHEET IS NOT COMPLETE AND MAY BE AMENDED PRIOR TO THE TIME OF SALE. THIS TERM SHEET IS NOT AN OFFER TO SELL THESE SECURITIES AND IT IS NOT A SOLICITATION OF AN OFFER TO BUY THESE SECURITIES IN ANY JURISDICTION WHERE THE OFFER OR SALE IS NOT PERMITTED.
| | | |
9 of 130
| Structural and Collateral Term Sheet | Benchmark 2018-B5 | |
| Collateral Characteristics | ||
| Original Amortization Term in Months |
| Weighted Average | |||||||||
| Original Amortization Term in Months | Number of Loans | Cut-off Date Principal Balance | % of IPB | Mortgage Rate | Remaining Loan Term(1) | UW NCF DSCR(2) | UW NOI DY(2) | Cut-off Date LTV(2)(3) | Maturity Date LTV(1)(2)(3) |
| Interest Only | 24 | $653,461,000 | 62.9% | 4.43151% | 101 | 2.59x | 11.7% | 50.2% | 50.3% |
| 240 | 1 | 31,924,901 | 3.1 | 4.83000% | 119 | 1.50x | 13.2% | 62.5% | 39.2% |
| 300 | 2 | 43,928,795 | 4.2 | 4.72592% | 119 | 1.61x | 13.2% | 64.6% | 48.0% |
| 360 | 28 | 309,817,464 | 29.8 | 5.01589% | 117 | 1.47x | 9.9% | 68.6% | 59.9% |
| Total / Weighted Average: | 55 | $1,039,132,161 | 100.0% | 4.63043% | 107 | 2.18x | 11.3% | 56.7% | 52.7% |
| Remaining Amortization Term in Months |
| Weighted Average | |||||||||||
| Range of Remaining Amortization Term in Months | Number of Loans | Cut-off Date Principal Balance | % of IPB | Mortgage Rate | Remaining Loan Term(1) | UW NCF DSCR(2) | UW NOI DY(2) | Cut-off Date LTV(2)(3) | Maturity Date LTV(1)(2)(3) | ||
| Interest Only | 24 | $653,461,000 | 62.9% | 4.43151% | 101 | 2.59x | 11.7% | 50.2% | 50.3% | ||
| 239 | - | 299 | 3 | 75,853,696 | 7.3% | 4.76972% | 119 | 1.56x | 13.2% | 63.7% | 44.3% |
| 300 | - | 360 | 28 | 309,817,464 | 29.8% | 5.01589% | 117 | 1.47x | 9.9% | 68.6% | 59.9% |
| Total / Weighted Average: | 55 | $1,039,132,161 | 100.0% | 4.63043% | 107 | 2.18x | 11.3% | 56.7% | 52.7% | ||
| Amortization Types |
Weighted Average | |||||||||
| Amortization Types | Number of Loans | Cut-off Date Principal Balance | % of IPB | Mortgage Rate | Remaining Loan Term(1) | UW NCF DSCR(2) | UW NOI DY(2) | Cut-off Date LTV(2)(3) | Maturity Date LTV(1)(2)(3) |
| Interest Only | 23 | $613,461,000 | 59.0% | 4.47865% | 100 | 2.56x | 11.7% | 50.9% | 51.0% |
| IO-Balloon | 18 | 207,038,250 | 19.9 | 4.98102% | 116 | 1.38x | 9.2% | 68.7% | 61.5% |
| Balloon | 13 | 178,632,911 | 17.2 | 4.95177% | 119 | 1.61x | 12.2% | 66.5% | 51.4% |
| ARD-Interest Only | 1 | 40,000,000 | 3.8 | 3.70860% | 116 | 3.14x | 11.8% | 39.6% | 39.6% |
| Total / Weighted Average: | 55 | $1,039,132,161 | 100.0% | 4.63043% | 107 | 2.18x | 11.3% | 56.7% | 52.7% |
| Underwritten Net Cash Flow Debt Service Coverage Ratios(2) |
| Weighted Average | |||||||||||
| Range of Underwritten Net Cash Flow Debt Service Coverage Ratios | Number of Loans | Cut-off Date Principal Balance | % of IPB | Mortgage Rate | Remaining Loan Term(1) | UW NCF DSCR(2) | UW NOI DY(2) | Cut-off Date LTV(2)(3) | Maturity Date LTV(1)(2)(3) | ||
| 1.21x | - | 1.49x | 23 | $293,726,689 | 28.3% | 4.90611% | 117 | 1.34x | 8.8% | 67.9% | 60.8% |
| 1.50x | - | 1.74x | 14 | 199,795,932 | 19.2 | 4.95317% | 119 | 1.59x | 9.8% | 63.4% | 57.0% |
| 1.75x | - | 1.99x | 5 | 77,828,577 | 7.5 | 5.01999% | 117 | 1.85x | 11.1% | 62.8% | 55.2% |
| 2.00x | - | 2.24x | 4 | 83,670,962 | 8.1 | 4.49717% | 119 | 2.18x | 12.0% | 58.1% | 55.4% |
| 2.25x | - | 5.13x | 9 | 384,110,000 | 37.0 | 4.20185% | 89 | 3.20x | 13.9% | 43.2% | 43.2% |
| Total / Weighted Average: | 55 | $1,039,132,161 | 100.0% | 4.63043% | 107 | 2.18x | 11.3% | 56.7% | 52.7% | ||
| (1) | In the case of Loan No. 8, with an anticipated repayment date, Remaining Term to Maturity and Maturity Date LTV are calculated as of the related anticipated repayment date. |
| (2) | In the case of Loan Nos. 1, 4, 7, 8, 14, 18 and 19, the UW NCF DSCR, UW NOI Debt Yield, Cut-off Date LTV and Maturity Date LTV calculations include the related Pari Passu Companion Loan(s). In the case of Loan Nos. 1, 3, 4, 7, 8 and 10, the UW NCF DSCR, UW NOI Debt Yield, Cut-off Date LTV and Maturity Date LTV calculations exclude the related Subordinate Companion Loan(s) and/or related mezzanine loan(s). In the case of (i) Loan Nos. 23 and 24 and (ii) Loan Nos. 26 and 27, the loans in each such group are cross-collateralized and cross-defaulted with each other. As such, the calculations are based on the aggregate Cut-off Date Principal Balances, Maturity Date Principal Balances, UW NOI, UW NCF and Debt Service of the related group of those mortgage loans. |
| (3) | In the case of Loan Nos. 3, 7, 8, 10, 11, 14, 28, 37, 38, 40 and 43 the Cut-off Date LTV and the Maturity Date LTV are calculated by using an appraised value based on certain hypothetical assumptions. Refer to “Description of the Mortgage Pool—Assessments of Property Value and Condition” and “—Appraised Value” in the Preliminary Prospectus for additional details. |
THE INFORMATION IN THIS STRUCTURAL AND COLLATERAL TERM SHEET IS NOT COMPLETE AND MAY BE AMENDED PRIOR TO THE TIME OF SALE. THIS TERM SHEET IS NOT AN OFFER TO SELL THESE SECURITIES AND IT IS NOT A SOLICITATION OF AN OFFER TO BUY THESE SECURITIES IN ANY JURISDICTION WHERE THE OFFER OR SALE IS NOT PERMITTED.
| | | |
10 of 130
| Structural and Collateral Term Sheet | Benchmark 2018-B5 | |
| Collateral Characteristics | ||
| LTV Ratios as of the Cut-off Date(2)(3) |
| Weighted Average | |||||||||||
| Range of Cut-off Date LTVs | Number of Loans | Cut-off Date Principal Balance | % of IPB | Mortgage Rate | Remaining Loan Term(1) | UW NCF DSCR(2) | UW NOI DY(2) | Cut-off Date LTV(2)(3) | Maturity Date LTV(1)(2)(3) | ||
| 31.3% | - | 39.9% | 4 | $167,000,000 | 16.1% | 3.97165% | 82 | 3.80x | 15.5% | 36.6% | 36.6% |
| 40.0% | - | 49.9% | 2 | 146,000,000 | 14.1 | 4.27032% | 101 | 2.71x | 12.3% | 40.7% | 40.7% |
| 50.0% | - | 59.9% | 6 | 97,862,269 | 9.4 | 4.53412% | 117 | 2.01x | 10.5% | 54.6% | 52.6% |
| 60.0% | - | 65.9% | 19 | 370,297,172 | 35.6 | 4.85435% | 112 | 1.81x | 10.1% | 63.2% | 59.4% |
| 66.0% | - | 74.7% | 24 | 257,972,720 | 24.8 | 4.97582% | 117 | 1.44x | 10.1% | 70.3% | 60.4% |
| Total / Weighted Average: | 55 | $1,039,132,161 | 100.0% | 4.63043% | 107 | 2.18x | 11.3% | 56.7% | 52.7% | ||
| LTV Ratios as of the Maturity Date(1)(2)(3) |
Weighted Average | |||||||||||
| Range of Maturity Date LTVs | Number of Loans | Cut-off Date Principal Balance | % of IPB | Mortgage Rate | Remaining Loan Term(1) | UW NCF DSCR(2) | UW NOI DY(2) | Cut-off Date LTV(2)(3) | Maturity Date LTV(1)(2)(3) | ||
| 31.3% | - | 39.9% | 6 | $212,901,170 | 20.5% | 4.13242% | 90 | 3.35x | 15.2% | 41.5% | 37.1% |
| 40.0% | - | 49.9% | 2 | 146,000,000 | 14.1 | 4.27032% | 101 | 2.71x | 12.3% | 40.7% | 40.7% |
| 50.0% | - | 54.9% | 9 | 157,225,797 | 15.1 | 4.79067% | 118 | 1.80x | 10.7% | 60.5% | 53.7% |
| 55.0% | - | 59.9% | 11 | 103,666,314 | 10.0 | 4.97974% | 119 | 1.59x | 10.7% | 68.2% | 58.0% |
| 60.0% | - | 68.6% | 27 | 419,338,880 | 40.4 | 4.86222% | 112 | 1.70x | 9.3% | 65.8% | 63.1% |
| Total / Weighted Average: | 55 | $1,039,132,161 | 100.0% | 4.63043% | 107 | 2.18x | 11.3% | 56.7% | 52.7% | ||
| Prepayment Protection |
Weighted Average | |||||||||
| Prepayment Protection | Number of Loans | Cut-off Date Principal Balance | % of IPB | Mortgage Rate | Remaining Loan Term(1) | UW NCF DSCR(2) | UW NOI DY(2) | Cut-off Date LTV(2)(3) | Maturity Date LTV(1)(2)(3) |
| Defeasance(4) | 42 | $714,113,584 | 68.7% | 4.59807% | 110 | 2.07x | 10.7% | 58.2% | 53.1% |
| Yield Maintenance | 11 | 240,818,577 | 23.2 | 4.89281% | 106 | 2.22x | 12.4% | 53.8% | 51.5% |
| Defeasance or Yield Maintenance | 2 | 84,200,000 | 8.1 | 4.15448% | 86 | 3.07x | 12.9% | 52.4% | 52.4% |
| Total / Weighted Average: | 55 | $1,039,132,161 | 100.0% | 4.63043% | 107 | 2.18x | 11.3% | 56.7% | 52.7% |
| Loan Purpose |
Weighted Average | |||||||||
| Loan Purpose | Number of Loans | Cut-off Date Principal Balance | % of IPB | Mortgage Rate | Remaining Loan Term(1) | UW NCF DSCR(2) | UW NOI DY(2) | Cut-off Date LTV(2)(3) | Maturity Date LTV(1)(2)(3) |
| Refinance | 34 | $751,269,349 | 72.3% | 4.71494% | 111 | 2.03x | 11.0% | 56.3% | 52.4% |
| Acquisition | 19 | 245,462,812 | 23.6 | 4.36406% | 93 | 2.67x | 12.1% | 59.7% | 55.3% |
| Recapitalization | 1 | 26,000,000 | 2.5 | 4.30000% | 119 | 2.61x | 12.5% | 31.3% | 31.3% |
| Acquisition/Refinance | 1 | 16,400,000 | 1.6 | 5.27000% | 119 | 1.30x | 8.9% | 69.9% | 62.2% |
| Total / Weighted Average: | 55 | $1,039,132,161 | 100.0% | 4.63043% | 107 | 2.18x | 11.3% | 56.7% | 52.7% |
| (1) | In the case of Loan No. 8, with an anticipated repayment date, Remaining Term to Maturity and Maturity Date LTV are calculated as of the related anticipated repayment date. |
| (2) | In the case of Loan Nos. 1, 4, 7, 8, 14, 18 and 19, the UW NCF DSCR, UW NOI Debt Yield, Cut-off Date LTV and Maturity Date LTV calculations include the related Pari Passu Companion Loan(s). In the case of Loan Nos. 1, 3, 4, 7, 8 and 10, the UW NCF DSCR, UW NOI Debt Yield, Cut-off Date LTV and Maturity Date LTV calculations exclude the related Subordinate Companion Loan(s) and/or related mezzanine loan(s). In the case of (i) Loan Nos. 23 and 24 and (ii) Loan Nos. 26 and 27, the loans in each such group are cross-collateralized and cross-defaulted with each other. As such, the calculations are based on the aggregate Cut-off Date Principal Balances, Maturity Date Principal Balances, UW NOI, UW NCF and Debt Service of the related group of those mortgage loans. |
| (3) | In the case of Loan Nos. 3, 7, 8, 10, 11, 14, 28, 37, 38, 40 and 43 the Cut-off Date LTV and the Maturity Date LTV are calculated by using an appraised value based on certain hypothetical assumptions. Refer to “Description of the Mortgage Pool—Assessments of Property Value and Condition” and “—Appraised Value” in the Preliminary Prospectus for additional details. |
| (4) | In the case of Loan Nos. 5 and 8 the loan documents permit the borrowers to prepay the related loan with yield maintenance premium in the event the defeasance lockout period has not expired after certain dates. See the “Description of the Mortgage Pool—Certain Terms of the Mortgage Loans—Defeasance; Collateral Substitution” in the Preliminary Prospectus. |
THE INFORMATION IN THIS STRUCTURAL AND COLLATERAL TERM SHEET IS NOT COMPLETE AND MAY BE AMENDED PRIOR TO THE TIME OF SALE. THIS TERM SHEET IS NOT AN OFFER TO SELL THESE SECURITIES AND IT IS NOT A SOLICITATION OF AN OFFER TO BUY THESE SECURITIES IN ANY JURISDICTION WHERE THE OFFER OR SALE IS NOT PERMITTED.
| | | |
11 of 130
| Structural and Collateral Term Sheet | Benchmark 2018-B5 | |
| Collateral Characteristics | ||
| Previous Securitization History(1) |
| No. | Loan Name | Cut-off Date Principal Balance | % of IPB | Location | Property Type | Previous Securitization |
| 3 | eBay North First Commons | $51,000,000 | 4.9% | San Jose, CA | Office | COMM 2013-CCRE7 |
| 10 | Embassy Suites Kennesaw | 31,968,577 | 3.1% | Kennesaw, GA | Hotel | JPMBB 2014-C24 |
| 15 | Woodland Gardens Apartments | 23,870,000 | 2.3% | Royal Oak, MI | Multifamily | FREMF 2016-KF25 |
| 17 | Kingsley Apartments | 21,280,000 | 2.0% | Sterling Heights, MI | Multifamily | FREMF 2016-KF22 |
| 20.03 | Amsdell Lawrenceville | 4,256,000 | 0.4% | Lawrenceville, GA | Self Storage | CGCMT 2016-GC36 |
| 33 | Deerfield Woods Apartments | 10,780,000 | 1.0% | Livonia, MI | Multifamily | FREMF 2016-KF25 |
| 46 | SSCP Little Rock | 6,925,000 | 0.7% | Little Rock, AR | Self Storage | GSMS 2012-GC6 |
| Total | $150,079,577 | 14.4% |
| (1) | The table above represents the properties for which the previously existing debt was securitized, based on information provided by the related borrower or obtained through searches of a third-party database. |
THE INFORMATION IN THIS STRUCTURAL AND COLLATERAL TERM SHEET IS NOT COMPLETE AND MAY BE AMENDED PRIOR TO THE TIME OF SALE. THIS TERM SHEET IS NOT AN OFFER TO SELL THESE SECURITIES AND IT IS NOT A SOLICITATION OF AN OFFER TO BUY THESE SECURITIES IN ANY JURISDICTION WHERE THE OFFER OR SALE IS NOT PERMITTED.
| | | |
12 of 130
| Structural and Collateral Term Sheet | Benchmark 2018-B5 |
[THIS PAGE INTENTIONALLY LEFT BLANK]
THE INFORMATION IN THIS STRUCTURAL AND COLLATERAL TERM SHEET IS NOT COMPLETE AND MAY BE AMENDED PRIOR TO THE TIME OF SALE. THIS TERM SHEET IS NOT AN OFFER TO SELL THESE SECURITIES AND IT IS NOT A SOLICITATION OF AN OFFER TO BUY THESE SECURITIES IN ANY JURISDICTION WHERE THE OFFER OR SALE IS NOT PERMITTED.
| | | |
13 of 130
| Structural and Collateral Term Sheet | Benchmark 2018-B5 | |
| Aventura Mall | ||

THE INFORMATION IN THIS STRUCTURAL AND COLLATERAL TERM SHEET IS NOT COMPLETE AND MAY BE AMENDED PRIOR TO THE TIME OF SALE. THIS TERM SHEET IS NOT AN OFFER TO SELL THESE SECURITIES AND IT IS NOT A SOLICITATION OF AN OFFER TO BUY THESE SECURITIES IN ANY JURISDICTION WHERE THE OFFER OR SALE IS NOT PERMITTED.
| | | |
14 of 130
| Structural and Collateral Term Sheet | Benchmark 2018-B5 | |
| Aventura Mall | ||
THE INFORMATION IN THIS STRUCTURAL AND COLLATERAL TERM SHEET IS NOT COMPLETE AND MAY BE AMENDED PRIOR TO THE TIME OF SALE. THIS TERM SHEET IS NOT AN OFFER TO SELL THESE SECURITIES AND IT IS NOT A SOLICITATION OF AN OFFER TO BUY THESE SECURITIES IN ANY JURISDICTION WHERE THE OFFER OR SALE IS NOT PERMITTED.
| | | |
15 of 130
| Structural and Collateral Term Sheet | Benchmark 2018-B5 | |
| Aventura Mall | ||
THE INFORMATION IN THIS STRUCTURAL AND COLLATERAL TERM SHEET IS NOT COMPLETE AND MAY BE AMENDED PRIOR TO THE TIME OF SALE. THIS TERM SHEET IS NOT AN OFFER TO SELL THESE SECURITIES AND IT IS NOT A SOLICITATION OF AN OFFER TO BUY THESE SECURITIES IN ANY JURISDICTION WHERE THE OFFER OR SALE IS NOT PERMITTED.
| | | |
16 of 130
| Structural and Collateral Term Sheet | Benchmark 2018-B5 | |
| Aventura Mall | ||
THE INFORMATION IN THIS STRUCTURAL AND COLLATERAL TERM SHEET IS NOT COMPLETE AND MAY BE AMENDED PRIOR TO THE TIME OF SALE. THIS TERM SHEET IS NOT AN OFFER TO SELL THESE SECURITIES AND IT IS NOT A SOLICITATION OF AN OFFER TO BUY THESE SECURITIES IN ANY JURISDICTION WHERE THE OFFER OR SALE IS NOT PERMITTED.
| | | |
17 of 130
| Structural and Collateral Term Sheet | Benchmark 2018-B5 | |
| Aventura Mall | ||
THE INFORMATION IN THIS STRUCTURAL AND COLLATERAL TERM SHEET IS NOT COMPLETE AND MAY BE AMENDED PRIOR TO THE TIME OF SALE. THIS TERM SHEET IS NOT AN OFFER TO SELL THESE SECURITIES AND IT IS NOT A SOLICITATION OF AN OFFER TO BUY THESE SECURITIES IN ANY JURISDICTION WHERE THE OFFER OR SALE IS NOT PERMITTED.
| | | |
18 of 130
| Structural and Collateral Term Sheet | Benchmark 2018-B5 | |
| Aventura Mall | ||
THE INFORMATION IN THIS STRUCTURAL AND COLLATERAL TERM SHEET IS NOT COMPLETE AND MAY BE AMENDED PRIOR TO THE TIME OF SALE. THIS TERM SHEET IS NOT AN OFFER TO SELL THESE SECURITIES AND IT IS NOT A SOLICITATION OF AN OFFER TO BUY THESE SECURITIES IN ANY JURISDICTION WHERE THE OFFER OR SALE IS NOT PERMITTED.
| | | |
19 of 130
| Structural and Collateral Term Sheet | Benchmark 2018-B5 | |
| Aventura Mall | ||
| Mortgage Loan Information | Property Information | |||
| Mortgage Loan Seller(1): | JPMCB/GACC | Single Asset / Portfolio: | Single Asset | |
| Credit Assessment | Title: | Fee | ||
| (DBRS/Fitch/S&P)(2): | BBB(high)/Asf/A | Property Type - Subtype: | Retail – Super Regional Mall | |
| Original Principal Balance(3): | $103,000,000 | Net Rentable Area (SF): | 1,217,508 | |
| Cut-off Date Principal Balance(3): | $103,000,000 | Location: | Aventura, FL | |
| % of Pool by IPB: | 9.9% | Year Built / Renovated: | 1983 / 2017 | |
| Loan Purpose: | Refinance | Occupancy(5): | 92.8% | |
| Borrower: | Aventura Mall Venture | Occupancy Date: | 2/14/2018 | |
| Sponsors: | Simon Property Group, L.P., | Number of Tenants: | 288 | |
| Jacquelyn Soffer, Jeffrey Soffer | 2015 NOI: | $109,025,339 | ||
| Interest Rate: | 4.12125% | 2016 NOI: | $110,653,403 | |
| Note Date: | 6/7/2018 | 2017 NOI: | $115,240,562 | |
| Maturity Date: | 7/1/2028 | TTM NOI (as of 3/31/2018): | $118,291,397 | |
| Interest-only Period: | 120 months | UW Economic Occupancy(5): | 92.9% | |
| Original Term: | 120 months | UW Revenues: | $185,479,647 | |
| Original Amortization: | None | UW Expenses: | $30,620,668 | |
| Amortization Type: | Interest Only | UW NOI(6): | $154,858,979 | |
| Call Protection(4): | L(25),Def(88),O(7) | UW NCF(6): | $151,571,708 | |
| Lockbox / Cash Management: | Hard; Master Lease Rents (Soft | Appraised Value / Per SF: | $3,450,000,000 / $2,834 | |
| Springing) / Springing | ||||
| Additional Debt: | Yes | |||
| Additional Debt Balance: | $1,303,700,000 / $343,300,000 | |||
| Additional Debt Type: | Pari Passu / Subordinate Debt | |||
| Escrows and Reserves(7) | Financial Information(3) | ||||||
| Initial | Monthly | Initial Cap | Senior Notes | Whole Loan | |||
| Taxes: | $0 | Springing | N/A | Cut-off Date Loan / SF: | $1,155 | $1,437 | |
| Insurance: | $0 | Springing | N/A | Maturity Date Loan / SF: | $1,155 | $1,437 | |
| Replacement Reserves: | $0 | Springing | $487,003 | Cut-off Date LTV: | 40.8% | 50.7% | |
| TI/LC: | $0 | Springing | $6,087,540 | Maturity Date LTV: | 40.8% | 50.7% | |
| Other(7): | $26,168,910 | $0 | N/A | UW NCF DSCR: | 2.58x | 2.07x | |
| UW NOI Debt Yield: | 11.0% | 8.8% | |||||
| Sources and Uses | ||||||
| Sources | Proceeds | % of Total | Uses | Proceeds | % of Total | |
| Whole Loan | $1,750,000,000 | 100.0% | Existing CMBS Mortgage Loan Payoff | $1,230,695,723 | 70.3% | |
| % | Construction Debt Payoff (Expansion) | 200,853,019 | 11.5% | |||
| Upfront Reserves | 26,168,910 | 1.5% | ||||
| Closing Costs | 13,967,630 | 0.8% | ||||
| Return of Equity | 278,314,718 | 15.9% | ||||
| Total Sources | $1,750,000,000 | 100.0% | Total Uses | $1,750,000,000 | 100.0% | |
| (1) | The Aventura Mall Whole Loan was co-originated by JPMCB, Wells Fargo Bank, N.A., DBNY and Morgan Stanley Bank, N.A. |
| (2) | DBRS/Fitch/S&P provided the ratings above for the Aventura Mall Loan in the context of its inclusion in the mortgage pool. |
| (3) | The Aventura Mall Loan is part of a whole loan comprised of (i) 24 senior pari passu notes, with an aggregate outstanding principal balance as of the Cut-off Date of $1.41 billion and (ii) four subordinate notes, with an aggregate outstanding principal balance as of the Cut-off Date of $343.3 million. The Senior Notes Financial Information presented in the chart above reflects the Cut-off Date balance of the senior notes, but excludes the related subordinate notes. The Whole Loan Financial Information presented in the chart above reflects the Cut-off Date Balance of the senior notes and subordinate notes evidencing the Aventura Mall Whole Loan. |
| (4) | The lockout period will be at least 25 payment dates beginning with and including the first payment date of August 1, 2018. Defeasance of the full $1.75 billion Aventura Mall Whole Loan is permitted after the date that is the earlier to occur of (i) August 1, 2021 or (ii) the date that is two years from the closing date of the securitization that includes the last note to be securitized (the “REMIC Prohibition Period”). If the REMIC Prohibition Period has not occurred by August 1, 2021, the borrower is permitted to prepay the Aventura Mall with a yield maintenance premium, except that the borrower is required to defease any portion of the Aventura Mall Whole Loan that is more than two years from its securitization date. The assumed lockout period of 25 payments is based on the expected Benchmark 2018-B5 securitization closing date in August 2018. The actual lockout period may be longer. |
| (5) | Occupancy and UW Economic Occupancy includes square footage to be leased by 12 tenants (33,813 square feet) with leases out for signature that are covered under a master lease as described under “Master Lease” herein. |
| (6) | UW NOI and UW NCF are based on the February 14, 2018 rent roll, executed leases and lender adjustments. See “Cash Flow Analysis” herein. |
| (7) | For a full description of Escrows and Reserves, please refer to “Escrows and Reserves” below. Other Initial Escrows and Reserves refers to two deposits made at closing by the Aventura Mall Borrower comprised of (i) $6,776,765 for certain free rent credits remaining in connection with certain leases at the Aventura Mall Property and (ii) $19,392,145 for certain outstanding tenant improvement allowances and/or leasing commissions due in connection with certain leases at the Aventura Mall Property. |
THE INFORMATION IN THIS STRUCTURAL AND COLLATERAL TERM SHEET IS NOT COMPLETE AND MAY BE AMENDED PRIOR TO THE TIME OF SALE. THIS TERM SHEET IS NOT AN OFFER TO SELL THESE SECURITIES AND IT IS NOT A SOLICITATION OF AN OFFER TO BUY THESE SECURITIES IN ANY JURISDICTION WHERE THE OFFER OR SALE IS NOT PERMITTED.
| | | |
20 of 130
| Structural and Collateral Term Sheet | Benchmark 2018-B5 | |
| Aventura Mall | ||
The Loan. The Aventura Mall loan (the “Aventura Mall Loan”) is part of a whole loan that has an outstanding principal balance as of the Cut-off Date of $1.75 billion (the “Aventura Mall Whole Loan”), which whole loan is secured by a first mortgage lien on the borrower’s fee interest in an approximately 1.2 million square feet super regional mall in Aventura, Florida. The Aventura Mall Whole Loan is comprised of (i) a senior loan, comprised of 24pari passu notes with an aggregate principal balance as of the Cut-off Date of $1,406.7 million, two of which, Note A-2-A-2 (JPMCB) and Note A-2-B-4 (GACC), with an outstanding principal balance as of the Cut-off Date of $65.0 million and $38.0 million, respectively, are being contributed to the Benchmark 2018-B5 Trust and constitute the Aventura Mall Loan, and the remaining notes have been or are expected to be contributed to other securitization trusts and (ii) a subordinate companion loan, comprised of fourpari passu notes, with an aggregate outstanding principal balance as of the Cut-off Date of $343.3 million (collectively, the “Aventura Mall Subordinate Companion Loan”), each as described below. The relationship between the holders of the Aventura Mall Whole Loan will be governed by a co-lender agreement as described under the “Description of the Mortgage Pool—The Whole Loans—The Non-Serviced AB Whole Loans—The Aventura Mall Whole Loan” in the Preliminary Prospectus. The Aventura Mall Whole Loan has a 10-year term and will be interest-only for the term of the loan. The most recent prior financing of the Aventura Mall property was included in the AVMT 2013-AVM securitization.
| Whole Loan Summary(1) |
B4 Notes A-2-B-3
| Companion A Notes (JPMCB)
| Companion A Notes (Aventura Mall Trust 2018-AVM) $406,700,000 Notes A-1-A, A-1-B, A-1-C, A-1-D | Companion A Notes (GACC) $142,000,000 Notes A-2-B-1, A-2-B-2, A-2-B-5 | Companion A Notes (MSMCH) $220,000,000 Notes A-2-C-1, A-2-C-2, A-2-C-3, A-2-C-4, A-2-C-5 | Companion A Notes (WFB) $220,000,000 Notes A-2-D-1, A-2-D-2, A-2-D-3, A-2-D-4, A-2-D-5 | B5 Notes A-2-B-4
|
| B Notes (Aventura Mall Trust 2018-AVM) $343,300,000 Notes B-1, B-2, B-3, B-4 | ||||||
| (1) | The Aventura Mall Whole Loan will be serviced pursuant to the trust and servicing agreement for the Aventura Mall Trust 2018-AVM securitization. |
The Borrower.The borrower is Aventura Mall Venture, a Florida general partnership structured to be a bankruptcy remote entity with two independent directors in its organizational structure (the “Aventura Mall Borrower”).
The Loan Sponsors. The loan sponsors and nonrecourse carveout guarantors are Jacquelyn Soffer and Jeffrey Soffer (the “Turnberry Guarantors”) and Simon Property Group, L.P. (the “Simon Guarantor”, and together with the Turnberry Guarantors, the “Guarantors”). The liability of the Guarantors for breaches or violations of the non-recourse carveout provisions in the loan documents is capped at $350.0 million plus all reasonable, out-of-pocket costs and expenses (including, but not limited to, court costs and fees and reasonable attorney’s fees) incurred by the lender in connection with the enforcement of, or preservation of the lender’s rights under, the guaranty. The liability as between the Turnberry Guarantors and the Simon Guarantor will be several but not joint.
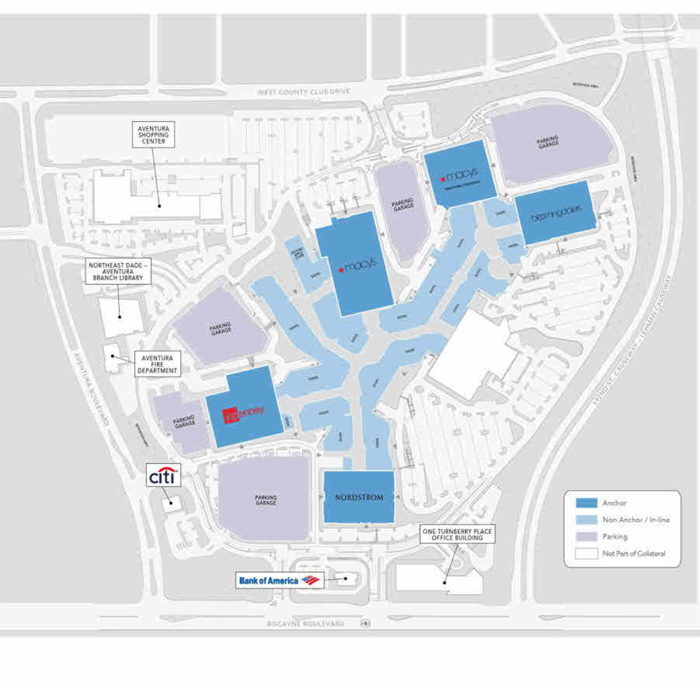
The Property. Aventura Mall is an approximately 2.2 million square foot, super regional mall that was developed by Turnberry in 1983 and subsequently expanded and renovated in 1997, 1998, 2006-2008 and 2017. Of the 2.2 million square feet, 1,217,508 square feet serves as collateral for the Aventura Mall Whole Loan (the “Aventura Mall Property”) which collateral also includes four anchor pad sites ground leased from the Aventura Mall Borrower. The collateral does not include 942,842 square feet of tenant-owned anchor improvements on those sites.
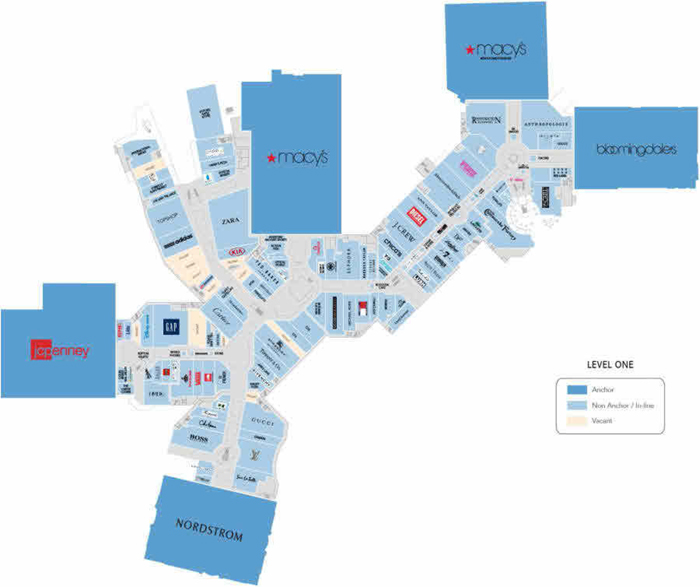
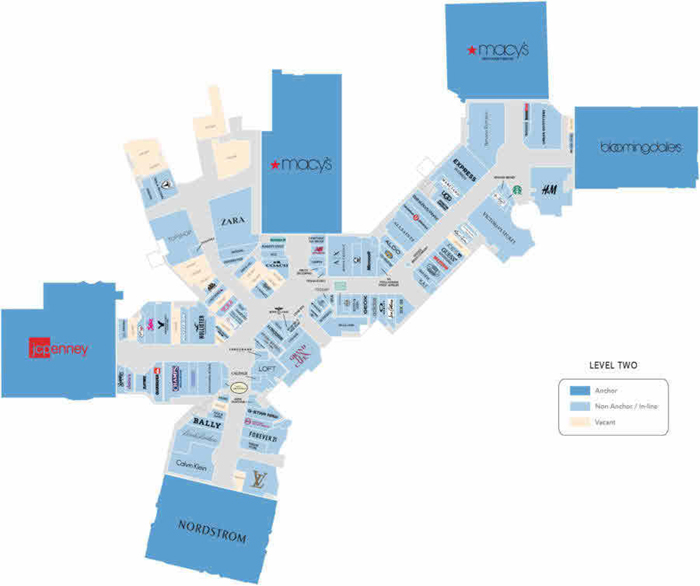
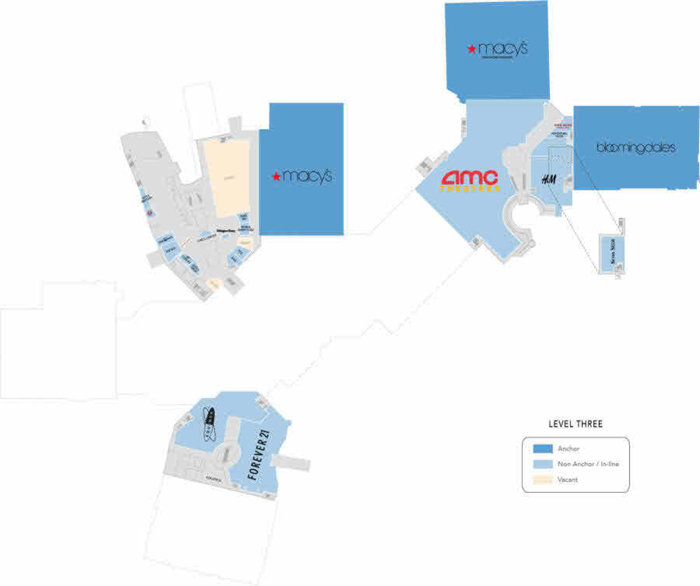
The Aventura Mall Property is located approximately 17 miles from downtown Miami and is surrounded by master-planned residential areas including Turnberry Isle, Porto Vita and the Waterways of Biscayne Bay. The Aventura Mall Property is the largest mall in Florida and the third largest mall in the United States. According to the appraisal, the Aventura Mall Property is the second most-visited shopping center in the United States with more than 28 million annual visitors. The Aventura Mall Property is anchored by a number of traditional mall anchors, including Macy’s, Bloomingdale’s, Macy’s Men’s & Home, Nordstrom and J.C. Penney Co., as well as a number of non-traditional mall anchors. The Aventura Mall has a mix of luxury, bridge to luxury and mass market tenants that appeal to a variety of shoppers.
The Aventura Mall Property is currently 92.8% leased as of February 14, 2018. The Aventura Mall Property is one of the top-performing malls in the U.S., with comparable in-line sales of $1,681 per square foot and total gross reported sales of approximately $1.2 billion as of the trailing 12 months ending February 2018.
In November 2017, the owners of the Aventura Mall Borrower opened a new 225,641 square foot expansion (the “Expansion Parcel”) at a cost of a $230.0 million, which is included in the collateral for the Aventura Mall Whole Loan. The Expansion Parcel features an approximately 20,000 square feet, two-level Apple store along with Tesla, Topshop, Zara, Serafina and Shake Shack. The Expansion Parcel is 72.2% leased as of February 14, 2018.
THE INFORMATION IN THIS STRUCTURAL AND COLLATERAL TERM SHEET IS NOT COMPLETE AND MAY BE AMENDED PRIOR TO THE TIME OF SALE. THIS TERM SHEET IS NOT AN OFFER TO SELL THESE SECURITIES AND IT IS NOT A SOLICITATION OF AN OFFER TO BUY THESE SECURITIES IN ANY JURISDICTION WHERE THE OFFER OR SALE IS NOT PERMITTED.
| | | |
21 of 130
| Structural and Collateral Term Sheet | Benchmark 2018-B5 | |
| Aventura Mall | ||
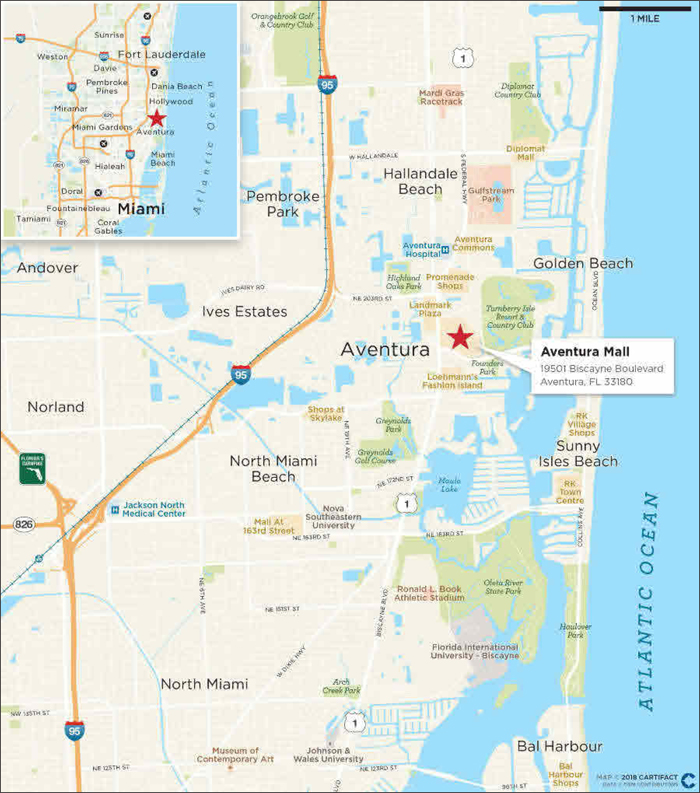
The Market. Regional access to the Aventura Mall is provided by I-95 and Biscayne Boulevard (U.S. Highway 1). The William Lehman Causeway, which connects the beach areas with U.S. Highway 1, also provides access to the Aventura Mall. The Aventura Mall is located approximately 17 miles from downtown Miami and is surrounded by Turnberry Isle, Porto Vita and the Waterways of Biscayne Bay. According to the appraisal, as of year-end 2017, Aventura Mall’s local trade area within a 15 mile radius is home to over 2.3 million people with an average income of $66,306.
As a destination retail mall north of Miami, Aventura Mall also appeals to a large international customer base, primarily from South America, Mexico and Europe.
| Population | Trade Area | Florida | USA |
| 2017 Population | 6,064,172 | 20,484,696 | 325,227,741 |
| Households | Trade Area | Florida | USA |
| 2017 Estimated # of Households | 2,270,759 | 8,032,734 | 122,737,174 |
| 2017 Average Household Income | $76,440 | $71,422 | $81,217 |
| Source: Appraisal. |
The appraiser considered six retail centers in the Miami MSA as the competitive set for the Aventura Mall Property. Three of the properties, Bal Harbour Shops, Sawgrass Mills and Dadeland Mall, are considered primary competition. The primary competition ranges from 460,000 square feet to approximately 2.4 million square feet and is located between 4.7 and 22.0 miles from the Aventura Mall Property. Pembroke Lakes Mall, Galleria Mall and Dolphin Mall are considered secondary competition. The secondary competition ranges from 955,000 square feet to approximately 1.4 million square feet and is located between 11.0 and 16.0 miles from the Aventura Mall Property.
| Competitive Set Summary(1) | ||||
| Property | Location | Proximity (Miles) | Year Built / Renovated | Total GLA |
| Aventura Mall | Aventura, Florida | NAP | 1983 / 2017 | 2,156,203 |
| Bal Harbour Shops | Bal Harbour, Florida | 4.7 | 1965 / 2008 | 460,000 |
| Sawgrass Mills | Sunrise, Florida | 19.0 | 1990 / 2006 | 2,384,000 |
| Dadeland Mall | Kendall, Florida | 22.0 | 1962 / 2013 | 1,488,000 |
| Pembroke Lakes Mall | Pembroke Pines, Florida | 11.0 | 1992 / 1998 | 1,136,000 |
| Galleria Mall | Fort Lauderdale, Florida | 13.0 | 1980 / 2005 | 955,000 |
| Dolphin Mall | Miami, Florida | 16.0 | 2001 / 2010 | 1,403,000 |
| (1) | Based on the appraisal. |
| Non-Owned Anchors | ||||
| Tenant | Ratings Fitch/Moody’s/S&P(1) | Net Rentable Area (SF) | TTM February Sales | TTM February Sales Per Square Foot |
| Macy’s (GL) | BBB / Baa3 / BBB- | 299,011 | $81,164,209 | $271 |
| Bloomingdales (GL) | BBB / Baa3 / BBB- | 251,831 | $105,328,660 | $418 |
| Macy’s (Men’s & Home) (GL) | BBB / Baa3 / BBB- | 225,000 | $41,967,714 | $187 |
| Nordstrom (GL) | BBB+ / Baa1 / BBB+ | 167,000 | $53,536,758 | $321 |
| (1) | Certain ratings are those of the parent company whether or not the parent guarantees the lease. |
| Historical and Current Occupancy(1) | |||||||||||
| 2008(2) | 2009 | 2010 | 2011 | 2012 | 2013 | 2014 | 2015 | 2016 | 2017 | Current | |
| Occupancy – Excluding Anchors | 84.1% | 94.9% | 95.2% | 96.6% | 94.9% | 98.9% | 97.8% | 97.8% | 97.3% | 97.7% | 91.4% |
| Occupancy – Including Anchors | 93.3% | 98.1% | 98.2% | 98.8% | 98.2% | 99.6% | 99.2% | 99.2% | 99.1% | 99.1% | 92.8% |
| (1) | Historical and Current Occupancy is based on the average of each respective year. Current occupancy is based on the February 14, 2018 rent roll, including recently executed leases and master leased tenants. |
| (2) | In 2008, occupancy declined due to a challenging corporate environment for several tenants including Stride Rite, Kay Bee Toys, The Sharper Image, Walden Books and Sigrid Olsen. 2008 occupancy as of December 31 was 87.9% and 96.1% for Occupancy – Excluding Anchors and Occupancy – Including Anchors, respectively. |
THE INFORMATION IN THIS STRUCTURAL AND COLLATERAL TERM SHEET IS NOT COMPLETE AND MAY BE AMENDED PRIOR TO THE TIME OF SALE. THIS TERM SHEET IS NOT AN OFFER TO SELL THESE SECURITIES AND IT IS NOT A SOLICITATION OF AN OFFER TO BUY THESE SECURITIES IN ANY JURISDICTION WHERE THE OFFER OR SALE IS NOT PERMITTED.
| | | |
22 of 130
| Structural and Collateral Term Sheet | Benchmark 2018-B5 | |
| Aventura Mall | ||
| Historical In-line Sales and Occupancy Costs(1) (2) | |||||
| 2015 | 2016 | 2017 | TTM February 2018 Sales Per Square Foot | TTM February 2018 Occupancy Cost | |
| Comparable Sales Per Square Foot w/ Apple | $1,626 | $1,544 | $1,630 | $1,681 | 13.0% |
| Comparable Sales Per Square Foot w/o Apple | $1,229 | $1,114 | $1,147 | $1,162 | 18.9% |
| (1) | Not all tenants at the Aventura Mall Property are required to report sales. |
| (2) | Apple’s sales are based on the tenant’s 6,303 square feet of space in the existing mall. |
| Collateral Tenant Summary | |||||||||
| Tenant | Ratings Moody’s/S&P/ Fitch(1) | Net Rentable Area (SF) | % of Total NRA | Base Rent Per Square Foot(2) | Lease Expiration(3) | % of Total Base Rent | Most Recent Sales Per Square Foot | Occupancy Cost | |
| Zara(4)(5) | NR / NR / NR | 34,454 | 2.8% | $119.58 | 10/31/2029 | 2.9% | $971 | 16.3% | |
| Apple (2 Levels)(4)(6) | NR / Aa1 / AA+ | 20,218 | 1.7 | 173.11 | 1/31/2030 | 2.5 | $31,124 | 0.5% | |
| H & M | NR / NR / NR | 28,830 | 2.4 | 117.09 | 1/31/2027 | 2.4 | $666 | 18.4% | |
| Abercrombie & Fitch | NR / NR / BB- | 11,246 | 0.9 | 281.38 | 1/31/2020 | 2.2 | $1,555 | 20.9% | |
| Victoria’s Secret | BB+ / Ba1 / BB+ | 18,387 | 1.5 | 165.00 | 7/31/2026 | 2.1 | $1,041 | 12.7% | |
| Banana Republic | BB+ / Baa2 / BB+ | 16,857 | 1.4 | 175.05 | 2/29/2020 | 2.1 | $580 | 37.8% | |
| Topshop(4) | NR / NR / NR | 23,296 | 1.9 | 122.00 | 10/31/2029 | 2.0 | NAV | NAV | |
| XXI Forever | NR / NR / NR | 32,504 | 2.7 | 75.82 | MTM | 1.7 | $381 | 22.6% | |
| Restoration Hardware | NR / NR / NR | 11,988 | 1.0 | 200.17 | 2/28/2019 | 1.7 | $2,150 | 11.4% | |
| Champs Sports | NR / Ba1 / BB+ | 7,331 | 0.6 | 323.94 | 5/31/2023 | 1.7 | $1,555 | 22.8% | |
| Louis Vuitton | WD / NR / A+ | 18,180 | 1.5 | 110.00 | 11/30/2022 | 1.4 | $1,989 | 7.8% | |
| AMC Theatres(7) | B / B2 / B+ | 78,738 | 6.5 | 23.50 | 8/31/2023 | 1.3 | $703,921 | 10.6% | |
| The Gap | BB+ / Baa2 / BB+ | 11,065 | 0.9 | 165.00 | 7/31/2024 | 1.3 | NAV | NAV | |
| Gucci(8) | NR / NR / BBB+ | 8,383 | 0.7 | 201.57 | 12/31/2026 | 1.2 | $2,257 | 10.9% | |
| Express | BB+ / Ba1 / BB+ | 11,320 | 0.9 | 145.75 | 1/31/2022 | 1.2 | $641 | 28.7% | |
| Footlocker | NR / Ba1 / BB+ | 5,024 | 0.4 | 319.30 | 2/28/2025 | 1.1 | $1,238 | 29.3% | |
| Mayor’s Jewelers | NR / NR / NR | 3,447 | 0.3 | 443.46 | 1/31/2024 | 1.1 | $6,052 | 7.9% | |
| J. Crew | NR / Caa2 / CCC+ | 7,750 | 0.6 | 191.28 | 6/30/2020 | 1.0 | $806 | 28.6% | |
| Armani Exchange | NR / NR / NR | 8,675 | 0.7 | 168.16 | 1/31/2021 | 1.0 | $924 | 23.0% | |
| Michael Kors | BBB- / NR / BBB- | 3,678 | 0.3 | 393.93 | 9/30/2021 | 1.0 | $1,013 | 46.7% | |
| Subtotal / Weighted Average | 361,371 | 29.7% | $129.41 | 33.0% | |||||
| Remaining Tenants | 767,910 | 63.1% | $123.55 | 67.0% | |||||
| Vacant | 88,227 | 7.2% | NAP | NAP | |||||
| Total / Weighted Average | 1,217,508 | 100.0% | $125.42 | 100.0% | |||||
| (1) | Certain ratings are those of the parent company whether or not the parent guarantees the lease. |
| (2) | Base Rent Per Square Foot reflects the following: (a) in-place leases based on the February 14, 2018 rent roll, (b) contractual rent steps through June 2019 totaling $6.5 million including the $1.4 million contractual rent step that is scheduled to occur in August 2019 for the executed renewal of Victoria’s Secret (included in the Bridge Rent and Reimbursement Reserve) and (c) ground rent in an amount of approximately $1.3 million for tenants that own their improvements (Macy’s, Bloomingdale’s, Macy’s Men’s & Home and Nordstrom). |
| (3) | Certain tenants may have termination or contraction options due to co-tenancy provisions in the related leases (which may become exercisable prior to the originally stated expiration date of the tenant lease). |
| (4) | A full year of sales and occupancy costs are not available for Expansion Parcel tenants. |
| (5) | Zara was originally a tenant in the non-expansion portion of Aventura Mall, occupying approximately 19,000 square feet, before departing for Bal Harbour Shops in 2012. Zara has since returned to the Aventura Mall Property and opened in the Expansion Parcel in November 2017. The Most Recent Sales Per Square Foot are based on the tenant’s annualized sales from November 2017 through April 2018. |
| (6) | Most Recent Sales Per Square Foot for Apple are based on the tenant’s 6,303 square feet space in the pre-existing portion of the Aventura Mall Property. Apple recently executed a lease for approximately 20,000 square feet at the Expansion Parcel. |
| (7) | AMC Theatres Most Recent Sales Per Square Foot number reflects sales per screen (24 screens). |
| (8) | Gucci’s Most Recent Sales Per Square Foot are based on only accessories and children’s inventory. There are no clothing sales at the subject store. |
THE INFORMATION IN THIS STRUCTURAL AND COLLATERAL TERM SHEET IS NOT COMPLETE AND MAY BE AMENDED PRIOR TO THE TIME OF SALE. THIS TERM SHEET IS NOT AN OFFER TO SELL THESE SECURITIES AND IT IS NOT A SOLICITATION OF AN OFFER TO BUY THESE SECURITIES IN ANY JURISDICTION WHERE THE OFFER OR SALE IS NOT PERMITTED.
| | | |
23 of 130
| Structural and Collateral Term Sheet | Benchmark 2018-B5 | |
| Aventura Mall | ||
| Lease Rollover Schedule | |||||||||
| Year | Number of Leases Expiring(1) | Net Rentable Area Expiring | % of NRA Expiring | Base Rent Expiring(2) | % of Base Rent Expiring | Cumulative Net Rentable Area Expiring | Cumulative % of NRA Expiring | Cumulative Base Rent Expiring | Cumulative % of Base Rent Expiring |
| 2018 & MTM(3) | 49 | 94,330 | 7.7% | $10,950,745 | 7.7% | 94,330 | 7.7% | $10,950,745 | 7.7% |
| 2019 | 31 | 91,803 | 7.5% | 12,376,749 | 8.7% | 186,133 | 15.3% | $23,327,493 | 16.5% |
| 2020 | 36 | 96,193 | 7.9% | 18,375,213 | 13.0% | 282,326 | 23.2% | $41,702,706 | 29.4% |
| 2021 | 24 | 54,397 | 4.5% | 13,685,691 | 9.7% | 336,723 | 27.7% | $55,388,398 | 39.1% |
| 2022 | 24 | 76,594 | 6.3% | 12,967,832 | 9.2% | 413,317 | 33.9% | $68,356,230 | 48.3% |
| 2023 | 29 | 352,941 | 29.0% | 16,933,820 | 12.0% | 766,258 | 62.9% | $85,290,050 | 60.2% |
| 2024 | 27 | 79,905 | 6.6% | 13,311,865 | 9.4% | 846,163 | 69.5% | $98,601,915 | 69.6% |
| 2025 | 13 | 19,020 | 1.6% | 5,163,035 | 3.6% | 865,183 | 71.1% | $103,764,950 | 73.3% |
| 2026 | 9 | 46,368 | 3.8% | 7,858,163 | 5.5% | 911,551 | 74.9% | $111,623,113 | 78.8% |
| 2027 | 20 | 78,035 | 6.4% | 10,641,238 | 7.5% | 989,586 | 81.3% | $122,264,351 | 86.3% |
| 2028 | 13 | 41,146 | 3.4% | 6,126,042 | 4.3% | 1,030,732 | 84.7% | $128,390,392 | 90.6% |
| 2029 & Beyond(4) | 13 | 98,549 | 8.1% | 13,247,802 | 9.4% | 1,129,281 | 92.8% | $141,638,194 | 100.0% |
| Vacant | NAP | 88,227 | 7.2% | NAP | NAP | 1,217,508 | 100.0% | NAP | NAP |
| Total / Wtd. Avg. | 288 | 1,217,508 | 100.0% | $141,638,194 | 100.0% | ||||
| (1) | Number of leases expiring excludes approximately 30 temporary/kiosk tenants who operate under short term leases. |
| (2) | Base Rent Expiring reflects the following: (a) in-place leases based on the February 14, 2018 rent roll, (b) contractual rent steps through June 2019 totaling approximately $6.5 million including the $1.4 million contractual rent step that is scheduled to occur in August 2019 for the executed renewal of Victoria’s Secret (included in the Bridge Rent and Reimbursements Reserve), and (c) ground rent in an amount of approximately $1.3 million for tenants that own their improvements (Macy’s, Bloomingdale’s, Macy’s Men’s & Home and Nordstrom). |
| (3) | 2018 & MTM includes temporary tenants. |
| (4) | 2029 & Beyond includes the recently executed Apple lease square feet and lease expiration for the Expansion Parcel. |
THE INFORMATION IN THIS STRUCTURAL AND COLLATERAL TERM SHEET IS NOT COMPLETE AND MAY BE AMENDED PRIOR TO THE TIME OF SALE. THIS TERM SHEET IS NOT AN OFFER TO SELL THESE SECURITIES AND IT IS NOT A SOLICITATION OF AN OFFER TO BUY THESE SECURITIES IN ANY JURISDICTION WHERE THE OFFER OR SALE IS NOT PERMITTED.
| | | |
24 of 130
| Structural and Collateral Term Sheet | Benchmark 2018-B5 | |
| Aventura Mall | ||
| Operating History and Underwritten Net Cash Flow | |||||||
| 2015 | 2016 | 2017 | TTM(1) | Underwritten | Per Square Foot | %(2) | |
| Rents in Place(3) | $99,418,818 | $103,197,968 | $106,500,453 | $109,896,747 | $141,638,194 | $116.33 | 71.1% |
| Vacant Income | 0 | 0 | 0 | 0 | 13,640,745 | 11.20 | 6.9% |
| Gross Potential Rent | $99,418,818 | $103,197,968 | $106,500,453 | $109,896,747 | $155,278,939 | $127.54 | 78.0% |
| Percentage Rent | 5,466,448 | 4,115,391 | 3,447,721 | 3,326,930 | 3,627,027 | 2.98 | 1.8% |
| Total Reimbursements | 26,727,546 | 26,287,600 | 27,329,454 | 28,195,516 | 32,253,113 | 26.49 | 16.2% |
| Specialty Leasing Income | 3,536,265 | 3,076,589 | 4,453,595 | 4,900,785 | 3,805,199 | 3.13 | 1.9% |
| Other Income(4) | 3,628,986 | 3,701,438 | 3,994,113 | 4,090,769 | 4,156,114 | 3.41 | 2.1% |
| Net Rental Income | $138,778,063 | $140,378,986 | $145,725,336 | $150,410,748 | $199,120,392 | $163.55 | 100.0% |
| (Vacancy/Credit Loss) | (272,229) | (422,401) | (438,454) | (634,418) | (13,640,745) | (11.20) | (6.9)% |
| Effective Gross Income | $138,505,834 | $139,956,585 | $145,286,882 | $149,776,330 | $185,479,647 | $152.34 | 93.1% |
| Total Expenses | $29,480,495 | $29,303,182 | $30,046,320 | $31,484,933 | $30,620,668 | $25.15 | 16.5% |
| Net Operating Income | $109,025,339 | $110,653,403 | $115,240,562 | $118,291,397 | $154,858,979 | $127.19 | 83.5% |
| Total TI/LC, Capex/RR | 0 | 0 | 0 | 0 | 3,287,272 | 2.70 | 1.8% |
| Net Cash Flow | $109,025,339 | $110,653,403 | $115,240,562 | $118,291,397 | $151,571,708 | $124.49 | 81.7% |
| (1) | TTM represents the trailing 12-month period ending March 31, 2018. |
| (2) | % column represents percent of Net Rental Income for all revenue lines and represents Effective Gross Income for the remainder of fields. |
| (3) | The increase in Rents in Place from TTM March 31, 2018 to Underwritten is primarily driven by the inclusion of the executed leases on the new Expansion Parcel which opened in November 2017 and is based on the February 14, 2018 annualized rent roll. Rents in Place also includes $1.3 million of ground rent paid by Bloomingdales, Macy’s, Macy’s Men’s & Home, and Nordstrom and approximately $3.4 million of master lease rent for current leases that are out for signature. Contractual rent steps were underwritten through June 2019 totaling approximately $6.5 million, including the $1.4 million contractual rent step for the executed renewal of Victoria’s Secret that is scheduled to occur in August 2019 (included in the Bridge Rent and Reimbursements Reserve). |
| (4) | Other Income includes fee income (revenues associated with license fees and valet management fees), and miscellaneous revenues (revenue associated with license fees, valet management fees, commissions, late charges, and other miscellaneous sources). |
Property Management. The Aventura Mall Property is currently managed by TB All Fees Operating LP (the “Property Manager”), which is an affiliate of the Turnberry Guarantors. In addition, the Property Manager is currently the leasing agent under a separate leasing agreement with the Aventura Mall Borrower. Turnberry Aventura Mall Company, Ltd., an affiliate of the Turnberry Guarantors, and SDG Aventura Limited Partnership, an affiliate of the Simon Guarantor, have joint approval rights with respect to certain major decisions of the Aventura Mall Borrower relating to the Aventura Mall Property.
Escrows and Reserves... At closing, the Aventura Mall Borrower deposited $6,776,765 for certain free rent credits remaining in connection with certain leases at the Aventura Mall Property and $19,392,145 for certain outstanding tenant improvement allowances and/or leasing commissions due in connection with certain leases at the Aventura Mall Property.
Tax Escrows -If the debt service coverage ratio (as calculated pursuant to the loan agreement based on the trailing four quarters) falls below 1.50x for two consecutive calendar quarters (among other conditions in certain cases), monthly escrows for real estate taxes in the amount of 1/12 of projected annual property taxes are required.
Insurance Escrows - If the debt service coverage ratio (as calculated pursuant to the loan agreement based on the trailing four quarters) falls below 1.50x for two consecutive calendar quarters (among other conditions in certain cases), insurance premiums in the amount of 1/12 of projected annual insurance premiums (also waived if blanket policy in place and there is no event of default continuing) are required.
THE INFORMATION IN THIS STRUCTURAL AND COLLATERAL TERM SHEET IS NOT COMPLETE AND MAY BE AMENDED PRIOR TO THE TIME OF SALE. THIS TERM SHEET IS NOT AN OFFER TO SELL THESE SECURITIES AND IT IS NOT A SOLICITATION OF AN OFFER TO BUY THESE SECURITIES IN ANY JURISDICTION WHERE THE OFFER OR SALE IS NOT PERMITTED.
| | | |
25 of 130
| Structural and Collateral Term Sheet | Benchmark 2018-B5 | |
| Aventura Mall | ||
Replacement Reserves - If the debt service coverage ratio (as calculated pursuant to the loan agreement based on the trailing four quarters) falls below 1.50x for two consecutive calendar quarters (among other conditions in certain cases), replacement funds (approximately $20,292 monthly (or $0.20 per square foot annually), subject to a cap of $487,003) are required.
TI/LC Funds - If the debt service coverage ratio (as calculated pursuant to the loan agreement based on the trailing four quarters) falls below 1.50x for two consecutive calendar quarters (among other conditions in certain cases), tenant rollover funds (approximately $253,647 monthly (or $2.50 per square foot annually), subject to a cap of $6,087,540) are required.
Lockbox / Cash Management.The Aventura Mall Whole Loan is structured with a hard lockbox and springing cash management. The Aventura Mall Borrower is required to notify each tenant under each lease (except the master leases) that has not received instructions from the Aventura Mall Borrower to send all payments of rents directly to the lender-controlled lockbox account at Wells Fargo Bank, National Association. Provided no Lockbox Event (as defined below) has occurred, all sums in the lockbox account are required to be transferred daily to an account designated by the Aventura Mall Borrower. In the event a Lockbox Event has occurred and is continuing, all funds in the lockbox account are required to be swept weekly into a cash management account controlled by the lender. In the event a Lockbox Event is caused only by the occurrence of a DSCR Trigger Event, as defined below, all funds in the cash management account are required to be applied by the lender each business day to payments of taxes, insurance, debt service, operating expenses, capital expenditure reserves and any remaining funds in the cash management account are required to be released to the Aventura Mall Borrower only to the extent necessary to reimburse the Aventura Mall Borrower for extraordinary expenses approved by the lender. All additional funds in the cash management account will be held by the lender as additional collateral for the Aventura Mall Whole Loan. In the event any Lockbox Event other than the DSCR Trigger Event has occurred and is continuing, all amounts in the cash management account may be applied in the lender’s sole discretion. In addition, following the occurrence and during the continuance of a Lockbox Event or a DSCR Trigger Event, all master lease rents are also required to be deposited directly into the lockbox account.
A “Lockbox Event” means the occurrence of (a) an event of default under the loan agreement, (b) the bankruptcy or insolvency of the Aventura Mall Borrower, (c) the bankruptcy or insolvency of the Property Manager except where such bankruptcy or insolvency does not result in the cash or bank accounts associated with the Aventura Mall Property being subsumed in such proceedings or result in a material adverse effect upon the operations of the Aventura Mall Property or the value or security of the lender’s lien, or (d) if the debt service coverage ratio (as calculated pursuant to the loan agreement based on the trailing four quarters) for the Aventura Mall Whole Loan falls below 1.35x for two consecutive quarters (a “DSCR Trigger Event”).
Master Lease.The Aventura Mall Borrower entered into a master lease (the “Master Lease”) at closing with the Guarantors and Turnberry Retail Holding, L.P., which Master Lease covers a certain portion of the Aventura Mall Property that is currently not occupied. The Master Lease provides for payment of rent in an annual amount up to $3,426,159. The Master Lease covers the spaces for 12 proposed tenants with leases that are out for signature or which are otherwise not occupied prior to the loan origination. The Master Lease provides for a reduction of rent as third-party tenants sign leases, take occupancy of space and commence paying contractual rent in the premises covered by the Master Lease (as well as tenants signing leases in any portion of the Aventura Mall Property, including the space under the Master Lease, to the extent the total annualized lease payments (excluding Master Lease rents) exceed $178,400,000. The term will expire on the earliest to occur of (a) 10 years after loan maturity, (b) the earlier of the date on which the annual rent under the Master Lease is reduced to zero or the date on which the annualized total lease payments from tenants at the Aventura Mall Property (not including percentage rent) exceeds $181,850,000 or (c) following the exercise of the master lessees’ cancellation option after a lender foreclosure or deed-in-lieu of foreclosure. The Master Lease equals 1.8% of the approximately $185.5 million of underwritten effective gross income.
Redevelopment Rights.If J.C. Penney Co. or any of Macy’s, Bloomingdales, Macy’s (Men’s & Home) or Nordstrom (each, a “Department Store”) ceases operations or seeks to assign its lease in any manner not expressly permitted thereunder, the Aventura Mall Borrower has the right to enter into a ground lease with a third party or an affiliate of the Aventura Mall Borrower and obtain a release of the lien on the ground leasehold interest in such J.C. Penney Co. or Department Store parcel so long as certain conditions in the loan agreement are satisfied, including (i) the ground lease is in form and substance reasonably acceptable to the lender, including that the rent to be paid thereunder is not less than the rent payable by J.C. Penney Co. or the Department Store immediately prior to such new lease, (ii) the tenant or the guarantor of such ground lease is a creditworthy person acceptable to the lender, (iii) no event of default is continuing, (iv) delivery of a rating agency confirmation, (v) if material work is being performed, delivery of a completion guaranty (or a collateral assignment of a completion guaranty in favor of Borrower) from a credit-worthy entity acceptable to the lender, (vi) the term of the ground lease expires no less than 20 years after the maturity of the Aventura Mall Loan, and (vii) compliance with the “anti-poaching” conditions set forth in the loan agreement. In lieu of entering into a new ground lease, the loan documents permit an affiliate of the Aventura Mall Borrower to accept an assignment of the existing leasehold interest, provided that the Aventura Mall Borrower satisfies the requirements in the loan documents including, without limitation, condition (i) above. J.C. Penney Co. has six, five-year renewal options remaining (each requiring 12 months’ notice).
THE INFORMATION IN THIS STRUCTURAL AND COLLATERAL TERM SHEET IS NOT COMPLETE AND MAY BE AMENDED PRIOR TO THE TIME OF SALE. THIS TERM SHEET IS NOT AN OFFER TO SELL THESE SECURITIES AND IT IS NOT A SOLICITATION OF AN OFFER TO BUY THESE SECURITIES IN ANY JURISDICTION WHERE THE OFFER OR SALE IS NOT PERMITTED.
| | | |
26 of 130
| Structural and Collateral Term Sheet | Benchmark 2018-B5 | |
| Aventura Mall | ||
The Aventura Mall Borrower is also permitted to (a) release (i) immaterial or non-income producing portions of the Aventura Mall Property to any federal, state or local government or any political subdivision thereof in connection with takings or condemnations of any portion of the Aventura Mall Property for dedication or public use and (ii) non-income producing portions of the Aventura Mall Property (including, without limitation, certain outparcels containing parking areas (the “Parking Lot Outparcels”) and portions of the “ring road”) to third parties or affiliates of the Aventura Mall Borrower, and (b) dedicate portions of the Aventura Mall Property or grant easements, restrictions, covenants, reservations and rights of way in the ordinary course of business for traffic circulation, ingress, egress, parking, access, utilities lines or for other similar purposes.
THE INFORMATION IN THIS STRUCTURAL AND COLLATERAL TERM SHEET IS NOT COMPLETE AND MAY BE AMENDED PRIOR TO THE TIME OF SALE. THIS TERM SHEET IS NOT AN OFFER TO SELL THESE SECURITIES AND IT IS NOT A SOLICITATION OF AN OFFER TO BUY THESE SECURITIES IN ANY JURISDICTION WHERE THE OFFER OR SALE IS NOT PERMITTED.
| | | |
27 of 130
| Structural and Collateral Term Sheet | Benchmark 2018-B5 | |
| NY & CT NNN Portfolio | ||
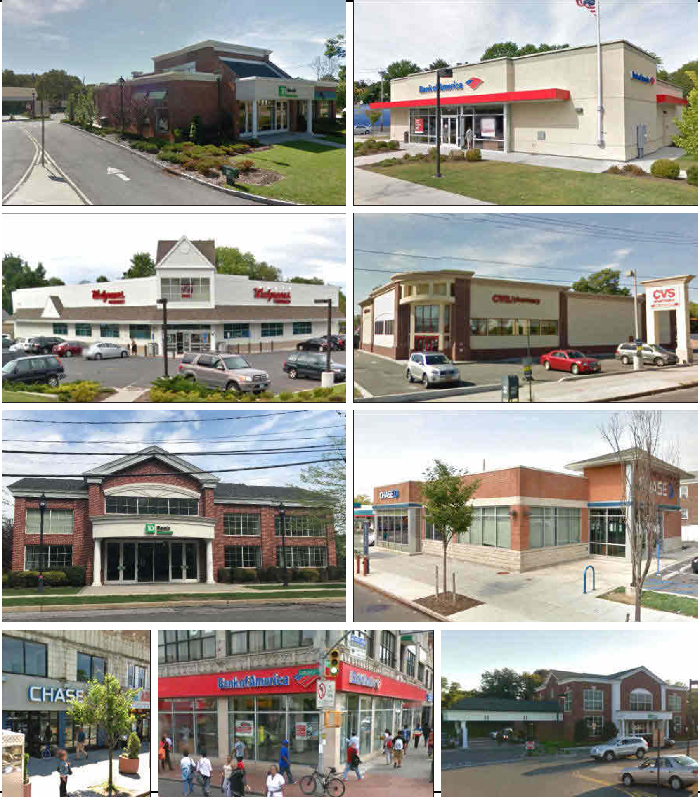
THE INFORMATION IN THIS STRUCTURAL AND COLLATERAL TERM SHEET IS NOT COMPLETE AND MAY BE AMENDED PRIOR TO THE TIME OF SALE. THIS TERM SHEET IS NOT AN OFFER TO SELL THESE SECURITIES AND IT IS NOT A SOLICITATION OF AN OFFER TO BUY THESE SECURITIES IN ANY JURISDICTION WHERE THE OFFER OR SALE IS NOT PERMITTED.
| | | |
28 of 130
| Structural and Collateral Term Sheet | Benchmark 2018-B5 | |
| NY & CT NNN Portfolio | ||
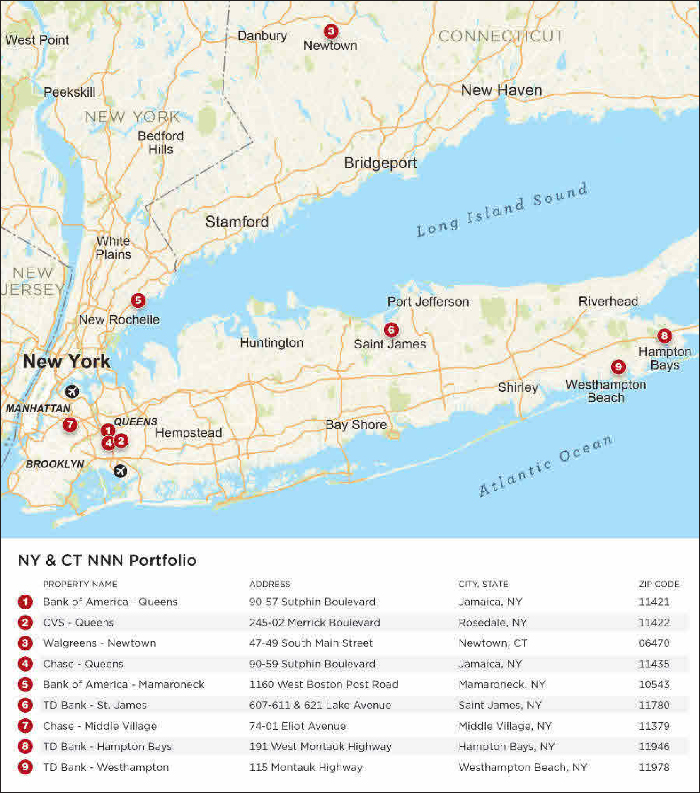
THE INFORMATION IN THIS STRUCTURAL AND COLLATERAL TERM SHEET IS NOT COMPLETE AND MAY BE AMENDED PRIOR TO THE TIME OF SALE. THIS TERM SHEET IS NOT AN OFFER TO SELL THESE SECURITIES AND IT IS NOT A SOLICITATION OF AN OFFER TO BUY THESE SECURITIES IN ANY JURISDICTION WHERE THE OFFER OR SALE IS NOT PERMITTED.
| | | |
29 of 130
| Structural and Collateral Term Sheet | Benchmark 2018-B5 | |
| NY & CT NNN Portfolio | ||
| Mortgage Loan Information | Property Information | |||
| Mortgage Loan Seller: | CREFI | Single Asset / Portfolio: | Portfolio | |
| Original Principal Balance: | $57,375,000 | Title: | Fee | |
| Cut-off Date Principal Balance: | $57,375,000 | Property Type - Subtype: | Retail - Various | |
| % of Pool by IPB: | 5.5% | Net Rentable Area (SF): | 70,333 | |
| Loan Purpose: | Refinance | Location: | Various | |
| Borrowers(1): | Various | Year Built / Renovated: | Various / Various | |
| Sponsor: | Robin Eshaghpour | Occupancy: | 100.0% | |
| Interest Rate: | 4.98000% | Occupancy Date: | 5/1/2018 | |
| Note Date: | 7/10/2018 | Number of Tenants: | 12 | |
| Maturity Date: | 8/6/2028 | 2015 NOI(2): | N/A | |
| Interest-only Period: | 120 months | 2016 NOI(2): | N/A | |
| Original Term: | 120 months | 2017 NOI(2): | N/A | |
| Original Amortization: | None | TTM NOI(2): | N/A | |
| Amortization Type: | Interest Only | UW Economic Occupancy: | 97.9% | |
| Call Protection: | L(24),Def(91),O(5) | UW Revenues: | $5,430,371 | |
| Lockbox / Cash Management: | Hard / Springing | UW Expenses: | $672,311 | |
| Additional Debt: | N/A | UW NOI: | $4,758,062 | |
| Additional Debt Balance: | N/A | UW NCF: | $4,665,111 | |
| Additional Debt Type: | N/A | Appraised Value / Per SF: | $93,700,000 / $1,332 | |
| Appraisal Date: | Various | |||
| Escrows and Reserves(3) | Financial Information | |||||||
| Initial | Monthly | Initial Cap | Cut-off Date Loan / SF: | $816 | ||||
| Taxes: | $72,049 | $21,016 | N/A | Maturity Date Loan / SF: | $816 | |||
| Insurance: | $36,410 | $5,201 | N/A | Cut-off Date LTV: | 61.2% | |||
| Replacement Reserves: | $0 | $1,493 | N/A | Maturity Date LTV: | 61.2% | |||
| TI/LC: | $0 | $0 | N/A | UW NCF DSCR: | 1.61x | |||
| Immediate Repairs: | $221,115 | $0 | N/A | UW NOI Debt Yield: | 8.3% | |||
| Other(3): | $54,400 | $0 | N/A | |||||
| Sources and Uses | ||||||
| Sources | Proceeds | % of Total | Uses | Proceeds | % of Total | |
| Mortgage Loan | $57,375,000 | 100.0% | Loan Payoff | $48,098,965 | 83.8% | |
| Other Uses(4) | 4,568,035 | 8.0 | ||||
| Closing Costs | 2,632,885 | 4.6 | ||||
| Return of Equity | 1,691,140 | 2.9 | ||||
| Upfront Reserves | 383,975 | 0.7 | ||||
| Total Sources | $57,375,000 | 100.0% | Total Uses | $57,375,000 | 100.0% | |
| (1) | The borrowers are 115 Owner LLC, 1160 Owner LLC, 191 Owner LLC, 245-02 Owner LLC, 49 Owner LLC, 621 Owner LLC, 74-01 Owner LLC, 90-55 Owner LLC and 90-59 Owner LLC. |
| (2) | Historical cash flow figures were not provided by the borrower due to the significant concentration of single or major tenants on long-term leases throughout the NY & CT NNN Portfolio Properties. The average tenant has been at the NY & CT NNN Portfolio Properties for a term of 6.9 years, as of May 1, 2018. |
| (3) | For a full description of Escrows and Reserves, please refer to“Escrows and Reserves”below. The initial Other Escrows and Reserves consists of a $29,400 reserve for TD Bank’s overpayment of CAM expenses at the TD Bank - Hampton Bays property and $25,000 for an environmental reserve for the Chase - Middle Village property which is occupied by Chase. |
| (4) | Other Uses consists of various fees and penalties paid by the borrower in connection with the payoff of prior debt. The prior debt securing the NY & CT NNN Portfolio Properties was in maturity default at the time of the payoff. The prior lender had commenced a foreclosure action on the assets; however, in connection with the origination of the NY & CT NNN Portfolio Loan, the prior lender delivered cancellation of the foreclosure proceedings and they have since been extinguished. |
The Loan.The NY & CT NNN Portfolio loan (the “NY & CT NNN Portfolio Loan”) is secured by a first mortgage lien on the borrower’s fee interest in a portfolio of nine, 100% occupied retail properties located throughout the Tri-State area (the “NY & CT NNN Portfolio Properties”). The NY & CT NNN Portfolio Loan has an outstanding principal balance as of the Cut-off Date of $57.375 million, a 10-year term and regular payments of interest-only for the full term.
THE INFORMATION IN THIS STRUCTURAL AND COLLATERAL TERM SHEET IS NOT COMPLETE AND MAY BE AMENDED PRIOR TO THE TIME OF SALE. THIS TERM SHEET IS NOT AN OFFER TO SELL THESE SECURITIES AND IT IS NOT A SOLICITATION OF AN OFFER TO BUY THESE SECURITIES IN ANY JURISDICTION WHERE THE OFFER OR SALE IS NOT PERMITTED.
| | | |
30 of 130
| Structural and Collateral Term Sheet | Benchmark 2018-B5 | |
| NY & CT NNN Portfolio | ||
The Borrowers. The borrowing entities for the NY & CT NNN Portfolio Loan are 115 Owner LLC, 1160 Owner LLC, 191 Owner LLC, 245-02 Owner LLC, 49 Owner LLC, 621 Owner LLC, 74-01 Owner LLC, 90-55 Owner LLC and 90-59 Owner LLC, all Delaware limited liability companies and special purpose entities with one independent director each.
The Loan Sponsors. The loan sponsor and nonrecoursecarve-out guarantor for the NY & CT NNN Portfolio Loan is Robin Eshaghpour, of Sutphin Properties, and The Robin Eshaghpour Revocable Trust. Robin Eshaghpour is a local, commercial real estate investor and developer in the New York Tri-State area specializing in purchasing and assembling land for lease to investment grade tenants such as banks, pharmacies, fast food restaurants and automotive fuel stations. In addition to single-tenant retail properties, the Sutphin Properties portfolio consists of multifamily properties and vacant land plus a significant amount of square feet of development and air rights.
The Properties.The NY & CT NNN Portfolio Properties is a portfolio of six, single-tenant and three multi-tenant properties that are 100.0% occupied and located throughout the New York Tri-State area. The NY & CT NNN Portfolio Properties are primarily leased to investment grade tenants on an absolute triple-net basis and the sponsor has owned each of the nine properties for over 10 years (see “Tenant Summary” chart below). The NY & CT NNN Portfolio Properties include: three TD Bank branches, two Bank of America branches, two JP Morgan Chase branches, a CVS space (that is in the process of being subleased) and a Walgreens location. The remaining net rentable area, which is approximately 16.5%, is leased to various, smaller and local retailers and businesses. The NY & CT NNN Portfolio Properties are located in Queens, Long Island and Westchester, New York (80.6% of net rentable area) and Newtown, Connecticut (19.4% of net rentable area) with approximately 83.5% of the net rentable area leased to investment grade tenants and 64.3% of the net rentable area leased through 2028.
| Property | Net Area (SF) | Year Built/ Renovated | Allocated Loan Amount | % of Loan | Appraised Value | % of Aggregate | UW NCF | % of UW NCF |
| Bank of America - Queens | 10,300 | 1931 / 2007 | $11,775,000 | 20.5% | $20,800,000 | 22.2 | $949,111 | 20.4% |
| CVS - Queens | 14,966 | 2007 | 8,720,000 | 15.2 | 14,500,000 | 15.5 | 685,951 | 14.7 |
| Bank of America - Mamaroneck | 4,500 | 2010 | 6,950,000 | 12.1 | 10,700,000 | 11.4 | 563,560 | 12.1 |
| Walgreens - Newtown | 13,667 | 2011 | 6,400,000 | 11.2 | 9,900,000 | 10.6 | 525,787 | 11.3 |
| Chase - Middle Village | 4,000 | 2010 | 5,490,000 | 9.6 | 8,700,000 | 9.3 | 425,570 | 9.1 |
| Chase - Queens | 6,600 | 1931 / 2007 | 5,270,000 | 9.2 | 9,200,000 | 9.8 | 413,131 | 8.9 |
| TD Bank - St. James | 7,300 | 2008 | 4,900,000 | 8.5 | 7,600,000 | 8.1 | 446,470 | 9.6 |
| TD Bank - Westhampton | 4,900 | 2005 | 3,970,000 | 6.9 | 6,300,000 | 6.7 | 324,731 | 7.0 |
| TD Bank - Hampton Bays | 4,100 | 2009 | 3,900,000 | 6.8 | 6,000,000 | 6.4 | 330,005 | 7.1 |
| Total | 70,333 | $57,375,000 | 100.0% | $93,700,000 | 100.0% | $4,665,111 | 100.0% |
| (1) | Based on the underwritten rent roll dated May 1, 2018. |
Bank of America - Queens – The property is located at 90-57 Sutphin Boulevard in Jamaica, New York. The property is comprised of a 5,000 square foot Bank of America branch and the remaining 5,300 square feet is leased to Furniture Deals NY Corp. Bank of America has been located at the property since October 2008 with a lease that expires in October 2027 with two, five-year renewal options and no termination options. The Bank of America lease is responsible for 90% of real estate taxes, utilities, interior maintenance and snow removal. Furniture Deals NY Corp. has been located at the property since October 2015 on a lease that expires in October 2022 with one, seven-year renewal option and no termination options.
CVS - Queens – The property is located at 245-02 Merrick Boulevard in Rosedale, New York, where CVS has occupied its space as the sole tenant since June 2013 on a triple-net ground lease. CVS initially executed a 25-year ground lease that expires in January 2039. The CVS lease is a triple-net ground lease with no landlord responsibilities. The entire CVS space is in the process of being subleased however CVS is responsible for paying a fixed annual rent for its space through lease expiration with no termination options available.
Bank of America - Mamaroneck – The property is located at 1160 West Boston Post Road in Mamaroneck, New York and is leased to Bank of America as the sole tenant through April 2031. Bank of America currently has four, five-year extension options and no termination options under its lease. The Bank of America lease is a triple-net ground lease with 100.0% responsibility for real estate taxes, insurance and all CAM, including structural and non-structural repairs. The property contains approximately 16 surface parking spaces reflecting an overall parking ratio of 3.56 spaces per 1,000 square feet of net rentable area.
THE INFORMATION IN THIS STRUCTURAL AND COLLATERAL TERM SHEET IS NOT COMPLETE AND MAY BE AMENDED PRIOR TO THE TIME OF SALE. THIS TERM SHEET IS NOT AN OFFER TO SELL THESE SECURITIES AND IT IS NOT A SOLICITATION OF AN OFFER TO BUY THESE SECURITIES IN ANY JURISDICTION WHERE THE OFFER OR SALE IS NOT PERMITTED.
| | | |
31 of 130
| Structural and Collateral Term Sheet | Benchmark 2018-B5 | |
| NY & CT NNN Portfolio | ||
Walgreens - Newtown – The property is located at 47-49 South Main Street in Newtown, Connecticut and has been occupied by Walgreens, since it was constructed in 2011, on a long-term lease which expires in June 2086 with a single termination option, requiring 12-months’ advance notice, on or after June 2036. The Walgreens lease is absolute triple-net with no landlord responsibilities. The property contains approximately 56 parking spaces which equates to an overall parking ratio of 4.10 spaces per 1,000 square feet of net rentable area. Walgreens is not required to report sales for this location.
Chase - Middle Village – The property is located at 74-01 Eliot Avenue in Middle Village, New York and has been occupied by Chase as the sole tenant for over eight years with a lease expiration of October 2029. Chase currently has two, five-year renewal options and no termination options. The Chase lease is a triple-net lease with no landlord responsibilities except for insurance. The property is comprised of a teller area, customer service area, offices, vault space and drive-thru window along the south side of the property. The property contains approximately 19 surface parking spaces with an overall parking ratio of 4.75 spaces per 1,000 square feet of net rentable area.
Chase - Queens – This is a two-story property that is located at 90-59 Sutphin Boulevard in Jamaica, New York. Chase has occupied 3,600 square feet at the property since 2007 and executed two, five-year renewal options resulting in a current lease expiration date of October 2022. Chase has one, five-year renewal option and no termination options under its lease. The remaining 3,000 square foot space is occupied by Eclipse Construction Management (“Eclipse”), a new tenant which signed a five-year lease in March 2018, for the second floor space. Eclipse has five, one-year renewal options remaining on its lease with no termination options and the company uses the space as a satellite office for personnel, file storage and related uses for its construction management business.
TD Bank - St. James – The property is located at 607-611 & 621 Lake Avenue in Saint James, New York with 4,000 square feet leased to TD Bank through November 2028. TD Bank has been at the property for approximately 10 years and currently has four, five-year renewal options and no termination options. The TD Bank lease is a triple-net ground lease with no landlord responsibilities. The TD Bank building is comprised of the teller and drive-thru banking areas, employee office areas, conference room, safe deposit box and main reception area. There is also a partial second floor that includes conference rooms and employee office areas. The remaining 3,300 square feet, located in a separate retail building, is occupied by Merceps Bros under a lease that expires in February 2026. Merceps Bros operates a meat market at the property and has been in the space since March 2016 with no renewal or termination options. The property contains approximately 28 surface parking spaces reflecting an overall parking ratio of 3.80 spaces per 1,000 square feet of net rentable area. The separate retail building has an additional 16 parking spaces.
TD Bank - Westhampton – The property is located at 115 Montauk Highway in Westhampton Beach, New York and leased to TD Bank as the sole tenant on a lease that expires in February 2026. TD Bank has been located at the property for approximately 13 years and has four, five-year renewal options and no termination options. The TD Bank lease is a triple-net ground lease with no landlord responsibilities. The property consists of several bank teller booths, employee office areas, main reception, conference room area and two drive-thru bays. The property contains approximately 28 surface parking spaces, reflecting an overall parking ratio of 5.71 spaces per 1,000 square feet of net rentable area.
TD Bank - Hampton Bays – The property is located at 191 West Montauk Highway in Hampton Bays, New York and leased to TD Bank as the sole tenant on a 20-year lease that expires in April 2030 with four, five-year renewal options and no termination options. The TD Bank lease is a triple-net ground lease with no landlord responsibilities. The property consists of several bank teller booths, glass-enclosed employee office areas, main reception, safe deposit box area, employee breakroom and two drive-thru bays. The property contains approximately 20 surface parking spaces, reflecting an overall parking ratio of 4.88 spaces per 1,000 square feet of net rentable area.
The Market. The NY & CT NNN Portfolio Properties are located within the Tri-State area within eight separate submarkets detailed below.
Bank of America - Queens; Chase - Queens – Both Bank of America and Chase are located in Jamaica, Queens, New York. Jamaica is the location of several government buildings and Jamaica Station, which is a major transit hub, is located next to the property. The Queens Supreme Court, Queens County Civil Court and Queens County Family Court are all near the property. There are a total of five bank branches within the immediate area. Bank of America has 8.23% market share in the area and this branch had approximately $59.5 million of deposits on hand as of June 2017. JPMorgan Chase Bank has the third largest market share (16.6%) in the immediate area. This Chase branch had approximately $47.6 million of deposits on hand as of June 2017. According to the appraiser, the property is located in the South Queens retail market which has a total inventory of 17 million square feet with a 3.7% vacancy rate and average asking rents of $25.00 per square foot to $50.00 per square foot. The appraiser identified 13 comparable bank branches ranging in size from 2,400 to 5,731 square feet, with an average of 3,497 square feet. The comparable leases have terms ranging from 10 to 20 years with an average of 14 years. Rental rates at the comparable properties ranged from $81.00 per square foot to $330.00 per square foot, with an average of $153.51 per square foot. The appraiser also identified eight second level leases in competitive buildings located within the Jamaica neighborhood ranging in size from 400 to 5,600 square feet, with an average of 2,548 square feet. These comparable leases have terms ranging from 5 to 15 years, and exhibit rents ranging from $30.00 per square foot to $75.00 per square
THE INFORMATION IN THIS STRUCTURAL AND COLLATERAL TERM SHEET IS NOT COMPLETE AND MAY BE AMENDED PRIOR TO THE TIME OF SALE. THIS TERM SHEET IS NOT AN OFFER TO SELL THESE SECURITIES AND IT IS NOT A SOLICITATION OF AN OFFER TO BUY THESE SECURITIES IN ANY JURISDICTION WHERE THE OFFER OR SALE IS NOT PERMITTED.
| | | |
32 of 130
| Structural and Collateral Term Sheet | Benchmark 2018-B5 | |
| NY & CT NNN Portfolio | ||
foot, with an average of $43.75 per square foot. Bank of America pays $179.86 per square foot and Chase pays $88.89 per square foot.
CVS - Queens – The property is centrally located in Nassau County. Cross Island Plaza, an office building with tenants including USCIS and Verizon, is located approximately 0.3 miles from the property. Green Acres Mall, a shopping mall, is located approximately 1.2 miles from the property. The closest CVS is approximately 1.4 miles away and the closest Walgreens is approximately 1.2 miles away. The population within a one-, two-, and three-mile radius is: 42,818, 169,479 and 341,378, respectively. The average household income within a one-, two-, and three-mile radius is: $106,517, $102,118 and $102,208, respectively. The property is located in the Northeast submarket of the Queens retail market. According to a third party report the overall Northeast Queens retail market contains over 16.0 million square feet of general retail space that is not located within a shopping center or mall. The submarket exhibited a direct vacancy rate of 8.0% and a direct asking rental rate ranging from $30.00 per square foot to $60.00 per square foot. Per the appraiser, typical leases for single tenant buildings in the Queens and Brooklyn retail markets were on a net basis and rents ranged from $50.00 per square foot to $175.00 per square foot. The CVS at the property pays $48.88 per square foot.
Walgreens - Newtown – The property is located in northern Fairfield County within the greater Danbury area. Major employers in the area include Immucor, Rainbow, Sikorsky Aircraft Corp, Liberty Tax Services and Danbury Hospital. Other Walgreens locations in the area are 6.8 miles from the property in Monroe, Connecticut and 6.8 miles from the property in Danbury, Connecticut. The closest CVS is approximately 1.1 miles north of the property. The population within a one-, two- and three-mile radius is: 1,842, 16,339 and 41,426, respectively. The average household income within a one-, two- and three-mile radius is: $143,745, $150,817 and $156,952, respectively. Per the appraiser, the Newtown retail submarket includes 47 properties totaling 555,671 square feet of retail space. As of the first quarter of 2018, the submarket was experiencing an average rent of $18.66 per square foot, a vacancy rate of 5.0% and positive absorption of 40,349 square feet over the past 12 months. The appraiser identified five comparable retail stores with spaces ranging in size from 12,900 square feet to 14,748 square feet for an average of 13,885 square feet. The rental rates ranged from $30.95 per square foot to $45.50 per square foot for an average of $37.73 per square foot.
Bank of America - Mamaroneck – The property is located in the Village and Town of Mamaroneck in Westchester County, New York, directly north of New York City and 30 miles north of Manhattan. The property is located next to Mamaroneck Middle School and is down the road from Mamaroneck High School. The population within a one-, two- and three-mile radius is: 16,830, 45,786 and 96,707, respectively. The average household income within a one-, two- and three-mile radius is: $191,120, $185,325 and $167,217, respectively. Bank of America has a 7.5% market share in the area and this branch currently had approximately $89.4 million of deposits on hand as of June 2017. Per the appraiser, the Mamaroneck retail submarket is comprised of 166 retail properties totaling 945,255 square feet with a 7.5% vacancy rate and average asking rents of $33.05 per square foot. The appraiser identified four comparable bank leases located in the property’s competitive area ranging in size from 2,500 square feet to 7,935 square feet, with an average of 4,153 square feet. The terms of the comparable leases ranged from 15 to 20 years, with an average of 15 years and initial rents ranged from $70.57 per square foot to $94.48 per square foot, with an average of $79.19 per square foot. The Bank of America at the property currently pays $130.75 per square foot.
TD Bank - St. James – The property’s immediate area contains a mix of commercial properties along Lake Avenue and Route 25A. Lake Avenue is considered the main retail corridor and shopping district for St. James. The remaining area, outside the retail district, is predominantly residential with single family homes and small townhouse developments. In addition, Smith Haven Mall, a 1.4 million square foot shopping mall, is located approximately two miles south of the property. The population within a one-, three- and five-mile radius is: 7,135, 59,070 and 170,968, respectively. The average household income within a one-, three- and five-mile radius is: $148,514, $152,398 and $140,683, respectively. According to a third party report, the property is located in the Western Suffolk retail submarket which has approximately 22.46 million square feet of inventory with a 4.5% vacancy rate and average asking rents of $26.06 per square foot. There are only two bank branches within the immediate area of St. James and TD Bank has a market share of 56.8%. This TD Bank currently had approximately $76.8MM of deposits as of June 2017. The appraiser identified five leases at comparable bank spaces ranging in size from 2,500 square feet to 4,800 square feet. Rental rates range from $59.50 per square foot to $110.00 per square foot for an average of $80.25 per square foot. TD Bank, at the property, pays $91.06 per square foot.
Chase - Middle Village – The property is located in central Queens in Middle Village at the intersection of Eliot Avenue 74thStreet. The property’s immediate area primarily consists of single-family homes and apartment buildings with Eliot Avenue serving as one of the main retail corridors in the area. The average population within a one-, three- and five-mile radius is: 75,967, 464,693 and 1,031,484, respectively. The average household income within a one-, three- and five-mile radius is: $89,819; $75,284; $73,658. Chase Bank has the largest market share (25.7%) in the Middle Village area. This Chase branch had approximately $101.9 million of deposits on hand as of June 2017. According to the appraisal, the property is located in the Northeast submarket of the Queens retail market. According to a third party report, the Northeast submarket is comprised of over 16.0 million square feet of inventory with an 8.0% vacancy rate and asking rents ranging from $30.00 per square foot to $60.00 per square foot. According to the appraisal, the average bank branch asking rent for the Queens retail market ranged from $50.00 per square foot to $150.00 per square foot with a 2.0% vacancy rate. The appraiser identified thirteen leases at comparable bank branches for spaces ranging in size from 2,400 square foot to 5,731 square foot
THE INFORMATION IN THIS STRUCTURAL AND COLLATERAL TERM SHEET IS NOT COMPLETE AND MAY BE AMENDED PRIOR TO THE TIME OF SALE. THIS TERM SHEET IS NOT AN OFFER TO SELL THESE SECURITIES AND IT IS NOT A SOLICITATION OF AN OFFER TO BUY THESE SECURITIES IN ANY JURISDICTION WHERE THE OFFER OR SALE IS NOT PERMITTED.
| | | |
33 of 130
| Structural and Collateral Term Sheet | Benchmark 2018-B5 | |
| NY & CT NNN Portfolio | ||
for an average of 3,497 square feet. Rental rates ranged from $81.00 per square foot to $330.00 per square foot for a weighted average of $161.41 per square feet. The Chase at the property pays $117.63 per square feet.
TD Bank - Hampton Bays – The property’s immediate area is primarily developed with residential housing ranging from single family homes to small townhouse developments. The area along Montauk Highway is developed with commercial properties, retail strip centers and free standing retail buildings. In addition to tourism, commercial fishing is a critical component of the local economy in Hampton Bays. Hampton Bays is the second-busiest commercial fishing port in the state of New York. The population within a one-, three- and five-mile radius is: 3,646, 16,581 and 23,680, respectively. The average household income within a one-, three- and five-mile radius is: $93,801, $102,264 and $105,500, respectively. According to a third party report, the property is located within the Eastern Suffolk retail submarket which has a total inventory of approximately 13.7 million square feet with a 4.0% vacancy rate and average asking rents of $34.09 per square foot. The submarket has experienced a positive net absorption of 86,043 square feet over the last 12 months. TD Bank has an 11.5% market share in the Hampton Bays area and the TD Bank branch at the property had approximately $65.7 million of deposits on hand as of June 2017. The appraiser identified five leases at comparable retail properties for spaces ranging in size from 2,412 square feet to 4,800 square feet. Rental rates ranged from $59.50 per square foot to $110.00 per square foot for a weighted average of $80.25 per square foot. TD Bank currently pays $84.40 per square foot.
TD Bank - Westhampton – The property’s immediate area is primarily developed with residential housing ranging from single family homes to small townhouse developments. The area along Montauk Highway is developed with commercial properties, retail strip centers and free standing retail buildings. Westhampton Beach High School is located next to the property and currently has an enrollment of approximately 945 students. According to the appraisal, the population within a one-, three- and five-mile radius is: 2,524, 7,886 and 16,437, respectively. According to the appraisal, the average household income within a one-, three- and five-mile radius is $130,065, $139,788 and $126,352, respectively. According to a third party report, the property is located within the Eastern Suffolk retail submarket which has a total inventory of approximately 13.7 million square feet with a 4.0% vacancy rate and average asking rents of $34.09 per square foot. The submarket has experienced a positive net absorption of 86,043 square feet over the last 12 months. TD Bank has the largest market share in the area totaling 22.8%. The TD Bank branch at the property currently had approximately $99.3 million of deposits on hand as of June 2017. The appraiser identified leases at comparable retail properties for spaces ranging in size from 1,094 square feet to 4,000 square feet. Rental rates ranged from $59.50 per square foot to $110.00 per square foot for a weighted average of $80.25 per square foot. TD Bank currently pays $71.39 per square foot.
| Historical and Current Occupancy(1) | |||
| 2015 | 2016 | 2017 | Current(2) |
| N/A | N/A | N/A | 100.0% |
| (1) | Historical occupancy figures were not provided by the borrowers as occupancy is not tracked due to the significant concentration of single-tenants on long-term leases throughout the NY & CT NNN Portfolio Properties. The average tenant has been at the NY & CT NNN Portfolio Properties for a term of 6.9 years, as of May 1, 2018. |
| (2) | Current Occupancy is as of May 1, 2018. |
| Tenant Summary(1) | |||||||
| Tenant | Property | Ratings(2) Moody’s/S&P/ Fitch | Net Rentable Area (SF) | % of Total NRA | Base Rent PSF | % of Total Base Rent | Lease Expiration Date |
| CVS | CVS - Queens | Baa1/BBB/NA | 14,966 | 21.3% | $48.88 | 14.5% | 1/31/2039 |
| Walgreens(3) | Walgreens - Newtown | Baa2/BBB/BBB | 13,667 | 19.4% | $40.02 | 10.8% | 6/30/2086 |
| Furniture Deals NY Corp. | Bank of America - Queens | NR/NR/NR | 5,300 | 7.5% | $26.21 | 2.8% | 10/31/2022 |
| Bank of America | Bank of America - Queens | A3/A-/A+ | 5,000 | 7.1% | $179.86 | 17.8% | 10/31/2027 |
| TD Bank | TD Bank - Westhampton | Aa2/AA-/AA- | 4,900 | 7.0% | $71.39 | 6.9% | 2/28/2026 |
| Bank of America | Bank of America - Mamaroneck | A3/A-/A+ | 4,500 | 6.4% | $130.75 | 11.7% | 4/30/2031 |
| TD Bank | TD Bank - Hampton Bays | Aa2/AA-/AA- | 4,100 | 5.8% | $84.40 | 6.9% | 4/30/2030 |
| JP Morgan Chase | Chase - Middle Village | A3/A-/AA- | 4,000 | 5.7% | $117.63 | 9.3% | 10/31/2029 |
| TD Bank(4) | TD Bank - St. James | Aa2/AA-/AA- | 4,000 | 5.7% | $91.06 | 7.2% | 11/28/2028 |
| JP Morgan Chase(4) | Chase - Queens | A3/A-/AA- | 3,600 | 5.1% | $88.89 | 6.3% | 10/31/2022 |
| (1) | Based on the underwritten rent roll dated May 1, 2018. |
| (2) | Ratings provided are for the parent company of the entity listed in the “Tenant” field whether or not the parent company guarantees the lease. |
| (3) | Walgreens has the right to terminate its lease effective after June 27, 2036, or any month thereafter, upon 12 month’s prior notice. |
| (4) | TD Bank – St. James and Chase – Queens are not single tenant properties. The TD Bank – St. James property has a second tenant that represents approximately 27.5% of the underwritten revenue and the Chase – Queens property has a second tenant that represents approximately 32.3% of the underwritten revenue. |
THE INFORMATION IN THIS STRUCTURAL AND COLLATERAL TERM SHEET IS NOT COMPLETE AND MAY BE AMENDED PRIOR TO THE TIME OF SALE. THIS TERM SHEET IS NOT AN OFFER TO SELL THESE SECURITIES AND IT IS NOT A SOLICITATION OF AN OFFER TO BUY THESE SECURITIES IN ANY JURISDICTION WHERE THE OFFER OR SALE IS NOT PERMITTED.
| | | |
34 of 130
| Structural and Collateral Term Sheet | Benchmark 2018-B5 | |
| NY & CT NNN Portfolio | ||
| Lease Rollover Schedule(1)(2) | |||||||||
| Year | Number of Leases Expiring | Net Rentable Area Expiring | % of NRA Expiring | Base Rent Expiring | % of Base Rent Expiring | Cumulative Net Rentable Area Expiring | Cumulative % of NRA Expiring | Cumulative Base Rent Expiring | Cumulative % of Base Rent Expiring |
| Vacant | NAP | 0 | 0.0% | NAP | NAP | 0 | 0.0% | NAP | NAP |
| 2018 & MTM | 0 | 0 | 0.0% | $0 | 0.0% | 0 | 0.0% | $0 | 0.0% |
| 2019 | 0 | 0 | 0.0% | 0 | 0.0% | 0 | 0.0% | $0 | 0.0% |
| 2020 | 0 | 0 | 0.0% | 0 | 0.0% | 0 | 0.0% | $0 | 0.0% |
| 2021 | 0 | 0 | 0.0% | 0 | 0.0% | 0 | 0.0% | $0 | 0.0% |
| 2022 | 2 | 8,900 | 12.7% | 458,915 | 9.1% | 8,900 | 12.7% | $458,915 | 9.1% |
| 2023 | 1 | 3,000 | 4.3% | 153,000 | 3.0% | 11,900 | 16.9% | $611,915 | 12.1% |
| 2024 | 0 | 0 | 0.0% | 0 | 0.0% | 11,900 | 16.9% | $611,915 | 12.1% |
| 2025 | 0 | 0 | 0.0% | 0 | 0.0% | 11,900 | 16.9% | $611,915 | 12.1% |
| 2026 | 2 | 8,200 | 11.7% | 487,801 | 9.7% | 20,100 | 28.6% | $1,099,716 | 21.8% |
| 2027 | 1 | 5,000 | 7.1% | 899,300 | 17.8% | 25,100 | 35.7% | $1,999,016 | 39.6% |
| 2028 | 1 | 4,000 | 5.7% | 364,259 | 7.2% | 29,100 | 41.4% | $2,363,275 | 46.8% |
| 2029 & Beyond | 5 | 41,233 | 58.6% | 2,683,539 | 53.2% | 70,333 | 100.0% | $5,046,814 | 100.0% |
| Total | 12 | 70,333 | 100.0% | $5,046,814 | 100.0% | ||||
| (1) | Based on the underwritten rent roll dated May 1, 2018. |
| (2) | Certain tenants may have termination or contraction options (which may become exercisable prior to the originally stated expiration date of the tenant lease) that are not considered in the above lease rollover schedule. |
| Operating History and Underwritten Net Cash Flow(1) | |||
| Underwritten | Per Square Foot | %(2) | |
| Rents in Place | $4,707,125 | $66.93 | 84.9% |
| Contractual Rent Steps(3) | 339,689 | 4.83 | 6.1% |
| Total Reimbursements | 497,657 | 7.08 | 9.0% |
| Net Rental Income | $5,544,471 | $78.83 | 100.0% |
| (Vacancy/Credit Loss) | (114,099) | (1.62) | (2.1) |
| Effective Gross Income | $5,430,371 | $77.21 | 97.9% |
| Total Expenses | $672,311 | $9.56 | 12.4% |
| Net Operating Income | $4,758,062 | $67.65 | 87.6% |
| Total TI/LC, Capex/RR | 92,951 | 1.32 | 1.7% |
| Net Cash Flow | $4,665,111 | $66.33 | 85.9% |
| (1) | Historical cash flow figures were not provided by the borrower due to the significant concentration of single-tenants on long-term leases throughout the NY & CT NNN Portfolio Properties. The average tenant has been at the NY & CT NNN Portfolio Properties for a term of 6.9 years, as of May 1, 2018. |
| (2) | % is calculated using Net Rental Income for all revenue items and Effective Gross Income for the remaining items. |
| (3) | Contractual rent steps are underwritten to the present value of all remaining rent steps through either the earlier of (i) the end of the lease term and (ii) the end of the loan term for investment grade tenants (CVS, Walgreens, TD Bank, Bank of America and JP Morgan Chase, in the total amount $324,074). For non-investment grade tenants, rent steps were underwritten taking into account actual rent increases through various dates no later than March 1, 2019 (totaling $15,615). |
Property Management. The NY & CT NNN Portfolio Properties are all managed by Rabinian LLC, a borrower-affiliated management company.
Escrows & Reserves.At origination, the borrower deposited into escrow $221,115 for immediate repairs to be completed at the NY & CT NNN Portfolio Properties, $72,049 for real estate taxes, $36,410 for insurance, $29,400 for the TD Bank CAM reserve related to a CAM overpayment by the TD Bank at the TD Bank - Hampton Bays property and $25,000 for an environmental reserve related to the Chase - Middle Village property that is occupied by Chase, as described under“Environmental” below.
Tax Escrows- Real estate tax escrows, with respect to six tenants, are waived so long as the six tenants pay the real estate taxes applicable to their respective properties and satisfy certain waiver conditions as set forth in the NY & CT NNN Portfolio loan agreement and an event of default has not occurred under the NY & CT NNN Portfolio Loan documents. If such conditions are no longer satisfied, on each payment date, the borrowers will be required to fund a real estate tax reserve in a monthly amount equal to 1/12 of the amount
THE INFORMATION IN THIS STRUCTURAL AND COLLATERAL TERM SHEET IS NOT COMPLETE AND MAY BE AMENDED PRIOR TO THE TIME OF SALE. THIS TERM SHEET IS NOT AN OFFER TO SELL THESE SECURITIES AND IT IS NOT A SOLICITATION OF AN OFFER TO BUY THESE SECURITIES IN ANY JURISDICTION WHERE THE OFFER OR SALE IS NOT PERMITTED.
| | | |
35 of 130
| Structural and Collateral Term Sheet | Benchmark 2018-B5 | |
| NY & CT NNN Portfolio | ||
that the lender estimates will be necessary to pay real estate taxes for any calendar year, which monthly amount currently equates to $214,016.
Insurance Escrows - Insurance escrows, with respect to six tenants, are waived so long as the six tenants maintain the policies and satisfy certain waiver conditions as set forth in the NY & CT NNN Portfolio loan agreement and an event of default has not occurred under the NY & CT NNN Portfolio Loan documents. If such conditions are no longer satisfied, on each payment date, the borrower will be required to fund an insurance reserve in a monthly amount equal to 1/12 of the amount that the lender estimates will be necessary to pay insurance premiums for the renewal of coverage, which monthly amount currently equates to $5,201.
Replacement Reserves -On a monthly basis, the borrowers are required to escrow $1,493 for replacement reserves, which amount may be re-assessed by the lender from time to time, and may be increased by the lender if it reasonably determines that such an increase is warranted. Notwithstanding the foregoing, provided that no Trigger Period exists and is continuing, and certain waiver conditions as set forth in the NY & CT NNN Portfolio loan agreement have been satisfied (including that the applicable tenant(s) are obligated under their leases to pay for all replacements in respect of their related leased premises), the borrowers will not be required to deposit sums to the replacement reserve account with respect to the portion of the replacement reserve allocable to the applicable tenants under any of the Chase –Middle Village lease, the TD Bank – Westhampton lease, the TD Bank - Hampton Bays lease, the TD Bank - St. James lease, or the Walgreens – Newtown lease as to which such waiver conditions are satisfied.
Lockbox / Cash Management.The NY & CT NNN Portfolio Loan is structured with a hard lockbox and springing cash management. The borrowers were required to send tenant direction letters to all tenants upon the origination of the loan instructing them to deposit all rents and payments directly into the lockbox account controlled by the lender. Prior to the occurrence of a Trigger Period (as defined below), on each business day all funds in the lockbox account are required to be transferred to or at the direction of the borrower. Upon the occurrence and during the continuance of a Trigger Period, all funds in the lockbox account are required to be swept each business day to a segregated cash management account under the control of the lender and disbursed on each payment date during the term of the loan in accordance with the loan documents. During a Trigger Period, except as described below, all excess cash flow after payment of mortgage debt service, required reserves and operating expenses is required to be held as additional collateral for the loan.
A “Trigger Period” means a period (A) commencing upon the earliest to occur of (i) an event of default, (ii) the debt yield falling below 7.0%, or (iii) a Specified Tenant Trigger Period (as defined below), and (B) expiring upon (x) if the Trigger Period is caused solely by the event described in clause (i) above, the acceptance by the lender of a cure of such event of default, if applicable; (y) if the Trigger Period is caused solely by the event described in clause (ii) above, the debt yield being equal to or greater than 7.0% for two consecutive calendar quarters; or (z) with respect to a Trigger Period caused by the event described in clause (iii) above, the lender’s receipt of reasonably acceptable evidence demonstrating the cure of the applicable event giving rise to the Specified Tenant Trigger Period in accordance with the NY & CT NNN Portfolio Loan documents.
A “Specified Tenant Trigger Period” means a period (A) commencing upon the first to occur of (i) a Specified Tenant being in default under the applicable Specified Tenant lease beyond the expiration of any applicable notice and cure periods, (ii) a Specified Tenant failing to be in actual, physical possession of its leased space or failing to be open to the public during customary hours, (iii) a Specified Tenant giving notice that it is terminating its lease for all or any material portion of its lease, (iv) any termination or cancellation of a Specified Tenant lease (including, without limitation, rejection in any bankruptcy or similar insolvency proceeding) and (v) any bankruptcy or similar insolvency of a Specified Tenant, and (B) expiring upon the first to occur of the lender’s receipt of evidence reasonably acceptable to the lender (which such evidence includes, a duly executed estoppel certificate from the applicable Specified Tenant in form and substance acceptable to the lender) of (1) the satisfaction of the Specified Tenant Cure Conditions or (2) the borrowers leasing the entire Specified Tenant space (or applicable portion thereof) for a term of at least 5 years from the commencement of rent for such renewal term in accordance with the applicable terms and conditions set forth in the loan agreement, the applicable tenant under such lease being in actual, physical occupancy of, and open to the public for business in, the space demised under its lease and paying the full amount of the rent due under its lease.
A “Specified Tenant” means (i) any tenant with a lease that accounts for 20% or more of the total rental income for the aggregate of all of the individual NY & CT NNN Portfolio Properties, together with any parent or affiliate thereof providing credit support or a guaranty under any such lease, and (ii) any other lessee of any specified tenant space (or any portion thereof) and any guarantor of the applicable related specified tenant lease.
“Specified Tenant Cure Conditions” mean each of the following, as applicable (i) the applicable Specified Tenant has cured all defaults under the applicable Specified Tenant lease, (ii) the applicable Specified Tenant is in actual, physical, possession of the Specified Tenant space (or applicable portion thereof), open to the public for business during customary hours and not “dark” in the Specified Tenant space (or applicable portion thereof), (iii) the applicable Specified Tenant has revoked or rescinded all termination or cancellation notices with respect to the applicable Specified Tenant lease and has re-affirmed the applicable Specified Tenant lease as being in full force and effect, (iv) with respect to any applicable bankruptcy or insolvency proceedings involving the applicable Specified Tenant and/or the applicable Specified Tenant lease, the applicable Specified Tenant is no longer insolvent or subject to any
THE INFORMATION IN THIS STRUCTURAL AND COLLATERAL TERM SHEET IS NOT COMPLETE AND MAY BE AMENDED PRIOR TO THE TIME OF SALE. THIS TERM SHEET IS NOT AN OFFER TO SELL THESE SECURITIES AND IT IS NOT A SOLICITATION OF AN OFFER TO BUY THESE SECURITIES IN ANY JURISDICTION WHERE THE OFFER OR SALE IS NOT PERMITTED.
| | | |
36 of 130
| Structural and Collateral Term Sheet | Benchmark 2018-B5 | |
| NY & CT NNN Portfolio | ||
bankruptcy or insolvency proceedings and has reaffirmed the applicable Specified Tenant lease pursuant to final, non-appealable order of a court of competent jurisdiction, and (v) the applicable Specified Tenant is paying full, unabated rent under the applicable Specified Tenant lease.
Property Release. The NY & CT NNN Portfolio Loan structure permits the release of one or more of the individual NY & CT NNN Portfolio Properties, at any time after the earlier to occur of (1) the third anniversary of the origination of the NY & CT NNN Portfolio Loan and (2) the date that is 2 years following the closing date of the Benchmark 2018-B5 securitization, subject to satisfaction of the applicable conditions set forth in the loan agreement, including: (i) no event of default has occurred and is continuing under the NY & CT NNN Portfolio Loan, (ii) the borrower has delivered a REMIC opinion with respect to any applicable release in form and substance reasonably acceptable to the lender and the rating agencies and such release otherwise satisfies then applicable REMIC rules and regulations, (iii) a partial defeasance of the NY & CT NNN Portfolio Loan in an amount equal to 120% of the allocated loan amount of the related individual property, (iii) after giving effect to the release, the debt service coverage ratio with respect to the remaining properties will be greater than the greater of (A) the debt service coverage ratio of all properties immediately prior to the release and (B) 1.65x, (iv) after giving effect to the release, the debt yield with respect to the remaining properties will be greater than the greater of (A) the debt yield of all properties immediately prior to the release and (B) 8.23%, and (v) after giving effect to the release, the loan-to-value ratio with respect to the remaining properties will no greater than the lesser of (A) 61.2% or (B) the loan-to-value ratio of all properties immediately prior to the release.
Environmental.In July 2001, a spills incident was reported at the Chase – Middle Village property which is currently occupied by Chase. The spills case is recorded in the New York State Department of Environmental Conservation (NYSDEC) database. According to information provided in the regulatory database, the spills incident was related to 12 former USTs that were removed from the property in 2001. A vapor barrier and a sub slab venting system was reportedly installed during the construction of the existing building; however, the groundwater impacts remain a recognized environmental condition with further monitoring required. The environmental consultant recommended that annual groundwater monitoring should be conducted until a no further action (“NFA”) letter is achieved for an estimated cost of $25,000 which was escrowed at closing. Further, under the tenant’s lease, the landlord is required to provide environmental liability coverage until such time that NFA status is achieved. See “Description of the Mortgage Pool—Environmental Considerations” in the Preliminary Prospectus.
Certificates of Occupancy. As of the closing date, the individual properties located at 90-59 Sutphin Boulevard and 245-02 Merrick Boulevard did not have valid certificates of occupancy. Local law requires that both such individual properties have valid certificates of occupancy. At closing, the lender obtained an architect’s letter stating that most retail uses are permitted at each individual property. The related loan agreement requires that the borrowers (i) diligently and in good faith pursue a new, permanent certificate of occupancy covering both individual properties, which expressly grants legal occupancy of each subject tenant space consistent with the use and occupancy of the applicable tenant currently occupying such spaces (each, a “PCO”), (ii) diligently and in good faith pursue completion of all of the conditions required under applicable legal requirements pertaining to each applicable individual property, including, without limitation, causing any violations and any outstanding items of record with respect to the applicable individual property to be completed and/or removed of record to the extent necessary for the issuance of a PCO, and (iii) deliver to the lender copies of each PCO upon its issuance. The NY & CT NNN Portfolio Loan is also recourse for losses to the carveout guarantor with respect to the failure to have any certificates of occupancy for any tenant spaces at the NY & CT NNN Portfolio Properties (including a PCO) and/or the breach or violation of the above covenant.
THE INFORMATION IN THIS STRUCTURAL AND COLLATERAL TERM SHEET IS NOT COMPLETE AND MAY BE AMENDED PRIOR TO THE TIME OF SALE. THIS TERM SHEET IS NOT AN OFFER TO SELL THESE SECURITIES AND IT IS NOT A SOLICITATION OF AN OFFER TO BUY THESE SECURITIES IN ANY JURISDICTION WHERE THE OFFER OR SALE IS NOT PERMITTED.
| | | |
37 of 130
| Structural and Collateral Term Sheet | Benchmark 2018-B5 |
| eBay North First Commons |
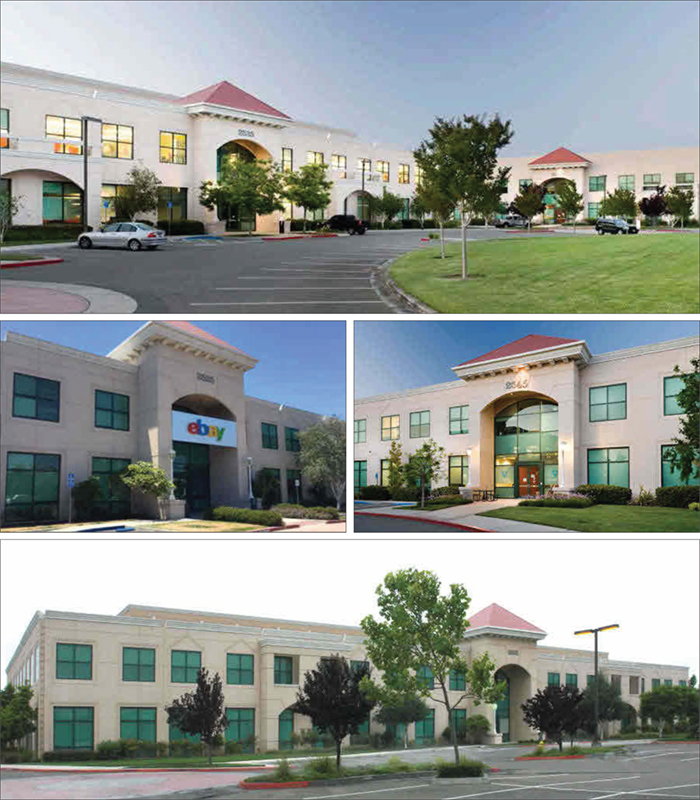
THE INFORMATION IN THIS STRUCTURAL AND COLLATERAL TERM SHEET IS NOT COMPLETE AND MAY BE AMENDED PRIOR TO THE TIME OF SALE. THIS TERM SHEET IS NOT AN OFFER TO SELL THESE SECURITIES AND IT IS NOT A SOLICITATION OF AN OFFER TO BUY THESE SECURITIES IN ANY JURISDICTION WHERE THE OFFER OR SALE IS NOT PERMITTED.
| | | |
38 of 130
| Structural and Collateral Term Sheet | Benchmark 2018-B5 |
| eBay North First Commons |
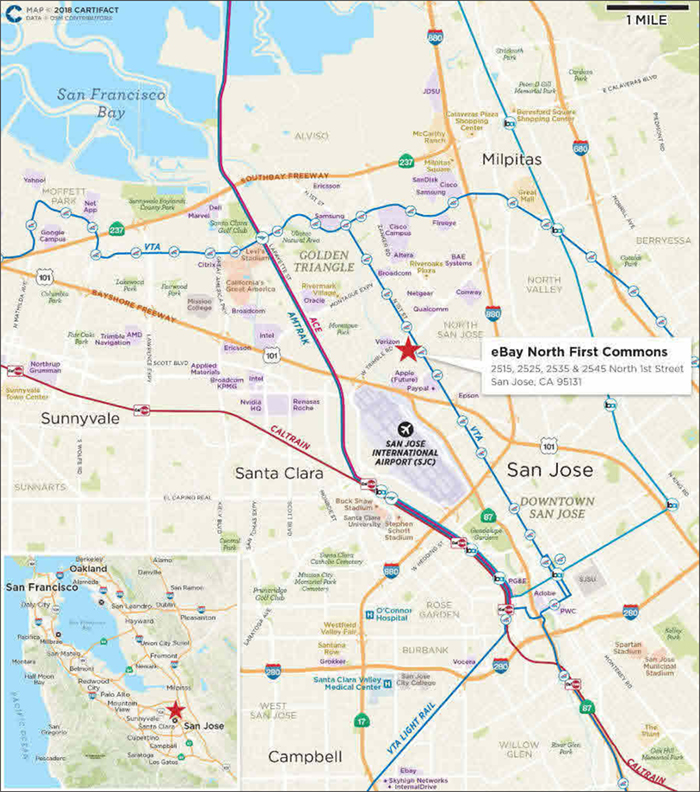
THE INFORMATION IN THIS STRUCTURAL AND COLLATERAL TERM SHEET IS NOT COMPLETE AND MAY BE AMENDED PRIOR TO THE TIME OF SALE. THIS TERM SHEET IS NOT AN OFFER TO SELL THESE SECURITIES AND IT IS NOT A SOLICITATION OF AN OFFER TO BUY THESE SECURITIES IN ANY JURISDICTION WHERE THE OFFER OR SALE IS NOT PERMITTED.
| | | |
39 of 130
| Structural and Collateral Term Sheet | Benchmark 2018-B5 |
| eBay North First Commons |
| Mortgage Loan Information | Property Information | |||
| Mortgage Loan Seller: | GACC | Single Asset / Portfolio: | Single Asset | |
| Credit Assessment | Title: | Fee | ||
| (S&P/Fitch/KBRA)(1): | [TBD] | Property Type - Subtype: | Office – Suburban | |
| Original Principal Balance(2): | $51,000,000 | Net Rentable Area (SF): | 250,056 | |
| Cut-off Date Principal Balance(2): | $51,000,000 | Location: | San Jose, CA | |
| % of Pool by IPB: | 4.9% | Year Built / Renovated: | 2001 / N/A | |
| Loan Purpose: | Acquisition | Occupancy(5): | 100.0% | |
| Borrower: | KT North First OW, LLC | Occupancy Date: | 8/6/2018 | |
| Sponsor(3): | Hana Alternative Asset | Number of Tenants: | 1 | |
| Management Co., Ltd. | 2015 NOI: | $5,621,627 | ||
| Interest Rate(4): | 2.637683824% | 2016 NOI: | $5,012,313 | |
| Note Date: | 6/7/2018 | 2017 NOI(6): | $4,227,441 | |
| Final Maturity Date: | 6/6/2023 | TTM NOI: | N/A | |
| Interest-only Period: | 60 months | UW Economic Occupancy: | 95.0% | |
| Original Term: | 60 months | UW Revenues: | $9,351,886 | |
| Original Amortization: | None | UW Expenses: | $2,294,695 | |
| Amortization Type: | Interest Only | UW NOI(6): | $7,057,191 | |
| Call Protection: | L(26),Def(30),O(4) | UW NCF: | $6,994,677 | |
| Lockbox / Cash Management: | Hard / In Place | Appraised Value / Per SF(7): | $133,800,000 / $535 | |
| Additional Debt: | Yes | Appraisal Date: | 2/1/2019 | |
| Additional Debt Balance: | $37,125,000 | |||
| Additional Debt Type: | Subordinate Debt | |||
| Escrows and Reserves(8) | Financial Information(2) | ||||||||
| Initial | Monthly | Initial Cap | A-Note | Whole Loan | |||||
| Taxes: | $0 | Springing | N/A | Cut-off Date Loan / SF: | $204 | $352 | |||
| Insurance: | $0 | Springing | N/A | Maturity Date Loan / SF: | $204 | $352 | |||
| Replacement Reserves: | $0 | Springing | N/A | Cut-off Date LTV(7): | 38.1% | 65.9% | |||
| TI/LC: | $5,325,840 | Springing | N/A | Maturity Date LTV(7): | 38.1% | 65.9% | |||
| Other: | $2,562,481 | $0 | N/A | UW NCF DSCR: | 5.13x | 2.13x | |||
| UW NOI Debt Yield: | 13.8% | 8.0% | |||||||
| Sources and Uses | ||||||||||||||||||
| Sources | Proceeds | % of Total | Uses | Proceeds | % of Total | |||||||||||||
| Mortgage Loan | $51,000,000 | 36.1% | Purchase Price | $132,500,000 | 93.7% | |||||||||||||
| Subordinate Debt | 37,125,000 | 26.3% | Upfront Reserves | 7,888,321 | 5.6% | |||||||||||||
| Principal Equity Contribution | 53,250,124 | 37.7% | Closing Costs | 986,803 | 0.7% | |||||||||||||
| Total Sources | $141,375,124 | 100.0% | Total Uses | $141,375,124 | 100.0% | |||||||||||||
| (1) | S&P, Fitch and KBRA have confirmed that the eBay North First Commons Loan has, in the context of its inclusion in the mortgage pool, credit characteristics consistent with an investment grade obligation. |
| (2) | The eBay North First Commons Loan is part of a whole loan comprised of (i) one senior note with an outstanding principal balance as of the Cut-off Date of $51.0 million and (ii) three subordinate notes with an outstanding principal balance as of the Cut-off Date of $37.125 million. The Senior Notes Financial Information presented in the chart above reflects the Cut-off Date balance of the A-Note, but excludes the related subordinate notes. The Whole Loan Financial Information presented in the chart above reflects the Cut-off Date Balance of the A-Note and subordinate note evidencing the eBay North First Commons Whole Loan. |
| (3) | There is no non-recourse carve-out guarantor or environmental indemnitor for the eBay North First Commons Whole Loan (as defined below). |
| (4) | The Interest Rate reflects the interest rate with respect to the eBay North First Commons A-Note (as defined below). The interest rate on the eBay North First Commons B-Notes (as defined below) is 5.1000%. |
| (5) | Occupancy reflects the executed eBay lease on 100.0% of the eBay North First Commons Property (as defined below). However, eBay occupies 74.9% of the total net rentable area (“NRA”) and is expected to complete build out on the remaining fourth building by September 2018 according to the borrower. |
| (6) | The UW NOI is higher than the 2017 NOI because eBay executed an 11-year lease and expanded into 62,784 square feet in March 2018. |
| (7) | The Appraised Value / Per SF reflects and the Cut-off Date LTV and Maturity Date LTV are based on, the “Prospective Market Value Upon Stabilization” that assumes that the outstanding approved tenant improvement and leasing commission obligations have been fulfilled, that there is no outstanding free rent and that rent has commenced. At origination, the borrower deposited into escrow $5,325,840 for outstanding approved leasing expenses, $1,440,997 for a free rent reserve and $1,121,484 for a stepped up rent reserve. The Cut-off Date LTV and Maturity Date LTV based on “Market Value As Is” of $122,300,000 as of February 5, 2018 for the eBay North First Commons loan is 41.7% and for the eBay North First Commons Whole Loan is 65.9%. The “Market Value as if Dark” appraised value is $87,100,000. Based on the “Market Value as if Dark” appraised value, the Cut-off Date LTV and Maturity Date LTV for the eBay North First Commons loan is 58.6% and the Cut-off Date LTV and Maturity Date LTV for the eBay North First Commons Whole Loan is 101.2%. |
| (8) | For a full description of Escrows and Reserves, please refer to “Escrows and Reserves” below. |
THE INFORMATION IN THIS STRUCTURAL AND COLLATERAL TERM SHEET IS NOT COMPLETE AND MAY BE AMENDED PRIOR TO THE TIME OF SALE. THIS TERM SHEET IS NOT AN OFFER TO SELL THESE SECURITIES AND IT IS NOT A SOLICITATION OF AN OFFER TO BUY THESE SECURITIES IN ANY JURISDICTION WHERE THE OFFER OR SALE IS NOT PERMITTED.
| | | |
40 of 130
| Structural and Collateral Term Sheet | Benchmark 2018-B5 |
| eBay North First Commons |
The Loan.The eBay North First Commons loan is secured by a first mortgage lien on the borrower’s fee interest in a 250,056 square foot office campus in San Jose, California within the Silicon Valley (the “eBay North First Commons Property”), which is 100.0% occupied by eBay through March 2029. The loan is part of a whole loan that has an outstanding principal balance as of the Cut-off Date of $88.125 million (the “eBay North First Commons Whole Loan”) and is comprised of one senior note (the “eBay North First Commons A-Note”) with an original principal balance of $51.0 million and three subordinate companion notes (the “eBay North First Commons B-Notes”) with an aggregate original principal balance of $37.125 million. The eBay North First Commons A-Note will be contributed to the Benchmark 2018-B5 Trust. The eBay North First Commons B-Notes is currently held by Athene Annuity and Life Company, Athene Annuity & Life Assurance Company and Voya Insurance and Annuity Company. The relationship between the holders of the eBay North First Commons A-Note and the eBay North First Commons B-Notes evidencing the eBay North First Commons Whole Loan is governed by a co-lender agreement as described under “Description of the Mortgage Pool—The Whole Loans—The Non-Serviced AB Whole Loans – The eBay North First Commons Whole Loan” in the Preliminary Prospectus.
| Whole Loan Summary | |||||
| Note | Original Balance | Cut-off Date Balance | Note Holder | Controlling Piece | |
| A Note | $51,000,000 | $51,000,000 | Benchmark 2018-B5 | No(1) | |
| B-1, B-2, B-3 | $37,125,000 | $37,125,000 | Athene Annuity and Life Company, Athene Annuity & Life Assurance Company and Voya Insurance and Annuity Company | Yes(2) | |
| Whole Loan Total | $88,125,000 | $88,125,000 | |||
| (1) | The eBay North First Commons Whole Loan will be serviced pursuant to the Benchmark 2018-B5 Pooling and Servicing Agreement. |
| (2) | The eBay North First Commons B-Notes are the controlling notes with respect to the eBay North First Commons Whole Loan, until the occurrence and continuance of a control appraisal period, after which the eBay North First Commons A-Note will be the controlling note. |
The Borrower.The borrowing entity for the eBay North First Commons Whole Loan is KT North First OW, LLC, a Delaware limited liability company structured to be bankruptcy remote with two independent directors.
The Loan Sponsor.The loan sponsor is Hana Alternative Asset Management Co., Ltd. There is no nonrecourse carve-out guarantor or environmental indemnitor, other than the borrower, for the eBay North First Commons Whole Loan. The loan sponsor acts as asset manager on behalf of certain Korean institutional investors and, as such, controls the borrower, but has no direct or indirect ownership interest in the borrower.
Hana Alternative Asset Management Co., Ltd., is based in Seoul, Republic of Korea, is a private subsidiary of Hana Financial Group, Inc. (“Hana”), a Korean joint stock corporation.
Originally founded as Korea Investment & Finance in 1971, Hana converted to a financial holding group in 2005 and is now one of the largest bank holding companies in Korea. Hana is publicly traded on the Korean stock exchanges (KRXL:086790). As of December 31, 2017, Hana employed over 19,194 employees and has operates across 24 countries in the Americas, Europe, Middle East and Asia-Pacific. Hana was ranked number 80 in a listing as of July 2018 of Top 1,000 World Banks 2016 ’ set forth in an industry publication.
The Property.The eBay North First Commons Property is a four-building office campus totaling 250,056 square feet that is 100.0% leased by eBay. Built in 2001, the eBay North First Commons Property is located in San Jose, California within the Silicon Valley and minutes from eBay’s global headquarters located in San Jose. eBay has occupied space at the eBay North First Commons Property since 2009, when it subleased two of the buildings on site according to the sponsor. In 2013, eBay expanded into a third building and executed a direct seven-year lease for all three buildings at the eBay North First Commons Property. In March 2018, eBay expanded again to occupy 100.0% of the eBay North First Commons Property through a newly executed 11-year lease extension through March 2029, with options to renew through March 2044.
eBay is a global commerce provider that connects millions of buyers and sellers around the world via marketplace platforms including www.ebay.com, StubHub and several classified sites around the world. eBay was founded in 1995 and is based in San Jose, California. As of December 31, 2017, eBay has approximately $26.0 billion in total assets, up from approximately $23.8 billion a year earlier. Additionally, eBay employed approximately 14,100 people globally as of December 31, 2017, with approximately 7,300 employees located in the U.S.
eBay uses the space at the eBay North First Commons Property for their payment processing group, marketing, and website infrastructure and security division. The payment processing group, which took over such functions after eBay’s split with former subsidiary PayPal, additionally handles financial transactions for foreign markets. The three buildings eBay currently occupies house approximately 980 employees. Once eBay has fully expanded into the fourth building they plan to increase total employee count to approximately 1,200 employees, according to the borrower. The expansion is also planned to add additional amenities on site including a new gym/showers, cafeteria, and lounge. eBay is responsible for completing their build out in the fourth building which it expects to be
THE INFORMATION IN THIS STRUCTURAL AND COLLATERAL TERM SHEET IS NOT COMPLETE AND MAY BE AMENDED PRIOR TO THE TIME OF SALE. THIS TERM SHEET IS NOT AN OFFER TO SELL THESE SECURITIES AND IT IS NOT A SOLICITATION OF AN OFFER TO BUY THESE SECURITIES IN ANY JURISDICTION WHERE THE OFFER OR SALE IS NOT PERMITTED.
| | | |
41 of 130
| Structural and Collateral Term Sheet | Benchmark 2018-B5 |
| eBay North First Commons |
completed by September 2018 according to the borrower. eBay has free rent on the fourth building through March 2019. In addition, eBay has three, five-year renewal options through March 2044 and one termination right effective March 31, 2026. The termination option is subject to a 12 months written notice and a termination fee equal to unamortized leasing commissions, tenant improvements, and one year of base rent.
The eBay North First Commons Property is located in San Jose, California within the northern portion of the city of San Jose, in an area known as the Golden Triangle. The Golden Triangle is bounded by US Highway 101 (1.0 mile west), State Highway 237 (3.0 miles north) and Interstate 880 (1.5 miles east) and is home to many established and start-up technology companies such as eBay and PayPal. The area is accessible via the Santa Clara Valley Transportation Authority’s light rail system (1.3 miles north) and has convenient accessibility to the San Jose International Airport (1.7 miles north).
The eBay North First Commons Property is located within the North San Jose - Brokaw Class B office submarket. According to an industry market report, the North San Jose - Brokaw Class B office submarket had approximately 2.2 million square feet across 37 buildings and had a reported vacancy rate of 8.5% and a market rent of $34.96 per square foot as of the first quarter 2018. Additionally, according to the same industry market report, the North San Jose office submarket cluster has reported new construction activity of 415,000 square feet across four buildings, which are not pre-leased according to an industry market report.
The appraisal concluded a rental rate of $28.20 per square foot for the eBay North First Commons Property after reviewing comparable lease information for seven comparable buildings, with rents ranging from $23.40 to $30.24 per square foot, with an average of $26.86 per square foot. The concluded market rent is in-line with the in-place rent of $28.20.
| Historical and Current Occupancy | |||
| 2015 | 2016 | 2017 | Current(1) |
| 100.0% | 74.9% | 74.9% | 100.0% |
| (1) | Current occupancy is as of August 6, 2018. |
| Tenant Summary(1) | ||||||
| Tenant | Ratings Moody’s/S&P/Fitch | Net Rentable Area (SF) | % of Total NRA | Base Rent PSF(2) | % of Base Rent(2) | Lease Expiration Date(3) |
| eBay | Baa1/BBB+/BBB | 250,056 | 100.0% | $28.20 | 100.0% | 3/31/2029 |
| (1) | Based on the underwritten rent roll. |
| (2) | eBay has three, five-year renewal options through March 2044 and one termination right in March 31, 2026. The termination option is subject to a 12 months written notice and a termination fee equal to unamortized leasing commissions, tenant improvements and one year of base rent. |
| Lease Rollover Schedule(1) | |||||||||
| Year | Number of Leases Expiring | Net Rentable Area Expiring | % of NRA Expiring | Base Rent Expiring(2) | % of Base Rent Expiring | Cumulative Net Rentable Area Expiring | Cumulative % of NRA Expiring | Cumulative Base Rent Expiring(2) | Cumulative % of Base Rent Expiring |
| Vacant | NAP | 0 | 0.0% | NAP | NAP | 0 | 0.0% | NAP | NAP |
| 2018 & MTM | 0 | 0 | 0.0% | $0 | 0.0%% | 0 | 0.0% | $0 | 0.0% |
| 2019 | 0 | 0 | 0.0% | 0 | 0.0%% | 0 | 0.0% | $0 | 0.0% |
| 2020 | 0 | 0 | 0.0% | 0 | 0.0%% | 0 | 0.0% | $0 | 0.0% |
| 2021 | 0 | 0 | 0.0% | 0 | 0.0%% | 0 | 0.0% | $0 | 0.0% |
| 2022 | 0 | 0 | 0.0% | 0 | 0.0%% | 0 | 0.0% | $0 | 0.0% |
| 2023 | 0 | 0 | 0.0% | 0 | 0.0%% | 0 | 0.0% | $0 | 0.0% |
| 2024 | 0 | 0 | 0.0% | 0 | 0.0%% | 0 | 0.0% | $0 | 0.0% |
| 2025 | 0 | 0 | 0.0% | 0 | 0.0%% | 0 | 0.0% | $0 | 0.0% |
| 2026 | 0 | 0 | 0.0% | 0 | 0.0%% | 0 | 0.0% | $0 | 0.0% |
| 2027 | 0 | 0 | 0.0% | 0 | 0.0%% | 0 | 0.0% | $0 | 0.0% |
| 2028 | 0 | 0 | 0.0% | 0 | 0.0%% | 0 | 0.0% | $0 | 0.0% |
| 2029 & Beyond | 1 | 250,056 | 100.0% | 7,051,579 | 100.0%% | 250,056 | 100.0% | $7,051,579 | 100.0% |
| Total | 1 | 250,056 | 100.0% | $7,051,579 | 100.0% | ||||
| (1) | Based on the underwritten rent roll. |
| (2) | eBay has a termination right on March 31, 2026. The termination option is subject to a 12 months written notice and a termination fee equal to unamortized leasing commissions, tenant improvements and one year of base rent. |
THE INFORMATION IN THIS STRUCTURAL AND COLLATERAL TERM SHEET IS NOT COMPLETE AND MAY BE AMENDED PRIOR TO THE TIME OF SALE. THIS TERM SHEET IS NOT AN OFFER TO SELL THESE SECURITIES AND IT IS NOT A SOLICITATION OF AN OFFER TO BUY THESE SECURITIES IN ANY JURISDICTION WHERE THE OFFER OR SALE IS NOT PERMITTED.
| | | |
42 of 130
| Structural and Collateral Term Sheet | Benchmark 2018-B5 |
| eBay North First Commons |
| Underwritten Net Cash Flow | ||||||
| 2015 | 2016 | 2017 | Underwritten | Per Square Foot | %(1) | |
| Rents in Place(2) | $5,671,625 | $5,178,572 | $4,556,323 | $7,549,396 | $30.19 | 76.7% |
| Vacant Income | 0 | 0 | 0 | 0 | 0.00 | 0.0 |
| Gross Potential Rent | $5,671,625 | $5,178,572 | $4,556,323 | $7,549,396 | $30.19 | 76.7% |
| Total Reimbursements | 1,053,056 | 883,197 | 769,440 | 2,294,695 | 9.18 | 23.3 |
| Net Rental Income | $6,724,681 | $6,061,769 | $5,325,763 | $9,844,091 | $39.37 | 100.0% |
| (Vacancy/Credit Loss)(3) | 0 | 0 | 0 | (492,205) | (1.97) | (5.0) |
| Effective Gross Income | $6,724,681 | $6,061,769 | $5,325,763 | $9,351,886 | $37.40 | 95.0% |
| Total Expenses(4) | $1,103,053 | $1,049,456 | $1,098,322 | $2,294,695 | $9.18 | 24.5% |
| Net Operating Income | $5,621,627 | $5,012,313 | $4,227,441 | $7,057,191 | $28.22 | 75.5% |
| Total TI/LC, Capex/RR | 0 | 0 | 0 | 62,514 | 0.25 | 0.7 |
| Net Cash Flow | $5,621,627 | $5,012,313 | $4,227,441 | $6,994,677 | $27.97 | 74.8% |
| (1) | % column represents percent of Net Rental Income for all revenue lines and represents percent of Effective Gross Income for the remainder of the fields. |
| (2) | Underwritten Rents in Place represents the average contractual rent over the eBay North First Commons Whole Loan term, comprised of the $28.20 per square foot in place rent and $1.99 per square foot in average rent credit. |
| (3) | The eBay North First Commons Property is 100.0% leased (and 74.9% physically occupied) as of August 6, 2018. However, vacancy was underwritten to 5.0%. |
| (4) | The eBay lease is absolute net and all expenses are paid directly by the tenant other than the management fee and the insurance payment reflected herein. |
Property Management.The eBay North First Commons Property is managed by OW Management Services Inc., (“Ocean West”). Based in Los Angeles, Ocean West is a full-service real estate investment, operations and management platform. Ocean West’s principals have over 100 years of combined experience in approximately $50.0 billion of real estate transactions. Ocean West, since its inception in 2009, has acquired and operated office and multifamily residential investments valued at approximately $5.0 billion, including the NASA Headquarters in Washington, DC. Furthermore, Ocean West has managed over 7.0 million square feet of commercial real estate and multifamily properties for its own account and on behalf of third party owners and loan servicers.
Escrows and Reserves. At origination, the borrower deposited into escrow $5,325,840 for outstanding approved leasing expenses, $1,440,997 for a free rent reserve and $1,121,484 for stepped up rent reserve. The stepped up rent reserve is created for the purpose of creating a reserve in order to simulate rent steps during the period prior to such step-up in rent under the eBay lease.
Tax Escrows – The borrower’s obligation to escrow an amount equal to 1/12 of projected annual property tax payments is waived so long as no Trigger Period (as defined below) has occurred and is continuing.
Insurance Escrows – The borrower’s obligation to escrow an amount equal to 1/12 of projected annual estimated insurance premiums is waived so long as an acceptable blanket policy is in effect and no Trigger Period has occurred or continuing. An acceptable blanket policy is in effect as of the closing date.
Replacement Reserves – On a monthly basis during the continuance of a Trigger Period, the borrower is required to escrow approximately $1,459 into a capital expenditure reserve.
TI/LC Reserves – On a monthly basis during the continuance of a Trigger Period, the borrower is required to escrow $31,257 into a tenant improvement and leasing commission reserve.
Lockbox / Cash Management.The eBay North First Commons Whole Loan is structured with a hard lockbox and in-place cash management. The eBay North First Commons Whole Loan documents required the borrower or the property manager to deliver tenant direction letters at origination, which directed tenants to pay rent directly to a lender-controlled lockbox account and required that all other money received by the borrower or manager with respect to the eBay North First Commons Property (other than tenant security deposits required to be held in escrow accounts) be promptly deposited within two business days into such lockbox account during the term of the eBay North First Commons Whole Loan. All amounts in the lockbox account are required to be swept to a lender-controlled cash management account on a daily basis and applied to payment of enumerated items, including debt service and operating expenses and funding of required reserves, with the remainder deposited into an excess cash flow reserve and held by the lender as additional collateral for the eBay North First Commons Whole Loan provided, however, that to the extent no Trigger Period is then ongoing, funds in the excess cash flow account will be made available to the borrower.
A “Trigger Period” occurs on the date that any of the following has occurred: (i) any event of default, (ii) the date that the debt service coverage ratio, as calculated in the loan documents at the end of each calendar quarter, falls below 1.15x and (iii) the commencement of a Lease Sweep Event.
THE INFORMATION IN THIS STRUCTURAL AND COLLATERAL TERM SHEET IS NOT COMPLETE AND MAY BE AMENDED PRIOR TO THE TIME OF SALE. THIS TERM SHEET IS NOT AN OFFER TO SELL THESE SECURITIES AND IT IS NOT A SOLICITATION OF AN OFFER TO BUY THESE SECURITIES IN ANY JURISDICTION WHERE THE OFFER OR SALE IS NOT PERMITTED.
| | | |
43 of 130
| Structural and Collateral Term Sheet | Benchmark 2018-B5 |
| eBay North First Commons |
A Trigger Period may be cured (a) with respect to clause (i) above, upon the acceptance by the lender of a cure of such event of default, (b) with respect to clause (ii) above, upon the achievement of a debt service coverage ratio of 1.20x or greater for two consecutive calendar quarters and (c) with respect to clause (iii), such Lease Sweep Event has ended.
Lease Sweep Event” commences upon the earlier of (i) the date that is 12 months prior to the expiration of a Sweep Lease (as defined below) or (ii) upon the date required under the Sweep Lease by which the Sweep Tenant (as defined) is required to give notice of its exercise of a renewal option thereunder (and such renewal has not been so exercised); (b) upon the early termination, early cancellation or early surrender of a Sweep Lease or upon borrower’s receipt of notice by a Sweep Tenant of its intent to effect an early termination, early cancellation or early surrender of its Sweep Lease (or gives notice that it intends to discontinue its business at the eBay North Commons Property); (c) if a Sweep Tenant has ceased operating its business at the eBay North First Commons Property (i.e., “goes dark”) at 50% or more of its space at the property; (d) upon a monetary or material non-monetary default under a Sweep Lease by a Sweep Tenant beyond any applicable notice and cure period or (e) upon a bankruptcy or insolvency proceeding of a Sweep Tenant or its parent.
“Sweep Lease” shall mean the lease with eBay and any replacement lease covering a majority of the space currently demised under such lease.
“Sweep Tenant” shall mean any tenant under a Sweep Lease.
THE INFORMATION IN THIS STRUCTURAL AND COLLATERAL TERM SHEET IS NOT COMPLETE AND MAY BE AMENDED PRIOR TO THE TIME OF SALE. THIS TERM SHEET IS NOT AN OFFER TO SELL THESE SECURITIES AND IT IS NOT A SOLICITATION OF AN OFFER TO BUY THESE SECURITIES IN ANY JURISDICTION WHERE THE OFFER OR SALE IS NOT PERMITTED.
| | | |
44 of 130
| Structural and Collateral Term Sheet | Benchmark 2018-B5 |
[THIS PAGE INTENTIONALLY LEFT BLANK]
THE INFORMATION IN THIS STRUCTURAL AND COLLATERAL TERM SHEET IS NOT COMPLETE AND MAY BE AMENDED PRIOR TO THE TIME OF SALE. THIS TERM SHEET IS NOT AN OFFER TO SELL THESE SECURITIES AND IT IS NOT A SOLICITATION OF AN OFFER TO BUY THESE SECURITIES IN ANY JURISDICTION WHERE THE OFFER OR SALE IS NOT PERMITTED.
| | | |
45 of 130
| Structural and Collateral Term Sheet | Benchmark 2018-B5 |
| Workspace | |
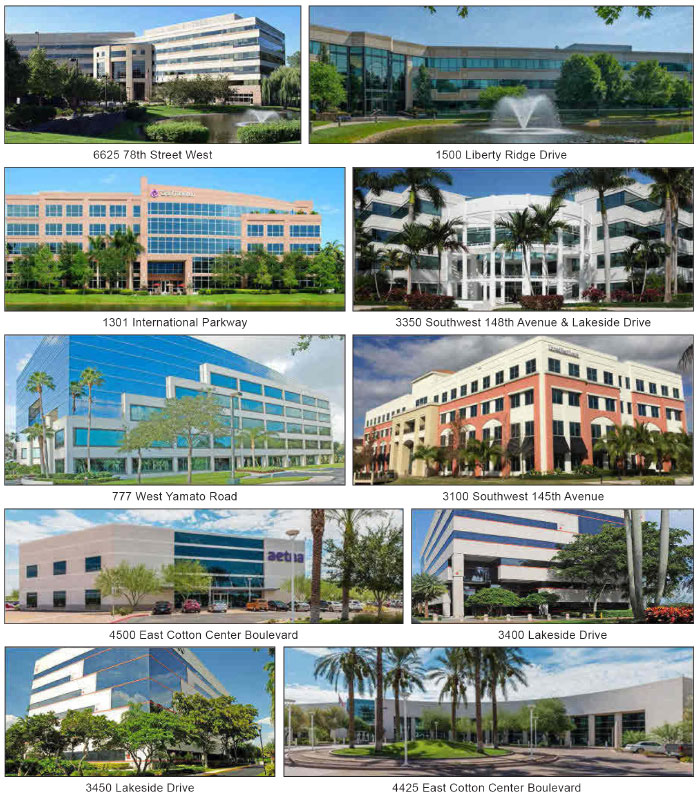
THE INFORMATION IN THIS STRUCTURAL AND COLLATERAL TERM SHEET IS NOT COMPLETE AND MAY BE AMENDED PRIOR TO THE TIME OF SALE. THIS TERM SHEET IS NOT AN OFFER TO SELL THESE SECURITIES AND IT IS NOT A SOLICITATION OF AN OFFER TO BUY THESE SECURITIES IN ANY JURISDICTION WHERE THE OFFER OR SALE IS NOT PERMITTED.
| | | |
46 of 130
| Structural and Collateral Term Sheet | Benchmark 2018-B5 |
| Workspace | |

THE INFORMATION IN THIS STRUCTURAL AND COLLATERAL TERM SHEET IS NOT COMPLETE AND MAY BE AMENDED PRIOR TO THE TIME OF SALE. THIS TERM SHEET IS NOT AN OFFER TO SELL THESE SECURITIES AND IT IS NOT A SOLICITATION OF AN OFFER TO BUY THESE SECURITIES IN ANY JURISDICTION WHERE THE OFFER OR SALE IS NOT PERMITTED.
| | | |
47 of 130
| Structural and Collateral Term Sheet | Benchmark 2018-B5 |
| Workspace | |
| Mortgage Loan Information | Property Information | |||
| Whole Loan Seller: | JPMCB | Single Asset / Portfolio: | Portfolio | |
| Credit Assessment (DBRS/Fitch/S&P)(1): | AA- / A / AA- | Title: | Various | |
| Original Principal Balance(2): | $50,000,000 | Property Type - Subtype: | Various / Various | |
| Cut-off Date Principal Balance(2): | $50,000,000 | Net Rentable Area (SF): | 9,884,763 | |
| % of Pool by IPB: | 4.8% | Location: | Various | |
| Loan Purpose: | Refinance | Year Built / Renovated: | Various / Various | |
| Borrowers(3): | Various | Occupancy: | 88.6% | |
| Sponsor(3): | Workspace Property Trust, L.P. | Occupancy Date: | 6/1/2018 | |
| Interest Rate(2): | 5.37200% | Number of Tenants: | 509 | |
| Note Date: | 6/8/2018 | 2015 NOI: | $113,129,919 | |
| Maturity Date(4): | 7/1/2023 | 2016 NOI: | $116,403,632 | |
| Interest-only Period: | 61 months | 2017 NOI: | $117,115,284 | |
| Original Term(4): | 61 months | TTM NOI(7): | $117,976,547 | |
| Original Amortization: | None | UW Economic Occupancy: | 90.4% | |
| Amortization Type: | Interest Only | UW Revenues: | $192,633,427 | |
| Call Protection(5): | Grtr1%orYM(57),O(4) | UW Expenses: | $67,314,318 | |
| Lockbox / Cash Management: | Hard / In-place | UW NOI(7): | $125,319,109 | |
| Additional Debt: | Yes | UW NCF: | $112,963,155 | |
| Additional Debt Balance: | $529,000,000 / $696,000,000 | Appraised Value / Per SF(8): | $1,634,285,000 / $165 | |
| Additional Debt Type: | Pari Passu / Subordinate Debt | Appraisal Date: | Various | |
| Escrows and Reserves(6) | Financial Information(2) | |||||||||
| Initial | Monthly | Initial Cap | Senior Fixed Rate Loan | Whole Loan | ||||||
| Taxes: | $11,849,855 | $2,040,615 | N/A | Cut-off Date Loan / SF: | $59 | $129 | ||||
| Insurance: | $350,000 | Springing | N/A | Maturity Date Loan / SF: | $59 | $129 | ||||
| Replacement Reserves: | $205,933 | $205,933 | $7,413,572 | Cut-off Date LTV: | 35.5% | 78.0% | ||||
| TI/LC: | $3,154,000 | $1,441,528 | N/A | Maturity Date LTV: | 35.5% | 78.0% | ||||
| Other: | $17,330,083 | Springing | N/A | UW NCF DSCR: | 3.60x | 1.63x | ||||
| UW NOI Debt Yield: | 21.8% | 9.3% | ||||||||
| Sources and Uses(9) | ||||||||
| Sources | Proceeds | % of Total | Uses | Proceeds | % of Total | |||
| Whole Loan(2) | $1,280,000,000 | 100.0% | Payoff Existing Debt(10) | $827,465,831 | 64.6% | |||
| Payoff KeyBank Credit Line | 227,559,344 | 17.8 | ||||||
| Redemption of Preferred Equity | 132,541,678 | 10.4 | ||||||
| Upfront Reserves | 32,889,871 | 2.6 | ||||||
| Closing Costs | 20,940,571 | 1.6 | ||||||
| IPO-Related Expenses | 19,049,085 | 1.5 | ||||||
| Deferred LP Distributions | 13,337,719 | 1.0 | ||||||
| Asset Management Fees | 5,337,711 | 0.4 | ||||||
| Return of Equity | 878,191 | 0.1 | ||||||
| Total Sources | $1,280,000,000 | 100.0% | Total Uses | $1,280,000,000 | 100.0% | |||
| (1) | DBRS, Fitch and S&P have confirmed that the Workspace Whole Loan (as defined below) has, in the context of its inclusion in the mortgage pool, credit characteristics consistent with an investment grade obligation. |
| (2) | The Workspace Mortgage Loan (as defined below) is part of the Workspace Whole Loan evidenced by 12 notes, with an aggregate outstanding principal balance as of the Cut-off Date of approximately $1.275 billion. The Workspace Whole Loan is split between (i) a 25-month floating rate componentized loan with three, one year extension options (the “Floating Rate Loan”) with an aggregate Cut-off Date principal balance of $255.0 million, and (ii) a 61-month fixed rate componentized loan (the “Fixed Rate Loan”) comprised of (A) a senior fixed rate componentized loan (the “Senior Fixed Rate Loan”), with an aggregate Cut-off Date principal balance of $463.2 million, and (B) a subordinate fixed rate componentized loan (the “Subordinate Fixed Rate Loan”), with an aggregate Cut-off Date principal balance of $556.8 million. The Senior Fixed Rate Loan is senior to the Subordinate Fixed Rate Loan. The interest rate on the Floating Rate Loan is LIBOR (subject to a floor of 0.25%) plus a spread of 3.15%. Each of the Fixed Rate Loan and Floating Rate Loan is divided into multiple components, each with different payment priorities prior to and following an event of default under the Workspace Whole Loan. See “The Loan” below. The Senior Fixed Rate Loan Financial Information presented in the chart above reflects the Senior Fixed Rate Loan and $115.8 million of the Floating Rate Loan, and excludes the remaining $139.2 million of the Floating Rate Loan and the Subordinate Fixed Rate Loan. The Whole Loan Financial Information presented in the chart above reflects the Workspace Whole Loan. For purposes of the Whole Loan Financial Information, LIBOR was assumed to be 2.09%. The Whole Loan NCF DSCR, based on a LIBOR cap of 3.00% for the Floating Rate Loan, is 1.58x. |
| (3) | For a full description of the Borrowers and Sponsor, see “The Borrowers” and “The Loan Sponsor” below. |
THE INFORMATION IN THIS STRUCTURAL AND COLLATERAL TERM SHEET IS NOT COMPLETE AND MAY BE AMENDED PRIOR TO THE TIME OF SALE. THIS TERM SHEET IS NOT AN OFFER TO SELL THESE SECURITIES AND IT IS NOT A SOLICITATION OF AN OFFER TO BUY THESE SECURITIES IN ANY JURISDICTION WHERE THE OFFER OR SALE IS NOT PERMITTED.
| | | |
48 of 130
| Structural and Collateral Term Sheet | Benchmark 2018-B5 |
| Workspace | |
| (4) | The Maturity Date and Original Term reflect the maturity date of the Fixed Rate Loan. The maturity date of the Floating Rate Loan is July 1, 2020, and the borrowers have the right to extend that maturity date for three successive one year extension terms, upon satisfaction of certain conditions. |
| (5) | Partial prepayments of the Mortgage Loan are permitted (i) in connection with a partial release, as described below under “Partial Release,” (ii) in connection with meeting certain debt yield triggers relating to the borrowers exercising the extension options with respect to the Floating Rate Loan. Prior to an event of default under the Workspace Whole Loan, all voluntary prepayments are required to be applied to repay the Floating Rate Loan in full, prior to any application to the Fixed Rate Loan. |
| (6) | For a full description of Escrows and Reserves, please refer to “Escrows and Reserves” below. |
| (7) | The increase in UW NOI from TTM NOI is primarily driven by underwriting based on the June 1 2018 in-place rent roll with rent steps underwritten to June 2019. Additionally, 10 tenants have executed leases since June 1, 2018 who have not yet taken occupancy, accounting for approximately $2.4 million in underwritten rent. |
| (8) | The appraiser also valued the Portfolio as a whole, as if sold in its entirety to a single buyer (the “Portfolio Appraised Value”). The Portfolio Appraised Value is $1.68 billion, which results in a Workspace Whole Loan Cut-off Date LTV and Maturity Date LTV of 75.9%. |
| (9) | Sources & Uses are based on the fully funded $1.28 billion Whole Loan as of the June 8, 2018 origination date and does not reflect a subsequent voluntary prepayment on July 13, 2018, resulting in a pay down of the Floating Rate Loan by $5 million from the original balance. The Financial Information is based on a current balance of $1.275 billion. |
| (10) | Existing debt was previously securitized in JPMCC 2016-WPT. |
The Loan.The Workspace loan is secured by the borrowers’ fee and leasehold interests in a portfolio of 147 properties comprising an approximately 9.9 square foot portfolio of office, flex, and retail properties located in suburban Philadelphia, southern Florida, Tampa, Minneapolis-St. Paul, and Phoenix (each a “Property” and altogether, the “Properties” or the “Portfolio”). The loan is part of a whole loan (the “Workspace Whole Loan”) evidenced by 12 notes, with an aggregate outstanding principal balance as of the Cut-off Date of approximately $1.275 billion, which are comprised of (i) a 25-month floating rate loan with three, one year extension options (the “Floating Rate Loan”) with an aggregate Cut-off Date principal balance of $255.0 million, and (ii) a 61-month fixed rate loan (the “Fixed Rate Loan”) comprised of (A) a senior fixed rate loan (the “Senior Fixed Rate Loan”), with an aggregate Cut-off Date principal balance of $463.2 million and (B) a subordinate fixed rate loan (the “Subordinate Fixed Rate Loan”), with an aggregate Cut-off Date principal balance of $556.8 million. The interest rate on the Floating Rate Loan is LIBOR (subject to a floor of 0.25%) plus a spread of 3.15%.Note A-5 and Note A-6, which are part of the Senior Fixed Rate Loan, and which have an aggregate outstanding principal balance as of the Cut-off Date of $50.0 million (the “Workspace Mortgage Loan”), are being contributed to the Benchmark 2018-B5 Trust. The Workspace Mortgage Loan will be interest-only for the entire Workspace Whole Loan term. The relationship among the lenders of the various portions of the Workspace Whole Loan will be governed by a co-lender agreement, as more fully described under “Description of the Mortgage Pool—The Whole Loans—The Non-Serviced AB Whole Loans—The Workspace Whole Loan” in the Preliminary Prospectus.
| Whole Loan Summary(1) | |||
| Fixed Rate Companion Loans | Fixed Rate | ||
| Trust Floating Rate Loan | Trust Senior Fixed Rate Notes | $120,000,000 | Benchmark 2018-B5 |
| $255,000,000 | $293,200,000 | Notes A-7, A-8 | $50,000,000 |
| Notes A1, A2(2) | Notes A-3, A-4(2) | A-9, A-10(2) | Notes A-5, A-6(2) |
| Trust Subordinate Fixed Rate Notes | |||
| $556,800,000 | |||
Notes B-1, B-2
| |||
| (1) | The Workspace Whole Loan will be serviced pursuant to the JPMCC 2018-WPT pooling and servicing agreement. |
| (2) | Each note is divided into two or more components. Each note comprising the Senior Fixed Rate Loan, including the Workspace Mortgage Loan, is divided into a senior component and a subordinate component, and forms a component pair with pari passu amounts of the Senior Fixed Rate Loan and of the Floating Rate Loan. Prior to an event of default under the Workspace Whole Loan, all payments of principal (including but not limited to any partial prepayment and the balloon payment due on the Floating Rate Loan if is not extended) are required to be applied to the Floating Rate Loan until paid in full, prior to any application to the Fixed Rate Loan. Following an event of default under the Workspace Whole Loan, collections under the Workspace Whole Loan will be applied first, pro rata, to interest and principal of (i) the senior component of the Workspace Mortgage Loan, (ii) the senior component of each of the remaining notes of the Senior Fixed Rate Loan and (iii) the corresponding senior component of the Floating Rate Loan, prior to application, pro rata, to (a) the subordinate component of the Workspace Mortgage Loan, (b) the subordinate component of each of the remaining notes of the Senior Fixed Rate Loan and the (iii) the corresponding subordinate component of the Floating Rate Loan, and losses will be applied in the reverse order among such notes. Accordingly a portion of the interest and principal of the Workspace Mortgage Loan will be subordinate to certain components of the other notes of the Senior Fixed Rate Loan and to the Floating Rate Loan, but will be pari passu to corresponding components of the Senior Fixed Rate Loan and Floating Rate Loan. See “Description of the Mortgage Pool—The Whole Loans—The Non-Serviced AB Whole Loans—The Workspace Whole Loan” in the Preliminary Prospectus. |
The Borrowers.The borrowers, WPT Land 2 LP, RV OP 2 LP, RV OP 3 Lessee LP, WPT Properties LP, and RV OP 1 LP, are each a Delaware limited partnership (the “Borrowers”), and a special purpose entity. Each of the Borrowers and its general partner has and is required to have two independent directors or managers.
THE INFORMATION IN THIS STRUCTURAL AND COLLATERAL TERM SHEET IS NOT COMPLETE AND MAY BE AMENDED PRIOR TO THE TIME OF SALE. THIS TERM SHEET IS NOT AN OFFER TO SELL THESE SECURITIES AND IT IS NOT A SOLICITATION OF AN OFFER TO BUY THESE SECURITIES IN ANY JURISDICTION WHERE THE OFFER OR SALE IS NOT PERMITTED.
| | | |
49 of 130
| Structural and Collateral Term Sheet | Benchmark 2018-B5 |
| Workspace | |
| Top-10 Property Summary | ||||||||
| Property Name | Location | Net Rentable Area (NRA) | Year Built | Occupancy % | Allocated Loan Amount | % of ALA | Appraised Value | % of Appraised Value |
| 6625 78th Street West | Bloomington, MN | 325,000 | 1997 | 94.5% | $44,385,938 | 3.5% | $56,950,000 | 3.5% |
| 1500 Liberty Ridge Drive | Tredyffrin Township, PA | 233,120 | 2003 | 92.3% | 39,953,320 | 3.1% | 51,350,000 | 3.1% |
| 3350 SW 148th Avenue & Lakeside Drive | Miramar, FL | 154,768 | 2000 | 99.6% | 34,185,938 | 2.7% | 44,000,000 | 2.7% |
| 1301 International Parkway | Sunrise, FL | 140,160 | 2006 | 100.0% | 29,982,422 | 2.4% | 38,500,000 | 2.4% |
| 777 West Yamato Road | Boca Raton, FL | 155,608 | 1989 | 84.5 | 29,593,945 | 2.3% | 38,000,000 | 2.3% |
| 4425 East Cotton Center Boulevard | Phoenix, AZ | 165,000 | 2001 | 100.0% | 27,651,563 | 2.2% | 35,500,000 | 2.2% |
| 4500 East Cotton Center Boulevard | Phoenix, AZ | 139,403 | 2013 | 100.0% | 24,922,266 | 2.0% | 32,000,000 | 2.0% |
| 3100 Southwest 145th Avenue | Miramar, FL | 104,337 | 2008 | 100.0% | 23,826,563 | 1.9% | 30,600,000 | 1.9% |
| 3400 Lakeside Drive | Miramar, FL | 120,130 | 1989 | 89.7% | 22,661,133 | 1.8% | 29,100,000 | 1.8% |
| 3450 Lakeside Drive | Miramar, FL | 119,598 | 1989 | 93.2% | 22,511,719 | 1.8% | 28,900,000 | 1.8% |
| Top-10 Total / Wtd. Average | 1,657,124 | 95.1% | $299,674,805 | 23.5% | 384,900,000 | 23.6% | ||
| Top-20 Total / Wtd. Average | 2,847,428 | 91.4% | $486,362,695 | 38.1% | 624,100,000 | 38.2% | ||
| Top-50 Total / Wtd. Average | 5,518,632 | 91.1% | $822,653,906 | 64.5% | 1,055,695,000 | 64.6% | ||
| Portfolio Total / Wtd. Average | 9,884,763 | 88.6% | $1,275,000,000 | 100.0% | $1,634,285,000 | 100.0% | ||
The Loan Sponsor.The loan sponsor and nonrecourse carveout guarantor is Workspace Property Trust, L.P., which is a privately held, vertically integrated, full service commercial real estate company specializing in the acquisition, development, management and operation of office and flex space. Workspace Property Trust, L.P. is led by Thomas A. Rizk and Roger Thomas. The company’s philosophy is to invest in suburban office and flex assets. Workspace Property Trust L.P. was founded in 2015 and currently owns and operates the Properties, which were acquired in 2015 and 2016.
Mr. Rizk has significant experience in real estate acquisition, development, management, and operation. In 1994, Mr. Rizk led the family-owned real estate partnership, Cali Associates, through its initial public offering as Cali Realty Corporation. As President and Chief Executive Officer, he also led the merger of Cali Realty Corporation into the Mack Company and Patriot American Office Group in 1997. Mr. Thomas has more than 30 years of experience in real estate. Mr. Thomas assisted Mr. Rizk in taking Cali Associates public and from 1994 until 2014 served as Executive Vice President, General Counsel and Secretary at Mack- Cali Realty Corporation, serving as a key member of the executive team.
The Properties.The Portfolio consists of approximately 9.9 million square feet of space across 87 office, 59 flex and one retail property, respectively representing approximately 72.7%, 27.2% and 0.0% of the original Allocated Whole Loan Amount (“ALA”), respectively. 65.3% of the office properties by ALA are Class A properties. The Properties are located within five broad office markets: suburban Philadelphia (40.3% of ALA), southern Florida (17.3%), Tampa (16.5%), Minneapolis-St. Paul (13.0%) and Phoenix (12.9%). The properties were built between 1972 and 2013 with the majority of the Portfolio (91.1% of the occupied NRA) under triple net leases. The Properties range in size from approximately 2,800 square feet to 325,000 square feet. As of June 1, 2018, the Portfolio was 88.6% occupied by a granular and diverse roster of more than 500 tenants with the largest tenant, United Healthcare Services, Inc., representing 4.2% of net rentable area. 11 of the top 20 tenants, which account for 17.7% of Portfolio net rentable area, have investment grade credit ratings from Moody’s or Standard & Poor’s. The top five and top ten Properties represent approximately 14.0% and 23.5% of the ALA, respectively, and the average Property accounts for 0.7% of the ALA.
6625 78thStreet West. The largest property by ALA, 6625 78th Street West is a six-story, 325,000 square foot office building located in Bloomington, Minnesota approximately 10.0 miles from the Minneapolis central business district, and represents 3.5% of the ALA. Local access is provided by East Bush Lake Road and Normandale Boulevard, and regional access to the area is provided by Interstate 494, which is located adjacent to the Property. The Property was built in 1997 and includes a cafeteria, a conference room, fitness center and a four-story parking garage. 6625 78th Street West is currently 94.5% occupied by 11 tenants at an average contractual rent of $14.16 per square foot with an average occupancy of 94.0% from 2005 to 2017. The largest tenant at the Property is Express Scripts, Inc, which occupies 130,071 square feet with its lease expiring in December 2023 accounting for 57.1% of the Property’s underwritten rent. The Property is located in the 494 Corridor submarket, which contains approximately 17.1 million square feet of office space with an overall vacancy rate of 16.2% and average asking rents of $14.66 per square foot. Per the appraisal, there is no new construction in this submarket.
1500 Liberty Ridge Drive. The second largest property by ALA, 1500 Liberty Ridge Drive, is a three-story, 233,120 square foot office building located in Tredyffrin Township, Pennsylvania approximately 23.0 miles from downtown Philadelphia. The Property is located approximately 1.5 miles south of Interstate 76 and approximately 24.0 miles northwest of Philadelphia International Airport. The Property was built in 2003 and is currently 92.3% occupied by 12 tenants at an average contractual rent of $17.75 per square foot with an average occupancy of 93.3% from 2005 to 2017. The largest tenant at the Property is ELAP Services, Inc, which occupies 39,981
THE INFORMATION IN THIS STRUCTURAL AND COLLATERAL TERM SHEET IS NOT COMPLETE AND MAY BE AMENDED PRIOR TO THE TIME OF SALE. THIS TERM SHEET IS NOT AN OFFER TO SELL THESE SECURITIES AND IT IS NOT A SOLICITATION OF AN OFFER TO BUY THESE SECURITIES IN ANY JURISDICTION WHERE THE OFFER OR SALE IS NOT PERMITTED.
| | | |
50 of 130
| Structural and Collateral Term Sheet | Benchmark 2018-B5 |
| Workspace | |
square feet with its lease expiring in September 2018 accounting for 17.7% of the Property’s underwritten rent. The Property is located in the King of Prussia/Valley Forge submarket which contains approximately 16.8 million square feet of office space with an overall vacancy rate of 12.3% and average rents of $26.85 per square foot. This is compared to a vacancy rate of 14.8% and an average rent of $26.09 per square foot on a gross basis as of the first quarter 2017. Per the appraisal, there is no new construction in this submarket.
3350 Southwest 148th Avenue & Lakeside Drive. The third largest property by ALA, 3350 Southwest 148th Avenue & Lakeside Drive, is a four-story, 154,768 square foot office building located in Miramar, Florida. The Property is located approximately 25 miles north of the Miami central business district and 25 miles southwest of the Fort Lauderdale central business district. Local access is provided by Miramar Parkway with regional access available via Interstate 75 which is less than half a mile from the Property. The Property was built in 2000 and is currently 99.6% occupied by 22 tenants, including two tenants leasing roof space and a cafe, at an average contractual rent of $19.17 per square foot on a NNN basis with an average occupancy of 88.1% from 2005 to 2017. The largest tenant at the Property is Carnival Corporation, which occupies 30,519 square feet with its lease expiring in November 2026 accounting for 19.7% of the Property’s underwritten rent. The Property is located in the Southwest Broward submarket which contains approximately 3.1 million square feet of office space with an overall vacancy rate of 6.8% and average rents of $22.26 per square foot on a NNN basis. Per the appraisal, there are four proposed or under construction office projects with a combined 184,440 square feet within the submarket.
1301 International Parkway. The fourth largest property by ALA, 1301 International Parkway, is a five-story, 140,160 square foot office building located in Sunrise, Florida approximately 13.0 miles from Fort Lauderdale and Fort Lauderdale International Airport. Local access is provided by Sunrise Boulevard and Oakland Park Boulevard to the north with regional access provided by Interstate 75 and Interstate 595 which are adjacent to the Property. The Property was built in 2006 and is currently 100.0% occupied by seven tenants, including one tenant leasing roof space, at an average contractual rent of $20.29 per square foot on a NNN basis with an average occupancy of 89.9% from 2008 to 2017. The largest tenant at the Property is Sunshine State Health Plan, Inc, which occupies 84,379 square feet with its lease expiring in November 2020 accounting for 56.4% of the Property’s underwritten rent. The Property is located in the Sawgrass submarket which contains approximately 2.5 million square feet of office space with an overall vacancy rate of 7.9% and average rents of $20.31 on a NNN basis. Per the appraisal, two large office parks are being proposed for construction, expecting to add 1,4 million square feet of office inventory to the submarket within the next five years.
777 West Yamato Road. The fifth largest property by ALA, 777 West Yamato Road, is a six-story, 155,608 square foot office building located in Boca Raton, Florida. The Property is located approximately two miles from Boca Raton Airport and approximately 23.0 miles from Palm Beach International Airport. Local access is provided by Yamato Road with regional access provided by Interstate 95 which is less than half a mile east of the Property. The Property was built in 1989 and is currently 84.5% occupied by 13 tenants, including one tenant leasing roof space, at an average contractual rent of $18.33 per square foot with an average occupancy of 92.6% from 2005 to 2017. The largest tenant at the Property is Relx, Inc, which occupies 51,404 square feet with its lease expiring in May 2024 accounting for 39.2% of the Property’s underwritten rent. The Property is located in the Boca Raton submarket which contains approximately 11.4 million square feet of office space with an overall vacancy rate of 20.2% and average rents of $20.64 per square foot on a NNN basis. Per the appraisal, new construction within the submarket is minimal with one two 11-story 111,971 square foot office tower breaking ground in Q4 2017.
THE INFORMATION IN THIS STRUCTURAL AND COLLATERAL TERM SHEET IS NOT COMPLETE AND MAY BE AMENDED PRIOR TO THE TIME OF SALE. THIS TERM SHEET IS NOT AN OFFER TO SELL THESE SECURITIES AND IT IS NOT A SOLICITATION OF AN OFFER TO BUY THESE SECURITIES IN ANY JURISDICTION WHERE THE OFFER OR SALE IS NOT PERMITTED.
| | | |
51 of 130
| Structural and Collateral Term Sheet | Benchmark 2018-B5 |
| Workspace | |
The table below displays the largest tenants for each of the Properties.
| Tenant Summary(1) | ||||||||
| Tenant | Property Name | Ratings(2) (Moody’s/S&P/Fitch) | Net Rentable Area (SF) | % of Total NRA | Base Rent PSF | % of Total Base Rent | Lease Expiration | |
| United HealthCare Services | Various | A3 / A+/ A- | 419,543 | 4.2% | $15.79 | 5.4% | 2022/2024/2025 | |
| Aetna Life Insurance | Various | Baa2 / A / A- | 323,943 | 3.3% | 15.52 | 4.1% | 2019/2020/2023 | |
| Siemens | Various | NR / A+ / A | 241,297 | 2.4% | 16.13 | 3.1% | 2020/2021 | |
| Kroll Ontrack | Various | NR / NR / NR | 195,879 | 2.0% | 12.17 | 1.9% | 2026 | |
| Dell Marketing | Various | Ba2 / NR / BB | 141,290 | 1.4% | 10.96 | 1.3% | 2024 | |
| Express Scripts | 6625 78th Street West | Baa2 / BBB+ / BBB | 130,071 | 1.3% | 15.00 | 1.6% | 2023 | |
| Reed Technology | 7 Walnut Grove Drive | Baa3 / BBB / BBB | 120,000 | 1.2% | 17.95 | 1.7% | 2025 | |
| Optum Services Inc.(3) | 4 Walnut Grove Drive | A2 / A+ / NR | 109,700 | 1.1% | 16.65 | 1.5% | 2025 | |
| GM Cruise LLC | 4410 East Cotton Center Boulevard | A3 / A- / NR | 101,269 | 1.0% | 10.82 | 0.9% | 2022 | |
| General Dynamics Information | 3020 US Highway 301 South | Ba1 / BB+ / NR | 99,039 | 1.0% | 15.45 | 1.2% | 2022 | |
| Carnival Corporation | Various | NR / NR / NR | 93,423 | 0.9% | 15.63 | 1.2% | 2026 | |
| Sunshine State Health Plan | 1301 International Parkway | A3 / A- / A- | 84,379 | 0.9% | 19.85 | 1.4% | 2020 | |
| Colorcon, Inc. | 333 Phoenixville Pike | A2 / A / A | 84,000 | 0.8% | 9.50 | 0.6% | 2024 | |
| Comcast | Various | NR / NR / NR | 82,996 | 0.8% | 14.22 | 1.0% | 2018/2019/2020 | |
| GE Parallel Design, Inc. | 4313 East Cotton Center Boulevard | Ba2 / NR / BB | 78,335 | 0.8% | 15.25 | 1.0% | 2028 | |
| Acist Medical Systems, Inc. | 7905 Fuller Road | Aaa / AAA / AAA | 74,224 | 0.8% | 11.03 | 0.7% | 2019 | |
| Boomi, Inc.(4) | 1400 Liberty Ridge Drive | NR / NR / NR | 71,788 | 0.7% | 24.70 | 1.4% | 2027 | |
| Janssen Biotech, Inc. | 155 Great Valley Parkway | NR / NR / NR | 71,200 | 0.7% | 9.40 | 0.5% | 2023 | |
| Cognizant Technology | Various | A3 / A+/ A- | 70,497 | 0.7% | 14.82 | 0.8% | 2024 | |
| CDx Holdings | 4610 South 44th Street | Baa2 / A / A- | 66,012 | 0.7% | 23.60 | 1.3% | 2020 | |
| Top 5 Total / Wtd. Average | 1,321,952 | 13.4% | $14.73 | 15.7% | ||||
| Top 10 Total / Wtd. Average | 1,882,031 | 19.0% | $14.90 | 22.6% | ||||
| Top 20 Total / Wtd. Average | 2,658,885 | 26.9% | $15.12 | 32.5% | ||||
| Portfolio Total / Wtd. Average | 8,624,672 | 87.3% | $14.36 | 100.0% | ||||
| (1) | Based on the underwritten rent roll as of June 1, 2018. Includes tenants with executed leases since June 1 that are not yet in occupancy and excludes tenants which are either dark or expected to leave upon lease expiration. |
| (2) | Certain ratings are those of the parent company whether or not the parent company guarantees the lease. |
| (3) | Optum Services is owned by United HealthCare Services, Inc. |
| (4) | Boomi, Inc. is owned by Dell, Inc. |
| Historical and Current Occupancy | |||
| 2015 | 2016 | 2017 | Current(1) |
| 89.1% | 89.3% | 89.1% | 88.6% |
| (1) | Current Occupancy is as of June 1, 2018. |
THE INFORMATION IN THIS STRUCTURAL AND COLLATERAL TERM SHEET IS NOT COMPLETE AND MAY BE AMENDED PRIOR TO THE TIME OF SALE. THIS TERM SHEET IS NOT AN OFFER TO SELL THESE SECURITIES AND IT IS NOT A SOLICITATION OF AN OFFER TO BUY THESE SECURITIES IN ANY JURISDICTION WHERE THE OFFER OR SALE IS NOT PERMITTED.
| | | |
52 of 130
| Structural and Collateral Term Sheet | Benchmark 2018-B5 |
| Workspace | |
| Lease Rollover Schedule(1)(2) | |||||||||
| Year | Number of Leases Expiring | Net Rentable Area Expiring | % of NRA Expiring | Base Rent Expiring | % of Base Rent Expiring | Cumulative Net Rentable Area Expiring | Cumulative % of NRA Expiring | Cumulative Base Rent Expiring | Cumulative % of Base Rent Expiring |
| Vacant | NAP | 1,260,091 | 12.7% | NAP | NAP | 1,260,091 | 12.7% | NAP | NAP |
| 2018 | 68 | 438,580 | 4.4% | 6,156,087 | 5.0% | 1,698,671 | 17.2% | $6,156,087 | 5.0% |
| 2019 | 104 | 1,164,018 | 11.8% | 16,245,789 | 13.1% | 2,862,689 | 29.0% | $22,401,876 | 18.1% |
| 2020 | 92 | 1,329,694 | 13.5% | 21,176,469 | 17.1% | 4,192,383 | 42.4% | $43,578,345 | 35.2% |
| 2021 | 86 | 962,460 | 9.7% | 14,200,327 | 11.5% | 5,154,843 | 52.1% | $57,778,672 | 46.7% |
| 2022 | 74 | 1,196,942 | 12.1% | 16,106,975 | 13.0% | 6,351,785 | 64.3% | $73,885,647 | 59.7% |
| 2023 | 50 | 909,812 | 9.2% | 12,885,375 | 10.4% | 7,261,597 | 73.5% | $86,771,022 | 70.1% |
| 2024 | 35 | 849,029 | 8.6% | 11,921,771 | 9.6% | 8,110,626 | 82.1% | $98,692,793 | 79.7% |
| 2025 | 35 | 624,749 | 6.3% | 9,621,713 | 7.8% | 8,735,375 | 88.4% | $108,314,50 | 87.5% |
| 2026 | 21 | 580,196 | 5.9% | 7,757,206 | 6.3% | 9,315,571 | 94.2% | $116,071,71 | 93.7% |
| 2027 | 8 | 260,767 | 2.6% | 4,263,582 | 3.4% | 9,576,338 | 96.9% | $120,335,29 | 97.2% |
| 2028 | 6 | 233,888 | 2.4% | 3,072,427 | 2.5% | 9,810,226 | 99.2% | $123,407,72 | 99.7% |
| 2029 & Beyond | 9 | 74,537 | 0.8% | 404,444 | 0.3% | 9,884,763 | 100.0% | $123,812,16 | 100.0% |
| Total | 588 | 9,884,763 | 100.0% | $123,812,164 | 100.0% | ||||
| (1) | Based on the underwritten rent roll dated June 1, 2018. Includes tenants with executed leases since June 1 that are not yet in occupancy and excludes tenants which are either dark or expected to leave upon lease expiration. |
| (2) | Certain tenants may have termination or contraction options (which may become exercisable prior to the originally stated expiration date of the tenant lease) that are not considered in the above Lease Rollover Schedule. |
| Operating History and Underwritten Net Cash Flow | ||||||||
| 2015 | 2016 | 2017 | TTM 3/31/2018 | Underwritten(2) | Per Square Foot | %(1) | ||
| Rents in Place | $111,087,339 | $115,072,969 | $115,982,258 | $117,201,735 | $123,812,164 | $12.53 | 58.0% | |
| Vacant Income | 0 | 0 | 0 | 0 | 21,891,292 | 2.21 | 10.2 | |
| Gross Potential Rent | $111,087,339 | $115,072,969 | $115,982,258 | $117,201,735 | $145,703,456 | $14.74 | 68.2% | |
| Total Reimbursements(3) | 63,113,439 | 60,935,637 | 66,666,852 | 66,698,913 | 67,906,938 | 6.87 | 31.8 | |
| Net Rental Income | $174,200,778 | $176,008,606 | $182,649,110 | $183,900,648 | $191,719,102 | $21.61 | 100.0% | |
| (Vacancy/Credit Loss) | 0 | 0 | 0 | 0 | (21,891,292) | (2.21) | (10.2) | |
| Other Income | 450,690 | 687,278 | 714,118 | 682,586 | 914,325 | 0.09 | 0.4 | |
| Effective Gross Income | $174,651,468 | $176,695,884 | $183,363,228 | $184,583,235 | $192,633,427 | $19.49 | 90.2% | |
| Total Expenses | $61,521,549 | $60,292,253 | $66,207,944 | $66,606,688 | $67,314,318 | $6.81 | 34.9% | |
| Net Operating Income | $113,129,919 | $116,403,632 | $117,155,284 | $117,976,547 | $125,319,109 | $12.68 | 65.1% | |
| Total TI/LC, Capex/RR | 0 | 0 | 0 | 0 | 12,355,954 | 1.25 | 6.4 | |
| Net Cash Flow | $113,129,919 | $116,403,632 | $117,155,284 | $117,976,547 | $112,963,155 | $11.43 | 58.6% | |
| (1) | % column represents percent of Net Rental Income for all revenue lines and represents percent of Effective Gross Income for the remainder of fields. |
| (2) | The increase in UW NOI from TTM NOI is primarily driven by underwriting based on the June 1 2018 in-place rent roll with rent steps underwritten to June 2019. Additionally, 10 tenants have executed leases since June 1, 2018 who have not yet taken occupancy, accounting for approximately $2.4 million in underwritten rent. |
| (3) | More than 90% of the in-place leases are NNN. In addition to recovering all operating expenses, leases also include a contractual tenant services fee, which is an obligation of the tenant and reimbursements can be greater than 100% of underwritten expenses as a result. |
Property Management.The Properties are managed by Workspace Property Management, L.P., a Delaware limited partnership and an affiliate of the Borrowers.
Escrows and Reserves.At origination, the Borrowers were required to deposit approximately $13.3 million for outstanding tenant improvements and leasing commissions, $11.8 million for upfront tax reserves, $3.5 million for free rent reserves and $3.2 million for initial tenant rollover reserves, $539,172 for deferred maintenance, $350,000 for insurance premiums, $37,500 for environmental reserves and $205,933 for replacement reserves.
Tax Escrows – On a monthly basis, the Borrowers are required to escrow 1/12 of the estimated annual real estate taxes into the tax reserve, which currently equates to $2,040,615.
THE INFORMATION IN THIS STRUCTURAL AND COLLATERAL TERM SHEET IS NOT COMPLETE AND MAY BE AMENDED PRIOR TO THE TIME OF SALE. THIS TERM SHEET IS NOT AN OFFER TO SELL THESE SECURITIES AND IT IS NOT A SOLICITATION OF AN OFFER TO BUY THESE SECURITIES IN ANY JURISDICTION WHERE THE OFFER OR SALE IS NOT PERMITTED.
| | | |
53 of 130
| Structural and Collateral Term Sheet | Benchmark 2018-B5 |
| Workspace | |
Insurance Escrows– On a monthly basis, the Borrowers are required to escrow 1/12 of annual insurance premiums in the insurance reserve. However, the requirement for monthly deposits is waived provided that (i) no event of default has occurred and is continuing, and (ii) the Borrowers provide the lender with reasonably satisfactory evidence (as determined by the lender) that the Property is insured in accordance with the loan documents pursuant to a blanket insurance policy reasonably acceptable to the lender and insuring substantially all of the real property owned, directly or indirectly, by the guarantor.
Replacement Reserves– On a monthly basis, the Borrowers are required to escrow an amount equal to $205,933 ($0.25 per square foot per year) for replacement reserves (the “Replacement Reserve”). In the event a property is released, the monthly deposit is required to be reduced by an amount equal to 1/12 of the product of $0.25 and the square footage of the property released. The Borrowers will not be required to make deposits into the Replacement Reserve at any time the balance in the Replacement Reserve is equal to the then current monthly deposit amount times the number of payment dates remaining until the maturity date (provided that the number of payment dates may not exceed 36 or be less than 12 under the loan documents).
Lease Rollover Reserve– On a monthly basis, the Borrowers are required to escrow approximately $1,441,528 for tenant improvements, reasonable legal fees incurred in connection with the negotiation of the leases (which is limited to $5,000 per lease in the loan documents) and leasing commission costs (the “Lease Rollover Reserve”). In the event a property is released, the monthly deposit is required to be reduced by an amount equal to 1/12 of the product of $1.75 times the square footage of the property that is released. The Borrowers will not be required to make deposits into the Lease Rollover Reserve at any time the balance in the Lease Rollover Reserve is equal to the then current monthly deposit amount times the number of payment dates remaining until the maturity date (provided that the number of payment dates may not exceed 18 or be less than 12 under the loan documents).
Environmental Reserve– At origination, the Borrowers deposited an upfront reserve equal to $37,500 (the “Environmental Reserve Funds”) in connection with additional investigation recommended by the environmental report for the Property known as 45-67 Great Valley Parkway with respect to three gas propane storage tanks located at the northwestern corner of the building. If the additional investigation determines that such tanks are underground storage tanks (“USTs”), the Borrowers are required to promptly cause such USTs to be properly closed and deliver evidence thereof reasonably satisfactory to lender. Upon the delivery of such evidence or if the additional investigation does not conclude that such tanks are USTs, provided no event of default is then continuing, the Environmental Reserve Funds are required to be promptly disbursed to the Borrowers.
Operating Expense Reserve – If, at any time that the financial reports delivered pursuant to the loan documents show that the actual aggregate expenses are more than 15% less than the budgeted expenses for the prior three month period tested on a quarterly basis (after taking into account any expense savings reasonably documented by the Borrowers), the Borrowers are required to escrow with the lender the difference between the actual and budgeted expenses during each such three month period.
Free Rent Reserve– The borrower may elect to deposit into the Free Rent Reserve an amount equal to any free rent credit due from the borrower in connection with satisfying the criteria set forth in the loan documents for any Trader Joe’s lease renewal or a Trader Joe’s replacement lease. Provided no event of default has occurred and is continuing, the lender is required to disburse such amounts to the lockbox account on a monthly basis on each payment date for each month of free rent credit deposited based on the corresponding month to which such free rent credit applies.
Lockbox / Cash Management.The Workspace Whole Loan is structured with a hard lockbox and in-place cash management. At origination, the Borrowers established a lender-controlled lockbox account. The Borrowers are required to cause all rent and other revenues from the Properties to be deposited directly into the lockbox account. All funds in the lockbox account (less the reasonable fees of the clearing bank) are required to be swept each business day into a lender-controlled cash management account.
Provided no Cash Sweep Event (as defined below) has occurred, all funds in the cash management account are required to be applied each business day to payments of taxes, insurance, debt service, reserves, and other items required pursuant to the loan documents and the remaining cash flow will be released to the Borrowers. In the event only a Cash Sweep Event described in clause (c) or (d) below has occurred, all funds in the cash management account are required to be applied by the lender each business day to payments of taxes, insurance, debt service, reserves, and other items required by the lender and all remaining cash flow will be released to the Borrowers for costs associated with new leases or amendments to leases approved by the lender in accordance with the loan documents, but only to the extent all amounts in the Lease Rollover Reserve have been disbursed, and additional cash flow will be held by the lender as additional collateral for the loan. In the event a Cash Sweep Event described in clause (a) or (b) below has occurred, cash flow may be applied in the lender’s sole discretion and may be held by the lender in its sole discretion.
A “Cash Sweep Event” means the occurrence of (a) an event of default, or (b) the bankruptcy or insolvency of the Borrowers or property manager, or (c) if the debt yield (as calculated in the loan documents) falls below 8.4% for the calendar quarter immediately preceding the date of determination, based on the trailing twelve month period, or (d) an Extension Sweep Event (as defined below).
THE INFORMATION IN THIS STRUCTURAL AND COLLATERAL TERM SHEET IS NOT COMPLETE AND MAY BE AMENDED PRIOR TO THE TIME OF SALE. THIS TERM SHEET IS NOT AN OFFER TO SELL THESE SECURITIES AND IT IS NOT A SOLICITATION OF AN OFFER TO BUY THESE SECURITIES IN ANY JURISDICTION WHERE THE OFFER OR SALE IS NOT PERMITTED.
| | | |
54 of 130
| Structural and Collateral Term Sheet | Benchmark 2018-B5 |
| Workspace | |
A “Cash Sweep Event Cure” means (A) if a Cash Sweep Event exists solely by reason of an event of default, the curing and acceptance of such cure by the lender of the applicable event of default, or (B) if a Cash Sweep Event exists solely by reason of a bankruptcy of a property manager, the replacement of such manager with a qualified manager acceptable to the lender pursuant to a management agreement acceptable to the lender within 60 days or, with respect to an involuntary petition filed against the manager for which neither the Borrowers, guarantor nor any member or affiliate of the Borrowers or guarantor solicited or caused to be solicited petitioning creditors or consented to or otherwise acquiesced in or joined in such involuntary petition and to the extent there were no adverse consequences to the loan or the property, upon the dismissal of such involuntary action within 60 days, (C) if a Cash Sweep Event exists solely by reason of a debt yield below 8.40%, the achievement of a debt yield for two consecutive quarters of at least 8.65%, based on the trailing 12 month period, or (D) if the Cash Sweep Event is caused solely by a bankruptcy or insolvency of the Borrowers based on an involuntary petition against the Borrowers with respect to which neither the Borrowers, guarantor nor any member or affiliate of the Borrowers or guarantor solicited or caused to be solicited petitioning creditors or consented to or otherwise acquiesced in or joined in such involuntary petition, upon the same being discharged, stayed or dismissed within 60 days of such filing, provided that in the lender’s sole discretion such filing does not result in any adverse consequences to the Workspace Whole Loan or the Portfolio, or (E) if the Cash Sweep Event is caused by an Extension Sweep Event, the occurrence of an Extension Sweep Cure (as defined below). In no event will the Borrowers have the right to cure a Cash Sweep Event occurring by reason of a Borrower bankruptcy except as set forth above.
An “Extension Sweep Event” means the failure of the Borrowers to satisfy the debt yield requirements in connection with an extension of the Floating Rate Loan, which are 9.00% for the second extension and 9.25% for the third extension.
An “Extension Sweep Event Cure” means (i) no event of default is continuing and (ii) the earlier to occur of (a) (1) with respect to the second extension term for the Floating Rate Loan, the date on which the debt yield is at least 9.0% and (2) with respect to the third extension term for the Floating Rate Loan, the date on which the debt yield is at least 9.25%, in each case as determined by the lender for the 12 full calendar months ending on the last day of each calendar quarter (the Borrowers are permitted to make a partial prepayment of the Workspace Whole Loan in an amount which would satisfy the foregoing debt yield requirements) and (b) the date on which the funds in the excess cash flow reserve equal at least an amount sufficient that, if applied to pay down the Workspace Whole Loan, would cause the debt yield tests to be satisfied.
Partial Releases.Provided the Borrowers have the right to prepay the Whole Loan at the time of the proposed release, a release of an individual Property only will be permitted upon prepayment by the Borrowers of 110% of the original ALA for such individual Property and in each case subject to such other terms and conditions set forth in the loan documents, including, without limitation (1) no event of default shall be continuing; (2) compliance with prepayment criteria; (3) the maintenance of a debt yield with respect to the remaining Properties following the release equal to or greater than the greater of (i) the debt yield immediately prior to the release, as tested on a trailing twelve month basis and (ii) the debt yield at closing, as increased by previously applied release premiums; (4) continued compliance with the single purpose entity requirements contained in the loan documents and delivery of new or updated non-consolidation opinions; (5) a loan to value ratio in compliance with REMIC requirements, (6) payment to the lender of the then current reasonable fee being assessed by the servicer for such releases in addition to any legal fees or other out-of-pocket costs actually incurred by the lender or the servicer to effect the release; (7) payment of all recording charges, filing fees, taxes or other expenses payable in connection therewith, and all costs and expenses (if any) of the rating agencies; and (8) such other matters typically required for transactions of this nature. In addition, the Borrowers are permitted to release an individual Property to an affiliate of the Borrowers upon the satisfaction of the following additional conditions: (a) a prepayment by the Borrowers of 115% (instead of 110%) of the original ALA for such individual Property and (b) the loan-to-value ratio of the portfolio after giving effect to the release is equal to or less than the lesser of (x) the origination date loan-to-value ratio of the Portfolio or (y) the loan-to-value ratio of the Portfolio immediately prior to giving effect to the release. In connection with the release of the Miramar parcel (as more specifically identified in the loan documents), the Borrowers are permitted to convert the related individual Property into a condominium, subject to conditions set forth in the loan documents.
With respect to the Property known as 155 Great Valley Parkway, a tenant has an option to purchase the Property at a price which is in excess of the release price of 110% of ALA. Additionally, the Borrower has the right to release certain non-income producing parcels identified in the loan documents without the payment of a release price.
THE INFORMATION IN THIS STRUCTURAL AND COLLATERAL TERM SHEET IS NOT COMPLETE AND MAY BE AMENDED PRIOR TO THE TIME OF SALE. THIS TERM SHEET IS NOT AN OFFER TO SELL THESE SECURITIES AND IT IS NOT A SOLICITATION OF AN OFFER TO BUY THESE SECURITIES IN ANY JURISDICTION WHERE THE OFFER OR SALE IS NOT PERMITTED.
| | | |
55 of 130
| Structural and Collateral Term Sheet | Benchmark 2018-B5 |
| Renaissance Tampa International Plaza Hotel |

THE INFORMATION IN THIS STRUCTURAL AND COLLATERAL TERM SHEET IS NOT COMPLETE AND MAY BE AMENDED PRIOR TO THE TIME OF SALE. THIS TERM SHEET IS NOT AN OFFER TO SELL THESE SECURITIES AND IT IS NOT A SOLICITATION OF AN OFFER TO BUY THESE SECURITIES IN ANY JURISDICTION WHERE THE OFFER OR SALE IS NOT PERMITTED.
| | | |
56 of 130
| Structural and Collateral Term Sheet | Benchmark 2018-B5 |
| Renaissance Tampa International Plaza Hotel |
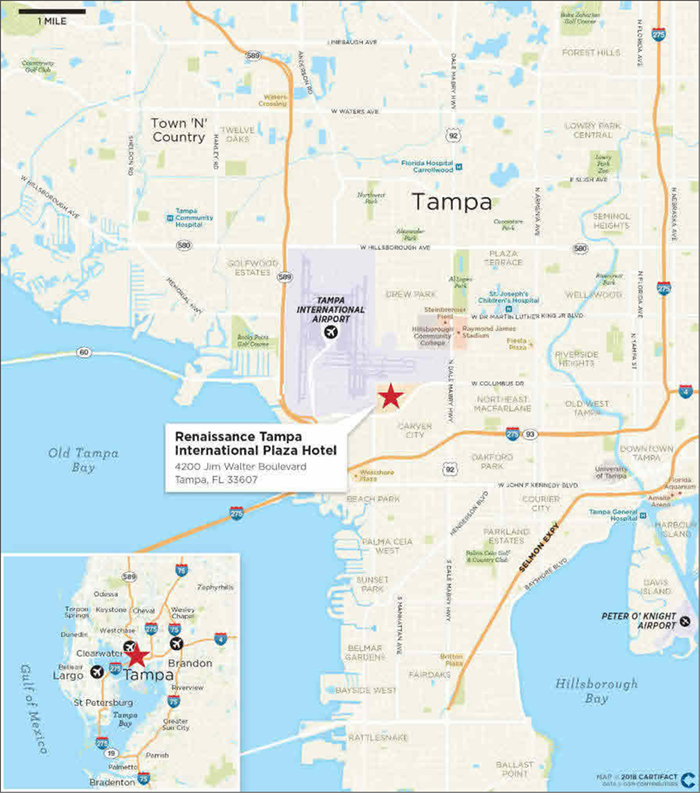
THE INFORMATION IN THIS STRUCTURAL AND COLLATERAL TERM SHEET IS NOT COMPLETE AND MAY BE AMENDED PRIOR TO THE TIME OF SALE. THIS TERM SHEET IS NOT AN OFFER TO SELL THESE SECURITIES AND IT IS NOT A SOLICITATION OF AN OFFER TO BUY THESE SECURITIES IN ANY JURISDICTION WHERE THE OFFER OR SALE IS NOT PERMITTED.
| | | |
57 of 130
| Structural and Collateral Term Sheet | Benchmark 2018-B5 |
| Renaissance Tampa International Plaza Hotel |
| Mortgage Loan Information | Property Information | |||
| Mortgage Loan Seller: | JPMCB | Single Asset / Portfolio: | Single Asset | |
| Original Principal Balance: | $44,200,000 | Title: | Leasehold | |
| Cut-off Date Principal Balance: | $44,200,000 | Property Type - Subtype: | Hotel – Full Service | |
| % of Pool by IPB: | 4.3% | Net Rentable Area (Rooms): | 293 | |
| Loan Purpose: | Acquisition | Location: | Tampa, FL | |
| Borrower: | Westshore Ren Hotel Project Owner, | Year Built / Renovated(1): | 2004 / 2016 | |
| LLC | Occupancy/ADR/RevPAR: | 82.9% / $190.51 / $158.02 | ||
| Sponsor: | Kline Hotel Holdings, LLC | Occupancy/ADR/RevPAR Date: | 3/31/2018 | |
| Interest Rate: | 4.55800% | Number of Tenants: | N/A | |
| Note Date: | 6/1/2018 | 2015 NOI(2): | $4,832,032 | |
| Maturity Date: | 6/6/2023 | 2016 NOI: | $5,785,805 | |
| Interest-only Period: | 60 months | 2017 NOI: | $6,020,922 | |
| Original Term: | 60 months | TTM NOI (as of 3/2018): | $6,063,035 | |
| Original Amortization: | None | UW Occupancy/ADR/RevPAR: | 82.9% / $190.51 / $158.02 | |
| Amortization Type: | Interest Only | UW Revenues: | $24,001,624 | |
| Call Protection: | Grtr1%orYM(26),DeforGrtr1% | UW Expenses: | $17,887,213 | |
| orYM(9),O(25) | UW NOI: | $6,124,411 | ||
| Lockbox / Cash Management: | Soft / Springing | UW NCF: | $6,124,411 | |
| Additional Debt: | N/A | Appraised Value / Per Room: | $69,200,000 / $236,177 | |
| Additional Debt Balance: | N/A | Appraisal Date: | 4/23/2018 | |
| Additional Debt Type: | N/A | |||
| Escrows and Reserves(2) | Financial Information | |||||||
| Initial | Monthly | Initial Cap | Cut-off Date Loan / Room: | $150,853 | ||||
| Taxes: | $0 | Springing | N/A | Maturity Date Loan / Room: | $150,853 | |||
| Insurance: | $0 | Springing | N/A | Cut-off Date LTV: | 63.9% | |||
| FF&E Reserves: | $0 | Springing | N/A | Maturity Date LTV: | 63.9% | |||
| Other: | $0 | Springing | N/A | UW NCF DSCR: | 3.00x | |||
| UW NOI Debt Yield: | 13.9% | |||||||
| Sources and Uses | ||||||||
| Sources | Proceeds | % of Total | Uses | Proceeds | % of Total | |
| Mortgage Loan | $44,200,000 | 63.9% | Purchase Price | $68,000,000 | 98.3% | |
| Sponsor Equity | 25,002,712 | 36.1% | Closing Costs | 1,202,712 | 1.7% | |
| Total Sources | $69,202,712 | 100.0% | Total Uses | $69,202,712 | 100.0% |
| (1) | The property underwent an approximately $4 million (approximately $13,652 per room) renovation of the guestrooms and lobby in 2015 through 2016. |
| (2) | For a full description of Escrows and Reserves, please refer to “Escrows and Reserves” below. |
The Loan.The Renaissance Tampa International Plaza Hotel loan has an outstanding principal balance as of the Cut-off Date of $44.2 million and is secured by a first mortgage lien on the borrower’s subleasehold interest in a 293-room full service hotel located in Tampa, Florida. The loan is interest-only for the entire five-year term.
The Borrower. The borrowing entity for the Renaissance Tampa International Plaza Hotel loan is Westshore Ren Hotel Project Owner, LLC, a Delaware limited liability company and special purpose entity, with one independent director in its organizational structure.
The Loan Sponsor.The loan sponsor and non-recourse carveout guarantor is Kline Hotel Holdings, LLC, an affiliate of Clearview Hotel Capital LLC (“Clearview”).
Founded in 2007 by Jon Kline, Clearview is a privately-held hotel investment and advisory company focused on acquiring and asset managing hotels headquartered in Newport Beach, California. Clearview has acquired over $1.0 billion of hotels containing over 8,500 rooms.
THE INFORMATION IN THIS STRUCTURAL AND COLLATERAL TERM SHEET IS NOT COMPLETE AND MAY BE AMENDED PRIOR TO THE TIME OF SALE. THIS TERM SHEET IS NOT AN OFFER TO SELL THESE SECURITIES AND IT IS NOT A SOLICITATION OF AN OFFER TO BUY THESE SECURITIES IN ANY JURISDICTION WHERE THE OFFER OR SALE IS NOT PERMITTED.
| | | |
58 of 130
| Structural and Collateral Term Sheet | Benchmark 2018-B5 |
| Renaissance Tampa International Plaza Hotel |
Oaktree Capital Management (“Oaktree”), also a loan sponsor, is a global alternative investment management firm. The company was formed in 1995 and currently employs over 900 individuals in 20 locations including Los Angeles, New York, London, Paris, Hong Kong and Tokyo. As of March 31, 2018, Oaktree has approximately $121 billion in assets under management for an investor base that includes pension plans, insurance companies, endowments, foundations and sovereign wealth funds. Oaktree’s clients include 75 of the 100 largest U.S. pension plans, over 400 corporations around the world, 38 of the 50 primary state retirement plans in the United States, over 350 endowments and foundations globally and over 15 sovereign wealth funds.
Clearview and Oaktree, through their respective affiliates, Westshore Hotel Grand Avenue Partners, LLC and CHC Lynch Holdings, LLC, have entered into a joint venture agreement to form Westshore Ren Hotel Project Partners, LLC, which is the sole member of the borrower.
The Property. The Renaissance Tampa International Plaza Hotel property is a full service hotel located in the Westshore District of Tampa, Florida. The Renaissance International Hotel property was built in 2004 and received an extensive renovation from May 2015 through November 2016 at a total cost of nearly $4 million (nearly $13,652 per room). The Renaissance Tampa International Plaza Hotel property features 293 guestrooms comprised of 176 king rooms, 111 queen rooms and six suites. The guestrooms feature porcelain and marble tile flooring, granite vanity countertops, floor-to-ceiling windows and modern décor. The hotel offers approximately 12,416 square feet of meeting space, two restaurants, a concierge lounge, complimentary airport shuttle, valet dry cleaning, an outdoor pool, business center, fitness center and a gift shop. The Renaissance Tampa International Plaza Hotelhas 266 surface parking spaces, which results in a parking ratio of approximately 0.9 spaces per room.
The Renaissance Tampa International Plaza Hotel property is not subject to a franchise agreement. It is operated under a management agreement (the “Renaissance Brand Management Agreement”) with Renaissance Hotel Management Company, LLC, an affiliate of Marriott International, Inc., through December 31, 2028 (including all renewal periods). The Renaissance Brand Management Agreement is subject to an automatic renewal of 5 successive periods of 10 years. The manager has a right to cancel the Renaissance Brand Management Agreement with one year’s notice.
Food and beverage outlets at the Renaissance Tampa International Plaza Hotel include Pelagia Trattoria, an Italian restaurant offering handmade pasta dishes, fresh seafood, and an outdoor patio, and Gabriella’s, a lobby bar and lounge. Meeting space at the Renaissance Tampa International Plaza Hotel is located on the first and second levels. The largest meeting room, the Costa del Sol Ballroom, is approximately 7,900 square feet and can seat approximately 500 guests banquet-style. Additionally, the Le Fuente Courtyard is an outdoor venue that can host up to 275 guests. Furthermore, the Renaissance Tampa International Plaza Hotel is also connected to International Plaza, a two-story upscale regional shopping center with over 200 stores and 29 restaurants. Anchored by Neiman Marcus, Dillard’s and Nordstrom, the shopping mall features such high-end tenants as Apple, Burberry, Coach, Gucci, Louis Vuitton, and Tiffany & Co.
The Renaissance Tampa International Plaza Hotel property is located in the Westshore District of Tampa. The Westshore District offers approximately 13.5 million square feet of office space, two major shopping malls, International Plaza and WestShore Plaza, approximately 250 restaurants and approximately 6.0 million square feet of retail development. WestShore Plaza is a super-regional mall located approximately 1.5 miles southwest of the Renaissance Tampa International Plaza Hotel property offering approximately 1.0 million square feet of space, and is anchored by Dick’s Sporting Goods, Old Navy, JCPenney, Macy’s, Sears and AMC 14 Theatres. Additionally, Raymond James Stadium, home to the NFL’s Tampa Bay Buccaneers, and Legends Field, the spring training home of the New York Yankees, are located approximately 0.5 miles northeast of the Renaissance Tampa International Plaza Hotel property. Furthermore, local demand generators include Busch Gardens, a 335-acre animal theme park located approximately 7.8 miles northwest of the Renaissance Tampa International Plaza Hotel property. In 2016, Busch Gardens park hosted 4.16 million people.
The Renaissance Tampa International Plaza Hotel property is situated northwest of the MetWest mixed-use development and major office complex in the Westshore District. MetWest includes three Class A office buildings and a retail village. The MetWest One office building is reportedly 99.4% occupied as of the appraisal report date and MetWest Two is 100.0% occupied as of the appraisal report date by Price Waterhouse Coopers. The third office building, One Metro Center is reportedly 98.7% occupied, as of the appraisal report date and is an 11-story, LEED Gold Certified Class A office building and was constructed in 1988. The retail village is roughly 75,000 square feet and includes notable tenants such as Davidoff, a premium cigar brand and steakhouse Texas de Brazil.
HARTline is Tampa’s public transportation system, and operates a free uptown/downtown connector trolley service. HARTline has approximately 40 fixed and express routes to Brandon, Town ‘n’ Country, Carrollwood, Northwest Hillsborough and Pinellas County. The Renaissance Tampa International Plaza Hotel property is located approximately 0.3 miles northeast from a HARTline stop. Additional area transportation consists of mass transit, seaports, airports, bus and rail and local interstate highways. In 2016, an approximately $222.0 million reconstruction and widening project of I-75 in the vicinity of the Renaissance Tampa International Plaza Hotel property was completed.
THE INFORMATION IN THIS STRUCTURAL AND COLLATERAL TERM SHEET IS NOT COMPLETE AND MAY BE AMENDED PRIOR TO THE TIME OF SALE. THIS TERM SHEET IS NOT AN OFFER TO SELL THESE SECURITIES AND IT IS NOT A SOLICITATION OF AN OFFER TO BUY THESE SECURITIES IN ANY JURISDICTION WHERE THE OFFER OR SALE IS NOT PERMITTED.
| | | |
59 of 130
| Structural and Collateral Term Sheet | Benchmark 2018-B5 |
| Renaissance Tampa International Plaza Hotel |
Furthermore, the Renaissance Tampa International Plaza Hotel property is located approximately 1.6 miles southeast from Tampa International Airport, which is in the midst of a multi-phase, approximately $953.0 million renovation and expansion plan. Additionally, Water Street, a new mixed-use, $3 billion, 53-acre development in Downtown Tampa approximately 4.5 miles southeast of the Renaissance Tampa International Plaza Hotel property broke ground in mid-2017 and is expected to be completed in phases through 2027. The project is expected to create approximately 2.0 million square feet of office space and approximately 1.0 million square feet of retail, cultural, education and entertainment space, and approximately 12.9 acres of park and public gathering places. The University of South Florida’s medical facility is also expected to relocate to Water Street in the fall of 2019.
The demand segmentation at the Renaissance Tampa International Plaza Hotel property consists of 30.0% meeting and group, 40.0% commercial and 30.0% leisure. The primary competitive set for the Renaissance Tampa International Plaza Hotel property consists of seven full service hotels located in Tampa’s Central Business District, ranging in size from 222 to 489 rooms, and containing an aggregate of 2,220 rooms, excluding the Renaissance Tampa International Plaza Hotel property. The appraisal indicates that a 175-room AC Hotel by Marriott opened at the MetWest office and retail park complex in January 2018 and the 180-room Autograph Collection Hotel by Marriott, which is expected to include 5,000 square feet of meeting space, will open by January 2019. Both new properties are in the Renaissance Tampa International Plaza Hotel property’s general area and are considered directly competitive by the appraisal. The Renaissance Tampa International Plaza Hotel property’s competitive set and its relative historical performance are detailed below:
| Historical Occupancy, ADR, RevPAR(1)(2) | |||||||||
| Competitive Set | Renaissance Tampa International Plaza Hotel(3) | Penetration Factor | |||||||
| Year | Occupancy | ADR | RevPAR | Occupancy | ADR | RevPAR | Occupancy | ADR | RevPAR |
| 2015 | 80.0% | $124.08 | $99.29 | 78.0% | $175.40 | $136.75 | 97.5% | 141.4% | 137.7% |
| 2016 | 78.7% | $132.20 | $104.02 | 81.2% | $188.12 | $152.79 | 103.2% | 142.3% | 146.9% |
| 2017 | 76.4% | $138.56 | $105.89 | 82.0% | $192.34 | $157.65 | 107.3% | 138.8% | 148.9% |
| TTM(4) | 76.3% | $141.24 | $107.75 | 82.9% | $190.51 | $158.02 | 108.7% | 134.9% | 146.7% |
| (1) | The minor variances between the underwriting, appraisal and above table with respect to Occupancy, ADR and RevPAR at the Renaissance Tampa International Plaza Hotel property are attributable to variances in reporting methodologies and/or timing differences. |
| (2) | Data provided by a third party travel research report. The competitive hotels in the report include the following properties: Renaissance Tampa International Plaza Hotel , DoubleTree Hotel Tampa Airport Westshore, Crowne Plaza Tampa Westshore, Four Points by Sheraton Suites Tampa Airport Westshore, Hilton Tampa Airport Westshore, Embassy Suites Tampa Airport Westshore, Grand Hyatt Tampa Bay, and Tribute Portfolio The Westshore Grand. |
| (3) | Based on operating statements provided by the borrower. |
| (4) | TTM represents the trailing 12-month period ending on March 31, 2018. |
| Competitive Hotels Profile(1) | |||||||||
| 2017 Estimated Market Mix | 2017 Estimated Operating Statistics | ||||||||
| Property | Rooms | Year Opened | Meeting Space (SF) | Commercial | Meeting and Group | Leisure | Occupancy | ADR | RevPAR |
| Renaissance Tampa International Plaza Hotel | 293 | 2004 | 12,416 | 40% | 30% | 30% | 83% | $191.08 | $157.65.x |
| Autograph Collection Epicurean Hotel | 137 | 2013 | 4,825 | 50% | 25% | 25% | 82% | $219.00 | $179.58x |
| DoubleTree Suites Tampa Bay | 203 | 1986 | 5,800 | 35% | 24% | 41% | 89% | $142.00 | $126.38x |
| Grand Hyatt Tampa Bay | 442 | 1986 | 22,000 | 50% | 30% | 20% | 75% | $179.00 | $134.25x |
| Westin Tampa Bay | 244 | 2009 | 10,100 | 40% | 20% | 40% | 72% | $172.00 | $123.84x |
| DoubleTree Hotel Tampa Airport Westshore | 489 | 1974 | 14,000 | 40% | 36% | 24% | 65% | $115.00 | $74.75x |
| Marriott Tampa Westshore | 310 | 1981 | 8,400 | 30% | 25% | 45% | 62% | $162.00 | $100.44x |
| Marriott Tampa Airport | 298 | 1982 | 21,310 | 30% | 30% | 40% | 86% | $174.00 | $149.64x |
| Hilton Tampa Airport Westshore | 238 | 1982 | 11,000 | 40% | 30% | 30% | 81% | $133.00 | $107.73x |
| Embassy Suites Tampa Airport Westshore | 243 | 1984 | 9,100 | 40% | 25% | 35% | 79% | $148.00 | $116.92x |
| Crowne Plaza Tampa Westshore | 222 | 1970 | 9,142 | 50% | 28% | 22% | 79% | $120.00 | $94.80x |
| Tribute Portfolio The Westshore Grand | 325 | 1987 | 17,000 | 50% | 25% | 25% | 81% | $130.00 | $105.30x |
| Total(2) | 3,151 | ||||||||
| (1) | Based on the appraisal. |
(2) Excludes subject property.
THE INFORMATION IN THIS STRUCTURAL AND COLLATERAL TERM SHEET IS NOT COMPLETE AND MAY BE AMENDED PRIOR TO THE TIME OF SALE. THIS TERM SHEET IS NOT AN OFFER TO SELL THESE SECURITIES AND IT IS NOT A SOLICITATION OF AN OFFER TO BUY THESE SECURITIES IN ANY JURISDICTION WHERE THE OFFER OR SALE IS NOT PERMITTED.
| | | |
60 of 130
| Structural and Collateral Term Sheet | Benchmark 2018-B5 |
| Renaissance Tampa International Plaza Hotel |
| Operating History and Underwritten Net Cash Flow | |||||||
| 2015 | 2016 | 2017 | TTM(1) | Underwritten | Per Room(2) | % of Total Revenue(3) | |
| Occupancy | 78.0% | 81.2% | 82.0% | 82.9% | 82.9% | ||
| ADR | $175.40 | $188.12 | $192.34 | $190.51 | $190.51 | ||
| RevPAR | $136.75 | $152.79 | $157.65 | $158.02 | $158.02 | ||
| Room Revenue | $14,624,842 | $16,384,854 | $16,859,536 | $16,898,960 | $16,898,960 | $57,676 | 70.4%% |
| Food & Beverage Revenue | 6,928,671 | 7,008,311 | 6,840,459 | 6,669,991 | 6,669,991 | 22,764 | 27.8%% |
| Other Departmental Revenue | 380,377 | 488,120 | 425,007 | 432,672 | 432,672 | 1,477 | 1.8%% |
| Total Revenue | $21,933,891 | $23,881,286 | $24,125,002 | $24,001,624 | $24,001,624 | $81,917 | 100.0%% |
| Room Expense | $3,243,554 | $3,252,762 | $3,165,342 | $3,152,006 | $3,152,006 | $10,758 | 18.7%% |
| Food & Beverage Expense | 4,453,995 | 4,486,143 | 4,356,640 | 4,317,908 | 4,317,908 | 14,737 | 64.7%% |
| Other Departmental Expense | 376,230 | 177,641 | 183,708 | 193,294 | 193,294 | 660 | 44.7%% |
| Departmental Expenses | $8,073,779 | $7,916,546 | $7,705,691 | $7,663,208 | $7,663,208 | $26,154 | 31.9%% |
| % | |||||||
| Departmental Profit | $13,860,112 | $15,964,739 | $16,419,312 | $16,338,416 | $16,338,416 | $55,763 | 68.1%% |
| Admin & General | $2,007,413 | $2,425,045 | $2,587,644 | $2,522,671 | $2,522,671 | $8,610 | 10.5%% |
| Maintenance & Repairs | 893,775 | 880,346 | 877,761 | 864,606 | 864,606 | 2,951 | 3.6%% |
| Utility Costs | 587,871 | 584,528 | 539,287 | 551,048 | 551,048 | 1,881 | 2.3%% |
| Marketing | 1,919,723 | 2,062,271 | 2,014,567 | 1,965,077 | 1,965,077 | 6,707 | 8.2%% |
| Management Fee | 767,686 | 835,845 | 844,375 | 840,057 | 840,057 | 2,867 | 3.5%% |
| Incentive Management fee | 0 | 334,095 | 434,859 | 452,908 | 479,212 | 1,636 | 2.0%% |
| Property Tax | 652,267 | 714,777 | 752,518 | 752,518 | 801,000 | 2,734 | 3.3%% |
| Insurance | 360,240 | 344,052 | 343,959 | 333,237 | 197,650 | 675 | 0.8%% |
| Ground Leases | 658,017 | 716,441 | 723,750 | 720,500 | 720,049 | 2,458 | 3.0%% |
| Other Expenses | 84,394 | 87,471 | 73,420 | 72,679 | 72,556 | 248 | 0.3%% |
| FF&E | 1,096,695 | 1,194,064 | 1,206,250 | 1,200,081 | 1,200,081 | 4,096 | 5.0%% |
| Total General/Unallocated Expenses | $9,028,080 | $10,178,934 | $10,398,390 | $10,275,381 | $10,214,006 | $34,860 | 42.6%% |
| Net Operating Income/NCF | $4,832,032 | $5,785,805 | $6,020,922 | $6,063,035 | $6,124,411 | $20,902 | 25.5%% |
| (1) | TTM column represents the trailing 12-month period ending on March 31, 2018. |
| (2) | Per Room values are based on 293 guest rooms. |
| (3) | % of Total Revenue for Room Expense, Food & Beverage Expense, and Other Departmental Expense are based on their corresponding revenue line items. |
Property Management. The Renaissance Tampa International Plaza Hotel property is managed by the Renaissance Hotel Management Company, LLC (the “Brand Manager”), which is an affiliate of Marriott International, Inc.
Escrows and Reserves.
Tax Escrows– The requirement for the borrower to make monthly deposits to the tax escrow is waived, provided the Renaissance Brand Manager, or a qualified replacement manager, is managing the Renaissance Tampa International Plaza Hotel property and delivers to the lender satisfactory evidence that deposits of monthly taxes required to be made into a tax and insurance escrow account maintained by Brand Manager are being made with Brand Manager and that Brand Manager is expending such funds on reserve for the payment of taxes in the amount not less than the amount required under the loan documents, or 1/12 of the estimated annual taxes (the “Required Tax Deposit”). If such conditions are no longer satisfied, the borrower will be required to deposit monthly into a tax reserve an amount equal to the difference between the amount actually deposited by the Brand Manager and the Required Tax Deposit.
THE INFORMATION IN THIS STRUCTURAL AND COLLATERAL TERM SHEET IS NOT COMPLETE AND MAY BE AMENDED PRIOR TO THE TIME OF SALE. THIS TERM SHEET IS NOT AN OFFER TO SELL THESE SECURITIES AND IT IS NOT A SOLICITATION OF AN OFFER TO BUY THESE SECURITIES IN ANY JURISDICTION WHERE THE OFFER OR SALE IS NOT PERMITTED.
| | | |
61 of 130
| Structural and Collateral Term Sheet | Benchmark 2018-B5 |
| Renaissance Tampa International Plaza Hotel |
Insurance Escrows– The requirement for the borrower to make monthly deposits to the insurance escrow is waived provided the Brand Manager, or a qualified replacement manager, is managing the Renaissance Tampa International Plaza Hotel property and delivers to the lender satisfactory evidence that deposits of monthly insurance premiums required to be made into a tax and insurance escrow account maintained by Brand Manager are being made with Brand Manager in the amount required under the loan documents (or 1/12 of the estimated annual insurance premiums) and that Brand Manager is expending such funds on reserve for the payment of the insurance premiums (the “Required Insurance Premiums Deposit”). If such conditions are no longer satisfied, the borrower will be required to deposit monthly into an insurance premiums reserve an amount equal to the difference between the amount actually deposited by the Brand Manager and the Required Insurance Premiums Deposit. In addition, the requirement for the borrower to make monthly deposits to the insurance escrow is waived provided that (i) no event of default has occurred and is continuing and (ii) the borrower provides the lender with satisfactory evidence that the property is insured pursuant to a blanket insurance policy meeting the requirements specified in the loan agreement.
FF&E Reserves– The requirement for the borrower to make monthly deposits to the FF&E reserve in the amount of the FF&E Monthly Deposit (as defined below) is waived, provided an amount equal to the FF&E Monthly Deposit is made into the Brand Manager FF&E Reserve (as defined below) by Renaissance Brand Manager pursuant to the related Brand Management Agreement. If such conditions are no longer satisfied, the borrower will be required to deposit monthly into the FF&E reserve an amount equal to the difference between the amount actually deposited by the Renaissance Brand Manager into the Brand Manager FF&E Reserve and the FF&E Monthly Deposit.
Land Sublease Reserve– The requirement for the borrower to make monthly deposits in the amount equal to 1/12 of the annual rent to the land sublease reserve is waived provided that (i) land sublease rent is being reserved by the Brand Manager or a Qualified Brand Manager (as defined below) pursuant to the related brand management agreement and that the Brand Manager or Qualified Brand Manager, as applicable, is expending such funds for land sublease rent or (ii) a Cash Sweep Period (as defined below) is not in existence and the lender receives satisfactory evidence that the land sublease rent is being paid in a timely manner.
“Qualified Brand Manager” means any of the following: (a) any hotel brand manager listed in the loan documents, or (b) in the sole judgment of the lender, a reputable and experienced brand manager possessing experience in acting as brand manager of hotel properties similar in size, scope, use and value as the property (subject to the receipt of a rating agency confirmation if required by the lender).
“FF&E Monthly Deposit” means an amount equal to the greatest of (i) 4.0% of the gross income from operations of the property for the calendar month that is two months prior to such payment date, (ii) amounts required to be deposited into the FF&E reserve required under the Brand Management Agreement (the “Brand Manager FF&E Reserve”) and (iii) if the Renaissance Tampa International Plaza Hotel property becomes subject to a hotel franchise agreement, the amount required by such hotel franchise agreement.
Lockbox / Cash Management.The loan is structured with a soft lockbox and springing cash management. The borrower is required to cause the Brand Manager to deposit all revenues, other than Petty Cash (as defined below), into the account established by the Brand Manager pursuant to the Renaissance Brand Management Agreement. The lender does not have a security interest in the account established pursuant to the Renaissance Brand Management Agreement. In the event the property is not being managed by the Brand Manager, the loan documents require that the borrower deliver (or cause any qualified hotel franchisor or Qualified Brand Manager to deliver) instruction letters to each tenant at the property and each credit card company or credit card clearing company to deliver rents, credit card receipts and other revenues directly to a lockbox account controlled by the lender. During a Cash Sweep Period, (i) all funds in the account established under the Renaissance Brand Management Agreement with the Brand Manager that constitute operating profit under the Renaissance Brand Management Agreement (which is net of taxes, insurance, operating expenses and the management fee payable to the Brand Manager) or (ii) all funds in the lockbox account (to the extent the property is no longer managed by the Brand Manager pursuant to the Renaissance Brand Management Agreement), as applicable, are required to be swept to a segregated cash management account under the control of the lender and all excess cash flow after payment of ground rent, debt service, required reserves and operating expenses is required to be held as additional collateral for the loan. The lender has been granted a first priority security interest in the cash management account.
A “Cash Sweep Period” means each period commencing on the occurrence of a Cash Sweep Event (as defined below) and continuing until the payment date next occurring following the related Cash Sweep Event Cure (as defined below).
A “Cash Sweep Event” means the occurrence of (i) an event of default (other than an event of default caused by any bankruptcy or insolvency of the borrower), (ii) any bankruptcy or insolvency action of the borrower or Brand Manager, (iii) any bankruptcy action of a qualified hotel franchisor (as defined in the loan documents), (iv) any bankruptcy action of a qualified manager (as defined in the loan documents) or (v) the date that the debt service coverage ratio (as calculated in the loan documents based on the interest only
THE INFORMATION IN THIS STRUCTURAL AND COLLATERAL TERM SHEET IS NOT COMPLETE AND MAY BE AMENDED PRIOR TO THE TIME OF SALE. THIS TERM SHEET IS NOT AN OFFER TO SELL THESE SECURITIES AND IT IS NOT A SOLICITATION OF AN OFFER TO BUY THESE SECURITIES IN ANY JURISDICTION WHERE THE OFFER OR SALE IS NOT PERMITTED.
| | | |
62 of 130
| Structural and Collateral Term Sheet | Benchmark 2018-B5 |
| Renaissance Tampa International Plaza Hotel |
payments for the loan and tested quarterly) based on the trailing 12-month period immediately preceding the date of determination falls below 1.50x (a “DSCR Trigger Event”).
A “Cash Sweep Event Cure” means (a) with respect to a DSCR Trigger Event, either (1) the achievement of a debt service coverage ratio, based on the trailing 12 month period immediately preceding the date of determination, of at least 1.50x for one quarter or (2) the borrower depositing cash or a letter of credit in an amount which, if applied to reduce the outstanding principal balance of the loan, would result in the achievement of the foregoing debt service coverage ratio requirement, (b) with respect to clause (i) above, the acceptance by the lender of a cure of such event of default (which the lender may accept or reject in its reasonable discretion, unless the lender has applied for a receiver, accelerated the debt or commenced foreclosure proceedings, in which case the lender may accept or reject in its sole and absolute discretion), (c) with respect to clause (ii) (solely with respect to the Brand Manager) or clause (iii) above, the borrower replacing the Brand Manager or qualified hotel franchisor with a qualified hotel manager or qualified hotel franchisor under a replacement management or franchise agreement, as applicable, (d) with respect to clause (iv) above solely with respect to the qualified manager, the borrower replacing such qualified manager with another qualified manager under a replacement management agreement, and (e) with respect to clause (ii) solely with respect to an involuntary bankruptcy petition against the borrower for which none of the borrower, guarantor, or any controlled affiliate (as defined in the loan documents) solicited petitioning creditors to file such involuntary petition or consented to or otherwise acquiesced in or joined in such involuntary petition, provided that such petition is discharged, stayed or dismissed within 90 days of such filing and such filing does not result in any material adverse consequences to the loan or the property (subject to, with respect to acquiescence, there being a good faith basis to contest such filing and that truthful compelled testimony in such proceedings shall not be considered acquiescence).
“Petty Cash” means an amount in cash or in an operating account for the property held by the borrower not to exceed, in the aggregate, $40,000.
Ground Lease. The Renaissance Tampa International Plaza Hotel loan is secured by ground subleasehold under a ground sublease between CNL Tampa International Hotel Partnership, KP, an affiliate of the borrower, and Tampa Westshore Associates Limited Partnership, relating to a ground lease agreement with Hillsborough County Aviation Authority. The sublease, dated April 9, 2003, expires on December 30, 2080. The ground rent on the sublease, as to which the rent commencement date was August 11, 2004, is equal to the following: (i) annual minimum rent for lease years 11 through 15 (August 11, 2014, through August 10, 2019), is $350,000per annum, and (ii) the annual minimum rent for lease years thereafter through expiration is equal to the average of the sum of (A) annual minimum rent plus (B) annual percentage rent (as described below) for the prior three years in accordance with the sublease, calculated every five years beginning with the first day of the 16th lease year (August 11, 2019); provided that the annual minimum rent for the period from August 11, 2019 through expiration may not be less than $400,000 or exceed 4% of gross revenues. The ground sublease also requires payment of annual percentage rent for each lease year equal to (A) 3% of gross revenues for such lease year minus (B) the annual minimum rent for such lease year. The ground lease between Tampa Westshore Associates and the Hillsborough County Aviation Authority expires on December 31, 2080.
Right of First Negotiation. The Brand Manager has a right of first negotiation in the event the borrower decided to sell the property to a third party. The Brand Manager has entered into a subordination, non-disturbance and attornment agreement which provides that the sale, transfer or assignment to a designee of an institutional lender or a trustee, at foreclosure, will not trigger the right of first negotiation, except to the extent such transfer, sale or assignment is to a competitor of the Brand Manager.
THE INFORMATION IN THIS STRUCTURAL AND COLLATERAL TERM SHEET IS NOT COMPLETE AND MAY BE AMENDED PRIOR TO THE TIME OF SALE. THIS TERM SHEET IS NOT AN OFFER TO SELL THESE SECURITIES AND IT IS NOT A SOLICITATION OF AN OFFER TO BUY THESE SECURITIES IN ANY JURISDICTION WHERE THE OFFER OR SALE IS NOT PERMITTED.
| | | |
63 of 130
| Structural and Collateral Term Sheet | Benchmark 2018-B5 | |
| 660 Columbus Avenue | ||
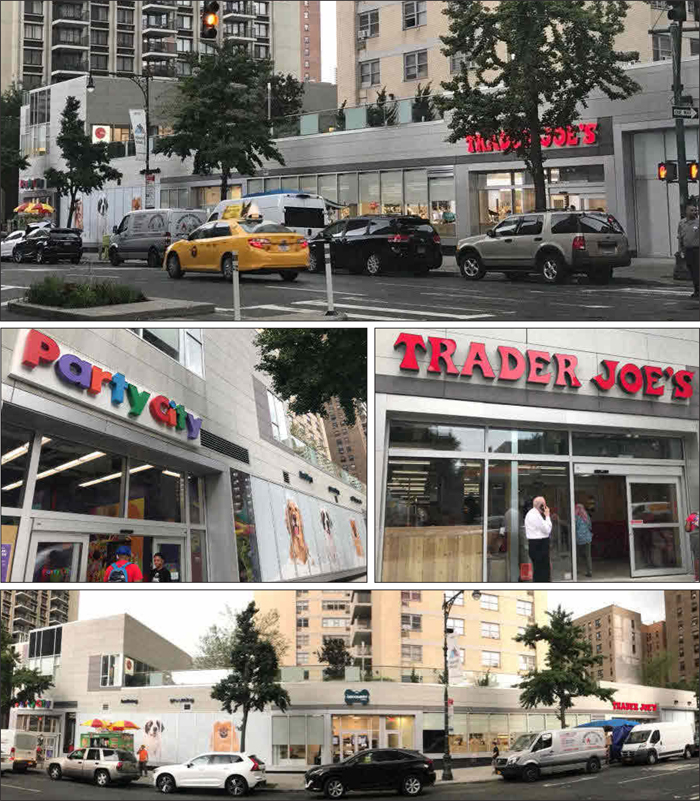
THE INFORMATION IN THIS STRUCTURAL AND COLLATERAL TERM SHEET IS NOT COMPLETE AND MAY BE AMENDED PRIOR TO THE TIME OF SALE. THIS TERM SHEET IS NOT AN OFFER TO SELL THESE SECURITIES AND IT IS NOT A SOLICITATION OF AN OFFER TO BUY THESE SECURITIES IN ANY JURISDICTION WHERE THE OFFER OR SALE IS NOT PERMITTED.
| | | |
64 of 130
| Structural and Collateral Term Sheet | Benchmark 2018-B5 | |
| 660 Columbus Avenue | ||
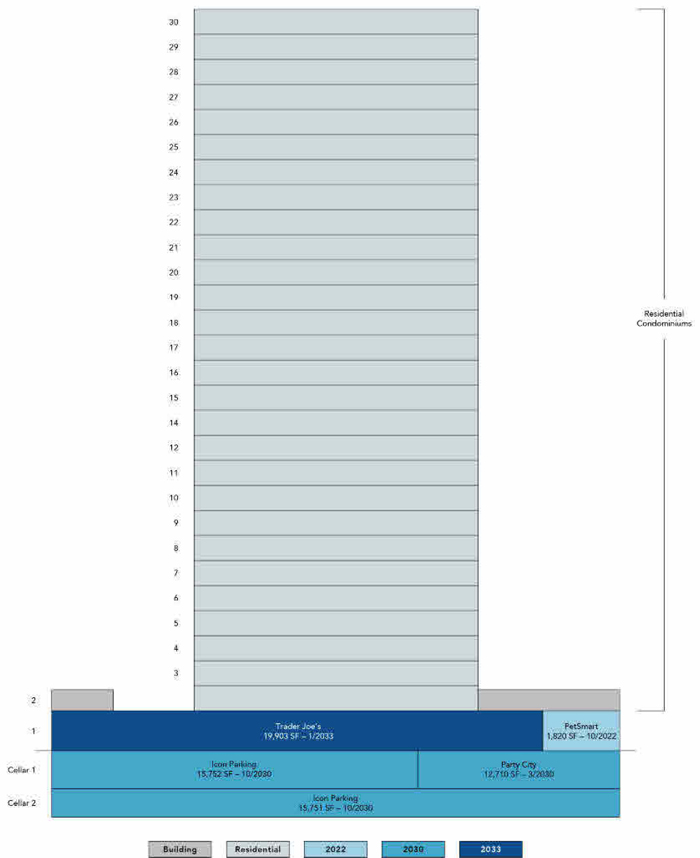
THE INFORMATION IN THIS STRUCTURAL AND COLLATERAL TERM SHEET IS NOT COMPLETE AND MAY BE AMENDED PRIOR TO THE TIME OF SALE. THIS TERM SHEET IS NOT AN OFFER TO SELL THESE SECURITIES AND IT IS NOT A SOLICITATION OF AN OFFER TO BUY THESE SECURITIES IN ANY JURISDICTION WHERE THE OFFER OR SALE IS NOT PERMITTED.
| | | |
65 of 130
| Structural and Collateral Term Sheet | Benchmark 2018-B5 | |
| 660 Columbus Avenue | ||
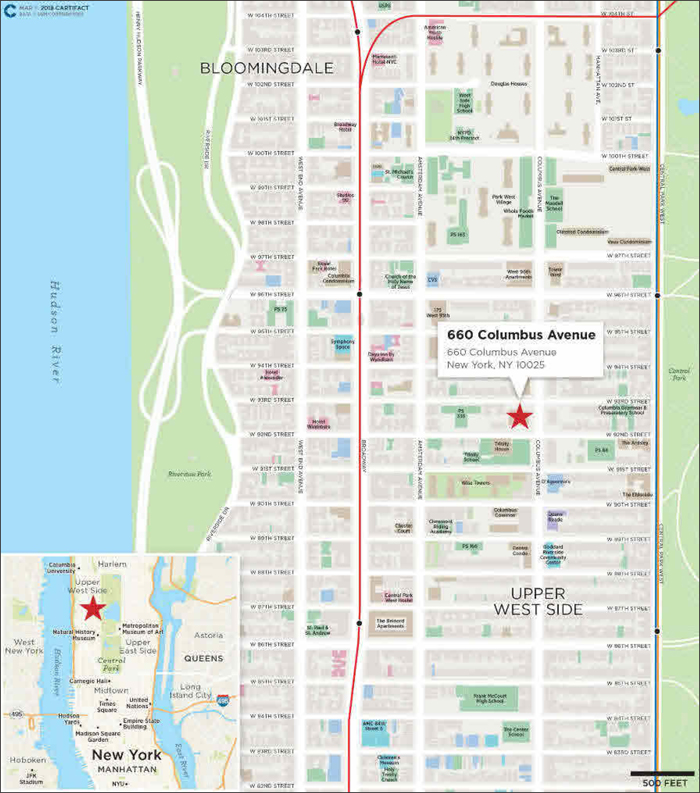
THE INFORMATION IN THIS STRUCTURAL AND COLLATERAL TERM SHEET IS NOT COMPLETE AND MAY BE AMENDED PRIOR TO THE TIME OF SALE. THIS TERM SHEET IS NOT AN OFFER TO SELL THESE SECURITIES AND IT IS NOT A SOLICITATION OF AN OFFER TO BUY THESE SECURITIES IN ANY JURISDICTION WHERE THE OFFER OR SALE IS NOT PERMITTED.
| | | |
66 of 130
| Structural and Collateral Term Sheet | Benchmark 2018-B5 | |
| 660 Columbus Avenue | ||
| Mortgage Loan Information | Property Information | |||
| Mortgage Loan Seller: | JPMCB | Single Asset / Portfolio: | Single Asset | |
| Original Principal Balance: | $43,500,000 | Title: | Fee | |
| Cut-off Date Principal Balance: | $43,500,000 | Property Type - Subtype: | Retail – Anchored | |
| % of Pool by IPB: | 4.2% | Net Rentable Area (SF): | 65,936 | |
| Loan Purpose: | Refinance | Location: | New York, NY | |
| Borrower: | 660 Columbus Retail Owner LLC | Year Built / Renovated: | 1973 / 2014 | |
| Sponsor: | Jacob Klein | Occupancy: | 100.0% | |
| Interest Rate: | 4.64000% | Occupancy Date: | 4/1/2018 | |
| Note Date: | 7/5/2018 | Number of Tenants: | 4 | |
| Maturity Date: | 8/1/2028 | 2016 NOI(1): | $941,661 | |
| Interest-only Period: | 120 months | 2017 NOI(1): | $672,941 | |
| Original Term: | 120 months | TTM NOI (as of 4/30/18)(2): | $662,350 | |
| Original Amortization: | None | UW Economic Occupancy: | 97.0% | |
| Amortization Type: | Interest Only | UW Revenues: | $4,002,382 | |
| Call Protection: | L(25),Grtr1%orYM(92),O(3) | UW Expenses: | $1,107,242 | |
| Lockbox / Cash Management | Hard / Springing | UW NOI(2): | $2,895,140 | |
| Additional Debt: | N/A | UW NCF: | $2,784,250 | |
| Additional Debt Balance: | N/A | Appraised Value / Per SF: | $69,400,000 / $1,053 | |
| Additional Debt Type: | N/A | Appraisal Date: | 5/31/2018 | |
| Escrows and Reserves(3) | Financial Information | |||||
| Initial | Monthly | Initial Cap | Mortgage Loan | |||
| Taxes: | $145,874 | $72,937 | N/A | Cut-off Date Loan / SF: | $660 | |
| Insurance: | $0 | Springing | N/A | Maturity Date Loan / SF: | $660 | |
| Replacement Reserves: | $0 | $0 | N/A | Cut-off Date LTV: | 62.7% | |
| TI/LC: | $0 | Springing | N/A | Maturity Date LTV: | 62.7% | |
| Other: | $0 | Springing | N/A | UW NCF DSCR: | 1.36x | |
| UW NOI Debt Yield: | 6.7% | |||||
| Sources and Uses |
| Sources | Proceeds | % of Total | Uses | Proceeds | % of Total | |
| Mortgage Loan | $43,500,000 | 100.0% | Payoff Existing Debt | $42,084,117 | 96.7% | |
| Closing Costs | 295,686 | 0.7 | ||||
| Upfront Reserves | 145,874 | 0.3 | ||||
| Return of Equity | 974,323 | 2.2 | ||||
| Total Sources | $43,500,000 | 100.0% | Total Uses | $43,500,000 | 100.0% |
| (1) | Full year 2015 financials are not available as the loan sponsor acquired the 660 Columbus Avenue property in October 2015. The decrease in 2017 NOI from 2016 NOI was primarily driven by a $231,513 increase in real estate taxes. |
| (2) | The increase in UW NOI from TTM NOI is primarily driven by rent from Trader Joe’s, which did not begin paying its initial annual contractual rent of $2.1 million until May 2018. |
| (3) | For a description of Escrows and Reserves, please refer to “Escrows and Reserves” below. |
THE INFORMATION IN THIS STRUCTURAL AND COLLATERAL TERM SHEET IS NOT COMPLETE AND MAY BE AMENDED PRIOR TO THE TIME OF SALE. THIS TERM SHEET IS NOT AN OFFER TO SELL THESE SECURITIES AND IT IS NOT A SOLICITATION OF AN OFFER TO BUY THESE SECURITIES IN ANY JURISDICTION WHERE THE OFFER OR SALE IS NOT PERMITTED.
| | | |
67 of 130
| Structural and Collateral Term Sheet | Benchmark 2018-B5 | |
| 660 Columbus Avenue | ||
The Loan. The 660 Columbus Avenue mortgage loan (the “660 Columbus Avenue Mortgage Loan”) has a Cut-off Date Principal Balance of $43.5 million and is secured by a first mortgage lien on the fee interest in a 65,936 square foot anchored retail property located in New York, New York. The 660 Columbus Avenue Mortgage Loan is interest only and has a 10-year term.
The Borrower. The borrowing entity for the 660 Columbus Avenue Mortgage Loan is 660 Columbus Retail Owner LLC, a New York limited liability company and special purpose entity with one independent manager in its organizational structure.
The Loan Sponsor. The loan sponsor and nonrecourse carve-out guarantor is Jacob Klein. Jacob Klein, President of The Klein Group, has been a real estate investor and developer for over two decades. The Klein Group investment portfolio includes 29 properties and over one million square feet of retail space. While overseeing the acquisition and development of this portfolio, Mr. Klein also provides property management services and partnership opportunities. Prior to inception of The Klein Group, Mr. Klein owned and operated Klein’s Associates where he acquired, developed and eventually sold his chain of 30 retail card stores (100,000 square feet of retail space) operating under the Hallmark and Carlton brand names, primarily in regional malls in the New York Tri-State area.
The Property. The 660 Columbus Avenue property (the “Property”) is a 65,936 square foot retail and parking component of a larger residential condominium development located at 660 Columbus Avenue in New York, New York. Situated on a 0.92-acre site, the Property consists of two condominium units (one unit is comprised of the 34,433 square foot retail component and one unit is comprised of the 31,503 square foot parking component). The remaining condominium interests consist of 28 stories of condominium apartments and one commercial unit, which are not included as collateral of the 660 Columbus Avenue Mortgage Loan. The Property occupies the western block front of Columbus Avenue between West 92nd Street and West 93rd Street in the Upper West Side neighborhood of Manhattan. The borrower acquired the 660 Columbus Avenue property in October 2015 for $60.5 million ($918 per square foot) when it was approximately 50.0% occupied.
As of April 1, 2018, the Property was 100.0% leased to four tenants including Trader Joe’s, Party City, PetSmart, and Icon Parking with a combined weighted average remaining lease term of 12.6 years. The largest tenant, Icon Parking (31,503 square feet; 47.8% of net rentable area; 9.4% of Underwritten Base Rent) is the largest parking operator in Manhattan with over 300 locations and more than 50 years in the business when combined with Quik Park. Icon Parking is situated on the two below-grade levels with 127 parking spaces whose lease expires in October 2030 and does not provide the tenant with any extension or termination options. The second largest tenant, Trader Joe’s (19,903 square feet; 30.2% of net rentable area;56.1% of Underwritten Base Rent) offers upscale grocery fare such as health foods, organic produce, and nutritional supplements. The Trader Joe’s lease expires inJanuary 2033, includes four five-year extension options anddoes not provide the tenant with any termination options. The third largest tenant, Party City (12,710 square feet; 19.3% of net rentable area; 26.7% of Underwritten Base Rent), is the #1 retailer of party supplies in the US. Party City operates roughly 900 company-owned and franchised locations, most under the Party City banner and approximately 300 seasonal Halloween City stores. Party City has a lease expiration in March 2030 and includes two extension options, the first being a 10-year option and the second being a five-year option.
The Market. The 660 Columbus Avenue property is located in the Upper West Side submarket of Manhattan between 59th and 125th Streets. The Upper West Side is situated between historic Central Park and the Riverside Park along the Hudson River. Bordered by Columbia University to the north and Lincoln Center to the south, the Upper West Side offers vibrant cultural experiences and shopping destinations in Manhattan. Local landmarks include the American Museum of Natural History, the Cathedral of St. John and the New York Historical Society.
The Upper West Side includes residential properties, including some luxury residences. Additionally, developers have been renovating and converting some of the older rental product in the submarket to condominiums. Additional developments in the neighborhood include the expansion of the Museum of Natural History, which is adding an additional building comprising 235,000 square feet. The submarket also benefits from transportation options. These include NYC Subway lines (B, C, 1, 2, 3), with southbound transit on these lines providing access to major transfer points like 59th Street/Columbus Circle, Times Square, and Penn Station. Public bus transportation is also available along all of the major avenues and major cross streets. The Henry Hudson Parkway, which can be accessed from 72nd, 79th and 96th Streets, provides access to the George Washington Bridge and Lincoln Tunnel, as well as to interstate highways.
According to the appraisal, the Upper West Side submarket contains 222 retail tenants and 3,731,564 square feet of total rentable area. As of the first quarter of 2018, there were 47,897 square feet of directly vacant space available, which equates to a direct vacancy rate of 1.3% with retail asking rents in the submarket of $195 per square foot.
The appraiser identified the following properties as rental comparables for the 660 Columbus Avenue property. The comparables range from $56.62 per square foot to $255.00 per square foot with an average of approximately $149.43 per square foot.
THE INFORMATION IN THIS STRUCTURAL AND COLLATERAL TERM SHEET IS NOT COMPLETE AND MAY BE AMENDED PRIOR TO THE TIME OF SALE. THIS TERM SHEET IS NOT AN OFFER TO SELL THESE SECURITIES AND IT IS NOT A SOLICITATION OF AN OFFER TO BUY THESE SECURITIES IN ANY JURISDICTION WHERE THE OFFER OR SALE IS NOT PERMITTED.
| | | |
68 of 130
| Structural and Collateral Term Sheet | Benchmark 2018-B5 | |
| 660 Columbus Avenue | ||
| Summary of Retail Leases(1) | ||||||
| Tenant (Address) | GLA | Lease Date | Term (Years) | Base Rent PSF | ||
| Dunkin Donuts (720 Columbus Avenue) | 1,378 | Apr-18 | 9 | $87.00 | ||
| Popular, Inc. (720 Columbus Avenue) | 1,740 | Nov-17 | 10 | $172.41 | ||
| Apple Nails and Spa (2389 Broadway) | 1,800 | Feb-18 | 10 | $165.70 | ||
| Bar Method (2385 Broadway) | 4,500 | Dec-17 | N/A | $125.00 | ||
| Petco (2473 Broadway) | 17,231 | Nov-17 | 5 | $58.03 | ||
| Vland Café (76 W 85th Street) | 2,356 | Apr-17 | 15 | $194.00 | ||
| Sweetgreen (2460 Broadway) | 3,930 | Feb-17 | N/A | $200.00 | ||
| Time Warner Cable, Inc. (2552 Broadway) | 7,760 | Feb-17 | 8 | $255.00 | ||
| Not Available (700 Columbus Avenue) | 4,451 | May-18 | N/A | $56.62 | ||
| Not Available (721-739 Amsterdam) | 11,940 | May-18 | N/A | $165.00 | ||
| (1) | Source: Appraisal. |
| Historical and Current Occupancy(1) | |||
| 2015 | 2016 | 2017 | Current(2) |
| 50.0% | 75.0% | 100.0% | 100.0% |
| (1) | Historical occupancies are as of December 31 of each respective year. |
| (2) | Current occupancy is as of April 1, 2018. |
| Tenant Summary(1) | ||||||
| Tenant | Ratings Fitch/Moody’s/S&P | Net Rentable Area (SF) | % of Total NRA | Base Rent PSF | % of Total Base Rent | Lease Expiration Date |
| Icon Parking | NA / NA / NA | 31,503 | 47.8% | $11.11 | 9.4% | 10/31/2030 |
| Trader Joe’s | NA / NA / NA | 19,903 | 30.2% | $105.51 | 56.1% | 1/31/2033 |
| Party City | NA / NA / NA | 12,710 | 19.3% | $78.68 | 26.7% | 3/31/2030 |
| PetSmart | NA / NA / NA | 1,820 | 2.8% | $159.73 | 7.8% | 10/31/2022 |
| (1) | Based on the underwritten rent roll dated April 1, 2018. |
| Lease Rollover Schedule(1) | |||||||||
Year | Number of Leases Expiring | Net Rentable Area Expiring | % of NRA Expiring | Base Rent Expiring | % of Base Rent Expiring | Cumulative Net Rentable Area Expiring | Cumulative % of NRA Expiring | Cumulative Base Rent Expiring | Cumulative % of Base Rent Expiring |
| Vacant | NAP | 0 | 0.0% | NAP | NAP | 0 | 0.0% | NAP | NAP |
| 2018 & MTM | 0 | 0 | 0.0 | $0 | 0.0 | 0 | 0.0% | $0 | 0.0% |
| 2019 | 0 | 0 | 0.0 | 0 | 0.0 | 0 | 0.0% | $0 | 0.0% |
| 2020 | 0 | 0 | 0.0 | 0 | 0.0 | 0 | 0.0% | $0 | 0.0% |
| 2021 | 0 | 0 | 0.0 | 0 | 0.0 | 0 | 0.0% | $0 | 0.0% |
| 2022 | 1 | 1,820 | 2.8 | 290,700 | 7.8 | 1,820 | 2.8% | $290,700 | 7.8% |
| 2023 | 0 | 0 | 0.0 | 0 | 0.0 | 1,820 | 2.8% | $290,700 | 7.8% |
| 2024 | 0 | 0 | 0.0 | 0 | 0.0 | 1,820 | 2.8% | $290,700 | 7.8% |
| 2025 | 0 | 0 | 0.0 | 0 | 0.0 | 1,820 | 2.8% | $290,700 | 7.8% |
| 2026 | 0 | 0 | 0.0 | 0 | 0.0 | 1,820 | 2.8% | $290,700 | 7.8% |
| 2027 | 0 | 0 | 0.0 | 0 | 0.0 | 1,820 | 2.8% | $290,700 | 7.8% |
| 2028 | 0 | 0 | 0.0 | 0 | 0.0 | 1,820 | 2.8% | $290,700 | 7.8% |
| 2029 & Beyond | 3 | 64,116 | 97.2 | 3,450,000 | 92.2 | 65,936 | 100.0% | $3,740,700 | 100.0% |
| Total | 4 | 65,936 | 100.0% | $3,740,700 | 100.0% | ||||
| (1) | Based on the underwritten rent roll dated April 1, 2018. |
THE INFORMATION IN THIS STRUCTURAL AND COLLATERAL TERM SHEET IS NOT COMPLETE AND MAY BE AMENDED PRIOR TO THE TIME OF SALE. THIS TERM SHEET IS NOT AN OFFER TO SELL THESE SECURITIES AND IT IS NOT A SOLICITATION OF AN OFFER TO BUY THESE SECURITIES IN ANY JURISDICTION WHERE THE OFFER OR SALE IS NOT PERMITTED.
| | | |
69 of 130
| Structural and Collateral Term Sheet | Benchmark 2018-B5 | |
| 660 Columbus Avenue | ||
| Operating History and Underwritten Net Cash Flow | ||||||
2016(1) | 2017(1) | TTM(2) | Underwritten(2) | Per Square | %(3) | |
| Rents In Place | $1,320,833 | $1,402,863 | $1,497,863 | $3,740,700 | $56.73 | 93.5% |
| Gross Potential Rent | $1,320,833 | $1,402,863 | $1,497,863 | $3,740,700 | $56.73 | 93.5% |
| Total Reimbursements | 130,617 | 111,519 | 114,662 | 385,467 | 5.85 | 9.6 |
| Less: Vacancy & Bad Debt | 0 | 0 | 0 | (123,785) | (1.88) | (3.1) |
| Effective Gross Income | $1,451,450 | $1,514,382 | $1,612,525 | $4,002,382 | $60.70 | 100.0% |
| Total Operating Expenses | 509,789 | 841,441 | 950,175 | 1,107,242 | 16.79 | 27.7 |
| Net Operating Income | $941,661 | $672,941 | $662,350 | $2,895,140 | $43.91 | 72.3% |
| TI/LC | 0 | 0 | 0 | 100,999 | 1.53 | 2.5 |
| Capital Expenditures | 0 | 0 | 0 | 9,890 | 0.15 | 0.2 |
| Net Cash Flow | $941,661 | $672,941 | $662,350 | $2,784,250 | $42.23 | 69.6% |
| (1) | Full year 2015 financials are not available as the loan sponsor acquired the property in October 2015. The decrease in 2017 NOI from 2016 NOI was primarily driven by a $231,513 increase in real estate taxes. |
| (2) | The increase in UW NOI from TTM NOI is primarily driven by rent from Trader Joe’s, which did not begin paying its initial annual contractual rent of $2.1 million until May 2018. |
| (3) | % column represents percentage of Effective Gross Income. |
Property Management. The Property is managed by The Klein Group LLC, a borrower affiliate.
Escrows and Reserves. At loan origination, the borrower deposited $145,874 for taxes.
Tax Escrows– On a monthly basis, the borrower is required to deposit 1/12 of the estimated annual real estate taxes into the tax reserve, which currently equates to $72,937.
Insurance Escrows– The requirement for the borrower to make monthly deposits to the insurance escrow is waived so long as (a) no event of default has occurred and is continuing and (b) the borrower provides satisfactory evidence that the Property is insured as part of a reasonably acceptable blanket policy in accordance with the loan documents.
Rollover Reserve– In the event of Trader Joe’s Trigger Event (as defined below), the borrower is required to deposit all excess cash flow after payment of debt service, required reserves and operating expenses into the rollover reserve. In addition, in connection with any other termination, amendment or modification of any tenant lease, reduction of rents, shortening of term, or surrender of space at the 660 Columbus Avenue property, the borrower is required to pay to the lender any termination fees or other consideration paid to the borrower in connection with such events. The loan documents require that funds be used for tenant improvements and leasing commissions incurred following the origination date or, with respect to any termination fees, for monthly debt service payments at the borrower’s option.
A “Trader Joe’s Trigger Event” means the occurrence of (i) any bankruptcy or insolvency action of Trader Joe’s, (ii) the borrower failing to renew the Trader Joe’s lease in accordance with the loan documents on or before the date that is nine months prior to the expiration date of the Trader Joe’s lease, or (iii) Trader Joe’s “goes dark,” vacates or abandons its premises at the property.
Free Rent Reserve– The borrower may elect to deposit into the Free Rent Reserve an amount equal to any free rent credit due from the borrower in connection with satisfying the criteria set forth in the loan documents for any Trader Joe’s lease renewal or a Trader Joe’s replacement lease. Provided no event of default has occurred and is continuing, the lender is required to disburse such amounts to the lockbox account on a monthly basis on each payment date for each month of free rent credit deposited based on the corresponding month to which such free rent credit applies.
Outstanding TI Reserve– The borrower may elect to deposit into the Outstanding TI Reserve an amount equal to any outstanding tenant improvement or outstanding leasing commission obligation of the borrower in connection with satisfying the criteria set forth in the loan documents for any Trader Joe’s lease renewal or a Trader Joe’s replacement lease. Provided no event of default exists, the lender is required to disburse from the Outstanding TI Reserve Account for tenant improvement obligations and/or leasing commissions incurred by the borrower in connection with satisfying the criteria for any Trader Joe’s lease renewal or the Trader Joe’s replacement lease. All such expenses must be approved by the lender in its sole discretion.
Condominium Assessments Reserve– During a Cash Sweep Period (as defined below) or in the event the borrower is unable to provide the lender with evidence that the condominium assessments have been paid at least five business days prior to the due date of such condominium assessments, the borrower is required to pay to the lender an amount such that the balance in the Condominium Assessments Reserve will at all times be greater than or equal to the aggregate amount of condominium assessments due from the borrower to the condominium association for the next one month period, as determined by the lender based on the most recent annual budget of the condominium association. The Condominium Assessments Reserve is required to be held as additional collateral for the
THE INFORMATION IN THIS STRUCTURAL AND COLLATERAL TERM SHEET IS NOT COMPLETE AND MAY BE AMENDED PRIOR TO THE TIME OF SALE. THIS TERM SHEET IS NOT AN OFFER TO SELL THESE SECURITIES AND IT IS NOT A SOLICITATION OF AN OFFER TO BUY THESE SECURITIES IN ANY JURISDICTION WHERE THE OFFER OR SALE IS NOT PERMITTED.
| | | |
70 of 130
| Structural and Collateral Term Sheet | Benchmark 2018-B5 | |
| 660 Columbus Avenue | ||
660 Columbus Avenue Mortgage Loan and may only be released to the borrower after the 660 Columbus Avenue Mortgage Loan has been paid in full.
DSCR Cure Deposit Reserve– To the extent the borrower has cured a debt service coverage ratio trigger event through the delivery of the DSCR Cure Deposit, such amounts are required to be held by the lender as additional security for the 660 Columbus Avenue Mortgage Loan. At such time that the debt service coverage ratio trigger event has been cured in accordance with the loan documents without taking into account any DSCR Cure Deposit funds in the reserve, provided no event of default shall have occurred and be continuing, all DSCR Cure Deposit Reserve amounts are required to be deposited into the lockbox account and disbursed in accordance with the loan documents.
“DSCR Cure Deposit” means a deposit from the borrower with the lender in the form of cash or a letter of credit in an amount that, if used to reduce the then outstanding principal balance of the 660 Columbus Avenue Mortgage Loan, would result in the achievement of a debt service coverage ratio of 1.20x or greater for two consecutive calendar quarters, based upon the trailing three month periods immediately preceding the date of determination.
Lockbox/ Cash Management.The 660 Columbus Avenue Mortgage Loan is structured with a hard lockbox and springing cash management. The borrower was required to send tenant direction letters to all tenants instructing them to deposit all rents and other payments into the lockbox account controlled by the lender. To the extent there is no Cash Sweep Period (as defined below) in effect, all funds in the lockbox account are required to be transferred to or at the direction of the borrower. During the continuance of a Cash Sweep Period, all funds in the lockbox account are required to be transferred each business day into the cash management account, and applied to all required payments and reserves as set forth in the 660 Columbus Avenue Mortgage Loan documents. Except as described above in “Rollover Reserve”, to the extent there is a Cash Sweep Period, all excess cash in the cash management account following payments for debt service, required reserves and operating expenses are required to be held as additional collateral for the loan. The lender has been granted a security interest in the cash management account.
A “Cash Sweep Event” means the occurrence of (i) an event of default, (ii) any bankruptcy or insolvency action of the borrower or property manager, (iii) the date the debt service coverage ratio (as calculated in the loan documents) falls below 1.20x based on the trailing three month period immediately preceding the determination date or (iv) a Trader Joe’s Trigger Event.
A “Cash Sweep Event Cure” means (a) with respect to clause (i) above, the acceptance by the lender of a cure of such event of default (which acceptance may not be unreasonably withheld, conditioned or delayed, unless the lender has applied for the appointment of a receiver, accelerated the debt or commenced a foreclosure action, in which case such acceptance may be in the lender’s sole and absolute discretion), (b) with respect to clause (ii) above, solely with respect to the property manager, if the borrower replaces the manager with a qualified manager under a replacement management agreement within 60 days after such action, (c) with respect to clause (ii) above, solely with respect to an involuntary bankruptcy petition for which none of the borrower, guarantor or their affiliates have colluded or assisted with or solicited or caused to be solicited creditors for such involuntary petition, upon the involuntary petition being discharged or dismissed within 90 days of filing without any material adverse consequences to the 660 Columbus Avenue Mortgage Loan or the property, (d) with respect to clause (iii) above, the achievement of a debt service coverage ratio of at least 1.20x for two consecutive quarters based on the trailing three month period or the receipt by the lender of the DSCR Cure Deposit, and (e) with respect to a Trader Joe’s Trigger Event, the execution of one or more replacement leases for the Trader Joe’s leased space with one or more replacement tenants approved by the lender in accordance with the loan documents and meeting certain requirements set forth in the loan documents. Each Cash Sweep Event Cure is also subject to the following conditions: (1) no other event of default has occurred and is continuing; (2) a Cash Sweep Event Cure may not occur more than an aggregate of four times during the term of the 660 Columbus Avenue Mortgage Loan; and (3) the borrower pays the lender’s reasonable expenses in connection with the Cash Sweep Event Cure, including reasonable attorney’s fees.
A “Cash Sweep Period” means each period commencing on the occurrence of a Cash Sweep Event and continuing until the payment date following the related Cash Sweep Event Cure.
The Condominium.The 660 Columbus Avenue property consists of two commercial units in a 283 unit condominium (with 280 residential units and three commercial units). The borrower owns an approximately 18.01% interest in the condominium. The condominium board of directors has seven board members, and board members are elected by a majority vote of the unit owners. The borrower does not control the related board of directors. The board of directors is generally responsible for the administration of the condominium including, without limitation, the operation and maintenance of the common areas, determinations of assessments and insuring the condominium common elements (subject to the rights of unit owners with respect to certain decisions). The condominium declaration may be modified or amended upon the vote of 66 and 2/3% of the unit owners, except that any amendment or modification which would alter the percentage interest of one or more unit owners requires the consent of all such affected owners and their mortgagees, and no amendment may be made to the declaration that impairs or prejudices the rights of any mortgagee. The entire property may be withdrawn from a condominium structure with the vote of at least 80% of the unit owners and their mortgagees. In the event of a casualty that results in the damage to 75% or more of the condominium, the board of directors is required to restore the
THE INFORMATION IN THIS STRUCTURAL AND COLLATERAL TERM SHEET IS NOT COMPLETE AND MAY BE AMENDED PRIOR TO THE TIME OF SALE. THIS TERM SHEET IS NOT AN OFFER TO SELL THESE SECURITIES AND IT IS NOT A SOLICITATION OF AN OFFER TO BUY THESE SECURITIES IN ANY JURISDICTION WHERE THE OFFER OR SALE IS NOT PERMITTED.
| | | |
71 of 130
| Structural and Collateral Term Sheet | Benchmark 2018-B5 | |
| 660 Columbus Avenue | ||
property unless 75% of the unit owners elect not to rebuild. The condominium declaration also establishes a second board of managers to make decisions related solely to the commercial units. The board of managers for the commercial units consists of four members, and the borrower is entitled to appoint three of those members. The condominium declaration provides that if the holder of an institutional mortgage of record or other purchaser at a foreclosure sale obtains title, the new owner will not be liable for any common charges to the extent such charges were assessed and became due prior to acquisition of title, and that any lien for such assessments is subordinate to the lien of a mortgage affecting such unit. The lender also has certain notice and cure rights for defaults by the borrower under the condominium documents.
THE INFORMATION IN THIS STRUCTURAL AND COLLATERAL TERM SHEET IS NOT COMPLETE AND MAY BE AMENDED PRIOR TO THE TIME OF SALE. THIS TERM SHEET IS NOT AN OFFER TO SELL THESE SECURITIES AND IT IS NOT A SOLICITATION OF AN OFFER TO BUY THESE SECURITIES IN ANY JURISDICTION WHERE THE OFFER OR SALE IS NOT PERMITTED.
| | | |
72 of 130
| Structural and Collateral Term Sheet | Benchmark 2018-B5 |
[THIS PAGE INTENTIONALLY LEFT BLANK]
THE INFORMATION IN THIS STRUCTURAL AND COLLATERAL TERM SHEET IS NOT COMPLETE AND MAY BE AMENDED PRIOR TO THE TIME OF SALE. THIS TERM SHEET IS NOT AN OFFER TO SELL THESE SECURITIES AND IT IS NOT A SOLICITATION OF AN OFFER TO BUY THESE SECURITIES IN ANY JURISDICTION WHERE THE OFFER OR SALE IS NOT PERMITTED.
| | | |
73 of 130
| Structural and Collateral Term Sheet | Benchmark 2018-B5 | |
| Aon Center | ||

THE INFORMATION IN THIS STRUCTURAL AND COLLATERAL TERM SHEET IS NOT COMPLETE AND MAY BE AMENDED PRIOR TO THE TIME OF SALE. THIS TERM SHEET IS NOT AN OFFER TO SELL THESE SECURITIES AND IT IS NOT A SOLICITATION OF AN OFFER TO BUY THESE SECURITIES IN ANY JURISDICTION WHERE THE OFFER OR SALE IS NOT PERMITTED.
| | | |
74 of 130
| Structural and Collateral Term Sheet | Benchmark 2018-B5 | |
| Aon Center | ||
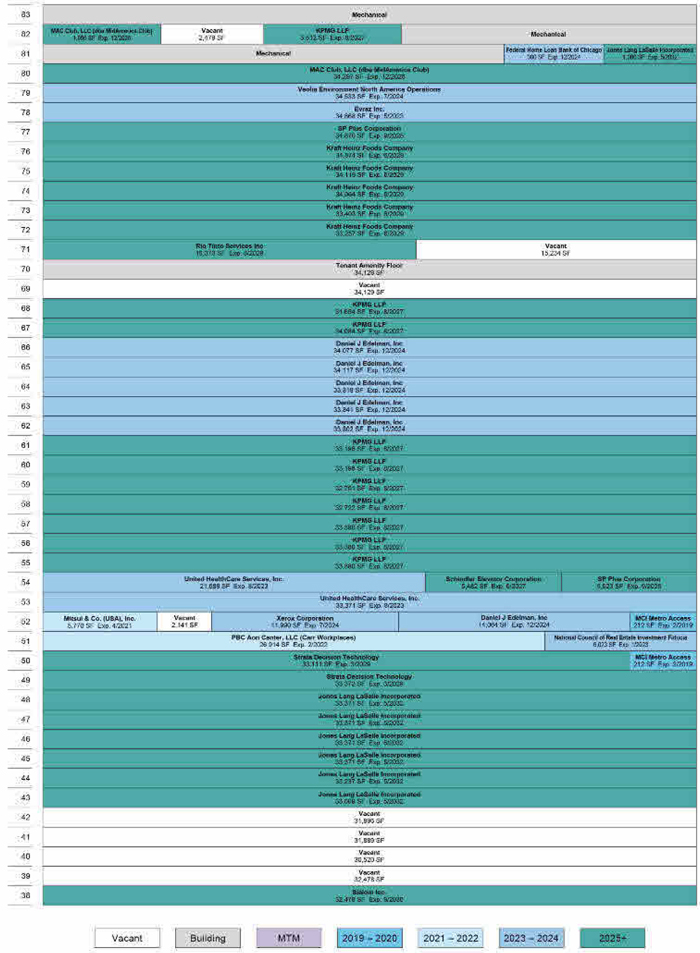
THE INFORMATION IN THIS STRUCTURAL AND COLLATERAL TERM SHEET IS NOT COMPLETE AND MAY BE AMENDED PRIOR TO THE TIME OF SALE. THIS TERM SHEET IS NOT AN OFFER TO SELL THESE SECURITIES AND IT IS NOT A SOLICITATION OF AN OFFER TO BUY THESE SECURITIES IN ANY JURISDICTION WHERE THE OFFER OR SALE IS NOT PERMITTED.
| | | |
75 of 130
| Structural and Collateral Term Sheet | Benchmark 2018-B5 | |
| Aon Center | ||
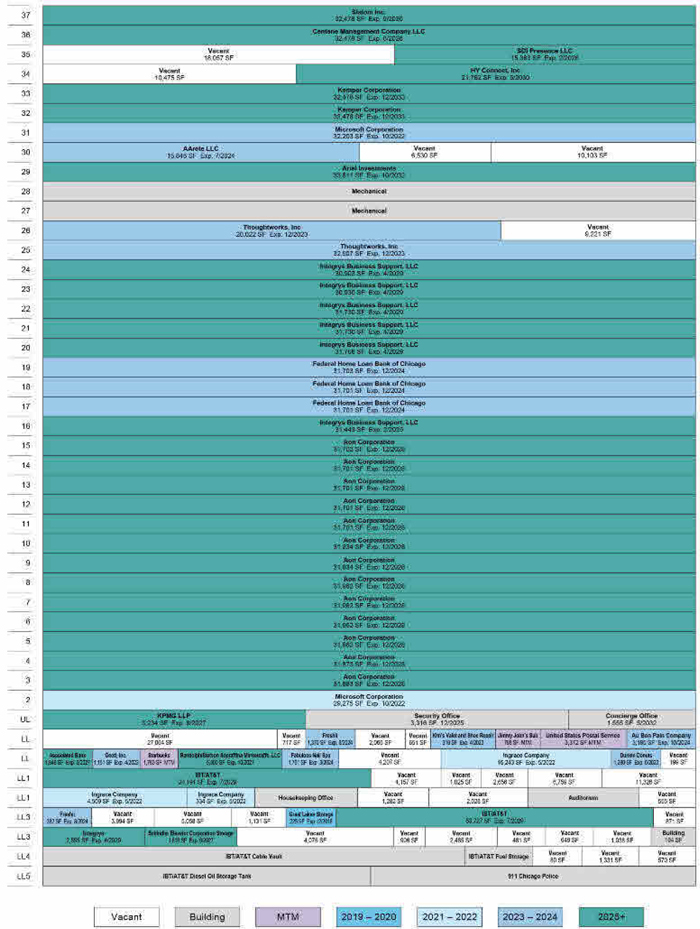
THE INFORMATION IN THIS STRUCTURAL AND COLLATERAL TERM SHEET IS NOT COMPLETE AND MAY BE AMENDED PRIOR TO THE TIME OF SALE. THIS TERM SHEET IS NOT AN OFFER TO SELL THESE SECURITIES AND IT IS NOT A SOLICITATION OF AN OFFER TO BUY THESE SECURITIES IN ANY JURISDICTION WHERE THE OFFER OR SALE IS NOT PERMITTED.
| | | |
76 of 130
| Structural and Collateral Term Sheet | Benchmark 2018-B5 | |
| Aon Center | ||
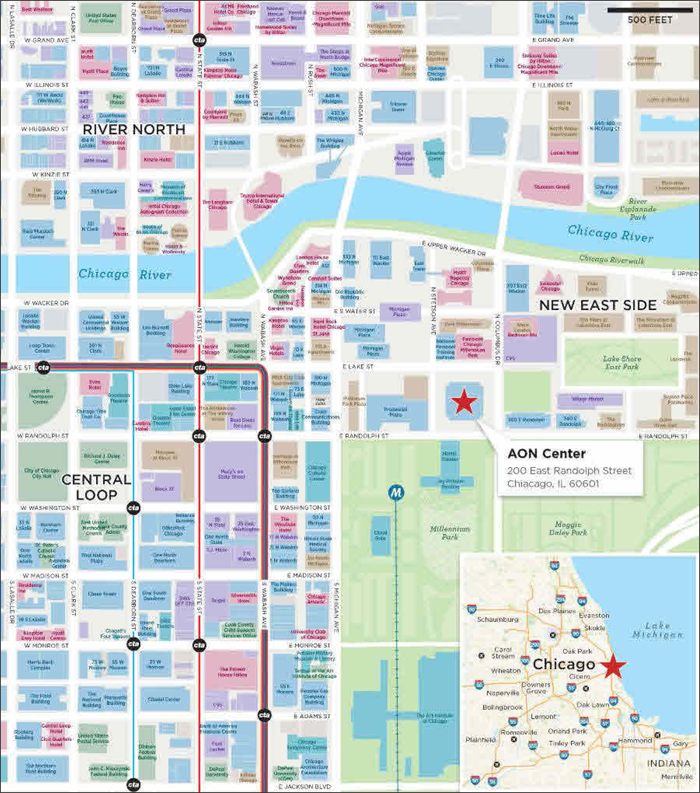
THE INFORMATION IN THIS STRUCTURAL AND COLLATERAL TERM SHEET IS NOT COMPLETE AND MAY BE AMENDED PRIOR TO THE TIME OF SALE. THIS TERM SHEET IS NOT AN OFFER TO SELL THESE SECURITIES AND IT IS NOT A SOLICITATION OF AN OFFER TO BUY THESE SECURITIES IN ANY JURISDICTION WHERE THE OFFER OR SALE IS NOT PERMITTED.
| | | |
77 of 130
| Structural and Collateral Term Sheet | Benchmark 2018-B5 | |
| Aon Center | ||
| Mortgage Loan Information | Property Information | |||
| Mortgage Loan Seller: | JPMCB | Single Asset / Portfolio: | Single Asset | |
| Credit Assessment | Title: | Fee | ||
| (DBRS/Fitch/S&P)(1): | [A(high)/BBB-sf/A] | Property Type - Subtype: | Office – CBD | |
| Original Principal Balance(2): | $43,000,000 | Net Rentable Area (SF): | 2,777,240 | |
| Cut-off Date Principal Balance(2): | $43,000,000 | Location: | Chicago, IL | |
| % of Pool by IPB: | 4.1% | Year Built / Renovated: | 1972 / 2018 | |
| Loan Purpose: | Refinance | Occupancy(4): | 87.9% | |
| Borrowers: | 601 W Companies LLC, Brickell 13 | Occupancy Date: | 5/1/2018 | |
| Chicago LLC | Number of Tenants: | 52 | ||
| Sponsors: | Mark Karasick, Michael Silberberg | 2014 NOI(5): | $34,828,947 | |
| Interest Rate: | 4.62740% | 2015 NOI(6): | NAV | |
| Note Date: | 6/8/2018 | 2016 NOI(5)(7): | $35,611,627 | |
| Maturity Date: | 7/1/2023 | 2017 NOI(5)(7): | $42,559,906 | |
| Interest-only Period: | 60 months | TTM NOI (as of 4/2018)(5)(8): | $43,382,250 | |
| Original Term: | 60 months | UW Economic Occupancy: | 87.9% | |
| Original Amortization: | None | UW Revenues: | $97,775,632 | |
| Amortization Type: | Interest Only | UW Expenses: | $46,208,188 | |
| Call Protection(3): | L(25),Def(32),O(3) | UW NOI(8): | $51,567,444 | |
| Lockbox / Cash Management: | Hard / Springing | UW NCF: | $49,706,693 | |
| Additional Debt(2): | Yes | Appraised Value / Per SF(9): | $824,000,000 / $297 | |
| Additional Debt Balance(2): | $307,000,000 / $186,000,000 / | Appraisal Date(9): | 5/1/2018 | |
| $141,500,000 | ||||
| Additional Debt Type: | Pari Passu / Subordinate Debt / | |||
| Mezzanine Loan | ||||
| Escrows and Reserves(10) | Financial Information(2) | ||||||
| Initial | Monthly | Initial Cap | Pari Passu Debt | Whole Loan | |||
| Taxes: | $6,612,672 | $1,502,880 | N/A | Cut-off Date Loan / SF: | $126 | $193 | |
| Insurance: | $1,084,347 | $120,483 | N/A | Maturity Date Loan / SF: | $126 | $193 | |
| Replacement Reserves: | $0 | $57,859 | N/A | Cut-off Date LTV(9)(11): | 40.3% | 62.8% | |
| TI/LC: | $0 | Springing | $5,600,000 | Maturity Date LTV(9)(11): | 40.3% | 62.8% | |
| Other: | $82,802,409 | $0 | N/A | UW NCF DSCR: | 3.03x | 1.98x | |
| UW NOI Debt Yield(11): | 15.5% | 10.0% | |||||
| Sources and Uses | ||||||
| Sources | Proceeds | % of Total | Uses | Proceeds | % of Total | |
| Senior Notes | $350,000,000 | 51.7% | Loan Payoff | $575,754,562 | 85.0% | |
| Subordinate Debt | 186,000,000 | 27.5 | Upfront Reserves | 90,499,428 | 13.4 | |
| Mezzanine Loans | 141,500,000 | 20.9 | Closing Costs | 8,101,336 | 1.2 | |
| Return of Equity | 3,144,674 | 0.5 | ||||
| Total Sources | $677,500,000 | 100.0% | Total Uses | $677,500,000 | 100.0% | |
| (1) | DBRS/Fitch/S&P provided the ratings above for the Aon Center Whole Loan in the context of its inclusion in the mortgage pool. |
| (2) | The Aon Center Mortgage Loan is part of a whole loan comprised of (i) the mortgage loan (comprised of one note with an outstanding principal balance as of the Cut-off Date of $43.0 million, (ii) three companion loans, each of which ispari passu with the Aon Center Mortgage Loan with an aggregate outstanding principal balance as of the Cut-off Date of $307.0 million and (iii) a subordinate companion loan (comprised of one note) with an outstanding principal balance as of the Cut-off Date of $186.0 million. The Pari Passu Debt Financial Information presented in the chart above reflects the $350.0 million aggregate Cut-off Date balance of the Aon Center Mortgage Loan and Senior Notes, as defined in“The Loan” below. The Whole Loan Financial Information presented in the chart above reflects the Cut-off Date balance of the $536.0 million Aon Center Whole Loan as defined in “The Loan” below. |
| (3) | The lockout period will be at least 25 months beginning with and including the payment date in August 2018. Defeasance of the full $536.0 million Aon Center Whole Loan is permitted at any time after the earlier to occur of (i) August 1, 2021 or (ii) two years after the closing date of the securitization that includes the last note to be securitized. The assumed lockout period of 25 months is based on the closing date of the Benchmark 2018-B5 securitization in August 2018. The actual lockout period may be longer. |
| (4) | Occupancy has been underwritten to the in-place rent roll as of May 1, 2018, inclusive of recently executed leases for which certain tenants are not yet in occupancy or paying rent. Most notably, occupancy reflects 132,933 square feet (4.8% of NRA) associated with recent new and expansion leasing, as well as three executed leases that are anticipated to backfill a portion of the vacant DDB Needham (“DDB”) space. See “The Property” herein. In certain instances, such tenants are currently in occupancy of temporary space at the property. |
| (5) | Rents In Place and Total Reimbursements for historical periods 2014, 2016, 2017 and TTM April 30, 2018 have been adjusted to gross up for actual rent abatements and abated recoveries totaling approximately $12.0 million, $15.3 million, $20.7 million and $20.9 million, respectively. A detailed breakdown is not available for the 2014 period as the Aon Center Property was owned and managed by a prior owner and manager. The aggregate full year 2016, 2017 and TTM April 2018 rent abatement and abated recovery figures in the preceding sentence are primarily attributable to free rent and abated recovery periods associated with DDB (approximately $16.6 |
THE INFORMATION IN THIS STRUCTURAL AND COLLATERAL TERM SHEET IS NOT COMPLETE AND MAY BE AMENDED PRIOR TO THE TIME OF SALE. THIS TERM SHEET IS NOT AN OFFER TO SELL THESE SECURITIES AND IT IS NOT A SOLICITATION OF AN OFFER TO BUY THESE SECURITIES IN ANY JURISDICTION WHERE THE OFFER OR SALE IS NOT PERMITTED.
| | | |
78 of 130
| Structural and Collateral Term Sheet | Benchmark 2018-B5 | |
| Aon Center | ||
| million) (which had a free rent period for the last 30 months of its contractual lease term and has vacated in June 2018), Kraft Heinz (approximately $6.7 million), Aon Corporation (approximately $5.5 million), Jones Lang LaSalle (approximately $6.6 million) and Integrys (approximately $2.4 million). The remaining aggregate full year 2016, 2017 and TTM April 2018 amount of approximately $4.1 million is attributable to rent abatements and abated recoveries across eight other tenants. |
| (6) | 2015 NOI is not available due to timing of the sponsors’ acquisition of the Aon Center Property. |
| (7) | The increase in 2017 NOI from 2016 NOI is primarily attributable to leasing over the course of 2016 and 2017, including Kraft Heinz (169,717 square feet), KPMG expansion space (31,654 square feet) and Strata Decision Technology (16,793 square feet), collectively accounting for approximately $5.6 million in underwritten gross rent. |
| (8) | The increase in UW NOI from TTM NOI is primarily attributable to (i) over 270,000 square feet in new and expansion leasing executed year-to-date, accounting for approximately $6.8 million in underwritten base rent and (ii) approximately $4.1 million in underwritten average rents and contractual rent steps. |
| (9) | Cut-off Date LTV and Maturity LTV are based on the “Hypothetical” Appraised Value of $824.0 million, which assumes (i) there are no leasing costs associated with recently signed leases, (ii) completion of the amenity floor build-out and (iii) demolition of the space previously occupied by DDB. At origination, the borrowers reserved approximately $13.2 million for all outstanding tenant improvement and leasing commissions, as well as approximately $8.0 million budgeted for the completion of the amenity floor build-out. The Cut-off Date LTV and Maturity LTV (unadjusted for the $18.3 million performance reserve described below) based on the “as-is” Appraised Value of $780.0 million for the Senior Notes and Whole Loan are each approximately 44.9% and 68.7%, respectively. |
| (10) | For a full description of Escrows and Reserves, please refer to“Escrows and Reserves”below. |
| (11) | At origination, the borrowers were required to reserve $18.3 million in connection with a performance reserve, to be released upon the borrowers having executed the Slalom lease (which condition was satisfied as of the origination date), in addition to 35,000 square feet in additional leasing, among other conditions (as further described herein). Cut-off Date LTV, Maturity Date LTV and UW NOI Debt Yield as presented in the Financial Information above are calculated net of the performance reserve. Assuming release of the performance reserve (without consideration for additional leasing), (i) the “Hypothetical” Appraised Value results in a Pari Passu Debt Cut-off LTV and Maturity LTV of approximately 42.5% and Whole Loan Cut-off Date LTV and Maturity LTV of approximately 65.0%, (ii) UW NOI results in a Pari Passu Debt and Whole Loan Debt Yield of approximately 14.7% and 9.6%, respectively. |
The Loan.The Aon Center loan is secured by a first mortgage lien on the borrowers’ fee interest in an 83-story, approximately 2.8 million square foot Class A office tower located in the East Loop neighborhood of Chicago, Illinois (the “Aon Center Property”). The whole loan was originated by JPMCB and has an outstanding principal balance as of the Cut-Off Date of $536.0 million (“The Aon Center Whole Loan”). The Aon Center Whole Loan is comprised of (i) a senior loan, comprised of fourpari passu senior notes with an aggregate original principal balance of $350.0 million (one of which, Note A-2, will be contributed to the Benchmark 2018-B5 Trust and is referred to as the “Aon Center Mortgage Loan” and the remaining notes are collectively referred to as the “Aon Center Pari Passu Companion Loan”) (the Aon Center Mortgage Loan and the Aon Center Pari Passu Companion Loan are collectively referred to as the “Senior Notes”) and (ii) a subordinate companion loan, comprised of one note, with outstanding principal balance of $186.0 million (the “Aon Center Subordinate Companion Loan”). The Aon Center Senior Notes arepari passuin right of payment with each other and are generally senior in right of payment to the Aon Center Subordinate Companion Loan as and to the extent described in “Description of the Mortgage Pool-The Whole Loans-The Non-Serviced AB Whole Loans-The Aon Center Whole Loan” in the Preliminary Prospectus. The Senior Note A-4 has been contributed to a private CMBS securitization that governs the servicing and administration of the Aon Center Whole Loan and is the controlling note under the related intercreditor agreement, the rights of which will be exercised by the directing certificateholder for the private CMBS securitization (or, following the occurrence and continuance of a control event under the related trust and servicing agreement (the “Aon Center Trust and Servicing Agreement”), the related trustee). However, the Benchmark 2018-B5 Trust will be entitled, under certain circumstances, to be consulted with respect to certain major decisions (which rights will be exercised by the Directing Certificateholder prior to a Control Termination Event). The Aon Center Whole Loan has a 10-year term and will be interest-only for the term of the loan.
| Whole Loan Summary |

THE INFORMATION IN THIS STRUCTURAL AND COLLATERAL TERM SHEET IS NOT COMPLETE AND MAY BE AMENDED PRIOR TO THE TIME OF SALE. THIS TERM SHEET IS NOT AN OFFER TO SELL THESE SECURITIES AND IT IS NOT A SOLICITATION OF AN OFFER TO BUY THESE SECURITIES IN ANY JURISDICTION WHERE THE OFFER OR SALE IS NOT PERMITTED.
| | | |
79 of 130
| Structural and Collateral Term Sheet | Benchmark 2018-B5 | |
| Aon Center | ||
The Borrowers.The borrowing entities for the Aon Center Whole Loan are 601 W Companies LLC and Brickell 13 Chicago LLC, each a Delaware limited liability company and special purpose entity. The borrowers own the Aon Center Property as tenants-in-common.
The Loan Sponsors.The loan sponsors and nonrecourse carve-out guarantors are Mark Karasick and Michael Silberberg, jointly and severally. The 601W Companies, led by key principal Mark Karasick, is a leading private real estate acquisition, ownership, development, and management company. Over the past 15 years, The 601W Companies has acquired a number of commercial properties throughout the country, aggregating approximately 24 million square feet, with a collective value in excess of $5.0 billion. The 601W Companies has raised more than $1.0 billion involving 32 office buildings. Notable investments are the Old Chicago Post Office (Chicago, IL), the Wells Fargo Center (Winston-Salem, NC), One South Broad Street (Philadelphia, PA), 111 West Jackson (Chicago, IL) and Civic Opera Building (Chicago, IL).
The Property.The Aon Center Property is an 83-story, approximately 2.8 million square foot Class A office tower located in the East Loop neighborhood of Chicago, Illinois. The Aon Center Property is the third tallest building in Chicago and occupies an entire city block immediately adjacent to Chicago’s Millennium Park. Furthermore, the Aon Center Property features unobstructed panoramic views of Lake Michigan, Millennium Park, Grant Park and the Chicago River. The Aon Center Property serves as a headquarters location for Aon Corporation (15.2% of net rentable area; rated Baa2/BBB+/A- by Moody’s/Fitch/S&P), Jones Lang LaSalle Inc. (7.2%; Baa1/NA/BBB), Kraft Heinz Food Company (6.1%; Aa2/A+/AA) and Daniel J. Edelman, Inc. (6.6%), as well as a regional hub for institutional quality tenants KPMG, LLP (11.0%), Integrys Business Support, LLC (6.9%; A3/BBB+/A-), Federal Home Loan Bank of Chicago (3.4% Aaa/AAA/AA+) and Microsoft Corporation (2.2%; Aaa/AA+/AAA). Additionally, the Aon Center Property includes a 678-space, four-level underground heated parking garage, resulting in a parking ratio of 0.24 spaces per 1,000 square feet of rentable space.
The Aon Center Property was originally constructed in 1972 and is currently in the midst of a significant renovation that began in 2016. The Aon Center Property has benefitted from a history of institutional ownership and thorough operational and capital improvement program. Dating back to 2003, prior ownership invested approximately $187.8 million in the Aon Center Property’s base building, systems and tenant spaces. According to the sponsors, since acquiring the Aon Center Property in 2015, an additional approximately $62.2 million has been invested towards further renovations and tenant improvements. Further, the sponsors have budgeted approximately $24.7 million for ongoing capital improvement projects, approximately $8.0 million of which was reserved at closing for the completion of the new tenant amenity floor (the remaining amount is not reserved for and is not required to be completed under the Aon Center Whole Loan documents). The Aon Center Property features nearly column-free floorplates, modern building systems, a retail concourse, a complete building amenity package (upon completion of the tenant amenity floor) and access to Chicago’s pedway system with immediate connectivity to the Fairmont Hotel and Lakeshore Sport and Fitness. The Aon Center Property has earned both ENERGY STAR designation and LEED Certification Silver. Additionally, the Aon Center Property was named The Outstanding Building of the Year by a building industry association in 2009/2010.
The sponsors initially acquired the Aon Center Property in 2015 at a cost of approximately $712.0 million ($256 per square foot). At the time of acquisition, DDB Needham one of the largest tenants (previously occupied 212,261 square feet), communicated its intent to vacate the Aon Center Property at the end of its lease in June 2018. Furthermore, DDB’s lease called for a free rent period over the final 30 months of its lease term. Since acquiring the Aon Center Property, the sponsors have marketed the building to a number of institutional quality and investment grade tenants, while also fully revamping the lobby and common areas and adding a state of the art tenant amenity floor (expected to be completed by year-end 2018). The tenant amenity floor is expected to include a modern gym, conference space and tenant lounge. The sponsors have backfilled a large portion of the DDB space to three tenants: Centene (32,478 square feet), HY Connect (21,728 square feet) and Slalom (64,956 square feet). This is consistent with overall leasing momentum at the Aon Center Property, having over 270,000 square feet (including the three tenants in the previous sentence) in new and expansion leases year signed to date at a weighted average term of 11.3 years and underwritten base rent of $25.15 per square foot.
The AON Center Property is located in Chicago’s East Loop office submarket, affording tenants immediate access to public transportation, as well as the city’s entertainment, hospitality and residential districts. The Aon Center Property’s location links the Magnificent Mile retail corridor to Chicago’s recreational and cultural destinations, and is anchored by Millennium Park and the State Street retail corridor. In particular, the Aon Center Property benefits from direct access to Lake Shore Drive and several key north/south thoroughfares via Route 290, including Michigan Avenue as well as Wacker Drive, which is a major artery that follows the south and east banks of the Chicago River within the CBD. Furthermore, the Aon Center Property provides access to public transportation with five of the seven CTA “L” lines accessible within two blocks, the Ogilvie Transportation Center located 11 blocks west of the Aon Center Property and commuter train service to the entire metropolitan area.
As of May 1, 2018, the Aon Center Property was 87.9% leased to 52 tenants, including a mix of international, institutional quality tenancy. Approximately 53.3% and 62.1% of net rentable area and underwritten base rent, respectively, are attributable to investment grade tenants. The Aon Center Property’s ten largest tenants (eight of which have investment grade credit ratings) occupy approximately 1.8 million square feet (63.4% of net rentable area) on a long-term basis with a weighted average remaining lease term of approximately 10.1 years.
THE INFORMATION IN THIS STRUCTURAL AND COLLATERAL TERM SHEET IS NOT COMPLETE AND MAY BE AMENDED PRIOR TO THE TIME OF SALE. THIS TERM SHEET IS NOT AN OFFER TO SELL THESE SECURITIES AND IT IS NOT A SOLICITATION OF AN OFFER TO BUY THESE SECURITIES IN ANY JURISDICTION WHERE THE OFFER OR SALE IS NOT PERMITTED.
| | | |
80 of 130
| Structural and Collateral Term Sheet | Benchmark 2018-B5 | |
| Aon Center | ||
The largest tenant, Aon Corporation (423,047 square feet; 15.2% of net rentable area; 14.6% of Underwritten Base Rent) (“Aon Corporation”) (rated Baa2/BBB+/A- by Moody’s, Fitch and S&P) (NYSE: AON), is a global professional services firm headquartered in London that provides consulting and solutions to clients focused on risk, retirement and health. Aon Corporation was founded in 1982 and has since grown to approximately 50,000 employees worldwide, serving 120 countries. Aon Corporation provides its services to all market segments, including individuals through personal lines, mid-market companies and large global companies, and serves almost every industry worldwide. As of 2017, Aon had revenues of approximately $10.0 billion and total assets of $26.1 billion.Aon Corporation currently occupies floors 3-15 through December 2028 and has two five-year renewal options.Aon currently subleases a portion of its space totaling 15,850 square feet to an affiliate, Hewitt Associates LLC, through December 2028.
The second largest tenant, KPMG LLP (304,439 square feet; 11.0% of net rentable area; 12.3% of Underwritten Base Rent) (“KPMG”), is a professional service company and one of the big four accounting firms. The company is headquartered in Amstelveen, the Netherlands, and employs approximately 197,263 people as of 2017. KPMG’s main lines of services include financial audit, tax and advisory and its practices serve companies across the globe. As of 2017, KPMG has revenues of approximately $26.4 billion, comprised of $10.4 billion across its audit business, $10.2 billion across its advisorybusinessand $5.8 billion across its tax business. KPMG recently executed a 31,654 square feet expansion lease commencing in July 2018 and is expected to complete build-out of its expansion space in August 2018 and take physical occupancy in September 2018. KPMG leases floors 51, 53-61, 67 and 68 through August 2027 and has three five-year renewal options.
The third largest tenant, Jones Lang LaSalle Inc. (“JLL”) (200,730 square feet; 7.2% of net rentable area; 8.1% of Underwritten Base Rent) (rated Baa1/BBB by Moody’s and S&P) (NYSE: JLL), is a globalprofessionalservices and investment management firm specializing in real estate and is a member of the Fortune 500. JLL’s teams provide integrated services to clients seeking increased value by owning, occupying, developing or investing in real estate. Headquartered in Chicago, JLL was founded in 1999 through the merger of Jones Lang Wootton and LaSalle Partners and currently employs approximately 82,000 people across 80 countries. As of 2017, JLL has revenue of $7.9 billion, managed approximately 4.6 billion square feet of space and completed investment sales, acquisitions and finance transactions of approximately $170 billion. JLL occupies floors 43-48 through May 2032 and has two five-year renewal options.
The Aon Center property is located in the central business district of Chicago, Illinois in the East Loop submarket within the greater Chicago office market. The East Loop submarket contains approximately 28.2 million square feet of office space and is bordered by the Chicago River to the north, Congress parkway to the south, Lake Michigan to the east and State Street to the west. The greater Chicago-Naperville-Joliet MSA ranks second nationally in total office inventory behind New York, containing nearly 234.3 million square feet of office space. Chicago’s largest employers include a diverse group of multinational corporations representing a variety of industries including telecommunications, aviation, manufacturing, retail and banking. Thirty-one of the nation’s Fortune 500 corporations are headquartered in the Chicago region including Walgreens, Boeing, United Continental Holdings, Inc., The Allstate Corporation, Exelon Corporation, McDonald’s Corporation, Sears Holdings Corporation and US Foods, Inc.
As of the first quarter of 2018, the greater Chicago Class A office market consisted of approximately 95.9 million square feet across 112 buildings with an overall market vacancy of 11.8% and average asking rents of approximately $31.88 PSF. At a more granular level, the East Loop Class A submarket totaled approximately 15.7 million square feet across 15 buildings with an overall market vacancy of 11.0% and average market asking rents of $24.59 PSF. The overall East Loop submarket vacancy rate is currently 10.6% which is down 1.2% compared to year-end 2017. During the same time period, quoted asking rents have increased modestly from $27.74 PSF to $28.10 PSF.
The appraisal identified eight Class A/B office rent comparables in the East Loop submarket with comparable buildings built between 1965 and 2005 and ranging in size from 737,308 square feet to 3,903,883 square feet. Recently executed leases at the comparable properties across approximately 853,121 square feet. in recent leasing ranged between $18.25 and $30.00 PSF with a weighted average of approximately $27.85 PSF. Based on the eight Class A/B office rent comparables identified, Class A properties have generally demanded rents nearly $10.00 PSF greater than Class B properties in the market. Over 270,000 square feet in leases signed year-to-date at the Aon Center property have been executed at a weighted average rent of approximately $25.15 PSF, in-line with leasing identified in the appraisal. Based on the appraiser’s analysis and concluded market rent across categories, the Aon Center property’s in-place rent is approximately 20% below market.
THE INFORMATION IN THIS STRUCTURAL AND COLLATERAL TERM SHEET IS NOT COMPLETE AND MAY BE AMENDED PRIOR TO THE TIME OF SALE. THIS TERM SHEET IS NOT AN OFFER TO SELL THESE SECURITIES AND IT IS NOT A SOLICITATION OF AN OFFER TO BUY THESE SECURITIES IN ANY JURISDICTION WHERE THE OFFER OR SALE IS NOT PERMITTED.
| | | |
81 of 130
| Structural and Collateral Term Sheet | Benchmark 2018-B5 | |
| Aon Center | ||
| Historical and Current Occupancy(1) | |||||
| 2014 | 2015(2) | 2016 | 2017 | Current(3) | |
| 78.9% | NAV | 77.7% | 85.0% | 87.9% | |
| (1) | Historical Occupancies are as of December 31 of eachrespective year. |
| (2) | 2015 Occupancy is unavailable due to the timing of the sponsors’ acquisition of the Aon Center Property. |
| (3) | Current Occupancy is as of May 1, 2018.As of May 1, 2018, the Aon Center Property had a physical occupancy of 87.9%. Current Occupancy has been underwritten to the in-place rent roll as of May 1, 2018, inclusive of recently executed leases for which certain tenants are not yet in occupancy or paying rent. Most notably, occupancy reflects 132,933 square feet (4.8% of NRA) associated with recent new and expansion leasing, as well as three executed leases that are anticipated to backfill a portion of the vacant DDB space. See “The Property” herein. In certain instances, such tenants are currently in occupancy of temporary space at the Aon Center Property. |
| Tenant Summary(1) | ||||||
| Tenant | Ratings(2) Moody’s/Fitch/S&P | Net Rentable Area (SF) | % of Total NRA | Base Rent PSF(3) | % of Total Base Rent | Lease Expiration Date(4) |
| Aon Corporation(5) | Baa2 / BBB+ / A- | 423,047 | 15.2% | $18.04 | 14.6% | 12/31/2028 |
| KPMG LLP(6) | NA / NA / NA | 304,439 | 11.0 | $21.01 | 12.3% | 8/5/2027 |
| Jones Lang LaSalle Inc. | Baa1 / NA / BBB | 200,730 | 7.2 | $20.95 | 8.1% | 5/31/2032 |
| Integrys Business Support LLC(7) | A3 / BBB+ / A- | 190,997 | 6.9 | $20.96 | 7.7% | 4/30/2029 |
| Daniel J. Edelman, Inc(8) | NA / NA / NA | 183,719 | 6.6 | $21.39 | 7.5% | 12/31/2024 |
| Kraft Heinz Foods Company | Aa2 / A+ / AA | 169,717 | 6.1 | $25.13 | 8.2% | 6/30/2029 |
| Federal Home Loan Bank Chicago | Aaa / AAA / AA+ | 95,405 | 3.4 | $23.19 | 4.2% | 12/31/2024 |
| Strata Decision Technology(6) | Baa3 / NA / BBB+ | 66,483 | 2.4 | $22.98 | 2.9% | 3/31/2029 |
| Kemper Corporation(6) | Baa3 / BBB- / BBB- | 64,956 | 2.3 | $25.23 | 3.1% | 12/31/2033 |
| Microsoft Corporation | Aaa / AA+ / AAA | 61,478 | 2.2 | $20.21 | 2.4% | 10/31/2022 |
| Total Major Office | 1,760,971 | 63.4% | $21.04 | 71.1% | ||
| Other Occupied Office(9) | 504,221 | 18.2 | $22.29 | 21.6% | ||
| Total Occupied Office | 2,265,192 | 81.6% | $21.32 | 92.7% | ||
| Retail | 22,729 | 0.8 | $39.47 | 1.7% | ||
| Telecom | 77,930 | 2.8 | $31.50 | 4.7% | ||
| Storage | 10,925 | 0.4 | $14.68 | 0.3% | ||
| Amenities / Building Office | 65,080 | 2.3 | $4.56 | 0.6% | ||
| Total Occupied Space | 2,441,856 | 87.9% | $21.34 | 100.0% | ||
| Vacant(10) | 335,384 | 12.1 | ||||
| Total / Wtd. Avg. | 2,777,240 | 100.0% | ||||
| (1) | Based on the underwritten rent roll dated as of May 1, 2018. |
| (2) | In certain instances, ratings provided are those of the federal government or parent company of the entity shown, whether or not the federal government or parent company guarantees the lease. |
| (3) | Base Rent PSF represents average rents over the term of the Aon Center Whole Loan for select investment grade tenants, including Jones Lang LaSalle Inc., Integrys Business Support, LLC, Kraft Heinz Foods Company, Kemper Corporation and AT&T Illinois a/k/a Illinois Bell Telephone. |
| (4) | Certain tenants may have termination or contraction options (which may become exercisable prior to the originally stated expiration date of the tenant lease). See“Description of the Mortgage Pool—Tenant Issues—Lease Expirations and Terminations” in the Preliminary Prospectus. |
| (5) | Aon Corporation subleases a portion of its space totaling 15,850 square feet to an affiliate, Hewitt Associates LLC, through December 2028. |
| (6) | With respect to the KPMG LLC leased space, 31,654 square feet is attributable to an executed expansion lease commencing in July 2018. KPMG LLC is expected to complete build-out of its expansion space in August 2018 and take physical occupancy in September 2018. Strata Decision Technology (only with respect to 16,318 square feet of its leased space) and Kemper Corporation are associated with recently executed leases, but are not yet in occupancy or paying rent. Strata Decision Technology (only with respect to 16,318 square feet of its leased space) and Kemper Corporation are expected to take occupancy in March 2019 and January 2019, respectively. |
| (7) | Integrys Business Support, LLC leases 190,997 square feet, of which (i) 159,554 square feet, accounting for $20.38 PSF in underwritten base rent, expires in April 2029 and (ii) 31,443 square feet, accounting for $23.89 PSF in underwritten base rent, expires in February 2025. |
| (8) | Daniel J. Edelman, Inc subleases a portion of its space totaling (i) 8,864 square feet to Gatesman, Inc. at a base rent of approximately $22.50 PSF and (ii) 5,642 square feet to Eshots, Inc. at a base rent of approximately $26.50 PSF, in each case through December 2021. |
| (9) | Inclusive of 64,956 square feet associated with Slalom Inc., accounting for approximately $1.6 million in underwritten base rent, which has recently executed its lease, but is not yet in occupancy. Slalom Inc. currently has an anticipated lease commencement date in January 2019. |
| (10) | The DDB leased space has been underwritten as vacant, though three tenants are anticipated to backfill a portion of the DDB space pursuant to executed leases, totaling 119,216 square feet that have been underwritten as in place. |
THE INFORMATION IN THIS STRUCTURAL AND COLLATERAL TERM SHEET IS NOT COMPLETE AND MAY BE AMENDED PRIOR TO THE TIME OF SALE. THIS TERM SHEET IS NOT AN OFFER TO SELL THESE SECURITIES AND IT IS NOT A SOLICITATION OF AN OFFER TO BUY THESE SECURITIES IN ANY JURISDICTION WHERE THE OFFER OR SALE IS NOT PERMITTED.
| | | |
82 of 130
| Structural and Collateral Term Sheet | Benchmark 2018-B5 | |
| Aon Center | ||
| Lease Rollover Schedule(1)(2) | |||||||||
| Year | Number of Leases Expiring | Net Rentable Area Expiring | % of NRA Expiring | Base Rent Expiring | % of Base Rent Expiring | Cumulative Net Rentable Area Expiring | Cumulative % of NRA Expiring | Cumulative Base Rent Expiring | Cumulative % of Base Rent Expiring |
| Vacant | NAP | 335,384 | 12.1% | NAP | NAP | 335,384 | 12.1% | NAP | NAP |
| 2018 & MTM | 4 | 6,158 | 0.2% | $323,744 | 0.6% | 341,542 | 12.3% | $323,744 | 0.6% |
| 2019 | 3 | 424 | 0.0% | 0 | 0.0% | 341,966 | 12.3% | $323,744 | 0.6% |
| 2020 | 0 | 0 | 0.0% | 0 | 0.0% | 341,966 | 12.3% | $323,744 | 0.6% |
| 2021 | 2 | 5,779 | 0.2% | 148,453 | 0.3% | 347,745 | 12.5% | $472,198 | 0.9% |
| 2022 | 4 | 109,478 | 3.9% | 2,022,002 | 3.9% | 457,223 | 16.5% | $2,494,200 | 4.8% |
| 2023 | 8 | 151,229 | 5.4% | 3,195,022 | 6.1% | 608,452 | 21.9% | $5,689,221 | 10.9% |
| 2024 | 8 | 348,190 | 12.5% | 7,947,889 | 15.3% | 956,642 | 34.4% | $13,637,111 | 26.2% |
| 2025 | 2 | 72,236 | 2.6% | 1,662,740 | 3.2% | 1,028,878 | 37.0% | $15,299,850 | 29.4% |
| 2026 | 3 | 84,153 | 3.0% | 1,606,355 | 3.1% | 1,113,031 | 40.1% | $16,906,206 | 32.4% |
| 2027 | 4 | 318,885 | 11.5% | 6,827,641 | 13.1% | 1,431,916 | 51.6% | $23,733,847 | 45.6% |
| 2028 & Beyond(3) | 15 | 1,345,324 | 48.4% | 28,365,507 | 54.4% | 2,777,240 | 100.0% | $52,099,354 | 100.0% |
| Total | 53 | 2,777,240 | 100.0% | $52,099,354 | 100.0% | ||||
| (1) | Based on the underwritten rent roll dated May 1, 2018. |
| (2) | Certain tenants may have termination or contraction options (which may become exercisable prior to the originally stated expiration date of the tenant lease) that are not considered in the above Lease Rollover Schedule. |
| (3) | 2028 & Beyond is inclusive of (i) 34,129 square feet associated with the tenant amenity floor currently under construction and anticipated to provide a gym and conference center upon completion with no attributable underwritten base rent, (ii) 4,871 square feet associated with building amenities including the security and concierge office, each of which has no attributable underwritten base rent and (ii) the building management office comprised of 4,994 square feet, accounting for $96,945 in underwritten base rent. |
| Operating History and Underwritten Net Cash Flow(1)(2) | |||||||
| 2014 | 2016 | 2017 | TTM(3) | Underwritten | Per Square Foot | %(4) | |
| Rents in Place(5)(6) | $37,867,681 | $39,670,015 | $ 45,487,490 | $45,850,620 | $52,099,354 | $18.76 | 47.1% |
| Vacant Income | 0 | 0 | 0 | 0 | 7,155,753 | 2.58 | 6.5 |
| Gross Potential Rent | $37,867,681 | $39,670,015 | $45,487,490 | $45,850,620 | $59,255,107 | $21.34 | 53.6% |
| Total Reimbursements(6) | 32,101,525 | 32,292,738 | 36,506,554 | 38,420,245 | 46,839,313 | 16.87 | 42.4 |
| Total Other Income | 5,007,573 | 4,808,987 | 4,526,297 | 4,517,840 | 4,493,365 | 1.62 | 4.1 |
| Net Rental Income | $74,976,779 | $76,771,740 | $86,520,341 | $88,788,705 | $110,587,785 | $39.82 | 100.0% |
| Less: Vacancy | 0 | 0 | 0 | 0 | (12,812,153) | (4.61) | (13.1) |
| Effective Gross Income | $74,976,779 | $76,771,740 | $86,520,341 | $88,788,705 | $97,775,632 | $35.21 | 100.0% |
| Total Operating Expenses | 40,147,832 | 41,160,114 | 43,960,435 | 45,406,455 | 46,208,188 | 16.64 | 47.3 |
| Net Operating Income(7) | $34,828,947 | $35,611,627 | $42,559,906 | $43,382,250 | $51,567,444 | $18.57 | 52.7% |
| TI/LC | 0 | 0 | 0 | 0 | 1,388,620 | 0.50 | 1.4 |
| Capital Expenditures | 0 | 0 | 0 | 0 | 472,131 | 0.17 | 0.5 |
| Net Cash Flow(8) | $34,828,947 | $35,611,627 | $42,559,906 | $43,382,250 | $49,706,693 | $17.90 | 50.8% |
| (1) | Based on the underwritten rent roll dated May 1, 2018. |
| (2) | Complete 2015 financials are not available due to timing of the sponsors’ acquisition of the Aon Center Property. |
| (3) | TTM column represents the trailing 12-month period ending on April 30, 2018. |
| (4) | % column represents percent of Net Rental Income for all revenue lines and represents percent of Effective Gross Income for the remainder of the fields. |
| (5) | Underwritten Rents in Place includes rent steps though May 2019 and is adjusted for vacated space (DDB) and pending leases (Jimmy John’s Sub and United States Postal Service underwritten based on most recent draft of the related leases). Investment grade tenants with a lease expiration date one year beyond the Aon Center Whole Loan maturity are underwritten to average rent over loan term. In total, Underwritten Base Rent is inclusive of approximately $4.1 million attributable to average rent and contractual rent steps. |
| (6) | Rents in Place and Total Reimbursements for historical periods 2014, 2016, 2017 and TTM have been adjusted to gross up for actual rent abatements and abated recoveries totaling approximately $12.0 million, $15.3 million, $20.7 million and $20.9 million, respectively. A detailed breakdown is not available for the 2014 period as the Aon Center Property was owned and managed by a prior owner and manager. The aggregate full year 2016, 2017 and TTM April 30, 2018 rent abatement and abated recovery figures in the preceding sentence are primarily attributable to free rent and abated recovery periods associated with DDB (approximately $16.6 million) (which had a free rent period for the last 30 months of its contractual lease term and vacated in June 2018), Kraft Heinz (approximately $6.7 million), Aon Corporation (approximately $5.5 million), Jones Lang LaSalle (approximately $6.6 million) and Integrys (approximately $2.4 million). The remaining aggregate full year 2016, 2017 and TTM April 30, 2018 amount of $4.1 million is attributable to rent abatements and abated recoveries across eight other tenants. |
| (7) | The increase in 2017 Net Operating Income from 2016 Net Operating Income is primarily attributable to leasing over the course of 2016 and 2017, including Kraft Heinz (169,717 square feet), KPMG expansion space (31,654 square feet) and Strata Decision Technology (16,793 square feet), collectively accounting for approximately $9.7 million in underwritten gross rent. |
| (8) | The increase in Underwritten Net Cash Flow from TTM April 30, 2018 Net Cash Flow is primarily attributable to (i) over 270,000 square feet in new and expansion leasing executed year-to-date, accounting for approximately $6.8 million in underwritten base rent and (ii) approximately $4.1 million in average rent and contractual rent steps. |
THE INFORMATION IN THIS STRUCTURAL AND COLLATERAL TERM SHEET IS NOT COMPLETE AND MAY BE AMENDED PRIOR TO THE TIME OF SALE. THIS TERM SHEET IS NOT AN OFFER TO SELL THESE SECURITIES AND IT IS NOT A SOLICITATION OF AN OFFER TO BUY THESE SECURITIES IN ANY JURISDICTION WHERE THE OFFER OR SALE IS NOT PERMITTED.
| | | |
83 of 130
| Structural and Collateral Term Sheet | Benchmark 2018-B5 | |
| Aon Center | ||
Property Management.The Aon Center Property is managed by Jones Lang LaSalle Americas (Illinois) L.P., an Illinois limited partnership.
Escrows and Reserves.At loan origination, the borrowers deposited (i) $38,000,000 into a new lease reserve (as described below), (ii) $18,300,000 into a performance reserve (as described below), (iii) $13,236,245 into an outstanding tenant improvements and leasing commission reserve, (iv) $7,960,197 into an amenity floor capital expenditure reserve, (v) $6,612,672 into a tax reserve account, (vi) $5,235,989 into an outstanding free rent reserve for all outstanding free rent over the first 12-months of the Aon Center Whole Loan term (representing over 50% of total free rent over the term of the loan; the unreserved portion of free rent over the loan term is approximately 87.9% attributable to investment grade tenants), (vii) $1,084,347 into an insurance reserve account and (viii) $69,978 into a required repairs reserve account.
On the origination date, the borrowers deposited with the lender $38,000,000, which amount is required to be held by the lender to cover tenant improvement obligations and/or leasing commissions for tenants that enter into Qualified Lease(s) (as defined below) after the closing date.
“Qualified Lease” means (a) certain existing leases specified in the mortgage loan documents (accounting for $16,896,608 in outstanding tenant improvement and leasing commission obligations), (b) any lease entered into after the origination date that qualifies for reimbursement or direct payment of leasing costs from the new lease reserve and otherwise satisfies the leasing criteria set forth in the mortgage loan documents; provided, however, that the lender can approve a lease for reimbursement or payment of leasing costs that does not otherwise meet the threshold for Qualified Leases; and provided further that, in the event a lease provides for leasing costs in excess of the maximum TI/LC amounts set forth on the applicable schedule to the mortgage loan agreement, such lease can still be deemed a Qualified Lease if the borrowers deposit the amount of the excess into the new lease reserve account.
On the origination date, the borrowers deposited with the lender $18,300,000 into a performance reserve, which amount is required to be held by the lender for capital expenditures and leasing costs that are reasonably approved by the lender. The performance reserve will be available to the borrowers for lender approved capital expenditures and reimbursement or direct payment of leasing costs provided the Performance Thresholds (as defined below) have been satisfied and a Cash Sweep Event has not occurred; provided, however, that such disbursements will not be duplicative of expenditures or costs for which funds have been disbursed from the rollover reserve fund, the new lease reserve, the outstanding tenant improvement and leasing commission reserve or the amenity floor capital expenditure reserve.
“Performance Threshold” means the execution of the Slalom lease (which has already occurred prior to the origination date) and a Qualified Lease equal to 35,000 square feet. The lender is required to release a pro-rata portion of the performance reserve in the event the borrowers sign a Qualified Lease of less than 35,000 square feet but more than 17,500 square feet.
Tax Reserve. The borrowers are required to deposit into a real estate tax reserve, on a monthly basis, 1/12 of annual real estate taxes, initially approximately $1,502,880.
Insurance Reserve. The borrowers are required to deposit into an insurance reserve, on a monthly basis, 1/12 of estimated insurance premiums (initially approximately $120,483). In the event the borrowers obtain and maintain a blanket insurance policy in form and substance reasonably acceptable to the lender and there is no event of default, the requirement for monthly deposits into the insurance reserve will be waived.
Replacement Reserve. The borrowers are required to deposit into a replacement reserve, on a monthly basis, 1/12 of $0.25 multiplied by the aggregate amount of rentable square feet at the Aon Center Property, initially approximately $57,859.
TI/LC Reserve Account. Commencing on the one year anniversary of the first payment date, the borrowers are required to deposit into a TI/LC reserve, on a monthly basis, approximately 1/12 of $0.75 multiplied by the aggregate amount of rentable square feet at the Aon Center Property, subject to a cap of $5,600,000. The borrowers are also required to deposit any termination fees or other consideration payable in connection with any early termination of a lease at the Aon Center Property.
Lockbox / Cash Management.The Aon Center Whole Loan is structured with a hard lockbox and springing cash management. The borrowers were required at origination to deliver tenant direction letters instructing all tenants to deposit rents into a lockbox account controlled by the lender. All funds in the lockbox account are required to be swept daily into the borrowers’ operating account, unless a Cash Sweep Event (as defined below) is continuing, in which event such funds are required to be swept not less than two times per week into a cash management account controlled by the lender and disbursed on each payment date in accordance with the loan documents. The lender has been granted a first priority security interest in the cash management account.
A “Cash Sweep Event” means the occurrence of (i) an event of default, (ii) a DSCR Trigger Event (as defined below), (iii) any bankruptcy action of the borrower or property manager, (iv) a Major Tenant Trigger Event (as defined below) or (v) an event of default under the mezzanine loans.
THE INFORMATION IN THIS STRUCTURAL AND COLLATERAL TERM SHEET IS NOT COMPLETE AND MAY BE AMENDED PRIOR TO THE TIME OF SALE. THIS TERM SHEET IS NOT AN OFFER TO SELL THESE SECURITIES AND IT IS NOT A SOLICITATION OF AN OFFER TO BUY THESE SECURITIES IN ANY JURISDICTION WHERE THE OFFER OR SALE IS NOT PERMITTED.
| | | |
84 of 130
| Structural and Collateral Term Sheet | Benchmark 2018-B5 | |
| Aon Center | ||
A Cash Sweep Event may be cured in accordance with the following conditions: with respect to a Cash Sweep Event caused solely by (a) clause (i) above, the acceptance of a cure by the lender of the related event of default, (b) clause (ii) above, a DSCR Cure Event (as defined below) has taken place, (c) clause (iii) above if borrower has replaced the manager with a qualified manager under a replacement management agreement within 60 days in accordance with the loan documents, (d) clause (iv) above, if the Cash Sweep Event is caused solely by the occurrence of a Major Tenant Trigger Event (as defined below) other than an Aon Trigger Event (as defined below), if the borrowers lease all or substantially all of the space previously leased to the respective major tenant that is the cause of such Major Tenant Trigger Event to one or more replacement tenant(s) reasonably acceptable to the lender pursuant to a lease(s) reasonably acceptable to the lender or if the Cash Sweep Event is caused solely by the occurrence of an Aon Trigger Event (as defined below), the borrowers lease all or substantially all of the space previously leased to Aon Corporation that has been vacated, abandoned or subleased to one or more replacement tenants reasonably acceptable to the lender pursuant to one or more leases reasonably acceptable to the lender, or the applicable space is being subleased by Aon Corporation to one or more investment grade rated tenant(s) who has accepted delivery of the related space and is paying unabated rent in an amount no less that the contract rate of the Aon lease or (e) clause (v) above, the acceptance of a cure by the mezzanine lender of the related mezzanine event of default. Each cure is also subject to the following conditions: (1) no other event of default may have occurred and be continuing; (2) a cure may occur no more than two times in the aggregate during the term of the Aon Center Whole Loan; and (3) the borrowers pay the lender’s reasonable expenses in connection with such cure. Notwithstanding the foregoing, in no event will the borrowers have the right to cure a Cash Sweep Event occurring from a borrower bankruptcy.
“DSCR Trigger Event” means the date on which the debt service coverage ratio (as calculated in the loan documents and including mezzanine debt service) based on the trailing three-month period immediately preceding the date of determination is less than 1.10x commencing on the date that is six months from loan origination.
“DSCR Cure Event” means the debt service coverage ratio, based on the trailing three-month period immediately preceding the date of determination, is at least 1.25x for two consecutive quarters.
“Major Tenant Trigger Event” means (a) any bankruptcy or insolvency action of JLL, Aon or KPMG, (b) if Aon vacates, abandons or subleases more than 50.0% or more of its premises at the Aon Center Property (an “Aon Trigger Event”) or (c) if JLL, Aon or KPMG terminates its lease without the lender’s approval.
Additional Debt. Two mezzanine loans, with an aggregate principal balance of $141.5 million were funded concurrently with the Aon Center Whole Loan. The Mezzanine A loan has an original principal balance of $73.75 million, accrues interest at a rate of 5.2500% and is senior to the Mezzanine B loan. The Mezzanine B loan has an original principal balance of $67.75 million and accrues interest at a rate of8.8000%.Both the Mezzanine A and Mezzanine B loans are interest-only for their full term and are coterminous with the Aon Center Whole Loan. Both the Mezzanine A and Mezzanine B loans have been soldby JPMCB to one or more third party investors. Including the Aon Center Whole Loan and mezzanine loans, calculated net of the $18.3 million performance reserve, the cumulative Cut-off Date LTV (based on the Hypothetical Appraised Value of $824 million), cumulative UW NCF DSCR and cumulative UW NOI Debt Yield are 80.0%, 1.42x and 7.8%, respectively. Assuming release of the $18.3 million performance reserve (without consideration for additional leasing), Aon Center Whole Loan and the mezzanine loans result in a cumulative Cut-off Date LTV (based on the Hypothetical Appraised Value of $824 million), cumulative UW NCF DSCR and cumulative UW NOI Debt Yield of 82.2%, 1.42x and 7.6%, respectively. The cumulative Cut-off Date LTV (unadjusted for the $18.3 million performance reserve) based on the “As Is” Appraised Value of $780.0 million is 86.9%. The mortgage and mezzanine lenders have entered into an intercreditor agreement.
Partial Release.The borrowers are permitted to obtain thereleaseof the non-income producing, non-office component of the Aon Center Property in connection with the creation of an observation deck at the Aon Center Property (which will be comprised of an observatory and entertainment center on floors 81-83 of the building) without any requirement to pay any portion of the loan, any release amount, prepayment fee, yield maintenance premium or otherwise, upon satisfaction of the conditions set forth in the loan documents. The appraisal did not attribute any value to such component.
THE INFORMATION IN THIS STRUCTURAL AND COLLATERAL TERM SHEET IS NOT COMPLETE AND MAY BE AMENDED PRIOR TO THE TIME OF SALE. THIS TERM SHEET IS NOT AN OFFER TO SELL THESE SECURITIES AND IT IS NOT A SOLICITATION OF AN OFFER TO BUY THESE SECURITIES IN ANY JURISDICTION WHERE THE OFFER OR SALE IS NOT PERMITTED.
| | | |
85 of 130
| Structural and Collateral Term Sheet | Benchmark 2018-B5 | |
| 181 Fremont Street | ||

THE INFORMATION IN THIS STRUCTURAL AND COLLATERAL TERM SHEET IS NOT COMPLETE AND MAY BE AMENDED PRIOR TO THE TIME OF SALE. THIS TERM SHEET IS NOT AN OFFER TO SELL THESE SECURITIES AND IT IS NOT A SOLICITATION OF AN OFFER TO BUY THESE SECURITIES IN ANY JURISDICTION WHERE THE OFFER OR SALE IS NOT PERMITTED.
| | | |
86 of 130
| Structural and Collateral Term Sheet | Benchmark 2018-B5 | |
| 181 Fremont Street | ||
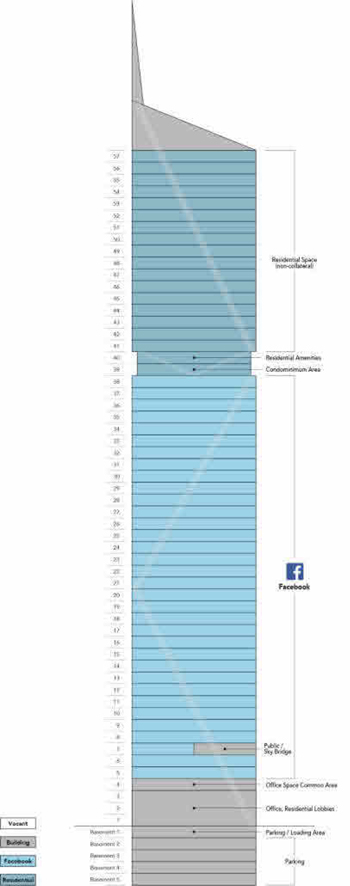
THE INFORMATION IN THIS STRUCTURAL AND COLLATERAL TERM SHEET IS NOT COMPLETE AND MAY BE AMENDED PRIOR TO THE TIME OF SALE. THIS TERM SHEET IS NOT AN OFFER TO SELL THESE SECURITIES AND IT IS NOT A SOLICITATION OF AN OFFER TO BUY THESE SECURITIES IN ANY JURISDICTION WHERE THE OFFER OR SALE IS NOT PERMITTED.
| | | |
87 of 130
| Structural and Collateral Term Sheet | Benchmark 2018-B5 | |
| 181 Fremont Street | ||

THE INFORMATION IN THIS STRUCTURAL AND COLLATERAL TERM SHEET IS NOT COMPLETE AND MAY BE AMENDED PRIOR TO THE TIME OF SALE. THIS TERM SHEET IS NOT AN OFFER TO SELL THESE SECURITIES AND IT IS NOT A SOLICITATION OF AN OFFER TO BUY THESE SECURITIES IN ANY JURISDICTION WHERE THE OFFER OR SALE IS NOT PERMITTED.
| | | |
88 of 130
| Structural and Collateral Term Sheet | Benchmark 2018-B5 | |
| 181 Fremont Street | ||
| Mortgage Loan Information | Property Information | |||
| Mortgage Loan Seller(1): | GACC | Single Asset / Portfolio: | Single Asset | |
| Original Principal Balance(2): | $40,000,000 | Title: | Fee | |
| Cut-off Date Principal Balance(2): | $40,000,000 | Property Type - Subtype: | Office – CBD | |
| % of Pool by IPB: | 3.8% | Net Rentable Area (SF): | 436,332 | |
| Loan Purpose: | Refinance | Location: | San Francisco, CA | |
| Borrower: | 181 Fremont Office LLC | Year Built / Renovated: | 2018 / N/A | |
| Sponsor(3): | Joseph K. Paul | Occupancy: | 100.0% | |
| Interest Rate(4): | 3.7086% | Occupancy Date: | 8/6/2018 | |
| Note Date: | 3/29/2018 | Number of Tenants: | 1 | |
| Anticipated Repayment Date(4): | 4/6/2028 | 2015 NOI(6): | N/A | |
| Final Maturity Date(4): | 4/6/2031 | 2016 NOI(6): | N/A | |
| Interest-only Period: | 120 months | 2017 NOI(6): | N/A | |
| Original Term(4): | 120 months | TTM NOI(6): | N/A | |
| Original Amortization: | None | UW Economic Occupancy: | 97.0% | |
| Amortization Type: | ARD-Interest Only | UW Revenues: | $43,664,053 | |
| Call Protection(5): | L(23),Gtr1%orYM(5), DeforGtr1%orYM(85),O(7) | UW Expenses: | $14,094,390 | |
| Lockbox / Cash Management: | Hard / In Place | UW NOI: | $29,569,663 | |
| Additional Debt(2): | Yes | UW NCF: | $29,482,397 | |
| Additional Debt Balance(2): | $210,000,000 / $225,000,000 | Appraised Value / Per SF(7): | $632,000,000 / $1,448 | |
| Additional Debt Type: | Pari Passu / Mezzanine Loans | Appraisal Date(7): | 3/1/2021 | |
| Escrows and Reserves(8) | Financial Information(2) | ||||||
| Initial | Monthly | Initial Cap | Cut-off Date Loan / SF: | $573 | |||
| Taxes: | $0 | $509,418 | N/A | Maturity Date Loan / SF: | $573 | ||
| Insurance: | $0 | Springing | N/A | Cut-off Date LTV: | 39.6% | ||
| Replacement Reserves: | $0 | Springing | N/A | Maturity Date LTV: | 39.6% | ||
| TI/LC: | $42,717,266 | $0 | N/A | UW NCF DSCR: | 3.14x | ||
| Other: | $68,379,092 | Springing | (8) | UW NOI Debt Yield: | 11.8% | ||
| Sources and Uses | ||||||
| Sources | Proceeds | % of Total | Uses | Proceeds | % of Total | |
| Mortgage Loan | $250,000,000 | 52.6% | Payoff Existing Debt | $362,943,921 | 76.3% | |
| Mezzanine Loans | 225,000,000 | 47.3% | Upfront Reserves | 111,096,358 | 23.4% | |
| Sponsor Equity | 695,692 | 0.1% | Closing Costs | 1,655,413 | 0.3% | |
| Total Sources | $475,695,692 | 100.0% | Total Uses | $475,695,692 | 100.0% | |
| (1) | The 181 Fremont Street Whole Loan (as defined in “The Loan” section below) was co-originated by Deutsche Bank AG, acting through its New York Branch and Barclays Bank PLC. |
| (2) | The 181 Fremont Street loan is part of a whole loan evidenced by sevenpari passu notes with an aggregate outstanding principal balance of $250.0 million. The Financial Information presented in the chart above reflects the $250.0 million aggregate Cut-off Date balance of the 181 Fremont Street Whole Loan. |
| (3) | The nonrecourse carve-out guarantor is a Paul Guarantor LLC as described in the “Loan Sponsor” section below. |
| (4) | The 181 Fremont Street Whole Loan has an anticipated repayment date of April 6, 2028 (the “Anticipated Repayment Date” or “ARD”) and a final maturity date of April 6, 2031. From and after the Anticipated Repayment Date, the 181 Fremont Street Whole Loan accrues interest at a fixed rate that is equal to the greater of (i) 3.7086% (the “Initial Interest Rate”) plus 1.5000%, (ii) the 10-year swap rate as of the ARD plus 2.4146% or (iii) when applicable, the default rate as defined in the 181 Fremont Street Whole Loan documents (the “Adjusted Interest Rate”); however, interest accrued at the excess of the Adjusted Interest Rate over the Initial Interest Rate (the “Accrued Interest”) will be deferred. In addition, from and after the ARD, all excess cash flow from the 181 Fremont Street property after the payment of reserves, interest calculated at the Initial Interest Rate, debt service on the 181 Fremont Street Mezzanine Loans and operating expenses will be applied (i)firstto repay the principal balance of the 181 Fremont Street Whole Loan and (ii)second to the payment of Accrued Interest. |
| (5) | The lockout period will be at least 23 payments beginning with and including the first payment date of May 6, 2018. Defeasance of the 181 Fremont Street Mortgage Whole Loan is permitted at any time after the earlier to occur of (i) two years after the closing date of the securitization that includes the lastpari passunote to be securitized and (ii) March 29, 2021. The assumed lockout period applicable to defeasance of 28 payments is based on the expected Benchmark 2018-B5 securitization closing date in August 2018. The actual lockout period may be longer. The borrower is also permitted to prepay the 181 Fremont Street Whole Loan on or after the payment date in April 2020 with a payment of a yield maintenance premium. |
| (6) | Historical NOI is not available because the 181 Fremont Street property was constructed in 2018. |
| (7) | Appraised Value shown is a prospective market value at stabilization that assumes the 181 Fremont Street property achieves stabilization as of March 1, 2021, the date upon which all free rent burns off. The “As-Is” Appraised Value is $461,000,000 as of February 28, 2018 and is inclusive of deductions for free rent, tenant improvement and leasing commission (“TI/LC”) obligations, which equates to a Cut-off Date LTV Ratio and Balloon LTV of 54.2%. At loan origination, the borrower deposited upfront reserves equal to $111,096,358 for such contractual TI/LC obligations and free rent. In addition, the appraiser concluded a “hypothetical go dark” appraised value of $522.0 million as of February 28, 2018, which equates to a loan-to-dark value ratio of 47.9%. |
(8) For a full description of Escrows and Reserves, please refer to the “Escrows and Reserves” section below.
THE INFORMATION IN THIS STRUCTURAL AND COLLATERAL TERM SHEET IS NOT COMPLETE AND MAY BE AMENDED PRIOR TO THE TIME OF SALE. THIS TERM SHEET IS NOT AN OFFER TO SELL THESE SECURITIES AND IT IS NOT A SOLICITATION OF AN OFFER TO BUY THESE SECURITIES IN ANY JURISDICTION WHERE THE OFFER OR SALE IS NOT PERMITTED.
| | | |
89 of 130
| Structural and Collateral Term Sheet | Benchmark 2018-B5 | |
| 181 Fremont Street | ||
The Loan.The 181 Fremont Street loan is secured by a first mortgage lien on the borrower’s fee interest in the Class A office condominium portion of 181 Fremont Street in San Francisco, California. The whole loan has an outstanding principal balance as of the Cut-off Date of $250.0 million (the “181 Fremont Street Whole Loan”), and is comprised of sevenpari passu notes, each as described below. The non-controlling Note A-5 with an outstanding principal balance as of the Cut-off Date of $40.0 million, will be contributed to the Benchmark 2018-B5 Trust. The remaining notes are currently held by the parties described in the “Whole Loan Summary” chart below and have been or are expected to be contributed to one or more future securitization trusts. The 181 Fremont Street Whole Loan is structured with an ARD of April 6, 2028, a final maturity date of April 6, 2031 and will be interest-only for the entire term until the ARD. Defeasance of the 181 Fremont Street Whole Loan is permitted at any time after the earlier to occur of (i) two years after the closing date of the securitization that includes the last note to be securitized or (ii) March 29, 2021. On April 6, 2020 and on any business day thereafter, the borrower has the right to prepay the 181 Fremont Street Whole Loan in whole, provided that the borrower pays the greater of a yield maintenance premium or a prepayment premium equal to 1.0% of the principal amount being prepaid. The relationship between the holders of the 181 Fremont Street Whole Loan will be governed by a co-lender agreement as described under “Description of the Mortgage Pool—The Whole Loans—The Non-Serviced Pari Passu Whole Loans” in the Preliminary Prospectus.
| Whole Loan Summary | |||||
| Note | Original Balance | Cut-off Date Balance | Note Holder | Controlling Piece | |
| A-5 | $40,000,000 | $40,000,000 | Benchmark 2018-B5 | No | |
| A-1, A-4 | $80,000,000 | $80,000,000 | Benchmark 2018-B4 | Yes | |
| A-2 | $58,000,000 | $58,000,000 | BANK 2018-BNK12 | No | |
| A-6-1 | $30,000,000 | $30,000,000 | WFCM 2018-C44 | No | |
| A-3 | $22,000,000 | $22,000,000 | Wells Fargo Bank, N.A. | No | |
| A-6-2 | $20,000,000 | $20,000,000 | Barclays Bank PLC | No | |
| Total | $250,000,000 | $25,000,000 | |||
The Borrower.The borrower is 181 Fremont Office LLC, a single-purpose Delaware limited liability company structured to be bankruptcy remote with two independent directors.
The Loan Sponsor.The loan sponsor of the 181 Fremont Street Whole Loan is Joseph K. Paul, the founder of the Jay Paul Company, a privately held real estate firm based in San Francisco, California. Founded in 1975, the Jay Paul Company concentrates on the acquisition, development and management of commercial properties throughout California. The Jay Paul Company has developed over 11.0 million square feet of institutional quality space with an additional 6.0 million square feet of space in its development pipeline. The Jay Paul Company has built projects for Google, Apple, Amazon, Motorola, Microsoft, Northrop Grumman, HP, Ariba, Synopsys, Rambus, Nokia and Dreamworks, among others. The non-recourse carveout guarantor is Paul Guarantor LLC, a Delaware limited liability company that is wholly owned by the Jay Paul Revocable Living Trust, of which Joseph K. Paul is the trustee and grantor.
The Property.The 181 Fremont Street property comprises the office condominium portion of a 57-story Class A, LEED Platinum tower constructed in 2018 and located in downtown San Francisco, California (see “Condominium” section below). The 181 Fremont Street tower consists of 654,698 square feet of total gross building area, with 436,332 square feet allocated to office space on the first 38 stories (collateral for the 181 Fremont Street Whole Loan) and 120,457 square feet of space allocated to 67 luxury market rate residential units on floors 39 to 57 (non-collateral). The 181 Fremont Street tower is over 800 feet tall and offers unobstructed views of the San Francisco Bay and the waterfront.
As of August 6, 2018, the 181 Fremont Street property was 100.0% leased to Facebook, Inc. (“Facebook”) on a triple-net basis through February 2031, with two, five-year extension options and no early termination options. As of the origination date, Facebook has taken possession of the 181 Fremont Street property and commenced the build out of its space. Outstanding rent concessions and tenant improvement allowances related to the Facebook lease were deposited into escrow by the borrower on the origination date. According to the borrower sponsor, Facebook is expected to occupy the 181 Fremont Street property in three phases with floors five through 13 expected to be occupied in February 2019, floors 14 through 25 expected to be occupied in March 2020 and floors 26 through 38 expected to be occupied in March 2021. Floors two and three are partially open to the first floor and also consist of residential storage and security offices. The fourth floor features bicycle storage, showers, storage and laundry areas.
Facebook is a technology company whose platforms allow users to communicate with family, friends and coworkers. Facebook currently shuttles thousands of employees to its Silicon Valley headquarters and is now adding a San Francisco footprint, as other technology companies have done, including Google and Apple. The 181 Fremont Street property will be Facebook’s first outpost in San Francisco, expected to house between 2,000 and 3,000 employees by 2021 to support its growth. One of Facebook’s divisions, Instagram, will be one of the groups to move a team into the 181 Fremont Street property. Daily and monthly active users across
THE INFORMATION IN THIS STRUCTURAL AND COLLATERAL TERM SHEET IS NOT COMPLETE AND MAY BE AMENDED PRIOR TO THE TIME OF SALE. THIS TERM SHEET IS NOT AN OFFER TO SELL THESE SECURITIES AND IT IS NOT A SOLICITATION OF AN OFFER TO BUY THESE SECURITIES IN ANY JURISDICTION WHERE THE OFFER OR SALE IS NOT PERMITTED.
| | | |
90 of 130
| Structural and Collateral Term Sheet | Benchmark 2018-B5 | |
| 181 Fremont Street | ||
Facebook’s platforms were up approximately 14.0% in 2017 year-over-year. As of December 2017, there were approximately 2.1 billion active users on Facebook each month, as of January 2018 there were 1.5 billion active users on WhatsApp (owned by Facebook) each month, and as of September 2017 there were 800 million active users on Instagram each month. Facebook reported 2017 revenue of approximately $40.7 billion, up approximately 47.1% over 2016, which is primarily attributable to approximately $39.9 billion of advertising revenue. Additionally, Facebook reported net income of approximately $15.9 billion in 2017, up approximately 56.0% from 2016.
The 181 Fremont Street property is located in San Francisco, California. According to the appraisal, the 181 Fremont Street property is located within the South Financial District office submarket. The South Financial District office submarket had fourth quarter 2017 inventory of approximately 15,384,000 square feet with a 7.6% vacancy rate and average asking rents of $72.94 per square foot, as compared to the broader San Francisco office market which had a 9.8% vacancy rate and average asking rents of $56.66 per square foot for the same period. The estimated 2017 population within a one-, three- and five-mile radius around the 181 Fremont Street property was 66,410, 369,991 and 636,799, respectively, reflective of a population compound growth rate from 2010 to 2017 of 1.6%, 1.5% and 1.3%, respectively. The estimated 2017 median household income within the same radii was $59,179, $78,089 and $82,936, respectively.
The following table presents certain information relating to comparable leases to the 181 Fremont Street property:
| Comparable Office Leases(1) | |||||||||
| Property Name | Year Built | # of Stories | Total GLA (Sq. Ft.) | Tenant Name | Lease Date | Term (Mos.) | Lease Area (Sq. Ft.) | Annual Base Rent | Lease Type |
| 181 Fremont Street Property | 2018 | 38 | 436,332 | Mar-18 | 156 | 436,332 | $61.80 | NNN | |
| Salesforce Tower | 2018 | 61 | 1,400,000 | Accenture | Mar-17 | 61 | 100,630 | $52.00 | Net |
| Two Rincon | 1989 | 6 | 326,001 | Mar-17 | 132 | 166,460 | $52.00 | NNN | |
| Foundry Square IV | 2003 | 10 | 247,238 | Slack | Jan-17 | 120 | 228,998 | $56.50 | Net |
| Charles Schwab Plaza | 1973 | 17 | 417,266 | Charles Schwab | Dec-16 | 120 | 359,000 | $50.00 | Net |
| First Market Tower | 1973 | 39 | 1,034,329 | Merrill Lynch | Dec-16 | 72 | 121,000 | $40.00 | Net |
| 350 Bush | 2018 | 19 | 386,907 | Twitch | Nov-17 | 120 | 178,000 | $62.00 | Net |
| Confidential | 2018 | 19 | 386,907 | NAV | May-18 | 136 | 145,217 | $67.00 | Net |
| Confidential | 2018 | 19 | 386,907 | NAV | Oct-18 | 128 | 52,880 | $69.00 | Net |
| (1) | Source: Appraisal |
| Historical and Current Occupancy(1) | |||
| 2015 | 2016 | 2017 | Current(2) |
| N/A | N/A | N/A | 100.0% |
| (1) | Historical occupancy is not available because the 181 Fremont Street property was constructed in 2018. |
| (2) | Current occupancy is as of August 6, 2018. |
| Tenant Summary(1) | ||||||||
| Tenant | Ratings Moody’s/S&P/Fitch | Net Rentable Area (SF) | % of Total NRA | Base Rent PSF(2) | % of Base Rent | Lease Expiration Date | ||
| NA / NA / NA | 436,332 | 100.0% | $72.22 | 100.0% | 2/28/2031 | |||
| (1) | Based on the underwritten rent roll dated August 6, 2018. |
| (2) | Base Rent PSF includes $4,546,579 of straight-line rent through the expiration date of the Facebook lease. The current annual base rent PSF as of the closing date is $61.80. |
THE INFORMATION IN THIS STRUCTURAL AND COLLATERAL TERM SHEET IS NOT COMPLETE AND MAY BE AMENDED PRIOR TO THE TIME OF SALE. THIS TERM SHEET IS NOT AN OFFER TO SELL THESE SECURITIES AND IT IS NOT A SOLICITATION OF AN OFFER TO BUY THESE SECURITIES IN ANY JURISDICTION WHERE THE OFFER OR SALE IS NOT PERMITTED.
| | | |
91 of 130
| Structural and Collateral Term Sheet | Benchmark 2018-B5 | |
| 181 Fremont Street | ||
| Lease Rollover Schedule(1) | ||||||||||
| Year | Number of Leases Expiring | Net Rentable Area Expiring | % of NRA Expiring | Base Rent Expiring(2) | % of Base Rent Expiring | Cumulative Net Rentable Area Expiring | Cumulative % of NRA Expiring | Cumulative Base Rent Expiring(2) | Cumulative % of Base Rent Expiring | |
| Vacant | NAP | 0 | 0.0% | NAP | NAP | 0 | 0.0% | NAP | NAP | |
| 2018 & MTM | 0 | 0 | 0.0% | $0 | 0.0%% | 0 | 0.0% | $0 | 0.0% | |
| 2019 | 0 | 0 | 0.0% | 0 | 0.0 | 0 | 0.0% | $0 | 0.0% | |
| 2020 | 0 | 0 | 0.0% | 0 | 0.0 | 0 | 0.0% | $0 | 0.0% | |
| 2021 | 0 | 0 | 0.0% | 0 | 0.0 | 0 | 0.0% | $0 | 0.0% | |
| 2022 | 0 | 0 | 0.0% | 0 | 0.0 | 0 | 0.0% | $0 | 0.0% | |
| 2023 | 0 | 0 | 0.0% | 0 | 0.0 | 0 | 0.0% | $0 | 0.0% | |
| 2024 | 0 | 0 | 0.0% | 0 | 0.0 | 0 | 0.0% | $0 | 0.0% | |
| 2025 | 0 | 0 | 0.0% | 0 | 0.0 | 0 | 0.0% | $0 | 0.0% | |
| 2026 | 0 | 0 | 0.0% | 0 | 0.0 | 0 | 0.0% | $0 | 0.0% | |
| 2027 | 0 | 0 | 0.0% | 0 | 0.0 | 0 | 0.0% | $0 | 0.0% | |
| 2028 | 0 | 0 | 0.0 | 0 | 0.0 | 0 | 0.0% | $0 | 0.0% | |
| 2029 & Beyond | 1 | 436,332 | 100.0% | 31,511,897 | 100.0% | 436,332 | 100.0% | $31,511,897 | 100.0% | |
| Total | 1 | 436,332 | 100.0% | $31,511,897 | 100.0% | |||||
| (1) | Based on the underwritten rent roll dated August 6, 2018. |
| (2) | Base Rent Expiring includes $4,546,579 of straight-line rent through the expiration date of the Facebook lease. The current annual base rent PSF as of the closing date is $61.80. |
| Underwritten Net Cash Flow(1) | |||
| Underwritten | Per Square Foot | %(2) | |
| Base Rent | $26,965,318 | $61.80 | 59.9% |
| Credit Tenant Rent Steps(3) | 4,546,579 | 10.42 | 10.1% |
| Value of Vacant Space | 0 | 0.00 | 0.0% |
| Gross Potential Rent | $31,511,897 | $72.22 | 70.0% |
| Total Recoveries | 13,502,591 | 30.95 | 30.0% |
| Net Rental Income | 45,014,488 | $103.17 | 100.0% |
| Less: Vacancy | (1,350,435) | (3.09) | (3.1)% |
| Effective Gross Income | $43,664,053 | $100.07 | 97.0% |
| Total Variable Expenses | 7,268,479 | 16.66 | 16.6% |
| Total Fixed Expenses | 6,825,911 | 15.64 | 15.6% |
| Net Operating Income | $29,569,663 | $67.77 | 67.7% |
| TI/LC | 0 | 0.00 | 0.0% |
| Capital Expenditures | 87,266 | 0.20 | 0.2% |
| Net Cash Flow | $29,482,397 | $67.57 | 67.5% |
| (1) | Historical financial information is not available as the 181 Fremont Street property was constructed in 2018. |
| (2) | % column represents percent of Net Rental Income for all revenue lines and represents percent of Effective Gross Income for the remainder of the fields. |
| (3) | Credit Tenant Rent Steps reflect the straight-line rent through the expiration date of the Facebook lease. |
Property Management.The 181 Fremont Street property is managed by Paul Holdings, Inc., an affiliate of the borrower.
Escrows and Reserves.
Tax Escrows –On a monthly basis, the borrower is required to deposit an amount equal to 1/12 of the estimated annual real estate taxes, which currently equate to $509,418, into a tax reserve.
Insurance Escrows –Insurance escrows are waived so long as the 181 Fremont Street property is covered by an acceptable blanket policy (which is currently maintained). If such condition is no longer satisfied, on each due date, the borrower will be required to fund an insurance reserve in a monthly amount equal to 1/12 of the amount that the lender estimates will be necessary to pay the annual insurance premiums.
Replacement Escrows –On a monthly basis, during the continuance of a Trigger Period, the borrower is required to escrow an amount equal to approximately $7,272 into a capital expenditure reserve.
THE INFORMATION IN THIS STRUCTURAL AND COLLATERAL TERM SHEET IS NOT COMPLETE AND MAY BE AMENDED PRIOR TO THE TIME OF SALE. THIS TERM SHEET IS NOT AN OFFER TO SELL THESE SECURITIES AND IT IS NOT A SOLICITATION OF AN OFFER TO BUY THESE SECURITIES IN ANY JURISDICTION WHERE THE OFFER OR SALE IS NOT PERMITTED.
| | | |
92 of 130
| Structural and Collateral Term Sheet | Benchmark 2018-B5 | |
| 181 Fremont Street | ||
TI/LC Reserves –At loan origination, the borrower deposited $42,717,266 for outstanding tenant improvements and leasing commissions into a TI/LC reserve.
Free Rent Reserves.At loan origination, the borrower deposited $68,379,092 into a free rent reserve.
Lockbox / Cash Management. The 181 Fremont Street Whole Loan is structured with a hard lockbox and in place cash management. The borrower was required at origination to deliver letters to all tenants at the 181 Fremont Street property directing them to pay all rents directly into a lender-controlled lockbox account. All funds received by the borrower or the manager are required to be deposited in the lockbox account within one business day following receipt. Funds on deposit in the lockbox account are required to be swept on each business day into a lender-controlled cash management account and applied on each payment date to the payment of debt service, the funding of required reserves, budgeted monthly operating expenses, debt service on the 181 Fremont Street Mezzanine Loans (as defined below) and, during a Lease Sweep Period (as defined below), to the payment of an amount equal to $636,318 to fund a lease sweep reserve account (the “Lease Sweep Reserve Account”) until the aggregate funds swept in the Lease Sweep Reserve Account during such lease sweep equals the Lease Sweep Reserve Threshold (as defined below) and then to the debt service reserve account until the aggregate funds transferred to the Lease Sweep Reserve Account and the debt service reserve account during such lease sweep equals the Lease Sweep and Debt Service Reserve Cap (as defined below). Provided no Trigger Period (as defined below) is continuing, excess cash in the deposit account will be disbursed to the borrower in accordance with the 181 Fremont Street Whole Loan documents. If a Trigger Period is continuing (other than a Trigger Period due to a Lease Sweep Period), excess cash in the deposit account will be transferred to an account (the “Cash Collateral Account”) held by the lender as additional collateral for the 181 Fremont Street Whole Loan.
A “Trigger Period” will commence upon the earliest to occur of (i) the ARD, (ii) an event of default under the 181 Fremont Street Whole Loan documents, (iii) as of the last day of any calendar quarter during the term of the 181 Fremont Street Whole Loan, (a) the 181 Fremont Street property not being fully leased to either Facebook or an investment grade tenant pursuant to a lease that is substantially on the same or better terms as the Facebook lease and (b) the debt service coverage ratio falling below 2.84x based on the 181 Fremont Street Whole Loan or 1.25x based on the 181 Fremont Street Total Debt (as defined below) (a “Low Debt Service Period”), (iv) the commencement of a Lease Sweep Period or (v) an event of default under the 181 Fremont Street Mezzanine Loans, and shall end upon, (a) with respect to clause (i) above, upon the 181 Fremont Street Whole Loan being repaid in full, (b) with respect to clause (ii) and (v) above, upon the cure of such event of default, (c) with respect to clause (iii) above, upon the date that the debt service coverage ratio is at least 2.84x based on the 181 Fremont Street Whole Loan and 1.25x based on the 181 Fremont Street Total Debt for two consecutive calendar quarters and (d) with respect to clause (iv) above, upon the ending of such Lease Sweep Period.
A “Lease Sweep Period” will commence upon the earliest to occur of (i) the date on which, with respect to any Lease Sweep Lease (as defined below), (a) a Lease Sweep Tenant Party (as defined below) cancels or terminates its Lease Sweep Lease with respect to all or a Material Termination Portion (as defined below) of the Lease Sweep Space (as defined below), subject to such Lease Sweep Lease prior to the then current expiration date under such Lease Sweep Lease, or (b) a Lease Sweep Tenant Party delivers to the borrower notice that it is canceling or terminating its Lease Sweep Lease with respect to all or a Material Termination Portion of the Lease Sweep Space subject to such Lease Sweep Lease (the affected space being the “Terminated Space”);provided, however, no Lease Sweep Period will commence pursuant to this clause (i) if, in connection with such termination or cancellation (or delivery of notice of termination or cancellation), the borrower simultaneously enters into a replacement lease with an entity or a wholly-owned subsidiary of an entity rated “BBB-” or equivalent by at least two of Fitch, Moody’s and S&P (an “Investment Grade Entity”) covering the Terminated Space,provided that such replacement lease is a qualified lease and the occupancy conditions, as specified in the 181 Fremont Street Whole Loan documents, are satisfied with respect to such replacement lease on or prior to the date of such termination or cancellation (or delivery of notice of termination or cancellation), (ii) the date on which, with respect to any Lease Sweep Lease, a Lease Sweep Tenant Party ceases operating its business (i.e., “goes dark”) at 20.0% or more of its Lease Sweep Space on a rentable square foot basis (a “Dark Period Event” and the affected space, the “Dark Space”),provided, however, that if the Lease Sweep Tenant Party either (a) is Facebook, (b) is an Investment Grade Entity or (c) has subleased the Dark Space portion of its premises to an Investment Grade Entity who has accepted delivery thereof (i.e., the lease has commenced) and is paying unabated rent at a contract rate no less than the contract rate required under the Lease Sweep Lease, such Lease Sweep Tenant Party will not be deemed to have “gone dark” for purposes of this clause (ii) and no Lease Sweep Period will commence pursuant to this clause (ii), (iii) an event of default under a Lease Sweep Lease by the tenant thereunder that continues beyond any applicable notice and cure period, (iv) a Lease Sweep Tenant Party being subject to an insolvency proceeding or (v) the date on which Facebook becomes rated by at least two of Fitch, Moody’s and S&P and thereafter is no longer rated as an Investment Grade Entity (a “Facebook Downgrade Event”). A Lease Sweep Period (other than a Lease Sweep Period triggered by clause (iv) above) will not be triggered (or, if already triggered, may be terminated) if the borrower delivers to the lender an acceptable letter of credit in an amount equal to the applicable Lease Sweep and Debt Service Reserve Cap (as defined below).
A Lease Sweep Period will end upon the earliest of, (a) with respect to clause (i) above, the date on which, with respect to each applicable Lease Sweep Space, one or more replacement tenants acceptable to the lender (in its sole but good faith discretion) execute and deliver replacement lease(s) covering the Requisite Lease Sweep Space (as defined below),provided that such replacement
THE INFORMATION IN THIS STRUCTURAL AND COLLATERAL TERM SHEET IS NOT COMPLETE AND MAY BE AMENDED PRIOR TO THE TIME OF SALE. THIS TERM SHEET IS NOT AN OFFER TO SELL THESE SECURITIES AND IT IS NOT A SOLICITATION OF AN OFFER TO BUY THESE SECURITIES IN ANY JURISDICTION WHERE THE OFFER OR SALE IS NOT PERMITTED.
| | | |
93 of 130
| Structural and Collateral Term Sheet | Benchmark 2018-B5 | |
| 181 Fremont Street | ||
lease(s) are qualified leases and the occupancy conditions, as specified in the 181 Fremont Street Whole Loan documents, are satisfied, (b) with respect to clause (ii) and (v) above, the date on which either (1) one or more replacement tenants acceptable to the lender (in its sole but good faith discretion) execute and deliver replacement lease(s) covering the Requisite Lease Sweep Space,provided that such replacement tenant(s) and lease(s) are qualified leases and the occupancy conditions, as specified in the 181 Fremont Street Whole Loan documents, are satisfied or (2) for a Dark Period Event or a Facebook Downgrade Event, Facebook is restored as an Investment Grade Entity or the entirety of the Lease Sweep Space has been sublet to an Investment Grade Entity who has accepted delivery thereof (i.e., the lease has commenced) and is paying unabated rent at a contract rate no less than the contract rate required under the Lease Sweep Lease, (c) with respect to clause (iii) above, the date on which the event of default has been cured and no other event of default under such Lease Sweep Lease occurs for a period of three consecutive months following such cure, (d) with respect to clause (iv) above, the Lease Sweep Tenant Party insolvency proceeding having terminated and the applicable Lease Sweep Lease having been affirmed, assumed or assigned in a manner satisfactory to the lender and (e) with respect to clause (i), (iii) and (v) above, the date on which the aggregate amount of funds transferred into the Lease Sweep Reserve Account and the debt service reserve account equals the applicable Lease Sweep and Debt Service Reserve Cap and if a Lease Sweep Period is continuing due to the occurrence of more than one Lease Sweep Trigger, the aggregate amount of funds required to be transferred over the course of the Lease Sweep Period will be equal to the amount of the largest Lease Sweep and Debt Service Reserve Cap applicable to all then-continuing Lease Sweep Periods, such that each Lease Sweep Period will be treated as concurrent and not duplicative or independent of another.
The “Lease Sweep Reserve Threshold” means (a) with respect to a Lease Sweep Period continuing solely pursuant to clauses (iii) and/or (v) above, $15,271,620 ($35.00 per square foot) or (b) with respect to a Lease Sweep Period continuing solely pursuant to clause (i) and/or (ii) above, $35.00 per square foot of the Dark Space and/or Terminated Space.
The “Lease Sweep and Debt Service Reserve Cap” means (a) with respect to a Lease Sweep Period continuing solely pursuant to clause (iii) under Lease Sweep Period above, $15,271,620 ($35.00 per square foot), (b) with respect to a Lease Sweep Period continuing solely pursuant to clause (i) above, $35.00 per square foot of the Terminated Space, (c) with respect to a Lease Sweep Period continuing pursuant to clause (ii) above, whether or not a Lease Sweep Period pursuant to clauses (i) and/or (iii) above is concurrently continuing, $50.00 per square foot of Dark Space or (d) with respect to clause (v) above, whether or not a Lease Sweep Period pursuant to clauses (i), (ii) and/or (iii) above is concurrently continuing, $21,816,600 ($50.00 per square foot).
The “Lease Sweep Space” means the space demised under a Lease Sweep Lease.
A “Lease Sweep Lease” is the Facebook lease or any replacement lease or leases which cover at least 75.0% of the rentable square feet demised under the Facebook lease (the “Requisite Lease Sweep Space”).
A “Lease Sweep Tenant Party” means any tenant under a Lease Sweep Lease or its direct or indirect parent company.
A “Material Termination Portion” is, with respect to any space under a Lease Sweep Lease, if the tenant under a Lease Sweep Lease cancels or terminates its Lease Sweep Lease with respect to at least 20,000 square feet of space (or, if a full floor of space is less than 20,000 square feet, a full floor of space) but less than the entirety of the space under such Lease Sweep Lease, the portion of space under the Lease Sweep Lease affected by such cancellation or termination.
Mezzanine or Subordinate Indebtedness Permitted.Deutsche Bank AG, acting through its New York Branch and Barclays Bank PLC funded $225,000,000 of mezzanine debt (the “181 Fremont Street Mezzanine Loans” and together with the 181 Fremont Street Whole Loan, the “181 Fremont Street Total Debt”). The 181 Fremont Street Mezzanine Loans consist of a $175,000,000 senior mezzanine loan and a $50,000,000 junior mezzanine loan. The senior mezzanine loan has a 4.8800% coupon and the junior mezzanine loan has a 6.5000% coupon (in each case the “Mezzanine Initial Interest Rate”). The 181 Fremont Street Mezzanine Loans are interest-only for the full term of the loans and have an ARD and a stated maturity date that are coterminous with the 181 Fremont Street Whole Loan. In the event that the 181 Fremont Street Mezzanine Loans are not repaid in full on or prior to the ARD, the 181 Fremont Street Mezzanine Loans will accrue interest at aper annumrate (in each case, the “Mezzanine Adjusted Interest Rate”) equal to the greater of (a) the Initial Interest Rate plus 1.5000%, (b) the 10-year swap rate as determined in the 181 Fremont Street Mezzanine Loan documents on the ARD plus (i) 2.0860% for the senior mezzanine loan plus 1.5000% and (ii) 3.7060% for the junior mezzanine loan plus 1.5000% or (c) when applicable, the default rate as defined in the 181 Fremont Street Mezzanine Loan documents; however, interest accrued at the excess of the Mezzanine Adjusted Interest Rate over the Mezzanine Initial Interest Rate will be deferred. In addition, from and after the ARD, all excess cash flow from the 181 Fremont Street property after the payment of reserves, interest calculated at the Initial Interest Rate, debt service on the 181 Fremont Street Mezzanine Loans and operating expenses will be applied (i)firstto repay the principal balance of the 181 Fremont Street Whole Loan and (ii)second to the payment of Accrued Interest. From and after the ARD period, the 181 Fremont Street Mezzanine Loans will receive an interest payment amount calculated at the Mezzanine Initial Interest Rate, until the 181 Fremont Street Whole Loan is repaid in full. All excess cash flow will be used to pay down the 181 Fremont Street Whole loan. Based on the 181 Fremont Street Total Debt, the Cut-off Date LTV, UW NCF DSCR and UW NOI Debt Yield are 75.2%, 1.38x and 6.2%, respectively. The mortgage lenders and the mezzanine lenders have entered into an intercreditor agreement. The 181 Fremont Street Mezzanine Loans were sold to third party purchasers. The rights of the
THE INFORMATION IN THIS STRUCTURAL AND COLLATERAL TERM SHEET IS NOT COMPLETE AND MAY BE AMENDED PRIOR TO THE TIME OF SALE. THIS TERM SHEET IS NOT AN OFFER TO SELL THESE SECURITIES AND IT IS NOT A SOLICITATION OF AN OFFER TO BUY THESE SECURITIES IN ANY JURISDICTION WHERE THE OFFER OR SALE IS NOT PERMITTED.
| | | |
94 of 130
| Structural and Collateral Term Sheet | Benchmark 2018-B5 | |
| 181 Fremont Street | ||
lender of the 181 Fremont Street Mezzanine Loans are further described under “Description of the Mortgage Pool—Additional Indebtedness—Mezzanine Indebtedness” in the Preliminary Prospectus.
Condominium.The 181 Fremont Street property is subject to a condominium regime. The 181 Fremont Street property consists of a two-parcel condominium, with the commercial parcel owned by the borrower as collateral for the 181 Fremont Street Whole Loan. The commercial parcel consists of the five basement levels, floors one through 40, the pedestrian bridge connecting 181 Fremont Street to the Transbay Terminal Rooftop Park and the roof of the 181 Fremont Street tower. The residential parcel, inclusive of the 67 luxury market rate residential units on floors 41 through 57, is not owned by the borrower and is not collateral for the 181 Fremont Street Whole Loan. The owner of the commercial parcel has 140 votes out of 200 votes in the condominium association and the owner of the residential parcel has 60 votes out of the 200 votes in the condominium association.
THE INFORMATION IN THIS STRUCTURAL AND COLLATERAL TERM SHEET IS NOT COMPLETE AND MAY BE AMENDED PRIOR TO THE TIME OF SALE. THIS TERM SHEET IS NOT AN OFFER TO SELL THESE SECURITIES AND IT IS NOT A SOLICITATION OF AN OFFER TO BUY THESE SECURITIES IN ANY JURISDICTION WHERE THE OFFER OR SALE IS NOT PERMITTED.
| | | |
95 of 130
| Structural and Collateral Term Sheet | Benchmark 2018-B5 | |
| Nassau Shopping Center | ||
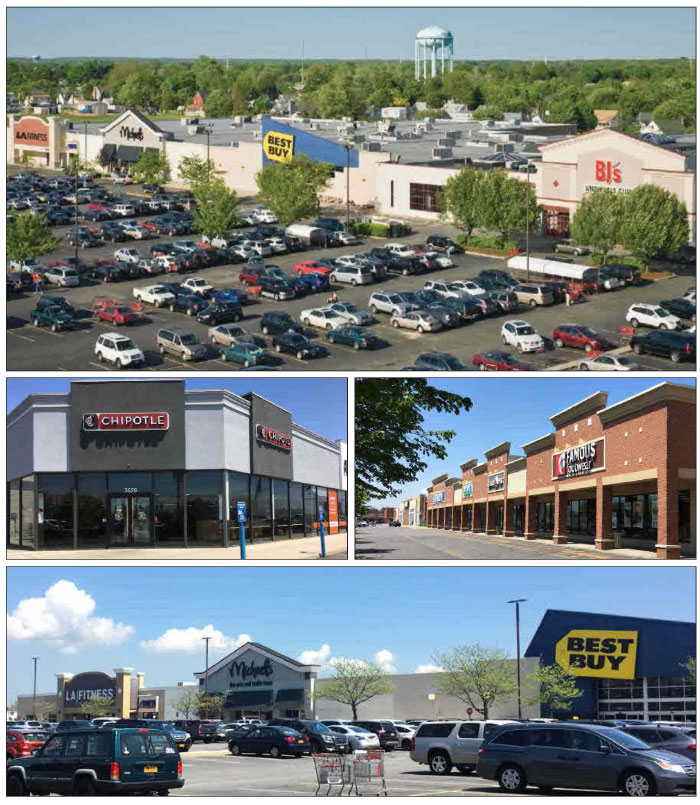
THE INFORMATION IN THIS STRUCTURAL AND COLLATERAL TERM SHEET IS NOT COMPLETE AND MAY BE AMENDED PRIOR TO THE TIME OF SALE. THIS TERM SHEET IS NOT AN OFFER TO SELL THESE SECURITIES AND IT IS NOT A SOLICITATION OF AN OFFER TO BUY THESE SECURITIES IN ANY JURISDICTION WHERE THE OFFER OR SALE IS NOT PERMITTED.
| | | |
96 of 130
| Structural and Collateral Term Sheet | Benchmark 2018-B5 | |
| Nassau Shopping Center | ||
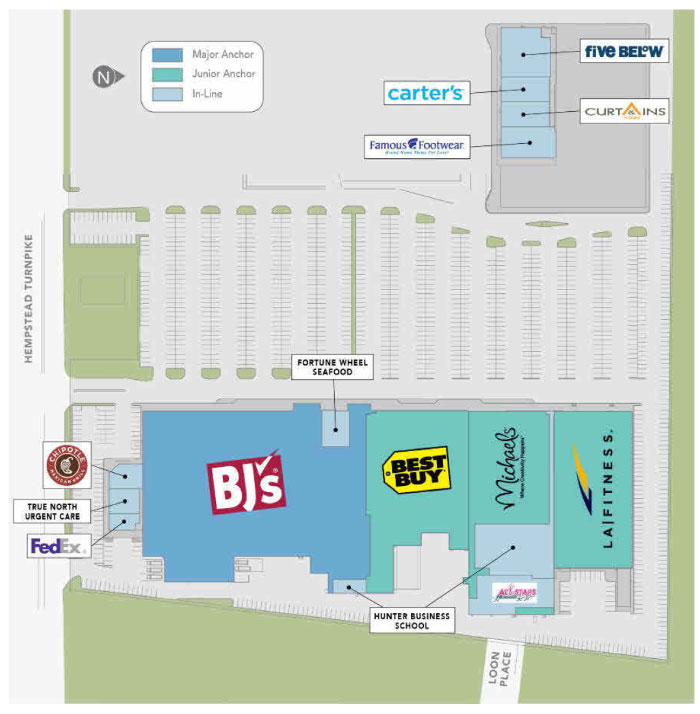
THE INFORMATION IN THIS STRUCTURAL AND COLLATERAL TERM SHEET IS NOT COMPLETE AND MAY BE AMENDED PRIOR TO THE TIME OF SALE. THIS TERM SHEET IS NOT AN OFFER TO SELL THESE SECURITIES AND IT IS NOT A SOLICITATION OF AN OFFER TO BUY THESE SECURITIES IN ANY JURISDICTION WHERE THE OFFER OR SALE IS NOT PERMITTED.
| | | |
97 of 130
| Structural and Collateral Term Sheet | Benchmark 2018-B5 | |
| Nassau Shopping Center | ||
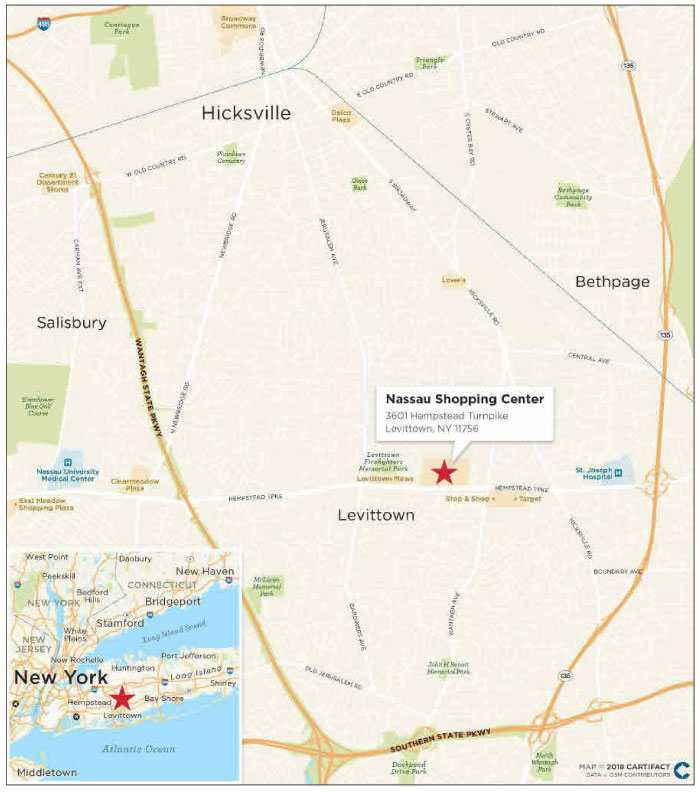
THE INFORMATION IN THIS STRUCTURAL AND COLLATERAL TERM SHEET IS NOT COMPLETE AND MAY BE AMENDED PRIOR TO THE TIME OF SALE. THIS TERM SHEET IS NOT AN OFFER TO SELL THESE SECURITIES AND IT IS NOT A SOLICITATION OF AN OFFER TO BUY THESE SECURITIES IN ANY JURISDICTION WHERE THE OFFER OR SALE IS NOT PERMITTED.
| | | |
98 of 130
| Structural and Collateral Term Sheet | Benchmark 2018-B5 | |
| Nassau Shopping Center | ||
| Mortgage Loan Information | Property Information | |||
| Mortgage Loan Seller: | CREFI | Single Asset / Portfolio: | Single Asset | |
| Original Principal Balance: | $40,000,000 | Title: | Fee | |
| Cut-off Date Principal Balance: | $40,000,000 | Property Type - Subtype: | Retail - Anchored | |
| % of Pool by IPB: | 3.8% | Net Rentable Area (SF): | 291,146 | |
| Loan Purpose: | Refinance | Location: | Levittown, NY | |
| Borrower: | Nassau Mall Fee Owner, LLC | Year Built / Renovated: | 1993 / 2000 | |
| Sponsor: | Jeffrey J. Feil | Occupancy: | 100.0% | |
| Interest Rate: | 4.35500% | Occupancy Date: | 4/1/2018 | |
| Note Date: | 6/28/2018 | Number of Tenants: | 14 | |
| Maturity Date: | 7/6/2028 | 2015 NOI: | $3,978,439 | |
| Interest-only Period: | 120 months | 2016 NOI: | $4,797,629 | |
| Original Term: | 120 months | 2017 NOI: | $4,760,340 | |
| Original Amortization: | None | TTM NOI: (as of 3/2018) | $4,740,230 | |
| Amortization Type: | Interest Only | UW Economic Occupancy: | 95.0% | |
| Call Protection: | L(25),Def(89),O(6) | UW Revenues: | $7,762,650 | |
| Lockbox / Cash Management: | Hard / Springing | UW Expenses: | $3,418,194 | |
| Additional Debt: | N/A
| UW NOI: | $4,344,455 | |
| Additional Debt Balance: | N/A | UW NCF: | $3,952,212 | |
| Additional Debt Type: | N/A | Appraised Value / Per SF: | $73,000,000 / $251 | |
| Appraisal Date: | 5/8/2018 | |||
| Escrows and Reserves(1) | Financial Information | |||||||
| Initial | Monthly | Initial Cap | Cut-off Date Loan / SF: | $137 | ||||
| Taxes: | $458,599 | $229,300 | N/A | Maturity Date Loan / SF: | $137 | |||
| Insurance: | $0 | Springing | N/A | Cut-off Date LTV: | 54.8% | |||
| Replacement Reserves: | $0 | $6,956 | N/A | Maturity Date LTV: | 54.8% | |||
| TI/LC: | $0 | $18,197 | N/A | UW NCF DSCR: | 2.24x | |||
| Other: | $0 | $0 | N/A | UW NOI Debt Yield: | 10.9% | |||
| Sources and Uses(2) | ||||||
| Sources | Proceeds | % of Total | Uses | Proceeds | % of Total | |
| Mortgage Loan | $40,000,000 | 100.0% | Loan Payoff | $12,533,217 | 31.3% | |
| Closing Costs | 1,088,001 | 2.7 | ||||
| Upfront Reserves | 458,599 | 1.1 | ||||
| Return of Equity | 25,920,183 | 64.8 | ||||
| Total Sources | $40,000,000 | 100.0% | Total Uses | $40,000,000 | 100.0% | |
| (1) | For a full description of Escrows and Reserves, please refer to“Escrows and Reserves”below. |
| (2) | Proceeds from the Nassau Shopping Center loan were used to retire existing debt of approximately $12.5 million and return equity to the sponsor of approximately $25.9 million. The sponsor purchased the property in July 1986 for approximately $11.9 million and subsequently invested a total of approximately $25.8 million in the Nassau Shopping Center Property over the 32-year span of ownership. The sponsor’s cost basis in the asset is approximately $37.7 million. |
The Loan.The Nassau Shopping Center loan has an outstanding principal balance as of the Cut-off Date of $40.0 million and is secured by a first mortgage lien on the borrower’s fee interest in a 291,146 square foot anchored retail center located in Levittown, New York (the “Nassau Shopping Center Property”). The Nassau Shopping Center loan has a 10-year term and requires payments of interest only for the entire loan term.
The Borrower.The borrowing entity for the Nassau Shopping Center loan is Nassau Mall Fee Owner, LLC, a Delaware limited liability company and special purpose entity with one independent director in its organizational structure.
The Loan Sponsor.The loan sponsor and nonrecoursecarve-out guarantor for the Nassau Shopping Center loan is Jeffrey J. Feil of the private real estate company known as The Feil Organization. Headquartered in New York City, The Feil Organization currently employs over 400 employees throughout its properties and four management offices. The Feil Organization currently owns, develops and manages over 26.0 million square feet of retail, commercial and industrial properties, over 5,000 residential units, as well as hundreds of net leased properties and thousands of acres of undeveloped land across the United States.
THE INFORMATION IN THIS STRUCTURAL AND COLLATERAL TERM SHEET IS NOT COMPLETE AND MAY BE AMENDED PRIOR TO THE TIME OF SALE. THIS TERM SHEET IS NOT AN OFFER TO SELL THESE SECURITIES AND IT IS NOT A SOLICITATION OF AN OFFER TO BUY THESE SECURITIES IN ANY JURISDICTION WHERE THE OFFER OR SALE IS NOT PERMITTED.
| | | |
99 of 130
| Structural and Collateral Term Sheet | Benchmark 2018-B5 | |
| Nassau Shopping Center | ||
The Property.The Nassau Shopping Center Property is a two-building, 291,146 square foot anchored retail center located on approximately 20.6 acres in Levittown, New York. Construction on the Nassau Shopping Center Property was completed in 1993 and the Nassau Shopping Center Property was further reconfigured and renovated in 2000 to convert smaller inline tenant space into the larger blocks of retail space currently occupied by anchors and junior anchors such as BJ’s Wholesale Club, Best Buy and LA Fitness. The Nassau Shopping Center Property is part of a greater site encompassing approximately 52.0 acres which is also owned by the sponsor and includes an office building and a separate shopping center (the office building and neighboring shopping center are not included as collateral for the Nassau Shopping Center loan). The neighboring shopping center includes tenants such as Kohl’s and AMC Theaters, which serve as shadow anchors to the Nassau Shopping Center Property. As of the underwritten rent roll dated April 1, 2018, the Nassau Shopping Center was 100.0% occupied by 14 tenants including several national tenants such as BJ’s Wholesale Club, Best Buy, Chipotle, Michaels, LA Fitness and Five Below. The Nassau Shopping Center Property offers 1,237 parking spaces which equates to 4.25 parking spaces per 1,000 square feet of net rentable area.
The largest tenant at the Nassau Shopping Center Property is BJ’s Wholesale Club (rated B1/B by Moody’s/S&P) which leases 114,491 square feet through December 8, 2024 and has four, five-year extension options with no termination options. BJ’s Wholesale Club constructed its store at its sole cost and has been in occupancy since December 2004 on its original 20-year lease with the title to the improvements reverting to the landlord upon lease expiration. BJ’s Wholesale Club is the nation’s third largest membership warehouse club with more than 9.0 million members and more than 205 locations across 15 states (with a primary focus on the East Coast). BJ’s Wholesale Club targets individual retail customers rather than small businesses and is owned by an affiliate of Leonard Green & Partners. The second largest tenant at the Nassau Shopping Center Property, Best Buy (46,617 square feet), executed a 15-year original lease commencing in March 2000 and expiring in January 2016, at which point the tenant exercised a five-year extension option. The current Best Buy lease expires in January 2021 and has two, five-year extension options remaining and no termination options. Best Buy is a large consumer electronics outlet chain. Best Buy (rated Baa1/BBB/BBB- by Moody’s/S&P/Fitch) offers products and services through approximately 1,700 retail, mobile stand-alone, and smaller express stores under various Best Buy banners such as Best Buy Mobile, Geek Squad and Best Buy Express. The third largest tenant at the Nassau Shopping Center Property, LA Fitness (40,550 square feet), executed a 15-year lease commencing in March 2012 and expiring in March 2027. LA Fitness has three, five-year extension options and no termination options. LA Fitness was founded in 1984 and currently operates approximately 675 fitness centers across the United States. LA Fitness features diverse sports club amenities, typically including cardio and strength equipment, personal training, indoor cycling, group exercise classes, pool, spa, basketball courts and racquetball.
The Nassau Shopping Center Property is situated approximately 25.0 miles east of Midtown Manhattan in Eastern Nassau County on Long Island, New York. The Nassau Shopping Center Property is part of the Nassau-Suffolk Primary Metropolitan Statistical Area (the “Nassau-Suffolk MSA”) which is the sixth densest MSA in the United States. The top employers in the Nassau-Suffolk MSA consist of Northwell Health, New York State, Catholic Health Services, Nassau County and the United States Federal Government. Access to the Nassau Shopping Center Property is provided primarily from the Wantagh Parkway which connects to both the Northern and Southern State Parkways of Long Island. Access to the Nassau Shopping Center Property is also provided via public transportation by public buses and the Long Island Rail Road (the “LIRR”). The closest LIRR stops include the Hicksville LIRR station (approximately 4.1 miles from the Nassau Shopping Center Property) and the Wantagh LIRR station (approximately 4.4 miles from the Nassau Shopping Center Property).
According to the appraisal, the Nassau Shopping Center Property is located within the Long Island retail market which, as of the first quarter of 2018, consisted of approximately 24.1 million square feet of retail space with a market vacancy of 6.3% and average gross asking rent per square foot of $28.78. According to the appraisal, the Nassau Shopping Center Property is located within the Hempstead retail submarket which, as of the first quarter of 2018, consisted of approximately 4.8 million square feet of retail space with a submarket vacancy of 6.2% and average gross asking rents per square foot of $32.14 (compared to the weighted average UW gross rent at the Nassau Shopping Center Property of $27.91). The Nassau Shopping Center Property’s weighted average UW gross rent of $27.91 is approximately 6.4% below the concluded gross market rent of $29.81.
According to the appraisal, Nassau County had a total population and average household income as of year-end 2017 of 1,368,111 and $140,500, respectively. As of December 31, 2017, population within a one-, three-, and five-mile radius of the Nassau Shopping Center Property was 23,721, 183,987 and 454,503, respectively. As of December 31, 2017, average household income within a one-, three-, and five-mile radius of the Nassau Shopping Center Property was $116,993, $122,102 and $128,839, respectively.
According to the appraisal, there are eight retail centers with comparable anchor leases located proximate to the Nassau Shopping Center Property within the Long Island Retail market. The eight comparable leases range from 11,225 square feet to 87,788 square feet and with rents ranging from $12.75 per square foot to $36.00 per square foot on a triple-net basis. The appraisal also identified nine retail centers with comparable in-line leases within the Long Island Retail market. The nine comparable in-line leases range from 1,350 square feet to 3,446 square feet with rents ranging from $21.26 per square foot to $65.00 per square foot on a triple-net basis.
THE INFORMATION IN THIS STRUCTURAL AND COLLATERAL TERM SHEET IS NOT COMPLETE AND MAY BE AMENDED PRIOR TO THE TIME OF SALE. THIS TERM SHEET IS NOT AN OFFER TO SELL THESE SECURITIES AND IT IS NOT A SOLICITATION OF AN OFFER TO BUY THESE SECURITIES IN ANY JURISDICTION WHERE THE OFFER OR SALE IS NOT PERMITTED.
| | | |
100 of 130
| Structural and Collateral Term Sheet | Benchmark 2018-B5 | |
| Nassau Shopping Center | ||
| Historical and Current Occupancy(1) | |||
| 2015 | 2016 | 2017 | Current(2) |
| 100.0% | 100.0% | 100.0% | 100.0% |
| (1) | Historical Occupancies are as of December 31 of each respective year. |
| (2) | Current Occupancy is as of April 1, 2018. |
| Tenant Summary(1) | |||||||
| Tenant | Ratings(2) Moody’s/S&P/Fitch | Net Rentable Area (SF) | % of Total NRA | Base Rent PSF | % of Total Base Rent | Lease Expiration Date | |
| BJ’s Wholesale Club | B1/B/NA | 114,491 | 39.3% | $18.56 | 35.1% | 12/8/2024 | |
| Best Buy | Baa1/BBB/BBB- | 46,617 | 16.0% | $22.00 | 16.9% | 1/31/2021 | |
| LA Fitness | NA/NA/NA | 40,550 | 13.9% | $18.63 | 12.5% | 3/31/2027 | |
| Michaels | NA/NA/NA | 27,102 | 9.3% | $15.00 | 6.7% | 2/29/2020 | |
| Hunter Business School(3) | NA/NA/NA | 19,841 | 6.8% | $29.34 | 9.6% | 4/30/2022 | |
| All Stars Gymnastics | NA/NA/NA | 9,781 | 3.4% | $14.33 | 2.3% | 4/30/2022 | |
| Five Below | NA/NA/NA | 7,785 | 2.7% | $23.10 | 3.0% | 1/31/2022 | |
| Famous Footwear | NA/NA/NA | 5,500 | 1.9% | $21.78 | 2.0% | 9/30/2021 | |
| Chipotle | NA/NA/NA | 2,700 | 0.9% | $56.00 | 2.5% | 12/31/2025 | |
| True North Urgent Care | NA/NA/NA | 2,478 | 0.9% | $63.67 | 2.6% | 2/28/2026 | |
| (1) | Based on the underwritten rent roll dated April 1, 2018. |
| (2) | Ratings provided are for the parent company of the entity listed in the “Tenant” field whether or not the parent company guarantees the lease. |
| (3) | Hunter Business School utilizes 19,841 square feet as office space at the Nassau Shopping Center Property and also leases 1,494 square feet of storage space on a month-to-month basis. Annual UW Base Rent associated with the storage space is $14,699 and is not included in the above chart for calculations. Net Rentable Area (SF) and Base Rent PSF for Hunter Business School, inclusive of the storage space, is equal to 21,335 square feet and $27.97, respectively. The figures shown in the chart above represent the calculations for the Hunter Business School office space only. |
| Lease Rollover Schedule(1)(2) | |||||||||||
| Year | Number of Leases Expiring | Net Rentable Area Expiring | % of NRA Expiring | Base Rent Expiring | % of Base Rent Expiring | Cumulative Net Rentable Area Expiring | Cumulative % of NRA Expiring | Cumulative Base Rent Expiring | Cumulative % of Base Rent Expiring | ||
| Vacant | NAP | 0 | 0.0% | NAP | NAP | 0 | 0.0% | NAP | NAP | ||
| 2018 & MTM(3) | 0 | 1,494 | 0.5% | $14,699 | 0.0% | 1,494 | 0.5% | $14,699 | 0.2% | ||
| 2019 | 0 | 0 | 0.0% | 0 | 0.0% | 1,494 | 0.5% | $14,699 | 0.2% | ||
| 2020 | 1 | 27,102 | 9.3% | 406,530 | 6.7% | 28,596 | 9.8% | $421,229 | 6.9% | ||
| 2021 | 3 | 56,117 | 19.3% | 1,237,764 | 20.4% | 84,713 | 29.1% | $1,658,993 | 27.3% | ||
| 2022 | 3 | 37,407 | 12.8% | 902,067 | 14.9% | 122,120 | 41.9% | $2,561,060 | 42.2% | ||
| 2023 | 0 | 0 | 0.0% | 0 | 0.0% | 122,120 | 41.9% | $2,561,060 | 42.2% | ||
| 2024 | 3 | 121,666 | 41.8% | 2,357,265 | 38.8% | 243,786 | 83.7% | $4,918,325 | 81.0% | ||
| 2025 | 1 | 2,700 | 0.9% | 151,200 | 2.5% | 246,486 | 84.7% | $5,069,525 | 83.5% | ||
| 2026 | 2 | 4,110 | 1.4% | 243,460 | 4.0% | 250,596 | 86.1% | $5,312,985 | 87.6% | ||
| 2027 | 1 | 40,550 | 13.9% | 755,484 | 12.4% | 291,146 | 100.0% | $6,068,469 | 100.0% | ||
| 2028 & Beyond | 0 | 0 | 0.0% | 0 | 0.0% | 291,146 | 100.0% | $6,068,469 | 100.0% | ||
| Total | 14 | 291,146 | 100.0% | $6,068,469 | 100.0% | ||||||
| (1) | Based on the underwritten rent roll dated April 1, 2018. |
| (2) | Certain tenants may have termination options or contraction options (which may become exercisable prior to the originally stated expiration date of the tenant lease) that are not considered in the above Lease Rollover Schedule. |
| (3) | Represents 1,494 square feet of storage space leased by Hunter Business School on a month-to-month basis with annual UW Base Rent of $14,699. |
THE INFORMATION IN THIS STRUCTURAL AND COLLATERAL TERM SHEET IS NOT COMPLETE AND MAY BE AMENDED PRIOR TO THE TIME OF SALE. THIS TERM SHEET IS NOT AN OFFER TO SELL THESE SECURITIES AND IT IS NOT A SOLICITATION OF AN OFFER TO BUY THESE SECURITIES IN ANY JURISDICTION WHERE THE OFFER OR SALE IS NOT PERMITTED.
| | | |
101 of 130
| Structural and Collateral Term Sheet | Benchmark 2018-B5 | |
| Nassau Shopping Center | ||
| Operating History and Underwritten Net Cash Flow | ||||||||
| 2015 | 2016 | 2017 | TTM(1) | Underwritten | Per Square Foot | %(3) | ||
| Rents in Place | $5,510,337 | $6,065,650 | $6,169,726 | $6,206,629 | $6,034,131 | $20.73 | 74.1% | |
| Contractual Rent Steps(2) | 0 | 0 | 0 | 0 | 19,639 | 0.07 | 0.2% | |
| Total Reimbursements | 1,777,295 | 1,948,504 | 1,900,682 | 1,850,778 | 2,072,737 | 7.12 | 25.5% | |
| Other Income | 16,563 | 17,081 | 17,727 | 17,976 | 14,699 | 0.05 | 0.2% | |
| Net Rental Income | $7,304,195 | $8,031,235 | $8,088,135 | $8,075,383 | $8,141,206 | $27.96 | 100.0% | |
| (Vacancy/Credit Loss) | 0 | 0 | 0 | 0 | (407,060) | (1.40) | (5.0) | |
| EGI Before Other Income | 7,304,195 | 8,031,235 | 8,088,135 | 8,075,383 | 7,734,146 | 26.56 | 95.0% | |
| Percentage Rent | 18,790 | 33,939 | 39,089 | 28,504 | 28,504 | 0.10 | 0.4% | |
| Effective Gross Income | $7,322,985 | $8,065,174 | $8,127,224 | $8,103,887 | $7,762,650 | $26.66 | 95.4% | |
| Total Expenses | $3,344,546 | $3,267,545 | $3,366,884 | $3,363,657 | $3,418,194 | $11.74 | 44.0% | |
| Net Operating Income | $3,978,439 | $4,797,629 | $4,760,340 | $4,740,230 | $4,344,455 | $14.92 | 56.0% | |
| Total TI/LC, Capex/RR | 0 | 0 | 0 | 0 | 392,244 | 1.35 | 5.1% | |
| Net Cash Flow | $3,978,439 | $4,797,629 | $4,760,340 | $4,740,230 | $3,952,212 | $13.57 | 50.9% | |
| (1) | TTM reflects the trailing 12-month period ending March 31, 2018. |
| (2) | Contractual Rent Steps represent rent steps through February 2019 for various tenants. |
| (3) | % column represents percentage of Net Rental Income for all revenue lines and represents percentage of Effective Gross Income for the remainder of the fields. |
Property Management. The property is managed by Jeffrey Management Corp., an affiliate of the Nassau Shopping Center borrower.
Escrows and Reserves. At origination, the borrower deposited into escrow $458,599 for real estate taxes.
Tax Escrows– On a monthly basis, the borrower is required to escrow 1/12 of the annual estimated tax payments, which currently equates to $229,300.
Insurance Escrows– The requirement for the borrower to make monthly deposits into the insurance escrow is waived so long as the policies required pursuant to the Nassau Shopping Center loan documents are maintained by the borrower pursuant to an approved blanket or umbrella policy.
Replacement Reserves–On a monthly basis, the borrower is required to escrow $6,956 (approximately $0.29 per square foot annually) for replacement reserves. The reserve is not subject to a cap.
TI/LC Reserves–On a monthly basis, the borrower is required to escrow $18,197 (approximately $0.75 per square foot annually) for tenant improvement and leasing commission reserves. The reserve is not subject to a cap.
Lockbox / Cash Management. The Nassau Shopping Center loan is structured with a hard lockbox and springing cash management. The borrower was required to send tenant direction letters to all tenants upon the origination of the loan instructing them to deposit all rents and payments directly into the lockbox account controlled by the lender. Prior to the occurrence of a Trigger Period (as defined below), on each business day all funds in the lockbox account are required to be transferred to or at the direction of the borrower. Upon the occurrence and during the continuance of a Trigger Period, all funds in the lockbox account are required to be swept each business day to a segregated cash management account under the control of the lender and disbursed on each payment date during the term of the loan in accordance with the loan documents. During a Trigger Period, except as described within the related loan documents, all excess cash flow after payment of mortgage debt service, required reserves and operating expenses is required to be held as additional collateral for the loan. The lender has been granted a first priority security interest in the cash management account.
A “Trigger Period” means a period (A) commencing upon the earliest to occur of (i) an event of default, (ii) the debt yield falling below 7.0%, or (iii) a Specified Tenant Trigger Period (as defined below), and (B) expiring upon (x) if the Trigger Period is caused solely by the event described in clause (i) above, the acceptance by the lender of a cure of such event of default, if applicable; (y) if the Trigger Period is caused solely by the event described in clause (ii) above, the debt yield being equal to or greater than 7.5% for two consecutive calendar quarters; or (z) with respect to a Trigger Period caused by the event described in clause (iii) above, the lender’s receipt of reasonably acceptable evidence demonstrating the cure of the applicable event giving rise to the Specified Tenant Trigger Period in accordance with the Nassau Shopping Center loan documents.
A “Specified Tenant Trigger Period” means a period (A) commencing upon the first to occur of (i) the occurrence of a bankruptcy action with respect to a Specified Tenant (as defined below), (ii) any termination or cancellation of a Specified Tenant lease (including, without limitation, rejection in any bankruptcy or similar insolvency proceeding), (iii) a Specified Tenant being in monetary or material non-monetary continuing default beyond any applicable notice or cure periods under its applicable lease, (iv) a Specified Tenant failing to be
THE INFORMATION IN THIS STRUCTURAL AND COLLATERAL TERM SHEET IS NOT COMPLETE AND MAY BE AMENDED PRIOR TO THE TIME OF SALE. THIS TERM SHEET IS NOT AN OFFER TO SELL THESE SECURITIES AND IT IS NOT A SOLICITATION OF AN OFFER TO BUY THESE SECURITIES IN ANY JURISDICTION WHERE THE OFFER OR SALE IS NOT PERMITTED.
| | | |
102 of 130
| Structural and Collateral Term Sheet | Benchmark 2018-B5 | |
| Nassau Shopping Center | ||
in actual, physical possession of its leased space or failing to be open to the public during customary hours and/or going dark, (v) a Specified Tenant giving notice that it is terminating its lease for all or any material portion of its space or (vi) the failure of a Specified Tenant to provide written notice of extension or renewal of its lease on or prior to the earlier of (1) the date occurring 12 months prior to the expiration of the then applicable term of the applicable Specified Tenant lease and (2) the last date on which the applicable Specified Tenant may exercise the then-applicable extension option pursuant to and in accordance with the Specified Tenant lease for the applicable Specified Tenant Renewal Term (as defined below) and (B) expiring upon the first to occur of the lender’s receipt of evidence reasonably acceptable to the lender of any of the following: (1) the satisfaction of the Specified Tenant Cure Conditions or (2) the borrower leasing the entire Specified Tenant space (or applicable portion thereof) for a period of not less than one (1) year (unless the applicable lease is entered into after July 6, 2027, in which case it must have a term that extends past July 6, 2030) in accordance with the applicable terms and conditions under the loan agreement, with the applicable tenant being in physical occupancy of, and open to the public for business in, its leased space and paying full rent under its lease.
A “Specified Tenant” means (a) BJ’s Wholesale Club, (b) Best Buy or (c) any replacement tenant of either BJ’s Wholesale Club or Best Buy, or any guarantors of the applicable related Specified Tenant lease.
“Specified Tenant Cure Conditions” mean each of the following, as applicable (i) the applicable Specified Tenant has cured all defaults under the applicable Specified Tenant lease, (ii) the applicable Specified Tenant is in actual, physical possession of the Specified Tenant space (or applicable portion thereof), open to the public for business during customary hours and not “dark”, (iii) the applicable Specified Tenant has revoked or rescinded all termination or cancellation notices with respect to the applicable Specified Tenant lease and has re-affirmed the applicable Specified Tenant lease as being in full force and effect, (iv) in the event the Specified Tenant Trigger Period is due to the applicable Specified Tenant’s failure to extend or renew the applicable Specified Tenant lease in accordance with clause (vi) of the definition of “Specified Tenant Trigger Period”, the applicable Specified Tenant has renewed or extended the applicable Specified Tenant lease for the applicable Specified Tenant Renewal Term, (v) with respect to any applicable bankruptcy or insolvency proceedings involving the applicable Specified Tenant and/or the applicable Specified Tenant lease, the applicable Specified Tenant has affirmed the applicable Specified Tenant lease pursuant to final, non-appealable order of a court of competent jurisdiction and (vi) the applicable Specified Tenant is paying full, unabated rent under the applicable Specified Tenant lease; provided, however, to the extent that such Specified Tenant’s rent is abated solely in connection with a free rent period or similar rent concession, the condition described in this clause (vi) will be satisfied with respect to the applicable tenant if the borrower shall have deposited the amount of any unexpired rent abatement (or similar concession), as reasonably determined by the lender, into a reserve with the lender (to be disbursed by the lender, in its reasonable discretion, during each applicable free rent period in a manner such that each disbursement covers the amount of the applicable rent concession for the applicable lease).
“Specified Tenant Renewal Term” means a term of (a) if prior to July 6, 2027, at least one year or (b) if subsequent to July 6, 2027, for a term that extends past July 6, 2030.
THE INFORMATION IN THIS STRUCTURAL AND COLLATERAL TERM SHEET IS NOT COMPLETE AND MAY BE AMENDED PRIOR TO THE TIME OF SALE. THIS TERM SHEET IS NOT AN OFFER TO SELL THESE SECURITIES AND IT IS NOT A SOLICITATION OF AN OFFER TO BUY THESE SECURITIES IN ANY JURISDICTION WHERE THE OFFER OR SALE IS NOT PERMITTED.
| | | |
103 of 130
| Structural and Collateral Term Sheet | Benchmark 2018-B5 | |
| Embassy Suites Kennesaw | ||

THE INFORMATION IN THIS STRUCTURAL AND COLLATERAL TERM SHEET IS NOT COMPLETE AND MAY BE AMENDED PRIOR TO THE TIME OF SALE. THIS TERM SHEET IS NOT AN OFFER TO SELL THESE SECURITIES AND IT IS NOT A SOLICITATION OF AN OFFER TO BUY THESE SECURITIES IN ANY JURISDICTION WHERE THE OFFER OR SALE IS NOT PERMITTED.
| | | |
104 of 130
| Structural and Collateral Term Sheet | Benchmark 2018-B5 | |
| Embassy Suites Kennesaw | ||
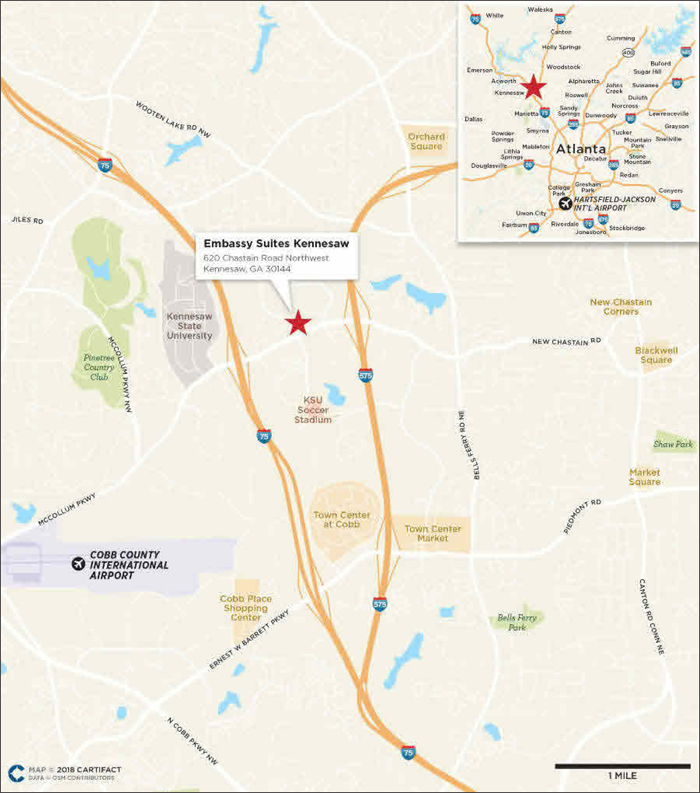
THE INFORMATION IN THIS STRUCTURAL AND COLLATERAL TERM SHEET IS NOT COMPLETE AND MAY BE AMENDED PRIOR TO THE TIME OF SALE. THIS TERM SHEET IS NOT AN OFFER TO SELL THESE SECURITIES AND IT IS NOT A SOLICITATION OF AN OFFER TO BUY THESE SECURITIES IN ANY JURISDICTION WHERE THE OFFER OR SALE IS NOT PERMITTED.
| | | |
105 of 130
| Structural and Collateral Term Sheet | Benchmark 2018-B5 | |
| Embassy Suites Kennesaw | ||
| Mortgage Loan Information | Property Information | |||
| Mortgage Loan Seller: | JPMCB | Single Asset / Portfolio: | Single Asset | |
| Original Principal Balance: | $32,000,000 | Title: | Fee | |
| Cut-off Date Principal Balance: | $31,968,577 | Property Type - Subtype: | Hotel – Full Service | |
| % of Pool by IPB: | 3.1% | Net Rentable Area (Rooms): | 192 | |
| Loan Purpose: | Refinance | Location: | Kennesaw, GA | |
| Borrower: | Townpark Hotel Holdings LLC | Year Built / Renovated: | 2009 / N/A | |
| Sponsor: | Gerald L. Sapp | Occupancy / ADR / RevPAR: | 81.9% / $153.69 / $125.86 | |
| Interest Rate: | 5.33000% | Occupancy / ADR / RevPAR Date: | 5/31/2018 | |
| Note Date: | 6/29/2018 | Number of Tenants: | N/A | |
| Maturity Date: | 7/1/2028 | 2015 NOI: | $3,489,689 | |
| Interest-only Period: | None | 2016 NOI: | $3,663,034 | |
| Original Term: | 120 months | 2017 NOI: | $3,887,407 | |
| Original Amortization: | 360 months | TTM NOI (as of 5/31/2018): | $3,894,381 | |
| Amortization Type: | Balloon | UW Occupancy / ADR / RevPAR: | 81.9% / $153.69 / $125.86 | |
| Call Protection: | L(25),Grtr1%orYM(92),O(3) | UW Revenues: | $9,404,615 | |
| Lockbox / Cash Management: | Hard / In-Place | UW Expenses: | $5,536,536 | |
| Additional Debt: | Yes | UW NOI: | $3,868,078 | |
| Additional Debt Balance: | $4,000,000 | UW NCF: | $3,868,078 | |
| Additional Debt Type: | Mezzanine Loan | Appraised Value / Per Room(1): | $49,500,000 / $257,813 | |
| Appraisal Date: | 5/1/2018 | |||
| Escrows and Reserves(2) | Financial Information | |||||
| Initial | Monthly | Initial Cap | Cut-off Date Loan / Room: | $166,503 | ||
| Taxes: | $374,838 | $37,484 | N/A | Maturity Date Loan / Room: | $138,515 | |
| Insurance: | $21,764 | Springing | N/A | Cut-off Date LTV(1): | 64.6% | |
| FF&E Reserves: | $3,200,000 | 4% of Gross Income | N/A | Maturity Date LTV(1): | 53.7% | |
| TI/LC: | $0 | $0 | N/A | UW NCF DSCR: | 1.81x | |
| Other: | $0 | Springing | $4,200,000 | UW NOI Debt Yield: | 12.1% | |
| Sources and Uses | ||||||
| Sources | Proceeds | % of Total | Uses | Proceeds | % of Total | |
| Mortgage Loan | $32,000,000 | 86.3% | Loan Payoff | $32,220,753 | 86.9% | |
| Mezzanine Loan | 4,000,000 | 10.8% | Upfront Reserves | 3,596,602 | 9.7 | |
| Sponsor Equity | 1,060,017 | 2.9% | NorthStar Pay Off | 625,000 | 1.7 | |
| Closing Costs | 617,662 | 1.7 | ||||
| Total Sources | $37,060,017 | 100.0% | Total Uses | $37,060,017 | 100.0% | |
| (1) | The Appraised Value / Per Room, Cut-off Date LTV and Maturity Date LTV reflect the “hypothetical market as-if funded” value of $49,500,000, which assumes that approximately $3,200,000 has been fully escrowed for scheduled capital expenditures. At origination of the mortgage loan, the borrower deposited $3,200,000 into the FF&E reserve. The “as-is” value as of May 1, 2018 is $46,500,000, which results in a Cut-off Date LTV and Maturity Date LTV of 68.7% and 57.2%, respectively. |
| (2) | Please see “Escrows and Reserves” below for additional details. |
THE INFORMATION IN THIS STRUCTURAL AND COLLATERAL TERM SHEET IS NOT COMPLETE AND MAY BE AMENDED PRIOR TO THE TIME OF SALE. THIS TERM SHEET IS NOT AN OFFER TO SELL THESE SECURITIES AND IT IS NOT A SOLICITATION OF AN OFFER TO BUY THESE SECURITIES IN ANY JURISDICTION WHERE THE OFFER OR SALE IS NOT PERMITTED.
| | | |
106 of 130
| Structural and Collateral Term Sheet | Benchmark 2018-B5 | |
| Embassy Suites Kennesaw | ||
The Loan.The Embassy Suites Kennesaw loan has an outstanding principal balance as of the Cut-off Date of approximately $31.97 million and is secured by a first mortgage lien on the borrower’s fee interest in a 192-room full service hotel property located in Kennesaw, Georgia. The loan has a 10-year term and will amortize on a 30-year schedule.
The Borrower.The borrowing entity for the Embassy Suites Kennesaw loan is Townpark Hotel Holdings LLC, a Delaware limited liability company and special purpose entity with one independent director in its organizational structure.
The loan sponsor and the nonrecourse carve-out guarantor is Gerald L. Sapp, the Chief Operating Officer of GS Development, LLC (“GS Development”). Headquartered in Tifton, Georgia, GS Development works with its affiliates, GS Hospitality, LLC and GS Management, LLC, to acquire and manage commercial real estate around the southern United States. According to the loan sponsor, Dr. Sapp and GS Development have, individually or through partnerships, developed 12 hotel projects with Hilton or Marriott franchises, four retail shopping centers, three build-to-suit restaurants and over 500 self-storage units throughout Georgia and Florida.
The Property. The Embassy Suites Kennesaw property is a 192-room full service hotel located in Kennesaw, Georgia. The property was built in 2009. Kennesaw is home to Kennesaw State University, the third largest university in Georgia by student population with approximately 35,000 students. Kennesaw State University is approximately 0.7 miles west of the Embassy Suites Kennesaw property. The Embassy Suites Kennesaw property is also approximately 22.6 miles northwest from downtown Atlanta. The Embassy Suites Kennesaw property consists of one seven-story building with approximately 6,580 square feet of meeting space, a restaurant, an indoor pool, a business center, a fitness center, a sundry shop and a guest self-laundry room. The Embassy Suites Kennesaw property is subject to a franchise agreement with HLT Existing Franchise Holding, LLC, through June 29, 2028.
According to the sponsor, since 2013, the Embassy Suites Kennesaw property’s capital expenditures have totaled approximately $606,208 (approximately $3,157 per room). Improvements include lobby upgrades, sofa upholstery, exterior signs and an ongoing fitness center renovation. The guestrooms at the property consist of 168 king bedrooms and 24 double-queen bedrooms. Room amenities for each guest room include two 37-inch HDTVs, a separate living room, sofa bed, dining table, mini refrigerator, wet bar and wireless internet access. The Embassy Suites Kennesaw property is not subject to a property improvement plan. According to property management, a renovation of the Embassy Suites Kennesaw property is expected to occur in the next four years that is expected to cost approximately $6,670,730 (approximately $34,743 per room). The $3.2 million upfront FF&E reserve is expected to be used to fund some of the expected upgrades to the guestrooms, pool, fitness center, restaurant and meeting spaces. The appraisal indicates that there are three hotels that recently opened or are under development that are expected to be partially or fully competitive with the property. The 100 room Hampton Inn Atlanta Kennesaw opened in July 2017 and is expected to be 25% competitive with the property, the 100 room Courtyard by Marriott Atlanta Kennesaw opened in March 2018 and is expected to be 100% competitive with the property and the 170 room Home2 Suites/Tru by Hilton Atlanta NW/Kennesaw Town Center is expected to open in March 2019 and be 50% competitive with the property. The Embassy Suite Kennesaw property is the only full service hotel in the competitive set.
| Historical Occupancy, ADR and RevPAR(1) | |||||||||||
| Competitive Set(2) | Embassy Suites Kennesaw(3) | Penetration Factor | |||||||||
| Year | Occupancy | ADR | RevPAR | Occupancy | ADR | RevPAR | Occupancy | ADR | RevPAR | ||
| 2015 | 76.1% | $116.71 | $88.82 | 81.5% | $141.10 | $115.01 | 107.1% | 120.9% | 129.5% | ||
| 2016 | 74.5% | $122.73 | $91.38 | 81.6% | $148.46 | $121.12 | 109.6% | 121.0% | 132.5% | ||
| 2017 | 75.1% | $124.49 | $93.54 | 82.9% | $151.89 | $125.93 | 110.3% | 122.0% | 134.6% | ||
| TTM(4) | 72.6% | $124.77 | $90.52 | 81.9% | $153.69 | $125.86 | 112.9% | 123.2% | 139.0% | ||
| (1) | The minor variances between the underwriting, appraisal and above table with respect to Occupancy, ADR and RevPAR at the Embassy Suites Kennesaw property are attributable to variances in reporting methodologies and/or timing differences. |
| (2) | Data was provided by a third party travel research report. The competitive hotels in the report include the following properties: Holiday Inn Express Atlanta Kennesaw, Residence Inn Atlanta Kennesaw Town Center, Springhill Suites Atlanta Kennesaw, Hilton Garden Inn Atlanta Northwest Kennesaw Town Center, Comfort Suites @ Kennesaw State University, and Homewood Suites Atlanta Northwest Kennesaw Town Center. |
| (3) | Based on operating statements provided by the borrower. |
| (4) | TTM represents the trailing 12-month period ending on May 31, 2018. |
THE INFORMATION IN THIS STRUCTURAL AND COLLATERAL TERM SHEET IS NOT COMPLETE AND MAY BE AMENDED PRIOR TO THE TIME OF SALE. THIS TERM SHEET IS NOT AN OFFER TO SELL THESE SECURITIES AND IT IS NOT A SOLICITATION OF AN OFFER TO BUY THESE SECURITIES IN ANY JURISDICTION WHERE THE OFFER OR SALE IS NOT PERMITTED.
| | | |
107 of 130
| Structural and Collateral Term Sheet | Benchmark 2018-B5 | |
| Embassy Suites Kennesaw | ||
| Competitive Hotels Profile(1) | ||||||||
| Rooms | Year Built | 2017 Estimated Market Mix | 2017 Estimated Operating Statistics | |||||
| Property | Commercial | Meeting & Group | Leisure | Occupancy | ADR | RevPAR | ||
| Embassy Suites Kennesaw | 192 | 2009 | 60% | 20% | 20% | 82.9% | $151.89 | $125.93 |
| Holiday Inn Express Kennesaw | 147 | 1988 | 60% | 15% | 25% | 75%-80% | $115-$120 | $85-$90 |
| Residence Inn Kennesaw | 120 | 1997 | 75% | 5% | 20% | 75%-80% | $125-$130 | $95-$100 |
| Springhill Suites Kennesaw | 90 | 2000 | 60% | 20% | 20% | 70%-75% | $125-$130 | $90-$95 |
| Hilton Garden Inn Kennesaw | 114 | 2005 | 65% | 20% | 15% | 75%-80% | $135-$140 | $100-$105 |
| Comfort Suites Kennesaw | 70 | 2007 | 65% | 5% | 30% | 70%-75% | $100-$105 | $70-$75 |
| Homewood Suites Kennesaw | 100 | 2008 | 70% | 5% | 25% | 75%-80% | $130-$135 | $100-$105 |
| Total(2) | 641 | |||||||
| (1) | Based on the appraisal. |
| (2) | Excludes the subject property. |
| Operating History and Underwritten Net Cash Flow | |||||||
| 2015 | 2016 | 2017 | TTM(1) | Underwritten | Per Room(2) | % of Total Revenue(3) | |
| Occupancy | 81.5% | 81.6% | 82.9% | 81.9% | 81.9% | ||
| ADR | $141.10 | $148.46 | $151.89 | $153.69 | $153.69 | ||
| RevPAR | $115.01 | $121.12 | $125.93 | $125.86 | $125.86 | ||
| Room Revenue | $8,060,166 | $8,488,134 | $8,824,973 | $8,819,475 | $8,819,475 | $45,935 | 93.8% |
| Food & Beverage Revenue | 410,988 | 447,459 | 474,982 | 444,753 | 444,753 | 2,316 | 4.7% |
| Telephone Revenue | 37,531 | 19,645 | 18,023 | 18,579 | 18,579 | 97 | 0.2% |
| Other Departmental Revenue(4) | 122,908 | 111,241 | 113,503 | 121,808 | 121,808 | 634 | 1.3% |
| Total Revenue | $8,631,593 | $9,066,479 | $9,431,481 | $9,404,615 | $9,404,615 | $48,982 | 100.0% |
| Room Expense | $1,943,332 | $2,065,593 | $2,087,140 | $2,072,072 | $2,072,072 | $10,792 | 23.5% |
| Food & Beverage Expense | 0 | 0 | 0 | 0 | 0 | 0 | 0.0% |
| Telephone Expense | 0 | 0 | 0 | 0 | 0 | 0 | 0.0% |
| Other Departmental Expenses | 34,990 | 35,985 | 32,328 | 30,699 | 30,699 | 160 | 25.2% |
| Departmental Expenses | $1,978,322 | $2,101,578 | $2,119,468 | $2,102,771 | $2,102,771 | $10,952 | 22.4% |
| Departmental Profit | $6,653,271 | $6,964,901 | $7,312,013 | $7,301,844 | $7,301,844 | $38,030 | 77.6% |
| Operating Expenses | $1,749,725 | $1,851,804 | $1,942,738 | $1,942,193 | $1,942,193 | $10,116 | 20.7% |
| Gross Operating Profit | $4,903,546 | $5,113,097 | $5,369,275 | $5,359,651 | $5,359,651 | $27,915 | 57.0% |
| Fixed Expenses | $487,222 | $475,885 | $468,446 | $466,476 | $480,470 | $2,502 | 5.1% |
| Management Fees | 258,946 | 271,994 | 283,167 | 282,139 | 282,138 | 1,469 | 3.0% |
| Franchise Fee | 322,425 | 339,525 | 352,996 | 352,779 | 352,779 | 1,837 | 3.8% |
| FF&E | 345,264 | 362,659 | 377,259 | 363,876 | 376,185 | 1,959 | 4.0% |
| Total Other Expenses | $1,413,857 | $1,450,063 | $1,481,868 | $1,465,270 | $1,491,573 | $7,769 | 15.9% |
| Net Operating Income | $3,489,689 | $3,663,034 | $3,887,407 | $3,894,381 | $3,868,078 | $20,146 | 41.1% |
| Net Cash Flow | $3,489,689 | $3,663,034 | $3,887,407 | $3,894,381 | $3,868,078 | $20,146 | 41.1% |
| (1) | TTM represents the trailing 12-month period ending on May 31, 2018. |
| (2) | Per Room values are based on 192 rooms. |
| (3) | % of Total Revenue for Room Expense, Food & Beverage Expense, Telephone Expense and Other Departmental Expenses is based on their corresponding revenue line item. |
| (4) | Other Departmental Revenue is comprised of parking and other rental income. |
THE INFORMATION IN THIS STRUCTURAL AND COLLATERAL TERM SHEET IS NOT COMPLETE AND MAY BE AMENDED PRIOR TO THE TIME OF SALE. THIS TERM SHEET IS NOT AN OFFER TO SELL THESE SECURITIES AND IT IS NOT A SOLICITATION OF AN OFFER TO BUY THESE SECURITIES IN ANY JURISDICTION WHERE THE OFFER OR SALE IS NOT PERMITTED.
| | | |
108 of 130
| Structural and Collateral Term Sheet | Benchmark 2018-B5 | |
| Embassy Suites Kennesaw | ||
Property Management.The Embassy Suites Kennesaw property is managed by Commonwealth Hotels, LLC. an unaffiliated management company. The management agreement is effective through June 27, 2028 with unlimited successive one-year renewal options.
Escrows and Reserves.At origination, the borrower deposited into escrow $374,838 for real estate taxes, $21,764 for insurance reserves and $3,200,000 for FF&E reserves.
Tax Escrows– On a monthly basis, the borrower is required to escrow 1/12 of annual estimated tax payments, which currently equates to $37,484.
Insurance Escrows– The requirement for the borrower to make monthly deposits to the insurance escrow is waived provided that (i) no event of default has occurred and is continuing and (ii) either (a) the borrower provides the lender with reasonably satisfactory evidence that the property is insured pursuant to a blanket insurance policy meeting the requirements specified in the loan agreement or (b) the borrower provides the lender with reasonably satisfactory evidence that the borrower is financing any premiums pursuant to a premium finance agreement in accordance with the loan documents and the borrower has deposited with the lender an amount equal to six regularly scheduled monthly installments due under the premium finance agreement in the insurance reserve.
FF&E Reserves – On a monthly basis, the borrower is required to escrow an amount equal to 4.0% of gross income from operations for the calendar month two months prior to such payment date. The borrower is also required to deposit with the lender amounts required to complete any work under a property improvement plan required by any franchisor, in monthly installments reasonably estimated by the lender.
Franchise Roll Reserve – On a monthly basis commencing on the payment date that is 36 months prior to the maturity date, the borrower is required to escrow an amount equal to $116,667 (the “Franchise Roll Monthly Deposit”) to the lender for a franchise roll reserve. The loan documents also permit the borrower, at its option, to make (i) one or more deposits into the franchise roll reserve account in addition to then applicable Franchise Roll Reserve Monthly Deposit and/or (ii) transfer an amount equal to no more than 50% of the then existing balance of the FF&E reserve account from the FF&E reserve account to the franchise roll reserve (the “FF&E Transfer Funds”), except that the total amount of FF&E Transfer Funds may not exceed $1,000,000. In the event the borrower makes such additional deposits or transfers such FF&E Transfer Funds into the franchise roll reserve, the lender will be required to recalculate the Franchise Roll Reserve Monthly Deposit to be an amount equal to (x) $4,200,000, less (y) the amount on deposit in the franchise roll reserve account as of such date, divided by (z) the lesser of (1) 36 and (2) the number of monthly payment dates remaining until the maturity date. If the borrower and franchisor have extended the franchise agreement for a period of at least 60 months after the maturity date of the loan and the borrower has deposited an amount equal to 110% of the amounts needed to complete any related property improvement plan with such extension, the borrower’s obligations to make the Franchise Roll Reserve Monthly Deposits will be waived under the loan documents.
Lockbox / Cash Management. The Embassy Suites Kennesaw Mortgage loan is structured with a hard lockbox and in-place cash management. The borrower was required to deliver direction letters to all tenants and credit card companies or credit card clearing banks with which the borrower or property manager has entered into merchant’s agreements, to deliver all rents and receipts payable with respect to the property directly to the lockbox account. All funds in the lockbox account are required to be transferred once every business day to a cash management account and disbursed in accordance with the loan documents. During a Cash Sweep Period (defined below), all excess cash flow after payment of mortgage and mezzanine debt service, required reserves and operating expenses is required to be deposited into an excess cash flow reserve and held as additional collateral for the loan. The lender has been granted a first priority security interest in the cash management account.
A “Cash Sweep Period” means each period commencing on the occurrence of a Cash Sweep Event (as defined below) and continuing until the payment date next occurring following the related Cash Sweep Event Cure (as defined below).
A “Cash Sweep Event” means the occurrence of (i) an event of default under the Embassy Suites Kennesaw loan documents (ii) any bankruptcy or insolvency action of the borrower, (iii) any bankruptcy or insolvency action with respect to the property manager (unless the manager is replaced with a qualified manager as provided under the Embassy Suites Kennesaw loan documents within 60 days), (iv) a DSCR Trigger Event (as defined below) or (v) an event of default under the mezzanine loan documents.
A “DSCR Trigger Event” means the date that the debt service coverage ratio (as calculated in the loan documents and including the mezzanine loan) based on the trailing 12 month period immediately preceding the date of determination is less than 1.35x.
A “Cash Sweep Event Cure” means (a) with respect a Cash Sweep Event caused solely by a DSCR Trigger Event, the achievement of a debt service coverage ratio (as calculated in the loan documents and including the mezzanine loan) of at least 1.40x for two consecutive quarters based upon the trailing 12 month period immediately preceding the date of determination (b) with respect to a
THE INFORMATION IN THIS STRUCTURAL AND COLLATERAL TERM SHEET IS NOT COMPLETE AND MAY BE AMENDED PRIOR TO THE TIME OF SALE. THIS TERM SHEET IS NOT AN OFFER TO SELL THESE SECURITIES AND IT IS NOT A SOLICITATION OF AN OFFER TO BUY THESE SECURITIES IN ANY JURISDICTION WHERE THE OFFER OR SALE IS NOT PERMITTED.
| | | |
109 of 130
| Structural and Collateral Term Sheet | Benchmark 2018-B5 | |
| Embassy Suites Kennesaw | ||
Cash Sweep Event caused solely by clause (i) above, the acceptance by the lender of a cure of such event of default (which cure may be accepted in the lender’s reasonable discretion unless the lender has accelerated the loan and moved for a receiver or commenced foreclosure proceedings, in which case the lender may reject or accept such cure in its sole and absolute discretion), (c) with respect to a Cash Sweep Event caused solely by clause (iii) above, if the borrower replaces the property manager with a qualified manager under a replacement management agreement in accordance with the loan documents or (d) with respect to a Cash Sweep Event caused solely by clause (v) above, the acceptance by the mezzanine lender of a cure of such mezzanine loan event of default (which cure may be rejected or accepted by the mezzanine lender in its sole and absolute discretion). Each Cash Sweep Event Cure is also subject to the following conditions: (i) no event of default has occurred and be continuing, (ii) a Cash Sweep Event Cure of a Cash Sweep Event caused by an event of default under the loan documents may occur no more than a total of two times in the aggregate during the term of the loan, and (iii) the borrower has paid all of the lender’s reasonable expenses incurred in connection with such Cash Sweep Event Cure including, reasonable attorney’s fees and expenses. The borrower does not have the right to cure a Cash Sweep Event caused by a bankruptcy action of the borrower, unless such bankruptcy action was involuntary and not solicited or consented to by the borrower, the guarantor or any of their affiliates, in which case such Cash Sweep Event is deemed cured under the loan documents if such action is discharged, stayed or dismissed within 90 days after the date of filing without any adverse consequences to the loan or the property (as determined by the lender in its sole discretion).
Additional Debt.TCM CRE REIT LLC, a third-party lender, has provided a $4.0 million mezzanine loan that is coterminous with the Embassy Suites Kennesaw loan. The mezzanine loan has a 10.50000% coupon and is interest-only for the entire loan term. Including the mezzanine loan, the cumulative Cut-off Date LTV, cumulative UW NCF DSCR and cumulative UW NOI Debt Yield are 72.7%, 1.51x and 10.8%, respectively. The mortgage and mezzanine lenders have entered into an intercreditor agreement.
Franchise Agreement. The borrower is a party to a franchise agreement with HLT Existing Franchise Holding LLC (as successor in interest to Promus Hotels, Inc.), which is an affiliate of Hilton. The franchise agreement expires on June 29, 2028 and requires a monthly royalty fee of 4.0% of gross rooms revenue and a monthly program fee of 4.0% of gross rooms revenue. In the event the borrower intends to market the hotel for sale or lease or sell a controlling interest in the borrower or an affiliate that controls the borrower, the franchisor has a right of first offer to purchase the related interests. The franchisor has executed a comfort letter that provides that the right of first offer will not apply to an acquisition of the property by the lender, but such right will apply for subsequent transfers.
THE INFORMATION IN THIS STRUCTURAL AND COLLATERAL TERM SHEET IS NOT COMPLETE AND MAY BE AMENDED PRIOR TO THE TIME OF SALE. THIS TERM SHEET IS NOT AN OFFER TO SELL THESE SECURITIES AND IT IS NOT A SOLICITATION OF AN OFFER TO BUY THESE SECURITIES IN ANY JURISDICTION WHERE THE OFFER OR SALE IS NOT PERMITTED.
| | | |
110 of 130
| Structural and Collateral Term Sheet | Benchmark 2018-B5 |
[THIS PAGE INTENTIONALLY LEFT BLANK]
THE INFORMATION IN THIS STRUCTURAL AND COLLATERAL TERM SHEET IS NOT COMPLETE AND MAY BE AMENDED PRIOR TO THE TIME OF SALE. THIS TERM SHEET IS NOT AN OFFER TO SELL THESE SECURITIES AND IT IS NOT A SOLICITATION OF AN OFFER TO BUY THESE SECURITIES IN ANY JURISDICTION WHERE THE OFFER OR SALE IS NOT PERMITTED.
| | | |
111 of 130
| Structural and Collateral Term Sheet | Benchmark 2018-B5 |
| Elite Hotel Management Georgia Portfolio |
| Mortgage Loan Information | Property Information | |||
| Mortgage Loan Seller: | CREFI | Single Asset / Portfolio: | Portfolio | |
| Original Principal Balance: | $32,000,000 | Title: | Fee | |
| Cut-off Date Principal Balance: | $31,924,901 | Property Type - Subtype: | Hotel – Various | |
| % of Pool by IPB: | 3.1% | Net Rentable Area (Rooms): | 362 | |
| Loan Purpose: | Refinance | Location: | Various, GA | |
| Borrowers: | DRAP Airport, LLC, DRAP Lodging, | Year Built / Renovated: | Various / Various | |
| LLC, Elite Hotel Management, LLC | Occupancy / ADR / RevPAR: | 76.5% / $109.84 / $84.07 | ||
| Sponsor: | Piyush K. Patel | Occupancy / ADR / RevPAR Date: | 4/30/2018 | |
| Interest Rate: | 4.83000% | Number of Tenants: | N/A | |
| Note Date: | 6/27/2018 | 2015 NOI: | NAV | |
| Maturity Date: | 7/6/2028 | 2016 NOI: | $3,341,323 | |
| Interest-only Period: | None | 2017 NOI: | $3,788,113 | |
| Original Term: | 120 months | TTM NOI (as of 4/30/2018): | $4,165,783 | |
| Original Amortization: | 240 months | UW Occupancy / ADR / RevPAR: | 76.5% / $109.84 / $84.07 | |
| Amortization Type: | Balloon | UW Revenues: | $11,320,375 | |
| Call Protection: | L(25),Def(92),O(3) | UW Expenses: | $7,114,826 | |
| Lockbox / Cash Management: | Springing / Springing | UW NOI: | $4,205,549 | |
| Additional Debt: | N/A | UW NCF: | $3,752,735 | |
| Additional Debt Balance: | N/A | Appraised Value / Per Room(1): | $51,100,000 / $141,160 | |
| Additional Debt Type: | N/A | Appraisal Date(1): | Various | |
| Escrows and Reserves | Financial Information | |||||||||
| Initial | Monthly | Initial Cap | Cut-off Date Loan / Room: | $88,190 | ||||||
| Taxes: | $251,249 | $27,917 | N/A | Maturity Date Loan / Room: | $55,337 | |||||
| Insurance: | $0 | Springing | N/A | Cut-off Date LTV(1): | 62.5% | |||||
| FF&E Reserves: | $0 | $37,735 | N/A | Maturity Date LTV(1): | 39.2% | |||||
| TI/LC: | $0 | $0 | N/A | UW NCF DSCR: | 1.50x | |||||
| Other(2): | $55,000 | $0 | N/A | UW NOI Debt Yield: | 13.2% | |||||
| Sources and Uses | ||||||||||
| Sources | Proceeds | % of Total | Uses | Proceeds | % of Total | |||||
| Mortgage Loan | $32,000,000 | 100.0% | Loan Payoff | $20,337,104 | 63.6% | |||||
| Return of Equity | 10,845,609 | 33.9 | ||||||||
| Closing Costs | 511,039 | 1.6 | ||||||||
| Upfront Reserves | 306,249 | 1.0 | ||||||||
| Total Sources | $32,000,000 | 100.0% | Total Uses | $32,000,000 | 100.0% | |||||
| (1) | The Appraised Value / Per Room represents the sum of the “As Stabilized” value of $22,100,000 (as of May 1, 2019) for the Hyatt Place Atlanta Airport North Property, the “as-is” value of $18,000,000 (as of May 1, 2018) for the Hampton Inn Norcross Property and the “as-is” value of $11,000,000 (as of May 1, 2018) for the Fairfield Inn and Suites Commerce Property. The “As Stabilized” value of $22,100,000 for the Hyatt Place Atlanta Airport North Property assumes that funds have been fully escrowed for scheduled capital expenditures. At origination of the mortgage loan, the borrower deposited $55,000, which represents 110% of the unfunded obligations set forth in the related PIP which is expected to be completed by May 1, 2019. The aggregate “as-is” value as of May 1, 2018 is $50,500,000, which results in a Cut-off Date LTV and Maturity Date LTV of 63.2% and 39.7%, respectively. |
| (2) | Other initial escrows and reserves represent 110% of the estimated costs of the scheduled PIP at the Hyatt Place Atlanta Airport North Property. |
The Loan.The Elite Hotel Management Georgia Portfolio loan has an outstanding principal balance as of the Cut-off Date of approximately $31.92 million and is secured by a first mortgage lien on the borrower’s fee interests in a 150-room select service hotel property located in East Point, Georgia (the “Hyatt Place Atlanta Airport North Property”), a 132-room limited service hotel property located in Norcross, Georgia (the “Hampton Inn Norcross Property”) and an 80-room limited service hotel located in Commerce, Georgia (the “Fairfield Inn and Suites Commerce Property”). The loan has a 10-year term and will amortize on a 20-year schedule.
THE INFORMATION IN THIS STRUCTURAL AND COLLATERAL TERM SHEET IS NOT COMPLETE AND MAY BE AMENDED PRIOR TO THE TIME OF SALE. THIS TERM SHEET IS NOT AN OFFER TO SELL THESE SECURITIES AND IT IS NOT A SOLICITATION OF AN OFFER TO BUY THESE SECURITIES IN ANY JURISDICTION WHERE THE OFFER OR SALE IS NOT PERMITTED.
| | | |
112 of 130
| Structural and Collateral Term Sheet | Benchmark 2018-B5 |
| Elite Hotel Management Georgia Portfolio |
The loan sponsor and nonrecourse carve-out guarantor is Piyush K. Patel, the President and CEO of Elite Hotel Management, LLC. Elite Hotel Management, LLC was founded in 2009 and currently owns and manages 14 hotels in Georgia. Piyush K. Patel, who is a Certified Hotel Administrator, has developed, owned and managed hotel flags such as Hampton Inn, Hyatt Place, Fairfield Inn, Holiday Inn Express, Comfort Suites, Best Western and Wyndham Hotels.
| Portfolio Summary(1) | ||||||||
| Property | Rooms | Year Built/ | Allocated Loan Amount | % of Allocated Loan Amount | Appraised Value | % of Appraised Value | UW NCF | % of UW NCF |
| Hyatt Place Atlanta Airport North | 150 | 2002/2014 | $12,250,000 | 38.3% | $22,100,000 | 43.2% | $1,499,957 | 40.0% |
| Hampton Inn Norcross | 132 | 1997/2015 | 11,750,000 | 36.7% | 18,000,000 | 35.2% | $1,249,589 | 33.3% |
| Fairfield Inn and Suites Commerce | 80 | 2010/NAP | 8,000,000 | 25.0% | 11,000,000 | 21.5% | $1,003,189 | 26.7% |
| Total/Wtd. Avg. | 362 | $32,000,000 | 100.0% | $51,100,000 | 100.0% | $3,752,735 | 100.0% | |
| (1) | Based on the appraisals and underwritten rent roll dated April 30, 2018. |
The Properties. The Hyatt Place Atlanta Airport North Property is a 150-room select service hotel located on Interstate 85 in East Point, Georgia, approximately 2.8 miles from the Hartsfield-Jackson Atlanta International Airport. The Hyatt Place Atlanta Airport North Property consists of one six-story building with approximately 960 square feet of meeting space, 97 parking spaces, an outdoor pool, fitness center, sundry shop, business center and a gallery lounge which offers complimentary breakfast. The Hyatt Place Atlanta Airport North Property operates under a franchise agreement with Hyatt Place Franchising, LLC with an expiration date of August 3, 2027 with the option to extend through August 2037.
The Hyatt Place Atlanta Airport North Property was built in 2002 and renovated in 2014 and offers a room mix of 117 king style bedrooms and 33 double-double style bedrooms. Room amenities for each guestroom include a work desk and chair, flat screen television, microwave, mini refrigerator, wireless internet access and all suites feature a separate living area with a pull-out sofa. Since the sponsor purchased the Hyatt Place Atlanta Airport North Property in March 2017, approximately $207,000 has been invested in new exercise equipment, commercial dryers, exterior lighting upgrades, computer equipment, water heaters and upgrades to the breakfast area.
The Hampton Inn Norcross Property is a 132-room limited service hotel located in Norcross, Georgia, approximately 18.8 miles north of Atlanta and 15.0 miles northeast of Buckhead. The Hampton Inn Norcross Property consists of one five-story building with approximately 1,094 square feet of meeting space, 150 parking spaces, a game room, indoor pool, sundry shop, fitness center business center and a guest self-laundry center. The Hampton Inn Norcross Property operates under a franchise agreement with Hampton Inns Franchise LLC with an expiration date of November 12, 2030.
The Hampton Inn Norcross Property was built in 1997 and renovated in 2015 and offers a guestroom mix of 57 king style bedrooms, 60 queen style bedrooms, seven suites and eight rooms that comply with the Americans with Disabilities Act. Room amenities for each guestroom include a work desk and chair, flat screen television, mini refrigerator, microwave, wireless internet access and all suites feature a separate living area with a pull-out sofa. The property previously operated as a Drury Inn and was purchased by the sponsor in 2014. The sponsor subsequently completed a $5.0 million renovation to convert the hotel to a Hampton Inn which reopened in November 2015.
The Fairfield Inn and Suites Commerce Property is an 80-room limited service hotel located in Commerce, Georgia, approximately 25.0 miles from Athens, the home of the University of Georgia. The Fairfield Inn and Suites Commerce Property consists of one four-story building with approximately 600 square feet of meeting space, 82 parking spaces, an indoor pool, fitness center, guest laundry facilities, a business center, sundry shop and complimentary breakfast area. The property was built in 2010 and offers a guestroom mix of 22 king-style bedrooms, 28 queen-queen style bedrooms and 30 king-style suites. Room amenities for each guestroom include a work desk and chair, flat screen television, microwave, sofa chair, wireless internet access and all suites feature a separate living area with a pull-out sofa. The Fairfield Inn and Suites Commerce Property operates under a franchise agreement with Marriott International, Inc. with an expiration date of October 5, 2030.
The Market.The Hyatt Place Atlanta Airport North Property is located in East Point, Georgia, approximately 2.8 miles from the Hartsfield-Jackson Atlanta International Airport and less than 10.0 miles from downtown Atlanta. According to the appraisal, the Hartsfield-Jackson Atlanta International Airport has been the busiest airport in the world since 1998 and served approximately 103.9 million passengers in 2017. In March 2016, a 20-year renovation plan was announced for the airport which will include an approximately $6.0 billion expansion.
THE INFORMATION IN THIS STRUCTURAL AND COLLATERAL TERM SHEET IS NOT COMPLETE AND MAY BE AMENDED PRIOR TO THE TIME OF SALE. THIS TERM SHEET IS NOT AN OFFER TO SELL THESE SECURITIES AND IT IS NOT A SOLICITATION OF AN OFFER TO BUY THESE SECURITIES IN ANY JURISDICTION WHERE THE OFFER OR SALE IS NOT PERMITTED.
| | | |
113 of 130
| Structural and Collateral Term Sheet | Benchmark 2018-B5 |
| Elite Hotel Management Georgia Portfolio |
According to the appraisal, the primary competitive set for the Hyatt Place Atlanta Airport North Property consists of five hotels which range in size from 71 to 174 rooms and collectively contain 586 rooms. The five competitive properties selected by the appraiser were built between 1990 and 2009 and only one of the five offers a lounge, pool and fitness center like the Hyatt Place Atlanta Airport North Property. The appraiser identified one future hotel that is anticipated to compete directly with the Hyatt Place Atlanta Airport North Property, a 99-room Home2 Suites located at 3439 Bobby Brown Parkway in Atlanta, Georgia. The Home2 Suites is expected to open in May 2019 and although it’s an extended stay hotel, the appraiser expects it to be 25.0% competitive with the Hyatt Place Atlanta Airport North Property due to its location and all-suite product.
The Hampton Inn Norcross Property is located in Norcross, Georgia, at the intersection of Jimmy Carter Boulevard and Interstate 85, approximately 20.0 miles north of Atlanta and 15.0 miles northeast of Buckhead, Georgia. According to the appraisal, economic drivers in the immediate area include the WestRock corporate headquarters, OFS Fitel LLC, an optical manufacturer, that announced an approximately $139.0 million expansion of its current plant, located less than a mile from the Hampton Inn Norcross Property and the Peachtree Corners Town Center which is currently being developed and will feature entertainment venues, restaurants, retail shops, office space, townhomes and a botanical garden. The Peachtree Corners Town Center is located approximately 6.0 miles from the Hampton Inn Norcross Property.
According to the appraisal, the primary competitive set for the Hampton Inn Norcross Property consists of five hotels which range in the size from 50 to 148 rooms and collectively contain 519 rooms. The five competitive properties selected by the appraiser were built between 1988 and 1999 and are all located within approximately 5.0 miles from the Hampton Inn Norcross Property. The appraiser did not identify any new supply that is anticipated to compete directly with the Hampton Inn Norcross Property.
The Fairfield Inn and Suites Commerce Property is located on the northwest side of Interstate 85 in Commerce, Georgia, between Greenville, South Carolina and Athens, Georgia. According to the appraisal, commercial demand drivers in the immediate area include an Amazon fulfillment center in Braselton, Georgia, approximately 12.0 miles from the Fairfield Inn and Suites Commerce Property, a FedEx distribution facility expected to open in August 2018, Tanger Outlets and The Atlanta Dragway, a drag racing track that is currently home to the NHRA Mello Yello Drag Racing Series and the Summit Racing Equipment Southern Nationals.
According to the appraisal, the primary competitive set for the Fairfield Inn and Suites Commerce Property consists of four hotels which range in size from 51 to 74 rooms and collectively contain 248 rooms. The four competitive properties selected by the appraiser were built between 1995 and 2009 and are all located within 1.0 mile from the Fairfield Inn and Suites Commerce Property. The appraiser identified one new hotel, the Holiday Inn Express & Suites Commerce, a 77-room hotel which opened in April 2018 and is expected to be directly competitive with the Fairfield Inn and Suites Commerce Property.
| Historical Occupancy, ADR and RevPAR(1) | |||||||||
| Occupancy | ADR | RevPAR | |||||||
| Property | 2016 | 2017 | TTM(2) | 2016 | 2017 | TTM(2) | 2016 | 2017 | TTM(2) |
| Hyatt Place Atlanta Airport North | 82.4% | 85.3% | 82.7% | $98.65 | $101.90 | $109.74 | $81.28 | $86.87 | $90.76 |
| Hampton Inn Norcross | 46.1% | 65.1% | 70.1% | $104.00 | $107.54 | $109.08 | $47.90 | $70.00 | $76.48 |
| Fairfield Inn and Suites Commerce | 68.1% | 64.9% | 71.6% | $95.70 | $101.66 | $106.54 | $65.18 | $66.00 | $76.28 |
| Weighted Average(3) | 66.0% | 73.4% | 75.7% | $99.95 | $103.90 | $108.79 | $65.55 | $76.11 | $82.36 |
| (1) | Based on a third party travel research report. |
| (2) | TTM represents the trailing 12-month period ending on April 30, 2018. |
| (3) | Weighted average calculations are based on the number of rooms at the related mortgaged properties. |
| Competitive Set Historical Occupancy, ADR and RevPAR(1) | |||||||||
| Occupancy | ADR | RevPAR | |||||||
| Competitive Set | 2016 | 2017 | TTM(2) | 2016 | 2017 | TTM(2) | 2016 | 2017 | TTM(2) |
| Hyatt Place Atlanta Airport North | 82.6% | 78.8% | 83.6% | $97.16 | $105.66 | $110.80 | $80.22 | $83.22 | $92.66 |
| Hampton Inn Norcross | 71.8% | 65.5% | 65.5% | $87.11 | $94.05 | $96.38 | $62.59 | $61.62 | $63.15 |
| Fairfield Inn and Suites Commerce | 64.6% | 58.4% | 62.0% | $88.23 | $91.10 | $94.82 | $56.96 | $53.19 | $58.75 |
| Weighted Average(3) | 75.1% | 69.9% | 72.7% | $91.67 | $98.54 | $102.34 | $69.19 | $69.43 | $75.12 |
| (1) | Based on a third party travel research report. |
| (2) | TTM represents the trailing 12-month period ending on April 30, 2018. |
| (3) | Weighted average calculations are based on the number of rooms included in each respective property’s competitive set as determined by a third party travel research report. |
THE INFORMATION IN THIS STRUCTURAL AND COLLATERAL TERM SHEET IS NOT COMPLETE AND MAY BE AMENDED PRIOR TO THE TIME OF SALE. THIS TERM SHEET IS NOT AN OFFER TO SELL THESE SECURITIES AND IT IS NOT A SOLICITATION OF AN OFFER TO BUY THESE SECURITIES IN ANY JURISDICTION WHERE THE OFFER OR SALE IS NOT PERMITTED.
| | | |
114 of 130
| Structural and Collateral Term Sheet | Benchmark 2018-B5 |
| Elite Hotel Management Georgia Portfolio |
| Historical Occupancy, ADR and RevPAR Penetration Rates(1) | |||||||||
| Occupancy | ADR | RevPAR | |||||||
| Property | 2016 | 2017 | TTM(2) | 2016 | 2017 | TTM(2) | 2016 | 2017 | TTM(2) |
| Hyatt Place Atlanta Airport North | 99.8% | 108.2% | 98.9% | 101.5% | 96.4% | 99.0% | 101.3% | 104.4% | 98.0% |
| Hampton Inn Norcross | 64.1% | 99.4% | 107.0% | 119.4% | 114.3% | 113.2% | 76.5% | 113.6% | 121.1% |
| Fairfield Inn and Suites Commerce | 105.5% | 111.2% | 115.6% | 108.5% | 111.6% | 112.4% | 114.4% | 124.1% | 129.9% |
| Weighted Average(3) | 88.0% | 105.7% | 105.5% | 109.6% | 106.3% | 107.1% | 95.2% | 112.1% | 113.5% |
| (1) | Based on a third party travel research report. |
| (2) | TTM represents the trailing 12-month period ending on April 30, 2018. |
| (3) | Weighted average calculations are based on the number of rooms at the related mortgaged properties. |
| Operating History and Underwritten Net Cash Flow | |||||||
| 2016 | 2017 | TTM(1) | Underwritten | Per Room(2) | % of Total Revenue(3) | ||
| Occupancy | 73.5% | 74.0% | 76.5% | 76.5% | |||
| ADR | $102.14 | $107.02 | $109.84 | $109.84 | |||
| RevPAR | $75.04 | $79.23 | $84.07 | $84.07 | |||
| Room Revenue | $9,941,986 | $10,469,075 | $11,108,354 | $11,108,354 | $30,686 | 98.1% | |
| Food & Beverage Revenue | 227,870 | 199,120 | 181,104 | 181,104 | 500 | 1.6% | |
| Other Revenue | 42,055 | 25,908 | 30,917 | 30,917 | 85 | 0.3% | |
| Total Revenue | $10,211,911 | $10,694,104 | $11,320,375 | $11,320,375 | $31,272 | 100.0% | |
| Room Expense | $2,935,452 | $2,730,445 | $2,855,922 | $2,855,922 | $7,889 | 25.7% | |
| Food & Beverage Expense | 136,009 | 339,215 | 336,437 | 336,437 | 929 | 185.8% | |
| Departmental Expenses | $3,071,462 | $3,069,659 | $3,192,360 | $3,192,360 | $8,819 | 28.2% | |
| Departmental Profit | $7,140,449 | $7,624,445 | $8,128,016 | $8,128,016 | $22,453 | 71.8% | |
| Undistributed Expenses | $1,726,071 | $1,590,514 | $1,639,663 | $1,639,663 | $4,529 | 14.5% | |
| Gross Operating Profit | $5,414,378 | $6,033,931 | $6,488,354 | $6,488,353 | $17,924 | 57.3% | |
| Fixed Expenses | $415,821 | $467,740 | $475,468 | $435,702 | $1,204 | 3.8% | |
| Management Fees | 306,357 | 320,823 | 339,611 | 339,611 | 938 | 3.0% | |
| Franchise Fee | 1,350,877 | 1,457,254 | 1,507,491 | 1,507,491 | 4,164 | 13.3% | |
| Total Other Expenses | $2,073,055 | $2,245,817 | $2,322,570 | $2,282,804 | $6,306 | 20.2% | |
| Net Operating Income | $3,341,323 | $3,788,113 | $4,165,783 | $4,205,549 | $11,618 | 37.2% | |
| FF&E | 408,476 | 427,764 | 452,815 | 452,815 | 1,251 | 4.0 | |
| Net Cash Flow | $2,932,847 | $3,360,349 | $3,712,968 | $3,752,735 | $10,367 | 33.2% | |
| (1) | TTM represents the trailing 12-month period ending on April 30, 2018. |
| (2) | Per Room values based on 362 rooms. |
| (3) | % of Total Revenue for Room Expense and Food & Beverage Expense are based on their corresponding revenue line item. |
Property Management.The Elite Hotel Management Georgia Portfolio properties are managed by Elite Hotel Management Group LLC, an affiliate of the Elite Hotel Management Georgia Portfolio borrower.
THE INFORMATION IN THIS STRUCTURAL AND COLLATERAL TERM SHEET IS NOT COMPLETE AND MAY BE AMENDED PRIOR TO THE TIME OF SALE. THIS TERM SHEET IS NOT AN OFFER TO SELL THESE SECURITIES AND IT IS NOT A SOLICITATION OF AN OFFER TO BUY THESE SECURITIES IN ANY JURISDICTION WHERE THE OFFER OR SALE IS NOT PERMITTED.
| | | |
115 of 130
| Structural and Collateral Term Sheet | Benchmark 2018-B5 | |
| First Place Tower | ||
| Mortgage Loan Information | Property Information | |||
| Mortgage Loan Seller: | GACC | Single Asset / Portfolio: | Single Asset | |
| Original Principal Balance: | $30,000,000 | Title: | Fee | |
| Cut-off Date Principal Balance: | $29,952,526 | Property Type - Subtype: | Office – CBD | |
| % of Pool by IPB: | 2.9% | Net Rentable Area (SF): | 594,984 | |
| Loan Purpose: | Refinance | Location: | Tulsa, OK | |
| Borrower: | First Place, LLC | Year Built / Renovated: | 1956, 1971 / 1995 | |
| Sponsor: | Jacqueline E. Price | Occupancy: | 80.1% | |
| Interest Rate: | 4.85000% | Occupancy Date: | 6/7/2018 | |
| Note Date: | 6/29/2018 | Number of Tenants: | 39 | |
| Maturity Date: | 7/6/2028 | 2015 NOI: | $1,569,697 | |
| Interest-only Period: | None | 2016 NOI: | $1,708,232 | |
| Original Term: | 120 months | 2017 NOI: | $2,321,475 | |
| Original Amortization: | 300 months | TTM NOI: | $2,704,465 | |
| Amortization Type: | Balloon | UW Economic Occupancy: | 81.2% | |
| Call Protection: | L(25),Def(91),O(4) | UW Revenues: | $6,915,617 | |
| Lockbox / Cash Management: | Hard / Springing | UW Expenses: | $3,393,061 | |
| Additional Debt: | N/A | UW NOI: | $3,522,556 | |
| Additional Debt Balance: | N/A | UW NCF: | $2,808,576 | |
| Additional Debt Type: | N/A | Appraised Value / Per SF: | $42,700,000 / $72 | |
| Appraisal Date: | 5/18/2018 | |||
| Escrows and Reserves | Financial Information | ||||||||||||||||
| Initial | Monthly | Initial Cap | Cut-off Date Loan / SF: | $50 | |||||||||||||
| Taxes: | $47,903 | $23,951 | N/A | Maturity Date Loan / SF: | $38 | ||||||||||||
| Insurance: | $0 | Springing | N/A | Cut-off Date LTV: | 70.1% | ||||||||||||
| Replacement Reserves: | $0 | $9,916 | N/A | Maturity Date LTV: | 52.3% | ||||||||||||
| TI/LC: | $1,241,027 | $49,582 | N/A | UW NCF DSCR: | 1.35x | ||||||||||||
| Other(1): | $389,734 | $0 | N/A | UW NOI Debt Yield: | 11.8% | ||||||||||||
| Sources and Uses | |||||||||||||||||
| Sources | Proceeds | % of Total | Uses | Proceeds | % of Total | ||||||||||||
| Mortgage Loan | $30,000,000 | 100.0% | Payoff Existing Debt | $20,288,291 | 67.6% | ||||||||||||
| Upfront Reserves | 1,678,664 | 5.6% | |||||||||||||||
| Closing Costs | 313,637 | 1.0 | |||||||||||||||
| Return of Equity | 7,719,408 | 25.7% | |||||||||||||||
| Total Sources | $30,000,000 | 100.0% | Total Uses | $30,000,000 | 100.0% | ||||||||||||
| (1) | Other Initial Escrows and Reserves represents a free rent reserve. |
The Loan.The First Place Tower loan is secured by a first mortgage lien on the borrower’s fee interest in a Class A 594,984 square foot office tower located in Tulsa, Oklahoma.
The borrower is First Place, LLC, a single-purpose Oklahoma limited liability company structured to be bankruptcy remote with two independent directors. The loan sponsor and nonrecourse carve-out guarantor of the First Place Tower loan is Jacqueline E. Price, the President of Price Family Properties, which is the largest office landlord in Tulsa, Oklahoma. Price Family Properties currently owns 13 office buildings in the Tulsa central business district (“CBD”) totaling over 2 million square feet of commercial office space, including the Bank of America Tower.
The Property.The First Place Tower is a 594,984 square foot, Class A office tower located in downtown Tulsa, Oklahoma. The First Place Tower property is comprised of two buildings including a 19-story midrise tower built in 1956 and a 41-story tower built in 1971. The First Place Tower property is the fourth tallest building in Oklahoma and the second tallest building in downtown Tulsa. The First Place Tower property features a large lobby with polished granite, modern finishes, a contemporary sculpture, revolving doors, and 24/7 security located on the lobby floor.
THE INFORMATION IN THIS STRUCTURAL AND COLLATERAL TERM SHEET IS NOT COMPLETE AND MAY BE AMENDED PRIOR TO THE TIME OF SALE. THIS TERM SHEET IS NOT AN OFFER TO SELL THESE SECURITIES AND IT IS NOT A SOLICITATION OF AN OFFER TO BUY THESE SECURITIES IN ANY JURISDICTION WHERE THE OFFER OR SALE IS NOT PERMITTED.
| | | |
116 of 130
| Structural and Collateral Term Sheet | Benchmark 2018-B5 | |
| First Place Tower | ||
As of June 7, 2018, the First Place Tower property was 80.1% leased to a diverse mix of 39 tenants, with all but the top two tenants leasing no more than 5.4% of the total net rentable area. The largest tenant at the First Place Tower property is ONE Gas, Inc. (rated A2/A by Moody’s/S&P), which leases 151,407 square feet (25.4% of NRA) across 14 suites. ONE Gas, Inc. is a publicly traded company included in the S&P MidCap 400 Index and provides natural gas distribution to more than 2 million customers across Oklahoma, Kansas and Texas. ONE Gas, Inc. is headquartered at the First Place Tower property and its divisions include Oklahoma Natural Gas, the largest natural gas distributor in Oklahoma; Kansas Gas Service, the largest in Kansas, and Texas Gas Service, the third largest in Texas, in terms of customers. As of year-end 2017, ONE Gas, Inc. reported a net income of approximately $163.0 million. ONE Gas, Inc. has been at the First Place Tower Property since March 2014 and has expanded its space twice, first in 2016 and second in 2018. In addition, there is another expansion LOI for 10,165 square feet expected to be executed by the end of August 2018, however there is no assurance the lease will be signed. The expansion space related to the LOI was not underwritten in the base rent. According to the sponsor, ONE Gas, Inc. has invested approximately $15.0 million ($105 per square foot) into their space. ONE Gas, Inc. does not have any other corporate office space in the United States. The tenant has two five-year renewal options and no termination options. The second largest tenant at the First Place Tower property is Samson Investment Company, which leases 61,148 square feet (10.3% of NRA) across six suites. Samson Investment Company is a holding company founded in 1986, and through its subsidiaries, explores and produces oil and gas in North America with a focus in onshore basins in the United States. It produces crude oil and natural gas; and provides various midstream activities, including gas transportation, processing, and storage. The company operates wells and has interests in producing properties in East Texas, Anadarko, Permian, San Juan, Green River, and the Williston Basin/Bakken. Samson Investment Company is headquartered in Tulsa, Oklahoma with division offices in Denver, Colorado and Houston and Midland, Texas. Samson Investment Company has been at the property since March 2017 with leases that expire in February 2022. Samson Investment Company has two, five-year renewal options and no termination options.
There is a parking garage with an expected 519 parking spaces currently under construction by the sponsor, adjacent to the First Place Tower property, located on the southeast corner of Fourth Street and Main Street. The parking garage is not included as part of the collateral for the First Place Tower loan, however, there is expected to be a perpetual REA in place between the garage and the First Place Tower property. The parking garage is expected to be complete by the end of 2018. Tenants at the First Place Tower property, including ONE Gas, Inc. and Samson Investment Company will be able to lease space upon completion. ONE Gas, Inc.’s lease allows them to lease a total of 400 non-reserved spaces for the lesser of market rate or $90 per month and Samson Investment Company’s lease allows them to lease up to 25 parking spaces for $100 per month.
The First Place Tower property is located in the central business district of Tulsa between Fourth & Fifth Streets on the west side of Boston Avenue and is situated near an array of restaurants, retail and entertainment venues along Boston Avenue and Main Street. The First Place Tower property has immediate access to the Main Street parking garage via an underground walkway and is in close proximity to downtown Tulsa, Oklahoma State University Medical Center, BOK Center, Cox Business Center and Drillers Stadium. In addition, the Santa Fe Square, located approximately 1.3 miles from the First Place Tower property, is a mixed use development currently under construction that will encompass two full blocks and consist of approximately 600,000 square feet of retail and office space, a 93 room Hotel Indigo, 291 new apartment units and public gathering spaces.
According to the appraisal, the First Place Tower property is located within the Tulsa CBD office submarket. The Tulsa CBD office submarket had first quarter 2018 inventory of approximately 12,905,763 square feet with a 11.2% vacancy rate and average asking rents of $15.07 per square foot. The estimated 2017 population within a one-, three- and five-mile radius around the First Place Tower property was 8,445, 75,232 and 165,881, respectively. The appraisal identified five properties as directly comparable to the First Place Tower property, ranging in size from 85,155 square feet to 750,000 square feet. The five properties reported occupancies ranging from 80% to 100% with asking rents ranging from $7.58 to $21.00 per square foot.
| Historical and Current Occupancy(1)(2) | |||
| 2015 | 2016 | 2017 | Current(3) |
| 52.3% | 49.0% | 75.0% | 80.1% |
| (1) | The sponsor acquired the property at the end of 2016. Since acquisition, the sponsor has leased up an additional 146,000 square feet. |
| (2) | Historical occupancies are as of December 31 of each respective year. |
| (3) | Current occupancy is as of June 7, 2018. |
THE INFORMATION IN THIS STRUCTURAL AND COLLATERAL TERM SHEET IS NOT COMPLETE AND MAY BE AMENDED PRIOR TO THE TIME OF SALE. THIS TERM SHEET IS NOT AN OFFER TO SELL THESE SECURITIES AND IT IS NOT A SOLICITATION OF AN OFFER TO BUY THESE SECURITIES IN ANY JURISDICTION WHERE THE OFFER OR SALE IS NOT PERMITTED.
| | | |
117 of 130
| Structural and Collateral Term Sheet | Benchmark 2018-B5 | |
| First Place Tower | ||
| Tenant Summary(1) | ||||||||
| Tenant | Ratings Moody’s/S&P/Fitch | Net Rentable Area (SF) | % of Total NRA | Base Rent PSF(2) | % of Base Rent | Lease Expiration Date | ||
| ONE Gas, Inc. | A2 / A / NA | 151,407 | 25.4% | $15.13 | 34.7% | 6/30/2024 | ||
| Samson Investment Co | NA / NA / NA | 61,148 | 10.3% | $10.97 | 10.1% | 2/28/2022 | ||
| Aerotek, Inc.(2) | NA / NA / NA | 32,315 | 5.4% | $17.06 | 8.3% | 8/31/2023 | ||
| Foundation Energy Management | NA / NA / NA | 20,410 | 3.4% | $13.50 | 4.2% | 1/31/2020 | ||
| Nadel & Gussman, LLC | NA / NA / NA | 20,330 | 3.4% | $11.14 | 3.4% | 11/30/2019 | ||
| Rodolph & Todd(3) | NA / NA / NA | 19,915 | 3.3% | $11.00 | 3.3% | 12/31/2029 | ||
| Associated Resources | NA / NA / NA | 17,051 | 2.9% | $13.49 | 3.5% | 7/31/2023 | ||
| Titus Hillis & Reynolds | NA / NA / NA | 10,627 | 1.8% | $13.46 | 2.2% | 12/31/2020 | ||
| Jones, Givens, Gotcher & Bogan | NA / NA / NA | 10,623 | 1.8% | $13.46 | 2.2% | 3/31/2020 | ||
| City Year, Inc(4) | NA / NA / NA | 10,398 | 1.7% | $12.76 | 2.0% | 10/31/2019 | ||
| (1) | Based on the underwritten rent roll dated June 7, 2018. |
| (2) | Aerotek, Inc. has one option to terminate its lease as of August 31, 2022 with 180 days’ prior notice and the payment of a termination fee. |
| (3) | Rodolph & Todd is currently not in occupancy but expected to take occupancy in January of 2019. Rodolph & Todd has a one option to terminate its lease as of December 31, 2023 with 180 days’ prior notice and the payment of a termination fee. |
| (4) | City Year, Inc has the option to terminate its lease at any time with 9 months’ notice and the payment of a termination fee. |
| Lease Rollover Schedule(1)(2) | |||||||||
| Year | Number of Leases Expiring | Net Rentable Area Expiring | % of NRA Expiring | Base Rent Expiring(3) | % of Base Rent Expiring | Cumulative Net Rentable Area Expiring | Cumulative % of NRA Expiring | Cumulative Base Rent Expiring | Cumulative % of Base Rent Expiring |
| Vacant | NAP | 118,185 | 19.9% | NAP | NAP | 118,185 | 19.9% | NAP | NAP |
| 2018 & MTM | 12 | 12,516 | 2.1 | $191,330 | 2.9% | 130,701 | 22.0% | $191,330 | 2.9% |
| 2019 | 3 | 36,757 | 6.2 | $443,561 | 6.7 | 167,458 | 28.1% | $634,890 | 9.6% |
| 2020 | 10 | 79,579 | 13.4 | 1,064,557 | 16.1 | 251,422 | 42.3% | $1,759,083 | 26.6% |
| 2021 | 2 | 6,604 | 1.1 | 101,065 | 1.5 | 258,026 | 43.4% | $1,860,148 | 28.1% |
| 2022 | 3 | 74,342 | 12.5 | 867,886 | 13.1 | 332,368 | 55.9% | $2,728,034 | 41.3% |
| 2023 | 7 | 75,060 | 12.6 | 1,179,141 | 17.8 | 403,043 | 67.7% | $3,847,539 | 58.2% |
| 2024 | 1 | 151,407 | 25.4 | 2,291,446 | 34.7 | 554,450 | 93.2% | $6,138,985 | 92.9% |
| 2025 | 0 | 0 | 0.0 | 0 | 0.0 | 554,450 | 93.2% | $6,138,985 | 92.9% |
| 2026 | 0 | 0 | 0.0 | 0 | 0.0 | 554,450 | 93.2% | $6,138,985 | 92.9% |
| 2027 | 3 | 10,607 | 1.8 | 159,540 | 2.4 | 565,057 | 95.0% | $6,298,525 | 95.3% |
| 2028 | 0 | 0 | 0.0 | 0 | 0.0 | 565,057 | 95.0% | $6,298,525 | 95.3% |
| 2029 & Beyond | 2 | 29,927 | 5.0 | 311,185 | 4.7 | 594,984 | 100.0% | $6,609,710 | 100.0% |
| Total | 43 | 594,984 | 100.0% | $6,609,710 | 100.0% | ||||
| (1) | Based on the underwritten rent roll dated June 7, 2018. |
| (2) | Certain tenants may have termination or contraction options (which may become exercisable prior to the originally stated expiration date of the tenant lease) that are not considered in the above Lease Rollover Schedule. |
| (3) | Base Rent Expiring includes $109,622 of base rent related to storage income and $31,494 of base rent related to antenna income. |
THE INFORMATION IN THIS STRUCTURAL AND COLLATERAL TERM SHEET IS NOT COMPLETE AND MAY BE AMENDED PRIOR TO THE TIME OF SALE. THIS TERM SHEET IS NOT AN OFFER TO SELL THESE SECURITIES AND IT IS NOT A SOLICITATION OF AN OFFER TO BUY THESE SECURITIES IN ANY JURISDICTION WHERE THE OFFER OR SALE IS NOT PERMITTED.
| | | |
118 of 130
| Structural and Collateral Term Sheet | Benchmark 2018-B5 | |
| First Place Tower | ||
| Operating History and Underwritten Net Cash Flow | |||||||
| 2015 | 2016 | 2017 | TTM(1) | Underwritten(2) | Per Square Foot | %(3) | |
| Base Rent | $4,850,752 | $4,715,425 | $5,410,784 | $5,869,444 | $6,468,594 | $10.87 | 77.3% |
| Contractual Rent Steps | 0 | 0 | 0 | 0 | 193,679 | 0.33 | 2.3 |
| Value of Vacant Space | 0 | 0 | 0 | 0 | 1,598,080 | 2.69 | 19.1 |
| Gross Potential Rent | $4,850,752 | $4,715,425 | $5,410,784 | $5,869,444 | $8,260,353 | $13.88 | 98.7% |
| Total Recoveries | 2,990 | 0 | 900 | 108,557 | 105,673 | 0.18 | 1.3 |
| Net Rental Income | $4,853,741 | $4,715,425 | $5,411,684 | $5,978,001 | $8,366,026 | $14.06 | 100.0% |
| Less: Vacancy | 0 | 0 | 0 | 0 | (1,598,080) | (2.69) | (19.1) |
| Other Income(4) | 66,873 | 57,943 | 91,369 | 74,179 | 147,671 | 0.25 | 1.8 |
| Effective Gross Income | $4,920,615 | $4,773,368 | $5,503,053 | $6,052,180 | $6,915,617 | $11.62 | 82.7% |
| Total Variable Expenses | 3,042,728 | 2,718,172 | 2,749,368 | 2,916,112 | 2,951,126 | 4.96 | 42.7 |
| Total Fixed Expenses | 308,190 | 346,965 | 432,210 | 431,603 | 441,935 | 0.74 | 6.4 |
| Net Operating Income | $1,569,697 | $1,708,232 | $2,321,475 | $2,704,465 | $3,522,556 | $5.92 | 50.9% |
| TI/LC | 0 | 0 | 0 | 0 | 594,984 | 1.00 | 8.6 |
| Capital Expenditures | 0 | 0 | 0 | 0 | 118,997 | 0.20 | 1.7 |
| Net Cash Flow | $1,569,697 | $1,708,232 | $2,321,475 | $2,704,465 | $2,808,576 | $4.72 | 40.6% |
| (1) | TTM reflects the trailing 12-month period ending April 30, 2018. |
| (2) | The increase in Underwritten Net Operating Income compared to TTM Net Operating Income is attributable to the signing of new leases beginning in 2018 and 2020, accounting for $965,822 in annual rent. |
| (3) | % column represents percent of Net Rental Income for all revenue lines and represents percent of Effective Gross Income for the remainder of the fields. |
| (4) | Other Income includes storage space income and antenna income. |
THE INFORMATION IN THIS STRUCTURAL AND COLLATERAL TERM SHEET IS NOT COMPLETE AND MAY BE AMENDED PRIOR TO THE TIME OF SALE. THIS TERM SHEET IS NOT AN OFFER TO SELL THESE SECURITIES AND IT IS NOT A SOLICITATION OF AN OFFER TO BUY THESE SECURITIES IN ANY JURISDICTION WHERE THE OFFER OR SALE IS NOT PERMITTED.
| | | |
119 of 130
| Structural and Collateral Term Sheet | BENCHMARK 2018-B5 |
| 215 Lexington Avenue | |
| Mortgage Loan Information | Property Information | |||
| Mortgage Loan Seller: | CREFI | Single Asset / Portfolio: | Single Asset | |
| Original Principal Balance: | $26,000,000 | Title: | Fee | |
| Cut-off Date Principal Balance: | $26,000,000 | Property Type - Subtype: | Office – CBD | |
| % of Pool by IPB: | 2.5% | Net Rentable Area (SF): | 120,677 | |
| Loan Purpose: | Recapitalization | Location: | New York, NY | |
| Borrower: | 215 Dorchester Partners LLC | Year Built / Renovated: | 1962 / N/A | |
| Sponsor: | David Eshaghian | Occupancy: | 78.3% | |
| Interest Rate: | 4.3000% | Occupancy Date: | 4/19/2018 | |
| Note Date: | 7/6/2018 | Number of Tenants: | 11 | |
| Maturity Date: | 7/6/2028 | 2015 NOI: | $3,809,794 | |
| Interest-only Period: | 120 months | 2016 NOI: | $3,609,503 | |
| Original Term: | 120 months | 2017 NOI: | $3,658,802 | |
| Original Amortization: | None | TTM NOI: (as of 3/2018) | $3,415,790 | |
| Amortization Type: | Interest Only | UW Economic Occupancy: | 78.8% | |
| Call Protection: | L(25),DeforGrtr1%orYM(91),O(4) | UW Revenues: | $5,422,659 | |
| Lockbox / Cash Management: | Springing / Springing | UW Expenses: | $2,177,492 | |
| Additional Debt: | N/A
| UW NOI: | $3,245,167 | |
| Additional Debt Balance: | N/A | UW NCF: | $2,955,959 | |
| Additional Debt Type: | N/A | Appraised Value / Per SF: | $83,000,000 / $688 | |
| Appraisal Date: | 5/11/2018 | |||
| Escrows and Reserves | Financial Information | ||||||||
| Initial | Monthly | Initial Cap | Cut-off Date Loan / SF: | $215 | |||||
| Taxes: | $0 | Springing | N/A | Maturity Date Loan / SF: | $215 | ||||
| Insurance: | $0 | Springing | N/A | Cut-off Date LTV: | 31.3% | ||||
| Replacement Reserves: | $0 | Springing | N/A | Maturity Date LTV: | 31.3% | ||||
| TI/LC: | $0 | Springing | N/A | UW NCF DSCR: | 2.61x | ||||
| Other: | $0 | Springing | N/A | UW NOI Debt Yield: | 12.5% | ||||
| Sources and Uses | ||||||
| Sources | Proceeds | % of Total | Uses | Proceeds | % of Total | |
| Mortgage Loan | $26,000,000 | 100.0% | Return of Equity | $25,654,480 | 98.7% | |
| Closing Costs | 345,520 | 1.3 | ||||
| Total Sources | $26,000,000 | 100.0% | Total Uses | $26,000,000 | 100.0% | |
The Loan.The 215 Lexington Avenue loan has an outstanding principal balance as of the Cut-off Date of $26.0 million and is secured by a first mortgage lien on the borrower’s fee interest in a 120,677 square foot, 12-floor office condominium located in New York, New York (the “215 Lexington Avenue Property”). The 215 Lexington Avenue loan has a 10-year term and requires payments of interest only for the entire loan term.
The borrowing entity for the 215 Lexington Avenue loan is 215 Dorchester Partners LLC, a Delaware limited liability company and special purpose entity. The sponsor and nonrecourse carve-out guarantor for the 215 Lexington Avenue loan is David Eshaghian of The Somerset Group. The Somerset Group is a privately held real estate investment, management and development organization headquartered in New York City. On behalf of their investment and joint venture partners, The Somerset Group has acquired and currently manages over two million square feet of retail, commercial and residential properties and have developed more than one million square feet of luxury residential condominiums over the last three decades.
The Property.The 215 Lexington Avenue Property is a 120,677 square foot, 12-floor office condominium located in New York, New York. The 215 Lexington Avenue Property consists of floors 9 through 21 of 215 Lexington Avenue, located between 32ndand 33rd streets in the Murray Hill neighborhood of Manhattan, New York. The non-collateral bottom eight floors of 215 Lexington Avenue, which makeup the remainder of the condominium regime, are owned by Yeshiva University and are occupied by Yeshiva University’s Israel Henry Beren Campus and Sy Sym’s School of Business. As of the underwritten rent roll dated April 19, 2018, the 215 Lexington
THE INFORMATION IN THIS STRUCTURAL AND COLLATERAL TERM SHEET IS NOT COMPLETE AND MAY BE AMENDED PRIOR TO THE TIME OF SALE. THIS TERM SHEET IS NOT AN OFFER TO SELL THESE SECURITIES AND IT IS NOT A SOLICITATION OF AN OFFER TO BUY THESE SECURITIES IN ANY JURISDICTION WHERE THE OFFER OR SALE IS NOT PERMITTED.
| | | |
120 of 130
| Structural and Collateral Term Sheet | BENCHMARK 2018-B5 |
| 215 Lexington Avenue | |
Avenue Property was 78.3% occupied by 11 tenants. 42,615 square feet of the 94,449 square feet of occupied space (45.1% of occupied net rentable area) has been located at the 215 Lexington Avenue Property since at least 2003. Between 2013 and 2017, the 215 Lexington Avenue Property had an average occupancy of 93.4%.
New York University is the largest tenant at the 215 Lexington Avenue Property, occupying 19,656 square feet (16.3% of the total net rentable area) through November 30, 2020. New York University currently utilizes its space for executive and administrative offices and has been located at the 215 Lexington Avenue Property since 2003. The second largest tenant, GRACE Communications Foundation, occupies 13,026 square feet (10.8% of the total square feet) through October 2019 and has been located at the 215 Lexington Avenue Property since August 2001. GRACE Communications Foundation is headquartered at the 215 Lexington Avenue Property and works to develop strategies to increase public awareness of the environmental and public health issues created by the industrial food system, and to advocate for sustainable alternatives. The third largest tenant, ARMS, Inc. occupies 11,181 square feet (9.3% of the total square feet) through July 2023 and has been located at the 215 Lexington Avenue Property since April 2013. ARMS, Inc. is headquartered at the 215 Lexington Avenue Property and helps its clients, more than 700 ambulatory health centers located throughout the United States, reduce risk and enhance patient safety.
The Market. The 215 Lexington Avenue Property is located in Midtown Manhattan on Lexington Avenue between 32nd and 33rd Streets in New York, New York. According to the appraisal, New York City had a 2017 estimated population of 8.6 million people and a 2017 average household income of $89,022. According to the New York State Department of Labor, New York City’s unemployment rate in February 2018 was 4.2%, as compared to its unemployment rate of 4.6% in February to 2017. New York City is home to the headquarters of 74 Fortune 1000 companies and 45 Fortune 500 companies. The education and health services sector is the largest employment sector in the New York City with the five largest hospital systems (Mount Sinai Health System, New York-Presbyterian, Continuum Health Partners, Montefiore Medical Center and New York University Langone) employing nearly 110,000 people.
According to the appraisal, the 215 Lexington Avenue Property is located within the Midtown Manhattan office market which, as of the first quarter of 2018, consisted of approximately 240.3 million square feet of office space with a direct vacancy of 7.7% and average gross asking rent per square foot of $81.00. According to the appraisal, the 215 Lexington Avenue Property is located within the Murray Hill office submarket which, as of the first quarter of 2018, consisted of approximately 6.3 million square feet of Class B office space with a submarket direct vacancy of 5.3% and average gross asking rents per square foot of $57.73 (compared to the weighted average underwritten gross rent at the 215 Lexington Avenue Property of $56.16). The appraiser concluded to a weighted average gross market rent per square foot for the 215 Lexington Avenue Property of $55.00 for the space on floors 9 through 16 and $60.00 for the space on floor’s 17 through 21. The 215 Lexington Avenue Property’s weighted average underwritten gross rent of $56.16 is in line with the appraiser’s concluded gross market rental range of $55.00 to $60.00.
| Historical and Current Occupancy(1) | |||
| 2015 | 2016 | 2017 | Current(2) |
| 93.1% | 94.5% | 92.5% | 78.3% |
| (1) | Historical Occupancies are as of December 31 of each respective year. |
| (2) | Current Occupancy is as of April 19, 2018. |
THE INFORMATION IN THIS STRUCTURAL AND COLLATERAL TERM SHEET IS NOT COMPLETE AND MAY BE AMENDED PRIOR TO THE TIME OF SALE. THIS TERM SHEET IS NOT AN OFFER TO SELL THESE SECURITIES AND IT IS NOT A SOLICITATION OF AN OFFER TO BUY THESE SECURITIES IN ANY JURISDICTION WHERE THE OFFER OR SALE IS NOT PERMITTED.
| | | |
121 of 130
| Structural and Collateral Term Sheet | BENCHMARK 2018-B5 |
| 215 Lexington Avenue | |
| Tenant Summary(1) | ||||||
| Tenant | Ratings(2) Moody’s/S&P/Fitch | Net Rentable Area (SF) | % of Total NRA | Base Rent PSF(3) | % of Total Base Rent(3) | Lease Expiration Date |
| New York University(4) | Aa2/NA/NA | 19,656 | 16.3% | $58.67 | 22.6% | 11/30/2020 |
| GRACE Communications Foundation | NA/NA/NA | 13,026 | 10.8% | $50.80 | 13.0% | 10/31/2019 |
| ARMS, Inc. | NA/NA/NA | 11,181 | 9.3% | $51.55 | 11.3% | 7/31/2023 |
| Waldner’s Business Environment | NA/NA/NA | 9,600 | 8.0% | $60.20 | 11.3% | 9/6/2028 |
| Jed C. Kaminetsky, M.D., P.C.(5) | NA/NA/NA | 9,084 | 7.5% | $49.63 | 8.8% | 8/31/2023 |
| Council for Aid to Education | NA/NA/NA | 8,117 | 6.7% | $49.09 | 7.8% | 2/9/2023 |
| Triplay, Inc. | NA/NA/NA | 6,492 | 5.4% | $56.00 | 7.1% | 8/1/2023 |
| The State of Texas | NA/NA/NA | 5,391 | 4.5% | $59.47 | 6.3% | 12/31/2019 |
| Real Data Management, Inc | NA/NA/NA | 5,207 | 4.3% | $53.17 | 5.4% | 3/31/2020 |
| Sofer & Haroun LLP | NA/NA/NA | 3,785 | 3.1% | $47.31 | 3.5% | 8/31/2021 |
| (1) | Based on the underwritten rent roll dated April 19, 2018. |
| (2) | Ratings provided are for the parent company of the entity listed in the “Tenant” field whether or not the parent company guarantees the lease. |
| (3) | Base Rent PSF and % of Total Base Rent include the straight line average of all rent steps through November 2020 for New York University ($120,640) and contractual rent steps for non-credit tenants through June 2019 ($114,572). |
| (4) | New York University has a termination option effective November 30, 2019, for both or either of the two floors it currently occupies, upon written notice 12-24 months prior to the termination date. If New York University exercises its termination option, it must pay a termination fee equal to the unamortized transaction costs including commissions, the value of free rent received ($163,800) and legal fees utilizing an 8.000% interest rate plus one month of the rent ($94,913). |
| (5) | Jed C. Kaminetsky, M.D., P.C. occupies a total of 9,084 square feet of space across two suites at the 215 Lexington Avenue Property. One suite (4,542 square feet) is leased through August 2018 (annual Base Rent of $199,848) and the other suite (4,542 square feet) is leased through August 2023 (annual Base Rent of $250,996). |
| Lease Rollover Schedule(1)(2) | ||||||||||||||||||
| Year | Number of Leases Expiring | Net Rentable Area Expiring | % of NRA Expiring | Base Rent Expiring(3) | % of Base Rent Expiring(3) | Cumulative Net Rentable Area Expiring | Cumulative % of NRA Expiring | Cumulative Base Rent Expiring(3) | Cumulative % of Base Rent Expiring(3) | |||||||||
| Vacant | NAP | 26,228 | 21.7% | NAP | NAP | 26,228 | 21.7% | NAP | NAP | |||||||||
| 2018 & MTM | 1 | 4,542 | 3.8% | $199,848 | 3.9% | 30,770 | 25.5% | $199,848 | 3.9% | |||||||||
| 2019 | 2 | 18,417 | 15.3% | 982,357 | 19.2% | 49,187 | 40.8% | $1,182,205 | 23.1% | |||||||||
| 2020 | 3 | 27,773 | 23.0% | 1,578,825 | 30.9% | 76,960 | 63.8% | $2,761,030 | 54.1% | |||||||||
| 2021 | 1 | 3,785 | 3.1% | 179,054 | 3.5% | 80,745 | 66.9% | $2,940,084 | 57.6% | |||||||||
| 2022 | 0 | 0 | 0.0% | 0 | 0.0% | 80,745 | 66.9% | $2,940,084 | 57.6% | |||||||||
| 2023 | 3 | 30,332 | 25.1% | 1,589,328 | 31.1% | 111,077 | 92.0% | $4,529,413 | 88.7% | |||||||||
| 2024 | 0 | 0 | 0.0% | 0 | 0.0% | 111,077 | 92.0% | $4,529,413 | 88.7% | |||||||||
| 2025 | 0 | 0 | 0.0% | 0 | 0.0% | 111,077 | 92.0% | $4,529,413 | 88.7% | |||||||||
| 2026 | 0 | 0 | 0.0% | 0 | 0.0% | 111,077 | 92.0% | $4,529,413 | 88.7% | |||||||||
| 2027 | 0 | 0 | 0.0% | 0 | 0.0% | 111,077 | 92.0% | $4,529,413 | 88.7% | |||||||||
| 2028 & Beyond | 1 | 9,600 | 8.0% | 577,940 | 11.3% | 120,677 | 100.0% | $5,107,353 | 100.0% | |||||||||
| Total | 11 | 120,677 | 100.0% | $5,107,353 | 100.0% | |||||||||||||
| (1) | Based on the underwritten rent roll dated April 19, 2018. |
| (2) | Certain tenants may have termination or contraction options (which may become exercisable prior to the originally stated expiration date of the tenant lease) that are not considered in the above lease rollover schedule. |
| (3) | Base Rent PSF and % of Total Base Rent include the straight line average of all rent steps through November 2020 for New York University ($120,640) and contractual rent steps for non-credit tenants through June 2019 ($114,572). |
THE INFORMATION IN THIS STRUCTURAL AND COLLATERAL TERM SHEET IS NOT COMPLETE AND MAY BE AMENDED PRIOR TO THE TIME OF SALE. THIS TERM SHEET IS NOT AN OFFER TO SELL THESE SECURITIES AND IT IS NOT A SOLICITATION OF AN OFFER TO BUY THESE SECURITIES IN ANY JURISDICTION WHERE THE OFFER OR SALE IS NOT PERMITTED.
| | | |
122 of 130
| Structural and Collateral Term Sheet | BENCHMARK 2018-B5 |
| 215 Lexington Avenue | |
| Operating History and Underwritten Net Cash Flow | ||||||||
| 2015 | 2016 | 2017 | TTM(1) | Underwritten | Per Square Foot | %(2) | ||
| Rents in Place | $5,404,673 | $5,256,594 | $5,411,384 | $5,186,185 | $4,872,140 | $40.37 | 71.3% | |
| Contractual Rent Steps(3) | 0 | 0 | 0 | 0 | 235,212 | 1.95 | 3.4 | |
| Vacant Income | 0 | 0 | 0 | 0 | 1,451,440 | 12.03 | 21.2 | |
| Total Reimbursements | 290,163 | 235,997 | 238,422 | 223,314 | 196,683 | 1.63 | 2.9 | |
| Other Income(4) | 53,312 | 64,496 | 74,700 | 83,197 | 80,676 | 0.67 | 1.2 | |
| Net Rental Income | $5,748,148 | $5,557,087 | $5,724,506 | $5,492,696 | $6,836,152 | $56.65 | 100.0% | |
| (Vacancy/Credit Loss) | 0 | 0 | 0 | 0 | (1,451,440) | (12.03) | (21.2) | |
| EGI Before Other Income | $5,748,148 | $5,557,087 | $5,724,506 | 5,492,696 | 5,384,712 | 44.62 | 78.8% | |
| Porter Wage Revenue | 35,828 | 42,652 | 48,501 | 43,680 | 25,322 | 0.21 | 0.4 | |
| Miscellaneous Income(5) | 28,453 | 22,776 | 9,472 | 12,626 | 12,626 | 0.10 | 0.2 | |
| Effective Gross Income | $5,812,429 | $5,622,515 | $5,782,479 | $5,549,002 | $5,422,659 | $44.94 | 79.3% | |
| Total Expenses | $2,002,635 | $2,013,012 | $2,123,677 | $2,133,212 | $2,177,492 | $18.04 | 40.2% | |
| Net Operating Income(6) | $3,809,794 | $3,609,503 | $3,658,802 | $3,415,790 | $3,245,167 | $26.89 | 59.8% | |
| Total TI/LC, Capex/RR | 0 | 0 | 0 | 0 | 289,208 | 2.40 | 5.3 | |
| Net Cash Flow | $3,809,794 | $3,609,503 | $3,658,802 | $3,415,790 | $2,955,959 | $24.49 | 54.5% | |
| (1) | TTM reflects the trailing 12-month period ending May 31, 2018. |
| (2) | % column represents percentage of Net Rental Income for all revenue lines and represents percentage of Effective Gross Income for the remainder of the fields. |
| (3) | Contractual Rent Steps represent the straight line average of all rent steps through November 2020 for New York University ($120,640) and contractual rent steps for non-credit tenants through June 2019 ($114,572). |
| (4) | Other Income includes fixed electric payments and multi-tenant floor electric reimbursement income. |
| (5) | Miscellaneous Income includes extra charges and overtime charges for rubbish removal, elevator service, HVAC, and other tenant-specific services. |
| (6) | The decrease in Net Operating Income from 2017 to Underwritten NOI is primarily attributable to recent vacating and downsizing activity at the 215 Lexington Avenue Property. National Review (13,027 square feet and $76,230 of base rent) vacated in September 2017, Rich Relevance (7,394 square feet and $374,491 of base rent) vacated in March 2018, and Waldner’s Business Environment downsized from 13,627 square feet to its current 9,600 square feet (reducing Waldner’s Business Environment base rent by $151,860). |
Property Management. The property is managed by Cushman & Wakefield U.S., Inc.
THE INFORMATION IN THIS STRUCTURAL AND COLLATERAL TERM SHEET IS NOT COMPLETE AND MAY BE AMENDED PRIOR TO THE TIME OF SALE. THIS TERM SHEET IS NOT AN OFFER TO SELL THESE SECURITIES AND IT IS NOT A SOLICITATION OF AN OFFER TO BUY THESE SECURITIES IN ANY JURISDICTION WHERE THE OFFER OR SALE IS NOT PERMITTED.
| | | |
123 of 130
| Structural and Collateral Term Sheet | Benchmark 2018-B5 | |
| Overland Park Xchange | ||
| Mortgage Loan Information | Property Information | |||
| Mortgage Loan Seller: | JPMCB | Single Asset / Portfolio: | Single Asset | |
| Original Principal Balance(1): | $25,000,000 | Title(2): | Fee | |
| Cut-off Date Principal Balance(1): | $25,000,000 | Property Type - Subtype: | Office – Suburban | |
| % of Pool by IPB: | 2.4% | Net Rentable Area (SF): | 733,400 | |
| Loan Purpose: | Refinance | Location: | Overland Park, KS | |
| Borrower: | OPX, LLC | Year Built / Renovated: | 1986 / 2015 | |
| Sponsor: | Gary L. Oborny | Occupancy: | 90.1% | |
| Interest Rate: | 4.70000% | Occupancy Date: | 7/1/2018 | |
| Note Date: | 6/28/2018 | Number of Tenants: | 3 | |
| Maturity Date: | 7/1/2028 | 2015 NOI(3): | $4,117,814 | |
| Interest-only Period: | 120 months | 2016 NOI(3): | $5,797,349 | |
| Original Term: | 120 months | 2017 NOI(3): | $6,852,484 | |
| Original Amortization: | None | TTM NOI: | $7,567,904 | |
| Amortization Type: | Interest Only | UW Economic Occupancy: | 89.2% | |
| Call Protection: | L(25),Grtr1%orYM(92),O(3) | UW Revenues: | $14,709,331 | |
| Lockbox / Cash Management: | Hard / Springing | UW Expenses: | $6,208,312 | |
| Additional Debt: | Yes | UW NOI: | $8,501,019 | |
| Additional Debt Balance: | $53,000,000 | UW NCF(4):: | $7,795,593 | |
| Additional Debt Type: | Pari Passu | Appraised Value / Per SF(5): | $119,700,000 / $163 | |
| Appraisal Date: | 6/13/2018 | |||
| Escrows and Reserves | Financial Information(1) | ||||||
| Initial | Monthly | Initial Cap | Cut-off Date Loan / SF: | $106 | |||
| Taxes: | $552,511 | $184,170 | N/A | Maturity Date Loan / SF: | $106 | ||
| Insurance: | $0 | Springing | N/A | Cut-off Date LTV: | 65.2% | ||
| Replacement Reserves: | $12,223 | $12,223 | N/A | Maturity Date LTV: | 66.3% | ||
| TI/LC: | $1,964,000 | $30,558 | N/A | UW NCF DSCR: | 2.10x | ||
| Other(6): | $2,863,221 | Other | $9,167,500 | UW NOI Debt Yield: | 10.9% | ||
| Sources and Uses | ||||||
| Sources | Proceeds | % of Total | Uses | Proceeds | % of Total | |
| Whole Loan | $78,000,000 | 94.9% | Payoff Existing Debt | $76,533,206 | 93.1% | |
| Sponsor Equity | 4,201,432 | 5.1% | Upfront Reserves | 5,391,955 | 6.6% | |
| Closing Costs | 276,272 | 0.3% | ||||
| Total Sources | $82,201,432 | 100.0% | Total Uses | $82,201,432 | 100.0% | |
| (1) | The Overland Park Xchange mortgage loan is part of a whole loan evidenced by two pari passu notes, with an aggregate outstanding principal balance as of the Cut-off Date of $78.0 million. The Financial Information presented in the chart above reflects the aggregate Cut-off Date balance of the $78.0 million Overland Park Xchange Whole Loan, as defined in “The Loan” below. |
| (2) | The borrower previously owned the fee interest in the property. The borrower conveyed fee title to the City of Overland Park, Kansas, which ground leased the property back to the borrower in order to facilitate a payment in lieu of taxes arrangement. Please see “PILOT Program” below for additional details. |
| (3) | The increase in NOI from 2015 to 2016 and 2016 to 2017 is due to lease-up following an approximately $40.0 million ground-up renovation that was completed in 2015. Renovations included reskinning the exterior with glass and metal panels, the addition of a parking garage, a completely revamped HVAC system, a fitness area (with locker room and showers) and vendor kiosks including dry cleaning, a bistro and a lounge with Wi-Fi access. |
| (4) | The increase from TTM to UW NOI reflects Select Quote taking occupancy after lease commencement on January 1, 2018. |
| (5) | The Appraised Value / Per SF represents the sum of the “As Is” appraised value for the property and the “As Is – NPV of Tax Abatement” appraised value. The “as-is” appraised value is $117,700,000 as of June 13, 2018, equating to a Cut-off Date LTV and Maturity Date LTV of 66.3%. The “As Is – NPV of Tax Abatement” appraised value is the appraiser’s determination of the net present value of the payment in lieu of taxes program affecting the property. See “PILOT Program” below for additional details. |
| (6) | The Initial Other Escrows and Reserves represents the aggregate of (i) $2,499,221 for outstanding tenant improvements and (ii) $364,000 for a Select Quote existing rent buyout reserve required under the Select Quote lease. The Monthly Other Escrows and Reserves represents the monthly amortization reserve, which equals the difference between (i) an amount equal to accrued interest due and payable on the unpaid principal balance of the loan during each applicable accrual period and (ii) a monthly debt service payment amount for the loan calculated assuming no interest only period and a constant monthly payment of principal and interest based on a 30 year amortization schedule. In lieu of a monthly deposit, the borrower may deposit a letter of credit in an amount equal to $9,167,500, which represents the cap on the amortization reserve. |
THE INFORMATION IN THIS STRUCTURAL AND COLLATERAL TERM SHEET IS NOT COMPLETE AND MAY BE AMENDED PRIOR TO THE TIME OF SALE. THIS TERM SHEET IS NOT AN OFFER TO SELL THESE SECURITIES AND IT IS NOT A SOLICITATION OF AN OFFER TO BUY THESE SECURITIES IN ANY JURISDICTION WHERE THE OFFER OR SALE IS NOT PERMITTED.
| | | |
124 of 130
| Structural and Collateral Term Sheet | Benchmark 2018-B5 | |
| Overland Park Xchange | ||
The Loan.The Overland Park Xchange loan is secured by a first mortgage lien on the borrower’s fee interest in a 733,400 square foot Class A office building located in Overland Park, Kansas. The loan is part of a whole loan (the “Overland Park Xchange Whole Loan”) that has an outstanding principal balance as of the Cut-off Date of $78.0 million and is comprised of twopari passunotes, each as described below. The controlling Note A-1, with an outstanding principal balance as of the Cut-off Date of $25.0 million, is being contributed to the Benchmark 2018-B5 Trust. The non-controlling Note A-2, with an outstanding principal balance as of the Cut-off Date of $53.0 million, is currently held by JPMCB and is expected to be contributed to one or more future securitization trusts. The relationship between the holders of the Overland Park Xchange Whole Loan will be governed by a co-lender agreement as described under the “Description of the Mortgage Pool—The Whole Loans—The Serviced Pari Passu Whole Loans” in the Preliminary Prospectus. The Overland Park Xchange Whole Loan has a 10-year term and will be interest only for the entire term.
| Whole Loan Summary | |||||
| Note | Original Balance | Cut-off Date Balance | Note Holder | Controlling Piece | |
| A-1 | $25,000,000 | $25,000,000 | Benchmark 2018-B5 | Yes | |
| A-2 | 53,000,000 | 53,000,000 | JPMCB | No | |
| Total | $78,000,000 | $78,000,000 | |||
The borrowing entity for the loan is OPX, LLC, a Kansas limited liability company and special purpose entity.
The loan sponsor and nonrecourse carve-out guarantor for the loan is Gary L. Oborny, who is the founder and Chief Executive Officer ofOccidental Management, Inc. (“Occidental”), a Kansas corporation. Established in 1997, Occidental is a vertically integrated company with services that include development, construction, sales and leasing, brokerage and property management. Occidental currently operates over 15 properties and is headquartered in Wichita, Kansas.
The Property.The Overland Park Xchange property is a 733,400 square foot Class A office complex located at 6800 West 115th Street in Overland Park, Kansas, approximately 12.6 miles southwest of downtown Kansas City. Constructed in 1986, the Overland Park Xchange property consists of one two-story building situated on approximately 30.0 acres.The property underwent an approximately $40.0 million renovation in 2015 and features a new fitness center and WiFi lounge.The 2015 renovation won three national awards from industry associations in 2016 and 2017. Additionally, the property has two parking garages which offers 2,979 parking space and results in a parking ratio of approximately 4.06 spaces per 1,000 square feet of net rentable area.
As of July 1, 2018, the Overland Park Xchange property was 90.1% leased to three tenants. The property has experienced recent leasing momentum, signing three leases to Select Quote (17.8% of net rentable area) in January 2018. The largest tenant, United Health Group (“United”), has offices at the property and leases 328,098 square feet (44.7% of the net rentable area) through December 2026 and has been a tenant at the property since 2005. Founded in 1977, United (NYSE: UNH) is headquartered in Minnetonka, MN. United has two business platforms: UnitedHealthcare and Optum. It serves the health benefits needs of individual consumers, employers, and seniors. The company also engages in local care delivery, care management, consumer engagement and support, distribution of benefits and services, and other business segments. The company reported revenue of $201.2 billion for the fiscal year ending December 31, 2017. United accounts for approximately 43.1% of the underwritten base rent at the property and its lease contains two five-year renewal options. The second largest tenant, Black & Veatch, leases 202,116 square feet (27.6% of the net rentable area) through April 2026 and has been a tenant at the property since 2015. Black & Veatch, which dates back to 1917, is an engineering, consulting and construction company. Black & Veatch is also headquartered in Overland Park, KS, approximately 0.6 miles northeast from the property. Black & Veatch accounts for approximately 32.9% of the underwritten base rent at the property and its lease contains three five-year renewal options. The third largest tenant, Select Quote, leases 130,449 square feet (17.8% of the net rentable area), with one lease for 27,259 square feet through December 2023, and the remaining square footage leased through August 2029. Select Quote has been a tenant since August 2017. Select Quote is a term life insurance sales agency and was founded in 1985. Select Quote accounts for approximately 24.0% of the underwritten base rent at the property and its lease contains one five-year extension option.
The Overland Park Xchange property is located in southwest Johnson County, approximately 13.2 miles southwest of the Kansas City Central Business District. The property benefits from access via State Highway 169 and Interstate 435. The commute to the Kansas City Central Business District is approximately twenty minutes. The Kansas City International Airport is approximately a thirty-minute drive from the northern section of the subject neighborhood. According to the appraisal, the 2017 estimated population within a one-, three- and five-mile radius of the property was 5,429, 82,859, and 242,550, respectively, and the average household income within a one-, three- and five-mile radius of the property was $119,740, $116,285 and $111,417, respectively.
THE INFORMATION IN THIS STRUCTURAL AND COLLATERAL TERM SHEET IS NOT COMPLETE AND MAY BE AMENDED PRIOR TO THE TIME OF SALE. THIS TERM SHEET IS NOT AN OFFER TO SELL THESE SECURITIES AND IT IS NOT A SOLICITATION OF AN OFFER TO BUY THESE SECURITIES IN ANY JURISDICTION WHERE THE OFFER OR SALE IS NOT PERMITTED.
| | | |
125 of 130
| Structural and Collateral Term Sheet | Benchmark 2018-B5 | |
| Overland Park Xchange | ||
According to the appraisal, the property is located in the South Johnson County submarket of the greater Kansas City market. According to a third party research report, as of the first quarter of 2018, the South Johnson County submarket consisted of approximately 29.3 million square feet of office space with an overall vacancy rate of 8.5% and average rents of $21.79 per square foot. The appraisal identified six properties as directly competitive with Overland Park Xchange property, which have a weighted average vacancy of 11.3%. The competitive set includes the 4.4 million square foot Sprint Headquarters Campus, which is the only property in the competitive set that is not 100.0% occupied. The six comparable properties range in size from approximately 50,025 square feet to 4.4 million square feet. Asking rents for the comparable leases ranged from $15.50 per square foot to $27.17 per square foot, with an adjusted weighted average rental rate of $21.23 on a gross basis. The weighted average underwritten base rent for office space at the Overland Park Xchange is $18.62, which is slightly lower than the appraisal’s concluded weighted average office rent of $20.50 per square foot for the Overland Xchange property.
| Historical and Current Occupancy(1) | |||
| 2015 | 2016 | 2017 | Current(2) |
| 74.8% | 77.7% | 83.7% | 90.1% |
| (1) | Historical Occupancies are as of December 31 of each respective year. |
| (2) | Current Occupancy is as of July 1, 2018. |
| Tenant Summary(1) | |||||||
| Tenant | Ratings(2) Moody’s/S&P/Fitch | Net Rentable Area (SF) | % of Total NRA | Base Rent PSF | % of Total Base Rent | Lease Expiration Date | |
| United Health Group(3) | A3 / A+ / A- | 328,098 | 44.7% | $16.16 | 43.1% | 12/31/2026 | |
| Black & Veatch | NR / NR / NR | 202,116 | 27.6% | $20.00 | 32.9% | 4/30/2026 | |
| Select Quote(4) | NR / NR / NR | 130,449 | 17.8% | $22.66 | 24.0% | Various(5) | |
| (1) | Based on the underwritten rent roll dated July 1, 2018. |
| (2) | Ratings provided are for the parent company of the entity listed in the “Tenant” field whether or not the parent company guarantees the lease. |
| (3) | United Health Group occupies 266,114 square feet at a base rent of $17.02 per square foot and 61,984 square feet at a base rent of $12.48 per square foot. United Health Group subleases 781 square feet to Baxter Credit Union. |
| (4) | Select Quote occupies 84,000 square feet under two leases at a base rent of $23.86 per square foot and 46,446 square feet under two leases at a base rent of $20.50. |
| (5) | Select Quote’s first lease expires on December 31, 2023 and covers 27,259 square feet at a base rent of $20.50 per square foot. Select Quote’s three remaining leases expire on August 31, 2029 at an average base rent of $23.24 per square foot. |
| (1) | Based on the underwritten rent roll dated July 1, 2018. |
| Lease Rollover Schedule(1)(2) | |||||||||
| Year | Number of Leases Expiring | Net Rentable Area Expiring | % of NRA Expiring | Base Rent Expiring | % of Base Rent Expiring | Cumulative Net Rentable Area Expiring | Cumulative % of NRA Expiring | Cumulative Base Rent Expiring | Cumulative % of Base Rent Expiring |
| Vacant | NAP | 72,737 | 9.9% | NAP | NAP | 72,737 | 9.9% | NAP | NAP% |
| 2018 | 0 | 0 | 0.0% | $0 | 0.0% | 72,737 | 9.9% | $0 | 0.0%% |
| 2019 | 0 | 0 | 0.0% | 0 | 0.0% | 72,737 | 9.9% | $0 | 0.0%% |
| 2020 | 0 | 0 | 0.0% | 0 | 0.0% | 72,737 | 9.9% | $0 | 0.0%% |
| 2021 | 0 | 0 | 0.0% | 0 | 0.0% | 72,737 | 9.9% | $0 | 0.0%% |
| 2022 | 0 | 0 | 0.0% | 0 | 0.0% | 72,737 | 9.9% | $0 | 0.0%% |
| 2023 | 1 | 27,259 | 3.7% | 558,810 | 4.5% | 99,996 | 13.6% | $558,810 | 4.5%% |
| 2024 | 0 | 0 | 0.0% | 0 | 0.0% | 99,996 | 13.6% | $558,810 | 4.5%% |
| 2025 | 0 | 0 | 0.0% | 0 | 0.0% | 99,996 | 13.6% | $558,810 | 4.5%% |
| 2026 | 2 | 530,214 | 72.3% | 9,344,754 | 76.0% | 630,210 | 85.9% | $9,903,564 | 80.5%% |
| 2027 | 0 | 0 | 0.0% | 0 | 0.0% | 630,210 | 85.9% | $9,903,564 | 80.5%% |
| 2028 | 0 | 0 | 0.0% | 0 | 0.0% | 630,210 | 85.9% | $9,903,564 | 80.5%% |
| 2029 & Beyond | 1 | 103,190 | 14.1% | 2,397,635 | 19.5% | 733,400 | 100.0% | $12,301,199 | 100.0%% |
| Total | 4 | 733,400 | 100.0% | $12,301,199 | 100.0% | ||||
| (2) | Certain tenants have lease termination options that may become exercisable prior to the originally stated expiration date of the tenant lease that are not considered in the lease rollover schedule. |
THE INFORMATION IN THIS STRUCTURAL AND COLLATERAL TERM SHEET IS NOT COMPLETE AND MAY BE AMENDED PRIOR TO THE TIME OF SALE. THIS TERM SHEET IS NOT AN OFFER TO SELL THESE SECURITIES AND IT IS NOT A SOLICITATION OF AN OFFER TO BUY THESE SECURITIES IN ANY JURISDICTION WHERE THE OFFER OR SALE IS NOT PERMITTED.
| | | |
126 of 130
| Structural and Collateral Term Sheet | Benchmark 2018-B5 | |
| Overland Park Xchange | ||
| Operating History and Underwritten Net Cash Flow | |||||||
| 2015 | 2016 | 2017 | TTM | Underwritten | Per Square Foot | %(2) | |
| Rents in Place(3) | $6,052,996 | $8,419,672 | $9,520,993 | $10,401,647 | $12,301,199 | $16.77 | 74.6% |
| Vacant Income | 0 | 0 | 0 | 0 | 1,491,109 | 2.03 | 9.0% |
| Gross Potential Rent | $6,052,996 | $8,419,672 | $9,520,993 | $10,401,647 | $13,792,307 | $18.81 | 83.6% |
| Total Reimbursements | 136,583 | 19,986 | 37,042 | 87,596 | 2,700,038 | 3.68 | 16.4% |
| Net Rental Income | $6,189,579 | $8,439,659 | $9,558,035 | $10,489,243 | $16,492,345 | $22.49 | 100.0% |
| (Vacancy/Credit Loss) | 0 | 0 | 0 | 0 | (1,783,014) | (2.43) | (10.8).. |
| Other Income | 437 | 663 | 561 | 3,278 | 0 | 0 | 0.0% |
| Effective Gross Income | $6,190,016 | $8,440,322 | $9,558,596 | $10,492,521 | $14,709,331 | $20.06 | 89.2% |
| Total Expenses | $2,072,203 | $2,642,972 | $2,706,112 | $2,924,618 | $6,208,312 | $8.47 | 42.2% |
| Net Operating Income(4) | $4,117,814 | $5,797,349 | $6,852,484 | $7,567,904 | $8,501,019 | $11.59 | 57.8% |
| Total TI/LC, Capex/RR | 0 | 0 | 0 | 0 | 705,426 | 0.96 | 4.8% |
| Net Cash Flow | $4,117,814 | $5,797,349 | $6,852,484 | $7,567,904 | $7,795,593 | $10.63 | 53.0% |
| (1) | TTM column represents the trailing 12-month period ending on June 30, 2018. |
| (2) | % column represents percent of Net Rental Income for all revenue lines and represents percent of Effective Gross Income for the remainder of the fields. |
| (3) | Rents in Place includes the weighted average underwritten base rent for United Health Group through its lease expiration. The current in-place rent is $15.10 per square foot. |
| (4) | The increase in Net Operating Income from 2015 to 2016 and 2016 to 2017 is due to lease-up following an approximately $40.0 million ground-up renovation that was completed in 2015. Renovations included reskinning the exterior with glass and metal panels, the addition of a parking garage, a completely revamped HVAC system, a fitness area (with locker room and showers) and vendor kiosks including dry cleaning, a bistro and a lounge with Wi-Fi access. |
PILOT Program.The property benefits from a tax abatement in the form of a 10-year payment in lieu of taxes program (the “PILOT Program”) through various agreements with the City of Overland Park, Kansas (the “City”), including a 10-year ground lease (the “Ground Lease”) and a bond structure. To receive the tax abatement through the PILOT Program, the borrower, as the original fee owner of the property, transferred the fee title to the property to the City, and, in return, the City (i) issued bonds (the “Bonds”) and (ii) leased the property back to the borrower via the Ground Lease, which allows the borrower to repurchase fee title in the Property for $1,000 upon expiration of the Ground Lease. The borrower has pledged the Bonds pursuant to that certain Bond Pledge Agreement among the lender, the borrower and the bond trustee (the “Bond Pledge Agreement”), and the Bonds cannot be transferred without the consent of the lender. In addition to the Bonds, the lender has obtained both the fee and the leasehold interest in the property as security for the loan. The PILOT Program results in tax abatements for 10 years, expiring in 2025, and provides a 15% discount on the taxes for an approximate amount of $282,000 per year. The mortgage enables the lender to maintain the PILOT Program upon the lender’s acquisition of title following foreclosure or deed in lieu, provided the City has approved the lender as the successor in interest to the borrower. In the event the City does not approve the lender as the transferee, the PILOT Program would terminate and the foreclosing lender would enforce the mortgage on fee title and terminate the ground lease entirely. In the event of such termination, Black & Veatch (“B&V”), a tenant at the property which receives a pro rata benefit of the tax abatement under the PILOT Program, would be entitled under its lease to reduce its rent by the amount of the lost tax abatement through 2025, provided such termination of the ground lease is not caused by B&V’s action. The loan documents provide (x) recourse carve-outs for losses arising from the borrower’s breach under the PILOT agreement, the documents entered into in connection with the City’s issuance of and the borrower’s purchase of the Bonds (collectively, the “Bond Documents”), and the Bond Pledge Agreement, and (y) recourse carve-outs for the full amount the remaining tax abatement that would have existed if the tax abatement granted and/or created by the Bond Documents and/or Ground Lease had remained in full force and effect through the expiration date set forth in the PILOT agreement in the event the PILOT Program is terminated.
THE INFORMATION IN THIS STRUCTURAL AND COLLATERAL TERM SHEET IS NOT COMPLETE AND MAY BE AMENDED PRIOR TO THE TIME OF SALE. THIS TERM SHEET IS NOT AN OFFER TO SELL THESE SECURITIES AND IT IS NOT A SOLICITATION OF AN OFFER TO BUY THESE SECURITIES IN ANY JURISDICTION WHERE THE OFFER OR SALE IS NOT PERMITTED.
| | | |
127 of 130
| Structural and Collateral Term Sheet | Benchmark 2018-B5 | |
| Woodland Gardens Apartments | ||
| Mortgage Loan Information | Property Information | |||
| Mortgage Loan Seller: | CREFI | Single Asset / Portfolio: | Single Asset | |
| Original Principal Balance: | $23,870,000 | Title: | Fee | |
| Cut-off Date Principal Balance: | $23,870,000 | Property Type - Subtype: | Multifamily – Garden | |
| % of Pool by IPB: | 2.3% | Net Rentable Area (Units): | 337 | |
| Loan Purpose: | Refinance | Location: | Royal Oak, MI | |
| Borrower: | Woodland Gardens MI LLC | Year Built / Renovated: | 1967 / 2017 | |
| Sponsor: | LSG Enterprises LLC | Occupancy: | 93.5% | |
| Interest Rate: | 4.80000% | Occupancy Date: | 6/1/2018 | |
| Note Date: | 6/28/2018 | Number of Tenants: | N/A | |
| Maturity Date: | 7/6/2028 | 2015 NOI: | $1,876,474 | |
| Interest-only Period: | 60 months | 2016 NOI: | $1,997,369 | |
| Original Term: | 120 months | 2017 NOI: | $2,123,733 | |
| Original Amortization: | 360 months | TTM NOI (as of 5/2018): | $2,116,839 | |
| Amortization Type: | IO - Balloon | UW Economic Occupancy: | 88.9% | |
| Call Protection: | L(25),Def(91),O(4) | UW Revenues: | $3,638,946 | |
| Lockbox / Cash Management: | Springing / Springing | UW Expenses: | $1,544,850 | |
| Additional Debt: | N/A | UW NOI: | $2,094,096 | |
| Additional Debt Balance: | N/A | UW NCF: | $2,007,343 | |
| Additional Debt Type: | N/A | Appraised Value / Per Unit: | $34,100,000 / $101,187 | |
| Appraisal Date: | 5/24/2018 | |||
| Escrows and Reserves | Financial Information | |||||||
| Initial | Monthly | Initial Cap | Cut-off Date Loan / Unit: | $70,831 | ||||
| Taxes: | $279,909 | $27,991 | N/A | Maturity Date Loan / Unit: | $65,136 | |||
| Insurance: | $0 | Springing | N/A | Cut-off Date LTV: | 70.0% | |||
| Replacement Reserves: | $0 | $7,229 | N/A | Maturity Date LTV: | 64.4% | |||
| TI/LC: | $0 | $0 | N/A | UW NCF DSCR: | 1.34x | |||
| Other: | $40,480 | $0 | N/A | UW NOI Debt Yield: | 8.8% | |||
| Sources and Uses | ||||||
| Sources | Proceeds | % of Total | Uses | Proceeds | % of Total | |
| Mortgage Loan | $23,870,000 | 100.0% | Loan Payoff | $14,134,635 | 59.2% | |
| Upfront Reserves | 320,389 | 1.3 | ||||
| Closing Costs | 144,771 | 0.6 | ||||
| Return of Equity | 9,270,206 | 38.8 | ||||
| Total Sources | $23,870,000 | 100.0% | Total Uses | $23,870,000 | 100.0% | |
The Loan.The Woodland Gardens Apartments loan has an outstanding principal balance as of the Cut-off Date of approximately $23.9 million and is secured by a first mortgage lien on the borrower’s fee interest in a 337-unit garden-style multifamily complex located in Royal Oak, Michigan (the “Woodland Gardens Apartments Property”). The loan has a 10-year term and following a five-year interest only period, will amortize on a 30-year schedule.
The borrowing entity for the Woodland Gardens Apartments loan is Woodland Gardens MI LLC, a Delaware limited liability company and special purpose entity with one independent director. The loan sponsor and nonrecourse carve-out guarantor is LSG Enterprises LLC, a Delaware limited liability company. David Lichtenstein is the chief executive officer of Woodland Gardens MI LLC and is chairman and chief executive officer of The Lightstone Group. The Lightstone Group, which was founded in 1988, is a privately held commercial real estate company focusing on the development, management and investment in all sectors of the real estate market. Headquartered in New York, The Lightstone Group has investments across 21 states inclusive of approximately 6.0 million square feet of office, retail and industrial commercial space, 11,000 residential units and 3,800 hotel keys.
The Property. The Woodland Gardens Apartments Property is a 13-building garden-style multifamily complex consisting of 337 residential units located at 4805 Woodland Avenue in Royal Oak, Michigan. Built in 1967 and renovated in 2017, the Woodland Gardens Apartments Property’s unit mix is comprised of six studio units, 191 one-bedroom units and 140 two-bedroom units. The
THE INFORMATION IN THIS STRUCTURAL AND COLLATERAL TERM SHEET IS NOT COMPLETE AND MAY BE AMENDED PRIOR TO THE TIME OF SALE. THIS TERM SHEET IS NOT AN OFFER TO SELL THESE SECURITIES AND IT IS NOT A SOLICITATION OF AN OFFER TO BUY THESE SECURITIES IN ANY JURISDICTION WHERE THE OFFER OR SALE IS NOT PERMITTED.
| | | |
128 of 130
| Structural and Collateral Term Sheet | Benchmark 2018-B5 | |
| Woodland Gardens Apartments | ||
Woodland Gardens Apartments Property contains a total of 13 buildings, 11 of which serve as residential buildings, one which serves as a clubhouse and one additional building utilized for office and storage space. The Woodland Gardens Apartments Property offers common amenities such as the clubhouse, a swimming pool, common laundry, a fitness center, grill and picnic area, a basketball court and a playground. The individual unit amenities at the Woodland Gardens Apartments Property include air conditioning, dishwasher, an electric oven/range combination, garbage disposal, hardwood flooring, intercom systems, walk-in closet space and a refrigerator with freezer.
The Woodland Gardens Apartments Property has maintained an average occupancy of 94.4% since June 2006 with a trough occupancy of 90.3% in 2010. As of the underwritten rent roll dated June 1, 2018, the Woodland Gardens Apartments Property was 93.5% occupied. Since 2013, the loan sponsor has invested approximately $1.4 million in the Woodland Gardens Apartments Property with the most recent capital expenditures in 2017 (approximately $350,000) consisting of parking lot, HVAC equipment, unit flooring renovations, interior unit upgrades and common area improvements.
| Historical and Current Occupancy(1) | |||
| 2015 | 2016 | 2017 | Current(2) |
| 96.4% | 95.6% | 93.4% | 93.5% |
| (1) | 2015, 2016 and 2017 historical occupancies are as of December 31 of each respective year. |
| (2) | Current Occupancy is as of the underwritten rent roll dated June 1, 2018. |
| Multifamily Unit Mix(1) | |||||||
| Unit Type | # of Units | % of Units | Occupied Units | % Occupied | Unit Size (SF) | Average Market Rent per Month | In-Place Average Rent per Month |
| Studio | 6 | 1.8% | 6 | 100.0% | 455 | $662 | $663 |
| 1 BR / 1 BA (645 SF) | 183 | 54.3 | 170 | 92.9 | 645 | $846 | $839 |
| 1 BR / 1 BA (695 SF) | 8 | 2.4 | 6 | 75.0 | 695 | $846 | $892 |
| 2 BR / 1 BA | 140 | 41.5 | 133 | 95.0 | 800 | $940 | $940 |
| Total / Wtd. Avg. | 337 | 100.0% | 315 | 93.5% | 707 | $882 | $879 |
| (1) | Based on the underwritten rent roll dated June 1, 2018. |
The Woodland Gardens Apartments Property is located in Royal Oak, within Oakland County, Michigan. Oakland County is part of the Detroit-Warren-Dearborn, MI Metropolitan Statistical Area (the “Detroit MSA”) which contains approximately 43.2% of the total Michigan population. Royal Oak is located in the southeast section of Michigan approximately 14.3 miles northwest of Detroit and approximately 37.1 miles northeast of Ann Arbor. According to the appraisal, the primary driver for the local economy is the automotive industry, with top employers consisting of Ford Motor Co., General Motors Co. and Chrysler LLC. Other notable employers in the region include the University of Michigan, the Henry Ford Health System and the United States Government. According to the appraisal, the total employment number within Oakland County has increased year over year for the time period of 2010 to 2017. During the same time period, the unemployment rate for Oakland County decreased from 11.8% to 3.4%.
The Woodland Gardens Apartments Property is located at 4805 Woodland Avenue, just off of 14 Mile Road and Crooks Road which provide local roadway access to the property and connect it to several commercial shopping centers including a WalMart Supercenter that is located approximately 1.4 miles from the Woodland Gardens Apartments Property. Interstate 75 (which runs north and south) and Interstate 696 (which runs east and west) are each located within 3.0 miles from the Woodland Gardens Apartments Property providing it with easy access to major highways. According to the appraisal, as of the year-end 2017, the population within a one-, three- and five-mile radius of the Woodland Gardens Apartments Property was 11,559, 112,787, and 285,129, respectively. According to the appraisal, as of the year-end 2017, the average household income within a one-, three- and five-mile radius of the Woodland Gardens Apartments Property was $71,570, $99,249, and $101,027, respectively.
According to the appraisal, the Woodland Gardens Apartments Property is part of the Detroit-Warren-Dearborn multifamily market which, as of the first quarter of 2018, contained 270,432 residential units with an overall vacancy rate of 4.0% and average asking rent per month of $943 per unit. The Woodland Gardens Apartments Property is also part of the Royal Oak/Oak Park multifamily submarket which, as of the first quarter of 2018, consisted of 12,588 residential units with an overall vacancy rate of 3.0% and average asking rent per month of $917 per unit. The appraisal identified five comparable multifamily properties located within approximately 2.5 miles from the Woodland Gardens Apartments Property. The comparables range from 49 to 458 units and indicate a quoted monthly rental range of $802 to $921 per unit, with a weighted average monthly market rent of $870 per unit which is in-line with the weighted average monthly underwritten rent of $879 per unit.
THE INFORMATION IN THIS STRUCTURAL AND COLLATERAL TERM SHEET IS NOT COMPLETE AND MAY BE AMENDED PRIOR TO THE TIME OF SALE. THIS TERM SHEET IS NOT AN OFFER TO SELL THESE SECURITIES AND IT IS NOT A SOLICITATION OF AN OFFER TO BUY THESE SECURITIES IN ANY JURISDICTION WHERE THE OFFER OR SALE IS NOT PERMITTED.
| | | |
129 of 130
| Structural and Collateral Term Sheet | Benchmark 2018-B5 | |
| Woodland Gardens Apartments | ||
| Operating History and Underwritten Net Cash Flow | |||||||
| 2015 | 2016 | 2017 | TTM(1) | Underwritten | Per Unit | %(2) | |
| Rents in Place(3) | $3,009,038 | $3,148,061 | $3,444,820 | $3,527,040 | $3,324,180 | $9,864 | 86.5% |
| Vacant Income | 0 | 0 | 0 | 0 | 231,240 | 686 | 6.0 |
| Other Income(4) | 249,328 | 300,103 | 286,651 | 286,690 | 286,690 | 851 | 7.5 |
| Gross Potential Rent | $3,258,366 | $3,448,164 | $3,731,471 | $3,813,730 | $3,842,110 | $11,401 | 100.0% |
| (Vacancy/Credit Loss)(5) | (117,172) | (139,574) | (367,953) | (397,392) | (425,772) | (1,263) | (11.1) |
| Other Income (Apartments)(6) | 202,076 | 189,505 | 230,701 | 222,608 | 222,608 | 661 | 5.8 |
| Effective Gross Income | $3,343,270 | $3,498,095 | $3,594,219 | $3,638,946 | $3,638,946 | $10,798 | 94.7% |
| Total Expenses | $1,466,796 | $1,500,726 | $1,470,486 | $1,522,106 | $1,544,850 | $4,584 | 42.5% |
| Net Operating Income | $1,876,474 | $1,997,369 | $2,123,733 | $2,116,839 | $2,094,096 | $6,214 | 57.5% |
| Total TI/LC, CapEx/RR | 0 | 0 | 0 | 0 | 86,753 | 257 | 2.4 |
| Net Cash Flow | $1,876,474 | $1,997,369 | $2,123,733 | $2,116,839 | $2,007,343 | $5,957 | 55.2% |
| (1) | TTM column represents the trailing 12-month period ending on May 31, 2018. |
| (2) | % column represents percentage of Gross Potential Rent for all revenue lines and represents percentage of Effective Gross Income for the remainder of fields. |
| (3) | Rents in Place was underwritten per the rent roll dated June 1, 2018. |
| (4) | Other Income consists of utility income. |
| (5) | Vacancy/Credit Loss was underwritten to 11.1% to constrain to Effective Gross Income to the TTM. |
| (6) | Other Income (Apartments) is comprised of laundry and vending income, late fees, resident charges, pet fees, application fees and month-to-month income. |
Property Management. The Woodland Gardens Apartments Property is managed by Beacon Property Management Limited Liability Company, an affiliate of the borrower sponsor.
THE INFORMATION IN THIS STRUCTURAL AND COLLATERAL TERM SHEET IS NOT COMPLETE AND MAY BE AMENDED PRIOR TO THE TIME OF SALE. THIS TERM SHEET IS NOT AN OFFER TO SELL THESE SECURITIES AND IT IS NOT A SOLICITATION OF AN OFFER TO BUY THESE SECURITIES IN ANY JURISDICTION WHERE THE OFFER OR SALE IS NOT PERMITTED.
| | | |
130 of 130