JP Morgan Chase Commercial Mortgage Securities
Filed: 29 Nov 18, 9:32pm
| FREE WRITING PROSPECTUS | ||
| FILED PURSUANT TO RULE 433 | ||
| REGISTRATION FILE NO.: 333-226123-01 | ||
| [November 29] 2018 | Benchmark 2018-B8 |
Free Writing Prospectus Structural and Collateral Term Sheet | ||
BENCHMARK 2018-B8
| ||
This material is for your information, and none of J.P. Morgan Securities LLC (“JPMS”), Deutsche Bank Securities Inc., Citigroup Global Markets Inc., Goldman Sachs & Co.LLC, Drexel Hamilton, LLC and Academy Securities, Inc., (each individually, an “Underwriter”, and together, the ‘‘Underwriters’’) are soliciting any action based upon it. This material is not to be construed as an offer to sell or the solicitation of any offer to buy any security in any jurisdiction where such an offer or solicitation would be illegal.
The depositor has filed a registration statement (including a prospectus) with the SEC (SEC File No. 333-226123) for the offering to which this free writing prospectus relates. Before you invest, you should read the prospectus in the registration statement and other documents the depositor has filed with the SEC for more complete information about the depositor, the issuing entity and this offering. You may get these documents for free by visiting EDGAR on the SEC Web site at www.sec.gov. Alternatively, the depositor, any underwriter or any dealer participating in the offering will arrange to send you the prospectus if you request it by calling (800) 408-1016 or by emailing the ABS Syndicate Desk atabs_synd@jpmorgan.com.
THE SECURITIES TO WHICH THIS INFORMATION RELATES WILL BE MORE FULLY DESCRIBED IN A PROSPECTUS (THE “PROSPECTUS”), WHICH IS NOT YET AVAILABLE. THE PROSPECTUS WILL CONTAIN MATERIAL INFORMATION THAT IS NOT CONTAINED IN THESE MATERIALS (INCLUDING WITHOUT LIMITATION A DETAILED DISCUSSION OF RISKS ASSOCIATED WITH AN INVESTMENT IN THE CERTIFICATES, UNDER THE HEADING“RISK FACTORS”IN THE PROSPECTUS).
Neither this document nor anything contained in this document shall form the basis for any contract or commitment whatsoever. The information contained in this document is preliminary as of the date of this document, supersedes any previous such information delivered to you and will be superseded by any such information subsequently delivered prior to the time of sale. These materials are subject to change, completion or amendment from time to time. This information is based upon management forecasts and reflects prevailing conditions and management’s views as of this date, all of which are subject to change.
J.P. Morgan is the marketing name for the investment banking businesses of JPMorgan Chase & Co. and its subsidiaries worldwide. Securities, syndicated loan arranging, financial advisory and other investment banking activities are performed by JPMS and its securities affiliates, and lending, derivatives and other commercial banking activities are performed by JPMorgan Chase Bank, National Association and its banking affiliates. JPMS is a member of SIPC and the NYSE.
THE UNDERWRITERS MAY FROM TIME TO TIME PERFORM INVESTMENT BANKING SERVICES FOR, OR SOLICIT INVESTMENT BANKING BUSINESS FROM, ANY COMPANY NAMED IN THESE MATERIALS. THE UNDERWRITERS AND/OR THEIR AFFILIATES OR RESPECTIVE EMPLOYEES MAY FROM TIME TO TIME HAVE A LONG OR SHORT POSITION IN ANY CERTIFICATE OR CONTRACT DISCUSSED IN THESE MATERIALS. | ||
THE INFORMATION IN THIS STRUCTURAL AND COLLATERAL TERM SHEET IS NOT COMPLETE AND MAY BE AMENDED PRIOR TO THE TIME OF SALE. THIS TERM SHEET IS NOT AN OFFER TO SELL THESE SECURITIES AND IT IS NOT A SOLICITATION OF AN OFFER TO BUY THESE SECURITIES IN ANY JURISDICTION WHERE THE OFFER OR SALE IS NOT PERMITTED. | ||||
 |  | 1 of 125 |  |  |
| [November 29] 2018 | Benchmark 2018-B8 |
THE REPUBLIC OF KOREA
THIS PROSPECTUS IS NOT, AND UNDER NO CIRCUMSTANCES IS THIS PROSPECTUS TO BE CONSTRUED AS, A PUBLIC OFFERING OF SECURITIES IN KOREA. NEITHER THE ISSUER NOR ANY OF ITS AGENTS MAKE ANY REPRESENTATION WITH RESPECT TO THE ELIGIBILITY OF ANY RECIPIENTS OF THIS PROSPECTUS TO ACQUIRE THE OFFERED CERTIFICATES UNDER THE LAWS OF KOREA, INCLUDING, BUT WITHOUT LIMITATION, THE FOREIGN EXCHANGE TRANSACTION LAW AND REGULATIONS THEREUNDER (THE “FETL”). THE OFFERED CERTIFICATES HAVE NOT BEEN REGISTERED WITH THE FINANCIAL SERVICES COMMISSION OF KOREA FOR PUBLIC OFFERING IN KOREA, AND NONE OF THE OFFERED CERTIFICATES MAY BE OFFERED, SOLD OR DELIVERED, DIRECTLY OR INDIRECTLY, OR OFFERED OR SOLD TO ANY PERSON FOR RE-OFFERING OR RESALE, DIRECTLY OR INDIRECTLY IN KOREA OR TO ANY RESIDENT OF KOREA EXCEPT PURSUANT TO THE FINANCIAL INVESTMENT SERVICES AND CAPITAL MARKETS ACT AND THE DECREES AND REGULATIONS THEREUNDER (THE “FSCMA”), THE FETL AND ANY OTHER APPLICABLE LAWS, REGULATIONS AND MINISTERIAL GUIDELINES IN KOREA. WITHOUT PREJUDICE TO THE FOREGOING, THE NUMBER OF OFFERED CERTIFICATES OFFERED IN KOREA OR TO A RESIDENT OF KOREA SHALL BE LESS THAN FIFTY AND FOR A PERIOD OF ONE YEAR FROM THE ISSUE DATE OF THE OFFERED CERTIFICATES, NONE OF THE OFFERED CERTIFICATES MAY BE DIVIDED RESULTING IN AN INCREASED NUMBER OF OFFERED CERTIFICATES. FURTHERMORE, THE OFFERED CERTIFICATES MAY NOT BE RESOLD TO KOREAN RESIDENTS UNLESS THE PURCHASER OF THE OFFERED CERTIFICATES COMPLIES WITH ALL APPLICABLE REGULATORY REQUIREMENTS (INCLUDING, BUT NOT LIMITED TO, GOVERNMENT REPORTING APPROVAL REQUIREMENTS UNDER THE FETL AND ITS SUBORDINATE DECREES AND REGULATIONS) IN CONNECTION WITH THE PURCHASE OF THE OFFERED CERTIFICATES.
JAPAN
THE OFFERED CERTIFICATES HAVE NOT BEEN AND WILL NOT BE REGISTERED UNDER THE FINANCIAL INSTRUMENTS AND EXCHANGE LAW OF JAPAN, AS AMENDED (THE “FIEL”), AND DISCLOSURE UNDER THE FIEL HAS NOT BEEN AND WILL NOT BE MADE WITH RESPECT TO THE OFFERED CERTIFICATES. ACCORDINGLY, EACH UNDERWRITER HAS REPRESENTED AND AGREED THAT IT HAS NOT, DIRECTLY OR INDIRECTLY, OFFERED OR SOLD AND WILL NOT, DIRECTLY OR INDIRECTLY, OFFER OR SELL ANY OFFERED CERTIFICATES IN JAPAN OR TO, OR FOR THE BENEFIT OF, ANY RESIDENT OF JAPAN (WHICH TERM AS USED IN THIS PROSPECTUS MEANS ANY PERSON RESIDENT IN JAPAN, INCLUDING ANY CORPORATION OR OTHER ENTITY ORGANIZED UNDER THE LAWS OF JAPAN) OR TO OTHERS FOR REOFFERING OR RE-SALE, DIRECTLY OR INDIRECTLY, IN JAPAN OR TO, OR FOR THE BENEFIT OF, ANY RESIDENT OF JAPAN EXCEPT PURSUANT TO AN EXEMPTION FROM THE REGISTRATION REQUIREMENTS OF, AND OTHERWISE IN COMPLIANCE WITH, THE FIEL AND OTHER RELEVANT LAWS, REGULATIONS AND MINISTERIAL GUIDELINES OF JAPAN. AS PART OF THIS OFFERING OF THE OFFERED CERTIFICATES, THE UNDERWRITERS MAY OFFER THE OFFERED CERTIFICATES IN JAPAN TO UP TO 49 OFFEREES IN ACCORDANCE WITH THE ABOVE PROVISIONS.
THE INFORMATION IN THIS STRUCTURAL AND COLLATERAL TERM SHEET IS NOT COMPLETE AND MAY BE AMENDED PRIOR TO THE TIME OF SALE. THIS TERM SHEET IS NOT AN OFFER TO SELL THESE SECURITIES AND IT IS NOT A SOLICITATION OF AN OFFER TO BUY THESE SECURITIES IN ANY JURISDICTION WHERE THE OFFER OR SALE IS NOT PERMITTED. | ||||
| | | 2 of 125 | | |
| Structural and Collateral Term Sheet | Benchmark 2018-B8 | |
| Collateral Characteristics | ||
| Loan Pool | ||
| Initial Pool Balance (“IPB”): | $1,049,017,463 | |
| Number of Mortgage Loans: | 41 | |
| Number of Mortgaged Properties: | 200 | |
| Average Cut-off Date Balance per Mortgage Loan: | $25,585,792 | |
| Weighted Average Current Mortgage Rate: | 4.89331% | |
| 10 Largest Mortgage Loans as % of IPB: | 47.6% | |
| Weighted Average Remaining Term to Maturity(1): | 112 months | |
| Weighted Average Seasoning: | 2 months | |
| Credit Statistics | ||
| Weighted Average UW NCF DSCR(2)(3): | 2.08x | |
| Weighted Average UW NOI Debt Yield(2): | 11.6% | |
| Weighted Average Cut-off Date Loan-to-Value Ratio (“LTV”)(2)(4): | 56.2% | |
| Weighted Average Maturity Date LTV(1)(2)(4): | 54.0% | |
| Other Statistics | ||
| % of Mortgage Loans with Additional Debt: | 41.5% | |
| % of Mortgaged Properties with Single Tenants: | 34.4% | |
| Amortization | ||
| Weighted Average Original Amortization Term(5): | 360 months | |
| Weighted Average Remaining Amortization Term(5): | 359 months | |
| % of Mortgage Loans with Interest-Only: | 60.5% | |
| % of Mortgage Loans with Partial Interest-Only followed by Amortizing Balloon: | 16.8% | |
| % of Mortgage Loans with Amortizing Balloon: | 10.8% | |
| % of Mortgage Loans with Interest-Only followed by ARD structure: | 9.5% | |
| % of Mortgage Loans with Partial Interest-Only followed by Amortizing Balloon ARD structure: | 2.5% | |
| Lockbox / Cash Management(6) | ||
| % of Mortgage Loans with In-Place, Hard Lockboxes: | 69.3% | |
| % of Mortgage Loans with Springing Lockboxes: | 21.4% | |
| % of Mortgage Loans with Hard; Master Lease Rents (Soft Springing): | 5.7% | |
| % of Mortgage Loans with In-Place, Soft Lockboxes: | 3.0% | |
| % of Mortgage Loans with No Lockboxes: | 0.7% | |
| % of Mortgage Loans with Springing Cash Management: | 70.8% | |
| % of Mortgage Loans with In-Place Cash Management: | 28.5% | |
| % of Mortgage Loans with No Cash Management: | 0.7% | |
| Reserves | ||
| % of Mortgage Loans Requiring Monthly Tax Reserves: | 60.7% | |
| % of Mortgage Loans Requiring Monthly Insurance Reserves: | 39.2% | |
| % of Mortgage Loans Requiring Monthly CapEx Reserves(7): | 62.8% | |
| % of Mortgage Loans Requiring Monthly TI/LC Reserves(8): | 36.8% | |
| (1) | In the case of Loan No. 2, 17, 19 and 22, with an anticipated repayment date, Remaining Term to Maturity and Maturity Date LTV are calculated as of the related anticipated repayment date. |
| (2) | In the case of Loan Nos. 1, 2, 4, 5, 8, 9, 10, 12, 15, 16, 18, 19, 22, 25 and 28, the UW NCF DSCR, UW NOI Debt Yield, Cut-off Date LTV and Maturity Date LTV calculations include the related Pari Passu Companion Loan(s). In the case of Loan Nos. 1, 3, 4, 7, 8, 9, 13, 15, 18 and 21, the UW NCF DSCR, UW NOI Debt Yield, Cut-off Date LTV and Maturity Date LTV calculations exclude the related Subordinate Companion Loan(s) and/or related mezzanine loan(s). See footnote 2 to the Mortgage Loan Information table in the Workspace loan description below for more information on the calculations of UW NCF DSCR, UW NOI Debt Yield, Cut-off Date LTV and Maturity Date LTV with respect to Loan No. 9. |
| (3) | In the case of Loan No. 4, the UW NCF DSCR is calculated using the sum of principal and interest payments over the first 12 amortizing monthly payments based on the assumed principal payment schedule provided on Annex I to the Preliminary Prospectus. |
| (4) | In the case of Loan Nos. 3, 5, 8, 11, 12.02, 18, 20, 23, 33 and 34, the Cut-off Date LTV and the Maturity Date LTV are calculated by using an appraised value based on certain hypothetical assumptions. Refer to “Description of the Mortgage Pool—Assessments of Property Value and Condition” and “—Appraised Value” in the Preliminary Prospectus for additional details. |
| (5) | Excludes 23 mortgage loans that are interest-only for the entire term or until the related anticipated repayment date. |
| (6) | For a more detailed description of Lockbox / Cash Management, refer to “Description of the Mortgage Pool—Certain Terms of the Mortgage Loans—Mortgaged Property Accounts” in the Preliminary Prospectus. |
| (7) | CapEx Reserves include FF&E reserves for hotel properties. |
| (8) | Calculated only with respect to the Cut-off Date Balance of mortgage loans secured or partially secured by retail, office, industrial, mixed use and flex properties. |
THE INFORMATION IN THIS STRUCTURAL AND COLLATERAL TERM SHEET IS NOT COMPLETE AND MAY BE AMENDED PRIOR TO THE TIME OF SALE. THIS TERM SHEET IS NOT AN OFFER TO SELL THESE SECURITIES AND IT IS NOT A SOLICITATION OF AN OFFER TO BUY THESE SECURITIES IN ANY JURISDICTION WHERE THE OFFER OR SALE IS NOT PERMITTED. | ||||
| | | 3 of 125 | | |
| Structural and Collateral Term Sheet | Benchmark 2018-B8 | |
| Collateral Characteristics | ||
Mortgage Loan Seller | Number of | Number of | Aggregate | % of IPB |
| JPMCB(1) | 14 | 160 | $330,478,250 | 31.5% |
| GACC(2) | 12 | 19 | 366,941,800 | 35.0 |
| GSMC | 7 | 7 | 192,192,960 | 18.3 |
| CREFI | 8 | 14 | 159,404,453 | 15.2 |
| Total: | 41 | 200 | $1,049,017,463 | 100.0% |
| (1) | In the case of Loan No. 1, the whole loan was co-originated by JPMCB, DBNY, Wells Fargo Bank, National Association and Morgan Stanley Bank N.A. In case of the Loan No. 22, the whole loan was co-originated by JPMCB and CREFI. |
| (2) | All of the loans for which GACC is the Mortgage Loan Seller were originated by Deutsche Bank, AG, New York Branch (“DBNY”) (an affiliate of GACC), with the exception of Loan No. 21, which was originated by GACC. In the case of Loan No. 4, the whole loan was co-originated by DBNY andSociété Générale, Financial Corporation. In the case of Loan No. 8, the whole loan was co-originated by DBNY, GSMC and Wells Fargo Bank, National Association. In the case of Loan No. 18, the whole loan was co-originated by DBNY and Barclays Bank PLC. |
| Ten Largest Mortgage Loans | ||||||||||||
| No. | Loan Name | Mortgage Loan Seller | No. of Prop. | Cut-off Date Balance | % of IPB | SF / Rooms | Property Type | UW NCF DSCR(1)(2) | UW NOI Debt Yield(1) | Cut-off Date LTV(1)(3) | Maturity Date LTV(1)(3)(4) | |
| 1 | Aventura Mall | JPMCB | 1 | $60,000,000 | 5.7% | 1,217,508 | Retail | 2.58x | 11.0% | 40.8% | 40.8% | |
| 2 | Staples Strategic Industrial | GACC | 8 | $56,100,000 | 5.3% | 4,031,127 | Industrial | 1.72x | 9.5% | 62.6% | 62.6% | |
| 3 | Embassy Suites Anaheim | GACC | 1 | $56,000,000 | 5.3% | 375 | Hotel | 2.32x | 14.1% | 51.3% | 51.3% | |
| 4 | Saint Louis Galleria | GACC | 1 | $55,000,000 | 5.2% | 465,695 | Retail | 1.67x | 11.3% | 51.5% | 47.0% | |
| 5 | 10 Brookline Place | JPMCB | 1 | $50,000,000 | 4.8% | 173,439 | Office | 2.19x | 10.2% | 49.4% | 49.4% | |
| 6 | 590 East Middlefield | GACC | 1 | $48,750,000 | 4.6% | 99,880 | Office | 1.45x | 7.9% | 60.9% | 60.9% | |
| 7 | 3 Huntington Quadrangle | CREFI | 1 | $47,000,000 | 4.5% | 408,917 | Office | 2.22x | 12.4% | 68.1% | 68.1% | |
| 8 | Moffett Towers - Buildings E,F,G | GACC | 1 | $46,800,000 | 4.5% | 676,598 | Office | 2.97x | 12.6% | 40.2% | 40.2% | |
| 9 | Workspace | JPMCB | 147 | $40,000,000 | 3.8% | 9,884,763 | Various | 3.60x | 21.6% | 35.4% | 35.4% | |
| 10 | 145 Clinton | GSMC | 1 | $40,000,000 | 3.8% | 67,217 | Retail | 1.30x | 6.7% | 65.0% | 65.0% | |
| Top 3 Total/Weighted Average | 10 | $172,100,000 | 16.4% | 2.22x | 11.5% | 51.3% | 51.3% | |||||
| Top 5 Total/Weighted Average | 12 | $277,100,000 | 26.4% | 2.10x | 11.2% | 51.0% | 50.1% | |||||
| Top 10 Total/Weighted Average | 163 | $499,650,000 | 47.6% | 2.19x | 11.6% | 52.4% | 51.9% | |||||
| (1) | In the case of Loan Nos. 1, 2, 4, 5, 8, 9 and 10, the UW NCF DSCR, UW NOI Debt Yield, Cut-off Date LTV and Maturity Date LTV calculations include the related Pari Passu Companion Loan(s). In the case of Loan Nos. 1, 3, 4, 7, 8 and 9, the UW NCF DSCR, UW NOI Debt Yield, Cut-off Date LTV and Maturity Date LTV calculations exclude the related Subordinate Companion Loan(s) and/or related mezzanine loan(s). See footnote 2 to the Mortgage Loan Information table in the Workspace loan description below for more information on the calculations of UW NCF DSCR, UW NOI Debt Yield, Cut-off Date LTV and Maturity Date LTV with respect to Loan No. 9. |
| (2) | In the case of Loan No. 4, the UW NCF DSCR is calculated using the sum of principal and interest payments over the first 12 amortizing monthly payments based on the assumed principal payment schedule provided on Annex I to the Preliminary Prospectus. |
| (3) | In the case of Loan Nos. 3, 5 and 8, the Cut-off Date LTV and the Maturity Date LTV are calculated by using an appraised value based on certain hypothetical assumptions. Refer to “Description of the Mortgage Pool—Assessments of Property Value and Condition” and “—Appraised Value” in the Preliminary Prospectus for additional details. |
| (4) | In the case of Loan No. 2, with an anticipated repayment date, Maturity Date LTV is calculated as of the related anticipated repayment date. |
THE INFORMATION IN THIS STRUCTURAL AND COLLATERAL TERM SHEET IS NOT COMPLETE AND MAY BE AMENDED PRIOR TO THE TIME OF SALE. THIS TERM SHEET IS NOT AN OFFER TO SELL THESE SECURITIES AND IT IS NOT A SOLICITATION OF AN OFFER TO BUY THESE SECURITIES IN ANY JURISDICTION WHERE THE OFFER OR SALE IS NOT PERMITTED. | ||||
| | | 4 of 125 | | |
| Structural and Collateral Term Sheet | Benchmark 2018-B8 | |
| Collateral Characteristics | ||
| Pari Passu Companion Loan Summary |
| Loan No. | Mortgage Loan | Note(s) | Original Balance ($) | Cut-off Date Balance ($) | Holder of Note | Lead Servicer for Whole Loan (Y/N) | Master Servicer Under Lead Securitization | Special Servicer Under Lead Securitization |
| 1 | Aventura Mall | A-1-A, A-1-B, A-1-C, A-1-D | $406,700,000 | $406,700,000 | Aventura Mall Trust 2018-AVM | Yes | Wells Fargo | CWCapital |
| A-2-A-3 | $50,000,000 | $50,000,000 | Benchmark 2018-B7 | No | ||||
| A-2-A-1, A-2-B-3 | $115,000,000 | $115,000,000 | Benchmark 2018-B4 | No | ||||
| A-2-A-2, A-2-B-2-A | $103,000,000 | $103,000,000 | Benchmark 2018-B5 | No | ||||
| A-2-B-1 | $60,000,000 | $60,000,000 | CD 2018-CD7 | No | ||||
| A-2-D-2 | $50,000,000 | $50,000,000 | CSAIL 2018-CX12 | No | ||||
| A-2-A-4, A-2-B-4 | $110,000,000 | $110,000,000 | Benchmark 2018-B6 | No | ||||
| A-2-C-2, A-2-D-1 | $100,000,000 | $100,000,000 | BANK 2018-BNK14 | No | ||||
| A-2-C-1 | $60,000,000 | $60,000,000 | MSC 2018-L1 | No | ||||
| A-2-D-3 | $50,000,000 | $50,000,000 | WFCM 2018-C47 | No | ||||
| A-2-B-2-B, A-2-B-2-C, A-2-B-5 | $47,000,000 | $47,000,000 | DBGS 2018-C1 | No | ||||
| A-2-A-5-A | $60,000,000 | $60,000,000 | Benchmark 2018-B8 | No | ||||
| A-2-A-5-B | $15,000,000 | $15,000,000 | JPMCB | No | ||||
| A-2-C-3, A-2-C-4, A-2-C-5 | $110,000,000 | $110,000,000 | Morgan Stanley Bank, N.A. | No | ||||
| A-2-D-4, A-2-D-5 | $70,000,000 | $70,000,000 | Wells Fargo | No | ||||
| B-1, B-2, B-3, B-4(1) | $343,300,000 | $343,300,000 | Aventura Mall Trust 2018-AVM | No | ||||
| Total | $1,750,000,000 | $1,750,000,000 | ||||||
| 2 | Staples Strategic Industrial | A-1-1, A-3 | $56,100,000 | $56,100,000 | Benchmark 2018-B8 | Yes | Midland | CWCapital |
| A-1-2, A-2-1, A-2-2, A-2-3, A-4 | $70,000,000 | $70,000,000 | DBNY | No | ||||
| Total | $126,100,000 | $126,100,000 | ||||||
| 4 | Saint Louis Galleria | A-1-A1 | $60,000,000 | $60,000,000 | DBNY | Yes(2) | TBD | TBD |
| A-1-A2 | $55,000,000 | $55,000,000 | Benchmark 2018-B8 | No(2) | ||||
| A-1-A3, A-1-A4, A-1-A5 | $46,479,245 | $46,479,245 | DBNY | No | ||||
| A-2-A1, A-2-A2, A-2-A3, A-2-A4, A-2-A5 | $78,520,755 | $78,520,755 | Société Générale | No(2) | ||||
| Total | $240 000 000 | $240 000 000 | ||||||
| 5 | 10 Brookline Place | A-1 | $50,000,000 | $50,000,000 | Benchmark 2018-B8 | Yes | Midland | CWCapital |
| A-2 | $32,000,000 | $32,000,000 | JPMCB | No | ||||
| Total | $82,0000,000 | $82,0000,000 | ||||||
| 8 | Moffett Towers E,F,G | A-1-4 , A-3 | $46,800,000 | $46,800,000 | Benchmark 2018-B8 | No | ||
| A-1-2, A-1-3, A-4 | $50,400,000 | $50,400,000 | Benchmark 2018-B7 | No | ||||
| A-1-1, A-5 | $80,000,000 | $80,000,000 | DBGS 2018-C1 | Yes | Wells Fargo | Rialto | ||
| A-2-1 | $25,000,000 | $25,000,000 | CGCMT 2018-C6 | No | ||||
| A-2-2 | $25,000,000 | $25,000,000 | BBCMS 2018-C2 | No | ||||
| A-6, A-7 | $56,800,000 | $56,800,000 | BANK - BNK15 | No | ||||
| Total | $284,000,000 | $284,000,000 | ||||||
| 9 | Workspace | A-1, A-2, A-3, A-4 | $548,200,000 | $548,200,000 | JPMCB 2018-WPT | Yes | KeyBank | KeyBank |
| A-5, A-6 | $50,000,000 | $50,000,000 | Benchmark 2018-B5 | No | ||||
| A-7, A-8 | $40,000,000 | $40,000,000 | Benchmark 2018-B6 | No | ||||
| A-9-A, A-10-A | $40,000,000 | $40,000,000 | Benchmark 2018-B7 | No | ||||
| A-9-B, A-10-B | $40,000,000 | $40,000,000 | Benchmark 2018-B8 | No | ||||
| B-1, B-2(1) | $556,800,000 | $556,800,000 | JPMCB 2018-WPT | Yes | ||||
| Total | $1,275,000,000 | $1,275,000,000 | ||||||
| 12 | Kawa Mixed Use Portfolio | A-1 | $38,000,000 | $38,000,000 | Benchmark 2018-B8 | Yes | Midland | CWCapital |
| A-2 | $36,500,000 | $36,500,000 | CREFI | No | ||||
| Total | $74,500,000 | $74,500,000 |
| (1) | Each note represents a subordinate companion loan |
| (2) | The Saint Louis Galleria Whole Loan is expected to be serviced under the pooling and servicing agreement for a securitization trust which is expected to close prior to the Benchmark 2018-B8 transaction, until such time the controlling note has been securitized, at which point such Whole Loan will be serviced under the pooling and servicing agreement related to such securitization. |
THE INFORMATION IN THIS STRUCTURAL AND COLLATERAL TERM SHEET IS NOT COMPLETE AND MAY BE AMENDED PRIOR TO THE TIME OF SALE. THIS TERM SHEET IS NOT AN OFFER TO SELL THESE SECURITIES AND IT IS NOT A SOLICITATION OF AN OFFER TO BUY THESE SECURITIES IN ANY JURISDICTION WHERE THE OFFER OR SALE IS NOT PERMITTED. | ||||
| | | 5 of 125 | | |
| Structural and Collateral Term Sheet | Benchmark 2018-B8 | |
| Collateral Characteristics | ||
| Loan No. | Mortgage Loan | Note(s) | Original Balance ($) | Cut-off Date Balance ($) | Holder of Note | Lead Servicer for Whole Loan (Y/N) | Master Servicer Under Lead Securitization | Special Servicer Under Lead Securitization |
| 10 | 145 Clinton | A-1 | $40,000,000 | $40,000,000 | Benchmark 2018-B8 | Yes | Midland | CWCapital |
| A-2 | $28,200,000 | $28,200,000 | GSMC | No | ||||
| Total | $68,200,000 | $68,200,000 | ||||||
| 15 | Dumbo Heights Portfolio | A-1-A, A-3-B | $80,000,000 | $80,000,000 | Benchmark 2018-B7 | Yes | KeyBank | LNR |
| A-1-B, A-2, A-3-C | $70,000,000 | $70,000,000 | CGCMT 2018-C6 | No | ||||
| A-3-A | $30,000,000 | $30,000,000 | Benchmark 2018-B8 | No | ||||
| B-1, B-2(1) | $145,000,000 | $145,000,000 | Shinhan AIM Real Estate Fund No. 5; and Shinhan AIM Real Estate Fund No. 5-A | Yes | ||||
| Total | $325,000,0000 | $325,000,0000 | ||||||
| 16 | 5444 & 5430 Westheimer | A-1 | $30,000,0000 | $30,000,0000 | Benchmark 2018-B8 | Yes | Midland | CWCapital |
| A-2 | $21,000,000 | $21,000,000 | GSMC | No | ||||
| Total | $51,000,000 | $51,000,000 | ||||||
| 18 | Moffett Towers II – Building 1 | A-2-2, A-3-2 | $25,000,000 | $25,000,000 | Benchmark 2018-B8 | No | ||
| A-2-1 | $25,000,000 | $25,000,000 | DBGS 2018-C1 | No | ||||
| A-1, A-3-1 | $76,000,000 | $76,000,000 | Benchmark 2018-B6 | Yes | KeyBank | Midland | ||
| A-4 | $22,000,000 | $22,000,000 | BBCMS 2018-C2 | No | ||||
| A-5 | $20,000,000 | $20,000,000 | WFCMT 2018-C46 | No | ||||
| Total | $168,000,000 | $168,000,000 | ||||||
| 19 | Trip Advisor HQ | A-1 | $75,000,000 | $75,000,000 | DBGS 2018-C1 | Yes | Wells Fargo | Rialto |
| A-2 | $23,150,000 | $23,150,000 | Benchmark 2018-B8 | No | ||||
| Total | $98,150,000 | $98,150,000 | ||||||
| 22 | 636 11th Avenue | A-1 | $50,000,000 | $50,000,000 | Benchmark 2018-B4 | Yes | Wells Fargo | CWCapital |
| A-3 | $50,000,000 | $50,000,000 | Benchmark 2018-B6 | No | ||||
| A-2-A | $40,000,000 | $40,000,000 | Benchmark 2018-B7 | No | ||||
| A-4 | $65,000,000 | $65,000,000 | CGCMT 2018-C5 | No | ||||
| A-5 | $15,000,000 | $15,000,000 | MSC 2018-H3 | No | ||||
| A-2-B | $20,000,000 | $20,000,000 | Benchmark 2018-B8 | No | ||||
| Total | $240,000,000 | $240,000,000 | ||||||
| 25 | 1421 West Shure Drive | A-1 | $17,000,000 | $17,000,000 | Benchmark 2018-B8 | Yes | Midland | CWCapital |
| A-2 | $12,376,000 | $12,376,000 | JPMCB | No | ||||
| Total | $29,376,000 | $29,376,000 | ||||||
| 28 | Sheraton Music City | A-1 | $40,000,000 | $40,000,000 | Benchmark 2018-B4 | Yes | Midland | CWCapital |
| A-2-A | $15,000,000 | $15,000,000 | Benchmark 2018-B8 | No | ||||
| A-2-B | $15,000,000 | $15,000,000 | JPMCB | No | ||||
| Total | $70,000,000 | $70,000,000 |
| (1) | Each note represents a subordinate companion loan |
THE INFORMATION IN THIS STRUCTURAL AND COLLATERAL TERM SHEET IS NOT COMPLETE AND MAY BE AMENDED PRIOR TO THE TIME OF SALE. THIS TERM SHEET IS NOT AN OFFER TO SELL THESE SECURITIES AND IT IS NOT A SOLICITATION OF AN OFFER TO BUY THESE SECURITIES IN ANY JURISDICTION WHERE THE OFFER OR SALE IS NOT PERMITTED. | ||||
| | | 6 of 125 | | |
| Structural and Collateral Term Sheet | Benchmark 2018-B8 | |
| Collateral Characteristics | ||
| Additional Debt Summary |
No. | Loan Name | Trust | Subordinate | Total Debt | Mortgage | Total | Mortgage | Total | Mortgage | Total |
| 1 | Aventura Mall | $60,000,000 | $343,300,000 | $1,750,000,000 | 2.58x | 2.07x | 40.8% | 50.7% | 11.0% | 8.8% |
| 3 | Embassy Suites Anaheim | $56,000,000 | $15,000,000 | $71,000,000 | 2.32x | 1.60x | 51.3% | 65.1% | 14.1% | 11.1% |
| 4 | Saint Louis Galleria | $55,000,000 | $24,688,302 | $264,688,302 | 1.67x | 1.55x | 51.5% | 56.8% | 11.3% | 10.3% |
| 7 | 3 Huntington Quadrangle | $47,000,000 | $8,000,000 | $55,000,000 | 2.22x | 1.71x | 68.1% | 79.7% | 12.4% | 10.6% |
| 8 | Moffett Towers - Buildings E,F,G | $46,800,000 | $216,000,000 | $500,000,000 | 2.97x | 1.41x | 40.2% | 70.8% | 12.6% | 7.2% |
| 9 | Workspace | $40,000,000 | $696,000,000 | $1,275,000,000 | 3.60x | 1.63x | 35.4% | 78.0% | 21.6% | 9.8% |
| 13 | Briar Hill at Manchester | $31,270,000 | $10,730,000 | $42,000,000 | 1.79x | 1.20x | 53.8% | 72.3% | 9.8% | 7.3% |
| 15 | DUMBO Heights Portfolio | $30,000,000 | $300,000,000 | $480,000,000 | 3.89x | 1.13x | 28.1% | 75.0% | 16.6% | 6.2% |
| 18 | Moffett Towers II - Building 1 | $25,000,000 | $112,000,000 | $280,000,000 | 2.00x | 1.17x | 46.8% | 78.1% | 11.5% | 6.9% |
| 21 | Douglasville Pavilion | $21,075,000 | $5,300,000 | $26,375,000 | 2.73x | 1.72x | 58.9% | 73.7% | 14.3% | 11.4% |
| (1) | In the case of Loan Nos. 1 and 9 Subordinate Debt Cut-off Date Balance represents one or more Subordinate Companion Loans. In the case of Loan No. 15, Subordinate Debt Cut-off Date Balance represents one or more Subordinate Companion Loans and one or more mezzanine loans. In the case of Loan Nos. 3, 4, 7, 8, 13, 18 and 21, Subordinate Debt Cut-off Date Balance represents one or more mezzanine loans. See footnote 2 to the Mortgage Loan Information table in the Workspace loan description below for more information on the Subordinate Debt related to Loan No. 9. |
| (2) | In the case of Loan Nos. 1, 4, 8, 9, 15 and 18 the Mortgage Loan UW NCF DSCR, Mortgage Loan Cut-off Date LTV and Mortgage Loan UW NOI Debt Yield calculations include the related Pari Passu Companion Loan(s). In the case of Loan Nos. 1, 3, 4, 7, 8, 9, 13, 15, 18 and 21 the Mortgage Loan UW NCF DSCR, Mortgage Loan Cut-off Date LTV and Mortgage Loan UW NOI Debt Yield, calculations exclude the related Subordinate Companion Loan(s) and/or related mezzanine loan(s). See footnote 2 to the Mortgage Loan Information table in the Workspace loan description below for more information on the calculations of Mortgage Loan UW NCF DSCR, Mortgage Loan Cut-off Date LTV and Mortgage Loan UW NOI Debt Yield with respect to Loan No. 9. |
| (3) | In the case of Loan No. 4, the Mortgage Loan UW NCF DSCR and Total Debt UW NCF DSCR are calculated using the sum of principal and interest payments over the first 12 amortizing monthly payments based on the assumed principal payment schedule provided on Annex I to the Preliminary Prospectus. |
| (4) | In the case of Loan Nos. 3, 8 and 18 the Cut-off Date LTV and the Maturity Date LTV are calculated by using an appraised value based on certain hypothetical assumptions. Refer to “Description of the Mortgage Pool—Assessments of Property Value and Condition” and “—Appraised Value” in the Preliminary Prospectus for additional details. |
THE INFORMATION IN THIS STRUCTURAL AND COLLATERAL TERM SHEET IS NOT COMPLETE AND MAY BE AMENDED PRIOR TO THE TIME OF SALE. THIS TERM SHEET IS NOT AN OFFER TO SELL THESE SECURITIES AND IT IS NOT A SOLICITATION OF AN OFFER TO BUY THESE SECURITIES IN ANY JURISDICTION WHERE THE OFFER OR SALE IS NOT PERMITTED. | ||||
| | | 7 of 125 | | |
| Structural and Collateral Term Sheet | Benchmark 2018-B8 | |
| Collateral Characteristics | ||
| Mortgaged Properties by Type(1) |
| Weighted Average | |||||||||
| Property Type | Property Subtype | Number of Properties | Cut-off Date Principal Balance | % of IPB | Occupancy | UW NCF DSCR(2)(3) | UW NOI Debt Yield(2) | Cut-off Date LTV(2)(4) | Maturity Date LTV(2)(4)(5) |
| Office | Suburban | 97 | $297,397,225 | 28.4% | 95.2% | 2.13x | 11.7% | 58.5% | 57.7% |
| CBD | 9 | 155,741,174 | 14.8 | 98.9% | 2.66x | 12.3% | 46.7% | 46.1% | |
| Subtotal: | 106 | $453,138,400 | 43.2% | 96.5% | 2.31x | 11.9% | 54.5% | 53.7% | |
| Retail | Anchored | 7 | $123,342,500 | 11.8% | 94.5% | 1.75x | 10.0% | 65.5% | 63.0% |
| Super Regional Mall | 2 | 115,000,000 | 11.0 | 94.8% | 2.14x | 11.1% | 45.9% | 43.8% | |
| Unanchored | 4 | 24,720,000 | 2.4 | 95.4% | 1.27x | 9.1% | 63.3% | 57.9% | |
| Freestanding | 3 | 22,477,738 | 2.1 | 100.0% | 1.78x | 9.3% | 59.4% | 59.4% | |
| Subtotal: | 16 | $285,540,238 | 27.2% | 95.1% | 1.87x | 10.3% | 56.9% | 54.5% | |
| Hotel | Full Service | 4 | $128,636,081 | 12.3% | 65.6% | 1.89x | 13.0% | 57.0% | 51.5% |
| Extended Stay | 1 | 30,462,082 | 2.9 | 78.9% | 2.34x | 16.0% | 57.4% | 46.9% | |
| Subtotal: | 5 | $159,098,163 | 15.2% | 68.2% | 1.97x | 13.6% | 57.1% | 50.6% | |
| Industrial | Warehouse/Distribution | 8 | $56,100,000 | 5.3% | 100.0% | 1.72x | 9.5% | 62.6% | 62.6% |
| Flex | 2 | 33,177,953 | 3.2 | 100.0% | 1.53x | 10.3% | 65.0% | 58.6% | |
| Subtotal: | 10 | $89,277,953 | 8.5% | 100.0% | 1.65x | 9.8% | 63.5% | 61.1% | |
| Multifamily | Garden | 1 | $31,270,000 | 3.0% | 98.8% | 1.79x | 9.8% | 53.8% | 53.8% |
| Subtotal: | 1 | $31,270,000 | 3.0% | 98.8% | 1.79x | 9.8% | 53.8% | 53.8% | |
| Self Storage | Self Storage | 2 | $12,500,000 | 1.2% | 92.3% | 1.94x | 10.6% | 55.6% | 51.6% |
| Subtotal: | 2 | $12,500,000 | 1.2% | 92.3% | 1.94x | 10.6% | 55.6% | 51.6% | |
| Flex | Office/Industrial | 58 | $10,708,125 | 1.0% | 93.3% | 3.60x | 21.6% | 35.4% | 35.4% |
| Industrial | 1 | 190,625 | 0.0 | 72.7% | 3.60x | 21.6% | 35.4% | 35.4% | |
| Subtotal: | 59 | $10,898,750 | 1.0% | 92.9% | 3.60x | 21.6% | 35.4% | 35.4% | |
| Mixed Use | Office/Eductaion | 1 | $7,293,960 | 0.7% | 91.9% | 1.85x | 9.8% | 65.8% | 65.8% |
| Subtotal: | 1 | $7,293,960 | 0.7% | 91.9% | 1.85x | 9.8% | 65.8% | 65.8% | |
| Total / Weighted Average: | 200 | 1,049,017,463 | 100.0% | 92.0% | 2.08x | 11.6% | 56.2% | 54.0% | |
| (1) | Because this table presents information relating to the mortgaged properties and not mortgage loans, the information for mortgage loans secured by more than one mortgaged property is based on allocated loan amounts. |
| (2) | In the case of Loan Nos. 1, 2, 4, 5, 8, 9, 10, 12, 15, 16, 18, 19, 22, 25 and 28, the UW NCF DSCR, UW NOI Debt Yield, Cut-off Date LTV and Maturity Date LTV calculations include the related Pari Passu Companion Loan(s). In the case of Loan Nos. 1, 3, 4, 7, 8, 9, 13, 15, 18 and 21, the UW NCF DSCR, UW NOI Debt Yield, Cut-off Date LTV and Maturity Date LTV calculations exclude the related Subordinate Companion Loan(s) and/or related mezzanine loan(s). See footnote 2 to the Mortgage Loan Information table in the Workspace loan description below for more information on the calculations of UW NCF DSCR, UW NOI Debt Yield, Cut-off Date LTV and Maturity Date LTV with respect to Loan No. 9. |
| (3) | In the case of Loan No. 4, the UW NCF DSCR is calculated using the sum of principal and interest payments over the first 12 amortizing monthly payments based on the assumed principal payment schedule provided on Annex I to the Preliminary Prospectus. |
| (4) | In the case of Loan Nos. 3, 5, 8, 11, 12.02, 18, 20, 23, 33 and 34 the Cut-off Date LTV and the Maturity Date LTV are calculated by using an appraised value based on certain hypothetical assumptions. Refer to “Description of the Mortgage Pool—Assessments of Property Value and Condition” and “—Appraised Value” in the Preliminary Prospectus for additional details. |
| (5) | In the case of Loan Nos. 2, 17, 19 and 22, with an anticipated repayment date, Maturity Date LTV is calculated as of the related anticipated repayment date. |
THE INFORMATION IN THIS STRUCTURAL AND COLLATERAL TERM SHEET IS NOT COMPLETE AND MAY BE AMENDED PRIOR TO THE TIME OF SALE. THIS TERM SHEET IS NOT AN OFFER TO SELL THESE SECURITIES AND IT IS NOT A SOLICITATION OF AN OFFER TO BUY THESE SECURITIES IN ANY JURISDICTION WHERE THE OFFER OR SALE IS NOT PERMITTED. | ||||
| | | 8 of 125 | | |
| Structural and Collateral Term Sheet | Benchmark 2018-B8 | |
| Collateral Characteristics | ||
| Mortgaged Properties by Location(1) | ||||||||
Weighted Average | ||||||||
State | Number of | Cut-off Date | % of | Occupancy | UW NCF DSCR(2)(3) | UW NOI Debt Yield(2) | Cut-off Date LTV(2)(4) | Maturity Date LTV(2)(4)(5) |
| California | 7 | 201,200,000 | 19.2 | 95.2% | 2.12x | 11.3% | 51.6% | 50.7% |
| New York | 9 | 166,426,895 | 15.9 | 94.9% | 2.23x | 11.1% | 58.2% | 58.2% |
| Florida | 47 | 112,338,691 | 10.7 | 70.5% | 2.32x | 12.6% | 48.6% | 45.2% |
| Texas | 5 | 73,617,500 | 7.0 | 91.1% | 1.95x | 10.8% | 65.2% | 63.6% |
| Massachusetts | 2 | 73,150,000 | 7.0 | 100.0% | 2.07x | 9.9% | 54.2% | 54.2% |
| Missouri | 3 | 69,230,872 | 6.6 | 96.7% | 1.71x | 11.0% | 54.4% | 50.9% |
| Georgia | 3 | 46,429,453 | 4.4 | 89.9% | 2.06x | 13.0% | 57.3% | 53.1% |
| Arizona | 17 | 44,794,063 | 4.3 | 88.8% | 2.29x | 13.3% | 54.6% | 51.8% |
| Indiana | 2 | 35,299,830 | 3.4 | 100.0% | 1.51x | 10.2% | 64.2% | 58.2% |
| Maryland | 2 | 31,367,775 | 3.0 | 100.0% | 1.72x | 9.2% | 61.7% | 61.7% |
| New Jersey | 1 | 31,270,000 | 3.0 | 98.8% | 1.79x | 9.8% | 53.8% | 53.8% |
| Idaho | 1 | 30,462,082 | 2.9 | 78.9% | 2.34x | 16.0% | 57.4% | 46.9% |
| Illinois | 2 | 23,670,000 | 2.3 | 100.0% | 1.70x | 11.0% | 67.2% | 63.4% |
| Nebraska | 1 | 16,526,174 | 1.6 | 100.0% | 1.85x | 9.8% | 65.8% | 65.8% |
| Pennsylvania | 69 | 16,101,250 | 1.5 | 88.0% | 3.60x | 21.6% | 35.4% | 35.4% |
| North Carolina | 1 | 14,900,000 | 1.4 | 99.1% | 1.72x | 11.5% | 73.4% | 64.9% |
| Tennessee | 1 | 14,895,750 | 1.4 | 76.7% | 1.82x | 11.8% | 60.4% | 50.0% |
| Utah | 1 | 10,250,000 | 1.0 | 100.0% | 1.64x | 11.3% | 68.8% | 56.6% |
| Michigan | 1 | 7,242,953 | 0.7 | 100.0% | 1.85x | 9.8% | 65.8% | 65.8% |
| Ohio | 1 | 6,895,718 | 0.7 | 100.0% | 1.72x | 9.5% | 62.6% | 62.6% |
| Minnesota | 20 | 6,748,973 | 0.6 | 91.5% | 3.17x | 18.8% | 41.7% | 41.7% |
| Connecticut | 2 | 5,672,284 | 0.5 | 100.0% | 1.72x | 9.5% | 62.6% | 62.6% |
| Virginia | 1 | 5,500,000 | 0.5 | 85.8% | 1.50x | 9.9% | 59.9% | 50.8% |
| Wisconsin | 1 | 5,027,201 | 0.5 | 100.0% | 1.72x | 9.5% | 62.6% | 62.6% |
| Total / Weighted Average: | 200 | $1,049,017,463 | 100.0% | 92.0% | 2.08x | 11.6% | 56.2% | 54.0% |
| (1) | Because this table presents information relating to the mortgaged properties and not mortgage loans, the information for mortgage loans secured by more than one mortgaged property is based on allocated loan amounts. |
| (2) | In the case of Loan Nos. 1, 2, 4, 5, 8, 9, 10, 12, 15, 16, 18, 19, 22, 25 and 28, the UW NCF DSCR, UW NOI Debt Yield, Cut-off Date LTV and Maturity Date LTV calculations include the related Pari Passu Companion Loan(s). In the case of Loan Nos. 1, 3, 4, 7, 8, 9, 13, 15, 18 and 21, the UW NCF DSCR, UW NOI Debt Yield, Cut-off Date LTV and Maturity Date LTV calculations exclude the related Subordinate Companion Loan(s) and/or related mezzanine loan(s). See footnote 2 to the Mortgage Loan Information table in the Workspace loan description below for more information on the calculations of UW NCF DSCR, UW NOI Debt Yield, Cut-off Date LTV and Maturity Date LTV with respect to Loan No. 9. |
| (3) | In the case of Loan No. 4, the UW NCF DSCR is calculated using the sum of principal and interest payments over the first 12 amortizing monthly payments based on the assumed principal payment schedule provided on Annex I to the Preliminary Prospectus. |
| (4) | In the case of Loan Nos. 3, 5, 8, 11, 12.02, 18, 20, 23, 33 and 34, the Cut-off Date LTV and the Maturity Date LTV are calculated by using an appraised value based on certain hypothetical assumptions. Refer to “Description of the Mortgage Pool—Assessments of Property Value and Condition” and “—Appraised Value” in the Preliminary Prospectus for additional details. |
| (5) | In the case of Loan Nos. 2, 17, 19 and 22, with an anticipated repayment date, Maturity Date LTV is calculated as of the related anticipated repayment date. |
THE INFORMATION IN THIS STRUCTURAL AND COLLATERAL TERM SHEET IS NOT COMPLETE AND MAY BE AMENDED PRIOR TO THE TIME OF SALE. THIS TERM SHEET IS NOT AN OFFER TO SELL THESE SECURITIES AND IT IS NOT A SOLICITATION OF AN OFFER TO BUY THESE SECURITIES IN ANY JURISDICTION WHERE THE OFFER OR SALE IS NOT PERMITTED. | ||||
| | | 9 of 125 | | |
| Structural and Collateral Term Sheet | Benchmark 2018-B8 | |
| Collateral Characteristics | ||
| Cut-off Date Principal Balance |
Weighted Average | |||||||||||
| Range of Cut-off Date Principal Balances | Number of Loans | Cut-off Date Principal Balance | % of IPB | Mortgage Rate | Remaining Loan Term(1) | UW NCF DSCR(2)(3) | UW NOI DY(2) | Cut-off Date LTV(2)(4) | Maturity Date LTV(1)(2)(4) | ||
| $4,745,000 | - | $9,999,999 | 7 | $43,890,000 | 4.2% | 5.17769% | 116 | 1.56x | 9.7% | 60.0% | 55.8% |
| $10,000,000 | - | $19,999,999 | 12 | 169,004,503 | 16.1 | 5.10481% | 119 | 1.65x | 10.7% | 65.2% | 59.9% |
| $20,000,000 | - | $24,999,999 | 4 | 86,995,000 | 8.3 | 4.59340% | 117 | 2.37x | 11.8% | 57.8% | 57.8% |
| $25,000,000 | - | $49,999,999 | 13 | 472,027,960 | 45.0 | 4.95922% | 106 | 2.20x | 12.2% | 55.3% | 53.2% |
| $50,000,000 | - | $60,000,000 | 5 | 277,100,000 | 26.4 | 4.70115% | 118 | 2.10x | 11.2% | 51.0% | 50.1% |
| 41 | $1,049,017,463 | 100.0% | 4.89331% | 112 | 2.08x | 11.6% | 56.2% | 54.0% | |||
| Mortgage Interest Rates |
Weighted Average | |||||||||||
| Range of Mortgage Interest Rates | Number of Loans | Cut-off Date Principal Balance | % of IPB | Mortgage Rate | Remaining Loan Term(1) | UW NCF DSCR(2)(3) | UW NOI DY(2) | Cut-off Date LTV(2)(4) | Maturity Date LTV(1)(2)(4) | ||
| 3.89397% | - | 3.99999% | 1 | $25,000,000 | 2.4% | 3.89397% | 112 | 2.00x | 11.5% | 46.8% | 42.8% |
| 4.00000% | - | 4.49999% | 5 | 206,800,000 | 19.7 | 4.16061% | 108 | 2.75x | 11.9% | 42.4% | 42.4% |
| 4.50000% | - | 4.99999% | 14 | 353,350,332 | 33.7 | 4.87771% | 119 | 1.92x | 11.1% | 60.3% | 57.5% |
| 5.00000% | - | 5.94000% | 21 | 463,867,131 | 44.2 | 5.28570% | 110 | 1.90x | 11.7% | 59.7% | 57.0% |
| 41 | $1,049,017,463 | 100.0% | 4.89331% | 112 | 2.08x | 11.6% | 56.2% | 54.0% | |||
| Original Term to Maturity in Months |
Weighted Average | |||||||||
| Original Term to Maturity in Months | Number of Loans | Cut-off Date Principal Balance | % of IPB | Mortgage Rate | Remaining Loan Term(1) | UW NCF DSCR(2)(3) | UW NOI DY(2) | Cut-off Date LTV(2)(4) | Maturity Date LTV(1)(2)(4) |
| 60 | 2 | $61,270,000 | 5.8% | 4.67418% | 59 | 2.82x | 13.1% | 41.2% | 41.2% |
| 61 | 1 | 40,000,000 | 3.8 | 5.37200% | 55 | 3.60x | 21.6% | 35.4% | 35.4% |
| 84 | 1 | 4,745,000 | 0.5 | 5.57800% | 83 | 1.25x | 9.3% | 65.0% | 61.5% |
| 116 | 1 | 25,000,000 | 2.4 | 3.89397% | 112 | 2.00x | 11.5% | 46.8% | 42.8% |
| 120 | 36 | 918,002,463 | 87.5 | 4.91075% | 119 | 1.97x | 11.0% | 58.3% | 55.9% |
| 41 | $1,049,017,463 | 100.0% | 4.89331% | 112 | 2.08x | 11.6% | 56.2% | 54.0% | |
| Remaining Term to Maturity in Months | |||||||||
| Weighted Average | |||||||||||
| Range of Remaining Term to Maturity in Months | Number of Loans | Cut-off Date Principal Balance | % of IPB | Mortgage Rate | Remaining Loan Term(1) | UW NCF DSCR(2)(3) | UW NOI DY(2) | Cut-off Date LTV(2)(4) | Maturity Date LTV(1)(2)(4) | ||
| 55 | - | 84 | 4 | $106,015,000 | 10.1% | 4.97792% | 58 | 3.04x | 16.2% | 40.1% | 39.9% |
| 85 | - | 119 | 21 | 581,984,963 | 55.5 | 4.80559% | 118 | 2.08x | 11.7% | 55.2% | 52.2% |
| 120 | - | 120 | 16 | 361,017,500 | 34.4 | 5.00987% | 120 | 1.79x | 9.9% | 62.5% | 60.9% |
| 41 | $1,049,017,463 | 100.0% | 4.89331% | 112 | 2.08x | 11.6% | 56.2% | 54.0% | |||
| (1) | In the case of Loan Nos. 2, 17, 19 and 22, with an anticipated repayment date, Remaining Term to Maturity and Maturity Date LTV are calculated as of the related anticipated repayment date. |
| (2) | In the case of Loan Nos. 1, 2, 4, 5, 8, 9, 10, 12, 15, 16, 18, 19, 22, 25 and 28, the UW NCF DSCR, UW NOI Debt Yield, Cut-off Date LTV and Maturity Date LTV calculations include the related Pari Passu Companion Loan(s). In the case of Loan Nos. 1, 3, 4, 7, 8, 9, 13, 15, 18 and 21, the UW NCF DSCR, UW NOI Debt Yield, Cut-off Date LTV and Maturity Date LTV calculations exclude the related Subordinate Companion Loan(s) and/or related mezzanine loan(s). See footnote 2 to the Mortgage Loan Information table in the Workspace loan description below for more information on the calculations of UW NCF DSCR, UW NOI Debt Yield, Cut-off Date LTV and Maturity Date LTV with respect to Loan No. 9. |
| (3) | In the case of Loan No. 4, the UW NCF DSCR is calculated using the sum of principal and interest payments over the first 12 amortizing monthly payments based on the assumed principal payment schedule provided on Annex I to the Preliminary Prospectus. |
| (4) | In the case of Loan Nos. 3, 5, 8, 11, 12.02, 18, 20, 23, 33 and 34, the Cut-off Date LTV and the Maturity Date LTV are calculated by using an appraised value based on certain hypothetical assumptions. Refer to “Description of the Mortgage Pool—Assessments of Property Value and Condition” and “—Appraised Value” in the Preliminary Prospectus for additional details. |
THE INFORMATION IN THIS STRUCTURAL AND COLLATERAL TERM SHEET IS NOT COMPLETE AND MAY BE AMENDED PRIOR TO THE TIME OF SALE. THIS TERM SHEET IS NOT AN OFFER TO SELL THESE SECURITIES AND IT IS NOT A SOLICITATION OF AN OFFER TO BUY THESE SECURITIES IN ANY JURISDICTION WHERE THE OFFER OR SALE IS NOT PERMITTED. | ||||
| | | 10 of 125 | | |
| Structural and Collateral Term Sheet | Benchmark 2018-B8 | |
| Collateral Characteristics | ||
| Original Amortization Term in Months |
| Weighted Average | |||||||||
| Original Amortization Term in Months | Number of Loans | Cut-off Date Principal Balance | % of IPB | Mortgage Rate | Remaining Loan Term(1) | UW NCF DSCR(2)(3) | UW NOI DY(2) | Cut-off Date LTV(2)(4) | Maturity Date LTV(1)(2)(4) |
| Interest Only | 23 | $733,694,300 | 69.9% | 4.80037% | 110 | 2.26x | 11.5% | 54.3% | 54.3% |
| 360 | 18 | 315,323,163 | 30.1 | 5.10955% | 118 | 1.65x | 11.6% | 60.5% | 53.1% |
| Total / Weighted Average: | 41 | $1,049,017,463 | 100.0% | 4.89331% | 112 | 2.08x | 11.6% | 56.2% | 54.0% |
| Remaining Amortization Term in Months |
| Weighted Average | |||||||||||
| Range of Remaining Amortization Term in Months | Number of Loans | Cut-off Date Principal Balance | % of IPB | Mortgage Rate | Remaining Loan Term(1) | UW NCF DSCR(2)(3) | UW NOI DY(2) | Cut-off Date LTV(2)(4) | Maturity Date LTV(1)(2)(4) | ||
| Interest Only | 23 | $733,694,300 | 69.9% | 4.80037% | 110 | 2.26x | 11.5% | 54.3% | 54.3% | ||
| 354 | - | 359 | 4 | 103,098,163 | 9.8 | 5.39151% | 118 | 1.79x | 13.3% | 60.2% | 50.2% |
| 360 | - | 360 | 14 | 212,225,000 | 20.2 | 4.97257% | 118 | 1.59x | 10.7% | 60.7% | 54.5% |
| Total / Weighted Average: | 41 | $1,049,017,463 | 100.0% | 4.89331% | 112 | 2.08x | 11.6% | 56.2% | 54.0% | ||
| Amortization Types |
Weighted Average | |||||||||
| Amortization Types | Number of Loans | Cut-off Date Principal Balance | % of IPB | Mortgage Rate | Remaining Loan Term(1) | UW NCF DSCR(2)(3) | UW NOI DY(2) | Cut-off Date LTV(2)(4) | Maturity Date LTV(1)(2)(4) |
| Interest Only | 20 | $634,444,300 | 60.5% | 4.80988% | 109 | 2.32x | 11.9% | 53.2% | 53.2% |
| IO-Balloon | 12 | 176,040,000 | 16.8 | 4.91294% | 117 | 1.61x | 10.8% | 59.6% | 54.1% |
| Balloon | 5 | 113,348,163 | 10.8 | 5.35828% | 118 | 1.77x | 13.1% | 61.0% | 50.8% |
| ARD-Interest Only | 3 | 99,250,000 | 9.5 | 4.73962% | 117 | 1.88x | 9.6% | 61.8% | 61.8% |
| ARD-IO-Balloon | 1 | 25,935,000 | 2.5 | 5.35700% | 120 | 1.44x | 10.4% | 64.8% | 56.6% |
| Total / Weighted Average: | 41 | $1,049,017,463 | 100.0% | 4.89331% | 112 | 2.08x | 11.6% | 56.2% | 54.0% |
| Underwritten Net Cash Flow Debt Service Coverage Ratios(2)(3) |
| Weighted Average | |||||||||||
| Range of Underwritten Net Cash Flow Debt Service Coverage Ratios | Number of Loans | Cut-off Date Principal Balance | % of IPB | Mortgage Rate | Remaining Loan Term(1) | UW NCF DSCR(2)(3) | UW NOI DY(2) | Cut-off Date LTV(2)(4) | Maturity Date LTV(1)(2)(4) | ||
| 1.20x | - | 1.49x | 10 | $200,035,879 | 19.1% | 5.37935% | 119 | 1.39x | 9.1% | 64.2% | 60.0% |
| 1.50x | - | 1.74x | 10 | 222,991,253 | 21.3 | 5.04289% | 119 | 1.67x | 10.7% | 61.1% | 57.0% |
| 1.75x | - | 1.99x | 7 | 139,883,250 | 13.3 | 5.05977% | 105 | 1.83x | 10.0% | 61.5% | 60.4% |
| 2.00x | - | 2.24x | 3 | 122,000,000 | 11.6 | 4.52475% | 118 | 2.16x | 11.3% | 56.1% | 55.3% |
| 2.25x | - | 3.89x | 11 | 364,107,082 | 34.7 | 4.59421% | 106 | 2.77x | 14.1% | 46.7% | 45.8% |
| Total / Weighted Average: | 41 | $1,049,017,463 | 100.0% | 4.89331% | 112 | 2.08x | 11.6% | 56.2% | 54.0% | ||
| (1) | In the case of Loan Nos. 2, 17, 19 and 22, with an anticipated repayment date, Remaining Term to Maturity and Maturity Date LTV are calculated as of the related anticipated repayment date. |
| (2) | In the case of Loan Nos. 1, 2, 4, 5, 8, 9, 10, 12, 15, 16, 18, 19, 22, 25 and 28, the UW NCF DSCR, UW NOI Debt Yield, Cut-off Date LTV and Maturity Date LTV calculations include the related Pari Passu Companion Loan(s). In the case of Loan Nos. 1, 3, 4, 7, 8, 9, 13, 15, 18 and 21, the UW NCF DSCR, UW NOI Debt Yield, Cut-off Date LTV and Maturity Date LTV calculations exclude the related Subordinate Companion Loan(s) and/or related mezzanine loan(s). See footnote 2 to the Mortgage Loan Information table in the Workspace loan description below for more information on the calculations of UW NCF DSCR, UW NOI Debt Yield, Cut-off Date LTV and Maturity Date LTV with respect to Loan No. 9. |
| (3) | In the case of Loan No. 4, the UW NCF DSCR is calculated using the sum of principal and interest payments over the first 12 amortizing monthly payments based on the assumed principal payment schedule provided on Annex I to the Preliminary Prospectus. |
| (4) | In the case of Loan Nos. 3, 5, 8, 11, 12.02, 18, 20, 23, 33 and 34, the Cut-off Date LTV and the Maturity Date LTV are calculated by using an appraised value based on certain hypothetical assumptions. Refer to “Description of the Mortgage Pool—Assessments of Property Value and Condition” and “—Appraised Value” in the Preliminary Prospectus for additional details. |
THE INFORMATION IN THIS STRUCTURAL AND COLLATERAL TERM SHEET IS NOT COMPLETE AND MAY BE AMENDED PRIOR TO THE TIME OF SALE. THIS TERM SHEET IS NOT AN OFFER TO SELL THESE SECURITIES AND IT IS NOT A SOLICITATION OF AN OFFER TO BUY THESE SECURITIES IN ANY JURISDICTION WHERE THE OFFER OR SALE IS NOT PERMITTED. | ||||
| | | 11 of 125 | | |
| Structural and Collateral Term Sheet | Benchmark 2018-B8 | |
| Collateral Characteristics | ||
| LTV Ratios as of the Cut-off Date(2)(4) |
| Weighted Average | |||||||||||
| Range of Cut-off Date LTVs | Number of Loans | Cut-off Date Principal Balance | % of IPB | Mortgage Rate | Remaining Loan Term(1) | UW NCF DSCR(2)(3) | UW NOI DY(2) | Cut-off Date LTV(2)(4) | Maturity Date LTV(1)(2)(4) | ||
| 28.1% | - | 39.9% | 2 | $70,000,000 | 6.7% | 4.80543% | 56 | 3.72x | 19.5% | 32.3% | 32.3% |
| 40.0% | - | 49.9% | 4 | 181,800,000 | 17.3 | 4.15184% | 117 | 2.49x | 11.3% | 43.8% | 43.3% |
| 50.0% | - | 59.9% | 12 | 281,726,534 | 26.9 | 4.96587% | 112 | 2.09x | 12.5% | 53.9% | 51.0% |
| 60.0% | - | 69.9% | 19 | 465,870,929 | 44.4 | 5.13305% | 119 | 1.71x | 10.0% | 64.3% | 62.0% |
| 70.0% | - | 73.4% | 4 | 49,620,000 | 4.7 | 5.07106% | 119 | 1.56x | 10.7% | 71.8% | 64.9% |
| Total / Weighted Average: | 41 | $1,049,017,463 | 100.0% | 4.89331% | 112 | 2.08x | 11.6% | 56.2% | 54.0% | ||
| LTV Ratios as of the Maturity Date(1)(2)(4) |
Weighted Average | |||||||||||
| Range of Maturity Date LTVs | Number of Loans | Cut-off Date Principal Balance | % of IPB | Mortgage Rate | Remaining Loan Term(1) | UW NCF DSCR(2)(3) | UW NOI DY(2) | Cut-off Date LTV(2)(4) | Maturity Date LTV(1)(2)(4) | ||
| 28.1% | - | 39.9% | 2 | $70,000,000 | 6.7% | 4.80543% | 56 | 3.72x | 19.5% | 32.3% | 32.3% |
| 40.0% | - | 49.9% | 7 | 286,191,534 | 27.3 | 4.47728% | 118 | 2.26x | 11.9% | 47.4% | 44.5% |
| 50.0% | - | 54.9% | 7 | 144,485,750 | 13.8 | 5.05721% | 106 | 2.11x | 12.2% | 53.5% | 51.9% |
| 55.0% | - | 59.9% | 8 | 141,265,879 | 13.5 | 5.15028% | 119 | 1.82x | 11.5% | 62.5% | 56.4% |
| 60.0% | - | 68.1% | 17 | 407,074,300 | 38.8 | 5.05355% | 119 | 1.74x | 9.7% | 65.2% | 64.2% |
| Total / Weighted Average: | 41 | $1,049,017,463 | 100.0% | 4.89331% | 112 | 2.08x | 11.6% | 56.2% | 54.0% | ||
| Prepayment Protection |
Weighted Average | |||||||||
| Prepayment Protection | Number of Loans | Cut-off Date Principal Balance | % of IPB | Mortgage Rate | Remaining Loan Term(1) | UW NCF DSCR(2)(3) | UW NOI DY(2) | Cut-off Date LTV(2)(4) | Maturity Date LTV(1)(2)(4) |
| Defeasance | 24 | $592,659,213 | 56.5% | 4.91664% | 115 | 1.98x | 11.1% | 57.2% | 54.5% |
| Yield Maintenance | 14 | 346,558,250 | 33.0 | 5.00796% | 106 | 2.15x | 12.4% | 56.2% | 54.5% |
| Defeasance or Yield Maintenance | 3 | 109,800,000 | 10.5 | 4.40546% | 117 | 2.36x | 11.4% | 50.6% | 49.7% |
| Total / Weighted Average: | 41 | $1,049,017,463 | 100.0% | 4.89331% | 112 | 2.08x | 11.6% | 56.2% | 54.0% |
| Loan Purpose |
Weighted Average | |||||||||
| Loan Purpose | Number of Loans | Cut-off Date Principal Balance | % of IPB | Mortgage Rate | Remaining Loan Term(1) | UW NCF DSCR(2)(3) | UW NOI DY(2) | Cut-off Date LTV(2)(4) | Maturity Date LTV(1)(2)(4) |
| Refinance | 22 | $561,069,084 | 53.5% | 4.79816% | 110 | 2.27x | 12.3% | 52.1% | 50.0% |
| Acquisition | 16 | 393,678,379 | 37.5 | 5.04419% | 119 | 1.85x | 10.8% | 61.9% | 59.1% |
| Recapitalization | 2 | 56,270,000 | 5.4 | 4.66031% | 83 | 1.88x | 10.6% | 50.7% | 48.9% |
| Refinance/Acquisition | 1 | 38,000,000 | 3.6 | 5.08000% | 120 | 1.85x | 9.8% | 65.8% | 65.8% |
| Total / Weighted Average: | 41 | $1,049,017,463 | 100.0% | 4.89331% | 112 | 2.08x | 11.6% | 56.2% | 54.0% |
| (1) | In the case of Loan Nos. 2, 17, 19 and 22, with an anticipated repayment date, Remaining Term to Maturity and Maturity Date LTV are calculated as of the related anticipated repayment date. |
| (2) | In the case of Loan Nos. 1, 2, 4, 5, 8, 9, 10, 12, 15, 16, 18, 19, 22, 25 and 28, the UW NCF DSCR, UW NOI Debt Yield, Cut-off Date LTV and Maturity Date LTV calculations include the related Pari Passu Companion Loan(s). In the case of Loan Nos. 1, 3, 4, 7, 8, 9, 13, 15, 18 and 21, the UW NCF DSCR, UW NOI Debt Yield, Cut-off Date LTV and Maturity Date LTV calculations exclude the related Subordinate Companion Loan(s) and/or related mezzanine loan(s). See footnote 2 to the Mortgage Loan Information table in the Workspace loan description below for more information on the calculations of UW NCF DSCR, UW NOI Debt Yield, Cut-off Date LTV and Maturity Date LTV with respect to Loan No. 9. |
| (3) | In the case of Loan No. 4, the UW NCF DSCR is calculated using the sum of principal and interest payments over the first 12 amortizing monthly payments based on the assumed principal payment schedule provided on Annex I to the Preliminary Prospectus. |
| (4) | In the case of Loan Nos. 3, 5, 8, 11, 12.02, 18, 20, 23, 33 and 34, the Cut-off Date LTV and the Maturity Date LTV are calculated by using an appraised value based on certain hypothetical assumptions. Refer to “Description of the Mortgage Pool—Assessments of Property Value and Condition” and “—Appraised Value” in the Preliminary Prospectus for additional details. |
THE INFORMATION IN THIS STRUCTURAL AND COLLATERAL TERM SHEET IS NOT COMPLETE AND MAY BE AMENDED PRIOR TO THE TIME OF SALE. THIS TERM SHEET IS NOT AN OFFER TO SELL THESE SECURITIES AND IT IS NOT A SOLICITATION OF AN OFFER TO BUY THESE SECURITIES IN ANY JURISDICTION WHERE THE OFFER OR SALE IS NOT PERMITTED. | ||||
| | | 12 of 125 | | |
| Structural and Collateral Term Sheet | Benchmark 2018-B8 | |
| Collateral Characteristics | ||
| Previous Securitization History(1) |
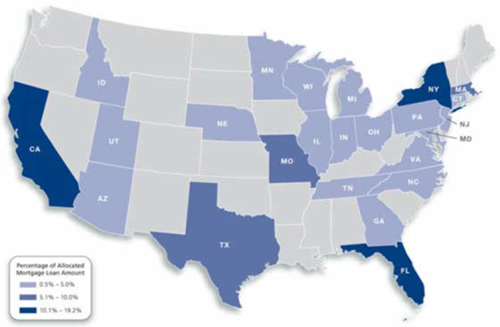
| No. | Loan Name | Cut-off Date Principal Balance | % of IPB | Location | Property Type | Previous Securitization |
| 1 | Aventura Mall | $60,000,000 | 5.7% | Aventura, FL | Retail | AVMT 2013-AVM |
| 3 | Embassy Suites Anaheim | $56,000,000 | 5.3% | Garden Grove, CA | Hotel | COMM 2014-UBS2 |
| 4 | Saint Louis Galleria | $55,000,000 | 5.2% | Saint Louis, MO | Retail | COMM 2013-CR13, COMM 2014-CCRE14 |
| 8 | Moffett Towers – Building E,F,G | $46,800,000 | 4.5% | Sunnyvale, CA | Office | COMM 2013-CCRE7, COMM 2013-CCRE8 |
| 9 | Workspace | $40,000,000 | 3.8% | Various | Various | JPMCC 2016-WPT |
| 23 | Glenn Hotel Downtown Atlanta | $18,929,453 | 1.8% | Atlanta, GA | Hotel | JPMBB 2014-C18 |
| 41 | Anthem Eastide Shops | $4,745,000 | 0.5% | Anthem, AZ | Retail | GSMS 2015-GC28 |
| (1) | The table above represents the properties for which the previously existing debt was securitized, based on information provided by the related borrower or obtained through searches of a third-party database. |
THE INFORMATION IN THIS STRUCTURAL AND COLLATERAL TERM SHEET IS NOT COMPLETE AND MAY BE AMENDED PRIOR TO THE TIME OF SALE. THIS TERM SHEET IS NOT AN OFFER TO SELL THESE SECURITIES AND IT IS NOT A SOLICITATION OF AN OFFER TO BUY THESE SECURITIES IN ANY JURISDICTION WHERE THE OFFER OR SALE IS NOT PERMITTED. | ||||
| | | 13 of 125 | | |
| Structural and Collateral Term Sheet | Benchmark 2018-B8 | |
| Aventura Mall | ||
THE INFORMATION IN THIS STRUCTURAL AND COLLATERAL TERM SHEET IS NOT COMPLETE AND MAY BE AMENDED PRIOR TO THE TIME OF SALE. THIS TERM SHEET IS NOT AN OFFER TO SELL THESE SECURITIES AND IT IS NOT A SOLICITATION OF AN OFFER TO BUY THESE SECURITIES IN ANY JURISDICTION WHERE THE OFFER OR SALE IS NOT PERMITTED. | ||||
| | | 14 of 125 | | |
| Structural and Collateral Term Sheet | Benchmark 2018-B8 | |
| Aventura Mall | ||
THE INFORMATION IN THIS STRUCTURAL AND COLLATERAL TERM SHEET IS NOT COMPLETE AND MAY BE AMENDED PRIOR TO THE TIME OF SALE. THIS TERM SHEET IS NOT AN OFFER TO SELL THESE SECURITIES AND IT IS NOT A SOLICITATION OF AN OFFER TO BUY THESE SECURITIES IN ANY JURISDICTION WHERE THE OFFER OR SALE IS NOT PERMITTED. | ||||
| | | 15 of 125 | | |
| Structural and Collateral Term Sheet | Benchmark 2018-B8 | |
| Aventura Mall | ||
THE INFORMATION IN THIS STRUCTURAL AND COLLATERAL TERM SHEET IS NOT COMPLETE AND MAY BE AMENDED PRIOR TO THE TIME OF SALE. THIS TERM SHEET IS NOT AN OFFER TO SELL THESE SECURITIES AND IT IS NOT A SOLICITATION OF AN OFFER TO BUY THESE SECURITIES IN ANY JURISDICTION WHERE THE OFFER OR SALE IS NOT PERMITTED. | ||||
| | | 16 of 125 | | |
| Structural and Collateral Term Sheet | Benchmark 2018-B8 | |
| Aventura Mall | ||
THE INFORMATION IN THIS STRUCTURAL AND COLLATERAL TERM SHEET IS NOT COMPLETE AND MAY BE AMENDED PRIOR TO THE TIME OF SALE. THIS TERM SHEET IS NOT AN OFFER TO SELL THESE SECURITIES AND IT IS NOT A SOLICITATION OF AN OFFER TO BUY THESE SECURITIES IN ANY JURISDICTION WHERE THE OFFER OR SALE IS NOT PERMITTED. | ||||
| | | 17 of 125 | | |
| Structural and Collateral Term Sheet | Benchmark 2018-B8 | |
| Aventura Mall | ||

THE INFORMATION IN THIS STRUCTURAL AND COLLATERAL TERM SHEET IS NOT COMPLETE AND MAY BE AMENDED PRIOR TO THE TIME OF SALE. THIS TERM SHEET IS NOT AN OFFER TO SELL THESE SECURITIES AND IT IS NOT A SOLICITATION OF AN OFFER TO BUY THESE SECURITIES IN ANY JURISDICTION WHERE THE OFFER OR SALE IS NOT PERMITTED. | ||||
| | | 18 of 125 | | |
| Structural and Collateral Term Sheet | Benchmark 2018-B8 | |
| Aventura Mall | ||
THE INFORMATION IN THIS STRUCTURAL AND COLLATERAL TERM SHEET IS NOT COMPLETE AND MAY BE AMENDED PRIOR TO THE TIME OF SALE. THIS TERM SHEET IS NOT AN OFFER TO SELL THESE SECURITIES AND IT IS NOT A SOLICITATION OF AN OFFER TO BUY THESE SECURITIES IN ANY JURISDICTION WHERE THE OFFER OR SALE IS NOT PERMITTED. | ||||
| | | 19 of 125 | | |
| Structural and Collateral Term Sheet | Benchmark 2018-B8 | |
| Aventura Mall | ||
| Mortgage Loan Information | Property Information | |||
| Mortgage Loan Seller(1): | JPMCB | Single Asset / Portfolio: | Single Asset | |
| Credit Assessment | Title: | Fee | ||
| (DBRS/Fitch/S&P)(2): | BBB(high)/Asf/A | Property Type - Subtype: | Retail – Super Regional Mall | |
| Original Principal Balance(3): | $60,000,000 | Net Rentable Area (SF): | 1,217,508 | |
| Cut-off Date Principal Balance(3): | $60,000,000 | Location: | Aventura, FL | |
| % of Pool by IPB: | 5.7% | Year Built / Renovated: | 1983 / 2017 | |
| Loan Purpose: | Refinance | Occupancy(5): | 92.8% | |
| Borrower: | Aventura Mall Venture | Occupancy Date: | 2/14/2018 | |
| Sponsors: | Simon Property Group, L.P., | Number of Tenants: | 288 | |
| Jacquelyn Soffer, Jeffrey Soffer | 2015 NOI: | $109,025,339 | ||
| Interest Rate: | 4.12125% | 2016 NOI: | $110,653,403 | |
| Note Date: | 6/7/2018 | 2017 NOI: | $115,240,562 | |
| Maturity Date: | 7/1/2028 | TTM NOI (as of 3/2018): | $118,291,397 | |
| Interest-only Period: | 120 months | UW Economic Occupancy(5): | 92.9% | |
| Original Term: | 120 months | UW Revenues: | $185,479,647 | |
| Original Amortization: | None | UW Expenses: | $30,620,668 | |
| Amortization Type: | Interest Only | UW NOI(6): | $154,858,979 | |
| Call Protection(4): | L(29),Def(84),O(7) | UW NCF(6): | $151,571,708 | |
| Lockbox / Cash Management: | Hard; Master Lease Rents (Soft | Appraised Value / Per SF: | $3,450,000,000 / $2,834 | |
| Springing) / Springing | ||||
| Additional Debt: | Yes | |||
| Additional Debt Balance: | $1,346,700,000 / $343,300,000 | |||
| Additional Debt Type: | Pari Passu / Subordinate Debt | |||
| Escrows and Reserves(7) | Financial Information(3) | ||||||
| Initial | Monthly | Initial Cap | Senior Notes | Whole Loan | |||
| Taxes: | $0 | Springing | N/A | Cut-off Date Loan / SF: | $1,155 | $1,437 | |
| Insurance: | $0 | Springing | N/A | Maturity Date Loan / SF: | $1,155 | $1,437 | |
| Replacement Reserves: | $0 | Springing | $487,003 | Cut-off Date LTV: | 40.8% | 50.7% | |
| TI/LC: | $0 | Springing | $6,087,540 | Maturity Date LTV: | 40.8% | 50.7% | |
| Other(7): | $26,168,910 | $0 | N/A | UW NCF DSCR: | 2.58x | 2.07x | |
| UW NOI Debt Yield: | 11.0% | 8.8% | |||||
| Sources and Uses | |||||||
| Sources | Proceeds | % of Total | Uses | Proceeds | % of Total | ||
| Whole Loan | $1,750,000,000 | 100.0% | Existing CMBS Mortgage | $1,230,695,723 | 70.3% | ||
| % | Construction Debt Payoff | 200,853,019 | 11.5% | ||||
| Upfront Reserves | 26,168,910 | 1.5% | |||||
| Closing Costs | 13,967,630 | 0.8% | |||||
| Return of Equity | 278,314,718 | 15.9% | |||||
| Total Sources | $1,750,000,000 | 100.0% | Total Uses | $1,750,000,000 | 100.0% | ||
| (1) | The Aventura Mall Whole Loan was co-originated by JPMCB, Wells Fargo Bank, N.A., DBNY and Morgan Stanley Bank, N.A. |
| (2) | DBRS/Fitch/S&P provided the ratings above for the Aventura Mall Loan in the context of its inclusion in the mortgage pool. |
| (3) | The Aventura Mall Loan is part of a whole loan comprised of (i) 27 senior pari passu notes, with an aggregate outstanding principal balance as of the Cut-off Date of $1.41 billion and (ii) four subordinate notes, with an aggregate outstanding principal balance as of the Cut-off Date of $343.3 million. The Senior Notes Financial Information presented in the chart above reflects the Cut-off Date balance of the senior notes, but excludes the related subordinate notes. The Whole Loan Financial Information presented in the chart above reflects the Cut-off Date Balance of the senior notes and subordinate notes evidencing the Aventura Mall Whole Loan. |
| (4) | The lockout period will be at least 29 payment dates beginning with and including the first payment date of August 1, 2018. Defeasance of the full $1.75 billion Aventura Mall Whole Loan is permitted after the date that is the earlier to occur of (i) August 1, 2021 or (ii) the date that is two years from the closing date of the securitization that includes the last note to be securitized (the “REMIC Prohibition Period”). If the REMIC Prohibition Period has not occurred by August 1, 2021, the borrower is permitted to prepay the Aventura Mall with a yield maintenance premium, except that the borrower is required to defease any portion of the Aventura Mall Whole Loan that is more than two years from its securitization date. The assumed lockout period of 29 payments is based on the expected Benchmark 2018-B8 securitization closing date in December 2018. The actual lockout period may be longer. |
| (5) | Occupancy and UW Economic Occupancy includes square footage to be leased by 12 tenants (33,813 square feet) with leases out for signature that are covered under a master lease as described under “Master Lease” herein. |
| (6) | UW NOI and UW NCF are based on the February 14, 2018 rent roll, executed leases and lender adjustments. See “Cash Flow Analysis” herein. |
THE INFORMATION IN THIS STRUCTURAL AND COLLATERAL TERM SHEET IS NOT COMPLETE AND MAY BE AMENDED PRIOR TO THE TIME OF SALE. THIS TERM SHEET IS NOT AN OFFER TO SELL THESE SECURITIES AND IT IS NOT A SOLICITATION OF AN OFFER TO BUY THESE SECURITIES IN ANY JURISDICTION WHERE THE OFFER OR SALE IS NOT PERMITTED. | ||||
| | | 20 of 125 | | |
| Structural and Collateral Term Sheet | Benchmark 2018-B8 | |
| Aventura Mall | ||
| (7) | For a full description of Escrows and Reserves, please refer to “Escrows and Reserves” below. Other Initial Escrows and Reserves refers to two deposits made at closing by the Aventura Mall Borrower comprised of (i) $6,776,765 for certain free rent credits remaining in connection with certain leases at the Aventura Mall Property and (ii) $19,392,145 for certain outstanding tenant improvement allowances and/or leasing commissions due in connection with certain leases at the Aventura Mall Property. |
The Loan. The Aventura Mall loan (the “Aventura Mall Loan”) is part of a whole loan that has an outstanding principal balance as of the Cut-off Date of $1.75 billion (the “Aventura Mall Whole Loan”), and is secured by a first mortgage lien on the borrower’s fee interest in an approximately 1.2 million square feet super regional mall in Aventura, Florida. The Aventura Mall Whole Loan is comprised of (i) a senior loan, comprised of 27pari passu notes with an aggregate principal balance as of the Cut-off Date of $1,406.7 million, one of which (Note A-2-A-5 with an outstanding principal balance as of the Cut-off Date of $75.0 million) is being contributed to the Benchmark 2018-B8 Trust and constitutes the Aventura Mall Loan, and the remainder of which have been contributed to other securitization trusts and (ii) a subordinate companion loan, comprised of fourpari passu notes, with an aggregate outstanding principal balance as of the Cut-off Date of $343.3 million (collectively, the “Aventura Mall Subordinate Companion Loan”), each as described below. The relationship between the holders of the Aventura Mall Whole Loan will be governed by a co-lender agreement as described under the “Description of the Mortgage Pool—The Whole Loans—The Non-Serviced AB Whole Loans—The Aventura Mall Whole Loan” in the Preliminary Prospectus. The Aventura Mall Whole Loan has a 10-year term and will be interest-only for the term of the loan. The most recent prior financing of the Aventura Mall property was included in the AVMT 2013-AVM securitization.
| Whole Loan Summary(1)(2) |
| Companion A Notes (Aventura Mall Trust 2018-AVM) $406,700,000 | Companion A Notes $745,000,000
| Companion A Notes (Future Conduit Securitizations)
| B8 Note
|
| Subordinate Companion B Notes (Aventura Mall Trust 2018-AVM) $343,300,000 | |||
| (1) | The Aventura Mall Whole Loan will be serviced pursuant to the trust and servicing agreement for the Aventura Mall Trust 2018-AVM securitization. |
| (2) | SeePari Passu Companion Loan Summary above for additional detail. |
The Borrower.The borrower is Aventura Mall Venture, a Florida general partnership structured to be a bankruptcy remote entity with two independent directors in its organizational structure (the “Aventura Mall Borrower”).
The Loan Sponsors. The loan sponsors and non-recourse carveout guarantors are Jacquelyn Soffer and Jeffrey Soffer (the “Turnberry Guarantors”) and Simon Property Group, L.P. (the “Simon Guarantor”, and together with the Turnberry Guarantors, the “Guarantors”). The liability of the Guarantors for breaches or violations of the non-recourse carveout provisions in the loan documents is capped at $350.0 million plus all reasonable, out-of-pocket costs and expenses (including, but not limited to, court costs and fees and reasonable attorney’s fees) incurred by the lender in connection with the enforcement of, or preservation of the lender’s rights, under the guaranty. The liability as between the Turnberry Guarantors and the Simon Guarantor will be several but not joint.
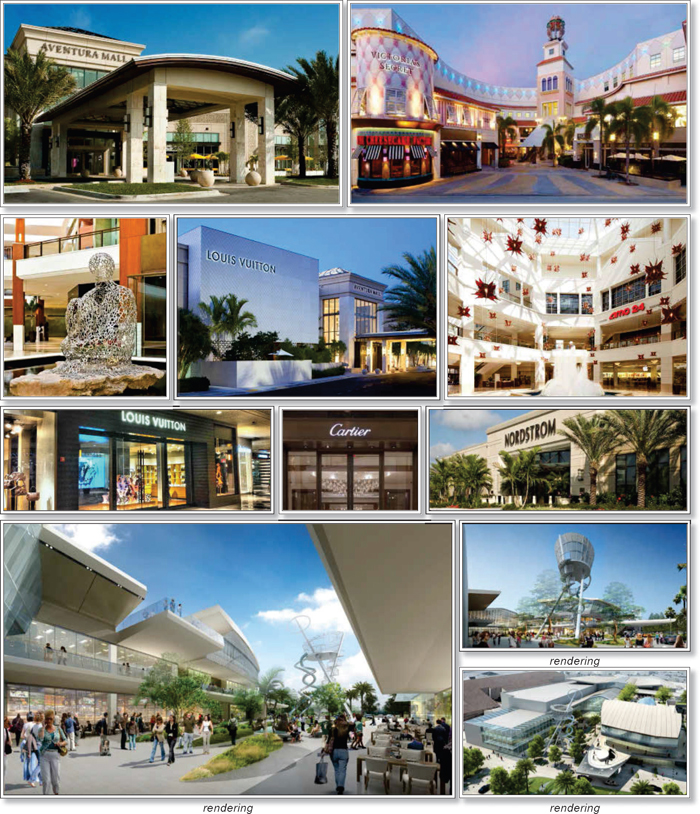
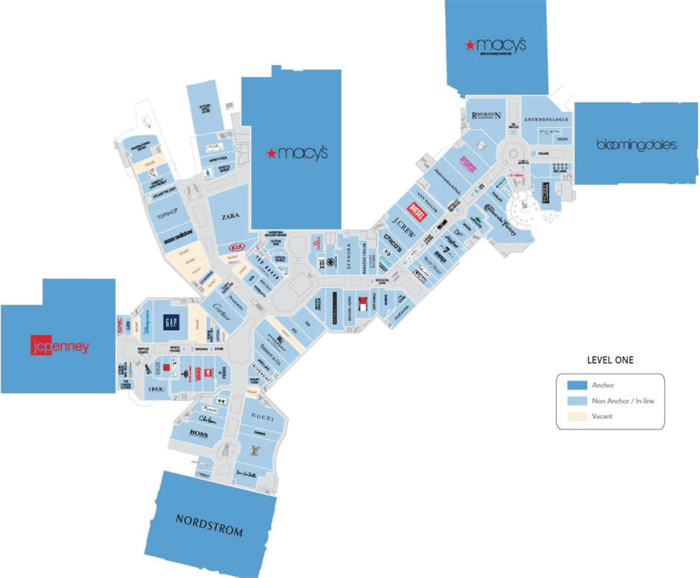
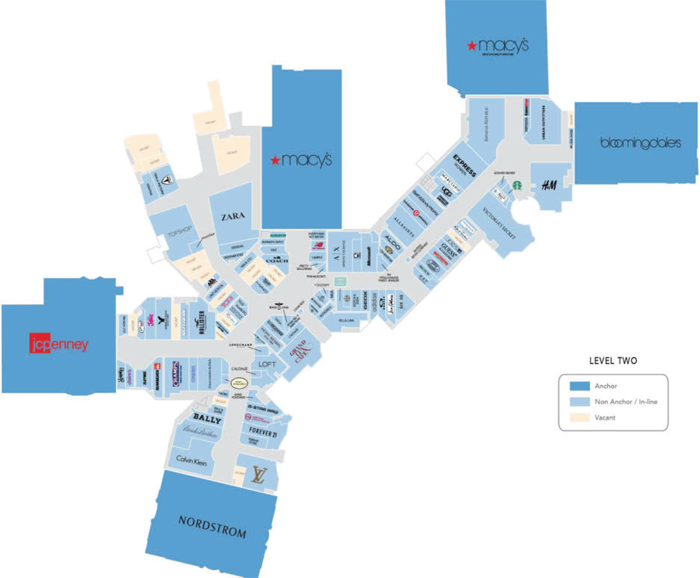
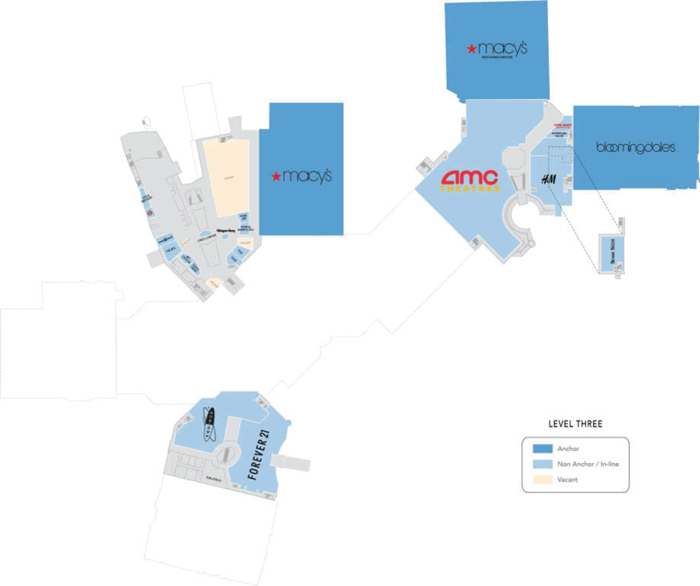
The Property. Aventura Mall is an approximately 2.2 million square foot, super regional mall that was developed by Turnberry in 1983 and subsequently expanded and renovated in 1997, 1998, 2006-2008 and 2017. Of the 2.2 million square feet, 1,217,508 square feet serves as collateral for the Aventura Mall Whole Loan (the “Aventura Mall Property”) which collateral also includes four anchor pad sites ground leased from the Aventura Mall Borrower. The collateral does not include 942,842 square feet of tenant-owned anchor improvements on those sites.
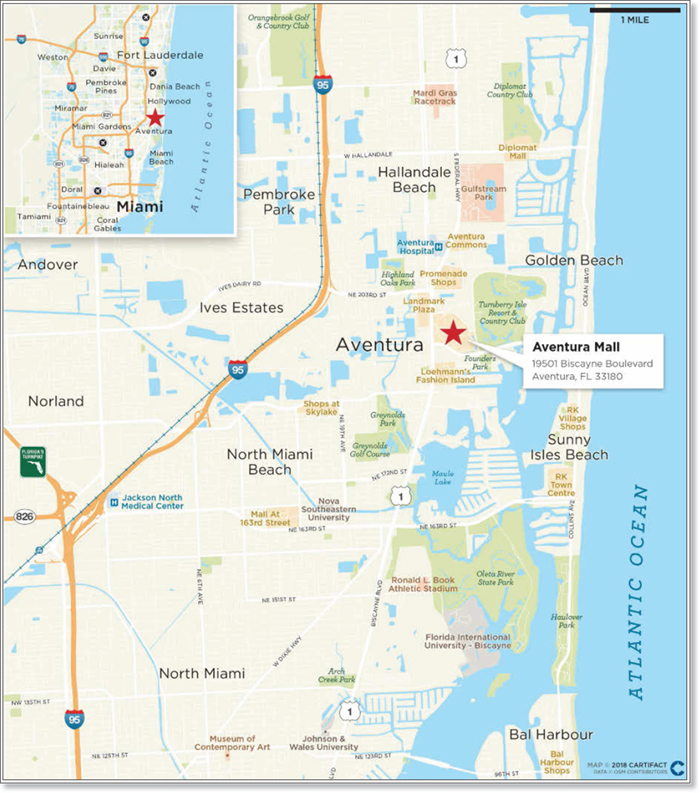
The Aventura Mall Property is located approximately 17 miles from downtown Miami and is surrounded by master-planned residential areas including Turnberry Isle, Porto Vita and the Waterways of Biscayne Bay. The Aventura Mall Property is the largest mall in Florida and the third largest mall in the United States. According to the appraisal, the Aventura Mall Property is the second most-visited shopping center in the United States with more than 28 million annual visitors. The Aventura Mall Property is anchored by a number of traditional mall anchors, including Macy’s, Bloomingdale’s, Macy’s Men’s & Home, Nordstrom and J.C. Penney Co., as well as a number of non-traditional mall anchors. The Aventura Mall has a mix of luxury, bridge to luxury and mass market tenants that appeal to a variety of shoppers.
The Aventura Mall Property is currently 92.8% leased as of February 14, 2018. The Aventura Mall Property is one of the top-performing malls in the U.S., with comparable in-line sales of $1,681 per square foot and total gross reported sales of approximately $1.2 billion as of the trailing 12 months ending February 2018.
In November 2017, the owners of the Aventura Mall Borrower opened a new 225,641 square foot expansion (the “Expansion Parcel”) at a cost of a $230.0 million, which is included in the collateral for the Aventura Mall Whole Loan. The Expansion Parcel features an
THE INFORMATION IN THIS STRUCTURAL AND COLLATERAL TERM SHEET IS NOT COMPLETE AND MAY BE AMENDED PRIOR TO THE TIME OF SALE. THIS TERM SHEET IS NOT AN OFFER TO SELL THESE SECURITIES AND IT IS NOT A SOLICITATION OF AN OFFER TO BUY THESE SECURITIES IN ANY JURISDICTION WHERE THE OFFER OR SALE IS NOT PERMITTED. | ||||
| | | 21 of 125 | | |
| Structural and Collateral Term Sheet | Benchmark 2018-B8 | |
| Aventura Mall | ||
approximately 20,000 square feet, two-level Apple store along with Tesla, Topshop, Zara, Serafina and Shake Shack. The Expansion Parcel is 72.2% leased as of February 14, 2018.
The Market. Regional access to the Aventura Mall is provided by I-95 and Biscayne Boulevard (U.S. Highway 1). The William Lehman Causeway, which connects the beach areas with U.S. Highway 1, also provides access to the Aventura Mall. The Aventura Mall is located approximately 17 miles from downtown Miami and is surrounded by Turnberry Isle, Porto Vita and the Waterways of Biscayne Bay. According to the appraisal, as of year-end 2017, Aventura Mall’s local trade area within a 15-mile radius is home to over 2.3 million people with an average income of $66,306.
As a destination retail mall north of Miami, Aventura Mall also appeals to a large international customer base, primarily from South America, Mexico and Europe.
| Population | Trade Area | Florida | USA |
| 2017 Population | 6,064,172 | 20,484,696 | 325,227,741 |
| 2017 Estimated # of Households | 2,270,759 | 8,032,734 | 122,737,174 |
| 2017 Average Household Income | $76,440 | $71,422 | $81,217 |
| Source: Appraisal. |
The appraiser considered six retail centers in the Miami MSA as the competitive set for the Aventura Mall Property. Three of the properties, Bal Harbour Shops, Sawgrass Mills and Dadeland Mall, are considered primary competition. The primary competition ranges from 460,000 square feet to approximately 2.4 million square feet and is located between 4.7 and 22.0 miles from the Aventura Mall Property. Pembroke Lakes Mall, Galleria Mall and Dolphin Mall are considered secondary competition. The secondary competition ranges from 955,000 square feet to approximately 1.4 million square feet and is located between 11.0 and 16.0 miles from the Aventura Mall Property.
| Competitive Set Summary(1) | ||||
| Property | Location | Proximity (Miles) | Year Built / Renovated | Total GLA |
| Aventura Mall | Aventura, Florida | NAP | 1983 / 2017 | 2,156,203 |
| Bal Harbour Shops | Bal Harbour, Florida | 4.7 | 1965 / 2008 | 460,000 |
| Sawgrass Mills | Sunrise, Florida | 19.0 | 1990 / 2006 | 2,384,000 |
| Dadeland Mall | Kendall, Florida | 22.0 | 1962 / 2013 | 1,488,000 |
| Pembroke Lakes Mall | Pembroke Pines, Florida | 11.0 | 1992 / 1998 | 1,136,000 |
| Galleria Mall | Fort Lauderdale, Florida | 13.0 | 1980 / 2005 | 955,000 |
| Dolphin Mall | Miami, Florida | 16.0 | 2001 / 2010 | 1,403,000 |
| (1) | Based on the appraisal. |
| Non-Owned Anchors | ||||
| Tenant | Ratings Moody’s/S&P/Fitch(1) | Net Rentable Area (SF) | TTM February Sales | TTM February Sales Per Square Foot |
| Macy’s (GL) | Baa3 / BBB- / BBB | 299,011 | $81,164,209 | $271 |
| Bloomingdales (GL) | Baa3 / BBB- / BBB | 251,831 | $105,328,660 | $418 |
| Macy’s (Men’s & Home) | Baa3 / BBB- / BBB | 225,000 | $41,967,714 | $187 |
| Nordstrom (GL) | Baa1 / BBB+ / BBB+ | 167,000 | $53,536,758 | $321 |
| (1) | Certain ratings are those of the parent company whether or not the parent guarantees the lease. |
| Historical and Current Occupancy(1) | |||||||||||
| 2008(2) | 2009 | 2010 | 2011 | 2012 | 2013 | 2014 | 2015 | 2016 | 2017 | Current | |
| Occupancy – Excluding Anchors | 84.1% | 94.9% | 95.2% | 96.6% | 94.9% | 98.9% | 97.8% | 97.8% | 97.3% | 97.7% | 91.4% |
| Occupancy – Including Anchors | 93.3% | 98.1% | 98.2% | 98.8% | 98.2% | 99.6% | 99.2% | 99.2% | 99.1% | 99.1% | 92.8% |
| (1) | Historical and Current Occupancy is based on the average of each respective year. Current occupancy is based on the February 14, 2018 rent roll, including recently executed leases and master leased tenants. |
| (2) | In 2008, occupancy declined due to a challenging corporate environment for several tenants including Stride Rite, Kay Bee Toys, The Sharper Image, Walden Books and Sigrid Olsen. 2008 occupancy as of December 31 was 87.9% and 96.1% for Occupancy – Excluding Anchors and Occupancy – Including Anchors, respectively. |
THE INFORMATION IN THIS STRUCTURAL AND COLLATERAL TERM SHEET IS NOT COMPLETE AND MAY BE AMENDED PRIOR TO THE TIME OF SALE. THIS TERM SHEET IS NOT AN OFFER TO SELL THESE SECURITIES AND IT IS NOT A SOLICITATION OF AN OFFER TO BUY THESE SECURITIES IN ANY JURISDICTION WHERE THE OFFER OR SALE IS NOT PERMITTED. | ||||
| | | 22 of 125 | | |
| Structural and Collateral Term Sheet | Benchmark 2018-B8 | |
| Aventura Mall | ||
| Historical In-line Sales and Occupancy Costs(1) (2) | |||||
| 2015 | 2016 | 2017 | TTM February 2018 Sales Per Square Foot | TTM February 2018 Occupancy Cost | |
| Comparable Sales Per Square Foot w/ Apple | $1,626 | $1,544 | $1,630 | $1,681 | 13.0% |
| Comparable Sales Per Square Foot w/o Apple | $1,229 | $1,114 | $1,147 | $1,162 | 18.9% |
| (1) | Not all tenants at the Aventura Mall Property are required to report sales. |
| (2) | Apple’s sales are based on the tenant’s 6,303 square feet of space in the existing mall. |
| Collateral Tenant Summary | |||||||||
| Tenant | Ratings Moody’s/S&P/ Fitch(1) | Net Rentable Area (SF) | % of Total NRA | Base Rent Per Square Foot(2) | Lease Expiration(3) | % of Total Base Rent | Most Recent Sales Per Square Foot | Occupancy Cost | |
| Zara(4)(5) | NR / NR / NR | 34,454 | 2.8% | $119.58% | 10/31/2029% | 2.9% | $971 | 16.3% | |
| Apple (2 Levels)(4)(6) | NR / Aa1 / AA+ | 20,218 | 1.7 | 173.11% | 1/31/2030% | 2.5 | $31,124 | 0.5% | |
| H & M | NR / NR / NR | 28,830 | 2.4 | 117.09% | 1/31/2027% | 2.4 | $666 | 18.4% | |
| Abercrombie & Fitch | NR / NR / BB- | 11,246 | 0.9 | 281.38% | 1/31/2020% | 2.2 | $1,555 | 20.9% | |
| Victoria’s Secret | BB+ / Ba1 / BB+ | 18,387 | 1.5 | 165.00% | 7/31/2026% | 2.1 | $1,041 | 12.7% | |
| Banana Republic | BB+ / Baa2 / BB+ | 16,857 | 1.4 | 175.05% | 2/29/2020% | 2.1 | $580 | 37.8% | |
| Topshop(4) | NR / NR / NR | 23,296 | 1.9 | 122.00% | 10/31/2029% | 2.0 | NAV | NAV | |
| XXI Forever | NR / NR / NR | 32,504 | 2.7 | 75.82% | MTM% | 1.7 | $381 | 22.6% | |
| Restoration Hardware | NR / NR / NR | 11,988 | 1.0 | 200.17% | 2/28/2019% | 1.7 | $2,150 | 11.4% | |
| Champs Sports | NR / Ba1 / BB+ | 7,331 | 0.6 | 323.94% | 5/31/2023% | 1.7 | $1,555 | 22.8% | |
| Louis Vuitton | WD / NR / A+ | 18,180 | 1.5 | 110.00% | 11/30/2022% | 1.4 | $1,989 | 7.8% | |
| AMC Theatres(7) | B / B2 / B+ | 78,738 | 6.5 | 23.50% | 8/31/2023% | 1.3 | $703,921 | 10.6% | |
| The Gap | BB+ / Baa2 / BB+ | 11,065 | 0.9 | 165.00% | 7/31/2024% | 1.3 | NAV | NAV | |
| Gucci(8) | NR / NR / BBB+ | 8,383 | 0.7 | 201.57% | 12/31/2026% | 1.2 | $2,257 | 10.9% | |
| Express | BB+ / Ba1 / BB+ | 11,320 | 0.9 | 145.75% | 1/31/2022% | 1.2 | $641 | 28.7% | |
| Footlocker | NR / Ba1 / BB+ | 5,024 | 0.4 | 319.30% | 2/28/2025% | 1.1 | $1,238 | 29.3% | |
| Mayor’s Jewelers | NR / NR / NR | 3,447 | 0.3 | 443.46% | 1/31/2024% | 1.1 | $6,052 | 7.9% | |
| J. Crew | NR / Caa2 / CCC+ | 7,750 | 0.6 | 191.28% | 6/30/2020% | 1.0 | $806 | 28.6% | |
| Armani Exchange | NR / NR / NR | 8,675 | 0.7 | 168.16% | 1/31/2021% | 1.0 | $924 | 23.0% | |
| Michael Kors | BBB- / NR / BBB- | 3,678 | 0.3 | 393.93% | 9/30/2021% | 1.0 | $1,013 | 46.7% | |
| Subtotal / Weighted Average | 361,371 | 29.7% | $129.41 | 33.0% | |||||
| Remaining Tenants | 767,910 | 63.1% | $123.55% | 67.0% | |||||
| Vacant | 88,227 | 7.2% | NAP% | NAP | |||||
| Total / Weighted Average | 1,217,508 | 100.0% | 100.0% | ||||||
| (1) | Certain ratings are those of the parent company whether or not the parent guarantees the lease. |
| (2) | Base Rent Per Square Foot reflects the following: (a) in-place leases based on the February 14, 2018 rent roll, (b) contractual rent steps through June 2019 totaling approximately $6.5 million including the $1.4 million contractual rent step that is scheduled to occur in August 2019 for the executed renewal of Victoria’s Secret (included in the Bridge Rent and Reimbursement Reserve) and (c) ground rent in an amount of approximately $1.3 million for tenants that own their improvements (Macy’s, Bloomingdale’s, Macy’s Men’s & Home and Nordstrom). |
| (3) | Certain tenants may have termination or contraction options due to co-tenancy provisions in the related leases (which may become exercisable prior to the originally stated expiration date of the tenant lease). |
| (4) | A full year of sales and occupancy costs are not available for Expansion Parcel tenants. |
| (5) | Zara was originally a tenant in the non-expansion portion of Aventura Mall, occupying approximately 19,000 square feet, before departing for Bal Harbour Shops in 2012. Zara has since returned to the Aventura Mall Property and opened in the Expansion Parcel in November 2017. The Most Recent Sales Per Square Foot are based on the tenant’s annualized sales from November 2017 through April 2018. |
| (6) | Most Recent Sales Per Square Foot for Apple are based on the tenant’s 6,303 square feet space in the pre-existing portion of the Aventura Mall Property. Apple recently executed a lease for approximately 20,000 square feet at the Expansion Parcel. |
| (7) | AMC Theatres’ Most Recent Sales Per Square Foot number reflects sales per screen (24 screens). |
| (8) | Gucci’s Most Recent Sales Per Square Foot are based on only accessories and children’s inventory. There are no clothing sales at the subject store. |
THE INFORMATION IN THIS STRUCTURAL AND COLLATERAL TERM SHEET IS NOT COMPLETE AND MAY BE AMENDED PRIOR TO THE TIME OF SALE. THIS TERM SHEET IS NOT AN OFFER TO SELL THESE SECURITIES AND IT IS NOT A SOLICITATION OF AN OFFER TO BUY THESE SECURITIES IN ANY JURISDICTION WHERE THE OFFER OR SALE IS NOT PERMITTED. | ||||
| | | 23 of 125 | | |
| Structural and Collateral Term Sheet | Benchmark 2018-B8 | |
| Aventura Mall | ||
| Lease Rollover Schedule | |||||||||
| Year | Number of Leases Expiring(1) | Net Rentable Area Expiring | % of NRA Expiring | Base Rent Expiring(2) | % of Base Rent Expiring | Cumulative Net Rentable Area Expiring | Cumulative % of NRA Expiring | Cumulative Base Rent Expiring | Cumulative % of Base Rent Expiring |
| Vacant | NAP | 88,227 | 7.2% | NAP | NAP | 1,217,508 | 100.0% | NAP | NAP |
| 2018 & MTM(3) | 49 | 94,330 | 7.7 | $10,950,745 | 7.7% | 94,330 | 7.7% | $10,950,745 | 7.7% |
| 2019 | 31 | 91,803 | 7.5% | 12,376,749 | 8.7% | 186,133 | 15.3% | $23,327,493 | 16.5% |
| 2020 | 36 | 96,193 | 7.9% | 18,375,213 | 13.0% | 282,326 | 23.2% | $41,702,706 | 29.4% |
| 2021 | 24 | 54,397 | 4.5% | 13,685,691 | 9.7% | 336,723 | 27.7% | $55,388,398 | 39.1% |
| 2022 | 24 | 76,594 | 6.3% | 12,967,832 | 9.2% | 413,317 | 33.9% | $68,356,230 | 48.3% |
| 2023 | 29 | 352,941 | 29.0% | 16,933,820 | 12.0% | 766,258 | 62.9% | $85,290,050 | 60.2% |
| 2024 | 27 | 79,905 | 6.6% | 13,311,865 | 9.4% | 846,163 | 69.5% | $98,601,915 | 69.6% |
| 2025 | 13 | 19,020 | 1.6% | 5,163,035 | 3.6% | 865,183 | 71.1% | $103,764,950 | 73.3% |
| 2026 | 9 | 46,368 | 3.8% | 7,858,163 | 5.5% | 911,551 | 74.9% | $111,623,113 | 78.8% |
| 2027 | 20 | 78,035 | 6.4% | 10,641,238 | 7.5% | 989,586 | 81.3% | $122,264,351 | 86.3% |
| 2028 | 13 | 41,146 | 3.4% | 6,126,042 | 4.3% | 1,030,732 | 84.7% | $128,390,392 | 90.6% |
| 2029 & Beyond(4) | 13 | 98,549 | 8.1% | 13,247,802 | 9.4% | 1,129,281 | 92.8% | $141,638,194 | 100.0% |
| Total | 288 | 1,217,508 | 100.0% | $141,638,194 | 100.0% | ||||
| (1) | Number of leases expiring excludes approximately 30 temporary/kiosk tenants who operate under short term leases. |
| (2) | Base Rent Expiring reflects the following: (a) in-place leases based on the February 14, 2018 rent roll, (b) contractual rent steps through June 2019 totaling approximately $6.5 million including the $1.4 million contractual rent step that is scheduled to occur in August 2019 for the executed renewal of Victoria’s Secret (included in the Bridge Rent and Reimbursements Reserve), and (c) ground rent in an amount of approximately $1.3 million for tenants that own their improvements (Macy’s, Bloomingdale’s, Macy’s Men’s & Home and Nordstrom). |
| (3) | 2018 & MTM includes temporary tenants. |
| (4) | 2029 & Beyond includes the recently executed Apple lease square feet and lease expiration for the Expansion Parcel. |
| Operating History and Underwritten Net Cash Flow | |||||||
| 2015 | 2016 | 2017 | TTM(1) | Underwritten | Per Square Foot | %(2) | |
| Rents in Place(3) | $99,418,818 | $103,197,968 | $106,500,453 | $109,896,747 | $141,638,194 | $116.33 | 71.1% |
| Vacant Income | 0 | 0 | 0 | 0 | 13,640,745 | 11.20 | 6.9% |
| Gross Potential Rent | $99,418,818 | $103,197,968 | $106,500,453 | $109,896,747 | $155,278,939 | $127.54 | 78.0% |
| Percentage Rent | 5,466,448 | 4,115,391 | 3,447,721 | 3,326,930 | 3,627,027 | 2.98 | 1.8% |
| Total Reimbursements | 26,727,546 | 26,287,600 | 27,329,454 | 28,195,516 | 32,253,113 | 26.49 | 16.2% |
| Specialty Leasing Income | 3,536,265 | 3,076,589 | 4,453,595 | 4,900,785 | 3,805,199 | 3.13 | 1.9% |
| Other Income(4) | 3,628,986 | 3,701,438 | 3,994,113 | 4,090,769 | 4,156,114 | 3.41 | 2.1% |
| Net Rental Income | $138,778,063 | $140,378,986 | $145,725,336 | $150,410,748 | $199,120,392 | $163.55 | 100.0% |
| (Vacancy/Credit Loss) | (272,229) | (422,401) | (438,454) | (634,418) | (13,640,745) | (11.20) | (6.9)% |
| Effective Gross Income | $138,505,834 | $139,956,585 | $145,286,882 | $149,776,330 | $185,479,647 | $152.34 | 93.1% |
| Total Operating Expenses | $29,480,495 | $29,303,182 | $30,046,320 | $31,484,933 | $30,620,668 | $25.15 | 16.5% |
| Net Operating Income | $109,025,339 | $110,653,403 | $115,240,562 | $118,291,397 | $154,858,979 | $127.19 | 83.5% |
| Total TI/LC, Capex/RR | 0 | 0 | 0 | 0 | 3,287,272 | 2.70 | 1.8% |
| Net Cash Flow | $109,025,339 | $110,653,403 | $115,240,562 | $118,291,397 | $151,571,708 | $124.49 | 81.7% |
| (1) | TTM represents the trailing 12-month period ending March 31, 2018. |
| (2) | % column represents percent of Net Rental Income for all revenue lines and represents Effective Gross Income for the remainder of fields. |
| (3) | The increase in Rents in Place and Net Operating Income from TTM March 31, 2018 to Underwritten is primarily driven by the inclusion of the executed leases on the new Expansion Parcel which opened in November 2017 and is based on the February 14, 2018 annualized rent roll. Rents in Place also includes $1.3 million of ground rent paid by Bloomingdales, Macy’s, Macy’s Men’s & Home, and Nordstrom and approximately $3.4 million of master lease rent for current leases that are out for signature. Contractual rent steps were underwritten through June 2019 totaling approximately $6.5 million, including the $1.4 million contractual rent step for the executed renewal of Victoria’s Secret that is scheduled to occur in August 2019 (included in the Bridge Rent and Reimbursements Reserve). |
| (4) | Other Income includes fee income (revenues associated with license fees and valet management fees), and miscellaneous revenues (revenue associated with license fees, valet management fees, commissions, late charges, and other miscellaneous sources). |
THE INFORMATION IN THIS STRUCTURAL AND COLLATERAL TERM SHEET IS NOT COMPLETE AND MAY BE AMENDED PRIOR TO THE TIME OF SALE. THIS TERM SHEET IS NOT AN OFFER TO SELL THESE SECURITIES AND IT IS NOT A SOLICITATION OF AN OFFER TO BUY THESE SECURITIES IN ANY JURISDICTION WHERE THE OFFER OR SALE IS NOT PERMITTED. | ||||
| | | 24 of 125 | | |
| Structural and Collateral Term Sheet | Benchmark 2018-B8 | |
| Aventura Mall | ||
Property Management. The Aventura Mall Property is currently managed by TB All Fees Operating LP (the “Property Manager”), which is an affiliate of the Turnberry Guarantors. In addition, the Property Manager is currently the leasing agent under a separate leasing agreement with the Aventura Mall Borrower. Turnberry Aventura Mall Company, Ltd., an affiliate of the Turnberry Guarantors, and SDG Aventura Limited Partnership, an affiliate of the Simon Guarantor, have joint approval rights with respect to certain major decisions of the Aventura Mall Borrower relating to the Aventura Mall Property.
Escrows and Reserves... At origination, the Aventura Mall Borrower deposited $6,776,765 for certain free rent credits remaining in connection with certain leases at the Aventura Mall Property and $19,392,145 for certain outstanding tenant improvement allowances and/or leasing commissions due in connection with certain leases at the Aventura Mall Property.
Tax Escrows -If the debt service coverage ratio (as calculated pursuant to the loan agreement based on the trailing four quarters) falls below 1.50x for two consecutive calendar quarters (among other conditions in certain cases), monthly escrows for real estate taxes in the amount of 1/12 of projected annual property taxes are required.
Insurance Escrows - If the debt service coverage ratio (as calculated pursuant to the loan agreement based on the trailing four quarters) falls below 1.50x for two consecutive calendar quarters (among other conditions in certain cases), insurance premiums in the amount of 1/12 of projected annual insurance premiums (also waived if blanket policy in place and there is no event of default continuing) are required.
Replacement Reserves - If the debt service coverage ratio (as calculated pursuant to the loan agreement based on the trailing four quarters) falls below 1.50x for two consecutive calendar quarters (among other conditions in certain cases), replacement funds (approximately $20,292 monthly (or $0.20 per square foot annually), subject to a cap of $487,003) are required.
TI/LC Funds - If the debt service coverage ratio (as calculated pursuant to the loan agreement based on the trailing four quarters) falls below 1.50x for two consecutive calendar quarters (among other conditions in certain cases), tenant rollover funds (approximately $253,647 monthly (or $2.50 per square foot annually), subject to a cap of $6,087,540) are required.
Lockbox / Cash Management.The Aventura Mall Whole Loan is structured with a hard lockbox and springing cash management. The Aventura Mall Borrower is required to notify each tenant under each lease (except the master leases) that has not received instructions from the Aventura Mall Borrower to send all payments of rents directly to the lender-controlled lockbox account at Wells Fargo Bank, National Association. Provided no Lockbox Event (as defined below) has occurred, all sums in the lockbox account are required to be transferred daily to an account designated by the Aventura Mall Borrower. In the event a Lockbox Event has occurred and is continuing, all funds in the lockbox account are required to be swept weekly into a cash management account controlled by the lender. In the event a Lockbox Event is caused only by the occurrence of a DSCR Trigger Event, as defined below, all funds in the cash management account are required to be applied by the lender each business day to payments of taxes, insurance, debt service, operating expenses, capital expenditure reserves and any remaining funds in the cash management account are required to be released to the Aventura Mall Borrower only to the extent necessary to reimburse the Aventura Mall Borrower for extraordinary expenses approved by the lender. All additional funds in the cash management account will be held by the lender as additional collateral for the Aventura Mall Whole Loan. In the event any Lockbox Event other than the DSCR Trigger Event has occurred and is continuing, all amounts in the cash management account may be applied in the lender’s sole discretion. In addition, following the occurrence and during the continuance of a Lockbox Event or a DSCR Trigger Event, all master lease rents are also required to be deposited directly into the lockbox account.
A “Lockbox Event” means the occurrence of (a) an event of default under the loan agreement, (b) the bankruptcy or insolvency of the Aventura Mall Borrower, (c) the bankruptcy or insolvency of the property manager except where such bankruptcy or insolvency does not result in the cash or bank accounts associated with the Aventura Mall Property being subsumed in such proceedings or result in a material adverse effect upon the operations of the Aventura Mall Property or the value or security of the lender’s lien, or (d) if the debt service coverage ratio (as calculated pursuant to the loan agreement based on the trailing four quarters) for the Aventura Mall Whole Loan falls below 1.35x for two consecutive quarters (a “DSCR Trigger Event”).
THE INFORMATION IN THIS STRUCTURAL AND COLLATERAL TERM SHEET IS NOT COMPLETE AND MAY BE AMENDED PRIOR TO THE TIME OF SALE. THIS TERM SHEET IS NOT AN OFFER TO SELL THESE SECURITIES AND IT IS NOT A SOLICITATION OF AN OFFER TO BUY THESE SECURITIES IN ANY JURISDICTION WHERE THE OFFER OR SALE IS NOT PERMITTED. | ||||
| | | 25 of 125 | | |
| Structural and Collateral Term Sheet | Benchmark 2018-B8 | |
| Aventura Mall | ||
Master Lease.The Aventura Mall Borrower entered into a master lease (the “Master Lease”) at closing with the Guarantors and Turnberry Retail Holding, L.P., which Master Lease covers a certain portion of the Aventura Mall Property that is currently not occupied. The Master Lease provides for payment of rent in an annual amount up to $3,426,159 in equal monthly installments of approximately $285,513 each during (x) a period commencing on the occurrence of the debt service coverage ratio based on the trailing four quarters falling below 1.50x for two consecutive quarters until cured in accordance with the loan documents, and/or (y) any of the following: (i) an event of default, (ii) bankruptcy of the borrower, (iii) bankruptcy of the property manager, or (iv) a period commencing on the occurrence of the Lockbox Event until cured in accordance with the loan documents. The Master Lease covers the spaces for 12 proposed tenants with leases that are out for signature or which are otherwise not occupied prior to the loan origination. The Master Lease provides for a reduction of rent as third-party tenants sign leases, take occupancy of space and commence paying contractual rent in the premises covered by the Master Lease (as well as tenants signing leases in any portion of the Aventura Mall Property, including the space under the Master Lease, to the extent the total annualized lease payments (excluding Master Lease rents) exceed $178,400,000. The term will expire on the earliest to occur of (a) 10 years after loan maturity, (b) the earlier of the date on which the annual rent under the Master Lease is reduced to zero or the date on which the annualized total lease payments from tenants at the Aventura Mall Property (not including percentage rent) exceeds $181,850,000 or (c) following the exercise of the master lessees’ cancellation option after a lender foreclosure or deed-in-lieu of foreclosure. The Master Lease equals 1.8% of the approximately $185.5 million of underwritten effective gross income.
Redevelopment Rights.If J.C. Penney Co. or any of Macy’s, Bloomingdales, Macy’s (Men’s & Home) or Nordstrom (each, a “Department Store”) ceases operations or seeks to assign its lease in any manner not expressly permitted thereunder, the Aventura Mall Borrower has the right to enter into a ground lease with a third party or an affiliate of the Aventura Mall Borrower and obtain a release of the lien on the ground leasehold interest in such J.C. Penney Co. or Department Store parcel so long as certain conditions in the loan agreement are satisfied, including (i) the ground lease is in form and substance reasonably acceptable to the lender, including that the rent to be paid thereunder is not less than the rent payable by J.C. Penney Co. or the Department Store immediately prior to such new lease, (ii) the tenant or the guarantor of such ground lease is a creditworthy person acceptable to the lender, (iii) no event of default is continuing, (iv) delivery of a rating agency confirmation, (v) if material work is being performed, delivery of a completion guaranty (or a collateral assignment of a completion guaranty in favor of the Aventura Mall Borrower) from a credit-worthy entity acceptable to the lender, (vi) the term of the ground lease expires no less than 20 years after the maturity of the Aventura Mall Loan, and (vii) compliance with the “anti-poaching” conditions set forth in the loan agreement. In lieu of entering into a new ground lease, the loan documents permit an affiliate of the Aventura Mall Borrower to accept an assignment of the existing leasehold interest, provided that the Aventura Mall Borrower satisfies the requirements in the loan documents including, without limitation, condition (i) above. J.C. Penney Co. has six, five-year renewal options remaining (each requiring 12 months’ notice).
The Aventura Mall Borrower is also permitted to (a) release (i) immaterial or non-income producing portions of the Aventura Mall Property to any federal, state or local government or any political subdivision thereof in connection with takings or condemnations of any portion of the Aventura Mall Property for dedication or public use and (ii) non-income producing portions of the Aventura Mall Property (including, without limitation, certain outparcels containing parking areas (the “Parking Lot Outparcels”) and portions of the “ring road”) to third parties or affiliates of the Aventura Mall Borrower, and (b) dedicate portions of the Aventura Mall Property or grant easements, restrictions, covenants, reservations and rights of way in the ordinary course of business for traffic circulation, ingress, egress, parking, access, utilities lines or for other similar purposes.
THE INFORMATION IN THIS STRUCTURAL AND COLLATERAL TERM SHEET IS NOT COMPLETE AND MAY BE AMENDED PRIOR TO THE TIME OF SALE. THIS TERM SHEET IS NOT AN OFFER TO SELL THESE SECURITIES AND IT IS NOT A SOLICITATION OF AN OFFER TO BUY THESE SECURITIES IN ANY JURISDICTION WHERE THE OFFER OR SALE IS NOT PERMITTED. | ||||
| | | 26 of 125 | | |
| Structural and Collateral Term Sheet | Benchmark 2018-B8 | |
| Staples Strategic Industrial | ||
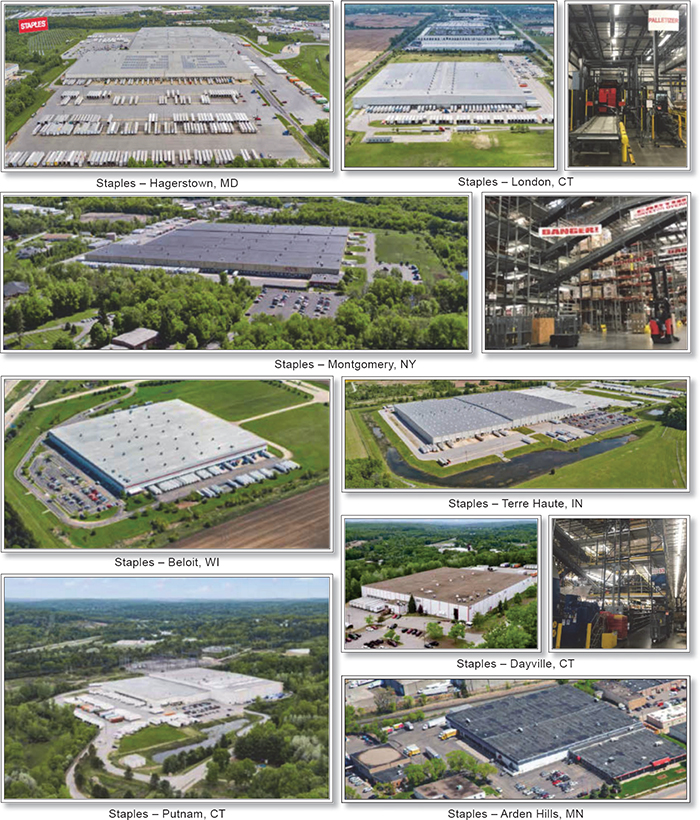
THE INFORMATION IN THIS STRUCTURAL AND COLLATERAL TERM SHEET IS NOT COMPLETE AND MAY BE AMENDED PRIOR TO THE TIME OF SALE. THIS TERM SHEET IS NOT AN OFFER TO SELL THESE SECURITIES AND IT IS NOT A SOLICITATION OF AN OFFER TO BUY THESE SECURITIES IN ANY JURISDICTION WHERE THE OFFER OR SALE IS NOT PERMITTED. | ||||
| | | 27 of 125 | | |
| Structural and Collateral Term Sheet | Benchmark 2018-B8 | |
| Staples Strategic Industrial | ||
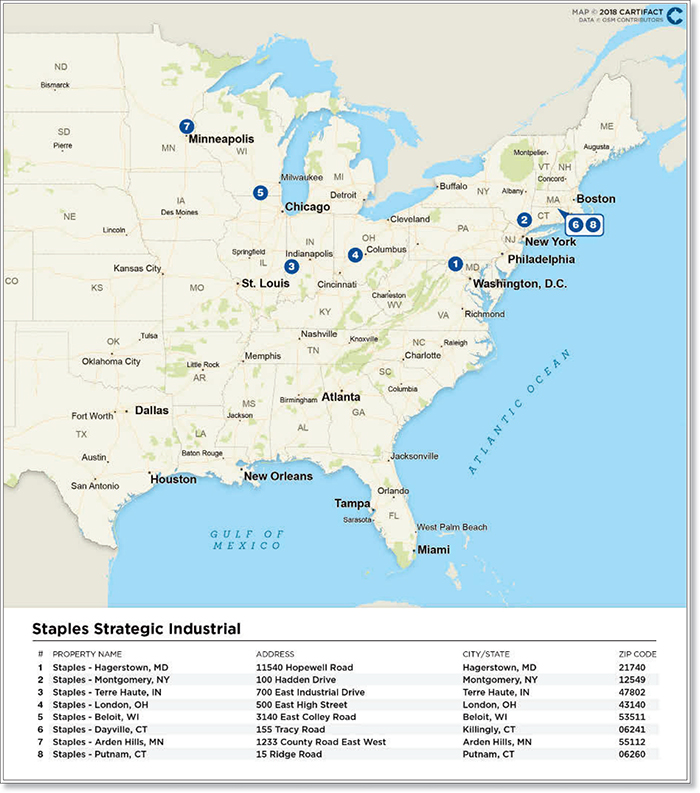
THE INFORMATION IN THIS STRUCTURAL AND COLLATERAL TERM SHEET IS NOT COMPLETE AND MAY BE AMENDED PRIOR TO THE TIME OF SALE. THIS TERM SHEET IS NOT AN OFFER TO SELL THESE SECURITIES AND IT IS NOT A SOLICITATION OF AN OFFER TO BUY THESE SECURITIES IN ANY JURISDICTION WHERE THE OFFER OR SALE IS NOT PERMITTED. | ||||
| | | 28 of 125 | | |
| Structural and Collateral Term Sheet | Benchmark 2018-B8 | |
| Staples Strategic Industrial | ||
| Mortgage Loan Information | Property Information | |||
| Mortgage Loan Seller: | GACC | Single Asset / Portfolio: | Portfolio | |
| Original Principal Balance(1): | $56,100,000 | Title: | Fee | |
| Cut-off Date Principal Balance(1): | $56,100,000 | Property Type - Subtype: | Industrial – | |
| % of Pool by IPB: | 5.3% | Warehouse/Distribution | ||
| Loan Purpose: | Acquisition | Net Rentable Area (SF): | 4,031,127 | |
| Borrowers: | LCN STP Hagerstown (Multi) LLC | Location: | Various | |
| Sponsor: | Edward V. LaPuma, Bryan York | Year Built / Renovated: | Various / Various | |
| Colwell | Occupancy: | 100.0% | ||
| Interest Rate(2): | 4.91800% | Occupancy Date: | 12/6/2018 | |
| Note Date: | 9/28/2018 | Number of Tenants: | 2 | |
| Anticipated Repayment Date(2): | 10/6/2028 | 2015 NOI(4): | N/A | |
| Final Maturity Date(2): | 10/6/2033 | 2016 NOI(4): | N/A | |
| Interest-only Period: | 120 months | 2017 NOI(4): | N/A | |
| Original Term(2): | 120 months | TTM NOI(4): | N/A | |
| Original Amortization: | None | UW Economic Occupancy: | 94.9% | |
| Amortization Type(2): | ARD - Interest Only | UW Revenues: | $12,403,200 | |
| Call Protection(3): | L(26),Def(89),O(5) | UW Expenses: | $372,096 | |
| Lockbox / Cash Management: | Hard / In Place | UW NOI(5): | $12,031,104 | |
| Additional Debt: | Yes | UW NCF: | $10,827,169 | |
| Additional Debt Balance(1): | $70,000,000 | Appraised Value / Per SF: | $201,450,000 / $50 | |
| Additional Debt Type(1): | Pari Passu | Appraisal Date(6): | Various | |
| Escrows and Reserves(7) | Financial Information(1) | ||||||
| Initial | Monthly | Initial Cap | Cut-off Date Loan / SF: | $31 | |||
| Taxes: | $0 | Springing | N/A | Maturity Date Loan / SF: | $31 | ||
| Insurance: | $0 | Springing | N/A | Cut-off Date LTV: | 62.6% | ||
| Replacement Reserves: | $0 | Springing | N/A | Maturity Date LTV: | 62.6% | ||
| TI/LC: | $0 | $0 | N/A | UW NCF DSCR: | 1.72x | ||
| Immediate Repairs: | $0 | $0 | N/A | UW NOI Debt Yield: | 9.5% | ||
| Other: | $0 | Springing | N/A | ||||
| Sources and Uses | ||||||
| Sources | Proceeds | % of Total | Uses | Proceeds | % of Total | |
| Whole Loan | $126,100,000 | 65.2% | Purchase Price | $192,000,000 | 99.3% | |
| Sponsor Equity | 67,286,309 | 34.8% | Closing Costs | 1,386,309 | 0.7% | |
| Total Sources | $193,386,309 | 100.0% | Total Uses | $193,386,309 | 100.0% | |
| (1) | The Staples Strategic Industrial Loan (as defined below) is part of a whole loan evidenced by seven notes with an aggregate outstanding principal balance of $126.1 million. The Financial Information presented in the chart above reflects the $126.1 million aggregate Cut-off Date balance of the Staples Strategic Industrial Whole Loan (as defined below). |
| (2) | The Staples Strategic Industrial Whole Loan has an anticipated repayment date of October 6, 2028 (the “Anticipated Repayment Date” or “ARD”) and a final maturity date of October 6, 2033. From and after the Anticipated Repayment Date, the Staples Strategic Industrial Whole Loan accrues interest at a fixed rate that is equal to the greater of (i) 4.91800% (or when applicable the default rate) plus 2.50000% or (ii) the swap rate calculated by the linear interpolation of mid-market swap yields, as reported on Reuters Capital Markets screen 19901 (SEMI-BOND column), with maturities most nearly approximating the Final Maturity Date plus 2.50000% (the “Adjusted Interest Rate”); however, interest accrued at the excess of the Adjusted Interest Rate over the Staples Strategic Industrial Initial Interest Rate (as defined below) (the “Accrued Interest”) will be deferred. From and after the ARD, all excess cash flow from the Staples Strategic Industrial Property (as defined below) after the payment of tax and insurance reserves, interest calculated at the Staples Strategic Industrial Initial Interest Rate and operating expenses will be applied (i) first to repay the principal balance of the Staples Strategic Industrial Whole Loan and (ii) second to the payment of Accrued Interest. |
| (3) | The lockout period will be at least 26 payment dates beginning with and including the first payment date of November 6, 2018. Defeasance of the full $126.1 million Staples Strategic Industrial Whole Loan is permitted after the date that is the earlier to occur of (i) September 28, 2021 or (ii) the date that is two years from the closing date of the securitization that includes the last note to be securitized. The assumed lockout period of 26 payments is based on the expected Benchmark 2018-B8 securitization closing date in December 2018. The actual lockout period may be longer. |
| (4) | Historical NOI information is not available because the Staples Strategic Industrial Properties were owned and operated by two of three core business units of former Staples, Inc., for approximately 17 years on average at each of the Staples Strategic Industrial Properties prior to the execution of a new 20-year lease as part of a sale-leaseback acquisition in October 2018. |
| (5) | The UW NOI is based on projected income based on the contractual terms of the Staples Strategic Industrial 20-year triple-net (“NNN”) leases. |
| (6) | The Appraisal Date for each of the Staples Strategic Industrial Properties were between August 29, 2018 and September 4, 2018 as illustrated in the Annex A-1 in the Preliminary Prospectus. |
| (7) | For a full description of Escrows and Reserves, please refer to“Escrows and Reserves”below. |
THE INFORMATION IN THIS STRUCTURAL AND COLLATERAL TERM SHEET IS NOT COMPLETE AND MAY BE AMENDED PRIOR TO THE TIME OF SALE. THIS TERM SHEET IS NOT AN OFFER TO SELL THESE SECURITIES AND IT IS NOT A SOLICITATION OF AN OFFER TO BUY THESE SECURITIES IN ANY JURISDICTION WHERE THE OFFER OR SALE IS NOT PERMITTED. | ||||
| | | 29 of 125 | | |
| Structural and Collateral Term Sheet | Benchmark 2018-B8 | |
| Staples Strategic Industrial | ||
The Loan.The Staples Strategic Industrial loan (the “Staples Strategic Industrial Loan”) is a fixed rate loan secured by the borrower’s fee interest in an approximately 4.0 million square foot portfolio of eight warehouse/distribution facilities that are 100.0% occupied by two of the three core business units of former Staples, Inc. company pursuant to two new, 20-year triple-net (“NNN”) leases. Loan proceeds were used in the sale leaseback transaction to acquire the Staples Strategic Industrial properties (“Staples Strategic Industrial Properties”), which have been occupied by the respective tenants for approximately 17 years on average and represent mission critical distribution and fulfillment centers within various East Coast and Midwest markets for the tenants according to the loan sponsors.
The Staples Strategic Industrial Loan is evidenced by the controlling Note A-1-1 and Note A-3, with an aggregate Original Balance and aggregate Cut-off Date Balance of $56.1 million. The Staples Strategic Industrial Loan is part of a whole loan (the “Staples Strategic Industrial Whole Loan”) with an aggregate Original Principal and aggregate Cut-off Date Balance of $126.1 million, evidenced by seven pari passu notes, as described below. Only the Staples Strategic Industrial Loan will be contributed to the Benchmark 2018-B8 Trust. The remaining notes are currently held by DBNY , as described in the “Total Debt Summary” chart below and are expected to be contributed to one or more future securitization trusts.
| Total Debt Summary | ||||
| Note | Original Balance | Cut-off Date Balance | Note Holder | Controlling Piece |
| A-1-1, A-3 | $56,100,000 | $56,100,000 | Benchmark 2018-B8 | Yes |
| A-1-2, A-2-1, A-2-2, A-2-3, A-4 | $70,000,000 | $70,000,000 | DBNY | No |
| Total | $126,100,000 | $126,100,000 | ||
The Staples Strategic Industrial Whole Loan is structured with an Anticipated Repayment Date of October 6, 2028, a final maturity date of October 6, 2033 and will be interest-only for the entire term. From and after the ARD, the Staples Strategic Industrial Whole Loan accrues interest at a fixed rate (the “Staples Strategic Industrial Adjusted Interest Rate”) that is equal to the greater of (i) 4.91800% (or when applicable the default rate) plus 2.50000% and (ii) the swap rate calculated by the linear interpolation of mid-market swap yields, as reported on Reuters Capital Markets screen 19901 (SEMI-BOND column), with maturities most nearly approximating the Maturity Date as of the Staples Strategic Industrial final maturity date plus 2.50000%; however, interest accrued at the excess of the Staples Strategic Industrial Adjusted Interest Rate over the Staples Strategic Industrial Initial Interest Rate (the “Staples Strategic Industrial Excess Interest”) will be deferred. In addition, from and after the Staples Strategic Industrial Anticipated Repayment Date, all excess cash flow from the Staples Strategic Industrial Property after the payment of tax and insurance reserves, interest calculated at the Staples Strategic Industrial Initial Interest Rate and operating expenses will be applied (i) first to repay the principal balance of the Staples Strategic Industrial Whole Loan until paid in full and (ii) second to the payment of accrued interest.
Defeasance of the Staples Strategic Industrial Whole Loan is permitted at any time after the earlier to occur of (i) two years after the closing date of the securitization that includes the last note to be securitized or (ii) September 28, 2021. The borrower has the right to prepay the Staples Strategic Industrial Whole Loan in whole on any business day on or after June 6, 2028.
The relationship between the holders of the Staples Strategic Industrial Whole Loan will be governed by a co-lender agreement as described under “Description of the Mortgage Pool—The Whole Loans—The Non-Serviced Pari Passu Whole Loans” in the Preliminary Prospectus.
The Borrowers. The borrower for the Staples Strategic Industrial Loan is LCN STP Hagerstown (Multi) LLC, a single purpose Delaware limited liability company structured to be bankruptcy-remote with two independent directors.
The Loan Sponsors. The loan sponsors and non-recoursecarveout guarantors for the Staples Strategic Industrial Loan are Edward V. LaPuma and Bryan York Colwell, the co-founders and managing partners ofLCN Capital Partners (“LCN”). LCN is a private equity firm with offices in New York, London and Luxembourg that specializes in sale-leaseback, built-to-suit and select net lease investments that range from $20 million to $200 million across North America and Europe. Prior to co-founding LCN, Edward V. LaPuma originated, negotiated and closed over $2.3 billion in sale-leaseback and net lease investments across North America, Europe, and Asia. LCN currently has over $1.2 billion in discretionary equity capital committed and has over $2 billion in real estate assets under management.
The Properties.TheStaples Strategic IndustrialProperties include eight industrial facilities, including five fulfilment centers and three distribution centers, across seven states within East Coast and Midwest markets, including Connecticut (2), Indiana (1), New York (1), Ohio (1), Maryland (1), Minnesota (1) and Wisconsin (1). TheStaples Strategic IndustrialProperties were built between 1969 and 2006, have 34 foot clear ceiling heights on average, feature 18 to 132 loading dock doors and encompass 5- to 118-acres of land per site. The current tenants have occupied each of theStaples Strategic IndustrialProperties for an average of approximately 17 years prior to the sale leaseback to the loan sponsor at loan origination.
THE INFORMATION IN THIS STRUCTURAL AND COLLATERAL TERM SHEET IS NOT COMPLETE AND MAY BE AMENDED PRIOR TO THE TIME OF SALE. THIS TERM SHEET IS NOT AN OFFER TO SELL THESE SECURITIES AND IT IS NOT A SOLICITATION OF AN OFFER TO BUY THESE SECURITIES IN ANY JURISDICTION WHERE THE OFFER OR SALE IS NOT PERMITTED. | ||||
| | | 30 of 125 | | |
| Structural and Collateral Term Sheet | Benchmark 2018-B8 | |
| Staples Strategic Industrial | ||
| Portfolio Summary(1) | |||||||
| Property | Center Type | Lease Guarantor | Net Rentable Area (SF) | Allocated Whole Loan Amount | % of Aggregate Allocated Loan Amounts | Appraised Value | Annual Rent |
| Staples - Hagerstown, MD | Distribution | USR Parent, Inc. | 1,022,145 | $35,000,000 | 27.8% | $54,700,000 | $3,580,000 |
| Staples - Montgomery, NY | Fulfillment | Staples, Inc. | 766,484 | 27,000,000 | 21.4% | 40,000,000 | 2,490,000 |
| Staples - Terre Haute, IN | Distribution | USR Parent, Inc. | 809,560 | 21,050,000 | 16.7% | 38,750,000 | 2,020,000 |
| Staples - London, OH | Fulfillment | Staples, Inc. | 496,818 | 15,500,000 | 12.3% | 24,100,000 | 1,370,000 |
| Staples - Beloit, WI | Fulfillment | Staples, Inc. | 399,652 | 11,300,000 | 9.0% | 18,700,000 | 1,300,000 |
| Staples - Dayville, CT | Distribution | USR Parent, Inc. | 310,157 | 9,500,000 | 7.5% | 14,300,000 | 1,160,000 |
| Staples - Arden Hills, MN | Fulfillment | Staples, Inc. | 113,096 | 3,500,000 | 2.8% | 5,600,000 | 540,000 |
| Staples - Putnam, CT | Fulfillment | Staples, Inc. | 113,215 | 3,250,000 | 2.6% | 5,300,000 | 340,000 |
| Total / Wtd. Avg. | 4,031,127 | $126,100,000 | 100.0% | $201,450,000 | $12,800,000 | ||
| (1) | Source: Appraisal |
Each of the Staples Strategic Industrial Properties feature warehouse build out, with five of the facilities built to suit for and by Staples, Inc. at an aggregate cost of approximately $224.1 million. In addition, since 2014, the tenants have invested over $38.5 million of their own capital into each of the eight properties, with investments ranging from $2.8 million to $7.2 million as illustrated below. In addition, according to the loan sponsor, the tenant plans to invest approximately $17.0 million in Staples - Montgomery, NY property for robotics implementation in 2019.
| CapEx Overview(1) | |||||||||
| Property | Net Rentable Area (SF) | Year Built/ Renovated | Clear Height (feet) | Land | Loading Docks | Built to Suit | Development | 2014 – 2018 YTD Historical Capital Expensed | 2014 – |
| Staples - Hagerstown, MD | 1,022,145 | 1996/2005 | 35’ | 118 | 103 | Yes | $73,600,000 | $4,300,000 | $4.21 |
| Staples - Montgomery, NY | 766,484 | 1985/2001 | 31’ | 80 | 132 | No(2) | N/A | $6,200,000 | $8.09 |
| Staples - Terre Haute, IN | 809,560 | 2000/2006 | 35’ | 70 | 116 | Yes | $34,500,000 | $3,800,000 | $4.69 |
| Staples - London, OH | 496,818 | 2001 | 35’ | 55 | 76 | Yes | $36,900,000 | $6,600,000 | $13.28 |
| Staples - Beloit, WI | 399,652 | 2006 | 35’ | 45 | 50 | Yes | $49,900,000 | $3,700,000 | $9.26 |
| Staples - Dayville, CT | 310,157 | 1997 | 36’ | 54 | 46 | Yes | $29,200,000 | $4,100,000 | $13.22 |
| Staples - Arden Hills, MN | 113,096 | 1969 | 34’ | 5 | 15 | No(3) | N/A | $2,800,000 | $24.76 |
| Staples - Putnam, CT | 113,215 | 1988 | 27’ | 19 | 17 | No(4) | N/A | $7,200,000 | $63.60 |
| Total / Wtd. Avg. | 4,031,127 | 34’ | 446 | 555 | $224,100,000 | $38,700,000 | $9.60 | ||
| (1) | Based on borrower provided information. |
| (2) | Formerly Service Merchandise; Staples took occupancy in 2001. |
| (3) | Built to suit for Corporate Express, which Staples acquired in 2009 and moved into the building. Formerly St. Paul Book and Stationary Company & Corporate Express. |
| (4) | This was an existing building that Staples took occupancy in 1998. |
The Tenants. The Staples Strategic Industrial Properties are individually leased and guaranteed by North American Delivery (“NAD”) and USR Parent Inc. (collectively, the “Staples Tenants”), two of the three core divisions that formerly operated together under Staples, Inc. As of September 2017 Staples, Inc. was taken private by Sycamore Partners in a $6.8 billion acquisition, at which time Staples, Inc. was split into three distinct and independent companies, including NAD, USR and Staples Canadian Retail. Although each company is independently capitalized, separately owned with dedicated management teams and separate supply chains, the companies share back office functions such as IT and combined purchasing. Sycamore Partners is a private equity firm founded in 2011 that specializes in retail and consumer investments and has over $3.5 billion of equity under management. Sycamore Partners investments include Belk, Hot Topic, Stuart Weitzman, Talbots and The Limited among others.
Staples US Retail (“USR”) (2,141,862 square feet, 53.1% NRA, 52.8% GPR). Staples US Retail is the brick and mortar retailer in the United States of core office products and adjacent categories. USR has 1,182 stores across 47 states as of 2017, with revenues in excess of $4.7 billion with approximately $261 million of free cash flow.
Staples North American Delivery (1,889,265 square feet, 46.9% NRA, 47.2% GPR). Staples NAD is the business to business (“B2B”) distributor of office supplies and extended categories in North America comprised of three online platforms including Staples Business Advantage (contract B2B sales), Quill.com (higher touch supplier to small businesses) and Staples.com (online retailer). NAD is the largest office supply distributor in the E-commerce market, the fifth largest E-commerce merchant in the United States and is utilized by
THE INFORMATION IN THIS STRUCTURAL AND COLLATERAL TERM SHEET IS NOT COMPLETE AND MAY BE AMENDED PRIOR TO THE TIME OF SALE. THIS TERM SHEET IS NOT AN OFFER TO SELL THESE SECURITIES AND IT IS NOT A SOLICITATION OF AN OFFER TO BUY THESE SECURITIES IN ANY JURISDICTION WHERE THE OFFER OR SALE IS NOT PERMITTED. | ||||
| | | 31 of 125 | | |
| Structural and Collateral Term Sheet | Benchmark 2018-B8 | |
| Staples Strategic Industrial | ||
65% of Fortune 100 companies. Additionally, NAD has a 95% annual sales retention of large accounts since 2014, which contributed to their approximately $10.3 billion of revenue in 2017. The NAD business is served by 41 fulfillment centers totaling approximately 12.0 million square feet and 95% of customers are covered by free next-day delivery. NAD sales are nearly 2 times that of their closest competitor, Office Depot.
| Tenant Summary(1) | |||||||
Tenant | Property | Ratings Moody’s/S&P/Fitch(2) | Net Rentable Area (SF) | % of Total NRA | Base Rent PSF(3) | % of Total Base Rent | Lease Expiration Date |
| US Retail Inc. / USR(3) | Staples – Hagerstown, MD | NR/NR/NR | 1,022,145 | 25.4% | $3.50 | 28.0% | 10/31/2038 |
| Staples – Terre Haute, IN | NR/NR/NR | 809,560 | 20.1% | 2.50 | 15.8% | 10/31/2038 | |
| Staples – Dayville, CT | NR/NR/NR | 310,157 | 7.7% | 3.74 | 9.1% | 10/31/2038 | |
| US Retail Inc. Total | 2,141,862 | 53.1% | $3.16 | 52.8% | |||
| Staples, Inc. / NAD(3) | Staples – Montgomery, NY | B3/B+/NR | 766,484 | 19.0% | 3.25 | 19.5% | 10/31/2038 |
| Staples – London, OH | B3/B+/NR | 496,818 | 12.3% | 2.76 | 10.7% | 10/31/2038 | |
| Staples – Beloit, WI | B3/B+/NR | 399,652 | 9.9% | 3.25 | 10.2% | 10/31/2038 | |
| Staples – Putnam, CT | B3/B+/NR | 113,215 | 2.8% | 4.77 | 4.2% | 10/31/2038 | |
| Staples – Arden Hills, MN | B3/B+/NR | 113,096 | 2.8% | 3.01 | 2.7% | 10/31/2038 | |
| Staples, Inc. Total | 1,889,265 | 46.9% | $3.20 | 47.2% | |||
| Total Occupied | 4,031,127 | 100.0% | $3.18 | 100.0% | |||
| Vacant | 0 | 0.0 | |||||
| Total | 4,031,127 | 100.0% | |||||
| (1) | Based on the underwritten rent roll. |
| (2) | Certain ratings are those of the parent company whether or not the parent guarantees the lease. |
| (3) | The tenants signed two new 20-year NNN lease with no termination options and three, approximately 10-year extension options that have rent escalations of 2% per year. |
The Market. The Staples Strategic Industrial Properties are located in a mix of secondary and tertiary industrial markets including Baltimore/DC, Minneapolis, Columbus, Greater NYC, Greater Chicago, Greater Indianapolis and Greater Boston. According to the loan sponsors, these markets were selected by Staples, Inc. senior leadership for their access to skilled labor pools, proximity to logistics corridors and nearness to Staples Strategic Industrial customers. The Staples Strategic Industrial Properties are within industrial markets that report market vacancy rates below 5.5% and submarket vacancy ranging from 0.0% to 7.2%. According to the appraisers’ concluded market rents, the Staples Strategic Industrial in-place rents are below market by 17.8% on a weighted average basis.
| Market Summary(1) | ||||||||||
| Property Name “Staples – “ | % of Allocated Loan Amount | Market | 5 Mile Radius 2017 Population | 5 Mile Radius 2017 Household Income | Industrial Market | Industrial Submarket | Rent | Vacancy | ||
Market / | Appraiser Concluded | In Place | Market / | |||||||
| Hagerstown, MD | 27.8% | Baltimore / DC | 61,542 | $50,119 | NAV | Washington County | NAV / $4.81 | $3.75 | $3.50 | NAV/2.6% |
| Montgomery, NY | 21.4% | Greater NYC | 28,583 | $82,328 | Northern New Jersey | Orange County | $7.87 / $6.81 | $5.25 | $3.25 | 3.9%/5.0% |
| Terre Haute, IN | 16.7% | Greater Indianapolis | 14,249 | $59,287 | Vigo County | NAV | $2.07 / NAV | $3.15 | $2.50 | 4.6%/NAV |
| London, OH | 12.3% | Columbus | 17,139 | $50,544 | Columbus | Madison County | $3.66 / $6.23 | $3.20 | $2.76 | 4.1%/0.0% |
| Beloit, WI | 9.0% | Greater Chicago | 59,938 | $47,466 | Madison | Rock County | $4.90 / $4.15 | $3.50 | $3.25 | 3.5%/5.2% |
| Dayville, CT | 7.5% | Greater Boston | 25,383 | $57,992 | Hartford | Windham County | $4.60 / $3.83 | $4.25 | $3.74 | 5.4%/7.2% |
| Arden Hills, MN | 2.8% | Minneapolis | 198,195 | $68,851 | Minneapolis / St. Paul | North Central | $6.72 / $6.79 | $4.00 | $3.01 | 3.6%/3.5% |
| Putnam, CT | 2.6% | Greater Boston | 22,735 | $60,123 | Hartford | Windham County | $4.60 / $3.83 | $4.00 | $4.77 | 5.4%/7.2% |
| Total / Wtd. Avg. | 100.0% | $3.87 | $3.18 | |||||||
| (1) | Source: Appraisal |
Staples - Hagerstown, MD(27.8% of Allocated Loan Amount (“ALA”)):Staples - Hagerstown, MD, encompassing over 1.0 million square feet on 118 acres, is USR Parent Inc.’s (“USR”)’s largest distribution center serving 300 stores throughout the eastern seaboard and handling nearly $1.7 billion in sales volume. Staples - Hagerstown, MD is located in the Washington County industrial market. According to the appraisal, Hagerstown’s central location and ease of access to Interstate 81 and Interstate 70, provides an ideal location for shipping and logistics companies in the area. As such, the concentration of transportation and warehousing employment in the area is more than
THE INFORMATION IN THIS STRUCTURAL AND COLLATERAL TERM SHEET IS NOT COMPLETE AND MAY BE AMENDED PRIOR TO THE TIME OF SALE. THIS TERM SHEET IS NOT AN OFFER TO SELL THESE SECURITIES AND IT IS NOT A SOLICITATION OF AN OFFER TO BUY THESE SECURITIES IN ANY JURISDICTION WHERE THE OFFER OR SALE IS NOT PERMITTED. | ||||
| | | 32 of 125 | | |
| Structural and Collateral Term Sheet | Benchmark 2018-B8 | |
| Staples Strategic Industrial | ||
twice that of the state and nation and has risen considerably over the past five years. Top employers in the area include national companies such as FedEx and smaller companies such as Bowman Logistics. Developers have entered the market and are building industrial properties speculatively. Vacancies have been at or below 5.0% for the past five years for this market. The market will deliver a 504,000 square foot warehouse later this year, which is likely to raise vacancy levels to 5.0% from 2.6% as of the second quarter 2018.
Staples - Montgomery, NY(21.4% of ALA):Staples - Montgomery, NY is located within a 75 mile radius of New York City, in the Northern New Jersey Industrial Market and services the New York Department of Education as well as the general New York City market. According to an industry report and the appraisal, vacancy in the Northern New Jersey Industrial Market has declined in eight consecutive years, following the economic downturn in 2008. Additionally, in the first half of 2018 nearly 9.3 million square feet of space has been absorbed.
Staples - Terre Haute, IN(16.7% of ALA):Staples - Terre Haute, IN is located in a rural community of southwestern Indiana, approximately 75 miles from the Indianapolis central business district. Staples - Terre Haute, IN is located within the Greater Indianapolis market and services 300 stores and handles more than $1.0 billion in sales volume in the Midwest and Texas.
Staples - London, OH(12.3% of ALA):Staples - London, OH is located in the Columbus Industrial market, approximately 25 miles west of Columbus and services 100% business customers and moves nearly 15 million cartons annually and generates approximately $756 million in sales volume. According to the appraisal, the Columbus metro area population has grown over the past decade and exhibits both a higher rate of GDP growth and a higher level of GDP per capita than the nation overall. The Columbus Industrial market also exhibited net absorption totaling approximately 2.4 million square feet in the second quarter 2018. According to the appraisal, Columbus is expected to add the most new jobs of any Ohio metro area through 2019, underpinned by gains in the professional, financial and health services sectors.
Staples - Beloit, WI (9.0% of ALA):Staples - Beloit, WI is located in south central Wisconsin and services the Chicago and Milwaukee markets that are located within a 75 mile radius. Staples - Beloit, WI property moves more than 9.5 million cartons annually and generates approximately $513 million in sales volume.
Staples - Dayville, CT(7.5% of ALA) andStaples – Putnam, CT (2.6% ALA):Staples - Dayville, CT and Staples – Putnam, CT are located within the Windham County industrial submarket within a two-mile radius. Staples - Dayville, CT features a distribution center buildout and is complimentary to the fulfillment center buildout of Staples - Putnam, CT. Windham County is situated along Interstate 395, and is within a 70 mile radius of Worchester, Hartford and Boston.
Staples - Dayville, CT is in critical proximity to the Boston and New York City markets and serves over 100 of USR’s stores.
Staples – Putnam, CTservices the Northeastern US and handles approximately $384 million of sales volume annually.
Staples – Arden Hills, MN(2.8% of ALA):Staples - Arden Hills, MN, is located within a 15-mile radius of the Minneapolis CBD and enables next day service to enterprise customer accounts that produce approximately $86 million in annual sales and features newly invested robotics that help move more than two million cartons annually.
| Historical and Current Occupancy(1) | |||
| 2015 | 2016 | 2017 | Current(2) |
| 100.0% | 100.0% | 100.0% | 100.0% |
| (1) | The average tenant has been at the Staples Strategic Industrial Properties for a term of approximately 17 years. |
| (2) | Current Occupancy is as of December 6, 2018. |
THE INFORMATION IN THIS STRUCTURAL AND COLLATERAL TERM SHEET IS NOT COMPLETE AND MAY BE AMENDED PRIOR TO THE TIME OF SALE. THIS TERM SHEET IS NOT AN OFFER TO SELL THESE SECURITIES AND IT IS NOT A SOLICITATION OF AN OFFER TO BUY THESE SECURITIES IN ANY JURISDICTION WHERE THE OFFER OR SALE IS NOT PERMITTED. | ||||
| | | 33 of 125 | | |
| Structural and Collateral Term Sheet | Benchmark 2018-B8 | |
| Staples Strategic Industrial | ||
| Lease Rollover Schedule(1) | |||||||||
| Year | Number of Leases Expiring | Net Rentable Area Expiring | % of NRA Expiring | Base Rent Expiring | % of Base Rent Expiring | Cumulative Net Rentable Area Expiring | Cumulative % of NRA Expiring | Cumulative Base Rent Expiring | Cumulative % of Base Rent Expiring |
| Vacant | NAP | 0 | 0.0% | NAP | NAP | 0 | 0.0% | NAP | NAP |
| 2018 & MTM | 0 | 0 | 0.0% | $0 | 0.0% | 0 | 0.0% | $0 | 0.0% |
| 2019 | 0 | 0 | 0.0% | 0 | 0.0% | 0 | 0.0% | $0 | 0.0% |
| 2020 | 0 | 0 | 0.0% | 0 | 0.0% | 0 | 0.0% | $0 | 0.0% |
| 2021 | 0 | 0 | 0.0% | 0 | 0.0% | 0 | 0.0% | $0 | 0.0% |
| 2022 | 0 | 0 | 0.0% | 0 | 0.0% | 0 | 0.0% | $0 | 0.0% |
| 2023 | 0 | 0 | 0.0% | 0 | 0.0% | 0 | 0.0% | $0 | 0.0% |
| 2024 | 0 | 0 | 0.0% | 0 | 0.0% | 0 | 0.0% | $0 | 0.0% |
| 2025 | 0 | 0 | 0.0% | 0 | 0.0% | 0 | 0.0% | $0 | 0.0% |
| 2026 | 0 | 0 | 0.0% | 0 | 0.0% | 0 | 0.0% | $0 | 0.0% |
| 2027 | 0 | 0 | 0.0% | 0 | 0.0% | 0 | 0.0% | $0 | 0.0% |
| 2028 | 0 | 0 | 0.0% | 0 | 0.0% | 0 | 0.0% | $0 | 0.0% |
| 2029 & Beyond | 2 | 4,031,127 | 100.0% | 12,800,000 | 100.0% | 4,031,127 | 100.0% | $12,800,000 | 100.0% |
| Total | 2 | 4,031,127 | 100.0% | $12,800,000 | 100.0% | ||||
| (1) | Based on the underwritten rent roll dated. |
| Operating History and Underwritten Net Cash Flow(1) | |||
| Underwritten | Per SF | %(2) | |
| Rents in Place | $12,800,000 | $3.18 | 98.0% |
| Contractual Rent Steps(3) | 256,000 | 0.06 | 2.0% |
| Total Reimbursements | 0 | 0.00 | 0.0% |
| Net Rental Income | $13,056,000 | $3.24 | 100.0% |
| (Vacancy/Credit Loss) | (652,800) | (0.16) | (5.0%) |
| Effective Gross Income | $12,403,200 | $3.08 | 95.0% |
| Total Expenses(4) | $372,096 | $0.09 | 3.0% |
| Net Operating Income | $12,031,104 | $2.98 | 97.0% |
| Total TI/LC, Capex/RR | 1,203,935 | 0.30 | 9.7% |
| Net Cash Flow | $10,827,169 | $2.69 | 87.3% |
| (1) | Historical cash flow figures were not provided by the borrowers as the Staples Strategic Industrial Properties were owned and operated by the tenant prior to the execution of a new 20-year lease as part of a sale-leaseback in October 2018. |
| (2) | % is calculated using Net Rental Income for all revenue items and Effective Gross Income for the remaining items. |
| (3) | Contractual Rent Steps are underwritten through September 2019. |
| (4) | Underwritten Total Expenses includes an unrecoverable 3.0% management fee. |
Property Management. The Staples Strategic Industrial Properties are self-managed by Staples, Inc., an affiliate of the tenant, under the respective leases.
Escrows & Reserves.
Tax Escrows- Real estate tax escrows are waived so long as (i) no Trigger Period (as defined below) is continuing (ii) the Staples Tenants or any replacement NNN lease are obligated to pay (and are paying) all real estate taxes directly to the applicable governmental authority, and (iii) the Staples Tenants’ leases any replacement NNN lease remain in full force and effect and no event of default beyond the expiration of any applicable notice and cure period is continuing thereunder. If such conditions are no longer satisfied, the borrower is required to deposit an amount equal to 1/12 of the estimated annual real estate taxes into a tax reserve.
Insurance Escrows- Insurance escrows are waived so long as (i) no Trigger Period is continuing, (ii) the Staples Tenants or any replacement NNN lease are obligated to obtain and pay for (and are paying for) all insurance coverages required under the Staples Strategic Industrial loan documents, and (iii) the Staples Tenants’ leases or any replacement NNN lease, respectively, remain in full force and effect and no event of default beyond the expiration of any applicable notice and cure period is continuing thereunder. If such conditions are no longer satisfied, on each due date, the borrower will be required to fund an insurance reserve in a monthly amount equal to 1/12 of the amount that the lender estimates will be necessary to pay the annual insurance premiums.
Replacement Reserves - On a monthly basis, during the continuance of (i) a Lease Sweep Period (as defined below) or (ii) any period when the entirety of theStaples Strategic IndustrialProperties are not leased pursuant to the respective leases, a replacement NNN
THE INFORMATION IN THIS STRUCTURAL AND COLLATERAL TERM SHEET IS NOT COMPLETE AND MAY BE AMENDED PRIOR TO THE TIME OF SALE. THIS TERM SHEET IS NOT AN OFFER TO SELL THESE SECURITIES AND IT IS NOT A SOLICITATION OF AN OFFER TO BUY THESE SECURITIES IN ANY JURISDICTION WHERE THE OFFER OR SALE IS NOT PERMITTED. | ||||
| | | 34 of 125 | | |
| Structural and Collateral Term Sheet | Benchmark 2018-B8 | |
| Staples Strategic Industrial | ||
lease which, in either case, requires such tenant to pay for all capital expenditures at the property, the borrower is required to escrow an amount equal to approximately $50,389 per month into a capital expenditure reserve.
Quarterly Rent Reserves - For so long as the respective lessees pay rent to the borrower on a quarterly basis, a quarterly rent reserves will be maintained to hold such full quarterly rent payments. An amount necessary to fund all outstanding reserves and pay monthly debt service on the Staples Strategic Industrial Loan for the month in which the quarterly rent payment is made (the “Monthly Required Payment Amount”) is applied to such outstanding reserves and monthly debt service for such month, an amount equal to two times the Monthly Required Payment Amount is held in a quarterly rent reserve account (to be applied on the next two succeeding monthly payment dates) and the excess is disbursed to the borrower, provided no Trigger Period is continuing.
Lockbox / Cash Management.The Staples Strategic Industrial Loan is structured with a hard lockbox and in-place cash management. The related borrower is required to cause all rents to be deposited directly into the lender-controlled lockbox account. All funds received by the borrower or the manager are required to be deposited in the lockbox account within two business days following receipt. Funds on deposit in the lockbox account are required to be swept on each business day into a lender-controlled cash management account and applied on each payment date to the payment of debt service, the funding of required reserves and budgeted monthly operating expenses. Provided no Trigger Period is continuing, excess cash in the deposit account will be disbursed to the borrower in accordance with the Staples Strategic Industrial Loan documents. If a Trigger Period is continuing (and no Lease Sweep Period (defined below) is continuing), excess cash in the deposit account will be transferred to an account held by the lender as additional collateral for the Staples Strategic Industrial Loan.
A “Trigger Period” occurs on the date that any of the following has occurred: (i) the ARD, (ii) any event of default, (iii) the date that the debt service coverage ratio, as calculated in the loan documents at the end of each calendar quarter, falls below 1.20x and (iv) the commencement of a Lease Sweep Period (as defined below) and may be cured (a) with respect to clause (i) above, if debt is paid in full (b) with respect to clause (ii) above, upon the acceptance by the lender of a cure of such event of default, (c) with respect to clause (iii) above, upon the achievement of a debt service coverage ratio of 1.25x or greater for one calendar quarter and (d) with respect to clause (iv), such Lease Sweep Period has ended pursuant to the terms of the Staples Strategic Industrial Whole Loan documents.
A “Lease Sweep Period” commences upon the first monthly payment date following the occurrence of any of the following: (a) upon the date required under the Sweep Lease (as defined below) by which the related tenant is required to give notice of its exercise of a renewal option thereunder (and such renewal has not been so exercised); (b) upon the early termination, early cancellation or early surrender of a Sweep Lease (or any material portion thereof) or upon borrower’s receipt of notice by the related tenant of its intent to effect an early termination, early cancellation or early surrender of its Sweep Lease (or any material portion thereof); (c) if a tenant under a Sweep Lease (as defined below) has ceased operating its business at 40% or more of the space leased by Staples USR or 40% or more of the space on the leased by Staples NAD or 40% or more of the aggregate square footage of all Staples Strategic Industrial Properties (i.e., “goes dark”); (d) upon a monetary or material non-monetary default under a Sweep Lease by a tenant beyond any applicable notice and cure period or (e) upon a bankruptcy or insolvency proceeding of a tenant under a Sweep Lease or its parent.
A Lease Sweep Period ends when (1) in the case of clauses (a), (b) or (c) above, the Staples Strategic Industrial Properties (or applicable portion thereof) have been leased pursuant to one or more “qualified leases” (as such term is defined in the Staples Strategic Industrial loan documents) and, in lender’s reasonable judgment, sufficient funds have accumulated in the lease sweep reserve account (during the continuance of the subject Lease Sweep Period) to cover all anticipated approved leasing expenses, free rent periods and/or rent abatement periods set forth in all such “qualified leases” and any shortfalls in required payments under the loan documents or operating expenses as a result of any anticipated down time prior to the commencement of payments under such qualified leases, (2) in the case of clause (a) above, the tenant exercises its renewal option and in lender’s reasonable judgment, sufficient funds have accumulated in the lease sweep reserve account (during the continuance of the subject Lease Sweep Period) to cover all anticipated approved leasing expenses, free rent periods and/or rent abatement periods in connection with such renewal or extension, (3) in the case of clause (c) above, either (x) funds in an amount equal to the applicable Go Dark Event Sweep Cap (defined below) have accumulated in the lease sweep reserve account or (y) borrower has delivered an acceptable letter of credit to lender with a face amount at least equal to the applicable Go Dark Event Sweep Cap, (4) in the case of clause (d) above, the subject default has been cured and (5) in the case of clause (e) above, the applicable bankruptcy has terminated and the applicable Sweep Lease has been affirmed, assumed or assigned in a manner reasonably satisfactory to lender.
Under the Staples, Inc. lease and the USR Parent Inc. lease, if the tenant thereunder goes dark (by either vacating or subleasing) in 40% or more of the total square footage demised under such lease, the tenant thereunder will be required to post a letter of credit with the borrower, in an amount equal to (i) 12 months’ base rent due under the applicable lease (if the tenant goes dark in 40% or more but less than 60% of such space) or (ii) 24 months’ base rent due under the applicable lease (if the tenant goes dark in more than 60% of such leased space). Upon receipt of any such letter of credit, the borrower is required to immediately assign such letter of credit to the lender and, if a Major Tenant Sweep Event is continuing pursuant to clause (c) above, the borrower is expected to offer such letter of credit to the lender to stop the applicable Lease Sweep Event, provided such letter of credit is at least equal to the portion of rent payable with respect to the dark space in question for the following twelve months and such letter of credit otherwise meets the definition of an approved
THE INFORMATION IN THIS STRUCTURAL AND COLLATERAL TERM SHEET IS NOT COMPLETE AND MAY BE AMENDED PRIOR TO THE TIME OF SALE. THIS TERM SHEET IS NOT AN OFFER TO SELL THESE SECURITIES AND IT IS NOT A SOLICITATION OF AN OFFER TO BUY THESE SECURITIES IN ANY JURISDICTION WHERE THE OFFER OR SALE IS NOT PERMITTED. | ||||
| | | 35 of 125 | | |
| Structural and Collateral Term Sheet | Benchmark 2018-B8 | |
| Staples Strategic Industrial | ||
letter of credit (as set forth in the loan agreement), as determined by the lender. For so long as the lender is holding a letter of credit, lender will hold such letter of credit in accordance with the terms of the applicable lease, except that, from and after an event of default under such lease, lender will have the right to immediately draw on such letter of credit in full and deposit such drawn amount into the lease sweep reserve under the loan. To the extent lender is unable to draw on such letter of credit after the occurrence of an event of default under the loan or an event of default under the applicable lease, the amount of such letter of credit (up to the portion of rent payable with respect to the dark space in question for the following twelve months) will be recourse to the guarantor.
“Sweep Lease” means (i) the leases with Staples NAD and/or Staples USR as applicable, and (ii) any replacement lease at the Staples Strategic Industrial Properties which covers (x) the entire rentable space at an individual Staples Strategic Industrial property or (y) 250,000 or more rentable sq. ft. at the Staples Strategic Industrial Properties.
Property Release or Substitution. The Staples Strategic Industrial is structured with no releases or substitutions, except for a 0.97-acre vacant strip of land located on the edge of the 80-acre Staples - Montgomery, NY property, which the borrower is currently in contract to sell to the adjacent landowner. In connection with such sale, the borrower will be permitted to release such strip of land from the lienwithout payment of any consideration for the release, provided that(i) no event of default continuing, (ii) such strip of land is legally subdivided and on a separate tax parcel from the remainder of the Staples - Montgomery, NY property, (iii) the release does not adversely affect the use or operation of, or access to or from, the remaining portion of the Staples - Montgomery, NY property, (iv) after giving effect to such release, the loan-to-value ratio of the remaining Staples Strategic Industrial Properties is no more than 125% (v) the lender has received and approved all applicable release documents and evidence of tax parcel separation and (v) the borrower pays all of lender’s costs and expenses.
Environmental. The Phase I environmental report dated September 19, 2018 for the Staples - Dayville, CT property (the “Dayville Property”) recommended further sampling to determine if any long-term monitoring or remediation is necessary in connection with suspected groundwater and soil pollution. In accordance with the State of Connecticut’s Property Transfer Act, the owner’s consultant, Ramboll, conducted soil and groundwater sampling at several Areas of Concern at the site. The first round of sampling was completed in April 2018 and results indicated that additional delineation and characterization was needed at five of the areas of concern on the site. On July 31 and August 1st a second round of investigation was conducted which entailed 16 soil borings and the installation of two additional monitoring wells. The results of this round of investigation concluded that additional delineation was still required for three remaining areas of concern on the site. At origination, the borrower obtained a Lender Environmental Collateral Protection and Liability Insurance Policy from Steadfast Insurance Company for the Dayville Property. Such policy has a term of 13 years and the borrower is required, on or prior to the ARD date, to obtain a new secured lender’s policy (on terms and with limits substantially similar to the policy in place at origination) with a term of no less than eight years unless, prior to the ARD date, the borrower delivers (i) a “no further action” letter from the applicable governmental authority indicating that no additional monitoring or remediation is required at the Dayville Property and (ii) a clean Phase I for the Dayville Property (in which case, no additional environmental policies will be required for such property). Staples, Inc. also purchased a premises pollution liability policy for the Dayville Property (the “Dayville PPL Policy”), which named the lender as an additional insured. The lender will agree pursuant to the loan agreement to look to the Dayville PPL Policy first before making a claim under the Environmental Indemnity Agreement.
THE INFORMATION IN THIS STRUCTURAL AND COLLATERAL TERM SHEET IS NOT COMPLETE AND MAY BE AMENDED PRIOR TO THE TIME OF SALE. THIS TERM SHEET IS NOT AN OFFER TO SELL THESE SECURITIES AND IT IS NOT A SOLICITATION OF AN OFFER TO BUY THESE SECURITIES IN ANY JURISDICTION WHERE THE OFFER OR SALE IS NOT PERMITTED. | ||||
| | | 36 of 125 | | |
| Structural and Collateral Term Sheet | Benchmark 2018-B8 | |
| Embassy Suites Anaheim | ||
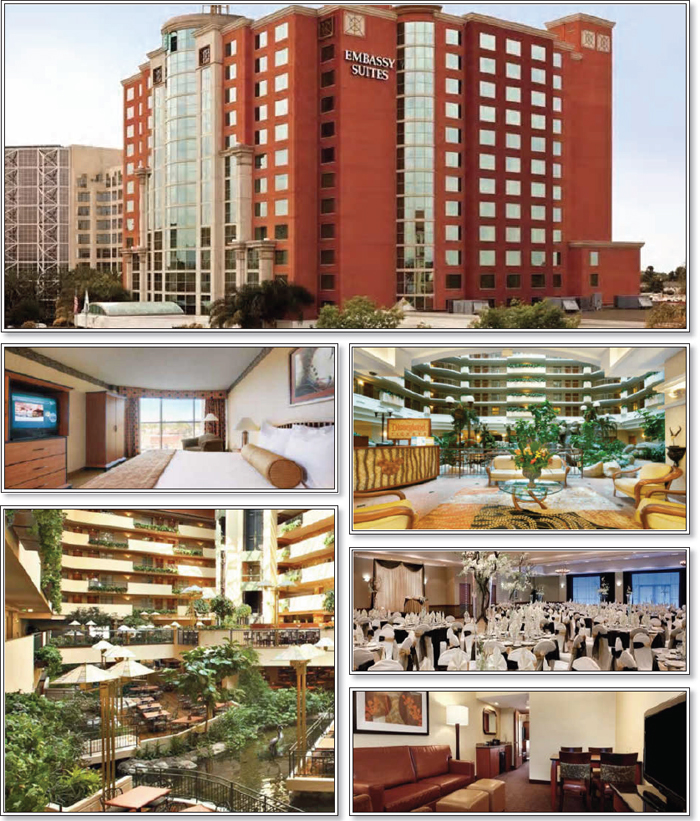
THE INFORMATION IN THIS STRUCTURAL AND COLLATERAL TERM SHEET IS NOT COMPLETE AND MAY BE AMENDED PRIOR TO THE TIME OF SALE. THIS TERM SHEET IS NOT AN OFFER TO SELL THESE SECURITIES AND IT IS NOT A SOLICITATION OF AN OFFER TO BUY THESE SECURITIES IN ANY JURISDICTION WHERE THE OFFER OR SALE IS NOT PERMITTED. | ||||
| | | 37 of 125 | | |
| Structural and Collateral Term Sheet | Benchmark 2018-B8 | |
| Embassy Suites Anaheim | ||

THE INFORMATION IN THIS STRUCTURAL AND COLLATERAL TERM SHEET IS NOT COMPLETE AND MAY BE AMENDED PRIOR TO THE TIME OF SALE. THIS TERM SHEET IS NOT AN OFFER TO SELL THESE SECURITIES AND IT IS NOT A SOLICITATION OF AN OFFER TO BUY THESE SECURITIES IN ANY JURISDICTION WHERE THE OFFER OR SALE IS NOT PERMITTED. | ||||
| | | 38 of 125 | | |
| Structural and Collateral Term Sheet | Benchmark 2018-B8 | |
| Embassy Suites Anaheim | ||
| Mortgage Loan Information | Property Information | |||
| Mortgage Loan Seller: | GACC | Single Asset / Portfolio: | Single Asset | |
| Original Principal Balance: | $56,000,000 | Title: | Fee | |
| Cut-off Date Principal Balance: | $56,000,000 | Property Type - Subtype: | Hotel – Full Service | |
| % of Pool by IPB: | 5.3% | Net Rentable Area (Rooms): | 375 | |
| Loan Purpose: | Refinance | Location: | Garden Grove, CA | |
| Borrower: | Landmark Hotels II, LLC | Year Built / Renovated: | 2001 / 2017 | |
| Sponsors: | Mark B. David, Richard H. Packard | Occupancy / ADR / RevPAR: | 84.6% / $157.70 / $133.49 | |
| Interest Rate: | 5.140017857% | Occupancy / ADR / RevPAR Date: | 10/31/2018 | |
| Note Date: | 11/6/2018 | Number of Tenants: | N/A | |
| Maturity Date: | 11/6/2028 | 2015 NOI: | $7,283,000 | |
| Interest-only Period: | 120 months | 2016 NOI: | $7,629,000 | |
| Original Term: | 120 months | 2017 NOI: | $7,307,000 | |
| Original Amortization: | None | TTM NOI (as of 10/2018): | $7,563,947 | |
| Amortization Type: | Interest Only | UW Occupancy / ADR / RevPAR: | 84.6% / $157.70 / $133.49 | |
| Call Protection: | L(23),Grtr1%orYM(92),O(5) | UW Revenues: | $22,368,820 | |
| Lockbox / Cash Management: | Springing / Springing | UW Expenses: | $14,488,840 | |
| Additional Debt: | Yes | UW NOI: | $7,879,980 | |
| Additional Debt Balance: | $15,000,000 | UW NCF: | $6,761,539 | |
| Additional Debt Type: | Mezzanine Debt | Appraised Value / Per Room(1): | $109,100,000 / $290,933 | |
| Appraisal Date: | 10/11/2020 | |||
| Escrows and Reserves(2) | Financial Information | |||||||
| Initial | Monthly | Initial Cap | Cut-off Date Loan / Room: | $149,333 | ||||
| Taxes: | $250,052 | $62,513 | N/A | Maturity Date Loan / Room: | $149,333 | |||
| Insurance: | $0 | Springing | N/A | Cut-off Date LTV(1): | 51.3% | |||
| FF&E: | $0 | 5.0% of Projected | N/A | Maturity Date LTV(1): | 51.3% | |||
| Revenues | UW NCF DSCR: | 2.32x | ||||||
| Other: | $10,100,000 | $Springing | N/A | UW NOI Debt Yield: | 14.1% | |||
| Sources and Uses | ||||||
| Sources | Proceeds | % of Total | Uses | Proceeds | % of Total | |
| Mortgage Loan | $56,000,000 | 78.2% | Payoff Existing Debt | $60,323,537 | 84.2% | |
| Mezzanine Loan | 15,000,000 | 20.9 | Upfront Reserves | 10,350,052 | 14.4 | |
| Sponsor Equity | 645,265 | 0.9 | Closing Costs | 971,676 | 1.4 | |
| Total Sources | $71,645,265 | 100.0% | Total Uses | $71,645,265 | 100.0% | |
| (1) | The Appraised Value / Per Room, Cut-off Date LTV and Maturity Date LTV reflect the “Prospective Market Value Upon Completion” of $109,100,000 as of October 11, 2020, which assumes the completion of a currently ongoing property improvement plan (“PIP”). Approximately $10.685 million of the anticipated $15.9 million PIP work will be completed in 2019. At origination of the mortgage loan, the borrower deposited $10,100,000 into the PIP reserve. The “as-is” appraised value as of October 11, 2018 is $98,300,000, which results in a Cut-off Date LTV and Maturity Date LTV of 57.0%. |
| (2) | For a full description of Escrows and Reserves, please refer to “Escrows and Reserves”below. |
The Loan.The Embassy Suites Anaheim loan has an outstanding principal balance as of the Cut-off Date of $56.0 million andissecured by a first mortgage lien on the borrower’s fee interest in 375-room full service hotel, located in Garden Grove, CA. The loan has a 10-year term and is interest only for the full loan term. The most recent prior financing of the Embassy Suites Anaheim loan was not included in a securitization.
The Borrower. The borrowing entity for the Embassy Suites Anaheim loan is Landmark Hotels II, LLC, a Delaware limited liability company and special purpose entity, with two independent directors organizational structure.
The Loan Sponsor.The loan sponsors and non-recourse carveout guarantors are Mark B. David and Richard H. Packard. Mark B. David is the Founder and CEO of Landmark Companies, LLC (“Landmark”) and Richard H. Packard serves as Landmark’s president. Landmark, founded in 1982, is a diversified real estate development firm, that has developed thousands of single family homes, condominiums, apartment units and hotel rooms. In addition, Landmark is the creator and owner of the Great Maple Restaurant chain with four southern California locations.
THE INFORMATION IN THIS STRUCTURAL AND COLLATERAL TERM SHEET IS NOT COMPLETE AND MAY BE AMENDED PRIOR TO THE TIME OF SALE. THIS TERM SHEET IS NOT AN OFFER TO SELL THESE SECURITIES AND IT IS NOT A SOLICITATION OF AN OFFER TO BUY THESE SECURITIES IN ANY JURISDICTION WHERE THE OFFER OR SALE IS NOT PERMITTED. | ||||
| | | 39 of 125 | | |
| Structural and Collateral Term Sheet | Benchmark 2018-B8 | |
| Embassy Suites Anaheim | ||
The Property.The Embassy Suites Anaheimproperty is a 13-story, 375-room full-service hotel located in Garden Grove, California. The Embassy Suites Anaheim property encompasses approximately 306,435 square feet situated on 4.06 acres, less than one mile south of Disneyland and the Anaheim Convention Center. Amenities and offerings at the Embassy Suites Anaheim property include free breakfast, an outdoor pool, large patio, hot tub, gift shop, Disneyland ticket sales, and large open atrium lobby. Additional amenities include room service, a restaurant, lounge, sundries shop and business center. There is 29,761 square feet of meeting space across six rooms, including the Garden Atrium (15,006 square feet), Landmark Ballroom (9,840 square feet) and Poolside Terrace (2,788 square feet). Parking is provided via a surface parking lot with 634 parking spaces, which equates to approximately 1.7 spaces per room.
The loan sponsors developed and opened the Embassy Suites Anaheim property in November 2001 under Hilton management. In 2011, the loan sponsors converted to a franchise and completed a capital improvement plan that upgraded 155 of the rooms, which included new soft goods, carpeting, drapes, case goods and new flat screen televisions. In 2016, the loan sponsors invested an additional $3.6 million ($16,364 per room) to similarly upgrade the remaining 220 rooms as well as the hotel common areas.
The Embassy Suites Anaheim property recently executed a new 17-year franchise agreement with Hilton Franchise Holding LLC, which will expire in September 2035. As part of the franchise agreement, a $15.9 million PIP commenced in 2018 with the loan sponsors replacing the cooling tower and guestroom televisions, totaling approximately $1.4 million. From 2019 to 2022, the ongoing PIP will be completed with the remaining approximatelyl $14.5 million ($38,635 per room). The remaining PIP will include all-inclusive renovations of the meeting space, fitness center, guest corridors, guest suites, bathrooms, building exterior, pool area, restrooms and atrium. At loan origination, the borrower reserved $10.1 million for a PIP reserve. The remainder of the $14.5 million PIP will be funded through the Embassy Suites Anaheim loan ongoing FF&E reserves, equal to 5.0% of effective gross income, estimated to be $1.1 million per annum ($4.5 million over the four year timeframe). The table below details the remaining PIP schedule.
| Property Improvement Plan | ||||
| 2019 | 2020 | 2021 | 2022 | |
| Cooling Tower Replacement(1) | ||||
| Guestroom TVs(1) | ||||
| Building Exterior | $400,000 | |||
| Atrium | $2,000,000 | |||
| Meeting Space | $350,000 | |||
| Fitness Center | $100,000 | |||
| Guest Corridors | $900,000 | |||
| Guest Suites | $7,650,000 | |||
| Guest Bathrooms | $1,000,000 | |||
| Design/Purchasing | $125,000 | $100,000 | ||
| Contingency | $900,000 | $5,000 | $85,000 | $235,000 |
| Other | $110,000 | $50,000 | $250,500 | $227,500 |
| Total | $10,685,000 | $55,000 | $885,500 | $2,862,500 |
| (1) | Completed in 2018. |
The Embassy Suites Anaheim property offers an all-suite guestroom configuration, consisting of 179 king rooms and 196 double/double rooms, across floors 2 through 14. The guestroom suites feature granite countertops, a wet-bar area with microwave, refrigerator, sink, coffeemaker, a flat-screen television, complimentary wireless internet, a sleeper sofa, and desk. The sleeping area offers a clothing armoire, sink and vanity, and either two double beds or one king bed. The Embassy Suites Anaheim property also offers Firework View Suites providing views of the Disneyland Park firework show.
The Embassy Suites Anaheim property is located along South Harbor Boulevard, between Orangewood Avenue to the north and Chapman Avenue to the south, in the city of Garden Grove. Garden Grove is located within northern Orange County, approximately 34 miles south of downtown Los Angeles, and 12 miles north of Long Beach. The local area is anchored by Disneyland, and Disney’s California Adventure parks, as well as Knott’s Berry Farm amusement park. Disneyland is located approximately 1.8 miles north and Knott’s Berry Farm is approximately 7.8 miles northwest of the Embassy Suites Anaheim property. Additional demand drivers include, the Anaheim Convention Center, which recently completed an approximately $190 million, 200,000 square feet expansion, Angel Stadium of Anaheim and the Honda Center.
The major demand driver for the Embassy Suites Anaheim property is Disneyland, which accounts for the largest portion of its transient demand. The Embassy Suites Anaheim property is the closest Embassy Suites hotel to Disneyland, within a 20-25 minute walk to the gate. Embassy Suites is Hilton International’s upscale, family-friendly flag. The Embassy Suites Anaheim offers value-propositions to families and patrons of the nearby theme parks through its amenities such as a free breakfast, suite-only room configurations, onsite Disneyland ticket sales and concierge, shuttle service to theme parks, and a large outdoor pool and patio. Over the last 10 years, Disneyland has averaged approximately 16.6 million visitors annually, with resort attractions including Disneyland Park, Disney’s
THE INFORMATION IN THIS STRUCTURAL AND COLLATERAL TERM SHEET IS NOT COMPLETE AND MAY BE AMENDED PRIOR TO THE TIME OF SALE. THIS TERM SHEET IS NOT AN OFFER TO SELL THESE SECURITIES AND IT IS NOT A SOLICITATION OF AN OFFER TO BUY THESE SECURITIES IN ANY JURISDICTION WHERE THE OFFER OR SALE IS NOT PERMITTED. | ||||
| | | 40 of 125 | | |
| Structural and Collateral Term Sheet | Benchmark 2018-B8 | |
| Embassy Suites Anaheim | ||
California Adventure Park and the Downtown Disney District. Disneyland is currently developing a new attraction, Star Wars – Galaxy Edge, which is expected to encompass 14 acres adjacent to Disneyland, also less than one mile from the Embassy Suites Anaheim property. The new theme park is expected to open in the summer of 2019.
Regional access to the Embassy Suites Anaheim property is via Interstate 5, which is the main highway on the west coast providing access to major cities including San Diego, Santa Ana, Los Angeles, Oakland, San Francisco and Sacramento. The nearest access to Interstate 5 is located approximately 2.5 miles north of the Embassy Suites Anaheim property. State Route 91 is the major east/west freeway located in southern California which provides access from Gardena to the west and Riverside to the east. The nearest access to State Route 91 is approximately 6.5 miles northwest of the Embassy Suites Anaheim property. John Wayne Orange County Airport is located approximately 13 miles southeast and is the only commercial service airport in Orange County, served by seven commercial airlines.
The demand segmentation at the Embassy Suites Anaheim property consists of 80.0% transient and 20.0% meeting and group. The primary competitive set for the Embassy Suites Anaheim property consists of eight full service hotels located in Anaheim and Garden Grove in Orange County, ranging in size from 223 to 653 rooms, and containing an aggregate of 3,088 rooms. The appraisal identified one new hotel coming online in the first quarter of 2019 that will be directly competitive with the Embassy Suites Anaheim property, the 352-room Cambria Suites, which will be located in Anaheim. The Embassy Suites Anaheim property’s competitive set and its relative historical performance are detailed below:
| Historical Occupancy, ADR, RevPAR(1) | |||||||||
| Competitive Set(2) | Embassy Suites Anaheim(3) | Penetration Factor | |||||||
| Year | Occupancy | ADR | RevPAR | Occupancy | ADR | RevPAR | Occupancy | ADR | RevPAR |
| 2015 | 78.7% | $134.66 | $105.95 | 81.8% | $155.81 | $127.47 | 103.9% | 115.7% | 120.3% |
| 2016 | 81.5% | $136.47 | $111.18 | 83.7% | $156.20 | $130.71 | 102.7% | 114.5% | 117.6% |
| 2017 | 82.9% | $140.98 | $116.81 | 84.6% | $156.51 | $132.43 | 102.1% | 111.0% | 113.4% |
| TTM(4) | 82.6% | $141.28 | $116.65 | 84.6% | $157.70 | $133.49 | 102.5% | 111.6% | 114.4% |
| (1) | The minor variances between the underwriting, appraisal and above table with respect to Occupancy, ADR and RevPAR at the Embassy Suites Anaheim property are attributable to variances in reporting methodologies and/or timing differences. |
| (2) | Data provided by a third party travel research report. The TTM competitive set contains the following properties: Anaheim Majestic Garden Hotel, Doubletree Anaheim Orange County, Embassy Suites Anaheim North, Hyatt Regency Orange County, Embassy Suites Anaheim Orange, Marriott Anaheim Suites and Delta Hotel Anaheim Garden Grove (formerly the Wyndham Anaheim Garden Grove). |
| (3) | Based on operating statements provided by the borrower. |
| (4) | TTM represents the trailing 12-month period ending on October 31, 2018 for the Embassy Suites Anaheim property and the trailing 12-month period ending on September 30, 2018 for the competitive set. |
| Competitive Hotels Profile(1) | ||||||
| 2017 Estimated Market Mix | ||||||
| Property | Distance to Disneyland (miles) | Rooms | Year Opened | Meeting Space (SF) | Transient | Meeting and Group |
| Embassy Suites Anaheim | 1.8 | 375 | 2001 | 29,761 | 80% | 20% |
| Anaheim Majestic Garden Hotel | 1.0 | 489 | 1969 | 17,538 | 70% | 30% |
| Embassy Suites Anaheim North | 7.2 | 223 | 1987 | 7,082 | 80% | 20% |
| Marriott Anaheim Suites | 1.9 | 371 | 2002 | 9,727 | 75% | 25% |
| Delta Hotel Anaheim Garden Grove | 2.0 | 376 | 2000 | 36,000 | 70% | 30% |
| Hyatt Regency Orange County | 2.0 | 653 | 1986 | 65,000 | 65% | 35% |
| Sheraton Hotel Garden Grove Anaheim South | 2.3 | 285 | 2008 | 8,182 | 87% | 13% |
| Embassy Suites Anaheim Orange | 4.0 | 230 | 1989 | 5,000 | 87% | 13% |
| Doubletree Anaheim Orange County | 4.4 | 461 | 1984 | 30,000 | 65% | 35% |
| (1) | Based on the appraisal. |
THE INFORMATION IN THIS STRUCTURAL AND COLLATERAL TERM SHEET IS NOT COMPLETE AND MAY BE AMENDED PRIOR TO THE TIME OF SALE. THIS TERM SHEET IS NOT AN OFFER TO SELL THESE SECURITIES AND IT IS NOT A SOLICITATION OF AN OFFER TO BUY THESE SECURITIES IN ANY JURISDICTION WHERE THE OFFER OR SALE IS NOT PERMITTED. | ||||
| | | 41 of 125 | | |
| Structural and Collateral Term Sheet | Benchmark 2018-B8 | |
| Embassy Suites Anaheim | ||
| Operating History and Underwritten Net Cash Flow | |||||||
| 2015 | 2016 | 2017 | TTM(1) | Underwritten(2) | Per Room(3) | % of Total Revenue(4) | |
| Occupancy | 81.8% | 83.7% | 84.6% | 84.6% | 84.6% | ||
| ADR | $155.81 | $156.20 | $156.51 | $157.70 | $157.70 | ||
| RevPAR | $127.47 | $130.71 | $132.43 | $133.49 | $133.49 | ||
| Room Revenue | $17,447,000 | $17,940,000 | $18,127,000 | $18,271,023 | $18,271,023 | $48,723 | 81.7% |
| Food & Beverage Revenue | 2,488,000 | 2,660,000 | 2,508,000 | 2,408,751 | 2,408,751 | 6,423 | 10.8 |
| Other Departmental Revenue | 1,343,000 | 1,590,000 | 1,456,000 | 1,689,046 | 1,689,046 | 4,504 | 7.6 |
| Total Revenue | $21,278,000 | $22,190,000 | $22,091,000 | $22,368,820 | $22,368,820 | $59,650 | 100.0% |
| Room Expense | $4,381,000 | $4,586,000 | $4,678,000 | $4,643,155 | $4,567,756 | $12,181 | 25.0% |
| Food and Beverage Expense | 1,990,000 | 2,101,000 | 2,044,000 | 2,056,957 | 2,009,309 | 5,358 | 83.4 |
| Other Departmental Expense | 310,000 | 302,000 | 313,000 | 314,613 | 329,031 | 877 | 19.5 |
| Departmental Expenses | $6,681,000 | $6,989,000 | $7,035,000 | $7,014,725 | $6,906,097 | $18,416 | 30.9% |
| Departmental Profit | $14,597,000 | $15,201,000 | $15,056,000 | $15,354,095 | $15,462,723 | $41,234 | 69.1% |
| Operating Expenses | $5,757,000 | $5,966,000 | $6,052,000 | $6,073,809 | $5,983,654 | $15,956 | 26.7% |
| Gross Operating Profit | $8,840,000 | $9,235,000 | $9,004,000 | $9,280,286 | $9,479,070 | $25,278 | 42.4% |
| Management Fees | 736,000 | 685,000 | 689,000 | 726,768 | 726,475 | 1,937 | 3.2 |
| Fixed Expenses | 821,000 | 921,000 | 1,008,000 | 989,571 | 872,615 | 2,327 | 3.9 |
| Total Other Expenses | $1,557,000 | $1,606,000 | $1,697,000 | $1,716,339 | $1,599,090 | $4,264 | 7.1% |
| Net Operating Income | $7,283,000 | $7,629,000 | $7,307,000 | $7,563,947 | $7,879,980 | $21,013 | 35.2% |
| FF&E | 1,066,000 | 1,109,000 | 1,105,000 | 1,118,584 | 1,118,441 | 2,983 | 5.0 |
| Net Cash Flow | $6,217,000 | $6,520,000 | $6,202,000 | $6,445,363 | $6,761,539 | $18,031 | 30.2% |
| (1) | TTM column represents the trailing 12-month period ending on October 31, 2018. |
| (2) | The increase in Net Cash Flow from TTM to Underwritten is due to (i) a lesser tax and insurance obligation and (ii) Underwritten Departmental Expenses based on the loan sponsor’s budgeted departmental expense ratio. |
| (3) | Per Room values are based on 375 guest rooms. |
| (4) | % of Total Revenue for Room Expense, Food & Beverage Expense and Other Departmental Expenses are based on their corresponding revenue line items. |
Property Management. The Embassy Suites Anaheim property is managed by the Dow Anaheim LLC, an affiliate of the Dow Hotel Company.
Escrows and Reserves. At loan origination, the borrower deposited for $10,100,000 for PIP Reverse and $250,052 for real estate taxes.
Tax Escrows– On a monthly basis, the borrower is required to escrow 1/12 of annual estimated tax payments, which currently equates to $62,513.
Insurance Escrows– The requirement for the borrower to make monthly deposits to the insurance escrow is waived provided that (i) no event of default has occurred and is continuing and (ii) either (a) the borrower provides the lender with reasonably satisfactory evidence that the property is insured pursuant to a blanket insurance policy meeting the requirements specified in the loan agreement or (b) the borrower provides the lender with reasonably satisfactory evidence that the borrower is financing any premiums pursuant to a premium finance agreement in accordance with the loan documents.
FF&E Reserves– On a monthly basis, the borrower is required to escrow the greatest of (i) an amount equal to 5.0% of the projected gross revenues for the prior month as set forth in the most recent approved annual budget, (ii) the then-current amount required by the management agreement and (iii) the then-current amount required by the franchise agreement for FF&E work.
Lockbox / Cash Management.The Embassy Suites Anaheim loan is structured with a springing lockbox and springing cash management. Upon the occurrence of a Lockbox Trigger Event (as defined below), a clearing account will be opened and maintained at a financial institution acceptable to the lender. Upon the commencement of a Lockbox Trigger Event, all revenues and sums payable by issuers of credit cards are required to be transmitted directly by such issuer into the clearing account. Thereafter, during any Trigger Period (as defined below), funds deposited into the clearing account will be swept by the clearing bank on a daily basis into the deposit account held by the lender.
A “Lockbox Trigger Event” means the occurrence of (i) an event of default and (ii) the debt service coverage falling below 1.30x for two consecutive calendar quarters.
THE INFORMATION IN THIS STRUCTURAL AND COLLATERAL TERM SHEET IS NOT COMPLETE AND MAY BE AMENDED PRIOR TO THE TIME OF SALE. THIS TERM SHEET IS NOT AN OFFER TO SELL THESE SECURITIES AND IT IS NOT A SOLICITATION OF AN OFFER TO BUY THESE SECURITIES IN ANY JURISDICTION WHERE THE OFFER OR SALE IS NOT PERMITTED. | ||||
| | | 42 of 125 | | |
| Structural and Collateral Term Sheet | Benchmark 2018-B8 | |
| Embassy Suites Anaheim | ||
A “Trigger Period” means the occurrence of (i) an event of default, (ii) a Low DSCR Period (as defined below), (iii) a mezzanine loan default or (iv) a PIP Sweep Period (as defined below).
A “Low DSCR Period” means the occurrence of (x) the Total Debt DSCR falling below 1.20x or (y) the Mortgage Loan DSCR falling below 1.74x, and shall end if (i)(a) the Total Debt DSCR is at least 1.25x and (b) the Mortgage Loan DSCR is at least 1.81x, in each case, for two consecutive calendar quarters or (ii) the borrower delivers a letter of credit to the lender in accordance with loan documents.
A “PIP Sweep Period” will occur if PIP is not completed prior to December 31, 2022.
Additional Debt.A mezzanine loan was funded concurrently and is coterminous with the Embassy Suites Anaheim loan (the “Total Debt”). The mezzanine loan has an original principal balance of $15.0 million, accrues interest at a rate of 8.6000% and is interest-only for the full term.The mezzanine loan was sold to Spruce Anaheim Hotel Lender,LLC which is an affiliate of Artemis Real Estate Partners. Based on the Prospective Market Value Upon Completion of $109.1 million as of October 11, 2020, the Total Debt Cut-off Date LTV is equal to 65.1%. Based on the UW NOI of approximately $7.9 million and UW NCF of approximately $6.8 million, the Total Debt UW NOI Debt Yield and UW NCF DSCR are 11.1% and 1.60x, respectively. The mortgage and mezzanine lenders have entered into an intercreditor agreement that governs the relation between the mortgage lenders and the mezzanine lenders.
THE INFORMATION IN THIS STRUCTURAL AND COLLATERAL TERM SHEET IS NOT COMPLETE AND MAY BE AMENDED PRIOR TO THE TIME OF SALE. THIS TERM SHEET IS NOT AN OFFER TO SELL THESE SECURITIES AND IT IS NOT A SOLICITATION OF AN OFFER TO BUY THESE SECURITIES IN ANY JURISDICTION WHERE THE OFFER OR SALE IS NOT PERMITTED. | ||||
| | | 43 of 125 | | |
| Structural and Collateral Term Sheet | Benchmark 2018-B8 | |
| Saint Louis Galleria | ||

THE INFORMATION IN THIS STRUCTURAL AND COLLATERAL TERM SHEET IS NOT COMPLETE AND MAY BE AMENDED PRIOR TO THE TIME OF SALE. THIS TERM SHEET IS NOT AN OFFER TO SELL THESE SECURITIES AND IT IS NOT A SOLICITATION OF AN OFFER TO BUY THESE SECURITIES IN ANY JURISDICTION WHERE THE OFFER OR SALE IS NOT PERMITTED. | ||||
| | | 44 of 125 | | |
| Structural and Collateral Term Sheet | Benchmark 2018-B8 | |
| Saint Louis Galleria | ||
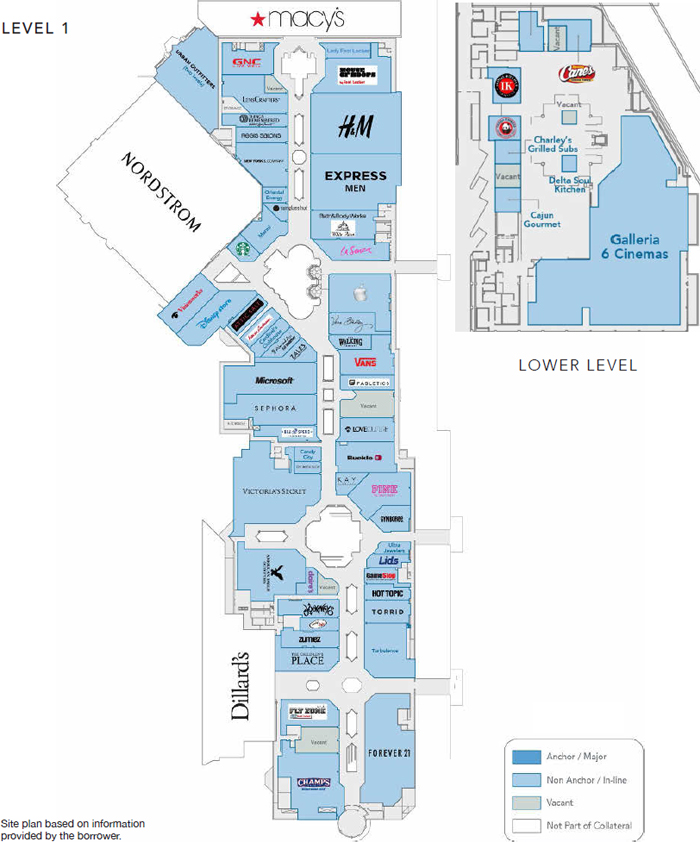
THE INFORMATION IN THIS STRUCTURAL AND COLLATERAL TERM SHEET IS NOT COMPLETE AND MAY BE AMENDED PRIOR TO THE TIME OF SALE. THIS TERM SHEET IS NOT AN OFFER TO SELL THESE SECURITIES AND IT IS NOT A SOLICITATION OF AN OFFER TO BUY THESE SECURITIES IN ANY JURISDICTION WHERE THE OFFER OR SALE IS NOT PERMITTED. | ||||
| | | 45 of 125 | | |
| Structural and Collateral Term Sheet | Benchmark 2018-B8 | |
| Saint Louis Galleria | ||

THE INFORMATION IN THIS STRUCTURAL AND COLLATERAL TERM SHEET IS NOT COMPLETE AND MAY BE AMENDED PRIOR TO THE TIME OF SALE. THIS TERM SHEET IS NOT AN OFFER TO SELL THESE SECURITIES AND IT IS NOT A SOLICITATION OF AN OFFER TO BUY THESE SECURITIES IN ANY JURISDICTION WHERE THE OFFER OR SALE IS NOT PERMITTED. | ||||
| | | 46 of 125 | | |
| Structural and Collateral Term Sheet | Benchmark 2018-B8 | |
| Saint Louis Galleria | ||
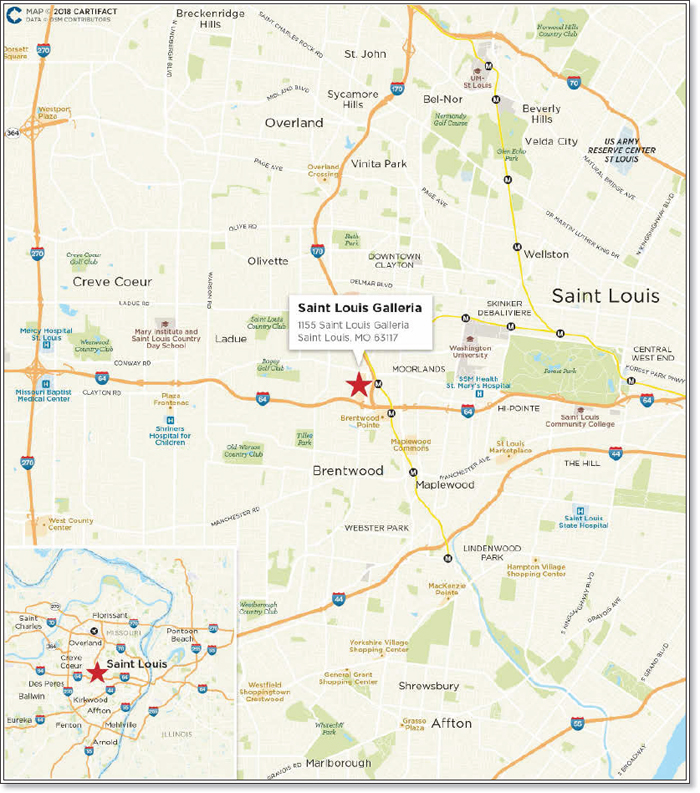
THE INFORMATION IN THIS STRUCTURAL AND COLLATERAL TERM SHEET IS NOT COMPLETE AND MAY BE AMENDED PRIOR TO THE TIME OF SALE. THIS TERM SHEET IS NOT AN OFFER TO SELL THESE SECURITIES AND IT IS NOT A SOLICITATION OF AN OFFER TO BUY THESE SECURITIES IN ANY JURISDICTION WHERE THE OFFER OR SALE IS NOT PERMITTED. | ||||
| | | 47 of 125 | | |
| Structural and Collateral Term Sheet | Benchmark 2018-B8 | |
| Saint Louis Galleria | ||
| Mortgage Loan Information | Property Information | |||
| Mortgage Loan Seller(1): | GACC | Single Asset / Portfolio: | Single Asset | |
| Original Principal Balance(2): | $55,000,000 | Title: | Fee | |
| Cut-off Date Principal Balance(2): | $55,000,000 | Property Type - Subtype: | Retail – Super Regional Mall | |
| % of Pool by IPB: | 5.2% | Net Rentable Area (SF)(5): | 465,695 | |
| Loan Purpose: | Refinance | Location: | Saint Louis, MO | |
| Borrower: | Saint Louis Galleria L.L.C. | Year Built / Renovated: | 1986 / 2011 | |
| Sponsors: | BPR OP, LP (F/K/A GGP | Occupancy(6): | 96.9% | |
| Operating Partnership, LP) | Occupancy Date: | 9/30/2018 | ||
| Interest Rate(3): | 4.99677083333333% | Number of Tenants: | 125 | |
| Note Date: | 11/1/2018 | 2015 NOI: | $25,166,866 | |
| Maturity Date: | 11/1/2028 | 2016 NOI: | $26,847,500 | |
| Interest-only Period: | 60 months | 2017 NOI: | $26,996,606 | |
| Original Term: | 120 months | TTM NOI (as of 8/2018): | $27,309,350 | |
| Original Amortization(3): | 360 months | UW Economic Occupancy: | 97.1% | |
| Amortization Type(3): | IO-Balloon | UW Revenues: | $37,642,385 | |
| Call Protection(4): | L(25),Def(90),O(5) | UW Expenses: | $10,481,622 | |
| Lockbox / Cash Management: | Hard / Springing | UW NOI: | $27,160,764 | |
| Additional Debt(2): | Yes | UW NCF: | $26,484,297 | |
| Additional Debt Balance(2): | $185,000,000 / $ 24,688,302 | Appraised Value / Per SF(5): | $465,600,000 / $1,000 | |
| Additional Debt Type(2): | Pari Passu / Mezzanine Debt | |||
| Escrows and Reserves(7) | Financial Information(2) | ||||||
| Initial | Monthly | Initial Cap | Cut-off Date Loan / SF: | $515 | |||
| Taxes: | $0 | Springing | N/A | Maturity Date Loan / SF: | $470 | ||
| Insurance: | $0 | Springing | N/A | Cut-off Date LTV: | 51.5% | ||
| Replacement Reserves: | $0 | Springing | $236,181 | Maturity Date LTV: | 47.0% | ||
| TI/LC: | $0 | Springing | $1,889,448 | UW NCF DSCR(4): | 1.67x | ||
| Other: | $1,675,345 | $0 | N/A | UW NOI Debt Yield: | 11.3% | ||
| Sources and Uses | ||||||
| Sources | Proceeds | % of Total | Uses | Proceeds | % of Total | |
| Mortgage Loan | $240,000,000 | 90.6% | Loan Payoff | $215,000,000 | 81.1% | |
| Mezzanine Notes | $25,000,000 | 9.4% | Upfront Reserves | 1,675,345 | 0.6% | |
| Closing Costs | 1,440,523 | 0.5% | ||||
| Return of Equity | 46,884,132 | 17.7% | ||||
| Total Sources | $265,000,000 | 100.0% | Total Uses | $265,000,000 | 100.0% | |
| (1) | The Saint Louis Galleria total debt was co-originated by DBNY and Société Générale Financial Corporation (“Société Générale”). |
| (2) | The Saint Louis Galleria loan is part of a whole loan evidenced by tenpari passu notes with an aggregate outstanding principal balance as of the Cut-off Date of $240.0 million. Financial Information presented in the chart above reflects the aggregate Cut-off Date balance of the $240.0 million Saint Louis Galleria Whole Loan (as defined below) |
| (3) | The Saint Louis Galleria Whole Loan, as well as the Saint Louis Galleria Mezzanine Loan (as defined below), amortizes pursuant to a fixed amortization schedule as set forth in Annex I in the Preliminary Prospectus. Debt service coverage ratios are calculated using the sum of the first 12 principal and interest payments after the expiration of the interest only period (period 61 to 72) based on the assumed principal and interest payment schedule set forth in Annex I in the Preliminary Prospectus. |
| (4) | The lockout period will be at least 25 payment dates beginning with and including the first payment date of December 1, 2018. Defeasance of the full $240.0 million Saint Louis Galleria Whole Loan is permitted after the date that is the earlier to occur of (i) November 1, 2021 or (ii) the date that is two years from the closing date of the securitization that includes the last note to be securitized. The assumed lockout period of 25 payments is based on the expected Benchmark 2018-B8 securitization closing date in December 2018. The actual lockout period may be longer. |
| (5) | Based on total collateral square feet of 465,695, which does not account for an additional 714,052 square feet at for Dillard’s (313,913 square feet), Macy’s (262,139 square feet) and Nordstrom (138,000 square feet), which are not part of the collateral. |
| (6) | The Saint Louis Galleria Occupancy includes five temporary tenants that collectively occupy 5,449 square feet (1.2% of net rentable area (“NRA”)), as well as one tenant that has a signed leases and has yet to take occupancy that accounts for 2,442 square feet (0.5% of NRA). Occupancy excludes three tenants vacating in the near term and one dark tenant, which collectively occupy 6,979 square feet (1.5% of NRA). |
| (7) | For a full description of Escrows and Reserves, please refer to “Escrows and Reserves” below. |
THE INFORMATION IN THIS STRUCTURAL AND COLLATERAL TERM SHEET IS NOT COMPLETE AND MAY BE AMENDED PRIOR TO THE TIME OF SALE. THIS TERM SHEET IS NOT AN OFFER TO SELL THESE SECURITIES AND IT IS NOT A SOLICITATION OF AN OFFER TO BUY THESE SECURITIES IN ANY JURISDICTION WHERE THE OFFER OR SALE IS NOT PERMITTED. | ||||
| | | 48 of 125 | | |
| Structural and Collateral Term Sheet | Benchmark 2018-B8 | |
| Saint Louis Galleria | ||
The Loan. The Saint Louis Galleria mortgage loan (the “Saint Louis Galleria Loan”) is a fixed rate loan secured by the borrower’s fee simple interest in a 465,695 square feet collateral portion of an approximately 1.2 million square feet super-regional mall located in Saint Louis, Missouri (the “Saint Louis Galleria”). The Saint Louis Galleria Loan is part of a whole loan comprised of ten seniorpari passunotes in the aggregate original principal balance of $240.0 million (the “Saint Louis Galleria Whole Loan”). The Saint Louis Galleria Loan is evidenced by the non-controlling Note A-1-A2, with an original principal balance and outstanding principal balance as of the Cut-off Date of $55.0 million, and is being contributed to the Benchmark 2018-B8 Trust. The remaining notes are expected to be contributed to one of more future securitization trusts, each as described below.
The relationship between the holders of the Saint Louis Galleria Whole Loan will be governed by a co-lender agreement as described under the “Description of the Mortgage Pool—The Whole Loans—The Non-Serviced Pari Passu Whole Loans” in the Preliminary Prospectus. The Saint Louis Galleria Whole Loan has a 10-year term and, following a five-year interest only period, will amortize on a 30-year schedule. The Saint Louis Galleria Whole Loan accrues interest and amortizes pursuant to a fixed amortization schedule as set forth in Annex I in the Preliminary Prospectus. The most recent prior financing of the Saint Louis Galleria was included in the COMM 2013-CCRE13 and COMM 2014-CCRE14 Trust.
| Total Debt Summary | |||||
| Note | Original Balance | Cut-off Date Balance | Note Holder | Controlling Piece | |
| A-1-A1 | $60,000,000 | $60,000,000 | DBNY | Yes | |
| A-1-A2 | $55,000,000 | $55,000,000 | Benchmark 2018-B8 | No | |
| A-1-A1, A-1-A3, A-1-A4, A-1-A5 | $46,479,245 | $46,479,245 | DBNY | No | |
| A-2-A2, A-2-A3, A-2-A4, A-2-A5 | $78,520,755 | $78,520,755 | Société Générale | No | |
| Total | $240,000,000 | $240,000,000 | |||
The Borrower.The borrower, Saint Louis Galleria L.L.C., is a single purpose Delaware limited liability company structured to be bankruptcy-remote, with two independent directors in its organizational structure.
The Loan Sponsor. The loan sponsor of the borrower and non-recourse guarantor is BPR OP, LP (F/K/A GGP Operating Partnership, LP).
The Saint Louis Galleria has historically been owned by General Growth Properties Inc. (“GGP Inc.”). In August 2018, GGP Inc. was acquired by Brookfield Property Partners L.P. (“BPY”), a large commercial real estate company, with approximately $90 billion in total assets and a diversified portfolio of office and retail assets, as well as interests in multifamily, triple net lease, industrial, hospitality, self-storage, student housing and manufactured housing assets. As a result of the acquisition, BPR was created as a public security intended to offer the economic equivalence to an investment in BPY in the form of a U.S. REIT stock. BPR is the successor of GGP Inc., which along with the Rouse Properties portfolio that BPY acquired in 2016, contains over $285 billion in assets under management within a portfolio of 163 shopping malls, across 41 states, comprising approximately 148 million square feet of gross leasable area across the U.S. In addition to the Saint Louis Galleria, other BPR malls include Ala Moana Center in Honolulu, Hawaii, Tyson’s Galleria in Washington, DC, Glendale Galleria in Los Angeles, California and Water Tower Place in Chicago, Illinois.
The Property. The Saint Louis Galleria consists of 465,695 collateral square feet of an approximately 1.2 million square feet, three-story, super regional mall located approximately eight miles west of downtown Saint Louis, Missouri. The 1.2 million square foot mall is anchored by Dillard’s, Macy’s and Nordstrom stores that are independently owned by their respective tenants and comprise 714,052 square feet, which are not part of the collateral. The collateral portion of the Saint Louis Galleria is 96.9% occupied as of September 30, 2018 by 126 retailers including nationally recognized tenants such as Apple, Forever 21, Gap, H&M, Microsoft and Victoria’s Secret as well as restaurants including The Cheesecake Factory, Weber Grill Restaurant and Five Guys Burgers & Fries, which is complemented by a food court. Additionally, the Saint Louis Galleria includes an independently run, movie theater (Galleria 6 Cinemas).
The Saint Louis Galleria was constructed in 1986 and renovated in 2011. Since January 1, 2018, 11 leases were signed at the Saint Louis Galleria (excluding temporary tenants), totaling 46,625 square feet (10.0% of collateral net rentable area) and accounting for approximately $2.1 million gross rent (9.0% of gross rent) at an average rent of $48.95 per square foot.
| Historical and Current Occupancy(1) | ||||
| 2015 | 2016 | 2017 | 9/30/2018(2) | |
| Occupancy – Excluding Anchors | 94.0% | 96.7% | 97.4% | 96.9% |
| Occupancy – Including Anchors | 97.6% | 98.7% | 99.0% | 98.8% |
| (1) | Source: borrower provided information. |
| (2) | Source: underwritten rent roll as of September 30, 2018. |
THE INFORMATION IN THIS STRUCTURAL AND COLLATERAL TERM SHEET IS NOT COMPLETE AND MAY BE AMENDED PRIOR TO THE TIME OF SALE. THIS TERM SHEET IS NOT AN OFFER TO SELL THESE SECURITIES AND IT IS NOT A SOLICITATION OF AN OFFER TO BUY THESE SECURITIES IN ANY JURISDICTION WHERE THE OFFER OR SALE IS NOT PERMITTED. | ||||
| | | 49 of 125 | | |
| Structural and Collateral Term Sheet | Benchmark 2018-B8 | |
| Saint Louis Galleria | ||
The subsequent chart represents historical sales at the Saint Louis Galleria property.
| Historical Sales for Non-Collateral Anchors | |||||||||||
| Sales Volume ($ in millions)(2) | Sales Volume (per square foot)(2) | National Average(3) | |||||||||
| Tenant | Ratings | Net Rentable Area (SF) | 2015 | 2016 | 2017 | 2015 | 2016 | 2017 | Sales Volume ($ in millions) | Sales Volume (per square foot) | |
| Moody’s/S&P/Fitch(1) | Size | ||||||||||
| Dillards | NR/NR/NR | 313,913 | $22.5 | $22.6 | $22.0 | $72 | $72 | $70 | 168,493 | $20.6 | $122 |
| Macy’s | Baa3/BBB-/BBB | 262,139 | $52.0 | $50.0 | $50.0 | $198 | $191 | $191 | 160,000 | $23.0 | $165 |
| Nordstrom | Baa1/BBB+/BBB+ | 138,000 | $35.0 | $32.5 | $28.7 | $254 | $236 | $208 | 175,000 | $43.3 | $337 |
| Total | 714,052 | $109.5 | $105.1 | $101.7 | $153 | $147 | $141 | ||||
| (1) | Certain ratings are those of the parent company. |
| (2) | Sales figures are based on estimates provided by the Loan Sponsor. |
| (3) | Source: Industry Research Report. |
| Historical Sales PSF for Collateral Tenants(1) | |||||
| 2015 | 2016 | 2017 | T-12 8/31/2018 | T-12 8/31/2013 Occupancy Cost | |
| Major Tenants (>10,000 square feet) | $386 | $380 | $321 | $304 | 19.8% |
| Galleria 6 Cinemas(2) | $396,459 | $419,059 | $416,955 | $423,954 | 20.0% |
| In-line Tenants (<10,000 square feet) (incl. Apple) | $682 | $672 | $650 | $647 | 13.0% |
| Apple | $5,427 | $5,373 | $5,520 | $6,172 | 1.2% |
| In-line Tenants (<10,000 square feet) (excl. Apple) | $574 | $565 | $537 | $520 | 16.3% |
| (1) | Historical Sales PSF for Collateral Tenants is based on thefigures provided from the Loan Sponsor’s historical sales reports. The Loan Sponsor defines comp in-line as tenants that have been open for more than 12 months as of the sales report date. Lender completed a separate analysis of tenant sales. Lender looked at “same-store” sales or tenants that have been at Saint Louis Galleria since 2015 and have reported sales figures through T-12 August 2018. Based on the lender’s “same store” sales analysis, Saint Louis Galleria generated same store in-line (<10,000 SF) sales of $734 PSF with an occupancy cost ratio of 11.7% as of T-12 Aug. 2018. Excluding the Apple store, Saint Louis Galleria generated same-store in-line (<10,000 SF) sales of $581 PSF with an occupancy cost ratio of 14.9% as of T-12 Aug. 2018. |
| (2) | Sales information represents sales per screen and is based on six screens. |
| (3) | Approximately 95.8%, 88.6%, 94.6 % and 87.8% of in-line tenants by collateral square feet reported sales in 2015, 2016, 2017 and as of trailing 12-month ended August 31, 2018, respectively. |
The Market. Saint Louis Galleria is located in an in-fill location with a minimal amount of developable land and is approximately eight miles west of downtown Saint Louis along Interstate 64. According to the appraisal, Saint Louis Galleria is the closest mall to downtown Saint Louis is home to approximately 7.0 million square feet of office space (over 35,000 employees) within the nearby neighborhood. Additionally, Washington University in Saint Louis and Saint Louis University are both located within a seven mile radius, with a combined student population of approximately 28,000 students.
The primary trade area of Saint Louis Galleria is considered to be a five-mile radius, which had a 2017 population and average household income of 293,260 and $93,375, respectively.
| Demographics(1) | 5 mile Trade Area | 7 mile Trade Area | 10 mile Trade Area | Saint Louis CBSA | State of Missouri | USA |
| 2017 Population | 293,260 | 598,543 | 948,538 | 2,838,426 | 6,158,933 | 325,372,858 |
| 2017 Estimated # of Households | 130,617 | 258,686 | 404,750 | 1,128,197 | 2,434,861 | 123,183,573 |
| 2017 Average Household Income | $93,375 | $80,012 | $77,741 | $80,927 | $69,400 | $81,217 |
| (1) | Source: Appraisal. |
THE INFORMATION IN THIS STRUCTURAL AND COLLATERAL TERM SHEET IS NOT COMPLETE AND MAY BE AMENDED PRIOR TO THE TIME OF SALE. THIS TERM SHEET IS NOT AN OFFER TO SELL THESE SECURITIES AND IT IS NOT A SOLICITATION OF AN OFFER TO BUY THESE SECURITIES IN ANY JURISDICTION WHERE THE OFFER OR SALE IS NOT PERMITTED. | ||||
| | | 50 of 125 | | |
| Structural and Collateral Term Sheet | Benchmark 2018-B8 | |
| Saint Louis Galleria | ||
The chart below summarizes Saint Louis Galleria’s competitive set. There is minimal anchor overlap between the Saint Louis Galleria and the competitive set with only West County Center sharing a Macy’s and Nordstrom anchor. No other competitor in the market has a Dillard’s. The appraisal concluded the Saint Louis Galleria to be the most dominant mall in the region followed by West County Center. The appraisal also deemed Plaza Frontenac, which is owned by an affiliate of the loan sponsor, to be a minimal competitive threat to the Saint Louis Galleria due to its different targeted customer base, smaller size and shared ownership. The other enclosed malls in the area, South County Center and Chesterfield Mall, are inferior to Saint Louis Galleria according to the appraisal.
| Competitive Set Summary(1) | ||||||
| Property | Location | Proximity (Miles) | Year Built / Renovated | Occupancy(2) | Total GLA(2) | Anchors |
| Saint Louis Galleria | Saint Louis, MO | N/A | 1986/2011 | 96.9% | 465,695 | Dillard’s, Macy’s, Nordstrom |
| St. Clair Square Mall | Fairview Heights, IL | 22.1 | 1974/2003 | 95% | 1,109,349 | Dillard’s, JC Penney, Macy’s, Sears |
| West County Center | Des Peres, MO | 7.2 | 2002 | 95% | 1,197,210 | Nordstrom, JC Penney, Macy’s Dick’s Sporting Goods |
| South County Center | Saint Louis, MO | 10.7 | 1963/2002 | 80% | 1,044,146 | Dillard’s, JC Penney, Macy’s, Sears (vacant) |
| Plaza Frontenac | Saint Louis, MO | 3.8 | 1974/2013 | 95% | 485,004 | Neiman Marcus, Saks Fifth Avenue |
| Saint Louis Premium Outlets | Chesterfield, MO | 18.8 | 2013 | 98% | 350,000 | Saks Off 5th, |
| Chesterfield Mall | Chesterfield, MO | 12.7 | 1976/2005 | 70% | 1,264,857 | Dillard’s, Macy’s Vacant Sears |
| (1) | Source: Appraisal. |
| (2) | Saint Louis Galleria figures are based on collateral of 465,695 square feet as of the September 30, 2018 rent roll. Occupancy based on the entire approximate 1.2 million Saint Louis Galleria mall is 98.8%, inclusive of the Dillard’s (313,913 square feet), Macy’s (262,139 square feet) and Nordstrom (138,000 square feet), which are not part of the collateral. The Saint Louis Galleria Occupancy includes five temporary tenants that collectively occupy 5,449 square feet (1.2% of net rentable area (“NRA”)), as well as one tenant that has a signed leases and has yet to take occupancy that accounts for 2,442 square feet (0.5% of NRA) |
THE INFORMATION IN THIS STRUCTURAL AND COLLATERAL TERM SHEET IS NOT COMPLETE AND MAY BE AMENDED PRIOR TO THE TIME OF SALE. THIS TERM SHEET IS NOT AN OFFER TO SELL THESE SECURITIES AND IT IS NOT A SOLICITATION OF AN OFFER TO BUY THESE SECURITIES IN ANY JURISDICTION WHERE THE OFFER OR SALE IS NOT PERMITTED. | ||||
| | | 51 of 125 | | |
| Structural and Collateral Term Sheet | Benchmark 2018-B8 | |
| Saint Louis Galleria | ||
| Collateral Tenant Summary | |||||||||
| Tenant | Ratings Moody’s/S&P/ Fitch(1) | Net Rentable Area (SF) | % of Total NRA | Base Rent Per Square Foot(2) | Lease Expiration(3) | % of Total Base Rent | Most Recent Sales Per Square Foot(4) | Occupancy Cost(4) | |
| Galleria 6 Cinemas | NR/NR/NR | 19,624 | 4.2% | $23.19 | 8/31/2023 | 2.0% | $423,954(5) | 20.0% | |
| H&M(6) | NR/NR/NR | 12,913 | 2.8% | (6) | 1/31/2021 | (6) | $303 | (6) | |
| Victoria’s Secret | Ba1/BB/NR | 12,892 | 2.8% | 46.00 | 1/31/2026 | 2.6% | $259 | 29.9% | |
| Urban Outfitters | NR/NR/NR | 12,623 | 2.7% | 46.93 | 1/31/2021 | 2.6% | $199 | 23.6% | |
| Forever 21 | NR/NR/NR | 11,798 | 2.5% | 62.52 | 1/31/2020 | 3.2% | $267 | 24.2% | |
| Helium Comedy Club(7) | NR/NR/NR | 11,477 | 2.5% | 13.87 | 1/31/2026 | 0.7% | N/A | N/A | |
| Express Men | NR/NR/NR | 11,467 | 2.5% | 34.80 | 1/31/2024 | 1.8% | $210 | 38.6% | |
| Footaction USA(8) | Ba1/BB+/NR | 11,114 | 2.4% | 66.84 | 1/31/2026 | 3.3% | N/A | N/A | |
| The Cheesecake Factory | NR/NR/NR | 10,104 | 2.2% | 40.00 | 1/31/2023 | 1.8% | $993 | 7.4% | |
| GAP/GAPKIDS/BABYGAP/GAPBO | Baa2/BB+/NR | 10,068 | 2.2% | 64.49 | 5/31/2025 | 2.9% | $335 | 33.8% | |
| Subtotal / Weighted Average | 124,080 | 26.6% | $42.57 | 20.8% | |||||
| Remaining Tenants(6)(9) | 327,038 | 70.2% | 56.94 | 79.2% | |||||
| Occupied Subtotal / Weighted Average | 451,118 | 96.9% | $50.43 | 100.0% | |||||
| Vacant | 14,577 | 3.1% | NAP | ||||||
| Total / Weighted Average | 465,695 | 100.0% | |||||||
| (1) | Certain ratings are those of the parent company whether or not the parent guarantees the lease. |
| (2) | Base Rent Per Square Foot reflects in-place leases based on the September 30, 2018 rent roll. Base Rent excludes rent for three tenants vacating in the near term and one dark tenant, which collectively occupy 6,979 square feet (1.5% of NRA). |
| (3) | Certain tenants may have termination or contraction options due to co-tenancy provisions in the related leases (which may become exercisable prior to the originally stated expiration date of the tenant lease). |
| (4) | Most Recent Sales Per Square Foot and Occupancy Cost are provided by the borrower and only include tenants reporting an entire 12 months of sales as of T-12 August 31, 2018. Occupancy Cost excludes utilities reimbursement. Based on a percentage of collateral square feet, approximately 70.5% of in-line tenants (<10,000 square feet) and 69.9% of total collateral tenants reported sales for the period. |
| (5) | Galleria 6 Cinemas Sales per square feet figure represents sales per screen and is based on six screens. |
| (6) | H&M is in negotiation to pay percentage rent. H&M expressed interest in expanding at Saint Louis Galleria into approx. 21,000 square feet. According to the sponsor, while the expansion is negotiated, the sponsor plans is to convert them to a percent in lieu of approximately 15% of gross sales through January 31, 2021. Additionally, according to the sponsor, negotiations are ongoing with J Crew (5,119 square feet, 1.1% of net rentable area) to convert them to a percent in lieu of 10% of gross sales through January 31, 2020. Underwritten cash flows reflects the respective tenants rent within the Percentage Rent category. |
| (7) | Helium Comedy Club, which took occupancy in January 2016, is not required to report sales information. |
| (8) | Footaction USA, which took occupancy in September 2015, is not required to report sales information.. |
| (9) | Remaining Tenants category includes five temporary tenants that collectively occupy 5,449 square feet (1.2% of NRA), as well as one tenant that has a signed leases and has yet to take occupancy that accounts for 2,442 square feet (0.5% of NRA). Remaining Tenants category excludes three tenants vacating in the near term and one dark tenant, which collectively occupy 6,979 square feet (1.5% of NRA). |
| Lease Rollover Schedule(1) | |||||||||
| Year | Number of Leases Expiring | Net Rentable Area Expiring | % of NRA Expiring | Base Rent Expiring | % of Base Rent Expiring | Cumulative Net Rentable Area Expiring | Cumulative % of NRA Expiring | Cumulative Base Rent Expiring | Cumulative % of Base Rent Expiring |
| Vacant | NAP | 14,577 | 3.1% | NAP | NAP | 14,577 | 3.1% | NAP | NAP |
| 2018 & MTM | 3 | 5,229 | 1.1% | $300,169 | 1.3% | 19,806 | 4.3% | $300,169 | 1.3% |
| 2019 | 16 | 46,347 | 10.0% | 1,781,810 | 7.8% | 66,153 | 14.2% | $2,081,979 | 9.2% |
| 2020 | 12 | 38,634 | 8.3% | 1,718,583 | 7.6% | 104,787 | 22.5% | $3,800,562 | 16.7% |
| 2021 | 27 | 87,106 | 18.7% | 4,539,431 | 20.0% | 191,893 | 41.2% | $8,339,993 | 36.7% |
| 2022 | 12 | 18,244 | 3.9% | 1,224,075 | 5.4% | 210,137 | 45.1% | $9,564,069 | 42.0% |
| 2023 | 16 | 66,618 | 14.3% | 3,107,300 | 13.7% | 276,755 | 59.4% | $12,671,369 | 55.7% |
| 2024 | 7 | 32,542 | 7.0% | 1,587,181 | 7.0% | 309,297 | 66.4% | $14,258,550 | 62.7% |
| 2025 | 8 | 31,495 | 6.8% | 2,264,926 | 10.0% | 340,792 | 73.2% | $16,523,476 | 72.6% |
| 2026 | 12 | 73,919 | 15.9% | 3,524,025 | 15.5% | 414,711 | 89.1% | $20,047,501 | 88.1% |
| 2027 | 7 | 25,214 | 5.4% | 1,596,388 | 7.0% | 439,925 | 94.5% | $21,643,889 | 95.1% |
| 2028 | 3 | 16,101 | 3.5% | 725,124 | 3.2% | 456,026 | 97.9% | $22,369,013 | 98.3% |
| 2029 & Beyond | 3 | 9,669 | 2.1% | 382,820 | 1.7% | 465,695 | 100.0% | $22,751,833 | 100.0% |
| Total | 126 | 465,695 | 100.0% | $22,751,833 | 100.0% | ||||
| (1) | Certain tenants have lease termination options that may become exercisable prior to the originally stated expiration date of the tenant lease and that are not considered in the lease rollover schedule or the site plan. |
THE INFORMATION IN THIS STRUCTURAL AND COLLATERAL TERM SHEET IS NOT COMPLETE AND MAY BE AMENDED PRIOR TO THE TIME OF SALE. THIS TERM SHEET IS NOT AN OFFER TO SELL THESE SECURITIES AND IT IS NOT A SOLICITATION OF AN OFFER TO BUY THESE SECURITIES IN ANY JURISDICTION WHERE THE OFFER OR SALE IS NOT PERMITTED. | ||||
| | | 52 of 125 | | |
| Structural and Collateral Term Sheet | Benchmark 2018-B8 | |
| Saint Louis Galleria | ||
| Operating History and Underwritten Net Cash Flow | |||||||
| 2015 | 2016 | 2017 | TTM(1) | Underwritten | Per Square Foot | %(2) | |
| Rents in Place(3) | $21,642,225 | $22,648,675 | $23,352,079 | $23,505,051 | $23,292,468 | $50.02 | 60.1% |
| Vacant Income | 0 | 0 | 0 | 0 | 1,140,069 | 2.45 | 2.9% |
| Gross Potential Rent | $21,642,225 | $22,648,675 | $23,352,079 | $23,505,051 | $24,432,538 | $52.46 | 63.0% |
| Percentage Rent | 97,128 | 35,290 | 56,473 | 78,668 | 755,659 | 1.62 | 1.9% |
| Total Reimbursements | 10,986,639 | 11,020,889 | 10,498,671 | 9,701,744 | 9,981,597 | 21.43 | 25.7% |
| Specialty Leasing Income | 2,089,966 | 2,055,726 | 1,994,393 | 2,026,772 | 2,026,772 | 4.35 | 5.2% |
| Other Income(4) | 1,065,181 | 1,706,586 | 1,385,382 | 2,091,610 | 1,585,889 | 3.41 | 4.1% |
| Net Rental Income | $35,881,139 | $37,467,166 | $37,286,999 | $37,403,846 | $38,782,454 | $83.28 | 100.0% |
| (Vacancy/Credit Loss) | (89,703) | (93,668) | (93,217) | (93,510) | (1,140,069) | (2.45) | (2.9) |
| Effective Gross Income | $35,791,437 | $37,373,498 | $37,193,781 | $37,310,336 | $37,642,385 | $80.83 | 97.1% |
| Total Operating Expenses | $10,624,571 | $10,525,998 | $10,197,175 | $10,000,986 | $10,481,622 | $22.51 | 27.8% |
| Net Operating Income | $25,166,866 | $26,847,500 | $26,996,606 | $27,309,350 | $27,160,764 | $58.32 | 72.2% |
| Total TI/LC, Capex/RR | 0 | 0 | 0 | 0 | 676,467 | 1.45 | 1.8% |
| Net Cash Flow | $25,166,866 | $26,847,500 | $26,996,606 | $27,309,350 | $26,484,297 | $56.87 | 70.4% |
| (1) | TTM represents the trailing 12-month period ending June 30, 2018. |
| (2) | % column represents percent of Net Rental Income for all revenue lines and represents percent of Effective Gross Income for the remainder of fields. |
| (3) | U/W Step Rent is based on rent steps through September 30, 2019. Base rent excludes rent from Chipotle (dark tenant), Brow Art 23 (vacating near term), Passport luggage (vacating near term) and Hyperactive by Jimmy Jazz (vacating near term) as vacant in the underwriting. |
| (4) | Underwritten Vacancy is reflective of in place economic vacancy. |
Property Management. The Saint Louis Galleria is managed by General Growth Services, Inc. an affiliate of the borrower.
Escrows and Reserves... At closing, the borrower deposited $1,593,050 for outstanding tenant improvement allowances and/or leasing commissions in connection with seven leases at the Saint Louis Galleria. At closing, the borrower also deposited $82,295 for free rent associated with tenants with executed leases for which rent payments have not yet commenced.
Tax Escrows -If the debt service coverage ratio (as calculated pursuant to the loan agreement based on the trailing four quarters) falls below 1.45x for two consecutive calendar quarters for the Saint Louis Galleria Whole Loan balance (among other conditions in certain cases), monthly escrows for real estate taxes in the amount of 1/12 of projected annual property taxes are required.
Insurance Escrows - If the debt service coverage ratio (as calculated pursuant to the loan agreement based on the trailing four quarters) falls below 1.45x for two consecutive calendar quarters for the Saint Louis Galleria Whole Loan balance (among other conditions in certain cases), insurance premiums in the amount of 1/12 of projected annual insurance premiums (also waived if blanket policy in place and there is no event of default continuing) are required.
Replacement Reserves - If the debt service coverage ratio (as calculated pursuant to the loan agreement based on the trailing four quarters) falls below 1.45x for two consecutive calendar quarters for the Saint Louis Galleria Whole Loan balance (among other conditions in certain cases), replacement funds of approximately $9,841 monthly (or $0.25 per square foot annually), subject to a cap of $236,181 (or $0.51 per square foot) are required.
TI/LC Funds - If the debt service coverage ratio (as calculated pursuant to the loan agreement based on the trailing four quarters) falls below 1.45x for two consecutive calendar quarters for the Saint Louis Galleria Whole Loan balance (among other conditions in certain cases), tenant rollover funds (approximately $78,727 monthly (or $2.03 per square foot annually), are required, subject to a cap of $1,889,448 (or $4.06 per square foot).
THE INFORMATION IN THIS STRUCTURAL AND COLLATERAL TERM SHEET IS NOT COMPLETE AND MAY BE AMENDED PRIOR TO THE TIME OF SALE. THIS TERM SHEET IS NOT AN OFFER TO SELL THESE SECURITIES AND IT IS NOT A SOLICITATION OF AN OFFER TO BUY THESE SECURITIES IN ANY JURISDICTION WHERE THE OFFER OR SALE IS NOT PERMITTED. | ||||
| | | 53 of 125 | | |
| Structural and Collateral Term Sheet | Benchmark 2018-B8 | |
| Saint Louis Galleria | ||
Lockbox / Cash Management.The Saint Louis Galleria Whole Loan are structured with a hard lockbox and springing cash management. All rents and other payments are required to be deposited directly into a clearing account controlled by the lender and are then transferred to an account controlled by the borrower until the occurrence of a Cash Sweep Period (as defined below).
During the continuance of a Cash Sweep Period, all excess cash will remain in the lender controlled account and held as additional collateral for the Saint Louis Galleria Whole Loan; provided, however, that if a Major Anchor Sweep Period (as defined below) is then continuing the excess cash will be deposited into a separate reserve account to be applied pursuant to the mortgage loan documents.
A “Cash Sweep Period” will occur upon (i) an event of default under the loan documents or mezzanine loan documents, (ii) during a bankruptcy action of the borrower, guarantor or property manager, (iii) during any Low DSCR Trigger Period (as defined below), or (iv) during the continuance of a Major Anchor Sweep Period (as defined below), and continue until such time that borrower has cured the applicable cause of the Cash Sweep Period in accordance with the terms of the mortgage loan documents.
A “Low DSCR Trigger Period” will occur in the event that, as of the end of any calendar quarter, upon (i) the debt service coverage ratio (“DSCR”) based on the Saint Louis Galleria Whole Loan is less than 1.45x or (ii) the combined DSCR based on the Saint Louis Galleria total debt inclusive of the Saint Louis Galleria Mezzanine Loan is less than 1.30x and (ii) will end on the earlier to occur of (x) the date a DSCR of at least 1.45x and a combined debt service coverage ratio of at least 1.30x is achieved for at least two consecutive calculation dates, as determined by the lender.
A “Major Anchor Sweep Period” will commence upon the earliest to occur of (a) the early termination, early cancellation or early surrender of the Major Anchor (as defined below) premises or upon borrower’s receipt of notice by a Major Anchor of its intent to effect an early termination, early cancellation or early surrender with respect its respective premises, (b) (i) Nordstrom failing to continue to operate its business in at least 130,000 square feet of its 138,000 square feet of space or (ii) Macy’s fails to continue to operate its business in at least 210,000 square feet of its 262,139 square feet, or (c) a bankruptcy action of any major anchor or its direct or indirect parent.
A Major Anchor Sweep Period will end if (a) such Major Anchor premises is owned by borrower or an affiliate of the borrower (i) at least (x) if a Major Anchor Sweep Event in is effect with respect to an Occupancy Threshold (as defined below) has been re-tenanted or renewed pursuant to their respective terms , or (ii) a portion of the Major Anchor premises equal to at least the Occupancy Threshold has been redeveloped and/or is being operated for a retail or related use and in a manner which is not inconsistent with the operation of the balance of Saint Louis Galleria and such Major Anchor premises have been re-tenanted pursuant to loan documents, or (iii) a portion of the Major Anchor premises equal to at least the Occupancy Threshold has been redeveloped and is open and being operated for a nonretail use in a manner which is complementary to the use of the balance of Saint Louis Galleria, but only if permitted by lender in its sole and absolute discretion, (b) if such Major Anchor premises is not owned by borrower or an affiliate of borrower, (i) such Major Anchor premises is otherwise occupied and open for business with one or more retail operators in at least the applicable Occupancy Threshold, (ii) such Major Anchor premises has been redeveloped and/or is being operated in a manner which is not inconsistent with the operation of the balance of the Property, as determined by lender and open for business with one or more retail operators in at least the Occupancy Threshold, or (iii) a portion of the Major Anchor premises equal to at least the Occupancy Threshold has been redeveloped and is open and being operated for a non-retail use in a manner which is not inconsistent with the use of the balance of Saint Louis Galleria, but only if approved by lender.
A “Major Anchor” is any of (a) Nordstrom, (b) Macy’s, (c) Dillard’s, or (d) any other owner, operator or tenant with respect to substantially all of any space occupied by such anchor tenants.
The “Occupancy Threshold” is 125,000 square feet of the 138,000 square foot Nordstrom space (90.6%) and 157,000 square feet of the 262,139 square feet Macy’s space (60.0%).
Additional Debt. DBNY has provided a mezzanine loan comprised of two subordinate notes with an aggregate principal balance of approximately $25.0 million (the “Saint Louis Galleria Mezzanine Loan”). The Saint Louis Galleria Mezzanine Loan is secured by a pledge of the direct equity interest in the borrower and is coterminous with the Saint Louis Galleria Whole Loan. The Saint Louis Galleria Mezzanine Loan accrues interest at a rate of 6.25000% per annum and is fully amortizing by the November 1, 2028 maturity date pursuant to a fixed amortization schedule as set forth in Annex I in the Preliminary Prospectus. The Saint Louis Galleria Mezzanine Loan is expected to be sold to a third party. Including the Saint Louis Galleria Mezzanine Loan, the cumulative Cut-off Date LTV is 56.8%, the cumulative UW NCF DSCR is 1.55x and the cumulative UW NOI Debt Yield is 10.3%. The rights of the lender of the Saint Louis Galleria Mezzanine Loan are further described under “Description of the Mortgage Pool—Additional Indebtedness—Mezzanine Indebtedness” in the Preliminary Prospectus.
Acquired Expansion Parcels.The borrower has the right, at its own expense, to acquire one or more parcels of land that constitutes an integral part of, or adjoins, the shopping center in which the Saint Louis Galleria is located and is not owned by the borrower on the date of origination of the Saint Louis Galleria Whole Loan (which shall expressly include any anchor premises or any part thereof) (“Expansion Parcel”), to become additional collateral for the Saint Louis Galleria Whole Loan whereupon, after amending the mortgage loan documents, such parcel will constitute a portion of the Saint Louis Galleria, upon satisfaction of specified conditions including, among other things, that (i) there is no event of default, (ii) the borrower acquires a fee simple or leasehold interest to the applicable Expansion Parcel and (iii) the expansion does not adversely affect the debt service coverage ratio except in a de minimis manner.
THE INFORMATION IN THIS STRUCTURAL AND COLLATERAL TERM SHEET IS NOT COMPLETE AND MAY BE AMENDED PRIOR TO THE TIME OF SALE. THIS TERM SHEET IS NOT AN OFFER TO SELL THESE SECURITIES AND IT IS NOT A SOLICITATION OF AN OFFER TO BUY THESE SECURITIES IN ANY JURISDICTION WHERE THE OFFER OR SALE IS NOT PERMITTED. | ||||
| | | 54 of 125 | | |
| Structural and Collateral Term Sheet | Benchmark 2018-B8 | |
| Saint Louis Galleria | ||
Partial Release and Substitution.The borrower may obtain the release of (A) one or more vacant, non-income producing and unimproved parcels or outlots and/or one or more parcels that adjoin the shopping center acquired by the borrower or (B) an Expansion Parcel (as defined below) upon satisfaction of specified conditions including, among other things, that (i) there is no event of default, (ii) the parcel subject to the release is not necessary for the remaining Saint Louis Galleria to comply with zoning or legal requirements, (iii) the release will not result in the downgrade, withdrawal or qualification of the then current rating assigned to any class of certificates, (iv) the release will not result in an LTV ratio that does not comply with REMIC guidelines and (v) the release will not result in a material diminution in the value of Saint Louis Galleria. In addition, with respect to an Expansion Parcel that is an anchor premises, such anchor premises may be released with the reasonable consent of Lender to another retail operator that has agreed in writing to open and operate the anchor premises for retail use within 24 months from the date of release and no reserve have been expended with respect to such anchor premises.
In addition, the borrower is permitted to obtain the release of collateral parcels (an “Exchange Parcel”) from the lien of the mortgage in exchange for the substitution of new parcels (each, an “Acquired Parcel”) as collateral for the Saint Louis Galleria Whole Loan upon 20 days prior notice, subject to the satisfaction of certain conditions, including among other things, that: (i) the Exchange Parcel is vacant, non-income producing and unimproved (or improved only by landscaping or readily re-locatable facilities), (ii) with respect to the Acquired Parcel, the borrower has delivered, among other things (a) an environmental report acceptable to lender, (b) title insurance and (c) if the Acquired Parcel is improved, a property condition report indicating that the Acquired Parcel is in good condition and (d) if repairs are recommended by the property condition report or if the environmental report discloses the presence of hazardous materials at the Acquired Parcel, cash or a guaranty from the guarantor in an amount equal to 125% of any estimated repairs or remediation costs, as applicable are provided, (iii) the LTV ratio of the remaining Saint Louis Galleria (after giving effect to such substitution) is equal to or less than 125% unless the Acquired Parcel has a fair market value equal to or greater than the fair market value of the Exchange Parcel and (iv) the substitution does not adversely affect the debt service coverage ratio of the Saint Louis Galleria except in a de minimis manner.
THE INFORMATION IN THIS STRUCTURAL AND COLLATERAL TERM SHEET IS NOT COMPLETE AND MAY BE AMENDED PRIOR TO THE TIME OF SALE. THIS TERM SHEET IS NOT AN OFFER TO SELL THESE SECURITIES AND IT IS NOT A SOLICITATION OF AN OFFER TO BUY THESE SECURITIES IN ANY JURISDICTION WHERE THE OFFER OR SALE IS NOT PERMITTED. | ||||
| | | 55 of 125 | | |
| Structural and Collateral Term Sheet | Benchmark 2018-B8 | |
| 10 Brookline Place | ||

THE INFORMATION IN THIS STRUCTURAL AND COLLATERAL TERM SHEET IS NOT COMPLETE AND MAY BE AMENDED PRIOR TO THE TIME OF SALE. THIS TERM SHEET IS NOT AN OFFER TO SELL THESE SECURITIES AND IT IS NOT A SOLICITATION OF AN OFFER TO BUY THESE SECURITIES IN ANY JURISDICTION WHERE THE OFFER OR SALE IS NOT PERMITTED. | ||||
| | | 56 of 125 | | |
| Structural and Collateral Term Sheet | Benchmark 2018-B8 | |
| 10 Brookline Place | ||
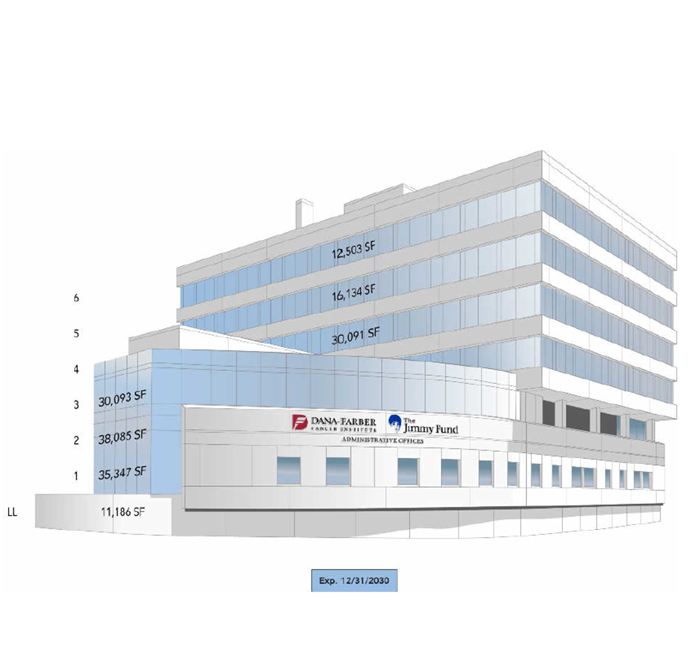
THE INFORMATION IN THIS STRUCTURAL AND COLLATERAL TERM SHEET IS NOT COMPLETE AND MAY BE AMENDED PRIOR TO THE TIME OF SALE. THIS TERM SHEET IS NOT AN OFFER TO SELL THESE SECURITIES AND IT IS NOT A SOLICITATION OF AN OFFER TO BUY THESE SECURITIES IN ANY JURISDICTION WHERE THE OFFER OR SALE IS NOT PERMITTED. | ||||
| | | 57 of 125 | | |
| Structural and Collateral Term Sheet | Benchmark 2018-B8 | |
| 10 Brookline Place | ||
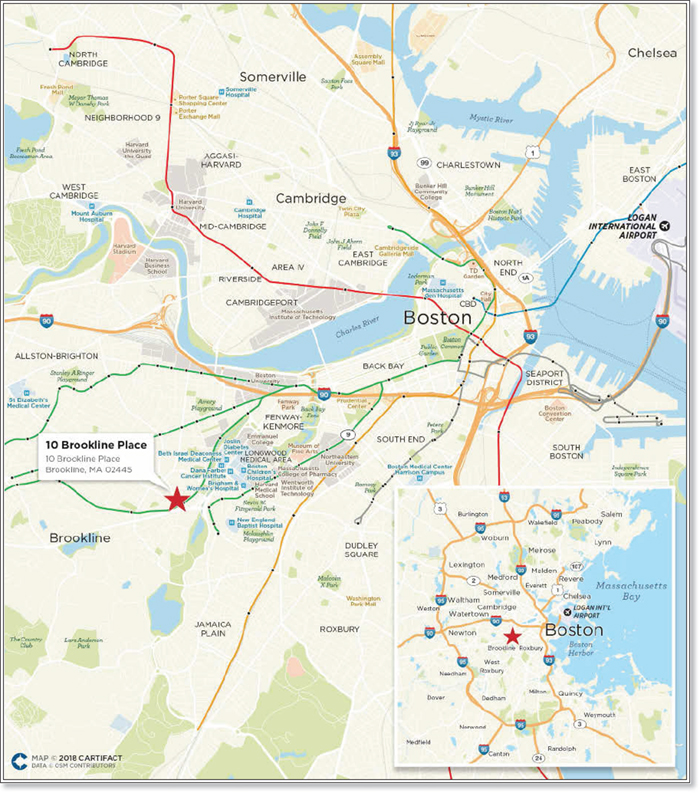
THE INFORMATION IN THIS STRUCTURAL AND COLLATERAL TERM SHEET IS NOT COMPLETE AND MAY BE AMENDED PRIOR TO THE TIME OF SALE. THIS TERM SHEET IS NOT AN OFFER TO SELL THESE SECURITIES AND IT IS NOT A SOLICITATION OF AN OFFER TO BUY THESE SECURITIES IN ANY JURISDICTION WHERE THE OFFER OR SALE IS NOT PERMITTED. | ||||
| | | 58 of 125 | | |
| Structural and Collateral Term Sheet | Benchmark 2018-B8 | |
| 10 Brookline Place | ||
| Mortgage Loan Information | Property Information | |||
| Mortgage Loan Seller: | JPMCB | Single Asset / Portfolio: | Single Asset | |
| Original Principal Balance(1): | $50,000,000 | Title: | Fee | |
| Cut-off Date Principal Balance(1): | $50,000,000 | Property Type - Subtype: | Office – Suburban | |
| % of Pool by IPB: | 4.8% | Net Rentable Area (SF): | 173,439 | |
| Loan Purpose: | Acquisition | Location: | Brookline, MA | |
| Borrower: | 10 BP Realty, LLC | Year Built / Renovated: | 1969 / 2010 | |
| Sponsors(2): | The Bulfinch Companies, Inc., | Occupancy: | 100.0% | |
| Harrison Street Real Estate Capital, | Occupancy Date: | 12/1/2018 | ||
| LLC, National Real Estate Advisors | Number of Tenants: | 1 | ||
| Interest Rate: | 4.33700% | 2015 NOI: | $8,369,126 | |
| Note Date: | 11/7/2018 | 2016 NOI: | $8,758,196 | |
| Maturity Date: | 12/1/2028 | 2017 NOI(3): | $8,723,969 | |
| Interest-only Period: | 120 months | TTM NOI (as of 9/2018)(3): | $5,367,487 | |
| Original Term: | 120 months | UW Economic Occupancy: | 98.0% | |
| Original Amortization: | None | UW Revenues: | $12,645,120 | |
| Amortization Type: | Interest Only | UW Expenses: | $4,248,959 | |
| Call Protection: | L(13),Grtr1%orYM(103),O(4) | UW NOI(3): | $8,396,161 | |
| Lockbox / Cash Management: | Hard / Springing | UW NCF: | $7,910,531 | |
| Additional Debt: | Yes | Appraised Value / Per SF(4): | $166,000,000 / $957 | |
| Additional Debt Balance(1): | $32,000,000 | Appraisal Date: | 1/1/2019 | |
| Additional Debt Type(1): | Pari Passu | |||
| Escrows and Reserves(5) | Financial Information(1) | ||||||
| Initial | Monthly | Initial Cap | Cut-off Date Loan / SF: | $473 | |||
| Taxes: | $0 | Springing | N/A | Maturity Date Loan / SF: | $473 | ||
| Insurance: | $0 | Springing | N/A | Cut-off Date LTV(4): | 49.4% | ||
| Replacement Reserves: | $0 | $0 | N/A | Maturity Date LTV(4): | 49.4% | ||
| TI/LC: | $0 | $0 | N/A | UW NCF DSCR: | 2.19x | ||
| Other: | $1,073,194 | $0 | N/A | UW NOI Debt Yield: | 10.2% | ||
| Sources and Uses | ||||||
| Sources | Proceeds | % of Total | Uses | Proceeds | % of Total | |
| Whole Loan | $82,000,000 | 49.9% | Purchase Price | $153,054,729 | 93.1% | |
| Sponsor Equity | 82,455,968 | 50.1% | Outstanding Dana Farber Leasing Costs(6) | 6,294,375 | 3.8% | |
| Closing Costs | 4,033,670 | 2.5% | ||||
| Upfront Reserves | 1,073,194 | 0.7% | ||||
| Total Sources | $164,455,968 | 100.0% | Total Uses | $164,455,968 | 100.0% | |
| (1) | The 10 Brookline Place loan is part of a whole loan evidenced by twopari passu notes with an aggregate original principal balance as of the Cut-off Date of $82.0 million. Financial Information presented in the chart above reflects the aggregate Cut-off Date balance of the $82.0 million 10 Brookline Place Whole Loan (as defined below). |
| (2) | There is no nonrecourse carveout guarantor for the 10 Brookline Place Whole Loan. For a full description of the Sponsors, please refer to “The Loan Sponsors” below. |
| (3) | The decrease in 2017 NOI to TTM NOI (as of 9/2018) and the increase from TTM NOI (as of 9/2018) to UW NOI is primarily attributable to free rent associated with the Dana Farber expansion lease for which all outstanding free rent obligations will expire in November 2019. |
| (4) | Cut-off Date LTV and Maturity Date LTV are calculated based on the “As Stabilized” appraised value, which assumes the 10 Brookline Place property achieves stabilization as of January 1, 2019, the date on which free rent disbursement begins. The “As-Is” appraised value as of May 11, 2018 is $156,000,000, which results in a Cut-off Date LTV and Maturity Date LTV of 52.6%. The appraisal also provided a “Hypothetical Go Dark” value of $131,000,000, which assumes the property is vacant and available for lease. The Cut-off Date LTV based on the “Hypothetical Go Dark” value is 62.6%. |
| (5) | For a full description of Escrows and Reserves, please refer to“Escrows and Reserves”below. |
| (6) | Outstanding Dana Farber Leasing Costs includes an approximately $6.1 million tenant improvement allowance and an approximately $171,195 free rent reserve deposit associated with outstanding leasing obligations paid to Dana Farber at closing. The Purchase Price above reflects the net purchase price excluding the aforementioned leasing obligations paid by the borrower at closing. |
THE INFORMATION IN THIS STRUCTURAL AND COLLATERAL TERM SHEET IS NOT COMPLETE AND MAY BE AMENDED PRIOR TO THE TIME OF SALE. THIS TERM SHEET IS NOT AN OFFER TO SELL THESE SECURITIES AND IT IS NOT A SOLICITATION OF AN OFFER TO BUY THESE SECURITIES IN ANY JURISDICTION WHERE THE OFFER OR SALE IS NOT PERMITTED. | ||||
| | | 59 of 125 | | |
| Structural and Collateral Term Sheet | Benchmark 2018-B8 | |
| 10 Brookline Place | ||
The Loan.The 10 Brookline Place loan is secured by a first mortgage lien on the borrower’s fee interest in a 173,439 square foot Class A office building located in Brookline, Massachusetts approximately 0.5 miles southwest of the Longwood Medical Area. The whole loan has an aggregate outstanding principal balance as of the Cut-off Date of $82.0 million (the “10 Brookline Place Whole Loan”) and is comprised of twopari passu notes, each as described below. The controlling Note A-1, with an outstanding principal balance as of the Cut-off Date of $50.0 million, will be contributed to the Benchmark 2018-B8 Trust. The non-controlling Note A-2, with an outstanding principal balance as of the Cut-off Date of $32.0 million, is currently held by JPMCB and is expected to be contributed to one or more future securitization trusts. The relationship between the holders of the 10 Brookline Place Whole Loan will be governed by a co-lender agreement as described under the “Description of the Mortgage Pool—The Whole Loans—The Serviced Pari Passu Whole Loans” in the Preliminary Prospectus. The 10 Brookline Place Whole Loan has a 10-year term and will be interest only for the entire term.
| Whole Loan Summary | |||||
| Note | Original Balance | Cut-off Date Balance | Note Holder | Controlling Piece | |
| A-1 | $50,000,000 | $50,000,000 | Benchmark 2018-B8 | Yes | |
| A-2 | 32,000,000 | 32,000,000 | JPMCB | No | |
| Total | $82,000,000 | $82,000,000 | |||
The Borrower. The borrowing entity for the 10 Brookline Place Whole Loan is 10 BP Realty, LLC, a Delaware limited liability company and a single-purpose entity structured to be bankruptcy remote with one independent director.
The Loan Sponsors.The loan sponsors of the 10 Brookline Place Whole Loan are The Bulfinch Companies, Inc. (“Bulfinch”), National Real Estate Advisors and Harrison Street Real Estate Capital, LLC (“Harrison Street”). Bulfinch is a third-generation commercial real estate investment firm specializing in the development, acquisition, repositioning and management of properties in the Greater Boston area. The firm has real estate assets of nearly $1.0 billion and currently owns and/or manages approximately 3.0 million square feet of real estate. National Real Estate Advisors is a real estate investment firm headquartered in Washington, DC that has approximately $2.7 billion of assets under management across 57 investments spanning various real estate sectors including mixed use, multifamily, office, retail, industrial, hospitality and data storage. Harrison Street is a real estate investment manager headquartered in Chicago, Illinois that manages approximately $12.2 billion in property assets and publicly traded securities. There is no nonrecourse carveout guarantor for the 10 Brookline Place Whole Loan, and the borrower is the sole party that is liable for breaches or violations of the nonrecourse carveout provisions in the loan documents or the environmental indemnity. In lieu of having a nonrecourse carveout guarantor be a party to the environmental indemnity, the borrower was required to obtain an environmental insurance policy against claims for pollution and remediation legal liability.
The Property. The 10 Brookline Place property is a six-story, 173,439 square foot Class A office building located in the Brookline Village neighborhood of Brookline, Massachusetts, approximately 0.5 miles southwest of the Longwood Medical Area (“LMA”). The LMA is an approximately 20.0 million square foot, 213-acre medical center which features 22 institutions, including three hospitals and three research centers. The 10 Brookline Place property was originally built in 1969 and was expanded in 2010. The 10 Brookline Place property has a two-level, 208-space underground parking garage in addition to approximately eight surface parking spaces, which results in a parking ratio of approximately 1.25 spaces per 1,000 square feet.
As of December 1, 2018, the 10 Brookline Place property is 100.0% leased to Dana Farber through December 2030. Founded in 1947, Dana Farber has been named the top ranked cancer hospital in New England by US News World and Report for 16 consecutive years, and is the only cancer center in the country ranked in the top five for both adult and pediatric cancer programs. Dana Farber employs more than 5,000 staff, faculty and clinicians supporting more than 640,000 annual outpatient visits, more than 1,000 hospital discharges per year and has approximately 575-600 therapeutic clinical trials open at any given time for patient accrual. Thirty-five of the 75 cancer drugs approved by the FDA in 2017 for use in cancer patients were developed at Dana Farber. Dana Farber is a principal teaching affiliate of Harvard Medical School, a federally designated Center for AIDS Research and a founding member of the Dana Farber/Harvard Cancer Center, a federally designated comprehensive cancer center.
Dana Farber has been an office tenant at the 10 Brookline Place property since 2001, housing elements of its legal, accounting and development departments, as well as the nucleus of The Jimmy Fund, the fundraising arm of the Institute. Dana Farber’s leased space has expanded at 10 Brookline Place, from approximately 88,821 square feet in July 2001 to 173,439 square feet in January 2018. Dana Farber amended and restated its lease in January 2018 and, as of October 1, 2018, occupies the entire building under a 13-year renewal term with two consecutive 10-year extension options and no termination options. At the time of acquisition, the borrower paid approximately $6.3 million to Dana Farber in connection with outstanding leasing costs. The approximately $153.1 million purchase price reflects the net amount paid to the previous owner, exclusive of the aforementioned amounts paid to Dana Farber. Additionally, the borrower was required at loan origination to reserve approximately $1.1 million for the remaining free rent associated with the Dana Farber expansion lease for January 2019 through November 2019.
THE INFORMATION IN THIS STRUCTURAL AND COLLATERAL TERM SHEET IS NOT COMPLETE AND MAY BE AMENDED PRIOR TO THE TIME OF SALE. THIS TERM SHEET IS NOT AN OFFER TO SELL THESE SECURITIES AND IT IS NOT A SOLICITATION OF AN OFFER TO BUY THESE SECURITIES IN ANY JURISDICTION WHERE THE OFFER OR SALE IS NOT PERMITTED. | ||||
| | | 60 of 125 | | |
| Structural and Collateral Term Sheet | Benchmark 2018-B8 | |
| 10 Brookline Place | ||
The 10 Brookline Place property is located on the northwest corner of Washington Street (Route 9) and Boylston Street in the Brookline Village neighborhood of Brookline, Massachusetts. Route 9 is a heavily travelled roadway that extends east to Boston and west to Worcester and provides access to Route 128/I-95.
The 10 Brookline Place property is located approximately 0.5 miles southwest of the LMA, which features medical institutions including the Beth Israel Deaconess Medical Center, Boston Children’s Hospital, Dana Farber Cancer Institute, Joslin Diabetes Center, Massachusetts College of Pharmacy and Health Sciences and Harvard Medical School. The LMA is located approximately 3.0 miles southwest of downtown Boston, adjacent to the neighborhoods of Fenway, Mission Hill, Audubon Circle and the Town of Brookline. More than 110,800 people commute to and visit the LMA daily including employees, students, volunteers, patients and visitors. The LMA is served by rail stations at opposite ends of Longwood Avenue on the MBTA Green Line D Branch and E Branch, as well as the LMA Medical Academic and Scientific Community Organization shuttle busses. The LMA is projected to grow by approximately 13,200 employees and approximately 6.9 million gross square feet by 2030.
According to the appraisal, the 10 Brookline Place property is located in the Route 128 West office submarket within the greater Boston office market. According to the appraisal, as of the first quarter of 2018, the Route 128 West office submarket, was comprised of 1,112 buildings and approximately 38.2 million square feet with an overall vacancy rate of 10.3% and average rents of approximately $27.53 per square foot. The appraisal identified 10 comparable NNN office leases in the Boston market signed between January 2016 and May 2018 and ranging in size from approximately 6,185 square feet to 143,750 square feet. Base rents for comparable NNN office leases ranged from $35.75 to $53.25 per square foot, with a weighted average of approximately $42.40 per square foot. The underwritten base rent for the property, based on the straight-line average over the remaining loan term, is $43.58 per square foot, in-line with the appraisal’s concluded NNN market rent of $42.50 per square foot.
| Historical and Current Occupancy(1) | |||
| 2015 | 2016 | 2017 | Current(2) |
| 100.0% | 100.0% | 100.0% | 100.0% |
| (1) | Historical Occupancies are as of December 31 of each respective year. |
| (2) | Current Occupancy is as of December 1, 2018. |
| Tenant Summary(1) | ||||||
| Tenant | Ratings Moody’s/S&P/Fitch(2) | Net Rentable Area (SF) | % of Total NRA | Base Rent PSF(3) | % of Total Base Rent | Lease Expiration Date |
| Dana Farber | NA1 / A / NR | 173,439 | 100.0% | $43.58 | 100.0% | 12/31/2030 |
| (1) | Based on the underwritten rent roll dated December 1, 2018. |
| (2) | Ratings represent those of revenue bonds issued through the Massachusetts Development Finance Agency. |
| (3) | Base Rent PSF represents average rent over the remaining loan term (current contractual rent is $40.37 per square foot). |
| Lease Rollover Schedule(1) | |||||||||
| Year | Number of Leases Expiring | Net Rentable Area Expiring | % of NRA Expiring | Base Rent Expiring(2) | % of Base Rent Expiring | Cumulative Net Rentable Area Expiring | Cumulative % of NRA Expiring | Cumulative Base Rent Expiring | Cumulative % of Base Rent Expiring |
| Vacant | NAP | 0 | 0.0% | NAP | NAP | 0 | 0.0% | NAP | NAP |
| 2018 & MTM | 0 | 0 | 0.0% | $0 | 0.0% | 0 | 0.0% | $0 | 0.0% |
| 2019 | 0 | 0 | 0.0% | 0 | 0.0% | 0 | 0.0% | $0 | 0.0% |
| 2020 | 0 | 0 | 0.0% | 0 | 0.0% | 0 | 0.0% | $0 | 0.0% |
| 2021 | 0 | 0 | 0.0% | 0 | 0.0% | 0 | 0.0% | $0 | 0.0% |
| 2022 | 0 | 0 | 0.0% | 0 | 0.0% | 0 | 0.0% | $0 | 0.0% |
| 2023 | 0 | 0 | 0.0% | 0 | 0.0% | 0 | 0.0% | $0 | 0.0% |
| 2024 | 0 | 0 | 0.0% | 0 | 0.0% | 0 | 0.0% | $0 | 0.0% |
| 2025 | 0 | 0 | 0.0% | 0 | 0.0% | 0 | 0.0% | $0 | 0.0% |
| 2026 | 0 | 0 | 0.0% | 0 | 0.0% | 0 | 0.0% | $0 | 0.0% |
| 2027 | 0 | 0 | 0.0% | 0 | 0.0% | 0 | 0.0% | $0 | 0.0% |
| 2028 | 0 | 0 | 0.0% | 0 | 0.0% | 0 | 0.0% | $0 | 0.0% |
| 2029 & Beyond | 1 | 173,439 | 100.0% | $7,558,229 | 100.0% | 173,439 | 100.0% | $7,558,229 | 100.0% |
| Total | 1 | 173,439 | 100.0% | $7,558,229 | 100.0% | ||||
| (1) | Based on the underwritten rent roll dated December 1, 2018. |
| (2) | Base Rent Expiring includes current contractual rent of $40.37 PSF and average rent over the remaining loan term. |
THE INFORMATION IN THIS STRUCTURAL AND COLLATERAL TERM SHEET IS NOT COMPLETE AND MAY BE AMENDED PRIOR TO THE TIME OF SALE. THIS TERM SHEET IS NOT AN OFFER TO SELL THESE SECURITIES AND IT IS NOT A SOLICITATION OF AN OFFER TO BUY THESE SECURITIES IN ANY JURISDICTION WHERE THE OFFER OR SALE IS NOT PERMITTED. | ||||
| | | 61 of 125 | | |
| Structural and Collateral Term Sheet | Benchmark 2018-B8 | |
| 10 Brookline Place | ||
| Operating History and Underwritten Net Cash Flow | |||||||
| 2015 | 2016 | 2017(1) | TTM(1)(2) | Underwritten(1) | Per Square Foot | %(3) | |
| Rents in Place(4) | $7,228,869 | $7,691,319 | $7,691,319 | $6,887,055 | $7,558,229 | $ 43.58 | 58.6% |
| Vacant Income | 0 | 0 | 0 | 0 | 0 | 0 | 0.0% |
| Total Reimbursements | 5,154,152 | 5,089,282 | 4,933,426 | 4,323,422 | 5,344,954 | 30.82 | 41.4% |
| Net Rental Income | $12,383,021 | $12,780,601 | $12,624,745 | $11,210,477 | $12,903,183 | $74.40 | 100.0% |
| (Vacancy/Credit Loss) | 0 | 0 | 0 | 0 | (258,064) | (1.49) | (2.0)% |
| (Concessions) | 0 | 0 | 0 | (1,902,992) | 0 | 0 | 0.0% |
| EGI Before Other Income | $12,383,021 | $12,780,601 | $12,624,745 | $9,307,485 | $12,645,120 | $72.91 | 98.0% |
| Other Income | 0 | 0 | 0 | 0 | 0 | 0 | 0.0% |
| Effective Gross Income | $12,383,021 | $12,780,601 | $12,624,745 | $9,307,485 | $12,645,120 | $72.91 | 98.0% |
| Total Expenses | 4,013,895 | 4,022,405 | 3,900,776 | 3,939,998 | 4,248,959 | 24.50 | 33.6% |
| Net Operating Income | $8,369,126 | $8,758,196 | $8,723,969 | $5,367,487 | $8,396,161 | $48.41 | 66.4% |
| Total TI/LC, Capex/RR | 0 | 0 | 0 | 0 | 485,629 | 2.80 | 3.8% |
| Net Cash Flow | $8,369,126 | $8,758,196 | $8,723,969 | $5,367,487 | $7,910,531 | $45.61 | 62.6% |
| (1) | The decrease in 2017 Net Operating Income to TTM Net Operating Income and the increase from TTM Net Operating Income to Underwritten Net Operating Income is primarily attributable to free rent associated with the Dana Farber expansion lease for which all outstanding free rent obligations will expire in November 2019. |
| (2) | TTM reflects the trailing 12-month period ending September 30, 2018. |
| (3) | % column represents the percent of Net Rental Income for all revenue lines and represents the percent of Effective Gross Income for the remainder of the fields. |
| (4) | Underwritten Rents in Place represents average rent over the remaining loan term (current contractual rent is $40.37 PSF). |
Property Management. The property is managed by The Bulfinch Companies, Inc., an affiliate of the borrower.
Escrows and Reserves. At loan origination, the borrower deposited $1,073,194 into a free rent reserve account to cover free rent associated with the Dana Farber lease.
Tax Escrows –The borrower is required to make monthly deposits into the real estate tax reserve in the amount of 1/12 of annual estimated real estate taxes (a) during an event of default, (b) if the debt service coverage ratio, as calculated in the loan documents and based on the trailing three-month period immediately preceding the date of determination, is less than 1.35x or (c) if the borrower fails to provide evidence satisfactory to the lender that all taxes and other charges have been paid prior to the related due date.
Insurance Escrows – The borrower is required to make monthly deposits into the insurance reserve account in the amount of 1/12 of the annual insurance premiums (a) upon an event of default or (b) if an acceptable blanket insurance policy is not in place.
Lockbox / Cash Management. The 10 Brookline Place Whole Loan is structured with a hard lockbox and springing cash management. The borrower was required at origination to send a tenant direction letter to the sole tenant at the 10 Brookline Place property instructing it to deposit all rents and payments into a lender controlled lockbox account. To the extent no Cash Sweep Period (as defined below) is continuing, all funds in the lockbox account are required to be transferred to or at the direction of the borrower. Following the occurrence and during the continuance of a Cash Sweep Period, all funds in the lockbox account are required to be swept each business day to a segregated cash management account under the control of the lender and disbursed in accordance with the loan documents. To the extent there is a Cash Sweep Period continuing, all excess cash flow after payment of debt service, required reserves and operating expenses are required to be held as additional collateral for the 10 Brookline Place Whole Loan. The lender has been granted a first priority security interest in the cash management account.
A “Cash Sweep Period” means each period commencing on the occurrence of a Cash Sweep Event and continuing until the earlier of the payment date next occurring following the related Cash Sweep Event Cure or payment in full of all principal and interest on the 10 Brookline Place Whole Loan.
A “Cash Sweep Event” means the occurrence of (i) an event of default or (ii) a DSCR Trigger Event (as defined below).
A “Cash Sweep Event Cure” means (a) with respect to clause (i) above, the acceptance by the lender of a cure of such event of default (which may not be unreasonably withheld, conditioned or delayed unless the lender has accelerated the 10 Brookline Place Whole Loan, commenced foreclosure proceedings or initiated any other remedy) or (b) with respect to a DSCR Trigger Event, a DSCR Cure Event (as defined below) has taken place.
A “DSCR Trigger Event” means the date on which the debt service coverage ratio (as calculated in the loan documents and based on the trailing three-month period immediately preceding the date of determination) is less than 1.25x.
A “DSCR Cure Event” means the debt service coverage ratio (as calculated in the loan documents and based on the trailing three-month period immediately preceding the date of determination) is at least 1.25x for two consecutive quarters.
THE INFORMATION IN THIS STRUCTURAL AND COLLATERAL TERM SHEET IS NOT COMPLETE AND MAY BE AMENDED PRIOR TO THE TIME OF SALE. THIS TERM SHEET IS NOT AN OFFER TO SELL THESE SECURITIES AND IT IS NOT A SOLICITATION OF AN OFFER TO BUY THESE SECURITIES IN ANY JURISDICTION WHERE THE OFFER OR SALE IS NOT PERMITTED. | ||||
| | | 62 of 125 | | |
| Structural and Collateral Term Sheet | Benchmark 2018-B8 | |
| 590 East Middlefield | ||

THE INFORMATION IN THIS STRUCTURAL AND COLLATERAL TERM SHEET IS NOT COMPLETE AND MAY BE AMENDED PRIOR TO THE TIME OF SALE. THIS TERM SHEET IS NOT AN OFFER TO SELL THESE SECURITIES AND IT IS NOT A SOLICITATION OF AN OFFER TO BUY THESE SECURITIES IN ANY JURISDICTION WHERE THE OFFER OR SALE IS NOT PERMITTED. | ||||
| | | 63 of 125 | | |
| Structural and Collateral Term Sheet | Benchmark 2018-B8 | |
| 590 East Middlefield | ||
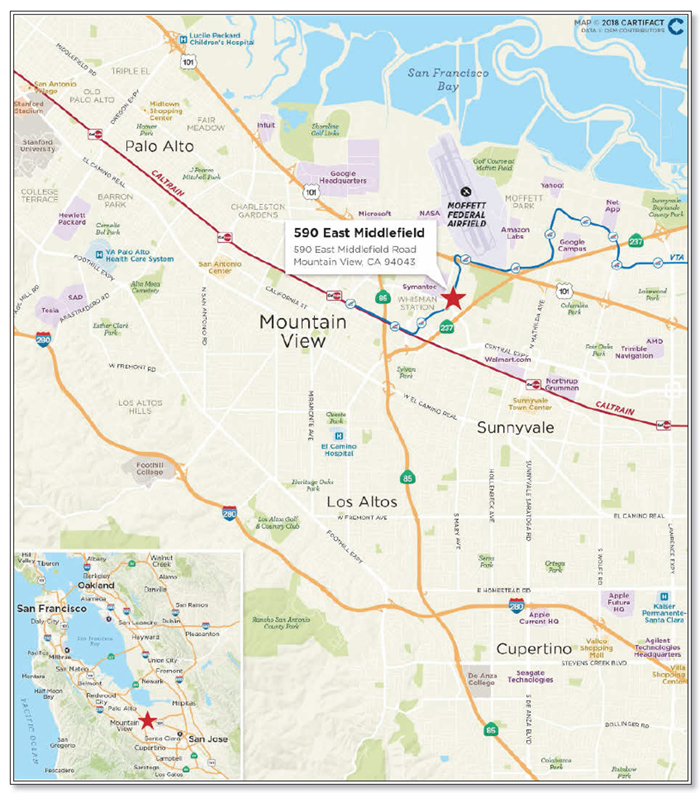
THE INFORMATION IN THIS STRUCTURAL AND COLLATERAL TERM SHEET IS NOT COMPLETE AND MAY BE AMENDED PRIOR TO THE TIME OF SALE. THIS TERM SHEET IS NOT AN OFFER TO SELL THESE SECURITIES AND IT IS NOT A SOLICITATION OF AN OFFER TO BUY THESE SECURITIES IN ANY JURISDICTION WHERE THE OFFER OR SALE IS NOT PERMITTED. | ||||
| | | 64 of 125 | | |
| Structural and Collateral Term Sheet | Benchmark 2018-B8 | |
| 590 East Middlefield | ||
| Mortgage Loan Information | Property Information | |||
| Mortgage Loan Seller: | GACC | Single Asset / Portfolio: | Single Asset | |
| Original Principal Balance: | $48,750,000 | Title: | Fee | |
| Cut-off Date Principal Balance: | $48,750,000 | Property Type - Subtype: | Office – Suburban | |
| % of Pool by IPB: | 4.6% | Net Rentable Area (SF): | 99,880 | |
| Loan Purpose: | Acquisition | Location: | Mountain View, CA | |
| Borrower: | SHP Middlefield, LLC | Year Built / Renovated: | 2012 / N/A | |
| Sponsor: | Peter Pau | Occupancy: | 100.0% | |
| Interest Rate: | 5.3690% | Occupancy Date: | 12/6/2018 | |
| Note Date: | 11/8/2018 | Number of Tenants: | 1 | |
| Final Maturity Date: | 12/6/2028 | 2015 NOI(1): | N/A | |
| Interest-only Period: | 120 months | 2016 NOI(1): | N/A | |
| Original Term: | 120 months | 2017 NOI: | $3,889,040 | |
| Original Amortization: | None | TTM NOI (as of 5/2018): | $3,789,791 | |
| Amortization Type: | Interest Only | UW Economic Occupancy: | 95.0% | |
| Call Protection: | L(24),Def(92),O(4) | UW Revenues: | $4,878,115 | |
| Lockbox / Cash Management: | Hard / Springing | UW Expenses: | $1,021,799 | |
| Additional Debt: | N/A | UW NOI: | $3,856,315 | |
| Additional Debt Balance: | N/A | UW NCF: | $3,836,339 | |
| Additional Debt Type: | N/A | Appraised Value / Per SF(2): | $80,000,000 / $801 | |
| Appraisal Date: | 7/16/2018 | |||
| Escrows and Reserves(3) | Financial Information | ||||||
| Initial | Monthly | Initial Cap | Cut-off Date Loan / SF: | $488 | |||
| Taxes: | $0 | Springing | N/A | Maturity Date Loan / SF: | $488 | ||
| Insurance: | $0 | Springing | N/A | Cut-off Date LTV(2): | 60.9% | ||
| Replacement Reserves: | $0 | Springing | N/A | Maturity Date LTV(2): | 60.9% | ||
| TI/LC: | $0 | $0 | N/A | UW NCF DSCR: | 1.45x | ||
| Other: | $0 | $0 | N/A | UW NOI Debt Yield: | 7.9% | ||
| Sources and Uses(4) | ||||||
| Sources | Proceeds | % of Total | Uses | Proceeds | % of Total | |
| Mortgage Loan | $48,750,000 | 47.4% | Purchase Price | $80,000,000 | 77.8% | |
| Bridge Loan | 20,500,000 | 19.9 | Bridge Loan Payoff | 20,848,815 | 20.3% | |
| Principal Equity Contribution | 33,622,192 | 32.7 | Closing Costs | 2,023,377 | 1.9% | |
| Total Sources | $102,872,192 | 100.0% | Total Uses | $102,872,192 | 100.0% | |
| (1) | Full year 2015 and 2016 NOI are not available as the loan sponsor acquired the 590 East Middlefield Property (as defined below) in September 2018. |
| (2) | Based on the appraised “Go Dark Value” of $75,000,000, the Cut-off Date LTV and Maturity Date LTV for the 590 East Middlefield loan is 65.0%. |
| (3) | For a full description of Escrows and Reserves, please refer to “Escrows and Reserves” below. |
| (4) | The loan sponsor purchased the 590 East Middlefield Property for $80,000,000 in September 2018. At the time of acquisition, Deutsche Bank AG, New York Branch provided a $20,500,000 bridge loan and the loan sponsor contributed $60,673,003 in equity. The 590 East Middlefield Loan was used to pay off the bridge loan and returned approximately $27,050,811 to the loan sponsor. The loan sponsor’s net equity contribution is $33,622,192. |
THE INFORMATION IN THIS STRUCTURAL AND COLLATERAL TERM SHEET IS NOT COMPLETE AND MAY BE AMENDED PRIOR TO THE TIME OF SALE. THIS TERM SHEET IS NOT AN OFFER TO SELL THESE SECURITIES AND IT IS NOT A SOLICITATION OF AN OFFER TO BUY THESE SECURITIES IN ANY JURISDICTION WHERE THE OFFER OR SALE IS NOT PERMITTED. | ||||
| | | 65 of 125 | | |
| Structural and Collateral Term Sheet | Benchmark 2018-B8 | |
| 590 East Middlefield | ||
The Loan.The 590 East Middlefield loan (the “590 East Middlefield Loan”) is secured by a first mortgage lien on the borrower’s fee interest in a 99,880 square foot office in Mountain View, California (the “590 East Middlefield Property”), which is 100.0% occupied by Omnicell, Inc. through October 15, 2022. The 590 East Middlefield Loan has an outstanding principal balance as of the Cut-off Date of $48.75 million, a 10-year term and will be interest only for the entire loan term.
The Borrower.The borrowing entity for the 590 East Middlefield Loan is SHP Middlefield, LLC, a Delaware limited liability company structured to be bankruptcy remote with one independent director.
The Loan Sponsor.The loan sponsor and the non-recourse carveout guarantor is Peter Pau, who is the Principal and co-founder of Sand Hill Property Group. Sand Hill Property Company (“SHPC”) is a real estate investment and development firm that was founded in 1988 by Peter and Susanna Pau. SHPC specializes in Silicon Valley real estate and focuses on long-term real estate investments. The company’s portfolio of assets includes shopping centers, mixed-use communities, office complexes, and hotels. SHPC has developed more than 40 projects encompassing approximately 14.0 million square feet of building area throughout the Silicon Valley area. Sand Hill Property Company self-manages all of their assets using their in-house property management division.
The Property.The 590 East Middlefield Property is a three-story Class A office building containing 99,880 square feet and located at 590 East Middlefield Road in Mountain View, California. The 590 East MiddlefieldProperty was built in 2012 and is currently 100% leased to a single tenant, Omnicell, Inc. The collateral includes a two-level parking structure containing 113 covered parking spaces and 201 surface parking spaces that surround the parking structure and office building. The 314 total spaces equate to a parking ratio of 3.14 spaces per 1,000 square feet of net rentable area.
The 590 East Middlefield Property was built-to-suit for Omnicell, Inc. and has served as the tenant’s headquarter office since construction in 1992. Omnicell, Inc. (NASDAQ: OMCL) is an American healthcare solutions company founded in 1992 in Mountain View, California, and has offices located in California, Florida, Illinois, North Carolina and Pennsylvania. Omnicell, Inc. specializes in medication and supply automation solutions for healthcare organizations and focuses heavily on pharmacy, nursing, materials management, and IT. Omnicell was founded in 1992 by Randall A. Lipps , who served as Chairman of the Board of Directors since 1992 and assumed the role of President and CEO in 2002. Omnicell, Inc. became a publicly traded company in August 2001, and since 2003, the San Jose Mercury News has recognized Omnicell, Inc. as one of the top Silicon Valley companies, as measured by market capitalization. Omnicell, Inc.’s solutions are used in over 4,000 hospitals throughout the world.
As of December 2017, Omnicell reported annual net revenue in excess of $716.2 million, up 3.4% from $692.6 million in 2016 and 47.8% from $484.6 million in 2015. The year-over-year revenue increase was primarily attributed to a 20% increase in service and other revenues, which represented 29% of total revenues in 2017. Product bookings increased by 5%, from $541 million in 2016 to $568 million in 2017, driven by the company’s growth strategies in differentiated products, new markets, and by the contributions from Omnicell’s acquisitions of Aesynt Ateb , and InPharmics in 2017. In the third quarter of 2018, Omnicell, Inc. had revenue of $204.3 million, up $17.5 million, or 9.4%, from the third quarter 2017. As of November 27, 2018, Omnicell, Inc. was valued at $73.24 per share, with market capitalization of approximately $2.883 billion.
Omnicell, Inc. signed a 10-year lease in 2012, and has a current annual base rent of $39.98 per square foot, which will increase to $41.18 per square foot on October 1, 2019. The Omnicell, Inc. lease is structured with an annual rental rate increase of 3.0% throughout the remainder of the term. The tenant has two, five-year extension options remaining with a minimum 12-month notice period, and no early termination options. The rental rate at each extension period will be equal to 95% of the greater of (i) the base rent being paid by the tenant at the end of the then-expiring term, or (ii) fair market rent.
The 590 East Middlefield Property is located in Mountain View, California, a suburban city located at the base of the San Francisco Peninsula, approximately 12 miles west of San Jose and approximately 50 miles south of San Francisco. The surrounding area is nearly 100% built out with predominantly office and R&D buildings. The City of Mountain View is home to a broad range of tech companies, from growth-stage startups to some of the largest tech companies in the world, including Google, Microsoft, Mozilla, LinkedIn, Symantec, and Intuit, among others. Googleplex, the corporate headquarters of Google, Inc. and its parent company Alphabet, Inc., is located less than five miles northwest of the 590 East Middlefield Property. The San Jose International Airport is located approximately 10 miles east of the 590 East Middlefield Property, while the San Francisco International Airport is located approximately 26 miles to the northwest. The 590 East Middlefield Property is additionally located adjacent to the Middlefield Light Rail Station.
The 590 East Middlefield Property is located in Silicon Valley, within the San Jose-Sunnyvale-Santa Clara metropolitan statistical area (the “San Jose MSA”). According to Claritas, the San Jose MSA had a March 2018 population of approximately 2.0 million. Silicon Valley, which is primarily located within Santa Clara County, encompasses 1,290 square miles of land along the southern portion of the San Francisco Peninsula and Bay Area, with a population density of 1,518 persons per square mile. Silicon Valley is one of the top research and development areas of the world, and is home to numerous corporate headquarters, startup companies, and multiple Fortune 500 corporations. The San Jose MSA had an unemployment rate as of March 2018 of 3.2%, down from 3.4% in March 2017, 3.9% in March 2016 and 4.2% in March 2015.
THE INFORMATION IN THIS STRUCTURAL AND COLLATERAL TERM SHEET IS NOT COMPLETE AND MAY BE AMENDED PRIOR TO THE TIME OF SALE. THIS TERM SHEET IS NOT AN OFFER TO SELL THESE SECURITIES AND IT IS NOT A SOLICITATION OF AN OFFER TO BUY THESE SECURITIES IN ANY JURISDICTION WHERE THE OFFER OR SALE IS NOT PERMITTED. | ||||
| | | 66 of 125 | | |
| Structural and Collateral Term Sheet | Benchmark 2018-B8 | |
| 590 East Middlefield | ||
The Mountain View office submarket contains approximately 8.8 million square feet of inventory, accounting for approximately 10.5% of the greater Silicon Valley market. According to the appraisal, as of the second quarter of 2018, the submarket had a vacancy rate of 6.6% with average asking rent of approximately $60.00 to $61.50 per square foot, NNN, which represents the highest rental rate among submarkets in the Silicon Valley market. This is a significant increase to market rental rates when the original Omnicell, Inc. lease was signed. Additionally, the appraiser concluded to a “Go Dark Value” of $75,000,000, which represents approximately 154.0% of the loan amount and land value of $23,300,000, which represents approximately 47.8% of the loan amount.
The appraisal identified seven buildings with comparable lease information to the 590 East Middlefield Property. Rental rates at the comparable buildings ranged from $53.40 to $71.40 per square foot, with a weighted average of $659.29 per square foot, NNN. The appraisal concluded to a market rental rate of $60.00 per square foot, NNN, for the 590 East Middlefield Property. The current rental rate of $39.98 per square foot, NNN. is approximately 33.4% below market.
The following table presents certain information relating to comparable leases to the 590 East Middlefield Property:
| Comparable Office Leases(1) | |||||||||
| Property Name | Location | Year Built | Distance from Subject (Mi) | Tenant Name | Lease Date | Lease Term (Mos.) | Lease Area (Sq. Ft.) | Annual Base Rent PSF | Lease Type |
| 590 East Middlefield Property | Mountain View, CA | 2012 | N/A | Omnicell, Inc. | Nov-12 | 120 | 99,880 | $39.98 | NNN |
| 605 Fairchild Drive | Mountain View, CA | 1997 | 0.7 | Coupang | Apr-17 | 62 | 53,361 | $58.80 | NNN |
| Mountain View Corporate Center | Mountain View, CA | 1988 | 1.2 | Coursera, Inc. | May-17 | 87 | 47,053 | $69.00 | NNN |
| Mountain View Corporate Center | Mountain View, CA | 1988 | 1.3 | Atlassian | Oct-17 | 120 | 67,000 | $71.40 | NNN |
| The Offices at The Village | Mountain View, CA | 2017 | 4.5 | WeWork Enterprise | Oct-17 | 120 | 239,006 | $65.40 | NNN |
| Fountain Park | Mountain View, CA | 1980 | 0.0 | JD.com | Nov-17 | 60 | 58,584 | $56.40 | NNN |
| Moffett Tower I Blds. E & F | Sunnyvale, CA | 2009 | 2.3 | Amazon.com | Jun-18 | 120 | 448,984 | $53.40 | NNN |
| Grove 221 | Sunnyvale, CA | 2018 | 2.3 | 23andMe, Inc. | Jun-18 | 144 | 154,987 | $60.00 | NNN |
| (1) | Source: Appraisal. |
| Historical and Current Occupancy(1) | |||
| 2015 | 2016 | 2017 | Current(2) |
| 100.0% | 100.0% | 100.0% | 100.0% |
| (1) | Although full year 2015 and 2016 financials are not available due to the acquisition, Omnicell, Inc. has been in occupancy at the 590 East Middlefield since 2012. |
| (2) | Current occupancy is as of December 6, 2018. |
| Tenant Summary(1) | ||||||
| Tenant | Ratings Moody’s/S&P/Fitch | Net Rentable Area (SF) | % of Total NRA | Base Rent PSF | % of Base Rent | Lease Expiration Date(2) |
| Omnicell, Inc. | NR/NR/NR | 99,880 | 100.0% | $39.98 | 100.0% | 10/15/2022 |
| (1) | Based on the underwritten rent roll. |
| (2) | Omnicell, Inc. has two, five-year renewal options through March 2032. The tenant does not have any early termination options. |
THE INFORMATION IN THIS STRUCTURAL AND COLLATERAL TERM SHEET IS NOT COMPLETE AND MAY BE AMENDED PRIOR TO THE TIME OF SALE. THIS TERM SHEET IS NOT AN OFFER TO SELL THESE SECURITIES AND IT IS NOT A SOLICITATION OF AN OFFER TO BUY THESE SECURITIES IN ANY JURISDICTION WHERE THE OFFER OR SALE IS NOT PERMITTED. | ||||
| | | 67 of 125 | | |
| Structural and Collateral Term Sheet | Benchmark 2018-B8 | |
| 590 East Middlefield | ||
| Lease Rollover Schedule(1) | |||||||||
| Year | Number of Leases Expiring | Net Rentable Area Expiring | % of NRA Expiring | Base Rent Expiring(2) | % of Base Rent Expiring | Cumulative Net Rentable Area Expiring | Cumulative % of NRA Expiring | Cumulative Base Rent Expiring(2) | Cumulative % of Base Rent Expiring |
| Vacant | NAP | 0 | 0.0% | NAP | NAP | NAP | NAP | NAP | NAP |
| 2018 & MTM | 0 | 0 | 0.0% | $0 | 0.0%% | 0 | 0.0% | $0 | 0.0% |
| 2019 | 0 | 0 | 0.0% | 0 | 0.0%% | 0 | 0.0% | $0 | 0.0% |
| 2020 | 0 | 0 | 0.0% | 0 | 0.0%% | 0 | 0.0% | $0 | 0.0% |
| 2021 | 0 | 0 | 0.0% | 0 | 0.0%% | 0 | 0.0% | $0 | 0.0% |
| 2022 | 1 | 99,880 | 100.0% | 3,993,202 | 100.0%% | 99,880 | 100.0% | $3,993,202 | 100.0% |
| 2023 | 0 | 0 | 0.0% | 0 | 0.0%% | 99,880 | 100.0% | $3,993,202 | 100.0% |
| 2024 | 0 | 0 | 0.0% | 0 | 0.0%% | 99,880 | 100.0% | $3,993,202 | 100.0% |
| 2025 | 0 | 0 | 0.0% | 0 | 0.0%% | 99,880 | 100.0% | $3,993,202 | 100.0% |
| 2026 | 0 | 0 | 0.0% | 0 | 0.0%% | 99,880 | 100.0% | $3,993,202 | 100.0% |
| 2027 | 0 | 0 | 0.0% | 0 | 0.0%% | 99,880 | 100.0% | $3,993,202 | 100.0% |
| 2028 | 0 | 0 | 0.0% | 0 | 0.0%% | 99,880 | 100.0% | $3,993,202 | 100.0% |
| 2029 & Beyond | 0 | 0 | 0.0% | 0 | 0.0%% | 99,880 | 100.0% | $3,993,202 | 100.0% |
| Total | 1 | 99,880 | 100.0%% | $3,993,202 | 100.0% | ||||
| (1) | Based on the underwritten rent roll. |
| Underwritten Net Cash Flow(1) | |||||
| 2017 | TTM 5/31/2018 | Underwritten | Per Square Foot | %(2) | |
| Rents in Place(3) | $3,791,907 | $3,838,952 | $4,113,058 | $41.18 | 80.1% |
| Vacant Income | 0 | 0 | 0 | 0.00 | 0.0 |
| Gross Potential Rent | $3,791,907 | $3,838,952 | $4,113,058 | $41.18 | 80.1% |
| Total Reimbursements(4) | 1,086,862 | 970,588 | 1,021,799 | 10.23 | 19.9 |
| Net Rental Income | $4,878,769 | $4,809,540 | $5,134,857 | $51.41 | 100.0% |
| (Vacancy)(5) | 0 | 0 | (256,743) | (2.57) | (5.03) |
| Effective Gross Income | $4,878,769 | $4,809,540 | $4,878,115 | $48.84 | 94.7% |
| Total Expenses | $989,729 | $1,019,749 | $1,021,799 | $10.23 | 20.9% |
| Net Operating Income | $3,889,040 | $3,789,791 | $3,856,315 | $38.61 | 79.1% |
| Total TI/LC, Capex/RR | 0 | 0 | 19,976 | 0.20 | 0.4 |
| Net Cash Flow | $3,889,040 | $3,789,791 | $3,836,339 | $38.41 | 78.6% |
| (1) | Full year 2015 and 2016 financials are not available as the loan sponsor acquired the 590 East Middlefield Property in September 2018. |
| (2) | % column represents percent of Net Rental Income for all revenue lines and represents percent of Effective Gross Income for the remainder of the fields. |
| (3) | Underwritten Rents in Place represents the in-place rental rate per the Omnicell, Inc. lease, plus $119,856 in step rent that will be in effect on October 1, 2019. |
| (4) | 2017 Total Reimbursements are higher than 2017 Total Expenses due to tenant true-up of prior reimbursements. |
| (5) | Underwritten Vacancy represents 5.0% of Net Rental Income, in line with the appraiser’s concluded economic vacancy of 5.0%. |
Property Management.The 590 East Middlefield Property is managed by Sand Hill Property Management, LLC, an affiliate of the borrower.
Escrows and Reserves. At origination, the borrower was not required to deposit upfront reserves.
Tax Escrows – The borrower’s obligation to escrow an amount as determined by lender (in equal monthly installments) in order to accumulate sufficient funds to pay all real estate taxes at least 30 days prior to their respective due dates is waived so long as, among other things, Omnicell, Inc. continues to pay taxes on a monthly basis.
Insurance Escrows – The borrower’s obligation to escrow an amount as determined by lender (in equal monthly installments) in order to accumulate sufficient funds to pay all insurance premiums for the policy renewal at least 30 days prior to the respective due dates is waived so long as an acceptable blanket policy is in effect or, among other things, Omnicell, Inc. pays insurance premiums on a monthly basis. An acceptable blanket policy is in effect as of the closing date.
Replacement Reserves – The borrower’s obligation to escrow an amount sufficient to pay all required annual capital expenditures is waived so long as, among other things, Omnicell, Inc. continues to pay all capital expenditures at the 590 East Middlefield Property.
THE INFORMATION IN THIS STRUCTURAL AND COLLATERAL TERM SHEET IS NOT COMPLETE AND MAY BE AMENDED PRIOR TO THE TIME OF SALE. THIS TERM SHEET IS NOT AN OFFER TO SELL THESE SECURITIES AND IT IS NOT A SOLICITATION OF AN OFFER TO BUY THESE SECURITIES IN ANY JURISDICTION WHERE THE OFFER OR SALE IS NOT PERMITTED. | ||||
| | | 68 of 125 | | |
| Structural and Collateral Term Sheet | Benchmark 2018-B8 | |
| 590 East Middlefield | ||
Lockbox / Cash Management.The 590 East Middlefield Loan is structured with a hard lockbox and springing cash management. The 590 East Middlefield Loan documents required the borrower or the property manager to deliver tenant direction letters at origination, which directed tenants to pay rent directly to a lender-controlled lockbox account and required that all other money received by the borrower or manager with respect to the 590 East Middlefield Property (other than tenant security deposits required to be held in escrow accounts) be promptly deposited within one business day into such lockbox account during the term of the 590 East Middlefield Loan. Prior to the occurrence of a Trigger Period (as defined below), all amounts in the lockbox account are required to be transferred to or at the direction of the borrower on a daily basis. Upon the occurrence and during the continuance of a Trigger Period, all funds in the lockbox account are required to be swept on each business day to a segregated cash management account under the control of the lender and disbursed in accordance with the loan documents. During a Trigger Period, all excess cash flow after payment of debt service, required reserves and operating expenses is required to be held by the lender as additional collateral for the 590 East Middlefield Loan unless such Trigger Period was due to the occurrence of a Lease Sweep Period (as defined below), in which event such funds will be disbursed to the lease sweep accounts, provided, however, that to the extent no Trigger Period is then ongoing, funds in the excess cash flow account will be made available to the borrower.
A “Trigger Period” occurs on the date that any of the following has occurred: (i) anevent of default, (ii) the date that the debt service coverage ratio, as calculated in the loan documents at the end of each calendar quarter, falls below 1.30x or (iii) the commencement of a Lease Sweep Period.
A Trigger Period may be cured (a) with respect to clause (i) above, upon the acceptance by the lender of a cure of such event of default, (b) with respect to clause (ii) above, upon the achievement of a debt service coverage ratio of 1.35x or greater for two consecutive calendar quarters and (c) with respect to clause (iii), when such Lease Sweep Period has ended.
A “Lease Sweep Period” commences upon the earlier of (a) (i) the date that is 18 months prior to the expiration of a Lease Sweep Lease (as defined below) or (ii) the date by which the Lease Sweep Tenant (as defined below) is required under the Lease Sweep Lease to give notice of its exercise of a renewal option thereunder (and such renewal has not been so exercised), (b) the borrower’s or the manager’s receipt of written notice by a Lease Sweep Tenant exercising its right to terminate the Lease Sweep Lease; (c) the early termination, early cancellation or early surrender of a Lease Sweep Lease or borrower’s receipt of notice by a Lease Sweep Tenant of its intent to effect an early termination, early cancellation or early surrender of its Lease Sweep Lease; (d) a Lease Sweep Tenant ceasing to operate its business at the 590 East Middlefield Property (i.e., “going dark”) in at least 25% or more of its space; (e) upon a monetary or material non-monetary default under a Lease Sweep Lease by a Lease Sweep Tenant beyond any applicable notice and cure period or (f) upon an insolvency proceeding of a Lease Sweep Tenant or its parent.
A Lease Sweep Period will end, (i) with respect to clause (a), (b), (c) and (d) above, upon the entirety of the lease sweep space (or applicable portion thereof) being leased pursuant to one or more qualified leases, and in lender’s reasonable judgment, sufficient funds having been accumulated in the lease sweep account to cover all anticipated leasing expenses in connection therewith, (ii) with respect to clause (a) above, on the date on which the Lease Sweep Tenant exercises its renewal or extension option with respect to all of its lease sweep space, (iii) with respect to clause (b) above, if such termination option is not exercised by the Lease Sweep Tenant, (iii) with respect to clause (e) above, on the date on which the subject default has been cured, (iv) with respect to clause (f) above, upon either the applicable insolvency proceeding having terminated or the Lease Sweep Lease having been assumed and assigned to a third party in a manner reasonably satisfactory to the lender, or (v) with respect to clause (a), (b), (c), (d), (e) and (f) above, on the date on which the following amounts have accumulated in the lease sweep reserve: (x) $40.00 per square foot with respect to any portion of the space demised under the applicable Lease Sweep Lease that has not been re-tenanted and (y) to the extent a portion of the space demised under the applicable Lease Sweep Lease has been re-tenanted pursuant to one or more qualified leases, in lender’s judgment, sufficient funds to cover all anticipated Lease Sweep Lease re-tenanting costs related to the space that has been re-tenanted.
A “Lease Sweep Lease” means the lease with Omnicell, Inc. or any replacement lease covering all or any portion of the space currently demised under such lease.
A “Lease Sweep Tenant” means any tenant under a Lease Sweep Lease or its direct or indirect parent company (if any).
THE INFORMATION IN THIS STRUCTURAL AND COLLATERAL TERM SHEET IS NOT COMPLETE AND MAY BE AMENDED PRIOR TO THE TIME OF SALE. THIS TERM SHEET IS NOT AN OFFER TO SELL THESE SECURITIES AND IT IS NOT A SOLICITATION OF AN OFFER TO BUY THESE SECURITIES IN ANY JURISDICTION WHERE THE OFFER OR SALE IS NOT PERMITTED. | ||||
| | | 69 of 125 | | |
| Structural and Collateral Term Sheet | Benchmark 2018-B8 | |
| 3 Huntington Quadrangle | ||
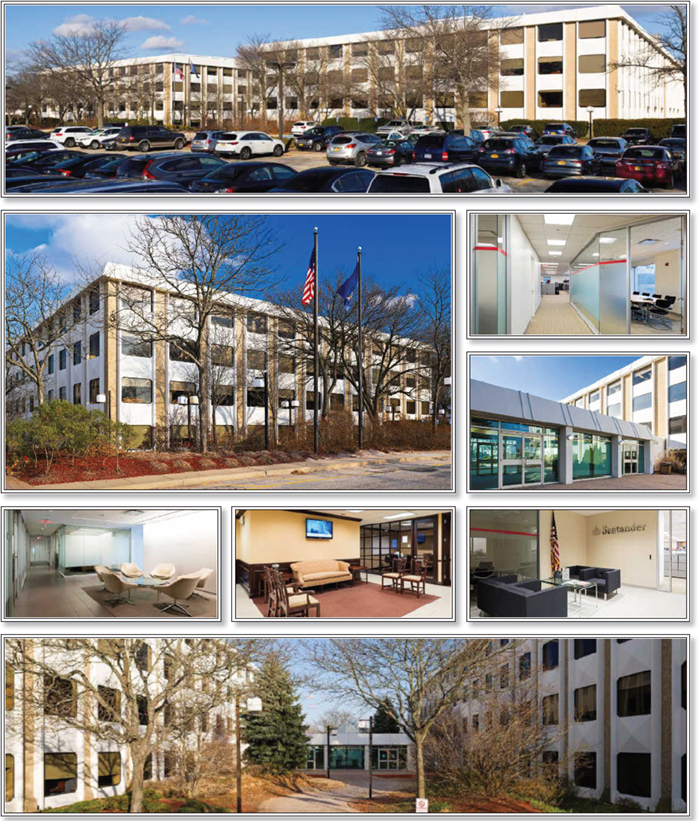
THE INFORMATION IN THIS STRUCTURAL AND COLLATERAL TERM SHEET IS NOT COMPLETE AND MAY BE AMENDED PRIOR TO THE TIME OF SALE. THIS TERM SHEET IS NOT AN OFFER TO SELL THESE SECURITIES AND IT IS NOT A SOLICITATION OF AN OFFER TO BUY THESE SECURITIES IN ANY JURISDICTION WHERE THE OFFER OR SALE IS NOT PERMITTED. | ||||
| | | 70 of 125 | | |
| Structural and Collateral Term Sheet | Benchmark 2018-B8 | |
| 3 Huntington Quadrangle | ||
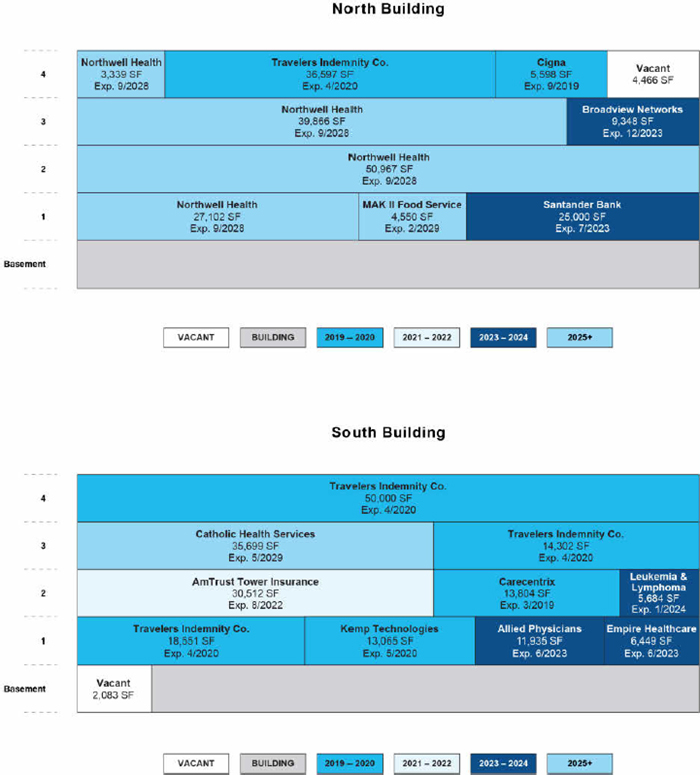
THE INFORMATION IN THIS STRUCTURAL AND COLLATERAL TERM SHEET IS NOT COMPLETE AND MAY BE AMENDED PRIOR TO THE TIME OF SALE. THIS TERM SHEET IS NOT AN OFFER TO SELL THESE SECURITIES AND IT IS NOT A SOLICITATION OF AN OFFER TO BUY THESE SECURITIES IN ANY JURISDICTION WHERE THE OFFER OR SALE IS NOT PERMITTED. | ||||
| | | 71 of 125 | | |
| Structural and Collateral Term Sheet | Benchmark 2018-B8 | |
| 3 Huntington Quadrangle | ||
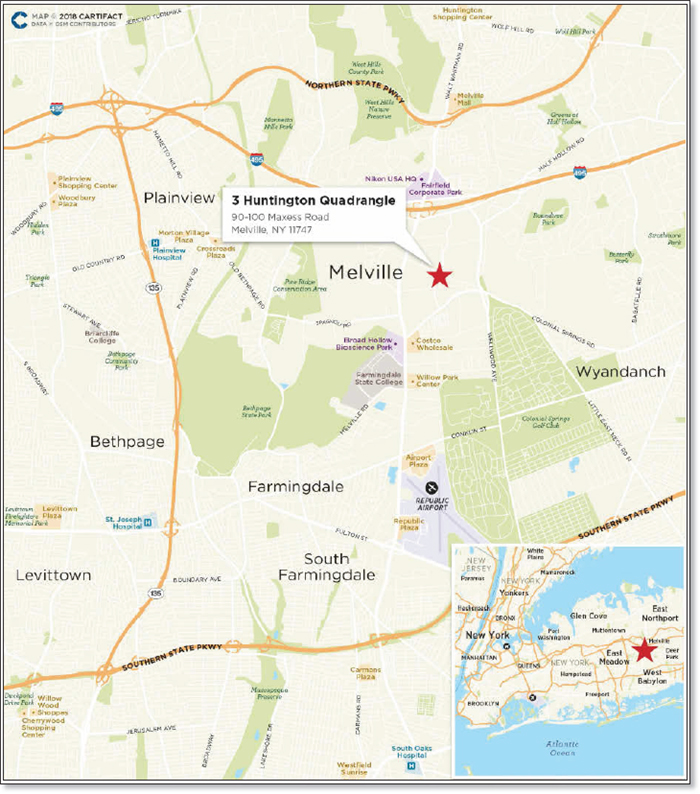
THE INFORMATION IN THIS STRUCTURAL AND COLLATERAL TERM SHEET IS NOT COMPLETE AND MAY BE AMENDED PRIOR TO THE TIME OF SALE. THIS TERM SHEET IS NOT AN OFFER TO SELL THESE SECURITIES AND IT IS NOT A SOLICITATION OF AN OFFER TO BUY THESE SECURITIES IN ANY JURISDICTION WHERE THE OFFER OR SALE IS NOT PERMITTED. | ||||
| | | 72 of 125 | | |
| Structural and Collateral Term Sheet | Benchmark 2018-B8 | |
| 3 Huntington Quadrangle | ||
| Mortgage Loan Information | Property Information | |||
| Mortgage Loan Seller: | CREFI | Single Asset / Portfolio: | Single Asset | |
| Original Principal Balance: | $47,000,000 | Title: | Fee | |
| Cut-off Date Principal Balance: | $47,000,000 | Property Type - Subtype: | Office – Suburban | |
| % of Pool by IPB: | 4.5% | Net Rentable Area (SF): | 408,917 | |
| Loan Purpose: | Acquisition | Location: | Melville, NY | |
| Borrowers: | 3HQ Owner LLC, Sutton 3HQ | Year Built / Renovated: | 1971 / 2016-2018 | |
| TIC LLC | Occupancy: | 98.4% | ||
| Sponsors: | Leibel Lederman, CLL LLC | Occupancy Date: | 10/1/2018 | |
| Interest Rate: | 5.06000% | Number of Tenants: | 13 | |
| Note Date: | 11/16/2018 | 2015 NOI(2): | N/A | |
| Maturity Date: | 12/6/2028 | 2016 NOI(2): | N/A | |
| Interest-only Period: | 120 months | 2017 NOI: | $4,983,577 | |
| Original Term: | 120 months | TTM NOI (as of 8/2018)(3): | $4,579,675 | |
| Original Amortization: | None | UW Economic Occupancy: | 95.0% | |
| Amortization Type: | Interest Only | UW Revenues: | $10,747,836 | |
| Call Protection: | L(24),Def(90),O(6) | UW Expenses: | $4,920,991 | |
| Lockbox / Cash Management(1): | Hard / In Place | UW NOI(3): | $5,826,845 | |
| Additional Debt: | Yes | UW NCF: | $5,356,669 | |
| Additional Debt Balance: | $8,000,000 | Appraised Value / Per SF: | $69,000,000 / $169 | |
| Additional Debt Type: | Mezzanine Loan | Appraisal Date: | 7/17/2018 | |
| Escrows and Reserves(4) | Financial Information | ||||||||
| Initial | Monthly | Initial Cap | Cut-off Date Loan / SF: | $115 | |||||
| Taxes: | $237,860 | $118,930 | N/A | Maturity Date Loan / SF: | $115 | ||||
| Insurance: | $23,553 | $11,776 | N/A | Cut-off Date LTV: | 68.1% | ||||
| Replacement Reserves: | $0 | $9,967 | N/A | Maturity Date LTV: | 68.1% | ||||
| TI/LC: | $2,000,000 | (1) | $3,000,000 | UW NCF DSCR: | 2.22x | ||||
| Other: | $476,538 | $0 | N/A | UW NOI Debt Yield: | 12.4% | ||||
| Sources and Uses | ||||||
| Sources | Proceeds | % of Total | Uses | Proceeds | % of Total | |
| Mortgage Loan | $47,000,000 | 64.4% | Purchase Price | $69,000,000 | 94.6% | |
| Mezzanine Loan | 8,000,000 | 11.0 | Upfront Reserves | 2,737,951 | 3.8 | |
| Sponsor Equity | 16,888,430 | 23.1 | Closing Costs | 1,221,998 | 1.7 | |
| Other Sources(5) | 1,071,519 | 1.5 | ||||
| Total Sources | $72,959,949 | 100.0% | Total Uses | $72,959,949 | 100.0% | |
| (1) | The 3 Huntington Quadrangle loan is structured with a hard lockbox and springing cash management, provided that a cash flow sweep is currently in place, effective as of the origination date of the 3 Huntington Quadrangle loan. Funds from the cash flow sweep will be deposited into the TI/LC Reserve until the balance in the TI/LC Reserve reaches $3,000,000. Subsequent to the balance in the TI/LC Reserve reaching $3,000,000, cash management will be springing upon the occurrence of a Trigger Period (as defined below) and deposits into the TI/LC Reserve will be springing (in an amount equal to approximately $42,596) upon the balance in the TI/LC Reserve falling below $500,000. As a cash flow sweep is currently in place, the chart above presents cash management as in place. |
| (2) | The seller of the 3 Huntington Quadrangle Property (as defined below) acquired the 3 Huntington Quadrangle Property in December 2016 and did not provide the borrowers with any historical financial information prior to their purchase. |
| (3) | The increase in net operating income from TTM NOI to UW NOI is primarily from (i) UW contractual rent steps of $898,033 and (ii) the third largest tenant, Catholic Health Services, executing a newly signed lease for 35,699 square feet in July and August 2018 representing $803,205 of UW base rent. |
| (4) | For a full description of Escrows and Reserves, please refer to “Escrows and Reserves” below. |
| (5) | Other Sources consists primarily of credits from the seller of the 3 Huntington Quadrangle Property for rent abatements, the transfer of security deposits, pro-rata November rent and reimbursable tenant expenses received so far in November. |
The Loan.The 3 Huntington Quadrangle loan has an outstanding principal balance as of the Cut-off Date of approximately $47.0 million and is secured by a first mortgage lien on the borrowers’ fee interest in a 408,917 square foot suburban office property located in Melville, New York (the “3 Huntington Quadrangle Property”). The 3 Huntington Quadrangle loan has a 10-year term and will be interest-only for the entire loan term.
THE INFORMATION IN THIS STRUCTURAL AND COLLATERAL TERM SHEET IS NOT COMPLETE AND MAY BE AMENDED PRIOR TO THE TIME OF SALE. THIS TERM SHEET IS NOT AN OFFER TO SELL THESE SECURITIES AND IT IS NOT A SOLICITATION OF AN OFFER TO BUY THESE SECURITIES IN ANY JURISDICTION WHERE THE OFFER OR SALE IS NOT PERMITTED. | ||||
| | | 73 of 125 | | |
| Structural and Collateral Term Sheet | Benchmark 2018-B8 | |
| 3 Huntington Quadrangle | ||
The Borrowers. The borrowing entities for the 3 Huntington Quadrangle loan are 3HQ Owner LLC and Sutton 3HQ TIC LLC, each a Delaware limited liability company and special purpose entity. The borrowers own the 3 Huntington Quadrangle Property as tenants-in-common.
The Loan Sponsors.The loan sponsors and nonrecourse carveout guarantors are Leibel Lederman and CLL LLC, a New York limited liability company, which is managed by Leibel Lederman and owned by the Lederman Family Trust (for which Leibel Lederman is the trustee) and the Chaya T. Lederman Family Trust (for which Chaya T. Lederman (Leibel Lederman’s wife) is the trustee). Leibel Lederman is a partner at Galil Management, a real estate investment and management company headquartered in New York City. Galil Management has been an investor in the New York residential real estate market for over four decades and today has a portfolio of over approximately 10,000 apartments. Leibel Lederman has an ownership interest in 92 properties, 89 of which are located in New York state.
The Property.The 3 Huntington Quadrangle Property is a 408,917 square foot suburban office property located in Melville, New York. The 3 Huntington Quadrangle Property consists of two inter-connected four story towers located on an approximately 22.2 acre site. The 3 Huntington Quadrangle Property was built in 1971 and from 2016 through 2018 underwent a renovation of approximately $12.0 million, which included renovations to the elevators, common area, bathrooms, HVAC and power and generators. There are approximately 1,513 surface parking spaces at the 3 Huntington Quadrangle Property, which result in a parking ratio of approximately 3.74 spaces per 1,000 square feet. As of October 1, 2018, the 3 Huntington Quadrangle Property was 98.4% leased to 13 tenants. Each of the three largest tenants, as well as four out of the top five tenants, are investment grade rated. In total, approximately 77.8% of UW base rent comes from tenants with an investment grade rating.
The largest tenant, Northwell Health (“Northwell”), leases 121,274 square feet (29.7% of net rentable area) through September 2028 and has been a tenant since June 2013. Northwell is the largest health care provider and private employer in New York State with over 2 million patients treated annually and more than 67,000 employees. Northwell’s health system includes, hospitals, education and research centers, emergency medical services, laboratory services, ambulatory specialty centers and diagnostic imaging. Northwell’s operating revenue for the year ended December 31, 2017 was approximately $9.96 billion. Northwell initially occupied 75,967 square feet beginning in June 2013 and subsequently expanded and added 45,307 square feet during 2016. Northwell accounts for approximately 31.2% of the underwritten base rent at the 3 Huntington Quadrangle Property, with two five-year renewal options remaining and no termination options.
The second largest tenant, Travelers Indemnity Co. (“Travelers”) (NYSE:TRV), leases 119,450 square feet (29.2% of net rentable area) through April 2020 and has been a tenant since September 2001. Travelers was founded in 1864 and is a provider of property casualty insurance for auto, home and businesses. A component of the Dow Jones Industrial Average, Travelers has approximately 30,000 employees and during 2017 had total revenue of approximately $29.0 billion. Travelers initially occupied 50,000 square feet at the 3 Huntington Quadrangle Property beginning in September 2001, and has since expanded their space twice, adding 32,853 square feet in July 2012 and 36,597 square feet in June 2014. Travelers accounts for approximately 29.4% of underwritten base rent at the 3 Huntington Quadrangle Property, with two, five-year renewal options remaining and no termination options.
The third largest tenant, Catholic Health Services, leases 35,699 square feet (8.7% of net rentable area) through May, 2029. Catholic Health Services was founded in 1997 by the Diocese of Rockville Center and is an integrated health care delivery system with health and human services agencies. Catholic Health Services includes six hospitals, three skilled nursing facilities, a regional home nursing service, hospice and a multiservice, community-based agency for persons with special needs. Catholic Health Services has approximately 18,400 employees, operates 1,928 certified hospital beds and 790 nursing home beds and had more than $2 billion in revenues during 2017. Catholic Health Services accounts for approximately 9.4% of underwritten base rent at the 3 Huntington Quadrangle Property with one, five-year renewal option remaining and no termination options.
The Market.The 3 Huntington Quadrangle Property is located in the city of Melville within the Town of Huntington in Suffolk County, New York. Melville is located within the western portion of Suffolk County and is bordered by Huntington to the north, Dix Hills to the east, Farmingdale to the south and Plainview to the west. Nassau and Suffolk Counties together comprise the Nassau-Suffolk Metropolitan Division which forms Long Island. Long Island encompasses approximately 1,200 square miles and has a population of almost 2.9 million. As of September 2018, Long Island had an unemployment rate of 3.3%, which was lower than both the New York State and national unemployment rates of 4.1% and 3.7%, respectively. Long Island’s largest employment sectors are the trade/transportation/utilities sector and education/health services sector, employing 20.7% and 19.5% of the workforce, respectively. The three largest employers in Long Island are (1) Northwell Health, the largest tenant at the 3 Huntington Quadrangle Property, (2) Henry Shein Inc., a Fortune 500 manufacturing company, and (3) Cablevision Systems Corp., which provides cable to three million New Yorkers and commercial broadband internet service to two million people.
THE INFORMATION IN THIS STRUCTURAL AND COLLATERAL TERM SHEET IS NOT COMPLETE AND MAY BE AMENDED PRIOR TO THE TIME OF SALE. THIS TERM SHEET IS NOT AN OFFER TO SELL THESE SECURITIES AND IT IS NOT A SOLICITATION OF AN OFFER TO BUY THESE SECURITIES IN ANY JURISDICTION WHERE THE OFFER OR SALE IS NOT PERMITTED. | ||||
| | | 74 of 125 | | |
| Structural and Collateral Term Sheet | Benchmark 2018-B8 | |
| 3 Huntington Quadrangle | ||
According to a third party report, the 2018 estimated population within a one-, three- and five-mile radius of the 3 Huntington Quadrangle Property was 2,929, 43,368 and 256,502, respectively. According to a third party report, the average household income within a one-, three- and five-mile radius of the 3 Huntington Quadrangle Property was $123,787, $174,334 and $160,790, respectively. According to a third party report, the 3 Huntington Quadrangle Property is located in the Western Suffolk office submarket. As of October 2018, the Western Suffolk office submarket had an inventory of approximately 24.2 million square feet with an 8.3% vacancy rate. Gross asking rents in the Western Suffolk office submarket were $26.11 per square foot as of October 2018, compared to the in-place gross rent at the 3 Huntington Quadrangle Property of $25.79. Year to date, 2018 net absorption in the Western Suffolk Office submarket was 23,125.
| Historical and Current Occupancy(1) | |||
| 2015(2) | 2016(2) | 2017 | Current(3) |
| NAV | NAV | 94.2% | 98.4% |
| (1) | Historical Occupancies are as of December 31 of each respective year. |
| (2) | The seller of the 3 Huntington Quadrangle Property acquired the 3 Huntington Quadrangle Property in December 2016 and did not provided the borrowers with any historical financial information prior to their purchase. |
| (3) | Current Occupancy is as of October 1, 2018. |
| Tenant | Ratings(2) Moody’s/S&P/Fitch | Tenant Summary(1) Net Rentable Area (SF) | % of Total NRA | Base Rent PSF | % of Total Base Rent | Lease Expiration Date | |
| Northwell Health(3) | A3 / A- / A- | 121,274 | 29.7% | $26.48 | 31.2% | 9/30/2028 | |
| Travelers(3) | A2 / A / A+ | 119,450 | 29.2% | $25.31 | 29.4% | 4/30/2020 | |
| Catholic Health Services(4) | Baa1 / A- / A- | 35,699 | 8.7% | $27.12 | 9.4% | 5/31/2029 | |
| AmTrust Tower Insurance | NA / NA / NA | 30,512 | 7.5% | $22.75 | 6.7% | 8/31/2022 | |
| Santander Bank(4) | A2 / A / A- | 25,000 | 6.1% | $25.91 | 6.3% | 7/31/2023 | |
| Carecentrix | NA / NA / NA | 13,804 | 3.4% | $29.14 | 3.9% | 3/31/2019 | |
| Kemp Technologies | NA / NA / NA | 13,065 | 3.2% | $22.66 | 2.9% | 5/31/2020 | |
| Allied Physicians(4) | NA / NA / NA | 11,935 | 2.9% | $25.32 | 2.9% | 6/30/2023 | |
| Broadview Networks(4) | NA / NA / NA | 9,348 | 2.3% | $24.21 | 2.2% | 12/31/2023 | |
| Empire Healthcare(5) | NA / NA / NA | 6,449 | 1.6% | $24.20 | 1.5% | 6/30/2023 | |
| (1) | Based on the underwritten rent roll dated October 1, 2018. |
| (2) | Ratings provided are for the parent company of the entity listed in the “Tenant” field whether or not the parent company guarantees the lease. |
| (3) | Tenant has two, five-year renewal options remaining under the terms of its lease. |
| (4) | Tenant has one, five-year renewal option remaining under the terms of its lease. |
| (5) | Empire Healthcare has an option to terminate its lease effective June 30, 2021 with notice by September 30, 2020 and payment of a $171,060 termination fee. |
| Lease Rollover Schedule(1)(2) | ||||||||||
| Year | Number of Leases Expiring | Net Rentable Area Expiring | % of NRA Expiring | Base Rent Expiring | % of Base Rent Expiring | Cumulative Net Rentable Area Expiring | Cumulative % of NRA Expiring | Cumulative Base Rent Expiring | Cumulative % of Base Rent Expiring | |
| Vacant | NAP | 6,549 | 1.6% | NAP | NAP | 6,549 | 1.6% | NAP | NAP | |
| 2018 & MTM | 0 | 0 | 0.0 | 0 | 0.0% | 6,549 | 1.6% | 0 | 0.0% | |
| 2019 | 2 | 19,402 | 4.7 | 548,999 | 5.3 | 25,951 | 6.3% | 548,999 | 5.3% | |
| 2020 | 2 | 132,515 | 32.4 | 3,319,905 | 32.3 | 158,466 | 38.8% | 3,868,904 | 37.6% | |
| 2021 | 0 | 0 | 0.0 | 0 | 0.0 | 158,466 | 38.8% | 3,868,904 | 37.6% | |
| 2022 | 1 | 30,512 | 7.5 | 694,229 | 6.7 | 188,978 | 46.2% | 4,563,134 | 44.4% | |
| 2023 | 4 | 52,732 | 12.9 | 1,332,384 | 13.0 | 241,710 | 59.1% | 5,895,517 | 57.3% | |
| 2024 | 1 | 5,684 | 1.4 | 145,960 | 1.4 | 247,394 | 60.5% | 6,041,477 | 58.7% | |
| 2025 | 0 | 0 | 0.0 | 0 | 0.0 | 247,394 | 60.5% | 6,041,477 | 58.7% | |
| 2026 | 0 | 0 | 0.0 | 0 | 0.0 | 247,394 | 60.5% | 6,041,477 | 58.7% | |
| 2027 | 0 | 0 | 0.0 | 0 | 0.0 | 247,394 | 60.5% | 6,041,477 | 58.7% | |
| 2028 | 1 | 121,274 | 29.7 | 3,211,441 | 31.2 | 368,668 | 90.2% | 9,252,919 | 89.9% | |
| 2029 & Beyond | 2 | 40,249 | 9.8 | 1,033,825 | 10.1 | 408,917 | 100.0% | 10,286,744 | 100.0% | |
| Total | 13 | 408,917 | 100.0% | 10,286,744 | 100.0% | |||||
| (1) | Based on the underwritten rent roll dated October 1, 2018. |
| (2) | Certain tenants may have termination or contraction options (which may become exercisable prior to the originally stated expiration date of the tenant lease) that are not considered in the above Lease Rollover Schedule. |
THE INFORMATION IN THIS STRUCTURAL AND COLLATERAL TERM SHEET IS NOT COMPLETE AND MAY BE AMENDED PRIOR TO THE TIME OF SALE. THIS TERM SHEET IS NOT AN OFFER TO SELL THESE SECURITIES AND IT IS NOT A SOLICITATION OF AN OFFER TO BUY THESE SECURITIES IN ANY JURISDICTION WHERE THE OFFER OR SALE IS NOT PERMITTED. | ||||
| | | 75 of 125 | | |
| Structural and Collateral Term Sheet | Benchmark 2018-B8 | |
| 3 Huntington Quadrangle | ||
| Operating History and Underwritten Net Cash Flow(1) | |||||
| 2017 | TTM(2) | Underwritten | Per Square Foot | %(3) | |
| Rents in Place(4) | $8,881,761 | $8,599,510 | $10,286,744 | $25.16 | 98.1% |
| Vacant Income | 0 | 0 | 104,951 | 0.26 | 1.0 |
| Gross Potential Rent | $8,881,761 | $8,599,510 | $10,391,695 | $25.41 | 99.1% |
| Total Reimbursements | 140,179 | 141,558 | 90,804 | 0.22 | 0.9 |
| Net Rental Income | $9,021,940 | $8,741,068 | $10,482,499 | $25.63 | 100.0% |
| (Vacancy/Credit Loss) | (0) | (0) | (524,240) | (1.28) | (5.0) |
| Other Income | 774,389 | 747,465 | 789,576 | 1.93 | %7.5 |
| Effective Gross Income | $9,796,328 | $9,488,532 | $10,747,836 | $26.28 | 102.5% |
| Total Expenses | $4,812,751 | $4,908,858 | $4,920,991 | $12.03 | 45.8% |
| Net Operating Income(5) | $4,983,577 | $4,579,675 | $5,826,845 | $14.25 | 54.2% |
| Total TI/LC, Capex/RR | 0 | 0 | 470,176 | 1.15 | 4.4% |
| Net Cash Flow | $4,983,577 | $4,579,675 | $5,356,669 | $13.10 | 49.8% |
| (1) | The seller of the 3 Huntington Quadrangle Property (as defined below) acquired the 3 Huntington Quadrangle Property in December 2016 and did not provide the borrowers with any historical financial information prior to their purchase. |
| (2) | TTM reflects the trailing 12-month period ending August 31, 2018. |
| (3) | % column represents percent of Net Rental Income for all revenue lines and represents percent of Effective Gross Income for the remainder of the fields. |
| (4) | Underwritten Rents in Place includes $158,676 in contractual rent steps through November 2019 for non-credit tenants and $739,356 related to the present value of all rent steps for three credit tenants through the earlier of the loan term or the tenant’s expiration date. |
| (5) | The increase in Net Operating Income from TTM to Underwritten is primarily due to (i) UW contractual rent steps of $898,033 and (ii) Catholic Health Services executing a newly signed lease for 35,699 square feet in July and August 2018 representing $968,320 of UW base rent. |
Property Management. The property is managed by TL Asset Management Corp., a New York corporation an unaffiliated management company.
Escrows and Reserves. At origination, the borrowers deposited into escrow $2,000,000 for tenant improvements and leasing commissions, $376,603 for outstanding free rent, $237,860 for real estate taxes, $99,935 related to deferred maintenance and $23,553 for insurance premiums.
Tax Escrows – On a monthly basis, the borrowers are required to escrow 1/12 of the annual estimated tax payments, which currently equates to $118,930.
Insurance Escrows - On a monthly basis, the borrowers are required to escrow 1/12 of the annual insurance premiums, which currently equates to $11,776.
Replacement Reserves - On a monthly basis, the borrowers are required to escrow $9,967 (approximately $0.29 per square foot annually) for replacement reserves. The reserve is not subject to a cap.
TI/LC Reserves – Effective as of the origination date of the 3 Huntington Quadrangle loan, a cash flow sweep is in place. Funds from the cash flow sweep will be deposited into the TI/LC Reserve until the balance in the TI/LC Reserve reaches $3,000,000 (the “TI/LC Reserve Cap”). Subsequent to the balance in the TI/LC Reserve reaching $3,000,000, the cash flow sweep will no longer be in place and deposits into the TI/LC Reserve will be springing upon the reserve balance falling below $500,000. To the extent the balance in the TI/LC reserve is below $500,000, on a monthly basis the borrowers are required to escrow $42,596 (approximately $1.25 per square foot annually) subject to the TI/LC Reserve Cap.
Lockbox / Cash Management.The 3 Huntington Quadrangle loan is structured with a hard lockbox and in place cash management, provided that the cash sweep currently in place effective as of the origination date of the 3 Huntington Quadrangle loan, will continue until the balance in the TI/LC reserve reaches $3,000,000 and then cease to exist. Subsequent to the balance of the TI/LC Reserve reaching $3,000,000, the 3 Huntington Quadrangle loan will be subject to springing cash management upon the occurrence of a Trigger Period (as defined below). All rents and other payments are required to be deposited directly into a clearing account controlled by the lender. Except during the continuance of a Trigger Period, all funds in the clearing account will be disbursed to borrowers on each business day. During the continuance of a Trigger Period, funds in the clearing account are required to be transferred on each business day into a deposit account controlled by the lender and disbursed in accordance with the loan documents.
THE INFORMATION IN THIS STRUCTURAL AND COLLATERAL TERM SHEET IS NOT COMPLETE AND MAY BE AMENDED PRIOR TO THE TIME OF SALE. THIS TERM SHEET IS NOT AN OFFER TO SELL THESE SECURITIES AND IT IS NOT A SOLICITATION OF AN OFFER TO BUY THESE SECURITIES IN ANY JURISDICTION WHERE THE OFFER OR SALE IS NOT PERMITTED. | ||||
| | | 76 of 125 | | |
| Structural and Collateral Term Sheet | Benchmark 2018-B8 | |
| 3 Huntington Quadrangle | ||
A “Trigger Period” means a period (A) commencing upon the earliest to occur of (i) an event of default, (ii) the debt yield falling below 7.0%, (iii) a Specified Tenant Trigger Period (as defined below); (iv) a Mezzanine Loan Cash Sweep Period (as defined below) and (v) the closing date of the 3 Huntington Quadrangle loan (the “Closing Date TI/LC Reserve Trigger Period”) and (B) expiring upon (v) if the Trigger Period is caused solely by clause (i) above, the acceptance by the lender of a cure of such event of default, if applicable; (w) if the Trigger Period is caused solely by clause (ii) above, the debt yield being equal to or greater than 7.5% for two consecutive calendar quarters; (x) with respect to a Trigger Period caused by (iii) above, the lender’s receipt of reasonably acceptable evidence demonstrating the cure of the applicable event giving rise to the Specified Tenant Trigger Period; (y) if the Trigger Period is caused solely by clause (iv) above, the expiration of the applicable Mezzanine Loan Cash Sweep Period and (z) if the Trigger Period is caused solely by clause (v) above, the date on which the amount of funds on deposit in the TI/LC Reserve account is equal to or greater than $3,000,000. If a Closing Date TI/LC Reserve Trigger Period is continuing (and no event of default is outstanding), all excess cash remaining after payment of mortgage and mezzanine loan debt service, reserves and operating expenses (the “Excess Cash Flow”) will be deposited in the TI/LC Reserve account. If the only Trigger Period outstanding is the Mezzanine Loan Cash Sweep Period, all Excess Cash Flow will be distributed to the mezzanine lender. If any Trigger Period other than the Closing Date TI/LC Reserve Trigger Period or the Mezzanine Loan Cash Sweep Period is outstanding, all Excess Cash Flow will be held by lender as additional security for the 3 Huntington Quadrangle loan.
A “Specified Tenant Trigger Period” means a period commencing upon the first to occur of (i) the Specified Tenant being in default under its lease, (ii) the Specified Tenant failing to be in actual, physical possession of its space, failing to be open to the public for business during customary hours and/or “going dark” in its space (or applicable portion thereof), (iii) the Specified Tenant giving notice that it is terminating its lease for all or any portion of its space, (iv) any termination or cancellation of a Specified Tenant lease (including, without limitation, rejection in any bankruptcy or similar insolvency proceeding) and/or a Specified Tenant lease otherwise failing to be in full force and effect, (v) any bankruptcy or similar insolvency of the Specified Tenant and (vi) the failure of a Specified Tenant to provide written notice of renewal of its lease for a term of at least five years by the earlier to occur of (a) one year prior to its then current lease expiration, (b) the date required to exercise a renewal under such Specified Tenant’s lease or (c) March 6, 2028 (i.e., the date that is nine months prior to the maturity date of the 3 Huntington Quadrangle loan).
A “Specified Tenant” means (a) Northwell Health, (b) Travelers, (c) any lease which individually or when aggregated with all other leases at the 3 Huntington Quadrangle Property with the same tenant or its affiliate, either (y) accounts for 20% or more of the total rental income for the 3 Huntington Quadrangle Property, or (z) demises 20% of the 3 Huntington Quadrangle Property’s gross leasable area and (d) any other lessees and any guarantors of the space demised to the foregoing persons.
A “Mezzanine Loan Cash Sweep Period” means a period (A) commencing on the mezzanine lender’s delivery of notice to the lender stating (i) an event of default under the mezzanine loan documents has occurred and is continuing and/or (ii) that the mezzanine lender is entitled to sums in excess and/or addition to the mezzanine loan monthly debt service under the mezzanine loan documents and (B) expiring upon the mezzanine lender’s delivery of notice to the lender that the circumstances referred to in clauses (i) and (ii) above are no longer in effect.
Additional Debt.Safety National Casualty Corporation, a third-party lender, has provided an $8.0 million mezzanine loan that is coterminous with the 3 Huntington Quadrangle loan. The mezzanine loan has an 8.91000% coupon and is interest-only for the entire loan term. Including the mezzanine loan, the cumulative Cut-off Date LTV, cumulative UW NCF DSCR and cumulative UW NOI Debt Yield are 79.7%, 1.71x and 10.6%, respectively. The mortgage and mezzanine lenders have entered into an intercreditor agreement that governs the relationship between the mortgage and mezzanine lenders.
THE INFORMATION IN THIS STRUCTURAL AND COLLATERAL TERM SHEET IS NOT COMPLETE AND MAY BE AMENDED PRIOR TO THE TIME OF SALE. THIS TERM SHEET IS NOT AN OFFER TO SELL THESE SECURITIES AND IT IS NOT A SOLICITATION OF AN OFFER TO BUY THESE SECURITIES IN ANY JURISDICTION WHERE THE OFFER OR SALE IS NOT PERMITTED. | ||||
| | | 77 of 125 | | |
| Structural and Collateral Term Sheet | Benchmark 2018-B8 | |
| Moffett Towers – Buildings E,F,G | ||

THE INFORMATION IN THIS STRUCTURAL AND COLLATERAL TERM SHEET IS NOT COMPLETE AND MAY BE AMENDED PRIOR TO THE TIME OF SALE. THIS TERM SHEET IS NOT AN OFFER TO SELL THESE SECURITIES AND IT IS NOT A SOLICITATION OF AN OFFER TO BUY THESE SECURITIES IN ANY JURISDICTION WHERE THE OFFER OR SALE IS NOT PERMITTED. | ||||
| | | 78 of 125 | | |
| Structural and Collateral Term Sheet | Benchmark 2018-B8 | |
| Moffett Towers – Buildings E,F,G | ||
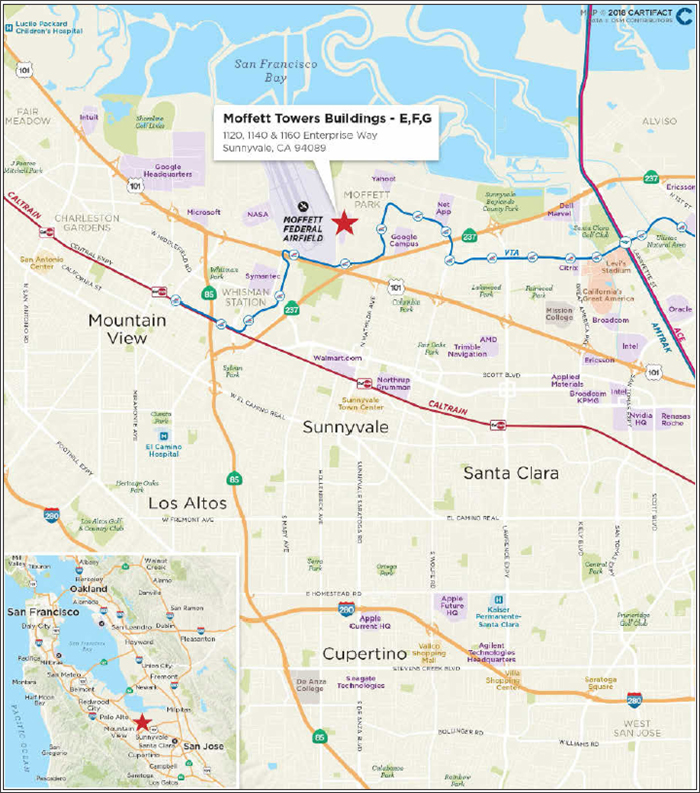
THE INFORMATION IN THIS STRUCTURAL AND COLLATERAL TERM SHEET IS NOT COMPLETE AND MAY BE AMENDED PRIOR TO THE TIME OF SALE. THIS TERM SHEET IS NOT AN OFFER TO SELL THESE SECURITIES AND IT IS NOT A SOLICITATION OF AN OFFER TO BUY THESE SECURITIES IN ANY JURISDICTION WHERE THE OFFER OR SALE IS NOT PERMITTED. | ||||
| | | 79 of 125 | | |
| Structural and Collateral Term Sheet | Benchmark 2018-B8 | |
| Moffett Towers – Buildings E,F,G | ||
| Mortgage Loan Information | Property Information | |||
| Mortgage Loan Seller(1): | GACC | Single Asset / Portfolio: | Single Asset | |
| Original Principal Balance(2): | $46,800,000 | Title: | Fee | |
| Cut-off Date Principal Balance(2): | $46,800,000 | Property Type - Subtype: | Office - CBD | |
| % of Pool by IPB: | 4.5% | Net Rentable Area (SF): | 676,598 | |
| Loan Purpose: | Refinance | Location: | Sunnyvale, CA | |
| Borrower: | MT3 EFG Real Estate LLC | Year Built / Renovated: | 2009 / 2011-2012 | |
| Sponsor: | Joseph K. Paul | Occupancy: | 100.0% | |
| Interest Rate: | 4.13098592% | Occupancy Date: | 12/6/2018 | |
| Note Date: | 9/7/2018 | Number of Tenants: | 1 | |
| Final Maturity Date: | 10/6/2028 | 2015 NOI: | $24,367,752 | |
| Interest-only Period: | 120 months | 2016 NOI: | $24,977,236 | |
| Original Term: | 120 months | 2017 NOI: | $24,953,252 | |
| Original Amortization: | None | TTM NOI (as of 5/2018)(4): | $25,168,813 | |
| Amortization Type: | Interest Only | UW Economic Occupancy: | 95.0% | |
| Call Protection(3): | L(24),Grtr1%orYM(2),DeforGrtr1% | UW Revenues: | $44,603,641 | |
| orYM(87),O(7) | UW Expenses: | $8,747,532 | ||
| Lockbox / Cash Management: | Hard / In Place | UW NOI(4): | $35,856,109 | |
| Additional Debt: | Yes | UW NCF: | $35,309,093 | |
| Additional Debt Balance(2): | $237,200,000 / $216,000,000 | Appraised Value / Per SF(5): | $705,800,000 / $1,043 | |
| Additional Debt Type(2): | Pari Passu / Mezzanine Loans | Appraisal Date(5): | 11/15/2019 | |
| Escrows and Reserves(6) | Financial Information(1) | |||||||
| Initial | Monthly | Initial Cap | Whole Loan | Total Debt | ||||
| Taxes: | $1,772,695 | $253,242 | N/A | Cut-off Date Loan / SF: | $420 | $801 | ||
| Insurance: | $0 | Springing | N/A | Maturity Date Loan / SF: | $420 | $801 | ||
| Replacement Reserves: | $0 | $11,277 | N/A | Cut-off Date LTV: | 40.2% | 76.8% | ||
| TI/LC: | $23,914,655 | $0 | N/A | Maturity Date LTV: | 40.2% | 76.8% | ||
| Immediate Repairs: | $0 | $0 | N/A | UW NCF DSCR: | 2.97x | 1.41x | ||
| Other: | $15,021,721 | Springing | (4) | UW NOI Debt Yield: | 12.6% | 6.6% | ||
| Sources and Uses | ||||||
| Sources | Proceeds | % of Total | Uses | Proceeds | % of Total | |
| Whole Loan | $284,000,000 | 56.8% | Payoff Existing Debt | $321,129,945 | 64.2% | |
| Mezzanine Loans | 216,000,000 | 43.2% | Upfront Reserves | 40,709,071 | 8.1 | |
| Closing Costs | 7,185,260 | 1.4 | ||||
| Return of Equity | 130,975,724 | 26.2% | ||||
| Total Sources | $500,000,000 | 100.0% | Total Uses | $500,000,000 | 100.0% | |
| (1) | The Moffett Towers – Building E,F,G Whole Loan was co-originated by DBNY, Goldman Sachs Mortgage Company (“GSMC”) and Wells Fargo Bank, National Association (“WFBNA”). |
| (2) | The Moffett Towers - Building E,F,G Loan (as defined below) is part of a whole loan evidenced by eleven notes with an aggregate outstanding principal balance as of the Cut-off Date of $284.0 million. The Financial Information presented in the chart above reflects the Cut-off Date Balance of the Moffett Towers – E,F,G Whole Loan. |
| (3) | The lockout period will be at least 24 payments beginning with and including the first payment date of November 6, 2018. The borrower is permitted to prepay the Moffett Towers – Building E,F,G Whole Loan on or after the payment date in November 2020 with a payment of a yield maintenance premium. Defeasance of the full $284.0 million Moffett Towers – Building E,F,G Whole Loan is permitted after the earlier to occur of (i) two years after the closing date of the securitization that includes the lastpari passucompanion loan to be securitized and (ii) September 7, 2021. |
| (4) | Underwritten NOI is higher than Most Recent NOI primarily due to new leases with the sole tenant, Amazon, to occupy certain space currently occupied by HP. The new leases make up 63.8% of annual rent and 58.2% of net rental area. See “Operating History and Underwritten Net Cash Flow” herein. |
| (5) | The Appraised Value / Per SF reflects a “prospective market value upon stabilization” which assumes rent concessions and outstanding tenant improvement and leasing commissions (“TI/LC”) are deposited into the TI/LC and free rent reserve accounts. At loan origination, the borrower deposited $23,914,655 into the TI/LC reserve account and $15,021,721 into the free rent reserve account. The Cut-off Date LTV and Maturity Date LTV are calculated based upon the Appraised Value of $705,800,000. The “As-is” appraised value is $646,700,000 as of July 30, 2018 equating to a Cut-off Date LTV and Maturity Date LTV of 43.9% and 43.9%, respectively, for the Moffett Towers – Buildings E,F,G Whole Loan balance of $284.0 million, and a Cut-off Date LTV and Maturity Date LTV of 77.3% and 77.3%, respectively, for the total debt balance of $500.0 million. In addition, the appraiser concluded a “hypothetical go dark” appraised value of $504,200,000 as of July 30, 2018, equating to a Cut-off Date LTV and Maturity Date LTV of 56.3% and 56.3%, respectively, for the Moffett Towers – Buildings E,F,G Whole Loan and a Cut-off Date LTV and Maturity Date LTV of 99.2% and 99.2%, respectively, for the total debt. |
| (6) | For a full description of Escrows and Reserves, please refer to“Escrows and Reserves”below. |
THE INFORMATION IN THIS STRUCTURAL AND COLLATERAL TERM SHEET IS NOT COMPLETE AND MAY BE AMENDED PRIOR TO THE TIME OF SALE. THIS TERM SHEET IS NOT AN OFFER TO SELL THESE SECURITIES AND IT IS NOT A SOLICITATION OF AN OFFER TO BUY THESE SECURITIES IN ANY JURISDICTION WHERE THE OFFER OR SALE IS NOT PERMITTED. | ||||
| | | 80 of 125 | | |
| Structural and Collateral Term Sheet | Benchmark 2018-B8 | |
| Moffett Towers – Buildings E,F,G | ||
The Loan.The Moffett Towers – Building E,F,G loan (the “Moffett Towers – Buildings E,F,G Loan”) is a fixed rate loan secured by the borrower’s fee interest in a Class A office building leased to a wholly-owned subsidiary of Amazon.com, Inc. (“Amazon”) located in Sunnyvale, California (the “Moffett Towers – Buildings E,F,G Property”). The Moffett Towers – Buildings E,F,G Whole Loan proceeds of $284.0 million, in addition to two mezzanine loans with an aggregate Original Principal Balance of $216.0 million, were used to (i) refinance the existing debt in an amount of approximately $321.1 million, (ii) fund upfront reserves of approximately $40.7 million, (iii) pay closing costs of approximately $7.2 million and (iv) return equity of approximately $131.0 million.
The Moffett Towers – Building E,F,G loan is evidenced by the non-controlling Note A-1-4 and Note A-3, with an aggregate Original Balance and aggregate Cut-off Date Balance of $46.8 million. The Moffett Towers – Buildings E,F,G Loan is part of a whole loan (the “Moffett Towers – Buildings E,F,G Whole Loan”) with an aggregate Original Principal and aggregate Cut-off Date Balance of $284.0 million, evidenced by eleven pari passu notes, as described below. Only the Moffett Towers – Buildings E,F,G Loan will be contributed to the Benchmark 2018-B8 Trust. The remaining notes are described in the “Total Debt Summary” chart below.
| Total Debt Summary | ||||
| Note | Original Balance | Cut-off Date Balance | Note Holder | Controlling Piece |
| A-1-4, A-3 | $46,800,000 | $46,800,000 | Benchmark 2018-B8 | No |
| A-1-1, A-5 | $80,000,000 | $80,000,000 | DBGS 2018-C1 | Yes |
| A-1-2, A-1-3, A-4 | $50,400,000 | $50,400,000 | Benchmark 2018-B7 | No |
| A-2-1 | $25,000,000 | $25,000,000 | CGCMT 2018-C6 | No |
| A-2-2 | $25,000,000 | $25,000,000 | BBCMS 2018-C2 | No |
| A-6, A-7 | $56,800,000 | $56,800,000 | BANK 2018-BNK15 | No |
| Whole Loan | $284,000,000 | $284,000,000 | ||
| Mezzanine Loans | $216,000,000 | $216,000,000 | ||
| Total | $500,000,000 | $500,000,000 | ||
The borrower is permitted to prepay the Moffett Towers – Building E,F,G Whole Loan on or after the payment date in November 2020 with a payment of a yield maintenance premium. Defeasance of the full $284.0 million Moffett Towers – Building E,F,G Whole Loan is permitted after the earlier to occur of (i) two years after the closing date of the securitization that includes the lastpari passu companion loan to be securitized and (ii) September 7, 2021.
The relationship between the holders of the Moffett Towers – Buildings E,F,G Whole Loan will be governed by a co-lender agreement as described under “Description of the Mortgage Pool—The Whole Loans—The Non-Serviced Pari Passu Whole Loans” in the Preliminary Prospectus.
The most recent prior financing of the Moffett Towers – Buildings E,F,G Property was previously securitized in COMM 2013-CCRE7 and COMM 2013-CCRE8.
The Borrower. The borrower of the Moffett Towers – Buildings E,F,G is MT3 EFG Real Estate LLC, a single purpose Delaware limited liability company structured to be bankruptcy-remote with two independent directors.
The Loan Sponsor. The borrower sponsor is Joseph K. Paul, founder of The Jay Paul Company, a privately held real estate firm based in San Francisco, California. Founded in 1975, The Jay Paul Company concentrates on the acquisition, development, and management of commercial properties throughout California. The Jay Paul Company has developed over 11.0 million square feet of institutional quality space. The Jay Paul Company’s portfolio includes other properties in Moffett Park, including Moffett Gateway, Moffett Towers and Moffett Towers II, and Moffett Place. Paul Guarantor LLC, a Delaware limited liability company, is the guarantor of certain non-recourse carveouts under the Moffett Towers II – Buildings E,F,G Whole Loan. Paul Guarantor LLC is wholly owned by the Jay Paul Revocable Living Trust, of which Joseph K. (Jay) Paul is trustee and grantor.
The Property.The Moffett Towers – Buildings E,F,G Property is comprised of three, eight-story, Class A office buildings totaling 676,598 square feet in Sunnyvale, California. As of December 6, 2018, the Moffett Towers – Buildings E,F,G Property was 100.0% leased to a wholly-owned subsidiary of Amazon on a triple-net basis through June 2030 with respect to the 452,106 square feet, Buildings F and G, and February 2024 with respect to the 224,492 square feet, Building E, with two, seven-year extension options. Amazon serves as guarantor of the lease and, as of the origination date, has taken possession of the Moffett Towers – Buildings E,F,G Property other than the space HP currently occupies and commenced the build out of its space. Outstanding rent concessions and tenant improvement allowances related to the Amazon lease were deposited into escrows by the borrower on the origination date. See “Initial and Ongoing Reserves” herein.
The Moffett Towers – Buildings E,F,G Property was built in 2009 and in 2011, HP executed leases to occupy 100.0% of Building F (224,492 square feet) and six floors of Building G (169,284 square feet) through March 31, 2023. In March 2013, Amazon executed a lease to occupy building E (224,492 square feet) through February 2024. In January 2014, Amazon signed a lease for the remaining two floors (58,330 square feet) of Building G through March 31, 2023. In May 2018, the borrower sponsor restructured the Amazon and HP
THE INFORMATION IN THIS STRUCTURAL AND COLLATERAL TERM SHEET IS NOT COMPLETE AND MAY BE AMENDED PRIOR TO THE TIME OF SALE. THIS TERM SHEET IS NOT AN OFFER TO SELL THESE SECURITIES AND IT IS NOT A SOLICITATION OF AN OFFER TO BUY THESE SECURITIES IN ANY JURISDICTION WHERE THE OFFER OR SALE IS NOT PERMITTED. | ||||
| | | 81 of 125 | | |
| Structural and Collateral Term Sheet | Benchmark 2018-B8 | |
| Moffett Towers – Buildings E,F,G | ||
leases so that Amazon could take over all of HP’s space, allowing the Moffett Towers – Buildings E,F,G property to be 100% occupied by Amazon going forward. As part of the restructuring, Amazon extended their lease on Building G through June 30, 2030. HP is required to fully vacate Building F (1140 Enterprise) no later than March 31, 2019. HP moved out of Building G (1160 Enterprise) in several stages to allow Amazon’s A2Z Development Center to take occupancy. HP vacated floors 1, 5, 6, 7 and 8 and the entire 2nd floor of Building G, except for the approximately 7,874 square feet consisting of a laboratory (totaling 135,632 square feet). HP is required to vacate the 2nd floor lab space (7,874 square feet) of Building G no later than March 21, 2023.
HP occupies Building F until March 31, 2019. If the borrower fails to deliver Building F to Amazon in the required delivery condition on or before October 15, 2019 (as such date may be extended on a day-for day basis for tenant delays or up to four months and 15 days in the aggregate for force majeure delays), Amazon may terminate the lease for Building F, upon at least 30 days’ notice, only if the borrower does not deliver Building F to Amazon in the required delivery condition within such 30 days and then within 15 days of Amazon’s second written notice to terminate after the initial 30 days expires. In order to deliver Building F to Amazon in the required delivery condition the borrower’s sole obligations are to ensure that Building F is free of tenants or occupants and any rights or claims of third parties under rights of first refusal, rights of first offer, or similar rights. HP occupies the Building G lab (7,874 square feet) until March 31, 2023. The free rent period for Building F (224,492 square feet) extends through October 2019 and through April 2019 for suite G100 (25,778 square feet). The free rent period for Building G extends through September 2023. All of the TI/LC, free rent, and gap rent required under the executed Amazon lease is held in a lender controlled reserve. Amazon is in occupancy of Building E, and has commenced its build out of Building G.
The Moffett Towers – Buildings E,F,G Property is a portion of a development known as Moffett Towers. Moffett Towers comprises Buildings A through G, consisting of seven, eight-story, CBD, class “A” office buildings collectively containing 1,985,577 square feet of net rentable area. The Moffett Towers – Buildings E,F,G Property collectively contains three, eight-story, CBD, class “A” office buildings totaling 676,598 square feet of net rentable area, has rights to the use of a four-level parking structure and a five-level parking structure (as described below) and is the majority portion of Moffett Towers Phase 2. The entire Moffett Towers Phase 2 development includes an additional, eight-story building containing 357,481 square feet of net rentable area that was completed in 2014. This building is known as Building D (1100 Enterprise Way) and is not part of the collateral. Also part of Moffett Towers is a one-story amenities building improved as café and fitness center containing 48,207 square feet, which is shared between all seven buildings.
The Moffett Towers – Buildings E,F,G Property features access to the fitness/amenities building and the two parking structures (the “Common Area Spaces”). To govern access to the Common Area Spaces, the borrower is subject to two separate declaration of covenants, conditions, restrictions, easements and charges agreements one governing the fitness/amenities building and the parcel on which it sits (the “Moffett Towers Amenities CCR”), made by and among Moffett Towers Lot 3 LLC, an affiliate of the borrower sponsor and the owner of the non-collateral buildings at the four-building Moffett Towers E,F,G office campus (the “Moffett Towers E,F,G Campus”), MT SPE, LLC, an affiliate of the borrower sponsor and the owner of three non-collateral buildings at a nearby office campus that also has access to the fitness/amenities building, the borrower and Moffett Towers Building H & Amenities Parcel Association LLC (the “Amenities Association”) and one governing the parking and the parcel on which the Moffett Towers E,F,G Campus sits (the “Moffett Towers Lot 3 CCR”), made by and between Moffett Towers Lot 3 LLC and MT Lot 3 Common Areas Association LLC (the “Lot 3 Association”). The Moffett Towers Amenities CCR grants the borrower non-exclusive easement rights to the fitness/amenities building and the parcel on which the building sits. Ownership of the fitness/amenities building is held by the Amenities Association, whose membership is comprised of the borrower, Moffett Towers Lot 3 LLC and MT SPE, LLC. The Moffett Towers Lot 3 CCR grants the borrower non-exclusive easement rights to the parking structures and the parcel on which the Moffett Towers E,F,G Campus sits. Ownership of the parking structures and the parcel on which the Moffett Towers E,F,G Campus sits is held by the Lot 3 Association, whose membership is comprised of the borrower and Moffett Towers Lot 3 LLC. The Amenities Association and the Lot 3 Association are obligated to maintain insurance coverage over their respective Common Area Spaces and are also responsible for maintenance of their respective Common Area Spaces, subject to the terms of the Amazon leases. The Moffett Towers Amenities CCR delineates shares of the voting interest in the Amenities Association, with each building that is part of the Amenities Association entitled to a proportionate share of the voting interest. There are seven buildings in the Amenities Association, with the borrower having three votes, and six of the seven votes are needed to make substantial changes to, expand, change the façade of or replace/reconstruct the fitness/amenities building. The Moffett Towers Lot 3 CCR delineates shares of the voting interest in the Lot 3 Association, with each building that is part of the Lot 3 Association entitled to a proportionate share of the voting interest. There are four buildings in the Lot 3 Association, with the borrower having 3 votes.
Amazon (NASDAQ: AMZN) is an American e-commerce company headquartered in Seattle, Washington. Founded in 1994, Amazon is now one of the largest online retailers in the world selling a wide range of products, services and entertainment to consumers. Amazon has reported that net sales have increased by approximately 43% to $51.0 billion in the first quarter of 2018 compared to $35.7 billion in the first quarter 2017. Amazon employed 563,100 full time employees as of the first quarter of 2018, up 60% from the first quarter of 2017.
The Moffett Towers – Buildings E,F,G Property is expected to house Amazon’s A2Z Development Center, Inc., a subsidiary that provides business and idea development support solutions. A2Z Development Center, Inc. houses Amazon’s Lab126 outlet. Lab126 began in 2004, originally creating the Kindle family of products and has since produced numerous devices such as Amazon’s Fire tablets, Fire TV and Amazon Echo.
THE INFORMATION IN THIS STRUCTURAL AND COLLATERAL TERM SHEET IS NOT COMPLETE AND MAY BE AMENDED PRIOR TO THE TIME OF SALE. THIS TERM SHEET IS NOT AN OFFER TO SELL THESE SECURITIES AND IT IS NOT A SOLICITATION OF AN OFFER TO BUY THESE SECURITIES IN ANY JURISDICTION WHERE THE OFFER OR SALE IS NOT PERMITTED. | ||||
| | | 82 of 125 | | |
| Structural and Collateral Term Sheet | Benchmark 2018-B8 | |
| Moffett Towers – Buildings E,F,G | ||
| Historical and Current Occupancy(1) | |||
| 2015 | 2016 | 2017 | Current(2) |
| 100% | 100% | 100% | 100% |
| (1) | Historical Occupancies are as of December 31st of each respective year. |
| (2) | Current occupancy is as of December 6, 2018. |
| Tenant / Building | Ratings (Fitch/Moody’s/S&P)(2) | Tenant Summary(1) Net Rentable Area (SF) | % of Total NRA | Base Rent PSF(3) | % of Base Rent | Lease Expiration Date |
| Amazon / Building E | A+/Baa1/AA- | 224,492 | 33.2% | $41.73 | 28.5% | 2/28/2024 |
| Amazon / Building F(4)(5)(6) | A+/Baa1/AA- | 224,492 | 33.2% | $53.77 | 36.7% | 6/30/2030 |
| Amazon / Building G(6)(7) | A+/Baa1/AA- | 227,614 | 33.6% | $50.19 | 34.8% | 6/30/2030 |
| Total / Wtd. Avg. Occupied | 676,598 | 100.0% | $48.57 | 100.0% | ||
| Vacant | 0 | 0% | ||||
| Total | 676,598 | 100.0% |
| (1) | Based on the underwritten rent roll. |
| (2) | Certain ratings are those of the parent company whether or not the parent guarantees the lease. |
| (3) | Excludes $4,389,651 ($6.49 per square foot) of straight-lined rent that was underwritten. See “Cash Flow Analysis” below. |
| (4) | Hewlett-Packard (“HP”) occupies Building F until March 31, 2019. All of the TI/LC, free rent, and gap rent required under the executed Amazon lease for this space is held in a lender controlled reserve. Amazon is in a free rent period from May 2019 until October 2019 for Building F. |
| (5) | If the borrower fails to deliver Building F to Amazon in the required delivery condition on or before October 15, 2019 (as such date may be extended on a day-for day basis for tenant delays or up to four months and 15 days in the aggregate for force majeure delays), Amazon may terminate the lease for Building F, upon at least 30 days’ notice, only if the borrower does not deliver Building F to Amazon in the required delivery condition within such 30 days and then within 15 days of Amazon’s second written notice to terminate after the initial 30 days expires. In order to deliver Building F to Amazon in the required delivery condition, the borrower’s sole obligations are to ensure that Building F is free of tenants or occupants and any rights or claims of third parties under rights of first refusal, rights of first offer, or similar rights. |
| (6) | The free rent period for Building F (224,492 square feet) extends through October 2019 and through April 2019 for suite G100 (25,778 square feet). The free rent period for Building G extends through September 2023. |
| (7) | HP occupies the Building G lab (7,874 square feet) until March 31, 2023. All of the TI/LC, free rent, and gap rent required under the executed Amazon lease for this space is held in a lender controlled reserve. |
| Lease Rollover Schedule(1)(2) | |||||||||
| Year | Number of Leases Expiring | NRA Expiring | % of NRA Expiring | Base Rent Expiring | % of Base Rent Expiring | Cumulative NRA Expiring | Cumulative % of NRA Expiring | Cumulative Base Rent Expiring | Cumulative % of U/W Base Rent |
| Vacant | NAP | NAP | NAP | NAP | NAP | 0 | 0.0% | NAP | NAP |
| 2018 & MTM | 0 | 0 | 0.0% | $0 | 0.0% | 0 | 0.0% | $0 | 0.0% |
| 2019 | 0 | 0 | 0.0% | $0 | 0.0% | 0 | 0.0% | $0 | 0.0% |
| 2020 | 0 | 0 | 0.0% | $0 | 0.0% | 0 | 0.0% | $0 | 0.0% |
| 2021 | 0 | 0 | 0.0% | $0 | 0.0% | 0 | 0.0% | $0 | 0.0% |
| 2022 | 0 | 0 | 0.0% | $0 | 0.0% | 0 | 0.0% | $0 | 0.0% |
| 2023 | 0 | 0 | 0.0% | $0 | 0.0% | 0 | 0.0% | $0 | 0.0% |
| 2024 | 1 | 224,492 | 33.2% | $9,368,919 | 28.5% | 224,492 | 33.2% | $9,368,919 | 28.5% |
| 2025 | 0 | 0 | 0.0% | $0 | 0.0% | 224,492 | 33.2% | $9,368,919 | 28.5% |
| 2026 | 0 | 0 | 0.0% | $0 | 0.0% | 224,492 | 33.2% | $9,368,919 | 28.5% |
| 2027 | 0 | 0 | 0.0% | $0 | 0.0% | 224,492 | 33.2% | $9,368,919 | 28.5% |
| 2028 | 0 | 0 | 0.0% | $0 | 0.0% | 224,492 | 33.2% | $9,368,919 | 28.5% |
| 2029 & Beyond | 5 | 452,106 | 66.8% | $23,493,124 | 71.5% | 676,598 | 100.0% | $32,862,043 | 100.0% |
| Total / Wtd. Avg. | 6 | 676,598 | 100.0% | $32,862,043 | 100.0% | ||||
| (1) | Based on the underwritten rent roll. |
| (2) | If the borrower fails to deliver Building F to Amazon in the required delivery condition on or before October 15, 2019 (as such date may be extended on a day-for day basis for tenant delays or up to four months and 15 days in the aggregate for force majeure delays), Amazon may terminate the lease for Building F, upon at least 30 days’ notice, only if the borrower does not deliver Building F to Amazon in the required delivery condition within such 30 days and then within 15 days of Amazon’s second written notice to terminate after the initial 30 days expires. In order to deliver Building F to Amazon in the required delivery condition the borrower’s sole obligations are to ensure that Building F is free of tenants or occupants and any rights or claims of third parties under rights of first refusal, rights of first offer, or similar rights. |
The Market. The Moffett Towers – Buildings E,F,G Property is located in Moffett Park, in the northern portion of the Sunnyvale submarket within Silicon Valley. Moffett Park is a 519-acre area comprised of recently developed office spaces and research and development buildings. Notable high technology firms currently in Moffett Park include Google Inc., Hewlett-Packard, Juniper Networks, Lab126 (an Amazon subsidiary), Lockheed-Martin, Microsoft, Motorola, NetApp and Rambus. The Moffett Towers – Buildings E,F,G Property is just north of State Highway 237, which forms the southern border of the Moffett Park area and provides access from Interstate 680 and Interstate 280 to the northeast and U.S. Highway 101 in Sunnyvale to the southwest. U.S. Highway 101 runs northward through San Francisco and southward through San Jose, terminating in the city of Los Angeles. The Santa Clara County Transit System provides bus
THE INFORMATION IN THIS STRUCTURAL AND COLLATERAL TERM SHEET IS NOT COMPLETE AND MAY BE AMENDED PRIOR TO THE TIME OF SALE. THIS TERM SHEET IS NOT AN OFFER TO SELL THESE SECURITIES AND IT IS NOT A SOLICITATION OF AN OFFER TO BUY THESE SECURITIES IN ANY JURISDICTION WHERE THE OFFER OR SALE IS NOT PERMITTED. | ||||
| | | 83 of 125 | | |
| Structural and Collateral Term Sheet | Benchmark 2018-B8 | |
| Moffett Towers – Buildings E,F,G | ||
service county-wide with stops near the Moffett Towers - Buildings E,F,G Property. In addition, a Santa Clara Light Rail System station is located directly across the street from the Moffett Towers - Buildings E,F,G Property and services the surrounding residential communities.
According to the appraisal, overall vacancy in the Silicon Valley market and the Sunnyvale submarket was 9.8% and 3.5%, respectively, as of the first quarter of 2018. According to the appraisal, as of the first quarter of 2018, new supply under construction in Silicon Valley stood at approximately 3.2 million square feet, which consisted of approximately 0.7 million square feet of build-to-suit construction and 2.6 million square feet of speculative space. As of first quarter of 2018, the total office annual average asking rent for the Sunnyvale submarket was $69.36 per square foot, which is above the Silicon Valley total office annual average asking rent of $55.20 per square foot. Within the Sunnyvale submarket, the annual average asking rent for Class A office properties is $81.36 per square foot (fully-serviced).
| Comparable Office Leases(1) | |||||||||
| Property Name / Location | Year Built | Stories | Tenant Name | Tenant Leased Space | Lease Date | Lease Term (years) | Lease Type | Base Rent PSF | |
Moffett Towers - Buildings E,F,G Property Sunnyvale, CA | 2009 | 8 | Amazon(2) | 676,598(2) | Various(2)(3) | 11.7(2) | NNN | $48.57(2) | |
Moffett Towers II Phase 3 Sunnyvale, CA | 2018 | 8 | 1,051,989 | Apr-18 | 15.0 | NNN | $52.20 | ||
Moffett Towers II Phase 2 Sunnyvale, CA | 2018 | 8 | Amazon | 362,563 | Jun-18 | 10.0 | NNN | $49.44 | |
Bay Meadows Station 2 San Mateo, CA | 2018 | 4 | Guidewire | 189,000 | Jan-18 | 10.4 | NNN | $60.60 | |
Santa Clara Square Ph. II Bldg. 5 Santa Clara, CA | 2016 | 6 | Regus | 220,156 | Apr-18 | 12.0 | NNN | $46.80 | |
Menlo Gateway Menlo Park, CA | 2018 | 8 | 205,222 | Aug-17 | 15.0 | NNN | $72.00 | ||
| (1) | Source: Appraisal. |
| (2) | Based on the underwritten rent roll dated December 6, 2018. |
| (3) | 224,492 square feet of Amazon’s space expires in February 2024, and 452,106 square feet of Amazon’s space expires in June 2030. |
| Operating History and Underwritten Net Cash Flow | |||||||
| 2015 | 2016 | 2017 | TTM(1) | Underwritten(2) | Per Square Foot | %(3) | |
| Base Rent | $24,343,756 | 24,880,050 | $24,897,611 | $24,995,672 | $32,862,043 | $48.57 | 70.1% |
| Credit Tenant Rent Step Credit(4) | 0 | 0 | 0 | 0 | 4,389,651 | $6.49 | 9.4% |
| Gross Potential Rent | $24,343,756 | 24,880,050 | $24,897,611 | $24,995,672 | $37,251,694 | $55.06 | 79.4% |
| Total Recoveries | 7,282,052 | 7,258,304 | 7,681,625 | 7,822,621 | 8,747,514 | $12.93 | 18.6% |
| Amenity Building Rent | 0 | 0 | 0 | 0 | 904,393 | $1.34 | 1.9% |
| Net Rental Income | $31,625,808 | $32,138,354 | $32,579,236 | $32,818,293 | $46,903,601 | $69.32 | 100.0% |
| Less: Vacancy(5) | 0 | 0 | 0 | 0 | (2,299,960) | ($3.40) | (5.2%) |
| Effective Gross Income | $31,625,808 | $32,138,354 | $32,579,236 | $32,818,293 | $44,603,641 | $65.92 | 100.0% |
| Total Operating Expenses | 7,258,056 | 7,161,119 | 7,625,984 | 7,649,481 | 8,747,532 | $12.93 | 19.6% |
| Net Operating Income | $24,367,752 | $24,977,236 | $24,953,252 | $25,168,813 | $35,856,109 | $52.99 | 80.4% |
| TI/LC(6) | 0 | 0 | 0 | 0 | 411,696 | $0.61 | 0.9% |
| Capital Expenditures | 0 | 0 | 0 | 0 | 135,320 | $0.20 | 0.3% |
| Net Cash Flow | $24,367,752 | $24,977,236 | $24,953,252 | $25,168,813 | $35,309,093 | $52.19 | 79.2% |
| (1) | TTM Column represents the trailing 12-month period ending on May 31, 2018. |
| (2) | Underwritten Net Operating Income is higher than TTM Net Operating Income primarily driven by new leases commencing in 2018 and beyond with the sole tenant, Amazon, to occupy the space currently occupied by HP. The new leases make up 63.8% of annual rent and 58.2% of net rental area. |
| (3) | % column represents percent of Net Rental Income for all revenue lines and represents percent of Effective Gross Income for the remainder of the fields. |
| (4) | Represents straight-lined rent through the maturity date of the Moffett Towers – Buildings E,F,G Whole Loan. |
| (5) | The Underwritten Less: Vacancy is 5.0%. The Moffett Towers - Buildings E,F,G Property is 100.0% leased as of December 6, 2018. |
| (6) | Underwritten TI/LC is inclusive of a credit of $1,184,047, equal to 1/20th of the Lease Sweep and Debt Service Reserve Cap (as defined below). This credit is netted out of the above TI/LC total. |
Property Management. The Moffett Towers – Buildings E,F,G Property is managed by Paul Holdings, Inc. d/b/a Jay Paul Company, the borrower sponsor.
Escrows & Reserves.
Tax Escrows. At loan origination, the borrower deposited $1,772,695 into a real estate tax reserve account. On a monthly basis, the borrower is required to deposit an amount equal to 1/12 of the estimated annual real estate taxes, which currently equate to $253,242, into a tax reserve.
THE INFORMATION IN THIS STRUCTURAL AND COLLATERAL TERM SHEET IS NOT COMPLETE AND MAY BE AMENDED PRIOR TO THE TIME OF SALE. THIS TERM SHEET IS NOT AN OFFER TO SELL THESE SECURITIES AND IT IS NOT A SOLICITATION OF AN OFFER TO BUY THESE SECURITIES IN ANY JURISDICTION WHERE THE OFFER OR SALE IS NOT PERMITTED. | ||||
| | | 84 of 125 | | |
| Structural and Collateral Term Sheet | Benchmark 2018-B8 | |
| Moffett Towers – Buildings E,F,G | ||
Insurance Escrows. Insurance escrows are waived so long as the Moffett Towers – Buildings E,F,G Property is covered by an acceptable blanket policy (which is currently maintained). If such condition is no longer satisfied, on each monthly payment date, the borrower will be required to fund an insurance reserve equal to 1/12 of the amount that the lender estimates will be necessary to pay the annual insurance premiums.
Replacement Reserves. On a monthly basis, the borrower is required to escrow an amount equal to approximately $11,277 into a capital expenditure reserve.
Rollover Reserves. At loan origination, the borrower deposited $23,914,655 for outstanding tenant improvements relating to the Amazon space, payable between October 2018 and May 2019.
Free Rent Reserve.At loan origination, the borrower deposited $15,021,721 for outstanding rent concessions due under the Amazon lease. This reserve is inclusive of both free rent and gap rent. The rent concession reserve will be drawn down from October 2018 to September 2023.
Debt Service Reserve.If, during a Lease Sweep Period, the aggregate lease sweep funds transferred into the lease sweep account during the Lease Sweep Period in question equals the Lease Sweep Reserve Threshold, then on each monthly payment date during such Lease Sweep Period, all Required Minimum Monthly Lease Sweep Deposit Amounts (as defined below) and available cash or other amounts required to be deposited will be deposited into the Debt Service Reserve account.
Lease Sweep Reserve.On each monthly payment date during the continuance of a Lease Sweep Period, but only until the aggregate lease sweep funds transferred in the lease sweep account during the lease sweep in question (inclusive of the initial lease termination payment application made into the lease sweep account with respect to such Lease Sweep Period) equals the Lease Sweep Reserve Threshold, borrower will pay to lender, (i) the Required Minimum Monthly Lease Sweep Deposit Amount and (ii) available cash.
Lockbox / Cash Management.The Moffett Towers – Buildings E,F,G Whole Loan is structured with a hard lockbox and in-place cash management. The borrower was required at origination to deliver letters to all tenants at the Moffett Towers - Buildings E,F,G Property directing them to pay all rents directly into a lender-controlled lockbox account. All funds received by the borrower or the manager are required to be deposited in the lockbox account within one business day following receipt. Funds on deposit in the lockbox account are required to be swept on each business day into a lender-controlled cash management account. Provided no Trigger Period (as defined below) exists, the cash management account will permit automatic transfer of deposits into the borrower’s operating account following payment of all monthly amounts due under the loan documents (including, without limitation, taxes and insurance, debt service and required reserves) and approved property operating expenses. Once a Trigger Period occurs, automatic transfers into the borrower’s operating account will cease and any excess funds are required to be held by the lender as additional collateral for the loan (provided that upon the occurrence of an event of default under the loan documents, such sums may be applied to amounts owed under the loan documents in such amounts, order and manner as the lender will elect in its sole discretion).
A “Trigger Period” will occur upon (a) an event of default under the Moffett Towers – Buildings E,F,G Whole Loan or the mezzanine loan, (b) the occurrence of a Low Debt Service Period (as defined herein) or (c) the commencement of a Lease Sweep Period.
A “Low Debt Service Period” will occur in the event that, as of the end of any calendar quarter (a) a Lease Sweep Tenant Party’s (as defined below) credit rating by Fitch, Moody’s or S&P is less than “BBB-”, “Baa3” or “BBB-”, respectively, and (b) the debt service coverage ratio is less than 2.90x or the combined debt service coverage ratio is less than 1.35x and (ii) will end on the earlier to occur of (x) the date a debt service coverage ratio of at least 2.90x and a combined debt service coverage ratio of at least 1.35x is achieved for at least two consecutive calculation dates, as determined by the lender and (y) funds on deposit in the cash collateral account equal the Lease Sweep and Debt Service Reserve Cap (as defined below), which equals $33,829,900 ($50.00 per square foot).
A “Lease Sweep Period” will commence upon the earliest to occur of (a) with respect to (x) the Amazon lease (Building E), Amazon fails to renew or extend such lease on or prior to August 6, 2023 or (y) with respect to the Amazon leases (Building F and G and Building E to the extent previously renewed) Amazon fails to renew or extend such lease on or prior to July 6, 2027; (b) the date on which, with respect to any Lease Sweep Lease (as defined below), (i) a Lease Sweep Tenant Party cancels or terminates its Lease Sweep Lease with respect to all or a Material Termination Portion (as defined below) of the Lease Sweep Space (as defined below) subject to such Lease Sweep Lease prior to the then current expiration date under such Lease Sweep Lease, or (ii) a Lease Sweep Tenant Party delivers to the Moffett Towers – Buildings E,F,G borrower notice that it is canceling or terminating its Lease Sweep Lease with respect to all or a Material Termination Portion of the Lease Sweep Space subject to such Lease Sweep Lease (the affected space being the “Terminated Space”); provided, however, that no Lease Sweep Period will commence pursuant to this clause (b) if, in connection with such termination or cancellation (or delivery of notice of termination or cancellation), the Moffett Towers – Buildings E,F,G borrower simultaneously enters into a replacement lease with an entity or a wholly-owned subsidiary of an entity rated “BBB-” or equivalent by at least two of Fitch, Moody’s and S&P (an “Investment Grade Entity”) covering the Terminated Space,provided that such replacement lease is a qualified lease and the occupancy conditions, as specified in the Moffett Towers – Buildings E,F,G Whole Loan documents, are satisfied with respect to such replacement lease on or prior to the date of such termination or cancellation (or delivery of notice of termination or cancellation); (c) the date on which, with respect to any Lease Sweep Lease, a Lease Sweep Tenant Party ceases operating its business
THE INFORMATION IN THIS STRUCTURAL AND COLLATERAL TERM SHEET IS NOT COMPLETE AND MAY BE AMENDED PRIOR TO THE TIME OF SALE. THIS TERM SHEET IS NOT AN OFFER TO SELL THESE SECURITIES AND IT IS NOT A SOLICITATION OF AN OFFER TO BUY THESE SECURITIES IN ANY JURISDICTION WHERE THE OFFER OR SALE IS NOT PERMITTED. | ||||
| | | 85 of 125 | | |
| Structural and Collateral Term Sheet | Benchmark 2018-B8 | |
| Moffett Towers – Buildings E,F,G | ||
(i.e., “goes dark”) at 20.0% or more of its Lease Sweep Space on a rentable square feet basis (a “Dark Period Event” and the affected space, the “Dark Space”), provided, however, that if the Lease Sweep Tenant Party either (x) is an Investment Grade Entity or (y) has subleased the Dark Space portion of its premises to an Investment Grade Entity who has accepted delivery thereof (i.e., the lease has commenced) and is paying unabated rent at a contract rate no less than the contract rate required under the Lease Sweep Lease, such Lease Sweep Tenant Party will not be deemed to have “gone dark” for purposes of this clause (c) and no Lease Sweep Period will commence pursuant to this clause (c); (d) upon a default under a Lease Sweep Lease by the tenant thereunder that continues beyond any applicable notice and cure period; (e) upon a Lease Sweep Tenant Party being subject to an insolvency proceeding or (f) the date on which neither the Amazon-subsidiary tenant nor Amazon is an Investment Grade Entity (an “Amazon Downgrade Event”).
A Lease Sweep Period will end upon the earliest to occur of (a) with respect to clause (a) or (b) above, the date on which, with respect to each Lease Sweep Space (1) in the case of clause (a), the Lease Sweep Tenant Parties have exercised a renewal or an extension right under their respective Lease Sweep Lease, provided that the Lease Sweep Lease in question is a qualified lease and the occupancy conditions, as specified in the Moffett Towers - Buildings E,F,G Whole Loan documents, are satisfied, (2) in the case of clause (a) or (b) above, one or more replacement tenants acceptable to the lender (in its sole but good faith discretion) execute and deliver replacement lease(s) covering the Requisite Lease Sweep Space (as defined below), provided that such replacement lease(s) are qualified leases and the occupancy conditions, as specified in the Moffett Towers – Buildings E,F,G Whole Loan documents, are satisfied or (3) a combination of lease renewals or extensions (as described in subclause (1) of this clause (a)) and replacement lease(s) (as described in subclause (2) of this clause (a)) occurs; (b) with respect to clauses (c) and (f) above, the date on which either (1) one or more replacement tenants acceptable to the lender (in its sole but good faith discretion) execute and deliver replacement lease(s) covering the Requisite Lease Sweep Space, provided that such replacement tenant(s) and lease(s) are qualified leases and the occupancy conditions, as specified in the Moffett Towers – Buildings E,F,G Whole Loan documents, are satisfied or (2) for a Dark Period Event or an Amazon Downgrade Event, the Amazon-subsidiary tenant or Amazon is restored as an Investment Grade Entity or the entirety of the Lease Sweep Space has been sublet to an Investment Grade Entity who has accepted delivery thereof (i.e., the lease has commenced) and is paying unabated rent at a contract rate no less than the contract rate required under the Lease Sweep Lease; (c) with respect to clause (d) above, the date on which the event of default has been cured and no other event of default under such Lease Sweep Lease occurs for a period of three consecutive months following such cure; (d) with respect to clause (e) above, the Lease Sweep Tenant Party insolvency proceeding has terminated and the applicable Lease Sweep Lease has been affirmed, assumed or assigned in a manner satisfactory to the lender; and (e) with respect to clauses (a), (b), (c), (d) and (f) above, the date on which the aggregate amount of funds transferred into the lease sweep reserve account over the course of the Lease Sweep Period and the debt service reserve account equals the applicable Lease Sweep And Debt Service Reserve Cap (as defined below) and if a Lease Sweep Period is continuing due to the occurrence of more than one Lease Sweep Period, the aggregate amount of funds required to be transferred over the course of the Lease Sweep Period will be equal to the amount of the largest Lease Sweep and Debt Service Reserve Cap applicable to all then-continuing Lease Sweep Periods, such that each Lease Sweep Period must be treated as concurrent and not duplicative or independent of another.
A “Lease Sweep Lease” is each Amazon lease or any replacement lease or leases which cover at least the Requisite Lease Sweep Space.
A “Lease Sweep and Debt Service Reserve Cap” means (i) with respect to a Lease Sweep Period continuing solely pursuant to clause (a) and/or (d) above, $23,680,930 ($35.00 PSF), (ii) with respect to a Lease Sweep Period continuing solely pursuant to clause (b) above, $35.00 PSF of the Terminated Space, (iii) with respect to a Lease Sweep Period continuing pursuant to clause (c) above, whether or not a Lease Sweep Period pursuant to clauses (a), (b) and/or (d) above is concurrently continuing, $50.00 PSF of Dark Space or (iv) with respect to clause (f) above, whether or not a Lease Sweep Period pursuant to clauses (a), (b), (c) and/or (d) above is concurrently continuing, $33,829,900 ($50.00 PSF).
A “Lease Sweep Reserve Threshold” means (i) with respect to a Lease Sweep Period continuing solely pursuant to clauses (a), (d) and/or (f) of the definition of “Lease Sweep Period” above, $20,297,940 ($30.00 PSF leased under the Lease Sweep Lease as of the loan origination date) or (ii) with respect to a Lease Sweep Period continuing solely pursuant to clause (b) and/or (c) above, $30.00 PSF of the Dark Space and/or Terminated Space.
A “Lease Sweep Space” means the space demised under a Lease Sweep Lease.
A “Lease Sweep Tenant Party” is a tenant under a Lease Sweep Lease or its direct or indirect parent company (if any).
A “Material Termination Portion” is, with respect to any space under a Lease Sweep Lease, if the tenant under a Lease Sweep Lease cancels or terminates its Lease Sweep Lease with respect to at least 60,000 square feet of space (or, if a full floor of space is less than 60,000 SF, a full floor of space) but less than the entirety of the space under such Lease Sweep Lease, the portion of space under the Lease Sweep Lease affected by such cancellation or termination.
“Required Minimum Monthly Lease Sweep Deposit Amount” will mean, on each monthly payment date during the continuance of a Lease Sweep Period, (i) if such Lease Sweep Period was triggered by clause (a)(x) of the definition of Lease Sweep Period (i.e. a failure of Amazon to give notice of intent to renew the Building E lease by August 6, 2023), an amount equal to $1,122,460 and (ii) if such Lease Sweep Period was triggered by any lease sweep trigger other than clause (a)(x) of the definition of Lease Sweep Period, $1,821,610.
THE INFORMATION IN THIS STRUCTURAL AND COLLATERAL TERM SHEET IS NOT COMPLETE AND MAY BE AMENDED PRIOR TO THE TIME OF SALE. THIS TERM SHEET IS NOT AN OFFER TO SELL THESE SECURITIES AND IT IS NOT A SOLICITATION OF AN OFFER TO BUY THESE SECURITIES IN ANY JURISDICTION WHERE THE OFFER OR SALE IS NOT PERMITTED. | ||||
| | | 86 of 125 | | |
| Structural and Collateral Term Sheet | Benchmark 2018-B8 | |
| Moffett Towers – Buildings E,F,G | ||
“Requisite Lease Sweep Space” means at least 75% of the rentable square feet demised under the Amazon lease as of September 7, 2018.
Additional Debt. Concurrent with the Moffett Towers–Buildings E,F,G Whole Loan, Deutsche Bank AG, New York Branch, Wells Fargo Bank, NationalAssociationand Goldman Sachs Mortgage Company funded a $150,000,000 Mezzanine A loan (the “Moffett Towers–Buildings E,F,G Mezzanine A Loan”) to MT Lot 3 EFG LLC (the “Moffett Towers–Buildings E,F,G Mezzanine A Borrower”), and a $66,000,000 Mezzanine B loan (“Moffett Towers – Buildings E,F,G Mezzanine B Loan”, and together with the Moffett Towers – Building E,F,G Mezzanine A Loan, the “Moffett Towers – Buildings E,F,G Mezzanine Loan”) to MT Lot 3 EFG Mezzanine LLC (the “Moffett Towers - Buildings E,F,G Mezzanine B Borrower”) both Delaware limited liability companies. The Moffett Towers–Buildings E,F,G Mezzanine A Loan accrues interest at a rate of 5.67000%per annum and requires interest-only payments through the maturity date of October 6, 2028. The Moffett Towers–Buildings E,F,G Mezzanine B Loan accrues interest at a rate of 6.80000%per annum and requires interest-only payments through the maturity date of October 6, 2028. The Mezzanine A Loan and the Mezzanine B Loan are expected to be sold to third parties. The mortgage and mezzanine lenders have entered into an intercreditor agreement that governs the relationship between the mortgage and mezzanine lenders. The rights of the lender of the Moffett Towers - Buildings E,F,G Mezzanine Loan are further described under“Description of the Mortgage Pool—Additional Indebtedness—Mezzanine Indebtedness” in the Prospectus.
Partial Release. On any business day after the prepayment lockout expiration date, the borrower may obtain the release of a release parcel (each a “Release Parcel”) comprised of either one or two of the three individual buildings comprising the Moffett Towers – Buildings E,F,G Property from that portion of the lien of the mortgage encumbering such Release Parcel thereon upon a bona fide third-party sale or conveyance to any affiliate in connection with a refinance of such parcel(s) by an institutional lender not affiliated with the borrower, any mezzanine borrower, or the non-recourse carveout guarantor, provided that each of the following conditions are satisfied: (a) the borrower makes a prepayment of principal in an amount equal to the applicable Release Amount (as defined below), and, if such release is prior to the open period, pays to the lender a prepayment fee equal to the greater of 1.00% or a yield maintenance premium on the principal being prepaid, and pays all accrued and unpaid interest on the principal being prepaid (including, if such prepayment is not made on a payment date, interest accrued to the next payment date); (b) after giving effect to such release and prepayment, the debt service coverage ratio for the remaining portion of the Moffett Towers – Buildings E,F,G Property (the “Remaining Property”) is no less than the greater of (i)(x) the Moffett Towers – Buildings E,F,G Whole Loan debt service coverage ratio immediately preceding such sale and (y) the combined Moffett Towers – Buildings E,F,G Whole Loan and Moffett Towers–Buildings E,F,G mezzanine debt service coverage ratio immediately preceding such sale and (ii)(x) 3.14x, which is the Moffett Towers–Buildings E,F,G Whole Loan debt service coverage ratio as of the loan origination date and (y) 1.49x, which is the combined Moffett Towers–Buildings E,F,G Whole Loan and Moffett Towers–Buildings E,F,G mezzanine debt service coverage ratio as of the loan origination date; (c) after giving effect to such release and prepayment, the loan-to-value ratio for the Remaining Property is no more than the lesser of (i) the combined loan-to-value ratio of the Moffett Towers–Buildings E,F,G Whole Loan and the Moffett Towers–Buildings E,F,G mezzanine debt immediately preceding such sale and (ii) 70.8%, which is the combined loan-to-value ratio as of the loan origination date; (d) the Release Parcel being released is legally subdivided and a separate tax parcel from the Remaining Property, and the release does not materially and adversely affect the use or operation of, or access to, the Remaining Property, or cause any portion of the Remaining Property to violate legal requirements or violate the terms of the Amazon lease or any other document relating to the Remaining Property; (e) if there are shared facilities, access, infrastructure and parking and no such easement already exists (or such easement exists but it does not provide for continued use of such shared facilities, access, infrastructure or parking for a period of no less than 75 years from the date of such release) borrower will enter into a reciprocal easement agreement pursuant to which the borrower will receive and grant such easements as are reasonably required for the continued use and operation of the Remaining Property in substantially the same manner and with the benefit of substantially the same rights as exist as of the date hereof for a period of no less than 75 years from the date of such easement or amendment and (f) release conditions under the Moffett Towers - Buildings E,F,G Mezzanine Loan are satisfied.
“Release Amount” means with respect to each release parcel, the greater of (i) the lender’s proportionate share (based on the ratio of the outstanding principal balance oftheMoffett Towers–Buildings E,F,G Whole Loan to the combined outstanding principal balance of the Moffett Towers - Buildings E,F,G Whole Loan and Moffett Towers–Buildings E,F,G mezzanine debt) of 100% of the net sales proceeds with respect to such Release Parcel and (ii) 125% of the Whole Loan Allocated Loan Amount (as defined below) for such Release Parcel.
The “WholeLoan Allocated Loan Amount” with respect to each Release Parcel is set forth below:
| Building | Address | Moffett Towers – Buildings E,F,G Whole Loan Allocated Loan Amount |
| E | 1120 Enterprise Way | $77,077,600 |
| F | 1140 Enterprise Way | $103,716,800 |
| G | 1160 Enterprise Way | $103,205,600 |
THE INFORMATION IN THIS STRUCTURAL AND COLLATERAL TERM SHEET IS NOT COMPLETE AND MAY BE AMENDED PRIOR TO THE TIME OF SALE. THIS TERM SHEET IS NOT AN OFFER TO SELL THESE SECURITIES AND IT IS NOT A SOLICITATION OF AN OFFER TO BUY THESE SECURITIES IN ANY JURISDICTION WHERE THE OFFER OR SALE IS NOT PERMITTED. | ||||
| | | 87 of 125 | | |
| Structural and Collateral Term Sheet | Benchmark 2018-B8 | |
| Workspace | ||
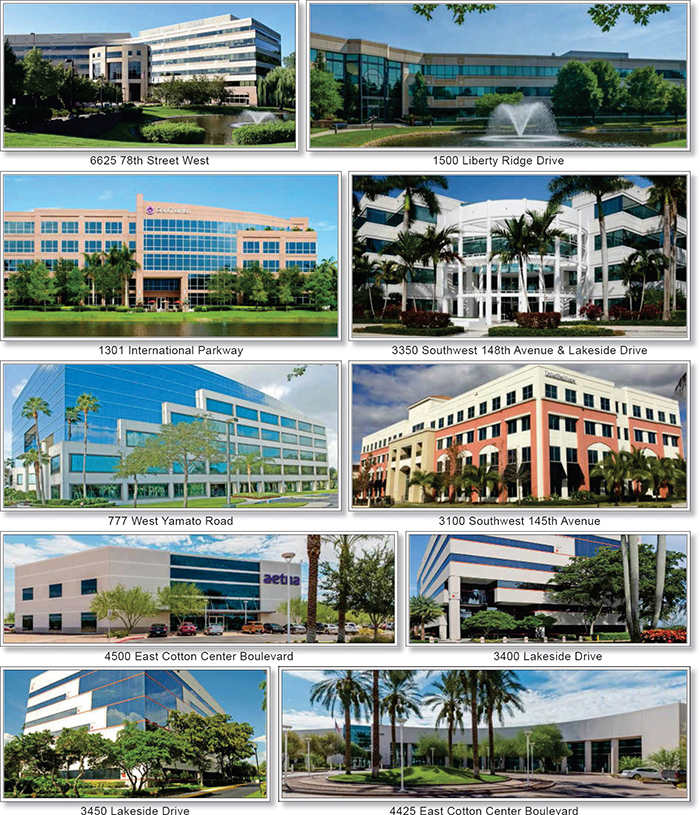
THE INFORMATION IN THIS STRUCTURAL AND COLLATERAL TERM SHEET IS NOT COMPLETE AND MAY BE AMENDED PRIOR TO THE TIME OF SALE. THIS TERM SHEET IS NOT AN OFFER TO SELL THESE SECURITIES AND IT IS NOT A SOLICITATION OF AN OFFER TO BUY THESE SECURITIES IN ANY JURISDICTION WHERE THE OFFER OR SALE IS NOT PERMITTED. | ||||
| | | 88 of 125 | | |
| Structural and Collateral Term Sheet | Benchmark 2018-B8 | |
| Workspace | ||
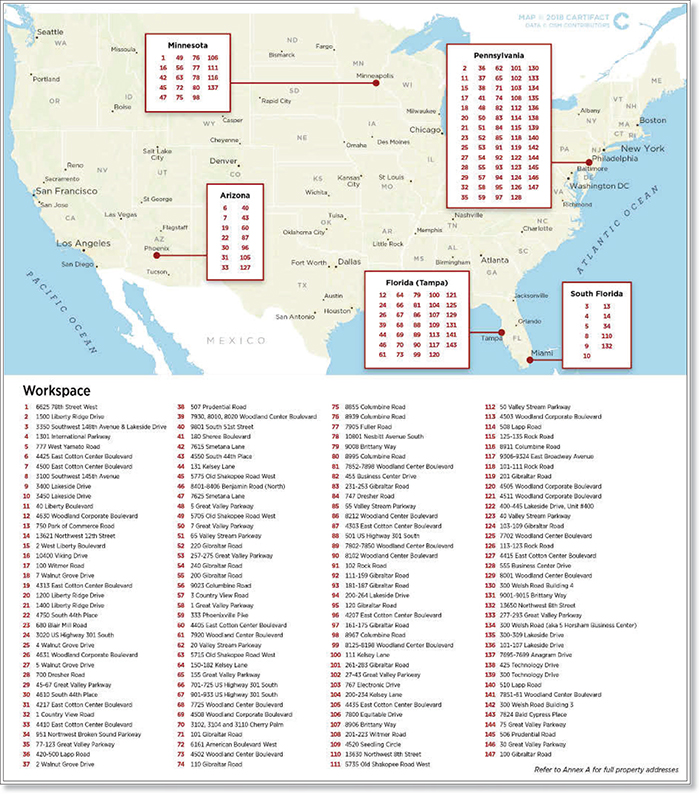
THE INFORMATION IN THIS STRUCTURAL AND COLLATERAL TERM SHEET IS NOT COMPLETE AND MAY BE AMENDED PRIOR TO THE TIME OF SALE. THIS TERM SHEET IS NOT AN OFFER TO SELL THESE SECURITIES AND IT IS NOT A SOLICITATION OF AN OFFER TO BUY THESE SECURITIES IN ANY JURISDICTION WHERE THE OFFER OR SALE IS NOT PERMITTED. | ||||
| | | 89 of 125 | | |
| Structural and Collateral Term Sheet | Benchmark 2018-B8 | |
| Workspace | ||
| Mortgage Loan Information | Property Information | |||
| Mortgage Loan Seller: | JPMCB | Single Asset / Portfolio: | Portfolio | |
| Credit Assessment | Title: | Various | ||
| (KBRA/Fitch/S&P)(1): | A/A/AA- | Property Type - Subtype: | Various / Various | |
| Original Principal Balance(2): | $40,000,000 | Net Rentable Area (SF): | 9,884,763 | |
| Cut-off Date Principal Balance(2): | $40,000,000 | Location: | Various | |
| % of Pool by IPB: | 3.8% | Year Built / Renovated: | Various / Various | |
| Loan Purpose: | Refinance | Occupancy: | 88.6% | |
| Borrowers(3): | Various | Occupancy Date: | 6/1/2018 | |
| Sponsor(3): | Workspace Property Trust, L.P. | Number of Tenants: | 509 | |
| Interest Rate(2): | 5.37200% | 2015 NOI: | $113,129,919 | |
| Note Date: | 6/8/2018 | 2016 NOI: | $116,403,632 | |
| Maturity Date(4): | 7/1/2023 | 2017 NOI: | $117,155,284 | |
| Interest-only Period: | 61 months | TTM NOI (as of 3/2018)(6): | $117,976,547 | |
| Original Term(4): | 61 months | UW Economic Occupancy: | 89.8% | |
| Original Amortization: | None | UW Revenues: | $192,633,427 | |
| Amortization Type: | Interest Only | UW Expenses: | $67,314,318 | |
| Call Protection(5): | Grtr1%orYM(57),O(4) | UW NOI(6): | $125,319,109 | |
| Lockbox / Cash Management: | Hard / In Place | UW NCF: | $112,963,155 | |
| Additional Debt: | Yes | Appraised Value / Per SF(7): | $1,634,285,000 / $165 | |
| Additional Debt Balance(2): | $539,000,000 / $696,000,000 | Appraisal Date: | Various | |
| Additional Debt Type(2): | Pari Passu / Subordinate Debt | |||
| Escrows and Reserves(8) | Financial Information(2) | |||||||
| Initial | Monthly | Initial Cap | Senior Fixed Rate Loan | Whole Loan | ||||
| Taxes: | $11,849,855 | $2,040,615 | N/A | Cut-off Date Loan / SF: | $59 | $129 | ||
| Insurance: | $350,000 | (9) | N/A | Maturity Date Loan / SF: | $59 | $129 | ||
| Replacement Reserves: | $205,933 | $205,933 | (8) | Cut-off Date LTV: | 35.4% | 78.0% | ||
| TI/LC: | $3,154,000 | $1,441,528 | (8) | Maturity Date LTV: | 35.4% | 78.0% | ||
| Other: | $17,330,083 | $0 | N/A | UW NCF DSCR: | 3.60x | 1.63x | ||
| UW NOI Debt Yield: | 21.6% | 9.8% | ||||||
| Sources and Uses(10) | ||||||||
| Sources | Proceeds | % of Total | Uses | Proceeds | % of Total | |||
| Whole Loan(2) | $1,280,000,000 | 100.0% | Payoff Existing Debt(11) | $827,465,831 | 64.6% | |||
| Payoff KeyBank Credit Line | 227,559,344 | 17.8% | ||||||
| Redemption of Preferred Equity | 132,541,678 | 10.4% | ||||||
| Upfront Reserves | 32,889,871 | 2.6% | ||||||
| Closing Costs | 20,940,571 | 1.6% | ||||||
| IPO-Related Expenses | 19,049,085 | 1.5% | ||||||
| Deferred LP Distributions | 13,337,719 | 1.0% | ||||||
| Asset Management Fees | 5,337,711 | 0.4% | ||||||
| Return of Equity | 878,191 | 0.1% | ||||||
| Total Sources | $1,280,000,000 | 100.0% | Total Uses | $1,280,000,000 | 100.0% | |||
| (1) | KBRA, Fitch and S&P have confirmed that the Workspace Whole Loan (as defined below) has, in the context of its inclusion in the mortgage pool, credit characteristics consistent with an investment grade obligation. |
| (2) | The Workspace Mortgage Loan (as defined below) is part of the Workspace Whole Loan evidenced by 14 notes, with an aggregate outstanding principal balance as of the Cut-off Date of approximately $1.275 billion. The Workspace Whole Loan is split between (i) a 25-month floating rate componentized loan with three, one-year extension options (the “Floating Rate Loan”) with an aggregate Cut-off Date principal balance of $255.0 million, and (ii) a 61-month fixed rate componentized loan (the “Fixed Rate Loan”) comprised of (A) a senior fixed rate componentized loan (the “Senior Fixed Rate Loan”), with an aggregate Cut-off Date principal balance of $463.2 million, and (B) a subordinate fixed rate componentized loan (the “Subordinate Fixed Rate Loan”), with an aggregate Cut-off Date principal balance of $556.8 million. The Senior Fixed Rate Loan is senior to the Subordinate Fixed Rate Loan. The interest rate on the Floating Rate Loan is LIBOR (subject to a floor of 0.25%) plus a spread of 3.15%. Each of the Fixed Rate Loan and Floating Rate Loan is divided into multiple components, each with different payment priorities prior to and following an event of default under the Workspace Whole Loan. See “The Loan” below. The Senior Fixed Rate Loan Financial Information presented in the chart above reflects the Senior Fixed Rate Loan and $115.8 million of the Cut-off Date principal balance of the Floating Rate Loan, and excludes the remaining $139.2 million of the Cut-off Date principal balance of the Floating Rate Loan and the Subordinate Fixed Rate Loan. The Whole Loan Financial Information presented in the chart above reflects the Workspace Whole Loan. For purposes of the Financial Information, LIBOR was assumed to be 2.09%. The Whole Loan NCF DSCR, based on a LIBOR cap of 3.00% for the Floating Rate Loan, is 1.58x. |
| (3) | For a description of the Borrowers and Sponsor, see “The Borrowers” and “The Loan Sponsor” below. |
THE INFORMATION IN THIS STRUCTURAL AND COLLATERAL TERM SHEET IS NOT COMPLETE AND MAY BE AMENDED PRIOR TO THE TIME OF SALE. THIS TERM SHEET IS NOT AN OFFER TO SELL THESE SECURITIES AND IT IS NOT A SOLICITATION OF AN OFFER TO BUY THESE SECURITIES IN ANY JURISDICTION WHERE THE OFFER OR SALE IS NOT PERMITTED. | ||||
| | | 90 of 125 | | |
| Structural and Collateral Term Sheet | Benchmark 2018-B8 | |
| Workspace | ||
| (4) | The Maturity Date and Original Term reflect the maturity date of the Fixed Rate Loan. The maturity date of the Floating Rate Loan is July 1, 2020, and the Borrowers have the right to extend that maturity date for three successive one year extension terms, upon satisfaction of certain conditions. |
| (5) | Partial prepayments of the Mortgage Loan are permitted (i) in connection with a partial release, as described below under “Partial Release,” and (ii) in connection with meeting certain debt yield triggers relating to the Borrowers exercising the extension options with respect to the Floating Rate Loan. Prior to an event of default under the Workspace Whole Loan, all prepayments are required to be applied to repay the Floating Rate Loan in full, prior to any application to the Fixed Rate Loan. |
| (6) | The increase in UW NOI from TTM NOI is primarily driven by underwriting based on the June 1, 2018 in-place rent roll with rent steps underwritten to June 2019. Additionally, 10 tenants have executed leases since June 1, 2018 who have not yet taken occupancy, accounting for approximately $2.4 million in underwritten rent. |
| (7) | The appraiser also valued the Portfolio as a whole, as if sold in its entirety to a single buyer (the “Portfolio Appraised Value”). The Portfolio Appraised Value is $1.68 billion, which results in a Workspace Whole Loan Cut-off Date LTV and Maturity Date LTV of 75.9%. |
| (8) | For a full description of Escrows and Reserves, please refer to “Escrows and Reserves” below. |
| (9) | Monthly insurance payments are $552,198 for the first four payments and $219,630 thereafter. |
| (10) | Sources & Uses are based on the fully funded $1.28 billion Whole Loan as of the June 8, 2018 origination date and does not reflect a subsequent voluntary prepayment on July 13, 2018, resulting in a pay down of the Floating Rate Loan by $5 million from the original balance. The Financial Information is based on a current balance of $1.275 billion. |
| (11) | Existing debt was previously securitized in JPMCC 2016-WPT. |
The Loan.The Workspace loan is secured by the borrowers’ fee and leasehold interests in a portfolio of 147 properties comprising an approximately 9.9 million square foot portfolio of office, flex, and retail properties located in suburban Philadelphia, Pennsylvania, southern Florida, Tampa, Florida, Minneapolis-St. Paul, Minnesota and Phoenix, Arizona (each a “Property” and altogether, the “Properties” or the “Portfolio”). The loan is part of a whole loan (the “Workspace Whole Loan”) evidenced by 14 notes, with an aggregate outstanding principal balance as of the Cut-off Date of approximately $1.275 billion, which is comprised of (i) a 25-month floating rate loan with three, one year extension options (the “Floating Rate Loan”) with an aggregate Cut-off Date principal balance of $255.0 million, and (ii) a 61-month fixed rate loan (the “Fixed Rate Loan”) comprised of (A) the Senior Fixed Rate Loan, with an aggregate Cut-off Date principal balance of $463.2 million and (B) the Subordinate Fixed Rate Loan, with an aggregate Cut-off Date principal balance of $556.8 million. The interest rate on the Floating Rate Loan is LIBOR (subject to a floor of 0.25%) plus a spread of 3.15%. Note A-9-B and Note A-10-B, which are part of the Senior Fixed Rate Loan, and which have an aggregate outstanding principal balance as of the Cut-off Date of $40.0 million (the “Workspace Mortgage Loan”), are being contributed to the Benchmark 2018-B8 Trust. The Workspace Mortgage Loan will be interest-only for the entire Workspace Whole Loan term. The relationship among the lenders of the various portions of the Workspace Whole Loan will be governed by a co-lender agreement, as more fully described under “Description of the Mortgage Pool—The Whole Loans—The Non-Serviced AB Whole Loans—The Workspace Whole Loan” in the Preliminary Prospectus.
| Whole Loan Summary(1) |
| Fixed Rate Companion Loans | Fixed Rate | ||
| Floating Rate Loan | Senior Fixed Rate Notes | $130,000,000 | Benchmark 2018-B8 |
| $255,000,000 | $293,200,000 | Notes A-5, A-6, A-7, A-8 | $40,000,000 |
| Notes A1, A2(2) | Notes A-3, A-4(2) | A-9-A, A-10-A(2) | Notes A-9-B, A-10-B(2) |
| Subordinate Fixed Rate Notes | |||
| $556,800,000 | |||
| Notes B-1, B-2 | |||
| (1) | The Workspace Whole Loan will be serviced pursuant to the JPMCC 2018-WPT pooling and servicing agreement. |
| (2) | Each note is divided into two or more components. Each note comprising the Senior Fixed Rate Loan, including the Workspace Mortgage Loan, is divided into a senior component and a subordinate component, and forms a component pair withpari passu components of the Senior Fixed Rate Loan and of the Floating Rate Loan. Prior to an event of default under the Workspace Whole Loan, all payments of principal (including but not limited to any partial prepayment and the balloon payment due on the Floating Rate Loan if is not extended) are required to be applied to the Floating Rate Loan until paid in full, prior to any application to the Fixed Rate Loan. Following an event of default under the Workspace Whole Loan, collections under the Workspace Whole Loan will be applied first,pro rata, to interest and principal of (i) the senior component of the Workspace Mortgage Loan, (ii) the senior component of each of the remaining notes of the Senior Fixed Rate Loan and (iii) the corresponding senior component of the Floating Rate Loan, prior to application,pro rata, to (a) the subordinate component of the Workspace Mortgage Loan, (b) the subordinate component of each of the remaining notes of the Senior Fixed Rate Loan and (iii) the corresponding subordinate component of the Floating Rate Loan, and losses will be applied in the reverse order among such notes. Accordingly a portion of the interest and principal of the Workspace Mortgage Loan will be subordinate to certain components of the other notes of the Senior Fixed Rate Loan and certain components of the Floating Rate Loan, but will bepari passu to corresponding components of the Senior Fixed Rate Loan and Floating Rate Loan. See “Description of the Mortgage Pool—The Whole Loans—The Non-Serviced AB Whole Loans—The Workspace Whole Loan” in the Preliminary Prospectus. |
THE INFORMATION IN THIS STRUCTURAL AND COLLATERAL TERM SHEET IS NOT COMPLETE AND MAY BE AMENDED PRIOR TO THE TIME OF SALE. THIS TERM SHEET IS NOT AN OFFER TO SELL THESE SECURITIES AND IT IS NOT A SOLICITATION OF AN OFFER TO BUY THESE SECURITIES IN ANY JURISDICTION WHERE THE OFFER OR SALE IS NOT PERMITTED. | ||||
| | | 91 of 125 | | |
| Structural and Collateral Term Sheet | Benchmark 2018-B8 | |
| Workspace | ||
The Borrowers. The borrowers, WPT Land 2 LP, RV OP 2 LP, RV OP 3 Lessee LP, WPT Properties LP, and RV OP 1 LP, are each a Delaware limited partnership (the “Borrowers”), and a special purpose entity. Each of the Borrowers and its general partner has and is required to have two independent directors or managers.
| Top-10 Property Summary | ||||||||
| Property Name | Location | Net Rentable Area (NRA) | Year Built | Occupancy % | Allocated Loan Amount | % of ALA | Appraised Value | % of Appraised Value |
| 6625 78th Street West | Bloomington, MN | 325,000 | 1997 | 94.5% | $44,385,938 | 3.5% | $56,950,000 | 3.5% |
| 1500 Liberty Ridge Drive | Tredyffrin Township, PA | 233,120 | 2003 | 92.3% | 39,953,320 | 3.1% | 51,350,000 | 3.1% |
| 3350 SW 148th Avenue & Lakeside Drive | Miramar, FL | 154,768 | 2000 | 99.6% | 34,185,938 | 2.7% | 44,000,000 | 2.7% |
| 1301 International Parkway | Sunrise, FL | 140,160 | 2006 | 100.0% | 29,982,422 | 2.4% | 38,500,000 | 2.4% |
| 777 West Yamato Road | Boca Raton, FL | 155,608 | 1989 | 84.5% | 29,593,945 | 2.3% | 38,000,000 | 2.3% |
| 4425 East Cotton Center Boulevard | Phoenix, AZ | 165,000 | 2001 | 100.0% | 27,651,563 | 2.2% | 35,500,000 | 2.2% |
| 4500 East Cotton Center Boulevard | Phoenix, AZ | 139,403 | 2013 | 100.0% | 24,922,266 | 2.0% | 32,000,000 | 2.0% |
| 3100 Southwest 145th Avenue | Miramar, FL | 104,337 | 2008 | 100.0% | 23,826,563 | 1.9% | 30,600,000 | 1.9% |
| 3400 Lakeside Drive | Miramar, FL | 120,130 | 1989 | 89.7% | 22,661,133 | 1.8% | 29,100,000 | 1.8% |
| 3450 Lakeside Drive | Miramar, FL | 119,598 | 1989 | 93.2% | 22,511,719 | 1.8% | 28,900,000 | 1.8% |
| Top-10 Total / Wtd. Average | 1,657,124 | 95.1% | $299,674,805 | 23.5% | 384,900,000 | 23.6% | ||
| Top-20 Total / Wtd. Average | 2,847,428 | 91.4% | $486,362,695 | 38.1% | 624,100,000 | 38.2% | ||
| Top-50 Total / Wtd. Average | 5,518,632 | 91.1% | $822,653,906 | 64.5% | 1,055,695,000 | 64.6% | ||
| Portfolio Total / Wtd. Average | 9,884,763 | 88.6% | $1,275,000,000 | 100.0% | $1,634,285,000 | 100.0% | ||
The Loan Sponsor.The loan sponsor and non-recourse carveout guarantor is Workspace Property Trust, L.P., which is a privately held, vertically integrated, full service commercial real estate company specializing in the acquisition, development, management and operation of office and flex space. Workspace Property Trust, L.P. is led by Thomas A. Rizk and Roger Thomas. The company’s philosophy is to invest in suburban office and flex assets. Workspace Property Trust L.P. was founded in 2015 and currently owns and operates the Properties, which were acquired in 2015 and 2016.
Mr. Rizk has significant experience in real estate acquisition, development, management, and operation. In 1994, Mr. Rizk led the family-owned real estate partnership, Cali Associates, through its initial public offering as Cali Realty Corporation. As President and Chief Executive Officer, he also led the merger of Cali Realty Corporation into the Mack Company and Patriot American Office Group in 1997. Mr. Thomas has more than 30 years of experience in real estate. Mr. Thomas assisted Mr. Rizk in taking Cali Associates public and from 1994 until 2014 served as Executive Vice President, General Counsel and Secretary at Mack- Cali Realty Corporation, serving as a key member of the executive team.
The Properties.The Portfolio consists of approximately 9.9 million square feet of space across 87 office, 59 flex and one retail property, respectively representing approximately 72.7%, 27.2% and 0.0% of the original Allocated Whole Loan Amount (“ALA”), respectively. 65.3% of the office properties by ALA are Class A properties. The Properties are located within five broad office markets: suburban Philadelphia (40.3% of ALA), southern Florida (17.3%), Tampa (16.5%), Minneapolis-St. Paul (13.0%) and Phoenix (12.9%). The properties were built between 1972 and 2013 with the majority of the Portfolio (91.1% of the occupied NRA) under triple net leases. The Properties range in size from approximately 2,800 square feet to 325,000 square feet. As of June 1, 2018, the Portfolio was 88.6% occupied by a granular and diverse roster of more than 500 tenants with the largest tenant, United Healthcare Services, Inc., representing 4.2% of net rentable area. Eleven of the top 20 tenants, which account for 17.7% of Portfolio net rentable area, have investment grade credit ratings from Moody’s or Standard & Poor’s. The top five and top ten Properties represent approximately 14.0% and 23.5% of the ALA, respectively, and the average Property accounts for 0.7% of the ALA.
6625 78th Street West. The largest property by ALA, 6625 78th Street West is a six-story, 325,000 square foot office building located in Bloomington, Minnesota approximately 10.0 miles from the Minneapolis central business district, and represents 3.5% of the ALA. Local access is provided by East Bush Lake Road and Normandale Boulevard, and regional access to the area is provided by Interstate 494, which is located adjacent to the Property. The Property was built in 1997 and includes a cafeteria, a conference room, fitness center and a four-story parking garage. 6625 78th Street West is currently 94.5% occupied by 11 tenants at an average contractual rent of $14.16 per square foot with an average occupancy of 94.0% from 2005 to 2017. The largest tenant at the Property is Express Scripts, Inc, which occupies 130,071 square feet with its lease expiring in December 2023 accounting for 57.1% of the Property’s underwritten rent. The Property is located in the 494 Corridor submarket, which contains approximately 16.3 million square feet of office space with an overall vacancy rate of 17.2% and average asking rents of $14.44 per square foot. Per the appraisal, there is no new construction in this submarket.
THE INFORMATION IN THIS STRUCTURAL AND COLLATERAL TERM SHEET IS NOT COMPLETE AND MAY BE AMENDED PRIOR TO THE TIME OF SALE. THIS TERM SHEET IS NOT AN OFFER TO SELL THESE SECURITIES AND IT IS NOT A SOLICITATION OF AN OFFER TO BUY THESE SECURITIES IN ANY JURISDICTION WHERE THE OFFER OR SALE IS NOT PERMITTED. | ||||
| | | 92 of 125 | | |
| Structural and Collateral Term Sheet | Benchmark 2018-B8 | |
| Workspace | ||
1500 Liberty Ridge Drive. The second largest property by ALA, 1500 Liberty Ridge Drive, is a three-story, 233,120 square foot office building located in Tredyffrin Township, Pennsylvania approximately 23.0 miles from downtown Philadelphia. The Property is located approximately 1.5 miles south of Interstate 76 and approximately 24.0 miles northwest of Philadelphia International Airport. The Property was built in 2003 and is currently 92.3% occupied by 12 tenants at an average contractual rent of $17.75 per square foot with an average occupancy of 93.3% from 2005 to 2017. The largest tenant at the Property is ELAP Services, Inc, which occupies 39,981 square feet with its lease expiring in September 2018 accounting for 17.7% of the Property’s underwritten rent. The Property is located in the King of Prussia/Valley Forge submarket, which contains approximately 16.8 million square feet of office space with an overall vacancy rate of 12.3% and average rents of $26.85 per square foot. This is compared to a vacancy rate of 14.8% and an average rent of $26.09 per square foot on a gross basis as of the first quarter 2017. Per the appraisal, there is no new construction in this submarket.
3350 Southwest 148th Avenue & Lakeside Drive. The third largest property by ALA, 3350 Southwest 148th Avenue & Lakeside Drive, is a four-story, 154,768 square foot office building located in Miramar, Florida. The Property is located approximately 25 miles north of the Miami central business district and 25 miles southwest of the Fort Lauderdale central business district. Local access is provided by Miramar Parkway with regional access available via Interstate 75, which is less than half a mile from the Property. The Property was built in 2000 and is currently 99.6% occupied by 22 tenants, including two tenants leasing roof space and a cafe, at an average contractual rent of $19.17 per square foot on a NNN basis with an average occupancy of 88.1% from 2005 to 2017. The largest tenant at the Property is Carnival Corporation, which occupies 30,519 square feet with its lease expiring in November 2026 accounting for 19.7% of the Property’s underwritten rent. The Property is located in the Southwest Broward submarket which contains approximately 3.1 million square feet of office space with an overall vacancy rate of 6.8% and average rents of $22.26 per square foot on a NNN basis. Per the appraisal, there are four proposed or under construction office projects with a combined 184,440 square feet within the submarket.
1301 International Parkway. The fourth largest property by ALA, 1301 International Parkway, is a five-story, 140,160 square foot office building located in Sunrise, Florida approximately 13.0 miles from Fort Lauderdale and Fort Lauderdale International Airport. Local access is provided by Sunrise Boulevard and Oakland Park Boulevard to the north with regional access provided by Interstate 75 and Interstate 595 which are adjacent to the Property. The Property was built in 2006 and is currently 100.0% occupied by seven tenants, including one tenant leasing roof space, at an average contractual rent of $20.29 per square foot on a NNN basis with an average occupancy of 89.9% from 2008 to 2017. The largest tenant at the Property is Sunshine State Health Plan, Inc, which occupies 84,379 square feet with its lease expiring in November 2020 accounting for 56.4% of the Property’s underwritten rent. The Property is located in the Sawgrass submarket, which contains approximately 2.5 million square feet of office space with an overall vacancy rate of 7.9% and average rents of $20.31 on a NNN basis. Per the appraisal, two large office parks are being proposed for construction, expecting to add 1.4 million square feet of office inventory to the submarket within the next five years.
777 West Yamato Road. The fifth largest property by ALA, 777 West Yamato Road, is a six-story, 155,608 square foot office building located in Boca Raton, Florida. The Property is located approximately two miles from Boca Raton Airport and approximately 23.0 miles from Palm Beach International Airport. Local access is provided by Yamato Road with regional access provided by Interstate 95 which is less than half a mile east of the Property. The Property was built in 1989 and is currently 84.5% occupied by 13 tenants, including one tenant leasing roof space, at an average contractual rent of $18.63 per square foot with an average occupancy of 92.6% from 2005 to 2017. The largest tenant at the Property is Relx, Inc, which occupies 51,404 square feet with its lease expiring in May 2024 accounting for 39.2% of the Property’s underwritten rent. The Property is located in the Boca Raton submarket, which contains approximately 11.5 million square feet of office space with an overall vacancy rate of 20.2% and average rents of $20.64 per square foot on a NNN basis. Per the appraisal, new construction within the submarket is minimal with one 11-story 111,971 square foot office tower breaking ground in Q4 2017.
THE INFORMATION IN THIS STRUCTURAL AND COLLATERAL TERM SHEET IS NOT COMPLETE AND MAY BE AMENDED PRIOR TO THE TIME OF SALE. THIS TERM SHEET IS NOT AN OFFER TO SELL THESE SECURITIES AND IT IS NOT A SOLICITATION OF AN OFFER TO BUY THESE SECURITIES IN ANY JURISDICTION WHERE THE OFFER OR SALE IS NOT PERMITTED. | ||||
| | | 93 of 125 | | |
| Structural and Collateral Term Sheet | Benchmark 2018-B8 | |
| Workspace | ||
The table below displays the largest tenants for each of the Properties.
| Tenant Summary(1) | |||||||
| Tenant | Property Name | Ratings(2) (Moody’s/S&P/Fitch) | Net Rentable Area (SF) | % of Total NRA | Base Rent PSF | % of Total Base Rent | Lease Expiration |
| United HealthCare Services, Inc.(3) | Various | A3 / A+/ A- | 419,543 | 4.2% | $15.79 | 5.4% | 2022/2024/2025 |
| Aetna Life Insurance Company(4) | Various | Baa2 / A / A- | 323,943 | 3.3% | 15.52 | 4.1% | 2019/2020/2023 |
| Siemens Medical Solutions USA, Inc.(5) | Various | NR / A+ / A | 241,297 | 2.4% | 16.13 | 3.1% | 2020/2021 |
| Kroll Ontrack | Various | NR / NR / NR | 195,879 | 2.0% | 12.17 | 1.9% | 2026 |
| Dell Marketing | Various | Ba2 / NR / BB | 141,290 | 1.4% | 10.96 | 1.3% | 2024 |
| Express Scripts | 6625 78th Street West | Baa2 / BBB+ / BBB | 130,071 | 1.3% | 15.00 | 1.6% | 2023 |
| Reed Technology | 7 Walnut Grove Drive | NR / NR / NR | 120,000 | 1.2% | 17.95 | 1.7% | 2025 |
| Optum Services Inc.(6) | 4 Walnut Grove Drive | A3 / A+ / A- | 109,700 | 1.1% | 16.65 | 1.5% | 2025 |
| GM Cruise LLC | 4410 East Cotton Center Boulevard | Baa3 / BBB / BBB | 101,269 | 1.0% | 10.82 | 0.9% | 2022 |
| General Dynamics Information | 3020 US Highway 301 South | A2 / A+ / NR | 99,039 | 1.0% | 15.45 | 1.2% | 2022 |
| Carnival Corporation | Various | A3 / A- / NR | 93,423 | 0.9% | 15.63 | 1.2% | 2026 |
| Sunshine State Health Plan | 1301 International Parkway | Ba1 / BB+ / NR | 84,379 | 0.9% | 19.85 | 1.4% | 2020 |
| Colorcon, Inc. | 333 Phoenixville Pike | NR / NR / NR | 84,000 | 0.8% | 9.50 | 0.6% | 2024 |
| Comcast(7) | Various | A3 / A- / A- | 82,996 | 0.8% | 14.22 | 1.0% | 2018/2019/2020 |
| GE Parallel Design, Inc. | 4313 East Cotton Center Boulevard | A2 / A / A | 78,335 | 0.8% | 15.25 | 1.0% | 2028 |
| Acist Medical Systems, Inc. | 7905 Fuller Road | NR / NR / NR | 74,224 | 0.8% | 11.03 | 0.7% | 2019 |
| Boomi, Inc.(8) | 1400 Liberty Ridge Drive | Ba2 / NR / BB | 71,788 | 0.7% | 24.70 | 1.4% | 2027 |
| Janssen Biotech, Inc. | 155 Great Valley Parkway | Aaa / AAA / AAA | 71,200 | 0.7% | 9.40 | 0.5% | 2023 |
| Cognizant Technology | Various | NR / NR / NR | 70,497 | 0.7% | 14.82 | 0.8% | 2024 |
| CDx Holdings | 4610 South 44th Street | NR / NR / NR | 66,012 | 0.7% | 23.60 | 1.3% | 2020 |
| Top 5 Total / Wtd. Average | 1,321,952 | 13.4% | $14.73 | 15.7% | |||
| Top 10 Total / Wtd. Average | 1,882,031 | 19.0% | $14.90 | 22.6% | |||
| Top 20 Total / Wtd. Average | 2,658,885 | 26.9% | $15.12 | 32.5% | |||
| Portfolio Total / Wtd. Average | 8,624,672 | 87.3% | $14.36 | 100.0% | |||
| (1) | Based on the underwritten rent roll as of June 1, 2018. Includes tenants with executed leases since June 1 that are not yet in occupancy and excludes tenants which are either dark or expected to leave upon lease expiration. |
| (2) | Certain ratings are those of the parent company whether or not the parent company guarantees the lease. |
| (3) | United HealthCare Services, Inc. leases 115,110 square feet at the 680 Blair Mill Road property with a lease expiration date of March 31, 2025, 165,000 square feet at the 4425 East Cotton Center Boulevard property with a lease expiration of March 31, 2024, 89,290 square feet at the 131 Kelsey Lane property, with a lease expiration date of September 30, 2024, and 50,143 square feet at the 3100 Southwest 145th Avenue property with a lease expiration of June 30, 2022. |
| (4) | Aetna Life Insurance Company leases 139,403 square feet at the 4500 East Cotton Center Boulevard property with a lease expiration date of December 31, 2023, 73,077 square feet at the 4630 Woodland Corporate Boulevard property with a lease expiration date of February 29, 2020, 69,094 square feet at the 4750 South 44th Place property with a lease expiration date of August 31, 2020, and 42,369 square feet at the 9801 South 51st Street property with a lease expiration date of February 28, 2019. |
| (5) | Siemens Medical Solution USA, Inc. leases 126,000 square feet at the 40 Liberty Boulevard property with a lease expiration of January 31, 2020, 61,313 square feet at the 65 Valley Stream Parkway property with a lease expiration of January 31, 2020, 41,211 square feet at the 55 Valley Stream Parkway property with a lease expiration of January 31, 2020, and 12,773 square feet at the 7930, 8010, 8020 Woodland Center Boulevard property with a lease expiration of June 30, 2021. |
| (6) | Optum Services Inc. is owned by United HealthCare Services, Inc. |
| (7) | Comcast leases 58,115 square feet at the 700 Dresher Road property with a lease expiration date of December 31, 2019, 18,000 square feet at the 103-1009 Gibraltar Road property with a lease expiration date of December 31, 2018, and 6,881 square feet at the 10400 Viking Drive property with a lease expiration date of April 30, 2020. |
| (8) | Boomi, Inc. is owned by Dell, Inc. |
| Historical and Current Occupancy(1) | |||
| 2015 | 2016 | 2017 | Current(2) |
| 89.1% | 89.3% | 89.1% | 88.6% |
| (1) | Historical Occupancies are as of December 31 of each respective year. |
| (2) | Current Occupancy is as of June 1, 2018. |
THE INFORMATION IN THIS STRUCTURAL AND COLLATERAL TERM SHEET IS NOT COMPLETE AND MAY BE AMENDED PRIOR TO THE TIME OF SALE. THIS TERM SHEET IS NOT AN OFFER TO SELL THESE SECURITIES AND IT IS NOT A SOLICITATION OF AN OFFER TO BUY THESE SECURITIES IN ANY JURISDICTION WHERE THE OFFER OR SALE IS NOT PERMITTED. | ||||
| | | 94 of 125 | | |
| Structural and Collateral Term Sheet | Benchmark 2018-B8 | |
| Workspace | ||
| Lease Rollover Schedule(1)(2) | |||||||||
| Year | Number of Leases Expiring | Net Rentable Area Expiring | % of NRA Expiring | Base Rent Expiring | % of Base Rent Expiring | Cumulative Net Rentable Area Expiring | Cumulative % of NRA Expiring | Cumulative Base Rent Expiring | Cumulative % of Base Rent Expiring |
| Vacant | NAP | 1,260,091 | 12.7% | NAP | NAP | 1,260,091 | 12.7% | NAP | NAP |
| 2018 | 68 | 438,580 | 4.4% | $6,156,087 | 5.0% | 1,698,671 | 17.2% | $6,156,087 | 5.0% |
| 2019 | 104 | 1,164,018 | 11.8% | 16,245,789 | 13.1% | 2,862,689 | 29.0% | $22,401,876 | 18.1% |
| 2020 | 92 | 1,329,694 | 13.5% | 21,176,470 | 17.1% | 4,192,383 | 42.4% | $43,578,345 | 35.2% |
| 2021 | 86 | 962,460 | 9.7% | 14,200,327 | 11.5% | 5,154,843 | 52.1% | $57,778,672 | 46.7% |
| 2022 | 74 | 1,196,942 | 12.1% | 16,106,975 | 13.0% | 6,351,785 | 64.3% | $73,885,647 | 59.7% |
| 2023 | 50 | 909,812 | 9.2% | 12,885,375 | 10.4% | 7,261,597 | 73.5% | $86,771,022 | 70.1% |
| 2024 | 35 | 849,029 | 8.6% | 11,921,771 | 9.6% | 8,110,626 | 82.1% | $98,692,793 | 79.7% |
| 2025 | 35 | 624,749 | 6.3% | 9,621,713 | 7.8% | 8,735,375 | 88.4% | $108,314,506 | 87.5% |
| 2026 | 21 | 580,196 | 5.9% | 7,757,206 | 6.3% | 9,315,571 | 94.2% | $116,071,711 | 93.7% |
| 2027 | 8 | 260,767 | 2.6% | 4,263,582 | 3.4% | 9,576,338 | 96.9% | $120,335,293 | 97.2% |
| 2028 | 6 | 233,888 | 2.4% | 3,072,427 | 2.5% | 9,810,226 | 99.2% | $123,407,720 | 99.7% |
| 2029 & Beyond | 9 | 74,537 | 0.8% | 404,444 | 0.3% | 9,884,763 | 100.0% | $123,812,164 | 100.0% |
| Total | 588 | 9,884,763 | 100.0% | $123,812,164 | 100.0% | ||||
| (1) | Based on the underwritten rent roll dated June 1, 2018. Includes tenants with executed leases since June 1 that are not yet in occupancy and excludes tenants which are either dark or expected to leave upon lease expiration. |
| (2) | Certain tenants may have termination or contraction options (which may become exercisable prior to the originally stated expiration date of the tenant lease) that are not considered in the above Lease Rollover Schedule. |
| Operating History and Underwritten Net Cash Flow | |||||||
| 2015 | 2016 | 2017 | TTM 3/31/2018(1) | Underwritten(1) | Per Square Foot | %(2) | |
| Rents in Place | $111,087,339 | $115,072,969 | $115,982,258 | $117,201,735 | $123,812,164 | $12.53 | 58.0% |
| Vacant Income | 0 | 0 | 0 | 0 | 21,891,292 | 2.21 | 10.2 |
| Gross Potential Rent | $111,087,339 | $115,072,969 | $115,982,258 | $117,201,735 | $145,703,456 | $14.74 | 68.2% |
| Total Reimbursements(3) | 63,113,439 | 60,935,637 | 66,666,852 | 66,698,913 | 67,906,938 | 6.87 | 31.8 |
| Gross Potential Revenue | $174,200,778 | $176,008,606 | $182,649,110 | $183,900,648 | $213,610,394 | $21.61 | 100.0% |
| (Vacancy/Credit Loss) | 0 | 0 | 0 | 0 | (21,891,292) | (2.21) | (10.2) |
| Other Income | 450,690 | 687,278 | 714,118 | 682,586 | 914,325 | 0.09 | 0.4 |
| Effective Gross Income | $174,651,468 | $176,695,884 | $183,363,228 | $184,583,235 | $192,633,427 | $19.49 | 90.2% |
| Total Expenses | $61,521,549 | $60,292,253 | $66,207,944 | $66,606,688 | $67,314,318 | $6.81 | 34.9% |
| Net Operating Income | $113,129,919 | $116,403,632 | $117,155,284 | $117,976,547 | $125,319,109 | $12.68 | 65.1% |
| Total TI/LC, Capex/RR | 0 | 0 | 0 | 0 | 12,355,954 | 1.25 | 6.4 |
| Net Cash Flow | $113,129,919 | $116,403,632 | $117,155,284 | $117,976,547 | $112,963,155 | $11.43 | 58.6% |
| (1) | The increase in Underwritten Net Operating Income from TTM 3/31/2018 Net Operating Income is primarily driven by underwriting based on the June 1, 2018 in-place rent roll with rent steps underwritten to June 2019. Additionally, 10 tenants have executed leases since June 1, 2018 who have not yet taken occupancy, accounting for approximately $2.4 million in underwritten rent. |
| (2) | % column represents percent of Net Rental Income for all revenue lines and represents percent of Effective Gross Income for the remainder of fields. |
| (3) | More than 90% of the in-place leases are NNN. In addition to recovering all operating expenses, leases also include a contractual tenant services fee, which is an obligation of the tenant and reimbursements can be greater than 100.0% of underwritten expenses as a result. |
Property Management. The Properties are managed by Workspace Property Management, L.P., a Delaware limited partnership and an affiliate of the Borrowers.
Escrows and Reserves. At origination, the Borrowers were required to deposit approximately $13.3 million for outstanding tenant improvements and leasing commissions, approximately $11.8 million for upfront tax reserves, approximately $3.5 million for free rent reserves, approximately $3.2 million for initial tenant rollover reserves, $539,172 for deferred maintenance, $350,000 for insurance premiums, $205,933 for replacement reserves and $37,500 for environmental reserves.
Tax Escrows – On a monthly basis, the Borrowers are required to escrow 1/12 of the estimated annual real estate taxes into the tax reserve, which currently equates to $2,040,615.
THE INFORMATION IN THIS STRUCTURAL AND COLLATERAL TERM SHEET IS NOT COMPLETE AND MAY BE AMENDED PRIOR TO THE TIME OF SALE. THIS TERM SHEET IS NOT AN OFFER TO SELL THESE SECURITIES AND IT IS NOT A SOLICITATION OF AN OFFER TO BUY THESE SECURITIES IN ANY JURISDICTION WHERE THE OFFER OR SALE IS NOT PERMITTED. | ||||
| | | 95 of 125 | | |
| Structural and Collateral Term Sheet | Benchmark 2018-B8 | |
| Workspace | ||
Insurance Escrows – Monthly insurance payments are $552,198 for the first four payments and $219,630 thereafter. However, the requirement for monthly deposits is waived provided that (i) no event of default has occurred and is continuing, and (ii) the Borrowers provide the lender with reasonably satisfactory evidence (as determined by the lender) that the Property is insured in accordance with the loan documents pursuant to a blanket insurance policy reasonably acceptable to the lender and insuring substantially all of the real property owned, directly or indirectly, by the guarantor.
Replacement Reserves– On a monthly basis, the Borrowers are required to escrow an amount equal to $205,933 ($0.25 per square foot per year) for replacement reserves (the “Replacement Reserve”). In the event a property is released, the monthly deposit is required to be reduced by an amount equal to 1/12 of the product of $0.25 and the square footage of the property released. The Borrowers will not be required to make deposits into the Replacement Reserve at any time the balance in the Replacement Reserve is equal to the then current monthly deposit amount times the number of payment dates remaining until the maturity date (provided that the number of payment dates may not exceed 36 or be less than 12 under the loan documents).
Rollover Reserve– On a monthly basis, the Borrowers are required to escrow approximately $1,441,528 for tenant improvements, reasonable legal fees incurred in connection with the negotiation of the leases (which is limited to $5,000 per lease in the loan documents) and leasing commission costs (the “Rollover Reserve”). In the event a property is released, the monthly deposit is required to be reduced by an amount equal to 1/12 of the product of $1.75 times the square footage of the property that is released. The Borrowers will not be required to make deposits into the Lease Rollover Reserve at any time the balance in the Lease Rollover Reserve is equal to the then current monthly deposit amount times the number of payment dates remaining until the maturity date (provided that the number of payment dates may not exceed 18 or be less than 12 under the loan documents).
Environmental Reserve– At origination, the Borrowers deposited an upfront reserve equal to $37,500 (the “Environmental Reserve Funds”) in connection with additional investigation recommended by the environmental report for the Property known as 45-67 Great Valley Parkway with respect to three gas propane storage tanks located at the northwestern corner of the building. If the additional investigation determines that such tanks are underground storage tanks (“USTs”), the Borrowers are required to promptly cause such USTs to be properly closed and deliver evidence thereof reasonably satisfactory to lender. Upon the delivery of such evidence or if the additional investigation does not conclude that such tanks are USTs, provided no event of default is then continuing, the Environmental Reserve Funds are required to be promptly disbursed to the Borrowers.
Operating Expense Reserve – If, at any time that the financial reports delivered pursuant to the loan documents show that the actual aggregate expenses are more than 15% less than the budgeted expenses for the prior three month period tested on a quarterly basis (after taking into account any expense savings reasonably documented by the Borrowers), the Borrowers are required to escrow with the lender the difference between the actual and budgeted expenses during each such three month period.
Lockbox / Cash Management.The Workspace Whole Loan is structured with a hard lockbox and in-place cash management. At origination, the Borrowers established a lender-controlled lockbox account. The Borrowers are required to cause all rent and other revenues from the Properties to be deposited directly into the lockbox account. All funds in the lockbox account (less the reasonable fees of the clearing bank) are required to be swept each business day into a lender-controlled cash management account.
Provided no Cash Sweep Event (as defined below) has occurred, all funds in the cash management account are required to be applied on each business day to payments of taxes, insurance, debt service, reserves, and other items required pursuant to the loan documents and the remaining cash flow will be released to the Borrowers. In the event only a Cash Sweep Event described in clause (c) or (d) below has occurred, all funds in the cash management account are required to be applied by the lender each business day to payments of taxes, insurance, debt service, reserves, and other items required by the lender and all remaining cash flow will be released to the Borrowers for costs associated with new leases or amendments to leases approved by the lender in accordance with the loan documents, but only to the extent all amounts in the Rollover Reserve have been disbursed, and additional cash flow will be held by the lender as additional collateral for the loan. In the event a Cash Sweep Event described in clause (a) or (b) below has occurred, cash flow may be applied in the lender’s sole discretion and may be held by the lender in its sole discretion.
A “Cash Sweep Event” means the occurrence of (a) an event of default, (b) the bankruptcy or insolvency of the Borrowers or property manager, (c) the debt yield (as calculated in the loan documents) falling below 8.4% for the calendar quarter immediately preceding the date of determination, based on the trailing 12 month period or (d) an Extension Sweep Event (as defined below).
THE INFORMATION IN THIS STRUCTURAL AND COLLATERAL TERM SHEET IS NOT COMPLETE AND MAY BE AMENDED PRIOR TO THE TIME OF SALE. THIS TERM SHEET IS NOT AN OFFER TO SELL THESE SECURITIES AND IT IS NOT A SOLICITATION OF AN OFFER TO BUY THESE SECURITIES IN ANY JURISDICTION WHERE THE OFFER OR SALE IS NOT PERMITTED. | ||||
| | | 96 of 125 | | |
| Structural and Collateral Term Sheet | Benchmark 2018-B8 | |
| Workspace | ||
A “Cash Sweep Event Cure” means (A) if a Cash Sweep Event exists solely by reason of an event of default, the curing and acceptance of such cure by the lender of the applicable event of default, (B) if a Cash Sweep Event exists solely by reason of a bankruptcy of a property manager, the replacement of such manager with a qualified manager acceptable to the lender pursuant to a management agreement acceptable to the lender within 60 days or, with respect to an involuntary petition filed against the manager for which neither the Borrowers, guarantor nor any member or affiliate of the Borrowers or guarantor solicited or caused to be solicited petitioning creditors or consented to or otherwise acquiesced in or joined in such involuntary petition and to the extent there were no adverse consequences to the loan or the property, upon the dismissal of such involuntary action within 60 days, (C) if a Cash Sweep Event exists solely by reason of a debt yield below 8.40%, the achievement of a debt yield for two consecutive quarters of at least 8.65%, based on the trailing 12 month period, (D) if the Cash Sweep Event is caused solely by a bankruptcy or insolvency of the Borrowers based on an involuntary petition against the Borrowers with respect to which neither the Borrowers, guarantor nor any member or affiliate of the Borrowers or guarantor solicited or caused to be solicited petitioning creditors or consented to or otherwise acquiesced in or joined in such involuntary petition, upon the same being discharged, stayed or dismissed within 60 days of such filing, provided that in the lender’s sole discretion such filing does not result in any adverse consequences to the Workspace Whole Loan or the Portfolio or (E) if the Cash Sweep Event is caused by an Extension Sweep Event, the occurrence of an Extension Sweep Cure (as defined below). In no event will the Borrowers have the right to cure a Cash Sweep Event occurring by reason of a Borrower bankruptcy except as set forth above.
An “Extension Sweep Event” means the failure of the Borrowers to satisfy the debt yield requirements in connection with an extension of the Floating Rate Loan, which are 9.00% for the second extension and 9.25% for the third extension.
An “Extension Sweep Event Cure” means (i) no event of default is continuing and (ii) the earlier to occur of (a) (1) with respect to the second extension term for the Floating Rate Loan, the date on which the debt yield is at least 9.0% and (2) with respect to the third extension term for the Floating Rate Loan, the date on which the debt yield is at least 9.25%, in each case as determined by the lender for the 12 full calendar months ending on the last day of each calendar quarter (the Borrowers are permitted to make a partial prepayment of the Workspace Whole Loan in an amount which would satisfy the foregoing debt yield requirements) and (b) the date on which the funds in the excess cash flow reserve equal at least an amount sufficient that, if applied to pay down the Workspace Whole Loan, would cause the debt yield tests to be satisfied.
Partial Releases. The Borrowers have the right to obtain the separate release of any one or more of the individual Properties, at any time during the term of the Workspace Whole Loan following the date that is 60 days after the closing of the Benchmark 2018-B8 Trust, provided, among other terms and conditions: (i) the Borrowers pay a release price equal to 110% of the allocated loan amount for the related individual Property (if the individual Property is being sold to a third party) or 115% of the allocated loan amount for the individual Property (if the individual Property is being released to an affiliate of the Borrower), as applicable, plus the payment of the yield maintenance premium, if applicable; (ii) after giving effect to the release, the debt yield for the remaining individual Properties is equal to or greater than the greater of (1) the debt yield for all of the Properties immediately prior to giving effect to the release based on the trailing 12 month period or (2) 9.9% (as may be adjusted by the lender to account for the payment of any prior release amounts in accordance with the Workspace Whole Loan documents); and (iii) if such release is to an affiliate of a Borrower, after giving effect to such release, the loan-to-value ratio for the Properties then remaining subject to the lien of the security instruments is equal to or less than the lesser of (1) 78.2% or (2) the loan-to-value ratio of all of the Properties immediately prior to giving effect to the release. The Borrowers are permitted to prepay a portion of the related Workspace Whole Loan in order to satisfy the foregoing debt yield and loan-to-value requirements in accordance with the Workspace Whole Loan documents. With respect to 25 of the individual properties, as identified in the preliminary prospectus, such individual Properties may not be released to an affiliate of the Borrowers except in connection with a release to cure a non-monetary default, and the borrowers are required to deliver updated surveys and appraisals with respect to certain other release parcels identified in the loan documents in connection with the release. The Borrowers may also obtain the release of four separate outparcels representing approximately 10.8 acres without the payment of any release price, upon satisfaction of certain terms and conditions set forth in the Workspace Whole Loan documents. In connection with the release of the Miramar parcel (as more specifically identified in the loan documents), the Borrowers are permitted to convert the related individual Property into a condominium, subject to conditions set forth in the loan documents. The Borrowers are permitted to prepay a portion of the related Whole Loan in order to satisfy the foregoing debt yield and loan-to-value requirements in accordance with the loan documents. Prepayments in connection with a partial release are allocated to the Floating Rate Loan until the Floating Rate Loan is paid in full, prior to any allocation to the Fixed Rate Loan. With respect to the Property known as 155 Great Valley Parkway, a tenant has an option to purchase the Property at a price which is in excess of the release price of 110% of ALA.
THE INFORMATION IN THIS STRUCTURAL AND COLLATERAL TERM SHEET IS NOT COMPLETE AND MAY BE AMENDED PRIOR TO THE TIME OF SALE. THIS TERM SHEET IS NOT AN OFFER TO SELL THESE SECURITIES AND IT IS NOT A SOLICITATION OF AN OFFER TO BUY THESE SECURITIES IN ANY JURISDICTION WHERE THE OFFER OR SALE IS NOT PERMITTED. | ||||
| | | 97 of 125 | | |
| Structural and Collateral Term Sheet | Benchmark 2018-B8 | |
| 145 Clinton | ||
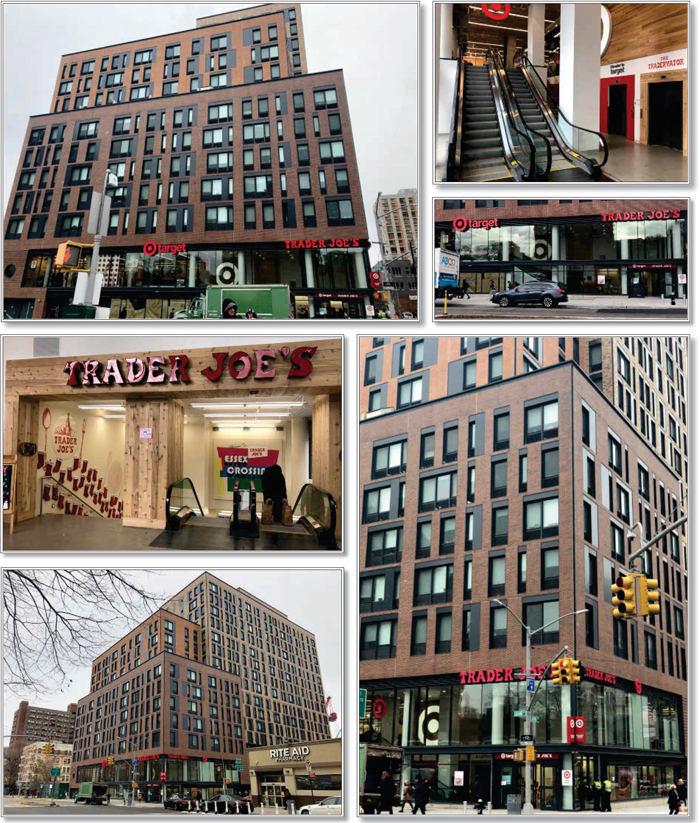
THE INFORMATION IN THIS STRUCTURAL AND COLLATERAL TERM SHEET IS NOT COMPLETE AND MAY BE AMENDED PRIOR TO THE TIME OF SALE. THIS TERM SHEET IS NOT AN OFFER TO SELL THESE SECURITIES AND IT IS NOT A SOLICITATION OF AN OFFER TO BUY THESE SECURITIES IN ANY JURISDICTION WHERE THE OFFER OR SALE IS NOT PERMITTED. | ||||
| | | 98 of 125 | | |
| Structural and Collateral Term Sheet | Benchmark 2018-B8 | |
| 145 Clinton | ||
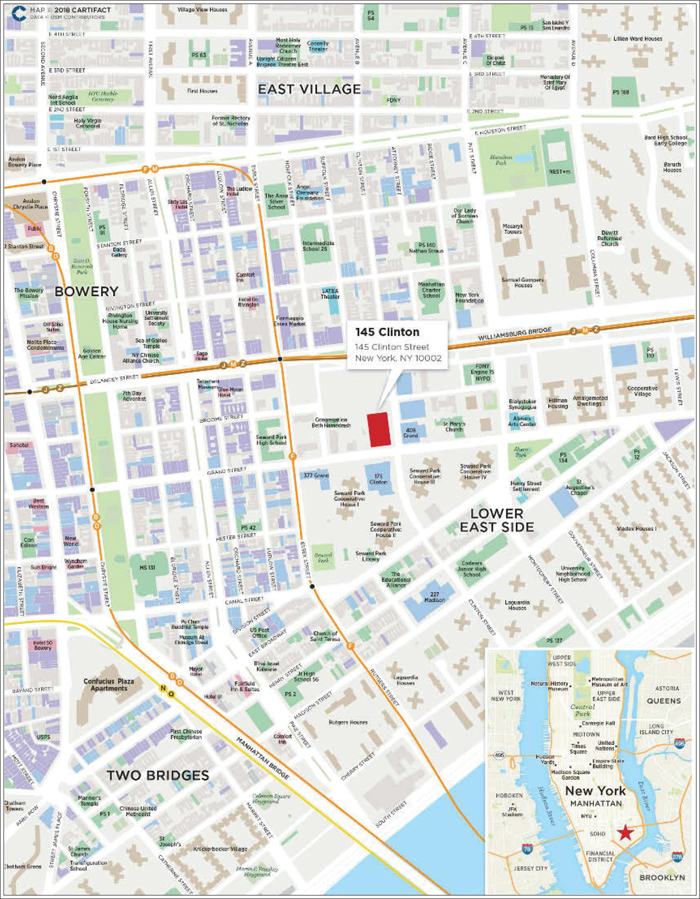
THE INFORMATION IN THIS STRUCTURAL AND COLLATERAL TERM SHEET IS NOT COMPLETE AND MAY BE AMENDED PRIOR TO THE TIME OF SALE. THIS TERM SHEET IS NOT AN OFFER TO SELL THESE SECURITIES AND IT IS NOT A SOLICITATION OF AN OFFER TO BUY THESE SECURITIES IN ANY JURISDICTION WHERE THE OFFER OR SALE IS NOT PERMITTED. | ||||
| | | 99 of 125 | | |
| Structural and Collateral Term Sheet | Benchmark 2018-B8 | |
| 145 Clinton | ||
| Mortgage Loan Information | Property Information | |||
| Mortgage Loan Seller: | GSMC | Single Asset / Portfolio: | Single Asset | |
| Original Principal Balance(1): | $40,000,000 | Title: | Fee | |
| Cut-off Date Principal Balance(1): | $40,000,000 | Property Type - Subtype: | Retail – Anchored | |
| % of Pool by IPB: | 3.8% | Net Rentable Area (SF): | 67,217 | |
| Loan Purpose: | Refinance | Location: | New York, NY | |
| Borrower: | Site 5 Commercial Owner DE LLC | Year Built / Renovated: | 2018 / N/A | |
| Sponsor: | DSA Phase I Holdings LLC | Occupancy(3): | 85.0% | |
| Interest Rate: | 4.96500% | Occupancy Date: | 9/15/2018 | |
| Note Date: | 11/19/2018 | Number of Tenants: | 3 | |
| Maturity Date: | 12/6/2028 | 2015 NOI: | N/A | |
| Interest-only Period: | 120 months | 2016 NOI: | N/A | |
| Original Term: | 120 months | 2017 NOI: | N/A | |
| Original Amortization: | None | TTM NOI: | N/A | |
| Amortization Type: | Interest Only | UW Economic Occupancy: | 86.8% | |
| Call Protection(2): | L(24),Def(92),O(4) | UW Revenues: | $5,641,247 | |
| Lockbox / Cash Management: | Hard / Springing | UW Expenses: | $1,091,948 | |
| Additional Debt Balance(1): | $28,200,000 | UW NOI(4): | $4,549,299 | |
| Additional Debt(1): | Pari Passu | UW NCF(4): | $4,454,859 | |
| Appraised Value / Per SF: | $105,000,000 / $1,562 | |||
| Appraisal Date: | 9/20/2018 | |||
| Escrows and Reserves | Financial Information | |||||||
| Initial | Monthly | Initial Cap | ||||||
| Taxes: | $0 | Springing | N/A | Cut-off Date Loan / SF: | $1,015 | |||
| Insurance: | $0 | Springing | N/A | Maturity Date Loan / SF: | $1,015 | |||
| Replacement Reserves: | $0 | Springing | N/A | Cut-off Date LTV: | 65.0% | |||
| TI/LC: | $0 | Springing | N/A | Maturity Date LTV: | 65.0% | |||
| Other: | $1,016,150 | $0 | N/A | UW NCF DSCR: | 1.30x | |||
| UW NOI Debt Yield: | 6.7% | |||||||
| Sources and Uses | ||||||||
| Sources | Proceeds | % of Total | Uses | Proceeds | % of Total | |||
| Whole Loan | $68,200,000 | 100.0% | Loan Payoff Existing Debt | $28,035,340 | 41.1% | |||
| % | Upfront Reserves | 1,016,150 | 1.5% | |||||
| Closing Costs | 1,010,837 | 1.5 | ||||||
| Return of Equity | 38,137,673 | 55.9 | ||||||
| Total Sources | $68,200,000 | 100.0% | Total Uses | $68,200,000 | 100.0% | |||
| (1) | The 145 Clinton Street loan is part of a whole loan evidenced by two pari passu notes with an aggregate outstanding principal balance of $68.2 million. The financial information presented in the chart above reflects the $68.2 million aggregate Cut-off Date balance of the 145 Clinton Whole Loan (as defined below). |
| (2) | The lockout period will be at least 24 payment dates beginning with and including the first payment date of January 6, 2019. Defeasance of the full $68.2 million 145 Clinton Whole Loan is permitted after the date that is the earlier to occur of (i) two years after the closing date of the securitization that includes the last note to be securitized and (ii) November 19, 2021. The assumed lockout period of 24 months is based on the expected closing date of the Benchmark 2018-B8 securitization in December 2018. The actual lockout period may be longer. |
| (3) | The 145 Clinton Property (as defined below) was built in 2018. The occupancy of 85.0% includes one tenant, Time Warner Cable (4,000 SF representing approximately 6.0% of the net rentable area), who has executed a lease but has not yet taken occupancy or begun paying rent. Time Warner Cable is anticipated to take occupancy in January 2019 and begin paying rent in May 2019. We cannot assure you that this tenant will take occupancy or pay rent as anticipated or at all. |
| (4) | UW NOI and UW NCF are based on the September 15, 2018 rent roll, executed leases and rent steps. See “Cash Flow Analysis” herein. |
The Loan. The 145 Clinton loan (the “145 Clinton Loan”) is part of a whole loan consisting of twopari passu promissory notes with an aggregate outstanding principal balance as of the Cut-off Date of $68.2 million (the “145 Clinton Whole Loan”), each as described below. The 145 Clinton Whole Loan was originated by GSMC. The controlling Note A-1, with an outstanding principal balance as of the Cut-off Date of $40.0 million, is being contributed to the Benchmark 2018-B8 Trust. The non-controlling Note A-2, with an outstanding principal balance as of the Cut-off Date of $28.2 million, is currently held by GSMC and is expected to be contributed to one or more future securitization trusts. The relationships between the holders of the 145 Clinton Whole Loan will be governed by a co-lender agreement as described under the “Description of the Mortgage Pool—The Whole Loans—The Serviced Pari Passu Whole Loans” in the Preliminary Prospectus. The 145 Clinton Whole Loan has a 10-year term and will be interest-only for the term of the loan.
THE INFORMATION IN THIS STRUCTURAL AND COLLATERAL TERM SHEET IS NOT COMPLETE AND MAY BE AMENDED PRIOR TO THE TIME OF SALE. THIS TERM SHEET IS NOT AN OFFER TO SELL THESE SECURITIES AND IT IS NOT A SOLICITATION OF AN OFFER TO BUY THESE SECURITIES IN ANY JURISDICTION WHERE THE OFFER OR SALE IS NOT PERMITTED. | ||||
| | | 100 of 125 | | |
| Structural and Collateral Term Sheet | Benchmark 2018-B8 | |
| 145 Clinton | ||
| Whole Loan Summary | |||||
| Note | Original Balance | Cut-off Date Balance | Note Holder | Controlling Piece | |
| A-1 | $40,000,000 | $40,000,000 | Benchmark 2018-B8 | Yes | |
| A-2 | $28,200,000 | $28,200,000 | GSMC | No | |
| Total | $68,200,000 | $68,200,000 | |||
The Borrower. The borrowing entity for the 145 Clinton Loan is Site 5 Commercial Owner DE LLC, a Delaware limited liability company and special purpose entity (the “145 Clinton Borrower”).
The Loan Sponsor.The loan sponsor and non-recourse carveout guarantor is DSA Phase I Holdings LLC (the “145 Clinton Loan Sponsor”).
DSA Phase I Holdings LLC is a partnership comprised of BFC Partners, L+M Development Partners, Inc. (“L+M”), Taconic Investment Partners and Goldman Sachs Urban Investment Group. BFC Partners and its principals have completed over $1.8 billion in acquisition and development projects since the firm’s inception in 1985 and an additional $2.3 billion of projects are currently under development. L+M is responsible for more than $7.0 billion in development and investment, and has acquired, built or preserved more than 22,000 residential units in New York’s tristate area, the West Coast, and Gulf Coast regions. Since its founding in 1997, Taconic Investment Partners has acquired, developed, redeveloped and repositioned over 13 million square feet of office, mixed-use, and retail space and more than 4,000 units of for-sale and multifamily housing primarily in New York City. Goldman Sachs Urban Investment Group has committed nearly $7.0 billion since it was founded in 2001, which has facilitated the creation and preservation of more than 24,000 housing units.
The Property.The 145 Clinton Property (the “145 Clinton Property”) consists of two retail condominium units that comprise the entire retail portion of a mixed use building with retail and residential condominium space located at 145 Clinton Street in the Lower East Side neighborhood of New York, New York (the “145 Clinton Mixed Use Building”). The two commercial retail condominium units that comprise the 145 Clinton Property contain approximately 67,217 square feet. The remaining condominium interests consist of three residential condominium units containing 211 rental apartments, which are not collateral for the 145 Clinton Whole Loan. See “—Condominium” below.
As of September 15, 2018, the 145 Clinton Property was 85.0% leased to three tenants including Trader Joe’s, Target and Time Warner Cable with a combined weighted average remaining lease term of approximately 14.7 years. The largest tenant, Trader Joe’s (30,621 square feet, 45.6% of net rentable area) offers upscale grocery fare such as health foods, organic produce, and nutritional supplements. The Trader Joe’s lease expires in September 2033. The second largest tenant, Target (22,480 square feet, 33.4% of net rentable area) is a general merchandise retailer selling products through its stores and digital channels. The Target lease expires in January 2034. The third largest tenant, Time Warner Cable (4,000 square feet, 6.0% of net rentable area) is a cable operator in the United States and a broadband communications services company. The Time Warner Cable lease expires in April 2029.
The Market.The 145 Clinton Property is situated on Site 5 of Essex Crossing. Spread over 1.9 million SF, Essex Crossing is a redevelopment project in the Lower East Side neighborhood in Manhattan and comprises nine sites with approximately 1,000 new apartments, 450,000 square feet of retail, 400,000 square feet of office, community attractions and green spaces. These nine sites, also known as Seward Park Extension Urban Renewal Area, sat mostly vacant since 1967 and represents an urban renewal development in New York City. Phased construction began in May 2015 and is scheduled to be completed by 2024 per the 145 Clinton Borrower. Essex Crossing sits at the foot of the Williamsburg Bridge, in the Lower East Side, and in close proximity to subway stations servicing the F, J, M, and Z MTA subway lines.
| Market Overview – Manhattan(1) | |||
| Inventory | 52,334,272 SF | Vacancy | 4.1% |
| Under Construction | 2,490,153 SF | Average Rental Rate | $101.35 |
| Sub-Market Overview – Downtown Manhattan(1) | |||
| Inventory | 4,253,381 SF | Vacancy | 9.8% |
| Under Construction | 0 SF | Average Rental Rate | $83.06 |
| (1) | Based on a market research report. |
THE INFORMATION IN THIS STRUCTURAL AND COLLATERAL TERM SHEET IS NOT COMPLETE AND MAY BE AMENDED PRIOR TO THE TIME OF SALE. THIS TERM SHEET IS NOT AN OFFER TO SELL THESE SECURITIES AND IT IS NOT A SOLICITATION OF AN OFFER TO BUY THESE SECURITIES IN ANY JURISDICTION WHERE THE OFFER OR SALE IS NOT PERMITTED. | ||||
| | | 101 of 125 | | |
| Structural and Collateral Term Sheet | Benchmark 2018-B8 | |
| 145 Clinton | ||
Based on a market research report, the vacancy within the subject property’s market and submarket range from 4.1% - 9.8%. The appraiser noted that the majority of the available space is situated within older buildings with inferior utility, ceiling heights and frontage. The appraisal also notes that the in-place rents at the 145 Clinton Property are below or at market. For comparison, Trader Joe’s ground level rent is 15.09% below market, Target’s lower level rent is 11.16% below market, and Time Warner Cable’s ground level rent is at market.
| Competitive Set Summary(1) | ||||
| Property | Location | Year Built | Total GLA | Occupancy % |
| 145 Clinton | New York, New York | 2018 | 67,217 | 85.0% |
| 412-414 West 14th Street | New York, New York | 1900 / 2017 | 17,236 | 100.0% |
| The Marquand | New York, New York | 1915 / 2015 | 10,845 | 100.0% |
| 401 East 60th Street | New York, New York | 1932 / 2015 | 94,447 | 100.0% |
| 1151 Third Avenue | New York, New York | 1930 / 1985 | 14,550 | 100.0% |
| Harlem Center | New York, New York | 1995 | 126,234 | 98.0% |
| 10 Madison Square West | New York, New York | 1915 / 2015 | 20,609 | 100.0% |
| 2139-2159 Broadway | New York, New York | 1901 / 1977 | 31,210 | 100.0% |
| (1) | Based on the appraisal. |
| Collateral Tenant Summary | ||||||||
| Tenant | Ratings Moody’s/S&P/ Fitch(1) | Net Rentable Area (SF) | % of Total NRA | Base Rent Per Square Foot(2) | Lease Expiration(3) | % of Total Base Rent | ||
| Trader Joe’s | NR / NR / NR | 30,621 | 45.6% | $63.68% | 9/30/2033% | 40.2% | ||
| Target | A2 / A / A- | 22,480 | 33.4 | 75.51% | 1/31/2034% | 35.0 | ||
| Time Warner Cable(4)(5) | Baa2 / BBB / A- | 4,000 | 6.0 | 300.00% | 4/30/2029% | 24.8 | ||
| Subtotal / Weighted Average | 57,101 | 85.0% | $84.89 | 100.0% | ||||
| Vacant | 10,116 | 15.0% | NAP% | NAP | ||||
| Total / Weighted Average | 67,217 | 100.0% | $84.89 | 100.0% | ||||
| (1) | Certain ratings are those of the parent company whether or not the parent guarantees the lease. |
| (2) | Base Rent Per Square Foot reflects the following in-place leases based on the September 15, 2018 rent roll, and contractual rent steps through October 2019 totaling approximately $364,124. |
| (3) | Certain tenants may have termination or contraction options due to co-tenancy provisions in the related leases (which may become exercisable prior to the originally stated expiration date of the tenant lease). |
| (4) | Time Warner Cable (4,000 SF) has executed a lease but has not yet taken occupancy or begun paying rent. Time Warner Cable is anticipated to take occupancy in January 2019 and begin paying rent in May 2019. We cannot assure you that this tenant will take occupancy or pay rent as anticipated or at all. |
| (5) | Time Warner Cable has a one-time option to terminate its lease if the 145 Clinton Loan Sponsor fails to deliver its space by August 2019. |
THE INFORMATION IN THIS STRUCTURAL AND COLLATERAL TERM SHEET IS NOT COMPLETE AND MAY BE AMENDED PRIOR TO THE TIME OF SALE. THIS TERM SHEET IS NOT AN OFFER TO SELL THESE SECURITIES AND IT IS NOT A SOLICITATION OF AN OFFER TO BUY THESE SECURITIES IN ANY JURISDICTION WHERE THE OFFER OR SALE IS NOT PERMITTED. | ||||
| | | 102 of 125 | | |
| Structural and Collateral Term Sheet | Benchmark 2018-B8 | |
| 145 Clinton | ||
| Lease Rollover Schedule | |||||||||
| Year | Number of Leases Expiring | Net Rentable Area Expiring | % of NRA Expiring | Base Rent Expiring(1)(2) | % of Base Rent Expiring | Cumulative Net Rentable Area Expiring | Cumulative % of NRA Expiring | Cumulative Base Rent Expiring | Cumulative % of Base Rent Expiring |
| Vacant | NAP | 10,116 | 15.0% | NAP | NAP | 10,116 | 15.0% | NAP | NAP |
| 2018 & MTM | 0 | 0 | 0.0 | $0 | 0.0% | 10,116 | 15.0% | $0 | 0.0% |
| 2019 | 0 | 0 | 0.0% | 0 | 0.0% | 10,116 | 15.0% | $0 | 0.0% |
| 2020 | 0 | 0 | 0.0% | 0 | 0.0% | 10,116 | 15.0% | $0 | 0.0% |
| 2021 | 0 | 0 | 0.0% | 0 | 0.0% | 10,116 | 15.0% | $0 | 0.0% |
| 2022 | 0 | 0 | 0.0% | 0 | 0.0% | 10,116 | 15.0% | $0 | 0.0% |
| 2023 | 0 | 0 | 0.0% | 0 | 0.0% | 10,116 | 15.0% | $0 | 0.0% |
| 2024 | 0 | 0 | 0.0% | 0 | 0.0% | 10,116 | 15.0% | $0 | 0.0% |
| 2025 | 0 | 0 | 0.0% | 0 | 0.0% | 10,116 | 15.0% | $0 | 0.0% |
| 2026 | 0 | 0 | 0.0% | 0 | 0.0% | 10,116 | 15.0% | $0 | 0.0% |
| 2027 | 0 | 0 | 0.0% | 0 | 0.0% | 10,116 | 15.0% | $0 | 0.0% |
| 2028 | 0 | 0 | 0.0% | 0 | 0.0% | 10,116 | 15.0% | $0 | 0.0% |
| 2029 & Beyond | 3 | 57,101 | 85.0% | 4,847,500 | 100.0% | 67,217 | 100.0% | $4,847,500 | 100.0% |
| Total | 3 | 67,217 | 100.0% | $4,847,500 | 100.0% | ||||
| (1) | Base Rent Per Square Foot reflects the following in-place leases based on the September 15, 2018 rent roll and contractual rent steps through October 2019 totaling approximately $364,124. |
| (2) | Time Warner Cable (4,000 SF) has executed a lease but has not yet taken occupancy or begun paying rent. Time Warner Cable is anticipated to take occupancy in January 2019 and begin paying rent in May 2019. We cannot assure you that this tenant will take occupancy or pay rent as anticipated or at all. |
| Operating History and Underwritten Net Cash Flow(1) | |||
| Underwritten | Per Square Foot | %(2) | |
| Base Rental Revenue | $4,847,500 | $72.12 | 74.6% |
| Contractual Rent Steps(3) | 364,124 | 5.42 | 5.6% |
| Total Reimbursement Revenue | 429,623 | 6.39 | 6.6% |
| Market Revenue from Vacant Units | 858,782 | 12.78 | 13.2% |
| Gross Revenue | $6,500,029 | $96.70 | 100.0% |
| Vacant Loss | (858,782) | (12.78) | (13.2%) |
| Effective Gross Income | $5,641,247 | $83.93 | 86.8% |
| Total Operating Expenses | 1,091,948 | 16.25 | 19.4% |
| Net Operating Income | $4,549,299 | $67.68 | 80.6% |
| Total TI/LC, Capex/RR | 94,440 | 1.41 | 1.7% |
| Net Cash Flow | $4,454,859 | $66.28 | 79.0% |
| (1) | Prior financials are not available because construction was completed in2018. |
| (2) | % column represents percent of Gross Revenue for all revenue lines and represents Effective Gross Income for the remainder of fields. |
| (3) | Contractual Rent Steps are underwritten to the present value of all remaining rent step increments over lease term for IG-tenants Target and Time Warner Cable |
Property Management. The 145 Clinton Property is managed by Taconic Management Company LLC, a Delaware limited liability company and an affiliate of the 145 Clinton Borrower.
Escrows and Reserves. At loan origination, the 145 Clinton Borrower deposited $1,016,150 into an escrow for (i) gap rent of $500,000 for Time Warner Cable, (ii) $433,350 for leasing commissions and (iii) $82,800 for building improvements for Time Warner Cable.
Tax Reserve–During the continuance of a 145 Clinton Trigger Period (as defined below), the 145 Clinton Borrower is required to fund a tax reserve, on a monthly basis, in an amount equal to 1/12 of the amount of taxes that the lender reasonably estimates will be payable during the next ensuing 12 months.
Insurance Reserve–During the continuance of a 145 Clinton Trigger Period, the 145 Clinton Borrower is required to fund an insurance reserve, on a monthly basis, in an amount equal to 1/12 of the amount of insurance premiums that the lender reasonably estimates will be payable during the next ensuing 12 months.
THE INFORMATION IN THIS STRUCTURAL AND COLLATERAL TERM SHEET IS NOT COMPLETE AND MAY BE AMENDED PRIOR TO THE TIME OF SALE. THIS TERM SHEET IS NOT AN OFFER TO SELL THESE SECURITIES AND IT IS NOT A SOLICITATION OF AN OFFER TO BUY THESE SECURITIES IN ANY JURISDICTION WHERE THE OFFER OR SALE IS NOT PERMITTED. | ||||
| | | 103 of 125 | | |
| Structural and Collateral Term Sheet | Benchmark 2018-B8 | |
| 145 Clinton | ||
TI/LC Reserve–During the continuance of a 145 Clinton Trigger Period, the 145 Clinton Borrower is required to fund a tenant improvement and leasing commission reserve, on a monthly basis, in an amount equal to $2,800.71. The 145 Clinton Borrower is also required to deposit any termination fees or other consideration payable in connection with any early termination of a lease at the 145 Clinton Property.
Replacement Reserve–During the continuance of a 145 Clinton Trigger Period, the 145 Clinton Borrower is required to fund a capital expenditure reserve, on a monthly basis, in an amount equal to $1,400.35.
A “145 Clinton Trigger Period” means any period that commences when (i) debt yield, determined as of the first day of each of two consecutive fiscal quarters, is less than 5.75% and concludes when debt yield, determined as of the first day of each of two consecutive fiscal quarters thereafter, is equal to or greater than 5.75%, (ii) the Target tenant, the Trader Joe’s tenant or any tenant that replaces the Target tenant or the Trader Joe’s tenant (a) delivers a termination notice pursuant to its lease or other written notice of its intention to terminate its lease, (b) vacates its leased premises and fails to continue to pay rent pursuant to the lease, or (c) fails to extend or renew its lease on or before the date set forth in the lease for such extension or renewal and the borrower has not executed a replacement lease with a tenant reasonably acceptable to the lender, and in the case of each of clause (a), (b) and (c) concludes when the applicable premises is relet in its entirety to a tenant reasonably acceptable to the lender pursuant to a lease reasonably acceptable to the lender, and (iii) certain financial statements required to be delivered by the borrower are not delivered, and such failure continues for 10 business days, and concludes when such financial statements are delivered and indicate that no 145 Clinton Trigger Period is ongoing.
Lockbox / Cash Management. The 145 Clinton Whole Loan is structured with a hard lockbox and springing cash management. The borrower is required by December 15, 2018 to deliver tenant direction letters instructing all tenants to deposit rents into a lockbox account controlled by the lender. All funds in the lockbox account are required to be swept each business day into the borrower’s operating account, unless a 145 Clinton Trigger Period or event of default under the 145 Clinton Whole Loan is continuing, in which event such funds are required to be swept each business day into a cash management account controlled by the lender. During a 145 Clinton Trigger Period (and, during an event of default under the 145 Clinton Whole Loan, in the lender’s sole discretion), all excess cash flow after payment of mortgage debt service, required reserves and operating expenses is required to be held as additional collateral for the 145 Clinton Whole Loan.
Condominium. The 145 Clinton Mixed Use Building is subject to a condominium regime, comprised of (i) the 145 Clinton Property, which consists of two retail condominium units that secure the 145 Clinton Whole Loan, and (ii) three residential condominium units, which are comprised of 211 residences and are not collateral for the 145 Clinton Whole Loan. The condominium board of directors has five board members, each appointed by a separate condominium unit owner. The borrower only appoints two of the five board members and therefore does not control the board of directors.
THE INFORMATION IN THIS STRUCTURAL AND COLLATERAL TERM SHEET IS NOT COMPLETE AND MAY BE AMENDED PRIOR TO THE TIME OF SALE. THIS TERM SHEET IS NOT AN OFFER TO SELL THESE SECURITIES AND IT IS NOT A SOLICITATION OF AN OFFER TO BUY THESE SECURITIES IN ANY JURISDICTION WHERE THE OFFER OR SALE IS NOT PERMITTED. | ||||
| | | 104 of 125 | | |
| Structural and Collateral Term Sheet | Benchmark 2018-B8 | |
| Crowne Plaza Melbourne | ||
| Mortgage Loan Information | Property Information | |||
| Mortgage Loan Seller: | GSMC | Single Asset / Portfolio: | Single Asset | |
| Original Principal Balance: | $38,850,000 | Title: | Fee | |
| Cut-off Date Principal Balance: | $38,810,879 | Property Type - Subtype: | Hotel – Full Service | |
| % of Pool by IPB: | 3.7% | Net Rentable Area (Rooms): | 290 | |
| Loan Purpose: | Acquisition | Location: | Melbourne, FL | |
| Borrower: | DAD 2605 N Highway A1A | Year Built / Renovated(1): | 1979, 1981 / 2017-2018 | |
| Melbourne Owner, LLC | Occupancy / ADR / RevPAR(1): | 28.3% / $133.71 / $37.85 | ||
| Sponsors: | Carlos J. Rodriguez, David | Occupancy / ADR / RevPAR Date: | 8/31/2018 | |
| Buddemeyer, Driftwood Acquisition | Number of Tenants: | N/A | ||
| & Development L.P. | 2015 NOI: | $3,966,814 | ||
| Interest Rate: | 5.94000% | 2016 NOI: | $4,775,427 | |
| Note Date: | 10/17/2018 | 2017 NOI(1): | $3,943,769 | |
| Maturity Date: | 11/6/2028 | TTM NOI (as of 8/2018)(1): | $1,727,659 | |
| Interest-only Period: | None | UW Occupancy / ADR / RevPAR: | 78.7% / $123.22 / $96.98 | |
| Original Term: | 120 months | UW Revenues: | $14,901,927 | |
| Original Amortization: | 360 months | UW Expenses: | $10,260,475 | |
| Amortization Type: | Balloon | UW NOI: | $4,641,452 | |
| Call Protection: | L(25),Def(88),O(7) | UW NCF: | $4,045,375 | |
| Lockbox / Cash Management: | Hard / Springing | Appraised Value / Per Room(2): | $59,500,000 / $205,172 | |
| Additional Debt: | N/A | Appraisal Date(2): | 6/1/2019 | |
| Additional Debt Balance: | N/A | |||
| Additional Debt Type: | N/A | |||
| Escrows and Reserves | Financial Information | ||||||
| Initial | Monthly | Initial Cap | Cut-off Date Loan / Room: | $133,831 | |||
| Taxes: | $233,831 | $25,981 | N/A | Maturity Date Loan / Room: | $113,412 | ||
| Insurance: | $83,740 | $41,870 | N/A | Cut-off Date LTV(2): | 65.2% | ||
| FF&E: | $0 | $50,328 | N/A | Maturity Date LTV(2): | 55.3% | ||
| Other(3): | $3,750,000 | $0 | N/A | UW NCF DSCR: | 1.46x | ||
| UW NOI Debt Yield: | 12.0% | ||||||
| Sources and Uses | ||||||
| Sources | Proceeds | % of Total | Uses | Proceeds | % of Total | |
| Loan Amount | $38,850,000 | 68.2% | Purchase Price | $52,000,000 | 91.3% | |
| Sponsor Equity Contribution | 18,104,904 | 31.8 | Other Reserve(3) | 4,067,571 | 7.1 | |
| Closing Costs | 887,333 | 1.6 | ||||
| Total Sources | $56,954,904 | 100.0% | Total Uses | $56,954,904 | 100.0% | |
| (1) | Due to Hurricane Irma in September 2017 and the subsequent damage, the Crowne Plaza Melbourne Property (as defined below) was taken partially offline. The renovation was completed in 2018. See “—The Property” below. |
| (2) | The Appraised Value / Per Room represents the “Prospective Market Value Upon Completion” of $59,500,000 (as of June 1, 2019) for the Crowne Plaza Melbourne Property, which assumes that renovations at the property have been completed. The appraiser also concluded a “hypothetical as-is” value of $53,000,000, which assumes a $6.2 million renovation is completed at the Crowne Plaza Melbourne Property, which as of the Cut-off Date, has been completed. The Appraised Value / Per Room based on the “hypothetical as-is” appraised value is $182,759. The Cut-off Date LTV Ratio and Maturity Date LTV Ratio based on the “hypothetical as-is” appraised value is 73.2% and 62.1%, respectively. The “as is” appraised value as of June 15, 2018, which represents the value before completion of the renovation is $47,000,000. The Appraised Value / Per Room based on the “as-is” appraised value is $162,069. The Cut-off Date LTV Ratio and Maturity Date LTV Ratio based on the “as-is” appraised value is 82.6% and 70.0%, respectively. |
| (3) | Other Initial escrows include a Capital Improvement Reserve ($3,500,000), Debt Service Reserve ($250,000), Real Estate Tax Reserve ($233,831) and Insurance Reserve ($83,740). |
The Loan.The Crowne Plaza Melbourne Loan (the “Crowne Plaza Melbourne Loan”) has an outstanding principal balance as of the Cut-off Date of approximately $38.8 million and is secured by a first mortgage lien on the borrower’s fee interest in a 290-room, full service waterfront hotel located in Melbourne, Florida (the “Crowne Plaza Melbourne Property”). The Crowne Plaza Melbourne Loan has a 10-year term and will amortize on a 30-year schedule. The Crowne Plaza Melbourne Property was damaged by Hurricane Irma in September 2017 with a total of 216 rooms damaged. The seller received insurance proceeds of $19.61 million to repair and renovate these units, as well as public areas in the hotel.
THE INFORMATION IN THIS STRUCTURAL AND COLLATERAL TERM SHEET IS NOT COMPLETE AND MAY BE AMENDED PRIOR TO THE TIME OF SALE. THIS TERM SHEET IS NOT AN OFFER TO SELL THESE SECURITIES AND IT IS NOT A SOLICITATION OF AN OFFER TO BUY THESE SECURITIES IN ANY JURISDICTION WHERE THE OFFER OR SALE IS NOT PERMITTED. | ||||
| | | 105 of 125 | | |
| Structural and Collateral Term Sheet | Benchmark 2018-B8 | |
| Crowne Plaza Melbourne | ||
The Borrower.The borrowing entity for the Crowne Plaza Melbourne Loan is DAD 2605 N Highway A1A Melbourne Owner, LLC, a Delaware limited liability company and special purpose entity.
The Loan Sponsors.The loan sponsors and non-recourse carveout guarantors are Carlos J. Rodriguez, David Buddemeyer and Driftwood Acquisition & Development L.P. (“DAD”). Carlos J. Rodriguez is the Chairman and CEO of Driftwood Acquisition & Development, L.P. and the Executive Vice President of Driftwood Hospitality Management, LLC. David Buddemeyer is the President of Driftwood Hospitality Management, LLC. After 25 years of sourcing, investing and managing hotels for investment funds, Mr. Rodriguez and Mr. Buddemeyer formed DAD to acquire hotel assets.
The Property. The Crowne Plaza Melbourne Property is a full service, 290-room hotel located on the waterfront of Melbourne, Florida. The hotel consists of two towers; the eight-story, 160-room north tower was originally constructed in 1979 and the five-story, 130-room south tower was constructed in 1981. The hotel features numerous amenities, including an oceanfront deck, fitness center, business center and 8,100 square feet of meeting space. On September 10, 2017, Hurricane Irma destroyed the property, taking 216 rooms offline. It also eroded approximately six feet of beach, which has been replaced. The Crowne Plaza Melbourne Property was substantially impacted by the hurricane, and beginning in September 2017 until September 2018, the Crowne Plaza Melbourne Property averaged over 63% of rooms offline. The amount of room product offline at the Crowne Plaza Melbourne Property peaked during the period from May 2018 until July 2018, when the Crowne Plaza Melbourne Property had an average of over 90.0% of rooms offline. After adjusting for the rooms that were offline at the Crowne Plaza Melbourne Property, the August 2018 RevPAR was $96.46, compared to the unadjusted RevPAR at the Crowne Plaza Melbourne Property of $37.85. The Crowne Plaza Melbourne Property underwent a $19.61 million (approximately $67,632 per room) renovation by the seller after receiving insurance proceeds for damage from Hurricane Irma. The renovation included a full renovation of 216 rooms at the Crowne Plaza Melbourne Property, as well as a complete lobby, fitness center and public area renovation of the north tower. In addition, the loan sponsors plan to complete a $3.5 million capital expenditure renovation ($12,069 per room) to renovate the remaining 74 rooms at the Crowne Plaza Melbourne Property, construct two additional revenue generating venues (a gelato shop and Starbucks) and expand/renovate the existing outdoor bar.
The Market.The Crowne Plaza Melbourne Property is a beachfront full service hotel and resort. The Crowne Plaza Melbourne Property is approximately 20 miles from Cape Canaveral, the Kennedy Space Station, and the Port Canaveral. Port Canaveral is one of the busiest cruise ports in the world with approximately 4.5 million cruise passengers passing through in 2017. In addition, the Crowne Plaza Melbourne Property is located in close proximity to Patrick Air Force Base (approximately 9 miles north) and Kennedy Space Station (approximately 20 miles north). The hotel is located approximately 69 miles from the Orlando Airport, 71 miles from Sea World, 72 miles from Walt Disney World Resort and 79 miles from Universal Orlando Resort.
The primary competitive set for the Crowne Plaza Melbourne Property consists of seven hotels, which range in size from 167 to 502 rooms, and contain an aggregate of 1,827 rooms. Due to Hurricane Irma, the Crowne Plaza Melbourne Property’s operating performance between September 2017 and October 2018 was negatively affected as it was one of the only hotels in the competitive set to be partially offline to the public. The competitive set and historical performance relative to its competitive set are detailed below:
| Historical Occupancy, ADR, RevPAR | |||||||||
| Competitive Set(1) | Crowne Plaza Melbourne(2) | Penetration Factor(3) | |||||||
| Year | Occupancy | ADR | RevPAR | Occupancy | ADR | RevPAR | Occupancy | ADR | RevPAR |
| 2015 | 67.3% | $116.40 | $78.35 | 70.3% | $120.57 | $84.75 | 104.5% | 103.6% | 108.2% |
| 2016 | 69.4% | $126.58 | $87.85 | 78.6% | $122.78 | $96.49 | 113.3% | 97.0% | 109.8% |
| TTM(4) | 67.8% | $128.72 | $87.29 | 78.7% | $123.22 | $96.98 | 116.1% | 95.7% | 111.1% |
| 2017 | 69.4% | $131.23 | $91.09 | 66.9% | $126.26 | $84.49 | 96.4% | 96.2% | 92.8% |
| TTM(5) | 70.4% | $142.49 | $100.37 | 28.3% | $133.71 | $37.85 | 40.2% | 93.8% | 37.7% |
| (1) | Data provided by a third party travel research report. The competitive set contains the following properties: International Palms Resort Cocoa Beach, Hilton Melbourne Rialto Place, Hilton Melbourne Beach Oceanfront, Radisson Resort @ The Port, Radisson Suite Hotel Oceanfront, Best Western Cocoa Beach Hotel & Suites and DoubleTree Suites Melbourne Beach Oceanfront. |
| (2) | Based on underwriting. |
| (3) | Penetration Factor reflects the underwritten performance of the Crowne Plaza Melbourne Property divided by the performance of the competitive set as determined by a market research report for the respective period(s). |
| (4) | TTM represents the trailing 12-month period ending on August 31, 2017. |
| (5) | TTM represents the trailing 12-month period ending on August 31, 2018 for the Crowne Plaza Melbourne Property and for the competitive set. The Crowne Plaza Melbourne Property was substantially offline from September 2017 until October 2018 after being hit by Hurricane Irma. |
THE INFORMATION IN THIS STRUCTURAL AND COLLATERAL TERM SHEET IS NOT COMPLETE AND MAY BE AMENDED PRIOR TO THE TIME OF SALE. THIS TERM SHEET IS NOT AN OFFER TO SELL THESE SECURITIES AND IT IS NOT A SOLICITATION OF AN OFFER TO BUY THESE SECURITIES IN ANY JURISDICTION WHERE THE OFFER OR SALE IS NOT PERMITTED. | ||||
| | | 106 of 125 | | |
| Structural and Collateral Term Sheet | Benchmark 2018-B8 | |
| Crowne Plaza Melbourne | ||
| Competitive Hotels Profile(1) | |||||||||
| 2017 Estimated Market Mix | 2017 Estimated Operating Statistics(2) | ||||||||
| Property | Rooms | Year Opened | Meeting Space (Square Feet) | Commercial | Meeting and Group | Leisure | Occupancy | ADR | RevPAR |
| Crowne Plaza Melbourne | 290 | 1979, 1981 | 8,100 | 35% | 25% | 40% | 67.0% | $125.76 | $84.26 |
| International Palms Resort Cocoa Beach | 502 | 1960 | 13,000 | 30% | 25% | 45% | 62.5% | $100.00 | $60.00 |
| Hilton Melbourne Rialto Place | 238 | 1985 | 14,000 | 55% | 30% | 15% | 77.5% | $125.00 | $95.00 |
| Hilton Melbourne Beach Oceanfront | 200 | 1986 | 6,621 | 40% | 20% | 40% | 82.5% | $165.00 | $130.00 |
| Radisson Resort @ The Port | 284 | 1967 | 30,000 | 25% | 15% | 60% | 62.5% | $135.00 | $85.00 |
| Radisson Suite Hotel Oceanfront | 167 | 1987 | 6,733 | 40% | 20% | 40% | 77.5% | $140.00 | $110.00 |
| Best Western Cocoa Beach Hotel & Suites | 229 | 1980 | 3,000 | 35% | 15% | 50% | 67.5% | $130.00 | $85.00 |
| DoubleTree Suites Melbourne Beach Oceanfront | 207 | 1987 | 2,730 | 40% | 20% | 40% | 82.5% | $155.00 | $125.00 |
| Total(3) | 1,827 | ||||||||
| (1) | Based on the appraisal. |
| (2) | Estimated statistics represent the midpoint of the range provided by the appraiser. |
| (3) | Excludes the Crowne Plaza Melbourne Property. |
| Operating History and Underwritten Net Cash Flow | ||||||||
| 2015 | 2016 | TTM (8/31/2017)(1) | 2017 | TTM (8/31/2018)(2) | Underwritten | Per Room(3) | % of Total Revenue(4) | |
| Occupancy | 70.3% | 78.6% | 78.7% | 66.9% | 28.3% | 78.7% | ||
| ADR | $120.57 | $122.78 | $123.22 | $126.26 | $133.71 | $123.22 | ||
| RevPAR | $84.75 | $96.49 | $96.98 | $84.49 | $37.85 | $96.98 | ||
| Room Revenue | $8,970,287 | $10,213,055 | $10,265,378 | $8,943,756 | $4,006,664 | $10,265,378 | $35,398 | 68.9% |
| Food & Beverage Revenue | 4,222,202 | 4,381,577 | 4,181,063 | 3,592,334 | 2,232,125 | 4,181,063 | 14,417 | 28.1 |
| Other Operating Departments Revenue | 86,991 | 82,671 | 80,609 | 69,647 | 137,483 | 80,609 | 278 | 0.5 |
| Other Revenue | 106,566 | 265,386 | 374,877 | 332,185 | 0 | 374,877 | 1,293 | 2.5 |
| Total Revenue | $13,386,046 | $14,942,689 | $14,901,927 | $12,937,922 | $6,376,272 | $14,901,927 | $51,386 | 100.0% |
| Room Expense | $1,887,002 | $1,921,127 | $1,859,074 | $1,643,924 | $936,614 | $1,859,074 | $6,411 | 12.5% |
| Food & Beverage Expense | 2,620,265 | 2,786,548 | 2,626,713 | 2,335,007 | 1,741,143 | 2,626,713 | 9,058 | 17.6 |
| Other Operating Departments Expense | 59,445 | 54,198 | 56,546 | 48,113 | 32,462 | 56,546 | 195 | 0.4 |
| Departmental Expenses | $4,566,712 | $4,761,873 | $4,542,333 | $4,027,044 | $2,710,219 | $4,542,333 | $15,663 | 30.5% |
| Gross Operating Income | $8,819,334 | $10,180,816 | $10,359,594 | $8,910,878 | $3,666,053 | $10,359,594 | $35,723 | 69.5% |
| Undistributed Expenses | $4,285,917 | $4,831,258 | $4,853,543 | $4,337,320 | $1,188,334 | $4,853,543 | $16,736 | 32.6% |
| Gross Operating Profit | $4,533,417 | $5,349,558 | $5,506,051 | $4,573,558 | $2,477,719 | $5,506,051 | $18,986 | 36.9% |
| Real Estate Taxes | $276,295 | $278,954 | $291,731 | $295,604 | $293,713 | $319,501 | $1,102 | 2.1% |
| Insurance | 290,308 | 295,177 | 310,335 | 334,185 | 456,347 | 545,098 | 1,880 | 3.7 |
| Total Fixed Expenses | $566,603 | $574,131 | $602,066 | $629,789 | $750,060 | $864,599 | $2,981 | 5.8% |
| Net Operating Income | $3,966,814 | $4,775,427 | $4,903,985 | $3,943,769 | $1,727,659 | $4,641,452 | $16,005 | 31.1% |
| FF&E | 535,442 | 597,708 | 596,077 | 517,517 | 255,124 | 596,077 | 2,055 | 4.0 |
| Net Cash Flow | $3,431,372 | $4,177,720 | $4,307,908 | $3,426,252 | $1,472,535 | $4,045,375 | $13,950 | 27.1% |
| (1) | The Crowne Plaza Melbourne Property was substantially offline from September 2017 until October 2018 after being hit by Hurricane Irma. |
| (2) | TTM 8/31/2018 includes data after the Crowne Plaza Melbourne Property was damaged by Hurricane Irma. |
| (3) | Per Room values based on underwriting and 290 rooms. |
| (4) | % of Total Revenue is based on the corresponding revenue line item. |
Property Management. The Crowne Plaza Melbourne Property is managed by Driftwood Hospitality Management, LLC, a Delaware limited liability company and an affiliate of the borrower.
THE INFORMATION IN THIS STRUCTURAL AND COLLATERAL TERM SHEET IS NOT COMPLETE AND MAY BE AMENDED PRIOR TO THE TIME OF SALE. THIS TERM SHEET IS NOT AN OFFER TO SELL THESE SECURITIES AND IT IS NOT A SOLICITATION OF AN OFFER TO BUY THESE SECURITIES IN ANY JURISDICTION WHERE THE OFFER OR SALE IS NOT PERMITTED. | ||||
| | | 107 of 125 | | |
| Structural and Collateral Term Sheet | Benchmark 2018-B8 | |
| Kawa Mixed Use Portfolio | ||
| Mortgage Loan Information | Property Information | |||
| Mortgage Loan Seller: | CREFI | Single Asset / Portfolio: | Portfolio | |
| Original Principal Balance(1): | $38,000,000 | Title(4): | Various | |
| Cut-off Date Principal Balance(1): | $38,000,000 | Property Type – Subtype(5): | Various | |
| % of Pool by IPB: | 3.6% | Net Rentable Area (SF): | 435,763 | |
| Loan Purpose(2): | Refinance/Acquisition | Location: | Various | |
| Borrowers: | KCP Fee Owner 1, LLC; KCP Fee | Year Built / Renovated(6): | Various / N/A | |
| Owner 2, LLC; KCP Fee Owner 3, | Occupancy: | 98.4% | ||
| LLC; KCP Fee Owner 4, LLC | Occupancy Date(7): | Various | ||
| Sponsors: | Kawa Capital Partners LLC | Number of Tenants: | 6 | |
| Interest Rate: | 5.08000% | 2015 NOI(8): | N/A | |
| Note Date: | 11/20/2018 | 2016 NOI(8): | N/A | |
| Maturity Date: | 12/6/2028 | 2017 NOI(8): | N/A | |
| Interest-only Period: | 120 months | TTM NOI(8): | N/A | |
| Original Term: | 120 months | UW Economic Occupancy: | 94.5% | |
| Original Amortization: | None | UW Revenues: | $11,284,065 | |
| Amortization Type: | Interest Only | UW Expenses: | $3,954,386 | |
| Call Protection(3): | L(24),DeforGrtr1%orYM(92),O(4) | UW NOI(8): | $7,329,679 | |
| Lockbox / Cash Management: | Hard / Springing | UW NCF: | $7,080,263 | |
| Additional Debt: | Yes | Appraised Value / Per SF: | $113,250,000 / $260 | |
| Additional Debt Balance(1): | $36,500,000 | Appraisal Date: | Various | |
| Additional Debt Type: | Pari Passu | |||
| Escrows and Reserves | Financial Information(1) | |||||
| Initial | Monthly | Initial Cap | Cut-off Date Loan / SF: | $171 | ||
| Taxes(9): | $0 | Springing | N/A | Maturity Date Loan / SF: | $171 | |
| Insurance: | $63,812 | $12,762 | N/A | Cut-off Date LTV: | 65.8% | |
| Replacement Reserves(10): | $0 | $6,173 | N/A | Maturity Date LTV: | 65.8% | |
| TI/LC(11): | $0 | Springing | N/A | UW NCF DSCR: | 1.85x | |
| Other(12): | $3,754,885 | Springing | N/A | UW NOI Debt Yield: | 9.8% | |
| Sources and Uses | ||||||
| Sources | Proceeds | % of Total | Uses | Proceeds | % of Total | |
| Mortgage Loan | $74,500,000 | 89.3% | Payoff Existing Debt | $58,484,592 | 70.1% | |
| Sponsor Equity | 4,982,781 | 6.0 | Purchase Price | 20,200,000 | 24.2 | |
| Other Sources(13) | 3,837,930 | 4.6 | Upfront Reserves | 3,818,697 | 4.6 | |
| Closing Costs | 918,422 | 1.1 | ||||
| Total Sources | $83,320,711 | 100.0% | Total Uses | $83,320,711 | 100.0% | |
| (1) | The Kawa Mixed Use Portfolio loan is part of a whole loan evidenced by twopari passunotes, with an aggregate outstanding principal balance as of the Cut-off Date of $74.5 million. The Financial Information presented in the chart above reflects the Cut-off Date balance of the $74.5 million Kawa Mixed Use Portfolio Whole Loan, as defined in “The Loan” below. |
| (2) | Mortgage Loan proceeds and sponsor equity were used to (i) pay off prior debt on the Gavilon Headquarters, Essence Group Headquarters and Oerlikon Industrial Facility properties (ii) fund the acquisition of the Northland Innovation Campus property, (iii) fund upfront reserves and (iv) pay closing costs. |
| (3) | The Kawa Mixed Use Portfolio Loan lockout period is required to be at least 24 payments beginning with and including the first payment date of January 6, 2019. Defeasance of the full $74.5 million whole loan is permitted at any time after the earlier to occur of (i) two years after the closing date of the securitization that includes the last promissory note to be securitized and (ii) three years from the note date. The assumed lockout period of 24 months is based on the expected closing date of the BMARK 2018-B8 securitization in December 2018. The actual lockout period may be longer. |
| (4) | The Northland Innovation Campus property is subject to a Taxable Industrial Development Revenue Bonds ground lease with the City of Gladstone, Missouri. See“The Properties-Northland Innovation Campus” below. |
| (5) | See“The Properties” below. |
| (6) | See“Portfolio Summary” below. |
| (7) | Based on the underwritten rent rolls dated December 6, 2018 for the Gavilon Headquarters, Essence Group Headquarters and Oerlikon Industrial Facility properties and August 6, 2018 for the Northland Innovation Campus property. |
| (8) | Historical operating statements were only provided for the Essence Group Headquarters and Northland Innovation properties (as presented in Annex A-1 to the prospectus), therefore, historical cash flows for the Kawa Mixed Use Portfolio are not available on a portfolio level. Historical operating statements were not provided for the Gavilon Headquarters property due to the nature of the single-tenant occupancy and triple-net lease in place at the property. With respect to the Oerlikon Industrial Facility property, historical operating statements were not available because development of the property was completed in 2018. UW NOI is based on contractual rent from in-place leases across the four properties that comprise the Kawa Mixed Use Portfolio. |
THE INFORMATION IN THIS STRUCTURAL AND COLLATERAL TERM SHEET IS NOT COMPLETE AND MAY BE AMENDED PRIOR TO THE TIME OF SALE. THIS TERM SHEET IS NOT AN OFFER TO SELL THESE SECURITIES AND IT IS NOT A SOLICITATION OF AN OFFER TO BUY THESE SECURITIES IN ANY JURISDICTION WHERE THE OFFER OR SALE IS NOT PERMITTED. | ||||
| | | 108 of 125 | | |
| Structural and Collateral Term Sheet | Benchmark 2018-B8 | |
| Kawa Mixed Use Portfolio | ||
| (9) | The requirement to make monthly deposits for tax reserves is provisionally waived so long as the borrowers deliver evidence to the lender that (i) no tax trigger period (as such term is defined under the Kawa Mixed Use Portfolio loan documents) has occurred and is continuing and (ii) (A) the specified tenant of such applicable individual property has timely paid the taxes directly to the appropriate taxing authority and (B) the borrowers or such specified tenant have provided evidence of such payment to the lender. |
| (10) | The monthly replacement reserve deposit consists of: (i) $639 with respect to the Gavilon Headquarters property, (ii) $217 with respect to the Northland Innovation Campus property, (iii) $133 with respect to the Oerlikon Industrial Facility property and (iv) $5,198 with respect to the Essence Group Headquarters property. |
| (11) | During the continuance of a leasing reserve trigger period (as such term is defined under the Kawa Mixed Use Portfolio loan documents), the borrowers are required to deposit excess cash flow for the immediately preceding interest accrual period for TI/LC reserves on each monthly payment date. Depending on the cause of the leasing reserve trigger period, the leasing reserve account is subject to certain caps under the Kawa Mixed Use Portfolio loan documents. |
| (12) | The Initial Other reserve consists of (i) $3,739,815 related to outstanding landlord obligations for the Essence Group and (ii) a $15,070 deposit for immediate repairs at the Essence Group Headquarters and Northland Innovation Campus properties, which represents 110.0% of the estimated costs. During the continuance of an Essence Group CAM trigger period (as defined under the Kawa Mixed Use Portfolio Loan documents), the borrowers are required to deposit a monthly amount equal to 1/12th of the amount payable, or estimated by the lender to be payable, for all fees, dues, charges and assessments payable by the borrowers pursuant to the Essence trust indenture and the Essence maintenance agreement (as such terms are defined under the Kawa Mixed Use Portfolio loan documents) during the next ensuing 12 months. |
| (13) | Other Sources consists of various credits with respect to the transfer of reserve balances held by the prior lender for items such as outstanding landlord obligations, tenant security deposits, free rent and gap rent related to the Essence Group tenant. |
The Loan.The Kawa Mixed Use Portfolio loan is secured by a first mortgage lien on the borrowers’ fee and leasehold interests in office, industrial and mixed use properties located in Nebraska, Missouri and Michigan. The loan is part of a whole loan that has an outstanding principal balance as of the Cut-off Date of $74.5 million (the “Kawa Mixed Use Portfolio Whole Loan”) and is comprised of twopari passu notes, each as described below. The controlling Note A-1, with an outstanding principal balance as of the Cut-off Date of $38.0 million, is being contributed to the Benchmark 2018-B8 Trust. The non-controlling note A-2, with an outstanding principal balance as of the Cut-off Date of $36.5 million, is currently held by CREFI and is expected to be contributed to one or more future securitizations. The Kawa Mixed Use Portfolio Whole Loan has a 10-year term and is interest only for the full term.
The borrowing entities for the Kawa Mixed Use Portfolio Whole Loan are KCP Fee Owner 1, LLC, KCP Fee Owner 2, LLC, KCP Fee Owner 3, LLC and KCP Fee Owner 4, LLC, each a Delaware limited liability company and special purpose entity. The Kawa Mixed Use Portfolio Whole Loan’s sponsor and nonrecourse carveout guarantor is Kawa Capital Partners LLC, a Florida limited liability company which operates as Kawa Capital Management. Kawa Capital Management is an independent asset management firm founded in 2007 with approximately $1.0 billion of assets under management (as of September 30, 2018) and headquartered in Miami, Florida.
| Whole Loan Summary | ||||
| Notes | Original Balance | Cut-off Date Balance | Note Holder | Controlling Piece |
| A-1 | $38,000,000 | $38,000,000 | BMARK 2018-B8 | Yes |
| A-2 | $36,500,000 | $36,500,000 | CREFI | No |
| Total | $74,500,000 | $74,500,000 | ||
| Portfolio Summary(1) | |||||||
| Property | Location | Net Rentable Area (SF) | Year Built/ | Allocated Whole Loan Amount | % of Allocated Loan Amount | Appraised Value | % of Appraised Value |
| Gavilon Headquarters | Omaha, NE | 127,810 | 2013 / NAP | $32,400,000 | 43.5% | $47,100,000 | 41.6% |
| Northland Innovation Campus | Gladstone, MO | 86,778 | 2016 / NAP | 14,300,000 | 19.2% | 20,500,000 | 18.1% |
| Oerlikon Industrial Facility | Plymouth, MI | 79,401 | 2018 / NAP | 14,200,000 | 19.1% | 22,400,000 | 19.8% |
| Essence Group Headquarters | Maryland Heights, MO | 141,774 | 1999 / NAP | 13,600,000 | 18.3% | 23,250,000 | 20.5% |
| Total/Wtd. Avg. | 435,763 | $74,500,000 | 100.0% | $113,250,000 | 100.0% | ||
| (1) | Based on the appraisals and the underwritten rent rolls dated December 6, 2018 for the Gavilon Headquarters, Essence Group Headquarters and Oerlikon Industrial Facility properties and August 6, 2018 for the Northland Innovation Campus property. |
The Properties.The Kawa Mixed Use Portfolio properties are comprised of 435,763 square feet of office, industrial and education space across four locations in Nebraska, Missouri and Michigan.
Gavilon Headquarters
The largest property by allocated loan amount, Gavilon Headquarters, is a five-story, 127,810 square foot Class A office building located at 1331 Capitol Avenue in downtown Omaha, Nebraska. The property was developed in 2013 as a build-to-suit for The Gavilon Group, LLC (“Gavilon”) at a total cost of approximately $44.6 million (with approximately $9.6 million contributed by Gavilon) to utilize the space as its global headquarters. In connection with the delivery of space in 2013, Gavilon executed a 20-year triple net lease through November 2033 with no termination options. The Gavilon Headquarters property has a covered parking garage that offers 190 spaces on floors one and two of the building, which equates to approximately 1.5 spaces per 1,000 square feet of rentable area. Gavilon also has a contract
THE INFORMATION IN THIS STRUCTURAL AND COLLATERAL TERM SHEET IS NOT COMPLETE AND MAY BE AMENDED PRIOR TO THE TIME OF SALE. THIS TERM SHEET IS NOT AN OFFER TO SELL THESE SECURITIES AND IT IS NOT A SOLICITATION OF AN OFFER TO BUY THESE SECURITIES IN ANY JURISDICTION WHERE THE OFFER OR SALE IS NOT PERMITTED. | ||||
| | | 109 of 125 | | |
| Structural and Collateral Term Sheet | Benchmark 2018-B8 | |
| Kawa Mixed Use Portfolio | ||
in place to lease between 215 and 295 spaces per month from a nearby parking garage which brings the parking ratio to approximately 3.2 to 3.8 spaces per 1,000 square feet of rentable area. The south end of the third floor consists of a trading floor equipped with raised floor systems that include air, power and data systems and a 20-foot glass curtain surrounds the perimeter with an open central staircase connecting the trading floor to additional office space in the mezzanine. The northern end of the third floor and the entire fourth and fifth floors, contain typical office build-out with break rooms, conference rooms and common areas. The Gavilon Headquarters property also offers on-site amenities such as a cafeteria, landscaped rooftop patio and fitness center. Gavilon was founded in 2008 and is a commodity management firm, connecting producers and consumers of feed, food and fuel through a global supply chain network. The company provides origination, storage and handling, transportation and logistics, marketing and distribution and risk management services to tens of thousands of customers each year. The Gavilon lease is guaranteed by Gavilon Agriculture Investment, Inc., an unrated entity that is 100.0% owned by Marubeni American Corporation (rated Baa2/BBB by Moody’s/S&P). Gavilon currently subleases 39,293 square feet (the entire fifth floor and a portion of the fourth floor) to MetLife through September 2028. Metlife has a one-time right, effective August 31, 2025, to terminate its sublease, provided that, Metlife gives 12-15 months’ written notice and pays a termination fee equal to three months of rent as of the effective date of termination plus Gavilon’s unamortized leasing costs with respect to the subleased space.
The Gavilon Headquarters property is located within the Omaha office market. According to the appraisal, as of June 30, 2018, the Omaha office market contained approximately 19.0 million square feet with a vacancy rate of 14.3% and average asking rents of $18.27 per square foot. Also according to the appraisal, the property is part of the Omaha Downtown/Midtown office submarket, which, as of the second quarter of 2018, contained approximately 5.1 million square feet of space with a vacancy rate of 15.3% and average asking rents of $16.27 per square foot. The Omaha central business district is bordered by Interstate 480 to the north and west, the Missouri River on the east and Leavenworth Street to the south. The Omaha commercial business district offers many notable demand drivers, including Century Link Center, Gallup University Campus, Joslyn Art Museum and Creighton University Hospital. The appraisal identified five comparable triple net leases for Class A office space with rents ranging from $19.50 per square foot to $26.50 per square and an average of $22.52 per square foot. Based on the existing Gavilon lease and the five comparable leases, the appraisal’s concluded market rent for the office space at the Gavilon Headquarters property is $24.00 per square foot.
Northland Innovation Campus
The second largest property by allocated loan amount, Northland Innovation Campus, is a four-story, 86,778 square foot Class A office and educational building located at 6889 North Oak Trafficway in Gladstone, Missouri. The Northland Innovation Campus property was built in 2016 and offers 189 on-site parking spaces (which equates to a parking ratio of approximately 2.2 spaces per 1,000 square feet of rentable area. The two largest tenants, North Kansas City School District (69.1% of net rentable area; 77.0% of underwritten base rent; rated Aa2/AA+ by Moody’s/S&P) and Northwest Missouri State University (21.4% of net rentable area; 20.9% of underwritten base rent; rated A3 by Moody’s), utilize their space for education. Floors one and two, along with a portion of the third floor, are occupied by the North Kansas City School District through April 2036 (with no termination options) and the space consists of open classrooms, a cafeteria, conference rooms, children’s restrooms, a fabrication lab and other school related space. The North Kansas City School District utilizes its space for students participating in its Students in Academically Gifted Education (“SAGE”) program. The SAGE program began in 1974 and currently includes approximately 950 students across 26 schools that visit the Northland Innovation Campus property through a one-day-a-week rotation schedule. The rest of the third floor consists of 7,049 square feet of vacant office suites and one 1,200 square foot suite currently occupied by Edward D. Jones & Co, LP through September 2027. Edward D. Jones & Co, LP (1.4% of net rentable area; 2.1% of underwritten base rent) has the option to terminate its lease on September 30, 2022 and September 30, 2024 with 180 days’ written notice and payment of a termination fee equal to four months’ rent and unamortized tenant improvement and leasing commission costs. The entire fourth floor is occupied by Northwest Missouri State University through April 2026 with no termination options. Although a majority of the space at the Northland Innovation Campus property is utilized for education, there is no recreational gym or auditorium in the building, or any other special use or non-office features that would require above-market capital expenditures to convert the space to traditional office use.
Taxable Industrial Development Revenue Bonds (Northland Innovation Center Project), Series 2015, in the maximum principal amount of $17,700,000 (the “Northland Chapter 100 Bonds”) were issued by the City of Gladstone, Missouri, to finance the acquisition and construction of the Northland Innovation Campus property improvements. The Northland Chapter 100 Bonds are now held by KCP Fee Owner 4, LLC (the “Northland Innovation Campus Borrower”). In connection therewith, the Northland Innovation Campus property was leased by the City of Gladstone, Missouri to the Northland Innovation Campus borrower pursuant to a lease agreement; rental payments under the lease agreement are offset against payments under the Northland Innovation Campus Bonds. The lease agreement allows the Northland Innovation Campus Borrower to mortgage and pledge its interest in the lease agreement to the lender as collateral security for the Kawa Mix Use Portfolio Loan. The lease agreement terminates on December 31, 2039 at which time the Northland Chapter 100 Bonds are cancelled and the Northland Innovation Campus Borrower is obligated to repurchase fee title to the Northland Innovation Campus property for $1,000. The interest of the Northland Innovation Campus Borrower in and to the Northland Chapter 100 Bonds and the lease agreement were assigned by the Northland Innovation Campus Borrower to the lender pursuant to the Kawa Mixed Use Portfolio Loan documents. The Northland Innovation Campus property is exempt from payment of real estate taxes (except for an annual payment in lieu of real estate taxes equal to $2,046 under the lease agreement with the City of Gladstone, Missouri) through December 31, 2039. A portion of the parking for the Northland Innovation Campus property is provided on land adjacent to the Northland Innovation Campus property owned by the City of Gladstone and leased to the Northland Innovation Campus Borrower pursuant to a lease agreement date
THE INFORMATION IN THIS STRUCTURAL AND COLLATERAL TERM SHEET IS NOT COMPLETE AND MAY BE AMENDED PRIOR TO THE TIME OF SALE. THIS TERM SHEET IS NOT AN OFFER TO SELL THESE SECURITIES AND IT IS NOT A SOLICITATION OF AN OFFER TO BUY THESE SECURITIES IN ANY JURISDICTION WHERE THE OFFER OR SALE IS NOT PERMITTED. | ||||
| | | 110 of 125 | | |
| Structural and Collateral Term Sheet | Benchmark 2018-B8 | |
| Kawa Mixed Use Portfolio | ||
June 19, 2015 (the “Northland Innovation Campus Parking Lease”). The Northland Innovation Campus Parking Lease expires on December 31, 2039 and there are no extension options. The rent payable by the Northland Innovation Campus Borrower pursuant to the Northland Innovation Campus Parking Lease is $1 per year. The Northland Innovation Campus Borrower is permitted pursuant to the Kawa Mixed Use Portfolio loan documents to modify the Northland Innovation Campus Parking Lease to extend the term or, alternatively, may terminate the Northland Innovation Campus Parking Lease provided that suitable substitute parking facilities are obtained by the Northland Innovation Campus Borrower.
The Northland Innovation Campus property is located within the Kansas City office market and Clay office submarket. According to the appraisal, as of the second quarter of 2018, the Kansas City office market contained approximately 43.1 million square feet of space with a 16.5% vacancy rate and average asking rents of $21.27. Also according to the appraisal, the Clay office submarket contains approximately 1.8 million square feet of space with a vacancy rate of 16.3% (consisting of a Class A vacancy rate of 7.3% and Class B/C vacancy rate of 22.3%) and average asking rents of $20.30 per square foot (consisting of $24.82 per square foot for Class A asking rents and $17.29 for Class B/C asking rents). Gladstone is located approximately 8.0 miles north of the Kansas City central business district and access is provided by Interstate 29 and US Highway 69. The appraisal identified five comparable leases for Class A office space with rents ranging from $26.54 per square foot to $29.40 per square and an average of $27.97 per square foot. Based on the existing leases at the Northland Innovation Campus property and the five comparable leases, the appraisal’s concluded market rent for the office space at the property is $25.00 per square foot.
Oerlikon Industrial Facility
The third largest property by allocated loan amount, Oerlikon Industrial Facility, is a single-story, 79,401 square foot industrial building located at 41144 Concept Drive in Plymouth, Michigan. Construction of the property was completed in 2018 as a build-to-suit site for Oerlikon Metco (US), Inc. (“Oerlikon Metco”), the surface solutions segment of OC Oerlikon Corporation AG, to be the sole occupant. Annual rent payments under the lease are guaranteed by Oerlikon Metco’s parent company, OC Oerlikon Corporation AG. Oerlikon Metco utilizes 45.0% of its space for manufacturing, 40.0% for research and development (“R&D”) and the remaining 15.0% for office use. Oerlikon Metco produces advanced titanium alloys and high-end thermal spray powders at the new facility. The developer contributed approximately $16.1 million ($203 per square foot) of the total $28.1 million ($353 per square foot) development cost, with the balance ($12.0 million / $151 per square foot) spent by Oerlikon Metco. After the construction of the subject, Oerlikon Metco invested an additional $30.0 million in equipment to be installed at the facility. Oerlikon Metco signed a 20-year triple-net lease with no termination options that commenced April 2018 and extends to May 2038. The Oerlikon Industrial Facility property offers 83 surface parking spaces, which equates to approximately 1.1 spaces per 1,000 square feet of rentable area. The majority of the building has a height of 38-feet, however, there is approximately 12,800 square feet of space with a building height of 63-feet. The manufacturing and R&D sections of the property are intermixed and consist of partitioned shop and laboratory spaces. They feature three dock high doors, four drive-in doors, static resistant flooring, epoxy walls, LED lighting throughout and approximately 5,000 square feet of mezzanine space.
The Oerlikon Industrial Facility property is located within the Detroit industrial market. According to the appraisal, as of the second quarter of 2018, the Detroit industrial market contained approximately 303.5 million square feet of space with a vacancy rate of 8.9% and average asking rents of $5.21 per square foot. According to the appraisal, the Oerlikon Industrial Facility property is located within the Airport/I-275 Industrial submarket. As of the third quarter of 2018, the submarket contained approximately 129.7 million square feet with a vacancy rate of 3.5% and average asking rents of $5.89 per square foot. Plymouth is located approximately 25.0 miles northwest of Detroit and 15.0 miles northeast of Ann Arbor. Access is provided by Interstate 275, Interstate 96 and Interstate 696. The appraisal identified five comparable leases for new or materially renovated industrial space with rents ranging from $17.29 per square foot to $21.45 per square foot and an average of $19.20 per square foot. Based on the existing leases at the Oerlikon Industrial Facility property and the five comparable leases, the appraisal’s concluded market rent for the rentable area at the property is $18.25 per square foot.
Essence Group Headquarters
The fourth largest property by allocated loan amount, Essence Group Headquarters, is a three-story, 141,774 square foot Class A office building located at 13900 Riverport Drive in Maryland Heights, Missouri. The building was constructed in 1999 and is 100.0% occupied by Essence Group Holding Corporation (“Essence Group”). Essence Group, founded in 2007, offers health insurance and software solutions necessary for health systems, health plans and provider organizations to better connect with patients. The Essence Group Headquarters property contains 664 surface parking spaces plus an additional 66 spaces at an adjacent property via a parking easement. In total, the property offers 730 surface parking spaces which equates to approximately 5.2 spaces per 1,000 square feet of rentable area. Essence Group has been in occupancy at the property since April 2009, originally taking 57,482 square feet comprised of 47,258 square feet of third floor office space, 9,803 square feet of cafeteria space and 421 square feet of first floor office space. Essence then expanded by 23,629 square feet in both August 2010 and February 2011, respectively, bringing the tenant’s total occupied square footage to 104,740 square feet (73.9% of net rentable area) with an initial lease expiration of July 31, 2019. In April 2015, the Essence Group Headquarters property was acquired by a joint venture between Starwood, Vanderbilt Real Estate Partners and Trinity Capital. In March 2018, the partnership entered into negotiations with Essence Group and the tenant subsequently agreed to lease the remaining 37,034 square feet of first floor office space (previously occupied by The Boeing Company) and extended its lease to July 2029 in exchange for a $3.5 million ($25 per square foot) tenant improvement allowance, fifteen months of abated rent on first floor expansion space (March 2018-February 2019; August-October 2019) and nine months of abated reimbursements on the first floor expansion space (March-
THE INFORMATION IN THIS STRUCTURAL AND COLLATERAL TERM SHEET IS NOT COMPLETE AND MAY BE AMENDED PRIOR TO THE TIME OF SALE. THIS TERM SHEET IS NOT AN OFFER TO SELL THESE SECURITIES AND IT IS NOT A SOLICITATION OF AN OFFER TO BUY THESE SECURITIES IN ANY JURISDICTION WHERE THE OFFER OR SALE IS NOT PERMITTED. | ||||
| | | 111 of 125 | | |
| Structural and Collateral Term Sheet | Benchmark 2018-B8 | |
| Kawa Mixed Use Portfolio | ||
November 2018). The remaining landlord obligations of these inducements totaled $3,739,815 and were reserved for at origination. In addition to the landlord-provided tenant improvement allowance of $3.5 million, Essence self-funded another $1.5 million ($11 per square foot) of capital expenditures into the property and used all proceeds towards a full renovation of the first floor of the building, with minor upgrades to the second and third floors. After its lease extension in March 2018, Essence Holding Group declared the property its official corporate headquarters and leased approximately 30,000 square feet in an adjacent building to accommodate the employee consolidation.
The Essence Group Headquarters property is located within the St. Louis office market. According to the appraisal, as of the second quarter of 2018, the St. Louis office market contained approximately 45.6 million square feet of space with a vacancy rate of 16.4% and average asking rents of $21.68 per square foot. According to the appraisal, the Essence Group Headquarters property is located within the North County/St. Charles office submarket. As of the third quarter of 2018, the submarket contained approximately 5.8 million square feet with a vacancy rate of 12.8% (17.7% for Class A office space and 24.5% for Class B/C office space) and average asking rents of $19.50 per square foot ($22.89 per square foot for Class A office space and $16.98 per square foot for Class B/C office space). The Essence Group Headquarters property is located within the greater Riverport Business Park, approximately 20.0 miles northwest of the St. Louis central business district and approximately 4.0 miles west of Lambert St. Louis International Airport. Access is provided by Interstate 370 to the north, Interstate 270 to the east and Casino Center Drive to the south. The appraisal identified six comparable leases for office space in with triple net rents ranging from $9.00 per square foot to $17.06 per square foot and an average of $12.15 per square foot. Based on the existing leases at the Essence Group Headquarters property and the six comparable leases, the appraisal’s concluded market rent for the rentable area at the property is $12.35 per square foot.
| Tenant | Ratings Moody’s/S&P/Fitch(2) | Tenant Summary(1) Net Rentable Area (SF) | % of Total NRA | Base Rent PSF(3) | % of Total Base Rent(3) | Lease Expiration Date |
| Gavilon(4)(5) | Baa2 / BBB / NA | 127,810 | 29.3% | $23.93 | 38.8% | 11/30/2033 |
| Essence Group(6) | NA / NA / NA | 141,774 | 32.5% | $12.35 | 22.2% | 7/31/2029 |
| Oerlikon Metco(7) | NA / NA / NA | 79,401 | 18.2% | $18.53 | 18.7% | 5/31/2038 |
| North Kansas City School District | Aa2 / AA+ / NA | 60,000 | 13.8% | $20.50 | 15.6% | 4/30/2036 |
| Northwest Missouri State University(8) | A3 / NA / NA | 18,529 | 4.3% | $18.00 | 4.2% | 4/30/2026 |
| Edward D. Jones & Co, LP(9)(10) | NA / NA / NA | 1,200 | 0.3% | $28.00 | 0.4% | 9/30/2027 |
| (1) | Based on the underwritten rent rolls dated December 6, 2018 for the Gavilon Headquarters, Essence Group Headquarters and Oerlikon Industrial Facility properties and August 6, 2018 for the Northland Innovation Campus property. |
| (2) | Ratings provided are for the parent company of the entity listed in the “Tenant” field whether or not the parent company guarantees the lease. |
| (3) | Base Rent PSF and % of Total Base Rent includes $89,422 of contractual rent steps through October 2019 and $149,918 which represents the present value of rent steps for North Kansas City School District through the end of the loan term. |
| (4) | Gavilon has one, 10-year renewal option followed by two, five-year renewal options remaining under the terms of its lease. |
| (5) | Gavilon currently subleases 39,293 square feet (the entire fifth floor and a portion of the fourth floor) to MetLife through September 2028. Metlife has a one-time right, effective August 31, 2025, to terminate its sublease, provided that, Metlife gives 12-15 months’ notice and pays a termination fee equal to three months of rent as of the effective date of termination plus Gavilon’s unamortized leasing costs with respect to the subleased space. |
| (6) | Essence Group has two, five-year renewal options remaining under the terms of its lease. |
| (7) | Oerlikon Metco has three, five-year renewal options remaining under the terms of its lease. |
| (8) | Northwest Missouri State University has one, ten-year renewal option remaining under the terms of its lease. |
| (9) | Tenant has one, five-year renewal option remaining under the terms of its lease. |
| (10) | Edward D. Jones & Co, LP has the option to terminate its lease on September 30, 2022 and September 30, 2024 with 180 days’ notice and payment of a termination fee equal to four months’ rent and unamortized tenant improvement and leasing commission costs. |
THE INFORMATION IN THIS STRUCTURAL AND COLLATERAL TERM SHEET IS NOT COMPLETE AND MAY BE AMENDED PRIOR TO THE TIME OF SALE. THIS TERM SHEET IS NOT AN OFFER TO SELL THESE SECURITIES AND IT IS NOT A SOLICITATION OF AN OFFER TO BUY THESE SECURITIES IN ANY JURISDICTION WHERE THE OFFER OR SALE IS NOT PERMITTED. | ||||
| | | 112 of 125 | | |
| Structural and Collateral Term Sheet | Benchmark 2018-B8 | |
| Kawa Mixed Use Portfolio | ||
| Lease Rollover Schedule(1)(2) | |||||||||
| Year | Number of Leases Expiring | Net Rentable Area Expiring | % of NRA Expiring | Base Rent Expiring(3) | % of Base Rent Expiring(3) | Cumulative Net Rentable Area Expiring | Cumulative % of NRA Expiring | Cumulative Base Rent Expiring(3) | Cumulative % of Base Rent Expiring(3) |
| Vacant | NAP | 7,049 | 1.6% | NAP | NAP | 7,049 | 1.6% | NAP | NAP |
| 2018 & MTM | 0 | 0 | 0.0% | $0 | 0.0% | 7,049 | 1.6% | $0 | 0.0% |
| 2019 | 0 | 0 | 0.0% | 0 | 0.0 | 7,049 | 1.6% | 0 | 0.0% |
| 2020 | 0 | 0 | 0.0% | 0 | 0.0 | 7,049 | 1.6% | 0 | 0.0% |
| 2021(4) | 1 | 0 | 0.0% | 500 | 0.0 | 7,049 | 1.6% | 500 | 0.0% |
| 2022 | 0 | 0 | 0.0% | 0 | 0.0 | 7,049 | 1.6% | 500 | 0.0% |
| 2023 | 0 | 0 | 0.0% | 0 | 0.0 | 7,049 | 1.6% | 500 | 0.0% |
| 2024 | 0 | 0 | 0.0% | 0 | 0.0 | 7,049 | 1.6% | 500 | 0.0% |
| 2025 | 0 | 0 | 0.0% | 0 | 0.0 | 7,049 | 1.6% | 500 | 0.0% |
| 2026 | 1 | 18,529 | 4.3% | 333,522 | 4.2 | 25,578 | 5.9% | 334,022 | 4.2% |
| 2027 | 1 | 1,200 | 0.3% | 33,600 | 0.4 | 26,778 | 6.1% | 367,622 | 4.7% |
| 2028 | 0 | 0 | 0.0% | 0 | 0.0 | 26,778 | 6.1% | 367,622 | 4.7% |
| 2029 & Beyond | 4 | 408,985 | 93.9% | 7,510,764 | 95.3 | 435,763 | 100.0% | 7,878,386 | 100.0% |
| Total | 7 | 435,763 | 100.0% | $7,878,386 | 100.0% | ||||
| (1) | Based on the underwritten rent rolls dated December 6, 2018 for the Gavilon Headquarters, Essence Group Headquarters and Oerlikon Industrial Facility properties and August 6, 2018 for the Northland Innovation Campus property. |
| (2) | Certain tenants may have termination options or contraction options (which may become exercisable prior to the originally stated expiration date of the tenant lease) that are not considered in the above Lease Rollover Schedule. |
| (3) | Includes $89,422 of contractual rent steps through October 2019 and $149,918 which represents the present value of rent steps for North Kansas City School District through the end of the loan term. |
| (4) | Represents Charter Communications, a roof antenna tenant at the Essence Group Headquarters property. |
| Underwritten Net Cash Flow(1) | |||
| Underwritten | Per Square Foot | %(2) | |
| Rents in Place | $7,639,046 | $17.53 | 64.0% |
| Rent Steps(3) | 239,340 | 0.55 | 2.0 |
| Vacant Income | 176,225 | 0.40 | 1.5% |
| Gross Potential Rent | $8,054,611 | $18.48 | 67.4% |
| Reimbursements | 3,888,031 | 8.92 | 32.6% |
| Net Rental Income | $11,942,642 | $27.41 | 100.0% |
| (Vacancy/Credit Loss) | (658,577) | (1.51) | (5.8) |
| Effective Gross Income | $11,284,065 | $25.89 | 94.5% |
| Total Operating Expenses | $3,954,386 | $9.07 | 35.0% |
| Net Operating Income | $7,329,679 | $16.82 | 65.0% |
| Total TI/LC, Capex/RR | 249,416 | 0.57 | 2.2% |
| Net Cash Flow | $7,080,263 | $16.25 | 62.7% |
| (1) | Due to the nature of the sale leaseback transaction, no historical cash flow information is available. |
| (2) | % column represents percent of Net Rental Income for all revenue lines and represents percent of Effective Gross Income for the remainder of the fields. |
| (3) | Includes $89,422 of contractual rent steps through October 2019 and $149,918 which represents the present value of rent steps for North Kansas City School District through the end of the loan term. |
Property Management. The Essence Group Headquarters property is managed by Vanderbilt Office Properties and the Northland Innovation Campus property is managed by US Assets Services LLC, each an independent third-party manager. The Gavilon Headquarters and Oerlikon Industrial Facility properties are self-managed.
THE INFORMATION IN THIS STRUCTURAL AND COLLATERAL TERM SHEET IS NOT COMPLETE AND MAY BE AMENDED PRIOR TO THE TIME OF SALE. THIS TERM SHEET IS NOT AN OFFER TO SELL THESE SECURITIES AND IT IS NOT A SOLICITATION OF AN OFFER TO BUY THESE SECURITIES IN ANY JURISDICTION WHERE THE OFFER OR SALE IS NOT PERMITTED. | ||||
| | | 113 of 125 | | |
| Structural and Collateral Term Sheet | Benchmark 2018-B8 | |
| Briar Hill at Manchester | ||
| Mortgage Loan Information | Property Information | |||||
| Mortgage Loan Seller: | JPMCB | Single Asset / Portfolio: | Single Asset | |||
| Original Principal Balance: | $31,270,000 | Title: | Fee | |||
| Cut-off Date Principal Balance: | $31,270,000 | Property Type - Subtype: | Multifamily – Garden | |||
| % of Pool by IPB: | 3.0% | Net Rentable Area (Units): | 344 | |||
| Loan Purpose: | Recapitalization | Location: | Manchester Township, NJ | |||
| Borrower: | Suncrest Village, LLC | Year Built / Renovated: | 1996-1999 | |||
| Sponsor: | Paul Celler | Occupancy: | 98.8% | |||
| Interest Rate: | 5.27300% | Occupancy Date: | 9/30/2018 | |||
| Note Date: | 11/8/2018 | Number of Tenants: | N/A | |||
| Maturity Date: | 12/1/2023 | 2015 NOI(1): | NAV | |||
| Interest-only Period: | 60 months | 2016 NOI(1): | NAV | |||
| Original Term: | 60 months | 2017 NOI(1): | NAV | |||
| Original Amortization: | None | TTM NOI (as of 9/2018): | $3,068,093 | |||
| Amortization Type: | Interest Only | UW Economic Occupancy: | 95.0% | |||
| Call Protection: | L(25),Grtr1%orYM(32),O(3) | UW Revenues: | $4,902,920 | |||
| Lockbox / Cash Management: | Soft / In Place | UW Expenses: | $1,822,881 | |||
| Additional Debt: | Yes | UW NOI: | $3,080,039 | |||
| Additional Debt Balance: | $10,730,000 | UW NCF(2): | $2,984,407 | |||
| Additional Debt Type: | Mezzanine Loan | Appraised Value / Per Unit: | $58,100,000 / $168,895 | |||
| Appraisal Date: | 10/11/2018 | |||||
| Escrows and Reserves(3) | Financial Information | ||||||||
| Initial | Monthly | Initial Cap | Cut-off Date Loan / Unit: | $90,901 | |||||
| Taxes: | $125,842 | $62,921 | N/A | Maturity Date Loan / Unit: | $90,901 | ||||
| Insurance: | $24,200 | $12,100 | N/A | Cut-off Date LTV: | 53.8% | ||||
| Replacement Reserves: | $7,965 | $7,965 | N/A | Maturity Date LTV: | 53.8% | ||||
| TI/LC: | $0 | $0 | N/A | UW NCF DSCR: | 1.79x | ||||
| Other: | $1,241,980 | $0 | N/A | UW NOI Debt Yield: | 9.8% | ||||
| Sources and Uses | ||||||
| Sources | Proceeds | % of Total | Uses | Proceeds | % of Total | |
| Mortgage Loan | $31,270,000 | 74.5% | Purchase Price(4) | $37,871,456 | 90.2% | |
| Mezzanine Loan | 10,730,000 | 25.5 | Upfront Reserves | 1,399,987 | 3.3 | |
| Payoff Existing Debt | 1,077,348 | 2.6 | ||||
| Closing Costs | 728,531 | 1.7 | ||||
| Return of Equity | 922,679 | 2.2 | ||||
| Total Sources | $42,000,000 | 100.0% | Total Uses | $42,000,000 | 100.0% | |
| (1) | Historical financials are not available as the prior controlling owner/manager had previously run corporate level expenses through the property level financials, which had historically misrepresented the cash flow of the property. |
| (2) | UW NCF is based on the in-place rent roll minus an assumed 5% economic vacancy. |
| (3) | Initial Other Escrows and Reserves consists of a reserve for deferred maintenance (which includes renovations to the unit interiors and exteriors and common areas), generally required to be completed within 360 days of the origination date, subject to grace periods for certain items. |
| (4) | The borrower previously owned a 30.0% non-controlling interest in the property. On the loan origination date, the borrower acquired the remaining 70.0% ownership interest, based on an implied purchase price of approximately $53.6 million. The Purchase Price above also reflects an additional $371,456 in net pro-rations. |
The Loan.The Briar Hill at Manchester loan is secured by a first mortgage lien on the borrower’s fee interest in a 344-unit, garden-style multifamily property located in Manchester Township, New Jersey. The loan has a five-year term and will be interest only for the entire term.
The Borrower. The borrowing entity for the loan is Suncrest Village, LLC, a Delaware limited liability company and special purpose entity, with two independent directors in its organizational structure.
THE INFORMATION IN THIS STRUCTURAL AND COLLATERAL TERM SHEET IS NOT COMPLETE AND MAY BE AMENDED PRIOR TO THE TIME OF SALE. THIS TERM SHEET IS NOT AN OFFER TO SELL THESE SECURITIES AND IT IS NOT A SOLICITATION OF AN OFFER TO BUY THESE SECURITIES IN ANY JURISDICTION WHERE THE OFFER OR SALE IS NOT PERMITTED. | ||||
| | | 114 of 125 | | |
| Structural and Collateral Term Sheet | Benchmark 2018-B8 | |
| Briar Hill at Manchester | ||
The Loan Sponsor.The loan sponsor and nonrecourse carveout guarantor is Paul Celler. Paul Celler has built and sold over 2,500 homes in New Jersey and is currently a partner in nearly 1,500 multifamily units across Hudson, Mercer, Middlesex, Ocean and Union Counties in New Jersey, with an additional 1,100 units in various stages of development. Furthermore, the loan sponsor owns nearly 150,000 square feet of medical and professional office space.
Historically, the loan sponsor had maintained a 30.0% non-controlling ownership interest in the property. On the loan origination date, the borrower acquired the remaining 70.0% ownership interest in the property based on an implied purchase price of approximately $53.6 million. Loan proceeds were used to buy out the sponsors operating partner, pay off the existing debt on the property, fund reserves, pay closings costs and return equity to the sponsor.
The Property. The Briar Hill at Manchester property is a 344-unit, Class B garden-style multifamily complex located in Manchester Township, New Jersey. Built in phases between 1996 and 1999, the property features a unit mix comprised of 144 one-bedroom units and 200 two-bedroom units. Situated on approximately 45.4 acres of land, the Briar Hill at Manchester property is dispersed throughout 25, two-story buildings. The property features a swimming pool, basketball court, tennis courts, playground, fitness center, on site leasing office and 662 parking spaces, which accommodate 1.9 spaces per unit. Individual unit amenities include central air conditioning and heating, in unit wash and dryers, walk in closets, full kitchen, living rooms, cable TV and hot water heaters.
The property is located in southeastern New Jersey approximately 30 miles southeast of Trenton, directly adjacent to the New Jersey shoreline. The property is approximately 50 miles east of Philadelphia and 70 miles south of New York City. Primary access to the property is provided via Route 37 and Route 70 in Manchester Township, which run through the neighborhood and provide regional access to Route 9 and the Garden State Parkway.
The Briar Hill at Manchester property is located in Ocean County multifamily submarket, located within the New York-Newark-Jersey City Metropolitan Statistical Area, among the most populous in the U.S. According to the appraisal, as of the second quarter of 2018, the Ocean County multifamily submarket is comprised of 5,041 units across 34 properties with an overall vacancy rate of 2.9% and average asking rents of approximately $1,129 per month. Further, the Ocean County Class B/C submarket was comprised of 2,580 units with an average vacancy rate of 2.9% and average asking rents of $985 per month. According to the appraisal, the Ocean County submarket has seen upward trends in population growth. From 2010 to 2017, population has grown at a compounded annual rate of approximately 0.7%, outperforming the broader New Jersey market. Asking rents have benefited from historically low vacancy trends with an increase of 18.2% as of the second quarter of 2018 in comparison to year-end 2010. According to the appraisal, the 2017 estimated population within a one-, three- and five-mile radius of the Briar Hill at Manchester property was 5,300, 36,851, and 87,046, respectively; while the 2017 estimated median household income within a one-, three- and five-mile radius was $43,382, $41,858 and $44,907, respectively.
The appraisal identified seven comparable properties built between 1968 and 2016 and ranging in size from 23 to 338 units. Average rents at the comparable properties ranged from $1,145 to $1,700 per month with a weighted average of approximately $1,312. Average in place rents at the Briar Hill at Manchester property for one- and two-bedroom units are approximately $1,134 and $1,281 per month, respectively, in-line with the appraisal’s concluded market rent for one- and two-bedroom properties of approximately $1,250 and $1,400 per month, respectively.
| Historical and Current Occupancy(1) | |||
| 2015(1) | 2016(2) | 2017(2) | Current(2) |
| 98.8% | 97.4% | 98.3% | 98.8% |
| (1) | Historical occupancies are as of December 31 of each respective year based on a third party data provider. |
| (2) | Current Occupancy is as of September 30, 2018 based on the underwritten rent roll. |
Multifamily Unit Mix(1)
| ||||||||||
| Unit Type | # of Units | % of Total | Occupancy(2) | Average Unit Size (SF) | Average Market Rent Per Unit(2) | Average Monthly In-Place Rents | ||||
| 1 BR | 144 | 41.9% | 98.6% | 950 | $1,250 | $1,134 | ||||
| 2 BR | 200 | 58.1 | 99.0% | 1,100 | $1,400 | $1,281 | ||||
| Total / Wtd. Avg. | 344 | 100.0% | 98.8% | 1,037 | $1,337 | $1,219 | ||||
| (1) | Based on the rent roll dated September 30, 2018 provided by the borrower. |
| (2) | Average Market Rent Per Unit represents the appraisal’s concluded market rent for each respective unit type. |
THE INFORMATION IN THIS STRUCTURAL AND COLLATERAL TERM SHEET IS NOT COMPLETE AND MAY BE AMENDED PRIOR TO THE TIME OF SALE. THIS TERM SHEET IS NOT AN OFFER TO SELL THESE SECURITIES AND IT IS NOT A SOLICITATION OF AN OFFER TO BUY THESE SECURITIES IN ANY JURISDICTION WHERE THE OFFER OR SALE IS NOT PERMITTED. | ||||
| | | 115 of 125 | | |
| Structural and Collateral Term Sheet | Benchmark 2018-B8 | |
| Briar Hill at Manchester | ||
| Operating History and Underwritten Net Cash Flow(1) | |||||
| TTM(2) | Underwritten | Per Unit | %(3) | ||
| Rents in Place | $4,870,335 | $5,034,000 | $14,634 | 98.8% | |
| Vacant Income | 0 | 63,600 | 185 | 1.2 | |
| Gross Potential Rent | $4,870,335 | $5,097,600 | $14,819 | 100.0% | |
| Total Reimbursements | 0 | 0 | 0 | 0.0 | |
| Net Rental Income | $4,870,335 | $5,097,600 | $14,819 | 100.0% | |
| (Vacancy/Credit Loss) | 0 | (254,880) | (741) | (5.0) | |
| Other Income | 107,296 | 60,200 | 175 | 1.2 | |
| Effective Gross Income | $4,977,631 | $4,902,920 | $14,253 | 96.2% | |
| Total Expenses | $1,909,538 | $1,822,881 | $5,299 | 37.2% | |
| Net Operating Income | $3,068,093 | $3,080,039 | $8,954 | 62.8% | |
| Replacement Reserves | 0 | 95,632 | 278 | 2.0 | |
| Net Cash Flow | $3,068,093 | $2,984,407 | $8,676 | 60.9% | |
| (1) | Historical financials are not available as the prior controlling owner/manager had previously run corporate level expenses through the property level financials, which had historically misrepresented the cash flow of the property. |
| (2) | TTM column represents the trailing 12-month period ending on September 30, 2018. |
| (3) | Percentage column represents percent of Net Rental Income for all revenue lines and represents percent of Effective Gross Income for the remainder of fields. |
Additional Debt. JPMCB has provided an approximately $10.7 million mezzanine loan that is secured by a pledge of the direct equity interests in the borrower and is coterminous with the Briar Hill at Manchester loan. The mezzanine loan has a 7.50000% coupon and is interest only for the full term of the loan. Including the mezzanine loan, the cumulative Cut-off Date LTV is 72.3%, the cumulative UW NCF DSCR is 1.22x and the cumulative UW NOI Debt Yield is 7.5%. The mortgage and mezzanine lenders have entered into an intercreditor agreement that governs the relationship between the mortgage lenders and the mezzanine lenders.
THE INFORMATION IN THIS STRUCTURAL AND COLLATERAL TERM SHEET IS NOT COMPLETE AND MAY BE AMENDED PRIOR TO THE TIME OF SALE. THIS TERM SHEET IS NOT AN OFFER TO SELL THESE SECURITIES AND IT IS NOT A SOLICITATION OF AN OFFER TO BUY THESE SECURITIES IN ANY JURISDICTION WHERE THE OFFER OR SALE IS NOT PERMITTED. | ||||
| | | 116 of 125 | | |
| Structural and Collateral Term Sheet | Benchmark 2018-B8 | |
| Residence Inn Boise City Center | ||
| Mortgage Loan Information | Property Information | |||
| Mortgage Loan Seller: | GSMC | Single Asset / Portfolio: | Single Asset | |
| Original Principal Balance: | $30,500,000 | Title: | Fee | |
| Cut-off Date Principal Balance: | $30,462,082 | Property Type - Subtype: | Hotel – Extended Stay | |
| % of Pool by IPB: | 2.9% | Net Rentable Area (Rooms): | 185 | |
| Loan Purpose: | Refinance | Location: | Boise, ID | |
| Borrower: | Pennbridge BODO DE, LLC | Year Built / Renovated: | 2017 / N/A | |
| Sponsors: | Jared Steven Smith, | Occupancy / ADR / RevPAR(1): | 78.9% / $160.42 / $126.53 | |
| Thomas W. Lewis, III | Occupancy / ADR / RevPAR Date(1): | 11/30/2018 | ||
| Interest Rate: | 4.81500% | Number of Tenants: | N/A | |
| Note Date: | 10/22/2018 | 2015 NOI(1): | N/A | |
| Maturity Date: | 11/6/2028 | 2016 NOI(1): | N/A | |
| Interest-only Period: | None | 2017 NOI(1): | N/A | |
| Original Term: | 120 months | TTM NOI (as of 11/2018)(2): | $5,076,211 | |
| Original Amortization: | 360 months | UW Occupancy / ADR / RevPAR: | 78.9% / $160.42 / $126.53 | |
| Amortization Type: | Balloon | UW Revenues: | $9,668,944 | |
| Call Protection: | L(25),Def(91),O(4) | UW Expenses: | $4,783,389 | |
| Lockbox / Cash Management: | Springing / Springing | UW NOI: | $4,885,555 | |
| Additional Debt: | N/A | UW NCF: | $4,498,797 | |
| Additional Debt Balance: | N/A | Appraised Value / Per Room: | $53,100,000 / $287,027 | |
| Additional Debt Type: | N/A | Appraisal Date: | 9/27/2018 | |
| Escrows and Reserves | Financial Information | ||||||
| Initial | Monthly | Initial Cap | Cut-off Date Loan / Room: | $164,660 | |||
| Taxes: | $215,870 | $36,518 | N/A | Maturity Date Loan / Room: | $134,722 | ||
| Insurance: | $0 | Springing | N/A | Cut-off Date LTV: | 57.4% | ||
| FF&E Reserves: | $0 | $31,599 | N/A | Maturity Date LTV: | 46.9% | ||
| Other: | $0 | $0 | N/A | UW NCF DSCR: | 2.34x | ||
| UW NOI Debt Yield: | 16.0% | ||||||
| Sources and Uses | |||||||
| Sources | Proceeds | % of Total | Uses | Proceeds | % of Total | ||
| Mortgage Loan | $30,500,000 | 100.0% | Payoff Existing Debt | $29,793,370 | 97.7% | ||
| Closing Costs | 389,117 | 1.3 | |||||
| Upfront Reserves | 215,870 | 0.7 | |||||
| Return of Equity | 101,643 | 0.3 | |||||
| Total Sources | $30,500,000 | 100.0% | Total Uses | $30,500,000 | 100.0% | ||
| (1) | Full year historical financials are not available as the Residence Inn Boise City Center Property (as defined below) was constructed in 2017 and opened in October 2017. |
| (2) | TTM NOI reflects the trailing 12-month period ending November 30, 2018, which includes 11 months of actual (December 2017 – October 2018) and one month (November 2018) of projected performance per the borrower’s budget as the Residence Inn Boise City Center Property was constructed in 2017 and opened in October 2017. |
The Loan.The Residence Inn Boise City Center loan has an outstanding principal balance as of the Cut-off Date of approximately $30.5 million and is secured by a first mortgage lien on the borrower’s fee interest in a 185-room, extended stay hotel located in Boise, Idaho (the “Residence Inn Boise City Center Property”). The Residence Inn Boise City Center loan has a 10-year term and will amortize on a 30-year schedule.
The Borrower.The borrowing entity for the Residence Inn Boise City Center loan is Pennbridge BODO DE, LLC, a Delaware limited liability company and special purpose entity.
The Loan Sponsors. The loan sponsors and non-recourse carveout guarantors are Jared Steven Smith and Thomas W. Lewis, III (collectively, the “Loan Sponsors”). The Loan Sponsors founded Pennbridge Capital in 2005. Pennbridge Capital is a real estate investment company focused on the acquisition, development and management of hotel properties. Pennbridge Capital is a franchisee of Marriott and InterContinental Hotels Group and currently has nine hotels in its portfolio, including the Residence Inn Boise City Center Property.
THE INFORMATION IN THIS STRUCTURAL AND COLLATERAL TERM SHEET IS NOT COMPLETE AND MAY BE AMENDED PRIOR TO THE TIME OF SALE. THIS TERM SHEET IS NOT AN OFFER TO SELL THESE SECURITIES AND IT IS NOT A SOLICITATION OF AN OFFER TO BUY THESE SECURITIES IN ANY JURISDICTION WHERE THE OFFER OR SALE IS NOT PERMITTED. | ||||
| | | 117 of 125 | | |
| Structural and Collateral Term Sheet | Benchmark 2018-B8 | |
| Residence Inn Boise City Center | ||
The Property. The Residence Inn Boise City Center Property is an extended stay, 185-room hotel located in Boise, Idaho. The Residence Inn Boise City Center Property was constructed in 2017. The Residence Inn Boise City Center Property consists of one 10-story building with approximately 4,700 square feet of meeting space, a restaurant, an indoor pool and whirlpool, a business center, a 24-hour fitness center, a sundry shop and outdoor firepits on the third floor terrace. The Residence Inn Boise City Center Property is subject to a franchise agreement with Marriott International, Inc. through October 19, 2047.
The Market.The Residence Inn Boise City Center Property is located in the commercial business district in Downtown Boise. The Residence Inn Boise City Center Property is located approximately less than one mile from Boise State University, the Boise Centre and St. Luke’s Boise Medical Center. According to the appraisal, Boise State University is the largest university in Idaho with an enrollment of approximately 22,000 students and enrollment is expected to increase to 35,000 by 2035. The Boise Centre, an approximately 100,000 square foot convention center, is located in Downtown Boise and is Idaho’s large convention, meeting and tradeshow facility. According to the appraisal, the Boise Centre underwent a 36,000 square foot expansion in 2016 and additional renovations in 2017. According to the appraisal, the Boise Centre hosts more than 220 diverse events each year since 2011 and brings in over 100,000 guests annually. According to the appraisal, St. Luke’s Boise Medical Center is undergoing an approximately $400 million, 576,000 square foot expansion and renovation that is anticipated to be completed in early 2019. The Boise City Center Property is located approximately 4 miles from the Boise Airport, which has received an increase in passenger traffic the last several years, including a 10.7% increase in passenger traffic as of May 2018 year-to-date, according to the appraisal.
According to a market research report, the primary competitive set for the Residence Inn Boise City Center Property consists of six hotels, which range in size from 104 to 243 rooms, and contain an aggregate of 917 rooms. The competitive set and historical performance relative to its competitive set are detailed below:
| Historical Occupancy, ADR, RevPAR | |||||||||
| Competitive Set(1) | Residence Inn Boise City Center(2) | Penetration Factor(3) | |||||||
| Year | Occupancy | ADR | RevPAR | Occupancy | ADR | RevPAR | Occupancy | ADR | RevPAR |
| 2016 | 74.3% | $140.80 | $104.67 | N/A | N/A | N/A | N/A | N/A | N/A |
| 2017 | 72.1% | $148.65 | $107.25 | N/A | N/A | N/A | N/A | N/A | N/A |
| TTM(4) | 72.9% | $147.23 | $107.29 | 78.9% | $160.42 | $126.53 | 108.2% | 109.0% | 117.9% |
| (1) | Data provided by a market research report. The competitive set contains the following properties: Hotel 43, Residence Inn Boise Downtown University, Courtyard Boise Downtown, The Grove Hotel, Hampton Inn Suites Boise Downtown and Inn @ 500 Capitol. |
| (2) | Full year historical financials are not available as the Residence Inn Boise City Center Property was constructed in 2017 and opened in October 2017. |
| (3) | Penetration Factor reflects the underwritten performance of the Residence Inn Boise City Center Property divided by the performance of the competitive set as determined by a market research report for the respective period(s). |
| (4) | TTM reflects the trailing 12-month period ending on September 30, 2018 for the competitive set and period ending November 30, 2018 for the Residence Inn Boise City Center Property, which includes 11 months of actual (December 2017 – October 2018) and one month (November 2018) of projected performance per the borrower’s budget. |
According to the appraisal, the primary competitive set for the Residence Inn Boise City Center Property consists of five hotels, which range in size from 104 to 186 rooms, and contain an aggregate of 724 rooms. The competitive set and historical performance relative to its competitive set are detailed below:
| Competitive Hotels Profile(1) | ||||||||||
| 2017 Estimated Market Mix | 2017 Estimated Operating Statistics(2) | |||||||||
| Property | Rooms | Year Opened | Meeting Space (SF) | Commercial | Meeting and Group | Leisure | Extended Stay | Occupancy | ADR | RevPAR |
| Residence Inn Boise City Center | 185 | 2017 | 4,748 | 45% | 13% | 20% | 22% | 41.1% | $144.62 | $59.48 |
| Hyatt Place Downtown Boise | 150 | 2017 | 2,751 | 55% | 25% | 15% | 5% | 62.5% | $135.00 | $87.50 |
| Hampton Inn & Suites Boise Downtown | 186 | 2007 | 1,250 | 60% | 25% | 15% | 0% | 77.5% | $165.00 | $127.50 |
| Courtyard by Marriot Boise Downtown | 163 | 1996 | 2,300 | 60% | 30% | 10% | 0% | 72.5% | $135.00 | $102.50 |
| Residence Inn by Marriott Boise Downtown | 104 | 1986 | NAP | 10% | 20% | 25% | 45% | 77.5% | $117.50 | $92.50 |
| TownePlace Suites by Marriott Boise Downtown | 121 | 2008 | 900 | 15% | 20% | 25% | 40% | 67.5% | $117.50 | $82.50 |
| Total(3) | 724 | |||||||||
| (1) | Based on the appraisal. |
| (2) | Estimated statistics represent the midpoint of the range provided by the appraisal. |
| (3) | Excludes the Residence Inn Boise City Center Property. |
THE INFORMATION IN THIS STRUCTURAL AND COLLATERAL TERM SHEET IS NOT COMPLETE AND MAY BE AMENDED PRIOR TO THE TIME OF SALE. THIS TERM SHEET IS NOT AN OFFER TO SELL THESE SECURITIES AND IT IS NOT A SOLICITATION OF AN OFFER TO BUY THESE SECURITIES IN ANY JURISDICTION WHERE THE OFFER OR SALE IS NOT PERMITTED. | ||||
| | | 118 of 125 | | |
| Structural and Collateral Term Sheet | Benchmark 2018-B8 | |
| Residence Inn Boise City Center | ||
| Operating History and Underwritten Net Cash Flow | ||||
| TTM(1) | Underwritten | Per Room(2) | % of Total Revenue(3) | |
| Occupancy | 78.9% | 78.9% | ||
| ADR | $160.42 | $160.42 | ||
| RevPAR | $126.53 | $126.53 | ||
| Room Revenue | $8,543,886 | $8,543,886 | $46,183 | 88.4% |
| Food & Beverage Revenue | 654,497 | 654,497 | 3,538 | 6.8% |
| Other Operating Departments Revenue | 470,561 | 470,561 | 2,544 | 4.9% |
| Total Revenue | $9,668,944 | $9,668,944 | $52,265 | 100.0% |
| Room Expense | $1,660,366 | $1,660,366 | $8,975 | 19.4% |
| Food & Beverage Expense | 410,028 | 410,028 | 2,216 | 62.6% |
| Other Operating Departments Expense | 71,072 | 71,072 | 384 | 15.1% |
| Departmental Expenses | $2,141,466 | $2,141,466 | $11,575 | 22.1% |
| Gross Operating Income | $7,527,478 | $7,527,478 | $40,689 | 77.9% |
| Undistributed Expenses | $1,960,796 | $2,165,833 | $11,707 | 22.4% |
| Gross Operating Profit | $5,566,682 | $5,361,645 | $28,982 | 55.5% |
| Real Estate Taxes | $440,008 | $431,742 | $2,334 | 4.5% |
| Insurance | 50,463 | 44,348 | 240 | 0.5% |
| Total Fixed Expenses | $490,471 | $476,090 | $2,573 | 4.9% |
| Net Operating Income | $5,076,211 | $4,885,555 | $26,408 | 50.5% |
| FF&E | 377,078 | 386,758 | 2,091 | 4.0% |
| Net Cash Flow | $4,699,133 | $4,498,797 | $24,318 | 46.5% |
| (1) | Full year historical financials are not available as the Residence Inn Boise City Center Property (as defined below) was constructed in 2017 and opened in October 2017. |
| (2) | TTM reflects the trailing 12-month period ending November 30, 2018, which includes 11 months of actual (December 2017 – October 2018) and one month (November 2018) of projected performance per the borrower’s budget. |
| (3) | Per Room values are based on 185 rooms. |
| (4) | % of Total Revenue for Room Expense, Food & Beverage Expense and Other Operating Departments Expense is based on the corresponding revenue line item. |
Property Management.The Residence Inn Boise City Center Property is managed by Pennbridge Lodging Corp, a Utah corporation and an affiliate of the Loan Sponsors.
THE INFORMATION IN THIS STRUCTURAL AND COLLATERAL TERM SHEET IS NOT COMPLETE AND MAY BE AMENDED PRIOR TO THE TIME OF SALE. THIS TERM SHEET IS NOT AN OFFER TO SELL THESE SECURITIES AND IT IS NOT A SOLICITATION OF AN OFFER TO BUY THESE SECURITIES IN ANY JURISDICTION WHERE THE OFFER OR SALE IS NOT PERMITTED. | ||||
| | | 119 of 125 | | |
| Structural and Collateral Term Sheet | Benchmark 2018-B8 | |
| DUMBO Heights Portfolio | ||
| Mortgage Loan Information | Property Information | |||
| Mortgage Loan Seller: | CREFI | Single Asset / Portfolio: | Portfolio | |
| Credit Assessment | Title: | Fee | ||
| (KBRA/Fitch/S&P)(1): | 2.9% | Property Type – Subtype: | Office – CBD | |
| Original Principal Balance(2): | $30,000,000 | Net Rentable Area (SF): | 753,074 | |
| Cut-off Date Principal Balance(2): | $30,000,000 | Location: | Brooklyn, NY | |
| % of Pool by IPB: | 2.9% | Year Built / Renovated(5): | Various / 2017 | |
| Loan Purpose: | Refinance | Occupancy: | 94.2% | |
| Borrowers(3): | Various | Occupancy Date: | Various | |
| Sponsors: | Seryl Kushner, Aby Rosen, | Number of Tenants: | 34 | |
| Michael Fuchs | 2015 NOI(6): | N/A | ||
| Interest Rate: | 4.05000% | 2016 NOI(6): | ($4,465,912) | |
| Note Date: | 8/30/2018 | 2017 NOI(6): | N/A | |
| Maturity Date: | 9/6/2023 | TTM NOI(as of 6/2018)(6): | $17,623,285 | |
| Interest-only Period: | 60 months | UW Economic Occupancy: | 94.1% | |
| Original Term: | 60 months | UW Revenues: | $40,176,183 | |
| Original Amortization: | None | UW Expenses: | $10,301,815 | |
| Amortization Type: | Interest Only | UW NOI(6): | $29,874,367 | |
| Call Protection(4): | L(27),Def(29),O(4) | UW NCF: | $28,723,752 | |
| Lockbox / Cash Management: | Hard / In Place | Appraised Value / Per SF: | $640,000,000 / $850 | |
| Additional Debt: | Yes | Appraisal Date: | 3/23/2018 | |
| Additional Debt Balance: | $150,000,000 / $145,000,000 / | |||
| $155,000,000 | ||||
| Additional Debt Type(2): | Pari Passu / Subordinate Debt / | |||
| Mezzanine Loan | ||||
| Escrows and Reserves | Financial Information(2) | ||||||
| Initial | Monthly | Initial Cap | Senior Notes | Whole Loan | |||
| Taxes: | $829,359 | $207,340 | N/A | Cut-off Date Loan / SF: | $239 | $432 | |
| Insurance(7): | $0 | Springing | N/A | Maturity Date Loan / SF: | $239 | $432 | |
| Replacement Reserves: | $0 | $9,413 | N/A | Cut-off Date LTV: | 28.1% | 50.8% | |
| TI/LC: | $0 | $83,333 | N/A | Maturity Date LTV: | 28.1% | 50.8% | |
| Other(8): | $17,051,092 | $0 | N/A | UW NCF DSCR: | 3.89x | 1.87x | |
| UW NOI Debt Yield: | 16.6% | 9.2% | |||||
| Sources and Uses | ||||||
| Sources | Proceeds | % of Total | Uses | Proceeds | % of Total | |
| Senior Notes | $180,000,000 | 37.5% | Payoff Existing Debt | $426,141,538 | 88.8% | |
| Subordinate Debt | 145,000,000 | 30.2 | Return of Equity | 30,524,768 | 6.4 | |
| Mezzanine Loan | 155,000,000 | 32.3 | Upfront Reserves | 17,880,451 | 3.7 | |
| Closing Costs | 5,453,243 | 1.1 | ||||
| Total Sources | $480,000,000 | 100.0% | Total Uses | $480,000,000 | 100.0% | |
| (1) | KBRA, Fitch and S&P provided the ratings above for the DUMBO Heights Portfolio Whole Loan (as defined below) in the context of its inclusion in the mortgage pool. |
| (2) | The DUMBO Heights Portfolio loan is part of a whole loan evidenced by (i) six seniorpari passunotes, with an aggregate outstanding principal balance as of the Cut-off Date of $180.0 million and (ii) two subordinate B notes, with an aggregate outstanding principal balance as of the Cut-off Date of $145.0 million. The Senior Notes financial information presented in the chart above reflects the Cut-off Date balance of the $180.0 million DUMBO Heights Portfolio senior notes and the Whole Loan financial information presented in the chart above reflects the Cut-off Date balance of the $325.0 million DUMBO Heights Portfolio Whole Loan, as defined in “The Loan” below. |
| (3) | See “The Loan” below. |
| (4) | The DUMBO Heights Portfolio Whole Loan lockout period is required to be at least 27 payments beginning with and including the first payment date of October 6, 2018. Defeasance of the full $325.0 million DUMBO Heights Portfolio Whole Loan is permitted at any time after the earlier to occur of (i) two years after the closing date of the securitization that includes the last promissory note to be securitized and (ii) three years from the note date. The assumed lockout period of 27 payments is based on the expected closing date of the Benchmark 2018-B8 securitization in December 2018. The actual lockout period may be longer. |
| (5) | See “Portfolio Summary” below. |
| (6) | 2017 NOI figures were unavailable because the borrower sponsors obtained a loan in the second quarter of 2017 to recapitalize and buy out Invesco’s interest in the DUMBO Heights Portfolio Properties (as defined below). 2015 financial information was not available due to the extensive renovation that began in 2014 at the DUMBO Heights Portfolio Properties. The difference between 2016 NOI, TTM NOI and UW NOI is primarily attributable to new leasing and the burn off of rent concessions associated with leasing up the DUMBO Heights Portfolio Properties post-renovation. All outstanding free rent, gap rent, and unfunded landlord obligations were reserved by the lender at origination. |
THE INFORMATION IN THIS STRUCTURAL AND COLLATERAL TERM SHEET IS NOT COMPLETE AND MAY BE AMENDED PRIOR TO THE TIME OF SALE. THIS TERM SHEET IS NOT AN OFFER TO SELL THESE SECURITIES AND IT IS NOT A SOLICITATION OF AN OFFER TO BUY THESE SECURITIES IN ANY JURISDICTION WHERE THE OFFER OR SALE IS NOT PERMITTED. | ||||
| | | 120 of 125 | | |
| Structural and Collateral Term Sheet | Benchmark 2018-B8 | |
| DUMBO Heights Portfolio | ||
| (7) | The requirement to make monthly deposits for insurance reserves is provisionally waived so long as the insurance is covered under an acceptable blanket policy. |
| (8) | The Initial Other reserve consists of (i) $35,650 for deferred maintenance, (ii) $10,760,171 for unfunded obligations, (iii) $5,904,411 for free rent (which is inclusive of $363,136 of gap rent related to the Etsy must-take space) until the must-take date occurs in January 2019 and (iv) $350,860 for gap rent related to the Shadowbox tenant at the 55 Prospect Street Property. At origination, with respect to the 2U must-take space, the lender obtained a payment guaranty from the borrower sponsors which guarantees payment of gap rent (a total of $3,686,813) until the must-take date occurs in December 2020. |
The Loan.The DUMBO Heights Portfolio loan is secured by a first mortgage lien on the borrowers’ fee interest in a four-building Class A office portfolio located in the DUMBO neighborhood of Brooklyn, New York, totaling 753,074 square feet of newly renovated office space (the “DUMBO Heights Portfolio Properties”). The loan is part of a whole loan that has an outstanding principal balance as of the Cut-off Date of $325.0 million (the“DUMBO Heights Portfolio Whole Loan”) and is comprised of six seniorpari passu notes and two subordinate B notes, each as described below. The non-controlling Note A-3-A, with an outstanding principal balance as of the Cut-off Date of $30.0 million, will be contributed to the Benchmark 2018-B8 securitization. The controlling Note A-1-A and non-controlling Note A-3-B, with an outstanding principal balance as of the Cut-off Date of $80.0 million, were contributed to the Benchmark 2018-B7 securitization. The non-controlling senior Notes A-1-B, A-2 and A-3-C, with an outstanding principal balance as of the Cut-off Date of $70.0 million, are currently held by Citi Real Estate Funding Inc. and expected to be contributed to the CGCMT 2018-C6 securitization. The subordinate notes B-1 and B-2, with an aggregate outstanding principal balance as of the Cut-off Date of $145.0 million, are currently held jointly bySHINHAN AIM REAL ESTATE FUND NO. 5; and SHINHAN AIM REAL ESTATE FUND NO. 5-A. The DUMBO Heights Portfolio Whole Loan has a five-year term and is interest only for the full term.
The borrowers are RFR 117 Adams Owner LLC, RFR/K 117 Adams Owner LLC, KC 117 Adams Owner LLC, RFR 77 Sands Owner LLC, RFR/K 77 Sands Owner LLC, KC 77 Sands Owner LLC, RFR 55 Prospect Owner LLC, RFR/K 55 Prospect Owner LLC, KC 55 Prospect Owner LLC, RFR 81 Prospect Owner LLC, RFR/K 81 Prospect Owner LLC and KC 81 Prospect Owner LLC, each a Delaware limited liability company and single purpose entity with two independent directors. The borrowing entities are each owned by the same three tenant-in-common entities: Desert Dumbo TIC LLC (37.7% interest), RFR/K Dumbo TIC LLC (46.6% interest) and KC Dumbo TIC LLC (15.7% interest). Legal counsel to the borrowers delivered a non-consolidation opinion in connection with the origination of the DUMBO Heights Portfolio Whole Loan. Seryl Kushner, Aby Rosen and Michael Fuchs are the nonrecourse carveout guarantors for the DUMBO Heights Portfolio Whole Loan.
RFR, founded by Aby Rosen and Michael Fuchs, is a real estate investment firm based in New York City with a core focus on select urban markets in the United States and Germany. RFR’s current portfolio has grown to include more than 100 properties comprising commercial, hospitality, residential and retail holdings. Some of RFR’s holdings include 160 Fifth Avenue, 375 Park Avenue, 390 Park Avenue, 17 State Street, 757 Third Avenue and 275 Madison Avenue. Kushner Companies is a diversified real estate organization headquartered in New York City with a national portfolio consisting of more than 20,000 multifamily units and approximately 13.0 million square feet of office, industrial and retail space. Some of Kushner Companies’ holdings include the Puck Building, 170 East Second Street and the Austin Nichols House.
| Whole Loan Summary | ||||
| Notes | Original Balance | Cut-off Date Balance | Note Holder | Controlling Piece |
| A-3-A | $30,000,000 | $30,000,000 | BMARK 2018-B8 | No |
| A-1-B, A-2, A-3-C | $70,000,000 | $70,000,000 | CREFI(1) | No |
| A-1-A, A-3-B | $80,000,000 | $80,000,000 | BMARK 2018-B7 | No(2) |
| B-1, B-2 | $145,000,000 | $145,000,000 | (3) | Yes(2) |
| Total | $325,000,000 | $325,000,000 | ||
| (1) | Currently held by CREFI and expected to be contributed to the CGCMT 2018-C6 securitization transaction upon closing of such transaction. |
| (2) | As long as no note B control appraisal period with respect to note B-1 is continuing, note B-1 will be the controlling note, however, following the occurrence (and during the continuance) of a note B control appraisal period, note A-1-A will be the controlling note. |
| (3) | Note held bySHINHAN AIM REAL ESTATE FUND NO. 5; and SHINHAN AIM REAL ESTATE FUND NO. 5-A. |
THE INFORMATION IN THIS STRUCTURAL AND COLLATERAL TERM SHEET IS NOT COMPLETE AND MAY BE AMENDED PRIOR TO THE TIME OF SALE. THIS TERM SHEET IS NOT AN OFFER TO SELL THESE SECURITIES AND IT IS NOT A SOLICITATION OF AN OFFER TO BUY THESE SECURITIES IN ANY JURISDICTION WHERE THE OFFER OR SALE IS NOT PERMITTED. | ||||
| | | 121 of 125 | | |
| Structural and Collateral Term Sheet | Benchmark 2018-B8 | |
| DUMBO Heights Portfolio | ||
| Portfolio Summary(1)(2) | |||||||
| Property | Location | Net Rentable Area (SF) | Year Built/ Renovated | Allocated Senior Loan Amount | % of Allocated Loan Amount | Appraised Value | % of Appraised Value |
| 55 Prospect Street | Brooklyn, NY | 255,504 | 1967 / 2017 | $60,000,000 | 33.3% | $220,000,000 | 34.4% |
| 117 Adams Street | Brooklyn, NY | 182,955 | 1926 / 2017 | 50,625,000 | 28.1% | 175,000,000 | 27.3% |
| 77 Sands Street | Brooklyn, NY | 223,729 | 1962 / 2017 | 46,875,000 | 26.0% | 175,000,000 | 27.3% |
| 81 Prospect Street | Brooklyn, NY | 90,886 | 1909 / 2017 | 22,500,000 | 12.5% | 70,000,000 | 10.9% |
| Total/Wtd. Avg. | 753,074 | $180,000,000 | 100.0% | $640,000,000 | 100.0% | ||
| (1) | Based on the underwritten rent rolls dated August 9, 2018 for the 55 Prospect Street Property and August 1, 2018 for the 117 Adams Street Property, 77 Sands Street Property and 81 Prospect Street Property and the DUMBO Heights Portfolio Loan documents. |
| (2) | Source: Appraisal. |
The Properties.The DUMBO Heights Portfolio Properties consists of a four-property creative office campus with buildings located at 55 Prospect Street, 117 Adams Street, 77 Sands Street and 81 Prospect Street (each a “DUMBO Heights Portfolio Property”), all of which are newly renovated Class A office buildings with ground floor retail in the DUMBO neighborhood of Brooklyn, New York. The DUMBO Heights Portfolio Properties encompass a total of 753,074 square feet across four, nine to 12-story buildings, each with contiguous open floor plates ranging from approximately 10,500 to 26,500 square feet. The DUMBO Heights Portfolio Properties are comprised of 703,440 square feet of office space, as well as 49,634 square feet of ground level retail space which is utilized by restaurant tenants such as Bluestone Lane Coffee and Mulberry & Vine and fitness tenants such as F45 Training and Shadowbox. The DUMBO Heights Portfolio Properties have loft-style ceilings (ranging from 10 to 14 feet for office space and 18 to 20 feet for retail space), open floor plates and interconnectivity between properties via sky bridges. The borrower sponsors have leased the DUMBO Heights Portfolio Properties’ office space, post-renovation, to several technology, advertising, media, information and co-working tenants such as Etsy, WeWork, 2U, Frog Design, Prolific Interactive, Wipro LLC and B-Reel. The DUMBO Heights Portfolio Properties offer several amenities, including but not limited to, bicycle storage rooms, rooftop decks with free Wi-Fi and outdoor plazas and dining areas. The DUMBO Heights Portfolio Properties also offer skyline views of New York City as well as direct views of both the Manhattan and Brooklyn bridges. The DUMBO Heights Portfolio Properties are currently 94.2% occupied as of the August 2018 underwritten rent rolls (inclusive of 26,500 square feet of must-take space for Etsy (with a final must-take date of January 1, 2019) and 26,500 square feet of must-take space for 2U (with a final must-take date of December 15, 2020) at the 55 Prospect Street Property). At origination, gap rent of $363,136 was reserved for the Etsy must-take space until the must-take date occurs in January 2019 and, with respect to the 2U must-take space, the lender obtained a payment guaranty from the borrower sponsors which guarantees payment of gap rent (a total of $3,686,813) until the must-take date occurs in December 2020. Etsy and 2U both have no contraction or termination options under their respective leases.
The DUMBO Heights Portfolio borrower sponsors, in collaboration with their previous equity partner, acquired the complex that serves as collateral for the DUMBO Heights Portfolio Loan from the Jehovah’s Witnesses in 2013 and subsequently gut renovated and repositioned the industrial buildings to serve as LEED designed Class A creative office buildings with ground floor retail space. From the acquisition of the DUMBO Heights Portfolio Properties in 2013 through March 31, 2017, the borrower sponsors, along with previous equity partners, invested approximately $122.3 million to complete the renovation which consisted of approximately $86.9 million on base building improvements, $29.5 million on tenant improvement contributions and $5.9 million on landlord improvements. In addition, approximately $15.8 million was spent on leasing commissions over the same time period. Since March 31, 2017, the borrower sponsors spent approximately $23.8 million more on landlord improvements, tenant improvements and leasing commissions to stabilize the DUMBO Heights Portfolio Properties.
Etsy (225,135 square feet; 29.9% of net rentable area; 31.8% of Underwritten Base Rent): Etsy, founded in June 2005 in Brooklyn, New York by Chad Dickerson, is a global e-commerce marketplace focused on handmade or vintage items and supplies, as well as unique factory-manufactured items. The website has created a community where crafters, artists and makers can buy and sell items and, as of year-end 2017, Etsy offered over 50.0 million items for sale, with approximately 2.0 million active sellers and approximately 35.8 million active buyers. Etsy utilizes its space at the 55 Prospect Street Property and 117 Adams Street Property as its global headquarters and had annual gross merchandise sales for 2017 of approximately $3.25 billion. Etsy filed for its initial public offering in April of 2015 and as of October 19, 2018, had a market capitalization of approximately $5.0 billion. Etsy leases 172,135 square feet in the 117 Adams Street Property (94.1% of property net rentable area) as well as 53,000 square feet in the 55 Prospect Street Property through July 2026 (which is inclusive of 26,500 square feet with a final must-take date of January 1, 2019).
WeWork (159,932 square feet; 21.2% of net rentable area; 22.4% of Underwritten Base Rent): WeWork, a provider of shared workspace for entrepreneurs, freelancers, startups and small businesses, occupies 84,704 square feet of space at the 81 Prospect Street Property through July 2031, as well as 75,228 square feet of space at the 77 Sands Street Property through November 2031. WeWork was founded in 2010 and is headquartered in New York City. As of March 1, 2018, WeWork had approximately 220,000 members with access to approximately 251,000 desks across 234 locations.
THE INFORMATION IN THIS STRUCTURAL AND COLLATERAL TERM SHEET IS NOT COMPLETE AND MAY BE AMENDED PRIOR TO THE TIME OF SALE. THIS TERM SHEET IS NOT AN OFFER TO SELL THESE SECURITIES AND IT IS NOT A SOLICITATION OF AN OFFER TO BUY THESE SECURITIES IN ANY JURISDICTION WHERE THE OFFER OR SALE IS NOT PERMITTED. | ||||
| | | 122 of 125 | | |
| Structural and Collateral Term Sheet | Benchmark 2018-B8 | |
| DUMBO Heights Portfolio | ||
2U (79,500 square feet; 10.6% of net rentable area; 12.9% of Underwritten Base Rent): 2U is an education technology company that partners with colleges and universities worldwide to bring their degree programs and credit-bearing courses online. The company’s clients include Georgetown University, Baylor University, American University, University of North Carolina and Vanderbilt University, among others. 2U, with a market capitalization of approximately $4.03 billion as of October 9, 2018, reported 2017 revenues of $286.8 million, which represents an increase of approximately 39.3% from 2016 annual revenues of $205.9 million.
Each of the DUMBO Heights Portfolio Properties is subject to tax abatements through the Industrial and Commercial Abatement Program (“ICAP”) of New York City. The 55 Prospect Street Property and 81 Prospect Street Property (approximately 45.8% of the DUMBO Heights Portfolio Loan based on allocated loan amounts) are subject to 25-year ICAP tax abatements while the 117 Adams Street Property and 77 Sands Street Property (approximately 54.2% of the DUMBO Heights Portfolio Loan based on allocated loan amounts) are subject to 15-year ICAP tax abatements. All of the DUMBO Heights Portfolio Properties are in the first year of their respective tax abatements and the abatements will not begin to phase out until after the DUMBO Heights Portfolio Loan maturity date in September 2023. The appraisal concluded to an unabated tax estimate for the Dumbo Heights Portfolio Properties of $4,518,135 ($6.00 per square foot) compared to the UW tax amount of $2,586,376, which represents $1,931,759 of tax savings for the 2018/2019 tax year. Real estate taxes were underwritten using the 2018/2019 tentative assessed value and the 2017/2018 tax rate plus the relevant business improvement district tax for each of the DUMBO Heights Portfolio Properties less each respective properties’ respective ICAP abatement.
The Market. The DUMBO Heights Portfolio Properties are located in the DUMBO neighborhood of Brooklyn, New York which is generally bound by the Brooklyn Bridge to the west, York Street to the south, the East River to the north and Bridge Street to the east. The DUMBO Heights Portfolio Properties, located just one block from Flatbush Avenue in Brooklyn, are accessible via subway, bus, train, ferry and by car. Both the Manhattan and Brooklyn bridges, as well as the Brooklyn-Queens Expressway, have ramps within three blocks, which offer direct vehicle access to the DUMBO neighborhood of Brooklyn. The DUMBO Heights Portfolio Properties are also located within a range of one to four blocks of the F (via the York Street Station), A and C (via the High Street – Brooklyn Bridge station), and 2 and 3 (via the Clark Street station) subway lines and approximately 0.5 miles from Brooklyn’s Pier 1, which provides access to the East River, South Brooklyn and Wall Street/Pier 11 ferry lines.
According to the appraisal, as of year-end 2017, the Brooklyn office market consisted of approximately 28.1 million square feet of office space with a direct vacancy rate of 9.9% and an average asking rent of $52.60 and $44.77 per square foot for Class A and Class B office space, respectively. As of the same period, the DUMBO office submarket consisted of approximately 3.3 million square feet of office space with a direct vacancy rate of 16.6% and an average asking rent of $76.85 and $56.15 per square foot for Class A and Class B office space, respectively. According to a third party report, as of year-end 2017, the population within a one-, three- and five-mile radius was106,570, 1,079,965 and 2,690,007, respectively. Additionally, for the same period, themedian household income within a one-, three- and five-mile radius was$128,903, $137,580 and $123,431, respectively. The table below shows the in-place underwritten gross rent compared to the appraisal’s concluded market gross rent on the occupied space at the DUMBO Heights Portfolio Properties.
Type of Space | Occupied Net Rentable Area (SF)(1) | Underwritten Gross Rent per SF(1) | Concluded Market Rent per SF(2) |
| Retail | 36,713 | $41.38 | $53.15 |
| Office | 672,521 | $56.01 | $59.36 |
| Total / Wtd. Avg. | 709,234 | $55.25 | $59.04 |
| (1) | Based on the underwritten rent rolls dated August 9, 2018 for the 55 Prospect Street Property and August 1, 2018 for the 117 Adams Street Property, 77 Sands Street Property and 81 Prospect Street Property. |
| (2) | Source: Appraisal. |
According to the appraisal, Brooklyn is projected to have one of the fastest employment growth rates of any New York City borough over the next five years. The appraisal highlighted several demand drivers for continued growth in the Brooklyn office market, including but not limited to, the rising cost of office space in Manhattan, large scale redevelopment projects such as the Domino Sugar Factory, the Watchtower properties and Brooklyn Navy Yard that will continue to reshape the office market, and the fact that the DUMBO Heights Portfolio Properties are situated within an area known as Brooklyn’s “Tech Triangle.” The “Tech Triangle” is an area identified by a local initiative that is currently being promoted to encourage Brooklyn’s evolution into a hub for technology companies. The plan, which is led by the Downtown Brooklyn Partnership, aims to cultivate a connection between downtown Brooklyn and the growing technology company presence in the DUMBO neighborhood and Brooklyn Navy Yard.
THE INFORMATION IN THIS STRUCTURAL AND COLLATERAL TERM SHEET IS NOT COMPLETE AND MAY BE AMENDED PRIOR TO THE TIME OF SALE. THIS TERM SHEET IS NOT AN OFFER TO SELL THESE SECURITIES AND IT IS NOT A SOLICITATION OF AN OFFER TO BUY THESE SECURITIES IN ANY JURISDICTION WHERE THE OFFER OR SALE IS NOT PERMITTED. | ||||
| | | 123 of 125 | | |
| Structural and Collateral Term Sheet | Benchmark 2018-B8 | |
| DUMBO Heights Portfolio | ||
| Tenant Summary(1) | ||||||
| Tenant | Ratings Moody’s/S&P/Fitch | Net Rentable Area (SF) | % of Total NRA | Base Rent PSF(2) | % of Total Base Rent(2) | Lease Expiration Date |
| Etsy(3)(4) | NA / NA / NA | 225,135 | 29.9% | $54.92 | 31.8% | 7/31/2026 |
| WeWork(5)(6) | NA / NA / NA | 159,932 | 21.2% | $54.34 | 22.4% | 7/31/2031 |
| Brooklyn Lab(7) | NA / NA / NA | 80,648 | 10.7% | $47.57 | 9.9% | 6/30/2034 |
| 2U(5)(8) | NA / NA / NA | 79,500 | 10.6% | $63.00 | 12.9% | 9/30/2029 |
| Frog Design(5) | NA / NA / NA | 26,500 | 3.5% | $62.12 | 4.2% | 12/31/2026 |
| Prolific Interactive(5) | NA / NA / NA | 18,807 | 2.5% | $62.42 | 3.0% | 12/31/2026 |
| Wipro LLC(5) | NA / NA / NA | 18,807 | 2.5% | $58.26 | 2.8% | 9/30/2027 |
| B-Reel Inc. | NA / NA / NA | 13,387 | 1.8% | $57.12 | 2.0% | 12/31/2027 |
| Husk Bakery(5) | NA / NA / NA | 9,262 | 1.2% | $31.63 | 0.8% | 4/30/2033 |
| Social Bicycle | NA / NA / NA | 8,812 | 1.2% | $58.21 | 1.3% | 8/30/2020 |
| (1) | Based on the underwritten rent rolls dated August 9, 2018 for the 55 Prospect Street Property and August 1, 2018 for the 117 Adams Street Property, 77 Sands Street Property and 81 Prospect Street Property. |
| (2) | Base Rent PSF and % of Total Base Rent includes $382,025 of contractual rent steps through September 1, 2019. |
| (3) | Etsy has two, five-year renewal options remaining under the terms of its lease. |
| (4) | Includes 26,500 square feet of must-take space with a final must-take date of January 1, 2019. Etsy has no termination or contraction options under its lease. |
| (5) | Tenants have one, five-year renewal option remaining under the terms of their leases. |
| (6) | WeWork occupies 84,704 square feet at the 81 Prospect Street Property with a lease expiration of July 31, 2031 and 75,228 square feet at the 77 Sands Street Property with a lease expiration date of November 30, 2031. |
| (7) | Brooklyn Lab has a one, five- or ten-year renewal option remaining under the terms of its lease. |
| (8) | Includes 26,500 SF of must-take space with a final must-take date of December 15, 2020. 2U has no termination or contraction options under its lease. |
| Lease Rollover Schedule(1)(2) | |||||||||
| Year | Number of Leases Expiring | Net Rentable Area Expiring | % of NRA Expiring | Base Rent Expiring(3) | % of Base Rent Expiring(3) | Cumulative Net Rentable Area Expiring | Cumulative % of NRA Expiring | Cumulative Base Rent Expiring(3) | Cumulative % of Base Rent Expiring(3) |
| Vacant | NAP | 43,840 | 5.8% | NAP | NAP | 43,840 | 5.8% | NAP | NAP |
| 2018 & MTM | 1 | 1,781 | 0.2% | $60,000 | 0.2% | 45,621 | 6.1% | $60,000 | 0.2% |
| 2019 | 4 | 7,825 | 1.0% | 473,543 | 1.2 | 53,446 | 7.1% | 533,543 | 1.4% |
| 2020 | 4 | 19,898 | 2.6% | 1,113,372 | 2.9 | 73,344 | 9.7% | 1,646,915 | 4.2% |
| 2021 | 4 | 10,463 | 1.4% | 655,997 | 1.7 | 83,807 | 11.1% | 2,302,912 | 5.9% |
| 2022 | 1 | 5,087 | 0.7% | 264,472 | 0.7 | 88,894 | 11.8% | 2,567,384 | 6.6% |
| 2023 | 0 | 0 | 0.0% | 0 | 0.0 | 88,894 | 11.8% | 2,567,384 | 6.6% |
| 2024 | 0 | 0 | 0.0% | 0 | 0.0 | 88,894 | 11.8% | 2,567,384 | 6.6% |
| 2025 | 1 | 2,451 | 0.3% | 0 | 0.0 | 91,345 | 12.1% | 2,567,384 | 6.6% |
| 2026 | 3 | 270,442 | 35.9% | 15,183,772 | 39.1 | 361,787 | 48.0% | 17,751,156 | 45.7% |
| 2027 | 3 | 33,209 | 4.4% | 1,928,361 | 5.0 | 394,996 | 52.5% | 19,679,517 | 50.6% |
| 2028 | 1 | 4,606 | 0.6% | 162,000 | 0.4 | 399,602 | 53.1% | 19,841,517 | 51.1% |
| 2029 & Beyond | 12 | 353,472 | 46.9% | 19,012,959 | 48.9 | 753,074 | 100.0% | 38,854,476 | 100.0% |
| Total | 34 | 753,074 | 100.0% | $38,854,476 | 100.0% | ||||
| (1) | Based on the underwritten rent rolls dated August 9, 2018 for the 55 Prospect Street Property and August 1, 2018 for the 117 Adams Street Property, 77 Sands Street Property and 81 Prospect Street Property. |
| (2) | Certain tenants may have termination options or contraction options (which may become exercisable prior to the originally stated expiration date of the tenant lease) that are not considered in the above Lease Rollover Schedule. |
| (3) | Includes $382,025 of contractual rent steps through September 1, 2019. |
THE INFORMATION IN THIS STRUCTURAL AND COLLATERAL TERM SHEET IS NOT COMPLETE AND MAY BE AMENDED PRIOR TO THE TIME OF SALE. THIS TERM SHEET IS NOT AN OFFER TO SELL THESE SECURITIES AND IT IS NOT A SOLICITATION OF AN OFFER TO BUY THESE SECURITIES IN ANY JURISDICTION WHERE THE OFFER OR SALE IS NOT PERMITTED. | ||||
| | | 124 of 125 | | |
| Structural and Collateral Term Sheet | Benchmark 2018-B8 | |
| DUMBO Heights Portfolio | ||
| Underwritten Net Cash Flow(1) | |||||
| 2016 | TTM(2) | Underwritten(3) | Per Square Foot | %(4) | |
| Rents in Place | $23,433,002 | $36,236,789 | $38,472,451 | $51.09 | 92.2% |
| Rent Steps(5) | 0 | 0 | 382,025 | 0.51 | 0.9 |
| Rent Concessions(6) | (20,003,491) | (8,768,983) | 0 | 0.00 | 0.0 |
| Vacant Income | 0 | 0 | 2,520,993 | 3.35 | 6.0% |
| Gross Potential Rent | $3,429,511 | $27,467,806 | $41,375,469 | $54.94 | 99.2% |
| Reimbursements | 0 | 167,539 | 330,922 | 0.44 | 0.8% |
| Net Rental Income | $3,429,511 | $27,635,345 | $41,706,391 | $55.38 | 100.0% |
| (Vacancy/Credit Loss) | (71,390) | 0 | (2,520,993) | (3.35) | (6.0) |
| Other Income | 662,386 | 998,674 | 990,784 | 1.32 | 2.4 |
| Effective Gross Income | $4,020,507 | $28,634,019 | $40,176,182 | $53.35 | 96.3% |
| Total Expenses(7) | $8,486,419 | $11,010,733 | $10,301,816 | $13.68 | 25.6% |
| Net Operating Income(8) | ($4,465,912) | 17,623,285 | $29,874,366 | $39.67 | 74.4% |
| Total TI/LC, Capex/RR | 0 | 0 | 1,150,615 | 1.53 | 2.9% |
| Net Cash Flow | ($4,465,912) | 17,623,285 | $28,723,752 | $38.14 | 71.5% |
| (1) | Historical cash flow information for 2017 was unavailable because the borrower sponsors obtained a loan in the second quarter of 2017 to recapitalize and buy out Invesco’s interest in the DUMBO Heights Portfolio Properties. 2015 financial information was not available due to the extensive renovation that began in 2014 at the DUMBO Heights Portfolio Properties. |
| (2) | TTM reflects the trailing 12-month period ending June 30, 2018. |
| (3) | Underwritten cash flow information is based on the underwritten rent rolls dated August 9, 2018 for the 55 Prospect Street Property and August 1, 2018 for the 117 Adams Street Property, 77 Sands Street Property and 81 Prospect Street Property. |
| (4) | % column represents percent of Net Rental Income for all revenue lines and represents percent of Effective Gross Income for the remainder of the fields. |
| (5) | Consists of contractual rent steps through September 1, 2019. |
| (6) | Rent Concessions were not underwritten because all gap rent, free rent and landlord obligations were reserved for by the lender at origination. |
| (7) | Total Expenses includes real estate taxes of $2,586,376 which were underwritten using the 2018/2019 tentative assessed value and the 2017/2018 tax rate plus the relevant business improvement district tax for each of the DUMBO Heights Portfolio Properties less each respective properties’ ICAP abatement. The appraisal concluded to unabated real estate taxes for the 2018/2019 tax year of $4,518,135. |
| (8) | The difference between TTM net operating income and Underwritten net operating income is primarily attributable to new leasing and the burn off of rent concessions associated with leasing up the DUMBO Heights Portfolio Properties post-renovation. All outstanding free rent, gap rent, and unfunded landlord obligations were reserved by the lender at origination. |
Property Management. The DUMBO Heights Portfolio Properties are managed by Watchtower Property Manager LLC, an affiliate of Seryl Kushner, one of the borrower sponsors.
Additional Debt.Two mezzanine loans, with aggregate principal balance of $155.0 million were funded concurrently with the DUMBO Heights Portfolio Whole Loan. The Mezzanine A loan has an original principal balance of $80.0 million, accrues interest at a rate of 5.70000% and is held bySHINHAN AIM REAL ESTATE FUND NO. 6; and DB INSURANCE CO., LTD.The Mezzanine B loan has an original principal balance of $75.0 million, accrues interest at a rate of 7.10000% and is held bySHINHAN AIM REAL ESTATE FUND NO. 5; and SHINHAN AIM REAL ESTATE FUND NO. 5-A. Both mezzanine loans have an original term of 60 months and are interest only for the full term. The aggregate principal balance of the total debt associated with the DUMBO Heights Portfolio Properties is equal to $480.0 million (the “DUMBO Heights Portfolio Total Loan”). The cumulative Cut-off Date LTV, cumulative UW NCF DSCR and cumulative UW NOI Debt Yield, inclusive of the mezzanine loans, are equal to 75.0%, 1.13x and 6.2%, respectively. The mortgage and mezzanine lenders have entered into an intercreditor agreement.
THE INFORMATION IN THIS STRUCTURAL AND COLLATERAL TERM SHEET IS NOT COMPLETE AND MAY BE AMENDED PRIOR TO THE TIME OF SALE. THIS TERM SHEET IS NOT AN OFFER TO SELL THESE SECURITIES AND IT IS NOT A SOLICITATION OF AN OFFER TO BUY THESE SECURITIES IN ANY JURISDICTION WHERE THE OFFER OR SALE IS NOT PERMITTED. | ||||
| | | 125 of 125 | | |