JP Morgan Chase Commercial Mortgage Securities
Filed: 8 Feb 19, 12:00am
| FREE WRITING PROSPECTUS | ||
| FILED PURSUANT TO RULE 433 | ||
| REGISTRATION FILE NO.: 333-226123-02 | ||
| February [7], 2019 | JPMCC 2019-COR4 |
| Free Writing Prospectus Structural and Collateral Term Sheet | ||
| JPMCC 2019-COR4 | ||
This material is for your information, and none of J.P. Morgan Securities LLC (“JPMS”), Deutsche Bank Securities Inc., Citigroup Global Markets Inc., Goldman Sachs & Co.LLC, Drexel Hamilton, LLC and Academy Securities, Inc., (each individually, an “Underwriter”, and together, the ‘‘Underwriters’’) are soliciting any action based upon it. This material is not to be construed as an offer to sell or the solicitation of any offer to buy any security in any jurisdiction where such an offer or solicitation would be illegal.
The depositor has filed a registration statement (including a prospectus) with the SEC (SEC File No. 333-206361) for the offering to which this free writing prospectus relates. Before you invest, you should read the prospectus in the registration statement and other documents the depositor has filed with the SEC for more complete information about the depositor, the issuing entity and this offering. You may get these documents for free by visiting EDGAR on the SEC Web site at www.sec.gov. Alternatively, the depositor, any underwriter or any dealer participating in the offering will arrange to send you the prospectus if you request it by calling (800) 408-1016 or by emailing the ABS Syndicate Desk atabs_synd@jpmorgan.com.
THE SECURITIES TO WHICH THIS INFORMATION RELATES WILL BE MORE FULLY DESCRIBED IN A PROSPECTUS (THE “PROSPECTUS”), WHICH IS NOT YET AVAILABLE. THE PROSPECTUS WILL CONTAIN MATERIAL INFORMATION THAT IS NOT CONTAINED IN THESE MATERIALS (INCLUDING WITHOUT LIMITATION A DETAILED DISCUSSION OF RISKS ASSOCIATED WITH AN INVESTMENT IN THE CERTIFICATES, UNDER THE HEADING“RISK FACTORS”IN THE PROSPECTUS).
Neither this document nor anything contained in this document shall form the basis for any contract or commitment whatsoever. The information contained in this document is preliminary as of the date of this document, supersedes any previous such information delivered to you and will be superseded by any such information subsequently delivered prior to the time of sale. These materials are subject to change, completion or amendment from time to time. This information is based upon management forecasts and reflects prevailing conditions and management’s views as of this date, all of which are subject to change.
J.P. Morgan is the marketing name for the investment banking businesses of JPMorgan Chase & Co. and its subsidiaries worldwide. Securities, syndicated loan arranging, financial advisory and other investment banking activities are performed by JPMS and its securities affiliates, and lending, derivatives and other commercial banking activities are performed by JPMorgan Chase Bank, National Association and its banking affiliates. JPMS is a member of SIPC and the NYSE.
THE UNDERWRITERS MAY FROM TIME TO TIME PERFORM INVESTMENT BANKING SERVICES FOR, OR SOLICIT INVESTMENT BANKING BUSINESS FROM, ANY COMPANY NAMED IN THESE MATERIALS. THE UNDERWRITERS AND/OR THEIR AFFILIATES OR RESPECTIVE EMPLOYEES MAY FROM TIME TO TIME HAVE A LONG OR SHORT POSITION IN ANY CERTIFICATE OR CONTRACT DISCUSSED IN THESE MATERIALS.
| ||
THE INFORMATION IN THIS STRUCTURAL AND COLLATERAL TERM SHEET IS NOT COMPLETE AND MAY BE AMENDED PRIOR TO THE TIME OF SALE. THIS TERM SHEET IS NOT AN OFFER TO SELL THESE SECURITIES AND IT IS NOT A SOLICITATION OF AN OFFER TO BUY THESE SECURITIES IN ANY JURISDICTION WHERE THE OFFER OR SALE IS NOT PERMITTED. | ||
 | 1 of 106 |  |
| February [7], 2019 | JPMCC 2019-COR4 |
THE REPUBLIC OF KOREA
THIS PROSPECTUS IS NOT, AND UNDER NO CIRCUMSTANCES IS THIS PROSPECTUS TO BE CONSTRUED AS, A PUBLIC OFFERING OF SECURITIES IN KOREA. NEITHER THE ISSUER NOR ANY OF ITS AGENTS MAKE ANY REPRESENTATION WITH RESPECT TO THE ELIGIBILITY OF ANY RECIPIENTS OF THIS PROSPECTUS TO ACQUIRE THE OFFERED CERTIFICATES UNDER THE LAWS OF KOREA, INCLUDING, BUT WITHOUT LIMITATION, THE FOREIGN EXCHANGE TRANSACTION LAW AND REGULATIONS THEREUNDER (THE “FETL”). THE OFFERED CERTIFICATES HAVE NOT BEEN REGISTERED WITH THE FINANCIAL SERVICES COMMISSION OF KOREA FOR PUBLIC OFFERING IN KOREA, AND NONE OF THE OFFERED CERTIFICATES MAY BE OFFERED, SOLD OR DELIVERED, DIRECTLY OR INDIRECTLY, OR OFFERED OR SOLD TO ANY PERSON FOR RE-OFFERING OR RESALE, DIRECTLY OR INDIRECTLY IN KOREA OR TO ANY RESIDENT OF KOREA EXCEPT PURSUANT TO THE FINANCIAL INVESTMENT SERVICES AND CAPITAL MARKETS ACT AND THE DECREES AND REGULATIONS THEREUNDER (THE “FSCMA”), THE FETL AND ANY OTHER APPLICABLE LAWS, REGULATIONS AND MINISTERIAL GUIDELINES IN KOREA. WITHOUT PREJUDICE TO THE FOREGOING, THE NUMBER OF OFFERED CERTIFICATES OFFERED IN KOREA OR TO A RESIDENT OF KOREA SHALL BE LESS THAN FIFTY AND FOR A PERIOD OF ONE YEAR FROM THE ISSUE DATE OF THE OFFERED CERTIFICATES, NONE OF THE OFFERED CERTIFICATES MAY BE DIVIDED RESULTING IN AN INCREASED NUMBER OF OFFERED CERTIFICATES. FURTHERMORE, THE OFFERED CERTIFICATES MAY NOT BE RESOLD TO KOREAN RESIDENTS UNLESS THE PURCHASER OF THE OFFERED CERTIFICATES COMPLIES WITH ALL APPLICABLE REGULATORY REQUIREMENTS (INCLUDING, BUT NOT LIMITED TO, GOVERNMENT REPORTING APPROVAL REQUIREMENTS UNDER THE FETL AND ITS SUBORDINATE DECREES AND REGULATIONS) IN CONNECTION WITH THE PURCHASE OF THE OFFERED CERTIFICATES.
JAPAN
THE OFFERED CERTIFICATES HAVE NOT BEEN AND WILL NOT BE REGISTERED UNDER THE FINANCIAL INSTRUMENTS AND EXCHANGE LAW OF JAPAN, AS AMENDED (THE “FIEL”), AND DISCLOSURE UNDER THE FIEL HAS NOT BEEN AND WILL NOT BE MADE WITH RESPECT TO THE OFFERED CERTIFICATES. ACCORDINGLY, EACH UNDERWRITER HAS REPRESENTED AND AGREED THAT IT HAS NOT, DIRECTLY OR INDIRECTLY, OFFERED OR SOLD AND WILL NOT, DIRECTLY OR INDIRECTLY, OFFER OR SELL ANY OFFERED CERTIFICATES IN JAPAN OR TO, OR FOR THE BENEFIT OF, ANY RESIDENT OF JAPAN (WHICH TERM AS USED IN THIS PROSPECTUS MEANS ANY PERSON RESIDENT IN JAPAN, INCLUDING ANY CORPORATION OR OTHER ENTITY ORGANIZED UNDER THE LAWS OF JAPAN) OR TO OTHERS FOR REOFFERING OR RE-SALE, DIRECTLY OR INDIRECTLY, IN JAPAN OR TO, OR FOR THE BENEFIT OF, ANY RESIDENT OF JAPAN EXCEPT PURSUANT TO AN EXEMPTION FROM THE REGISTRATION REQUIREMENTS OF, AND OTHERWISE IN COMPLIANCE WITH, THE FIEL AND OTHER RELEVANT LAWS, REGULATIONS AND MINISTERIAL GUIDELINES OF JAPAN. AS PART OF THIS OFFERING OF THE OFFERED CERTIFICATES, THE UNDERWRITERS MAY OFFER THE OFFERED CERTIFICATES IN JAPAN TO UP TO 49 OFFEREES IN ACCORDANCE WITH THE ABOVE PROVISIONS.
THE INFORMATION IN THIS STRUCTURAL AND COLLATERAL TERM SHEET IS NOT COMPLETE AND MAY BE AMENDED PRIOR TO THE TIME OF SALE. THIS TERM SHEET IS NOT AN OFFER TO SELL THESE SECURITIES AND IT IS NOT A SOLICITATION OF AN OFFER TO BUY THESE SECURITIES IN ANY JURISDICTION WHERE THE OFFER OR SALE IS NOT PERMITTED. | ||
| | 2 of 106 | |
| Structural and Collateral Term Sheet | JPMCC 2019-COR4 | |
| Collateral Characteristics | ||
| Loan Pool | ||
| Initial Pool Balance (“IPB”): | $774,087,963 | |
| Number of Mortgage Loans: | 38 | |
| Number of Mortgaged Properties: | 56 | |
| Average Cut-off Date Balance per Mortgage Loan: | $20,370,736 | |
| Weighted Average Current Mortgage Rate: | 5.03331% | |
| 10 Largest Mortgage Loans as % of IPB: | 57.7% | |
| Weighted Average Remaining Term to Maturity: | 114 months | |
| Weighted Average Seasoning: | 6 months | |
| Credit Statistics | ||
| Weighted Average UW NCF DSCR(1)(2): | 1.66x | |
| Weighted Average UW NOI Debt Yield(1): | 10.2% | |
| Weighted Average Cut-off Date Loan-to-Value Ratio (“LTV”)(1)(3): | 59.2% | |
| Weighted Average Maturity Date LTV(1)(3): | 55.5% | |
| Other Statistics | ||
| % of Mortgage Loans with Additional Debt: | 18.0% | |
| % of Mortgaged Properties with Single Tenants: | 20.5% | |
| Amortization | ||
| Weighted Average Original Amortization Term(4): | 360 months | |
| Weighted Average Remaining Amortization Term(4): | 359 months | |
| % of Mortgage Loans with Interest-Only: | 49.3% | |
| % of Mortgage Loans with Partial Interest-Only followed by Amortizing Balloon: | 40.7% | |
| % of Mortgage Loans with Amortizing Balloon: | 10.0% | |
| Lockbox / Cash Management(5) | ||
| % of Mortgage Loans with In-Place, Hard Lockboxes: | 75.2% | |
| % of Mortgage Loans with Springing Lockboxes: | 8.3% | |
| % of Mortgage Loans with In-Place, Soft Lockboxes: | 16.5% | |
| % of Mortgage Loans with Springing Cash Management: | 95.8% | |
| % of Mortgage Loans with In-Place Cash Management: | 4.2% | |
| Reserves | ||
| % of Mortgage Loans Requiring Monthly Tax Reserves: | 66.0% | |
| % of Mortgage Loans Requiring Monthly Insurance Reserves: | 41.8% | |
| % of Mortgage Loans Requiring Monthly CapEx Reserves(6): | 57.7% | |
| % of Mortgage Loans Requiring Monthly TI/LC Reserves(7): | 37.8% | |
| (1) | In the case of Loan Nos. 1, 3, 5, 6, 10 and 18, the UW NCF DSCR, UW NOI Debt Yield, Cut-off Date LTV and Maturity Date LTV calculations include the related Pari Passu Companion Loan(s). In the case of Loan Nos. 4, 5, 8 and 11, the UW NCF DSCR, UW NOI Debt Yield, Cut-off Date LTV and Maturity Date LTV calculations exclude the related mezzanine loan(s). |
| (2) | With respect to Loan No. 5, the UW NCF DSCR is calculated using the sum of the first 12 whole loan principal and interest payments after the expiration of the whole loan interest only period based on the assumed principal and interest payment schedule set forth in Annex G of the Preliminary Prospectus. With respect to Loan No. 8, the UW NCF DSCR is calculated using the sum of the first 12 principal and interest payments after the expiration of the interest only period based on the assumed principal and interest payment schedule set forth in Annex H of the Preliminary Prospectus. With respect to Loan No. 11, the UW NCF DSCR is calculated using the sum of the first 12 principal and interest payments after the expiration of the interest only period based on the assumed principal and interest payment schedule set forth in Annex I of the Preliminary Prospectus. |
| (3) | In the case of Loan Nos. 22 and 38, the Cut-off Date LTV and the Maturity Date LTV are calculated by using an appraised value based on certain hypothetical assumptions. Refer to “Description of the Mortgage Pool—Assessments of Property Value and Condition” and “—Appraised Value” in the Preliminary Prospectus for additional details. |
| (4) | Excludes 15 mortgage loans that are interest-only for the entire term. |
| (5) | For a more detailed description of Lockbox / Cash Management, refer to “Description of the Mortgage Pool—Certain Terms of the Mortgage Loans—Mortgaged Property Accounts” in the Preliminary Prospectus. |
| (6) | CapEx Reserves include FF&E reserves for hotel properties. |
| (7) | Calculated only with respect to the Cut-off Date Balance of mortgage loans secured or partially secured by retail, office, industrial and mixed use properties. |
THE INFORMATION IN THIS STRUCTURAL AND COLLATERAL TERM SHEET IS NOT COMPLETE AND MAY BE AMENDED PRIOR TO THE TIME OF SALE. THIS TERM SHEET IS NOT AN OFFER TO SELL THESE SECURITIES AND IT IS NOT A SOLICITATION OF AN OFFER TO BUY THESE SECURITIES IN ANY JURISDICTION WHERE THE OFFER OR SALE IS NOT PERMITTED. | ||
| | 3 of 106 | |
| Structural and Collateral Term Sheet | JPMCC 2019-COR4 | |
| Collateral Characteristics | ||
Mortgage Loan Seller | Number of | Number of | Aggregate | % of IPB |
| LCM(1) | 30 | 46 | $648,493,903 | 83.8% |
| JPMCB | 8 | 10 | 125,594,061 | 16.2 |
| Total: | 38 | 56 | $774,087,963 | 100.0% |
| (1) | Five of the mortgage loans being sold by LCM were originated by Deutsche Bank AG, acting through its New York Branch (“DBNY”), or German American Capital Corporation or an affiliate thereof, and have been or will be purchased by LCM or an affiliate. One of the mortgage loans being sold by LCM, the Saint Louis Galleria mortgage loan, is part of a whole loan that was co-originated by Société Générale Financial Corporation and DBNY. Such mortgage loan has been or will be purchased by LCM or an affiliate. |
| Ten Largest Mortgage Loans | ||||||||||||
| No. | Loan Name | Mortgage Loan Seller | No. of Prop. | Cut-off Date Balance | % of IPB | SF / Rooms | Property Type | UW NCF DSCR(1)(2) | UW NOI Debt Yield(1) | Cut-off Date LTV(1) | Maturity Date LTV(1) | |
| 1 | Renaissance Seattle | LCM | 1 | $77,000,000 | 9.9% | 557 | Hotel | 2.22x | 12.6% | 55.3% | 55.3% | |
| 2 | 400 South El Camino | LCM | 1 | $75,000,000 | 9.7% | 145,179 | Office | 1.57x | 10.3% | 58.6% | 50.3% | |
| 3 | Liberty Station Retail | JPMCB | 1 | $67,000,000 | 8.7% | 327,704 | Retail | 1.45x | 8.0% | 68.8% | 68.8% | |
| 4 | Bedford Square | LCM | 1 | $48,000,000 | 6.2% | 107,943 | Mixed Use | 1.59x | 9.0% | 45.7% | 45.7% | |
| 5 | Saint Louis Galleria | LCM | 1 | $46,479,245 | 6.0% | 465,695 | Retail | 1.67x | 11.3% | 51.5% | 47.0% | |
| 6 | Grand Hyatt Seattle | LCM | 1 | $33,000,000 | 4.3% | 457 | Hotel | 2.21x | 12.3% | 54.9% | 54.9% | |
| 7 | Fleet Farm Distribution Center | LCM | 1 | $32,303,006 | 4.2% | 1,126,368 | Industrial | 1.33x | 9.5% | 64.0% | 52.7% | |
| 8 | Peachtree Corners Marketplace | LCM | 1 | $24,600,000 | 3.2% | 121,379 | Retail | 1.39x | 9.5% | 61.5% | 55.0% | |
| 9 | Pier 54 Seattle | LCM | 1 | $23,000,000 | 3.0% | 65,749 | Mixed Use | 1.56x | 8.0% | 56.1% | 56.1% | |
| 10 | CBBC Industrial Portfolio | LCM | 4 | $20,000,000 | 2.6% | 951,651 | Industrial | 1.77x | 10.4% | 61.7% | 61.7% | |
| Top 3 Total/Weighted Average | 3 | $219,000,000 | 28.3% | 1.76x | 10.4% | 60.6% | 57.7% | |||||
| Top 5 Total/Weighted Average | 5 | $313,479,245 | 40.5% | 1.72x | 10.3% | 56.9% | 54.3% | |||||
| Top 10 Total/Weighted Average | 13 | $446,382,251 | 57.7% | 1.71x | 10.2% | 57.7% | 54.7% | |||||
| (1) | In the case of Loan Nos. 1, 3, 5, 6 and 10, the UW NCF DSCR, UW NOI Debt Yield, Cut-off Date LTV and Maturity Date LTV calculations include the related Pari Passu Companion Loan(s). In the case of Loan Nos. 4, 5 and 8, the UW NCF DSCR, UW NOI Debt Yield, Cut-off Date LTV and Maturity Date LTV calculations exclude the related mezzanine loan(s). |
| (2) | With respect to Loan No. 5, the UW NCF DSCR is calculated using the sum of the first 12 whole loan principal and interest payments after the expiration of the whole loan interest only period based on the assumed principal and interest payment schedule set forth in Annex G of the Preliminary Prospectus. With respect to Loan No. 8, the UW NCF DSCR is calculated using the sum of the first 12 principal and interest payments after the expiration of the interest only period based on the assumed principal and interest payment schedule set forth in Annex H of the Preliminary Prospectus. |
THE INFORMATION IN THIS STRUCTURAL AND COLLATERAL TERM SHEET IS NOT COMPLETE AND MAY BE AMENDED PRIOR TO THE TIME OF SALE. THIS TERM SHEET IS NOT AN OFFER TO SELL THESE SECURITIES AND IT IS NOT A SOLICITATION OF AN OFFER TO BUY THESE SECURITIES IN ANY JURISDICTION WHERE THE OFFER OR SALE IS NOT PERMITTED. | ||
| | 4 of 106 | |
| Structural and Collateral Term Sheet | JPMCC 2019-COR4 | |
| Collateral Characteristics | ||
| Pari Passu Companion Loan Summary |
| Loan No. | Mortgage Loan | Note(s) | Original Balance ($) | Cut-off Date Balance ($) | Holder of Note | Lead Servicer for Whole Loan (Y/N) | Master Servicer Under Lead Securitization | Special Servicer Under Lead Securitization |
| 1 | Renaissance Seattle | Note A-1 | $50,000,000 | $50,000,000 | COMM 2017-COR2 | Y | Midland | Midland |
| Note A-2, A-3 | $77,000,000 | $77,000,000 | JPMCC 2019-COR4 | N | ||||
| Total | $127,000,000 | $127,000,000 | ||||||
3
| Liberty Station Retail | Note A-1 | $67,000,000 | $67,000,000 | JPMCC 2019-COR4 | Y | Midland | Midland |
| Note A-2 | $20,000,000 | $20,000,000 | JPMCB | N | ||||
| Note A-3 | $30,000,000 | $30,000,000 | Benchmark 2019-B9(1) | N | ||||
| Total | $117,000,000 | $117,000,000 | ||||||
| 5 | Saint Louis Galleria | Note A-1-A1 | $60,000,000 | $60,000,000 | DBNY | Y | TBD | TBD |
| Note A-1-A2 | $55,000,000 | $55,000,000 | Benchmark 2018-B8 | N | ||||
| Note A-1-A3, A-1-A4, A-1-A5 | $46,479,245 | $46,479,245 | JPMCC 2019-COR4 | N | ||||
| Note A-2-A1, A-2-A3 | $45,000,000 | $45,000,000 | UBS 2018-C15 | N | ||||
| Note A-2-A2, A-2-A4, A-2-A5 | $33,520,755 | $33,520,755 | Société Générale | N | ||||
| Total | $240,000,000 | $240,000,000 | ||||||
6
| Grand Hyatt Seattle | Note A-1 | $50,000,000 | $50,000,000 | COMM 2017-COR2 | Y | Midland | Midland |
| Note A-2 | $50,000,000 | $50,000,000 | COMM 2018-COR3 | N | ||||
| Note A-3 | $33,000,000 | $33,000,000 | JPMCC 2019-COR4 | N | ||||
| Total | $133,000,000 | $133,000,000 | ||||||
10
| CBBC Industrial Portfolio | Note A-1 | $33,030,000 | $33,030,000 | UBS 2018-C15 | Y | Midland | Midland |
| Note A-2 | $20,000,000 | $20,000,000 | JPMCC 2019-COR4 | N | ||||
| Total | $53,030,000 | $53,030,000 | ||||||
18
| Sheraton Music City | Note A-1 | $40,000,000 | $39,633,229 | Benchmark 2018-B4 | Y | Wells Fargo | CWCapital |
| Note A-2-A | $15,000,000 | $14,862,461 | Benchmark 2018-B8 | N | ||||
| Note A-2-B | $15,000,000 | $14,862,461 | JPMCC 2019-COR4 | N | ||||
| Total | $70,000,000 | $69,358,151 |
| (1) | The Benchmark 2019-B9 transaction is expected to close on February 14, 2019. |
| (2) | In the case of Loan No. 4, the whole loan is expected to be serviced under the Benchmark 2018-B8 pooling and servicing agreement until such time the controlling note has been securitized, at which point such whole loan will be serviced under the pooling and servicing agreement related to such securitization. DBNY holds the related controllingpari passucompanion loan and is entitled to exercise control rights until the securitization of such controllingpari passucompanion loan. |
THE INFORMATION IN THIS STRUCTURAL AND COLLATERAL TERM SHEET IS NOT COMPLETE AND MAY BE AMENDED PRIOR TO THE TIME OF SALE. THIS TERM SHEET IS NOT AN OFFER TO SELL THESE SECURITIES AND IT IS NOT A SOLICITATION OF AN OFFER TO BUY THESE SECURITIES IN ANY JURISDICTION WHERE THE OFFER OR SALE IS NOT PERMITTED. | ||
| | 5 of 106 | |
| Structural and Collateral Term Sheet | JPMCC 2019-COR4 | |
| Collateral Characteristics | ||
| Additional Debt Summary |
No. | Loan Name | Trust | Subordinate | Total Debt | Mortgage | Total Debt | Mortgage | Total | Mortgage | Total |
| 4 | Bedford Square | $48,000,000 | $20,000,000 | $68,000,000 | 1.59x | 1.01x | 45.7% | 64.8% | 9.0% | 6.4% |
| 5 | Saint Louis Galleria | $46,479,245 | $24,136,252 | $264,136,252 | 1.67x | 1.55x | 51.5% | 56.7% | 11.3% | 10.3% |
| 8 | Peachtree Corners Marketplace | $24,600,000 | $2,900,000 | $27,500,000 | 1.39x | 1.20x | 61.5% | 68.8% | 9.5% | 8.5% |
| 11 | Arbors at the Park Ole Miss | $19,950,000 | $4,050,000 | $24,000,000 | 1.43x | 1.12x | 55.9% | 67.2% | 9.5% | 7.9% |
| (1) | In the case of Loan Nos. 4, 5, 8 and 11, Subordinate Debt Cut-off Date Balance represents one or more mezzanine loans. |
| (2) | In the case of Loan Nos. 4, 5, 8 and 11, the Mortgage Loan UW NCF DSCR, Mortgage Loan UW NOI Debt Yield and Mortgage Loan Cut-off Date LTV calculations exclude the related mezzanine loan(s). In the case of Loan No. 5, the Mortgage Loan UW NCF DSCR, Mortgage Loan UW NOI Debt Yield and Mortgage Loan Cut-off Date LTV calculations include the related Pari Passu Companion Loan(s). |
| (3) | With respect to Loan No. 5, the Mortgage Loan UW NCF DSCR is calculated using the sum of the first 12 whole loan principal and interest payments after the expiration of the whole loan interest only period based on the assumed principal and interest payment schedule set forth in Annex G of the Preliminary Prospectus. With respect to Loan No. 8, the Mortgage Loan UW NCF DSCR is calculated using the sum of the first 12 principal and interest payments after the expiration of the interest only period based on the assumed principal and interest payment schedule set forth in Annex H of the Preliminary Prospectus. With respect to Loan No. 11, the Mortgage Loan UW NCF DSCR is calculated using the sum of the first 12 principal and interest payments after the expiration of the interest only period based on the assumed principal and interest payment schedule set forth in Annex I of the Preliminary Prospectus. |
THE INFORMATION IN THIS STRUCTURAL AND COLLATERAL TERM SHEET IS NOT COMPLETE AND MAY BE AMENDED PRIOR TO THE TIME OF SALE. THIS TERM SHEET IS NOT AN OFFER TO SELL THESE SECURITIES AND IT IS NOT A SOLICITATION OF AN OFFER TO BUY THESE SECURITIES IN ANY JURISDICTION WHERE THE OFFER OR SALE IS NOT PERMITTED. | ||
| | 6 of 106 | |
| Structural and Collateral Term Sheet | JPMCC 2019-COR4 | |
| Collateral Characteristics | ||
| Mortgaged Properties by Type(1) |
| Weighted Average | |||||||||
| Property Type | Property Subtype | Number of Properties | Cut-off Date Principal Balance | % of IPB | Occupancy | UW NCF DSCR(2)(3) | UW NOI Debt Yield(2) | Cut-off Date LTV(2)(4) | Maturity Date LTV(2)(4) |
| Retail | Anchored | 4 | $106,087,500 | 13.7% | 93.6% | 1.46x | 8.9% | 67.1% | 64.5% |
| Super Regional Mall | 1 | 46,479,245 | 6.0 | 96.9% | 1.67x | 11.3% | 51.5% | 47.0% | |
| Freestanding | 6 | 37,834,687 | 4.9 | 100.0% | 1.66x | 9.2% | 55.9% | 54.9% | |
| Unanchored | 3 | 6,591,652 | 0.9 | 100.0% | 1.37x | 9.4% | 66.6% | 56.5% | |
| Shadow Anchored | 1 | 4,046,001 | 0.5 | 100.0% | 1.46x | 10.2% | 71.4% | 59.3% | |
| Subtotal: | 15 | $201,039,085 | 26.0% | 95.9% | 1.55x | 9.5% | 61.4% | 58.3% | |
| Office | Suburban | 8 | $87,700,000 | 11.3% | 94.5% | 1.71x | 10.8% | 59.9% | 57.3% |
| CBD | 2 | 86,000,000 | 11.1 | 96.5% | 1.56x | 10.1% | 58.4% | 51.2% | |
| Medical | 10 | 26,030,000 | 3.4 | 100.0% | 1.55x | 9.8% | 60.1% | 54.9% | |
| Subtotal: | 20 | $199,730,000 | 25.8% | 96.1% | 1.63x | 10.3% | 59.3% | 54.3% | |
| Hotel | Full Service | 3 | $124,862,461 | 16.1% | 82.3% | 2.17x | 12.4% | 55.8% | 54.6% |
| Limited Service | 2 | 19,975,000 | 2.6 | 78.7% | 1.80x | 12.4% | 65.5% | 54.9% | |
| Subtotal: | 5 | $144,837,461 | 18.7% | 81.8% | 2.12x | 12.4% | 57.1% | 54.6% | |
| Mixed Use | Retail/Multifamily | 1 | $48,000,000 | 6.2% | 83.9% | 1.59x | 9.0% | 45.7% | 45.7% |
| Retail/Office | 1 | 23,000,000 | 3.0 | 66.6% | 1.56x | 8.0% | 56.1% | 56.1% | |
| Office/Retail | 2 | 12,350,000 | 1.6 | 88.6% | 1.31x | 9.2% | 60.2% | 53.5% | |
| Subtotal: | 4 | $83,350,000 | 10.8% | 79.8% | 1.54x | 8.8% | 50.7% | 49.7% | |
| Industrial | Warehouse/Distribution | 6 | $71,553,006 | 9.2% | 100.0% | 1.46x | 9.9% | 64.6% | 58.2% |
| Warehouse | 1 | 9,178,412 | 1.2 | 100.0% | 1.75x | 12.0% | 67.0% | 55.7% | |
| Subtotal: | 7 | $80,731,418 | 10.4% | 100.0% | 1.49x | 10.1% | 64.9% | 57.9% | |
| Multifamily | Student | 1 | $19,950,000 | 2.6% | 97.1% | 1.43x | 9.5% | 55.9% | 47.5% |
| Mid-Rise | 1 | 18,200,000 | 2.4 | 97.4% | 1.44x | 7.8% | 59.3% | 59.3% | |
| Garden | 2 | 15,500,000 | 2.0 | 94.9% | 1.46x | 8.2% | 71.9% | 71.9% | |
| Subtotal: | 4 | $53,650,000 | 6.9% | 96.6% | 1.44x | 8.5% | 61.7% | 58.5% | |
| Manufactured Housing | Manufactured Housing | 1 | $10,750,000 | 1.4% | 97.1% | 1.32x | 8.9% | 55.2% | 49.2% |
| Subtotal: | 1 | $10,750,000 | 1.4% | 97.1% | 1.32x | 8.9% | 55.2% | 49.2% | |
| Total / Weighted Average: | 56 | $774,087,963 | 100.0% | 92.1% | 1.66x | 10.2% | 59.2% | 55.5% | |
| (1) | Because this table represents information relating to the mortgaged properties and not mortgage loans, the information for the mortgage loans secured by more than one mortgaged property is based on allocated loan amounts. |
| (2) | In the case of Loan Nos. 1, 3, 5, 6, 10 and 18, the UW NCF DSCR, UW NOI Debt Yield, Cut-off Date LTV and Maturity Date LTV calculations include the related Pari Passu Companion Loan(s). In the case of Loan Nos. 4, 5, 8 and 11, the UW NCF DSCR, UW NOI Debt Yield, Cut-off Date LTV and Maturity Date LTV calculations exclude the related mezzanine loan(s). |
| (3) | With respect to Loan No. 5, the UW NCF DSCR is calculated using the sum of the first 12 whole loan principal and interest payments after the expiration of the whole loan interest only period based on the assumed principal and interest payment schedule set forth in Annex G of the Preliminary Prospectus. With respect to Loan No. 8, the UW NCF DSCR is calculated using the sum of the first 12 principal and interest payments after the expiration of the interest only period based on the assumed principal and interest payment schedule set forth in Annex H of the Preliminary Prospectus. With respect to Loan No. 11, the UW NCF DSCR is calculated using the sum of the first 12 principal and interest payments after the expiration of the interest only period based on the assumed principal and interest payment schedule set forth in Annex I of the Preliminary Prospectus. |
| (4) | In the case of Loan Nos. 22 and 38, the Cut-off Date LTV and the Maturity Date LTV are calculated by using an appraised value based on certain hypothetical assumptions. Refer to “Description of the Mortgage Pool—Assessments of Property Value and Condition” and “—Appraised Value” in the Preliminary Prospectus for additional details. |
THE INFORMATION IN THIS STRUCTURAL AND COLLATERAL TERM SHEET IS NOT COMPLETE AND MAY BE AMENDED PRIOR TO THE TIME OF SALE. THIS TERM SHEET IS NOT AN OFFER TO SELL THESE SECURITIES AND IT IS NOT A SOLICITATION OF AN OFFER TO BUY THESE SECURITIES IN ANY JURISDICTION WHERE THE OFFER OR SALE IS NOT PERMITTED. | ||
| | 7 of 106 | |
| Structural and Collateral Term Sheet | JPMCC 2019-COR4 | |
| Collateral Characteristics | ||

| Mortgaged Properties by Location(1) | ||||||||
Weighted Average | ||||||||
State | Number of Properties | Cut-off Date | % of | Occupancy | UW NCF DSCR(2)(3) | UW NOI Debt Yield(2) | Cut-off Date LTV(2)(4) | Maturity Date LTV(2)(4) |
| California | 13 | $268,750,000 | 34.7% | 95.1% | 1.58x | 9.5% | 61.0% | 57.8% |
| Washington | 4 | 151,200,000 | 19.5 | 82.3% | 2.02x | 11.3% | 55.8% | 55.8% |
| Missouri | 5 | 62,522,746 | 8.1 | 97.2% | 1.66x | 11.2% | 55.0% | 49.6% |
| Connecticut | 1 | 48,000,000 | 6.2 | 83.9% | 1.59x | 9.0% | 45.7% | 45.7% |
| Georgia | 5 | 47,521,865 | 6.1 | 88.8% | 1.58x | 10.8% | 62.5% | 54.5% |
| Wisconsin | 2 | 34,383,006 | 4.4 | 100.0% | 1.35x | 9.5% | 63.6% | 52.7% |
| Tennessee | 3 | 27,287,461 | 3.5 | 84.4% | 1.65x | 10.3% | 65.3% | 59.3% |
| Mississippi | 1 | 19,950,000 | 2.6 | 97.1% | 1.43x | 9.5% | 55.9% | 47.5% |
| Indiana | 1 | 19,250,000 | 2.5 | 100.0% | 1.34x | 10.0% | 68.8% | 63.9% |
| Texas | 4 | 19,114,690 | 2.5 | 98.3% | 1.70x | 10.8% | 65.4% | 61.8% |
| Illinois | 5 | 16,897,822 | 2.2 | 91.7% | 1.36x | 9.4% | 59.1% | 52.8% |
| Florida | 3 | 14,185,310 | 1.8 | 100.0% | 1.70x | 9.7% | 63.9% | 63.9% |
| Ohio | 2 | 13,270,064 | 1.7 | 100.0% | 1.64x | 11.3% | 68.1% | 56.5% |
| New Mexico | 1 | 11,700,000 | 1.5 | 100.0% | 1.70x | 12.3% | 60.9% | 56.4% |
| Arizona | 1 | 8,600,000 | 1.1 | 100.0% | 1.36x | 9.2% | 63.7% | 57.7% |
| Pennsylvania | 1 | 3,840,000 | 0.5 | 100.0% | 1.65x | 10.3% | 57.4% | 52.7% |
| South Carolina | 2 | 3,555,000 | 0.5 | 100.0% | 1.65x | 10.3% | 57.4% | 52.7% |
| Colorado | 1 | 2,360,000 | 0.3 | 100.0% | 1.63x | 9.8% | 59.4% | 54.3% |
| Kentucky | 1 | 1,700,000 | 0.2 | 100.0% | 1.65x | 10.3% | 57.4% | 52.7% |
| Total / Weighted Average | 56 | $774,087,963 | 100.0% | 92.1% | 1.66x | 10.2% | 59.2% | 55.5% |
| (1) | Because this table represents information relating to the mortgaged properties and not mortgage loans, the information for the mortgage loans secured by more than one mortgaged property is based on allocated loan amounts. |
| (2) | In the case of Loan Nos. 1, 3, 5, 6, 10 and 18, the UW NCF DSCR, UW NOI Debt Yield, Cut-off Date LTV and Maturity Date LTV calculations include the related Pari Passu Companion Loan(s). In the case of Loan Nos. 4, 5, 8 and 11, the UW NCF DSCR, UW NOI Debt Yield, Cut-off Date LTV and Maturity Date LTV calculations exclude the related mezzanine loan(s). |
| (3) | With respect to Loan No. 5, the UW NCF DSCR is calculated using the sum of the first 12 whole loan principal and interest payments after the expiration of the whole loan interest only period based on the assumed principal and interest payment schedule set forth in Annex G of the Preliminary Prospectus. With respect to Loan No. 8, the UW NCF DSCR is calculated using the sum of the first 12 principal and interest payments after the expiration of the interest only period based on the assumed principal and interest payment schedule set forth in Annex H of the Preliminary Prospectus. With respect to Loan No. 11, the UW NCF DSCR is calculated using the sum of the first 12 principal and interest payments after the expiration of the interest only period based on the assumed principal and interest payment schedule set forth in Annex I of the Preliminary Prospectus. |
| (4) | In the case of Loan Nos. 22 and 38, the Cut-off Date LTV and the Maturity Date LTV are calculated by using an appraised value based on certain hypothetical assumptions. Refer to “Description of the Mortgage Pool—Assessments of Property Value and Condition” and “—Appraised Value” in the Preliminary Prospectus for additional details. |
THE INFORMATION IN THIS STRUCTURAL AND COLLATERAL TERM SHEET IS NOT COMPLETE AND MAY BE AMENDED PRIOR TO THE TIME OF SALE. THIS TERM SHEET IS NOT AN OFFER TO SELL THESE SECURITIES AND IT IS NOT A SOLICITATION OF AN OFFER TO BUY THESE SECURITIES IN ANY JURISDICTION WHERE THE OFFER OR SALE IS NOT PERMITTED. | ||
| | 8 of 106 | |
| Structural and Collateral Term Sheet | JPMCC 2019-COR4 | |
| Collateral Characteristics | ||
| Cut-off Date Principal Balance |
Weighted Average | |||||||||||
| Range of Cut-off Date Principal Balances | Number of Loans | Cut-off Date Principal Balance | % of IPB | Mortgage Rate | Remaining Loan Term | UW NCF DSCR(1)(2) | UW NOI Debt Yield(1) | Cut-off Date LTV(1)(3) | Maturity Date LTV(1)(3) | ||
| $4,046,001 | - | $9,999,999 | 11 | $75,793,252 | 9.8% | 5.03399% | 114 | 1.68x | 10.7% | 65.2% | 58.2% |
| $10,000,000 | - | $19,999,999 | 17 | 251,912,461 | 32.5 | 5.14050% | 117 | 1.56x | 9.9% | 60.1% | 56.2% |
| $20,000,000 | - | $24,999,999 | 3 | 67,600,000 | 8.7 | 5.09771% | 116 | 1.56x | 9.3% | 59.7% | 57.4% |
| $25,000,000 | - | $49,999,999 | 4 | 159,782,251 | 20.6 | 5.01974% | 112 | 1.69x | 10.5% | 53.0% | 49.4% |
| $50,000,000 | - | $77,000,000 | 3 | 219,000,000 | 28.3 | 4.89979% | 112 | 1.76x | 10.4% | 60.6% | 57.7% |
| Total / Weighted Average: | 38 | $774,087,963 | 100.0% | 5.03331% | 114 | 1.66x | 10.2% | 59.2% | 55.5% | ||
| Mortgage Interest Rates |
Weighted Average | |||||||||||
| Range of Mortgage Interest Rates | Number of Loans | Cut-off Date Principal Balance | % of IPB | Mortgage Rate | Remaining Loan Term | UW NCF DSCR(1)(2) | UW NOI Debt Yield(1) | Cut-off Date LTV(1)(3) | Maturity Date LTV(1)(3) | ||
| 4.39200% | - | 4.89200% | 8 | $267,473,006 | 34.6% | 4.73327% | 109 | 1.84x | 11.2% | 58.2% | 53.8% |
| 4.89201% | - | 5.39200% | 26 | 422,564,958 | 54.6 | 5.13863% | 116 | 1.57x | 9.7% | 60.4% | 56.8% |
| 5.39201% | - | 5.48600% | 4 | 84,050,000 | 10.9 | 5.45860% | 117 | 1.51x | 9.3% | 56.6% | 54.8% |
| Total / Weighted Average: | 38 | $774,087,963 | 100.0% | 5.03331% | 114 | 1.66x | 10.2% | 59.2% | 55.5% | ||
| Original Term to Maturity in Months |
Weighted Average | ||||||||||
| Original Term to Maturity in Months | Number of Loans | Cut-off Date Principal Balance | % of IPB | Mortgage Rate | Remaining Loan Term | UW NCF DSCR(1)(2) | UW NOI Debt Yield(1) | Cut-off Date LTV(1)(3) | Maturity Date LTV(1)(3) | |
| 60 | 1 | $4,994,687 | 0.6% | 5.00000% | 59 | 1.72x | 11.2% | 51.3% | 47.4% | |
| 120 | 35 | 659,093,277 | 85.1 | 5.07434% | 117 | 1.56x | 9.8% | 60.0% | 55.6% | |
| 121 | 2 | 110,000,000 | 14.2 | 4.78900% | 100 | 2.22x | 12.5% | 55.2% | 55.2% | |
| Total / Weighted Average: | 38 | $774,087,963 | 100.0% | 5.03331% | 114 | 1.66x | 10.2% | 59.2% | 55.5% | |
| Remaining Term to Maturity in Months |
| Weighted Average | |||||||||||
| Range of Remaining Term to Maturity in Months | Number of Loans | Cut-off Date Principal Balance | % of IPB | Mortgage Rate | Remaining Loan Term | UW NCF DSCR(1)(2) | UW NOI Debt Yield(1) | Cut-off Date LTV(1)(3) | Maturity Date LTV(1)(3) | ||
| 59 | - | 84 | 1 | $4,994,687 | 0.6% | 5.00000% | 59 | 1.72x | 11.2% | 51.3% | 47.4% |
| 85 | - | 119 | 33 | 725,380,777 | 93.7 | 5.03262% | 114 | 1.65x | 10.2% | 59.1% | 55.3% |
| 120 | - | 120 | 4 | 43,712,500 | 5.6 | 5.04851% | 120 | 1.71x | 9.9% | 62.7% | 59.2% |
| Total / Weighted Average: | 38 | $774,087,963 | 100.0% | 5.03331% | 114 | 1.66x | 10.2% | 59.2% | 55.5% | ||
| (1) | In the case of Loan Nos. 1, 3, 5, 6, 10 and 18, the UW NCF DSCR, UW NOI Debt Yield, Cut-off Date LTV and Maturity Date LTV calculations include the related Pari Passu Companion Loan(s). In the case of Loan Nos. 4, 5, 8 and 11, the UW NCF DSCR, UW NOI Debt Yield, Cut-off Date LTV and Maturity Date LTV calculations exclude the related mezzanine loan(s). |
| (2) | With respect to Loan No. 5, the UW NCF DSCR is calculated using the sum of the first 12 whole loan principal and interest payments after the expiration of the whole loan interest only period based on the assumed principal and interest payment schedule set forth in Annex G of the Preliminary Prospectus. With respect to Loan No. 8, the UW NCF DSCR is calculated using the sum of the first 12 principal and interest payments after the expiration of the interest only period based on the assumed principal and interest payment schedule set forth in Annex H of the Preliminary Prospectus. With respect to Loan No. 11, the UW NCF DSCR is calculated using the sum of the first 12 principal and interest payments after the expiration of the interest only period based on the assumed principal and interest payment schedule set forth in Annex I of the Preliminary Prospectus. |
| (3) | In the case of Loan Nos. 22 and 38, the Cut-off Date LTV and the Maturity Date LTV are calculated by using an appraised value based on certain hypothetical assumptions. Refer to “Description of the Mortgage Pool—Assessments of Property Value and Condition” and “—Appraised Value” in the Preliminary Prospectus for additional details. |
THE INFORMATION IN THIS STRUCTURAL AND COLLATERAL TERM SHEET IS NOT COMPLETE AND MAY BE AMENDED PRIOR TO THE TIME OF SALE. THIS TERM SHEET IS NOT AN OFFER TO SELL THESE SECURITIES AND IT IS NOT A SOLICITATION OF AN OFFER TO BUY THESE SECURITIES IN ANY JURISDICTION WHERE THE OFFER OR SALE IS NOT PERMITTED. | ||
| | 9 of 106 | |
| Structural and Collateral Term Sheet | JPMCC 2019-COR4 | |
| Collateral Characteristics | ||
| Original Amortization Term in Months |
| Weighted Average | |||||||||
| Original Amortization Term in Months | Number of Loans | Cut-off Date Principal Balance | % of IPB | Mortgage Rate | Remaining Loan Term | UW NCF DSCR(1)(2) | UW NOI Debt Yield(1) | Cut-off Date LTV(1)(3) | Maturity Date LTV(1)(3) |
| Interest Only | 15 | $381,300,000 | 49.3% | 5.09018% | 112 | 1.77x | 9.8% | 58.2% | 58.2% |
| 360 | 23 | 392,787,963 | 50.7 | 4.97810% | 116 | 1.55x | 10.6% | 60.2% | 52.9% |
| Total / Weighted Average: | 38 | $774,087,963 | 100.0% | 5.03331% | 114 | 1.66x | 10.2% | 59.2% | 55.5% |
| Remaining Amortization Term in Months |
| Weighted Average | ||||||||||||
| Range of Remaining Amortization Term in Months | Number of Loans | Cut-off Date Principal Balance | % of IPB | Mortgage Rate | Remaining Loan Term | UW NCF DSCR(1)(2) | UW NOI Debt Yield(1) | Cut-off Date LTV(1)(3) | Maturity Date LTV(1)(3) | |||
| Interest Only | 15 | $381,300,000 | 49.3% | 5.09018% | 112 | 1.77x | 9.8% | 58.2% | 58.2% | |||
| 350 | - | 359 | 6 | 69,476,218 | 9.0 | 4.91499% | 109 | 1.53x | 10.5% | 63.5% | 52.9% | |
| 360 | - | 360 | 17 | 323,311,745 | 41.8 | 4.99166% | 117 | 1.56x | 10.6% | 59.5% | 52.9% | |
| Total / Weighted Average: | 38 | $774,087,963 | 100.0% | 5.03331% | 114 | 1.66x | 10.2% | 59.2% | 55.5% | |||
| Amortization Types |
Weighted Average | |||||||||
| Amortization Types | Number of Loans | Cut-off Date Principal Balance | % of IPB | Mortgage Rate | Remaining Loan Term | UW NCF DSCR(1)(2) | UW NOI Debt Yield(1) | Cut-off Date LTV(1)(3) | Maturity Date LTV(1)(3) |
| Interest Only | 15 | $381,300,000 | 49.3% | 5.09018% | 112 | 1.77x | 9.8% | 58.2% | 58.2% |
| IO-Balloon | 16 | 315,186,745 | 40.7 | 4.98629% | 117 | 1.55x | 10.6% | 59.4% | 52.9% |
| Balloon | 7 | 77,601,218 | 10.0 | 4.94483% | 110 | 1.54x | 10.5% | 63.7% | 53.0% |
| Total / Weighted Average: | 38 | $774,087,963 | 100.0% | 5.03331% | 114 | 1.66x | 10.2% | 59.2% | 55.5% |
| Underwritten Net Cash Flow Debt Service Coverage Ratios(1)(2) |
| Weighted Average | |||||||||||
| Range of Underwritten Net Cash Flow Debt Service Coverage Ratios | Number of Loans | Cut-off Date Principal Balance | % of IPB | Mortgage Rate | Remaining Loan Term | UW NCF DSCR(1)(2) | UW NOI Debt Yield(1) | Cut-off Date LTV(1)(3) | Maturity Date LTV(1)(3) | ||
| 1.31x | - | 1.49x | 12 | $234,240,659 | 30.3% | 5.18508% | 116 | 1.39x | 8.9% | 64.5% | 59.8% |
| 1.50x | - | 1.75x | 20 | 374,034,844 | 48.3 | 5.01858% | 116 | 1.62x | 10.1% | 56.6% | 52.6% |
| 1.76x | - | 2.00x | 3 | 46,712,461 | 6.0 | 5.03038% | 116 | 1.82x | 11.6% | 62.2% | 56.4% |
| 2.01x | - | 2.25x | 2 | 110,000,000 | 14.2 | 4.78900% | 100 | 2.22x | 12.5% | 55.2% | 55.2% |
| 2.26x | - | 2.30x | 1 | 9,100,000 | 1.2 | 4.70000% | 120 | 2.30x | 11.3% | 65.0% | 65.0% |
| Total / Weighted Average: | 38 | $774,087,963 | 100.0% | 5.03331% | 114 | 1.66x | 10.2% | 59.2% | 55.5% | ||
| (1) | In the case of Loan Nos. 1, 3, 5, 6, 10 and 18, the UW NCF DSCR, UW NOI Debt Yield, Cut-off Date LTV and Maturity Date LTV calculations include the related Pari Passu Companion Loan(s). In the case of Loan Nos. 4, 5, 8 and 11, the UW NCF DSCR, UW NOI Debt Yield, Cut-off Date LTV and Maturity Date LTV calculations exclude the related mezzanine loan(s). |
| (2) | With respect to Loan No. 5, the UW NCF DSCR is calculated using the sum of the first 12 whole loan principal and interest payments after the expiration of the whole loan interest only period based on the assumed principal and interest payment schedule set forth in Annex G of the Preliminary Prospectus. With respect to Loan No. 8, the UW NCF DSCR is calculated using the sum of the first 12 principal and interest payments after the expiration of the interest only period based on the assumed principal and interest payment schedule set forth in Annex H of the Preliminary Prospectus. With respect to Loan No. 11, the UW NCF DSCR is calculated using the sum of the first 12 principal and interest payments after the expiration of the interest only period based on the assumed principal and interest payment schedule set forth in Annex I of the Preliminary Prospectus. |
| (3) | In the case of Loan Nos. 22 and 38, the Cut-off Date LTV and the Maturity Date LTV are calculated by using an appraised value based on certain hypothetical assumptions. Refer to “Description of the Mortgage Pool—Assessments of Property Value and Condition” and “—Appraised Value” in the Preliminary Prospectus for additional details. |
THE INFORMATION IN THIS STRUCTURAL AND COLLATERAL TERM SHEET IS NOT COMPLETE AND MAY BE AMENDED PRIOR TO THE TIME OF SALE. THIS TERM SHEET IS NOT AN OFFER TO SELL THESE SECURITIES AND IT IS NOT A SOLICITATION OF AN OFFER TO BUY THESE SECURITIES IN ANY JURISDICTION WHERE THE OFFER OR SALE IS NOT PERMITTED. | ||
| | 10 of 106 | |
| Structural and Collateral Term Sheet | JPMCC 2019-COR4 | |
| Collateral Characteristics | ||
| LTV Ratios as of the Cut-off Date(1)(3) |
| Weighted Average | |||||||||||
| Range of Cut-off Date LTVs | Number of Loans | Cut-off Date Principal Balance | % of IPB | Mortgage Rate | Remaining Loan Term | UW NCF DSCR(1)(2) | UW NOI Debt Yield(1) | Cut-off Date LTV(1)(3) | Maturity Date LTV(1)(3) | ||
| 45.7% | - | 55.7% | 8 | $248,223,932 | 32.1% | 5.03306% | 109 | 1.88x | 11.1% | 52.2% | 51.0% |
| 55.8% | - | 65.7% | 22 | 400,597,967 | 51.8 | 4.94936% | 116 | 1.58x | 10.0% | 60.4% | 54.8% |
| 65.8% | - | 69.9% | 4 | 100,328,412 | 13.0 | 5.28235% | 118 | 1.46x | 8.8% | 68.6% | 66.6% |
| 70.0% | - | 73.8% | 4 | 24,937,653 | 3.2 | 5.38245% | 114 | 1.46x | 9.6% | 72.8% | 66.5% |
| Total / Weighted Average: | 38 | $774,087,963 | 100.0% | 5.03331% | 114 | 1.66x | 10.2% | 59.2% | 55.5% | ||
| LTV Ratios as of the Maturity Date(1)(3) |
Weighted Average | |||||||||||
| Range of Maturity Date LTVs | Number of Loans | Cut-off Date Principal Balance | % of IPB | Mortgage Rate | Remaining Loan Term | UW NCF DSCR(1)(2) | UW NOI Debt Yield(1) | Cut-off Date LTV(1)(3) | Maturity Date LTV(1)(3) | ||
| 45.7% | - | 49.9% | 5 | $130,173,932 | 16.8% | 5.23868% | 115 | 1.58x | 10.0% | 50.3% | 46.8% |
| 50.0% | - | 54.9% | 10 | 227,410,467 | 29.4 | 4.82096% | 113 | 1.65x | 10.4% | 58.4% | 52.1% |
| 55.0% | - | 59.9% | 15 | 265,953,565 | 34.4 | 5.00944% | 112 | 1.76x | 10.8% | 59.4% | 56.3% |
| 60.0% | - | 73.6% | 8 | 150,550,000 | 19.4 | 5.21867% | 117 | 1.55x | 9.1% | 67.7% | 66.7% |
| Total / Weighted Average: | 38 | $774,087,963 | 100.0% | 5.03331% | 114 | 1.66x | 10.2% | 59.2% | 55.5% | ||
| Prepayment Protection |
Weighted Average | |||||||||
| Prepayment Protection | Number of Loans | Cut-off Date Principal Balance | % of IPB | Mortgage Rate | Remaining Loan Term | UW NCF DSCR(1)(2) | UW NOI Debt Yield(1) | Cut-off Date LTV(1)(3) | Maturity Date LTV(1)(3) |
| Defeasance | 29 | $562,672,315 | 72.7% | 5.05806% | 113 | 1.67x | 10.3% | 57.8% | 54.4% |
| Yield Maintenance | 6 | 115,315,648 | 14.9 | 4.81647% | 115 | 1.62x | 10.7% | 59.9% | 51.2% |
| Defeasance or Yield Maintenance | 3 | 96,100,000 | 12.4 | 5.14860% | 118 | 1.60x | 8.8% | 67.0% | 67.0% |
| Total / Weighted Average: | 38 | $774,087,963 | 100.0% | 5.03331% | 114 | 1.66x | 10.2% | 59.2% | 55.5% |
| Loan Purpose |
Weighted Average | |||||||||
| Loan Purpose | Number of Loans | Cut-off Date Principal Balance | % of IPB | Mortgage Rate | Remaining Loan Term | UW NCF DSCR(1)(2) | UW NOI Debt Yield(1) | Cut-off Date LTV(1)(3) | Maturity Date LTV(1)(3) |
| Refinance | 18 | $451,498,893 | 58.3% | 5.00752% | 113 | 1.72x | 10.5% | 56.2% | 52.5% |
| Acquisition | 17 | 263,194,413 | 34.0 | 5.12018% | 117 | 1.60x | 10.0% | 64.0% | 60.9% |
| Recapitalization | 3 | 59,394,658 | 7.7 | 4.84442% | 111 | 1.42x | 8.9% | 61.4% | 54.4% |
| Total / Weighted Average: | 38 | $774,087,963 | 100.0% | 5.03331% | 114 | 1.66x | 10.2% | 59.2% | 55.5% |
| (1) | In the case of Loan Nos. 1, 3, 5, 6, 10 and 18, the UW NCF DSCR, UW NOI Debt Yield, Cut-off Date LTV and Maturity Date LTV calculations include the related Pari Passu Companion Loan(s). In the case of Loan Nos. 4, 5, 8 and 11, the UW NCF DSCR, UW NOI Debt Yield, Cut-off Date LTV and Maturity Date LTV calculations exclude the related mezzanine loan(s). |
| (2) | With respect to Loan No. 5, the UW NCF DSCR is calculated using the sum of the first 12 whole loan principal and interest payments after the expiration of the whole loan interest only period based on the assumed principal and interest payment schedule set forth in Annex G of the Preliminary Prospectus. With respect to Loan No. 8, the UW NCF DSCR is calculated using the sum of the first 12 principal and interest payments after the expiration of the interest only period based on the assumed principal and interest payment schedule set forth in Annex H of the Preliminary Prospectus. With respect to Loan No. 11, the UW NCF DSCR is calculated using the sum of the first 12 principal and interest payments after the expiration of the interest only period based on the assumed principal and interest payment schedule set forth in Annex I of the Preliminary Prospectus. |
| (3) | In the case of Loan Nos. 22 and 38, the Cut-off Date LTV and the Maturity Date LTV are calculated by using an appraised value based on certain hypothetical assumptions. Refer to “Description of the Mortgage Pool—Assessments of Property Value and Condition” and “—Appraised Value” in the Preliminary Prospectus for additional details. |
THE INFORMATION IN THIS STRUCTURAL AND COLLATERAL TERM SHEET IS NOT COMPLETE AND MAY BE AMENDED PRIOR TO THE TIME OF SALE. THIS TERM SHEET IS NOT AN OFFER TO SELL THESE SECURITIES AND IT IS NOT A SOLICITATION OF AN OFFER TO BUY THESE SECURITIES IN ANY JURISDICTION WHERE THE OFFER OR SALE IS NOT PERMITTED. | ||
| | 11 of 106 | |
| Structural and Collateral Term Sheet | JPMCC 2019-COR4 | |
| Collateral Characteristics | ||
| Previous Securitization History(1) |
| No. | Loan Name | Cut-off Date Principal Balance | % of IPB | Location | Property Type | Previous Securitization |
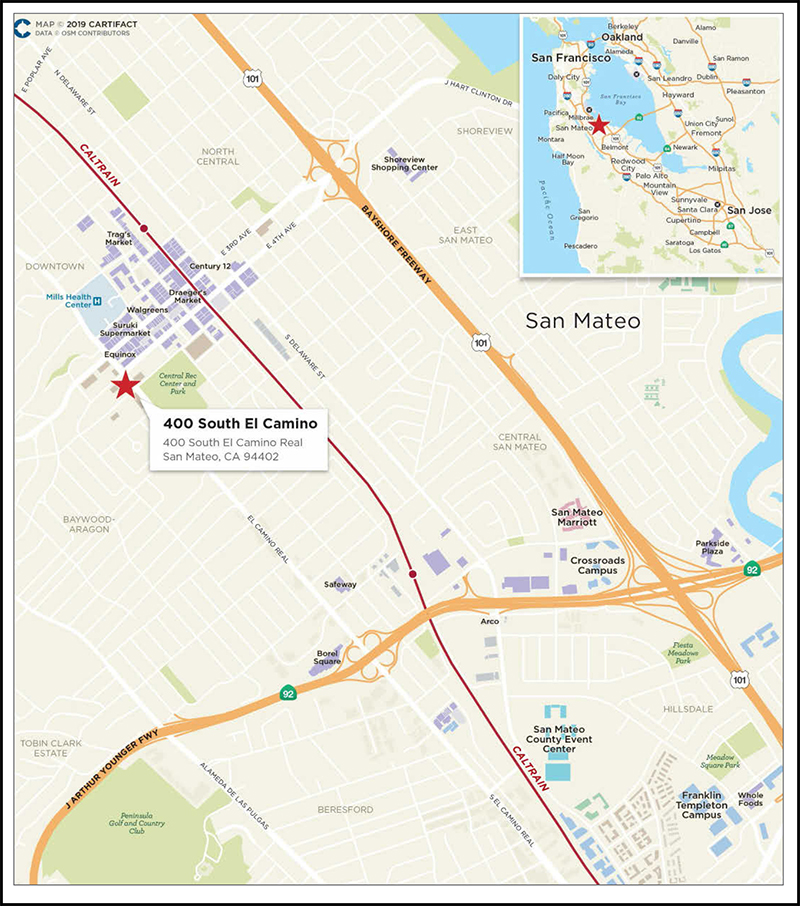
| 2 | 400 South El Camino | $75,000,000 | 9.7% | San Mateo, CA | Office | COMM 2007-FL14 |
| 5 | Saint Louis Galleria | $46,479,245 | 6.0 | Saint Louis, MO | Retail | COMM 2014-CCRE14 |
| 19.01 | RDM Chicago Portfolio – 1200 North Ashland Avenue | $9,500,000 | 1.2 | Chicago, IL | Mixed Use | MSBAM 2014-C14 |
| 19.04 | RDM Chicago Portfolio – 230 West Division Street | $1,190,000 | 0.2 | Chicago, IL | Retail | MSBAM 2014-C14 |
| 27 | Hickory View Apartments | $10,600,000 | 1.4 | Nashville, TN | Multifamily | FNA 2015-M10 |
| Total | $142,769,245 | 18.4% |
| (1) | The table above represents the properties for which the previously existing debt was securitized, based on information provided by the related borrower or obtained through searches of a third-party database. |
THE INFORMATION IN THIS STRUCTURAL AND COLLATERAL TERM SHEET IS NOT COMPLETE AND MAY BE AMENDED PRIOR TO THE TIME OF SALE. THIS TERM SHEET IS NOT AN OFFER TO SELL THESE SECURITIES AND IT IS NOT A SOLICITATION OF AN OFFER TO BUY THESE SECURITIES IN ANY JURISDICTION WHERE THE OFFER OR SALE IS NOT PERMITTED. | ||
| | 12 of 106 | |
| Structural and Collateral Term Sheet | JPMCC 2019-COR4 | |
| Renaissance Seattle | ||
THE INFORMATION IN THIS STRUCTURAL AND COLLATERAL TERM SHEET IS NOT COMPLETE AND MAY BE AMENDED PRIOR TO THE TIME OF SALE. THIS TERM SHEET IS NOT AN OFFER TO SELL THESE SECURITIES AND IT IS NOT A SOLICITATION OF AN OFFER TO BUY THESE SECURITIES IN ANY JURISDICTION WHERE THE OFFER OR SALE IS NOT PERMITTED. | ||
| | 13 of 106 | |
| Structural and Collateral Term Sheet | JPMCC 2019-COR4 | |
| Renaissance Seattle | ||
THE INFORMATION IN THIS STRUCTURAL AND COLLATERAL TERM SHEET IS NOT COMPLETE AND MAY BE AMENDED PRIOR TO THE TIME OF SALE. THIS TERM SHEET IS NOT AN OFFER TO SELL THESE SECURITIES AND IT IS NOT A SOLICITATION OF AN OFFER TO BUY THESE SECURITIES IN ANY JURISDICTION WHERE THE OFFER OR SALE IS NOT PERMITTED. | ||
| | 14 of 106 | |
| Structural and Collateral Term Sheet | JPMCC 2019-COR4 | |
| Renaissance Seattle | ||
| Mortgage Loan Information | Property Information | |||
| Mortgage Loan Seller: | LCM | Single Asset / Portfolio: | Single Asset | |
| Original Principal Balance(1): | $77,000,000 | Title: | Fee | |
| Cut-off Date Principal Balance(1): | $77,000,000 | Property Type - Subtype: | Hotel – Full Service | |
| % of Pool by IPB: | 9.9% | Net Rentable Area (Rooms): | 557 | |
| Loan Purpose: | Refinance | Location: | Seattle, WA | |
| Borrower: | Madison Hotel LLC | Year Built / Renovated: | 1978 / 2014-2017 | |
| Sponsor(2): | Hedreen Holdings LLC | Occupancy / ADR / RevPAR | 81.6% / $208.70 / $170.36 | |
| Interest Rate: | 4.81000% | Occupancy / ADR / RevPAR Date: | 9/30/2018 | |
| Note Date: | 5/2/2017 | Number of Tenants: | N/A | |
| Maturity Date: | 6/6/2027 | 2015 NOI: | $15,824,756 | |
| Interest-only Period: | 121 months | 2016 NOI: | $16,093,069 | |
| Original Term: | 121 months | 2017 NOI: | $16,282,562 | |
| Original Amortization: | None | TTM NOI (as of 9/2018): | $16,263,877 | |
| Amortization Type: | Interest Only | UW Occupancy / ADR / RevPAR: | 81.6% / $208.70 / $170.36 | |
| Call Protection: | L(45),Def(72),O(4) | UW Revenues: | $44,885,370 | |
| Lockbox / Cash Management: | Hard / Springing | UW Expenses: | $28,882,387 | |
| Additional Debt: | Yes | UW NOI: | $16,002,982 | |
| Additional Debt Balance(1): | $50,000,000 | UW NCF: | $13,758,714 | |
| Additional Debt Type(1): | Pari Passu | Appraised Value / Per Room: | $229,700,000 / $412,388 | |
| Appraisal Date: | 3/8/2017 | |||
| Escrows and Reserves(3) | Financial Information(1) | |||||||
| Initial | Monthly | Initial Cap | Cut-off Date Loan / Room: | $228,007 | ||||
| Taxes: | $95,000 | $116,000 | N/A | Maturity Date Loan / Room: | $228,007 | |||
| Insurance: | $280,000 | $28,000 | N/A | Cut-off Date LTV: | 55.3% | |||
| FF&E Reserves: | $0 | 5% of Gross | N/A | Maturity Date LTV: | 55.3% | |||
| Income | UW NCF DSCR: | 2.22x | ||||||
| TI/LC: | $0 | $0 | N/A | UW NOI Debt Yield: | 12.6% | |||
| Other: | $2,866,271 | $0 | N/A | |||||
| Sources and Uses | ||||||||
| Sources | Proceeds | % of Total | Uses | Proceeds | % of Total | |
| Whole Loan | $127,000,000 | 100.0% | Payoff Existing Debt | $92,423,041 | 72.8% | |
| Upfront Reserves | 3,241,271 | 2.6% | ||||
| % | Closing Costs | 385,422 | 0.3% | |||
| % | Return of Equity | 30,950,266 | 24.4% | |||
| Total Sources | $127,000,000 | 100.0% | Total Uses | $127,000,000 | 100.0% |
| (1) | The Renaissance Seattle Mortgage Loan (as defined below) is part of a whole loan evidenced by threepari passu notes, with an aggregate outstanding principal balance as of the Cut-off Date of $127.0 million. The Financial Information presented in the chart above reflects the Cut-off Date balance of the $127.0 million Renaissance Seattle Whole Loan, (as defined below). |
| (2) | The sponsor is also the sponsor of the mortgage loan identified on Annex A-1 to the Preliminary Prospectus as Grand Hyatt Seattle, which has a Cut-off Date Principal Balance of $33.0 million. |
| (3) | For a full description of Escrows and Reserves, please refer to “Escrows and Reserves” below. |
THE INFORMATION IN THIS STRUCTURAL AND COLLATERAL TERM SHEET IS NOT COMPLETE AND MAY BE AMENDED PRIOR TO THE TIME OF SALE. THIS TERM SHEET IS NOT AN OFFER TO SELL THESE SECURITIES AND IT IS NOT A SOLICITATION OF AN OFFER TO BUY THESE SECURITIES IN ANY JURISDICTION WHERE THE OFFER OR SALE IS NOT PERMITTED. | ||
| | 15 of 106 | |
| Structural and Collateral Term Sheet | JPMCC 2019-COR4 | |
| Renaissance Seattle | ||
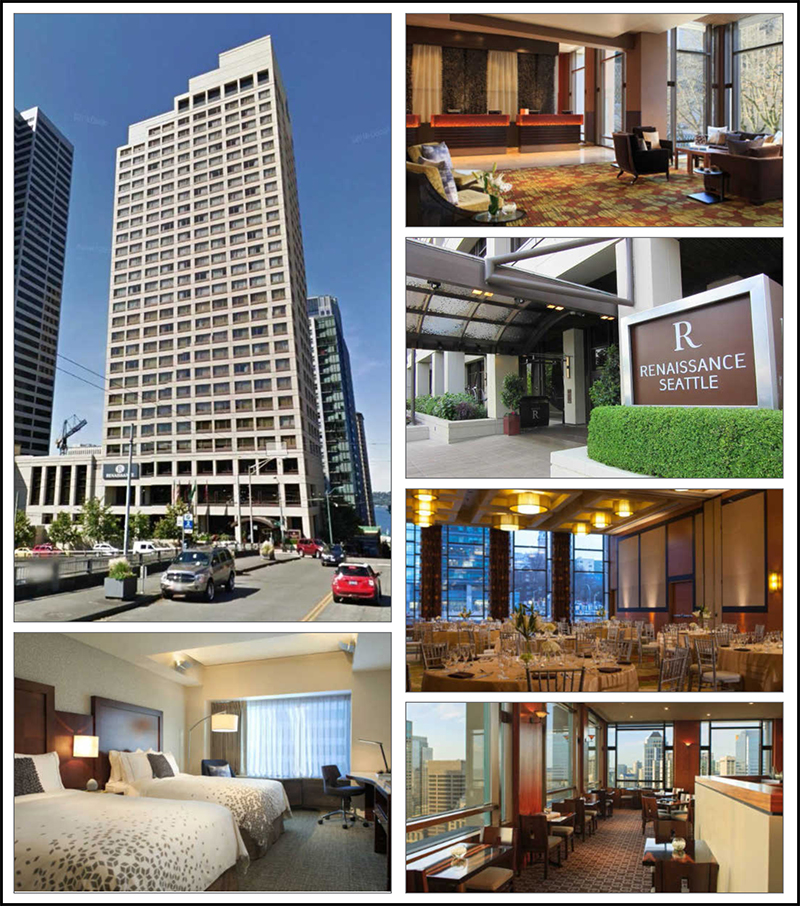
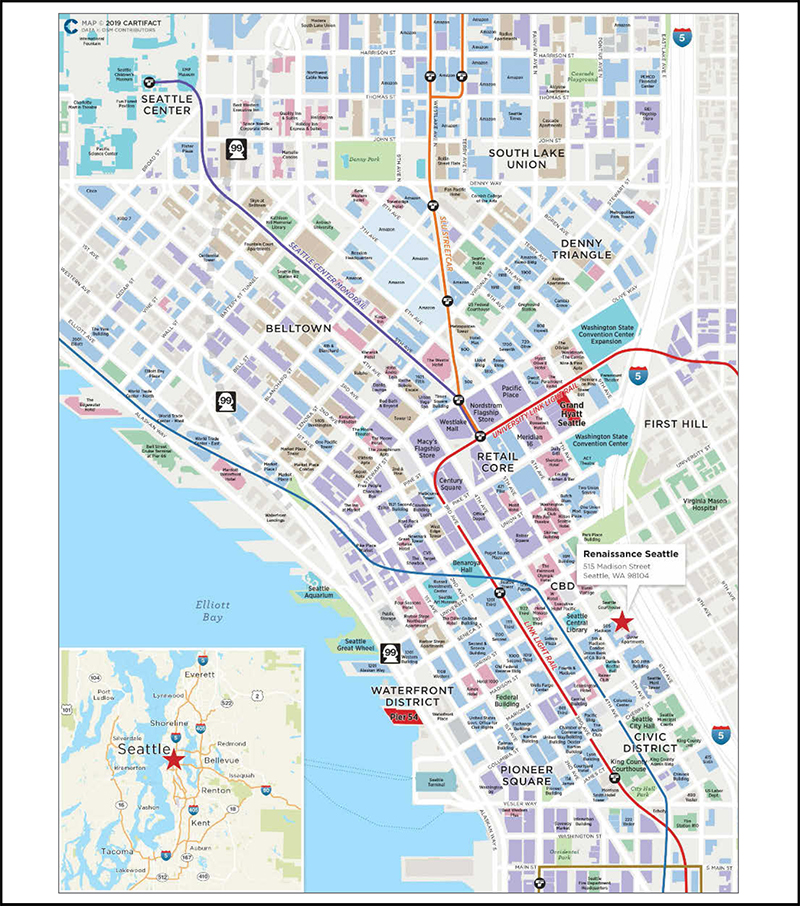
The Loan.The Renaissance Seattle loan (the “Renaissance Seattle Mortgage Loan”) is secured by a first mortgage lien on the borrower’s fee interest in a 557-room full-service hotel located at 515 Madison Street in downtown Seattle, Washington (the “Renaissance Seattle Property”). The Renaissance Seattle Mortgage Loan is part of a whole loan that has an aggregate original principal balance of $127.0 million (the “Renaissance Seattle Whole Loan”) and is comprised of threepari passu notes, each described below. The controlling Note A-1 was contributed to the COMM 2017-COR2 trust as described in the “Whole Loan Summary” chart below. The non-controlling Notes A-2 and A-3, with an aggregate outstanding principal balance as of the Cut-off Date of $77.0 million, are being contributed to the JPMCC 2019-COR4 Trust. The relationship between the holders of the Renaissance Seattle Whole Loan will be governed by a co-lender agreement as described under “Description of the Mortgage Pool—The Whole Loans—The Non-Serviced Pari Passu Whole Loans” in the Preliminary Prospectus. The Renaissance Seattle Whole Loan has an approximately 10-year term and requires interest only payments for the term of the loan. The most recent prior financing of the Renaissance Seattle Property was not included in a securitization.
| Whole Loan Summary | ||||
| Notes | Original Balance | Cut-off Date Balance | Note Holder | Controlling Piece |
| A-1 | $50,000,000 | $50,000,000 | COMM 2017-COR2 | Yes |
| A-2 | 50,000,000 | 50,000,000 | JPMCC 2019-COR4 | No |
| A-3 | 27,000,000 | 27,000,000 | JPMCC 2019-COR4 | No |
| Total | $127,000,000 | $127,000,000 | ||
The Borrower. The borrower, Madison Hotel LLC, is a single purpose Delaware limited liability company structured to be bankruptcy-remote, with two independent directors in its organizational structure.
The Loan Sponsor. The Renaissance Seattle Whole Loan’s sponsor and the nonrecourse carve-out guarantor is Hedreen Holdings LLC. Richard Hedreen, the CEO of R.C. Hedreen Co., the parent company of Hedreen Holdings LLC, has over 50 years of experience in real estate development, acquisition, and management. Mr. Hedreen’s current real estate portfolio includes the Renaissance Seattle Property, the Grand Hyatt Seattle (also an asset in the JPMCC 2019-COR4 Trust), the Hyatt @ Olive 8 and the 7th & Pine retail and parking property which is located directly below the Grand Hyatt Seattle hotel (but is not collateral for the Grand Hyatt Seattle Loan). All the properties in Mr. Hedreen’s current portfolio are located in downtown Seattle and all were originally developed by Mr. Hedreen.
Other notable developments by Mr. Hedreen include the Hilton Seattle, the Crowne Plaza Seattle Downtown hotel and the Olive 8 Condominiums which is comprised of 229 individually owned residential condominium units located above the Hyatt @ Olive 8 hotel. The 40-story Hyatt @ Olive 8 tower has one of the largest green roofs in downtown Seattle (8,355 square feet) and is LEED silver certified.
The Property. The Renaissance Seattle Property is a 557-room, 28-story, AAA Four-Diamond rated, full-service hotel located at 515 Madison Street in downtown Seattle, Washington, within the Seattle central business district. The borrower completed the construction of the Renaissance Seattle Property in 1978. Beginning in 2014, following the extension of the original Marriott franchise agreement through August 2028, the borrower commenced an approximately $24.7 million ($44,343 per room), chain-mandated PIP encompassing guestroom renovations, elevator upgrades, noise mitigation for windows, ballroom HVAC and lighting upgrades, renovations to the public space, fitness center, 28th floor meeting room and public restroom renovations and life safety upgrades which was completed in December 2017.
The Renaissance Seattle Property features 557 newly renovated guestrooms and suites, a Maxwell’s Restaurant and Lounge, the 515 Coffee Bar & Lounge, The Fig & The Judge Restaurant which also serves as the Renaissance Seattle Property’s concierge lounge, approximately 28,000 square feet of flexible meeting space, a newly renovated fitness center, a business center and a five-level subterranean parking garage containing 193 parking spaces. The Renaissance Seattle Property offers four guestroom configurations and suites. The configurations include 274 king guestrooms (350 square feet), 207 double/double guestrooms (350 square feet), 71 corner king guestrooms (350 square feet) and five luxury suites (750 square feet). Each guestroom at the Renaissance Seattle Property includes either a king or two double beds, at least one TV, a mini-fridge, a coffeemaker, work area with desk, dual line phones with voicemail, iron and ironing board, bathrobes, in-room safe, alarm clock radio and Wi-Fi throughout. Suites include a separate sitting area.
THE INFORMATION IN THIS STRUCTURAL AND COLLATERAL TERM SHEET IS NOT COMPLETE AND MAY BE AMENDED PRIOR TO THE TIME OF SALE. THIS TERM SHEET IS NOT AN OFFER TO SELL THESE SECURITIES AND IT IS NOT A SOLICITATION OF AN OFFER TO BUY THESE SECURITIES IN ANY JURISDICTION WHERE THE OFFER OR SALE IS NOT PERMITTED. | ||
| | 16 of 106 | |
| Structural and Collateral Term Sheet | JPMCC 2019-COR4 | |
| Renaissance Seattle | ||
The Renaissance Seattle Property is located in the area known as the retail core neighborhood in downtown Seattle, a restaurant and shopping district just south of the Denny Triangle, situated near South Lake Union. According to the appraisal, the Renaissance Seattle Property is located near the area’s primary generators of lodging demand including dozens of upscale retailers and restaurants, major department stores, shopping centers, hotels, office buildings and the Washington State Convention Center (“WSCC”). Because of its central location, the retail core has a substantial daytime population throughout the week. According to the appraisal, the nearby neighborhoods Denny Triangle and South Lake Union represent two of the city’s fastest growing neighborhoods. Amazon’s corporate headquarters was relocated to South Lake Union in 2015.
According to the Downtown Seattle Association, Amazon’s footprint totals 7.6 million square feet with another 3.1 million square feet under development. Amazon reportedly will occupy a total of 12.0 million square feet by 2022, or equal to about a fifth of the inventory of downtown’s best-in-class office space.
In 2015, Expedia announced plans to relocate its headquarters from Bellevue to Downtown Seattle. The development plans will allow Expedia to transition its 3,500 employees to the Seattle campus, with full occupancy expected in 2019. Additionally, several Silicon Valley high-tech companies, such as Google and Facebook, also have a presence in Seattle. In 2016, Google announced plans to relocate its Fremont campus to South Lake Union in 2019. Google’s new campus, which began construction in the second quarter of 2017, will occupy 607,000 square feet of office space and will be able to accommodate 3,000 to 4,000 employees.
The loan sponsor also developed Seattle’s largest hotel, the Hyatt Regency located at 8th & Howell. The 1,260 room Hyatt Regency hotel broke ground in 2016, on a site previously owned by an affiliate of the loan sponsor and opened for business in December 2018. The Hyatt Regency is adjacent to the Washington State Convention Center Addition (“WSCC Addition”), which is scheduled to open in 2021. The preliminary cost of the WSCC Addition project is estimated at over $1.5 billion, and the expansion is expected to more than double the size of the existing WSCC, with an additional 440,000 square feet of meeting space planned for the project. The WSCC Addition project is expected to provide several economic benefits, including as much as $240.0 million annually in visitor spending, as many as 3,900 direct and indirect jobs, and some 6,000 jobs during construction.
The demand segmentation for the Renaissance Seattle Property consists of 50% commercial demand, 20% meeting and group demand, 15% leisure demand and 15% contract demand. The Renaissance Seattle Property’s top corporate accounts include Boeing, Pricewaterhouse, Accenture, Deloitte and Ernst & Young.
| Historical Occupancy, ADR, RevPAR(1)(2) | |||||||||
| Competitive Set | Renaissance Seattle(3) | Penetration Factor | |||||||
| Year | Occupancy | ADR | RevPAR | Occupancy | ADR | RevPAR | Occupancy | ADR | RevPAR |
| 2015 | 84.3% | $225.52 | $190.05 | 82.2% | $190.32 | $156.52 | 97.5% | 84.4% | 82.4% |
| 2016 | 82.2% | $232.80 | $191.47 | 84.0% | $195.78 | $164.42 | 102.1% | 84.1% | 85.9% |
| 2017 | 86.5% | $244.44 | $211.35 | 84.0% | $203.92 | $171.25 | 97.2% | 83.4% | 81.0% |
| TTM(4) | 84.0% | $230.91 | $193.87 | 81.6% | $208.70 | $170.36 | 97.2% | 90.4% | 87.9% |
| (1) | The minor variances between the underwriting, appraisal and above table with respect to Occupancy, ADR and RevPAR at the Renaissance Seattle Property are attributable to variances in reporting methodologies and/or timing differences. |
| (2) | Data provided by a third party travel research report. |
| (3) | Based on operating statements provided by the borrower. |
| (4) | TTM represents the trailing 12-month period ending on September 30, 2018. |
The Renaissance Seattle Property’s immediate marketplace includes eight competitive properties. The eight primary competitors range in size from 237 to 891 rooms. Overall, when taking into account the Renaissance Seattle Property, the competitive set collectively contains an aggregate of 4,137 rooms.
In total, the loan sponsor has developed approximately 55.6% of the appraisal’s competitive set by number of hotels (five of nine) and 48.6% by number of rooms (2,012 of 4,137), and currently owns 33.3% of the appraisal’s competitive set by number of hotels (three of nine) and 32.9% by number of rooms (1,360 of 4,137).
THE INFORMATION IN THIS STRUCTURAL AND COLLATERAL TERM SHEET IS NOT COMPLETE AND MAY BE AMENDED PRIOR TO THE TIME OF SALE. THIS TERM SHEET IS NOT AN OFFER TO SELL THESE SECURITIES AND IT IS NOT A SOLICITATION OF AN OFFER TO BUY THESE SECURITIES IN ANY JURISDICTION WHERE THE OFFER OR SALE IS NOT PERMITTED. | ||
| | 17 of 106 | |
| Structural and Collateral Term Sheet | JPMCC 2019-COR4 | |
| Renaissance Seattle | ||
| Competitive Hotels Profile(1) | ||||||
| 2016 Estimated Operating Statistics | ||||||
| Property | Rooms | Year Opened | Meeting Space (SF) | Occupancy | ADR | RevPAR |
| Renaissance Seattle(2)(3) | 557 | 1978 | 28,000 | 84.0% | $195.78 | $164.42.x |
| Grand Hyatt Seattle(2) | 457 | 2001 | 22,000 | 80-85% | $230-240 | $200-210x |
| Hilton Seattle(4) | 237 | 1970 | 6,000 | 90-95% | $210-220 | $200-210x |
| Fairmont Olympic Hotel Seattle | 450 | 1924 | 17,500 | 65-70% | $250-260 | $180-190x |
| Westin Seattle | 891 | 1929 | 48,000 | 80-85% | $210-220 | $170-180x |
| Marriott Seattle Waterfront Hotel | 358 | 2003 | 11,000 | 80-85% | $260-270 | $210-220x |
| Hyatt @ Olive 8(2) | 346 | 2009 | 10,500 | 80-85% | $220-230 | $190-200x |
| Crowne Plaza Seattle Downtown(4) | 415 | 1983 | 8,500 | 80-85% | $170-180 | $140-150x |
| W Hotel Seattle | 426 | 1999 | 10,000 | 70-75% | $230-240 | $170-180x |
| Total | 4,137 | |||||
| (1) | Based on the appraisal. |
| (2) | Originally developed and currently owned by the loan sponsor. |
| (3) | The Renaissance Seattle 2016 Occupancy, ADR and RevPAR are based on operating statement provided by the borrower. |
| (4) | Originally developed by the loan sponsor and subsequently sold to a third party. |
| Operating History and Underwritten Net Cash Flow | |||||||
| 2015 | 2016 | 2017 | TTM(1) | Underwritten | Per Room(2) | % of Total Revenue(3) | |
| Occupancy | 82.2% | 84.0% | 84.0% | 81.6% | 81.6% | ||
| ADR | $190.32 | $195.78 | $203.92 | $208.70 | $208.70 | ||
| RevPAR | $156.52 | $164.42 | $171.25 | $170.36 | $170.36 | ||
| Room Revenue | $31,735,225 | $33,509,972 | $34,816,678 | $34,635,950 | $34,635,950 | $62,183 | 77.2%% |
| Food & Beverage Revenue | 7,434,644 | 6,886,049 | 7,564,440 | 8,638,781 | 8,638,781 | 15,509 | 19.2%% |
| Other Departmental Revenue | 1,738,457 | 1,754,032 | 1,683,406 | 1,610,639 | 1,610,639 | 2,892 | 3.6%% |
| Total Revenue | $40,908,326 | $42,150,053 | $44,064,524 | $44,885,370 | $44,885,370 | $80,584 | 100.0%% |
| Room Expense | $7,679,367 | $7,868,949 | $8,350,870 | $8,293,845 | $8,293,845 | $14,890 | 23.9%% |
| Food & Beverage Expense | 5,876,452 | 6,133,686 | 6,238,916 | 6,284,901 | 6,284,901 | 11,283 | 72.8%% |
| Other Departmental Expense | 462,850 | 475,932 | 574,497 | 565,787 | 565,787 | 1,016 | 35.1%% |
| Departmental Expenses | $14,018,669 | $14,478,567 | $15,164,283 | $15,144,532 | $15,144,532 | $27,189 | 33.7%% |
| % | |||||||
| Gross Operating Profit | $26,889,657 | $27,671,486 | $28,900,241 | $29,740,838 | $29,740,838 | $53,395 | 66.3%% |
| Admin & General | $2,639,121 | $2,720,847 | $2,991,161 | $3,077,181 | $3,077,181 | $5,525 | 6.9%% |
| Maintenance & Repairs | 1,547,679 | 1,563,521 | 1,597,454 | 1,610,200 | 1,610,200 | 2,891 | 3.6%% |
| Utility Costs | 1,046,315 | 1,067,538 | 1,112,436 | 1,124,860 | 1,124,860 | 2,019 | 2.5%% |
| Marketing | 2,493,020 | 2,594,580 | 2,664,136 | 2,690,699 | 2,690,699 | 4,831 | 6.0%% |
| Franchise Fee | 1,272,210 | 1,343,966 | 1,518,186 | 1,735,838 | 1,731,798 | 3,109 | 3.9%% |
| Management Fee | 609,244 | 579,003 | 714,455 | 1,080,876 | 1,346,561 | 2,418 | 3.0%% |
| Property Tax | 887,547 | 1,086,366 | 1,347,156 | 1,498,746 | 1,518,173 | 2,726 | 3.4%% |
| Insurance | 337,275 | 349,370 | 357,959 | 341,773 | 321,596 | 577 | 0.7%% |
| Other Expenses | 232,490 | 273,227 | 314,736 | 316,788 | 316,788 | 569 | 0.7%% |
| Total General/Unallocated Expenses | $11,064,901 | $11,578,417 | $12,617,678 | $13,476,960 | $13,737,855 | $24,664 | 30.6%% |
| Net Operating Income | $15,824,756 | $16,093,069 | $16,282,562 | $16,263,877 | $16,002,982 | $28,731 | 35.7%% |
| FF&E | 2,107,503 | 2,107,503 | 2,203,226 | 2,244,268 | 2,244,268 | 4,029 | 5.0%% |
| Net Cash Flow | $13,717,253 | $13,985,567 | $14,079,336 | $14,019,609 | $13,758,714 | $24,701 | 30.7%% |
| (1) | TTM column represents the trailing 12-month period ending on September 30, 2018. |
| (2) | Per Room values are based on 557 guest rooms. |
| (3) | % of Total Revenue for Room Expense, Food & Beverage Expense, and Other Departmental Expense are based on their corresponding revenue line items. |
THE INFORMATION IN THIS STRUCTURAL AND COLLATERAL TERM SHEET IS NOT COMPLETE AND MAY BE AMENDED PRIOR TO THE TIME OF SALE. THIS TERM SHEET IS NOT AN OFFER TO SELL THESE SECURITIES AND IT IS NOT A SOLICITATION OF AN OFFER TO BUY THESE SECURITIES IN ANY JURISDICTION WHERE THE OFFER OR SALE IS NOT PERMITTED. | ||
| | 18 of 106 | |
| Structural and Collateral Term Sheet | JPMCC 2019-COR4 | |
| Renaissance Seattle | ||
Property Management. The Renaissance Seattle Property is managed by the R.C. Hedreen Co., which is an affiliate of the borrower.
Franchise Agreement. The Renaissance Seattle Property is subject to a franchise agreement with Marriott International, Inc. The franchise agreement commenced on March 1, 1998 and currently runs through August 14, 2028.
Escrows and Reserves. At origination, the borrower deposited (i) $2,866,271 for a PIP reserve, (ii) $280,000 for insurance premiums and (iii) $95,000 for real estate taxes.
Tax Escrows– On a monthly basis, the borrower is required to escrow 1/12 of annual estimated tax payments, which currently equates to $116,000.
Insurance Escrows– On a monthly basis, the borrower is required to escrow 1/12 of annual estimated insurance premiums, which currently equates to $28,000.
FF&E Reserves –On a monthly basis, the borrower is required to escrow 5.0% of the gross operating income for the preceding month.
Lockbox / Cash Management.The Renaissance Seattle Whole Loan is structured with a hard lockbox and springing cash management. All credit card receipts are required to be deposited by credit card processing companies directly into a lockbox account, and all non-credit card receipts are required to be deposited into the lockbox account within one business day of receipt by borrower or property manager. Amounts on deposit in the lockbox account will be transferred daily to an account controlled by the borrower unless a Cash Management Period (as defined below) is continuing. During a Cash Management Period, all funds in the lockbox account are required to be deposited into a lender-controlled cash management account and will be applied to pay monthly amounts due as required under the Renaissance Seattle Whole Loan, and any excess amounts will be retained by the lender as additional collateral for the Renaissance Seattle Whole Loan.
A “Cash Management Period” will occur (i) during the continuation of an event of default or (ii) if the debt yield is less than 7.5% for any quarter (until such time that the debt yield is at least 7.5% for two consecutive quarters).
THE INFORMATION IN THIS STRUCTURAL AND COLLATERAL TERM SHEET IS NOT COMPLETE AND MAY BE AMENDED PRIOR TO THE TIME OF SALE. THIS TERM SHEET IS NOT AN OFFER TO SELL THESE SECURITIES AND IT IS NOT A SOLICITATION OF AN OFFER TO BUY THESE SECURITIES IN ANY JURISDICTION WHERE THE OFFER OR SALE IS NOT PERMITTED. | ||
| | 19 of 106 | |
| Structural and Collateral Term Sheet | JPMCC 2019-COR4 | |
| 400 South El Camino | ||
THE INFORMATION IN THIS STRUCTURAL AND COLLATERAL TERM SHEET IS NOT COMPLETE AND MAY BE AMENDED PRIOR TO THE TIME OF SALE. THIS TERM SHEET IS NOT AN OFFER TO SELL THESE SECURITIES AND IT IS NOT A SOLICITATION OF AN OFFER TO BUY THESE SECURITIES IN ANY JURISDICTION WHERE THE OFFER OR SALE IS NOT PERMITTED. | ||
| | 20 of 106 | |
| Structural and Collateral Term Sheet | JPMCC 2019-COR4 | |
| 400 South El Camino | ||
THE INFORMATION IN THIS STRUCTURAL AND COLLATERAL TERM SHEET IS NOT COMPLETE AND MAY BE AMENDED PRIOR TO THE TIME OF SALE. THIS TERM SHEET IS NOT AN OFFER TO SELL THESE SECURITIES AND IT IS NOT A SOLICITATION OF AN OFFER TO BUY THESE SECURITIES IN ANY JURISDICTION WHERE THE OFFER OR SALE IS NOT PERMITTED. | ||
| | 21 of 106 | |
| Structural and Collateral Term Sheet | JPMCC 2019-COR4 | |
| 400 South El Camino | ||
THE INFORMATION IN THIS STRUCTURAL AND COLLATERAL TERM SHEET IS NOT COMPLETE AND MAY BE AMENDED PRIOR TO THE TIME OF SALE. THIS TERM SHEET IS NOT AN OFFER TO SELL THESE SECURITIES AND IT IS NOT A SOLICITATION OF AN OFFER TO BUY THESE SECURITIES IN ANY JURISDICTION WHERE THE OFFER OR SALE IS NOT PERMITTED. | ||
| | 22 of 106 | |
| Structural and Collateral Term Sheet | JPMCC 2019-COR4 | |
| 400 South El Camino | ||
| Mortgage Loan Information | Property Information | |||
| Mortgage Loan Seller: | LCM | Single Asset / Portfolio: | Single Asset | |
| Original Principal Balance: | $75,000,000 | Title: | Fee | |
| Cut-off Date Principal Balance: | $75,000,000 | Property Type - Subtype: | Office – CBD | |
| % of Pool by IPB: | 9.7% | Net Rentable Area (SF): | 145,179 | |
| Loan Purpose: | Refinance | Location: | San Mateo, CA | |
| Borrower: | Romel 400, LLC | Year Built / Renovated: | 1973 / 2015 | |
| Loan Sponsor: | A.J. Batt | Occupancy: | 96.0% | |
| Interest Rate: | 4.69700% | Occupancy Date: | 11/1/2018 | |
| Note Date: | 11/28/2018 | Number of Tenants: | 21 | |
| Maturity Date: | 12/6/2028 | 2015 NOI: | $5,305,486 | |
| Interest-only Period: | 24 months | 2016 NOI: | $5,706,746 | |
| Original Term: | 120 months | 2017 NOI: | $6,009,997 | |
| Original Amortization: | 360 months | TTM NOI (as of 9/2018): | $7,377,820 | |
| Amortization Type: | IO–Balloon | UW Economic Occupancy: | 95.0% | |
| Call Protection: | Grtr1%orYM(116),O(4) | UW Revenues: | $10,328,734 | |
| Lockbox / Cash Management: | Soft / Springing | UW Expenses: | $2,583,895 | |
| Additional Debt: | N/A | UW NOI: | $7,744,839 | |
| Additional Debt Balance: | N/A | UW NCF: | $7,319,465 | |
| Additional Debt Type: | N/A | Appraised Value / Per SF: | $128,000,000 / $882 | |
| Appraisal Date: | 10/9/2018 | |||
| Escrows and Reserves(1) | Financial Information | ||||||||||||||
| Initial | Monthly | Initial Cap | Cut-off Date Loan / SF: | $517 | |||||||||||
| Taxes: | $0 | Springing | N/A | Maturity Date Loan / SF: | $444 | ||||||||||
| Insurance: | $0 | Springing | N/A | Cut-off Date LTV: | 58.6% | ||||||||||
| Replacement Reserves: | $0 | Springing | N/A | Maturity Date LTV: | 50.3% | ||||||||||
| TI/LC: | $0 | Springing | N/A | UW NCF DSCR: | 1.57x | ||||||||||
| Other | $0 | $0 | N/A | UW NOI Debt Yield: | 10.3% | ||||||||||
| Sources and Uses | |||||||||||||||
| Sources | Proceeds | % of Total | Uses | Proceeds | % of Total | ||||||||||
| Mortgage Loan | $75,000,000 | 100.0% | Payoff Existing Debt | $55,419,285 | 73.9% | ||||||||||
| Closing Costs | 492,155 | 0.7% | |||||||||||||
| Return of Equity | 19,088,559 | 25.5% | |||||||||||||
| Total Sources | $75,000,000 | 100.0% | Total Uses | $75,000,000 | 100.0% | ||||||||||
| (1) | For a full description of Escrows and Reserves, please refer to“Escrows and Reserves”below. |
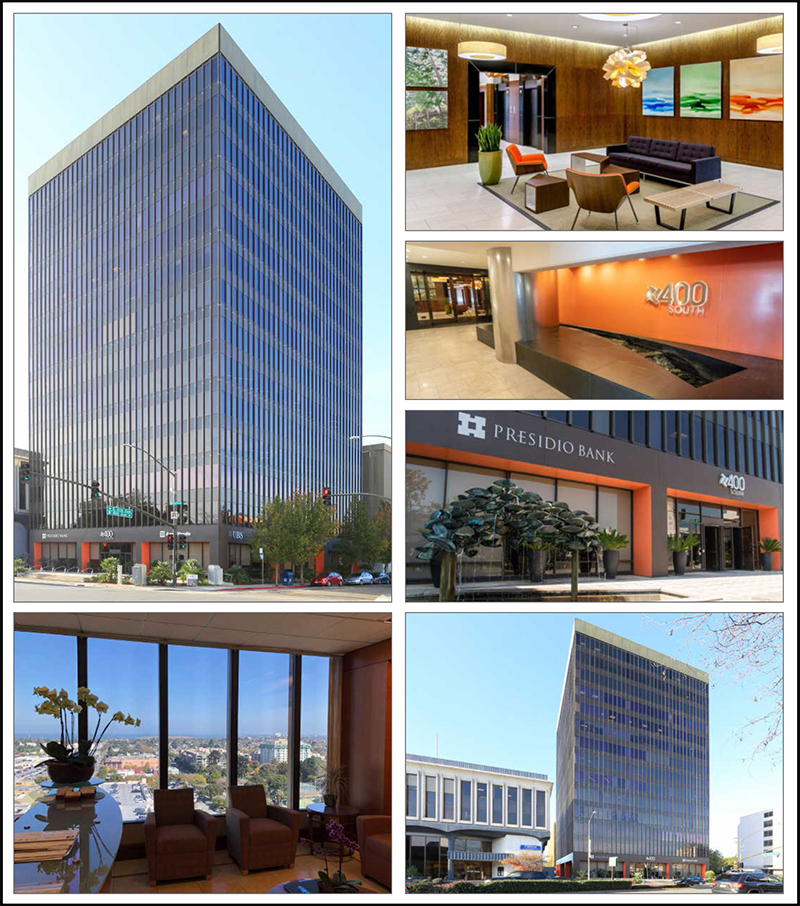
The Loan. The 400 South El Camino loan (the “400 South El Camino Mortgage Loan”) has an outstanding principal balance as of the Cut-off Date of $75.0 million and is secured by a first mortgage lien on the borrower’s fee interest in a 14-story, 145,179 square foot Class A office building located in the central business district (“CBD”) of downtown San Mateo, California (the “400 South El Camino Property”). The 400 South El Camino Mortgage Loan has a 10-year term and, following a two-year interest-only period, will amortize on a 30-year schedule.
The Borrower.The borrowing entity for the 400 South El Camino Mortgage Loan is Romel 400, LLC, a Delaware limited liability company structured to be bankruptcy remote with one independent director.
The Loan Sponsor.The loan sponsor and nonrecourse carve-out guarantor is A.J. Batt. Mr. Batt founded ATEL Financial Services in 1977. During his tenure as founder and CEO, ATEL was one of the world’s largest equipment leasing companies, reportedly with a portfolio of equipment leases in excess of $1.5 billion. Mr. Batt sold ATEL in 2001 and has since been investing in real estate through his primary investment vehicles. Mr. Batt owns interests in over 20 commercial real estate properties located mainly in and around San Francisco.
THE INFORMATION IN THIS STRUCTURAL AND COLLATERAL TERM SHEET IS NOT COMPLETE AND MAY BE AMENDED PRIOR TO THE TIME OF SALE. THIS TERM SHEET IS NOT AN OFFER TO SELL THESE SECURITIES AND IT IS NOT A SOLICITATION OF AN OFFER TO BUY THESE SECURITIES IN ANY JURISDICTION WHERE THE OFFER OR SALE IS NOT PERMITTED. | ||
| | 23 of 106 | |
| Structural and Collateral Term Sheet | JPMCC 2019-COR4 | |
| 400 South El Camino | ||
The Property. The 400 South El Camino Property is a 14-story, 145,179 square foot Class A office building located on South El Camino Real in San Mateo, California within the main business district and retail core and walking distance from the San Mateo Caltrain Station, which provides rail service through the West Bay cities of San Francisco, Burlingame, Palo Alto, and down to Sunnyvale and Santa Clara. The 400 South El Camino Property is the one of the tallest buildings in San Mateo, features floor-to-ceiling windows providing expansive views of the San Francisco Bay, includes 10,400 square foot floorplates and an adjoining six-story, 254-space parking garage providing a parking ratio of 1.75 spaces per 1,000 square feet of net rentable area (“NRA”). In addition to its proximity to the amenities and entertainment located in downtown San Mateo, the 400 South El Camino Property offers office tenants a location that is approximately equidistant to the major population and commercial centers of San Francisco, Silicon Valley and the East Bay.
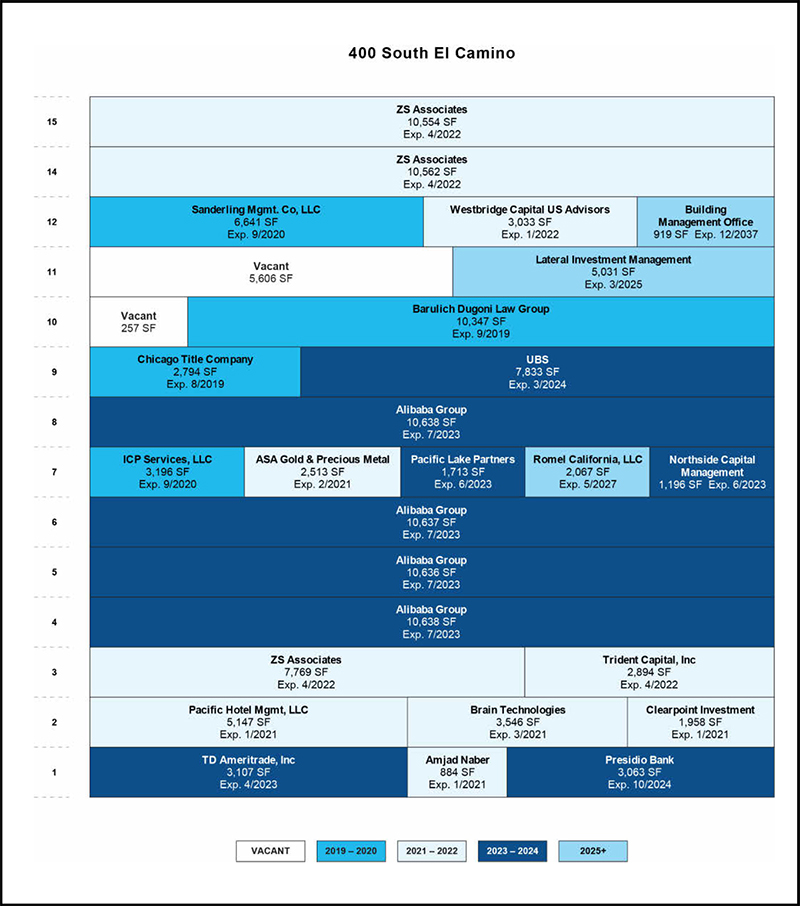
The 400 South El Camino Property was originally constructed in 1973 and has been renovated over the years, most recently in 2015. The 400 South El Camino Property has benefitted from its location in the downtown area of San Mateo and exhibits an average occupancy of 95.0% dating back to 2009. Due to a lack of new supply, challenging zoning regulations, high land costs and lack of available development sites, this occupancy average is expected to persist into the future. As of November 1, 2018, the 400 South El Camino Property was 96.0% leased to 21 tenants under 30 leases at weighted average rents equal to $66.35 per square foot which is approximately 19.9% below market compared to the appraisal’s market rental rate of $82.80 per square foot. Approximately 36.8% of NRA and 42.5% of underwritten base rent is attributable to investment grade tenants which include the Alibaba Group (29.3% of NRA; rated A1/A+/A+ by Moody’s/Fitch/S&P), UBS (5.4% of NRA; rated NR/NR/A- by Moody’s/Fitch/S&P) and TD Ameritrade (2.1% of NRA; rated A2/NR/A by Moody’s/Fitch/S&P).
The largest tenant, Alibaba Group (42,549 square feet; 29.3% of NRA; 34.3% of Underwritten Base Rent; rated A1/A+/A+ by Moody’s/Fitch/S&P) (NYSE: BABA, approximately $401.5 billion market cap as of January 24, 2019), is a Chinese multinational conglomerate specializing in e-commerce and AI technology. The 400 South El Camino Property serves as the tenant’s U.S. headquarters. Founded in 1999, the company provides consumer-to-consumer, business-to-consumer, and business-to-business sales services via online marketplaces, electronic payment services, shopping search engines, and cloud computing services. The company’s $25.0 billion initial public offering in 2014 was the largest in history at the time. It has also been named one of the world’s most admired companies by Fortune, placing 300 on the Fortune 500 list in 2017. Alibaba Group leases four floors on coterminous leases expiring on July 31, 2023 at rents that are approximately 20.5% below market. The Alibaba Group lease includes one, three-year renewal option and no termination options. Alibaba Group currently subleases 5,284 square feet through June 2023 at $69.00 per square foot which equates to a 4.9% premium to their contract rent of $65.79 per square foot. For further discussion on this subleasing arrangement, please see “Description of the Mortgage Pool—Tenant Issues—Lease Expirations and Terminations—Other”in the Preliminary Prospectus.
The second largest tenant, ZS Associates (28,885 square feet; 19.9% of NRA; 14.6% of Underwritten Base Rent), is a U.S. management consulting firm headquartered in Evanston, IL, that provides advisory services primarily in the pharmaceutical, biotechnology and healthcare industries. ZS Associates has its strongest presence in healthcare, with standing working relationships with 49 of the 50 largest drug-makers and 17 of the 20 largest medical device makers in the industry. In 2017, ZS Associates was rated by Consulting Magazine as the 10th best firm to work for. ZS Associates is one of the longest tenured tenants, having occupied space at the 400 South El Camino Property since January 2002. ZS Associates has coterminous leases expiring on April 30, 2022, with no termination options and two, five-year renewal options. Rents under the ZS Associates leases are approximately 43.8% below market and the tenant currently subleases 18,331 square feet through April 2022 at $65.97 per square foot which equates to a 45.3% premium to their contract rent of $45.40 per feet.
The third largest tenant, Barulich Dugoni Law Group (10,347 square feet; 7.1% of NRA; 6.2% of Underwritten Base Rent), provides legal advisory services. The 400 South El Camino Property serves as the tenant’s headquarters. Founded in 1989, the firm’s practice areas include estate planning, probate and trust administration, probate and trust litigation, business planning, non-profit planning and support, and taxation. Barulich Dugoni Law Group leases the entire 10th floor on a lease expiring on September 30, 2019, with no termination options and one, five-year renewal option. Rent under the Barulich Dugoni Law Group lease is approximately 33.4% below market.
The 400 South El Camino Property is located in the San Mateo-Downtown North submarket, within the greater San Francisco office market. As of the third quarter of 2018, the greater San Francisco office market consisted of approximately 172.5 million square feet across 3,928 buildings with an overall market vacancy of 6.3% and average asking rents of approximately $61.15 per square foot. The San Mateo-Downtown North submarket consists of approximately 1.7 million square feet and contains approximately 166 buildings with an overall market vacancy of 9.7% and average market asking rents of $54.60 per square foot. According to the appraisal, the 400 South El Camino Property is a top competitor in its immediate area achieving rental rates above the MSA’s average for similar properties and is the primary Class A office building within the City of San Mateo. The 400 South El Camino Property has been renovated to meet current market standards and as such should remain a top competitor in its market segment.
THE INFORMATION IN THIS STRUCTURAL AND COLLATERAL TERM SHEET IS NOT COMPLETE AND MAY BE AMENDED PRIOR TO THE TIME OF SALE. THIS TERM SHEET IS NOT AN OFFER TO SELL THESE SECURITIES AND IT IS NOT A SOLICITATION OF AN OFFER TO BUY THESE SECURITIES IN ANY JURISDICTION WHERE THE OFFER OR SALE IS NOT PERMITTED. | ||
| | 24 of 106 | |
| Structural and Collateral Term Sheet | JPMCC 2019-COR4 | |
| 400 South El Camino | ||
Given its recognition as the top competitor within San Mateo’s downtown area, the appraisal concluded it was necessary to research competing properties outside of the subject’s immediate area for rent comparables. The appraisal included seven closed office transactions and one active office listing in suburban cities along the San Francisco Peninsula for a total of eight rent comparables. Of the eight comparables, five were triple net (“NNN”) with the remaining three full service gross (“FSG”). The five NNN rent comparables range from $61.80 to $84.00 per square foot with a weighted average of approximately $71.08 per square foot NNN. The three FSG rent comparables range from $72.00 to $87.00 per square foot with a weighted average of approximately $85.37 per square foot FSG.
| Historical and Current Occupancy(1) | |||||||||
| 2009 | 2010 | 2011 | 2012 | 2013 | 2014 | 2015 | 2016 | 2017 | Current(2) |
| 88.9% | 93.0% | 98.8% | 97.4% | 89.4% | 100.0% | 100.0% | 95.5% | 91.5% | 96.0% |
| (1) | Historical Occupancies are as of December 31 of each respective year. |
| (2) | Current Occupancy is as of November 1, 2018. |
| Tenant Summary(1) | |||||||
| Tenant | Ratings(2) Moody’s/Fitch/S&P | Net Rentable Area (SF) | % of Total NRA | Base Rent PSF(3) | % of Total Base Rent | Lease Expiration Date | |
| Alibaba Group(4)(5) | A1 / A+ / A+ | 42,549 | 29.3% | $73.91 | 34.0% | 7/31/2023 | |
| ZS Associates(4)(5) | NR / NR / NR | 28,885 | 19.9 | $46.78 | 14.6% | 4/30/2022 | |
| Barulich Dugoni Law Group(5) | NR / NR / NR | 10,347 | 7.1 | $55.17 | 6.2% | 9/30/2019 | |
| UBS(5) | NR / NR / A- | 7,833 | 5.4 | $66.20 | 5.6% | 3/31/2024 | |
| Sanderling Mgmt. Co, LLC(5) | NR / NR / NR | 6,641 | 4.6 | $52.52 | 3.8% | 9/30/2020 | |
| Pacific Hotel Mgmt, LLC(5) | NR / NR / NR | 5,147 | 3.5 | $82.51 | 4.6% | 1/31/2021 | |
| Lateral Investment Management(5) | NR / NR / NR | 5,031 | 3.5 | $88.44 | 4.8% | 3/31/2025 | |
| Brain Technologies(5) | NR / NR / NR | 3,546 | 2.4 | $82.80 | 3.2% | 3/31/2021 | |
| ICP Services, LLC(5) | NR / NR / NR | 3,196 | 2.2 | $73.60 | 2.5% | 9/30/2020 | |
| TD Ameritrade(5) | A2 / NR / A | 3,107 | 2.1 | $84.28 | 2.8% | 4/30/2023 | |
| (1) | Based on the underwritten rent roll dated as of November 1, 2018. |
| (2) | In certain instances, ratings provided are those of the parent company of the entity shown, whether or not the parent company guarantees the lease. |
| (3) | Base Rent PSF includes average rent over the lease term for investment grade tenants Alibaba Group ($345,215), UBS ($42,462) and TD Ameritrade ($31,612) and includes $129,350 of contractual rent steps through January 2020. |
| (4) | Alibaba Group subleases a portion of its space totaling 5,284 square feet through June 2023 at approximately a 4.9% premium to their contract rent. ZS Associates subleases a portion of its space totaling 18,331 square feet through April 2022 at approximately a 45.3% premium to their contract rent. |
| (5) | Alibaba Group has one, three-year renewal option remaining, ZS Associates have two, five-year renewal options remaining, Barulich Dugoni Law Group has one, five-year renewal option remaining, UBS has two, five-year renewal options remaining, Sanderling Mgmt. Co, LLC has one, five-year renewal option remaining, Pacific Hotel Mgmt, LLC has one, five-year renewal option remaining, Lateral Investment Management has one, five-year renewal option remaining, Brain Technologies has one, three-year renewal option remaining, ICP Services, LLC has one, three-year renewal option remaining and TD Ameritrade has one, five-year renewal option remaining. |
| Lease Rollover Schedule(1) | ||||||||||
| Year | Number of Leases Expiring | Net Rentable Area Expiring | % of NRA Expiring | Base Rent Expiring | % of Base Rent Expiring | Cumulative Net Rentable Area Expiring | Cumulative % of NRA Expiring | Cumulative Base Rent Expiring | Cumulative % of Base Rent Expiring | |
| Vacant | NAP | 5,863 | 4.0% | NAP | NAP | 5,863 | 4.0% | NAP | NAP | |
| 2019 & MTM | 2 | 13,141 | 9.1% | $750,090 | 8.1% | 19,004 | 13.1% | $750,090 | 8.1% | |
| 2020 | 2 | 9,837 | 6.8% | 584,011 | 6.3% | 28,841 | 19.9% | $1,334,101 | 14.4% | |
| 2021 | 5 | 14,048 | 9.7% | 1,090,806 | 11.8% | 42,889 | 29.5% | $2,424,907 | 26.2% | |
| 2022 | 8 | 34,812 | 24.0% | 1,861,314 | 20.1% | 77,701 | 53.5% | $4,286,220 | 46.4% | |
| 2023 | 8 | 48,565 | 33.5% | 3,653,957 | 39.5% | 126,266 | 87.0% | $7,940,177 | 85.9% | |
| 2024 | 2 | 10,896 | 7.5% | 731,603 | 7.9% | 137,162 | 94.5% | $8,671,780 | 93.8% | |
| 2025 | 1 | 5,031 | 3.5% | 444,951 | 4.8% | 142,193 | 97.9% | $9,116,731 | 98.6% | |
| 2026 | 0 | 0 | 0.0% | 0 | 0.0% | 142,193 | 97.9% | $9,116,731 | 98.6% | |
| 2027 | 1 | 2,067 | 1.4% | 126,513 | 1.4% | 144,260 | 99.4% | $9,243,244 | 100.0% | |
| 2028 | 0 | 0 | 0.0% | 0 | 0.0% | 144,260 | 99.4% | $9,243,244 | 100.0% | |
| 2029 | 0 | 0 | 0.0% | 0 | 0.0% | 144,260 | 99.4% | $9,243,244 | 100.0% | |
| 2030 & Beyond | 1 | 919 | 0.6% | 0 | 0.0% | 145,179 | 100.0% | $9,243,244 | 100.0% | |
| Total | 30 | 145,179 | 100.0% | $9,243,244 | 100.0% | |||||
| (1) | Based on the underwritten rent roll dated November 1, 2018. |
THE INFORMATION IN THIS STRUCTURAL AND COLLATERAL TERM SHEET IS NOT COMPLETE AND MAY BE AMENDED PRIOR TO THE TIME OF SALE. THIS TERM SHEET IS NOT AN OFFER TO SELL THESE SECURITIES AND IT IS NOT A SOLICITATION OF AN OFFER TO BUY THESE SECURITIES IN ANY JURISDICTION WHERE THE OFFER OR SALE IS NOT PERMITTED. | ||
| | 25 of 106 | |
| Structural and Collateral Term Sheet | JPMCC 2019-COR4 | |
| 400 South El Camino | ||
| Operating History and Underwritten Net Cash Flow | |||||||||||||
| 2015 | 2016 | 2017 | TTM(1) | Underwritten | Per Square Foot | %(2) | |||||||
| Rents in Place | $6,796,990 | $7,312,835 | $7,507,699 | $8,839,633 | $8,694,604 | $59.89 | 80.2% | ||||||
| Straight Line Rent(3) | 0 | 0 | 0 | 0 | 419,290 | 2.89 | 3.9 | ||||||
| Contractual Rent Steps(4) | 0 | 0 | 0 | 0 | 129,350 | 0.89 | 1.2 | ||||||
| Vacant Income | 0 | 0 | 0 | 0 | 488,820 | 3.37 | 4.5 | ||||||
| Gross Potential Rent | $6,796,990 | $7,312,835 | $7,507,699 | $8,839,633 | $9,732,064 | $67.03 | 89.8% | ||||||
| Total Reimbursements | 267,172 | 239,350 | 323,125 | 412,238 | 446,219 | 3.07 | 4.1 | ||||||
| Total Other Income(5) | 294,172 | 434,435 | 513,013 | 511,481 | 659,365 | 4.54 | 6.1 | ||||||
| Net Rental Income | $7,358,335 | $7,986,620 | $8,343,837 | $9,763,351 | $10,837,649 | $74.65 | 100.0% | ||||||
| (Vacancy/Credit Loss) | 0 | 0 | 0 | 0 | (508,914) | (3.51) | (5.0) | ||||||
| Effective Gross Income | $7,358,335 | $7,986,620 | $8,343,837 | $9,763,351 | $10,328,734 | $71.14 | 95.3% | ||||||
| Total Expenses | $2,052,848 | $2,279,874 | $2,333,841 | $2,385,531 | $2,583,895 | $17.80 | 25.0% | ||||||
| Net Operating Income | $5,305,486 | $5,706,746 | $6,009,997 | $7,377,820 | $7,744,839 | $53.35 | 75.0% | ||||||
| Total TI/LC, CapEx/RR | 0 | 0 | 0 | 0 | 425,374 | 2.93 | 4.1 | ||||||
| Net Cash Flow | $5,305,486 | $5,706,746 | $6,009,997 | $7,377,820 | $7,319,465 | $50.42 | 70.9% | ||||||
| (1) | TTM column represents the trailing 12-month period ending on September 30, 2018. |
| (2) | % column represents percent of Net Rental Income for all revenue lines and represents percent of Effective Gross Income for the remainder of the fields. |
| (3) | Based on the average rent over the lease term for Alibaba Group ($345,215), UBS ($42,462) and TD Ameritrade ($31,612). |
| (4) | Based on the contractual rent steps through January 2020 for certain tenants. |
| (5) | Underwritten Total Other Income includes TTM parking income ($474,604), TTM other income ($36,877) and the in-place cell tower lease ($147,884) which has historically been included Gross Potential Rent in the historical cash flows. |
Property Management.The 400 South El Camino Property is managed by Orchard Commercial, Inc, a third party management company.
Escrows and Reserves.
Tax Escrows– On a monthly basis, during the continuance of a Cash Management Period (as defined below), the borrower is required to escrow 1/12 of the projected annual estimated tax payments.
Insurance Escrows– On a monthly basis, during the continuance of a Cash Management Period, the borrower is required to escrow 1/12 of the projected annual estimated insurance premiums.
Replacement Reserves –On a monthly basis, during the continuance of a Cash Management Period, the borrower is required to escrow 1/12 of an amount estimated by the lender into a replacement reserve.
TI/LC Reserves –The borrower is required to escrow all lease termination payments into a TI/LC reserve.
Lockbox / Cash Management. The 400 South El Camino Mortgage Loan is structured with a soft lockbox and springing cash management. All rents are required to be deposited into a lockbox account within two business day of receipt by the borrower or property manager. All funds in the lockbox account are required to be swept daily into the borrowers’ operating account, unless a Cash Management Period (as defined below) is continuing. Upon the occurrence of a Cash Management Period, funds in the lockbox account will be swept daily into a lender-controlled account, from which account such funds will be disbursed on each payment date in accordance with the loan documents and any excess will be retained by the lender as additional collateral for the 400 South El Camino Mortgage Loan.
A “Cash Management Period” will commence upon an event of default under the mortgage loan documents.
THE INFORMATION IN THIS STRUCTURAL AND COLLATERAL TERM SHEET IS NOT COMPLETE AND MAY BE AMENDED PRIOR TO THE TIME OF SALE. THIS TERM SHEET IS NOT AN OFFER TO SELL THESE SECURITIES AND IT IS NOT A SOLICITATION OF AN OFFER TO BUY THESE SECURITIES IN ANY JURISDICTION WHERE THE OFFER OR SALE IS NOT PERMITTED. | ||
| | 26 of 106 | |
| Structural and Collateral Term Sheet | JPMCC 2019-COR4 | |
| Liberty Station Retail | ||
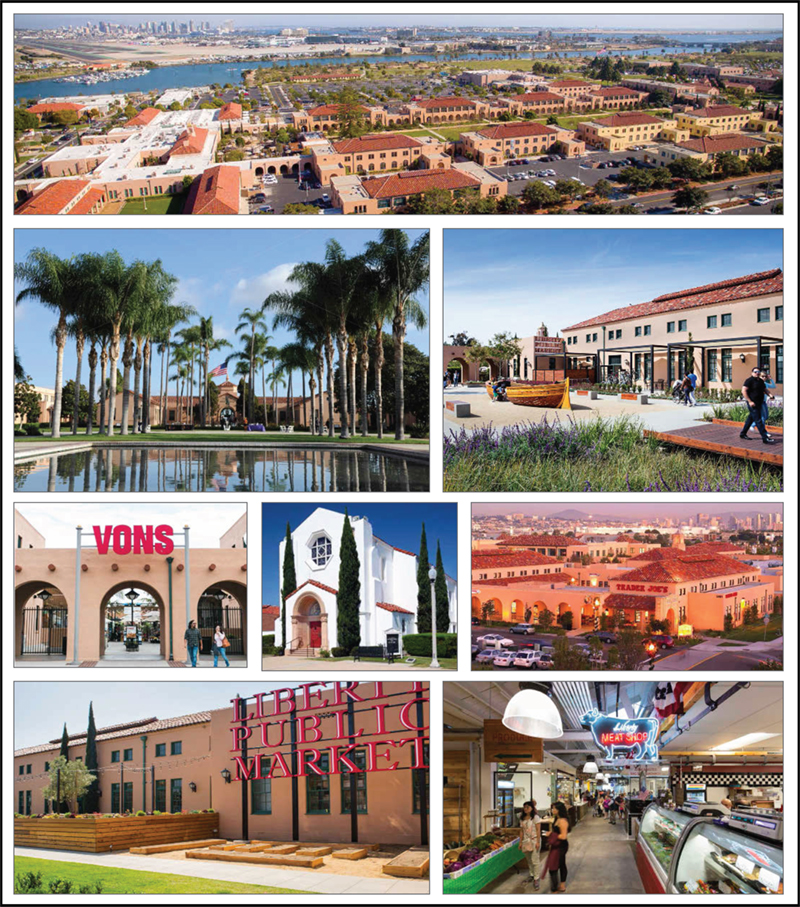
THE INFORMATION IN THIS STRUCTURAL AND COLLATERAL TERM SHEET IS NOT COMPLETE AND MAY BE AMENDED PRIOR TO THE TIME OF SALE. THIS TERM SHEET IS NOT AN OFFER TO SELL THESE SECURITIES AND IT IS NOT A SOLICITATION OF AN OFFER TO BUY THESE SECURITIES IN ANY JURISDICTION WHERE THE OFFER OR SALE IS NOT PERMITTED. | ||
| | 27 of 106 | |
| Structural and Collateral Term Sheet | JPMCC 2019-COR4 | |
| Liberty Station Retail | ||
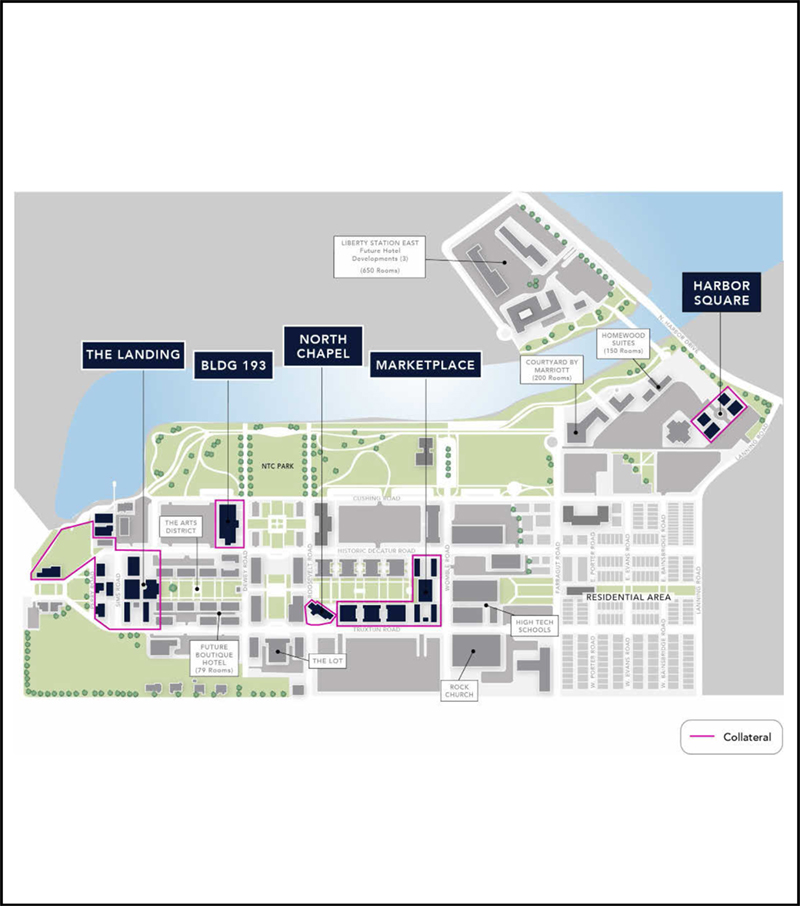
THE INFORMATION IN THIS STRUCTURAL AND COLLATERAL TERM SHEET IS NOT COMPLETE AND MAY BE AMENDED PRIOR TO THE TIME OF SALE. THIS TERM SHEET IS NOT AN OFFER TO SELL THESE SECURITIES AND IT IS NOT A SOLICITATION OF AN OFFER TO BUY THESE SECURITIES IN ANY JURISDICTION WHERE THE OFFER OR SALE IS NOT PERMITTED. | ||
| | 28 of 106 | |
| Structural and Collateral Term Sheet | JPMCC 2019-COR4 | |
| Liberty Station Retail | ||

THE INFORMATION IN THIS STRUCTURAL AND COLLATERAL TERM SHEET IS NOT COMPLETE AND MAY BE AMENDED PRIOR TO THE TIME OF SALE. THIS TERM SHEET IS NOT AN OFFER TO SELL THESE SECURITIES AND IT IS NOT A SOLICITATION OF AN OFFER TO BUY THESE SECURITIES IN ANY JURISDICTION WHERE THE OFFER OR SALE IS NOT PERMITTED. | ||
| | 29 of 106 | |
| Structural and Collateral Term Sheet | JPMCC 2019-COR4 | |
| Liberty Station Retail | ||
| Mortgage Loan Information | Property Information | |||
| Mortgage Loan Seller: | JPMCB | Single Asset / Portfolio: | Single Asset | |
| Original Principal Balance(1): | $67,000,000 | Title(5): | Fee/Leasehold | |
| Cut-off Date Principal Balance(1): | $67,000,000 | Property Type - Subtype: | Retail – Anchored | |
| % of Pool by IPB: | 8.7% | Net Rentable Area (SF): | 327,704 | |
| Loan Purpose: | Acquisition | Location: | San Diego, CA | |
| Borrowers(2): | Various | Year Built / Renovated(6): | Various / 2009 | |
| Sponsors(3): | Seligman & Associates, Inc., | Occupancy: | 92.4% | |
| Pendulum Property Partners, LLC | Occupancy Date: | 8/1/2018 | ||
| Interest Rate: | 5.23000% | Number of Tenants: | 69 | |
| Note Date: | 11/15/2018 | 2015 NOI: | $6,333,620 | |
| Maturity Date: | 12/1/2028 | 2016 NOI: | $7,700,055 | |
| Interest-only Period: | 120 months | 2017 NOI(7): | $7,650,638 | |
| Original Term: | 120 months | TTM NOI (as of 8/2018)(7): | $9,052,432 | |
| Original Amortization: | None | UW Economic Occupancy: | 94.8% | |
| Amortization Type: | Interest Only | UW Revenues: | $13,968,591 | |
| Call Protection(4): | L(25),Grtr1%orYM(1), | UW Expenses: | $4,609,164 | |
| DeforGrtr1%orYM(91),O(3) | UW NOI: | $9,359,427 | ||
| Lockbox / Cash Management: | Hard / Springing | UW NCF: | $8,982,567 | |
| Additional Debt: | Yes | Appraised Value / Per SF: | $170,000,000 / $519 | |
| Additional Debt Balance(1): | $50,000,000 | |||
| Additional Debt Type(1): | Pari Passu | |||
| Escrows and Reserves(8) | Financial Information(1) | |||||||
| Initial | Monthly | Initial Cap | Cut-off Date Loan / SF: | $357 | ||||
| Taxes: | $515,493 | $103,098 | N/A | Maturity Date Loan / SF: | $357 | |||
| Insurance: | $0 | Springing | N/A | Cut-off Date LTV: | 68.8% | |||
| Replacement Reserves: | $4,074 | $4,074 | N/A | Maturity Date LTV: | 68.8% | |||
| TI/LC: | $27,159 | $27,309 | $1,638,520 | UW NCF DSCR: | 1.45x | |||
| Other: | $1,202,027 | $0 | N/A | UW NOI Debt Yield: | 8.0% | |||
| Sources and Uses | ||||||||
| Sources | Proceeds | % of Total | Uses | Proceeds | % of Total | |||
| Whole Loan | $117,000,000 | 68.6% | Purchase Price(9) | $165,357,991 | 97.0% | |||
| Sponsor Equity | 53,514,050 | 31.4% | Closing Costs | 3,407,306 | 2.0 | |||
| Upfront Reserves | 1,748,753 | 1.0 | ||||||
| Total Sources | $170,514,050 | 100.0% | Total Uses | $170,514,050 | 100.0% | |||
| (1) | The Liberty Station Retail loan is part of a whole loan evidenced by threepari passunotes with an aggregate original principal balance as of the Cut-off Date of $117.0 million. Financial Information presented in the chart above reflects the aggregate Cut-off Date balance of the $117.0 million Liberty Station Retail Whole Loan (as defined below). |
| (2) | The borrowers are Seligman Liberty Station, LLC, Seligman Liberty Station II LLC, Seligman Liberty Station III LLC, Seligman Liberty Station IV LLC, and Seligman Liberty Station V LLC, each a Delaware limited liability company structured to be a bankruptcy remote entity with two independent directors in its organizational structure (collectively, the “Borrowers”). |
| (3) | Seligman & Associates, Inc. is the guarantor of the nonrecourse carve-outs under the Liberty Station Retail Whole Loan (as defined below) documents. |
| (4) | The Borrowers have the option to (i) prepay the full $117.0 million Liberty Street Station Whole Loan after January 1, 2021, with payment of a yield maintenance premium, or (ii) defease the full $117.0 million Liberty Station Retail Whole Loan at any time after the date that is 24 months after the closing date of the securitization that includes the last note to be securitized. |
| (5) | A portion of the collateral includes the borrowers’ leasehold interests in each of the five parcels of the Liberty Station Retail Property (as defined below), ground leased from the Redevelopment Agency of the City of San Diego as the ground lessor. The annual ground lease rental payment for each ground lease is $1, which was prepaid at the beginning of the term. The borrowers own the Liberty Station Retail Property as tenants-in-common. Please see “Description of the Mortgage Pool—Mortgage Pool Characteristics—Fee & Leasehold Estates; Ground Leases” in the Preliminary Prospectus for additional information. |
| (6) | The Liberty Station Retail Property consists of five sections known as The Landing, Liberty Station Marketplace, North Chapel, Building 193 and Harbor Square that were constructed in 1923, 1932, 1942, 1942 and 2007, respectively. |
| (7) | The increase in TTM NOI from 2017 NOI is primarily attributable to eight new triple net leases accounting for $744,561 in annual gross rent at the Liberty Station Retail Property. |
| (8) | For a full description of Escrows and Reserves, please refer to “Escrows and Reserves” below. |
| (9) | The stated purchase price of the Liberty Station Retail Property was approximately $168.0 million, which is inclusive of an $11.0 million prepayment penalty paid by the sponsors at loan origination. The Purchase Price above is also net of seller proration’s in the amount of approximately $2,622,009 associated with rent collections, reimbursements and security deposits. |
THE INFORMATION IN THIS STRUCTURAL AND COLLATERAL TERM SHEET IS NOT COMPLETE AND MAY BE AMENDED PRIOR TO THE TIME OF SALE. THIS TERM SHEET IS NOT AN OFFER TO SELL THESE SECURITIES AND IT IS NOT A SOLICITATION OF AN OFFER TO BUY THESE SECURITIES IN ANY JURISDICTION WHERE THE OFFER OR SALE IS NOT PERMITTED. | ||
| | 30 of 106 | |
| Structural and Collateral Term Sheet | JPMCC 2019-COR4 | |
| Liberty Station Retail | ||
The Loan. The Liberty Station Retail loan is secured by a first mortgage lien on the borrowers’ fee and leasehold interests in a 327,704 square foot anchored retail center located in San Diego, California. The whole loan has an aggregate outstanding principal balance as of the Cut-off Date of $117.0 million (the “Liberty Station Retail Whole Loan”) and is comprised of threepari passu notes, each as described below. The controlling Note A-1, with an outstanding principal balance as of the Cut-off Date of $67.0 million, will be contributed to the JPMCC 2019-COR4 Trust. The relationship between the holders of the Liberty Station Retail Whole Loan will be governed by a co-lender agreement as described under the “Description of the Mortgage Pool—The Whole Loans—The Serviced Pari Passu Whole Loans” in the Preliminary Prospectus. The Liberty Station Retail Whole Loan has a 10-year term and will be interest only for the entire term.
| Whole Loan Summary | ||||
| Note | Original Balance | Cut-off Date Balance | Note Holder | Controlling Piece |
| A-1 | $67,000,000 | $67,000,000 | JPMCC 2019-COR4 | Yes |
| A-2 | 20,000,000 | 20,000,000 | JPMCB | No |
| A-3 | 30,000,000 | 30,000,000 | Benchmark 2019-B9 | No |
| Total | $117,000,000 | $117,000,000 | ||
The Borrowers.The borrowers are Seligman Liberty Station, LLC, Seligman Liberty Station II LLC, Seligman Liberty Station III LLC, Seligman Liberty Station IV LLC, and Seligman Liberty Station V LLC, each a Delaware limited liability company structured to be a bankruptcy remote entity with two independent directors in its organizational structure (collectively, the “Borrowers”). The Borrowers own the Liberty Station Retail Property (as defined below) as tenants-in-common.
The Loan Sponsors. The loan sponsors are Seligman & Associates, Inc. (“Seligman & Associates”), which also serves as the nonrecourse carve-out guarantor of the Liberty Station Retail Whole Loan and Pendulum Property Partners, LLC (“Pendulum”). Seligman & Associates, along with founder Irving R. Seligman, founded the Seligman Group in 1954, the parent company of Seligman & Associates. The Seligman Group specializes in development, acquisition and management of commercial and residential properties throughout the western U.S. Pendulum is an owner, operator, developer and management firm of commercial and multi-family real estate assets, creating and executing value-enhancing strategies. Pendulum currently manages on behalf of The Seligman Group, as its agent and asset manager, an asset portfolio of over 2.8 million square feet of office, retail and industrial assets, as well as 800 apartment units in San Francisco, Los Angeles, Orange County, Hawaii and Las Vegas.
The Property. The property is an approximately 327,704 square foot, anchored retail center located in San Diego, California (the “Liberty Station Retail Property”), and serves as collateral for the Liberty Station Whole Loan. Originally constructed in various stages from 1923 to 2007, and most recently renovated in 2009, the Liberty Station Retail Property is situated on an approximately 21.5 acre site that was previously a naval training center. The City of San Diego approved the redevelopment of a portion of the training center and established the area as a site for an approximately 360-acre urban village, of which the Liberty Station Retail Property is a part. The Liberty Station Retail Property consists of 18 buildings that are dispersed across five different sections within the larger development, each offering a different retail experience. The design of the urban village is focused on entertainment, restaurants, and daily needs along with various experiential components geared towards keeping customers on-site.
As of August 1, 2018, the Liberty Station Retail Property was 92.4% leased by a granular and diverse roster of 69 tenants under 71 leases. Fifty-four of the tenants are retail, restaurant and entertainment tenants, totaling 260,824 square feet, and 15 tenants are office tenants, totaling 41,813 square feet. The Liberty Station Retail Property is anchored by VONS Companies, Stone Brewing Co., Liberty Public Market, Trader Joes and Corvette Diner, which collectively represent approximately 38.4% of net rentable area and approximately 29.6% of underwritten base rent. The Liberty Station Retail Property has experienced recent leasing momentum, with 30 tenants accounting for 104,794 square feet and 39.6% of underwritten base rent, having renewed or signed new leases since May 2017. Gross annual sales for 2018 at the Liberty Station Retail Property were approximately $70.2 million for tenants that are required to report sales. The Liberty Station Retail Property reports average restaurant sales exceeding $578 per square foot.
THE INFORMATION IN THIS STRUCTURAL AND COLLATERAL TERM SHEET IS NOT COMPLETE AND MAY BE AMENDED PRIOR TO THE TIME OF SALE. THIS TERM SHEET IS NOT AN OFFER TO SELL THESE SECURITIES AND IT IS NOT A SOLICITATION OF AN OFFER TO BUY THESE SECURITIES IN ANY JURISDICTION WHERE THE OFFER OR SALE IS NOT PERMITTED. | ||
| | 31 of 106 | |
| Structural and Collateral Term Sheet | JPMCC 2019-COR4 | |
| Liberty Station Retail | ||
The largest tenant at the Liberty Station Retail Property, VONS Companies, leases 51,839 square feet and accounts for approximately 12.2% of underwritten base rent. Founded in 1906, VONS Companies is a southern California supermarket chain that provides a wide array of grocery and general merchandise items. VONS Companies has 273 stores throughout southern California and Nevada, and also operates grocery delivery services in major U.S. Cities and suburbs as well as offering online ordering capabilities. VONS Companies leases its space through October 2027 with four five-year extension options remaining. VONS Companies is located at Liberty Station Marketplace. The second largest tenant at the Liberty Station Retail Property, Stone Brewing Co., leases 22,514 square feet and accounts for approximately 5.2% of underwritten base rent. Stone Brewing Co. has been at the Liberty Station Retail Property since 2011 and is the eighth largest craft brewery in the U.S. Stone Brewing Co. has been listed as one of the fastest growing private companies from Inc. 500 | 5,000 11 times. Stone Brewing Co. has accentuated the location’s historical naval presence through its layout, which replicates a military mess hall. The space also includes a large indoor and outdoor eating space, bars and games. Stone Brewing Co. leases its space through August 2027 with three five-year extension options remaining. The third largest tenant at the Liberty Station Retail Property, Liberty Public Market, leases 21,929 square feet of net rentable area and accounts for approximately 6.0% of underwritten base rent. Liberty Public Market was the first public market in San Diego offering an extensive variety of culinary options under one roof. Liberty Public Market is open seven days a week, and the space is home to 27 vendors with an additional five vendors expected to be added. Liberty Public Market leases its space through January 2026 with two five-year extension options remaining. Both Stone Brewing Co. and Liberty Public Market are located at The Landing.
The Liberty Station Retail Property is located approximately 4.3 miles from downtown San Diego and adjacent to San Diego Bay. The Liberty Station Retail Property is located in the Point Loma/Sports Arena retail submarket in San Diego. Point Loma is a peninsula community, which is surrounded by the Pacific Ocean and Ocean Beach. Point Loma, outside of its high concentration of military bases, is primarily a residential community with high barriers to entry for retail developments. Regional access to the Liberty Station Retail Property is provided by Interstate-8 and Interstate-5. The Liberty Station Retail Property is approximately 1.3 miles away from the San Diego International Airport.
According to the appraisal, the 2018 estimated population within a one-, three- and five-mile radius of the Liberty Station Retail Property is 17,380, 102,941, and 306,665, respectively. Additionally, the median household income within a one-, three- and five-mile radius of the Liberty Station Retail Property is $77,924, $72,713, and $66,192, respectively. The median household income within a five-mile radius is 14.3% higher than the estimated 2018 California median household income of $57,920. According to CoStar as of November 2018, retail vacancy within the Point Loma/Sports Arena retail submarket is 3.2%, which is lower than the 3.8% weighted average vacancy rate within the submarket over the last four years.
The appraisal considered comparable leases from eight retail centers in the San Diego-Carlsbad, CA Metropolitan Statistical Area located between 10.8 and 25.4 miles from the Liberty Station Retail Property. Comparable leases range from approximately 1,090 square feet to approximately 3,655 square feet and base rent per square foot ranges from $33.60 to $87.00 per square foot. The appraiser also identified seven anchor retail leases in the San Diego-Carlsbad, CA, Metropolitan Statistical Area as the competitive set for the Liberty Station Retail Property. Comparable anchor leased areas ranged from 12,078 square feet to 32,000 square feet. The competitive base rent per square foot ranges from $19.92 to $32.52. Base rent per square foot is associated with the total weighted average of the anchor tenants lease terms and underwritten based rent per square foot at the Liberty Station Retail Property. The weighted average base rent per square foot for all leasing at the Liberty Station Retail Property is approximately $31.92, which compares favorably to the appraisal’s concluded market rent of $32.67 per square foot.
| Historical Occupancy(1) | ||||
| 2015 | 2016 | 2017 | Current(2) | |
| Occupancy | 85.0% | 91.0% | 92.0% | 92.4% |
| (1) | As provided by the borrower and which represents the average occupancy for the indicated year unless otherwise specified. |
| (2) | Current Occupancy is based on the August 1, 2018 rent roll, including recently executed leases. |
THE INFORMATION IN THIS STRUCTURAL AND COLLATERAL TERM SHEET IS NOT COMPLETE AND MAY BE AMENDED PRIOR TO THE TIME OF SALE. THIS TERM SHEET IS NOT AN OFFER TO SELL THESE SECURITIES AND IT IS NOT A SOLICITATION OF AN OFFER TO BUY THESE SECURITIES IN ANY JURISDICTION WHERE THE OFFER OR SALE IS NOT PERMITTED. | ||
| | 32 of 106 | |
| Structural and Collateral Term Sheet | JPMCC 2019-COR4 | |
| Liberty Station Retail | ||
| Collateral Tenant Summary | |||||||||
| Tenant | Section | Ratings Moody’s/S&P/ Fitch(1) | Net Rentable Area (SF) | % of Total NRA | Base Rent PSF(2) | Lease Expiration | % of Total Base Rent | Most Recent Sales PSF(3)(4) | Occupancy Cost(3)(4) |
| VONS Companies | Marketplace | B3/B/NR | 51,839 | 15.8% | $22.70 | 10/31/2027 | 12.2% | $390 | 6.8% |
| Stone Brewing Co. | The Landing | NR/NR/NR | 22,514 | 6.9% | 22.37 | 8/31/2027 | 5.2% | NAV | NAV |
| Liberty Public Market | The Landing | NR/NR/NR | 21,929 | 6.7% | 26.22 | 1/31/2026 | 6.0% | $641 | 6.8% |
| 828 Events | The Landing | NR/NR/NR | 14,896 | 4.5% | 36.89 | 5/31/2029(5) | 5.7% | $187 | 28.7% |
| Trader Joe’s | Marketplace | NR/NR/NR | 14,843 | 4.5% | 23.76 | 3/31/2022 | 3.7% | NAV | NAV |
| Corvette Diner | The Landing | NR/NR/NR | 14,801 | 4.5% | 16.65 | 6/21/2024 | 2.6% | NAV | NAV |
| Metron Inc. | Building 193 | NR/NR/NR | 10,658 | 3.3% | 40.17 | 8/1/2025 | 4.4% | NAV | NAV |
| Advanced Reservation | Marketplace | NR/NR/NR | 6,014 | 1.8% | 34.78 | 10/22/2019 | 2.2% | NAV | NAV |
| Navy Federal Credit Union | Marketplace | NR/NR/NR | 5,643 | 1.7% | 39.68 | 5/31/2022 | 2.3% | NAV | NAV |
| Scripps | Marketplace | Baa3/NR/BBB- | 5,582 | 1.7% | 36.00 | 2/1/2024 | 2.1% | NAV | NAV |
| Subtotal / Weighted Average | 168,719 | 51.5% | $26.47 | 46.2% | |||||
| Remaining Tenants | 133,918 | 40.9% | $38.78 | 53.8% | |||||
| Vacant | 25,067 | 7.6% | NAP | NAP | |||||
| Total / Weighted Average | 327,704 | 100.0% | $31.92 | 100.0% | |||||
| (1) | Certain ratings are those of the parent company whether or not the parent guarantees the lease. |
| (2) | Base Rent Per Square Foot reflects the following: (a) in-place leases based on the August 1, 2018 rent roll, and (b) contractual rent steps through October 2019 totaling approximately $205,310. |
| (3) | Not all tenants at the Liberty Station Retail Property are required to report sales. Occupancy Cost is inclusive of underwritten base rent and total reimbursements. |
| (4) | Most Recent Sales PSF and Occupancy Cost for 828 Events are associated with 6,119 square feet currently occupied by the tenant. In January 2019, 828 Events leased an additional 8,777 square feet, for which Most Recent Sales PSF and Occupancy Cost figures are not available. |
| (5) | 6,119 SF associated with 828 Events has a lease expiration date of April 30, 2030. |
| Lease Rollover Schedule | ||||||||||
| Year | Number of Leases Expiring(1) | Net Rentable Area Expiring | % of NRA Expiring | Base Rent Expiring(1)(2) | % of Base Rent Expiring | Cumulative Net Rentable Area Expiring | Cumulative % of NRA Expiring | Cumulative Base Rent Expiring | Cumulative % of Base Rent Expiring | |
| Vacant | NAP | 25,067 | 7.6 | % | NAP | NAP | 25,067 | 7.6% | NAP | NAP |
| 2019 & MTM | 5 | 11,006 | 3.4 | 387,315 | 4.0% | 36,073 | 11.0% | $387,315 | 4.0% | |
| 2020 | 10 | 23,603 | 7.2 | % | 827,540 | 8.6% | 59,676 | 18.2% | $1,214,854 | 12.6% |
| 2021 | 6 | 13,408 | 4.1 | % | 447,399 | 4.6% | 73,084 | 22.3% | $1,662,254 | 17.2% |
| 2022 | 19 | 59,174 | 18.1 | % | 2,317,698 | 24.0% | 132,258 | 40.4% | $3,979,952 | 41.2% |
| 2023 | 5 | 13,336 | 4.1 | % | 505,711 | 5.2% | 145,594 | 44.4% | $4,485,663 | 46.4% |
| 2024 | 4 | 24,356 | 7.4 | % | 589,964 | 6.1% | 169,950 | 51.9% | $5,075,627 | 52.5% |
| 2025 | 3 | 14,800 | 4.5 | % | 569,223 | 5.9% | 184,750 | 56.4% | $5,644,849 | 58.4% |
| 2026 | 4 | 29,827 | 9.1 | % | 863,588 | 8.9% | 214,577 | 65.5% | $6,508,437 | 67.4% |
| 2027 | 9 | 89,382 | 27.3 | % | 2,244,970 | 23.2% | 303,959 | 92.8% | $8,753,407 | 90.6% |
| 2028 | 4 | 8,849 | 2.7 | % | 356,432 | 3.7% | 312,808 | 95.5% | $9,109,838 | 94.3% |
| 2029 | 1 | 8,777 | 2.7 | % | 315,972 | 3.3% | 321,585 | 98.1% | $9,425,810 | 97.6% |
| 2030 & Beyond | 1 | 6,119 | 1.9 | 233,501 | 2.4 | 327,704 | 100.0% | $9,659,311 | 100.0% | |
| Total | 71 | 327,704 | 100.0 | % | $9,659,311 | 100.0% | ||||
| (1) | Number of Leases Expiring and Base Rent Expiring excludes seven temporary/kiosk tenants who operate under short term leases who are not included in underwritten rent. |
| (2) | Base Rent Expiring reflects the following: (a) in-place leases based on the August 1, 2018 rent roll and (b) contractual rent steps through October 2019 totaling approximately $205,310. |
THE INFORMATION IN THIS STRUCTURAL AND COLLATERAL TERM SHEET IS NOT COMPLETE AND MAY BE AMENDED PRIOR TO THE TIME OF SALE. THIS TERM SHEET IS NOT AN OFFER TO SELL THESE SECURITIES AND IT IS NOT A SOLICITATION OF AN OFFER TO BUY THESE SECURITIES IN ANY JURISDICTION WHERE THE OFFER OR SALE IS NOT PERMITTED. | ||
| | 33 of 106 | |
| Structural and Collateral Term Sheet | JPMCC 2019-COR4 | |
| Liberty Station Retail | ||
| Operating History and Underwritten Net Cash Flow | |||||||
| 2015 | 2016 | 2017 | TTM(1) | Underwritten |
Per Square | %(2) | |
| Rents in Place(3) | $7,296,384 | $8,336,929 | $8,927,236 | $9,246,582 | $9,659,311 | $29.48 | 65.6% |
| Vacant Income(4) | 0 | 0 | 0 | 0 | $761,030 | $2.32 | 5.2% |
| Gross Potential Rent | $7,296,384 | $8,336,929 | $8,927,236 | $9,246,582 | $10,420,341 | $31.80 | 70.7% |
| Percentage Rent(5) | 0 | 25,137 | 197,253 | 280,348 | $251,454 | $0.77 | 1.7% |
| Other Reimbursements | 1,949,680 | 2,616,920 | 2,617,534 | 3,206,254 | $4,015,985 | $12.25 | 27.3% |
| Other Income(6) | 16,469 | 8,828 | 10,607 | 6,019 | $41,841 | $0.13 | 0.3% |
| Net Rental Income | $9,262,534 | $10,987,815 | $11,752,629 | $12,739,202 | $14,729,621 | $44.95 | 100.0% |
| (Vacancy/Credit Loss) | 0 | 0 | 0 | 0 | ($761,030) | ($2.32) | (5.4)% |
| Effective Gross Income | $9,262,534 | $10,987,815 | $11,752,629 | $12,739,202 | $13,968,591 | $42.63 | 100.0% |
| Total Operating Expenses | $2,928,914 | $3,287,760 | $4,101,991 | $3,686,770 | $4,609,164 | $14.07 | 33.0% |
| Net Operating Income(7) | $6,333,620 | $7,700,055 | $7,650,638 | $9,052,432 | $9,359,427 | $28.56 | 67.0% |
| Total TI/LC, Capex/RR | 0 | 0 | 0 | 0 | $376,860 | $1.15 | 2.7% |
| Net Cash Flow | $6,333,620 | $7,700,055 | $7,650,638 | $9,052,432 | $8,982,567 | $27.41 | 64.3% |
| (1) | TTM represents the trailing 12-month period ending August 31, 2018. |
| (2) | % column represents percent of Net Rental Income for all revenue lines and represents Effective Gross Income for the remainder of fields. |
| (3) | Underwritten Rents in Place include contractual rent steps underwritten through October 2019 totaling approximately $205,310. |
| (4) | Underwritten Vacant Income is inclusive of seven vacant units at the Liberty Station Retail Property totaling 25,067 square feet, which includes one tenant that is currently in occupancy but has given notice to vacate and all kiosk space. |
| (5) | Underwritten Percentage Rent is associated with the estimated percentage rent payments for Captain Fish, Ikiru Sushi, Fig Tree Liberty, Luke 1909 and Breakfast Republic based on trailing 12 month sales. |
| (6) | Other Income is inclusive of cell tower income from executed Verizon lease, late fees and NSF fees, and administrative fees. |
| (7) | The increase in TTM Net Operating Income from 2017 Net Operating Income is primarily attributable to eight new triple net leases accounting for $744,561 in annual gross rent at the Liberty Station Retail Property. |
Property Management. The property is managed by Seligman & Associates, LLC, an affiliate of the Borrowers acting as the prime manager, and RiverRock Real Estate Group, Inc., acting as the sub-manager (collectively, the “Manager”). The prime manager supervises the sub-manager, ensuring the property is operated in accordance with set operational standards.
Escrows and Reserves. At loan origination, the Borrowers deposited $970,683 for outstanding tenant improvements and leasing commissions in connection with five leases, $515,493 for upfront tax reserves, $231,344 for free rent credits in connection with five leases, $27,159 for upfront tenant improvements and leasing commission reserves and approximately $4,074 for upfront replacement reserves.
Tax Escrows –On a monthly basis, the Borrowers are required to deposit an amount equal to 1/12 of the estimated annual real estate taxes, which currently equates to $103,098.
Insurance Escrows –Insurance escrows are waived so long as the Liberty Station Retail Property is covered by an acceptable blanket policy (which is currently maintained). If such condition is no longer satisfied, on each payment date, the Borrowers will be required to fund an insurance reserve in an amount equal to 1/12 of the amount that the lender estimates will be necessary to pay the annual insurance premiums.
Replacement Escrows – The Borrowers are required to pay to the lender on each payment date an amount equal to $4,074 for replacement reserves (or $0.15 per square foot annually). The reserve is not subject to a cap.
TI/LC Reserves –The Borrowers are required to pay to the lender on each payment date an amount equal to approximately $27,309 for tenant improvements and leasing commission (or $1.00 per square foot annually), subject to a cap of $1,638,520.
THE INFORMATION IN THIS STRUCTURAL AND COLLATERAL TERM SHEET IS NOT COMPLETE AND MAY BE AMENDED PRIOR TO THE TIME OF SALE. THIS TERM SHEET IS NOT AN OFFER TO SELL THESE SECURITIES AND IT IS NOT A SOLICITATION OF AN OFFER TO BUY THESE SECURITIES IN ANY JURISDICTION WHERE THE OFFER OR SALE IS NOT PERMITTED. | ||
| | 34 of 106 | |
| Structural and Collateral Term Sheet | JPMCC 2019-COR4 | |
| Liberty Station Retail | ||
Lockbox / Cash Management. The Liberty Station Retail Whole Loan is structured with a hard lockbox and springing cash management. The Borrowers were required within three business days of origination to send a tenant direction letter to each of the tenants at the Liberty Station Retail Property, instructing them to deposit all rents and payments into a lender controlled lockbox account. To the extent no Cash Sweep Period (as defined below) is continuing, all funds in the lockbox account are required to be transferred to or at the direction of the Borrowers. Following the occurrence and during the continuance of a Cash Sweep Period, all funds in the lockbox account are required to be swept each business day to a segregated cash management account under the control of the lender and disbursed in accordance with the loan documents. To the extent there is a Cash Sweep Period continuing, all excess cash flow after payment of debt service, required reserves and operating expenses are required to be held as additional collateral for the Liberty Station Retail Whole Loan. The lender has been granted a first priority security interest in the cash management account.
A “Cash Sweep Period” means each period commencing on the occurrence of a Cash Sweep Event (as defined below) and continuing until the earlier of the payment date next occurring following the related Cash Sweep Event Cure (as defined below) or payment in full of all principal and interest on the Liberty Station Retail Whole Loan.
A “Cash Sweep Event” means the occurrence of (i) an event of default, (ii) the bankruptcy or insolvency of the Borrowers or property manager, (iii) the debt service coverage ratio (as calculated in the loan documents and based on the trailing six-month period immediately preceding the date of determination) is less than 1.20x or (iv) VONS Companies or any other lessee occupying the premises currently demised to VONS Companies (a) becoming involved in a bankruptcy or insolvency, (b) failing to renew its lease 12 months prior to its lease expiration date, or (c) going “dark.”
A “Cash Sweep Event Cure” means (a) with respect to clause (i) above, the acceptance by the lender of a cure of such event of default, (b) with respect to clause (ii) above, if the Borrowers replace the manager with a qualified manager under a replacement management agreement, (c) with respect to clause (iii) above, a DSCR Cure Event (as defined below) has taken place, or (d) with respect to clause (iv) above, all or substantially all of the applicable specified tenant space is re-leased to one or more replacement tenants acceptable to lender has taken place.
A “DSCR Cure Event” means (i) the debt service coverage ratio (as calculated in the loan documents and based on the trailing six-month period immediately preceding the date of determination) is at least 1.25x for two consecutive quarters, or (ii) the Borrowers posting with the lender cash or an irrevocable letter of credit in an amount that, if applied to repay the Liberty Station Retail Whole Loan, would cause the outstanding principal amount of the Liberty Station Retail Whole Loan to have a debt service coverage ratio of 1.25x.
Ground Leases. A portion of the collateral includes the Liberty Station Retail Borrowers’ leasehold interests in the Liberty Station Retail Property, ground leased from the Redevelopment Agency of the City of San Diego as the ground lessor. The terms of all the ground leases for the ground lease tracts expire on December 31, 2070. The base rent under each ground lease is $1, which was prepaid at the beginning of the term. The Liberty Station Retail Borrowers have fee interest in the remaining portion of the Liberty Station Marketplace.
Use Restrictions. The Liberty Station Retail Property is situated within a site that previously served as a naval training center, which was subsequently redeveloped pursuant to a site plan approval by the City of San Diego. The site plan approval and certain Declaration of Covenants, Conditions, Restrictions and Reservation of Easements to which the Liberty Station Retail Property is subject require that the Liberty Station Retail Property be used in accordance with the aforementioned site plan approval and restrict the use of certain portions of the Liberty Station Retail Property. For additional information, see “Description of the Mortgage Pool—Zoning and Use Restrictions” in the Preliminary Prospectus.
Partial Releases.None.
THE INFORMATION IN THIS STRUCTURAL AND COLLATERAL TERM SHEET IS NOT COMPLETE AND MAY BE AMENDED PRIOR TO THE TIME OF SALE. THIS TERM SHEET IS NOT AN OFFER TO SELL THESE SECURITIES AND IT IS NOT A SOLICITATION OF AN OFFER TO BUY THESE SECURITIES IN ANY JURISDICTION WHERE THE OFFER OR SALE IS NOT PERMITTED. | ||
| | 35 of 106 | |
| Structural and Collateral Term Sheet | JPMCC 2019-COR4 | |
| Bedford Square | ||

THE INFORMATION IN THIS STRUCTURAL AND COLLATERAL TERM SHEET IS NOT COMPLETE AND MAY BE AMENDED PRIOR TO THE TIME OF SALE. THIS TERM SHEET IS NOT AN OFFER TO SELL THESE SECURITIES AND IT IS NOT A SOLICITATION OF AN OFFER TO BUY THESE SECURITIES IN ANY JURISDICTION WHERE THE OFFER OR SALE IS NOT PERMITTED. | ||
| | 36 of 106 | |
| Structural and Collateral Term Sheet | JPMCC 2019-COR4 | |
| Bedford Square | ||

THE INFORMATION IN THIS STRUCTURAL AND COLLATERAL TERM SHEET IS NOT COMPLETE AND MAY BE AMENDED PRIOR TO THE TIME OF SALE. THIS TERM SHEET IS NOT AN OFFER TO SELL THESE SECURITIES AND IT IS NOT A SOLICITATION OF AN OFFER TO BUY THESE SECURITIES IN ANY JURISDICTION WHERE THE OFFER OR SALE IS NOT PERMITTED. | ||
| | 37 of 106 | |
| Structural and Collateral Term Sheet | JPMCC 2019-COR4 | |
| Bedford Square | ||
| Mortgage Loan Information | Property Information | |||
| Mortgage Loan Seller: | LCM | Single Asset / Portfolio: | Single Asset | |
| Original Principal Balance: | $48,000,000 | Title: | Fee | |
| Cut-off Date Principal Balance: | $48,000,000 | Property Type – Subtype: | Mixed Use – Retail / Multifamily | |
| % of Pool by IPB: | 6.2% | Net Rentable Area (SF)(2): | 107,943 | |
| Loan Purpose: | Refinance | Location: | Westport, CT | |
| Borrower: | Bedford Square Properties, LLC | Year Built/Renovated: | 1900 / 2018 | |
| Loan Sponsors: | B. Lance Sauerteig, David | Occupancy(3): | 83.9% | |
| Waldman, Paul S. Brandes, | Occupancy Date: | 11/1/2018 | ||
| Dan Zelson | Number of Tenants(4): | 11 | ||
| Interest Rate: | 5.45150% | 2015 NOI(5): | N/A | |
| Note Date: | 11/30/2018 | 2016 NOI(5): | N/A | |
| Maturity Date: | 12/6/2028 | 2017 NOI(5): | N/A | |
| Interest-only Period: | 120 months | TTM NOI (as of 10/2018)(5): | $3,439,461 | |
| Original Term: | 120 months | UW Economic Occupancy: | 83.7% | |
| Original Amortization: | None | UW Revenues(6): | $6,048,015 | |
| Amortization Type: | Interest Only | UW Expenses: | $1,723,994 | |
| Call Protection: | L(26),Def(90),O(4) | UW NOI: | $4,324,021 | |
| Lockbox / Cash Management(1): | Hard / Springing | UW NCF: | $4,220,081 | |
| Additional Debt: | Yes | Appraised Value / Per SF(7): | $105,000,000 / $973 | |
| Additional Debt Balance: | $20,000,000 | Appraisal Date: | 10/19/2018 | |
| Additional Debt Type: | Mezzanine Loan | |||
| Escrows and Reserves(8) | Financial Information | ||||||
| Initial | Monthly | Initial Cap | Cut-off Date Loan / SF(7): | $445 | |||
| Taxes: | $235,000 | $90,000 | N/A | Maturity Date Loan / SF(7): | $445 | ||
| Insurance: | $70,000 | $12,300 | N/A | Cut-off Date LTV: | 45.7% | ||
| Replacement Reserves: | $0 | $1,804 | $64,944 | Maturity Date LTV: | 45.7% | ||
| TI/LC: | $0 | $4,889 | $176,004 | UW NCF DSCR: | 1.59x | ||
| Other: | $684,740 | $0 | N/A | UW NOI Debt Yield: | 9.0% | ||
| Sources and Uses | |||||||
| Sources | Proceeds | % of Total | Uses | Proceeds | % of Total | ||
| Mortgage Loan | $48,000,000 | 65.2 | % | Payoff Existing Debt | $71,732,565 | 97.5% | |
| Mezzanine Loan | 20,000,000 | 27.2 | Upfront Reserves | 989,740 | 1.3% | ||
| Sponsor Equity | 5,603,337 | 7.6 | Closing Costs | 881,032 | 1.2% | ||
| Total Sources | $73,603,337 | 100.0 | % | Total Uses | $73,603,337 | 100.0% | |
| (1) | The Bedford Square Mortgage Loan (as defined below) is structured with a hard lockbox for the retail tenants and a soft lockbox for the multifamily tenants. |
| (2) | Net Rentable Area (SF) of 107,943 square feet represents 78,221 square feet of retail space and 29,722 square feet attributable to 24 multifamily units. |
| (3) | Occupancy is weighted based on total occupied square footage of the retail and multifamily components of the Bedford Square Property (as defined below). Individually, the retail and multifamily components are approximately 85.8% and 78.9% occupied, as of the Occupancy Date, respectively. |
| (4) | Number of Tenants reflects retail tenants only. |
| (5) | 2015-2017 NOI are not available due to the full redevelopment of the Bedford Square Property from 2015-2018 and the TTM NOI as of October 31, 2018, represents the lease up period. |
| (6) | Approximately 19.1% of the UW Revenues are attributable to the multifamily component of the Bedford Square Property. |
| (7) | Appraised Value / Per SF, Cut-off Date Loan / SF and Maturity Date Loan / SF are each calculated based on the combined net rentable area of 107,943 square feet of retail and multifamily space. |
| (8) | For a full description of Escrows and Reserves, please refer to the “Escrows and Reserves” section below. |
THE INFORMATION IN THIS STRUCTURAL AND COLLATERAL TERM SHEET IS NOT COMPLETE AND MAY BE AMENDED PRIOR TO THE TIME OF SALE. THIS TERM SHEET IS NOT AN OFFER TO SELL THESE SECURITIES AND IT IS NOT A SOLICITATION OF AN OFFER TO BUY THESE SECURITIES IN ANY JURISDICTION WHERE THE OFFER OR SALE IS NOT PERMITTED. | ||
| | 38 of 106 | |
| Structural and Collateral Term Sheet | JPMCC 2019-COR4 | |
| Bedford Square | ||
The Loan. The Bedford Square mortgage loan (the “Bedford Square Mortgage Loan”) has an outstanding principal balance as of the Cut-off Date of $48.0 million and is secured by a first mortgage lien on the borrower’s fee interest in a 107,943 square foot mixed use development comprised of a 78,221 square foot retail component and a 24-unit multifamily component (29,722 square feet) located in Westport, Connecticut (the “Bedford Square Property”). The Bedford Square Mortgage Loan has a 10-year term and will be interest only for the entire term. The previously existing debt was not included in a securitization.
The Borrower. The borrowing entity for the Bedford Square Mortgage Loan is Bedford Square Properties, LLC, a Delaware limited liability company and special purpose entity structured to be bankruptcy remote with one independent director.
The Loan Sponsors. The loan sponsors and nonrecourse carve-out guarantors are B. Lance Sauerteig, David Waldman, Paul S. Brandes and Dan Zelson. Mr. Brandes and Mr. Zelson are co-founders and principals of Charter Realty & Development Corp., a full-service real estate investment, development, management and brokerage company founded in 1993. Mr. Waldman is the founder and president of David Adam Realty, a multi-faceted commercial real estate firm specializing in investment, development, brokerage, property and construction management services. Mr. Sauerteig is a partner at Balance Point Capital, a middle market investment firm headquartered in Westport, Connecticut.
The Property. The Bedford Square Property is a 107,943 square foot mixed use development situated on an approximately 1.44-acre site improved with six interconnected buildings which include a 78,221 square foot retail component and a 24-unit multifamily component comprising 29,722 square feet. Additionally, the Bedford Square Property features an 85-space subterranean parking garage and multiple open-air community gathering areas. The Bedford Square Property site was previously home to the Westport Weston Family YMCA which occupied the historic 1923 Bedford Mansion and Firehouse located at the corner of Main Street and Boston Post Road, and an adjoining pavilion located along Church Lane. The loan sponsors acquired the former YMCA complex and an adjoining property in 2010 and 2014, respectively, and completely redeveloped the Bedford Square Property into its current use. The project went through an extensive permitting and approval process that lasted nearly six years and the Bedford Square Property officially opened in the Spring of 2017. The area is a historic district and due to this designation, no material changes were made to the exterior of the Bedford Square Property buildings.
Retail use is located at street level with select tenants provided with basement space. Parking is provided at the 85-space subterranean parking garage and additional parking is available at a large municipal lot on Elm Street. The street level retail component of the Bedford Square Property is comprised of 78,221 square feet and is currently 85.8% leased by 11 tenants, as of November 1, 2018. The retail component is anchored by a 40,758 square foot (52.1% of retail net rentable area) flagship Anthropologie store on a 15-year triple net lease through August 2032. The remaining tenancy is comprised of a variety of in-line and restaurant tenants.
The Bedford Square Property is located within Westport, Connecticut’s “golden triangle” which encompasses downtown’s primary commercial district along Main Street, Post Road, Church Lane and Elm Street. The Bedford Square Property is a unique live-work-play destination that is the only of its kind in Downtown Westport. Downtown Westport has no significant land parcels available for development and strict zoning regulations make future development/redevelopment of competing properties challenging. According to a research report, Westport is ranked the ninth wealthiest community in the nation and the second wealthiest in Connecticut. The area surrounding the Bedford Square Property is generally characterized as a densely populated trade area featuring upscale national retailers including Anthropologie, Tiffany & Co., Ann Taylor Loft, Intermix, Nike Running, Allen Edmonds, Theory, Eileen Fisher, and Madewell, among others. Downtown Westport features tree lined streets, brick sidewalks, local boutiques, art galleries and various high-end dining options.
As of 2018, the estimated population within a one-, three- and five-mile radius was approximately 5,911, 46,703 and 128,404, respectively. The median household income within a one-, three- and five-mile radius was $154,004, $132,417 and $103,982, respectively, and median owner-occupied housing value within a one-, three- and five-mile radius was $1,043,967, $746,329 and $611,889, respectively.
According to a third party research report, the Bedford Square Property falls within the Westport retail submarket within the greater Fairfield County retail market. As of the third quarter of 2018, the Westport retail submarket was comprised of approximately 2.7 million square feet of space with a vacancy rate of 6.0% and average asking rents of $52.83 per square foot. Additionally, the appraisal identified eight comparable retail leases at competitive properties ranging in size from 863 square feet to 7,784 square feet. Base rents for the comparable leases ranged from $55.00 per square foot to $130.00 per square foot, with a weighted average of approximately $80.45 per square foot. The appraisal also identified 13 comparable retail leases located in downtown Westport ranging in size from 636 square feet to 4,300 square feet. Base rents for the downtown Westport comparable leases ranged from $67.00 per square foot to $165.00 per square foot, with a weighted average of approximately $105.77 per square foot. The appraisal concluded retail market rents for anchor space were $55.00 per square foot and that market rents for the inline space ranged between $60.00 and $82.00 per square foot.
THE INFORMATION IN THIS STRUCTURAL AND COLLATERAL TERM SHEET IS NOT COMPLETE AND MAY BE AMENDED PRIOR TO THE TIME OF SALE. THIS TERM SHEET IS NOT AN OFFER TO SELL THESE SECURITIES AND IT IS NOT A SOLICITATION OF AN OFFER TO BUY THESE SECURITIES IN ANY JURISDICTION WHERE THE OFFER OR SALE IS NOT PERMITTED. | ||
| | 39 of 106 | |
| Structural and Collateral Term Sheet | JPMCC 2019-COR4 | |
| Bedford Square | ||
The multifamily component of the collateral consists of 24 units totaling 29,722 square feet and is comprised of 11 one-bedroom and 13 two-bedroom layouts. Of the 24 units, 19 are fair market units and five are affordable units. The multifamily component was 78.9% occupied based on square footage as of November 1, 2018. According to a third party research report, the Bedford Square Property falls within the Middle Fairfield County multifamily submarket, which reported a total inventory of 568 units as of Q3 2018. The submarket reported a vacancy rate of 2.9% with effective rents of $2,485 per unit. The appraisal and a third party research report identified nine comparable multifamily leases ranging in size from 900 square feet to 2,727 square feet. Monthly multifamily rents for the comparable leases ranged from $2,950 per unit to $15,000 per unit, with an average of approximately $7,695 per unit.
| Multifamily Unit Mix(1) | |||||||||
| Unit Type | # of Units | % of Total | Occupied Units | Occupancy(2) | Average Unit Size (SF) | Average Monthly Rental Rate | Average Monthly Rental Rate PSF | Monthly Market Rent | Monthly Market Rent PSF |
| 1 BR – 1 BA Fair Market | 3 | 12.5% | 2 | 66.0% | 766 | $3,250 | $4.24 | $3,333 | $4.35 |
| 1 BR – 1 BA Affordable | 2 | 8.3% | 2 | 100.0% | 725 | $1,270 | $1.75 | $1,270 | $1.75 |
| 1 BR – 1.5 BA Fair Market | 5 | 20.8% | 3 | 62.0% | 1,193 | $6,600 | $5.53 | $6,180 | $5.18 |
| 1 BR – 2 BA Affordable | 1 | 4.2% | 1 | 100.0% | 1,403 | $1,199 | $0.85 | $1,199 | $0.85 |
| 2 BR – 2 BA Fair Market | 7 | 29.2% | 6 | 87.2% | 1,238 | $6,108 | $4.93 | $6,093 | $4.92 |
| 2 BR – 2 BA Affordable | 2 | 8.3% | 2 | 100.0% | 1,314 | $1,533 | $1.17 | $1,533 | $1.17 |
| 2 BR – 2.5 BA Fair Market | 4 | 16.7% | 3 | 71.2% | 1,827 | $8,917 | $4.88 | $9,050 | $4.95 |
| Total/ Wtd. Avg. | 24 | 100.0% | 19 | 78.9% | 1,238 | $5,079 | $4.10 | $5,273 | $4.26 |
| (1) | Based on the November 1, 2018 multifamily rent roll. |
| (2) | Occupancy is weighted based on the total occupied square footage of the multifamily component. |
| Tenant Summary(1) | ||||||
| Tenant | Ratings Moody’s/Fitch/S&P | Net Rentable Area (SF) | % of Total NRA | Base Rent PSF | % of Total Base Rent | Lease Expiration Date |
| Anthropologie(2)(3) | NR / NR / NR | 40,758 | 52.1% | $53.98 | 54.8% | 8/31/2032 |
| Williams-Sonoma(2) | NR / NR / NR | 7,424 | 9.5 | $72.20 | 13.3% | 1/31/2029 |
| HSBC(2)(4) | Aa3 / NR / AA- | 3,230 | 4.1 | $65.04 | 5.2% | 2/29/2028 |
| Higgins Group(2) | NR / NR / NR | 2,900 | 3.7 | $55.00 | 4.0% | 5/31/2024 |
| Charter Realty & Dev.(2)(5) | NR / NR / NR | 2,714 | 3.5 | $47.50 | 3.2% | 7/31/2022 |
| Wafu(2) | NR / NR / NR | 2,329 | 3.0 | $49.00 | 2.8% | 10/31/2038 |
| Whip Salon(2) | NR / NR / NR | 2,027 | 2.6 | $55.00 | 2.8% | 7/31/2028 |
| Barbour(2) | NR / NR / NR | 1,827 | 2.3 | $65.00 | 3.0% | 6/30/2028 |
| Savannah Bee(2) | NR / NR / NR | 1,804 | 2.3 | $103.20 | 4.6% | 8/31/2027 |
| Nic+Zoe(2) | NR / NR / NR | 1,492 | 1.9 | $123.45 | 4.6% | 9/30/2027 |
| (1) | Based on the underwritten rent roll dated as of November 1, 2018. |
| (2) | Anthropologie has two, 10-year renewal options remaining, Williams-Sonoma has two, five-year renewal options remaining, HSBC has one, five-year renewal option remaining, Higgins Group has one, six-year renewal options remaining, Charter Realty & Dev. has one, five-year renewal option remaining, Wafu has one, five-year renewal option remaining, Whip Salon has one, five-year renewal option remaining, Barbour has one, five-year renewal option remaining, Savannah Bee has one, five-year renewal option remaining and Nic+Zoe has two, five-year renewal options remaining. |
| (3) | Anthropologie has subleased 2,053 square feet to its affiliate, Amis Trattoria, under a coterminous 15-year lease term. Anthropologie remains liable under the sublease. |
| (4) | HSBC has a termination right effective February 2025 upon one year’s prior written notice, provided tenant delivers a termination fee that includes 100.0% of the unamortized portion of the tenant improvement allowance, rent concessions and leasing commissions plus nine months of minimum rent and additional rent. |
| (5) | Charter Realty & Dev. is an affiliate of the borrower and the space is used for office and leasing. |
THE INFORMATION IN THIS STRUCTURAL AND COLLATERAL TERM SHEET IS NOT COMPLETE AND MAY BE AMENDED PRIOR TO THE TIME OF SALE. THIS TERM SHEET IS NOT AN OFFER TO SELL THESE SECURITIES AND IT IS NOT A SOLICITATION OF AN OFFER TO BUY THESE SECURITIES IN ANY JURISDICTION WHERE THE OFFER OR SALE IS NOT PERMITTED. | ||
| | 40 of 106 | |
| Structural and Collateral Term Sheet | JPMCC 2019-COR4 | |
| Bedford Square | ||
| Retail Lease Rollover Schedule(1)(2)(3) | |||||||||
| Year | Number of Leases Expiring | Net Rentable Area Expiring | % of NRA Expiring | Base Rent Expiring | % of Base Rent Expiring | Cumulative Net Rentable Area Expiring | Cumulative % of NRA Expiring | Cumulative Base Rent Expiring | Cumulative % of Base Rent Expiring |
| Vacant | NAP | 11,144 | 14.2% | NAP | NAP | 11,144 | 14.2% | NAP | NAP |
| 2019 & MTM | 0 | 0 | 0.0% | $0 | 0.0% | 11,144 | 14.2% | $0 | 0.0% |
| 2020 | 0 | 0 | 0.0% | 0 | 0.0% | 11,144 | 14.2% | $0 | 0.0% |
| 2021 | 1 | 572 | 0.7% | 66,000 | 1.6% | 11,716 | 15.0% | $66,000 | 1.6% |
| 2022 | 1 | 2,714 | 3.5% | 128,915 | 3.2% | 14,430 | 18.4% | $194,915 | 4.9% |
| 2023 | 0 | 0 | 0.0% | 0 | 0.0% | 14,430 | 18.4% | $194,915 | 4.9% |
| 2024 | 1 | 2,900 | 3.7% | 159,500 | 4.0% | 17,330 | 22.2% | $354,415 | 8.8% |
| 2025 | 0 | 0 | 0.0% | 0 | 0.0% | 17,330 | 22.2% | $354,415 | 8.8% |
| 2026 | 0 | 0 | 0.0% | 0 | 0.0% | 17,330 | 22.2% | $354,415 | 8.8% |
| 2027 | 2 | 3,296 | 4.2% | 370,364 | 9.2% | 20,626 | 26.4% | $724,779 | 18.1% |
| 2028 | 3 | 7,084 | 9.1% | 440,330 | 11.0% | 27,710 | 35.4% | $1,165,109 | 29.0% |
| 2029 | 1 | 7,424 | 9.5% | 536,000 | 13.3% | 35,134 | 44.9% | $1,701,109 | 42.4% |
| 2030 & Beyond | 2 | 43,087 | 55.1% | 2,314,121 | 57.6% | 78,221 | 100.0% | $4,015,230 | 100.0% |
| Total | 11 | 78,221 | 100.0% | $4,015,230 | 100.0% | ||||
| (1) | Based on the underwritten retail rent roll dated November 1, 2018. |
| (2) | Certain retail tenants may have termination or contraction options (which may become exercisable prior to the originally stated expiration date of the tenant lease) that are not considered in the above Retail Lease Rollover Schedule. |
| (3) | Based on 78,221 square feet, which excludes 29,722 square feet and $1,158,060 of underwritten base rent attributable to the multifamily component of the Bedford Square Property. |
| Operating History and Underwritten Net Cash Flow(1) | ||||
| TTM(2) | Underwritten | Per Square Foot(3) | %(4) | |
| Retail Rents in Place | $3,401,825 | $4,004,138 | $37.09 | 55.5% |
| Multifamily Rents in Place | 726,944 | 1,158,060 | 10.73 | 16.1 |
| Straight Line Rent | 0 | 4,492 | 0.04 | 0.1 |
| Contractual Rent Steps | 0 | 6,600 | 0.06 | 0.1 |
| Vacant Retail Income | 0 | 817,360 | 7.57 | 11.3 |
| Vacant Multifamily Income | 0 | 360,600 | 3.34 | 5.0 |
| Gross Potential Rent | $4,128,770 | $6,351,250 | $58.84 | 88.1% |
| Total Reimbursements | 539,273 | 860,684 | 7.97 | 11.9% |
| Net Rental Income | $4,668,043 | $7,211,934 | $66.81 | 100.0% |
| (Vacancy/Credit Loss) | 0 | (1,177,960) | (10.91) | (16.3)-- |
| Other Income | 9,537 | 14,041 | 0.13 | 0.2% |
| Effective Gross Income | $4,677,580 | $6,048,015 | $56.03 | 83.9% |
| Total Expenses | $1,238,119 | $1,723,994 | $15.97 | 28.5% |
| Net Operating Income | $3,439,461 | $4,324,021 | $40.06 | 71.5% |
| Total TI/LC, CapEx/RR | 0 | 103,940 | 0.96 | 1.7 |
| Net Cash Flow | $3,439,461 | $4,220,081 | $39.10 | 69.8% |
| (1) | 2015-2017 NOI are not available due to the full redevelopment of the Bedford Square Property from 2015-2018 and the TTM NOI represents the lease up period. |
| (2) | TTM column represents the trailing 12-month period ending October 31, 2018. |
| (3) | Per Square Foot is based on 107,943 square feet, which represents 78,221 square feet of retail space and 29,722 square feet of multifamily space attributable to 24 units. |
| (4) | % column represents percent of Net Rental Income for all revenue lines and represents percent of Effective Gross Income for the remainder of the fields. |
THE INFORMATION IN THIS STRUCTURAL AND COLLATERAL TERM SHEET IS NOT COMPLETE AND MAY BE AMENDED PRIOR TO THE TIME OF SALE. THIS TERM SHEET IS NOT AN OFFER TO SELL THESE SECURITIES AND IT IS NOT A SOLICITATION OF AN OFFER TO BUY THESE SECURITIES IN ANY JURISDICTION WHERE THE OFFER OR SALE IS NOT PERMITTED. | ||
| | 41 of 106 | |
| Structural and Collateral Term Sheet | JPMCC 2019-COR4 | |
| Bedford Square | ||
Property Management. Both the multifamily and retail portions of the Bedford Square Property are managed by Charter Realty Management Corp. and David Adam Realty, Inc., which are affiliates of the borrower.
Escrows and Reserves. At origination, the borrower deposited into escrow $500,000 for required repairs which will be reimbursed to Anthropologie for flood related repairs, $235,000 for real estate taxes, $184,740 for outstanding tenant improvements and leasing commissions and $70,000 for insurance premiums.
Tax Escrows– On a monthly basis, the borrower is required to escrow 1/12 of the annual estimated tax payments which currently equates to $90,000.
Insurance Escrows– On a monthly basis, the borrower is required to escrow 1/12 of the annual estimated insurance premiums which currently equates to $12,300.
Replacement Reserves –On a monthly basis, the borrower is required to escrow $1,804 for replacement reserves into a replacement reserve account, comprised of approximately $1,304 for the retail component ($0.20 per square foot of retail space annually) and $500 for the multifamily component ($250 per unit of multifamily space annually). The reserve is subject to a cap of $64,944.
TI/LC Reserves – On a monthly basis, the borrower is required to escrow $4,889 (approximately $0.75 per square foot of retail space annually) for tenant improvements and leasing commissions. The reserve is subject to a cap of $176,004.
Lockbox / Cash Management.The Bedford Square Mortgage Loan is structured with a hard lockbox, with respect to the retail tenants and a soft lockbox, with respect to the multifamily tenants, and springing cash management. All retail rents are required to be deposited directly by the tenant into a lockbox account controlled by the lender and all multifamily rents are required to be deposited into a lockbox account within one business day of receipt by the borrower or property manager. All funds in the lockbox account are required to be swept daily into the borrower’s operating account, unless a Cash Management Period (as defined below) is continuing. Upon the occurrence of a Cash Management Period, funds in the lockbox account will be swept daily into a lender-controlled account, from which account such funds will be disbursed on each payment date in accordance with the loan documents and any excess will be retained by the lender as additional collateral for the Bedford Square Mortgage Loan.
A “Cash Management Period” will commence upon (i) an event of default (including an event of default under the mezzanine loan), (ii) if the debt service coverage is less than 1.00x during the first 23 months of the Bedford Square Mortgage Loan term and 1.05x thereafter (until such time that the debt service coverage ratio is greater than or equal to 1.00x for two consecutive quarters during the first 23 months of the loan term and 1.05x for two consecutive quarters thereafter) or (iii) during a Lease Sweep Period (as defined below).
A “Lease Sweep Period” will commence on the first payment date following (i) the date that is 12 months prior to the end of the term (including any renewal terms) of any Lease Sweep Lease (as defined below), (ii) the date required under a Lease Sweep Lease by which the applicable Lease Sweep Tenant (as defined below) is required to give notice of its exercise of a renewal option thereunder (and such renewal has not so been exercised), (iii) if any Lease Sweep Lease is surrendered, cancelled or terminated prior to its then-current expiration date, (iv) if any Lease Sweep Tenant goes dark or gives notice that it intends to discontinue its business at its premises, (v) upon the occurrence of a material default under any Lease Sweep Lease or (vi) upon the occurrence of a Lease Sweep Tenant insolvency proceeding.
A “Lease Sweep Lease” means the Anthropologie lease and any lease which covers 10,000 or more square feet or represents 10.0% or more of total annual rent.
A “Lease Sweep Tenant” means any tenant under a Lease Sweep Lease, or under one or more leases which when taken together would constitute a Lease Sweep Lease.
Additional Debt. A mezzanine loan was funded concurrently and is coterminous with the Bedford Square Mortgage Loan. The mezzanine loan has an original principal balance of $20.0 million, accrues interest at a rate of 7.50000% and is interest-only for the entire loan term. Including the mezzanine loan, the cumulative Cut-off Date LTV, cumulative UW NCF DSCR and cumulative UW NOI DY are 64.8%, 1.01x and 6.3%, respectively. The current borrower under the mezzanine loan is Bedford Square Holding Company, LLC. The mezzanine loan is currently held by LCM.
THE INFORMATION IN THIS STRUCTURAL AND COLLATERAL TERM SHEET IS NOT COMPLETE AND MAY BE AMENDED PRIOR TO THE TIME OF SALE. THIS TERM SHEET IS NOT AN OFFER TO SELL THESE SECURITIES AND IT IS NOT A SOLICITATION OF AN OFFER TO BUY THESE SECURITIES IN ANY JURISDICTION WHERE THE OFFER OR SALE IS NOT PERMITTED. | ||
| | 42 of 106 | |
| Structural and Collateral Term Sheet | JPMCC 2019-COR4 | |
| Saint Louis Galleria | ||
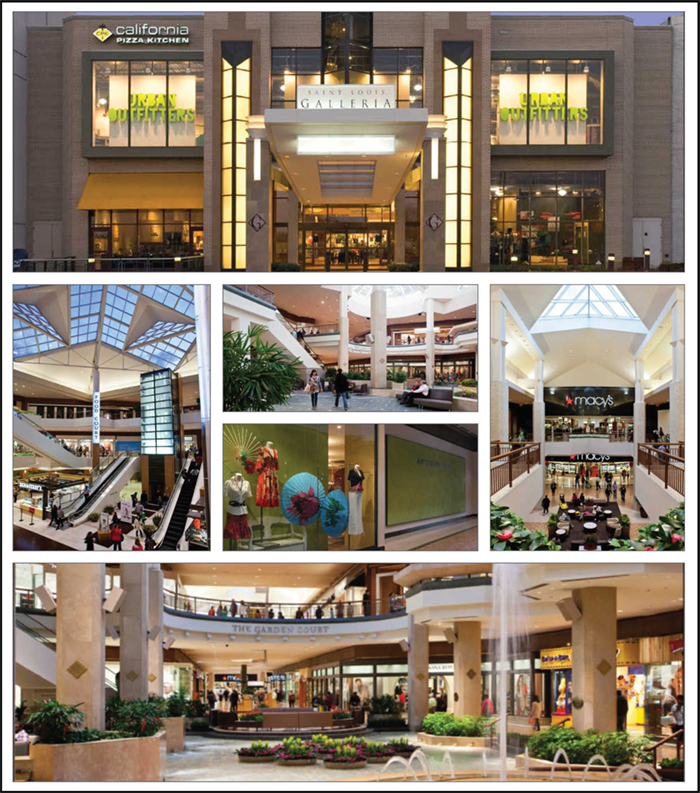
THE INFORMATION IN THIS STRUCTURAL AND COLLATERAL TERM SHEET IS NOT COMPLETE AND MAY BE AMENDED PRIOR TO THE TIME OF SALE. THIS TERM SHEET IS NOT AN OFFER TO SELL THESE SECURITIES AND IT IS NOT A SOLICITATION OF AN OFFER TO BUY THESE SECURITIES IN ANY JURISDICTION WHERE THE OFFER OR SALE IS NOT PERMITTED. | ||
| | 43 of 106 | |
| Structural and Collateral Term Sheet | JPMCC 2019-COR4 | |
| Saint Louis Galleria | ||
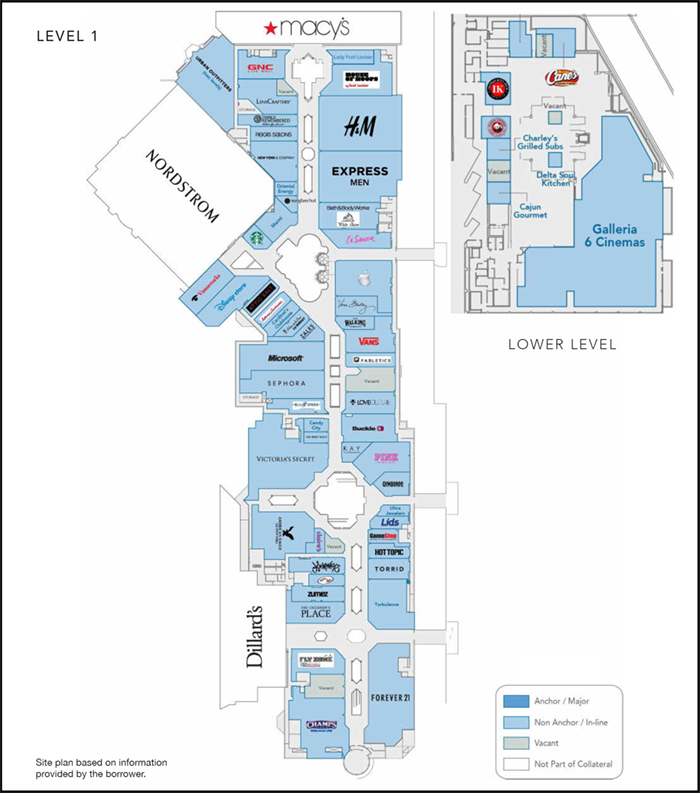
THE INFORMATION IN THIS STRUCTURAL AND COLLATERAL TERM SHEET IS NOT COMPLETE AND MAY BE AMENDED PRIOR TO THE TIME OF SALE. THIS TERM SHEET IS NOT AN OFFER TO SELL THESE SECURITIES AND IT IS NOT A SOLICITATION OF AN OFFER TO BUY THESE SECURITIES IN ANY JURISDICTION WHERE THE OFFER OR SALE IS NOT PERMITTED. | ||
| | 44 of 106 | |
| Structural and Collateral Term Sheet | JPMCC 2019-COR4 | |
| Saint Louis Galleria | ||
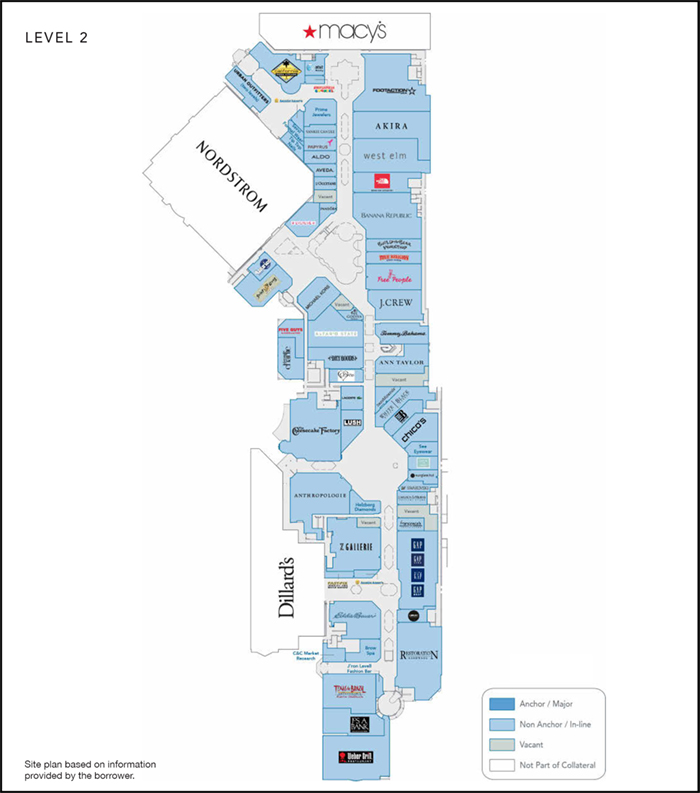
THE INFORMATION IN THIS STRUCTURAL AND COLLATERAL TERM SHEET IS NOT COMPLETE AND MAY BE AMENDED PRIOR TO THE TIME OF SALE. THIS TERM SHEET IS NOT AN OFFER TO SELL THESE SECURITIES AND IT IS NOT A SOLICITATION OF AN OFFER TO BUY THESE SECURITIES IN ANY JURISDICTION WHERE THE OFFER OR SALE IS NOT PERMITTED. | ||
| | 45 of 106 | |
| Structural and Collateral Term Sheet | JPMCC 2019-COR4 | |
| Saint Louis Galleria | ||
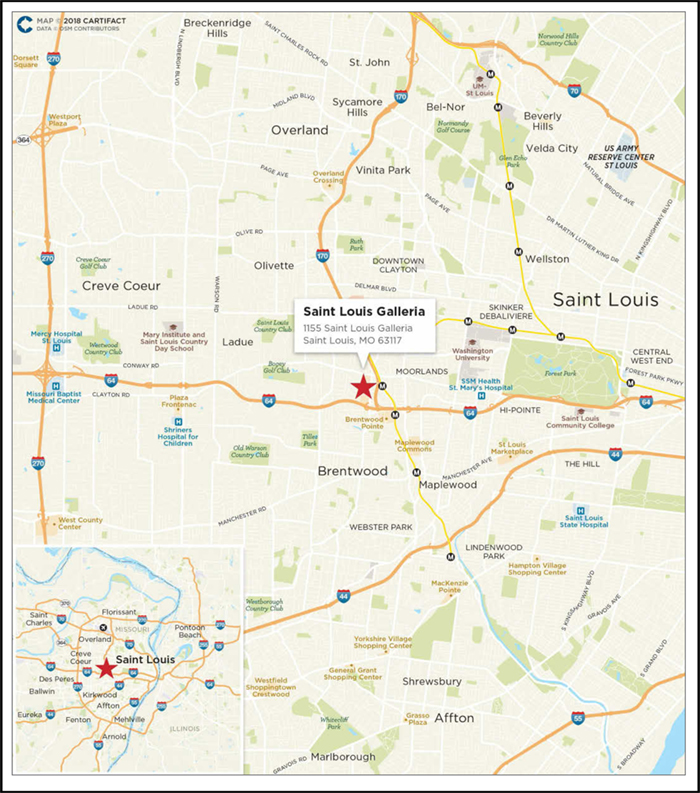
THE INFORMATION IN THIS STRUCTURAL AND COLLATERAL TERM SHEET IS NOT COMPLETE AND MAY BE AMENDED PRIOR TO THE TIME OF SALE. THIS TERM SHEET IS NOT AN OFFER TO SELL THESE SECURITIES AND IT IS NOT A SOLICITATION OF AN OFFER TO BUY THESE SECURITIES IN ANY JURISDICTION WHERE THE OFFER OR SALE IS NOT PERMITTED. | ||
| | 46 of 106 | |
| Structural and Collateral Term Sheet | JPMCC 2019-COR4 | |
| Saint Louis Galleria | ||
| Mortgage Loan Information | Property Information | |||
| Mortgage Loan Seller(1): | LCM | Single Asset / Portfolio: | Single Asset | |
| Original Principal Balance(2): | $46,479,245 | Title: | Fee | |
| Cut-off Date Principal Balance(2): | $46,479,245 | Property Type - Subtype: | Retail – Super Regional Mall | |
| % of Pool by IPB: | 6.0% | Net Rentable Area (SF)(5): | 465,695 | |
| Loan Purpose: | Refinance | Location: | Saint Louis, MO | |
| Borrower: | Saint Louis Galleria L.L.C. | Year Built / Renovated: | 1986 / 2011 | |
| Sponsor: | BPR OP, LP (F/K/A GGP | Occupancy(6): | 96.9% | |
| Operating Partnership, LP) | Occupancy Date: | 9/30/2018 | ||
| Interest Rate(3): | 4.99677083333333% | Number of Tenants: | 125 | |
| Note Date: | 11/1/2018 | 2015 NOI: | $25,166,866 | |
| Maturity Date: | 11/1/2028 | 2016 NOI: | $26,847,500 | |
| Interest-only Period: | 60 months | 2017 NOI: | $26,996,606 | |
| Original Term: | 120 months | TTM NOI (as of 8/2018): | $27,309,350 | |
| Original Amortization(3): | 360 months | UW Economic Occupancy: | 97.1% | |
| Amortization Type(3): | IO-Balloon | UW Revenues: | $37,642,385 | |
| Call Protection(4): | L(27),Def(88),O(5) | UW Expenses: | $10,481,622 | |
| Lockbox / Cash Management: | Hard / Springing | UW NOI: | $27,160,764 | |
| Additional Debt(2): | Yes | UW NCF: | $26,484,297 | |
| Additional Debt Balance(2)(3): | $193,520,755 / $24,136,252 | Appraised Value / Per SF(5): | $465,600,000 / $1,000 | |
| Additional Debt Type(2)(3): | Pari Passu / Mezzanine Loan | |||
| Escrows and Reserves(7) | Financial Information(2) | ||||||
| Initial | Monthly | Initial Cap | Cut-off Date Loan / SF: | $515 | |||
| Taxes: | $0 | Springing | N/A | Maturity Date Loan / SF: | $470 | ||
| Insurance: | $0 | Springing | N/A | Cut-off Date LTV: | 51.5% | ||
| Replacement Reserves: | $0 | Springing | $236,181 | Maturity Date LTV: | 47.0% | ||
| TI/LC: | $0 | Springing | $1,889,448 | UW NCF DSCR(4): | 1.67x | ||
| Other: | $1,675,345 | $0 | N/A | UW NOI Debt Yield: | 11.3% | ||
| Sources and Uses | |||||||
| Sources | Proceeds | % of Total | Uses | Proceeds | % of Total | ||
| Whole Loan | $240,000,000 | 90.6% | Payoff Existing Debt | $215,000,000 | 81.1% | ||
| Mezzanine Loan | 25,000,000 | 9.4% | Upfront Reserves | 1,675,345 | 0.6% | ||
| Closing Costs | 1,440,523 | 0.5% | |||||
| Return of Equity | 46,884,132 | 17.7% | |||||
| Total Sources | $265,000,000 | 100.0% | Total Uses | $265,000,000 | 100.0% | ||
| (1) | The Saint Louis Galleria Whole Loan (as defined below) was co-originated by Deutsche Bank AG, acting through its New York Branch (“DBNY”) and Société Générale Financial Corporation (“Société Générale” and together with DBNY, the “Originators”). The Saint Louis Galleria Loan will be sold to LCM prior to the closing date of this securitization. |
| (2) | The Saint Louis Galleria loan is part of a whole loan evidenced by tenpari passu notes with an aggregate outstanding principal balance as of the Cut-off Date of $240.0 million. Financial Information presented in the chart above reflects the aggregate Cut-off Date balance of the $240.0 million Saint Louis Galleria Whole Loan. |
| (3) | The Saint Louis Galleria Whole Loan, as well as the Saint Louis Galleria Mezzanine Loan (as defined below), amortizes pursuant to a fixed amortization schedule as set forth in Annex G in the Preliminary Prospectus. Debt service coverage ratios are calculated using the sum of the first 12 principal and interest payments after the expiration of the interest only period (period 61 to 72) based on the assumed principal and interest payment schedule set forth in Annex G in the Preliminary Prospectus. |
| (4) | The lockout period will be at least 27 payment dates beginning with and including the first payment date of December 1, 2018. Defeasance of the full $240.0 million Saint Louis Galleria Whole Loan is permitted after the date that is the earlier to occur of (i) November 1, 2021 or (ii) the date that is two years from the closing date of the securitization that includes the last note to be securitized. The assumed lockout period of 27 payments is based on the expected JPMCC 2019-COR4 securitization closing date in February 2019. The actual lockout period may be longer. |
| (5) | Based on total collateral square feet of 465,695, which does not account for an additional 714,052 square feet for Dillard’s (313,913 square feet), Macy’s (262,139 square feet) and Nordstrom (138,000 square feet), which are not part of the collateral. |
| (6) | Occupancy includes five temporary tenants that collectively occupy 5,449 square feet (1.2% of net rentable area (“NRA”)), as well as one tenant that signed a lease and has not yet taken occupancy that accounts for 2,442 square feet (0.5% of NRA). Occupancy excludes three tenants vacating in the near term and one dark tenant, which collectively occupy 6,979 square feet (1.5% of NRA). |
| (7) | For a full description of Escrows and Reserves, please refer to “Escrows and Reserves” below. |
THE INFORMATION IN THIS STRUCTURAL AND COLLATERAL TERM SHEET IS NOT COMPLETE AND MAY BE AMENDED PRIOR TO THE TIME OF SALE. THIS TERM SHEET IS NOT AN OFFER TO SELL THESE SECURITIES AND IT IS NOT A SOLICITATION OF AN OFFER TO BUY THESE SECURITIES IN ANY JURISDICTION WHERE THE OFFER OR SALE IS NOT PERMITTED. | ||
| | 47 of 106 | |
| Structural and Collateral Term Sheet | JPMCC 2019-COR4 | |
| Saint Louis Galleria | ||
The Loan. The Saint Louis Galleria loan (the “Saint Louis Galleria Mortgage Loan”) is a fixed rate loan secured by the borrower’s fee interest in a 465,695 square feet collateral portion of an approximately 1.2 million square feet super regional mall located in Saint Louis, Missouri (the “Saint Louis Galleria Property”). The Saint Louis Galleria Loan is part of a whole loan comprised of ten seniorpari passunotes in the aggregate original principal balance of $240.0 million (the “Saint Louis Galleria Whole Loan”). The Saint Louis Galleria Loan is evidenced by the non-controlling Notes A-1-A3, A-1-A4, A-1-A5, with an outstanding principal balance as of the Cut-off Date of approximately $46.5 million, and is being contributed to the JPMCC 2019-COR4 Trust. The remaining notes have been or are expected to be contributed to one of more future securitization trusts, each as described below.
The relationship between the holders of the Saint Louis Galleria Whole Loan will be governed by a co-lender agreement as described under the “Description of the Mortgage Pool—The Whole Loans—The Non-Serviced Pari Passu Whole Loans” in the Preliminary Prospectus. The Saint Louis Galleria Whole Loan has a 10-year term and, following a five-year interest only period, will amortize on a 30-year schedule. The Saint Louis Galleria Whole Loan accrues interest and amortizes pursuant to a fixed amortization schedule as set forth in Annex G in the Preliminary Prospectus. The most recent prior financing of the Saint Louis Galleria Property was included in the COMM 2014-CCRE14 trust.
| Whole Loan Summary | ||||
| Note | Original Balance | Cut-off Date Balance | Note Holder | Controlling Piece |
| A-1-A3, A-1-A4, A-1-A5 | $46,479,245 | $46,479,245 | JPMCC 2019-COR4 | No |
| A-1-A2 | $55,000,000 | $55,000,000 | Benchmark 2018-B8 | No |
| A-1-A1 | $60,000,000 | $60,000,000 | DBNY | Yes |
| A-2-A1, A-2-A3 | $45,000,000 | $45,000,000 | UBS 2018-C15 | No |
| A-2-A2, A-2-A4, A-2-A5 | $33,520,755 | $33,520,755 | Société Générale | No |
| Total | $240,000,000 | $240,000,000 | ||
The Borrower.The borrower, Saint Louis Galleria L.L.C., is a single purpose Delaware limited liability company structured to be bankruptcy-remote, with two independent directors in its organizational structure.
The Loan Sponsor. The loan sponsor of the borrower and nonrecourse carve-out guarantor is BPR OP, LP (F/K/A GGP Operating Partnership, LP) (“BPR”).
The Saint Louis Galleria Property has historically been majority owned by GGP Inc. In August 2018, GGP Inc. was acquired by Brookfield Property Partners L.P. (“BPY”), a large commercial real estate company, with approximately $90 billion in total assets and a diversified portfolio of office and retail assets, as well as interests in multifamily, triple net lease, industrial, hospitality, self-storage, student housing and manufactured housing assets. As a result of the acquisition, BPR was created as a public security intended to offer the economic equivalence to an investment in BPY in the form of a U.S. REIT stock. BPR is the successor of GGP Inc., which along with the Rouse Properties portfolio that BPY acquired in 2016, contains over $285 billion in assets under management within a portfolio of 163 shopping malls, across 41 states, comprising approximately 148 million square feet of gross leasable area across the U.S. In addition to the Saint Louis Galleria Property, other BPR malls include Ala Moana Center in Honolulu, Hawaii, Tyson’s Galleria in Washington, DC, Glendale Galleria in Los Angeles, California and Water Tower Place in Chicago, Illinois.
The Property. The Saint Louis Galleria Property consists of 465,695 collateral square feet of an approximately 1.2 million square feet, three-story, super regional mall located approximately eight miles west of downtown Saint Louis, Missouri. The 1.2 million square foot mall is anchored by Dillard’s, Macy’s and Nordstrom stores that are independently owned by their respective tenants and comprise 714,052 square feet, which are not part of the collateral. The Saint Louis Galleria Property is 96.9% occupied as of September 30, 2018 by 125 retailers including nationally recognized tenants such as Apple, Forever 21, Gap, H&M, Microsoft and Victoria’s Secret as well as restaurants including The Cheesecake Factory, Weber Grill Restaurant and Five Guys Burgers & Fries, which is complemented by a food court. Additionally, the Saint Louis Galleria includes an independently run movie theater (Galleria 6 Cinemas).
The Saint Louis Galleria Property was constructed in 1986 and renovated in 2011. Since January 1, 2018, 11 leases were signed at the Saint Louis Galleria Property (excluding temporary tenants), totaling 46,625 square feet (10.0% of collateral NRA) and accounting for approximately $2.1 million gross rent (9.0% of gross rent) at an average rent of $48.95 per square foot.
Historical and Current Occupancy(1) | ||||
| 2015 | 2016 | 2017 | 9/30/2018(2) | |
| Occupancy – Excluding Anchors | 94.0% | 96.7% | 97.4% | 96.9% |
| Occupancy – Including Anchors | 97.6% | 98.7% | 99.0% | 98.8% |
| (1) | Source: borrower provided information. |
| (2) | Source: underwritten rent roll as of September 30, 2018. |
THE INFORMATION IN THIS STRUCTURAL AND COLLATERAL TERM SHEET IS NOT COMPLETE AND MAY BE AMENDED PRIOR TO THE TIME OF SALE. THIS TERM SHEET IS NOT AN OFFER TO SELL THESE SECURITIES AND IT IS NOT A SOLICITATION OF AN OFFER TO BUY THESE SECURITIES IN ANY JURISDICTION WHERE THE OFFER OR SALE IS NOT PERMITTED. | ||
| | 48 of 106 | |
| Structural and Collateral Term Sheet | JPMCC 2019-COR4 | |
| Saint Louis Galleria | ||
The subsequent chart represents historical sales at the Saint Louis Galleria Property.
| Historical Sales for Non-Collateral Anchors | ||||||||||||
| Sales Volume ($ in millions)(2) | Sales Volume (per square foot)(2) | National Average(3) | ||||||||||
| Tenant | Ratings | Net Rentable Area (SF) | 2015 | 2016 | 2017 | 2015 | 2016 | 2017 | Sales Volume ($ in millions) | Sales Volume (per square foot) | ||
| Moody’s/S&P/Fitch(1) | Size | |||||||||||
| Dillard’s | NR/NR/NR | 313,913 | $22.5 | $22.6 | $22.0 | $72 | $72 | $70 | 168,493 | $20.6 | $127 | |
| Macy’s | Baa3/BBB-/BBB | 262,139 | $52.0 | $50.0 | $50.0 | $198 | $191 | $191 | 160,000 | $23.0 | $165 | |
| Nordstrom | Baa1/BBB+/BBB+ | 138,000 | $35.0 | $32.5 | $28.7 | $254 | $236 | $208 | 175,000 | $43.3 | $337 | |
| Total / Wtd. Avg. | 714,052 | $109.5 | $105.1 | $100.7 | $153 | $147 | $141 | |||||
| (1) | Certain ratings are those of the parent company. |
| (2) | Sales figures are based on estimates provided by the loan sponsor. |
| (3) | Source: Industry Research Report. |
| Historical Sales PSF for Collateral Tenants(1)(2) | |||||
| 2015 | 2016 | 2017 | T-12 8/31/2018 | T-12 8/31/2018 Occupancy Cost | |
| Major Tenants (>10,000 square feet) | $386 | $380 | $321 | $304 | 19.8% |
| Galleria 6 Cinemas(3) | $396,459 | $419,059 | $416,955 | $423,954 | 20.0% |
| In-line Tenants (<10,000 square feet) (incl. Apple) | $682 | $672 | $650 | $647 | 13.0% |
| Apple | $5,427 | $5,373 | $5,520 | $6,172 | 1.2% |
| In-line Tenants (<10,000 square feet) (excl. Apple) | $574 | $565 | $537 | $520 | 16.3% |
| (1) | Historical Sales PSF for Collateral Tenants is based on the figures provided from the loan sponsor’s historical sales reports. The loan sponsor defines comparable in-line as tenants that have been open for more than 12 months as of the sales report date. In connection with the origination of the Saint Louis Galleria Whole Loan, the Originators completed a separate analysis of tenant sales. The Originators looked at “same-store” sales of tenants that have been at Saint Louis Galleria since 2015 and have reported sales figures through T-12 August 2018. Based on the Originators’ “same-store” sales analysis, the Saint Louis Galleria Property generated same store in-line (<10,000 SF) sales of $734 PSF with an occupancy cost ratio of 11.7% as of T-12 Aug. 2018. Excluding the Apple store, Saint Louis Galleria Property generated same-store in-line (<10,000 SF) sales of $581 PSF with an occupancy cost ratio of 14.9% as of T-12 Aug. 2018. |
| (2) | Approximately 95.8%, 88.6%, 94.6 % and 87.8% of in-line tenants by collateral square feet reported sales in 2015, 2016, 2017 and as of trailing 12-month ended August 31, 2018, respectively. |
| (3) | Sales information represents sales per screen and is based on six screens. |
The Saint Louis Galleria is located in an in-fill location with a minimal amount of developable land and is approximately eight miles west of downtown Saint Louis along Interstate 64. According to the appraisal, the Saint Louis Galleria mall is the closest mall to downtown Saint Louis. Saint Louis is home to approximately 7.0 million square feet of office space (with over 35,000 employees). Additionally, Washington University in Saint Louis and Saint Louis University are both located within a seven-mile radius of the Saint Louis Galleria mall, with a combined student population of approximately 28,000 students.
According to the appraisal, the primary trade area of Saint Louis Galleria mall is considered to be a seven-mile radius, which had a 2017 population and average household income of 598,543 and $80,012, respectively.
| Demographics(1) | 5 mile Trade Area | 7 mile Trade Area | 10 mile Trade Area | Saint Louis CBSA | State of Missouri | USA |
| 2017 Population | 293,260 | 598,543 | 948,538 | 2,838,426 | 6,158,933 | 325,372,858 |
| 2017 Estimated # of Households | 130,617 | 258,686 | 404,750 | 1,128,197 | 2,434,861 | 123,183,573 |
| 2017 Average Household Income | $93,375 | $80,012 | $77,741 | $80,927 | $69,400 | $81,217 |
| (1) | Source: Appraisal. |
THE INFORMATION IN THIS STRUCTURAL AND COLLATERAL TERM SHEET IS NOT COMPLETE AND MAY BE AMENDED PRIOR TO THE TIME OF SALE. THIS TERM SHEET IS NOT AN OFFER TO SELL THESE SECURITIES AND IT IS NOT A SOLICITATION OF AN OFFER TO BUY THESE SECURITIES IN ANY JURISDICTION WHERE THE OFFER OR SALE IS NOT PERMITTED. | ||
| | 49 of 106 | |
| Structural and Collateral Term Sheet | JPMCC 2019-COR4 | |
| Saint Louis Galleria | ||
The chart below summarizes Saint Louis Galleria Property’s competitive set. The appraisal concluded the Saint Louis Galleria mall to be the most dominant mall in the region followed by West County Center. The appraisal also deemed Plaza Frontenac, which is owned by an affiliate of the loan sponsor, to be a minimal competitive threat to the Saint Louis Galleria mall due to its different targeted customer base, smaller size and shared ownership. The other enclosed malls in the area, South County Center and Chesterfield Mall, are inferior to Saint Louis Galleria mall according to the appraisal.
| Competitive Set Summary(1) | ||||||
| Property | Location | Proximity (Miles) | Year Built / Renovated | Occupancy | Sales Per Square Foot(2) | Total GLA | Anchors |
| Saint Louis Galleria Property(3) | Saint Louis, MO | N/A | 1986/2011 | 96.9% | $520 | 465,695 | Dillard’s, Macy’s, |
| Nordstrom | ||||||
| St. Clair Square Mall | Fairview Heights, IL | 20.0 | 1974/2003 | 95% | $378 | 1,109,349 | Dillard’s, JC Penney, |
| Macy’s, Sears | ||||||
| West County Center | Des Peres, MO | 6.0 | 2002 | 95% | $400 | 1,197,210 | Nordstrom, JC Penney, |
| Macy’s | ||||||
| Dick’s Sporting Goods | ||||||
| South County Center | Saint Louis, MO | 9.0 | 1963/2002 | 80% | $250 | 1,044,146 | Dillard’s, JC Penney, |
| Macy’s, Sears (vacant) | ||||||
| Plaza Frontenac | Saint Louis, MO | 3.0 | 1974/2013 | 95% | $730 | 485,004 | Neiman Marcus, |
| Saks Fifth Avenue | ||||||
| Saint Louis Premium Outlets | Chesterfield, MO | 17.0 | 2013 | 98% | $485 | 350,000 | Saks Off 5th, |
| Chesterfield Mall | Chesterfield, MO | 12.0 | 1976/2005 | 70% | $250 | 1,264,857 | Dillard’s, Macy’s, |
| Vacant Sears | ||||||
| (1) | Source: Appraisal. |
| (2) | Sales PSF figures reflect sales for In-line Tenants (<10,000 square feet) and excluding Apple, where applicable. |
| (3) | Saint Louis Galleria Occupancy | Sales Per Square Foot and Total GLA figures are based on collateral of 465,695 square feet as of the September 30, 2018 rent roll, the respective sales figures are as of TTM August 2018. Occupancy based on the entire approximate 1.2 million square feet Saint Louis Galleria mall is 98.8%, inclusive of the Dillard’s (313,913 square feet), Macy’s (262,139 square feet) and Nordstrom (138,000 square feet), which are not part of the collateral. The Saint Louis Galleria Property Occupancy includes five temporary tenants that collectively occupy 5,449 square feet (1.2% of NRA), as well as one tenant that has a signed lease and has yet to take occupancy that accounts for 2,442 square feet (0.5% of NRA). |
THE INFORMATION IN THIS STRUCTURAL AND COLLATERAL TERM SHEET IS NOT COMPLETE AND MAY BE AMENDED PRIOR TO THE TIME OF SALE. THIS TERM SHEET IS NOT AN OFFER TO SELL THESE SECURITIES AND IT IS NOT A SOLICITATION OF AN OFFER TO BUY THESE SECURITIES IN ANY JURISDICTION WHERE THE OFFER OR SALE IS NOT PERMITTED. | ||
| | 50 of 106 | |
| Structural and Collateral Term Sheet | JPMCC 2019-COR4 | |
| Saint Louis Galleria | ||
Collateral Tenant Summary | |||||||||
| Tenant | Ratings Moody’s/S&P/ Fitch(1) | Net Rentable Area (SF) | % of Total NRA | Base Rent Per Square Foot(2) | Lease Expiration(3) | % of Total Base Rent | Most Recent Sales Per Square Foot(4) | Occupancy Cost(4) | |
| Galleria 6 Cinemas | NR/NR/NR | 19,624 | 4.2% | $23.19 | 8/31/2023 | 2.0% | $423,954(5) | 20.0% | |
| H&M(6) | NR/NR/NR | 12,913 | 2.8% | (6) | 1/31/2021 | (6) | $303 | (6) | |
| Victoria’s Secret | Ba1/BB/NR | 12,892 | 2.8% | 46.00 | 1/31/2026 | 2.6% | $259 | 29.9% | |
| Urban Outfitters | NR/NR/NR | 12,623 | 2.7% | 46.93 | 1/31/2021 | 2.6% | $199 | 23.6% | |
| Forever 21 | NR/NR/NR | 11,798 | 2.5% | 62.52 | 1/31/2020 | 3.2% | $267 | 24.2% | |
| Helium Comedy Club(7) | NR/NR/NR | 11,477 | 2.5% | 13.87 | 1/31/2026 | 0.7% | N/A | N/A | |
| Express Men | NR/NR/NR | 11,467 | 2.5% | 34.80 | 1/31/2024 | 1.8% | $210 | 38.6% | |
| Footaction USA(8) | Ba1/BB+/NR | 11,114 | 2.4% | 66.84 | 1/31/2026 | 3.3% | N/A | N/A | |
| The Cheesecake Factory | NR/NR/NR | 10,104 | 2.2% | 40.00 | 1/31/2023 | 1.8% | $993 | 7.4% | |
| GAP(9) | Baa2/BB+/NR | 10,068 | 2.2% | 64.49 | 5/31/2025 | 2.9% | $335 | 33.8% | |
| Subtotal / Wtd. Avg. | 124,080 | 26.6% | $42.57 | 20.8% | |||||
| Remaining Tenants(6)(10) | 327,038 | 70.2% | 56.94 | 79.2% | |||||
| Occupied Subtotal / Weighted Average | 451,118 | 96.9% | $53.20 | 100.0% | |||||
| Vacant | 14,577 | 3.1% | NAP | ||||||
| Total | 465,695 | 100.0% | |||||||
| (1) | Certain ratings are those of the parent company whether or not the parent guarantees the lease. |
| (2) | Base Rent Per Square Foot reflects in-place leases based on the September 30, 2018 rent roll. Base Rent Per Square Foot excludes rent for three tenants vacating in the near term and one dark tenant, which collectively occupy 6,979 square feet (1.5% of NRA). |
| (3) | Certain tenants may have termination or contraction options due to co-tenancy provisions in the related leases (which may become exercisable prior to the originally stated expiration date of the tenant lease). |
| (4) | Most Recent Sales Per Square Foot and Occupancy Cost are provided by the borrower and only include tenants reporting an entire 12 months of sales as of T-12 August 31, 2018. Occupancy Cost excludes utilities reimbursement. Based on a percentage of collateral square feet, approximately 70.5% of in-line tenants (<10,000 square feet) and 69.9% of total collateral tenants reported sales for the period. |
| (5) | Galleria 6 Cinemas Sales per square feet figure represents sales per screen and is based on six screens. |
| (6) | H&M pays percentage rent equal to approximately 15% of gross sales through January 31, 2021. Underwritten cash flows reflect the H&M rent within the Percentage Rent category. |
| (7) | Helium Comedy Club, which took occupancy in January 2016, is not required to report sales information. |
| (8) | Footaction USA, which took occupancy in September 2015, is not required to report sales information. |
| (9) | GAP refers to all GAP affiliated brands, listed on the rent roll as GAP/GAPKIDS/BABYGAP/GAPBO. |
| (10) | Remaining Tenants category includes five temporary tenants that collectively occupy 5,449 square feet (1.2% of NRA), as well as one tenant that has signed a lease and has yet to take occupancy that accounts for 2,442 square feet (0.5% of NRA). Remaining Tenants category excludes three tenants vacating in the near term and one dark tenant, which collectively occupy 6,979 square feet (1.5% of NRA). |
THE INFORMATION IN THIS STRUCTURAL AND COLLATERAL TERM SHEET IS NOT COMPLETE AND MAY BE AMENDED PRIOR TO THE TIME OF SALE. THIS TERM SHEET IS NOT AN OFFER TO SELL THESE SECURITIES AND IT IS NOT A SOLICITATION OF AN OFFER TO BUY THESE SECURITIES IN ANY JURISDICTION WHERE THE OFFER OR SALE IS NOT PERMITTED. | ||
| | 51 of 106 | |
| Structural and Collateral Term Sheet | JPMCC 2019-COR4 | |
| Saint Louis Galleria | ||
| Lease Rollover Schedule(1) | |||||||||
| Year | Number of Leases Expiring | Net Rentable Area Expiring | % of NRA Expiring | Base Rent Expiring | % of Base Rent Expiring | Cumulative Net Rentable Area Expiring | Cumulative % of NRA Expiring | Cumulative Base Rent Expiring | Cumulative % of Base Rent Expiring |
| Vacant | NAP | 14,577 | 3.1% | NAP | NAP | 14,577 | 3.1% | NAP | NAP |
| MTM & 2019 | 19 | 51,576 | 11.1% | $2,081,979 | 9.2% | 66,153 | 14.2% | $2,081,979 | 9.2% |
| 2020 | 12 | 38,634 | 8.3% | 1,718,583 | 7.6% | 104,787 | 22.5% | $3,800,562 | 16.7% |
| 2021 | 27 | 87,106 | 18.7% | 4,539,431 | 20.0% | 191,893 | 41.2% | $8,339,993 | 36.7% |
| 2022 | 12 | 18,244 | 3.9% | 1,224,075 | 5.4% | 210,137 | 45.1% | $9,564,069 | 42.0% |
| 2023 | 16 | 66,618 | 14.3% | 3,107,300 | 13.7% | 276,755 | 59.4% | $12,671,369 | 55.7% |
| 2024 | 7 | 32,542 | 7.0% | 1,587,181 | 7.0% | 309,297 | 66.4% | $14,258,550 | 62.7% |
| 2025 | 8 | 31,495 | 6.8% | 2,264,926 | 10.0% | 340,792 | 73.2% | $16,523,476 | 72.6% |
| 2026 | 12 | 73,919 | 15.9% | 3,524,025 | 15.5% | 414,711 | 89.1% | $20,047,501 | 88.1% |
| 2027 | 7 | 25,214 | 5.4% | 1,596,388 | 7.0% | 439,925 | 94.5% | $21,643,889 | 95.1% |
| 2028 | 3 | 16,101 | 3.5% | 725,124 | 3.2% | 456,026 | 97.9% | $22,369,013 | 98.3% |
| 2029 | 2 | 7,227 | 1.6% | 300,524 | 1.3% | 463,253 | 99.5% | $22,669,538 | 99.6% |
| 2030 & Beyond | 1 | 2,442 | 0.5% | 82,295 | 0.4% | 465,695 | 100.0% | $22,751,833 | 100.0% |
| Total | 126 | 465,695 | 100.0% | $22,751,833 | 100.0% | ||||
| (1) | Certain tenants have lease termination options that may become exercisable prior to the originally stated expiration date of the tenant lease and that are not considered in the lease rollover schedule. |
Operating History and Underwritten Net Cash Flow | |||||||
| 2015 | 2016 | 2017 | TTM(1) | Underwritten | Per Square Foot | %(2) | |
| Rents in Place(3) | $21,642,225 | $22,648,675 | $23,352,079 | $23,505,051 | $23,292,468 | $50.02 | 60.1% |
| Vacant Income | 0 | 0 | 0 | 0 | 1,140,069 | 2.45 | 2.9% |
| Gross Potential Rent | $21,642,225 | $22,648,675 | $23,352,079 | $23,505,051 | $24,432,538 | $52.46 | 63.0% |
| Percentage Rent(4) | 97,128 | 35,290 | 56,473 | 78,668 | 755,659 | 1.62 | 1.9% |
| Total Reimbursements | 10,986,639 | 11,020,889 | 10,498,671 | 9,701,744 | 9,981,597 | 21.43 | 25.7% |
| Specialty Leasing Income | 2,089,966 | 2,055,726 | 1,994,393 | 2,026,772 | 2,026,772 | 4.35 | 5.2% |
| Other Income | 1,065,181 | 1,706,586 | 1,385,382 | 2,091,610 | 1,585,889 | 3.41 | 4.1% |
| Net Rental Income | $35,881,139 | $37,467,166 | $37,286,999 | $37,403,846 | $38,782,454 | $83.28 | 100.0% |
| (Vacancy/Credit Loss)(5) | (89,703) | (93,668) | (93,217) | (93,510) | (1,140,069) | (2.45) | (2.9) |
| Effective Gross Income | $35,791,437 | $37,373,498 | $37,193,781 | $37,310,336 | $37,642,385 | $80.83 | 97.1% |
| Total Operating Expenses | $10,624,571 | $10,525,998 | $10,197,175 | $10,000,986 | $10,481,622 | $22.51 | 27.8% |
| Net Operating Income | $25,166,866 | $26,847,500 | $26,996,606 | $27,309,350 | $27,160,764 | $58.32 | 72.2% |
| Total TI/LC, Capex/RR | 0 | 0 | 0 | 0 | 676,467 | 1.45 | 1.8% |
| Net Cash Flow | $25,166,866 | $26,847,500 | $26,996,606 | $27,309,350 | $26,484,297 | $56.87 | 70.4% |
| (1) | TTM represents the trailing 12-month period ending August 31, 2018. |
| (2) | % column represents percent of Net Rental Income for all revenue lines and represents percent of Effective Gross Income for the remainder of fields. |
| (3) | Underwritten Rents in Place is inclusive of rent steps through September 30, 2019. Rents in Place excludes rent from Chipotle (dark tenant), Brow Art 23 (vacating near term), Passport luggage (vacating near term) and Hyperactive by Jimmy Jazz (vacating near term) as vacant in the underwriting. |
| (4) | Percentage Rent includes the anticipated percentage rent from H&M and J Crew. |
| (5) | Underwritten Vacancy is reflective of in place economic vacancy. |
THE INFORMATION IN THIS STRUCTURAL AND COLLATERAL TERM SHEET IS NOT COMPLETE AND MAY BE AMENDED PRIOR TO THE TIME OF SALE. THIS TERM SHEET IS NOT AN OFFER TO SELL THESE SECURITIES AND IT IS NOT A SOLICITATION OF AN OFFER TO BUY THESE SECURITIES IN ANY JURISDICTION WHERE THE OFFER OR SALE IS NOT PERMITTED. | ||
| | 52 of 106 | |
| Structural and Collateral Term Sheet | JPMCC 2019-COR4 | |
| Saint Louis Galleria | ||
Property Management. The Saint Louis Galleria Property is managed by General Growth Services, Inc. an affiliate of the borrower.
Escrows and Reserves. At origination, the borrower deposited $1,593,050 for outstanding tenant improvement allowances and/or leasing commissions in connection with seven leases at the Saint Louis Galleria Property and deposited $82,295 for free rent associated with tenants with executed leases for which rent payments have not yet commenced.
Tax Escrows –On a monthly basis, during the continuance of a Cash Sweep Period (as defined below), the borrower is required to escrow for real estate taxes in the amount of 1/12 of projected annual property taxes required.
Insurance Escrows –On a monthly basis, during the continuance of a Cash Sweep Period, the borrower is required to escrows for insurance premiums in the amount of 1/12 of projected annual insurance premiums (also waived if blanket policy in place and there is no event of default continuing).
Replacement Reserves – On a monthly basis, during the continuance of a Cash Sweep Period, the borrower is required to escrow for replacement funds of approximately $9,841 monthly ($0.25 per square foot annually), subject to a cap of $236,181 ($0.51 per square foot) are required.
TI/LC Funds –On a monthly basis, during the continuance of a Cash Sweep Period, the borrower is required to escrows for tenant rollover funds (approximately $78,727 monthly ($2.03 per square foot annually), are required, subject to a cap of $1,889,448 ($4.06 per square foot).
Lockbox / Cash Management.The Saint Louis Galleria Whole Loan is structured with a hard lockbox and springing cash management. The borrower was required at loan origination to deliver letters to all tenants at the Saint Louis Galleria Property directing them to deposit all rents and payments into a lender controlled lockbox account. To the extent no Cash Sweep Period (as defined below) is continuing, all funds in the lockbox account are required to be transferred to or at the direction of the borrower. Following the occurrence and during the continuance of a Cash Sweep Period, all funds in the lockbox account are required to be swept each business day to a segregated cash management account under the control of the lender and disbursed in accordance with the loan documents.
During the continuance of a Cash Sweep Period, all excess cash will remain in the lender controlled account and held as additional collateral for the Saint Louis Galleria Whole Loan; provided, however, that if a Major Anchor Sweep Period (as defined below) is then continuing the excess cash will be deposited into a major anchor sweep reserve account to be applied pursuant to the mortgage loan documents.
A “Cash Sweep Period” means any period during the continuance of (i) an event of default under the loan documents or mezzanine loan documents, (ii) during a bankruptcy action of the borrower or guarantor, (iii) any Low DSCR Trigger Period (as defined below), or (iv) the continuance of a Major Anchor Sweep Period (as defined below), until such time that borrower has cured the applicable cause of the Cash Sweep Period in accordance with the terms of the mortgage loan documents.
A “Low DSCR Trigger Period” means any period during the continuance of which (i) the debt service coverage ratio (“DSCR”) based on the Saint Louis Galleria Whole Loan is less than 1.45x or (ii) the combined DSCR based on the Saint Louis Galleria Whole Loan and related mezzanine loan is less than 1.30x and will end on the earlier to occur of the date a DSCR of at least 1.45x and a combined DSCR of at least 1.30x is achieved for at least two consecutive calculation dates, as determined by the lender.
A “Major Anchor Sweep Period” will commence upon the earliest to occur of (a) the early termination, early cancellation or early surrender of the Major Anchor (as defined below) premises or upon borrower’s receipt of notice by a Major Anchor of its intent to effect an early termination, early cancellation or early surrender with respect its respective premises, (b) (i) Nordstrom (not part of the collateral) failing to continue to operate its business in at least 130,000 square feet of its 138,000 square feet of space or (ii) Macy’s (not part of the collateral) failing to continue to operate its business in at least 210,000 square feet of its 262,139 square feet or (c) a bankruptcy action of any major anchor or its direct or indirect parent.
A Major Anchor Sweep Period will end (a) if such Major Anchor premises is owned by borrower or an affiliate of the borrower, (i) at least (x) if a Major Anchor Sweep Event is in effect with respect to an Occupancy Threshold (as defined below) and (y) a portion of the space leased by the Major Anchor Space equal to the Occupancy Threshold has been re-tenanted pursuant to the loan documents or has been renewed pursuant to the respective lease terms, or (ii) a portion of the Major Anchor premises equal to at least the Occupancy Threshold has been redeveloped and/or is being operated for a retail or related use and in a manner which is not inconsistent with the operation of the balance of Saint Louis Galleria Property and such Major Anchor premises have been re-tenanted pursuant to the loan documents, or (iii) a portion of the Major Anchor premises equal to at least the Occupancy Threshold has been redeveloped and is open and being operated for a non-retail use in a manner which is complementary to the use of the balance of Saint Louis Galleria Property, but only if permitted by lender in its sole and absolute discretion, (b) if such Major Anchor premises is not owned by borrower or an affiliate of borrower, and (i) such Major Anchor premises is otherwise occupied and open for business with one or more retail
THE INFORMATION IN THIS STRUCTURAL AND COLLATERAL TERM SHEET IS NOT COMPLETE AND MAY BE AMENDED PRIOR TO THE TIME OF SALE. THIS TERM SHEET IS NOT AN OFFER TO SELL THESE SECURITIES AND IT IS NOT A SOLICITATION OF AN OFFER TO BUY THESE SECURITIES IN ANY JURISDICTION WHERE THE OFFER OR SALE IS NOT PERMITTED. | ||
| | 53 of 106 | |
| Structural and Collateral Term Sheet | JPMCC 2019-COR4 | |
| Saint Louis Galleria | ||
operators in at least the applicable Occupancy Threshold, (ii) such Major Anchor premises has been redeveloped and/or is being operated in a manner which is not inconsistent with the operation of the balance of the Saint Louis Galleria Property, as determined by lender and open for business with one or more retail operators in at least the Occupancy Threshold, or (iii) a portion of the Major Anchor premises equal to at least the Occupancy Threshold has been redeveloped and is open and being operated for a non-retail use in a manner which is not inconsistent with the use of the balance of Saint Louis Galleria, but only if approved by lender.
A “Major Anchor” is any of (a) Nordstrom, (b) Macy’s, or (c) any other owner, operator or tenant with respect to substantially all of any space occupied by such anchor tenants.
The “Occupancy Threshold” is 125,000 square feet of the 138,000 square foot Nordstrom space (90.6%) and 157,000 square feet of the 262,139 square feet Macy’s space (60.0%).
Additional Debt. In connection with origination of Saint Louis Galleria Whole Loan, the Originators provided a mezzanine loan comprised of two mezzanine notes with an aggregate principal balance of approximately $25.0 million (the “Saint Louis Galleria Mezzanine Loan”) to an affiliate of the borrower. The Saint Louis Galleria Mezzanine Loan is secured by a pledge of the direct equity interest in the borrower and is coterminous with the Saint Louis Galleria Whole Loan. The Saint Louis Galleria Mezzanine Loan accrues interest at a rate of 6.25000% perannum and is fully amortizing by the November 1, 2028 maturity date pursuant to a fixed amortization schedule as set forth in Annex G in the Preliminary Prospectus. The Saint Louis Galleria Mezzanine Loan was sold to a third party. Based on the combined Saint Louis Galleria Whole Loan and the Saint Louis Galleria Mezzanine Loan, the cumulative Cut-off Date LTV is 56.7%, the cumulative UW NCF DSCR is 1.55x and the cumulative UW NOI Debt Yield is 10.3%. The rights of the mezzanine lender under the Saint Louis Galleria Mezzanine Loan are further described under “Description of the Mortgage Pool—Additional Indebtedness—Mezzanine Indebtedness” in the Preliminary Prospectus.
Acquired Expansion Parcels. The borrower has the right, at its own expense, to acquire one or more parcels of land that constitutes an integral part of, or adjoins, the Saint Louis Galleria mall, which land was not owned by the borrower on the date of origination of the Saint Louis Galleria Whole Loan (which shall expressly include any anchor premises or any part thereof) (such acquired land, an “Expansion Parcel”), to become additional collateral for the Saint Louis Galleria Whole Loan whereupon, after amending the Saint Louis Galleria Whole Loan documents, such parcel will constitute a portion of the Saint Louis Galleria Property, upon satisfaction of specified conditions including, among other things, that (i) there is no event of default, (ii) the borrower acquires a fee simple or leasehold interest to the applicable Expansion Parcel and (iii) the expansion does not adversely affect the debt service coverage ratio except in a de minimis manner.
Partial Release and Substitution. The borrower may obtain the release of (A) one or more vacant, non-income producing and unimproved parcels or outlots or (B) an Expansion Parcel upon satisfaction of specified conditions including, among other things, that (i) there is no event of default, (ii) the parcel subject to the release is not necessary for the remaining Saint Louis Galleria Property to comply with zoning or legal requirements, (iii) the release will not result in the downgrade, withdrawal or qualification of the then current rating assigned to any class of certificates, (iv) the release will not result in an LTV ratio that does not comply with REMIC guidelines and (v) the release will not result in a material diminution in the value of Saint Louis Galleria Property. In addition, with respect to an Expansion Parcel that is an anchor premises, such anchor premises may be released with the reasonable consent of the lender to another retail operator that has agreed in writing to open and operate the anchor premises for retail use within 24 months from the date of release and no reserves have been expended with respect to such anchor premises.
In addition, the borrower is permitted to obtain the release of collateral parcels (an “Exchange Parcel”) from the lien of the mortgage in exchange for the substitution of new parcels (each, an “Acquired Parcel”) as collateral for the Saint Louis Galleria Whole Loan upon 20 days prior notice, subject to the satisfaction of certain conditions, including among other things, that: (i) the Exchange Parcel is vacant, non-income producing and unimproved (or improved only by landscaping or readily re-locatable facilities), (ii) with respect to the Acquired Parcel, the borrower has delivered, among other things (a) an environmental report acceptable to lender, (b) title insurance and (c) if the Acquired Parcel is improved, a property condition report indicating that the Acquired Parcel is in good condition and (d) if repairs are recommended by the property condition report or if the environmental report discloses the presence of hazardous materials at the Acquired Parcel, in an amount equal to $13,750,000 (“Alteration Threshold”), cash or a guaranty from the guarantor in an amount equal to 125% of any estimated repairs or remediation costs, as applicable, (iii) the LTV ratio of the remaining Saint Louis Galleria Property (after giving effect to such substitution) is equal to or less than 125% unless the Acquired Parcel has a fair market value equal to or greater than the fair market value of the Exchange Parcel and (iv) the substitution does not adversely affect the debt service coverage ratio of the Saint Louis Galleria Whole Loan except in a de minimis manner. See “Description of the Mortgage Pool – Certain Terms of the Mortgage Loans – Partial Releases” in the Preliminary Prospectus.
THE INFORMATION IN THIS STRUCTURAL AND COLLATERAL TERM SHEET IS NOT COMPLETE AND MAY BE AMENDED PRIOR TO THE TIME OF SALE. THIS TERM SHEET IS NOT AN OFFER TO SELL THESE SECURITIES AND IT IS NOT A SOLICITATION OF AN OFFER TO BUY THESE SECURITIES IN ANY JURISDICTION WHERE THE OFFER OR SALE IS NOT PERMITTED. | ||
| | 54 of 106 | |
| Structural and Collateral Term Sheet | JPMCC 2019-COR4 | |
| Grand Hyatt Seattle | ||
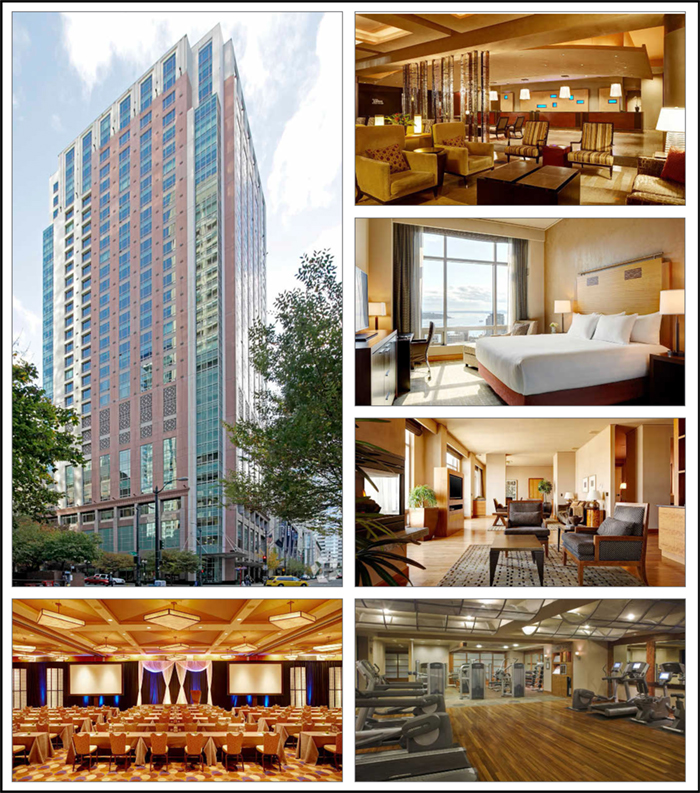
THE INFORMATION IN THIS STRUCTURAL AND COLLATERAL TERM SHEET IS NOT COMPLETE AND MAY BE AMENDED PRIOR TO THE TIME OF SALE. THIS TERM SHEET IS NOT AN OFFER TO SELL THESE SECURITIES AND IT IS NOT A SOLICITATION OF AN OFFER TO BUY THESE SECURITIES IN ANY JURISDICTION WHERE THE OFFER OR SALE IS NOT PERMITTED. | ||
| | 55 of 106 | |
| Structural and Collateral Term Sheet | JPMCC 2019-COR4 | |
| Grand Hyatt Seattle | ||
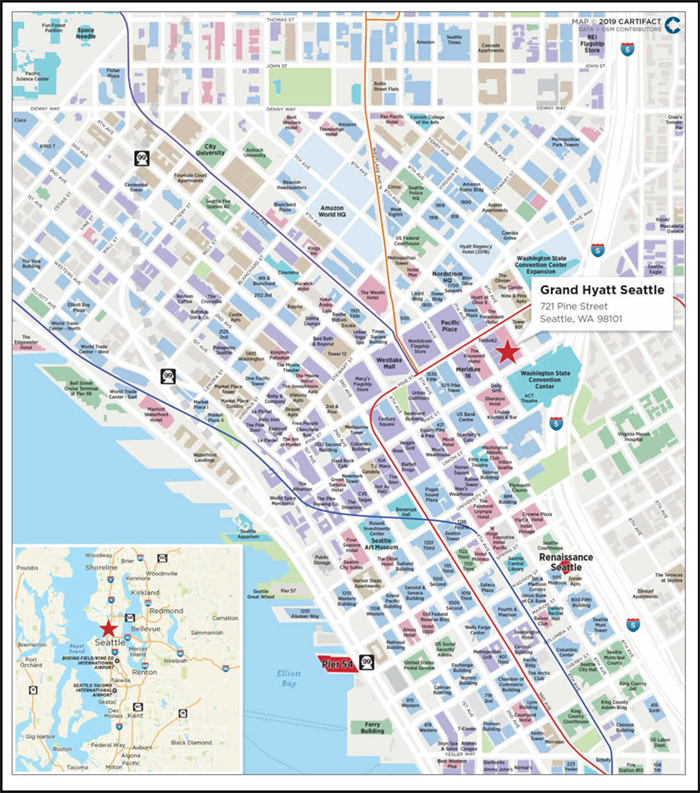
THE INFORMATION IN THIS STRUCTURAL AND COLLATERAL TERM SHEET IS NOT COMPLETE AND MAY BE AMENDED PRIOR TO THE TIME OF SALE. THIS TERM SHEET IS NOT AN OFFER TO SELL THESE SECURITIES AND IT IS NOT A SOLICITATION OF AN OFFER TO BUY THESE SECURITIES IN ANY JURISDICTION WHERE THE OFFER OR SALE IS NOT PERMITTED. | ||
| | 56 of 106 | |
| Structural and Collateral Term Sheet | JPMCC 2019-COR4 | |
| Grand Hyatt Seattle | ||
Mortgage Loan Information | Property Information | |||
| Mortgage Loan Seller: | LCM | Single Asset / Portfolio: | Single Asset | |
| Original Principal Balance(1): | $33,000,000 | Title: | Fee | |
| Cut-off Date Principal Balance(1): | $33,000,000 | Property Type - Subtype: | Hotel – Full Service | |
| % of Pool by IPB: | 4.3% | Net Rentable Area (Rooms): | 457 | |
| Loan Purpose: | Refinance | Location: | Seattle, WA | |
| Borrower: | Hedreen Hotel LLC | Year Built / Renovated: | 2001 / 2016 | |
| Sponsor(2): | Hedreen Holdings LLC | Occupancy / ADR / RevPAR | 86.6% / $249.94 / $216.52 | |
| Interest Rate: | 4.74000% | Occupancy / ADR / RevPAR Date: | 8/31/2018 | |
| Note Date: | 5/5/2017 | Number of Tenants: | N/A | |
| Maturity Date: | 6/6/2027 | 2015 NOI: | $14,518,134 | |
| Interest-only Period: | 121 months | 2016 NOI: | $15,332,692 | |
| Original Term: | 121 months | 2017 NOI: | $16,018,146 | |
| Original Amortization: | None | TTM NOI (as of 8/2018): | $16,479,703 | |
| Amortization Type: | Interest Only | UW Occupancy / ADR / RevPAR: | 86.4% / $249.94 / $216.00 | |
| Call Protection: | L(45),Def(72),O(4) | UW Revenues: | $43,899,089 | |
| Lockbox / Cash Management: | Hard / Springing | UW Expenses: | $27,568,430 | |
| Additional Debt: | Yes | UW NOI: | $16,330,659 | |
| Additional Debt Balance(1): | $100,000,000 | UW NCF: | $14,135,705 | |
| Additional Debt Type(1): | Pari Passu | Appraised Value / Per Room: | $242,300,000 / $530,197 | |
| Appraisal Date: | 3/8/2017 | |||
| Escrows and Reserves(3) | Financial Information(1) | |||||||
| Initial | Monthly | Initial Cap | Cut-off Date Loan / Room: | $291,028 | ||||
| Taxes: | $0 | Springing | N/A | Maturity Date Loan / Room: | $291,028 | |||
| Insurance: | $0 | Springing | N/A | Cut-off Date LTV: | 54.9% | |||
| FF&E Reserves: | $0 | Springing | N/A | Maturity Date LTV: | 54.9% | |||
| TI/LC: | $0 | $0 | N/A | UW NCF DSCR: | 2.21x | |||
| Other: | $0 | $0 | N/A | UW NOI Debt Yield: | 12.3% | |||
| Sources and Uses | ||||||||
| Sources | Proceeds | % of Total | Uses | Proceeds | % of Total | |
| Whole Loan | $133,000,000 | 100.0% | Payoff Existing Debt | $92,671,898 | 69.7% | |
| % | Closing Costs | 338,910 | 0.3% | |||
| Return of Equity | 39,989,192 | 30.1% | ||||
| Total Sources | $133,000,000 | 100.0% | Total Uses | $133,000,000 | 100.0% |
| (1) | The Grand Hyatt Seattle Mortgage Loan (as defined below) is part of a whole loan evidenced by threepari passu notes, with an aggregate outstanding principal balance as of the Cut-off Date of $133.0 million. The Financial Information presented in the chart above reflects the Cut-off Date balance of the $133.0 million Grand Hyatt Seattle Whole Loan, as defined in “The Loan” below. |
| (2) | The sponsor is also the sponsor of the mortgage loan identified on Annex A-1 to the Preliminary Prospectus as Renaissance Seattle, which has a Cut-off Date Principal Balance of $77.0 million. |
| (3) | For a full description of Escrows and Reserves, please refer to “Escrows and Reserves” below. |
THE INFORMATION IN THIS STRUCTURAL AND COLLATERAL TERM SHEET IS NOT COMPLETE AND MAY BE AMENDED PRIOR TO THE TIME OF SALE. THIS TERM SHEET IS NOT AN OFFER TO SELL THESE SECURITIES AND IT IS NOT A SOLICITATION OF AN OFFER TO BUY THESE SECURITIES IN ANY JURISDICTION WHERE THE OFFER OR SALE IS NOT PERMITTED. | ||
| | 57 of 106 | |
| Structural and Collateral Term Sheet | JPMCC 2019-COR4 | |
| Grand Hyatt Seattle | ||
The Loan.The Grand Hyatt Seattle mortgage loan (the “Grand Hyatt Seattle Mortgage Loan”) is secured by a first mortgage lien on the borrower’s fee interest in a 457-room full service hotel located at 721 Pine Street in downtown Seattle, Washington (the “Grand Hyatt Seattle Property”). The Grand Hyatt Seattle Mortgage Loan is part of a whole loan that has an aggregate original principal balance of $133.0 million (the “Grand Hyatt Seattle Whole Loan”) and is comprised of threepari passu notes, each described below. The controlling Note A-1 was contributed to the COMM 2017-COR2 trust and the non-controlling Note A-2 was contributed to the COMM 2018-COR3 trust, as described in the “Whole Loan Summary” chart below. The non-controlling Note A-3, with an outstanding principal balance as of the Cut-off Date of $33.0 million, is being contributed to the JPMCC 2019-COR4 Trust. The relationship between the holders of the Grand Hyatt Seattle Whole Loan will be governed by a co-lender agreement as described under “Description of the Mortgage Pool—The Whole Loans—The Non-Serviced Pari Passu Whole Loans” in the Preliminary Prospectus. The Grand Hyatt Seattle Whole Loan has an approximately 10-year term and requires interest only payments for the term of the loan. The most recent prior financing of the Grand Hyatt Seattle Property was not included in a securitization.
| Whole Loan Summary | ||||
| Notes | Original Balance | Cut-off Date Balance | Note Holder | Controlling Piece |
| A-1 | $50,000,000 | $50,000,000 | COMM 2017-COR2 | Yes |
| A-2 | 50,000,000 | 50,000,000 | COMM 2018-COR3 | No |
| A-3 | 33,000,000 | 33,000,000 | JPMCC 2019-COR4 | No |
| Total | $133,000,000 | $133,000,000 | ||
The Borrower. The borrower, Hedreen Hotel LLC, is a single purpose Delaware limited liability company structured to be bankruptcy-remote, with two independent directors in its organizational structure.
The Loan Sponsor. The Grand Hyatt Seattle Whole Loan’s sponsor and the nonrecourse carve-out guarantor is Hedreen Holdings LLC. Richard Hedreen, the CEO of R.C. Hedreen Co., the parent company of Hedreen Holdings LLC, has over 50 years of experience in real estate development, acquisition, and management. Mr. Hedreen’s current real estate portfolio includes the Grand Hyatt Seattle Property, the Renaissance Seattle (also an asset in the JPMCC 2019-COR4 Trust), the Hyatt @ Olive 8 and the 7th & Pine retail and parking property which is located directly below the Grand Hyatt Seattle hotel (but is not collateral for the Grand Hyatt Seattle Mortgage Loan). All the properties in Mr. Hedreen’s current portfolio are located in downtown Seattle and all were originally developed by Mr. Hedreen.
Other notable developments by Mr. Hedreen include the Hilton Seattle, the Crowne Plaza Seattle Downtown hotel and the Olive 8 Condominiums which is comprised of 229 individually owned residential condominium units located above the Hyatt @ Olive 8 hotel. The 40-story Hyatt @ Olive 8 tower has one of the largest green roofs in downtown Seattle (8,355 square feet) and is LEED silver certified.
The Property. The Grand Hyatt Seattle Property is a 457-room, 30-story, AAA Four-Diamond rated, full-service hotel located at 721 Pine Street in downtown Seattle, Washington, within the Seattle central business district. The borrower completed the construction of the Grand Hyatt Seattle Property in 2001. Beginning in 2014, the borrower converted 32 suites into 64 standard guestrooms, increasing the number of rooms from 425 to 446 in 2014 and then from 446 to 457 in 2015. Per the borrower, the cost to convert the suites into standard guestrooms was equal to $4,171,754 ($65,184 per room based on 64 standard guestrooms). The Grand Hyatt Seattle Property comprises two condominium interests, the 457-room Grand Hyatt Seattle Property (the “Hotel Unit”) and the air rights above the Hotel Unit (the “Air Unit”). A third condominium interest, which is not part of the Grand Hyatt Seattle Property, contains 361,650 square feet of which 24,140 square feet is ground floor retail space and 337,510 square feet is a multi-level parking garage containing 950 stalls (the “7th & Pine Retail and Garage Unit”). The 7th & Pine Retail and Garage Unit is located directly below the Grand Hyatt Seattle Property and is also owned by the loan sponsor. A loan secured by the 7th & Pine Retail and Garage Unit was included in the CFCRE 2016-C6 securitization.
The Grand Hyatt Seattle Property features 457 guestrooms and suites, a full banquet kitchen on the first floor which offers room service as well as catering services for events and meetings, an approximately 14,300 square feet Ruth’s Chris Steak House located at the east end of the lobby, a concierge, a Stay Fit Fitness Center with sauna, steam room, whirlpool and fitness equipment, a gift shop, a business center and valet parking. The Grand Hyatt Seattle Property offers five guestroom configurations and suites. The configurations include 350 king guestrooms (380 square feet), 74 double/double guestrooms (380 square feet), 21 corner suites (500 square feet), 11 emerald suites (500 square feet) and one presidential suite (1,000 square feet). Each guestroom at the Grand Hyatt Seattle Property includes either a king or two double Hyatt Grand Beds, at least one LG flat-screen TV, a mini-fridge, a coffeemaker, work area with desk, dual line phones with voicemail, iron and ironing board, in-room safe, alarm clock radio, complimentary Wi-Fi throughout and expansive floor-to-ceiling windows offering views of the city. Suites include a foyer and separate sitting area.
THE INFORMATION IN THIS STRUCTURAL AND COLLATERAL TERM SHEET IS NOT COMPLETE AND MAY BE AMENDED PRIOR TO THE TIME OF SALE. THIS TERM SHEET IS NOT AN OFFER TO SELL THESE SECURITIES AND IT IS NOT A SOLICITATION OF AN OFFER TO BUY THESE SECURITIES IN ANY JURISDICTION WHERE THE OFFER OR SALE IS NOT PERMITTED. | ||
| | 58 of 106 | |
| Structural and Collateral Term Sheet | JPMCC 2019-COR4 | |
| Grand Hyatt Seattle | ||
The Grand Hyatt Seattle Property is located adjacent to the Washington State Convention Center (“WSCC”) and contains a skywalk bridge located above Pike Street that connects the Grand Hyatt Seattle Property to the WSCC. The Grand Hyatt Seattle Property offers approximately 22,000 square feet of flexible meeting space located on the first, sixth and seventh floors. Meeting space is comprised of two ballrooms, nine breakout rooms, a boardroom, an amphitheater and pre-function space.
The Grand Hyatt Seattle Property is located in the area known as the retail core neighborhood in downtown Seattle, a restaurant and shopping district just south of the Denny Triangle, situated near South Lake Union. According to the appraisal, the Grand Hyatt Seattle Property is located near the area’s primary generators of lodging demand including dozens of upscale retailers and restaurants, major department stores, shopping centers, hotels, office buildings and the Washington State Convention Center (“WSCC”). Because of its central location, the retail core has a substantial daytime population throughout the week. According to the appraisal, the nearby neighborhoods Denny Triangle and South Lake Union represent two of the city’s fastest growing neighborhoods. Amazon’s corporate headquarters was relocated to South Lake Union in 2015.
According to the Downtown Seattle Association, Amazon’s footprint totals 7.6 million square feet with another 3.1 million square feet under development. Amazon reportedly will occupy a total of 12.0 million square feet by 2022, or equal to about a fifth of the inventory of downtown’s best-in-class office space.
In 2015, Expedia announced plans to relocate its headquarters from Bellevue to Downtown Seattle. The development plans will allow Expedia to transition its 3,500 employees to the Seattle campus, with full occupancy in 2019. Additionally, several Silicon Valley high-tech companies, such as Google and Facebook, also have a presence in Seattle. In 2016, Google announced plans to relocate its Fremont campus to South Lake Union in 2019. Google’s new campus, which began construction in the second quarter of 2017, will occupy 607,000 square feet of office space and will be able to accommodate 3,000 to 4,000 employees.
The loan sponsor also developed Seattle’s largest hotel, the Hyatt Regency located at 8th & Howell. The 1,260 room Hyatt Regency hotel broke ground in 2016, on a site previously owned by an affiliate of the loan sponsor and opened for business in December 2018. The Hyatt Regency will be adjacent to the Washington State Convention Center Addition (“WSCC Addition”), which is scheduled to open in 2020. The preliminary cost of the WSCC Addition project is estimated at over $1.5 billion, and the expansion is expected to more than double the size of the existing WSCC, with an additional 440,000 square feet of meeting space planned for the project. The WSCC Addition project is expected to provide several economic benefits, including as much as $240.0 million annually in visitor spending, as many as 3,900 direct and indirect jobs, and some 6,000 jobs during construction.
The demand segmentation for the Grand Hyatt Seattle Property consists of 35.0% corporate demand, 40.0% meeting and group demand and 25.0% leisure demand. The Grand Hyatt Seattle Property’s top corporate accounts include the National Basketball Association, the National Football League, Microsoft, Facebook, Amazon, IBM and Boeing.
| Historical Occupancy, ADR, RevPAR(1)(2) | |||||||||
| Competitive Set | Grand Hyatt Seattle(3) | Penetration Factor | |||||||
| Year | Occupancy | ADR | RevPAR | Occupancy | ADR | RevPAR | Occupancy | ADR | RevPAR |
| 2015 | 82.4% | $212.12 | $174.72 | 86.3% | $224.53 | $193.81%% | 104.7% | 105.8% | 110.9% |
| 2016 | 81.2% | $215.96 | $175.43 | 85.3% | $236.60 | $201.86%% | 105.0% | 109.6% | 115.1% |
| 2017 | 84.3% | $227.49 | $191.75 | 87.4% | $244.92 | $214.11%% | 103.7% | 107.7% | 111.7% |
| TTM(4) | 84.2% | $233.63 | $196.71 | 86.6% | $249.94 | $216.52%% | 102.9% | 107.0% | 110.1% |
| (1) | The minor variances between the underwriting, appraisal and above table with respect to Occupancy, ADR and RevPAR at the Grand Hyatt Seattle property are attributable to variances in reporting methodologies and/or timing differences. |
| (2) | Data provided by a third party travel research report. |
| (3) | Based on operating statements provided by the borrower. |
| (4) | TTM represents the trailing 12-month period ending on August 31, 2018. |
The Grand Hyatt Seattle Property’s immediate marketplace includes eight competitive properties. The eight primary competitors range in size from 237 to 891 rooms. Overall, when taking into account the Grand Hyatt Seattle Property, the competitive set collectively contains an aggregate of 4,137 rooms.
In total, the loan sponsor has developed approximately 55.6% of the appraisal’s competitive set by number of hotels (five of nine) and 48.6% by number of rooms (2,012 of 4,137), and currently owns 33.3% of the appraisal’s competitive set by number of hotels (three of nine) and 32.9% by number of rooms (1,360 of 4,137).
THE INFORMATION IN THIS STRUCTURAL AND COLLATERAL TERM SHEET IS NOT COMPLETE AND MAY BE AMENDED PRIOR TO THE TIME OF SALE. THIS TERM SHEET IS NOT AN OFFER TO SELL THESE SECURITIES AND IT IS NOT A SOLICITATION OF AN OFFER TO BUY THESE SECURITIES IN ANY JURISDICTION WHERE THE OFFER OR SALE IS NOT PERMITTED. | ||
| | 59 of 106 | |
| Structural and Collateral Term Sheet | JPMCC 2019-COR4 | |
| Grand Hyatt Seattle | ||
| Competitive Hotels Profile(1) | ||||||
| 2016 Estimated Operating Statistics | ||||||
| Property | Rooms | Year Opened | Meeting Space (SF) | Occupancy | ADR | RevPAR |
| Grand Hyatt Seattle(3) | 457 | 2001 | 22,000 | 85.3% | $236.60 | $201.86 |
| Renaissance Seattle(2) | 557 | 1978 | 28,000 | 80-85% | $190-200 | $160-170 |
| Hilton Seattle(4) | 237 | 1970 | 6,000 | 90-95% | $210-220 | $200-210 |
| Fairmont Olympic Hotel Seattle | 450 | 1924 | 17,500 | 65-70% | $250-260 | $180-190 |
| Westin Seattle | 891 | 1929 | 48,000 | 80-85% | $210-220 | $170-180 |
| Marriott Seattle Waterfront Hotel | 358 | 2003 | 11,000 | 80-85% | $260-270 | $210-220 |
| Hyatt @ Olive 8(2) | 346 | 2009 | 10,500 | 80-85% | $220-230 | $190-200 |
| Crowne Plaza Seattle Downtown(4) | 415 | 1983 | 8,500 | 80-85% | $170-180 | $140-150 |
| W Hotel Seattle | 426 | 1999 | 10,000 | 70-75% | $230-240 | $170-180 |
| Total | 4,137 | |||||
| (1) | Based on the appraisal. |
| (2) | Originally developed and currently owned by the loan sponsor. |
| (3) | The Grand Hyatt Seattle 2016 Occupancy, ADR and RevPAR are based on the operating statement provided by the borrower. |
| (4) | Originally developed by the loan sponsor and subsequently sold to a third party. |
| Operating History and Underwritten Net Cash Flow | |||||||
| 2015 | 2016 | 2017 | TTM(1) | Underwritten | Per Room(2) | % of Total Revenue(3) | |
| Occupancy | 86.3% | 85.3% | 87.4% | 86.6% | 86.4% | ||
| ADR | $224.53 | $236.60 | $244.92 | $249.94 | $249.94 | ||
| RevPAR | $193.81 | $201.86 | $214.11 | $216.52 | $216.00 | ||
| Room Revenue | $32,328,718 | $33,764,041 | $35,714,908 | $36,117,386 | $36,029,977 | $78,840 | 82.1%% |
| Food & Beverage Revenue | 6,624,923 | 6,960,095 | 6,015,827 | 6,280,939 | 6,280,939 | 13,744 | 14.3%% |
| Other Departmental Revenue | 1,457,566 | 1,344,993 | 1,505,097 | 1,588,173 | 1,588,173 | 3,475 | 3.6%% |
| Total Revenue | $40,411,207 | $42,069,129 | $43,235,832 | $43,986,498 | $43,899,089 | $96,059 | 100.0%% |
| Room Expense | $7,920,486 | $8,246,290 | $8,523,853 | $8,732,852 | $8,711,717 | $19,063 | 24.2%% |
| Food & Beverage Expense | 5,087,190 | 5,018,849 | 4,616,893 | 4,690,508 | 4,690,508 | 10,264 | 74.7%% |
| Other Departmental Expense | 370,176 | 452,123 | 476,837 | 511,016 | 511,016 | 1,118 | 32.2%% |
| Departmental Expenses | $13,377,852 | $13,717,262 | $13,617,583 | $13,934,376 | $13,913,241 | $30,445 | 31.7%% |
| % | |||||||
| Departmental Profit | $27,033,355 | $28,351,867 | $29,618,249 | $30,052,122 | $29,985,848 | $65,615 | 68.3%% |
| Admin & General | $3,325,424 | $3,464,991 | $3,675,008 | $3,409,529 | $3,409,529 | $7,461 | 7.8%% |
| Maintenance & Repairs | 1,438,333 | 1,510,602 | 1,499,084 | 1,499,520 | 1,499,520 | 3,281 | 3.4%% |
| Utility Costs | 1,164,226 | 1,175,935 | 1,230,706 | 1,259,046 | 1,259,046 | 2,755 | 2.9%% |
| Marketing | 2,919,545 | 2,873,620 | 2,986,113 | 2,985,911 | 2,979,977 | 6,521 | 6.8%% |
| Franchise Fee | 461,846 | 485,524 | 476,692 | 481,706 | 480,749 | 1,052 | 1.1%% |
| Management Fee | 1,208,355 | 1,258,116 | 1,381,236 | 1,414,496 | 1,411,685 | 3,089 | 3.2%% |
| Property Tax | 891,500 | 1,140,009 | 1,227,213 | 1,383,254 | 1,469,084 | 3,215 | 3.3%% |
| Insurance | 282,253 | 289,666 | 285,855 | 270,742 | 277,384 | 607 | 0.6%% |
| Other Expenses | 823,739 | 820,713 | 838,196 | 868,215 | 868,215 | 1,900 | 2.0%% |
| Total General/Unallocated Expenses | $12,515,221 | $13,019,175 | $13,600,103 | $13,572,419 | $13,655,189 | $29,880 | 31.1%% |
| Net Operating Income | $14,518,134 | $15,332,692 | $16,018,146 | $16,479,703 | $16,330,659 | $35,734 | 37.2%% |
| FF&E | 2,013,926 | 2,096,863 | 2,154,091 | 2,193,111 | 2,194,954 | 4,803 | 5.0%% |
| Net Cash Flow | $12,504,207 | $13,235,829 | $13,864,055 | $14,286,592 | $14,135,705 | $30,932 | 32.2%% |
| (1) | TTM column represents the trailing 12-month period ending on August 31, 2018. |
| (2) | Per Room values are based on 457 guest rooms. |
| (3) | % of Total Revenue for Room Expense, Food & Beverage Expense, and Other Departmental Expense are based on their corresponding revenue line items. |
THE INFORMATION IN THIS STRUCTURAL AND COLLATERAL TERM SHEET IS NOT COMPLETE AND MAY BE AMENDED PRIOR TO THE TIME OF SALE. THIS TERM SHEET IS NOT AN OFFER TO SELL THESE SECURITIES AND IT IS NOT A SOLICITATION OF AN OFFER TO BUY THESE SECURITIES IN ANY JURISDICTION WHERE THE OFFER OR SALE IS NOT PERMITTED. | ||
| | 60 of 106 | |
| Structural and Collateral Term Sheet | JPMCC 2019-COR4 | |
| Grand Hyatt Seattle | ||
Property Management. The Grand Hyatt Seattle Property is managed by Hyatt Corporation (“Hyatt”). The management agreement commenced on April 20, 2001, currently runs through January 31, 2044 and contains one, five-year renewal option.
Escrows and Reserves.
Tax Escrows– On a monthly basis, in the event Hyatt fails to make payments when due and payable, among other conditions listed in the Grand Hyatt Seattle Whole Loan documents, the borrower is required to escrow 1/12 of annual estimated tax payments into a tax reserve account.
Insurance Escrows– On a monthly basis, in the event Hyatt fails to make payments when due and payable, among other conditions listed in the Grand Hyatt Seattle Whole Loan documents, the borrower is required to escrow 1/12 of annual estimated insurance payments into an insurance reserve account.
FF&E Reserves –On a monthly basis, so long as the hotel management agreement is in effect, the borrower is required to deposit 5.0% of gross operating income for the month immediately preceding each payment date, into an FF&E reserve account held by Hyatt. In the event the property management agreement with Hyatt is no longer in effect, the FF&E reserve will be transferred into a lender-controlled FF&E reserve account.
Lockbox / Cash Management.The Grand Hyatt Seattle Whole Loan is structured with a hard lockbox and springing cash management. Pursuant to the management agreement, Hyatt has established operating accounts for the Grand Hyatt Seattle Property which are currently with U.S. Bank. The operating accounts are in the name of borrower but Hyatt has sole signature authority over the operating accounts and is entitled to draw funds from the operating accounts in accordance with the property management agreement. Gross revenue from the Grand Hyatt Seattle Property is deposited into a Hyatt controlled clearing account and is transferred on a daily basis to the Hyatt controlled operating accounts unless a Cash Management Period (as defined below) is continuing. Hyatt has sole signature authority over the clearing account. The clearing account is in the name of the borrower but is pledged to the lender as security for the Grand Hyatt Seattle Whole Loan and a deposit account control agreement was executed by the depository bank, the borrower, Hyatt and the lender in order to perfect the pledge. The lender can only take control of the clearing account after the termination of the property management agreement. During a Cash Management Period, all funds in the clearing account are required to be deposited into a lender-controlled cash management account and will be applied to pay monthly amounts due as required under the Grand Hyatt Seattle Whole Loan, and any excess amounts will be retained by the lender as additional collateral for the Grand Hyatt Seattle Whole Loan.
A “Cash Management Period” will occur (i) during the continuation of an event of default or (ii) if the debt yield is less than 7.5% for any quarter (until such time that the debt yield is at least 7.5% for two consecutive quarters).
THE INFORMATION IN THIS STRUCTURAL AND COLLATERAL TERM SHEET IS NOT COMPLETE AND MAY BE AMENDED PRIOR TO THE TIME OF SALE. THIS TERM SHEET IS NOT AN OFFER TO SELL THESE SECURITIES AND IT IS NOT A SOLICITATION OF AN OFFER TO BUY THESE SECURITIES IN ANY JURISDICTION WHERE THE OFFER OR SALE IS NOT PERMITTED. | ||
| | 61 of 106 | |
| Structural and Collateral Term Sheet | JPMCC 2019-COR4 | |
| Fleet Farm Distribution Center | ||
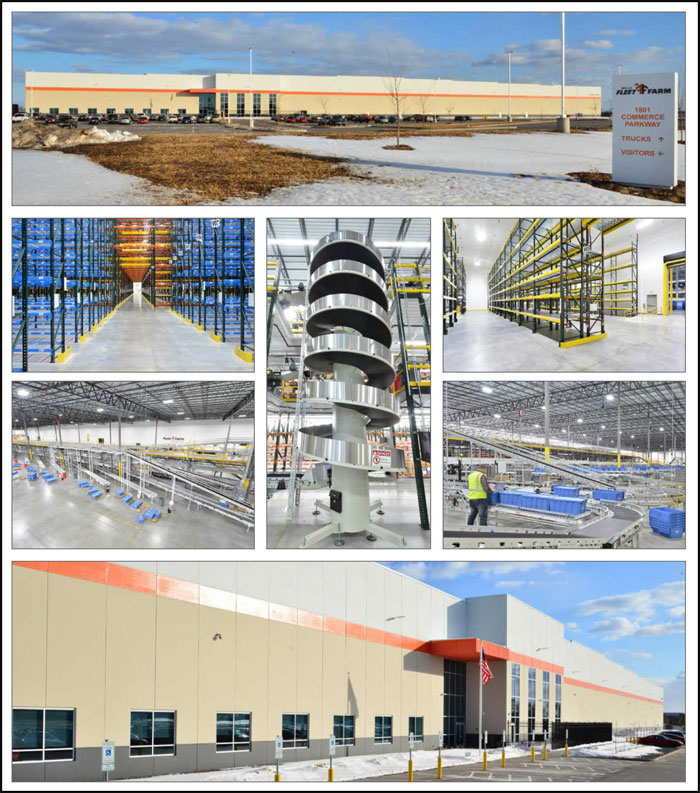
THE INFORMATION IN THIS STRUCTURAL AND COLLATERAL TERM SHEET IS NOT COMPLETE AND MAY BE AMENDED PRIOR TO THE TIME OF SALE. THIS TERM SHEET IS NOT AN OFFER TO SELL THESE SECURITIES AND IT IS NOT A SOLICITATION OF AN OFFER TO BUY THESE SECURITIES IN ANY JURISDICTION WHERE THE OFFER OR SALE IS NOT PERMITTED. | ||
| | 62 of 106 | |
| Structural and Collateral Term Sheet | JPMCC 2019-COR4 | |
| Fleet Farm Distribution Center | ||
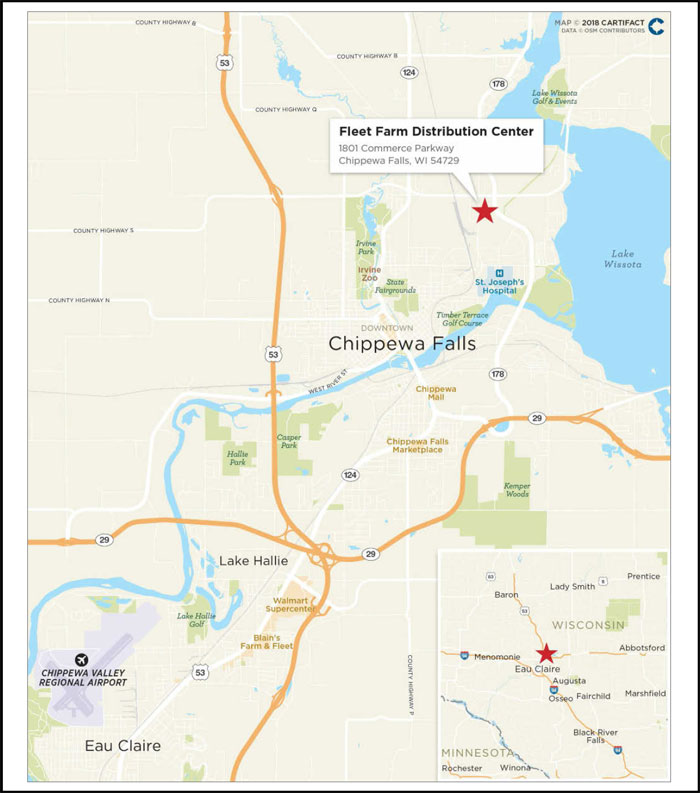
THE INFORMATION IN THIS STRUCTURAL AND COLLATERAL TERM SHEET IS NOT COMPLETE AND MAY BE AMENDED PRIOR TO THE TIME OF SALE. THIS TERM SHEET IS NOT AN OFFER TO SELL THESE SECURITIES AND IT IS NOT A SOLICITATION OF AN OFFER TO BUY THESE SECURITIES IN ANY JURISDICTION WHERE THE OFFER OR SALE IS NOT PERMITTED. | ||
| | 63 of 106 | |
| Structural and Collateral Term Sheet | JPMCC 2019-COR4 | |
| Fleet Farm Distribution Center | ||
| Mortgage Loan Information | Property Information | |||
| Mortgage Loan Seller: | LCM | Single Asset / Portfolio: | Single Asset | |
| Original Principal Balance: | $32,700,000 | Title: | Fee | |
| Cut-off Date Principal Balance: | $32,303,006 | Property Type - Subtype: | Industrial – Warehouse/Distribution | |
| % of Pool by IPB: | 4.2% | Net Rentable Area (SF): | 1,126,368 | |
| Loan Purpose: | Recapitalization | Location: | Chippewa Falls, WI | |
| Borrower: | MFF NLA LLC | Year Built / Renovated: | 2017 / N/A | |
| Sponsor: | iStar Net Lease I LLC | Occupancy: | 100.0% | |
| Interest Rate: | 4.69700% | Occupancy Date: | 2/6/2019 | |
| Note Date: | 3/23/2018 | Number of Tenants: | 1 | |
| Maturity Date: | 4/6/2028 | 2015 NOI(1): | N/A | |
| Interest-only Period: | None | 2016 NOI(1): | N/A | |
| Original Term: | 120 months | 2017 NOI(1): | N/A | |
| Original Amortization: | 360 months | TTM NOI(1): | N/A | |
| Amortization Type: | Balloon | UW Economic Occupancy: | 90.0% | |
| Call Protection: | L(34),Def(82),O(4) | UW Revenues: | $3,155,531 | |
| Lockbox / Cash Management: | Hard / In Place | UW Expenses: | $94,666 | |
| Additional Debt: | N/A | UW NOI: | $3,060,865 | |
| Additional Debt Balance: | N/A | UW NCF: | $2,711,691 | |
| Additional Debt Type: | N/A | Appraised Value / Per SF: | $50,500,000 / $45 | |
| Appraisal Date: | 12/5/2017 | |||
| Escrows and Reserves(2) | Financial Information | ||||||
| Initial | Monthly | Initial Cap | Cut-off Date Loan / SF: | $29 | |||
| Taxes: | $0 | Springing | N/A | Maturity Date Loan / SF: | $24 | ||
| Insurance: | $0 | Springing | N/A | Cut-off Date LTV: | 64.0% | ||
| Replacement Reserves: | $0 | Springing | N/A | Maturity Date LTV: | 52.7% | ||
| TI/LC: | $0 | $0 | N/A | UW NCF DSCR: | 1.33x | ||
| Other: | $0 | $0 | N/A | UW NOI Debt Yield: | 9.5% | ||
| Sources and Uses | |||||||
| Sources | Proceeds | % of Total | Uses | Proceeds | % of Total | ||
| Mortgage Loan | $32,700,000 | 64.3% | Purchase Price(3) | $50,300,000 | 98.9% | ||
| Sponsor Equity | 18,161,184 | 35.7 | Closing Costs | 561,184 | 1.1% | ||
| Total Sources | $50,861,184 | 100.0% | Total Uses | $50,861,184 | 100.0% | ||
| (1) | The Fleet Farm Distribution Center Property (as defined below) was recently constructed in 2017 and therefore no historical cash flow information is available. |
| (2) | For a full description of Escrows and Reserves, please refer to“Escrows and Reserves”below. |
| (3) | The sponsor purchased the Fleet Farm Distribution Center Property in an all-cash transaction in February 2018 for $50.3 million. |
The Loan. The Fleet Farm Distribution Center mortgage loan (the “Fleet Farm Distribution Center Mortgage Loan”) has an outstanding principal balance as of the Cut-off Date of approximately $32.3 million and is secured by a first mortgage lien on the borrower’s fee interest in a newly-constructed, 1,126,368 square foot warehouse/distribution facility located in Chippewa Falls, Wisconsin (the “Fleet Farm Distribution Center Property”). The Fleet Farm Distribution Center Mortgage Loan has a 10-year term and amortizes on a 30-year schedule.
The Borrower.The borrowing entity for the Fleet Farm Distribution Center Mortgage Loan is MFF NLA LLC, a Delaware limited liability company structured to be bankruptcy remote with two independent directors.
THE INFORMATION IN THIS STRUCTURAL AND COLLATERAL TERM SHEET IS NOT COMPLETE AND MAY BE AMENDED PRIOR TO THE TIME OF SALE. THIS TERM SHEET IS NOT AN OFFER TO SELL THESE SECURITIES AND IT IS NOT A SOLICITATION OF AN OFFER TO BUY THESE SECURITIES IN ANY JURISDICTION WHERE THE OFFER OR SALE IS NOT PERMITTED. | ||
| | 64 of 106 | |
| Structural and Collateral Term Sheet | JPMCC 2019-COR4 | |
| Fleet Farm Distribution Center | ||
The Loan Sponsor.The loan sponsor and nonrecourse carve-out guarantor is iStar Net Lease I LLC, an investment vehicle that was formed by iStar Inc. (rated Ba3/BB/BB- by Moody’s/Fitch/S&P) (NYSE: STAR, $656.1 million market cap as of January 30, 2019) in 2014 to invest in entities that own net lease properties. iStar Inc. finances, invests in and develops real estate and real estate related projects as part of its fully-integrated investment platform. Over the past two decades, iStar Inc. has been involved in more than $35 billion of transactions.
The Property. The Fleet Farm Distribution Center Property is a newly-constructed, 1,126,368 square foot warehouse/distribution facility located in Chippewa Falls, Wisconsin. The Fleet Farm Distribution Center Property is 100.0% occupied by Fleet Farm Group, LLC (“Fleet Farm”) under a 20-year triple net (“NNN”) lease that commenced on March 1, 2018. Approximately 1.3% of the floor area, or 14,605 square feet, is built out for office, cafeteria, and locker space. The Fleet Farm Distribution Center Property features 36’ clear ceiling height, 107 dock-height doors with levelers, parking for 590 cars and 220 tractor-trailer trucks, 58‘x50’ column spacing, cross-dock capability and is located on an approximately 72.07-acre site that offers the ability to expand the building by up to 281,400 additional square feet, if necessary. Amenities include an outdoor patio, cafeteria, locker room, guardhouse, security fence around the entire perimeter, and a 500 square foot box-in-box cooler with a 10’ interior clear height. The Fleet Farm Distribution Center Property was developed by Minneapolis-based Ryan Companies US, Inc. at a total project cost of approximately $49.6 million ($44 per square foot). Additionally, the tenant installed equipment and other personal property at their own cost totaling approximately $19.2 million ($17 per square foot).
Fleet Farm (formerly known as Mills Fleet Farm) was founded in 1955 and purchased by KKR (rated NR/A/A by Moody’s/Fitch/S&P) (NYSE: KKR, $18.8 billion market cap as of January 30, 2019) in February 2016. The company currently has 36 locations in Minnesota, Wisconsin, Iowa and North Dakota that offer a wide assortment of goods anchored by five categories: farm/pet supplies, hunting & fishing products, auto parts, home improvement/home living goods and outdoor & work apparel. Fleet Farm has expansion plans over the next six years and the company intends to use the facility in a way that will help it streamline its supply chain and reduce its overall freight spend. Approximately 78% of the Fleet Farm stores are within a three-hour drive of the Fleet Farm Distribution Center Property and the company believes that the facility will allow it to reduce the amount of floor space it currently devotes to inventory storage and the company also anticipates that the replacement of its direct-to-store shipping method with a centralized distribution model will reduce its freight costs. Under the terms of the lease, the tenant is responsible for all property maintenance and the direct payment of taxes and insurance premiums, while the landlord is responsible for Fleet Farm Distribution Center Property’s roof and structure. The current rent is equal to $3.06 per square foot through February 28, 2019 and the lease provides for 1.75% annual rent escalations, four, five-year renewal options exercisable with one-year prior notice and contains no termination options.
The Fleet Farm Distribution Center Property is located approximately two miles north of the downtown portion of the City of Chippewa Falls, Wisconsin and the site is also 15 miles north of Interstate 94, which provides access to Minneapolis, 100 miles to the west, and Madison and Milwaukee, 190 and 270 miles to the southeast, respectively. Chippewa Falls is also served by Highways 29 and 53, which provide access to larger regional population centers Eau Claire, 10 miles to the south, and Wausau, 90 miles to the east. Chippewa Falls is the county seat of Chippewa County, which has a population of over 62,000. Chippewa Falls is the largest city within the county and has over 14,000 residents that benefit from an economy that blends tourism, retail, agriculture and industry.
The Fleet Farm Distribution Center Property is situated within Lake Wissota Business Park, an approximately 203-acre mixed-use park containing corporate office, retail, medical, manufacturing, and industrial sites. The Lake Wissota Business Park has nearby access to I-94 in addition to direct access to US Highway 53 and Highway 29. There are currently 24 business users located in the Lake Wissota Business Park . Top users include Fleet Farm, St. Joseph’s Hospital, Nordson EDI Technology, Cray Inc., Marshfield Clinic, General Beer Northwest, and Northwood Orthopedic Sports Medicine. Located adjacent to Lake Wissota Business Park is Jacob Leinenkugel Brewing Company. Founded in 1867, Leinenkugel’s is the seventh oldest operating brewery in the nation.
Given its new construction and location within a market with few large-scale leased industrial facilities, the appraisal concluded it was necessary to utilize competing properties outside of the subject’s immediate area. Similar Wisconsin cities were researched for rent comparables. In total, the appraisal included 14 NNN rent comparables ranging from $2.30 per square foot NNN to $4.95 per square foot with a weighted average of approximately $3.84 per square foot NNN.
| Historical and Current Occupancy(1) | |||
| 2015 | 2016 | 2017 | Current(2) |
| N/A | N/A | N/A | 100.0% |
| (1) | The Fleet Farm Distribution Center Property was recently constructed in 2017 and therefore no historical occupancy information is available. |
| (2) | Current occupancy is as of February 6, 2019. |
THE INFORMATION IN THIS STRUCTURAL AND COLLATERAL TERM SHEET IS NOT COMPLETE AND MAY BE AMENDED PRIOR TO THE TIME OF SALE. THIS TERM SHEET IS NOT AN OFFER TO SELL THESE SECURITIES AND IT IS NOT A SOLICITATION OF AN OFFER TO BUY THESE SECURITIES IN ANY JURISDICTION WHERE THE OFFER OR SALE IS NOT PERMITTED. | ||
| | 65 of 106 | |
| Structural and Collateral Term Sheet | JPMCC 2019-COR4 | |
| Fleet Farm Distribution Center | ||
| Tenant Summary(1) | ||||||
| Tenant | Ratings Moody’s/Fitch/S&P | Net Rentable Area (SF) | % of Total NRA | Base Rent PSF | % of Total Base Rent | Lease Expiration Date |
| Fleet Farm(2) | NR / NR / NR | 1,126,368 | 100.0% | $3.11 | 100.0% | 2/28/2038 |
| (1) | Based on the underwritten rent roll. |
| (2) | Fleet Farm has four, five-year renewal options remaining. |
| Lease Rollover Schedule(1) | ||||||||||
| Year | Number of Leases Expiring | Net Rentable Area Expiring | % of NRA Expiring | Base Rent Expiring | % of Base Rent Expiring | Cumulative Net Rentable Area Expiring | Cumulative % of NRA Expiring | Cumulative Base Rent Expiring | Cumulative % of Base Rent Expiring | |
| Vacant | NAP | 0 | 0.0% | NAP | NAP | 0 | 0.0% | NAP | NAP | |
| 2019 & MTM | 0 | 0 | 0.0% | $0 | 0.0% | 0 | 0.0% | $0 | 0.0% | |
| 2020 | 0 | 0 | 0.0% | 0 | 0.0% | 0 | 0.0% | $0 | 0.0% | |
| 2021 | 0 | 0 | 0.0% | 0 | 0.0% | 0 | 0.0% | $0 | 0.0% | |
| 2022 | 0 | 0 | 0.0% | 0 | 0.0% | 0 | 0.0% | $0 | 0.0% | |
| 2023 | 0 | 0 | 0.0% | 0 | 0.0% | 0 | 0.0% | $0 | 0.0% | |
| 2024 | 0 | 0 | 0.0% | 0 | 0.0% | 0 | 0.0% | $0 | 0.0% | |
| 2025 | 0 | 0 | 0.0% | 0 | 0.0% | 0 | 0.0% | $0 | 0.0% | |
| 2026 | 0 | 0 | 0.0% | 0 | 0.0% | 0 | 0.0% | $0 | 0.0% | |
| 2027 | 0 | 0 | 0.0% | 0 | 0.0% | 0 | 0.0% | $0 | 0.0% | |
| 2028 | 0 | 0 | 0.0% | 0 | 0.0% | 0 | 0.0% | $0 | 0.0% | |
| 2029 | 0 | 0 | 0.0% | 0 | 0.0% | 0 | 0.0% | $0 | 0.0% | |
| 2030 & Beyond | 1 | 1,126,368 | 100.0% | 3,506,145 | 100.0% | 1,126,368 | 100.0% | $3,506,145 | 100.0% | |
| Total | 1 | 1,126,368 | 100.0% | $3,506,145 | 100.0% | |||||
| (1) | Based on the underwritten rent roll dated February 6, 2019. |
| (2) | Base rent Expiring includes contractual rent steps through March 1, 2019 |
| Underwritten Net Cash Flow(1) | |||||
| Underwritten | Per Square Foot | %(2) | |||
| Rents in Place | $3,445,843 | $3.06 | 98.3% | ||
| Contractual Rent Steps(3) | 60,302 | 0.05 | 1.7 | ||
| Vacant Income | 0 | 0.00 | 0.0 | ||
| Gross Potential Rent | $3,506,145 | $3.11 | 100.0% | ||
| Total Reimbursements | 0 | 0.00 | 0.0 | ||
| Net Rental Income | $3,506,145 | $3.11 | 100.0% | ||
| Less: Vacancy | (350,615) | (0.31) | 10.0 | ||
| Effective Gross Income | $3,155,531 | $2.80 | 90.0% | ||
| Total Expenses | $94,666 | $0.08 | 3.0% | ||
| Net Operating Income | $3,060,865 | $2.72 | 97.0% | ||
| Total TI/LC, CapEx/RR | 349,174 | 0.31 | 11.1 | ||
| Net Cash Flow | $2,711,691 | $2.41 | 85.9% | ||
| (1) | The Fleet Farm Distribution Center Property was recently constructed in 2017 and therefore no historical cash flow information is available. |
| (2) | % column represents percent of Net Rental Income for all revenue lines and represents percent of Effective Gross Income for the remainder of the fields. |
| (3) | Based on the contractual rent steps through March 1, 2019. |
THE INFORMATION IN THIS STRUCTURAL AND COLLATERAL TERM SHEET IS NOT COMPLETE AND MAY BE AMENDED PRIOR TO THE TIME OF SALE. THIS TERM SHEET IS NOT AN OFFER TO SELL THESE SECURITIES AND IT IS NOT A SOLICITATION OF AN OFFER TO BUY THESE SECURITIES IN ANY JURISDICTION WHERE THE OFFER OR SALE IS NOT PERMITTED. | ||
| | 66 of 106 | |
| Structural and Collateral Term Sheet | JPMCC 2019-COR4 | |
| Fleet Farm Distribution Center | ||
Property Management.The Fleet Farm Distribution Center Property is self-managed.
Escrows and Reserves.
Tax Escrows– On a monthly basis, during the continuance of a Lease Sweep Period (as defined below), the borrower is required to escrow 1/12 of the projected annual estimated tax payments.
Insurance Escrows– On a monthly basis, during the continuance of a Lease Sweep Period, the borrower is required to escrow 1/12 of the projected annual estimated insurance premiums (also waived if a blanket policy is in place and there is no Lease Sweep Period continuing).
Replacement Reserves –On a monthly basis, during the continuance of a Cash Trap Period (as defined below), the borrower is required to escrow approximately $13,897 for replacement reserves.
Lockbox / Cash Management. The Fleet Farm Distribution Center Mortgage Loan is structured with a hard lockbox and in place cash management. All rents are required to be deposited directly by the tenant into a lockbox account controlled by the lender. All funds in the lockbox account are required to be swept to a lender-controlled cash management account every business day and applied on each payment date to the payment of debt service and the funding of required reserves. Provided no Cash Trap Period is continuing, all funds remaining in the cash management account after payment of the aforementioned items will be transferred into the borrower’s operating account. During a Cash Trap Period, all excess cash in the cash management account will be retained by the lender as additional collateral for the Fleet Farm Distribution Center Mortgage Loan.
A “Cash Trap Period” will commence upon (i) an event of default, (ii) if the debt yield is less than 8.75% for any quarter on or after March 6, 2019 (until such time that the debt yield is greater than or equal to 8.75% for two consecutive quarters) or (iii) a Lease Sweep Period.
A “Lease Sweep Period” will commence (i) if any Major Lease (as defined below) is surrendered, cancelled or terminated prior to its then-current expiration date; (ii) if any Major Tenant (as defined below) goes dark or gives notice that it intends to discontinue its business, (iii) upon the occurrence of a monetary or material non-monetary default under any Major Lease or (iv) upon the occurrence of a Major Tenant insolvency proceeding.
A “Major Lease” means the Fleet Farm lease.
A “Major Tenant” means any tenant under a Major Lease.
THE INFORMATION IN THIS STRUCTURAL AND COLLATERAL TERM SHEET IS NOT COMPLETE AND MAY BE AMENDED PRIOR TO THE TIME OF SALE. THIS TERM SHEET IS NOT AN OFFER TO SELL THESE SECURITIES AND IT IS NOT A SOLICITATION OF AN OFFER TO BUY THESE SECURITIES IN ANY JURISDICTION WHERE THE OFFER OR SALE IS NOT PERMITTED. | ||
| | 67 of 106 | |
| Structural and Collateral Term Sheet | JPMCC 2019-COR4 | |
| Peachtree Corners Marketplace | ||
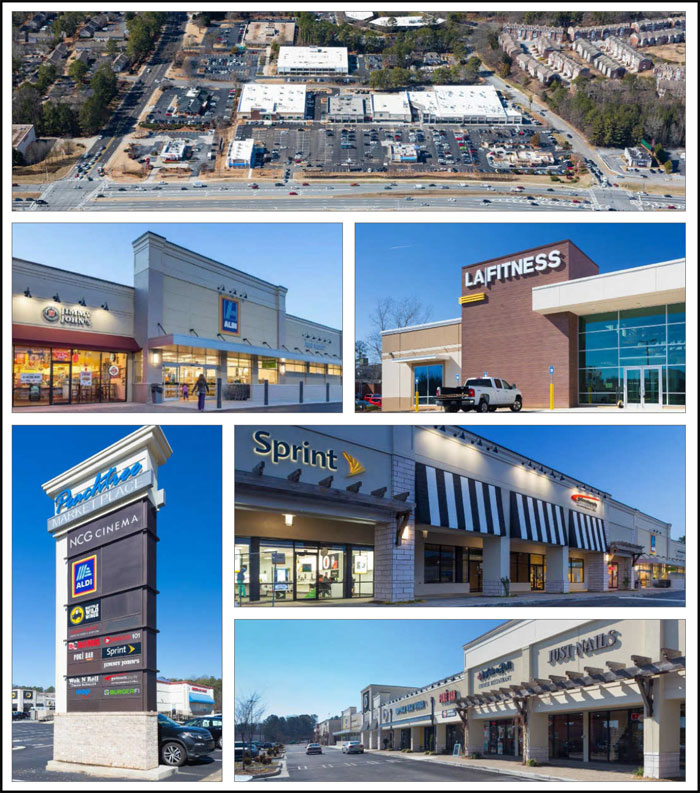
THE INFORMATION IN THIS STRUCTURAL AND COLLATERAL TERM SHEET IS NOT COMPLETE AND MAY BE AMENDED PRIOR TO THE TIME OF SALE. THIS TERM SHEET IS NOT AN OFFER TO SELL THESE SECURITIES AND IT IS NOT A SOLICITATION OF AN OFFER TO BUY THESE SECURITIES IN ANY JURISDICTION WHERE THE OFFER OR SALE IS NOT PERMITTED. | ||
| | 68 of 106 | |
| Structural and Collateral Term Sheet | JPMCC 2019-COR4 | |
| Peachtree Corners Marketplace | ||

THE INFORMATION IN THIS STRUCTURAL AND COLLATERAL TERM SHEET IS NOT COMPLETE AND MAY BE AMENDED PRIOR TO THE TIME OF SALE. THIS TERM SHEET IS NOT AN OFFER TO SELL THESE SECURITIES AND IT IS NOT A SOLICITATION OF AN OFFER TO BUY THESE SECURITIES IN ANY JURISDICTION WHERE THE OFFER OR SALE IS NOT PERMITTED. | ||
| | 69 of 106 | |
| Structural and Collateral Term Sheet | JPMCC 2019-COR4 | |
| Peachtree Corners Marketplace | ||
| Mortgage Loan Information | Property Information | |||
| Mortgage Loan Seller: | LCM | Single Asset / Portfolio: | Single Asset | |
| Original Principal Balance: | $24,600,000 | Title: | Fee | |
| Cut-off Date Principal Balance: | $24,600,000 | Property Type - Subtype: | Retail – Anchored | |
| % of Pool by IPB: | 3.2% | Net Rentable Area (SF): | 121,379 | |
| Loan Purpose: | Refinance | Location: | Norcross, GA | |
| Borrower: | Peachtree Marketplace Outparcel | Year Built / Renovated: | 1976 / 2018 | |
| LLC | Occupancy: | 95.6% | ||
| Loan Sponsor: | Jacob Khotoveli | Occupancy Date: | 11/1/2018 | |
| Interest Rate: | 5.21280% | Number of Tenants: | 15 | |
| Note Date: | 11/13/2018 | 2015 NOI(2): | $428,472 | |
| Maturity Date: | 12/6/2028 | 2016 NOI(2): | $641,163 | |
| Interest-only Period: | 36 months | 2017 NOI(2): | $1,025,042 | |
| Original Term: | 120 months | TTM NOI (as of 7/2018)(2): | $1,405,164 | |
| Original Amortization(1): | 360 months | UW Economic Occupancy: | 93.0% | |
| Amortization Type(1): | IO–Balloon | UW Revenues: | $2,864,949 | |
| Call Protection: | L(26),Def(91),O(3) | UW Expenses: | $520,992 | |
| Lockbox / Cash Management: | Soft / Springing | UW NOI: | $2,343,957 | |
| Additional Debt: | Yes | UW NCF: | $2,228,647 | |
| Additional Debt Balance(1): | $2,900,000 | Appraised Value / Per SF: | $40,000,000 / $330 | |
| Additional Debt Type(1): | Mezzanine Loan | Appraisal Date: | 8/29/2018 | |
| Escrows and Reserves(3) | Financial Information | ||||||
| Initial | Monthly | Initial Cap | Cut-off Date Loan / SF: | $203 | |||
| Taxes: | $30,000 | $22,000 | N/A | Maturity Date Loan / SF: | $181 | ||
| Insurance: | $32,000 | $2,900 | N/A | Cut-off Date LTV: | 61.5% | ||
| Replacement Reserves: | $0 | $2,023 | N/A | Maturity Date LTV: | 55.0% | ||
| TI/LC: | $0 | $7,586 | $364,137 | UW NCF DSCR(1): | 1.39x | ||
| Other: | $61,565 | N/A | N/A | UW NOI Debt Yield: | 9.5% | ||
| Sources and Uses | |||||||
| Sources | Proceeds | % of Total | Uses | Proceeds | % of Total | ||
| Mortgage Loan | $24,600,000 | 89.5% | Payoff Existing Debt | $20,941,541 | 76.2% | ||
| Mezzanine Loan | 2,900,000 | 10.5 | Closing Costs | 448,016 | 1.6% | ||
| Upfront Reserves | 123,565 | 0.4% | |||||
| Return of Equity | 5,986,878 | 21.8% | |||||
| Total Sources | $27,500,000 | 100.0% | Total Uses | $27,500,000 | 100.0% | ||
| (1) | The Peachtree Marketplace Mortgage Loan (as defined below), as well as the Peachtree Corners Marketplace Mezzanine Loan (as defined below), amortizes pursuant to a fixed amortization schedule as set forth in Annex I in the Preliminary Prospectus. Debt service coverage ratios are calculated using the sum of the first 12 principal and interest payments after the expiration of the interest only period (period 37 to 48) based on the assumed principal and interest payment schedule set forth in Annex H in the Preliminary Prospectus. |
| (2) | The Peachtree Corners Marketplace Property (as defined below) was fully redeveloped by the sponsor over the last three years. Historical cash flows represent the ramp up during the redevelopment and the UW NOI represents the current stabilized operations. |
| (3) | For a full description of Escrows and Reserves, please refer to“Escrows and Reserves”below. |
THE INFORMATION IN THIS STRUCTURAL AND COLLATERAL TERM SHEET IS NOT COMPLETE AND MAY BE AMENDED PRIOR TO THE TIME OF SALE. THIS TERM SHEET IS NOT AN OFFER TO SELL THESE SECURITIES AND IT IS NOT A SOLICITATION OF AN OFFER TO BUY THESE SECURITIES IN ANY JURISDICTION WHERE THE OFFER OR SALE IS NOT PERMITTED. | ||
| | 70 of 106 | |
| Structural and Collateral Term Sheet | JPMCC 2019-COR4 | |
| Peachtree Corners Marketplace | ||
The Loan. The Peachtree Corners Marketplace mortgage loan (the “Peachtree Corners Marketplace Mortgage Loan”) has an outstanding principal balance as of the Cut-off Date of $24.6 million and is secured by a first mortgage lien on the borrower’s fee interest in a newly redeveloped, 121,379 square foot, Class A anchored retail shopping center located in Norcross, Georgia (the “Peachtree Corners Marketplace Property”), approximately 20 miles northeast of Downtown Atlanta. The Peachtree Corners Marketplace Mortgage Loan has a 10-year term and, following a three-year interest-only period, will amortize pursuant to a fixed amortization schedule as set forth in Annex H in the Preliminary Prospectus
The Borrower.The borrowing entity for the Peachtree Corners Marketplace Mortgage Loan is Peachtree Marketplace Outparcel LLC, a Delaware limited liability company structured to be bankruptcy remote with one independent director.
The Loan Sponsor.The loan sponsor and nonrecourse carve-out guarantor is Jacob Khotoveli. Mr. Khotoveli is the founder and Managing Partner of JBL Asset Management (“JBL”). Founded in 2005, JBL is a privately held fully integrated commercial real estate company specializing in retail shopping center acquisitions, management and development.
The Property. The Peachtree Corners Marketplace Property is a newly redeveloped, 121,379 square foot, Class A, 95.6% occupied anchored retail center located along a primary retail corridor known as Peachtree Parkway that provides for a combined average daily traffic count of approximately 113,500 vehicles per day. The Peachtree Corners Marketplace Property is comprised of three buildings including: (i) a 78,019 square feet (approximately 64.3% of net rentable area (“NRA��)) multi-tenant main center (the “Main Center”), (ii) a 37,000 square feet (approximately 30.5% of NRA) LA Fitness outparcel (the “LA Fitness Outparcel”) and (ii) a 6,360 square feet (approximately 5.2% of NRA) smaller two-tenant outparcel (the “Small Outparcel”). The Main Center is currently approximately 93.2% occupied with only one available unit, the LA Fitness Outparcel is solely occupied by LA Fitness, and the Small Outparcel is 100.0% occupied by Aspen Dental and BurgerFi. The center also includes IHOP and Chick-fil-A outparcels that are not part of the collateral.
The Peachtree Corners Marketplace Property was originally built in 1976 and significantly redeveloped by the sponsor over the past three years. The sponsor acquired the Main Center in December 2014 and subsequently purchased the former restaurant and gas station that would eventually become the LA Fitness Outparcel and the Small Outparcel in February and November of 2016, respectively. The sponsor has since completely redeveloped the Main Center, constructed the new outparcels, completed an environmental clean-up of the former gas station (NFA letter received) and stabilized the Peachtree Corners Marketplace Property with a mix of long-term national and regional tenancy. As of November 1, 2018, the Peachtree Corners Marketplace Property was 95.6% leased to 15 tenants at weighted average underwritten rents equal to $20.54 per square foot.
The Market.The Peachtree Corners Marketplace Property is located in the Norcross/Peachtree Road submarket, within the greater Atlanta retail market. As of the third quarter of 2018, the Norcross/Peachtree Road retail submarket consisted of approximately 10.5 million square feet across 772 buildings with an overall market vacancy of 6.3% and average asking rents of approximately $16.94 per square foot. The appraisal identified 10 comparable inline retail leases at competitive properties ranging in size from 900 square feet to 6,000 square feet. Base rents for the comparable inline leases ranged from $15.00 per square foot to $44.00 per square foot, with a weighted average of $29.80 per square foot. Additionally, the appraisal identified five comparable anchor retail leases at competitive properties ranging in size from 18,000 square feet to 29,813 square feet. Base rents for the comparable anchor leases ranged from $7.75 per square foot to $22.50 per square foot, with a weighted average of $14.10 per square foot. Lastly, the appraisal identified seven comparable LA Fitness leases at competitive properties ranging in size from 34,000 square feet to 45,000 square feet. Base rents for the comparable LA Fitness leases ranged from $16.10 per square foot to $22.00 per square foot, with a weighted average of $18.93 per square foot.
| Historical and Current Occupancy(1) | |||
| 2015 | 2016 | 2017 | Current(2) |
| N/A | N/A | N/A | 95.6% |
| (1) | The Peachtree Corners Marketplace Property was fully redeveloped by the sponsor over the last three years and therefore historical occupancies are not available. |
| (2) | Current occupancy is as of November 1, 2018. |
THE INFORMATION IN THIS STRUCTURAL AND COLLATERAL TERM SHEET IS NOT COMPLETE AND MAY BE AMENDED PRIOR TO THE TIME OF SALE. THIS TERM SHEET IS NOT AN OFFER TO SELL THESE SECURITIES AND IT IS NOT A SOLICITATION OF AN OFFER TO BUY THESE SECURITIES IN ANY JURISDICTION WHERE THE OFFER OR SALE IS NOT PERMITTED. | ||
| | 71 of 106 | |
| Structural and Collateral Term Sheet | JPMCC 2019-COR4 | |
| Peachtree Corners Marketplace | ||
| Tenant Summary(1) | ||||||||
| Tenant | Ratings(2) Moody’s/Fitch/S&P | Net Rentable Area (SF) | % of Total NRA | Base Rent PSF | % of Total Base Rent | Most Recent Sales PSF/Screen | Occupancy Cost | Lease Expiration Date |
| LA Fitness(3) | NR / NR / B+ | 37,000 | 30.5% | $20.40 | 31.7% | NAV | NAV | 10/31/2033 |
| NCG Cinemas(3)(4) | NR / NR / NR | 30,009 | 24.7 | $13.00 | 16.4% | $391,319 | 16.3%% | 1/31/2031 |
| Aldi(3) | NR / NR / NR | 17,374 | 14.3 | $15.00 | 10.9% | NAV | NAV | 2/28/2032 |
| Buffalo Wild Wings(3) | NR / NR / NR | 5,540 | 4.6 | $27.00 | 6.3% | NAV | NAV | 5/31/2027 |
| County Tag Office(3) | NR / NR / NR | 4,000 | 3.3 | $21.63 | 3.6% | NAV | NAV | 3/31/2019 |
| Happy Sumo Steak/Sushi(3) | NR / NR / NR | 3,736 | 3.1 | $25.13 | 3.9% | NAV | NAV | 9/30/2026 |
| Aspen Dental(3) | NR / NR / B | 3,500 | 2.9 | $44.00 | 6.5% | NAV | NAV | 4/30/2028 |
| BurgerFi(3) | NR / NR / NR | 2,860 | 2.4 | $47.50 | 5.7% | NAV | NAV | 2/28/2028 |
| SprintCom(3)(4) | B3 / B+ / B | 2,672 | 2.2 | $37.00 | 4.1% | $396 | 10.2%% | 1/31/2022 |
| Bombay Salon & Spa(3) | NR / NR / NR | 2,617 | 2.2 | $22.50 | 2.5% | NAV | NAV | 9/30/2024 |
| (1) | Based on the underwritten rent roll dated as of November 1, 2018. |
| (2) | In certain instances, ratings provided are those of the parent company of the entity shown, whether or not the parent company guarantees the lease. |
| (3) | LA Fitness has three, five-year renewal options remaining, NCG Cinemas has two, five-year renewal options remaining, Aldi has six, five-year renewal options remaining, Buffalo Wild Wings has four, five-year renewal options remaining, County Tag Office has five, automatic one-year renewal options remaining, Happy Sumo Steak/Sushi has two, five-year renewal options remaining, Aspen Dental has three, five-year renewal options remaining, BurgerFi has three, five-year renewal options remaining, SprintCom has one, five-year renewal option remaining and Bombay Salon & Spa has two, five-year renewal options remaining. |
| (4) | Most Recent Sales PSF/Screen and Occupancy Cost for NCG Cinemas represent sales for the trailing 12-month period ending August 31, 2018 and is based on the theater’s eight screens. Most Recent Sales PSF and Occupancy Cost for SprintCom represent sales for the trailing 12-month period ending December 31, 2017. |
| Lease Rollover Schedule(1) | ||||||||||
| Year | Number of Leases Expiring | Net Rentable Area Expiring | % of NRA Expiring | Base Rent Expiring | % of Base Rent Expiring | Cumulative Net Rentable Area Expiring | Cumulative % of NRA Expiring | Cumulative Base Rent Expiring | Cumulative % of Base Rent Expiring | |
| Vacant | NAP | 5,328 | 4.4% | NAP | NAP | 5,328 | 4.4% | NAP | NAP | |
| 2019 & MTM | 1 | 4,000 | 3.3% | $86,520 | 3.6% | 9,328 | 7.7% | $86,520 | 3.6% | |
| 2020 | 0 | 0 | 0.0% | 0 | 0.0% | 9,328 | 7.7% | $86,520 | 3.6% | |
| 2021 | 0 | 0 | 0.0% | 0 | 0.0% | 9,328 | 7.7% | $86,520 | 3.6% | |
| 2022 | 2 | 4,193 | 3.5% | 153,696 | 6.4% | 13,521 | 11.1% | $240,216 | 10.1% | |
| 2023 | 2 | 2,804 | 2.3% | 64,765 | 2.7% | 16,325 | 13.4% | $304,981 | 12.8% | |
| 2024 | 2 | 3,747 | 3.1% | 98,455 | 4.1% | 20,072 | 16.5% | $403,436 | 16.9% | |
| 2025 | 0 | 0 | 0.0% | 0 | 0.0% | 20,072 | 16.5% | $403,436 | 16.9% | |
| 2026 | 1 | 3,736 | 3.1% | 93,896 | 3.9% | 23,808 | 19.6% | $497,332 | 20.9% | |
| 2027 | 2 | 6,828 | 5.6% | 191,052 | 8.0% | 30,636 | 25.2% | $688,384 | 28.9% | |
| 2028 | 2 | 6,360 | 5.2% | 289,850 | 12.2% | 36,996 | 30.5% | $978,234 | 41.0% | |
| 2029 | 0 | 0 | 0.0% | 0 | 0.0% | 36,996 | 30.5% | $978,234 | 41.0% | |
| 2030 & Beyond | 3 | 84,383 | 69.5% | 1,405,527 | 59.0% | 121,379 | 100.0% | $2,383,761 | 100.0% | |
| Total | 15 | 121,379 | 100.0% | $2,383,761 | 100.0% | |||||
| (1) | Based on the underwritten rent roll dated November 1, 2018. |
THE INFORMATION IN THIS STRUCTURAL AND COLLATERAL TERM SHEET IS NOT COMPLETE AND MAY BE AMENDED PRIOR TO THE TIME OF SALE. THIS TERM SHEET IS NOT AN OFFER TO SELL THESE SECURITIES AND IT IS NOT A SOLICITATION OF AN OFFER TO BUY THESE SECURITIES IN ANY JURISDICTION WHERE THE OFFER OR SALE IS NOT PERMITTED. | ||
| | 72 of 106 | |
| Structural and Collateral Term Sheet | JPMCC 2019-COR4 | |
| Peachtree Corners Marketplace | ||
| Operating History and Underwritten Net Cash Flow(1) | |||||||||||||
| 2015 | 2016 | 2017 | TTM(2) | Underwritten | Per Square Foot | %(3) | |||||||
| Rents in Place | $499,502 | $691,378 | $1,072,759 | $1,435,677 | $2,377,609 | $19.59 | 77.2% | ||||||
| Contractual Rent Steps(4) | 0 | 0 | 0 | 0 | 6,152 | 0.05 | 0.2 | ||||||
| Vacant Income | 0 | 0 | 0 | 0 | 159,840 | 1.32 | 5.2 | ||||||
| Gross Potential Rent | $499,502 | $691,378 | $1,072,759 | $1,435,677 | $2,543,601 | $20.96 | 82.6% | ||||||
| Total Reimbursements | 153,176 | 248,453 | 322,152 | 350,458 | 498,567 | 4.11 | 16.2 | ||||||
| Total Other Income(5) | 4,287 | 2,100 | 4,466 | 11,733 | 35,733 | 0.29 | 1.2 | ||||||
| Net Rental Income | $656,966 | $941,931 | $1,399,377 | $1,797,868 | $3,077,900 | $25.36 | 100.0% | ||||||
| Less: Vacancy | 0 | 0 | 0 | 0 | (212,952) | (1.75) | (7.0) | ||||||
| Effective Gross Income | $656,966 | $941,931 | $1,399,377 | $1,797,868 | $2,864,949 | $23.60 | 93.1% | ||||||
| Total Operating Expenses | 228,494 | 300,768 | 374,336 | 392,704 | 520,992 | 4.29 | 18.2 | ||||||
| Net Operating Income(1) | $428,472 | $641,163 | $1,025,042 | $1,405,164 | $2,343,957 | $19.31 | 81.8% | ||||||
| TI/LC | 0 | 0 | 0 | 0 | 91,034 | 0.75 | 3.2 | ||||||
| Capital Expenditures | 0 | 0 | 0 | 0 | 24,276 | 0.20 | 0.8 | ||||||
| Net Cash Flow | $428,472 | $641,163 | $1,025,042 | $1,405,164 | $2,228,647 | $18.36 | 77.8% | ||||||
| (1) | The Peachtree Corners Marketplace Property was fully redeveloped by the sponsor over the last three years. Historical cash flows represent the ramp up during the redevelopment and the Underwritten Net Operating Income represents the current stabilized operations. |
| (2) | TTM column represents the trailing 12-month period ending on July 31, 2018. |
| (3) | % column represents percent of Net Rental Income for all revenue lines and represents percent of Effective Gross Income for the remainder of the fields. |
| (4) | Based on the contractual rent steps through December 2019 for certain tenants. |
| (5) | Underwritten Total Other Income includes TTM other income ($11,733) and the contractual PNC Bank ATM annual income ($24,000). Contractual PNC Bank ATM annual income has historically been included Gross Potential Rent in the historical cash flows. |
Property Management.The Peachtree Corners Marketplace Property is managed by JBL Asset Management LLC, an affiliate of the borrower.
Escrows and Reserves. At origination, the borrower deposited approximately $53,515 for outstanding tenant improvements and leasing commissions, $32,000 for insurance premiums, $30,000 for real estate taxes and $8,050 for required repairs.
Tax Escrows– On a monthly basis, the borrower is required to escrow 1/12 of the annual estimated tax premiums, which currently equates to $22,000.
Insurance Escrows– On a monthly basis, the borrower is required to escrow 1/12 of the annual estimated insurance premiums, which currently equates to $2,900.
Replacement Reserves –On a monthly basis, the borrower is required to escrow $2,023 for replacement reserves (approximately $0.20 per square foot annually).
TI/LC Reserves – On a monthly basis, the borrower is required to escrow approximately $7,586 (approximately $0.75 per square foot annually) for tenant improvements and leasing commissions. The reserve is subject to a cap of $364,137.
Lockbox / Cash Management. The Peachtree Corners Marketplace Mortgage Loan is structured with a soft lockbox and springing cash management. All rents are required to be deposited into a lockbox account within one business day of receipt by the borrower or property manager. All funds in the lockbox account are required to be swept daily into the borrower’s operating account, unless a Cash Management Period (as defined below) is continuing. Upon the occurrence of a Cash Management Period, all funds in the lockbox account will be swept daily into a lender-controlled account, from which account such funds will be disbursed on each payment date in accordance with the loan documents and any excess will be retained by the lender as additional collateral for the Peachtree Corners Marketplace Mortgage Loan.
A “Cash Management Period” will commence upon (i) an event of default, (ii) an event of default under the mezzanine loan, (iii) if the debt service coverage is less than 1.10x (until such time that the debt service coverage ratio is greater than or equal to 1.10x) or (iv) during a Lease Sweep Period (as defined below).
THE INFORMATION IN THIS STRUCTURAL AND COLLATERAL TERM SHEET IS NOT COMPLETE AND MAY BE AMENDED PRIOR TO THE TIME OF SALE. THIS TERM SHEET IS NOT AN OFFER TO SELL THESE SECURITIES AND IT IS NOT A SOLICITATION OF AN OFFER TO BUY THESE SECURITIES IN ANY JURISDICTION WHERE THE OFFER OR SALE IS NOT PERMITTED. | ||
| | 73 of 106 | |
| Structural and Collateral Term Sheet | JPMCC 2019-COR4 | |
| Peachtree Corners Marketplace | ||
A “Lease Sweep Period” will commence (i) on the date that is 12 months prior to the end of the term (including any renewal terms) of any Lease Sweep Lease (as defined below), (ii) the date required under a Lease Sweep Lease by which the applicable Lease Sweep Tenant (defined below) is required to give notice of its exercise of a renewal option thereunder (and such renewal has not so been exercised), (iii) if any Lease Sweep Lease is surrendered, cancelled or terminated prior to its then-current expiration date, (iv) if any Lease Sweep Tenant goes dark or gives notice that it intends to discontinue its business at its premises, (v) upon the occurrence of a default under any Lease Sweep Lease or (vi) upon the occurrence of a Lease Sweep Tenant insolvency proceeding.
A “Lease Sweep Lease” means the LA Fitness lease, the NCG Cinemas lease, the Aldi lease and any lease which covers (i) 10.0% or more of the NRA of the Peachtree Corners Marketplace Property or (ii) 10.0% or more of the total annual rental revenue of the Peachtree Corners Marketplace Property.
A “Lease Sweep Tenant” means any tenant under a Lease Sweep Lease, or under one or more leases which when taken together would constitute a Lease Sweep Lease.
Additional Debt. The Peachtree Corners mezzanine loan (the “Peachtree Corners Marketplace Mezzanine Loan”) was funded concurrently and is coterminous with the Peachtree Corners Marketplace Mortgage Loan. The Peachtree Corners Marketplace Mezzanine Loan has an original principal balance of $2.9 million, accrues interest at a rate of 7.50000% and following a three-year interest-only period, will amortize pursuant to a fixed amortization schedule as set forth in Annex H in the Preliminary Prospectus. Including the Peachtree Corners Marketplace Mezzanine Loan, the cumulative Cut-off Date LTV, cumulative UW NCF DSCR and cumulative UW NOI DY are 68.8%, 1.20x and 8.5%, respectively. The current borrower under the Peachtree Corners Marketplace Mezzanine Loan is Peachtree Mezzanine Borrower LLC. The Peachtree Corners Marketplace Mezzanine Loan is currently held by LCM.
THE INFORMATION IN THIS STRUCTURAL AND COLLATERAL TERM SHEET IS NOT COMPLETE AND MAY BE AMENDED PRIOR TO THE TIME OF SALE. THIS TERM SHEET IS NOT AN OFFER TO SELL THESE SECURITIES AND IT IS NOT A SOLICITATION OF AN OFFER TO BUY THESE SECURITIES IN ANY JURISDICTION WHERE THE OFFER OR SALE IS NOT PERMITTED. | ||
| | 74 of 106 | |
| Structural and Collateral Term Sheet | JPMCC 2019-COR4 | |
| Pier 54 Seattle | ||

THE INFORMATION IN THIS STRUCTURAL AND COLLATERAL TERM SHEET IS NOT COMPLETE AND MAY BE AMENDED PRIOR TO THE TIME OF SALE. THIS TERM SHEET IS NOT AN OFFER TO SELL THESE SECURITIES AND IT IS NOT A SOLICITATION OF AN OFFER TO BUY THESE SECURITIES IN ANY JURISDICTION WHERE THE OFFER OR SALE IS NOT PERMITTED. | ||
| | 75 of 106 | |
| Structural and Collateral Term Sheet | JPMCC 2019-COR4 | |
| Pier 54 Seattle | ||
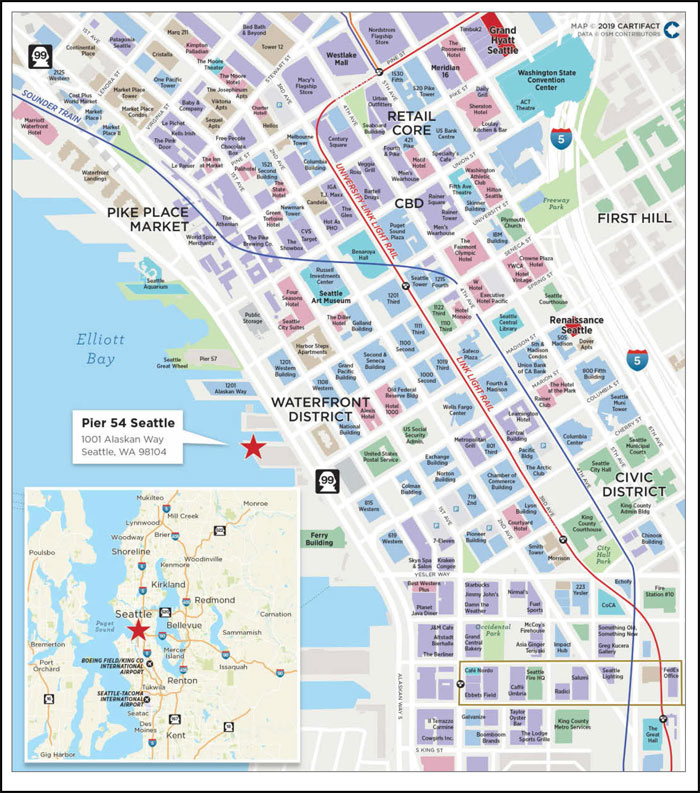
THE INFORMATION IN THIS STRUCTURAL AND COLLATERAL TERM SHEET IS NOT COMPLETE AND MAY BE AMENDED PRIOR TO THE TIME OF SALE. THIS TERM SHEET IS NOT AN OFFER TO SELL THESE SECURITIES AND IT IS NOT A SOLICITATION OF AN OFFER TO BUY THESE SECURITIES IN ANY JURISDICTION WHERE THE OFFER OR SALE IS NOT PERMITTED. | ||
| | 76 of 106 | |
| Structural and Collateral Term Sheet | JPMCC 2019-COR4 | |
| Pier 54 Seattle | ||
| Mortgage Loan Information | Property Information | |||
| Mortgage Loan Seller: | LCM | Single Asset / Portfolio: | Single Asset | |
| Original Principal Balance: | $23,000,000 | Title: | Fee/Leasehold | |
| Cut-off Date Principal Balance: | $23,000,000 | Property Type - Subtype: | Mixed Use – Retail/Office | |
| % of Pool by IPB: | 3.0% | Net Rentable Area (SF): | 65,749 | |
| Loan Purpose: | Recapitalization | Location: | Seattle, WA | |
| Borrower: | Pier 54, LLC | Year Built / Renovated: | 1900 / 2015 | |
| Loan Sponsor: | A. F. Gilmore Company | Occupancy: | 66.6% | |
| Interest Rate: | 4.99000% | Occupancy Date: | 10/1/2018 | |
| Note Date: | 5/25/2018 | Number of Tenants: | 8 | |
| Maturity Date: | 6/6/2028 | 2015 NOI(1): | N/A | |
| Interest-only Period: | 120 months | 2016 NOI(1): | N/A | |
| Original Term: | 120 months | 2017 NOI: | $1,589,832 | |
| Original Amortization: | None | TTM NOI (as of 8/2018): | $1,898,513 | |
| Amortization Type: | Interest Only | UW Economic Occupancy: | 66.6% | |
| Call Protection: | L(32),Def(84),O(4) | UW Revenues: | $2,873,322 | |
| Lockbox / Cash Management: | Soft / Springing | UW Expenses: | $1,024,372 | |
| Additional Debt: | N/A | UW NOI: | $1,848,950 | |
| Additional Debt Balance: | N/A | UW NCF: | $1,817,390 | |
| Additional Debt Type: | N/A | Appraised Value / Per SF: | $41,000,000 / $624 | |
| Appraisal Date: | 2/1/2018 | |||
| Escrows and Reserves(2) | Financial Information | ||||||
| Initial | Monthly | Initial Cap | Cut-off Date Loan / SF: | $350 | |||
| Taxes: | $18,000 | $9,250 | N/A | Maturity Date Loan / SF: | $350 | ||
| Insurance: | $93,000 | $16,600 | N/A | Cut-off Date LTV: | 56.1% | ||
| Replacement Reserves: | $0 | $1,371 | N/A | Maturity Date LTV: | 56.1% | ||
| TI/LC: | $0 | Springing | $200,000 | UW NCF DSCR: | 1.56x | ||
| Other: | $11,281 | $3,800 | N/A | UW NOI Debt Yield: | 8.0% | ||
| Sources and Uses | |||||||
| Sources | Proceeds | % of Total | Uses | Proceeds | % of Total | ||
| Mortgage Loan | $23,000,000 | 57.5% | Purchase Price(3) | $39,500,000 | 98.8% | ||
| Sponsor Equity | 16,973,465 | 42.5 | Closing Costs | 351,183 | 0.9% | ||
| Upfront Reserves | 122,281 | 0.3% | |||||
| Total Sources | $39,973,465 | 100.0% | Total Uses | $39,973,465 | 100.0% | ||
| (1) | The loan sponsor recently purchased the Pier 54 Seattle Property (as defined below) from the largest tenant at the Pier 54 Seattle Property, Ivar’s, Inc. (“Ivar’s”), in a sale-leaseback transaction. Ivar’s has been in occupancy at the Pier 54 Seattle Property since 1938 and was the previous owner of the Pier 54 Seattle Property from 1966 to May 2017. Prior to the sale-leaseback transaction, Ivar’s completed a $36.0 million renovation of the Pier 54 Seattle Property. No historical cash flow information is available prior to 2017. |
| (2) | For a full description of Escrows and Reserves, please refer to“Escrows and Reserves”below. |
| (3) | The loan sponsor purchased the Pier 54 Seattle Property in an all-cash transaction in May 2017 for $39.5 million. |
The Loan. The Pier 54 Seattle mortgage loan (the “Pier 54 Seattle Mortgage Loan”) has an outstanding principal balance as of the Cut-off Date of $23.0 million and is secured by a first mortgage lien on the borrower’s fee and leasehold interests in a recently renovated 65,749 square foot mixed-use retail and office building situated on top of a 2.89-acre pier located on Seattle’s historic waterfront, known as Pier 54 (the “Pier 54 Seattle Property”). The Pier 54 Seattle Mortgage Loan has a 10-year term and requires interest-only payments for the term of the loan.
The Borrower.The borrowing entity for the Pier 54 Seattle Mortgage Loan is Pier 54, LLC, a California limited liability company structured to be bankruptcy remote with one independent director.
THE INFORMATION IN THIS STRUCTURAL AND COLLATERAL TERM SHEET IS NOT COMPLETE AND MAY BE AMENDED PRIOR TO THE TIME OF SALE. THIS TERM SHEET IS NOT AN OFFER TO SELL THESE SECURITIES AND IT IS NOT A SOLICITATION OF AN OFFER TO BUY THESE SECURITIES IN ANY JURISDICTION WHERE THE OFFER OR SALE IS NOT PERMITTED. | ||
| | 77 of 106 | |
| Structural and Collateral Term Sheet | JPMCC 2019-COR4 | |
| Pier 54 Seattle | ||
The Loan Sponsor.The loan sponsor and nonrecourse carve-out guarantor is A. F. Gilmore Company. A. F. Gilmore Company is a family-owned business (entirely held within the Gilmore family), that focuses on the long-term ownership of commercial real estate, with a focus on specialty retail assets. The most prominent assets in the loan sponsor’s real estate portfolio are the well-known Farmers Market and the Grove, both located in Los Angeles, California.
The Property. The Pier 54 Seattle Property is a recently renovated, 65,749 square foot mixed-use building consisting of 43,808 square feet of first floor retail, restaurant and office space, with approximately 200 feet of frontage along Alaskan Way, as well as 21,941 square feet of second floor, creative office space. Several Seattle landmarks such as Pike’s Place Market, the Seattle Great Wheel and the Seattle Aquarium are located within 0.5 miles of the Pier 54 Seattle Property and act as primary business drivers of demand.
The Pier 54 Seattle Property is 66.6% leased as of October 1, 2018 by eight tenants and is comprised of 35,573 square feet of retail space (54.1% of net rentable area (“NRA”)) and 30,176 square feet of office space (45.9% of NRA) of which 21,941 square feet accounts for the entire second floor of the building. The ground floor retail and office components are 100.0% leased and the second floor creative office space is vacant.
The largest tenant at the Pier 54 Seattle Property, Ivar’s, leases 36,006 square feet or 54.8% of NRA under four separate leases as follows: a full-service restaurant (Acres of Clams), two smaller casual restaurants (Pier 54 Kidd Valley Restaurant and Pier 54 Fish Bar) and an office space (Ivar’s, Inc.) at the Pier 54 Seattle Property. Ivar’s has been in occupancy at the Pier 54 Seattle Property since 1938 and was the previous owner of the Pier 54 Seattle Property from 1966 to May 2017, when it completed a sale-leaseback with the loan sponsor at a purchase price equal to $39.5 million. Prior to the sale-leaseback transaction, Ivar’s completed an approximately $36.0 million renovation of the Pier 54 Seattle Property which coincided with an approximate $330.0 million reconstruction and modernization of the Elliot Bay Seawall by the City of Seattle. The Pier 54 Seattle Property’s renovation involved a complete overhaul of the interior restaurant and tenant spaces, an expansion of the Ivar’s kitchen area, the repurposing of the second floor from its former storage use to open floorplan office space, and the replacement and repair of the pilings that support the pier.
At the closing of the sale-leaseback transaction, Ivar’s entered into four separate leases, with terms ranging from 10-years for its corporate office space to 29-years for the full-service restaurant space (with no early termination options), at a blended rental rate of approximately $46.41 per square foot triple net. The second floor of the building consists of 21,941 square feet of currently vacant office space, which formerly served as storage for Ivar’s. The office space is currently being marketed for lease.
The Pier 54 Seattle Property is located in the Pioneer Square/Waterfront submarket, within the greater Seattle/Puget Sound retail market. As of the fourth quarter of 2018, the Pioneer Square/Waterfront retail submarket consisted of approximately 1.5 million square feet across 87 buildings with an overall market vacancy of 3.7% and average asking rents of approximately $25.43 per square foot. The appraisal identified six comparable restaurant leases ranging in size from 2,340 square feet to 13,905 square feet. Base rents for the comparable restaurant leases ranged from $29.53 per square foot to $46.00 per square foot, with a weighted average of approximately $37.88 per square foot. Additionally, the appraisal identified four comparable retail leases ranging in size from 2,000 square feet to 4,030 square feet. Base rents for the comparable retail leases ranged from $25.00 per square foot to $51.50 per square foot, with a weighted average of approximately $31.06 per square foot. Lastly, the appraisal identified six comparable office leases ranging in size from 8,000 square feet to 210,000 square feet. Base rents for the comparable office leases ranged from $21.00 per square foot to $35.00 per square foot, with a weighted average of approximately $33.32 per square foot.
| Historical and Current Occupancy(1) | |||
| 2015 | 2016 | 2017 | Current(2) |
| N/A | N/A | N/A | 66.6% |
| (1) | The loan sponsor recently purchased the Pier 54 Seattle Property from the largest tenant at the Pier 54 Seattle Property, Ivar’s, in a sale-leaseback transaction. Ivar’s has been in occupancy at the Pier 54 Seattle Property since 1938 and was the previous owner of the Pier 54 Seattle Property from 1966 to May 2017. Prior to the sale-leaseback transaction, Ivar’s completed a $36.0 million renovation of the Pier 54 Seattle Property. No historical occupancy information is available. |
| (2) | Current occupancy is as of October 1, 2018. |
THE INFORMATION IN THIS STRUCTURAL AND COLLATERAL TERM SHEET IS NOT COMPLETE AND MAY BE AMENDED PRIOR TO THE TIME OF SALE. THIS TERM SHEET IS NOT AN OFFER TO SELL THESE SECURITIES AND IT IS NOT A SOLICITATION OF AN OFFER TO BUY THESE SECURITIES IN ANY JURISDICTION WHERE THE OFFER OR SALE IS NOT PERMITTED. | ||
| | 78 of 106 | |
| Structural and Collateral Term Sheet | JPMCC 2019-COR4 | |
| Pier 54 Seattle | ||
| Tenant Summary(1) | ||||||||
| Tenant | Ratings Moody’s/Fitch/S&P | Net Rentable Area (SF) | % of Total NRA | Base Rent PSF | % of Total Base Rent | Sales PSF(2) | Occupancy Costs(2) | Lease Expiration Date |
| Acres of Clams(3)(4) | NR / NR / NR | 21,747 | 33.1% | $36.41 | 39.6% | $407 | 12.9%% | 5/31/2046 |
| Ivar’s, Inc.(3)(4) | NR / NR / NR | 8,235 | 12.5 | $36.33 | 15.0% | NAV | NAV | 5/31/2027 |
| Pier 54 Kidd Valley Restaurant(3)(4) | NR / NR / NR | 3,512 | 5.3 | $70.04 | 12.3% | $338 | 25.9%% | 5/31/2037 |
| Ye Olde Curiosity Shop, Inc.(3) | NR / NR / NR | 3,462 | 5.3 | $29.37 | 5.1% | NAV | NAV | 11/30/2025 |
| Pier 54 Fish Bar(3)(4) | NR / NR / NR | 2,512 | 3.8 | $149.61 | 18.8% | $1,369 | 12.4%% | 5/31/2046 |
| Simply Seattle, Inc. | NR / NR / NR | 1,899 | 2.9 | $50.08 | 4.8% | $712 | 9.4%% | 5/31/2026 |
| Cherry Street Coffee House, LLC(3)(5) | NR / NR / NR | 1,252 | 1.9 | $37.00 | 2.3% | NAV | NAV | 2/29/2032 |
| Thompson Motorsports, Inc.(3) | NR / NR / NR | 1,189 | 1.8 | $38.00 | 2.3% | $473 | 11.5%% | 4/30/2021 |
| (1) | Based on the underwritten rent roll dated as of October 1, 2018. |
| (2) | Sales PSF and Occupancy Costs represent sales for the 12-month period ending September 30, 2018. |
| (3) | Acres of Clams has two, five-year renewal options remaining, Ivar’s Inc. has one, five-year renewal option remaining, Pier 54 Kidd Valley Restaurant has two, five-year renewal options remaining, Ye Olde Curiosity Shop, Inc. has two, five-year renewal options remaining, Pier 54 Fish Bar has two, five-year renewal options remaining, Cherry Street Coffee House, LLC has one, five-year renewal options remaining and Thompson Motorsports, Inc. has two, five-year renewal options remaining. |
| (4) | Acres of Clams, Ivar’s, Inc., Pier 54 Kidd Valley Restaurant and Pier 54 Fish Bar are under separate leases but are affiliated tenants. |
| (5) | Cherry Street Coffee House, LLC subleased 100.0% of its space to Ceres Roasting Company, LLC at identical terms as under the Cherry Street Coffee House, LLC primary lease. Cherry Street Coffee House, LLC remains liable under the primary lease. |
| Lease Rollover Schedule(1) | ||||||||||
| Year | Number of Leases Expiring | Net Rentable Area Expiring | % of NRA Expiring | Base Rent Expiring(2) | % of Base Rent Expiring | Cumulative Net Rentable Area Expiring | Cumulative % of NRA Expiring | Cumulative Base Rent Expiring | Cumulative % of Base Rent Expiring | |
| Vacant | NAP | 21,941 | 33.4% | NAP | NAP | 21,941 | 33.4% | NAP | NAP | |
| 2019 & MTM | 0 | 0 | 0.0% | $0 | 0.0% | 21,941 | 33.4% | $0 | 0.0% | |
| 2020 | 0 | 0 | 0.0% | 0 | 0.0% | 21,941 | 33.4% | $0 | 0.0% | |
| 2021 | 1 | 1,189 | 1.8% | 45,182 | 2.3% | 23,130 | 35.2% | $45,182 | 2.3% | |
| 2022 | 0 | 0 | 0.0% | 0 | 0.0% | 23,130 | 35.2% | $45,182 | 2.3% | |
| 2023 | 0 | 0 | 0.0% | 0 | 0.0% | 23,130 | 35.2% | $45,182 | 2.3% | |
| 2024 | 0 | 0 | 0.0% | 0 | 0.0% | 23,130 | 35.2% | $45,182 | 2.3% | |
| 2025 | 1 | 3,462 | 5.3% | 101,684 | 5.1% | 26,592 | 40.4% | $146,866 | 7.3% | |
| 2026 | 1 | 1,899 | 2.9% | 95,100 | 4.8% | 28,491 | 43.3% | $241,966 | 12.1% | |
| 2027 | 1 | 8,235 | 12.5% | 299,176 | 15.0% | 36,726 | 55.9% | $541,142 | 27.0% | |
| 2028 | 0 | 0 | 0.0% | 0 | 0.0% | 36,726 | 55.9% | $541,142 | 27.0% | |
| 2029 | 0 | 0 | 0.0% | 0 | 0.0% | 36,726 | 55.9% | $541,142 | 27.0% | |
| 2030 & Beyond | 4 | 29,023 | 44.1% | 1,459,987 | 73.0% | 65,749 | 100.0% | $2,001,129 | 100.0% | |
| Total | 8 | 65,749 | 100.0% | $2,001,129 | 100.0% | |||||
| (1) | Based on the underwritten rent roll dated October 1, 2018. |
| (2) | Base Rent Expiring is inclusive of contractual rent steps through June 2019 for certain tenants. |
THE INFORMATION IN THIS STRUCTURAL AND COLLATERAL TERM SHEET IS NOT COMPLETE AND MAY BE AMENDED PRIOR TO THE TIME OF SALE. THIS TERM SHEET IS NOT AN OFFER TO SELL THESE SECURITIES AND IT IS NOT A SOLICITATION OF AN OFFER TO BUY THESE SECURITIES IN ANY JURISDICTION WHERE THE OFFER OR SALE IS NOT PERMITTED. | ||
| | 79 of 106 | |
| Structural and Collateral Term Sheet | JPMCC 2019-COR4 | |
| Pier 54 Seattle | ||
| Operating History and Underwritten Net Cash Flow(1) | |||||||||
| 2017 | TTM(2) | Underwritten | Per Square Foot | %(3) | |||||
| Rents in Place | $1,960,134 | $1,928,541 | $1,959,352 | $29.80 | 68.2% | ||||
| Contractual Rent Steps(4) | 0 | 0 | 41,777 | 0.64 | 1.5 | ||||
| Percentage Rent | 87,956 | 19,356 | 19,356 | 0.29 | 0.7 | ||||
| Vacant Income | 0 | 0 | 0 | 0.00 | 0.0 | ||||
| Gross Potential Rent | $2,048,090 | $1,947,897 | $2,020,485 | $30.73 | 70.3% | ||||
| Total Reimbursements | 618,652 | 780,271 | 720,884 | 10.96 | 25.1 | ||||
| Total Other Income(5) | 119,708 | 121,453 | 131,953 | 2.01 | 4.6 | ||||
| Net Rental Income | $2,786,450 | $2,849,621 | $2,873,322 | $43.70 | 100.0% | ||||
| (Vacancy/Credit Loss) | 0 | 0 | 0 | 0 | 0.0 | ||||
| Effective Gross Income | $2,786,450 | $2,849,621 | $2,873,322 | $43.70 | 100.0% | ||||
| Total Expenses | $1,196,618 | 951,108 | 1,024,372 | 15.58 | 35.7 | ||||
| Net Operating Income | $1,589,832 | $1,898,513 | $1,848,950 | $28.12 | 64.3% | ||||
| TI/LC | 0 | 0 | 15,122 | 0.23 | 0.5 | ||||
| Capital Expenditures | 0 | 0 | 16,437 | 0.25 | 0.6 | ||||
| Net Cash Flow | $1,589,832 | $1,898,513 | $1,817,390 | $27.64 | 63.3% | ||||
| (1) | The loan sponsor recently purchased the Pier 54 Seattle Property from the largest tenant at the Pier 54 Seattle Property, Ivar’s, in a sale-leaseback transaction. Ivar’s has been in occupancy at the Pier 54 Seattle Property since 1938 and was the previous owner of the Pier 54 Seattle Property from 1966 to May 2017. Prior to the sale-leaseback transaction, Ivar’s completed a $36.0 million renovation of the Pier 54 Seattle Property. No historical cash flow information is available prior to 2017. |
| (2) | TTM column represents the trailing 12-month period ending on August 31, 2018. |
| (3) | % column represents percent of Net Rental Income for all revenue lines and represents percent of Effective Gross Income for the remainder of the fields. |
| (4) | Based on the contractual rent steps though June 2019 for certain tenants. |
| (5) | Underwritten Total Other Income includes TTM other income ($28,953) and the contractual kiosk annual base rent ($103,000) as of June 2019. |
Property Management.The Pier 54 Seattle Property is managed by American Management Services Northwest LLC, a third party management company.
Escrows and Reserves. At origination, the borrower deposited into escrow $93,000 for insurance premiums, $18,000 for real estate taxes and approximately $11,281 for the Department of Natural Resources (“DNR”) aquatic ground lease (the “DNR Lease”) payments.
Tax Escrows– On a monthly basis, the borrower is required to escrow 1/12 of the annual estimated tax payments, which currently equates to $9,250.
Insurance Escrows– On a monthly basis, the borrower is required to escrow 1/12 of the annual estimated insurance payments, which currently equates to $16,600. Liability coverage (including excess liability) is currently covered under a blanket policy. Consequently, the related premiums are excluded from the escrow as long as such blanket policy is in place.
Replacement Reserves –On a monthly basis, the borrower is required to escrow approximately $1,371 for replacement reserves (approximately $0.25 per square foot annually).
TI/LC Reserves –On a monthly basis, beginning on the 37th payment date and on each payment date thereafter, the borrower is required to escrow approximately $5,483 for tenant improvements and leasing commissions (approximately $1.00 per square foot annually).
DNR Lease – On a monthly basis, the borrower is required to escrow 1/12 of the annual DNR Lease payments, which currently equates to $3,800.
THE INFORMATION IN THIS STRUCTURAL AND COLLATERAL TERM SHEET IS NOT COMPLETE AND MAY BE AMENDED PRIOR TO THE TIME OF SALE. THIS TERM SHEET IS NOT AN OFFER TO SELL THESE SECURITIES AND IT IS NOT A SOLICITATION OF AN OFFER TO BUY THESE SECURITIES IN ANY JURISDICTION WHERE THE OFFER OR SALE IS NOT PERMITTED. | ||
| | 80 of 106 | |
| Structural and Collateral Term Sheet | JPMCC 2019-COR4 | |
| Pier 54 Seattle | ||
Lockbox / Cash Management. The Pier 54 Seattle Mortgage Loan is structured with a soft lockbox and springing cash management. All rents are required to be deposited into a lockbox account within one business day of receipt by the borrower or property manager. All funds in the lockbox account are required to be swept daily into the borrower’s operating account, unless a Cash Management Period (as defined below) is continuing. Upon the occurrence of a Cash Management Period, all funds in the lockbox account will be swept daily into a lender-controlled account, from which account such funds will be disbursed on each payment date in accordance with the loan documents and any excess will be retained by the lender as additional collateral for the Pier 54 Seattle Mortgage Loan.
A “Cash Management Period” will commence upon (i) an event of default, (ii) if the debt yield is less than 7.0% (until the next payment date following the date upon which the lender has determined that the debt yield is greater than or equal to 7.0%), (iii) during a Lease Sweep Period (as defined below) or (iv) a monetary or material non-monetary default under the DNR Lease (until such time as the subject default has been cured, such cure has been accepted by the DNR, and no other monetary or material non-monetary default under the DNR Lease is then continuing).
A “Lease Sweep Period” will commence (i) if any Lease Sweep Lease (as defined below) is surrendered, cancelled or terminated prior to its then-current expiration date, (ii) if any Lease Sweep Tenant (as defined below) goes dark or gives notice that it intends to discontinue its business at its premises, or if Ivar’s Leased Space (as defined below) goes dark in more than 25% of its space or gives notice that it intends to discontinue its business at its premises, (iii) upon the occurrence of a default under any Lease Sweep Lease by the applicable Lease Sweep Tenant or (iv) upon the occurrence of a Lease Sweep Tenant insolvency proceeding.
A “Lease Sweep Lease” means the Acres of Clams, Ivar’s, Inc., Pier 54 Kidd Valley Restaurant and Pier 54 Fish Bar leases (collectively, “Ivar’s Leased Space”) or any tenant that covers 10,000 square feet or more of the NRA of the Pier 54 Seattle Property.
A “Lease Sweep Tenant” means any tenant under a Lease Sweep Lease, or under one or more leases which when taken together would constitute a Lease Sweep Lease.
DNR Lease.A portion of the Pier 54 Seattle Property site, located at the far Western extremity of the pier underneath the building apron, is owned by the DNR. This portion of the Pier 54 Seattle Property is on an aquatic lands lease or DNR Lease through July 2046. The annual ground rent is approximately $45,126, payable in quarterly installments. With respect to the lease rent, the DNR has the right to increase the rent annually for an inflation adjustment, and every four years to market (subject to an annual increase cap of 50.0%). The rent in 1994 was approximately $25,805 and was most recently reset to approximately $45,126 in 2017. The portion of the Pier 54 Seattle Property subject to the DNR Lease can only be accessed from the water, or through the fee portion of the Pier 54 Seattle Property. There are five other nearby historic piers located along the waterfront, all of which are constructed entirely on aquatic land leases from the DNR. According to the appraisal, the DNR has historically extended leases with other pier owners upon expiration.
THE INFORMATION IN THIS STRUCTURAL AND COLLATERAL TERM SHEET IS NOT COMPLETE AND MAY BE AMENDED PRIOR TO THE TIME OF SALE. THIS TERM SHEET IS NOT AN OFFER TO SELL THESE SECURITIES AND IT IS NOT A SOLICITATION OF AN OFFER TO BUY THESE SECURITIES IN ANY JURISDICTION WHERE THE OFFER OR SALE IS NOT PERMITTED. | ||
| | 81 of 106 | |
| Structural and Collateral Term Sheet | JPMCC 2019-COR4 | |
| CBBC Industrial Portfolio | ||
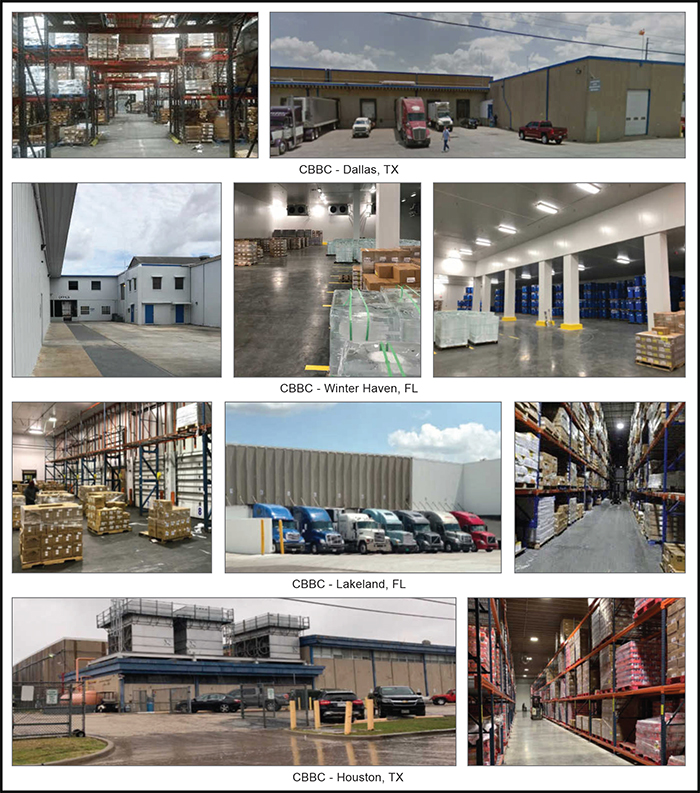
THE INFORMATION IN THIS STRUCTURAL AND COLLATERAL TERM SHEET IS NOT COMPLETE AND MAY BE AMENDED PRIOR TO THE TIME OF SALE. THIS TERM SHEET IS NOT AN OFFER TO SELL THESE SECURITIES AND IT IS NOT A SOLICITATION OF AN OFFER TO BUY THESE SECURITIES IN ANY JURISDICTION WHERE THE OFFER OR SALE IS NOT PERMITTED. | ||
| | 82 of 106 | |
| Structural and Collateral Term Sheet | JPMCC 2019-COR4 | |
| CBBC Industrial Portfolio | ||
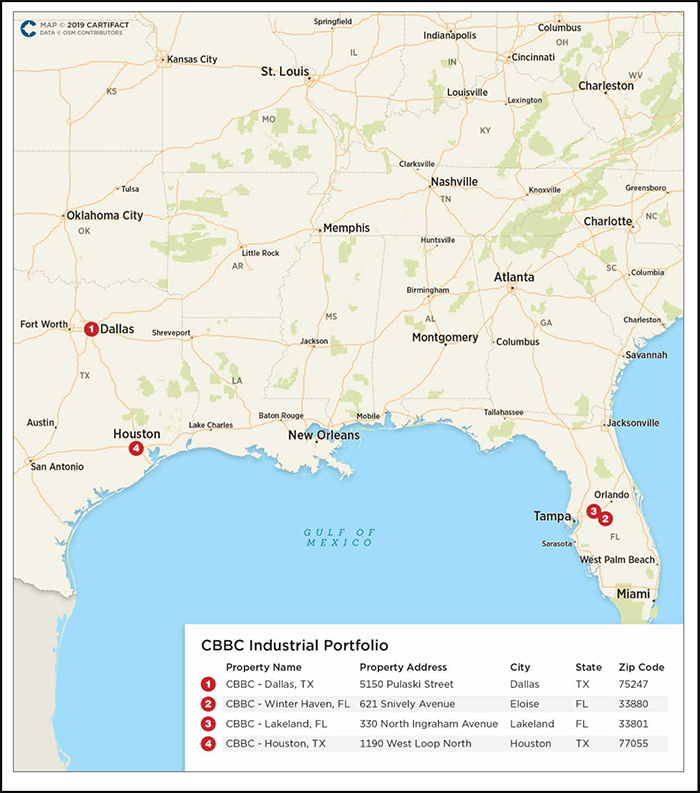
THE INFORMATION IN THIS STRUCTURAL AND COLLATERAL TERM SHEET IS NOT COMPLETE AND MAY BE AMENDED PRIOR TO THE TIME OF SALE. THIS TERM SHEET IS NOT AN OFFER TO SELL THESE SECURITIES AND IT IS NOT A SOLICITATION OF AN OFFER TO BUY THESE SECURITIES IN ANY JURISDICTION WHERE THE OFFER OR SALE IS NOT PERMITTED. | ||
| | 83 of 106 | |
| Structural and Collateral Term Sheet | JPMCC 2019-COR4 | |
| CBBC Industrial Portfolio | ||
| Mortgage Loan Information | Property Information | |||
| Mortgage Loan Seller(1): | LCM | Single Asset / Portfolio: | Portfolio | |
| Original Principal Balance(1): | $20,000,000 | Title: | Fee | |
| Cut-off Date Principal Balance(1): | $20,000,000 | Property Type - Subtype: | Industrial – Warehouse/Distribution | |
| % of Pool by IPB: | 2.6% | Net Rentable Area (SF): | 951,651 | |
| Loan Purpose(2): | Acquisition | Location: | Various | |
| Borrower: | NM BXBF, L.P. | Year Built / Renovated: | Various / Various | |
| Sponsors(3): | Various | Occupancy: | 100.0% | |
| Interest Rate: | 5.08000% | Occupancy Date: | 2/6/2019 | |
| Note Date: | 10/30/2018 | Number of Tenants: | 1 | |
| Final Maturity Date: | 11/6/2028 | 2015 NOI(5): | N/A | |
| Interest-only Period: | 120 months | 2016 NOI(5): | N/A | |
| Original Term: | 120 months | 2017 NOI(5): | N/A | |
| Original Amortization: | None | TTM NOI(5): | N/A | |
| Amortization Type: | Interest Only | UW Economic Occupancy: | 95.0% | |
| Call Protection(4): | L(23),Grtr1%orYM(4), | UW Revenues: | 5,678,349 | |
| DeforGrtr1%orYM(88),O(5) | UW Expenses: | $170,350 | ||
| Lockbox / Cash Management: | Hard / Springing | UW NOI(6): | $5,507,998 | |
| Additional Debt: | Yes | UW NCF: | $4,825,635 | |
| Additional Debt Balance(1): | $33,030,000 | Appraised Value / Per SF: | $85,880,000 / $90 | |
| Additional Debt Type(1): | Pari Passu | Appraisal Date(6): | Various | |
| Escrows and Reserves(7) | Financial Information(1) | |||||
| Initial | Monthly | Initial Cap | Cut-off Date Loan / SF: | $56 | ||
| Taxes: | $0 | Springing | N/A | Maturity Date Loan / SF: | $56 | |
| Insurance: | $0 | Springing | N/A | Cut-off Date LTV: | 61.7% | |
| Replacement Reserves: | $0 | Springing | $190,330 | Maturity Date LTV: | 61.7% | |
| TI/LC: | $0 | Springing | $666,156 | UW NCF DSCR: | 1.77x | |
| Other: | $0 | $0 | N/A | UW NOI Debt Yield: | 10.4% | |
| Sources and Uses | ||||||
| Sources | Proceeds | % of Total | Uses | Proceeds | % of Total | |
| Whole Loan | $53,030,000 | 64.7% | Purchase Price(2) | $81,287,081 | 99.2% | |
| Sponsor Equity | 28,878,758 | 35.3% | Closing Costs | 621,677 | 0.8% | |
| Total Sources | $81,908,758 | 100.0% | Total Uses | $81,908,758 | 100.0% | |
| (1) | The CBBC Industrial Portfolio Mortgage Loan (as defined below) was originated by Deutsche Bank AG, acting through its New York Branch (“DBNY”). The CBBC Industrial Portfolio Mortgage Loan will be sold to LCM prior to the closing date of this securitization. The CBBC Industrial Portfolio Mortgage Loan is part of a whole loan (the “CBBC Industrial Portfolio Whole Loan”) evidenced by twopari passu notes with an aggregate outstanding principal balance of $53.03 million. The Financial Information presented in the chart above reflects the $53.03 million aggregate Cut-off Date balance of the CBBC Industrial Portfolio Whole Loan. |
| (2) | On October 12, 2018, the loan sponsors acquired the CBBC Industrial Portfolio Properties (as defined below) in an all-cash sale leaseback transaction for approximately $81.3 million. Subsequently, on October 30, 2018, loan proceeds were used to recapitalize the borrower at loan origination. |
| (3) | The loan sponsors and nonrecourse carve-out guarantors are New Mountain Net Lease Corporation and New Mountain Net Lease Partners Corporation, on a joint and several basis. |
| (4) | See “Release of Property” and “Substitution” below for discussion of partial release provisions. |
| (5) | Historical NOI information is not available because the loan sponsors purchased the CBBC Industrial Portfolio Properties on October 12, 2018 and prior to that the CBBC Industrial Portfolio Properties were owned and occupied by the Colorado Beef Boxed Company or an affiliate. |
| (6) | The appraisal concluded a “go dark” value as of September 2018 equal to $65,500,000, which equates to a Cut-off Date LTV Ratio and Maturity Date LTV Ratio of 81.0% and 81.0%, respectively. |
| (7) | For a full description of Escrows and Reserves, please refer to “Escrows and Reserves” below. |
THE INFORMATION IN THIS STRUCTURAL AND COLLATERAL TERM SHEET IS NOT COMPLETE AND MAY BE AMENDED PRIOR TO THE TIME OF SALE. THIS TERM SHEET IS NOT AN OFFER TO SELL THESE SECURITIES AND IT IS NOT A SOLICITATION OF AN OFFER TO BUY THESE SECURITIES IN ANY JURISDICTION WHERE THE OFFER OR SALE IS NOT PERMITTED. | ||
| | 84 of 106 | |
| Structural and Collateral Term Sheet | JPMCC 2019-COR4 | |
| CBBC Industrial Portfolio | ||
The Loan.The CBBC Industrial Portfolio loan (the “CBBC Industrial Portfolio Mortgage Loan”) is a fixed rate loan secured by the borrower’s fee interest in a portfolio of four industrial properties totaling 951,651 square feet located in Texas and Florida (collectively, the “CBBC Industrial Portfolio Properties” and individually each a “CBBC Industrial Portfolio Property”). Loan proceeds together with approximately $28.9 million of loan sponsors’ equity, were used to acquire the CBBC Industrial Portfolio Properties and pay closing costs. The loan sponsors acquired the CBBC Industrial Portfolio Properties in October 2018 in a sale leaseback transaction. In conjunction with the sale, CBBC Opco, LLC (the “CBBC Tenant”) executed a new 20-year absolute triple net lease relating to all CBBC Industrial Portfolio Properties through October 2038.
The CBBC Industrial Portfolio Mortgage Loan is evidenced by the non-controlling Note A-2 with an Original Balance and Cut-off Date Balance of $20.0 million. The CBBC Industrial Portfolio Mortgage Loan is part of the CBBC Industrial Portfolio Whole Loan with an aggregate Original Principal and aggregate Cut-off Date Balance of $53.03 million, evidenced by twopari passu notes, as described below. Only the CBBC Industrial Portfolio Mortgage Loan will be contributed to the JPMCC 2019-COR4 Trust. The remaining note was securitized in the UBS 2018-C15 transaction. The relationship between the holders of the CBBC Industrial Portfolio Whole Loan will be governed by a co-lender agreement as described under “Description of the Mortgage Pool—The Whole Loans—The Non-Serviced Pari Passu Whole Loans” in the Preliminary Prospectus.
| Whole Loan Summary | ||||
| Note | Original Balance | Cut-off Date Balance | Note Holder | Controlling Piece |
| A-1 | $33,030,000 | $33,030,000 | UBS 2018-C15 | Yes |
| A-2 | 20,000,000 | 20,000,000 | JPMCC 2019-COR4 | No |
| Total | $53,030,000 | $53,030,000 | ||
The Borrower. The borrower for the CBBC Industrial Portfolio Whole Loan is NM BXBF, L.P., a single purpose Delaware limited partnership structured to be bankruptcy-remote with two independent directors.
The Loan Sponsor. The loan sponsors and nonrecourse carve-out guarantors of the CBBC Industrial Portfolio Whole Loan are New Mountain Net Lease Corporation and New Mountain Net Lease Partners Corporation, affiliates of New Mountain Capital, LLC (“New Mountain Capital”). New Mountain Capital is an alternative investment asset manager with private equity, public equity and private credit strategies. New Mountain Capital’s public equity arm, Vantage, takes non-control positions in publicly traded companies. New Mountain Capital, together with its affiliates, has assets under management totaling more than $20.0 billion. The joint and several liability of the nonrecourse carve-out guarantors under the environmental indemnity is capped at 110% of the original principal balance of the CBBC Industrial Portfolio Mortgage Whole Loan.
The Properties.The CBBC Industrial Portfolio Properties consist of four industrial properties located in Florida (2) and Texas (2) with a total net rentable area of 951,651 square feet. The total net rentable area includes cooler/freezer space (748,323 square feet, approximately 78.6% of net rentable area), warehouse space (161,950 square feet, approximately 17.0% of net rentable area), and office space (41,379 square feet, 4.3% of net rentable area). The CBBC Industrial Portfolio Properties range from 104,974 square feet to 330,000 square feet. On October 12, 2018, the CBBC Tenant commenced a 20-year absolute triple net lease on all four of the CBBC Industrial Portfolio Properties (the “CBBC Lease”). The CBBC Lease is guaranteed by CBBC Holdings, Inc., an affiliate of Colorado Beef Boxed Company (“CBBC”). CBBC has a total of 10 assets, and the four properties in the CBBC Industrial Portfolio represent 61.8% of the total square footage of CBBC’s total assets. Additionally, the Lakeland Property is the distribution headquarters for all of CBBC’s assets. Over the past four years, CBBC has invested approximately $11.9 million in capital improvements across the four CBBC Industrial Portfolio Properties. The appraisal concluded a “go dark” value as of September 2018 equal to $65,500,000, which equates to a Cut-off Date LTV Ratio and Maturity Date LTV Ratio of 81.0% and 81.0%, respectively.
| Portfolio Summary | |||||||
| Property | Year Built | Net Rentable Area (SF) | Allocated Whole Loan Amount | % of Aggregate Allocated Loan Amounts | Appraised Value(1) | Annual Rent(2) | % of Annual Rent |
| CBBC - Dallas, TX | 1965, 1978 | 284,550 | $21,410,000 | 40.4% | $34,680,000 | $2,276,400 | 40.0% |
| CBBC - Winter Haven, FL | 1950-2001 | 330,000 | 12,970,000 | 24.5% | $21,000,000 | $1,402,500 | 24.7% |
| CBBC - Lakeland, FL | 1957-1996 | 232,127 | 11,650,000 | 22.0% | $19,300,000 | $1,271,441 | 22.4% |
| CBBC - Houston, TX | 1965, 2000 | 104,974 | 7,000,000 | 13.2% | $10,900,000 | $735,690 | 12.9% |
| Total | 951,651 | $53,030,000 | 100.0% | $85,880,000 | $5,686,031 | 100.0% | |
| (1) | Source: Appraisal |
| (2) | Annual Rent is based on the underwritten rent roll. The CBBC Industrial Portfolio Properties are leased under a single lease, which allocates separate rental amounts to each of the CBBC Industrial Portfolio Properties. |
THE INFORMATION IN THIS STRUCTURAL AND COLLATERAL TERM SHEET IS NOT COMPLETE AND MAY BE AMENDED PRIOR TO THE TIME OF SALE. THIS TERM SHEET IS NOT AN OFFER TO SELL THESE SECURITIES AND IT IS NOT A SOLICITATION OF AN OFFER TO BUY THESE SECURITIES IN ANY JURISDICTION WHERE THE OFFER OR SALE IS NOT PERMITTED. | ||
| | 85 of 106 | |
| Structural and Collateral Term Sheet | JPMCC 2019-COR4 | |
| CBBC Industrial Portfolio | ||
CBBC - Dallas, TX. The CBBC - Dallas, TX property (“Dallas Property”) is a 284,550 square feet single-tenant industrial warehouse building located in Dallas, Texas, approximately 6.2 miles northwest of the Dallas central business district. The Dallas Property is 100.0% occupied by CBBC which has occupied the Dallas Property since July 2015. The improvements include four connected one-story buildings constructed in 1965 and 1978, which are situated on an approximately 9.34-acre site. The Dallas Property was most recently renovated in 2015 when CBBC replaced the roof and spent approximately $4.0 million to convert/retrofit 70,000 square feet to freezer space and added a new glycol system in the flooring. In addition, CBBC added LED lighting and motion detectors around the Dallas Property. The Dallas Property contains 92% freezer/cold storage space, has 26 loading docks and two drive-in doors with a clearance height of 28 feet. There are 85 surface parking spaces which equates to a parking ratio of approximately 0.3 spaces per 1,000 square feet.
CBBC - Winter Haven, FL. The CBBC - Winter Haven, FL property (“Winter Haven Property”) consists of 11 one-story industrial warehouse/distribution buildings, totaling 330,000 square feet, located in Eloise, Florida. The Winter Haven Property is 100.0% occupied by CBBC and operated by Phoenix Industries, a CBBC subsidiary and third-party cold storage provider. The improvements were constructed in phases between 1950 and 2001 and are situated on a 17.28-acre site. The Winter Haven Property was most recently renovated in 2017 when the cold storage equipment was upgraded. Additional capital expenditures in recent years include approximately $4.2 million to convert 35,000 square feet of dry space to freezer space, the building of a fourth engine room with a brand new, ammonia-based system, and installing new LED lights. Furthermore, there are eight new freezer doors being installed throughout the facility. The Winter Haven Property consists of approximately 87% ammonia-based freezer/cold storage space, with 21 dock high doors and two drive-in overhead doors, including three rail-served loading doors. The freezer area contains 6-7 main freezer/cooler rooms with ammonia refrigeration system. The building sizes range from 10,232 square feet to 68,690 square feet and the clear heights range from 15 feet to 32 feet. There are 42 surface parking spaces which equates to a parking ratio of approximately 0.13 spaces per 1,000 square feet. The Winter Haven Property is served by CSX rail services and offers 1,800 feet of rail sliding capable of holding 20 plus cars.
CBBC - Lakeland, FL. The CBBC - Lakeland, FL property (“Lakeland Property”) consists of 10 one- and two-story industrial warehouse/distribution buildings, totaling 232,127 square feet, located in Lakeland, Florida. The Lakeland Property is 100.0% occupied by CBBC and is the company’s distribution headquarters. The improvements were constructed in phases between 1957 and 1996 and are situated on a 16.06-acre site. The Lakeland Property was most recently renovated in 2017, which included $3 million for refrigeration upgrades, including the conversion of 30,000 square feet to freezer space. The Lakeland Property consists of approximately 52% of ammonia-based freezer/cold storage space, 12% office space, 30 dock-high doors and two drive-in doors. A 15,400 square feet, two-story office building is located across the street from the primary warehouse area and also includes a small, 800 square feet guard house. The Lakeland Property features 116 surface parking spaces which equates to a parking ratio of 0.50 spaces per 1,000 square feet. The Lakeland Property accounts for approximately a third of CBBC’s overall weekly shipping capacity, distributing 4.5 million to 5.5 million pounds of volume per week.
CBBC - Houston, TX. The CBBC - Houston, TX property (“Houston Property”) consists of one, one-story industrial warehouse/distribution building totaling 104,974 square feet, located in Houston, Texas. The Houston Property is 100% occupied by CBBC and is situated on a 4.87-acre lot located approximately six miles northwest of the Houston central business district. The improvements were constructed in 1965 and 2000 and most recently renovated in 2007. CBBC has spent $150,000 to upgrade the dock doors and levelers. The Houston Property consists of 75% freezer/cold storage space with 23 docks and clear heights of 28 feet. The Houston Property holds on average 20-22 million pounds of inventory at any one time. The location services the Galleria submarket. CBBC is currently using the warehouse as its primary distribution and third party cold storage facility in the Austin and Waco, Texas areas. The Houston Property distributes an average of 2.7-3.0 million pounds of volume a week.
The Tenant. CBBC Opco, LLC (951,651 square feet, 100.0% of net rentable area, 100.0% of underwritten base rent). The CBBC Industrial Portfolio Properties are leased to CBBC Tenant and occupied by CBBC. CBBC was founded in 1975 and engages in the distribution of refrigerated and frozen food products. Its distribution portfolio includes beef, pork, poultry, seafood, lamb and veal, ethnic products, specialty food items, deli products, grocery products, and packaged food products, as well as packing supplies in various colors and sizes. The company also supplies cheese, vegetables, lunch meat, and various dry products. It serves independent and chain retailers/grocery stores, cruise lines, food service distributors, restaurants, the United States military, amusement/theme parks, and various other food outlets/purveyors in the United States and internationally. CBBC goes to market both directly to end consumers, and through distributors and wholesalers (approximately 30% via distributors / retailers). CBBC is a diversified business with the top five customers representing less than 7% of CBBC’s total revenue. CBBC has gradually increased volume over the past several years from 574 million pounds in 2013 to 697 million pounds in 2017.
In June 2017, Altamont Capital Partners (“ACP”) acquired CBBC. ACP is a private equity firm with over $2.5 billion of capital under management, focused primarily on making long term, control investments in middle market businesses. ACP has a diverse portfolio that includes consumer products, industrials, retail, restaurants & franchising, financial services, and healthcare.
THE INFORMATION IN THIS STRUCTURAL AND COLLATERAL TERM SHEET IS NOT COMPLETE AND MAY BE AMENDED PRIOR TO THE TIME OF SALE. THIS TERM SHEET IS NOT AN OFFER TO SELL THESE SECURITIES AND IT IS NOT A SOLICITATION OF AN OFFER TO BUY THESE SECURITIES IN ANY JURISDICTION WHERE THE OFFER OR SALE IS NOT PERMITTED. | ||
| | 86 of 106 | |
| Structural and Collateral Term Sheet | JPMCC 2019-COR4 | |
| CBBC Industrial Portfolio | ||
The CBBC Lease provides that the tenant has the right to require the borrower to substitute up to one property under the CBBC Lease during the initial 10 years of the lease term (which ends October 31, 2028), and up to two properties under the CBBC Lease during the subsequent 10 years, provided that certain conditions are satisfied. If such conditions are satisfied, the borrower is required to sell the substituted-for CBBC Industrial Portfolio Property to CBBC or a third party designated by it and purchase the property to be substituted from CBBC or a third party designated by it, and the CBBC Lease is deemed to be automatically amended to add the substitute property and terminate the substituted-for property. See “Substitution” below and “Description of the Mortgage Pool—Certain Terms of the Mortgage Loans-Releases; Partial Releases” in the Preliminary Prospectus.
The CBBC Industrial Portfolio Properties are located in a mix of industrial markets including Dallas, Tampa/St. Petersburg and Houston. The CBBC Industrial Portfolio Properties are within industrial submarkets that reported vacancy rates ranging from 4.3% to 8.3% and average asking rental rates ranging from $4.73 - $7.33 per square foot.
| Historical and Current Occupancy | |||
| 2015 | 2016 | 2017 | Current(2) |
| 100.0% | 100.0% | 100.0% | 100.0% |
| (2) | Current Occupancy is as of February 6, 2019. |
| Market Summary(1) | ||||||||
| Property Name | Net Rentable Area(2) | % of Allocated Loan Amount | Population (5-Mile | Submarket | Submarket Vacancy | Submarket Rent PSF | Appraisal Concluded Market Rent PSF(4) | Underwritten Base Rent PSF(2) |
| CBBC - Dallas, TX | 284,550 | 40.4% | 308,285 | South Stemmons | 4.3% | $5.38 | $8.00 | $8.00 |
| CBBC - Winter Haven, FL | 330,000 | 24.5% | 95,631 | Polk County | 8.3% | $4.73 | $4.25 | $4.25 |
| CBBC - Lakeland, FL | 232,127 | 22.0% | 138,595 | Polk County | 8.3% | $4.73 | $5.48 | $5.48 |
| CBBC - Houston, TX | 104,974 | 13.2% | 465,931 | Northwest Corridor | 5.4% | $7.33 | $7.01 | $7.01 |
| Total / Wtd. Avg. | 951,651 | 100.0% | 6.8% | $5.21 | $5.98 | $5.98 | ||
| (1) | Source: Appraisal |
| (2) | Information is based on the underwritten rent roll. |
| (3) | Population (5-Mile Radius) is based on estimated 2018 figures, excluding the Dallas Property, which are from 2017. |
| (4) | The Appraisal Concluded Market Rent PSF is based on analysis of comparable properties, as well as the CBBC Lease. |
CBBC - Dallas, TX: The Dallas Property is located in Dallas, Texas, approximately 6.2 miles northwest of the Dallas central business district. The location provides access to Dallas’ transportation network including access to Interstate 35E, Interstate 30, and State Highway 12. The Dallas Fort Worth Airport is approximately 14 miles from the Dallas Property. The major employers in the area include Southwest Airlines, Dallas Love Field Airport, FedEx and AT&T.
CBBC - Winter Haven, FL: The Winter Haven Property is located in Eloise, Florida, approximately 2.8 miles southwest of the Winter Haven central business district, and centrally located between the Tampa central business district (49.7 miles) and Orlando central business district (49.5 miles). Primary regional access to the area is provided by Interstate 4 (13.0 miles northeast), which is the main east/west arterial highway connecting Tampa to Orlando and the east coast. Additional access is provided by County Highway 60, U.S. Highway 17, and U.S. Highway 27. U.S. Highway 17 and County Highway 60 are major arterials that cross the Lakeland/Winter Haven MSA in both the north/south and east/west direction. Located approximately 8 miles southeast of the Winter Haven Property is the CSX Integrated Logistics Center that opened in Winter Haven in 2014. This terminal serves domestic intermodal freight with the following products available: UMAX, Private Containers and RailPlus. The terminal can process up to 300,000 containers a year. The area surrounding the facility includes 932-acres dubbed the Central Florida Intermodel Logistics Center and according to the appraisal is expected to slowly fill with industrial warehouse developments. This area is located approximately nine miles south of the Winter Haven Property.
CBBC - Lakeland, FL: The Lakeland Property is located in Lakeland, Florida, approximately 1.0 mile northeast of the Lakeland central business district, and is centrally located between the Tampa central business district (34.5 miles) and Orlando central business district (54.2 miles). The Lakeland Property is located within Polk County along Interstate 4, which is the main east/west arterial highway connecting Tampa to Orlando and the east coast. In 2015, Amazon added a 1.02 million square feet fulfillment center that added an estimated 2,000 jobs to the Lakeland area. Walmart also recently opened their two building, 2 million square feet distribution center in Davenport, bringing an additional 550 jobs. Additionally, IKEA is opening a 325,000 square feet distribution center off Allen K Breed Highway.
THE INFORMATION IN THIS STRUCTURAL AND COLLATERAL TERM SHEET IS NOT COMPLETE AND MAY BE AMENDED PRIOR TO THE TIME OF SALE. THIS TERM SHEET IS NOT AN OFFER TO SELL THESE SECURITIES AND IT IS NOT A SOLICITATION OF AN OFFER TO BUY THESE SECURITIES IN ANY JURISDICTION WHERE THE OFFER OR SALE IS NOT PERMITTED. | ||
| | 87 of 106 | |
| Structural and Collateral Term Sheet | JPMCC 2019-COR4 | |
| CBBC Industrial Portfolio | ||
CBBC - Houston, TX: The Houston Property is located in Houston, Texas, approximately eight miles northwest of the Houston central business district. The Houston Property is accessed by West Loop Parkway to the west and West 11th Street to the north, northwest of Downtown Houston. Access to the local area is provided by Interstate 610, a 38 mile six-lane highway extending around Houston, which experiences daily traffic volume of nearly 285,948 vehicles daily. 1.1 miles north of the Houston Property I-610 intersects with State Route 290, which travels northwest for 141 miles to Austin, TX. Additionally, Interstate 10, which is 0.6 miles southeast of the Houston Property, provides direct eastern access to the Houston central business district and continues all the way to the east coast where it ends in Jacksonville, FL, as well as, extending west to San Antonio, TX. Most recently, Amazon and FedEx each completed distribution facilities exceeding 800,000 square feet in September 2017, and Amazon completed a 1 million square feet facility in early 2018 in the area. A few of the metro’s largest leases over the past two years have been in logistics facilities, including IKEA (1,000,000 square feet ), Emser Tile (600,000 square feet ), Kuraray America (465,000 square feet ) and Advance Auto Parts (440,000 square feet), among others.
| Tenant Summary(1)(2) | |||||||
Tenant | Property | Ratings Moody’s/S&P/Fitch | Net Rentable Area (SF) | % of Total NRA | Base Rent PSF | % of Total Base Rent | Lease Expiration Date |
| CBBC | Dallas Property | NR/NR/NR | 284,550 | 29.9% | $8.00 | 40.0% | 10/31/2038 |
| CBBC | Winter Haven Property | NR/NR/NR | 330,000 | 34.7% | $4.25 | 24.7% | 10/31/2038 |
| CBBC | Lakeland Property | NR/NR/NR | 232,127 | 24.4% | $5.48 | 22.4% | 10/31/2038 |
| CBBC | Houston Property | NR/NR/NR | 104,974 | 11.0% | $7.01 | 12.9% | 10/31/2038 |
| (1) | Based on the underwritten rent roll. |
| (2) | The CBBC Industrial Portfolio Properties are leased under a single lease, which allocates separate rental rates to each of the CBBC Industrial Portfolio Properties. |
| Lease Rollover Schedule(1) | |||||||||
| Year | Number of Leases Expiring(2) | Net Rentable Area Expiring | % of NRA Expiring | Base Rent Expiring | % of Base Rent Expiring | Cumulative Net Rentable Area Expiring | Cumulative % of NRA Expiring | Cumulative Base Rent Expiring | Cumulative % of Base Rent Expiring |
| Vacant | NAP | 0 | 0.0% | NAP | NAP | 0 | 0.0% | NAP | NAP |
| 2019 & MTM | 0 | 0 | 0.0% | $0 | 0.0% | 0 | 0.0% | $0 | 0.0% |
| 2020 | 0 | 0 | 0.0% | 0 | 0.0% | 0 | 0.0% | $0 | 0.0% |
| 2021 | 0 | 0 | 0.0% | 0 | 0.0% | 0 | 0.0% | $0 | 0.0% |
| 2022 | 0 | 0 | 0.0% | 0 | 0.0% | 0 | 0.0% | $0 | 0.0% |
| 2023 | 0 | 0 | 0.0% | 0 | 0.0% | 0 | 0.0% | $0 | 0.0% |
| 2024 | 0 | 0 | 0.0% | 0 | 0.0% | 0 | 0.0% | $0 | 0.0% |
| 2025 | 0 | 0 | 0.0% | 0 | 0.0% | 0 | 0.0% | $0 | 0.0% |
| 2026 | 0 | 0 | 0.0% | 0 | 0.0% | 0 | 0.0% | $0 | 0.0% |
| 2027 | 0 | 0 | 0.0% | 0 | 0.0% | 0 | 0.0% | $0 | 0.0% |
| 2028 | 0 | 0 | 0.0% | 0 | 0.0% | 0 | 0.0% | $0 | 0.0% |
| 2029 | 0 | 0 | 0.0% | 0 | 0.0% | 0 | 0.0% | $0 | 0.0% |
| 2030 & Beyond | 1 | 951,651 | 100.0% | 5,686,031 | 100.0% | 951,651 | 100.0% | $5,686,031 | 100.0% |
| Total | 1 | 951,651 | 100.0% | $5,686,031 | 100.0% | ||||
| (1) | Based on the underwritten rent roll. |
| (2) | The CBBC Industrial Portfolio Properties are leased under a single lease, which allocates separate rental rates to each of the CBBC Industrial Portfolio Properties. |
THE INFORMATION IN THIS STRUCTURAL AND COLLATERAL TERM SHEET IS NOT COMPLETE AND MAY BE AMENDED PRIOR TO THE TIME OF SALE. THIS TERM SHEET IS NOT AN OFFER TO SELL THESE SECURITIES AND IT IS NOT A SOLICITATION OF AN OFFER TO BUY THESE SECURITIES IN ANY JURISDICTION WHERE THE OFFER OR SALE IS NOT PERMITTED. | ||
| | 88 of 106 | |
| Structural and Collateral Term Sheet | JPMCC 2019-COR4 | |
| CBBC Industrial Portfolio | ||
| Operating History and Underwritten Net Cash Flow(1) | |||
| Underwritten | Per SF | %(2) | |
| Rents in Place | $5,686,031 | $5.97 | 95.1% |
| Contractual Rent Steps(3) | 120,828 | 0.13 | 2.0% |
| Total Reimbursements | 170,350 | 0.18 | 2.8% |
| Net Rental Income | $5,977,209 | $6.28 | 100.0% |
| (Vacancy/Credit Loss) | (298,860) | (0.31) | (5.0)% |
| Effective Gross Income | $5,678,349 | $5.97 | 95.0% |
| Total Expenses(4) | $170,350 | $0.18 | 3.0% |
| Net Operating Income | $5,507,998 | $5.79 | 97.0% |
| Total TI/LC, Capex/RR | 682,363 | 0.72 | 12.0% |
| Net Cash Flow | $4,825,635 | $5.07 | 85.0% |
| (1) | The loan sponsors purchased the CBBC Industrial Portfolio Properties on October 12, 2018 and prior to that they were owner occupied. As a result, the historical financial information is unavailable. |
| (2) | % is calculated using Net Rental Income for all revenue items and Effective Gross Income for the remaining items. |
| (3) | Contractual Rent Steps are underwritten through October 2019. |
| (4) | Underwritten Total Expenses includes an unrecoverable 3.0% management fee. |
Property Management. The CBBC Industrial Portfolio Properties are self-managed by the CBBC Tenant, under the CBBC Lease.
Escrows and Reserves.So long as the Reserve Waiver Conditions (as defined below) are met, all of the monthly escrow deposits will be suspended. If the Reserve Waiver Conditions are not met, the borrower is required to escrow monthly (i) 1/12 of the annual estimated tax payments, (ii) 1/12 of the annual insurance premiums, (iii) $7,930 for capital expenditures, subject to a cap of $190,330 ($0.20 per square foot) and (iv) $27,756 for tenant improvements and leasing commissions, subject to a cap of $666,156 ($0.70 per square foot). In addition to the Reserve Waiver Conditions, the requirement of the borrower to escrow monthly insurance premiums is waived so long as the CBBC Industrial Portfolio Properties are covered under a blanket insurance policy and evidence satisfactory to the lender is provided.
The “Reserve Waiver Conditions” mean (i) the CBBC Lease or a replacement lease is in full force and effect, the entirety of each of the CBBC Industrial Portfolio Properties is demised pursuant to said lease, and the applicable lease is a “triple net” lease, (ii) no Trigger Period (as defined below) has occurred and is continuing, (iii) the tenant under the CBBC Lease or a replacement lease is obligated to, pursuant to its lease, (a) pay all taxes directly to the applicable governmental authority, (b) maintain insurance on all of the CBBC Industrial Portfolio Properties pursuant to an acceptable insurance policy under the loan documents, (c) perform and pay for all capital expenditures at the CBBC Industrial Portfolio Properties and (d) perform and pay for all other ongoing recurring property-related operating expenses, (iv) all of such obligations are performed in a timely manner and (v) upon lender’s request, the borrower provides evidence of such timely performance of the tenant to the lender in a form acceptable to the lender in its reasonable discretion.
Lockbox / Cash Management.The CBBC Industrial Portfolio Whole Loan has a hard lockbox with springing cash management. To the extent no Trigger Period (as defined below) is continuing, all funds in the lockbox account are required to be transferred to the borrower. Following the occurrence and during the continuance of a Trigger Period, all funds in the lockbox account are required to be swept each business day to a cash management account under the control of the lender and disbursed in accordance with the loan documents.
A “Trigger Period” will commence upon the lender giving notice to the clearing bank of the occurrence of any of the following: (i) an event of default, (ii) the debt service coverage ratio falling below 1.15x, or (iii) the commencement of a Lease Sweep Period (as defined below), and will end upon the lender giving notice to the clearing bank that the sweeping of funds into the deposit account may cease, (a) with respect to the matters described in clause (i) above, if such event of default has been cured and no other event of default has occurred and is continuing, (b) with respect to the matter described in clause (ii) above, if the debt service coverage ratio is at least 1.20x for two consecutive calendar quarters, or (c) with respect to the matter described in clause (iii) above, if such Lease Sweep Period has ended.
THE INFORMATION IN THIS STRUCTURAL AND COLLATERAL TERM SHEET IS NOT COMPLETE AND MAY BE AMENDED PRIOR TO THE TIME OF SALE. THIS TERM SHEET IS NOT AN OFFER TO SELL THESE SECURITIES AND IT IS NOT A SOLICITATION OF AN OFFER TO BUY THESE SECURITIES IN ANY JURISDICTION WHERE THE OFFER OR SALE IS NOT PERMITTED. | ||
| | 89 of 106 | |
| Structural and Collateral Term Sheet | JPMCC 2019-COR4 | |
| CBBC Industrial Portfolio | ||
A “Lease Sweep Period” will occur upon any of the following: (i) the date under a Lease Sweep Lease (as defined below) by which the applicable Major Tenant (as defined below) is required to give notice of its exercise of a renewal option thereunder (and such renewal has not been so exercised), (ii) any Lease Sweep Lease (or any material portion thereof) is surrendered, cancelled or terminated prior to its then current expiration date, (iii) any Major Tenant discontinues its business at its premises (i.e., “goes dark”) or gives notice that it intends to discontinue its business, (iv) the occurrence and continuance (beyond any applicable notice and cure periods) of a material default under any Lease Sweep Lease by the applicable Major Tenant thereunder, or (v) the occurrence of a Major Tenant insolvency proceeding and will end upon (a) with respect to the occurrence of a Lease Sweep Period caused by a matter described in clause (i) above, upon the date on which the Major Tenant irrevocably exercises its renewal or extension option (or otherwise enters into an extension agreement with the borrower that is acceptable to the lender in its reasonable discretion) with respect to all of the space demised under its Lease Sweep Lease, and in the lender’s judgment, sufficient funds have been accumulated in the special rollover reserve subaccount (during the continuance of the subject Lease Sweep Period) to pay for all anticipated major leasing expenses and free rent or rent abatement periods in connection with such renewal or extension, (b) in the case of a Lease Sweep Period caused by a matter described in clause (iii) above, either (x) the tenant opens for business in its space and continuously operates for a least 30 days and irrevocably rescinds any notice of going dark or (y) the date on which the funds in the special rollover reserve (including related lease termination payments) are equal to the total rentable square feet of the applicable Lease Sweep Lease multiplied by $6.00, unless the applicable Major Tenant space has been relet and the replacement leases require the borrower to incur expenses and/or free rent or rent abatement periods which the lender determines exceed such amount, in which case the Lease Sweep Period will continue until such additional amounts are reserved, (c) in the case of a Lease Sweep Period caused by a matter described in clause (i), (ii) or (iii) above, the date on which all of the space demised under the Lease Sweep Lease (or portion thereof) that gave rise to the Lease Sweep Period has been fully leased pursuant to a replacement lease or replacement leases (which meet certain requirements in the loan documents), and in the lender’s judgment, sufficient funds have been accumulated in the special rollover reserve subaccount (during the continuance of the subject Lease Sweep Period) to pay for all anticipated major leasing expenses, free rent or rent abatement periods, and any shortfalls in loan payments or operating expenses as a result of any down time prior to the commencement of payments under such leases, (d) with respect to a Lease Sweep Period caused by a matter described in clause (iv) above, if the subject Major Tenant default has been cured, and (e) with respect to a Lease Sweep Period caused by a matter described in clause (v) above, if the applicable Major Tenant insolvency proceeding has terminated and the applicable Lease Sweep Lease has been affirmed, assumed or assigned in a manner reasonably satisfactory to the lender.
A “Lease Sweep Lease” means (i) the CBBC Lease, as the same may be amended, supplemented or otherwise modified from time to time in accordance with the loan documents or (ii) any replacement lease that either individually, or when taken together with any other lease with the same tenant or its affiliates, and assuming the exercise of all expansion rights and all preferential rights to lease additional space contained in such lease, covers 100,000 or more rentable square feet or covers the entirety of an individual CBBC Industrial Portfolio Property.
A “Major Tenant” means any tenant under a Lease Sweep Lease.
Release of Property. The borrower is permitted to obtain the release of any individual CBBC Industrial Portfolio Property on any business day after the expiration of the related defeasance lockout expiration date,provided that, among other conditions: (i) the sale of such CBBC Industrial Portfolio Property is pursuant to an arm’s-length agreement with an unaffiliated third party, (except in the case of (a) a Defaulted Individual Property (as described below) or (b) a sale related to a default by the sole tenant that relates solely to the CBBC Industrial Portfolio Property to be released, which may be made to a borrower affiliate (other than an SPC Party (as defined below)); (ii) the related borrower (a) defeases an amount equal to the Release Amount (as defined below) or (b) prepays the Release Amount, together with, if prior to the open period, a prepayment fee equal to the greater of 1.00% of the amount prepaid and a yield maintenance premium (the “Prepayment Fee”); (iii) after giving effect to such release, (a) the debt service coverage ratio for the remaining CBBC Industrial Portfolio Properties will not be less than the greater of (x) the debt service coverage ratio immediately preceding such release and (y) 1.367x; and (b) the loan-to-value ratio for the remaining CBBC Industrial Portfolio Properties will be no greater than the lesser of (x) the loan-to-value ratio for the CBBC Industrial Portfolio Properties immediately preceding the release and (y) 61.75%; (iv) after giving effect to such release, the loan-to-value ratio of the CBBC Industrial Portfolio Mortgage Loan (with value to be determined by the lender in its reasonable discretion based on a commercially reasonable valuation method permitted to a REMIC trust and which will exclude the value of personal property or going concern value, if any) is not more than 125%, (v) the sole tenant’s lease is amended to remove the released CBBC Industrial Portfolio Property, and (vi) after giving effect to the release, the portion of the CBBC Industrial Portfolio Properties in which the tenant has gone dark, if any, does not represent more than 10% of the total rent of the CBBC Industrial Portfolio Properties.
In addition, the borrower is permitted to obtain the release of a Defaulted Individual Property (as defined below) at any time (including during the defeasance lockout period), provided that, among other things, (a) the Defaulted Individual Property is sold to a third party or an affiliate of the borrower (other than an SPC Party), (b) (i) if the release is prior to the expiration of the defeasance lockout period, the borrower prepays the Release Amount, together with the Prepayment Fee or (ii) if the release is after the expiration of the defeasance lockout period, the borrower either prepays the Release Amount together with (if prior to the open period) the Prepayment Fee or defeases an amount equal to the Release Amount, and (c) the conditions in clauses (iii), (iv), (v) and (vi) above are satisfied. See“Description of the Mortgage Pool—Certain Terms of the Mortgage Loans—Releases; Partial Releases”in the Preliminary Prospectus.
THE INFORMATION IN THIS STRUCTURAL AND COLLATERAL TERM SHEET IS NOT COMPLETE AND MAY BE AMENDED PRIOR TO THE TIME OF SALE. THIS TERM SHEET IS NOT AN OFFER TO SELL THESE SECURITIES AND IT IS NOT A SOLICITATION OF AN OFFER TO BUY THESE SECURITIES IN ANY JURISDICTION WHERE THE OFFER OR SALE IS NOT PERMITTED. | ||
| | 90 of 106 | |
| Structural and Collateral Term Sheet | JPMCC 2019-COR4 | |
| CBBC Industrial Portfolio | ||
The “Release Amount” is the greater of (i) 90% of the net sales proceeds with respect to such CBBC Industrial Portfolio Property and (ii) 110.0% of the allocated loan amount for such CBBC Industrial Portfolio Property.
A “Defaulted Individual Property” means a CBBC Industrial Portfolio Property as to which (i) an event of default is continuing relating solely to such individual CBBC Industrial Portfolio Property, (ii) the lender has delivered notice of such event of default or commenced exercising remedies, (iii) the borrower has demonstrated to the lender’s reasonable satisfaction that it has promptly and diligently pursued a cure of such event of default but has been unable to effect such cure, (iv) after giving effect to a partial prepayment or defeasance with respect to such CBBC Industrial Portfolio Property, no event of default or material default will be continuing and (v) the borrower will not be subject to any material contingent liabilities relating to such CBBC Industrial Portfolio Property after its release.
The “SPC Party” means the borrower’s general partner or managing member.
Substitution.The borrower is permitted obtain the release of any one CBBC Industrial Portfolio Property (the “Release Property”) by providing a substitute property (the “Substitute Property”),provided that among other things, (i) no event of default is continuing, (ii) the lender is satisfied the Substitute Property is of like kind and quality as the Release Property, including with respect to age and location, (iii) the borrower will own the fee interest in the Substitute Property, (iv) the sale of the Release Property is (a) pursuant to an arm’s length agreement to a third party not affiliated with the borrower or the guarantor or (b) to an affiliate of the borrower and/or guarantor (other than the borrower or SPC Party) pursuant to terms and conditions that would be set forth in a bona fide arm’s length third-party transaction, (v) the lender receives an appraisal showing a fair market value of the Substitute Property that is no less than the fair market value of the Release Property as of such date, (vi) the underwritten net cash flow of the Substitute Property is no less than that of the Release Property as of the origination date and immediately preceding substitution, whichever is greater, (vii) the loan-to-value ratio for the CBBC Industrial Properties, including the Substitute Property is no more than the lesser of (a) the loan-to-value ratio immediately preceding such substitution and (b) 61.75%, (viii) the debt service coverage ratio for the CBBC Industrial Portfolio Properties, including the Substitute Property is no less than the greater of (a) the debt service coverage ratio immediately preceding such substitution and (b) 1.367x, (ix) after giving effect to the substitution, the loan-to-value ratio (with value to be determined by the lender in its reasonable discretion based on a commercially reasonable valuation method permitted to a REMIC trust and which excludes the value of personal property or going concern value, if any) is not more than 125%, (x) the sole tenant’s lease is amended to remove the Release Property and add the Substitute Property (with the same terms and conditions, including remaining term and expiration date, except for adjustment of rent in accordance with the following clause), (xi) rent under the lease at the Substitute Property is not materially greater than rent for comparable space in the market in which it is located and (xii) rating agency confirmation, and other documents reasonably acceptable to a prudent lender, are provided with respect to the substitution. As noted above under “Major Tenant”, the CBBC Lease provides that the tenant has the right to require the borrower to substitute up to one property under the CBBC Lease during the initial 10 years of the lease term (which ends October 31, 2028), and up to two properties under the CBBC Lease during the subsequent 10 years, provided that certain conditions are satisfied. If such conditions are satisfied, the borrower is required to sell the substituted-for property to CBBC or a third party designated by it and purchase the property to be substituted from CBBC or a third party designated by it, and the CBBC Lease is deemed to be automatically amended to add the substitute property and terminate the substituted-for property. The conditions to substitution in the CBBC Lease require that any customary and commercially reasonable requirements of the borrower’s mortgagee are satisfied in all respects, but do not include all of the conditions in the CBBC Industrial Portfolio Whole Loan documents. See “Description of the Mortgage Pool—Certain Terms of the Mortgage Loans-Releases; Partial Releases” in the Preliminary Prospectus.
THE INFORMATION IN THIS STRUCTURAL AND COLLATERAL TERM SHEET IS NOT COMPLETE AND MAY BE AMENDED PRIOR TO THE TIME OF SALE. THIS TERM SHEET IS NOT AN OFFER TO SELL THESE SECURITIES AND IT IS NOT A SOLICITATION OF AN OFFER TO BUY THESE SECURITIES IN ANY JURISDICTION WHERE THE OFFER OR SALE IS NOT PERMITTED. | ||
| | 91 of 106 | |
| Structural and Collateral Term Sheet | JPMCC 2019-COR4 | |
| Arbors at the Park Ole Miss | ||
| Mortgage Loan Information | Property Information | |||
| Mortgage Loan Seller: | LCM | Single Asset / Portfolio: | Single Asset | |
| Original Principal Balance: | $19,950,000 | Title: | Fee | |
| Cut-off Date Principal Balance: | $19,950,000 | Property Type – Subtype: | Multifamily – Student | |
| % of Pool by IPB: | 2.6% | Net Rentable Area (Beds): | 340 | |
| Loan Purpose: | Refinance | Location: | Oxford, MS | |
| Borrower: | Arbors Borrower LLC | Year Built / Renovated: | 2018 / N/A | |
| Loan Sponsors: | Trinity Business Group, L.L.C., Sidney G. Brian | Occupancy: | 97.1% | |
| Interest Rate: | 5.29000% | Occupancy Date: | 8/1/2018 | |
| Note Date: | 10/9/2018 | Number of Tenants: | N/A | |
| Maturity Date: | 11/6/2028 | 2015 NOI(2): | N/A | |
| Interest-only Period: | 6 months | 2016 NOI(2): | N/A | |
| Original Term: | 120 months | 2017 NOI(2): | N/A | |
| Original Amortization(1): | 360 months | TTM NOI(2): | N/A | |
| Amortization Type(1): | IO–Balloon | UW Economic Occupancy: | 92.5% | |
| Call Protection: | L(27),Def(90),O(3) | UW Revenues: | $2,587,400 | |
| Lockbox / Cash Management: | Hard / Springing | UW Expenses: | $688,417 | |
| Additional Debt: | Yes | UW NOI: | $1,898,983 | |
| Additional Debt Balance(1): | $4,050,000 | UW NCF: | $1,864,983 | |
| Additional Debt Type(1): | Mezzanine Loan | Appraised Value / Per Bed: | $35,700,000 / $105,000 | |
| Appraisal Date: | 8/23/2018 | |||
| Escrows and Reserves | Financial Information | ||||||
| Initial | Monthly | Initial Cap | Cut-off Date Loan / Bed: | $58,676 | |||
| Taxes: | $9,276 | $17,662 | N/A | Maturity Date Loan / Bed: | $49,905 | ||
| Insurance(3): | $19,724 | Springing | N/A | Cut-off Date LTV: | 55.9% | ||
| Replacement Reserves: | $0 | $2,833 | N/A | Maturity Date LTV: | 47.5% | ||
| TI/LC: | $0 | $0 | N/A | UW NCF DSCR(1): | 1.43x | ||
| Other(4): | $706,000 | $0 | N/A | UW NOI Debt Yield: | 9.5% | ||
| Sources and Uses | ||||||
| Sources | Proceeds | % of Total | Uses | Proceeds | % of Total | |
| Mortgage Loan | $19,950,000 | 83.1% | Payoff Existing Debt | $20,938,533 | 87.2% | |
| Mezzanine Loan | 4,050,000 | 16.9 | Upfront Reserves(4) | 735,000 | 3.1% | |
| Closing Costs | 571,780 | 2.4% | ||||
| Return of Equity | 1,754,687 | 7.3% | ||||
| Total Sources | $24,000,000 | 100.0% | Total Uses | $24,000,000 | 100.0% | |
| (1) | The Arbors at the Park Ole Miss mortgage loan, as well as the Arbors at the Park Ole Miss mezzanine loan, amortize pursuant to a fixed amortization schedule as set forth in Annex I in the Preliminary Prospectus. Debt service coverage ratios are calculated using the sum of the first 12 principal and interest payments after the expiration of the interest only period based on the assumed principal and interest payment schedule set forth in Annex I in the Preliminary Prospectus. |
| (2) | Construction of the property was completed in 2018 and therefore no historical cash flows are available. |
| (3) | On a monthly basis, if an acceptable blanket policy is not long in effect, the borrower is required to escrow 1/12 of the annual estimated insurance payments, which currently equates to approximately $6,575. |
| (4) | At origination, the borrower delivered a letter of credit in the amount of approximately $706,000 which is held by lender until zoning approval is obtained (which has been obtained) and the amended site plan has been approved (which has been applied for). |
The Loan. The Arbors at the Park Ole Miss mortgage loan has an outstanding principal balance as of the Cut-off Date of $19.95 million and is secured by a first mortgage lien on the borrower’s fee interest in a 340-bed multifamily student housing property located in Oxford, Mississippi. The loan has a 10-year term and, following a six-month interest-only period, will amortize on a 30-year schedule, pursuant to a fixed amortization schedule as set forth in Annex I in the Preliminary Prospectus.
THE INFORMATION IN THIS STRUCTURAL AND COLLATERAL TERM SHEET IS NOT COMPLETE AND MAY BE AMENDED PRIOR TO THE TIME OF SALE. THIS TERM SHEET IS NOT AN OFFER TO SELL THESE SECURITIES AND IT IS NOT A SOLICITATION OF AN OFFER TO BUY THESE SECURITIES IN ANY JURISDICTION WHERE THE OFFER OR SALE IS NOT PERMITTED. | ||
| | 92 of 106 | |
| Structural and Collateral Term Sheet | JPMCC 2019-COR4 | |
| Arbors at the Park Ole Miss | ||
The Borrower. The borrowing entity for the loan is Arbors Borrower LLC, a Delaware limited liability company and special purpose entity structured to be bankruptcy remote with two independent directors.
The Loan Sponsors. The loan sponsors and nonrecourse carve-out guarantors are Trinity Business Group, L.L.C. and Sidney G. Brian. Mr. Brian is the founder and owner of Trinity Business Group. Headquartered in Baton Rouge, Louisiana, Trinity Business Group’s holdings are typically centered around land and real estate developments but also include businesses in manufacturing, wetland mitigation banking, recycling and solid waste disposal. In addition to the Arbors at the Park Ole Miss property, Mr. Brian currently owns four other multifamily properties in Oxford, Mississippi.
The Property. The Arbors at the Park Ole Miss property is a newly constructed, 100-unit, 340-bed luxury multifamily student housing complex situated on an approximately 8.44-acre, site improved with 10 predominantly three-story apartment buildings with finishes including high-end stainless steel appliances, granite countertops, custom wood cabinetry, private ensuite bathrooms, luxury vinyl tile flooring, private screened in porches with swing beds and amenities including a resort-style pool, modern fitness center, on-site clubhouse and leasing center. Additionally, the Arbors at the Park Ole Miss property features 466 surface parking spaces which accommodates approximately 1.4 spaces per bed. Each unit features an electric range/oven, vent-hood, frost-free refrigerator with icemaker, garbage disposal, dishwasher and built-in microwave oven. The bathrooms within each unit feature combination tub/showers with travertine tile surround and each bathroom features a commode, wood cabinet with granite counter and built-in porcelain sink and tile flooring. The loan sponsor constructed the Arbors at the Park Ole Miss property in 2018 at a total cost of approximately $28.1 million (approximately $82,558 per bed).
The Arbors at the Park Ole Miss property is within walking distance to the University of Mississippi (“Ole Miss”) campus and other popular gathering areas, and adjacent to the widely used Pat Lamar Park, which offers jogging and bike trails. The Arbors at the Park Ole Miss property is leased by the bed and, based on the current occupancy, all tenants are members of the Kappa Kappa Gamma, Chi Omega and Delta Gamma sororities.
The Market.Ole Miss was founded in February of 1844 by the Mississippi Legislature, and opened its doors in the fall of 1848. As of the fall semester 2017, Ole Miss had a total enrollment of 20,861 students, which represents the largest school in the state of Mississippi. Enrollment at Ole Miss has followed a rapid growth trend with a total increase of 50.0% over the past 10 years. Approximately 5,130 students live on campus in 11 residence halls, two residential colleges and three apartment complexes. All freshmen are required to live in campus housing their first year unless they meet certain commuter guidelines. Students in the Ole Miss dorms pay between the equivalent of $560 per bed per month up to $761 per bed per month. In addition, Ole Miss has 10 sorority houses and 14 fraternity houses.
As of 2018, the estimated population within a one-, three- and five-mile radius was approximately 7,571, 29,291 and 39,560, respectively. The median household income within a one-, three- and five-mile radius was $39,030, $39,403 and $42,581, respectively.
The appraisal identified eight comparable apartment rentals ranging in size from 72 beds to 636 beds. Monthly multifamily rents for the comparable rentals ranged from $475 per bed to $811 per bed, with a weighted average of approximately $584 per bed.
| Multifamily Unit Mix(1) | |||||||||
| Unit Type | # of Beds | % of Total | Occupied Beds | Occupancy | Average Unit Size (Bed) | Average Monthly Rental Rate | Average Monthly Rental Rate Per SF | Monthly Market Rent | Monthly Market Rent Per SF |
| 3 BR – 3 BA | 180 | 52.9% | 172 | 95.6% | 422 | $650 | $1.54 | $650 | $1.54 |
| 4 BR – 4 BA | 160 | 47.1% | 158 | 98.8% | 376 | $650 | $1.73 | $650 | $1.73 |
| Total / Wtd. Avg. | 340 | 100.0% | 330 | 97.1% | 400 | $650 | $1.63 | $650 | $1.63 |
| (1) | Based on the underwritten rent roll dated as of August 1, 2018. |
THE INFORMATION IN THIS STRUCTURAL AND COLLATERAL TERM SHEET IS NOT COMPLETE AND MAY BE AMENDED PRIOR TO THE TIME OF SALE. THIS TERM SHEET IS NOT AN OFFER TO SELL THESE SECURITIES AND IT IS NOT A SOLICITATION OF AN OFFER TO BUY THESE SECURITIES IN ANY JURISDICTION WHERE THE OFFER OR SALE IS NOT PERMITTED. | ||
| | 93 of 106 | |
| Structural and Collateral Term Sheet | JPMCC 2019-COR4 | |
| Arbors at the Park Ole Miss | ||
| Operating History and Underwritten Net Cash Flow(1) | |||
| Underwritten | Per Bed | %(2) | |
| Rents in Place | $2,574,000 | $7,571 | 97.1% |
| Vacant Income | 78,000 | 229 | 2.9 |
| Gross Potential Rent | $2,652,000 | $7,800 | 100.0% |
| Total Reimbursements | 0 | 0 | 0.0% |
| Net Rental Income | $2,652,000 | $7,800 | 100.0% |
| (Vacancy/Credit Loss) | (198,900) | (585) | (7.5)-- |
| Other Income | 134,300 | 395 | 5.1% |
| Effective Gross Income | $2,587,400 | $7,610 | 97.6% |
| Total Expenses | $688,417 | $2,025 | 26.6% |
| Net Operating Income | $1,898,983 | $5,585 | 73.4% |
| Replacement Reserves | 34,000 | 100 | 1.3 |
| Net Cash Flow | $1,864,983 | $5,485 | 72.1% |
| Occupancy(3) | 92.5% | ||
| (1) | Construction of the property was completed in 2018 and therefore no historical cash flows are available. |
| (2) | % column represents percent of Net Rental Income for all revenue lines and represents percent of Effective Gross Income for the remainder of the fields. |
| (3) | Underwritten Occupancy represents economic occupancy. |
Additional Debt. A mezzanine loan was funded concurrently and is coterminous with the Arbors at the Park Ole Miss mortgage loan. The mezzanine loan has an original principal balance of $4.05 million, accrues interest at a rate of 7.53000% and, following a six-month interest-only period, will amortize pursuant to a fixed amortization schedule as set forth in Annex I in the Preliminary Prospectus. Including the mezzanine loan, the cumulative Cut-off Date LTV, cumulative UW NCF DSCR and cumulative UW NOI DY are 67.2%, 1.12x and 7.9%, respectively. The current borrower under the mezzanine loan is Arbors Member, LLC. The mezzanine loan is currently held by LCM.
THE INFORMATION IN THIS STRUCTURAL AND COLLATERAL TERM SHEET IS NOT COMPLETE AND MAY BE AMENDED PRIOR TO THE TIME OF SALE. THIS TERM SHEET IS NOT AN OFFER TO SELL THESE SECURITIES AND IT IS NOT A SOLICITATION OF AN OFFER TO BUY THESE SECURITIES IN ANY JURISDICTION WHERE THE OFFER OR SALE IS NOT PERMITTED. | ||
| | 94 of 106 | |
| Structural and Collateral Term Sheet | JPMCC 2019-COR4 | |
| Inland Empire Office Portfolio I | ||
| Mortgage Loan Information | Property Information | |||
| Mortgage Loan Seller: | LCM | Single Asset / Portfolio: | Portfolio | |
| Original Principal Balance: | $19,800,000 | Title: | Fee | |
| Cut-off Date Principal Balance: | $19,800,000 | Property Type - Subtype: | Office – Suburban | |
| % of Pool by IPB: | 2.6% | Net Rentable Area (SF): | 148,463 | |
| Loan Purpose: | Acquisition | Location: | San Bernardino, CA | |
| Borrower: | KB Tri-City I DST | Year Built / Renovated: | Various / Various | |
| Loan Sponsor(1): | Jeff Pori | Occupancy(2): | 93.3% | |
| Interest Rate: | 4.77500% | Occupancy Date(2): | Various | |
| Note Date: | 9/11/2018 | Number of Tenants: | 15 | |
| Maturity Date: | 10/6/2028 | 2015 NOI: | N/A | |
| Interest-only Period: | 60 months | 2016 NOI(3): | $1,503,978 | |
| Original Term: | 120 months | 2017 NOI(3): | $1,413,110 | |
| Original Amortization: | 360 months | TTM NOI (as of 7/2018)(3): | $1,430,292 | |
| Amortization Type: | IO–Balloon | UW Economic Occupancy: | 92.1% | |
| Call Protection: | L(28),Def(89),O(3) | UW Revenues: | $3,693,905 | |
| Lockbox / Cash Management: | Hard / Springing | UW Expenses: | $1,440,541 | |
| Additional Debt: | N/A | UW NOI(3): | $2,253,365 | |
| Additional Debt Balance: | N/A | UW NCF: | $2,038,094 | |
| Additional Debt Type: | N/A | Appraised Value / Per SF: | $32,500,000 / $219 | |
| Appraisal Date: | 6/26/2018 | |||
| Escrows and Reserves | Financial Information | ||||||
| Initial | Monthly | Initial Cap | Cut-off Date Loan / SF: | $133 | |||
| Taxes: | $260,000 | $34,500 | N/A | Maturity Date Loan / SF: | $123 | ||
| Insurance(4): | $0 | Springing | N/A | Cut-off Date LTV: | 60.9% | ||
| Replacement Reserves(5): | $500,000 | Springing | $400,000 | Maturity Date LTV: | 56.0% | ||
| TI/LC(6): | $2,500,000 | Springing | $2,000,000 | UW NCF DSCR: | 1.64x | ||
| Other(7): | $49,400 | $0 | N/A | UW NOI Debt Yield: | 11.4% | ||
| Sources and Uses | |||||||
| Sources | Proceeds | % of Total | Uses | Proceeds | % of Total | ||
| Mortgage Loan | $19,800,000 | 55.3% | Purchase Price | $31,300,000 | 87.5% | ||
| Sponsor Equity | 15,987,972 | 44.7% | Upfront Reserves | 3,309,400 | 9.2% | ||
| Closing Costs | 1,178,572 | 3.3% | |||||
| Total Sources | $35,787,972 | 100.0% | Total Uses | $35,787,972 | 100.0% | ||
| (1) | The loan sponsor is also the loan sponsor of the mortgage loans identified on Annex A-1 to the Preliminary Prospectus as Inland Empire Office Portfolio II, Medical Office & Walgreens Portfolio, Altura Office Building and Fresenius & DaVita Portfolio, which have Cut-off Date Balances of $16.6 million, $13.0 million, $11.7 million and approximately $8.3 million, respectively. |
| (2) | Based on the underwritten rent rolls dated as of July 31, 2018 for the Lakeside Tower property and February 6, 2019 for the One Hospitality property. The Lakeside Tower property is currently 91.4% occupied and the One Hospitality property is currently 100.0% occupied. |
| (3) | The lease with the County of San Bernardino was signed shortly after a prior tenant, which leased 100.0% of the One Hospitality property, vacated in July 2016. A lengthy County approval process and building expansion/renovation took approximately 18 months and the County of San Bernardino took occupancy in January 2018, resulting in the increase in UW NOI. The County of San Bernardino’s current annual base rent is equal to $940,512. |
| (4) | On a monthly basis, if an acceptable blanket policy is no longer in place, the borrower is required to escrow 1/12 of the annual estimated insurance premiums. |
| (5) | On a monthly basis, if the balance in the replacement reserve falls below the $400,000 cap amount, the borrower is required to escrow approximately $2,474 for replacement reserves. |
| (6) | On a monthly basis, if the balance in the TI/LC reserve falls below the $2,000,000 cap amount, the borrower is required to escrow approximately $15,465 for tenant improvements and leasing commissions. |
| (7) | Initial Other Escrows and Reserves consist of (i) an initial deposit of $28,500 into the outstanding TI/LC reserve and (ii) an initial deposit of $20,900 into the free rent reserve. |
THE INFORMATION IN THIS STRUCTURAL AND COLLATERAL TERM SHEET IS NOT COMPLETE AND MAY BE AMENDED PRIOR TO THE TIME OF SALE. THIS TERM SHEET IS NOT AN OFFER TO SELL THESE SECURITIES AND IT IS NOT A SOLICITATION OF AN OFFER TO BUY THESE SECURITIES IN ANY JURISDICTION WHERE THE OFFER OR SALE IS NOT PERMITTED. | ||
| | 95 of 106 | |
| Structural and Collateral Term Sheet | JPMCC 2019-COR4 | |
| Inland Empire Office Portfolio I | ||
The Loan. The Inland Empire Office Portfolio I mortgage loan has an outstanding principal balance as of the Cut-off Date of $19.8 million and is secured by a first mortgage lien on the borrower’s fee interest in a two-building office portfolio located in San Bernardino, California. The Inland Empire Office Portfolio I loan has a 10-year term and, following a five-year interest-only period, will amortize on a 30-year schedule.
The Borrower. The borrowing entity for the loan is KB Tri-City I DST, a Delaware statutory trust and special purpose entity structured to be bankruptcy remote, with one independent director in its organizational structure.
The Loan Sponsor. The loan sponsor and nonrecourse carve-out guarantor is Jeff Pori. Mr. Pori is the CEO of Kingsbarn Realty Capital (“Kingsbarn”). Mr. Pori directs all aspects of Kingsbarn, from initiating the company’s strategic direction and initiatives to managing the day-to-day operations and overseeing all property financing and acquisitions. Mr. Pori’s 27-year career in commercial real estate has been as a principal involved in construction, development, syndications, finance and property operations.
| Portfolio Summary | |||||||
| Property | Location | Net Rentable Area (SF) | Year Built/ Renovated | Allocated Loan Amount | % of Allocated Loan Amount | Appraised Value | % of Appraised Value |
| Lakeside Tower | San Bernardino, CA | 116,603 | 1989 / N/A | $14,553,000 | 73.5% | $24,200,000 | 74.5% |
| One Hospitality | San Bernardino, CA | 31,860 | 1996 / 2018 | 5,247,000 | 26.5 | 8,300,000 | 25.5 |
| Total / Wtd. Avg. | 148,463 | $19,800,000 | 100.0% | $32,500,000 | 100.0% | ||
The Portfolio. The Inland Empire Office Portfolio I is a two-building Class A office portfolio totaling 148,463 square feet located in San Bernardino, California within the Tri-City Corporate Centre, a large, master-planned mixed-use development spanning over 153 acres that provides a unique campus environment with outdoor amenities and nearly two million square feet of office, retail and hospitality space including more than 30 restaurants, hotels, and stores. The community also provides direct access and visibility from the I-10 and I-215 freeways connecting it to all of Southern California and is also serviced by a rapid transit bus stop and nearby two-line Metrolink connecting station.
The Inland Empire Office Portfolio I properties are currently 93.3% leased to 15 tenants representing the healthcare, legal, financial, government, engineering, and professional service industries. The individual assets consist of (i) Lakeside Tower, a 116,603 square foot, six-story, Class A office building that is currently 91.4% leased to 14 tenants and (ii) One Hospitality, a 31,860 square foot, one-story, single-tenant office building 100.0% leased to the County of San Bernardino under a lease through January 15, 2028.
The Market. The Inland Empire Office Portfolio I properties are situated within the Tri-City Corporate Centre, a master-planned commercial development, specifically located in the Inland Empire East submarket. The master-planned complex, located near the intersection of Interstate 10 and Interstate 215, offers approximately two million square feet of office and retail development. The Inland Empire Office Portfolio I properties are located specifically in the East San Bernardino office submarket, within the greater Inland Empire office market. As of the fourth quarter of 2018, the greater Inland Empire office market consisted of approximately 74.7 million square feet across 6,397 buildings with an overall market vacancy of 7.1% and average asking rents of approximately $21.48 per square foot. The East San Bernardino office submarket consists of approximately 16.0 million square feet across 1,368 buildings with an overall market vacancy of 8.3% and average market asking rents of $18.92 per square foot.
The appraisal identified 16 comparable office leases ranging in size from 1,739 square feet to 51,933 square feet. Base rents for the comparable office leases ranged from $21.60 per square foot to $33.48 per square foot.
| Tenant Summary(1) | |||||||
| Tenant | Ratings(2) Moody’s/Fitch/S&P | Net Rentable Area (SF) | % of Total NRA | Base Rent PSF | % of Total Base Rent | Lease Expiration Date | |
| County of San Bernardino | A1 / NR / AA | 31,860 | 21.5% | $29.52 | 25.9% | 1/15/2028 | |
| Lewis Brisbois Bisgaard & Smith LLP | NR / NR / NR | 29,725 | 20.0 | $25.55 | 20.9% | 8/31/2023 | |
| CalPERS | Aa3 / AA- / AA- | 13,851 | 9.3 | $25.57 | 9.8% | 11/30/2020 | |
| Copier Source, Inc. | NR / NR / NR | 12,246 | 8.2 | $24.67 | 8.3% | 1/31/2021 | |
| Health Net of California, Inc | NR / NR / NR | 9,500 | 6.4 | $26.40 | 6.9% | 12/31/2021 | |
| WFG Title | NR / NR / NR | 7,014 | 4.7 | $21.63 | 4.2% | 2/28/2022 | |
| Mundell, Odlum & Haws LLP | NR / NR / NR | 6,204 | 4.2 | $25.96 | 4.4% | 11/30/2020 | |
| Employbridge, LLC | NR / NR / NR | 4,672 | 3.1 | $25.80 | 3.3% | 9/30/2023 | |
| Law Office of C. Robert Bakke | NR / NR / NR | 4,549 | 3.1 | $24.74 | 3.1% | 8/31/2020 | |
| Willdan Engineering | NR / NR / NR | 4,475 | 3.0 | $25.57 | 3.2% | 4/30/2019 | |
| (1) | Based on the underwritten rent rolls dated as of July 31, 2018 for the Lakeside Tower property and February 6, 2019 for the One Hospitality property. |
| (2) | Certain ratings are those of the parent company whether or not the parent guarantees the lease. |
THE INFORMATION IN THIS STRUCTURAL AND COLLATERAL TERM SHEET IS NOT COMPLETE AND MAY BE AMENDED PRIOR TO THE TIME OF SALE. THIS TERM SHEET IS NOT AN OFFER TO SELL THESE SECURITIES AND IT IS NOT A SOLICITATION OF AN OFFER TO BUY THESE SECURITIES IN ANY JURISDICTION WHERE THE OFFER OR SALE IS NOT PERMITTED. | ||
| | 96 of 106 | |
| Structural and Collateral Term Sheet | JPMCC 2019-COR4 | |
| Inland Empire Office Portfolio I | ||
| Lease Rollover Schedule(1) | ||||||||||
| Year | Number of Leases Expiring | Net Rentable Area Expiring | % of NRA Expiring | Base Rent Expiring | % of Base Rent Expiring | Cumulative Net Rentable Area Expiring | Cumulative % of NRA Expiring | Cumulative Base Rent Expiring | Cumulative % of Base Rent Expiring | |
| Vacant | NAP | 10,018 | 6.7% | NAP | NAP | 10,018 | 6.7% | NAP | NAP | |
| 2019 & MTM | 2 | 7,456 | 5.0% | $181,463 | 5.0% | 17,474 | 11.8% | $181,463 | 5.0% | |
| 2020 | 5 | 29,665 | 20.0% | 755,575 | 20.8% | 47,139 | 31.8% | $937,038 | 25.8% | |
| 2021 | 4 | 28,053 | 18.9% | 718,789 | 19.8% | 75,192 | 50.6% | $1,655,827 | 45.6% | |
| 2022 | 1 | 7,014 | 4.7% | 151,702 | 4.2% | 82,206 | 55.4% | $1,807,529 | 49.8% | |
| 2023 | 2 | 34,397 | 23.2% | 879,982 | 24.3% | 116,603 | 78.5% | $2,687,511 | 74.1% | |
| 2024 | 0 | 0 | 0.0% | 0 | 0.0% | 116,603 | 78.5% | $2,687,511 | 74.1% | |
| 2025 | 0 | 0 | 0.0% | 0 | 0.0% | 116,603 | 78.5% | $2,687,511 | 74.1% | |
| 2026 | 0 | 0 | 0.0% | 0 | 0.0% | 116,603 | 78.5% | $2,687,511 | 74.1% | |
| 2027 | 0 | 0 | 0.0% | 0 | 0.0% | 116,603 | 78.5% | $2,687,511 | 74.1% | |
| 2028 | 1 | 31,860 | 21.5% | 940,512 | 25.9% | 148,463 | 100.0% | $3,628,023 | 100.0% | |
| 2029 | 0 | 0 | 0.0% | 0 | 0.0% | 148,463 | 100.0% | $3,628,023 | 100.0% | |
| 2030 & Beyond | 0 | 0 | 0.0% | 0 | 0.0% | 148,463 | 100.0% | $3,628,023 | 100.0% | |
| Total | 15 | 148,463 | 100.0% | $3,628,023 | 100.0% | |||||
| (1) | Based on the underwritten rent rolls dated as of July 31, 2018 for the Lakeside Tower property and June 30, 2018 for the One Hospitality property. |
| Operating History and Underwritten Net Cash Flow(1) | |||||||||
| 2016 | 2017 | TTM(2) | Underwritten | Per Square Foot | %(3) | ||||
| Rents in Place | $2,559,430 | $2,445,255 | $2,603,213 | $3,626,840 | $24.43 | 90.4% | |||
| Contractual Rent Steps(4) | 0 | 0 | 0 | 1,183 | 0.01 | 0.0 | |||
| Vacant Income | 0 | 0 | 0 | 270,486 | 1.82 | 6.7 | |||
| Gross Potential Rent | $2,559,430 | $2,445,255 | $2,603,213 | $3,898,509 | $26.26 | 97.2% | |||
| Total Reimbursements | 26,141 | 28,906 | 4,489 | 112,143 | 0.76 | 2.8 | |||
| Total Other Income | 288 | 651 | 815 | 765 | 0.01 | 0.0 | |||
| Net Rental Income | $2,585,859 | $2,474,812 | $2,608,517 | $4,011,417 | $27.02 | 100.0% | |||
| (Vacancy/Credit Loss) | 0 | 0 | 0 | (317,512) | (2.14) | (7.9) | |||
| Effective Gross Income | $2,585,859 | $2,474,812 | $2,608,517 | $3,693,905 | $24.88 | 92.1% | |||
| Total Expenses | $1,081,881 | $1,061,702 | $1,178,225 | $1,440,541 | $9.70 | 39.0% | |||
| Net Operating Income(1) | $1,503,978 | $1,413,110 | $1,430,292 | $2,253,365 | $15.18 | 61.0% | |||
| Total TI/LC, CapEx/RR | 0 | 0 | 0 | 215,271 | 1.45 | 5.8 | |||
| Net Cash Flow | $1,503,978 | $1,413,110 | $1,430,292 | $2,038,094 | $13.73 | 55.2% | |||
| Occupancy | 79.7% | 73.0% | 93.3% | 92.1% | |||||
| (1) | The lease with the County of San Bernardino was signed shortly after a prior tenant, which leased 100.0% of the One Hospitality property, vacated in July 2016. A lengthy County approval process and building expansion/renovation took approximately 18 months and the County of San Bernardino took occupancy in January 2018, resulting in the increase in Underwritten Net Operating Income. The County of San Bernardino’s current annual base rent is equal to $940,512. |
| (2) | TTM column represents the trailing 12-month period ending on July 31, 2018. |
| (3) | % column represents percent of Net Rental Income for all revenue lines and represents percent of Effective Gross Income for the remainder of the fields. |
| (4) | Based on the contractual rent steps through March 2019 for certain tenants. |
| (5) | Historical Occupancies are as of December 31 of each respective year. TTM Occupancy is as of underwritten rent rolls dated as of July 31, 2018 for the Lakeside Tower property and February 6, 2019 for the One Hospitality property. Underwritten Occupancy represents economic occupancy. |
THE INFORMATION IN THIS STRUCTURAL AND COLLATERAL TERM SHEET IS NOT COMPLETE AND MAY BE AMENDED PRIOR TO THE TIME OF SALE. THIS TERM SHEET IS NOT AN OFFER TO SELL THESE SECURITIES AND IT IS NOT A SOLICITATION OF AN OFFER TO BUY THESE SECURITIES IN ANY JURISDICTION WHERE THE OFFER OR SALE IS NOT PERMITTED. | ||
| | 97 of 106 | |
| Structural and Collateral Term Sheet | JPMCC 2019-COR4 | |
| 221 S Franklin | ||
| Mortgage Loan Information | Property Information | |||
| Mortgage Loan Seller: | LCM | Single Asset / Portfolio: | Single Asset | |
| Original Principal Balance: | $19,250,000 | Title: | Fee | |
| Cut-off Date Principal Balance: | $19,250,000 | Property Type - Subtype: | Industrial – Warehouse/Distribution | |
| % of Pool by IPB: | 2.5% | Net Rentable Area (SF): | 823,088 | |
| Loan Purpose: | Acquisition | Location: | Indianapolis, IN | |
| Borrower: | CPA Franklin Industrial DST | Year Built / Renovated: | 1972, 1978 / N/A | |
| Loan Sponsor: | John R. Saunders | Occupancy: | 100.0% | |
| Interest Rate: | 5.48600% | Occupancy Date: | 11/1/2018 | |
| Note Date: | 11/13/2018 | Number of Tenants: | 12 | |
| Maturity Date: | 12/6/2028 | 2015 NOI(1): | N/A | |
| Interest-only Period: | 60 months | 2016 NOI(1): | N/A | |
| Original Term: | 120 months | 2017 NOI(1): | $482,138 | |
| Original Amortization: | 360 months | TTM NOI (as of 7/2018)(1): | $1,559,015 | |
| Amortization Type: | IO–Balloon | UW Economic Occupancy: | 92.3% | |
| Call Protection: | L(26),Def(90),O(4) | UW Revenues: | $2,798,930 | |
| Lockbox / Cash Management: | Hard / Springing | UW Expenses: | $876,738 | |
| Additional Debt: | N/A | UW NOI(1): | $1,922,192 | |
| Additional Debt Balance: | N/A | UW NCF: | $1,757,944 | |
| Additional Debt Type: | N/A | Appraised Value / Per SF: | $28,000,000 / $34 | |
| Appraisal Date: | 8/2/2018 | |||
| Escrows and Reserves | Financial Information | ||||||
| Initial | Monthly | Initial Cap | Cut-off Date Loan / SF: | $23 | |||
| Taxes: | $75,000 | $37,300 | N/A | Maturity Date Loan / SF: | $22 | ||
| Insurance: | $24,000 | $7,940 | N/A | Cut-off Date LTV: | 68.8% | ||
| Replacement Reserves(2): | $300,000 | Springing | N/A | Maturity Date LTV: | 63.9% | ||
| TI/LC: | $1,900,000 | $0 | N/A | UW NCF DSCR: | 1.34x | ||
| Other(3): | $52,918 | $0 | N/A | UW NOI Debt Yield: | 10.0% | ||
| Sources and Uses | |||||||
| Sources | Proceeds | % of Total | Uses | Proceeds | % of Total | ||
| Mortgage Loan | $19,250,000 | 59.0% | Purchase Price | $28,853,208 | 88.5% | ||
| Sponsor Equity | 13,359,243 | 41.0% | Upfront Reserves | 2,351,918 | 7.2% | ||
| Closing Costs | 1,404,117 | 4.3% | |||||
| Total Sources | $32,609,243 | 100.0% | Total Uses | $32,609,243 | 100.0% | ||
| (1) | The prior owner acquired the property in 2016 when the property was approximately 46.0% occupied. After acquisition, the prior owner signed new leases which brought occupancy at the property up to approximately 78.0%. By year-end 2017, the remainder of the property was leased up to 100.0% occupancy, resulting in the increase in UW NOI. The prior owner did not provide historical cash flows prior to 2017. |
| (2) | Monthly deposits to the replacement reserve are as follows: (i) waived during the first three years of the loan term, (ii) $4,166.67 on each payment date during the fourth year of the loan term, (ii) $8,333.33 on each payment date during the fifth year of the loan term, (iii) waived during the sixth year of the loan term, (iv) $4,166.67 on each payment date during each of the seventh and eighth years of the loan term and (iv) and $8,333.33 on each payment date during each of the ninth and 10th years of the loan term. |
| (3) | Initial Other Escrows and Reserves consist of (i) an initial deposit of $37,188 into the immediate repairs reserve and (ii) an initial deposit of $15,730 into the free rent reserve. |
THE INFORMATION IN THIS STRUCTURAL AND COLLATERAL TERM SHEET IS NOT COMPLETE AND MAY BE AMENDED PRIOR TO THE TIME OF SALE. THIS TERM SHEET IS NOT AN OFFER TO SELL THESE SECURITIES AND IT IS NOT A SOLICITATION OF AN OFFER TO BUY THESE SECURITIES IN ANY JURISDICTION WHERE THE OFFER OR SALE IS NOT PERMITTED. | ||
| | 98 of 106 | |
| Structural and Collateral Term Sheet | JPMCC 2019-COR4 | |
| 221 S Franklin | ||
The Loan. The 221 S Franklin mortgage loan has an outstanding principal balance as of the Cut-off Date of approximately $19.3 million and is secured by a first mortgage lien on the borrower’s fee interest in an 823,088 square foot, three-building industrial property located in Indianapolis, Indiana. The 221 S Franklin loan has a 10-year term and, following a five-year interest-only period, will amortize on a 30-year schedule.
The Borrower. The borrowing entity for the 221 S Franklin mortgage loan is CPA Franklin Industrial DST, a Delaware statutory trust and special purpose entity structured to be bankruptcy remote with one independent director.
The Loan Sponsor. The loan sponsor and nonrecourse carve-out guarantor is John R. Saunders. Mr. Saunders is chairman of CORE Realty Holdings, LLC. During the past 17 years, Mr. Saunders has become one of Orange County, California’s largest commercial real estate owners. Mr. Saunders is currently the owner of over four million square feet of commercial real estate.
The Property. The 221 S Franklin property is an 823,088 square foot, three-building industrial property situated on an approximately 38.17-acre site and is currently 100.0% leased to 12 tenants. The 221 S Franklin property’s three buildings are as follows: (i) Building A is a 384,000 square foot bulk distribution building that features approximately 4.6% office finish, 26’ to 28’ ceiling clear heights, 42 docks and three drive-in doors. Building A is located on the western portion of the site and is fully occupied by Pioneer (256,000 square feet) and Dimplex North America Limited (128,000 square feet), (ii) Building B is a 385,088 square foot distribution building that features approximately 1.0% office finish, 26’ to 28’ ceiling clear heights, 42 docks and two drive-in doors. Building B is fully occupied by Hoosier Freight & Warehousing (166,688 square feet), Balsam Brands (128,000 square feet) and Horner Industrial Services, Inc. (90,400 square feet) and (iii) Building C is a 54,000 square foot flex building that features approximately 14.7% office finish, 16’ ceiling clear height, 11 docks and two drive-in doors. Building C is fully occupied by seven tenants, two of which lease spaces totaling 12,000 square feet and the remaining five lease spaces totaling 6,000 square feet.
The Market. The 221 S Franklin property is located in a historically strong industrial submarket in the eastern portion of Indianapolis. The 221 S Franklin property is located approximately one-half mile southeast of an Interstate 465 and Washington Street interchange, which is an important feature for the typical industrial users at the property. Due to the property’s ceiling clear heights, number of loading docks and typical size of tenant suites, most industrial users have a significant amount of inbound and outbound truck deliveries.
The 221 S Franklin property is located specifically in the Washington Square industrial submarket, within the greater Indianapolis industrial market. As of the fourth quarter of 2018, the greater Indianapolis industrial market consisted of approximately 337.8 million square feet across 6,886 buildings with an overall market vacancy of 3.9% and average asking rents of approximately $4.42 per square foot. The Washington Square industrial submarket consists of approximately 13.9 million square feet across 203 buildings with an overall market vacancy of 5.5% and average market asking rents of $4.79 per square foot.
The appraisal identified 11 comparable bulk industrial leases ranging in size from 40,178 square feet to 206,756 square feet. Base rents for the comparable bulk industrial leases ranged from $2.45 per square foot to $4.05 per square foot. Additionally, the appraisal identified 14 comparable flex leases ranging in size from 4,988 square feet to 43,750 square feet. Base rents for the comparable flex leases ranged from $4.00 per square foot to $5.80 per square foot.
| Tenant Summary(1) | |||||||
| Tenant | Ratings Moody’s/Fitch/S&P | Net Rentable Area (SF) | % of Total NRA | Base Rent PSF | % of Total Base Rent | Lease Expiration Date | |
| Pioneer | Baa2 / BBB / BBB | 256,000 | 31.1% | $3.12 | 29.8% | 8/31/2024 | |
| Hoosier Freight & Warehousing | NR / NR / NR | 166,688 | 20.3 | $3.10 | 19.2% | 7/31/2022 | |
| Balsam Brands | NR / NR / NR | 128,000 | 15.6 | $3.28 | 15.6% | 6/30/2023 | |
| Dimplex North America Limited | NR / NR / NR | 128,000 | 15.6 | $3.07 | 14.6% | 12/31/2020 | |
| Horner Industrial Services, Inc | NR / NR / NR | 90,400 | 11.0 | $3.02 | 10.2% | 2/28/2021 | |
| Sherwin Williams | Baa3 / BBB / BBB | 12,000 | 1.5 | $5.29 | 2.4% | 4/30/2024 | |
| Continuum Games Inc. | NR / NR / NR | 12,000 | 1.5 | $5.10 | 2.3% | 7/31/2019 | |
| Midwest Grip & Lighting | NR / NR / NR | 6,000 | 0.7 | $6.41 | 1.4% | 5/31/2021 | |
| Creation Gardens | NR / NR / NR | 6,000 | 0.7 | $5.28 | 1.2% | 5/31/2021 | |
| Solid Surfaces of Indiana | NR / NR / NR | 6,000 | 0.7 | $4.99 | 1.1% | 12/31/2019 | |
| (1) | Based on the underwritten rent roll dated as of November 1, 2018. |
THE INFORMATION IN THIS STRUCTURAL AND COLLATERAL TERM SHEET IS NOT COMPLETE AND MAY BE AMENDED PRIOR TO THE TIME OF SALE. THIS TERM SHEET IS NOT AN OFFER TO SELL THESE SECURITIES AND IT IS NOT A SOLICITATION OF AN OFFER TO BUY THESE SECURITIES IN ANY JURISDICTION WHERE THE OFFER OR SALE IS NOT PERMITTED. | ||
| | 99 of 106 | |
| Structural and Collateral Term Sheet | JPMCC 2019-COR4 | |
| 221 S Franklin | ||
| Lease Rollover Schedule(1) | ||||||||||
| Year | Number of Leases Expiring | Net Rentable Area Expiring | % of NRA Expiring | Base Rent Expiring | % of Base Rent Expiring | Cumulative Net Rentable Area Expiring | Cumulative % of NRA Expiring | Cumulative Base Rent Expiring | Cumulative % of Base Rent Expiring | |
| Vacant | NAP | 0 | 0.0% | NAP | NAP | 0 | 0.0% | NAP | NAP | |
| 2019 & MTM | 2 | 18,000 | 2.2% | $91,140 | 3.4% | 18,000 | 2.2% | $91,140 | 3.4% | |
| 2020 | 2 | 134,000 | 16.3% | 424,350 | 15.8% | 152,000 | 18.5% | $515,490 | 19.2% | |
| 2021 | 3 | 102,400 | 12.4% | 343,148 | 12.8% | 254,400 | 30.9% | $858,638 | 31.9% | |
| 2022 | 1 | 166,688 | 20.3% | 516,733 | 19.2% | 421,088 | 51.2% | $1,375,371 | 51.2% | |
| 2023 | 1 | 128,000 | 15.6% | 419,840 | 15.6% | 549,088 | 66.7% | $1,795,211 | 66.8% | |
| 2024 | 2 | 268,000 | 32.6% | 863,041 | 32.1% | 817,088 | 99.3% | $2,658,251 | 98.9% | |
| 2025 | 1 | 6,000 | 0.7% | 29,220 | 1.1% | 823,088 | 100.0% | $2,687,471 | 100.0% | |
| 2026 | 0 | 0 | 0.0% | 0 | 0.0% | 823,088 | 100.0% | $2,687,471 | 100.0% | |
| 2027 | 0 | 0 | 0.0% | 0 | 0.0% | 823,088 | 100.0% | $2,687,471 | 100.0% | |
| 2028 | 0 | 0 | 0.0% | 0 | 0.0% | 823,088 | 100.0% | $2,687,471 | 100.0% | |
| 2029 | 0 | 0 | 0.0% | 0 | 0.0% | 823,088 | 100.0% | $2,687,471 | 100.0% | |
| 2030 & Beyond | 0 | 0 | 0.0% | 0 | 0.0% | 823,088 | 100.0% | $2,687,471 | 100.0% | |
| Total | 12 | 823,088 | 100.0% | $2,687,471 | 100.0% | |||||
| (1) | Based on the underwritten rent roll dated as of November 1, 2018. |
| Operating History and Underwritten Net Cash Flow(1) | ||||||||
| 2017 | TTM(2) | Underwritten | Per Square Foot | %(3) | ||||
| Rents in Place | $1,155,958 | $2,148,289 | $2,620,252 | $3.18 | 86.4% | |||
| Straight Line Rent(4) | 0 | 0 | 35,761 | 0.04 | 1.2 | |||
| Contractual Rent Steps(5) | 0 | 0 | 31,459 | 0.04 | 1.0 | |||
| Vacant Income | 0 | 0 | 0 | 0.00 | 0.0 | |||
| Gross Potential Rent | $1,155,958 | $2,148,289 | $2,687,471 | $3.27 | 88.6% | |||
| Total Reimbursements | 4,312 | 283,591 | 344,558 | 0.42 | 11.4 | |||
| Total Other Income | 0 | 367 | 367 | 0.00 | 0.0 | |||
| Net Rental Income | $1,160,270 | $2,432,247 | $3,032,396 | $3.68 | 100.0% | |||
| (Vacancy/Credit Loss) | 0 | 0 | (233,466) | (0.28) | (7.7) | |||
| Effective Gross Income | $1,160,270 | $2,432,247 | $2,798,930 | $3.40 | 92.3% | |||
| Total Expenses | $678,132 | $873,232 | $876,738 | $1.07 | 31.3 | |||
| Net Operating Income(1) | $482,138 | $1,559,015 | $1,922,192 | $2.34 | 68.7% | |||
| Total TI/LC, CapEx/RR | 0 | 0 | 164,247 | 0.20 | 5.9 | |||
| Net Cash Flow | $482,138 | $1,559,015 | $1,757,944 | $2.14 | 62.8% | |||
| Occupancy(6) | 100.0% | 100.0% | 92.3% | |||||
| (1) | The prior owner acquired the property in 2016 when the property was approximately 46.0% occupied. After acquisition, the prior owner signed new leases which brought occupancy at the property up to approximately 78.0%. By year-end 2017, the remainder of the property was leased up to 100.0% occupancy, resulting in the increase in Underwritten Net Operating Income. The prior owner did not provide historical cash flows prior to 2017. |
| (2) | TTM column represents the trailing 12-month period ending on July 31, 2018. |
| (3) | % column represents percent of Net Rental Income for all revenue lines and represents percent of Effective Gross Income for the remainder of the fields. |
| (4) | Based on the average rent over the lease term for Pioneer ($31,610) and Sherwin Williams ($4,150). |
| (5) | Based on contractual rent steps through October 1, 2019 for certain tenants. |
| (6) | 2017 Occupancy is as of December 31. TTM Occupancy is as of the underwritten rent roll dated November 1, 2018. Underwritten Occupancy represents economic occupancy. |
THE INFORMATION IN THIS STRUCTURAL AND COLLATERAL TERM SHEET IS NOT COMPLETE AND MAY BE AMENDED PRIOR TO THE TIME OF SALE. THIS TERM SHEET IS NOT AN OFFER TO SELL THESE SECURITIES AND IT IS NOT A SOLICITATION OF AN OFFER TO BUY THESE SECURITIES IN ANY JURISDICTION WHERE THE OFFER OR SALE IS NOT PERMITTED. | ||
| | 100 of 106 | |
| Structural and Collateral Term Sheet | JPMCC 2019-COR4 | |
| Sorento Flats | ||
| Mortgage Loan Information | Property Information | |||||
| Mortgage Loan Seller(1): | LCM | Single Asset / Portfolio: | Single Asset | |||
| Original Principal Balance: | $18,200,000 | Title: | Fee | |||
| Cut-off Date Principal Balance: | $18,200,000 | Property Type - Subtype: | Multifamily – Mid-Rise | |||
| % of Pool by IPB: | 2.4% | Net Rentable Area (Units): | 154 | |||
| Loan Purpose: | Refinance | Location: | Seattle, WA | |||
| Borrower: | Sorento On Yesler Owner LLC | Year Built / Renovated: | 2017 / N/A | |||
| Sponsors: | Bogdan Maksimchuk, | Occupancy(2): | 97.4% | |||
| Nadezhda Maksimchuk | Occupancy Date: | 1/1/2019 | ||||
| Interest Rate: | 5.20000% | Number of Tenants: | N/A | |||
| Note Date: | 1/23/2019 | 2015 NOI(3): | N/A | |||
| Maturity Date: | 2/6/2029 | 2016 NOI(3): | N/A | |||
| Interest-only Period: | 120 months | 2017 NOI(3): | N/A | |||
| Original Term: | 120 months | T-3 Annualized NOI(4): | $1,387,899 | |||
| Original Amortization: | None | UW Economic Occupancy: | 95.0% | |||
| Amortization Type: | Interest Only | UW Revenues: | $2,053,123 | |||
| Call Protection: | L(24),Def(91),O(5) | UW Expenses: | $631,443 | |||
| Lockbox / Cash Management: | Springing / Springing | UW NOI: | $1,421,680 | |||
| Additional Debt: | N/A | UW NCF: | $1,383,180 | |||
| Additional Debt Balance: | N/A | Appraised Value / Per Unit: | $30,700,000 / $199,351 | |||
| Additional Debt Type: | N/A | Appraisal Date: | 10/11/2018 | |||
| Escrows and Reserves | Financial Information | ||||||||
| Initial | Monthly | Initial Cap | Cut-off Date Loan / Unit: | $118,182 | |||||
| Taxes: | $78,872 | $19,718 | N/A | Maturity Date Loan / Unit: | $118,182 | ||||
| Insurance: | $34,291 | $2,449 | N/A | Cut-off Date LTV: | 59.3% | ||||
| Replacement Reserves: | $0 | $3,208 | N/A | Maturity Date LTV: | 59.3% | ||||
| TI/LC: | $0 | $0 | N/A | UW NCF DSCR: | 1.44x | ||||
| Other(5): | $206,390 | $3,101 | N/A | UW NOI Debt Yield: | 7.8% | ||||
| Sources and Uses | ||||||
| Sources | Proceeds | % of Total | Uses | Proceeds | % of Total | |
| Mortgage Loan | $18,200,000 | 100.0% | Payoff Existing Debt | $15,495,286 | 85.1% | |
| Upfront Reserves | 319,553 | 1.8% | ||||
| Closing Costs | 259,097 | 1.4% | ||||
| Return of Equity | 2,126,064 | 11.7% | ||||
| Total Sources | $18,200,000 | 100.0% | Total Uses | $18,200,000 | 100.0% | |
| (1) | The Sorento Flats loan was originated by Deutsche Bank AG, acting through its New York Branch (“DBNY”) and the Sorento Flats loan will be sold to LCM prior to the closing date of this securitization. |
| (2) | Occupancy is based on the multifamily portion of the collateral only. There is a 2,500 square foot retail space on the ground level that is 100.0% occupied. |
| (3) | Historical financials are unavailable as construction of the property was completed in 2017 and the Sorento Flats property was in a lease up period thereafter. |
| (4) | T-3 Annualized NOI is calculated based on the annualized income from September to November 2018 and annualized expenses from September to October 2018. |
| (5) | Other reserves are made up of (i) an upfront $190,000 Coffee on Yesler reserve (to be released once this ground floor retail tenant has obtained required permits (which had not been obtained as of the origination date), completed build-out and is open for business), (ii) a $10,188 deferred maintenance reserve and (iii) an upfront $6,202 and monthly $3,101 Sewer Capacity reserve (a sewer capacity fixed charge, for each parcel, required to be paid quarterly in the amount of $9,303 to the City of Seattle, for 58 months after the origination of the Sorento Flats loan). |
THE INFORMATION IN THIS STRUCTURAL AND COLLATERAL TERM SHEET IS NOT COMPLETE AND MAY BE AMENDED PRIOR TO THE TIME OF SALE. THIS TERM SHEET IS NOT AN OFFER TO SELL THESE SECURITIES AND IT IS NOT A SOLICITATION OF AN OFFER TO BUY THESE SECURITIES IN ANY JURISDICTION WHERE THE OFFER OR SALE IS NOT PERMITTED. | ||
| | 101 of 106 | |
| Structural and Collateral Term Sheet | JPMCC 2019-COR4 | |
| Sorento Flats | ||
The Loan.The Sorento Flats loan has an outstanding principal balance as of the Cut-off Date of $18.2 million and is secured by a first mortgage lien on the borrower’s fee interest in a 154 unit apartment complex located in Seattle, Washington. The loan has a 10-year term and will be interest-only for the term of the loan.
The Borrower. The borrowing entity for the Sorento Flats loan is Sorento On Yesler Owner LLC, a Delaware limited liability company and special purpose entity with one independent director in its organizational structure.
The Loan Sponsors. The loan sponsors and nonrecourse carve-out guarantors are Bogdan Maksimchuk and Nadezhda Maksimchuk. Bogdan Maksimchuk is the principal and owner of Barcelo Homes, a development company which was founded in 2009 as Benjamin Custom Homes. Since inception, Barcelo Homes has sold 37 townhomes, low- to mid-rise condominiums, single family and multifamily developments. Barcelo Homes purchased the vacant underlying land of the Sorento Flats property in April 2015 for $2.3 million and finished construction in July of 2017 for a total cost basis of approximately $16.7 million, which includes the architecture fees and overall construction costs.
The Property. The Sorento Flats property is a 154-unit mid-rise style multifamily complex located in Seattle, Washington. The Sorento Flats property was developed by the loan sponsor and completed in 2017. Each unit has a micro studio floor plan with a private bathroom, and a kitchenette that includes a sink, mini-refrigerator and microwave oven with wood cabinets and vinyl plank flooring. The units can be rented either furnished or unfurnished. Amenities include on-site washer/dryers, a rooftop patio with a barbeque and firepit with views of Mount Rainier and downtown Seattle, fitness room, community lounge, a lighted courtyard, secure building access, bike storage, and Wi-Fi and utilities included in rent. Nine of the units are leased to a single individual, who uses the units as corporate housing for his employees, and seven of the units are rented to a sibling of one of the nonrecourse carve-out guarantors, who subleases the units for short term periods via AirBnB. The Sorento Flats property also features 2,500 square feet of retail space on the ground level that is 100.0% leased, of which an affiliated tenant, Barcelo Homes Inc., leases 1,000 square feet, and a coffee shop, Coffee on Yesler, which leases the remaining square feet. Coffee on Yesler is paying rent but has not completed its tenant improvements (pending obtaining necessary permits) and is not yet in occupancy. Together, all affiliated multifamily and retail tenants represent 11.2% of square feet and 8.7% of the effective gross income.
The Market.The Sorento Flats property is located one-half mile east of downtown Seattle, between the Seattle CBD, Capitol Hill, Madrona and North Beacon Hill. The Broadway Retail District, which begins one mile northwest of the Sorento Flats Property, serves as the primary retail and entertainment area for both Capitol Hill and the Central District neighborhoods. The central location provides the residents accessibility to nearby work and entertainment. The Sorento Flats property is located approximately 0.4 miles east of Interstate 5, 3.1 miles south of State Route 520 and 0.6 miles north of Interstate 90. In addition, the Sorento Flats property is 3.6 miles south of the University of Washington and one mile south of the University of Seattle. Public transportation includes the First Hill Streetcar (light rail) at 14th Ave & S Washington Street, one block south of the Sorento Flats property. According to the appraisal, the 2018 estimated population within a one-, three- and five-mile radius of the Sorento Flats property was 53,882, 201,593, 438,576, respectively; while the 2018 estimated median household income within a one-, three- and five-mile radius was $46,613, $68,058 and $74,702.
According to the appraisal, the Sorento Flats property is located in the Downtown/Capitol Hill/Queen Anne multifamily submarket. As of the second quarter of 2018 the Downtown/Capitol Hill/Queen Anne multifamily submarket had an overall vacancy rate of 5.1% and average asking rents of approximately $2,244 per month. The appraisal identified six comparable properties built between 2013 and 2016 and ranging in size from 54 to 105 units. Average asking rents at the comparable properties for micro unit studios ranged from $950 to $1,495 per month with an average asking rent of $1,109 per month.
| Historical and Current Occupancy(1) | |||
| 2015 | 2016 | 2017 | Current(2)(3) |
| N/A | N/A | N/A | 97.4% |
| (1) | Historical Occupancy is not available as construction of the property was completed in 2017 and the Sorento Flats property was in a lease up period thereafter. |
| (2) | Occupancy is based on the multifamily portion of the collateral only. There is a 2,500 square foot retail space on the ground level that is 100.0% leased. |
| (3) | Current Occupancy is as of January 1, 2019. |
THE INFORMATION IN THIS STRUCTURAL AND COLLATERAL TERM SHEET IS NOT COMPLETE AND MAY BE AMENDED PRIOR TO THE TIME OF SALE. THIS TERM SHEET IS NOT AN OFFER TO SELL THESE SECURITIES AND IT IS NOT A SOLICITATION OF AN OFFER TO BUY THESE SECURITIES IN ANY JURISDICTION WHERE THE OFFER OR SALE IS NOT PERMITTED. | ||
| | 102 of 106 | |
| Structural and Collateral Term Sheet | JPMCC 2019-COR4 | |
| Sorento Flats | ||
| Multifamily Unit Mix(1) | |||||||
| Unit Type | No. Units | No. of Occupied Units | Occupancy | Average Unit Size (SF) | Average Rent per SF | Average Rent per Unit | Average Market Rent per Unit(2) |
| Micro Studio | 154 | 150 | 97.4% | 208 | $5.40 | $1,123 | $1,175 |
| (1) | Based on the underwritten rent roll dated January 1, 2019. |
| (2) | Average Market Rent Per Unit represents appraisal’s concluded market rent. |
| Underwritten Net Cash Flow(1) | ||||
| Annualized T-3 11/30/2018 | Underwritten | Per Unit | %(2) | |
| Rents in Place | $1,944,676 | $2,078,760 | $13,498 | 94.9% |
| Commercial Income | 3,600 | 80,555 | 523 | 3.7 |
| Other Income | 28,076 | 31,920 | 207 | 1.5 |
| Net Rental Income | $1,976,352 | $2,191,235 | $14,229 | 100.0% |
| Vacant Income | 0 | (134,084) | (871) | (6.1) |
| Commercial Vacancy | 0 | (4,028) | (26) | (0.2) |
| Effective Gross Income | $1,976,352 | $2,053,123 | $13,332 | 93.7% |
| Total Expenses | $588,453 | $631,443 | $4,100 | 30.8% |
| Net Operating Income | $1,387,899 | $1,421,680 | $9,232 | 69.2% |
| Replacement Reserves | 0 | 38,500 | 250 | 1.9 |
| Net Cash Flow | $1,387,899 | $1,383,180 | $8,982 | 67.4% |
| (1) | Historical financials are unavailable as construction of the Sorento Flats property was completed in 2017 and the property was in a lease up period thereafter. |
| (2) | % column represents percent of Net Rental Income for all revenue lines and represents percent of Effective Gross Income for the remained of the fields. |
| (3) | T-3 Annualized NOI is calculated based on the annualized income from September to November 2018 and annualized expenses from September to October 2018. |
Permitted Mezzanine Debt. The loan documents permit the equity owners of the borrower to obtain a mezzanine loan secured by the equity interests in the borrower upon satisfaction of certain terms and conditions, including, among others, (i) the combined loan-to-value ratio (calculated pursuant to the loan documents) does not exceed 59.3% (the LTV at loan closing), (ii) the combined debt service coverage ratio (calculated pursuant to the loan documents) is not less than 1.46x, (iii) the combined debt yield (calculated pursuant to the loan documents) is not less than 7.593%, (iv) a principal amount not in excess of $6,000,000 and (iv) the mezzanine lender enters into an intercreditor agreement acceptable to the mortgage lender and each rating agency and (vi) delivery of a rating agency confirmation.
THE INFORMATION IN THIS STRUCTURAL AND COLLATERAL TERM SHEET IS NOT COMPLETE AND MAY BE AMENDED PRIOR TO THE TIME OF SALE. THIS TERM SHEET IS NOT AN OFFER TO SELL THESE SECURITIES AND IT IS NOT A SOLICITATION OF AN OFFER TO BUY THESE SECURITIES IN ANY JURISDICTION WHERE THE OFFER OR SALE IS NOT PERMITTED. | ||
| | 103 of 106 | |
| Structural and Collateral Term Sheet | JPMCC 2019-COR4 | |
| LA Fitness Van Nuys | ||
| Mortgage Loan Information | Property Information | |||
| Mortgage Loan Seller: | LCM | Single Asset / Portfolio: | Single Asset | |
| Original Principal Balance: | $18,000,000 | Title: | Fee | |
| Cut-off Date Principal Balance: | $18,000,000 | Property Type - Subtype: | Retail – Freestanding | |
| % of Pool by IPB: | 2.3% | Net Rentable Area (SF): | 53,200 | |
| Loan Purpose: | Refinance | Location: | Van Nuys, CA | |
| Borrower: | Jiselle Properties Inc. | Year Built / Renovated: | 2013 / 2018 | |
| Sponsor(1): | Fahmy Mushmel | Occupancy: | 100.0% | |
| Interest Rate: | 5.11100% | Occupancy Date: | 2/6/2019 | |
| Note Date: | 10/31/2018 | Number of Tenants: | 1 | |
| Maturity Date: | 11/6/2028 | 2015 NOI(2): | $400,000 | |
| Interest-only Period: | 120 months | 2016 NOI(2): | $400,000 | |
| Original Term: | 120 months | 2017 NOI(2): | $400,000 | |
| Original Amortization: | None | TTM NOI (as of 8/2018)(2): | $1,100,000 | |
| Amortization Type: | Interest Only | UW Economic Occupancy: | 95.0% | |
| Call Protection: | L(27),Def(90),O(3) | UW Revenues: | $1,781,087 | |
| Lockbox / Cash Management: | Hard / Springing | UW Expenses: | $274,828 | |
| Additional Debt: | N/A | UW NOI(2): | $1,506,259 | |
| Additional Debt Balance: | N/A | UW NCF: | $1,495,619 | |
| Additional Debt Type: | N/A | Appraised Value / Per SF: | $30,450,000 / $572 | |
| Appraisal Date: | 9/14/2018 | |||
| Escrows and Reserves | Financial Information | ||||||
| Initial | Monthly | Initial Cap | Cut-off Date Loan / SF: | $338 | |||
| Taxes(3): | $0 | Springing | N/A | Maturity Date Loan / SF: | $338 | ||
| Insurance(4): | $0 | Springing | N/A | Cut-off Date LTV: | 59.1% | ||
| Replacement Reserves(5): | $0 | Springing | N/A | Maturity Date LTV: | 59.1% | ||
| TI/LC(6): | $0 | Springing | N/A | UW NCF DSCR: | 1.60x | ||
| Other: | $0 | $0 | N/A | UW NOI Debt Yield: | 8.4% | ||
| Sources and Uses | |||||||
| Sources | Proceeds | % of Total | Uses | Proceeds | % of Total | ||
| Mortgage Loan | $18,000,000 | 100.0% | Payoff Existing Debt | $12,617,871 | 70.1% | ||
| Closing Costs | 140,798 | 0.8% | |||||
| Return of Equity | 5,241,331 | 29.1% | |||||
| Total Sources | $18,000,000 | 100.0% | Total Uses | $18,000,000 | 100.0% | ||
| (1) | The loan sponsor is also the loan sponsor of the mortgage loan identified on Annex A-1 to the Preliminary Prospectus as LA Fitness Northridge which has a Cut-off Date Principal Balance of $11.0 million. |
| (2) | Historical cash flows represent the LA Fitness lease payments which had abated rent through February 1, 2018, resulting in the increase in UW NOI. |
| (3) | Monthly real estate tax escrows are waived so long as (i) no event of default exists, (ii) the LA Fitness lease remains in full force and effect, (iii) LA Fitness remains fully responsible for direct payment of real estate taxes and is in fact making such payments and (iv) the borrower delivers to lender evidence that all real estate taxes have been paid by LA Fitness. |
| (4) | Monthly insurance escrows are waived so long as (i) no event of default is continuing, (ii) the borrower is not required to maintain the coverage due to continued satisfaction of the LA Fitness tenant insurance conditions and (iii) the borrower delivers to lender evidence that all insurance premiums have been paid. |
| (5) | Monthly replacement reserve escrows are waived so long as the borrower has no obligation to pay for any capital expenses under the LA Fitness lease. |
| (6) | Monthly TI/LC escrows are waived so long as the LA Fitness lease is in full force and effect. |
THE INFORMATION IN THIS STRUCTURAL AND COLLATERAL TERM SHEET IS NOT COMPLETE AND MAY BE AMENDED PRIOR TO THE TIME OF SALE. THIS TERM SHEET IS NOT AN OFFER TO SELL THESE SECURITIES AND IT IS NOT A SOLICITATION OF AN OFFER TO BUY THESE SECURITIES IN ANY JURISDICTION WHERE THE OFFER OR SALE IS NOT PERMITTED. | ||
| | 104 of 106 | |
| Structural and Collateral Term Sheet | JPMCC 2019-COR4 | |
| LA Fitness Van Nuys | ||
The Loan. The LA Fitness Van Nuys mortgage loan has an outstanding principal balance as of the Cut-off Date of $18.0 million and is secured by a first mortgage lien on the borrower’s fee interest in an 53,200 square foot, single-story retail building fully leased by LA Fitness and located in the Los Angeles community, of Van Nuys, California. The LA Fitness Van Nuys loan has a 10-year term and requires interest only payments for the term of the loan.
The Borrower.The borrowing entity for the LA Fitness Van Nuys mortgage loan is Jiselle Properties Inc., a California corporation structured to be bankruptcy remote.
The Loan Sponsor.The loan sponsor and nonrecourse carve-out guarantor is Fahmy Mushmel. Mr. Mushmel is the founder of Mushmel Properties, a family owned and operated real estate investment firm located in Sherman Oaks, California. Mr. Mushmel has been investing in real estate for over 40 years and owns approximately two million square feet located throughout Southern California.
The Property. The LA Fitness Van Nuys property represents a ground-leased site, improved with a 53,200 square foot, retail, freestanding fitness center 100.0% leased to LA Fitness situated on approximately 4.1-acres. The property is located along the west side of Sepulveda Boulevard, north of Oxnard Street in Van Nuys, California, a community in Los Angeles County. In 2011, LA Fitness entered into an agreement with the previous owner to lease the ground and construct their own building. The building was constructed in 2013 and a 20-year absolute ground lease commenced with an initial expiration in January 2033. The lease exhibits one, 10-year option to extend and one, four-year option to extend. The ground lease is similar to an absolute net lease where the tenant is responsible for all expenses pertaining to the improvements including taxes, insurance, management and maintenance of the gym. All expenses are paid directly by LA Fitness.
The Market. The LA Fitness Van Nuys property is located specifically in the Eastern San Fernando Valley retail submarket, within the greater Los Angeles retail market. As of the fourth quarter of 2018, the greater Los Angeles retail market consisted of approximately 482.3 million square feet across 48,792 buildings with an overall market vacancy of 4.0% and average asking rents of approximately $30.67 per square foot. As of the fourth quarter of 2018, the Eastern San Fernando Valley retail submarket consists of approximately 20.9 million square feet across 2,243 buildings with an overall market vacancy of 4.1% and average market asking rents of $26.89 per square foot.
The appraisal identified six lease comparables ranging in size from 18,000 square feet to 45,000 square feet. Base rents for the comparable leases ranged from $19.12 per square foot to $40.00 per square foot.
| Tenant Summary(1) | ||||||
| Tenant | Ratings Moody’s/Fitch/S&P | Net Rentable Area (SF) | % of Total NRA | Base Rent PSF | % of Total Base Rent | Lease Expiration Date |
| LA Fitness | NR / NR / B+ | 53,200 | 100.0% | $30.08 | 100.0% | 1/31/2033 |
| (1) | Based on the underwritten rent roll. |
| Lease Rollover Schedule(1) | |||||||||
| Year | Number of Leases Expiring | Net Rentable Area Expiring | % of NRA Expiring | Base Rent Expiring | % of Base Rent Expiring | Cumulative Net Rentable Area Expiring | Cumulative % of NRA Expiring | Cumulative Base Rent Expiring | Cumulative % of Base Rent Expiring |
| Vacant | NAP | 0 | 0.0% | NAP | NAP | 0 | 0.0% | NAP | NAP |
| 2019 & MTM | 0 | 0 | 0.0% | $0 | 0.0% | 0 | 0.0% | $0 | 0.0% |
| 2020 | 0 | 0 | 0.0% | 0 | 0.0% | 0 | 0.0% | $0 | 0.0% |
| 2021 | 0 | 0 | 0.0% | 0 | 0.0% | 0 | 0.0% | $0 | 0.0% |
| 2022 | 0 | 0 | 0.0% | 0 | 0.0% | 0 | 0.0% | $0 | 0.0% |
| 2023 | 0 | 0 | 0.0% | 0 | 0.0% | 0 | 0.0% | $0 | 0.0% |
| 2024 | 0 | 0 | 0.0% | 0 | 0.0% | 0 | 0.0% | $0 | 0.0% |
| 2025 | 0 | 0 | 0.0% | 0 | 0.0% | 0 | 0.0% | $0 | 0.0% |
| 2026 | 0 | 0 | 0.0% | 0 | 0.0% | 0 | 0.0% | $0 | 0.0% |
| 2027 | 0 | 0 | 0.0% | 0 | 0.0% | 0 | 0.0% | $0 | 0.0% |
| 2028 | 0 | 0 | 0.0% | 0 | 0.0% | 0 | 0.0% | $0 | 0.0% |
| 2029 | 0 | 0 | 0.0% | 0 | 0.0% | 0 | 0.0% | $0 | 0.0% |
| 2030 & Beyond | 1 | 53,200 | 100.0% | 1,600,000 | 100.0% | 53,200 | 100.0% | $1,600,000 | 100.0% |
| Total | 1 | 53,200 | 100.0% | $1,600,000 | 100.0% | ||||
| (1) | Based on the underwritten rent roll. |
THE INFORMATION IN THIS STRUCTURAL AND COLLATERAL TERM SHEET IS NOT COMPLETE AND MAY BE AMENDED PRIOR TO THE TIME OF SALE. THIS TERM SHEET IS NOT AN OFFER TO SELL THESE SECURITIES AND IT IS NOT A SOLICITATION OF AN OFFER TO BUY THESE SECURITIES IN ANY JURISDICTION WHERE THE OFFER OR SALE IS NOT PERMITTED. | ||
| | 105 of 106 | |
| Structural and Collateral Term Sheet | JPMCC 2019-COR4 | |
| LA Fitness Van Nuys | ||
| Operating History and Underwritten Net Cash Flow(1) | |||||||
2015 | 2016 | 2017 | TTM(2) | Underwritten | Per Square Foot | %(3) | |
| Rents in Place | $400,000 | $400,000 | $400,000 | $1,100,000 | $1,600,000 | $30.08 | 85.3% |
| Vacant Income | 0 | 0 | 0 | 0 | 0 | 0.00 | 0.0 |
| Gross Potential Rent | $400,000 | $400,000 | $400,000 | $1,100,000 | $1,600,000 | $30.08 | 85.3% |
| Total Reimbursements | 0 | 0 | 0 | 0 | 274,828 | 5.17 | 14.7% |
| Total Other Income | 0 | 0 | 0 | 0 | 0 | 0.00 | 0.0 |
| Net Rental Income | $400,000 | $400,000 | $400,000 | $1,100,000 | $1,874,828 | $35.24 | 100.0% |
| Less: Vacancy | 0 | 0 | 0 | 0 | (93,741) | (1.76) | (5.0) |
| Effective Gross Income | $400,000 | $400,000 | $400,000 | $1,100,000 | $1,781,087 | $33.48 | 95.0% |
| Total Expenses | $0 | $0 | $0 | $0 | $274,828 | $5.17 | 15.4% |
| Net Operating Income(1) | $400,000 | $400,000 | $400,000 | $1,100,000 | $1,506,259 | $28.31 | 84.6% |
| Total TI/LC, CapEx/RR | 0 | 0 | 0 | 0 | 10,640 | 0.20 | 0.6 |
| Net Cash Flow | $400,000 | $400,000 | $400,000 | $1,100,000 | $1,495,619 | $28.11 | 84.0% |
| Occupancy(4) | 100.0% | 100.0% | 100.0% | 100.0% | 95.0% | ||
| (1) | Historical cash flows represent the LA Fitness lease payments which had abated rent through February 1, 2018, resulting in the increase in Underwritten Net Operating Income. |
| (2) | TTM column represents the trailing 12-month period ending on August 31, 2018. |
| (3) | % column represents percent of Net Rental Income for all revenue lines and represents percent of Effective Gross Income for the remainder of the fields. |
| (4) | Historical Occupancies are as of December 31 of each respective year. TTM Occupancy is as February 6, 2019. Underwritten Occupancy represents economic occupancy. |
THE INFORMATION IN THIS STRUCTURAL AND COLLATERAL TERM SHEET IS NOT COMPLETE AND MAY BE AMENDED PRIOR TO THE TIME OF SALE. THIS TERM SHEET IS NOT AN OFFER TO SELL THESE SECURITIES AND IT IS NOT A SOLICITATION OF AN OFFER TO BUY THESE SECURITIES IN ANY JURISDICTION WHERE THE OFFER OR SALE IS NOT PERMITTED. | ||
| | 106 of 106 | |