| FREE WRITING PROSPECTUS | |
| FILED PURSUANT TO RULE 433 | |
| REGISTRATION FILE NO.: 333-226123-05 | |
| October 29, 2019 | Benchmark 2019-B14 |
Free Writing Prospectus Structural and Collateral Term Sheet | ||
BENCHMARK 2019-B14
| ||
$1,322,249,369 (Approximate Mortgage Pool Balance) | ||
$1,144,205,000 (Approximate Offered Certificates) | ||
J.P. Morgan Chase Commercial Mortgage Securities Corp. Depositor | ||
| ||
BENCHMARK 2019-B14 mORTGAGE TRUST, Commercial Mortgage Pass-Through Certificates Series 2019-B14
| ||
| JPMorgan Chase Bank, National Association Citi Real Estate Funding Inc. German American Capital Corporation | ||
| Sponsors and Mortgage Loan Sellers | ||
| J.P. Morgan | Citigroup | Deutsche Bank Securities |
Co-Lead Managers and Joint Bookrunners | ||
| Drexel Hamilton |
Co-Managers
| Academy Securities |
THE INFORMATION IN THIS STRUCTURAL AND COLLATERAL TERM SHEET IS NOT COMPLETE AND MAY BE AMENDED PRIOR TO THE TIME OF SALE. THIS TERM SHEET IS NOT AN OFFER TO SELL THESE SECURITIES AND IT IS NOT A SOLICITATION OF AN OFFER TO BUY THESE SECURITIES IN ANY JURISDICTION WHERE THE OFFER OR SALE IS NOT PERMITTED.
| October 29, 2019 | Benchmark 2019-B14 |
This material is for your information, and none of J.P. Morgan Securities LLC (“JPMS”), Citigroup Global Markets Inc. (“CGMI”), Deutsche Bank Securities Inc. (“DBSI”), Drexel Hamilton, LLC (“Drexel”) or Academy Securities, Inc. (“Academy Securities”) (each individually, an “Underwriter”, and together, the ‘‘Underwriters’’) are soliciting any action based upon it. This material is not to be construed as an offer to sell or the solicitation of any offer to buy any security in any jurisdiction where such an offer or solicitation would be illegal.
The Depositor has filed a registration statement (including a prospectus) with the SEC (SEC File no. 333-226123) for the offering to which this free writing prospectus relates. Before you invest, you should read the prospectus in the registration statement and other documents the Depositor has filed with the SEC for more complete information about the Depositor, the issuing entity and this offering. You may get these documents for free by visiting EDGAR on the SEC Website at www.sec.gov. Alternatively, the Depositor or any Underwriter or any dealer participating in the offering will arrange to send you the prospectus if you request itby calling (800) 408-1016 or by emailing the ABS Syndicate Desk at abs_synd@jpmorgan.com.
Neither this document nor anything contained in this document shall form the basis for any contract or commitment whatsoever. The information contained in this document is preliminary as of the date of this document, supersedes any previous such information delivered to you and will be superseded by any such information subsequently delivered prior to the time of sale. These materials are subject to change, completion or amendment from time to time.
This document has been prepared by the Underwriters for information purposes only and does not constitute, in whole or in part, a prospectus for the purposes of Regulation (EU) 2017/1129 (as amended) and/or Part VI of the Financial Services and Markets Act 2000 (as amended) or other offering document.
The attached information contains certain tables and other statistical analyses (the “Computational Materials”) that have been prepared in reliance upon information furnished by the Mortgage Loan Sellers. Numerous assumptions were used in preparing the Computational Materials, which may or may not be reflected in this document. The Computational Materials should not be construed as either projections or predictions or as legal, tax, financial or accounting advice. You should consult your own counsel, accountant and other advisors as to the legal, tax, business, financial and related aspects of a purchase of these certificates. Any weighted average lives, yields and principal payment periods shown in the Computational Materials are based on prepayment and/or loss assumptions, and changes in such prepayment and/or loss assumptions may dramatically affect such weighted average lives, yields and principal payment periods. In addition, it is possible that prepayments or losses on the underlying assets will occur at rates higher or lower than the rates shown in the Computational Materials. The specific characteristics of the certificates may differ from those shown in the Computational Materials due to differences between the final underlying assets and the preliminary underlying assets used in preparing the Computational Materials. The principal amount and designation of any certificate described in the Computational Materials are subject to change prior to issuance. None of the Underwriters nor any of their respective affiliates make any representation or warranty as to the actual rate or timing of payments or losses on any of the underlying assets or the payments or yield on the certificates.
This information is based upon management forecasts and reflects prevailing conditions and management’s views as of this date, all of which are subject to change.
This document contains forward-looking statements. Those statements are subject to certain risks and uncertainties that could cause the success of collections and the actual cash flow generated to differ materially from the information set forth in this document. While such information reflects projections prepared in good faith based upon methods and data that are believed to be reasonable and accurate as of their dates, the Depositor undertakes no obligation to revise these forward-looking statements to reflect subsequent events or circumstances. Investors should not place undue reliance on forward-looking statements and are advised to make their own independent analysis and determination with respect to the forecasted periods, which reflect the Depositor’s view only as of the date of this document.
J.P. Morgan is the marketing name for the investment banking businesses of JPMorgan Chase & Co. and its subsidiaries worldwide. Securities, syndicated loan arranging, financial advisory and other investment banking activities are performed by JPMS and its securities affiliates, and lending, derivatives and other commercial banking activities are performed by JPMorgan Chase Bank, National Association and its banking affiliates. JPMS is a member of SIPC and the NYSE. Securities and investment banking activities in the United States are performed by Deutsche Bank Securities Inc., a member of NYSE, FINRA and SIPC, and its broker-dealer affiliates. Lending and other commercial banking activities in the United States are performed by Deutsche Bank AG, acting through its New York Branch.
Capitalized terms used in this material but not defined herein shall have the meanings ascribed to them in the Preliminary Prospectus (as defined below).
THE CERTIFICATES REFERRED TO IN THESE MATERIALS ARE SUBJECT TO MODIFICATION OR REVISION (INCLUDING THE POSSIBILITY THAT ONE OR MORE CLASSES OF CERTIFICATES MAY BE SPLIT, COMBINED OR ELIMINATED AT ANY TIME PRIOR TO ISSUANCE OR AVAILABILITY OF A FINAL PROSPECTUS) AND ARE OFFERED ON A “WHEN, AS AND IF ISSUED” BASIS.
THE UNDERWRITERS MAY FROM TIME TO TIME PERFORM INVESTMENT BANKING SERVICES FOR, OR SOLICIT INVESTMENT BANKING BUSINESS FROM, ANY COMPANY NAMED IN THESE MATERIALS. THE UNDERWRITERS AND/OR THEIR AFFILIATES OR RESPECTIVE EMPLOYEES MAY FROM TIME TO TIME HAVE A LONG OR SHORT POSITION IN ANY CERTIFICATE OR CONTRACT DISCUSSED IN THESE MATERIALS.
THE INFORMATION IN THIS STRUCTURAL AND COLLATERAL TERM SHEET IS NOT COMPLETE AND MAY BE AMENDED PRIOR TO THE TIME OF SALE. THIS TERM SHEET IS NOT AN OFFER TO SELL THESE SECURITIES AND IT IS NOT A SOLICITATION OF AN OFFER TO BUY THESE SECURITIES IN ANY JURISDICTION WHERE THE OFFER OR SALE IS NOT PERMITTED.
 |  |  |
2 of 156
| Structural and Collateral Term Sheet | Benchmark 2019-B14 | |
| Indicative Capital Structure | ||
Publicly Offered Certificates
| Class | Expected Ratings (S&P / Fitch / KBRA) | Approximate Initial Certificate Balance or Notional Amount(1) | Approximate Initial Credit Support(2) | Expected Weighted Avg. Life (years)(3) | Expected Principal Window(3) | Certificate Principal to Value Ratio(4) | Underwritten NOI Debt Yield(5) |
| A-1 | AAA(sf) / AAAsf / AAA(sf) | $22,760,000 | 30.000% | 2.64 | 12/2019 – 8/2024 | 42.0% | 14.1% |
| A-2 | AAA(sf) / AAAsf / AAA(sf) | $249,620,000 | 30.000% | 4.94 | 8/2024 – 11/2024 | 42.0% | 14.1% |
| A-3 | AAA(sf) / AAAsf / AAA(sf) | $55,480,000 | 30.000% | 6.98 | 11/2026 – 11/2026 | 42.0% | 14.1% |
| A-4 | AAA(sf) / AAAsf / AAA(sf) | (6) | 30.000% | (6) | (6) | 42.0% | 14.1% |
| A-5 | AAA(sf) / AAAsf / AAA(sf) | (6) | 30.000% | (6) | (6) | 42.0% | 14.1% |
| A-SB | AAA(sf) / AAAsf / AAA(sf) | $37,040,000 | 30.000% | 7.39 | 11/2024 – 6/2029 | 42.0% | 14.1% |
| X-A | AA-(sf) / AAAsf / AAA(sf) | $1,029,785,000(7) | N/A | N/A | N/A | N/A | N/A |
| X-B | NR / A-sf / AAA(sf) | $114,420,000(7) | N/A | N/A | N/A | N/A | N/A |
| A-S | AA-(sf) / AAAsf / AAA(sf) | $127,315,000 | 20.125% | 9.98 | 11/2029 – 11/2029 | 47.9% | 12.4% |
| B | NR / AA-sf / AA-(sf) | $61,240,000 | 15.375% | 9.98 | 11/2029 – 11/2029 | 50.8% | 11.7% |
| C | NR / A-sf / A-(sf) | $53,180,000 | 11.250% | 9.98 | 11/2029 – 11/2029 | 53.2% | 11.2% |
Privately Offered Certificates(8)
| Class | Expected Ratings (S&P / Fitch / KBRA) | Approximate Initial Certificate Balance or Notional Amount(1) | Approximate Initial Credit Support(2) | Expected Weighted Avg. Life (years)(3) | Expected Principal Window(3) | Certificate Principal to Value Ratio(4) | Underwritten NOI Debt Yield(5) |
| X-D | NR / BBB-sf / BBB-(sf) | $59,630,000(7) | N/A | N/A | N/A | N/A | N/A |
| D | NR / BBBsf / BBB(sf) | $33,845,000 | 8.625% | 9.98 | 11/2029 – 11/2029 | 54.8% | 10.8% |
| E | NR / BBB-sf / BBB-(sf) | $25,785,000 | 6.625% | 9.98 | 11/2029 – 11/2029 | 56.0% | 10.6% |
| F-RR | NR / BB-sf / BB-(sf) | $24,175,000 | 4.750% | 9.98 | 11/2029 – 11/2029 | 57.1% | 10.4% |
| G-RR | NR / B-sf / B-(sf) | $12,890,000 | 3.750% | 9.98 | 11/2029 – 11/2029 | 57.7% | 10.3% |
| NR-RR | NR / NR / NR | $48,349,368 | 0.000% | 9.98 | 11/2029 – 11/2029 | 60.0% | 9.9% |
Privately Offered Loan-Specific Certificates(8)(9)
| Class | Expected Ratings (KBRA) | Approximate Initial Certificate Balance or Notional Amount(1) | Approximate Initial Credit Support(2) | Expected Weighted Avg. Life (years)(3) | Expected Principal Window(3) | Certificate Principal to Value Ratio(10) | Underwritten NOI Debt Yield(11) |
| 225B-A | A-(sf) | $11,595,000 | 38.341% | 4.98 | 11/2024 - 11/2024 | 36.6% | 12.7% |
| 225B-B | BBB-(sf) | $33,958,000 | 28.128% | 4.98 | 11/2024 - 11/2024 | 42.7% | 10.9% |
| 225B-C | BB-(sf) | $35,434,000 | 17.472% | 4.98 | 11/2024 - 11/2024 | 49.0% | 9.5% |
| 225B-D | B-(sf) | $48,723,000 | 2.818% | 4.98 | 11/2024 - 11/2024 | 57.7% | 8.0% |
| 225B-E | NR | $9,370,000 | 0.000% | 4.98 | 11/2024 - 11/2024 | 59.4% | 7.8% |
Non-Offered Vertical Risk Retention Interest(8)
| Non-Offered Vertical Risk Retention Interest | Expected Ratings (S&P / Fitch / KBRA) | Approximate Initial Certificate Balance(1) | Approximate Initial Credit Support(2) | Expected Weighted Avg. Life (years)(3)(12) | Expected Principal Window(3)(12) | Certificate Principal to Value Ratio(4) | Underwritten NOI Debt Yield(5) |
| VRR Interest(13)(14) | NR / NR / NR | $33,000,000 | N/A | 8.62 | 12/2019 – 11/2029 | N/A | N/A |
| 225B-VRR Interest(15)(16) | NR / NR / NR | $7,320,000 | N/A | 4.98 | 11/2024 - 11/2024 | N/A | N/A |
| (1) | In the case of each such Class, subject to a permitted variance of plus or minus 5%. The certificate balance of each of the VRR Interest and the 225B-VRR Interest is not included in the certificate balance or notional amount of any class of certificates set forth under “Publicly Offered Certificates”, “Privately Offered Certificates” or “Privately Offered Loan-Specific Certificates” in the table above, and neither the VRR Interest nor the 225B-VRR Interest is offered by this Term Sheet. In addition, the notional amounts of the Class X-A, Class X-B and Class X-D Certificates may vary depending upon the final pricing of the Classes of Pooled Principal Balance Certificates whose Certificate Balances comprise such notional amounts, and, if as a result of such pricing the pass-through rate of any Class of the Class X-A, Class X-B and Class X-D Certificates, as applicable, would be equal to zero at all times, such Class of Certificates will not be issued on the closing date of this securitization. |
| (2) | The credit support percentages set forth for Class A-1, Class A-2, Class A-3, Class A-4, Class A-5 and Class A-SB Certificates represent the approximate initial credit support for the Class A-1, Class A-2, Class A-3, Class A-4, Class A-5 and Class A-SB Certificates in the aggregate. The approximate initial credit support percentages shown in the table above for the Pooled Principal Balance Certificates do not take into account the VRR Interest. However, losses incurred on the mortgage loans will be allocated between the VRR Interest, on the one hand, and the Pooled Non-VRR Certificates (exclusive of the Class X and Class R certificates), on the other hand,pro rata in accordance with their respective outstanding certificate balances. The approximate initial credit support percentages show in the table above for the Pooled Principal Balance Certificates do not include the subordination provided by the 225 Bush subordinate companion loan (the “Trust Subordinate Companion Loan”) to the 225 Bush mortgage loan. Privately Offered the Loan-Specific Certificates will not provide credit support to any class of Pooled Certificates except to the extent of the subordination of the Trust Subordinate Companion Loan (in which the Loan-Specific Certificates each represent an interest) to the 225 Bush mortgage loan included in the mortgage pool. |
THE INFORMATION IN THIS STRUCTURAL AND COLLATERAL TERM SHEET IS NOT COMPLETE AND MAY BE AMENDED PRIOR TO THE TIME OF SALE. THIS TERM SHEET IS NOT AN OFFER TO SELL THESE SECURITIES AND IT IS NOT A SOLICITATION OF AN OFFER TO BUY THESE SECURITIES IN ANY JURISDICTION WHERE THE OFFER OR SALE IS NOT PERMITTED.
| | |
3 of 156
| Structural and Collateral Term Sheet | Benchmark 2019-B14 | |
| Indicative Capital Structure | ||
| (3) | Assumes 0% CPR / 0% CDR and a November 21, 2019 closing date. Based on modeling assumptions as described in the Preliminary Prospectus dated October 29, 2019 (the “Preliminary Prospectus”). |
| (4) | The “Certificate Principal to Value Ratio” for any Class of Pooled Principal Balance Certificates (other than the Class A-1, Class A-2, Class A-3, Class A-4, Class A-5 and Class A-SB Certificates) is calculated as the product of (a) the weighted average Cut-off Date LTV for the mortgage loans, multiplied by (b) a fraction, the numerator of which is the total initial Certificate Balance of such Class of Certificates and all Classes of Pooled Principal Balance Certificates senior to such Class of Certificates and the denominator of which is the total initial Certificate Balance of all of the Pooled Principal Balance Certificates. The Class A-1, Class A-2, Class A-3, Class A-4, Class A-5 and Class A-SB Certificate Principal to Value Ratios are calculated in the aggregate for those Classes as if they were a single class. Investors should note, however, that excess mortgaged property value associated with a mortgage loan will not be available to offset losses on any other mortgage loan. |
| (5) | The “Underwritten NOI Debt Yield” for any Class of Pooled Principal Balance Certificates (other than the Class A-1, Class A-2, Class A-3, Class A-4, Class A-5 and Class A-SB Certificates) is calculated as the product of (a) the weighted average UW NOI DY for the mortgage loans and (b) the total initial Certificate Balance of all of the Classes of Pooled Principal Balance Certificates divided by the total initial Certificate Balance for such Class and all Classes of Pooled Principal Balance Certificates senior to such Class of Certificates. The Underwritten NOI Debt Yield for each of the Class A-1, Class A-2, Class A-3, Class A-4, Class A-5 and Class A-SB Certificates is calculated in the aggregate for those Classes as if they were a single Class. Investors should note, however, that net operating income from any mortgaged property supports only the related mortgage loan and will not be available to support any other mortgage loan. |
| (6) | The exact initial certificate balances of the Class A-4 and Class A-5 certificates are unknown and will be determined based on the final pricing of those classes of certificates. However, the respective initial certificate balances, weighted average lives and expected principal windows of the Class A-4 and Class A-5 certificates are expected to be within the applicable ranges reflected in the following chart. The aggregate initial offered certificate balance of the Class A-4 and Class A-5 certificates is expected to be approximately $537,570,000, subject to a variance of plus or minus 5%. |
| Class of Certificates | Expected Range of Initial Certificate Balance | Expected Range of Weighted Avg. Life (Yrs.) | Expected Range of Principal Window |
| A-4 | $100,000,000 – $187,000,000 | 9.67 – 9.76 | 6/2029-9/2029 / 6/2029-10/2029 |
| A-5 | $350,570,000 – $437,570,000 | 9.92 – 9.91 | 10/2029-11/2029 / 9/2029-11/2029 |
| (7) | The Class X-A, Class X-B and Class X-D Notional Amounts are defined in the Preliminary Prospectus. |
| (8) | The Classes of Certificates set forth under “Privately Offered Certificates”, “Non-Offered Vertical Risk Retention Interest” and “Privately Offered Loan-Specific Certificates” in the tables above are not being offered by the Preliminary Prospectus or this Term Sheet. The Class R Certificates are not shown above. |
| (9) | The loan-specific certificates will only be entitled to receive distributions from, and will only incur losses with respect to, the Trust Subordinate Companion Loan. The Trust Subordinate Companion Loan will be included as an asset of the issuing entity but will not be part of the mortgage pool backing the pooled certificates. No class of pooled certificates will have any interest in the Trust Subordinate Companion Loan. See “Description of the Mortgage Pool—The Whole Loans—The AB Whole Loans—225 Bush Whole Loan”. |
| (10) | The “Certificate Principal to Value Ratio” for any Class of Loan-Specific Principal Balance Certificates is calculated as the product of (a) the Cut-off Date LTV for the 225 Bush Whole Loan, multiplied by (b) a fraction, the numerator of which is the sum of (i) the initial Certificate Balance of such class of Loan-Specific Certificates and all other classes of Loan-Specific Certificates, if any, that are senior to such class (including any portions of the 225B-VRR Interest that is considered to bepari passu or senior to such class) and (ii) the principal balance as of the Cut-off Date of the 225 Bush senior mortgage loan, and the denominator of which is the total initial Certificate Balance of all classes of Loan-Specific Certificates (including any portions of the 225B-VRR Interest that is considered to bepari passu or senior to such class) and the principal balance as of the Cut-off Date of 225 Bush senior mortgage loan. |
| (11) | The “Underwritten NOI Debt Yield” for any class of Loan-Specific Certificates is calculated as the product of (a) the NOI Debt Yield for the 225 Bush Whole Loan, multiplied by (b) a fraction, the numerator of which is the total initial Certificate Balance of all classes of Loan-Specific Certificates (including any portions of the 225B-VRR Interest that is considered to bepari passu or senior to such class) and the principal balance as of the Cut-off Date of 225 Bush senior mortgage loan and the denominator of which is the total initial Certificate Balance of such class of Loan-Specific Certificates (including any portions of the 225B-VRR Interest that is considered to bepari passuor senior to such class) and all other classes of Loan-Specific Certificates, if any, that are senior to such class as well as the 225 Bush senior mortgage loan. |
| (12) | The weighted average life and principal window during which distributions of principal would be received as set forth in the foregoing table with respect to the VRR interest are based on the assumptions set forth under “Yield and Maturity Considerations—Weighted Average Life” in the Preliminary Prospectus and on the assumptions that there are no prepayments, modifications or losses in respect of the mortgage loans and that there are no extensions or forbearances of maturity dates or anticipated repayments dates of the mortgage loans. |
| (13) | German American Capital Corporation, as the retaining sponsor for the securitization transaction constituted by the issuance of the Pooled Certificates, is expected to acquire from the depositor, on the Closing Date, an “eligible vertical interest” (as defined in Regulation RR) in the form of a single vertical security with an expected aggregate initial Certificate Balance of $33,000,000 (the “VRR Interest”), which is expected to represent approximately 2.50% of all Pooled Principal Balance Certificates and the VRR Interest. A portion of the VRR Interest will be retained by each of German American Capital Corporation or its “majority-owned affiliate”, JPMorgan Chase Bank, National Association and Citi Real Estate Funding Inc., in accordance with the U.S. credit risk retention rules applicable to the pooled securitization. See “Credit Risk Retention” in the Preliminary Prospectus. |
| (14) | Although it does not have a specified pass-through rate (other than for tax reporting purposes), the effective interest rate for the VRR Interest will be the WAC rate. |
| (15) | German American Capital Corporation, as the retaining sponsor with respect to the securitization transaction constituted by the issuance of the Loan-Specific Certificates, is expected to acquire from the depositor, on the Closing Date, an “eligible vertical interest” (as defined in Regulation RR) in the form of a single vertical security with an expected aggregate initial Certificate Balance of $7,320,000 (the “225B-VRR Interest”), which is expected to represent approximately 5.0% of all Loan-Specific Principal Balance Certificates and the 225B-VRR Interest. The 225B-VRR Interest will be retained by German American Capital Corporation or its “majority-owned affiliate”, in accordance with the U.S. credit risk retention rules applicable to the loan-specific securitization. |
| (16) | Although it does not have a specified pass-through rate (other than for tax reporting purposes), the effective interest rate for the 225B-VRR Interest will be the net mortgage rate on the Trust Subordinate Companion Loan. |
THE INFORMATION IN THIS STRUCTURAL AND COLLATERAL TERM SHEET IS NOT COMPLETE AND MAY BE AMENDED PRIOR TO THE TIME OF SALE. THIS TERM SHEET IS NOT AN OFFER TO SELL THESE SECURITIES AND IT IS NOT A SOLICITATION OF AN OFFER TO BUY THESE SECURITIES IN ANY JURISDICTION WHERE THE OFFER OR SALE IS NOT PERMITTED.
| | |
4 of 156
| Structural and Collateral Term Sheet | Benchmark 2019-B14 | |
| Summary of Transaction Terms | ||
| Securities Offered: | $1,144,205,000 monthly pay, multi-class, commercial mortgage REMIC Pass-Through Certificates. |
| Co-Lead Managers and Joint Bookrunners: | J.P. Morgan Securities LLC, Citigroup Global Markets Inc. and Deutsche Bank Securities Inc. |
| Co-Managers: | Drexel Hamilton, LLC and Academy Securities, Inc. |
| Mortgage Loan Sellers: | JPMorgan Chase Bank, National Association (“JPMCB”) (47.2%), Citi Real Estate Funding Inc. (“CREFI”) (30.6%) and German American Capital Corporation (“GACC”) (22.2%). |
| Master Servicer: | Midland Loan Services, a Division of PNC Bank, National Association. |
| Special Servicer: | Midland Loan Services, a Division of PNC Bank, National Association. |
| Directing Certificateholder: | KKR Real Estate Credit Opportunity Partners II L.P. |
| Trustee: | Wells Fargo Bank, National Association. |
| Certificate Administrator: | Wells Fargo Bank, National Association. |
| Operating Advisor: | Pentalpha Surveillance LLC. |
| Asset Representations Reviewer: | Pentalpha Surveillance LLC. |
| Rating Agencies: | S&P Global Ratings, acting through Standard and Poor’s Financial Services LLC (“S&P”), Fitch Ratings, Inc. (“Fitch”) and Kroll Bond Rating Agency, Inc. (“KBRA”). |
| U.S. Credit Risk Retention: | GACC is expected to act as the “retaining sponsor” for the securitization constituted by the issuance of the Pooled Certificates, and intends to satisfy the U.S. credit risk retention requirement by (i) acquiring (either through itself or through one or more of its “majority owned affiliates” (as defined in Regulation RR)) from the depositor, on the Closing Date, an “eligible vertical interest” which will be comprised of the VRR Interest and a portion of which will be transferred by GACC to each of JPMCB and CREFI and (ii) the purchase by KKR CMBS II Aggregator Type 1 L.P., as “third-party purchaser” (as defined in Regulation RR), from the depositor, on the Closing Date, of an “eligible horizontal residual interest”, which will be comprised of the Class F-RR, G-RR and NR-RR Certificates.
GACC is also expected to act as the “retaining sponsor” for the securitization constituted by the issuance of the Loan-Specific Certificates, and intends to satisfy the U.S. credit risk retention requirement by acquiring (either through itself or through one or more of its “majority owned affiliates” (as defined in Regulation RR)) from the depositor, on the Closing Date, an “eligible vertical interest” which will be comprised of the 225B-VRR Interest. The 225B-VRR Interest will be at least equal to 5% of the aggregate certificate balance of all Loan-Specific Certificates issued by the issuing entity.
The restrictions on hedging and transfer under the U.S. credit risk retention rules as in effect on the closing date of this transaction will expire on and after the date that is the latest of (i) the date on which the aggregate principal balance of the mortgage loans has been reduced to 33% of the aggregate principal balance of the mortgage loans as of the Cut-off Date; (ii) the date on which the total unpaid principal obligations under the Certificates has been reduced to 33% of the aggregate total unpaid principal obligations under the Certificates as of the Closing Date; or (iii) two years after the Closing Date.
The restrictions on hedging and transfer under the U.S. credit risk retention rules as in effect on the closing date of the loan-specific securitization transaction securitization transaction will expire on and after the date that is the latest of (i) the date on which the principal balance of the Trust Subordinate Companion Loan has been reduced to 33% of the principal balance of the Trust Subordinate Companion Loan as of the Cut-off Date; (ii) the date on which the total unpaid principal obligations under the Loan Specific Certificates has been reduced to 33% of the aggregate total unpaid principal obligations under Loan Specific Certificates as of the Closing Date; or (iii) two years after the Closing Date.
The Pooling and Servicing Agreement (as defined below) will include the required provisions applicable to an operating advisor necessary for the pooled securitization to comply with the credit risk retention rules utilizing the “third-party purchaser” option. See “Operating Advisor” below.
Notwithstanding any references in this term sheet to the credit risk retention rules, the Regulation RR, the retaining sponsor and other risk retention related matters, in the event the credit risk retention rules and/or Regulation RR (or any relevant portion thereof) are repealed or determined by applicable regulatory agencies to be no longer applicable to the pooled securitization transaction or the loan-specific securitization transaction, none of the retaining sponsor or any other party will be required to comply with or act in accordance with the U.S. credit risk retention rules and/or Regulation RR (or such relevant portion thereof).
For additional information, see “Credit Risk Retention” in the Preliminary Prospectus.
|
| EU Credit Risk Retention: | The transaction is not structured to satisfy the EU risk retention and due diligence requirements. |
| Pricing Date: | On or about November 4, 2019. |
THE INFORMATION IN THIS STRUCTURAL AND COLLATERAL TERM SHEET IS NOT COMPLETE AND MAY BE AMENDED PRIOR TO THE TIME OF SALE. THIS TERM SHEET IS NOT AN OFFER TO SELL THESE SECURITIES AND IT IS NOT A SOLICITATION OF AN OFFER TO BUY THESE SECURITIES IN ANY JURISDICTION WHERE THE OFFER OR SALE IS NOT PERMITTED.
| | |
5 of 156
| Structural and Collateral Term Sheet | Benchmark 2019-B14 | |
| Summary of Transaction Terms | ||
| Closing Date: | On or about November 21, 2019. |
| Cut-off Date: | With respect to each mortgage loan, the related due date in November 2019 or with respect to any mortgage loan that has its first due date in December 2019, the date that would otherwise have been the related due date in November 2019. |
| Distribution Date: | The 4th business day after the Determination Date in each month, commencing in December 2019. |
| Determination Date: | 11th day of each month, or if the 11th day is not a business day, the next succeeding business day, commencing in December 2019. |
| Assumed Final Distribution Date: | The Distribution Date in November 2029, which is the latest anticipated repayment date of the Certificates. |
| Rated Final Distribution Date: | The Distribution Date in December 2062. |
| Tax Treatment: | The Publicly Offered Certificates are expected to be treated as REMIC “regular interests” for U.S. federal income tax purposes. |
| Form of Offering: | The Class A-1, Class A-2, Class A-3, Class A-4, Class A-5, Class A-SB, Class X-A, Class X-B, Class A-S, Class B and Class C Certificates (the “Publicly Offered Certificates”) will be offered publicly. The Class X-D, Class D, Class E, Class F-RR, Class G-RR, Class NR-RR and Class R Certificates (the “Privately Offered Certificates”) and the Class 225B-A, Class 225B-B, Class 225B-C, Class 225B-D and Class 225B-E Certificates (the “Privately Offered Loan-Specific Certificates”) will be offered domestically to Qualified Institutional Buyers and to Institutional Accredited Investors (other than the Class R Certificates) and to institutions that are not U.S. Persons pursuant to Regulation S. |
| SMMEA Status: | The Publicly Offered Certificates will not constitute “mortgage related securities” for purposes of SMMEA. |
| ERISA: | The Publicly Offered Certificates are expected to be ERISA eligible. |
| Optional Termination: | On any Distribution Date on which the aggregate principal balance of the pool of mortgage loans and the Trust Subordinate Companion Loan is less than 1% of the aggregate principal balance of the mortgage loans and the Trust Subordinate Companion Loan as of the Cut-off Date, certain entities specified in the Preliminary Prospectus will have the option to purchase all of the remaining mortgage loans and the Trust Subordinate Companion Loan (and all property acquired through exercise of remedies in respect of any mortgage loan) at the price specified in the Preliminary Prospectus. Refer to “Pooling and Servicing Agreement—Termination; Retirement of Certificates” in the Preliminary Prospectus. |
| Minimum Denominations: | The Publicly Offered Certificates (other than the Class X-A and Class X-B Certificates) will be issued in minimum denominations of $10,000 and integral multiples of $1 in excess of $10,000. The Class X-A and Class X-B Certificates will be issued in minimum denominations of $1,000,000 and in integral multiples of $1 in excess of $1,000,000. |
| Settlement Terms: | DTC, Euroclear and Clearstream Banking. |
| Analytics: | The transaction is expected to be modeled by Intex Solutions, Inc. and Trepp, LLC and is expected to be available on Bloomberg L.P., Blackrock Financial Management, Inc., Interactive Data Corporation, CMBS.com, Inc., Markit Group Limited, Moody’s Analytics, MBS Data, LLC, RealINSIGHT and Thomson Reuters Corporation. |
| Risk Factors: | THE CERTIFICATES INVOLVE CERTAIN RISKS AND MAY NOT BE SUITABLE FOR ALL INVESTORS. REFER TO “RISK FACTORS” IN THE PRELIMINARY PROSPECTUS. |
THE INFORMATION IN THIS STRUCTURAL AND COLLATERAL TERM SHEET IS NOT COMPLETE AND MAY BE AMENDED PRIOR TO THE TIME OF SALE. THIS TERM SHEET IS NOT AN OFFER TO SELL THESE SECURITIES AND IT IS NOT A SOLICITATION OF AN OFFER TO BUY THESE SECURITIES IN ANY JURISDICTION WHERE THE OFFER OR SALE IS NOT PERMITTED.
| | |
6 of 156
| Structural and Collateral Term Sheet | Benchmark 2019-B14 | |
| Collateral Characteristics | ||
| Loan Pool | ||
| Initial Pool Balance (“IPB”): | $1,322,249,369 | |
| Number of Mortgage Loans: | 53 | |
| Number of Mortgaged Properties: | 112 | |
| Average Cut-off Date Balance per Mortgage Loan: | $24,948,101 | |
| Weighted Average Current Mortgage Rate: | 3.79106% | |
| 10 Largest Mortgage Loans as % of IPB: | 39.9% | |
| Weighted Average Remaining Term to Maturity: | 106 months | |
| Weighted Average Seasoning: | 1 months | |
| Credit Statistics | ||
| Weighted Average UW NCF DSCR(1): | 2.30x | |
| Weighted Average UW NOI DY(1)(2): | 9.9% | |
| Weighted Average Cut-off Date Loan-to-Value Ratio (“LTV”)(1)(3): | 60.0% | |
| Weighted Average Maturity Date LTV(1)(3): | 56.8% | |
| Other Statistics | ||
| % of Mortgage Loans with Additional Debt: | 20.2% | |
| % of Mortgaged Properties with Single Tenants: | 11.9% | |
| Amortization | ||
| Weighted Average Original Amortization Term(4): | 362 months | |
| Weighted Average Remaining Amortization Term(4): | 362 months | |
| % of Mortgage Loans with Interest-Only: | 62.8% | |
| % of Mortgage Loans with Partial Interest-Only followed by Amortizing Balloon: | 21.8% | |
| % of Mortgage Loans with Amortizing Balloon: | 14.8% | |
| % of Mortgage Loans with Fully Amortizing: | 0.6% | |
| Lockbox / Cash Management(5) | ||
| % of Mortgage Loans with In-Place, Hard Lockboxes: | 62.5% | |
| % of Mortgage Loans with Springing Lockboxes: | 28.5% | |
| % of Mortgage Loans with In-Place, Soft Lockboxes: | 3.9% | |
| % of Mortgage Loans with In-Place, Soft (Multifamily) / Hard (Office) Lockboxes: | 3.6% | |
| % of Mortgage Loans with Springing, Soft (Multifamily) / Hard (Retail) Lockboxes: | 1.5% | |
| % of Mortgage Loans with Springing Cash Management: | 88.6% | |
| % of Mortgage Loans with In-Place Cash Management: | 11.4% | |
| Reserves | ||
| % of Mortgage Loans Requiring Monthly Tax Reserves: | 81.3% | |
| % of Mortgage Loans Requiring Monthly Insurance Reserves: | 42.4% | |
| % of Mortgage Loans Requiring Monthly CapEx Reserves(6): | 78.6% | |
| % of Mortgage Loans Requiring Monthly TI/LC Reserves(7): | 45.9% | |
| (1) | In the case of Loan Nos. 2, 3, 4, 5, 6, 7, 9, 10, 11, 12, 19, 20, 23, 28, 29 and 30, the UW NCF DSCR, UW NOI DY, Cut-off Date LTV and Maturity Date LTV calculations include the relatedPari Passu Companion Loan(s). In the case of Loan Nos. 2, 4, 5, 9, 19 and 21, the UW NCF DSCR, UW NOI DY, Cut-off Date LTV and Maturity Date LTV calculations exclude the related Subordinate Companion Loan(s) and/or mezzanine loan(s). |
| (2) | In the case of Loan Nos. 36 and 49, the UW NOI DY are calculated net of a holdback reserve. |
| (3) | In the case of Loan Nos. 3, 7, 11, 12, 20, 21, 24, 29, 32, 35, 39, 41 and 50, the Cut-off Date LTV and the Maturity Date LTV are calculated by using an appraised value based on certain hypothetical assumptions. Refer to “Description of the Mortgage Pool—Assessments of Property Value and Condition” and “—Appraised Value” in the Preliminary Prospectus for additional details. |
| (4) | Excludes 28 mortgage loans that are interest-only for the entire term or until the related anticipated repayment date. |
| (5) | For a more detailed description of Lockbox / Cash Management, refer to “Description of the Mortgage Pool—Certain Terms of the Mortgage Loans—Mortgaged Property Accounts” in the Preliminary Prospectus. |
| (6) | CapEx Reserves include FF&E reserves for hotel properties. |
| (7) | Calculated only with respect to the Cut-off Date Balance of mortgage loans secured or partially secured by retail, office, industrial and mixed use properties. |
THE INFORMATION IN THIS STRUCTURAL AND COLLATERAL TERM SHEET IS NOT COMPLETE AND MAY BE AMENDED PRIOR TO THE TIME OF SALE. THIS TERM SHEET IS NOT AN OFFER TO SELL THESE SECURITIES AND IT IS NOT A SOLICITATION OF AN OFFER TO BUY THESE SECURITIES IN ANY JURISDICTION WHERE THE OFFER OR SALE IS NOT PERMITTED.
| | |
7 of 156
| Structural and Collateral Term Sheet | Benchmark 2019-B14 | |
| Collateral Characteristics | ||
Mortgage Loan Seller | Number of Mortgage Loans | Number of Mortgaged Properties | Aggregate | % of IPB |
| JPMCB(1) | 23 | 43 | $624,759,959 | 47.2% |
| CREFI | 19 | 53 | 404,497,000 | 30.6 |
| GACC(2) | 11 | 16 | 292,992,410 | 22.2 |
| Total | 53 | 112 | $1,322,249,369 | 100.0% |
| (1) | In the case of loan No. 4, the whole loan was co-originated by JPMCB and Goldman Sachs Bank USA. In the case of Loan No. 10, the whole loan was co-originated by JPMCB and Wells Fargo Bank, National Association. In the case of Loan No. 19, the whole loan was co-originated by JPMCB, Morgan Stanley Bank, N.A., Wells Fargo Bank, National Association and Goldman Sachs Bank USA. In the case of Loan No. 20, the whole loan was co-originated by JPMCB, Wells Fargo Bank, National Association and Bank of America, N.A. In the case of Loan No. 29, the whole loan was co-originated by JPMCB and Wells Fargo Bank, National Association. |
| (2) | Nine of the mortgage loans (15.5%) being sold by German American Capital Corporation (“GACC”) were originated or co-originated by an affiliate thereof, DBR Investments Co. Limited, and will be transferred to GACC on or prior to the closing date. Two of the mortgage loans (6.7%) being sold by GACC were originated or co-originated by an affiliate thereof, Deutsche Bank AG, New York Branch (“DBNY”). DBNY on the origination date transferred such mortgage loans to DBRI, and DBRI will transfer such mortgage loans to GACC on or prior to the closing date. |
| Ten Largest Mortgage Loans | |||||||||||
| No. | Loan Name | Mortgage Loan Seller | No. of Prop. | Cut-off Date Balance | % of IPB | SF / Units | Property Type | UW NCF DSCR(1) | UW NOI DY(1) | Cut-off Date LTV(1)(2) | Maturity Date LTV(1)(2) |
| 1 | Watergate Office Building | CREFI | 1 | $73,000,000 | 5.5% | 215,200 | Office | 2.04x | 8.2% | 69.5% | 69.5% |
| 2 | 225 Bush | GACC | 1 | $60,000,000 | 4.5% | 579,987 | Office | 3.85x | 13.4% | 34.6% | 34.6% |
| 3 | Innovation Park | JPMCB | 1 | $60,000,000 | 4.5% | 1,854,729 | Office | 2.96x | 11.6% | 68.8% | 68.8% |
| 4 | The Essex | JPMCB | 1 | $56,900,000 | 4.3% | 195 | Mixed Use | 3.66x | 10.3% | 39.9% | 39.9% |
| 5 | 180 Water | GACC | 1 | $50,000,000 | 3.8% | 573 | Multifamily | 3.15x | 11.0% | 30.5% | 30.5% |
| 6 | Harvey Building Products | CREFI | 30 | $50,000,000 | 3.8% | 2,046,119 | Various | 1.51x | 9.1% | 69.4% | 62.8% |
| 7 | Legends at Village West | CREFI | 1 | $50,000,000 | 3.8% | 702,750 | Retail | 1.67x | 9.5% | 53.3% | 48.3% |
| 8 | 80 on the Commons | GACC | 1 | $47,300,000 | 3.6% | 296,190 | Mixed Use | 3.50x | 11.0% | 64.4% | 64.4% |
| 9 | Osborn Triangle | JPMCB | 3 | $40,000,000 | 3.0% | 676,947 | Mixed Use | 3.12x | 12.5% | 37.1% | 37.1% |
| 10 | Tysons Tower | JPMCB | 1 | $40,000,000 | 3.0% | 528,730 | Office | 3.07x | 11.0% | 52.1% | 52.1% |
| Top 3 Total/Weighted Average | 3 | $193,000,000 | 14.6% | 2.89x | 10.9% | 58.4% | 58.4% | ||||
| Top 5 Total/Weighted Average | 5 | $299,900,000 | 22.7% | 3.08x | 10.8% | 50.3% | 50.3% | ||||
| Top 10 Total/Weighted Average | 41 | $527,200,000 | 39.9% | 2.84x | 10.7% | 52.8% | 51.7% | ||||
| (1) | In the case of Loan Nos. 2, 3, 4, 5, 6, 7, 9 and 10, the UW NCF DSCR, UW NOI DY, Cut-off Date LTV and LTV Ratio at Maturity calculations include the relatedPari Passu Companion Loan(s). In the case of Loan Nos. 2, 4, 5 and 9, the UW NCF DSCR, UW NOI DY, Cut-off Date LTV and Maturity Date LTV calculations exclude the related Subordinate Companion Loan(s). |
| (2) | In the case of Loan Nos. 3 and 7, the Cut-off Date LTV and the Maturity Date LTV are calculated by using an appraised value based on certain hypothetical assumptions. Refer to “Description of the Mortgage Pool—Assessments of Property Value and Condition” and “—Appraised Value” in the Preliminary Prospectus for additional details. |
THE INFORMATION IN THIS STRUCTURAL AND COLLATERAL TERM SHEET IS NOT COMPLETE AND MAY BE AMENDED PRIOR TO THE TIME OF SALE. THIS TERM SHEET IS NOT AN OFFER TO SELL THESE SECURITIES AND IT IS NOT A SOLICITATION OF AN OFFER TO BUY THESE SECURITIES IN ANY JURISDICTION WHERE THE OFFER OR SALE IS NOT PERMITTED.
| | |
8 of 156
| Structural and Collateral Term Sheet | Benchmark 2019-B14 | |
| Collateral Characteristics | ||
| Companion Loan Summary | ||||||||
| Loan No. | Mortgage Loan | Note(s) | Original Balance ($) | Cut-off Date Balance ($) | Holder of Note | Lead Servicer for Whole Loan (Y/N) | Master Servicer Under Lead Securitization | Special Servicer Under Lead Securitization |
| 2 | 225 Bush | A-1, A-6 | $60,000,000 | $60,000,000 | BMARK 2019-B14 | Yes(2) | Midland | Midland |
| A-2, A-3, A-4, A-5 | $143,600,000 | $143,600,000 | DBRI | No | ||||
| B-1(1) | $146,400,000 | $146,400,000 | BMARK 2019-B14 | No(2) | ||||
| Total | $350,000,000 | $350,000,000 | ||||||
| 3 | Innovation Park
| A-1 | $60,000,000 | $60,000,000 | BMARK 2019-B14 | No(3) | ||
| A-2 | $70,000,000 | $70,000,000 | JPMCB | Yes | (3) | (3) | ||
| A-3 | $52,250,000 | $52,250,000 | JPMCB | No | ||||
| Total | $182,250,000 | $182,250,000 | ||||||
| 4 | The Essex | A-1-1, A-1-3 | $56,900,000 | $56,900,000 | BMARK 2019-B14 | Yes | Midland | Midland |
| A-1-2 | $25,000,000 | $25,000,000 | JPMCB | No | ||||
| A-1-4 | $35,100,000 | $35,100,000 | GS | No | ||||
| B-1(1) | $40,600,000 | $40,600,000 | JPMCB(4) | No | ||||
| B-2(1) | $17,400,000 | $17,400,000 | GS(4) | No | ||||
| Total | $175,000,000 | $175,000,000 | ||||||
| 5 | 180 Water | A-1 | $50,000,000 | $50,000,000 | BMARK 2019-B14 | No(5) | ||
| A-2 | $40,000,000 | $40,000,000 | DBRI | Yes | (5) | (5) | ||
| A-3, A-4, A-5 | $47,500,000 | $47,500,000 | DBRI | No | ||||
| B-1(1) | $127,500,000 | $127,500,000 | DBRI | No(5) | ||||
| Total | $265,000,000 | $265,000,000 | ||||||
| 6 | Harvey Building Products | A-1 | $60,000,000 | $60,000,000 | CREFI | No | ||
| A-2 | $50,000,000 | $50,000,000 | BMARK 2019-B14 | Yes | Midland | Midland | ||
| A-3 | $50,000,000 | $50,000,000 | CREFI | No | ||||
| Total | $160,000,000 | $160,000,000 | ||||||
| 7 | Legends at Village West | A-1 | $50,000,000 | $50,000,000 | BMARK 2019-B14 | Yes | Midland | Midland |
| A-2 | $40,000,000 | $40,000,000 | CREFI | No | ||||
| A-3 | $30,000,000 | $30,000,000 | CREFI | No | ||||
| Total | $120,000,000 | $120,000,000 | ||||||
| 9 | Osborn Triangle | A-1 | $250,000,000 | $250,000,000 | JPMCC 2019-OSB | Yes | KeyBank | Situs |
| A-2 | $50,000,000 | $50,000,000 | BMARK 2019-B12 | No | ||||
| A-3 | $50,000,000 | $50,000,000 | BMARK 2019-B13 | No | ||||
| A-4 | $40,000,000 | $40,000,000 | BMARK 2019-B14 | No | ||||
| A-5 | $20,000,000 | $20,000,000 | JPMCB | No | ||||
| A-6-1 | $20,000,000 | $20,000,000 | CCRE | No | ||||
| B-1(1) | $145,000,000 | $145,000,000 | JPMCC 2019-OSB | No | ||||
| Total | $575,000,000 | $575,000,000 | ||||||
| 10 | Tysons Tower | A-1 | $50,000,000 | $50,000,000 | BANK 2019-BNK21 | Yes | Rialto | Wells |
| A-2, A-3 | $45,000,000 | $45,000,000 | WFB | No | ||||
| A-4 | $40,000,000 | $40,000,000 | BMARK 2019-B14 | No | ||||
| A-5, A-6, A-7 | $55,000,000 | $55,000,000 | JPMCB | No | ||||
| Total | $190,000,000 | $190,000,000 | ||||||
| 11 | 900 & 990 Stewart Avenue | A-1 | $45,000,000 | $45,000,000 | BMARK 2019-B13 | Yes | Midland | CWCapital |
| A-2 | $39,000,000 | $39,000,000 | BMARK 2019-B14 | No | ||||
| Total | $84,000,000 | $84,000,000 | ||||||
| 12 | Hilton Cincinnati Netherland Plaza | A-1 | $35,500,000 | $35,500,000 | BMARK 2019-B14 | Yes | Midland | Midland |
| A-2 | $17,000,000 | $17,000,000 | JPMCB | No | ||||
| A-3 | $20,000,000 | $20,000,000 | JPMCB | No | ||||
| Total | $72,500,000 | $72,500,000 | ||||||
| (1) | Each note represents a subordinate companion loan. |
| (2) | In the case of Loan No. 2, the initial control note is Note B-1. During the continuance of a 225 Bush Control Appraisal Period, Note A-1 will be the Control Note. See “Description of the Mortgage Pool—The Whole Loans—The Non-Serviced AB Whole Loans—225 Bush Whole Loan” in the Preliminary Prospectus. |
| (3) | In the case of Loan No. 3, the whole loan is expected to be serviced under the BMARK 2019-B14 pooling and servicing agreement until such time the controlling note has been securitized, at which point such whole loan will be serviced under the pooling and servicing agreement related to such securitization. JPMCB holds the related controllingpari passu companion loan and is entitled to exercise control rights until the securitization of such controllingpari passu companion loan. |
| (4) | In the case of Loan No. 4, Note B-1 and B-2 are expected to be sold to an unrelated third party. The initial control note is Note B-1. During the continuance of The Essex Control Appraisal Period, Note A-1-1 will be the Control Note. The whole loan will be serviced under the BMARK 2019-B14 pooling and servicing agreement. JPMCB holds the related controlling subordinate companion loan and is entitled to exercise control rights of such controlling subordinate companion loan. See “Description of the Mortgage Pool--The Whole Loans--The Serviced AB Whole Loans--The Essex Whole Loan” in the Preliminary Prospectus. |
| (5) | In the case of Loan No. 5, the initial control note is Note B-1. During the continuance of a 180 Water Control Appraisal Period, Note A-1 will be the Control Note. The whole loan is expected to be serviced under the BMARK 2019-B14 pooling and servicing agreement until such time both another Note A and Note B-1 have been securitized, at which point such whole loan will be serviced under the pooling and servicing agreement related to such securitization. DBRI holds the related controlling subordinate companion loan and is entitled to exercise control rights until the securitization of such controlling subordinate companion loan. See “Description of the Mortgage Pool—The Whole Loans—The Non-Serviced AB Whole Loans—180 Water Whole Loan” in the Preliminary Prospectus. |
THE INFORMATION IN THIS STRUCTURAL AND COLLATERAL TERM SHEET IS NOT COMPLETE AND MAY BE AMENDED PRIOR TO THE TIME OF SALE. THIS TERM SHEET IS NOT AN OFFER TO SELL THESE SECURITIES AND IT IS NOT A SOLICITATION OF AN OFFER TO BUY THESE SECURITIES IN ANY JURISDICTION WHERE THE OFFER OR SALE IS NOT PERMITTED.
| | |
9 of 156
| Structural and Collateral Term Sheet | Benchmark 2019-B14 | |
| Collateral Characteristics | ||
| Loan No. | Mortgage Loan | Note(s) | Original Balance ($) | Cut-off Date Balance ($) | Holder of Note | Lead Servicer for Whole Loan (Y/N) | Master Servicer Under Lead Securitization | Special Servicer Under Lead Securitization |
| 19 | Grand Canal Shoppes | A-1-1, A-1-6 | $70,000,000 | $70,000,000 | MSC 2019-H7 | Yes(2) | Midland | LNR |
| A-1-2, A-2-1 | $100,000,000 | $100,000,000 | BANK 2019-BNK19 | No | ||||
| A-3-1 | $50,000,000 | $50,000,000 | BMARK 2019-B12 | No | ||||
| A-3-2 | $50,000,000 | $50,000,000 | BMARK 2019-B13 | No | ||||
| A-4-1 | $60,000,000 | $60,000,000 | CGCMT 2019-GC41 | No | ||||
| A-4-3 | $20,000,000 | $20,000,000 | GSMS 2019-GC42 | No | ||||
| A-1-7, A-1-8, A-2-2-1 | $40,000,000 | $40,000,000 | BANK 2019-BNK20 | No | ||||
| A-2-2-2 | $30,000,000 | $30,000,000 | CSAIL 2019-C17 | No | ||||
| A-2-3, A-2-5 | $50,384,615 | $50,384,615 | UBS 2019-C17 | No | ||||
| A-1-4 | $40,000,000 | $40,000,000 | BANK 2019-BNK21 | No | ||||
| A-3-3-1, A-3-5 | $30,384,615 | $30,384,615 | BMARK 2019-B14 | No | ||||
| A-1-3, A-1-5 | $53,846,154 | $53,846,154 | MSNBA | No | ||||
| A-3-3-2 | $20,000,000 | $20,000,000 | JPMCB | No | ||||
| A-3-4 | $25,000,000 | $25,000,000 | CCRE | No | ||||
| A-4-2, A-4-4, A-4-5 | $95,384,615 | $95,384,615 | GSBI | No | ||||
| A-2-4 | $25,000,000 | $25,000,000 | UBS AG | No | ||||
| B-1(1) | $215,000,000 | $215,000,000 | CPPIB Credit Investment II Inc. | No(2) | ||||
| Total | $975,000,000 | $975,000,000 | ||||||
| 20 | 230 Park Avenue South
| A-1, A-4 | $110,000,000 | $110,000,000 | BANK 2019-BNK21 | Yes | Rialto | Wells |
| A-2, A-3 | $55,000,000 | $55,000,000 | WFB | No | ||||
| A-5, A-6 | $55,000,000 | $55,000,000 | BAML | No | ||||
| A-7 | $30,000,000 | $30,000,000 | BMARK 2019-B14 | No | ||||
| Total | $250,000,000 | $250,000,000 | ||||||
| 23 | 8 West Centre | A-1 | $26,000,000 | $26,000,000 | BMARK 2019-B14 | Yes | Midland | Midland |
| A-2 | $18,200,000 | $18,200,000 | JPMCB | No | ||||
| Total | $44,200,000 | $44,200,000 | ||||||
| 29 | 600 & 620 National | A-1-1 | $38,950,000 | $38,950,000 | UBSCM 2019-C17 | Yes | Midland | CWCapital |
| A-2-1-A | $20,000,000 | $20,000,000 | BMARK 2019-B14 | No | ||||
| A-1-2 | $30,000,000 | $30,000,000 | WFM | No | ||||
| A-2-1-B, A-2-2-A, A-2-2-B, A-2-3 | $48,950,000 | $48,950,000 | JPMCB | No | ||||
| Total | $137,900,000 | $137,900,000 | ||||||
| 28 | Sunset North | A-1 | $75,000,000 | $75,000,000 | BMARK 2019-B13 | Yes | Midland | CWCapital |
| A-2 | $20,000,000 | $20,000,000 | BMARK 2019-B14 | No | ||||
| A-3 | $39,500,000 | $39,500,000 | JPMCB | No | ||||
| A-4 | $15,500,000 | $15,500,000 | JPMCB | No | ||||
| Total | $150,000,000 | $150,000,000 | ||||||
| 30 | City Hyde Park | A-1 | $45,000,000 | $45,000,000 | BMARK 2019-B13 | Yes | Midland | CWCapital |
| A-2-A | $20,000,000 | $20,000,000 | BMARK 2019-B14 | No | ||||
| A-2-B | $20,000,000 | $20,000,000 | JPMCB | No | ||||
| A-3 | $27,000,000 | $27,000,000 | JPMCB | No | ||||
| Total | $112,000,000 | $112,000,000 |
| (1) | Each note represents a subordinate companion loan. |
| (2) | In the case of Loan No. 19, the initial control note is Note B-1. During the continuance of a Grand Canal Shoppes Control Appraisal Period, Note A-1-1 will be the Control Note. See “Description of the Mortgage Pool—The Whole Loans—The Non-Serviced AB Whole Loans—Grand Canal Shoppes Whole Loan” in the Preliminary Prospectus. |
THE INFORMATION IN THIS STRUCTURAL AND COLLATERAL TERM SHEET IS NOT COMPLETE AND MAY BE AMENDED PRIOR TO THE TIME OF SALE. THIS TERM SHEET IS NOT AN OFFER TO SELL THESE SECURITIES AND IT IS NOT A SOLICITATION OF AN OFFER TO BUY THESE SECURITIES IN ANY JURISDICTION WHERE THE OFFER OR SALE IS NOT PERMITTED.
| | |
10 of 156
| Structural and Collateral Term Sheet | Benchmark 2019-B14 | |
| Collateral Characteristics | ||
| Additional Debt Summary |
No. | Loan Name | Trust | Subordinate | Total Debt | Mortgage | Total | Mortgage | Total | Mortgage | Total |
| 2 | 225 Bush | $60,000,000 | $146,400,000 | $350,000,000 | 3.85x | 2.24x | 34.6% | 59.4% | 13.4% | 7.8% |
| 4 | The Essex | $56,900,000 | $98,000,000 | $215,000,000 | 3.66x | 1.33x | 39.9% | 73.4% | 10.3% | 5.6% |
| 5 | 180 Water | $50,000,000 | $227,500,000 | $365,000,000 | 3.15x | 0.85x | 30.5% | 80.8% | 11.0% | 4.1% |
| 9 | Osborn Triangle | $40,000,000 | $145,000,000 | $575,000,000 | 3.12x | 2.33x | 37.1% | 49.7% | 12.5% | 9.3% |
| 19 | Grand Canal Shoppes | $30,384,615 | $215,000,000 | $975,000,000 | 2.46x | 1.67x | 46.3% | 59.5% | 9.6% | 7.5% |
| 21 | Villas on Nueces | $30,000,000 | $7,000,000 | $37,000,000 | 2.04x | 1.49x | 52.7% | 65.0% | 9.6% | 7.8% |
| (1) | In the case of Loan Nos. 2, 9 and 19 Subordinate Debt Cut-off Date Balance represents one or more Subordinate Companion Loans. In the case of Loan Nos. 4 and 5, Subordinate Debt Cut-off Date Balance represents one or more Subordinate Companion Loans and one or more mezzanine loans. In the case of Loan No. 21, Subordinate Debt Cut-off Date Balance represents one or more mezzanine loans. |
| (2) | In the case of Loan Nos. 2, 4, 5, 9 and 19, the Mortgage Loan UW NCF DSCR, Mortgage Loan Cut-off Date LTV and Mortgage Loan UW NOI DY calculations include the relatedPari Passu Companion Loan(s). In the case of Loan Nos. 2, 4, 5, 9, 19 and 21 the Mortgage Loan UW NCF DSCR, Mortgage Loan Cut-off Date LTV and Mortgage Loan UW NOI DY, calculations exclude the related Subordinate Companion Loan(s) and/or related mezzanine loan(s). |
| (3) | In the case of Loan No. 21, the Mortgage Loan Cut-off Date LTV and Total Debt Cut-off Date LTV is calculated using an appraised value based on certain hypothetical assumptions. Refer to “Description of the Mortgage Pool—Assessments of Property Value and Condition” and “—Appraised Value” in the Preliminary Prospectus for additional details. |
THE INFORMATION IN THIS STRUCTURAL AND COLLATERAL TERM SHEET IS NOT COMPLETE AND MAY BE AMENDED PRIOR TO THE TIME OF SALE. THIS TERM SHEET IS NOT AN OFFER TO SELL THESE SECURITIES AND IT IS NOT A SOLICITATION OF AN OFFER TO BUY THESE SECURITIES IN ANY JURISDICTION WHERE THE OFFER OR SALE IS NOT PERMITTED.
| | |
11 of 156
| Structural and Collateral Term Sheet | Benchmark 2019-B14 | |
| Collateral Characteristics | ||
| Mortgaged Properties by Type(1) |
| Weighted Average | |||||||||
| Property Type | Property Subtype | Number of Properties | Cut-off Date Principal Balance | % of IPB | Occupancy | UW NCF DSCR(2) | UW NOI DY(2)(3) | Cut-off Date LTV(2)(4) | Maturity Date LTV(2)(4) |
| Office | Suburban | 9 | $268,898,438 | 20.3% | 96.7% | 2.49x | 10.5% | 65.1% | 62.7% |
| CBD | 3 | 163,000,000 | 12.3 | 93.5% | 2.82x | 10.2% | 53.2% | 53.2% | |
| Subtotal: | 12 | $431,898,438 | 32.7% | 95.5% | 2.61x | 10.4% | 60.6% | 59.2% | |
| Multifamily | Garden | 28 | $125,672,343 | 9.5% | 95.9% | 1.53x | 8.2% | 70.8% | 66.0% |
| High-Rise | 2 | 82,500,000 | 6.2 | 96.5% | 2.42x | 9.2% | 46.3% | 42.9% | |
| Student Housing | 2 | 50,053,000 | 3.8 | 97.5% | 1.94x | 10.0% | 56.9% | 54.5% | |
| Mid-Rise | 3 | 39,150,000 | 3.0 | 98.1% | 1.65x | 6.8% | 66.1% | 66.1% | |
| Subtotal: | 35 | $297,375,343 | 22.5% | 96.6% | 1.86x | 8.6% | 61.0% | 57.7% | |
| Retail | Anchored | 6 | $152,694,410 | 11.5% | 91.1% | 1.96x | 9.8% | 62.7% | 57.1% |
| Specialty Retail | 1 | 30,384,615 | 2.3 | 94.0% | 2.46x | 9.6% | 46.3% | 46.3% | |
| Single Tenant | 2 | 22,770,000 | 1.7 | 100.0% | 1.88x | 8.1% | 61.9% | 61.9% | |
| Unanchored | 2 | 22,250,000 | 1.7 | 95.4% | 1.45x | 9.3% | 64.7% | 48.5% | |
| Shadow Anchored | 1 | 13,475,000 | 1.0 | 94.9% | 1.53x | 9.3% | 74.4% | 61.2% | |
| Freestanding | 2 | 8,600,000 | 0.7 | 100.0% | 2.11x | 13.1% | 59.9% | 51.5% | |
| Subtotal: | 14 | $250,174,025 | 18.9% | 93.2% | 1.95x | 9.7% | 61.3% | 55.5% | |
| Mixed use | Multifamily/Retail | 2 | $76,900,000 | 5.8% | 99.1% | 2.98x | 9.4% | 48.7% | 47.1% |
| Office/Multifamily | 1 | 47,300,000 | 3.6 | 95.1% | 3.50x | 11.0% | 64.4% | 64.4% | |
| Office/Laboratory | 3 | 40,000,000 | 3.0 | 100.0% | 3.12x | 12.5% | 37.1% | 37.1% | |
| Retail/Office | 1 | 12,400,000 | 0.9 | 97.2% | 3.11x | 11.6% | 57.7% | 57.7% | |
| Subtotal: | 7 | $176,600,000 | 13.4% | 98.1% | 3.16x | 10.7% | 50.9% | 50.2% | |
| Industrial | Warehouse/Distribution | 22 | $25,368,750 | 1.9% | 100.0% | 1.51x | 9.1% | 69.4% | 62.8% |
| Manufacturing | 2 | 15,281,250 | 1.2 | 100.0% | 1.51x | 9.1% | 69.4% | 62.8% | |
| Flex | 1 | 12,500,000 | 0.9 | 92.7% | 1.58x | 9.9% | 58.1% | 53.0% | |
| Warehouse | 6 | 12,451,563 | 0.9 | 100.0% | 1.48x | 15.3% | 49.7% | 22.6% | |
| Subtotal: | 31 | $65,601,563 | 5.0% | 98.6% | 1.52x | 10.4% | 63.5% | 53.3% | |
| Self Storage | Self Storage | 9 | $51,300,000 | 3.9% | 82.6% | 2.28x | 9.3% | 62.7% | 60.7% |
| Subtotal: | 9 | $51,300,000 | 3.9% | 82.6% | 2.28x | 9.3% | 62.7% | 60.7% | |
| Hotel | Full Service | 1 | $35,500,000 | 2.7% | 74.8% | 1.62x | 10.9% | 68.7% | 63.7% |
| Extended Stay | 2 | 7,000,000 | 0.5 | 92.3% | 4.59x | 17.0% | 51.9% | 51.9% | |
| Subtotal: | 3 | $42,500,000 | 3.2% | 77.7% | 2.11x | 11.9% | 65.9% | 61.8% | |
| Manufactured Housing | Manufactured Housing | 1 | $6,800,000 | 0.5% | 94.4% | 1.56x | 9.1% | 73.1% | 63.2% |
| Subtotal: | 1 | $6,800,000 | 0.5% | 94.4% | 1.56x | 9.1% | 73.1% | 63.2% | |
| Total / Weighted Average: | 112 | 1,322,249,369 | 100.0% | 94.7% | 2.30x | 9.9% | 60.0% | 56.8% | |
| (1) | Because this table presents information relating to the mortgaged properties and not mortgage loans, the information for mortgage loans secured by more than one mortgaged property is based on allocated loan amounts. |
| (2) | In the case of Loan Nos. 2, 3, 4, 5, 6, 7, 9, 10, 11, 12, 19, 20, 23, 28, 29 and 30, the UW NCF DSCR, UW NOI DY, Cut-off Date LTV and Maturity Date LTV calculations include the relatedPari Passu Companion Loan(s). In the case of Loan Nos. 2, 4, 5, 9, 19 and 21, the UW NCF DSCR, UW NOI DY, Cut-off Date LTV and Maturity Date LTV calculations exclude the related Subordinate Companion Loan(s) and/or mezzanine loan(s). |
| (3) | In the case of Loan Nos. 36 and 49, the UW NOI DY are calculated net of a holdback reserve. |
| (4) | In the case of Loan Nos. 3, 7, 11, 12, 20, 21, 24, 29, 32, 35, 39, 41 and 50, the Cut-off Date LTV and the Maturity Date LTV are calculated using an appraised value based on certain hypothetical assumptions. Refer to “Description of the Mortgage Pool—Assessments of Property Value and Condition” and “—Appraised Value” in the Preliminary Prospectus for additional details. |
THE INFORMATION IN THIS STRUCTURAL AND COLLATERAL TERM SHEET IS NOT COMPLETE AND MAY BE AMENDED PRIOR TO THE TIME OF SALE. THIS TERM SHEET IS NOT AN OFFER TO SELL THESE SECURITIES AND IT IS NOT A SOLICITATION OF AN OFFER TO BUY THESE SECURITIES IN ANY JURISDICTION WHERE THE OFFER OR SALE IS NOT PERMITTED.
| | |
12 of 156
| Structural and Collateral Term Sheet | Benchmark 2019-B14 | |
| Collateral Characteristics | ||
| Mortgaged Properties by Location(1) | ||||||||
Weighted Average | ||||||||
State | Number of Properties | Cut-off Date Principal Balance | % of IPB | Occupancy | UW NCF DSCR(2) | UW NOI DY(2)(3) | Cut-off Date LTV(2)(4) | Maturity Date LTV(2)(4) |
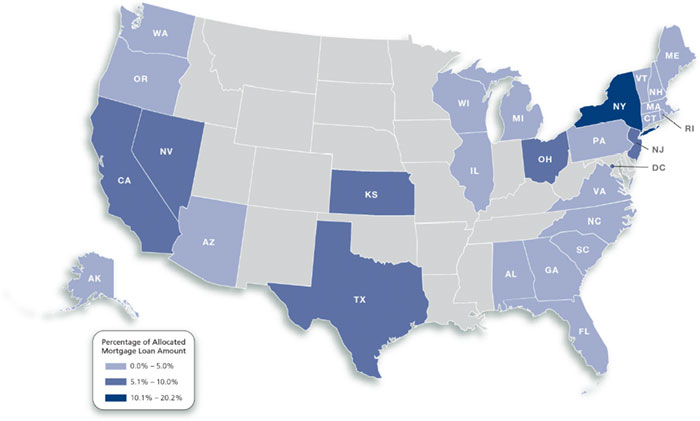
| New York | 10 | $267,750,000 | 20.2% | 97.0% | 2.46x | 9.2% | 52.2% | 50.0% |
| California | 5 | 120,700,000 | 9.1 | 97.1% | 2.79x | 10.5% | 49.5% | 49.0% |
| New Jersey | 21 | 101,160,000 | 7.7 | 93.8% | 1.47x | 8.6% | 73.7% | 66.9% |
| Ohio | 3 | 89,600,000 | 6.8 | 87.0% | 2.61x | 10.8% | 66.8% | 64.0% |
| Texas | 7 | 85,552,343 | 6.5 | 97.2% | 1.90x | 10.5% | 60.6% | 53.9% |
| District of Columbia | 2 | 83,570,000 | 6.3 | 88.9% | 2.07x | 8.3% | 68.6% | 68.6% |
| Kansas | 2 | 70,053,000 | 5.3 | 92.6% | 1.70x | 9.8% | 56.2% | 50.9% |
| Nevada | 3 | 69,735,115 | 5.3 | 91.9% | 2.71x | 10.2% | 56.6% | 56.6% |
| North Carolina | 2 | 63,914,200 | 4.8 | 95.4% | 2.93x | 11.5% | 68.4% | 68.4% |
| Florida | 5 | 63,406,680 | 4.8 | 95.0% | 1.93x | 9.9% | 65.3% | 57.2% |
| Massachusetts | 14 | 61,243,750 | 4.6 | 100.0% | 2.56x | 11.3% | 48.3% | 46.0% |
| Virginia | 1 | 40,000,000 | 3.0 | 100.0% | 3.07x | 11.0% | 52.1% | 52.1% |
| Arizona | 1 | 35,250,000 | 2.7 | 85.8% | 1.52x | 9.0% | 66.3% | 57.2% |
| Wisconsin | 1 | 34,000,000 | 2.6 | 100.0% | 2.87x | 10.1% | 65.3% | 65.3% |
| Illinois | 2 | 25,600,000 | 1.9 | 97.4% | 1.33x | 8.4% | 71.3% | 64.3% |
| Washington | 1 | 20,000,000 | 1.5 | 98.8% | 2.63x | 9.1% | 66.1% | 66.1% |
| Michigan | 6 | 18,510,000 | 1.4 | 94.6% | 3.55x | 14.9% | 53.9% | 53.9% |
| New Hampshire | 5 | 15,187,500 | 1.1 | 100.0% | 1.51x | 9.1% | 69.4% | 62.8% |
| Alabama | 1 | 13,475,000 | 1.0 | 94.9% | 1.53x | 9.3% | 74.4% | 61.2% |
| Georgia | 3 | 11,879,120 | 0.9 | 79.8% | 2.52x | 9.3% | 62.2% | 62.2% |
| Oregon | 1 | 11,593,910 | 0.9 | 93.4% | 1.69x | 10.2% | 74.8% | 59.1% |
| Connecticut | 7 | 8,075,000 | 0.6 | 100.0% | 1.51x | 9.1% | 69.4% | 62.8% |
| Alaska | 1 | 3,500,000 | 0.3 | 82.9% | 3.34x | 12.7% | 44.9% | 44.9% |
| South Carolina | 1 | 3,000,000 | 0.2 | 100.0% | 1.78x | 10.2% | 55.6% | 50.2% |
| Pennsylvania | 3 | 2,256,250 | 0.2 | 100.0% | 1.51x | 9.1% | 69.4% | 62.8% |
| Rhode Island | 2 | 2,071,875 | 0.2 | 100.0% | 1.51x | 9.1% | 69.4% | 62.8% |
| Maine | 1 | 843,750 | 0.1 | 100.0% | 1.51x | 9.1% | 69.4% | 62.8% |
| Vermont | 1 | 321,875 | 0.0 | 100.0% | 1.51x | 9.1% | 69.4% | 62.8% |
| Total / Weighted Average: | 112 | $1,322,249,369 | 100.0% | 94.7% | 2.30x | 9.9% | 60.0% | 56.8% |
| (1) | Because this table presents information relating to the mortgaged properties and not mortgage loans, the information for mortgage loans secured by more than one mortgaged property is based on allocated loan amounts. |
| (2) | In the case of Loan Nos. 2, 3, 4, 5, 6, 7, 9, 10, 11, 12, 19, 20, 23, 28, 29 and 30 , the UW NCF DSCR, UW NOI DY, Cut-off Date LTV and Maturity Date LTV calculations include the relatedPari Passu Companion Loan(s). In the case of Loan Nos. 2, 4, 5, 9, 19 and 21, the UW NCF DSCR, UW NOI DY, Cut-off Date LTV and Maturity Date LTV calculations exclude the related Subordinate Companion Loan(s) and/or mezzanine loan(s). |
| (3) | In the case of Loan Nos. 36 and 49, the UW NOI DY are calculated net of a holdback reserve. |
| (4) | In the case of Loan Nos. 3, 7, 11, 12, 20, 21, 24, 29, 32, 35, 39, 41 and 50, the Cut-off Date LTV and the Maturity Date LTV are calculated using an appraised value based on certain hypothetical assumptions. Refer to “Description of the Mortgage Pool—Assessments of Property Value and Condition” and “—Appraised Value” in the Preliminary Prospectus for additional details. |
THE INFORMATION IN THIS STRUCTURAL AND COLLATERAL TERM SHEET IS NOT COMPLETE AND MAY BE AMENDED PRIOR TO THE TIME OF SALE. THIS TERM SHEET IS NOT AN OFFER TO SELL THESE SECURITIES AND IT IS NOT A SOLICITATION OF AN OFFER TO BUY THESE SECURITIES IN ANY JURISDICTION WHERE THE OFFER OR SALE IS NOT PERMITTED.
| | |
13 of 156
| Structural and Collateral Term Sheet | Benchmark 2019-B14 | |
| Collateral Characteristics | ||
| Cut-off Date Principal Balance |
Weighted Average | |||||||||||
| Range of Cut-off Date Principal Balances | Number of Loans | Cut-off Date Principal Balance | % of IPB | Mortgage Rate | Remaining Loan Term | UW NCF DSCR(1) | UW NOI DY(1)(2) | Cut-off Date LTV(1)(3) | Maturity Date LTV(1)(3) | ||
| $3,000,000 | - | $9,999,999 | 10 | $54,724,843 | 4.1% | 3.95537% | 119 | 2.12x | 12.4% | 59.1% | 47.7% |
| $10,000,000 | - | $19,999,999 | 13 | 173,153,410 | 13.1 | 4.02067% | 110 | 1.92x | 9.7% | 65.4% | 59.6% |
| $20,000,000 | - | $24,999,999 | 6 | 125,176,500 | 9.5 | 3.74034% | 119 | 2.11x | 8.7% | 66.9% | 64.9% |
| $25,000,000 | - | $49,999,999 | 17 | 569,294,615 | 43.1 | 3.93399% | 111 | 2.20x | 9.6% | 61.9% | 58.7% |
| $50,000,000 | - | $73,000,000 | 7 | 399,900,000 | 30.2 | 3.48156% | 91 | 2.71x | 10.4% | 53.0% | 51.6% |
Total / Wtd. Avg: | 53 | $1,322,249,369 | 100.0% | 3.79106% | 106 | 2.30x | 9.9% | 60.0% | 56.8% | ||
| Mortgage Interest Rates |
Weighted Average | |||||||||||
| Range of Mortgage Interest Rates | Number of Loans | Cut-off Date Principal Balance | % of IPB | Mortgage Rate | Remaining Loan Term | UW NCF DSCR(1) | UW NOI DY(1)(2) | Cut-off Date LTV(1)(3) | Maturity Date LTV(1)(3) | ||
| 2.75900% | - | 3.99999% | 38 | $1,038,302,025 | 78.5% | 3.57420% | 107 | 2.51x | 10.2% | 57.5% | 54.7% |
| 4.00000% | - | 4.49999% | 8 | 112,499,843 | 8.5 | 4.27968% | 91 | 1.71x | 9.1% | 68.3% | 63.9% |
| 4.50000% | - | 4.99999% | 6 | 135,947,500 | 10.3 | 4.63591% | 120 | 1.37x | 7.7% | 70.0% | 65.6% |
| 5.00000% | - | 5.35000% | 1 | 35,500,000 | 2.7 | 5.35000% | 60 | 1.62x | 10.9% | 68.7% | 63.7% |
| Total / Wtd. Avg: | 53 | $1,322,249,369 | 100.0% | 3.79106% | 106 | 2.30x | 9.9% | 60.0% | 56.8% | ||
| Original Term to Maturity in Months |
Weighted Average | |||||||||
| Original Term to Maturity in Months | Number of Loans | Cut-off Date Principal Balance | % of IPB | Mortgage Rate | Remaining Loan Term | UW NCF DSCR(1) | UW NOI DY(1)(2) | Cut-off Date LTV(1)(3) | Maturity Date LTV(1)(3) |
| 60 | 7 | $262,827,000 | 19.9% | 3.96300% | 60 | 2.52x | 10.8% | 50.1% | 48.2% |
| 84 | 1 | 56,900,000 | 4.3 | 2.75900% | 84 | 3.66x | 10.3% | 39.9% | 39.9% |
| 120 | 45 | 1,002,522,369 | 75.8 | 3.80456% | 119 | 2.17x | 9.6% | 63.8% | 60.0% |
Total / Wtd. Avg: | 53 | $1,322,249,369 | 100.0% | 3.79106% | 106 | 2.30x | 9.9% | 60.0% | 56.8% |
| Remaining Term to Maturity in Months | |||||||||
| Weighted Average | |||||||||||
| Range of Remaining Term to Maturity in Months | Number of Loans | Cut-off Date Principal Balance | % of IPB | Mortgage Rate | Remaining Loan Term | UW NCF DSCR(1) | UW NOI DY(1)(2) | Cut-off Date LTV(1)(3) | Maturity Date LTV(1)(3) | ||
| 57 | - | 84 | 8 | $319,727,000 | 24.2% | 3.74873% | 64 | 2.72x | 10.7% | 48.3% | 46.7% |
| 85 | - | 119 | 23 | 500,634,369 | 37.9 | 3.76333% | 118 | 2.23x | 9.6% | 61.4% | 58.6% |
| 120 | - | 120 | 22 | 501,888,000 | 38.0 | 3.84568% | 120 | 2.11x | 9.7% | 66.2% | 61.4% |
| Total / Wtd. Avg: | 53 | $1,322,249,369 | 100.0% | 3.79106% | 106 | 2.30x | 9.9% | 60.0% | 56.8% | ||
| (1) | In the case of Loan Nos. 2, 3, 4, 5, 6, 7, 9, 10, 11, 12, 19, 20, 23, 28, 29 and 30, the UW NCF DSCR, UW NOI DY, Cut-off Date LTV and Maturity Date LTV calculations include the relatedPari Passu Companion Loan(s). In the case of Loan Nos. 2, 4, 5, 9, 19 and 21, the UW NCF DSCR, UW NOI DY, Cut-off Date LTV and Maturity Date LTV calculations exclude the related Subordinate Companion Loan(s) and/or mezzanine loan(s). |
| (2) | In the case of Loan Nos. 36 and 49, the UW NOI DY are calculated net of a holdback reserve. |
| (3) | In the case of Loan Nos. 3, 7, 11, 12, 20, 21, 24, 29, 32, 35, 39, 41 and 50, the Cut-off Date LTV and the Maturity Date LTV are calculated by using an appraised value based on certain hypothetical assumptions. Refer to “Description of the Mortgage Pool—Assessments of Property Value and Condition” and “—Appraised Value” in the Preliminary Prospectus for additional details. |
THE INFORMATION IN THIS STRUCTURAL AND COLLATERAL TERM SHEET IS NOT COMPLETE AND MAY BE AMENDED PRIOR TO THE TIME OF SALE. THIS TERM SHEET IS NOT AN OFFER TO SELL THESE SECURITIES AND IT IS NOT A SOLICITATION OF AN OFFER TO BUY THESE SECURITIES IN ANY JURISDICTION WHERE THE OFFER OR SALE IS NOT PERMITTED.
| | |
14 of 156
| Structural and Collateral Term Sheet | Benchmark 2019-B14 | |
| Collateral Characteristics | ||
| Original Amortization Term in Months |
| Weighted Average | |||||||||||
| Original Amortization Term in Months | Number of Loans | Cut-off Date Principal Balance | % of IPB | Mortgage Rate | Remaining Loan Term | UW NCF DSCR(1) | UW NOI DY(1)(2) | Cut-off Date LTV(1)(3) | Maturity Date LTV(1)(3) | ||
| Interest Only | 28 | $829,955,115 | 62.8% | 3.57053% | 105 | 2.77x | 10.2% | 55.7% | 55.7% | ||
| 120 | - | 324 | 2 | 26,500,000 | 2.0 | 3.90811% | 120 | 1.44x | 12.1% | 56.9% | 32.5% |
| 360 | - | 480 | 23 | 465,794,253 | 35.2 | 4.17733% | 107 | 1.53x | 9.3% | 67.9% | 60.2% |
| Total / Wtd. Avg: | 53 | $1,322,249,369 | 100.0% | 3.79106% | 106 | 2.30x | 9.9% | 60.0% | 56.8% | ||
| Remaining Amortization Term in Months |
| Weighted Average | |||||||||||
| Range of Remaining Amortization Term in Months | Number of Loans | Cut-off Date Principal Balance | % of IPB | Mortgage Rate | Remaining Loan Term | UW NCF DSCR(1) | UW NOI DY(1)(2) | Cut-off Date LTV(1)(3) | Maturity Date LTV(1)(3) | ||
Interest Only | 28 | $829,955,115 | 62.8% | 3.57053% | 105 | 2.77x | 10.2% | 55.7% | 55.7% | ||
| 120 | - | 359 | 4 | 47,818,753 | 3.6 | 3.97705% | 119 | 1.52x | 11.2% | 63.3% | 43.3% |
| 360 | - | 480 | 21 | 444,475,500 | 33.6 | 4.18283% | 106 | 1.52x | 9.2% | 67.8% | 60.4% |
| Total / Wtd. Avg: | 53 | $1,322,249,369 | 100.0% | 3.79106% | 106 | 2.30x | 9.9% | 60.0% | 56.8% | ||
| Amortization Types |
Weighted Average | |||||||||
| Amortization Types | Number of Loans | Cut-off Date Principal Balance | % of IPB | Mortgage Rate | Remaining Loan Term | UW NCF DSCR(1) | UW NOI DY(1)(2) | Cut-off Date LTV(1)(3) | Maturity Date LTV(1)(3) |
| Interest Only | 28 | $829,955,115 | 62.8% | 3.57053% | 105 | 2.77x | 10.2% | 55.7% | 55.7% |
| IO-Balloon | 16 | 287,975,500 | 21.8 | 4.15819% | 120 | 1.48x | 9.1% | 70.7% | 63.1% |
| Balloon | 8 | 196,318,753 | 14.8 | 4.17835% | 90 | 1.59x | 9.6% | 63.6% | 54.6% |
| Fully Amortizing | 1 | 8,000,000 | 0.6 | 3.95000% | 120 | 1.46x | 18.7% | 38.8% | 0.2% |
| Total / Wtd. Avg: | 53 | $1,322,249,369 | 100.0% | 3.79106% | 106 | 2.30x | 9.9% | 60.0% | 56.8% |
| Underwritten Net Cash Flow Debt Service Coverage Ratios(1) |
| Weighted Average | |||||||||||
| Range of Underwritten Net Cash Flow Debt Service Coverage Ratios | Number of Loans | Cut-off Date Principal Balance | % of IPB | Mortgage Rate | Remaining Loan Term | UW NCF DSCR(1) | UW NOI DY(1)(2) | Cut-off Date LTV(1)(3) | Maturity Date | ||
| 1.06x | - | 1.49x | 8 | $158,310,000 | 12.0% | 4.28087% | 120 | 1.22x | 7.7% | 71.6% | 61.9% |
| 1.50x | - | 1.74x | 15 | 295,781,253 | 22.4 | 4.16949% | 100 | 1.59x | 9.1% | 65.1% | 59.0% |
| 1.75x | - | 1.99x | 8 | 171,153,000 | 12.9 | 4.02942% | 105 | 1.87x | 9.9% | 66.7% | 61.7% |
| 2.00x | - | 2.24x | 2 | 103,000,000 | 7.8 | 3.98291% | 119 | 2.04x | 8.6% | 64.6% | 64.6% |
| 2.25x | - | 4.59x | 20 | 594,005,115 | 44.9 | 3.37014% | 103 | 3.12x | 11.1% | 51.7% | 51.6% |
| Total / Wtd. Avg: | 53 | $1,322,249,369 | 100.0% | 3.79106% | 106 | 2.30x | 9.9% | 60.0% | 56.8% | ||
| (1) | In the case of Loan Nos. 2, 3, 4, 5, 6, 7, 9, 10, 11, 12, 19, 20, 23, 28, 29 and 30, the UW NCF DSCR, UW NOI DY, Cut-off Date LTV and Maturity Date LTV calculations include the relatedPari Passu Companion Loan(s). In the case of Loan Nos. 2, 4, 5, 9, 19 and 21, the UW NCF DSCR, UW NOI DY, Cut-off Date LTV and Maturity Date LTV calculations exclude the related Subordinate Companion Loan(s) and/or mezzanine loan(s). |
| (2) | In the case of Loan Nos. 36 and 49, the UW NOI DY are calculated net of a holdback reserve. |
| (3) | In the case of Loan Nos. 3, 7, 11, 12, 20, 21, 24, 29, 32, 35, 39, 41 and 50, the Cut-off Date LTV and the Maturity Date LTV are calculated by using an appraised value based on certain hypothetical assumptions. Refer to “Description of the Mortgage Pool—Assessments of Property Value and Condition” and “—Appraised Value” in the Preliminary Prospectus for additional details. |
THE INFORMATION IN THIS STRUCTURAL AND COLLATERAL TERM SHEET IS NOT COMPLETE AND MAY BE AMENDED PRIOR TO THE TIME OF SALE. THIS TERM SHEET IS NOT AN OFFER TO SELL THESE SECURITIES AND IT IS NOT A SOLICITATION OF AN OFFER TO BUY THESE SECURITIES IN ANY JURISDICTION WHERE THE OFFER OR SALE IS NOT PERMITTED.
| | |
15 of 156
| Structural and Collateral Term Sheet | Benchmark 2019-B14 | |
| Collateral Characteristics | ||
| LTV Ratios as of the Cut-off Date(1)(3) |
| Weighted Average | |||||||||||
| Range of Cut-off Date LTVs | Number of Loans | Cut-off Date Principal Balance | % of IPB | Mortgage Rate | Remaining Loan Term | UW NCF DSCR(1) | UW NOI DY(1)(2) | Cut-off Date LTV(1)(3) | Maturity Date LTV(1)(3) | ||
| 30.5% | - | 39.9% | 5 | $214,900,000 | 16.3% | 3.29998% | 79 | 3.41x | 12.1% | 35.7% | 34.2% |
| 40.0% | - | 49.9% | 2 | 33,884,615 | 2.6 | 3.73555% | 116 | 2.55x | 9.9% | 46.2% | 46.2% |
| 50.0% | - | 59.9% | 9 | 198,900,000 | 15.0 | 3.76401% | 101 | 2.45x | 10.5% | 53.3% | 51.6% |
| 60.0% | - | 69.9% | 28 | 690,535,843 | 52.2 | 3.83582% | 112 | 2.16x | 9.7% | 66.4% | 63.2% |
| 70.0% | - | 78.6% | 9 | 184,028,910 | 13.9 | 4.23603% | 119 | 1.36x | 7.6% | 74.2% | 66.9% |
Total / Wtd. Avg: | 53 | $1,322,249,369 | 100.0% | 3.79106% | 106 | 2.30x | 9.9% | 60.0% | 56.8% | ||
| LTV Ratios as of the Maturity Date(1)(3) |
Weighted Average | |||||||||||
| Range of Maturity Date LTVs | Number of Loans | Cut-off Date Principal Balance | % of IPB | Mortgage Rate | Remaining Loan Term | UW NCF DSCR(1) | UW NOI DY(1)(2) | Cut-off Date LTV(1)(3) | Maturity Date LTV(1)(3) | ||
| 0.2% | - | 39.9% | 5 | $214,900,000 | 16.3% | 3.29998% | 79 | 3.41x | 12.1% | 35.7% | 34.2% |
| 40.0% | - | 49.9% | 4 | 102,384,615 | 7.7 | 3.82423% | 89 | 1.92x | 9.6% | 53.0% | 47.2% |
| 50.0% | - | 54.9% | 10 | 177,824,843 | 13.4 | 3.81290% | 115 | 2.48x | 11.0% | 55.4% | 52.0% |
| 55.0% | - | 59.9% | 7 | 111,046,910 | 8.4 | 3.84976% | 119 | 1.86x | 10.6% | 65.9% | 57.4% |
| 60.0% | - | 72.0% | 27 | 716,093,000 | 54.2 | 3.91917% | 112 | 2.05x | 8.9% | 68.6% | 66.0% |
Total / Wtd. Avg: | 53 | $1,322,249,369 | 100.0% | 3.79106% | 106 | 2.30x | 9.9% | 60.0% | 56.8% | ||
| Prepayment Protection |
Weighted Average | |||||||||
| Prepayment Protection | Number of Loans | Cut-off Date Principal Balance | % of IPB | Mortgage Rate | Remaining Loan Term | UW NCF DSCR(1) | UW NOI DY(1)(2) | Cut-off Date LTV(1)(3) | Maturity Date LTV(1)(3) |
Defeasance | 41 | $979,084,025 | 74.0% | 3.77113% | 104 | 2.27x | 9.7% | 60.1% | 56.5% |
Yield Maintenance | 10 | 263,165,343 | 19.9 | 3.91910% | 110 | 2.55x | 10.9% | 58.9% | 57.5% |
| Defeasance or Yield Maintenance | 2 | 80,000,000 | 6.1 | 3.61375% | 119 | 1.94x | 9.0% | 62.5% | 58.4% |
Total / Wtd. Avg: | 53 | $1,322,249,369 | 100.0% | 3.79106% | 106 | 2.30x | 9.9% | 60.0% | 56.8% |
| Loan Purpose |
Weighted Average | |||||||||
| Loan Purpose | Number of Loans | Cut-off Date Principal Balance | % of IPB | Mortgage Rate | Remaining Loan Term | UW NCF DSCR(1) | UW NOI DY(1)(2) | Cut-off Date LTV(1)(3) | Maturity Date LTV(1)(3) |
| Refinance | 30 | $709,971,459 | 53.7% | 3.87617% | 99 | 2.26x | 9.7% | 56.3% | 52.6% |
| Acquisition | 21 | 561,707,910 | 42.5 | 3.71935% | 113 | 2.31x | 10.1% | 65.3% | 62.4% |
| Recapitalization | 2 | 50,570,000 | 3.8 | 3.39271% | 119 | 2.90x | 10.5% | 54.2% | 54.2% |
| Total / Wtd. Avg: | 53 | $1,322,249,369 | 100.0% | 3.79106% | 106 | 2.30x | 9.9% | 60.0% | 56.8% |
| (1) | In the case of Loan Nos. 2, 3, 4, 5, 6, 7, 9, 10, 11, 12, 19, 20, 23, 28, 29 and 30, the UW NCF DSCR, UW NOI DY, Cut-off Date LTV and Maturity Date LTV calculations include the relatedPari Passu Companion Loan(s). In the case of Loan Nos. 2, 4, 5, 9, 19 and 21, the UW NCF DSCR, UW NOI DY, Cut-off Date LTV and Maturity Date LTV calculations exclude the related Subordinate Companion Loan(s) and/or mezzanine loan(s). |
| (2) | In the case of Loan Nos. 36 and 49, the UW NOI DY are calculated net of a holdback reserve. |
| (3) | In the case of Loan Nos. 3, 7, 11, 12, 20, 21, 24, 29, 32, 35, 39, 41 and 50, the Cut-off Date LTV and the Maturity Date LTV are calculated by using an appraised value based on certain hypothetical assumptions. Refer to “Description of the Mortgage Pool—Assessments of Property Value and Condition” and “—Appraised Value” in the Preliminary Prospectus for additional details. |
THE INFORMATION IN THIS STRUCTURAL AND COLLATERAL TERM SHEET IS NOT COMPLETE AND MAY BE AMENDED PRIOR TO THE TIME OF SALE. THIS TERM SHEET IS NOT AN OFFER TO SELL THESE SECURITIES AND IT IS NOT A SOLICITATION OF AN OFFER TO BUY THESE SECURITIES IN ANY JURISDICTION WHERE THE OFFER OR SALE IS NOT PERMITTED.
| | |
16 of 156
| Structural and Collateral Term Sheet | Benchmark 2019-B14 | |
| Collateral Characteristics | ||
| Previous Securitization History(1) |
| No. | Mortgaged Property | Cut-off Date Principal Balance | % of IPB | Location | Property Type | Previous Securitization |
| 2 | 225 Bush | $60,000,000 | 4.5% | San Francisco, CA | Office | GSMS 2017-GS5 |
| 6 | Harvey Building Products | $50,000,000 | 3.8% | Various | Various | COMM 2015-LC23 |
| 15.01 | Compass Self Storage Bloomfield | $13,000,000 | 1.0% | Bloomfield, NJ | Self Storage | CGCMT 2013-GC11 |
| 15.02 | Compass Self Storage Smyrna | $4,668,040 | 0.4% | Smyrna, GA | Self Storage | CGCMT 2013-GC11 |
| 15.03 | Compass Self Storage Port Richey | $4,206,680 | 0.3% | New Port Richey, FL | Self Storage | GSMS 2013-GC16 |
| 15.05 | Compass Self Storage Duluth | $3,676,480 | 0.3% | Duluth, GA | Self Storage | CGCMT 2013-GC11 |
| 15.06 | Compass Self Storage Kennesaw | $3,534,600 | 0.3% | Kennesaw, GA | Self Storage | CGCMT 2013-GC11 |
| 17 | Jersey City Group 1 | $32,050,000 | 2.4% | Jersey City, NJ | Multifamily | TRTX 2018-FL1 |
| 18 | Jersey City Group 3 | $31,110,000 | 2.4% | Jersey City, NJ | Multifamily | TRTX 2018-FL1 |
| 19 | Grand Canal Shoppes | $30,384,615 | 2.3% | Las Vegas, NV | Retail | GSMS 2012-SHOP |
| 24 | Florham Park Corporate Center | $25,000,000 | 1.9% | Florham Park, NJ | Office | RSO 2015-CRE4 |
| 25 | Sparks Galleria | $23,523,500 | 1.8% | Sparks, NV | Retail | Prime 2014-1 |
| 31 | Keystone Plaza | $18,500,000 | 1.4% | North Miami Beach, FL | Retail | CGCMT 2013-GC17 |
| 40 | CubeSmart Self Storage - Pembroke Pines | $11,800,000 | 0.9% | Pembroke Pines, FL | Self Storage | JPMBB 2015-C31 |
| (1) | The table above represents the properties for which the previously existing debt was securitized, based on information provided by the related borrower or obtained through searches of a third-party database. |
THE INFORMATION IN THIS STRUCTURAL AND COLLATERAL TERM SHEET IS NOT COMPLETE AND MAY BE AMENDED PRIOR TO THE TIME OF SALE. THIS TERM SHEET IS NOT AN OFFER TO SELL THESE SECURITIES AND IT IS NOT A SOLICITATION OF AN OFFER TO BUY THESE SECURITIES IN ANY JURISDICTION WHERE THE OFFER OR SALE IS NOT PERMITTED.
| | |
17 of 156
| Structural and Collateral Term Sheet | Benchmark 2019-B14 | |
| Class A-2(1) | ||
No. | Loan Name | Location | Cut-off Date | % of | Maturity Date | % of | Original | Remaining | UW | UW NOI | Cut-off | Maturity |
| 2 | 225 Bush | San Francisco, CA | $60,000,000 | 4.5% | $60,000,000 | 24.0% | 60 | 60 | 3.85x | 13.4% | 34.6% | 34.6% |
| 5 | 180 Water | New York, NY | 50,000,000 | 3.8 | $50,000,000 | 20.0% | 60 | 60 | 3.15x | 11.0% | 30.5% | 30.5% |
| 7 | Legends at Village West | Kansas City, KS | 50,000,000 | 3.8 | $45,272,295 | 18.1% | 60 | 60 | 1.67x | 9.5% | 53.3% | 48.3% |
| 11 | 900 & 990 Stewart Avenue | Garden City, NY | 39,000,000 | 2.9 | $39,000,000 | 15.6% | 60 | 57 | 1.95x | 9.1% | 69.2% | 69.2% |
| 12 | Hilton Cincinnati Netherland Plaza | Cincinnati, OH | 35,500,000 | 2.7 | $32,914,191 | 13.2% | 60 | 60 | 1.62x | 10.9% | 68.7% | 63.7% |
| 33 | Caughlin Ranch | Reno, NV | 15,827,000 | 1.2 | $15,827,000 | 6.3% | 60 | 60 | 2.32x | 9.8% | 65.0% | 65.0% |
| 37 | Arrow Business Park | Rancho Cucamonga, CA | 12,500,000 | 0.9 | $11,393,223 | 4.6% | 60 | 60 | 1.58x | 9.9% | 58.1% | 53.0% |
| Total / Wtd. Avg. | $262,827,000 | 19.9% | $254,406,709 | 101.9% | 60 | 60 | 2.52x | 10.8% | 50.1% | 48.2% | ||
| (1) | The table above presents the mortgage loans whose balloon payments would be applied to pay down the certificate balance of the Class A-2 Certificates, assuming a 0% CPR and applying the “Modeling Assumptions” described in the Preliminary Prospectus, including the assumptions that (i) none of the mortgage loans in the pool experience prepayments, defaults or losses; (ii) there are no extensions of maturity dates of any mortgage loans in the pool; and (iii) each mortgage loan in the pool is paid in full on its stated maturity date. Each Class of Certificates, including the Class A-2 Certificates, evidences undivided ownership interests in the entire pool of mortgage loans. Debt service coverage ratio, debt yield and loan-to-value ratio information does not take into account subordinate debt (whether or not secured by the mortgaged property), if any, that exists or is allowed under the terms of any mortgage loan. See Annex A-1 to the Preliminary Prospectus. |
| (2) | Reflects the percentage equal to the Maturity Date Balance divided by the initial Class A-2 Certificate Balance. |
THE INFORMATION IN THIS STRUCTURAL AND COLLATERAL TERM SHEET IS NOT COMPLETE AND MAY BE AMENDED PRIOR TO THE TIME OF SALE. THIS TERM SHEET IS NOT AN OFFER TO SELL THESE SECURITIES AND IT IS NOT A SOLICITATION OF AN OFFER TO BUY THESE SECURITIES IN ANY JURISDICTION WHERE THE OFFER OR SALE IS NOT PERMITTED.
| | |
18 of 156
| Structural and Collateral Term Sheet | Benchmark 2019-B14 | |
| Class A-3(1) | ||
No. | Loan Name | Location | Cut-off Date | % of | Maturity Date | % of | Original | Remaining | UW NCF | UW NOI | Cut-off | Maturity |
| 4 | The Essex | New York, NY | $56,900,000 | 4.3% | $56,900,000 | 102.6% | 84 | 84 | 3.66x | 10.3% | 39.9% | 39.9% |
| Total / Wtd. Avg. | $56,900,000 | 4.3% | $56,900,000 | 102.6% | 84 | 84 | 3.66x | 10.3% | 39.9% | 39.9% | ||
| (1) | The table above presents the mortgage loans whose balloon payments would be applied to pay down the certificate balance of the Class A-3 Certificates, assuming a 0% CPR and applying the “Modeling Assumptions” described in the Preliminary Prospectus, including the assumptions that (i) none of the mortgage loans in the pool experience prepayments, defaults or losses; (ii) there are no extensions of maturity dates of any mortgage loans in the pool; and (iii) each mortgage loan in the pool is paid in full on its stated maturity date. Each Class of Certificates, including the Class A-3 Certificates, evidences undivided ownership interests in the entire pool of mortgage loans. Debt service coverage ratio, debt yield and loan-to-value ratio information does not take into account subordinate debt (whether or not secured by the mortgaged property), if any, that exists or is allowed under the terms of any mortgage loan. See Annex A-1 to the Preliminary Prospectus. |
| (2) | Reflects the percentage equal to the Maturity Date Balance divided by the initial Class A-3 Certificate Balance. |
THE INFORMATION IN THIS STRUCTURAL AND COLLATERAL TERM SHEET IS NOT COMPLETE AND MAY BE AMENDED PRIOR TO THE TIME OF SALE. THIS TERM SHEET IS NOT AN OFFER TO SELL THESE SECURITIES AND IT IS NOT A SOLICITATION OF AN OFFER TO BUY THESE SECURITIES IN ANY JURISDICTION WHERE THE OFFER OR SALE IS NOT PERMITTED.
| | |
19 of 156
| Structural and Collateral Term Sheet | Benchmark 2019-B14 |
| Structural Overview | |
| ■ Accrual: | Each Class of Certificates (other than the Class R Certificates) will accrue interest on a 30/360 basis. The Class R Certificates will not accrue interest. | |
| ■ Allocation between VRR Interest and the Non-VRR Certificates: | The aggregate amount available for distribution to holders of the Pooled Certificates (including the VRR Interest) on each Distribution Date will be: (i) the gross amount of interest, principal, yield maintenance charges and prepayment premiums collected with respect to the Mortgage Loans in the applicable one-month collection period, net of specified expenses of the issuing entity, including fees payable therefrom to, and losses, liabilities, costs and expenses reimbursable or indemnifiable therefrom to, the Master Servicer, the Special Servicer, the Certificate Administrator, the Trustee, the Operating Advisor, the Asset Representations Reviewer and CREFC®; and (ii) allocated to amounts available for distribution to the holders of the VRR Interest, on the one hand, and amounts available for distribution to the holders of the remaining Pooled Certificates (the “Non-VRR Certificates”), on the other hand. On each Distribution Date, the portion of such pooled aggregate available funds allocable to: (a) the VRR Interest will be the product of such pooled aggregate available funds multiplied by a fraction, expressed as a percentage, the numerator of which is the initial Certificate Balance of the VRR Interest, and the denominator of which is the aggregate initial Certificate Balances of the Pooled Principal Balance Certificates and the initial Certificate Balance of the VRR Interest (the “VRR Percentage”); and (b) the Non-VRR Certificates will at all times be the product of such pooled aggregate available funds multiplied by the difference between 100% and the VRR Percentage (such difference, the “Non-VRR Percentage”). See “Credit Risk Retention” and “Description of the Certificates” in the Preliminary Prospectus. | |
| ■ Distribution of Interest: | On each Distribution Date, accrued interest for each Class of Non-VRR Certificates (other than the Class R Certificates) at the applicable pass-through rate will be distributed in the following order of priority to the extent of pooled aggregate available funds: first, to the Class A-1, Class A-2, Class A-3, Class A-4, Class A-5, Class A-SB, Class X-A, Class X-B and Class X-D Certificates (the “Senior Certificates”), on apro rata basis, based on the interest entitlement for each such Class on such date, and then to the Class A-S, Class B, Class C, Class D, Class E, Class F-RR, Class G-RR and Class NR-RR Certificates, in that order, in each case until the interest entitlement for such date payable to each such Class is paid in full.
The pass-through rate applicable to the Class A-1, Class A-2, Class A-3, Class A-4, Class A-5, Class A-SB, Class A-S, Class B, Class C, Class D, Class E, Class F-RR, Class G-RR and Class NR-RR Certificates on each Distribution Date, will be aper annum rate equal to one of (i) a fixed rate, (ii) the weighted average of the net mortgage rates on the mortgage loans (in each case adjusted, if necessary, to accrue on the basis of a 360-day year consisting of twelve 30-day months), (iii) the lesser of a specified fixed pass-through rate and the rate described in clause (ii) above or (iv) the rate described in clause (ii) above less a specified percentage.
The pass-through rate for the Class X-A Certificates for any Distribution Date will be aper annum rate equal to the excess, if any, of (a) the weighted average of the net mortgage rates on the mortgage loans (in each case adjusted, if necessary, to accrue on the basis of a 360-day year consisting of twelve 30-day months), over (b) the weighted average of the pass-through rates on the Class A-1, Class A-2, Class A-3, Class A-4, Class A-5, Class A-SB and Class A-S Certificates for the related Distribution Date, weighted on the basis of their respective Certificate Balances outstanding immediately prior to that Distribution Date.
The pass-through rate for the Class X-B Certificates for any Distribution Date will be aper annum rate equal to the excess, if any, of (a) the weighted average of the net mortgage rates on the mortgage loans (in each case adjusted, if necessary, to accrue on the basis of a 360-day year consisting of twelve 30-day months), over (b) the weighted average of the pass-through rates on the Class B and Class C Certificates for the related Distribution Date weighted based on their respective Certificate Balances outstanding immediately prior to that Distribution Date..
The pass-through rate for the Class X-D Certificates for any Distribution Date will be aper annum rate equal to the excess, if any, of (a) the weighted average of the net mortgage rates on the mortgage loans (in each case adjusted, if necessary, to accrue on the basis of a 360-day year consisting of twelve 30-day months), over (b) the weighted average of the pass-through rates on the Class D and Class E Certificates for the related Distribution Date weighted based on their respective Certificate Balances outstanding immediately prior to that Distribution Date.
No class of Pooled Certificates will be entitled to distribution paid or advanced on and allocable to the Trust Subordinate Companion Loan. The holders of the Loan-Specific Certificates will only be entitled to distributions from amounts paid or advances on and allocated to the Trust Subordinate Companion Loan in accordance with the intercreditor agreement relating to the 225 Bush Whole Loan. |
THE INFORMATION IN THIS STRUCTURAL AND COLLATERAL TERM SHEET IS NOT COMPLETE AND MAY BE AMENDED PRIOR TO THE TIME OF SALE. THIS TERM SHEET IS NOT AN OFFER TO SELL THESE SECURITIES AND IT IS NOT A SOLICITATION OF AN OFFER TO BUY THESE SECURITIES IN ANY JURISDICTION WHERE THE OFFER OR SALE IS NOT PERMITTED.
| | |
20 of 156
| Structural and Collateral Term Sheet | Benchmark 2019-B14 |
| Structural Overview | |
See “Description of the Certificates—Distributions” in the Preliminary Prospectus. | ||
| ■ Distribution of Principal: | On any Distribution Date prior to the Cross-Over Date, payments in respect of the Non-VRR Percentage of principal on the Non-VRR Certificates will be distributed, up to the Non-VRR Percentage of pooled aggregate available funds:
first, to the Class A-SB Certificates until the Certificate Balance of the Class A-SB Certificates is reduced to the Class A-SB planned principal balance for the related Distribution Date set forth in Annex G to the Preliminary Prospectus, second, to the Class A-1 Certificates, until the Certificate Balance of such Class is reduced to zero, third, to the Class A-2 Certificates, until the Certificate Balance of such Class is reduced to zero, fourth, to the Class A-3 Certificates, until the Certificate Balance of such Class is reduced to zero, fifth, to the Class A-4 Certificates, until the Certificate Balance of such Class is reduced to zero, sixth, to the Class A-5 Certificates until the Certificate Balance of such Class is reduced to zero, and seventh, to the Class A-SB Certificates, until the Certificate Balance of such Class is reduced to zero and then to the Class A-S, Class B, Class C, Class D, Class E, Class F-RR, Class G-RR and Class NR-RR Certificates, in that order, until the Certificate Balance of each such Class is reduced to zero.
On any Distribution Date on or after the Cross-Over Date, payments in respect of the Non-VRR Percentage of principal on the Non-VRR Certificates will be distributed, up to the Non-VRR Percentage of pooled available funds, to the Class A-1, Class A-2, Class A-3, Class A-4, Class A-5 and Class A-SB Certificates,pro rata based on the Certificate Balance of each such Class until the Certificate Balance of each such Class is reduced to zero.
The “Cross-Over Date” means the Distribution Date on which the Certificate Balances of the Class A-S, Class B, Class C, Class D, Class E, Class F-RR, Class G-RR and Class NR-RR Certificates have been reduced to zero as a result of the allocation of pooled realized losses to such Classes.
The Class X-A, Class X-B and Class X-D Certificates (the “Class X Certificates”) will not be entitled to receive distributions of principal; however, the notional amount of the Class X-A Certificates will be reduced by the aggregate amount of principal distributions, realized losses and trust fund expenses, if any, allocated to the Class A-1, Class A-2, Class A-3, Class A-4, Class A-5, Class A-SB and Class A-S Certificates, the notional amount of the Class X-B Certificates will be reduced by the aggregate amount of principal distributions, realized losses and trust fund expenses, if any, allocated to the Class B and Class C Certificates, the notional amount of the Class X-D Certificates will be reduced by the aggregate amount of principal distributions, realized losses and trust fund expenses, if any, allocated to the Class D and Class E Certificates.
The holders of the Loan-Specific Certificates will only be entitled to distributions from amounts paid or advanced on and allocated to the Trust Subordinate Companion Loan in accordance with the intercreditor agreement relating to the 225 Bush Whole Loan and no class of Pooled Certificates will be entitled to distributions paid or advanced on and allocable to the Trust Subordinate Companion Loan.
See “Description of the Certificates—Distributions” in the Preliminary Prospectus. | |
| ■ Yield Maintenance / Fixed Penalty Allocation: | For purposes of the distribution of Yield Maintenance Charges on any Distribution Date, the Non-VRR Percentage of any Yield Maintenance Charges collected in respect of the mortgage loans will be allocated pro rata among certain groups (based on the aggregate amount of principal distributed to the Pooled Principal Balance Certificates in each group), consisting of (a) the Class A-1, Class A-2, Class A-3, Class A-4, Class A-5, Class A-SB, Class A-S and Class X-A Certificates ("YM Group A"), (b) the Class X-B, Class B and Class C Certificates (“YM Group B”) and (c) the Class X-D, Class D and Class E Certificates (“YM Group D”). As among the Classes of Certificates in each YM Group, each Class of Certificates entitled to distributions of principal will receive an amount calculated generally in accordance with the following formula and as more specifically described in the Preliminary Prospectus, with any remaining Yield Maintenance Charges on such Distribution Date being distributed to the class of Class X Certificates in such YM Group. |
| YM Charge | X | Principal Paid to Class | X | (Pass-Through Rate on Class – Discount Rate) |
| Total Principal Paid to the related YM Group | (Mortgage Rate on Loan – Discount Rate) |
THE INFORMATION IN THIS STRUCTURAL AND COLLATERAL TERM SHEET IS NOT COMPLETE AND MAY BE AMENDED PRIOR TO THE TIME OF SALE. THIS TERM SHEET IS NOT AN OFFER TO SELL THESE SECURITIES AND IT IS NOT A SOLICITATION OF AN OFFER TO BUY THESE SECURITIES IN ANY JURISDICTION WHERE THE OFFER OR SALE IS NOT PERMITTED.
| | |
21 of 156
| Structural and Collateral Term Sheet | Benchmark 2019-B14 |
| Structural Overview | |
| No Yield Maintenance Charges will be distributed to the Class R Certificates. | ||
| Any Yield Maintenance Charges payable in respect of the Trust Subordinate Companion Loan will be distributed to the holders of the Loan-Specific Certificates. | ||
| ■ Realized Losses: | On each Distribution Date, the Non-VRR Percentage of losses on the mortgage loans will be allocated first to the Class NR-RR, Class G-RR, Class F-RR, Class E, Class D, Class C, Class B and Class A-S Certificates, in that order, in each case until the Certificate Balance of all such Classes have been reduced to zero, and then, to the Class A-1, Class A-2, Class A-3, Class A-4, Class A-5 and Class A-SB Certificates,pro rata, based on the Certificate Balance of each such Class, until the Certificate Balance of each such Class has been reduced to zero. The notional amounts of the Class X-A, Class X-B and Class X-D Certificates will be reduced by the aggregate amount of realized losses allocated to Certificates that are components of the notional amounts of the Class X-A, Class X-B and Class X-D, respectively.
The loan-specific non-VRR percentage of losses on the Trust Subordinate Companion Loan will be allocated first to the Class 225B-E Certificates, second to the Class 225B-D Certificates, third to the Class 225B-C Certificates, fourth, to the Class 225B-B Certificates, and finally to the Class 225B-A Certificates, in each case, until the Certificate Balance of such Class has been reduced to zero.
Losses on each Whole Loan will be allocated first, to any related subordinate companion loan(s) until reduced to zero and then to the related mortgage loan and any relatedpari passu companion loans,pro rata, based on their respective principal balances.
See “Description of the Certificates—Priority of Distributions” in the Preliminary Prospectus. | |
| ■ Interest Shortfalls: | A shortfall with respect to the amount of available funds distributable in respect of interest can result from, among other sources: (a) delinquencies and defaults by borrowers; (b) shortfalls resulting from the application of appraisal reductions to reduce P&I Advances; (c) shortfalls resulting from interest on Advances made by the Master Servicer, the Special Servicer or the Trustee; (d) shortfalls resulting from the payment of Special Servicing Fees and other additional compensation that the Special Servicer is entitled to receive; (e) shortfalls resulting from extraordinary expenses of the trust, including indemnification payments payable to the Depositor, the Master Servicer, the Special Servicer, the Certificate Administrator, the Trustee, the Operating Advisor and the Asset Representations Reviewer; (f) shortfalls resulting from a modification of a mortgage loan’s interest rate or principal balance; and (g) shortfalls resulting from other unanticipated or default-related expenses of the trust. Any such shortfalls that decrease the amount of pooled available funds distributable in respect of interest to the Certificateholders will reduce distributions to the classes of Certificates (other than the Class R Certificates) beginning with those with the lowest payment priorities, in reverse sequential order. See “Description of the Certificates—Distributions—Priority of Distributions” in the Preliminary Prospectus. | |
| ■ Appraisal Reduction Amounts: | With respect to mortgage loans serviced under the Pooling and Servicing Agreement, upon the occurrence of certain trigger events with respect to a mortgage loan, which are generally tied to certain events of default under the related mortgage loan documents, the Special Servicer will be obligated to obtain an appraisal of the related mortgaged property and the Master Servicer will calculate the Appraisal Reduction Amount. The “Appraisal Reduction Amount” is generally the amount by which the current principal balance of the related mortgage loan or serviced whole loan, plus outstanding advances, real estate taxes, unpaid servicing fees and certain similar amounts exceeds the sum of (a) 90% of the appraised value of the related mortgaged property, (b) the amount of any escrows, letters of credit and reserves and (c) all insurance and casualty proceeds and condemnation awards that are collateral for the related mortgage loan.
With respect to the Non-Serviced Whole Loans, any Appraisal Reduction Amount will be similarly determined pursuant to the related trust and servicing agreement or pooling and servicing agreement, as applicable, under which it is serviced.
In general, the Non-VRR Percentage of any Appraisal Reduction Amount that is allocated to a mortgage loan is notionally allocated to reduce, in reverse sequential order, the Certificate Balance of each Class of Certificates (other than the Class A-1, Class A-2, Class A-3, Class A-4, Class A-5 and Class A-SB Certificates) beginning with the Class NR-RR Certificates for certain purposes, including certain voting rights, the determination of the controlling class and the determination of an Operating Advisor Consultation Event. As a result of calculating one or more Appraisal Reduction Amounts (and, in the case of any Whole Loan, to the extent allocated to the |
THE INFORMATION IN THIS STRUCTURAL AND COLLATERAL TERM SHEET IS NOT COMPLETE AND MAY BE AMENDED PRIOR TO THE TIME OF SALE. THIS TERM SHEET IS NOT AN OFFER TO SELL THESE SECURITIES AND IT IS NOT A SOLICITATION OF AN OFFER TO BUY THESE SECURITIES IN ANY JURISDICTION WHERE THE OFFER OR SALE IS NOT PERMITTED.
| | |
22 of 156
| Structural and Collateral Term Sheet | Benchmark 2019-B14 |
| Structural Overview | |
related mortgage loan), the amount of any required P&I Advance will be reduced, which will have the effect of reducing the amount of interest available to the most subordinate class of certificates then-outstanding (i.e.,first, to Class NR-RR Certificates;second, to the Class G-RR Certificates;third, to the Class F-RR Certificates;fourth, to the Class E Certificates;fifth, to the Class D Certificates;sixth, to the Class C Certificates;seventh, to the Class B Certificates;eighth, to the Class A-S Certificates and finally,pro rata based on their respective interest entitlements, to the Senior Certificates).
As a result of calculating an Appraisal Reduction Amount that is allocated to the Trust Subordinate Companion Loan, the amount of any required P&I Advance with respect to the Trust Subordinate Companion Loan will be reduced, which will have the effect of reducing the amount of interest available to the Loan-Specific Certificates then-outstanding in reverse sequential order of payment priority.
With respect to each Serviced Whole Loan, the Appraisal Reduction Amount is notionally allocated,first,to any related serviced subordinate companion loan(s),then pro rata, between the related mortgage loan and any related servicedpari passu companion loan(s), based upon their respective principal balances. | ||
| ■ Appraisal Reduced Interest: | Accrued and unpaid interest at the related Mortgage Rate for a mortgage loan that is not advanced by the Master Servicer or the Trustee as backup master servicer due to the application of Appraisal Reduction Amounts to such mortgage loan. | |
| ■ Master Servicer Advances: | The Master Servicer will be required to advance certain delinquent scheduled mortgage loan or Trust Subordinate Companion Loan payments of principal and interest and certain property protection advances, in each case, to the extent the Master Servicer deems such advances to be recoverable. At any time that an Appraisal Reduction Amount exists, the amount that would otherwise be required to be advanced by the Master Servicer in respect of delinquent payments of interest on any mortgage loan or the Trust Subordinate Companion Loan will be reduced to equal the product of (x) the interest portion of the amount that would be advanced without regard to any Appraisal Reduction Amount and (y) a fraction, the numerator of which is the then-outstanding principal balance of the mortgage loan or the Trust Subordinate Companion Loan, as applicable, minus the Appraisal Reduction Amount and the denominator of which is the then-outstanding principal balance of the mortgage loan or the Trust Subordinate Companion Loan, as applicable. The Master Servicer will not make any principal or interest advances with respect to any companion loan that is not held by the issuing entity. | |
| ■ Whole Loans: | Sixteen mortgage loans are each evidenced by one mortgage loan and one or more companion loans (each a “Companion Loan” and collectively with the related mortgage loan, a “Whole Loan”), secured by the same mortgage(s) on the related mortgaged property(ies). Each such mortgage loan and its related Companion Loan(s) are subject to an intercreditor agreement. None of these Companion Loans will be part of the trust.
In the case of all of the Whole Loans, referred to as the “225 Bush Whole Loan”, “Innovation Park Whole Loan”, the “The Essex Whole Loan”, the “180 Water Whole Loan”, the “Harvey Building Products Whole Loan”, the “Legends at Village West Whole Loan”, the “Osborn Triangle Whole Loan”, the “Tysons Tower Whole Loan”, the “900 &990 Stewart Avenue Whole Loan”, the “Hilton Cincinnati Netherland Plaza Whole Loan”, the “Grand Canal Shoppes Whole Loan”, the “230 Park Avenue South Whole Loan”, the “8 West Centre Whole Loan”, the “Sunset North Whole Loan”, the “600 & 620 National Avenue Whole Loan”, the “City Hyde Park Whole Loan” and the one or more related Companion Loans arepari passu with the related mortgage loan (these Companion Loans are also referred to as the “Pari Passu Companion Loans”). In the case of each of the 225 Bush Whole Loan, The Essex Whole Loan, the 180 Water Whole Loan, the Grand Canal Shoppes Whole Loan and the Osborn Triangle Whole Loan, one or more related Companion Loans are subordinate in right of payment to the related mortgage loan and any relatedPari Passu Companion Loans (these Companion Loans are also referred to as the “Subordinate Companion Loans”).
The Osborn Triangle Whole Loan, the Tysons Tower Whole Loan, the 900 & 990 Stewart Avenue Whole Loan, the Grand Canal Shoppes Whole Loan, the 230 Park Avenue South Whole Loan, the 600 & 620 National Avenue Whole Loan, the City Hyde Park Whole Loan and the Sunset North Whole Loan (each, a “Non-Serviced Whole Loan”) are being serviced and administered pursuant to the applicable trust and servicing agreement or pooling and servicing agreement as described under “Description of the Mortgage Pool—The Whole Loans—The Non-Serviced Pari Passu Whole Loans”, “—The Non-Serviced AB Whole Loans” and “Pooling and Servicing Agreement—Servicing of the Non-Serviced Mortgage Loans” in the Preliminary Prospectus. |
THE INFORMATION IN THIS STRUCTURAL AND COLLATERAL TERM SHEET IS NOT COMPLETE AND MAY BE AMENDED PRIOR TO THE TIME OF SALE. THIS TERM SHEET IS NOT AN OFFER TO SELL THESE SECURITIES AND IT IS NOT A SOLICITATION OF AN OFFER TO BUY THESE SECURITIES IN ANY JURISDICTION WHERE THE OFFER OR SALE IS NOT PERMITTED.
| | |
23 of 156
| Structural and Collateral Term Sheet | Benchmark 2019-B14 |
| Structural Overview | |
Each of the Innovation Park Whole Loan and the 180 Water Whole Loan (each, a “Servicing Shift Whole Loan”, and the related mortgage loan, a “Servicing Shift Mortgage Loan”) will initially be serviced pursuant to the Pooling and Servicing Agreement. After the securitization of the related controlling companion loan, the related Servicing Shift Whole Loan is expected to be serviced pursuant to the pooling and servicing agreement relating to the securitization of such controlling companion loan as described under “Description of the Mortgage Pool—The Whole Loans” in the Preliminary Prospectus. | ||
| ■ Highlighted Servicing Provisions: | The following are certain servicing provisions of note:
A mortgage loan may become a specially serviced loan as a result of an imminent or reasonably foreseeable default only if the Master Servicer or, if Midland is not both the Special Servicer and the Master Servicer, the Special Servicer determines such default is not likely to be cured by the related borrower within 60 days.
A mortgage loan will not become a specially serviced loan for up to 120 days in circumstances where the related borrower does not make its balloon payment at maturity upon satisfaction of certain conditions, including that the borrower has, prior to such maturity date, provided documentation from an acceptable lender, including, without limitation, an executed term sheet or refinancing commitment or an executed purchase and sale agreement, in each case, that is consistent with CMBS market practices and is reasonably satisfactory in form and substance to the Master Servicer or the Special Servicer evidencing an expected refinancing of the mortgage loan or sale of the related mortgaged property.
The Special Servicer will not be entitled to any fees from the securitization trust or the related borrower during a fee restricted period, other than a special servicing fee, and, in certain circumstances described in the succeeding paragraph, a liquidation fee, if the Special Servicer elects to cause a mortgage loan to be transferred to special servicing as a result of an imminent or reasonably foreseeable default when the Master Servicer has not independently transferred the mortgage loan to special servicing for that reason.
Notwithstanding the foregoing, the special servicer may be entitled to a liquidation fee if it transfers a mortgage loan into special servicing as described above and a default occurs that leads to a liquidation of the applicable mortgage loan.
In order to streamline the servicing and administration of the mortgage loans with the goal of reducing the amount of time a CMBS borrower has to wait for certain approvals from the lender, “major decisions” will be administered solely by the Special Servicer, thereby reducing the number of parties involved in the approval process. Under these updated terms, the Special Servicer will be directly responsible for obtaining the consent of the Directing Certificateholder for “major decisions” involving all mortgage loans, rather than requiring the Master Servicer’s involvement in the approval process for Non-Specially Serviced Loans. In prior CMBS transactions, the master servicer would commonly prepare a recommendation related to a particular approval and be required to obtain the consent of the special servicer (who, in turn, would commonly be required to obtain the consent of the Directing Certificateholder before providing its consent to the master servicer) prior to taking any action with respect to that “major decision”.
In addition, certain revisions have been incorporated in the scope of the “major decisions” in the Preliminary Prospectus, that limit the involvement of the Directing Certificateholder in (1) the replacement of the related property management company, (2) the approval of releases of certain performance escrows and earnouts, and (3) the consent to modifications of any mezzanine intercreditor agreement in circumstances when the Directing Certificateholder is affiliated with the mezzanine lender.
The Certificate Administrator will be required to identify the then-current Directing Certificateholder as part of its monthly distribution date statement.
See“Description of the Certificates” and“Pooling and Servicing Agreement” in the Preliminary Prospectus. | |
| ■ Liquidated Loan Waterfall: | On liquidation of any mortgage loan, all net liquidation proceeds related to the mortgage loan (but not any related Companion Loan) will be applied so that amounts allocated as a recovery of accrued and unpaid interest will not, in the first instance, include any delinquent interest that was not advanced as a result of Appraisal Reduction Amounts or interest that accrued on any junior note(s) if such mortgage loan is an AB Modified Loan. After the adjusted interest amount is so allocated, any remaining liquidation proceeds will be allocated to offset certain advances and to |
THE INFORMATION IN THIS STRUCTURAL AND COLLATERAL TERM SHEET IS NOT COMPLETE AND MAY BE AMENDED PRIOR TO THE TIME OF SALE. THIS TERM SHEET IS NOT AN OFFER TO SELL THESE SECURITIES AND IT IS NOT A SOLICITATION OF AN OFFER TO BUY THESE SECURITIES IN ANY JURISDICTION WHERE THE OFFER OR SALE IS NOT PERMITTED.
| | |
24 of 156
| Structural and Collateral Term Sheet | Benchmark 2019-B14 |
| Structural Overview | |
pay principal on the mortgage loan until the unpaid principal amount of the mortgage loan has been reduced to zero. Any remaining liquidation proceeds will then be allocated to pay delinquent interest that was not advanced as a result of Appraisal Reduction Amounts and any interest that accrued on any junior note(s) if such mortgage loan is an AB Modified Loan. Any liquidation proceeds in respect of each such mortgage loan in excess of the related outstanding balance willfirst be applied to offset any interest shortfalls allocated to the Certificates (other than the Class R Certificates), in sequential order, andthen to offset any realized losses allocated to the Certificates (other than the Class R Certificates), in sequential order. Any liquidation proceeds remaining after such applications will be distributed to the Class R Certificates. | ||
| ■ Sale of Defaulted Loans and REO Properties: | The Special Servicer is required to solicit offers for any defaulted loan (other than a non-serviced mortgage loan) in such a manner as will be reasonably likely to maximize the value of the defaulted loan on a net present value basis, if the Special Servicer determines that no satisfactory arrangements can be made for collection of delinquent payments and the sale would be in the best economic interests of the certificateholders (or, in the case of any Serviced Whole Loan, the certificateholders and any holders of the related serviced Companion Loans, as a collective whole, taking into account thepari passu or subordinate nature of such serviced Companion Loans), on a net present value basis. Additionally, the Special Servicer may offer to sell any REO property if, and when, the Special Servicer determines that such a sale would be in the best economic interest of the issuing entity and the holders of any related Companion Loans, on a net present value basis.
In the case of each non-serviced mortgage loan, under certain circumstances permitted under the related intercreditor agreement, to the extent that such non-serviced mortgage loan is not sold together with the related non-serviced companion loan by the special servicer for the related Non-Serviced Whole Loans, the Special Servicer will be entitled to sell (with respect to any mortgage loan other than an Excluded Loan, with the consent of the Directing Certificateholder if no Control Termination Event has occurred and is continuing) such non-serviced mortgage loan if it determines in accordance with the servicing standard that such action would be in the best interests of the certificateholders.
The Special Servicer is required to accept a cash offer received from any person for any defaulted loan or REO property in an amount at least equal to par plus accrued interest plus all other outstanding amounts due under such mortgage loan or Trust Subordinate Companion Loan and any outstanding expenses of the trust relating to such mortgage loan (the “Purchase Price”) except as described in the Preliminary Prospectus.
With respect to the Serviced Whole Loans, any such sale of the related defaulted loan is required to also include any related Companion Loans, if any, and the prices will be adjusted accordingly.
Within 30 days of a defaulted loan becoming a specially serviced loan, the Special Servicer is required to order an appraisal and, within 30 days of receipt of such appraisal, is required to determine the fair value of such defaulted loan in accordance with the applicable servicing standard. If, however, the Special Servicer is already in the process of obtaining an appraisal with respect to the related mortgaged property, the Special Servicer is required to make its fair value determination as soon as reasonably practicable (but in any event within 30 days) after its receipt of such appraisal. Additionally, with respect to the mortgage loans that have mezzanine debt or permit mezzanine debt in the future, the mezzanine lenders may have the option to purchase the related mortgage loan after certain events of default under such mortgage loan.
The Directing Certificateholder will not have a right of first refusal to purchase a defaulted loan.
If the Special Servicer does not receive a cash offer at least equal to the Purchase Price, the Special Servicer may purchase the defaulted loan or REO property at the Purchase Price. If the Special Servicer does not purchase the defaulted loan or REO property at the Purchase Price, the Special Servicer is required to accept the highest offer received from any person that is determined to be a fair price (supported by an appraisal required to be obtained by the Special Servicer within 30 days of a mortgage loan becoming a specially serviced loan) for such defaulted loan or REO property, if the highest offeror is a person other than an Interested Person. If the highest offer is made by an Interested Person, the Trustee will determine (based upon the most recent appraisal or updated appraisal conducted in accordance with the terms of the Pooling and Servicing Agreement) whether the offer constitutes a fair price for the defaulted loan or REO property provided that no offer from an Interested Person will constitute a fair price unless (A) it is the highest offer received and (B) if the offer is less than the applicable Purchase Price, at least two other offers are received from independent third parties and the Trustee may conclusively rely on the opinion of an independent appraiser or other independent expert retained by the |
THE INFORMATION IN THIS STRUCTURAL AND COLLATERAL TERM SHEET IS NOT COMPLETE AND MAY BE AMENDED PRIOR TO THE TIME OF SALE. THIS TERM SHEET IS NOT AN OFFER TO SELL THESE SECURITIES AND IT IS NOT A SOLICITATION OF AN OFFER TO BUY THESE SECURITIES IN ANY JURISDICTION WHERE THE OFFER OR SALE IS NOT PERMITTED.
| | |
25 of 156
| Structural and Collateral Term Sheet | Benchmark 2019-B14 |
| Structural Overview | |
Trustee in connection with making such determination. Neither the Trustee nor any of its affiliates may make an offer for or purchase any specially serviced loan or REO property. An “Interested Person” is any person that is (i) a party to the Pooling and Servicing Agreement, the Directing Certificateholder, any sponsor, any Borrower Party, any independent contractor engaged by the Special Servicer, any holder of a mezzanine loan (but only with respect to the related mortgage loan) or any known affiliate of any such person or, (ii) with respect to a defaulted whole loan, the depositor, the master servicer, the special servicer (or independent contractor engaged by such special servicer) or the trustee for any securitization that includes a related Companion Loan and each holder of any related Companion Loan, or any known affiliate of any such person.
The Special Servicer is not required to accept the highest offer for a defaulted loan or REO property if the Special Servicer determines, in accordance with the servicing standard (and subject to the requirements of any related intercreditor agreement), that a rejection of such offer would be in the best interests of the Certificateholders and, with respect to any Serviced Whole Loan, the holder of the related Companion Loans, as a collective whole, as if such Certificateholders and, if applicable, the related Companion Loan Holder(s) constituted a single lender), and may accept a lower offer (so long as such lower offer was not made by the Special Servicer or any of its affiliates) if it determines that acceptance of such lower offer would be in the best interests of the Certificateholders and, with respect to any Serviced Whole Loan, the holder of the related Companion Loans, as a collective whole, as if such Certificateholders and, if applicable, the related Companion Loan Holder(s) constituted a single lender).
If title to any mortgaged property is acquired by the trust fund, the Special Servicer will be required to sell such mortgaged property prior to the close of the third calendar year beginning after the year of acquisition, unless (a) the IRS grants or has not denied an extension of time to sell such mortgaged property or (b) the Special Servicer, Trustee and the Certificate Administrator receive an opinion of independent counsel to the effect that the holding of the property by the trust longer than the above-referenced three-year period will not result in the imposition of a tax on any REMIC of the trust fund or cause any REMIC of the trust fund to fail to qualify as a REMIC.
The foregoing applies to mortgage loans serviced under the Pooling and Servicing Agreement. With respect to each Non-Serviced Whole Loan, if the special servicer under the applicable trust and servicing agreement or pooling and servicing agreement determines to sell the related Companion Loan(s) as described above, then the applicable special servicer will be required to sell the related non-serviced mortgage loan, included in the Benchmark 2019-B14 trust, and the related Companion Loan(s), as a single loan. In connection with any such sale, the then-applicable special servicer will be required to follow procedures substantially similar to those set forth above. | ||
| ■ Control Eligible Certificates: | Classes F-RR, G-RR and NR-RR. | |
| ■ Control Rights: | The Control Eligible Certificates will have certain control rights attached to them. The “Directing Certificateholder” will be (a) with respect to each serviced mortgage loan (other than any Servicing Shift Mortgage Loans, the 225 Bush Mortgage Loan or the The Essex Mortgage Loan) the Controlling Class Certificateholder (or its representative) selected by more than 50% of the Controlling Class Certificateholders;provided,however, that (1) absent that selection, (2) until a Directing Certificateholder is so selected or (3) upon receipt of a notice from a majority of the Controlling Class Certificateholders that a Directing Certificateholder is no longer designated, the Controlling Class Certificateholder that owns the largest aggregate Certificate Balance of the Controlling Class (or its representative) will be the Directing Certificateholder;provided,however, that in the case of this clause (3), in the event no one holder owns the largest aggregate Certificate Balance of the Controlling Class, then there will be no Directing Certificateholder until appointed in accordance with the terms of the Pooling and Servicing Agreement, (b) with respect to any Servicing Shift Mortgage Loan, the “controlling holder” or any analogous concept under the related intercreditor agreement, which prior to the securitization of the related controlling companion loan will be the holder of such companion loan, (c) with respect to the 225 Bush Whole Loan, (1) for so long as no control appraisal period exists under the related intercreditor agreement, the 225 Bush controlling class certificateholder (or its representative) selected by a majority of the 225 Bush controlling class certificateholders (by certificate principal balance) and (2) for so long as a control appraisal period exists under the related intercreditor agreement, the Directing Certificateholder selected under clause (a) above and (d) with respect to The Essex Whole Loan, (1) for so long as no control appraisal period has occurred and is continuing, the holder of Note B-1, and (2) for so long as a control appraisal period exists under the related intercreditor agreement, the Directing Certificateholder selected under clause (a) above. With respect to any mortgage loan (other than any Servicing Shift Mortgage Loan, any non-serviced |
THE INFORMATION IN THIS STRUCTURAL AND COLLATERAL TERM SHEET IS NOT COMPLETE AND MAY BE AMENDED PRIOR TO THE TIME OF SALE. THIS TERM SHEET IS NOT AN OFFER TO SELL THESE SECURITIES AND IT IS NOT A SOLICITATION OF AN OFFER TO BUY THESE SECURITIES IN ANY JURISDICTION WHERE THE OFFER OR SALE IS NOT PERMITTED.
| | |
26 of 156
| Structural and Collateral Term Sheet | Benchmark 2019-B14 |
| Structural Overview | |
mortgage loan, the 225 Bush Mortgage Loan, The Essex Mortgage Loan or any Excluded Loan), unless a Control Termination Event has occurred and is continuing, the Directing Certificateholder will be entitled to direct the Special Servicer to take, or refrain from taking, certain actions with respect to such mortgage loan. Furthermore, the Directing Certificateholder will also have the right to receive notice and provide consent with respect to certain material actions that the Master Servicer and the Special Servicer plan on taking with respect to a mortgage loan (other than any Servicing Shift Mortgage Loan, non-serviced mortgage loan, the 225 Bush Mortgage Loan, The Essex Mortgage Loan or any Excluded Loan). With respect to any mortgage loan that has or may in the future have mezzanine debt, pursuant to the related intercreditor agreement, the related mezzanine lender may have certain consent rights with respect to certain modifications related to such mortgage loan.
A “Borrower Party” means a borrower, a mortgagor, a manager of a mortgaged property, an Accelerated Mezzanine Loan Lender, any other person controlling or controlled by or under common control with such borrower, mortgagor, manager or Accelerated Mezzanine Loan Lender, as applicable, or any other person owning, directly or indirectly, 25% or more of the beneficial interests in such borrower, mortgagor, manager or Accelerated Mezzanine Loan Lender, as applicable. For purposes of this definition, “control” when used with respect to any specified person means the power to direct the management and policies of such person, directly or indirectly, whether through the ownership of voting securities, by contract or otherwise and the terms “controlling” and “controlled” have meanings correlative to the foregoing.
An “Accelerated Mezzanine Loan Lender” means a mezzanine lender under a mezzanine loan that has been accelerated or as to which foreclosure or enforcement proceedings have been commenced against the equity collateral pledged to secure such mezzanine loan.
An “Excluded Loan” is a mortgage loan or Whole Loan with respect to which the Directing Certificateholder or the holder of the majority of the controlling class (or, with respect to the 225 Bush Whole Loan prior to the continuation of a control appraisal period under the related intercreditor agreement, the 225 Bush controlling class certificateholder (or its representative) selected by a majority of the 225 Bush controlling class certificateholders (by certificate principal balance)) is a Borrower Party. As of the Closing Date, it is expected that there will be no Excluded Loans in this securitization.
With respect to the Serviced Whole Loans, direction, consent and consultation rights with respect to the related Whole Loan are subject to certain consultation rights of the holders of the relatedPari Passu Companion Loans and Subordinate Companion Loans pursuant to the related intercreditor agreement.
With respect to any Non-Serviced Whole Loan, direction, consent and consultation rights with respect to the related Whole Loan will be exercised by the directing certificateholder or controlling class representative under the applicable trust and servicing agreement or pooling and servicing agreement or the holder of the related controlling Companion Loan, as applicable.
With respect to any Servicing Shift Whole Loan, direction, consent and consultation rights with respect to the related Whole Loan will be exercised by the related controlling noteholder and, after the securitization of the related controlling note, the applicable directing holder pursuant to the applicable pooling and servicing agreement and related intercreditor agreement. | ||
| ■ Directing Certificateholder: | KKR CMBS II Aggregator Type 1 L.P. (or its affiliate) is expected to be appointed as the initial directing certificateholder with respect to all serviced mortgage loans (other than the Excluded Loans, any Servicing Shift Mortgage Loan, the 225 Bush Mortgage Loan and The Essex Mortgage Loan). | |
| ■ Controlling Class: | The “Controlling Class” will at any date of determination be the most subordinate Class of Control Eligible Certificates then outstanding that has an aggregate Certificate Balance, as notionally reduced by any Cumulative Appraisal Reduction Amounts allocable to such Class, equal to no less than 25% of the initial Certificate Balance for such Class;provided that if at any time the Certificate Balances of the certificates other than the Control Eligible Certificates have been reduced to zero as a result of the allocation of principal payments on the mortgage loans, then the Controlling Class will be the most subordinate Class among the Control Eligible Certificates that has an aggregate Certificate Balance greater than zero without regard to any Cumulative Appraisal Reduction Amounts. The Controlling Class as of the Closing Date will be the Class NR-RR Certificates.
Each holder of a certificate of the Controlling Class is referred to herein as a “Controlling Class Certificateholder”. |
THE INFORMATION IN THIS STRUCTURAL AND COLLATERAL TERM SHEET IS NOT COMPLETE AND MAY BE AMENDED PRIOR TO THE TIME OF SALE. THIS TERM SHEET IS NOT AN OFFER TO SELL THESE SECURITIES AND IT IS NOT A SOLICITATION OF AN OFFER TO BUY THESE SECURITIES IN ANY JURISDICTION WHERE THE OFFER OR SALE IS NOT PERMITTED.
| | |
27 of 156
| Structural and Collateral Term Sheet | Benchmark 2019-B14 |
| Structural Overview | |
| ■ Control Termination Event: | A “Control Termination Event” will occur (a) with respect to any serviced Mortgage Loan (other than the 225 Bush Mortgage Loan and The Essex Mortgage Loan), when the Class F-RR Certificates have a Certificate Balance (taking into account the application of any Cumulative Appraisal Reduction Amounts to notionally reduce the Certificate Balance of such class) of less than 25% of the initial Certificate Balance of that classprovided that prior to the applicable securitization of the controlling Companion Loan with respect to a Servicing Shift Whole Loan, no Control Termination Event may occur with respect to the Directing Certificateholder related to such Servicing Shift Whole Loan, and the term “Control Termination Event” will not be applicable to the Directing Certificateholder related to such Servicing Shift Whole Loan;provided, further, that a Control Termination Event will not be deemed to be continuing in the event the Certificate Balances of all Classes of Pooled Principal Balance Certificates other than the Control Eligible Certificates have been reduced to zero and (b) with respect to the 225 Bush Whole Loan and The Essex Whole Loan, when a control appraisal period under the related intercreditor agreement has occurred and is continuing and when the events in clause (a) above are occurring.
The “Cumulative Appraisal Reduction Amount” as of any date of determination, is equal to the sum of (i) with respect to any mortgage loan, all Appraisal Reduction Amounts then in effect, and (ii) with respect to any AB Modified Loan, any Collateral Deficiency Amount then in effect.
An “AB Modified Loan” means any corrected loan (1) that became a corrected loan (which includes for purposes of this definition any non-serviced mortgage loan that became a “corrected loan” (or any term substantially similar thereto) pursuant to the trust and servicing agreement or pooling and servicing agreement, as applicable, governing such non-serviced mortgage loan) due to a modification thereto that resulted in the creation of an A/B note structure (or similar structure) and as to which the new junior note(s) did not previously exist or the principal amount of the new junior note(s) was previously part of either an A note held by the issuing entity or the original unmodified mortgage loan and (2) as to which an Appraisal Reduction Amount is not in effect.
The “Collateral Deficiency Amount” means, with respect to any AB Modified Loan as of any date of determination, the excess of (i) the principal balance of such AB Modified Loan (taking into account the related junior note(s) and anypari passu notes included therein), over (ii) the sum of (in the case of a Whole Loan, solely to the extent allocable to the subject mortgage loan) (x) the most recent Appraised Value for the related mortgaged property or mortgaged properties, plus (y) solely to the extent not reflected or taken into account in such Appraised Value and to the extent on deposit with, or otherwise under the control of, the lender as of the date of such determination, any capital or additional collateral contributed by the related borrower at the time the mortgage loan became (and as part of the modification related to) such AB Modified Loan for the benefit of the related mortgaged property or mortgaged properties (provided that in the case of a non-serviced mortgage loan, the amounts set forth in this clause (y) will be taken into account solely to the extent relevant information is received by the Master Servicer), plus (z) any other escrows or reserves (in addition to any amounts set forth in the immediately preceding clause (y)) held by the lender in respect of such AB Modified Loan as of the date of such determination.
Upon the occurrence and during the continuance of a Control Termination Event, the Controlling Class will no longer have any control rights and the Directing Certificateholder will relinquish its right to direct certain actions of the Special Servicer and will no longer have consent rights with respect to certain actions that the Master Servicer or the Special Servicer plan on taking with respect to a mortgage loan. Following the occurrence and during the continuance of a Control Termination Event, the Directing Certificateholder will retain consultation rights with the Special Servicer with respect to certain material actions that the Special Servicer plans on taking with respect to any mortgage loan other than an Excluded Loan. Such consultation rights will continue until the occurrence of a Consultation Termination Event. | |
| ■ Consultation Termination Event: | A “Consultation Termination Event” will occur (a) with respect to any serviced Mortgage Loan (other than the 225 Bush Mortgage Loan and The Essex Mortgage Loan), when there is no class of Control Eligible Certificates that has a then-outstanding Certificate Balance at least equal to 25% of the initial Certificate Balance of that class, in each case, without regard to the application of any Cumulative Appraisal Reduction Amounts;provided that prior to the applicable securitization of the controlling Companion Loan with respect to a Servicing Shift Whole Loan, no Consultation Termination Event may occur with respect to with respect to the Directing Certificateholder related to such Servicing Shift Whole Loan, and the term “Consultation Termination Event” will not be applicable to the Directing Certificateholder related to such Servicing Shift Whole Loan; provided,further,that a Consultation Termination Event will not be deemed to be continuing in the event the Certificate Balances of all Classes of Pooled Principal |
THE INFORMATION IN THIS STRUCTURAL AND COLLATERAL TERM SHEET IS NOT COMPLETE AND MAY BE AMENDED PRIOR TO THE TIME OF SALE. THIS TERM SHEET IS NOT AN OFFER TO SELL THESE SECURITIES AND IT IS NOT A SOLICITATION OF AN OFFER TO BUY THESE SECURITIES IN ANY JURISDICTION WHERE THE OFFER OR SALE IS NOT PERMITTED.
| | |
28 of 156
| Structural and Collateral Term Sheet | Benchmark 2019-B14 |
| Structural Overview | |
Balance Certificates other than the Control Eligible Certificates have been reduced to zero and (b) with respect to the 225 Bush Whole Loan and The Essex Whole Loan, when a control appraisal period under the related intercreditor agreement has occurred and is continuing and when the events in clause (a) above are occurring.
Upon the occurrence of a Consultation Termination Event, there will be no Class of Certificates that will act as the Controlling Class and the Directing Certificateholder will have no rights under the Pooling and Servicing Agreement, other than those rights generally available to all Certificateholders. | ||
| ■ Operating Advisor Consultation Event | An “Operating Advisor Consultation Event” will occur when the Certificate Balances of the Class F-RR, Class G-RR and Class NR-RR Certificates in the aggregate (taking into account the application of any Cumulative Appraisal Reduction Amounts to notionally reduce the Certificate Balances of such classes) is 25% or less of the initial Certificate Balances of such classes in the aggregate. | |
| ■ Risk Retention Consultation Parties: | The risk retention consultation parties will have certain non-binding consultation rights with respect to certain material servicing actions. The holders of the VRR Interest, which is expected to be transferred by the depositor on the Closing Date to DBNY (a majority-owned affiliate of GACC), JPMCB and CREFI, will each be entitled to appoint a risk retention consultation party. DBNY, JPMCB and CREFI are expected to be appointed as the initial risk retention consultation parties.
DBNY is expected to be the risk retention consultation party with respect to the Privately Offered Loan-Specific Certificates.
| |
| ■ Appraised-Out Class: | A Class of Control Eligible Certificates that has been determined, as a result of Appraisal Reduction Amounts or Collateral Deficiency Amounts allocable to such Class, to no longer be the Controlling Class. | |
| ■ Remedies Available to Holders of an Appraised-Out Class: | Holders of the majority of any Appraised-Out Class will have the right, at their sole expense, to require the Special Servicer to order a supplemental appraisal report from an MAI appraiser (selected by the Special Servicer) for any mortgage loan (or Serviced Whole Loan) that results in the Class becoming an Appraised-Out Class.
Upon receipt of that supplemental appraisal, the Special Servicer will be required to determine, in accordance with the Servicing Standard, whether, based on its assessment of the supplemental appraisal, any recalculation of the Appraisal Reduction Amount or Collateral Deficiency Amount is warranted, and if so warranted, the Master Servicer will be required to recalculate the Appraisal Reduction Amount or Collateral Deficiency Amount, as applicable, based on the supplemental appraisal and if required by such recalculation, the Appraised-Out Class will be reinstated as the Controlling Class. The holders of an Appraised-Out Class requesting a supplemental appraisal are not permitted to exercise any control or consent rights of the Controlling Class until such time, if any, as the Class is reinstated as the Controlling Class. | |
| ■ Operating Advisor: | The Operating Advisor will initially be Pentalpha Surveillance LLC. The Operating Advisor will have certain review and consultation rights relating to the performance of the Special Servicer and with respect to its actions taken in connection with the resolution and/or liquidation of specially serviced loans. With respect to each mortgage loan (other than a non-serviced mortgage loan) or Serviced Whole Loan, the Operating Advisor will be responsible for:
● reviewing the actions of the Special Servicer with respect to any Specially Serviced Loan;
● reviewing (i) all reports by the Special Servicer made available to Privileged Persons on the Certificate Administrator’s website and (ii) each Final Asset Status Report;
● recalculating and reviewing for accuracy and consistency with the Pooling and Servicing Agreement the mathematical calculations and the corresponding application of the non-discretionary portion of the applicable formulas required to be utilized in connection with net present value calculations used in the Special Servicer’s determination of what course of action to take in connection with the workout or liquidation of a Specially Serviced Loan; and
● preparing an annual report (if any mortgage loan (other than any non-serviced mortgage loan) or Serviced Whole Loan was a Specially Serviced Loan at any time during the prior calendar year or an Operating Advisor Consultation Event occurred during the prior calendar year) that sets forth whether the Operating Advisor believes, in its sole discretion exercised in good faith, that the Special Servicer is operating in compliance with the Servicing Standard with respect to its performance of its duties under the Pooling and Servicing Agreement with |
THE INFORMATION IN THIS STRUCTURAL AND COLLATERAL TERM SHEET IS NOT COMPLETE AND MAY BE AMENDED PRIOR TO THE TIME OF SALE. THIS TERM SHEET IS NOT AN OFFER TO SELL THESE SECURITIES AND IT IS NOT A SOLICITATION OF AN OFFER TO BUY THESE SECURITIES IN ANY JURISDICTION WHERE THE OFFER OR SALE IS NOT PERMITTED.
| | |
29 of 156
| Structural and Collateral Term Sheet | Benchmark 2019-B14 |
| Structural Overview | |
respect to Specially Serviced Loans (and, after the occurrence and continuance of an Operating Advisor Consultation Event, with respect to Major Decisions on Non-Specially Serviced Loans) during the prior calendar year on a “trust-level basis”. The Operating Advisor will identify (1) which, if any, standards the Operating Advisor believes, in its sole discretion exercised in good faith, the Special Servicer has failed to comply with and (2) any material deviations from the Special Servicer’s obligations under the Pooling and Servicing Agreement with respect to the resolution or liquidation of any Specially Serviced Loan or REO Property (other than with respect to any REO Property related to any non-serviced mortgage loan). In preparing any Operating Advisor Annual Report, the Operating Advisor will not be required to report on instances of non-compliance with, or deviations from, the Servicing Standard or the Special Servicer’s obligations under the Pooling and Servicing Agreement that the Operating Advisor determines, in its sole discretion exercised in good faith, to be immaterial.
With respect to each mortgage loan (other than any non-serviced mortgage loan) or Serviced Whole Loan, after the Operating Advisor has received notice that an Operating Advisor Consultation Event has occurred and is continuing, in addition to the duties described above, the Operating Advisor will be required to perform the following additional duties:
● to consult (on a non-binding basis) with the Special Servicer in respect of Asset Status Reports and
● to consult (on a non-binding basis) with the Special Servicer with respect to Major Decisions processed by the Special Servicer or for which the consent of the Special Servicer is required.
In addition, if at any time the Operating Advisor determines, in its sole discretion exercised in good faith, that (1) the Special Servicer is not performing its duties as required under the Pooling and Servicing Agreement or is otherwise not acting in accordance with the Servicing Standard and (2) the replacement of the Special Servicer would be in the best interest of the certificateholders as a collective whole, then, the Operating Advisor will have the right to recommend the replacement of the Special Servicer and will submit its formal recommendation to the Trustee and the Certificate Administrator (along with its rationale, its proposed replacement special servicer and other relevant information justifying its recommendation).
The Operating Advisor’s recommendation to replace the Special Servicer must be confirmed by an affirmative vote of holders of Pooled Principal Balance Certificates evidencing at least a majority of a quorum of certificateholders (which, for this purpose, is the holders of Pooled Principal Balance Certificates that (i) evidence at least 20% of the Voting Rights (taking into account the application of any Appraisal Reduction Amounts to notionally reduce the respective Certificate Balances) of all Pooled Principal Balance Certificates on an aggregate basis, and (ii) consist of at least three Certificateholders or certificate owners that are not affiliated with each other). In the event the holders of Pooled Principal Balance Certificates evidencing at least a majority of a quorum of certificateholders elect to remove and replace the Special Servicer (which requisite affirmative votes must be received within 180 days of the posting of the notice of the Operating Advisor’s recommendation to replace the Special Servicer to the Certificate Administrator's website), the Certificate Administrator will be required to receive a Rating Agency Confirmation from each of the Rating Agencies at that time. | ||
| ■ Replacement of Operating Advisor: | The Operating Advisor may be terminated or removed under certain circumstances and a replacement operating advisor appointed as described in the Preliminary Prospectus.
Any replacement operating advisor (or the personnel responsible for supervising the obligations of the replacement operating advisor) must be an institution (A) that is a special servicer or operating advisor on a commercial mortgage-backed securities transaction rated by the Rating Agencies (including, in the case of the Operating Advisor, this transaction) but has not been special servicer or operating advisor on a transaction for which any of the Rating Agencies has qualified, downgraded or withdrawn its rating or ratings of, one or more classes of certificates for such transaction publicly citing servicing concerns with the operating advisor in its capacity as special servicer or operating advisor on such commercial mortgage-backed securities transaction as the sole or a material factor in such rating action; (B) that can and will make the representations and warranties of the operating advisor set forth in the Pooling and Servicing Agreement; (C) that is not (and is not affiliated or risk retention affiliated with) the Depositor, the Trustee, the Certificate Administrator, the Master Servicer, the Special Servicer, a Mortgage Loan Seller, the Third Party Purchaser, the Directing Certificateholder, a Risk Retention Consultation Party, a depositor, a trustee, a certificate administrator, a master servicer or special servicer with respect |
THE INFORMATION IN THIS STRUCTURAL AND COLLATERAL TERM SHEET IS NOT COMPLETE AND MAY BE AMENDED PRIOR TO THE TIME OF SALE. THIS TERM SHEET IS NOT AN OFFER TO SELL THESE SECURITIES AND IT IS NOT A SOLICITATION OF AN OFFER TO BUY THESE SECURITIES IN ANY JURISDICTION WHERE THE OFFER OR SALE IS NOT PERMITTED.
| | |
30 of 156
| Structural and Collateral Term Sheet | Benchmark 2019-B14 |
| Structural Overview | |
to any securitization that includes a Companion Loan, or any of their respective affiliates; (D) that has not been paid by any Special Servicer or successor special servicer any fees, compensation or other remuneration (x) in respect of its obligations hereunder or (y) for the appointment or recommendation for replacement of a successor special servicer to become the Special Servicer; (E) that (x) has been regularly engaged in the business of analyzing and advising clients in commercial mortgage-backed securities matters and that has at least five years of experience in collateral analysis and loss projections and (y) has at least five years of experience in commercial real estate asset management and experience in the workout and management of distressed commercial real estate assets; and (F) that does not directly or indirectly, through one or more affiliates or otherwise, own or have derivative exposure in any interest in any certificates, any mortgage loans, any Companion Loan or any securities backed by a Companion Loan or otherwise have any financial interest in the securitization transaction to which the PSA relates, other than in fees from its role as operating advisor and asset representations reviewer (to the extent it also acts as the asset representations reviewer). | ||
| ■ Asset Representations Reviewer: | The Asset Representations Reviewer will be required to review certain delinquent mortgage loans after a specified delinquency threshold has been exceeded and notification from the Certificate Administrator that the required percentage of Certificateholders have voted to direct a review of such delinquent mortgage loans. An “Asset Review Trigger” will occur when either (1) mortgage loans with an aggregate outstanding principal balance of 25.0% or more of the aggregate outstanding principal balance of all of the mortgage loans (including any REO Loans (or a portion of any REO Loan in the case of a Whole Loan) held by the issuing entity as of the end of the applicable Collection Period are Delinquent Loans, (2)(A) prior to and including the second anniversary of the Closing Date, at least 10 mortgage loans are Delinquent Loans and the outstanding principal balance of such Delinquent Loans in the aggregate constitutes at least 15.0% of the aggregate outstanding principal balance of all of the mortgage loans (including any REO Loans (or a portion of any REO Loan in the case of a Whole Loan)) held by the issuing entity as of the end of the applicable Collection Period or (B) after the second anniversary of the Closing Date, at least 15 mortgage loans are Delinquent Loans and the outstanding principal balance of such Delinquent Loans in the aggregate constitutes at least 20.0% of the aggregate outstanding principal balance of all of the mortgage loans (including any REO Loans (or a portion of any REO Loan in the case of a Whole Loan)) held by the issuing entity as of the end of the applicable Collection Period.
Following the determination that an Asset Review Trigger has occurred, the Certificate Administrator will include in the Form 10-D relating to the distribution period in which the Asset Review Trigger occurred a description of the events that caused the Asset Review Trigger to occur. Once an Asset Review Trigger has occurred, Certificateholders evidencing not less than 5% of the voting rights may deliver to the Certificate Administrator a written direction requesting a vote on whether to commence an Asset Review within 90 days after the filing of the Form 10-D reporting the occurrence of the Asset Review Trigger (an “Asset Review Vote Election”). If directed by such Certificateholders, a vote of all Certificateholders will commence and an Asset Review will occur if a majority of Certificateholders voting (assuming Certificateholders representing a minimum of 5% of the voting rights respond) vote affirmatively within 150 days of the Asset Review Vote Election. If the vote does not pass, then no Certificateholder may request a vote or cast a vote for an Asset Review and the Asset Representations Reviewer will not be required to review any delinquent mortgage loan until an additional mortgage loan becomes a Delinquent Loan, an Asset Review Trigger occurs as a result or is otherwise in effect, another Asset Review Vote Election is made and a majority of Certificateholders voting (assuming Certificateholders representing a minimum of 5% of the voting rights respond) vote affirmatively within 150 days of such Asset Review Vote Election. |
THE INFORMATION IN THIS STRUCTURAL AND COLLATERAL TERM SHEET IS NOT COMPLETE AND MAY BE AMENDED PRIOR TO THE TIME OF SALE. THIS TERM SHEET IS NOT AN OFFER TO SELL THESE SECURITIES AND IT IS NOT A SOLICITATION OF AN OFFER TO BUY THESE SECURITIES IN ANY JURISDICTION WHERE THE OFFER OR SALE IS NOT PERMITTED.
| | |
31 of 156
| Structural and Collateral Term Sheet | Benchmark 2019-B14 |
| Structural Overview | |
| ■ Replacement of the Asset Representations Reviewer: | The Asset Representations Reviewer may be terminated and replaced without cause. Upon (i) the written direction of Certificateholders evidencing not less than 25% of the voting rights (without regard to the application of any Appraisal Reduction Amounts) requesting a vote to terminate and replace the Asset Representations Reviewer with a proposed successor asset representations reviewer that is an Eligible Asset Representations Reviewer, and (ii) payment by such holders to the Certificate Administrator of the reasonable fees and expenses to be incurred by the Certificate Administrator in connection with administering such vote, the Certificate Administrator will promptly provide notice to all Certificateholders and the Asset Representations Reviewer of such request by posting such notice on its website, and by mailing to all Certificateholders and the Asset Representations Reviewer. Upon the written direction of Certificateholders evidencing at least 75% of a Certificateholder Quorum (without regard to the application of any Appraisal Reduction Amounts), the Trustee will terminate all of the rights and obligations of the Asset Representations Reviewer under the Pooling and Servicing Agreement by written notice to the Asset Representations Reviewer, and the proposed successor asset representations reviewer will be appointed. | |
| ■ Appointment and Replacement of Special Servicer: | The Directing Certificateholder will appoint the initial Special Servicer as of the Closing Date. Prior to the occurrence and continuance of a Control Termination Event, the Special Servicer may generally be replaced at any time, with or without cause by the Directing Certificateholder.
If the Special Servicer obtains knowledge that it is a Borrower Party with respect to any mortgage loan or Serviced Whole Loan (any such mortgage loan or Serviced Whole Loan, an “Excluded Special Servicer Loan”), the Special Servicer will be required to resign as Special Servicer of that Excluded Special Servicer Loan. Prior to the occurrence and continuance of a Control Termination Event, if the applicable Excluded Special Servicer Loan is not also an Excluded Loan, the controlling class certificateholders or the Directing Certificateholder on their behalf will be required to select a successor special servicer that is not a Borrower Party in accordance with the terms of the Pooling and Servicing Agreement (an “Excluded Special Servicer”) for the related Excluded Special Servicer Loan. After the occurrence and during the continuance of a Control Termination Event or if at any time the applicable Excluded Special Servicer Loan is also an Excluded Loan, the resigning Special Servicer will be required to use reasonable efforts to select the related Excluded Special Servicer.
Upon the occurrence and during the continuance of a Control Termination Event, the Directing Certificateholder will no longer have the right to replace the Special Servicer and such replacement will occur based on a vote of holders of all voting eligible Classes of Certificates as described below.
The Operating Advisor may also recommend the replacement of the Special Servicer at any time as described in “Operating Advisor” above. | |
| ■ Replacement of Special Servicer by Vote of Certificateholders: | After the occurrence and during the continuance of a Control Termination Event (other than with respect to the 225 Bush Mortgage Loan) and upon (a) the written direction of holders of Pooled Principal Balance Certificates and VRR Interest evidencing not less than 25% of the Pooled Voting Rights of the Pooled Principal Balance Certificates (taking into account the application of Appraisal Reduction Amounts to notionally reduce the Certificate Balances of the Pooled Principal Balance Certificates) requesting a vote to replace the Special Servicer with a replacement special servicer, (b) payment by such requesting holders to the Certificate Administrator of all reasonable fees and expenses to be incurred by the Certificate Administrator in connection with administering such vote and (c) delivery by such holders to the Certificate Administrator and the Trustee of written confirmations from each Rating Agency that the appointment of such replacement special servicer will not result in a downgrade, withdrawal or qualification of the Certificates (which confirmations will be obtained at the expense of such holders), the Certificate Administrator will be required to post notice of such direction on its website and by mail, and conduct the solicitation of votes of all Certificates in such regard, which such vote must occur within 180 days of the posting of such notice. Upon the written direction of holders of Pooled Principal Balance Certificates evidencing at least 50% of a Certificateholder Quorum, the Trustee will immediately replace the Special Servicer (other than with respect to the 225 Bush Whole Loan) with a qualified replacement special servicer designated by such holders of Certificates.
A “Certificateholder Quorum” means, in connection with any solicitation of votes in connection with the replacement of the Special Servicer (other than with respect to the 225 Bush Whole Loan) or the Asset Representations Reviewer described above, the holders of Certificates |
THE INFORMATION IN THIS STRUCTURAL AND COLLATERAL TERM SHEET IS NOT COMPLETE AND MAY BE AMENDED PRIOR TO THE TIME OF SALE. THIS TERM SHEET IS NOT AN OFFER TO SELL THESE SECURITIES AND IT IS NOT A SOLICITATION OF AN OFFER TO BUY THESE SECURITIES IN ANY JURISDICTION WHERE THE OFFER OR SALE IS NOT PERMITTED.
| | |
32 of 156
| Structural and Collateral Term Sheet | Benchmark 2019-B14 |
| Structural Overview | |
evidencing at least 50% of the aggregate Pooled Voting Rights (taking into account the application of realized losses and, other than with respect to the termination of the Asset Representations Reviewer, the application of any Appraisal Reduction Amounts to notionally reduce the Certificate Balance of the Certificates) of all Pooled Principal Balance Certificates on an aggregate basis.
The foregoing rights with respect to the 225 Bush Whole Loan will include holders of the Loan-Specific Certificates and only apply with respect to the replacement of the Special Servicer after a control appraisal period has occurred under the related intercreditor agreement.
With respect to each of the Serviced Whole Loan, subject to the related intercreditor agreement, the holders of the relatedPari Passu Companion Loans, under certain circumstances following a servicer termination event with respect to the Special Servicer, will be entitled to direct the Trustee (and the Trustee will be required) to terminate the Special Servicer solely with respect to such Serviced Whole Loan. A replacement special servicer will be selected by the Trustee or, prior to a Control Termination Event, by the Directing Certificateholder;provided,however, that any successor special servicer appointed to replace the Special Servicer with respect to such Whole Loan can generally not be the person (or its affiliate) that was terminated at the direction of the holder of the relatedPari Passu Companion Loan.
With respect to any Non-Serviced Whole Loan, subject to the related intercreditor agreement, the Benchmark 2019-B14 trust as holder of the related mortgage loan has similar termination rights in the event of a servicer termination event with respect to the special servicer under the applicable trust and servicing agreement or pooling and servicing agreement, as applicable, as described above, which may be exercised by the Directing Certificateholder prior to the Control Termination Event. However, the successor special servicer will be selected pursuant to the applicable trust and servicing agreement or pooling and servicing agreement, as applicable, by the related directing holder prior to a control event under such trust and servicing agreement or pooling and servicing agreement, as applicable. The Master Servicer and Special Servicer are entitled to certain fees in connection with the servicing and administration of the mortgage loans as more fully described in “Pooling and Servicing Agreement—Servicing and Other Compensation and Payment of Expenses” in the Preliminary Prospectus. |
| ■ Dispute Resolution Provisions: | Each Mortgage Loan Seller will be subject to the dispute resolution provisions set forth in the Pooling and Servicing Agreement to the extent those provisions are triggered with respect to any mortgage loan or Trust Subordinate Companion Loan sold to the Depositor by a Mortgage Loan Seller and such Mortgage Loan Seller will be obligated under the related mortgage loan purchase agreement to comply with all applicable provisions and to take part in any mediation or arbitration proceedings that may result.
Generally, in the event that a request to repurchase a mortgage loan or the Trust Subordinate Companion Loan (a “Repurchase Request”) is not “Resolved” (as defined below) within 180 days after the related Mortgage Loan Seller receives such Repurchase Request (a “Resolution Failure”), then the Enforcing Servicer (as defined below) will be required to send a notice to the “Initial Requesting Certificateholder” (if any) indicating the Enforcing Servicer’s intended course of action with respect to the Repurchase Request. If (a) the Enforcing Servicer’s intended course of action with respect to the Repurchase Request does not involve pursuing further action to exercise rights against the related Mortgage Loan Seller with respect to the Repurchase Request and the Initial Requesting Certificateholder, if any, or any other Certificateholder or Certificate Owner wishes to exercise its right to refer the matter to mediation (including nonbinding arbitration) or arbitration, or (b) the Enforcing Servicer’s intended course of action is to pursue further action to exercise rights against the related Mortgage Loan Seller with respect to the Repurchase Request but the Initial Requesting Certificateholder, if any, or any other Certificateholder or Certificate Owner does not agree with the dispute resolution method selected by the Enforcing Servicer, then the Initial Requesting Certificateholder, if any, or such other Certificateholder or Certificate Owner may deliver a written notice to the Enforcing Servicer indicating its intent to exercise its right to refer the matter to either mediation or arbitration.
The Enforcing Servicer will be required to consult with any Certificateholder or Certificate Owner that delivers a notice of its intent to exercise its dispute resolution rights (a “Requesting Certificateholder”) so that a Requesting Certificateholder may consider the views of the Enforcing Servicer as to the claims underlying the Repurchase Request and possible dispute resolution methods. If a Requesting Certificateholder elects to exercise its right to refer the matter to either mediation or arbitration, then it will become the party responsible for enforcing the Repurchase Request and must promptly submit the matter to mediation (including nonbinding arbitration) or arbitration. Failure to make an election to exercise that right or failure to begin the elected form |
THE INFORMATION IN THIS STRUCTURAL AND COLLATERAL TERM SHEET IS NOT COMPLETE AND MAY BE AMENDED PRIOR TO THE TIME OF SALE. THIS TERM SHEET IS NOT AN OFFER TO SELL THESE SECURITIES AND IT IS NOT A SOLICITATION OF AN OFFER TO BUY THESE SECURITIES IN ANY JURISDICTION WHERE THE OFFER OR SALE IS NOT PERMITTED.
| | |
33 of 156
| Structural and Collateral Term Sheet | Benchmark 2019-B14 |
| Structural Overview | |
of proceedings within the certain timeframe set forth in the Pooling and Servicing Agreement will generally waive the Certificateholders’ or Certificate Owners’ rights with respect to the related Repurchase Request.
The “Enforcing Servicer” will be (a) with respect to a specially serviced loan, the Special Servicer, and (b) with respect to a non-specially serviced loan, (i) in the case of a Repurchase Request made by the Special Servicer, the Directing Certificateholder or a Controlling Class Certificateholder, the Master Servicer, and (ii) in the case of a Repurchase Request made by any person other than the Special Servicer, the Directing Certificateholder or a Controlling Class Certificateholder, (A) prior to a Resolution Failure relating to such non-specially serviced loan, the Master Servicer, and (B) from and after a Resolution Failure relating to such non-specially serviced Loan, the Special Servicer.
“Resolved” means, with respect to a Repurchase Request, (i) that the related Material Defect has been cured, (ii) the related mortgage loan or Trust Subordinate Companion Loan has been repurchased in accordance with the related mortgage loan purchase agreement, (iii) a mortgage loan has been substituted for the related mortgage loan in accordance with the related mortgage loan purchase agreement, (iv) the applicable Mortgage Loan Seller has made a Loss of Value Payment, (v) a contractually binding agreement is entered into between the Enforcing Servicer, on behalf of the issuing entity, and the related Mortgage Loan Seller that settles the related Mortgage Loan Seller’s obligations under the related mortgage loan purchase agreement, or (vi) the related mortgage loan or Trust Subordinate Companion Loan is no longer property of the issuing entity as a result of a sale or other disposition in accordance with the Pooling and Servicing Agreement. | ||
| ■ Investor Communications | The Certificate Administrator is required to include on any Form 10–D any request received from a Certificateholder to communicate with other Certificateholders related to Certificateholders exercising their rights under the terms of the Pooling and Servicing Agreement. Any Certificateholder wishing to communicate with other Certificateholders regarding the exercise of its rights under the terms of the Pooling and Servicing Agreement should deliver a written request signed by an authorized representative of the requesting investor to the Certificate Administrator at the address below:
9062 Old Annapolis Road
Columbia, Maryland 21045
Attention: Corporate Trust Administration Group – Benchmark 2019-B14
With a copy to: trustadministrationgroup@wellsfargo.com | |
| ■ Master Servicer and Special Servicer Compensation: | The Master Servicer is entitled to a fee (the “Servicing Fee”) payable monthly from interest received in respect of each mortgage loan, the Trust Subordinate Companion Loan, any related REO loan and any related serviced Companion Loan that will accrue at the related servicing fee rate described in the Preliminary Prospectus. The Special Servicer is also entitled to a fee (the “Special Servicing Fee”) with respect to each specially serviced loan and REO loan (other than a non-serviced mortgage loan) at the special servicing fee rate described in the Preliminary Prospectus.
In addition to the Servicing Fee, Special Servicing Fee and certain other fees described below, the Master Servicer and Special Servicer are entitled to retain and share certain additional servicing compensation, including assumption application fees, assumption fees, defeasance fees, processing fees and certain Excess Modification Fees and consent fees with respect to the mortgage loans. The Special Servicer may also be entitled to either a Workout Fee or Liquidation Fee, but not both, from recoveries in respect of any particular mortgage loan.
An “Excess Modification Fee” with respect to any mortgage loan (other than the non-serviced mortgage loans) or Serviced Whole Loan is the sum of (A) the excess, if any, of (i) any and all Modification Fees with respect to a mortgage loan or Serviced Whole Loan, as applicable, over (ii) all unpaid or unreimbursed additional expenses described in the Preliminary Prospectus (excluding Special Servicing Fees, Workout Fees and Liquidation Fees) outstanding or previously incurred on behalf of the issuing entity with respect to the related mortgage loan or Serviced Whole Loan, as applicable, and reimbursed from such Modification Fees and (B) expenses previously paid or reimbursed from Modification Fees as described in clause (A), which expenses have been recovered from the related borrower or otherwise. |
THE INFORMATION IN THIS STRUCTURAL AND COLLATERAL TERM SHEET IS NOT COMPLETE AND MAY BE AMENDED PRIOR TO THE TIME OF SALE. THIS TERM SHEET IS NOT AN OFFER TO SELL THESE SECURITIES AND IT IS NOT A SOLICITATION OF AN OFFER TO BUY THESE SECURITIES IN ANY JURISDICTION WHERE THE OFFER OR SALE IS NOT PERMITTED.
| | |
34 of 156
| Structural and Collateral Term Sheet | Benchmark 2019-B14 |
| Structural Overview | |
With respect to the Master Servicer and Special Servicer, the Excess Modification Fees collected and earned by such servicer from the related borrower (taken in the aggregate with any other Excess Modification Fees collected and earned by such servicer from the related borrower within the prior 18 months of the collection of the current Excess Modification Fees) will be subject to a cap of 1.00% of the outstanding principal balance of the related mortgage loan or Serviced Whole Loan, as applicable, on the closing date of the related modification, extension, waiver or amendment. A “Modification Fee” with respect to any mortgage loan (other than the non-serviced mortgage loans) or serviced Companion Loan is generally any fee with respect to a modification, extension, waiver or amendment of any mortgage loan and/or related serviced Companion Loan (other than all assumption fees, assumption application fees, consent fees, defeasance fees, Special Servicing Fees, Liquidation Fees or Workout Fees).
A “Workout Fee” will generally be payable with respect to each corrected loan (except with respect to a corrected loan that was a fee restricted specially serviced loan and became a corrected loan while it was a fee restricted specially serviced loan) (as more specifically described in the Preliminary Prospectus) and will be calculated at a rate of 1.00% of payments of principal and interest on the respective mortgage loan for so long as it remains a corrected loan, subject to a maximum of $1,000,000 in the aggregate with respect to any particular corrected loan. After receipt by the Special Servicer of Workout Fees with respect to a corrected loan in an amount equal to $25,000, any Workout Fees in excess of such amount will be reduced by the Excess Modification Fee Amount;provided that in the event the Workout Fee, collected over the course of such workout calculated at the Workout Fee Rate is less than $25,000, then the Special Servicer will be entitled to an amount from the final payment on the related corrected loan (including any related serviced Companion Loan) that would result in the total Workout Fees payable to the Special Servicer in respect of that corrected loan (including any related serviced Companion Loan) to be $25,000.
The “Excess Modification Fee Amount” for any corrected loan is an amount equal to any Excess Modification Fees paid by or on behalf of the related borrower with respect to the related mortgage loan (including the related serviced Companion Loan, unless prohibited under the related intercreditor agreement) and received and retained by the Master Servicer or the Special Servicer, as applicable, as compensation within the prior 18 months of the related modification, waiver, extension or amendment resulting in the mortgage loan or REO loan being a corrected loan, but only to the extent those fees have not previously been deducted from a Workout Fee or Liquidation Fee.
A “Liquidation Fee” will generally be payable with respect to (i) each specially serviced loan (except, under certain circumstances, with respect to any fee restricted specially serviced loan) or REO property (except with respect to any non-serviced mortgage loan), (ii) each Mortgage Loan repurchased by a Mortgage Loan Seller or (iii) each defaulted Mortgage Loan that is a Non-Serviced Mortgage Loan sold by the Special Servicer in accordance with the Pooling and Servicing Agreement, in each case, as to which the Special Servicer obtains a full or partial recovery of the related asset. The Liquidation Fee for each specially serviced loan will be payable at a rate of 1.00% of the liquidation proceeds (exclusive of default interest) subject to a maximum of $1,000,000;provided,however, that no Liquidation Fee will be less than $25,000.
The Liquidation Fees will be reduced by the amount of any Excess Modification Fees received by the Special Servicer with respect to the related mortgage loan (including a serviced Companion Loan) or REO property as additional compensation within the prior 18 months, but only to the extent those fees have not previously been deducted from a Workout Fee or Liquidation Fee.
Similar fees to those described above will be payable to the applicable special servicer for the Non-Serviced Whole Loans under the related trust and servicing agreement or pooling and servicing agreement, as applicable.
Subject to certain limited exceptions, in connection with its duties under the Pooling and Servicing Agreement, the Special Servicer and its affiliates are prohibited from receiving or retaining any compensation (other than compensation specifically provided for under the Pooling and Servicing Agreement) from anyone in connection with the disposition, workout or foreclosure of any mortgage loan, the management or disposition of any REO property, or the performance of any other special servicing duties under the Pooling and Servicing Agreement. In the event the Special Servicer does receive any such compensation, it will be required to disclose those fees to the Certificate Administrator who will include it as part of the statement to Certificateholders. |
THE INFORMATION IN THIS STRUCTURAL AND COLLATERAL TERM SHEET IS NOT COMPLETE AND MAY BE AMENDED PRIOR TO THE TIME OF SALE. THIS TERM SHEET IS NOT AN OFFER TO SELL THESE SECURITIES AND IT IS NOT A SOLICITATION OF AN OFFER TO BUY THESE SECURITIES IN ANY JURISDICTION WHERE THE OFFER OR SALE IS NOT PERMITTED.
| | |
35 of 156
| Structural and Collateral Term Sheet | Benchmark 2019-B14 |
| Structural Overview | |
In addition, no liquidation fee will be payable to the Special Servicer if a mortgage loan or Serviced Whole Loan becomes a specially serviced loan only because of a maturity default and the related liquidation proceeds are received within 90 days following the related maturity date as a result of the related mortgage loan or Serviced Whole Loan being refinanced or otherwise repaid in full.
See “Pooling and Servicing Agreement—Servicing and Other Compensation and Payment of Expenses” in the Preliminary Prospectus. | ||
| ■ Deal Website: | The Certificate Administrator will maintain a deal website to which certain persons will have access to certain information including, but not limited to the following, which will be posted:
■ special notices;
■ summaries of any final asset status reports;
■ appraisals in connection with Appraisal Reductions plus any second appraisals ordered;
■ an “Investor Q&A Forum”;
■ a voluntary investor registry;
■ SEC EDGAR filings; and
■ risk retention. |
THE INFORMATION IN THIS STRUCTURAL AND COLLATERAL TERM SHEET IS NOT COMPLETE AND MAY BE AMENDED PRIOR TO THE TIME OF SALE. THIS TERM SHEET IS NOT AN OFFER TO SELL THESE SECURITIES AND IT IS NOT A SOLICITATION OF AN OFFER TO BUY THESE SECURITIES IN ANY JURISDICTION WHERE THE OFFER OR SALE IS NOT PERMITTED.
| | |
36 of 156
| Structural and Collateral Term Sheet | Benchmark 2019-B14 |
[THIS PAGE INTENTIONALLY LEFT BLANK]
THE INFORMATION IN THIS STRUCTURAL AND COLLATERAL TERM SHEET IS NOT COMPLETE AND MAY BE AMENDED PRIOR TO THE TIME OF SALE. THIS TERM SHEET IS NOT AN OFFER TO SELL THESE SECURITIES AND IT IS NOT A SOLICITATION OF AN OFFER TO BUY THESE SECURITIES IN ANY JURISDICTION WHERE THE OFFER OR SALE IS NOT PERMITTED.
| | |
37 of 156
| Structural and Collateral Term Sheet | Benchmark 2019-B14 | |
| Watergate Office Building | ||

THE INFORMATION IN THIS STRUCTURAL AND COLLATERAL TERM SHEET IS NOT COMPLETE AND MAY BE AMENDED PRIOR TO THE TIME OF SALE. THIS TERM SHEET IS NOT AN OFFER TO SELL THESE SECURITIES AND IT IS NOT A SOLICITATION OF AN OFFER TO BUY THESE SECURITIES IN ANY JURISDICTION WHERE THE OFFER OR SALE IS NOT PERMITTED.
| | |
38 of 156
| Structural and Collateral Term Sheet | Benchmark 2019-B14 | |
| Watergate Office Building | ||
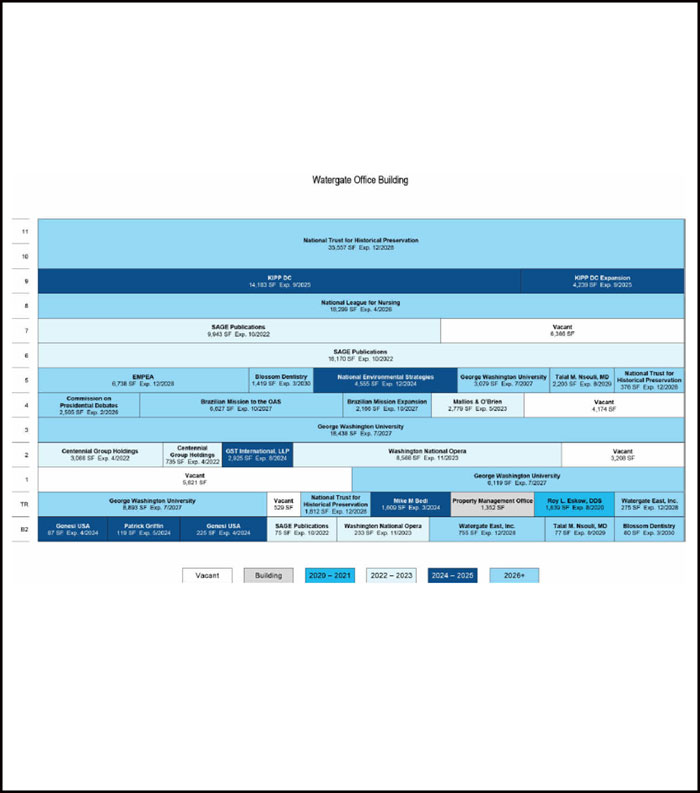
THE INFORMATION IN THIS STRUCTURAL AND COLLATERAL TERM SHEET IS NOT COMPLETE AND MAY BE AMENDED PRIOR TO THE TIME OF SALE. THIS TERM SHEET IS NOT AN OFFER TO SELL THESE SECURITIES AND IT IS NOT A SOLICITATION OF AN OFFER TO BUY THESE SECURITIES IN ANY JURISDICTION WHERE THE OFFER OR SALE IS NOT PERMITTED.
| | |
39 of 156
| Structural and Collateral Term Sheet | Benchmark 2019-B14 | |
| Watergate Office Building | ||

THE INFORMATION IN THIS STRUCTURAL AND COLLATERAL TERM SHEET IS NOT COMPLETE AND MAY BE AMENDED PRIOR TO THE TIME OF SALE. THIS TERM SHEET IS NOT AN OFFER TO SELL THESE SECURITIES AND IT IS NOT A SOLICITATION OF AN OFFER TO BUY THESE SECURITIES IN ANY JURISDICTION WHERE THE OFFER OR SALE IS NOT PERMITTED.
| | |
40 of 156
| Structural and Collateral Term Sheet | Benchmark 2019-B14 | |
| Watergate Office Building | ||
| Mortgage Loan Information | Property Information | |||
| Mortgage Loan Seller: | CREFI | Single Asset / Portfolio: | Single Asset | |
| Original Principal Balance: | $73,000,000 | Title: | Fee / Leasehold | |
| Cut-off Date Principal Balance: | $73,000,000 | Property Type - Subtype: | Office - CBD | |
| % of Pool by IPB: | 5.5% | Net Rentable Area (SF): | 215,200 | |
| Loan Purpose: | Acquisition | Location: | Washington, D.C. | |
| Borrowers(1): | Various | Year Built / Renovated: | 1967 / 2012-2018 | |
| Sponsor: | Scott J. Seligman | Occupancy: | 87.3% | |
| Interest Rate: | 3.73000% | Occupancy Date: | 8/6/2019 | |
| Note Date: | 9/26/2019 | Number of Tenants: | 20 | |
| Maturity Date: | 10/6/2029 | 2016 NOI: | N/A | |
| Interest-only Period: | 120 months | 2017 NOI: | $3,875,980 | |
| Original Term: | 120 months | 2018 NOI: | $4,000,973 | |
| Original Amortization: | None | TTM NOI (as of 7/2019)(2): | $4,215,470 | |
| Amortization Type: | Interest Only | UW Economic Occupancy: | 90.1% | |
| Call Protection: | L(25),Def(90),O(5) | UW Revenues: | $9,931,731 | |
| Lockbox / Cash Management: | Hard / Springing | UW Expenses: | $3,922,559 | |
| Additional Debt: | N/A | UW NOI(2): | $6,009,172 | |
| Additional Debt Balance: | N/A | UW NCF: | $5,643,332 | |
| Additional Debt Type: | N/A | Appraised Value / Per SF: | $105,000,000 / $488 | |
| Appraisal Date: | 8/29/2019 | |||
| Escrows and Reserves(3) | Financial Information | ||||||
| Initial | Monthly | Initial Cap | Cut-off Date Loan / SF: | $339 | |||
| Taxes: | $250,005 | $125,003 | N/A | Maturity Date Loan / SF: | $339 | ||
| Insurance: | $78,181 | $11,169 | N/A | Cut-off Date LTV: | 69.5% | ||
| Replacement Reserves: | $0 | $3,587 | N/A | Maturity Date LTV: | 69.5% | ||
| TI/LC: | $750,000 | $26,900 | $2,364,000 | UW NCF DSCR: | 2.04x | ||
| Other(4): | $732,146 | Springing | N/A | UW NOI Debt Yield: | 8.2% | ||
| Sources and Uses | ||||||
| Sources | Proceeds | % of Total | Uses | Proceeds | % of Total | |
| Mortgage Loan | $73,000,000 | 69.2% | Purchase Price | $101,200,000 | 95.9% | |
| Sponsor Equity | 31,818,333 | 30.2 | Closing Costs | 2,497,315 | 2.4 | |
| Other Sources | 689,316 | 0.7 | Upfront Reserves | 1,810,333 | 1.7 | |
| Total Sources | $105,507,648 | 100.0% | Total Uses | $105,507,648 | 100.0% | |
| (1) | See “The Borrowers” below. |
| (2) | The increase from TTM NOI to UW NOI is primarily due to recent leasing at the Watergate Office Building Property (as defined below) and rent steps ($218,785 of contractual rent steps through August 2020 and $238,217, which represents present value of rent steps for GWU (defined below)). Eight new leases were executed since January 2019 accounting for $393,511 of base rent. |
| (3) | For a full description of Escrows and Reserves, see “Escrows and Reserves”. |
| (4) | Initial Other reserves consist of $141,435 deposited into the unfunded obligations reserve and $590,711 deposited into the Sage Fidelity Escrow Reserve (as defined below). |
THE INFORMATION IN THIS STRUCTURAL AND COLLATERAL TERM SHEET IS NOT COMPLETE AND MAY BE AMENDED PRIOR TO THE TIME OF SALE. THIS TERM SHEET IS NOT AN OFFER TO SELL THESE SECURITIES AND IT IS NOT A SOLICITATION OF AN OFFER TO BUY THESE SECURITIES IN ANY JURISDICTION WHERE THE OFFER OR SALE IS NOT PERMITTED.
| | |
41 of 156
| Structural and Collateral Term Sheet | Benchmark 2019-B14 | |
| Watergate Office Building | ||
The Loan.The Watergate Office Building mortgage loan (the “Watergate Office Building Loan”) is a fixed rate loan secured by a first mortgage lien on the borrower’s fee and leasehold interest in a 215,200 square foot Class A/B office building located in Washington, D.C. (the “Watergate Office Building Property”). The Watergate Office Building Loan has a 10-year term and will be interest-only for the entire loan term. The most recent prior acquisition of the Watergate Office Building Property was not included in a securitization transaction.
The Borrowers. There are five borrowing entities for the Watergate Office Building Loan: 2600 Virginia Avenue 1 LLC, 2600 Virginia Avenue 2 LLC, 2600 Virginia Avenue 3 LLC, 2600 Virginia Avenue 4 LLC and 2600 Virginia Avenue Master Lessee LLC, all of which are Delaware limited liability companies and special purpose entities with one independent director in each organizational structure. Four of these entities own the fee interest in the Watergate Office Building Property as tenants in common: 2600 Virginia Avenue 1 LLC, 2600 Virginia Avenue 2 LLC, 2600 Virginia Avenue 3 LLC, 2600 Virginia Avenue 4 LLC. The fifth borrower (2600 Virginia Avenue Master Lessee LLC) is the tenant under a master lease structure created to facilitate a reverse 1031 exchange to be consummated by 2600 Virginia Avenue 4 LLC.
The Loan Sponsor.The Watergate Office Building Loan sponsor and non-recourse carveout guarantor is Scott J. Seligman of The Seligman Group. The Watergate Office Building Property is managed by Seligman & Associates, LLC, an affiliate of the Watergate Office Building Loan sponsor, which has engaged LPC Commercial Services, Inc. as a sub-manager. LPC Commercial Services, Inc. is an affiliate of Lincoln Property Company, which is one of the largest property managers in Washington, D.C., with four management offices that are spread throughout the Washington, D.C. metro area, and over $30.0 billion in assets under management.
The Property.The Watergate Office Building Property is a 215,200 square foot Class A/B office tower located on the Potomac Riverfront at 2600 Virginia Avenue Northwest, in Washington, D.C. The Watergate Office Building Property was built in 1967 and fully gut-renovated between 2012 and 2018, at a cost of approximately $28.9 million ($134.40 per square foot). It is a symbol in Washington, D.C. and worldwide as a result of its historical significance in relation to the 1972 Watergate Scandal which resulted in the President Richard Nixon’s resignation; this is a recognizable address in Washington, D.C. The Watergate Office Building Property is located within the Watergate Complex Renaissance, a development which is comprised of the five-star Watergate Hotel, the “Watergate 600” office building, the Watergate residential Co-op, a luxury apartment building and the Kennedy Center. The Watergate Office Building Property is part of Washington, D.C.’s West End, a core downtown submarket known for its luxurious hotels, high-end restaurants and record-setting luxury residential sale prices. The Watergate Office Building Property features panoramic views of the Georgetown Waterfront, Potomac River, Key Bridge and the Rosslyn-Ballston Corridor skyline. It connects directly, via adjoining main lobbies, to the newly-renovated five-star Watergate Hotel and enjoys access to 60,000 square feet of restaurant, retail and service amenities within the Watergate Shops which is the central retail plaza within the Watergate Complex. Since 2012, the Watergate Office Building Property has undergone significant renovations and capital improvements of $28.9 million ($134.40 per square foot) to transform it into a Class A asset in downtown Washington, D.C. The Watergate Office Building Property received a complete HVAC upgrade along with upgrades to the roof and elevator and a gut renovation of the main lobby. The immediate interior improvements also included an installation of a fitness center with showers and lockers plus a bike room. Upon sale in 2016, the then sponsor, Rockwood Capital, updated the restrooms and tenant lobbies.
The largest tenant, National Trust for Historic Preservation (“NTHP”) (17.5% of net rentable area; 20.6% of underwritten base rent), occupies 37,745 square feet of office space through December 2028 with one, five-year renewal option and no termination options. NTHP is a private-funded nonprofit organization with the mission to preserve significant places throughout the United States, including historic buildings, monuments, institutions, main streets, parks and other national treasures. NTHP was founded in 1949 and today has a staff of approximately 300 employees based at its headquarters at the Watergate Office Building Property, and has 750,000 members and supporters. As of June 2018, NTHP had an endowment of approximately $251 million and total assets of $366 million.
The second largest tenant, George Washington University (“GWU”) (17.0% of net rentable area; 21.2% of underwritten base rent; rated A1 by Moody’s and A+ by S&P), occupies 36,529 square feet of office space. The current term of the lease expires in July 2027 and the lease has one, five or 10-year renewal option and no termination options. GWU was founded in 1821 and it is one of the largest private employers in the Washington, D.C. area. It is a not-for-profit institution of higher education comprised of 14 schools and colleges that offer undergraduate and graduate degrees across a wide array of subject matter. GWU has experienced growth over the last few years, with operating revenues growing by approximately 13% between 2016 and 2018, reporting $1.2 million in operating revenues in 2018 and further expanding at the Watergate Office Building Property. According to the tenant, this is a strategic location for the university as it houses offices for the School of Medicine & Health Sciences, including the primary offices for the GW Cancer Institute, the Rodham Institute and the GW Institute for Spirituality & Health. The Watergate Office Building Property is approximately one mile from the GWU Hospital and the center of GWU’s Campus. GWU has a right of first refusal to expand into any space that opens up on the second floor of the Watergate Office Building Property.
THE INFORMATION IN THIS STRUCTURAL AND COLLATERAL TERM SHEET IS NOT COMPLETE AND MAY BE AMENDED PRIOR TO THE TIME OF SALE. THIS TERM SHEET IS NOT AN OFFER TO SELL THESE SECURITIES AND IT IS NOT A SOLICITATION OF AN OFFER TO BUY THESE SECURITIES IN ANY JURISDICTION WHERE THE OFFER OR SALE IS NOT PERMITTED.
| | |
42 of 156
| Structural and Collateral Term Sheet | Benchmark 2019-B14 | |
| Watergate Office Building | ||
The third largest tenant, SAGE Publications (12.2% of net rentable area; 12.9% of underwritten base rent), occupies 26,188 square feet of office space on a lease expiring in October 2022 with one, five-year renewal option and a one-time termination option effective November 30, 2020 with 12-months’ notice and payment of a termination fee. SAGE Publications is an independent publishing company that employs over 1,500 people globally out of seven office locations. SAGE Publications publishes over 1,000 journals and over 800 books annually under a variety of brands. The company’s Washington, D.C. office at the Watergate Office Building Property supports its market presence in American government, international affairs, journalism, mass communications and politics.
The Watergate Office Building Property is located at the intersection of I-66, Whitehurst Freeway and Rock Creek Parkway within the District of Columbia central business district. The routes are commuting corridors for the majority of the Washington, D.C. Metro area’s housing neighborhoods in Northern Virginia and Southern Maryland. The Watergate Office Building Property is accessible by train and is a five-minute walk to the Foggy Bottom Metro Station, which is served by the Orange, Silver and Blue Lines, providing direct access to Reagan National Airport, the Pentagon, Amazon HQ2 at National Landing, Tysons and Dulles International Airport (upon Silver Line completion in 2020). According to the appraisal, the Washington, D.C. metro area is one of the strongest and most diverse economies in the United States, with a highly educated workforce, high STEM research investments, the largest recipient of government contract spending and consistently low unemployment. The three largest sectors in the economy are Professional and Business Services (22.8%), Government (21.2%) and Education & Health (13.5%). According to the appraisal, the year-end 2018 population in a one-, three- and five-mile radius was 35,963, 360,803 and 790,934, respectively. According to the appraisal, the year-end 2018 average household income in a one-, three- and five-mile radius was $162,060, $144,089 and $139,473, respectively.
According to a third party report, the Watergate Office Building Property is part of the West End office submarket, of the Washington, D.C. office market. Based on a third party report, the West End office submarket contains approximately 4.8 million square feet of office inventory, with a current vacancy rate of 10.7% for 4 & 5 star office properties and an average gross asking rent of $53.64 per square foot which is expected to modestly increase in the next four years. According to the appraisal, the office market is becoming increasingly dependent on premium office space and amenities as a means of attracting tenants and labor talent.
The appraisal identified recent leases negotiated in 11 office rent comparable buildings in the West End/Georgetown submarket. The comparable office leases selected range in size from 1,466 square feet to 51,252 square feet with terms ranging from two to 17 years. The comparable tenants reported annual rental rates ranging from $50.00 per square foot to $60.00 per square foot, on a full service basis, with an average of $54.42 per square foot. The appraisal concluded to a market rent (on a full service basis) of $51.00 per square foot for first floor space; $53.00 per square foot for floors two through five; $55.00 per square foot for floors six through 11; and $48.00 per square foot for the terrace space. The weighted average in-place rent for the office space at the property is $51.17 per square foot, which is below the appraisal rent conclusion.
| Historical and Current Occupancy(1) | ||
| 2017 | 2018 | Current(2) |
| 84.3% | 82.8% | 87.3% |
| (1) | Historical Occupancies are as of December 31 of each respective year. |
| (2) | Current Occupancy is as of August 6, 2019. |
THE INFORMATION IN THIS STRUCTURAL AND COLLATERAL TERM SHEET IS NOT COMPLETE AND MAY BE AMENDED PRIOR TO THE TIME OF SALE. THIS TERM SHEET IS NOT AN OFFER TO SELL THESE SECURITIES AND IT IS NOT A SOLICITATION OF AN OFFER TO BUY THESE SECURITIES IN ANY JURISDICTION WHERE THE OFFER OR SALE IS NOT PERMITTED.
| | |
43 of 156
| Structural and Collateral Term Sheet | Benchmark 2019-B14 | |
| Watergate Office Building | ||
| Tenant Summary(1) | |||||||
| Tenant | Ratings Moody’s/S&P/Fitch(2) | Net Rentable Area (SF) | % of Total NRA | Base Rent PSF(3) | % of Total Base Rent | Lease Expiration Date | |
| National Trust for Historic Preservation(4) | NR / NR / NR | 37,745 | 17.5% | $52.04 | 20.6% | 12/31/2028 | |
| GWU(5) | A1 / A+ / NR | 36,529 | 17.0 | $55.32 | 21.2 | 7/31/2027 | |
| SAGE Publications(6) | NR / NR / NR | 26,188 | 12.2 | $47.04 | 12.9 | 10/31/2022 | |
| KIPP DC(7) | NR / NR / NR | 18,422 | 8.6 | $51.63 | 10.0 | 9/30/2025 | |
| National League for Nursing(8) | NR / NR / NR | 18,299 | 8.5 | $51.27 | 9.8 | 4/30/2026 | |
| Washington National Opera(9) | NR / NR / NR | 8,799 | 4.1 | $46.82 | 4.3 | 11/30/2023 | |
| Brazilian Mission to the OAS | NR / NR / NR | 8,793 | 4.1 | $51.15 | 4.7 | 10/31/2027 | |
| EMPEA(10) | NR / NR / NR | 6,738 | 3.1 | $50.61 | 3.6 | 12/31/2028 | |
| National Environmental Strategies | NR / NR / NR | 4,555 | 2.1 | $50.00 | 2.4 | 12/31/2024 | |
| Centennial Group Holdings | NR / NR / NR | 3,801 | 1.8 | $50.61 | 2.0 | 4/30/2022 | |
| Ten Largest Tenants | 169,869 | 78.9% | $51.39 | 91.4% | |||
| Remaining Tenants(11) | 18,049 | 8.4 | $48.98 | 8.6 | |||
| Vacant | 27,282 | 12.7 | $0.00 | 0.0 | |||
| Total / Wtd. Avg.(11) | 215,200 | 100.0% | $51.17 | 100.0% | |||
| (1) | Based on the underwritten rent roll dated August 6, 2019. |
| (2) | Ratings provided are for the parent company of the entity listed in the “Tenant” field whether or not the parent company guarantees the lease. |
| (3) | Base Rent PSF includes $218,785 of contractual rent steps through August 2020 and $238,217 which represents present value of rent steps for GWU. |
| (4) | Tenant has one, five-year renewal option under its lease. |
| (5) | Tenant has one, five-year or 10-year renewal option under its lease. |
| (6) | Tenant has one, five-year renewal option under its lease. Tenant has the one-time right to terminate its lease effective November 30, 2020 with at least 12 months’ written notice and payment of a termination fee equal to the unamortized portion of leasing costs plus four monthly installments of base rent in effect on the termination date. |
| (7) | Tenant has one, five-year renewal option under its lease. |
| (8) | Tenant has two, five-year renewal options under its lease. |
| (9) | Tenant has one, five-year renewal option under its lease. |
| (10) | Tenant has one, five-year renewal option under its lease. |
| (11) | Remaining Tenants and Total / Wtd. Avg. Base Rent PSF excludes 1,352 square feet of building office space. |
| Lease Rollover Schedule(1)(2) | |||||||||||
| Year | Number of Tenants Expiring | Net Rentable Area Expiring | % of NRA Expiring | Base Rent Expiring(2) | % of Base Rent Expiring(2) | Cumulative Net Rentable Area Expiring | Cumulative % of NRA Expiring | Cumulative Expiring(2) | Cumulative % of Base Rent Expiring(2) | ||
| Vacant | NAP | 27,282 | 12.7% | NAP | NAP | 27,282 | 12.7% | NAP | NAP | ||
| MTM(3) | 0 | 1,352 | 0.6 | $0 | 0.0% | 28,634 | 13.3% | $0 | 0.0% | ||
| 2019 | 0 | 0 | 0.0 | 0 | 0.0% | 28,634 | 13.3% | $0 | 0.0% | ||
| 2020 | 1 | 1,639 | 0.8 | 77,489 | 0.8% | 30,273 | 14.1% | $77,489 | 0.8% | ||
| 2021 | 0 | 0 | 0.0 | 0 | 0.0% | 30,273 | 14.1% | $77,489 | 0.8% | ||
| 2022 | 2 | 29,989 | 13.9 | 1,424,240 | 14.9% | 60,262 | 28.0% | $1,501,729 | 15.7% | ||
| 2023 | 2 | 11,578 | 5.4 | 557,989 | 5.8% | 71,840 | 33.4% | $2,059,718 | 21.6% | ||
| 2024 | 5 | 9,520 | 4.4 | 462,724 | 4.8% | 81,360 | 37.8% | $2,522,442 | 26.4% | ||
| 2025 | 1 | 18,422 | 8.6 | 951,059 | 10.0% | 99,782 | 46.4% | $3,473,501 | 36.4% | ||
| 2026 | 2 | 20,804 | 9.7 | 1,071,706 | 11.2% | 120,586 | 56.0% | $4,545,207 | 47.6% | ||
| 2027 | 2 | 45,322 | 21.1 | 2,470,464 | 25.9% | 165,908 | 77.1% | $7,015,672 | 73.5% | ||
| 2028 | 3 | 45,513 | 21.1 | 2,331,121 | 24.4% | 211,421 | 98.2% | $9,346,792 | 97.9% | ||
| 2029 | 1 | 2,280 | 1.1 | 126,032 | 1.3% | 213,701 | 99.3% | $9,472,824 | 99.2% | ||
| 2030 & Beyond | 1 | 1,499 | 0.7 | 73,845 | 0.8% | 215,200 | 100.0% | $9,546,669 | 100.0% | ||
| Total | 20 | 215,200 | 100.0% | $9,546,669 | 100.0% | ||||||
| (1) | Based on the underwritten rent roll dated August 6, 2019. |
| (2) | Base Rent Expiring, % of Base Rent Expiring, Cumulative Base Rent Expiring and Cumulative % of Base Rent Expiring includes $218,785 of contractual rent steps through August 2020 and $238,217 which represents present value of rent steps for GWU. |
| (3) | MTM includes 1,352 square feet of building office space with no rent attributed to it. |
THE INFORMATION IN THIS STRUCTURAL AND COLLATERAL TERM SHEET IS NOT COMPLETE AND MAY BE AMENDED PRIOR TO THE TIME OF SALE. THIS TERM SHEET IS NOT AN OFFER TO SELL THESE SECURITIES AND IT IS NOT A SOLICITATION OF AN OFFER TO BUY THESE SECURITIES IN ANY JURISDICTION WHERE THE OFFER OR SALE IS NOT PERMITTED.
| | |
44 of 156
| Structural and Collateral Term Sheet | Benchmark 2019-B14 | |
| Watergate Office Building | ||
| Operating History and Underwritten Net Cash Flow | ||||||
| 2017 | 2018 | TTM(1) | Underwritten | Per Square Foot | %(2) | |
| Rents in Place(3) | $8,276,155 | $8,013,807 | $8,591,563 | $9,546,669 | $44.36 | 89.4% |
| Vacant Income | 0 | 0 | 0 | 1,053,439 | 4.90 | 9.9 |
| Gross Potential Rent | $8,276,155 | $8,013,807 | $8,591,563 | $10,600,108 | $49.26 | 99.3% |
| Total Reimbursements | 299,411 | 215,256 | 194,906 | 75,066 | 0.35 | 0.7 |
| Net Rental Income | $8,575,566 | $8,229,063 | $8,786,469 | $10,675,174 | $49.61 | 100.0% |
| (Vacancy/Credit Loss) | (886,080) | (446,921) | (878,058) | (1,053,439) | (4.90) | (9.9) |
| Parking | 243,135 | 214,204 | 268,697 | 268,697 | 1.25 | 2.5 |
| Other Income(4) | 53,445 | 34,631 | 31,300 | 41,300 | 0.19 | 0.4 |
| Effective Gross Income | $7,986,067 | $8,030,977 | $8,208,408 | $9,931,731 | $46.15 | 93.0% |
| Total Expenses | $4,110,086 | $4,030,004 | $3,992,937 | $3,922,559 | $18.23 | 39.5% |
| Net Operating Income(5) | $3,875,980 | $4,000,973 | $4,215,470 | $6,009,172 | $27.92 | 60.5% |
| Total TI/LC, Capex/RR | 0 | 0 | 0 | 365,840 | 1.70 | 3.7% |
| Net Cash Flow | $3,875,980 | $4,000,973 | $4,215,470 | $5,643,332 | $26.22 | 56.8% |
| (1) | TTM represents the trailing 12-month period ending July 31, 2019. |
| (2) | % column represents percent of Net Rental Income for all revenue lines and represents percent of Effective Gross Income for the remainder of the fields. |
| (3) | Underwritten Rents in Place includes $218,785 of contractual rent steps through August 2020 and $238,217 which represents present value of rent steps for GWU. |
| (4) | Other Income consists of UPS and FedEx drop box income and cell tower income for Omnipoint Communications. |
| (5) | The increase from TTM Net Operating Income to Underwritten Net Operating Income is primarily due to recent leasing at the Watergate Office Building Property and rent steps ($218,785 of contractual rent steps through August 2020 and $238,217 which represents the present value of rent steps for GWU). Eight new leases were executed since January 2019 accounting for $393,511 of base rent. |
Property Management. The Watergate Office Building Property is managed by Seligman & Associates, LLC, an affiliate of the Watergate Office Building Loan sponsor, which has engaged LPC Commercial Services, Inc. as an unaffiliated third-party sub-manager.
Escrows and Reserves. On the origination date of the Watergate Office Building Loan, the borrowers deposited $750,000 into the tenant improvement and leasing commission reserve, $250,005 into the tax reserve account, $141,435 into the unfunded obligations reserve and $78,181 into the insurance reserve. The unfunded obligations reserve consists of $55,309 for free rent under the National Environmental Strategies lease, $36,021 for free rent under the Blossom Dentistry lease and $50,105 for tenant improvement allowances and/or leasing commissions with respect to the National Environmental Strategies lease.
Tax Escrows– On a monthly basis, the borrowers are required to deposit an amount equal to 1/12 of the estimated annual real estate taxes into a tax reserve (initially estimated at $125,003).
Insurance Escrows – On a monthly basis, the borrowers are required to deposit an amount equal to 1/12 of the estimated annual insurance premiums into an insurance reserve account (initially estimated at $11,169).
ReplacementReserves – On a monthly basis, the borrowers are required to escrow approximately $3,587 for replacement reserves. The reserve is not subject to a cap.
TI/LC Reserves –On a monthly basis, the borrowers are required to deposit an amount equal to $26,900 for tenant improvements and leasing commissions, subject to a cap of $2,364,000. The TI/LC reserve cap will be reduced dollar for dollar by the amount of any portion of the TI/LC reserve initial deposit that has been disbursed to the borrowers pursuant to the Watergate Office Building Loan documents, provided that the TI/LC reserve cap amount may not be reduced to less than $1,614,000.
THE INFORMATION IN THIS STRUCTURAL AND COLLATERAL TERM SHEET IS NOT COMPLETE AND MAY BE AMENDED PRIOR TO THE TIME OF SALE. THIS TERM SHEET IS NOT AN OFFER TO SELL THESE SECURITIES AND IT IS NOT A SOLICITATION OF AN OFFER TO BUY THESE SECURITIES IN ANY JURISDICTION WHERE THE OFFER OR SALE IS NOT PERMITTED.
| | |
45 of 156
| Structural and Collateral Term Sheet | Benchmark 2019-B14 | |
| Watergate Office Building | ||
Sage Escrow Reserves – On the origination date of the Watergate Office Building Loan, approximately $590,711 was deposited into escrow (“Sage Fidelity Escrow Reserve”) with Fidelity National Title Insurance Company (“Fidelity”) with respect to certain tenant improvement allowances and/or leasing commissions that may become due and payable pursuant to a potential amendment to the lease with Sage Publications, which amendment is currently being negotiated. Pursuant to an escrow agreement between the seller, Watergate Office Fee Owner, LLC, and certain borrowers, the borrowers will be entitled to receive such escrowed funds in the event that amendment is executed on or prior to October 31, 2020, to the extent such amendment requires payment of such tenant improvement allowances and/or leasing commissions. Fidelity and the borrowers have agreed that, to the extent that any borrower is entitled to receive any amount of such escrowed funds, all such funds will instead be paid to the lender. Pursuant to the Watergate Office Building Loan documents, any such funds will be made available by the lender for the applicable tenant improvement allowances and/or leasing commissions, as applicable, subject to satisfaction of the conditions set forth in the Watergate Office Building Loan documents.
Lockbox / Cash Management.The Watergate Office Building Loan is structured with a hard lockbox and springing cash management. The borrowers were required to deliver tenant direction letters to each existing tenant at the Watergate Office Building Property directing each of them to remit their rent checks directly to the lender-controlled lockbox. The borrowers are required to cause revenue received by the borrower or the property manager from the Watergate Office Building Property to be immediately deposited into such lockbox. All funds deposited into the lockbox are required to be transferred on each business day to or at the direction of the borrowers unless a Trigger Period (as defined below) exists. Upon the occurrence and during the continuance of a Trigger Period, all funds in the lockbox account are required to be swept on each business day to a cash management account under the control of the lender to be applied and disbursed in accordance with the Watergate Office Building Loan documents, and all excess cash flow funds remaining in the cash management account after the application of such funds in accordance with the Watergate Office Building Loan documents are required to be held by the lender in an excess cash flow reserve account as additional collateral for the Watergate Office Building Loan. If such Trigger Period has been cured, the excess cash flow funds are required to be returned to the borrowers (except to the extent that such excess cash flow funds are being used to satisfy the Collateral Cure Condition (as defined below)).
A “Trigger Period” means a period (A) commencing upon the earliest to occur of (i) an event of default, (ii) the debt yield being less than 6.25%, (iii) a Specified Tenant Trigger Period (as defined below), and (iv) the senior unsecured credit rating (or the equivalent thereof) of GWU falling below investment grade (a long-term credit rating of BBB or better by each rating agency), and (B) expiring upon (a) with respect to clause (i) above, the cure of such event of default, (b) with respect to clause (ii) above, the debt yield being equal to or greater than 6.25% for two consecutive calendar quarters, (c) with respect to clause (iii) above, such Specified Tenant Trigger Period ceasing to exist, and (d) with respect to clause (iv) above, the senior unsecured credit rating (or the equivalent thereof) of GWU improving to a long-term credit rating of BBB+ or better by each rating agency.
A “Specified Tenant” means, as applicable, (i) GWU, (ii) NTHP, (iii) any other tenant leasing all or a portion of the applicable Specified Tenant space and any guarantor of a Specified Tenant lease at the Watergate Office Building Property, and (iv) any other tenant pursuant to any lease which, individually or when aggregated with all other leases at the Watergate Office Building Property with the same tenant or its affiliate, either (A) accounts for twenty percent (20%) or more of the total rental income for the Watergate Office Building Property, or (B) demises twenty percent (20%) or more of the Watergate Office Building Property’s gross leasable area.
A “Specified Tenant Trigger Period” will (A) commence upon the first to occur of (i) any Specified Tenant being in a monetary or material non-monetary default under the applicable Specified Tenant lease beyond all applicable notice and cure periods, (ii) any Specified Tenant failing to be in actual, physical possession of its space, failing to be open to the public for business during customary hours and/or, to the extent such Specified Tenant is a retail tenant, “going dark” in the applicable Specified Tenant space, (iii) any Specified Tenant giving notice that it is terminating its lease for all or any material portion of the Specified Tenant space, (iv) any termination or cancellation of any Specified Tenant lease and/or any Specified Tenant lease failing to otherwise be in full force and effect, (v) any bankruptcy or similar insolvency of a Specified Tenant, and (vi) any Specified Tenant failing to extend or renew the applicable Specified Tenant lease on or prior to the applicable Specified Tenant extension deadline in accordance with the applicable terms and conditions of the applicable Specified Tenant lease and the Watergate Office Building Loan documents for a term of at least three years, and (B) expire upon the first to occur of (i) the satisfaction of the Specified Tenant cure conditions under the Watergate Office Building Loan documents, or (ii) the borrowers re-leasing the entire Specified Tenant space, the applicable tenant under such lease being in actual, physical occupancy of, and open to the public for business in, the space demised under such Lease and paying the full amount of the rent due under such lease. A Specified Tenant Trigger Period will not be deemed to exist to the extent that the borrowers have (i) deposited cash into an account with the lender, (ii) delivered to the lender an acceptable letter of credit, or (iii) caused excess cash flow to be deposited into the excess cash flow account, in each case, as additional collateral for the Watergate Office Building Loan and in an amount equal to 12 months of the applicable Specified Tenant’s gross rent (the “Collateral Cure Condition”).
THE INFORMATION IN THIS STRUCTURAL AND COLLATERAL TERM SHEET IS NOT COMPLETE AND MAY BE AMENDED PRIOR TO THE TIME OF SALE. THIS TERM SHEET IS NOT AN OFFER TO SELL THESE SECURITIES AND IT IS NOT A SOLICITATION OF AN OFFER TO BUY THESE SECURITIES IN ANY JURISDICTION WHERE THE OFFER OR SALE IS NOT PERMITTED.
| | |
46 of 156
| Structural and Collateral Term Sheet | Benchmark 2019-B14 | |
| Watergate Office Building | ||
Master Lease / Reverse 1031 Exchange: 2600 Virginia Avenue Master Lessee LLC is the tenant under a master lease structure created to facilitate a reverse 1031 exchange to be consummated by 2600 Virginia Avenue 4 LLC. Upon consummation of the reverse 1031 exchange in accordance with the terms and conditions set forth in the Watergate Office Building Loan documents, the related borrower is permitted to terminate this master lease subject to satisfaction of certain requirements set forth in the Watergate Office Building Loan documents.
Parking Lease / Fitness Lease: The borrowers are leasing certain fitness center space from an adjacent property owner through a certain lease (the “Fitness Lease”) to satisfy certain obligations to provide access to a fitness center pursuant to certain leases under which the borrowers are the landlord. In addition, the borrowers are leasing certain parking spaces from an adjacent property owner through a certain lease (the “Parking Lease”) to satisfy certain obligations to provide access to parking spaces pursuant to certain leases under which the borrowers are the landlord. The borrowers have collaterally assigned their interests under both the Fitness Lease and the Parking Lease to the lender pursuant to the related mortgage. Subject to satisfaction of certain requirements set forth in the Watergate Office Building Loan documents, the borrowers will be permitted (with the lender’s consent) to replace the Fitness Lease and/or the Parking Lease with another instrument or instruments that (together with any applicable facilities at the Watergate Office Building Property) satisfy all tenant (and legal) requirements with respect to access to a fitness center and/or parking spaces, respectively.
THE INFORMATION IN THIS STRUCTURAL AND COLLATERAL TERM SHEET IS NOT COMPLETE AND MAY BE AMENDED PRIOR TO THE TIME OF SALE. THIS TERM SHEET IS NOT AN OFFER TO SELL THESE SECURITIES AND IT IS NOT A SOLICITATION OF AN OFFER TO BUY THESE SECURITIES IN ANY JURISDICTION WHERE THE OFFER OR SALE IS NOT PERMITTED.
| | |
47 of 156
| Structural and Collateral Term Sheet | Benchmark 2019-B14 | |
| 225 Bush | ||
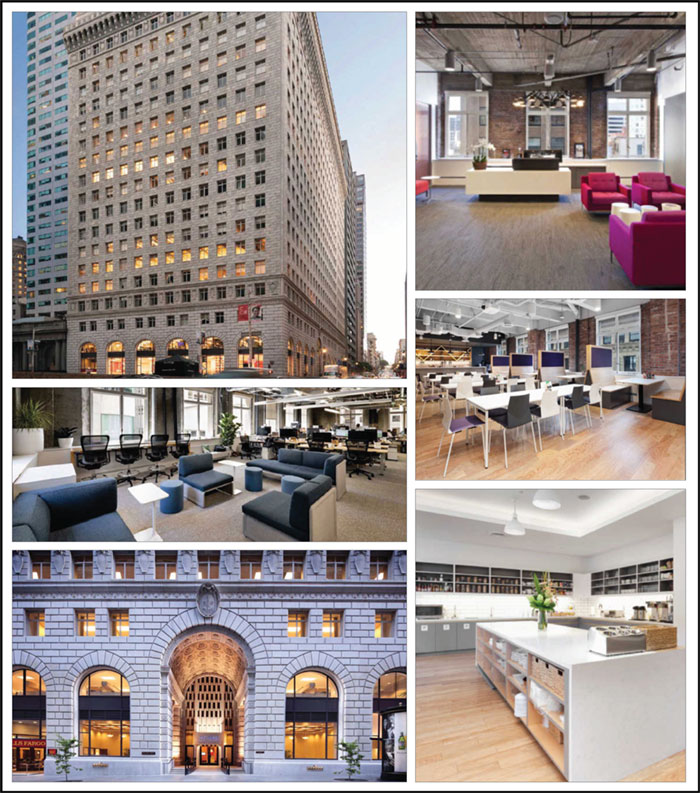
THE INFORMATION IN THIS STRUCTURAL AND COLLATERAL TERM SHEET IS NOT COMPLETE AND MAY BE AMENDED PRIOR TO THE TIME OF SALE. THIS TERM SHEET IS NOT AN OFFER TO SELL THESE SECURITIES AND IT IS NOT A SOLICITATION OF AN OFFER TO BUY THESE SECURITIES IN ANY JURISDICTION WHERE THE OFFER OR SALE IS NOT PERMITTED.
| | |
48 of 156
| Structural and Collateral Term Sheet | Benchmark 2019-B14 | |
| 225 Bush | ||

THE INFORMATION IN THIS STRUCTURAL AND COLLATERAL TERM SHEET IS NOT COMPLETE AND MAY BE AMENDED PRIOR TO THE TIME OF SALE. THIS TERM SHEET IS NOT AN OFFER TO SELL THESE SECURITIES AND IT IS NOT A SOLICITATION OF AN OFFER TO BUY THESE SECURITIES IN ANY JURISDICTION WHERE THE OFFER OR SALE IS NOT PERMITTED.
| | |
49 of 156
| Structural and Collateral Term Sheet | Benchmark 2019-B14 | |
| 225 Bush | ||
| Mortgage Loan Information | Property Information | |||
| Mortgage Loan Seller: | GACC | Single Asset / Portfolio: | Single Asset | |
| Credit Assessment: | Title: | Fee | ||
| (Fitch / KBRA / S&P)(1): | BBB-sf / A(sf) / N/A | Property Type - Subtype: | Office – CBD | |
| Original Principal Balance(2): | $60,000,000 | Net Rentable Area (SF): | 579,987 | |
| Cut-off Date Principal Balance(2): | $60,000,000 | Location: | San Francisco, CA | |
| % of Pool by IPB: | 4.5% | Year Built / Renovated: | 1922, 1955 / 2010-2013 | |
| Loan Purpose: | Refinance | Occupancy: | 97.8% | |
| Borrower: | 225 Bush Street Owners LLC | Occupancy Date: | 9/30/2019 | |
| Sponsor: | Kylli Inc. | Number of Tenants: | 32 | |
| Interest Rate: | 3.30300% | 2016 NOI: | $25,426,362 | |
| Note Date: | 10/11/2019 | 2017 NOI: | $24,788,393 | |
| Maturity Date: | 11/6/2024 | 2018 NOI(5): | $25,674,474 | |
| Interest-only Period: | 60 months | TTM NOI (as of 8/2019)(5): | $24,512,257 | |
| Original Term: | 60 months | UW Economic Occupancy: | 95.1% | |
| Original Amortization: | None | UW Revenues: | $41,830,321 | |
| Amortization Type: | Interest Only | UW Expenses: | $14,566,655 | |
| Call Protection(3): | L(24),Def(30),O(6) | UW NOI(5): | $27,263,666 | |
| Lockbox / Cash Management: | Hard / Springing | UW NCF: | $26,277,688 | |
| Additional Debt(2)(4): | Yes | Appraised Value / Per SF: | $589,000,000 / $1,016 | |
| Additional Debt Balance(2)(4): | $143,600,000 / $146,400,000 | Appraisal Date: | 9/5/2019 | |
| Additional Debt Type(2)(4): | Pari Passu / Subordinate Debt | |||
| Escrows and Reserves(6) | Financial Information | ||||||
| Initial | Monthly | Initial Cap | Senior Notes | Whole Loan | |||
| Taxes: | $3,012,292 | $376,536 | N/A | Cut-off Date Loan / SF: | $351 | $603 | |
| Insurance: | $838,031 | $119,719 | N/A | Maturity Date Loan / SF: | $351 | $603 | |
| Replacement Reserves: | $0 | $9,666 | $231,995 | Cut-off Date LTV: | 34.6% | 59.4% | |
| TI/LC: | $0 | $96,665 | $3,479,922 | Maturity Date LTV: | 34.6% | 59.4% | |
| Other: | $4,983,228 | $0 | N/A | UW NCF DSCR: | 3.85x | 2.24x | |
| UW NOI Debt Yield: | 13.4% | 7.8% | |||||
Sources and Uses | |||||||
| Sources | Proceeds | % of Total | Uses | Proceeds | % of Total | ||
| Senior Notes | $203,600,000 | 58.2% | Payoff Existing Debt | $241,210,092 | 68.9% | ||
| Subordinate Debt | 146,400,000 | 41.8% | Return of Equity | 96,364,753 | 27.5 | ||
| Upfront Reserves | 8,833,550 | 2.5% | |||||
| Closing Costs | 3,591,605 | 1.0% | |||||
| Total Sources | $350,000,000 | 100.0% | Total Uses | $350,000,000 | 100.0% | ||
| (1) | Fitch and KBRA provided the listed assessments for the 225 Bush Loan (as defined below) in the context of its inclusion in the mortgage pool. S&P does not provide a credit assessment but confirmed that the 225 Bush Loan has, in the context of its inclusion in the mortgage pool, credit characteristics consistent with an investment grade obligation. |
| (2) | The 225 Bush Loan consists of the non-controlling Note A-1 and Note A-6 and is part of the 225 Bush Whole Loan (as defined below) evidenced by six seniorpari passu notes and one subordinate note, with an aggregate outstanding principal balance as of the Cut-off Date of $350.0 million. For additional information, see “The Loan” below. |
| (3) | The lockout period will be at least 24 payments beginning with and including the first payment date of December 6, 2019. The borrower has the option to defease the entire $350.0 million 225 Bush Whole Loan in whole (and not in part) after the earlier to occur of (i) two years after the closing date of the securitization that includes the last note to be securitized and (ii) October 11, 2022. The assumed lockout period of 24 months is based on the expected closing date of the Benchmark 2019-B14 securitization in November 2019. The actual lockout period may be longer. |
| (4) | See “Current Mezzanine or Subordinate Indebtedness" below. |
| (5) | NOI fluctuations year-over-year are due to tenant rent abatements associated with new leases. |
| (6) | For a full description of Escrows and Reserves, please refer to“Escrows and Reserves”below. |
THE INFORMATION IN THIS STRUCTURAL AND COLLATERAL TERM SHEET IS NOT COMPLETE AND MAY BE AMENDED PRIOR TO THE TIME OF SALE. THIS TERM SHEET IS NOT AN OFFER TO SELL THESE SECURITIES AND IT IS NOT A SOLICITATION OF AN OFFER TO BUY THESE SECURITIES IN ANY JURISDICTION WHERE THE OFFER OR SALE IS NOT PERMITTED.
| | |
50 of 156
| Structural and Collateral Term Sheet | Benchmark 2019-B14 | |
| 225 Bush | ||
The Loan.The 225 Bush mortgage loan (the “225 Bush Loan”) is part of a whole loan with an aggregate outstanding principal balance as of the Cut-off Date of $350.0 million (the “225 Bush Whole Loan”), which whole loan is secured by the borrower’s fee interest in a 579,987 square foot, Class A, office building with ground floor retail located in San Francisco, California (the “225 Bush Property”).The 225 Bush Whole Loan is comprised of (i) a senior loan, comprised of sixpari passunotes with an aggregate principal balance as of the Cut-off Date of $203.6 million (the “225 Bush Senior Notes”), two of which (Note A-1 and A-6 with an aggregate outstanding principal balance as of the Cut-off Date of $60.0 million) are being contributed to the Benchmark 2019-B14 Trust and constitute the 225 Bush Loan, and the remainder of which are expected to be contributed to one or more other securitization trusts and (ii) a subordinate loan, comprised of one note, with an outstanding principal balance as of the Cut-off Date of $146.4 million (collectively, the “225 Bush Subordinate Companion Note”). The 225 Bush Subordinate Companion Note will be an asset of the trust but will not be pooled together with the other Mortgage Loans, and payments of interest and principal received in respect of the 225 Bush Subordinate Companion Note will be available to make distributions in respect of the loan specific classes of certificates only.The relationship between the holders of the 225 Bush Senior Notes and 225 Bush Subordinate Companion Note will be governed by a co-lender agreement as described under“Description of the Mortgage Pool—The Whole Loans—The Serviced AB Whole Loans—The 225 Bush Whole Loan”in the Preliminary Prospectus. The 225 Bush Whole Loan was originated by DBNY and, on the origination date, was transferred to DBR Investments Co. Limited (“DBRI”). The 225 Bush Whole Loan has a five-year term and will be interest-only for its entire term.
| Whole Loan Summary | |||||
| Note | Original Balance | Cut-off Date Balance | Note Holder | Controlling Piece | |
| Note A-1 | $50,000,000 | $50,000,000 | Benchmark 2019-B14 | No(1) | |
| Note A-2 | 50,000,000 | 50,000,000 | DBRI | No | |
| Note A-3 | 38,000,000 | 38,000,000 | DBRI | No | |
| Note A-4 | 35,000,000 | 35,000,000 | DBRI | No | |
| Note A-5 | 20,600,000 | 20,600,000 | DBRI | No | |
| Note A-6 | 10,000,000 | 10,000,000 | Benchmark 2019-B14 | No | |
| Senior Notes | $203,600,000 | $203,600,000 | |||
| Note B | 146,400,000 | 146,400,000 | Benchmark 2019-B14 (loan specific certificates) | Yes(1) | |
| Whole Loan | $350,000,000 | $350,000,000 | |||
| (1) | The initial controlling note is Note B, so long as no 225 Bush Control Appraisal Period has occurred and is continuing. If and for so long as a 225 Bush Control Appraisal Period has occurred and is continuing, then the controlling note will be the Note A-1. See “Description of the Mortgage Pool—The Whole Loans—The Serviced AB Whole Loans—The 225 Bush Whole Loan”. The 225 Bush Whole Loan will be serviced pursuant to the Benchmark 2019-B14 Pooling and Servicing Agreement. For so long as Note B is included in the Benchmark 2019-B14 trust, and no 225 Bush Control Appraisal Period has occurred and is continuing, the control rights of Note B when it is the controlling note will be exercisable by the Loan-Specific Directing Holder for the Benchmark 2019-B14 loan-specific certificates. |
The Borrower.The borrower is 225 Bush Street Owners LLC, a Delaware limited liability company. The company is structured to be a single purpose bankruptcy-remote entity with 225 Bush Street Owners LLC having two independent directors in its organizational structure.
The Loan Sponsor.The loan sponsor and non-recourse carveout guarantor is Kylli Inc. Kylli Inc. is a full-service real estate investment management company focused on the acquisition, development and management of assets in the San Francisco Bay Area. Kylli Inc. is a wholly-owned subsidiary of Genzon Investment Group Co., Ltd., which is a privately-held full service investment company headquartered in Shenzhen, China. Kylli Inc.’s assets in the United States, include (in addition to the 225 Bush Street Property) (i) over 500,000 square feet of office space under management in San Francisco, (ii) 767,000 square feet of office space under construction in Burlingame Point, California fully leased to Facebook and (iii) over 48 acres of developable land in Santa Clara, California.
The Property.The 225 Bush Property is a Class A, 22-story, 579,987 square foot office building with ground floor retail located in the North Financial District neighborhood of San Francisco, California. The 225 Bush Property was originally constructed in two phases in 1922 and 1955. Formerly known as the “Standard Oil Building,” the 225 Bush Property was developed by John D. Rockefeller as the headquarters for Standard Oil and later became the headquarters of Chevron. The 225 Bush Property was designed by George W. Kelham and modeled after the Federal Reserve Bank of New York in Manhattan’s financial district. The 225 Bush Property features 26,000 square foot floor plates, a fitness center with locker rooms and showers, 110 subterranean valet parking spaces and is situated on a 0.88-acre site at the corner of Bush Street and Sansome Street, one block north of Market Street.
THE INFORMATION IN THIS STRUCTURAL AND COLLATERAL TERM SHEET IS NOT COMPLETE AND MAY BE AMENDED PRIOR TO THE TIME OF SALE. THIS TERM SHEET IS NOT AN OFFER TO SELL THESE SECURITIES AND IT IS NOT A SOLICITATION OF AN OFFER TO BUY THESE SECURITIES IN ANY JURISDICTION WHERE THE OFFER OR SALE IS NOT PERMITTED.
| | |
51 of 156
| Structural and Collateral Term Sheet | Benchmark 2019-B14 | |
| 225 Bush | ||
The loan sponsor purchased the 225 Bush Property in 2014 for $350.0 million and thereafter invested approximately $5.0 million in building system upgrades and approximately $23.0 million in tenant improvements. Historical investments include a $1.1 million renovation of the east and west lobbies in 2009 which included new lighting, interior paneling, carpeting, artwork, furniture, security desks, and the installation of new street-level property signage. From 2010 to 2013, the 225 Bush Property underwent a $12.8 million renovation which consisted of a full renovation of the terra cotta brick façade, including waterproofing, repairs of the terra cotta brick, refurbishing and painting of the steel windows and storefronts, as well as lobby renovations and the installation of the 13th floor fitness center. The loan sponsor has indicated that it plans to execute a $7.0 million modernization of the building’s elevator systems which is expected to commence before the end of 2019 and be completed in 2022; however the borrower is under no obligation to conduct the modernization and no amounts were reserved therefor under the 225 Bush Street Whole Loan.
As of September 30, 2019, the 225 Bush Property was 97.8% leased to 32 office tenants and an investment grade retail tenant, Target, which occupies 20,677 square feet of ground floor retail space. The 225 Bush Property’s 10 largest tenants occupy 77.8% of the net rentable area and no tenant occupies more than 14.5% of the total net rentable area.
The largest tenant, Twitch Interactive, Inc. (“Twitch”) (84,035 square feet; 14.5% ofnet rentable area; 14.2% of underwritten base rent), is a wholly owned subsidiary of Amazon.com, Inc. (“Amazon”) (rated A3/A+/AA- by Moody’s/Fitch/S&P). Twitch is a live social media entertainment company which has developed a platform allowing people to create and live-stream their own original entertainment to a global audience. Twitch is a platform for channels relating to cooking, fitness, music, the arts, talk shows and other genres. According to the Twitch website, in 2018, Twitch viewers watched over 505 billion minutes of original content. Additionally, the Twitch platform has over 3 million unique broadcasters each month on average, over 15 million average daily visitors and over 1.3 million average viewership at any given moment.Twitch has been inoccupancyat the 225 Bush Property since May 2013, originally occupying 26,351 square foot (6th floor) under a five-year lease. In November 2014, the tenant executed a six-year renewal, expanding their premises by 25,653 square feet (8th floor) and 26,457 square feet (9th floor) for a total footprint of 78,461 square feet (not including storage space). Twitch has one, five-year extension option remaining as well as a right of first offer to lease the entire 2nd, 5th, 7th and 10th floors. Amazon fully guarantees Twitch’s lease.
The second largest tenant, LiveRamp, Inc (“LiveRamp”) (76,724 square feet; 13.2% of net rentable area; 15.4% ofunderwritten base rent) provides an identity resolutionsoftwareplatform to companies that enables a customer to use their offline customer data in online advertising. According to LiveRamp’s financial statements, as of March 2019, LiveRamp reported an annual revenue $285.62 million. Subscription revenue was $237 million, up 38% and contributed 83% of total revenue. LiveRamp has been in occupancy at the 225 Bush Property since May 2015, originally occupying 25,891 square feet (17th floor) under a seven-year lease. LiveRampexpandedat the 225 Bush Property in August 2016 by 25,809 square feet (16th floor) and once more in in July 2017 by an additional 25,024 square feet (15th floor) for a total footprint of 76,724 square feet. The tenant has one, five-year extension option remaining for the entirety of its space.
The third largest tenant, Benefit Cosmetics, LLC (61,917 square feet; 10.7% of net rentable area; 6.0% ofunderwritten base rent) is a wholly owned subsidiary of Moët Hennessy – Louis Vuitton (“LVMH”), which itself is multinational luxury goods conglomerate headquartered in Paris, France. According to the loan sponsor, Benefit Cosmetics has indicated that it will not be extending its lease at the end of its term in August 2020. Benefit Cosmetics is currently in occupancy and paying full rent at $35.90 per square foot, which is approximately 60.1% below the appraisal’s concluded market rent for the Benefit Cosmetics space of $90.00 per square foot.
The 225 Bush Property is located in San Francisco’s North Financial District on the corner of Sansome Street and Bush Street, one block from the South of Market (“SOMA”) neighborhood. The 225 Bush Property is approximately 0.5 miles east of Union Square, which features major international retailers such as Nike, Apple, Gucci, Macy’s and Louis Vuitton and approximately 0.1 miles from the popular dining corridor known as Belden Place. In addition, the 225 Bush Property is within walking distance to the Montgomery BART station (0.3 miles), MUNI light rail, bus system stops and the Transbay Terminal development.
As of the second quarter of 2019, the North Financial District office submarket consisted of approximately 30.3 million square feet of office space with an overall market vacancy of 5.2% and average asking rents of approximately $67.81 per square foot.
THE INFORMATION IN THIS STRUCTURAL AND COLLATERAL TERM SHEET IS NOT COMPLETE AND MAY BE AMENDED PRIOR TO THE TIME OF SALE. THIS TERM SHEET IS NOT AN OFFER TO SELL THESE SECURITIES AND IT IS NOT A SOLICITATION OF AN OFFER TO BUY THESE SECURITIES IN ANY JURISDICTION WHERE THE OFFER OR SALE IS NOT PERMITTED.
| | |
52 of 156
| Structural and Collateral Term Sheet | Benchmark 2019-B14 | |
| 225 Bush | ||
The appraisal identified six directly competitive office rent comparables located in the Financial District submarket. Comparable buildings were built between 1912 and 2000 and range in size from 47,733 square feet to 485,000 square feet. Direct asking rents at the comparable properties ranged between $77.00 and $92.00 per square foot (full service leases) with a weighted average of approximately $86.29 per square foot. The 225 Bush Property’s in-place weighted average office rent is $68.89 per square foot, which is lower than the appraisal’s concluded office market rent, which ranges from $75.00 per square foot to $90.00 per square foot. The 225 Bush Property’s in-place weighted average office rent is approximately 18.1% below the weighted average concluded office market rent.
| Summary of Appraisal’s Concluded Office Market Rent | |
| Floor(s) | Appraisal’s Concluded Office Market Rent PSF |
| Partial Floor | $75.00 |
| Full Floor | $85.00 |
| Benefit Cosmetics Space | $90.00 |
| Historical and Current Occupancy | |||
| 2016(1) | 2017(1) | 2018(1) | Current(2) |
| 93.4% | 92.0% | 92.5% | 97.8% |
| (1) | Historical Occupancies are as of December 31 of each respective year. |
| (2) | Current Occupancy is as of September 30, 2019. |
| Tenant Summary(1) | |||||||
| Tenant | Ratings Moody’s/Fitch/S&P(2) | Net Rentable Area (SF) | % of Total NRA | Base Rent PSF(3) | % of Total Base Rent | Lease Expiration Date | |
| Twitch Interactive(3) | A3 / A+ / AA- | 84,035 | 14.5% | $62.98 | 14.2% | 8/18/2021 | |
| LiveRamp, Inc | NR / NR / NR | 76,724 | 13.2% | $74.86 | 15.4% | 5/4/2022 | |
| Benefit Cosmetics, LLC(4)(5) | NR / NR / NR | 61,917 | 10.7% | $35.90 | 6.0% | 8/31/2020 | |
| Handshake | NR / NR / NR | 52,735 | 9.1% | $90.01 | 12.7% | 7/30/2027 | |
| SunRun | NR / NR / NR | 43,850 | 7.6% | $81.75 | 9.6% | 5/31/2024 | |
| Knotel | NR / NR / NR | 26,664 | 4.6% | $79.00 | 5.6% | 7/14/2026 | |
| Jewish Vocational Services(6) | NR / NR / NR | 26,497 | 4.6% | $47.59 | 3.4% | 2/28/2021 | |
| Mesosphere, Inc. | NR / NR / NR | 26,339 | 4.5% | $79.31 | 5.6% | 4/30/2023 | |
| HEAP, Inc. | NR / NR / NR | 26,333 | 4.5% | $73.13 | 5.2% | 8/21/2023 | |
| General Assembly Space, Inc. | NR / NR / NR | 26,320 | 4.5% | $64.92 | 4.6% | 8/29/2024 | |
| Total Major Office and Retail | 451,414 | 77.8% | $67.97 | 82.1% | |||
| Other Occupied(7) | 115,919 | 20.0% | $57.58 | 17.9% | |||
| Total Occupied | 567,333 | 97.8% | $65.84 | 100.0% | |||
| Vacant | 12,654 | 2.2% | |||||
| Total | 579,987 | 100.0% | |||||
| (1) | Based on the underwritten rent roll dated September 30, 2019. |
| (2) | In certain instances, ratings provided are those of the parent company of the entity shown, whether or not the parent company guarantees the lease. |
| (3) | The Net Rentable Area (SF) and Base Rent PSF for Twitch Interactive includes 5,574 square feet of storage space with an average base rent of $11.39 per square foot. |
| (4) | According to the loan sponsor, Benefit Cosmetics has indicated that it will not be extending its lease at the end of its term in August 2020. Benefit Cosmetics is currently in occupancy and paying full rent at $35.90 per square foot, which is approximately 60.1% below the appraisal’s concluded market rent for the Benefit Cosmetics space of $90.00 per square foot. |
| (5) | The Net Rentable Area (SF) and Base Rent PSF for Benefit Cosmetics, LLC includes 1,787 square feet of storage space with an average base rent of $17.83 per square foot. |
| (6) | The Net Rentable Area (SF) and Base Rent PSF for Jewish Vocational Services includes 305 square feet of storage space with a base rent of $12.00 per square foot. |
| (7) | Other is inclusive of a 8,766 square feet of conference room space and fitness center space and 3,957 square feet of storage space and antenna space with no attributable underwritten base rent. |
THE INFORMATION IN THIS STRUCTURAL AND COLLATERAL TERM SHEET IS NOT COMPLETE AND MAY BE AMENDED PRIOR TO THE TIME OF SALE. THIS TERM SHEET IS NOT AN OFFER TO SELL THESE SECURITIES AND IT IS NOT A SOLICITATION OF AN OFFER TO BUY THESE SECURITIES IN ANY JURISDICTION WHERE THE OFFER OR SALE IS NOT PERMITTED.
| | |
53 of 156
| Structural and Collateral Term Sheet | Benchmark 2019-B14 | |
| 225 Bush | ||
| Lease Rollover Schedule(1)(2) | |||||||||
| Year | Number of Leases Expiring | Net Rentable Area Expiring | % of NRA Expiring | Base Rent Expiring | % of Base Rent Expiring | Cumulative Net Rentable Area Expiring | Cumulative % of NRA Expiring | Cumulative Base Rent Expiring | Cumulative % of Base Rent Expiring |
| Vacant | NAP | 12,654 | 2.2% | NAP | NAP | 12,654 | 2.2% | NAP | NAP |
| MTM & 2019 | 0 | 0 | 0.0% | $0 | 0.0% | 12,654 | 2.2% | $0 | 0.0% |
| 2020 | 7 | 67,403 | 11.6% | 2,558,372 | 6.8% | 80,057 | 13.8% | $2,558,372 | 6.8% |
| 2021 | 13 | 141,317 | 24.4% | 8,618,220 | 23.1% | 221,374 | 38.2% | $11,176,592 | 29.9% |
| 2022 | 6 | 92,117 | 15.9% | 6,756,201 | 18.1% | 313,491 | 54.1% | $17,932,793 | 48.0% |
| 2023 | 6 | 56,632 | 9.8% | 4,253,332 | 11.4% | 370,123 | 63.8% | $22,186,125 | 59.4% |
| 2024 | 12 | 94,693 | 16.3% | 7,070,153 | 18.9% | 464,816 | 80.1% | $29,256,278 | 78.3% |
| 2025 | 1 | 20,677 | 3.6% | 1,199,266 | 3.2% | 485,493 | 83.7% | $30,455,544 | 81.5% |
| 2026 | 1 | 26,664 | 4.6% | 2,106,456 | 5.6% | 512,157 | 88.3% | $32,562,000 | 87.2% |
| 2027 | 2 | 52,735 | 9.1% | 4,746,576 | 12.7% | 564,892 | 97.4% | $37,308,576 | 99.9% |
| 2028 | 0 | 0 | 0.0% | 0 | 0.0% | 564,892 | 97.4% | $37,308,576 | 99.9% |
| 2029 | 0 | 0 | 0.0% | 0 | 0.0% | 564,892 | 97.4% | $37,308,576 | 99.9% |
| 2030 and Thereafter(3) | 4 | 15,095 | 2.6% | 46,412 | 0.1% | 579,987 | 100.0% | $37,354,988 | 100.0% |
| Total | 52 | 579,987 | 100.0% | $37,354,988 | 100.0% | ||||
| (1) | Based on the underwritten rent roll dated September 30, 2019. |
| (2) | Certain tenants may have termination or contraction options (which may become exercisable prior to the originally stated expiration date of the tenant lease) that are not considered in the above Lease Rollover Schedule. |
| (3) | 2030 and Thereafter is inclusive of a 8,766 square feet of conference room space and fitness center space and 3,957 square feet of storage space and antenna space that have no underwritten rent. |
| Operating History and Underwritten Net Cash Flow | |||||||
| 2016 | 2017 | 2018 | TTM Aug | Underwritten | Per Square Foot | %(1) | |
| Base Rent(2)(3) | $32,955,563 | $32,773,764 | $33,530,722 | $33,115,349 | $38,476,742 | $66.34 | 87.4% |
| Vacant Income | 0 | 0 | 0 | 0 | 613,434 | $1.06 | 1.4% |
| Gross Potential Rent | $32,955,563 | $32,773,764 | $33,530,722 | $33,115,349 | $39,090,176 | $67.40 | 88.8% |
| Total Reimbursements | 3,060,722 | 2,256,601 | 2,572,270 | 2,655,316 | 4,439,738 | $7.65 | 10.1% |
| Total Other Income | 833,678 | 776,575 | 679,963 | 760,436 | 476,903 | $0.82 | 1.1% |
| Net Rental Income | $36,849,963 | $35,806,940 | $36,782,955 | $36,531,101 | $44,006,816 | $75.88 | 100.0% |
| (Vacancy/Credit Loss) | 0 | 0 | 0 | 0 | (2,176,496) | ($3.75 | (4.9)% |
| Effective Gross Income | $36,849,963 | $35,806,940 | $36,782,955 | $36,531,101 | $41,830,321 | $72.12 | 95.1% |
| Total Expenses | 11,423,601 | 11,018,547 | 11,108,481 | 12,018,844 | 14,566,655 | $25.12 | 34.8% |
| Net Operating Income(4) | $25,426,362 | $24,788,393 | $25,674,474 | $24,512,257 | $27,263,666 | $47.01 | 65.2% |
| Total TI/LC, Capex/RR | 0 | 0 | 0 | 0 | 985,978 | $1.70 | 2.4% |
| Net Cash Flow | $25,426,362 | $24,788,393 | $25,674,474 | $24,512,257 | $26,277,688 | $45.31 | 62.8% |
| (1) | % column represents percent of Net Rental Income for all revenue lines and represents percent of Effective Gross Income for the remainder of the fields. |
| (2) | Underwritten Base Rent is based on the in place rent roll as of September 30, 2019 and inclusive of Benefit Cosmetics, which has indicated that it will not be extending its lease at the end of its term in August 2020. Benefit Cosmetics is currently in occupancy and paying full rent at $35.90 per square foot, which is approximately 60.1% below the appraisal’s concluded market rent for the Benefit Cosmetics space of $90.00 per square foot. |
| (3) | Underwritten Base Rent is inclusive of (i) rent steps through November 2020 for all tenants and through November 2021 for Handshake equal to $1,055,382 and (ii) straight line rent for Target and Twitch over the loan term, equal to $66,371. |
| (4) | Net Operating Income fluctuations year-over-year are due to tenant rent abatements associated with new leases. |
Property Management.The 225 Bush Property is managed by 225 Bush Street Partners LLC, a Delaware limited liability company and an affiliate of the borrower.
THE INFORMATION IN THIS STRUCTURAL AND COLLATERAL TERM SHEET IS NOT COMPLETE AND MAY BE AMENDED PRIOR TO THE TIME OF SALE. THIS TERM SHEET IS NOT AN OFFER TO SELL THESE SECURITIES AND IT IS NOT A SOLICITATION OF AN OFFER TO BUY THESE SECURITIES IN ANY JURISDICTION WHERE THE OFFER OR SALE IS NOT PERMITTED.
| | |
54 of 156
| Structural and Collateral Term Sheet | Benchmark 2019-B14 | |
| 225 Bush | ||
Escrows and Reserves.At loan origination, the borrower deposited (i) $3,012,292 into a tax reserve, (ii) $838,031 into an insurance reserve, (iii) approximately $4,097,106 into an outstanding tenant improvements and leasing commission reserve in connection with five leases and (iv) approximately $886,122 into a free rent reserve in connection with two leases.
Tax Reserve - The borrower is required to deposit into a real estate tax reserve, on a monthly basis, 1/12 of the estimated annual real estate taxes (initially estimated at $376,536).
Insurance Reserve - The borrower is required to deposit into an insurance reserve, on a monthly basis, 1/12 of estimated insurance premiums (initially estimated at $119,719).
Replacement Reserve - The borrower is required to deposit into a replacement reserve, on a monthly basis, an amount equal to $9,666 for replacement reserves (approximately $0.20 per square foot annually), subject to a cap of $231,995 (approximately $0.40 per square foot).
TI/LC Reserve - The borrower is required to deposit into a TI/LC reserve, on a monthly basis, an amount equal to $96,665 for tenant improvement and leasing commission obligations (approximately $2.00 per square foot annually), subject to a cap of $3,479,922 (approximately $6.00 per square foot).
Lockbox / Cash Management. The 225 Bush Whole Loan is structured with a hard lockbox and springing cash management. The borrower is required to direct all existing tenants of the 225 Bush Property to directly deposit all rents into a clearing account controlled by the lender. If no Trigger Period exists, the funds in the clearing account will be swept on a daily basis into the borrower’s operating account and, if a Trigger Period exists, such funds are required to be swept on a daily basis into a deposit account controlled by the lender. During a Trigger Period, funds in the deposit account are required to be applied and disbursed in accordance with the 225 Bush Whole Loan documents. During a Trigger Period, all excess cash after payment of the monthly debt service on the 225 Bush Whole Loan, all required reserves and budgeted operating expenses, and certain other items in the payment waterfall described in the 225 Bush Whole Loan documents will be reserved as additional collateral for the 225 Bush Whole Loan. Under certain circumstances and for limited purposes described in the 225 Bush Whole Loan documents, the borrower may request disbursements of such excess cash flow.
A “Trigger Period” means the occurrence and continuation of (i) an event of default or (ii) a Low DSCR Period (as defined below).
A Trigger Period may be cured in accordance with the following conditions: with respect to a Trigger Period caused solely by (a) clause (i) above, the acceptance of a cure by the lender of the related event of default and (b) with respect to clause (ii) above, the debt service coverage ratio is at least 1.60x as of the last day of any calendar quarter.
A “Low DSCR Period” will commence if and when the debt service coverage ratio on the 225 Bush Whole Loan (as calculated in the 225 Bush Whole Loan documents), as of the last day of any calendar quarter, is less than 1.55x and end if and when such event is cured as described above.
Current Mezzanine or Subordinate Indebtedness. The 225 Bush Subordinate Companion Note has an outstanding principal balance as of the Cut-off Date of $146.4 million, and accrues interest at a fixed rate of 3.30300%per annum. The 225 Bush Subordinate Companion Note has a five-year term and is interest-only for the full term. For additional information, see“Description of the Mortgage Pool—The Whole Loans—The Serviced AB Whole Loans—The 225 Bush Whole Loan”in the Preliminary Prospectus.
Partial Release. None.
THE INFORMATION IN THIS STRUCTURAL AND COLLATERAL TERM SHEET IS NOT COMPLETE AND MAY BE AMENDED PRIOR TO THE TIME OF SALE. THIS TERM SHEET IS NOT AN OFFER TO SELL THESE SECURITIES AND IT IS NOT A SOLICITATION OF AN OFFER TO BUY THESE SECURITIES IN ANY JURISDICTION WHERE THE OFFER OR SALE IS NOT PERMITTED.
| | |
55 of 156
| Structural and Collateral Term Sheet | Benchmark 2019-B14 |
| Innovation Park | |

THE INFORMATION IN THIS STRUCTURAL AND COLLATERAL TERM SHEET IS NOT COMPLETE AND MAY BE AMENDED PRIOR TO THE TIME OF SALE. THIS TERM SHEET IS NOT AN OFFER TO SELL THESE SECURITIES AND IT IS NOT A SOLICITATION OF AN OFFER TO BUY THESE SECURITIES IN ANY JURISDICTION WHERE THE OFFER OR SALE IS NOT PERMITTED.
| | |
56 of 156
| Structural and Collateral Term Sheet | Benchmark 2019-B14 |
| Innovation Park | |

THE INFORMATION IN THIS STRUCTURAL AND COLLATERAL TERM SHEET IS NOT COMPLETE AND MAY BE AMENDED PRIOR TO THE TIME OF SALE. THIS TERM SHEET IS NOT AN OFFER TO SELL THESE SECURITIES AND IT IS NOT A SOLICITATION OF AN OFFER TO BUY THESE SECURITIES IN ANY JURISDICTION WHERE THE OFFER OR SALE IS NOT PERMITTED.
| | |
57 of 156
| Structural and Collateral Term Sheet | Benchmark 2019-B14 |
| Innovation Park | |

THE INFORMATION IN THIS STRUCTURAL AND COLLATERAL TERM SHEET IS NOT COMPLETE AND MAY BE AMENDED PRIOR TO THE TIME OF SALE. THIS TERM SHEET IS NOT AN OFFER TO SELL THESE SECURITIES AND IT IS NOT A SOLICITATION OF AN OFFER TO BUY THESE SECURITIES IN ANY JURISDICTION WHERE THE OFFER OR SALE IS NOT PERMITTED.
| | |
58 of 156
| Structural and Collateral Term Sheet | Benchmark 2019-B14 |
| Innovation Park | |
| Mortgage Loan Information | Property Information | |||
| Mortgage Loan Seller: | JPMCB | Single Asset / Portfolio: | Single Asset | |
| Original Principal Balance(1): | $60,000,000 | Title: | Fee | |
| Cut-off Date Principal Balance(1): | $60,000,000 | Property Type - Subtype: | Office – Suburban | |
| % of Pool by IPB: | 4.5% | Net Rentable Area (SF): | 1,854,729 | |
| Loan Purpose: | Acquisition | Location: | Charlotte, NC | |
| Borrower: | BRI 1881 Innovation Park, LLC | Year Built / Renovated: | 1979-2013 / 2011 | |
| Sponsors: | Aleph Investment Properties, | Occupancy(2): | 96.1% | |
| LLLP; Aleph Investment Properties | Occupancy Date: | 8/5/2019 | ||
| (US), LLLP | Number of Tenants: | 16 | ||
| Interest Rate: | 3.50500% | 2016 NOI(3): | $15,306,649 | |
| Note Date: | 10/18/2019 | 2017 NOI(3): | $16,907,586 | |
| Maturity Date: | 11/1/2029 | 2018 NOI(3): | $18,648,044 | |
| Interest-only Period: | 120 months | TTM NOI (as of 8/2019)(3): | $19,635,371 | |
| Original Term: | 120 months | UW Economic Occupancy: | 94.8% | |
| Original Amortization: | None | UW Revenues: | $32,323,781 | |
| Amortization Type: | Interest Only | UW Expenses: | $11,117,049 | |
| Call Protection: | L(25),Grtr1%orYM(91),O(4) | UW NOI: | $21,206,732 | |
| Lockbox / Cash Management: | Hard / Springing | UW NCF: | $19,162,924 | |
| Additional Debt(1): | Yes | Appraised Value / Per SF(4): | $264,900,000 / $143 | |
| Additional Debt Balance(1): | $122,250,000 | Appraisal Date: | 8/22/2019 | |
| Additional Debt Type(1): | Pari Passu | |||
| Escrows and Reserves(5) | Financial Information(1) | ||||||
| Initial | Monthly | Initial Cap | Cut-off Date Loan / SF: | $98 | |||
| Taxes: | $441,662 | $147,221 | N/A | Maturity Date Loan / SF: | $98 | ||
| Insurance: | $0 | Springing | N/A | Cut-off Date LTV(4): | 68.8% | ||
| Replacement Reserves: | $30,912 | $30,912 | N/A | Maturity Date LTV(4): | 68.8% | ||
| TI/LC: | $115,921 | $115,921 | $1,400,000 | UW NCF DSCR: | 2.96x | ||
| UW NOI Debt Yield: | 11.6% | ||||||
| Sources and Uses | ||||||
| Sources | Proceeds | % of Total | Uses | Proceeds | % of Total | |
| Whole Loan | $182,250,000 | 64.2% | Purchase Price | $270,000,000 | 95.1% | |
| Sponsor Equity | 101,642,381 | 35.8% | Closing Costs | 13,303,886 | 4.7% | |
| Upfront Reserves | 588,495 | 0.2% | ||||
| Total Sources | $283,892,381 | 100.0% | Total Uses | $283,892,381 | 100.0% | |
| (1) | The Innovation Park loan is part of a whole loan evidenced by threepari passu notes, with an aggregate outstanding principal balance as of the Cut-off Date of $182.25 million. The Financial Information presented in the chart above reflects the Cut-off Date balance of the $182.25 million Innovation Park Whole Loan (as defined below). |
| (2) | Occupancy is inclusive of (i) 38,553 square feet associated with amenity space and (ii) 118,829 square feet associated with vacancy for non-rentable space at the Innovation Park property with no attributable underwritten base rent. |
| (3) | The increase from 2016 NOI through TTM NOI is primarily attributable to a 146,881 square foot expansion by AXA Equitable consisting of (i) 38,200 square feet leased to AXA Equitable in October 2017 and (ii) 108,681 additional square feet leased to AXA Equitable in September 2018, in total representing 7.9% of total net rentable area and 13.9% of total underwritten base rent at the property. |
| (4) | Appraised Value / Per SF, Cut-off Date LTV and Maturity Date LTV are calculated based on the “Hypothetical As-Is” appraised value of $264.9 million. As of the date of origination, there were no outstanding tenant improvement and leasing commission obligations remaining. Based on the As-Is appraised value of $262.9 million as of August 22, 2019, the Cut-off Date LTV and Maturity Date LTV are equal to 69.3% and 69.3%, respectively. |
| (5) | For a full description of Escrows and Reserves, please refer to “Escrows and Reserves” below. |
THE INFORMATION IN THIS STRUCTURAL AND COLLATERAL TERM SHEET IS NOT COMPLETE AND MAY BE AMENDED PRIOR TO THE TIME OF SALE. THIS TERM SHEET IS NOT AN OFFER TO SELL THESE SECURITIES AND IT IS NOT A SOLICITATION OF AN OFFER TO BUY THESE SECURITIES IN ANY JURISDICTION WHERE THE OFFER OR SALE IS NOT PERMITTED.
| | |
59 of 156
| Structural and Collateral Term Sheet | Benchmark 2019-B14 |
| Innovation Park | |
The Loan. The Innovation Park loan is part of a whole loan evidenced by three pari passu promissory notes, each as described below, with an aggregate original balance of $182.25 million (the “Innovation Park Whole Loan”), secured by a first mortgage lien on the borrower’s fee interest in a 1,854,729 square foot Class A office complex located in Charlotte, North Carolina. The non-controlling Note A-1, with an outstanding principal balance as of the Cut-off Date of $60.0 million, will be included in the Benchmark 2019-B14 trust. The remaining notes, which are currently held by JPMCB, are expected to be contributed to one or more future securitization trusts. The relationship between the holders of the Innovation Park Whole Loan will be governed by a co-lender agreement as described under “Description of the Mortgage Pool—The Whole Loans—The Serviced Pari Passu Whole Loans” and “Description of the Mortgage Pool—The Whole Loans—The Non-Serviced Pari Passu Whole Loans.” The Innovation Park Whole Loan has a ten-year term and is interest-only for the entire term. The Innovation Park Whole Loan will be serviced pursuant to the pooling and servicing component for the Benchmark 2019-B14 Trust until the controlling Note A-2 is securitized, where upon the Innovation Park Whole Loan will be serviced pursuant to the pooling and servicing agreement for such future securitization.
| Whole Loan Summary | ||||
| Note | Original Balance | Cut-off Date Balance | Note Holder | Controlling Piece |
| A-1 | $60,000,000 | $60,000,000 | Benchmark 2019-B14 | No |
| A-2 | $70,000,000 | $70,000,000 | JPMCB | Yes |
| A-3 | $52,500,000 | $52,500,000 | JPMCB | No |
| Total | $182,250,000 | $182,250,000 | ||
The Borrower. The borrower is BRI 1881 Innovation Park, LLC, a Delaware limited liability company and special purpose entity with two independent directors in its organizational structure.
The Loan Sponsors.The loan sponsors and non-recourse guarantors are Aleph Investment Properties (US), LLLP and Aleph Investment Properties, LLLP. The borrower is a joint-venture between Accesso Partners, LLC (“Accesso Partners”) and Partners Group AG, (SIX: PGHN) (“Partners Group”). Accesso Partners is a real estate investment and property development group that currently owns a portfolio of over $3.0 billion in assets totaling over 15.0 million square feet of office space across 44 properties, 21 major cities and eight states. Headquartered in Hallandale Beach, Florida, Accesso Partners offers a full range of services including acquisition, asset management, property management construction and accounting with additional offices in Houston, Dallas, Minneapolis, Atlanta and Chicago. Partners Group is a global private markets investment manager, serving over 900 institutional investors worldwide. Since inception, Partners Group has over $91 billion in assets under management and employs over 1,300 professionals across 20 offices worldwide. Partners Group has invested over $100 billion in private equity, private real estate, private debt and private infrastructure on behalf of its clients. Partners Group is one of the largest private markets investment managers in the world.
The Property.The Innovation Park property is a 1,854,729 square foot office complex located in Charlotte, North Carolina, consisting of 11 interconnected office buildings, a free standing industrial flex building, a free standing 1,200 seat chapel, a central utility plant and two parking structures. The property is situated on an approximately 202-acre site which includes an approximately 89.2 acre vacant parcel of undeveloped excess land, which does not serve as collateral for the Innovation Park Whole Loan. The Innovation Park property includes two parking structures containing 7,601 surface and garage parking spaces, resulting in a parking ratio of approximately 4.12 spaces per 1,000 square feet. Of the 7,601 parking spaces, 2,366 serve as collateral for the Innovation Park Whole Loan. The buildings were completed between 1979 and 2013, while the parking structures were constructed in 2005 and 2012. The property was originally constructed as IBM’s research and development campus and was repositioned as the Innovation Park property in 2011 after IBM vacated a majority of the park. After acquiring the park in 2010, the prior owner made significant upgrades including a number of on-campus amenities such as two fitness centers with locker rooms, a cafeteria, two conference centers and extensive landscaping and tenant lounge areas. The prior owner reportedly invested over $54.4 million in tenant improvements since 2010 and approximately $19.7 million in total capital expenditures since 2016.
THE INFORMATION IN THIS STRUCTURAL AND COLLATERAL TERM SHEET IS NOT COMPLETE AND MAY BE AMENDED PRIOR TO THE TIME OF SALE. THIS TERM SHEET IS NOT AN OFFER TO SELL THESE SECURITIES AND IT IS NOT A SOLICITATION OF AN OFFER TO BUY THESE SECURITIES IN ANY JURISDICTION WHERE THE OFFER OR SALE IS NOT PERMITTED.
| | |
60 of 156
| Structural and Collateral Term Sheet | Benchmark 2019-B14 |
| Innovation Park | |
As of August 5, 2019, the property was 96.1% leased to 16 tenants representing several industries including financial services, insurance, technology and design. In addition, approximately 42.4% of the net rentable area at the Innovation Park property is leased to investment grade tenants. The largest tenant at the Innovation Park property, AXA Equitable (NYSE: EQH) (Moody’s/S&P/Fitch: A2/A/A-) (“AXA”), accounts for approximately 15.7% of net rentable area and approximately 25.3% of underwritten base rent. Founded in 1859, AXA is a financial services company that offers a variety of variable annuity products, term, variable and universal life insurance products, employee benefit products and investment products principally to individuals, small and medium-sized businesses and professional and trade associations. As of the second quarter of 2019, AXA reported approximately $6.9 billion in net income, and as of the year end 2018, AXA had $618.6 billion in assets under management. The space leased by AXA at the Innovation Park property serves as its life-insurance operations and service center where approximately 600 AXA employees work. AXA has been a tenant at Innovation Park since 2013 and has a lease expiration date of November 30, 2028 with one five-year extension option remaining. AXA originally leased 144,647 square feet, subsequently expanded by 38,200 square feet in 2017 and expanded by an additional 108,681 square feet in 2018. AXA has the right to terminate its lease with respect to 144,647 square feet (approximately 50% of their leased space) in December 2024 with 12 months’ prior written notice and the payment of a termination fee.
The second largest tenant at the property, Allstate Insurance Company (“Allstate”) (NYSE: ALL) (Moody’s/S&P/Fitch: A3/A-/BBB+) accounts for approximately 13.9% of net rentable area and approximately 22.4% of underwritten base rent. Founded in 1931 and serving approximately 16 million households in the United States, Allstate offers a variety of insurance product options including auto, homeowners, renters, condominium and stand-alone scheduled personal property through different distribution channels including Allstate exclusive agencies, independent agencies, online and call centers. As of year-end 2018, Allstate had nearly $39.8 billion in revenues and $112.2 billion in assets. The Innovation Park property serves as Allstate’s current operations center. Allstate has been at Innovation Park since 2014 and has a lease expiration of December 31, 2027 with two, five-year extension options. Allstate originally leased 217,062 square feet at the property and expanded by 40,311 square feet in July 2019. Allstate has the right to terminate its lease in November 2022 with nine months’ prior written notice and the payment of a termination fee.
The third largest tenant at the property, Classic Graphics, accounts for approximately 12.9% of net rentable area and approximately 4.5% of underwritten base rent. Classic Graphics specializes in custom large format signage, trade show displays and other visual communications solutions. Class Graphics is a subsidiary of the IMAGINE group (“IMAGINE”), which consists of a family of five companies focused on delivering visual communications solutions to brands across the retail, entertainment, gaming, quick service restaurant and consumer packaged goods industries. Classic Graphics originally leased 179,775 square feet and subsequently expanded by 58,969 square feet in 2013. Classic Graphic has been a tenant since 2011 and has a lease expiration date of January 31, 2026 with one, five-year extension option remaining pertaining to the expansion space. Classic Graphics has the right to terminate its lease with respect to 58,969 square feet in December 31 2020, with nine months’ prior written notice and the payment of a termination fee.
The loan sponsors expect to convert approximately 242,992 square feet of industrial space in Building 001, currently leased through 2023, and Building 002, currently vacant, to office space with the goal of putting the space to more efficient use at higher rental rates. The loan sponsor has budgeted approximately $130 per square foot, or $31.6 million, in capital expenses and tenant improvements associated with the conversion. In addition, the loan sponsors have indicated that they expect the outlying parcels which are not included in the collateral to be converted to retail, residential and office use.
The Innovation Park property is located in Charlotte, North Carolina, approximately nine miles north of Charlotte’s central business district. According to the appraisal, the city of Charlotte is the nation’s third largest banking center and home to the headquarters of six Fortune 500 companies including Bank of America, Lowe’s Home Improvement Warehouse, Duke Energy, Nucor and Sonic Automotive. According to the Bureau of Labor Statistics, as of April 2019, the labor pool in the Charlotte metro area grew 3.0% year-over-year and the number of new jobs increased 2.5%. In addition to strong job growth, Charlotte has experienced strong infrastructure development including the 2018 completion of the $1.2 billion LYNX Blue line rail extension, Charlotte’s first 18.9 mile long light rail service. The Innovation Park property is located within University City, the second largest employment center in Charlotte. University City is comprised of over 11 million square feet of office space, 4.8 million of which is LEED certified, and consists of approximately 73,000 employees, 23 Fortune 500 companies and three headquarter locations. The area benefits from its proximity to the University of North Carolina at Charlotte which has an enrollment of over 25,000 students as well as Carolina’s Medical Center – University. Additional demand drivers within University City include University Research Park, University Executive Park Atrium Health University City, Belgate Shopping Center, Concord Mills Mall and Charlotte Motor Speedway, one of NASCAR’s racing venues.
As of the second quarter of 2019, the Charlotte office market consisted of approximately 110 million square feet of office space with an overall vacancy rate of 7.9% and average asking rents of $26.07 per square foot. The University City submarket totaled approximately 8.6 million square feet with an average vacancy of 10.4% and average asking rents of $23.91 per square foot. The overall Charlotte office market achieved 2.5 million square feet in leasing activity through mid-year 2019 and projects positive net absorption through year end 2019.
THE INFORMATION IN THIS STRUCTURAL AND COLLATERAL TERM SHEET IS NOT COMPLETE AND MAY BE AMENDED PRIOR TO THE TIME OF SALE. THIS TERM SHEET IS NOT AN OFFER TO SELL THESE SECURITIES AND IT IS NOT A SOLICITATION OF AN OFFER TO BUY THESE SECURITIES IN ANY JURISDICTION WHERE THE OFFER OR SALE IS NOT PERMITTED.
| | |
61 of 156
| Structural and Collateral Term Sheet | Benchmark 2019-B14 |
| Innovation Park | |
The appraiser identified seven office rent comparables for the Innovation Park property. Comparable buildings were built between 1972 and 2017 and range in size from 56,871 to 199,571 square feet. Direct asking rents at the comparable properties ranged between $22.00 and $29.50 per square foot with a weighted average office rent of approximately $25.30 per square foot. The Innovation Park property’s in-place weighted average office rent is $19.30 per square foot, below the appraisal’s concluded office market rent of $25.00 per square foot.
The appraisal identified eleven industrial rent comparables for the Innovation Park property with rents ranging from $4.50 to $7.35 per square foot with a weighted average of $5.54 per square foot. The Innovation Park property’s in-place weighted average industrial rent is $5.07 per square foot, in-line with the appraisal’s concluded industrial rent of $5.50 per square foot.
| Historical and Current Occupancy(1) | |||
| 2016 | 2017 | 2018 | Current(2)(3) |
| 96.1% | 95.4% | 95.9% | 96.1% |
| (1) | Historical Occupancies are as of December 31 of each respective year. |
| (2) | Current Occupancy is as of August 5, 2019. |
| (3) | Occupancy is inclusive of (i) 38,553 square feet associated with amenity space and (ii) 118,829 square feet associated with vacancy for non-rentable space at the Innovation Park property with no attributable underwritten base rent. |
| Tenant Summary(1) | ||||||
| Tenant | Ratings Moody’s/S&P/Fitch(2) | Net Rentable Area (SF) | % of Total NRA | Base Rent PSF(3)(4) | % of Total Base Rent(3) | Lease Expiration |
| AXA Equitable(5) | A2 / A / A- | 291,528 | 15.7% | $23.93 | 25.3% | 11/30/2028 |
| Allstate Insurance Company(6) | A3 / A- / BBB+ | 257,393 | 13.9% | $24.04 | 22.4% | 12/31/2027 |
| Classic Graphics(7) | NR / NR / NR | 238,744 | 12.9% | $5.23 | 4.5% | 1/31/2026 |
| Alight Solutions LLC(8) | NR / NR / NR | 216,377 | 11.7% | $16.06 | 12.6% | 11/30/2025 |
| Wells Fargo Bank | A2 / A- / A+ | 196,613 | 10.6% | $22.76 | 16.2% | 3/31/2025 |
| TVS | NR / NR / NR | 183,324 | 9.9% | $5.16 | 3.4% | 4/30/2023 |
| TTI Worldwide | NR / NR / NR | 75,335 | 4.1% | $23.14 | 6.3% | 12/31/2026 |
| BB&T | A2 / A- / A+ | 40,666 | 2.2% | $12.66 | 1.9% | 5/31/2024 |
| Elevation Church | NR / NR / NR | 36,890 | 2.0% | $14.20 | 1.9% | 3/31/2025 |
| Framatone | NR / NR / NR | 31,858 | 1.7% | $22.32 | 2.6% | 10/31/2023 |
| Top 10 Total / Wtd. Avg. | 1,568,728 | 84.6% | $17.09 | 97.2% | ||
| Remaining Tenants | 57,016 | 3.1% | $13.59 | 2.8% | ||
| Building & Amenity(9) | 157,382 | 8.5% | ||||
| Total Occupied Space | 1,783,126 | 96.1% | ||||
| Vacant | 71,603 | 3.9% | ||||
| Total / Wtd. Avg. | 1,854,729 | 100.0% | $15.47 | 100.0% |
| (1) | Based on the underwritten rent roll dated August 5, 2019. |
| (2) | Certain ratings are those of the parent company whether or not the parent company guarantees the lease. |
| (3) | Base Rent PSF is inclusive of (a) contractual rent steps through June 2020 and (b) straight line rent for investment grade tenants over the loan term. |
| (4) | Base Rent PSF is inclusive of (i) 38,553 square feet associated with amenity space and (ii) 118,829 square feet associated with vacancy for non-rentable space at the Innovation Park property with no attributable underwritten base rent. |
| (5) | AXA Equitable has the right to terminate its lease with respect to 144,647 square feet on December 31, 2024, with 12 months’ prior written notice and a termination fee equal to the unamortized amounts of brokerage commissions, rent abatements and landlord work costs related to such space. |
| (6) | Allstate Insurance Company has the right to terminate its lease on November 30, 2022, with nine months’ prior written notice and the payment of a termination fee equal to the unamortized amounts of brokerage commissions, rent abatements and landlord work costs related to such space. |
| (7) | Classic Graphics has the right to terminate its lease with respect to 58,969 square feet on December 31, 2020, with nine months' prior written notice and the payment of a termination fee equal to the unamortized amounts of brokerage commissions, landlord work costs related to tenant spaces and the cost of dividing the existing space from any additional space leased to Classic Graphics. |
| (8) | Alight Solutions LLC has the right to terminate its lease on November 30, 2022 with 12 months’ prior notice and the payment of a termination fee equal to three months base rent and unamortized brokerage commissions, rent abatements and landlord work costs related to such space. |
| (9) | Building & Amenity is inclusive of (i) 38,553 square feet associated with amenity space and (ii) 118,829 square feet associated with vacancy for non-rentable space at the Innovation Park property with no attributable underwritten base rent. |
THE INFORMATION IN THIS STRUCTURAL AND COLLATERAL TERM SHEET IS NOT COMPLETE AND MAY BE AMENDED PRIOR TO THE TIME OF SALE. THIS TERM SHEET IS NOT AN OFFER TO SELL THESE SECURITIES AND IT IS NOT A SOLICITATION OF AN OFFER TO BUY THESE SECURITIES IN ANY JURISDICTION WHERE THE OFFER OR SALE IS NOT PERMITTED.
| | |
62 of 156
| Structural and Collateral Term Sheet | Benchmark 2019-B14 |
| Innovation Park | |
| Lease Rollover Schedule(1)(2) | |||||||||
Year | Number of Leases Expiring | Net Rentable Area Expiring | % of NRA Expiring | Base Rent Expiring(3) | % of Base Rent Expiring | Cumulative Net Rentable Area Expiring | Cumulative % of NRA Expiring | Cumulative Base Rent Expiring | Cumulative % of Base Rent Expiring |
| Vacant | NAP | 71,603 | 3.9% | NAP | NAP | 71,603 | 3.9% | NAP | NAP |
| 2019 & MTM | 0 | 0 | 0.0% | $0 | 0.0% | 71,603 | 3.9% | $0 | 0.0% |
| 2020 | 0 | 0 | 0.0% | 0 | 0.0% | 71,603 | 3.9% | $0 | 0.0% |
| 2021 | 0 | 0 | 0.0% | 0 | 0.0% | 71,603 | 3.9% | $0 | 0.0% |
| 2022 | 1 | 22,775 | 1.2% | 241,643 | 0.9% | 94,378 | 5.1% | $241,643 | 0.9% |
| 2023 | 4 | 223,538 | 12.1% | 1,735,498 | 6.3% | 317,916 | 17.1% | $1,977,141 | 7.2% |
| 2024 | 2 | 61,909 | 3.3% | 875,549 | 3.2% | 379,825 | 20.5% | $2,852,689 | 10.3% |
| 2025 | 3 | 449,880 | 24.3% | 8,473,891 | 30.7% | 829,705 | 44.7% | $11,326,581 | 41.1% |
| 2026 | 2 | 314,079 | 16.9% | 2,991,809 | 10.8% | 1,143,784 | 61.7% | $14,318,389 | 51.9% |
| 2027 | 1 | 257,393 | 13.9% | 6,187,005 | 22.4% | 1,401,177 | 75.5% | $20,505,394 | 74.4% |
| 2028(4) | 2 | 293,752 | 15.8% | 7,028,908 | 25.5% | 1,694,929 | 91.4% | $27,534,302 | 99.8% |
| 2029 & Beyond(5) | 9 | 159,800 | 8.6% | 42,484 | 0.2% | 1,854,729 | 100.0% | $27,576,787 | 100.0% |
| Total | 24 | 1,854,729 | 100.0% | $27,576,787 | 100.0% | ||||
| (1) | Based on the underwritten rent roll dated August 5, 2019. |
| (2) | Certain tenants may have termination or contraction options (which may become exercisable prior to the originally stated expiration date of the tenant lease) that are not considered in the above Lease Rollover Schedule. |
| (3) | Base Rent Expiring is inclusive of (a) contractual rent steps through June 2020 and (b) straight line rent for investment grade tenants over the loan term accounting for approximately $2.0 million in underwritten base rent. |
| (4) | 2028 is inclusive of 7,731 square feet leased to Bon Appetit Management Company that serves as amenity space for tenants at the property. |
| (5) | 2029 & Beyond is inclusive of (i) 30,822 square feet associated with amenity space and (ii) 118,829 square feet associated with vacancy for non-rentable space at the Innovation Park property with no attributable underwritten base rent. |
| Underwritten Net Cash Flow | |||||||
| 2016 | 2017 | 2018 | TTM(1) | Underwritten | Per Square Foot | %(2) | |
| Base Rent(3) | $21,832,902 | $23,050,139 | $24,785,667 | $25,837,745 | $27,576,787 | $14.87 | 81.3% |
| Vacant Income | 0 | 0 | 0 | 0 | 1,500,862 | 0.81 | 4.4 |
| Gross Potential Rent | $21,832,902 | $23,050,139 | $24,785,667 | $25,837,745 | $29,077,649 | $15.68 | 85.7% |
| Total Reimbursements | 3,715,621 | 3,914,912 | 4,512,707 | 4,848,580 | 4,847,972 | 2.61 | 14.3 |
| Net Rental Income | $25,548,523 | $26,965,051 | $29,298,373 | $30,686,325 | $33,925,621 | $18.29 | 100.0% |
| (Vacancy / Credit Loss) | 0 | 0 | 0 | 0 | (1,751,094) | (0.94) | (5.2) |
| Other Income | 169,565 | 157,973 | 213,576 | 149,254 | 149,254 | 0.08 | 0.4 |
| Effective Gross Income | $25,718,088 | $27,123,025 | $29,511,950 | $30,835,578 | $32,323,781 | $17.43 | 95.3% |
| Total Expenses | 10,411,439 | $10,215,438 | $10,863,906 | $11,200,207 | $11,117,049 | $5.99 | 34.4 |
| Net Operating Income(4) | $15,306,649 | $16,907,586 | $18,648,044 | $19,635,371 | $21,206,732 | $11.43 | 65.6% |
| Total TI/LC, CapEx | 0 | 0 | 0 | 0 | 2,043,807 | 1.10 | 6.3 |
| Net Cash Flow | $15,306,649 | $16,907,586 | $18,648,044 | $19,635,371 | $19,162,924 | $10.33 | 59.3% |
| (1) | TTM column represents the trailing 12-month period ending August 31, 2019. |
| (2) | % column represents percent of Net Rental Income for all revenue lines and represents percent of Effective Gross Income for the remainder of the fields. |
| (3) | Base Rent is inclusive of (a) contractual rent steps through June 2020 and (b) straight line rent for investment grade tenants over the loan term accounting for approximately $2.0 million in underwritten base rent. |
| (4) | The increase from 2016 NOI through TTM NOI was attributable to a 146,881 square foot expansion by AXA Equitable inclusive of (i) 38,200 square feet leased to AXA Equitable in October 2017 and (ii) 108,681 additional square feet leased to AXA Equitable in September 2018 representing 7.9% of total net rentable area and 13.9% of underwritten total rent at the property. |
THE INFORMATION IN THIS STRUCTURAL AND COLLATERAL TERM SHEET IS NOT COMPLETE AND MAY BE AMENDED PRIOR TO THE TIME OF SALE. THIS TERM SHEET IS NOT AN OFFER TO SELL THESE SECURITIES AND IT IS NOT A SOLICITATION OF AN OFFER TO BUY THESE SECURITIES IN ANY JURISDICTION WHERE THE OFFER OR SALE IS NOT PERMITTED.
| | |
63 of 156
| Structural and Collateral Term Sheet | Benchmark 2019-B14 |
| Innovation Park | |
Property Management. The Innovation Park property is managed by Accesso Services LLC, a Florida limited liability company and an affiliate of the loan sponsors.
Escrows and Reserves.At loan origination, the borrowers deposited approximately $441,662 into a tax reserve account, $30,912 into a replacement reserve account and $115,921 into a rollover reserve account.
Tax Escrows–On a monthly basis, theborrowersare required to deposit an amount equal to 1/12 of the estimated annual real estate taxes (initially estimated to be $147,221).
Insurance Escrows – Insurance escrows are waived so long as (i) no event of default has occurred and is continuing and (ii) the Innovation Park property is covered by an acceptable blanket policy (which is currently maintained). If such condition is no longer satisfied, on each payment date, the borrowers will be required to fundaninsurance reserve in an amount equal to 1/12 of the amount that the lender estimates will be necessary to pay the annual insurance premiums.
Replacement Escrows – On a monthly basis, the borrowers are required to depositapproximately$30,912 for replacement reserves (or approximately $0.20 per square foot annually). The replacement reserve is not subject to a cap.
TI/LC Reserves – On a monthly basis through the payment date occurring in November 2022, the borrowers are required to deposit $115,921 for tenant improvements and leasing commission (or approximately $0.75 per square foot annually). On each monthly payment date thereafter, the borrower is required to pay $193,201. Monthly payments made prior to October 2022 are waived if the applicable amount of funds on deposit in the TI/LC Reserve account is equal to or greater than $1,400,000. The aggregate amount of the applicable amount of funds on deposit may not exceed a cap of $5,000,000 on any payment date.
Lockbox / Cash Management.The Innovation Park Whole Loan is structured with a hard lockbox and springing cash management. The borrower was required at loan origination to send tenant direction letters instructing the tenants to deposit all rents and payments into a lender controlled lockbox account. To the extent no Cash Sweep Period (as defined below) is continuing, all funds in the lockbox account are required to be transferred to or at the direction of the borrowers. Following the occurrence and during the continuance of a Cash Sweep Period, all funds in the lockbox account are required to be swept each business day to a segregated cash management account under the control of the lender and disbursed in accordance with the loan documents. To the extent there is a Cash Sweep Period continuing, all excess cash flow after payment of debt service, required reserves and operating expenses are required to be held as additional collateral for the Innovation Park Whole Loan. The lender has been granted a first priority security interest in the cash management account.
A “Cash Sweep Period” means each period commencing on the occurrence of a Cash Sweep Event (as defined below) and continuing until the earlier of the payment date next occurring following the related Cash Sweep Event Cure (as defined below) or payment in full of all principal and interest on the Innovation Park Whole Loan.
A “Cash Sweep Event” means the occurrence of (i) an event of default, (ii) any bankruptcy action of a borrower or property manager, (iii) the date on which the debt service coverage ratio (as calculated in the loan documents and based on the trailing six-month period immediately preceding the date of determination) is less than 1.75x, or (iv) the event of default under any new mezzanine loans permitted under the Innovation Park Whole Loan documents as described below and more fully set forth in the Innovation Park Whole Loan documents.
THE INFORMATION IN THIS STRUCTURAL AND COLLATERAL TERM SHEET IS NOT COMPLETE AND MAY BE AMENDED PRIOR TO THE TIME OF SALE. THIS TERM SHEET IS NOT AN OFFER TO SELL THESE SECURITIES AND IT IS NOT A SOLICITATION OF AN OFFER TO BUY THESE SECURITIES IN ANY JURISDICTION WHERE THE OFFER OR SALE IS NOT PERMITTED.
| | |
64 of 156
| Structural and Collateral Term Sheet | Benchmark 2019-B14 |
| Innovation Park | |
A “Cash Sweep Event Cure” means (a) with respect to clause (i) above, the acceptance by the lender of a cure of such event of default (b) with respect to clause (ii) above, (1) only with respect to a bankruptcy action of a property manager, the borrowers replaces the property manager with a qualified manager under a replacement management agreement within 60 days of such bankruptcy action or, if such bankruptcy action is involuntary and not consented to or colluded in by the property manager or any of its affiliates, such bankruptcy action is discharged, stayed or dismissed within 60 days of such filing without any adverse consequences to the Innovation Park Whole Loan or the Innovation Park property, determined in the lender’s sole discretion, and (2)only with respect to a bankruptcy action of theborrower that is involuntary and not consented to or colluded in by the borrower, if such bankruptcy action is involuntary and not consented to or colluded in by the property manager or any of its affiliates, such bankruptcy action is discharged, stayed or dismissed within 60 days of such filing without any adverse consequences to the Innovation Park Whole Loan or the Innovation Park property, determined in the lender’s sole discretion,(c) with respect to clause (iii) above, the debt service coverage ratio (as calculated in the Innovation park Whole Loan documents and based on the trailing six-month period immediately preceding the date of determination) is at least 1.75x for two consecutive quarters, or (d) with respect to clause (iv) above, such event of default relating to any new mezzanine loan has been cured in accordance with the terms of the related New Mezzanine Loan documents.Each cure is also subject to the following conditions: (1) no other event of default may have occurred and be continuing; (2) a Cash Sweep Event Cure may occur no more than a total of two times in the aggregate during the term of the Innovation Park Whole Loan; (3) a Cash Sweep Event Cure following a DSCR trigger event may occur an unlimited number of times during the term of the Innovation Park Whole Loan and (4) the borrower pays the lender’s reasonable expenses in connection with such cure. Notwithstanding the foregoing, except as provide in clause (b)(2) above, in no event will the borrower have the right to cure a Cash Sweep Event occurring from a bankruptcy of the borrower.
Future Mezzanine or Subordinate Indebtedness Permitted.So long as no new transfer and assumption mezzanine loan is then currently outstanding, in connection with a bona fide sale of the property to a third party or funding tenant improvement and leasing commission obligations under any new lease approved by the lender and any new mezzanine lender in order to convert the existing industrial space at the Innovation Park property to office use (individually and collectively, a “New Mezzanine Loan”),the direct or indirect equity holders of the borrower are permitted to incur a new mezzanine loan from an institutional lender secured by a pledge of their direct or indirect equity interests in the borrower so long as, among other things: (a) no event of default has occurred and is continuing, (b) the lender and such institutional lender have entered into a customary subordination and intercreditor agreement reasonably acceptable to the lender, (c) immediately after giving effect to the closing of such mezzanine loan, the loan-to-value ratio (as calculated in the Innovation Park Whole Loan documents) may not exceed 68.8%, (d) immediately after giving effect to the closing of such mezzanine loan, the debt service coverage ratio (as calculated in the Innovation Park Whole Loan documents) is not less than 2.46x, (e) the maturity date of the mezzanine loan is not earlier than the maturity date of the Innovation Park Whole Loan and (f) rating agency confirmation is obtained.
Partial Release. None.
THE INFORMATION IN THIS STRUCTURAL AND COLLATERAL TERM SHEET IS NOT COMPLETE AND MAY BE AMENDED PRIOR TO THE TIME OF SALE. THIS TERM SHEET IS NOT AN OFFER TO SELL THESE SECURITIES AND IT IS NOT A SOLICITATION OF AN OFFER TO BUY THESE SECURITIES IN ANY JURISDICTION WHERE THE OFFER OR SALE IS NOT PERMITTED.
| | |
65 of 156
| Structural and Collateral Term Sheet | Benchmark 2019-B14 | |
| The Essex | ||
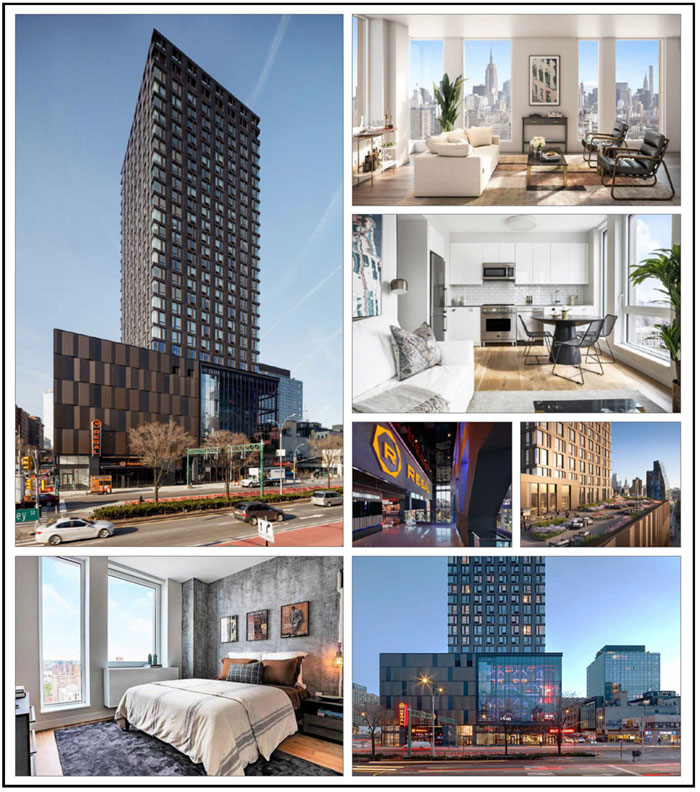
THE INFORMATION IN THIS STRUCTURAL AND COLLATERAL TERM SHEET IS NOT COMPLETE AND MAY BE AMENDED PRIOR TO THE TIME OF SALE. THIS TERM SHEET IS NOT AN OFFER TO SELL THESE SECURITIES AND IT IS NOT A SOLICITATION OF AN OFFER TO BUY THESE SECURITIES IN ANY JURISDICTION WHERE THE OFFER OR SALE IS NOT PERMITTED.
| | |
66 of 156
| Structural and Collateral Term Sheet | Benchmark 2019-B14 | |
| The Essex | ||
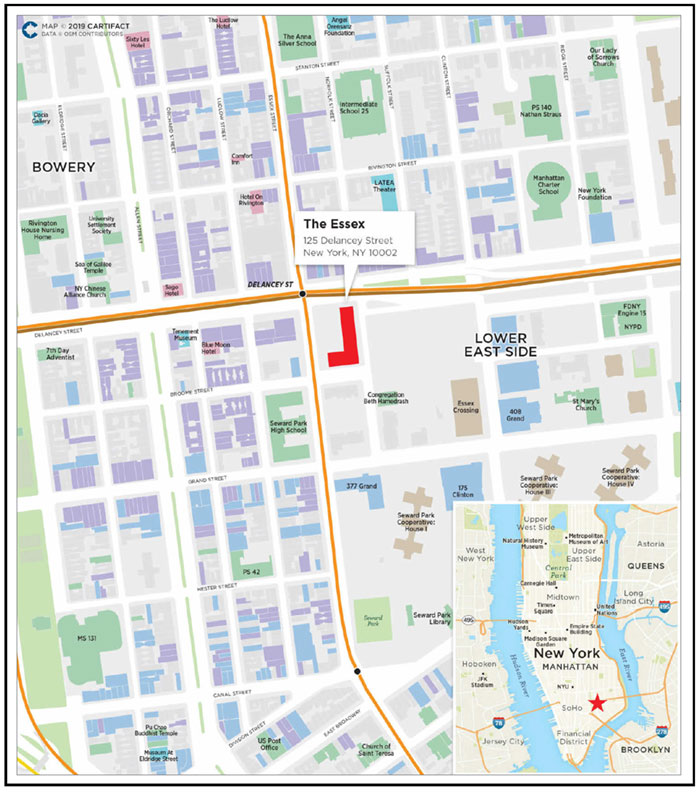
THE INFORMATION IN THIS STRUCTURAL AND COLLATERAL TERM SHEET IS NOT COMPLETE AND MAY BE AMENDED PRIOR TO THE TIME OF SALE. THIS TERM SHEET IS NOT AN OFFER TO SELL THESE SECURITIES AND IT IS NOT A SOLICITATION OF AN OFFER TO BUY THESE SECURITIES IN ANY JURISDICTION WHERE THE OFFER OR SALE IS NOT PERMITTED.
| | |
67 of 156
| Structural and Collateral Term Sheet | Benchmark 2019-B14 | |
| The Essex | ||
| Mortgage Loan Information | Property Information | |||
| Mortgage Loan Seller(1): | JPMCB | Single Asset / Portfolio: | Single Asset | |
| Credit Assessment: | Title(5): | Fee | ||
| (Fitch / KBRA / S&P)(2): | BBB-sf / BBB-(sf) / N/A | Property Type - Subtype: | Mixed Use – Multifamily/Retail | |
| Original Principal Balance(3): | $56,900,000 | Net Rentable Area (Unit)(6): | 195 | |
| Cut-off Date Principal Balance(3): | $56,900,000 | Location: | New York, NY | |
| % of Pool by IPB: | 4.3% | Year Built / Renovated: | 2019 / N/A | |
| Loan Purpose: | Refinance | Occupancy(7): | 100.0% | |
| Borrowers: | Site 2 DSA Residential LLC, | Occupancy Date: | 9/10/2019 | |
| Site 2 DSA Theater LLC | Number of Tenants: | N/A | ||
| Loan Sponsors(4): | Various | 2016 NOI(8): | N/A | |
| Interest Rate: | 2.75900% | 2017 NOI(8): | N/A | |
| Note Date: | 10/25/2019 | 2018 NOI(8): | N/A | |
| Maturity Date: | 11/1/2026 | UW Economic Occupancy: | 95.6% | |
| Interest-only Period: | 84 months | UW Revenues: | $14,909,246 | |
| Original Term: | 84 months | UW Expenses: | $2,857,283 | |
| Original Amortization: | None | UW NOI(7): | $12,051,963 | |
| Amortization Type: | Interest Only | UW NCF: | $11,993,463 | |
| Call Protection: | L(24),Def(55),O(5) | Appraised Value / Per Unit: | $293,000,000 / $1,502,564 | |
| Lockbox / Cash Management: | Hard / Springing | Appraisal Date: | 8/21/2019 | |
| Additional Debt: | Yes | |||
| Additional Debt Balance(3): | $60,100,000 / $58,000,000 / | |||
| $40,000,000 | ||||
| Additional Debt Type(3): | Pari Passu/ Subordinate Debt / | |||
| Mezzanine Loan | ||||
| Escrows and Reserves(9) | Financial Information(3) | |||||||
| Initial | Monthly | Initial Cap | Senior Notes | Whole Loan | Total Debt | |||
| Taxes: | $311,439 | $62,288 | N/A | Cut-off Date Loan / Unit: | $600,000 | $897,436 | $1,102,564 | |
| Insurance: | $0 | Springing | N/A | Maturity Date Loan / Unit: | $600,000 | $897,436 | $1,102,564 | |
| Replacement Reserves: | $4,875 | $5,415 | N/A | Cut-off Date LTV: | 39.9% | 59.7% | 73.4% | |
| TI/LC: | $0 | $0 | N/A | Maturity Date LTV: | 39.9% | 59.7% | 73.4% | |
| UW NCF DSCR: | 3.66x | 1.89x | 1.33x | |||||
| UW NOI Debt Yield: | 10.3% | 6.9% | 5.6% | |||||
| Sources and Uses |
| Sources | Proceeds | % of Total | Uses | Proceeds | % of Total | |
| Senior Notes | $117,000,000 | 54.4% | Payoff Existing Debt | $154,290,280 | 71.8% | |
| B-Notes | 58,000,000 | 27.0% | Closing Costs | 2,880,941 | 1.3 % | |
| Mezzanine Loan | 40,000,000 | 18.6% | Upfront Reserves | 316,314 | 0.1 % | |
| Return of Equity | 57,512,465 | 26.7 % | ||||
| Total Sources | $215,000,000 | 100.0% | Total Uses | $ 215,000,000 | 100.0% |
| (1) | The Essex Whole Loan was co-originated by JPMorgan Chase Bank, National Association and Goldman Sachs Bank USA (“GS”). |
| (2) | Fitch and KBRA provided the listed assessments for The Essex Loan (as defined below) in the context of its inclusion in the mortgage pool. S&P does not provide a credit assessment but confirmed that The Essex Loan has, in the context of its inclusion in the mortgage pool, credit characteristics consistent with an investment grade obligation. |
THE INFORMATION IN THIS STRUCTURAL AND COLLATERAL TERM SHEET IS NOT COMPLETE AND MAY BE AMENDED PRIOR TO THE TIME OF SALE. THIS TERM SHEET IS NOT AN OFFER TO SELL THESE SECURITIES AND IT IS NOT A SOLICITATION OF AN OFFER TO BUY THESE SECURITIES IN ANY JURISDICTION WHERE THE OFFER OR SALE IS NOT PERMITTED.
| | |
68 of 156
| Structural and Collateral Term Sheet | Benchmark 2019-B14 | |
| The Essex | ||
| (3) | The Essex Whole Loan (as defined below) is comprised of (i) The Essex Mortgage Loan (comprised of two senior notes with an outstanding principal balance as of the Cut-off Date of $56.9 million), (ii) a companion loan, which ispari passu with The Essex Mortgage Loan (comprised of twopari passunotes) with an aggregate principal balance as of the Cut-off Date of $60.1 million and (iii) a subordinate companion loan (comprised of twopari passu notes) with aggregate principal balance as of the Cut-off Date of $58.0 million. The Senior Notes Financial Information presented in the chart above reflects the $117.0 million aggregate Cut-off Date balance of The Essex Mortgage Loan and The Essex Pari Passu Companion Loan, excluding The Essex Subordinate Companion Loan. The Whole Loan Financial Information presented in the chart above reflects the $175.0 million aggregate Cut-off Date balance of The Essex Whole Loan, and excludes the related The Essex Mezzanine Loan. The Total Debt Financial Information presented in the chart above reflects the $215.0 million aggregate Cut-off Date balance of The Essex Whole Loan and The Essex Mezzanine Loan. |
| (4) | The loan sponsors are Taconic Development Capital LLC, L&M Development Partners Inc., Donald Capoccia, Brandon Baron and Joseph Ferrara. |
| (5) | Site 2 DSA Residential LLC has a beneficial ownership in a portion of the residential portion of The Essex Property. |
| (6) | Net Rentable Area (Units) is based on the multifamily component totaling 195 residential units and 140,070 square feet. The Essex Property (as defined below) has an additional retail component totaling 65,000 square feet leased in its entirety to Regal Cinemas. |
| (7) | Occupancy and UW NOI are inclusive of both the residential space and commercial space. |
| (8) | 2016 NOI through 2018 NOI are not available as The Essex Property was completed construction in 2019. |
| (9) | For a full description of Escrows and Reserves, please refer to “Escrows and Reserves” below. |
The Loan. The Essex loan is secured by the Borrowers’ fee simple interest or beneficial ownership interest in four condominium units: three multifamily condominiums and one retail condominium located in New York, New York. The Essex loan is part of a whole loan with an aggregate outstanding principal balance as of the Cut-off Date of $175.0 million (the “The Essex Whole Loan”) and is comprised of (i) a seniorloan, comprised of fourpari passunotes, with an aggregate outstanding principal balance as of the Cut-off Date of $117.0 million (“The Essex Senior Notes”) (two ofwhich, Note A-1-1, with an outstanding principal balance as of the Cut-off Date of $30 million, and Note A-1-3, with an outstanding principal balance as of the Cut-off Date of $26.9 million are being contributed to the Benchmark 2019-B14 Trust (“The Essex Mortgage Loan”) and the remainder of which, with an outstanding principal of $60.1 million, are expected to be contributed to one more future securitization trusts (“The Essex Pari Passu Companion Loan”), (ii) a subordinate companion loan, comprised of twopari passu notes, with an aggregate principal balance as of the Cut-off Date of $58.0 million (collectively, “The Essex Subordinate Companion Loan”) each as described below.The relationship between the holders of The Essex Senior Notes and The Essex Subordinate Companion Loan will be governed by a co-lender agreement as described under “Description of the Mortgage Pool—The Whole Loans—The Serviced AB Whole Loans—The Essex Whole Loan”in the Preliminary Prospectus.The Essex Whole Loan was co-originated by JPMCB and GS. The Essex Whole Loan has a seven-year term and is interest-only for the entire term.
| Whole Loan Summary | |||||
Note
| Original Balance | Cut-off Date Balance | Note Holder | Controlling Piece | |
| Note A-1-1 | $30,000,000 | $30,000,000 | Benchmark 2019-B14 | No(1) | |
| Note A-1-2 | 25,000,000 | 25,000,000 | JPMCB | No | |
| Note A-1-3 | 26,900,000 | 26,900,000 | Benchmark 2019-B14 | No | |
| Note A-1-4 | 35,100,000 | 35,100,000 | GS | No | |
Senior Notes
| $117,000,000 | $117,000,000 | |||
| Note B-1 | 40,600,000 | 40,600,000 | JPMCB(2) | Yes(1) | |
| Note B-2 | 17,400,000 | 17,400,000 | GS(2) | No | |
| Whole Loan | $175,000,000 | $175,000,000 | |||
| (1) | The Essex Whole Loan will be serviced pursuant to the BMARK 2019-B14 pooling and servicing agreement. However, for so long as no The Essex Control Appraisal Period has occurred and is continuing, the holder of the related Note B-1 will be the controlling noteholder and will have the right to approve certain modification and consent to certain actions taken with respect to the related whole loan. If and for so long as a The Essex Control Appraisal Period has occurred and is continuing, then the controlling note will be Note A-1. See “Description of the Mortgage Pool—The Whole Loans—The Serviced Pari Passu-AB Whole Loan—The Essex Whole Loan” in the Preliminary Prospectus. |
| (2) | Currently held by JPMCB and GS and expected to be sold to one or more third party investors. |
The Borrowers. The borrowers are Site 2 DSA Residential LLC, a Delaware limited liability company (“Residential Borrower”), and Site 2 DSA Theater LLC, a Delaware limited liability company (together, with the Residential Borrower, the “Borrowers”).
The Loan Sponsors.The loan sponsors and non-recourse carveout guarantors are Taconic Development Capital LLC, L&M Development Partners Inc., Donald Capoccia, Brandon Baron and Joseph Ferrara. Taconic Development Capital LLC is an affiliate of Taconic Investment Partners, an owner, operator and developer of over 13.0 million square feet of office, mixed use and retail space and over 4,000 housing units primarily in New York City. L&M Development Partners Inc. is a developer of affordable, mixed-income and market rate housing, with experience investing over $7.0 billion and acquiring, building or preserving over 22,000 residential units in New York’s tri-state area, the West Coast and Gulf Coast regions. Donald Capoccia, Brandon Baron and Joseph Ferrara are principals at BFC Partners, a real estate firm that has concluded over $1.8 billion in acquisition and development with an additional $2.3 billion of projects under development.
THE INFORMATION IN THIS STRUCTURAL AND COLLATERAL TERM SHEET IS NOT COMPLETE AND MAY BE AMENDED PRIOR TO THE TIME OF SALE. THIS TERM SHEET IS NOT AN OFFER TO SELL THESE SECURITIES AND IT IS NOT A SOLICITATION OF AN OFFER TO BUY THESE SECURITIES IN ANY JURISDICTION WHERE THE OFFER OR SALE IS NOT PERMITTED.
| | |
69 of 156
| Structural and Collateral Term Sheet | Benchmark 2019-B14 | |
| The Essex | ||
The Property. The Essex property is a 205,070 square foot, 26-story, mixed-use tower, situated on Site Two of the multi-phase Essex Crossing development located in the Lower East Side of Manhattan, New York (“The Essex Property”). Collateral for The Essex Whole Loan consists of 140,070 square feet of residential space (195 units) and 65,000 square feet of theater space. Constructed in 2019, The Essex Property consists of seven condominium units, four of which serve as collateral for The Essex Whole Loan, including three condominium units associated with the multifamily units and one unit associated with a 14-screen movie theater leased to Regal Cinemas. The remaining three condominium units (which do not serve as collateral for The Essex Whole Loan) consist of the Market Line, which is owned and operated by Delancey Street Associates, Essex Market, which is owned and operated by New York City, and an urban farm located on the sixth floor terrace of The Essex. Amenities for the multifamily portion of The Essex Property include a 24-hour attended lobby, fitness center, resident lounge, children’s playroom, conference room, library, landscaped terrace and grilling stations on the sixth floor and rooftop terrace. The residential units feature in-unit washers and dryers and offer views of the surrounding cityscape and East River Crossings.
The Essex Property multifamily unit mix consists of 48 studio, 49 one-bedroom, 71 two-bedroom and 27 three-bedroom units. As part of the overall Essex Crossing master-plan, The Essex Property is required to operate 46.0% of the residential units as affordable housing units. The Essex Property contains 97 market rate units and 98 affordable units. The affordable units consist of 53 low income units and 45 moderate income units. The low income units are designated for households whose income is between 37.0% and 57.0% of the area median income (“AMI”). The moderate income units are designated for households whose income is between 110.0% and 155.0% of the AMI. Leasing for the residential component started in December 2018 with all units 100.0% occupied as of September 10, 2019.
Opened in January 2019, The Essex Property is part of the greater Essex Crossing development in the Lower East Side of Manhattan, New York, a 1.9 million square foot development project expected to be completed in 2024, comprised of nine sites with over 1,000 new residences, 300,000 square feet of retail space, including Trader Joe’s and Target, 350,000 square feet of office space and 100,000 square feet of green space, which will be connected by a below-ground, 150,000 square foot market place known as the Market Line. Additional offerings within Essex Crossing include Essex Market, a public market, the Gutter, a 12-lane bowling alley, an outdoor park space featuring a children’s play area and the International Center of Photography, which is expected to open in January 2020. Essex Crossing was developed by Delancey Street Associates, a partnership between L+M Development Partners (5.0%), BFC Partners (5.0%), Taconic Investment Partners (5.0%) and within Taconic, the Prusik Group (2.0% of Taconic’s 5.0%- 0.1%) and the Goldman Sachs Urban Investment Group (85.0%).
The Essex Property’s retail component is 100.0% leased to Regal Cinemas, which operates a 14-screen movie theater located on floors two through five of the building. According to the loan sponsors, Regal Cinemas spent approximately $11.0 million on theater build out. The theatre has modern reserved seating, a bar, concessions and Regal’s RPX screens. As of October 2019, Regal Cinemas operates 7,221 screens in 550 theatres located in 42 states along with American Samoa, the District of Columbia, Guam and Saipan. In February 2018, Regal Cinemas was acquired by Cineworld Group Plc, an international cinema chain operating in 10 countries. As of year-end 2018, Cineworld reported $4.7 billion in revenue. Regal Cinemas opened in April 2019 and has a lease expiration date of March 2039 with three, five-year renewal options and no termination options.
The Essex Property is located in the Lower East Side neighborhood of Manhattan, New York and offers convenient access to the area’s network of highways including FDR Drive, Interstate 78 and Interstate 278. The Essex Property is located adjacent to Delancey Street Station, a subway stop that provides access to two of New York City’s 24-hour subway lines, and within walking distance to additional subway stations including Grand Street, Second Avenue and East Broadway. Additional transportation options in the area include the MTA Bus system and Port Authority Trans-Hudson Corporation, a heavy rail rapid-transit system that connects Manhattan and New Jersey. According to a third party report, as of the fourth quarter of 2018, New York City’s average household income is $197,449.
According to a third party report, The Essex Property is located within the Soho retail submarket within the New York retail market. As of the third quarter of 2019, the New York retail market and Soho retail submarket had overall inventory of 591.7 million square feet and 5.8 million square feet, respectively, and exhibited vacancy rates of 3.8% and 5.8%, respectively. According to a third party report, The Essex Property is located within the Lower East Side multifamily submarket within the New York multifamily market. The New York multifamily market is experiencing rent growth of approximately 3.3% in 2019, and as of the third quarter of 2019, reported a vacancy rate of 2.0%. As of the third quarter of 2019, the Lower East Side multifamily submarket reported an average asking rent of $3,683 and vacancy rate of 2.5%.
THE INFORMATION IN THIS STRUCTURAL AND COLLATERAL TERM SHEET IS NOT COMPLETE AND MAY BE AMENDED PRIOR TO THE TIME OF SALE. THIS TERM SHEET IS NOT AN OFFER TO SELL THESE SECURITIES AND IT IS NOT A SOLICITATION OF AN OFFER TO BUY THESE SECURITIES IN ANY JURISDICTION WHERE THE OFFER OR SALE IS NOT PERMITTED.
| | |
70 of 156
| Structural and Collateral Term Sheet | Benchmark 2019-B14 | |
| The Essex | ||
| Total Unit Mix | |||||||
Unit Type | Units | Occupied | Avg. | Monthly | Annual | PSF | Occupancy |
| Studio | 48 | 48 | 436 | $1,949 | $1,122,492 | $54 | 100.0% |
| 1 BR | 49 | 49 | 601 | $3,455 | $2,031,768 | $69 | 100.0% |
| 2 BR | 71 | 71 | 848 | $4,605 | $3,923,280 | $65 | 100.0% |
| 3 BR | 27 | 27 | 1,093 | $7,093 | $2,298,120 | $78 | 100.0% |
| Total / Wtd. Avg. | 195 | 195 | 718 | $4,007 | $9,375,660 | $65 | 100.0% |
| Market | Affordable: Moderate Income | Affordable: Low Income | |||||||||||||
Unit Type | Units | Avg. | Monthly | Annual | PSF | Units | Avg. | Monthly | Annual | PSF | Units | Avg. | Monthly | Annual | PSF |
| Studio | 12 | 497 | $4,288 | $617,532 | $103 | 15 | 415 | $1,695 | $305,088 | $49 | 21 | 415 | $793 | $199,872 | $23 |
| 1 BR | 25 | 626 | $5,455 | $1,636,380 | $105 | 9 | 575 | $2,227 | $240,516 | $46 | 15 | 575 | $860 | $154,872 | $18 |
| 2 BR | 39 | 906 | $6,804 | $3,184,380 | $90 | 17 | 776 | $2,660 | $542,544 | $41 | 15 | 778 | $1,091 | $196,356 | $17 |
| 3 BR | 21 | 1,108 | $8,468 | $2,134,020 | $92 | 4 | 1040 | $2,919 | $140,112 | $34 | 2 | 1051 | $1,000 | $23,988 | $11 |
| Total / Wtd. Avg. | 97 | 827 | $6,505 | $7,572,312 | $96 | 45 | 639 | $2,275 | $1,228,260 | $44 | 53 | 587 | $904 | $575,088 | $19 |
| Retail Tenant Summary | ||||||||
| Tenant | Ratings Fitch/Moody’s/S&P | Net Rentable Area (SF) | % of Total NRA | Base Rent PSF | % of Total Base Rent | Lease Expiration Date | Most Recent Sales Per Screen(1) | Occupancy Cost |
| Regal Cinemas | NR / NR / NR | 65,000 | 100.0% | $78.85 | 100.0% | 3/31/2039 | $701,825 | 52.2% |
| (1) | The Most Recent Sales Per Screen is based on 14 screens and the annualized sales from the reporting period of April 1, 2019 to July 31, 2019 which amounted to $3,275,185. Regal Cinemas opened in April 2019. |
| Retail Lease Rollover Schedule(1) | |||||||||
Year | Number of | Net | % of NRA | Base Rent | % of Base | Cumulative | Cumulative | Cumulative | Cumulative |
| Vacant | 0 | 0 | 0.0% | $0 | 0.0% | 0 | 0.0% | $0 | 0.0% |
| 2019 | 0 | 0 | 0.0% | 0 | 0.0% | 0 | 0.0% | $0 | 0.0% |
| 2020 | 0 | 0 | 0.0% | 0 | 0.0% | 0 | 0.0% | $0 | 0.0% |
| 2021 | 0 | 0 | 0.0% | 0 | 0.0% | 0 | 0.0% | $0 | 0.0% |
| 2022 | 0 | 0 | 0.0% | 0 | 0.0% | 0 | 0.0% | $0 | 0.0% |
| 2023 | 0 | 0 | 0.0% | 0 | 0.0% | 0 | 0.0% | $0 | 0.0% |
| 2024 | 0 | 0 | 0.0% | 0 | 0.0% | 0 | 0.0% | $0 | 0.0% |
| 2025 | 0 | 0 | 0.0% | 0 | 0.0% | 0 | 0.0% | $0 | 0.0% |
| 2026 | 0 | 0 | 0.0% | 0 | 0.0% | 0 | 0.0% | $0 | 0.0% |
| 2027 | 0 | 0 | 0.0% | 0 | 0.0% | 0 | 0.0% | $0 | 0.0% |
| 2028 | 0 | 0 | 0.0% | 0 | 0.0% | 0 | 0.0% | $0 | 0.0% |
| 2029 | 0 | 0 | 0.0% | 0 | 0.0% | 0 | 0.0% | $0 | 0.0% |
| 2030 & Beyond | 1 | 65,000 | 100.0% | 5,125,250 | 100.0% | 65,000 | 100.0% | $5,125,250 | 100.0% |
| Total | 1 | 65,000 | 100.0% | $5,125,250 | 100.0% | ||||
| (1) | Based on the underwritten rent roll dated November 1, 2019. |
THE INFORMATION IN THIS STRUCTURAL AND COLLATERAL TERM SHEET IS NOT COMPLETE AND MAY BE AMENDED PRIOR TO THE TIME OF SALE. THIS TERM SHEET IS NOT AN OFFER TO SELL THESE SECURITIES AND IT IS NOT A SOLICITATION OF AN OFFER TO BUY THESE SECURITIES IN ANY JURISDICTION WHERE THE OFFER OR SALE IS NOT PERMITTED.
| | |
71 of 156
| Structural and Collateral Term Sheet | Benchmark 2019-B14 | |
| The Essex | ||
| Cash Flow Analysis | ||||
| Underwritten | Per Unit(1)(2) | %(3) | ||
| Residential Income(4) | $9,375,660 | $48,080 | 60.5% | |
| Retail Income | 5,125,000 | 78.85 | 33.1% | |
| Vacant Income | 0 | 0 | 0.0% | |
| Gross Potential Rent | $14,500,660 | $74,362 | 93.6% | |
| Total Reimbursements | 998,998 | 5,123 | 6.4% | |
| Net Rental Income | $15,499,658 | $79,485 | 100.0% | |
| Vacancy | (684,816) | (3,512) | (4.4)% | |
| Other Income | 94,404 | 484
| 0.6%
| |
| Effective Gross Income | $14,909,246 | $76,458 | 96.2% | |
| Total Expenses(5) | 2,857,283 | 14,653 | 19.2% | |
| Net Operating Income | $12,051,963 | $61,805 | 80.8% | |
| Replacement Reserves(6) | 58,500 | 300 | 0.4% | |
| Net Cash Flow | $11,993,463 | $61,505 | 80.4% | |
| (1) | Residential Income Per Unit and Retail Income Per Unit are calculated based on 195 multifamily units and 65,000 commercial square feet, respectively. |
| (2) | Underwritten Retail Income (Per Unit) is calculated based on Regal Cinemas’ in-place rent. |
| (3) | % column represents percent of Net Rental Income for all revenue lines and represents percent of Effective Gross Income for the remainder of the fields. |
| (4) | Underwritten Residential Income is based on the in-place rent roll as of September 10, 2019. |
| (5) | The Essex Property is subject to a 421-a tax abatement that started in 2019. Real estate taxes were underwritten to the 12 year average tax expense. |
| (6) | Replacement Reserves include rent from one commercial tenant and all residential units. |
Property Management. The residential units are managed by C&C Apartment Management LLC. The theater unit is managed by Taconic Management Company LLC, a wholly owned subsidiary of Taconic Investment Partners.
Escrows and Reserves. At loan origination, the Borrowers deposited (i) approximately $311,439 into a real estate tax reserve and (ii) $4,875 into a replacement reserve.
Tax Reserve –The Borrowers are required to deposit into a real estate tax reserve, on a monthly basis, an amount equal to 1/12 of the estimated annual real estate taxes, which currently equates to $62,288 per month.
Insurance Reserve –The Borrowers are required to deposit into an insurance reserve, on a monthly basis, an amount equal to 1/12 of estimated insurance premiums. In the event the Borrowers obtain and maintain a blanket insurance policy acceptable to the lender and no event of default under the loan or The Essex Mezzanine Loan (as defined below) has occurred and is continuing, the requirement for monthly deposits into the insurance reserve will be waived.
Replacements Reserve –The Borrowers are required to deposit into a replacement reserve, on a monthly basis, an amount equal to $4,602.50 for the residential units and $812.50 for the theater unit.
Lockbox / Cash Management.The Essex Whole Loan is structured with a hard lockbox and springing cash management. The Borrowers were required at loan origination to deliver tenant direction letters instructing (a) residential tenants to send all payments in the form of credit card payments or checks to ClickPay who will process such payments and deposit the amount of such payments into a lender controlled lockbox account (the “Lockbox Account”), and (b) residential tenants and retail tenant to deposit all other payments directly into the Lockbox Account. Additionally, the property manager is required to deposit all amounts constituting rents that it receives directly into the Lockbox Account. To the extent no Cash Sweep Event (as defined below) is continuing, all funds in the lockbox account are required to be transferred to or at the direction of the Borrowers. Following the occurrence and during the continuance of a Cash Sweep Event, all funds in the Lockbox Account are required to be swept each business day to a segregated cash management account under the control of the lender and disbursed in accordance with The Essex Whole Loan documents. To the extent there is a Cash Sweep Event continuing, all excess cash flow after payment of debt service, required reserves and operating expenses are required to be held as additional collateral for The Essex Whole Loan. The lender has been granted a first priority security interest in the cash management account.
THE INFORMATION IN THIS STRUCTURAL AND COLLATERAL TERM SHEET IS NOT COMPLETE AND MAY BE AMENDED PRIOR TO THE TIME OF SALE. THIS TERM SHEET IS NOT AN OFFER TO SELL THESE SECURITIES AND IT IS NOT A SOLICITATION OF AN OFFER TO BUY THESE SECURITIES IN ANY JURISDICTION WHERE THE OFFER OR SALE IS NOT PERMITTED.
| | |
72 of 156
| Structural and Collateral Term Sheet | Benchmark 2019-B14 | |
| The Essex | ||
A “Cash Sweep Event” means the occurrence of (i) an event of default, (ii) an event of default under The Essex Mezzanine Loan (as defined below), (iii) any bankruptcy action of a Borrowers or property manager, or (iv) the date on which the debt service coverage ratio (as calculated in The Essex Whole Loan documents and based on the trailing three-month period immediately preceding the date of determination) is less than 1.15x.
A Cash Sweep Event Cure may be cured in accordance with the following conditions: with respect to a Cash Sweep Event caused solely by (a) clause (i) above, the acceptance by the lender of a cure of such event of default, (b) clause (ii) above, The Essex Mezzanine Loan default has been cured in accordance with the terms of The Essex Mezzanine Loan documents, (c) clause (iii) above, the Borrowers replace the property manager with a qualified manager under a replacement management agreement within 90 days of such bankruptcy action, and (d) clause (iv) above, the debt service coverage ratio (as calculated in The Essex Whole Loan documents and based on the trailing three-month period immediately preceding the date of determination) is at least 1.15x for two consecutive quarters
Additional Debt.The related mezzanine loan (the “Essex Mezzanine Loan”) was funded concurrently and is coterminous with The Essex Whole Loan. The Essex Mezzanine Loan has an original principal balance as of the Cut-off Date of $40.0 million, accrues interest at a rate of 6.62500%per annum and is interest-only for the full term.
In connection with the tax abatement described below, Borrowers executed two enforcement notes payable to the order of the City of New York, acting by and through the Department of Housing Preservation and Development in the aggregate amount of $77,799,999 which are secured by two enforcement mortgages. No payments are due under the notes during the term of The Essex Whole Loan and the enforcement mortgages are subordinate to the lien of the mortgage in favor of the lender. The notes will mature on October 25, 2099 but no payments of principal and interest are due until the maturity date. Upon a foreclosure of the lien of the mortgage in favor of the lender, the enforcement mortgages would be extinguished.
Condominium. The Essex Property consists of four condominium units out of a total of seven condominium units that collectively comprise a condominium regime. The borrowers control three out of the seven votes on the condominium board and the Master Tenant, which is an affiliate of the borrowers, controls two out of the seven votes on the condominium board pursuant to an irrevocably proxy given by the borrower in favor of the Master Tenant under the Master Lease. In the event of a significant casualty or condemnation, borrowers are required to cause the Master Tenant to vote to rebuild and the failure to do so will result in full recourse to guarantor. Additionally, the lender has been appointed as the insurance trustee. If any amendment, modification or waiver to the condominium documents (i) adversely impairs or changes the priority of the lien held by a mortgagee with respect to a unit, or (ii) terminates the condominium, such amendment, waiver or modification will not be binding upon such mortgagee without its prior written consent.
Master Lease. The affordable housing unit at the Essex Property is subject to a master lease (the “Master Lease”) between the Residential Borrower and Site 2 DSA Affordable MT LLC (“Master Tenant”), pursuant to which the Master Tenant will operate the affordable housing unit and enter into subleases with residential tenants. Master Tenant and the lender entered into a subordination, non-disturbance and attornment agreement with respect to the Master Lease whereby the Master Tenant agreed to subordinate the Master Lease to the lien of the mortgage in exchange for non-disturbance so long as the Master Tenant is not in default under the Master Lease. The Master Tenant is a joint venture between Site 2 DSA Affordable Managers LLC, an affiliate of the Residential Borrower (“Site 2 Affordable Managers”), and Wells Fargo Affordable Housing Community Development Corporation (“Investor Member”). Site 2 Affordable Managers owns 0.01% of the interests in Master Tenant and controls the day to day operations of Master Tenant, and Investor Member owns 99.99% of the interests in Master Tenant. The lender has taken a pledge of Site 2 Affordable Manager’s equity interests in the Master Tenant so that, upon foreclosure, an affiliate of Residential Borrower will not control the Master Tenant.
Tax Abatement. The Essex Property has received a tax exemption pursuant to Section 421-a of the New York Real Property Tax Law by which the Essex Property is currently exempt from the payment of approximately 93.45% of the real estate taxes with respect to the residential units and 84.42% of real property taxes with respect to the theater unit, resulting in a total estimated real estate tax abatement of approximately $28 million. The exemption expires in 2054.
THE INFORMATION IN THIS STRUCTURAL AND COLLATERAL TERM SHEET IS NOT COMPLETE AND MAY BE AMENDED PRIOR TO THE TIME OF SALE. THIS TERM SHEET IS NOT AN OFFER TO SELL THESE SECURITIES AND IT IS NOT A SOLICITATION OF AN OFFER TO BUY THESE SECURITIES IN ANY JURISDICTION WHERE THE OFFER OR SALE IS NOT PERMITTED.
| | |
73 of 156
| Structural and Collateral Term Sheet | Benchmark 2019-B14 |
| 180 Water | |

THE INFORMATION IN THIS STRUCTURAL AND COLLATERAL TERM SHEET IS NOT COMPLETE AND MAY BE AMENDED PRIOR TO THE TIME OF SALE. THIS TERM SHEET IS NOT AN OFFER TO SELL THESE SECURITIES AND IT IS NOT A SOLICITATION OF AN OFFER TO BUY THESE SECURITIES IN ANY JURISDICTION WHERE THE OFFER OR SALE IS NOT PERMITTED.
| | |
74 of 156
| Structural and Collateral Term Sheet | Benchmark 2019-B14 |
| 180 Water | |
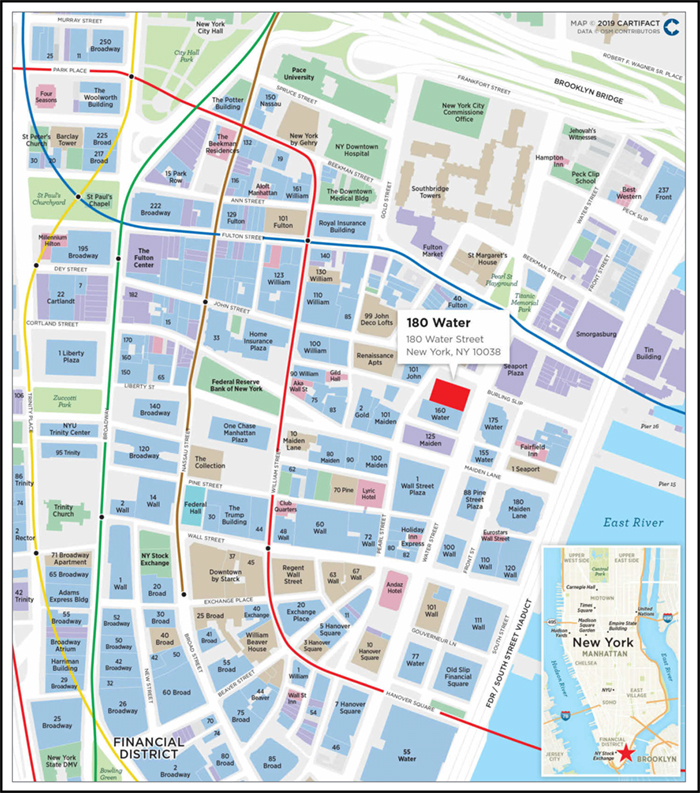
THE INFORMATION IN THIS STRUCTURAL AND COLLATERAL TERM SHEET IS NOT COMPLETE AND MAY BE AMENDED PRIOR TO THE TIME OF SALE. THIS TERM SHEET IS NOT AN OFFER TO SELL THESE SECURITIES AND IT IS NOT A SOLICITATION OF AN OFFER TO BUY THESE SECURITIES IN ANY JURISDICTION WHERE THE OFFER OR SALE IS NOT PERMITTED.
| | |
75 of 156
| Structural and Collateral Term Sheet | Benchmark 2019-B14 |
| 180 Water | |
| Mortgage Loan Information | Property Information | |||
| Mortgage Loan Seller: | GACC | Single Asset / Portfolio: | Single Asset | |
| Credit Assessment: | Title: | Fee | ||
| (Fitch / KBRA / S&P)(1): | BBB-sf / A(sf) / N/A | Property Type - Subtype: | Multifamily – High-Rise | |
| Original Principal Balance(2): | $50,000,000 | Net Rentable Area (Units): | 573 | |
| Cut-off Date Principal Balance(2): | $50,000,000 | Location: | New York, NY | |
| % of Pool by IPB: | 3.8% | Year Built / Renovated: | 1971 / 2017 | |
| Loan Purpose: | Refinance | Occupancy: | 97.0% | |
| Borrower: | 180 Water LLC | Occupancy Date: | 10/17/2019 | |
| Sponsor: | Nathan Berman | Number of Tenants: | N/A | |
| Interest Rate: | 3.410377% | 2016 NOI(5): | N/A | |
| Note Date: | 10/18/2019 | 2017 NOI(5): | N/A | |
| Maturity Date: | 11/6/2024 | 2018 NOI: | $11,665,024 | |
| Interest-only Period: | 60 months | TTM NOI (as of 6/2019)(6): | $13,118,762 | |
| Original Term: | 60 months | UW Economic Occupancy: | 91.2% | |
| Original Amortization: | None | UW Revenues: | $30,028,135 | |
| Amortization Type: | Interest Only | UW Expenses: | $14,955,048 | |
| Call Protection(3): | L(24),Def(32),O(4) | UW NOI(6): | $15,073,087 | |
| Lockbox / Cash Management: | Hard / In Place | UW NCF: | $14,955,732 | |
| Additional Debt(2)(4): | Yes | Appraised Value / Per Unit(7): | $451,500,000 / $787,958 | |
| Additional Debt Balance(2)(4): | $87,500,000 / $127,500,000 / | Appraisal Date: | 9/18/2019 | |
| $100,000,000 | ||||
| Additional Debt Type(2)(4): | Pari Passu / Subordinate Notes / | |||
| Mezzanine Debt | ||||
| Escrows and Reserves(8) | Financial Information(2)(1) | |||||||
| Initial | Monthly | Initial Cap | Senior | Whole Loan | Total Debt | |||
| Taxes: | $2,830,078 | $739,930 | N/A | Cut-off Date Loan / Unit: | $239,965 | $462,478 | $636,998 | |
| Insurance: | $100,505 | $82,813 | N/A | Maturity Date Loan / Unit: | $239,965 | $462,478 | $636,998 | |
| Replacement Reserves: | $0 | $11,936 | N/A | Cut-off Date LTV: | 30.5% | 58.7% | 80.8% | |
| TI/LC: | $333,406 | $0 | N/A | Maturity Date LTV: | 30.5% | 58.7% | 80.8% | |
| Other: | $4,100,046 | Springing | N/A | UW NCF DSCR(9): | 3.15x | 1.63x | 0.85x | |
| UW NOI Debt Yield: | 11.0% | 5.7% | 4.1% | |||||
| Sources and Uses | ||||||
| Sources | Proceeds | % of Total | Uses | Proceeds | % of Total | |
| Whole Loan | $265,000,000 | 68.4% | Loan Payoff | $378,415,399 | 97.7% | |
| Mezzanine Loan | 100,000,000 | 25.8 | Closing Costs | 2,746,128 | 0.7 | |
| Sponsor Equity | 22,434,416 | 5.8 | Upfront Reserves | 6,272,889 | 1.6 | |
| Total Sources | $387,434,416 | 100.0% | Total Uses | $387,434,416 | 100.0% | |
| (1) | Fitch and KBRA provided the listed assessments for the 180 Water Loan (as defined below) in the context of its inclusion in the mortgage pool. S&P does not provide a credit assessment but confirmed that the 180 Water Loan has, in the context of its inclusion in the mortgage pool, credit characteristics consistent with an investment grade obligation. |
| (2) | The 180 Water Loan (as defined below) consists of the non-controlling Note A-1, which is part of the 180 Water Whole Loan (as defined below) evidenced by five seniorpari passunotes and one subordinate note, with an aggregate outstanding principal balance as of the Cut-off Date of $265.0 million. For additional information, see “The Loan” below. |
| (3) | The lockout period will be at least 24 payments beginning with and including the first payment date of December 6, 2019. The borrower has the option to defease the full $265.0 million 180 Water Whole Loan after the earlier to occur of (i) two years after the closing date of the securitization that includes the last note to be securitized and (ii) the third anniversary of the first payment date. The assumed lockout period of 24 months is based on the expected closing date of the Benchmark 2019-B14 securitization in November 2019. The actual lockout period may be longer. |
| (4) | See “Current Mezzanine or Subordinate Indebtedness” and “Future Mezzanine or Subordinate Indebtedness” below. |
| (5) | 2016 and 2017 NOI are not available because the 180 Water Property (as defined below) was under renovation during this period. |
| (6) | The increase in Net Operating Income from TTM to Underwritten is a result of the lease up and stabilization of the residential component and signing of two retail leases. |
THE INFORMATION IN THIS STRUCTURAL AND COLLATERAL TERM SHEET IS NOT COMPLETE AND MAY BE AMENDED PRIOR TO THE TIME OF SALE. THIS TERM SHEET IS NOT AN OFFER TO SELL THESE SECURITIES AND IT IS NOT A SOLICITATION OF AN OFFER TO BUY THESE SECURITIES IN ANY JURISDICTION WHERE THE OFFER OR SALE IS NOT PERMITTED.
| | |
76 of 156
| Structural and Collateral Term Sheet | Benchmark 2019-B14 |
| 180 Water | |
| (7) | Based on the as-is appraised value. The appraisal also concluded to (i) an “Alternate As-Is” appraised value of $453.5 million and (ii) a “Prospective As Complete” appraised value of $458.5 million. The “Alternate As-Is” value is based on the assumption that the remaining planned capital expenditures for the mezzanine unit additions are fully funded and reserved by the lender, and that these reserved funds would pass with title to any purchaser of the 180 Water Property. The “Prospective As Complete” appraised value assumes the completion of the construction of seven additional residential units to be located on the mezzanine floor of the 180 Water Property as described below. At loan origination, the borrower reserved approximately $1.8 million for the conversion and completion of the mezzanine units. |
| (8) | For a full description of Escrows and Reserves, please refer to “Escrows and Reserves” below. The Other Reserve includes additional reserves in the amount of $1,091,146 required to be deposited by the borrower on November 6, 2019 consisting of (i) $891,146 into a prepaid rent reserve and (ii) $200,000 into a shortfall reserve. |
| (9) | At loan origination, the borrower deposited $1.2 million into a shortfall reserve with an additional $200,000 required to be deposited on November 6, 2019. The shortfall reserve will be available to cover cash flow shortfalls in debt service on the Total Debt (as defined below), reserves and operating expenses until the Total Debt DSCR is equal to 1.15x. See “Escrows and Reserves” below. The borrower’s current business plan is to (i) lease-up the 180 Water Property’s retail component and (ii) complete the conversion of additional mezzanine space between the grade level and the second floor into seven additional residential units. See “The Property” below. |
The Loan.The 180 Water mortgage loan (the “180 Water Loan”) is part of a whole loan with an aggregate outstanding principal balance as of the Cut-off Date of $265.0 million (the “180 Water Whole Loan”), secured by the borrower’s fee simple interest in a 573 unit, Class A, high-rise multifamily property, with ground floor retail, located in the Financial District of New York, New York (the “180 Water Property”).The 180 Water Whole Loan is comprised of (i) a senior loan, comprised of fivepari passunotes with an aggregate principal balance as of the Cut-off Date of $137.5 million (the “180 Water Senior Notes”), one of which (Note A-1 with an outstanding principal balance as of the Cut-off Date of $50.0 million) is being contributed to the Benchmark 2019-B14 Trust and constitutes the 180 Water Loan, and the remainder of which are expected to be contributed to one or more future securitization trusts and (ii) a subordinate loan, comprised of one note, with an outstanding principal balance as of the Cut-off Date of $127.5 million (the “180 Water Subordinate Companion Loan”), each as described below.The relationship between the holders of the 180 Water Senior Notes and 180 Water Subordinate Companion Loan will be governed by a co-lender agreement as described under“Description of the Mortgage Pool—The Whole Loans—The Non-Serviced AB Whole Loans—The 180 Water Whole Loan”in the Preliminary Prospectus. The 180 Water Whole Loan was originated by DBR Investments Co. Limited (“DBRI”). The 180 Water Whole Loan has a five-year term and is interest-only for the full term of the loan.
| Whole Loan Summary | |||||
| Note | Original Balance | Cut-off Date Balance | Note Holder | Controlling Piece | |
| A-1 | $50,000,000 | $50,000,000 | Benchmark 2019-B14 | No(1) | |
| A-2 | $40,000,000 | $40,000,000 | DBRI | No | |
| A-3 | $25,000,000 | $25,000,000 | DBRI | No | |
| A-4 | $15,000,000 | $15,000,000 | DBRI | No | |
| A-5 | $7,500,000 | $7,500,000 | DBRI | No | |
| Senior Notes | $137,500,000 | $137,500,000 | |||
| B | 127,500,000 | 127,500,000 | DBRI | Yes(1) | |
| Whole Loan | $265,000,000 | $265,000,000 | |||
| Mezzanine | $100,000,000 | $100,000,000 | |||
| Total | $365,000,000 | $365,000,000 | |||
| (1) | The initial controlling note is Note B, so long as no 180 Water Control Appraisal Period has occurred and is continuing. If and for so long as a 180 Water Control Appraisal Period has occurred and is continuing, then the controlling note will be Note A-1. See “Description of the Mortgage Pool—The Whole Loans—The Non-Serviced Pari Passu-AB Whole Loan—180 Water Whole Loan”. |
The Borrower. The borrowing entity for the 180 Water Whole Loan is 180 Water LLC, a Delaware limited liability company and special purpose entity.
The Loan Sponsor.The loan sponsor and nonrecourse carve-out guarantor is Nathan Berman. Nathan Berman is the founder and owner of Metro Loft Management LLC (“Metro Loft”), a vertically integrated real estate development and management company. Based in New York, Metro Loft focuses on luxury rental and developmental properties in Lower Manhattan and is the largest residential manager in Downtown Manhattan. Family owned and operated, Metro Loft privately develops, manages, and leases its properties exclusively. Nathan Berman is a developer who has renovated and constructed 14 other former office buildings into residential apartments and condos, including landmarks such as 20 Exchange Place, 63 Wall Street, 116 John Street, 17 John Street, 84 William Street, 135 William Street, 71 Leonard Street, 47 Ann Street, and 443 Greenwich Street.
The Property. The 180 Water Property is a Class A, 573-unit multifamily property located in the Financial District of Manhattan, New York. The 180 Water Property was constructed in 1971 as an office building and was converted into a high-rise multifamily building with ground floor retail, following a gut renovation that was completed in 2017.
THE INFORMATION IN THIS STRUCTURAL AND COLLATERAL TERM SHEET IS NOT COMPLETE AND MAY BE AMENDED PRIOR TO THE TIME OF SALE. THIS TERM SHEET IS NOT AN OFFER TO SELL THESE SECURITIES AND IT IS NOT A SOLICITATION OF AN OFFER TO BUY THESE SECURITIES IN ANY JURISDICTION WHERE THE OFFER OR SALE IS NOT PERMITTED.
| | |
77 of 156
| Structural and Collateral Term Sheet | Benchmark 2019-B14 |
| 180 Water | |
Each residential unit features high-end finishes, 8 to 11 foot ceiling heights, and in-unit washer/dryers. The 180 Water Property features 17,184 square feet of amenity space. The amenity space includes a rooftop pool, landscaped and furnished rooftop terrace, fitness facility, personal storage and bike storage units, 24-hour doorman, on-site valet and on-site concierge (dry cleaning, maid service, laundry and pet care, among others).
As of October 17, 2019, the 180 Water Property residential space was 97.0% occupied with a weighted average rent of $4,283 per unit. The 180 Water Property has 13,773 square feet of ground floor retail occupied by two credit rated tenants. In July 2018, Dunkin Donuts signed a 10-year lease for 750 square feet on the ground floor plus an additional 200 square feet of mezzanine space, and Citibank (rated A3/BBB+/A by Moody’s/S&P/Fitch) recently executed a 10-year, 3,496 square foot lease. In addition, there is an outstanding letter of intent for Neopolitan Express to occupy approximately 650 square feet at $211 per square foot on a ten year lease (but there is no assurance that a lease will be executed with that entity or on those terms).
The borrower’s current business plan is to lease-up the 180 Water Property’s retail component, which is 30.8% occupied as of June 30, 2019, although the borrower is under no obligation to pursue the plan. The borrower also plans, and is required under the 180 Water Whole Loan documents, to complete the conversion of additional mezzanine space between the grade level and the second floor into seven additional residential units. The lease up of the retail component and the construction and lease up of the additional mezzanine units is estimated to add approximately $1.1 million and $400,000 to net cash flow, respectively. There can be no assurance as to whether or when the seven additional residential units will be constructed, or whether such residential units or additional retail units will be leased, or of the rental rates or income on any such units. At loan origination, the borrower deposited approximately $1.8 million into a conversion holdback reserve for the completion of the seven residential units and $333,406 into a rollover reserve for future tenant improvements and leasing commissions.
The 180 Water Property is located at the southwest corner of John Street and Water Street in the Financial District of downtown Manhattan. The 180 Water Property is located four blocks from the Fulton Transit Center, two blocks from the FDR, four blocks from the Brooklyn Bridge and is serviced by 12 different NYC subway lines, the PATH trains and numerous bus and ferry lines. According to the appraisal, the 180 Water Property is located in the Financial District residential submarket. As of the second quarter of 2019, the Financial District residential inventory consisted of 26,101 units with a 2.0% vacancy rate and average rent of $4,238 per unit. According to the appraisal, the 2019 estimated population within the 10038 zip code is 21,826; while the 2019 estimated average household income within the zip code is $154,459.
The appraisal identified five comparable multifamily properties proximate to the 180 Water Property. The 180 Water Property comparables range from 475 to 650 units with an average of 580 units. Residential lease comparables are presented in the table below.
| Residential Lease Comparables(1) | ||||||||||
| No. | Property Location | Distance from Subject (miles) | Year Built/Renovated | Number of Stories | Occupancy | No. Units | Unit Type | Lease Areas (SF) | Base Rent | Base Rent PSF |
| 1 | 95 Wall Street | 0.10 mile(s) | 1970/2008 | 22 | 97.0% | 507 | 0BR | 454 | $3,178 | $84.00 |
| 1BR | 678 | $4,035 | $71.42 | |||||||
| 2BR | 1079 | $6,000 | $66.73 | |||||||
| 2 | 2 Gold Street | 0.11 mile(s) | 2005 | 51 | 99.0% | 650 | 0BR | 446 | $3,090 | $83.14 |
| 1BR | 680 | $3,700 | $65.29 | |||||||
| 2BR | 880 | $5,740 | $78.27 | |||||||
| 3 | 10 Hanover Square | 0.11 mile(s) | 1971/2005 | 28 | 98.6% | 500 | 0BR | 545 | $3,277 | $72.15 |
| 1BR | 781 | $5,194 | $79.81 | |||||||
| 2BR | 1,161 | $6,292 | $65.03 | |||||||
| 4 | 63 Wall Street(2) | 0.10 mile(s) | 1928/2003 | 37 | 96.8% | 475 | 0BR | N/A | $3,150 | N/A |
| 1BR | N/A | $3,870 | N/A | |||||||
| 2BR | N/A | $5,435 | N/A | |||||||
| 3BR | 991 | $6,405 | $77.56 | |||||||
| 5 | 200 Water Street | 0.00 mile(s) | 1971/2009 | 32 | 98.6% | 576 | 0BR | 548 | $3,300 | $72.26 |
| 0BR | 632 | $3,525 | $66.93 | |||||||
| 1BR | 650 | $4,000 | $73.85 | |||||||
| 1BR | 722 | $4,350 | $72.30 | |||||||
| 2BR | 980 | $6,050 | $74.08 | |||||||
| (1) | Source: Appraisal. |
| (2) | 63 Wall Street is owned by the loan sponsor. |
THE INFORMATION IN THIS STRUCTURAL AND COLLATERAL TERM SHEET IS NOT COMPLETE AND MAY BE AMENDED PRIOR TO THE TIME OF SALE. THIS TERM SHEET IS NOT AN OFFER TO SELL THESE SECURITIES AND IT IS NOT A SOLICITATION OF AN OFFER TO BUY THESE SECURITIES IN ANY JURISDICTION WHERE THE OFFER OR SALE IS NOT PERMITTED.
| | |
78 of 156
| Structural and Collateral Term Sheet | Benchmark 2019-B14 |
| 180 Water | |
| Historical and Current Occupancy | |||
| 2016(1) | 2017(1) | 2018(2)(3) | Current(3)(4) |
| N/A | N/A | 96.0% | 97.0% |
| (1) | Historical Occupancy is not available because the 180 Water Property opened in 2017 after completion of the renovation. |
| (2) | 2018 Historical Occupancy is as of December 31, 2018. |
| (3) | Represents the occupancy for the multifamily component of the 180 Water Property. |
| (4) | Current Occupancy is as of October 17, 2019. |
| Multifamily Unit Mix(1)(2) | ||||||
| Unit Type | # of Units | % of Total Units | Occupancy | Average Unit Size (SF) | Average Rent Per Unit | Average Rent PSF/Year |
| Studio | 256 | 44.7% | 96.9% | 455 | $3,165 | $83.64 |
| 1BR/1BA | 166 | 29.0 | 99.4% | 623 | $4,251 | $81.78 |
| 1BR/2BA | 50 | 8.7 | 98.0% | 882 | $5,445 | $74.18 |
| 2BR/2BA | 53 | 9.2 | 98.1% | 878 | $5,641 | $77.32 |
| 3BR/3BA | 48 | 8.4 | 87.5% | 1,258 | $7,965 | $76.04 |
| Total / Wtd. Avg. | 573 | 100.0% | 97.0% | 648 | $4,283 | $80.03 |
| (1) | Based on the underwritten rent roll dated October 17, 2019. |
| (2) | Occupancy, Average Unit Size (SF), and Average Monthly In-Place Rents represent a weighted average of the various unit type layouts. |
| Commercial Tenant Summary(1) | |||||||
| Tenant | Ratings Moody’s/Fitch/S&P(2) | Net Rentable Area (SF) | % of Total NRA | Base Rent PSF(3) | % of Total Base Rent | Lease Expiration Date | |
| Citibank | A3 / BBB+ / A | 3,496 | 25.4 | $225.00 | 82.2% | 2/28/2029 | |
| Dunkin Donuts | NR / NR / NR | 750 | 5.4 | $226.67 | 17.8 | 8/31/2029 | |
| Total Occupied | 4,246 | 30.8 | 225.29 | 100.0 | |||
| Vacant | 9,527 | 69.2 | |||||
| Total | 13,773 | 100.0% | |||||
| (1) | Based on the underwritten rent roll dated June 30, 2019. |
THE INFORMATION IN THIS STRUCTURAL AND COLLATERAL TERM SHEET IS NOT COMPLETE AND MAY BE AMENDED PRIOR TO THE TIME OF SALE. THIS TERM SHEET IS NOT AN OFFER TO SELL THESE SECURITIES AND IT IS NOT A SOLICITATION OF AN OFFER TO BUY THESE SECURITIES IN ANY JURISDICTION WHERE THE OFFER OR SALE IS NOT PERMITTED.
| | |
79 of 156
| Structural and Collateral Term Sheet | Benchmark 2019-B14 |
| 180 Water | |
| Operating History and Underwritten Net Cash Flow | |||||
| 2018 | TTM(1) | Underwritten | Per Unit(2) | %(3) | |
| Residential Income | |||||
| Gross Potential Rent | $ 27,773,850 | $ 29,050,974 | $29,637,638 | $51,724 | 101.8% |
| Vacancy | (433,534) | (1,076,071) | (1,063,154) | (1,855) | (3.7)% |
| Concessions | (1,744,444) | (916,613) | (418,728) | (731) | (1.4)% |
| Net Residential Income | $ 25,595,872 | $ 27,058,291 | $28,155,756 | $49,137 | 96.7% |
| Commercial Income | |||||
| Commercial Income | 2,594,772 | 1,729,848 | 2,273,325 | 165 | 7.8% |
| Vacancy | (2,465,454) | (1,729,848) | (1,316,725) | (96) | (4.5)% |
| Net Commercial Income | $129,318 | $0 | $956,600 | 69 | 3.3% |
| Other Income(4) | 921,404 | 915,779 | 915,779 | 1,598 | 3.1% |
| Effective Gross Income | $26,646,594 | $27,974,070 | $30,028,135 | $52,405 | 100.0% |
| Total Variable Expenses | 5,159,727 | 5,336,195 | 5,369,020 | 9,370 | 17.9% |
| Total Fixed Expenses | 9,821,843 | 9,519,113 | 9,586,028 | 16,730 | 31.9% |
| Total Expenses | 14,981,570 | 14,855,308 | $14,955,048 | $26,100 | 49.8% |
| Net Operating Income(5) | $11,665,024 | $13,118,762 | $15,073,087 | $26,306 | 50.2% |
| Replacement Reserves | 0 | 0 | 117,355 | 205 | 0.4% |
| Net Cash Flow | $11,665,024 | $13,118,762 | $14,955,732 | $26,101 | 49.8% |
| (1) | TTM column represents the trailing 12-month period ending on June 30, 2019. |
| (2) | Commercial Income related line items are based on the total commercial square footage of 13,773. All other line items are based on the 573 residential units. |
| (3) | % column represents percent of Net Rental Income for all revenue lines and represents percent of Effective Gross Income for the remainder of fields. |
| (4) | Other Income includes surrender income, storage income, pool rental income, late fees, residential electric income, escalation and miscellaneous income. |
| (5) | The increase in Net Operating Income from TTM to Underwritten is a result of the lease up and stabilization of the residential component and signing of two retail leases. |
Property Management. The 180 Water Property is managed byMetro Loft Management, LLC, an affiliate of the loan sponsor.
Escrows and Reserves.At origination, the borrower deposited (i) $2,830,078 for a tax reserve, (ii) $100,505 for an insurance reserve, (iii) $333,406 for a rollover reserve, (iv) $1,200,000 into an operating shortfall reserve and (v) $1,808,900 into a conversion reserve. On November 6, 2019, the borrower is required to deposit (i) $891,146 into a prepaid rent reserve and (ii) $200,000 into the shortfall reserve.
Tax Reserve-The borrower is required to deposit into a real estate tax reserve, on a monthly basis commencing on November 6, 2019, 1/12 of the estimated annual real estate taxes (initially estimated at $739,930).
Insurance Reserve-The borrower is required to deposit into an insurance reserve, on a monthly basis commencing on November 6, 2019, 1/12 of the estimated annual real estate taxes (initially estimated at $82,813), except that deposits will not be required with respect to the premiums for all risk insurance during any period when the borrower maintains coverage under a blanket insurance policy.
Replacement Reserve - The borrower is required to deposit into a replacement reserve, on a monthly basis commencing on November 6, 2019, $20.83 per residential unit (initially estimated at $11,936).
Shortfall Reserve - The shortfall reserve will be available to cover cash flow shortfalls in debt service on the Total Debt (as defined below), reserves and operating expenses. If the lender determines that the balance of the shortfall reserve is less than the shortfalls expected to occur over the immediately succeeding three-month period, then the lender may notify the borrower, and the borrower will be required to deposit additional funds into the shortfall reserve such that the balance will cover all expected shortfalls to occur over the immediately succeeding six-month period.If the debt service coverage ratio of the Total Debt is equal to or greater than 1.15x and the debt service coverage ratio for the 180 Water Whole Loan is equal to or greater than 2.21x as of the end of any calendar quarter, any remaining balance in the shortfall reserve will be returned to the borrower.
THE INFORMATION IN THIS STRUCTURAL AND COLLATERAL TERM SHEET IS NOT COMPLETE AND MAY BE AMENDED PRIOR TO THE TIME OF SALE. THIS TERM SHEET IS NOT AN OFFER TO SELL THESE SECURITIES AND IT IS NOT A SOLICITATION OF AN OFFER TO BUY THESE SECURITIES IN ANY JURISDICTION WHERE THE OFFER OR SALE IS NOT PERMITTED.
| | |
80 of 156
| Structural and Collateral Term Sheet | Benchmark 2019-B14 |
| 180 Water | |
Prepaid Rent Reserve – The borrower is permitted to collect residential rents more than one month (but not more than twelve months) in advance, provided that, within three business days following the borrower’s receipt of any such rents, the borrower deposits such prepaid rents into the prepaid rent reserve. On each monthly payment date, 1/12 of the prepaid rent reserve will be included in the cash flow applied on such monthly payment date pursuant to the cash management provisions described under “Lockbox/Cash Management” below.
Conversion Reserve– Funds in the conversion reserve will be made available to the borrower to cover the costs of converting the mezzanine space of the 180 Water Property into seven additional residential units as described above. The borrower is required to substantially complete such conversion not later than October 18, 2020 (subject to certain force majeure events).
Lockbox / Cash Management. The 180 Water Whole Loan is structured with a hard lockbox and in place cash management.The related borrower is required to cause all rents to be deposited directly into the lender-controlled lockbox account. All funds received by the borrower or the manager are required to be deposited in the lockbox account within one business day following receipt. Funds on deposit in the lockbox account are required to be swept on each business day into a lender-controlled cash management account and applied on each payment date to the payment of debt service (mortgage and mezzanine), the funding of required reserves and budgeted and approved extraordinary monthly operating expenses. Provided that no Trigger Period (as defined below) is continuing, excess cash in the cash management account will be disbursed to the borrower in accordance with the 180 Water Loan documents. If a Trigger Period is continuing, excess cash in the cash management account will be transferred to an account held by the lender as additional collateral for the 180 Water Whole Loan. As of the origination date of the 180 Water Whole Loan, a Trigger Period existed as a result of a Low DSCR Period (as defined below) with respect to the Total Debt and with respect to the 180 Water Whole Loan.
A “Trigger Period” means a period commencing upon the occurrence of: (i) an event of default; (ii) a Low DSCR Period (as defined below); or (iii) a default under the Mezzanine Loan (as defined below).
A Trigger Period may be cured (a) with respect to clause (i) above, upon the acceptance by the lender of a cure of such event of default, (b) with respect to clause (ii) above, the debt service coverage ratio has satisfied the conditions as defined below or (c) with respect to clause (iii) above, upon the receipt by the lender of a notice from the mezzanine lender that such event of default has been cured.
A “Low DSCR Period” will commence upon (i) the aggregate debt service coverage ratio of the 180 Water Whole Loan and the Mezzanine Loan (or any replacement thereof described below) (together, the “Total Debt”) is less than 1.15x or (ii) the debt service coverage ratio of the 180 Water Whole Loan is less than 2.21x and will end if, (a) with respect to a Low DSCR Period continuing pursuant to clause (i), the 180 Water Property achieves an aggregate debt service coverage ratio for the Total Debt of at least 1.15x for two consecutive calendar quarters and (B) with respect to a Low DSCR Period continuing pursuant to clause (ii), the 180 Water Property has achieved a debt service coverage ratio for the 180 Water Whole Loan of at least 2.21x for two consecutive calendar quarters. As of the origination date of the 180 Water Whole Loan, a Low DSCR Period existed with respect to the Total Debt and with respect to the 180 Water Whole Loan.
Current Mezzanine or Subordinate Indebtedness. A mezzanine loan (the “Mezzanine Loan”) was funded to the owners of the borrower concurrently with the 180 Water Whole Loan. The Mezzanine Loan has an originalprincipalbalance of $100.0 million, accrues interest at a per annum rate of 8.30000% and is interest-only for its entire term, provided that if the Total Debtdebt yield increases to 6.50%, then the interest rate will be reduced to a per annum rate of 7.80000%. The Mezzanine Loan is expected to be sold to an unaffiliated third party. As described above, the borrower incurred the 180 Water Subordinate Companion Note as part of the 180 Water Whole Loan.The 180 Water Subordinate Companion Note has an outstanding principal balance as of the Cut-off Date of $127.5 million and accrues interest at a fixed rate of 3.410377% per annum. The 180 Water Subordinate Companion Note has a 60-month term and is interest only for the full term of the loan. For additional information, see“Description of the Mortgage Pool—The Whole Loans—The Non-Serviced AB Whole Loans—The 180 Water Whole Loan”in the Preliminary Prospectus.
Future Mezzanine or Subordinate Indebtedness Permitted.The borrower has a one-time right to replace the Mezzanine Loan in whole (but not in part) with a replacement mezzanine loan, so long as certain conditions are satisfied, including that: (i) the principal amount of the replacement mezzanine loan would be no greater than the lesser of the outstanding principal balance of the Mezzanine Loan at such time, or $100.0 million, (ii) the new lender executes an intercreditor agreement that is substantially the same as the initial intercreditor agreement for the Mezzanine Loan, (ii) immediately after the closing of the replacement mezzanine loan, the Total Debt DSCR would be no less than the greater of (a) the origination date Total Debt debt service coverage ratio (0.85x) and (b) the Total Debt debt service coverage ratio immediately prior to the closing of the replacement mezzanine loan and (iii) immediately after the closing of the replacement mezzanine loan, the Total Debt debt yield would be no less than the greater of (a) the origination date Total Debt debt yield (4.1%) and (b) the Total Debt debt yield immediately prior to the closing of the replacement mezzanine loan.
THE INFORMATION IN THIS STRUCTURAL AND COLLATERAL TERM SHEET IS NOT COMPLETE AND MAY BE AMENDED PRIOR TO THE TIME OF SALE. THIS TERM SHEET IS NOT AN OFFER TO SELL THESE SECURITIES AND IT IS NOT A SOLICITATION OF AN OFFER TO BUY THESE SECURITIES IN ANY JURISDICTION WHERE THE OFFER OR SALE IS NOT PERMITTED.
| | |
81 of 156
| Structural and Collateral Term Sheet | Benchmark 2019-B14 |
| 180 Water | |
Zoning Lot Merger. The borrower has the right to consummate a zoning lot merger of the 180 Water Property with the adjacent property known as 160 Water Street in order to permit the owner of 160 Water Street to use a substantial portion of the unused residential density of the 180 Water Property, provided that the borrower sponsor has a material economic interest in the owner of 160 Water Street and is actively involved with such owner in the conversion of the 160 Water Street building from office use to residential and/or hotel use. This right is subject to satisfaction of certain conditions set forth in the 180 Water Whole Loan documents, including the execution of certain development right agreements that are approved or pre-approved by the lender; the receipt by the lender of a REMIC opinion; and the satisfaction of other REMIC requirements. It is anticipated that, prior to the initial issuance of the Benchmark 2019-B14 certificates, the 180 Water Whole Loan documents will be amended to pre-approve the form of development rights agreements.
Partial Release. None.
THE INFORMATION IN THIS STRUCTURAL AND COLLATERAL TERM SHEET IS NOT COMPLETE AND MAY BE AMENDED PRIOR TO THE TIME OF SALE. THIS TERM SHEET IS NOT AN OFFER TO SELL THESE SECURITIES AND IT IS NOT A SOLICITATION OF AN OFFER TO BUY THESE SECURITIES IN ANY JURISDICTION WHERE THE OFFER OR SALE IS NOT PERMITTED.
| | |
82 of 156
| Structural and Collateral Term Sheet | Benchmark 2019-B14 |
[THIS PAGE INTENTIONALLY LEFT BLANK]
THE INFORMATION IN THIS STRUCTURAL AND COLLATERAL TERM SHEET IS NOT COMPLETE AND MAY BE AMENDED PRIOR TO THE TIME OF SALE. THIS TERM SHEET IS NOT AN OFFER TO SELL THESE SECURITIES AND IT IS NOT A SOLICITATION OF AN OFFER TO BUY THESE SECURITIES IN ANY JURISDICTION WHERE THE OFFER OR SALE IS NOT PERMITTED.
| | |
83 of 156
| Structural and Collateral Term Sheet | Benchmark 2019-B14 | |
| Harvey Building Products | ||

THE INFORMATION IN THIS STRUCTURAL AND COLLATERAL TERM SHEET IS NOT COMPLETE AND MAY BE AMENDED PRIOR TO THE TIME OF SALE. THIS TERM SHEET IS NOT AN OFFER TO SELL THESE SECURITIES AND IT IS NOT A SOLICITATION OF AN OFFER TO BUY THESE SECURITIES IN ANY JURISDICTION WHERE THE OFFER OR SALE IS NOT PERMITTED.
| | |
84 of 156
| Structural and Collateral Term Sheet | Benchmark 2019-B14 | |
| Harvey Building Products | ||

THE INFORMATION IN THIS STRUCTURAL AND COLLATERAL TERM SHEET IS NOT COMPLETE AND MAY BE AMENDED PRIOR TO THE TIME OF SALE. THIS TERM SHEET IS NOT AN OFFER TO SELL THESE SECURITIES AND IT IS NOT A SOLICITATION OF AN OFFER TO BUY THESE SECURITIES IN ANY JURISDICTION WHERE THE OFFER OR SALE IS NOT PERMITTED.
| | |
85 of 156
| Structural and Collateral Term Sheet | Benchmark 2019-B14 | |
| Harvey Building Products | ||
| Mortgage Loan Information | Property Information | |||
| Mortgage Loan Seller: | CREFI | Single Asset / Portfolio: | Portfolio | |
| Original Principal Balance(1): | $50,000,000 | Title: | Fee | |
| Cut-off Date Principal Balance(1): | $50,000,000 | Property Type - Subtype(3): | Various – Various | |
| % of Pool by IPB: | 3.8% | Net Rentable Area (SF): | 2,046,119 | |
| Loan Purpose: | Acquisition | Location(3): | Various, Various | |
| Borrower: | AGNL Pane, L.L.C. | Year Built / Renovated(3): | Various / Various | |
| Sponsor: | AG Net Lease IV Corp. | Occupancy: | 100.0% | |
| Interest Rate: | 3.82000% | Occupancy Date: | 11/6/2019 | |
| Note Date: | 10/21/2019 | Number of Tenants: | 1 | |
| Maturity Date: | 11/6/2029 | 2016 NOI(4): | N/A | |
| Interest-only Period: | 60 months | 2017 NOI(4): | N/A | |
| Original Term: | 120 months | 2018 NOI(4): | N/A | |
| Original Amortization: | 360 months | TTM NOI(4): | N/A | |
| Amortization Type: | IO-Balloon | UW Economic Occupancy: | 95.0% | |
| Call Protection(2): | L(24),DeforGrtr1%orYM(90),O(6) | UW Revenues: | $18,933,995 | |
| Lockbox / Cash Management: | Hard / Springing | UW Expenses: | $4,362,956 | |
| Additional Debt(1): | Yes | UW NOI: | $14,571,039 | |
| Additional Debt Balance(1): | $110,000,000 | UW NCF: | $13,536,402 | |
| Additional Debt Type(1): | Pari Passu | Appraised Value / Per SF(3): | $230,600,000 / $113 | |
| Appraisal Date(3): | Various | |||
| Escrows and Reserves(5) | Financial Information(1) | |||||
| Initial | Monthly | Initial Cap | Cut-off Date Loan / SF: | $78 | ||
| Taxes: | $0 | Springing | N/A | Maturity Date Loan / SF: | $71 | |
| Insurance: | $0 | Springing | N/A | Cut-off Date LTV: | 69.4% | |
| Replacement Reserves: | $0 | Springing | N/A | Maturity Date LTV: | 62.8% | |
| TI/LC: | $0 | $0 | N/A | UW NCF DSCR: | 1.51x | |
| Other(6): | $0 | $0 | N/A | UW NOI Debt Yield: | 9.1% | |
| Sources and Uses | ||||||
| Sources | Proceeds | % of Total | Uses | Proceeds | % of Total | |
| Whole Loan(1) | $160,000,000 | 68.6% | Purchase Price | $230,750,000 | 99.0% | |
| Sponsor Equity | 70,172,133 | 30.1 | Closing Costs | 2,400,937 | 1.0 | |
| Other Sources | 2,978,804 | 1.3 | ||||
| Total Sources | $233,150,937 | 100.0% | Total Uses | $233,150,937 | 100.0% | |
| (1) | The Harvey Building Products Loan (as defined below) is part of a whole loan evidenced by threepari passu notes with an aggregate outstanding principal balance of $160.0 million. The Financial Information presented in the chart above reflects the $160.0 million aggregate Cut-off Date balance of the Harvey Building Products Whole Loan (as defined below). |
| (2) | The Harvey Building Products Loan lockout period is required to be at least 24 payments beginning with and including the first payment date of December 6, 2019. Defeasance of the full $160.0 million whole loan is permitted at any time after the earlier to occur of (i) two years after the closing date of the securitization that includes the last promissory note to be securitized and (ii) three years from the note date. The assumed lockout period of 24 months is based on the expected closing date of the Benchmark 2019-B14 securitization in November 2019. The actual lockout period may be longer. The lockout period does not apply to the borrower’s ability to prepay with yield maintenance. |
| (3) | See “Portfolio Summary” chart below. The Portfolio Market Value of $237.0 million as of October 17, 2019 results in a Cut-off Date LTV of 67.5% and Maturity Date LTV of 61.1%. |
| (4) | Historical information was not provided due to the NNN nature of the Harvey lease. |
| (5) | For a full description of Escrows and Reserves, see “Escrows and Reserves”. |
| (6) | Pursuant to the lease between the borrower, as landlord, and Harvey (as defined below), as tenant, Harvey is required to deliver a letter of credit to the borrower in the amount of $2,500,000 to secure the repayment of the work associated with certain repairs. For further details, please refer to “Escrows and Reserves” below. |
THE INFORMATION IN THIS STRUCTURAL AND COLLATERAL TERM SHEET IS NOT COMPLETE AND MAY BE AMENDED PRIOR TO THE TIME OF SALE. THIS TERM SHEET IS NOT AN OFFER TO SELL THESE SECURITIES AND IT IS NOT A SOLICITATION OF AN OFFER TO BUY THESE SECURITIES IN ANY JURISDICTION WHERE THE OFFER OR SALE IS NOT PERMITTED.
| | |
86 of 156
| Structural and Collateral Term Sheet | Benchmark 2019-B14 | |
| Harvey Building Products | ||
The Loan.The Harvey Building Products mortgage loan (the “Harvey Building Products Loan”) is a fixed rate loan secured by a first mortgage lien on the borrower’s fee interest in 27 warehouses, two manufacturing facilities and one headquarters office location totaling 2,046,119 square feet located in the Northeast United States (the “Harvey Building Products Properties”). The Harvey Building Products Loan is part of a whole loan comprised of threepari passunotes in the aggregate original principal balance of $160.0 million (the “Harvey Building Products Whole Loan”). The Harvey Building Products Loan is evidenced by the controlling Note A-2, with an original principal balance and outstanding principal balance as of the Cut-off Date of $50.0 million, and is being contributed to the Benchmark 2019-B14 mortgage trust. The non-controlling Note A-1 ($60.0 million) and non-controlling Note A-3 ($50.0 million) are currently held by CREFI and expected to be contributed to one or more future securitization transactions. The relationship between the holders of the Harvey Building Products Whole Loan will be governed by a co-lender agreement as described under“Description of the Mortgage Pool—The Whole Loans—The Serviced Pari Passu Whole Loans” in the Preliminary Prospectus. The Harvey Building Products Loan has a 10-year term and will be interest-only for the first 60 months of the loan term and will amortize on a 30-year schedule. The most recent prior financing of the Harvey Building Products Properties were included in the COMM 2015-LC23 securitization transaction.
| Whole Loan Summary | |||||
| Note | Original Balance | Cut-off Date Balance | Note Holder | Controlling Piece | |
| A-1 | $60,000,000 | $60,000,000 | CREFI | No | |
| A-2 | $50,000,000 | $50,000,000 | Benchmark 2019-B14 | Yes | |
| A-3 | $50,000,000 | $50,000,000 | CREFI | No | |
| Total | $160,000,000 | $160,000,000 | |||
The Borrower. The borrowing entity for the Harvey Building Products Whole Loan is AGNL Pane, L.L.C., a Delaware limited liability company and special purpose entity with two independent directors in its organizational structure.
The Loan Sponsor.The loan sponsor and non-recourse carveout guarantor is AG Net Lease IV Corp. (“AGNL”). AGNL is required to maintain a net worth of at least $5.0 million through the term of the Harvey Building Products Whole Loan. AGNL focuses primarily on industrial and warehouse/distribution facilities and has no specific geographic concentration.
The Properties. The Harvey Building Products Properties are comprised of 27 warehouse, two manufacturing facilities and one headquarters office location totaling 2,046,119 square feet located in the Northeast United States (see chart below). The Harvey Building Products Properties are 100% occupied by Harvey Building Products (“Harvey”) and represent 30 of its 44 current locations; the remaining properties are leased by Harvey from third party owners. The 30 locations for Harvey comprise their entire manufacturing operation and a corporate headquarters location as well. Harvey manufactures and distributes building products which include siding, roofing, windows, doors, patio rooms and decking products. Harvey generates approximately 80% of its revenue from the remodel/repairs market and rest from residential and commercial construction. The company has a diverse, granular and consistent base of around 46,000 customers consisting primarily of contractors with no single customer accounting for more than 0.5% of total revenue and a 95.0% customer retention rate.
The company was founded in 1961 and its corporate headquarters location is based out of Waltham, Massachusetts with approximately 1,600 employees. Harvey has locations in New Hampshire, Vermont, Maine, Rhode Island, Connecticut, New York, New Jersey and Pennsylvania. All of the company’s products are manufactured in the United States and their warehouse facilities include dedicated recycling areas in order to minimize Harvey Business Products’ environmental impact. Harvey was family-owned until 2015 at which point it was acquired by a private equity firm, Dunes Point Capital (“DPC”). DPC also acquired three window and door producers in the Midwest and Mid-Atlantic and has successfully expanded Harvey’s footprint into Ohio, Minnesota and Pennsylvania.
THE INFORMATION IN THIS STRUCTURAL AND COLLATERAL TERM SHEET IS NOT COMPLETE AND MAY BE AMENDED PRIOR TO THE TIME OF SALE. THIS TERM SHEET IS NOT AN OFFER TO SELL THESE SECURITIES AND IT IS NOT A SOLICITATION OF AN OFFER TO BUY THESE SECURITIES IN ANY JURISDICTION WHERE THE OFFER OR SALE IS NOT PERMITTED.
| | |
87 of 156
| Structural and Collateral Term Sheet | Benchmark 2019-B14 | |
| Harvey Building Products | ||
| Portfolio Summary | ||||||||
| Property | Location | Property Subtype | SF | Year Built/ Renovated | Allocated Loan Amount | % of Allocated Loan Amount | Appraised Value(1) | % of Appraised Value |
| Londonderry / Manufacturing | Londonderry, NH | Manufacturing | 376,294 | 2007 | $9,656,250 | 19.31% | $41,200,000 | 17.87% |
| Dartmouth / Manufacturing | North Dartmouth, MA | Manufacturing | 235,239 | 1999 | $5,625,000 | 11.25% | $24,000,000 | 10.41% |
| Waltham Corporate | Waltham, MA | Suburban | 54,400 | 2000 | $4,898,438 | 9.80% | $20,900,000 | 9.06% |
| Woburn | Woburn, MA | Warehouse/Distribution | 76,054 | 1989 | $2,796,875 | 5.59% | $13,900,000 | 6.03% |
| Nashua | Nashua, NH | Warehouse/Distribution | 111,594 | 2006 | $2,062,500 | 4.13% | $9,800,000 | 4.25% |
| Woburn CPD | Woburn, MA | Warehouse/Distribution | 59,800 | 1989 | $2,000,000 | 4.00% | $9,200,000 | 3.99% |
| (West) Bridgewater | West Bridgewater, MA | Warehouse | 81,776 | 2005 | $1,746,875 | 3.49% | $8,600,000 | 3.73% |
| Manchester, NH | Manchester, NH | Warehouse/Distribution | 81,747 | 2003 | $1,625,000 | 3.25% | $7,700,000 | 3.34% |
| Norwalk 256 | Norwalk, CT | Warehouse/Distribution | 40,232 | 1972 | $1,500,000 | 3.00% | $6,900,000 | 2.99% |
| New London | Waterford, CT | Warehouse/Distribution | 70,642 | 2008 | $1,406,250 | 2.81% | $6,750,000 | 2.93% |
| East Haven | East Haven, CT | Warehouse/Distribution | 70,089 | 2005 | $1,346,875 | 2.69% | $6,500,000 | 2.82% |
| Lincoln | Lincoln, RI | Warehouse/Distribution | 80,240 | 2003 | $1,300,000 | 2.60% | $6,400,000 | 2.78% |
| Bethlehem | Bethlehem, PA | Warehouse/Distribution | 71,091 | 1973 / 2005 | $1,218,750 | 2.44% | $6,000,000 | 2.60% |
| Salem | Salem, NH | Warehouse/Distribution | 58,286 | 2001 | $1,218,750 | 2.44% | $5,800,000 | 2.52% |
| Norwalk 260 | Norwalk, CT | Warehouse/Distribution | 30,000 | 1974 | $1,198,438 | 2.40% | $5,900,000 | 2.56% |
| Berlin | Berlin, CT | Warehouse/Distribution | 43,796 | 1994 | $1,109,375 | 2.22% | $5,400,000 | 2.34% |
| Dartmouth | Dartmouth, MA | Warehouse | 63,117 | 1974 / 2004 | $1,096,875 | 2.19% | $5,400,000 | 2.34% |
| Manchester, CT | Manchester, CT | Warehouse/Distribution | 49,175 | 1996 | $873,438 | 1.75% | $4,300,000 | 1.86% |
| Portland | Portland, ME | Warehouse/Distribution | 48,145 | 1976 / 2003 | $843,750 | 1.69% | $4,100,000 | 1.78% |
| Braintree | Braintree, MA | Warehouse/Distribution | 32,531 | 1986 | $828,125 | 1.66% | $4,000,000 | 1.73% |
| Warwick | Warwick, RI | Warehouse/Distribution | 43,899 | 1997 | $771,875 | 1.54% | $3,800,000 | 1.65% |
| Fitchburg | Fitchburg, MA | Warehouse | 39,433 | 1983 | $656,250 | 1.31% | $3,400,000 | 1.47% |
| Auburn | Auburn, MA | Warehouse/Distribution | 37,132 | 1983 / 2006 | $643,750 | 1.29% | $3,300,000 | 1.43% |
| Berlin CPD | Berlin, CT | Warehouse/Distribution | 28,163 | 1977 | $640,625 | 1.28% | $3,150,000 | 1.37% |
| Portsmouth | Portsmouth, NH | Warehouse/Distribution | 31,470 | 1985 / 1999 | $625,000 | 1.25% | $3,000,000 | 1.30% |
| Southampton | Huntingdon Valley, PA | Warehouse/Distribution | 36,421 | 1971 / 2009 | $537,500 | 1.08% | $2,600,000 | 1.13% |
| Wilkes-Barre | Forty Fort, PA | Warehouse/Distribution | 32,200 | 1950 / 1999 | $500,000 | 1.00% | $2,400,000 | 1.04% |
| Hyannis | Hyannis, MA | Warehouse | 24,070 | 1986 / 2002 | $484,375 | 0.97% | $2,300,000 | 1.00% |
| Springfield | Springfield, MA | Warehouse | 25,347 | 1989 | $467,188 | 0.93% | $2,300,000 | 1.00% |
| White River Junction | White River Junction, VT | Warehouse/Distribution | 13,736 | 1981 / 2001 | $321,875 | 0.64% | $1,600,000 | 0.69% |
| Total / Wtd. Avg. | 2,046,119 | $50,000,000 | 100.00% | $230,600,000 | 100.00% | |||
| (1) | The Appraised Value represents the as-is appraised value for each property as of various dates in September 2019. The Portfolio Market Value of $237,000,000 as of October 17, 2019 results in a Cut-off Date LTV of 67.5% and Maturity Date LTV of 61.1%. |
THE INFORMATION IN THIS STRUCTURAL AND COLLATERAL TERM SHEET IS NOT COMPLETE AND MAY BE AMENDED PRIOR TO THE TIME OF SALE. THIS TERM SHEET IS NOT AN OFFER TO SELL THESE SECURITIES AND IT IS NOT A SOLICITATION OF AN OFFER TO BUY THESE SECURITIES IN ANY JURISDICTION WHERE THE OFFER OR SALE IS NOT PERMITTED.
| | |
88 of 156
| Structural and Collateral Term Sheet | Benchmark 2019-B14 | |
| Harvey Building Products | ||
The Market. The 30 facilities comprising the Harvey Building Products Properties are spread across the northeastern United States and have the following state concentrations based on total square footage: Massachusetts – 35.6%, New Hampshire – 32.2%, Connecticut – 16.2%, Pennsylvania – 6.8%, Rhode Island – 6.1%, Maine – 2.4% and Vermont – 0.7%.
Corporate Headquarters – Waltham, Massachusetts
The corporate headquarters property is situated in Waltham, Massachusetts, which is approximately 11 miles northwest of downtown Boston. The city stretches along the Charles River and is close to several US interstate highways including Interstate-95 which is also Route 128. The corporate headquarters property is located along the south side of Main Street. According to the appraisal, the estimated 2019 population within a one-, three- and five-mile radius of the property is 6,522, 82,109 and 208,839, respectively with an average household income of $156,237, $142,692 and $180,180 within a one-, three-, and five-mile radius. According to a third party report, as of the second quarter of 2019, the Waltham office submarket has a total inventory of approximately 14.5 million square feet with an average vacancy rate of 11.9% and average market rent of $38.61 per square foot. There is new construction in the market and negative net absorption of around 45,000 square feet. The appraiser reviewed four comparable leases that were most similar to the Waltham headquarters building and concluded to market rent of $26.50 triple-net which is slightly above the in-place rental rate of $26.00 per square foot triple-net.
Londonderry Manufacturing – Londonderry, New Hampshire (Rockingham industrial submarket)
Londonderry is located just outside Manchester which is the largest city in New Hampshire. According to the appraisal, the Londonderry property benefits from its location and condition. As a Class B building, it is considered an above average product in its market. According to the appraisal, the estimated 2019 population within a one-, three- and five-mile radius of the property is 1,813, 14,891 and 81,733, respectively with an average household income of $99,866, $111,513 and $88,869 within a one-, three- and five-mile radius. According to a third party report, as of the second quarter of 2019, the Rockingham industrial submarket has a total inventory of approximately 28.0 million square feet with an average vacancy rate of 2.6% and average market rent of $9.26 per square foot. There is new construction in the market of around 20,000 square feet and positive net absorption of around 40,000 square feet. The appraiser reviewed four comparable leases including distribution properties and concluded to market rent of $6.85 triple-net which is equates to the in-place rental rate.
Dartmouth Manufacturing – North Dartmouth, Massachusetts (Attleboro / New Bedford industrial submarket)
Dartmouth is located in southwestern Massachusetts proximate to the state’s border with Rhode Island and about 30 miles east of Providence. According to the appraisal, North Dartmouth is the town’s primary commercial district and home to Dartmouth Towne Center, Dartmouth Mall and the University of Massachusetts Dartmouth. According to the appraisal, the estimated 2019 population within a one-, three- and five-mile radius of the property is 549, 53,484 and 138,940, respectively with an average household income of $94,138, $65,676 and $69,931 within a one-, three- and five-mile radius. According to a third party report, as of the second quarter of 2019, the Attleboro / New Bedford industrial submarket has a total inventory of approximately 66.0 million square feet with an average vacancy rate of 6.2% and average market rent of $7.15 per square foot. There is new construction in the market and negative net absorption. The appraiser reviewed four comparable leases and concluded to market rent of $6.50 net which is directly in line with the in-place rental rate at the property.
Warehouse & Showroom Facilities
The remaining 27 facilities serve as both warehouses and sales offices for Harvey’s products. According to the individual property appraisals, the majority of the warehouse facilities are situated proximate to major interstates and span across Massachusetts, Connecticut, New Hampshire, Pennsylvania, Rhode Island, Maine and Vermont. Harvey’s primary customers tend to be located within 30 miles of each branch. All 27 facilities are primarily warehouse facilities with a small component, of each property, representing showroom/distribution space.
| Current Occupancy(1)(2) |
| 100.0% |
| (1) | Current Occupancy is as of November 6, 2019. |
| (2) | Historical information was not provided due to the NNN nature of the Harvey lease. |
THE INFORMATION IN THIS STRUCTURAL AND COLLATERAL TERM SHEET IS NOT COMPLETE AND MAY BE AMENDED PRIOR TO THE TIME OF SALE. THIS TERM SHEET IS NOT AN OFFER TO SELL THESE SECURITIES AND IT IS NOT A SOLICITATION OF AN OFFER TO BUY THESE SECURITIES IN ANY JURISDICTION WHERE THE OFFER OR SALE IS NOT PERMITTED.
| | |
89 of 156
| Structural and Collateral Term Sheet | Benchmark 2019-B14 | |
| Harvey Building Products | ||
| Tenant Summary(1) | ||||||
| Tenant | Ratings(2) Moody’s/S&P/Fitch | Net Rentable Area (SF) | % of Total NRA | Base Rent PSF(3) | % of Total Base Rent | Lease Expiration Date |
| Harvey Building Products | NA / NA / NA | 2,046,119 | 100.0% | $7.61 | 100.0% | 10/21/2039 |
| (1) | Based on the underwritten rent roll. |
| (2) | Ratings provided are for the parent company of the entity listed in the “Tenant” field whether or not the parent company guarantees the lease. |
| (3) | Base Rent PSF includes $342,563 of contractual rent steps through October 2020. |
| Lease Rollover Schedule(1)(2) | |||||||||
| Year | Number of Leases Expiring | Net Rentable Area Expiring | % of NRA Expiring | Base Rent Expiring(2) | % of Base Rent Expiring(2) | Cumulative Net Rentable Area Expiring | Cumulative % of NRA Expiring | Cumulative Base Rent Expiring(2) | Cumulative % of Base Rent Expiring(2) |
| Vacant | NAP | NAP | NAP | NAP | NAP | NAP | NAP | NAP | NAP |
| MTM | 0 | 0 | 0.0% | $0 | 0.0% | 0 | 0 | 0 | 0 |
| 2019 | 0 | 0 | 0.0% | 0 | 0.0% | 0 | 0 | 0 | 0 |
| 2020 | 0 | 0 | 0.0% | 0 | 0.0% | 0 | 0 | 0 | 0 |
| 2021 | 0 | 0 | 0.0% | 0 | 0.0% | 0 | 0 | 0 | 0 |
| 2022 | 0 | 0 | 0.0% | 0 | 0.0% | 0 | 0 | 0 | 0 |
| 2023 | 0 | 0 | 0.0% | 0 | 0.0% | 0 | 0 | 0 | 0 |
| 2024 | 0 | 0 | 0.0% | 0 | 0.0% | 0 | 0 | 0 | 0 |
| 2025 | 0 | 0 | 0.0% | 0 | 0.0% | 0 | 0 | 0 | 0 |
| 2026 | 0 | 0 | 0.0% | 0 | 0.0% | 0 | 0 | 0 | 0 |
| 2027 | 0 | 0 | 0.0% | 0 | 0.0% | 0 | 0 | 0 | 0 |
| 2028 | 0 | 0 | 0.0% | 0 | 0.0% | 0 | 0 | 0 | 0 |
| 2029 | 0 | 0 | 0.0% | 0 | 0.0% | 0 | 0 | 0 | 0 |
| 2030 & Beyond | 1 | 2,046,119 | 100.0% | 15,567,566 | 100.0% | 2,046,119 | 100.0% | $15,567,566 | 100.0% |
| Total | 1 | 2,046,119 | 100.0% | $15,567,566 | 100.0% | ||||
| (1) | Based on the underwritten rent roll. |
| (2) | Base Rent Expiring, % of Base Rent Expiring, Cumulative Base Rent Expiring and Cumulative % of Base Rent Expiring includes $342,563 of contractual rent steps through October 2020. |
| Operating History and Underwritten Net Cash Flow(1) | |||
| Underwritten | Per Square Foot | %(2) | |
| Rents in Place(3) | $15,567,566 | $7.61 | 78.1% |
| Vacant Income | 0 | 0.00 | 0.0 |
| Gross Potential Rent | $15,567,566 | $7.61 | 78.1% |
| Total Reimbursements | 4,362,956 | 2.13 | 21.9 |
| Net Rental Income | $19,930,521 | $9.74 | 100.0% |
| (Vacancy/Credit Loss) | (996,526) | (0.49) | (5.0) |
| Other Income | 0 | 0.00 | 0.0 |
| Effective Gross Income | $18,933,995 | $9.25 | 95.0% |
| Total Expenses | $4,362,956 | $2.13 | 23.0% |
| Net Operating Income | $14,571,039 | $7.12 | 77.0% |
| Total TI/LC, Capex/RR | 1,034,637 | 0.51 | 5.5% |
| Net Cash Flow | $13,536,402 | $6.62 | 71.5% |
| (1) | Historical information was not provided due to the NNN nature of the Harvey lease. |
| (2) | % column represents percent of Net Rental Income for all revenue lines and represents percent of Effective Gross Income for the remainder of the fields. |
| (3) | Underwritten Rents in Place includes $342,563 of contractual rent steps through October 2020. |
THE INFORMATION IN THIS STRUCTURAL AND COLLATERAL TERM SHEET IS NOT COMPLETE AND MAY BE AMENDED PRIOR TO THE TIME OF SALE. THIS TERM SHEET IS NOT AN OFFER TO SELL THESE SECURITIES AND IT IS NOT A SOLICITATION OF AN OFFER TO BUY THESE SECURITIES IN ANY JURISDICTION WHERE THE OFFER OR SALE IS NOT PERMITTED.
| | |
90 of 156
| Structural and Collateral Term Sheet | Benchmark 2019-B14 | |
| Harvey Building Products | ||
Property Management. The Harvey Building Products Properties are self-managed.
Escrows and Reserves. On the origination date of the Harvey Building Products Whole Loan, the borrower was not required to deposit any upfront reserves, however the borrower is required, or is required to cause Harvey, to perform certain repairs at the Harvey Building Products Properties by October 21, 2020 pursuant to the Harvey Building Products Whole Loan documents. In addition, pursuant to the lease between the borrower, as landlord, and Harvey, as tenant (“Harvey Lease”), Harvey is required to deliver a letter of credit to the borrower in the amount of $2,500,000 to secure the repayment of the work associated with certain repairs. In the event that the borrower is entitled to draw on any letter of credit posted by Harvey, the borrower must, upon the occurrence of an event of default under the Harvey Building Products Whole Loan documents, deliver the portion of the proceeds of such letter of credit that has not been applied as set forth in the Harvey Lease, to the lender, to be held by the lender and applied as set forth in the Harvey Lease.
Tax Escrows – The requirement to make monthly deposits for tax reserves is provisionally waived so long as (i) no Trigger Period (as defined below) is then continuing and (ii) neither the borrower nor Harvey has (a) timely paid the taxes directly to the appropriate taxing authority and (b) provided evidence of such payment to the lender. If the conditions above are no longer satisfied, the borrower is required to deposit an amount equal to one-twelfth of the amount estimated annual real estate taxes into a tax reserve account.
Insurance Escrows - The requirement to make monthly deposits for insurance reserves is provisionally waived so long as (i) no Trigger Period is then continuing and (ii) neither the borrower nor Harvey has (a) timely paid the insurance premiums due on the policies to the issuer of the policies and (b) provided evidence of such payment to the lender. If the conditions above are no longer satisfied, the borrower is required to deposit an amount equal to one-twelfth of the estimated annual insurance premiums into an insurance reserve account.
Replacement Reserves – The requirement to make monthly deposits for insurance reserves is provisionally waived so long as (i) no Trigger Period is then continuing and (ii) neither the borrower nor Harvey has diligently made the required replacements. If the conditions above are no longer satisfied, the borrower is required to deposit an amount equal to approximately $34,102 into a replacement reserve account. The replacement reserve is not subject to a cap.
Lockbox / Cash Management.The Harvey Building Products Whole Loan is structured with a hard lockbox and springing cash management. The borrower is required to deliver a tenant direction letter to Harvey, the existing tenant at the Harvey Building Products Properties directing it to remit its rent checks directly to the lender-controlled lockbox. The borrower is required to cause revenue received by the borrower or the property manager from the Harvey Building Products Properties to be deposited into such lockbox immediately. All funds deposited into the lockbox are required to be transferred on each business day to or at the direction of the borrower unless a Trigger Period exists. Upon the occurrence and during the continuance of a Trigger Period, all funds in the lockbox account are required to be swept on each business day to a cash management account under the control of the lender to be applied and disbursed in accordance with the Harvey Building Products Whole Loan documents, and all excess cash flow funds remaining in the cash management account after the application of such funds in accordance with the Harvey Building Products Whole Loan documents are required to be held by the lender in an excess cash flow reserve account as additional collateral for the Harvey Building Products Whole Loan. Upon the cure of the applicable Trigger Period, so long as no other Trigger Period exists, the lender is required to return any amounts remaining on deposit in the excess cash flow reserve account to the borrower. Upon an event of default under the Harvey Building Products Whole Loan documents, the lender will apply funds to the debt in such priority as it may determine.
A “Trigger Period” means a period commencing upon the earliest to occur of (i) an event of default, (ii) the debt service coverage ratio being less than 1.20x for two consecutive calendar quarters, and (iii) a Specified Tenant Trigger Period (as defined below), and expiring upon (a) with respect to clause (i) above, the cure (if applicable) of such event of default, (b) with respect to clause (ii) above, the debt service coverage ratio being equal to or greater than 1.20x for two consecutive calendar quarters, and (c) with respect to clause (iii) above, such Specified Tenant Trigger Period ceasing to exist.
A “Specified Tenant” means, as applicable, (i) Harvey, together with any parent or affiliate thereof providing credit support or a guaranty, or (ii) any replacement tenant of Harvey approved in accordance with the Harvey Building Products Whole Loan documents.
THE INFORMATION IN THIS STRUCTURAL AND COLLATERAL TERM SHEET IS NOT COMPLETE AND MAY BE AMENDED PRIOR TO THE TIME OF SALE. THIS TERM SHEET IS NOT AN OFFER TO SELL THESE SECURITIES AND IT IS NOT A SOLICITATION OF AN OFFER TO BUY THESE SECURITIES IN ANY JURISDICTION WHERE THE OFFER OR SALE IS NOT PERMITTED.
| | |
91 of 156
| Structural and Collateral Term Sheet | Benchmark 2019-B14 | |
| Harvey Building Products | ||
A “Specified Tenant Trigger Period” will (A) commence upon the first to occur of (i) an event of default under the applicable Specified Tenant lease arising directly as a result of the Specified Tenant’s failure to be in actual, physical possession of, or abandoning the Specified Tenant space (or applicable portion thereof), (ii) any termination or cancellation of the Specified Tenant lease (including, without limitation, rejection in any bankruptcy or similar insolvency proceeding), or (iii) any bankruptcy or similar insolvency of the Specified Tenant, and (B) expire upon (x) with respect to clause (i) above, the lender’s receipt of satisfactory evidence that any event of default arising directly as a result of the Specified Tenant’s failure to be in actual, physical possession of, or abandoning the Specified Tenant space (or applicable portion thereof) has been cured, (y) with respect to clause (ii) above, the Specified Tenant space being re-leased pursuant to one or more replacement leases approved by the lender in accordance with the Harvey Building Products Whole Loan documents and the tenants thereunder being in actual physical occupancy of the Harvey Building Products Properties and paying fully unabated rent, and (z) with respect to clause (iii) above, (a) the applicable Specified Tenant no longer being insolvent or subject to any bankruptcy or insolvency proceedings and having affirmed the applicable Specified Tenant lease pursuant to final, non-appealable order of a court of competent jurisdiction, (b) if the Specified Tenant lease is assumed in connection with such proceedings, the bankruptcy court having issued a final order approving the Specified Tenant’s reorganization plan or (c) if the Specified Tenant lease is rejected or otherwise terminated due to any bankruptcy or insolvency proceedings, the Harvey Building Products Property being re-leased pursuant to one or more replacement leases approved by the lender in accordance with the Harvey Building Products Loan documents and the tenants thereunder being in actual physical occupancy of the Harvey Building Products Property and paying full unabated rent.
Partial Release. Provided that no event of default is continuing under the Harvey Building Products Whole Loan documents, at any time after the earlier of (a) the third anniversary of the origination date, and (b) the date that is two years after the closing date of the securitization that includes the last note to be securitized, the borrower may (i) deliver defeasance collateral and obtain release of one or more individual Harvey Building Products Properties (except that the following individual Harvey Building Products Properties are not permitted to be released: (i) the Londonderry / Manufacturing property (0.7% of the initial pool balance), (ii) the Dartmouth / Manufacturing property (0.4% of the initial pool balance), and (iii) the Waltham Corporate property (0.4% of the initial pool balance) (the “Restricted Release Properties”), and/or (ii) partially prepay the Harvey Building Products Whole Loan and obtain release of one or more individual Harvey Building Products Properties (except that the Restricted Release Properties are not permitted to be released), in each case, provided that, among other conditions (i) the defeasance collateral or partial prepayment, as applicable, is in an amount equal to 110% of the allocated loan amount for the individual Harvey Building Products Property, (ii) the borrower delivers a REMIC opinion, (iii) in the case of a partial defeasance, the borrower delivers a rating agency confirmation or, in the case of a partial prepayment, the borrower delivers a rating agency confirmation only if requested by the lender, (iv) as of the date of the consummation of the partial release (whether by partial prepayment or partial defeasance), after giving effect to the release, the debt service coverage ratio with respect to the remaining Harvey Building Products Properties is greater than the greater of (a) the debt service coverage ratio for all of the Harvey Building Products Properties as of the date of the consummation of the partial release, and (b) 1.51x, (v) as of the date of the consummation of the partial release (whether by partial prepayment or partial defeasance), after giving effect to the release, the loan-to-value ratio with respect to the remaining Harvey Building Products Properties is no greater than the lesser of (a) 67.5% and (b) the loan-to-value ratio for all of the Harvey Building Products Properties as of the date of the consummation of the partial release, and (vi) as of the date of the consummation of the partial release (whether by partial prepayment or partial defeasance), after giving effect to the release, the debt yield with respect to the remaining Harvey Building Products Properties is greater than the greater of (a) 8.65% and (b) the debt yield for all of the Harvey Building Products Properties as of the date of the consummation of the partial release.
Future Mezzanine or Subordinate Indebtedness Permitted. At any time after the earlier of (a) the third anniversary of the origination date, and (b) the date that is two years after the closing date of the securitization that includes the last note to be securitized, the direct or indirect owners of the borrower are permitted to obtain mezzanine financing secured by direct or indirect ownership interests in the borrower so long as, among other things: (a) no event of default has occurred and is continuing, (b) the lender and such mezzanine lender have entered into an intercreditor agreement reasonably satisfactory to the lender, (c) the combined loan-to-value ratio (as calculated in the Harvey Building Products Whole Loan documents) is no greater than 67.5%, (d) the debt service coverage ratio (as calculated in the Harvey Building Products Whole Loan documents) is equal to or greater than 1.51x, (e) the debt yield (as calculated in the Harvey Building Products Whole Loan documents) is equal to or greater than 8.65%, (f) the maturity date of the mezzanine loan is not earlier than the maturity date of the Harvey Building Products Whole Loan and (f) if required by the lender, a rating agency confirmation is delivered with respect to the mezzanine loan.
THE INFORMATION IN THIS STRUCTURAL AND COLLATERAL TERM SHEET IS NOT COMPLETE AND MAY BE AMENDED PRIOR TO THE TIME OF SALE. THIS TERM SHEET IS NOT AN OFFER TO SELL THESE SECURITIES AND IT IS NOT A SOLICITATION OF AN OFFER TO BUY THESE SECURITIES IN ANY JURISDICTION WHERE THE OFFER OR SALE IS NOT PERMITTED.
| | |
92 of 156
| Structural and Collateral Term Sheet | Benchmark 2019-B14 |
[THIS PAGE INTENTIONALLY LEFT BLANK]
THE INFORMATION IN THIS STRUCTURAL AND COLLATERAL TERM SHEET IS NOT COMPLETE AND MAY BE AMENDED PRIOR TO THE TIME OF SALE. THIS TERM SHEET IS NOT AN OFFER TO SELL THESE SECURITIES AND IT IS NOT A SOLICITATION OF AN OFFER TO BUY THESE SECURITIES IN ANY JURISDICTION WHERE THE OFFER OR SALE IS NOT PERMITTED.
| | |
93 of 156
| Structural and Collateral Term Sheet | Benchmark 2019-B14 | |
| Legends at Village West | ||

THE INFORMATION IN THIS STRUCTURAL AND COLLATERAL TERM SHEET IS NOT COMPLETE AND MAY BE AMENDED PRIOR TO THE TIME OF SALE. THIS TERM SHEET IS NOT AN OFFER TO SELL THESE SECURITIES AND IT IS NOT A SOLICITATION OF AN OFFER TO BUY THESE SECURITIES IN ANY JURISDICTION WHERE THE OFFER OR SALE IS NOT PERMITTED.
| | |
94 of 156
| Structural and Collateral Term Sheet | Benchmark 2019-B14 | |
| Legends at Village West | ||
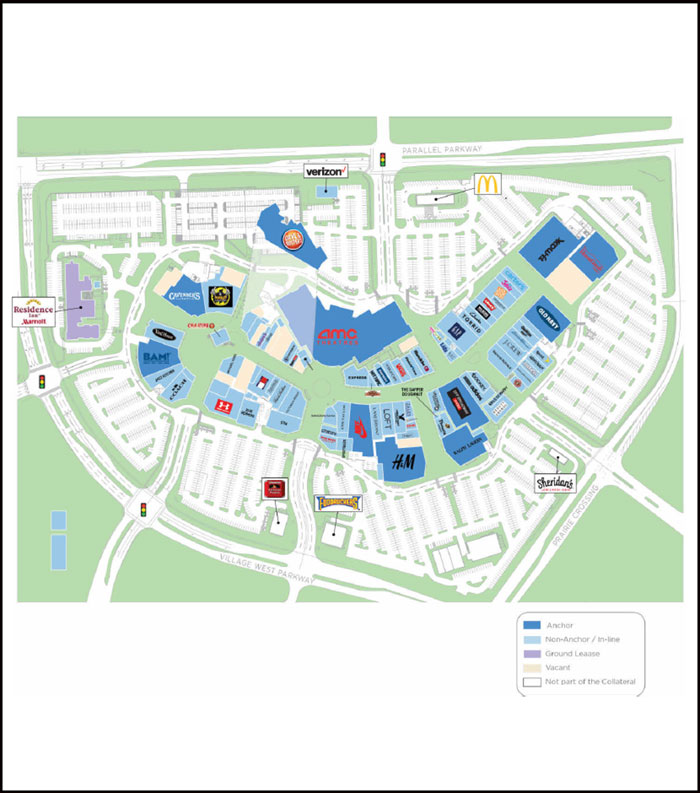
THE INFORMATION IN THIS STRUCTURAL AND COLLATERAL TERM SHEET IS NOT COMPLETE AND MAY BE AMENDED PRIOR TO THE TIME OF SALE. THIS TERM SHEET IS NOT AN OFFER TO SELL THESE SECURITIES AND IT IS NOT A SOLICITATION OF AN OFFER TO BUY THESE SECURITIES IN ANY JURISDICTION WHERE THE OFFER OR SALE IS NOT PERMITTED.
| | |
95 of 156
| Structural and Collateral Term Sheet | Benchmark 2019-B14 | |
| Legends at Village West | ||

THE INFORMATION IN THIS STRUCTURAL AND COLLATERAL TERM SHEET IS NOT COMPLETE AND MAY BE AMENDED PRIOR TO THE TIME OF SALE. THIS TERM SHEET IS NOT AN OFFER TO SELL THESE SECURITIES AND IT IS NOT A SOLICITATION OF AN OFFER TO BUY THESE SECURITIES IN ANY JURISDICTION WHERE THE OFFER OR SALE IS NOT PERMITTED.
| | |
96 of 156
| Structural and Collateral Term Sheet | Benchmark 2019-B14 | |
| Legends at Village West | ||
| Mortgage Loan Information | Property Information | |||
| Mortgage Loan Seller: | CREFI | Single Asset / Portfolio: | Single Asset | |
| Original Principal Balance(1): | $50,000,000 | Title: | Fee | |
| Cut-off Date Principal Balance(1): | $50,000,000 | Property Type - Subtype: | Retail - Anchored | |
| % of Pool by IPB: | 3.8% | Net Rentable Area (SF): | 702,750 | |
| Loan Purpose: | Refinance | Location: | Kansas City, KS | |
| Borrower: | W-LD Legends Owner VII, L.L.C. | Year Built / Renovated: | 2005 / 2019 | |
| Sponsor(2): | Various | Occupancy: | 92.1% | |
| Interest Rate: | 3.86000% | Occupancy Date: | 9/15/2019 | |
| Note Date: | 10/22/2019 | Number of Tenants: | 90 | |
| Maturity Date: | 11/6/2024 | 2016 NOI: | $10,933,398 | |
| Interest-only Period: | None | 2017 NOI: | $11,786,643 | |
| Original Term: | 60 months | 2018 NOI: | $11,283,528 | |
| Original Amortization: | 360 months | TTM NOI (as of 8/2019): | $11,613,298 | |
| Amortization Type: | Balloon | UW Economic Occupancy: | 90.4% | |
| Call Protection(3): | L(24),Def(32),O(4) | UW Revenues: | $22,757,007 | |
| Lockbox / Cash Management: | Hard / Springing | UW Expenses: | $11,382,857 | |
| Additional Debt: | Yes | UW NOI: | $11,374,151 | |
| Additional Debt Balance: | $70,000,000 | UW NCF: | $11,254,688 | |
| Additional Debt Type: | Pari Passu | Appraised Value / Per SF: | $225,000,000 / $320 | |
| Appraisal Date: | 9/1/2021 | |||
| Escrows and Reserves(4) | Financial Information(1) | |||||
| Initial | Monthly | Initial Cap | Cut-off Date Loan / SF: | $171 | ||
| Taxes: | $3,569,900 | $594,983 | N/A | Maturity Date Loan / SF: | $155 | |
| Insurance: | $0 | Springing | N/A | Cut-off Date LTV: | 53.3% | |
| Replacement Reserves: | $0 | $9,955 | N/A | Maturity Date LTV: | 48.3% | |
| TI/LC: | $10,000,000 | Springing | $2,500,000 | UW NCF DSCR: | 1.67x | |
| Immediate Repairs: | $227,700 | $0 | N/A | UW NOI Debt Yield: | 9.5% | |
| Sources and Uses(1) | ||||||
| Sources | Proceeds | % of Total | Uses | Proceeds | % of Total | |
| Mortgage Loan | $120,000,000 | 84.4% | Loan Payoff | $127,397,288 | 89.6% | |
| Sponsor Equity | 22,257,132 | 15.6 | Upfront Reserves | 13,797,600 | 9.7 | |
| Closing Costs | 1,062,245 | 0.7 | ||||
| Total Sources | $142,257,132 | 100.0% | Total Uses | $142,257,132 | 100.0% | |
| (1) | The Legends at Village West Loan (as defined below) is part of a whole loan evidenced by threepari passu notes with an aggregate outstanding principal balance of $120.0 million. The financial information presented in the chart above reflects the $120.0 million aggregate Cut-off Date balance of the Legends at Village West Whole Loan (as defined below). |
| (2) | See “The Loan Sponsors” below. |
| (3) | The Legends at Village West Loan lockout period is required to be at least 24 payments beginning with and including the first payment date of December 6, 2019. Defeasance of the full $120.0 million whole loan is permitted at any time after the earlier to occur of (i) two years after the closing date of the securitization that includes the last promissory note to be securitized and (ii) three years from the note date. The assumed lockout period of 24 months is based on the expected closing date of the Benchmark 2019-B14 securitization in November 2019. The actual lockout period may be longer. |
| (4) | For a full description of Escrows and Reserves, see “Escrows and Reserves”. |
THE INFORMATION IN THIS STRUCTURAL AND COLLATERAL TERM SHEET IS NOT COMPLETE AND MAY BE AMENDED PRIOR TO THE TIME OF SALE. THIS TERM SHEET IS NOT AN OFFER TO SELL THESE SECURITIES AND IT IS NOT A SOLICITATION OF AN OFFER TO BUY THESE SECURITIES IN ANY JURISDICTION WHERE THE OFFER OR SALE IS NOT PERMITTED.
| | |
97 of 156
| Structural and Collateral Term Sheet | Benchmark 2019-B14 | |
| Legends at Village West | ||
The Loan.The Legends at Village West mortgage loan (the “Legends at Village West Loan”) is a fixed rate loan secured by a first mortgage lien on the borrower’s fee interest in a 702,750 square foot regional open-air outlet shopping center located in Kansas City, Kansas (the “Legends at Village West Property”). The Legends at Village West Loan is part of a whole loan comprised of threepari passunotes in the aggregate original principal balance of $120.0 million (the “Legends at Village West Whole Loan”). The Legends at Village West Loan is evidenced by the controlling Note A-1, with an original principal balance and outstanding principal balance as of the Cut-off Date of $50.0 million, and is being contributed to the Benchmark 2019-B14 mortgage trust. The non-controlling Note A-2 ($40.0 million) and non-controlling Note A-3 ($30.0 million) are currently held by CREFI and expected to be contributed to one or more future securitization transactions. The relationship between the holders of the Legends at Village West Whole Loan will be governed by a co-lender agreement as described under “Description of the Mortgage Pool—The Whole Loans—The Serviced Pari Passu Whole Loans” in the Preliminary Prospectus. The Legends at Village West Whole Loan has a five-year term and will amortize on a 30-year schedule. The most recent prior financing of the Legends at Village West Property was not included in a prior securitization transaction.
| Whole Loan Summary | |||||
| Note | Original Balance | Cut-off Date Balance | Note Holder | Controlling Piece | |
| A-1 | $50,000,000 | $50,000,000 | Benchmark 2019-B14 | Yes | |
| A-2 | $40,000,000 | $40,000,000 | CREFI | No | |
| A-3 | $30,000,000 | $30,000,000 | CREFI | No | |
| Total | $120,000,000 | $120,000,000 | |||
The Borrower. The borrowing entity for the Legends at Village West Whole Loan is W-LD Legends Owner VII, L.L.C., a Delaware limited liability company and special purpose entity with at least two independent directors in its organizational structure.
The Loan Sponsors.The loan sponsors and non-recourse carveout guarantors are Walton Street Real Estate FUND VII, L.P., Walton Street Real Estate Investors VII, L.P., Walton Street Real Estate Fund VII-Q, L.P., Walton Street Real Estate Fund VII-E, L.P., Walton Street Real Estate Partners VII, L.P., Walton Street Real Estate Partners VII-NGE, L.P., Walton Street Real Estate Fund VII-NUS, L.P. and WSC Capital Holdings VII, L.P. (collectively, “Walton Street”). Walton Street is required to maintain a net worth of at least $75.0 million and liquidity of at least $7.5 million through the term of the Legends at Village West Whole Loan. Walton Street, a private equity real estate investment firm based in Chicago, sponsors equity and debt investment funds and currently has approximately $10.2 billion of real estate assets under management.
The Property. The Legends at Village West Property is a regional open-air outlet shopping center that comprises 702,750 square feet of gross leasable area (including two operation and easement agreement outparcels that contribute to common area maintenance only), located in the southeast quadrant of Village West Parkway and Parallel Parkway in Kansas City, Kansas. The Legends at Village West Property was developed by RED Development in 2005 and later underwent a successful conversion project, in order to become an entertainment-focused outlet center. The Legends at Village West Property is located on a site that is 79.2 acres and it is part of the 400-acre Village West Tourism District which includes: the Nebraska Furniture Mart, Community America Ballpark, Kansas Speedway, Hollywood Casino, Sporting KC’s soccer stadium (18,500 seats), Kansas City T-Bones stadium (4,800 seats) and the 660,000 square foot Cerner office campus. Kansas Speedway and Village West attract over 10 million visitors annually. In addition, the Legend at Village West Property’s proximity to the Nebraska Furniture Mart, one of the nation’s top two highest-volume furniture outlets in the country and Cabela’s, brings a large volume of traffic to the Legends at Village West Property.
The Legends at Village West Property is 92.1% leased to a collection of 90 tenants comprised of two theater/entertainment tenants, 16 restaurants, and 72 designer and brand-name outlet stores. The anchor/major tenants include: AMC Theaters, Dave and Busters, TJ Maxx, Off Broadway Shoes and HomeGoods. Additional retail line-up includes many of the top performing outlet merchants in the industry, including Coach, Kate Spade, Michael Kors, Nike, Under Armour, Ralph Lauren, H&M, Tommy Hilfiger, J.Crew, GAP, Old Navy and Banana Republic. Additionally, the Legends at Village West Property includes two ground leases held by Residence Inn and Taco Bueno, which pay approximately $269,000 and $60,000, respectively, on an annual basis.
The largest tenant at the Legends at Village West Property, American Multi-Cinema, Inc. (NYSE: “AMC”), leases 88,270 square feet (12.6% of net rentable area) and has occupied the property since 2015 with the original lease term expiring on August 31, 2028 plus three, five-year renewal options. AMC operates 14 screens at the Legends at Village West Property and reported sales of approximately $6.5 million as of August 31, 2019, resulting in sales of $466,417 per screen. Founded in 1920 and headquartered in Leawood, Kansas, AMC is the largest movie theater chain in the United States. As of August 2019, the company operated approximately 1,000 theaters with 11,000 screens worldwide. The company operates under the Dalian Wanda Group after being acquired by the Chinese media conglomerate in 2012. In the second quarter of 2019, AMC generated roughly $1.5 billion in total revenues which was a 4.4% increase year-over-year.
THE INFORMATION IN THIS STRUCTURAL AND COLLATERAL TERM SHEET IS NOT COMPLETE AND MAY BE AMENDED PRIOR TO THE TIME OF SALE. THIS TERM SHEET IS NOT AN OFFER TO SELL THESE SECURITIES AND IT IS NOT A SOLICITATION OF AN OFFER TO BUY THESE SECURITIES IN ANY JURISDICTION WHERE THE OFFER OR SALE IS NOT PERMITTED.
| | |
98 of 156
| Structural and Collateral Term Sheet | Benchmark 2019-B14 | |
| Legends at Village West | ||
The second largest tenant at the Legends at Village West Property, Dave & Busters (NASDAQ: PLAY), leases 46,953 square feet (6.7% of net rentable area) and has occupied the property since November 2005. Dave & Busters currently has a lease expiration date of November 30, 2022 plus three, five-year extension options remaining and no termination options. Dave & Busters reported sales of approximately $7.6 million as of August 31, 2019. Dave & Busters was founded in 1982 and it is currently headquartered in Dallas, Texas. The company operates a chain of restaurants offering a variety of American-style menu options, a full bar and entertainment options which include an arcade and sports viewings. As of September 2019, the company operated over 110 locations in 39 states, Puerto Rico and one in Canada. During its second quarter of 2019, Dave & Busters reported total revenues of $344.6 million which represented an 8.0% increase from the prior year.
The third largest tenant at the Legends at Village West Property, TJ Maxx (NYSE: “TJX”), has been a tenant since October 2005 and occupies 29,956 square feet (4.3% of net rentable area). TJX holds a lease that expires in October 2020 and has four, five-year extension options remaining. TJ Maxx reported sales of approximately $9.8 million as of August 31, 2019, a 9.2% increase since December 31, 2018. Founded in 1956 and headquartered in Framingham, Massachusetts, TJX (rated A2/A+ by Moody’s/S&P) is the nation’s largest off-price apparel and home fashion retailer. TJX sells brand-name goods at discounted prices. TJX operated 4,412 stores totaling over 118 million square feet of space across the United States, Canada, Europe, and Australia. This includes 1,260 TJ Maxx stores, 1,107 Marshalls stores, 783 HomeGoods stores, 39 Sierra Trading Post stores and 23 Homesense stores in the United States. TJX Companies reported estimated net sales for 2019 of approximately $39.0 billion which was an 8.7% increase from 2018. For the first half of fiscal 2020, net sales are projected to be $19.1 billion, representing a 5.8% year-over-year increase.
The Market.The Legends at Village West Property is situated approximately 10.0 miles west of downtown Kansas City, at the northwest intersection of Interstate 70 and Interstate 435 and is part of the Kansas City, Missouri-Kansas Metropolitan Statistical Area (the “Kansas City MSA”). The Kansas City MSA is the 30th largest MSA in terms of population and 28th largest in terms of gross domestic product. Major employers in the Kansas City MSA consist of the Federal Government, Cerner Corporation, Children’s Mercy Hospital, the Internal Revenue Service, the City of Kansas City and the University of Missouri. Access to the Legends at Village West Property is provided by Parallel Parkway, which intersects with Interstate-435. The Legends at Village West Property also benefits from regional linkages, as Interstate 70, 435, 635, 29, and 35 all converge in various locations within 15 miles of the property. Access to the property is also provided via bus service from the Kansas City Area Transportation Authority. The closest stop is the Valley West transit center, located on Parallel Parkway and Village West Parkway, with access to the 101, 113, and 116 buses.
According to the appraisal, the Legends at Village West Property is located in the Kansas City (Kansas) retail submarket which, as of the second quarter of 2019, consisted of 8.3 million square feet of retail space with a 4.1% vacancy and average gross asking rent per square foot of $15.71. The appraiser concluded to a weighted average market rent per square foot of $21.77, compared to the property’s underwritten weighted average contract rent of $19.29 per square foot (excludes ground lease tenants which only pay common area maintenance). The concluded appraisal weighted average market rent per square foot is 12.9% higher than the underwritten weighted average contract rent of the property.
According to the appraisal, the Kansas City MSA estimated 2019 population is 2,179,053. The average household income for the MSA in 2019 is estimated to be $88,209 which is close to that of the property’s neighborhood. According to a third party report, as of January 1, 2019, the population within a one-, three- and five-mile radius of the Legends at Village West Property was 2,008, 15,177 and 44,455, respectively. Additionally, the average household income within a one-, three- and five-mile radius of the property was $98,681, $108,484 and $94,399, respectively.
The appraisal concluded that five comparable retail centers were sold within the past three years. The sales comps are located throughout the United States including Oregon, Maryland, Georgia, Arizona, and Missouri.
| Sales Comparable Summary | ||||||
| Sale | Property Name | Location | Gross Leasable Area | Sale Price | Date of Sale | OAR |
| Subject Property | Legends at Village West | Kansas City, KS | 702,750 | Oct-19 | 6.3% | |
| 1 | Seaside Outlets | Seaside, OR 97138 | 115,667 | $18,991,000 | Pending | 7.3% |
| 2 | Ellsworth Place | Silver Springs, MD 20910 | 347,172 | $92,000,000 | Jul-18 | 6.9% |
| 3 | Tanger Outlets | Savannah, GA 31408 | 420,000 | $197,000,000 | Aug-16 | 5.9% |
| 4 | Tanger Outlet Center Westgate | Glendale, AZ 85305 | 410,664 | $159,500,000 | Jun-16 | 6.3% |
| 5 | Country Club Plaza | Kansas City, MO 64112 | 1,272,000 | $660,000,000 | Mar-16 | 4.7% |
THE INFORMATION IN THIS STRUCTURAL AND COLLATERAL TERM SHEET IS NOT COMPLETE AND MAY BE AMENDED PRIOR TO THE TIME OF SALE. THIS TERM SHEET IS NOT AN OFFER TO SELL THESE SECURITIES AND IT IS NOT A SOLICITATION OF AN OFFER TO BUY THESE SECURITIES IN ANY JURISDICTION WHERE THE OFFER OR SALE IS NOT PERMITTED.
| | |
99 of 156
| Structural and Collateral Term Sheet | Benchmark 2019-B14 | |
| Legends at Village West | ||
| Historical and Current Occupancy(1) | |||
| 2016 | 2017 | 2018 | Current(2) |
| 95.2% | 90.9% | 96.6% | 92.1% |
| (1) | Historical Occupancies are as of December 31 of each respective year. |
| (2) | Current Occupancy is as of September 15, 2019. |
| Tenant Summary(1) | ||||||||
| Tenant | Ratings Moody’s/S&P/Fitch(2) | Net Rentable Area (SF) | % of Total NRA | Base Rent PSF(3) | % of Total Base Rent(3) | Lease Expiration Date | Most Recent Sales PSF(4) | Occupancy Cost(4) |
| American Multi-Cinema, Inc.(5) | NR / NR / NR | 88,270 | 12.6% | $13.73 | 8.9% | 8/31/2028 | $466,417 | 27.0% |
| Dave & Busters(5) | NR / NR / NR | 46,953 | 6.7% | $18.15 | 6.3% | 11/30/2022 | $161 | 17.0% |
| TJ Maxx(6) | A2 / A+ / NR | 29,956 | 4.3% | $9.50 | 2.1% | 10/31/2020 | $328 | 7.1% |
| H&M(7) | NR / NR / NR | 25,025 | 3.6% | $7.42 | 1.4% | 1/31/2028 | $106 | 7.0% |
| Off Broadway Shoes(8) | NR / NR / NR | 21,554 | 3.1% | $16.75 | 2.7% | 1/31/2026 | $321 | 10.4% |
| HomeGoods(6) | A2 / A+ / NR | 20,150 | 2.9% | $12.15 | 1.8% | 5/31/2028 | N/A | N/A |
| Old Navy(9) | Baa2 / BB+ / NR | 17,266 | 2.5% | $15.00 | 1.9% | 7/31/2021 | $294 | 10.6% |
| Polo Ralph Lauren(6) | A2 / A- / NR | 16,979 | 2.4% | $2.42 | 0.3% | 10/31/2021 | $247 | 2.1% |
| Books a Million(10) | NR / NR / NR | 16,846 | 2.4% | $7.83 | 1.0% | 1/31/2022 | $73 | 10.8% |
| Cavender's(11) | NR / NR / NR | 16,207 | 2.3% | $11.02 | 1.3% | 5/31/2028 | $241 | 8.9% |
| Subtotal/Weighted Average | 299,206 | 42.6% | $12.54 | 27.7% | ||||
| Other Tenants | 348,093 | 49.5% | 28.17 | 72.3% | ||||
| Total Occupied Space | 647,299 | 92.1% | $20.94 | 100.0% | ||||
| Vacant | 55,451 | 7.9% | NAP | |||||
| Total | 702,750 | 100.0% | $19.29 | |||||
| (1) | Based on the September 15, 2019 rent roll. |
| (2) | Ratings provided are for the parent company of the entity listed in the “Tenant” field whether or not the parent company guarantees the lease. |
| (3) | Base Rent PSF and % Total Base Rent of $13,007,843 includes $123,690 of contractual rent steps underwritten through October 2020 and $66,204 related to the present value of all rent steps for Verizon, Converse, Under Armour, and Homegoods through the term of the loan. Base Rent PSF and % of Total Base Rent also includes $547,978 of percentage rent paid by tenants whose rent is calculated monthly as a factor of sales. |
| (4) | Most Recent Sales PSF and Occupancy Cost are as of August 31, 2019. Most Recent Sales PSF for American Multi-Cinema, Inc. represents sales per screen, 14 screens, at the Legends at Village West Property. |
| (5) | Tenant has three, five-year renewal options. |
| (6) | Tenant has four, five-year lease renewal options, including an option to extend the term (original or having been extended) to the January 31 following term expiration. |
| (7) | Tenant has four, five-year lease renewal options. |
| (8) | Off Broadway Shoes has one, five-year renewal options. |
| (9) | Old Navy has two, five-year renewal options. |
| (10) | Books a Million has four, three-year renewal options. |
| (11) | Cavender’s has one, five-year renewal option. |
THE INFORMATION IN THIS STRUCTURAL AND COLLATERAL TERM SHEET IS NOT COMPLETE AND MAY BE AMENDED PRIOR TO THE TIME OF SALE. THIS TERM SHEET IS NOT AN OFFER TO SELL THESE SECURITIES AND IT IS NOT A SOLICITATION OF AN OFFER TO BUY THESE SECURITIES IN ANY JURISDICTION WHERE THE OFFER OR SALE IS NOT PERMITTED.
| | |
100 of 156
| Structural and Collateral Term Sheet | Benchmark 2019-B14 | |
| Legends at Village West | ||
| Lease Rollover Schedule(1)(2) | |||||||||
| Year | Number of Leases Expiring | Net Rentable Area Expiring | % of NRA Expiring | Base Rent Expiring(3) | % of Base Rent Expiring(3) | Cumulative Net Rentable Area Expiring | Cumulative % of NRA Expiring | Cumulative Base Rent Expiring(3) | Cumulative % of Base Rent Expiring(3) |
| Vacant | NAP | 55,451 | 7.9% | NAP | NAP | 55,451 | 7.9% | NAP | NAP |
| 2019(4) | 4 | 30,005 | 4.3% | $153,605 | 1.1% | 85,456 | 12.2% | $153,605 | 1.1% |
| 2020 | 9 | 63,490 | 9.0% | 1,198,975 | 8.8% | 148,946 | 21.2% | 1,352,580 | 10.0% |
| 2021 | 21 | 126,798 | 18.0% | 2,619,929 | 19.3% | 275,744 | 39.2% | 3,972,509 | 29.3% |
| 2022 | 10 | 92,365 | 13.1% | 2,033,772 | 15.0% | 368,109 | 52.4% | 6,006,281 | 44.3% |
| 2023 | 6 | 21,153 | 3.0% | 686,949 | 5.1% | 389,262 | 55.4% | 6,693,230 | 49.4% |
| 2024 | 10 | 23,919 | 3.4% | 738,516 | 5.4% | 413,181 | 58.8% | 7,431,746 | 54.8% |
| 2025 | 3 | 11,333 | 1.6% | 440,041 | 3.2% | 424,514 | 60.4% | 7,871,787 | 58.1% |
| 2026 | 12 | 69,555 | 9.9% | 2,072,741 | 15.3% | 494,069 | 70.3% | 9,944,528 | 73.4% |
| 2027 | 5 | 35,130 | 5.0% | 1,006,391 | 7.4% | 529,199 | 75.3% | 10,950,918 | 80.8% |
| 2028 | 6 | 157,392 | 22.4% | 2,043,315 | 15.1% | 686,591 | 97.7% | 12,994,233 | 95.9% |
| 2029 | 3 | 11,906 | 1.7% | 197,681 | 1.5% | 698,497 | 99.4% | 13,191,914 | 97.3% |
| 2030 & Beyond | 1 | 4,253 | 0.6% | 363,906 | 2.7% | 702,750 | 100.0% | 13,555,820 | 100.0% |
| Total | 90 | 702,750 | 100.0% | $13,555,820 | 100.0% | 100.0% | $13,555,820 | 100.0% | |
| (1) | Based on the underwritten rent roll dated September 15, 2019. |
| (2) | Certain tenants may have termination or contraction options (which may become exercisable prior to the originally stated expiration date of the tenant lease) that are not considered in the above Lease Rollover Schedule. |
| (3) | Base Rent Expiring, % of Base Rent Expiring, Cumulative Base Rent Expiring and Cumulative % of Base Rent of $13,007,843 includes $123,690 of contractual rent steps underwritten through October 2020 and $66,204 related to the present value of all rent steps for Verizon, Converse, Under Armour, and Homegoods through the term of the loan. Base Rent PSF and % of Total Base Rent also includes $547,978 of percentage rent paid by tenants whose rent is calculated monthly as a factor of sales. |
| (4) | Includes MTM tenants. |
| Operating History and Underwritten Net Cash Flow | |||||||
| 2016 | 2017 | 2018 | TTM(1) | Underwritten | Per Square Foot | %(4) | |
| Rents in Place | $11,844,504 | $13,154,702 | $12,727,178 | $12,936,723 | $12,817,949 | $18.24 | 53.5% |
| Contractual Rent Steps(2) | 0 | 0 | 0 | 0 | 189,893 | 0.27 | 0.8% |
| Potential Income from Vacant Space(3) | 0 | 0 | 0 | 0 | 2,308,911 | 3.29 | 9.6% |
| Total Reimbursements | 7,704,228 | 8,494,591 | 8,394,509 | 8,970,806 | 8,639,619 | 12.29 | 36.1% |
| Other Income | 1,394,849 | 708,097 | 583,664 | 561,568 | 561,568 | 0.80 | 2.3% |
| Percentage Rent | 472,982 | 503,106 | 555,029 | 620,330 | 547,978 | 0.78 | 2.3% |
| Net Rental Income | $19,548,732 | $21,649,293 | $21,121,687 | $21,907,529 | $23,956,373 | $34.09 | 100.0% |
| (Vacancy/Credit Loss) | 0 | 0 | 0 | 0 | (2,308,911) | (3.29) | (9.6)% |
| EGI Before Other Income | $19,548,732 | $21,649,293 | $21,121,687 | $21,907,529 | $21,647,462 | $30.80 | 90.4% |
| Effective Gross Income | $21,416,563 | $22,860,496 | $22,260,380 | $23,089,427 | $22,757,007 | $32.38 | 95.0% |
| Total Expenses | $10,483,165 | $11,073,853 | $10,976,852 | $11,476,129 | $11,382,857 | $16.20 | 50.0% |
| Net Operating Income | $10,933,398 | $11,786,643 | $11,283,528 | $11,613,298 | $11,374,151 | $16.19 | 50.0% |
| Total TI/LC, Capex/RR | 0 | 0 | 0 | 0 | 119,463 | 0.17 | 0.5% |
| Net Cash Flow | $10,933,398 | $11,786,643 | $11,283,528 | $11,613,298 | $11,254,688 | $16.02 | 49.5% |
| (1) | TTM reflects the trailing 12-month period ending August 31, 2019. |
| (2) | Contractual Rent Steps includes $123,690 of contractual rent steps underwritten through October 2020 and $66,204 related to the present value of all rent steps for Verizon, Converse, Under Armour, and Homegoods through the term of the loan. |
| (3) | Potential Income from Vacant Space was underwritten based on the appraisal’s concluded market rent assumptions |
| (4) | % column represents percent of Net Rental Income for all revenue lines and represents percent of Effective Gross Income for the remainder of the fields. |
THE INFORMATION IN THIS STRUCTURAL AND COLLATERAL TERM SHEET IS NOT COMPLETE AND MAY BE AMENDED PRIOR TO THE TIME OF SALE. THIS TERM SHEET IS NOT AN OFFER TO SELL THESE SECURITIES AND IT IS NOT A SOLICITATION OF AN OFFER TO BUY THESE SECURITIES IN ANY JURISDICTION WHERE THE OFFER OR SALE IS NOT PERMITTED.
| | |
101 of 156
| Structural and Collateral Term Sheet | Benchmark 2019-B14 | |
| Legends at Village West | ||
Property Management. The property is managed by Legacy Asset Management, LLC.
Escrows and Reserves. On the origination date of the Legends at Village West Whole Loan, the borrower was required to deposit $3,569,900 for real estate taxes, $10,000,000 for tenant improvements and leasing commissions and $227,700 for immediate repairs.
Tax Escrows – On a monthly basis, the borrowers are required to escrow 1/12 of the annual estimated tax payments, which currently equates to $594,983.
Insurance Escrows – The requirement to make monthly deposits for insurance reserves is provisionally waived so long as the borrower delivers evidence to the lender that the borrower maintains a blanket policy meeting the requirements of the Legends at Village West Whole Loan documents. If the borrower does not maintain such blanket policy, the borrower is required to deposit on a monthly basis an amount equal to 1/12 of the amount that the lender estimates will be necessary to cover premiums over the then succeeding 12-month period into an insurance reserve account.
Replacement Reserves – On a monthly basis, the borrowers are required to escrow $9,955 (approximately $0.17 per square foot annually) for replacement reserves. The reserve is not subject to a cap.
TI/LC Reserves –The requirement to make monthly deposits for tenant improvement and leasing commission reserves are waived so long as the balance in the account remains greater than or equal to $2,500,000. If the balance in the tenant improvement and leasing commission reserve account falls below $2,500,000 the borrower is required to deposit a monthly amount equal to $87,840 until the balance reaches $2,500,000. In addition to standard disbursement conditions, and only with regard to the upfront $10,000,000 deposited on the origination date of the Legends at Village West Whole Loan for tenant improvement and leasing commissions, the debt yield, calculated in accordance with the Legends at Village West Whole Loan documents, must be equal to or greater than 8.0% on both the date any such request is made and when such disbursement is actually made to the borrower, before any such funds are disbursed to the borrower.
Lockbox / Cash Management.The Legends at Village West Whole Loan is structured with a hard lockbox and springing cash management. The borrower is required to deliver tenant direction letters to each existing tenant at the Legends at Village West property directing each of them to remit their rent checks directly to the lender-controlled lockbox. The borrower is required to cause revenue received by the borrower or the property manager from the Legends at Village West Property to be deposited into such lockbox promptly upon receipt. All funds deposited into the lockbox are required to be transferred on each business day to or at the direction of the borrower unless a Trigger Period (as defined below) exists. Upon the occurrence and during the continuance of a Trigger Period, all funds in the lockbox account are required to be swept on each business day to a cash management account under the control of the lender to be applied and disbursed in accordance with the Legends at Village West Whole Loan documents, and all excess cash flow funds remaining in the cash management account after the application of such funds in accordance with the Legends at Village West Whole Loan documents are required to be held by the lender in an excess cash flow reserve account as additional collateral for the Legends at Village West Whole Loan. Upon an event of default under the Legends at Village West Whole Loan documents, the lender will apply funds to the debt in such priority as it may determine.
A “Trigger Period” means a period commencing upon the earliest to occur of (i) an event of default, (ii) the occurrence of any bankruptcy event with respect to the borrower, guarantor or any affiliated manager, (iii) the debt yield being less than 8.00%, and (iv) the guarantor failing to provide the lender with financial statements in accordance with the Legends at Village West Whole Loan documents, and expiring upon (a) with respect to clause (i) above, the cure of such event of default, (b) with respect to clause (ii) above, the cure of such bankruptcy event (unless such bankruptcy event involves borrower, which is not permitted to be cured), (c) with respect to clause (iii) above, the date that the debt yield is equal to or greater than 8.25% for one calendar quarter and (d) with respect to clause (iv) above, the date on which the guarantor provides the lender with the financial statements required in accordance with the Legends at Village West Whole Loan documents.
THE INFORMATION IN THIS STRUCTURAL AND COLLATERAL TERM SHEET IS NOT COMPLETE AND MAY BE AMENDED PRIOR TO THE TIME OF SALE. THIS TERM SHEET IS NOT AN OFFER TO SELL THESE SECURITIES AND IT IS NOT A SOLICITATION OF AN OFFER TO BUY THESE SECURITIES IN ANY JURISDICTION WHERE THE OFFER OR SALE IS NOT PERMITTED.
| | |
102 of 156
| Structural and Collateral Term Sheet | Benchmark 2019-B14 |
[THIS PAGE INTENTIONALLY LEFT BLANK]
THE INFORMATION IN THIS STRUCTURAL AND COLLATERAL TERM SHEET IS NOT COMPLETE AND MAY BE AMENDED PRIOR TO THE TIME OF SALE. THIS TERM SHEET IS NOT AN OFFER TO SELL THESE SECURITIES AND IT IS NOT A SOLICITATION OF AN OFFER TO BUY THESE SECURITIES IN ANY JURISDICTION WHERE THE OFFER OR SALE IS NOT PERMITTED.
| | |
103 of 156
| Structural and Collateral Term Sheet | Benchmark 2019-B14 | |
| 80 on the Commons | ||

THE INFORMATION IN THIS STRUCTURAL AND COLLATERAL TERM SHEET IS NOT COMPLETE AND MAY BE AMENDED PRIOR TO THE TIME OF SALE. THIS TERM SHEET IS NOT AN OFFER TO SELL THESE SECURITIES AND IT IS NOT A SOLICITATION OF AN OFFER TO BUY THESE SECURITIES IN ANY JURISDICTION WHERE THE OFFER OR SALE IS NOT PERMITTED.
| | |
104 of 156
| Structural and Collateral Term Sheet | Benchmark 2019-B14 | |
| 80 on the Commons | ||

THE INFORMATION IN THIS STRUCTURAL AND COLLATERAL TERM SHEET IS NOT COMPLETE AND MAY BE AMENDED PRIOR TO THE TIME OF SALE. THIS TERM SHEET IS NOT AN OFFER TO SELL THESE SECURITIES AND IT IS NOT A SOLICITATION OF AN OFFER TO BUY THESE SECURITIES IN ANY JURISDICTION WHERE THE OFFER OR SALE IS NOT PERMITTED.
| | |
105 of 156
| Structural and Collateral Term Sheet | Benchmark 2019-B14 | |
| 80 on the Commons | ||
| Mortgage Loan Information | Property Information | |||
| Mortgage Loan Seller: | GACC | Single Asset / Portfolio: | Single Asset | |
| Original Principal Balance: | $47,300,000 | Title: | Fee | |
| Cut-off Date Principal Balance: | $47,300,000 | Property Type - Subtype: | Mixed Use – Office/Multifamily | |
| % of Pool by IPB: | 3.6% | Net Rentable Area (SF)(1): | 296,190 | |
| Loan Purpose: | Acquisition | Location: | Columbus, OH | |
| Borrower: | 80 on the Commons, L.L.C. | Year Built / Renovated: | 2018 / N/A | |
| Sponsor: | Starwood Real Estate | Occupancy(1): | 95.1% | |
| Income Trust | Occupancy Date(2): | 9/2019 | ||
| Interest Rate: | 2.95000% | Number of Tenants(3): | 5 | |
| Note Date: | 10/8/2019 | 2016 NOI: | N/A | |
| Maturity Date: | 11/6/2029 | 2017 NOI: | N/A | |
| Interest-only Period: | 120 months | 2018 NOI: | N/A | |
| Original Term: | 120 months | TTM NOI (as of 7/2019)(4): | $1,417,367 | |
| Original Amortization: | None | UW Economic Occupancy: | 92.6% | |
| Amortization Type: | Interest Only | UW Revenues: | $6,693,827 | |
| Call Protection: | L(24),Def(92),O(4) | UW Expenses: | $1,500,202 | |
| Lockbox / Cash Management: | Hard (Office); Soft (Multifamily) / | UW NOI(4): | $5,193,625 | |
| Springing | UW NCF: | $4,952,057 | ||
| Additional Debt: | N/A | Appraised Value / Per SF(1): | $73,500,000 / $248 | |
| Additional Debt Balance: | N/A | Appraisal Date: | 9/16/2019 | |
| Additional Debt Type: | N/A | |||
| Escrows and Reserves(5) | Financial Information(1) | ||||||
| Initial | Monthly | Initial Cap | Cut-off Date Loan / SF(1): | $160 | |||
| Taxes: | $38,172 | $6,362 | N/A | Maturity Date Loan / SF(1): | $160 | ||
| Insurance: | $0 | Springing | N/A | Cut-off Date LTV: | 64.4% | ||
| Replacement Reserves: | $0 | $5,693 | N/A | Maturity Date LTV: | 64.4% | ||
| TI/LC: | $1,116,512 | Springing | N/A | UW NCF DSCR: | 3.50x | ||
| Other: | $440,537 | Springing | N/A | UW NOI Debt Yield: | 11.0% | ||
| Sources and Uses | ||||||
| Sources | Proceeds | % of Total | Uses | Proceeds | % of Total | |
| Mortgage Loan | $47,300,000 | 62.4% | Loan Payoff | $72,000,000 | 95.0% | |
| Sponsor Equity | 28,524,885 | 37.6 | Closing Costs | 2,229,664 | 2.9 | |
| Upfront Reserves | 1,595,221 | 2.1 | ||||
| Total Sources | $75,824,885 | 100.0% | Total Uses | $75,824,885 | 100.0% | |
| (1) | Based on the 173,254 square foot office component and 122,936 square foot multifamily component. The multifamily component consists of 125 residential units. |
| (2) | Based on the multifamily rent roll dated September 19, 2019 and the office rent roll dated September 20, 2019. |
| (3) | Based on the office component only. |
| (4) | The increase in Effective Gross Income and Net Operating Income from TTM to Underwritten is due to the lease up and stabilization of both the residential and commercial components. |
| (5) | For a full description of Escrows and Reserves, please refer to “Escrows and Reserves” below. |
THE INFORMATION IN THIS STRUCTURAL AND COLLATERAL TERM SHEET IS NOT COMPLETE AND MAY BE AMENDED PRIOR TO THE TIME OF SALE. THIS TERM SHEET IS NOT AN OFFER TO SELL THESE SECURITIES AND IT IS NOT A SOLICITATION OF AN OFFER TO BUY THESE SECURITIES IN ANY JURISDICTION WHERE THE OFFER OR SALE IS NOT PERMITTED.
| | |
106 of 156
| Structural and Collateral Term Sheet | Benchmark 2019-B14 | |
| 80 on the Commons | ||
The Loan.The 80 on the Commons mortgage loan (the “80 on the Commons Loan”) has an outstanding principal balance as of the Cut-off Date of $47.3 million and is secured by the borrower’s fee simple interest in a mixed use property consisting of 173,254 square feet of office space and 125 residential units located in Columbus, Ohio (the “80 on the Commons Property”). The 80 on the Commons Loan has a 10-year term and is interest-only for the entire term.
The Borrower. The borrowing entity for the 80 on the Commons Loan is 80 on the Commons, L.L.C., a Delaware limited liability company and special purpose entity.
The Loan Sponsor.The loan sponsor is Starwood Real Estate Income Trust, a Maryland corporation (“SREIT”), a real estate investment trust created by Starwood Capital Group (“Starwood”). The nonrecourse carve-out guarantor is Starwood REIT Operating Partnership, L.P, a Delaware limited partnership whose general partner is SREIT. The obligations of the non-recourse carve-out guarantor for recourse events related to voluntary bankruptcy or collusive involuntary bankruptcy and other bankruptcy-related events are capped at 20% of the outstanding principal balance of the 80 on the Commons Loan as of the date of the applicable bankruptcy event, plus the lender’s reasonably incurred costs and expenses in enforcing or preserving its rights under the non-recourse carveout guaranty. Starwood is a private investment firm with a primary focus on global real estate. Starwood has invested in more than 30 countries, ranging from the Americas to Europe to Asia.
The Property. The 80 on the Commons Property is a 12-story mixed-use building constructed in 2018 on 0.9 acres located in downtown Columbus, Ohio. The 80 on the Commons Property consists of 173,254 square feet of Class A office space and 125 upscale multifamily units. Floors one through six are demised into office suites and floors seven through 12 include the 125 apartment units. There is a fitness center for office tenants on the first floor as well as a shared lobby for office and apartment tenants. The sixth floor includes a 1,605 square foot community room and a 3,075 square foot outdoor amenity deck, which includes outside community areas overlooking the Columbus Commons greenspace. Both apartment and office tenants have access to 840 dedicated parking spaces in an adjoining parking garage.
The office component (58.5% of total net rentable area; 52.3% of underwritten base rent) consists of 173,254 square feet of office space and was 94.9% occupied as of September 2019. This office space has modern Class A finishes which include concrete, carpet, and tile flooring, painted drywall walls, exposed ceilings, and large glass windows. The largest office tenant is Root Insurance (109,062 square feet; 62.9% of net rentable area; 66.0% of underwritten base rent), which leases floors three through five, as well as a suite on the sixth floor. Root Insurance has not yet taken occupancy of the sixth floor space, but has commenced paying rent. Root Insurance is a startup technology driven car insurance company that measures driving behavior, such as braking, speed of turns, driving times, and route regularity, through a smartphone application to determine driver safety. Once a driver’s safety level is determined, Root Insurance’s goal is to offer more affordable rates to safe drivers. The 80 on the Commons Property is the headquarters for Root Insurance, which has expanded twice (43,228 square feet) since executing its lease in November 2018 for 65,834 square feet.
The multifamily component (41.5% of total net rentable area; 47.7% of underwritten base rent) consists of 125 units (122,936 square feet) and opened in July 2018, As of September 19, 2019, the multifamily component had a 95.2% occupancy rate. The unit mix includes studio, one and two bedroom units with floor plans that range from 464 square feet to 2,261 square feet. The units include modern finishes and well-appointed amenities, including stainless steel appliances, over-sized windows, private balcony and an in-unit washer and dryer. Community amenities of the multifamily component include a first floor common area/lounge, rooftop terrace, fitness center, and leasing office.
The 80 on the Commons Property is located in the central business district of Columbus, Ohio on Columbus Commons. Columbus Commons is a six-acre park, which features gardens, a performance stage, reading room, two cafes and serves as a frequent venue for concerts and events. Major employers in the downtown Columbus area include Nationwide Insurance, JPMorgan Chase, and American Electric Power. Over 80,000 people work in the Columbus central business district. Ohio State University also drives demand in the Columbus area and is the largest employer in the area and enrolls over 44,000 students. The 80 on the Commons Property is also in close proximity to the home of Nationwide Children’s Hospital, which employs approximately 8,400 people and is ranked the seventh best children’s hospital in the United States according to a magazine survey. As of 2018, the total population within a one-, three- and five-mile radius is 14,352, 141,954 and 350,821, respectively. As of 2018, the average household income within a one-, three- and five-mile radius is $89,808, $63,798 and $64,981, respectively.
THE INFORMATION IN THIS STRUCTURAL AND COLLATERAL TERM SHEET IS NOT COMPLETE AND MAY BE AMENDED PRIOR TO THE TIME OF SALE. THIS TERM SHEET IS NOT AN OFFER TO SELL THESE SECURITIES AND IT IS NOT A SOLICITATION OF AN OFFER TO BUY THESE SECURITIES IN ANY JURISDICTION WHERE THE OFFER OR SALE IS NOT PERMITTED.
| | |
107 of 156
| Structural and Collateral Term Sheet | Benchmark 2019-B14 | |
| 80 on the Commons | ||
According to the appraisal, the 80 on the Commons Property is located in the University/Downtown multifamily submarket. As of the second quarter of 2019, the University/Downtown multifamily submarket had an inventory of 92 properties with an average monthly asking rent of $1,454 per unit. The University/Downtown submarket had a vacancy rate of 7.1%. The appraisal identified five comparable multifamily properties proximate to the 80 on the Commons Property. The 80 on the Commons Property comparables range from 84 to 301 units and indicate a market rent range of $1,097 to $1,720 per month for studios, $1,335 to $1,878 per month for one-bedroom apartments and $1,971 to $4,196 for two-bedroom apartments. The comparable properties had occupancies ranging from 92.9% to 95.9%, with a weighted average occupancy of 94.3%.
According to the appraisal, the 80 on the Commons Property is located in the Downtown submarket of the Columbus office market. As of the second quarter of 2019, the Downtown office submarket had a total office inventory of approximately 29.0 million square feet with an average asking rent of $16.44 per square foot and a vacancy rate of 7.1%. The appraisal identified five comparable office leases with a weighted average base rent of $18.47 per square foot.
| Historical and Current Occupancy | |||
| 2016(1) | 2017(1) | 2018(1) | Current(2) |
| N/A | N/A | N/A | 95.1% |
| (1) | Historical Occupancy is not available since the 80 on the Commons Property opened mid-2018. |
| (2) | Current Occupancy is as of September 2019 and based on the total square feet of the office and multifamily component. |
| Multifamily Unit Mix(1) | |||||||
| Unit Type | # of Units | % of Total Units | Occupancy | Average Unit Size (SF) | Average Monthly Rent Per Unit | Average Rent PSF/Year | |
| 0BR / 1BA | 10 | 8.0% | 100.0% | 479 | $1,208 | $30.29 | |
| 1BR / 1BA | 74 | 59.2% | 93.2% | 818 | $1,644 | $24.19 | |
| 2BR / 2BA | 40 | 32.0% | 97.5% | 1,384 | $2,671 | $23.14 | |
| 2BR / 3BA | 1 | 0.8% | 100.0% | 2,261 | $4,300 | $22.82 | |
| Total / Wtd. Avg. | 125 | 100.0% | 95.2% | 983 | $1,966 | $23.93 | |
| (1) | Based on the rent roll dated September 19, 2019 provided by the borrower. |
| Commercial Tenant Summary(1) | |||||||
| Tenant | Ratings Moody’s/Fitch/S&P(2) | Net Rentable Area (SF) | % of Total NRA | Base Rent PSF | % of Total Base Rent | Lease Expiration Date | |
| Root Insurance(2) | NR / NR / NR | 109,062 | 62.9% | $18.64 | 66.0% | 11/30/2024 | |
| Coastal Ridge(3)(4) | NR / NR / NR | 20,001 | 11.5% | $18.50 | 12.0% | 6/30/2030 | |
| BBI Logistics | NR / NR / NR | 18,815 | 10.9% | $19.95 | 12.2% | 9/30/2027 | |
| AEP Service Company | NR / NR / NR | 11,847 | 6.8% | $17.95 | 6.9% | 1/31/2024 | |
| Sweney Cartwright(2) | NR / NR / NR | 4,665 | 2.7% | $19.50 | 3.0% | 12/31/2026 | |
| Total Occupied | 164,390 | 94.9% | $18.75 | 100.0% | |||
| Vacant | 8,864 | 5.1% | |||||
| Total | 173,254 | 100.0% | |||||
| (1) | Based on the rent roll dated September 20, 2019. |
| (2) | Root Insurance has not yet taken occupancy of its space on the sixth floor, but has commenced paying rent. The lease for space on the sixth floor is for 10,311 square feet and expires on May 31, 2026. |
| (3) | Coastal Ridge and Sweney Cartwright have executed leases and are expected to take occupancy in January and February 2020, respectively. At loan origination, the borrower reserved approximately $1.1 million for outstanding landlord obligations and $440,537 in gap rent. |
| (4) | Coastal Ridge is an affiliate of the property manager and also holds an approximately 4.0% passive interest in the borrower. Coastal Ridge has a one-time right to terminate its lease on the 84th month of its lease (February 1, 2027) with 12 months’ notice and a termination fee of approximately $352,516. |
THE INFORMATION IN THIS STRUCTURAL AND COLLATERAL TERM SHEET IS NOT COMPLETE AND MAY BE AMENDED PRIOR TO THE TIME OF SALE. THIS TERM SHEET IS NOT AN OFFER TO SELL THESE SECURITIES AND IT IS NOT A SOLICITATION OF AN OFFER TO BUY THESE SECURITIES IN ANY JURISDICTION WHERE THE OFFER OR SALE IS NOT PERMITTED.
| | |
108 of 156
| Structural and Collateral Term Sheet | Benchmark 2019-B14 | |
| 80 on the Commons | ||
| Commercial Tenants Lease Rollover Schedule(1)(2) | |||||||||
| Year | Number of Leases Expiring | Net Rentable Area Expiring | % of NRA Expiring | Base Rent Expiring | % of Base Rent Expiring | Cumulative Net Rentable Area Expiring | Cumulative % of NRA Expiring | Cumulative Base Rent Expiring | Cumulative % of Base Rent Expiring |
| Vacant | NAP | 8,864 | 5.1% | NAP | NAP | 8,864 | 5.1% | NAP | NAP |
| MTM & 2019 | 0 | 0 | 0.0% | $0 | 0.0% | 8,864 | 5.1% | 0.0% | 0.0% |
| 2020 | 0 | 0 | 0.0% | 0 | 0.0% | 8,864 | 5.1% | $0 | 0.0% |
| 2021 | 0 | 0 | 0.0% | 0 | 0.0% | 8,864 | 5.1% | $0 | 0.0% |
| 2022 | 0 | 0 | 0.0% | 0 | 0.0% | 8,864 | 5.1% | $0 | 0.0% |
| 2023 | 0 | 0 | 0.0% | 0 | 0.0% | 8,864 | 5.1% | $0 | 0.0% |
| 2024 | 4 | 110,598 | 63.8% | 2,039,548 | 66.2% | 119,462 | 69.0% | $2,039,548 | 66.2% |
| 2025 | 0 | 0 | 0.0% | 0 | 0.0% | 119,462 | 69.0% | $2,039,548 | 66.2% |
| 2026 | 2 | 14,976 | 8.6% | 296,672 | 9.6% | 134,438 | 77.6% | $2,336,219 | 75.8% |
| 2027 | 1 | 18,815 | 10.9% | 375,359 | 12.2% | 153,253 | 88.5% | $2,711,578 | 88.0% |
| 2028 | 0 | 0 | 0.0% | 0 | 0.0% | 153,253 | 88.5% | $2,711,578 | 88.0% |
| 2029 | 0 | 0 | 0.0% | 0 | 0.0% | 153,253 | 88.5% | $2,711,578 | 88.0% |
| 2030 and Thereafter | 1 | 20,001 | 11.5% | 370,019 | 12.0% | 173,254 | 100.0% | $3,081,597 | 100.0% |
| Total | 8 | 173,254 | 100.0% | $3,081,597 | 100.0% | ||||
| (1) | Based on the underwritten rent roll dated September 20, 2019. |
| (2) | Certain tenants may have termination or contraction options (which may become exercisable prior to the originally stated expiration date of the tenant lease) that are not considered in the above Lease Rollover Schedule. |
| Operating History and Underwritten Net Cash Flow | ||||
| TTM(1) | Underwritten | Per SF(2) | %(3) | |
| Residential Income | ||||
| Gross Potential Rent | $2,793,153 | $2,847,720 | $9.61 | 43.3% |
| Vacancy | (1,000,929) | (257,956) | (0.87) | (3.9)% |
| Concessions | (101,295) | 0 | 0.00 | 0.0% |
| Net Residential Income | $1,690,929 | $2,589,764 | $8.74 | 39.3% |
| Commercial Income | ||||
| Commercial Income | 545,229 | 3,344,367 | 11.29 | 50.8% |
| Recoveries | 261,079 | 843,229 | 2.85 | 12.8% |
| Vacancy | 0 | (194,421) | (0.66) | (3.0)% |
| Net Commercial Income | $806,308 | $3,993,175 | $13.48 | 60.7% |
| Other Income | 110,888 | 110,888 | 0.37 | 1.7% |
| Effective Gross Income(4) | $2,608,125 | $6,693,827 | $22.60 | 101.7% |
| Total Variable Expenses | 1,016,271 | 1,335,980 | 4.51 | 20.0% |
| Total Fixed Expenses(5) | 174,488 | 164,222 | 0.55 | 2.5% |
| Total Expenses | $1,190,759 | $1,500,202 | $5.06 | 22.4% |
| Net Operating Income(4) | $1,417,367 | $5,193,625 | $17.53 | 77.6% |
| Replacement Reserves | 0 | 68,314 | 0.23 | 1.0% |
| TI/LCs | 0 | 173,254 | 0.58 | 2.6% |
| Net Cash Flow | $1,417,367 | $4,952,057 | $16.72 | 74.0% |
| (1) | TTM column represents the trailing 12-month period ending on July 31, 2019. |
| (2) | Based on the total square feet of the commercial and residential space. |
| (3) | % column represents percent of the aggregate of the Net Residential Income and Net Commercial Income for all revenue lines and represents percent of Effective Gross Income for the remainder of fields. |
| (4) | The increase in Effective Gross Income and Net Operating Income from TTM to Underwritten is due to the lease up and stabilization of both the residential and commercial components. |
| (5) | All use components of the building benefit from a 15-year, 100% tax abatement on the improvements. See “Tax Abatement” below. The 80 on the Commons Loan was underwritten based on the abated taxes. |
THE INFORMATION IN THIS STRUCTURAL AND COLLATERAL TERM SHEET IS NOT COMPLETE AND MAY BE AMENDED PRIOR TO THE TIME OF SALE. THIS TERM SHEET IS NOT AN OFFER TO SELL THESE SECURITIES AND IT IS NOT A SOLICITATION OF AN OFFER TO BUY THESE SECURITIES IN ANY JURISDICTION WHERE THE OFFER OR SALE IS NOT PERMITTED.
| | |
109 of 156
| Structural and Collateral Term Sheet | Benchmark 2019-B14 | |
| 80 on the Commons | ||
Property Management. The 80 on the Commons Property is managed byCoastal Ridge Management, LLC.
Escrows and Reserves.At origination, theborrowerdeposited (i) $1,116,512 for outstanding landlord obligations related to the Sweney Cartwright and Coastal Ridge leases, (ii) $440,537 into a free rent reserve and (iii) $38,172 for a tax reserve.
Tax Escrows-The borrower is required to deposit into a real estate tax reserve, on a monthly basis, 1/12 of the estimated annual real estate taxes (initially estimated at $6,362).
Insurance Escrows-The borrower is required to deposit into an insurance reserve, on a monthly basis, 1/12 of the estimated annual insurance premiums. In the event the borrowers obtain and maintain a blanket insurance policy acceptable to the lender and there is no event of default continuing, the requirement for monthly deposits into the insurance reserve will be waived.
Replacement Reserves - The borrower is required to deposit, on a monthly basis, $5,692 into a replacement reserve.
TI/LC Reserves – Solely during a Trigger Period (as defined below), the borrower is required to deposit, on a monthly basis, approximately $14,438 into a reserve for tenant improvements and leasing commissions that may be incurred after the loan origination date.
Condominium Reserves – Upon the consummation of a condominium conversion, the borrower is required to deposit, on a monthly basis, an amount equal to 1/12 of annual estimated condominium charges in order to accumulate sufficient funds to pay all such common charges.
Lockbox / Cash Management. The 80 on the Commons Loan is structured with a hard lockbox for the commercial tenants and soft lockbox for the residential tenants and springing cash management. The borrower is required to cause the property manager to deposit all revenues from the residential portion of the 80 on the Commons Property, and the commercial tenants are required to deposit all rents directly into the lockbox account controlled by the lender within two business day of receipt. During a Trigger Period, the funds in the lockbox account are required to be swept to a segregated cash management account under the control of the lender and all excess cash flow after payment of debt service, required reserves and operating expenses is required to (i) if a Lease Sweep Period (as defined below) exists, into a reserve (the “Lease Sweep Reserve”) to be used for tenanting the applicable Sweep Lease (as defined below) space, and (ii) otherwise, to be held as additional collateral for the 80 on the Commons Loan during the continuance of the Trigger Period.
A “Trigger Period” means a period commencing upon the occurrence of: (i) an event of default; (ii) the commencement of a Low Debt Yield Period (as defined below); or (iii) the commencement of a Lease Sweep Period (as defined below).
A Trigger Period may be cured (a) with respect to clause (i) above, upon the acceptance by the lender of a cure of such event of default, (b) with respect to clause (ii) above, upon the Low Debt Yield Period ending as set forth in the definition of such term or (c) with respect to clause (iii) above, upon the Lease Sweep Period ending as set forth in the definition of such term.
A “Low Debt Yield Period” will commence upon (i) the debt yield being less than 8.75% at the end of a calendar quarter, and will end if the debt yield is equal to or greater than 8.75% at the end of a calendar quarter. In the event of a Low Debt Yield Period, the borrower may cure a Low Debt Yield period by delivering to the lender a letter of credit or depositing funds as additional collateral for the 80 on the Commons Loan, in each case in an amount, which if applied to prepay the 80 on the Commons Loan would cure the Low Debt Yield Period.
A “Lease Sweep Period” will commence (but only if a Low Debt Yield Trigger period would commence if rents from the Sweep Lease were not included in the calculation of the debt yield), (a) upon the earlier of (i) 15 months prior to the expiration of the Sweep Lease or (ii) upon the date required under the Sweep Lease by which the Sweep Tenant (as defined below) is required to give notice of its exercise of a renewal option thereunder (and such renewal has not been so exercised); (b) upon the early termination, early cancellation or early surrender of a Sweep Lease or upon the borrower’s receipt of notice by a Sweep Tenant of its intent to effect an early termination, early cancellation or early surrender of its Sweep Lease; (c) if a Sweep Tenant has ceased operating its business at the 80 on the Commons Property (i.e., “goes dark”) at a majority of its space at the 80 on the Commons Property, or upon the borrower’s receipt of notice by a Sweep Tenant of its intent to “go dark”; (d) upon a monetary or material non-monetary default under a Sweep Lease by a Sweep Tenant beyond any applicable notice and cure period, or (e) upon a bankruptcy or insolvency proceeding of a Sweep Tenant or its parent.
THE INFORMATION IN THIS STRUCTURAL AND COLLATERAL TERM SHEET IS NOT COMPLETE AND MAY BE AMENDED PRIOR TO THE TIME OF SALE. THIS TERM SHEET IS NOT AN OFFER TO SELL THESE SECURITIES AND IT IS NOT A SOLICITATION OF AN OFFER TO BUY THESE SECURITIES IN ANY JURISDICTION WHERE THE OFFER OR SALE IS NOT PERMITTED.
| | |
110 of 156
| Structural and Collateral Term Sheet | Benchmark 2019-B14 | |
| 80 on the Commons | ||
A Lease Sweep Period commenced under clauses (a) through (c) above will end once the space demised under the Sweep Lease has been re-tenanted pursuant to one or more “qualified leases” as defined in the 80 on the Commons Loan documents (or, if applicable, the applicable Sweep Lease has been renewed pursuant to its terms) and, in the case of a cure by entering into new qualified leases, in the lender’s reasonable judgment, sufficient funds have been accumulated in the Lease Sweep Reserve to cover all anticipated tenant improvements and leasing commissions and free and/or abated rent in connection therewith (and any operating shortfalls relating to the delay in the commencement of full rent payments). A Lease Sweep Period commenced under clause (d) above will end once the default has been cured and no other default by Sweep Tenant has occurred and is continuing. A Lease Sweep Period commenced under clause (e) above will end once the bankruptcy proceeding has terminated and the Sweep Lease has been affirmed and assumed by the Lease Sweep Tenant in a manner reasonably satisfactory to the lender or, the Sweep Lease has been affirmed and assumed by the Sweep Tenant, and assigned to a third party in a manner reasonably satisfactory to the lender, in each case, pursuant to a court-approved plan of reorganization. In addition, any Lease Sweep Period will end once the Lease Sweep Reserve contains the sum of $40 per square foot with respect to any vacant portion of the Sweep Lease space, plus, for portions of the Sweep Lease space that have been re-tenanted pursuant to qualified leases, sufficient funds to cover all anticipated tenant improvements and leasing commissions with respect to such qualified leases.
A “Sweep Lease” means the Root Insurance lease and any replacement lease covering a majority of the space currently demised under such lease.
A “Sweep Tenant” means any tenant under a Sweep Lease.
Tax Abatement. The 80 on the Commons Property benefits from a 15 year tax abatement which commenced in the 2018 (payable 2019) tax year and includes an abatement on 100% of the value of the site improvements, but does not abate taxes on the land value. According to the appraisal, the estimated taxes, without such abatement, for the 2018 (payable 2019) tax year on the office portion of the 80 on the Commons Property are $1,005,687 compared to taxes, after such abatement, of $51,600. The estimated taxes, without such abatement, for the 2018 (payable 2019) tax year on the multifamily portion of the 80 on the Commons Property are $800,239, compared to taxes, after such abatement, of $36,756. See “Description of the Mortgage Pool–Real Estate and Other Tax Considerations” in the Preliminary Prospectus.
Permitted Condominium Conversion. The borrower has the right to convert the 80 on the Commons Property into a condominium comprised of one office condominium unit and one multifamily condominium unit, subject to certain conditions, including lender approval of the condominium documents, rating agency confirmation and a REMIC opinion. See “Risk Factors—Risks Relating to the Mortgage Loans—Condominium Ownership May Limit Use and Improvements”.
Partial Release. None.
THE INFORMATION IN THIS STRUCTURAL AND COLLATERAL TERM SHEET IS NOT COMPLETE AND MAY BE AMENDED PRIOR TO THE TIME OF SALE. THIS TERM SHEET IS NOT AN OFFER TO SELL THESE SECURITIES AND IT IS NOT A SOLICITATION OF AN OFFER TO BUY THESE SECURITIES IN ANY JURISDICTION WHERE THE OFFER OR SALE IS NOT PERMITTED.
| | |
111 of 156
| Structural and Collateral Term Sheet | Benchmark 2019-B14 |
| Osborn Triangle | |

THE INFORMATION IN THIS STRUCTURAL AND COLLATERAL TERM SHEET IS NOT COMPLETE AND MAY BE AMENDED PRIOR TO THE TIME OF SALE. THIS TERM SHEET IS NOT AN OFFER TO SELL THESE SECURITIES AND IT IS NOT A SOLICITATION OF AN OFFER TO BUY THESE SECURITIES IN ANY JURISDICTION WHERE THE OFFER OR SALE IS NOT PERMITTED.
| | |
112 of 156
| Structural and Collateral Term Sheet | Benchmark 2019-B14 |
| Osborn Triangle | |
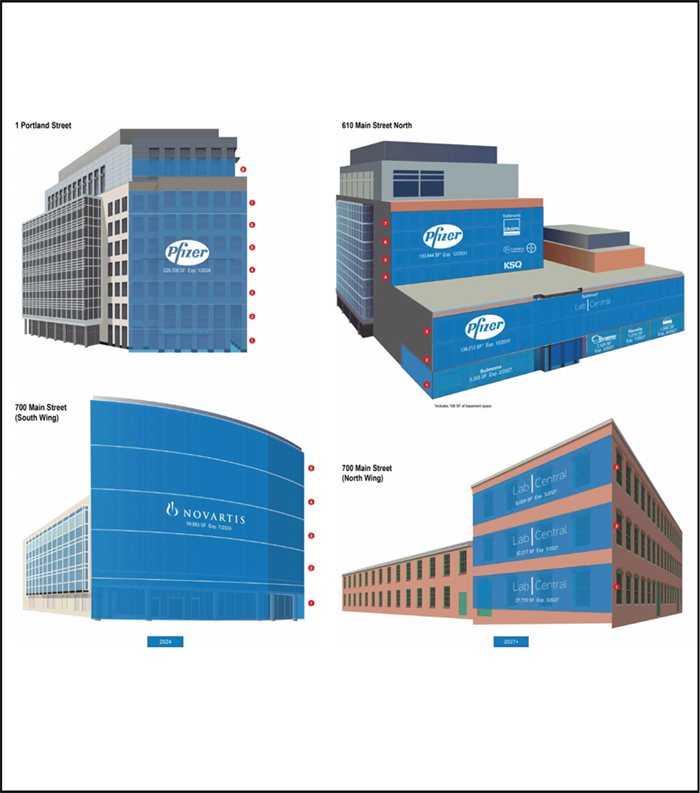
THE INFORMATION IN THIS STRUCTURAL AND COLLATERAL TERM SHEET IS NOT COMPLETE AND MAY BE AMENDED PRIOR TO THE TIME OF SALE. THIS TERM SHEET IS NOT AN OFFER TO SELL THESE SECURITIES AND IT IS NOT A SOLICITATION OF AN OFFER TO BUY THESE SECURITIES IN ANY JURISDICTION WHERE THE OFFER OR SALE IS NOT PERMITTED.
| | |
113 of 156
| Structural and Collateral Term Sheet | Benchmark 2019-B14 |
| Osborn Triangle | |

THE INFORMATION IN THIS STRUCTURAL AND COLLATERAL TERM SHEET IS NOT COMPLETE AND MAY BE AMENDED PRIOR TO THE TIME OF SALE. THIS TERM SHEET IS NOT AN OFFER TO SELL THESE SECURITIES AND IT IS NOT A SOLICITATION OF AN OFFER TO BUY THESE SECURITIES IN ANY JURISDICTION WHERE THE OFFER OR SALE IS NOT PERMITTED.
| | |
114 of 156
| Structural and Collateral Term Sheet | Benchmark 2019-B14 |
| Osborn Triangle | |
| Mortgage Loan Information | Property Information | |||
| Mortgage Loan Seller: | JPMCB | Single Asset / Portfolio: | Portfolio | |
| Credit Assessment: | Title: | Leasehold | ||
| (Fitch / KBRA / S&P)(1): | BBB-sf / BBB+(sf) / N/A | Property Type - Subtype: | Mixed Use – Office/Laboratory | |
| Original Principal Balance(2): | $40,000,000 | Net Rentable Area (SF): | 676,947 | |
| Cut-off Date Principal Balance(2): | $40,000,000 | Location: | Cambridge, MA | |
| % of Pool by IPB: | 3.0% | Year Built / Renovated: | Various / Various | |
| Loan Purpose: | Acquisition | Occupancy: | 100.0% | |
| Borrowers(3): | Various | Occupancy Date: | Various | |
| Sponsor(4): | NAP | Number of Tenants: | 7 | |
| Interest Rate: | 3.79700% | 2016 NOI(5): | N/A | |
| Note Date: | 5/16/2019 | 2017 NOI: | $42,036,811 | |
| Maturity Date: | 6/1/2029 | 2018 NOI: | $43,904,648 | |
| Interest-only Period: | 120 months | TTM NOI (as of 3/2019)(6): | $45,007,805 | |
| Original Term: | 120 months | UW Economic Occupancy: | 98.9% | |
| Original Amortization: | None | UW Revenues: | $70,789,429 | |
| Amortization Type: | Interest Only | UW Expenses: | $17,055,013 | |
| Call Protection: | L(25),Grtr1%orYM(88),O(7) | UW NOI(6): | $53,734,416 | |
| Lockbox / Cash Management: | Hard / Springing | UW NCF: | $51,673,090 | |
| Additional Debt(2): | Yes | Appraised Value / Per SF: | $1,158,000,000 / $1,711 | |
| Additional Debt Balance(2): | $390,000,000 / $145,000,000 | Appraisal Date: | 4/11/2019 | |
| Additional Debt Type(2): | Pari Passu/ Subordinate Debt | |||
| Escrows and Reserves(7) | Financial Information(1) | ||||||
| Initial | Monthly | Initial Cap | Senior Notes | Whole Loan | |||
| Taxes: | $0 | Springing | N/A | Cut-off Date Loan / SF: | $635 | $849 | |
| Insurance: | $0 | Springing | N/A | Maturity Date Loan / SF: | $635 | $849 | |
| Replacement Reserves: | $0 | $0 | N/A | Cut-off Date LTV: | 37.1% | 49.7% | |
| TI/LC: | $0 | $0 | N/A | Maturity Date LTV: | 37.1% | 49.7% | |
| UW NCF DSCR: | 3.12x | 2.33x | |||||
| UW NOI Debt Yield: | 12.5% | 9.3% | |||||
| Sources and Uses | ||||||
| Sources | Proceeds | % of Total | Uses | Proceeds | % of Total | |
| Senior Notes | $430,000,000 | 37.2% | Purchase Price | $1,148,275,000 | 99.3% | |
| Subordinate Debt | 145,000,000 | 12.5% | Closing Costs | 8,667,656 | 0.7 | |
| Sponsor Equity | 581,942,656 | 50.3% | ||||
| Total Sources | $1,156,942,656 | 100.0% | Total Uses | $1,156,942,656 | 100.0% | |
| (1) | Fitch and KBRA provided the listed assessments for the Osborn Triangle Loan (as defined below) in the context of its inclusion in the mortgage pool. S&P does not provide a credit assessment but confirmed that the Osborn Triangle Loan has, in the context of its inclusion in the mortgage pool, credit characteristics consistent with an investment grade obligation. |
| (2) | The Osborn Triangle Loan consists of the non-controlling Note A-4, which is part of the Osborn Triangle Whole Loan evidenced by six seniorpari passu notes and one subordinate note, with an aggregate outstanding principal balance as of the Cut-off Date of $575.0 million. For additional information, see “The Loan” below. |
| (3) | The borrowers for the Osborn Triangle Whole Loan are 610 Main Street North Leasehold LLC, 610 Main Street South Leasehold LLC, 700 Main Street Leasehold LLC and 610-700 Main Garage Leasehold LLC. |
| (4) | The Osborn Triangle Whole Loan has no separate carveout guarantor, and the borrower is the only indemnitor under the related environmental indemnity agreement. |
| (5) | 2016 NOI is not available because one of the properties, 610 Main Street North, was built in 2016. |
| (6) | The increase in Underwritten NOI from TTM NOI is primarily attributable to (i) contractual rent steps through May 2020 and (ii) the present value of rent steps and a mark to market at the end of the lease term for investment grade tenants Pfizer and Novartis (as defined below). The average contractual rent per square foot over the lease term is $70.96 per square foot for the Pfizer lease expiration, $86.61 per square foot for the 2031 Pfizer lease expiration and $59.46 per square foot for the 2024 Novartis lease expiration. |
| (7) | For a full description of Escrows and Reserves, please refer to“Escrows and Reserves”below. |
THE INFORMATION IN THIS STRUCTURAL AND COLLATERAL TERM SHEET IS NOT COMPLETE AND MAY BE AMENDED PRIOR TO THE TIME OF SALE. THIS TERM SHEET IS NOT AN OFFER TO SELL THESE SECURITIES AND IT IS NOT A SOLICITATION OF AN OFFER TO BUY THESE SECURITIES IN ANY JURISDICTION WHERE THE OFFER OR SALE IS NOT PERMITTED.
| | |
115 of 156
| Structural and Collateral Term Sheet | Benchmark 2019-B14 |
| Osborn Triangle | |
The Loan.The Osborn Triangle mortgage loan (the “Osborn Triangle Loan”) is part of a whole loan with an aggregate outstanding principal balance as of the Cut-off Date of $575.0 million (the “Osborn Triangle Whole Loan”), secured by the borrowers’ leasehold interest in four condominium units that together comprise Class A office/laboratory properties and a parking garage located in Cambridge, Massachusetts (the “Osborn Triangle Property”).The Osborn Triangle Whole Loan is comprised of (i) a senior loan, comprised of sixpari passunotes with an aggregate principal balance as of the Cut-off Date of $430.0 million (the “Osborn Triangle Senior Notes”), one of which (Note A-4 with an outstanding principal balance as of the Cut-off Date of $40.0 million) is being contributed to the Benchmark 2019-B14 Trust and constitutes the Osborn Triangle Loan, and the remainder of which have been, or are expected to be contributed to other securitization trusts and (ii) a subordinate loan, comprised of one note, with an original principal balance as of the Cut-off Date of $145.0 million (collectively, the “Osborn Triangle Subordinate Companion Loan”) that was contributed to a prior securitization trust, each as described below.The relationship between the holders of the Osborn Triangle Senior Notes and Osborn Triangle Subordinate Companion Loan is governed by a co-lender agreement as described under“Description of the Mortgage Pool—The Whole Loans—The Non-Serviced AB Whole Loans—The Osborn Triangle Whole Loan”in the Preliminary Prospectus. The Osborn Triangle Whole Loan was originated by JPMCB. The Osborn Triangle Whole Loan has a 10-year term and will be interest-only for the term of the loan. The financing of the Osborn Triangle Property has been securitized in the JPMCC 2019-OSB, Benchmark 2019-B12 and Benchmark 2019-B13 transaction.
| Whole Loan Summary | |||||
| Note | Original Balance | Cut-off Date Balance | Note Holder | Controlling Piece | |
| Note A-1 | $250,000,000 | $250,000,000 | JPMCC 2019-OSB | Yes | |
| Note A-2 | 50,000,000 | 50,000,000 | Benchmark 2019-B12 | No | |
| Note A-3 | 50,000,000 | 50,000,000 | Benchmark 2019-B13 | No | |
| Note A-4 | 40,000,000 | 40,000,000 | Benchmark 2019-B14 | No | |
| Note A-5-1 | 20,000,000 | 20,000,000 | JPMCB | No | |
| Note A-6-1 | 20,000,000 | 20,000,000 | Cantor Commercial Real Estate | No | |
| Senior Notes | $430,000,000 | $430,000,000 | |||
| Note B-1 | 145,000,000 | 145,000,000 | JPMCC 2019-OSB | No | |
| Whole Loan | $575,000,000 | $575,000,000 | |||
The Borrowers.The borrowers are 610 Main Street North Leasehold LLC, 610 Main Street South Leasehold LLC, 700 Main Street Leasehold LLC and 610-700 Main Garage Leasehold LLC, each a single purpose Massachusetts limited liability company. Each borrower is structured to be a single purpose bankruptcy-remote entity having two independent directors in its organizational structure. For additional information, please see “Description of the Mortgage Pool—Mortgage Pool Characteristics—Tenancies-in-Common or Diversified Ownership” in the Preliminary Prospectus. Legal counsel to the borrowers delivered a non-consolidation opinion in connection with the origination of the Osborn Triangle Whole Loan.
The Property.The Osborn Triangle Property consists of three Class A office/laboratory buildings totaling 676,947 square feet and a 650-space parking garage located directly adjacent to the Massachusetts Institute of Technology (“MIT”) campus in Cambridge, Massachusetts. The Osborn Triangle Property consists of 610 Main Street North, 1 Portland Street, 700 Main Street and a subterranean 650-space parking garage situated on approximately 4.8 acres of land. The three properties are set around Watson Court, a central green space with outdoor seating. The Osborn Triangle Property was designed by Boston-based Elkus Manfredi Architects, Lab Architect Group and Tsai Kobus and completed by MIT Investment Management Company. 610 Main Street North is LEED Gold certified and designed with electric vehicle charging stations, a reflective roof as well as water efficient fixtures and irrigation. 1 Portland Street has efficient layouts for a variety of office and laboratory requirements. 700 Main Street was converted from an industrial building into a life science facility in 2002, further expanded in 2012.
The Osborn Triangle Property is currently 100.0% leased to seven tenants consisting of three office tenants and four retail tenants. The three office tenants at the Osborn Triangle Property consist of Pfizer, Novartis Institutes for Biomedical Research, Inc. (“Novartis”) and Lab Central Inc. (“Lab Central”). Retail tenants include Sulmona Restaurant Group, Café Luna, Boston Burger and Revela which occupy approximately 1.3% of net rentable area and 0.6% of underwritten base rent.
THE INFORMATION IN THIS STRUCTURAL AND COLLATERAL TERM SHEET IS NOT COMPLETE AND MAY BE AMENDED PRIOR TO THE TIME OF SALE. THIS TERM SHEET IS NOT AN OFFER TO SELL THESE SECURITIES AND IT IS NOT A SOLICITATION OF AN OFFER TO BUY THESE SECURITIES IN ANY JURISDICTION WHERE THE OFFER OR SALE IS NOT PERMITTED.
| | |
116 of 156
| Structural and Collateral Term Sheet | Benchmark 2019-B14 |
| Osborn Triangle | |
The largest tenant, Pfizer, (499,386 square feet; 73.8% of net rentable area; 77.9% of underwritten base rent), (NYSE: PFE) (rated A1/AA/A+ by Fitch and S&P), is one of the world’s largest biopharmaceutical companies, with a global portfolio that encompasses medicines, vaccines and healthcare products. Headquartered in New York City with approximately 92,400 employees worldwide, Pfizer’s products are sold in over 125 countries. As of 2018, Pfizer reported revenues of approximately $53.6 billion. Pfizer’s location at 610 Main Street North and 1 Portland Street employs approximately 1,000 people and focuses on pharmaceutical and biologics research, drug metabolism, biotechnology and therapeutic areas including inflammation, immunology, rare diseases and internal medicine. In addition to Pfizer’s location at the Osborn Triangle Property, Massachusetts is home to Pfizer’s research and manufacturing site in Andover and serves as the global headquarters for Pfizer’s Center for Therapeutic Innovation. Pfizer has occupied the Osborn Triangle Property since December 2013. Pfizer leases 229,330 square feet of space at 1 Portland Street which expires in January 2024 and 270,056 square feet of space at 610 Main Street North which expires in December 2031, both with two, five-year renewal options and no termination options. Pfizer subleases a portion of its space totaling 163,644 square feet to CRISPR Therapeutics, Lab Central, Casebia Therapeutics and KSQ Therapeutics.
The second largest tenant, Novartis (99,883 square feet; 14.8% of net rentable area; 14.1% of underwritten base rent) (NYSE: NVS) (rated A1/AA-/AA- by Moody’s, Fitch and S&P), is a multinational medicine company. Headquartered in Basel Switzerland, Novartis has approximately 125,000 employees worldwide. As of 2018, Novartis reported sales of $51.9 billion. Novartis’ location at 700 Main Street is home to Novartis Institutes for BioMedical Research (“NIBR”), the innovation arm of Novartis which focuses on developing new drugs. NIBR employs approximately 6,000 people in six research campuses across the globe. In addition to Novartis’ 700 Main Street location, Novartis has complementary Cambridge locations along Massachusetts Avenue, Windsor Street and within Technology Square. Novartis has occupied office and laboratory space at the Osborn Triangle Property since March 2014. Novartis occupies space at 700 Main Street through July 2024 with two, five-year renewal options and no termination options.
The third largest tenant, Lab Central (68,996 square feet; 10.2% of net rentable area; 7.4% of underwritten base rent), is a shared laboratory space designed as a launchpad for potential life-sciences and biotech startups. Founded in 2013, Lab Central was primarily funded by two grants from the Massachusetts Life Sciences Center and MIT. 700 Main Street serves as Lab Central’s headquarters and primary incubator space. Along with 610 Main Street North, Lab Central’s two-building campus offers fully permitted laboratory and office space with a capacity to serve 450 scientists and entrepreneurs in about 70 companies. Lab Central has been a tenant at the Osborn Triangle Property since April 2013. Lab Tenant occupies office and laboratory space at 700 Main Street through March 2027 with two five-year renewal options and no termination options. Lab Central subleases additional space from Pfizer at 610 Main Street North.
The Osborn Triangle Property is located in Cambridge, Massachusetts, within the Boston office market (specifically the East Cambridge/Kendall Square office submarket). Situated on approximately 4.8 acres of land directly adjacent to MIT, the Osborn Triangle Property is located in the East Cambridge neighborhood in a dynamic biotech cluster, which is bound by Main Street, Albany Street and Massachusetts Avenue. Osborn Triangle Property’s location allows it to capitalize on its proximity to major institutional and research entities in Cambridge, affording its tenants immediate access to parking and public transportation, as well as the city’s entertainment, hospitality and residential districts. The neighborhood is anchored by the Kendall/MIT MBTA Red Line subway station and the approximately 166-acre MIT campus. MIT’s iconic Great Dome is less than 400 yards from the center of the Osborn Triangle Property. The Osborn Triangle Property is surrounded by a cluster of global life science/technology companies and fast-growing start-ups anchored by Akamai, Amazon, Apple, Biogen, Boeing, Broad Institute, Cambridge Innovation Center, Draper, Google, Koch Institute and Microsoft. Logan International Airport is located approximately 4.3 miles northeast of the Osborn Triangle Property and offers 40 airlines that fly non-stop to more than 100 domestic and international destinations. Furthermore, the Massachusetts Port Authority recently announced $1.0 billion worth of investments to further expand the airport’s international terminal, reconfigure other terminals and redesign its roadways.
East Cambridge/Kendall Square comprises nearly 21.0 million square feet of world-class office and laboratory space complemented by a dense cluster of apartments, shopping destinations and dining amenities in addition to 2.5 acres of landscaped open space. Notable developments in the immediate area include the Cambridge Side Galleria mall, Canal Park, Riverview Office Park, Royal Sonesta Hotel and several high-rise residential condominium buildings. According to a third party research report, as of the fourth quarter of 2018, the East Cambridge submarket had approximately 7.4 million square feet of laboratory space with approximately 1.4 million square feet under construction. The average East Cambridge submarket vacancy in 2018 was approximately 0.2%. East Cambridge Class B NNN laboratory space had an average asking rents of $78.00 per square foot, while Class A NNN laboratory space commanded nearly an $11 premium at $88.80 per square foot. Recent leasing in the Cambridge office/laboratory submarket in the first quarter of 2019 includes more than 620,000 square feet to tenants including Infinity Pharmaceuticals, Boston Microfluidics, BetterLesson, Syros Pharmaceuticals, Invaio Sciences, Ultragenyx Pharmaceutical, HiFiBiO Therapeutics and Casma Therapeutics.
THE INFORMATION IN THIS STRUCTURAL AND COLLATERAL TERM SHEET IS NOT COMPLETE AND MAY BE AMENDED PRIOR TO THE TIME OF SALE. THIS TERM SHEET IS NOT AN OFFER TO SELL THESE SECURITIES AND IT IS NOT A SOLICITATION OF AN OFFER TO BUY THESE SECURITIES IN ANY JURISDICTION WHERE THE OFFER OR SALE IS NOT PERMITTED.
| | |
117 of 156
| Structural and Collateral Term Sheet | Benchmark 2019-B14 |
| Osborn Triangle | |
In 2018, the Greater Boston area had approximately 20.3 million square feet of laboratory space with an average vacancy rate of 4.9%. The laboratory submarkets across Greater Boston combined for 1.5 million square feet of net absorption in 2018. 62 public companies with a combined market value of approximately $170.0 billion, the majority of them biotechnology firms are headquartered in Cambridge. Global pharmaceutical companies, including Takeda Pharmaceutical Co., Sanofi SA and Novartis AG, also have extensive research operations in the city. In the fourth quarter of 2018, tenants absorbed 468,000 square feet of biotechnology-focused laboratory real estate in Greater Boston, with much of that growth occurring in the last of the Alexandria Center at Kendall Square buildings to be delivered. Bristol-Myers Squibb took occupancy of 208,000 square feet, while Facebook moved into 133,000 square feet and furthered a trend of traditional office users paying significant premiums for Kendall Square space, even though that space was originally developed for lab use.
As of the first quarter of 2019, the Cambridge – East office submarket contained approximately 9.4 million square feet of office space, had a direct vacancy rate of 1.4% and average asking NNN rents of $94.52 per square foot (compared to underwritten gross rent of $77.32 per square foot at the Osborn Triangle Property) according to a third party research report. As of the same time period, according to the appraisal, the Cambridge – East laboratory submarket contained approximately 12.3 million square feet of laboratory space, had a direct vacancy rate of 0.9% and average asking NNN rents of $94.75 per square foot (compared to underwritten gross rent of $77.32 per square foot at the Osborn Triangle Property) according to a third party research report. The appraisal surveyed a competitive set of rent comparables from six other class A/B office/laboratory buildings in the Kendall Square. Base rent across the approximately 670,007 square feet of leases ranges from $76.00 to $95.00 per square foot (reflected in the chart below). The appraisal concluded office/laboratory market rent of $87.50 per square foot and retail space market rent of $45.00 per square foot. Based on the appraiser’s analysis and concluded market rent, the Osborn Triangle Property’s in-place rent is approximately 24.3% and 17.4% below market with respect to office/laboratory and retail space, respectively.
According to the appraisal, the Osborn Triangle Property is located within the Boston metropolitan statistical area (the “Boston MSA”). As of year-end 2018, the Boston MSA had an unemployment rate of approximately 3.3%, a median household income of approximately $85,800 and a population of approximately 2.0 million.
| Historical Occupancy(1) | ||||
| 2016 | 2017 | 2018 | Current(2) | |
| Occupancy | 99.6% | 99.9% | 100.0% | 100.0% |
| (1) | Historical occupancies are as of December 31 of each respective year. |
| (2) | Current Occupancy is based on the May 1, 2019 rent roll. |
| Tenant Summary(1) | |||||||
| Tenant | Type | Ratings Moody’s/Fitch/S&P(2) | Net Rentable Area (SF) | % of Total NRA | Base Rent(3) | % of Total Base Rent(3) | Lease Expiration Date |
| Pfizer(4)(5) | Lab/Office | A1 / A+ / AA | 499,386 | 73.8% | $81.64 | 77.9% | Various(6) |
| Novartis | Lab/Office | A1 / AA- / AA- | 99,883 | 14.8% | $73.91 | 14.1% | 7/31/2024 |
| Lab Central | Lab/Office | NR / NR / NR | 68,996 | 10.2% | $55.85 | 7.4% | 3/31/2027 |
| Sulmona Restaurant Group | Retail | NR / NR / NR | 3,355 | 0.5% | $37.63 | 0.2% | 2/28/2027 |
| Café Luna | Retail | NR / NR / NR | 2,328 | 0.3% | $37.13 | 0.2% | 3/31/2027 |
| Boston Burger | Retail | NR / NR / NR | 1,984 | 0.3% | $36.05 | 0.1% | 9/30/2027 |
| Revela | Retail | NR / NR / NR | 1,015 | 0.1% | $47.15 | 0.1% | 7/31/2027 |
| Total / Wtd. Avg | 676,947 | 100.0% | $77.32 | 100.0% | |||
| (1) | Based on the underwritten rent roll dated May 1, 2019. |
| (2) | In certain instances, ratings provided are those of the parent company of the entity shown, whether or not the parent company guarantees the lease. |
| (3) | Base Rent is inclusive of (i) the contractual rent steps through May 2020 and (ii) the present value of rent steps and a mark to market at the end of the lease term for Pfizer and Novartis. The average contractual rent per square foot over the lease term is $70.96 per square foot for the 2024 Pfizer lease expiration, $86.61 per square foot for the 2031 Pfizer lease expiration and $59.46 per square foot for the 2024 Novartis lease expiration. For the remaining tenants, the Base Rent per square foot and % of Total Base Rent includes rent steps through May 1, 2020. |
| (4) | Pfizer leases 499,386 square feet of which (i) 139,212 square feet of space leased at 610 Main Street and 229,330 square feet leased at 1 Portland Street has 2.75% annual lease rent escalations and (ii) 130,844 square feet of space leased at 610 Main Street North has 3.0% annual lease escalations. |
| (5) | Pfizer subleases a portion of its space totaling 163,644 square feet to CRISPR Therapeutics, Lab Central (as defined below), Casebia Therapeutics and KSQ Therapeutics. Casebia Therapeutics sub-subleases 5,184 square feet of its space to Bayer’s Life Hub Boston through March 31, 2024 at $77.26 per square feet plus 3.0% annual increases commencing April 1, 2019. Bayer reimburses expenses at a rate of $4.40 per square feet. |
| (6) | Pfizer leases 499,386 square feet, of which (i) 229,330 square feet of space at 1 Portland Street is set to expire January 31, 2024 and (ii) 270,056 square feet of space at 610 Main Street which is set to expire December 31, 2031. |
THE INFORMATION IN THIS STRUCTURAL AND COLLATERAL TERM SHEET IS NOT COMPLETE AND MAY BE AMENDED PRIOR TO THE TIME OF SALE. THIS TERM SHEET IS NOT AN OFFER TO SELL THESE SECURITIES AND IT IS NOT A SOLICITATION OF AN OFFER TO BUY THESE SECURITIES IN ANY JURISDICTION WHERE THE OFFER OR SALE IS NOT PERMITTED.
| | |
118 of 156
| Structural and Collateral Term Sheet | Benchmark 2019-B14 |
| Osborn Triangle | |
| Lease Rollover Schedule(1)(2) | |||||||||
| Year | Number of Leases Expiring | Net Rentable Area Expiring | % of NRA Expiring | Base Rent Expiring | % of Base Rent Expiring | Cumulative Net Rentable Area Expiring | Cumulative % of NRA Expiring | Cumulative Base Rent Expiring | Cumulative % of Base Rent Expiring |
| Vacant | NAP | 0 | 0.0% | NAP | NAP | 0 | 0.0% | NAP | NAP |
| MTM & 2019 | 0 | 0 | 0.0% | $0 | 0.0% | 0 | 0.0% | $0 | 0.0% |
| 2020 | 0 | 0 | 0.0% | 0 | 0.0% | 0 | 0.0% | $0 | 0.0% |
| 2021 | 0 | 0 | 0.0% | 0 | 0.0% | 0 | 0.0% | $0 | 0.0% |
| 2022 | 0 | 0 | 0.0% | 0 | 0.0% | 0 | 0.0% | $0 | 0.0% |
| 2023 | 0 | 0 | 0.0% | 0 | 0.0% | 0 | 0.0% | $0 | 0.0% |
| 2024 | 2 | 329,213 | 48.6% | 25,600,102 | 48.9% | 329,213 | 48.6% | $25,600,102 | 48.9% |
| 2025 | 0 | 0 | 0.0% | 0 | 0.0% | 329,213 | 48.6% | $25,600,102 | 48.9% |
| 2026 | 0 | 0 | 0.0% | 0 | 0.0% | 329,213 | 48.6% | $25,600,102 | 48.9% |
| 2027 | 6 | 77,678 | 11.5% | 4,185,425 | 8.0% | 406,891 | 60.1% | $29,785,527 | 56.9% |
| 2028 | 0 | 0 | 0.0% | 0 | 0.0% | 406,891 | 60.1% | $29,785,527 | 56.9% |
| 2029 | 0 | 0 | 0.0% | 0 | 0.0% | 406,891 | 60.1% | $29,785,527 | 56.9% |
| 2030 & Thereafter | 3 | 270,056 | 39.9% | 22,554,072 | 43.1% | 676,947 | 100.0% | $52,339,600 | 100.0% |
| Total / Wtd. Avg. | 11 | 676,947 | 100.0% | $52,339,60 | 100.0% | ||||
| (1) | Based on the underwritten rent roll dated as of May 1, 2019. |
| (2) | Certain tenants may have termination or contraction options (which may become exercisable prior to the originally stated expiration date of the tenant lease) that are not considered in the above Lease Rollover Schedule. |
| Operating History and Underwritten Net Cash Flow(1) | ||||||
| 2017 | 2018 | TTM(2) | Underwritten | Per Square Foot | %(3) | |
| Base Rent | $40,270,949 | $42,583,273 | $43,432,253 | $44,714,419 | $66.05 | 62.9% |
| IG Rent Steps and Market Adjustment(4) | 0 | 0 | 0 | 7,625,181 | 11.26 | 10.7% |
| Vacant Income | 0 | 0 | 0 | 0 | 0.00 | 0.0% |
| Reimbursements | 13,282,194 | 14,252,881 | 14,607,789 | 16,481,111 | 24.35 | 23.2% |
| Parking Income | 1,920,448 | 2,339,140 | 2,363,122 | 2,255,641 | 3.33 | 3.2% |
| Gross Potential Income | $55,473,591 | $59,175,294 | $60,403,164 | $71,076,352 | $105.00 | 100.0% |
| Total Other Income(5) | 413,828 | 451,151 | 464,927 | 529,887 | 0.78 | 0.7% |
| (Vacancy/Credit Loss)(6) | 0 | 0 | 0 | (816,810) | (1.21) | (1.1)% |
| Effective Gross Income | $55,887,418 | $59,626,445 | $60,868,091 | $70,789,429 | $104.57 | 99.6% |
| Total Expenses | 13,850,608 | 15,721,797 | 15,860,286 | 17,055,013 | 25.19 | 24.1% |
| Net Operating Income(7) | $42,036,811 | $43,904,648 | $45,007,805 | $53,734,416 | $79.38 | 75.9% |
| TI/LC | 0 | 0 | 0 | 1,878,551 | 2.78 | 2.7% |
| Capital Expenditures | 0 | 0 | 0 | 182,776 | 0.27 | 0.3% |
| Net Cash Flow | $42,036,811 | $43,904,648 | $45,007,805 | $51,673,090 | $76.33 | 73.0% |
| (1) | 2016 NOI is not available because one of the properties, 610 Main Street North, was built in 2016. |
| (2) | TTM reflects the trailing 12 month period ending March 31, 2019. |
| (3) | % column represents percent of Net Rental Income for all revenue lines and represents percent of Effective Gross Income for the remainder of the fields. |
| (4) | IG Rent Steps and Market Adjustment is inclusive of (i) the contractual rent steps through May 2020 and (ii) the present value of rent steps and a mark to market at the end of the lease term for Pfizer and Novartis. The average contractual rent per square foot over the lease term is $70.96 per square feet for the 2024 Pfizer lease expiration, $86.61 per square foot for the 2031 Pfizer lease expiration and $59.46 per square foot for the 2024 Novartis lease expiration. For the remaining tenants, the Base Rent per square foot and % of Total Base Rent includes rent steps through May 1, 2020. |
| (5) | Total Other Income consists of storage income, percentage rent (retail tenancy), sublease income and TI rent. |
| (6) | Vacancy is underwritten to the blended economic vacancy of 1.1%. The blended vacancy reflects the appraiser’s assumption of 2.0% market vacancy for 1 Portland Street and 700 Main Street, as well as the appraiser’s 0.0% vacancy assumption for 610 Main Street North because of its long term lease with credit tenant, Pfizer, which has a December 2031 expiration and is 2.5 years beyond the loan term. Other third party data sources show a submarket vacancy between 0.5% and 1.0% for buildings completed after 2009. The Osborn Triangle Property was completed or gut renovated between 2012 and 2016. |
| (7) | The increase in Underwritten NOI from Most Recent NOI is primarily attributable to (i) contractual rent steps through May 2020 and (ii) the present value of rent steps and a mark to market at the end of the lease term for investment grade tenants Pfizer and Novartis. The average contractual rent per square foot over the lease term is $70.96 per square foot for the Pfizer lease expiration, $86.61 per square foot for the 2031 Pfizer lease expiration and $59.46 per square foot for the 2024 Novartis lease expiration. |
THE INFORMATION IN THIS STRUCTURAL AND COLLATERAL TERM SHEET IS NOT COMPLETE AND MAY BE AMENDED PRIOR TO THE TIME OF SALE. THIS TERM SHEET IS NOT AN OFFER TO SELL THESE SECURITIES AND IT IS NOT A SOLICITATION OF AN OFFER TO BUY THESE SECURITIES IN ANY JURISDICTION WHERE THE OFFER OR SALE IS NOT PERMITTED.
| | |
119 of 156
| Structural and Collateral Term Sheet | Benchmark 2019-B14 |
| Osborn Triangle | |
Property Management.The Osborn Triangle Property is managed by Bulfinch Property Management, LLC, a Massachusetts limited liability company and an affiliate of the borrowers. The lender has the right to require the borrowers to terminate the management agreement and replace the manager in accordance with the Osborn Triangle Whole Loan documents if (i) an event of default occurs and remains uncured under the Osborn Triangle Whole Loan, (ii) the manager becoming insolvent or a debtor in any bankruptcy or insolvency proceeding or (iii) there is an event of default of the manager under the management agreement beyond all applicable cure periods. The borrowers are permitted to terminate the existing management agreement and replace manager with a pre-approved manager, subject to delivery of a management agreement and collateral assignment of management each in the forms pre-approved by the lender and attached as exhibits to the mortgage loan agreement.
Escrows and Reserves.At loan origination, the borrowers were not required to deposit any upfront reserves.
Tax Reserve. On a monthly basis, the borrowers are required to deposit into a real estate tax reserve, the amount equal to 1/12 of the estimated annual real estate taxes. In the event the borrowers provide evidence reasonably satisfactory to the lender that all taxes and other charges have been paid prior to the related due date and there is no event of default continuing, the requirement for monthly deposits into the tax reserve will be waived.
Insurance Reserve. On a monthly basis, the borrowers are required to deposit into an insurance reserve, the amount equal to 1/12 of estimated insurance premiums. In the event the borrowers obtain and maintain a blanket insurance policy acceptable to the lender and there is no event of default continuing, the requirement for monthly deposits into the insurance reserve will be waived.
TI/LC Reserve. On a monthly basis during the continuance of a Tenant Trigger Event (as defined below), the borrowers are required to deposit into a TI/LC reserve, an amount equal to $3.625 per square foot each month for outstanding tenant improvement and leasing commission obligations/
A “Tenant Trigger Event” means if either Pfizer or Novartis (i) fails to renew its lease 12 months prior to its lease expiration date or renewal period or (ii) if either tenant vacates, abandons or “goes dark” for a period of 90 consecutive days, excluding commercially reasonable periods of time in connection with a restoration at the Osborn Triangle Property.
Lockbox / Cash Management. The Osborn Triangle Whole Loan is structured with a hard lockbox and springing cash management. The borrowers were required at origination to deliver tenant direction letters instructing all tenants to deposit rents into a lockbox account controlled by the lender. All funds in the lockbox account are required to be swept each business day into a cash management account controlled by the lender and disbursed on each payment date in accordance with the loan documents. All funds on deposit in the cash management account following the occurrence and during the continuance of a Cash Sweep Event, all funds in the lockbox account are required to be swept daily into a lender-controlled account, from which account such funds will be disbursed on each payment date in accordance with the loan documents and any excess will be retained by the lender as additional collateral for the Osborn Triangle Whole Loan
A “Cash Sweep Event” means the occurrence and continuation of (i) an event of default, (ii) any bankruptcy action of the borrowers or property manager, (iii) a DSCR Trigger Event or (iv) a Tenant Trigger.
A Cash Sweep Event may be cured in accordance with the following conditions: with respect to a Cash Sweep Event caused solely by (a) clause (i) above, the acceptance of a cure by the lender of the related event of default, (b) clause (ii) above if the borrowers have replaced the manager with a qualified manager under a replacement management agreement within 60 days in accordance with the loan documents, (c) clause (iii) above, a DSCR Cure Event (as defined below) has taken place, (d) clause (iv) above, if the Cash Sweep Event is caused solely by the occurrence of (x) a Tenant BK Trigger (as defined below), Young & Rubicam or its parent company affirming the Young & Rubicam lease in the applicable bankruptcy proceeding, (y) a Tenant Vacancy Trigger (as defined below), the replacement of Young & Rubicam with an acceptable replacement tenant pursuant to lease(s) approved in accordance with the terms of the loan documents and such tenant has accepted possession of its premises under the lease(s), with all tenant improvement costs and free rent amounts reserved with the lender, or (z) any Tenant Trigger, upon the satisfaction of the Tenant Escrow Requirement (as defined below) (in which case, the borrowers are deemed to have cured any existing Tenant Trigger immediately upon such date). Each cure is also subject to the following conditions: (1) no other event of default may have occurred and be continuing; and (2) the borrowers pay the lender’s reasonable expenses in connection with such cure. Notwithstanding the foregoing, in no event will the borrowers have the right to cure a Cash Sweep Event occurring from a borrower bankruptcy.
“DSCR Trigger Event” means the debt service coverage ratio on the Osborn Triangle Whole Loan (as calculated in the loan documents) based on the trailing three-month period immediately preceding the date of determination is less than 1.25x.
“DSCR Cure Event” means the debt service coverage ratio on the Osborn Triangle Whole Loan (as calculated in the loan documents), based on the trailing three-month period immediately preceding the date of determination, is at least 1.25x for two consecutive quarters.
THE INFORMATION IN THIS STRUCTURAL AND COLLATERAL TERM SHEET IS NOT COMPLETE AND MAY BE AMENDED PRIOR TO THE TIME OF SALE. THIS TERM SHEET IS NOT AN OFFER TO SELL THESE SECURITIES AND IT IS NOT A SOLICITATION OF AN OFFER TO BUY THESE SECURITIES IN ANY JURISDICTION WHERE THE OFFER OR SALE IS NOT PERMITTED.
| | |
120 of 156
| Structural and Collateral Term Sheet | Benchmark 2019-B14 |
| Osborn Triangle | |
Additional Debt. The Osborn Triangle Subordinate Companion Loan, with an aggregate outstanding principal balance as of the Cut-off Date of $145.0 million, accrues interest at a fixed rate of 3.79700%per annum. The Osborn Triangle Subordinate Companion Loan has a 120-month term and is interest only for the full term. For additional information, see“Description of the Mortgage Pool—The Whole Loans—The Non-Serviced AB Whole Loans—The Osborn Triangle Whole Loan”in the Preliminary Prospectus.
The Osborn Triangle Whole Loan documents permit the upper tier beneficial owners of the borrowers to pledge up to 75.0% of the direct or indirect equity interests in HSRE-Osborn Core Holding, LLC as part of a corporate financing, subject to satisfaction of certain terms and conditions in the Osborn Triangle Whole Loan documents including, without limitation: (i) the pledge is to an institutional investor meeting the requirements of the Osborn Triangle Whole Loan documents; (ii) at least 75.0% of the permitted pledge is secured by assets other than the Osborn Triangle Property or the direct or indirect interests in the Osborn Triangle Property; and (iii) the pledge will not result in a change in control of the borrowers.
Condominium.The Osborn Triangle Property is subject to a condominium declaration, which divides the underlying property into four units, the 610 Main Street North unit, the 610 Main Street South unit (a/k/a/ 1 Portland Street), the 700 Main Street unit and the parking garage unit. The fee interests in the condominium units are owned by an affiliate of MIT, which is also the declarant under the condominium declaration. The fee owner of the units master leases each unit to the individual borrower, and the Osborn Triangle Whole Loan is secured by such leasehold interests. Pursuant to each master lease, the fee owner of the units has delegated the rights to exercise its rights and privileges in its capacity as the fee owner of the units under the condominium declaration to each borrower, and the individual borrowers control 100% of the condominium interests. The term of each of the master lease expires on May 15, 2084. The base rent under each ground lease was prepaid in full prior to the origination of the Osborn Triangle Whole Loan. Please see “Description of the Mortgage Pool—Mortgage Pool Characteristics—Fee & Leasehold Estates; Ground Leases” in the Preliminary Prospectus for additional information.
Partial Release.At any time after July 1, 2021, the borrowers may obtain the release of either the 1 Portland Street and/or the 700 Main Street property provided that, among other conditions, (i) the borrowers pay the release price equal to 110% of the allocated loan amount for such property, plus a yield maintenance premium (if applicable), (ii) the debt service coverage ratio (as calculated in the Osborn Triangle Whole Loan documents) for the properties then remaining subject to the lien of the Osborn Triangle Whole Loan documents based on the trailing 12 month period is equal to or greater than the greater of (a) 2.03x and (b) the debt service coverage ratio for all of the Osborn Triangle Property (including the property subject to the release) based on the trailing 12 month period, (iii) the remaining properties (after the release) will not be in violation of the condominium documents, the master lease documents, any leases or the then applicable laws, and the borrower continues to control the board of trustees of the condominium association and (iv) the borrower may not lease any space at the released property to an existing tenant unless either (a) the borrower has re-leased the space in the Osborn Triangle Property to a new tenant with an effective rent per square foot in an amount equal to or greater than the tenant that was relocated or (b) the lender consents to such relocation (which consent may not be unreasonably withheld, conditioned or delayed). The Osborn Triangle Whole Loan documents provide that if the loan-to-value ratio exceeds or would exceed 125% immediately after the release, no release will be permitted unless the principal balance of the Osborn Triangle Whole Loan is prepaid by an amount set forth in the Osborn Triangle Whole Loan documents or the borrower delivers a REMIC opinion. The borrower is not permitted to release the 610 Main Street North or parking garage properties.
THE INFORMATION IN THIS STRUCTURAL AND COLLATERAL TERM SHEET IS NOT COMPLETE AND MAY BE AMENDED PRIOR TO THE TIME OF SALE. THIS TERM SHEET IS NOT AN OFFER TO SELL THESE SECURITIES AND IT IS NOT A SOLICITATION OF AN OFFER TO BUY THESE SECURITIES IN ANY JURISDICTION WHERE THE OFFER OR SALE IS NOT PERMITTED.
| | |
121 of 156
| Structural and Collateral Term Sheet | Benchmark 2019-B14 | |
| Tysons Tower | ||

THE INFORMATION IN THIS STRUCTURAL AND COLLATERAL TERM SHEET IS NOT COMPLETE AND MAY BE AMENDED PRIOR TO THE TIME OF SALE. THIS TERM SHEET IS NOT AN OFFER TO SELL THESE SECURITIES AND IT IS NOT A SOLICITATION OF AN OFFER TO BUY THESE SECURITIES IN ANY JURISDICTION WHERE THE OFFER OR SALE IS NOT PERMITTED.
| | |
122 of 156
| Structural and Collateral Term Sheet | Benchmark 2019-B14 | |
| Tysons Tower | ||

THE INFORMATION IN THIS STRUCTURAL AND COLLATERAL TERM SHEET IS NOT COMPLETE AND MAY BE AMENDED PRIOR TO THE TIME OF SALE. THIS TERM SHEET IS NOT AN OFFER TO SELL THESE SECURITIES AND IT IS NOT A SOLICITATION OF AN OFFER TO BUY THESE SECURITIES IN ANY JURISDICTION WHERE THE OFFER OR SALE IS NOT PERMITTED.
| | |
123 of 156
| Structural and Collateral Term Sheet | Benchmark 2019-B14 | |
| Tysons Tower | ||

THE INFORMATION IN THIS STRUCTURAL AND COLLATERAL TERM SHEET IS NOT COMPLETE AND MAY BE AMENDED PRIOR TO THE TIME OF SALE. THIS TERM SHEET IS NOT AN OFFER TO SELL THESE SECURITIES AND IT IS NOT A SOLICITATION OF AN OFFER TO BUY THESE SECURITIES IN ANY JURISDICTION WHERE THE OFFER OR SALE IS NOT PERMITTED.
| | |
124 of 156
| Structural and Collateral Term Sheet | Benchmark 2019-B14 | |
| Tysons Tower | ||
| Mortgage Loan Information | Property Information | |||
| Mortgage Loan Seller(1): | JPMCB | Single Asset / Portfolio: | Single Asset | |
| Original Principal Balance(2): | $40,000,000 | Title: | Fee | |
| Cut-off Date Principal Balance(2): | $40,000,000 | Property Type – Subtype: | Office – Suburban | |
| % of Pool by IPB: | 3.0% | Net Rentable Area (SF): | 528,730 | |
| Loan Purpose: | Recapitalization | Location: | McLean, VA | |
| Borrower: | Tysons Corner Office I LLC | Year Built / Renovated: | 2014 / N/A | |
| Loan Sponsor(3): | NAP | Occupancy: | 100.0% | |
| Interest Rate: | 3.33000% | Occupancy Date: | 8/30/2019 | |
| Note Date: | 9/12/2019 | Number of Tenants: | 20 | |
| Maturity Date: | 10/11/2029 | 2016 NOI(5): | $12,562,865 | |
| Interest-only Period: | 120 months | 2017 NOI(5): | $17,880,418 | |
| Original Term: | 120 months | 2018 NOI(5): | $20,965,668 | |
| Original Amortization: | None | TTM NOI (as of 6/2019)(5): | $21,702,519 | |
| Amortization Type: | Interest Only | UW Economic Occupancy: | 90.0% | |
| Call Protection(4): | L(25),Grtr1%orYM(90),O(5) | UW Revenues: | $31,434,407 | |
| Lockbox / Cash Management: | Hard / Springing | UW Expenses: | $10,604,603 | |
| Additional Debt(2): | Yes | UW NOI: | $20,829,804 | |
| Additional Debt Balance(2): | $150,000,000 | UW NCF: | $19,666,598 | |
| Additional Debt Type: | Pari Passu | Appraised Value / Per SF: | $365,000,000 / $690 | |
| Appraisal Date: | 8/12/2019 | |||
| Escrows and Reserves(6) | Financial Information(2) | ||||||
| Initial | Monthly | Initial Cap | Cut-off Date Loan / SF: | $359 | |||
| Taxes: | $0 | Springing | N/A | Maturity Date Loan / SF: | $359 | ||
| Insurance: | $0 | Springing | N/A | Cut-off Date LTV: | 52.1% | ||
| Replacement Reserves: | $0 | Springing | $1,000,000 | Maturity Date LTV: | 52.1% | ||
| TI/LC: | $0 | Springing | $1,321,825 | UW NCF DSCR: | 3.07x | ||
| UW NOI Debt Yield: | 11.0% | ||||||
| Sources and Uses | ||||||||
| Sources | Proceeds | % of Total | Uses | Proceeds | % of Total | |||
| Whole Loan | $190,000,000 | 100.0% | Return of Equity(7) | $188,546,123 | 99.2% | |||
| Closing Costs | 1,453,877 | 0.8% | ||||||
| Total Sources | $190,000,000 | 100.0% | Total Uses | $190,000,000 | 100.0% | |||
| (1) | The Tysons Tower Whole Loan (as defined below) was co-originated by JPMorgan Chase Bank, N.A. (“JPMCB”) and Wells Fargo Bank, National Association (“WFB”) on September 12, 2019. |
| (2) | The Tysons Tower Loan (as defined below) is part of a whole loan evidenced by sevenpari passunotes with an aggregate original principal balance as of the Cut-off Date of $190.0 million. Financial information presented in the chart above reflects the aggregate Cut-off Date balance of the $190.0 million Tysons Tower Whole Loan (as defined below). |
| (3) | The Tysons Tower Whole Loan has no separate carveout guarantor, and the borrower is the only indemnitor under the related environmental indemnity agreement. |
| (4) | The lockout period will be at least 25 payment dates beginning with and including the first payment date of November 11, 2019. Prepayment of the Tysons Tower Whole Loan is permitted upon payment of the yield maintenance premium at any time after the earlier to occur of (a) the end of the two-year period commencing on the closing date of the securitization of the last promissory note representing a portion of the Tysons Tower Whole Loan to be securitized and (b) November 11, 2022. The assumed lockout period of 25 months is based on the expected closing date of the Benchmark 2019-B14 securitization in November 2019. The actual lockout period may be longer. |
| (5) | The increase from 2016 NOI through TTM NOI is primarily attributable to (i) new leasing including 54,623 square feet of leases executed in 2017 accounting for approximately 10.8% of underwritten base rent and (ii) contractual rent steps. |
| (6) | For a full description of Escrows and Reserves, please refer to “Escrows and Reserves” below. |
| (7) | The Tysons Tower property was previously unencumbered. The loan sponsors constructed the Tysons Tower property in 2014 at a total cost of approximately $218.2 million ($413 per square foot). |
THE INFORMATION IN THIS STRUCTURAL AND COLLATERAL TERM SHEET IS NOT COMPLETE AND MAY BE AMENDED PRIOR TO THE TIME OF SALE. THIS TERM SHEET IS NOT AN OFFER TO SELL THESE SECURITIES AND IT IS NOT A SOLICITATION OF AN OFFER TO BUY THESE SECURITIES IN ANY JURISDICTION WHERE THE OFFER OR SALE IS NOT PERMITTED.
| | |
125 of 156
| Structural and Collateral Term Sheet | Benchmark 2019-B14 | |
| Tysons Tower | ||
The Loan.The Tysons Tower loan is part of a whole loan evidenced by sevenpari passu promissory notes, each as described below, with an aggregate original principal balance as of the Cut-off Date of $190.0 million (the “Tysons Tower Whole Loan”), secured by the borrower’s fee simple interest in a 528,730 square foot, Class A, suburban office building located in McLean, Virginia.The non-controlling note A-4, with an aggregate outstanding principal balance as of the Cut-off Date of $40.0 million, will be included in the Benchmark 2019-B14 Trust. The controlling Note A-1 has been included in the BANK 2019-BNK21 securitization. The remaining notes, which are currently held by WFB and JPMCB, are expected to be contributed to one or more future securitization trusts. The relationship between the holders of the Tysons Tower Whole Loan will be governed by a co-lender agreement as described under “Description of the Mortgage Pool—The Whole Loans—The Non-Serviced Pari Passu Whole Loans” in the Preliminary Prospectus. The Tysons Tower Whole Loan has a 10-year term and is interest-only for the full term of the loan.
| Whole Loan Summary | |||||
| Note | Original Balance | Cut-off Date Balance | Note Holder | Controlling Piece | |
| Note A-1 | $50,000,000 | $50,000,000 | BANK 2019-BNK21 | Yes | |
| Note A-2 | 25,000,000 | 25,000,000 | WFB | No | |
| Note A-3 | 20,000,000 | 20,000,000 | WFB | No | |
| Note A-4 | 40,000,000 | 40,000,000 | Benchmark 2019-B14 | No | |
| Note A-5 | 10,000,000 | 10,000,000 | JPMCB | No | |
| Note A-6 | 15,000,000 | 15,000,000 | JPMCB | No | |
| Note A-7 | 30,000,000 | 30,000,000 | JPMCB | No | |
| Whole Loan | $190,000,000 | $190,000,000 | |||
The Borrower.The borrower is Tysons Corner Office I LLC, a Delaware limited liability company and single purpose entity with two independent directors.
The borrower sponsors are The Macerich Partnership, L.P. (“MPLP”) and Alaska Permanent Fund Corporation (“APFC”), each of which has a 50.0% indirect joint venture ownership interest in the Tysons Tower Borrower.
There is no non-recourse carveout guarantor. MPLP is an affiliate of The Macerich Company (“Macerich”) (NYSE: MAC) which maintained an equity market capitalization of approximately $4.7 billion as of June 30, 2019. Macerich is a self-administered and self-managed real estate investment trust involved in the acquisition, ownership, development, redevelopment, management and leasing of regional and community shopping centers located throughout the United States. Macerich specializes in retail properties in many of the country’s most densely populated markets, with a significant presence on the west coast, Arizona, Chicago and in the corridor from the greater New York metropolitan area to Washington, D.C. As of June 30, 2019, Macerich had ownership interest in commercial real estate assets totaling approximately 51 million square feet consisting primarily of 47 regional shopping centers, including the Tysons Corner Center super-regional mall located adjacent to the Tysons Tower property.
APFC is a sovereign wealth fund created in 1980 by the Alaska Legislature and is the largest state-level fund of its kind in the United States. APFC’s investment strategy employs a combination of internally managed direct investments alongside externally managed fund investments. Major asset classes include public equities, fixed-income, private equity, real estate, infrastructure, and absolute return strategies. As of June 30, 2019, APFC’s real estate portfolio included partial or complete ownership in 54 properties valued at approximately $4.1 billion. As of June 30, 2019, APFC had a total fund value of approximately $66.3 billion.
The Property.The Tysons Tower property is a 20-story, 528,730 square foot, Class A, LEED Gold certified suburban office building located in McLean, Virginia, approximately 11.4 miles west of Washington, D.C. The borrower sponsors constructed the Tysons Tower property in 2014 at a total cost of approximately $218.2 million ($413 per square foot). Amenities at the Tysons Tower property include a fitness center with locker rooms, a full service restaurant, covered bike storage, a rooftop garden with panoramic views of Washington, D.C. and the Blue Ridge Mountains, and 1,204 surface and garage parking spaces, resulting in a parking ratio of 2.3 spaces per 1,000 square feet of net rentable area. As of August 30, 2019, the Tysons Tower property was 100.0% occupied by 20 tenants including 17 office tenants, one restaurant retail tenant, one bank retail tenant and one management office.
THE INFORMATION IN THIS STRUCTURAL AND COLLATERAL TERM SHEET IS NOT COMPLETE AND MAY BE AMENDED PRIOR TO THE TIME OF SALE. THIS TERM SHEET IS NOT AN OFFER TO SELL THESE SECURITIES AND IT IS NOT A SOLICITATION OF AN OFFER TO BUY THESE SECURITIES IN ANY JURISDICTION WHERE THE OFFER OR SALE IS NOT PERMITTED.
| | |
126 of 156
| Structural and Collateral Term Sheet | Benchmark 2019-B14 | |
| Tysons Tower | ||
The Tysons Tower property is part of a three-building complex known as the “Tysons Corner Campus”, which also includes the 28-story Vita Apartments and the 300-room Hyatt Regency Tysons Corner hotel (each owned by affiliates of Macerich, but not part of the collateral for the Tysons Tower Whole Loan). The Tysons Corner Campus is connected via an elevated, 1.5-acre pedestrian plaza that features games, a children’s play area, outdoor common areas, as well as space to host concerts and events. The Tysons Corner Campus is also connected via an elevated walkway to the Macerich-owned, approximately 2.0 million square foot Tysons Corner Center super-regional mall, which is located across the street from the Tysons Tower property. With more than 300 shops, dining and entertainment options, Tysons Corner Center is one of the largest shopping centers in the United States. Major retailers at Tysons Corner Center include Nordstrom, Bloomingdale’s, Macy’s, Apple, Dyson, Uniqlo, American Girl, Louis Vuitton, Gucci, Michael Kors, Lacoste, and The Disney Store, among others.
The largest tenant, Intelsat Global Service Corporation (212,572 square feet; 40.2% of net rentable area; 41.5% of underwritten base rent)(“Intelsat”),is a provider of global satellite services serving billions of people worldwide. Intelsat executed its lease at the Tysons Tower property in July 2014 and was one of the first tenants to take occupancy in the building. Intelsat occupies floors 12 through 20 at the Tysons Tower property, which serves as thecompany’sadministrative headquarters. Intelsat has a lease expiration of July 2029 with two renewal options with 18 months’ notice at the fair market rental rate at the maximum extension of 15 years (in the aggregate, at Intelsat’s discretion).
The second largest tenant,Deloitte,LLP (94,378 square feet; 17.8% ofnet rentable area; 17.2% of underwritten base rent) (“Deloitte”), provides clients with a broad range of audit and assurance, consulting, financial advisory, risk, and tax services. Deloitte executed its lease at the Tysons Tower property in August 2014 and was one of the first tenants to take occupancy in the building. Deloitte originally occupied floors seven through nine, and exercised an expansion right for a portion of the sixth floor in 2019. Deloitte has a lease expiration of August 2027 with the option to elect either (i) one, 10-year renewal option, or (ii) two, 5-year renewal options, each with 18 months’ notice at the fair market rental rate.
The third largest tenant, Splunk Inc (57,521 square feet; 10.9% ofnet rentable area; 11.9% of underwritten base rent) (“Splunk”) provides software solutions that enable organizations to gain real-time operational intelligence in the United States and internationally. Splunk serves cloud and onlineservices, education, financial services, government, healthcare/pharmaceuticals, industrials/manufacturing, media/entertainment, retail/e-commerce, technology, and telecommunications industries. Splunk initially took occupancy in the eleventh floor in phases in November 2014 and May 2015, and expanded to occupy the tenth floor in December 2017. Splunk has a lease expiration of May 2022 with one, 5-year option to renew with 10 months’ notice at the fair market rental rate.
The Tysons Tower property is situated on the northwest corner of the intersection of Tysons One Place and Westpark Drive within the Tysons Corner submarket of McLean, Virginia. The Tysons Tower property is situated approximately two blocks southeast of the Tysons Corner Metrorail station, which operates on the Silver Metro rail line that travels east-west through Washington, D.C. The Tysons Corner Metrorail station was built as part of Phase I of the Dulles Corridor Metrorail project, an extension of the Metrorail system through Tysons Corner to Dulles International Airport and Loudoun County, which began operation in 2014. Additionally, the Tysons Tower property is located adjacent to the Capital Beltway (Interstate-495) and Route 123 interchange, approximately 15.0 miles east of the Dulles International Airport, and approximately 13.1 miles west of the Ronald Reagan Washington Airport.
Tysons Corner is the largest office submarket in Northern Virginia, consisting of approximately 29.0 million square feet of office space. Several Fortune 500 companies have headquarters within the Tysons Corner submarket, including Freddie Mac, Capital One Financial, SAIC, Hilton Worldwide and Gannett. Tysons Corner also features over 5.7 million square feet of retail space including the aforementioned Tysons Corner Center super-regional mall as well as Tysons Galleria, which features Saks Fifth Avenue and Neiman Marcus. Residential uses in Tysons Corner feature numerous garden-style, mid-rise and high-rise apartment and condominium projects. Additionally, during the last 20 years, a significant number of luxury townhouse and single-family detached communities have been developed on in-fill parcels within and surrounding Tysons Corner. According to a third party market research provider, the estimated 2019 population within a three- and five-mile radius of the Tysons Tower property was approximately 105,483 and 268,473, respectively; and the estimated 2019 average household income within the same radii was approximately $156,464 and $163,643, respectively.
THE INFORMATION IN THIS STRUCTURAL AND COLLATERAL TERM SHEET IS NOT COMPLETE AND MAY BE AMENDED PRIOR TO THE TIME OF SALE. THIS TERM SHEET IS NOT AN OFFER TO SELL THESE SECURITIES AND IT IS NOT A SOLICITATION OF AN OFFER TO BUY THESE SECURITIES IN ANY JURISDICTION WHERE THE OFFER OR SALE IS NOT PERMITTED.
| | |
127 of 156
| Structural and Collateral Term Sheet | Benchmark 2019-B14 | |
| Tysons Tower | ||
According to a third-party market research report, the Tysons Tower property is situated within the Tysons Corner submarket of the Washington, D.C. office market. As of the second quarter of 2019, the Tysons Corner Class A submarket reported a total inventory of approximately 19.2 million square feet with a 13.3% vacancy rate and average asking rent of $40.76 per square foot, gross.
The following table presents certain information relating to the appraisal’s market rent conclusion for the Tysons Tower property:
| Summary of Appraisal’s Concluded Office Market Rent(1) | ||||
| Upper Office | Lower Office | |||
| (Floors 10-20) | (Floors 2-10) | Restaurant | Bank | |
| Market Rent (PSF) | $58.00 | $56.00 | $50.00 | $65.00 |
| Lease Term (Years) | 10 | 8 | 10 | 10 |
| Lease Type (Reimbursements) | Full Service(2) | Full Service(2) | Full Service(2) | NNN |
| Rent Increase Projection | 2.75%per annum | 2.75%per annum | 3.00%per annum | 3.00%per annum |
| (1) | The appraiser’s ‘Full Service’ designation assumes tenants reimburse the landlord for future increases over the base year. |
The appraisal identified 12 comparable office leases with rents ranging from $47.00 to $63.00 per square foot with a weighted average rent of approximately $54.31 per square foot. The Tysons Tower property’s in-place weighted average office rent is approximately $53.22 and $56.96 per square foot for the lower and upper office levels, respectively, below the appraisal’s concluded market rents of $56.00 and $58.00 per square foot for the same spaces, respectively.
| Historical Occupancy(1) | ||||
| 2016 | 2017 | 2018 | Current(2) | |
| Occupancy | 96.1% | 98.4% | 100.0% | 100.0% |
| (1) | Historical occupancies are as of December 31 of each respective year. |
| (2) | Current Occupancy is based on the August 30, 2019 rent roll. |
| Tenant Summary(1) | ||||||
| Tenant | Ratings Moody’s/Fitch/S&P(2) | Net Rentable Area (SF) | % of Total NRA | Base Rent PSF(3) | % of Total Base Rent | Lease Expiration Date |
| Intelsat Global Service Corporation | NR / NR / CCC+ | 212,572 | 40.2% | $58.48 | 41.5% | 7/31/2029 |
| Deloitte, LLP | NR / NR / NR | 94,378 | 17.8% | $54.51 | 17.2% | 8/31/2027 |
| Splunk Inc | NR / NR / NR | 57,521 | 10.9% | $61.86 | 11.9% | 5/31/2022 |
| Morgan Franklin(4) | NR / NR / NR | 28,553 | 5.4% | $55.73 | 5.3% | 2/28/2027 |
| Reed Smith LLP(5) | NR / NR / NR | 28,553 | 5.4% | $52.34 | 5.0% | 7/31/2029 |
| GTT | B2 / B- / CCC+ | 19,076 | 3.6% | $52.96 | 3.4% | 1/31/2022 |
| Transwestern Commercial Services(6) | NR / NR / NR | 13,155 | 2.5% | $54.97 | 2.4% | 2/28/2024 |
| IronNet CyberSecurity | NR / NR / NR | 12,238 | 2.3% | $56.84 | 2.3% | 11/30/2026 |
| Slalom, LLC | NR / NR / NR | 10,176 | 1.9% | $53.90 | 1.8% | 7/31/2023 |
| The Siegfried Group, LLP | NR / NR / NR | 7,827 | 1.5% | $56.00 | 1.5% | 6/30/2025 |
| Total Major Office | 484,049 | 91.5% | $57.09 | 92.2% | ||
| Other(7) | 44,681 | 8.5% | $51.99 | 7.8% | ||
| Total Occupied | 528,730 | 100.0% | $56.66 | 100.0% | ||
| Vacant | 0 | 0.0% | ||||
| Total | 528,730 | 100.0% |
| (1) | Based on the underwritten rent roll dated August 30, 2019. |
| (2) | In certain instances, ratings provided are those of the parent company of the entity shown, whether or not the parent company guarantees the lease. |
| (3) | Base Rent PSF is inclusive of rent steps through September 2020 totaling $751,235. The lender’s underwriting gives separate credit for straight-line rent averaging for Bank of NY Mellon, an investment grade tenant, over its remaining lease term totaling $18,013. Base Rent PSF shown in theTenant Summary above is not inclusive of credit given for straight-line rent averaging for such investment grade tenant. |
| (4) | Morgan Franklin subleases approximately 3,990 square feet to BackOffice Associates, LLC at a base rental rate of $49.92 per square foot through January 30, 2020. Morgan Franklin has the one-time right to terminate its lease effective February 28, 2024, with 12 months’ prior notice, subject to a termination fee equal to the then-unamortized amount of tenant improvements and leasing commissions, as of the effective date of termination. |
| (5) | Reed Smith LLP has the one-time right to terminate its lease effective August 1, 2027, with 15 months’ prior notice, subject to a termination fee equal to (i) three months of base rent and (ii) the then-unamortized amount of tenant improvements and leasing commissions, as of the effective date of termination. |
| (6) | Transwestern Commercial Services subleases approximately 1,904 square feet to Technalink, Inc. at a base rental rate of $38.11 per square foot through July 31, 2021. |
| (7) | Other includes 1,821 square feet management office with no attributable underwritten base rent. |
THE INFORMATION IN THIS STRUCTURAL AND COLLATERAL TERM SHEET IS NOT COMPLETE AND MAY BE AMENDED PRIOR TO THE TIME OF SALE. THIS TERM SHEET IS NOT AN OFFER TO SELL THESE SECURITIES AND IT IS NOT A SOLICITATION OF AN OFFER TO BUY THESE SECURITIES IN ANY JURISDICTION WHERE THE OFFER OR SALE IS NOT PERMITTED.
| | |
128 of 156
| Structural and Collateral Term Sheet | Benchmark 2019-B14 | |
| Tysons Tower | ||
Lease Rollover Schedule(1)(2) | |||||||||
| Year | Number of Leases Expiring | Net Rentable Area Expiring | % of NRA Expiring | Base Rent Expiring | % of Base Rent Expiring | Cumulative Net Rentable Area Expiring | Cumulative % of NRA Expiring | Cumulative Base Rent Expiring | Cumulative % of Base Rent Expiring |
| Vacant | NAP | 0 | 0.0% | NAP | NAP | 0 | 0.0% | NAP | NAP |
| MTM & 2019(3) | 1 | 1,821 | 0.3% | $0 | 0.0% | 1,821 | 0.3% | $0 | 0.0% |
| 2020 | 0 | 0 | 0.0% | 0 | 0.0% | 1,821 | 0.3% | $0 | 0.0% |
| 2021 | 0 | 0 | 0.0% | 0 | 0.0% | 1,821 | 0.3% | $0 | 0.0% |
| 2022 | 6 | 79,811 | 15.1% | 4,736,831 | 15.8% | 81,632 | 15.4% | $4,736,831 | 15.8% |
| 2023 | 2 | 10,176 | 1.9% | 548,523 | 1.8% | 91,808 | 17.4% | $5,285,354 | 17.6% |
| 2024 | 3 | 19,880 | 3.8% | 1,095,158 | 3.7% | 111,688 | 21.1% | $6,380,512 | 21.3% |
| 2025 | 6 | 28,966 | 5.5% | 1,523,660 | 5.1% | 140,654 | 26.6% | $7,904,172 | 26.4% |
| 2026 | 3 | 18,377 | 3.5% | 1,043,433 | 3.5% | 159,031 | 30.1% | $8,947,605 | 29.9% |
| 2027 | 7 | 128,574 | 24.3% | 7,085,208 | 23.7% | 287,605 | 54.4% | $16,032,813 | 53.5% |
| 2028 | 0 | 0 | 0.0% | 0 | 0.0% | 287,605 | 54.4% | $16,032,813 | 53.5% |
| 2029 and Thereafter | 12 | 241,125 | 45.6% | 13,925,227 | 46.5% | 528,730 | 100.0% | $29,958,040 | 100.0% |
| Total | 40 | 528,730 | 100.0% | $29,958,040 | 100.0% | ||||
| (1) | Based on the underwritten rent roll dated August 30, 2019. |
| (2) | Certain tenants may have termination or contraction options (which may become exercisable prior to the originally stated expiration date of the tenant lease) that are not considered in the aboveLease Rollover Schedule. |
| (3) | MTM & 2019 includes 1,821 square feet management office with no attributable underwritten base rent. |
| Operating History and Underwritten Net Cash Flow | |||||||
| 2016 | 2017 | 2018 | TTM(1) | Underwritten | Per Square Foot | %(2) | |
| Base Rent(3) | $19,206,816 | $25,076,626 | $27,814,508 | $28,183,964 | $29,958,040 | $56.66 | 87.0% |
| Percentage Rent | 0 | 38,688 | 34,469 | 59,577 | 59,577 | 0.11 | 0.2% |
| Straight Line Rent | 0 | 0 | 0 | 0 | 18,013 | 0.03 | 0.1% |
| Vacant Income | 0 | 0 | 0 | 0 | 0 | 0.00 | 0.0% |
| Gross Potential Rent | $19,206,816 | $25,115,314 | $27,848,977 | $28,243,541 | $30,035,630 | $56.81 | 87.2% |
| Total Reimbursements | 208,561 | 367,411 | 896,729 | 1,296,894 | 1,732,303 | 3.28 | 5.0% |
| Total Other Income | 2,229,538 | 2,410,211 | 2,602,519 | 2,662,278 | 2,662,278 | 5.04 | 7.7% |
| Net Rental Income | $21,644,915 | $27,892,936 | $31,348,225 | $32,202,713 | $34,430,211 | $65.12 | 100.0% |
| (Vacancy/Credit Loss) | 0 | 0 | 0 | 0 | (2,995,804) | (5.67) | 8.7% |
| Effective Gross Income | $21,644,915 | $27,892,936 | $31,348,225 | $32,202,713 | $31,434,407 | $59.45 | 91.3% |
| Total Expenses | 9,082,050 | 10,012,518 | 10,382,557 | 10,500,194 | 10,604,603 | 20.06 | 33.7% |
| Net Operating Income(4) | $12,562,865 | $17,880,418 | $20,965,668 | $21,702,519 | $20,829,804 | $39.40 | 66.3% |
| TI/LC | 0 | 0 | 0 | 0 | 1,057,460 | 2.00 | 3.4% |
| Capital Expenditures | 0 | 0 | 0 | 0 | 105,746 | 0.20 | 0.3% |
| Net Cash Flow | $12,562,865 | $17,880,418 | $20,965,668 | $21,702,519 | $19,666,598 | $37.20 | 62.6% |
| (1) | TTM represents the trailing 12-month period ending June 30, 2019. |
| (2) | % column represents percent of Net Rental Income for all revenue lines and represents percent of Effective Gross Income for the remainder of the fields. |
| (3) | Underwritten Base Rent is inclusive of rent steps through September 2020 totaling $751,235. |
| (4) | The increase from 2016 Net Operating Income through TTM Net Operating Income is primarily attributable to (i) new leasing including 54,623 square feet of leases executed in 2017 accounting for approximately 10.8% of underwritten base rent and (ii) contractual rent steps. |
THE INFORMATION IN THIS STRUCTURAL AND COLLATERAL TERM SHEET IS NOT COMPLETE AND MAY BE AMENDED PRIOR TO THE TIME OF SALE. THIS TERM SHEET IS NOT AN OFFER TO SELL THESE SECURITIES AND IT IS NOT A SOLICITATION OF AN OFFER TO BUY THESE SECURITIES IN ANY JURISDICTION WHERE THE OFFER OR SALE IS NOT PERMITTED.
| | |
129 of 156
| Structural and Collateral Term Sheet | Benchmark 2019-B14 | |
| Tysons Tower | ||
Property Management.The Tysons Tower property is managed by Hines Interests Limited Partnership, a Delaware limited partnership.
Escrows and Reserves.
Tax Reserve –On a monthly basis, upon the occurrence and continuance of a Cash Trap Event Period (as defined below), the borrowers are required to deposit an amount equal to 1/12 of the estimated annual real estate taxes into the tax reserve account.
Insurance Reserve –On a monthly basis, the borrower is required to deposit into an insurance reserve an amount equal to 1/12 of estimated insurance premiums. So long as the borrower provides the lender evidence of timely payment of insurance premiums and there is no event of default or Cash Trap Event Period continuing, the requirement for monthly deposits into the insurance reserve is waived.
Replacement Reserve – On a monthly basis, upon the occurrence and continuance of a Cash Trap Event Period, the borrowers are required to deposit $50,000 into a replacement reserve, subject to a cap of $1,000,000.
TI/LC Reserve – On a monthly basis, upon the occurrence and continuance of a Cash Trap Event Period, the borrowers are required to deposit $110,152 into a TI/LC reserve, subject to a cap of $1,321,825.
Lockbox / Cash Management. The Tysons Tower Whole Loan is structured with a hard lockbox, which is already in place, and springing cash management. The Tysons Tower Borrower is required to direct tenants to pay rent directly into such lockbox account and all rents received directly by the Tysons Tower Borrower or the property manager are required to be deposited into the lockbox account within three business days of receipt. Prior to the occurrence of a Cash Trap Event Period, all funds in the lockbox account are required to be distributed to The Tysons Tower Borrower. During a Cash Trap Event Period, funds in the lockbox account are required to be swept on each business day to a lender-controlled cash management account. Any excess cash flow remaining after satisfaction of the waterfall items outlined in the loan documents is required to be swept to an excess cash flow subaccount controlled by the lender as additional security for the Tysons Tower Whole Loan during the continuance of the Cash Trap Event Period.
A “Cash Trap Event Period” will commence upon the earlier to occur of (i) an event of default or (ii) the debt service coverage ratio, calculated on a hypothetical fully amortizing 30-year schedule, is less than 1.15x at the end of any Calculation Date (as defined below).
A Cash Trap Event Period may be cured in accordance with the following conditions: with respect to a Cash Sweep Event caused solely by (a) clause (i) above, the acceptance of a cure by the lender of the related event of default or (b) clause (ii) above, the debt service coverage ratio is at least 1.20x for two consecutive Calculation Dates.
A “Calculation Date” means the 45th day following the end of each calendar quarter during the Tyson Towers Whole Loan term.
Partial Release.None.
THE INFORMATION IN THIS STRUCTURAL AND COLLATERAL TERM SHEET IS NOT COMPLETE AND MAY BE AMENDED PRIOR TO THE TIME OF SALE. THIS TERM SHEET IS NOT AN OFFER TO SELL THESE SECURITIES AND IT IS NOT A SOLICITATION OF AN OFFER TO BUY THESE SECURITIES IN ANY JURISDICTION WHERE THE OFFER OR SALE IS NOT PERMITTED.
| | |
130 of 156
| Structural and Collateral Term Sheet | Benchmark 2019-B14 |
[THIS PAGE INTENTIONALLY LEFT BLANK]
THE INFORMATION IN THIS STRUCTURAL AND COLLATERAL TERM SHEET IS NOT COMPLETE AND MAY BE AMENDED PRIOR TO THE TIME OF SALE. THIS TERM SHEET IS NOT AN OFFER TO SELL THESE SECURITIES AND IT IS NOT A SOLICITATION OF AN OFFER TO BUY THESE SECURITIES IN ANY JURISDICTION WHERE THE OFFER OR SALE IS NOT PERMITTED.
| | |
131 of 156
| Structural and Collateral Term Sheet | Benchmark 2019-B14 | |
| 900 & 990 Stewart Avenue | ||
| Mortgage Loan Information | Property Information | |||
| Mortgage Loan Seller: | JPMCB | Single Asset / Portfolio: | Single Asset | |
| Original Principal Balance(1): | $39,000,000 | Title: | Leasehold | |
| Cut-off Date Principal Balance(1): | $39,000,000 | Property Type - Subtype: | Office – Suburban | |
| % of Pool by IPB: | 2.9% | Net Rentable Area (SF): | 461,820 | |
| Loan Purpose: | Acquisition | Location: | Garden City, NY | |
| Borrower: | Stewart Avenue Holdings LLC | Year Built / Renovated: | 1987, 1988 / 2014, 2018 | |
| Loan Sponsor: | Leibel Lederman | Occupancy(2): | 88.6% | |
| Interest Rate: | 4.49000% | Occupancy Date: | 6/11/2019 | |
| Note Date: | 7/25/2019 | Number of Tenants: | 39 | |
| Maturity Date: | 8/1/2024 | 2016 NOI: | $4,982,784 | |
| Interest-only Period: | 60 months | 2017 NOI: | $4,197,812 | |
| Original Term: | 60 months | 2018 NOI(3): | $4,477,840 | |
| Original Amortization: | None | UW Economic Occupancy: | 89.0% | |
| Amortization Type: | Interest Only | UW Revenues: | $14,329,713 | |
| Call Protection: | L(25),Grtr1%orYM(32),O(3) | UW Expenses: | $6,653,537 | |
| Lockbox / Cash Management: | Hard / In Place | UW NOI(2)(3): | $7,676,175 | |
| Additional Debt(1): | Yes | UW NCF: | $7,447,208 | |
| Additional Debt Balance(1): | $45,000,000 | Appraised Value / Per SF(4): | $121,400,000 / $263 | |
| Additional Debt Type(1): | Pari Passu | Appraisal Date(4): | 5/2/2019 | |
| Escrows and Reserves | Financial Information(1) | |||||
| Initial | Monthly | Initial Cap | Cut-off Date Loan / SF: | $182 | ||
| Taxes: | $520,691 | $173,564 | N/A | Maturity Date Loan / SF: | $182 | |
| Insurance: | $46,815 | $16,073 | N/A | Cut-off Date LTV(4): | 69.2% | |
| Replacement Reserves: | $1,000,000 | 0 | N/A | Maturity Date LTV(4): | 69.2% | |
| TI/LC: | $7,000,000 | 0 | N/A | UW NCF DSCR: | 1.95x | |
| Other(5)(6)(7): | $2,774,228 | Springing | N/A | UW NOI Debt Yield: | 9.1% | |
| Sources and Uses | ||||||
| Sources | Proceeds | % of Total | Uses | Proceeds | % of Total | |
| Whole Loan | $84,000,000 | 68.4% | Purchase Price | $108,000,000 | 88.0% | |
| Sponsor Equity | 38,743,655 | 31.6% | Upfront Reserves | 11,341,734 | 9.2 | |
| Closing Costs | 3,401,921 | 2.8 | ||||
| Total Sources | $122,743,655 | 100.0% | Total Uses | $122,743,655 | 100.0% |
| (1) | The 900 & 990 Stewart Avenue Loan (as defined below) is part of a whole loan evidenced by twopari passu notes, with an aggregate outstanding principal balance as of the Cut-off Date of $84.0 million. Financial information presented in the chart above reflects the aggregate Cut-off Date Balance of the $84.0 million 900 & 990 Stewart Avenue Whole Loan (as defined below). |
| (2) | Occupancy and UW NOI are inclusive of Mutual of America Life Insurance (5,899 square feet), which executed its lease commencing October 1, 2019, but has not yet taken occupancy or begun paying rent. |
| (3) | The increase in UW NOI from 2018 NOI is primarily attributable to new leasing including (i) 109,719 square feet of new leases executed in 2018 representing 27.3% of underwritten base rent, (ii) 15,370 square feet of new leases executed in 2019 representing 4.0% of underwritten base rent, largely backfilling the approximately 252,343 square feet previously occupied by Chase who vacated in 2015 and 2016 and (iii) average rent for investment grade tenants AT&T, Mass Mutual, AON, Wright Risk Management and Nationwide. |
| (4) | Appraised Value / Per SF, Cut-off Date LTV and Maturity Date LTV are based on the “As Complete” appraised value as of May 2, 2019 of $121.4 million. The “As Complete” appraised value assumes that (i) the borrower deposited $8.0 million into reserves for future tenant improvements, leasing commissions and capital expenditures and (ii) the PILOT (as defined below) program is extended beyond its current expiration date. The $8.0 million in tenant improvements, leasing commissions and capital expenditures was reserved at loan origination and based upon historic precedent, the PILOT program is expected to be extended. For additional information, see “IDA / PILOT” below. The “As Is” appraised value as of May 2, 2019 is $101.9 million, resulting in a Cut-off Date LTV and Maturity Date LTV of 82.4%. |
| (5) | Initial Other Escrows and Reserves are inclusive of (i) $1,595,038 into an outstanding TI/LC reserve in connection with five leases, (ii) $831,093 into a master lease reserve (the “Master Lease Reserve Fund”), (iii) $327,772 into a free rent reserve in connection with two leases and (iv) $20,325 into a ground rent reserve. |
THE INFORMATION IN THIS STRUCTURAL AND COLLATERAL TERM SHEET IS NOT COMPLETE AND MAY BE AMENDED PRIOR TO THE TIME OF SALE. THIS TERM SHEET IS NOT AN OFFER TO SELL THESE SECURITIES AND IT IS NOT A SOLICITATION OF AN OFFER TO BUY THESE SECURITIES IN ANY JURISDICTION WHERE THE OFFER OR SALE IS NOT PERMITTED.
| | |
132 of 156
| Structural and Collateral Term Sheet | Benchmark 2019-B14 | |
| 900 & 990 Stewart Avenue | ||
| (6) | The lender is required to release from the Master Lease Reserve Fund and deposit into the cash management account (a) a monthly rent payment in an amount equal to (i) $35.00 per rentable square foot of each vacant space at the 900 & 990 Stewart Avenue Property (each, a “Vacant Space”) other than Suite 990 and (ii) $33.00 per rentable square foot for Suite 990, and (b) if the borrower enters into a new lease for any Vacant Space, the lender is required to release a portion of the Master Lease Reserve Fund attributable to such tenant in accordance with the related terms of the 900 & 990 Stewart Avenue Whole Loan documents. The balance in the master lease reserve will be released to the borrower upon the earlier to occur of (i) July 1, 2020 or (ii) the date on which all Vacant Space has been fully leased at an average rent of at least (a) $35.00 per rentable square foot per month for each vacant space other than Suite 990 or (b) $33.00 per rentable square foot per month for Suite 900, and each master lease tenant is in possession and paying full contractual rent under its respective master lease. |
| (7) | Monthly Other Escrows and Reserves are inclusive of a springing ground rent reserve. On a quarterly basis, in the event that the ground rent reserve is less than one-fourth of the aggregate amount of rents estimated to be due under the ground lease for the immediately succeeding 12-month period, the borrower is required to deposit into the ground rent reserve an amount equal to the shortage. |
The Loan. The 900 & 990 Stewart Avenue loan (the “900 & 990 Stewart Avenue Loan”) is secured by a first mortgage lien on the borrower’s leasehold interest in a 461,820 square foot Class A office complex consisting of two buildings located in Garden City, New York (the “900 & 990 Stewart Avenue Property”). The 900 & 990 Stewart Avenue Loan is part of a whole loan that has an aggregate outstanding principal balance as of the Cut-off Date of $84.0 million (the “900 & 990 Stewart Avenue Whole Loan”) and is comprised of twopari passunotes, each as described below. The non-controlling Note A-2, with an outstanding principal balance as of the Cut-off Date of $39.0 million, will be contributed to the Benchmark 2019-B14 Trust. The relationship between the holders of the 900 & 990 Stewart Avenue Whole Loan will be governed by a co-lender agreement as described under the “Description of the Mortgage Pool—The Whole Loans—The Non-Serviced Pari Passu Whole Loans” in the Preliminary Prospectus. The 900 & 990 Stewart Avenue Whole Loan has a five-year interest only term.
| Whole Loan Summary | |||||
| Note | Original Balance | Cut-off Date Balance | Note Holder | Controlling Piece | |
| A-1 | $45,000,000 | $45,000,000 | Benchmark 2019-B13 | Yes | |
| A-2 | 39,000,000 | 39,000,000 | Benchmark 2019-B14 | No | |
| Total | $84,000,000 | $84,000,000 | |||
The Borrower. The borrower is Stewart Avenue Holdings LLC, a single purpose entity and Delaware limited liability company structured to be a bankruptcy-remote entity with two independent directors in its organizational structure.
The Loan Sponsor. The loan sponsor and nonrecourse carve-out guarantor is Leibel Lederman, a partner at Lionstone Capital with a record of purchasing over 65 buildings located in New York. Lionstone Capital is a real estate development and management firm with over 40 years of experience, specializing in the operations of affordable housing, as well as the ownership of retail and office properties. Lionstone Capital maintains ownership in 11 commercial assets, encompassing over 5.0 million square feet of office space, located in New York, New Jersey and Pennsylvania. Legal counsel to the borrower delivered a non-consolidation opinion in connection with the origination of the 900 & 990 Stewart Avenue Whole Loan.
The Property. The 900 & 990 Stewart Avenue Property is a 461,820 square foot, Class A suburban office complex consisting of two buildings located in Garden City, New York. The 900 & 990 Stewart Avenue Property is accessible from the Meadowbrook State Parkway, approximately 20.0 miles east of midtown Manhattan. Each building comprising the 900 & 990 Stewart Avenue Property offers a café, six-story atrium, elevator service and card access. Parking for the 900 & 990 Stewart Avenue Property includes 330,000square feetof covered parking and a total of 1,683 open and covered parking spaces, resulting in a parking ratio of approximately 3.64 spaces per 1,000square feetof net rentable area.
The 900 & 990 Stewart Avenue Property buildings were constructed in 1987 and 1988, respectively, and renovated in 2014 and 2018, respectively. Beginning in 2015, the 900 & 990 Stewart Avenue Property underwent an approximately $25.0 million capital improvement plan, with approximately $13.0 million invested in extensive building wide renovations and approximately $12.0 million invested in tenant spaces. Major improvements to the 900 & 990 Stewart Avenue Property include renovations to the lobby, café, restrooms and common areas, parking deck repairs, elevator modernization and mechanicals upgrades.
The 900 & 990 Stewart Avenue Property has experienced strong leasing momentum since 2015. In 2015 and 2016, Chase vacated its space at the 900 Stewart Avenue building, which at the time it had occupied as the sole tenant. Following Chase’s departure, the sponsor backfilled the vacated space, signing new leases totaling 332,022square feet(71.9% of net rentable area). In 2015, 2016, 2017 and 2018, 95,343square feet, 80,364square feet, 31,226square feetand 109,719square feet,respectively, of leases, were executed at the 900 & 990 Stewart Avenue Property. Recently in 2019, an additional 15,370square feetof leases were executed.
THE INFORMATION IN THIS STRUCTURAL AND COLLATERAL TERM SHEET IS NOT COMPLETE AND MAY BE AMENDED PRIOR TO THE TIME OF SALE. THIS TERM SHEET IS NOT AN OFFER TO SELL THESE SECURITIES AND IT IS NOT A SOLICITATION OF AN OFFER TO BUY THESE SECURITIES IN ANY JURISDICTION WHERE THE OFFER OR SALE IS NOT PERMITTED.
| | |
133 of 156
| Structural and Collateral Term Sheet | Benchmark 2019-B14 | |
| 900 & 990 Stewart Avenue | ||
As of June 11, 2019, the 900 & 990 Stewart Avenue Property was 88.6% leased to a roster of 39 tenants operating in various industries including financial services, insurance, healthcare, technology, government and law. Approximately 34.7% and 39.2% of net rentable area and underwritten base rent, respectively, are attributable to investment grade tenants. The 900 & 990 Stewart Avenue Property’s five largest tenants occupy approximately 173,624square feet(37.6% of net rentable area) with no other tenant occupying more than 3.6% of net rentable area.
The largest tenant, AON (NYSE: AON) (rated Baa2/BBB+/A- by Moody’s, Fitch and S&P), is a leading global professional services firm that provides advice and solutions to clients focused on risk, retirement and health. AON’s approximately 50,000 employees in 120 countries and sovereignties operate in five principal products and services, including commercial risk solutions, reinsurance solutions, retirement solutions, health solutions and data and analytic services. As of 2018, AON reported $10.8 billion in total revenue. AON executed its lease at the 900 & 990 Stewart Avenue Property in 2016 and currently occupies space on floors three and four in the 900 Stewart Avenue building through September 2028 with the right to terminate its lease in September 2025 with no less than 12 months’ prior written notice and the payment of a $3,283,065 termination fee.
The second largest tenant, Wright Risk Management (“Wright”), a subsidiary of Brown & Brown Insurance (NYSE: BRO) (rated Baa3/BBB- by Moody’s and S&P), designs and supervises comprehensive, fully-insured, and self-insured risk financing and risk management programs. In addition to acting as a program administrator for the New York Schools Insurance Reciprocal and the New York Municipal Insurance Reciprocal, Wright specializes in general and professional liability, directors and officers liability, employment practices liability, construction liability, environmental liability, commercial property, commercial automobile, and workers' compensation. In 2014, Wright was acquired by Brown & Brown Insurance, the sixth largest independent insurance brokerage in the United States. Founded in 1939 and headquartered in Daytona Beach, Florida, Brown & Brown Insurance has 291 locations in the United States as well as locations in England, Canada, Bermuda and the Cayman Islands. As of year-end 2018, Brown & Brown Insurance reported approximately $2.0 billion in total revenue. Wright executed its lease at the 900 & 990 Stewart Avenue Property in 2018 and currently occupies space on floor six of the 900 Stewart Avenue building through June 2029 with the right to terminate its lease in April 2026 with no less than 12 months’ prior written notice and the payment of a $1,393,364 termination fee.
The third largest tenant, Meyer, Suozzi, English & Klein (“Meyer”), is a law firm dedicated to a range of practices including business, litigation and dispute resolution, personal and labor and government. Founded in 1960, its attorneys come from prestigious backgrounds including New York County Assistant District Attorney, New York Supreme Court Justice, New York Appellate Division Justice, White House Deputy Chief of Staff and New York State Deputy Chief of the Labor Bureau. The Meyer office at the 900 & 990 Stewart Avenue Property serves as one of three locations for the firm, with additional locations in New York, New York and Washington, D.C. Meyer occupies space on floors three and four of the 990 Stewart Avenue building through February 2026, with additional storage spaces on the lower level through February 2023 and February 2026, with no termination options.
The 900 & 990 Stewart Avenue Property is located in Garden City, Nassau County, and is part of the Nassau-Suffolk Primary metropolitan statistical area, the sixth densest in the nation. Nassau County is situated in western Long Island, bordering New York City’s Queens borough to the west and Suffolk County to the east, affording the area extensive transportation connectivity including the Long Island Expressway, Meadowbrook Parkway and the Long Island Railroad. The 900 & 990 Stewart Avenue Property provides easy access to recreational and institutional demand drivers including Roosevelt Field Mall, Eisenhower Park, Garden City Golf Club, Hofstra University, Nassau Community College and the Nassau Coliseum. According to the appraisal, as of year-end 2018, the population within a one-, three- and five-mile radius of the 900 & 990 Stewart Avenue Property was 4,104, 193,625 and 504,787, respectively. Additionally, over the same period, the average household income within a one-, three- and five-mile radius was $158,504, $115,890 and $134,964, respectively.
The 900 & 990 Stewart Avenue Property is located within the Central Nassau Class A office submarket of the Long Island Class A office market. As of the first quarter of 2019, the Long Island Class A office market consisted of approximately 19.3 million square feet of office space with an overall market vacancy of 10.4% and average asking rents of approximately $32.18 per square foot. The Central Nassau Class A submarket totaled approximately 5.4 million square feet with an average vacancy of 9.7% and average market asking rents of $33.23 per square foot. According to the appraisal, the overall Long Island Class A office market has remained relatively stable in comparison to significant fluctuations in availability and asking rents experienced by other markets in the region, with vacancy ranging between 6.6% and 10.4% and asking rents ranging between $30.87 per square foot to $32.18 per square foot over the past two years. The Long Island Class A office market achieved 210,524 square feet in leasing activity in the first quarter of 2019 with overall absorption totaling 20,942 square feet.
THE INFORMATION IN THIS STRUCTURAL AND COLLATERAL TERM SHEET IS NOT COMPLETE AND MAY BE AMENDED PRIOR TO THE TIME OF SALE. THIS TERM SHEET IS NOT AN OFFER TO SELL THESE SECURITIES AND IT IS NOT A SOLICITATION OF AN OFFER TO BUY THESE SECURITIES IN ANY JURISDICTION WHERE THE OFFER OR SALE IS NOT PERMITTED.
| | |
134 of 156
| Structural and Collateral Term Sheet | Benchmark 2019-B14 | |
| 900 & 990 Stewart Avenue | ||
The appraisal identified 14 competitive Class A office rent comparables located across 10 properties in the Central Nassau submarket. The comparables range in size between 2,501 square feet to 13,426 square feet. Asking rents range from $28.52 to $37.09 per square foot, with a weighted average of approximately $32.75 per square foot. The 900 & 990 Stewart Avenue Property’s in-place weighted average office rent is $32.30 per square foot, which is in line with the appraisal’s concluded office market rent, ranging between $33.00 and $34.00 per square foot, as demonstrated in the table below.
| Summary of Appraisal’s Concluded Market Rent | ||
| Space Type | Appraisal’s Concluded Market Rent PSF | 900 & 990 Stewart Avenue Market Rent PSF(1) |
| Office <5,000 | $34.00 | $32.75 |
| Office 5,000–10,000 | $33.50 | $34.81 |
| Office >10,000 | $33.00 | $31.26 |
| Storage | $12.50 | $14.67 |
| (1) | Based on the in place rent roll dated June 11, 2019. |
| Tenant Summary(1) | ||||||
| Tenant | Ratings Moody’s/Fitch/S&P(2) | Net Rentable Area (SF) | % of Total NRA | Base Rent PSF(3) | % of Total Base Rent | Lease Expiration Date |
| AON(4) | Baa2 / BBB+ / A- | 60,143 | 13.0% | $31.46 | 14.6%% | 9/1/2028 |
| Wright Risk Management(5) | Baa3 / NR / BBB- | 37,550 | 8.1% | 32.96 | 9.5%% | 6/1/2029 |
| Meyer, Suozzi, English & Klein(6) | NR / NR / NR | 35,578 | 7.7% | 30.60 | 8.4%% | Various |
| Contour Mortgage(7) | NR / NR / NR | 21,566 | 4.7% | 29.80 | 4.9%% | Various |
| Nationwide(8) | A1 / NR / A+ | 18,787 | 4.1% | 29.03 | 4.2%% | 8/1/2023 |
| Signature Bank | NR / NR / NR | 16,414 | 3.6% | 31.67 | 4.0%% | 10/1/2028 |
| RSC Insurance | NR / NR / NR | 15,499 | 3.4% | 33.95 | 4.0%% | 9/1/2026 |
| Centers Plan for Healthy Living | NR / NR / NR | 14,684 | 3.2% | 29.87 | 3.4%% | 2/1/2026 |
| GSA(9) | Aaa / AAA / AA+ | 12,805 | 2.8% | 31.07 | 3.1%% | 8/16/2022 |
| US Government Federal Aviation(10) | Aaa / AAA / AA+ | 11,795 | 2.6% | 35.67 | 3.2%% | 9/1/2023 |
| Total Major Office and Retail | 244,821 | 53.0% | $31.49 | 59.3%% | ||
| Other Occupied Office and Retail(11) | 164,327 | 35.6% | 32.20 | 40.7%% | ||
| Total Occupied Office and Retail | 409,148 | 88.6% | $31.77 | 100.0%% | ||
| Vacant(12) | 52,672 | 11.4% | ||||
| Total / Wtd. Avg. | 461,820 | 100.0% | ||||
| (1) | Based on the underwritten rent roll dated June 11, 2019. |
| (2) | In certain instances, ratings provided are those of the parent company of the entity or government entity shown, whether or not the parent company guarantees the lease. |
| (3) | Base Rent PSF is based on the in place rent roll as of June 11, 2019 and includes straight line average rent for investment grade tenants AT&T, Mass Mutual, AON, Wright Risk Management and Nationwide. |
| (4) | AON has a right to terminate its lease in September 2025 with no less than 12 months’ prior written notice and the payment of a $3,283,065 termination fee. |
| (5) | Wright Risk Management has a right to terminate its lease in April 2026 with no less than 12 months’ prior written notice and the payment of a $1,393,364 termination fee. |
| (6) | Meyer, Suozzi, English & Klein leases 35,578 square feet, of which (i) 35,084 square feet is leased for $30.91 per square foot with a lease expiration of February 1, 2026, (ii) 294 square feet of storage space is leased for $15.00 per square foot with a lease expiration of February 1, 2023 and (iii) 200 square feet is storage space with no attributable base rent and a lease expiration of February 1, 2026. |
| (7) | Contour Mortgage leases 21,566 square feet, of which (i) 18,388 square feet is leased for $29.87 per square foot with a lease expiration of May 1, 2025, (ii) 2,978 square feet is leased for $29.87 per square foot with a lease expiration of October 1, 2025 and (ii) 200 square feet is leased for $22.20 per square foot with a lease expiration of May 1, 2025. |
| (8) | Nationwide has a one-time option to terminate its lease on February 28, 2021 by providing at least 12 months' notice and paying an early termination fee equal to the sum of six months of base rent plus the sum of (i) any unamortized portion of the tenant improvement allowance, (ii) the unamortized portion of the rent concession and (iii) the unamortized portion of any commissions. |
| (9) | GSA has the right to terminate its lease at any time after the firm term or after August 16, 2021, with 90 days’ notice. |
| (10) | US Government Federal Aviation has the right to terminate its lease at any time (i) with respect to the lease covering 3,273 square feet, upon 180 days’ written notice, and (ii) with respect to the lease covering 8,522 square feet, upon 90 days’ written notice. |
| (11) | Other Occupied Office and Retail includes 602 square feet associated with a management office leased for $24.00 per square foot with no stated lease expiration and 6,500 square feet associated with a café space with no attributable underwritten rent. |
| (12) | Vacant includes 14,378 square feet associated with three master lease tenants with no attributable underwritten base rent. |
THE INFORMATION IN THIS STRUCTURAL AND COLLATERAL TERM SHEET IS NOT COMPLETE AND MAY BE AMENDED PRIOR TO THE TIME OF SALE. THIS TERM SHEET IS NOT AN OFFER TO SELL THESE SECURITIES AND IT IS NOT A SOLICITATION OF AN OFFER TO BUY THESE SECURITIES IN ANY JURISDICTION WHERE THE OFFER OR SALE IS NOT PERMITTED.
| | |
135 of 156
| Structural and Collateral Term Sheet | Benchmark 2019-B14 | |
| 900 & 990 Stewart Avenue | ||
| Lease Rollover Schedule(1)(2) | |||||||||
Year | Number of Leases Expiring | Net Rentable Area Expiring | % of NRA Expiring | Base Rent Expiring | % of Base Rent Expiring | Cumulative Net Rentable Area Expiring | Cumulative % of NRA Expiring | Cumulative Base Rent Expiring | Cumulative % of Base Rent Expiring |
| Vacant | NAP | 52,672 | 11.4% | NAP | NAP% | 52,672 | 11.4% | NAP | NAP |
| 2019 & MTM | 0 | 0 | 0.0% | $0 | 0.0% | 52,672 | 11.4% | $0 | 0.0% |
| 2020 | 6 | 18,408 | 4.0% | 580,266 | 4.5% | 71,080 | 15.4% | $580,266 | 4.5% |
| 2021 | 2 | 2,308 | 0.5% | 65,652 | 0.5% | 73,388 | 15.9% | $645,918 | 5.0% |
| 2022 | 3 | 25,859 | 5.6% | 878,906 | 6.8% | 99,247 | 21.5% | $1,524,824 | 11.7% |
| 2023 | 10 | 60,270 | 13.1% | 1,917,013 | 14.7% | 159,517 | 34.5% | $3,441,837 | 26.5% |
| 2024 | 3 | 25,410 | 5.5% | 817,917 | 6.3% | 184,927 | 40.0% | $4,259,755 | 32.8% |
| 2025 | 6 | 52,149 | 11.3% | 1,720,918 | 13.2% | 237,076 | 51.3% | $5,980,673 | 46.0% |
| 2026 | 5 | 78,988 | 17.1% | 2,514,216 | 19.3% | 316,064 | 68.4% | $8,494,888 | 65.3% |
| 2027 | 1 | 5,899 | 1.3% | 197,617 | 1.5% | 321,963 | 69.7% | $8,692,505 | 66.9% |
| 2028 | 2 | 76,557 | 16.6% | 2,411,908 | 18.6% | 398,520 | 86.3% | $11,104,413 | 85.4% |
| 2029 | 2 | 47,085 | 10.2% | 1,576,474 | 12.1% | 445,605 | 96.5% | $12,680,887 | 97.5% |
| 2030 & Beyond(3) | 3 | 16,215 | 3.5% | 319,734 | 2.5% | 461,820 | 100.0% | $13,000,621 | 100.0% |
| Total | 43 | 461,820 | 100.0% | $13,000,621 | 100.0% | ||||
| (1) | Based on the underwritten rent roll dated June 11, 2019 and includes straight line average rent for investment grade tenants AT&T, Mass Mutual, AON, Wright Risk Management and Nationwide. |
| (2) | Certain tenants may have termination or contraction options (which may become exercisable prior to the originally stated expiration date of the tenant lease) that are not considered in the above Lease Rollover Schedule. |
| (3) | 2030 & Beyond is inclusive of (i) 6,500 square feet associated with a café space that has no underwritten rent and (ii) 602 square feet associated with a management office underwritten to $24.00 per square foot. |
| Operating History and Underwritten Net Cash Flow | ||||||
| 2016 | 2017 | 2018 | Underwritten | Per Square Foot | %(1) | |
| Base Rent(2) | $10,829,919 | $9,779,901 | $9,850,286 | $13,000,621 | $28.15 | 81.1% |
| Vacant Income(3) | $0 | $0 | $0 | $1,608,412 | $3.48 | 10.0% |
| Gross Potential Rent | $10,829,919 | $9,779,901 | $9,850,286 | $14,609,033 | $31.63 | 91.2% |
| Total Reimbursements | 1,175,152 | 1,011,140 | 880,309 | 1,412,657 | 3.06 | 8.8% |
| Net Rental Income | $12,005,071 | $10,791,041 | $10,730,595 | $16,021,690 | $34.69 | 100.0% |
| Less: Vacancy | $0 | $0 | $0 | (1,763,941) | (3.82) | (11.0) |
| Other Income | 145,064 | 96,244 | 896,576 | 71,964 | 0.16 | 0.4 |
| Effective Gross Income | $12,150,135 | $10,887,285 | $11,627,171 | $14,329,713 | $31.03 | 89.4% |
| Total Expenses | $7,167,351 | $6,689,472 | $7,149,331 | $6,653,537 | $14.41 | 46.4% |
| Net Operating Income(4) | $4,982,784 | $4,197,812 | $4,477,840 | $7,676,175 | $16.62 | 53.6% |
| Total TI/LC, CapEx | $0 | $0 | $0 | $228,968 | $0.50 | 1.6% |
| Net Cash Flow | $4,982,784 | $4,197,812 | $4,477,840 | $7,447,208 | $16.13 | 52.0% |
| (1) | % column represents percent of Net Rental Income for all revenue lines and represents percent of Effective Gross Income for the remainder of the fields. |
| (2) | Base Rent includes average rent for investment grade tenants over the loan term. |
| (3) | Vacant master lease tenants totaling 14,378 square feet were underwritten to a weighted average of $34.51 per square foot. Vacant office units totaling 21,818 square feet were underwritten to a weighted average of $33.28 per square foot. Vacant lower level space totaling 16,088 square feet was underwritten to $24.00 per square foot. The remaining vacant storage space totaling 388 square feet has no associated underwritten base rent. |
| (4) | The increase in Underwritten Net Operating Income from 2018 Net Operating Income is primarily attributable to new leasing including (i) 109,719 square feet of new leases executed in 2018 representing 27.3% of underwritten base rent, (ii) 15,370 square feet of new leases executed in 2019 representing 4.0% of underwritten base rent, largely backfilling the approximately 252,343 square feet previously occupied by Chase who vacated in 2015 and 2016 and (iii) average rent for investment grade tenants AT&T, Mass Mutual, AON, Wright Risk Management and Nationwide. |
THE INFORMATION IN THIS STRUCTURAL AND COLLATERAL TERM SHEET IS NOT COMPLETE AND MAY BE AMENDED PRIOR TO THE TIME OF SALE. THIS TERM SHEET IS NOT AN OFFER TO SELL THESE SECURITIES AND IT IS NOT A SOLICITATION OF AN OFFER TO BUY THESE SECURITIES IN ANY JURISDICTION WHERE THE OFFER OR SALE IS NOT PERMITTED.
| | |
136 of 156
| Structural and Collateral Term Sheet | Benchmark 2019-B14 | |
| 900 & 990 Stewart Avenue | ||
Property Management. The 900 & 990 Stewart Avenue Property is managed by Stewart Ave PM LLC, a New York limited liability company and an affiliate of the borrower.
Ground Lease. The 900 & 990 Stewart Avenue Property is subject to a ground lease with the County of Nassau. The 900 Stewart Avenue property ground lease has an expiration date of January 31, 2030 with four, 10-year and one, 14-year extension options. The 990 Stewart Avenue property ground lease has an expiration date of July 31, 2050 with two, 10-year and one, 14-year extension options. The base annual rent for each ground lease is $22,500 per acre per year until the expiration of the term of each ground lease.
IDA / PILOT.To obtain the payment-in-lieu of taxes benefits, the borrower leases each of the 900 Avenue portion and the 990 Avenue portion comprising the900 & 990 Stewart AvenueProperty to the Town of Hempstead Industrial Development Agency (the “Hempstead IDA”), and the Hempstead IDA subleases each such portion back to the borrower (collectively and individually, the “Hempstead IDA Leaseback”), with the 900 Stewart Avenue leases and the 990 Stewart Avenue leases scheduled to expire on December 31, 2030 and December 31, 2031, respectively. Under each Hempstead IDA Leaseback document, as long as the Hempstead IDA Leaseback is in effect, the borrower is required to make payments-in-lieu of taxes (“PILOT Payments”) in accordance with the payment schedule set forth in the applicable Hempstead IDA Leaseback document (a) with respect to the 900 Stewart Avenue leases, for tax years 2019 through 2030, ranging from $1,246,054 for the tax year 2019 to approximately $1,646,852 for the tax year 2030, and (b) with respect to the 990 Stewart Avenue leases, for tax years 2019 through 2031, ranging from $824,386 for the tax year 2019 to approximately $1,045,521 for the tax year 2031. Upon the occurrence of certain recapture events, the borrower will be required to pay the Hempstead IDA amounts equal to the difference between the PILOT Payments and the real estate taxes that otherwise would have to be paid, which will have accrued to the benefit of the borrower during the fiscal years(s) in which such recapture event occurs.
THE INFORMATION IN THIS STRUCTURAL AND COLLATERAL TERM SHEET IS NOT COMPLETE AND MAY BE AMENDED PRIOR TO THE TIME OF SALE. THIS TERM SHEET IS NOT AN OFFER TO SELL THESE SECURITIES AND IT IS NOT A SOLICITATION OF AN OFFER TO BUY THESE SECURITIES IN ANY JURISDICTION WHERE THE OFFER OR SALE IS NOT PERMITTED.
| | |
137 of 156
| Structural and Collateral Term Sheet | Benchmark 2019-B14 | |
| Hilton Cincinnati Netherland Plaza | ||
| Mortgage Loan Information | Property Information | |||
| Mortgage Loan Seller: | JPMCB | Single Asset / Portfolio: | Single Asset | |
| Original Principal Balance(1): | $35,500,000 | Title: | Fee | |
| Cut-off Date Principal Balance(1): | $35,500,000 | Property Type - Subtype: | Hotel – Full Service | |
| % of Pool by IPB: | 2.7% | Net Rentable Area (Rooms): | 561 | |
| Loan Purpose: | Refinance | Location: | Cincinnati, OH | |
| Borrower: | Cincinnati Netherland Hotel LLC | Year Built / Renovated: | 1931 / 1981, 2004, 2013 | |
| Sponsor: | Greg A. Power | Occupancy/ADR/RevPAR: | 74.8% / $154.12 / $115.28 | |
| Interest Rate: | 5.35000% | Occupancy/ADR/RevPAR Date: | 8/31/2019 | |
| Note Date: | 10/2/2019 | Number of Tenants: | N/A | |
| Maturity Date: | 11/1/2024 | 2016 NOI(3): | $4,936,813 | |
| Interest-only Period: | None | 2017 NOI(3): | $6,535,947 | |
| Original Term: | 60 months | 2018 NOI(3): | $8,217,020 | |
| Original Amortization: | 360 months | TTM NOI (as of 8/2019): | $8,350,207 | |
| Amortization Type: | Balloon | UW Occupancy/ADR/RevPAR: | 74.8% / $154.12 / $115.28 | |
| Call Protection(2): | L(24),Def(33),O(3) | UW Revenues: | $37,757,247 | |
| Lockbox / Cash Management: | Hard / In Place | UW Expenses: | $29,865,599 | |
| Additional Debt(1): | Yes | UW NOI: | $7,891,648 | |
| Additional Debt Balance(1): | $37,000,000 | UW NCF: | $7,891,648 | |
| Additional Debt Type(1): | Pari Passu | Appraised Value / Per Room(4): | $105,500,000 / $188,057 | |
| Appraisal Date(4): | 8/22/2019 | |||
| Escrows and Reserves | Financial Information(1) | |||||
| Initial | Monthly | Initial Cap | Cut-off Date Loan / Room: | $129,234 | ||
| Taxes: | $460,682 | $115,170 | N/A | Maturity Date Loan / Room: | $119,820 | |
| Insurance(5): | $0 | Springing | N/A | Cut-off Date LTV(4): | 68.7% | |
| FF&E Reserves: | $0 | 4.0% of Gross Revenues | N/A | Maturity Date LTV(4): | 63.7% | |
| Other(6)(7): | $3,472,792 | $18,745 | $1,000,000 | UW NCF DSCR: | 1.62x | |
| UW NOI Debt Yield: | 10.9% | |||||
| Sources and Uses | ||||||
| Sources | Proceeds | % of Total | Uses | Proceeds | % of Total | |
| Whole Loan | $72,500,000 | 100.0% | Payoff Existing Debt | $66,866,408 | 92.2% | |
| Upfront Reserves | 3,933,473 | 5.4% | ||||
| Closing Costs | 1,700,119 | 2.3% | ||||
| Total Sources | $72,500,000 | 100.0% | Total Uses | $72,500,000 | 100.0% |
| (1) | The Hilton Cincinnati Netherland Plaza Loan is part of a whole loan evidenced by threepari passu notes with an aggregate original principal balance as of the Cut-off Date of $72.5 million. Financial information presented in the chart above reflects the aggregate Cut-off Date balance of the $72.5 million Hilton Cincinnati Netherland Plaza Whole Loan (as defined below). |
| (2) | The lockout period will be at least 24 payments beginning with and including the first payment date of December 1, 2019. The assumed lockout period of 24 months is based on the expected closing date of the Benchmark 2019-B14 securitization in November 2019. The actual lockout period may be longer. |
| (3) | The increase from 2016 NOI through 2018 NOI was primarily driven by the implementation of new management in 2017 (seeThe Property below). Specifically, there was an improvement in the food and beverage profit margin, which increased from approximately 18.3% of revenue in 2016 to approximately 25.4% as of TTM August 2019. |
| (4) | Appraised Value / Per Room, Cut-off Date LTV and Maturity Date LTV are calculated based on the “Hypothetical As-Is” appraised value of $105.5 million, which assumes that $1.5 million of PIP (as defined below) work has been completed. At loan origination, approximately 110.0% of the estimated cost of the remaining PIP work, totaling approximately $1.7 million, was reserved. The “As-Is” appraised value as of August 22, 2019 is $104.0 million, which results in a Cut-off Date LTV and Maturity Date LTV of 69.7% and 64.6%, respectively. |
| (5) | Monthly Insurance reserves are waived so long as (i) no event of default has occurred and is continuing and (ii) the borrower provides the lender with satisfactory evidence (as determined by the lender) that the Hilton Cincinnati Netherland Plaza is insured in accordance with the loan documents pursuant to a blanket insurance policy acceptable to the lender. |
| (6) | Initial Other Escrows and Reserves are inclusive of (i) $1,687,534 into a PIP reserve, covering approximately 110.0% of the remaining estimated PIP work; (ii) $902,875 into a working capital reserve to pay for shortfalls in operating expenses prior to the payment date occurring in December 2019; (iii) $500,000 into a seasonality reserve; and (v) $382,383 into an immediate repairs reserve. |
| (7) | Monthly Other Escrows and Reserves are inclusive of (i) a $18,745 monthly deposit into a condominium reserve and (ii) a monthly deposit into the seasonality reserve of all excess cash flow, subject to a monthly cap of $250,000. So long as the amount in the seasonality reserve is at least $1,000,000, the requirement for monthly deposits into the seasonality reserve is waived. |
THE INFORMATION IN THIS STRUCTURAL AND COLLATERAL TERM SHEET IS NOT COMPLETE AND MAY BE AMENDED PRIOR TO THE TIME OF SALE. THIS TERM SHEET IS NOT AN OFFER TO SELL THESE SECURITIES AND IT IS NOT A SOLICITATION OF AN OFFER TO BUY THESE SECURITIES IN ANY JURISDICTION WHERE THE OFFER OR SALE IS NOT PERMITTED.
| | |
138 of 156
| Structural and Collateral Term Sheet | Benchmark 2019-B14 | |
| Hilton Cincinnati Netherland Plaza | ||
The Loan.The Hilton Cincinnati Netherland Plaza loan, with an outstanding principal balance as of the Cut-off Date of approximately $35.5 million (the “Hilton Cincinnati Netherland Plaza Loan”), is secured by a first mortgage lien on the borrower’s fee interest in a certain condominium unit comprised of a 561-room full service hotel located in Cincinnati, Ohio. The Hilton Cincinnati Netherland Plaza Loan is part of a whole loan that has an aggregate original principal balance as of the Cut-off Date of $72.5 million (the “Hilton Cincinnati Netherland Plaza Whole Loan”) and is comprised of threepari passu notes, each as described in the “Whole Loan Summary” chart below. The controlling note A-1, with an outstanding principal balance as of the Cut-off Date of $35.5 million, is being contributed to the Benchmark 2019-B14 Trust. The relationship between the holders of the Hilton Cincinnati Netherland Plaza Whole Loan will be governed by a co-lender agreement as described under “Description of the Mortgage Pool—The Whole Loans—The Serviced Pari Passu Whole Loans” in the Preliminary Prospectus. The Hilton Cincinnati Netherland Plaza Whole Loan has a five-year term and amortizes on a 30-year schedule.
| Whole Loan Summary | ||||
| Note | Original Balance | Cut-off Date Balance | Note Holder | Controlling Piece |
| A-1 | $35,500,000 | $35,500,000 | Benchmark 2019-B14 | Yes |
| A-2 | 17,000,000 | 17,000,000 | JPMCB | No |
| A-3 | 20,000,000 | 20,000,000 | JPMCB | No |
| Total | $72,500,000 | $72,500,000 | ||
The Borrower. The borrowing entity for the Hilton Cincinnati Netherland Plaza Whole Loan is Cincinnati Netherland Hotel LLC, a Delaware limited liability company and special purpose entity with two independent directors in its organizational structure.
The Loan Sponsor.The loan sponsor and non-recourse carveout guarantor is Greg A. Power, the founder and president of Power Realty Advisors. Headquartered in Cincinnati, Ohio, Power Realty Advisors is a boutique investment and real estate brokerage firm that works with institutions, REITs, insurance companies and state and corporate pension plans to invest in all asset types nationally. With over 42 years of experience in the real estate industry, Greg A. Power has been involved in over $12.0 billion in transactions.
The Property. The Hilton Cincinnati Netherland Plaza property is a 29-story, full service hotel located in downtown Cincinnati, Ohio. Designed by the architectural firm, W. W. Ahlschlager & Associates, and built by Starrett Brothers, Inc., the Hilton Cincinnati Netherland Plaza property opened in 1931 and its French art deco design served as a model for the Empire State Building. The Hilton Cincinnati Netherland Plaza property holds both National Historical Register and National Landmark status and is a national charter member of the Historic Hotels of America. Most recently in 2017, the Hilton Cincinnati Netherland Plaza property received the Hilton Hospitality Award of Excellence. The Hilton Cincinnati Netherland Plaza property features 561 guestrooms comprised of 218 double rooms, 147 queen rooms, 87 king rooms, 60 one bedroom suites, 37 junior suites, six queen suites, four studio suites and two presidential suites. Each guestroom features a flat-screen TV, mini fridge, in-room safe, alarm clock with MP3 connection and coffeemaker. The Hilton Cincinnati Netherland Plaza property offers over 40,000 square feet of meeting space, including three ballrooms and 28 breakout rooms, three on-site dining options and an executive lounge, the Belvedere Club. Additional hotel amenities include a fitness room, indoor pool, sauna, barber shop, gift shop, convenience store, business center, laundry and valet service and beauty salon.
The loan sponsor acquired the HiltonCincinnati Netherland Plaza property in November 2014 as part of its purchase of Belvedere Corporation. At the time of purchase, the Hilton Cincinnati Netherland Plaza property was part of the Carew Tower Complex, which included the Carew Tower, a 49-story, approximately 400,000 square foot office building, a retail arcade totaling approximately 110,000 square feet and the subject property. In 2018, the loan sponsor worked with the City of Cincinnati to separate the three components of the Carew Tower Complex into three condominiums units.
TheHiltonCincinnati Netherland Plaza property is subject to a franchise agreement with Hilton Franchise Holding LLC, a subsidiary of Hilton Worldwide, through November 2029. As part of the Hilton Cincinnati Netherland Plaza franchise agreement, the sponsor agreed to an approximately $4.5 million ($7,947 per room) property improvement plan (“PIP”), of which approximately $2.9 million has been spent, primarily renovating the public areas and meeting spaces. The remaining PIP work, totaling approximately $1.5 million, will target the guestrooms including new carpets, wallcovering, soft goods, lighting and bathroom upgrades, and according to the loan sponsor, is expected to be completed by the end of the 2019. Since 2013, and inclusive of the remaining PIP work, the Hilton Cincinnati Netherland Plaza property will have received approximately $10.0 million ($17,858 per room) in capital improvements focused on upgrading public areas, meeting spaces and guestrooms.
THE INFORMATION IN THIS STRUCTURAL AND COLLATERAL TERM SHEET IS NOT COMPLETE AND MAY BE AMENDED PRIOR TO THE TIME OF SALE. THIS TERM SHEET IS NOT AN OFFER TO SELL THESE SECURITIES AND IT IS NOT A SOLICITATION OF AN OFFER TO BUY THESE SECURITIES IN ANY JURISDICTION WHERE THE OFFER OR SALE IS NOT PERMITTED.
| | |
139 of 156
| Structural and Collateral Term Sheet | Benchmark 2019-B14 | |
| Hilton Cincinnati Netherland Plaza | ||
TheHiltonCincinnati Netherland Plaza property is operated under a management agreement with SSH Cincinnati LLC, a subsidiary of StepStone Hospitality (“StepStone”), through December 2019 with two automatic, two-year extension options. Prior to the hiring of StepStone, the Hilton Cincinnati Netherland Plaza property was self-managed by the prior owner. StepStone was hired in February 2017 and implemented cost saving initiatives including optimizing purchase orders and evaluating payroll, and focused on driving business by attracting higher quality groups and adding live music to the bar. Since StepStone took over management, the Hilton Cincinnati Netherland Plaza property has experienced significant improvement in operating performance, including an approximately 69.1% increase in net cash flow from 2016 to TTM August 2019. A large driver of the improvement was an improvement in food and beverage profit margin, which has increased from approximately 18.3% of food and beverage revenue in 2016 to approximately 25.4% as of TTM August 2019.
Food and beverage outlets at the Hilton Cincinnati Netherland Plaza property include the Bar at Palm Court, the Grille at Palm Court and Orchids at Palm Court, Ohio’s only AAA Five Diamond and Forbes Four Star rated restaurant. Meeting space at the Hilton Cincinnati Netherland Plaza property features three ballrooms including the 1930s art deco Pavilion Ballroom, gold-plated Hall of Mirrors ballroom and Italian marble Continental Ballroom, with capacity for up to 1,000, 650 and 380 guests, respectively. Furthermore, the Hilton Cincinnati Netherland Plaza property is connected via an enclosed skywalk to Carew Tower, a 49-story office building featuring an observation deck, shops, restaurants and amenities.
The Hilton Cincinnati Netherland Plaza property is located in downtown Cincinnati at the intersection of Race Street and West 5th Street and is readily accessible via Interstate 71 and Interstate 75. The Hilton Cincinnati Netherland Plaza property is located approximately two blocks away from the Duke Energy Convention Center, which features 750,000 square feet of function space, including a 40,000 square feet ballroom, and hosted 757,009 delegates in 2018. Additional local demand is driven by Cincinnati’s three riverfront professional sports venues including the Cincinnati Reds’ Great American Ball Park, the Cincinnati Bengals’ Paul Brown Stadium and the Cincinnati Cyclones’ U.S. Bank Arena, all of which are located within 0.5 miles of the Hilton Cincinnati Netherland Plaza property. The Hilton Cincinnati Netherland Plaza property is located two blocks away from a stop on the Cincinnati Bell Connector Streetcar, an approximately 3.6 mile long public transportation system that connects sites along Cincinnati’s riverfront, and approximately 8.5 miles to the northeast of Cincinnati/Northern Kentucky International Airport (“CVG Airport”). According to the appraisal, CVG Airport experienced passenger traffic of approximately 8.9 million in 2018, a 13.1% increase from 2017, and is currently undergoing an approximately $150.0 million project to build a 1.4 million square feet rental car facility expected to be completed by 2021.
Cincinnati benefits from a variety of tourist and leisure attractions including the Cincinnati Art Museum, Cincinnati Museum Center, The National Underground Railroad Freedom Center, Cincinnati Zoo and Botanical Garden, Jack Cincinnati Casino, Coney Island Amusement Park and the Duke Energy Convention Center. Cincinnati is also home to eight Fortune 500 companies including Kroger, Proctor & Gamble, Macy’s, Fifth Third Bancorp, Western & Southern Financial Group, American Financial Group, AK Steel and Cintas.
The Cincinnati area has experienced new development including DHL’s $108.0 million expansion of its cargo hub at CVG Airport, the completion of The University of Cincinnati Health’s $60.0 million Neuroscience Institute and the ongoing expansion of The Banks, a mixed use destination situated on the Ohio River. According to The Banks development team, The Banks project is expected to be completed in multiple phases over the next fifteen years, and upon completion, will include 1,800 residential units, approximately 1.0 million square feet of office space and over 400,000 square feet of retail space. Future projects also include the National Institute for Occupational Health and Safety’s $110.0 million laboratory expected to be completed by 2021, The University of Cincinnati’s Innovation Center, a $21.0 million, 100,000 square foot facility expected to be completed by 2020, FC Cincinnati’s $250.0 million Major League Soccer stadium expected to be completed by 2021 and Amazon’s approximately $1.5 billion air-freight headquarters at CVG Airport expected to be completed by 2020.
THE INFORMATION IN THIS STRUCTURAL AND COLLATERAL TERM SHEET IS NOT COMPLETE AND MAY BE AMENDED PRIOR TO THE TIME OF SALE. THIS TERM SHEET IS NOT AN OFFER TO SELL THESE SECURITIES AND IT IS NOT A SOLICITATION OF AN OFFER TO BUY THESE SECURITIES IN ANY JURISDICTION WHERE THE OFFER OR SALE IS NOT PERMITTED.
| | |
140 of 156
| Structural and Collateral Term Sheet | Benchmark 2019-B14 | |
| Hilton Cincinnati Netherland Plaza | ||
The demand segmentation at the Hilton Cincinnati Netherland Plaza property consists of 45.0% meeting and group, 30.0% commercial and 25.0% leisure. The primary competitive set for the Hilton Cincinnati Netherland Plaza property consists of three full service hotels located in downtown Cincinnati, ranging in size from 323 to 491 rooms, and offering meeting space ranging in size from 12,290 square feet to 39,932 square feet, in both instances less than that offered by the Hilton Cincinnati Netherland Plaza property. The appraisal indicates that a 106 room Lytle Park Autograph Collection Hotel is expected to open in January 2020 six blocks away from the Hilton Cincinnati Netherland Plaza property; however, the new hotel is viewed as a secondary competitor given its smaller size and boutique product offering. The Hilton Cincinnati Netherland Plaza property’s competitive set and its relative historical performance are detailed below:
| Historical Occupancy, ADR, RevPAR(1) | |||||||||
| Competitive Set(2) | Hilton Cincinnati Netherland Plaza(3) | Penetration Factor | |||||||
| Year | Occupancy | ADR | RevPAR | Occupancy | ADR | RevPAR | Occupancy | ADR | RevPAR |
| 2016 | 59.7% | $150.99 | $90.16 | 75.2% | $149.52 | $112.47%% | 126.0% | 99.0% | 124.8% |
| 2017 | 56.8% | $151.92 | $86.30 | 72.6% | $156.96 | $113.98%% | 127.8% | 103.3% | 132.1% |
| 2018 | 56.3% | $151.99 | $85.53 | 75.1% | $155.36 | $116.66%% | 133.4% | 102.2% | 136.4% |
| TTM(4) | 57.4% | $153.75 | $88.26 | 74.8% | $154.12 | $115.28%% | 130.3% | 100.2% | 130.6% |
| (1) | The minor variances between the underwriting, appraisal and above table with respect to Occupancy, ADR and RevPAR at the Hilton Cincinnati Netherland Plaza property are attributable to variances in reporting methodologies and/or timing differences. |
| (2) | Data provided by a third party travel research report. The competitive set contains the following properties: Hilton Cincinnati Netherland Plaza, Hyatt Regency Cincinnati, Millennium Cincinnati, The Westin Cincinnati, Embassy Suites Cincinnati Rivercenter Covington, Marriott Cincinnati @ Rivercenter and Renaissance Cincinnati Downtown Hotel. |
| (3) | Based on operating statements provided by the borrower. |
| (4) | TTM represents the trailing 12-month period ending on August 31, 2019. |
| Competitive Hotels Profile(1) | |||||||
| Estimated Segmentation | |||||||
| Property | Rooms | Year Opened | Year Renovated | Meeting Space (SF) | Commercial | Meeting and Group | Leisure |
| Hilton Cincinnati Netherland Plaza | 561 | 1931 | 2013 | 41,036 | 30% | 45% | 25% |
| Hyatt Regency Cleveland | 491 | 1984 | 2017 | 39,932 | 45% | 40% | 15% |
| Renaissance Cincinnati Downtown Hotel | 323 | 2014 | N/A | 12,290 | 45% | 35% | 20% |
| Westin Cincinnati | 456 | 1982 | 2015 | 29,559 | 50% | 30% | 20% |
| (1) | Based on the appraisal. |
THE INFORMATION IN THIS STRUCTURAL AND COLLATERAL TERM SHEET IS NOT COMPLETE AND MAY BE AMENDED PRIOR TO THE TIME OF SALE. THIS TERM SHEET IS NOT AN OFFER TO SELL THESE SECURITIES AND IT IS NOT A SOLICITATION OF AN OFFER TO BUY THESE SECURITIES IN ANY JURISDICTION WHERE THE OFFER OR SALE IS NOT PERMITTED.
| | |
141 of 156
| Structural and Collateral Term Sheet | Benchmark 2019-B14 | |
| Hilton Cincinnati Netherland Plaza | ||
| Operating History and Underwritten Net Cash Flow | |||||||
| 2016 | 2017 | 2018 | TTM(1) | Underwritten | Per Room(2) | % of Total Revenue(3) | |
| Occupancy | 75.2% | 72.6% | 75.1% | 74.8% | 74.8% | ||
| ADR | $149.52 | $156.96 | $155.36 | $154.12 | $154.12 | ||
| RevPAR | $112.47 | $113.98 | $116.66 | $115.28 | $115.28 | ||
| Room Revenue | $23,092,923 | $23,338,774 | $23,888,251 | $23,604,769 | $23,604,769 | $42,076 | 62.5%% |
| Food & Beverage Revenue | 11,104,372 | 12,321,658 | 12,716,931 | 13,426,141 | 13,426,141 | 23,933 | 35.6%% |
| Other Departmental Revenue | 515,681 | 514,163 | 697,700 | 726,337 | 726,337 | 1,295 | 1.9%% |
| Total Revenue | $34,712,976 | $36,174,595 | $37,302,883 | $37,757,247 | $37,757,247 | $67,303 | 100.0%% |
| Room Expense | $5,790,817 | $5,823,170 | $5,766,134 | $5,937,800 | $5,937,800 | $10,584 | 25.2%% |
| Food & Beverage Expense | 9,073,489 | 9,773,907 | 9,747,268 | 10,011,229 | 10,011,229 | 17,845 | 74.6%% |
| Other Departmental Expense | 46,358 | 190,102 | 209,873 | 209,525 | 209,525 | 373 | 28.8%% |
| Departmental Expenses | $14,910,664 | $15,787,179 | $15,723,275 | $16,158,554 | $16,158,554 | $28,803 | 42.8%% |
| % | |||||||
| Departmental Profit | $19,802,312 | $20,387,415 | $21,579,608 | $21,598,693 | $21,598,693 | $38,500 | 57.2%% |
| Admin & General | $3,537,177 | $3,046,354 | $2,827,852 | $2,630,343 | $2,630,343 | $4,689 | 7.0%% |
| Maintenance & Repairs | 1,738,923 | 1,443,033 | 1,279,443 | 1,176,436 | 1,176,436 | 2,097 | 3.1%% |
| Utility Costs | 1,447,205 | 1,514,870 | 1,360,686 | 1,346,892 | 1,346,892 | 2,401 | 3.6%% |
| Marketing | 2,316,851 | 1,919,179 | 1,743,576 | 1,821,259 | 1,821,259 | 3,246 | 4.8%% |
| Franchise Fee | 2,079,927 | 2,032,527 | 2,151,499 | 2,124,862 | 2,258,691 | 4,026 | 6.0%% |
| Management fee | 1,041,389 | 1,091,668 | 1,139,277 | 1,152,908 | 1,132,717 | 2,019 | 3.0%% |
| Property Tax | 1,070,013 | 1,096,901 | 1,107,006 | 1,106,956 | 1,382,045 | 2,464 | 3.7%% |
| Insurance | 245,494 | 217,083 | 119,413 | 178,369 | 248,201 | 442 | 0.7%% |
| Other Expenses | 0 | 42,870 | 141,721 | 200,171 | 200,171 | 357 | 0.5%% |
| FF&E | 1,388,519 | 1,446,984 | 1,492,115 | 1,510,290 | 1,510,290 | 2,692 | 4.0%% |
| Total Expenses | $14,865,498 | $13,851,468 | $13,362,588 | $13,248,486 | $13,707,045 | $24,433 | 36.3%% |
| Net Operating Income/NCF | $4,936,813 | $6,535,947 | $8,217,020 | $8,350,207 | $7,891,648 | $14,067 | 20.9%% |
| (1) | TTM column represents the trailing 12-month period ending on August 31, 2019. |
| (2) | Per Room values are based on 561 guest rooms. |
| (3) | % of Total Revenue for Room Expense, Food & Beverage Expense, and Other Departmental Expense are based on their corresponding revenue line items. |
Property Management. The Hilton Cincinnati Netherland Plaza property is managed by SSH Cincinnati LLC, which is a subsidiary of StepStone Hospitality.
Franchise Agreement. The Hilton Cincinnati Netherland Plaza property is subject to a franchise agreement with Hilton Franchise Holding LLC, which is a subsidiary of Hilton Worldwide. The Hilton Cincinnati Netherland Plaza franchise agreement is effective as of November 18, 2014 for a term of approximately 15 years, with an expiration date of November 30, 2029. The franchise agreement provides for (i) a monthly royalty fee of 5.0% of gross rooms revenue; (ii) a monthly program fee of 4.0% of gross rooms revenue and (iii) a monthly food and beverage fee of 1.0% of food and beverage revenue effective from June 4, 2022 until November 30, 2029.
Condominium. The Hilton Cincinnati Netherland Plaza property is one of three condominium units that collectively constitute a condominium regime. The borrower owns a 44.38% interest in the condominium, and the loan sponsor, Greg A. Power, is one of three members of the board of directors (the “Board”). However, the loan sponsor controls Carew Realty, Inc., which is the declarant under the related condominium declaration (the “Declaration”). Each of the three unit owners in the condominium appoints one member of the Board. The other two units in the condominium are owned by an affiliate of the borrower. The Declaration may not be amended without the affirmative vote of the members consisting of 75% ownership of the condominium association and their mortgagees’s consent.
THE INFORMATION IN THIS STRUCTURAL AND COLLATERAL TERM SHEET IS NOT COMPLETE AND MAY BE AMENDED PRIOR TO THE TIME OF SALE. THIS TERM SHEET IS NOT AN OFFER TO SELL THESE SECURITIES AND IT IS NOT A SOLICITATION OF AN OFFER TO BUY THESE SECURITIES IN ANY JURISDICTION WHERE THE OFFER OR SALE IS NOT PERMITTED.
| | |
142 of 156
| Structural and Collateral Term Sheet | Benchmark 2019-B14 |
[THIS PAGE INTENTIONALLY LEFT BLANK]
THE INFORMATION IN THIS STRUCTURAL AND COLLATERAL TERM SHEET IS NOT COMPLETE AND MAY BE AMENDED PRIOR TO THE TIME OF SALE. THIS TERM SHEET IS NOT AN OFFER TO SELL THESE SECURITIES AND IT IS NOT A SOLICITATION OF AN OFFER TO BUY THESE SECURITIES IN ANY JURISDICTION WHERE THE OFFER OR SALE IS NOT PERMITTED.
| | |
143 of 156
| Structural and Collateral Term Sheet | Benchmark 2019-B14 | |
| Oro Valley Marketplace | ||
| Mortgage Loan Information | Property Information | |||
| Mortgage Loan Seller: | CREFI | Single Asset / Portfolio: | Single Asset | |
| Original Principal Balance: | $35,250,000 | Title: | Fee | |
| Cut-off Date Principal Balance: | $35,250,000 | Property Type - Subtype: | Retail - Anchored | |
| % of Pool by IPB: | 2.7% | Net Rentable Area (SF): | 517,901 | |
| Loan Purpose: | Acquisition | Location: | Oro Valley, AZ | |
| Borrowers(1): | Various | Year Built / Renovated: | 2008 / N/A | |
| Sponsors: | HSL Properties, Inc., Town West | Occupancy: | 85.8% | |
| Realty, Inc. and Town West Realty | Occupancy Date: | 7/1/2019 | ||
| II, Inc. | Number of Tenants: | 25 | ||
| Interest Rate: | 3.93000% | 2016 NOI: | $3,567,793 | |
| Note Date: | 9/19/2019 | 2017 NOI: | $3,622,927 | |
| Maturity Date: | 10/6/2029 | 2018 NOI: | $3,653,967 | |
| Interest-only Period: | 36 months | TTM NOI (as of 6/2019): | $3,244,310 | |
| Original Term: | 120 months | UW Economic Occupancy: | 76.9% | |
| Original Amortization: | 360 months | UW Revenues: | $5,519,270 | |
| Amortization Type: | IO-Balloon | UW Expenses: | $2,338,280 | |
| Call Protection: | L(25),Def(91),O(4) | UW NOI: | $3,180,990 | |
| Lockbox / Cash Management: | Springing / Springing | UW NCF: | $3,042,755 | |
| Additional Debt: | N/A | Appraised Value / Per SF: | $53,200,000 / $103 | |
| Additional Debt Balance: | N/A | Appraisal Date: | 7/31/2019 | |
| Additional Debt Type: | N/A | |||
| Escrows and Reserves | Financial Information | |||||
| Initial | Monthly | Initial Cap | Cut-off Date Loan / SF: | $68 | ||
| Taxes: | $74,538 | $74,538 | N/A | Maturity Date Loan / SF: | $59 | |
| Insurance: | $12,271 | 6,135 | N/A | Cut-off Date LTV: | 66.3% | |
| Replacement Reserves: | $0 | $5,108 | N/A | Maturity Date LTV: | 57.2% | |
| TI/LC: | $990,000 | Springing | $880,000 | UW NCF DSCR: | 1.52x | |
| Other: | $2,510,280 | $0 | N/A | UW NOI Debt Yield: | 9.0% | |
| Sources and Uses | ||||||
| Sources | Proceeds | % of Total | Uses | Proceeds | % of Total | |
| Mortgage Loan | $35,250,000 | 70.9% | Purchase Price | $45,000,000 | 90.6% | |
| Sponsor Equity | 13,590,000 | 27.3% | Upfront Reserves | 3,587,089 | 7.2 | |
| Other Sources | 851,658 | 1.7% | Closing Costs | 1,104,569 | 2.2 | |
| Total Sources | $49,691,658 | 100.0% | Total Uses | $49,691,658 | 100.0% | |
| (1) | The borrowers are Campbell Blacklidge Plaza DE LLC, First Ave./Wetmore Office Plaza DE LLC, Casa Presidio Apartments LLC and OVM Delaware LLC. |
The Loan.The Oro Valley Marketplace loan (the “Oro Valley Marketplace Loan”) is secured by a first mortgage lien on the borrowers’ fee interest in a 517,901 square foot anchored retail center located in Oro Valley, Arizona (the “Oro Valley Marketplace Property”). The Oro Valley Marketplace Loan has a 10-year term and requires payments of interest-only for 36 months and will amortize on a 30-year schedule.
The Borrowers. The borrowing entities for the Oro Valley Marketplace Loan are Campbell Blacklidge Plaza DE LLC, First Ave./Wetmore Office Plaza DE LLC, Casa Presidio Apartments LLC, and OVM Delaware LLC, each a Delaware limited liability company and special purpose entity, with at least one independent director in its organizational structure, and which collectively own the fee interest in the Oro Valley Marketplace Property as tenants in common.
The loan sponsors and nonrecoursecarve-out guarantors for the Oro Valley Marketplace Loan are HSL Properties, Inc., Town West Realty, Inc. and Town West Realty II, Inc. HSL Properties, Inc. (“HSL”) was cofounded in 1975 by Humberto Lopez and Glenn Toyoshima. Over the past 44 years, HSL has acquired, owned, operated and developed properties in Arizona, California, Colorado, Georgia, New Mexico, and Texas, and has formed more than 100 limited partnerships and limited liability companies. HSL is focused
THE INFORMATION IN THIS STRUCTURAL AND COLLATERAL TERM SHEET IS NOT COMPLETE AND MAY BE AMENDED PRIOR TO THE TIME OF SALE. THIS TERM SHEET IS NOT AN OFFER TO SELL THESE SECURITIES AND IT IS NOT A SOLICITATION OF AN OFFER TO BUY THESE SECURITIES IN ANY JURISDICTION WHERE THE OFFER OR SALE IS NOT PERMITTED.
| | |
144 of 156
| Structural and Collateral Term Sheet | Benchmark 2019-B14 | |
| Oro Valley Marketplace | ||
on multi-family apartment communities, but has also invested in office and retail buildings, shopping malls, a golf course and hotels. HSL is headquartered in Tucson, Arizona and is well known for its multi-family housing in the Southwestern United States. Town West Realty, Inc. (”TWR”), established in 1980, is a commercial real estate brokerage and investment firm that offers a full range of services for buyers, sellers and investors. TWR, along with various affiliate companies own, operate and manage a local real estate portfolio in excess of $200 million consisting of medical, retail, office, and multi-family residential buildings.
The Property.The Oro Valley Marketplace Property is a Class A, 517,901 square foot power center anchored by Wal-Mart, located at the southwest corner of North Oracle Road and Tangerine Road in Oro Valley, Arizona. Construction of the Oro Valley Marketplace Property was completed in 2008 and consists of 11 retail buildings. The property was 85.8% occupied by 25 tenants as of July 1, 2019.
The largest tenant at the Oro Valley Marketplace Property, Wal-Mart, holds a ground lease of approximately 195,273 square feet (37.7% of net rentable area) and currently pays an annual base rent of $522,551. The lease commenced in March 2008 for a 20-year original term with 10, five-year extension options.
The second largest tenant at the Oro Valley Marketplace Property is Ashley Furniture which leases 45,197 square feet (8.7% of net rentable area) through January 31, 2035 and has three, five-year extension options. Ashley Furniture has executed its lease but is not expected to commence paying rent until around May 2020. The lease also includes a corporate guaranty from Sam Levits Furniture Company, Inc. as well as a $1.5 million personal guaranty from Sam and Valerie Levitz. Ashley Furniture is an American furniture store chain that sells furniture products. Ashley Furniture is a subsidiary of Ashley Furniture Industries, which has more than 650 locations in the United States, and is the number one furniture manufacturer in the world.
The third largest tenant at the Oro Valley Marketplace Property, Century Theatres (39,081 square feet, 7.5% of net rentable area), executed a 15-year original lease commencing in October 2008 and expires in October 2023. Upon the expiration of its lease, the tenant has the ability to execute the first of four, five-year extension options. Century Theatres (rated BB by S&P) is a movie theatre chain that operates cinemas in the western United States. Founded in 1941, the chain was headquartered in San Rafael, California until it was acquired by Cinemark Theatres in 2006. However, many Cinemark owned theatres continue to operate under the Century brand. Cinemark Holdings, Inc. has approximately 549 theatres and 6,086 screens in 41 states and 12 countries.
The Market. The Oro Valley Marketplace Property is situated approximately 10 miles north of downtown Tucson in the eastern section of Pima County. The Oro Valley Marketplace Property is located in Oro Valley, Arizona, part of the Tucson Metropolitan Statistical Area (the “Tucson MSA”). The top employers in the Tucson MSA consist of the University of Arizona, Raytheon Missile Systems, Davis-Monthan Air Force Base, Wal-Mart Stores Inc., and U.S. Customs and Border Protection. Access to the Oro Valley Marketplace Property is provided primarily by east-west arterials of Tangerine Road, Lambert Lane, Magee Road, Ina Road, Orange Grove Road, River Road, Prince Road, Fort Lowell Road, and Grant Road. North-south arterials include 1st Avenue, North Oracle Road, Campbell Avenue, and Alvernon Way. The subject neighborhood is connected to Interstate 10 by the east-west arterials.
According to the appraisal, the Oro Valley Marketplace Property is located in the Tucson Retail market which, as of the second quarter of 2019, consisted of 54.2 million square feet of retail space with a market vacancy of 5.6% and average gross market rent per square foot of $15.00. According to a third party report, the Oro Valley Marketplace Property is located in the North/Oro Valley retail submarket which, as of the second quarter of 2019, consisted of approximately 2.6 million square feet of retail space with a submarket vacancy of 7.4%. The submarket experienced average gross market rents per square foot of $20.35, which were higher than the Tucson Retail market and the weighted average UW gross rent at the Oro Valley Marketplace Property of $9.81 per square foot. The market rent is higher than the overall Tucson MSA market as the subject submarket is considered an upper tier submarket as compared to the other submarkets in the overall Tucson MSA area, per the appraisal. The appraiser concluded an in-place weighted average market asking rent for the Oro Valley Marketplace Property of $10.59 per square foot. The Oro Valley Marketplace Property’s weighted average underwritten gross rent of $9.81 per square foot is approximately 7.95% below the appraiser’s concluded market rent of $10.59 per square foot.
According to the appraisal, the 2018 population of the Tucson MSA was approximately 1,035,700, an increase of 4.46% from the 2012 population of approximately 991,500. The Tucson MSA is expected to see continued growth with a population of approximately 1,112,600 by 2023, reflecting an annual growth rate of 1.44%. Median household income in the statistical area as of 2018 was approximately $49,600, a 10.96% increase from the 2012 level of approximately $44,700. Median income is expected to grow at a robust rate of 16.13%, increasing to approximately $57,600, by 2023. The Tucson MSA employs a total of approximately 382,500 people with an unemployment rate of 4.1% as of 2018. The unemployment rate has decreased from a high of 7.4% in 2012, and is predicted to drop to 3.7% in 2019.
THE INFORMATION IN THIS STRUCTURAL AND COLLATERAL TERM SHEET IS NOT COMPLETE AND MAY BE AMENDED PRIOR TO THE TIME OF SALE. THIS TERM SHEET IS NOT AN OFFER TO SELL THESE SECURITIES AND IT IS NOT A SOLICITATION OF AN OFFER TO BUY THESE SECURITIES IN ANY JURISDICTION WHERE THE OFFER OR SALE IS NOT PERMITTED.
| | |
145 of 156
| Structural and Collateral Term Sheet | Benchmark 2019-B14 | |
| Oro Valley Marketplace | ||
| Historical and Current Occupancy(1) | |||
| 2016 | 2017 | 2018 | Current(2) |
| 91.1% | 90.4% | 88.9% | 85.8% |
| (1) | Historical occupancies are as of December 31 of each respective year. |
| (2) | Current Occupancy is as of July 1, 2019. |
Tenant Summary(1) | ||||||
| Tenant | Ratings(2) Moody’s/S&P/Fitch | Net Rentable Area (SF) | % of Total NRA | Base Rent PSF(3) | % of Total Base Rent | Lease Expiration Date |
| Wal-Mart(4) | Aa2 / AA / AA | 195,273 | 37.7% | $2.68 | 12.0% | 3/27/2028 |
| Ashley Furniture(5) | NR / NR / NR | 45,197 | 8.7% | $14.67 | 15.2% | 1/31/2035 |
| Century Theatres(6) | NR / BB / NR | 39,081 | 7.5% | $14.50 | 13.0% | 10/31/2023 |
| Best Buy(7) | Baa1 / BBB / BBB | 30,162 | 5.8% | $13.00 | 9.0% | 3/31/2022 |
| Big Lots(8) | NR / BBB- / NR | 28,486 | 5.5% | $9.00 | 5.9% | 1/31/2021 |
| Petco(9) | NR / NR / NR | 15,257 | 2.9% | $12.00 | 4.2% | 1/31/2024 |
| DSW Shoe Warehouse | NR / NR / NR | 14,500 | 2.8% | $9.00 | 3.0% | 1/31/2024 |
| Ulta Beauty(10) | NR / NR / NR | 10,554 | 2.0% | $18.60 | 4.5% | 2/28/2024 |
| The Keg Steakhouse(11) | NR / NR / NR | 8,700 | 1.7% | $22.95 | 4.6% | 5/31/2024 |
| Tuesday Morning(12) | NR / NR / NR | 8,000 | 1.5% | $14.50 | 2.7% | 1/31/2023 |
| Subtotal / Weighted Average | 395,210 | 76.3% | $8.16 | 74.0% | ||
| Remaining Tenants | 49,274 | 9.5% | $22.98 | 26.0% | ||
| Vacant | 73,417 | 14.2% | NAP | NAP% | ||
| Total / Weighted Average | 517,901 | 100.0% | $9.81 | 100.0% | ||
| (1) | Based on the underwritten rent roll dated July 1, 2019. |
| (2) | Ratings provided are for the parent company of the entity listed in the “Tenant” field whether or not the parent company guarantees the lease. |
| (3) | Base Rent PSF includes $2,520 of contractual rent steps through February 2020. |
| (4) | Tenant holds 10, five-year renewal options. |
| (5) | Tenant holds three, five-year renewal options. |
| (6) | Tenant holds four, five-year renewal options. |
| (7) | Tenant holds two, five-year renewal options. |
| (8) | Tenant holds two, five-year renewal options. |
| (9) | Tenant holds two, five-year renewal options. |
| (10) | Tenant holds three, five-year renewal options. |
| (11) | Tenant holds three, five-year renewal options with rent increases during each option. |
| (12) | Tenant holds one, five-year renewal option with a rent increase. |
| Lease Rollover Schedule(1)(2) | |||||||||
| Year | Number of Leases Expiring | Net Rentable Area Expiring | % of NRA Expiring | Base Rent Expiring(3) | % of Base Rent Expiring(3) | Cumulative Net Rentable Area Expiring | Cumulative % of NRA Expiring | Cumulative Base Rent Expiring(3) | Cumulative % of Base Rent Expiring |
| Vacant | NAP | 73,417 | 14.2% | NAP | NAP | 73,417 | 14.2% | NAP | NAP |
| 2019 & MTM | 0 | 0 | 0.0% | $0 | 0.0% | 73,417 | 14.2% | $0 | 0.0% |
| 2020 | 1 | 2,711 | 0.5% | 65,064 | 1.5% | 76,128 | 14.7% | $65,064 | 1.5% |
| 2021 | 2 | 30,781 | 5.9% | 296,078 | 6.8% | 106,909 | 20.6% | $361,142 | 8.3% |
| 2022 | 2 | 34,161 | 6.6% | 471,286 | 10.8% | 141,070 | 27.2% | $832,428 | 19.1% |
| 2023 | 3 | 54,479 | 10.5% | 839,975 | 19.3% | 195,549 | 37.8% | $1,672,403 | 38.3% |
| 2024 | 8 | 62,058 | 12.0% | 980,316 | 22.5% | 257,607 | 49.7% | $2,652,719 | 60.8% |
| 2025 | 1 | 3,150 | 0.6% | 92,925 | 2.1% | 260,757 | 50.3% | $2,745,644 | 63.0% |
| 2026 | 2 | 4,970 | 1.0% | 140,280 | 3.2% | 265,727 | 51.3% | $2,885,924 | 66.2% |
| 2027 | 1 | 1,260 | 0.2% | 32,445 | 0.7% | 266,987 | 51.6% | $2,918,369 | 66.9% |
| 2028 | 2 | 199,628 | 38.5% | 722,201 | 16.6% | 466,615 | 90.1% | $3,640,570 | 83.5% |
| 2029 | 1 | 2,619 | 0.5% | 57,618 | 1.3% | 469,234 | 90.6% | $3,698,188 | 84.8% |
| 2030 & Beyond | 2 | 48,667 | 9.4% | 662,989 | 15.2% | 517,901 | 100.0% | $4,361,177 | 100.0% |
| Total | 25 | 517,901 | 100.0% | $4,361,177 | 100.0% | ||||
| (1) | Based on the underwritten rent roll dated July 1, 2019. |
| (2) | Certain tenants may hold termination or contraction options (which may become exercisable prior to the originally stated expiration date of the tenant lease) that are not considered in the above Lease Rollover Schedule. Individual tenant termination options can be found in the footnotes under the ‘Tenant Summary’ table. |
| (3) | Base Rent Expiring includes $2,520 of contractual rent steps through February 2020. |
THE INFORMATION IN THIS STRUCTURAL AND COLLATERAL TERM SHEET IS NOT COMPLETE AND MAY BE AMENDED PRIOR TO THE TIME OF SALE. THIS TERM SHEET IS NOT AN OFFER TO SELL THESE SECURITIES AND IT IS NOT A SOLICITATION OF AN OFFER TO BUY THESE SECURITIES IN ANY JURISDICTION WHERE THE OFFER OR SALE IS NOT PERMITTED.
| | |
146 of 156
| Structural and Collateral Term Sheet | Benchmark 2019-B14 | |
| Oro Valley Marketplace | ||
| Operating History and Underwritten Net Cash Flow | |||||||
| 2016 | 2017 | 2018 | TTM(1) | Underwritten | Per Square Foot | %(2) | |
| Rents in Place | $4,075,707 | $4,275,983 | $4,297,686 | $3,987,369 | $4,358,657 | $8.42 | 60.9% |
| Contractual Rent Steps(3) | 0 | 0 | 0 | 0 | 2,520 | 0.00 | 0.0% |
| Potential Income from Vacant Space | 0 | 0 | 0 | 0 | 1,653,711 | 3.19 | 23.1% |
| Total Reimbursements | 1,607,581 | 1,657,405 | 1,702,156 | 1,449,296 | 1,294,302 | 2.50 | 18.1% |
| Mark-to-Market Adjustment | 0 | 0 | 0 | 0 | (156,325) | (0.30) | (2.2)% |
| Net Rental Income | $5,683,288 | $5,933,388 | $5,999,842 | $5,436,665 | $7,152,866 | $13.81 | 100.0% |
| (Vacancy/Credit Loss) | 0 | (88,040) | (58,653) | 0 | (1,653,711) | (3.19) | (23.1)% |
| Other Income | 19,907 | 15,839 | 17,016 | 20,115 | 20,115 | 0.04 | 0.3% |
| Effective Gross Income | $5,703,195 | $5,861,187 | $5,958,206 | $5,456,780 | $5,519,270 | $10.66 | 77.2% |
| Total Expenses | $2,135,402 | $2,238,260 | $2,304,239 | $2,212,469 | $2,338,280 | $4.51 | 42.4% |
| Net Operating Income | $3,567,793 | $3,622,927 | $3,653,967 | $3,244,310 | $3,180,990 | $6.14 | 57.6% |
| Total TI/LC, Capex/RR | 0 | 0 | 0 | 0 | 138,235 | 0.27 | 2.5% |
| Net Cash Flow | $3,567,793 | $3,622,927 | $3,653,967 | $3,244,310 | $3,042,755 | $5.88 | 55.1% |
| (1) | TTM reflects the trailing 12-month period ending June 30, 2019. |
| (2) | % column represents percent of Net Rental Income for all revenue lines and represents percent of Effective Gross Income for the remainder of the fields. |
| (3) | Contractual Rent Steps represents contractual rent steps underwritten through February 2020. |
Property Management. The Oro Valley Marketplace Property is managed by Town West Realty, Inc., an affiliate of the borrower.
THE INFORMATION IN THIS STRUCTURAL AND COLLATERAL TERM SHEET IS NOT COMPLETE AND MAY BE AMENDED PRIOR TO THE TIME OF SALE. THIS TERM SHEET IS NOT AN OFFER TO SELL THESE SECURITIES AND IT IS NOT A SOLICITATION OF AN OFFER TO BUY THESE SECURITIES IN ANY JURISDICTION WHERE THE OFFER OR SALE IS NOT PERMITTED.
| | |
147 of 156
| Structural and Collateral Term Sheet | Benchmark 2019-B14 | |
| Spectrum Brands Global Headquarters | ||
| Mortgage Loan Information | Property Information | |||
| Mortgage Loan Seller: | JPMCB | Single Asset / Portfolio: | Single Asset | |
| Original Principal Balance: | $34,000,000 | Title: | Fee | |
| Cut-off Date Principal Balance: | $34,000,000 | Property Type - Subtype: | Office – Suburban | |
| % of Pool by IPB: | 2.6% | Net Rentable Area (SF): | 252,122 | |
| Loan Purpose: | Acquisition | Location: | Middleton, WI | |
| Borrowers(1): | Various | Year Built / Renovated: | 2013 / 2017 | |
| Sponsors(2): | Various | Occupancy: | 100.0% | |
| Interest Rate: | 3.43000% | Occupancy Date: | 11/1/2019 | |
| Note Date: | 10/11/2019 | Number of Tenants: | 1 | |
| Maturity Date: | 11/1/2029 | 2016 NOI(3): | $2,849,833 | |
| Interest-only Period: | 120 months | 2017 NOI(3): | $3,286,836 | |
| Original Term: | 120 months | 2018 NOI: | $3,334,243 | |
| Original Amortization: | None | TTM NOI(4): | N/A | |
| Amortization Type: | Interest Only | UW Economic Occupancy: | 95.0% | |
| Call Protection: | L(24),Def(92),O(4) | UW Revenues: | $4,237,922 | |
| Lockbox / Cash Management: | Hard / Springing | UW Expenses: | $804,669 | |
| Additional Debt: | N/A | UW NOI: | $3,433,253 | |
| Additional Debt Balance: | N/A | UW NCF: | $3,395,434 | |
| Additional Debt Type: | N/A | Appraised Value / Per SF: | $52,100,000 / $207 | |
| Appraisal Date: | 8/13/2019 | |||
| Escrows and Reserves | Financial Information | |||||
| Initial | Monthly | Initial Cap | Cut-off Date Loan / SF: | $135 | ||
| Taxes: | $0 | Springing | N/A | Maturity Date Loan / SF: | $135 | |
| Insurance: | $0 | Springing | N/A | Cut-off Date LTV: | 65.3% | |
| Replacement Reserves: | $0 | $3,152 | N/A | Maturity Date LTV: | 65.3% | |
| TI/LC(5): | $0 | $5,235 | $250,000 | UW NCF DSCR: | 2.87x | |
| Other: | $0 | $0 | N/A | UW NOI Debt Yield: | 10.1% | |
| Sources and Uses | ||||||
| Sources | Proceeds | % of Total | Uses | Proceeds | % of Total | |
| Mortgage Loan | $34,000,000 | 64.3% | Purchase Price | $52,000,000 | 98.4% | |
| Sponsor Equity | 18,849,867 | 35.7% | Closing Costs | 849,867 | 1.6% | |
| Total Sources | $52,849,867 | 100.0% | Total Uses | $52,849,867 | 100.0% | |
| (1) | The borrowers are 3001 Deming Associates, LP, SDN 3001 Deming, LLC, NBH & BJB 3001 Deming, LLC, 16 Ave 3001 Deming, LLC, Wolfsnare 3001 Deming, LLC, and Evolve 3001 Deming, LLC. |
| (2) | The loan sponsors are HGGP Capital VIII, LLC, HGGP Capital IX, LLC, HGGP Capital X, LLC, HGGP Capital XI, LLC, HGGP Capital XII, LLC, HGGP Capital XIII, LLC, and HGGP Capital XIV, LP. |
| (3) | The increase in 2017 NOI from 2016 NOI is driven by a 30,120 square foot expansion by the sole tenant at the Spectrum Brands Global Headquarters property in 2017 and a corresponding increase in rent. |
| (4) | TTM financials are not available as the seller did not provide at the time of the acquisition. |
| (5) | The borrowers are required to make a monthly rollover deposit of $21,010 subject to a cap of $1,000,000 during the continuance of a period where Spectrum’s (as defined below) parent company’s credit rating is either (a) withdrawn by either Moody’s or S&P or (b) downgraded below “B3” by Moody’s or “B+“ by S&P. |
The Loan.The Spectrum Brands Global Headquarters loan has an outstanding principal balance as of the Cut-off Date of $34.0 million and is secured by a first mortgage lien on the borrowers’ fee interest in a 252,122 square foot Class A office building located in Middleton, Wisconsin. The Spectrum Brands Global Headquarters loan has a 10-year term and will be interest-only for the entire loan term.
The Borrowers. The borrowers are 3001 Deming Associates, LP, SDN 3001 Deming, LLC, NBH & BJB 3001 Deming, LLC, 16 Ave 3001 Deming, LLC, Wolfsnare 3001 Deming, LLC, and Evolve 3001 Deming, LLC, each a Delaware limited partnership or Delaware limited liability company structured to be a bankruptcy remote entity with one independent director in its organizational structure. The borrowers own the Spectrum Brands Global Headquarters property as tenants-in-common. For additional information, please see
THE INFORMATION IN THIS STRUCTURAL AND COLLATERAL TERM SHEET IS NOT COMPLETE AND MAY BE AMENDED PRIOR TO THE TIME OF SALE. THIS TERM SHEET IS NOT AN OFFER TO SELL THESE SECURITIES AND IT IS NOT A SOLICITATION OF AN OFFER TO BUY THESE SECURITIES IN ANY JURISDICTION WHERE THE OFFER OR SALE IS NOT PERMITTED.
| | |
148 of 156
| Structural and Collateral Term Sheet | Benchmark 2019-B14 | |
| Spectrum Brands Global Headquarters | ||
“Description of the Mortgage Pool–Mortgage Pool Characteristics–Tenancies-in-Common or Diversified Ownership” in the Preliminary Prospectus.
The Loan Sponsors.The loan sponsors and nonrecourse carve-out guarantors for the Spectrum Brands Global Headquarters loan are HGGP Capital VIII, LLC, HGGP Capital IX, LLC, HGGP Capital X, LLC, HGGP Capital XI, LLC, HGGP Capital XII, LLC, HGGP Capital XIII, LLC, and HGGP Capital XIV, LP, which are all affiliates of Harbor Group International (“HGI”). HGI is a fully-integrated owner and operator of office, retail and multifamily assets in North America and Europe. With a portfolio valued at approximately $9.7 billion and 750 employees, HGI currently owns in excess of 3.6 million square feet of commercial properties and approximately 33,000 multifamily units.
The Property.The Spectrum Brands Global Headquarters property is a single-tenant, four-story office building totaling 252,122 square feet located in Middleton, Wisconsin. The property was constructed in 2013 as a built to suit for Spectrum Brands Inc. (“Spectrum”) (NYSE: SPB) as its global headquarters. Due to Spectrum’s employment growth, the building was expanded by 30,120 square feet in 2017. The property features cubicles and individual offices, kitchenettes, break rooms, training and conference rooms as well as a cafeteria, outdoor seating and a fitness center. Additionally, the property features on-site parking totaling 758 parking spaces resulting in a parking ratio of approximately 3.01 per 1,000 square feet.
As of November 1, 2019, the property was 100.0% leased to a single tenant, Spectrum. Spectrum is a global and diversified consumer products company covering global pet care, hardware & home improvement, home & garden and home & personal care. The property currently serves as Spectrum’s global headquarters, and since 2014, Spectrum has reportedly invested over $10.3 million ($40.95 per square foot) in capital improvements to the property. Spectrum executed an early lease renewal in March 2017 in conjunction with a 30,120 square foot building expansion in order to accommodate additional employment growth. The lease extension extended Spectrum’s initial lease term from December 2028 to February 2034 with three five-year extension options.
Spectrum has a market capitalization of approximately $2.48 billion as of October 2019. Annual sales for Spectrum in fiscal year 2018 were approximately $3.1 billion (up from $3.0 billion in 2017). In January 2019, Spectrum sold its global battery and lighting unit to Energizer Holdings. Concurrently with the sale, Energizer Brands, LLC, an Energizer Holdings’ affiliate, subleased 67,663 square feet at the property. The Sublease (as defined below) rent is the same as Spectrum’s rent and has an initial lease expiration of July 2025 with one five-year extension option and one four-year extension option thereafter.
The Spectrum Brands Global Headquarters property is located in Middleton, Wisconsin, which is approximately 7.0 miles west of the Madison Capital area. The property is located within a corporate park including tenants such as Fiskars Brands, Mead & Hunt, American Girl and UW health. The property benefits from having four access points to Deming Way, providing easy access to University Avenue (US Highway 14) and Airport Road. The property is approximately 10 minutes from downtown Madison and the University of Wisconsin. Commercial uses located within 1.0 mile of the property include the Park Bank Building, Country Inn Suites, Courtyard by Marriott, restaurants P.F. Chang’s and Quaker Steak & Lube, regional chain Monk’s Bar & Grill and local restaurant Which Wich Superior Sandwiches, all anchored by a 150,000-square foot Costco Wholesale that opened in 2008.
The Market.According to the appraisal, the property is located in the Dane County office submarket. According to a third party report, as of the first quarter of 2019, the Dane County office submarket consisted of 1,188 buildings totaling approximately 33.7 million square feet of office space with an overall vacancy rate of 4.4% and average rents of $16.81 per square foot. The appraisal identified five comparable office leases in the greater Middleton area ranging in size from approximately 60,000 square feet to 109,607 square feet. Base rents for the comparable office leases ranged from $12.88 per square foot to $17.12 per square foot, with a weighted average of approximately $14.45 per square foot. The comparable leases identified by the appraisal are all on a triple-net basis. Per Spectrum’s recently executed lease extension, Spectrum is required to pay $14.45 per square foot on a double-net basis as of June 2019. The appraisal concluded a market rent of $14.50 per square foot which is in line with the property’s base rent.
| Tenant Summary(1) | |||||||
| Tenant | Ratings(2) Moody’s/S&P/Fitch | Net Rentable Area (SF) | % of Total NRA | Base Rent PSF(3) | % of Total Base Rent | Lease Expiration Date | |
| Spectrum(4) | B3 / B+ / NR | 252,122 | 100.0% | $14.67 | 100.0% | 2/1/2034 | |
| (1) | Based on the underwritten rent roll as of November 1, 2019. |
| (2) | Ratings provided are for the parent company of the entity listed in the “Tenant” field whether or not the parent company guarantees the lease. |
| (3) | Base Rent PSF includes rent steps through June 2020. |
| (4) | Pursuant to a sublease between Spectrum and Energizer Brands, LLC (the “Sublease”), Spectrum has subleased 67,663 square feet of space to Energizer Brands, LLC. The Sublease requires the same rent as the rent under the prime lease and has an initial lease expiration of July 2025 with one five-year extension option and one four-year extension option thereafter. |
THE INFORMATION IN THIS STRUCTURAL AND COLLATERAL TERM SHEET IS NOT COMPLETE AND MAY BE AMENDED PRIOR TO THE TIME OF SALE. THIS TERM SHEET IS NOT AN OFFER TO SELL THESE SECURITIES AND IT IS NOT A SOLICITATION OF AN OFFER TO BUY THESE SECURITIES IN ANY JURISDICTION WHERE THE OFFER OR SALE IS NOT PERMITTED.
| | |
149 of 156
| Structural and Collateral Term Sheet | Benchmark 2019-B14 | |
| Spectrum Brands Global Headquarters | ||
| Lease Rollover Schedule(1) | |||||||||||||||
| Year | Number of Leases Expiring | Net Rentable Area Expiring | % of NRA Expiring | Base Rent Expiring(2) | % of Base Rent Expiring | Cumulative Net Rentable Area Expiring | Cumulative % of NRA Expiring | Cumulative Base Rent Expiring(2) | Cumulative % of Base Rent Expiring | ||||||
| Vacant | NAP | 0 | 0.0% | NAP | NAP | 0 | 0.0% | NAP | NAP | ||||||
| 2019 | 0 | 0 | 0.0% | $0 | 0.0% | 0 | 0.0% | $0 | 0.0% | ||||||
| 2020 | 0 | 0 | 0.0% | 0 | 0.0% | 0 | 0.0% | $0 | 0.0% | ||||||
| 2021 | 0 | 0 | 0.0% | 0 | 0.0% | 0 | 0.0% | $0 | 0.0% | ||||||
| 2022 | 0 | 0 | 0.0% | 0 | 0.0% | 0 | 0.0% | $0 | 0.0% | ||||||
| 2023 | 0 | 0 | 0.0% | 0 | 0.0% | 0 | 0.0% | $0 | 0.0% | ||||||
| 2024 | 0 | 0 | 0.0% | 0 | 0.0% | 0 | 0.0% | $0 | 0.0% | ||||||
| 2025 | 0 | 0 | 0.0% | 0 | 0.0% | 0 | 0.0% | $0 | 0.0% | ||||||
| 2026 | 0 | 0 | 0.0% | 0 | 0.0% | 0 | 0.0% | $0 | 0.0% | ||||||
| 2027 | 0 | 0 | 0.0% | 0 | 0.0% | 0 | 0.0% | $0 | 0.0% | ||||||
| 2028 | 0 | 0 | 0.0% | 0 | 0.0% | 0 | 0.0% | $0 | 0.0% | ||||||
| 2029 | 0 | 0 | 0.0% | 0 | 0.0% | 0 | 0.0% | $0 | 0.0% | ||||||
| 2030 & Beyond | 1 | 252,122 | 100.0% | 3,698,680 | 100.0% | 252,122 | 100.0% | $3,698,680 | 100.0% | ||||||
| Total | 1 | 252,122 | 100.0% | $3,698,680 | 100.0% | ||||||||||
| (1) | Based on the underwritten rent roll as of November 1, 2019. |
| (2) | Base Rent Expiring and Cumulative Base Rent Expiring includes rent steps through June 2020. |
Operating History and Underwritten Net Cash Flow | ||||||
| 2016 | 2017 | 2018 | Underwritten | Per Square Foot | %(1) | |
| Rents in Place(2)(3) | $3,034,116 | $3,486,742 | $3,557,180 | $3,698,680 | $14.67 | 82.9% |
| Vacant Income | 0 | 0 | 0 | 0 | 0.00 | 0.0% |
| Gross Potential Rent | $3,034,116 | $3,486,742 | $3,557,180 | $3,698,680 | $14.67 | 82.9% |
| Total Reimbursements | 531,216 | 843,302 | 729,055 | 762,290 | 3.02 | 17.1% |
| Net Rental Income | $3,565,332 | $4,330,045 | $4,286,235 | $4,460,970 | $17.69 | 100.0% |
| (Vacancy/Credit Loss) | 0 | 0 | 0 | (223,049) | (0.88) | (5.0)% |
| Effective Gross Income | $3,565,332 | $4,330,045 | $4,286,235 | $4,237,922 | $16.81 | 95.0% |
| Total Expenses | 715,499 | 1,043,208 | 951,992 | 804,669 | 3.19 | 19.0% |
| Net Operating Income | $2,849,833 | $3,286,836 | $3,334,243 | $3,433,253 | $13.62 | 81.0% |
| Total Capex/RR | 0 | 0 | 0 | 37,818 | 0.15 | 0.9% |
| Net Cash Flow | $2,849,833 | $3,286,836 | $3,334,243 | $3,395,434 | $13.47 | 80.1% |
| (1) | % column represents percent of Net Rental Income for all revenue lines and represents percent of Effective Gross Income for the remainder of the fields. |
| (2) | The increase in 2017 Rents in Place from 2016 Rents in Place is driven by a 30,120 square foot expansion by Spectrum in 2017 and a corresponding increase in rent. |
| (3) | Rents in Place includes rent steps through June 2020. |
Property Management. The property is managed by Harbor Group Management Co., LLC, a Virginia limited liability company and an affiliate of the loan sponsor.
THE INFORMATION IN THIS STRUCTURAL AND COLLATERAL TERM SHEET IS NOT COMPLETE AND MAY BE AMENDED PRIOR TO THE TIME OF SALE. THIS TERM SHEET IS NOT AN OFFER TO SELL THESE SECURITIES AND IT IS NOT A SOLICITATION OF AN OFFER TO BUY THESE SECURITIES IN ANY JURISDICTION WHERE THE OFFER OR SALE IS NOT PERMITTED.
| | |
150 of 156
| Structural and Collateral Term Sheet | Benchmark 2019-B14 |
[THIS PAGE INTENTIONALLY LEFT BLANK]
THE INFORMATION IN THIS STRUCTURAL AND COLLATERAL TERM SHEET IS NOT COMPLETE AND MAY BE AMENDED PRIOR TO THE TIME OF SALE. THIS TERM SHEET IS NOT AN OFFER TO SELL THESE SECURITIES AND IT IS NOT A SOLICITATION OF AN OFFER TO BUY THESE SECURITIES IN ANY JURISDICTION WHERE THE OFFER OR SALE IS NOT PERMITTED.
| | |
151 of 156
| Structural and Collateral Term Sheet | Benchmark 2019-B14 |
| Compass AGP Storage Portfolio | |
| Mortgage Loan Information | Property Information | |||
| Mortgage Loan Seller: | CREFI | Single Asset / Portfolio: | Portfolio | |
| Original Principal Balance: | $33,000,000 | Title: | Fee | |
| Cut-off Date Principal Balance: | $33,000,000 | Property Type - Subtype: | Self Storage | |
| % of Pool by IPB: | 2.5% | Net Rentable Area (SF): | 406,680 | |
| Loan Purpose | Refinance | Location(2): | Various | |
| Borrowers(1): | Various | Year Built / Renovated(2): | Various / Various | |
| Sponsor: | Amsdell Group, LLC | Occupancy: | 80.6% | |
| Interest Rate: | 3.57000% | Occupancy Date: | 7/31/2019 | |
| Note Date: | 10/8/2019 | Number of Tenants: | N/A | |
| Maturity Date: | 11/6/2029 | 2017 NOI: | $2,871,870 | |
| Interest-only Period: | 120 months | 2018 NOI: | $3,009,125 | |
| Original Term: | 120 months | TTM NOI (as of 7/2019): | $3,083,974 | |
| Original Amortization: | None | UW Economic Occupancy: | 73.9% | |
| Amortization Type: | Interest Only | UW Revenues: | $5,099,798 | |
| Call Protection: | L(24),Def(92),O(4)
| UW Expenses: | $2,044,134 | |
| Lockbox / Cash Management: | Springing / Springing | UW NOI: | $3,055,664 | |
| Additional Debt: | N/A
| UW NCF: | $3,011,972 | |
| Additional Debt Balance: | N/A | Appraised Value / Per SF: | $53,030,000 / $130 | |
| Additional Debt Type: | N/A | Appraisal Date(2): | Various | |
| Escrows and Reserves | Financial Information | ||||||
| Initial | Monthly | Initial Cap | Cut-off Date Loan / SF: | $81 | |||
| Taxes: | $151,811 | $45,006 | N/A | Maturity Date Loan / SF: | $81 | ||
| Insurance: | $0 | Springing | N/A | Cut-off Date LTV: | 62.2% | ||
| Replacement Reserves: | $0 | $3,641 | N/A | Maturity Date LTV: | 62.2% | ||
| TI/LC: | $0 | $0 | N/A | UW NCF DSCR: | 2.52x | ||
| Other: | $0 | $0 | N/A | UW NOI Debt Yield: | 9.3% | ||
| Sources and Uses | ||||||
| Sources | Proceeds | % of Total | Uses | Proceeds | % of Total | |
| Mortgage Loan | $33,000,000 | 100.0% | Loan Payoff | $23,691,677 | 71.8% | |
| Return of Equity | 8,483,457 | 25.7 | ||||
| Closing Costs | 673,055 | 2.0 | ||||
| Upfront Reserves | 151,811 | 0.5 | ||||
| Total Sources | $33,000,000 | 100.0% | Total Uses | $33,000,000 | 100.0% | |
| (1) | Borrowers include Amsdell Storage Ventures XVI, LLC, Amsdell Storage Ventures XLVII, LLC, Amsdell Storage Ventures VIII, LLC, Amsdell Storage Ventures X, LLC. |
| (2) | See “Portfolio Summary” chart below. |
The Loan.The Compass AGP Storage Portfolio loan (the “Compass AGP Storage Portfolio Loan”) is secured by a first mortgage lien on the borrower’s fee interest in a 406,680 square foot self-storage portfolio consisting of six properties located in various regions across the eastern United States. The Compass AGP Storage Portfolio Loan has a 10-year interest-only term.
The borrowing entities for the Compass AGP Storage Portfolio Loan are Amsdell Storage Ventures XVI, LLC, Amsdell Storage Ventures XLVII, LLC, Amsdell Storage Ventures VIII, LLC, and Amsdell Storage Ventures X, LLC, each a Delaware limited liability company and special purpose entity.
The loan sponsor for the Compass AGP Storage Portfolio Loan is Amsdell Group, LLC and the nonrecoursecarve-out guarantors for the Compass AGP Storage Portfolio Loan are Robert J. Amsdell and Barry L. Amsdell. Compass Self Storage, LLC is a member of the Amsdell Companies headquartered in Cleveland, Ohio. The company was founded in 1928 and has since been active in real estate, with a primary focus in self storage. Amsdell has owned and operated more than 500 storage centers under various trade names in over 25 states.
THE INFORMATION IN THIS STRUCTURAL AND COLLATERAL TERM SHEET IS NOT COMPLETE AND MAY BE AMENDED PRIOR TO THE TIME OF SALE. THIS TERM SHEET IS NOT AN OFFER TO SELL THESE SECURITIES AND IT IS NOT A SOLICITATION OF AN OFFER TO BUY THESE SECURITIES IN ANY JURISDICTION WHERE THE OFFER OR SALE IS NOT PERMITTED.
| | |
152 of 156
| Structural and Collateral Term Sheet | Benchmark 2019-B14 |
| Compass AGP Storage Portfolio | |
The Property.The Compass AGP Storage Portfolio is a 406,680 square foot self-storage portfolio consisting of six properties located in various regions across the eastern United States. The portfolio currently consists of 3,757 storage units (406,680 NRA). The portfolio’s unit mix is comprised of 1,948 climate controlled units (51.8% of units / 44.5% of NRA), 1,519 non-climate controlled units (40.4% of units / 53.6% of NRA), 239 lockers (6.4% of units / 1.5% of NRA), 34 vehicle storage spaces (0.9% of units), 7 cell tower spaces (0.2% of units / 0.3% of NRA), and 10 office spaces (0.3% of units / 0.1% of NRA).
The largest property in the Compass AGP Storage Portfolio, Compass Self Storage Bloomfield (39.4% of allocated loan amount), is a three-story, 96,070 square foot self-storage facility located in Bloomfield, New Jersey comprised of 1,129 climate-controlled storage units, 239 lockers, and 8 offices. As of July 31, 2019, the property was 78.8% occupied and receives $1,843,044 in total annual base rent. Construction of Compass Self Storage Bloomfield took place in 1960 and renovations were made in 2012. Compass Self Storage Bloomfield is situated on a 2.45 acre site at 58 Locust Avenue, Bloomfield, New Jersey. The second largest property in the Compass AGP Storage Portfolio, Compass Self Storage Smyrna (14.1% of allocated loan amount), is a 60,605 square foot self-storage facility located in Smyrna, Georgia. The improvements were constructed in 2002 and are situated on 2.58 acres at 2350 Atlanta Road, Smyrna, Georgia. The facility consists of four, two-story storage buildings with 299 non-climate controlled units and 223 climate-controlled units. As of July 31, 2019, the property was 75.8% occupied and receives $660,580 in total annual base rent. The third largest property in the Compass AGP Storage Portfolio, Compass Self Storage Port Richey (12.7% of allocated loan amount), is a 66,355 square foot self storage facility located in New Port Richey, Florida. The improvements were constructed in 2007, and are situated on a 6.28 acre site at 4413 Madison Street, New Port Richey, Florida. The Compass Self Storage Port Richey property consists of 11, single-story storage buildings, with 166 climate controlled units, 262 non-climate controlled units, 2 office units, 16 vehicle storage spaces and a single-story leasing office with a manager apartment unit. As of July 31, 2019, the property was 80.3% occupied and receives $687,216 in total annual base rent.
The Market. The Compass AGP Storage Portfolio contains properties across various regions throughout the United States. Compass Self Storage Kennesaw, Smyrna and Duluth are located in the Atlanta-Sandy Springs-Roswell, GA Metropolitan Statistical Area (the “Atlanta MSA”). Compass Self Storage Kennesaw and Smyrna are located in Cobb County and Compass Self Storage Duluth is located in Gwinnett County. Compass Self Storage Bloomfield is located in Bloomfield, New Jersey, part of the New York-Newark-Jersey City, NY-NJ-PA Metropolitan Statistical Area (the “New York MSA”), which includes three states. Compass Self Storage Port Richey is located in New Port Richey, Florida, part of the Tampa-St. Petersburgh-Clearwater, FL Metropolitan Statistical Area (the “Tampa MSA”). Compass Self Storage Wendell is located in Wendell, North Carolina, part of the Raleigh, NC Metropolitan Statistical Area (the “Raleigh MSA”).
According to the appraisal, the Atlanta MSA had a 2018 total population of 5,986,262, representing a 1.7% annual growth rate since 2010, and has a projected annual growth rate of 1.5% by 2023. According to a third party report, the estimated 2019 population within a five-mile radius of Compass Self Storage Kennesaw is 191,977; 234,445 for Compass Self Storage Smyrna; and 246,190 for Compass Self Storage Duluth. The projected population growth rates by 2024 for Compass Self Storage Kennesaw, Compass Self Storage Smyrna, and Compass Self Storage Duluth are 3.89%, 3.44%, and 5.17%, respectively. The average 2018 household income for the Atlanta MSA was $93,820, 15.5% higher than the state’s average household income. The estimated 2019 average household incomes within a five-mile radius of Compass Self Storage Kennesaw, Compass Self Storage Smyrna, and Compass Self Storage Duluth are $103,678, $97,931, and $90,974, respectively. The Atlanta MSA is considered to be the business capital of the southern United States, and a global business hub. The economy is driven by a diverse group of sectors, which includes healthcare, education, transportation, distribution, retail, finance, and government. According to the appraisal, the supply of storage space within a three-mile radius of Compass Self Storage Kennesaw is 648,086 net rentable square feet, 855,892 net rentable square feet for Compass Self Storage Smyrna, and 762,855 net rentable square feet for Compass Self Storage Duluth.
According to the appraisal, the New York MSA had a 2018 total population of 20,438,199, representing an annual growth rate of 0.6% since 2010, with a projected growth rate of 0.4% by 2023. According to a third party report, the estimated 2019 population within a five-mile radius of the Compass Self Storage Bloomfield property is 741,781 with a projected growth rate of 3.87% by 2024. The average household income in 2018 was $114,227 for the New York MSA. The estimated 2019 average household income within a five-mile radius of the Compass Self Storage Bloomfield property is $100,580. The New York MSA has one of the largest economies in the nation and is primarily driven by development and growth in New York City. The property is located 16.0 miles from New York City and 6.0 miles away from Newark, New Jersey. According to the appraisal, there is a supply of 992,356 net rentable square feet of storage space within a three-mile radius of Compass Self Storage Bloomfield, which equates to a supply ratio of 2.9 square feet per person. For context, the national average ratio of self storage square feet per person is 5.4 square feet per person.
THE INFORMATION IN THIS STRUCTURAL AND COLLATERAL TERM SHEET IS NOT COMPLETE AND MAY BE AMENDED PRIOR TO THE TIME OF SALE. THIS TERM SHEET IS NOT AN OFFER TO SELL THESE SECURITIES AND IT IS NOT A SOLICITATION OF AN OFFER TO BUY THESE SECURITIES IN ANY JURISDICTION WHERE THE OFFER OR SALE IS NOT PERMITTED.
| | |
153 of 156
| Structural and Collateral Term Sheet | Benchmark 2019-B14 |
| Compass AGP Storage Portfolio | |
According to the appraisal, the Tampa MSA had a 2018 total population of 3,160,627, representing an annual growth rate of 1.7% since 2010, with a projected growth rate of 1.3% by 2023. According to a third party report, the estimated 2019 population within a five-mile radius from Compass Self Storage Port Richey is 169,764 with a projected growth rate of 5.14% by 2024. The Tampa MSA in 2018 had an average household income of $77,199. The Tampa MSA represents a diverse economy fueled by a variety of sectors including financial and professional services, information technologies, life sciences, education and healthcare, defense, manufacturing, distribution and logistics industries. Major military installations such as MacDill Air Force base and Coast Guard Air Station Clearwater, along with top companies such as USAA Depository Trust & Clearing Corporation, MetLife, Citi, and TransferWise are located throughout the Tampa MSA. According to the appraisal, there is a supply of 590,141 net rentable square feet of storage space within a three-mile radius of Compass Self Storage Port Richey.
According to appraisal, the Raleigh MSA had a 2018 total population of 1,388,381, representing an annual growth rate of 2.6% since 2010, with a projected growth rate of 2.1% by 2023. According to a third party report, the estimated 2019 population within a five-mile radius of Compass Self Storage Wendell is 39,425 with a projected growth rate of 6.09% by 2024. In 2018 the average household income was $100,233 for the Raleigh MSA. The 2019 estimated average household income within a five-mile radius of the property is $84,893, while it is lower than the average for the Raleigh MSA it is still higher than the state’s average of $76,665. The property is located within North Carolina’s Research Triangle, home to colleges and research universities including: Duke University, North Carolina State University, and the University of North Carolina at Chapel Hill. According to the appraisal, there is a supply of 225,243 net rentable square feet of storage space within a five-mile radius of Compass Self Storage Wendell.
| Historical and Current Occupancy(1) | ||
| 2017 | 2018 | Current(2) |
| 80.2% | 77.8% | 80.6% |
| (1) | Historical Occupancies are as of December 31 of each respective year. |
| (2) | Current Occupancy is as of July 31, 2019. |
| Portfolio Summary | |||||||||
| Property Name | City, State | Year Built | Property NRA | Property Occupancy(1) | Allocated Cut-Off Date Balance | % Allocated Loan Original Principal Balance | Appraised Value(2) | % Appraised Value | UW NCF |
| Compass Self Storage Bloomfield | Bloomfield, NJ | 1960 | 96,070 | 78.8% | $13,000,000 | 39.4% | $21,580,000 | 40.7% | $1,056,066 |
| Compass Self Storage Smyrna | Smyrna, GA | 2002 | 60,605 | 75.8% | 4,668,040 | 14.1 | 7,180,000 | 13.5 | 464,864 |
| Compass Self Storage Port Richey | New Port Richey, FL | 2007 | 66,355 | 80.3% | 4,206,680 | 12.7 | 6,760,000 | 12.7 | 400,824 |
| Compass Self Storage Wendell | Wendell, NC | 2004 | 59,575 | 85.1% | 3,914,200 | 11.9 | 6,290,000 | 11.9 | 364,731 |
| Compass Self Storage Duluth | Duluth, GA | 2000 | 62,970 | 81.0% | 3,676,480 | 11.1 | 5,540,000 | 10.4 | 369,069 |
| Compass Self Storage Kennesaw | Kennesaw, GA | 1997 | 61,105 | 83.8% | 3,534,600 | 10.7 | 5,680,000 | 10.7 | 356,418 |
| Total / Weighted Average | 406,680 | 80.6% | $33,000,000 | 100.0% | $53,030,000 | 100.0% | $3,011,972 | ||
| (1) | Based on the underwritten rent roll dated July 31, 2019 for the Compass AGP Storage Portfolio properties. |
| (2) | The appraisal date for (i) Compass Self Storage Smyrna, Compass Self Storage Duluth, and Compass Self Storage Kennesaw is September 5, 2019; (ii) Compass Self Storage Bloomfield is September 6, 2019; (iii) Compass Self Storage Port Richey is September 7, 2019; and (iv) Compass Self Storage Wendell is September 9, 2019. |
THE INFORMATION IN THIS STRUCTURAL AND COLLATERAL TERM SHEET IS NOT COMPLETE AND MAY BE AMENDED PRIOR TO THE TIME OF SALE. THIS TERM SHEET IS NOT AN OFFER TO SELL THESE SECURITIES AND IT IS NOT A SOLICITATION OF AN OFFER TO BUY THESE SECURITIES IN ANY JURISDICTION WHERE THE OFFER OR SALE IS NOT PERMITTED.
| | |
154 of 156
| Structural and Collateral Term Sheet | Benchmark 2019-B14 |
| Compass AGP Storage Portfolio | |
| Storage Unit Mix(1) | ||||
| Property Name | Unit Type | # of Units | Occupied Units | % Occupied |
| Compass Self Storage Bloomfield(2) | Climate Controlled | 1,129 | 893 | 79.1% |
| Compass Self Storage Smyrna(3) | Non-Climate Controlled | 299 | 256 | 85.6% |
| Climate Controlled | 223 | 150 | 67.3% | |
| Compass Self Storage Port Richey(4) | Non-Climate Controlled | 262 | 213 | 81.3% |
| Climate Controlled | 166 | 127 | 76.5% | |
| Compass Self Storage Wendell(5) | Non-Climate Controlled | 310 | 261 | 84.2% |
| Climate Controlled | 112 | 104 | 92.9% | |
| Compass Self Storage Duluth(6) | Non-Climate Controlled | 342 | 269 | 78.7% |
| Climate Controlled | 148 | 110 | 74.3% | |
| Compass Self Storage Kennesaw(7) | Non-Climate Controlled | 306 | 261 | 85.3% |
| Climate Controlled | 170 | 146 | 85.9% | |
| (1) | Based on the underwritten rent roll dated July 31, 2019 for the Compass AGP Storage Portfolio properties. |
| (2) | The Compass Self Storage Bloomfield property is 96,070 square feet comprised of 1,129 storage spaces, 239 lockers, and 8 offices. The underwritten annual base rent for the storage space is $1,762,452, $73,428 for locker space, and $7,164 for office space. |
| (3) | The Compass Self Storage Smyrna property is 60,605 square feet comprised of 522 storage spaces. The underwritten annual base rent for the storage space is $660,580. |
| (4) | The Compass Self Storage Port Richey property is 66,355 square feet comprised of 428 storage spaces, 16 vehicle storage spaces, and 2 offices. The underwritten annual base rent for the storage space is $664,200, $18,396 for the vehicle spaces, and $4,620 for the office space. |
| (5) | The Compass Self Storage Wendell property is 59,575 square feet comprised of 422 storage spaces and 8 vehicle storage spaces. The underwritten annual base rent for the storages bases is $619,937 and $8,928 for the vehicle storage spaces. |
| (6) | The Compass Self Storage Duluth property is 62,970 square feet comprised of 490 storage spaces, 6 vehicle storage spaces, and 7 cell towers. The underwritten annual base rent for the storage space is $524,828, $8,160 for the vehicle storage space, and $42,727 for the cell towers. |
| (7) | The Compass Self Storage Kennesaw property is 61,105 square feet comprised of 476 storage spaces and 4 vehicle storage spaces. The underwritten annual base rent for the storage space is $621,638 and $3,804 for the vehicle storage space. |
| Operating History and Underwritten Net Cash Flow(1) | ||||||
| Storage Income | 2017 | 2018 | TTM(2) | Underwritten | Per Square Foot | %(3)
|
| Base Rent | $5,685,204 | $5,645,427 | $5,624,077 | $5,020,862 | $12.35 | 80.6% |
| Potential Income from Vacant Units | 0 | 0 | 0 | 1,207,836 | 2.97 | 19.4% |
| Net Rental Income | $5,685,204 | $5,645,427 | $5,624,077 | $6,228,698 | $15.32 | 100.0% |
| Vacancy & Credit Loss & Concessions(4) | (1,379,592) | (1,095,106) | (1,019,310) | (1,623,932) | (3.99) | (26.1)% |
| Storage EGI (before Other Income) | $4,305,612 | $4,550,322 | $4,604,766 | $4,604,766 | $11.32 | 73.9% |
| Other Income(5) | 448,658 | 456,363 | 495,032 | 495,032 | 1.22 | 7.9% |
| Effective Gross Income | $4,754,270 | $5,006,684 | $5,099,798 | $5,099,798 | $12.54 | 81.9% |
| Total Expenses | 1,882,400 | 1,997,560 | 2,015,825 | 2,044,134 | 5.03 | 40.1% |
| Net Operating Income | $2,871,870 | $3,009,125 | $3,083,974 | $3,055,664 | $7.51 | 59.9% |
| Replacement Reserves | 0 | 0 | 0 | 43,693 | 0.11 | 0.9% |
| Net Cash Flow | $2,871,870 | $3,009,125 | $3,083,974 | $3,011,972 | $7.41 | 59.1% |
| (1) | Certain items such as straight line rent, interest expense, interest income, lease cancellation income, depreciation, amortization, debt service payments and any other non-recurring or non-operating items were excluded from the historical presentation and are not considered for the underwritten cash flow. |
| (2) | TTM as of July 2019. |
| (3) | % column represents percent of Net Rental Income for all revenue lines and represents percent of Effective Gross Income for the remainder of the fields. |
| (4) | Vacancy & Credit Loss & Concessions is underwritten to the current, economic vacancy of 26.1%. |
| (5) | Other Income includes truck rental income, tenant insurance commission, ancillary item sales, admin fees and miscellaneous income. |
Property Management. The property is managed by Compass Self Storage, LLC, an affiliate of the Compass AGP Storage Portfolio borrower.
THE INFORMATION IN THIS STRUCTURAL AND COLLATERAL TERM SHEET IS NOT COMPLETE AND MAY BE AMENDED PRIOR TO THE TIME OF SALE. THIS TERM SHEET IS NOT AN OFFER TO SELL THESE SECURITIES AND IT IS NOT A SOLICITATION OF AN OFFER TO BUY THESE SECURITIES IN ANY JURISDICTION WHERE THE OFFER OR SALE IS NOT PERMITTED.
| | |
155 of 156
| Structural and Collateral Term Sheet | Benchmark 2019-B14 |
| Contacts | |
| J.P. Morgan CMBS Capital Markets & Banking | ||
| Contact | Phone Number | |
Kunal Singh Managing Director | kunal.k.singh@jpmorgan.com | (212) 834-5467 |
Brad Horn
| bradley.j.horn@jpmorgan.com | (212) 834-9708 |
| J.P. Morgan CMBS Trading | ||
| Contact | Phone Number | |
Avinash Sharma Executive Director | avinash.sharma@jpmorgan.com | (212) 834-3111 |
Derrick Fetzer Vice President |
derrick.e.fetzer@jpmchase.com | (212) 834-3111 |
| J.P. Morgan Securitized Products Syndicate | ||
| Contact | Phone Number | |
Andy Cherna Managing Director | andy.cherna@jpmorgan.com | (212) 834-4154 |
Kailin Twomey Associate | kailin.e.twomey@jpmchase.com | (212) 834-4154 |
| Deutsche Bank CMBS Capital Markets & Banking | ||
| Contact | Phone Number | |
Lainie Kaye Managing Director | lainie.kaye@db.com | (212) 250-5270 |
Natalie Grainger Director | natalie.grainger@db.com | (212) 250-1254 |
| Deutsche Bank CMBS Trading | ||
| Contact | Phone Number | |
Ryan Horvath Vice President | ryan.horvath@db.com | (212) 250-5149 |
| Deutsche Bank CMBS Structuring | ||
| Contact | Phone Number | |
Shaishav Agarwal Managing Director | shaishav.agarwal@db.com | (212) 250-6290 |
Dan Penn Director | daniel.penn@db.com | (212) 250-5149 |
| Citigroup CMBS Capital Markets & Securitization | ||
| Contact | Phone Number | |
Rick Simpson Director | richard.simpson@citi.com | (212) 816-5343 |
Sana Petersen Director | sana.petersen@citi.com | (212) 816-3852 |
| Citigroup Structuring, Trading & Syndicate | ||
| Contact | Phone Number | |
Raul Orozco Director | raul.d.orozco@citi.com | (212) 723-1295 |
Mattison Perry Vice President | mattison.perry@citi.com | (212) 723-1295 |
THE INFORMATION IN THIS STRUCTURAL AND COLLATERAL TERM SHEET IS NOT COMPLETE AND MAY BE AMENDED PRIOR TO THE TIME OF SALE. THIS TERM SHEET IS NOT AN OFFER TO SELL THESE SECURITIES AND IT IS NOT A SOLICITATION OF AN OFFER TO BUY THESE SECURITIES IN ANY JURISDICTION WHERE THE OFFER OR SALE IS NOT PERMITTED.
| | |
156 of 156