JP Morgan Chase Commercial Mortgage Securities
Filed: 15 Jun 20, 4:58pm
| FREE WRITING PROSPECTUS | ||
| FILED PURSUANT TO RULE 433 | ||
| REGISTRATION FILE NO.: 333-226123-09 | ||
June [15], 2020 | JPMDB 2020-COR7 |
Collateral Term Sheet |
JPMDB 2020-COR7
This material is for your information, and none of J.P. Morgan Securities LLC (“JPMS”), Deutsche Bank Securities Inc., Goldman Sachs & Co. LLC, Jefferies LLC and Drexel Hamilton, LLC, (each individually, an “Underwriter”, and together, the ‘‘Underwriters’’) are soliciting any action based upon it. This material is not to be construed as an offer to sell or the solicitation of any offer to buy any security in any jurisdiction where such an offer or solicitation would be illegal.
The depositor has filed a registration statement (including a prospectus) with the SEC (SEC File No. 333-226123) for the offering to which this free writing prospectus relates. Before you invest, you should read the prospectus in the registration statement and other documents the depositor has filed with the SEC for more complete information about the depositor, the issuing entity and this offering. You may get these documents for free by visiting EDGAR on the SEC Web site at www.sec.gov. Alternatively, the depositor, any underwriter or any dealer participating in the offering will arrange to send you the prospectus if you request it by calling (800) 408-1016 or by emailing the ABS Syndicate Desk atabs_synd@jpmorgan.com.
THE SECURITIES TO WHICH THIS INFORMATION RELATES WILL BE MORE FULLY DESCRIBED IN A PROSPECTUS (THE “PROSPECTUS”), WHICH IS NOT YET AVAILABLE. THE PROSPECTUS WILL CONTAIN MATERIAL INFORMATION THAT IS NOT CONTAINED IN THESE MATERIALS (INCLUDING WITHOUT LIMITATION A DETAILED DISCUSSION OF RISKS ASSOCIATED WITH AN INVESTMENT IN THE CERTIFICATES, UNDER THE HEADING“RISK FACTORS”IN THE PROSPECTUS).
Neither this document nor anything contained in this document shall form the basis for any contract or commitment whatsoever. The information contained in this document is preliminary as of the date of this document, supersedes any previous such information delivered to you and will be superseded by any such information subsequently delivered prior to the time of sale. These materials are subject to change, completion or amendment from time to time. This information is based upon management forecasts and reflects prevailing conditions and management's views as of this date, all of which are subject to change.
J.P. Morgan is the marketing name for the investment banking businesses of JPMorgan Chase & Co. and its subsidiaries worldwide. Securities, syndicated loan arranging, financial advisory and other investment banking activities are performed by JPMS and its securities affiliates, and lending, derivatives and other commercial banking activities are performed by JPMorgan Chase Bank, National Association and its banking affiliates. JPMS is a member of SIPC and the NYSE.
THE UNDERWRITERS MAY FROM TIME TO TIME PERFORM INVESTMENT BANKING SERVICES FOR, OR SOLICIT INVESTMENT BANKING BUSINESS FROM, ANY COMPANY NAMED IN THESE MATERIALS. THE UNDERWRITERS AND/OR THEIR AFFILIATES OR RESPECTIVE EMPLOYEES MAY FROM TIME TO TIME HAVE A LONG OR SHORT POSITION IN ANY CERTIFICATE OR CONTRACT DISCUSSED IN THESE MATERIALS.
|
| THE INFORMATION IN THIS STRUCTURAL AND COLLATERAL TERM SHEET IS NOT COMPLETE AND MAY BE AMENDED PRIOR TO THE TIME OF SALE. THIS TERM SHEET IS NOT AN OFFER TO SELL THESE SECURITIES AND IT IS NOT A SOLICITATION OF AN OFFER TO BUY THESE SECURITIES IN ANY JURISDICTION WHERE THE OFFER OR SALE IS NOT PERMITTED. |
| June [15], 2020 | JPMDB 2020-COR7 |
THE REPUBLIC OF KOREA
THIS PROSPECTUS IS NOT, AND UNDER NO CIRCUMSTANCES IS THIS PROSPECTUS TO BE CONSTRUED AS, A PUBLIC OFFERING OF SECURITIES IN KOREA. NEITHER THE ISSUER NOR ANY OF ITS AGENTS MAKE ANY REPRESENTATION WITH RESPECT TO THE ELIGIBILITY OF ANY RECIPIENTS OF THIS PROSPECTUS TO ACQUIRE THE OFFERED CERTIFICATES UNDER THE LAWS OF KOREA, INCLUDING, BUT WITHOUT LIMITATION, THE FOREIGN EXCHANGE TRANSACTION LAW AND REGULATIONS THEREUNDER (THE “FETL”). THE OFFERED CERTIFICATES HAVE NOT BEEN REGISTERED WITH THE FINANCIAL SERVICES COMMISSION OF KOREA FOR PUBLIC OFFERING IN KOREA, AND NONE OF THE OFFERED CERTIFICATES MAY BE OFFERED, SOLD OR DELIVERED, DIRECTLY OR INDIRECTLY, OR OFFERED OR SOLD TO ANY PERSON FOR RE-OFFERING OR RESALE, DIRECTLY OR INDIRECTLY IN KOREA OR TO ANY RESIDENT OF KOREA EXCEPT PURSUANT TO THE FINANCIAL INVESTMENT SERVICES AND CAPITAL MARKETS ACT AND THE DECREES AND REGULATIONS THEREUNDER (THE “FSCMA”), THE FETL AND ANY OTHER APPLICABLE LAWS, REGULATIONS AND MINISTERIAL GUIDELINES IN KOREA. WITHOUT PREJUDICE TO THE FOREGOING, THE NUMBER OF OFFERED CERTIFICATES OFFERED IN KOREA OR TO A RESIDENT OF KOREA SHALL BE LESS THAN FIFTY AND FOR A PERIOD OF ONE YEAR FROM THE ISSUE DATE OF THE OFFERED CERTIFICATES, NONE OF THE OFFERED CERTIFICATES MAY BE DIVIDED RESULTING IN AN INCREASED NUMBER OF OFFERED CERTIFICATES. FURTHERMORE, THE OFFERED CERTIFICATES MAY NOT BE RESOLD TO KOREAN RESIDENTS UNLESS THE PURCHASER OF THE OFFERED CERTIFICATES COMPLIES WITH ALL APPLICABLE REGULATORY REQUIREMENTS (INCLUDING, BUT NOT LIMITED TO, GOVERNMENT REPORTING APPROVAL REQUIREMENTS UNDER THE FETL AND ITS SUBORDINATE DECREES AND REGULATIONS) IN CONNECTION WITH THE PURCHASE OF THE OFFERED CERTIFICATES.
JAPAN
THE OFFERED CERTIFICATES HAVE NOT BEEN AND WILL NOT BE REGISTERED UNDER THE FINANCIAL INSTRUMENTS AND EXCHANGE LAW OF JAPAN, AS AMENDED (THE “FIEL”), AND DISCLOSURE UNDER THE FIEL HAS NOT BEEN AND WILL NOT BE MADE WITH RESPECT TO THE OFFERED CERTIFICATES. ACCORDINGLY, EACH UNDERWRITER HAS REPRESENTED AND AGREED THAT IT HAS NOT, DIRECTLY OR INDIRECTLY, OFFERED OR SOLD AND WILL NOT, DIRECTLY OR INDIRECTLY, OFFER OR SELL ANY OFFERED CERTIFICATES IN JAPAN OR TO, OR FOR THE BENEFIT OF, ANY RESIDENT OF JAPAN (WHICH TERM AS USED IN THIS PROSPECTUS MEANS ANY PERSON RESIDENT IN JAPAN, INCLUDING ANY CORPORATION OR OTHER ENTITY ORGANIZED UNDER THE LAWS OF JAPAN) OR TO OTHERS FOR REOFFERING OR RE-SALE, DIRECTLY OR INDIRECTLY, IN JAPAN OR TO, OR FOR THE BENEFIT OF, ANY RESIDENT OF JAPAN EXCEPT PURSUANT TO AN EXEMPTION FROM THE REGISTRATION REQUIREMENTS OF, AND OTHERWISE IN COMPLIANCE WITH, THE FIEL AND OTHER RELEVANT LAWS, REGULATIONS AND MINISTERIAL GUIDELINES OF JAPAN. AS PART OF THIS OFFERING OF THE OFFERED CERTIFICATES, THE UNDERWRITERS MAY OFFER THE OFFERED CERTIFICATES IN JAPAN TO UP TO 49 OFFEREES IN ACCORDANCE WITH THE ABOVE PROVISIONS.
| THE INFORMATION IN THIS STRUCTURAL AND COLLATERAL TERM SHEET IS NOT COMPLETE AND MAY BE AMENDED PRIOR TO THE TIME OF SALE. THIS TERM SHEET IS NOT AN OFFER TO SELL THESE SECURITIES AND IT IS NOT A SOLICITATION OF AN OFFER TO BUY THESE SECURITIES IN ANY JURISDICTION WHERE THE OFFER OR SALE IS NOT PERMITTED. | ||
 | 
2 of 130 |  |
| Structural and Collateral Term Sheet | JPMDB 2020-COR7 | |
| Collateral Characteristics | ||
| Loan Pool | ||
| Initial Pool Balance (“IPB”): | $909,405,614 | |
| Number of Mortgage Loans: | 37 | |
| Number of Mortgaged Properties: | 153 | |
| Average Cut-off Date Balance per Mortgage Loan: | $24,578,530 | |
| Weighted Average Current Mortgage Rate: | 3.66595% | |
| 10 Largest Mortgage Loans as % of IPB: | 54.3% | |
| Weighted Average Remaining Term to Maturity: | 106 months | |
| Weighted Average Seasoning: | 5 months | |
| Credit Statistics(1)(2)(3) | ||
| Weighted Average UW NCF DSCR(4): | 2.50x | |
| Weighted Average UW NOI Debt Yield: | 10.4% | |
| Weighted Average Cut-off Date Loan-to-Value Ratio (“LTV”)(5): | 55.7% | |
| Weighted Average Maturity Date LTV(5): | 52.5% | |
| Other Statistics | ||
| % of Mortgage Loans with Additional Debt: | 28.5% | |
| % of Mortgaged Properties with Single Tenants: | 31.6% | |
| Amortization | ||
| Weighted Average Original Amortization Term(6): | 360 months | |
| Weighted Average Remaining Amortization Term(6): | 357 Months | |
| % of Mortgage Loans with Interest-Only: | 66.6% | |
| % of Mortgage Loans with Partial Interest-Only followed by Amortizing Balloon: | 23.4% | |
| % of Mortgage Loans with Amortizing Balloon: | 10.0% | |
| Lockbox / Cash Management(7) | ||
| % of Mortgage Loans with In-Place, Hard Lockboxes: | 89.7% | |
| % of Mortgage Loans with In-Place, Soft Lockboxes: | 6.3% | |
| % of Mortgage Loans with Springing Lockboxes: | 4.0% | |
| % of Mortgage Loans with In-Place Cash Management: | 88.2% | |
| % of Mortgage Loans with Springing Cash Management: | 11.8% | |
| Reserves | ||
| % of Mortgage Loans Requiring Monthly Tax Reserves: | 56.0% | |
| % of Mortgage Loans Requiring Monthly Insurance Reserves: | 32.5% | |
| % of Mortgage Loans Requiring Monthly CapEx Reserves: | 53.4% | |
| % of Mortgage Loans Requiring Monthly TI/LC Reserves(8): | 31.6% | |
| (1) | In the case of Loan Nos. 1, 3, 4, 5, 6, 7, 8, 9, 10, 14, 17, 18, 21, 23, 26, 27, 28 and 33, the UW NCF DSCR, UW NOI Debt Yield, Cut-off Date LTV and Maturity Date LTV calculations include the related Pari Passu Companion Loan(s). In the case of Loan Nos. 3, 4, 5, 8, 10, 13 and 18, the UW NCF DSCR, UW NOI Debt Yield, Cut-off Date LTV and Maturity Date LTV calculations exclude the related Subordinate Companion Loan(s) and/or related mezzanine loan(s). |
| (2) | In the case of Loan No. 10, the BX Industrial Portfolio mortgage loan is part of a whole loan with an aggregate principal balance as of the Cut-off Date of approximately $649.428 million that is split between (i) a 17-month floating rate loan with five, one-year extension options (the “BX Industrial Portfolio Floating Rate Loan”) with an aggregate Cut-off Date principal balance of approximately $99.428 million, and (ii) a 77-month fixed rate loan (the “BX Industrial Portfolio Fixed Rate Loan”) with an aggregate Cut-off Date principal balance of $550.0 million that is comprised of comprised of (A) a senior fixed rate loan (the “BX Industrial Portfolio Senior Fixed Rate Loan”), with an aggregate Cut-off Date principal balance of $322.4 million and (B) a subordinate fixed rate loan (the “BX Industrial Portfolio Subordinate Fixed Rate Loan”), with an aggregate Cut-off Date principal balance of $227.6 million. The BX Industrial Portfolio Senior Fixed Rate Loan is senior to the BX Industrial Portfolio Subordinate Fixed Rate Loan and the BX Industrial Portfolio mortgage loan is comprised of a portion of the BX Industrial Portfolio Senior Fixed Rate Loan. The interest rate on the BX Industrial Portfolio Floating Rate Loan is LIBOR (subject to a floor of 0.000%) plus a spread of 1.450%. The BX Industrial Portfolio Fixed Rate Loan and the BX Industrial Portfolio Floating Rate Loan arepari passu,provided that voluntary prepayments are applied first to the BX Industrial Portfolio Floating Rate Loan until paid in full, and then to the BX Industrial Portfolio Fixed Rate Loan. The financial information presented in the Collateral Characteristics section above reflects the BX Industrial Portfolio Senior Fixed Rate Loan and approximately $58.283 million of the Cut-off Date principal balance of the BX Industrial Portfolio Floating Rate Loan, and excludes the remaining approximately $41.145 million of the Cut-off Date principal balance of the BX Industrial Portfolio Floating Rate Loan and the BX Industrial Portfolio Subordinate Fixed Rate Loan. For purposes of all calculations herein, LIBOR is assumed to be 0.500%. |
| (3) | In the case of Loan Nos. 3 and 4, Chase Center Tower I and the Chase Center Tower II, respectively (collectively, the “Chase Center Tower Mortgage Loans”), the mortgage loans are cross-collateralized and cross-defaulted. As such, all calculations herein are based on the aggregate Cut-off Date Balance, Maturity or ARD Balance, U/W NOI, U/W NCF and Debt Services of the Chase Center Tower Mortgage Loans. |
| (4) | With respect to Loan No. 8, the UW NCF DSCR is calculated using the sum of the first 12 whole loan principal and interest payments after the Cut-off Date based on the assumed principal and interest payment schedule set forth in Annex I of the Preliminary Prospectus. |
| (5) | In the case of Loan Nos. 3, 4, 7 and 18, the Cut-off Date LTV and the Maturity Date LTV are calculated by using an appraised value based on certain hypothetical assumptions. Refer to“Description of the Mortgage Pool—Assessments of Property Value and Condition” and“—Appraised Value” in the Preliminary Prospectus for additional details. |
| (6) | Excludes 21 mortgage loans that are interest-only for the entire term. |
| (7) | For a more detailed description of Lockbox / Cash Management, refer to“Description of the Mortgage Pool—Certain Terms of the Mortgage Loans—Mortgaged Property Accounts” in the Preliminary Prospectus. |
| (8) | Calculated only with respect to the Cut-off Date Balance of mortgage loans secured or partially secured by retail, office, industrial and mixed use properties. |
| THE INFORMATION IN THIS STRUCTURAL AND COLLATERAL TERM SHEET IS NOT COMPLETE AND MAY BE AMENDED PRIOR TO THE TIME OF SALE. THIS TERM SHEET IS NOT AN OFFER TO SELL THESE SECURITIES AND IT IS NOT A SOLICITATION OF AN OFFER TO BUY THESE SECURITIES IN ANY JURISDICTION WHERE THE OFFER OR SALE IS NOT PERMITTED. | ||
| |
3 of 130 | |
| Structural and Collateral Term Sheet | JPMDB 2020-COR7 | |
| Collateral Characteristics | ||
Mortgage Loan Seller | Number of | Number of | Aggregate | % of IPB |
| LCM | 16 | 52 | $442,192,626 | 48.6% |
| JPMCB | 7 | 7 | 159,900,000 | 17.6 |
| GACC(1) | 6 | 75 | 129,387,500 | 14.2 |
| GSMC(2) | 7 | 18 | 120,425,488 | 13.2 |
| JPMCB/GACC/GSMC(1)(3) | 1 | 1 | 57,500,000 | 6.3 |
| Total | 37 | 153 | $909,405,614 | 100.0% |
| (1) | Seven of the mortgage loans (16.4%), or the applicable portion thereof, being sold by GACC were originated or co-originated by an affiliate thereof, DBRI or DBNY, and will be transferred to GACC on or prior to the closing date. |
| (2) | In the case of Loan No. 9, the whole loan was co-originated by Goldman Sachs Bank USA and Bank of America, N.A. In the case of Loan No. 17, the whole loan was co-originated by Goldman Sachs Bank USA and Morgan Stanley Bank, N.A. In the case of Loan No. 18, the whole loan was co-originated by Goldman Sachs Bank USA, DBR Investments Co. Limited (“DBRI”) and JPMCB. |
| (3) | In the case of Loan No. 5, the whole loan was co-originated by Goldman Sachs Bank USA, JPMCB, DBRI and Wells Fargo Bank, National Association.JPMCB will be contributing $27.5 million of the Cut-off Date Balance, GACC will be contributing $20.0 million of the Cut-Off Date Balance and GSMC will be contributing $10.0 million of the Cut-Off Date Balance. |
| Ten Largest Mortgage Loans | |||||||||||
| No. | Loan Name | Mortgage Loan Seller | No. of Prop. | Cut-off Date Balance | % of IPB | SF / Units/ Rooms / Beds | Property Type | UW NCF DSCR(1)(2)(3)(4) | UW NOI Debt Yield(1)(3) (4) | Cut-off Date LTV(1) (3)(4)(5) | Maturity Date LTV(1)(3)(4)(5) |
| 1 | 530 Broadway | LCM | 1 | $80,000,000 | 8.8% | 1,060 | Mixed Use | 2.73x | 8.4% | 53.2% | 53.2% |
| 2 | LA County Office Portfolio | LCM | 5 | $69,000,000 | 7.6% | 199 | Office | 1.38x | 9.2% | 67.9% | 60.5% |
| 3 | Chase Center Tower I | JPMCB | 1 | $36,427,500 | 4.0% | 461 | Office | 3.87x | 13.9% | 31.3% | 31.3% |
| 4 | Chase Center Tower II | JPMCB | 1 | $31,072,500 | 3.4% | 461 | Office | 3.87x | 13.9% | 31.3% | 31.3% |
| 5 | 1633 Broadway | JPMCB / GACC / GSMC | 1 | $57,500,000 | 6.3% | 391 | Office | 3.84x | 11.9% | 41.7% | 41.7% |
| 6 | 12555 & 12655 Jefferson | LCM | 2 | $57,000,000 | 6.3% | 572 | Office | 1.80x | 7.6% | 59.5% | 59.5% |
| 7 | 675 Creekside Way | GACC | 1 | $43,400,000 | 4.8% | 469 | Office | 2.52x | 9.5% | 58.3% | 58.3% |
| 8 | Hampton Roads Office Portfolio | LCM | 22 | $42,387,896 | 4.7% | 99 | Office | 1.40x | 10.9% | 70.8% | 60.3% |
| 9 | 711 Fifth Avenue | GSMC | 1 | $40,000,000 | 4.4% | 1,603 | Mixed Use | 2.90x | 9.4% | 54.5% | 54.5% |
| 10 | BX Industrial Portfolio | GACC | 68 | $37,400,000 | 4.1% | 34 | Various | 3.57x | 12.8% | 39.6% | 39.6% |
| Top 3 Total/Weighted Average | 7 | $185,427,500 | 20.4% | 2.45x | 9.8% | 54.4% | 51.6% | ||||
| Top 5 Total/Weighted Average | 9 | $274,000,000 | 30.1% | 2.90x | 10.7% | 49.1% | 47.2% | ||||
| Top 10 Total/Weighted Average | 103 | $494,187,896 | 54.3% | 2.66x | 10.3% | 52.7% | 50.7% | ||||
| (1) | In the case of Loan Nos. 1, 3, 4, 5, 6, 7, 8, 9 and 10, the UW NCF DSCR, UW NOI Debt Yield, Cut-off Date LTV and Maturity Date LTV calculations include the related Pari Passu Companion Loan(s). In the case of Loan Nos. 3, 4, 5, 8 and 10, the UW NCF DSCR, UW NOI Debt Yield, Cut-off Date LTV and Maturity Date LTV calculations exclude the related Subordinate Companion Loan(s) and/or related mezzanine loan(s). |
| (2) | With respect to Loan No. 8, the UW NCF DSCR is calculated using the sum of the first 12 whole loan principal and interest payments after the Cut-off Date based on the assumed principal and interest payment schedule set forth in Annex I of the Preliminary Prospectus. |
| (3) | In the case of Loan No. 10, the UW NCF DSCR, UW NOI DY, Cut-off Date LTV and Maturity Date LTV calculations reflect the BX Industrial Portfolio Senior Fixed Rate Loan and approximately $58.283 million of the Cut-off Date principal balance of the BX Industrial Portfolio Floating Rate Loan, and exclude the remaining approximately $41.145 million of the Cut-off Date principal balance of the BX Industrial Portfolio Floating Rate Loan and the BX Industrial Portfolio Subordinate Fixed Rate Loan. The interest rate on the BX Industrial Portfolio Floating Rate Loan is LIBOR (subject to a floor of 0.000%) plus a spread of 1.450%. For purposes of all calculations herein regarding BX Industrial Portfolio Mortgage Loan, LIBOR is assumed to be 0.500%. |
| (4) | In the case of Loan Nos. 3 and 4, the Chase Center Tower Mortgage Loans, the mortgage loans are cross-collateralized and cross-defaulted. As such, all calculations herein are based on the aggregate Cut-off Date Balance, Maturity or ARD Balance, U/W NOI, U/W NCF and Debt Services of the Chase Center Tower Mortgage Loans. |
| (5) | In the case of Loan Nos. 3, 4 and 7, the Cut-off Date LTV and the Maturity Date LTV are calculated by using an appraised value based on certain hypothetical assumptions. Refer to “Description of the Mortgage Pool—Assessments of Property Value and Condition” and “—Appraised Value” in the Preliminary Prospectus for additional details. |
| THE INFORMATION IN THIS STRUCTURAL AND COLLATERAL TERM SHEET IS NOT COMPLETE AND MAY BE AMENDED PRIOR TO THE TIME OF SALE. THIS TERM SHEET IS NOT AN OFFER TO SELL THESE SECURITIES AND IT IS NOT A SOLICITATION OF AN OFFER TO BUY THESE SECURITIES IN ANY JURISDICTION WHERE THE OFFER OR SALE IS NOT PERMITTED. | ||
| |
4 of 130 | |
| Structural and Collateral Term Sheet | JPMDB 2020-COR7 | |
| Collateral Characteristics | ||
| Pari Passu Companion Loan Summary |
| Loan No. | Mortgage Loan | Note(s) | Original Balance ($) | Cut-off Date Balance ($) | Holder of Note | Lead Servicer for Whole Loan (Y/N)(1) | Master Servicer Under Lead Securitization | Special Servicer Under Lead Securitization |
| 1 | 530 Broadway | A-1, A-7, A-8, A-9 | $80,000,000 | $80,000,000 | JPMDB 2020-COR7 | Yes | Midland | Midland |
| A-2, A-3, A-4, A-5, A-6 | $130,000,000 | $130,000,000 | LCM | No | ||||
| Total | $210,000,000 | $210,000,000 | ||||||
| 3 | Chase Center Tower I | A-1-A, A-1-B, A-1-C | $54,641,250 | $54,641,250 | Benchmark 2020-IG2 | No | ||
| A-1-D, A-1-E | $36,427,500 | $36,427,500 | Benchmark 2020-IG3 | No | ||||
| A-1-F, A-1-G | $36,427,500 | $36,427,500 | JPMDB 2020-COR7 | No | ||||
| A-1-H | $18,213,750 | $18,213,750 | JPMCB | No | ||||
| Total Senior Notes | $145,710,000 | $145,710,000 | ||||||
| B-1(2) | $83,637,000 | $83,637,000 | Benchmark 2020-IG2 (Loan Specific Certificates) | Yes | Midland | Midland | ||
| C-1(2) | $94,453,000 | $94,453,000 | Third Party Investor | No | ||||
| Total | $323,800,000 | $323,800,000 | ||||||
| 4 | Chase Center Tower II | A-2-A, A-2-B, A-2-C | $46,608,750 | $46,608,750 | Benchmark 2020-IG2 | No | ||
| A-2-D, A-2-E | $31,072,500 | $31,072,500 | Benchmark 2020-IG3 | No | ||||
| A-2-F, A-2-G | $31,072,500 | $31,072,500 | JPMDB 2020-COR7 | No | ||||
| A-2-H | $15,536,250 | $15,536,250 | JPMCB | No | ||||
| Total Senior Notes | $124,290,000 | $124,290,000 | ||||||
| B-2(2) | $71,363,000 | $71,363,000 | Benchmark 2020-IG2 (Loan Specific Certificates) | Yes | Midland | Midland | ||
| C-2(2) | $80,547,000 | $80,547,000 | Third Party Investor | No | ||||
| Total | $276,200,000 | $276,200,000 | ||||||
| 5 | 1633 Broadway
| A-1-S-1, A-2-S-1, A-3-S-1, A-4-S-1 | $1,000,000 | $1,000,000 | BWAY 2019-1633 | No | ||
| A-1-C-4-A | $30,000,000 | $30,000,000 | GSBI | No | ||||
| A-1-C-2, A-2-C-5 | $60,000,000 | $60,000,000 | GSMS 2020-GC45 | No | ||||
| A-1-C-1, A-1-C-5, A-2-C-1-A | $110,000,000 | $110,000,000 | CGCMT 2020-GC46 | No | ||||
| A-1-C-3, A-1-C-6 | $65,000,000 | $65,000,000 | GSMS 2020-GC47 | No | ||||
| A-2-C-3-A, A-2-C-4-B, A-2-C-4-C, A-2-C-4-D, A-2-C-6 | $90,000,000 | $90,000,000 | DBRI | No | ||||
| A-3-C-2, A-2-C-3-B | $64,650,000 | $64,650,000 | Benchmark 2020-IG1 | No | ||||
| A-3-C-3, A-2-C-2-A | $70,000,000 | $70,000,000 | Benchmark 2020-IG2 | No | ||||
| A-3-C-4, A-2-C-4-A, A-2-C-7, A-1-C-7 | $80,000,000 | $80,000,000 | Benchmark 2020-IG3 | No | ||||
| A-2-C-1-B, A-3-C-1-B | $45,000,000 | $45,000,000 | Benchmark 2020-B16 | No | ||||
| A-3-C-5, A-3-C-6 | $50,000,000 | $50,000,000 | Benchmark 2020-B17 | No | ||||
| A-3-C-7, A-1-C-4-B, A-2-C-2-B | $57,500,000 | $57,500,000 | JPMDB 2020-COR7 | No | ||||
| A-3-C-1-A | $27,850,000 | $27,850,000 | JPMCB | No | ||||
| A-4-C-1, A-4-C-2 | $100,000,000 | $100,000,000 | BANK 2020-BNK25 | No | ||||
| A-4-C-6, A-4-C-7 | $40,000,000 | $40,000,000 | BANK 2020-BNK26 | No | ||||
| A-4-C-4, A-4-C-5 | $70,000,000 | $70,000,000 | WFCM 2020-C55 | No | ||||
| A-4-C-3 | $40,000,000 | $40,000,000 | WFB | No | ||||
| Total Senior Notes | $1,001,000,000 | $1,001,000,000 | ||||||
| B-1, B-2, B-3, B-4(2) | $249,000,000 | $249,000,000 | BWAY 2019-1633 | Yes | KeyBank | Situs | ||
| Total | $1,250,000,000 | $1,250,000,000 | ||||||
| 6 | 12555 & 12655 Jefferson | A-1 | $54,000,000 | $54,000,000 | JPMDB 2019-COR6 | Yes | Midland | Midland |
| A-2, A-3 | $57,000,000 | $57,000,000 | JPMDB 2020-COR7 | No | ||||
| Total | $111,000,000 | $111,000,000 | ||||||
| 7 | 675 Creekside Way | A-1, A-4 | $43,400,000 | $43,400,000 | JPMDB 2020-COR7 | Yes | Midland | Midland |
| A-2, A-3 | $40,000,000 | $40,000,000 | DBRI | |||||
| Total | $83,400,000 | $83,400,000 | ||||||
| 8 | Hampton Roads Office Portfolio | A-1, A-5 | $50,000,000 | $49,288,251 | JPMCC 2019-COR5 | Yes | Midland | Midland |
| A-3, A-4 | $40,000,000 | $39,430,601 | JPMDB 2019-COR6 | No | ||||
| A-2, A-6 | $43,000,000 | $42,387,896 | JPMDB 2020-COR7 | No | ||||
| Total | $133,000,000 | $131,106,747 | ||||||
| 9 | 711 Fifth Avenue | A-1-1, A-1-10 | $62,500,000 | $62,500,000 | GSMS 2020-GC47 | Yes | Wells | KeyBank |
| A-1-2, A-1-3, A-1-4, A-1-5, A-1-8, A-1-9, A-1-11, A-1-12, A-1-13, A-1-14, A-1-15, A-1-16, A-1-17 | $279,000,000 | $279,000,000 | GSBI | No | ||||
| A-1-6, A-1-7 | $40,000,000 | $40,000,000 | JPMDB 2020-COR7 | No | ||||
| A-2-1, A-2-2, A-2-3, A-2-4 | $163,500,000 | $163,500,000 | BANA | No | ||||
| Total | $545,000,000 | $545,000,000 |
| THE INFORMATION IN THIS STRUCTURAL AND COLLATERAL TERM SHEET IS NOT COMPLETE AND MAY BE AMENDED PRIOR TO THE TIME OF SALE. THIS TERM SHEET IS NOT AN OFFER TO SELL THESE SECURITIES AND IT IS NOT A SOLICITATION OF AN OFFER TO BUY THESE SECURITIES IN ANY JURISDICTION WHERE THE OFFER OR SALE IS NOT PERMITTED. | ||
| |
5 of 130 | |
| Structural and Collateral Term Sheet | JPMDB 2020-COR7 | |
| Collateral Characteristics | ||
| 10 | BX Industrial Portfolio | A-1-A-1 | $80,000,000 | $80,000,000 | Benchmark 2020-IG3 | No | ||
| A-1-A-2, A-1-A-3, A-1-A-4, A-1-A-6, A-1-A-7 | $205,000,000 | $205,000,000 | DBRI | No | ||||
| A-1-A-5, A-1-A-8 | $37,400,000 | $37,400,000 | JPMDB 2020-COR7 | No | ||||
| Total Senior Fixed Rate Notes | $322,400,000 | $322,400,000 | ||||||
| A-1-B(2) | $72,600,000 | $72,600,000 | Benchmark 2020-IG3 (Loan-Specific Certificates) | No | ||||
| A-1-C-1, A-1-C-2(2) | $110,000,000 | $110,000,000 | Third Party Investor | No | ||||
| A-1-D(2) | $45,000,000 | $45,000,000 | Third Party Investor | Yes(3) | Midland | Midland | ||
| Total Fixed Rate Notes | $550,000,000 | $550,000,000 | ||||||
| A-2 (Floating Rate Note) | $99,427,615 | $99,427,615 | Deutsche Bank AG, London Branch | No | ||||
| Total | $649,427,615 | $649,427,615 | ||||||
| 14 | Los Angeles Leased Fee Portfolio | A-1 | $61,000,000 | $61,000,000 | JPMDB 2019-COR6 | Yes | Midland | Midland |
| A-2 | $24,000,000 | $24,000,000 | JPMDB 2020-COR7 | No | ||||
| Total | $85,000,000 | $85,000,000 | ||||||
| 17 | City National Plaza
| A-1, A-2, A-3, A-4 | $330,000,000 | $330,000,000 | MSC 2020-CNP | Yes | KeyBank | KeyBank |
| A-5 | $50,000,000 | $50,000,000 | GSMS 2020-GC47 | No | ||||
| A-6 | $70,000,000 | $70,000,000 | Benchmark 2020-IG2 | No | ||||
| A-7, A-8 | $80,000,000 | $80,000,000 | Benchmark 2020-IG3 | No | ||||
| A-9 | $20,000,000 | $20,000,000 | JPMDB 2020-COR7 | No | ||||
| Total | $550,000,000 | $550,000,000 | ||||||
| 18 | Moffett Towers Buildings A, B & C | A-1-C-1, A-1-C-8 | $65,000,000 | $65,000,000 | GSMS 2020-GC47 | No(4) | ||
| A-1-C-5 | $20,000,000 | $20,000,000 | JPMDB 2020-COR7 | No | ||||
| A-1-C-2, A-1-C-3, A-1-C-6, A-1-C-7 A-1-C-9, A-1-C-10 | $128,100,000 | $128,100,000 | GSBI | No | ||||
| A-1-S-1, A-2-S-1. A-3-S-1 | $1,000,000 | $1,000,000 | MOFT 2020-ABC | No | ||||
| A-1-C-4, A-2-C-1 | $80,000,000 | $80,000,000 | Benchmark 2020-IG3 | No | ||||
| A-2-C-2, A-3-C-2, A-3-C-4 | $69,450,000 | $69,450,000 | Benchmark 2020-IG2 | No | ||||
| A-2-C-3, A-2-C-4, A-3-C-1, A-3-C-3 | $79,450,000 | $79,450,000 | Benchmark 2020-B17 | No | ||||
| Total Senior Notes | $443,000,000 | $443,000,000 | ||||||
| B-1, B-2, B-3(2) | $327,000,000 | $327,000,000 | MOFT 2020-ABC | Yes(4) | KeyBank | Situs | ||
| Total | $770,000,000 | $770,000,000 |
| THE INFORMATION IN THIS STRUCTURAL AND COLLATERAL TERM SHEET IS NOT COMPLETE AND MAY BE AMENDED PRIOR TO THE TIME OF SALE. THIS TERM SHEET IS NOT AN OFFER TO SELL THESE SECURITIES AND IT IS NOT A SOLICITATION OF AN OFFER TO BUY THESE SECURITIES IN ANY JURISDICTION WHERE THE OFFER OR SALE IS NOT PERMITTED. | ||
| |
6 of 130 | |
| Structural and Collateral Term Sheet | JPMDB 2020-COR7 | |
| Collateral Characteristics | ||
| 21 | PCI Pharma Portfolio | A-1 | $40,000,000 | $40,000,000 | COMM 2019-GC44 | Yes | Midland | Rialto |
| A-2, A-4, A-6 | $35,000,000 | $35,000,000 | GSMS 2020-GC45 | No | ||||
| A-3 | $16,750,000 | $16,750,000 | GSMS 2020-GC47 | No | ||||
| A-5, A-7 | $16,750,000 | $16,750,000 | JPMDB 2020-COR7 | No | ||||
| Total | $108,500,000 | $108,500,000 | ||||||
| 23 | Apollo Education Group HQ Campus | A-1 | $50,000,000 | $50,000,000 | BMARK 2020-B17 | Yes | Midland | Midland |
| A-2 | $26,500,000 | $26,500,000 | JPMCB | No | ||||
| A-3 | $15,000,000 | $15,000,000 | JPMDB 2020-COR7 | No | ||||
| Total | $91,500,000 | $91,500,000 | ||||||
| 26 | Belvedere Place | A-1 | $32,750,000 | $32,750,000 | JPMDB 2019-COR6 | Yes | Midland | Midland |
| A-2 | $11,250,000 | $11,250,000 | JPMDB 2020-COR7 | No | ||||
| Total | $44,000,000 | $44,000,000 | ||||||
| 27 | Staples Headquarters | A-1 | $50,000,000 | $50,000,000 | CGCMT 2020-GC46 | Yes | Midland | CWCapital |
| A-2, A-3-1 | $30,000,000 | $30,000,000 | BMARK 2020-B17 | No | ||||
| A-3-2 | $10,000,000 | $10,000,000 | JPMDB 2020-COR7 | No | ||||
| Total | $90,000,000 | $90,000,000 | ||||||
| 28 | NOV Headquarters | A-1 | $20,000,000 | $20,000,000 | JPMCC 2019-COR5 | Yes | Midland | Midland |
| A-2 | $9,200,000 | $9,200,000 | JPMDB 2019-COR6 | No | ||||
| A-3 | $10,000,000 | $10,000,000 | JPMDB 2020-COR7 | No | ||||
| Total | $39,200,000 | $39,200,000 | ||||||
| 33 | Midland Atlantic Portfolio | A-1 | $23,000,000 | $23,000,000 | CGCMT 2020-GC46 | Yes | Midland | CWCapital |
| A-2 | $14,500,000 | $14,500,000 | GSMS 2020-GC47 | No | ||||
| A-3 | $7,500,000 | $7,500,000 | JPMDB 2020-COR7 | No | ||||
| Total | $45,000,000 | $45,000,000 |
| (1) | In the case of Loan Nos. 3, 4, 5, 10 and 18, the related Whole Loan will be serviced under the applicable controlling note securitization. During the continuance of a control appraisal period, the controlling noteholder will be the holder of the note as described further for each Whole Loan in the Preliminary Prospectus. See “Description of the Mortgage Pool—The Whole Loans” for more details. |
| (2) | Each note represents a subordinate companion loan. |
| (3) | The initial controlling note is the BX Industrial Portfolio Note A-1-D, so long as no control appraisal period with respect to the BX Industrial Portfolio Note A-1-D is continuing If and for so long as a control appraisal period with respect to the BX Industrial Portfolio Note A-1-D has occurred and is continuing, then the controlling notes will be the BX Industrial Portfolio Note A-1-C-1 and the BX Industrial Portfolio Note A-1-C-2, so long as no control appraisal period with respect to the BX Industrial Portfolio Note A-1-C-1 and the BX Industrial Portfolio Note A-1-C-2 is continuing. If and for so long as a control appraisal period with respect to the BX Industrial Portfolio Note A-1-C-1 the BX Industrial Portfolio Note A-1-C-2 has occurred and is continuing, then the controlling notes will be the BX Industrial Portfolio Note A-1-B, so long as no control appraisal period with respect to the BX Industrial Portfolio Note A-1-B is continuing. If a control appraisal period with respect to the BX Industrial Portfolio Note A-1-B has occurred and is continuing, then the controlling note will be Note A-1-A-1. See “Description of the Mortgage Pool—The Whole Loans—The Serviced AB Whole Loans—The BX Industrial Portfolio Whole Loan” in the Preliminary Prospectus. |
| (4) | The initial controlling notes are Note B-1, B-2 and B-3, so long as no Moffett Towers Buildings A, B & C control appraisal period has occurred and is continuing. If and for so long as a Moffett Towers Buildings A, B & C control appraisal period has occurred and is continuing, then the controlling note will be the Note A-1-C-1. See “Description of the Mortgage Pool—The Whole Loans—The Non-Serviced AB Whole Loans—The Moffett Towers Buildings A, B & C Whole Loan” in the Preliminary Prospectus. The Moffett Towers Buildings A, B & C Whole Loan will be serviced pursuant to the MOFT 2020-ABC trust and servicing agreement. For so long as no Moffett Towers Buildings A, B & C control appraisal period has occurred and is continuing, the control rights of the Moffett Towers Buildings A, B & C Subordinate Companion Notes will be exercisable by the controlling class under the MOFT 2020-ABC trust and servicing agreement. |
| THE INFORMATION IN THIS STRUCTURAL AND COLLATERAL TERM SHEET IS NOT COMPLETE AND MAY BE AMENDED PRIOR TO THE TIME OF SALE. THIS TERM SHEET IS NOT AN OFFER TO SELL THESE SECURITIES AND IT IS NOT A SOLICITATION OF AN OFFER TO BUY THESE SECURITIES IN ANY JURISDICTION WHERE THE OFFER OR SALE IS NOT PERMITTED. | ||
| |
7 of 130 | |
| Structural and Collateral Term Sheet | JPMDB 2020-COR7 | |
| Collateral Characteristics | ||
| Additional Debt Summary |
No. | Loan Name | Trust | Subordinate | Total Debt | Mortgage | Total Debt | Mortgage | Total | Mortgage | Total |
| 3 | Chase Center Tower I | $36,427,500 | $178,090,000 | $323,800,000 | 3.87x | 1.36x | 31.3% | 69.5% | 13.9% | 6.2% |
| 4 | Chase Center Tower II | $31,072,500 | $151,910,000 | $276,200,000 | 3.87x | 1.36x | 31.3% | 69.5% | 13.9% | 6.2% |
| 5 | 1633 Broadway | $57,500,000 | $249,000,000 | $1,250,000,000 | 3.84x | 3.08x | 41.7% | 52.1% | 11.9% | 9.5% |
| 8 | Hampton Roads Office Portfolio | $42,387,896 | $19,715,300 | $150,822,047 | 1.40x | 1.16x | 70.8% | 81.4% | 10.9% | 9.5% |
| 10 | BX Industrial Portfolio | $37,400,000 | $268,744,955 | $649,427,615 | 3.57x | 2.09x | 39.6% | 67.6% | 12.8% | 7.5% |
| 13 | Peace Coliseum | $34,500,000 | $12,220,159 | $46,720,159 | 2.93x | 2.03x | 43.1% | 58.4% | 13.7% | 10.1% |
| 18 | Moffett Towers Buildings A, B & C | $20,000,000 | $327,000,000 | $770,000,000 | 3.63x | 2.09x | 38.7% | 67.2% | 13.1% | 7.5% |
| (1) | In the case of Loan Nos. 8 and 13, Subordinate Debt Cut-off Date Balance represents one or more mezzanine loans. In the case of Loan Nos. 3, 4, 5, 10 and 18, Subordinate Debt Cut-off Date Balance represents one or more Subordinate Companion Loans. |
| (2) | In the case of Loan Nos. 3, 4, 5, 8, 10 and 18, the UW NCF DSCR, UW NOI Debt Yield and Cut-off Date LTV calculations include the related Pari Passu Companion Loan(s). In the case of Loan Nos. 3, 4, 5, 8, 10, 13 and 18, the UW NCF DSCR, UW NOI Debt Yield and Cut-off Date LTV calculations exclude the related Subordinate Companion Loan(s) and/or related mezzanine loan(s). |
| (3) | With respect to Loan No. 8, the UW NCF DSCR is calculated using the sum of the first 12 whole loan principal and interest payments after the Cut-off Date based on the assumed principal and interest payment schedule set forth in Annex I of the Preliminary Prospectus. |
| (4) | In the case of Loan No. 10, the Mortgage Loan UW NCF DSCR, Mortgage Loan Cut-off Date LTV and Mortgage Loan UW NOI DY calculations reflect the BX Industrial Portfolio Senior Fixed Rate Loan and approximately $58.283 million of the Cut-off Date principal balance of the BX Industrial Portfolio Floating Rate Loan, and exclude the remaining approximately $41.145 million of the Cut-off Date principal balance of the BX Industrial Portfolio Floating Rate Loan and the BX Industrial Portfolio Subordinate Fixed Rate Loan. The Total Debt UW NCF DSCR, Total Debt Cut-off Date LTV and Total Debt UW NOI DY calculations reflect the $550.0 million BX Industrial Portfolio Fixed Rate Loan and the approximately $99.428 million BX Industrial Portfolio Floating Rate Loan. The interest rate on the BX Industrial Portfolio Floating Rate Loan is LIBOR (subject to a floor of 0.000%) plus a spread of 1.450%. For purposes of all calculations herein, LIBOR is assumed to be 0.500%. |
| (5) | In the case of Loan Nos. 3 and 4, the Chase Center Tower Mortgage Loans, the mortgage loans are cross-collateralized and cross-defaulted. As such, all calculations herein are based on the aggregate Cut-off Date Balance, Maturity or ARD Balance, U/W NOI, U/W NCF and Debt Services of the Chase Center Tower Mortgage Loans. |
| (6) | In the case of Loan Nos. 3, 4 and 18, the Mortgage Loan Cut-off Date LTV and Total Debt Mortgage Loan LTV are calculated by using an appraised value based on certain hypothetical assumptions. Refer to “Description of the Mortgage Pool—Assessments of Property Value and Condition” and “—Appraised Value” in the Preliminary Prospectus for additional details. |
| THE INFORMATION IN THIS STRUCTURAL AND COLLATERAL TERM SHEET IS NOT COMPLETE AND MAY BE AMENDED PRIOR TO THE TIME OF SALE. THIS TERM SHEET IS NOT AN OFFER TO SELL THESE SECURITIES AND IT IS NOT A SOLICITATION OF AN OFFER TO BUY THESE SECURITIES IN ANY JURISDICTION WHERE THE OFFER OR SALE IS NOT PERMITTED. | ||
| |
8 of 130 | |
| Structural and Collateral Term Sheet | JPMDB 2020-COR7 | |
| Collateral Characteristics | ||
| Mortgaged Properties by Type(1) |
| Weighted Average | |||||||||
| Property Type | Property Subtype | Number of Properties | Cut-off Date Principal Balance | % of IPB | Occupancy | UW NCF DSCR(2)(3)(4)(5) | UW NOI Debt Yield(2)(4)(5) | Cut-off Date LTV(2)(4) (5)(6) | Maturity Date LTV(2)(4)(5)(6) |
| Office | Suburban | 43 | $371,227,845 | 40.8% | 97.1% | 2.14x | 10.6% | 60.5% | 55.7% |
| CBD | 7 | 237,250,000 | 26.1 | 93.3% | 3.10x | 11.2% | 47.3% | 45.5% | |
| Medical | 4 | 8,025,000 | 0.9 | 100.0% | 1.67x | 9.5% | 58.6% | 53.0% | |
| Suburban Flex | 2 | 3,310,835 | 0.4 | 100.0% | 2.61x | 9.5% | 65.4% | 65.4% | |
| Subtotal: | 56 | $619,813,681 | 68.2% | 95.7% | 2.50x | 10.8% | 55.4% | 51.9% | |
| Mixed Use | Office/Retail | 3 | $140,500,000 | 15.4% | 92.1% | 2.64x | 9.1% | 55.9% | 55.0% |
| Multifamily/Retail | 2 | 20,150,000 | 2.2 | 100.0% | 1.92x | 7.9% | 58.2% | 56.6% | |
| Subtotal: | 5 | $160,650,000 | 17.7% | 93.1% | 2.55x | 8.9% | 56.2% | 55.2% | |
| Industrial | Warehouse/Distribution | 41 | $29,725,958 | 3.3% | 93.7% | 3.40x | 12.2% | 44.2% | 44.2% |
| Flex | 13 | 10,436,859 | 1.1 | 94.4% | 2.67x | 12.0% | 53.4% | 46.5% | |
| Manufacturing | 5 | 8,573,623 | 0.9 | 98.9% | 1.85x | 9.1% | 67.5% | 57.1% | |
| R&D/Flex | 2 | 7,773,182 | 0.9 | 100.0% | 2.63x | 9.6% | 64.8% | 64.8% | |
| Warehouse/Storage | 3 | 3,203,132 | 0.4 | 21.0% | 3.57x | 12.8% | 39.6% | 39.6% | |
| Warehouse | 3 | 1,798,925 | 0.2 | 91.8% | 3.28x | 11.8% | 47.5% | 47.5% | |
| Subtotal: | 67 | $61,511,680 | 6.8% | 91.5% | 2.97x | 11.4% | 51.5% | 48.8% | |
| Retail | Anchored | 7 | $23,304,288 | 2.6% | 96.7% | 1.93x | 11.7% | 66.0% | 55.6% |
| Single Tenant | 2 | 4,537,500 | 0.5 | 100.0% | 1.38x | 8.1% | 75.0% | 61.8% | |
| Shadow Anchored | 1 | 371,200 | 0.0 | 79.7% | 1.42x | 8.9% | 70.1% | 59.0% | |
| Subtotal: | 10 | $28,212,988 | 3.1% | 97.0% | 1.83x | 11.0% | 67.5% | 56.6% | |
| Other | Leased Fee | 13 | $24,717,266 | 2.7% | 97.1% | 1.80x | 6.4% | 62.3% | 62.3% |
| Subtotal: | 13 | $24,717,266 | 2.7% | 97.1% | 1.80x | 6.4% | 62.3% | 62.3% | |
| Multifamily | Garden | 1 | $8,800,000 | 1.0% | 95.2% | 2.46x | 14.3% | 51.1% | 41.4% |
| Subtotal: | 1 | $8,800,000 | 1.0% | 95.2% | 2.46x | 14.3% | 51.1% | 41.4% | |
| Manufactured Housing | Manufactured Housing | 1 | $5,700,000 | 0.6% | 82.0% | 2.29x | 9.7% | 42.2% | 42.2% |
| Subtotal: | 1 | $5,700,000 | 0.6% | 82.0% | 2.29x | 9.7% | 42.2% | 42.2% | |
| 153 | 909,405,614 | 100.0% | 94.9% | 2.50x | 10.4% | 55.7% | 52.5% | ||
| (1) | Because this table presents information relating to the mortgaged properties and not mortgage loans, the information for mortgage loans secured by more than one mortgaged property is based on allocated loan amounts. |
| (2) | In the case of Loan Nos. 1, 3, 4, 5, 6, 7, 8, 9, 10, 14, 17, 18, 21, 23, 26, 27, 28 and 33, the UW NCF DSCR, UW NOI Debt Yield, Cut-off Date LTV and Maturity Date LTV calculations include the related Pari Passu Companion Loan(s). In the case of Loan Nos. 3, 4, 5, 8, 10, 13 and 18, the UW NCF DSCR, UW NOI Debt Yield, Cut-off Date LTV and Maturity Date LTV calculations exclude the related Subordinate Companion Loan(s) and/or related mezzanine loan(s). |
| (3) | With respect to Loan No. 8, the UW NCF DSCR is calculated using the sum of the first 12 whole loan principal and interest payments after the Cut-off Date based on the assumed principal and interest payment schedule set forth in Annex I of the Preliminary Prospectus. |
| (4) | In the case of Loan No. 10, the UW NCF DSCR, UW NOI DY, Cut-off Date LTV and Maturity Date LTV calculations reflect the BX Industrial Portfolio Senior Fixed Rate Loan and approximately $58.283 million of the Cut-off Date principal balance of the BX Industrial Portfolio Floating Rate Loan, and exclude the remaining approximately $41.145 million of the Cut-off Date principal balance of the BX Industrial Portfolio Floating Rate Loan and the BX Industrial Portfolio Subordinate Fixed Rate Loan. The interest rate on the BX Industrial Portfolio Floating Rate Loan is LIBOR (subject to a floor of 0.000%) plus a spread of 1.450%. For purposes of all calculations herein, LIBOR is assumed to be 0.500%. |
| (5) | In the case of Loan Nos. 3 and 4, the Chase Center Tower Mortgage Loans, the mortgage loans are cross-collateralized and cross-defaulted. As such, all calculations herein are based on the aggregate Cut-off Date Balance, Maturity or ARD Balance, U/W NOI, U/W NCF and Debt Services of the Chase Center Tower Mortgage Loans. |
| (6) | In the case of Loan Nos. 3, 4, 7 and 18, the Cut-off Date LTV and the Maturity Date LTV are calculated by using an appraised value based on certain hypothetical assumptions. Refer to “Description of the Mortgage Pool—Assessments of Property Value and Condition” and “—Appraised Value” in the Preliminary Prospectus for additional details. |
| THE INFORMATION IN THIS STRUCTURAL AND COLLATERAL TERM SHEET IS NOT COMPLETE AND MAY BE AMENDED PRIOR TO THE TIME OF SALE. THIS TERM SHEET IS NOT AN OFFER TO SELL THESE SECURITIES AND IT IS NOT A SOLICITATION OF AN OFFER TO BUY THESE SECURITIES IN ANY JURISDICTION WHERE THE OFFER OR SALE IS NOT PERMITTED. | ||
| |
9 of 130 | |
| Structural and Collateral Term Sheet | JPMDB 2020-COR7 | |
| Collateral Characteristics | ||
| Mortgaged Properties by Location(1) | ||||||||
Weighted Average | ||||||||
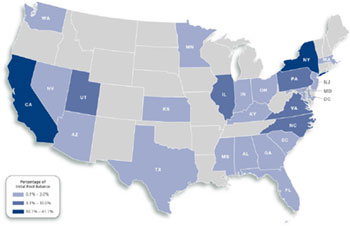
State | Number of Properties | Cut-off Date | % of | Occupancy | UW NCF DSCR(2)(3)(4)(5) | UW NOI Debt Yield(2)(4)(5) | Cut-off Date LTV(2)(4)(5)(6) | Maturity Date LTV(2)(3)(4)(5)(6) |
| California | 30 | 374,054,288 | 41.1% | 97.2% | 2.48x | 10.1% | 54.1% | 52.4% |
| New York | 5 | 191,350,000 | 21.0 | 94.4% | 3.05x | 9.9% | 50.3% | 49.7% |
| Virginia | 41 | 51,722,175 | 5.7 | 90.6% | 1.79x | 11.2% | 65.2% | 56.6% |
| Pennsylvania | 6 | 45,935,477 | 5.1 | 78.9% | 1.94x | 10.3% | 67.6% | 58.7% |
| North Carolina | 2 | 37,824,012 | 4.2 | 95.3% | 1.68x | 10.7% | 63.9% | 50.8% |
| Illinois | 19 | 36,122,088 | 4.0 | 97.7% | 2.52x | 12.1% | 58.8% | 52.3% |
| Utah | 1 | 34,500,000 | 3.8 | 100.0% | 2.93x | 13.7% | 43.1% | 43.1% |
| Florida | 2 | 24,625,000 | 2.7 | 100.0% | 1.93x | 9.1% | 68.3% | 66.9% |
| South Carolina | 2 | 22,300,000 | 2.5 | 92.6% | 1.77x | 11.0% | 68.6% | 61.9% |
| Arizona | 1 | 15,000,000 | 1.6 | 100.0% | 4.15x | 14.9% | 47.2% | 47.2% |
| Texas | 6 | 14,416,646 | 1.6 | 96.1% | 1.99x | 9.1% | 62.8% | 61.9% |
| Nevada | 1 | 13,850,000 | 1.5 | 100.0% | 1.45x | 8.8% | 68.6% | 56.2% |
| Massachusetts | 1 | 10,000,000 | 1.1 | 100.0% | 3.98x | 12.9% | 45.5% | 45.5% |
| Alabama | 2 | 7,732,073 | 0.9 | 99.6% | 1.39x | 8.2% | 74.4% | 61.4% |
| Washington | 1 | 5,700,000 | 0.6 | 82.0% | 2.29x | 9.7% | 42.2% | 42.2% |
| Kentucky | 9 | 5,595,084 | 0.6 | 93.4% | 2.92x | 11.6% | 48.8% | 45.4% |
| Mississippi | 2 | 4,049,221 | 0.4 | 100.0% | 1.55x | 9.2% | 64.3% | 56.0% |
| New Jersey | 3 | 3,120,597 | 0.3 | 14.2% | 3.57x | 12.8% | 39.6% | 39.6% |
| Minnesota | 7 | 2,963,388 | 0.3 | 93.2% | 3.57x | 12.8% | 39.6% | 39.6% |
| Ohio | 7 | 2,536,753 | 0.3 | 78.0% | 3.26x | 12.2% | 44.1% | 42.4% |
| Georgia | 1 | 1,975,000 | 0.2 | 100.0% | 1.67x | 9.5% | 58.6% | 53.0% |
| District of Columbia | 1 | 1,912,500 | 0.2 | 100.0% | 1.38x | 8.1% | 75.0% | 61.8% |
| Indiana | 1 | 812,549 | 0.1 | 70.5% | 1.42x | 8.9% | 70.1% | 59.0% |
| Maryland | 1 | 754,603 | 0.1 | 53.5% | 3.57x | 12.8% | 39.6% | 39.6% |
| Kansas | 1 | 554,161 | 0.1 | 100.0% | 3.57x | 12.8% | 39.6% | 39.6% |
| Total / Weighted Average | 153 | $909,405,614 | 100.0% | 94.9% | 2.50x | 10.4% | 55.7% | 52.5% |
| (1) | Because this table represents information relating to the mortgaged properties and not mortgage loans, the information for the mortgage loans secured by more than one mortgaged property is based on allocated loan amounts. |
| (2) | In the case of Loan Nos. 1, 3, 4, 5, 6, 7, 8, 9, 10, 14, 17, 18, 21, 23, 26, 27, 28 and 33, the UW NCF DSCR, UW NOI Debt Yield, Cut-off Date LTV and Maturity Date LTV calculations include the related Pari Passu Companion Loan(s). In the case of Loan Nos. 3, 4, 5, 8, 10, 13 and 18, the UW NCF DSCR, UW NOI Debt Yield, Cut-off Date LTV and Maturity Date LTV calculations exclude the related Subordinate Companion Loan(s) and/or related mezzanine loan(s). |
| (3) | With respect to Loan No. 8, the UW NCF DSCR is calculated using the sum of the first 12 whole loan principal and interest payments after the Cut-off Date based on the assumed principal and interest payment schedule set forth in Annex I of the Preliminary Prospectus. |
| (4) | In the case of Loan No. 10, the UW NCF DSCR, UW NOI DY, Cut-off Date LTV and Maturity Date LTV calculations reflect the BX Industrial Portfolio Senior Fixed Rate Loan and approximately $58.283 million of the Cut-off Date principal balance of the BX Industrial Portfolio Floating Rate Loan, and exclude the remaining approximately $41.145 million of the Cut-off Date principal balance of the BX Industrial Portfolio Floating Rate Loan and the BX Industrial Portfolio Subordinate Fixed Rate Loan. The interest rate on the BX Industrial Portfolio Floating Rate Loan is LIBOR (subject to a floor of 0.000%) plus a spread of 1.450%. For purposes of all calculations herein, LIBOR is assumed to be 0.500%. |
| (5) | In the case of Loan Nos. 3 and 4, the Chase Center Tower Mortgage Loans, the mortgage loans are cross-collateralized and cross-defaulted. As such, all calculations herein are based on the aggregate Cut-off Date Balance, Maturity or ARD Balance, U/W NOI, U/W NCF and Debt Services of the Chase Center Tower Mortgage Loans. |
| (6) | In the case of Loan Nos. 3, 4, 7 and 18, the Cut-off Date LTV and the Maturity Date LTV are calculated by using an appraised value based on certain hypothetical assumptions. Refer to “Description of the Mortgage Pool—Assessments of Property Value and Condition” and “—Appraised Value” in the Preliminary Prospectus for additional details. |
| THE INFORMATION IN THIS STRUCTURAL AND COLLATERAL TERM SHEET IS NOT COMPLETE AND MAY BE AMENDED PRIOR TO THE TIME OF SALE. THIS TERM SHEET IS NOT AN OFFER TO SELL THESE SECURITIES AND IT IS NOT A SOLICITATION OF AN OFFER TO BUY THESE SECURITIES IN ANY JURISDICTION WHERE THE OFFER OR SALE IS NOT PERMITTED. | ||
| |
10 of 130 | |
| Structural and Collateral Term Sheet | JPMDB 2020-COR7 | |
| Collateral Characteristics | ||
| Cut-off Date Principal Balance |
Weighted Average | |||||||||||
| Range of Cut-off Date Principal Balances | Number of Loans | Cut-off Date Principal Balance | % of IPB | Mortgage Rate | Remaining Loan Term | UW NCF DSCR(1)(2) (3)(4) | UW NOI Debt Yield(1)(3)(4) | Cut-off Date LTV(1)(3)(4)(5) | Maturity Date LTV(1)(3)(4)(5) | ||
| $4,954,198 | - | $9,999,999 | 9 | $62,804,687 | 6.9% | 3.82024% | 116 | 1.88x | 10.9% | 61.4% | 53.2% |
| $10,000,000 | - | $19,999,999 | 10 | 139,987,500 | 15.4 | 3.71039% | 109 | 2.38x | 10.0% | 60.7% | 57.6% |
| $20,000,000 | - | $39,999,999 | 11 | 317,325,532 | 34.9 | 3.62508% | 98 | 2.84x | 11.7% | 50.1% | 46.8% |
| $40,000,000 | - | $59,999,999 | 5 | 240,287,896 | 26.4 | 3.77402% | 107 | 2.53x | 9.9% | 56.2% | 54.3% |
| $60,000,000 | - | $80,000,000 | 2 | 149,000,000 | 16.4 | 3.47193% | 117 | 2.10x | 8.8% | 60.0% | 56.6% |
| Total / Weighted Average: | 37 | $909,405,614 | 100.0% | 3.66595% | 106 | 2.50x | 10.4% | 55.7% | 52.5% | ||
| Mortgage Interest Rates |
Weighted Average | |||||||||||
| Range of Mortgage Interest Rates | Number of Loans | Cut-off Date Principal Balance | % of IPB | Mortgage Rate | Remaining Loan Term | UW NCF DSCR(1)(2) (3)(4) | UW NOI Debt Yield(1)(3)(4) | Cut-off Date LTV(1)(3)(4)(5) | Maturity Date LTV(1)(3)(4)(5) | ||
| 2.44000% | - | 3.00000% | 3 | $157,500,000 | 17.3% | 2.84905% | 116 | 3.37x | 10.2% | 47.5% | 47.5% |
| 3.00001% | - | 3.50000% | 8 | 151,775,488 | 16.7 | 3.34391% | 109 | 2.82x | 10.5% | 55.0% | 53.5% |
| 3.50001% | - | 4.00000% | 16 | 379,754,730 | 41.8 | 3.69972% | 97 | 2.46x | 10.7% | 54.5% | 50.9% |
| 4.00001% | - | 4.50000% | 8 | 167,987,500 | 18.5 | 4.17677% | 116 | 1.82x | 10.0% | 62.4% | 57.1% |
| 4.50001% | - | 5.30000% | 2 | 52,387,896 | 5.8 | 5.17211% | 106 | 1.46x | 10.4% | 70.4% | 61.9% |
| Total / Weighted Average: | 37 | $909,405,614 | 100.0% | 3.66595% | 106 | 2.50x | 10.4% | 55.7% | 52.5% | ||
| Original Term to Maturity in Months |
| Weighted Average | |||||||||||
| Range of Original Term to Maturity in Months | Number of Loans | Cut-off Date Principal Balance | % of IPB | Mortgage Rate | Remaining Loan Term | UW NCF DSCR(1)(2) (3)(4) | UW NOI Debt Yield(1)(3)(4) | Cut-off Date LTV(1)(3)(4)(5) | Maturity Date LTV(1)(3)(4)(5) | ||
| 59 | - | 60 | 3 | $82,500,000 | 9.1% | 3.49076% | 57 | 3.92x | 14.1% | 34.2% | 34.2% |
| 77 | - | 84 | 2 | 80,800,000 | 8.9 | 3.62520% | 79 | 3.01x | 11.0% | 49.6% | 49.6% |
| 120 | - | 122 | 32 | 746,105,614 | 82.0 | 3.68974% | 115 | 2.29x | 10.0% | 58.8% | 54.8% |
| Total / Weighted Average: | 37 | $909,405,614 | 100.0% | 3.66595% | 106 | 2.50x | 10.4% | 55.7% | 52.5% | ||
| Remaining Term to Maturity in Months |
| Weighted Average | |||||||||||
| Range of Remaining Term to Maturity in Months | Number of Loans | Cut-off Date Principal Balance | % of IPB | Mortgage Rate | Remaining Loan Term | UW NCF DSCR(1)(2) (3)(4) | UW NOI Debt Yield(1)(3)(4) | Cut-off Date LTV(1)(3)(4)(5) | Maturity Date LTV(1)(3)(4)(5) | ||
| 56 | - | 84 | 5 | $163,300,000 | 18.0% | 3.55728% | 68 | 3.47x | 12.6% | 41.8% | 41.8% |
| 85 | - | 118 | 32 | 746,105,614 | 82.0 | 3.68974% | 115 | 2.29x | 10.0% | 58.8% | 54.8% |
| Total / Weighted Average: | 37 | $909,405,614 | 100.0% | 3.66595% | 106 | 2.50x | 10.4% | 55.7% | 52.5% | ||
| (1) | In the case of Loan Nos. 1, 3, 4, 5, 6, 7, 8, 9, 10, 14, 17, 18, 21, 23, 26, 27, 28 and 33, the UW NCF DSCR, UW NOI Debt Yield, Cut-off Date LTV and Maturity Date LTV calculations include the related Pari Passu Companion Loan(s). In the case of Loan Nos. 3, 4, 5, 8, 10, 13 and 18, the UW NCF DSCR, UW NOI Debt Yield, Cut-off Date LTV and Maturity Date LTV calculations exclude the related Subordinate Companion Loan(s) and/or related mezzanine loan(s). |
| (2) | With respect to Loan No. 8, the UW NCF DSCR is calculated using the sum of the first 12 whole loan principal and interest payments after the Cut-off Date based on the assumed principal and interest payment schedule set forth in Annex I of the Preliminary Prospectus. |
| (3) | In the case of Loan No. 10, the UW NCF DSCR, UW NOI DY, Cut-off Date LTV and Maturity Date LTV calculations reflect the BX Industrial Portfolio Senior Fixed Rate Loan and approximately $58.283 million of the Cut-off Date principal balance of the BX Industrial Portfolio Floating Rate Loan, and exclude the remaining approximately $41.145 million of the Cut-off Date principal balance of the BX Industrial Portfolio Floating Rate Loan and the BX Industrial Portfolio Subordinate Fixed Rate Loan. The interest rate on the BX Industrial Portfolio Floating Rate Loan is LIBOR (subject to a floor of 0.000%) plus a spread of 1.450%. For purposes of all calculations herein, LIBOR is assumed to be 0.500%. |
| (4) | In the case of Loan Nos. 3 and 4, the Chase Center Tower Mortgage Loans, the mortgage loans are cross-collateralized and cross-defaulted. As such, all calculations herein are based on the aggregate Cut-off Date Balance, Maturity or ARD Balance, U/W NOI, U/W NCF and Debt Services of the Chase Center Tower Mortgage Loans. |
| (5) | In the case of Loan Nos. 3, 4, 7 and 18, the Cut-off Date LTV and the Maturity Date LTV are calculated by using an appraised value based on certain hypothetical assumptions. Refer to “Description of the Mortgage Pool—Assessments of Property Value and Condition” and “—Appraised Value” in the Preliminary Prospectus for additional details. |
| THE INFORMATION IN THIS STRUCTURAL AND COLLATERAL TERM SHEET IS NOT COMPLETE AND MAY BE AMENDED PRIOR TO THE TIME OF SALE. THIS TERM SHEET IS NOT AN OFFER TO SELL THESE SECURITIES AND IT IS NOT A SOLICITATION OF AN OFFER TO BUY THESE SECURITIES IN ANY JURISDICTION WHERE THE OFFER OR SALE IS NOT PERMITTED. | ||
| |
11 of 130 | |
| Structural and Collateral Term Sheet | JPMDB 2020-COR7 | |
| Collateral Characteristics | ||
| Original Amortization Term in Months |
| Weighted Average | |||||||||
| Original Amortization Term in Months | Number of Loans | Cut-off Date Principal Balance | % of IPB | Mortgage Rate | Remaining Loan Term | UW NCF DSCR(1)(2) (3)(4) | UW NOI Debt Yield(1)(3)(4) | Cut-off Date LTV(1)(3)(4)(5) | Maturity Date LTV(1)(3)(4)(5) |
| Interest Only | 21 | $605,600,000 | 66.6% | 3.46440% | 102 | 2.95x | 10.5% | 50.0% | 50.0% |
| 360 | 16 | 303,805,614 | 33.4 | 4.06771% | 115 | 1.60x | 10.2% | 67.2% | 57.6% |
| Total / Weighted Average: | 37 | $909,405,614 | 100.0% | 3.66595% | 106 | 2.50x | 10.4% | 55.7% | 52.5% |
| Remaining Amortization Term in Months |
| Weighted Average | |||||||||||
| Range of Remaining Amortization Term in Months | Number of Loans | Cut-off Date Principal Balance | % of IPB | Mortgage Rate | Remaining Loan Term | UW NCF DSCR(1)(2) (3)(4) | UW NOI Debt Yield(1)(3)(4) | Cut-off Date LTV(1)(3)(4)(5) | Maturity Date LTV(1)(3)(4)(5) | ||
| Interest Only | 21 | $605,600,000 | 66.6% | 3.46440% | 102 | 2.95x | 10.5% | 50.0% | 50.0% | ||
| 346 | - | 360 | 16 | 303,805,614 | 33.4 | 4.06771% | 115 | 1.60x | 10.2% | 67.2% | 57.6% |
| Total / Weighted Average: | 37 | $909,405,614 | 100.0% | 3.66595% | 106 | 2.50x | 10.4% | 55.7% | 52.5% | ||
| Amortization Types |
Weighted Average | |||||||||
| Amortization Types | Number of Loans | Cut-off Date Principal Balance | % of IPB | Mortgage Rate | Remaining Loan Term | UW NCF DSCR(1)(2) (3)(4) | UW NOI Debt Yield(1)(3)(4) | Cut-off Date LTV(1)(3)(4)(5) | Maturity Date LTV(1)(3)(4)(5) |
| Interest Only | 21 | $605,600,000 | 66.6% | 3.46440% | 102 | 2.95x | 10.5% | 50.0% | 50.0% |
| IO-Balloon | 12 | 212,512,500 | 23.4 | 3.92441% | 116 | 1.60x | 9.9% | 67.2% | 58.6% |
| Balloon | 4 | 91,293,114 | 10.0 | 4.40130% | 111 | 1.59x | 11.0% | 67.3% | 55.2% |
| Total / Weighted Average: | 37 | $909,405,614 | 100.0% | 3.66595% | 106 | 2.50x | 10.4% | 55.7% | 52.5% |
| Underwritten Net Cash Flow Debt Service Coverage Ratios(1)(2)(3)(4) |
| Weighted Average | |||||||||||
| Range of Underwritten Net Cash Flow Debt Service Coverage Ratios | Number of Loans | Cut-off Date Principal Balance | % of IPB | Mortgage Rate | Remaining Loan Term | UW NCF DSCR(1)(2) (3)(4) | UW NOI Debt Yield(1)(3)(4) | Cut-off Date LTV(1)(3)(4)(5) | Maturity Date LTV(1)(3)(4)(5) | ||
| 1.19x | - | 1.99x | 16 | $369,830,126 | 40.7% | 4.05633% | 114 | 1.60x | 9.3% | 66.3% | 59.1% |
| 2.00x | - | 2.99x | 13 | 312,175,488 | 34.3 | 3.49580% | 111 | 2.57x | 9.9% | 55.7% | 54.9% |
| 3.00x | - | 4.59x | 8 | 227,400,000 | 25.0 | 3.26466% | 88 | 3.88x | 13.0% | 38.5% | 38.5% |
| Total / Weighted Average: | 37 | $909,405,614 | 100.0% | 3.66595% | 106 | 2.50x | 10.4% | 55.7% | 52.5% | ||
| (1) | In the case of Loan Nos. 1, 3, 4, 5, 6, 7, 8, 9, 10, 14, 17, 18, 21, 23, 26, 27, 28 and 33, the UW NCF DSCR, UW NOI Debt Yield, Cut-off Date LTV and Maturity Date LTV calculations include the related Pari Passu Companion Loan(s). In the case of Loan Nos. 3, 4, 5, 8, 10, 13 and 18, the UW NCF DSCR, UW NOI Debt Yield, Cut-off Date LTV and Maturity Date LTV calculations exclude the related Subordinate Companion Loan(s) and/or related mezzanine loan(s). |
| (2) | With respect to Loan No. 8, the UW NCF DSCR is calculated using the sum of the first 12 whole loan principal and interest payments after the Cut-off Date based on the assumed principal and interest payment schedule set forth in Annex I of the Preliminary Prospectus. |
| (3) | In the case of Loan No. 10, the UW NCF DSCR, UW NOI DY, Cut-off Date LTV and Maturity Date LTV calculations reflect the BX Industrial Portfolio Senior Fixed Rate Loan and approximately $58.283 million of the Cut-off Date principal balance of the BX Industrial Portfolio Floating Rate Loan, and exclude the remaining approximately $41.145 million of the Cut-off Date principal balance of the BX Industrial Portfolio Floating Rate Loan and the BX Industrial Portfolio Subordinate Fixed Rate Loan. The interest rate on the BX Industrial Portfolio Floating Rate Loan is LIBOR (subject to a floor of 0.000%) plus a spread of 1.450%. For purposes of all calculations herein, LIBOR is assumed to be 0.500%. |
| (4) | In the case of Loan Nos. 3 and 4, the Chase Center Tower Mortgage Loans, the mortgage loans are cross-collateralized and cross-defaulted. As such, all calculations herein are based on the aggregate Cut-off Date Balance, Maturity or ARD Balance, U/W NOI, U/W NCF and Debt Services of the Chase Center Tower Mortgage Loans. |
| (5) | In the case of Loan Nos. 3, 4, 7 and 18, the Cut-off Date LTV and the Maturity Date LTV are calculated by using an appraised value based on certain hypothetical assumptions. Refer to “Description of the Mortgage Pool—Assessments of Property Value and Condition” and “—Appraised Value” in the Preliminary Prospectus for additional details. |
| THE INFORMATION IN THIS STRUCTURAL AND COLLATERAL TERM SHEET IS NOT COMPLETE AND MAY BE AMENDED PRIOR TO THE TIME OF SALE. THIS TERM SHEET IS NOT AN OFFER TO SELL THESE SECURITIES AND IT IS NOT A SOLICITATION OF AN OFFER TO BUY THESE SECURITIES IN ANY JURISDICTION WHERE THE OFFER OR SALE IS NOT PERMITTED. | ||
| |
12 of 130 | |
| Structural and Collateral Term Sheet | JPMDB 2020-COR7 | |
| Collateral Characteristics | ||
| LTV Ratios as of the Cut-off Date(1)(3)(4)(5) |
| Weighted Average | |||||||||||
| Range of Cut-off Date LTVs | Number of Loans | Cut-off Date Principal Balance | % of IPB | Mortgage Rate | Remaining Loan Term | UW NCF DSCR(1)(2) (3)(4) | UW NOI Debt Yield(1)(3)(4) | Cut-off Date LTV(1)(3)(4)(5) | Maturity Date LTV(1)(3)(4)(5) | ||
| 31.3% | - | 49.9% | 10 | $267,600,000 | 29.4% | 3.40922% | 92 | 3.72x | 13.0% | 39.2% | 39.2% |
| 50.0% | - | 59.9% | 7 | 252,325,000 | 27.7 | 3.39676% | 110 | 2.43x | 8.8% | 55.9% | 55.4% |
| 60.0% | - | 64.9% | 7 | 124,351,020 | 13.7 | 3.63503% | 114 | 1.93x | 9.8% | 62.5% | 56.5% |
| 65.0% | - | 69.9% | 9 | 168,704,198 | 18.6 | 4.03435% | 114 | 1.67x | 9.4% | 67.9% | 62.2% |
| 70.0% | - | 75.0% | 4 | 96,425,396 | 10.6 | 4.47820% | 112 | 1.49x | 10.2% | 71.1% | 59.9% |
| Total / Weighted Average: | 37 | $909,405,614 | 100.0% | 3.66595% | 106 | 2.50x | 10.4% | 55.7% | 52.5% | ||
| LTV Ratios as of the Maturity Date(1)(3)(4)(5) |
Weighted Average | |||||||||||
| Range of Maturity Date LTVs | Number of Loans | Cut-off Date Principal Balance | % of IPB | Mortgage Rate | Remaining Loan Term | UW NCF DSCR(1)(2) (3)(4) | UW NOI Debt Yield(1)(3)(4) | Cut-off Date LTV(1)(3)(4)(5) | Maturity Date LTV(1)(3)(4)(5) | ||
| 31.3% | - | 39.9% | 4 | $124,900,000 | 13.7% | 3.52528% | 72 | 3.74x | 13.4% | 35.0% | 35.0% |
| 40.0% | - | 49.9% | 7 | 151,500,000 | 16.7 | 3.32752% | 110 | 3.63x | 12.8% | 43.3% | 42.8% |
| 50.0% | - | 59.9% | 14 | 375,680,218 | 41.3 | 3.49374% | 112 | 2.19x | 9.3% | 59.6% | 55.6% |
| 60.0% | - | 64.9% | 9 | 208,575,396 | 22.9 | 4.23195% | 113 | 1.59x | 9.3% | 67.5% | 61.2% |
| 65.0% | - | 68.8% | 3 | 48,750,000 | 5.4 | 3.98355% | 110 | 2.15x | 9.1% | 67.0% | 67.0% |
| Total / Weighted Average: | 37 | $909,405,614 | 100.0% | 3.66595% | 106 | 2.50x | 10.4% | 55.7% | 52.5% | ||
| Prepayment Protection |
Weighted Average | |||||||||
| Prepayment Protection | Number of Loans | Cut-off Date Principal Balance | % of IPB | Mortgage Rate | Remaining Loan Term | UW NCF DSCR(1)(2) (3)(4) | UW NOI Debt Yield(1)(3)(4) | Cut-off Date LTV(1)(3)(4)(5) | Maturity Date LTV(1)(3)(4)(5) |
| Defeasance | 31 | $764,067,718 | 84.0% | 3.62415% | 107 | 2.42x | 10.1% | 56.3% | 53.2% |
| Yield Maintenance | 2 | 79,787,896 | 8.8 | 4.47970% | 92 | 2.42x | 11.8% | 56.2% | 50.6% |
| Defeasance or Yield Maintenance | 4 | 65,550,000 | 7.2 | 3.16275% | 116 | 3.51x | 12.1% | 48.0% | 46.7% |
| Total / Weighted Average: | 37 | $909,405,614 | 100.0% | 3.66595% | 106 | 2.50x | 10.4% | 55.7% | 52.5% |
| Loan Purpose |
Weighted Average | |||||||||
| Loan Purpose | Number of Loans | Cut-off Date Principal Balance | % of IPB | Mortgage Rate | Remaining Loan Term | UW NCF DSCR(1)(2) (3)(4) | UW NOI Debt Yield(1)(3)(4) | Cut-off Date LTV(1)(3)(4)(5) | Maturity Date LTV(1)(3)(4)(5) |
| Refinance | 19 | $543,813,032 | 59.8% | 3.60009% | 104 | 2.63x | 10.6% | 53.5% | 50.0% |
| Acquisition | 17 | 331,092,582 | 36.4 | 3.71411% | 109 | 2.25x | 9.8% | 60.7% | 57.6% |
| Recapitalization | 1 | 34,500,000 | 3.8 | 4.24200% | 117 | 2.93x | 13.7% | 43.1% | 43.1% |
| Total / Weighted Average: | 37 | $909,405,614 | 100.0% | 3.66595% | 106 | 2.50x | 10.4% | 55.7% | 52.5% |
| (1) | In the case of Loan Nos. 1, 3, 4, 5, 6, 7, 8, 9, 10, 14, 17, 18, 21, 23, 26, 27, 28 and 33, the UW NCF DSCR, UW NOI Debt Yield, Cut-off Date LTV and Maturity Date LTV calculations include the related Pari Passu Companion Loan(s). In the case of Loan Nos. 3, 4, 5, 8, 10, 13 and 18, the UW NCF DSCR, UW NOI Debt Yield, Cut-off Date LTV and Maturity Date LTV calculations exclude the related Subordinate Companion Loan(s) and/or related mezzanine loan(s). |
| (2) | With respect to Loan No. 8, the UW NCF DSCR is calculated using the sum of the first 12 whole loan principal and interest payments after the Cut-off Date based on the assumed principal and interest payment schedule set forth in Annex I of the Preliminary Prospectus. |
| (3) | In the case of Loan No. 10, the UW NCF DSCR, UW NOI DY, Cut-off Date LTV and Maturity Date LTV calculations reflect the BX Industrial Portfolio Senior Fixed Rate Loan and approximately $58.283 million of the Cut-off Date principal balance of the BX Industrial Portfolio Floating Rate Loan, and exclude the remaining approximately $41.145 million of the Cut-off Date principal balance of the BX Industrial Portfolio Floating Rate Loan and the BX Industrial Portfolio Subordinate Fixed Rate Loan. The interest rate on the BX Industrial Portfolio Floating Rate Loan is LIBOR (subject to a floor of 0.000%) plus a spread of 1.450%. For purposes of all calculations herein, LIBOR is assumed to be 0.500%. |
| (4) | In the case of Loan Nos. 3 and 4, the Chase Center Tower Mortgage Loans, the mortgage loans are cross-collateralized and cross-defaulted. As such, all calculations herein are based on the aggregate Cut-off Date Balance, Maturity or ARD Balance, U/W NOI, U/W NCF and Debt Services of the Chase Center Tower Mortgage Loans. |
| (5) | In the case of Loan Nos. 3, 4, 7 and 18, the Cut-off Date LTV and the Maturity Date LTV are calculated by using an appraised value based on certain hypothetical assumptions. Refer to “Description of the Mortgage Pool—Assessments of Property Value and Condition” and “—Appraised Value” in the Preliminary Prospectus for additional details. |
| THE INFORMATION IN THIS STRUCTURAL AND COLLATERAL TERM SHEET IS NOT COMPLETE AND MAY BE AMENDED PRIOR TO THE TIME OF SALE. THIS TERM SHEET IS NOT AN OFFER TO SELL THESE SECURITIES AND IT IS NOT A SOLICITATION OF AN OFFER TO BUY THESE SECURITIES IN ANY JURISDICTION WHERE THE OFFER OR SALE IS NOT PERMITTED. | ||
| |
13 of 130 | |
| Structural and Collateral Term Sheet | JPMDB 2020-COR7 | |
| Collateral Characteristics | ||
| Previous Securitization History(1) |
| No. | Property Name | Cut-off Date Principal Balance | % of IPB | Location | Property Type | Previous Securitization |
| 11 | Whitehall III & V | $36,175,532 | 4.0% | Charlotte, North Carolina | Office | LNCR 2019-CRE2; LNCR 2019-CRE3 |
| 12 | Frick Building | $35,250,000 | 3.9% | Pittsburgh, Pennsylvania | Office | WFRBS 2011-C4 |
| 18 | Moffett Towers Buildings A, B & C | $20,000,000 | 2.2% | Sunnyvale, California | Office | COMM 2013-LC6; COMM 2013-CCRE6; COMM 2013-CCRE7 |
| 23 | Apollo Education Group HQ Campus | $15,000,000 | 1.6% | Phoenix, Arizona | Office | CGCMT 2015-GC29 |
| 29 | Briarcliff Apartments | $8,800,000 | 1.0% | Depew, New York | Multifamily | UBSCM 2012-C1 |
| 33 | Midland Atlantic Portfolio | $7,500,000 | 0.8% | Various | Retail | MSBAM 2012-C5 |
| (1) | The table above represents the properties for which the previously existing debt was securitized, based on information provided by the related borrower or obtained through searches of a third-party database. |
| THE INFORMATION IN THIS STRUCTURAL AND COLLATERAL TERM SHEET IS NOT COMPLETE AND MAY BE AMENDED PRIOR TO THE TIME OF SALE. THIS TERM SHEET IS NOT AN OFFER TO SELL THESE SECURITIES AND IT IS NOT A SOLICITATION OF AN OFFER TO BUY THESE SECURITIES IN ANY JURISDICTION WHERE THE OFFER OR SALE IS NOT PERMITTED. | ||
| |
14 of 130 | |
| Structural and Collateral Term Sheet | JPMDB 2020-COR7 | |
| Collateral Characteristics | ||
| COVID Update* |
| No. | Property Name | Mortgage Loan Seller | Information as of Date | Property Type | May Debt Service Payment Received (Yes/No) | June Debt Service Payment Received (Yes/No) | Forbearance or Other Debt Service Relief Requested (Yes/No) | Other Loan Modification Requested (Yes/No) | Lease Modification or Rent Relief Requested (Yes/No) | Occupied SF or Unit Count Making Full April Rent Payment (%) | UW Base Rent Paid (%) | Occupied SF or Unit Count Making Full May Rent Payment (%) | UW Base Rent Paid (%) |
| 1 | 530 Broadway(1) | LCM | 5/29/2020 | Mixed Use | Yes | Yes | No | No | Yes | 100.0% | 100.0% | 94.3% | 76.9% |
| 2 | LA County Office Portfolio(2) | LCM | 5/29/2020 | Office | Yes | Yes | No | No | Yes | 87.1% | 85.5% | 83.9% | 83.8% |
| 3 | Chase Center Tower I | JPMCB | 6/10/2020 | Office | Yes | Yes | No | No | No | 100.0% | 100.0% | 100.0% | 100.0% |
| 4 | Chase Center Tower II | JPMCB | 6/10/2020 | Office | Yes | Yes | No | No | No | 100.0% | 100.0% | 100.0% | 100.0% |
| 5 | 1633 Broadway | JPMCB / GACC / GSMC | 6/3/2020 | Office | Yes | Yes | No | No | Yes(3) | 86.5% | 89.9% | 86.5% | 89.9% |
| 6 | 12555 & 12655 Jefferson | LCM | 5/29/2020 | Office | Yes | Yes | No | No | No | 100.0% | 100.0% | 100.0% | 100.0% |
| 7 | 675 Creekside Way | GACC | 6/6/2020 | Office | Yes | Yes | No | No | No | 100.0% | 100.0% | 100.0% | 100.0% |
| 8 | Hampton Roads Office Portfolio(4) | LCM | 5/29/2020 | Office | Yes | Yes | No | Yes | No | 97.6% | 96.4% | 90.1% | 87.6% |
| 9 | 711 Fifth Avenue | GSMC | 6/11/2020 | Mixed Use | Yes | Yes | No | No | Yes(5) | 100.0%(6) | 81.3%(6) | 100.0%(6) | 72.4%(6) |
| 10 | BX Industrial Portfolio | GACC | 6/9/2020 | Various | NAP(7) | Yes | No | No | No | 96.5% | 97.9% | 93.8%(8) | 90.3%(8) |
| 11 | Whitehall III & V | LCM | 5/29/2020 | Office | Yes | Yes | No | No | No | 100.0% | 100.0% | 100.0% | 100.0% |
| 12 | Frick Building(9) | JPMCB | 6/1/2020 | Office | Yes | Yes | No | No | Yes | 96.9% | 96.6% | 96.8% | 96.5% |
| 13 | Peace Coliseum | LCM | 5/29/2020 | Office | Yes | Yes | No | No | No | 100.0% | 100.0% | 100.0% | 100.0% |
| 14 | Los Angeles Leased Fee Portfolio(10) | LCM | 5/29/2020 | Other | Yes | Yes | No | No | Yes | 100.0% | 100.0% | 100.0% | 100.0% |
| 15 | 1340 Concord(11) | JPMCB | 6/1/2020 | Office | Yes | Yes | No | No | No | 100.0% | 100.0% | 100.0% | 100.0% |
| 16 | 1333 Main Street(12) | LCM | 5/29/2020 | Mixed Use | Yes | Yes | No | No | No | 99.2% | 99.0% | 95.1% | 95.2% |
| 17 | City National Plaza | GSMC | 5/12/2020 | Office | Yes | Yes | No | No | Yes(13) | 92.1% | 92.3% | 91.0% | 90.8% |
| 18 | Moffett Tower A, B & C | GSMC | 5/5/2020 | Office | Yes | Yes | No | No | Yes(14) | 98.8% | 96.3% | 98.8% | 96.3% |
| 19 | Roscoe Office | GACC | 6/6/2020 | Office | Yes | Yes | No | No | No | 100.00% | 100.0% | 100.0% | 100.0% |
| 20 | Lava Ridge Business Center(15) | LCM | 5/29/2020 | Office | Yes | Yes | No | No | No | 98.4% | 98.1% | 98.4% | 98.1% |
| 21 | PCI Pharma Portfolio | GSMC | 6/8/2020 | Various | Yes | Yes | No | No | No | 100.0% | 100.0% | 100.0% | 100.0% |
| 22 | The Oliver(16) | JPMCB | 6/1/2020 | Mixed Use | Yes | Yes | No | No | Yes | 83.4% | 81.8% | 81.7% | 80.9% |
| 23 | Apollo Education Group HQ Campus | JPMCB | 6/5/2020 | Office | Yes | Yes | No | No | No | 100.0% | 100.0% | 100.0% | 100.0% |
| 24 | SHP Building IV(17) | LCM | 5/29/2020 | Office | Yes | Yes | No | No | Yes | 100.0% | 100.0% | 100.0% | 100.0% |
| 25 | GIP REIT Portfolio | GACC | 6/6/2020 | Various | Yes | Yes | No | No | No | 100.0% | 100.0% | 100.0% | 100.0% |
| 26 | Belvedere Place(18) | LCM | 5/29/2020 | Office | Yes | Yes | No | No | Yes | 100.0% | 100.0% | 97.7% | 97.5% |
| 27 | Staples Headquarters | GACC | 6/6/2020 | Office | Yes | Yes | No | No | No | 100.0% | 100.0% | 100.0% | 100.0% |
| 28 | NOV Headquarters | LCM | 5/29/2020 | Office | Yes | Yes | No | No | No | 100.0% | 100.0% | 100.0% | 100.0% |
| 29 | Briarcliff Apartments | GACC | 6/6/2020 | Multifamily | Yes | Yes | No | No | No | 98.7% | 98.8% | 97.5%(19) | 97.5%(20) |
| 30 | Stuart's Crossing | GSMC | 6/9/2020 | Retail | Yes | Yes | No | No | Yes(21) | 90.1% | 89.7% | 88.3% | 85.3% |
| 31 | KB Fresenius & DaVita Southeast Portfolio | LCM | 5/29/2020 | Office | Yes | Yes | No | No | No | 100.0% | 100.0% | 100.0% | 100.0% |
| 32 | Caton Crossings | GSMC | 6/9/2020 | Retail | Yes | Yes | No | No | Yes(22) | 98.1% | 96.6% | 88.5% | 86.1% |
| 33 | Midland Atlantic Portfolio | GSMC | 6/3/2020 | Retail | Yes | Yes | No | No | Yes(23) | 71.4% | 82.6%(24) | 78.6% | 89.5%(25) |
| 34 | Guidepost Montessori | LCM | 5/29/2020 | Office | Yes | Yes | No | No | No | 100.0% | 100.0% | 100.0% | 100.0% |
| 35 | Maple Grove RV Resort | LCM | 5/29/2020 | Manufactured Housing | Yes | Yes | No | No | No | 100.0% | 100.0% | 100.0% | 100.0% |
| 36 | 278 Court Street(26) | JPMCB | 6/1/2020 | Mixed Use | Yes | Yes | No | No | No | 100.0% | 100.0% | 100.0% | 100.0% |
| 37 | Willow Lake Tech Center(27) | LCM | 5/29/2020 | Industrial | Yes | Yes | No | Yes | No | 94.2% | 92.3% | 94.2% | 92.3% |
| * | The information in this chart is as of the date indicated and is based on information provided by the related borrowers. The information was based on reports and data aggregated from the related borrower’s existing financial and operational reporting systems and in certain circumstances was produced on an interim or ad hoc basis or was provided by the related borrower verbally. While we have no reason to believe the information presented is not accurate, we cannot assure you that it will not change or be updated in the future. |
| THE INFORMATION IN THIS STRUCTURAL AND COLLATERAL TERM SHEET IS NOT COMPLETE AND MAY BE AMENDED PRIOR TO THE TIME OF SALE. THIS TERM SHEET IS NOT AN OFFER TO SELL THESE SECURITIES AND IT IS NOT A SOLICITATION OF AN OFFER TO BUY THESE SECURITIES IN ANY JURISDICTION WHERE THE OFFER OR SALE IS NOT PERMITTED. | ||
| |
15 of 130 | |
| Structural and Collateral Term Sheet | JPMDB 2020-COR7 | |
| Collateral Characteristics | ||
| (1) | Two tenants representing approximately 36.9% of the underwritten base rent and 30.2% of net rentable area have requested rent relief. Tenants are currently undergoing conversations with the borrower. |
| (2) | Five tenants representing approximately 39.1% of the underwritten base rent and 38.2% of net rentable area have requested rent relief. Two tenants have been granted a rent deferral and three tenants are currently undergoing conversations with the borrower. |
| (3) | One tenant, representing approximately 8% of underwritten base rent, paid reduced May rent and has signed an amendment for reduced rent through year end 2020. The difference between the underwritten contractual rent per the original lease and the reduced rent pursuant to signed amendment is required to be repaid over a 36-month period beginning January 1, 2021 at an imputed interest rate of 3.75% (from April 1, 2020) on the amount of rent deferred. One tenant, representing approximately 4.7% of the underwritten base rent, has agreed to a three month rent deferral for the months of April, May and June 2020. |
| (4) | The borrower requested an amendment to the Mortgage Loan documents and the borrower, guarantor and Midland Loan Services, a Division of PNC Bank, National Association, as master servicer for the JPMCC 2019-COR5 securitization transaction have agreed to an amendment to temporarily defer the required monthly payments into the rollover and replacement reserve accounts, which deferred amounts will be required to be repaid. |
| (5) | One retail tenant, representing approximately 4.2% of net rentable area and 37.3% of underwritten base rent, agreed with the borrower sponsor to pay 50% abated rent for April, May and June 2020 with 50% recaptured by year end 2020 and the remaining 50% recaptured by the end of the first quarter 2021. The borrower sponsor is in the process of finalizing an agreement for rent relief with respect to the Polo Bar space (7,436 square feet of the 38,638 total square feet attributable to Ralph Lauren and 1.4% of underwritten base rent attributable to Ralph Lauren) which is temporarily closed. The agreement includes a $250,000 rent abatement and $250,000 rent deferral for May 2020 and a $250,000 rent deferral for June 2020 (totaling $750,000). |
| (6) | Includes (i) one tenant, representing 4.2% of net rentable area and 37.3% of underwritten base rent, that paid their rent in accordance with an agreement to pay 50% abated rent for the month of May and (ii) one tenant, representing 11.4% of net rentable area and 41.1% of the underwritten base rent, that is in the process of executing an agreement with the borrower sponsor and is anticipated to pay May and June rent upon execution of the amendment. |
| (7) | The BX Industrial Portfolio mortgage loan was originated in May 2020 and the first due date was June 9, 2020. |
| (8) | As of the May collections period, 11 tenants, representing approximately 6.2% of net rentable area and 9.7% of the underwritten base rent, either did not pay rent or paid a portion of their scheduled rent amount. |
| (9) | Two tenants representing 6.1% of underwritten base rent have delayed rent commencement dates due to delays in tenant build-outs as result of COVID related closures. Additionally, one retail tenant, representing 0.5% of underwritten base rent has been granted temporary rent relief due to ongoing COVID related disruption. |
| (10) | One tenant representing approximately 33.7% of the underwritten base rent and 34.4% of net rentable area has been granted a rent deferral. |
| (11) | The sole tenant at the property, Ultimate Software, has taken possession of its space and commenced paying rent. However, due to COVID related closures, the build-pit pf its space has been delayed. Ultimate Software is expected to take occupancy upon completion of its build-out. |
| (12) | Two tenants representing approximately 1.7% of the underwritten base rent and 2.0% of net rentable area have requested rent relief. Tenants are currently undergoing conversations with the borrower. |
| (13) | Eight tenants, representing 13.1% of the underwritten base rent, are in discussions with the borrower sponsor with regards to lease amendments and restructures. |
| (14) | The Occupied SF or Unit Count Making Full May Rent Payment (%) and UW Base Rent Paid (%) are based on the percentage of underwritten tenant leases with rent due in May. Based on the underwritten rent roll, there are a total of six tenant leases at the Moffett Towers Buildings A, B & C Mortgaged Property and four of those tenant leases owed rent for May. Of those four tenant leases, one tenant lease, representing approximately 4% of the expected May rent collection, did not pay. Two tenants, Google and Comcast, have executed leases; however, rent was not due under those leases for May. Google is currently building-out additional leased premises and Comcast is scheduled to relocate at the Moffett Towers Buildings A, B & C Mortgaged Property. Google has executed leases for Buildings B and C, representing approximately 56% of underwritten base rent. Google is expected to take possession of Building B in January 2021. Google is expected to take possession of its premises in Building C in two phases: 96,282 square feet was taken possession of in March 2020 and 84,914 square feet is expected to be taken possession of in July 2020. Google is expected to begin paying rent for Building B and Building C in June 2021 and September 2020, respectively. Comcast has executed a lease extension and relocation for Building C and is expected to take possession of the relocation space in November 2020 and begin paying rent on both the existing space and relocation space in March 2021, representing approximately 13% of underwritten base rent. |
| (15) | One tenant, representing approximately 1.8% of the underwritten base rent and 1.6% of net rentable area, has requested rent relief. Tenant is currently undergoing conversations with the borrower. |
| (16) | The loan sponsor is currently evaluating rent relief requests with respect to a large portion of the retail component of the property, accounting for 22.3% of underwritten base rent. |
| (17) | Two tenants, representing approximately 37.2% of the underwritten base rent and 37.3% of the net rentable area, have requested rent relief. One tenant has been granted a rent deferral and one tenant is currently undergoing conversations with the borrower. |
| (18) | Two tenants, representing approximately 46.2% of the underwritten base rent and 47.3% of net rentable area, have requested rent relief. Tenants are currently undergoing conversations with the borrower. |
| (19) | Calculated based on the number of units for which rent was fully paid divided by the total number of occupied units. |
| (20) | Calculated based on a 95.2% occupancy percentage reflected in the January 21, 2020 underwritten rent roll. As of borrower provided rent roll dated May 27, 2020, the occupancy was 96.8% occupied with a May rent collections rate of 97.5% by unit count. |
| (21) | Two tenants, representing 8.4% of the underwritten base rent, agreed with the borrower sponsor to defer rent for the months of April ($7,500), May ($11,441) and June ($7,500) to be repaid within 12 months. |
| (22) | Four tenants, representing 21.8% of the underwritten base rent, agreed with the borrower sponsor to defer rent for the months of April ($10,102), May ($18,004), June ($11,929) and July ($4,027) to be repaid within four months ($8,054), 12 months ($15,804) and 24 months ($20,204). |
| (23) | 23 tenants, representing approximately 27.3% of underwritten base rent, have requested rent relief. |
| (24) | Inclusive of additional April rent collections received in May and June. |
| (25) | Seven tenants, representing 9.4% of net rentable area, are permanently closed, have filed bankruptcy or are having their space marketed for lease by the landlord due to lease default and have been removed from the underwriting and UW May Base Rent Paid %. |
| (26) | The sole retail tenant at the property, Bobby Buka Dermatology, has taken possession of its space and commenced paying rent. Due to the COVID related stay-at-home order, build-out of the tenant space has been delayed by several weeks, though the tenant plans to take occupancy in the second half of 2020. |
| (27) | Borrower and Lender have agreed to (i) defer monthly payments to the Rollover and CapEx reserve accounts for a period of three months (5/6/20 commencement) and (ii) permit funds held in the Rollover reserve account may to be disbursed to pay debt service and other amounts due under the Mortgage Loan in the event there is a shortfall on the payment dates occurring in (i) May 2020, (ii) June 2020 and/or (iii) July 2020. The amendment also permits funds in the Rollover account to be disbursed to pay debt service and other amounts due under the Mortgage Loan in the event there is a shortfall on the payment dates occurring in May 2020, June 2020 and/or July 2020, provided that if on any such payment date, the Mortgage Loan (i) is in a cash management period, lender is permitted to disburse funds to itself from the Rollover reserve account and (ii) is not in a cash management period, such amounts from the rollover reserve will be disbursed to the borrower (up to a maximum of $8,750.67). Pursuant to the amendment, on the first to occur of an Event of Default (as defined in the Mortgage Loan documents) or the payment date in July 2021, the borrower is required to deliver to lender the deferred reserve deposits together with any amounts disbursed to the borrower pursuant to clause (ii) above. |
| THE INFORMATION IN THIS STRUCTURAL AND COLLATERAL TERM SHEET IS NOT COMPLETE AND MAY BE AMENDED PRIOR TO THE TIME OF SALE. THIS TERM SHEET IS NOT AN OFFER TO SELL THESE SECURITIES AND IT IS NOT A SOLICITATION OF AN OFFER TO BUY THESE SECURITIES IN ANY JURISDICTION WHERE THE OFFER OR SALE IS NOT PERMITTED. | ||
| |
16 of 130 | |
| Structural and Collateral Term Sheet | JPMDB 2020-COR7 |
| 530 Broadway | |
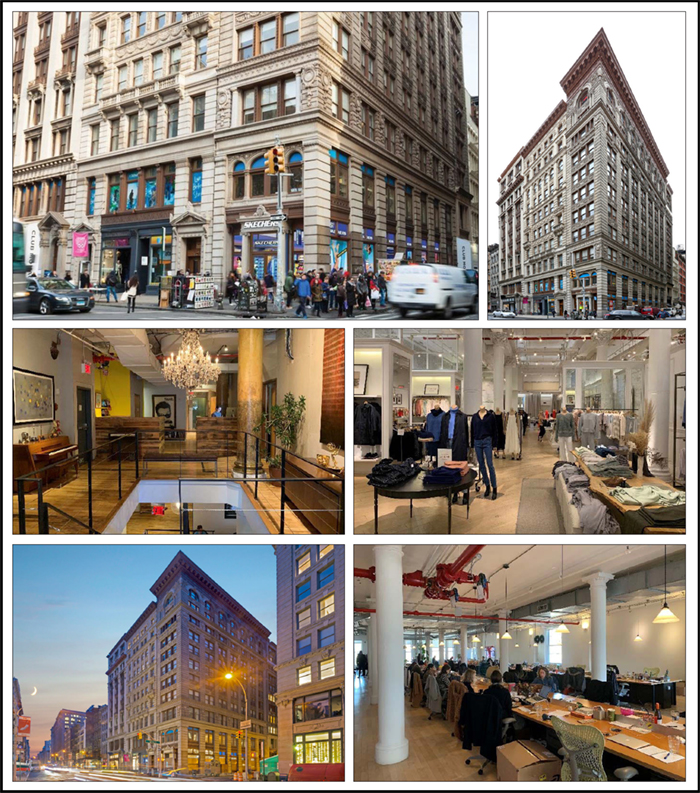
| THE INFORMATION IN THIS STRUCTURAL AND COLLATERAL TERM SHEET IS NOT COMPLETE AND MAY BE AMENDED PRIOR TO THE TIME OF SALE. THIS TERM SHEET IS NOT AN OFFER TO SELL THESE SECURITIES AND IT IS NOT A SOLICITATION OF AN OFFER TO BUY THESE SECURITIES IN ANY JURISDICTION WHERE THE OFFER OR SALE IS NOT PERMITTED. | ||
| |
17 of 130 | |
| Structural and Collateral Term Sheet | JPMDB 2020-COR7 |
| 530 Broadway | |

| THE INFORMATION IN THIS STRUCTURAL AND COLLATERAL TERM SHEET IS NOT COMPLETE AND MAY BE AMENDED PRIOR TO THE TIME OF SALE. THIS TERM SHEET IS NOT AN OFFER TO SELL THESE SECURITIES AND IT IS NOT A SOLICITATION OF AN OFFER TO BUY THESE SECURITIES IN ANY JURISDICTION WHERE THE OFFER OR SALE IS NOT PERMITTED. | ||
| |
18 of 130 | |
| Structural and Collateral Term Sheet | JPMDB 2020-COR7 |
| 530 Broadway | |
| Mortgage Loan Information | Property Information | |||
| Mortgage Loan Seller: | LCM | Single Asset / Portfolio: | Single Asset | |
| Original Principal Balance(1): | $80,000,000 | Title: | Fee | |
| Cut-off Date Principal Balance(1): | $80,000,000 | Property Type - Subtype: | Mixed Use – Office/Retail | |
| % of Pool by IPB: | 8.8% | Net Rentable Area (SF): | 198,048 | |
| Loan Purpose: | Acquisition | Location: | New York, NY | |
| Borrower: | BSD 530 Broadway PropCo LLC | Year Built / Renovated: | 1901 / 2011 | |
| Loan Sponsors(2): | Serdar Bilgili, Michael Shvo, | Occupancy(4): | 97.5% | |
| Deutsche Finance America LLC, | Occupancy Date: | 3/31/2020 | ||
| DF Deutsche Finance Holding AG, | Number of Tenants(4): | 8 | ||
| BAYVK Immobilien-Dachfonds 1 | 2017 NOI: | $13,867,891 | ||
| SCS SICAV-FIS ELEKTRA 2 | 2018 NOI: | $15,418,208 | ||
| Interest Rate: | 2.85000% | 2019 NOI(5): | N/A | |
| Note Date: | 3/3/2020 | TTM NOI (as of 9/2019)(5): | $17,844,588 | |
| Maturity Date: | 3/6/2030 | UW Economic Occupancy(6): | 92.6% | |
| Interest-only Period: | 120 months | UW Revenues: | $25,861,209 | |
| Original Term: | 120 months | UW Expenses: | $8,144,869 | |
| Original Amortization: | None | UW NOI(6): | $17,716,340 | |
| Amortization Type: | Interest Only | UW NCF(6): | $16,587,466 | |
| Call Protection(3): | L(27),Def(86),O(7) | Appraised Value / Per SF(6): | $395,000,000 / $1,994 | |
| Lockbox / Cash Management: | Hard / Springing | Appraisal Date: | 1/24/2020 | |
| Additional Debt(1): | Yes | |||
| Additional Debt Balance(1): | $130,000,000 | |||
| Additional Debt Type(1): | Pari Passu | |||
| Escrows and Reserves(7) | Financial Information(1)(6) | ||||||
| Initial | Monthly | Initial Cap | Cut-off Date Loan / SF: | $1,060 | |||
| Taxes: | $0 | Springing | N/A | Maturity Date Loan / SF: | $1,060 | ||
| Insurance: | $0 | Springing | N/A | Cut-off Date LTV: | 53.2% | ||
| Replacement Reserves: | $0 | Springing | N/A | Maturity Date LTV: | 53.2% | ||
| TI/LC: | $0 | Springing | $346,800 | UW NCF DSCR: | 2.73x | ||
| Other(8): | $19,267,979 | $0 | N/A | UW NOI Debt Yield: | 8.4% | ||
Sources and Uses | |||||||
| Sources | Proceeds | % of Total | Uses | Proceeds | % of Total | ||
| Whole Loan(1) | $210,000,000 | 51.5% | Purchase Price | $ 382,000,000 | 93.7% | ||
| Sponsor Equity | 197,779,169 | 48.5 | Prorations and Adjustments | (1,620,169) | (0.4) | ||
| Upfront Reserves(8) | 19,267,979 | 4.7 | |||||
| Closing Costs | 8,131,359 | 2.0 | |||||
| Total Sources | $407,779,169 | 100.0% | Total Uses | $407,779,169 | 100.0% | ||
| (1) | The 530 Broadway Loan (as defined below) is part of a whole loan evidenced by ninepari passu notes, with an aggregate outstanding principal balance as of the Cut-off Date of $210.0 million. The Financial Information presented in the chart above reflects the Cut-off Date Balance of the $210.0 million 530 Broadway Whole Loan (as defined below). |
| (2) | There is no non-recourse carveout guarantor or separate environmental indemnitor with respect to the 530 Broadway Whole Loan. |
| (3) | The lockout period will be at least 27 payment dates beginning with and including the first payment date of April 6, 2020. Defeasance of the full 530 Broadway Whole Loan is permitted after the date that is the earlier to occur of the payment date that is (i) two years after the closing date of the securitization that includes the lastpari passu note to be securitized and (ii) March 3, 2023. The assumed lockout period of 27 payments is based on the expected JPMDB 2020-COR7 securitization closing date in June 2020. The actual lockout period may be longer. |
| (4) | Occupancy and Number of Tenants excludes Vince Camuto, which currently leases 4,896 square feet (2.5% of net rentable area) through November 30, 2026 but is currently dark. Including this tenant, the 530 Broadway Property (as defined below) is 100.0% leased. |
| (5) | The seller was not required to provide more recent historical financials and there is a gap in the historical financials after the borrower’s acquisition in March 2020 due to a change in financial reporting. Therefore, a more recent trailing 12-month period is unavailable. |
| (6) | All NOI, NCF and occupancy information, as well as the appraised value, were determined prior to the emergence of the novel coronavirus pandemic, and the economic disruption resulting from measures to combat the pandemic, and all DSCR, LTV and Debt Yield metrics were calculated, and the 530 Broadway Loan was underwritten, |
| THE INFORMATION IN THIS STRUCTURAL AND COLLATERAL TERM SHEET IS NOT COMPLETE AND MAY BE AMENDED PRIOR TO THE TIME OF SALE. THIS TERM SHEET IS NOT AN OFFER TO SELL THESE SECURITIES AND IT IS NOT A SOLICITATION OF AN OFFER TO BUY THESE SECURITIES IN ANY JURISDICTION WHERE THE OFFER OR SALE IS NOT PERMITTED. | ||
| |
19 of 130 | |
| Structural and Collateral Term Sheet | JPMDB 2020-COR7 |
| 530 Broadway | |
| based on such prior information. See “Risk Factors—Risks Related to Market Conditions and Other External Factors—Coronavirus Pandemic Has Adversely Affected the Global Economy and Will Likely Adversely Affect the Performance of the Mortgage Loans” in the Preliminary Prospectus. |
| (7) | For a full description of Escrows and Reserves, please refer to“Escrows and Reserves”below. |
| (8) | Initial Other Escrows and Reserves consist of (i) an $18,000,000 Holdback From Acquisition (as described below), which amount is not held in a lender controlled account, (ii) $714,484 for outstanding tenant improvements and leasing commissions, (iii) approximately $547,975 for outstanding free rent and (iv) $5,520 for required repairs. The reserve amounts identified in (ii), (iii) and (iv) are held in lender controlled accounts. |
The Loan.The 530 Broadway mortgage loan, with a principal balance of $80.0 million as of the Cut-off Date (the “530 Broadway Loan”), is secured by a first mortgage lien on the borrower’s fee simple interest in three interconnected 11-story, mixed-use buildings comprised of 198,048 square feet of net rentable area located in New York, New York (the “530 Broadway Property”). The 530 Broadway Loan is part of a whole loan that has an aggregate outstanding principal balance as of the Cut-off Date of $210.0 million (the “530 Broadway Whole Loan”) and is comprised of ninepari passu notes, each as described in the “Whole Loan Summary” chart below. The controlling Note A-1, together with Notes A-7, A-8 and A-9, with an aggregate outstanding principal balance as of the Cut-off Date of $80.0 million, are being contributed to the JPMDB 2020-COR7 Trust. The non-controlling Notes A-2, A-3, A-4, A-5 and A-6, with an aggregate outstanding principal balance as of the Cut-off Date of $130.0 million, are held by LCM or an affiliate and are expected to be contributed to one or more future securitizations or may otherwise be transferred at any time. The relationship between the holders of the 530 Broadway Whole Loan will be governed by a co-lender agreement as described under “Description of the Mortgage Pool—The Whole Loans—The Serviced Pari Passu Whole Loans” in the Preliminary Prospectus. The 530 Broadway Loan has a 10-year term and is interest only for the entire term.The most recent prior financing of the530 BroadwayProperty was not included in a securitization.
| Whole Loan Summary | ||||
| Note | Original Balance | Cut-off Date Balance | Note Holder | Controlling Piece |
| A-1, A-7, A-8, A-9 | $80,000,000 | $80,000,000 | JPMDB 2020-COR7 | Yes |
| A-2, A-3, A-4, A-5, A-6 | 130,000,000 | 130,000,000 | LCM | No |
| Total | $210,000,000 | $210,000,000 | ||
The Borrower. The borrowing entity is BSD 530 Broadway PropCo LLC, a Delaware limited liability company and special purpose entity structured to be bankruptcy remote with two independent directors. Legal counsel to the borrower delivered a non-consolidation opinion in connection with the origination of the 530 Broadway Whole Loan.
The Loan Sponsor.There is no non-recourse carveout guarantor or separate environmental indemnitor with respect to the 530 Broadway Whole Loan. The borrower is owned and controlled by the loan sponsors, a joint venture between German pension fund Bayerische Versorgungskammer (“BVK”), Deutsche Finance America (“DFA”), BLG Capital (“BLG”), and Michael Shvo.
BVK is Germany’s largest pension fund provider with over €77.0 billion of assets under management. DFA is the US private equity platform of the Munich based Deutsche Finance Group. BLG is a Turkish global private equity company focused on investments in real assets and companies with underlying real estate assets in major gateway cities. Michael Shvo is a New York City-based real estate owner and developer with over $6.0 billion of assets in its portfolio and over 2.1 million square feet in development.
The Property.The 530 Broadway Property is comprised of three interconnected buildings which was integrated into one conjoined building. Built in 1901 and renovated in 2011, the 530 Broadway Property contains 198,048 rentable square feet, including 174,454 square feet of office space and 23,594 square feet of retail space. As of the March 31, 2020 underwritten rent roll, the 530 Broadway Property was 100.0% leased by nine tenants; however, Vince Camuto, which currently leases 4,896 square feet (2.5% of net rentable area) through November 30, 2026, is currently dark and has been excluded from the underwriting. Excluding Vince Camuto, the 530 Broadway Property is 97.5% occupied at an underwritten base rent equal to approximately $113.51 per square foot.
The largest tenant at the 530 Broadway Property is Anomaly Partners LLC (“Anomaly”) (84,662 square feet; 42.7% of net rentable area; 30.0% of underwritten base rent). Anomaly is a marketing, communications and advertising agency that offers product development, interactive marketing, media strategy and design, and advertising services to its clients. The company was founded in 2004 and uses the 530 Broadway Property as the company’s headquarters with additional offices in London and Amsterdam. Anomaly has occupied the 530 Broadway Property since 2005, expanding from 12,702 square feet originally to its current footprint of 84,662 square feet and has a lease expiration of September 2024 with one, five-year renewal option remaining and no termination options. Anomaly pays underwritten base rent equal to $77.67 per square foot.
The second largest tenant at the 530 Broadway Property is Knotel (48,524 square feet; 24.5% of net rentable area; 14.9% of underwritten base rent). Knotel is a flexible workspace provider focused on providing private and fully furnished workspaces to large enterprises. The company has more than 4.0 million square feet across more than 200 locations in New York, San Francisco, London, Los Angeles, Washington, D.C., Paris, Berlin, Toronto, Boston, São Paulo and Rio de Janeiro. Knotel has been a tenant at the 530 Broadway Property since2018 and has a lease expiration of April 2029 with one, five-year renewal option remaining and no termination options. Knotel pays underwritten base rent equal to $67.24 per square foot. Knotel did not pay rent due in April or May and the borrower drew down $530,530
| THE INFORMATION IN THIS STRUCTURAL AND COLLATERAL TERM SHEET IS NOT COMPLETE AND MAY BE AMENDED PRIOR TO THE TIME OF SALE. THIS TERM SHEET IS NOT AN OFFER TO SELL THESE SECURITIES AND IT IS NOT A SOLICITATION OF AN OFFER TO BUY THESE SECURITIES IN ANY JURISDICTION WHERE THE OFFER OR SALE IS NOT PERMITTED. | ||
| |
20 of 130 | |
| Structural and Collateral Term Sheet | JPMDB 2020-COR7 |
| 530 Broadway | |
($265,265 per month) on the security deposit letter of credit ($1.5 million) for April and May rent and deposited the $530,530 into the lockbox account. On May 13, 2020, the borrower sent a notice to Knotel to replenish the letter of credit. Knotel is in discussions with the borrower regarding rent relief.
The third largest tenant at the 530 Broadway Property is Avalanche Studios NY Inc. (“Avalanche”) (17,990 square feet; 9.1% of net rentable area; 5.6% of underwritten base rent). Founded in 2003, Avalanche is a video game developer and publisher most recognized as the creator of the Just Cause franchise and Mad Max. Avalanche currently employs more than 270 people with offices in Stockholm and New York City. Avalanche has been a tenant at the 530 Broadway Property since 2011 and has a lease expiration ofMarch 2022 with no renewal options remaining and no termination options.Avalanche pays underwritten base rent equal to $67.74 per square foot.
COVID-19 Update.As of June 1, 2020, the530 Broadway Propertyis closed as a result of New York City stay at home orders resulting from the COVID19 pandemic; however, most, if not all, office tenants are working remotely. As of the March 31, 2020 underwritten rent roll, the530 Broadway Propertyremained 97.5% occupied (excluding Vince Camuto). For April and May of 2020, tenants representing approximately 100.0% and 94.3% of net rentable area, respectively, have paid rent in-full, with the loans sponsors having collected approximately 100.0% and 76.9% of underwritten base rent, respectively. Two tenants, representing approximately 36.9% of the underwritten base rent and 30.2% of net rentable area, have requested rent relief. Those tenants are currently undergoing conversations with the borrower. The 530 Broadway Whole Loan is current through the June 6, 2020 payment date. As of June 1, 2020, the530 Broadway WholeLoan is not subject to any modification or forbearance request.
The Market.The 530 Broadway Property is located in the Soho office and retail submarket, within the overall New York City office and retail market. According to a market report, as of the June 2, 2020, the overall New York City office and retail market contained approximately 941.2 million square feet and approximately 599.0 million square feet, respectively, with overall market vacancies of 8.4% and 4.0%, respectively, and average asking rents of approximately $58.79 per square foot and $43.75 per square foot, respectively. As of June 2, 2020, the Soho office and retail submarket contained approximately 11.7 million square feet and approximately 6.0 million square feet, respectively, with overall market vacancies of 9.8% and 4.9%, respectively, and average asking rents of approximately $72.88 per square foot and $123.28 per square foot, respectively.
The appraisals for the 530 Broadway Property included 12 office rent comparables. The office rent comparables ranged from $75.00 to $160.00 per square foot with a weighted average of approximately $112.39 per square foot. The appraisals for the 530 Broadway Property included 10 retail rent comparables. The retail rent comparables ranged from $280.00 to $670.00 per square foot with a weighted average of approximately $405.80 per square foot.
| Historical and Current Occupancy(1) | ||||
| 2016 | 2017 | 2018 | 2019 | Current(2)(3) |
| 86.0% | 77.0% | 100.0% | 100.0% | 97.5% |
| (1) | Historical Occupancies are as of December 31 of eachrespective year. |
| (2) | Current Occupancy is as of the underwritten rent roll dated March 31, 2020. |
| (3) | Current Occupancy excludes Vince Camuto, which currently leases 4,896 square feet (2.5% of net rentable area) through November 30, 2026 but is currently dark. Including this tenant, the 530 Broadway Property is 100.0% leased. |
| THE INFORMATION IN THIS STRUCTURAL AND COLLATERAL TERM SHEET IS NOT COMPLETE AND MAY BE AMENDED PRIOR TO THE TIME OF SALE. THIS TERM SHEET IS NOT AN OFFER TO SELL THESE SECURITIES AND IT IS NOT A SOLICITATION OF AN OFFER TO BUY THESE SECURITIES IN ANY JURISDICTION WHERE THE OFFER OR SALE IS NOT PERMITTED. | ||
| |
21 of 130 | |
| Structural and Collateral Term Sheet | JPMDB 2020-COR7 |
| 530 Broadway | |
| Tenant Summary(1) | |||||||
| Tenant | Ratings Moody’s/Fitch/S&P(2) | Tenant Type | Net Rentable Area (SF) | % of Total NRA | Base Rent PSF(3) | % of Total Base Rent(3) | Lease Expiration Date |
| Anomaly Partners LLC(4) | NR / NR / NR | Office | 84,662 | 42.7% | $77.67 | 30.0% | 9/30/2024 |
| Knotel(4) | NR / NR / NR | Office | 48,524 | 24.5 | $67.24 | 14.9 | 4/30/2029 |
| Avalanche Studios NY Inc. | NR / NR / NR | Office | 17,990 | 9.1 | $67.74 | 5.6 | 3/31/2022 |
| Alanda Music Ltd.(4) | NR / NR / NR | Office | 13,573 | 6.9 | $55.43 | 3.4 | 9/30/2022 |
| Club Monaco(4)(5) | A3 / NR / A- | Retail | 11,382 | 5.7 | $479.89 | 24.9 | 3/31/2029 |
| JKR Inc.(4) | NR / NR / NR | Office | 9,705 | 4.9 | $76.15 | 3.4 | 10/31/2027 |
| Skechers USA Inc. | NR / NR / NR | Retail | 4,941 | 2.5 | $501.28 | 11.3 | 1/31/2033 |
| AT & T Mobility(4) | Baa2 / A- / BBB | Retail | 2,375 | 1.2 | $605.00 | 6.6 | 6/30/2023 |
| Total Occupied Space | 193,152 | 97.5% | $113.51 | 100.0% | |||
| Vacant | 4,896 | 2.5 | |||||
| Total | 198,048 | 100.0% | |||||
| (1) | Based on the underwritten rent roll dated as of March 31, 2020. |
| (2) | In certain instances, ratings provided are those of the parent company of the entity shown, whether or not the parent company guarantees the lease. |
| (3) | Base Rent PSF and % of Total Base Rent include approximately $348,290 in contractual rent steps through December 2020 for certain tenants and approximately $685,912 of average rent over the loan term for Club Monaco. |
| (4) | Anomaly Partners LLC has one, five-year renewal option remaining, Knotel has one, five-year renewal option remaining, Alanda Music Ltd. has one, five-year renewal option remaining, Club Monaco has two, five-year renewal options remaining, JKR Inc. has one, five-year renewal option remaining, and AT & T Mobility has one, five-year renewal option remaining. |
| (5) | Club Monaco is in discussions with the borrower regarding rent relief. |
| Lease Rollover Schedule(1) | |||||||||
| Year | Number of Leases Expiring | Net Rentable Area Expiring | % of NRA Expiring | Base Rent Expiring(2) | % of Base Rent Expiring(2) | Cumulative Net Rentable Area Expiring | Cumulative % of NRA Expiring | Cumulative Base Rent Expiring(2) | Cumulative % of Base Rent Expiring(2) |
| Vacant | NAP | 4,896 | 2.5% | NAP | NAP | 4,896 | 2.5% | NAP | NAP |
| 2020 & MTM | 0 | 0 | 0.0 | 0 | 0.0 | 4,896 | 2.5% | $0 | 0.0% |
| 2021 | 0 | 0 | 0.0 | 0 | 0.0 | 4,896 | 2.5% | $0 | 0.0% |
| 2022 | 5 | 31,563 | 15.9 | 1,970,960 | 9.0 | 36,459 | 18.4% | $1,970,960 | 9.0% |
| 2023 | 1 | 2,375 | 1.2 | 1,436,875 | 6.6 | 38,834 | 19.6% | $3,407,835 | 15.5% |
| 2024 | 13 | 84,662 | 42.7 | 6,575,697 | 30.0 | 123,496 | 62.4% | $9,983,533 | 45.5% |
| 2025 | 0 | 0 | 0.0 | 0 | 0.0 | 123,496 | 62.4% | $9,983,533 | 45.5% |
| 2026 | 0 | 0 | 0.0 | 0 | 0.0 | 123,496 | 62.4% | $9,983,533 | 45.5% |
| 2027 | 1 | 9,705 | 4.9 | 739,008 | 3.4 | 133,201 | 67.3% | $10,722,541 | 48.9% |
| 2028 | 0 | 0 | 0.0 | 0 | 0.0 | 133,201 | 67.3% | $10,722,541 | 48.9% |
| 2029 | 5 | 59,906 | 30.2 | 8,724,875 | 39.8 | 193,107 | 97.5% | $19,447,416 | 88.7% |
| 2030 | 0 | 0 | 0.0 | 0 | 0.0 | 193,107 | 97.5% | $19,447,416 | 88.7% |
| 2031 & Beyond | 2 | 4,941 | 2.5 | 2,476,848 | 11.3 | 198,048 | 100.0% | $21,924,264 | 100.0% |
| Total | 27 | 198,048 | 100.0% | $21,924,264 | 100.0% | ||||
| (1) | Based on the underwritten rent roll dated March 31, 2020. |
| (2) | Base Rent Expiring, % of Base Rent Expiring, Cumulative Base Rent Expiring and Cumulative % of Base Rent Expiring include approximately $348,290 in contractual rent steps through December 2020 for certain tenants and approximately $685,912 of average rent over the loan term for Club Monaco. |
| THE INFORMATION IN THIS STRUCTURAL AND COLLATERAL TERM SHEET IS NOT COMPLETE AND MAY BE AMENDED PRIOR TO THE TIME OF SALE. THIS TERM SHEET IS NOT AN OFFER TO SELL THESE SECURITIES AND IT IS NOT A SOLICITATION OF AN OFFER TO BUY THESE SECURITIES IN ANY JURISDICTION WHERE THE OFFER OR SALE IS NOT PERMITTED. | ||
| |
22 of 130 | |
| Structural and Collateral Term Sheet | JPMDB 2020-COR7 |
| 530 Broadway | |
| Operating History and Underwritten Net Cash Flow | ||||||
| 2017 | 2018 | TTM(1) | Underwritten(2) | Per Square Foot | %(3) | |
| Rents in Place | $16,442,380 | $18,089,468 | $19,969,541 | $20,890,062 | $105.48 | 74.8% |
| Straight Line Rent(4) | 0 | 0 | 0 | 685,912 | 3.46 | 2.5 |
| Contractual Rent Steps(5) | 0 | 0 | 0 | 348,290 | 1.76 | 1.2 |
| Vacant Income | 0 | 0 | 0 | 2,056,747 | 10.39 | 7.4 |
| Gross Potential Rent | $16,442,380 | $18,089,468 | $19,969,541 | $23,981,010 | $121.09 | 85.9% |
| Total Reimbursements | 2,794,046 | 3,512,513 | 4,392,343 | 3,933,946 | 19.86 | 14.1 |
| Total Other Income | 3,000 | 3,000 | 3,000 | 3,000 | 0.02 | 0.0 |
| Net Rental Income | $19,239,426 | $21,604,981 | $24,364,884 | $27,917,956 | $140.97 | 100.0% |
| (Vacancy/Credit Loss) | 0 | 0 | 0 | (2,056,747) | (10.39) | (7.4) |
| Effective Gross Income | $19,239,426 | $21,604,981 | $24,364,884 | $25,861,209 | $130.58 | 92.6% |
| Total Expenses(6) | $5,371,535 | $6,186,773 | $6,520,296 | $8,144,869 | $41.13 | 31.5% |
| Net Operating Income | $13,867,891 | $15,418,208 | $17,844,588 | $17,716,340 | $89.45 | 68.5% |
| Total TI/LC, CapEx/RR | 0 | 0 | 0 | 1,128,874 | 5.70 | 4.4 |
| Net Cash Flow | $13,867,891 | $15,418,208 | $17,844,588 | $16,587,466 | $83.75 | 64.1% |
| (1) | TTM column represents the trailing 12-month period ending September 30, 2019. The seller was not required to provide more recent historical financials and there is a gap in the historical financials after the borrower’s acquisition in March 2020 due to a change in financial reporting. Therefore, a more recent trailing 12-month period is unavailable. |
| (2) | For the avoidance of doubt, no COVID-19 specific adjustments have been incorporated in the lender underwriting. |
| (3) | % column represents percent of Net Rental Income for all revenue lines and represents percent of Effective Gross Income for the remainder of the fields. |
| (4) | Based on the average rent over the loan term for investment grade tenant Club Monaco. |
| (5) | Based on the contractual rent steps through December 2020 for certain tenants. |
| (6) | The increase from TTM Total Expenses to Underwritten Total Expenses is primarily attributable to (i) $932,448 in higher Underwritten management fees and (ii) $576,184 in higher Underwritten real estate taxes. |
Property Management.The 530 Broadway Property is managed by SHVO Property Management LLC, an affiliate of the borrower, and sub-managed by Jones Lang LaSalle.
Escrows and Reserves. At origination, the borrower deposited into escrow $714,484 for outstanding tenant improvements and leasing commissions, approximately $547,975 for outstanding free rent and $5,520 for required repairs.
Tax Escrows– On a monthly basis, during the continuance of a Cash Management Period (as defined below),the borrower is required to escrow 1/12 of the projected annual estimated tax payments.
Insurance Escrows– On a monthly basis, during the continuance of a Cash Management Period,the borrower is required to escrow 1/12 of the projected annual estimated insurance premiums.
Replacement Reserves –On a monthly basis, during the continuance of a Cash Management Period, the borrower is required to escrow $3,300 for replacement reserves.
TI/LC Reserves – On a monthly basis, during the continuance of a Cash Management Period, the borrower is required to escrow $28,900 for tenant improvements and leasing commissions, subject to a cap of $346,800.
Holdback From Acquisition– Separate from the upfront reserves with lender, but in connection with the purchase of the 530 Broadway Property from the prior owner (the “Prior Owner”), at origination of the 530 Broadway Whole Loan, the borrower deposited $18,000,000 (the “Holdback”) in escrow with the related title company, pending transfer to Signature Bank. Pursuant to a securities account control agreement and control account agreement (each entered into on May 15, 2020 between the borrower, the Prior Owner, Signature Bank and the lender), Signature Bank established an escrow account to hold the Holdback (the “Holdback Account”) from which borrower is permitted to withdraw portions of the Holdback for the reimbursement of and/or payment of leasing costs, capital expenditures (capped at $3,000,000) and real estate taxes (capped at $5,000,000). Any amounts remaining in the Holdback Account seven years after March 3, 2020 will be, (i) if no Cash Management Period is in effect, distributed to the borrower and (ii) if a Cash Management Period is in effect, deposited into a lender account. Prior to March 3, 2027, upon an event of default, the lender has the right to withdraw any amounts remaining in the Holdback Account (less certain amounts as described in the control agreements) and retain such amounts as additional collateral for the 530 Broadway Whole Loan.
| THE INFORMATION IN THIS STRUCTURAL AND COLLATERAL TERM SHEET IS NOT COMPLETE AND MAY BE AMENDED PRIOR TO THE TIME OF SALE. THIS TERM SHEET IS NOT AN OFFER TO SELL THESE SECURITIES AND IT IS NOT A SOLICITATION OF AN OFFER TO BUY THESE SECURITIES IN ANY JURISDICTION WHERE THE OFFER OR SALE IS NOT PERMITTED. | ||
| |
23 of 130 | |
| Structural and Collateral Term Sheet | JPMDB 2020-COR7 |
| 530 Broadway | |
Lockbox / Cash Management.The 530 Broadway Whole Loan is structured with a hard lockbox and springing cash management. All rents are required to be deposited directly by the tenants into a lockbox account controlled by the lender. All funds in the lockbox account are required to be swept daily into the borrower’s operating account, unless a Cash Management Period is continuing. During the continuance of a Cash Management Period, all funds in the lockbox account will be swept daily into a lender-controlled account, from which account such funds will disbursed on each payment date in accordance with the 530 Broadway Whole Loan documents and any excess will be retained by the lender as additional collateral for the 530 Broadway Whole Loan.
A “Cash Management Period” will commence (i) upon an event of default (until the payment date following the cure of such event of default) or (ii) if the debt service coverage ratio is less than 1.25x (until such time that the debt service coverage ratio is greater than or equal to 1.25x for two consecutive quarters).
Notwithstanding the foregoing, the borrower may avoid the commencement or continuance of Cash Management Period by depositing with the lender cash or a letter of credit in such amount that if applied to partially repay the 530 Broadway Whole Loan would result in a debt service coverage ratio equal to or greater than 1.25x.
Additional Debt. None.
Partial Release. None.
| THE INFORMATION IN THIS STRUCTURAL AND COLLATERAL TERM SHEET IS NOT COMPLETE AND MAY BE AMENDED PRIOR TO THE TIME OF SALE. THIS TERM SHEET IS NOT AN OFFER TO SELL THESE SECURITIES AND IT IS NOT A SOLICITATION OF AN OFFER TO BUY THESE SECURITIES IN ANY JURISDICTION WHERE THE OFFER OR SALE IS NOT PERMITTED. | ||
| |
24 of 130 | |
| Structural and Collateral Term Sheet | JPMDB 2020-COR7 | |
| LA County Office Portfolio | ||
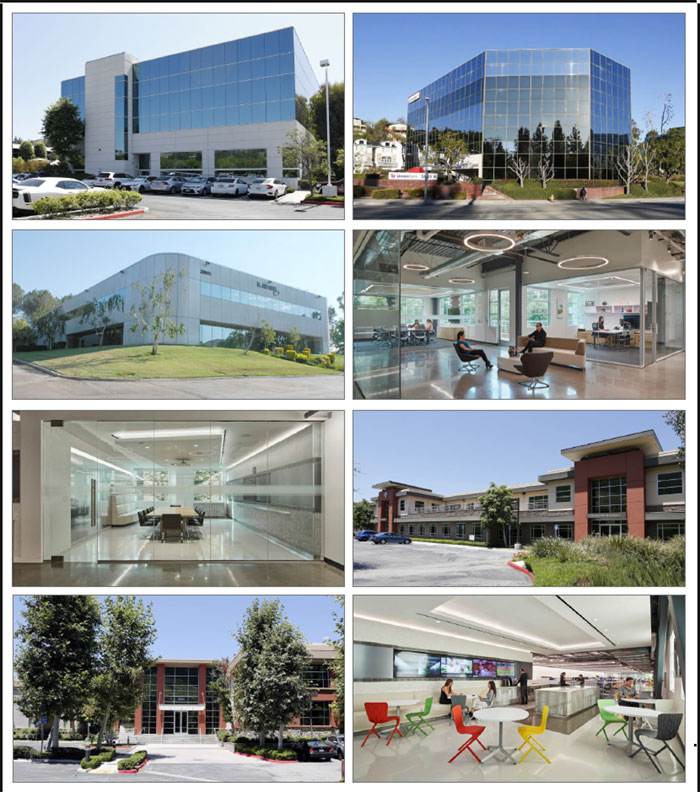
| THE INFORMATION IN THIS STRUCTURAL AND COLLATERAL TERM SHEET IS NOT COMPLETE AND MAY BE AMENDED PRIOR TO THE TIME OF SALE. THIS TERM SHEET IS NOT AN OFFER TO SELL THESE SECURITIES AND IT IS NOT A SOLICITATION OF AN OFFER TO BUY THESE SECURITIES IN ANY JURISDICTION WHERE THE OFFER OR SALE IS NOT PERMITTED. | ||
| |
25 of 130 | |
| Structural and Collateral Term Sheet | JPMDB 2020-COR7 | |
| LA County Office Portfolio | ||
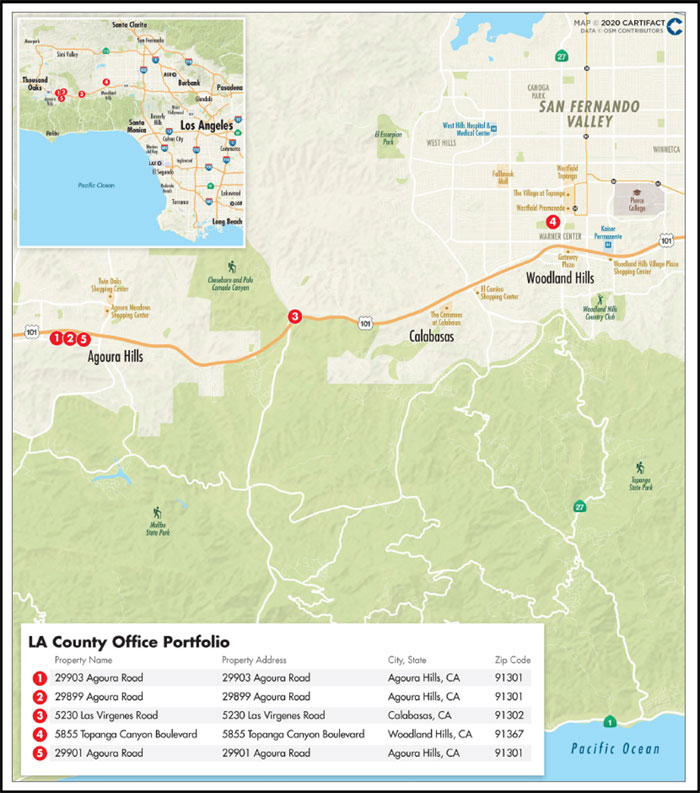
| THE INFORMATION IN THIS STRUCTURAL AND COLLATERAL TERM SHEET IS NOT COMPLETE AND MAY BE AMENDED PRIOR TO THE TIME OF SALE. THIS TERM SHEET IS NOT AN OFFER TO SELL THESE SECURITIES AND IT IS NOT A SOLICITATION OF AN OFFER TO BUY THESE SECURITIES IN ANY JURISDICTION WHERE THE OFFER OR SALE IS NOT PERMITTED. | ||
| |
26 of 130 | |
| Structural and Collateral Term Sheet | JPMDB 2020-COR7 | |
| LA County Office Portfolio | ||
| Mortgage Loan Information | Property Information | |||
| Mortgage Loan Seller: | LCM | Single Asset / Portfolio: | Portfolio | |
| Original Principal Balance: | $69,000,000 | Title: | Fee | |
| Cut-off Date Principal Balance: | $69,000,000 | Property Type - Subtype: | Office – Suburban | |
| % of Pool by IPB: | 7.6% | Net Rentable Area (SF): | 346,786 | |
| Loan Purpose: | Refinance | Location: | Various, CA | |
| Borrowers(1): | Various | Year Built / Renovated: | Various / Various | |
| Loan Sponsor: | Norman J. Kravetz | Occupancy: | 97.8% | |
| Interest Rate: | 4.19300% | Occupancy Date: | Various | |
| Note Date: | 1/9/2020 | Number of Tenants: | 25 | |
| Maturity Date: | 2/6/2030 | 2017 NOI: | $5,728,586 | |
| Interest-only Period: | 48 months | 2018 NOI: | $5,868,148 | |
| Original Term: | 120 months | 2019 NOI: | $6,306,185 | |
| Original Amortization: | 360 months | TTM NOI: | N/A | |
| Amortization Type: | IO-Balloon | UW Economic Occupancy(2): | 91.6% | |
| Call Protection: | L(28),Def(88),O(4) | UW Revenues: | $10,574,259 | |
| Lockbox / Cash Management: | Hard / Springing | UW Expenses: | $4,259,991 | |
| Additional Debt: | N/A | UW NOI(2): | $6,314,268 | |
| Additional Debt Balance: | N/A | UW NCF(2): | $5,602,334 | |
| Additional Debt Type: | N/A | Appraised Value / Per SF(2): | $101,600,000 / $293 | |
| Appraisal Date: | 9/6/2019 | |||
| Escrows and Reserves(3) | Financial Information(2) | |||||
| Initial | Monthly | Initial Cap | Cut-off Date Loan / SF: | $199 | ||
| Taxes: | $335,000 | $66,750 | N/A | Maturity Date Loan / SF: | $177 | |
| Insurance: | $35,000 | $8,700 | N/A | Cut-off Date LTV: | 67.9% | |
| Replacement Reserves: | $308,190 | $7,225 | N/A | Maturity Date LTV: | 60.5% | |
| TI/LC: | $1,000,000 | Springing | $1,000,000 | UW NCF DSCR: | 1.38x | |
| Other: | $2,304,474 | $0 | N/A | UW NOI Debt Yield: | 9.2% | |
| Sources and Uses | ||||||
| Sources | Proceeds | % of Total | Uses | Proceeds | % of Total | |
| Mortgage Loan | $69,000,000 | 100.0% | Payoff Existing Debt | $51,484,745 | 74.6% | |
| Upfront Reserves | 3,982,664 | 5.8% | ||||
| Closing Costs | 646,423 | 0.9% | ||||
| Return of Equity | 12,886,168 | 18.7% | ||||
| Total Sources | $69,000,000 | 100.0% | Total Uses | $69,000,000 | 100.0% | |
| (1) | The borrowers are RBE 29899 Agoura LLC, RBE 29901 Agoura LLC, RBE Agoura North LLC, 5855 Topanga Warner LLC and Colorado Capital Calabasas LLC. |
| (2) | All NOI, NCF and occupancy information, as well as the appraised value, were determined prior to the emergence of the novel coronavirus pandemic, and the economic disruption resulting from measures to combat the pandemic, and all DSCR, LTV and Debt Yield metrics were calculated, and the LA County Office Portfolio Loan (as defined below) was underwritten, based on such prior information. See “Risk Factors—Risks Related to Market Conditions and Other External Factors—Coronavirus Pandemic Has Adversely Affected the Global Economy and Will Likely Adversely Affect the Performance of the Mortgage Loans” in the Preliminary Prospectus. |
| (3) | For a full description of Escrows and Reserves, please refer to“Escrows and Reserves”below. |
The Loan.The LA County Office Portfolio mortgage loan has an outstanding principal balance as of the Cut-off Date of $69.0 million (the “LA County Office Portfolio Loan”) and is secured by a first mortgage lien on the borrowers’ fee simple interest in five office properties comprised a total of approximately 346,786 square feet of net rentable area (the “LA County Office Portfolio Properties” or the “LA County Office Portfolio”) located in Agoura Hills, Calabasas and Woodland Hills, California. The LA County Office Portfolio Loan has a 10-year term and following a four-year interest-only period, will amortize on a 30-year schedule.
The Borrowers. The borrowing entities are RBE 29899 Agoura LLC, RBE 29901 Agoura LLC, RBE Agoura North LLC, 5855 Topanga Warner LLC and Colorado Capital Calabasas LLC, each a Delaware limited liability company and special purpose entity structured to be
| THE INFORMATION IN THIS STRUCTURAL AND COLLATERAL TERM SHEET IS NOT COMPLETE AND MAY BE AMENDED PRIOR TO THE TIME OF SALE. THIS TERM SHEET IS NOT AN OFFER TO SELL THESE SECURITIES AND IT IS NOT A SOLICITATION OF AN OFFER TO BUY THESE SECURITIES IN ANY JURISDICTION WHERE THE OFFER OR SALE IS NOT PERMITTED. | ||
| |
27 of 130 | |
| Structural and Collateral Term Sheet | JPMDB 2020-COR7 | |
| LA County Office Portfolio | ||
bankruptcy remote with two independent directors. Legal counsel to the borrowers delivered a non-consolidation opinion in connection with the origination of the LA County Office Portfolio Loan.
The Loan Sponsor.The loan sponsor and nonrecourse carve-out guarantor is Norman J. Kravetz. Mr. Kravetz is the managing member and principal owner of Realty Bancorp Equities, LLC (“RBE”), a real estate development and property management company that currently owns and operates over two million square feet of retail, office and industrial properties, in addition to actively managing several locations for third party clients. Mr. Kravetz has been active in the Southern California real estate market for over 40 years.
The Properties.The LA County Office Portfolio Properties are comprised of five office properties totaling 346,786 square feet situated throughout the greater Los Angeles area in Agoura Hills (three properties, 63.4% of net rentable area; 67.6% of underwritten net operating income), Calabasas (one property, 22.2% of net rentable area; 17.6% of underwritten net operating income) and Woodland Hills (one property, 14.4% of net rentable area; 14.8% of underwritten net operating income). The LA County Office Portfolio Properties are leased by national organizations, regional companies, and local businesses. The tenant base represents various industries including law, financial services, healthcare, logistics, technology, communications, sporting, manufacturing, and insurance. No single tenant at the LA County Office Portfolio occupies more than 14.7% of net rentable area. Additionally, the LA County Office Portfolio has exhibited an average historical occupancy since 2016 equal to 94.5%. As of the May 27, 2020 rent rolls, the LA County Office Portfolio Properties were 97.8% occupied to 25 tenants at a weighted average underwritten base rent equal to $31.44 per square foot.
| Portfolio Summary | ||||||||
| Property Name | City | Year Built | Total SF | % of Total | Occupancy(1) | UW NOI | Allocated Loan Original Balance | Appraised Value |
| 29903 Agoura Road | Agoura Hills | 1981 | 103,394 | 29.8% | 100.0% | $1,877,886 | $20,650,000 | $30,400,000 |
| 29899 Agoura Road | Agoura Hills | 2008 | 78,590 | 22.7% | 100.0 | 1,767,495 | 17,660,000 | 26,000,000 |
| 5230 Las Virgenes Road | Calabasas | 1997 | 77,025 | 22.2% | 95.0 | 1,112,084 | 13,580,000 | 20,000,000 |
| 5855 Topanga Canyon Boulevard | Woodland Hills | 1981 | 50,019 | 14.4% | 92.6 | 934,829 | 10,190,000 | 15,000,000 |
| 29901 Agoura Road | Agoura Hills | 1979 | 37,758 | 10.9% | 100.0 | 621,974 | 6,920,000 | 10,200,000 |
| Total / Wtd. Avg. | 346,786 | 100.0% | 97.8% | $6,314,268 | $69,000,000 | $101,600,000 | ||
| (1) | Based on the underwritten rent rolls dated as of May 27, 2020. |
The largest tenant at the LA County Office Portfolio is Private National Mortgage Acceptance Company, LLC (“PNMAC”) (50,924 square feet; 14.7% of net rentable area; 15.3% of underwritten base rent). PNMAC operates as a subsidiary of PennyMac Financial Services, Inc. (NYSE: PFSI). Founded in 2008,PNMAC is a specialty financial services firm with a comprehensive mortgage platform and integrated business focused on the production and servicing of United States mortgage loans and the management of investments related to the United States mortgage market. PNMAC, together with its subsidiaries, employs 4,215 people across the United States. The tenant occupies 50,924 square feet at the 29903 Agoura Road property located in Agoura Hills, California, where it originally took occupancy in 2015 on a lease initially expiring in June 2024. PNMAC currently pays base rent equal to $31.06 per square foot, has no termination options and has one, five-year renewal option remaining.
The second largest tenant at the LA County Office Portfolio is CYDCOR, LLC (“CYDCOR”) (43,013 square feet; 12.4% of net rentable area; 14.2% of underwritten base rent). Since 1994, CYDCOR has provided sales management and sales consulting services to Fortune 500 and emerging companies in a range of business that include telecommunications, cable, internet, energy, and office supplies seeking to outsource their sales operations. CYDCOR specializes in providing clients with face-to-face sales, operating locally, nationally, and internationally. CYDCOR manages a network of more than 375 independent sales offices in the United States, Canada, and the United Kingdom. CYDCOR occupies 43,013 square feet at the 29899 Agoura Road property located in Agoura Hills, California, where it originally took occupancy in 2014 and is on a lease initially expiring in May 2025. CYDCOR’s underwritten base rent is equal to $35.11 per square foot and the tenant has one, five-year renewal option remaining and a one-time termination option effective in December 2021, with 12-months prior notice and payment of a termination fee in the amount equal to $800,000. CYDCOR is in discussions with the borrowers regarding rent relief.
The third largest tenant at the LA County Office Portfolio is Motor Vehicle Software Corp (“MVSC”) (42,307 square feet; 12.2% of net rentable area; 11.8% of underwritten base rent). Launched in 2015, MVSC operates as a subsidiary of Vitu and manages electronic vehicle transactions across the United States and United Kingdom. Serving as the company’s corporate headquarters, MVSC occupies 42,307 square feet across two of the LA County Office Portfolio Properties, 37,758 square feet at the 29901 Agoura Road property and 4,549 square feet at the 29903 Agoura Road property, both of which are located in Agoura Hills, California. The tenant originally took occupancy in 2018 at the 29901 Agoura Road property and later expanded in 2019 at the 29903 Agoura Road property. MVSC currently pays base rent equal to $29.67 per square foot, has no renewal options remaining and no termination options for its 4,549 square foot space at the 29903 Agoura Road property and one, five-year renewal option remaining for its 37,758 square foot space at the 29901 Agoura Road property with an ongoing termination option effective any date after February 2024, with 12-months prior notice and payment of a termination fee in the amount equal to the sum of any unamortized tenant improvements and leasing commissions and abated rent.
| THE INFORMATION IN THIS STRUCTURAL AND COLLATERAL TERM SHEET IS NOT COMPLETE AND MAY BE AMENDED PRIOR TO THE TIME OF SALE. THIS TERM SHEET IS NOT AN OFFER TO SELL THESE SECURITIES AND IT IS NOT A SOLICITATION OF AN OFFER TO BUY THESE SECURITIES IN ANY JURISDICTION WHERE THE OFFER OR SALE IS NOT PERMITTED. | ||
| |
28 of 130 | |
| Structural and Collateral Term Sheet | JPMDB 2020-COR7 | |
| LA County Office Portfolio | ||
The borrowers and the tenant have executed a lease amendment which (i) defers 100.0% of base rent for June and July 2020 and 50.0% of base rent for August through October 2020, which is required to be repaid by March 2021 and (ii) extends the tenant’s lease expiration date from June 2028 to August 2030.
COVID-19 Update.As of June 1, 2020, the LA County Office Portfolio Properties have remained open; however, many office tenants have chosen to work remotely. As of the May 27, 2020 underwritten rent rolls, the LA County Office Portfolio Properties remained 97.8% occupied. For April and May of 2020, tenants representing approximately 87.1% and 85.5% of net rentable area, respectively, have paid rent in-full, with the loan sponsor having collected approximately 85.5% and 83.8% of underwritten base rent, respectively. Five tenants representing approximately 39.1% of the underwritten base rent and 38.2% of the LA County Office Portfolio net rentable have requested rent relief. Two tenants have been granted a rent deferral and three tenants are in discussions with the borrowers for rent relief. The LA County Office Portfolio Loan is current through the June 6, 2020 payment date. As of June 1, 2020, the LA County Office Portfolio Loan is not subject to any modification or forbearance request.
The Market.The LA County Office Portfolio Properties are located across two individual submarkets within the Los Angeles office market in Southern California: Calabasas/Westlake Village in Agoura Hills and Calabasas (four properties; 85.6% of net rentable area; 85.2% of underwritten net operating income) and Woodland Hills/Warner Center in Woodland Hills (one property; 14.4% of net rentable area; 14.8% of underwritten net operating income). The LA County Office Portfolio Properties are in close proximity to one another.
According to a market report, as of May 31, 2020, the Calabasas/Westlake Village office submarket contained approximately 7.3 million square feet with an overall market vacancy of 9.9% and average asking rents of approximately $32.81 per square foot. The Woodland Hills/Warner Center office submarket contained approximately 9.9 million square feet with an overall market vacancy of 13.1% and average asking rents of approximately $32.09 per square foot. Based on the square footage of the LA County Office Portfolio Properties, the weighted average vacancy and average asking rents were equal to 10.4% and $32.71 per square foot, respectively.
Historical and Current Occupancy(1) | ||||
| 2016 | 2017 | 2018 | 2019 | Current(2) |
| 92.7% | 91.9% | 97.2% | 98.4% | 97.8% |
| (1) | Historical Occupancies are as of December 31 of eachrespective year. |
| (2) | Current Occupancy is as of the rent rolls dated May 27, 2020. |
| Tenant Summary(1) | ||||||||
| Tenant | Ratings Moody’s/Fitch/S&P | Net Rentable Area (SF) | % of Total NRA | Base Rent PSF(2) | % of Total Base Rent(2) | Lease Expiration Date | ||
| PNMAC, LLC(3)(4) | NR / NR / NR | 50,924 | 14.7 | % | $32.00 | 15.3 | % | 6/30/2024 |
| CYDCOR, LLC(3)(5) | NR / NR / NR | 43,013 | 2.4 | $35.11 | 14.2 | 5/31/2025 | ||
| Motor Vehicle Software Corp(3)(5) | NR / NR / NR | 42,307 | 12.2 | $29.67 | 11.8 | 8/31/2030 | ||
| Western General Insurance(3)(6) | NR / NR / NR | 36,609 | 10.6 | $29.61 | 10.2 | 2/28/2025 | ||
| Nuance | NR / NR / NR | 34,256 | 9.9 | $29.05 | 9.3 | 9/30/2024 | ||
| Anchor Loans(3) | NR / NR / NR | 21,076 | 6.1 | $28.20 | 5.6 | 8/31/2023 | ||
| LA Rams(3) | NR / NR / NR | 17,462 | 5.0 | $32.40 | 5.3 | 8/31/2021 | ||
| Nationwide Medical | NR / NR / NR | 13,665 | 3.9 | $33.00 | 4.2 | 6/30/2024 | ||
| JML Law Firm | NR / NR / NR | 10,020 | 2.9 | $30.55 | 2.9 | 6/30/2025 | ||
| Chatsworth Products(3) | NR / NR / NR | 9,367 | 2.7 | $31.74 | 2.8 | 2/28/2023 | ||
| Top 10 Total / Wtd. Avg. | 278,699 | 80.4 | % | $31.17 | 81.5 | % | ||
| Other Tenants | 60,559 | 17.5 | $32.65 | 18.5 | ||||
| Total Occupied Space | 339,258 | 97.8 | % | $31.44 | 100.0 | % | ||
| Vacant | 7,528 | 2.2 | ||||||
| Total | 346,786 | 100.0 | % | |||||
| (1) | Based on the underwritten rent rolls dated as of May 27, 2020. |
| (2) | Base Rent PSF and % of Total Base Rent include approximately $239,062 in contractual rent steps through March 2021 for certain tenants. |
| (3) | PNMAC, LLC has one, five-year renewal option remaining, CYDCOR, LLC has one, five-year renewal option remaining, Motor Vehicle Software Corp has one, five-year renewal option remaining for its 37,758 square foot space at the 29901 Agoura Road property, Western General Insurance has one, five-year renewal option remaining, Anchor Loans has one, three-year renewal option remaining, LA Rams has one, three-year renewal option remaining and Chatsworth Products has one, five-year renewal option remaining. |
| (4) | PNMAC has a free rent period during the month of January 2024 for approximately $148,698. At origination, the borrower deposited approximately $219,397 into a free rent reserve. |
| (5) | CYDCOR, LLC has a one-time termination option effective in December 2021, with 12-months prior notice and payment of a termination fee in the amount equal to $800,000 and Motor Vehicle Software Corp has an ongoing termination option effective any date after February 2024, with 12-months prior notice and payment of a termination fee in the amount equal to the sum of any unamortized tenant improvements and leasing commissions and abated rent for its 37,758 square foot space at the 29901 Agoura Road property. |
| (6) | Western General Insurance is in discussions with the borrowers regarding rent relief. |
| THE INFORMATION IN THIS STRUCTURAL AND COLLATERAL TERM SHEET IS NOT COMPLETE AND MAY BE AMENDED PRIOR TO THE TIME OF SALE. THIS TERM SHEET IS NOT AN OFFER TO SELL THESE SECURITIES AND IT IS NOT A SOLICITATION OF AN OFFER TO BUY THESE SECURITIES IN ANY JURISDICTION WHERE THE OFFER OR SALE IS NOT PERMITTED. | ||
| |
29 of 130 | |
| Structural and Collateral Term Sheet | JPMDB 2020-COR7 | |
| LA County Office Portfolio | ||
Lease Rollover Schedule(1)(2) | |||||||||
| Year | Number of Leases Expiring | Net Rentable Area Expiring | % of NRA Expiring | Base Rent Expiring(3) | % of Base Rent Expiring(3) | Cumulative Net Rentable Area Expiring | Cumulative % of NRA Expiring | Cumulative Base Rent Expiring(3) | Cumulative % of Base Rent Expiring(3) |
| Vacant | NAP | 7,528 | 2.2% | NAP | NAP | 7,528 | 2.2% | NAP | NAP |
| 2020 & MTM | 1 | 898 | 0.3 | $25,464 | 0.2% | 8,426 | 2.4% | $25,464 | 0.2% |
| 2021 | 2 | 22,330 | 6.4 | 700,126 | 6.6 | 30,756 | 8.9% | $725,590 | 6.8% |
| 2022 | 7 | 34,416 | 9.9 | 1,224,409 | 11.5 | 65,172 | 18.8% | $1,949,999 | 18.3% |
| 2023 | 7 | 37,530 | 10.8 | 1,095,047 | 10.3 | 102,702 | 29.6% | $3,045,045 | 28.6% |
| 2024 | 5 | 101,151 | 29.2 | 3,143,380 | 29.5 | 203,853 | 58.8% | $6,188,426 | 58.0% |
| 2025 | 7 | 95,843 | 27.6 | 3,074,896 | 28.8 | 299,696 | 86.4% | $9,263,321 | 86.9% |
| 2026 | 1 | 4,783 | 1.4 | 146,855 | 1.4 | 304,479 | 87.8% | $9,410,176 | 88.2% |
| 2027 | 0 | 0 | 0.0 | 0 | 0.0 | 304,479 | 87.8% | $9,410,176 | 88.2% |
| 2028 | 0 | 0 | 0.0 | 0 | 0.0 | 304,479 | 87.8% | $9,410,176 | 88.2% |
| 2029 | 0 | 0 | 0.0 | 0 | 0.0 | 304,479 | 87.8% | $9,410,176 | 88.2% |
| 2030 | 2 | 42,307 | 12.2 | 1,255,180 | 11.8 | 346,786 | 100.0% | $10,665,357 | 100.0% |
| 2031 & Beyond | 0 | 0 | 0.0 | 0 | 0.0 | 346,786 | 100.0% | $10,665,357 | 100.0% |
| Total | 32 | 346,786 | 100.0% | $10,665,357 | 100.0% | ||||
| (1) | Based on the underwritten rent rolls dated May 27, 2020. |
| (2) | Certain tenants have lease termination options that may become exercisable prior to the originally stated expiration date of the tenant lease and that are not considered in the lease rollover schedule. |
| (3) | Base Rent Expiring, % of Base Rent Expiring, Cumulative Base Rent Expiring and Cumulative % of Base Rent Expiring include approximately $239,062 in contractual rent steps through March 2021 for certain tenants. |
| Operating History and Underwritten Net Cash Flow | ||||||||
| 2016 | 2017 | 2018 | 2019 | Underwritten(1) | Per Square Foot | %(2) | ||
| Rents in Place | $8,170,126 | $8,754,674 | $9,281,578 | $9,606,157 | $10,426,295 | $30.07 | 90.4 | % |
| Contractual Rent Steps(3) | 0 | 0 | 0 | 0 | 239,062 | 0.69 | 2.1 | |
| Vacant Income | 0 | 0 | 0 | 0 | 212,172 | 0.61 | 1.8 | |
| Gross Potential Rent | $8,170,126 | $8,754,674 | $9,281,578 | $9,606,157 | $10,877,529 | $31.37 | 94.3 | % |
| Total Reimbursements | 204,312 | 239,565 | 276,739 | 517,219 | 468,058 | 1.35 | 4.1 | |
| Total Other Income | 145,697 | 168,702 | 162,449 | 168,690 | 183,587 | 0.53 | 1.6 | |
| Net Rental Income | $8,520,135 | $9,162,941 | $9,720,766 | $10,292,066 | $11,529,175 | $33.25 | 100.0 | % |
| (Vacancy/Credit Loss) | 0 | 0 | 0 | 0 | (954,916) | (2.75) | (8.3) | |
| Effective Gross Income | $8,520,135 | $9,162,941 | $9,720,766 | $10,292,066 | $10,574,259 | $30.49 | 91.7 | % |
| Total Expenses | $3,208,795 | $3,434,355 | $3,852,618 | $3,985,881 | $4,259,991 | $12.28 | 40.3 | % |
| Net Operating Income | $5,311,340 | $5,728,586 | $5,868,148 | $6,306,185 | $6,314,268 | $18.21 | 59.7 | % |
| Total TI/LC, CapEx/RR | 0 | 0 | 0 | 0 | 711,934 | 2.05 | 6.7 | |
| Net Cash Flow | $5,311,340 | $5,728,586 | $5,868,148 | $6,306,185 | $5,602,334 | $16.16 | 53.0 | % |
| (1) | For the avoidance of doubt, no COVID-19 specific adjustments have been incorporated in the lender underwriting. |
| (2) | % column represents percent of Net Rental Income for all revenue lines and represents percent of Effective Gross Income for the remainder of the fields. |
| (3) | Based on the contractual rent steps through March 2021 for certain tenants. |
Property Management.The LA County Office Portfolio Properties are managed by Realty Bancorp Equities, LLC, an affiliate of the borrowers.
Escrows and Reserves. At origination, the borrowers deposited into escrow $2,080,140 for outstanding tenant improvements and leasing commissions, $1,000,000 for future leasing costs, $335,000 for real estate taxes, approximately $308,190 for replacement reserves, approximately $219,397 for outstanding free rent, $35,000 for insurance premiums and approximately $4,938 for required repairs.
Tax Escrows– On a monthly basis,the borrowers are required to escrow 1/12 of the annual estimated tax payments, which currently equates to $66,750.
Insurance Escrows– On a monthly basis,the borrowers are required to escrow 1/12 of the annual estimated insurance premiums, which currently equates to $8,700.
| THE INFORMATION IN THIS STRUCTURAL AND COLLATERAL TERM SHEET IS NOT COMPLETE AND MAY BE AMENDED PRIOR TO THE TIME OF SALE. THIS TERM SHEET IS NOT AN OFFER TO SELL THESE SECURITIES AND IT IS NOT A SOLICITATION OF AN OFFER TO BUY THESE SECURITIES IN ANY JURISDICTION WHERE THE OFFER OR SALE IS NOT PERMITTED. | ||
| |
30 of 130 | |
| Structural and Collateral Term Sheet | JPMDB 2020-COR7 | |
| LA County Office Portfolio | ||
Replacement Reserves –On a monthly basis, the borrowers are required to escrow $7,225 for replacement reserves.
TI/LC Reserves – On a monthly basis, the borrowers are required to escrow $43,348 for tenant improvements and leasing commissions, subject to a cap of $1,000,000.
Lockbox / Cash Management.The LA County Office Portfolio Loan is structured with a hard lockbox and springing cash management. All rents are required to be deposited directly by the tenants into a lockbox account controlled by the lender. All funds in the lockbox account are required to be swept daily into the borrower’s operating account, unless a Cash Management Period (as defined below) is continuing. During the continuance of a Cash Management Period, all funds in the lockbox account will be swept daily into a lender-controlled account, from which account such funds will disbursed on each payment date in accordance with the LA County Office Portfolio Loan documents and any excess will be retained by the lender as additional collateral for the LA County Office Portfolio Loan.
A “Cash Management Period” will commence (i) upon an event of default (until the payment date following the cure of such event of default), (ii) if the debt service coverage ratio is less than 1.15x for any calendar quarter (until such time that the debt service coverage ratio is greater than or equal to 1.15x) or (iii) upon a Lease Sweep Period (as defined below).
A “Lease Sweep Period” will commence (i) on the date that is nine months prior to the end of the term (including any renewal terms) of any Lease Sweep Lease (as defined below);provided, however, a Lease Sweep Period will not commence pursuant to clause (i) if, and to the extent that, the borrowers have deposited $30.00 per square foot with respect to the applicable Lease Sweep Lease that gave rise to the subject Lease Sweep Period, (ii) on the date that is required under a Lease Sweep Lease by which the applicable Lease Sweep Tenant (as defined below) is required to give notice of its exercise of a renewal option thereunder (and such renewal has not so been exercised), (iii) if any Lease Sweep Lease is surrendered, cancelled or terminated prior to its then-current expiration date, (iv) if any Lease Sweep Tenant goes dark or gives notice that it intends to discontinue its business at its premises;provided, however, a Lease Sweep Period will not commence until the date that is 12 months prior to the end of the term of the applicable Lease Sweep Tenant pursuant to clause (iv) if, and to the extent that, the applicable Lease Sweep Tenant has a credit rating of “A” or better by S&P (or its functional equivalent by any other rating agency), (v) upon the occurrence and continuance of a default under any Lease Sweep Lease or (vi) upon the occurrence of an insolvency proceeding for any Lease Sweep Tenant.
A “Lease Sweep Lease” means the PNMAC lease, the CYDCOR lease, the MVSC lease, the Western General Insurance lease, and any other lease which covers 35,000 or more rentable square feet of the improvements.
A “Lease Sweep Tenant” means any tenant under a Lease Sweep Lease, or under one or more leases (leased by such tenant and/or its affiliates) which when taken together would constitute a Lease Sweep Lease.
Additional Debt. None.
Partial Release. Commencing on the July 6, 2022 payment date, the borrowers may obtain the release of any of the LA County Office Portfolio Properties,provided that, among other conditions, (i) the borrowers defease a portion of the LA County Office Portfolio Loan equal to the greater of (a) 115.0% of the allocated loan amount of the LA County Office Portfolio Property being released and (b) 100.0% of net sales proceeds, (ii) the debt yield (as calculated in accordance with the LA County Office Portfolio Loan documents) for the remaining LA County Office Portfolio Properties following the release is not less than the greater of (a) the debt yield immediately preceding such release and (b) 7.7%, and (iii) the release complies with customary REMIC requirements.
| THE INFORMATION IN THIS STRUCTURAL AND COLLATERAL TERM SHEET IS NOT COMPLETE AND MAY BE AMENDED PRIOR TO THE TIME OF SALE. THIS TERM SHEET IS NOT AN OFFER TO SELL THESE SECURITIES AND IT IS NOT A SOLICITATION OF AN OFFER TO BUY THESE SECURITIES IN ANY JURISDICTION WHERE THE OFFER OR SALE IS NOT PERMITTED. | ||
| |
31 of 130 | |
Structural and Collateral Term Sheet |
| JPMDB 2020-COR7 |
| ||
Chase Center Towers I & II | ||
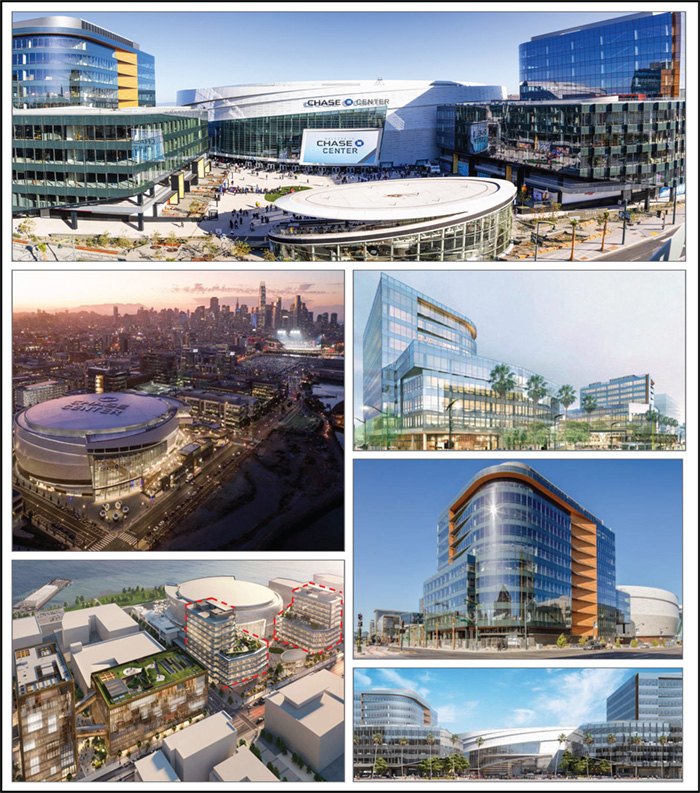
| THE INFORMATION IN THIS STRUCTURAL AND COLLATERAL TERM SHEET IS NOT COMPLETE AND MAY BE AMENDED PRIOR TO THE TIME OF SALE. THIS TERM SHEET IS NOT AN OFFER TO SELL THESE SECURITIES AND IT IS NOT A SOLICITATION OF AN OFFER TO BUY THESE SECURITIES IN ANY JURISDICTION WHERE THE OFFER OR SALE IS NOT PERMITTED. | ||
| |
32 of 130 | |
Structural and Collateral Term Sheet |
| JPMDB 2020-COR7 |
| ||
Chase Center Towers I & II | ||
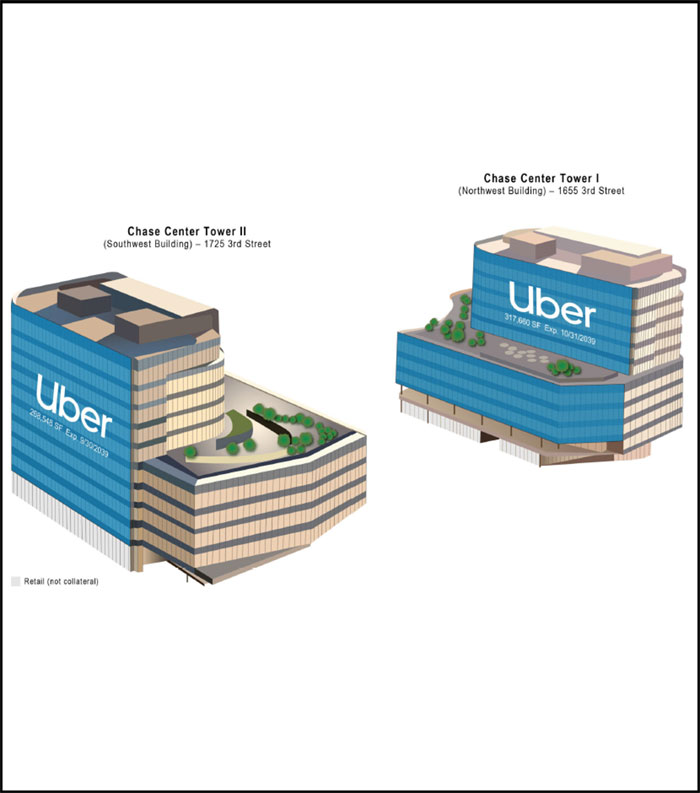
| THE INFORMATION IN THIS STRUCTURAL AND COLLATERAL TERM SHEET IS NOT COMPLETE AND MAY BE AMENDED PRIOR TO THE TIME OF SALE. THIS TERM SHEET IS NOT AN OFFER TO SELL THESE SECURITIES AND IT IS NOT A SOLICITATION OF AN OFFER TO BUY THESE SECURITIES IN ANY JURISDICTION WHERE THE OFFER OR SALE IS NOT PERMITTED. | ||
| |
33 of 130 | |
Structural and Collateral Term Sheet |
| JPMDB 2020-COR7 |
| ||
Chase Center Towers I & II | ||
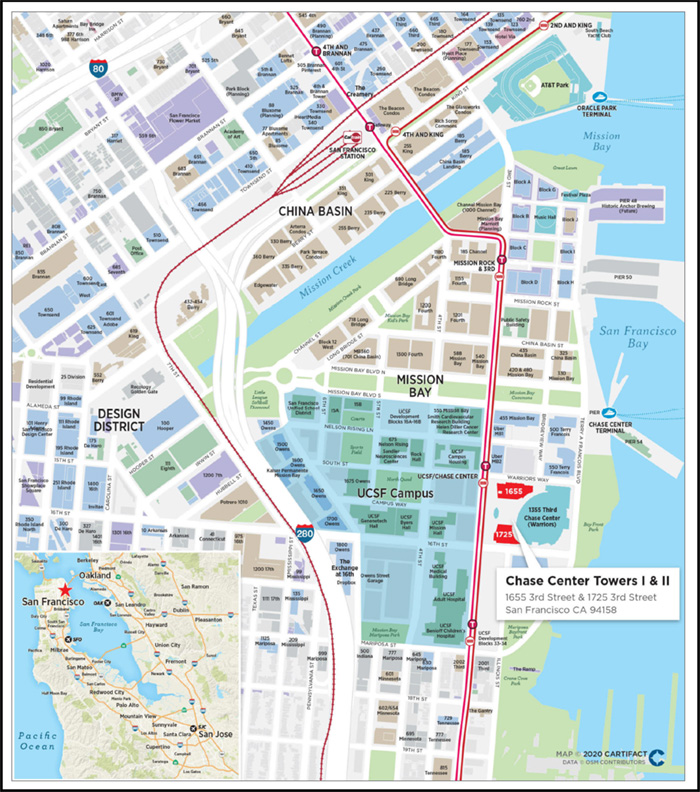
| THE INFORMATION IN THIS STRUCTURAL AND COLLATERAL TERM SHEET IS NOT COMPLETE AND MAY BE AMENDED PRIOR TO THE TIME OF SALE. THIS TERM SHEET IS NOT AN OFFER TO SELL THESE SECURITIES AND IT IS NOT A SOLICITATION OF AN OFFER TO BUY THESE SECURITIES IN ANY JURISDICTION WHERE THE OFFER OR SALE IS NOT PERMITTED. | ||
| |
34 of 130 | |
Structural and Collateral Term Sheet |
| JPMDB 2020-COR7 |
| ||
Chase Center Towers I & II | ||
Mortgage Loan Information |
| Property Information | ||
Mortgage Loan Seller: | JPMCB |
| Single Asset / Portfolio(1): | Two Crossed Assets |
Original Principal Balance(1)(2): | $67,500,000 |
| Title: | Fee |
Cut-off Date Principal Balance(1)(2): | $67,500,000 |
| Property Type – Subtype: | Office – CBD |
% of Pool by IPB: | 7.4% |
| Net Rentable Area (SF): | 586,208 |
Loan Purpose: | Refinance |
| Location: | San Francisco, CA |
Borrowers: | ECOP Tower I Owner LLC, |
| Year Built / Renovated(8): | 2019 / N/A |
| ECOP Tower II Owner LLC |
| Occupancy(9): | 100.0% |
Loan Sponsors(3): | Various |
| Occupancy Date: | 6/10/2020 |
Interest Rate(4): | 3.5220381% |
| Number of Tenants: | 1 |
Note Date: | 3/12/2020 |
| 2017 NOI(10): | N/A |
Maturity Date: | 3/10/2025 |
| 2018 NOI(10): | N/A |
Interest-only Period: | 59 months |
| 2019 NOI(10): | N/A |
Original Term: | 59 months |
| TTM NOI(10): | N/A |
Original Amortization: | None |
| UW Economic Occupancy(12): | 95.0% |
Amortization Type: | Interest Only |
| UW Revenues: | $62,842,493 |
Call Protection(5): | L(26),Def(29),O(4) |
| UW Expenses: | $25,383,829 |
Lockbox / Cash Management: | Hard / Springing |
| UW NOI(9)(11)(12): | $37,458,664 |
Additional Debt(2)(6): | Yes |
| UW NCF(9)(11)(12): | $37,341,422 |
Additional Debt Balance(2)(6): | $202,500,000 / $155,000,000 / |
| Appraised Value / Per SF(12)(13): | $863,500,000 / $1,473 |
| $175,000,000 |
| Appraisal Date(13): | 12/19/2019 |
Additional Debt Type(2)(6): | Pari Passu / B Notes / C Notes |
|
|
|
|
|
|
|
|
| Escrows and Reserves(7) | Financial Information(1)(12) | ||||||
| Initial | Monthly | Initial Cap | Senior Notes | Whole Loans | |||
| Taxes: | $0 | Springing | N/A | Cut-off Date Loan / SF: | $461 | $1,024 | |
| Insurance: | $0 | Springing | N/A | Maturity Date Loan / SF: | $461 | $1,024 | |
| Replacement Reserves: | $0 | Springing | N/A | Cut-off Date LTV(13): | 31.3% | 69.5% | |
| TI/LC: | $0 | Springing | N/A | Maturity Date LTV: | 31.3% | 69.5% | |
| Outstanding TIs: | $47,514,548 | $0 | N/A | UW NCF DSCR: | 3.87x | 1.36x | |
| Outstanding Repairs: | $15,163,800 | $0 | N/A | UW NOI Debt Yield: | 13.9% | 6.2% | |
| Other: | $0 | Springing | N/A | ||||
Sources and Uses | |||||||
Sources | Proceeds | % of Total |
| Uses | Proceeds |
| % of Total |
Senior Notes | $270,000,000 | 45.0% |
| Loan Payoff | $314,637,958 |
| 52.4% |
Senior-Subordinate Notes | 155,000,000 | 25.8% |
| Upfront Reserves | 62,678,348 |
| 10.4% |
Junior-Subordinate Notes | 175,000,000 | 29.2% |
| Closing Costs | 20,447,539 |
| 3.4% |
|
|
|
| Return of Equity | 202,236,155 |
| 33.7% |
Total Sources | $600,000,000 | 100.0% |
| Total Uses | $600,000,000 |
| 100.0% |
(1) | The Chase Center Towers Loans (as defined below) represent the cross-defaulted and cross-collateralized interests in the Chase Center Tower I Loan (as defined below) and the Chase Center Tower II Loan (as defined below). The financial information presented in the chart above reflects the aggregate Cut-off Date balance of the Chase Center Towers Loans. All information herein is represented on an aggregate basis, except as otherwise specified. |
(2) | The Chase Center Towers Loans consist of the non-controlling Notes A-1-F and A-1-G (Chase Center Tower I Loan) and Notes A-2-F and A-2-G (Chase Center Tower II Loan) and are part of the Chase Center Towers Whole Loans (as defined below), evidenced by 16 senior pari passu notes, two senior-subordinate notes and two junior-subordinate notes, with an aggregate outstanding principal balance as of the Cut-off Date of $600.0 million. For additional information, see “The Loans” herein. |
(3) | The Chase Center Towers Whole Loans sponsors are GSW Sports LLC; Uber Technologies, Inc. and Alexandria Real Estate Equities, Inc. There is no non-recourse carveout guarantor or separate environmental indemnitor for the Chase Center Towers Whole Loans. |
(4) | The interest rate reflects the weighted average interest rate of the Chase Center Towers Senior Notes (as defined below) only. See “Current Mezzanine or Subordinate Indebtedness” for additional information pertaining to the Chase Center Towers Junior-Subordinate Notes (as defined below). |
(5) | The lockout period will be at least 26 payments beginning with and including the first payment date of May 10, 2020. At any time after the earlier of (i) second anniversary of the securitization closing date of the last note to be securitized and (ii) May 10, 2023 (such earlier date, the “Permitted Release Date”), the Chase Center Towers Whole Loans may be defeased as permitted under the loan documents. The assumed lockout period of 26 months is based on the expected closing date of the JPMDB 2020-COR7 securitization in June 2020. The actual lockout period may be longer. After the Permitted Release Date in connection with the partial release of an individual building, repayment of an individual loan and uncrossing of the loans, a portion of the Chase Center Towers Whole Loan may be prepaid with a prepayment fee in an amount equal to the greater of (i) the yield maintenance amount or (ii) 1.00% of the outstanding principal balance as of the prepayment date. |
(6) | See “Current Mezzanine or Subordinate Indebtedness” herein. |
| THE INFORMATION IN THIS STRUCTURAL AND COLLATERAL TERM SHEET IS NOT COMPLETE AND MAY BE AMENDED PRIOR TO THE TIME OF SALE. THIS TERM SHEET IS NOT AN OFFER TO SELL THESE SECURITIES AND IT IS NOT A SOLICITATION OF AN OFFER TO BUY THESE SECURITIES IN ANY JURISDICTION WHERE THE OFFER OR SALE IS NOT PERMITTED. | ||
| |
35 of 130 | |
Structural and Collateral Term Sheet |
| JPMDB 2020-COR7 |
| ||
Chase Center Towers I & II | ||
(7) | See “Escrows and Reserves” herein. |
(8) | As of the Cut-off Date, construction of the Chase Center Towers Properties (as defined below) is substantially complete. The buildout of the interior space is currently underway and once completed Uber (as defined below) is expected to take occupancy. For more details on timing, see “The Property” herein. |
(9) | Occupancy and UW NOI are inclusive of two executed leases with Uber. Uber has begun paying rent, but is not yet in occupancy. Uber was scheduled to begin taking occupancy upon completion of construction in June 2020, which has since been delayed due to the on-going COVID-19 pandemic (see below for additional information). |
(10) | Historical NOI figures are unavailable as the Chase Center Towers Properties are newly constructed as of 2019. |
(11) | UW NOI and UW NCF are inclusive of contractual rent steps through December 2020, consisting of an annual increase in base rent of 3.0%. |
(12) | All NOI, NCF and occupancy information, as well as the appraised value, were determined prior to the emergence of the novel coronavirus pandemic, and the economic disruption resulting from measures to combat the pandemic, and all DSCR, LTV and Debt Yield metrics were calculated, and the Chase Centers Towers Loans were underwritten, based on such prior information. See “Risk Factors—Risks Related to Market Conditions and Other External Factors—Coronavirus Pandemic Has Adversely Affected the Global Economy and Will Likely Adversely Affect the Performance of the Mortgage Loans” in the Preliminary Prospectus. |
(13) | Appraised Value is reflective of the “Hypothetical As-If Funded” Appraised Value, which assumes all remaining construction and tenant improvements as of December 19, 2019 have been paid for or funded. At origination, the borrowers reserved $62,678,348 for all outstanding tenant improvements and outstanding repairs. The “As-Is” appraised value as of December 19, 2019 is $789.1 million, which results in a Senior Notes and Whole Loan Cut-off LTV of approximately 34.2% and 76.0%, respectively. |
The Loans. The Chase Center Tower I mortgage loan and the Chase Center Tower II mortgage loan (collectively, the “Chase Center Towers Loans”) represent two cross-collateralized, cross-defaulted, fixed rate loans secured by the first mortgages encumbering the borrowers’ fee simple condominium interest in the office tower portion of two newly constructed, Class A office towers, comprised of 586,208 square feet located in San Francisco, California (the “Chase Center Towers Properties”). The two individual mortgage loans that comprise the Chase Center Towers Loans are the Chase Center Tower I mortgage loan (the “Chase Center Tower I Loan”), which is secured by the Northwest Tower (the “Chase Center Tower I”) and the Chase Center Tower II mortgage loan (the “Chase Center Tower II Loan”), which is secured by the Southwest Tower (the “Chase Center Tower II”). The Chase Center Tower I Loan is evidenced by the non-controlling senior pari passu Notes A-1-F and A-1-G with an outstanding principal balance as of the Cut-off Date of $36,427,500, which is part of a $323.8 million whole loan (the “Chase Center Tower I Whole Loan”) that includes (i) eight senior pari passu notes with an aggregate outstanding principal balance as of the Cut-off Date of $145,710,000 (the “Chase Center Tower I Senior Notes”), (ii) a senior-subordinate note with an outstanding principal balance as of the Cut-off Date of $83,637,000 (the “Chase Center Tower I Senior-Subordinate Note”) and (iii) a junior-subordinate note with an outstanding principal balance as of the Cut-off Date of $94,453,000 (the “Chase Center Tower I Junior Subordinate Note”). The Chase Center Tower II Loan is evidenced by the non-controlling senior pari passu Notes A-2-F and A-2-G with an outstanding principal balance as of the Cut-off Date of $31,072,500, which is part of a $276.2 million whole loan (the “Chase Center Tower II Whole Loan“ and, together with the Chase Center Tower I Whole Loan, the “Chase Center Towers Whole Loans”) that includes (i) eight senior pari passu notes with an aggregate outstanding principal balance as of the Cut-off Date of $124,290,000 (the “Chase Center Tower II Senior Notes” and, together with the Chase Center Tower I Senior Notes, the “Chase Center Towers Senior Notes”), (ii) a senior-subordinate note with an outstanding principal balance as of the Cut-off Date of $71,363,000 (the “Chase Center Tower II Senior-Subordinate Note” and, together with the Chase Center Tower I Senior-Subordinate Note, the “Chase Center Towers Senior-Subordinate Notes”) and (iii) a junior-subordinate note with an outstanding principal balance as of the Cut-off Date of $80,547,000 (the “Chase Center Tower II Junior-Subordinate Note” and, together with the Chase Center Tower I Junior-Subordinate Notes, the “Chase Center Towers Junior-Subordinate Notes”). The Chase Center Towers Whole Loans have a 59-month term and are interest only for the full term. Only the Chase Center Towers Loans will be included in the mortgage pool for the JPMDB 2020-COR7 trust.
The relationship between the holders of the Chase Center Towers Senior Notes, the Chase Center Towers Senior-Subordinate Notes, and the Chase Center Towers Junior-Subordinate Note will be governed by co-lender agreements as described under “Description of the Mortgage Pool—The Whole Loans—The Non-Serviced AB Whole Loans—The Chase Center Towers Whole Loans” in the Preliminary Prospectus.
| THE INFORMATION IN THIS STRUCTURAL AND COLLATERAL TERM SHEET IS NOT COMPLETE AND MAY BE AMENDED PRIOR TO THE TIME OF SALE. THIS TERM SHEET IS NOT AN OFFER TO SELL THESE SECURITIES AND IT IS NOT A SOLICITATION OF AN OFFER TO BUY THESE SECURITIES IN ANY JURISDICTION WHERE THE OFFER OR SALE IS NOT PERMITTED. | ||
| |
36 of 130 | |
Structural and Collateral Term Sheet |
| JPMDB 2020-COR7 |
| ||
Chase Center Towers I & II | ||
Whole Loan Summary(1)(2)(3) | |||||
Note | Original Balance | Cut-off Date Balance |
| Note Holder | Controlling Piece |
A-1-A, A-2-A | $33,750,000 | $33,750,000 |
| Benchmark 2020-IG2 | No(5) |
A-1-B, A-2-B | 33,750,000 | 33,750,000 |
| Benchmark 2020-IG2 | No |
A-1-C, A-2-C | 33,750,000 | 33,750,000 |
| Benchmark 2020-IG2 | No |
A-1-D, A-2-D | 33,750,000 | 33,750,000 |
| Benchmark 2020-IG3 | No |
A-1-E, A-2-E | 33,750,000 | 33,750,000 |
| Benchmark 2020-IG3 | No |
A-1-F, A-2-F, A-1-G, A-2-G | 67,500,000 | 67,500,000 |
| JPMDB 2020-COR7 | No |
A-1-H, A-2-H | 33,750,000 | 33,750,000 |
| JPMCB(4) | No |
Senior Notes | $270,000,000 | $270,000,000 |
|
|
|
B-1, B-2(6) | 155,000,000 | 155,000,000 |
| Benchmark 2020-IG2 | No(5) |
C-1, C-2(6) | 175,000,000 | 175,000,000 |
| Third Party(7) | Yes(5) |
Whole Loan | $600,000,000 | $600,000,000 |
|
|
|
(1) | Representative of all promissory notes attributable to the cross-collateralized and cross-defaulted Chase Center Tower I Whole Loan and Chase Center Tower II Whole Loan. |
(2) | All Notes designated with “A-1” and “A-2” are reflective of the Chase Center Tower I Senior Notes and Chase Center Tower II Senior Notes, respectively. Notes designated with “B-1” and “B-2” are reflective of the Chase Center Tower I Senior-Subordinate Notes and Chase Center Tower II Senior-Subordinate Notes, respectively. All Notes designated with “C-1” and “C-2” are reflective of the Chase Center Tower I Junior-Subordinate Notes and Chase Center Tower II Junior-Subordinate Notes, respectively. |
(3) | The Notes above represent the combination of the Chase Center Tower I Loan and Chase Center Tower II Loan promissory notes which are allocated to their respective whole loans by an approximately 54.0% to 46.0% split, respectively. |
(4) | The related notes are expected to be contributed to one or more future securitization transactions and/or sold to one or more third party investors. |
(5) | The initial Control Notes are Note C-1 and Note C-2, so long as no Chase Center Towers control appraisal period has occurred and is continuing. See “Description of the Mortgage Pool—The Whole Loans—The Non-Serviced AB Whole Loans—The Chase Center Towers Whole Loans” in the Preliminary Prospectus. The Chase Center Towers Whole Loans will be serviced under the pooling and servicing agreement for the Benchmark 2020-IG2 transaction. |
(6) | The Chase Center Towers Senior-Subordinate Notes are subordinate in right of payment to the Chase Center Towers Senior Notes. The Chase Center Towers Junior-Subordinate Notes are subordinate in right of payment of the Chase Center Towers Senior Notes and the Chase Center Towers Senior-Subordinate Notes. |
(7) | Note C-1 and C-2 are currently held by Security Benefit Life Insurance Company. |
The Borrowers. The borrowers are ECOP Tower I Owner LLC (“Tower I Borrower”) and ECOP Tower II Owner LLC (“Tower II Borrower” and together with the Tower I Borrower, collectively, the “Borrowers”), each, a Delaware limited liability company and single purpose entity with two independent directors. The Borrowers have entered into a cross-default and cross-collateralization agreement under which the Chase Center Towers I Loan and Chase Center Towers II Loan are cross-defaulted and cross-collateralized and are permitted to effectuate an uncross in accordance with the terms of such agreement. Legal counsel to the Borrowers delivered a non-consolidation opinion in connection with the origination of the Chase Center Towers Whole Loans. There is no non-recourse carveout guarantor or separate environmental indemnitor for the Chase Center Towers Whole Loans.
The Loan Sponsors. The Borrowers are indirectly owned or controlled by a joint venture between GSW Sports LLC (the ownership group of the Golden State Warriors NBA franchise), Uber Technologies, Inc. (“Uber”) and Alexandria Real Estate Equities, Inc. (“ARE”) (collectively the “Borrower Sponsors”). Uber owns 45.0% of the Borrowers and is also leasing 100.0% of the Chase Center Towers Properties. GSW Sports LLC owns 45.0% of the Borrowers and is comprised of the Golden State Warriors basketball franchise ownership group which is led by Joe Lacob and Peter Guber. A business magazine ranks the Golden State Warriors as the NBA’s third most valuable franchise as of February 2020 at approximately $4.3 billion. ARE, which owns 10.0% of the Borrowers is also the manager of the joint venture which owns the Borrowers. ARE is a national development REIT focused on collaborative life science and technology campuses, with an asset base in North America of approximately 39.2 million square feet as of December 31, 2019.
In lieu of an environmental indemnity, the Borrower Sponsors provided a secured lender environmental policy.
The Properties. The Chase Center Towers Properties are comprised of two 11-story, Class A, office condominium buildings totaling 586,208 square feet located adjacent to the newly constructed Chase Arena in the Mission Bay submarket of San Francisco, California. The Chase Center Towers Properties, which are part of the broader Chase Center complex, are comprised of the Chase Center Tower I (317,660 square feet) and Chase Center Tower II (268,548 square feet). As of June 2020, the Chase Center Towers Properties are 100.0% leased to Uber which executed two leases for the premises in March 2018. Uber took possession of the completed Chase Center Towers Properties in October 2019 (Chase Center Tower I) and September 2019 (Chase Center Tower II). Uber began paying rent upon taking possession of its space, but is not yet in occupancy. Uber had been building out its interior space and was expected to start moving employees on-site in June 2020. In March 2020, the remaining buildout was put on hold pursuant to the City of San Francisco stay-at-home directive due to the on-going COVID-19 pandemic. Effective May 4, 2020, the City of San Francisco permitted all construction activities to resume. The Borrowers have indicated that the pause in construction will delay Uber’s move-in date but does not impact the tenant’s contractual rent obligations.
| THE INFORMATION IN THIS STRUCTURAL AND COLLATERAL TERM SHEET IS NOT COMPLETE AND MAY BE AMENDED PRIOR TO THE TIME OF SALE. THIS TERM SHEET IS NOT AN OFFER TO SELL THESE SECURITIES AND IT IS NOT A SOLICITATION OF AN OFFER TO BUY THESE SECURITIES IN ANY JURISDICTION WHERE THE OFFER OR SALE IS NOT PERMITTED. | ||
| |
37 of 130 | |
Structural and Collateral Term Sheet |
| JPMDB 2020-COR7 |
| ||
Chase Center Towers I & II | ||
Upon taking occupancy, over $212.0 million will have been invested in the build-out of the Uber space. In total, Uber will have contributed approximately $158.2 million to be utilized towards building a variety of unique office spaces, libraries and design labs. The invested capital will also be utilized in non-building system materials or equipment including Uber’s voice or data cabling, as well as furniture and other personal property items. Uber is also expected to occupy two adjacent buildings that are currently under construction (not a part of the collateral). Collectively, the four buildings are expected to represent Uber’s new headquarters campus. The campus will be home to approximately 7,000 employees and will represent Uber’s largest footprint in San Francisco with over 1.0 million square feet.
The Chase Center Towers Properties have been designed for and are expected to achieve LEED Gold certification (according to a third party report) and have been constructed to allow adaptability by both high-tech and biotech tenants. The Chase Center Towers Properties are situated on a portion of a 10.92 acre complex known as the Chase Center. Included in the Chase Center complex is the Chase Arena which serves as the home arena for the Golden State Warriors, and hosts concerts and events throughout the year. Chase Arena is an 18,000 seat arena that is one of the nation’s most advanced sporting arenas. The Chase Center complex also includes a retail component and three levels of subterranean parking containing approximately 584 parking spaces.
The sole tenant at the two properties is Uber Technologies, Inc. (586,208 square feet; 100.0% of net rentable area; 100.0% of underwritten base rent). Uber (rated B1 / NR / B- by Moody’s / Fitch / S&P) executed its leases for the Chase Center Tower I and Chase Center Tower II in March 2018 and has been paying rent since October 2019 and September 2019, respectively. According to the company’s most recent annual 10-K, Uber is a technology company and ride hailing service currently available in 69 countries and over 10,000 cities with approximately 111.0 million users, and possesses 69.7% of the US ride hailing market. In 2019, Uber had over $65.0 billion in gross bookings and over 26 billion miles driven. Uber has also grown its line of services to include UberEats, a food delivery service. Uber has also begun to develop autonomous car technology. Uber has five operating and reportable segments which include Rides, Eats, Freight, Other Bets and Advanced Technologies Group and Other Technology. Uber executed two individual leases in Chase Center Tower I and Chase Center Tower II. Each executed lease is subject to a 20-year term. Contractual rent under each lease is $65.00 per square foot on a NNN basis, subject to annual rent escalations of 3.0% which will occur on each anniversary of each respective rent commencement date. Each Uber lease includes one 14-year extension option at market rent. There are no early termination options (except in connection with a casualty or condemnation) or contraction options structured into the leases. The terms and conditions of tenancy at the Chase Center Tower I and Chase Center Tower II are each governed and subject to terms set forth in the individual leases applicable to each individual property. Although similar, the leases remain uncrossed and are not impacted by conditions and terms applicable to the other lease.
COVID-19 Update. As of June 1, 2020, Uber has paid all contractual rent obligations in-full. The Chase Center Towers Whole Loans are current through the June 1, 2020 payment date. As of June 1, 2020, the Chase Center Towers Whole Loans are not subject to any modification or forbearance request.
The Market. The Chase Center Towers Properties are located within the San Francisco-Oakland-Hayward, California metropolitan statistical area (“MSA”). San Francisco and the greater Bay Area are known for the fields of technology, life science/biotech, hardware, software, social media, and alternative energy, due, in part, to the presence of Stanford University and the University of California Berkeley, which provide a base of intellectual capital. According to the appraisal, within the Bay Area, the City of San Francisco is attractive as a location for technology businesses due to the urban environment and the appeal that it holds for recent college graduates.
San Francisco and the greater Bay Area are also home to the fifth largest corporate base of Fortune 500 companies in the United States. The region’s venture capital community and research and academic institutions have spawned global technology and biotechnology companies including Google, Apple, Facebook, Salesforce, Oracle, Cisco Systems, EBay, Genentech, and Gilead. In addition, the region continues to foster a host of next wave companies including Uber, Twitter, Dropbox, Airbnb, Square, and Okta.
According to the appraisal, as of the third quarter of 2019, the office building development cycle in San Francisco included 4.3 million square feet currently under construction throughout the MSA. In total, approximately 60.0% of the inventory under construction has been preleased. Less than 2.0 million square feet of office space currently under construction throughout the MSA is available for lease.
The Chase Center Towers Properties are located in the Mission Bay submarket of San Francisco, California. The submarket is anchored by the University of California, San Francisco’s Mission Bay Campus (“UCSF Mission Bay”) which focuses on the medical and biotech sectors. The Mission Bay submarket benefits from its proximity to downtown San Francisco and from significant infrastructure investment in the form of the San Francisco Light Rail which runs directly past the Chase Center Towers. The submarket offers almost entirely new office space, which according to the appraisal have asking rents among the highest in the San Francisco office market.
According to a third party market report as of April 2020, the total office inventory in the Mission Bay/China Basin submarket stood at approximately 4.15 million square feet up from approximately 3.4 million square feet at the end of 2018 with a positive net absorption of 746,101 square feet at year end 2019 from year end 2018. Average asking rents were at $77.45 per square foot on a NNN basis representing an approximately 6.7% and 0.2% increase from year end 2018 and year end 2019, respectively. The current vacancy rate
| THE INFORMATION IN THIS STRUCTURAL AND COLLATERAL TERM SHEET IS NOT COMPLETE AND MAY BE AMENDED PRIOR TO THE TIME OF SALE. THIS TERM SHEET IS NOT AN OFFER TO SELL THESE SECURITIES AND IT IS NOT A SOLICITATION OF AN OFFER TO BUY THESE SECURITIES IN ANY JURISDICTION WHERE THE OFFER OR SALE IS NOT PERMITTED. | ||
| |
38 of 130 | |
Structural and Collateral Term Sheet |
| JPMDB 2020-COR7 |
| ||
Chase Center Towers I & II | ||
in the submarket is at 1.2% with an availability rate of 4.7%. There was approximately 1.0 million square feet under-construction in the submarket, all of which was preleased to Uber, of which 586,208 square feet represents the Chase Center Towers Properties and the remaining 422,980 square feet represents two additional office towers located to the north of the Chase Center Towers Properties. Collectively, the four buildings represent Uber’s new HQ campus.
According to a third party market report, San Francisco’s economy grew rapidly in the expansion cycle and maintained strength heading into 2020 before the coronavirus pandemic hit. The trajectory of San Francisco’s economy and its commercial real estate sector will depend on how widely the virus spreads, and how long containment policies like social distancing need to be maintained.
The appraisal identified six office rent comparables from other class A/B office buildings in the Mission Bay/China Basin office submarket and the surrounding submarkets. Base rent across approximately 332,225 square feet of recently executed leases ranges from $70.00 (NNN) to $100.00 (full service) per square foot. The appraisal concluded a contractual base rent on a NNN basis of $65.00 per square foot for the Chase Center Towers Properties. The appraisal concluded a full service market rental rate of $95.00 per square foot. On June 5, 2018, San Francisco passed a 3.5% gross receipts tax that applies to income generated by office buildings in addition to the in-place 0.3% gross tax receipt. The new tax (“Prop C”) took effect on January 1, 2019. The Prop C tax expense is recoverable from tenants on a NNN lease and is fully reimbursable with respect to the Chase Center Towers Properties based on the in-place lease with Uber. According to the appraisal, triple-net leases are less common in the San Francisco market than full-service and industrial gross leases. The concluded market rent of $95.00 is based on a full-service expense provision with the tenant paying a 3.5% Prop C tax on a net basis.
Historical Occupancy(1) | ||||
| 2017 | 2018 | 2019 | Current(2) |
Occupancy | NAV | NAV | NAV | 100.0% |
(1) | Historical occupancy is unavailable as the Chase Center Towers Properties are newly constructed as of 2019. |
(2) | Current Occupancy is as of June 10, 2020. |
Tenant Summary(1) | |||||||
Building | Tenant | Credit Rating (Moody’s/Fitch/S&P)(2) | Net Rentable Area | % of Total | Base Rent | % of Total Base Rent(3) | Lease Expiration |
Chase Center Tower I | Uber Technologies, Inc. | B1 / NR / B- | 317,660 | 54.2% | $66.95 | 54.2% | 10/31/2039 |
Chase Center Tower II | Uber Technologies, Inc. | B1 / NR / B- | 268,548 | 45.8% | 66.95 | 45.8% | 9/30/2039 |
Total |
| 586,208 | 100.0% | $66.95 | 100.0% |
| |
(1) | Based on the underwritten rent roll. |
(2) | In certain instances, ratings provided are those of the parent company of the entity shown, whether or not the parent company guarantees the lease. |
(3) | Base Rent PSF and % of Total Base Rent is inclusive of contractual rent steps through December 2020. |
(4) | Both leases are structured with one, 14-year extension option upon expiration of their respective initial terms. |
Lease Rollover Schedule(1)(2) | |||||||||
Year | Number of Leases | Net Rentable Area Expiring | % of NRA Expiring | Base Rent Expiring | % of Base | Cumulative Net Rentable Area Expiring | Cumulative | Cumulative Base Rent Expiring | Cumulative % of Base Rent Expiring |
Vacant | NAP | 0 | 0.0% | NAP | NAP | 0 | 0.0% | NAP | NAP |
2020 & MTM | 0 | 0 | 0.0 | $0 | 0.0% | 0 | 0.0% | $0 | 0.0% |
2021 | 0 | 0 | 0.0 | 0 | 0.0 | 0 | 0.0% | $0 | 0.0% |
2022 | 0 | 0 | 0.0 | 0 | 0.0 | 0 | 0.0% | $0 | 0.0% |
2023 | 0 | 0 | 0.0 | 0 | 0.0 | 0 | 0.0% | $0 | 0.0% |
2024 | 0 | 0 | 0.0 | 0 | 0.0 | 0 | 0.0% | $0 | 0.0% |
2025 | 0 | 0 | 0.0 | 0 | 0.0 | 0 | 0.0% | $0 | 0.0% |
2026 | 0 | 0 | 0.0 | 0 | 0.0 | 0 | 0.0% | $0 | 0.0% |
2027 | 0 | 0 | 0.0 | 0 | 0.0 | 0 | 0.0% | $0 | 0.0% |
2028 | 0 | 0 | 0.0 | 0 | 0.0 | 0 | 0.0% | $0 | 0.0% |
2029 | 0 | 0 | 0.0 | 0 | 0.0 | 0 | 0.0% | $0 | 0.0% |
2030 and Thereafter | 2 | 586,208 | 100.0 | 39,246,626 | 100.0 | 586,208 | 100.0% | 39,246,626 | 100.0% |
Total | 2 | 586,208 | 100.0% | $39,246,626 | 100.0% |
|
| $39,246,626 |
|
(1) | Based on the underwritten rent roll. |
(2) | Base Rent Expiring is inclusive of contractual rent steps through December 2020. |
| THE INFORMATION IN THIS STRUCTURAL AND COLLATERAL TERM SHEET IS NOT COMPLETE AND MAY BE AMENDED PRIOR TO THE TIME OF SALE. THIS TERM SHEET IS NOT AN OFFER TO SELL THESE SECURITIES AND IT IS NOT A SOLICITATION OF AN OFFER TO BUY THESE SECURITIES IN ANY JURISDICTION WHERE THE OFFER OR SALE IS NOT PERMITTED. | ||
| |
39 of 130 | |
Structural and Collateral Term Sheet |
| JPMDB 2020-COR7 |
| ||
Chase Center Towers I & II | ||
Underwritten Net Cash Flow(1)(2) | |||
| Underwritten(3) | Per Square Foot | %(4) |
Base Rent(5) | $39,246,626 | $66.95 | 59.3% |
Vacant Income | 0 | 0 | 0.0% |
Gross Potential Rent | $39,246,626 | $66.95 | 59.3% |
CAM Reimbursements | 24,793,767 | 42.30 | 37.5% |
Parking Income | 2,109,600 | 3.60 | 3.2% |
Gross Potential Income | $66,149,993 | $112.84 | 100.0% |
(Vacancy/Credit Loss)(6) | (3,307,500) | (5.64) | (5.0) |
Effective Gross Income | $62,842,493 | $107.20 | 95.0% |
Total Operating Expenses | 25,383,829 | 43.30 | 40.4% |
Net Operating Income | $37,458,664 | $63.90 | 59.6% |
Capital Expenditures | 117,242 | 0.20 | 0.2% |
Net Cash Flow | $37,341,422 | $63.70 | 59.4% |
(1) | The financials provided above are reflective of the consolidated underwritings for the Chase Center Tower I and the Chase Center Tower II. For the avoidance of doubt, no COVID-19 specific adjustments have been incorporated in the lender underwriting. |
(2) | Historical financials are not available as the Chase Center Towers Properties are newly built as of 2019. |
(3) | Based on the underwritten rent roll. |
(4) | % column represents percent of Gross Potential Income for all revenue lines and represents percent of Effective Gross Income for the remainder of fields. |
(5) | Underwritten Base Rent is inclusive of contractual rent steps through December 2020, which reflect an annual increase of 3.0%. |
(6) | Vacancy is underwritten to 5.0% of Gross Potential Income. |
Property Management. The Chase Center Towers Properties are currently managed by ARE-San Francisco No. 68, LLC, a Delaware limited liability company and affiliate of ARE, a Borrower Sponsor.
Escrows and Reserves. At origination, the Borrowers deposited approximately $47,514,548 in the aggregate for outstanding tenant improvements and approximately $15,163,800 in the aggregate for outstanding repairs. The outstanding tenant improvement and outstanding repairs reserve were funded upfront in connection with the buildout of the Uber office space.
Real Estate Taxes and Insurance Reserves – On each payment date, the Borrowers are required to make monthly deposits of: (i) a tax reserve in an amount equal to 1/12 of the amount that the lender estimates will be necessary to pay taxes over the then succeeding 12-month period (such reserve has been conditionally waived so long as no event of default under the related loan documents has occurred and is continuing, the taxes are paid by Uber or the taxes are paid by the Borrowers and reimbursed by Uber and the Borrowers have provided satisfactory evidence upon request that taxes have been paid in accordance with the requirements of the loan documents) and (ii) an insurance reserve in an amount equal to 1/12 of the amount that the lender estimates will be necessary to cover premiums over the then succeeding 12-month period (such reserve has been conditionally waived so long as no event of default under the related loan documents has occurred and is continuing, and the Chase Center Towers Properties are insured by a policy (which may be a blanket policy) meeting the requirements of the loan documents).
Replacement Reserves – Upon the occurrence of a Cash Sweep Event and continuing on a monthly basis during such Cash Sweep Event, an escrow for replacements equal to $12,213 in the aggregate per month.
TI/LC Reserve – Upon the occurrence of a Cash Sweep Event and continuing on a monthly basis during such Cash Sweep Event, an escrow for tenant improvement and leasing commission obligations incurred following the origination date and if reasonably approved by the lender (or if such costs are included in a leasing plan for the Chase Center Towers Properties approved by the lender), other tenant incentives incurred by the Borrowers equal to $48,851 in the aggregate per month.
Common Charges Reserve –On each payment date, the Borrowers will be required to deposit with the lender 1/12 of the common charges and other regular assessments due under the condominium documents and master association documents that the lender reasonably estimates will be payable by the Borrowers under the condominium documents and master association documents during the next ensuing 12 months in order to accumulate with the lender sufficient funds to pay all such common charges at least 30 days prior to the respective due dates, provided that (i) the monthly deposits for common charges and any other amounts required to be deposited will be waived for each applicable month if (x) no event of default has occurred and is continuing, (y) the common charges are required to be paid by Uber or, if not paid directly by Uber, are paid by the Borrowers by the due date and reimbursed or required to be reimbursed to the Borrowers in accordance with the Uber lease, and (z) from and after the date that common charges or other regular assessments due under the condominium documents and master association documents commence being assessed and become due and payable thereunder, the Borrowers provide reasonable evidence of the payment of such common charges and/or other regular assessments that
| THE INFORMATION IN THIS STRUCTURAL AND COLLATERAL TERM SHEET IS NOT COMPLETE AND MAY BE AMENDED PRIOR TO THE TIME OF SALE. THIS TERM SHEET IS NOT AN OFFER TO SELL THESE SECURITIES AND IT IS NOT A SOLICITATION OF AN OFFER TO BUY THESE SECURITIES IN ANY JURISDICTION WHERE THE OFFER OR SALE IS NOT PERMITTED. | ||
| |
40 of 130 | |
Structural and Collateral Term Sheet |
| JPMDB 2020-COR7 |
| ||
Chase Center Towers I & II | ||
are then due and payable under the condominium documents and master association documents, as applicable for the applicable payment date.
Lockbox / Cash Management. The loan documents require a hard lockbox and springing cash management. At origination, the Borrowers delivered tenant direction letters to the existing tenant at the Chase Center Towers Properties, Uber, directing Uber to remit its rent checks directly to the lender-controlled lockbox. So long as no Cash Sweep Event then exists, all funds deposited into the lockbox account are required to be transferred weekly to or at the direction of the Borrowers. Upon the occurrence and during the continuance of a Cash Sweep Event, all funds in the lockbox account are required to be swept weekly to a cash management account under the control of the lender to be applied and disbursed, so long as no event of default is continuing, for payment of taxes, insurance premiums, operating expenses, debt service, reserves, and other amounts payable in accordance with the loan documents, and all excess cash flow funds remaining in the cash management account after the application of such funds in accordance with the loan documents are required to be held by the lender in an excess cash flow reserve account as additional collateral for the Chase Center Towers Whole Loans. Upon the occurrence and during the continuance of an event of default under the loan documents or any bankruptcy action of the Borrowers, the lender may apply funds to the debt in such priority as it may determine.
A “Cash Sweep Event” will commence upon the occurrence of (i) an event of default, (ii) a bankruptcy action of any individual Borrower or (iii) a Lease Sweep Event.
A Cash Sweep Event may be cured, with respect to (a) clause (i) above, either (A) a cure of such event of default, (B) there has been a reinstatement cure, or (C) the waiver of such event of default in writing by the lender (in its sole and absolute discretion), and (b) clause (iii) above, the occurrence of a Lease Sweep Termination Event (as defined below); provided, however, that the foregoing cure conditions will not be deemed to have occurred until satisfaction of the following additional conditions: (i) no other event of default is continuing under the Chase Center Towers Whole Loan documents, and (ii) the Borrowers have paid all of the lender’s reasonable out-of-pocket expenses actually incurred in connection with such Cash Sweep Event cure including reasonable attorney’s fees and expenses. Subject to applicable law, in no event may a Cash Sweep Event cure occur with respect to any Cash Sweep Event caused by a bankruptcy proceeding with respect to the Borrowers.
A “Lease Sweep Event” will be deemed to exist if any of the following have occurred and are continuing: (i) there is an event of default by Uber under the Uber lease beyond any applicable grace or cure period, (ii) a bankruptcy or insolvency of Uber, (iii) Uber’s long term debt rating received from Moody’s drops below Caa1, CCC+ by S&P or CCC by Fitch (if rated by Fitch), or (iv) Uber’s average market capitalization falls below $20 billion for any two consecutive calendar quarters.
A “Lease Sweep Termination Event“ means (a) if the Lease Sweep Event is caused by any of clauses (i) through (iv) in the definition of “Lease Sweep Event,” the applicable Borrower delivers one (or more) replacement lease(s), which may include sublease(s), with one or more tenants or subtenants entered into in accordance with the loan documents for the space demised under the lease that triggered such Lease Sweep Event, provided that (x) each such replacement lease and/or sublease is a qualified lease, (y) such replacement tenant(s) or subtenant(s) under the replacement lease(s) is/are paying full contractual rent without right of offset (except for any offset rights in such replacement lease(s) which are substantially similar to those granted to Uber under the Uber lease) equal in the aggregate (after taking into account any rent free periods amortized over the term of the applicable lease(s)), to the rent payable under the Uber lease, and the applicable Borrower has delivered to the lender an Officer’s Certificate certifying the foregoing and (z) with respect to any sublease, the applicable Borrower has delivered a subordination, non-disturbance and attornment agreement or recognition agreement in a commercially reasonable form and substance reasonably acceptable to the lender and such sublessee and paid all of lender’s reasonable out-of-pocket costs and expenses actually incurred in connection therewith, (b) if the Lease Sweep Event is caused by clause (iii) in the definition of “Lease Sweep Event”, unless the requirements described in clause (a) of this definition have been satisfied, the long-term debt rating of Uber is at least “Caa1” by Moody’s, “CCC+” by S&P or “CCC” by Fitch (if rated by Fitch), and (c) if the Lease Sweep Event is caused by clause (iv) in the definition of “Lease Sweep Event”, unless the requirements described in clause (a) of this definition have been satisfied, Uber’s average market capitalization equals or exceeds $20 billion for two consecutive calendar quarters.
Current Mezzanine or Subordinate Indebtedness. The Chase Center Towers Senior-Subordinate Notes represent an aggregate outstanding balance as of the Cut-off Date of $155.0 million and the Chase Center Towers Junior-Subordinate Notes represent an aggregate outstanding balance as of the Cut-off Date of $175.0 million. The Chase Center Towers Senior-Subordinate Notes accrue interest at a weighted average fixed rate of approximately 3.52203812% per annum. The Chase Center Towers Junior-Subordinate Notes accrue interest at a fixed rate of approximately 6.87500% per annum. The Chase Center Towers Senior-Subordinate Notes and the Chase Center Towers Junior-Subordinate Notes have a 59-month term and are interest only for the full term. For additional information, see “Description of the Mortgage Pool—The Whole Loans—The Non-Serviced AB Whole Loans—The Chase Center Towers Whole Loans” in the Preliminary Prospectus.
Future Mezzanine or Subordinate Indebtedness Permitted. None.
| THE INFORMATION IN THIS STRUCTURAL AND COLLATERAL TERM SHEET IS NOT COMPLETE AND MAY BE AMENDED PRIOR TO THE TIME OF SALE. THIS TERM SHEET IS NOT AN OFFER TO SELL THESE SECURITIES AND IT IS NOT A SOLICITATION OF AN OFFER TO BUY THESE SECURITIES IN ANY JURISDICTION WHERE THE OFFER OR SALE IS NOT PERMITTED. | ||
| |
41 of 130 | |
Structural and Collateral Term Sheet |
| JPMDB 2020-COR7 |
| ||
Chase Center Towers I & II | ||
Cross Default and Cross Collateralization. Pursuant to the term of the cross-default agreement, until the earlier to occur of (x) the satisfaction of the Individual Loan Repayment Conditions (as defined below) and (y) the consummation of a separation and uncross transaction, the Chase Center Tower I Loan and Chase Center Tower II Loan are cross-defaulted and cross-collateralized such that (i) an event of default under any of either individual loan for each office tower constitutes an event of default under each of the other mortgages; (ii) an event of default under any note, any loan agreement or the cross agreement constitutes an event of default under each mortgage; (iii) (x) the Chase Center Tower I mortgage and the Chase Center Tower II second mortgage each constitute security for the Chase Center Tower I Loan, and the Chase Center Tower I Loan lender holds a lien on both properties and (y) the Chase Center Tower II mortgage and the Chase Center Tower I second mortgage each constitute security for the Chase Center Tower II Loan, and the Chase Center Tower II lender holds a lien on both properties; (iv) the Chase Center Tower II second mortgage constitutes security for the repayment of the guaranteed obligations under the Chase Center Tower I note guaranty and (v) the Chase Center Tower I second mortgage constitutes security for repayment of the guaranteed obligations under the Chase Center Tower II note guaranty.
Partial Release. The loan documents provide that the Borrowers have the right to the release of an individual Chase Center Towers Property from the lien of the mortgage, provided that the Borrowers satisfy certain terms and conditions set forth in the cross agreement (the “Individual Loan Repayment Conditions”), including among other things (i) no event of default under the loan documents has occurred and is continuing, (ii) the individual Borrower making such request will (1) make a prepayment of the released loan in full in accordance with its respective loan agreement or defease the released loan in full, and (2) cause the Borrower under the remaining loan to either (x) pay to the remaining lender, an amount equal to 15% of the outstanding principal balance of the released loan including, interest for the full accrual period during which the prepayment occurs (or if such payment is made on a payment date, the full accrual period applicable to such payment date) and if such prepayment is made on or before the permitted prepayment date, the yield maintenance premium, which amount will be applied as a prepayment of the principal balance of the remaining loan or (y) defease the remaining loan in part by an amount equal to 15% of the outstanding principal balance of the released loan including interest that has or would have accrued on the portion of the remaining loan defeased for the full accrual period during which the partial defeasance occurs (or if such partial defeasance is made on a payment date, the full accrual period applicable to such payment date), (iii) delivery of evidence reasonably acceptable to the remaining lender that (A) the release property and the remaining property have been separately assessed for taxes and the release property constitutes or will constitute a separate tax lot, and (B) the lender receives evidence reasonably satisfactory to the lender that after giving effect to such release, the remaining property will continue to comply with all applicable laws (including all zoning, building, land use or parking or other similar legal requirements with respect to such property), (iv) subsequent to such release, the Borrower that owns the remaining property will continue to be a special purpose entity, (v) the debt service coverage ratio of the remaining loan, after giving effect to the release and to the partial prepayment of the remaining loan, will be equal to or greater than the greater of (x) 1.45x for the release of the Chase Center Tower II and 1.43x for the release of the Chase Center Tower I and (y) the aggregate debt service coverage ratio immediately prior to such release, and (vi) the REMIC release requirements are satisfied. Under certain circumstances, a non-recourse carveout guaranty from Uber or an affiliate of Uber satisfactory to the lender will be required to be delivered in connection with a release. For more details regarding the release provisions of the Chase Center Towers Loan, see “Description of the Mortgage Pool—Certain Terms of the Mortgage Loans—Partial Releases” in the Preliminary Prospectus.
Condominium and Master Association Structure. The Chase Center Towers Properties are subject to a condominium declaration. Each office tower is a condominium comprised of an office unit (which is the collateral for the Chase Center Towers Whole Loans) and a retail unit (which is not collateral for the Chase Center Towers Whole Loans). The Borrowers act as a managing owner of each condominium association. The Borrowers have approximately 89.0% of the votes in the condominium association and approximately 11.0% of the votes are held by the owner of the retail unit, which is an affiliate of the GSW Sports LLC. The condominium association does not have a board and is managed by the managing owner. Each of the Chase Center Towers Properties are subject to a Master Association with respect to the Chase Center complex. The Master Association has a board of 11 directors and each Borrower acting as a managing owner has the right to appoint two directors. Please see “Description of the Mortgage Pool—Mortgage Pool Characteristics—Fee & Leasehold Estates; Ground Leases” in the Preliminary Prospectus for additional information.
| THE INFORMATION IN THIS STRUCTURAL AND COLLATERAL TERM SHEET IS NOT COMPLETE AND MAY BE AMENDED PRIOR TO THE TIME OF SALE. THIS TERM SHEET IS NOT AN OFFER TO SELL THESE SECURITIES AND IT IS NOT A SOLICITATION OF AN OFFER TO BUY THESE SECURITIES IN ANY JURISDICTION WHERE THE OFFER OR SALE IS NOT PERMITTED. | ||
| |
42 of 130 | |
Structural and Collateral Term Sheet |
| JPMDB 2020-COR7 |
| ||
1633 Broadway | ||
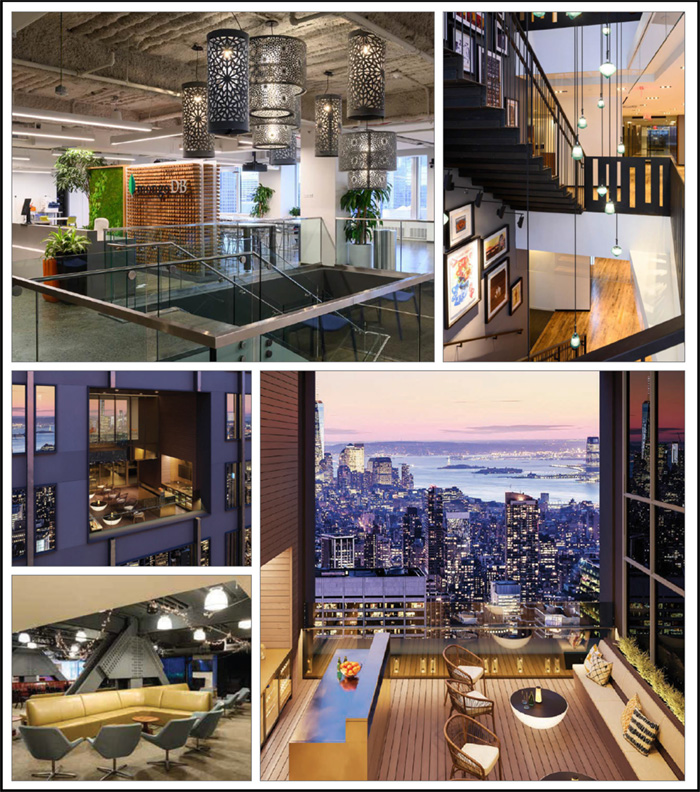
| THE INFORMATION IN THIS STRUCTURAL AND COLLATERAL TERM SHEET IS NOT COMPLETE AND MAY BE AMENDED PRIOR TO THE TIME OF SALE. THIS TERM SHEET IS NOT AN OFFER TO SELL THESE SECURITIES AND IT IS NOT A SOLICITATION OF AN OFFER TO BUY THESE SECURITIES IN ANY JURISDICTION WHERE THE OFFER OR SALE IS NOT PERMITTED. | ||
| |
43 of 130 | |
Structural and Collateral Term Sheet |
| JPMDB 2020-COR7 |
| ||
1633 Broadway | ||
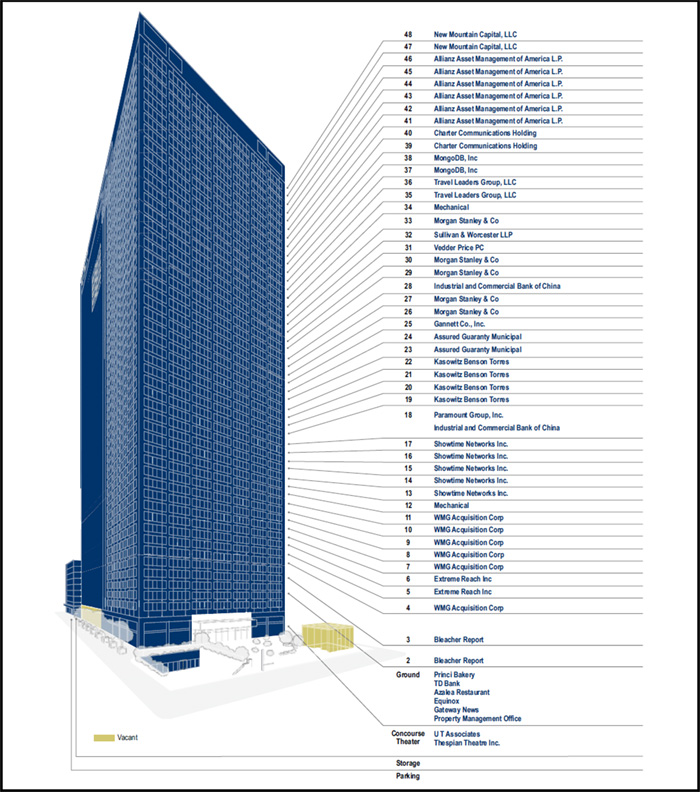
| THE INFORMATION IN THIS STRUCTURAL AND COLLATERAL TERM SHEET IS NOT COMPLETE AND MAY BE AMENDED PRIOR TO THE TIME OF SALE. THIS TERM SHEET IS NOT AN OFFER TO SELL THESE SECURITIES AND IT IS NOT A SOLICITATION OF AN OFFER TO BUY THESE SECURITIES IN ANY JURISDICTION WHERE THE OFFER OR SALE IS NOT PERMITTED. | ||
| |
44 of 130 | |
Structural and Collateral Term Sheet |
| JPMDB 2020-COR7 |
| ||
1633 Broadway | ||
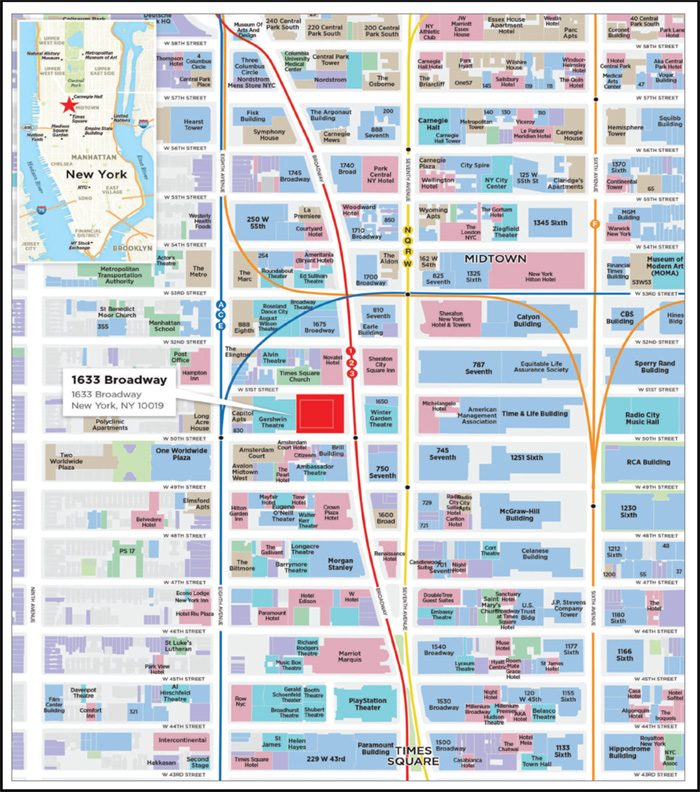
| THE INFORMATION IN THIS STRUCTURAL AND COLLATERAL TERM SHEET IS NOT COMPLETE AND MAY BE AMENDED PRIOR TO THE TIME OF SALE. THIS TERM SHEET IS NOT AN OFFER TO SELL THESE SECURITIES AND IT IS NOT A SOLICITATION OF AN OFFER TO BUY THESE SECURITIES IN ANY JURISDICTION WHERE THE OFFER OR SALE IS NOT PERMITTED. | ||
| |
45 of 130 | |
Structural and Collateral Term Sheet |
| JPMDB 2020-COR7 |
| ||
1633 Broadway | ||
Mortgage Loan Information |
| Property Information | ||
Mortgage Loan Sellers(1): | JPMCB/GACC/GSMC |
| Single Asset / Portfolio: | Single Asset |
Credit Assessment |
|
| Title: | Fee |
(Fitch/KBRA/S&P)(7): | [ ] |
| Property Type - Subtype: | Office – CBD |
Original Principal Balance(1): | $57,500,000 |
| Net Rentable Area (SF): | 2,561,512 |
Cut-off Date Principal Balance(1): | $57,500,000 |
| Location: | New York, NY |
% of Pool by IPB: | 6.3% |
| Year Built / Renovated: | 1972 / 2013 |
Loan Purpose: | Refinance |
| Occupancy: | 98.4% |
Borrowers: | PGREF I 1633 Broadway Land, |
| Occupancy Date: | 10/31/2019 |
| L.P., 1633 Broadway Owner I, LP, |
| Number of Tenants: | 38 |
| 1633 Broadway Owner II, LP |
| 2017 NOI: | $94,190,007 |
Loan Sponsor(2): | Paramount Group Operating |
| 2018 NOI: | $109,098,450 |
| Partnership LP |
| 2019 NOI(6): | $110,809,315 |
Interest Rate: | 2.99000% |
| TTM NOI (as of 5/2020): | $110,826,000 |
Note Date: | 11/25/2019 |
| UW Economic Occupancy(5): | 95.9% |
Maturity Date: | 12/6/2029 |
| UW Revenues: | $190,585,947 |
Interest-only Period: | 120 months |
| UW Expenses: | $71,435,784 |
Original Term: | 120 months |
| UW NOI(5): | $119,150,163 |
Original Amortization: | None |
| UW NCF(5): | $116,677,727 |
Amortization Type: | Interest Only |
| Appraised Value / Per SF(5): | $2,400,000,000 / $937 |
Call Protection(3): | L(30),Def(83),O(7) |
| Appraisal Date: | 10/24/2019 |
Lockbox / Cash Management: | Hard / Springing |
|
|
|
Additional Debt(1): | Yes |
|
|
|
Additional Debt Balance(1): | $943,500,000 / $249,000,000 |
|
|
|
Additional Debt Type(1): | Pari Passu / Subordinate Debt |
|
|
|
|
|
|
|
|
|
|
|
|
|
Escrows and Reserves(4) |
| Financial Information(1)(5) | ||||||
| Initial | Monthly | Initial Cap |
|
| Senior Notes |
| Whole Loan |
Taxes: | $0 | Springing | N/A |
| Cut-off Date Loan / SF: | $391 |
| $488 |
Insurance: | $0 | Springing | N/A |
| Maturity Date Loan / SF: | $391 |
| $488 |
Replacement Reserves: | $0 | Springing | $1,024,605 |
| Cut-off Date LTV(5): | 41.7% |
| 52.1% |
TI/LC: | $0 | Springing | $5,123,024 |
| Maturity Date LTV(5): | 41.7% |
| 52.1% |
Other: | $36,389,727 | $0 | N/A |
| UW NCF DSCR(5): | 3.84x |
| 3.08x |
|
|
|
|
| UW NOI Debt Yield(5): | 11.9% |
| 9.5% |
|
|
|
|
|
|
|
| |
Sources and Uses | ||||||
Sources | Proceeds | % of Total |
| Uses | Proceeds | % of Total |
Senior Notes | $1,001,000,000 | 80.1% |
| Payoff Existing Debt | $1,052,884,467 | 84.2% |
Subordinate Notes | 249,000,000 | 19.9% |
| Upfront Reserves | 36,389,727 | 2.9% |
|
|
|
| Closing Costs | 20,840,154 | 1.7% |
|
|
|
| Return of Equity | 139,885,652 | 11.2% |
Total Sources | $1,250,000,000 | 100.0% |
| Total Uses | $1,250,000,000 | 100.0% |
(1) | The 1633 Broadway Whole Loan (as defined below) was co-originated by Goldman Sachs Bank USA (“GSBI”), JPMorgan Chase Bank, National Association (“JPMCB”), DBR Investments Co. Limited (“DBRI”) and Wells Fargo Bank, National Association (“WFB”). JPMCB is contributing Note A-3-C-7 with a Cut-off Date Balance of $27,500,000, German American Capital Corporation (“GACC”) is contributing Note A-2-C-2-B with a Cut-off Date Balance of $20,000,000 and Goldman Sachs Mortgage Company (“GSMC”) is contributing Note A-1-C-4-B with a Cut-off Date Balance of $10,000,000. The 1633 Broadway Loan (as defined below) is part of a whole loan evidenced by 40 senior pari passu notes with an aggregate outstanding principal balance as of the Cut-off Date of $1,001,000,000, and four pari passu subordinate notes with an aggregate outstanding principal balance as of the Cut-off Date of $249,000,000. For additional information, see “The Loan“ and “Current Mezzanine or Subordinate Secured Indebtedness” herein. |
(2) | There is no non-recourse carveout guarantor or separate environmental indemnitor with respect to the 1633 Broadway Whole Loan. |
(3) | The defeasance lockout period will be at least 30 payments beginning with and including the first payment date of January 6, 2020. At any time after the earlier to occur of (i) November 25, 2022 and (ii) the second anniversary of the closing date of the securitization into which the last note of the 1633 Broadway Whole Loan is deposited, the 1633 Broadway Whole Loan may be defeased in whole (or in part) with direct, non-callable obligations of the United States of America. The assumed defeasance lockout period of 30 months is based on the expected closing date of the JPMDB 2020-COR7 securitization in June 2020. The actual lockout period may be longer. |
(4) | For a full description of Escrows and Reserves, please refer to “Escrows and Reserves” herein. |
| THE INFORMATION IN THIS STRUCTURAL AND COLLATERAL TERM SHEET IS NOT COMPLETE AND MAY BE AMENDED PRIOR TO THE TIME OF SALE. THIS TERM SHEET IS NOT AN OFFER TO SELL THESE SECURITIES AND IT IS NOT A SOLICITATION OF AN OFFER TO BUY THESE SECURITIES IN ANY JURISDICTION WHERE THE OFFER OR SALE IS NOT PERMITTED. | ||
| |
46 of 130 | |
Structural and Collateral Term Sheet |
| JPMDB 2020-COR7 |
| ||
1633 Broadway | ||
(5) | All NOI, NCF and occupancy information, as well as the appraised value, were determined prior to the emergence of the novel coronavirus pandemic, and the economic disruption resulting from measures to combat the pandemic, and all DSCR, LTV and Debt Yield metrics were calculated, and the 1633 Broadway Whole Loan was underwritten, based on such prior information. See “Risk Factors—Risks Related to Market Conditions and Other External Factors Coronavirus Pandemic Has Adversely Affected the Global Economy and Will Likely Adversely Affect the Performance of the Mortgage Loans” in the Preliminary Prospectus. |
(6) | 2019 NOI is reflective of the net operating income as of the trailing 12-month period ending September 2019 rather than December 31, 2019. |
(7) | Fitch, S&P and KBRA provided the listed assessments for the 1633 Broadway Loan in the context of its inclusion in the mortgage pool. |
The Loan. The 1633 Broadway mortgage loan (the “1633 Broadway Loan”) is part of a whole loan (the “1633 Broadway Whole Loan”) consisting of 40 senior pari passu promissory notes with an aggregate original principal balance of $1,001,000,000 (the “1633 Broadway Senior Notes”) and four subordinate pari passu notes with an aggregate original principal balance of $249,000,000 (the “1633 Broadway Subordinate Companion Loan”). The 1633 Broadway Whole Loan has an aggregate original principal balance of $1,250,000,000 and is secured by a first mortgage encumbering the borrowers’ fee simple interest in an office building in New York, New York (the “1633 Broadway Property”).
The 1633 Broadway Whole Loan was co-originated by GSBI, JPMCB, DBRI and WFB on November 25, 2019. The 1633 Broadway Whole Loan has a 10-year interest-only term and accrues interest at a rate of 2.99000% per annum. The relationship between the holders of the 1633 Broadway Whole Loan is governed by a co-lender agreement as described under “Description of the Mortgage Pool–The Whole Loans—The Non-Serviced AB Whole Loans—The 1633 Broadway Whole Loan” in the Preliminary Prospectus.
The borrowers utilized the proceeds of the 1633 Broadway Whole Loan to refinance existing debt on the 1633 Broadway Property, fund reserves, pay closing costs and return equity to the borrower sponsor. Based on the “As Is” appraised value of $2.4 billion as of October 24, 2019, the Cut-off Date LTV Ratio is 41.7% for the 1633 Broadway Senior Notes and 52.1% for the 1633 Broadway Whole Loan.
Whole Loan Summary | ||||
Note | Original Balance | Cut-off Date Balance | Note Holder | Controlling Piece |
A-1-S-1, A-2-S-1, A-3-S-1, A-4-S-1 | $1,000,000 | $1,000,000 | BWAY 2019-1633 | No |
A-1-C-1, A-1-C-5, A-2-C-1-A | 110,000,000 | 110,000,000 | CGCMT 2020-GC46 | No(1) |
A-1-C-2, A-2-C-5 | 60,000,000 | 60,000,000 | GSMS 2020-GC45 | No |
A-1-C-3, A-1-C-6 | 65,000,000 | 65,000,000 | GSMS 2020-GC47 | No |
A-2-C-1-B, A-3-C-1-B | 45,000,000 | 45,000,000 | Benchmark 2020-B16 | No |
A-3-C-5, A-3-C-6 | 50,000,000 | 50,000,000 | Benchmark 2020-B17 | No |
A-2-C-2-A, A-3-C-3 | 70,000,000 | 70,000,000 | Benchmark 2020-IG2 | No |
A-2-C-3-B, A-3-C-2 | 64,650,000 | 64,650,000 | Benchmark 2020-IG1 | No |
A-4-C-1, A-4-C-2 | 100,000,000 | 100,000,000 | BANK 2020-BNK25 | No |
A-4-C-6, A-4-C-7 | 40,000,000 | 40,000,000 | BANK 2020-BNK26 | No |
A-4-C-4, A-4-C-5 | 70,000,000 | 70,000,000 | WFCM 2020-C55 | No |
A-3-C-4, A-2-C-4-A, A-2-C-7, A-1-C-7 | 80,000,000 | 80,000,000 | Benchmark 2020-IG3 | No |
A-3-C-7, A-1-C-4-B, A-2-C-2-B | 57,500,000 | 57,500,000 | JPMDB 2020-COR7(2) | No |
A-2-C-3-A, A-2-C-4-B, A-2-C-4-C, A-2-C-4-D, A-2-C-6 | 90,000,000 | 90,000,000 | DBRI(3) | No |
A-3-C-1-A | 27,850,000 | 27,850,000 | JPMCB(3) | No |
A-1-C-4-A | 30,000,000 | 30,000,000 | GSBI(3) | No |
A-4-C-3 | 40,000,000 | 40,000,000 | WFB(3) | No |
Senior Notes | $1,001,000,000 | $1,001,000,000 |
|
|
Note B-1, B-2, B-3, B-4 | $249,000,000 | $249,000,000 | BWAY 2019-1633 | Yes |
Whole Loan | $1,250,000,000 | $1,250,000,000 |
|
|
| (1) | During the continuance of a control appraisal period relating to the BWAY 2019-1633 securitization transaction (i.e., when the most senior class of certificates in such transaction have been control appraised out), Note A-1-C-1 will be the controlling note. See “Description of the Mortgage Pool—The Whole Loans—The Non-Serviced AB Whole Loans—The 1633 Broadway Whole Loan” in the Preliminary Prospectus. |
| (2) | JPMCB is contributing Note A-3-C-7 with an outstanding principal balance as of the Cut-off Date of $27,500,000, GACC is contributing Note A-2-C-2-B with an outstanding principal balance as of the Cut-off Date of $20,000,000 and GSMC is contributing Note A-1-C-4-B with an outstanding principal balance as of the Cut-off Date of $10,000,000. |
| (3) | The related notes are expected to be contributed to one or more future securitization transactions. |
The Borrowers. The borrowers are PGREF I 1633 Broadway Land, L.P., 1633 Broadway Owner I, LP and 1633 Broadway Owner II, LP, each a Delaware limited partnership. The three borrowers, as tenants in common, are the fee owners of the 1633 Broadway Property. Legal counsel to the borrowers delivered a non-consolidation opinion in connection with the origination of the 1633 Broadway Whole Loan. There is no non-recourse carveout guarantor or separate environmental indemnitor with respect to the 1633 Broadway Whole Loan.
| THE INFORMATION IN THIS STRUCTURAL AND COLLATERAL TERM SHEET IS NOT COMPLETE AND MAY BE AMENDED PRIOR TO THE TIME OF SALE. THIS TERM SHEET IS NOT AN OFFER TO SELL THESE SECURITIES AND IT IS NOT A SOLICITATION OF AN OFFER TO BUY THESE SECURITIES IN ANY JURISDICTION WHERE THE OFFER OR SALE IS NOT PERMITTED. | ||
| |
47 of 130 | |
Structural and Collateral Term Sheet |
| JPMDB 2020-COR7 |
| ||
1633 Broadway | ||
The Loan Sponsor. The loan sponsor is Paramount Group Operating Partnership LP, which indirectly owns and controls the borrowers. Paramount Group, Inc. (NYSE: PGRE), an approximately 92.0% general partner of the borrower sponsor, is a real estate investment trust that owns and/or manages a 13.4 million square foot portfolio of 18 Class A office and retail buildings in New York City, Washington, D.C., and San Francisco. Paramount Group, Inc. has a New York City portfolio that includes: 1633 Broadway, 1301 Avenue of the Americas, 1325 Avenue of the Americas, 31 West 52nd Street, 900 Third Avenue, 712 Fifth Avenue, 60 Wall Street, 745 Fifth Avenue, 718 Fifth Avenue, and 0 Bond Street.
At the time of origination of the 1633 Broadway Whole Loan, PGREF I 1633 Broadway Land, L.P. owned the 1633 Broadway Property entirely in fee and also ground leased the 1633 Broadway Property to PGREF I 1633 Broadway Tower, L.P. (i.e., both landlord and tenant interests in the ground lease were pledged as collateral, in addition to the fee interest in the 1633 Broadway Property); however, effective May 26, 2020, such ground lease was eliminated (such that collateral for the 1633 Broadway Whole Loan consists entirely of the fee interest in the 1633 Broadway Property) and PGREF I 1633 Broadway Land, L.P. transferred undivided tenant in common interests in the 1633 Broadway Property to each of the additional tenant-in-common borrowers.
The Property. The 1633 Broadway Property is an approximately 2.6 million square foot, 48-story office tower that is situated with a full block of Broadway frontage between 50th and 51st Streets in Midtown Manhattan. The 1633 Broadway Property contains views of the Hudson River, Central Park, and Midtown from above the 36th floor. In addition to the office space, the 1633 Broadway Property includes retail space (anchored by Equinox), a parking garage across three levels below grade, two theaters comprising a total of 145,192 square feet (the Gershwin Theatre and Circle in the Square Theatre) and storage space comprising 18,384 square feet.
The 1633 Broadway Property is located on a 90,400 square foot parcel comprising the entire western block front of Broadway between West 50th and West 51st Streets within the Westside office submarket of Midtown Manhattan. The 1633 Broadway Property was constructed in 1972 and was most recently renovated in 2013. Since 2010, the borrower sponsor has invested a total of approximately $41.6 million in lobby renovations, plaza redevelopment, and retail renovations. In addition, the borrower sponsor has invested approximately $230.0 million in tenant improvements and leasing commissions since 2010. Going forward, the borrower sponsor provided a 10-year renovation budget which totals approximately $55.98 million; the renovation budget is anticipated to be utilized for items including a roof replacement, structural upgrades, fire alarm system upgrades, Gershwin Theatre upgrades, completion of the terrace on the 47th and 48th floors, and development of the Retail Cube. Such renovations are not required by the 1633 Broadway Whole Loan documents, and have not been reserved for. We cannot assure you that such renovations will proceed as expected or at all.
The 1633 Broadway Property comprises 2,561,512 square feet and was 98.4% leased as of October 31, 2019. The 1633 Broadway Property office component is currently 100.0% leased to 18 tenants. The retail space within the 1633 Broadway Property totals approximately 80,000 square feet of net rentable area and is anchored by Equinox (25,458 square feet) through February 2040. Approximately 94.3% of the underwritten rent is from office tenants.
The parking component within the 1633 Broadway Property consists of a 250-space parking garage across three levels below grade and comprises 64,158 square feet. The space is currently leased to ABM Parking Services, Inc., a parking garage operator, through July 2026. The operator is responsible for a contract rent of approximately $2.39 million, or $9,560 per space, which will increase by 1.50% per annum throughout the remainder of the lease term.
The largest tenant by underwritten base rent is Allianz Asset Management of America L.P. (“Allianz”) (320,911 square feet; 12.5% of net rentable area; 15.7% of underwritten base rent). Allianz occupies six suites with leases expiring in January 2031. Allianz is an asset manager with over 800 investment professionals in 25 offices worldwide and manages assets for individuals, families and institutions. The 1633 Broadway Property serves as the United States headquarters for Allianz.
The second largest tenant by underwritten base rent is Morgan Stanley & Co (“Morgan Stanley”) (260,829 square feet; 10.2% of net rentable area; 11.1% of underwritten base rent). Morgan Stanley occupies five suites with leases expiring in March 2032. Morgan Stanley, a financial holding company, provides various financial products and services to corporations, governments, financial institutions and individuals in the Americas, Europe, the Middle East, Africa and Asia. The company operates through three segments: Institutional Securities, Wealth Management and Investment Management.
The third largest tenant by underwritten base rent is WMG Acquisition Corp (“Warner Music Group”) (293,888 square feet; 11.5% of net rentable area; 10.4% of underwritten base rent). Warner Music Group is an American multinational entertainment and record label conglomerate. It is one of the “Big Three” recording companies and the third largest in the global music industry, next to Universal Music Group and Sony Music Entertainment. The 1633 Broadway Property serves as Warner Music Group’s headquarters.
| THE INFORMATION IN THIS STRUCTURAL AND COLLATERAL TERM SHEET IS NOT COMPLETE AND MAY BE AMENDED PRIOR TO THE TIME OF SALE. THIS TERM SHEET IS NOT AN OFFER TO SELL THESE SECURITIES AND IT IS NOT A SOLICITATION OF AN OFFER TO BUY THESE SECURITIES IN ANY JURISDICTION WHERE THE OFFER OR SALE IS NOT PERMITTED. | ||
| |
48 of 130 | |
Structural and Collateral Term Sheet |
| JPMDB 2020-COR7 |
| ||
1633 Broadway | ||
The 1633 Broadway Property features two theatres that comprise 5.7% of the total net rentable area and account for 1.2% of the underwritten rental revenue. The larger of the two theatres is the U. T. Associates of the Gershwin Theatre (“Gershwin Theatre”), which is notable for hosting the musical Wicked since 2003. The Gershwin theatre contains three, five-year renewal options that could potentially extend the term through May 2042. The 1633 Broadway Property contains an additional theatre known as the Circle in the Square, which comprises approximately 800 seats and 34,570 square feet and most recently hosted the show OKLAHOMA! The 1633 Broadway Property also houses the Circle in the Square Theatre School, the only accredited training conservatory associated with a Broadway theatre, which offers two, two-year training programs, in acting and musical theatre. The tenant currently pays a total contract rent of $864,250, or $25.00 per square foot through September 2021.
COVID-19 Update. As of June 3, 2020, the 1633 Broadway Property is open; however, all retail tenants and the two theaters are closed and the office tenants are largely working remotely. For April and May of 2020, tenants representing approximately 86.5% and 86.5% of net rentable area, respectively, have paid rent in-full, with the borrowers having collected approximately 89.9% and 89.9% of underwritten base rent, respectively. One of those tenants, representing approximately 8% of underwritten base rent, paid reduced April and May rent and has signed an amendment for reduced rent through year end 2020. The difference between the underwritten contractual rent per the original lease and the reduced rent pursuant to signed amendment is required to be repaid over a 36-month period beginning on January 1, 2021 at an imputed interest rate of 3.75% (from April 1, 2020) on the amount of rent deferred. One tenant, representing approximately 4.7% of the underwritten base rent, has agreed to a three month rent deferral for the months of April, May and June 2020.The 1633 Broadway Whole Loan is current through the June 6, 2020 payment date. As of June 3, 2020, the 1633 Broadway Whole Loan is not subject to any modification or forbearance request.
The Market. The 1633 Broadway Property is located in the Times Square neighborhood of Midtown Manhattan, a commercial corridor that produces approximately 15% of New York City’s economic output. The neighborhood is bounded by 41st Street to the south and 52nd Street to the north between Avenue of the Americas and Eighth Avenue. The 1633 Broadway Property is located within one block of the 50th Street/Broadway, 50th Street and 49th Street subway stations, which serve the 1, 2, C, E, N, R and W lines.
According to the appraisal, the 1633 Broadway Property is located within the Westside office submarket of Midtown within the Manhattan market. Historically, the submarket has benefitted from the office space located around the boundaries of Central Park along major corridors such as West 57th Street, Broadway and Seventh Avenue, which consist primarily of Class A office product that take advantage of protected Central Park Views. The area’s proximity to these locations has assisted with the historically low vacancy and availability rates exhibited by this submarket since 2010. As of the third quarter of 2019, the Westside office submarket had an existing inventory of approximately 25.7 million square feet, a vacancy rate of 5.4% and an average asking rent of $66.21 per square foot. As of the third quarter of 2019, the Manhattan office market had an existing inventory of approximately 456.1 million square feet, a vacancy rate of 5.9% and an average asking rent of $79.25 per square foot.
| THE INFORMATION IN THIS STRUCTURAL AND COLLATERAL TERM SHEET IS NOT COMPLETE AND MAY BE AMENDED PRIOR TO THE TIME OF SALE. THIS TERM SHEET IS NOT AN OFFER TO SELL THESE SECURITIES AND IT IS NOT A SOLICITATION OF AN OFFER TO BUY THESE SECURITIES IN ANY JURISDICTION WHERE THE OFFER OR SALE IS NOT PERMITTED. | ||
| |
49 of 130 | |
Structural and Collateral Term Sheet |
| JPMDB 2020-COR7 |
| ||
1633 Broadway | ||
Competitive Set – Comparable Office Leases(1) | ||||||
Property | Total GLA | Tenant Name | Lease Date / Term | Lease Area (square feet) | Monthly Base Rent PSF | Lease Type |
1633 Broadway New York, NY | 2,561,512 | Various | Various | Various | $66.93 | -- |
1155 Avenue of the Americas New York, NY | 752,996 | BKD, LLC | September 2019 / 162 Mos. | 20,899 | $77.00 | MG |
1 Rockefeller Plaza New York, NY | 603,397 | Veteran Advisers, Inc. | September 2019 / 92 Mos. | 2,552 | $83.50 | MG |
1675 Broadway New York, NY | 878,321 | Davis & Gilbert LLP | August 2019 / 192 Mos. | 85,852 | $72.00 | MG |
142 West 57th Street New York, NY | 255,586 | Wedbush Securities Inc. | August 2019 / 130 Mos. | 15,626 | $65.00 | MG |
1251 Avenue of the Americas New York, NY | 2,364,000 | IHI Americas, Inc | July 2019 / 124 Mos. | 9,438 | $70.50 | MG |
1345 Avenue of the Americas New York, NY | 1,998,994 | Global Infrastructure Partners | June 2019 / 204 Mos. | 84,856 | $89.50 | MG |
810 Seventh Avenue New York, NY | 765,000 | Colonial Consulting LLC | May 2019 / 150 Mos. | 17,320 | $71.00 | MG |
1271 Avenue of the Americas New York, NY | 2,100,000 | Greenhill & Company | May 2019 / 183 Mos. | 77,622 | $91.00 | MG |
1271 Avenue of the Americas New York, NY | 2,100,000 | AIG - American International Group, Inc. | April 2019 / 198 Mos. | 320,237 | $97.13 | MG |
1700 Broadway New York, NY | 625,000 | Excel Sports Management, LLC | April 2019 / 91 Mos. | 17,078 | $79.00 | MG |
1325 Avenue of the Americas New York, NY | 808,998 | Dominus Capital, L.P. | March 2019 / 126 Mos. | 9,361 | $75.00 | MG |
1290 Avenue of the Americas New York, NY | 2,113,000 | Linklaters, LLP | March 2019 / 193 Mos. | 90,508 | $84.00 | MG |
1177 Avenue of the Americas New York, NY | 1,000,000 | Mill Point Capital | January 2019 / 126 Mos. | 11,644 | $87.00 | MG |
1700 Broadway New York, NY | 625,000 | M. Arthur Gensler, Jr. & Associates, Inc. | January 2019 / 119 Mos. | 13,237 | $71.00 | MG |
114 West 47th Street New York, NY | 658,000 | IFM Investments | October 2018 / 180 Mos. | 18,000 | $68.00 | MG |
(1) Source: Appraisal. |
| Historical and Current Occupancy(1) | |||
| 2016 | 2017 | 2018 | Current(2) |
| 86.3% | 95.4% | 95.4% | 98.4% |
| (1) | Historical Occupancies are as of December 31 of each respective year. |
| (2) | Current Occupancy is as of October 31, 2019. |
Tenant Summary(1) | ||||||
Tenant | Ratings | Net Rentable | % of | Base Rent PSF | % of Total | Lease Expiration |
Allianz(4) | Aa3/AA-/AA | 320,911 | 12.5% | $82.66 | 15.7% | 1/31/2031 |
Morgan Stanley(5) | A3/A/BBB+ | 260,829 | 10.2% | $71.61 | 11.1 | 3/31/2032 |
WMG Acquisition Corp(6) | NR/NR/NR | 293,888 | 11.5% | $59.62 | 10.4 | 7/31/2029 |
Showtime Networks Inc | Baa2/BBB/BBB | 261,196 | 10.2% | $55.28 | 8.6 | 1/31/2026 |
Kasowitz Benson Torres(7) | NR/NR/NR | 203,394 | 7.9% | $68.00 | 8.2 | 3/31/2037 |
New Mountain Capital, LLC(8) | NR/NR/NR | 108,374 | 4.2% | $86.00 | 5.5 | 10/15/2035 |
Charter Communications Holding | Ba2/NR/BB+ | 106,176 | 4.1% | $84.00 | 5.3 | 12/15/2025 |
MongoDB, Inc. | NR/NR/NR | 106,230 | 4.1% | $76.00 | 4.8 | 12/31/2029 |
Travel Leaders Group, LLC | NR/NR/B+ | 107,205 | 4.2% | $74.58 | 4.7 | 12/31/2033 |
Assured Guaranty Municipal | NR/NR/A | 103,838 | 4.1% | $69.88 | 4.3 | 2/28/2032 |
Top 10 Total / Wtd. Avg. |
| 1,872,041 | 73.1% | $70.81 | 78.5% |
|
Remaining Tenants |
| 649,710 | 25.4% | $55.74 | 21.5 |
|
Total Occupied Space |
| 2,521,751 | 98.4% | $66.93 | 100.0% |
|
Vacant |
| 39,761 | 1.6% |
|
|
|
Total / Wtd. Avg. |
| 2,561,512 | 100.0% |
|
|
|
| (1) | Based on the underwritten rent roll dated October 31, 2019. |
| (2) | Certain ratings are those of the parent company whether or not the parent company guarantees the lease. |
| (3) | Borrowers’ owned space. Does not include non-owned anchors or outparcels. |
| THE INFORMATION IN THIS STRUCTURAL AND COLLATERAL TERM SHEET IS NOT COMPLETE AND MAY BE AMENDED PRIOR TO THE TIME OF SALE. THIS TERM SHEET IS NOT AN OFFER TO SELL THESE SECURITIES AND IT IS NOT A SOLICITATION OF AN OFFER TO BUY THESE SECURITIES IN ANY JURISDICTION WHERE THE OFFER OR SALE IS NOT PERMITTED. | ||
| |
50 of 130 | |
Structural and Collateral Term Sheet |
| JPMDB 2020-COR7 |
| ||
1633 Broadway | ||
| (4) | Allianz subleases 20,600 square feet of suite 4600 (totaling 54,118 square feet) to Triumph Hospitality at a base rent of $46.80 per square foot through December 30, 2030. Triumph Hospitality further subleases 3,000 square feet of suite 4600 to Stein Adler Dabah & Zelkowitz at a base rent of $41.33 per square foot through July 31, 2022. Underwritten base rent is based on the contractual rent under the prime lease. |
| (5) | Morgan Stanley has the option to terminate its lease as to all or any portion (but not less than one full floor) of its space at any time after April 1, 2027, upon 18 months’ notice and payment of a termination fee. |
| (6) | WMG Acquisition Corp subleases 3,815 square feet of suite 0400 (totaling 36,854 square feet) to Cooper Investment Partners LLC at a base rent of $58.37 per square foot on a month-to-month basis. Underwritten base rent is based on the contractual rent under the prime lease. |
| (7) | Kasowitz Benson Torres subleases a collective 32,487 square feet of Suite 2200 (totaling 50,718 square feet) to three tenants. Delcath Systems, Inc. subleases 6,877 square feet and pays a rent of $68.50 per square foot through February 28, 2021; Avalonbay Communities subleases 12,145 square feet through October 31, 2026 and pays a current rent of $74.00 per square foot; Cresa New York subleases 13,195 square feet and pays a rent of $65.00 per square foot through April 30, 2021. Kasowitz Benson Torres has the right to terminate all or any portion of one full floor of the premises located on the uppermost or lowermost floors (provided that the terminated space is in a commercially reasonable configuration), effective as of March 31, 2024, upon notice by March 31, 2023 and payment of a termination fee. Underwritten base rent is based on the contractual rent under the prime lease. |
| (8) | New Mountain Capital, LLC has executed a lease but has not yet taken occupancy or begun paying rent. We cannot assure you that they will take occupancy or begin paying rent as expected or at all. |
Lease Rollover Schedule(1)(2) | |||||||||
Year | Number of Leases Expiring | Net Rentable Area Expiring | % of NRA Expiring | Base Rent Expiring | % of Base Rent Expiring | Cumulative Net Rentable Area Expiring | Cumulative % of NRA Expiring | Cumulative Base Rent Expiring | Cumulative % of Base Rent Expiring |
Vacant | NAP | 39,761 | 1.6% | NAP | NAP | 39,761 | 1.6% | NAP | NAP |
2020 & MTM | 12 | 10,442 | 0.4% | $666,945 | 0.4% | 50,203 | 2.0% | $666,945 | 0.4% |
2021 | 2 | 34,570 | 1.3% | $864,250 | 0.5% | 84,773 | 3.3% | $1,531,195 | 0.9% |
2022 | 4 | 116,337 | 4.5% | $2,813,374 | 1.7% | 201,110 | 7.9% | $4,344,569 | 2.6% |
2023 | 2 | 38,550 | 1.5% | $1,299,854 | 0.8% | 239,660 | 9.4% | $5,644,423 | 3.3% |
2024 | 1 | 51,276 | 2.0% | $4,666,116 | 2.8% | 290,936 | 11.4% | $10,310,539 | 6.1% |
2025 | 1 | 106,176 | 4.1% | $8,918,784 | 5.3% | 397,112 | 15.5% | $19,229,323 | 11.4% |
2026 | 4 | 435,474 | 17.0% | $24,289,491 | 14.4% | 832,586 | 32.5% | $43,518,814 | 25.8% |
2027 | 2 | 55,247 | 2.2% | $4,584,436 | 2.7% | 887,833 | 34.7% | $48,103,250 | 28.5% |
2028 | 2 | 90,001 | 3.5% | $6,043,229 | 3.6% | 977,834 | 38.2% | $54,146,479 | 32.1% |
2029 | 3 | 399,717 | 15.6% | $25,579,624 | 15.2% | 1,377,551 | 53.8% | $79,726,103 | 47.2% |
2030 & Beyond | 10 | 1,183,961 | 46.2% | $89,044,498 | 52.8% | 2,561,512 | 100.0% | $168,770,601 | 100.0% |
Total / Wtd. Avg. | 43 | 2,561,512 | 100.0% | $168,770,601 | 100.0% |
|
|
|
|
(1) | Based on the underwritten rent roll dated October 31, 2019. |
(2) | Certain tenants may have lease termination or contraction options (which may become exercisable prior to the originally stated expiration date of the tenant lease) that are not considered in the above Lease Rollover Schedule. |
| THE INFORMATION IN THIS STRUCTURAL AND COLLATERAL TERM SHEET IS NOT COMPLETE AND MAY BE AMENDED PRIOR TO THE TIME OF SALE. THIS TERM SHEET IS NOT AN OFFER TO SELL THESE SECURITIES AND IT IS NOT A SOLICITATION OF AN OFFER TO BUY THESE SECURITIES IN ANY JURISDICTION WHERE THE OFFER OR SALE IS NOT PERMITTED. | ||
| |
51 of 130 | |
Structural and Collateral Term Sheet |
| JPMDB 2020-COR7 |
| ||
1633 Broadway | ||
Operating History and Underwritten Net Cash Flow(1) | ||||||||
| 2016 | 2017 | 2018 | 2019(2) |
TTM(3) | Underwritten | Per Square Foot | %(4) |
Base Rent(5) | $141,156,682 | $143,219,431 | $160,621,035 | $161,646,240 | $164,097,000 | $168,770,601 | $65.89 | 84.9% |
Credit Tenant Rent Steps(6) | 0 | 0 | 0 | 0 | 0 | 7,558,579 | 2.95 | 3.8% |
Vacant Space | 0 | 0 | 0 | 0 | 0 | 2,879,875 | 1.12 | 1.4% |
Reimbursements | 9,150,315 | 11,228,307 | 13,952,510 | 16,874,074 | 17,589,000 | 15,267,588 | 5.96 | 7.7% |
Gross Potential Rent | $150,306,997 | $154,447,738 | $174,573,545 | $178,520,314 | $181,686,000 | $194,476,643 | $75.92 | 97.8% |
Other Income(7) | 5,692,549 | 5,017,065 | 4,645,691 | 4,240,034 | 2,761,000 | 4,279,853 | 1.67 | 2.200 |
Concessions | 0 | 0 | 0 | 0 | 0 | 0 | 0.00 | 0.000 |
Net Rental Income | $155,999,546 | $159,464,803 | $179,219,236 | $182,760,348 | $184,447,000 | $198,756,496 | $77.59 | 100.0% |
Vacancy & Credit Loss | (309,756) | 0 | 0 | 0 | 0 | (8,170,549) | (3.19) | (4.1)0 |
Effective Gross Income | $155,689,790 | $159,464,803 | $179,219,236 | $182,760,348 | $184,447,000 | $190,585,947 | $74.40 | 95.9% |
Real Estate Taxes | 35,413,254 | 38,391,946 | 41,366,170 | 43,693,114 | 45,484,000 | 45,478,153 | 17.75 | 23.90 |
Insurance | 1,061,417 | 908,564 | 1,009,544 | 1,082,131 | 1,170,000 | 1,069,190 | 0.42 | 0.60 |
Management Fee | 2,507,162 | 2,981,306 | 3,149,432 | 3,287,347 | 3,413,000 | 1,000,000 | 0.39 | 0.50 |
Other Operating Expenses | 22,886,571 | 22,992,980 | 24,595,640 | 23,888,441 | 23,554,000 | 23,888,441 | 9.33 | 12.50 |
Total Operating Expenses | 61,868,404 | 65,274,796 | 70,120,786 | 71,951,033 | 73,621,000 | 71,435,784 | 27.89 | 37.50 |
Net Operating Income | $93,821,386 | $94,190,007 | $109,098,450 | $110,809,315 | $110,826,000 | $119,150,163 | $46.52 | 62.5% |
TI/LC | 0 | 0 | 0 | 0 | 0 | 2,011,364 | 0.79 | 1.1% |
Capital Expenditures | 0 | 0 | 0 | 0 | 0 | 461,072 | 0.18 | 0.2% |
Net Cash Flow | $93,821,386 | $94,190,007 | $109,098,450 | $110,809,315 | $110,826,000 | $116,677,727 | $45.55 | 61.2% |
(1) | The historical cash flows have been adjusted to remove rent abatements (for 2016, $34,935,925; for 2017, $11,971,070; for 2018, $16,606,621; and for 2019, $16,408,451), bad debt, lease termination income, interest income, and other non-recurring items. |
(2) | 2019 financial information is based on the trailing 12 months ending on September 30, 2019. |
(3) | TTM column represents the trailing 12-month period ending May 31, 2020. |
(4) | % column represents percent of Net Rental Income for all revenue lines and represents percent of Effective Gross Income for the remainder of fields. |
(5) | Base Rent reflects annualized in-place rents as of October 31, 2019 ($167,497,806), with contractual rent steps through November 30, 2020 ($1,272,795). For the avoidance of doubt, no COVID-19 specific adjustments have been incorporated in the lender underwriting. |
(6) | Underwritten Credit Tenant Rent Steps reflects the net present value of contractual rent step increments over the lease term using a discount rate of 7.0% (for investment grade tenants). |
(7) | Other Income consists of overage rent, storage income, parking income, lease termination income, tenant work order income and other miscellaneous income. |
Property Management. The 1633 Broadway Property is currently managed by Paramount Group Property-Asset Management LLC, an affiliate of the borrowers.
Escrows and Reserves. On the loan origination date, the borrowers provided a guaranty from Paramount Group Operating Partnership LP of up to $4,000,000 and funded a reserve of approximately $36,389,727 with respect to unfunded tenant improvements, tenant allowance and leasing commissions and free rent obligations consisting of (a) $24,105,228 for certain outstanding tenant improvements, (b) $804,393 for certain outstanding leasing commissions and (c) $15,480,107 for certain outstanding free rent. Subsequently, the borrowers substituted a letter of credit for the cash on reserve in such reserve account.
On each due date during the continuance of a 1633 Broadway Trigger Period (as defined below), the borrowers are required to fund (i) a tax and insurance reserve in an amount equal to 1/12 of the taxes and insurance premiums that the lender reasonably estimates will be payable during the next ensuing 12 months, unless in the case of insurance premiums, the borrowers are maintaining a blanket policy in accordance with the related 1633 Broadway Whole Loan documents; (ii) a tenant improvement and leasing commission reserve in an amount equal to $213,459.33 (capped at $5,123,024); and (iii) a capital expenditure reserve in an amount equal to $42,691.87 (capped at $1,024,604.80).
Lockbox / Cash Management. The 1633 Broadway Whole Loan is structured with a hard lockbox and springing cash management. The borrowers are required to direct each tenant at the 1633 Broadway Property to deposit rents directly into a lender-controlled lockbox account. In addition, the borrowers are required to cause all cash revenues relating to the 1633 Broadway Property and all other money received by the borrowers or the property manager with respect to the 1633 Broadway Property (other than tenant security deposits) to be deposited into the lockbox account or a lender-controlled cash management account within one business day of receipt. On each business day during the continuance of a 1633 Broadway Trigger Period or an event of default under the 1633 Broadway Whole Loan, all amounts in the lockbox account are required to be remitted to the cash management account. On each business day that no 1633 Broadway Trigger Period or event of default under the 1633 Broadway Whole Loan is continuing, all funds in the lockbox account are required to be swept into a borrower-controlled operating account.
| THE INFORMATION IN THIS STRUCTURAL AND COLLATERAL TERM SHEET IS NOT COMPLETE AND MAY BE AMENDED PRIOR TO THE TIME OF SALE. THIS TERM SHEET IS NOT AN OFFER TO SELL THESE SECURITIES AND IT IS NOT A SOLICITATION OF AN OFFER TO BUY THESE SECURITIES IN ANY JURISDICTION WHERE THE OFFER OR SALE IS NOT PERMITTED. | ||
| |
52 of 130 | |
Structural and Collateral Term Sheet |
| JPMDB 2020-COR7 |
| ||
1633 Broadway | ||
On each due date during the continuance of a 1633 Broadway Trigger Period or, at the lender’s discretion, during an event of default under the 1633 Broadway Whole Loan, all funds on deposit in the cash management account after payment of debt service, required reserves and budgeted operating expenses are required to be reserved as additional collateral for the 1633 Broadway Whole Loan.
A “1633 Broadway Trigger Period” means each period (i) commencing when the debt yield (as calculated under the 1633 Broadway Whole Loan documents), determined as of the last day of each of two consecutive fiscal quarters, is less than 5.75%, and concluding when the debt yield (as calculated under the 1633 Broadway Whole Loan documents), determined as of the last day of each of two consecutive fiscal quarters thereafter, is at least 5.75%, and (ii) commencing upon the borrowers’ failure to deliver annual, quarterly or monthly financial reports as and when required under the 1633 Broadway Whole Loan documents and concluding when such reports are delivered and indicate that no other 1633 Broadway Trigger Period is ongoing.
Provided no event of default under the 1633 Broadway Whole Loan documents is continuing, the borrowers have the right to avoid the commencement, or terminate the continuance, of a 1633 Broadway Trigger Period by delivering to the lender additional collateral in the form of a guaranty, letter of credit and/or cash that is reasonably acceptable to the lender and that would, when subtracted from the then-outstanding principal balance of the 1633 Broadway Whole Loan, result in a debt yield (as calculated under the 1633 Broadway Whole Loan documents) equal to or greater than 5.75%.
Current Mezzanine or Subordinate Secured Indebtedness. The 1633 Broadway Subordinate Companion Loan, with an aggregate outstanding principal balance as of the Cut-off Date of $249.0 million, accrues interest at a fixed rate of 2.99000% per annum. The 1633 Broadway Subordinate Companion Loan has a 120-month term and is interest-only for the full term. For additional information, see “Description of the Mortgage Pool—The Whole Loans—The Non-Serviced AB Whole Loans—The 1633 Broadway Whole Loan” in the Preliminary Prospectus.
Future Mezzanine or Subordinate Indebtedness Permitted. On or after November 25, 2020, the owner of the direct or indirect equity interests of the borrowers is permitted to incur mezzanine debt (the “1633 Broadway Permitted Mezzanine Loan”) secured by a pledge of direct or indirect equity interests in the borrowers, provided that certain conditions set forth in the 1633 Broadway Whole Loan documents are satisfied, including, without limitation: (i) the loan-to-value ratio (as calculated under the 1633 Broadway Whole Loan documents and taking into account the 1633 Broadway Permitted Mezzanine Loan and the 1633 Broadway Whole Loan) is no greater than 52.08%, (ii) the debt service coverage ratio (as calculated under the 1633 Broadway Whole Loan documents and taking into account the 1633 Broadway Permitted Mezzanine Loan and the 1633 Broadway Whole Loan) is at least 3.08x, (iii) the debt yield (as calculated under the 1633 Broadway Whole Loan documents and taking into account the 1633 Broadway Permitted Mezzanine Loan and the 1633 Broadway Whole Loan) is at least 9.35%, (iv) the execution of a subordination and intercreditor agreement that is reasonably acceptable to the lender, and (v) receipt of a rating agency confirmation. The 1633 Broadway Permitted Mezzanine Loan may bear a floating rate of interest (subject to an interest rate cap agreement with a “reasonable strike price”), and may alternately take the form of debt-like preferred equity.
Partial Release. None.
| THE INFORMATION IN THIS STRUCTURAL AND COLLATERAL TERM SHEET IS NOT COMPLETE AND MAY BE AMENDED PRIOR TO THE TIME OF SALE. THIS TERM SHEET IS NOT AN OFFER TO SELL THESE SECURITIES AND IT IS NOT A SOLICITATION OF AN OFFER TO BUY THESE SECURITIES IN ANY JURISDICTION WHERE THE OFFER OR SALE IS NOT PERMITTED. | ||
| |
53 of 130 | |
| Structural and Collateral Term Sheet | JPMDB 2020-COR7 | |
| 12555 & 12655 Jefferson | ||
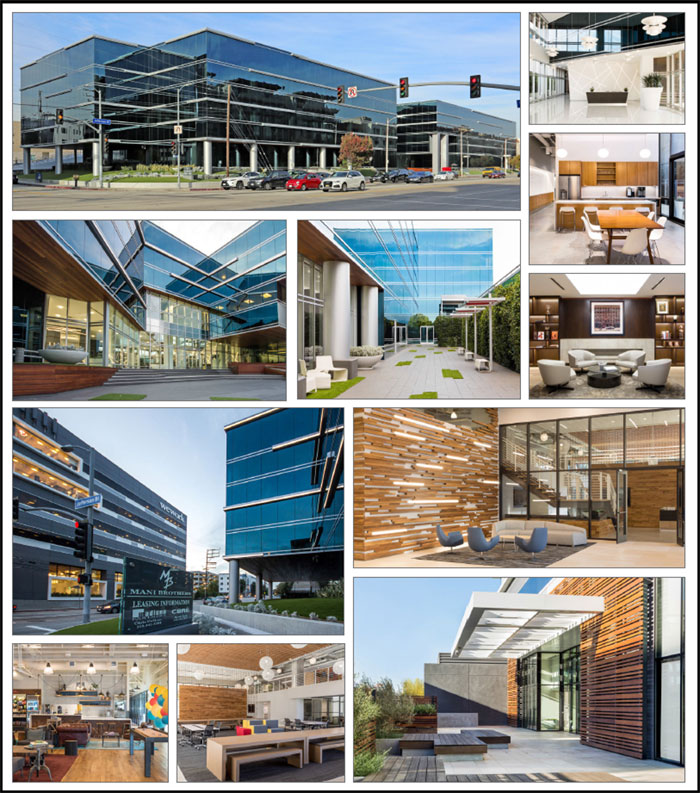
| THE INFORMATION IN THIS STRUCTURAL AND COLLATERAL TERM SHEET IS NOT COMPLETE AND MAY BE AMENDED PRIOR TO THE TIME OF SALE. THIS TERM SHEET IS NOT AN OFFER TO SELL THESE SECURITIES AND IT IS NOT A SOLICITATION OF AN OFFER TO BUY THESE SECURITIES IN ANY JURISDICTION WHERE THE OFFER OR SALE IS NOT PERMITTED. | ||
| |
54 of 130 | |
| Structural and Collateral Term Sheet | JPMDB 2020-COR7 | |
| 12555 & 12655 Jefferson | ||
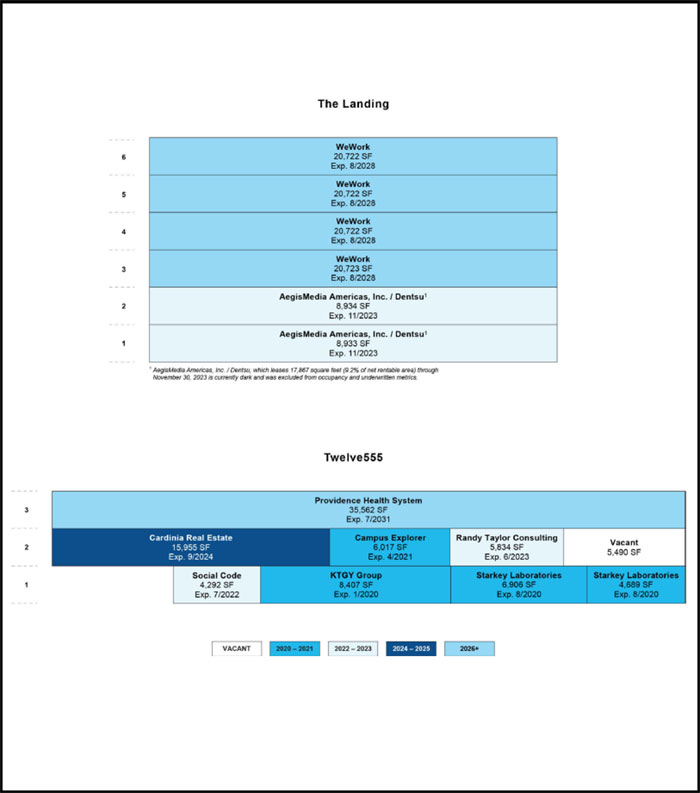
| THE INFORMATION IN THIS STRUCTURAL AND COLLATERAL TERM SHEET IS NOT COMPLETE AND MAY BE AMENDED PRIOR TO THE TIME OF SALE. THIS TERM SHEET IS NOT AN OFFER TO SELL THESE SECURITIES AND IT IS NOT A SOLICITATION OF AN OFFER TO BUY THESE SECURITIES IN ANY JURISDICTION WHERE THE OFFER OR SALE IS NOT PERMITTED. | ||
| |
55 of 130 | |
| Structural and Collateral Term Sheet | JPMDB 2020-COR7 | |
| 12555 & 12655 Jefferson | ||

| THE INFORMATION IN THIS STRUCTURAL AND COLLATERAL TERM SHEET IS NOT COMPLETE AND MAY BE AMENDED PRIOR TO THE TIME OF SALE. THIS TERM SHEET IS NOT AN OFFER TO SELL THESE SECURITIES AND IT IS NOT A SOLICITATION OF AN OFFER TO BUY THESE SECURITIES IN ANY JURISDICTION WHERE THE OFFER OR SALE IS NOT PERMITTED. | ||
| |
56 of 130 | |
| Structural and Collateral Term Sheet | JPMDB 2020-COR7 | |
| 12555 & 12655 Jefferson | ||
| Mortgage Loan Information | Property Information | |||
| Mortgage Loan Seller: | LCM | Single Asset / Portfolio: | Portfolio | |
| Original Principal Balance(1): | $57,000,000 | Title: | Fee | |
| Cut-off Date Principal Balance(1): | $57,000,000 | Property Type - Subtype: | Office – CBD | |
| % of Pool by IPB: | 6.3% | Net Rentable Area (SF): | 193,908 | |
| Loan Purpose: | Refinance | Location: | Los Angeles, CA | |
| Borrowers: | Mani 12555 Jefferson (DE), LLC, | Year Built / Renovated: | 1985 / Various | |
| Mani Jefferson Landing (DE), LLC | Occupancy(2): | 88.0% | ||
| Loan Sponsors: | Simon Mani, Daniel Mani | Occupancy Date: | 3/31/2020 | |
| Interest Rate: | 3.92500% | Number of Tenants(2): | 8 | |
| Note Date: | 9/16/2019 | 2017 NOI: | $6,414,993 | |
| Maturity Date: | 10/6/2029 | 2018 NOI: | $7,943,743 | |
| Interest-only Period: | 120 months | 2019 NOI: | $8,587,095 | |
| Original Term: | 120 months | TTM NOI: | N/A | |
| Original Amortization: | None | UW Economic Occupancy(3): | 87.5% | |
| Amortization Type: | Interest Only | UW Revenues: | $12,691,019 | |
| Call Protection: | L(32),Def(84),O(4) | UW Expenses: | $4,254,586 | |
| Lockbox / Cash Management: | Soft / Springing | UW NOI(3): | $8,436,433 | |
| Additional Debt(1): | Yes | UW NCF(3): | $7,944,846 | |
| Additional Debt Balance(1): | $54,000,000 | Appraised Value / Per SF(3): | $186,650,000 / $963 | |
| Additional Debt Type(1): | Pari Passu | Appraisal Date: | 6/28/2019 | |
| Escrows and Reserves(4) | Financial Information(1)(3) | |||||||
| Initial | Monthly | Initial Cap | Cut-off Date Loan / SF: | $572 | ||||
| Taxes: | $1,250,000 | $137,610 | N/A | Maturity Date Loan / SF: | $572 | |||
| Insurance: | $6,000 | $5,900 | N/A | Cut-off Date LTV: | 59.5% | |||
| Replacement Reserves: | $0 | $4,040 | N/A | Maturity Date LTV: | 59.5% | |||
| TI/LC: | $2,538,191 | $16,159 | Various | UW NCF DSCR: | 1.80x | |||
| Other: | $3,544,603 | $0 | N/A | UW NOI Debt Yield: | 7.6% | |||
| ||||||||
| Sources and Uses | ||||||||
| Sources | Proceeds | % of Total | Uses | Proceeds | % of Total | |||
| Whole Loan(1) | $111,000,000 | 96.1% | Payoff Existing Debt | $107,473,387 | 93.1% | |||
| Sponsor Equity | 4,482,179 | 3.9 | Upfront Reserves | 7,338,794 | 6.4 | |||
| Closing Costs | 669,997 | 0.6 | ||||||
| Total Sources | $115,482,179 | 100.0% | Total Uses | $115,482,179 | 100.0% | |||
| (1) | The 12555 & 12655 Jefferson Loan (as defined below) is part of a whole loan evidenced by threepari passu notes, with an aggregate outstanding principal balance as of the Cut-off Date of $111.0 million. The Financial Information presented in the chart above reflects the Cut-off Date Balance of the $111.0 million 12555 & 12655 Jefferson Whole Loan (as defined below). |
| (2) | Occupancy and number of tenants excludes AegisMedia Americas, Inc. / Dentsu, which currently leases 17,867 square feet (9.2% of net rentable area) through November 30, 2023 but is currently dark. Including this tenant, the 12555 & 12655 Jefferson Properties (as defined below) are 97.2% leased. |
| (3) | All NOI, NCF and occupancy information, as well as the appraised value, were determined prior to the emergence of the novel coronavirus pandemic, and the economic disruption resulting from measures to combat the pandemic, and all DSCR, LTV and Debt Yield metrics were calculated, and the 12555 & 12655 Jefferson Whole Loan was underwritten, based on such prior information. See “Risk Factors—Risks Related to Market Conditions and Other External Factors—Coronavirus Pandemic Has Adversely Affected the Global Economy and Will Likely Adversely Affect the Performance of the Mortgage Loans” in the Preliminary Prospectus. |
| (4) | For a full description of Escrows and Reserves, please refer to“Escrows and Reserves”below. |
The Loan.The 12555 & 12655 Jefferson mortgage loan, with a principal balance of $57.0 million as of the Cut-off Date (the “12555 & 12655 Jefferson Loan”), is secured by a first mortgage lien on the borrowers’ fee simple interest in two adjacent office properties comprised of 193,908 square feet of net rentable area (the “12555 & 12655 Jefferson Properties”) located in Los Angeles, California. The 12555 & 12655 Jefferson Loan is part of a whole loan that has an aggregate outstanding principal balance as of the Cut-off Date of $111.0 million (the “12555 & 12655 Jefferson Whole Loan”) and is comprised of threepari passu notes, each as described in the “Whole Loan Summary” chart below. The non-controlling Notes A-2 and A-3, with an aggregate outstanding principal balance as of the Cut-off Date of $57.0 million, are being contributed to the JPMDB 2020-COR7 Trust. The controlling Note A-1, with an aggregate outstanding
| THE INFORMATION IN THIS STRUCTURAL AND COLLATERAL TERM SHEET IS NOT COMPLETE AND MAY BE AMENDED PRIOR TO THE TIME OF SALE. THIS TERM SHEET IS NOT AN OFFER TO SELL THESE SECURITIES AND IT IS NOT A SOLICITATION OF AN OFFER TO BUY THESE SECURITIES IN ANY JURISDICTION WHERE THE OFFER OR SALE IS NOT PERMITTED. | ||
| |
57 of 130 | |
| Structural and Collateral Term Sheet | JPMDB 2020-COR7 | |
| 12555 & 12655 Jefferson | ||
principal balance as of the Cut-off Date of $54.0 million, was contributed to the JPMDB 2019-COR6 Trust. The relationship between the holders of the 12555 & 12655 Jefferson Whole Loan will be governed by a co-lender agreement as described under “Description of the Mortgage Pool—The Whole Loans—The Non-Serviced Pari Passu Whole Loans” in the Preliminary Prospectus. The 12555 & 12655 Jefferson Whole Loan has a 10-year term and will be interest only for the entire term.The most recent prior financing of the12555 & 12655 JeffersonProperties was not included in a securitization.
| Whole Loan Summary | ||||
| Note | Original Balance | Cut-off Date Balance | Note Holder | Controlling Piece |
| A-1 | $54,000,000 | $54,000,000 | JPMDB 2019-COR6 | Yes |
| A-2, A-3 | 57,000,000 | 57,000,000 | JPMDB 2020-COR7 | No |
| Total | $111,000,000 | $111,000,000 | ||
The Borrowers. The borrowing entities are Mani 12555 Jefferson (DE), LLC and Mani Jefferson Landing (DE), LLC, each a Delaware limited liability company and special purpose entity structured to be bankruptcy remote with two independent directors. Legal counsel to the borrowers delivered a non-consolidation opinion in connection with the origination of the 12555 & 12655 Jefferson Whole Loan.
The Loan Sponsors.The loan sponsors and nonrecourse carve-out guarantors are Simon Mani and Daniel Mani, on a joint and several basis. Simon Mani and Daniel Mani founded Mani Brothers Real Estate Investment Group, a privately-held real estate investment firm that owns, renovates, operates, manages and leases 1.3 million square feet of commercial property.
The loan sponsors acquired the 12655 Jefferson property (“The Landing”) in November 2017 for approximately $80.0 million. In addition to the purchase price of $80.0 million, the loan sponsors were responsible for the payment of approximately $1.2 million in rent abatements and approximately $800,000 in leasing commissions, increasing the effective purchase price to approximately $82.0 million. The prior owner, Hudson Pacific Properties (“HPP”), acquired The Landing physically vacant in 2014, but 100.0% leased to Edutrek International (“Edutrek”) under an existing lease that was to expire in July 2015 who vacated the building in 2009. After the Edutrek lease expired in July 2015, HPP commenced an approximately $10.0 million renovation including capital repairs, core and shell work and leasing costs to bring occupancy at The Landing to 100.0%.
The loan sponsors acquired the 12555 Jefferson property (“Twelve555”) in March 2015 for approximately $48.5 million in an off-market transaction. At the time of acquisition, Twelve555 was 60.4% leased. Since acquiring Twelve555, the loan sponsors commenced an approximately $8.0 million renovation to the common areas, lobby and the façade. Additionally, a new space on the first floor was created by enclosing a portion of the building on the ground level, which added 4,127 rentable square feet. After completing the renovation, the loan sponsors secured a new 15-year lease with Providence Health System (“Providence”) (rated Aa3/AA-/AA- by Moody’s/Fitch/S&P) for the entire third floor. The loan sponsors report a total cost basis in the 12555 & 12655 Jefferson Properties of approximately $138.5 million.
| Portfolio Summary | |||||||
| Property Name | Year Built / Renovated | Total SF | % of Total | Occupancy(1)(2) | UW NOI | Allocated Whole Loan Original Balance | Appraised Value |
| The Landing | 1985 / 2015-2016 | 100,756 | 52.0% | 82.3% | $3,709,962 | $56,000,000 | $94,150,000 |
| Twelve555 | 1985 / 2016-2017 | 93,152 | 48.0 | 94.1% | 4,726,471 | 55,000,000 | 92,500,000 |
| Total / Wtd. Avg. | 193,908 | 100.0% | 88.0% | $8,436,433 | $111,000,000 | $186,650,000 | |
| (1) | Based on the underwritten rent rolls dated as of March 31, 2020. |
| (2) | Occupancy excludes AegisMedia Americas, Inc. / Dentsu, which currently leases 17,867 square feet (9.2% of net rentable area) through November 30, 2023 but is currently dark. Including this tenant, the 12555 & 12655 Jefferson Properties are 97.2% leased. |
The Properties.The 12555 & 12655 Jefferson Properties are comprised of two, adjacent, Class A office properties comprised of 193,908 square feet of net rentable area located on the north side of Jefferson Boulevard, between Centinela Avenue to the north and Lincoln Boulevard to the south, in the Playa Vista community within West Los Angeles.
The Landing is a six-story, multi-tenant, Class A office building situated on a 1.11-acre site. The Landing was built in 1985 and was most recently renovated between 2015-2016. The Landing also includes a parking garage totaling 268 spaces (approximately 2.7 spaces per 1,000 square feet). As of the March 31, 2020 underwritten rent roll, The Landing was 100.0% leased by two tenants; however, AegisMedia Americas, Inc. / Dentsu, which currently leases 17,867 square feet (9.2% of net rentable area) through November 30, 2023, is currently dark and has been excluded from the underwriting. Excluding AegisMedia Americas, Inc. / Dentsu, The Landing is 82.3% occupied at an underwritten base rent equal to $57.72 per square foot.
| THE INFORMATION IN THIS STRUCTURAL AND COLLATERAL TERM SHEET IS NOT COMPLETE AND MAY BE AMENDED PRIOR TO THE TIME OF SALE. THIS TERM SHEET IS NOT AN OFFER TO SELL THESE SECURITIES AND IT IS NOT A SOLICITATION OF AN OFFER TO BUY THESE SECURITIES IN ANY JURISDICTION WHERE THE OFFER OR SALE IS NOT PERMITTED. | ||
| |
58 of 130 | |
| Structural and Collateral Term Sheet | JPMDB 2020-COR7 | |
| 12555 & 12655 Jefferson | ||
Twelve555 is three-story, multi-tenant, Class A office building situated on a 1.876-acre site. Twelve555 was built in 1985 and was most recently renovated between 2016-2017. Twelve555 also includes a parking garage totaling 307 spaces (approximately 3.3 spaces per 1,000 square feet). As of the March 31, 2020 underwritten rent roll, Twelve555 was 94.1% leased to seven tenants at a weighted average underwritten base rent equal to $47.55 per square foot.
As of the March 31, 2020 underwritten rent rolls, the 12555 & 12655 Jefferson Properties were 88.0% occupied by eight tenants at a weighted average underwritten base rent equal to $52.49 per square foot excluding AegisMedia Americas, Inc. / Dentsu, which currently leases 17,867 square feet (9.2% of net rentable area) through November 30, 2023 but is currently dark.
The largest tenant at the 12555 & 12655 Jefferson Properties is WeWork (82,889 square feet; 42.7% of net rentable area; 53.4% of underwritten base rent). WeWork provides furnished and fully-serviced shared workspaces, primarily to small and midmarket enterprises. WeWork has been a tenant since 2016 and has a lease expiration of August 2028 with one, five-year renewal option remaining and no termination options. WeWork currently pays underwritten base rent equal to $57.72 per square foot.
The second largest tenant at the 12555 & 12655 Jefferson Properties is Providence (35,562 square feet; 18.3% of net rentable area; 23.2% of underwritten base rent; rated Aa3/AA-/AA- by Moody’s/Fitch/S&P). Providence is the third largest not-for-profit health system in the United States. Providence’s system includes more than 82,000 employees with services including acute care, physician clinics, long-term and assisted living, palliative and hospice care, home health, supportive housing and education. Providence has been a tenant since2016 and has a lease expiration of July 2031 with two, five-year renewal options remaining and no termination options. Providence currently pays base rent equal to $49.83 per square foot. Underwritten base rent of $58.41 is based on average rent over the loan term.
The third largest tenant at the 12555 & 12655 Jefferson Properties is Cardinia Real Estate (“Cardinia”) (15,955 square feet; 8.2% of net rentable area; 7.0% of underwritten base rent). Cardinia is a subsidiary of Ominicom Group, a global network of leading marketing communications companies which offers a range of marketing solutions including brand advertising, customer relationship management, media planning and buying services, public relations and numerous specialty communications services. Cardinia has been a tenant since 2018 and has a lease expiration ofSeptember 2024 with two renewal options (one, five-year and one, four-year) remaining and no termination options.Cardinia currently pays base rent equal to $37.95 per square foot. Cardinia’s base rent steps to $39.08 per square foot on 10/1/2020.
COVID-19 Update.As of June 1, 2020, the12555 & 12655 Jefferson Propertiesare closed; however, most, if not all, office tenants are working remotely. As of the March 31, 2020 underwritten rent rolls, the12555 & 12655 Jefferson Propertiesremain 88.0% occupied. For April and May of 2020, tenants representing 100.0% of the square footage have paid rent in-full with the loan sponsors having collected 100.0% of the underwritten base rent. The 12555 & 12655 Jefferson Whole Loan is current through the June 6, 2020 payment date. As of June 1, 2020, the12555 & 12655 JeffersonLoan is not subject to any modification or forbearance request.
The Market.The 12555 & 12655 Jefferson Properties are located in the Marina Del Rey/Venice office submarket, within the overall Los Angeles office market. According to a market report, as of May 28, 2020, the overall Los Angeles office market contained approximately 423.5 million square feet with an overall market vacancy of 10.1% and average asking rents of approximately $41.27 per square foot. As of May 28, 2020, the Marina Del Rey/Venice office submarket contained approximately 10.7 million square feet across with an overall submarket vacancy of 12.6% and average asking rents of approximately $56.65 per square foot.
The appraisals for 12555 & 12655 Jefferson Properties included 14 rent comparables. Of the 14 comparables, one was triple net (“NNN”) with the remaining 13 full service gross (“FSG”). The one NNN rent comparable was equal to $40.80 per square foot while the 13 FSG rent comparables ranged from $51.60 to $72.00 per square foot with a weighted average of approximately $62.97 per square foot.
| Historical and Current Occupancy(1) | ||||
| 2016(2) | 2017 | 2018 | 2019 | Current(3)(4) |
| N/A | 90.6% | 93.7% | 97.2% | 88.0% |
| (1) | Historical Occupancies are as of December 31 of eachrespective year. |
| (2) | 2016 Occupancy is not available as the 12555 & 12655 Jefferson Properties were significantly renovated during this time. |
| (3) | Current Occupancy is as of the rent rolls dated March 31, 2020. |
| (4) | Current Occupancy excludes AegisMedia Americas, Inc. / Dentsu, which currently leases 17,867 square feet (9.2% of net rentable area) through November 30, 2023 but is currently dark. Including this tenant, the 12555 & 12655 Jefferson Properties are 97.2% leased. |
| THE INFORMATION IN THIS STRUCTURAL AND COLLATERAL TERM SHEET IS NOT COMPLETE AND MAY BE AMENDED PRIOR TO THE TIME OF SALE. THIS TERM SHEET IS NOT AN OFFER TO SELL THESE SECURITIES AND IT IS NOT A SOLICITATION OF AN OFFER TO BUY THESE SECURITIES IN ANY JURISDICTION WHERE THE OFFER OR SALE IS NOT PERMITTED. | ||
| |
59 of 130 | |
| Structural and Collateral Term Sheet | JPMDB 2020-COR7 | |
| 12555 & 12655 Jefferson | ||
| Tenant Summary(1) | ||||||
| Tenant | Ratings Moody’s/Fitch/S&P(2) | Net Rentable Area (SF) | % of Total NRA | Base Rent PSF(3) | % of Total Base Rent(3) | Lease Expiration Date |
| WeWork(4) | NR / CCC / B- | 82,889 | 42.7% | $57.72 | 53.4% | 8/31/2028 |
| Providence Health System(4) | Aa3 / AA- / AA- | 35,562 | 18.3 | $58.41 | 23.2 | 7/31/2031 |
| Cardinia Real Estate(4) | Baa1 / NR / BBB+ | 15,955 | 8.2 | $39.08 | 7.0 | 9/30/2024 |
| Starkey Laboratories(4)(5) | NR / NR / NR | 11,595 | 6.0 | $36.81 | 4.8 | 8/31/2020 |
| KTGY Group(4) | NR / NR / NR | 8,407 | 4.3 | $36.86 | 3.5 | MTM |
| Campus Explorer(4) | NR / NR / NR | 6,017 | 3.1 | $45.19 | 3.0 | 4/30/2021 |
| Randy Taylor Consulting(4) | NR / NR / NR | 5,834 | 3.0 | $43.88 | 2.9 | 6/30/2023 |
| Social Code(4) | NR / NR / NR | 4,292 | 2.2 | $47.21 | 2.3 | 7/31/2022 |
| Total / Wtd. Avg. Occupied Space | 170,551 | 88.0% | $52.49 | 100.0% | ||
| Vacant | 23,357 | 12.0 | ||||
| Total | 193,908 | 100.0% | ||||
| (1) | Based on the underwritten rent rolls dated as of March 31, 2020. |
| (2) | In certain instances, ratings provided are those of the parent company of the entity shown, whether or not the parent company guarantees the lease. |
| (3) | Base Rent PSF and % of Total Base Rent include approximately $178,693 in contractual rent steps through October 2020 for certain tenants and approximately $305,105 of average rent over the loan term for Providence Health System. |
| (4) | WeWork has one, five-year renewal option remaining, Providence Health System has two, five-year renewal options remaining, Cardinia Real Estate has one, four-year renewal option remaining and one five-year renewal option remaining, Starkey Laboratories has one, five-year renewal option remaining, KTGY Group has one, five-year renewal option remaining, Campus Explorer has one, three-year renewal option remaining, Randy Taylor Consulting has one, three-year renewal option remaining and Social Code has one, five-year renewal option remaining. |
| (5) | Starkey Laboratories subleases all of its space to Good Leaf, Inc. through August 31, 2020 at a base rent equal to $37.20 per square foot. |
| Lease Rollover Schedule(1) | |||||||||
| Year | Number of Leases Expiring | Net Rentable Area Expiring | % of NRA Expiring | Base Rent Expiring(2) | % of Base Rent Expiring(2) | Cumulative Net Rentable Area Expiring | Cumulative % of NRA Expiring | Cumulative Base Rent Expiring(2) | Cumulative % of Base Rent Expiring(2) |
| Vacant | NAP | 23,357 | 12.0% | NAP | NAP | 23,357 | 12.0% | NAP | NAP |
| 2020 & MTM | 2 | 20,002 | 10.3 | 736,690 | 8.2 | 43,359 | 22.4% | $736,690 | 8.2% |
| 2021 | 1 | 6,017 | 3.1 | 271,934 | 3.0 | 49,376 | 25.5% | $1,008,624 | 11.3% |
| 2022 | 1 | 4,292 | 2.2 | 202,607 | 2.3 | 53,668 | 27.7% | $1,211,231 | 13.5% |
| 2023 | 1 | 5,834 | 3.0 | 255,984 | 2.9 | 59,502 | 30.7% | $1,467,215 | 16.4% |
| 2024 | 1 | 15,955 | 8.2 | 623,578 | 7.0 | 75,457 | 38.9% | $2,090,794 | 23.4% |
| 2025 | 0 | 0 | 0.0 | 0 | 0.0 | 75,457 | 38.9% | $2,090,794 | 23.4% |
| 2026 | 0 | 0 | 0.0 | 0 | 0.0 | 75,457 | 38.9% | $2,090,794 | 23.4% |
| 2027 | 0 | 0 | 0.0 | 0 | 0.0 | 75,457 | 38.9% | $2,090,794 | 23.4% |
| 2028 | 1 | 82,889 | 42.7 | 4,784,353 | 53.4 | 158,346 | 81.7% | $6,875,147 | 76.8% |
| 2029 | 0 | 0 | 0.0 | 0 | 0.0 | 158,346 | 81.7% | $6,875,147 | 76.8% |
| 2030 | 0 | 0 | 0.0 | 0 | 0.0 | 158,346 | 81.7% | $6,875,147 | 76.8% |
| 2031 & Beyond | 1 | 35,562 | 18.3 | 2,077,101 | 23.2 | 193,908 | 100.0% | $8,952,248 | 100.0% |
| Total | 8 | 193,908 | 100.0% | $8,952,248 | 100.0% | ||||
| (1) | Based on the underwritten rent rolls dated March 31, 2020. |
| (2) | Base Rent Expiring, % of Base Rent Expiring, Cumulative Base Rent Expiring and Cumulative % of Base Rent Expiring include approximately $178,693 in contractual rent steps through October 2020 for certain tenants and approximately $305,105 of average rent over the loan term for Providence Health System. |
| THE INFORMATION IN THIS STRUCTURAL AND COLLATERAL TERM SHEET IS NOT COMPLETE AND MAY BE AMENDED PRIOR TO THE TIME OF SALE. THIS TERM SHEET IS NOT AN OFFER TO SELL THESE SECURITIES AND IT IS NOT A SOLICITATION OF AN OFFER TO BUY THESE SECURITIES IN ANY JURISDICTION WHERE THE OFFER OR SALE IS NOT PERMITTED. | ||
| |
60 of 130 | |
| Structural and Collateral Term Sheet | JPMDB 2020-COR7 | |
| 12555 & 12655 Jefferson | ||
| Operating History and Underwritten Net Cash Flow | ||||||
| 2017 | 2018 | 2019 | Underwritten(1) | Per Square Foot | %(2) | |
| Rents in Place | $6,720,770 | $8,568,895 | $9,048,921 | $8,468,449 | $43.67 | 59.7% |
| Straight Line Rent(3) | 0 | 0 | 0 | 305,105 | 1.57 | 2.2 |
| Contractual Rent Steps(4) | 0 | 0 | 0 | 178,693 | 0.92 | 1.3 |
| Vacant Income | 0 | 0 | 0 | 1,482,532 | 7.65 | 10.5 |
| Gross Potential Rent | $6,720,770 | $8,568,895 | $9,048,921 | $10,434,780 | $53.81 | 73.6% |
| Total Reimbursements | 1,342,889 | 1,504,938 | 1,804,363 | 1,753,297 | 9.04 | 12.4 |
| Total Other Income(5) | 1,594,176 | 1,861,639 | 2,192,699 | 1,985,475 | 10.24 | 14.0 |
| Net Rental Income | $9,657,835 | $11,935,471 | $13,045,983 | $14,173,551 | $73.09 | 100.0% |
| (Vacancy/Credit Loss) | 0 | 0 | 0 | (1,482,532) | (7.65) | (10.5) |
| Effective Gross Income | $9,657,835 | $11,935,471 | $13,045,983 | $12,691,019 | $65.45 | 89.5% |
| Total Expenses | $3,242,842 | $3,991,728 | $4,458,888 | $4,254,586 | $21.94 | 33.5% |
| Net Operating Income | $6,414,993 | $7,943,743 | $8,587,095 | $8,436,433 | $43.51 | 66.5% |
| Total TI/LC, CapEx/RR | 0 | 0 | 0 | 491,587 | 2.54 | 3.9 |
| Net Cash Flow | $6,414,993 | $7,943,743 | $8,587,095 | $7,944,846 | $40.97 | 62.6% |
| (1) | For the avoidance of doubt, no COVID-19 specific adjustments have been incorporated in the lender underwriting. |
| (2) | % column represents percent of Net Rental Income for all revenue lines and represents percent of Effective Gross Income for the remainder of the fields. |
| (3) | Based on the average rent over the loan term for investment grade tenant Providence Health System. |
| (4) | Based on the contractual rent steps through October 2020 for certain tenants. |
| (5) | Total Underwritten Other Income includes parking income ($1,966,366) and miscellaneous other income ($19,109). |
Property Management.The 12555 & 12655 Jefferson Properties are managed by Mani Brothers, LLC, an affiliate of the borrowers.
Escrows and Reserves. At origination, the borrowers deposited into escrow $3,500,000 for an Earnout Reserve (as defined below), $2,538,191 for outstanding tenant improvements and leasing commissions, $1,250,000 for real estate taxes, $44,603 for outstanding free rent and $6,000 for insurance premiums.
Tax Escrows– On a monthly basis,the borrowers are required to escrow 1/12 of the annual estimated tax payments, which currently equates to $137,610.
Insurance Escrows– On a monthly basis,the borrowers are required to escrow 1/12 of the annual estimated insurance premiums, which currently equates to $5,900.
Replacement Reserves –On a monthly basis, the borrowers are required to escrow approximately $4,040 for replacement reserves.
TI/LC Reserves – On a monthly basis, the borrowers are required to escrow $16,159 for tenant improvements and leasing commissions, subject to a cap of (i) $1,000,000 if the 12555 & 12655 Jefferson Properties are less than 94.0% leased or (ii) $400,000 if 12555 & 12655 Jefferson Properties are greater than or equal to 94.0% leased.
Earnout Reserve– Provided no default or event of default has occurred and is continuing, the lender will release the $3,500,000 in the Earnout Reserve to the borrowers upon the 12555 & 12655 Jefferson Properties achieving a debt yield equal to or greater than 7.5%.
Lockbox / Cash Management.The 12555 & 12655 Jefferson Whole Loan is structured with a soft lockbox and springing cash management. All rents are required to be deposited into a lockbox account within one business day of receipt by the borrower or property manager. All funds in the lockbox account are required to be swept daily into the borrowers’ operating account, unless a Cash Management Period (as defined below) is continuing. During the continuance of a Cash Management Period, funds in the lockbox account will be swept daily into a lender-controlled account, from which account such funds will be disbursed on each payment date in accordance with the 12555 & 12655 Jefferson Whole Loan documents and any excess will be retained by the lender as additional collateral for the 12555 & 12655 Jefferson Whole Loan.
A “Cash Management Period” will commence (i) upon an event of default (until the payment date following the cure of such event of default), (ii) if the debt yield is less than 5.4% for any calendar quarter (a “Cash Management Debt Yield Trigger”) (until such time that the debt yield is greater than or equal to 5.4% for two consecutive quarters) or (iii) upon a Lease Sweep Period (as defined below).
| THE INFORMATION IN THIS STRUCTURAL AND COLLATERAL TERM SHEET IS NOT COMPLETE AND MAY BE AMENDED PRIOR TO THE TIME OF SALE. THIS TERM SHEET IS NOT AN OFFER TO SELL THESE SECURITIES AND IT IS NOT A SOLICITATION OF AN OFFER TO BUY THESE SECURITIES IN ANY JURISDICTION WHERE THE OFFER OR SALE IS NOT PERMITTED. | ||
| |
61 of 130 | |
| Structural and Collateral Term Sheet | JPMDB 2020-COR7 | |
| 12555 & 12655 Jefferson | ||
Notwithstanding the foregoing, the borrowers may avoid the commencement or continuance of Cash Management Period by depositing with lender cash or a letter of credit (“LOC”) which (i) with respect to a Cash Management Debt Yield Trigger, the amount of such cash or LOC when added to the net operating income of the 12555 & 12655 Jefferson Properties would result in a debt yield that is equal to or greater than 5.4% or (ii) with respect to a Cash Management Period triggered by a Lease Sweep Period, cash or an LOC in an amount equal to $1,300,000.
A “Lease Sweep Period” will commence (i) the date that is twelve months prior to the end of the term of any Lease Sweep Lease (including any renewal terms); (ii) with respect to the WeWork or Providence leases (but not any other lease that is a Lease Sweep Lease), upon the earlier to occur of (x) on the date that is 12 months prior to the end of the lease term (including any renewal terms), or (y) on the date by which the applicable Lease Sweep Tenant (defined below) is required to give notice of its exercise of a renewal option under the Leases Sweep Lease (and such renewal has not so been exercised), (iii) if any Lease Sweep Lease is surrendered, cancelled or terminated prior to its then-current expiration date, (iv) if any Lease Sweep Tenant goes dark or gives notice that it intends to discontinue its business at its premises, (v) upon the occurrence and continuance of a monetary or material non-monetary default under any Lease Sweep Lease or (vi) upon the occurrence of a Lease Sweep Tenant insolvency proceeding.
Notwithstanding the foregoing, the borrowers may avoid the commencement or continuance of a Lease Sweep Period, provided that the borrowers deposit with lender cash or a LOC in an amount equal to $2,200,000.
A “Lease Sweep Lease” means the WeWork lease, the Providence lease and any other lease which covers 25,000 or more square feet.
A “Lease Sweep Tenant” means any tenant under a Lease Sweep Lease, or under one or more leases (leased by such tenant and/or its affiliates) which when taken together would constitute a Lease Sweep Lease.
Additional Debt. None.
Partial Release. None.
| THE INFORMATION IN THIS STRUCTURAL AND COLLATERAL TERM SHEET IS NOT COMPLETE AND MAY BE AMENDED PRIOR TO THE TIME OF SALE. THIS TERM SHEET IS NOT AN OFFER TO SELL THESE SECURITIES AND IT IS NOT A SOLICITATION OF AN OFFER TO BUY THESE SECURITIES IN ANY JURISDICTION WHERE THE OFFER OR SALE IS NOT PERMITTED. | ||
| |
62 of 130 | |
| Structural and Collateral Term Sheet | JPMDB 2020-COR7 | |
| 675 Creekside Way | ||
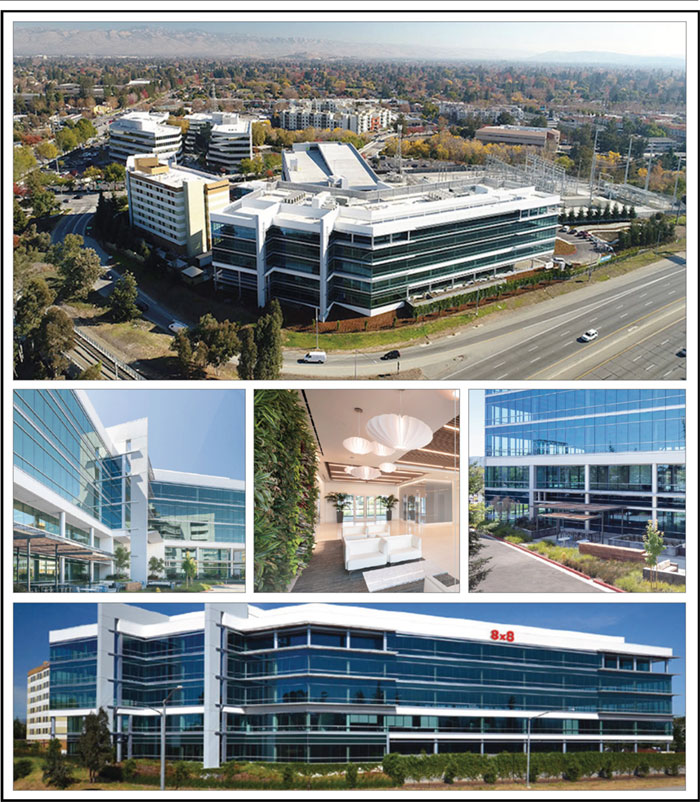
| THE INFORMATION IN THIS STRUCTURAL AND COLLATERAL TERM SHEET IS NOT COMPLETE AND MAY BE AMENDED PRIOR TO THE TIME OF SALE. THIS TERM SHEET IS NOT AN OFFER TO SELL THESE SECURITIES AND IT IS NOT A SOLICITATION OF AN OFFER TO BUY THESE SECURITIES IN ANY JURISDICTION WHERE THE OFFER OR SALE IS NOT PERMITTED. | ||
| |
63 of 130 | |
| Structural and Collateral Term Sheet | JPMDB 2020-COR7 | |
| 675 Creekside Way | ||
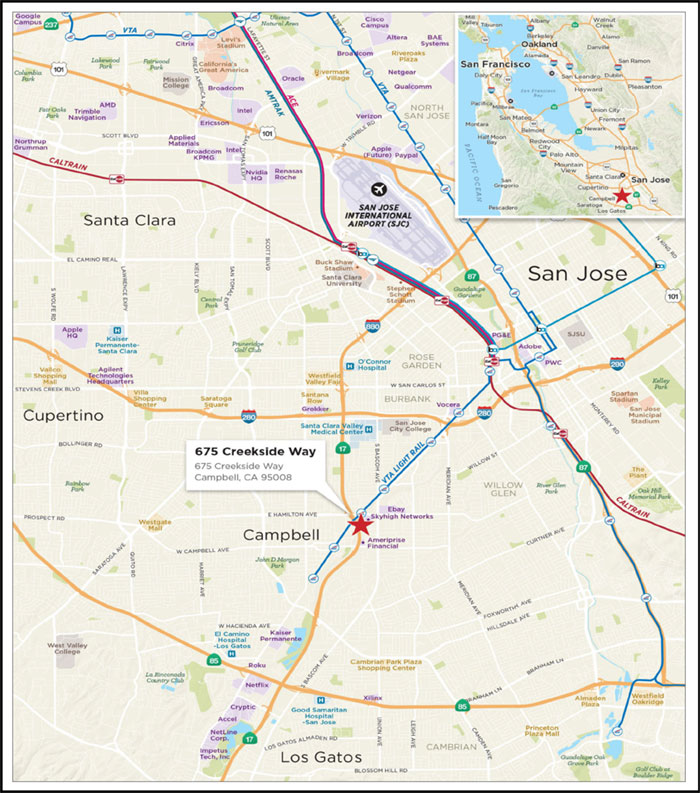
| THE INFORMATION IN THIS STRUCTURAL AND COLLATERAL TERM SHEET IS NOT COMPLETE AND MAY BE AMENDED PRIOR TO THE TIME OF SALE. THIS TERM SHEET IS NOT AN OFFER TO SELL THESE SECURITIES AND IT IS NOT A SOLICITATION OF AN OFFER TO BUY THESE SECURITIES IN ANY JURISDICTION WHERE THE OFFER OR SALE IS NOT PERMITTED. | ||
| |
64 of 130 | |
| Structural and Collateral Term Sheet | JPMDB 2020-COR7 | |
| 675 Creekside Way | ||
| Mortgage Loan Information | Property Information | |||
| Mortgage Loan Seller: | GACC | Single Asset / Portfolio: | Single Asset | |
| Original Principal Balance(1): | $43,400,000 | Title: | Fee | |
| Cut-off Date Principal Balance(1): | $43,400,000 | Property Type - Subtype: | Office – Suburban | |
| % of Pool by IPB: | 4.8% | Net Rentable Area (SF): | 177,815 | |
| Loan Purpose: | Acquisition | Location: | Campbell, CA | |
| Borrower: | 675 Creekside Owner LLC | Year Built / Renovated: | 2016 / N/A | |
| Loan Sponsor: | Larry Botel | Occupancy: | 100.0% | |
| Interest Rate: | 3.69000% | Occupancy Date: | 6/6/2020 | |
| Note Date: | 3/2/2020 | Number of Tenants: | 1 | |
| Maturity Date: | 3/6/2027 | 2017 NOI(3): | N/A | |
| Interest-only Period: | 84 months | 2018 NOI(3): | N/A | |
| Original Term: | 84 months | 2019 NOI(3): | N/A | |
| Original Amortization: | None | TTM NOI(3): | N/A | |
| Amortization Type: | Interest Only | UW Economic Occupancy(4): | 95.0% | |
| Call Protection(2): | L(27),Def(53),O(4) | UW Revenues: | $10,300,299 | |
| Lockbox / Cash Management: | Hard / Springing | UW Expenses: | $2,397,845 | |
| Additional Debt(1): | Yes | UW NOI(4): | $7,902,454 | |
| Additional Debt Balance(1): | $40,000,000 | UW NCF(4): | $7,866,891 | |
| Additional Debt Type(1): | Pari Passu | Appraised Value / Per SF(4)(5): | $143,000,000 / $804 | |
| Appraisal Date(5): | 1/1/2021 | |||
| Escrows and Reserves(6) | Financial Information(1)(4) | ||||||
| Initial | Monthly | Initial Cap | |||||
| Taxes: | $0 | $59,117 | N/A | Cut-off Date Loan / SF: | $469 | ||
| Insurance: | $0 | Springing | N/A | Maturity Date Loan / SF: | $469 | ||
| Replacement Reserves: | $0 | $2,964 | $106,689 | Cut-off Date LTV: | 58.3% | ||
| TI/LC: | $0 | Springing | N/A | Maturity Date LTV: | 58.3% | ||
| Other: | $11,087,071 | $0 | N/A | UW NCF DSCR: | 2.52x | ||
| UW NOI Debt Yield: | 9.5% | ||||||
Sources and Uses | |||||||
| Sources | Proceeds | % of Total | Uses | Proceeds | % of Total | ||
| Whole Loan | $83,400,000 | 59.0% | Purchase Price(7) | $127,912,929 | 90.6% | ||
| Loan Sponsor Equity | 57,854,279 | 41.0 | Upfront Reserves | 11,087,071 | 7.8 | ||
| Closing Costs | 2,254,279 | 1.6 | |||||
| Total Sources | $141,254,279 | 100.0% | Total Uses | $141,254,279 | 100.0% | ||
| (1) | The 675 Creekside Way Loan (as defined below) is part of a whole loan evidenced by fourpari passu notes with an aggregate outstanding principal balance as of the Cut-off Date of $83.4 million. The Financial Information presented in the chart above reflects the Cut-off Date Balance of the $83.4 million 675 Creekside Way Whole Loan (as defined below). For additional information, see “The Loan” herein. |
| (2) | The defeasance lockout period will be at least 27 payments beginning with and including the first payment date of April 6, 2020. The borrower has the option to defease the entire $83.4 million 675 Creekside Way Whole Loan in whole (but not in part) after the earlier to occur of (i) two years after the closing date of the securitization that includes the last note to be securitized and (ii) March 2, 2023. The assumed defeasance lockout period of 27 months is based on the expected closing date of the JPMDB 2020-COR7 securitization in June 2020. The actual lockout period may be longer. |
| (3) | Historical NOI is not available because the 675 Creekside Way Property (as defined below) was recently constructed and delivered to the tenant. |
| (4) | All NOI, NCF and occupancy information, as well as the appraised value, were determined prior to the emergence of the novel coronavirus pandemic, and the economic disruption resulting from measures to combat the pandemic, and all DSCR, LTV and Debt Yield metrics were calculated, and the 675 Creekside Way Whole Loan was underwritten, based on such prior information. See “Risk Factors—Risks Related to Market Conditions and Other External Factors—Coronavirus Pandemic Has Adversely Affected the Global Economy and Will Likely Adversely Affect the Performance of the Mortgage Loans” in the Preliminary Prospectus. |
| (5) | The appraised value represents the “As Stabilized” appraised value, which assumes all free rent has burned off and rent commencement has begun. The sole tenant, 8x8, has fully taken possession of its space and approximately $8.5 million was reserved upfront in a free rent reserve. Based on the “As-Is” appraised value as of December 16, 2019 equal to $131.0 million, the Cut-off Date LTV and Maturity Date LTV are 63.7%. In addition, the appraisal concluded to a “Go Dark” appraised value of $105.0 million as of December 16, 2019, which equates to a Cut-off Date LTV of 79.4%. |
| (6) | For a full description of Escrows and Reserves, please refer to“Escrows and Reserves”below. |
| (7) | The purchase price represents the contractual purchase price net of seller credits for outstanding tenant improvements and free rent, which were reserved at loan origination. The contractual purchase price is $139.0 million. |
| THE INFORMATION IN THIS STRUCTURAL AND COLLATERAL TERM SHEET IS NOT COMPLETE AND MAY BE AMENDED PRIOR TO THE TIME OF SALE. THIS TERM SHEET IS NOT AN OFFER TO SELL THESE SECURITIES AND IT IS NOT A SOLICITATION OF AN OFFER TO BUY THESE SECURITIES IN ANY JURISDICTION WHERE THE OFFER OR SALE IS NOT PERMITTED. | ||
| |
65 of 130 | |
| Structural and Collateral Term Sheet | JPMDB 2020-COR7 | |
| 675 Creekside Way | ||
The Loan.The 675 Creekside Way mortgage loan (the “675 Creekside Way Loan”) is part of a whole loan with an aggregate outstanding principal balance as of the Cut-off Date of $83.4 million (the “675 Creekside Way Whole Loan”), which is secured by the borrower’s fee interest in a Class A office building located in Campbell, California (the “675 Creekside Way Property”). The controlling Note A-1 and non-controlling Note A-4, with an aggregate outstanding principal balance as of the Cut-off Date of $43.4 million, will be included in the JPMDB 2020-COR7 trust. The remaining notes are expected to be contributed to one or more future securitization trusts. The relationship between the holders of the 675 Creekside Way Whole Loan is governed by a co-lender agreement as described under“Description of the Mortgage Pool—The Whole Loans—The Serviced Pari Passu Whole Loans”in the Preliminary Prospectus. The 675 Creekside Way Whole Loan has a 7-year term and will be interest-only for its entire term.
| Whole Loan Summary | |||||
| Note | Original Balance | Cut-off Date Balance | Note Holder | Controlling Piece | |
| Note A-1, A-4 | $43,400,000 | $43,400,000 | JPMDB 2020-COR7 | Yes | |
| Note A-2, A-3 | 40,000,000 | 40,000,000 | DBRI | No | |
| Whole Loan | $83,400,000 | $83,400,000 | |||
The Borrower.The borrower is 675 Creekside Owner LLC, a single purpose Delaware limited liability company structured to be bankruptcy remote with two independent directors in the organizational structure. Legal counsel to the borrower delivered a non-consolidation opinion in connection with the origination of the 675 Creekside Way Whole Loan.
The Loan Sponsor.The loan sponsor and non-recourse carveout guarantor is Larry Botel, who is the co-founder of JOSS Realty Partners (“JOSS”), a real estate investment management firm headquartered in New York City. Since inception in 2005, JOSS has acquired 26 properties totaling over 3 million square feet in New York, Philadelphia, Washington DC, Miami, Los Angeles and San Francisco. JOSS’s current portfolio includes 55 Walkers Brook Drive in Boston, Massachusetts, 209 Madison Street in Alexandria, Virginia, 2233 Wisconsin Avenue in Washington DC, 165 Township Line Road, 1701 South Street, 230 South Broad Street and East Market in Philadelphia, Pennsylvania, and Napa Square in San Francisco, California.
Qualitas, a real estate investment management firm based in Australia, also has an indirect ownership interest in the 675 Creekside Way Property. In addition, the 675 Creekside Way Loan documents permit Qualitas to obtain control of the borrower so long as certain conditions are satisfied, including delivering a replacement non-recourse carveout guaranty and environmental indemnity provided by a guarantor acceptable to the lender; provided that a guarantor that controls the borrower and satisfies certain net worth and liquidity requirements will be deemed to be acceptable. Founded in 2008, Qualitas has investments in senior debt, mezzanine debt, preferred equity, and equity with a focus on development, value add, and debt and equity investments. Qualitas is active in the major capital cities of Australia, deploying institutional and private investor capital to fund commercial real estate partners. Qualitas manages approximately AU $3 billion of committed capital. Qualitas manages discretionary funds on behalf of institutional and wholesale clients in Australia, Asia, and Europe and its fund strategies include closed-end and open-ended vehicles, bespoke mandates, and a publicly-listed debt fund.
The Property.The 675 Creekside Way Property is a newly developed Class A, 177,815 square feet office building located in Campbell, California. The 675 Creekside Way Property has five floors with flexible floorplates ranging from 33,713 to 36,842 square feet with three entrance points and central elevators. The second through fourth floors are improved with open office areas around the perimeter, interior private offices and conference rooms, and employee break areas with storage areas. Amenities include collaboration areas, a 2,500 square feet fully-equipped gym with designated fitness areas and locker rooms with showers. The 675 Creekside Way Property has approximately 380 feet of frontage along Creekside Way as well as 550 feet along Highway 17 with prominent signage on the building’s top exterior that is visible from both streets. There are 575 available parking spaces at the 675 Creekside Way Property during working hours which includes a one-level subterranean parking garage with 79 parking spaces and the remaining spaces located in a freestanding parking garage. As of June 6, 2020, the 675 Creekside Way Property was 100.0% leased to 8x8.
The sole tenant, 8x8 (177,815 square feet; 100.0% of net rentable area; 100.0% of Underwritten Base Rent), is a cloud provider of voice, video, chat and contact center solutions for over one million users in more than 150 countries. 8x8 was founded in 1987 as a provider of Voice over Internet Protocol (“VoIP”) in office phone systems, versus the public switched telephone network (old-fashioned telephone service). 8x8 was one of the first VoIP providers to expand into cloud-based communications. In 1997, 8x8 completed its IPO and it is currently traded on the NYSE under the ticker EGHT. 8x8 offers a range of cloud-based communication products and services for enterprise users and start-ups. Their single cloud technology platform serves the entire market (voice, message, video conference, contact / call center, etc.). As of the 2020 fiscal year ending March 31, 2020, 8x8’s total revenue was approximately $446.2 million, an approximately 27% increase year over year. Over the same period, the company reported a net loss of approximately $172.4 million, as the company targeted FY 2019-2020 as investment years. This included spending in research and development and sales and marketing, along with expanding its workforce by over 20%. As of the fiscal year ending March 31, 2020, 8x8 had approximately $137.4 million of cash and cash equivalents on its balance sheet.
| THE INFORMATION IN THIS STRUCTURAL AND COLLATERAL TERM SHEET IS NOT COMPLETE AND MAY BE AMENDED PRIOR TO THE TIME OF SALE. THIS TERM SHEET IS NOT AN OFFER TO SELL THESE SECURITIES AND IT IS NOT A SOLICITATION OF AN OFFER TO BUY THESE SECURITIES IN ANY JURISDICTION WHERE THE OFFER OR SALE IS NOT PERMITTED. | ||
| |
66 of 130 | |
| Structural and Collateral Term Sheet | JPMDB 2020-COR7 | |
| 675 Creekside Way | ||
8x8 has consolidated its office space across Silicon Valley into the 675 Creekside Way Property, making the 675 Creekside Way Property its headquarters location. According to the loan sponsor, 8x8 has invested approximately $150 per square foot to build out its space in addition to the approximately $87 per square foot in tenant improvement allowance 8x8 received under its lease. 8x8 has an in place base rent of $44.40 per square foot with 3% annual rent escalations. 8x8 signed an 11-year lease which expires in December 2030 and has two, five-year extension options at 100% of the fair market rent with notice required to be given no earlier than 15 months and no later than 9 months prior to expiration of the initial lease term. 8x8 has a one-time option to terminate its lease effective on December 31, 2028 by providing no less than 12 months’ notice and delivering a termination fee equal to 12 months of base rent plus a percentage share of operating expenses payable through the 120th month of the lease term. 8x8 is entitled to free rent through the end of 2020, which has been fully reserved.
COVID-19 Update. As of June 2, 2020, the 675 Creekside Way Property is open; however, most employees of 8x8, if not all, are working remotely to follow the California stay-at-home directive due to the on-going COVID-19 pandemic. The sole tenant is currently in a free rent period. The 675 Creekside Way Whole Loan is current through the June 6, 2020 payment date. As of June 8, 2020, the 675 Creekside Way Whole Loan is not subject to any modification or forbearance request.
The Market. The 675 Creekside Way Property is located in Campbell, Santa Clara County, California, within California’s Silicon Valley. The 675 Creekside Way Property is located six miles south of downtown San Jose and 50 miles from San Francisco. Campbell is situated in the southern portion of the Santa Clara Valley, with Highway 17 passing through eastern Campbell and Highway 85 to its south. The historic downtown section sits just west of the railroad in the central area. The 675 Creekside Way Property is located off Highway 17 with access to mass transit via the VTA Light Rail (Hamilton Station is adjacent to the 675 Creekside Way Property) and Caltrain.
According to a market research report, the 2019 estimated population within a one-, three- and five-mile radius of the 675 Creekside Way Property is 29,894, 246,085, and 598,177, respectively. Household growth from 2010 to 2019 within a one-, three-, and five-mile radius of the 675 Creekside Way Property was reported at 8.47%, 8.63%, and 9.74%, respectively, and is expected to grow by 4.88%, 4.79%, and 5.02%, respectively, by 2024. The 2019 median and average household income within a five-mile radius were estimated to be $113,643 and $160,871, respectively.
According to the appraisal, as of the third quarter of 2019, the Campbell office submarket consisted of approximately 2.6 million square feet of office space with an overall market vacancy of 20.3% and average asking rents of approximately $47.52 per square foot.
The appraisal identified eight office rent comparables located in the Greater Silicon Valley market. Comparable buildings were built between 2008 and 2020 and range in size from 162,557 square feet to 321,531 square feet. Direct asking rents at the comparable properties ranged between $39.12 and $57.00 per square foot (net leases) with an average of approximately $48.66 per square foot. The appraisal concluded a market rent at the 675 Creekside Way Property of $48.00 per square foot. The 675 Creekside Way Property’s in-place rent of $44.40 per square foot is approximately 7.5% below the concluded market rent.
| Historical and Current Occupancy | |||
| 2017(1) | 2018(1) | 2019(1) | Current(2) |
| N/A | N/A | N/A | 100.0% |
| (1) | Historical Occupancy is not available because the 675 Creekside Way Property was recently constructed and delivered to the tenant. |
| (2) | Current Occupancy is based on the underwritten rent roll as of June 6, 2020. |
| THE INFORMATION IN THIS STRUCTURAL AND COLLATERAL TERM SHEET IS NOT COMPLETE AND MAY BE AMENDED PRIOR TO THE TIME OF SALE. THIS TERM SHEET IS NOT AN OFFER TO SELL THESE SECURITIES AND IT IS NOT A SOLICITATION OF AN OFFER TO BUY THESE SECURITIES IN ANY JURISDICTION WHERE THE OFFER OR SALE IS NOT PERMITTED. | ||
| |
67 of 130 | |
| Structural and Collateral Term Sheet | JPMDB 2020-COR7 | |
| 675 Creekside Way | ||
| Tenant Summary(1) | |||||||
| Tenant | Ratings Moody’s/Fitch/S&P | Net Rentable Area (SF) | % of Total NRA | Base Rent PSF | % of Total Base Rent | Lease Expiration Date | |
| 8x8(2) | NR / NR / NR | 177,815 | 100.0% | $44.40 | 100.0% | 12/31/2030 | |
| Total Occupied | 177,815 | 100.0% | $44.40 | 100.0% | |||
| Vacant | 0 | 0.0 | |||||
| Total | 177,815 | 100.0% | |||||
| (1) | Based on the underwritten rent roll as of June 6, 2020. |
| (2) | 8x8 has a one-time option to terminate its lease effective on December 31, 2028 by providing no less than 12 months’ notice and delivering a termination fee equal to 12 months of base rent plus a percentage share of operating expenses payable through the 120th month of the lease term. 8x8 has two, five-year extension options at 100% of the fair market rent, with notice required to be given no earlier than 15 months and no later than 9 months prior to expiration of the initial lease term. |
Lease Rollover Schedule(1)(2) | |||||||||
| Year | Number of Leases Expiring | Net Rentable Area Expiring | % of NRA Expiring | Base Rent Expiring | % of Base Rent Expiring | Cumulative Net Rentable Area Expiring | Cumulative % of NRA Expiring | Cumulative Base Rent Expiring | Cumulative % of Base Rent Expiring |
| Vacant | NAP | 0 | 0.0% | NAP | NAP | 0 | 0.0% | NAP | NAP |
| MTM & 2020 | 0 | 0 | 0.0 | $0 | 0.0% | 0 | 0.0% | $0 | 0.0% |
| 2021 | 0 | 0 | 0.0 | 0 | 0.0 | 0 | 0.0% | $0 | 0.0% |
| 2022 | 0 | 0 | 0.0 | 0 | 0.0 | 0 | 0.0% | $0 | 0.0% |
| 2023 | 0 | 0 | 0.0 | 0 | 0.0 | 0 | 0.0% | $0 | 0.0% |
| 2024 | 0 | 0 | 0.0 | 0 | 0.0 | 0 | 0.0% | $0 | 0.0% |
| 2025 | 0 | 0 | 0.0 | 0 | 0.0 | 0 | 0.0% | $0 | 0.0% |
| 2026 | 0 | 0 | 0.0 | 0 | 0.0 | 0 | 0.0% | $0 | 0.0% |
| 2027 | 0 | 0 | 0.0 | 0 | 0.0 | 0 | 0.0% | $0 | 0.0% |
| 2028 | 0 | 0 | 0.0 | 0 | 0.0 | 0 | 0.0% | $0 | 0.0% |
| 2029 | 0 | 0 | 0.0 | 0 | 0.0 | 0 | 0.0% | $0 | 0.0% |
| 2030 | 1 | 177,815 | 100.0 | 7,894,986 | 100.0 | 177,815 | 100.0% | $7,894,986 | 100.0% |
| 2031 and Thereafter | 0 | 0 | 0.0 | 0 | 0.0 | 177,815 | 100.0% | $7,894,986 | 100.0% |
| Total | 1 | 177,815 | 100.0% | $7,894,986 | 100.0% | ||||
| (1) | Based on the underwritten rent roll as of June 6, 2020. |
| (2) | The tenant has a termination option (which may become exercisable prior to the originally stated expiration date of the tenant lease) that is not considered in the above Lease Rollover Schedule. |
| THE INFORMATION IN THIS STRUCTURAL AND COLLATERAL TERM SHEET IS NOT COMPLETE AND MAY BE AMENDED PRIOR TO THE TIME OF SALE. THIS TERM SHEET IS NOT AN OFFER TO SELL THESE SECURITIES AND IT IS NOT A SOLICITATION OF AN OFFER TO BUY THESE SECURITIES IN ANY JURISDICTION WHERE THE OFFER OR SALE IS NOT PERMITTED. | ||
| |
68 of 130 | |
| Structural and Collateral Term Sheet | JPMDB 2020-COR7 | |
| 675 Creekside Way | ||
| Underwritten Net Cash Flow(1) | |||
| Underwritten(2) | Underwritten PSF | %(3) | |
| Base Rent | $7,894,986 | $44.40 | 72.8% |
| Amortized Operating Expense Reimbursements(4) | 304,320 | $1.71 | 2.8 |
| Rent Steps(5) | 236,850 | $1.33 | 2.2 |
| Vacant Income | 0 | $0.00 | 0.0 |
| Gross Potential Rent | $8,436,156 | $47.44 | 77.8% |
| Total Reimbursements | 2,397,845 | $13.49 | 22.1 |
| Total Other Income | 8,419 | $0.05 | 0.1 |
| Net Rental Income | $10,842,420 | $60.98 | 100.0% |
| (Vacancy/Credit Loss) | (542,121) | ($3.05) | (5.0) |
| Effective Gross Income | $10,300,299 | $57.93 | 95.0% |
| Total Expenses | 2,397,845 | $13.49 | 23.3 |
| Net Operating Income | $7,902,454 | $44.44 | 76.7% |
| TI/LCs | 0 | $0.00 | 0.0 |
| Capital Expenditures | 35,563 | $0.20 | 0.3 |
| Net Cash Flow | $7,866,891 | $44.24 | 76.4% |
| (1) | Historical NOI is not available because the 675 Creekside Way Property was recently constructed and delivered to the tenant. |
| (2) | For the avoidance of doubt, no COVID-19 specific adjustments have been incorporated in the lender underwriting. |
| (3) | % column represents percent of Net Rental Income for all revenue lines and represents percent of Effective Gross Income for the remainder of the fields. |
| (4) | Amortized operating expenses commence in 2021 per the 8x8 lease, and are required to be reimbursed to the borrower by the tenant on an amortized basis over the remaining 10-years of the lease term. |
| (5) | Represents rent steps through December 31, 2021. |
Property Management.The 675 Creekside Way Property is managed by Avison Young – Washington, D.C., LLC, a third-party property manager.
Escrows and Reserves.At loan origination, the borrower deposited (i) approximately $8,527,538 into a free rent reserve and (ii) approximately $2,559,534 into an outstanding tenant improvement reserve. As of the May 2020 payment date, approximately $6,161,233 and $1,596,449 remained in the free rent and tenant improvement reserves, respectively.
Tax Reserve - The borrower is required to deposit into a real estate tax reserve, on a monthly basis, 1/12 of the estimated annual real estate taxes payable during the next 12 months (initially estimated at approximately $59,117).
Insurance Reserve – In the event that an acceptable blanket insurance policy is no longer in place, the borrower is required to deposit into an insurance reserve, on a monthly basis, 1/12 of estimated insurance premiums.
Replacement Reserve - The borrower is required to deposit into a replacement reserve, on a monthly basis, an amount equal to $2,964 for replacement reserves (approximately $0.20 per square foot annually), subject to a cap of $106,689 (approximately $0.60 per square foot).
TI/LC Reserve – Upon the Single Tenant Conditions no longer being satisfied, the borrower is required to deposit any Non-Lease Sweep Extraordinary Payments into the rollover account. “Non-Lease Sweep Extraordinary Payments” are defined as, other than lease sweep lease termination payments, all sums paid with respect to (A) a modification of any lease or otherwise paid in connection with the borrower taking any action under any lease or waiving any provision thereof, (B) any settlement of claims of the borrower against third parties in connection with any lease, (C) any rejection, termination, surrender or cancellation of any lease (including in any bankruptcy case) or any lease buy-out or surrender payment from any tenant (including any payment relating to unamortized tenant improvements and/or leasing commissions and/or application of any security deposit) (collectively, “Lease Termination Payments”), and (D) any sum received from any tenant to obtain a consent to an assignment or sublet or otherwise, or any holdover rents or use and occupancy fees from any tenant or former tenant (to the extent not being paid for use and occupancy or holdover rent).
| THE INFORMATION IN THIS STRUCTURAL AND COLLATERAL TERM SHEET IS NOT COMPLETE AND MAY BE AMENDED PRIOR TO THE TIME OF SALE. THIS TERM SHEET IS NOT AN OFFER TO SELL THESE SECURITIES AND IT IS NOT A SOLICITATION OF AN OFFER TO BUY THESE SECURITIES IN ANY JURISDICTION WHERE THE OFFER OR SALE IS NOT PERMITTED. | ||
| |
69 of 130 | |
| Structural and Collateral Term Sheet | JPMDB 2020-COR7 | |
| 675 Creekside Way | ||
Lockbox / Cash Management. The 675 Creekside Way Whole Loan is structured with a hard lockbox and springing cash management. All rents are required to be directly deposited into a clearing account maintained by the borrower. If no Trigger Period (as defined below) exists, the funds in the clearing account will be swept on a daily basis into the borrower’s operating account and, if a Trigger Period exists, such funds are required to be swept on a daily basis into a deposit account controlled by the lender. During a Trigger Period, funds in the deposit account are required to be applied and disbursed in accordance with the 675 Creekside Way Whole Loan documents. During a Trigger Period, all excess cash after payment of the monthly debt service on the 675 Creekside Way Whole Loan, all required reserves and budgeted operating expenses, and certain other items in the payment waterfall described in the 675 Creekside Way Whole Loan documents will be reserved as additional collateral for the 675 Creekside Way Whole Loan.
A “Trigger Period” means the occurrence and continuation of (i) an event of default, (ii) a Low DSCR Period (as defined below) or (iii) a Lease Sweep Period (as defined below).
A Trigger Period may be cured in accordance with the following conditions: with respect to a Trigger Period caused solely by (a) clause (i) above, the acceptance of a cure by the lender of the related event of default, (b) with respect to clause (ii) above, the debt service coverage ratio is at least 1.70x (based on interest only payments) for two consecutive calendar quarters and (c) with respect to clause (iii) above, the Lease Sweep Period is cured according to the terms highlighted below.
A “Low DSCR Period” will commence if (i) the Single Tenant Condition (as defined below) is not satisfied, (ii) if the debt service coverage ratio on the 675 Creekside Way Whole Loan, as of the last day of any calendar quarter, is less than 1.60x (based on interest only payments) and will end upon the debt service coverage ratio achieving 1.70x (based on interest only payments) for two consecutive calendar quarters.
A “Single Tenant Condition” means (i) the 8x8 lease is in full force and effect, (ii) no Lease Sweep Period is ongoing with respect to said lease and (iii) no event of default has occurred and is then continuing.
A “Lease Sweep Period” will commence (i) upon the earlier to occur of (a) 15 months prior to the expiration of a Lease Sweep Lease (as defined below) and (b) the date a Lease Sweep Tenant Party (as defined below) is required to give notice of its exercise of a renewal option, (ii) the date that a Lease Sweep Lease (or any material portion thereof) is surrendered, cancelled or terminated prior to its then current expiration date, (iii) the date that any tenant under a Lease Sweep Lease discontinues its business (i.e., “goes dark”) in more than 25% of its Lease Sweep Lease space, (iv) a material monetary or non-monetary default under a Lease Sweep Lease, (v) a Lease Sweep Tenant Party insolvency proceeding and (vi) the occurrence or continuance of a Low Lease Sweep Tenant Performance Period (as defined below);provided further that any Lease Sweep Period which is ongoing solely in connection with this clause will be suspended for so long as on each monthly payment date the amount of lease sweep funds on deposit in the lease sweep account (or the borrower has provided lender with a letter of credit in an amount that) equals or exceeds the Low Lease Sweep Tenant Performance Cap Amount (as defined below).
A Lease Sweep Period will end upon (a) with respect to clause (i), (ii) or (iii) above, the Lease Sweep Tenant Party exercises its renewal option or the entirety of the Lease Sweep Lease space is leased pursuant to one or more qualified leases and sufficient funds have been accumulated in the lease sweep account to cover related expenses; (b) with respect to clause (iv) above, the default has been cured and no other default occurs for three consecutive months following the cure; (c) with respect to clause (v) above, the insolvency proceeding has terminated; (d) with respect to clause (vi), a Low Lease Sweep Tenant Performance Period has been cured.
A “Lease Sweep Lease” means (i) the 8x8 lease or (ii) any replacement lease that, either individually, or when taken together with any other lease with the same tenant or its affiliates covers the majority of the applicable lease sweep space.
A “Lease Sweep Tenant Party” means any tenant under a Lease Sweep Lease or its direct or indirect parent company.
A “Low Lease Sweep Tenant Performance Period” will commence if: (i) any tenant financial reports show trailing 12 month gross revenue for the tenant pursuant to the 8x8 lease of less than $313,875,000 and (ii) end at such time as the quarterly tenant financial reports show for two consecutive quarters that the trailing 12 month gross revenue for the tenant pursuant to the 8x8 lease equals or exceeds $334,800,000. Further, in no event will a Low Lease Sweep Tenant Performance Period be deemed to be continuing at any time that (and for so long as) the tenant pursuant to the 8x8 lease either (A) has an investment grade rating, (B) has delivered a guaranty of the 8x8 lease, which such guaranty is from an affiliated guarantor that has an investment grade rating and covers all monetary obligations of the applicable tenant pursuant to the 8x8 lease, and/or (C) is continuing to satisfy the Low Lease Sweep Positive NOI Conditions (as defined below).
| THE INFORMATION IN THIS STRUCTURAL AND COLLATERAL TERM SHEET IS NOT COMPLETE AND MAY BE AMENDED PRIOR TO THE TIME OF SALE. THIS TERM SHEET IS NOT AN OFFER TO SELL THESE SECURITIES AND IT IS NOT A SOLICITATION OF AN OFFER TO BUY THESE SECURITIES IN ANY JURISDICTION WHERE THE OFFER OR SALE IS NOT PERMITTED. | ||
| |
70 of 130 | |
| Structural and Collateral Term Sheet | JPMDB 2020-COR7 | |
| 675 Creekside Way | ||
A “Low Lease Sweep Tenant Performance Cap Amount” means, with respect to a particular Low Lease Sweep Tenant Performance Period, an amount equal to (i) with respect to the period from the date of the occurrence of the applicable Low Lease Sweep Tenant Performance Period through (but excluding) the first anniversary of such occurrence, the aggregate total rentable square feet of the applicable Lease Sweep Lease(s)multiplied by$10.00, (ii) with respect to the period from the first anniversary of the occurrence of the applicable Low Lease Sweep Tenant Performance Period through (but excluding) the second anniversary of such occurrence, the aggregate total rentable square feet of the applicable Lease Sweep Lease(s)multiplied by$25.00, (iii) with respect to the period from the second anniversary of the occurrence of the applicable Low Lease Sweep Tenant Performance Period through (but excluding) the third anniversary of such occurrence, the aggregate total rentable square feet of the applicable Lease Sweep Lease(s)multiplied by$45.00, (iv) with respect to the period from the third anniversary of the occurrence of the applicable Low Lease Sweep Tenant Performance Period through (but excluding) the fourth anniversary of such occurrence, the aggregate total rentable square feet of the applicable Lease Sweep Lease(s)multiplied by$70.00, and (v) with respect to the period from the fourth anniversary of the occurrence of the applicable Low Lease Sweep Tenant Performance Period through (but excluding) the fifth anniversary of such occurrence, the aggregate total rentable square feet of the applicable Lease Sweep Lease(s)multiplied by$100.00.
The “Low Lease Sweep Positive NOI Conditions” will be deemed to be satisfied on any date of determination that (x) the tenant financial reports show trailing 12 month net operating income for the tenant pursuant to the 8x8 lease of greater than $0.00 for two consecutive quarters and (y) the tenant financial reports show trailing 12 month gross revenue for the tenant pursuant to the 8x8 lease of not less than $275,000,000 for the same two consecutive quarters.
Current Mezzanine or Subordinate Indebtedness.None.
Future Mezzanine or Subordinate Indebtedness Permitted.None.
Partial Release.None.
| THE INFORMATION IN THIS STRUCTURAL AND COLLATERAL TERM SHEET IS NOT COMPLETE AND MAY BE AMENDED PRIOR TO THE TIME OF SALE. THIS TERM SHEET IS NOT AN OFFER TO SELL THESE SECURITIES AND IT IS NOT A SOLICITATION OF AN OFFER TO BUY THESE SECURITIES IN ANY JURISDICTION WHERE THE OFFER OR SALE IS NOT PERMITTED. | ||
| |
71 of 130 | |
| Structural and Collateral Term Sheet | JPMDB 2020-COR7 | |
| Hampton Roads Office Portfolio | ||
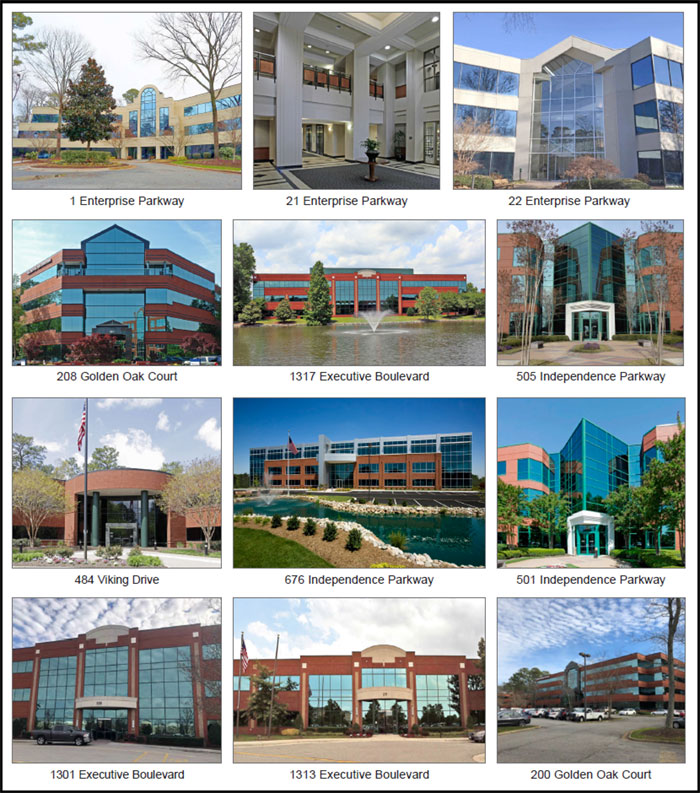
| THE INFORMATION IN THIS STRUCTURAL AND COLLATERAL TERM SHEET IS NOT COMPLETE AND MAY BE AMENDED PRIOR TO THE TIME OF SALE. THIS TERM SHEET IS NOT AN OFFER TO SELL THESE SECURITIES AND IT IS NOT A SOLICITATION OF AN OFFER TO BUY THESE SECURITIES IN ANY JURISDICTION WHERE THE OFFER OR SALE IS NOT PERMITTED. | ||
| |
72 of 130 | |
| Structural and Collateral Term Sheet | JPMDB 2020-COR7 | |
| Hampton Roads Office Portfolio | ||
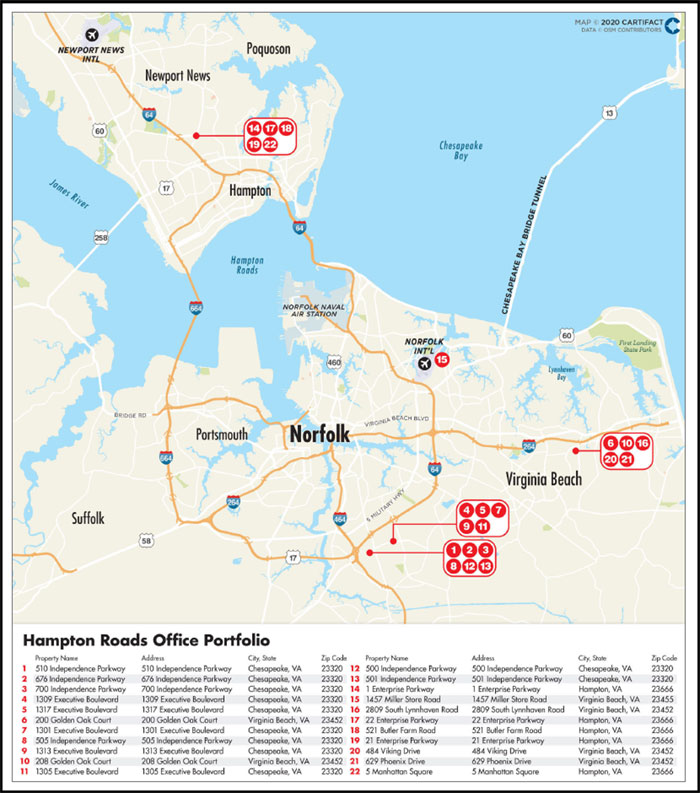
| THE INFORMATION IN THIS STRUCTURAL AND COLLATERAL TERM SHEET IS NOT COMPLETE AND MAY BE AMENDED PRIOR TO THE TIME OF SALE. THIS TERM SHEET IS NOT AN OFFER TO SELL THESE SECURITIES AND IT IS NOT A SOLICITATION OF AN OFFER TO BUY THESE SECURITIES IN ANY JURISDICTION WHERE THE OFFER OR SALE IS NOT PERMITTED. | ||
| |
73 of 130 | |
| Structural and Collateral Term Sheet | JPMDB 2020-COR7 | |
| Hampton Roads Office Portfolio | ||
| Mortgage Loan Information | Property Information | |||
| Mortgage Loan Seller: | LCM | Single Asset / Portfolio: | Portfolio | |
| Original Principal Balance(1): | $43,000,000 | Title: | Fee | |
| Cut-off Date Principal Balance(1): | $42,387,896 | Property Type - Subtype: | Office – Suburban | |
| % of Pool by IPB: | 4.7% | Net Rentable Area (SF): | 1,322,003 | |
| Loan Purpose: | Acquisition | Location: | Various, VA | |
| Borrowers(2): | Various | Year Built / Renovated: | Various / N/A | |
| Loan Sponsor: | Lawrence Heller | Occupancy: | 88.5% | |
| Interest Rate: | 5.30000% | Occupancy Date: | Various | |
| Note Date: | 3/28/2019 | Number of Tenants: | 138 | |
| Maturity Date: | 4/6/2029 | 2016 NOI: | $12,770,635 | |
| Interest-only Period: | None | 2017 NOI: | $13,066,165 | |
| Original Term: | 120 months | 2018 NOI: | $13,467,187 | |
| Original Amortization(3): | 360 months | TTM NOI (as of 3/2020)(4): | $13,811,489 | |
| Amortization Type(3): | Balloon | UW Economic Occupancy(5): | 86.4% | |
| Call Protection: | L(38),Grtr1%orYM(79),O(3) | UW Revenues: | $22,491,550 | |
| Lockbox / Cash Management: | Hard / In Place | UW Expenses: | $8,208,420 | |
| Additional Debt(1): | Yes | UW NOI(4)(5): | $14,283,130 | |
| Additional Debt Balance(1): | $88,718,851 / $19,715,300 | UW NCF(5): | $12,283,620 | |
| Additional Debt Type(1): | Pari Passu / Mezzanine Loan | Appraised Value / Per SF(5): | $185,200,000 / $140 | |
| Appraisal Date: | 1/7/2019 | |||
| Escrows and Reserves(6) | Financial Information(1)(5) | ||||||
| Initial | Monthly | Initial Cap | Whole Loan | Total Debt | |||
| Taxes: | $600,000 | $150,800 | N/A | Cut-off Date Loan / SF: | $99 | $114 | |
| Insurance: | $30,000 | $22,200 | N/A | Maturity Date Loan / SF: | $84 | $97 | |
| Replacement Reserves: | $250,000 | $33,050 | $4,000,000 | Cut-off Date LTV: | 70.8% | 81.4% | |
| TI/LC: | $1,500,000 | $168,555 | N/A | Maturity Date LTV: | 60.3% | 69.3% | |
| Other: | $1,311,289 | $0 | N/A | UW NCF DSCR: | 1.40x | 1.16x | |
| UW NOI Debt Yield: | 10.9% | 9.5% | |||||
| Sources and Uses | ||||||
| Sources | Proceeds | % of Total | Uses | Proceeds | % of Total | |
| Whole Loan(1) | $133,000,000 | 69.7% | Purchase Price | $183,000,000 | 95.9% | |
| Mezzanine Loan | 20,000,000 | 10.5 | Closing Costs | 4,206,061 | 2.2% | |
| Sponsor Equity | 37,897,350 | 19.9 | Upfront Reserves | 3,691,289 | 1.9% | |
| Total Sources | $190,897,350 | 100.0% | Total Uses | $190,897,350 | 100.0% | |
| (1) | The Hampton Roads Office Portfolio Loan (as defined below) is part of a whole loan evidenced by sixpari passu notes, with an aggregate outstanding principal balance as of the Cut-off Date of approximately $131.1 million. The Financial Information presented in the chart above reflects the Cut-off Date Balance of the approximately $131.1 million Hampton Roads Office Portfolio Whole Loan (as defined below). |
| (2) | The borrowers are Hampton Roads I Owner, LLC, Hampton Roads II Owner, LLC, Hampton Roads III Owner, LLC, Hampton Roads IV Owner, LLC, Hampton Roads V Owner, LLC, Hampton Roads VI Owner, LLC, Hampton Roads VII Owner, LLC, Hampton Roads VIII Owner, LLC, Hampton Roads IX Owner, LLC, Hampton Roads TRS Holding A, LLC, Hampton Roads TRS Holding B, LLC and Hampton Roads TRS Holding C, LLC. |
| (3) | The Hampton Roads Office Portfolio Whole Loan amortizes pursuant to a fixed amortization schedule as set forth in Annex I to the Preliminary Prospectus. Debt service coverage ratios are calculated using the sum of the first 12 principal and interest payments after the Cut-off Date based on the assumed principal and interest payment schedule set forth in Annex I to the Preliminary Prospectus. |
| (4) | The increase from TTM NOI to UW NOI is primarily attributable to approximately $507,663 of contractual rent steps through November 2020. |
| (5) | All NOI, NCF and occupancy information, as well as the appraised value, were determined prior to the emergence of the novel coronavirus pandemic, and the economic disruption resulting from measures to combat the pandemic, and all DSCR, LTV and Debt Yield metrics were calculated, and the Hampton Roads Office Whole Loan was underwritten, based on such prior information. See “Risk Factors—Risks Related to Market Conditions and Other External Factors—Coronavirus Pandemic Has Adversely Affected the Global Economy and Will Likely Adversely Affect the Performance of the Mortgage Loans” in the Preliminary Prospectus. |
| (6) | For a full description of Escrows and Reserves, please refer to“Escrows and Reserves”below. |
| THE INFORMATION IN THIS STRUCTURAL AND COLLATERAL TERM SHEET IS NOT COMPLETE AND MAY BE AMENDED PRIOR TO THE TIME OF SALE. THIS TERM SHEET IS NOT AN OFFER TO SELL THESE SECURITIES AND IT IS NOT A SOLICITATION OF AN OFFER TO BUY THESE SECURITIES IN ANY JURISDICTION WHERE THE OFFER OR SALE IS NOT PERMITTED. | ||
| |
74 of 130 | |
| Structural and Collateral Term Sheet | JPMDB 2020-COR7 | |
| Hampton Roads Office Portfolio | ||
The Loan.The Hampton Roads Office Portfolio mortgage loan, with a principal balance of approximately $42.4 million as of the Cut-off Date (the “Hampton Roads Office Portfolio Loan”), is secured by a first mortgage lien on the borrowers’ fee simple interest in 22 office properties comprised of 1,322,003 square feet of net rentable area (the “Hampton Roads Office Portfolio Properties” or the “Hampton Roads Office Portfolio”) located in Chesapeake, Hampton and Virginia Beach, Virginia. The Hampton Roads Office Portfolio Loan is part of a whole loan that has an aggregate outstanding principal balance as of the Cut-off Date of approximately $131.1 million (the “Hampton Roads Office Portfolio Whole Loan”) and is comprised of sixpari passu notes, each as described in the “Whole Loan Summary” chart below. The non-controlling Notes A-2 and A-6, with an aggregate outstanding principal balance as of the Cut-off Date of approximately $42.4 million, are being contributed to the JPMDB 2020-COR7 Trust. The controlling Notes A-1 and A-5, with an aggregate outstanding principal balance as of the Cut-off Date of approximately $49.3 million, were contributed to the JPMCC 2019-COR5 Trust. The non-controlling Notes A-3 and A-4, with an aggregate outstanding principal balance as of the Cut-off Date of approximately $39.4 million, were contributed to the JPMDB 2019-COR6 Trust. The relationship between the holders of the Hampton Roads Office Portfolio Whole Loan will be governed by a co-lender agreement as described under “Description of the Mortgage Pool—The Whole Loans—The Non-Serviced Pari Passu Whole Loans” in the Preliminary Prospectus. The Hampton Roads Office Portfolio Loan has a 10-year term and amortizes pursuant to a fixed amortization schedule as set forth in Annex I to the Preliminary Prospectus.The most recent prior financing of theHampton Roads Office PortfolioProperties was not included in a securitization.
| Whole Loan Summary | ||||
| Note | Original Balance | Cut-off Date Balance | Note Holder | Controlling Piece |
| A-1, A-5 | $50,000,000 | $49,288,251 | JPMCC 2019-COR5 | Yes |
| A-3, A-4 | 40,000,000 | 39,430,601 | JPMDB 2019-COR6 | No |
| A-2, A-6 | 43,000,000 | 42,387,896 | JPMDB 2020-COR7 | No |
| Total | $133,000,000 | $131,106,747 | ||
The Borrowers. The borrowing entities are Hampton Roads I Owner, LLC, Hampton Roads II Owner, LLC, Hampton Roads III Owner, LLC, Hampton Roads IV Owner, LLC, Hampton Roads V Owner, LLC, Hampton Roads VI Owner, LLC, Hampton Roads VII Owner, LLC, Hampton Roads VIII Owner, LLC, Hampton Roads IX Owner, LLC, Hampton Roads TRS Holding A, LLC, Hampton Roads TRS Holding B, LLC and Hampton Roads TRS Holding C, LLC, each a Delaware limited liability company and special purpose entity structured to be bankruptcy remote with two independent directors. Legal counsel to the borrowers delivered a non-consolidation opinion in connection with the origination of the Hampton Roads Portfolio Whole Loan.
The Loan Sponsor.The loan sponsor and nonrecourse carve-out guarantor is Lawrence Heller. Mr. Heller is the managing member of Acme Equities LLC, a private holding company that invests in the real estate, oil and gas, power, hotel and high yield markets. Mr. Heller has over 30 years of experience in the development and execution of deals involving real estate acquisitions, distressed oil and gas assets, real estate workouts, and high yield debt trading and has actively managed a portfolio of family real estate holdings comprised of over 175 properties throughout the United States. In addition, Mr. Heller has invested over $5.0 billion of capital over the past decade.
The Properties.The Hampton Roads Office Portfolio Properties are comprised of 22 office properties totaling 1,322,003 square feet situated throughout Virginia in Chesapeake (11 properties, 54.3% of net rentable area; 65.7% of underwritten net operating income), Virginia Beach (six properties, 25.0% of net rentable area; 21.1% of underwritten net operating income) and Hampton (five properties, 20.7% of net rentable area; 13.1% of underwritten net operating income). The Hampton Roads Office Portfolio Properties are leased by a granular and diverse roster of publicly-traded and national and international firms, regional companies, and local businesses. The tenant base represents a broad range of industries including law, financial services, healthcare, military, logistics, technology, consumer goods, communications, insurance, and real estate and offers limited exposure, as no single tenant occupies more than 3.8% of net rentable area. Additionally, the Hampton Roads Office Portfolio has exhibited an average 10-year historical occupancy since 2009 equal to 88.8%. As of the March 31, 2020 underwritten rent rolls, the Hampton Roads Office Portfolio Properties were 88.5% leased to 138 tenants over 154 leases at a weighted average underwritten base rent equal to $15.49 per square foot.
| THE INFORMATION IN THIS STRUCTURAL AND COLLATERAL TERM SHEET IS NOT COMPLETE AND MAY BE AMENDED PRIOR TO THE TIME OF SALE. THIS TERM SHEET IS NOT AN OFFER TO SELL THESE SECURITIES AND IT IS NOT A SOLICITATION OF AN OFFER TO BUY THESE SECURITIES IN ANY JURISDICTION WHERE THE OFFER OR SALE IS NOT PERMITTED. | ||
| |
75 of 130 | |
| Structural and Collateral Term Sheet | JPMDB 2020-COR7 | |
| Hampton Roads Office Portfolio | ||
| Portfolio Summary | ||||||||
| Property Name | City | Year Built | Total SF | % of Total | Occupancy(1) | UW NOI | Allocated Whole Loan Original Balance | Appraised Value |
| 510 Independence Parkway | Chesapeake | 1999 | 97,081 | 7.3% | 89.4% | $1,177,063 | $11,030,000 | $14,100,000 |
| 676 Independence Parkway | Chesapeake | 2008 | 73,345 | 5.5% | 100.0% | 1,168,144 | 11,010,000 | 11,200,000 |
| 700 Independence Parkway | Chesapeake | 2001 | 96,807 | 7.3% | 100.0% | 1,091,349 | 9,050,000 | 13,400,000 |
| 1309 Executive Boulevard | Chesapeake | 2001 | 49,870 | 3.8% | 100.0% | 793,477 | 7,770,000 | 8,500,000 |
| 1317 Executive Boulevard | Chesapeake | 2007 | 73,583 | 5.6% | 100.0% | 1,123,742 | 7,560,000 | 12,400,000 |
| 200 Golden Oak Court | Virginia Beach | 1988 | 74,290 | 5.6% | 84.1% | 804,828 | 7,260,000 | 10,900,000 |
| 1301 Executive Boulevard | Chesapeake | 2006 | 50,020 | 3.8% | 100.0% | 728,185 | 7,070,000 | 8,100,000 |
| 505 Independence Parkway | Chesapeake | 2000 | 63,568 | 4.8% | 97.2% | 769,826 | 7,010,000 | 8,500,000 |
| 1313 Executive Boulevard | Chesapeake | 2002 | 49,870 | 3.8% | 100.0% | 667,712 | 6,360,000 | 8,500,000 |
| 208 Golden Oak Court | Virginia Beach | 1989 | 63,825 | 4.8% | 94.6% | 715,592 | 6,310,000 | 9,000,000 |
| 1305 Executive Boulevard | Chesapeake | 2002 | 49,865 | 3.8% | 81.2% | 470,235 | 6,090,000 | 7,100,000 |
| 500 Independence Parkway | Chesapeake | 2001 | 51,000 | 3.9% | 100.0% | 654,058 | 6,000,000 | 7,400,000 |
| 501 Independence Parkway | Chesapeake | 2000 | 63,474 | 4.8% | 90.1% | 743,090 | 5,880,000 | 8,000,000 |
| 1 Enterprise Parkway | Hampton | 1987 | 63,029 | 4.8% | 65.2% | 360,625 | 5,450,000 | 7,700,000 |
| 1457 Miller Store Road | Virginia Beach | 1988 | 65,192 | 4.9% | 100.0% | 521,930 | 5,060,000 | 6,100,000 |
| 2809 South Lynnhaven Road | Virginia Beach | 1987 | 62,924 | 4.8% | 74.9% | 572,631 | 4,360,000 | 9,500,000 |
| 22 Enterprise Parkway | Hampton | 1990 | 72,444 | 5.5% | 76.2% | 571,304 | 4,140,000 | 8,900,000 |
| 521 Butler Farm Road | Hampton | 1989 | 44,651 | 3.4% | 100.0% | 427,505 | 4,080,000 | 6,300,000 |
| 21 Enterprise Parkway | Hampton | 1998 | 75,915 | 5.7% | 59.0% | 376,638 | 3,820,000 | 9,100,000 |
| 484 Viking Drive | Virginia Beach | 1987 | 39,633 | 3.0% | 43.3% | 133,955 | 3,780,000 | 5,400,000 |
| 629 Phoenix Drive | Virginia Beach | 1996 | 24,549 | 1.9% | 100.0% | 270,336 | 2,640,000 | 2,900,000 |
| 5 Manhattan Square | Hampton | 1999 | 17,068 | 1.3% | 100.0% | 140,904 | 1,270,000 | 2,200,000 |
| Total / Wtd. Avg. | 1,322,003 | 100.0% | 88.5% | $14,283,130 | $133,000,000 | $185,200,000 | ||
| (1) | Based on the underwritten rent rolls dated as of March 31, 2020. |
The largest tenant at the Hampton Roads Office Portfolio is Cegedim Dendrite (“Cegedim”) (49,870 square feet; 3.8% of net rentable area; 4.7% of underwritten base rent). Founded in 1969, Cegedim is a global technology and services company that supplies services, technological tools, specialized software, data flow management services and databases. Cegedim’s offerings are targeted notably at healthcare professionals, healthcare industries, life science companies, and health insurance companies. Cegedim employs more than 4,500 people in more than 10 countries. Cegedim fully occupies the 1309 Executive Boulevard property located in Chesapeake, Virginia, where it originally took occupancy in 2001 and is on a lease initially expiring in December 2020. Cegedim currently pays base rent equal to $17.05 per square foot, has no termination options and has two, five-year renewal options remaining.
The second largest tenant at the Hampton Roads Office Portfolio is Sutherland Global Services Inc. (“Sutherland”) (49,870 square feet; 3.8% of net rentable area; 3.9% of underwritten base rent). Found in 1986, Sutherland is a business process outsourcing and technology-enabled services company that provides an integrated set of back-office and customer facing front-office services that support the entire customer lifecycle. Sutherland offers digital, customer engagement, and business process transformation services. Sutherland serves clients in banking and financial services, healthcare, technology, media and communications, retail, insurance, travel and hospitality, government industries in the United States and internationally.Sutherland fully occupies the 1313 Executive Boulevard property located in Chesapeake, Virginia, where it originally took occupancy in 2012 and is on a lease initially expiring in September 2024. Sutherland currently pays base rent equal to $14.10 per square foot, has no termination options and one, five-year renewal option remaining.
The third largest tenant at the Hampton Roads Office Portfolio is General Dynamics Info (“General Dynamics”) (46,745 square feet; 3.5% of net rentable area; 3.1% of underwritten base rent; rated A2/NR/A+ by Moody’s/Fitch/S&P). General Dynamics is an American aerospace and defense multinational corporation. General Dynamics ranked No. 92 in the 2019 Fortune 500 list of the largest United States corporations by total revenue. General Dynamics occupies 46,745 square feet at the 700 Independence Parkway property located in Chesapeake, Virginia, where it originally took occupancy in 2017and is on a lease initially expiring in January 2022. General Dynamics currently pays base rent equal to $12.02 per square foot, has no termination options and one, five-year renewal option remaining.
| THE INFORMATION IN THIS STRUCTURAL AND COLLATERAL TERM SHEET IS NOT COMPLETE AND MAY BE AMENDED PRIOR TO THE TIME OF SALE. THIS TERM SHEET IS NOT AN OFFER TO SELL THESE SECURITIES AND IT IS NOT A SOLICITATION OF AN OFFER TO BUY THESE SECURITIES IN ANY JURISDICTION WHERE THE OFFER OR SALE IS NOT PERMITTED. | ||
| |
76 of 130 | |
| Structural and Collateral Term Sheet | JPMDB 2020-COR7 | |
| Hampton Roads Office Portfolio | ||
COVID-19 Update.As of June 1, 2020, the Hampton Roads Office Portfolio Properties are closed; however, most, if not all, office tenants are working remotely. As of the March 31, 2020 underwritten rent rolls, the Hampton Roads Office Portfolio Properties remained 88.5% occupied. For April and May of 2020, tenants representing approximately 97.6% and 90.1% of net rentable area, respectively, have paid rent in-full, with the loan sponsor having collected approximately 96.4% and 87.6% of the underwritten base rent, respectively. The Hampton Roads Office Portfolio Whole Loan is current through the June 6, 2020 payment date. As of June 1, 2020, the Hampton Roads Office Portfolio Loan is not subject to any modification or forbearance request.
The Market.The Hampton Roads Office Portfolio Properties are located across four individual submarkets within the Hampton Roads office market in Southeastern Virginia: Battlefield in Chesapeake (six properties; 33.7% of net rentable area; 39.2% of underwritten net operating income), Lynnhaven in Virginia Beach (six properties; 25.0% of net rentable area; 21.1% of underwritten net operating income), Greenbrier in Chesapeake (five properties; 20.7% of net rentable area; 26.5% of underwritten net operating income) and Hampton Roads Center in Hampton (five properties; 20.7% of net rentable area; 13.1% of underwritten net operating income). The majority of the Hampton Roads Office Portfolio Properties within each submarket are in close proximity to one another and are located within individual business parks.
According to a market report, as of May 28, 2020, the Battlefield office submarket contained approximately 1.3 million square feet with an overall market vacancy of 1.9% and average asking rents of approximately $20.04 per square foot. The Lynnhaven office submarket contained approximately 1.9 million square feet with an overall market vacancy of 8.1% and average asking rents of approximately $19.21 per square foot. The Greenbrier office submarket contained approximately 3.6 million square feet with an overall market vacancy of 3.9% and average asking rents of approximately $21.00 per square foot. The Hampton Roads Center office submarket contained approximately 1.2 million square feet with an overall market vacancy of 25.3% and average asking rents of approximately $17.95 per square foot. Based on the square footage of the Hampton Roads Office Portfolio Properties, the weighted average vacancy and average asking rents as of May 28, 2020 were equal to 8.7% and $19.60 per square foot, respectively.
| Historical and Current Occupancy(1) | ||||||||||
| 2009 | 2010 | 2011 | 2012 | 2013 | 2014 | 2015 | 2016 | 2017 | 2018 | Current(2) |
| 87.7% | 89.2% | 86.9% | 88.5% | 89.2% | 89.2% | 87.9% | 87.3% | 92.0% | 90.5% | 88.5% |
| (1) | Historical Occupancies are as of December 31 of eachrespective year. |
| (2) | Current Occupancy is as of the underwritten rent rolls dated March 31, 2020. |
| Tenant Summary(1) | ||||||
| Tenant | Ratings Moody’s/Fitch/S&P(2) | Net Rentable Area (SF) | % of Total NRA | Base Rent PSF(3) | % of Total Base Rent(3) | Lease Expiration Date |
| Cegedim Dendrite(4) | NR / NR / NR | 49,870 | 3.8% | $17.05 | 4.7% | 12/31/2020 |
| Sutherland Global Services Inc.(4) | NR / NR / NR | 49,870 | 3.8 | $14.10 | 3.9 | 9/30/2024 |
| General Dynamics Info(4) | A2 / NR / A | 46,745 | 3.5 | $12.02 | 3.1 | 1/31/2022 |
| Ferguson Enterprises, Inc. | NR / NR / NR | 44,651 | 3.4 | $10.24 | 2.5 | 3/31/2021 |
| Children's Hospital of The King's Daughters, Inc.(4)(5) | NR / NR / NR | 38,213 | 2.9 | $12.94 | 2.7 | 5/31/2026 |
| Antech Systems(6) | NR / NR / NR | 33,413 | 2.5 | $19.36 | 3.6 | Various(6) |
| Ultralife Corporation | NR / NR / NR | 32,522 | 2.5 | $9.26 | 1.7 | 4/30/2021 |
| Schenker, Inc.(4)(7) | NR / NR / NR | 31,709 | 2.4 | $12.30 | 2.1 | Various(7) |
| Science Systems and Applications Inc.(8) | NR / NR / NR | 30,755 | 2.3 | $11.54 | 2.0 | 5/31/2021 |
| United States Coast Guard Community Services | Aaa / AAA / AA+ | 27,498 | 2.1 | $15.23 | 2.3 | 1/31/2027 |
| Top 10 Total / Wtd. Avg. | 385,246 | 29.1% | $13.44 | 28.6% | ||
| Other Tenants | 785,175 | 59.4 | $16.49 | 71.4 | ||
| Total Occupied Space | 1,170,421 | 88.5% | $15.49 | 100.0% | ||
| Vacant | 151,582 | 11.5 | ||||
| Total | 1,322,003 | 100.0% | ||||
| (1) | Based on the underwritten rent rolls dated as of March 31, 2020. |
| (2) | In certain instances, ratings provided are those of the parent company of the entity shown, whether or not the parent company guarantees the lease. |
| (3) | Base Rent PSF includes approximately $507,663 in contractual rent steps through November 2020 for certain tenants. |
| (4) | Cegedim Dendrite has two, five-year renewal options remaining, Sutherland Global Services Inc. has one, five-year renewal options remaining, General Dynamics Info has one, five-year renewal option remaining, Children's Hospital of The King's Daughters, Inc. has one, five-year renewal option remaining and Schenker, Inc. has two, five-year renewal options remaining. |
| (5) | Children's Hospital of The King's Daughters, Inc. has the right to terminate its lease at any time after May 31, 2023 by providing at least 12 months’ notice. |
| (6) | Antech Systems leases 5,028 square feet through May 2021, 4,804 square feet through May 2022 and 23,581 square feet through May 2023. |
| (7) | Schenker, Inc. leases 26,283 square feet through January 2021 and 5,426 square feet through June 2022. |
| (8) | Science Systems and Applications Inc. has the right to terminate its lease at any time by providing at least six months’ notice and payment of a termination fee. |
| THE INFORMATION IN THIS STRUCTURAL AND COLLATERAL TERM SHEET IS NOT COMPLETE AND MAY BE AMENDED PRIOR TO THE TIME OF SALE. THIS TERM SHEET IS NOT AN OFFER TO SELL THESE SECURITIES AND IT IS NOT A SOLICITATION OF AN OFFER TO BUY THESE SECURITIES IN ANY JURISDICTION WHERE THE OFFER OR SALE IS NOT PERMITTED. | ||
| |
77 of 130 | |
| Structural and Collateral Term Sheet | JPMDB 2020-COR7 | |
| Hampton Roads Office Portfolio | ||
| Lease Rollover Schedule(1)(2) | |||||||||
| Year | Number of Leases Expiring | Net Rentable Area Expiring | % of NRA Expiring | Base Rent Expiring(3) | % of Base Rent Expiring(3) | Cumulative Net Rentable Area Expiring | Cumulative % of NRA Expiring | Cumulative Base Rent Expiring(3) | Cumulative % of Base Rent Expiring(3) |
| Vacant | NAP | 151,582 | 11.5% | NAP | NAP | 151,582 | 11.5% | NAP | NAP |
| 2020 & MTM | 38 | 246,001 | 18.6% | $3,638,979 | 20.1% | 397,583 | 30.1% | $3,638,979 | 20.1% |
| 2021 | 37 | 340,900 | 25.8% | 4,894,521 | 27.0% | 738,483 | 55.9% | $8,533,499 | 47.1% |
| 2022 | 26 | 170,041 | 12.9% | 2,779,998 | 15.3% | 908,524 | 68.7% | $11,313,497 | 62.4% |
| 2023 | 21 | 133,321 | 10.1% | 2,445,071 | 13.5% | 1,041,845 | 78.8% | $13,758,569 | 75.9% |
| 2024 | 15 | 139,422 | 10.5% | 2,305,645 | 12.7% | 1,181,267 | 89.4% | $16,064,214 | 88.6% |
| 2025 | 6 | 38,327 | 2.9% | 583,550 | 3.2% | 1,219,594 | 92.3% | $16,647,764 | 91.8% |
| 2026 | 1 | 38,213 | 2.9% | 494,604 | 2.7% | 1,257,807 | 95.1% | $17,142,368 | 94.6% |
| 2027 | 2 | 29,796 | 2.3% | 450,062 | 2.5% | 1,287,603 | 97.4% | $17,592,430 | 97.0% |
| 2028 | 0 | 0 | 0.0% | 0 | 0.0% | 1,287,603 | 97.4% | $17,592,430 | 97.0% |
| 2029 | 0 | 0 | 0.0% | 0 | 0.0% | 1,287,603 | 97.4% | $17,592,430 | 97.0% |
| 2030 | 1 | 25,625 | 1.9% | 537,263 | 3.0% | 1,313,228 | 99.3% | $18,129,693 | 100.0% |
| 2031 & Beyond | 7 | 8,775 | 0.7% | 0 | 0.0% | 1,322,003 | 100.0% | $18,129,693 | 100.0% |
| Total | 154 | 1,322,003 | 100.0% | $18,129,693 | 100.0% | ||||
| (1) | Based on the underwritten rent rolls dated March 31, 2020. |
| (2) | Certain tenants have lease termination options that may become exercisable prior to the originally stated expiration date of the tenant lease and that are not considered in the lease rollover schedule. |
| (3) | Base Rent Expiring, % of Base Rent Expiring, Cumulative Base Rent Expiring and Cumulative % of Base Rent Expiring include approximately $507,663 in contractual rent steps through November 2020 for certain tenants. |
| Operating History and Underwritten Net Cash Flow | |||||||
| 2016 | 2017 | 2018 | TTM(1) | Underwritten(2) | Per Square Foot | %(3) | |
| Rents in Place | $14,197,324 | $15,261,475 | $16,317,558 | $17,218,968 | $17,622,030 | $13.33 | 67.7% |
| Contractual Rent Steps(4) | 0 | 0 | 0 | 0 | 507,663 | 0.38 | 2.0% |
| Vacant Income | 0 | 0 | 0 | 0 | 2,936,081 | 2.22 | 11.3% |
| Gross Potential Rent | $14,197,324 | $15,261,475 | $16,317,558 | $17,218,968 | $21,065,775 | $15.93 | 80.9% |
| Total Reimbursements | 6,233,629 | 5,649,360 | 5,536,333 | 4,603,385 | 4,763,361 | 3.60 | 18.3% |
| Total Other Income | 165,751 | 176,645 | 170,993 | 164,936 | 194,268 | 0.15 | 0.7% |
| Net Rental Income | $20,596,704 | $21,087,480 | $22,024,884 | $21,987,290 | $26,023,404 | $19.68 | 100.0% |
| (Vacancy/Credit Loss) | 0 | 0 | 0 | 0 | (3,531,853) | (2.67) | (13.6)% |
| Effective Gross Income | $20,596,704 | $21,087,480 | $22,024,884 | $21,987,290 | $22,491,550 | $17.01 | 86.4% |
| Total Expenses | $7,826,069 | $8,021,316 | $8,557,697 | $8,175,801 | $8,208,420 | $6.21 | 36.5% |
| Net Operating Income(5) | $12,770,635 | $13,066,165 | $13,467,187 | $13,811,489 | $14,283,130 | $10.80 | 63.5% |
| Total TI/LC, CapEx/RR | 0 | 0 | 0 | 0 | 1,999,510 | 1.51 | 8.9% |
| Net Cash Flow | $12,770,635 | $13,066,165 | $13,467,187 | $13,811,489 | $12,283,620 | $9.29 | 54.6% |
| (1) | TTM column represents the trailing 12-month period ending March 31, 2020. |
| (2) | For the avoidance of doubt, no COVID-19 specific adjustments have been incorporated in the lender underwriting. |
| (3) | % column represents percent of Net Rental Income for all revenue lines and represents percent of Effective Gross Income for the remainder of the fields. |
| (4) | Based on the contractual rent steps through November 2020 for certain tenants. |
| (5) | The increase from TTM Net Operating Income to Underwritten Net Operating Income is primarily attributable to approximately $507,663 of contractual rent steps through November 2020. |
Property Management.The Hampton Roads Office Portfolio Properties are managed by LingComm, LLC, a third-party management company.
Escrows and Reserves. At origination, the borrowers deposited into escrow $1,500,000 for anticipated tenant improvements and leasing commissions, approximately $1,001,936 for outstanding tenant improvements and leasing commissions, $600,000 for real estate taxes, $250,000 for replacement reserves, $223,102 for required repairs, approximately $86,251 for outstanding free rent and $30,000 for insurance premiums.
Tax Escrows– On a monthly basis,the borrowers are required to escrow 1/12 of the annual estimated tax payments, which currently equates to $150,800.
| THE INFORMATION IN THIS STRUCTURAL AND COLLATERAL TERM SHEET IS NOT COMPLETE AND MAY BE AMENDED PRIOR TO THE TIME OF SALE. THIS TERM SHEET IS NOT AN OFFER TO SELL THESE SECURITIES AND IT IS NOT A SOLICITATION OF AN OFFER TO BUY THESE SECURITIES IN ANY JURISDICTION WHERE THE OFFER OR SALE IS NOT PERMITTED. | ||
| |
78 of 130 | |
| Structural and Collateral Term Sheet | JPMDB 2020-COR7 | |
| Hampton Roads Office Portfolio | ||
Insurance Escrows– On a monthly basis,the borrowers are required to escrow 1/12 of the annual estimated insurance premiums, which currently equates to $22,200.
Replacement Reserves –On a monthly basis, the borrowers are required to escrow $33,050 for replacement reserves, subject to a cap of $4,000,000.
TI/LC Reserves – On a monthly basis, the borrowers are required to escrow $168,555 for tenant improvements and leasing commissions.
Lockbox / Cash Management.The Hampton Roads Office Portfolio Whole Loan is structured with a hard lockbox and in place cash management. All rents are required to be deposited directly by the tenants into a lockbox account controlled by the lender. All funds in the lockbox account are required to be swept to a lender-controlled cash management account every business day and applied on each payment date to the payment of debt service and the funding of required reserves. Provided no Cash Trap Period (as defined below) is continuing, all funds remaining in the cash management account after payment of the aforementioned items will be transferred into the borrowers’ operating account. During a Cash Trap Period, all excess cash in the cash management account will be retained by the lender as additional collateral for the Hampton Roads Office Portfolio Whole Loan.
A “Cash Trap Period” will commence (i) upon an event of default (including an event of default under the mezzanine loan) (until the payment date following the cure of such event of default), (ii) from and after October 6, 2019, if the debt service coverage ratio is less than 1.10x for any calendar quarter (including the mezzanine loan) (until such time that the debt service coverage ratio is greater than or equal to 1.10x for two consecutive quarters) or (iii) upon 60 days after the death or incapacity of the loan sponsor.
Current Mezzanine or Subordinate Indebtedness. A mezzanine loan was funded concurrently and is coterminous with the Hampton Roads Office Portfolio Whole Loan. The mezzanine loan has an original principal balance of $20.0 million, accrues interest at a rate of 7.97750%per annum, and amortizes pursuant to a fixed amortization schedule. Including the mezzanine loan, the cumulative Cut-off Date LTV, cumulative UW NCF DSCR and cumulative UW NOI DY are 81.4%, 1.16x and 9.5%, respectively. The mezzanine loan is currently held by LCM or an affiliate.
Release Parcels. The Hampton Roads Office Portfolio Whole Loan provides for the release of two unimproved outparcel tracts consisting of approximately 0.814 acres and 0.998 acres, respectively,provided that, among other things, (i) the borrowers deposit $200,000 per release into the replacement reserve account and (ii) the release is in compliance with the REMIC conditions.
Partial Release. Commencing on the date that is the earlier to occur of (x) two years after the securitization closing date of the lastpari passu note to be securitized and (y) October 6, 2022, the borrowers may obtain the release of any of the Hampton Roads Office Portfolio Properties,provided that, among other conditions, (i) the borrowers prepay a portion of the Hampton Roads Office Portfolio Whole Loan equal to the greater of (a) 115.0% of the allocated loan amount of the Hampton Roads Office Portfolio Property being released and (b) 100.0% of net sales proceeds multiplied by the fraction obtained by dividing the then outstanding principal balance of the Hampton Roads Office Portfolio Whole Loan by the sum of the outstanding principal balances of the Hampton Roads Office Portfolio Whole Loan and the related mezzanine loan, in each case, together with the applicable yield maintenance premium, (ii) the debt yield (as calculated in accordance with the Hampton Roads Office Portfolio Whole Loan documents) for the remaining Hampton Roads Office Portfolio Properties following the release is not less than the greater of (a) the debt yield immediately preceding such release and (b) 8.3%, and (iii) the release complies with customary REMIC requirements.
| THE INFORMATION IN THIS STRUCTURAL AND COLLATERAL TERM SHEET IS NOT COMPLETE AND MAY BE AMENDED PRIOR TO THE TIME OF SALE. THIS TERM SHEET IS NOT AN OFFER TO SELL THESE SECURITIES AND IT IS NOT A SOLICITATION OF AN OFFER TO BUY THESE SECURITIES IN ANY JURISDICTION WHERE THE OFFER OR SALE IS NOT PERMITTED. | ||
| |
79 of 130 | |
| Structural and Collateral Term Sheet | JPMDB 2020-COR7 | |
| 711 Fifth Avenue | ||
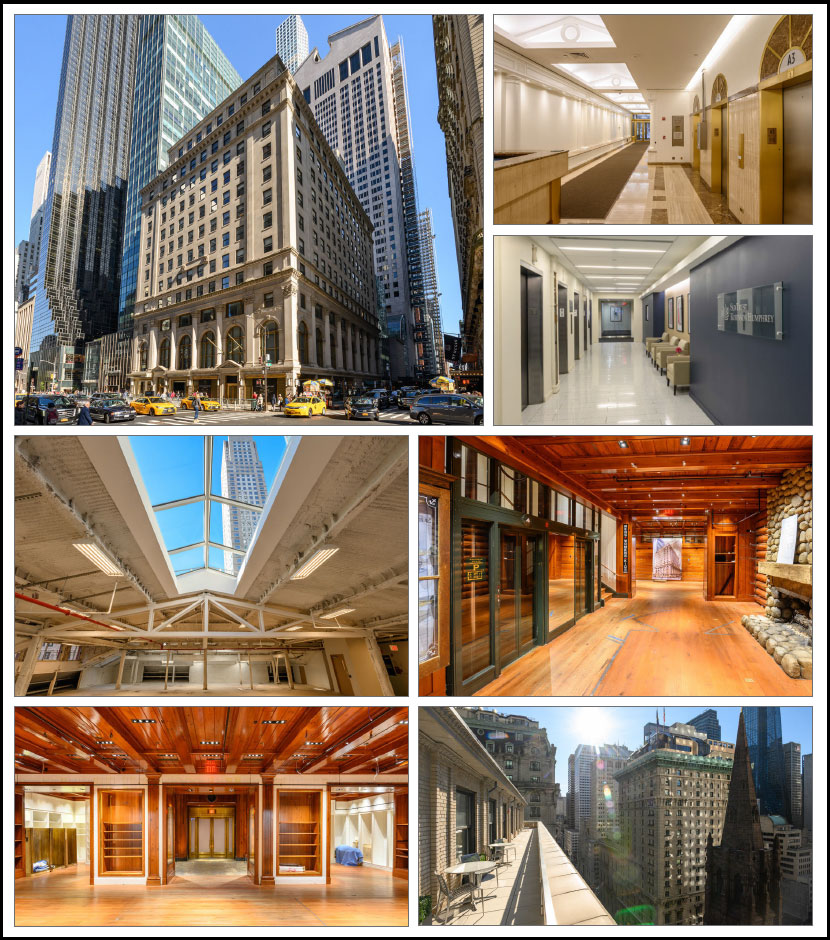
| THE INFORMATION IN THIS STRUCTURAL AND COLLATERAL TERM SHEET IS NOT COMPLETE AND MAY BE AMENDED PRIOR TO THE TIME OF SALE. THIS TERM SHEET IS NOT AN OFFER TO SELL THESE SECURITIES AND IT IS NOT A SOLICITATION OF AN OFFER TO BUY THESE SECURITIES IN ANY JURISDICTION WHERE THE OFFER OR SALE IS NOT PERMITTED. | ||
| |
80 of 130 | |
| Structural and Collateral Term Sheet | JPMDB 2020-COR7 | |
| 711 Fifth Avenue | ||

| THE INFORMATION IN THIS STRUCTURAL AND COLLATERAL TERM SHEET IS NOT COMPLETE AND MAY BE AMENDED PRIOR TO THE TIME OF SALE. THIS TERM SHEET IS NOT AN OFFER TO SELL THESE SECURITIES AND IT IS NOT A SOLICITATION OF AN OFFER TO BUY THESE SECURITIES IN ANY JURISDICTION WHERE THE OFFER OR SALE IS NOT PERMITTED. | ||
| |
81 of 130 | |
| Structural and Collateral Term Sheet | JPMDB 2020-COR7 | |
| 711 Fifth Avenue | ||
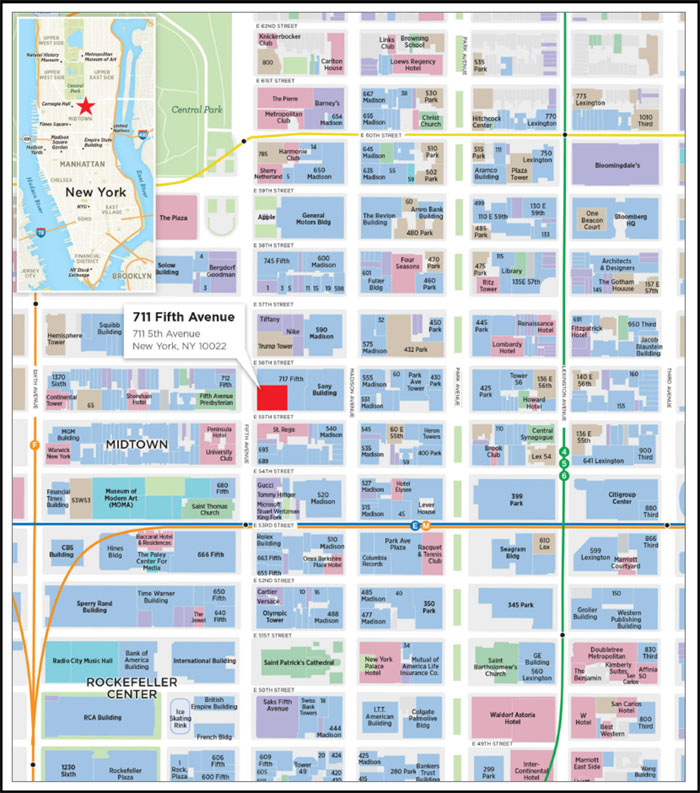
| THE INFORMATION IN THIS STRUCTURAL AND COLLATERAL TERM SHEET IS NOT COMPLETE AND MAY BE AMENDED PRIOR TO THE TIME OF SALE. THIS TERM SHEET IS NOT AN OFFER TO SELL THESE SECURITIES AND IT IS NOT A SOLICITATION OF AN OFFER TO BUY THESE SECURITIES IN ANY JURISDICTION WHERE THE OFFER OR SALE IS NOT PERMITTED. | ||
| |
82 of 130 | |
| Structural and Collateral Term Sheet | JPMDB 2020-COR7 | |
| 711 Fifth Avenue | ||
| Mortgage Loan Information | Property Information | |||
| Mortgage Loan Seller: | GSMC | Single Asset / Portfolio: | Single Asset | |
| Original Principal Balance(1): | $40,000,000 | Title: | Fee | |
| Cut-off Date Principal Balance(1): | $40,000,000 | Property Type - Subtype: | Mixed Use – Office/Retail | |
| % of Pool by IPB: | 4.4% | Net Rentable Area (SF): | 340,024 | |
| Loan Purpose: | Refinance | Location: | New York, NY | |
| Borrower: | 711 Fifth Ave Principal Owner LLC | Year Built / Renovated: | 1927 / 2013-2019 | |
| Loan Sponsors(2): | Various | Occupancy: | 76.5% | |
| Interest Rate: | 3.16000% | Occupancy Date: | 1/31/2020 | |
| Note Date: | 3/6/2020 | Number of Tenants: | 7 | |
| Maturity Date: | 3/6/2030 | 2016 NOI: | $37,888,406 | |
| Interest-only Period: | 120 months | 2017 NOI: | $45,365,518 | |
| Original Term: | 120 months | 2018 NOI: | $44,088,566 | |
| Original Amortization: | None | 2019 NOI: | $48,596,349 | |
| Amortization Type: | Interest Only | UW Economic Occupancy(4): | 90.6% | |
| Call Protection(3): | L(27),Def(86),O(7) | UW Revenues: | $74,193,553 | |
| Lockbox / Cash Management: | Hard / Springing | UW Expenses: | $22,888,769 | |
| Additional Debt(1): | Yes | UW NOI(4): | $51,304,783 | |
| Additional Debt Balance(1): | $505,000,000 | UW NCF(4): | $50,675,427 | |
| Additional Debt Type(1): | Pari Passu | Appraised Value / Per SF(4): | $1,000,000,000 / $2,941 | |
| Appraisal Date: | 1/23/2020 | |||
| Escrows and Reserves(5) | Financial Information(1)(4) | |||||||
| Initial | Monthly | Initial Cap | Cut-off Date Loan / SF: | $1,603 | ||||
| Taxes: | $0 | Springing | N/A | Maturity Date Loan / SF: | $1,603 | |||
| Insurance: | $0 | Springing | N/A | Cut-off Date LTV: | 54.5% | |||
| Replacement Reserves: | $0 | Springing | $170,012 | Maturity Date LTV: | 54.5% | |||
| TI/LC: | $0 | Springing | $1,020,027 | UW NCF DSCR: | 2.90x | |||
| Other(6): | $3,048,024 | $0 | N/A | UW NOI Debt Yield: | 9.4% | |||
| Downgraded Tenant Reserve: | $0 | Springing | N/A | |||||
| Sources and Uses | ||||||
| Sources | Proceeds | % of Total | Uses | Proceeds | % of Total | |
| Whole Loan | $545,000,000 | 90.0% | Loan Payoff | $598,153,683 | 98.8% | |
| Sponsor Equity | 60,294,721 | 10.0 | Closing Costs | 4,093,014 | 0.7 | |
| Upfront Reserves | 3,048,024 | 0.5 | ||||
| Total Sources | $605,294,721 | 100.0% | Total Uses | $605,294,721 | 100.0% | |
| (1) | The 711 Fifth Avenue Loan is part of a whole loan evidenced by 21pari passu notes, with an aggregate outstanding principal balance as of the Cut-off Date of $545.0 million. The Financial Information presented in the chart above reflects the Cut-off Date balance of the $545.0 million 711 Fifth Avenue Whole Loan. |
| (2) | The loan sponsors are one or more of (a) Bayerische Versorgungskammer (“BVK”), (b) Deutsche Finance America LLC and/or DF Deutsche Finance Holding AG (together, “DFA”) and/or (c) Hessen Lawyers Pension Fund. |
| (3) | The lockout period will be at least 27 payments beginning with and including the first payment date in April 2020. The 711 Fifth Avenue Borrower has the option to defease the full $545,000,000 711 Fifth Avenue Whole Loan after the earlier to occur of (i) two years after the closing date of the securitization that includes the last note to be securitized and (ii) March 6, 2023. The lockout period of 27 payments is based on the expected JPMDB 2020-COR7 transaction closing date occurring in June 2020. The actual lockout period may be longer. |
| (4) | All NOI, NCF and occupancy information, as well as the appraised value, were determined prior to the emergence of the novel coronavirus pandemic, and the economic disruption resulting from measures to combat the pandemic, and all DSCR, LTV and Debt Yield metrics were calculated, and the 711 Fifth Avenue Whole Loan was underwritten, based on such prior information. See “Risk Factors—Risks Related to Market Conditions and Other External Factors—Coronavirus Pandemic Has Adversely Affected the Global Economy and Will Likely Adversely Affect the Performance of the Mortgage Loans” in the Preliminary Prospectus. |
| (5) | For a full description of Escrows and Reserves, please refer to “Escrows and Reserves” below. |
| (6) | The 711 Fifth Avenue Borrower obtained a new temporary certificate of occupancy in April 2020, and the $2,000,000 has been disbursed to the 711 Fifth Avenue Borrower. |
| THE INFORMATION IN THIS STRUCTURAL AND COLLATERAL TERM SHEET IS NOT COMPLETE AND MAY BE AMENDED PRIOR TO THE TIME OF SALE. THIS TERM SHEET IS NOT AN OFFER TO SELL THESE SECURITIES AND IT IS NOT A SOLICITATION OF AN OFFER TO BUY THESE SECURITIES IN ANY JURISDICTION WHERE THE OFFER OR SALE IS NOT PERMITTED. | ||
| |
83 of 130 | |
| Structural and Collateral Term Sheet | JPMDB 2020-COR7 | |
| 711 Fifth Avenue | ||
The Loan.The 711 Fifth Avenue mortgage loan (the “711 Fifth Avenue Loan”) is part of a whole loan with an aggregate original and outstanding principal balance as of the Cut-off Date of $545,000,000 (the “711 Fifth Avenue Whole Loan”), which is secured by a first mortgage encumbering the 711 Fifth Avenue Borrower’s fee simple interest in a 340,024 square foot office and retail building located in New York, New York (the “711 Fifth Avenue Property”). The 711 Fifth Avenue Whole Loan is comprised of 21pari passu promissory notes, two of which (non-controlling note A-1-6 and non-controlling note A-1-7), having an aggregate original and outstanding principal balance as of the Cut-off Date of $40,000,000, are being contributed to the JPMDB 2020-COR7 transaction and constitute the 711 Fifth Avenue Loan.
The 711 Fifth Avenue Whole Loan was co-originated by Goldman Sachs Bank USA (“GSBI”) and Bank of America, N.A. (“BANA”) on March 6, 2020. The 711 Fifth Avenue Whole Loan has an interest rate of 3.16000%per annum. The 711 Fifth Avenue Borrower utilized the proceeds of the 711 Fifth Avenue Whole Loan and the principal’s cash contribution to refinance existing debt on the 711 Fifth Avenue Property, fund reserves and pay origination costs.
The 711 Fifth Avenue Whole Loan has a 10-year term and will be interest-only for its entire term. The 711 Fifth Avenue Whole Loan had an initial term of 120 months and has a remaining term of 117 months as of the Cut-off Date. The scheduled maturity date of the 711 Fifth Avenue Whole Loan is the due date in March 2030. Voluntary prepayment of the 711 Fifth Avenue Whole Loan in whole is prohibited prior to September 6, 2029, provided that the 711 Fifth Avenue Borrower may prepay (with yield maintenance) the 711 Fifth Avenue Whole Loan in part in connection with a DY Cure Event (as defined under “Lockbox / Cash Management below) after the 711 Fifth Avenue Lockout Period. At any time after the date that is the earlier of (i) two years from the closing date of the securitization that includes the last note to be securitized and (ii) March 6, 2023, (the “711 Fifth Avenue Lockout Period”), the 711 Fifth Avenue Whole Loan permits (a) defeasance in whole with direct, non-callable obligations of the United States of America and (b) solely to cure a debt yield trigger as described below under “Escrows and Reserves”, partial defeasance or partial prepayment (which prepayment must be accompanied by any applicable yield maintenance).
The table below summarizes the promissory notes that comprise 711 Fifth Avenue Whole Loan. The relationship between the holders of 711 Fifth Avenue Whole Loan is governed by a co-lender agreement as described under “Description of the Mortgage Pool—The Whole Loans—The Non-Serviced Pari Passu Whole Loans” in the Preliminary Prospectus.
| Whole Loan Summary | ||||
| Note | Original Balance | Cut-off Date Balance | Note Holder | Controlling Piece |
| A-1-1, A-1-10 | $62,500,000 | $62,500,000 | GSMS 2020-GC47 | Yes |
A-1-2, A-1-3, A-1-4, A-1-5, A-1-8, A-1-9, A-1-11, A-1-12, A-1-13, A-1-14, A-1-15, A-1-16, A-1-17 | 279,000,000 | 279,000,000 | GSBI(1) | No |
| A-1-6, A-1-7 | 40,000,000 | 40,000,000 | JPMDB 2020-COR7 | No |
| A-2-1, A-2-2, A-2-3, A-2-4 | 163,500,000 | 163,500,000 | BANA(1) | No |
| Total | $545,000,000 | $545,000,000 | ||
| (1) | Expected to be contributed to a future securitization. |
The Borrower. The borrower is 711 Fifth Ave Principal Owner LLC, a Delaware limited liability company (the “711 Fifth Avenue Borrower”). Legal counsel to the 711 Fifth Avenue Borrower delivered a non-consolidation opinion in connection with the origination of the 711 Fifth Avenue Whole Loan. There is no nonrecourse carve-out guarantor or separate environmental indemnitor with respect to the 711 Fifth Avenue Whole Loan.
The Loan Sponsors. As of the 711 Fifth Avenue Whole Loan origination date, the borrower sponsors are one or more of (a) Bayerische Versorgungskammer (“BVK”), (b) Deutsche Finance America LLC and/or DF Deutsche Finance Holding AG (together, “DFA”) and/or (c) Hessen Lawyers Pension Fund. These entities collectively have acquired five other assets located in major cities. BVK, a public-law pension group in Germany, managed 12 independent professional and municipal pension funds with a total of 2.3 million policyholders and pension recipients, €4.8 billion in annual contributions and reimbursement income, and approximately €3.4 billion in annual pension payments as of December 31, 2018. BVK managed a total investment volume of €77 billion by book value as of December 31, 2018. DFA, the American private equity arm of Deutsche Finance Group, was established in 2018 and has acquired 11 properties with a total capitalization of over $3.1 billion as of April 21, 2020. Hessen Lawyers Pension Fund is the pension fund for the German state of Hessen, with approximately €4.12 billion assets under management as of February 29, 2020.
| THE INFORMATION IN THIS STRUCTURAL AND COLLATERAL TERM SHEET IS NOT COMPLETE AND MAY BE AMENDED PRIOR TO THE TIME OF SALE. THIS TERM SHEET IS NOT AN OFFER TO SELL THESE SECURITIES AND IT IS NOT A SOLICITATION OF AN OFFER TO BUY THESE SECURITIES IN ANY JURISDICTION WHERE THE OFFER OR SALE IS NOT PERMITTED. | ||
| |
84 of 130 | |
| Structural and Collateral Term Sheet | JPMDB 2020-COR7 | |
| 711 Fifth Avenue | ||
The Property. The 711 Fifth Avenue Property is an 18-story, 340,024 square foot Class A mixed use building with an office component (levels four – 18; 286,226 square feet) and a retail component (levels B – three; 53,798 square feet) located in Midtown Manhattan on the corner of Fifth Avenue and East 55th Street. The 711 Fifth Avenue Property was originally constructed in 1927 and has undergone various capital improvements from 2013 through mid-2019. Major capital improvements include a sixth floor corridor upgrade, 14th floor roof replacement, main roof replacement, fourth and ninth floor renovations, and elevator modernization. Based on the underwritten rent roll dated January 31, 2020, the 711 Fifth Avenue Property is currently 76.5% leased (based on net rentable area), to a diverse tenant roster including banking (SunTrust Banks), fashion (Ralph Lauren Retail Inc. (“Ralph Lauren”) and The Swatch Group Ltd. (“The Swatch Group”)), and luxury goods (Loro Piana USA), as well as finance (Allen & Company).
Office (84.2% of net rentable area; 21.5% of underwritten base rent)
The Class A office space at the 711 Fifth Avenue Property is currently 72.3% occupied by five tenants that collectively contribute 21.5% of underwritten base rent (inclusive of storage rent derived from office tenants). 84,516 square foot of the office space (29.5% of Class A office net rentable area) at the 711 Fifth Avenue Property is leased to an investment grade-rated office tenant (SunTrust Banks).
The largest office tenant at the 711 Fifth Avenue Property, SunTrust Banks, occupies 24.9% of the 711 Fifth Avenue Property’s net rentable area and accounts for 8.9% of underwritten base rent. The tenant has occupied space in the 711 Fifth Avenue Property since 2004 and has expanded several times. The bank's primary businesses include deposits, lending, credit cards, and trust and investment services. Through its various subsidiaries, the bank provides corporate and investment banking, capital market services, mortgage banking, and wealth management.
The second largest office tenant at the 711 Fifth Avenue Property, Allen & Company, occupies 20.9% of the 711 Fifth Avenue Property’s net rentable area and accounts for 7.4% of underwritten base rent. The tenant has occupied space in the 711 Fifth Avenue Property since 1985 and has expanded several times. The 711 Fifth Avenue Property serves as Allen & Company’s headquarters. Allen & Company is a privately held boutique investment bank, which specializes in real estate, technology, media and entertainment.
The third largest office tenant at the 711 Fifth Avenue Property, Loro Piana USA, occupies 7.2% of the 711 Fifth Avenue Property’s net rentable area and accounts for 2.6% of underwritten base rent. The tenant has occupied space in the 711 Fifth Avenue Property since 2005. Loro Piana USA is an Italian fabrics and clothing company specializing in high-end, luxury cashmere and wool products.
Retail (15.8% of net rentable area; 78.5% of underwritten base rent)
The 53,798 square feet of multi-level retail space at the 711 Fifth Avenue Property is currently anchored by Ralph Lauren (which has been dark but paying rent since April 2017) and The Swatch Group that collectively contribute 78.5% of underwritten base rent (inclusive of storage/restaurant rent derived from retail tenants). Ralph Lauren is a wholly owned subsidiary of Ralph Lauren Corporation. Ralph Lauren, the largest retail tenant by underwritten base rent, leases 11.4% of net rentable area and accounts for 41.1% of underwritten base rent. The 711 Fifth Avenue Property served as Ralph Lauren’s former flagship location; however, its space is now dark and available for sublease. Ralph Lauren continues to operate the Polo Bar (7,436 square feet of the total Ralph Lauren 38,638 square feet) at this location, but the Polo Bar is temporarily closed.
The Swatch Group is the second largest retail tenant at the 711 Fifth Avenue Property. The Swatch Group occupies 4.2% of the 711 Fifth Avenue Property’s net rentable area and accounts for 37.3% of underwritten base rent. The Swatch Group has occupied space in the 711 Fifth Avenue Property since 2011, and brands that are currently represented at the 711 Fifth Avenue Property include Omega and Jaquet Droz. The Swatch Group engages in the design, manufacture, and sale of finished watches, jewelry as well as watch movements and components. It operates through two segments including, watches and jewelry, and electronic systems. The watches and jewelry segment designs, produces, and markets watches and jewelry. The electronic systems segment develops, manufactures, and sells electronic components and sports timing activities.
| THE INFORMATION IN THIS STRUCTURAL AND COLLATERAL TERM SHEET IS NOT COMPLETE AND MAY BE AMENDED PRIOR TO THE TIME OF SALE. THIS TERM SHEET IS NOT AN OFFER TO SELL THESE SECURITIES AND IT IS NOT A SOLICITATION OF AN OFFER TO BUY THESE SECURITIES IN ANY JURISDICTION WHERE THE OFFER OR SALE IS NOT PERMITTED. | ||
| |
85 of 130 | |
| Structural and Collateral Term Sheet | JPMDB 2020-COR7 | |
| 711 Fifth Avenue | ||
COVID-19 Update. As of June 11, 2020, the 711 Fifth Avenue Property is open; however, all retail tenants are closed and most, if not all, office tenants are working remotely. One retail tenant, representing approximately 37% of the underwritten base rent, executed a rent deferral agreement as of May 18, 2020 with 711 Fifth Avenue Borrower regarding rent relief which provides for a 50% rent abatement for April, May and June 2020, which abated rent is to be repaid as follows: 50% of the abated total amount to be repaid by the end of 2020 and the remaining 50% to be repaid by the end of March 2021. On May 26, 2020, 711 Fifth Avenue Borrower executed a modification of the 711 Fifth Avenue Whole Loan documents to (a) provide that lender will release any funds that are deposited with lender to cure a DY Cure Event once the debt yield test is satisfied for 2 consecutive quarters and (b) update the organizational chart of 711 Fifth Avenue Borrower. The borrower sponsor is in discussion with Ralph Lauren regarding rent relief with respect to the Polo Bar space (7,436 of 38,638 square feet attributable to Ralph Lauren and 1.4% of underwritten base rent attributable to Ralph Lauren) which is temporarily closed. The Ralph Lauren modification is expected to provide (but the final terms may not provide for), among other things, (a) a rent abatement for May 2020 rent in the amount of $250,000 and (b) a deferral of rent for May 2020 and June 2020 in the amount of $250,000 for each month, which must be repaid no later than December 31, 2020. All of the tenants have paid or are anticipated to pay their May rent (which includes one tenant, representing 4.2% of the square footage and 37.3% of underwritten base rent of the 711 Fifth Avenue property who paid their rent in accordance with an agreement to pay 50% abated rent for the month of May and one tenant, representing 11.4% of the square footage and 41.1% of the underwritten base rent of the 711 Fifth Avenue property who is in the process of executing an agreement with the borrower sponsor and is anticipated to pay May and June rent upon execution of the amendment) which represents approximately 72.4% of the underwritten May base rent. The 711 Fifth Avenue Whole Loan is current through the June 6, 2020 payment date.
| Historical and Current Occupancy(1) | |||
| 2017 | 2018 | 2019 | Current(2) |
| 73.7% | 67.4% | 66.9% | 76.5% |
| (1) | Historical Occupancies are as of December 31 of each respective year. |
| (2) | Current Occupancy is as of January 31, 2020. |
| Tenant Summary(1) | ||||||
| Tenant | Ratings Moody’s/Fitch/S&P(2) | Net Rentable Area (SF) | % of Total NRA | Base Rent PSF(3) | % of Total Base Rent(3) | Lease Expiration |
| Ralph Lauren(4) | A2/NR/A- | 38,638 | 11.4% | $712.36 | 41.1% | 6/30/2029 |
| The Swatch Group | NR/NR/NR | 14,274 | 4.2 | $1,749.81 | 37.3 | 12/31/2029 |
| SunTrust Banks | A3/A+/NR | 84,516 | 24.9 | $70.09 | 8.9 | 4/30/2024 |
| Allen & Company | NR/NR/NR | 70,972 | 20.9 | $69.73 | 7.4 | 9/30/2033 |
| Loro Piana USA | NR/NR/NR | 24,388 | 7.2 | $71.38 | 2.6 | 8/31/2025 |
| Sandler Capital | NR/NR/NR | 17,200 | 5.1 | $80.17 | 2.1 | 6/30/2027 |
| Catalyst Investors | NR/NR/NR | 6,034 | 1.8 | $67.00 | 0.6 | 11/30/2023 |
| Seven Largest Owned Tenants | 256,022 | 75.3% | $261.29 | 100.0% | ||
| Remaining Owned Tenants(5) | 3,935 | 1.2 | $0.00 | 0.0 | ||
| Vacant Spaces (Owned Space) | 80,067 | 23.5 | $0.00 | 0.0 | ||
| Total / Wtd. Avg. | 340,024 | 100.0% | $261.29 | 100.0% |
| (1) | Calculated based on the approximate square footage occupied by each owned tenant. |
| (2) | Certain ratings are those of the parent entity whether or not the parent entity guarantees the lease. |
| (3) | Base Rent PSF and % of Total Base Rent are based on the underwritten rent roll dated January 31, 2020. |
| (4) | Currently, the Ralph Lauren spaces totaling 38,638 square feet are now dark and available for sublease. The tenant continues to operate the Polo Bar space of 7,436 square feet at the 711 Fifth Avenue Property, but the Polo Bar is temporarily closed. |
| (5) | Remaining Owned Tenants includes non-revenue spaces of 2,330 square feet attributable to the property management office, 1,042 square feet attributable to the building security office and 563 square feet attributable to the porter locker room. |
| THE INFORMATION IN THIS STRUCTURAL AND COLLATERAL TERM SHEET IS NOT COMPLETE AND MAY BE AMENDED PRIOR TO THE TIME OF SALE. THIS TERM SHEET IS NOT AN OFFER TO SELL THESE SECURITIES AND IT IS NOT A SOLICITATION OF AN OFFER TO BUY THESE SECURITIES IN ANY JURISDICTION WHERE THE OFFER OR SALE IS NOT PERMITTED. | ||
| |
86 of 130 | |
| Structural and Collateral Term Sheet | JPMDB 2020-COR7 | |
| 711 Fifth Avenue | ||
| Lease Rollover Schedule(1)(2) | |||||||||
Year | Number of Leases Expiring | Net Rentable Area Expiring | % of NRA Expiring | Base Rent Expiring(3) | % of Base Rent Expiring(3)�� | Cumulative Net Rentable Area Expiring | Cumulative % of NRA Expiring | Cumulative Base Rent Expiring(3) | Cumulative % of Base Rent Expiring(3) |
| Vacant | NAP | 80,067 | 23.5% | NAP | NAP | 80,067 | 23.5% | NAP | NAP |
| 2020 & MTM | 0 | 0 | 0.0 | $0 | 0.0% | 80,067 | 23.5% | $0 | 0.0% |
| 2021 | 0 | 0 | 0.0 | 0 | 0.0 | 80,067 | 23.5% | $0 | 0.0% |
| 2022 | 0 | 0 | 0.0 | 0 | 0.0 | 80,067 | 23.5% | $0 | 0.0% |
| 2023 | 1 | 6,034 | 1.8 | 404,278 | 0.6 | 86,101 | 25.3% | $404,278 | 0.6% |
| 2024 | 6 | 84,516 | 24.9 | 5,923,390 | 8.9 | 170,617 | 50.2% | $6,327,668 | 9.5% |
| 2025 | 2 | 24,388 | 7.2 | 1,740,900 | 2.6 | 195,005 | 57.4% | $8,068,568 | 12.1% |
| 2026 | 0 | 0 | 0.0 | 0 | 0.0 | 195,005 | 57.4% | $8,068,568 | 12.1% |
| 2027 | 1 | 17,200 | 5.1 | 1,378,924 | 2.1 | 212,205 | 62.4% | $9,447,492 | 14.1% |
| 2028 | 0 | 0 | 0.0 | 0 | 0.0 | 212,205 | 62.4% | $9,447,492 | 14.1% |
| 2029 | 12 | 52,912 | 15.6 | 52,500,732 | 78.5 | 265,117 | 78.0% | $61,948,224 | 92.6% |
| 2030 | 0 | 0 | 0.0 | 0 | 0.0 | 265,117 | 78.0% | $61,948,224 | 92.6% |
| 2031 & Beyond(4) | 8 | 74,907 | 22.0 | 4,948,540 | 7.4 | 340,024 | 100.0% | $66,896,764 | 100.0% |
| Total / Wtd. Avg. | 30 | 340,024 | 100.0% | $66,896,764 | 100.0% | ||||
| (1) | Calculated based on the approximate square footage occupied by each owned tenant. |
| (2) | Certain tenants may have termination or contraction options (which may become exercisable prior to the originally stated expiration date of the tenant lease) that are not considered in the above Lease Rollover Schedule. |
| (3) | Base Rent Expiring, % of Base Rent Expiring, Cumulative Base Rent Expiring and Cumulative % of Base Rent Expiring are based on the underwritten rent roll dated January 31, 2020. |
| (4) | Includes non-revenue spaces of 2,330 square feet attributable to the property management office, 1,042 square feet attributable to the building security office and 563 square feet attributable to the porter locker room. |
Operating History and Underwritten Net Cash Flow(1)
| ||||||||||||||
2016 | 2017 | 2018 | 2019 | Underwritten(2) | Per Square Foot(2) | %(3) | ||||||||
| Base Rent | $50,709,002 | $59,133,963 | $58,947,171 | $64,979,130 | $66,896,764 | $196.74 | 81.7% | |||||||
| Contractual Rent Steps(4) | 0 | 0 | 0 | 0 | 1,962,475 | 5.77 | 2.4 | |||||||
| Vacant Income | 0 | 0 | 0 | 0 | 7,680,090 | 22.59 | 9.4 | |||||||
| Reimbursements | 1,826,845 | 3,069,898 | 3,727,298 | 4,194,777 | 4,962,830 | 14.60 | 6.1 | |||||||
| Other Income | 307,215 | 519,693 | 364,227 | 389,683 | 371,484 | 1.09 | 0.5 | |||||||
| Gross Revenue | $52,843,062 | $62,723,555 | $63,038,695 | $69,563,590 | $81,873,643 | $240.79 | 100.0% | |||||||
| Vacancy & Credit Loss(5) | 0 | 0 | 0 | 0 | (7,680,090) | (22.59) | (9.4) | |||||||
| Effective Gross Income | $52,843,062 | $62,723,555 | $63,038,695 | $69,563,590 | $74,193,553 | $218.20 | 90.6% | |||||||
| Total Operating Expenses | 14,954,656 | 17,358,037 | 18,950,129 | 20,967,241 | 22,888,769 | 67.32 | 30.9 | |||||||
| Net Operating Income | $37,888,406 | $45,365,518 | $44,088,566 | $48,596,349 | $51,304,783 | $150.89 | 69.1% | |||||||
| TI/LC | 0 | 0 | 0 | 0 | 544,350 | 1.60 | 0.7 | |||||||
| Capital Expenditures | 0 | 0 | 0 | 0 | 85,006 | 0.25 | 0.1 | |||||||
| Net Cash Flow | $37,888,406 | $45,365,518 | $44,088,566 | $48,596,349 | $50,675,427 | $149.03 | 68.3% | |||||||
| (1) | Certain items such as straight line rent, interest expense, interest income, lease cancellation income, depreciation, amortization, debt service payments and any other non-recurring or non-operating items were excluded from the historical presentation and are not considered for the underwritten cash flow. |
| (2) | For the avoidance of doubt, no COVID-19 specific adjustments have been incorporated in the lender underwriting. |
| (3) | % column represents percent of Gross Revenue for all revenue lines and represents percent of Effective Gross Income for the remainder of the fields. |
| (4) | Contractual Rent Steps include $1,962,475 underwritten for various tenants through January 31, 2021. |
| (5) | Underwritten Vacancy & Credit Loss represents an underwritten economic vacancy of 9.4%. |
Property Management. The 711 Fifth Avenue Property is currently managed by SHVO Property Management LLC (an affiliate of the borrower sponsors) (“SHVO”), pursuant to a management agreement and sub-managed by Jones Lang LaSalle Americas, Inc. (“JLL”) pursuant to a sub-management agreement. Under the 711 Fifth Avenue Whole Loan documents, the 711 Fifth Avenue Property is required to be managed by SHVO and sub-managed by JLL, respectively, or any other management or sub-management company, as applicable, approved by the lender and with respect to which a Rating Agency Confirmation has been received.
| THE INFORMATION IN THIS STRUCTURAL AND COLLATERAL TERM SHEET IS NOT COMPLETE AND MAY BE AMENDED PRIOR TO THE TIME OF SALE. THIS TERM SHEET IS NOT AN OFFER TO SELL THESE SECURITIES AND IT IS NOT A SOLICITATION OF AN OFFER TO BUY THESE SECURITIES IN ANY JURISDICTION WHERE THE OFFER OR SALE IS NOT PERMITTED. | ||
| |
87 of 130 | |
| Structural and Collateral Term Sheet | JPMDB 2020-COR7 | |
| 711 Fifth Avenue | ||
Escrows and Reserves. At origination, the 711 Fifth Avenue Borrower funded (a) approximately $1,048,024 for outstanding free rent (including any rent credits) and (b) $2,000,000 for estimated costs in connection with obtaining a new temporary or permanent certificate of occupancy to replace the temporary certificate of occupancy that expired in November 2019. The 711 Fifth Avenue Borrower obtained a temporary certificate of occupancy that was effective as of March 24, 2020, and the $2,000,000 has been disbursed to the 711 Fifth Avenue Borrower. On each due date during the continuance of a 711 Fifth Avenue Trigger Period, the 711 Fifth Avenue Borrower will be required to fund (i) a tax and insurance reserve in an amount equal to 1/12 of the property taxes and insurance premiums that the lender reasonably estimates will be payable during the next ensuing 12 months; provided that reserves for insurance premiums will be waived if the 711 Fifth Avenue Property is covered by an acceptable blanket insurance policy; (ii) a capital expenditure reserve in an amount equal to approximately $7,084 capped at an amount equal to the lender’s good faith estimate of capital expenses to be performed during the next two years; (iii) a tenant improvements and leasing commissions reserve in an amount equal to $42,503 capped at an amount equal to the greater of (x) the lender’s good faith estimate of all leasing commissions and tenant improvements to be performed during the next two years and (y) the aggregate amount of all outstanding leasing commissions and tenant improvements under leases then in effect.
Additionally, during the continuance of a Tenant Rollover Sweep, all excess cash (and any other amounts sufficient to result in a reserve amount for such month of at least $2,500,000) after payment of applicable debt service, budgeted operating expenses and other required reserves are required to be reserved in a tenant rollover reserve, or to avoid such sweep, 711 Fifth Avenue Borrower may deposit with the lender an amount equal to the greater of (x) $7,500,000 and (y) all excess cash flow estimated by lender in its good faith that would have been deposited in such reserve account for the three-month period following the deposit of such funds (the “Tenant Rollover Sweep Equity Amount”). Additionally, during the continuance of a Downgraded Tenant Sweep (if no deposits are required to be deposited into the tenant rollover reserve), all excess cash (capped at 18 months’ worth of rent payments by the downgraded tenant (as such amount may be reduced per the 711 Fifth Avenue Whole Loan documents) after payment of applicable debt service, budgeted operating expenses and other required reserves is required to be reserved in a tenant downgrade reserve.
A “Downgraded Tenant Sweep” will be continuing upon any tenant under a Major Lease (or with regard to Ralph Lauren, its highest rated parent entity, as applicable) that is rated investment grade is downgraded below investment grade (as determined by S&P or Moody’s), until (a) the downgraded tenant is once more rated investment grade (as determined by S&P or Moody’s), (b) such space is relet in accordance with the 711 Fifth Avenue Whole Loan documents, or (c) an amount sufficient to pay unabated rent for 18 consecutive months then due under the applicable downgraded tenant’s lease (subject to reduction in accordance with the 711 Fifth Avenue Whole Loan documents) has been deposited in the downgraded tenant reserve (the occurrence of (a), (b) or (c) above, a “Downgraded Tenant Sweep Cure”).
A “Major Lease” means any of the leases with Ralph Lauren, The Swatch Group and any lease that when aggregated with all other leases at the 711 Fifth Avenue Property with the same or an affiliated tenant (assuming the exercise of all expansion rights and all preferential rights to lease additional space), is expected to demise more than 30% of the rentable square footage or account for 20% or more of the total rental income. Additionally, any lease with any purchase option, with a 711 Fifth Avenue Borrower affiliate or entered into during an event of default will also be considered a Major Lease.
A “Tenant Rollover Sweep” will exist if any tenant under a Major Lease (i) terminates their lease, (ii) goes “dark” (other than (a) Ralph Lauren if it has an investment grade rating or (b) is guaranteed by an entity rated investment grade (as determined by S&P or Moody’s)), (iii) vacates or provides indication of their intent to vacate all or any portion of their leased space or (iv) fails to provide written notice of their intent to renew such lease on the date that is 36 months prior to its then current lease expiration date.
A “Tenant Rollover Sweep Cure” means, as applicable, (a) a tenant under a Major Lease renews its lease or enters into a new lease on substantially the same terms and conditions, is no longer “dark” or moves back into its space or revokes any prior notice of intent to vacate or (b) such space is relet in accordance with the terms of the 711 Fifth Avenue Whole Loan documents.
Lockbox / Cash Management.The 711 Fifth Avenue Whole Loan is structured with a hard lockbox and springing cash management. The 711 Fifth Avenue Borrower is required to direct all existing and future tenants of the 711 Fifth Avenue Property to directly deposit all rents into a clearing account controlled by the lender. Provided no 711 Fifth Avenue Trigger Period exists, the funds in the clearing account are required to be swept on a daily basis into a borrower operating account. During the continuance of a 711 Fifth Avenue Trigger Period (or an event of default at the lender’s election), the funds in the clearing account are required to be swept on a daily basis into a cash management account controlled by the lender and all amounts on deposit in the cash management account after payment of the monthly debt service, required reserves and budgeted operating expenses are required to be held as additional security for the 711 Fifth Avenue Whole Loan during the continuance of such 711 Fifth Avenue Trigger Period, except that if there exists no event of default and the only 711 Fifth Avenue Trigger Period then in existence is a Tenant Rollover Sweep and the applicable Tenant Rollover Sweep Equity Amount was deposited with the lender as required under the 711 Fifth Avenue Whole Loan documents, then all excess cash flow that would have been reserved is required to be released to the 711 Fifth Avenue Borrower.
| THE INFORMATION IN THIS STRUCTURAL AND COLLATERAL TERM SHEET IS NOT COMPLETE AND MAY BE AMENDED PRIOR TO THE TIME OF SALE. THIS TERM SHEET IS NOT AN OFFER TO SELL THESE SECURITIES AND IT IS NOT A SOLICITATION OF AN OFFER TO BUY THESE SECURITIES IN ANY JURISDICTION WHERE THE OFFER OR SALE IS NOT PERMITTED. | ||
| |
88 of 130 | |
| Structural and Collateral Term Sheet | JPMDB 2020-COR7 | |
| 711 Fifth Avenue | ||
A “711 Fifth Avenue Trigger Period” means each period that commences upon the first to occur of: (a) debt yield, determined as of the first day of any fiscal quarter, is less than 7.0%, until the occurrence of a DY Cure Event (and if financial reports are not delivered to the lender as and when required under the 711 Fifth Avenue Whole Loan documents, a 711 Fifth Avenue Trigger Period will be deemed to have commenced and be ongoing, unless and until such reports are delivered and they indicate that, in fact, no 711 Fifth Avenue Trigger Period is ongoing); (b) there exists an event of default under any mezzanine loan until cured; (c) any major tenant leasing space that is rated investment grade is downgraded below investment grade (as determined by S&P or Moody’s), until the occurrence of a Downgraded Tenant Sweep Cure, and (d) any major tenant that (i) terminates its lease, (ii) “goes dark”, unless such applicable lease is and continues to be guaranteed by an entity rated investment grade (as determined by S&P or Moody’s), (iii) vacates or provides indication of its intent to vacate all of its leased space (or any portion thereof), or (iv) fails to provide written notice to the 711 Fifth Avenue Borrower of its intent to renew its applicable lease 36 months prior to its then current lease expiration date, until the occurrence of a Tenant Rollover Sweep Cure.
A “DY Cure Event” means (a) no event of default is continuing and (b) the achievement of a debt yield, determined as of the first day of each of two consecutive fiscal quarters thereafter, equal to or greater than 7.0% (which (i) after the 711 Fifth Avenue Lockout Period, debt yield test may be satisfied, at the 711 Fifth Avenue Borrower’s sole discretion, by either (x) making voluntary prepayments or (y) effectuating a partial defeasance, in amounts necessary to achieve the required debt yield or (ii) the debt yield test may be satisfied, at the 711 Fifth Avenue Borrower’s sole discretion, by depositing in a reserve account, as additional collateral, cash or a letter of credit in an amount that when subtracted from the principal indebtedness for purposes of calculating debt yield would result in a debt yield that equals or exceeds 7.0% (provided that the aggregate notional amount of all outstanding letters of credit delivered may at no time exceed 10.0% of the principal indebtedness).
Additionally, provided no event of default under the 711 Fifth Avenue Whole Loan is continuing, the 711 Fifth Avenue Borrower has the right at any time from and after the expiration of the 711 Fifth Avenue Lockout Period (a) solely to effect a DY Cure Event to partially defease (with no corresponding release of collateral) and (b) to totally defease, the 711 Fifth Avenue Whole Loan in the amount necessary to either cause the achievement of a DY Cure Event as determined by the lender in its reasonable discretion or defease the 711 Fifth Avenue Whole Loan in whole, subject to the satisfaction of certain conditions, including, among others, delivery of defeasance collateral in an amount sufficient to make all payments of interest and principal due under the defeased note until the first due date in the prepayment period, a REMIC opinion and a Rating Agency Confirmation.
Future Mezzanine or Subordinate Indebtedness Permitted.A 100% direct or indirect owner of the 711 Fifth Avenue Borrower or any existing mezzanine borrower is permitted one time during the term of the 711 Fifth Avenue Whole Loan to obtain a mezzanine loan from a lender meeting certain requirements under the 711 Fifth Avenue Whole Loan documents secured by a pledge of the equity interests in the 711 Fifth Avenue Borrower, provided that, among other conditions: (a) the mezzanine loan is in an amount not to exceed the lesser of (i) $35,000,000 and (ii) an amount that, when added to the 711 Fifth Avenue Whole Loan will result in (A) a combined loan to “as-is” appraised value ratio of the 711 Fifth Avenue Property of no more than 54.5%, (B) a combined debt service coverage ratio (based on the 711 Fifth Avenue Whole Loan and the proposed mezzanine loan) of greater than 2.80x and (C) the combined debt yield being equal to or greater than 8.98%; (b) the mezzanine loan is secured by an equity pledge encumbering direct and indirect ownership interests in the 711 Fifth Avenue Borrower (and not any collateral securing the 711 Fifth Avenue Whole Loan); (c) the mezzanine loan will be coterminous with the 711 Fifth Avenue Whole Loan; and (d) the mezzanine lender (i) is not an affiliate of the 711 Fifth Avenue Borrower and (ii) enters into an intercreditor agreement with the lender satisfactory in all respects to the lender in its reasonable discretion and any applicable rating agency. Additionally, such financing will be subject to receipt by the lender of Rating Agency Confirmations from the applicable rating agencies.
Partial Release. None.
| THE INFORMATION IN THIS STRUCTURAL AND COLLATERAL TERM SHEET IS NOT COMPLETE AND MAY BE AMENDED PRIOR TO THE TIME OF SALE. THIS TERM SHEET IS NOT AN OFFER TO SELL THESE SECURITIES AND IT IS NOT A SOLICITATION OF AN OFFER TO BUY THESE SECURITIES IN ANY JURISDICTION WHERE THE OFFER OR SALE IS NOT PERMITTED. | ||
| |
89 of 130 | |
| Structural and Collateral Term Sheet | JPMDB 2020-COR7 | |
| BX Industrial Portfolio | ||
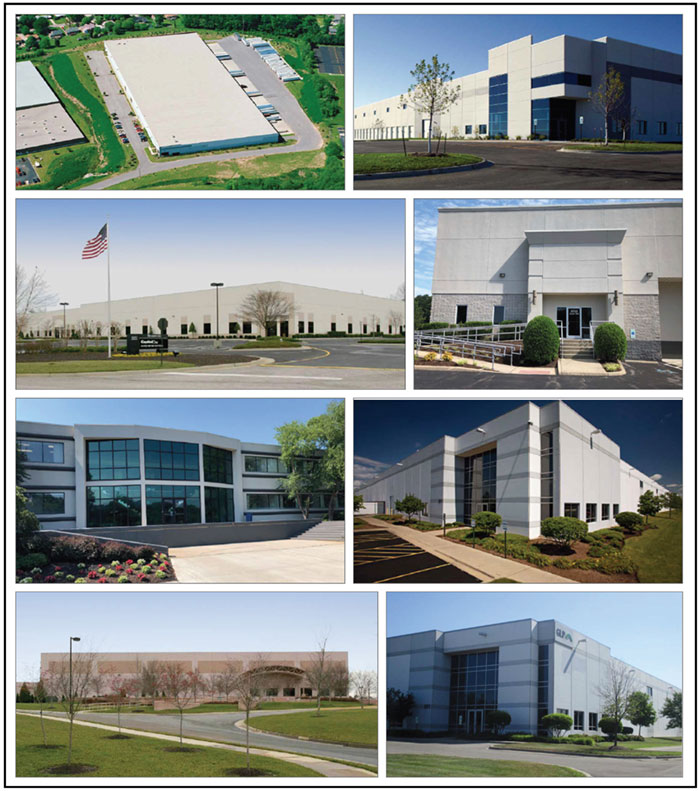
| THE INFORMATION IN THIS STRUCTURAL AND COLLATERAL TERM SHEET IS NOT COMPLETE AND MAY BE AMENDED PRIOR TO THE TIME OF SALE. THIS TERM SHEET IS NOT AN OFFER TO SELL THESE SECURITIES AND IT IS NOT A SOLICITATION OF AN OFFER TO BUY THESE SECURITIES IN ANY JURISDICTION WHERE THE OFFER OR SALE IS NOT PERMITTED. | ||
| |
90 of 130 | |
| Structural and Collateral Term Sheet | JPMDB 2020-COR7 | |
| BX Industrial Portfolio | ||
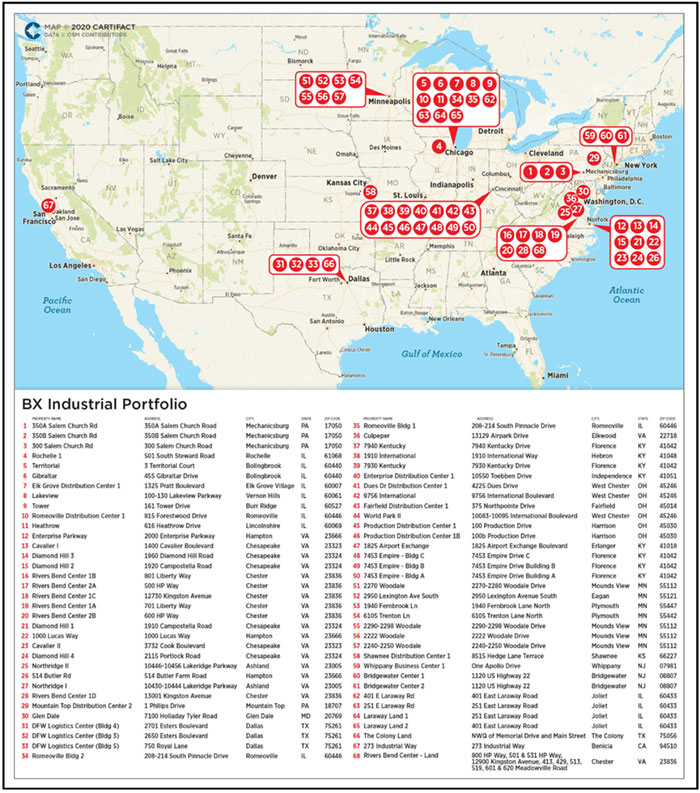
| THE INFORMATION IN THIS STRUCTURAL AND COLLATERAL TERM SHEET IS NOT COMPLETE AND MAY BE AMENDED PRIOR TO THE TIME OF SALE. THIS TERM SHEET IS NOT AN OFFER TO SELL THESE SECURITIES AND IT IS NOT A SOLICITATION OF AN OFFER TO BUY THESE SECURITIES IN ANY JURISDICTION WHERE THE OFFER OR SALE IS NOT PERMITTED. | ||
| |
91 of 130 | |
| Structural and Collateral Term Sheet | JPMDB 2020-COR7 | |
| BX Industrial Portfolio | ||
Mortgage Loan Information |
| Property Information | ||
Mortgage Loan Seller: | GACC |
| Single Asset / Portfolio: | Portfolio |
Original Principal Balance(1): | $37,400,000 |
| Title: | Various |
Cut-off Date Principal Balance(1): | $37,400,000 |
| Property Type - Subtype: | Various |
% of Pool by IPB: | 4.1% |
| Net Rentable Area (SF): | 11,097,713 |
Loan Purpose: | Refinance |
| Location: | Various |
Borrowers(2): | Various |
| Year Built / Renovated: | Various / Various |
Loan Sponsor: | BREIT Industrial Holdings LLC |
| Occupancy: | 87.3% |
Interest Rate(1)(3): | 3.55000% |
| Occupancy Date: | 3/31/2020 |
Note Date: | 5/13/2020 |
| Number of Tenants: | 130 |
Maturity Date: | 10/9/2026 |
| 2017 NOI: | $43,221,019 |
Interest-only Period(1): | 77 months |
| 2018 NOI: | $42,169,941 |
Original Term(1): | 77 months |
| 2019 NOI: | $48,315,634 |
Original Amortization: | None |
| TTM NOI (as of 3/2020): | $50,958,160 |
Amortization Type: | Interest Only |
| UW Economic Occupancy(6): | 85.1% |
Call Protection(4): | Grtr1%orYM(70),O(7) |
| UW Revenues: | $68,219,859 |
Lockbox / Cash Management: | Hard / Springing |
| UW Expenses: | $19,321,765 |
Additional Debt(1)(5): | Yes |
| UW NOI(6): | $48,898,094 |
Additional Debt Balance(1)(5): | $285,000,000 / $72,600,000 / |
| UW NCF(6): | $45,568,781 |
| $110,000,000 / $45,000,000 / |
| Appraised Value / Per SF(6)(7): | $960,750,000 / $87 |
| $99,427,615 |
| Appraisal Date(7): | Various |
Additional Debt Type(1)(5): | Pari Passu Debt / B-Note / C-Notes |
|
|
|
| / D-Note / Floating Rate Debt |
|
|
|
|
|
|
|
|
Escrows and Reserves(8) |
| Financial Information(1)(3)(6) | |||||
| Initial | Monthly | Initial Cap |
|
| Senior Notes | Whole Loan |
Taxes: | $0 | Springing | N/A |
| Cut-off Date Loan / SF: | $34 | $59 |
Insurance: | $0 | Springing | N/A |
| Maturity Date Loan / SF: | $34 | $59 |
Replacement Reserves: | $0 | Springing | $19,975,883 |
| Cut-off Date LTV: | 39.6% | 67.6% |
TI/LC: | $4,048,428 | Springing | $46,610,395 |
| Maturity Date LTV: | 39.6% | 67.6% |
Other: | $0 | Springing | N/A |
| UW NCF DSCR: | 3.57x | 2.09x |
|
|
|
|
| UW NOI Debt Yield: | 12.8% | 7.5% |
|
|
|
|
|
|
| |
| |||||||
(1) | The BX Industrial Portfolio Loan (as defined below) is part of a whole loan (the “BX Industrial Portfolio Whole Loan”) evidenced by 13 notes, with an aggregate outstanding principal balance as of the Cut-off Date of approximately $649.4 million. The BX Industrial Portfolio Whole Loan is split between (i) a 17-month revolving floating rate loan with five, one-year extension options (the “BX Industrial Portfolio Floating Rate Loan”) with an aggregate Cut-off Date principal balance of approximately $99.4 million, and (ii) a 77-month fixed rate componentized loan (the “BX Industrial Portfolio Fixed Rate Loan”) comprised of (A) a senior fixed rate loan (the “BX Industrial Portfolio Senior Fixed Rate Loan”), with an aggregate Cut-off Date principal balance of $322.4 million evidenced by eight A-Notes, and (B) a subordinate fixed rate loan (the “BX Industrial Portfolio Subordinate Fixed Rate Loan”), with an aggregate Cut-off Date principal balance of $227.6 million, evidenced by Note A-1-B, Note A-1-C-1 and Note A-1-C-2, and Note A-1-D, each of which is subordinate to all notes with a prior alphabetical designation. The BX Industrial Portfolio Senior Fixed Rate Loan is senior to the BX Industrial Portfolio Subordinate Fixed Rate Loan. The interest rate on the BX Industrial Portfolio Floating Rate Loan is LIBOR plus a spread of 1.45000%. The financial information presented in the table above under the Senior Notes reflects the BX Industrial Portfolio Senior Fixed Rate Loan and approximately $58.283 million of the Cut-off Date balance of the BX Industrial Portfolio Floating Rate Loan (which is assumed to pay pro rata with the BX Industrial Portfolio Senior Fixed Rate Loan). The Financial Information presented in the chart above under the Whole Loan reflects the Cut-off Date balance of the approximately $649.4 million BX Industrial Whole Loan. For purposes of the debt service coverage ratio calculations above and herein, LIBOR is assumed to be 0.50000%. See “The Loan“ and “Current Mezzanine or Subordinate Indebtedness” herein. |
(2) | Please see “The Borrowers” herein. |
(3) | Interest Rate is reflective of the BX Industrial Portfolio Fixed Rate Loan interest rate. The applicable interest rate for the BX Industrial Portfolio Floating Rate Loan (as defined below) is LIBOR (subject to a floor of 0.00000%) plus a spread of 1.45000%. For purposes of all calculations herein, LIBOR is assumed to be 0.50000%. Based on the LIBOR Cap of 4.00000%, the BX Industrial Portfolio Whole Loan NOI DSCR and NCF DSCR are 1.93x and 1.80x, respectively. |
(4) | All voluntary prepayments are required to be allocated to the BX Industrial Portfolio Floating Rate Loan until repaid in full, and then to the BX Industrial Portfolio Fixed Rate Loan. The first $57.8 million of the BX Industrial Portfolio Floating Rate Loan may be prepaid without any yield maintenance premium or prepayment fee. |
(5) | See “Current Mezzanine or Subordinate Indebtedness” herein. |
(6) | All NOI, NCF and occupancy information, as well as the appraised value, were determined prior to the emergence of the novel coronavirus, and the economic disruption resulting from measures to combat the coronavirus, and all DSCR, LTV and Debt Yield metrics were calculated, and the BX Industrial Portfolio Whole Loan was underwritten, based on such prior information. See “Risk Factors—Risks Related to Market Conditions and Other External Factors—Coronavirus Pandemic Has Adversely Affected the Global Economy and Will Likely Adversely Affect the Performance of the Mortgage Loans” in the Preliminary Prospectus. |
(7) | The Appraised Value is based on an aggregate “As-Is” value of the BX Industrial Properties (as defined below). |
(8) | For a full description of Escrows and Reserves, please refer to “Escrows and Reserves” below. |
| THE INFORMATION IN THIS STRUCTURAL AND COLLATERAL TERM SHEET IS NOT COMPLETE AND MAY BE AMENDED PRIOR TO THE TIME OF SALE. THIS TERM SHEET IS NOT AN OFFER TO SELL THESE SECURITIES AND IT IS NOT A SOLICITATION OF AN OFFER TO BUY THESE SECURITIES IN ANY JURISDICTION WHERE THE OFFER OR SALE IS NOT PERMITTED. | ||
| |
92 of 130 | |
| Structural and Collateral Term Sheet | JPMDB 2020-COR7 | |
| BX Industrial Portfolio | ||
Sources and Uses. In November 2019, Blackstone Group acquired assets from three Global Logistics Properties’ (“GLP”) funds for a total purchase price of $18.7 billion. The overall acquisition encompasses approximately 179.0 million square feet of urban, infill logistics assets located across the United States. The acquisition of industrial assets from GLP (including properties that are part of the BX Industrial Portfolio) by certain Blackstone entities includes, among other things, the following (i) an acquisition purchase price of approximately $10.6 billion, (ii) total transaction closings costs of approximately $543.6 million and (iii) approximately $2.6 billion of sponsor equity. The BX Industrial Portfolio Whole Loan is a refinance of part of the existing debt used to finance the overall acquisition.
The Loan. The BX Industrial Portfolio mortgage loan (the “BX Industrial Portfolio Loan”) is part of a fixed and floating rate whole loan (the “BX Industrial Portfolio Whole Loan”) secured by the borrower’s fee simple or leasehold interests in 68 industrial properties totaling approximately 11.1 million square feet (the “BX Industrial Portfolio Property” or “BX Industrial Portfolio Properties”, and the portfolio comprised of all such properties, the “BX Industrial Portfolio”). The BX Industrial Portfolio Whole Loan is evidenced by 13 notes, with an aggregate outstanding principal balance as of the Cut-off Date of approximately $649.4 million. The BX Industrial Portfolio Loan is evidenced by the fixed rate Note A-1-A-5 and Note A-1-A-8 with an aggregate original principal balance and outstanding principal balance as of the Cut-off Date of $37.4 million. The BX Industrial Portfolio Whole Loan is split between (i) a 17-month floating rate loan with five, one-year extension options (the “BX Industrial Portfolio Floating Rate Loan”) with an aggregate Cut-off Date principal balance of approximately $99.4 million, and (ii) a 77-month fixed rate loan (the “BX Industrial Portfolio Fixed Rate Loan”) comprised of (A) a senior fixed rate loan (the “BX Industrial Portfolio Senior Fixed Rate Loan”), with an aggregate Cut-off Date principal balance of $322.4 million evidenced by eight A-Notes, including the BX Industrial Portfolio Loan, and (B) a subordinate fixed rate loan (the “BX Industrial Portfolio Subordinate Fixed Rate Loan”) consisting of a B-Note in the Cut-off Date principal balance of $72.6 million (the “BX Industrial Portfolio B-Note”), two C-Notes in the aggregate Cut-off Date principal balance of $110.0 million (the “BX Industrial Portfolio C-Notes”) and a D-Note in the Cut-off Date principal balance of $45.0 million (the “BX Industrial Portfolio D-Note”), with an aggregate Cut-off Date principal balance of $227.6 million. The BX Industrial Portfolio Fixed Rate Loan has a 77-month interest-only term and will accrue interest at a fixed rate of 3.55000% per annum. The BX Industrial Portfolio Floating Rate Loan has a 17-month interest-only term with five, one-year extension options and will accrue interest at a rate of one-month LIBOR (subject to a floor of 0.00000%) plus a spread of 1.45000% per annum. The BX Industrial Portfolio Whole Loan was primarily used to refinance existing debt secured by the BX Industrial Portfolio Properties, fund upfront reserves and pay closing costs.
The loan documents permit the borrower to prepay the BX Industrial Portfolio Floating Rate Loan and, subject to the satisfaction of certain conditions set forth in the loan agreement, subsequently re-borrow such amounts pursuant to a request for an additional advance (a “Revolving Advance”) from the holder of the BX Industrial Portfolio Floating Rate Loan up to the initial principal balance of the BX Industrial Portfolio Floating Rate Loan; provided that prepayments in connection with the following are considered permanent and may not be re-borrowed: (a) individual BX Industrial Portfolio Property releases, including both regular releases and releases upon an event of default, (b) mandatory prepayments and/or releases made in connection with casualty or condemnation, (c) prepayments to avoid a cash management period caused by failure to satisfy a debt yield test, (d) a voluntary prepayment for which the borrower has elected that such prepayment will permanently reduce the available amount of the BX Industrial Portfolio Floating Rate Loan and (e) any prepayment made during the continuance of an event of default. In the event that the holder of the BX Industrial Portfolio Floating Rate Loan does not fund a Revolving Advance, the loan documents provide that the borrower may not reduce, discharge or release any obligations due on the BX Industrial Portfolio Fixed Rate Loan via offset of the disputed amount associated with the Revolving Advance.
| THE INFORMATION IN THIS STRUCTURAL AND COLLATERAL TERM SHEET IS NOT COMPLETE AND MAY BE AMENDED PRIOR TO THE TIME OF SALE. THIS TERM SHEET IS NOT AN OFFER TO SELL THESE SECURITIES AND IT IS NOT A SOLICITATION OF AN OFFER TO BUY THESE SECURITIES IN ANY JURISDICTION WHERE THE OFFER OR SALE IS NOT PERMITTED. | ||
| |
93 of 130 | |
| Structural and Collateral Term Sheet | JPMDB 2020-COR7 | |
| BX Industrial Portfolio | ||
The relationship between the holders of the BX Industrial Portfolio Whole Loan will be governed by a co-lender agreement as described under “Description of the Mortgage Pool—The Whole Loans—The Non-Serviced AB Whole Loans—The BX Industrial Portfolio Whole Loan” in the Preliminary Prospectus.
Whole Loan Summary | |||||
Note | Original Balance | Cut-off Date Balance | Note Holder | Controlling Piece | Cut-off Date Balance |
A-1-A-1 | $80,000,000 | $80,000,000 | Benchmark 2020-IG3 | No(1) | A-2 $99,427,615 Floating Rate Loan
Note Holder: Deutsche Bank AG, London Branch |
A-1-A-5, A-1-A-8 | 37,400,000 | $37,400,000 | JPMDB 2020-COR7 | No | |
A-1-A-2, A-1-A-3, A-1-A-4, A-1-A-6, A-1-A-7 | 205,000,000 | 205,000,000 | DBRI(2) | No | |
Senior Fixed Rate Notes | $322,400,000 | $322,400,000 |
|
| |
A-1-B | 72,600,000 | 72,600,000 | Benchmark 2020-IG3 (loan-specific certificates) | No(1) | |
A-1-C-1, A-1-C-2 | 110,000,000 | 110,000,000 | Unaffiliated Third Party | No(1) | |
A-1-D | 45,000,000 | 45,000,000 | Unaffiliated Third Party | Yes(1) | |
Whole Loan(3) | $649,427,615 |
|
|
|
|
(1) | The initial controlling note is the BX Industrial Portfolio Note A-1-D, so long as no control appraisal period with respect to the BX Industrial Portfolio Note A-1-D is continuing. If and for so long as a control appraisal period with respect to the BX Industrial Portfolio Note A-1-D has occurred and is continuing, then the controlling notes will be the BX Industrial Portfolio Note A-1-C-1 and the BX Industrial Portfolio Note A-1-C-2, so long as no control appraisal period with respect to the BX Industrial Portfolio Note A-1-C-1 and the BX Industrial Portfolio Note A-1-C-2 is continuing. If and for so long as a control appraisal period with respect to the BX Industrial Portfolio Note A-1-C-1 and the BX Industrial Portfolio Note A-1-C-2 has occurred and is continuing, then the controlling note will be the BX Industrial Portfolio Note A-1-B, so long as no control appraisal period with respect to the BX Industrial Portfolio Note A-1-B is continuing. If a control appraisal period with respect to the BX Industrial Portfolio Note A-1-B has occurred and is continuing, then the controlling note will be BX Industrial Portfolio Note A-1-A-1. The BX Industrial Portfolio Note A-1-B and the BX Industrial Portfolio Note A-1-A-1 have been included in the Benchmark 2020-IG3 securitization and, therefore, during the continuance of a control appraisal period with respect to the BX Industrial Portfolio Note A-1-C-1 and the BX Industrial Portfolio Note A-1-C-2, the related trust directing holder under the Benchmark 2020-IG3 pooling and servicing agreement is expected to exercise the rights of the controlling holder with respect to the BX Industrial Portfolio whole loan. See “Description of the Mortgage Pool—The Whole Loans—The Non-Serviced AB Whole Loans—The BX Industrial Portfolio Whole Loan” in the Preliminary Prospectus. |
(2) | Expected to be contributed to one or more future securitization transactions. |
(3) | The Whole Loan amount represents the sum of the balances of the BX Industrial Portfolio Floating Rate Loan and the BX Industrial Portfolio Fixed Rate Loan. |
The Borrowers. The borrowers, listed in Annex-A-1 to the Preliminary Prospectus, are each a single purpose Delaware limited liability company structured to be bankruptcy remote with two independent directors in the organizational structure. Legal counsel to the borrowers delivered a non-consolidation opinion in connection with the origination of the BX Industrial Portfolio Whole Loan.
The Loan Sponsor. The loan sponsor and nonrecourse carve-out guarantor is BREIT Industrial Holdings LLC, an affiliate of the Blackstone Group, L.P. The liability of the non-recourse carveout guarantor in the event of a bankruptcy action by or against the related borrowers or guarantor is limited to 10% of the then-outstanding principal balance of the BX Industrial Portfolio Whole Loan, plus the enforcement cost relating to such bankruptcy action. In addition, for so long as the borrower maintains the environmental insurance policy required under the loan agreement, the non-recourse carveout guarantor will have no liability under the related environmental indemnity agreement, and such guarantor’s liability relating to the borrowers’ failure to renew the environmental insurance policy is capped at the amount of coverage required for such policy.
The Blackstone Group, L.P. (NYSE: BX) is an investment firm with approximately $538 billion of assets under management as of March 31, 2020 across real estate funds, private equity funds, credit businesses and hedge fund solutions. Blackstone Group’s Real Estate group was founded in 1991 and has over $161 billion of real estate assets under management. The global team consists of over 550 Blackstone Real Estate professionals around the world, with both investments and employees in North America, Europe, Asia, and Latin America.
The Property. The BX Industrial Portfolio consists of 68 industrial properties totaling approximately 11.1 million square feet located throughout 11 states. The largest state concentrations are in Virginia (25.1% of total net rentable area, 28.7% of underwritten base rent) and Illinois (23.2% of total net rentable area, 22.8% of underwritten base rent), with no other state comprising more than 10.7% of the total net rentable area or more than 14.0% of the underwritten base rent. On a property level, no single BX Industrial Portfolio Property comprises more than 6.8% of the allocated loan amount and no more than 6.0% of the underwritten base rent. In addition, five of the BX Industrial Portfolio Properties are leased fee and account for 1.9% of the total allocated loan amount. These five properties are not included in square footage calculations and do not comprise any underwritten base rent.
According to the loan sponsor, as of the May 2020 rent payment date, approximately 90.7% of rent collections were made. The first payment date for the BX Industrial Portfolio Whole Loan is scheduled for June 9, 2020. As of May 14, 2020, the BX Industrial Portfolio Whole Loan is not subject to any modification or forbearance request.
| THE INFORMATION IN THIS STRUCTURAL AND COLLATERAL TERM SHEET IS NOT COMPLETE AND MAY BE AMENDED PRIOR TO THE TIME OF SALE. THIS TERM SHEET IS NOT AN OFFER TO SELL THESE SECURITIES AND IT IS NOT A SOLICITATION OF AN OFFER TO BUY THESE SECURITIES IN ANY JURISDICTION WHERE THE OFFER OR SALE IS NOT PERMITTED. | ||
| |
94 of 130 | |
| Structural and Collateral Term Sheet | JPMDB 2020-COR7 | |
| BX Industrial Portfolio | ||
COVID-19 Update. As of June 8, 2020, the BX Industrial Portfolio Properties have remained open. As of the March 31, 2020 underwritten rent rolls, the BX Industrial Portfolio Properties remain 87.3% occupied. For April and May of 2020, tenants representing approximately 96.5% and 93.8% of the net rentable area, respectively, have paid in rent in-full, with the borrower having collected approximately 97.9% and 90.3% of the underwritten base rent, respectively. The BX Industrial Portfolio Whole Loan is current through the June 9, 2020 payment date. As of June 9, 2020, the BX Industrial Portfolio Whole Loan is not subject to any modification or forbearance request.
Historical and Current Occupancy | |||
2017(1) | 2018(1) | 2019(1) | Current(2) |
84.7% | 89.4% | 92.4% | 87.3% |
(1) | Historical Occupancies are as of December 31 of each respective year. |
(2) | Current Occupancy is the occupancy as of March 31, 2020. |
Tenant Summary(1)(2) | |||||||
Tenant | Property Name | Ratings (Fitch/Moody’s/S&P)(3) | Net Rentable Area (SF) | % of Total | Base Rent PSF | % of Total Base Rent | Lease Expiration(4) |
Amazon(5) | Various | A+ / A2 / AA- | 695,780 | 6.3% | $4.31 | 6.1% | Various |
DHL | Various | BBB+ / A3 / NR | 659,600 | 5.9% | $4.71 | 6.3% | 7/31/2021 |
Signify North America Corp | Mountain Top Distribution Center 2 | NA / Baa3 / BBB- | 400,000 | 3.6% | $4.48 | 3.6% | 4/30/2022 |
National Distribution Centers, LLC | 251 E Laraway Rd | NR / NR / NR | 374,460 | 3.4% | $3.90 | 3.0% | 6/30/2021 |
Del Monte Foods, Inc. | Rochelle 1 | NR / Caa1 / CCC | 312,750 | 2.8% | $3.09 | 2.0% | 4/30/2021 |
Wayne/Scott Fetzer Company | Various | NR / NR / NR | 308,880 | 2.8% | $2.15 | 1.3% | 4/30/2023 |
Qualis Automotive, L.L.C. | 1910 International | NR / NR / NR | 300,000 | 2.7% | $3.75 | 2.3% | 10/31/2022 |
Clarkwestern Dietrich Building Systems LLC | Rochelle 1 |
NR / NR / NR | 266,825 | 2.4% | $3.63 | 2.0% | 10/14/2028 |
Ford Motor Company | Shawnee Distribution Center 1 | BB+ / Ba2 / BB+ | 223,200 | 2.0% | $4.06 | 1.8% | 9/30/2023 |
Taylor Logistics, Inc. | 9756 International | NR / NR / NR | 192,000 | 1.7% | $3.69 | 1.4% | 1/31/2024 |
Total / Wtd. Avg. Major Tenants |
|
| 3,733,495 | 33.6% | $3.94 | 29.7% |
|
Remaining Tenants |
|
| 5,956,511 | 53.7% | $5.84 | 70.3% |
|
Total / Wtd. Avg. Occupied |
|
| 9,690,006 | 87.3% | $5.11 | 100.0% |
|
Vacant Space |
|
| 1,407,707 | 12.7% |
|
|
|
Total |
|
| 11,097,713 | 100.0% |
|
|
|
|
|
|
|
|
|
|
|
(1) | Based on the underwritten rent roll as of March 31, 2020. |
(2) | The BX Industrial Portfolio includes five leased fee properties that are not included in square footage calculations and do not comprise any underwritten base rent. |
(3) | Certain ratings are those of the parent company whether or not the parent guarantees the lease. |
(4) | There are no termination options associated with the leases of the top 10 tenants at the BX Industrial Portfolio. |
(5) | Amazon occupies (i) 475,104 square feet at the 401 E Laraway Rd property with a lease expiration date of July 31, 2025, (ii) 93,048 square feet at the Romeoville Bldg 1 with a lease expiration date of July 31, 2029, (iii) 75,980 square feet at the Diamond Hill 2 property with a lease expiration date of September 30, 2026 and (iv) 51,648 square feet at the 6105 Trenton Ln property with a lease expiration date of May 31, 2025. |
| THE INFORMATION IN THIS STRUCTURAL AND COLLATERAL TERM SHEET IS NOT COMPLETE AND MAY BE AMENDED PRIOR TO THE TIME OF SALE. THIS TERM SHEET IS NOT AN OFFER TO SELL THESE SECURITIES AND IT IS NOT A SOLICITATION OF AN OFFER TO BUY THESE SECURITIES IN ANY JURISDICTION WHERE THE OFFER OR SALE IS NOT PERMITTED. | ||
| |
95 of 130 | |
| Structural and Collateral Term Sheet | JPMDB 2020-COR7 | |
| BX Industrial Portfolio | ||
Lease Rollover Schedule(1)(2)(3) | |||||||||
Year | Number of | Net Rentable | % of NRA | Base Rent | % of Base Rent Expiring | Cumulative | Cumulative % | Cumulative | Cumulative % |
Vacant | NAP | 1,407,707 | 12.7% | NAP | NAP | 1,407,707 | 12.7% | NAP | NAP |
MTM & 2020 | 22 | 955,206 | 8.6% | $5,038,097 | 10.2% | 2,362,913 | 21.3% | $5,038,097 | 10.2% |
2021 | 28 | 2,232,795 | 20.1% | $10,146,476 | 20.5% | 4,595,708 | 41.4% | $15,184,573 | 30.7% |
2022 | 29 | 1,688,748 | 15.2% | $8,805,626 | 17.8% | 6,284,456 | 56.6% | $23,990,199 | 48.5% |
2023 | 22 | 1,649,237 | 14.9% | $8,286,303 | 16.7% | 7,933,693 | 71.5% | $32,276,503 | 65.2% |
2024 | 18 | 846,761 | 7.6% | $3,851,983 | 7.8% | 8,780,454 | 79.1% | $36,128,486 | 73.0% |
2025 | 10 | 758,426 | 6.8% | $3,582,462 | 7.2% | 9,538,880 | 86.0% | $39,710,948 | 80.3% |
2026 | 6 | 275,895 | 2.5% | $1,484,009 | 3.0% | 9,814,775 | 88.4% | $41,194,957 | 83.3% |
2027 | 9 | 355,367 | 3.2% | $1,720,296 | 3.5% | 10,170,142 | 91.6% | $42,915,253 | 86.7% |
2028 | 11 | 783,933 | 7.1% | $5,669,869 | 11.5% | 10,954,075 | 98.7% | $48,585,122 | 98.2% |
2029 | 1 | 93,048 | 0.8% | $465,240 | 0.9% | 11,047,123 | 99.5% | $49,050,362 | 99.1% |
2030 & Thereafter | 3 | 50,590 | 0.5% | $427,447 | 0.9% | 11,097,713 | 100.0% | $49,477,809 | 100.0% |
Total | 159 | 11,097,713 | 100.0% | $49,477,809 | 100.0% |
|
|
|
|
(1) | Based on the underwritten rent roll as of March 31, 2020. |
(2) | The BX Industrial Portfolio includes five leased fee properties that are not included in square footage calculations and do not comprise any underwritten base rent. |
(3) | Certain tenants may have lease termination options that are not reflected in the Lease Rollover Schedule. |
| THE INFORMATION IN THIS STRUCTURAL AND COLLATERAL TERM SHEET IS NOT COMPLETE AND MAY BE AMENDED PRIOR TO THE TIME OF SALE. THIS TERM SHEET IS NOT AN OFFER TO SELL THESE SECURITIES AND IT IS NOT A SOLICITATION OF AN OFFER TO BUY THESE SECURITIES IN ANY JURISDICTION WHERE THE OFFER OR SALE IS NOT PERMITTED. | ||
| |
96 of 130 | |
| Structural and Collateral Term Sheet | JPMDB 2020-COR7 | |
| BX Industrial Portfolio | ||
Portfolio Summary – Top 20(1)(2) | ||||||||
Property Name | City, State | Property Sub-Type | Year Built / Renovated | Square Feet | Clear Height | Occupancy | % of | % of Total Base Rent |
Bridgewater Center 1(3) | Bridgewater, NJ | Warehouse/Storage | 1951 / 1994 | 437,117 | 29 | 0.5% | 6.8% | 0.1% |
401 E Laraway Rd | Joliet, IL | Warehouse/Distribution | 2005 / NAP | 475,104 | 30 | 100.0% | 4.4% | 3.7% |
Rochelle 1 | Rochelle, IL | Warehouse/Distribution | 2005 / NAP | 579,575 | 32 | 100.0% | 3.6% | 3.9% |
350A Salem Church Rd | Mechanicsburg, PA | Warehouse/Distribution | 1990 / NAP | 405,100 | 28 | 100.0% | 3.5% | 4.0% |
Romeoville Bldg 1 | Romeoville, IL | Warehouse/Distribution | 2016 / NAP | 199,924 | 32 | 100.0% | 3.2% | 2.0% |
251 E Laraway Rd | Joliet, IL | Warehouse/Distribution | 2005 / NAP | 374,460 | 30 | 100.0% | 3.1% | 3.0% |
7940 Kentucky | Florence, KY | Flex | 1992 / NAP | 128,077 | 18 | 94.7% | 3.0% | 6.0% |
Mountain Top Distribution Center 2 | Mountain Top, PA | Warehouse/Distribution | 1992 / NAP | 400,000 | 29 | 100.0% | 2.5% | 3.6% |
Enterprise Parkway | Hampton, VA | Flex | 1996 / NAP | 402,652 | 49 | 76.6% | 2.5% | 2.2% |
Cavalier I | Chesapeake, VA | Warehouse/Distribution | 1969 / NAP | 300,117 | 28 | 77.0% | 2.4% | 2.6% |
1910 International | Hebron, KY | Warehouse/Distribution | 1990 / 2004 | 300,000 | 24 | 100.0% | 2.2% | 2.3% |
Glen Dale | Glen Dale, MD | Warehouse/Distribution | 1968 / NAP | 314,590 | 21 | 53.5% | 2.0% | 1.4% |
Romeoville Bldg 2 | Romeoville, IL | Warehouse/Distribution | 2016 / NAP | 199,924 | 32 | 30.9% | 2.0% | 0.8% |
Enterprise Distribution Center 1 | Independence, KY | Warehouse/Distribution | 2005 / NAP | 275,000 | 28 | 100.0% | 1.8% | 2.0% |
2270 Woodale | Mounds View, MN | Warehouse | 1990 / NAP | 144,783 | 22 | 100.0% | 1.8% | 2.0% |
2950 Lexington Ave South | Eagan, MN | Warehouse/Storage | 1979 / NAP | 184,545 | 24 | 100.0% | 1.8% | 1.8% |
Rivers Bend Center 1B | Chester, VA | Warehouse/Distribution | 1998 / NAP | 170,800 | 24 | 100.0% | 1.8% | 1.8% |
DFW Logistics Center (Bldg 4) | Dallas, TX | Warehouse/Distribution | 2018 / NAP | 144,000 | 28 | 100.0% | 1.7% | 1.8% |
Rivers Bend Center 1C | Chester, VA | Flex | 2001 / NAP | 158,400 | 24 | 100.0% | 1.7% | 2.5% |
Territorial | Bolingbrook, IL | Manufacturing | 2001 / NAP | 125,448 | 24 | 100.0% | 1.6% | 2.1% |
Subtotal |
|
|
| 5,719,616 |
|
| 53.4% | 49.4% |
Remaining Properties |
|
|
| 5,378,097 |
|
| 46.6% | 50.6% |
Total |
|
|
| 11,097,713 |
|
| 100.0% | 100.0% |
(1) | Based on the underwritten rent roll as of March 31, 2020. |
(2) | The BX Industrial Portfolio includes five leased fee properties that are not included in square footage calculations and do not comprise any underwritten base rent. The leased fee properties account for 1.9% of the total allocated loan amount. |
(3) | The largest tenant at Bridgewater Center 1 property, Baker & Taylor (410,350 square feet) recently vacated in March 2020. On April 28, 2020, the borrower sponsor executed a 6-month lease with Salson Logistics to occupy 349,054 square feet at a monthly base rent of $289,424 and a lease expiration date of October 31, 2020. The Salson Logistics base rent is not included in the lender’s underwriting. |
| THE INFORMATION IN THIS STRUCTURAL AND COLLATERAL TERM SHEET IS NOT COMPLETE AND MAY BE AMENDED PRIOR TO THE TIME OF SALE. THIS TERM SHEET IS NOT AN OFFER TO SELL THESE SECURITIES AND IT IS NOT A SOLICITATION OF AN OFFER TO BUY THESE SECURITIES IN ANY JURISDICTION WHERE THE OFFER OR SALE IS NOT PERMITTED. | ||
| |
97 of 130 | |
| Structural and Collateral Term Sheet | JPMDB 2020-COR7 | |
| BX Industrial Portfolio | ||
Property Sub-Type Summary(1)(2) | ||||||||
Property Sub-Type | # of | Square Feet | % of Total | In-Place | Allocated Loan | % of Total | Base Rent | % of Total |
Warehouse/Distribution | 40 | 8,235,571 | 74.2% | 91.0% | $423,977,413 | 65.3% | $32,470,428 | 65.6% |
Flex | 12 | 1,344,906 | 12.1% | 90.9% | $95,202,976 | 14.7% | $10,102,835 | 20.4% |
Warehouse/Storage | 3 | 723,662 | 6.5% | 39.9% | $55,620,377 | 8.6% | $1,546,381 | 3.1% |
Manufacturing | 4 | 428,799 | 3.9% | 93.7% | $31,666,080 | 4.9% | $2,910,094 | 5.9% |
Warehouse | 2 | 264,783 | 2.4% | 88.5% | $21,702,184 | 3.3% | $1,936,291 | 3.9% |
Suburban | 1 | 61,488 | 0.6% | 12.6% | $5,459,669 | 0.8% | $124,430 | 0.3% |
R&D/Flex | 1 | 38,504 | 0.3% | 100.0% | $3,344,047 | 0.5% | $387,350 | 0.8% |
Leased Fee | 5 | NAP | 0.0% | 0.0% | $12,454,870 | 1.9% | $0 | 0.0% |
Total | 68 | 11,097,713 | 100.0% | 87.3% | $649,427,615 | 100.0% | $49,477,809 | 100.0% |
(1) | Based on the underwritten rent roll as of March 31, 2020. |
(2) | The BX Industrial Portfolio includes five leased fee properties that are not included in square footage calculations and do not comprise any underwritten base rent. The leased fee properties account for 1.9% of the total allocated loan amount. |
The BX Industrial Portfolio Properties are located throughout 11 states which include the following top five states by square feet, Virginia (25.1% of net rentable area; 28.7% of underwritten base rent), Illinois (23.2% of net rentable area; 22.8% of underwritten base rent), Kentucky (10.7% of net rentable area; 14.0% of underwritten base rent), Ohio (10.6% of net rentable area; 5.5% of underwritten base rent) and Pennsylvania (9.5% of net rentable area; 9.9% of underwritten base rent).
Geographic Summary(1)(2) | ||||||||
State | # of | Square Feet | % of | In-Place | Allocated Loan Amount | % of Total | Base Rent | % of Total |
VA | 19 | 2,783,855 | 25.1% | 88.6% | $162,083,920 | 25.0% | $14,178,600 | 28.7% |
IL | 14 | 2,579,841 | 23.2% | 93.6% | $158,603,381 | 24.4% | $11,279,283 | 22.8% |
KY | 8 | 1,187,058 | 10.7% | 99.4% | $67,870,509 | 10.5% | $6,921,518 | 14.0% |
OH | 6 | 1,174,650 | 10.6% | 78.0% | $37,603,470 | 5.8% | $2,743,658 | 5.5% |
PA | 4 | 1,059,600 | 9.5% | 100.0% | $53,914,230 | 8.3% | $4,898,077 | 9.9% |
MN | 7 | 735,645 | 6.6% | 93.4% | $51,457,379 | 7.9% | $4,015,681 | 8.1% |
NJ | 3 | 659,117 | 5.9% | 29.4% | $54,187,214 | 8.3% | $1,614,361 | 3.3% |
TX | 4 | 380,157 | 3.4% | 100.0% | $38,490,666 | 5.9% | $2,212,521 | 4.5% |
MD | 1 | 314,590 | 2.8% | 53.5% | $13,103,205 | 2.0% | $707,917 | 1.4% |
KS | 1 | 223,200 | 2.0% | 100.0% | $9,622,666 | 1.5% | $906,192 | 1.8% |
CA | 1 | NAP | 0.0% | 0.0% | $2,490,974 | 0.4% | $0 | 0.0% |
Total | 68 | 11,097,713 | 100.0% | 87.3% | $649,427,615 | 100.0% | $49,477,809 | 100.0% |
(1) | Based on the underwritten rent roll as of March 31, 2020. |
(2) | The BX Industrial Portfolio includes five leased fee properties that are not included in square footage calculations and do not comprise any underwritten base rent. The leased fee properties account for 1.9% of the total allocated loan amount. |
| THE INFORMATION IN THIS STRUCTURAL AND COLLATERAL TERM SHEET IS NOT COMPLETE AND MAY BE AMENDED PRIOR TO THE TIME OF SALE. THIS TERM SHEET IS NOT AN OFFER TO SELL THESE SECURITIES AND IT IS NOT A SOLICITATION OF AN OFFER TO BUY THESE SECURITIES IN ANY JURISDICTION WHERE THE OFFER OR SALE IS NOT PERMITTED. | ||
| |
98 of 130 | |
| Structural and Collateral Term Sheet | JPMDB 2020-COR7 | |
| BX Industrial Portfolio | ||
Market Summary(1)(2) | |||||||||
Market | # of Properties | Square Feet | % of Total | Allocated Loan | % of Total | Base Rent | Occupancy | Market | Market |
South Virginia | 19 | 2,783,855 | 25.1% | $162,083,920 | 25.0% | $14,178,600 | 88.6% | $7.42 | 3.6% |
Chicago | 14 | 2,579,841 | 23.2% | $158,603,381 | 24.4% | $11,279,283 | 93.6% | $7.37 | 6.1% |
Cincinnati | 14 | 2,361,708 | 21.3% | $105,473,979 | 16.2% | $9,665,176 | 88.8% | $5.32 | 5.2% |
Northern NJ | 3 | 659,117 | 5.9% | $54,187,214 | 8.3% | $1,614,361 | 29.4% | $10.12 | 4.1% |
Eastern / Central PA | 4 | 1,059,600 | 9.5% | $53,914,230 | 8.3% | $4,898,077 | 100.0% | $5.78 | 8.0% |
Minneapolis | 7 | 735,645 | 6.6% | $51,457,379 | 7.9% | $4,015,681 | 93.4% | $6.98 | 3.4% |
Dallas/Fort Worth | 4 | 380,157 | 3.4% | $38,490,666 | 5.9% | $2,212,521 | 100.0% | $6.77 | 6.3% |
Washington DC | 1 | 314,590 | 2.8% | $13,103,205 | 2.0% | $707,917 | 53.5% | $12.05 | 6.1% |
Kansas City | 1 | 223,200 | 2.0% | $9,622,666 | 1.5% | $906,192 | 100.0% | $5.43 | 4.9% |
Bay Area | 1 | NAP | NAP | $2,490,974 | 0.4% | $0 | NAP | NAP | NAP |
Total | 68 | 11,097,713 | 100.0% | $649,427,615 | 100.00 | $49,477,809 | 87.3% | $7.01 | 5.2% |
(1) | Based on the underwritten rent roll as of March 31, 2020. |
(2) | The BX Industrial Portfolio includes five leased fee properties that are not included in square footage calculations and do not comprise any underwritten base rent. The leased fee properties account for 1.9% of the total allocated loan amount. The Bay Area Market includes the 273 Industrial Way property which is a leased fee property with no attributable rent or square feet. |
Top 20 Properties - Submarket Analysis(1) | ||||||||
Property Name | Allocated Loan | % of Total | Base Rent | % of Total | Market(2) | Submarket(2) | Submarket | Submarket Vacancy(2) |
Bridgewater Center 1 | $44,155,072 | 6.8% | $28,567 | 0.1% | Northern NJ | Central New Jersey Warehouse/Distribution | $7.28 | 1.9% |
401 E Laraway Rd | $28,867,999 | 4.4% | $1,824,886 | 7.5% | Chicago | Interstate 80 Corridor | $3.85 | 10.0% |
Rochelle 1 | $23,613,068 | 3.6% | $1,934,972 | 7.9% | Chicago | Interstate 39 Corridor | $3.08 | 4.9% |
350A Salem Church Rd | $22,521,134 | 3.5% | $1,972,837 | 8.1% | Eastern / Central PA | I-81/I-78 Corridor | $4.82 | 6.8% |
Romeoville Bldg 1 | $20,542,004 | 3.2% | $985,726 | 4.0% | Chicago | Interstate 55 | $4.72 | 9.7% |
251 E Laraway Rd | $19,859,546 | 3.1% | $1,460,394 | 6.0% | Chicago | Interstate 80 Corridor | $3.85 | 10.0% |
7940 Kentucky | $19,791,300 | 3.0% | $2,951,805 | 12.1% | Cincinnati | Florence/Richwood Industrial | $4.02 | 1.3% |
Mountain Top Distribution Center 2 | $16,447,253 | 2.5% | $1,792,000 | 7.3% | Eastern / Central PA | Mountain Top | $4.95 | 4.2% |
Enterprise Parkway | $15,969,532 | 2.5% | $1,077,433 | 4.4% | South Virginia | Copeland | $6.64 | 1.9% |
Cavalier I | $15,764,794 | 2.4% | $1,272,656 | 5.2% | South Virginia | Cavalier | $7.51 | 4.7% |
1910 International | $14,195,139 | 2.2% | $1,125,000 | 4.6% | Cincinnati | Airport Industrial | $4.51 | 3.9% |
Glen Dale | $13,103,205 | 2.0% | $707,917 | 2.9% | Washington DC | Suburban Maryland Industrial | $8.30 | 8.8% |
Romeoville Bldg 2 | $12,898,468 | 2.0% | $396,043 | 1.6% | Chicago | Interstate 55 | $4.72 | 9.7% |
Enterprise Distribution Center 1 | $11,943,026 | 1.8% | $975,150 | 4.0% | Cincinnati | Florence/Richwood Industrial | $4.02 | 1.3% |
2270 Woodale | $11,670,042 | 1.8% | $987,996 | 4.0% | Minneapolis | North Central | $6.69 | 4.2% |
2950 Lexington Ave South | $11,465,305 | 1.8% | $880,314 | 3.6% | Minneapolis | South Central | $5.24 | 4.9% |
Rivers Bend Center 1B | $11,397,059 | 1.8% | $890,195 | 3.6% | South Virginia | Southeast Richmond | $5.18 | 3.6% |
DFW Logistics Center (Bldg 4) | $11,192,321 | 1.7% | $885,773 | 3.6% | Dallas/Fort Worth | DFW Airport Industrial | $4.63 | 4.4% |
Rivers Bend Center 1C | $10,782,846 | 1.7% | $1,253,768 | 5.1% | South Virginia | Southeast Richmond | $5.18 | 3.6% |
Territorial | $10,578,108 | 1.6% | $1,041,051 | 4.3% | Chicago | Interstate 55 | $4.72 | 9.7% |
Total | $346,757,221 | 53.4% | $24,444,483 | 100.0% |
|
|
|
|
(1) | Based on the underwritten rent roll as of March 31, 2020. |
(2) | Source: Appraisal. |
| THE INFORMATION IN THIS STRUCTURAL AND COLLATERAL TERM SHEET IS NOT COMPLETE AND MAY BE AMENDED PRIOR TO THE TIME OF SALE. THIS TERM SHEET IS NOT AN OFFER TO SELL THESE SECURITIES AND IT IS NOT A SOLICITATION OF AN OFFER TO BUY THESE SECURITIES IN ANY JURISDICTION WHERE THE OFFER OR SALE IS NOT PERMITTED. | ||
| |
99 of 130 | |
| Structural and Collateral Term Sheet | JPMDB 2020-COR7 | |
| BX Industrial Portfolio | ||
Operating History and Underwritten Net Cash Flow(1) | |||||||
| 2017 | 2018 | 2019 | TTM(2) | Underwritten | Per Square Foot | %(3) |
Base Rent | $43,755,073 | $43,647,125 | $50,879,764 | $51,531,584 | $49,477,809 | $4.46 | 61.8% |
Contractual Rent Steps | 0 | 0 | 0 | 0 | 1,340,873 | 0.12 | 1.7% |
Value of Vacant Space | 0 | 0 | 0 | 0 | 11,899,234 | 1.07 | 14.9% |
Gross Potential Rent | $43,755,073 | $43,647,125 | $50,879,764 | $51,531,584 | $62,717,915 | $5.65 | 78.3% |
Total Reimbursement Revenue | 14,024,977 | 14,425,751 | 16,951,400 | 16,820,366 | 17,301,645 | 1.56 | 21.6% |
Other Income | 1,961,648 | 2,043,742 | 309,016 | 330,389 | 99,533 | 0.01 | 0.1% |
Net Rental Income | 59,741,698 | 60,116,618 | 68,140,180 | 68,682,339 | 80,119,093 | $7.22 | 100.0% |
Less: Bad Debt/Abatements | (834,770) | (1,307,105) | (1,377,111) | (635,171) | 0 | 0.00 | 0.0% |
Less: Vacancy | 0 | 0 | 0 | 0 | (11,899,234) | (1.07) | (14.9) |
Effective Gross Income | $58,906,928 | $58,809,513 | $66,763,069 | $68,047,168 | $68,219,859 | $6.15 | 85.1% |
Real Estate Taxes | 8,152,906 | 8,193,458 | 8,932,002 | 8,705,953 | 10,366,547 | 0.93 | 15.2% |
Insurance | 656,152 | 636,196 | 668,401 | 665,525 | 611,507 | 0.06 | 0.9% |
Management Fees | 807,687 | 813,304 | 1,679,835 | 789,265 | 907,868 | 0.08 | 1.3% |
Total Other Expenses | 6,069,165 | 6,996,614 | 7,167,196 | 6,928,265 | 7,435,842 | 0.67 | 10.9% |
Total Operating Expenses | 15,685,910 | 16,639,572 | 18,447,435 | 17,089,007 | 19,321,765 | 1.74 | 28.3% |
Net Operating Income | $43,221,019 | $42,169,941 | $48,315,634 | $50,958,160 | $48,898,094 | $4.41 | 71.7% |
TI/LC | 0 | 0 | 0 | 0 | 2,219,543 | 0.20 | 3.3% |
Capital Expenditures | 0 | 0 | 0 | 0 | 1,109,771 | 0.10 | 1.6% |
Net Cash Flow | $43,221,019 | $42,169,941 | $48,315,634 | $50,958,160 | $45,568,781 | $4.11 | 66.8% |
(1) | Underwritten Base Rent is based on the underwritten rent roll as of March 31, 2020. For avoidance of doubt, no COVID-19 specific adjustments have been incorporated in the lender underwriting. |
(2) | TTM represents the trailing 12 month period ending March 31, 2020. |
(3) | % column represents percent of Net Rental Income for all revenue lines and represents percent of Effective Gross Income for the remainder of fields. |
Property Management. The BX Industrial Portfolio Property is managed by Link Industrial Management LLC, an affiliate of the borrowers, and sub-managed by third party sub-managers.
Escrows and Reserves. At loan origination, the borrowers deposited approximately $4,048,428 into a rollover reserve account for existing tenant improvements and leasing costs.
Tax Reserve – On each payment date during the continuance of a Trigger Period, the borrowers are required to deposit into a real estate tax reserve, on a monthly basis, 1/12 of the estimated annual real estate taxes payable during the next 12 months.
Insurance Reserve – On each payment date during the continuance of a Trigger Period, the borrowers are required to deposit into an insurance reserve, on a monthly basis, 1/12 of estimated annual insurance premiums.
Replacement Reserve – On each payment date during the continuance of a Trigger Period, the borrowers are required to deposit into a replacement reserve, on a monthly basis, an amount equal to $0.15 per square foot for replacement reserves, subject to a cap of twelve times the monthly deposit amount.
Rollover Reserves – On each payment date during the continuance of a Trigger Period, the borrowers are required to deposit $0.35 per square foot into a rollover reserve for tenant improvements and leasing commissions, subject to a cap of twelve times the monthly deposit amount.
Ground Rent Reserves – On each payment date during the continuance of a Trigger Period, the borrowers are required to deposit the applicable ground rent amount required under the ground leases into a ground rent reserve.
| THE INFORMATION IN THIS STRUCTURAL AND COLLATERAL TERM SHEET IS NOT COMPLETE AND MAY BE AMENDED PRIOR TO THE TIME OF SALE. THIS TERM SHEET IS NOT AN OFFER TO SELL THESE SECURITIES AND IT IS NOT A SOLICITATION OF AN OFFER TO BUY THESE SECURITIES IN ANY JURISDICTION WHERE THE OFFER OR SALE IS NOT PERMITTED. | ||
| |
100 of 130 | |
| Structural and Collateral Term Sheet | JPMDB 2020-COR7 | |
| BX Industrial Portfolio | ||
Lockbox / Cash Management. The BX Industrial Portfolio Whole Loan is structured with a hard lockbox and springing cash management. The borrowers are required to cause all rents to be deposited directly into a lender approved lockbox account. All funds received by such borrowers or the manager are required to be deposited in a lockbox account within two business days following receipt. During the continuance of a Trigger Period (as defined below), all funds on deposit in the lockbox account are required to be swept not less than twice per week into a lender-controlled cash management account and applied on each payment date and disbursed in accordance with the loan agreement. During the continuance of a Trigger Period, all funds remaining in the cash management account after payment of debt service, reserves, budgeted operating expenses and lender-approved extraordinary expenses are required to be held in a cash collateral reserve as additional security for the BX Industrial Portfolio Whole Loan, provided that amounts in such reserve may be used, at the borrower’s request, to pay operating expenses, emergency repairs or life/safety items, capital expenditures, expenses and shortfalls relating to restoration after a casualty or condemnation, debt service, the purchase of interest rate cap agreements, voluntary prepayments, reserve account shortfalls, approved leasing expenses, fees and costs associated with the loan documents, including the cost of extending any environmental policy, leasing preparation costs not to exceed $25 per square foot, legal audit and accounting costs not in excess of $250,000, pre-approved alterations, ground rents, condominium charges, distributions of up to $250,000 per annum to redeem any preferred shareholders of any REIT in the ownership structure of borrowers or to pay distributions necessary to satisfy REIT qualifications and avoid entity taxes, and such other amounts as are reasonably approved by the lender. Provided no Trigger Period is continuing, funds on deposit in the lockbox accounts will be disbursed to the borrowers’ operating account.
Provided that no event of default is continuing, the borrowers have the right to provide a guaranty from the non-recourse carveout guarantor or from BREIT Operating Partnership L.P. in lieu of depositing excess cash flow into the cash collateral reserve, or in replacement of funds previously deposited into the cash collateral reserve, provided that the amount outstanding under such guaranty may not exceed 15% of the outstanding principal balance of the BX Industrial Portfolio Whole Loan.
A “Trigger Period” means a period commencing upon the occurrence of: (i) an event of default under the BX Industrial Portfolio Whole Loan or (ii) a Low Debt Yield Period (as defined below).
A Trigger Period may be cured (a) with respect to clause (i) above, upon the acceptance by the lender of a cure of such event of default, and (b) with respect to clause (ii) above, the Low Debt Yield Period has been cured as set forth below.
A “Low Debt Yield Period“ will commence upon (i) the debt yield of the BX Industrial Portfolio Whole Loan being less than 6.50% as of the last day of any calendar quarter during the period up to and including November 9, 2022 and (ii) the debt yield of the BX Industrial Portfolio Whole Loan being less than 6.75% as of the last day of two consecutive calendar quarters at any time thereafter (collectively, the “Debt Yield Threshold”), and will end if (i) the BX Industrial Portfolio exceeds the applicable Debt Yield Threshold for two consecutive quarters or (ii) the borrowers make a prepayment such that the debt yield is at least equal to the Debt Yield Threshold in accordance with the terms of the loan agreement.
Current Mezzanine or Subordinate Indebtedness. The BX Industrial Portfolio Subordinate Fixed Rate Loan is comprised of (i) the BX Industrial Portfolio B-Note in the amount of $72.6 million, the BX Industrial Portfolio C-Notes in the amount of $110.0 million and the BX Industrial Portfolio D-Note in the amount of $45.0 million. The BX Industrial Portfolio B-Note will accrue interest at a fixed rate of 3.55000% and has been contributed to the Benchmark 2020-IG3 securitization, in which it supports a series of loan specific certificates. The BX Industrial Portfolio C-Notes will accrue interest at a fixed rate of 3.55000% and were sold to an unaffiliated third party investor. The BX Industrial Portfolio D-Note will accrue interest at a fixed rate of 3.55000% and was sold to an unaffiliated third party investor.
Future Mezzanine or Subordinate Indebtedness Permitted. None.
Partial Release. The borrowers are permitted to prepay a portion of the BX Industrial Portfolio Floating Rate Loan in an aggregate amount not to exceed $57,800,000 at any time without a spread maintenance payment. Any voluntary prepayment, including in connection with a partial release, will first be allocated to the BX Industrial Portfolio Floating Rate Loan until it is prepaid in full and then to the BX Industrial Portfolio Fixed Rate Loan.
| THE INFORMATION IN THIS STRUCTURAL AND COLLATERAL TERM SHEET IS NOT COMPLETE AND MAY BE AMENDED PRIOR TO THE TIME OF SALE. THIS TERM SHEET IS NOT AN OFFER TO SELL THESE SECURITIES AND IT IS NOT A SOLICITATION OF AN OFFER TO BUY THESE SECURITIES IN ANY JURISDICTION WHERE THE OFFER OR SALE IS NOT PERMITTED. | ||
| |
101 of 130 | |
| Structural and Collateral Term Sheet | JPMDB 2020-COR7 | |
| BX Industrial Portfolio | ||
The borrowers may obtain the release of an individual property upon, among other terms and conditions outlined in the loan documents, (i) prepayment by the borrowers of the Adjusted Release Amount (as defined below) for the individual property to be released, (ii) no event of default is continuing; (iii) the debt yield with respect to the remaining properties following the release must be equal to or greater than the greater of (1) 7.5% and (2) the lesser of (a) the debt yield immediately prior to such release and (b) 8.5%, and (iv) satisfaction of REMIC related conditions. Any such prepayment allocable to the BX Industrial Portfolio Floating Rate Loan prior to October 9, 2020, will require a spread maintenance premium equal to the product of (x) 1.450%, (y) the amount prepaid and (z) a fraction, the numerator of which is the number of days from the date of prepayment to and including October 9, 2020, and the denominator of which is 360. Any such prepayment allocable to the BX Industrial Portfolio Fixed Rate Loan prior to March 9, 2026 will require a yield maintenance premium in an amount equal to the greater of (a) 1.00% of the amount prepaid and (b) a yield maintenance premium. In the event that there is an undrawn Revolving Advance on the BX Industrial Portfolio Floating Rate Loan that is available for borrowing at the time of the partial release, the borrower may, in lieu of paying the Adjusted Release Amount, cause the available amount of such undrawn Revolving Advance to be reduced by an amount equal to the Adjusted Release Amount; provided that the borrower has paid any spread maintenance payment then due. In addition, the borrowers are permitted to obtain the release of an individual BX Industrial Portfolio Property in order to (a) cure an event of default relating to such property or (b) for a ground leased BX Industrial Portfolio Property, cure an event of default relating to a default under such a ground lease. In each instance, satisfaction of the debt yield requirement above is not required to obtain such a release, and such a release will not trigger any prepayment or yield maintenance premiums. See “Description of the Mortgage Pool—Certain Terms of the Mortgage Loans—Partial Releases” in the Preliminary Prospectus.
“Adjusted Release Amount” means for any individual BX Industrial Portfolio Property to be released, the sum of (a) the Amortized Release Amount for such property and (b) the applicable Release Price Premium for such property.
“Amortized Release Amount” means, for any individual BX Industrial Portfolio Property, the original allocated loan amount for such property, as such amount may be reduced by certain prepayments permitted under the loan documents.
“Release Price Premium” means, for each individual BX Industrial Portfolio Property, an amount equal to (a) 5% of the Amortized Release Amount for the applicable property until 30% of the original principal balance of the BX Industrial Portfolio Whole Loan has been prepaid in accordance with the loan documents and (b) thereafter, 10% of the Amortized Release Amount for the applicable property.
| THE INFORMATION IN THIS STRUCTURAL AND COLLATERAL TERM SHEET IS NOT COMPLETE AND MAY BE AMENDED PRIOR TO THE TIME OF SALE. THIS TERM SHEET IS NOT AN OFFER TO SELL THESE SECURITIES AND IT IS NOT A SOLICITATION OF AN OFFER TO BUY THESE SECURITIES IN ANY JURISDICTION WHERE THE OFFER OR SALE IS NOT PERMITTED. | ||
| |
102 of 130 | |
| Structural and Collateral Term Sheet | JPMDB 2020-COR7 | |
| Whitehall III & V | ||
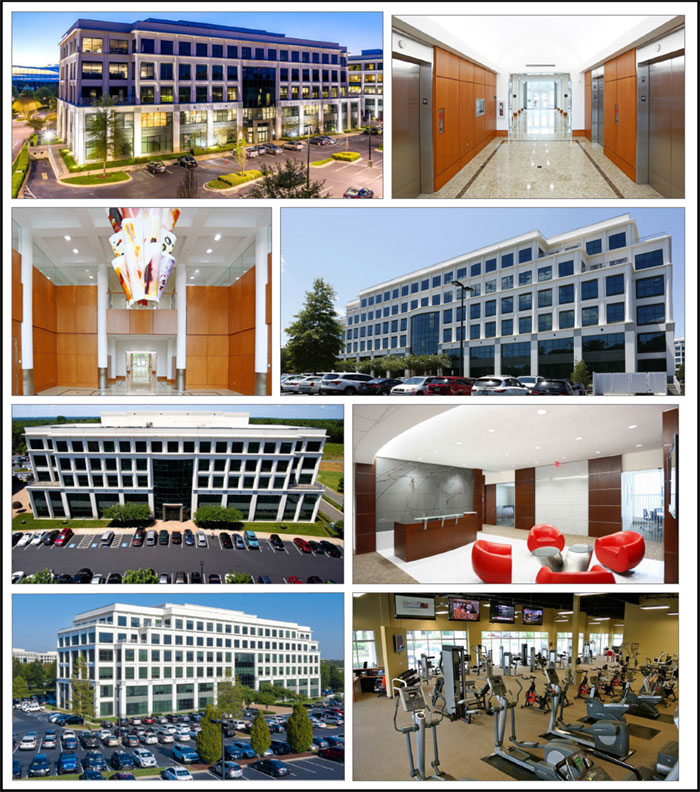
| THE INFORMATION IN THIS STRUCTURAL AND COLLATERAL TERM SHEET IS NOT COMPLETE AND MAY BE AMENDED PRIOR TO THE TIME OF SALE. THIS TERM SHEET IS NOT AN OFFER TO SELL THESE SECURITIES AND IT IS NOT A SOLICITATION OF AN OFFER TO BUY THESE SECURITIES IN ANY JURISDICTION WHERE THE OFFER OR SALE IS NOT PERMITTED. | ||
| |
103 of 130 | |
| Structural and Collateral Term Sheet | JPMDB 2020-COR7 | |
| Whitehall III & V | ||
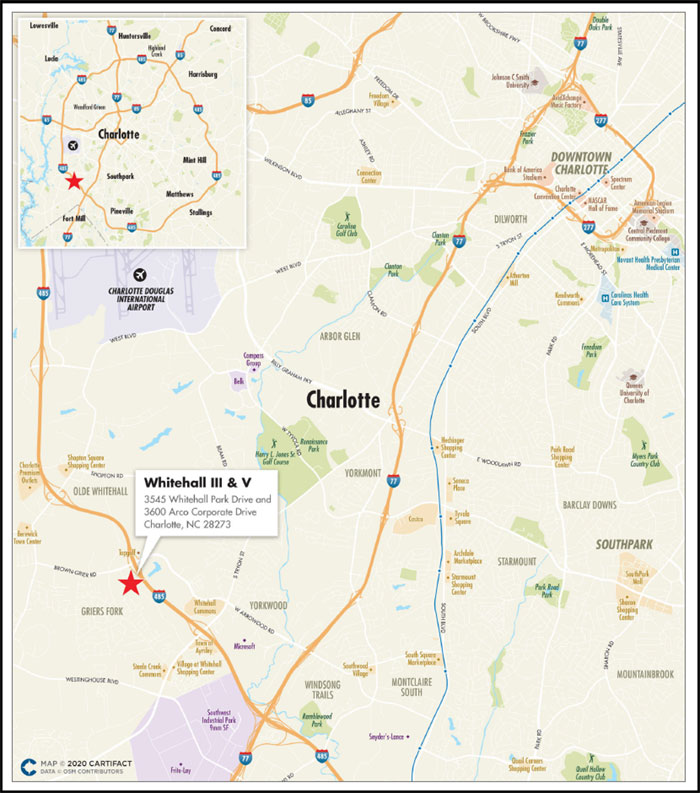
| THE INFORMATION IN THIS STRUCTURAL AND COLLATERAL TERM SHEET IS NOT COMPLETE AND MAY BE AMENDED PRIOR TO THE TIME OF SALE. THIS TERM SHEET IS NOT AN OFFER TO SELL THESE SECURITIES AND IT IS NOT A SOLICITATION OF AN OFFER TO BUY THESE SECURITIES IN ANY JURISDICTION WHERE THE OFFER OR SALE IS NOT PERMITTED. | ||
| |
104 of 130 | |
| Structural and Collateral Term Sheet | JPMDB 2020-COR7 | |
| Whitehall III & V | ||
| Mortgage Loan Information | Property Information | |||
| Mortgage Loan Seller: | LCM | Single Asset / Portfolio: | Single Asset | |
| Original Principal Balance: | $36,500,000 | Title: | Fee | |
| Cut-off Date Principal Balance: | $36,175,532 | Property Type - Subtype: | Office – Suburban | |
| % of Pool by IPB: | 4.0% | Net Rentable Area (SF): | 295,893 | |
| Loan Purpose: | Refinance | Location: | Charlotte, NC | |
| Borrower: | WH 3 & 5, LLC | Year Built / Renovated: | 2006-2007 / N/A | |
| Loan Sponsor: | Riprand Count Arco | Occupancy: | 95.6% | |
| Interest Rate: | 3.69300% | Occupancy Date: | 4/30/2020 | |
| Note Date: | 11/25/2019 | Number of Tenants: | 19 | |
| Maturity Date: | 12/6/2029 | 2017 NOI: | $2,799,392 | |
| Interest-only Period: | None | 2018 NOI: | $2,141,744 | |
| Original Term: | 120 months | 2019 NOI: | $2,537,925 | |
| Original Amortization: | 360 months | TTM NOI (as of 3/2020)(1): | $2,906,116 | |
| Amortization Type: | Balloon | UW Economic Occupancy(2): | 90.0% | |
| Call Protection: | L(30),Def(86),O(4) | UW Revenues: | $6,288,405 | |
| Lockbox / Cash Management: | Hard / Springing | UW Expenses: | $2,384,341 | |
| Additional Debt: | N/A | UW NOI(1)(2): | $3,904,063 | |
| Additional Debt Balance: | N/A | UW NCF(2): | $3,401,045 | |
| Additional Debt Type: | N/A | Appraised Value / Per SF(2): | $56,900,000 / $192 | |
| Appraisal Date: | 10/24/2019 | |||
| Escrows and Reserves(3) | Financial Information(2) | ||||||
| Initial | Monthly | Initial Cap | Cut-off Date Loan / SF: | $122 | |||
| Taxes: | $44,614 | $44,614 | N/A | Maturity Date Loan / SF: | $97 | ||
| Insurance: | $14,411 | $3,603 | N/A | Cut-off Date LTV: | 63.6% | ||
| Replacement Reserves: | $0 | $4,932 | N/A | Maturity Date LTV: | 50.4% | ||
| TI/LC: | $1,345,891 | $36,987 | $1,000,000 | UW NCF DSCR: | 1.69x | ||
| Other: | $364,904 | $0 | N/A | UW NOI Debt Yield: | 10.8% | ||
| Sources and Uses | ||||||
| Sources | Proceeds | % of Total | Uses | Proceeds | % of Total | |
| Mortgage Loan | $36,500,000 | 100.0% | Payoff Existing Debt | $33,371,949 | 91.4% | |
| Upfront Reserves | 1,769,820 | 4.8 | ||||
| Closing Costs | 849,149 | 2.3 | ||||
| Return of Equity | 509,082 | 1.4 | ||||
| Total Sources | $36,500,000 | 100.0% | Total Uses | $36,500,000 | 100.0% | |
| (1) | The increase from TTM NOI to UW NOI is primarily attributable to (i) the GSA – ATF’s rent commencement in June 2020 (approximately $754,668 of annual rent), (ii) approximately $133,779 of average rent over the loan term for investment grade tenants and (iii) approximately $126,773 of contractual rent steps through February 2021. |
| (2) | All NOI, NCF and occupancy information, as well as the appraised value, were determined prior to the emergence of the novel coronavirus pandemic, and the economic disruption resulting from measures to combat the pandemic, and all DSCR, LTV and Debt Yield metrics were calculated, and the Whitehall III & V Loan (as defined below) was underwritten, based on such prior information. See “Risk Factors—Risks Related to Market Conditions and Other External Factors—Coronavirus Pandemic Has Adversely Affected the Global Economy and Will Likely Adversely Affect the Performance of the Mortgage Loans” in the Preliminary Prospectus. |
| (3) | For a full description of Escrows and Reserves, please refer to“Escrows and Reserves”below. |
The Loan. The Whitehall III & V mortgage loan (the “Whitehall III & V Loan”) has an outstanding principal balance as of the Cut-off Date of approximately $36.2 million and is secured by a first priority mortgage lien on the borrower’s fee interest in two office buildings totaling 295,893 square feet of net rentable area (the “Whitehall III & V Properties”) located in Charlotte, North Carolina. The Whitehall III & V Loan has a 10-year term and amortizes on a 30-year schedule.The most recent prior financing of theWhitehall III & V Propertieswas securitized in LNCR 2019-CRE2 and LNCR 2019-CRE3.
The Borrower. The borrowing entity is WH 3 & 5, LLC, a Delaware limited liability company and special purpose entity structured to be bankruptcy remote with two independent directors. Legal counsel to the borrower delivered a non-consolidation opinion in connection with the origination of the Whitehall III & V Loan.
| THE INFORMATION IN THIS STRUCTURAL AND COLLATERAL TERM SHEET IS NOT COMPLETE AND MAY BE AMENDED PRIOR TO THE TIME OF SALE. THIS TERM SHEET IS NOT AN OFFER TO SELL THESE SECURITIES AND IT IS NOT A SOLICITATION OF AN OFFER TO BUY THESE SECURITIES IN ANY JURISDICTION WHERE THE OFFER OR SALE IS NOT PERMITTED. | ||
| |
105 of 130 | |
| Structural and Collateral Term Sheet | JPMDB 2020-COR7 | |
| Whitehall III & V | ||
The Loan Sponsor.The loan sponsor and nonrecourse carve-out guarantor is Riprand Count Arco (“Count Arco”). Count Arco is the founder and serves as Chairman of the Board for American Asset Corporation (“AAC”). Founded in 1986, AAC is focused on the acquisition and development of real estate projects in emerging southeastern United States markets. Since 1986, AAC has been involved in over 8.0 million square feet of real estate projects, including development of over 6.0 million square feet.
The Properties. The Whitehall III & V Properties are comprised of two buildings: Whitehall Corporate Center III (“Whitehall III”), a six-story, multi-tenant, 178,803 square foot office building, and Whitehall Corporate Center V (“Whitehall V”), a five-story, multi-tenant, 117,090 square foot office building, with an aggregate total of 295,893 square feet located in Charlotte, North Carolina. The Whitehall III & V Properties are located within the larger 700-acre Whitehall master planned community, which includes a technology park, a corporate center, a retail district, several residential communities and a nature preserve. The loan sponsor owns additional office buildings in the community.
The Whitehall III & V Properties were built by the loan sponsor between 2006 and 2007 at a reported total cost of approximately $38.7 million ($131 per square foot). The Whitehall III & V Properties also includes 1,084 surface parking spaces (3.7 per 1,000 square feet), an on-site fitness center exclusive to the tenants with personal trainers and group classes, 24-hour on-site security, an on-site car wash and detail center and on-site conference facilities seating 35-40 individuals with complimentary WiFi, projector/ATV systems and conference call capabilities. As of the April 30, 2020 underwritten rent roll, the Whitehall III & V Properties were 95.6% leased to 19 tenants over 21 leases at a weighted average underwritten base rent equal to $23.26 per square foot.
The largest tenant at the Whitehall III & V Properties is the Charlotte Mecklenburg Hospital Authority (“Atrium Health”) (76,827 square feet; 26.0% of net rentable area; 23.9% of underwritten base rent). Atrium Health, formerly Carolinas HealthCare System, is a healthcare organization with more than 40 hospitals and 900 care locations ranging from doctors’ offices to behavioral health centers to nursing homes. Atrium Health has been a tenant at the Whitehall III property since 2013 and has a lease expiration date of June 30, 2021 with one, five-year renewal option and no termination options. Atrium Health originally leased 63,287 square feet and subsequently expanded by 13,540 square feet in 2016. Atrium Health currently pays base rent equal to $20.50 per square foot.
The second largest tenant at the Whitehall III & V Properties is Novant Health, Inc. (“Novant Health”) (33,215 square feet; 11.2% of net rentable area; 13.1% of underwritten base rent; rated A1/AA-/AA- by Moody’s/Fitch/S&P). Novant Health is a four-state integrated network of physician clinics, outpatient centers and hospitals consisting of more than 1,600 physicians and 29,000 employees at more than 640 locations, including 15 medical centers and hundreds of outpatient facilities and physician clinics. Novant Health has been a tenant at the Whitehall V property since 2017 and operates pursuant to two separate leases with staggered lease expirations in June 2025 (23,654 square feet) and November 2026 (9,561 square feet). The larger Novant Health suite currently pays base rent equal to $25.45 per square foot, has no termination options and has one, three-year renewal option remaining. The 2019 expansion suite currently pays underwritten base rent equal to $27.33 per square foot, has no termination options and has two, three-year renewal options remaining.
The third largest tenant at the Whitehall III & V Properties is GSA – ATF (“ATF”) (30,371 square feet; 10.3% of net rentable area; 12.1% of underwritten base rent; rated Aaa/AAA/AA+ by Moody’s/Fitch/S&P). ATF is a law enforcement agency in the United States’ Department of Justice focused on violent criminals, criminal organizations, the illegal use and trafficking of firearms, the illegal use and storage of explosives, acts of arson and bombings, acts of terrorism, and the illegal diversion of alcohol and tobacco products. The ATF recently took occupancy at Whitehall III & V Properties in February 2020 and has a lease expiration of February 2030 with one, five-year renewal option and no termination options. The ATF currently pays base rent equal to $26.12 per square foot.
COVID-19 Update. As of June 1, 2020, the Whitehall III & V Properties are open; however, most, if not all, office tenants are working remotely. As of the April 30, 2020 underwritten rent roll, the Whitehall III & V Properties remained 95.6% occupied. For April and May and 2020, tenants representing 100.0% of net rentable area have paid rent in-full with the loan sponsor having collected 100.0% of underwritten base rent. The Whitehall III & V Loan is current through the June 6, 2020 payment date. As of June 1, 2020, the Whitehall III & V Loan is not subject to any modification or forbearance request.
The Market. The Whitehall III & V Properties are located within the Airport submarket within the overall Charlotte office market. According to a market report, as of June 8, 2020, the overall Charlotte office market contained a total inventory of approximately 120.3 million square feet with an overall market vacancy rate of 7.6% and average asking rents of approximately $29.57 per square foot. As of June 8, 2020, the Airport office submarket contained a total inventory of approximately 14.1 million square feet with an overall market vacancy rate of 11.3% and average asking rents of approximately $26.80 per square foot. The appraisal for the Whitehall III & V Properties included eight rent comparables. The rent comparables ranged from $22.68 to $27.00 per square foot with a weighted average of approximately $23.81 per square foot.
| THE INFORMATION IN THIS STRUCTURAL AND COLLATERAL TERM SHEET IS NOT COMPLETE AND MAY BE AMENDED PRIOR TO THE TIME OF SALE. THIS TERM SHEET IS NOT AN OFFER TO SELL THESE SECURITIES AND IT IS NOT A SOLICITATION OF AN OFFER TO BUY THESE SECURITIES IN ANY JURISDICTION WHERE THE OFFER OR SALE IS NOT PERMITTED. | ||
| |
106 of 130 | |
| Structural and Collateral Term Sheet | JPMDB 2020-COR7 | |
| Whitehall III & V | ||
| Historical and Current Occupancy(1) | |||
| 2016 | 2017 | 2018(2) | Current(2)(3) |
| 79.5% | 95.3% | 81.9% | 95.6% |
| (1) | Historical Occupancies are as of December 31 of eachrespective year. |
| (2) | The increase in Occupancy from 2018 to Current is primarily attributable to approximately 66,279 square feet of expansion and new leasing since July 2019. |
| (3) | Current Occupancy is as of the underwritten rent roll dated April 30, 2020. |
| Tenant Summary(1) | ||||||
| Tenant | Ratings Moody’s/Fitch/S&P | Net Rentable Area (SF) | % of Total NRA | Base Rent PSF(2) | % of Total Base Rent(2) | Lease Expiration Date |
| Charlotte Mecklenburg Hospital Authority(3) | NR / NR / NR | 76,827 | 26.0% | $20.50 | 23.9% | 6/30/2021 |
| Novant Health, Inc.(3) | A1 / AA- / AA- | 33,215 | 11.2 | $25.99 | 13.1 | Various(4) |
| GSA – ATF(3) | Aaa / AAA / AA+ | 30,371 | 10.3 | $26.12 | 12.1 | 2/9/2030 |
| GSA – MEPCOM(5) | Aaa / AAA / AA+ | 24,632 | 8.3 | $25.45 | 9.5 | 1/15/2033 |
| The Haskell Company(3) | NR / NR / NR | 23,390 | 7.9 | $24.60 | 8.7 | 11/30/2024 |
| Arrowpoint(3) | NR / NR / NR | 21,581 | 7.3 | $20.50 | 6.7 | 11/30/2021 |
| Retirement Clearinghouse(3) | NR / NR / NR | 19,974 | 6.8 | $21.50 | 6.5 | 4/30/2021 |
| O'Brien & Gere Engineers(3) | NR / NR / NR | 14,708 | 5.0 | $25.13 | 5.6 | 1/31/2028 |
| Unilever(3) | A1 / A / A+ | 8,359 | 2.8 | $22.35 | 2.8 | 11/30/2020 |
| Ricoh USA(3) | NR / NR / NR | 7,758 | 2.6 | $25.13 | 3.0 | 6/30/2022 |
| Top 10 Total / Wtd. Avg. | 260,815 | 88.1% | $23.22 | 92.1% | ||
| Other Tenants | 22,110 | 7.5 | $23.64 | 7.9 | ||
| Total Occupied Space | 282,925 | 95.6% | $23.26 | 100.0% | ||
| Vacant | 12,968 | 4.4 | ||||
| Total | 295,893 | 100.0% | ||||
| (1) | Based on the underwritten rent roll dated as of April 30, 2020. |
| (2) | Base Rent PSFincludes approximately $133,779 of average rent over the loan term for investment grade tenants and approximately $126,773 of contractual rent steps through February 2021. |
| (3) | Charlotte Mecklenburg Hospital Authority (Atrium Health) has one, five-year renewal option remaining, Novant Health (23,654 square feet) has one, three-year renewal option remaining, Novant Health (9,561 square feet) has two, three-year renewal options remaining, GSA – ATF has one, five-year renewal option remaining, The Haskell Company has one, five-year renewal option remaining, Arrowpoint has one, five-year renewal option remaining, Retirement Clearinghouse has one, five-year renewal option, O'Brien & Gere Engineers has two, five-year renewal options remaining, Unilever has two, five-year renewal options remaining and Ricoh USA has two, five-year renewal options remaining. |
| (4) | Novant Health, Inc. leases 23,654 square feet through June 2025 and 9,561 square feet through November 2026. |
| (5) | GSA – MEPCOM has a one-time termination option effective in January 2028, with 90-days prior notice. |
| THE INFORMATION IN THIS STRUCTURAL AND COLLATERAL TERM SHEET IS NOT COMPLETE AND MAY BE AMENDED PRIOR TO THE TIME OF SALE. THIS TERM SHEET IS NOT AN OFFER TO SELL THESE SECURITIES AND IT IS NOT A SOLICITATION OF AN OFFER TO BUY THESE SECURITIES IN ANY JURISDICTION WHERE THE OFFER OR SALE IS NOT PERMITTED. | ||
| |
107 of 130 | |
| Structural and Collateral Term Sheet | JPMDB 2020-COR7 | |
| Whitehall III & V | ||
| Lease Rollover Schedule(1)(2) | |||||||||
| Year | Number of Leases Expiring | Net Rentable Area Expiring | % of NRA Expiring | Base Rent Expiring(3) | % of Base Rent Expiring(3) | Cumulative Net Rentable Area Expiring | Cumulative % of NRA Expiring | Cumulative Base Rent Expiring(3) | Cumulative % of Base Rent Expiring(3) |
| Vacant | NAP | 12,968 | 4.4% | NAP | NAP | 12,968 | 4.4% | NAP | NAP |
| 2020 & MTM | 4 | 14,886 | 5.0 | $335,987 | 5.1% | 27,854 | 9.4% | $335,987 | 5.1% |
| 2021 | 5 | 119,599 | 40.4 | 2,477,107 | 37.6 | 147,453 | 49.8% | $2,813,094 | 42.8% |
| 2022 | 3 | 15,646 | 5.3 | 380,130 | 5.8 | 163,099 | 55.1% | $3,193,224 | 48.5% |
| 2023 | 1 | 2,431 | 0.8 | 62,028 | 0.9 | 165,530 | 55.9% | $3,255,252 | 49.5% |
| 2024 | 2 | 25,130 | 8.5 | 614,093 | 9.3 | 190,660 | 64.4% | $3,869,344 | 58.8% |
| 2025 | 1 | 23,654 | 8.0 | 602,059 | 9.1 | 214,314 | 72.4% | $4,471,403 | 68.0% |
| 2026 | 2 | 11,868 | 4.0 | 318,854 | 4.8 | 226,182 | 76.4% | $4,790,258 | 72.8% |
| 2027 | 0 | 0 | 0.0 | 0 | 0.0 | 226,182 | 76.4% | $4,790,258 | 72.8% |
| 2028 | 1 | 14,708 | 5.0 | 369,612 | 5.6 | 240,890 | 81.4% | $5,159,870 | 78.4% |
| 2029 | 0 | 0 | 0.0 | 0 | 0.0 | 240,890 | 81.4% | $5,159,870 | 78.4% |
| 2030 | 1 | 30,371 | 10.3 | 793,240 | 12.1 | 271,261 | 91.7% | $5,953,109 | 90.5% |
| 2031 & Beyond | 1 | 24,632 | 8.3 | 626,793 | 9.5 | 295,893 | 100.0% | $6,579,902 | 100.0% |
| Total | 21 | 295,893 | 100.0% | $6,579,902 | 100.0% | ||||
| (1) | Based on the underwritten rent roll dated April 30, 2020. |
| (2) | Certain tenants may have termination or contraction options (which may become exercisable prior to the originally stated expiration date of the tenant lease) that are not considered in the above Lease Rollover Schedule. |
| (3) | Base Rent Expiring includes approximately $133,779 of average rent over the loan term for investment grade tenants and approximately $126,773 of contractual rent steps through February 2021. |
| Operating History and Underwritten Net Cash Flow | |||||||
| 2017 | 2018 | 2019 | TTM(1) | Underwritten(2) | Per Square Foot | %(3) | |
| Rents in Place | $4,843,676 | $4,457,295 | $4,829,380 | $5,232,781 | $6,319,351 | $ 21.36 | 90.4% |
| Straight Line Rent(4) | 0 | 0 | 0 | 0 | 133,779 | 0.45 | 1.9 |
| Contractual Rent Steps(5) | 0 | 0 | 0 | 0 | 126,773 | 0.43 | 1.8 |
| Vacant Income | 0 | 0 | 0 | 0 | 317,716 | 1.07 | 4.5 |
| Gross Potential Rent | $4,843,676 | $4,457,295 | $4,829,380 | $5,232,781 | $6,897,618 | $23.31 | 98.7% |
| Total Reimbursements | 118,373 | 109,529 | 226,665 | 227,196 | 89,498 | 0.30 | 1.3 |
| Total Other Income | 24,846 | 0 | 96 | 96 | 0 | 0.00 | 0.0 |
| Net Rental Income | $4,986,895 | $4,566,824 | $5,056,141 | $5,460,073 | $6,987,116 | $23.61 | 100.0% |
| (Vacancy/Credit Loss) | 0 | 0 | 0 | 0 | (698,712) | (2.36) | (10.0) |
| Effective Gross Income | $4,986,895 | $4,566,824 | $5,056,141 | $5,460,073 | $6,288,405 | $21.25 | 90.0% |
| Total Expenses | $2,187,503 | $2,425,080 | $2,518,216 | $2,553,957 | $2,384,341 | $8.06 | 37.9% |
| Net Operating Income(6) | $2,799,392 | $2,141,744 | $2,537,925 | $2,906,116 | $3,904,063 | $13.19 | 62.1% |
| Total TI/LC, CapEx/RR | 0 | 0 | 0 | 0 | 503,018 | 1.70 | 8.0 |
| Net Cash Flow | $2,799,392 | $2,141,744 | $2,537,925 | $2,906,116 | $3,401,045 | $11.49 | 54.1% |
| (1) | TTM column represents the trailing 12-month period ending March 31, 2020. |
| (2) | For the avoidance of doubt, no COVID-19 specific adjustments have been incorporated in the lender underwriting. |
| (3) | % column represents percent of Net Rental Income for all revenue lines and represents percent of Effective Gross Income for the remainder of the fields. |
| (4) | Based on the average rent over the loan term for GSA – ATF, GSA – MEPCOM and Novant Health. |
| (5) | Based on the contractual rent steps through February 2021 for certain tenants. |
| (6) | The increase from TTM Net Operating Income to Underwritten Net Operating Income is primarily attributable to (i) the GSA – ATF’s rent commencement in June 2020 (approximately $754,668 of annual rent), (ii) approximately $133,779 of average rent over the loan term for investment grade tenants and (iii) approximately $126,773 of contractual rent steps through February 2021. |
Property Management.The Whitehall III & V Properties are managed by AAC, an affiliate of the borrower.
Escrows and Reserves. At origination, the borrower deposited into escrow $1,345,891 for outstanding tenant improvements and leasing commissions, $364,904 for outstanding free rent, approximately $44,614 for real estate taxes and approximately $14,411 for insurance.
Tax Escrows– On a monthly basis,the borrower is required to escrow 1/12 of the annual estimated tax payments, which currently equates toapproximately$44,614.
| THE INFORMATION IN THIS STRUCTURAL AND COLLATERAL TERM SHEET IS NOT COMPLETE AND MAY BE AMENDED PRIOR TO THE TIME OF SALE. THIS TERM SHEET IS NOT AN OFFER TO SELL THESE SECURITIES AND IT IS NOT A SOLICITATION OF AN OFFER TO BUY THESE SECURITIES IN ANY JURISDICTION WHERE THE OFFER OR SALE IS NOT PERMITTED. | ||
| |
108 of 130 | |
| Structural and Collateral Term Sheet | JPMDB 2020-COR7 | |
| Whitehall III & V | ||
Insurance Escrows– On a monthly basis,the borrower is required to escrow 1/12 of the annual estimated insurance premiums, which currently equates toapproximately$3,603.
Replacement Reserves –On a monthly basis, the borrower is required to escrow approximately $4,932 for replacement reserves.
TI/LC Reserves – On a monthly basis, the borrower is required to escrow approximately $36,987 for tenant improvements and leasing commissions, subject to a cap of $1,000,000.
GSA Rent Reserve – To the extent the borrower receives a lump sum payment by either GSA – ATF, occupying 30,371 square feet, or GSA – MEPCOM, occupying 24,632 square feet, for all or any part of the remaining unpaid amortized balance of any tenant improvement allowance, the borrower is required to deposit such payment with the lender.
Lockbox / Cash Management. The Whitehall III & V Loan is structured with a hard lockbox and springing cash management. All rents are required to be deposited directly by the tenants into a lockbox account controlled by the lender. All funds in the lockbox account are required to be swept daily into the borrower’s operating account, unless a Cash Management Period (as defined below) is continuing. Upon the occurrence of a Cash Management Period, all funds in the lockbox account will be swept daily into a lender-controlled account, from which account such funds will disbursed on each payment date in accordance with the loan documents and any excess will be retained by the lender as additional collateral for the Whitehall III & V Loan.
A “Cash Management Period” will commence (i) upon an event of default (until the payment date following the cure of such event of default), (ii) if the debt yield is less than 7.0% for any calendar quarter (until such time that the debt yield is greater than or equal to 7.0% for two consecutive quarters) or (iii) upon a Lease Sweep Period (as defined below).
A “Lease Sweep Period” will commence (i) on the date that is 12 months prior to the end of the term (including any renewal terms) of any Lease Sweep Lease (as defined below), (ii) on the date that is required under a Lease Sweep Lease by which the applicable Lease Sweep Tenant (as defined below) is required to give notice of its exercise of a renewal option thereunder (and such renewal has not so been exercised), (iii) if any Lease Sweep Lease is surrendered, cancelled or terminated prior to its then-current expiration date, (iv) if any Lease Sweep Tenant goes dark or gives notice that it intends to discontinue its business at its premises, (v) upon the occurrence and continuance of a default under any Lease Sweep Lease or (vi) upon the occurrence of a Lease Sweep Tenant insolvency proceeding.
A “Lease Sweep Lease” means the Charlotte Mecklenburg Hospital Authority (Atrium Health) lease, the GSA – ATF lease, the GSA – MEPCOM lease, the Novant Health lease, The Haskell Company lease and any other lease which covers 20,000 or more square feet.
A “Lease Sweep Tenant” means any tenant under a Lease Sweep Lease, or under one or more leases (leased by such tenant and/or its affiliates), which when taken together would constitute a Lease Sweep Lease.
Additional Debt. None.
Partial Release. None.
| THE INFORMATION IN THIS STRUCTURAL AND COLLATERAL TERM SHEET IS NOT COMPLETE AND MAY BE AMENDED PRIOR TO THE TIME OF SALE. THIS TERM SHEET IS NOT AN OFFER TO SELL THESE SECURITIES AND IT IS NOT A SOLICITATION OF AN OFFER TO BUY THESE SECURITIES IN ANY JURISDICTION WHERE THE OFFER OR SALE IS NOT PERMITTED. | ||
| |
109 of 130 | |
| Structural and Collateral Term Sheet | JPMDB 2020-COR7 | |
| Frick Building | ||
| Mortgage Loan Information | Property Information | |||
| Mortgage Loan Seller: | JPMCB | Single Asset / Portfolio: | Single Asset | |
| Original Principal Balance: | $35,250,000 | Title: | Fee | |
| Cut-off Date Principal Balance: | $35,250,000 | Property Type – Subtype: | Office – CBD | |
| % of Pool by IPB: | 3.9% | Net Rentable Area (SF): | 353,807 | |
| Loan Purpose: | Refinance | Location: | Pittsburgh, PA | |
| Borrower: | Frick Lender Associates, L.P. | Year Built / Renovated: | 1902 / N/A | |
| Loan Sponsors(1): | Various | Occupancy: | 72.5% | |
| Interest Rate: | 3.70000% | Occupancy Date: | 5/26/2020 | |
| Note Date: | 2/28/2020 | Number of Tenants: | 46 | |
| Maturity Date: | 3/1/2030 | 2017 NOI: | $3,871,979 | |
| Interest-only Period: | 24 months | 2018 NOI: | $3,519,424 | |
| Original Term: | 120 months | 2019 NOI: | $3,774,282 | |
| Original Amortization: | 360 months | TTM NOI (as of 3/2020): | $3,801,950 | |
| Amortization Type: | IO-Balloon | UW Economic Occupancy(4): | 73.8% | |
| Call Protection: | L(27),Def(90),O(3) | UW Revenues: | $6,362,831 | |
| Lockbox / Cash Management: | Hard / Springing | UW Expenses: | $2,754,914 | |
| Additional Debt: | N/A | UW NOI(4): | $3,607,917 | |
| Additional Debt Balance: | N/A | UW NCF(4): | $3,214,491 | |
| Additional Debt Type: | N/A | Appraised Value / Per SF(4): | $50,000,000 / $141 | |
| Appraisal Date: | 1/10/2020 | |||
| Escrows and Reserves | Financial Information(4) | ||||||
| Initial | Monthly | Initial Cap | Cut-off Date Loan / SF: | $100 | |||
| Taxes: | $80,733 | $40,367 | N/A | Maturity Date Loan / SF: | $83 | ||
| Insurance: | $0 | Springing | N/A | Cut-off Date LTV: | 70.5% | ||
| Replacement Reserves: | $5,897 | $5,897 | N/A | Maturity Date LTV: | 58.9% | ||
| TI/LC: | $29,484 | $29,484 | $1,769,040 | UW NCF DSCR: | 1.65x | ||
| Other(2)(3): | $813,849 | Springing | $1,452,000 | UW NOI Debt Yield: | 10.2% | ||
| Sources and Uses | ||||||
| Sources | Proceeds | % of Total | Uses | Proceeds | % of Total | |
| Mortgage Loan | $35,250,000 | 100.0% | Payoff Existing Debt | $22,122,510 | 62.8% | |
| Return of Equity | 11,438,632 | 32.5 | ||||
| Upfront Reserves | 929,963 | 2.6 | ||||
| Closing Costs | 758,895 | 2.2 | ||||
| Total Sources | $35,250,000 | 100.0% | Total Uses | $35,250,000 | 100.0% | |
| (1) | The loan sponsors are Aaron Stauber, Alan Ades, Maurice Ades, Robert Ades, Albert Erani, and Dennis Erani. See “The Loan Sponsors” herein. |
| (2) | Initial Other Escrows and Reserves are inclusive of a $737,840 outstanding TI/LC reserve in connection with five leases and a $72,159 free rent reserve in connection with two leases. |
| (3) | Monthly Other Escrows and Reserves are inclusive of a springing Major Tenant Trigger Reserve. Upon the occurrence and continuance of (a) the debt yield for the mortgaged property being less than 9.57% and (b) County of Allegheny, a political subdivision of The Commonwealth of Pennsylvania, on behalf of its Court of Common Pleas (the “Major Tenant”) having failed to either renew or exercised its option to extend its lease prior to December 31, 2026, and, so long as no event of default has occurred and is continuing, the borrower is required to deposit all excess cash flow for costs incurred with respect to re-tenanting the premises currently demised to the Major Tenant Premises, subject to a cap of $1,452,000. |
| (4) | All NOI, NCF and occupancy information, as well as the appraised value, were determined prior to the emergence of the novel coronavirus pandemic, and the economic disruption resulting from measures to combat the pandemic, and all DSCR, LTV and Debt Yield metrics were calculated, and the Frick Building Loan (as defined below) was underwritten, based on such prior information. See “Risk Factors—Risks Related to Market Conditions and Other External Factors—Coronavirus Pandemic Has Adversely Affected the Global Economy and Will Likely Adversely Affect the Performance of the Mortgage Loans” in the Preliminary Prospectus. |
The Loan.The Frick Building mortgage loan (the “Frick Building Loan”) has an outstanding principal balance as of the Cut-off Date of approximately $35.25 million and is secured by a first mortgage lien on the borrower’s fee interest in a 353,807 square foot Class A office building located in Pittsburgh, Pennsylvania (the “Frick Building Property”). The Frick Building Loan has a 10-year term and following a two-year interest-only period, will amortize on a 30-year amortization schedule. The Frick Building was previously securitized in the WFRBS 2011-C4 transaction.
| THE INFORMATION IN THIS STRUCTURAL AND COLLATERAL TERM SHEET IS NOT COMPLETE AND MAY BE AMENDED PRIOR TO THE TIME OF SALE. THIS TERM SHEET IS NOT AN OFFER TO SELL THESE SECURITIES AND IT IS NOT A SOLICITATION OF AN OFFER TO BUY THESE SECURITIES IN ANY JURISDICTION WHERE THE OFFER OR SALE IS NOT PERMITTED. | ||
| |
110 of 130 | |
| Structural and Collateral Term Sheet | JPMDB 2020-COR7 | |
| Frick Building | ||
The Borrower.The borrower is Frick Lender Associates, L.P., a Pennsylvania limited partnership and special purpose entity structured to be bankruptcy remote with one independent director. Legal counsel to the borrower delivered a non-consolidation opinion in connection with the origination of the Frick Building Loan.
The Loan Sponsors. The loan sponsors and non-recourse carveout guarantors are Aaron Stauber, Alan Ades, Maurice Ades, Robert Ades, Albert Erani, and Dennis Erani, all of whom serve as principals at Rugby Realty, a New Jersey-based private equity firm with approximately $1.0 billion of real estate owned throughout New York, New Jersey, Pennsylvania, Connecticut, Florida and Georgia. Rugby Realty is involved in all aspects of commercial real estate operations, including the purchase, development and management of a broad range of real estate holdings. As of December 2018, Rugby Realty owned more than 6.5 million square feet of real estate valued in excess of $860 million.
The Property.The Frick Building Property is a 20-story, 353,807 square feet, Class A office building located in Pittsburgh, Pennsylvania. The Frick Building Property is comprised of 322,974 square feet of office space which is currently 72.4% leased, 10,937 square feet of retail space which is currently 100% leased, 11,625 square feet of storage space which is currently 29.5% leased, 6,749 square feet of amenity space in the Frick Innovation Center and the remaining 1,522 square feet devoted to management and antenna space.
The Frick Building was designed by D.H. Burnham & Co. and constructed in 1902. The loan sponsors acquired the Frick Building Property in 2005 for approximately $17.0 million (approximately $48 per square foot). At the time of purchase, the building was approximately 50% leased. Subsequently, the loan sponsors invested $18.0 million (approximately $51 per square foot) to update and modernize the Frick Building Property, resulting in a costs basis of approximately $35.0 million (approximately $99 per square foot). The loan sponsors also continue to invest in maintaining the Frick Building Property. The Frick Building Property has been awarded the “BOMA Building of the Year” for historic buildings.
The loan sponsors’ initial investment in the Frick Building Property focused on modernizing the property’s infrastructure. Since 2011, Rugby Realty has invested approximately $9.6 million (approximately $27 per square foot) in capital expenditures and building improvements, with an additional $5.9 million (approximately $17 per square foot) in tenant improvements and $2.3 million (approximately $7 per square foot) in leasing commissions. Recent capital improvements include a comprehensive façade and cornice restoration, window renovations, new boilers and chillers, roof repairs, elevator upgrades, the installation of a new fitness facility and the addition of the Frick Innovation Center, a new, state-of-the-art amenity center. The main area of the Frick Innovation Center, featuring two-story ceiling heights, is complete with glass enclosed individual “offices,” co-working desks, collaborative tables, a tenant lounge with couches, printing services, bathrooms, a full-service kitchen and bar and a foosball table. In addition, the Frick Innovation Center includes three board and conference rooms which include poly-coms, multi-media connectivity, white boards and projectors. Various improvements have also been made to modernize the office suites and bathrooms throughout the Frick Building Property.
As of May 26, 2020, the Frick Building Property was 72.5% leased to 46 tenants operating in a variety of industries, including financial services, human resources, technology and real estate. In-place tenancy results in a weighted average underwritten rent of $23.30 per square foot and a remaining lease term of approximately 3.0 years. Approximately 34.2% of tenants by net rentable area have been in occupancy since at least 2006, including Geohring, Rutter & Boehm, currently the second largest tenant and an original tenant at the Frick Building Property in 1902. Additionally, 13.4% of net rentable area and 14.0% of underwritten rent is attributable to corporate headquarters for two tenants: Allegheny Court of Common Pleas and Elite Transit Solutions, LLC.
The largest tenant, Allegheny Court of Common Pleas, (34,277 square feet; 9.7% of net rentable area; 12.5% of underwritten base rent), whose courthouse is adjacent to the Frick Building Property, holds its headquarters at the Frick Building Property (as well as the offices of several justices, including the chief justice and various courtrooms and judge’s chambers). Also known as the “Fifth Judicial District of Pennsylvania, Court of Common Pleas,” the Fifth Judicial Court is a trial court of general jurisdiction and has original jurisdiction over all cases not exclusively assigned to another court. The various divisions of the court adjudicate a wide array of matters including criminal prosecutions, civil disputes involving money or property, child support and custody, among others. Allegheny Court of Common Pleas has been a tenant at the Frick Building Property since 2001 and has a lease expiration date of December 2027 with no termination options and one five-year renewal option.
The second largest tenant, Goehring, Rutter Boehm (26,521 square feet; 7.5% of net rentable area; 9.4% of underwritten base rent), now known as GRB Law, is a Pittsburgh-based law firm with a broad practice that spans nine core groups ranging from business law to estate planning and administration. The firm’s lawyers represent families, individuals, small companies, Fortune 500 corporations, school districts, governments and real estate developers. An original tenant of the Frick Building in 1902, GRB Law has a lease expiration date of December 2021 with no termination options and no renewal options.
| THE INFORMATION IN THIS STRUCTURAL AND COLLATERAL TERM SHEET IS NOT COMPLETE AND MAY BE AMENDED PRIOR TO THE TIME OF SALE. THIS TERM SHEET IS NOT AN OFFER TO SELL THESE SECURITIES AND IT IS NOT A SOLICITATION OF AN OFFER TO BUY THESE SECURITIES IN ANY JURISDICTION WHERE THE OFFER OR SALE IS NOT PERMITTED. | ||
| |
111 of 130 | |
| Structural and Collateral Term Sheet | JPMDB 2020-COR7 | |
| Frick Building | ||
The third largest tenant, Kids Voice (18,412 square feet; 5.2% of net rentable area; 2.7% of underwritten base rent), is a non-profit agency that advocates in court and in the community to ensure a safe and permanent home for abused, neglected, and at-risk children. Each year, Kids Voice represents nearly 3,000 children involved in the child-welfare system in Allegheny County’s Juvenile Court. These children range in age from birth to 21 and are of every ethnicity, race, gender and socioeconomic status, the majority being from families with incomes below the federal poverty guidelines. Kids Voice has a lease expiration date of September 2026 with no termination options and no renewal options.
COVID-19 Update. As of the June 2020 payment, the Frick Building Property officially remains open; however, most, if not all, tenants are currently working remotely. Occupancy at the Frick Building Property remains 72.5% as of the May 26, 2020 rent roll. For April and May of 2020, tenants representing approximately 96.9% and 96.8% of net rentable area, respectively, have paid rent in-full, with the loan sponsors having collected approximately 96.6% and 96.5%, respectively, of underwritten base. As May 26, 2020, two commercial tenants representing 6.1% of underwritten base rent have delayed rent commencement dates as a function of delays to tenant specific build-outs and one retail tenant representing 0.5% of underwritten base rent has been granted temporary rent relief due to ongoing COVID-19 related disruption. The Frick Building Loan is current through the June 1, 2020 payment date. As of June 1, 2020 the Frick Building Loan is not subject to any modification or forbearance request.
The Market. The Frick Building Property is located on Grant Street in downtown Pittsburgh, Allegheny County, Pennsylvania in the city’s central business district (“CBD”) and is part of the Pittsburgh office market. The Pittsburgh CBD is bound on its northern side by the Allegheny River and on its southern side by the Monongahela River. These rivers join at the apex of the “Golden Triangle” to form the Ohio River. To the east, the CBD extends to just beyond the Crosstown Boulevard (I-579) and 11th Street. According to CoStar as of the first quarter of 2020, the Pittsburgh office market had a vacancy rate of 8.5% and asking rent of $21.32 per square foot. According to the appraisal, several prominent landmarks integral to the city of Pittsburgh also lie just outside, demarcating the Pittsburgh CBD. Such landmarks include PNC Park, the home of the Major League Baseball’s Pittsburgh Pirates, and Heinz Field, the home of the National Football League’s Pittsburgh Steelers, immediately north of the Pittsburgh CBD. Station Square, an upscale shopping area and tourist attraction, is opposite the CBD to the south. Immediately east of the Pittsburgh CBD is PPG Paint Arena, home of the Pittsburgh Penguins NHL hockey team.
The Frick Building Property is located within the Pittsburgh CBD Class A submarket. According to the appraisal, as of the fourth quarter 2019, the Pittsburgh Central Business District Class A submarket had a vacancy rate of 13.2% and asking rent of $29.44 per square foot. The Frick Building Property’s location within the Golden Triangle gives tenants at the Frick Building Property access to a number of public transportation options, including the Steel Plaza Stop 0.2 miles away, the Wood Street Stop 0.3 miles away, the Gateway Center and First Avenue Stops both 0.4 miles away, and the Station Square stop 0.8 miles away. In addition, the Golden Triangle is easily accessible via major roadways, including the “Parkway East” (I-376) from Monroeville, the “Parkway West” (I-376) from the airport area, the “Parkway North” (I-279) from the North Hills, and I-579. Pittsburgh International Airport, the state’s second largest airport, which announced a billion dollar renovation to be completed within the next five years, is approximately 17.5 miles west of the Frick Building Property.
According to the appraisal, the estimated 2019 population within a one-, three- and five-mile radius of the Frick Building Property was approximately 19,768, 153,063 and 393,059, respectively. The estimated 2019 average household income within the same radii was approximately $70,040, $60,788, and $73,724, respectively.
The appraisal identified eight comparable office leases ranging in size from 368,840 square feet to 1,467,972 square feet. Comparable tenants reported rental rates ranging from ranging from $24.50 to $31.50 per square foot with a weighted average rent of approximately $26.09 per square foot. The comparable properties were built between 1913 and 1982 and have occupancies ranging from 37.0% to 98.0%. The weighted average underwritten office rent at the Frick Building Property is approximately $22.29 per square foot, approximately 8.2% below the appraisal’s market rent conclusion of $24.27.
| Historical Occupancy(1) | ||||
| 2017 | 2018 | 2019 | Current(2) | |
| Occupancy | 75.8% | 73.1% | 76.5% | 72.5% |
| (1) | Historical occupancies are as of December 31 of each respective year. |
| (2) | Current Occupancy is as of May 26, 2020. |
| THE INFORMATION IN THIS STRUCTURAL AND COLLATERAL TERM SHEET IS NOT COMPLETE AND MAY BE AMENDED PRIOR TO THE TIME OF SALE. THIS TERM SHEET IS NOT AN OFFER TO SELL THESE SECURITIES AND IT IS NOT A SOLICITATION OF AN OFFER TO BUY THESE SECURITIES IN ANY JURISDICTION WHERE THE OFFER OR SALE IS NOT PERMITTED. | ||
| |
112 of 130 | |
| Structural and Collateral Term Sheet | JPMDB 2020-COR7 | |
| Frick Building | ||
| Tenant Summary(1) | |||||||
| Tenant | Ratings Moody’s/Fitch/S&P(2) | Net Rentable Area (SF) | % of Total NRA | Base Rent PSF(3) | % of Total Base Rent | Lease Expiration Date(4) | |
| Major Office Tenants | |||||||
| Allegheny Court of Common Pleas | Aa3 / AA- / A+ | 34,277 | 9.7% | $21.80 | 12.5% | 12/31/2027 | |
| Goehring, Rutter Boehm(4) | NR / NR / NR | 25,322 | 7.2% | $22.25 | 9.4% | 12/31/2021 | |
| Kids Voice | NR / NR / NR | 18,412 | 5.2% | $11.90 | 3.7% | 9/30/2026 | |
| Dunbar, Bender, Zapf | NR / NR / NR | 14,016 | 4.0% | $24.00 | 5.6% | 5/31/2023 | |
| Elite Transit Solutions, LLC(5) | NR / NR / NR | 13,226 | 3.7% | $30.60 | 6.8% | 2/28/2030 | |
| CDI - L.R. Kimball | NR / NR / NR | 12,031 | 3.4% | $23.57 | 4.7% | 3/31/2021 | |
| MacLachlan, Cornelius & Filoni(6) | NR / NR / NR | 10,821 | 3.1% | $24.50 | 4.4% | 7/31/2027 | |
| The Disciplinary Board of the Supreme Court of PA | Aa3 / AA- / A+ | 9,677 | 2.7% | $22.29 | 3.6% | 5/31/2026 | |
| Raphael, Ramsden & Behers | NR / NR / NR | 7,837 | 2.2% | $16.84 | 2.2% | 4/30/2022 | |
| Rosen, Louik, Perry | NR / NR / NR | 7,803 | 2.2% | $21.23 | 2.8% | 8/31/2022 | |
| Total Major Office Tenants | 153,422 | 43.4% | $21.72 | 55.8% | |||
| Other Occupied Office | 80,285 | 22.7% | $23.38 | 31.4% | |||
| Total Occupied Retail | 10,937 | 3.1% | $66.55 | 12.2% | |||
| Total Occupied Storage | 3,426 | 1.0% | $8.54 | 0.5% | |||
| Other Occupied(7) | 8,271 | 2.3% | $0.73 | 0.1% | |||
| Total Occupied | 256,341 | 72.5% | $23.30 | 100.0% | |||
| Vacant Office | 89,267 | 25.2% | |||||
| Vacant Storage | 8,199 | 2.3% | |||||
| Total / Wtd. Avg. | 353,807 | 100.0% | |||||
| (1) | Based on the underwritten rent roll as of May 26, 2020. |
| (2) | Certain ratings are those of the parent company whether or not the parent company guarantees the lease. |
| (3) | Base Rent PSF is inclusive of contractual rent steps through October 1, 2020. |
| (4) | Goehring, Rutter Boehm has 1,199 square feet of storage space, which is included in Total Occupied Storage. |
| (5) | Elite Transit Solutions, LLC has a one-time right to terminate its lease effective as of May 2026 with no less than 12 months’ prior notice, subject to a termination fee equal to the then-unamortized amount of tenant improvements and leasing commissions, as of the effective date of termination. |
| (6) | MacLachlan, Cornelius & Filoni has a one-time right to terminate its lease effective as of July 2024 with no less than 12 months’ prior notice, subject to a termination fee equal to two months of the then current rent plus a fee equal to the then-unamortized amount of tenant improvements and leasing commissions, as of the effective date of termination. |
| (7) | Other Occupied is inclusive of 1,521 square feet attributable to management space, 1 square foot attributable to Lightower Fiber Networks II’s antenna and 6,749 square feet attributable to amenity space comprising of the Frick Innovation Center. |
| Lease Rollover Schedule(1)(2) | |||||||||
| Year | Number of Leases Expiring | Net Rentable Area Expiring | % of NRA Expiring | Base Rent Expiring(3) | % of Base Rent Expiring | Cumulative Net Rentable Area Expiring | Cumulative % of NRA Expiring | Cumulative Base Rent Expiring | Cumulative % of Base Rent Expiring |
| Vacant | NAP | 97,466 | 27.5% | NAP | NAP | 97,466 | 27.5% | NAP | NAP |
| MTM & 2020(4) | 12 | 17,580 | 5.0 | $251,655 | 4.2% | 115,046 | 32.5% | $251,655 | 4.2% |
| 2021 | 20 | 47,149 | 13.3 | $1,129,271 | 18.9% | 162,195 | 45.8% | $1,380,926 | 23.1% |
| 2022 | 6 | 28,585 | 8.1 | $591,300 | 9.9% | 190,780 | 53.9% | $1,972,226 | 33.0% |
| 2023 | 11 | 40,961 | 11.6 | $1,334,508 | 22.3% | 231,741 | 65.5% | $3,306,734 | 55.4% |
| 2024 | 5 | 12,314 | 3.5 | $264,938 | 4.4% | 244,055 | 69.0% | $3,571,672 | 59.8% |
| 2025 | 6 | 14,851 | 4.2 | $374,524 | 6.3% | 258,906 | 73.2% | $3,946,196 | 66.1% |
| 2026 | 4 | 31,030 | 8.8 | $511,363 | 8.6% | 289,936 | 81.9% | $4,457,560 | 74.6% |
| 2027 | 7 | 49,124 | 13.9 | $1,110,313 | 18.6% | 339,060 | 95.8% | $5,567,873 | 93.2% |
| 2028 | 0 | 0 | 0.0 | $0 | 0.0% | 339,060 | 95.8% | $5,567,873 | 93.2% |
| 2029 | 0 | 0 | 0.0 | $0 | 0.0% | 339,060 | 95.8% | $5,567,873 | 93.2% |
| 2030 | 2 | 14,747 | 4.2 | $404,716 | 6.8% | 353,807 | 100.0% | $5,972,588 | 100.0% |
| 2031 and Thereafter | 0 | 0 | 0.0 | $0 | 0.0% | 353,807 | 100.0% | $5,972,588 | 100.0% |
| Total | 73 | 353,807 | 100.0% | $5,972,588 | 100.0% | ||||
| (1) | Based on the underwritten rent roll as of May 26, 2020. |
| (2) | Certain tenants may have termination or contraction options (which may become exercisable prior to the originally stated expiration date of the tenant lease) that are not considered in the above Lease Rollover Schedule. |
| (3) | Base Rent Expiring is inclusive of contractual rent steps through October 1, 2020. |
| (4) | MTM & 2020 is inclusive of 5,099 square feet associated with Sittig, Cortese and Wratcher and 224 square feet associated with Fran’s Place, which are on a month-to-month basis. |
| THE INFORMATION IN THIS STRUCTURAL AND COLLATERAL TERM SHEET IS NOT COMPLETE AND MAY BE AMENDED PRIOR TO THE TIME OF SALE. THIS TERM SHEET IS NOT AN OFFER TO SELL THESE SECURITIES AND IT IS NOT A SOLICITATION OF AN OFFER TO BUY THESE SECURITIES IN ANY JURISDICTION WHERE THE OFFER OR SALE IS NOT PERMITTED. | ||
| |
113 of 130 | |
| Structural and Collateral Term Sheet | JPMDB 2020-COR7 | |
| Frick Building | ||
| Operating History and Underwritten Net Cash Flow | |||||||
2017 | 2018 | 2019 | TTM(1) | Underwritten(2) | Per Square Foot | %(3) | |
| Base Rent(4) | $6,233,000 | $5,864,677 | $6,098,473 | $6,082,288 | $5,972,588 | $16.88 | 69.9% |
| Vacant Income | 0 | 0 | 0 | 0 | 2,239,691 | 6.33 | 26.2% |
| Gross Potential Rent | $6,233,000 | $5,864,677 | $6,098,473 | $6,082,288 | $8,212,279 | $23.21 | 96.1% |
| Total Reimbursements | 311,098 | 410,919 | 391,839 | 430,550 | 337,139 | 0.95 | 3.9% |
| Net Rental Income | $6,544,098 | $6,275,596 | $6,490,312 | $6,512,838 | $8,549,418 | $24.16 | 100.0% |
| (Vacancy/Credit Loss) | 0 | 0 | 0 | 0 | (2,239,691) | (6.33) | %(26.2) |
| Total Other Income | 34,413 | 56,785 | 54,728 | 53,104 | 53,104 | 0.15 | 0.6% |
| Effective Gross Income | $6,578,511 | $6,332,381 | $6,545,040 | $6,565,942 | $6,362,831 | $17.98 | 74.4% |
| Total Expenses | $2,706,532 | $2,812,957 | $2,770,758 | $2,763,992 | $2,754,914 | $7.79 | 43.3% |
| Net Operating Income | $3,871,979 | $3,519,424 | $3,774,282 | $3,801,950 | $3,607,917 | $10.20 | 56.7% |
| TI/LC | 0 | 0 | 0 | 0 | 342,110 | 0.97 | 5.4% |
| Replacement Reserves | 0 | 0 | 0 | 0 | 51,317 | 0.15 | 0.8% |
| Net Cash Flow | $3,871,979 | $3,519,424 | $3,774,282 | $3,801,950 | $3,214,491 | $9.09 | 50.5% |
| (1) | TTM represents the trailing 12-month period ending March 2020. |
| (2) | For the avoidance of doubt, no COVID-19 specific adjustments have been incorporated in the lender underwriting. |
| (3) | % column represents percent of Net Rental Income for all revenue lines and represents percent of Effective Gross Income for the remainder of the fields. |
| (4) | Underwritten Base Rent is inclusive of contractual rent steps through October 1, 2020. |
Property Management.The Frick Building Property is managed by DraxxHall Management Corporation, an affiliate of the borrower.
| THE INFORMATION IN THIS STRUCTURAL AND COLLATERAL TERM SHEET IS NOT COMPLETE AND MAY BE AMENDED PRIOR TO THE TIME OF SALE. THIS TERM SHEET IS NOT AN OFFER TO SELL THESE SECURITIES AND IT IS NOT A SOLICITATION OF AN OFFER TO BUY THESE SECURITIES IN ANY JURISDICTION WHERE THE OFFER OR SALE IS NOT PERMITTED. | ||
| |
114 of 130 | |
| Structural and Collateral Term Sheet | JPMDB 2020-COR7 | |
| Peace Coliseum | ||
| Mortgage Loan Information | Property Information | |||
| Mortgage Loan Seller: | LCM | Single Asset / Portfolio: | Single Asset | |
| Original Principal Balance: | $34,500,000 | Title: | Fee | |
| Cut-off Date Principal Balance: | $34,500,000 | Property Type - Subtype: | Office – Suburban | |
| % of Pool by IPB: | 3.8% | Net Rentable Area (SF): | 236,585 | |
| Loan Purpose: | Recapitalization | Location: | Midvale, UT | |
| Borrower: | Peace Coliseum, LLC | Year Built / Renovated: | 2015 / N/A | |
| Loan Sponsor: | Overstock.com, Inc. | Occupancy(1): | 100.0% | |
| Interest Rate: | 4.24200% | Occupancy Date: | 6/6/2020 | |
| Note Date: | 3/6/2020 | Number of Tenants: | 1 | |
| Maturity Date: | 3/6/2030 | 2017 NOI(1): | N/A | |
| Interest-only Period: | 120 months | 2018 NOI(1): | N/A | |
| Original Term: | 120 months | 2019 NOI(1): | N/A | |
| Original Amortization: | None | TTM NOI(1): | N/A | |
| Amortization Type: | Interest Only | UW Economic Occupancy(2): | 92.5% | |
| Call Protection: | L(27),Def(89),O(4) | UW Revenues: | $6,696,348 | |
| Lockbox / Cash Management: | Hard / In-Place | UW Expenses: | $1,975,278 | |
| Additional Debt: | Yes | UW NOI(2): | $4,721,069 | |
| Additional Debt Balance: | $12,220,159 | UW NCF(2): | $4,346,858 | |
| Additional Debt Type: | Mezzanine Loan | Appraised Value / Per SF(2): | $80,000,000 / $338 | |
| Appraised Dark Value / Per SF(2)(3): | $62,000,000 / $262 | |||
| Appraisal Date: | 2/14/2020 | |||
| Escrows and Reserves | Financial Information(2) | ||||||
| Initial | Monthly | Initial Cap | Mortgage Loan | Total Debt | |||
| Taxes: | $290,000 | $72,000 | N/A | Cut-off Date Loan / SF: | $146 | $197 | |
| Insurance: | $170,000 | $14,500 | N/A | Maturity Date Loan / SF: | $146 | $146 | |
| Replacement Reserves(4): | $0 | Springing | N/A | Cut-off Date LTV: | 43.1% | 58.4% | |
| TI/LC(4): | $0 | Springing | N/A | Maturity Date LTV: | 43.1% | 43.1% | |
| Other(5): | $0 | $0 | N/A | UW NCF DSCR: | 2.93x | 2.03x | |
| UW NOI Debt Yield: | 13.7% | 10.1% | |||||
| Sources and Uses | |||||||
| Sources | Proceeds | % of Total | Uses | Proceeds | % of Total | ||
| Mortgage Loan | $34,500,000 | 72.6% | Return of Equity(6) | $46,371,527 | 97.6% | ||
| Mezzanine Loan | 13,000,000 | 27.4 | Closing Costs | 668,473 | 1.4 | ||
| Upfront Reserves | 460,000 | 1.0 | |||||
| Total Sources | $47,500,000 | 100.0% | Total Uses | $47,500,000 | 100.0% | ||
| (1) | The Overstock.com lease commenced in March 2020. No historical cash flow information is available prior to the commencement of the Overstock.com lease. |
| (2) | All NOI, NCF and occupancy information, as well as the appraised values, were determined prior to the emergence of the novel coronavirus pandemic, and the economic disruption resulting from measures to combat the pandemic, and all DSCR, LTV and Debt Yield metrics were calculated, and the Peace Coliseum Loan (as defined below) was underwritten, based on such prior information. See “Risk Factors—Risks Related to Market Conditions and Other External Factors—Coronavirus Pandemic Has Adversely Affected the Global Economy and Will Likely Adversely Affect the Performance of the Mortgage Loans” in the Preliminary Prospectus. |
| (3) | The appraisal concluded to an “As If Vacant” value as of February 14, 2020 equal to $62,000,000 ($262 per square foot), which equates to a Cut-off Date LTV and Maturity LTV Ratio of 55.6% and 55.6%, respectively. |
| (4) | Monthly replacement reserve and TI/LC escrows are waived so long as the Overstock.com lease is in full force and effect. |
| (5) | On each payment date during a lease sweep period, all available cash will be deposited into the special rollover reserve account. |
| (6) | The Peace Coliseum property was previously unencumbered. The loan sponsor constructed the Peace Coliseum property in 2015 at a total cost of approximately $100.1 million ($423 per square foot). |
The Loan. The Peace Coliseum mortgage loan, with an outstanding principal balance of $34.5 million as of the Cut-off Date (the “Peace Coliseum Loan”), is secured by a first mortgage lien on the borrower’s fee simple interest in an office property comprised of 236,585 square feet of net rentable area (the “Peace Coliseum Property”) located in Midvale, Utah. The Peace Coliseum Loan has a 10-year term and is interest only for the entire term.
| THE INFORMATION IN THIS STRUCTURAL AND COLLATERAL TERM SHEET IS NOT COMPLETE AND MAY BE AMENDED PRIOR TO THE TIME OF SALE. THIS TERM SHEET IS NOT AN OFFER TO SELL THESE SECURITIES AND IT IS NOT A SOLICITATION OF AN OFFER TO BUY THESE SECURITIES IN ANY JURISDICTION WHERE THE OFFER OR SALE IS NOT PERMITTED. | ||
| |
115 of 130 | |
| Structural and Collateral Term Sheet | JPMDB 2020-COR7 | |
| Peace Coliseum | ||
The Borrower. The borrowing entity is Peace Coliseum, LLC, a Delaware limited liability company and special purpose entity structured to be bankruptcy remote with at least two independent directors. Legal counsel to the borrowers delivered a non-consolidation opinion in connection with the origination of the Peace Coliseum Loan.
The Loan Sponsor.The loan sponsor and nonrecourse carve-out guarantor is Overstock.com, Inc. (“Overstock”). Overstock, the sole tenant at the Peace Coliseum Property, is a billion-dollar, tech driven online retailer located in Salt Lake City, Utah. The company was founded as a Utah limited liability company in 1997, recognized as a C Corporation in the state of Utah in 1998, and reincorporated in Delaware in 2002. The company, which launched their initial website in March 1999, employs over 1,600 full-time employees.
The Property. The Peace Coliseum Property is a Class-A office campus comprised of 236,585 square feet of net rentable area within two buildings, which includes a three-story circular building and a single-story amenity building located in Midvale, Utah. The Peace Coliseum Property contains a three-story parking structure that includes 1,188 parking spaces (approximately 5.0 spaces per 1,000 square feet). The Peace Coliseum Property was built in 2015 at a total cost of approximately $100.1 million ($423 per square foot) and features a full court basketball court, on-site sidewalk trail and a 9,000 square foot glass greenhouse. The Peace Coliseum Property is 100.0% leased to Overstock, an online retailer offering a broad range of price-competitive products, including furniture, home décor, bedding and bath, and housewares, among other products. The Peace Coliseum Property serves as Overstock’s corporate headquarters and is subject to a 25-year, non-terminable absolute triple net lease that commenced in March 2020 and expires in February 2045 with five, five-year renewal options (the “Overstock Lease”). The Overstock Lease includes 5.0% annual increases on each five-year anniversary until expiration, inclusive of any extension term.
COVID-19 Update. As of June 1, 2020, the Peace ColiseumProperty is open; however most, if not all, Overstock employees are working remotely. As of the June 6, 2020 underwritten rent roll, thePeace Coliseum Propertyremains 100.0% occupied. Overstock is current with respect to all contractual rent obligations for April and May of 2020. The Peace Coliseum Loan is current through the June 6, 2020 payment date. As of June 1, 2020, thePeace ColiseumLoan is not subject to any modification or forbearance request.
The Market. The Peace Coliseum Property is located in the Salt Lake City, UT metropolitan statistical area. According to the appraisal, the area has a population of approximately 1.2 million, which has increased 1.3% per annum since 2010 and is expected to increase 1.2% per annum through 2024. Primary access to the Peace Coliseum Property neighborhood is provided by Interstate 15. Public transportation is provided by the Utah Transit Authority (“UTA”) via a bus line or UTA Trax, which has a light rail station (the Bingham Junction Station) located near the east end of the Peace Coliseum Property.
The Peace Coliseum Property is located in the Union Park District office submarket, within the overall Salt Lake City office market. According to a market report, as of June 5, 2020, the overall Salt Lake City office market contained approximately 74.8 million square feet with an overall market vacancy of 7.3% and average asking rents of approximately $23.50 per square foot. As of June 5, 2020, the Union Park District office submarket contained approximately 4.7 million square feet across with an overall market vacancy of 5.0% and average asking rents of approximately $22.80 per square foot. The appraisal identified eight comparable office leases in the Salt Lake and Northern Utah Counties ranging in size from 116,328 square feet of leased area to 287,367 square feet of leased area. Base rents for the comparable office leases ranged from $19.38 per square foot to $34.00 per square foot, with a weighted average of approximately $27.79 per square foot. Six of the comparable leases identified by the appraisal are on a full service basis and two comparable leases are on a triple net basis. The appraisal concluded a market rent of $23.00 per square foot which is in line with the Peace Coliseum Property’s base rent.
| Tenant Summary(1) | ||||||
| Tenant | Ratings Moody’s/Fitch/S&P | Net Rentable Area (SF) | % of Total NRA | Base Rent PSF | % of Total Base Rent | Lease Expiration Date |
| Overstock.com(2) | NR / NR / NR | 236,585 | 100.0% | $22.25 | 100.0% | 2/28/2045 |
| (1) | Based on the underwritten rent roll. |
| (2) | Overstock.com has five, five-year renewal options and no termination options. |
| THE INFORMATION IN THIS STRUCTURAL AND COLLATERAL TERM SHEET IS NOT COMPLETE AND MAY BE AMENDED PRIOR TO THE TIME OF SALE. THIS TERM SHEET IS NOT AN OFFER TO SELL THESE SECURITIES AND IT IS NOT A SOLICITATION OF AN OFFER TO BUY THESE SECURITIES IN ANY JURISDICTION WHERE THE OFFER OR SALE IS NOT PERMITTED. | ||
| |
116 of 130 | |
| Structural and Collateral Term Sheet | JPMDB 2020-COR7 | |
| Peace Coliseum | ||
| Lease Rollover Schedule(1) | |||||||||
| Year | Number of Leases Expiring | Net Rentable Area Expiring | % of NRA Expiring | Base Rent Expiring | % of Base Rent Expiring | Cumulative Net Rentable Area Expiring | Cumulative % of NRA Expiring | Cumulative Base Rent Expiring | Cumulative % of Base Rent Expiring |
| Vacant | NAP | 0 | 0.0% | NAP | NAP | 0 | 0.0% | NAP | NAP |
| 2020 & MTM | 0 | 0 | 0.0% | $0 | 0.0% | 0 | 0.0% | $0 | 0.0% |
| 2021 | 0 | 0 | 0.0% | 0 | 0.0% | 0 | 0.0% | $0 | 0.0% |
| 2022 | 0 | 0 | 0.0% | 0 | 0.0% | 0 | 0.0% | $0 | 0.0% |
| 2023 | 0 | 0 | 0.0% | 0 | 0.0% | 0 | 0.0% | $0 | 0.0% |
| 2024 | 0 | 0 | 0.0% | 0 | 0.0% | 0 | 0.0% | $0 | 0.0% |
| 2025 | 0 | 0 | 0.0% | 0 | 0.0% | 0 | 0.0% | $0 | 0.0% |
| 2026 | 0 | 0 | 0.0% | 0 | 0.0% | 0 | 0.0% | $0 | 0.0% |
| 2027 | 0 | 0 | 0.0% | 0 | 0.0% | 0 | 0.0% | $0 | 0.0% |
| 2028 | 0 | 0 | 0.0% | 0 | 0.0% | 0 | 0.0% | $0 | 0.0% |
| 2029 | 0 | 0 | 0.0% | 0 | 0.0% | 0 | 0.0% | $0 | 0.0% |
| 2030 | 0 | 0 | 0.0% | 0 | 0.0% | 0 | 0.0% | $0 | 0.0% |
| 2031 & Beyond | 1 | 236,585 | 100.0% | 5,264,016 | 100.0% | 236,585 | 100.0% | $5,264,016 | 100.0% |
| Total | 1 | 236,585 | 100.0% | $5,264,016 | 100.0% | ||||
| (1) | Based on the underwritten rent roll. |
| Operating History and Underwritten Net Cash Flow(1) | |||
| Underwritten(2) | Per Square Foot | %(3) | |
| Rents in Place | $5,264,016 | $22.25 | 72.7% |
| Vacant Income | 0 | 0.00 | 0.0% |
| Gross Potential Rent | $5,264,016 | $22.25 | 72.7% |
| Total Reimbursements | 1,975,278 | 8.35 | 27.3% |
| Total Other Income | 0 | 0.00 | 0.0% |
| Net Rental Income | $7,239,295 | $30.60 | 100.0% |
| (Vacancy/Credit Loss) | (542,947) | (2.29) | (7.5)% |
| Effective Gross Income | $6,696,348 | $28.30 | 92.5% |
| Total Expenses | $1,975,278 | $8.35 | 29.5% |
| Net Operating Income | $4,721,069 | $19.96 | 70.5% |
| Total TI/LC, CapEx/RR | 374,211 | 1.58 | 5.6% |
| Net Cash Flow | $4,346,858 | $18.37 | 64.9% |
| (1) | The Overstock.com lease commenced in March 2020. No historical cash flow information is available prior to the commencement of the Overstock.com lease. |
| (2) | For the avoidance of doubt, no COVID-19 specific adjustments have been incorporated in the lender underwriting. |
| (3) | % column represents percent of Net Rental Income for all revenue lines and represents percent of Effective Gross Income for the remainder of the fields. |
Property Management.The Peace Coliseum Property is self-managed.
Current Mezzanine or Subordinate Indebtedness. A mezzanine loan was funded concurrently and is coterminous with the Peace Coliseum Loan. The mezzanine loan has a Cut-off Date balance of approximately $12,220,159, an original principal balance of $13.0 million, accrues interest at a rate of 5.00200%per annum and is interest-only for the entire loan term. All available funds after payment of interest due on the mezzanine loan and any applicable reserves will be applied toward the repayment in full of the principal. Including the mezzanine loan, the cumulative Cut-off Date LTV, cumulative UW NCF DSCR and cumulative UW NOI DY are 58.4%, 2.03x and 10.1%, respectively. The mezzanine loan is currently held by LCM or an affiliate.
| THE INFORMATION IN THIS STRUCTURAL AND COLLATERAL TERM SHEET IS NOT COMPLETE AND MAY BE AMENDED PRIOR TO THE TIME OF SALE. THIS TERM SHEET IS NOT AN OFFER TO SELL THESE SECURITIES AND IT IS NOT A SOLICITATION OF AN OFFER TO BUY THESE SECURITIES IN ANY JURISDICTION WHERE THE OFFER OR SALE IS NOT PERMITTED. | ||
| |
117 of 130 | |
| Structural and Collateral Term Sheet | JPMDB 2020-COR7 |
| Los Angeles Leased Fee Portfolio | |
| Mortgage Loan Information | Property Information | |||
| Mortgage Loan Seller: | LCM | Single Asset / Portfolio: | Portfolio | |
| Original Principal Balance(1): | $24,000,000 | Title: | Fee | |
| Cut-off Date Principal Balance(1): | $24,000,000 | Property Type - Subtype: | Other – Leased Fee | |
| % of Pool by IPB: | 2.6% | Net Rentable Area (SF): | 556,202 | |
| Loan Purpose: | Refinance | Location: | Los Angeles, CA | |
| Borrower: | KOAR Airport Associates, LLC | Year Built / Renovated: | N/A / N/A | |
| Loan Sponsor: | Paul Alanis, Cofinance, Inc. | Occupancy: | 100.0% | |
| Interest Rate: | 3.50000% | Occupancy Date: | 6/6/2020 | |
| Note Date: | 8/28/2019 | Number of Tenants: | N/A | |
| Maturity Date: | 9/6/2029 | 2017 NOI: | $3,636,860 | |
| Interest-only Period: | 120 months | 2018 NOI: | $3,972,571 | |
| Original Term: | 120 months | 2019 NOI: | N/A | |
| Original Amortization: | None | TTM NOI (as of 6/2019)(2): | $4,160,964 | |
| Amortization Type: | Interest Only | UW Economic Occupancy(3): | 100.0% | |
| Call Protection: | L(33),Def(83),O(4) | UW Revenues: | $5,267,904 | |
| Lockbox / Cash Management: | Hard / Springing | UW Expenses: | $0 | |
| Additional Debt(1): | Yes | UW NOI(2)(3): | $5,267,904 | |
| Additional Debt Balance(1): | $61,000,000 | UW NCF(3): | $5,267,904 | |
| Additional Debt Type(1): | Pari Passu | Appraised Value / Per SF(3): | $134,900,000 / $243 | |
| Appraisal Date: | 7/4/2019 | |||
| Escrows and Reserves | Financial Information(1)(3) | ||||||
| Initial | Monthly | Initial Cap | Cut-off Date Loan / SF: | $153 | |||
| Taxes(4): | $0 | Springing | N/A | Maturity Date Loan / SF: | $153 | ||
| Insurance(5): | $0 | Springing | N/A | Cut-off Date LTV: | 63.0% | ||
| Replacement Reserves: | $0 | $0 | N/A | Maturity Date LTV: | 63.0% | ||
| TI/LC: | $0 | $0 | N/A | UW NCF DSCR: | 1.75x | ||
| Other: | $0 | $0 | N/A | UW NOI Debt Yield: | 6.2% | ||
| Sources and Uses | |||||||
| Sources | Proceeds | % of Total | Uses | Proceeds | % of Total | ||
| Whole Loan(1) | $85,000,000 | 100.0% | Payoff Existing Debt | $47,446,775 | 55.8% | ||
| Closing Costs | 1,121,154 | 1.3 | |||||
| Return of Equity | 36,432,070 | 42.9 | |||||
| Total Sources | $85,000,000 | 100.0% | Total Uses | $85,000,000 | 100.0% | ||
| (1) | The Los Angeles Leased Fee Portfolio Loan (as defined below) is part of a whole loan evidenced by twopari passu notes, with an aggregate outstanding principal balance as of the Cut-off Date of $85.0 million. The Financial Information presented in the chart above reflects the Cut-off Date Balance of the $85.0 million Los Angeles Leased Fee Portfolio Whole Loan (as defined below). |
| (2) | The increase from TTM NOI to UW NOI is attributable to approximately $950,940 of underwritten average ground rent over loan term. |
| (3) | All NOI, NCF and occupancy information, as well as the appraised value, were determined prior to the emergence of the novel coronavirus pandemic, and the economic disruption resulting from measures to combat the pandemic, and all DSCR, LTV and Debt Yield metrics were calculated, and the Los Angeles Leased Fee Portfolio Whole Loan was underwritten, based on such prior information. See “Risk Factors—Risks Related to Market Conditions and Other External Factors—Coronavirus Pandemic Has Adversely Affected the Global Economy and Will Likely Adversely Affect the Performance of the Mortgage Loans” in the Preliminary Prospectus. |
| (4) | On a monthly basis, during the continuance of a lease sweep period, the borrower is required to escrow 1/12 of the projected annual estimated tax payments. |
| (5) | On a monthly basis, during the continuance of a lease sweep period, the borrower is required to escrow 1/12 of the projected annual estimated insurance premiums. |
The Loan. The Los Angeles Leased Fee Portfolio loan, with a principal balance of $24.0 million as of the Cut-off Date (the “Los Angeles Leased Fee Portfolio Loan”), is secured by a first priority fee simple mortgage encumbering the land beneath four hotel properties, three parking structures and one office property, all of which land is encumbered by eight separate, cross-collateralized and cross-defaulted, absolute triple net (“NNN”) ground leases totaling 556,202 square feet of land located adjacent to the Los Angeles International Airport (“LAX”) in Los Angeles, California (collectively, the “Los Angeles Leased Fee Portfolio Properties” or the “Los Angeles Leased Fee Portfolio”). The Los Angeles Leased Fee Portfolio Loan is part of a whole loan that has an aggregate outstanding principal balance as of the Cut-off Date of $85.0 million (the “Los Angeles Leased Fee Portfolio Whole Loan”) and is comprised of twopari passu notes, each as
| THE INFORMATION IN THIS STRUCTURAL AND COLLATERAL TERM SHEET IS NOT COMPLETE AND MAY BE AMENDED PRIOR TO THE TIME OF SALE. THIS TERM SHEET IS NOT AN OFFER TO SELL THESE SECURITIES AND IT IS NOT A SOLICITATION OF AN OFFER TO BUY THESE SECURITIES IN ANY JURISDICTION WHERE THE OFFER OR SALE IS NOT PERMITTED. | ||
| |
118 of 130 | |
| Structural and Collateral Term Sheet | JPMDB 2020-COR7 |
| Los Angeles Leased Fee Portfolio | |
described in the “Whole Loan Summary” chart below. The non-controlling Note A-2, with an outstanding principal balance as of the Cut-off Date of $24.0 million, is being contributed to the JPMDB 2020-COR7 Trust. The controlling Note A-1, with an outstanding principal balance as of the Cut-off Date of $61.0 million, was contributed to the JPMDB 2019-COR6 Trust. The relationship between the holders of the Los Angeles Leased Fee Portfolio Whole Loan will be governed by a co-lender agreement as described under “Description of the Mortgage Pool—The Whole Loans—The Non-Serviced Pari Passu Whole Loans” in the Preliminary Prospectus. The Los Angeles Leased Fee Portfolio Loan has a 10-year term and will be interest only for the entire term.The most recent prior financing of theLos Angeles Leased Fee PortfolioProperties was not included in a securitization.
| Whole Loan Summary | ||||
| Note | Original Balance | Cut-off Date Balance | Note Holder | Controlling Piece |
| A-1 | $61,000,000 | $61,000,000 | JPMDB 2019-COR6 | Yes |
| A-2 | 24,000,000 | 24,000,000 | JPMDB 2020-COR7 | No |
| Total | $85,000,000 | $85,000,000 | ||
The Borrower. The borrowing entity is KOAR Airport Associates, LLC, a Delaware limited liability company and special purpose entity structured to be bankruptcy remote with two independent directors. Legal counsel to the borrower delivered a non-consolidation opinion in connection with the origination of the Los Angeles Leased Fee Portfolio Whole Loan.
The Loan Sponsors.The loan sponsors and nonrecourse carve-out guarantors are Paul Alanis and Cofinance, Inc., on a joint and several basis. Mr. Alanis is a principal of KOAR International, LLC (“KOAR”), a Los Angeles-based real estate development company. KOAR has advised investors who have acquired over $1 billion of assets in the Greater Los Angeles area. Cofinance, Inc. is a subsidiary of Cofinance Group SA (“Cofinance”), a Luxembourg-based real estate company. Through its subsidiaries, Cofinance owns, operates, develops and manages commercial real estate with approximately $750 million of asset under management across the United States (New York City, Los Angeles and the greater Northeast), France and Canada.
The Properties. The Los Angeles Leased Fee Portfolio consists of eight, ground leased land parcels totaling 556,202 square feet of land located adjacent to LAX in Los Angeles, California. Each of the eight land parcels is owned by the borrower and is improved with an asset subject to a 99-year, absolute NNN ground lease that commenced in 2016 and expires in December 2114 with no extension options. The eight ground leases are structured with contractual annual rent increases, fair market value resets, right of first negotiation in the event of a sale and no early termination options. The leasehold improvements, which are not collateral for the Los Angeles Leased Fee Portfolio Whole Loan, total approximately 2.2 million square feet of net rentable area and include four hotels (one of which is currently being converted from an office building to a hotel), three parking structures and an office building. The following table presents certain information relating to the Los Angeles Leased Fee Portfolio Properties.
Portfolio Summary
| |||||||||
| Property Name | Total Land SF | % of | Ground Lease Expiration | Leasehold Owner | Leased Fee UW NOI(1) | % of Total | Appraised Value | % of Total | |
| 5901 West Century Boulevard | 71,003 | 12.8% | 12/31/2114 | ROX TRG Airport Blvd, LLC(2) | $812,081 | 15.4% | $21,700,000 | 16.1% | |
| 5959 West Century Boulevard | 79,279 | 14.3 | 12/31/2114 | 5959 LLC | 708,834 | 13.5 | 19,000,000 | 14.1 | |
| 6151 West Century Boulevard | 78,844 | 14.2 | 12/31/2114 | SVI Airport LLC | 680,761 | 12.9 | 18,000,000 | 13.3 | |
| 5933 West Century Boulevard | 73,181 | 13.2 | 12/31/2114 | SVI LAX LLC | 601,110 | 11.4 | 16,400,000 | 12.2 | |
| 5940 West 98th Street | 67,518 | 12.1 | 12/31/2114 | LR Century Parking I LLC et al. | 660,427 | 12.5 | 15,700,000 | 11.6 | |
| 9801 Airport Boulevard | 62,726 | 11.3 | 12/31/2114 | BA LAX LLC | 558,210 | 10.6 | 15,000,000 | 11.1 | |
| 6144 West 98th Street | 62,726 | 11.3 | 12/31/2114 | LR Century Parking VI | 644,875 | 12.2 | 14,900,000 | 11.0 | |
| 5960 West 98th Street | 60,925 | 11.0 | 12/31/2114 | LR Century Parking I LLC | 601,606 | 11.4 | 14,200,000 | 10.5 | |
| Total | 556,202 | 100.0% | $5,267,904 | 100.0% | $134,900,000 | 100.0% | |||
| (1) | Based on the average ground rent over loan term. |
| (2) | Represents the prior leasehold owner at the time of origination. The prior owner sold the leasehold improvements in October 2019 for approximately $45.0 million to a third party. |
COVID-19 Update.As of June 1, 2020, the leasehold improvements situated on the land parcels encumbered by the Los Angeles Leased Fee Portfolio Properties remain open with the exception of the 5959 West Century Boulevard improvements that are currently under construction. As of the June 6, 2020 underwritten rent rolls, the Los Angeles Leased Fee Portfolio Properties remain 100.0% occupied. For April and May of 2020, the loan sponsor has collected 100.0% of underwritten base rent. The Los Angeles Leased Fee Portfolio Whole Loan is current through the June 6, 2020 payment date. As of June 1, 2020, the Los Angeles Leased Fee Portfolio Loan is not subject to any modification or forbearance request.
| THE INFORMATION IN THIS STRUCTURAL AND COLLATERAL TERM SHEET IS NOT COMPLETE AND MAY BE AMENDED PRIOR TO THE TIME OF SALE. THIS TERM SHEET IS NOT AN OFFER TO SELL THESE SECURITIES AND IT IS NOT A SOLICITATION OF AN OFFER TO BUY THESE SECURITIES IN ANY JURISDICTION WHERE THE OFFER OR SALE IS NOT PERMITTED. | ||
| |
119 of 130 | |
| Structural and Collateral Term Sheet | JPMDB 2020-COR7 |
| Los Angeles Leased Fee Portfolio | |
The following table presents certain information relating to the improvements which underlie the Los Angeles Leased Fee Portfolio Properties.
| Look Through Portfolio Summary(1) | ||||||
| Property Name | Property Type | Leasehold Property Name / Operator | Year Built / Renovated | SF / Rooms / Spaces | Look Through NOI | Hypothetical Stabilized Fee Simple Appraised Value(2) |
| 5901 West Century Boulevard | Office | Airport Center Building III | 1968 / 2017 | 306,243 | $4,106,826 | $68,400,000 |
| 5959 West Century Boulevard | Hotel | Hyatt House / Hyatt Place(3) | 1966 / 2020(3) | 401 | N/A(3) | 135,300,000 |
| 6151 West Century Boulevard | Hotel | Homewood Suites / Curio Collection by Hilton | 1963 / 2017 | 290 | 6,068,455 | 93,400,000 |
| 5933 West Century Boulevard | Hotel | Residence Inn | 1982 / 2015 | 231 | 5,245,797 | 80,700,000 |
| 5940 West 98th Street | Parking | L&R Century Parking | 1968 / N/A | 1,300 | 1,670,488 | 25,700,000 |
| 9801 Airport Boulevard | Hotel | Embassy Suites | 1989 / N/A | 222 | 3,519,458 | 54,100,000 |
| 6144 West 98th Street | Parking | L&R Century Parking | 1970 / N/A | 1,400 | 1,718,505 | 26,400,000 |
| 5960 West 98th Street | Parking | L&R Century Parking | 1982 / N/A | 1,300 | 1,652,575 | 25,400,000 |
| Total | $23,982,104 | $509,400,000 | ||||
| (1) | Source: Appraisals. |
| (2) | The Hypothetical Stabilized Fee Simple Appraised Value assumes the properties are unencumbered by the ground leases. |
| (3) | The 5959 West Century Boulevard improvements are currently under construction. The improvements are being converted from an office building to a dual branded Hyatt Place/Hyatt House hotel. The Hyatt Place/Hyatt House hotel will be a 14-story tower with 401 rooms. The Hyatt Place will offer 272 guestrooms and the Hyatt House will offer 129 guestrooms. According to the appraisal, the total project cost is approximately $120.0 million. |
| Ground Rent Summary | ||||||||||
| Property Name | 2020 Rent | 2021 Rent | 2022 Rent | 2023 Rent | 2024 Rent | 2025 Rent | 2026 Rent | 2027 Rent | 2028 Rent | 2029 Rent |
| 5901 West Century Boulevard | $713,951 | $735,370 | $757,431 | $780,154 | $803,558 | $827,665 | $852,495 | $878,070 | $904,412 | $931,544 |
| 5959 West Century Boulevard | 623,180 | 641,875 | 661,132 | 680,966 | 701,395 | 722,436 | 744,110 | 766,433 | 789,426 | 813,109 |
| 6151 West Century Boulevard | 600,000 | 618,000 | 636,540 | 655,636 | 675,305 | 695,564 | 716,431 | 737,924 | 760,062 | 782,864 |
| 5933 West Century Boulevard | 500,000 | 525,000 | 550,000 | 575,000 | 600,000 | 625,000 | 643,750 | 663,063 | 682,954 | 703,443 |
| 5940 West 98th Street(1) | 587,662 | 603,544 | 619,903 | 636,753 | 654,108 | 671,983 | 690,395 | 709,360 | 728,893 | 749,012 |
| 9801 Airport Boulevard | 491,000 | 505,730 | 520,902 | 536,529 | 552,625 | 569,204 | 586,280 | 603,868 | 621,984 | 640,644 |
| 6144 West 98th Street(2) | 577,224 | 591,990 | 607,199 | 622,864 | 638,999 | 655,618 | 672,735 | 690,367 | 708,527 | 727,232 |
| 5960 West 98th Street(3) | 535,948 | 550,279 | 565,040 | 580,243 | 595,903 | 612,033 | 628,646 | 645,758 | 663,383 | 681,537 |
| Total | $4,628,964 | $4,771,787 | $4,918,146 | $5,068,144 | $5,221,892 | $5,379,502 | $5,534,841 | $5,694,842 | $5,859,640 | $6,029,384 |
| (1) | Ground rent includes approximately $58,251 of underwritten percentage rent paid by the leasehold improvements. |
| (2) | Ground rent includes approximately $85,030 of underwritten percentage rent paid by the leasehold improvements. |
| (3) | Ground rent includes approximately $58,251 of underwritten percentage rent paid by the leasehold improvements. |
The 5901 West Century Boulevardproperty improvements consist of a 306,243 square foot, 15-story office building. The prior leasehold owner acquired the improvements in May 2017 for $12.5 million and performed an approximately $8.0 million renovation converting the spaces to a creative office design. In October 2019 the prior leasehold owner sold the leasehold improvements for approximately $45.0 million to a third party.
The 5959 West Century Boulevardproperty improvements are currently under construction as the improvements are being converted from an office building to a dual branded Hyatt Place/Hyatt House hotel. The Hyatt Place/Hyatt House hotel will be a 14-story tower with 401 rooms. The Hyatt Place will offer 272 guestrooms and the Hyatt House will offer 129 guestrooms. According to the appraisal, the total project cost is approximately $120.0 million.
The 6151 West Century Boulevardproperty improvements consists of a dual brand Homewood Suites and Curio Collection by Hilton hotel, in a 12-story tower with 290 rooms. The Homewood Suites hotel offers 122, all-suite rooms, and the Curio Collection by Hilton hotel offers 168 guestrooms. The improvements were constructed in 1963 and converted to a hotel in 2017. The hotel’s amenities include meeting rooms totaling 4,532 square feet, an outdoor swimming pool, fitness room, restaurant, free breakfast (Homewood Suites) and airport shuttle. Although the improvements offer only a limited number of parking spaces onsite, there is a seven-story parking garage immediately to the north adjacent to the hotel for guest parking.
| THE INFORMATION IN THIS STRUCTURAL AND COLLATERAL TERM SHEET IS NOT COMPLETE AND MAY BE AMENDED PRIOR TO THE TIME OF SALE. THIS TERM SHEET IS NOT AN OFFER TO SELL THESE SECURITIES AND IT IS NOT A SOLICITATION OF AN OFFER TO BUY THESE SECURITIES IN ANY JURISDICTION WHERE THE OFFER OR SALE IS NOT PERMITTED. | ||
| |
120 of 130 | |
| Structural and Collateral Term Sheet | JPMDB 2020-COR7 |
| Los Angeles Leased Fee Portfolio | |
The 5933 West Century Boulevardproperty improvements consists of a Residence Inn LAX, an upscale, extended stay hotel with 231 guestrooms. The improvements were converted from an office building in an approximately $37.5 million conversion project which was completed in 2015. The hotel offers studio, one-bedroom, and two-bedroom guestrooms in a 12-story tower with three, ground floor retail spaces. The hotel amenities include four meeting rooms totaling 1,822 square feet, an outdoor swimming pool and deck area, fitness room, free breakfast and airport shuttle. The improvements do not offer any parking spaces; however, the hotel owner has the right to lease up to 300 spaces at market rates from the adjacent seven-story parking garage immediately to the north.
The 5940 West 98th Streetproperty improvements consists of a one-building, 340,420 square foot concrete parking structure built in 1968. The improvements include seven levels of parking including six covered levels and one exposed rooftop level. The facility includes 1,300 parking spaces. Access to the parking garage is available via concrete curb cuts at 98th Street. Access is also available from Century Boulevard to the south via asphalt concrete driveways. The parking garage is operated by L&R Group of Companies, one of the largest parking property owners in the Los Angeles area.
The 6144 West 98th Streetproperty improvements consists of a one-building, 350,598 square foot concrete parking structure built in 1970. The improvements include seven levels of parking including six covered levels and one exposed rooftop level. The facility includes 1,400 parking spaces. Access to the parking garage is available via concrete curb cuts at 98th Street, with secondary access available from Century Boulevard to the south via driveways. The parking garage is operated by L&R Group of Companies.
The 9801 Airport Boulevardproperty improvements consists of an Embassy Suites, an extended stay hotel with 222 guestrooms. The hotel was built in 1989 and was built as a hotel. The hotel offers one-bedroom suites in an eight-story tower. The hotel amenities include meeting rooms totaling 4,532 square feet, an indoor swimming pool, fitness room, free breakfast and airport shuttle. Although the improvements offer only a limited number of parking spaces onsite, there is a seven-story parking garage immediately to the west.
The 5960 West 98th Streetproperty improvements consists of a one-building, 338,386 square foot concrete parking structure built in 1982. The improvements include seven levels of parking including six covered levels and one exposed rooftop level. The facility includes 1,300 parking spaces. Access to the parking garage is available via concrete curb cuts at 98th Street. Access is also available from Century Boulevard to the south via asphalt concrete driveways. The parking garage is operated by L&R Group of Companies.
The Los Angeles Leased Fee Portfolio Properties are located adjacent to LAX. According to the appraisal, LAX is the busiest airport on the West Coast and is a bustling domestic stop and an important international hub. The airport has a large impact on tourism and travel in the greater Los Angeles area as many international tourists use LAX as an entrance to the United States. Passenger travel at LAX has grown significantly and surpassed pre-recession passenger counts. According to the appraisal, total passenger counts recently reached a record level of nearly 84.5 million passengers.
Major developments have broken ground at LAX, including a $14 billion modernization program, including a $5.5 billion landside access modernization program to improve access to the airport, relieve congestion within the Central Terminal Area and surrounding streets, and connect with the future automated people mover station. A consolidated rent-a-car facility, roadway improvements, and an intermodal transportation facility – west will provide better transportation to the airport, remove shuttle trips to/from the terminal area, and provide more efficient access to rental cars. The people mover is under construction and scheduled for completion in 2023. There are also plans to extend the Green Line into the new Torrance transit center. The 4.6-mile extension of the light rail line, which currently ends at the northern border of Redondo Beach, would allow riders to connect to LAX via the future automated 96th Street Station.
| THE INFORMATION IN THIS STRUCTURAL AND COLLATERAL TERM SHEET IS NOT COMPLETE AND MAY BE AMENDED PRIOR TO THE TIME OF SALE. THIS TERM SHEET IS NOT AN OFFER TO SELL THESE SECURITIES AND IT IS NOT A SOLICITATION OF AN OFFER TO BUY THESE SECURITIES IN ANY JURISDICTION WHERE THE OFFER OR SALE IS NOT PERMITTED. | ||
| |
121 of 130 | |
| Structural and Collateral Term Sheet | JPMDB 2020-COR7 |
| Los Angeles Leased Fee Portfolio | |
| Operating History and Underwritten Net Cash Flow | ||||||
| 2017 | 2018 | TTM(1) | Underwritten(2) | Per Square Foot | %(3) | |
| Rents in Place | $3,491,433 | $3,803,433 | $3,959,433 | $4,115,433 | $7.40 | 78.1% |
| Straight Line Rent(4) | 0 | 0 | 0 | 950,940 | 1.71 | 18.1 |
| Vacant Income | 0 | 0 | 0 | 0 | 0.00 | 0.0 |
| Gross Potential Rent | $3,491,433 | $3,803,433 | $3,959,433 | $5,066,373 | $9.11 | 96.2% |
| Percentage Rent | 145,427 | 169,138 | 201,531 | 201,531 | 0.36 | 3.8 |
| Total Reimbursements | 0 | 0 | 0 | 0 | 0.00 | 0.0 |
| Total Other Income | 0 | 0 | 0 | 0 | 0.00 | 0.0 |
| Net Rental Income | $3,636,860 | $3,972,571 | $4,160,964 | $5,267,904 | $9.47 | 100.0% |
| (Vacancy/Credit Loss) | 0 | 0 | 0 | 0 | 0.00 | 0.0 |
| Effective Gross Income | $3,636,860 | $3,972,571 | $4,160,964 | $5,267,904 | $9.47 | 100.0% |
| Total Expenses | $0 | $0 | $0 | $0 | $0.00 | 0.0% |
| Net Operating Income(5) | $3,636,860 | $3,972,571 | $4,160,964 | $5,267,904 | $9.47 | 100.0% |
| Total TI/LC, CapEx/RR | 0 | 0 | 0 | 0 | 0.00 | 0.0 |
| Net Cash Flow | $3,636,860 | $3,972,571 | $4,160,964 | $5,267,904 | $9.47 | 100.0% |
| (1) | TTM column represents the trailing 12-month period ending June 30, 2019. |
| (2) | For the avoidance of doubt, no COVID-19 specific adjustments have been incorporated in the lender underwriting. |
| (3) | % column represents percent of Net Rental Income for all revenue lines and represents percent of Effective Gross Income for the remainder of the fields. |
| (4) | Based on the average ground rent over loan term. |
| (5) | The increase from TTM Net Operating Income to Underwritten Net Operating Income is attributable to approximately $950,940 of underwritten average ground rent over loan term. |
Property Management.The Los Angeles Leased Fee Portfolio Properties are self-managed.
| THE INFORMATION IN THIS STRUCTURAL AND COLLATERAL TERM SHEET IS NOT COMPLETE AND MAY BE AMENDED PRIOR TO THE TIME OF SALE. THIS TERM SHEET IS NOT AN OFFER TO SELL THESE SECURITIES AND IT IS NOT A SOLICITATION OF AN OFFER TO BUY THESE SECURITIES IN ANY JURISDICTION WHERE THE OFFER OR SALE IS NOT PERMITTED. | ||
| |
122 of 130 | |
| Structural and Collateral Term Sheet | JPMDB 2020-COR7 |
| 1340 Concord | |
| Mortgage Loan Information | Property Information | |||
| Mortgage Loan Seller: | JPMCB | Single Asset / Portfolio: | Single Asset | |
| Original Principal Balance: | $22,000,000 | Title: | Fee | |
| Cut-off Date Principal Balance: | $22,000,000 | Property Type – Subtype: | Office – Suburban | |
| % of Pool by IPB: | 2.4% | Net Rentable Area (SF): | 100,710 | |
| Loan Purpose: | Acquisition | Location: | Sunrise, FL | |
| Borrowers: | SDN 1340 Concord, LLC, 909 1340 | Year Built / Renovated: | 1998 / N/A | |
| Concord, LLC, 1340 Concord | Occupancy: | 100.0% | ||
| Associates, LP | Occupancy Date: | 6/1/2020 | ||
| Loan Sponsors(1): | Various | Number of Tenants: | 1 | |
| Interest Rate: | 4.15000% | 2017 NOI(2): | N/A | |
| Note Date: | 7/25/2019 | 2018 NOI(2): | N/A | |
| Maturity Date: | 8/1/2029 | 2019 NOI(2): | N/A | |
| Interest-only Period: | 120 months | TTM NOI(2): | N/A | |
| Original Term: | 120 months | UW Economic Occupancy(4): | 95.0% | |
| Original Amortization: | None | UW Revenues: | $3,448,952 | |
| Amortization Type: | Interest Only | UW Expenses: | $1,421,792 | |
| Call Protection: | L(34),Def(82),O(4) | UW NOI(4): | $2,027,160 | |
| Lockbox / Cash Management: | Hard / Springing | UW NCF(4): | $1,852,277 | |
| Additional Debt: | N/A | Appraised Value / Per SF(4): | $32,600,000 / $324 | |
| Additional Debt Balance: | N/A | Appraisal Date: | 6/14/2019 | |
| Additional Debt Type: | N/A | |||
| Escrows and Reserves | Financial Information(4) | ||||||
| Initial | Monthly | Initial Cap | Cut-off Date Loan / SF: | $218 | |||
| Taxes: | $0 | Springing | N/A | Maturity Date Loan / SF: | $218 | ||
| Insurance: | $0 | Springing | N/A | Cut-off Date LTV: | 67.5% | ||
| Replacement Reserves: | $0 | $1,427 | N/A | Maturity Date LTV: | 67.5% | ||
| TI/LC: | $0 | $0 | N/A | UW NCF DSCR: | 2.00x | ||
| Other(3): | $7,123,924 | $0 | N/A | UW NOI Debt Yield: | 9.2% | ||
| Sources and Uses | |||||||
| Sources | Proceeds | % of Total | Uses | Proceeds | % of Total | ||
| Mortgage Loan | $22,000,000 | 54.5% | Purchase Price | $32,500,000 | 80.5% | ||
| Sponsor Equity | $18,386,054 | 45.5% | Closing Costs | 762,130 | 1.9 | ||
| Upfront Reserves | 7,123,924 | 17.6 | |||||
| Total Sources | $40,386,054 | 100.0% | Total Uses | $40,386,054 | 100.0% | ||
| (1) | The loan sponsors are HGGP Capital VIII, LLC, HGGP Capital IX, LLC, HGGP Capital X, LLC, HGGP Capital XI, LLC, HGGP Capital XII, LLC and HGGP Capital XIII, LLC. |
| (2) | Historical financial information was not provided as the borrower acquired the 1340 Concord Property (as defined below) subject to a triple net lease structure in July 2019. |
| (3) | The Initial Other Reserve consists of (i) $4,028,400 of outstanding TI reserve, (ii) approximately $1,530,457 of free rent reserve, (iii) $977,742 of gap rent reserve, (iv) approximately $308,263 of prepaid rent reserve and (v) $279,063 of engineering reserve. |
| (4) | All NOI, NCF and occupancy information, as well as the appraised value, were determined prior to the emergence of the novel coronavirus pandemic, and the economic disruption resulting from measures to combat the pandemic, and all DSCR, LTV and Debt Yield metrics were calculated, and the 1340 Concord Loan was underwritten, based on such prior information. See “Risk Factors—Risks Related to Market Conditions and Other External Factors Coronavirus Pandemic Has Adversely Affected the Global Economy and Will Likely Adversely Affect the Performance of the Mortgage Loans” in the Preliminary Prospectus. |
The Loan.The 1340 Concord loan (the “1340 Concord Loan”) is secured by a first mortgage lien on the borrowers’ fee interest in a 100,710 square foot office building located in Sunrise, FL (the “1340 Concord Property”). The 1340 Concord Loan (as defined below) has a ten-year term and is interest only for the entire term.
The Borrowers.The borrowers are SDN 1340 Concord, LLC, 909 1340 Concord, LLC and 1340 Concord Associates, LP. SDN 1340 Concord, LLC and 909 1340 Concord, LLC are each a Delaware limited liability company and 1340 Concord Associates, LP is a Delaware limited partnership. Each borrower is structured to be bankruptcy remote with one independent director. Legal counsel to the borrowers delivered a non-consolidation opinion in connection with the origination of the 1340 Concord Loan. The borrowers own the 1340 Concord Property as tenants-in-common.
| THE INFORMATION IN THIS STRUCTURAL AND COLLATERAL TERM SHEET IS NOT COMPLETE AND MAY BE AMENDED PRIOR TO THE TIME OF SALE. THIS TERM SHEET IS NOT AN OFFER TO SELL THESE SECURITIES AND IT IS NOT A SOLICITATION OF AN OFFER TO BUY THESE SECURITIES IN ANY JURISDICTION WHERE THE OFFER OR SALE IS NOT PERMITTED. | ||
| |
123 of 130 | |
| Structural and Collateral Term Sheet | JPMDB 2020-COR7 |
| 1340 Concord | |
The Loan Sponsors. The loan sponsors are HGGP Capital VIII, LLC, HGGP Capital IX, LLC, HGGP Capital X, LLC, HGGP Capital XI, LLC, HGGP Capital XII, LLC and HGGP Capital XIII, LLC (collectively “HGGP Capital”), which collectively constitute a partnership acting as the carveout guarantors for the 1340 Concord Loan. HGGP Capital entities are owned by Harbor Group International (“HGI”), a fully-integrated global real estate investment and management firm that owns and operates office, retail and multifamily assets in North America and Europe. HGI encompasses the limited partnerships under HGGP Capital. As of year-end 2019, HGI had a commercial real estate portfolio consisting of approximately 4.8 million square feet, including 45,000 multifamily units, valued in excess of $12.5 billion. HGI has over 1,150 employees who facilitate acquisitions, dispositions, asset management, construction, leasing and property management. The 1340 Concord Property was acquired by the loan sponsors in July of 2019 for a purchase price of $32.5 million (approximately $322.71 per square foot).
The Property.The 1340 Concord Property is a three-story, mid-rise, single tenant office building totaling 100,710 square feet, located in Sunrise, Florida, approximately 14.0 miles west of downtown Fort Lauderdale in Broward County.
The 1340 Concord Property was built in 1998 and was occupied by Aetna for 20 years. The 1340 Concord Property is currently 100.0% leased to Ultimate Software. Ultimate Software was delivered the premises on June 5, 2019 and its lease commenced on November 1, 2019. Ultimate Software had finalized plans to begin its buildout at the 1340 Concord Property prior to the COVID-19 pandemic. As a result of the pandemic, construction at the 1340 Concord Property was put on hold. Ultimate Software is now re-finalizing its buildout plans for the space while taking into consideration the guidelines related to COVID-19 and will commence its buildout as soon as it is feasible in light of the pandemic. As of June 2020, Ultimate Software is current on its rent and has not requested any rent relief. Furthermore, the 1340 Concord Loan is structured with an upfront reserve for tenant improvements (approximately $4.0 million or $40 per square foot). In addition, Ultimate Software plans to provide its own funds for another $60 per square foot to further customize and upgrade its space, according to the loan sponsors. Ultimate Software has a NNN lease with an initial rent of $22.75 per square foot and 3.0% annual contractual escalations thereafter. Ultimate Software already has 13 buildings in the Weston, Florida submarket, including its headquarters building, which is located approximately 6 miles southwest of the 1340 Concord Property. The buildout at the 1340 Concord Property will be modeled after 2250 North Commerce Parkway, which is Ultimate Software’s most recent building and located 5 miles away. According to the loan sponsors, it is anticipated that 1340 Concord Property will house approximately 500 employees, who will be primarily newly hired engineers and developers as Ultimate Software continues to rapidly expand and grow its workforce. The 1340 Concord Property features 587 surface parking spaces, resulting in a parking ratio of 5.83 spaces per 1,000 square feet of net rentable area.
As of June 1, 2020, the 1340 Concord Property was 100.0% occupied by Ultimate Software. The sole tenant at the property, Ultimate Software (100,710 square feet; 100.0% of net rentable area; 100.0% of underwritten base rent), leases the property pursuant to a NNN lease expiring in May 2030 with two five-year extension options.Founded in 1990, Ultimate Software is an American technology company that develops and sells UltiPro, a cloud-based software system for business. Ultimate Software has been building human capital management and employee experience solutions since its inception. Ultimate Software recorded $1.14 billion in total revenues as of the fourth quarter of 2018. Ultimate Software was acquired by a private equity group, Hellman & Friedman, in February 2019 for approximately $11.0 billion and now operates as a privately held company. The1340 Concord Property is situated approximately 6 miles southwest of Ultimate Software’s headquarters in Weston, Florida.
COVID-19 Update.As of the June 2020 payment date, the 1340 Concord Property remains under construction with the sole tenant, Ultimate Software, finalizing its planned build-out. Ultimate Software has taken possession of its space and has commenced paying rent. As of June 1, 2020, Ultimate Software has paid all rent in full. The 1340 Concord Loan is current through the June 1, 2020 payment date. As of June 1, 2020, the 1340 Concord Loan is not subject to any modification or forbearance request.
The Market.The 1340 Concord Property is located in Broward County, Florida, within the Sawgrass International Corporate Park, South Florida's largest office park, which is situated at Sawgrass Expressway, Interstate-75 and Interstate 595. The 1340 Concord Property is located approximately 22 minutes west of Fort Lauderdale on approximately 10.1 acres of land. The region is accessible via Interstate-95, Interstate-75 and the Florida Turnpike, the primary north/south freeways in South Florida. Another major thoroughfare is the Sawgrass Expressway, the major north/south thoroughfare throughout Broward County and Interstate-595, which is the major east/west thoroughfare. The Sawgrass International Corporate Park is the regional headquarters to a number of blue chip companies including Fidelity Information Systems, Ford, AT&T, American Express, Harris Corporation, New York Life, Xerox, Equity Residential and Ticketmaster. Additionally, the 1340 Concord Property is approximately 16.0 miles from Fort Lauderdale-Hollywood International Airport and approximately 30.0 miles from Miami International Airport. According to the appraisal, the estimated 2018 population within a one-, three- and five-mile radius of the 1340 Concord Property was approximately 897, 60,697 and 187,218, respectively. The estimated 2018 average household income within the same radii was approximately $103,133, $99,557, and $106,639, respectively.
According to CoStar, the 1340 Concord Property is located in the Fort Lauderdale office market. As of the first quarter of 2020, the Fort Lauderdale office market has approximately 71.3 million square feet of office space with a market vacancy of 9.1%. Average gross asking rents for the Fort Lauderdale office market are $29.78 per square foot. According to the appraisal, as of June 14, 2019, the South Florida
| THE INFORMATION IN THIS STRUCTURAL AND COLLATERAL TERM SHEET IS NOT COMPLETE AND MAY BE AMENDED PRIOR TO THE TIME OF SALE. THIS TERM SHEET IS NOT AN OFFER TO SELL THESE SECURITIES AND IT IS NOT A SOLICITATION OF AN OFFER TO BUY THESE SECURITIES IN ANY JURISDICTION WHERE THE OFFER OR SALE IS NOT PERMITTED. | ||
| |
124 of 130 | |
| Structural and Collateral Term Sheet | JPMDB 2020-COR7 |
| 1340 Concord | |
region is home to five Fortune 500 corporations – World Fuel Services, AutoNation, Lennar, Office Depot, and Ryder System. The region’s largest employers are national and multinational corporations spanning a variety of industries including healthcare, retail, and technology. The 1340 Concord Property is located in the West Broward submarket. According to the appraisal, as of the first quarter of 2019, the West Broward submarket consisted of approximately 7.1 million square feet of office inventory with an overall vacancy rate of 6.3% and an overall asking rent of $28.66 per square foot.
The appraisal identified five comparable office leases ranging in size from 53,654 square feet to 215,749 square feet. The comparable properties were built between 1981 and 2001. The comparable tenants reported annual rental rates ranging from $18.00 to $27.00 per square foot with a weighted average rent of approximately $23.89 per square foot, inclusive of NNN comparable leases. Ultimate Software has a NNN rent of $22.75 per square foot, which is in-line with the appraiser’s concluded market rent for the 1340 Concord Property of $22.75 per square foot.
| Historical Occupancy(1) | ||||
| 2017 | 2018 | 2019 | Current(2) | |
| Occupancy | NAV | NAV | NAV | 100.0% |
| (1) | Historical occupancy was not provided as the borrower acquired the 1340 Concord Property subject to a triple net lease structure in July 2019. |
| (2) | Current Occupancy is as of June 1, 2020. |
| Tenant Summary(1) | |||||||
| Tenant | Ratings Moody’s/Fitch/S&P | Net Rentable Area (SF) | % of Total NRA | Base Rent PSF | % of Total Base Rent | Lease Expiration Date | |
| Ultimate Software(2) | NR / NR / NR | 100,710 | 100.0% | $22.75 | 100.0% | 5/31/2030 | |
| Total Occupied | 100,710 | 100.0% | $22.75 | 100.0% | |||
| Vacant | 0 | 0.0 | |||||
| Total | 100,710 | 100.0% | |||||
| (1) | Based on the underwritten rent roll as of June 1, 2020. |
| (2) | Ultimate Software has a one-time right to terminate its lease effective as of May 2027 with no less than 12 months’ prior notice and the payment of a termination fee. |
| Lease Rollover Schedule(1) | |||||||||
| Year | Number of Leases Expiring | Net Rentable Area Expiring | % of NRA Expiring | Base Rent Expiring | % of Base Rent Expiring | Cumulative Net Rentable Area Expiring | Cumulative % of NRA Expiring | Cumulative Base Rent Expiring | Cumulative % of Base Rent Expiring |
| Vacant | NAP | 0 | 0.0% | NAP | NAP | 0 | 0.0% | NAP | NAP |
| 2020 & MTM | 0 | 0 | 0.0 | $0 | 0.0% | 0 | 0.0% | $0 | 0.0% |
| 2021 | 0 | 0 | 0.0 | 0 | 0.0 | 0 | 0.0% | $0 | 0.0% |
| 2022 | 0 | 0 | 0.0 | 0 | 0.0 | 0 | 0.0% | $0 | 0.0% |
| 2023 | 0 | 0 | 0.0 | 0 | 0.0 | 0 | 0.0% | $0 | 0.0% |
| 2024 | 0 | 0 | 0.0 | 0 | 0.0 | 0 | 0.0% | $0 | 0.0% |
| 2025 | 0 | 0 | 0.0 | 0 | 0.0 | 0 | 0.0% | $0 | 0.0% |
| 2026 | 0 | 0 | 0.0 | 0 | 0.0 | 0 | 0.0% | $0 | 0.0% |
| 2027 | 0 | 0 | 0.0 | 0 | 0.0 | 0 | 0.0% | $0 | 0.0% |
| 2028 | 0 | 0 | 0.0 | 0 | 0.0 | 0 | 0.0% | $0 | 0.0% |
| 2029 | 0 | 0 | 0.0 | 0 | 0.0 | 0 | 0.0% | $0 | 0.0% |
| 2030 | 1 | 100,710 | 100.0 | $2,291,153 | 100.0 | 100,710 | 100.0% | $2,291,153 | 100.0% |
| 2031 and Thereafter | 0 | 0 | 0.0 | 0 | 0.0 | 100,710 | 100.0% | $2,291,153 | 100.0% |
| Total | 1 | 100,710 | 100.0% | $2,291,153 | 100.0% | ||||
| (1) | Based on the underwritten rent roll as of June 1, 2020. |
| THE INFORMATION IN THIS STRUCTURAL AND COLLATERAL TERM SHEET IS NOT COMPLETE AND MAY BE AMENDED PRIOR TO THE TIME OF SALE. THIS TERM SHEET IS NOT AN OFFER TO SELL THESE SECURITIES AND IT IS NOT A SOLICITATION OF AN OFFER TO BUY THESE SECURITIES IN ANY JURISDICTION WHERE THE OFFER OR SALE IS NOT PERMITTED. | ||
| |
125 of 130 | |
| Structural and Collateral Term Sheet | JPMDB 2020-COR7 |
| 1340 Concord | |
| Underwritten Net Cash Flow | |||
| Underwritten(1) | Per Square Foot | %(2) | |
| Base Rent | $2,291,153 | $22.75 | 63.1% |
| Vacant Income | 0 | 0.00 | 0.0 |
| Gross Potential Rent | $2,291,153 | $22.75 | 63.1% |
| Total Reimbursements | 1,339,323 | 13.30 | 36.9 |
| Net Rental Income | $3,630,476 | $36.05 | 100.0% |
| (Vacancy/Credit Loss) | (181,524) | (1.80) | (5.0) |
| Total Other Income | 0 | 0.00 | 0.0 |
| Effective Gross Income | $3,448,952 | $34.25 | 95.0% |
| Total Expenses | $1,421,792 | $14.12 | 41.2% |
| Net Operating Income | $2,027,160 | $20.13 | 58.8% |
| TI/LC | 157,762 | 1.57 | 4.6 |
| Replacement Reserves | 17,121 | 0.17 | 0.5 |
| Net Cash Flow | $1,852,277 | $18.39 | 53.7% |
| (1) For the avoidance of doubt, no COVID-19 specific adjustments have been incorporated in the lender underwriting. |
| (2) % column represents percent of Net Rental Income for all revenue lines and represents percent of Effective Gross Income for the remainder of the fields. |
Property Management.The 1340 Concord Property is managed by Harbor Group Management Co., LLC, a Virginia limited liability company, an affiliate of the borrowers.
| THE INFORMATION IN THIS STRUCTURAL AND COLLATERAL TERM SHEET IS NOT COMPLETE AND MAY BE AMENDED PRIOR TO THE TIME OF SALE. THIS TERM SHEET IS NOT AN OFFER TO SELL THESE SECURITIES AND IT IS NOT A SOLICITATION OF AN OFFER TO BUY THESE SECURITIES IN ANY JURISDICTION WHERE THE OFFER OR SALE IS NOT PERMITTED. | ||
| |
126 of 130 | |
| Structural and Collateral Term Sheet | JPMDB 2020-COR7 | |
| 1333 Main Street | ||
| Mortgage Loan Information | Property Information | |||
| Mortgage Loan Seller: | LCM | Single Asset / Portfolio: | Single Asset | |
| Original Principal Balance: | $20,500,000 | Title: | Fee | |
| Cut-off Date Principal Balance: | $20,500,000 | Property Type - Subtype: | Mixed Use – Office/Retail | |
| % of Pool by IPB: | 2.3% | Net Rentable Area (SF): | 224,314 | |
| Loan Purpose: | Acquisition | Location: | Columbia, SC | |
| Borrower: | Galium 1333 Main, LLC | Year Built / Renovated: | 1983 / 1998-2015 | |
| Loan Sponsors: | Jacques Bessoudo, Iser Rabinovitz | Occupancy: | 92.0% | |
| Interest Rate: | 3.68550% | Occupancy Date: | 1/14/2020 | |
| Note Date: | 2/27/2020 | Number of Tenants: | 19 | |
| Maturity Date: | 3/6/2030 | 2017 NOI: | $2,184,303 | |
| Interest-only Period: | 60 months | 2018 NOI: | $2,192,836 | |
| Original Term: | 120 months | 2019 NOI: | $2,316,405 | |
| Original Amortization: | 360 months | TTM NOI: | N/A | |
| Amortization Type: | IO-Balloon | UW Economic Occupancy(1): | 92.0% | |
| Call Protection: | L(27),Def(90),O(3) | UW Revenues: | $4,729,409 | |
| Lockbox / Cash Management: | Hard / Springing | UW Expenses: | $2,462,836 | |
| Additional Debt: | N/A | UW NOI(1): | $2,266,573 | |
| Additional Debt Balance: | N/A | UW NCF(1): | $2,015,265 | |
| Additional Debt Type: | N/A | Appraised Value / Per SF(1): | $29,500,000 / $132 | |
| Appraisal Date: | 1/3/2020 | |||
| Escrows and Reserves | Financial Information(1) | ||||||
| Initial | Monthly | Initial Cap | Cut-off Date Loan / SF: | $91 | |||
| Taxes: | $210,000 | $69,400 | N/A | Maturity Date Loan / SF: | $82 | ||
| Insurance: | $15,000 | $5,300 | N/A | Cut-off Date LTV: | 69.5% | ||
| Replacement Reserves: | $600,000 | $4,673 | N/A | Maturity Date LTV: | 62.7% | ||
| TI/LC: | $1,075,000 | $18,693 | $1,500,000 | UW NCF DSCR: | 1.78x | ||
| Other(2): | $145,013 | $0 | N/A | UW NOI Debt Yield: | 11.1% | ||
| |||||||
| Sources and Uses | |||||||
| Sources | Proceeds | % of Total | Uses | Proceeds | % of Total | ||
| Mortgage Loan | $20,500,000 | 65.1% | Purchase Price | $29,350,000 | 93.3% | ||
| Sponsor Equity | $10,973,568 | 34.9 | Prorations and Adjustments | (625,121) | (2.0) | ||
| Upfront Reserves | 2,045,013 | 6.5 | |||||
| Closing Costs | 703,676 | 2.2 | |||||
| Total Sources | $31,473,568 | 100.0% | Total Uses | $31,473,568 | 100.0% | ||
| (1) | All NOI, NCF and occupancy information, as well as the appraised value, were determined prior to the emergence of the novel coronavirus pandemic, and the economic disruption resulting from measures to combat the pandemic, and all DSCR, LTV and Debt Yield metrics were calculated, and the 1333 Main Street Loan (as defined below) was underwritten, based on such prior information. See “Risk Factors—Risks Related to Market Conditions and Other External Factors—Coronavirus Pandemic Has Adversely Affected the Global Economy and Will Likely Adversely Affect the Performance of the Mortgage Loans” in the Preliminary Prospectus. |
| (2) | Initial Other Escrows and Reserves consist of an initial deposit of approximately $145,013 for outstanding tenant improvements and leasing commissions. |
| THE INFORMATION IN THIS STRUCTURAL AND COLLATERAL TERM SHEET IS NOT COMPLETE AND MAY BE AMENDED PRIOR TO THE TIME OF SALE. THIS TERM SHEET IS NOT AN OFFER TO SELL THESE SECURITIES AND IT IS NOT A SOLICITATION OF AN OFFER TO BUY THESE SECURITIES IN ANY JURISDICTION WHERE THE OFFER OR SALE IS NOT PERMITTED. | ||
| |
127 of 130 | |
| Structural and Collateral Term Sheet | JPMDB 2020-COR7 | |
| 1333 Main Street | ||
The Loan.The 1333 Main Street mortgage loan, with a principal balance of $20.5 million as of the Cut-off Date (the “1333 Main Street Loan”), is secured by a first mortgage lien on the borrower’s fee interest in a 224,314 square foot mixed-use building, an adjacent 110-space surface parking lot and a three-story,775-space parking garage located in downtown Columbia, South Carolina (the “1333 Main Street Property”). The 1333 Main Street Loan has a 10-year term and following a five-year interest-only period, will amortize on a 30-year schedule.
The Borrower. The borrowing entity is Galium 1333 Main, LLC, a Delaware limited liability company and special purpose entity structured to be bankruptcy remote with one independent director.
The Loan Sponsors.The loan sponsors and nonrecourse carve-out guarantors are Jacques Bessoudo and Iser Rabinovitz on a joint and several basis. Mr. Bessoudo and Mr. Rabinovitz are the managing partners of Galium Capital, a commercial real estate investment and development company founded in 2017 and based in Miami, Florida.
The Property.The 1333 Main Street Property is a seven-story, mixed-use office and retail building totaling 224,314 square feet and includes an adjacent 110-space surface parking lot and a three-story, 775-space parking garage located in Columbia, South Carolina. Originally constructed in 1983 and renovated between 1998 and 2015, the 1333 Main Street Property consists of 17 office suites and 13 ground floor retail suites. The 1333 Main Street Property includes 885 total stalls (for a parking ratio of approximately 3.9 per 1,000 square feet) across a three-story, 775-space structured garage and a 110-space asphalt paved surface parking lot. As of the January 14, 2020 underwritten rent roll, the 1333 Main Street Property was 92.0% leased by a mix of 19 national, regional and local tenants with a weighted average underwritten base rent of approximately $18.35 per square foot.
The largest tenant at the 1333 Main Street Property is PricewaterhouseCoopers, LLP (“PwC”) (57,921 square feet, 25.8% of net rentable area; 28.1% of underwritten base rent). Founded in 1998, PwC is a global network of firms delivering assurance, tax and consulting services for businesses, whose network of firms operate in 157 countries, employ more than 276,000 people, and serve 86 percent of Fortune Global 500 companies and more than 100,000 entrepreneurial and private businesses. PwC has been a tenant since 2005 and has a lease expiration of May 2025 with two, five-year renewal options remaining and has a one-time termination option effective in May 2022, with nine months prior notice and payment of a termination fee in the amount equal to approximately $618,497. PwC currently pays underwritten base rent equal to $18.39 per square foot, which escalates approximately 2.5% per annum.
The second largest tenant at the 1333 Main Street Property is SC Education Lottery (34,012 square feet; 15.2% of net rentable area; 16.0% of underwritten base rent, rated Aaa/AAA/AA+ by Moody’s/Fitch/S&P). Headquartered at the 1333 Main Street Property and founded in 2002, SC Education Lottery manages a state lottery which provides funding to enhance education programs in South Carolina. SC Education Lottery has been a tenant since2007 and has a lease expiration of July 2021 with one, three-year renewal option remaining and an ongoing termination option at any time with 30-days’ notice among other conditions, as is standard for state tenants. SC Education Lottery currently occupies 32,248 square feet of office space and 1,764 square feet of retail space at an underwritten base rent equal to $17.85 per square foot.
The third largest tenant at the 1333 Main Street Property is SC Workers' Compensation (24,103 square feet; 10.7% of net rentable area; 10.7% of underwritten base rent, rated Aaa/AAA/AA+ by Moody’s/Fitch/S&P). Headquartered at the 1333 Main Street Property, SC Workers’ Compensation administers the workers' compensation laws of the state of South Carolina with the ultimate goal of ensuring that workers injured on the job receive prompt payment of lost work time benefits and attendant medical expenses. SC Workers’ Compensation has been a tenant since 2009 and has a lease expiration ofMarch 2022 with no renewal options remaining and an ongoing termination option at any time with 30-days’ notice among other conditions, as is standard for state tenants. SC Workers’ Compensation currently occupies 24,103 square feet of office and storage space, paying an underwritten base rent equal to $16.83 per square foot, which escalates $0.40 per square foot per annum.
COVID-19 Update. As of June 1, 2020, the 1333 Main Street Property is open; however, most, if not all, office tenants are working remotely. As of the January 14, 2020 underwritten rent roll, the 1333 Main Street Property remained 92.0% occupied. For April and May of 2020, tenants representing approximately 99.2% and 95.1% of net rentable area, respectively, have paid rent in-full or in part, with the loan sponsor having collected approximately 99.0% and 95.2% of the underwritten base rent, respectively. The 1333 Main Street Loan is current through the June 6, 2020 payment date. As of June 1, 2020, the 1333 Main Street Loan is not subject to any modification or forbearance request.
The Market.The 1333 Main Street Property is located in the Columbia, South Carolina metropolitan statistical area. According to the appraisal, the area has a population of 837,258 people, which has increased 1.0% per annum since 2010 and is expected to increase 1.1% per annum through 2024.
The 1333 Main Street Property is located in the central business district (“CBD”) office and retail submarket, within the overall Columbia office and retail market. According to a market report, as of the June 9, 2020, the overall Columbia office and retail market contained approximately 33.3 million square feet and approximately 55.3 million square feet, respectively, with overall market vacancies of 6.4% and 4.2%, respectively, and average asking rents of approximately $19.66 per square foot and $14.24 per square foot, respectively. As
| THE INFORMATION IN THIS STRUCTURAL AND COLLATERAL TERM SHEET IS NOT COMPLETE AND MAY BE AMENDED PRIOR TO THE TIME OF SALE. THIS TERM SHEET IS NOT AN OFFER TO SELL THESE SECURITIES AND IT IS NOT A SOLICITATION OF AN OFFER TO BUY THESE SECURITIES IN ANY JURISDICTION WHERE THE OFFER OR SALE IS NOT PERMITTED. | ||
| |
128 of 130 | |
| Structural and Collateral Term Sheet | JPMDB 2020-COR7 | |
| 1333 Main Street | ||
of June 9, 2020, the CBD office and retail submarket contained approximately 9.3 million square feet and approximately 2.9 million square feet, respectively, with overall submarket vacancies of 5.9% and 6.0%, respectively, and average asking rents of approximately $21.16 per square foot and $18.34 per square foot, respectively.
The appraisal included six office rent comparables. Of the six comparables, one was net with the remaining five full service gross (“FSG”). The one net rent comparable was equal to $26.38 per square foot while the five FSG rent comparables ranged from $17.59 to $22.74 per square foot with a weighted average of approximately $20.89 per square foot. The appraisal included three retail rent comparables which ranged from $22.42 to $24.64 per square foot with a weighted average of approximately $23.73 per square foot.
| Historical and Current Occupancy(1) | ||||
| 2016 | 2017 | 2018 | 2019 | Current(2) |
| 94.0% | 92.0% | 91.8% | 93.0% | 92.0% |
| (1) | Historical Occupancies are as of December 31 of eachrespective year. |
| (2) | Current Occupancy is as of the rent roll dated January 14, 2020. |
| Tenant Summary(1) | ||||||
| Tenant | Ratings Moody’s/Fitch/S&P(2) | Net Rentable Area (SF) | % of Total NRA | Base Rent PSF(3) | % of Total Base Rent(3) | Lease Expiration Date |
| PwC(4)(5) | NR / NR / NR | 57,921 | 25.8% | $18.39 | 28.1% | 5/31/2025 |
| SC Education Lottery(4)(5) | Aaa / AAA / AA+ | 34,012 | 15.2 | $17.85 | 16.0 | 7/31/2021 |
| SC Workers' Compensation(5) | Aaa / AAA / AA+ | 24,103 | 10.7 | $16.83 | 10.7 | 3/31/2022 |
| Dovetail Insurance Corp. | Baa1 / A- / A- | 18,312 | 8.2 | $21.89 | 10.6 | 2/28/2022 |
| Ameris Bank(4) | NR / NR / NR | 15,501 | 6.9 | $19.30 | 7.9 | 7/31/2023 |
| CBRE, Inc. | Baa1 / NR / BBB+ | 8,748 | 3.9 | $19.57 | 4.5 | 4/30/2021 |
| Trumbull Services, LLC(4) | NR / NR / NR | 6,610 | 2.9 | $18.57 | 3.2 | 7/31/2020 |
| The Michael Jeffcoat Firm(4)(5) | NR / NR / NR | 6,244 | 2.8 | $21.47 | 3.5 | 9/30/2028 |
| MCI Communication Services Inc(4) | NR / NR / NR | 5,487 | 2.4 | $19.00 | 2.8 | 6/30/2032 |
| Granger Owings(4) | NR / NR / NR | 5,386 | 2.4 | $23.45 | 3.3 | 12/31/2027 |
| Top 10 Total / Wtd. Avg. | 182,324 | 81.3% | $18.85 | 90.7% | ||
| Other Tenants | 24,100 | 10.7 | $14.56 | 9.3 | ||
| Total Occupied Space | 206,424 | 92.0% | $18.35 | 100.0% | ||
| Vacant | 17,890 | 8.0 | ||||
| Total | 224,314 | 100.0% | ||||
| (1) | Based on the underwritten rent roll dated as of January 14, 2020. |
| (2) | In certain instances, ratings provided are those of the parent company of the entity shown, whether or not the parent company guarantees the lease. |
| (3) | Base Rent PSF includes approximately $79,242 in contractual rent steps through January 2021 for certain tenants. |
| (4) | PwC has two, five-year renewal options remaining, SC Education Lottery has one, three-year renewal option remaining, Ameris Bank has two, five-year renewal options remaining, Trumbull Services, LLC has one, five-year renewal option remaining, The Michael Jeffcoat Firm has one, three-year renewal option remaining, MCI Communication Services Inc has two, five-year renewal options remaining, and Granger Owings has one, five-year renewal option remaining. |
| (5) | PwC has a one-time termination option effective in May 2022, with 9-months prior notice and payment of a termination fee in the amount equal to approximately $618,497, SC Education Lottery has an ongoing termination option with 30-days’ prior notice amongst other conditions, SC Workers’ Compensation has an ongoing termination option with 30-days’ prior notice amongst other conditions, and The Michael Jeffcoat Firm has a one-time termination option effective June 2025, with 6-months prior notice and payment of a termination fee in the amount equal to approximately $66,138. |
| THE INFORMATION IN THIS STRUCTURAL AND COLLATERAL TERM SHEET IS NOT COMPLETE AND MAY BE AMENDED PRIOR TO THE TIME OF SALE. THIS TERM SHEET IS NOT AN OFFER TO SELL THESE SECURITIES AND IT IS NOT A SOLICITATION OF AN OFFER TO BUY THESE SECURITIES IN ANY JURISDICTION WHERE THE OFFER OR SALE IS NOT PERMITTED. | ||
| |
129 of 130 | |
| Structural and Collateral Term Sheet | JPMDB 2020-COR7 | |
| 1333 Main Street | ||
| Lease Rollover Schedule(1)(2) | |||||||||
| Year | Number of Leases Expiring | Net Rentable Area Expiring | % of NRA Expiring | Base Rent Expiring(3) | % of Base Rent Expiring(3) | Cumulative Net Rentable Area Expiring | Cumulative % of NRA Expiring | Cumulative Base Rent Expiring(3) | Cumulative % of Base Rent Expiring(3) |
| Vacant | NAP | 17,890 | 8.0 | NAP | NAP | 17,890 | 8.0% | NAP | NAP |
| 2020 & MTM | 3 | 9,255 | 4.1 | $145,596 | 3.8% | 27,145 | 12.1% | $145,596 | 3.8% |
| 2021 | 5 | 49,435 | 22.0 | 919,593 | 24.3 | 76,580 | 34.1% | $1,065,188 | 28.1% |
| 2022 | 5 | 46,980 | 20.9 | 871,340 | 23.0 | 123,560 | 55.1% | $1,936,528 | 51.1% |
| 2023 | 1 | 15,501 | 6.9 | 299,169 | 7.9 | 139,061 | 62.0% | $2,235,698 | 59.0% |
| 2024 | 3 | 7,003 | 3.1 | 121,589 | 3.2 | 146,064 | 65.1% | $2,357,286 | 62.2% |
| 2025 | 1 | 57,921 | 25.8 | 1,065,167 | 28.1 | 203,985 | 90.9% | $3,422,454 | 90.4% |
| 2026 | 0 | 0 | 0.0 | 0 | 0.0 | 203,985 | 90.9% | $3,422,454 | 90.4% |
| 2027 | 1 | 5,386 | 2.4 | 126,280 | 3.3 | 209,371 | 93.3% | $3,548,733 | 93.7% |
| 2028 | 2 | 6,244 | 2.8 | 134,069 | 3.5 | 215,615 | 96.1% | $3,682,802 | 97.2% |
| 2029 | 0 | 0 | 0.0 | 0 | 0.0 | 215,615 | 96.1% | $3,682,802 | 97.2% |
| 2030 | 0 | 0 | 0.0 | 0 | 0.0 | 215,615 | 96.1% | $3,682,802 | 97.2% |
| 2031 & Beyond | 1 | 8,699 | 3.9 | 104,253 | 2.8 | 224,314 | 100.0% | $3,787,055 | 100.0% |
| Total | 22 | 224,314 | 100.0% | $3,787,055 | 100.0% | ||||
| (1) | Based on the underwritten rent roll dated January 14, 2020. |
| (2) | Certain tenants may have termination or contraction options (which may become exercisable prior to the originally stated expiration date of the tenant lease) that are not considered in the above Lease Rollover Schedule. |
| (3) | Base Rent Expiring, % of Base Rent Expiring, Cumulative Base Rent Expiring and Cumulative % of Base Rent Expiring include approximately $79,242 in contractual rent steps through January 2021 for certain tenants. |
| Operating History and Underwritten Net Cash Flow | ||||||
| 2017 | 2018 | 2019 | Underwritten(1) | Per Square Foot | %(2) | |
| Rents in Place | $3,430,898 | $3,496,209 | $3,577,378 | $3,707,812 | $16.53 | 72.8% |
| Contractual Rent Steps(3) | 0 | 0 | 0 | 79,242 | 0.35 | 1.6 |
| Vacant Income | 0 | 0 | 0 | 335,673 | 1.50 | 6.6 |
| Gross Potential Rent | $3,430,898 | $3,496,209 | $3,577,378 | $4,122,728 | $18.38 | 81.0% |
| Total Reimbursements | 385,411 | 310,193 | 427,693 | 397,364 | 1.77 | 7.8 |
| Total Other Income(4) | 498,553 | 518,333 | 568,348 | 570,925 | 2.55 | 11.2 |
| Net Rental Income | $4,314,861 | $4,324,735 | $4,573,419 | $5,091,016 | $22.70 | 100.0% |
| (Vacancy/Credit Loss) | 0 | 0 | 0 | (361,607) | (1.61) | (7.1) |
| Effective Gross Income | $4,314,861 | $4,324,735 | $4,573,419 | $4,729,409 | $21.08 | 92.9% |
| Total Expenses | $2,130,557 | $2,131,899 | $2,257,014 | $2,462,836 | $10.98 | 52.1% |
| Net Operating Income | $2,184,303 | $2,192,836 | $2,316,405 | $2,266,573 | $10.10 | 47.9% |
| Total TI/LC, CapEx/RR | 0 | 0 | 0 | 251,308 | 1.12 | 5.3 |
| Net Cash Flow | $2,184,303 | $2,192,836 | $2,316,405 | $2,015,265 | $8.98 | 42.6% |
| (1) | For the avoidance of doubt, no COVID-19 specific adjustments have been incorporated in the lender underwriting. |
| (2) | % column represents percent of Net Rental Income for all revenue lines and represents percent of Effective Gross Income for the remainder of the fields. |
| (3) | Based on the contractual rent steps through January 2021 for certain tenants. |
| (4) | Total Other Income includes parking income, storage income, antenna income, late fees, card key fees, and miscellaneous income. |
Property Management.The 1333 Main Street Property is managed by CBRE, Inc.
| THE INFORMATION IN THIS STRUCTURAL AND COLLATERAL TERM SHEET IS NOT COMPLETE AND MAY BE AMENDED PRIOR TO THE TIME OF SALE. THIS TERM SHEET IS NOT AN OFFER TO SELL THESE SECURITIES AND IT IS NOT A SOLICITATION OF AN OFFER TO BUY THESE SECURITIES IN ANY JURISDICTION WHERE THE OFFER OR SALE IS NOT PERMITTED. | ||
| |
130 of 130 | |