JP Morgan Chase Commercial Mortgage Securities
Filed: 8 Oct 20, 2:32pm
| FREE WRITING PROSPECTUS | ||
| FILED PURSUANT TO RULE 433 | ||
| REGISTRATION FILE NO.: 333-226123-10 | ||
| October [7], 2020 | Benchmark 2020-B20 |
| Collateral Term Sheet |
BENCHMARK 2020-B20
This material is for your information, and none of J.P. Morgan Securities LLC (“JPMS”), Deutsche Bank Securities Inc., Citigroup Global Markets Inc., Goldman Sachs & Co. LLC, Drexel Hamilton, LLC and Academy Securities, Inc., (each individually, an “Underwriter”, and together, the ‘‘Underwriters’’) are soliciting any action based upon it. This material is not to be construed as an offer to sell or the solicitation of any offer to buy any security in any jurisdiction where such an offer or solicitation would be illegal.
The depositor has filed a registration statement (including a prospectus) with the SEC (SEC File No. 333-226123) for the offering to which this free writing prospectus relates. Before you invest, you should read the prospectus in the registration statement and other documents the depositor has filed with the SEC for more complete information about the depositor, the issuing entity and this offering. You may get these documents for free by visiting EDGAR on the SEC Web site at www.sec.gov. Alternatively, the depositor, any underwriter or any dealer participating in the offering will arrange to send you the prospectus if you request it by calling (800) 408-1016 or by emailing the ABS Syndicate Desk at abs_synd@jpmorgan.com.
THE SECURITIES TO WHICH THIS INFORMATION RELATES WILL BE MORE FULLY DESCRIBED IN A PROSPECTUS (THE “PROSPECTUS”), WHICH IS NOT YET AVAILABLE. THE PROSPECTUS WILL CONTAIN MATERIAL INFORMATION THAT IS NOT CONTAINED IN THESE MATERIALS (INCLUDING WITHOUT LIMITATION A DETAILED DISCUSSION OF RISKS ASSOCIATED WITH AN INVESTMENT IN THE CERTIFICATES, UNDER THE HEADING “RISK FACTORS” IN THE PROSPECTUS).
Neither this document nor anything contained in this document shall form the basis for any contract or commitment whatsoever. The information contained in this document is preliminary as of the date of this document, supersedes any previous such information delivered to you and will be superseded by any such information subsequently delivered prior to the time of sale. These materials are subject to change, completion or amendment from time to time. This information is based upon management forecasts and reflects prevailing conditions and management's views as of this date, all of which are subject to change.
J.P. Morgan is the marketing name for the investment banking businesses of JPMorgan Chase & Co. and its subsidiaries worldwide. Securities, syndicated loan arranging, financial advisory and other investment banking activities are performed by JPMS and its securities affiliates, and lending, derivatives and other commercial banking activities are performed by JPMorgan Chase Bank, National Association and its banking affiliates. JPMS is a member of SIPC and the NYSE.
THE CERTIFICATES REFERRED TO IN THESE MATERIALS ARE SUBJECT TO MODIFICATION OR REVISION (INCLUDING THE POSSIBILITY THAT ONE OR MORE CLASSES OF CERTIFICATES MAY BE SPLIT, COMBINED OR ELIMINATED AT ANY TIME PRIOR TO ISSUANCE OR AVAILABILITY OF A FINAL PROSPECTUS) AND ARE OFFERED ON A “WHEN, AS AND IF ISSUED” BASIS.
THE UNDERWRITERS MAY FROM TIME TO TIME PERFORM INVESTMENT BANKING SERVICES FOR, OR SOLICIT INVESTMENT BANKING BUSINESS FROM, ANY COMPANY NAMED IN THESE MATERIALS. THE UNDERWRITERS AND/OR THEIR AFFILIATES OR RESPECTIVE EMPLOYEES MAY FROM TIME TO TIME HAVE A LONG OR SHORT POSITION IN ANY CERTIFICATE OR CONTRACT DISCUSSED IN THESE MATERIALS. |
THE INFORMATION IN THIS STRUCTURAL AND COLLATERAL TERM SHEET IS NOT COMPLETE AND MAY BE AMENDED PRIOR TO THE TIME OF SALE. THIS TERM SHEET IS NOT AN OFFER TO SELL THESE SECURITIES AND IT IS NOT A SOLICITATION OF AN OFFER TO BUY THESE SECURITIES IN ANY JURISDICTION WHERE THE OFFER OR SALE IS NOT PERMITTED. |
| October [7], 2020 | Benchmark 2020-B20 |
THE REPUBLIC OF KOREA
THIS PROSPECTUS IS NOT, AND UNDER NO CIRCUMSTANCES IS THIS PROSPECTUS TO BE CONSTRUED AS, A PUBLIC OFFERING OF SECURITIES IN KOREA. NEITHER THE ISSUER NOR ANY OF ITS AGENTS MAKE ANY REPRESENTATION WITH RESPECT TO THE ELIGIBILITY OF ANY RECIPIENTS OF THIS PROSPECTUS TO ACQUIRE THE OFFERED CERTIFICATES UNDER THE LAWS OF KOREA, INCLUDING, BUT WITHOUT LIMITATION, THE FOREIGN EXCHANGE TRANSACTION LAW AND REGULATIONS THEREUNDER (THE “FETL”). THE OFFERED CERTIFICATES HAVE NOT BEEN REGISTERED WITH THE FINANCIAL SERVICES COMMISSION OF KOREA FOR PUBLIC OFFERING IN KOREA, AND NONE OF THE OFFERED CERTIFICATES MAY BE OFFERED, SOLD OR DELIVERED, DIRECTLY OR INDIRECTLY, OR OFFERED OR SOLD TO ANY PERSON FOR RE-OFFERING OR RESALE, DIRECTLY OR INDIRECTLY IN KOREA OR TO ANY RESIDENT OF KOREA EXCEPT PURSUANT TO THE FINANCIAL INVESTMENT SERVICES AND CAPITAL MARKETS ACT AND THE DECREES AND REGULATIONS THEREUNDER (THE “FSCMA”), THE FETL AND ANY OTHER APPLICABLE LAWS, REGULATIONS AND MINISTERIAL GUIDELINES IN KOREA. WITHOUT PREJUDICE TO THE FOREGOING, THE NUMBER OF OFFERED CERTIFICATES OFFERED IN KOREA OR TO A RESIDENT OF KOREA SHALL BE LESS THAN FIFTY AND FOR A PERIOD OF ONE YEAR FROM THE ISSUE DATE OF THE OFFERED CERTIFICATES, NONE OF THE OFFERED CERTIFICATES MAY BE DIVIDED RESULTING IN AN INCREASED NUMBER OF OFFERED CERTIFICATES. FURTHERMORE, THE OFFERED CERTIFICATES MAY NOT BE RESOLD TO KOREAN RESIDENTS UNLESS THE PURCHASER OF THE OFFERED CERTIFICATES COMPLIES WITH ALL APPLICABLE REGULATORY REQUIREMENTS (INCLUDING, BUT NOT LIMITED TO, GOVERNMENT REPORTING APPROVAL REQUIREMENTS UNDER THE FETL AND ITS SUBORDINATE DECREES AND REGULATIONS) IN CONNECTION WITH THE PURCHASE OF THE OFFERED CERTIFICATES.
JAPAN
THE OFFERED CERTIFICATES HAVE NOT BEEN AND WILL NOT BE REGISTERED UNDER THE FINANCIAL INSTRUMENTS AND EXCHANGE LAW OF JAPAN, AS AMENDED (THE “FIEL”), AND DISCLOSURE UNDER THE FIEL HAS NOT BEEN AND WILL NOT BE MADE WITH RESPECT TO THE OFFERED CERTIFICATES. ACCORDINGLY, EACH UNDERWRITER HAS REPRESENTED AND AGREED THAT IT HAS NOT, DIRECTLY OR INDIRECTLY, OFFERED OR SOLD AND WILL NOT, DIRECTLY OR INDIRECTLY, OFFER OR SELL ANY OFFERED CERTIFICATES IN JAPAN OR TO, OR FOR THE BENEFIT OF, ANY RESIDENT OF JAPAN (WHICH TERM AS USED IN THIS PROSPECTUS MEANS ANY PERSON RESIDENT IN JAPAN, INCLUDING ANY CORPORATION OR OTHER ENTITY ORGANIZED UNDER THE LAWS OF JAPAN) OR TO OTHERS FOR REOFFERING OR RE-SALE, DIRECTLY OR INDIRECTLY, IN JAPAN OR TO, OR FOR THE BENEFIT OF, ANY RESIDENT OF JAPAN EXCEPT PURSUANT TO AN EXEMPTION FROM THE REGISTRATION REQUIREMENTS OF, AND OTHERWISE IN COMPLIANCE WITH, THE FIEL AND OTHER RELEVANT LAWS, REGULATIONS AND MINISTERIAL GUIDELINES OF JAPAN. AS PART OF THIS OFFERING OF THE OFFERED CERTIFICATES, THE UNDERWRITERS MAY OFFER THE OFFERED CERTIFICATES IN JAPAN TO UP TO 49 OFFEREES IN ACCORDANCE WITH THE ABOVE PROVISIONS.
THE INFORMATION IN THIS STRUCTURAL AND COLLATERAL TERM SHEET IS NOT COMPLETE AND MAY BE AMENDED PRIOR TO THE TIME OF SALE. THIS TERM SHEET IS NOT AN OFFER TO SELL THESE SECURITIES AND IT IS NOT A SOLICITATION OF AN OFFER TO BUY THESE SECURITIES IN ANY JURISDICTION WHERE THE OFFER OR SALE IS NOT PERMITTED.
 |  | 2 of 144 |  |  |
| Structural and Collateral Term Sheet | Benchmark 2020-B20 |
| Collateral Characteristics |
| Loan Pool | |
| Initial Pool Balance (“IPB”): | $903,488,876 |
| Number of Mortgage Loans: | 34 |
| Number of Mortgaged Properties: | 89 |
| Average Cut-off Date Balance per Mortgage Loan: | $26,573,202 |
| Weighted Average Current Mortgage Rate: | 3.56841% |
| 10 Largest Mortgage Loans as % of IPB: | 55.7% |
| Weighted Average Remaining Term to Maturity(1): | 109 months |
| Weighted Average Seasoning: | 2 months |
| Credit Statistics | |
| Weighted Average UW NCF DSCR(2)(3): | 2.71x |
| Weighted Average UW NOI DY(2)(3): | 10.9% |
| Weighted Average Cut-off Date Loan-to-Value Ratio (“LTV”)(2)(3)(4): | 56.0% |
| Weighted Average Maturity Date LTV(1)(2)(3)(4): | 53.5% |
| Other Statistics | |
| % of Mortgage Loans with Additional Debt: | 22.7% |
| % of Mortgaged Properties with Single Tenants: | 36.9% |
| Amortization | |
| Weighted Average Original Amortization Term(5): | 349 months |
| Weighted Average Remaining Amortization Term(5): | 349 months |
| % of Mortgage Loans with Interest-Only: | 65.4% |
| % of Mortgage Loans with Partial Interest-Only followed by Amortizing Balloon: | 12.1% |
| % of Mortgage Loans with Amortizing Balloon: | 12.0% |
| % of Mortgage Loans with ARD-Interest Only: | 10.5% |
| Lockbox / Cash Management(6) | |
| % of Mortgage Loans with In-Place, Hard Lockboxes: | 81.8% |
| % of Mortgage Loans with Springing Lockboxes: | 17.4% |
| % of Mortgage Loans with In-Place, Soft Lockboxes: | 0.8% |
| % of Mortgage Loans with Springing Cash Management: | 85.1% |
| % of Mortgage Loans with In-Place Cash Management: | 14.9% |
| Reserves | |
| % of Mortgage Loans Requiring Monthly Tax Reserves: | 70.2% |
| % of Mortgage Loans Requiring Monthly Insurance Reserves: | 31.9% |
| % of Mortgage Loans Requiring Monthly CapEx Reserves(7): | 50.3% |
| % of Mortgage Loans Requiring Monthly TI/LC Reserves(8): | 54.8% |
| (1) | In the case of Loan Nos. 3 and 16, with an anticipated repayment date, Remaining Term to Maturity and Maturity Date LTV are calculated as of the related anticipated repayment date. |
| (2) | In the case of Loan Nos. 1, 2, 3, 4, 6, 9, 11, 12, 16, 17, 18, 19 and 23, the UW NCF DSCR, UW NOI DY, Cut-off Date LTV and Maturity Date LTV Ratio calculations include the related Pari Passu Companion Loan(s). In the case of Loan Nos. 1, 3, 9, and 17, the UW NCF DSCR, UW NOI DY, Cut-off Date LTV and Maturity Date LTV calculations exclude the related Subordinate Companion Loan(s) and/or related mezzanine loan(s). |
| (3) | In the case of Loan No. 21, the UW NOI DY, Cut-Off Date LTV and Maturity Date LTV are calculated net of a holdback reserve. In the case of Loan No. 3, the UW NCF DSCR and UW NOI DY are calculated based on the master lease annual rent of $292,000,000. |
| (4) | In the case of Loan Nos. 1, 3, 6, 7, 16, 18, and 20, the Cut-off Date LTV and the Maturity Date LTV are calculated by using an appraised value based on certain hypothetical assumptions. Refer to “Description of the Mortgage Pool—Assessments of Property Value and Condition” and “—Appraised Value” in the Preliminary Prospectus for additional details. |
| (5) | Excludes 24 mortgage loans that are interest-only for the entire term. |
| (6) | For a more detailed description of Lockbox / Cash Management, refer to “Description of the Mortgage Pool—Certain Terms of the Mortgage Loans—Mortgaged Property Accounts” in the Preliminary Prospectus. |
| (7) | CapEx Reserves include FF&E reserves for hotel properties. |
| (8) | Calculated only with respect to the Cut-off Date Balance of mortgage loans secured or partially secured by retail, office, industrial and mixed use properties. |
THE INFORMATION IN THIS STRUCTURAL AND COLLATERAL TERM SHEET IS NOT COMPLETE AND MAY BE AMENDED PRIOR TO THE TIME OF SALE. THIS TERM SHEET IS NOT AN OFFER TO SELL THESE SECURITIES AND IT IS NOT A SOLICITATION OF AN OFFER TO BUY THESE SECURITIES IN ANY JURISDICTION WHERE THE OFFER OR SALE IS NOT PERMITTED.
| | 3 of 144 | | |
| Structural and Collateral Term Sheet | Benchmark 2020-B20 |
| Collateral Characteristics |
Mortgage Loan Seller | Number of Mortgage Loans | Number of Mortgaged Properties | Aggregate Cut-off Date Balance | % of IPB |
| CREFI | 12 | 18 | $252,572,750 | 28.0% |
| GSMC(1)(2) | 10 | 11 | 195,080,000 | 21.6 |
| GACC(3)(4) | 7 | 9 | 193,336,126 | 21.4 |
| JPMCB | 3 | 48 | 122,500,000 | 13.6 |
| CREFI/GACC(3)(5) | 1 | 2 | 70,000,000 | 7.7 |
| JPMCB/CREFI(6) | 1 | 1 | 70,000,000 | 7.7 |
| Total | 34 | 89 | $903,488,876 | 100.0% |
| (1) | Eight of the mortgage loans (16.1%) being sold by Goldman Sachs Mortgage Company (“GSMC”) were originated or co-originated by an affiliate thereof, Goldman Sachs Bank USA, and will be transferred to GSMC on or prior to the Closing Date. |
| (2) | In the case of Loan No. 11, the whole loan was co-originated by Goldman Sachs Bank USA (“GSBI”), American General Life Insurance Company, The Variable Annuity Life Insurance Company, National Union Fire Insurance Company of Pittsburgh, PA. and American Home Assurance Company. In the case of Loan No. 23, the whole loan was co-originated by GSBI and Bank of America, N.A. |
| (3) | Each mortgage loan being sold by German American Capital Corporation (“GACC”) was originated or co-originated, either DBR Investments Co. Limited or Deutsche Bank AG, New York Branch, each an affiliate of GACC and will be transferred to GACC on or prior to the Closing Date. |
| (4) | In the case of Loan No. 1, the whole loan was co-originated by DBR Investments Co. Limited and JPMCB. |
| (5) | In the case of Loan No. 3, the whole loan was co-originated by CREFI, Barclays Capital Real Estate Inc., Deutsche Bank AG, New York Branch and Société Générale Financial Corporation. Loan No. 3 is evidenced by two promissory notes: (i) Note A-13-4, with a principal balance of $46,666,667 as of the Cut-off Date, as to which CREFI is acting as mortgage loan seller, and (ii) Note A-15-4, with a principal balance of $23,333,333 as of the Cut-off Date, as to which GACC is acting as mortgage loan seller. |
| (6) | In the case of Loan No. 2, the whole loan was co-originated by Wells Fargo Bank, National Association, JPMCB and CREFI. Loan No. 2 is evidenced by four promissory notes: (i) Note A-4 and Note A-5, with an aggregate principal balance of $35,000,000 as of the Cut-off Date, as to which JPMCB is acting as mortgage loan seller, and (ii) Note A-6 and Note A-7, with an aggregate principal balance of $35,000,000 as of the Cut-off Date, as to which CREFI is acting as mortgage loan seller. |
| Ten Largest Mortgage Loans |
| No. | Loan Name | Mortgage Loan Seller | No. of Prop. | Cut-off Date Balance | % of IPB | SF / Units | Property Type | UW NCF DSCR(1)(2) | UW NOI DY(1)(2) | Cut-off Date LTV(1)(3) | Maturity Date LTV(1)(3)(4) |
| 1 | Moffett Place - Building 6 | GACC | 1 | $74,850,000 | 8.3% | 314,352 | Office | 3.50x | 12.2% | 37.1% | 37.1% |
| 2 | 120 Wall Street | JPMCB/CREFI | 1 | $70,000,000 | 7.7% | 668,276 | Office | 2.74x | 9.3% | 57.9% | 57.9% |
| 3 | MGM Grand & Mandalay Bay | CREFI/GACC | 2 | $70,000,000 | 7.7% | 9,748 | Hotel | 4.95x | 17.9% | 35.5% | 35.5% |
| 4 | 4 West 58th Street | JPMCB | 1 | $62,500,000 | 6.9% | 83,537 | Mixed Use | 1.94x | 7.4% | 69.4% | 69.4% |
| 5 | Northern Trust Office | CREFI | 1 | $40,400,000 | 4.5% | 149,371 | Office | 2.58x | 9.4% | 62.6% | 62.6% |
| 6 | Coleman Highline | GACC | 1 | $40,000,000 | 4.4% | 380,951 | Office | 3.64x | 10.3% | 50.8% | 50.8% |
| 7 | Point West Portfolio | GACC | 3 | $39,500,000 | 4.4% | 346,227 | Office | 3.30x | 11.7% | 59.4% | 59.4% |
| 8 | Skywater Technology HQ | CREFI | 1 | $39,000,000 | 4.3% | 393,765 | Industrial | 1.80x | 11.5% | 49.5% | 34.8% |
| 9 | Agellan Portfolio | JPMCB | 46 | $35,000,000 | 3.9% | 6,094,177 | Various | 3.03x | 15.7% | 41.9% | 41.9% |
| 10 | 2010 South Lamar | CREFI | 1 | $32,100,000 | 3.6% | 80,067 | Office | 2.17x | 9.5% | 59.9% | 59.9% |
| Top 3 Total/Weighted Average | 4 | $214,850,000 | 23.8% | 3.72x | 13.1% | 43.4% | 43.4% | ||
| Top 5 Total/Weighted Average | 6 | $317,750,000 | 35.2% | 3.23x | 11.5% | 50.9% | 50.9% | ||
| Top 10 Total/Weighted Average | 58 | $503,350,000 | 55.7% | 3.07x | 11.6% | 51.4% | 50.3% |
| (1) | In the case of Loan Nos. 1, 2, 3, 4, 6 and 9 the UW NCF DSCR, UW NOI DY, Cut-off Date LTV and Maturity Date LTV Ratio calculations include the related Pari Passu Companion Loan(s). In the case of Loan Nos. 1, 3 and 9, the UW NCF DSCR, UW NOI DY, Cut-off Date LTV and Maturity Date LTV calculations exclude the related Subordinate Companion Loan(s) and/or related mezzanine loan(s). |
| (2) | In the case of Loan No. 3, the UW NCF DSCR and UW NOI DY are calculated based on the master lease annual rent of $292,000,000. |
| (3) | In the case of Loan Nos. 1, 3, 6 and 7, the Cut-off Date LTV and the Maturity Date LTV are calculated by using an appraised value based on certain hypothetical assumptions. Refer to “Description of the Mortgage Pool—Assessments of Property Value and Condition” and “—Appraised Value” in the Preliminary Prospectus for additional details. |
| (4) | In the case of Loan No. 3, with an anticipated repayment date, Maturity Date LTV is calculated as of the related anticipated repayment date. |
THE INFORMATION IN THIS STRUCTURAL AND COLLATERAL TERM SHEET IS NOT COMPLETE AND MAY BE AMENDED PRIOR TO THE TIME OF SALE. THIS TERM SHEET IS NOT AN OFFER TO SELL THESE SECURITIES AND IT IS NOT A SOLICITATION OF AN OFFER TO BUY THESE SECURITIES IN ANY JURISDICTION WHERE THE OFFER OR SALE IS NOT PERMITTED.
| | 4 of 144 | | |
| Structural and Collateral Term Sheet | Benchmark 2020-B20 |
| Collateral Characteristics |
| Companion Loan Summary |
| Lead Servicer for | Master Servicer | Special Servicer | |||||||
| Loan | Original | Cut-off Date | Whole Loan | Under Lead | Under Lead | ||||
| No. | Mortgage Loan | Note(s) | Balance ($) | Balance ($) | Holder of Note | (Y/N) | Securitization | Securitization | |
| 1 | Moffett Place - | A-1-S, A-2-S | $500,000 | $500,000 | MOFT 2020-B6 | No | |||
| Building 6 | |||||||||
| A-1-C1, A-1-C2, A-1-C3, A-1-C4, A-1- | |||||||||
| C6 | $74,850,000 | $74,850,000 | BMARK 2020-B20 | No | |||||
| A-1-C5-1, A-2-C | $57,750,000 | $57,750,000 | BMARK 2020-B19 | No | |||||
| B-1, B-2(1) | $66,900,000 | $66,900,000 | MOFT 2020-B6 | Yes(2) | KeyBank | KeyBank | |||
| Total | $200,000,000 | $200,000,000 | |||||||
| 2 | 120 Wall Street | A-1, A-2, A-3 | $95,000,000 | $95,000,000 | WFB | Yes | (3) | (3) | |
| A-4, A-5, A-6, A-7 | $70,000,000 | $70,000,000 | BMARK 2020-B20 | No(3) | |||||
| Total | $165,000,000 | $165,000,000 | |||||||
| MGM Grand & | |||||||||
| 3 | Mandalay Bay | A-1, A-2, A-3, A-4 | $670,139 | $670,139 | BX 2020-VIVA | No | |||
| A-5, A-6, A-7, A-8 | $794,861 | $794,861 | BX 2020-VIV2 | No | |||||
| A-9, A-10, A-11, A-12 | $1,000,000 | $1,000,000 | BX 2020-VIV3 | No | |||||
| A-13-1, A-15-1 | $65,000,000 | $65,000,000 | BMARK 2020-B18 | No | |||||
| A-14-1, A-16-1 | $69,500,000 | $69,500,000 | BBCMS 2020-C8 | No | |||||
| A-13-2, A-15-3 | $80,000,000 | $80,000,000 | BMARK 2020-B19 | No | |||||
| A-15-2 | $50,000,000 | $50,000,000 | DBJPM 2020-C9 | No | |||||
| A-16-2, A-16-3 | $301,347,000 | $301,347,000 | SocGen | No | |||||
| A-13-4, A-15-4 | $70,000,000 | $70,000,000 | BMARK 2020-B20 | No | |||||
| A-14-3, A-14-4 | $241,847,000 | $241,847,000 | Barclays | No | |||||
| A-13-3, A-13-5 | $509,360,667 | $509,360,667 | CREFI | No | |||||
| A-15-5, A-15-6 | $204,680,333 | $204,680,333 | DBRI | No | |||||
| B-1-A, B-2-A, B-3-A, B-4-A, B-1-B, B-2-B, B-3-B, B-4-B(1) | $329,861 | $329,861 | BX 2020-VIVA | No | |||||
| B-5-A, B-6-A, B-7-A, B-8-A, B-5-B, B-6-B, B-7-B, B-8-B(1) | $374,355,139 | $374,355,139 | BX 2020-VIV2 | No | |||||
| B-9-A, B-10-A, B-11-A, B-12-A(1) | $429,715,000 | $429,715,000 | BX 2020-VIV3 | No | |||||
| C-1, C-2, C-3, C-4(1) | $561,400,000 | $561,400,000 | BX 2020-VIVA | Yes(4) | KeyBank | Situs | |||
| Total | $3,000,000,000 | $3,000,000,000 | |||||||
| 4 | 4 West 58th Street | A-1 | $62,500,000 | $62,500,000 | BMARK 2020-B20 | Yes | Midland | Midland | |
| A-2, A-3 | $62,500,000 | $62,500,000 | JPMCB | No | |||||
| Total | $125,000,000 | $125,000,000 | |||||||
| 6 | Coleman Highline | A-1, A-3, A-5 | $85,000,000 | $85,000,000 | BMARK 2020-B19 | Yes | Midland | Rialto | |
| A-2 | $30,000,000 | $30,000,000 | DBJPM 2020-C9 | No | |||||
| A-4, A-6 | $40,000,000 | $40,000,000 | BMARK 2020-B20 | No | |||||
| Total | $155,000,000 | $155,000,000 | |||||||
| (1) | Each note represents a subordinate companion loan. |
| (2) | In the case of Loan No. 1, the controlling note as of the date hereof is a related subordinate note. Upon the occurrence of certain trigger events specified in the related co-lender agreement, however, control will generally shift to a more senior note in the subject whole loan, which more senior note will thereafter be the controlling note. The more senior note may be included in another securitization trust, in which case the directing party for the related whole loan will be the party designated under the servicing agreement for such securitization trust. See “Description of the Mortgage Pool—The Whole Loans—The Non-Serviced AB Whole Loans—The Moffett Place – Building 6 Whole Loan” in the Preliminary Prospectus. |
| (3) | In the case of Loan No. 2, the whole loan is expected to be serviced under the Benchmark 2020-B20 pooling and servicing agreement until such time as the controlling note has been securitized, at which point the whole loan will be serviced under the pooling and servicing agreement related to such securitization. |
| (4) | In the case of Loan No. 3, the initial controlling note is Note C-1, so long as no related control appraisal period with respect to Note C-1 and the related pari passu C notes has occurred and is continuing. If and for so long as a control appraisal period has occurred and is continuing, then the controlling note will be as described under “Description of the Mortgage Pool—The Whole Loans—The Non-Serviced AB Whole Loans—The MGM Grand & Mandalay Bay Pari Passu-AB Whole Loan” in the Preliminary Prospectus. |
THE INFORMATION IN THIS STRUCTURAL AND COLLATERAL TERM SHEET IS NOT COMPLETE AND MAY BE AMENDED PRIOR TO THE TIME OF SALE. THIS TERM SHEET IS NOT AN OFFER TO SELL THESE SECURITIES AND IT IS NOT A SOLICITATION OF AN OFFER TO BUY THESE SECURITIES IN ANY JURISDICTION WHERE THE OFFER OR SALE IS NOT PERMITTED.
| | 5 of 144 | | |
| Structural and Collateral Term Sheet | Benchmark 2020-B20 |
| Collateral Characteristics |
| Lead | Master | Special | ||||||
| Servicer for | Servicer | Servicer Under | ||||||
| Loan | Original | Cut-off Date | Whole Loan | Under Lead | Lead | |||
| No. | Mortgage Loan | Note(s) | Balance ($) | Balance ($) | Holder of Note | (Y/N) | Securitization | Securitization |
| 9 | Agellan Portfolio | A-1 | $75,000,000 | $75,000,000 | BMARK 2020-B18 | No | ||
| A-2, A-6 | $61,000,000 | $61,000,000 | DBJPM 2020-C9 | No | ||||
| A-3, A-4 | $60,000,000 | $60,000,000 | BMARK 2020-B19 | No | ||||
| A-5, A-7 | $35,000,000 | $35,000,000 | BMARK 2020-B20 | No | ||||
| B Note(1) | $172,000,000 | $172,000,000 | BMARK 2020-B18 | Yes(2) | Midland | Midland | ||
| Total | $403,000,000 | $403,000,000 | ||||||
| 11 | 333 South Wabash | A-1 (AGL, AGL-Fortitude) | $91,000,000 | $91,000,000 | AGL | |||
| A-1 (VALIC) | $35,000,000 | $35,000,000 | VALIC | |||||
| A-2-A | $30,000,000 | $30,000,000 | BMARK 2020-B20 | |||||
| A-2-B | $50,000,000 | $50,000,000 | BMARK 2020-B19 | Yes(3) | Midland | Rialto | ||
| A-2-C | $20,000,000 | $20,000,000 | DBJPM 2020-C9 | |||||
| A-1 (AHAC, AHAC- | $11,200,000 | $11,200,000 | AHAC | |||||
| Fortitude) | ||||||||
| A-1 (NUFI-Fortitude) | $2,800,000 | $2,800,000 | NUFI | |||||
| Total | $240,000,000 | $240,000,000 | ||||||
| Redmond Town | ||||||||
| 12 | Center | A-1-1, A-2 | $30,000,000 | $30,000,000 | BMARK 2020-B19 | Yes | Midland | Rialto |
| A-1-2-A, A-1-2-B, A-3-2 | $41,500,000 | $41,500,000 | CREFI | No | ||||
| A-3-1, A-4 | $30,000,000 | $30,000,000 | BMARK 2020-B20 | No | ||||
| Total | $101,500,000 | $101,500,000 | ||||||
| 16 | USAA Plano | A-1 | $38,600,000 | $38,600,000 | BMARK 2020-B19 | Yes | Midland | Rialto |
| A-2 | $25,000,000 | $25,000,000 | BMARK 2020-B20 | No | ||||
| Total | $63,600,000 | $63,600,000 | ||||||
| 17 | The Hub | A-1 | $25,000,000 | $25,000,000 | BMARK 2020-B20 | Yes | Midland | Midland |
| A-2 | 19,205,881 | 19,205,881 | GSBI | No | ||||
| Total | $44,205,881 | $44,205,881 | ||||||
| 18 | Troy Technology Park | A-1 | $25,000,000 | $25,000,000 | BMARK 2020-B20 | Yes | Midland | Midland |
| A-2 | $20,000,000 | $20,000,000 | JPMCB | No | ||||
| $45,000,000 | $45,000,000 | |||||||
| Total | ||||||||
| 19 | Amazon Industrial Portfolio | A-1 | $80,000,000 | $80,000,000 | BMARK 2020-B19 | Yes | Midland | Rialto |
| A-2 | $35,000,000 | $35,000,000 | DBJPM 2020-C9 | No | ||||
| A-3 | $24,100,000 | $24,100,000 | BMARK 2020-B20 | No | ||||
| Total | $139,100,000 | $139,100,000 | ||||||
| 23 | 711 Fifth Avenue | A-1-1, A-1-10 | $62,500,000 | $62,500,000 | GSMS 2020-GC47 | Yes | Wells Fargo | KeyBank |
| A-1-2, A-1-3, A-1-4, A-1-5- | $184,000,000 | $184,000,000 | GSBI | No | ||||
| A, A-1-5-C, A-1-16, A-1-17 | ||||||||
| A-1-5-B | $15,000,000 | $15,000,000 | BMARK 2020-B20 | No | ||||
| A-1-6, A-1-7 | $40,000,000 | $40,000,000 | JPMDB 2020-COR7 | No | ||||
| A-1-8, A-1-13, A-1-9 | $45,000,000 | $45,000,000 | BMARK 2020-B18 | No | ||||
| A-1-11, A-1-12, A-1-14 | $25,000,000 | $25,000,000 | DBJPM 2020-C9 | No | ||||
| A-1-15 | $10,000,000 | $10,000,000 | BMARK 2020-B19 | No | ||||
| A-2-1 | $60,000,000 | $60,000,000 | BANK 2020-BNK28 | No | ||||
| A-2-2 | $43,000,000 | $43,000,000 | BANK 2020-BNK27 | No | ||||
| A-2-3, A-2-4 | $60,500,000 | $60,500,000 | BANA | No | ||||
| Total | $545,000,000 | $545,000,000 |
| (1) | Each note represents a subordinate companion loan. |
| (2) | In the case of Loan No. 9, the initial controlling note is Note B, for so long as no control appraisal period with respect to Note B is continuing. See “Description of the Mortgage Pool—The Whole Loans The Non-Serviced AB Whole Loans—The Agellan Portfolio Whole Loan” in the Preliminary Prospectus. The Agellan Portfolio Whole Loan will be serviced under the pooling and servicing agreement for the Benchmark 2020-B18 transaction. |
| (3) | In the case of Loan No. 11, The controlling note is A-2-B; however, so long as AGL, VALIC, AHAC and NUFI (collectively, the “Life Company Lenders”) hold at least $75,000,000 in outstanding principal balance of the 333 South Wabash whole loan, Asset Management (U.S.), LLC (“AIG”) is irrevocably appointed as the controlling note holder representative with the ability to exercise all rights of the Controlling Note holder. Accordingly, for purposes of discussing the rights of the directing holder and related matters in this Term Sheet, the notes evidencing the portion of the 333 South Wabash whole loan held by the Life Company Lenders will be deemed to collectively constitute the related Controlling Note. |
THE INFORMATION IN THIS STRUCTURAL AND COLLATERAL TERM SHEET IS NOT COMPLETE AND MAY BE AMENDED PRIOR TO THE TIME OF SALE. THIS TERM SHEET IS NOT AN OFFER TO SELL THESE SECURITIES AND IT IS NOT A SOLICITATION OF AN OFFER TO BUY THESE SECURITIES IN ANY JURISDICTION WHERE THE OFFER OR SALE IS NOT PERMITTED.
| | 6 of 144 | | |
| Structural and Collateral Term Sheet | Benchmark 2020-B20 |
| Collateral Characteristics |
| Additional Debt Summary |
No. | Loan Name | Trust Cut-off Date Balance | Subordinate Debt Cut-off Date Balance(1) | Total Debt Cut-off Date Balance | Mortgage Loan UW NCF DSCR(2)(3) | Total Debt UW NCF DSCR(3) | Mortgage Loan Cut-off Date LTV(2)(4) | Total Debt Cut-off Date LTV(4) | Mortgage Loan UW NOI DY(2)(3) | Total Debt UW NOI DY(3) |
| 1 | Moffett Place - Building 6 | $74,850,000 | $115,900,000 | $249,000,000 | 3.50x | 1.59x | 37.1% | 69.3% | 12.2% | 6.5% |
| 3 | MGM Grand & Mandalay Bay | $70,000,000 | $1,365,800,000 | $3,000,000,000 | 4.95x | 2.70x | 35.5% | 65.2% | 17.9% | 9.7% |
| 9 | Agellan Portfolio | $35,000,000 | $203,000,000 | $434,000,000 | 3.03x | 1.54x | 41.9% | 78.8% | 15.7% | 8.3% |
| 17 | The Hub | $25,000,000 | $2,560,000 | $46,765,881 | 3.04x | 2.76x | 54.7% | 57.9% | 11.1% | 10.5% |
| (1) | In the case of Loan Nos. 3 and 17, Subordinate Debt Cut-off Date Balance represents one or more Subordinate Companion Loans. In the case of Loan Nos. 1 and 9, Subordinate Debt Cut-off Date Balance represents one or more Subordinate Companion Loans and one or more mezzanine loans. |
| (2) | In the case of Loan Nos. 1, 3, 9 and 17, the Mortgage Loan UW NCF DSCR, Mortgage Loan UW NOI DY and Mortgage Loan Cut-off Date LTV calculations include the related Pari Passu Companion Loan(s). In the case of Loan Nos. 1, 3, 9 and 17, the Mortgage Loan UW NCF DSCR, Mortgage Loan UW NOI DY and Mortgage Loan Cut-off Date LTV calculations exclude the related Subordinate Companion Loan(s) and/or related mezzanine loan(s). |
| (3) | In the case of Loan No. 3, the Mortgage Loan UW NCF DSCR, Total Debt UW NCF DSCR, Mortgage Loan UW NOI DY and Total Debt UW NOI DY are calculated based on the master lease annual rent of $292,000,000. |
| (4) | In the case of Loan Nos. 1 and 3, the Mortgage Loan Cut-off Date LTV and Total Debt Cut-Off Date LTV are calculated by using an appraised value based on certain hypothetical assumptions. Refer to “Description of the Mortgage Pool—Assessments of Property Value and Condition” and “—Appraised Value” in the Preliminary Prospectus for additional details. |
THE INFORMATION IN THIS STRUCTURAL AND COLLATERAL TERM SHEET IS NOT COMPLETE AND MAY BE AMENDED PRIOR TO THE TIME OF SALE. THIS TERM SHEET IS NOT AN OFFER TO SELL THESE SECURITIES AND IT IS NOT A SOLICITATION OF AN OFFER TO BUY THESE SECURITIES IN ANY JURISDICTION WHERE THE OFFER OR SALE IS NOT PERMITTED.
| | 7 of 144 | | |
| Structural and Collateral Term Sheet | Benchmark 2020-B20 |
| Collateral Characteristics |
| Mortgaged Properties by Type(1) |
| Weighted Average | |||||||||
| Cut-off Date | UW | UW | Cut-off | Maturity | |||||
| Number of | Principal | % of | NCF | NOI | Date | Date LTV | |||
| Property Type | Property Subtype | Properties | Balance | IPB | Occupancy | DSCR(2)(3) | DY(2)(3) | LTV(2)(3)(4) | (2)(3)(4)(5) |
| Office | CBD | 9 | $279,342,804 | 30.9% | 95.7% | 2.86x | 10.4% | 53.8% | 53.8% |
| Suburban | 9 | 173,980,645 | 19.3 | 95.6% | 2.78x | 11.0% | 57.9% | 54.1% | |
| Medical | 1 | 9,500,000 | 1.1 | 100.0% | 2.36x | 9.3% | 60.1% | 60.1% | |
| Subtotal: | 19 | $462,823,449 | 51.2% | 95.7% | 2.82x | 10.6% | 55.5% | 54.0% | |
| Mixed Use | Office/Retail | 2 | $77,500,000 | 8.6% | 95.5% | 2.13x | 7.8% | 66.5% | 66.5% |
| Retail/Office | 2 | 55,000,000 | 6.1 | 96.1% | 2.36x | 10.9% | 61.5% | 59.5% | |
| Industrial/Office | 1 | 25,000,000 | 2.8 | 85.8% | 1.66x | 9.2% | 72.9% | 60.9% | |
| Medical/Retail | 1 | 20,400,000 | 2.3 | 83.6% | 2.06x | 9.1% | 58.2% | 58.2% | |
| Multifamily/Retail | 1 | 5,700,000 | 0.6 | 100.0% | 2.08x | 8.6% | 48.7% | 48.7% | |
| Multifamily/Office | 1 | 2,300,000 | 0.3 | 100.0% | 1.90x | 8.0% | 50.0% | 50.0% | |
| Subtotal: | 8 | $185,900,000 | 20.6% | 93.2% | 2.12x | 9.1% | 64.2% | 62.0% | |
| Industrial | Flex/R&D | 3 | $64,130,250 | 7.1% | 98.3% | 1.77x | 11.0% | 56.0% | 42.3% |
| Warehouse/Distribution | 20 | 38,437,841 | 4.3 | 98.2% | 2.62x | 10.9% | 56.2% | 56.2% | |
| Flex | 23 | 13,120,223 | 1.5 | 89.9% | 3.03x | 15.7% | 41.9% | 41.9% | |
| Manufacturing | 1 | 6,186,126 | 0.7 | 100.0% | 2.11x | 11.3% | 59.5% | 48.9% | |
| Warehouse | 1 | 168,486 | 0.0 | 100.0% | 3.03x | 15.7% | 41.9% | 41.9% | |
| Subtotal: | 48 | $122,042,927 | 13.5% | 97.4% | 2.19x | 11.5% | 54.7% | 47.0% | |
| Hotel | Full Service | 2 | $70,000,000 | 7.7% | 87.5% | 4.95x | 17.9% | 35.5% | 35.5% |
| Subtotal: | 2 | $70,000,000 | 7.7% | 87.5% | 4.95x | 17.9% | 35.5% | 35.5% | |
| Self Storage | Self Storage | 8 | $36,722,500 | 4.1% | 85.4% | 2.00x | 9.3% | 62.4% | 55.3% |
| Subtotal: | 8 | $36,722,500 | 4.1% | 85.4% | 2.00x | 9.3% | 62.4% | 55.3% | |
| Retail | Anchored | 1 | $7,800,000 | 0.9% | 98.9% | 1.81x | 11.5% | 65.0% | 59.0% |
| Other | 1 | 7,250,000 | 0.8 | 100.0% | 2.97x | 10.7% | 54.1% | 54.1% | |
| Subtotal: | 2 | $15,050,000 | 1.7% | 99.4% | 2.37x | 11.1% | 59.7% | 56.6% | |
| Multifamily | Mid-Rise | 1 | $5,800,000 | 0.6% | 100.0% | 1.85x | 7.5% | 63.7% | 63.7% |
| Garden | 1 | 5,150,000 | 0.6 | 100.0% | 2.48x | 9.8% | 55.1% | 55.1% | |
| Subtotal: | 2 | $10,950,000 | 1.2% | 100.0% | 2.15x | 8.6% | 59.7% | 59.7% | |
| Total / Weighted Average: | 89 | $903,488,876 100.0% | 94.5% | 2.71x | 10.9% | 56.0% | 53.5% | ||
| (1) | Because this table presents information relating to the mortgaged properties and not mortgage loans, the information for mortgage loans secured by more than one mortgaged property is based on allocated loan amounts. |
| (2) | In the case of Loan Nos. 1, 2, 3, 4, 6, 9, 11, 12, 16, 17, 18, 19 and 23, the UW NCF DSCR, UW NOI DY, Cut-off Date LTV and Maturity Date LTV Ratio calculations include the related Pari Passu Companion Loan(s). In the case of Loan Nos. 1, 3, 9 and 17, the UW NCF DSCR, UW NOI DY, Cut-off Date LTV and Maturity Date LTV calculations exclude the related Subordinate Companion Loan(s) and/or related mezzanine loan(s). |
| (3) | In the case of Loan No. 21, the UW NOI DY, Cut-off Date LTV and Maturity Date LTV are calculated net of a holdback reserve. In the case of Loan No. 3, the UW NCF DSCR and UW NOI DY are calculated based on the master lease annual rent of $292,000,000. |
| (4) | In the case of Loan Nos. 1, 3, 6, 7, 16, 18, and 20, the Cut-off Date LTV and the Maturity Date LTV are calculated by using an appraised value based on certain hypothetical assumptions. Refer to “Description of the Mortgage Pool—Assessments of Property Value and Condition” and “—Appraised Value” in the Preliminary Prospectus for additional details. |
| (5) | In the case of Loan Nos. 3 and 16, with an anticipated repayment date, Maturity Date LTV is calculated as of the related anticipated repayment date. |
THE INFORMATION IN THIS STRUCTURAL AND COLLATERAL TERM SHEET IS NOT COMPLETE AND MAY BE AMENDED PRIOR TO THE TIME OF SALE. THIS TERM SHEET IS NOT AN OFFER TO SELL THESE SECURITIES AND IT IS NOT A SOLICITATION OF AN OFFER TO BUY THESE SECURITIES IN ANY JURISDICTION WHERE THE OFFER OR SALE IS NOT PERMITTED.
| | 8 of 144 | | |
| Structural and Collateral Term Sheet | Benchmark 2020-B20 |
| Collateral Characteristics |
| Mortgaged Properties by Location(1) |
State | Number of Properties | Cut-off Date | % of IPB | Weighted Average | ||||
Occupancy | UW NCF DSCR(2)(3) | UW NOI DY(2)(3) | Cut-off Date | Maturity Date | ||||
| California | 10 | $241,580,250 | 26.7% | 94.0% | 3.00x | 10.9% | 51.7% | 50.0% |
| New York | 7 | 186,300,000 | 20.6 | 96.3% | 2.47x | 8.8% | 60.9% | 60.9% |
| Texas | 24 | 95,050,993 | 10.5 | 97.9% | 2.50x | 11.5% | 56.4% | 53.5% |
| Nevada | 2 | 70,000,000 | 7.7 | 87.5% | 4.95x | 17.9% | 35.5% | 35.5% |
| Michigan | 3 | 56,194,169 | 6.2 | 91.2% | 1.79x | 10.2% | 66.7% | 58.0% |
| Minnesota | 2 | 49,300,000 | 5.5 | 97.8% | 1.83x | 11.6% | 53.3% | 39.8% |
| Illinois | 11 | 43,553,474 | 4.8 | 92.2% | 2.83x | 11.0% | 58.3% | 58.3% |
| Arizona | 1 | 40,400,000 | 4.5 | 100.0% | 2.58x | 9.4% | 62.6% | 62.6% |
| Washington | 3 | 40,290,000 | 4.5 | 92.2% | 1.83x | 10.3% | 65.7% | 61.2% |
| Florida | 2 | 16,551,136 | 1.8 | 100.0% | 2.55x | 10.1% | 58.6% | 58.6% |
| Kansas | 1 | 11,959,907 | 1.3 | 100.0% | 2.38x | 8.0% | 64.7% | 64.7% |
| Idaho | 3 | 11,887,500 | 1.3 | 84.6% | 1.41x | 8.6% | 67.5% | 54.2% |
| Alabama | 1 | 7,800,000 | 0.9 | 98.9% | 1.81x | 11.5% | 65.0% | 59.0% |
| Louisiana | 1 | 7,080,000 | 0.8 | 91.7% | 2.87x | 10.2% | 58.8% | 58.8% |
| Wisconsin | 1 | 6,186,126 | 0.7 | 100.0% | 2.11x | 11.3% | 59.5% | 48.9% |
| New Jersey | 1 | 5,200,000 | 0.6 | 86.6% | 2.55x | 10.1% | 54.9% | 54.9% |
| Pennsylvania | 1 | 4,800,000 | 0.5 | 85.7% | 2.55x | 10.1% | 54.9% | 54.9% |
| Georgia | 9 | 3,944,665 | 0.4 | 95.2% | 3.03x | 15.7% | 41.9% | 41.9% |
| Oregon | 1 | 2,615,000 | 0.3 | 78.9% | 1.41x | 8.6% | 67.5% | 54.2% |
| Indiana | 1 | 1,534,615 | 0.2 | 100.0% | 3.03x | 15.7% | 41.9% | 41.9% |
| Ohio | 2 | 582,754 | 0.1 | 55.2% | 3.03x | 15.7% | 41.9% | 41.9% |
| Maryland | 1 | 464,640 | 0.1 | 92.2% | 3.03x | 15.7% | 41.9% | 41.9% |
| Kentucky | 1 | 213,648 | 0.0 | 100.0% | 3.03x | 15.7% | 41.9% | 41.9% |
| Total / Weighted Average: | 89 | $903,488,876 | 100.0% | 94.5% | 2.71x | 10.9% | 56.0% | 53.5% |
| (1) | Because this table presents information relating to the mortgaged properties and not mortgage loans, the information for mortgage loans secured by more than one mortgaged property is based on allocated loan amounts. |
| (2) | In the case of Loan Nos. 1, 2, 3, 4, 6, 9, 11, 12, 16, 17, 18, 19 and 23, the UW NCF DSCR, UW NOI DY, Cut-off Date LTV and Maturity Date LTV Ratio calculations include the related Pari Passu Companion Loan(s). In the case of Loan Nos. 1, 3, 9 and 17, the UW NCF DSCR, UW NOI DY, Cut-off Date LTV and Maturity Date LTV calculations exclude the related Subordinate Companion Loan(s) and/or related mezzanine loan(s). |
| (3) | In the case of Loan No. 21, the UW NOI DY, Cut-off Date LTV and Maturity Date LTV are calculated net of a holdback reserve. In the case of Loan No. 3, the UW NCF DSCR and UW NOI DY are calculated based on the master lease annual rent of $292,000,000. |
| (4) | In the case of Loan Nos. 1, 3, 6, 7, 16, 18, and 20, the Cut-off Date LTV and the Maturity Date LTV are calculated by using an appraised value based on certain hypothetical assumptions. Refer to “Description of the Mortgage Pool—Assessments of Property Value and Condition” and “—Appraised Value” in the Preliminary Prospectus for additional details. |
| (5) | In the case of Loan Nos. 3 and 16, with an anticipated repayment date, Maturity Date LTV is calculated as of the related anticipated repayment date. |
THE INFORMATION IN THIS STRUCTURAL AND COLLATERAL TERM SHEET IS NOT COMPLETE AND MAY BE AMENDED PRIOR TO THE TIME OF SALE. THIS TERM SHEET IS NOT AN OFFER TO SELL THESE SECURITIES AND IT IS NOT A SOLICITATION OF AN OFFER TO BUY THESE SECURITIES IN ANY JURISDICTION WHERE THE OFFER OR SALE IS NOT PERMITTED.
| | 9 of 144 | | |
| Structural and Collateral Term Sheet | Benchmark 2020-B20 |
| Collateral Characteristics |
| Cut-off Date Principal Balance |
Range of Cut-off Date Principal Balances | Number of | Cut-off Date | % of IPB | Weighted Average | ||||||
Mortgage | Remaining Loan Term(1) | UW DSCR(2)(3) | UW NOI DY(2)(3) | Cut-off Date LTV(2)(3)(4) | Maturity Date LTV(1)(2)(3)(4) | |||||
| $2,300,000 - | $9,999,999 | 9 | $56,766,126 | 6.3% | 3.71571% | 110 | 2.31x | 9.8% | 58.1% | 56.2% |
| $10,000,000 - | $19,999,999 | 4 | 54,942,500 | 6.1 | 3.83999% | 118 | 2.12x | 9.7% | 61.7% | 55.2% |
| $20,000,000 - | $24,999,999 | 3 | 66,100,000 | 7.3 | 3.55261% | 111 | 2.22x | 9.7% | 63.2% | 59.0% |
| $25,000,000 - | $49,999,999 | 14 | 448,330,250 | 49.6 | 3.59549% | 103 | 2.52x | 10.8% | 58.2% | 54.7% |
| $50,000,000 - | $74,850,000 | 4 | 277,350,000 | 30.7 | 3.44446% | 116 | 3.32x | 11.8% | 49.2% | 49.2% |
| Total / Wtd. Avg: | 34 | $903,488,876 | 100.0% | 3.56841% | 109 | 2.71x | 10.9% | 56.0% | 53.5% | |
| Mortgage Interest Rates |
Range of Mortgage Interest Rates | Number of Loans | Cut-off Date | % of IPB | Weighted Average | ||||||
Mortgage | Remaining Loan Term(1) | UW DSCR(2)(3) | UW NOI DY(2)(3) | Cut-off Date LTV(2)(3)(4) | Maturity Date LTV(1)(2)(3)(4) | |||||
| 2.80000% - | 3.00000% | 1 | $40,000,000 | 4.4% | 2.80000% | 119 | 3.64x | 10.3% | 50.8% | 50.8% |
| 3.00001% - | 3.50000% | 10 | 307,966,126 | 34.1 | 3.29246% | 118 | 2.88x | 10.7% | 52.0% | 50.0% |
| 3.50001% - | 4.00000% | 17 | 450,480,250 | 49.9 | 3.65316% | 108 | 2.61x | 10.9% | 59.4% | 56.4% |
| 4.00001% - | 4.50000% | 5 | 70,042,500 | 7.8 | 4.14594% | 97 | 1.91x | 9.5% | 61.9% | 56.9% |
| 4.50001% - | 4.62820% | 1 | 35,000,000 | 3.9 | 4.62820% | 58 | 3.03x | 15.7% | 41.9% | 41.9% |
| Total / Wtd. Avg: | 34 | $903,488,876 | 100.0% | 3.56841% | 109 | 2.71x | 10.9% | 56.0% | 53.5% | |
| Original Term to Maturity in Months |
Original Term to Maturity in Months | Number of Loans | Cut-off Date | % of IPB | Weighted Average | |||||
Mortgage | Remaining Loan Term(1) | UW DSCR(2)(3) | UW NOI DY(2)(3) | Cut-off Date LTV(2)(3)(4) | Maturity Date LTV(1)(2)(3)(4) | ||||
| 60 | 4 | $73,000,000 | 8.1% | 4.24284% | 56 | 2.41x | 12.8% | 53.1% | 51.6% |
| 84 | 2 | 72,500,000 | 8.0 | 3.81237% | 84 | 2.40x | 9.4% | 61.4% | 61.4% |
| 96 | 1 | 30,000,000 | 3.3 | 3.53000% | 95 | 2.75x | 10.1% | 62.8% | 62.8% |
| 107 | 1 | 24,100,000 | 2.7 | 3.25000% | 105 | 2.38x | 8.0% | 64.7% | 64.7% |
| 110 | 1 | 21,600,000 | 2.4 | 3.71800% | 110 | 2.19x | 12.3% | 66.3% | 53.5% |
| 120 | 25 | 682,288,876 | 75.5 | 3.47853% | 118 | 2.80x | 11.0% | 54.8% | 52.0% |
| Total / Wtd. Avg: | 34 | $903,488,876 | 100.0% | 3.56841% | 109 | 2.71x | 10.9% | 56.0% | 53.5% |
| Remaining Term to Maturity in Months(1) |
| Weighted Average | ||||||||||
Range of Remaining Term to Maturity in Months | Number of | Cut-off Date Principal Balance | % of IPB | Mortgage Rate | Remaining Loan Term(1) | UW DSCR(2)(3) | UW NOI DY(2)(3) | Cut-off Date LTV(2)(3)(4) | Maturity Date LTV(1)(2)(3)(4) | |
| 53 - | 60 | 4 | $73,000,000 | 8.1% | 4.24284% | 56 | 2.41x | 12.8% | 53.1% | 51.6% |
| 61 - | 84 | 2 | 72,500,000 | 8.0 | 3.81237% | 84 | 2.40x | 9.4% | 61.4% | 61.4% |
| 85 - | 119 | 10 | 370,850,000 | 41.0 | 3.44319% | 113 | 3.21x | 11.6% | 51.7% | 50.8% |
| 120 - | 120 | 18 | 387,138,876 | 42.8 | 3.51551% | 120 | 2.34x | 10.2% | 59.7% | 54.9% |
| Total / Wtd. Avg: | 34 | $903,488,876 | 100.0% | 3.56841% | 109 | 2.71x | 10.9% | 56.0% | 53.5% | |
| (1) | In the case of Loan Nos. 3 and 16, with an anticipated repayment date, Remaining Loan Term and Maturity Date LTV is calculated as of the related anticipated repayment date. |
| (2) | In the case of Loan Nos. 1, 2, 3, 4, 6, 9, 11, 12, 16, 17, 18, 19 and 23, the UW NCF DSCR, UW NOI DY, Cut-off Date LTV and Maturity Date LTV calculations include the related Pari Passu Companion Loan(s). In the case of Loan Nos. 1, 3, 9 and 17, the UW NCF DSCR, UW NOI DY, Cut-off Date LTV and Maturity Date LTV calculations exclude the related Subordinate Companion Loan(s) and/or related mezzanine loan(s). |
| (3) | In the case of Loan No. 21, the UW NOI DY, Cut-off Date LTV and Maturity Date LTV are calculated net of a holdback reserve. In the case of loan No. 3, the UW NCF DSCR, UW NOI DY are calculated based on the master lease annual rent of $292,000,000. |
| (4) | In the case of Loan Nos. 1, 3, 6, 7, 16, 18 and 20, the Cut-off Date LTV and the Maturity Date LTV are calculated by using an appraised value based on certain hypothetical assumptions. Refer to “Description of the Mortgage Pool—Assessments of Property Value and Condition” and “—Appraised Value” in the Preliminary Prospectus for additional details. |
THE INFORMATION IN THIS STRUCTURAL AND COLLATERAL TERM SHEET IS NOT COMPLETE AND MAY BE AMENDED PRIOR TO THE TIME OF SALE. THIS TERM SHEET IS NOT AN OFFER TO SELL THESE SECURITIES AND IT IS NOT A SOLICITATION OF AN OFFER TO BUY THESE SECURITIES IN ANY JURISDICTION WHERE THE OFFER OR SALE IS NOT PERMITTED.
| | 10 of 144 | | |
| Structural and Collateral Term Sheet | Benchmark 2020-B20 |
| Collateral Characteristics |
| Original Amortization Term in Months |
| Weighted Average | |||||||||||
Original Amortization Term in Months | Number | Cut-off Date | % of IPB | Mortgage | Remaining | UW NCF DSCR(2)(3) | UW | Cut-off | Maturity | ||
| Interest Only | 24 | $685,630,000 | 75.9% | 3.52361% | 109 | 3.00x | 11.0% | 53.7% | 53.7% | ||
| 300 | - | 300 | 1 | 39,000,000 | 4.3 | 3.44000% | 120 | 1.80x | 11.5% | 49.5% | 34.8% |
| 360 | - | 360 | 9 | 178,858,876 | 19.8 | 3.76816% | 107 | 1.77x | 10.3% | 66.4% | 56.7% |
| Total / Wtd. Avg: | 34 | $903,488,876 | 100.0% | 3.56841% | 109 | 2.71x | 10.9% | 56.0% | 53.5% | ||
| Remaining Amortization Term in Months |
| Weighted Average | |||||||||||
Range of Remaining Amortization Term in Months | Number | Cut-off Date | % of IPB | Mortgage | Remaining | UW NCF DSCR(2)(3) | UW | Cut-off | Maturity | ||
| Interest Only | 24 | $685,630,000 | 75.9% | 3.52361% | 109 | 3.00x | 11.0% | 53.7% | 53.7% | ||
| 300 | - | 300 | 1 | 39,000,000 | 4.3 | 3.44000% | 120 | 1.80x | 11.5% | 49.5% | 34.8% |
| 360 | - | 360 | 9 | 178,858,876 | 19.8 | 3.76816% | 107 | 1.77x | 10.3% | 66.4% | 56.7% |
| Total / Wtd. Avg: | 34 | $903,488,876 | 100.0% | 3.56841% | 109 | 2.71x | 10.9% | 56.0% | 53.5% | ||
| Amortization Types |
Amortization Types | Number | Cut-off Date | % of IPB | Weighted Average | |||||
Mortgage | Remaining Loan Term(1) | UW DSCR(2)(3) | UW NOI DY(2)(3) | Cut-off Date LTV(2)(3)(4) | Maturity Date LTV(1)(2)(3)(4) | ||||
| Interest Only | 22 | $590,630,000 | 65.4% | 3.51528% | 108 | 2.78x | 10.2% | 55.8% | 55.8% |
| IO-Balloon | 6 | 109,286,126 | 12.1 | 3.72708% | 101 | 1.81x | 10.6% | 66.6% | 59.3% |
| Balloon | 4 | 108,572,750 | 12.0 | 3.69163% | 118 | 1.75x | 10.5% | 60.1% | 46.2% |
| ARD-Interest Only | 2 | 95,000,000 | 10.5 | 3.57537% | 115 | 4.39x | 16.0% | 40.1% | 40.1% |
| Total / Wtd. Avg: | 34 | $903,488,876 | 100.0% | 3.56841% | 109 | 2.71x | 10.9% | 56.0% | 53.5% |
| Underwritten Net Cash Flow Debt Service Coverage Ratios(2)(3) |
| Weighted Average | ||||||||||
Range of Underwritten Net Cash Flow Debt Service Coverage Ratios | Number of Loans | Cut-off Date | % of IPB | Mortgage | Remaining | UW DSCR(2)(3) | UW | Cut-off | Maturity | |
| 1.41x - | 1.49x | 1 | $19,642,500 | 2.2% | 4.28000% | 120 | 1.41x | 8.6% | 67.5% | 54.2% |
| 1.50x - | 1.74x | 2 | 53,330,250 | 5.9 | 3.64750% | 120 | 1.61x | 9.1% | 68.7% | 55.6% |
| 1.75x - | 1.99x | 8 | 187,700,000 | 20.8 | 3.68445% | 106 | 1.86x | 9.8% | 63.1% | 57.7% |
| 2.00x - | 2.24x | 5 | 85,986,126 | 9.5 | 3.85904% | 100 | 2.14x | 10.2% | 60.3% | 56.4% |
| 2.25x - | 4.95x | 18 | 556,830,000 | 61.6 | 3.45174% | 110 | 3.23x | 11.7% | 51.3% | 51.3% |
| Total / Wtd. Avg: | 34 | $903,488,876 | 100.0% | 3.56841% | 109 | 2.71x | 10.9% | 56.0% | 53.5% | |
| (1) | In the case of Loan Nos. 3 and 16, with an anticipated repayment date, Remaining Loan Term and Maturity Date LTV is calculated as of the related anticipated repayment date. |
| (2) | In the case of Loan Nos. 1, 2, 3, 4, 6, 9, 11, 12, 16, 17, 18, 19 and 23, the UW NCF DSCR, UW NOI DY, Cut-off Date LTV and Maturity Date LTV calculations include the related Pari Passu Companion Loan(s). In the case of Loan Nos. 1, 3, 9 and 17, the UW NCF DSCR, UW NOI DY, Cut-off Date LTV and Maturity Date LTV calculations exclude the related Subordinate Companion Loan(s) and/or related mezzanine loan(s). |
| (3) | In the case of Loan No. 21, the UW NOI DY, Cut-off Date LTV and Maturity Date LTV are calculated net of a holdback reserve. In the case of loan No. 3, the UW NCF DSCR, UW NOI DY are calculated based on the master lease annual rent of $292,000,000. |
| (4) | In the case of Loan Nos. 1, 3, 6, 7, 16, 18 and 20, the Cut-off Date LTV and the Maturity Date LTV are calculated by using an appraised value based on certain hypothetical assumptions. Refer to “Description of the Mortgage Pool—Assessments of Property Value and Condition” and “—Appraised Value” in the Preliminary Prospectus for additional details. |
THE INFORMATION IN THIS STRUCTURAL AND COLLATERAL TERM SHEET IS NOT COMPLETE AND MAY BE AMENDED PRIOR TO THE TIME OF SALE. THIS TERM SHEET IS NOT AN OFFER TO SELL THESE SECURITIES AND IT IS NOT A SOLICITATION OF AN OFFER TO BUY THESE SECURITIES IN ANY JURISDICTION WHERE THE OFFER OR SALE IS NOT PERMITTED.
| | 11 of 144 | | |
| Structural and Collateral Term Sheet | Benchmark 2020-B20 |
| Collateral Characteristics |
| LTV Ratios as of the Cut-off Date(2)(3)(4) |
| Weighted Average | ||||||||||
Range of Cut-off Date LTVs | Number of Loans | Cut-off Date Principal Balance | % of IPB | Mortgage | Remaining Loan Term(1) | UW DSCR(2)(3) | UW NOI DY(2)(3) | Cut-off Date LTV(2)(3)(4) | Maturity Date LTV(1)(2)(3)(4) | |
| 35.5% - | 39.9% | 2 | $144,850,000 | 16.0% | 3.46048% | 116 | 4.20x | 15.0% | 36.3% | 36.3% |
| 40.0% - | 49.9% | 3 | 79,700,000 | 8.8 | 4.00399% | 88 | 2.36x | 13.1% | 46.1% | 38.9% |
| 50.0% - | 59.9% | 15 | 333,966,126 | 37.0 | 3.39208% | 116 | 2.83x | 10.2% | 56.6% | 56.4% |
| 60.0% - | 69.9% | 13 | 319,972,750 | 35.4 | 3.68332% | 103 | 2.07x | 9.4% | 65.5% | 61.2% |
| 70.0% - | 72.9% | 1 | 25,000,000 | 2.8 | 3.69000% | 120 | 1.66x | 9.2% | 72.9% | 60.9% |
| Total / Wtd. Avg: | 34 | $903,488,876 | 100.0% | 3.56841% | 109 | 2.71x | 10.9% | 56.0% | 53.5% | |
| LTV Ratios as of the Maturity Date(1)(2)(3)(4) |
Range of Maturity Date LTVs | Number of Loans | Cut-off Date | % of IPB | Weighted Average | ||||||
Mortgage | Remaining Loan Term(1) | UW DSCR(2)(3) | UW NOI DY(2)(3) | Cut-off Date LTV(2)(3)(4) | Maturity Date LTV(1)(2)(3)(4) | |||||
| 34.8% - | 39.9% | 3 | $183,850,000 | 20.3% | 3.45614% | 117 | 3.69x | 14.2% | 39.1% | 36.0% |
| 40.0% - | 44.9% | 1 | 35,000,000 | 3.9 | 4.62820% | 58 | 3.03x | 15.7% | 41.9% | 41.9% |
| 45.0% - | 49.9% | 2 | 11,886,126 | 1.3 | 3.59647% | 91 | 2.10x | 10.0% | 54.3% | 48.8% |
| 50.0% - | 54.9% | 10 | 194,122,750 | 21.5 | 3.48373% | 117 | 2.61x | 10.2% | 57.7% | 52.9% |
| 55.0% - | 69.4% | 18 | 478,630,000 | 53.0 | 3.56769% | 107 | 2.36x | 9.6% | 62.9% | 61.4% |
| Total / Wtd. Avg: | 34 | $903,488,876 | 100.0% | 3.56841% | 109 | 2.71x | 10.9% | 56.0% | 53.5% | |
| Prepayment Protection |
Prepayment Protection | Number of Loans | Cut-off Date | % of IPB | Weighted Average | |||||
Mortgage | Remaining Loan Term(1) | UW DSCR(2)(3) | UW NOI DY(2)(3) | Cut-off Date LTV(2)(3)(4) | Maturity Date LTV(1)(2)(3)(4) | ||||
| Defeasance | 25 | $565,252,750 | 62.6% | 3.59919% | 106 | 2.38x | 10.2% | 60.1% | 56.6% |
| Defeasance or Yield Maintenance | 4 | 221,036,126 | 24.5 | 3.37093% | 117 | 3.68x | 13.1% | 43.8% | 43.5% |
| Yield Maintenance | 5 | 117,200,000 | 13.0 | 3.79242% | 108 | 2.47x | 10.5% | 59.6% | 57.2% |
| Total / Wtd. Avg: | 34 | $903,488,876 | 100.0% | 3.56841% | 109 | 2.71x | 10.9% | 56.0% | 53.5% |
| Loan Purpose |
Loan Purpose | Number of | Cut-off Date | % of IPB | Weighted Average | |||||
Mortgage | Remaining Loan Term(1) | UW DSCR(2)(3) | UW NOI DY(2)(3) | Cut-off Date LTV(2)(3)(4) | Maturity Date LTV(1)(2)(3)(4) | ||||
| Refinance | 22 | $527,658,626 | 58.4% | 3.53664% | 109 | 2.78x | 10.7% | 54.5% | 53.4% |
| Acquisition | 8 | 222,730,250 | 24.7 | 3.58243% | 113 | 3.09x | 12.2% | 54.6% | 51.0% |
| Recapitalization | 4 | 153,100,000 | 16.9 | 3.65754% | 103 | 1.91x | 9.8% | 63.5% | 57.2% |
| Total / Wtd. Avg: | 34 | $903,488,876 | 100.0% | 3.56841% | 109 | 2.71x | 10.9% | 56.0% | 53.5% |
| (1) | In the case of Loan Nos. 3 and 16, with an anticipated repayment date, Remaining Loan Term and Maturity Date LTV is calculated as of the related anticipated repayment date. |
| (2) | In the case of Loan Nos. 1, 2, 3, 4, 6, 9, 11, 12, 16, 17, 18, 19 and 23, the UW NCF DSCR, UW NOI DY, Cut-off Date LTV and Maturity Date LTV calculations include the related Pari Passu Companion Loan(s). In the case of Loan Nos. 1, 3, 9 and 17, the UW NCF DSCR, UW NOI DY, Cut-off Date LTV and Maturity Date LTV calculations exclude the related Subordinate Companion Loan(s) and/or related mezzanine loan(s). |
| (3) | In the case of Loan No. 21, the UW NOI DY, Cut-off Date LTV and Maturity Date LTV are calculated net of a holdback reserve. In the case of loan No. 3, the UW NCF DSCR, UW NOI DY are calculated based on the master lease annual rent of $292,000,000. |
| (4) | In the case of Loan Nos. 1, 3, 6, 7, 16, 18 and 20, the Cut-off Date LTV and the Maturity Date LTV are calculated by using an appraised value based on certain hypothetical assumptions. Refer to “Description of the Mortgage Pool—Assessments of Property Value and Condition” and “—Appraised Value” in the Preliminary Prospectus for additional details. |
THE INFORMATION IN THIS STRUCTURAL AND COLLATERAL TERM SHEET IS NOT COMPLETE AND MAY BE AMENDED PRIOR TO THE TIME OF SALE. THIS TERM SHEET IS NOT AN OFFER TO SELL THESE SECURITIES AND IT IS NOT A SOLICITATION OF AN OFFER TO BUY THESE SECURITIES IN ANY JURISDICTION WHERE THE OFFER OR SALE IS NOT PERMITTED.
| | 12 of 144 | | |
| Structural and Collateral Term Sheet | Benchmark 2020-B20 |
| Collateral Characteristics |
| Previous Securitization History(1) |
No. | Mortgaged Property | Cut-off Date Principal Balance | % of IPB | Location | Property Type | Previous Securitization |
| 2 | 120 Wall Street | $70,000,000 | 7.7% | New York, NY | Office | MSBAM 2014-C14 |
| 7 | Point West Portfolio | $39,500,000 | 4.4% | Sacramento, CA | Office | PFP 2017-4 |
| 9 | Agellan Portfolio | $35,000,000 | 3.9% | Various, Various | Various | MSC 2019-AGLN |
| 14 | 2665 North First | $29,000,000 | 3.2% | San Jose, CA | Office | PFP 2015-2 |
| 25.01 | Storage at Atlas(2) | $5,200,000 | 0.6% | Ocean Township, NJ | Self Storage | CGCMT 2016-P3 |
| 25.02 | Storage at Mont Mini(2) | $4,800,000 | 0.5% | Montgomeryville, PA | Self Storage | GSMS 2015-GC34 |
| 29 | Storage Post – Jefferson, LA | $7,080,000 | 0.8% | Jefferson, LA | Self Storage | UBSCM 2012-C1 |
| (1) | The table above represents the properties for which the previously existing debt was securitized, based on information provided by the related borrower or obtained through searches of a third-party database. |
| (2) | Cut-off Date Principal Balance represents the allocated loan amount for each respective mortgaged property. |
THE INFORMATION IN THIS STRUCTURAL AND COLLATERAL TERM SHEET IS NOT COMPLETE AND MAY BE AMENDED PRIOR TO THE TIME OF SALE. THIS TERM SHEET IS NOT AN OFFER TO SELL THESE SECURITIES AND IT IS NOT A SOLICITATION OF AN OFFER TO BUY THESE SECURITIES IN ANY JURISDICTION WHERE THE OFFER OR SALE IS NOT PERMITTED.
| | 13 of 144 | | |
| Structural and Collateral Term Sheet | Benchmark 2020-B20 |
| Moffett Place - Building 6 | |

THE INFORMATION IN THIS STRUCTURAL AND COLLATERAL TERM SHEET IS NOT COMPLETE AND MAY BE AMENDED PRIOR TO THE TIME OF SALE. THIS TERM SHEET IS NOT AN OFFER TO SELL THESE SECURITIES AND IT IS NOT A SOLICITATION OF AN OFFER TO BUY THESE SECURITIES IN ANY JURISDICTION WHERE THE OFFER OR SALE IS NOT PERMITTED.
| | 14 of 144 | | |
| Structural and Collateral Term Sheet | Benchmark 2020-B20 |
| Moffett Place - Building 6 | |
THE INFORMATION IN THIS STRUCTURAL AND COLLATERAL TERM SHEET IS NOT COMPLETE AND MAY BE AMENDED PRIOR TO THE TIME OF SALE. THIS TERM SHEET IS NOT AN OFFER TO SELL THESE SECURITIES AND IT IS NOT A SOLICITATION OF AN OFFER TO BUY THESE SECURITIES IN ANY JURISDICTION WHERE THE OFFER OR SALE IS NOT PERMITTED.
| | 15 of 144 | | |
| Structural and Collateral Term Sheet | Benchmark 2020-B20 |
| Moffett Place - Building 6 | |
| Mortgage Loan Information | Property Information | |||
| Mortgage Loan Seller: | GACC | Single Asset / Portfolio: | Single Asset | |
| Original Principal Balance(1): | $74,850,000 | Title: | Fee | |
| Cut-off Date Principal Balance(1): | $74,850,000 | Property Type - Subtype: | Office – CBD | |
| % of Pool by IPB: | 8.3% | Net Rentable Area (SF): | 314,352 | |
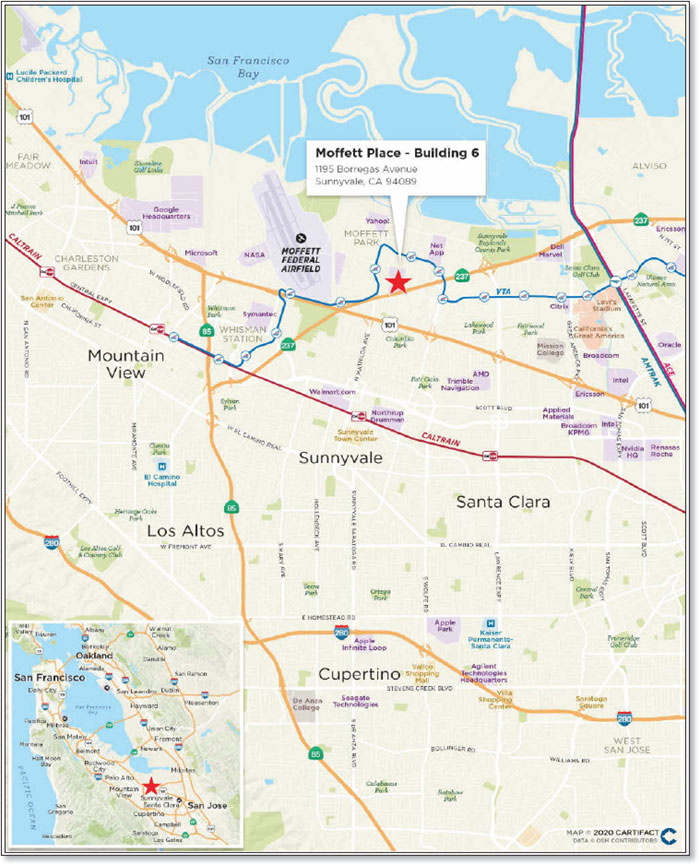
| Loan Purpose: | Refinance | Location: | Sunnyvale, CA | |
| Borrower: | MP B6 LLC | Year Built / Renovated: | 2020 / N/A | |
| Loan Sponsor: | Jay Paul | Occupancy: | 100.0% | |
| Interest Rate: | 3.369279% | Occupancy Date: | 10/6/2020 | |
| Note Date: | 8/6/2020 | Number of Tenants: | 1 | |
| Maturity Date: | 8/6/2030 | 2017 NOI: | N/A | |
| Interest-only Period: | 120 months | 2018 NOI: | N/A | |
| Original Term: | 120 months | 2019 NOI: | N/A | |
| Original Amortization: | None | TTM NOI: | N/A | |
| Amortization Type: | Interest Only | UW Economic Occupancy: | 95.0% | |
| Call Protection: | L(24),Grtr1%orYM(2), | UW Revenues: | $18,990,159 | |
| DeforGrtr1%orYM(87),O(7) | UW Expenses: | $2,692,414 | ||
| Lockbox / Cash Management: | Hard / In Place | UW NOI(5): | $16,297,746 | |
| Additional Debt: | Yes | UW NCF(5): | $15,910,023 | |
| Additional Debt Balance: | $58,250,000 / $66,900,000 / | Appraised Value / Per SF(2)(5): | $359,200,000 / $1,143 | |
| $49,000,000 | Appraisal Date: | 5/1/2021 | ||
| Additional Debt Type: | Pari Passu / Subordinate / | |||
| Mezzanine | ||||
| Escrows and Reserves(3) | Financial Information(5) | ||||||
| Initial | Monthly | Initial Cap | Senior Notes | Whole Loan/Total Debt | |||
| Taxes: | $0 | $85,000 | N/A | Cut-off Date Loan / SF: | $423 | $636 / $792 | |
| Insurance: | $0 | Springing | N/A | Maturity Date Loan / SF: | $423 | $636 / $792 | |
| Replacement Reserves: | $0 | Springing | N/A | Cut-off Date LTV(2): | 37.1% | 55.7% / 69.3% | |
| TI/LC: | $2,728,059 | $0 | N/A | Maturity Date LTV(2): | 37.1% | 55.7% / 69.3% | |
| Other(4): | $14,559,592 | Springing | N/A | UW NCF DSCR: | 3.50x | 2.33x / 1.59x | |
| UW NOI Debt Yield: | 12.2% | 8.1% / 6.5% | |||||
| Sources and Uses | ||||||
| Sources | Proceeds | % of Total | Uses | Proceeds | % of Total | |
| Senior Notes | $133,100,000 | 53.5% | Payoff Existing Debt | $164,454,172 | 66.0% | |
| Junior Notes | 66,900,000 | 26.9 | Return of Equity | 57,161,746 | 23.0 | |
| Mezzanine Loan | 49,000,000 | 19.7 | Upfront Reserves | 17,287,652 | 6.9 | |
| Closing Costs | 10,096,430 | 4.1 | ||||
| Total Sources | $249,000,000 | 100.0% | Total Uses | $249,000,000 | 100.0% | |
| (1) | The Cut-off Date Balance of $74,850,000 represents the non-controlling Note A-1-C1, Note A-1-C2, Note A-1-C3, Note A-1-C4, and Note A-1-C6, and is part of the Moffett Place - Building 6 Whole Loan (as defined below), which is evidenced by nine pari passu senior notes and two junior notes, and has an aggregate outstanding principal balance as of the Cut-off Date of $200,000,000. For additional information, see “The Loan” herein. |
| (2) | The appraised value represents the “Prospective Market Value Upon Stabilization” as of May 1, 2021. The appraiser also concluded an “As-Is” appraised value of $333,000,000 as of August 1, 2020, which results in a Cut-off Date LTV and Maturity Date LTV of 40.0% for the Moffett Place - Building 6 Senior Notes (as defined below), 60.1% for the Moffett Place - Building 6 Whole Loan (as defined below) and 74.8% for the Moffett Place - Building 6 Total Debt (as defined below). |
| (3) | For a full description of Escrows and Reserves, please refer to “Escrows and Reserves” below. In addition, the appraisal concluded to a “Hypothetical As If Vacant” appraised value (“Go Dark” Value) equal to $289,100,000 as of August 1, 2020. Based on the “Hypothetical Go Dark” appraised value, the Cut-off Date LTV and Maturity Date LTV are 46.0 % for the Moffett Place - Building 6 Senior Notes, 69.2% for the Moffett Place - Building 6 Whole Loan and 86.1% for the Moffett Place - Building 6 Total Debt. |
| (4) | The Other reserve is comprised of a $2,496,716 debt service reserve, a $12,062,876 free rent reserve and a springing lease sweep reserve. The lease sweep reserve is subject to the Lease Sweep Reserve Cap (as defined below). |
| (5) | While the Moffett Place – Building 6 Whole Loan was originated after the emergence of the novel coronavirus pandemic and the economic disruption resulting from measures to combat the pandemic, the pandemic is an evolving situation and could impact the Moffett Place – Building 6 Whole Loan more severely than assumed in the |
THE INFORMATION IN THIS STRUCTURAL AND COLLATERAL TERM SHEET IS NOT COMPLETE AND MAY BE AMENDED PRIOR TO THE TIME OF SALE. THIS TERM SHEET IS NOT AN OFFER TO SELL THESE SECURITIES AND IT IS NOT A SOLICITATION OF AN OFFER TO BUY THESE SECURITIES IN ANY JURISDICTION WHERE THE OFFER OR SALE IS NOT PERMITTED.
| | 16 of 144 | | |
| Structural and Collateral Term Sheet | Benchmark 2020-B20 |
| Moffett Place - Building 6 | |
underwriting of the Moffett Place – Building 6 Whole Loan and could adversely affect the NOI, NCF and occupancy information, as well as the appraised value and the DSCR, LTV and Debt Yield metrics presented above. See “Risk Factors— Risks Related to Market Conditions and Other External Factors—Coronavirus Pandemic Has Adversely Affected the Global Economy and Will Likely Adversely Affect the Performance of the Mortgage Loans” in the Preliminary Prospectus.
The Loan. The Moffett Place - Building 6 mortgage loan (the “Moffett Place - Building 6 Loan”) is part of a whole loan with an aggregate outstanding principal balance as of the Cut-off Date of $200.0 million (the “Moffett Place - Building 6 Whole Loan”), evidenced by nine pari passu senior notes with an aggregate initial principal balance of $133,100,000 (collectively the “Moffett Place - Building 6 Senior Notes”) and two junior notes with an aggregate initial principal balance of $66,900,000 (collectively the “Moffett Place - Building 6 Junior Notes”). The loan is secured by the borrower’s fee interest in a 314,352 square foot, newly constructed Class A office building located in Sunnyvale, California. The non-controlling Note A-1-C1, Note A-1-C2, Note A-1-C3, Note A-1-C4, and Note A-1-C6, with an outstanding principal balance as of the Cut-off Date of $74.85 million, will be included in the Benchmark 2020-B20 trust. The remaining notes have been contributed to one or more securitization trusts. The relationship between the holders of the Moffett Place - Building 6 Whole Loan is governed by a co-lender agreement as described under “Description of the Mortgage Pool—The Whole Loans—The Non-Serviced Pari Passu Whole Loans” in the Preliminary Prospectus. The Moffett Place – Building 6 Whole Loan will be serviced under the trust and servicing agreement for the MOFT 2020-B6 transaction. The Moffett Place - Building 6 Whole Loan has a 10-year term and will be interest-only for the term of the loan.
| Whole Loan Summary | ||||
| Note | Original Balance | Cut-off Date Balance | Note Holder | Controlling Piece |
| A-1-S, A-2-S | $500,000 | $500,000 | MOFT 2020-B6 | No |
| A-1-C5, A-2-C | $57,750,000 | $57,750,000 | Benchmark 2020-B19 | No(1) |
| A-1-C1, A-1-C2, A-1-C3, A-1-C4, A-1-C6 | $74,850,000 | $74,850,000 | Benchmark 2020-B20 | No |
| B-1, B-2 | $66,900,000 | $66,900,000 | MOFT 2020-B6 | Yes(1) |
| Whole Loan | $200,000,000 | $200,000,000 | ||
| (1) | The initial controlling notes are Note B-1 and Note B-2, so long as no Moffett Place - Building 6 control appraisal period has occurred and is continuing. If and for so long as a Moffett Place - Building 6 control appraisal period has occurred and is continuing, then the controlling note will be the Note A-1-C5. See “Description of the Mortgage Pool—The Whole Loans—The Moffett Place - Building 6 Pari Passu-AB Whole Loan” in the Preliminary Prospectus. The Moffett Place - Building 6 Whole Loan is being serviced pursuant to the MOFT 2020-B6 trust and servicing agreement. For so long as no Moffett Place - Building 6 control appraisal period has occurred and is continuing, the control rights of the Moffett Place - Building 6 Junior Notes will be exercisable by the controlling class under the MOFT 2020-B6 trust and servicing agreement. |
The Borrower. The borrower is MP B6 LLC. The borrower is structured to be a single purpose entity with two independent directors in its organizational structure.
The Loan Sponsor. The loan sponsor is Joseph K. Paul, also known as Jay Paul, and the non-recourse carveout guarantor is Paul Guarantor LLC. Jay Paul is the founder of Jay Paul Company, which is a privately-held real estate firm based in San Francisco, California that concentrates on the acquisition, development and management of commercial properties throughout California with a specific focus on creating projects for technology firms. Jay Paul Company has developed over 13.0 million square feet of institutional quality space including projects for Apple, Amazon, Facebook, Google, Microsoft, HP, Rambus, Nokia, Tencent and DreamWorks. Jay Paul Company owns over 25 office buildings in Moffett Park, totaling nearly 7.2 million square feet including Moffett Place, Moffett Gateway, Technology Corner, Moffett Towers, Moffett Towers II and Moffett Towers Buildings A, B & C.
The Property. The Moffett Place - Building 6 property is a newly-constructed eight-story, Class A LEED Gold Certified, office building totaling 314,352 square feet located in Sunnyvale, California. The Moffett Place - Building 6 property is part of a larger six building, 55 acre campus known as Moffett Place (the “Moffett Campus”), which in the aggregate (including the Moffett Place - Building 6 property) includes approximately 1.9 million square feet of Class A office space that is 100.0% leased to Google, an approximately 52,500 square feet amenities building including a conference center, a swimming pool, an outdoor common area space, a café and three separate parking structures and surface parking. The overall parking ratio is 3.3 spaces per 1,000 square feet of net rentable area. The rooftop level (level 3) on one of the parking structures is improved with the landlord's "High Garden" concept as a project amenity. The "High Garden" features walking and running trails, outdoor volleyball, bocce ball courts and other recreational features.
To govern access to the non-collateral common areas, conference facility and parking structures (the “Common Area Spaces”), the Moffett Place - Building 6 property is subject to a declaration of covenants, conditions and restrictions (the “Moffett Place CCR”) with Moffett Place LLC (an affiliate of the loan sponsor and an affiliate of the owner of the non-collateral buildings at the Moffett Campus). The Moffett Place CCR grants the borrower non-exclusive easement rights over the Common Area Spaces. Ownership of the Common Area Spaces governed by the Moffett Place CCR is held by Moffett Place Association LLC (the “Association”).
The Moffett Place - Building 6 property is 100.0% leased to Google (Google’s parent company, Alphabet Inc. (NASDAQ: GOOG) is rated Aa2/AA+ by Moody’s/S&P) pursuant to a new 8.7-year triple net lease through January 2029, with two, seven-year extension options and
THE INFORMATION IN THIS STRUCTURAL AND COLLATERAL TERM SHEET IS NOT COMPLETE AND MAY BE AMENDED PRIOR TO THE TIME OF SALE. THIS TERM SHEET IS NOT AN OFFER TO SELL THESE SECURITIES AND IT IS NOT A SOLICITATION OF AN OFFER TO BUY THESE SECURITIES IN ANY JURISDICTION WHERE THE OFFER OR SALE IS NOT PERMITTED.
| | 17 of 144 | | |
| Structural and Collateral Term Sheet | Benchmark 2020-B20 |
| Moffett Place - Building 6 | |
no early termination rights. Google has an in place base rent of $49.56 per square foot with approximately 2.2% annual rent escalations. The Google lease commenced on May 21, 2020 and Google has fully accepted its space with no outs or remaining landlord work. Google is in the process of building out its space with an expected occupancy date by September/October of 2021. Google was provided $55.10 per square foot in tenant improvements and approximately 12 months of free rent. At loan origination, approximately $2.7 million was reserved for the remaining outstanding tenant obligations and approximately $12.1 million for free rent.
Under the Google lease, so long as the landlord owns the Moffett Place - Building 6 property, Google has a right of first offer to purchase all or any portion of the six building Moffett Campus which the landlord has determined in its sole discretion to sell. Such right excludes an offer to sell one or more buildings in the Moffett Campus to an affiliate of the landlord or to an entity or person that becomes the owner of the Moffett Place - Building 6 property or the Moffett Campus through a foreclosure by trustee’s power of sale, judicially or otherwise, or as a purchaser at a foreclosure sale.
COVID-19 Update. On July 27, 2020, due to the COVID-19 pandemic, Google announced that it would extend its global voluntary work-from-home option through June of 2021 for roles of employees that are not needed in the office. Google had originally told employees to expect to return to the office in January of 2021. As of October 1, 2020, Google has not made any requests for rent relief. Google is in a free rent period through May 2021. As of October 1, 2020, the Moffett Place – Building 6 Whole Loan is not subject to any modification or forbearance requests related to the COVID-19 pandemic. The Moffett Place – Building 6 Whole Loan is current as of the September 2020 payment date. See “Risk Factors—Risks Related to Market Conditions and Other External Factors—Current Coronavirus Pandemic May Adversely Affect the Global Economy and the Performance of the Mortgage Loans” in the Preliminary Prospectus.
The Market. The Moffett Place - Building 6 property is located in Moffett Park, a submarket of Sunnyvale in Silicon Valley, California. Moffett Park comprises 519 acres which has undergone significant redevelopment over the past 15 years. The area has grown into one of the San Francisco Bay Area’s technology hubs, with firms such as Amazon, Google, Facebook, Comcast, and Verizon (Yahoo!) leasing significant space. Moffett Park is located adjacent to State Highway 237, Interstate 680, Interstate 280, and U.S. Highway 101 and has access from both the northern peninsula and areas in San Jose and the East Bay, making it a convenient location for corporate users.
Regional commuter service is indirectly provided for Moffett Park. Shuttles from Downtown Sunnyvale Caltrain station and the Altamont Commuter Express Great America station provide morning and evening services to the park. Future indirect regional access may be provided by the Bay Area Rapid Transit (“BART”) to San Jose extension. The BART extension would provide service potential from East Bay cities to downtown San Jose where additional shuttle or VTA light rail connections would be necessary to serve Moffett Park.
The VTA light rail Borregas Station is located within a half mile of the Moffett Place - Building 6 property along Java Drive, while the Java / Borregas bus stop is a five minute walk away. Access to major highways 101 and 237 is within a mile of the Moffett Place - Building 6 property and the downtown Sunnyvale Caltrain station is approximately three miles to the south. The San Jose International Airport is located about nine miles from the Moffett Place - Building 6 property.
According to the appraisal, the Moffett Park office submarket had a vacancy rate of 0.6% with an average asking rent of $69.60 per square foot. The following chart summarizes comparable office leases that range in base rent from $50.40 to $60.00 per square foot.
THE INFORMATION IN THIS STRUCTURAL AND COLLATERAL TERM SHEET IS NOT COMPLETE AND MAY BE AMENDED PRIOR TO THE TIME OF SALE. THIS TERM SHEET IS NOT AN OFFER TO SELL THESE SECURITIES AND IT IS NOT A SOLICITATION OF AN OFFER TO BUY THESE SECURITIES IN ANY JURISDICTION WHERE THE OFFER OR SALE IS NOT PERMITTED.
| | 18 of 144 | | |
| Structural and Collateral Term Sheet | Benchmark 2020-B20 |
| Moffett Place - Building 6 | |
| Summary of Comparable Office Leases(1) | ||||||||
| Property | Tenant Name | Lease Start Date | Term (mos.) | Lease Type | Tenant Size (SF) | Base Rent PSF | Free Rent (mos.) | TI PSF |
| Moffett Place -Building 6 | May-20 | 105 | NNN | 314,352(2) | $49.56(2) | 12 | $55.10 | |
| Moffett Towers II -Building III | Jan-20 | 180 | NNN | 1,087,689 | $52.20 | 7 | $60.00 | |
| 520 Almanor Avenue | Nokia, Inc | Apr-19 | 150 | NNN | 231,000 | $50.40 | 6 | $80.00 |
| Grove 221 | 23 and Me | May-19 | 144 | NNN | 154,987 | $60.00 | 9 | $83.71 |
| 1001 North Shoreline | Apr-18 | 144 | NNN | 132,960 | $60.00 | 3 | $50.00 | |
| Pathline Park | Synopsys | Nov-19 | 144 | NNN | 360,100 | $51.00 | 0 | $70.00 |
| 620 National View | Dec-18 | 120 | NNN | 151,065 | $59.40 | 0 | $80.00 | |
| Total / Wtd. Avg.(3) | 161 | 2,117,801 | $53.37 | 5 | $66.42 | |||
| (1) | Source: Appraisal. |
| (2) | Based on the rent roll as of October 6, 2020. |
| (3) | Total / Wtd. Avg. excludes the Moffett Place - Building 6 property. |
| Summary of Comparable Office Sales(1) | ||||||||
| Property | City, State | NRA | Year Built/Renovated | Occupancy | Transaction Date | Sales Price | Sales Price PSF | Cap Rate |
| Moffett Place - Building | Sunnyvale, CA | 314,352 | 2020 | 100.0% | NAP | NAP | NAP | NAP |
| 620 National View | Mountain View, CA | 151,065 | 2017 | 100.0% | Sep-19 | $190,000,000 | $1,258 | 4.8% |
| Grove 221 | Sunnyvale, CA | 154,987 | 2018 | 100.0% | Mar-19 | $183,000,000 | $1,181 | 5.1% |
| Shoreline Technology | Mountain View, CA | 795,663 | 1985 / 2000 | 92.0% | Nov-18 | $1,000,000,000 | $1,257 | 3.5% |
| 1001 North Shoreline | Mountain View, CA | 132,960 | 2017 | 100.0% | Mar-18 | $169,000,000 | $1,158 | 4.4% |
| Menlo Gateway | Menlo Park, CA | 772,983 | 2019 | 100.0% | Nov-17 | $850,000,000 | $1,100 | 5.0% |
| Total / Wtd. Avg.(2) | 2,007,658 | 96.8% | $763,194,608 | $1,184 | 4.4% | |||
| (1) | Source: Appraisal. |
| (2) | Total / Wtd. Avg. excludes the Moffett Place - Building 6 property. |
| Historical and Current Occupancy(1) | |||
| 2017 | 2018 | 2019 | Current(2) |
| NAP | NAP | NAP | 100.0% |
| (1) | Historical information is not available due to the recent construction of the Moffett Place - Building 6 property. |
| (2) | Based on the rent roll as of October 6, 2020. |
| Tenant Summary(1) | ||||||
| Tenant | Ratings Moody’s/Fitch/S&P(2) | Net Rentable Area (SF) | % of Total NRA | Base Rent PSF | % of Total Base Rent | Lease Expiration Date |
| Aa2 / NR / AA+ | 314,352 | 100.0% | $49.56 | 100.0% | 1/31/2029 | |
| Total | 314,352 | 100.0% | $49.56 | 100.0% | ||
| Other Occupied | 0 | 0.0 | $0.00 | 0.0 | ||
| Total Occupied | 314,352 | 100.0% | $49.56 | 100.0% | ||
| Vacant | 0 | 0.0 | ||||
| Total | 314,352 | 100.0% | ||||
| (1) | Based on the rent roll as of October 6, 2020. |
| (2) | Credit Ratings are those of the parent company. The tenant is the sole obligor with respect to the lease obligation. |
THE INFORMATION IN THIS STRUCTURAL AND COLLATERAL TERM SHEET IS NOT COMPLETE AND MAY BE AMENDED PRIOR TO THE TIME OF SALE. THIS TERM SHEET IS NOT AN OFFER TO SELL THESE SECURITIES AND IT IS NOT A SOLICITATION OF AN OFFER TO BUY THESE SECURITIES IN ANY JURISDICTION WHERE THE OFFER OR SALE IS NOT PERMITTED.
| | 19 of 144 | | |
| Structural and Collateral Term Sheet | Benchmark 2020-B20 |
| Moffett Place - Building 6 | |
| Lease Rollover Schedule(1) | |||||||||
| Year | Number of Leases Expiring | Net Rentable Area Expiring | % of NRA Expiring | Base Rent Expiring | % of Base Rent Expiring | Cumulative Net Rentable Area Expiring | Cumulative % of NRA Expiring | Cumulative Base Rent Expiring | Cumulative % of Base Rent Expiring |
| Vacant | NAP | 0 | 0.0% | NAP | NAP | 0 | 0.0% | NAP | NAP |
| MTM & 2020 | 0 | 0 | 0.0 | $0 | 0.0% | 0 | 0.0% | $0 | 0.0% |
| 2021 | 0 | 0 | 0.0 | 0 | 0.0 | 0 | 0.0% | $0 | 0.0% |
| 2022 | 0 | 0 | 0.0 | 0 | 0.0 | 0 | 0.0% | $0 | 0.0% |
| 2023 | 0 | 0 | 0.0 | 0 | 0.0 | 0 | 0.0% | $0 | 0.0% |
| 2024 | 0 | 0 | 0.0 | 0 | 0.0 | 0 | 0.0% | $0 | 0.0% |
| 2025 | 0 | 0 | 0.0 | 0 | 0.0 | 0 | 0.0% | $0 | 0.0% |
| 2026 | 0 | 0 | 0.0 | 0 | 0.0 | 0 | 0.0% | $0 | 0.0% |
| 2027 | 0 | 0 | 0.0 | 0 | 0.0 | 0 | 0.0% | $0 | 0.0% |
| 2028 | 0 | 0 | 0.0 | 0 | 0.0 | 0 | 0.0% | $0 | 0.0% |
| 2029 | 1 | 314,352 | 100.0 | 15,579,285 | 100.0 | 314,352 | 100.0% | $15,579,285 | 100.0% |
| 2030 | 0 | 0 | 0.0 | 0 | 0.0 | 314,352 | 100.0% | $15,579,285 | 100.0% |
| 2031 and Thereafter | 0 | 0 | 0.0 | 0 | 0.0 | 314,352 | 100.0% | $15,579,285 | 100.0% |
| Total | 1 | 314,352 | 100.0% | $15,579,285 | 100.0% | ||||
| (1) | Based on the rent roll as of October 6, 2020. |
| Underwritten Net Cash Flow(1) | |||
| Underwritten | Underwritten $ Per Square Foot | %(2) | |
| Base Rent | $15,579,285 | $49.56 | 77.9% |
| Straight Line Rent Credit(3) | 1,297,970 | 4.13 | 6.5% |
| Amenities Rent | 469,779 | 1.49 | 2.4% |
| Reimbursements | 2,642,608 | 8.41 | 13.2% |
| Net Rental Income | $19,989,641 | $63.59 | 100.0% |
| Vacancy & Credit Loss(4) | (999,482) | (3.18) | (5.0%) |
| Effective Gross Income | $18,990,159 | $60.41 | 95.0% |
| Real Estate Taxes | $592,541 | $1.88 | 3.1% |
| Insurance | 221,528 | 0.70 | 1.2% |
| Management Fee | 168,773 | 0.54 | 0.9% |
| Other Operating Expenses | 1,709,572 | 5.44 | 9.0% |
| Total Operating Expenses | $2,692,414 | $8.56 | 14.2% |
| Net Operating Income | $16,297,746 | $51.85 | 85.8% |
| TI/LC | 323,102 | 1.03 | 1.7% |
| Capital Expenditures | 64,620 | 0.21 | 0.3% |
| Net Cash Flow | $15,910,023 | $50.61 | 83.8% |
| (1) | Historical cash flow information is not available due to the recent construction of the Moffett Place – Building 6 property |
| (2) | % column represents percent of Net Rental Income for all revenue lines and represents percent of Effective Gross Income for the remainder of the fields. |
| (3) | Straight Line Rent Credit is given to Google through the lease term. |
| (4) | Represents an underwritten economic vacancy of 5.0%. |
THE INFORMATION IN THIS STRUCTURAL AND COLLATERAL TERM SHEET IS NOT COMPLETE AND MAY BE AMENDED PRIOR TO THE TIME OF SALE. THIS TERM SHEET IS NOT AN OFFER TO SELL THESE SECURITIES AND IT IS NOT A SOLICITATION OF AN OFFER TO BUY THESE SECURITIES IN ANY JURISDICTION WHERE THE OFFER OR SALE IS NOT PERMITTED.
| | 20 of 144 | | |
| Structural and Collateral Term Sheet | Benchmark 2020-B20 |
| Moffett Place - Building 6 | |
Property Management. The Moffett Place - Building 6 property is managed by Paul Holdings, Inc., an affiliate of the borrower.
Escrows and Reserves. At loan origination, the borrower was required to deposit the following into upfront reserves: (i) $2,728,059 into a TI/LC reserve for outstanding tenant obligations, (ii) $2,496,716 into a debt service reserve (equal to three months of Moffett Place - Building 6 Total Debt service payments) and (iii) $12,062,876 into a free rent reserve.
Tax Reserve – The borrower is required to deposit into a real estate tax reserve, on a monthly basis, 1/12 of the estimated annual real estate taxes (initially estimated at $85,000 per month).
Insurance Reserve – The borrower is required to deposit into an insurance reserve, on a monthly basis, 1/12 of estimated insurance premiums, unless an acceptable blanket policy is in effect. As of the origination date, an acceptable blanket policy was in place.
Lease Sweep Reserve – During a Lease Sweep Period (as defined below), all excess cash flow after payment of debt service, required reserves and budgeted operating expenses is required to be transferred to a lease sweep reserve until amounts on deposit equal the Lease Sweep Reserve Cap (as defined below). In the event that excess cash flow is not sufficient to meet the Required Minimum Monthly Lease Sweep Deposit Amount (as defined below), the borrower is required to deposit the Required Monthly Lease Sweep Deposit Amount into the lease sweep reserve.
A “Lease Sweep Period” will commence upon the earliest to occur of any of the following: (i) Google or a Lease Sweep Tenant Party (as defined below) fails to give notice of its intent to renew or extend the Google lease by May 31, 2027, which is 20 months prior to the lease expiration date until Google has exercised a renewal or an extension under the Lease Sweep Lease (as defined below) or a replacement tenant acceptable to lender executes a replacement lease covering the Requisite Lease Sweep Space (as defined below) or the total amount swept into the lease sweep reserve equals the applicable Lease Sweep Reserve Cap; (ii) the date on which (a) a Lease Sweep Tenant Party cancels or terminates its Lease Sweep Lease with respect to all or at least 41,000 square feet of the Lease Sweep Space (as defined below) prior to the then current expiration date or (b) a Lease Sweep Tenant Party delivers to borrower or manager a notice to terminate its Lease Sweep Lease with respect to all or at least 41,000 square feet of the Lease Sweep Space until either a renewal or retenanting occurs or the total amount swept into the lease sweep reserve equals the applicable Lease Sweep Reserve Cap; (iii) the Lease Sweep Tenant Party ceases operating its business in 20.0% or more of the space in a building subject to its leases (the “Dark Space”) (unless such tenant ceasing to operate is (a) Google, or (b) one or more investment grade entities, until a replacement tenant acceptable to lender executes a replacement lease covering the Requisite Lease Sweep Space or the total amount swept into the lease sweep reserve equals the applicable Lease Sweep Reserve Cap (clauses (i) through (iv) collectively, a “Lease Sweep Trigger”); (iv) a default under the lease by the Lease Sweep Tenant Party, until either such default is cured and no other default occurs for three consecutive months or the total amount swept into the lease sweep reserve equals the applicable Lease Sweep Reserve Cap; (v) a bankruptcy of Google or any parent entity under the applicable lease, until the related bankruptcy proceedings have terminated and the applicable lease has been affirmed, assumed or assigned in a manner satisfactory to the lender; and (vi) with respect to the Google lease, the date on which neither Google nor its parent company is an investment grade entity (a “Google Downgrade Event”), until one of (a) such tenant (or its parent company) becomes an investment grade entity again, (b) a renewal or re-tenanting occurs or (c) the total amount swept into the lease sweep reserve equals the applicable Lease Sweep Reserve Cap.
A “Lease Sweep Tenant Party” means any tenant under a Lease Sweep Lease or its direct or indirect parent company.
A “Lease Sweep Lease” means (i) the Google lease or (ii) any lease which is entered into by the borrower in replacement of any Google lease, and that, either individually, or when taken together with any other lease with the same tenant or its affiliates, and assuming the exercise of all expansion rights and all preferential rights to lease additional space contained in such replacement lease, demises Lease Sweep Space equal to or greater than the Requisite Lease Sweep Space.
The “Lease Sweep Space” means the space demised under a Lease Sweep Lease.
The “Requisite Lease Sweep Space” means 75% or more of the rentable SF demised under the applicable Lease Sweep Lease.
A “Required Minimum Monthly Lease Sweep Deposit Amount” means on each monthly payment date during the continuance of a Lease Sweep Period, an amount equal to: (i) from the payment date in September 2020 through October 2021, $475,000, (ii) from the payment date in November 2021 through October 2022, $505,000, (iii) from the payment date in November 2022 through October 2023, $535,000, (iv) from the payment date in November 2023 through October 2024, $555,000, (v) from the payment date in November 2024 through October 2025, $585,000, (vi) from the payment date in November 2025 through October 2026, $615,000 and (vii) from the payment date in November 2026 and thereafter, $628,700; provided that with respect to a Lease Sweep Period pursuant to clause (v) of the definition of Lease Sweep Period, such amount will be $0.00 on the date that funds then on deposit in the lease sweep reserve equal or exceed $15,717,600.
THE INFORMATION IN THIS STRUCTURAL AND COLLATERAL TERM SHEET IS NOT COMPLETE AND MAY BE AMENDED PRIOR TO THE TIME OF SALE. THIS TERM SHEET IS NOT AN OFFER TO SELL THESE SECURITIES AND IT IS NOT A SOLICITATION OF AN OFFER TO BUY THESE SECURITIES IN ANY JURISDICTION WHERE THE OFFER OR SALE IS NOT PERMITTED.
| | 21 of 144 | | |
| Structural and Collateral Term Sheet | Benchmark 2020-B20 |
| Moffett Place - Building 6 | |
A “Lease Sweep Reserve Cap” means: (i) with respect to a Lease Sweep Period continuing solely pursuant to clause (i) of the defined term “Lease Sweep Period”, an amount equal to $40.00 per rentable square foot that is leased pursuant to the Lease Sweep Lease in question; (ii) with respect to a Lease Sweep Period continuing solely pursuant to clause (iv) of the defined term “Lease Sweep Period”, $35.00 per rentable square foot that is leased pursuant to the Lease Sweep Lease in question; (iii) with respect to a Lease Sweep Period continuing solely pursuant to clause (ii) of the defined term “Lease Sweep Period”, $40.00 per rentable square foot of the terminated space; (iv) with respect to a Lease Sweep Period continuing pursuant to a Dark Period Event (clause (iii) of the defined term “Lease Sweep Period”), whether or not a Lease Sweep Trigger pursuant to clauses (i), (ii) and/or (iv) of the defined term “Lease Sweep Period” is concurrently continuing, $50.00 per rentable square foot of Dark Space; (v) with respect to a Lease Sweep Period continuing pursuant to a Google Downgrade Event (clause (vi) of the defined term “Lease Sweep Period”), whether or not a Lease Sweep Trigger pursuant to clauses (i), (ii), (iii) and/or (iv) of the defined term “Lease Sweep Period” is concurrently continuing, $15,717,600 (i.e., $50.00 per rentable square foot that is leased pursuant to the Lease Sweep Lease in question).
Lockbox / Cash Management. The Moffett Place - Building 6 Whole Loan is structured with a hard lockbox and in place cash management. The borrower is required to direct all existing tenants of the Moffett Place - Building 6 property to directly deposit all rents into a deposit account controlled by the lender. Funds in the deposit account are required to be applied and disbursed in accordance with the Moffett Place - Building 6 Whole Loan documents. During a Trigger Period (as defined below), all excess cash after payment of the monthly debt service on the Moffett Place - Building 6 Whole Loan, all required reserves and budgeted operating expenses, and certain other items in the payment waterfall described in the Moffett Place - Building 6 Whole Loan documents will be reserved (i) if a Lease Sweep Period is continuing, into the lease sweep reserve until the aggregate amount of funds transferred into such reserve during the Lease Sweep Period in question equals the applicable Lease Sweep Reserve Cap, if any, (ii) if a DS Reimbursement Period (as defined below) is continuing, into the debt service reserve account, and (iii) if no DS Reimbursement Period is continuing, into a cash collateral account as additional collateral for the Moffett Place - Building 6 Whole Loan.
A “Trigger Period” will commence upon (i) the occurrence of an event of default under the Moffett Place - Building 6 Whole Loan until cured, (ii) (A) the Moffett Place - Building 6 property not fully being leased to either Google or an investment grade entity and (B) the debt service coverage ratio being less than (a) 2.19x based on the Moffett Place - Building 6 Whole Loan and (b) 1.50x based on the Moffett Place - Building 6 Total Debt (a “Low DSCR Period”) until (x) the debt service coverage ratio based on the Moffett Place - Building 6 Whole Loan is equal to or greater than 2.19x and the debt service coverage ratio based on the Moffett Place - Building 6 Total Debt is equal to or greater than 1.50x, in each case, for one calendar quarter or (y) funds on deposit in the cash collateral account equal $15,717,600, (iii) the commencement of a Lease Sweep Period until such Lease Sweep Period is cured, (iv) the occurrence of a mezzanine loan default until the mezzanine lender notifies the lender that such mezzanine loan default has been cured or waived or (v) the commencement of a DS Reimbursement Period until such DS Reimbursement Period has ended.
A “DS Reimbursement Period” will commence upon (i) the allocation of any debt service reserve funds to any required debt service amounts pursuant to the Moffett Place - Building 6 Whole Loan documents and will end upon the earlier to occur of (a) the satisfaction of all DS Reserve Release Conditions (as defined below) and (b) the satisfaction of all DS Reimbursement Obligations (as defined below).
The “DS Reserve Release Conditions” means each of the following requirements has been satisfied: (i) no Trigger Period has occurred and is continuing (unless the Trigger Period is solely ongoing in connection with an ongoing DS Reimbursement Period) and (ii) with respect to the Google lease, the borrower has delivered evidence reasonably satisfactory to the lender that all contingencies under the Google lease have been satisfied and Google has actually commenced the payment of full contractual rent and any initial free rent period or period of partial rent abatements has expired.
The “DS Reimbursement Obligations” means the obligation of the borrower to reimburse to the lender all amounts disbursed from the lender-controlled debt service reserve.
Current Mezzanine or Subordinate Indebtedness. The Moffett Place - Building 6 Whole Loan consists of nine pari passu senior notes with an aggregate initial principal balance of $133,100,000 and two junior notes, with an aggregate initial principal balance of $66,900,000. In conjunction with the Moffett Place - Building 6 Whole Loan, on August 6, 2020, Security Benefit Life Insurance Company funded a $49.0 million mezzanine loan (and together with the Moffett Place - Building 6 Whole Loan, the “Moffett Place - Building 6 Total Debt”). The mezzanine loan has a fixed interest rate per annum of 6.35000% and maturity date of August 6, 2030. The Cut-off Date LTV Ratio, Maturity Date LTV Ratio, DSCR Based on Underwritten NCF and Debt Yield Based on Underwritten NOI for the Moffett Place - Building 6 Total Debt are set forth below:
THE INFORMATION IN THIS STRUCTURAL AND COLLATERAL TERM SHEET IS NOT COMPLETE AND MAY BE AMENDED PRIOR TO THE TIME OF SALE. THIS TERM SHEET IS NOT AN OFFER TO SELL THESE SECURITIES AND IT IS NOT A SOLICITATION OF AN OFFER TO BUY THESE SECURITIES IN ANY JURISDICTION WHERE THE OFFER OR SALE IS NOT PERMITTED.
| | 22 of 144 | | |
| Structural and Collateral Term Sheet | Benchmark 2020-B20 |
| Moffett Place - Building 6 | |
| Financial Information | |||
| Senior Notes | Whole Loan | Total Debt | |
| Cut-off Date Balance | $133,100,000 | $200,000,000 | $249,000,000 |
| Cut-off Date LTV Ratio | 37.1% | 55.7% | 69.3% |
| Maturity Date LTV Ratio | 37.1% | 55.7% | 69.3% |
| DSCR Based on Underwritten NCF | 3.50x | 2.33x | 1.59x |
| Debt Yield Based on Underwritten NOI | 12.2% | 8.1% | 6.5% |
Future Mezzanine or Subordinate Indebtedness Permitted. None.
Partial Release. None.
Common Area Subdivision: The borrower, together with certain affiliates, may seek to reconfigure and reduce the Common Area Spaces and transfer a portion of the Common Area Spaces to an affiliate of the borrower or the Association to allow for the construction of one or more office buildings and associated common area improvements, to be owned in fee by an affiliate of borrower or of the Association (the “Common Area Subdivision and Release”). In connection with such transfer, the borrower and other members of the Association intend to amend the terms of the Moffett Place CCR to allow such Common Area Subdivision and Release. The Moffett Place - Building 6 Whole Loan documents permit the borrower to effectuate a Common Area Subdivision and Release subject to the satisfaction of certain terms and conditions, including, among others: (a) such subdivision and release (i) will not materially adversely interfere with any tenant’s use of its leased premises upon the Moffett Place - Building 6 property pursuant to the terms of its lease, (ii) will not materially adversely affect the Moffett Place - Building 6 property or its use or operation, (iii) does not violate the terms of any document or instrument relating to the Moffett Place - Building 6 property or Common Area Spaces, including any lease, reciprocal easement agreement or the Moffett Place CCR, (iv) will not cause any portion of the Moffett Place - Building 6 property and/or the reduced common area to be in violation of any legal requirements (including with respect to zoning and parking), and (v) does not create any liens on the Moffett Place- Building 6 property or Common Area Spaces and (b) not less than 20 days prior to the date of the commencement of such Common Area Subdivision and Release, the borrower submits to the lender copies of all plans, specifications, permits and approvals (as well as drafts of any shared facilities, access, infrastructure or parking easements to be entered into in connection with such Common Area Subdivision and Release), each as reasonably requested by the lender. Notwithstanding the foregoing, no such Common Area Subdivision and Release will be permitted if at the time of the effectuation of such Common Area Subdivision and Release, and after giving effect thereto, in the lender’s good faith discretion, the ratio of the unpaid principal balance of the Moffett Place - Building 6 Whole Loan to the value of the remaining Moffett Place - Building 6 property is greater than 125%.
THE INFORMATION IN THIS STRUCTURAL AND COLLATERAL TERM SHEET IS NOT COMPLETE AND MAY BE AMENDED PRIOR TO THE TIME OF SALE. THIS TERM SHEET IS NOT AN OFFER TO SELL THESE SECURITIES AND IT IS NOT A SOLICITATION OF AN OFFER TO BUY THESE SECURITIES IN ANY JURISDICTION WHERE THE OFFER OR SALE IS NOT PERMITTED.
| | 23 of 144 | | |
| Structural and Collateral Term Sheet | Benchmark 2020-B20 |
| 120 Wall Street | |
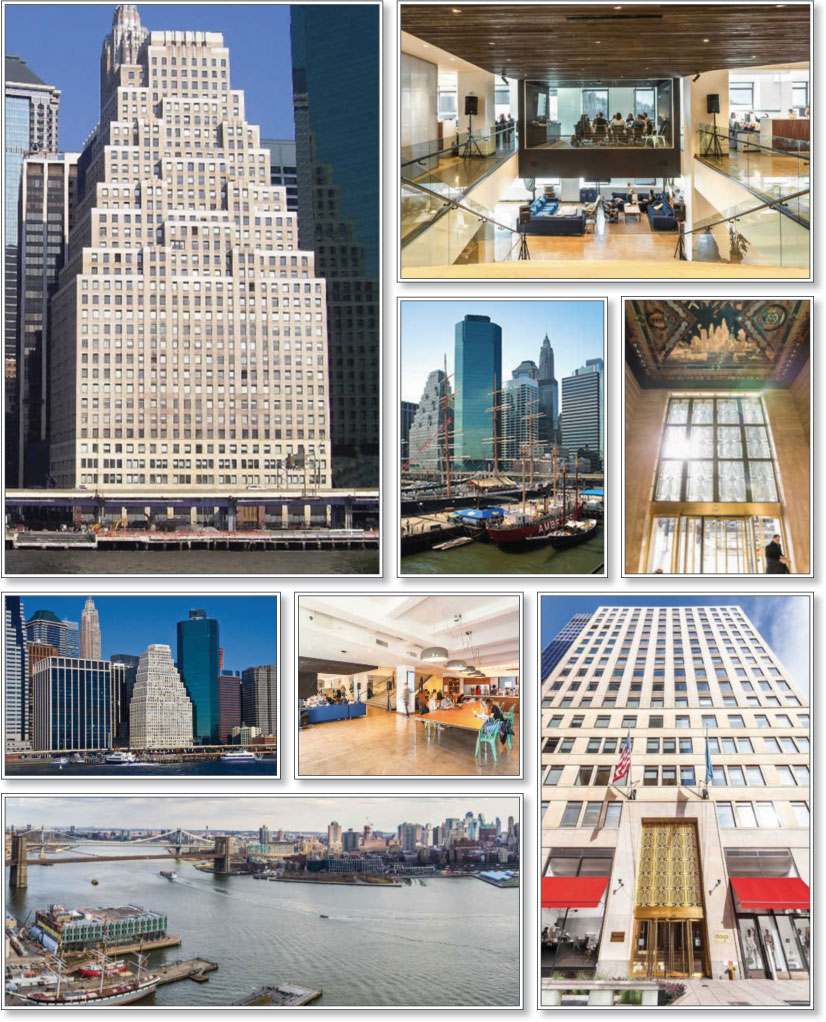
THE INFORMATION IN THIS STRUCTURAL AND COLLATERAL TERM SHEET IS NOT COMPLETE AND MAY BE AMENDED PRIOR TO THE TIME OF SALE. THIS TERM SHEET IS NOT AN OFFER TO SELL THESE SECURITIES AND IT IS NOT A SOLICITATION OF AN OFFER TO BUY THESE SECURITIES IN ANY JURISDICTION WHERE THE OFFER OR SALE IS NOT PERMITTED.
| | 24 of 144 | | |
| Structural and Collateral Term Sheet | Benchmark 2020-B20 |
| 120 Wall Street | |

THE INFORMATION IN THIS STRUCTURAL AND COLLATERAL TERM SHEET IS NOT COMPLETE AND MAY BE AMENDED PRIOR TO THE TIME OF SALE. THIS TERM SHEET IS NOT AN OFFER TO SELL THESE SECURITIES AND IT IS NOT A SOLICITATION OF AN OFFER TO BUY THESE SECURITIES IN ANY JURISDICTION WHERE THE OFFER OR SALE IS NOT PERMITTED.
| | 25 of 144 | | |
| Structural and Collateral Term Sheet | Benchmark 2020-B20 |
| 120 Wall Street | |

THE INFORMATION IN THIS STRUCTURAL AND COLLATERAL TERM SHEET IS NOT COMPLETE AND MAY BE AMENDED PRIOR TO THE TIME OF SALE. THIS TERM SHEET IS NOT AN OFFER TO SELL THESE SECURITIES AND IT IS NOT A SOLICITATION OF AN OFFER TO BUY THESE SECURITIES IN ANY JURISDICTION WHERE THE OFFER OR SALE IS NOT PERMITTED.
| | 26 of 144 | | |
| Structural and Collateral Term Sheet | Benchmark 2020-B20 |
| 120 Wall Street | |
| Mortgage Loan Information | |
| Mortgage Loan Sellers(1): | JPMCB/CREFI |
| Original Principal Balance(2): | $70,000,000 |
| Cut-off Date Principal Balance(2): | $70,000,000 |
| % of Pool by IPB: | 7.7% |
| Loan Purpose: | Refinance |
| Borrower: | 120 Wall Property Owner, LLC |
| Loan Sponsor: | Silverstein Holdco I LLC |
| Interest Rate: | 3.20100% |
| Note Date: | 10/1/2020 |
| Maturity Date: | 10/11/2030 |
| Interest-only Period: | 120 months |
| Original Term: | 120 months |
| Original Amortization: | None |
| Amortization Type: | Interest Only |
| Call Protection(3): | YM(24),DeforYM(92),O(4) |
| Lockbox / Cash Management: | Hard / Springing |
| Additional Debt(2): | Yes |
| Additional Debt Balance(2): | $95,000,000 |
| Additional Debt Type: | Pari Passu |
| Escrows and Reserves(6) | |||
| Initial | Monthly | Initial Cap | |
| Taxes: | $1,306,557 | $326,640 | N/A |
| Insurance: | $0 | Springing | N/A |
| Replacement Reserves: | $0 | Springing | $501,207 |
| TI/LC: | $3,472,525 | $111,379 | $4,009,656 |
| Other: | $1,759,579 | $0 | N/A |
| Property Information | |
| Single Asset / Portfolio: | Single Asset |
| Title: | Fee |
| Property Type – Subtype: | Office – CBD |
| Net Rentable Area (SF): | 668,276 |
| Location: | New York, NY |
| Year Built / Renovated: | 1929 / 2013 |
| Occupancy: | 95.1% |
| Occupancy Date: | 8/31/2020 |
| Number of Tenants: | 37 |
| 2017 NOI(4): | $12,487,548 |
| 2018 NOI(4): | $10,046,537 |
| 2019 NOI(4): | $12,952,334 |
| TTM NOI (as of 7/2020)(5): | $13,190,289 |
| UW Economic Occupancy: | 94.0% |
| UW Revenues: | $28,608,590 |
| UW Expenses: | $13,183,745 |
| UW NOI(5)(7): | $15,424,845 |
| UW NCF(5)(7): | $14,656,328 |
| Appraised Value / Per SF(7): | $285,000,000 / $426 |
| Appraisal Date: | 8/25/2020 |
| Financial Information(2)(7) | |
| Cut-off Date Loan / SF: | $247 |
| Maturity Date Loan / SF: | $247 |
| Cut-off Date LTV: | 57.9% |
| Maturity Date LTV: | 57.9% |
| UW NCF DSCR: | 2.74x |
| UW NOI Debt Yield: | 9.3% |
| Sources and Uses | |||||
| Sources | Proceeds | % of Total | Uses | Proceeds | % of Total |
| Whole Loan | $165,000,000 | 100.0% | Payoff Existing Debt | $135,478,875 | 82.1% |
| Return of Equity | 20,711,672 | 12.6 | |||
| Upfront Reserves | 6,538,661 | 4.0 | |||
| Closing Costs | 2,270,792 | 1.4 | |||
| Total Sources | $165,000,000 | 100.0% | Total Uses | $165,000,000 | 100.0% |
| (1) | The 120 Wall Street Whole Loan (as defined below) was co-originated by Wells Fargo Bank, National Association (“WFB”), JPMorgan Chase Bank, National Association. (“JPMCB”) and Citi Real Estate Funding Inc. (“CREFI”) on October 1, 2020. JPMCB will be contributing $35,000,000 (Notes A-4 and A-5) and CREFI will be contributing $35,000,000 (Notes A-6 and A-7) to the Benchmark 2020-B20 transaction. |
| (2) | The 120 Wall Street Loan (as defined below) is part of the 120 Wall Street Whole Loan evidenced by seven pari passu notes with an aggregate original principal balance as of the Cut-off Date of $165.0 million. Financial information presented in the chart above reflects the aggregate Cut-off Date balance of the $165.0 million 120 Wall Street Whole Loan. |
| (3) | The defeasance lockout period will be at least 24 payment dates beginning with and including the first payment date of November 2020. Defeasance of the 120 Wall Street Whole Loan is permitted at any time after the earlier to occur of (a) the end of the two-year period commencing on the closing date of the securitization of the last promissory note representing a portion of the 120 Wall Street Whole Loan to be securitized and (b) the payment date occurring in November 2023. The assumed defeasance lockout period of 24 months is based on the expected closing date of the Benchmark 2020-B20 securitization in October 2020. The actual defeasance lockout period may be longer. Additionally, the borrower may prepay the 120 Wall Street Whole Loan at any time during the term of the 120 Wall Street Whole Loan with a 15-day prior notice and, if such prepayment date occurs before July 11, 2030, upon payment of the yield maintenance premium. |
| (4) | The decrease from 2017 NOI to 2018 NOI and subsequent increase from 2018 NOI to 2019 NOI is primarily attributable to new leases executed in 2018 accounting for 11.4% of net rentable area and 12.9% of underwritten base rent. In connection with executing such leases, the Borrower (as defined below) provided new tenants with free rent periods accounting for an adjustment of approximately $2,427,673 in 2018 base rent. |
| (5) | The increase from TTM NOI (as of 7/2020) to UW NOI at the 120 Wall Street property is primarily attributable to (i) new leases commencing in 2020 and 2021 accounting for an increase of approximately $1.9 million in underwritten base rent and (ii) approximately $298,037 in contractual rent steps through November 2021. |
| (6) | For a full description of Escrows and Reserves, please refer to “Escrows and Reserves” below. |
THE INFORMATION IN THIS STRUCTURAL AND COLLATERAL TERM SHEET IS NOT COMPLETE AND MAY BE AMENDED PRIOR TO THE TIME OF SALE. THIS TERM SHEET IS NOT AN OFFER TO SELL THESE SECURITIES AND IT IS NOT A SOLICITATION OF AN OFFER TO BUY THESE SECURITIES IN ANY JURISDICTION WHERE THE OFFER OR SALE IS NOT PERMITTED.
| | 27 of 144 | | |
| Structural and Collateral Term Sheet | Benchmark 2020-B20 |
| 120 Wall Street | |
| (7) | While the 120 Wall Street Whole Loan was originated after the emergence of the novel coronavirus pandemic and the economic disruption resulting from measures to combat the pandemic, the pandemic is an evolving situation and could impact the 120 Wall Street Whole Loan more severely than assumed in the underwriting of the 120 Wall Street Whole Loan and could adversely affect the NOI, NCF and occupancy information, as well as the appraised value and the DSCR, LTV and Debt Yield metrics presented above. See “Risk Factors— Risks Related to Market Conditions and Other External Factors—Coronavirus Pandemic Has Adversely Affected the Global Economy and Will Likely Adversely Affect the Performance of the Mortgage Loans” in the Preliminary Prospectus. |
The Loan. The 120 Wall Street loan is part of a whole loan evidenced by seven pari passu promissory notes, each as described below, with an aggregate original principal balance as of the Cut-off Date of $165.0 million (the “120 Wall Street Whole Loan”), secured by the ESD’s (as defined below) fee simple interest and the borrower’s leasehold interest in a 668,276 square foot, Class B, CBD office building located in New York, New York. The non-controlling notes A-4, A-5, A-6 and A-7, with an aggregate outstanding principal balance as of the Cut-off Date of $70.0 million, will be included in the Benchmark 2020-B20 Trust. The remaining notes, which are currently held by WFB, are expected to be contributed to one or more future securitization trusts. The relationship between the holders of the 120 Wall Street Whole Loan will be governed by a co-lender agreement as described under “Description of the Mortgage Pool—The Whole Loans— The Serviced Pari Passu Whole Loans” in the Preliminary Prospectus. The 120 Wall Street Whole Loan has a 10-year term and is interest only for the full term of the loan.
| Whole Loan Summary | ||||
| Note | Original Balance | Cut-off Date Balance | Note Holder | Controlling Piece |
| Note A-1(1) | $70,000,000 | $70,000,000 | WFB | Yes |
| Note A-2(1) | $10,000,000 | $10,000,000 | WFB | No |
| Note A-3(1) | $15,000,000 | $15,000,000 | WFB | No |
| Note A-4, A-5, A-6, A-7(2) | $70,000,000 | $70,000,000 | Benchmark 2020-B20 | No(3) |
| Whole Loan | $165,000,000 | $165,000,000 | ||
| (1) | Expected to be contributed to one or more future securitization transactions. |
| (2) | JPMCB will be contributing Note A-4 and Note A-5, which have an aggregate outstanding principal balance of approximately $35,000,000, to the Benchmark 2020-B20 mortgage trust. CREFI will be contributing Note A-6 and Note A-7, which have an aggregate outstanding principal balance of approximately $35,000,000, to the Benchmark 2020-B20 mortgage trust. |
| (3) | The 120 Wall Street Whole Loan is expected to be serviced under the Benchmark 2020-B20 pooling and servicing agreement until such time as the controlling note has been securitized, at which point the 120 Wall Street Whole Loan will be serviced under the pooling and servicing agreement related to such securitization. |
The Borrower. The borrower is 120 Wall Property Owner, LLC (the “Borrower”), a Delaware limited liability company and single purpose entity with two independent directors.
The borrower sponsor is Silverstein Properties, Inc. (“Silverstein Properties”) and the non-recourse carveout guarantor is Silverstein Holdco I LLC. Silverstein Properties is a privately held, full-service real estate development, investment and management firm based in New York. Founded in 1957, Silverstein has developed, owned and managed more than 40 million square feet of office, residential, hotel, retail and mixed-use properties. Silverstein Properties is widely recognized for their role in rebuilding the World Trade Center following the tragic events of September 11, 2001. Silverstein Properties’ commercial and residential portfolio, includes over 12 million square feet of office and residential properties in Midtown and Lower Manhattan.
The Property. The 120 Wall Street property is a 35-story, 668,276 square foot, Class B, LEED Gold certified office building located in the Financial District of Manhattan in New York City. The property was constructed in 1929 and most recently renovated in 2013. The borrower sponsor purchased the 120 Wall Street property in 1980 and has invested significant capital to reposition and modernize the building. In 2005, the borrower sponsor restored the façade of the building, entrance and distinctive art deco lobby enhancing the building’s appeal. Since 2012, the borrower sponsor has invested $11.0 million in capital improvements ($16.47 per square foot) including a $4.5 million lobby renovation that includes the expansion and widening of the lobby footprint, new revolving doors, installing turnstiles, new flooring, new lighting, new security desks and restoration of interior lobby walls, as well as an approximately $3.4 million elevator modernization. The 120 Wall Street property is designated a historic landmark by the New York City Landmark’s Preservation Commission. Amenities at the 120 Wall Street property include unobstructed views across the East River, private terraces and around the clock security. As of August 31, 2020, the 120 Wall Street property was 95.1% occupied by 37 distinct tenants including 29 office tenants, five telecom tenants, two retail tenants and one management office.
The borrower sponsor has owned the 120 Wall Street property since 1980 and facilitated its designation as New York City’s first association center in 1992, which allows for not-for-profit (“NFP”) tenancy to receive financial incentives for leasing space at the 120 Wall Street property. On September 12, 2012, the 120 Wall Street property entered into a real estate tax program with the New York State Urban Development Corporation d/b/a Empire State Development (“ESD”), where the building was deeded to the ESD and leased back by the Borrower. Under the agreement the Borrower makes a payment in lieu of real estate taxes (“PILOT”). To the extent that NFP tenants lease space at the property, the Borrower’s PILOT amount reduces proportionately, resulting in expense savings. A portion of
THE INFORMATION IN THIS STRUCTURAL AND COLLATERAL TERM SHEET IS NOT COMPLETE AND MAY BE AMENDED PRIOR TO THE TIME OF SALE. THIS TERM SHEET IS NOT AN OFFER TO SELL THESE SECURITIES AND IT IS NOT A SOLICITATION OF AN OFFER TO BUY THESE SECURITIES IN ANY JURISDICTION WHERE THE OFFER OR SALE IS NOT PERMITTED.
| | 28 of 144 | | |
| Structural and Collateral Term Sheet | Benchmark 2020-B20 |
| 120 Wall Street | |
the expense savings are then required to be passed back to the NFP tenant in the form of a rent credit. The ground lease expires on December 31, 2032 at which time the Borrower would obtain the fee ownership, repurchasing the deed for $1. There is no ground rent associated with the lease structure other than the PILOT tax payments for any for-profit tenants at the 120 Wall Street property. Under the program, any NFP tenant that executes a new lease or renews a current lease is eligible to participate in the program. Currently, 12 NFP tenants representing approximately 31.6% of net rentable area at the 120 Wall Street property participate in the program, resulting in an expected tax savings of approximately $1.6 million in 2020. 120 Wall Street is the only office building in Manhattan to offer this incentive for NFP tenants. The average NFP benefit is approximately $6.17 per square foot. See “Risk Factors—Risks Relating to the Mortgage Loans—Increases in Real Estate Taxes May Reduce Available Funds” in the Preliminary Prospectus.
The largest tenant, Droga5, LLC (202,396 square feet; 30.3% of net rentable area; 32.6% of underwritten base rent) (“Droga5”), is an international creative and strategic advertising agency that was founded in 2006. Droga5 was acquired by Accenture (NYSE: ACN) Interactive in May 2019. Droga5 has worked on advertising campaigns for some of the largest corporation in the world including Coca- Cola, Motorola, Mondelez International, Kraft Heinz Company, LVMH, Unilever and the United Nations. Droga5 executed its lease at the 120 Wall Street property in October 2013 for 91,442 square feet and expanded its space at the property in 2016 and 2018 for 52,320 square feet and 58,634 square feet, respectively. The 120 Wall Street property serves as the company’s global headquarters. Droga5 has a lease expiration of September 2029 with one, ten-year renewal option for the entire premises or at least two full contiguous floors exercisable with at least 15 months’ notice but no more than 24 months prior to expiration. Droga5 has no termination options.
The second largest tenant, Success Academy Charter School (54,658 square feet; 8.2% of net rentable area; 8.1% of underwritten base rent), was founded in 2006 and is the largest and highest-performing free, public charter school network in New York City. Admission is open to all New York State children in grades K-12, including those with special needs and English language learners. Success Academy operates 47 schools serving 20,000 students in Manhattan, Brooklyn, Queens and the Bronx. The non-profit organization ranks in the top 1% among all schools in the state in math and English for 2019. Success Academy Charter School utilizes its space at 120 Wall Street for office and administrative space. Success Academy Charter School has a lease expiration of June 2029 with no renewal options. Success Academy Charter School has a one-time right to terminate its lease for the entire premises effective August 31, 2024, with 12 months’ notice and a termination fee of $3,497,468. According to the appraisal, Success Academy Charter School currently receives an NFP benefit in the form of a rent credit amounting to approximately $244,937.
The third largest tenant, AFS-USA, Inc. (40,029 square feet; 6.0% of net rentable area; 5.9% of underwritten base rent) (“AFS”) is an international youth exchange organization consisting of over 50 independent non-profit organizations. AFS provides young people with immersive, international or intercultural experiences, supports them with structured and facilitated learning and gives them real world social-impact and change making exposure. In 2018 alone, AFS served over 66,000 students across nine countries, raised over $36 million in scholarships and had more than 12,000 study-abroad participants. AFS has a lease expiration of June 2029 with one, 10-year renewable option exercisable with notice provided no later than 12 months, but no earlier than 18 months, prior to the expiration date. AFS has a one-time right to terminate its lease for the entire premises effective June 30, 2024, with 18 months’ prior notice, subject to a termination fee equal to $2,593,000. According to the appraisal, AFS-USA, Inc. currently receives an NFP benefit in the form of a rent credit amounting to approximately $181,879.
COVID-19 Update. As of October 1, 2020, the 120 Wall Street property is open for operations. As of September 11, 2020, four tenants accounting for approximately 12.7% of net rentable area and 12.1% of underwritten base rent in aggregate have requested tenant relief in the form of rent modifications and deferral. The borrower sponsor has not formally agreed to any such agreement. For April, May, June, July and August, the borrower sponsor collected approximately 99%, 100% 100%, 95% and 92% of base rent, respectively. As of September 11, 2020, the third largest tenant at the 120 Wall Street property, AFS, which accounts for 6.0% of net rentable area and 5.9% of underwritten base rent, has requested a rent reduction or a reduction in its square footage on the fourth floor by approximately 18,000 square feet. Two additional tenants at the property, Geourgoulis / Cohen and The New Press, accounting for 2.1% of net rentable area and 2.2% of underwritten base rent, have missed a payment but are expected to make such payment in full by the end of 2020. As of October 1, 2020 the 120 Wall Street Whole Loan is not subject to any modification or forbearance requests. See “Risk Factors—Risks Related to Market Conditions and Other External Factors—Current Coronavirus Pandemic May Adversely Affect the Global Economy and the Performance of the Mortgage Loans”.
The Market. The 120 Wall Street property is situated in the Downtown East Office submarket of the Manhattan Office market. The 120 Wall Street Property is a short walk from the PATH, 4, 5, A, C, E, J, M, Z, W, R, 1, 2, 3 and the new Fulton Street Transit Center which provides access to New Jersey, Brooklyn and residential neighborhoods in Lower Manhattan. The FDR Drive, Brooklyn Bridge and Manhattan Bridge are accessible from the subject property and are located on the westernmost sections of Manhattan.
The Downtown East Office submarket had approximately 49.9 million square feet of inventory as of the second quarter of 2020. According to the appraisal, the Downtown East Office submarket had a vacancy rate as of second quarter 2020 of 7.0% and an average asking rent
THE INFORMATION IN THIS STRUCTURAL AND COLLATERAL TERM SHEET IS NOT COMPLETE AND MAY BE AMENDED PRIOR TO THE TIME OF SALE. THIS TERM SHEET IS NOT AN OFFER TO SELL THESE SECURITIES AND IT IS NOT A SOLICITATION OF AN OFFER TO BUY THESE SECURITIES IN ANY JURISDICTION WHERE THE OFFER OR SALE IS NOT PERMITTED.
| | 29 of 144 | | |
| Structural and Collateral Term Sheet | Benchmark 2020-B20 |
| 120 Wall Street | |
of $56.27 per square foot. The appraisal identified 12 comparable office leases with rents ranging from $52.00 to $70.79 per square foot with a weighted average rent of approximately $59.97 per square foot. The 120 Wall Street property’s underwritten weighted average rent for occupied office space is approximately $40.41 per square foot, approximately 22.0% below the appraisal’s concluded market rent of $51.80 per square foot for the same spaces.
The traditional office tenant within the Downtown East office submarket primarily consisted of financial institutions, insurance companies, and real estate corporations, which are commonly referred to as “FIRE” tenants. However, based on the discounted rents when compared to many other submarkets throughout Manhattan, the Downtown East office submarket has redefined its typical tenancy base, signing large anchor leases to companies within the technology, advertising, media and information technology sector, which are commonly referred to as “TAMI” tenants. Due to the recalibration of the tenancy base throughout New York City, there is no longer one definitive corridor or office market that is centralized around one specific tenancy base.
According to the appraisal, the estimated 2020 population within a 0.25, 0.5, and 1-mile radius of the 120 Wall Street property is 9,835, 33,707, and 94,136, respectively. In addition, the appraisal states that the estimated 2020 average household income within a 0.25, 0.5, and 1-mile radius is $268,181, $247,402, and $196,812, respectively.
The following table presents certain information relating to the appraisal’s market rent conclusion for the 120 Wall Street property:
| Summary of Appraisal’s Concluded Office and Retail Market Rent(1) | ||||||
| Office | ||||||
| Storage | Floor (2) | Floors (3-9) | Floors (10-16) | Floors (17-25) | Floors (26-34) | Retail (Grade) |
| $25.00 | $44.00 | $48.00 | $52.00 | $56.00 | $60.00 | $65.00 |
| (1) | Source: Appraisal. |
| Historical Occupancy(1) | ||||
| 2017 | 2018 | 2019 | Current(2) | |
| Occupancy | 96.0% | 95.0% | 92.0% | 95.1% |
| (1) | Historical occupancies are as of December 31 of each respective year. |
| (2) | Current Occupancy is based on the August 31, 2020 rent roll. |
THE INFORMATION IN THIS STRUCTURAL AND COLLATERAL TERM SHEET IS NOT COMPLETE AND MAY BE AMENDED PRIOR TO THE TIME OF SALE. THIS TERM SHEET IS NOT AN OFFER TO SELL THESE SECURITIES AND IT IS NOT A SOLICITATION OF AN OFFER TO BUY THESE SECURITIES IN ANY JURISDICTION WHERE THE OFFER OR SALE IS NOT PERMITTED.
| | 30 of 144 | | |
| Structural and Collateral Term Sheet | Benchmark 2020-B20 |
| 120 Wall Street | |
| Tenant Summary(1) | ||||||
Tenant | Ratings Moody’s/Fitch/S&P(2) | Net Rentable Area (SF) | % of Total NRA | Base Rent PSF(3) | % of Total Base Rent | Lease Expiration Date |
| Droga5, LLC(4) | Aa3 / A+ / A+ | 202,396 | 30.3% | $41.56 | 32.6% | 9/30/2029 |
| Success Academy Charter School(5) | NR / NR / NR | 54,658 | 8.2 | $38.35 | 8.1 | 6/30/2029 |
| AFS-USA, Inc.(6)(7) | NR / NR / NR | 40,029 | 6.0 | $37.95 | 5.9 | 6/30/2029 |
| Foundation for AIDS Research | NR / NR / NR | 30,822 | 4.6 | $33.97 | 4.1 | 8/31/2027 |
| Center for Appellate Litigation(8) | NR / NR / NR | 20,535 | 3.1 | $40.88 | 3.2 | 1/31/2025 |
| Lambda Legal Defense & Education Fund | NR / NR / NR | 20,321 | 3.0 | $34.00 | 2.7 | 7/31/2027 |
| Public Relations Society of America(9) | NR / NR / NR | 19,448 | 2.9 | $48.00 | 3.6 | 2/28/2027 |
| Lavazza Premium Coffees Corp. | NR / NR / NR | 19,173 | 2.9 | $43.14 | 3.2 | 10/31/2027 |
| Catalyst, Inc. | NR / NR / NR | 18,176 | 2.7 | $41.00 | 2.9 | 7/31/2027 |
| American Institute of Chemical Engineers | NR / NR / NR | 16,706 | 2.5 | $38.33 | 2.5 | 3/31/2029 |
| Total Major Office | 442,264 | 66.2% | $40.14 | 68.7% | ||
| Other Occupied(10)(11)(12) | 193,407 | 28.9 | $41.79 | 31.3 | ||
| Total Occupied | 635,671 | 95.1% | $40.64 | 100.0% | ||
| Vacant | 32,605 | 4.9 | ||||
| Total / Wtd. Avg. | 668,276 | 100.0% | ||||
| (1) | Based on the underwritten rent roll dated August 31, 2020. |
| (2) | In certain instances, ratings provided are those of the parent company of the entity shown, whether or not the parent company guarantees the lease. |
| (3) | Base Rent PSF is inclusive of rent steps through November 2021 totaling $298,037. |
| (4) | Jax Media is currently subleasing an additional 13,076 square feet from Droga5 through June 2029 at a base rental rate of $52.15 per square foot. |
| (5) | Success Academy Charter School has a one-time right to terminate its lease for the entire premises effective August 2024, with 12 months’ notice and a termination fee of $3,497,468. |
| (6) | AFS-USA, Inc. is currently subleasing an additional 13,076 square feet from Success Academy Charter School through June 2029 at a base rental rate of $39.00 per square foot. |
| (7) | AFS-USA, Inc. has a one-time right to terminate its lease for the entire premises effective June 2024, with 18 months’ prior notice and a termination fee equal to $2,593,000. |
| (8) | Center for Appellate Litigation is currently subleasing an additional 8,788 square feet from American Suicide Foundation through November 2021 at which point Center for Appellate Litigation will pay $58.00 per square foot pursuant to a direct lease thereafter. |
| (9) | Kelley Jasons McGowan Spinelli Hanna & Reber, L.L.P (“KJMSHR”) is subleasing 2,442 square feet to Public Relations Society of America at a base rental rate of $46.00 per square foot through February 2027. KJMSHR leases no additional space at the 120 Wall Street property. |
| (10) | Other Occupied is inclusive of 7,281 square feet of retail space. |
| (11) | Other Occupied is inclusive of Pico Quantitative Trading which is currently dark. The tenant continues to pay rent in full at the 120 Wall Street property. |
| (12) | Other Occupied includes a 2,253 square feet management office with no attributable base rent. |
| Lease Rollover Schedule(1)(2) | |||||||||
Year | Number of Leases Expiring | Net Rentable Area Expiring | % of NRA Expiring | Base Rent Expiring | % of Base Rent Expiring | Cumulative Net Rentable Area Expiring | Cumulative % of NRA Expiring | Cumulative Base Rent Expiring | Cumulative % of Base Rent Expiring |
| Vacant | NAP | 32,605 | 4.9% | NAP | NAP | 32,605 | 4.9% | NAP | NAP |
| MTM & 2020 | 1 | 6 | 0.0 | $0 | 0.0% | 32,611 | 4.9% | $0 | 0.0% |
| 2021 | 5 | 34,869 | 5.2 | 1,406,534 | 5.4% | 67,480 | 10.1% | $1,406,534 | 5.4% |
| 2022 | 3 | 12,950 | 1.9 | 404,608 | 1.6% | 80,430 | 12.0% | $1,811,142 | 7.0% |
| 2023 | 3 | 21,624 | 3.2 | 812,918 | 3.1% | 102,054 | 15.3% | $2,624,060 | 10.2% |
| 2024 | 2 | 3,912 | 0.6 | 195,440 | 0.8% | 105,966 | 15.9% | $2,819,500 | 10.9% |
| 2025 | 3 | 35,306 | 5.3 | 1,441,320 | 5.6% | 141,272 | 21.1% | $4,260,820 | 16.5% |
| 2026 | 1 | 6,024 | 0.9 | 219,876 | 0.9% | 147,296 | 22.0% | $4,480,696 | 17.3% |
| 2027 | 7 | 134,269 | 20.1 | 5,166,723 | 20.0% | 281,565 | 42.1% | $9,647,419 | 37.3% |
| 2028 | 1 | 4,357 | 0.7 | 157,515 | 0.6% | 285,922 | 42.8% | $9,804,934 | 38.0% |
| 2029 | 6 | 336,505 | 50.4 | 13,546,996 | 52.4% | 622,427 | 93.1% | $23,351,930 | 90.4% |
| 2030 and Thereafter(3) | 5 | 45,849 | 6.9 | 2,481,934 | 9.6% | 668,276 | 100.0% | $25,833,864 | 100.0% |
| Total | 37 | 668,276 | 100.0% | $25,833,864 | 100.0% | ||||
| (1) | Based on the underwritten rent roll dated August 31, 2020. |
| (2) | Certain tenants may have termination or contraction options (which may become exercisable prior to the originally stated expiration date of the tenant lease) that are not considered in the above Lease Rollover Schedule. |
| (3) | 2030 & Thereafter includes 2,253 square feet of management office with no attributable underwritten base rent. |
THE INFORMATION IN THIS STRUCTURAL AND COLLATERAL TERM SHEET IS NOT COMPLETE AND MAY BE AMENDED PRIOR TO THE TIME OF SALE. THIS TERM SHEET IS NOT AN OFFER TO SELL THESE SECURITIES AND IT IS NOT A SOLICITATION OF AN OFFER TO BUY THESE SECURITIES IN ANY JURISDICTION WHERE THE OFFER OR SALE IS NOT PERMITTED.
| | 31 of 144 | | |
| Structural and Collateral Term Sheet | Benchmark 2020-B20 |
| 120 Wall Street | |
| Operating History and Underwritten Net Cash Flow | |||||||
| 2017 | 2018 | 2019 | TTM(1) | Underwritten | Per Square Foot | %(2) | |
| Base Rent(3) | $21,819,923 | $20,742,361 | $23,378,989 | $23,582,233 | $25,833,864 | $38.66 | 85.7% |
| Vacant Income | 0 | 0 | 0 | 0 | 1,821,818 | 2.73 | 6.0 |
| NFP Rent Credit(4) | (875,867) | (910,278) | (947,348) | (922,477) | (967,163) | (1.45) | (3.2) |
| Gross Potential Rent | $20,944,056 | $19,832,083 | $22,431,641 | $22,659,756 | $26,688,519 | $39.94 | 88.5% |
| Total Reimbursements | 3,108,126 | 3,395,970 | 3,502,179 | 3,321,088 | 3,467,820 | 5.19 | 11.5 |
| Gross Rental Income | $24,052,182 | $23,228,053 | $25,933,820 | $25,980,844 | $30,156,339 | $45.13 | 100.0% |
| (Vacancy/Credit Loss) | 0 | 0 | 0 | 0 | (1,821,818) | (2.73) | (6.0) |
| Total Other Income(5) | 88,120 | 71,433 | 259,483 | 274,069 | 274,069 | 0.41 | 0.9 |
| Effective Gross Income | $24,140,302 | $23,299,486 | $26,193,303 | $26,254,913 | $28,608,590 | 42.81 | 94.9% |
| Total Expenses | 11,652,754 | 13,252,949 | 13,240,969 | 13,064,624 | 13,183,745 | 19.73 | 46.1 |
| Net Operating Income(6)(7) | $12,487,548 | $10,046,537 | $12,952,334 | $13,190,289 | $15,424,845 | 23.08 | 53.9% |
| TI/LC | 0 | 0 | 0 | 0 | 668,276 | 1.00 | 2.3 |
| Capital Expenditures | 0 | 0 | 0 | 0 | 100,241 | 0.15 | 0.4 |
| Net Cash Flow | $12,487,548 | $10,046,537 | $12,952,334 | $13,190,289 | $14,656,328 | 21.93 | 51.2% |
| (1) | TTM represents the trailing 12-month period ending July 31, 2020. |
| (2) | % column represents percent of Gross Rental Income for all revenue lines and represents percent of Effective Gross Income for the remainder of the fields. |
| (3) | Underwritten Base Rent is inclusive of rent steps through November 2021 totaling $298,037. |
| (4) | NFP Rent Credit is based on contractual rent credits for 12 NFP tenants representing approximately 32.9% of net rentable area at the 120 Wall Street property |
| (5) | Total Other Income includes telecom income, license income, miscellaneous event income, lease cancellation fees and construction management fees. |
| (6) | The increase from TTM NOI (as of 7/2020) to UW NOI at the 120 Wall Street property is primarily attributable to (i) new leases commencing in 2020 and 2021 accounting for an increase of approximately $1.9 million in underwritten base rent and (ii) contractual rent steps through November 2021. |
| (7) | The decrease from 2017 NOI to 2018 NOI and subsequent increase from 2018 NOI to 2019 NOI is primarily attributable to new leases executed in 2018 accounting for 11.4% of net rentable area and 12.9% of underwritten base rent. In connection with executing such leases, the Borrower provided new tenants with free rent periods accounting for an adjustment of approximately $2,427,673 in 2018 base rent. |
Property Management. The 120 Wall Street property is managed by Silverstein Properties, LLC, a Delaware limited liability company and an affiliate of the Borrower.
Escrows and Reserves. At loan origination, the Borrower deposited (i) $1,306,557 into a real estate tax reserve, (ii) $3,472,525 into an outstanding TI/LC reserve, including $415,000 for Hydra tenant improvements and (iii) $1,759,579 into a rent concession reserve funds consisting of (a) approximately $434,099 for Hydra, (b) approximately $176,067 for Droga5, LLC, (c) approximately $45,721 for Illuminating Engineers Society, (d) approximately $67,555 for Excess Line Association of New York, (e) approximately $908,712 for the Nathan Cummins Foundation, Inc and (f) approximately $127,426 for Center for Appellate Litigation.
Tax Reserve – On a monthly basis, the Borrower is required to deposit an amount equal to 1/12 of the estimated annual real estate taxes into the tax reserve account (initially $326,640).
Insurance Reserve – On a monthly basis, the Borrower is required to deposit into an insurance reserve an amount equal to 1/12 of estimated insurance premiums. So long as a blanket policy acceptable to the lender is in effect, the Borrower provides the lender evidence of timely payment of insurance premiums, and there is no event of default continuing, the requirement for monthly deposits into the insurance reserve is waived.
Replacement Reserve – On a monthly basis, during the continuance of a Cash Trap Event Period, the Borrower is required to deposit approximately $13,922 into a replacement reserve, subject to a cap of $501,207.
TI/LC Reserve – On a monthly basis, the Borrower is required to deposit approximately $111,379 into a TI/LC reserve, subject to a cap of $4,009,656.
Lockbox / Cash Management. The 120 Wall Street Whole Loan is structured with a hard lockbox and springing cash management. The Borrower is required to direct tenants to pay rent directly into the lender-controlled lockbox account and all rents received directly by the Borrower or the property manager are required to be deposited into the lockbox account within two business days of receipt. Prior to the occurrence of a Cash Trap Event Period, all funds in the lockbox account are required to be distributed to the Borrower. During a Cash Trap Event Period, funds in the lockbox account are required to be swept on each business day to a lender-controlled cash management account to be applied and disbursed in accordance with the 120 Wall Street Whole Loan documents. Any excess cash flow remaining after satisfaction of the waterfall items outlined in the loan documents is required to be swept to an excess cash flow subaccount controlled by the lender as additional collateral for the 120 Wall Street Whole Loan during the continuance of the Cash Trap Event Period. Provided
THE INFORMATION IN THIS STRUCTURAL AND COLLATERAL TERM SHEET IS NOT COMPLETE AND MAY BE AMENDED PRIOR TO THE TIME OF SALE. THIS TERM SHEET IS NOT AN OFFER TO SELL THESE SECURITIES AND IT IS NOT A SOLICITATION OF AN OFFER TO BUY THESE SECURITIES IN ANY JURISDICTION WHERE THE OFFER OR SALE IS NOT PERMITTED.
| | 32 of 144 | | |
| Structural and Collateral Term Sheet | Benchmark 2020-B20 |
| 120 Wall Street | |
no event of default is continuing, any excess cash flow funds remaining in the excess cash flow account will be disbursed to the Borrower upon the expiration of any Cash Trap Event Period provided that such funds are used for, among other things, preapproved capital expenditures, preapproved leasing expenses, operating expenses, and approved extraordinary expenses (other than material tenant sweep funds, which will be disbursed to the Borrower for reimbursement of permitted leasing expenses in accordance with the 120 Wall Street Whole Loan documents). Upon an event of default under the 120 Wall Street Whole Loan documents, the lender may apply funds to the debt in such priority as it may determine.
A “Cash Trap Event Period” will commence upon the earlier to occur of (i) an event of default, (ii) the debt yield being less than 6.25% (as calculated in the 120 Wall Street Whole Loan documents) as of any Calculation Date (as defined below) and (iii) Droga5, LLC failing to renew or extend its lease by June 30, 2028.
A Cash Trap Event Period may be cured upon, with respect to a Cash Trap Event Period caused solely by (a) clause (i) above, the cure (if applicable) of the related event of default, (b) clause (ii) above, the earliest to occur of the date on which (A) the debt yield is at least 6.25% for two consecutive Calculation Dates or (B) the Borrower delivers a letter of credit reasonably satisfactory to the lender in an amount sufficient such that the debt yield would not be less than 6.25%, (c) clause (iii) above, the Borrower having deposited with the lender an amount equal to $50.00 per square foot of leased space under Droga5’s lease.
A “Calculation Date” means the last day of each calendar quarter during the 120 Wall Street Whole Loan term.
Future Mezzanine or Subordinate Indebtedness Permitted. The holder of 100% of the indirect equity interests in the Borrower is permitted to obtain mezzanine financing secured by 100% of the indirect ownership interests in the Borrower so long as, among other things: (a) no event of default has occurred and is continuing, (b) the lender and such mezzanine lender have entered into an intercreditor agreement reasonably satisfactory to the lender, (c) the aggregate loan-to-value ratio (as calculated in the 120 Wall Street Whole Loan documents) is no greater than 57.9%, (d) the aggregate debt service coverage ratio (as calculated in the 120 Wall Street Whole Loan documents) is equal to or greater than 2.37x, (e) the aggregate debt yield (as calculated in the 120 Wall Street Whole Loan documents) is equal to or greater than 7.7%, (f) the maturity date of the mezzanine loan is not earlier than the maturity date of the 120 Wall Street Whole Loan and (g) the mezzanine lender is a qualified mezzanine lender (as defined in the 120 Wall Street Whole Loan documents).
Partial Release. None.
THE INFORMATION IN THIS STRUCTURAL AND COLLATERAL TERM SHEET IS NOT COMPLETE AND MAY BE AMENDED PRIOR TO THE TIME OF SALE. THIS TERM SHEET IS NOT AN OFFER TO SELL THESE SECURITIES AND IT IS NOT A SOLICITATION OF AN OFFER TO BUY THESE SECURITIES IN ANY JURISDICTION WHERE THE OFFER OR SALE IS NOT PERMITTED.
| | 33 of 144 | | |
| Structural and Collateral Term Sheet | Benchmark 2020-B20 |
| MGM Grand & Mandalay Bay | |

THE INFORMATION IN THIS STRUCTURAL AND COLLATERAL TERM SHEET IS NOT COMPLETE AND MAY BE AMENDED PRIOR TO THE TIME OF SALE. THIS TERM SHEET IS NOT AN OFFER TO SELL THESE SECURITIES AND IT IS NOT A SOLICITATION OF AN OFFER TO BUY THESE SECURITIES IN ANY JURISDICTION WHERE THE OFFER OR SALE IS NOT PERMITTED.
| | 34 of 144 | | |
| Structural and Collateral Term Sheet | Benchmark 2020-B20 |
| MGM Grand & Mandalay Bay | |
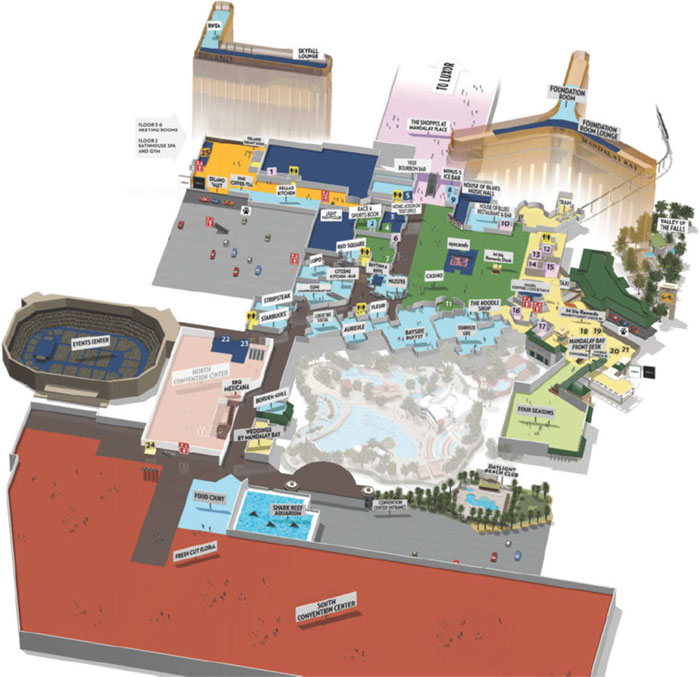
THE INFORMATION IN THIS STRUCTURAL AND COLLATERAL TERM SHEET IS NOT COMPLETE AND MAY BE AMENDED PRIOR TO THE TIME OF SALE. THIS TERM SHEET IS NOT AN OFFER TO SELL THESE SECURITIES AND IT IS NOT A SOLICITATION OF AN OFFER TO BUY THESE SECURITIES IN ANY JURISDICTION WHERE THE OFFER OR SALE IS NOT PERMITTED.
| | 35 of 144 | | |
| Structural and Collateral Term Sheet | Benchmark 2020-B20 |
| MGM Grand & Mandalay Bay | |
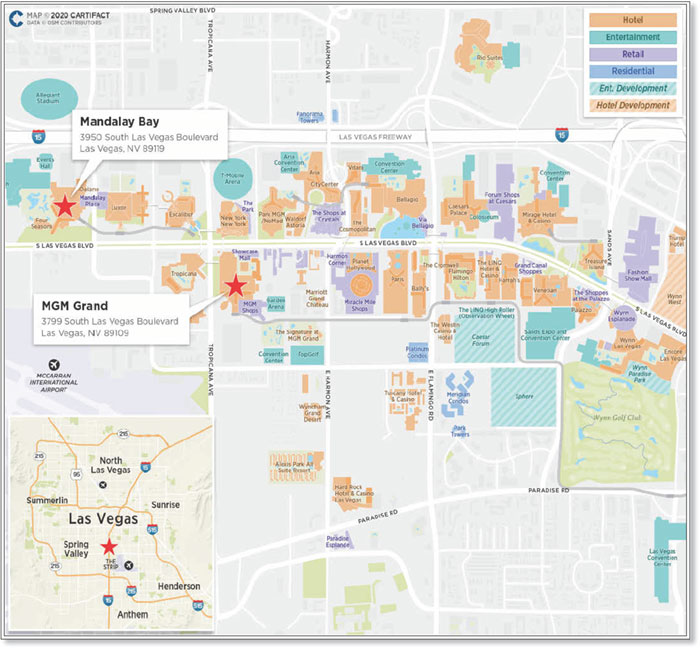
THE INFORMATION IN THIS STRUCTURAL AND COLLATERAL TERM SHEET IS NOT COMPLETE AND MAY BE AMENDED PRIOR TO THE TIME OF SALE. THIS TERM SHEET IS NOT AN OFFER TO SELL THESE SECURITIES AND IT IS NOT A SOLICITATION OF AN OFFER TO BUY THESE SECURITIES IN ANY JURISDICTION WHERE THE OFFER OR SALE IS NOT PERMITTED.
| | 36 of 144 | | |
| Structural and Collateral Term Sheet | Benchmark 2020-B20 |
| MGM Grand & Mandalay Bay | |
| Mortgage Loan Information | |
| Mortgage Loan Sellers(1): | CREFI/GACC |
| Original Principal Balance(2): | $70,000,000 |
| Cut-off Date Principal Balance(2): | $70,000,000 |
| % of Pool by IPB: | 7.7% |
| Loan Purpose: | Acquisition |
| Borrowers(3): | MGM Grand PropCo, LLC, Mandalay |
| PropCo, LLC | |
| Sponsors(3): | BREIT Operating Partnership L.P., |
| MGM Growth Properties Operating | |
| Partnership LP | |
| Interest Rate: | 3.55800% |
| Note Date: | 2/14/2020 |
| Anticipated Repayment Date(4): | 3/5/2030 |
| Final Maturity Date(4): | 3/5/2032 |
| Interest-only Period(4): | 120 months |
| Original Term(4): | 120 months |
| Original Amortization: | None |
| Amortization Type(4): | ARD-Interest Only |
| Call Protection(5): | Grtr0.5%orYM(31),DeforGrtr0.5%or |
| YM(82),O(7) | |
| Lockbox / Cash Management: | Hard / Springing |
| Additional Debt(2): | Yes |
| Additional Debt Balance(2): | $1,564,200,000 / $804,400,000 / |
| $561,400,000 | |
| Additional Debt Type(2): | Pari Passu / B Notes / C Notes |
| Property Information | |
| Single Asset / Portfolio: | Portfolio |
| Title: | Fee |
| Property Type - Subtype: | Hotel – Full Service |
| Net Rentable Area (Rooms)(6): | 9,748 |
| Location: | Las Vegas, NV |
| Year Built / Renovated(7): | Various / N/A |
| Occupancy/ADR/RevPAR(6): | 87.5% / $197.27 / $172.60 |
| Occupancy/ADR/RevPAR Date: | 6/30/2020 |
Number of Tenants: |
N/A |
| 2017 NOI: | $605,037,208 |
| 2018 NOI: | $617,369,266 |
| 2019 NOI: | $520,080,353 |
| TTM NOI (as of 6/2020)(3): | $381,156,903 |
| UW Occupancy/ADR/RevPAR: | 92.1% / $196.52 / $180.94 |
| UW Revenues: | $2,106,295,488 |
| UW Expenses: | $1,586,215,135 |
| UW NOI(11): | $520,080,353 |
| UW NCF(11): | $487,305,761 |
| Appraised Value / Per Room(8)(11): | $4,600,000,000 / $471,892 |
| Appraisal Date: | 1/10/2020 |
| Escrows and Reserves(9) | |||
| Initial | Monthly | Initial Cap | |
| Taxes: | $0 | Springing | N/A |
| Insurance: | $0 | Springing | N/A |
| FF&E Reserves: | $0 | Springing | N/A |
| Other: | $0 | $0 | N/A |
| Financial Information(11) | ||
| Senior Notes | Whole Loan | |
| Cut-off Date Loan / Room(2): | $167,645 | $307,755 |
| Maturity Date Loan / Room(2): | $167,645 | $307,755 |
| Cut-off Date LTV(2)(8): | 35.5% | 65.2% |
| Maturity Date LTV(2)(8): | 35.5% | 65.2% |
| UW DSCR Master Lease Rent(3): | 4.95x | 2.70x |
| UW Debt Yield Master Lease Rent(3): | 17.9% | 9.7% |
| Sources and Uses | |||||
| Sources | Proceeds | % of Total | Uses | Proceeds | % of Total |
| Senior Notes | $1,634,200,000 | 35.4% | Purchase Price | $4,600,000,000 | 99.6% |
| Junior Notes | 1,365,800,000 | 29.6 | Closing Costs | 17,792,163 | 0.4 |
| Sponsor Equity(10) | 1,617,792,163 | 35.0 | |||
| Total Sources | $4,617,792,163 | 100.0% | Total Uses | $4,617,792,163 | 100.0% |
| (1) | The MGM Grand & Mandalay Bay Whole Loan was co-originated by Citi Real Estate Funding Inc. (“CREFI”), Barclays Capital Real Estate Inc. (“BCREI”), Deutsche Bank AG, acting through its New York Branch (“DBNY”) and Société Générale Financial Corporation (“SGFC”). CREFI will be contributing Note A-13-4 with an outstanding principal balance of approximately $46,666,667 and GACC will be contributing Note A-15-4 with an outstanding principal balance of approximately $23,333,333 to the Benchmark 2020-B20 mortgage trust. |
| (2) | The MGM Grand & Mandalay Bay Loan (as defined below) is part of the MGM Grand & Mandalay Bay Whole Loan (as defined below), which is comprised of (i) 30 pari passu senior promissory notes with an aggregate Cut-off Date balance of $1,634,200,000 (the “MGM Grand & Mandalay Bay Senior Notes,” and collectively, the “MGM Grand & Mandalay Bay Senior Loan”) and (ii) 24 promissory notes with an aggregate Cut-off Date balance of $1,365,800,000 consisting of multiple subordination levels, which are subordinate to the MGM Grand & Mandalay Bay Senior Notes (the “MGM Grand & Mandalay Bay Junior Notes”). The MGM Grand Property has an allocated mortgage loan amount (“ALA”) of $1,635,000,000 and the Mandalay Bay Property has an ALA equal to $1,365,000,000. |
| (3) | On January 14, 2020, MGM Growth Properties Operating Partnership LP (“MGP OP”), an affiliate of BREIT Operating Partnership L.P. (“BREIT OP”) and certain other parties entered into an agreement to, among other things, form a joint venture (50.1% indirectly owned by MGP OP and 49.9% indirectly owned by BREIT OP) (the “Joint Venture”) to acquire the MGM Grand & Mandalay Bay Properties (as defined below) for a purchase price of $4.60 billion ($471,892 per room). Contemporaneously with the acquisition, the MGM Grand & Mandalay Bay Borrowers (as defined below), as landlord entered into a 30-year triple-net master/operating lease (the “MGM/Mandalay |
THE INFORMATION IN THIS STRUCTURAL AND COLLATERAL TERM SHEET IS NOT COMPLETE AND MAY BE AMENDED PRIOR TO THE TIME OF SALE. THIS TERM SHEET IS NOT AN OFFER TO SELL THESE SECURITIES AND IT IS NOT A SOLICITATION OF AN OFFER TO BUY THESE SECURITIES IN ANY JURISDICTION WHERE THE OFFER OR SALE IS NOT PERMITTED.
| | 37 of 144 | | |
| Structural and Collateral Term Sheet | Benchmark 2020-B20 |
| MGM Grand & Mandalay Bay | |
Lease” or “Master Lease”) with two, 10-year renewal options with MGM Lessee II, LLC (“MGM Tenant”), a wholly owned subsidiary of MGM Resorts International (“MGM”). Financial and other information presented in this Term Sheet is presented on a “look through” basis, based on the rents and receipts of the MGM Grand & Mandalay Bay Properties. For so long as the MGM/Mandalay Lease is in effect, the MGM Grand & Mandalay Bay Borrowers will be entitled only to the rent due under the MGM/Mandalay Lease and not to the underlying rent and other income from the MGM Grand & Mandalay Bay Properties. The UW DSCR Master Lease Rent and UW Debt Yield Master Lease Rent presented in the chart above are based on the initial MGM/Mandalay Lease annual rent of $292,000,000. The UW EBITDAR Debt Yield and the UW NCF DSCR for the MGM Grand & Mandalay Bay A Notes (based on the UW EBITDAR of $520.1 million and UW NCF of $487.3 million) are 31.8% and 8.27x, respectively. On May 1, 2020, MGM Resorts International reported that, as a result of the temporary closure of its domestic properties (which includes the MGM Grand & Mandalay Bay Properties) following the outbreak of COVID-19, its domestic properties (which includes the MGM Grand & Mandalay Bay Properties) were effectively generating no revenue, there were high levels of room and convention cancellation through the third quarter of 2020, and that, following the re-opening of its domestic properties (which includes the MGM Grand & Mandalay Bay Properties), it expected weakened demand in light of consumer fears and general economic uncertainty, among other things. The June 2020 TTM financials reflect the suspension of operations at the MGM Grand & Mandalay Bay Properties from March 17, 2020 through the end of the first calendar quarter of 2020 (although operations at the MGM Grand Property remained suspended until June 4, 2020 and operations at The Shoppes at Mandalay Bay Place and the Mandalay Bay resort remained suspended through June 24, 2020 and June 30, 2020, respectively). The adjusted June 2020 TTM EBITDAR of $381.2 million takes into account an adjustment for a combined net extraordinary loss add-back of approximately $82.4 million during the June 2020 TTM period (primarily comprised of employee payroll expenses and corporate allocations and net of a combined extraordinary gain of approximately $0.7 million related to a reversal of certain accrued benefit expenses) related to the temporary closure of the MGM Grand & Mandalay Bay Properties following the outbreak of COVID-19. The lender underwriting is based on 2019 financials, which reflects a full year of uninterrupted operations at the MGM Grand & Mandalay Bay Properties. Please see the “Operating History and Underwritten Net Cash Flow” and “Historical Performance” tables herein, and the footnotes thereto, for more detailed underwritten cash flow information.
| (4) | The MGM Grand & Mandalay Bay Whole Loan is structured with an Anticipated Repayment Date (“ARD”) of March 5, 2030 and a final maturity date of March 5, 2032. After the ARD, the following structure will apply: (i) the interest rate will increase by 200 basis points over the greater of (x) 3.55800%, and (y) (1) the ARD Treasury Note Rate (as defined below) in effect on the ARD plus (2) 1.77000%, (ii) amounts in the Excess Cash Flow Reserve (as defined below) will be applied first to pay monthly additional interest amounts which, to the extent not paid (such amount not paid, together with accrued interest thereon at the Adjusted Interest Rate (as defined below), the “Accrued Interest”), will be deferred and added to the principal balance of the MGM Grand & Mandalay Bay Whole Loan, and (iii) a full cash flow sweep to the extent of remaining amounts in the Excess Cash Flow Reserve will be applied to the principal of the MGM Grand & Mandalay Bay Whole Loan. The metrics presented above are calculated based on the ARD. |
| (5) | The lockout period will be at least 31 payment dates beginning with and including the first payment date of April 5, 2020. The MGM Grand & Mandalay Bay Borrowers have the option to defease the MGM Grand & Mandalay Bay Whole Loan, in whole or in part, after the earlier to occur of (i) two years after the closing date of the securitization that includes the last note to be securitized and (ii) February 14, 2023. The MGM Grand & Mandalay Bay Whole Loan may be prepaid in whole or in part at any time, subject to payment of the applicable yield maintenance premium if such prepayment occurs prior to September 5, 2029 (provided no yield maintenance will be due in connection with mandatory prepayments arising out of any casualty, condemnation or in connection with a Special Release or a Default Release (as defined in the Preliminary Prospectus)). The assumed lockout period of 31 payment dates is based on the expected Benchmark 2020–B20 securitization closing date in October 2020. The actual lockout period may be longer. |
| (6) | Net Rentable Area (Rooms) and Occupancy/ADR/RevPAR are based solely on the hotel at the MGM Grand & Mandalay Bay Properties. As of the trailing 12 months ending June 30, 2020, approximately 29.5% of revenues were generated by rooms, 19.7% of revenues were from gaming, 28.4% from food & beverage and 22.4% from other sources. |
| (7) | The MGM Grand Property (as defined below) was built in 1993 and the Mandalay Bay Property (as defined below) was built in 1999. The MGM Grand Property has benefited from capital investment of approximately $480.0 million (approximately $96,000 per room) since 2010, $144.0 million of which was spent on a full rooms’ renovation from 2010 to 2013. Additionally, approximately $118.9 million was recently spent on an expansion and renovation of the convention center completed in December 2018, which is expected to expand the group business at the MGM Grand Property. The Mandalay Bay Property (including the Delano) underwent a substantial rooms’ renovation for approximately $159.7 million from 2012 to 2016 and, inclusive of the Four Seasons, has received a total of approximately $510.6 million (approximately $107,500 per room) of capital investment since 2010. |
| (8) | The Appraised Value of $4,600,000,000 as of January 10, 2020, set forth above is the appraised value solely with respect to real property at the MGM Grand & Mandalay Bay Properties, excluding personal property and intangible property attributable to the MGM Grand & Mandalay Bay Properties (the “Aggregate Real Property Appraised Value”). The appraisal also includes an (“As Leased-Sale-Leaseback Appraised Value,”), which is equal to the Aggregate Real Property Appraised Value. The appraised value of $7,352,600,000 (“Aggregate As-Is Appraised Value”) as of January 10, 2020, includes personal property and intangible property attributable to the MGM Grand & Mandalay Bay Properties. The personal property and intangible property relating to the MGM Grand & Mandalay Bay Properties is owned by the MGM Tenant or certain sublessees at the MGM Grand & Mandalay Bay Properties that are wholly owned subsidiaries of MGM (the “MGM/Mandalay Operating Subtenants”) (as more particularly provided in the Master Lease), which granted a security interest in certain property of the MGM Tenant and the MGM/Mandalay Operating Subtenants (with certain exclusions, including an exclusion for the intellectual property of MGM Tenant as more particularly described in the Master Lease); and provided that the FF&E is only transferred to the MGM Grand & Mandalay Bay Borrowers at no cost in the event of a termination of the Master Lease due to an event of default by the MGM Tenant thereunder) in favor of the MGM Grand & Mandalay Bay Borrowers, and such security interest was collaterally assigned by the MGM Grand & Mandalay Bay Borrowers to the mortgage lender. The Cut-off Date LTV and Maturity Date LTV based on the Aggregate As-Is Appraised Value are 22.2% and 22.2%, respectively, based on the MGM Grand & Mandalay Bay Senior Loan. The Cut-off Date LTV and Maturity Date LTV based on the Aggregate As-Is Appraised Value are 40.8% and 40.8%, respectively, based on the MGM Grand & Mandalay Bay Whole Loan. |
| (9) | For a full description of Escrows and Reserves, please refer to “Escrows and Reserves” below. |
| (10) | Includes MGM’s approximately $80.0 million of retained equity interest in the MGM Grand & Mandalay Bay Properties after the sale-leaseback, by virtue of operating partnership units in MGP OP issued to MGM on the origination date of the MGM Grand & Mandalay Bay Whole Loan. |
| (11) | All NOI, NCF and occupancy information, as well as the appraised value, were determined prior to the emergence of the novel coronavirus pandemic, and the economic disruption resulting from measures to combat the pandemic, and all DSCR, LTV and Debt Yield metrics were calculated, and the MGM Grand & Mandalay Bay Whole loan was underwritten, based on such prior information See “Risk Factors—Risks Related to Market Conditions and Other External Factors—Coronavirus Pandemic Has Adversely Affected the Global Economy and Will Likely Adversely Affect the Performance of the Mortgage Loans” in the Preliminary Prospectus. |
The Loan. The MGM Grand & Mandalay Bay mortgage loan (the “MGM Grand & Mandalay Bay Loan”) is part of a fixed rate whole loan secured by the borrowers’ fee simple interest in two full service luxury resort and casinos located in Las Vegas, Nevada (the “MGM Grand Property,” and the “Mandalay Bay Property,” and collectively “The MGM Grand & Mandalay Bay Properties”). The MGM Grand & Mandalay Bay Loan is evidenced by the non-controlling Notes A-13-4 and A-15-4 with an outstanding principal balance as of the Cut-off Date of $70.0 million. The MGM Grand & Mandalay Bay Loan is part of a $3.00 billion whole loan (the MGM Grand & Mandalay Bay Whole Loan”) that is evidenced by (i) 30 MGM Grand & Mandalay Bay Senior Notes with an aggregate principal balance of $1,634,200,000 and (ii) the MGM Grand & Mandalay Bay Junior Notes comprised of 24 notes of multiple subordination levels, which are subordinate to the MGM Grand & Mandalay Bay Senior Loan with an aggregate principal balance of $1,365,800,000. Only the MGM Grand & Mandalay Bay Loan will be included
THE INFORMATION IN THIS STRUCTURAL AND COLLATERAL TERM SHEET IS NOT COMPLETE AND MAY BE AMENDED PRIOR TO THE TIME OF SALE. THIS TERM SHEET IS NOT AN OFFER TO SELL THESE SECURITIES AND IT IS NOT A SOLICITATION OF AN OFFER TO BUY THESE SECURITIES IN ANY JURISDICTION WHERE THE OFFER OR SALE IS NOT PERMITTED.
| | 38 of 144 | | |
| Structural and Collateral Term Sheet | Benchmark 2020-B20 |
| MGM Grand & Mandalay Bay | |
in the mortgage pool for the Benchmark 2020-B20 mortgage trust. The relationship between the holders of the MGM Grand & Mandalay Bay Whole Loan is governed by a co-lender agreement as described under “Description of the Mortgage Pool—The Whole Loans—The Non-Serviced AB Whole Loans—The MGM Grand & Mandalay Bay Pari Passu-AB Whole Loan” in the Preliminary Prospectus. The MGM Grand & Mandalay Bay Whole Loan has a 10-year interest-only term. The MGM Grand & Mandalay Bay Whole Loan will be serviced pursuant to the trust and servicing agreement for the BX 2020-VIVA transaction.
The MGM Grand & Mandalay Bay Whole Loan has a 10-year interest-only term through the ARD of March 5, 2030. After the ARD, through and including March 5, 2032 (the “Maturity Date”), the following structure would apply: (i) the interest rate will increase by 200 basis points over the greater of (x) 3.55800%, and (y)(1) the ARD Treasury Note Rate in effect on the ARD (such new rate, the “Adjusted Interest Rate”) plus (2) 1.77000%, (ii) amounts in the Excess Cash Flow Reserve (as defined below) will be applied first to pay monthly additional interest amounts which, to the extent not paid, will be deferred (together with interest accrued thereon at the Adjusted Interest Rate) and added to the principal balance of the MGM Grand & Mandalay Bay Whole Loan, and (iii) a full cash flow sweep to the extent of remaining amounts in the Excess Cash Flow Reserve will be applied to principal of the MGM Grand & Mandalay Bay Whole Loan. For the period from the origination date through the ARD, the MGM Grand & Mandalay Bay Senior Notes and Junior Notes accrue at the rate of 3.55800% per annum. The MGM Grand & Mandalay Bay Whole Loan proceeds along with loan sponsor equity were used to purchase the MGM Grand & Mandalay Bay Properties for $4.6 billion.
“ARD Treasury Note Rate” means the rate of interest per annum calculated by the linear interpolation of the yields, as reported in Federal Reserve Statistical Release H.15 Selected Interest Rates under the heading “U.S. Government Securities/Treasury Constant Maturities” for the business day ending immediately prior to the ARD, of “U.S. Government Securities/Treasury Constant Maturities” with maturity dates (one longer and one shorter) most nearly approximating the Maturity Date. In the event Federal Reserve Statistical Release H.15 Selected Interest Rates is no longer published or in the event Federal Reserve Statistical Release H.15 Selected Interest Rates no longer publishes “U.S. Government Securities/Treasury Constant Maturities”, the mortgage lender will select a comparable publication to determine such “U.S. Government Securities/Treasury Constant Maturities” and the applicable ARD Treasury Note Rate. The mortgage lender’s determination of the ARD Treasury Note Rate will be final absent manifest error.
| Whole Loan Summary | ||||
| Note | Original Balance | Cut-off Date Balance | Note Holder | Controlling Piece |
| A-13-4, A-15-4 | $70,000,000 | $70,000,000 | Benchmark 2020-B20(1) | No |
| A-13-2, A-15-3 | $80,000,000 | $80,000,000 | Benchmark 2020-B19 | No |
| A-13-1, A-15-1 | $65,000,000 | $65,000,000 | Benchmark 2020-B18 | No |
| A-15-2 | $50,000,000 | $50,000,000 | DBJPM 2020-C9 | No |
| A-1, A-2, A-3, A-4 | $670,139 | $670,139 | BX 2020-VIVA | No |
| A-5, A-6, A-7, A-8 | $794,861 | $794,861 | BX 2020-VIV2 | No |
| A-9, A-10, A-11, A-12 | $1,000,000 | $1,000,000 | BX 2020-VIV3 | No |
| A-14-1, A-16-1 | $69,500,000 | $69,500,000 | BBCMS 2020-C8 | No |
| A-13-3, A-13-5 | $509,360,667 | $509,360,667 | CREFI(2) | No |
| A-14-2, A-14-3, A-14-4 | $281,347,000 | $281,347,000 | Barclays Bank PLC(2) | No |
| A-15-5, A-15-6 | $204,680,333 | $204,680,333 | DBRI(2) | No |
| A-16-2, A-16-3 | $301,347,000 | $301,347,000 | SGFC(2) | No |
| Total Senior Notes | $1,634,200,000 | $1,634,200,000 | ||
| B-1-A, B-2-A, B-3-A, B-4-A, B-1-B, B-2-B, B-3-B, B-4-B(4) | $329,861 | $329,861 | BX 2020-VIVA | No |
| B-5-A, B-6-A, B-7-A, B-8-A, B-5-B, B-6-B, B-7-B, B-8-B(4) | $374,355,139 | $374,355,139 | BX 2020-VIV2 | No |
| B-9-A, B-10-A, B-11-A, B-12-A(4) | $429,715,000 | $429,715,000 | BX 2020-VIV3 | No |
| C-1, C-2, C-3, C-4(4) | $561,400,000 | $561,400,000 | BX 2020-VIVA | Yes(3) |
| Whole Loan | $3,000,000,000 | $3,000,000,000 | ||
| (1) | CREFI will be contributing Note A-13-4, which has an outstanding principal balance of approximately $46,666,667 to the Benchmark 2020-B20 mortgage trust. GACC will be contributing Note A-15-4, which has an outstanding principal balance of approximately $23,333,333 to the Benchmark 2020-B20 mortgage trust. |
| (2) | Expected to be contributed to one or more future securitization transactions. |
| (3) | The initial controlling note is Note C-1, so long as no related control appraisal period with respect to Note C-1 so long as no related control appraisal period with respect to Note C-1 and the related pari passu C notes has occurred and is continuing. If and for so long as a control appraisal period has occurred and is continuing, then the controlling note will be as described under “Description of the Mortgage Pool—The Whole Loans—The Non-Serviced AB Whole Loans—The MGM Grand & Mandalay Bay Pari Passu-AB Whole Loan” in the Preliminary Prospectus. |
| (4) | The MGM Grand & Mandalay Bay Junior Notes are subordinate to the MGM Grand & Mandalay Bay Senior Notes. |
The Borrowers. On January 14, 2020, MGM Growth Properties Operating Partnership LP, an affiliate of BREIT Operating Partnership L.P. (the “Sponsors”, more particularly referred to as the “Loan Sponsors”), and certain other parties entered into an agreement to, among other things, form a joint venture (50.1% indirectly owned by MGP OP and 49.9% indirectly owned by BREIT OP) to acquire the MGM
THE INFORMATION IN THIS STRUCTURAL AND COLLATERAL TERM SHEET IS NOT COMPLETE AND MAY BE AMENDED PRIOR TO THE TIME OF SALE. THIS TERM SHEET IS NOT AN OFFER TO SELL THESE SECURITIES AND IT IS NOT A SOLICITATION OF AN OFFER TO BUY THESE SECURITIES IN ANY JURISDICTION WHERE THE OFFER OR SALE IS NOT PERMITTED.
| | 39 of 144 | | |
| Structural and Collateral Term Sheet | Benchmark 2020-B20 |
| MGM Grand & Mandalay Bay | |
Grand & Mandalay Bay Properties in Las Vegas for a purchase price of $4.60 billion ($471,892 per room). The borrowers under the MGM Grand & Mandalay Bay Whole Loan are MGM Grand PropCo, LLC and Mandalay PropCo, LLC (individually, a “MGM Grand & Mandalay Bay Borrower” and, collectively, the “MGM Grand & Mandalay Bay Borrowers” or the “Borrowers”), which are subsidiaries of the Joint Venture. The MGM Grand & Mandalay Bay Borrowers are Delaware limited liability companies and single purpose entities with two independent directors. Blackstone Real Estate Income Trust, Inc. (“BREIT”) is a non-traded real estate investment trust focused on investing in commercial real estate properties diversified by sector with an emphasis on providing investors with access to Blackstone’s institutional real estate investment platform. BREIT seeks to directly own stabilized income-generating United States commercial real estate across the key property types, including multifamily, industrial, retail, hotel, healthcare and office. BREIT is managed by an external advisor, BX REIT Advisors L.L.C., which is an affiliate of The Blackstone Group Inc. (“Blackstone”). Blackstone’s real estate investor capital under management totals approximately $161.0 billion as of March 31, 2020 and includes prime assets such as the Bellagio, Cosmopolitan Las Vegas, Hotel Del Coronado, Grand Wailea, Arizona Biltmore, Ritz Carlton Kapalua, and Turtle Bay Resort.
MGM Growth Properties LLC (“MGP”) is one of the leading publicly traded real estate investment trusts engaged in the acquisition, ownership and leasing of large-scale destination entertainment and leisure resorts. MGP currently owns a portfolio of properties, consisting of 12 premier destination resorts in Las Vegas and elsewhere across the United States, with over 27,400 rooms, as well as MGM Northfield Park in Northfield, OH, Empire Resort Casino in Yonkers, NY, and a retail and entertainment district, The Park, in Las Vegas.
MGP OP and BREIT OP (together, individually or collectively as the context may require, the “Guarantor”), are the non-recourse carveout guarantors on a several basis in proportion to each Guarantor’s Liability Percentage (as defined below). The Liability Percentage of each Guarantor will be automatically increased or decreased from time to time, as applicable, to the extent any direct and/or indirect equity interest in the Borrowers is transferred by one Guarantor (or its affiliates) to the other Guarantor (or its affiliates) with the transferring Guarantor’s Liability Percentage increasing by the amount of such transferred interests and the transferee Guarantor’s Liability Percentage decreasing by such amount. In no event will the Liability Percentage of the Guarantors in the aggregate be less than or greater than one hundred percent (100%). For the avoidance of doubt, transfers by a Guarantor (or its affiliates) to a third party that is not an affiliate of the other Guarantor will not result in an adjustment to the Liability Percentage of either Guarantor. For illustrative purposes, if BREIT OP transfers a twenty-five percent (25%) indirect equity interest in Borrower to a third party that is not an Affiliate of MGP OP and subsequently transfers a ten percent (10%) indirect equity interest in Borrower to MGP OP, the adjustments required to be made as a result of such transfers will be: (i) a decrease of ten percentage points to BREIT OP's Liability Percentage and (ii) an increase of 10 percentage points to MGP OP's Liability Percentage.
The Guarantor’s liability for full recourse events is capped at an amount equal to 10% of the aggregate outstanding principal balance of the MGM Grand & Mandalay Bay Whole Loan as of the date of the event. In addition, only the Borrowers are liable for breaches of environmental covenants; provided, however, that if the Borrowers fail to maintain an environmental insurance policy required under the MGM Grand & Mandalay Bay Whole Loan documents, the Guarantor is liable for losses other than (x) for any amounts in excess of the applicable coverage amounts under the environmental policy had the same been renewed, replaced or extended as required under the loan agreement and (y) for any amounts recovered under the environmental policy. In addition, recourse for transfers of the MGM Grand & Mandalay Bay Properties or controlling equity interests in the MGM Grand & Mandalay Bay Borrowers is loss recourse, rather than full recourse.
“Liability Percentage” means, initially, (x) with respect to BREIT OP, 49.9% and (y) with respect to MGP OP, 50.1%.
The Properties.
MGM Grand (54.5% of Mortgage ALA and Master Lease Rent)
Built in 1993, the MGM Grand Property is a full-service luxury resort and casino property located on the Las Vegas Strip, situated between Tropicana Boulevard and Harmon Avenue. According to World Atlas, the MGM Grand Property is the third largest hotel in the world by room count. The MGM Grand Property is also a recipient of the AAA Four Diamond award. The MGM Grand Property covers approximately 101.9 acres and consists of 4,998 hotel rooms: 4,270 standard rooms, 554 suites, 88 luxury suites, 51 SKYLOFTS suites (excluding one additional office unit), 30 mansion villas (Mediterranean-themed villas targeted for high-end gamblers, celebrities and casino-invited guests on the strip) (the “Mansion Villas”) and four entourage rooms associated with the Mansion Villas. The MGM Grand Property contains approximately 177,268 square feet of casino space, featuring 1,553 slot machines and 128 gaming tables, over 748,000 square feet of meeting space, 18 restaurants, an approximately 22,858 square foot spa, four swimming pools and approximately 41,800 square feet of rentable retail space (featuring 31 retailers). The MGM Grand Property is home to Cirque du Soleil’s “Kà”, an acrobatic theater production that has been in residence at the MGM Grand Property since October 2004. The MGM Grand Property also includes the David Copperfield Theatre, Hakkasan Nightclub and the MGM Grand Garden Arena, which has a seating capacity of over 16,000 and hosts premier concerts, award shows, sporting events including championship boxing, and other special events.
THE INFORMATION IN THIS STRUCTURAL AND COLLATERAL TERM SHEET IS NOT COMPLETE AND MAY BE AMENDED PRIOR TO THE TIME OF SALE. THIS TERM SHEET IS NOT AN OFFER TO SELL THESE SECURITIES AND IT IS NOT A SOLICITATION OF AN OFFER TO BUY THESE SECURITIES IN ANY JURISDICTION WHERE THE OFFER OR SALE IS NOT PERMITTED.
| | 40 of 144 | | |
| Structural and Collateral Term Sheet | Benchmark 2020-B20 |
| MGM Grand & Mandalay Bay | |
Room sizes range from 346 square feet to 11,517 square feet and the MGM Grand Property offers one to four bedroom rooms. Standard room amenities include air conditioning, in-room dining service, minibar, telephone, hair dryer, in-room safe, and high-speed internet. SKYLOFTS at MGM Grand, a AAA Four-Diamond, Forbes Five Star hotel, occupies the top two floors of the main building. The hotel has 51 lofts ranging from 1,401 to 6,040 square feet per loft. SKYLOFTS is also a member of The Leading Hotels of the World. The Mansion at the MGM Grand Property contains 30 Mansion Villas ranging from 2,358 to 11,517 square feet per villa and $5,000 to $35,000 per night.
Since 2010, the MGM Grand Property has benefited from total capital investment of approximately $480.0 million (approximately $96,036 per room). Notable capital expenditures from this time period include an approximately $144.0 million full rooms renovation from 2010 to 2013 and a recent $118.9 million expansion and renovation of the conference center, which was completed in December 2018.
Mandalay Bay (45.5% of Mortgage ALA and Master Lease Rent)
Built in 1999, the Mandalay Bay Property is a full-service luxury resort and casino property located as the first major resort on the strip to greet visitors arriving by automobile from Southern California. The AAA Four Diamond award winning resort is a premier conference hotel in Las Vegas with approximately 2.2 million square feet of convention, ballroom and meeting space, making it the fifth single largest event space in the United States. The Mandalay Bay Property is immediately across Interstate 15 from Allegiant Stadium, the new home stadium of the National Football League’s (“NFL”) Raiders, which was substantially completed on July 31, 2020 and began being utilized in September 2020. The Mandalay Bay Property covers approximately 124.1 acres and consists of 4,750 hotel rooms. Also included within the Mandalay Bay Property are: (i) the Delano, which is an all-suite hotel tower within the complex and (ii) a Four Seasons hotel, each of which has its own lobby, restaurants and pool and spa. In addition to the significant meeting space, the Mandalay Bay Property contains approximately 152,159 square feet of casino space, featuring approximately 1,232 slot machines and 71 gaming tables, 27 total restaurants, an approximately 30,000 square foot spa, ten swimming pools and approximately 54,000 square feet of rentable retail space featuring 41 retailers. The Mandalay Bay Property is also the home to Cirque du Soleil’s Michael Jackson “ONE”, which has been in residence at the Mandalay Bay Property in an approximately 1,805-seat showroom since 2013, an approximately 12,000-seat special events arena, the House of Blues (which features an arena seating up to 2,500 people) and the Shark Reef Aquarium. Additionally, the Mandalay Bay Property’s expansive pool and beach area plays host to an array of evening open air concerts during the pool season, a large wave pool, and Moorea, a European-style “ultra” beach and Daylight Beach Club.
Room sizes range from 400 to 5,605 square feet and the Mandalay Bay Property offers one- to four-bedroom rooms. Standard room amenities include air conditioning, in-room dining service, minibar, telephone, hair dryer, in-room safe, and high-speed internet. Floors 60–62 are designed as penthouse suites, with a penthouse lounge on level 62 for guests staying in the penthouses. Floors numbered 35–39 of the main hotel building are occupied by the five-star and AAA Four-Diamond Four Seasons Hotel Las Vegas. Located at the resort's 43-story second tower, the Delano Las Vegas is comprised of 45 rooms and 1,072 suites. Each suite at the Delano is at least 725 square feet.
The Mandalay Bay Property (including the Delano) underwent a substantial rooms’ renovation of approximately $159.7 million (approximately $35,150 per room) from 2012 to 2016 and has received a total of approximately $510.6 million (approximately $107,485 per room) of capital investment since 2010.
Cirque du Soleil performances at the MGM Grand & Mandalay Bay Properties have been suspended until further notice due to COVID-19. On June 29, 2020, Cirque du Soleil Entertainment Group (“Cirque”) announced that it and certain of its affiliated companies filed for protection from creditors under the Companies’ Creditors Arrangement Act in order to restructure its capital structure, which application was granted by the court. On July 16, 2020, Cirque announced that it entered into a new “stalking horse” purchase agreement with a group of existing first lien and second lien secured lenders pursuant to which such lenders would acquire substantially all of Cirque’s assets in settlement of Cirque’s first and second lien debt. Such purchase agreement was approved by the court on July 17, 2020, and served as the new “stalking horse” bid in a SISP supervised by the court and the court-appointed monitor. As of August 18, 2020, it was reported that the lenders’ bid was the highest bid, which requires court approval to take effect.
Revenue Streams. The MGM Grand & Mandalay Bay Properties benefit from a diverse set of revenue streams with a substantial contribution from non-gaming sources (only 18.0% of combined year-end (“YE”) December 2019 revenues were derived from casinos) and offer nearly 2.8 million square feet of combined meeting and convention space.
As of YE December 2019, the MGM Grand Property generated 77.8% of net revenues from rooms, food and beverage, retail, entertainment and other operations. The gaming segment contributed 22.2% of net revenue (approximately $257.9 million), representing a decline from the 2018 level of 29.8% of net revenue (of approximately $365.7 million). A portion of the decline can be attributed to a renovation of the Mansion Villas in 2019, which serve as the MGM Grand Property’s main attractant to high-end gamblers. Nearly all
THE INFORMATION IN THIS STRUCTURAL AND COLLATERAL TERM SHEET IS NOT COMPLETE AND MAY BE AMENDED PRIOR TO THE TIME OF SALE. THIS TERM SHEET IS NOT AN OFFER TO SELL THESE SECURITIES AND IT IS NOT A SOLICITATION OF AN OFFER TO BUY THESE SECURITIES IN ANY JURISDICTION WHERE THE OFFER OR SALE IS NOT PERMITTED.
| | 41 of 144 | | |
| Structural and Collateral Term Sheet | Benchmark 2020-B20 |
| MGM Grand & Mandalay Bay | |
departments at the MGM Grand Property (including rooms, F&B, retail and entertainment) experienced continued growth in the YE December 2019 period despite the decline in casino revenue.
The Mandalay Bay Property has a much smaller casino department as a percentage of total net revenue (12.9% as of YE December 2019) than most casinos on the Las Vegas strip. The Mandalay Bay Property revenues are primarily driven by (i) the focus on group and convention business (according to the appraisal, the Mandalay Bay Property had a 2019 penetration factor of 134.8% for group business) and (ii) the fact that two of the three room types are operated as non-casino focused third party franchises (the Delano and Four Seasons). As of YE December 2019, 64.1% of total revenues at the Mandalay Bay Property were derived from rooms’ revenue (34.1%) and food & beverage revenue (30.0%).
As of YE December 2019, the MGM Grand Property achieved occupancy, ADR and RevPAR of 91.4%, $190.29 and $173.85, respectively. As of YE December 2019, the Mandalay Bay Property achieved occupancy, ADR and RevPAR of 92.8%, $202.98 and $188.40, respectively.
THE INFORMATION IN THIS STRUCTURAL AND COLLATERAL TERM SHEET IS NOT COMPLETE AND MAY BE AMENDED PRIOR TO THE TIME OF SALE. THIS TERM SHEET IS NOT AN OFFER TO SELL THESE SECURITIES AND IT IS NOT A SOLICITATION OF AN OFFER TO BUY THESE SECURITIES IN ANY JURISDICTION WHERE THE OFFER OR SALE IS NOT PERMITTED.
| | 42 of 144 | | |
| Structural and Collateral Term Sheet | Benchmark 2020-B20 |
| MGM Grand & Mandalay Bay | |
| Historical Performance | ||||||||||||||||
| EBITDAR ($ Millions)(1) | 2006 | 2007 | 2008 | 2009 | 2010 | 2011 | 2012 | 2013 | 2014 | 2015 | 2016 | 2017 | 2018 | 2019 | March 2020 TTM(1) | June 2020 TTM(1) |
| MGM Grand | $329 | $396 | $271 | $214 | $163 | $149 | $181 | $236 | $255 | $281 | $332 | $345 | $372 | $283 | $263 | $220 |
| Mandalay Bay | $282 | $291 | $251 | $160 | $125 | $169 | $147 | $167 | $176 | $204 | $237 | $260 | $246 | $237 | $224 | $161 |
| Total Collateral | $611 | $688 | $522 | $374 | $288 | $318 | $327 | $403 | $431 | $485 | $569 | $605 | $617 | $520 | $487 | $381 |
| Debt Yield(2) | 20.4% | 22.9% | 17.4% | 12.5% | 9.6% | 10.6% | 10.9% | 13.4% | 14.4% | 16.2% | 19.0% | 20.2% | 20.6% | 17.3% | 16.2% | 12.7% |
| Rent Coverage(3) | 2.1x | 2.4x | 1.8x | 1.3x | 1.0x | 1.1x | 1.1x | 1.4x | 1.5x | 1.7x | 1.9x | 2.1x | 2.1x | 1.8x | 1.7x | 1.3x |
| (1) | On May 1, 2020, MGM Resorts International reported in its first quarter Form 10-Q filing that, as a result of the temporary closure of its domestic properties (which includes the MGM Grand & Mandalay Bay Properties) following the outbreak of COVID-19, its domestic properties (which includes the MGM Grand & Mandalay Bay Properties) were effectively generating no revenue, and there were high levels of room and convention cancellation through the third quarter of 2020. The March 2020 TTM financials presented above reflect the suspension of operations at the MGM Grand & Mandalay Bay Properties from March 17, 2020 through the end of the first calendar quarter of 2020. On August 3, 2020, MGM reported in its second quarter Form 10-Q filing that, while throughout May, June and July 2020, it re-opened most of its properties with limited amenities and certain measures to mitigate the spread of COVID-19, such properties (which include the MGM Grand & Mandalay Bay Properties) may be subject to temporary, complete or partial shutdowns in the future, and that it has seen and expects to continue to see weakened demand in light of consumer fears and general economic uncertainty, among other things. The June 2020 TTM financials presented above reflect the operations at the MGM Grand Property, which remained suspended until June 4, 2020 and operations at The Shoppes at Mandalay Bay Place and the Mandalay Bay resort, which remained suspended through June 24, 2020 and June 30, 2020, respectively. The $487 million presented above represents the adjusted March 2020 TTM EBITDAR, which takes into account an adjustment for a combined net extraordinary loss of approximately $20.6 million during the March 2020 TTM period (reflecting primarily operating losses during closure comprised mainly of employee payroll expenses and corporate allocations and net of a combined extraordinary gain of approximately $0.7 million related to a reversal of certain accrued benefit expenses) related to the temporary closure of the MGM Grand |
& Mandalay Bay Properties following the outbreak of COVID-19. The $381 million presented above represents the adjusted June 2020 TTM EBITDAR, which takes into account an adjustment for a combined net extraordinary loss of approximately $82.4 million during the June 2020 TTM period (reflecting primarily operating losses during closure comprised mainly of employee payroll expenses and corporate allocations and net of a combined extraordinary gain of approximately $0.7 million related to a reversal of certain accrued benefit expenses) related to the temporary closure of the MGM Grand & Mandalay Bay Properties following the outbreak of COVID-19. The lender underwriting presented above is based on 2019 financials, which reflects a full year of uninterrupted operations at the MGM Grand & Mandalay Bay Properties. Please see “Operating History and Underwritten Net Cash Flow” herein, and the footnotes thereto, for more detailed underwritten cash flow information.
| (2) | Debt Yield metrics presented above are based on the MGM Grand & Mandalay Bay Whole Loan Cut-off Date balance of $3.0 billion and the EBITDAR of each respective time period. |
| (3) | Rent Coverage ratios presented above are based on the initial Master Lease Rent of $292.0 million and the EBITDAR of each respective time period. |
| Historical Performance – MGM Grand (1) | ||||||||||||||||
| March | June | |||||||||||||||
| 2020 | 2020 | |||||||||||||||
| 2006 | 2007 | 2008 | 2009 | 2010 | 2011 | 2012 | 2013 | 2014 | 2015 | 2016 | 2017 | 2018 | 2019 | TTM(2) | TTM(2) | |
| RevPAR | $154 | $162 | $145 | $112 | $112 | $128 | $136 | $138 | $151 | $155 | $162 | $167 | $169 | $174 | $172 | $161 |
| Net Revenue ($bns) | $1.19 | $1.32 | $1.22 | $1.09 | $1.03 | $1.05 | $1.07 | $1.15 | $1.21 | $1.16 | $1.15 | $1.18 | $1.23 | $1.16 | $1.10 | $0.87 |
| EBITDAR Margin | 28% | 30% | 22% | 20% | 16% | 14% | 17% | 21% | 21% | 24% | 29% | 29% | 30% | 24% | 24% | 25% |
| (1) | Any financial information contained in this Term Sheet for the MGM Grand Property which relates to any period prior to 2015 has not been recast to reflect the adoption of ASC 606 revenue recognition under GAAP and thus, any financial information provided for periods prior to 2015 may not be comparable to periods on or after 2015 with respect to which recasting has been applied. |
| (2) | The March 2020 TTM financials presented above reflect the suspension of operations at the MGM Grand & Mandalay Bay Properties from March 17, 2020 through the end of the first calendar quarter of 2020. On August 3, 2020, MGM reported in its second quarter Form 10-Q filing that, while throughout May, June and July 2020, it re-opened most of its properties with limited amenities and certain measures to mitigate the spread of COVID-19, such properties (which include the MGM Grand and Mandalay Bay Properties) may be subject to temporary, complete or partial shutdowns in the future, and that it has seen and expects to continue to see weakened demand in light of consumer fears and general economic uncertainty, among other things. The June 2020 TTM financials presented above reflect the operations at the MGM Grand Property, which remained suspended until June 4, 2020 and operations at The Shoppes at Mandalay Bay Place and the Mandalay Bay resort, which remained suspended through June 24, 2020 and June 30, 2020, respectively. The lender underwriting presented above is based on 2019 financials, which reflects a full-year of uninterrupted operations at the MGM Grand & Mandalay Bay Properties. |
| Historical Performance – Mandalay Bay(1) | ||||||||||||||||
| March | June | |||||||||||||||
| 2020 | 2020 | |||||||||||||||
| 2006 | 2007 | 2008 | 2009 | 2010 | 2011 | 2012 | 2013 | 2014 | 2015 | 2016 | 2017 | 2018 | 2019 | TTM(2) | TTM(2) | |
| RevPAR | $199 | $213 | $193 | $142 | $142 | $160 | $162 | $164 | $176 | $177 | $185 | $186 | $184 | $188 | $188 | $186 |
| Net Revenue ($ bns) | $0.99 | $1.02 | $0.95 | $0.79 | $0.78 | $0.84 | $0.78 | $0.86 | $0.95 | $0.94 | $0.97 | $0.98 | $0.97 | $0.94 | $0.90 | $0.67 |
| EBITDAR Margin | 29% | 28% | 26% | 20% | 16% | 20% | 19% | 19% | 19% | 22% | 24% | 27% | 25% | 25% | 25% | 24% |
| (1) | Any financial information contained in this Term Sheet for the Mandalay Bay Property which relates to any period prior to 2015 has not been recast to reflect the adoption of ASC 606 revenue recognition under GAAP and thus, any financial information provided for periods prior to 2015 may not be comparable to periods on or after 2015 with respect to which recasting has been applied. |
| (2) | The March 2020 TTM financials presented above reflect the suspension of operations at the Properties from March 17, 2020 through the end of the first calendar quarter of 2020. On August 3, 2020, MGM reported in its second quarter Form 10-Q filing that, while throughout May, June and July 2020, it re-opened most of its properties with limited amenities and certain measures to mitigate the spread of COVID-19, such properties (which include the MGM Grand and Mandalay Bay Properties) may be subject to temporary, complete or partial shutdowns in the future, and that it has seen and expects to continue to see weakened demand in light of consumer fears and general economic uncertainty, among other things. The June 2020 TTM financials presented above reflect the operations at the MGM Grand Property, which remained suspended until June 4, 2020 and operations at The Shoppes at Mandalay Bay Place and the Mandalay Bay resort, which remained suspended through June 24, 2020 and June 30, 2020, respectively. The lender underwriting presented above is based on 2019 financials, which reflects a full-year of uninterrupted operations at the MGM Grand & Mandalay Bay Properties. |
THE INFORMATION IN THIS STRUCTURAL AND COLLATERAL TERM SHEET IS NOT COMPLETE AND MAY BE AMENDED PRIOR TO THE TIME OF SALE. THIS TERM SHEET IS NOT AN OFFER TO SELL THESE SECURITIES AND IT IS NOT A SOLICITATION OF AN OFFER TO BUY THESE SECURITIES IN ANY JURISDICTION WHERE THE OFFER OR SALE IS NOT PERMITTED.
| | 43 of 144 | | |
| Structural and Collateral Term Sheet | Benchmark 2020-B20 |
| MGM Grand & Mandalay Bay | |
Master Lease. The MGM Grand & Mandalay Bay Properties are master leased to MGM Lessee II, LLC (“MGM Tenant”), a wholly-owned subsidiary of MGM under a 30-year, triple-net master and operating lease with two, ten-year renewal options. In turn, the MGM Tenant has subleased a portion of the MGM Grand & Mandalay Bay Properties to each of MGM Grand Hotel, LLC, a Nevada limited liability company (“Grand Operating Subtenant”), Mandalay Bay, LLC, a Nevada limited liability company (“Mandalay Bay Subtenant”) and Mandalay Place, LLC, a Nevada limited liability company (“Mandalay Place Subtenant”; and, together with Grand Operating Subtenant and Mandalay Bay Subtenant, individually or collectively as the context may require, together with any person to whom all or any portion of a Property is sublet by MGM Tenant pursuant to a MGM/Mandalay Operating sublease pursuant to the express terms and conditions of the MGM/Mandalay Lease, each a “MGM/Mandalay Operating Subtenant”). Each MGM/Mandalay Operating Subtenant executed a joinder to the MGM/Mandalay Lease for the purpose of (x) agreeing to be bound by the terms and provisions of the MGM/Mandalay Lease regarding the disposition of any portion of the MGM Tenant’s Property owned by such MGM/Mandalay Operating Subtenant and (y) granting a security interest to the Borrowers in the portion of the MGM Tenant’s pledged property owned by such MGM/Mandalay Operating Subtenant and certain reserve funds under the MGM/Mandalay Lease. The MGM Tenant and each MGM/Mandalay Operating Subtenant is not a borrower or an obligor under the MGM Grand & Mandalay Bay Loan documents.
Under the Master Lease, the MGM Tenant is required to pay to the Borrowers an initial lease rent of $292.0 million per annum ($159.0 million allocated to the MGM Grand Property and $133.0 million allocated to the Mandalay Bay Property, the “Master Lease Rent”), subject to annual increases of (i) 2.0% in years 2 through 15 of the initial lease term, and (ii) thereafter, the greater of 2.0% or CPI (CPI capped at 3.0%) for the remainder of the initial lease term. Additionally, MGM will be required to continue to invest in the MGM Grand & Mandalay Bay Properties, with (x) a minimum aggregate capital investment requirement of 3.5% of actual net revenues every five years (the first such period beginning January 1, 2020 and expiring December 31, 2024, and the second such period beginning January 1, 2021 and expiring December 31, 2025, and each five-year period thereafter on a rolling basis) in the aggregate for the MGM Grand & Mandalay Bay Properties (such amount not to be less than 2.5% of the actual net revenue of any individual Property) (collectively, the “Required CapEx”) and (y) a monthly reserve equal to 1.5% of actual net revenues which may be used for FF&E and on qualifying capital expenditures in satisfaction of the Required CapEx spend. Upon early termination of the Master Lease due to an event of default by MGM Tenant thereunder, the FF&E will be transferred to the Borrowers at no cost.
Beginning with the first full calendar quarter after the origination date for the MGM Grand & Mandalay Bay Whole Loan and continuing thereafter, if either (a) (x) EBITDAR to Rent Ratio (as defined in the Master Lease) for the prior four fiscal quarters is less than 1.60x and (y) MGM’s market cap is less than $6.0 billion or (b) (x) MGM is no longer publicly traded and listed on NYSE, AMEX or NASDAQ and (y) the EBITDAR to Rent Ratio for the prior four fiscal quarters is less than 2.0x, then the MGM Tenant will be required to provide one or more letters of credit or fund a cash escrow in an aggregate amount equal to the following year’s rent (taking into account the applicable escalations). Based on the adjusted June 2020 TTM EBITDAR of approximately $381.2 million and the initial Master Lease rent of $292.0 million, the MGM Grand & Mandalay Bay Whole Loan results in a June 2020 TTM EBITDAR-to-rent coverage ratio of 1.31x.
No intellectual property is licensed to the Borrowers and the Borrowers have no option to purchase upon expiration of the Master Lease. Upon the expiration of the Master Lease term or earlier termination of Master Lease, the MGM Tenant will be obligated to provide up to 18 months of transition services to permit the continuous and uninterrupted operation of the MGM Grand & Mandalay Bay Properties.
MGM (NYSE: MGM, rated Ba3/BB-/BB- by Moody’s, Fitch and S&P) guarantees to the Borrowers the payment and performance of all monetary obligations and certain other obligations of the MGM Tenant under the Master Lease. In addition to the lease guaranty, MGM (in such capacity, the “Shortfall Collection Guarantor”) has executed a shortfall guaranty for the benefit of the mortgage lenders for the MGM Grand & Mandalay Bay Loan, pursuant to which MGM has guaranteed to the mortgage lenders the unpaid portion of the initial principal amount of the MGM Grand & Mandalay Bay Loan (without giving effect to any future amendments that may increase the principal balance) and all interest accrued and unpaid thereon. For the avoidance of doubt, the Shortfall Collection Guarantor does not guarantee any Accrued Interest or any additional principal as a result of any unpaid Accrued Interest after the ARD. Transfers of interests in MGM are not restricted under the MGM Grand & Mandalay Bay Loan documents and any bankruptcy or other adverse event with respect to the Shortfall Collection Guarantor does not constitute a default under the MGM Grand & Mandalay Bay Loan documents. Neither MGM nor its affiliates (including, without limitation, MGM Tenant) are considered an affiliate of the Borrowers for any purpose under the MGM Grand & Mandalay Bay Loan documents so long as such person does not control the Borrowers. There is no continuing net worth requirement with respect to MGM in connection with the shortfall guaranty. As of the origination of the MGM Grand & Mandalay Bay Loan, neither MGM nor MGM Tenant controlled the Borrowers.
As of December 31, 2019, MGM had a market capitalization of approximately $16.7 billion, full-year 2019 revenue of approximately $12.9 billion and consolidated, adjusted earnings before interest, taxes, depreciation and amortization (“EBITDA”) of approximately $3.0 billion. As of March 31, 2020, MGM reported revenue of approximately $2.3 billion for the first quarter of 2020. This represents a 29% decrease to the first quarter of 2019, which was primarily driven by MGM’s temporary suspension of its domestic and Macau casino operations related to the COVID-19 pandemic. MGM had $6.0 billion of cash and cash equivalents as of March 31, 2020, which included $1.8 billion
THE INFORMATION IN THIS STRUCTURAL AND COLLATERAL TERM SHEET IS NOT COMPLETE AND MAY BE AMENDED PRIOR TO THE TIME OF SALE. THIS TERM SHEET IS NOT AN OFFER TO SELL THESE SECURITIES AND IT IS NOT A SOLICITATION OF AN OFFER TO BUY THESE SECURITIES IN ANY JURISDICTION WHERE THE OFFER OR SALE IS NOT PERMITTED.
| | 44 of 144 | | |
| Structural and Collateral Term Sheet | Benchmark 2020-B20 |
| MGM Grand & Mandalay Bay | |
at MGP and $381 million at MGM China. In addition, on April 23, 2020, MGM commenced a private offering of $750 million in aggregate principal amount of 6.75% coupon senior notes due in 2025, which further added to MGM’s cash position. As of June 30, 2020, MGM reported (i) revenue of approximately $290.0 million for the second quarter of 2020 (of which approximately $151.0 million was derived from MGM’s Las Vegas Strip resorts(1)), (ii) a total consolidated liquidity position of $8.1 billion (which includes MGM Resorts, MGM China and MGP and is comprised of cash and cash equivalents of approximately $4.8 billion and approximately $3.3 billion available under certain revolving credit facilities) and (iii) a market capitalization of approximately $8.3 billion. According to MGM’s second quarter 2020 earnings presentation, the Adjusted Property EBITDAR margin across all reopened MGM properties on the Las Vegas Strip (during the period the properties were operating through June 30, 2020) increased by approximately 450 basis points compared to the second quarter of 2019 (calculation methodology presented below)(2).
The MGM Tenant is a casino owner-operator for 29 unique hotel offerings totaling over 44,000 rooms across Las Vegas, United States regional markets and Macau. The MGM Tenant has managed the MGM Grand Property and Mandalay Bay Property for more than 27 and 18 years, respectively.
| (1) | Second quarter 2020 revenue of approximately $151.0 million for MGM’s Las Vegas Strip resorts reflects revenue from certain resorts which reopened during the second quarter of 2020 with limited amenities and certain COVID-19 mitigation procedures: the Bellagio (reopened on June 4, 2020), the MGM Grand (reopened on June 4, 2020), New York, New York (reopened on June 4, 2020), Excalibur (reopened on June 11, 2020) and Luxor (reopened on June 25, 2020). The Mandalay Bay, ARIA, Vdara, Mirage and Park MGM resorts were not open during the second quarter of 2020. |
| (2) | Second quarter 2020 Adjusted Property EBITDAR calculation methodology: Reflects MGM management's estimates of operating trends for the periods in which the properties were operating (commencing on each respective properties reopening date and calculated through June 30, 2020), compared to the same periods in 2019 using monthly property level financials and internally generated daily operating reports to calculate activity for partial monthly periods, based on the days in the second quarter of 2020 that such properties were opened prior to June 30, 2020, including activity for invitation only customer events prior to reopening to the general public. |
COVID-19 Update. According to a press release issued on March 15, 2020, MGM announced that it would suspend operations at all of its Las Vegas properties, including the MGM Grand & Mandalay Bay Properties, until further notice, effective as of March 17, 2020, and that casino operations would close on March 16, 2020, followed by hotel operations on March 17, 2020. MGM cited COVID-19 as a pandemic that had intensified in the United States, requiring major collective action to slow its progression. MGM stated that it cancelled all reservations at its Las Vegas properties prior to May 21, 2020. MGM further reported that it incurred substantial operating losses in March 2020 and did not expect to see a material improvement until more is known regarding the duration and severity of the pandemic, including when MGM’s properties can reopen to the public. On May 1, 2020, MGM reported that as a result of the government-mandated closure, its domestic properties (which includes the MGM Grand & Mandalay Bay Properties and several properties which are not part of the collateral for the MGM Grand & Mandalay Bay Whole Loan) were effectively generating no revenue. In addition, MGM Resorts International reported high levels of room and convention cancellation across its domestic properties through the third quarter of 2020 with some tentative re-bookings in the fourth quarter and into 2021, and it indicated that when it is able to re-open its domestic properties, it expects weakened demand in light of continued domestic and international travel restrictions or warnings, consumer fears and reduced consumer discretionary spending and general economic uncertainty. As of June 4, 2020, the MGM Grand Property was reopened, with limited amenities and certain COVID-19 mitigation procedures. MGM reopened The Shoppes at Mandalay Bay Place on June 25, 2020 and the Mandalay Bay resort on July 1, 2020, both with limited amenities and certain COVID-19 mitigation procedures. On August 28, 2020, several news outlets reported that MGM is expected to lay off approximately 18,000 furloughed workers in the United States, more than one-quarter of its pre-COVID-19 pandemic U.S. workforce, due to the continued impact of the COVID-19 pandemic on MGM’s business. As of the date of the Preliminary Prospectus, the MGM Grand & Mandalay Bay Properties continue to operate subject to the restrictions described above. August and September debt service payments have been made on the MGM Grand & Mandalay Bay Whole Loan and no loan modification or forbearance requests have been made. Additionally, August and September master lease payments have been made and there have been no lease modification requests. See “Risk Factors—Risks Related to Market Conditions and Other External Factors—Current Coronavirus Pandemic May Adversely Affect the Global Economy and the Performance of the Mortgage Loans”.
The Market. The MGM Grand & Mandalay Bay Properties are located on the Las Vegas Strip in the heart of Las Vegas, Nevada. Visitor volume and airport passenger traffic into the Las Vegas region have more than doubled from 1990 to 2019. In connection with the financial downturn in 2008 and 2009, the Las Vegas market generally experienced a contraction. During 2010, the market began to rebound and visitation returned to near peak levels. McCarran International Airport welcomed 51.5 million passengers in 2019 (surpassing the 2018 passenger count of approximately 49.6 million).
THE INFORMATION IN THIS STRUCTURAL AND COLLATERAL TERM SHEET IS NOT COMPLETE AND MAY BE AMENDED PRIOR TO THE TIME OF SALE. THIS TERM SHEET IS NOT AN OFFER TO SELL THESE SECURITIES AND IT IS NOT A SOLICITATION OF AN OFFER TO BUY THESE SECURITIES IN ANY JURISDICTION WHERE THE OFFER OR SALE IS NOT PERMITTED.
| | 45 of 144 | | |
| Structural and Collateral Term Sheet | Benchmark 2020-B20 |
| MGM Grand & Mandalay Bay | |
Since 2010, annual convention attendance in Las Vegas has grown by over 2 million people (4.0% CAGR). With an estimated local population of 2.3 million people as of 2019, an additional approximately 42.5 million tourists visiting the metropolitan Las Vegas area annually and recent investment in Las Vegas by major sports leagues, the amount of existing gaming activity has increased steadily since the 2009 trough. In Clark County, gaming revenue has increased approximately 17.2% through 2019 since the gaming revenue trough in 2009.
| Market Overview(1) | ||||||||||||
Category | 1990 | 2009 | 2010 | 2011 | 2012 | 2013 | 2014 | 2015 | 2016 | 2017 | 2018 | 2019 |
| Visitor Volume (thousands) | 20,954 | 36,351 | 37,335 | 38,929 | 39,727 | 39,668 | 41,127 | 42,312 | 42,936 | 42,214 | 42,117 | 42,524 |
| YoY % Change | NAP | -3.0% | 2.7% | 4.3% | 2.1% | -0.1% | 3.7% | 2.9% | 1.5% | -1.7% | -0.2% | 1.0% |
| Clark County Gaming Revenues ($mm) | $4,104 | $8,838 | $8,909 | $9,223 | $9,400 | $9,674 | $9,554 | $9,618 | $9,714 | $9,979 | $10,250 | $10,355 |
| YoY % Change | NAP | -9.8% | 0.8% | 3.5% | 1.9% | 2.9% | -1.2% | 0.7% | 1.0% | 2.7% | 2.7% | 1.0% |
| Hotel / Motel Rooms Inventory | 73,730 | 148,941 | 148,935 | 150,161 | 150,481 | 150,593 | 150,544 | 149,213 | 149,339 | 148,896 | 149,158 | 149,422 |
| YoY % Change | NAP | 6.0% | 0.0% | 0.8% | 0.2% | 0.1% | 0.0% | -0.9% | 0.1% | -0.3% | 0.2% | 0.2% |
| Airport Passenger Traffic (thousands) | 19,090 | 40,469 | 39,757 | 41,481 | 41,668 | 41,857 | 42,885 | 45,319 | 47,368 | 48,430 | 49,645 | 51,538 |
| YoY % Change | NAP | -8.2% | -1.8% | 4.3% | 0.4% | 0.5% | 2.5% | 5.7% | 4.5% | 2.2% | 2.5% | 3.8% |
| Convention Attendance (thousands) | 1,742 | 4,492 | 4,473 | 4,865 | 4,944 | 5,107 | 5,195 | 5,891 | 6,311 | 6,646 | 6,502 | 6,649 |
| YoY % Change | NAP | -23.9% | -0.4% | 8.8% | 1.6% | 3.3% | 1.7% | 13.4% | 7.1% | 5.3% | -2.2% | 2.3% |
| (1) | Source: Las Vegas Convention and Visitors Authority. |
The Las Vegas Strip hotel average occupancy has been approximately 90% over the last three years. The Las Vegas Strip average 2019 occupancy was 90.4% and average 2018 occupancy was 89.5%. The Las Vegas Strip average 2019 ADR of $143.31 increased 3.3% relative to the average 2018 ADR of $138.71.
| Historical Occupancy, ADR, RevPAR – Competitive Set | ||||||||||
| MGM Grand Resort(1) | Competitive Set(2)(3) | MGM Grand Penetration Factor(2) | ||||||||
| Year | Occupancy | ADR | RevPAR | Occupancy | ADR | RevPAR | Occupancy | ADR | RevPAR | |
| December 31, 2017 | 92.1% | $181.76 | $167.36 | 92.0% | $181.95 | $167.10 | 100.2% | 100.0% | 100.3% | |
| December 31, 2018 | 92.7% | $182.10 | $168.76 | 93.0% | $187.63 | $173.66 | 100.1% | 97.4% | 97.6% | |
| December 31, 2019 | 91.4% | $190.29 | $173.85 | 94.0% | $193.23 | $181.41 | 98.7% | 98.6% | 97.3% | |
| (1) | Source: Historical operating statements. |
| (2) | Source: Appraisal. |
| (3) | Includes: The Mirage, New York New York, Luxor, Caesars, Planet Hollywood, and Venetian/Palazzo. |
| Historical Occupancy, ADR, RevPAR – Competitive Set | ||||||||||
| Mandalay Bay Resort(1) | Competitive Set(2)(3) | Mandalay Bay Penetration Factor(2) | ||||||||
| Year | Occupancy | ADR | RevPAR | Occupancy | ADR | RevPAR | Occupancy | ADR | RevPAR | |
| December 31, 2017 | 90.0% | $206.28 | $185.57 | 92.0% | $177.98 | $164.06 | 98.0% | 113.2% | 110.9% | |
| December 31, 2018 | 90.2% | $203.96 | $183.96 | 93.0% | $183.94 | $171.13 | 97.4% | 109.2% | 106.4% | |
| December 31, 2019 | 92.8% | $202.98 | $188.40 | 94.0% | $190.09 | $178.15 | 96.6% | 108.8% | 105.1% | |
| (1) | Source: Historical operating statements. |
| (2) | Source: Appraisal. |
| (3) | Includes: The Mirage, New York New York, Luxor, Caesars, Planet Hollywood, and Venetian/Palazzo. |
Additional group business is expected to enter the market as a result of the delivery of Allegiant Stadium in August 2020 (across the street from the Mandalay Bay Property) which will serve as the home stadium for the Raiders NFL team. Non-gaming revenue in the Las Vegas market was approximately 65% of total revenue in 2019 compared to pre-recession levels of approximately 59% in 2007.
Each of the MGM Grand & Mandalay Bay Properties share the same competitive set. The primary competitive set for the MGM Grand & Mandalay Bay Properties consists of six hotels, which range in size from 2,024 to 7,117 rooms and collectively contain an aggregate 23,058 rooms. According to the appraisal, there are two mega resorts in the construction phase with planned delivery between 2021 and 2022. Resorts World Las Vegas is a 59-story Chinese-themed mega resort under construction at the former Stardust Resort and Casino site on the northern Las Vegas Strip with scheduled delivery by summer of 2021 according to the appraisal. The Drew is a 735-foot tall, 75% completed mega casino resort scheduled to be delivered by 2022.
THE INFORMATION IN THIS STRUCTURAL AND COLLATERAL TERM SHEET IS NOT COMPLETE AND MAY BE AMENDED PRIOR TO THE TIME OF SALE. THIS TERM SHEET IS NOT AN OFFER TO SELL THESE SECURITIES AND IT IS NOT A SOLICITATION OF AN OFFER TO BUY THESE SECURITIES IN ANY JURISDICTION WHERE THE OFFER OR SALE IS NOT PERMITTED.
| | 46 of 144 | | |
| Structural and Collateral Term Sheet | Benchmark 2020-B20 |
| MGM Grand & Mandalay Bay | |
| Comparable Properties(1) | |||||||
Property Name | No. of Rooms | Year Opened | Meeting Space (sq. ft.) | Casino Space (sq. ft.) | Estimated 2019 Occ. | Estimated 2019 ADR | Estimated 2019 RevPAR |
| MGM Grand(2) | 4,998 | 1993 | 748,325 | 177,268 | 91.4% | $190.29 | $173.85 |
| Mandalay Bay(2) | 4,750 | 1999 | 2,100,000 | 152,159 | 92.8% | $202.98 | $188.40 |
| The Mirage | 3,044 | 1989 | 170,000 | 94,000 | 94.6% | $178.00 | $168.39 |
| New York New York | 2,024 | 1997 | 30,500 | 81,000 | 95.5% | $151.00 | $144.21 |
| Luxor | 4,397 | 1993 | 20,000 | 120,000 | 95.0% | $119.00 | $113.05 |
| Caesar’s Palace | 3,976 | 1966 | 300,000 | 124,200 | 93.0% | $221.00 | $205.53 |
| Planet Hollywood | 2,500 | 2000 | 20,000 | 64,500 | 90.0% | $185.00 | $166.50 |
| Venetian/Palazzo | 7,117 | 1999 | 450,000 | 335,878 | 94.6% | $237.00 | $224.20 |
| (1) | Source: Appraisal, unless otherwise indicated. |
| (2) | Source: Underwriting and Loan Sponsor provided information. |
THE INFORMATION IN THIS STRUCTURAL AND COLLATERAL TERM SHEET IS NOT COMPLETE AND MAY BE AMENDED PRIOR TO THE TIME OF SALE. THIS TERM SHEET IS NOT AN OFFER TO SELL THESE SECURITIES AND IT IS NOT A SOLICITATION OF AN OFFER TO BUY THESE SECURITIES IN ANY JURISDICTION WHERE THE OFFER OR SALE IS NOT PERMITTED.
| | 47 of 144 | | |
| Structural and Collateral Term Sheet | Benchmark 2020-B20 |
| MGM Grand & Mandalay Bay | |
| Operating History and Underwritten Net Cash Flow(1) | |||||||||
| 2015 | 2016 | 2017 | 2018 | 2019 | TTM(2) | Underwritten | Per Room | % of Total Revenue(3) | |
| Occupancy | 92.5% | 92.4% | 91.0% | 91.5% | 92.1% | 87.5% | 92.1% | ||
| ADR | $179.08 | $187.27 | $193.58 | $192.62 | $196.52 | $197.27 | $196.52 | ||
| RevPAR | $165.56 | $172.97 | $176.24 | $176.18 | $180.94 | $172.60 | $180.94 | ||
| Hotel Revenue | $576,193,751 | $611,611,719 | $621,671,255 | $619,356,266 | $635,408,160 | $454,847,334 | $635,408,160 | $65,183 | 30.2% |
| Casino Revenue | 461,726,103 | 438,253,825 | 459,676,698 | 492,001,712 | 379,532,959 | 304,523,632 | 379,532,959 | $38,934 | 18.0% |
| F&B Revenue | 578,021,518 | 598,992,505 | 608,876,978 | 604,859,218 | 629,566,379 | 438,092,332 | 629,566,379 | $64,584 | 29.9% |
| Other Revenue | 480,778,051 | 465,818,022 | 471,735,234 | 475,323,334 | 461,787,990 | 345,071,444 | 461,787,990(4) | $47,373 | 21.9% |
| Total Revenue | $2,096,719,423 | $2,114,676,071 | $2,161,960,165 | $2,191,540,530 | $2,106,295,488 | $1,542,534,742 | $2,106,295,488 | $216,075 | 100.0% |
| Hotel Expense | 230,915,708 | 235,477,994 | 249,304,637 | 255,303,612 | 265,201,312 | 205,510,281 | 265,201,312 | $27,206 | 41.7% |
| Casino Expense | 253,918,628 | 213,245,938 | 229,109,011 | 226,996,812 | 223,320,361 | 189,641,029 | 223,320,361 | $22,909 | 58.8% |
| F&B Expense | 428,952,166 | 429,128,035 | 433,970,578 | 437,033,184 | 449,487,794 | 329,402,047 | 449,487,794 | $46,111 | 71.4% |
| Other Expense | 349,547,741 | 323,328,025 | 322,504,168 | 316,078,620 | 304,747,043 | 225,847,118 | 304,747,043 | $31,263 | 66.0% |
| Total Departmental | $1,263,334,243 | $1,201,179,992 | $1,234,888,394 | $1,235,412,228 | $1,242,756,510 | $950,400,475 | $1,242,756,510 | $127,488 | 59.0% |
| Gross Operating Income | $833,385,180 | $913,496,079 | $927,071,771 | $956,128,302 | $863,538,978 | $592,134,267 | $863,538,978 | $88,586 | 41.0% |
| Total Undistributed Expenses | 278,305,919 | 261,847,999 | 247,318,999 | 257,487,307 | 258,119,417 | 215,257,835 | 258,119,417 | $26,479 | 12.3% |
| Gross Operating Profit | $555,079,261 | $651,648,080 | $679,752,772 | $698,640,995 | $605,419,561 | $376,876,432 | $605,419,561 | $62,107 | 28.7% |
| Management Fee | 46,463,959 | 59,835,056 | 53,171,104 | 56,764,258 | 57,698,013 | 48,582,051 | 57,698,013 | $5,919 | 2.7% |
| Taxes | 16,605,853 | 16,929,584 | 15,852,622 | 17,309,478 | 18,451,931 | 19,072,787 | 18,451,931 | $1,893 | 0.9% |
| Insurance | 6,711,471 | 6,110,026 | 5,691,838 | 7,197,993 | 9,189,264 | 10,442,121 | 9,189,264 | $943 | 0.4% |
| Net Extraordinary Loss Add-back | 0 | 0 | 0 | 0 | 0 | 82,377,430 | 0 | $0 | 0.0% |
| Total Operating Expenses | $1,611,421,445 | $1,545,902,657 | $1,556,922,957 | $1,574,171,264 | $1,586,215,135 | $1,161,377,839 | $1,586,215,135 | $162,722 | 75.3% |
| EBITDAR | $485,297,978 | $568,773,414 | $605,037,208 | $617,369,266 | $520,080,353 | $381,156,903(6) | $520,080,353 | $53,353 | 24.7% |
| Capital Expenditures(5) | 0 | 0 | 0 | 0 | 0 | 0 | 32,774,592 | $3,362 | 1.6% |
| Net Cash Flow | $485,297,978 | $568,773,414 | $605,037,208 | $617,369,266 | $520,080,353 | $381,156,903(6) | $487,305,761 | $49,990 | 23.1% |
| (1) | Certain items such as interest expense, interest income, depreciation, amortization, debt service payments and any other non-recurring or non-operating items were excluded from the historical presentation and are not considered for the underwritten cash flow. |
| (2) | TTM column represents the trailing 12-month period ending June 30, 2020. |
| (3) | % of Total Revenue for Hotel Expense, Casino Expense, F&B Expense and Other Expenses are based on their corresponding aggregate revenue line item. |
| (4) | The most recent available breakout of the Signature Condo-Hotel revenue as a component of Other Revenue was from the November 2019 trailing 12-month period. |
| (5) | Underwritten Capital Expenditures is based on the 1.5% contractual FF&E reserve based on total net revenues (excluding net revenues associated with the Signature Condo-Hotel development at the MGM Grand Property for which FF&E is not reserved under the Master Lease). With respect to the Mandalay Bay Property, 5.0% FF&E Reserve was underwritten for the revenues associated with the closing date Four Seasons Management Agreement. |
| (6) | The TTM financials presented above reflect the suspension of operations at the Properties from March 17, 2020 through the end of the first calendar quarter of 2020. On August 3, 2020, MGM reported in its second quarter Form 10-Q filing that, while throughout May, June and July 2020, it re-opened most of its properties with limited amenities and certain measures to mitigate the spread of COVID-19, such properties (which include the MGM Grand and Mandalay Bay Properties) may be subject to temporary, complete or partial shutdowns in the future, and that it has seen and expects to continue to see weakened demand in light of consumer fears and general economic uncertainty, among other things. The TTM June 2020 financials presented above reflect the operations at the MGM Grand Property, which remained suspended until June 4, 2020 and operations at The Shoppes at Mandalay Bay Place and the Mandalay Bay resort, which remained suspended through June 24, 2020 and June 30, 2020, respectively. The lender UW presented above is based on 2019 financials, which reflects a full-year of uninterrupted operations at the MGM Grand & Mandalay Bay Properties. |
THE INFORMATION IN THIS STRUCTURAL AND COLLATERAL TERM SHEET IS NOT COMPLETE AND MAY BE AMENDED PRIOR TO THE TIME OF SALE. THIS TERM SHEET IS NOT AN OFFER TO SELL THESE SECURITIES AND IT IS NOT A SOLICITATION OF AN OFFER TO BUY THESE SECURITIES IN ANY JURISDICTION WHERE THE OFFER OR SALE IS NOT PERMITTED.
| | 48 of 144 | | |
| Structural and Collateral Term Sheet | Benchmark 2020-B20 |
| MGM Grand & Mandalay Bay | |
Property Management. The MGM Grand & Mandalay Bay Properties are currently managed by the MGM Tenant and/or the applicable MGM/Mandalay Operating Subtenant, and there are no management agreements currently in effect with the Borrowers and, other than the management agreement with respect to the Four Seasons hotel and the management agreement with respect to certain signature hotel units (which, for the avoidance of doubt, are not part of the MGM Grand & Mandalay Bay Properties), for which management fees related thereto are included as part of the collateral, there are no management agreements currently in effect with respect to the MGM Grand & Mandalay Bay Properties.
Escrows and Reserves. At loan origination, the Borrowers were not required to deposit any upfront reserves.
Under the Master Lease, the MGM Tenant is obligated to make monthly deposits of 1.50% of net revenues at an eligible institution to be used for FF&E and qualifying capital expenditures (the “OpCo FF&E Reserve Account”). MGM Tenant granted the Borrowers a security interest in the OpCo FF&E Reserve Account, and the Borrowers collaterally assigned the Borrowers’ security interest in the OpCo FF&E Reserve Account to the mortgage lender.
Tax Reserve – For so long as the MGM Grand & Mandalay Bay Properties are subject to the Master Lease, no reserves for real estate taxes are required under the MGM Grand & Mandalay Bay Whole Loan documents. If the MGM Grand & Mandalay Bay Properties are not subject to the Master Lease, solely if a MGM Grand & Mandalay Bay Trigger Period is in effect, the MGM Grand & Mandalay Bay Whole Loan documents provide for ongoing monthly reserves for real estate taxes in an amount equal to 1/12 of the real estate taxes that the lender estimates will be payable during the next 12 months at least 30 days prior to their respective due dates. Notwithstanding the foregoing, the requirement for such monthly reserves will be reduced dollar for dollar by any taxes paid or reserved for by a brand manager or casino operator pursuant to a brand management or casino management agreement relating to the MGM Grand & Mandalay Bay Properties.
Insurance Reserve – For so long as the MGM Grand & Mandalay Bay Properties are subject to the Master Lease, no reserves for insurance premiums are required under the MGM Grand & Mandalay Bay Whole Loan documents. If the MGM Grand & Mandalay Bay Properties are not subject to the Master Lease, solely if a MGM Grand & Mandalay Bay Trigger Period is in effect, the MGM Grand & Mandalay Bay Whole Loan documents provide for ongoing monthly reserves for insurance premiums in an amount equal to 1/12 of the insurance premiums that the lender estimates will be payable for the renewal of the insurance policies at least 30 days prior to the expiration thereof. Notwithstanding the foregoing, the requirement for such monthly reserves will be reduced dollar for dollar by any insurance premiums paid or reserved for by a brand manager or casino operator pursuant to a brand management or casino management agreement relating to the MGM Grand & Mandalay Bay Properties. In addition, such monthly reserves will not be required so long as (i) no event of default is continuing, and (ii) the insurance coverage for the MGM Grand & Mandalay Bay Properties are included in a blanket policy reasonably acceptable to the lender.
FF&E Reserve – For so long as the MGM Grand & Mandalay Bay Properties are not subject to the Master Lease, (i) on each payment date during a MGM Grand & Mandalay Bay Trigger Period, the Borrowers will be required to make a deposit equal to (a) 4.0% of net revenue from guest rooms and Borrower-managed food and beverage operations and (b) 0.5% of all other net revenue (other than non-recurring items), in each case for the calendar month that is two months prior to the calendar month in which the applicable deposit to the replacement reserve fund is to be made (the sum of (a) and (b), the “Replacement Reserve Monthly Deposit”), and (ii) if a MGM Grand & Mandalay Bay Trigger Period does not exist, on the first payment date of each calendar quarter, an amount equal to the lesser of (x) the Replacement Reserve Current Year Lookback Deficiency (as defined below) and (y) the Replacement Reserve Five Year Lookback Deficiency (as defined below) (the lesser of (x) and (y), the “Replacement Reserve Quarterly Deposit”), provided that for so long as any individual MGM Grand & Mandalay Bay Property is managed by (x) a brand manager pursuant to a brand management agreement and/or (y) a casino operator pursuant to a casino management agreement, the amounts required to be funded as a Replacement Reserve Monthly Deposit or a Replacement Reserve Quarterly Deposit will be reduced on a dollar-for-dollar basis by any amounts deposited into a manager account for replacements, PIP work or brand mandated work for the applicable calendar months as set forth in the annual budget and required pursuant to the terms of the brand management agreement and/or casino management agreement if the Borrowers deliver evidence reasonably satisfactory to the mortgage lender that such deposit has been made.
A “Replacement Reserve Current Year Lookback Deficiency” means an amount equal to (x) the aggregate amount of Replacement Reserve Monthly Deposits which would have been funded from the beginning of the then calendar year to the date of determination had a MGM Grand & Mandalay Bay Trigger Period been in effect for the entirety of such period less (y) the sum of (1) the aggregate amount expended on replacements, PIP work and brand mandated work during such calendar year to date and (2) the aggregate amount funded into the Replacement Reserve during such calendar year to date; provided that, if the foregoing calculation results in a negative number, the Replacement Reserve Current Year Lookback Deficiency will be deemed to be zero.
A “Replacement Reserve Five Year Lookback Deficiency” means (i) zero, with respect to any period before December 31, 2024, and (ii) from and after January 1, 2025, an amount equal to (x) 4.0% of net revenue from guest rooms and Borrower-managed food and beverage
THE INFORMATION IN THIS STRUCTURAL AND COLLATERAL TERM SHEET IS NOT COMPLETE AND MAY BE AMENDED PRIOR TO THE TIME OF SALE. THIS TERM SHEET IS NOT AN OFFER TO SELL THESE SECURITIES AND IT IS NOT A SOLICITATION OF AN OFFER TO BUY THESE SECURITIES IN ANY JURISDICTION WHERE THE OFFER OR SALE IS NOT PERMITTED.
| | 49 of 144 | | |
| Structural and Collateral Term Sheet | Benchmark 2020-B20 |
| MGM Grand & Mandalay Bay | |
operations and 0.5% of all other net revenues (other than non-recurring items) during the Replacement Reserve Five Year Lookback Period (as defined below) less (y) the sum of (1) the aggregate amount expended on replacements, PIP Work and brand mandated work during the Replacement Reserve Five Year Lookback Period (including amounts expended by MGM Tenant pursuant to the express terms and conditions of the Master Lease) and (2) the aggregate amounts funded into the Replacement Reserve during such Replacement Reserve Five Year Lookback Period; provided, if the foregoing calculation results in a negative number, the Replacement Reserve Five Year Lookback Deficiency will be deemed to be zero.
A “Replacement Reserve Five Year Lookback Period” means each five year period (on a rolling basis) with the first period commencing on January 1, 2020 and expiring on December 31, 2024 and the second period commencing on January 1, 2021 and expiring on December 31, 2025.
Lockbox / Cash Management. The MGM Grand & Mandalay Bay Whole Loan is subject to a hard lockbox with springing cash management. Amounts on deposit in the lockbox account will be disbursed to the Borrower’s operating account in accordance with the clearing account agreement. After the occurrence and during the continuation of a MGM Grand & Mandalay Bay Trigger Period (as defined below), the Borrowers will establish a cash management account and, at least two times per week, the clearing account bank will sweep funds from the lockbox accounts into the cash management account in accordance with the clearing account agreement and the cash management bank will apply funds on deposit in the order of priority described in the MGM Grand & Mandalay Bay Whole Loan documents, with the remaining excess cash flow (“Excess Cash Flow Reserve”) to be held as additional collateral for the MGM Grand & Mandalay Bay Whole Loan (and, after the ARD, all amounts in the Excess Cash Flow Reserve account will be used to pay the monthly additional interest amount and applied to the principal of the MGM Grand & Mandalay Bay Whole Loan).
A “MGM Grand & Mandalay Bay Trigger Period” means a period (A) commencing upon the occurrence of any of the following: (i) the Debt Service Coverage Ratio (“DSCR”) falling below 2.50x (“DSCR Threshold”) for two consecutive quarters (“DSCR Trigger”), (ii) the MGM Tenant is subject to a bankruptcy action (“OpCo Bankruptcy”), (iii) an event of default under the MGM Grand & Mandalay Bay Whole Loan has occurred and is continuing (“EOD Trigger”), (iv) an OpCo Trigger Event (as defined below) or (v) the Borrowers fail to repay the MGM Grand & Mandalay Bay Whole Loan in full on or before the ARD and (B) terminating upon (i) in the event of a DSCR Trigger, either such time that the DSCR exceeds the DSCR Threshold for two consecutive quarters or the Borrowers make voluntary prepayments of the MGM Grand & Mandalay Bay Whole Loan in accordance with the terms of the MGM Grand & Mandalay Bay Whole Loan documents in amounts necessary to achieve a DSCR greater than or equal to the DSCR Threshold (without any obligation to wait two consecutive quarters), (ii) in the event of an OpCo Bankruptcy, the assumption of the Master Lease in such bankruptcy proceeding or the replacement of the MGM Tenant as provided in the MGM Grand & Mandalay Bay Whole Loan documents (or in the event the Master Lease is terminated and not replaced, the DSCR is equal to or greater than the DSCR Threshold or the Borrowers make voluntary prepayments of the MGM Grand & Mandalay Bay Whole Loan in accordance with the terms of the MGM Grand & Mandalay Bay Whole Loan documents in amounts necessary to achieve a DSCR greater than or equal to the DSCR Threshold (without any obligation to wait two consecutive quarters)), (iii) in the event of an OpCo Trigger Period, any OpCo Trigger Event Cure (as defined below) and (iv) in the event of an EOD Trigger, no other events of default exist and are continuing and the mortgage lender will have accepted a cure by the Borrowers of such event of default. For the avoidance of doubt, in no instance will a MGM Grand & Mandalay Bay Trigger Period caused by the failure of the Borrowers to repay the MGM Grand & Mandalay Bay Whole Loan in full on or before the ARD be capable of being cured or deemed to expire.
An “OpCo Trigger Event” means the occurrence and continuance of all of the following conditions simultaneously: (i) an event of default under the Master Lease has occurred and is continuing; (ii) (x) the managing member of the Joint Venture is an affiliate of the Borrowers other than MGP or MGP OP that is controlled by MGP or MGP OP and (y) MGP OP is controlled by MGM and (iii) such managing member is permitted under the terms of the Joint Venture agreement to take any of the following actions without the consent of (x) BCORE Windmill Parent LLC (the member of the Joint Venture that is affiliated with BREIT OP) (a) granting any consent, approval or wavier or making any election under the Master Lease, Lease Guaranty or other related lease documents, (b) entering into any amendment, supplement or modification to the Master Lease, Lease Guaranty or other related lease documents, or (c) declaring an event of default under the Master Lease, Lease Guaranty or other related lease documents or (y) if applicable, a Qualified Transferee (as defined in the MGM Grand & Mandalay Bay Whole Loan documents) that is not an affiliate of MGM Tenant which owns a 15% or greater direct and/or indirect interest in the Borrowers.
A “Lease Guaranty” means that certain Guaranty of Lease Documents dated as of February 14, 2020, made by MGM in favor of the Borrowers.
An “OpCo Trigger Event Cure” means, as applicable, (i) the Borrowers have provided evidence to the mortgage lender of the cure of the event of default under the Master Lease, (ii) the Borrowers have waived the event of default under the Master Lease, provided that such waiver was approved by the mortgage lender, or (iii) in the event that the event of default results in the termination of the Master Lease,
THE INFORMATION IN THIS STRUCTURAL AND COLLATERAL TERM SHEET IS NOT COMPLETE AND MAY BE AMENDED PRIOR TO THE TIME OF SALE. THIS TERM SHEET IS NOT AN OFFER TO SELL THESE SECURITIES AND IT IS NOT A SOLICITATION OF AN OFFER TO BUY THESE SECURITIES IN ANY JURISDICTION WHERE THE OFFER OR SALE IS NOT PERMITTED.
| | 50 of 144 | | |
| Structural and Collateral Term Sheet | Benchmark 2020-B20 |
| MGM Grand & Mandalay Bay | |
either (a) (I) the Borrowers and MGM Tenant have entered into a new lease on terms and conditions substantially similar to those contained in the Master Lease as of the origination of the MGM Grand & Mandalay Bay Whole Loan and (II) the Master Lease opinion delivery requirements have been satisfied, or (b) after giving effect to the termination of the Master Lease the DSCR is equal to or greater than 2.50x for two consecutive quarters or the Borrowers make voluntary prepayments in accordance with the terms of the MGM Grand & Mandalay Bay Whole Loan documents in an amount necessary to achieve a DSCR equal to or greater than 2.50x.
Current Mezzanine or Subordinate Indebtedness. In addition to the MGM Grand & Mandalay Bay Loan, the MGM Grand & Mandalay Bay Properties also secure the MGM Grand & Mandalay Bay Senior Notes not included in the Benchmark 2020-B20 mortgage trust, which have an aggregate Cut-off Date principal balance of $1,549,200,000, and the MGM Grand & Mandalay Bay Junior Notes (which have an aggregate Cut-off Date principal balance of $1,365,800,000). The MGM Grand & Mandalay Bay Senior Notes not included in the Benchmark 2020-B20 trust and the MGM Grand & Mandalay Bay Junior Notes accrue interest at the same rate as the MGM Grand & Mandalay Bay Loan. The MGM Grand & Mandalay Bay Loan is entitled to payments of interest and principal on a pro rata and pari passu basis with the MGM Grand & Mandalay Bay Senior Notes not included in the Benchmark 2020-B20 mortgage trust. The MGM Grand & Mandalay Bay Loan and the MGM Grand & Mandalay Bay Senior Notes not included in the Benchmark 2020-B20 mortgage trust are generally senior to the MGM Grand & Mandalay Bay Junior Notes.
Future Mezzanine or Subordinate Indebtedness Permitted. The MGM Grand & Mandalay Bay Borrowers have a one-time right to borrow a mezzanine loan subordinate to the MGM Grand & Mandalay Bay Whole Loan (“Mezzanine Loan”), subject to credit and legal criteria specified in the MGM Grand & Mandalay Bay Whole Loan documents, including, without limitation: (i) a combined maximum loan to value ratio (based on appraisals ordered by the lender in connection with the closing of the Mezzanine Loan and calculated based on the outstanding principal balance of the MGM Grand & Mandalay Bay Whole Loan and the initial principal amount of the Mezzanine Loan) of 67.0%, (ii) a debt service coverage ratio at the closing of the Mezzanine Loan at least equal to 4.81x, in each case, inclusive of the additional mezzanine debt and (iii) an intercreditor agreement reasonably satisfactory to the lender. The lender’s receipt of a rating agency confirmation will not be required in connection with the Mezzanine Loan.
Notwithstanding the foregoing, (1) during a MGM Grand & Mandalay Bay Trigger Period (and for so long as no event of default has occurred and is continuing), in the event that the Mezzanine Loan (or any portion thereof) is directly or indirectly or beneficially owned by the MGM Grand & Mandalay Bay Borrowers, mezzanine borrower or a “broad affiliate” (as defined in the MGM Grand & Mandalay Whole Loan documents) of the Borrowers or mezzanine borrower (“Affiliated Mezzanine Lender”), in no instance will the Affiliated Mezzanine Lender be permitted to receive late charges, principal (other than the pro rata prepayment of the Mezzanine Loan upon the release of an individual Property or prepayment of the MGM Grand & Mandalay Bay Whole Loan in accordance with the terms and conditions of the MGM Grand & Mandalay Bay Whole Loan documents and the Mezzanine Loan documents) or interest at the default rate, even if an event of default has occurred and is continuing under the Mezzanine Loan and such Affiliated Mezzanine Lender will only be permitted to receive interest at the non-default rate on a monthly basis, (2) during a MGM Grand & Mandalay Bay Trigger Period (and for so long as no event of default has occurred and is continuing under the MGM Grand & Mandalay Bay Whole Loan documents), for so long as the whole Mezzanine Loan is not directly or indirectly or beneficially owned by an Affiliated Mezzanine Lender, the mezzanine lender will receive on a monthly basis interest at the non-default rate and, if an event of default has occurred and is continuing under the Mezzanine Loan, funds sufficient to pay any other amounts then due under the Mezzanine Loan and the Mezzanine Loan documents (other than the payment of the outstanding principal amount of the Mezzanine Loan on the maturity date of the Mezzanine Loan whether on the scheduled date for such payment or earlier due to an acceleration of the Mezzanine Loan) and (3) after the ARD, in no instance will any mezzanine lender be permitted to receive any payments whatsoever.
Partial Release. So long as no event of default has occurred and is continuing (other than as set forth below), the Borrowers may at any time release an individual MGM Grand & Mandalay Bay Property from the MGM Grand & Mandalay Bay Whole Loan by prepaying the applicable Release Percentage (as defined below) of the ALA of the subject individual property (including any yield maintenance premium, if required), and subject to the terms and conditions in the MGM Grand & Mandalay Bay Whole Loan documents, including, without limitation: (i) the DSCR after giving effect to such release is at least equal to 4.81x; (ii) continued compliance with the single purpose entity requirements contained in the MGM Grand & Mandalay Bay Whole Loan documents; (iii) payment to an agent or servicer of the then current and customary fee by such persons for such releases in an amount not to exceed $2,000.00 and any reasonable legal fees or other out-of-pocket costs incurred by the lender to effect the release and any applicable prepayment premiums (provided the legal fees may not exceed $10,000.00); (iv) payment of all recording charges, filing fees, taxes or other similar expenses payable in connection therewith; (v) compliance with applicable REMIC requirements relating to the REMIC 125% LTV test for release which may be satisfied by delivery of any of the following if permitted by REMIC requirements: an existing or updated appraisal, a broker’s price opinion or other written determination of value using a commercially reasonable valuation method, in each case satisfactory to the lender, but will be based solely on the value of real property and will exclude personal property and going-concern value; and (vi) if the property is subject to the Master Lease, the Borrowers removing the released individual property from the Master Lease and entering into a new triple-net
THE INFORMATION IN THIS STRUCTURAL AND COLLATERAL TERM SHEET IS NOT COMPLETE AND MAY BE AMENDED PRIOR TO THE TIME OF SALE. THIS TERM SHEET IS NOT AN OFFER TO SELL THESE SECURITIES AND IT IS NOT A SOLICITATION OF AN OFFER TO BUY THESE SECURITIES IN ANY JURISDICTION WHERE THE OFFER OR SALE IS NOT PERMITTED.
| | 51 of 144 | | |
| Structural and Collateral Term Sheet | Benchmark 2020-B20 |
| MGM Grand & Mandalay Bay | |
lease with respect to the remaining individual property on substantially the same terms as the Master Lease (collectively, the “Release Conditions”).
A “Release Percentage” means, with respect to any individual MGM Grand & Mandalay Bay Property, 105.0% until such time as the outstanding principal balance of the MGM Grand & Mandalay Bay Whole Loan is reduced to $2,250,000,000 (the “Release Percentage Threshold”), and 110.0% thereafter. In calculating the Release Amount for an individual Property, the Release Percentage may initially be one hundred and five percent (105%) until the application of a portion of such prepayment would reach the Release Percentage Threshold and with respect to any remaining prepayment for such individual Property, the Release Percentage would be one hundred and ten percent (110%).
Notwithstanding the foregoing, in the event that the DSCR following the release would not satisfy the DSCR requirement in clause (i) of the Release Conditions, and such release is in connection with an arms’ length transaction with an unrelated third party, the Borrowers will be permitted to release the subject property and the amount that will be required to be prepaid (or defeased) in connection with such Release will equal the greater of (I) the Release Percentage of the ALA for such individual property, together with, to the extent the release does not occur in connection with a partial defeasance, any yield maintenance premium required (if any) and (II) the lesser of (x) one hundred percent (100.0%) of the net sales proceeds for the sale of such individual property (net of reasonable and customary closing costs associated with the sale of such individual property) and (y) an amount necessary to, after giving effect to such release of the individual property, achieve the DSCR requirement in the preceding paragraph.
The Borrowers may release any defaulting individual property, without the payment of any yield maintenance premium, in order to cure a default or an event of default related to such individual property, subject to the satisfaction of other terms and conditions in the MGM Grand & Mandalay Bay Whole Loan documents (including, without limitation, Release Conditions (other than clause (i)) (“Default Release”). In addition, the Borrowers may release an individual property (including to an affiliate) if the estimated net proceeds following any casualty or condemnation at such individual Property will be equal to or greater than (x) 25.0% of its ALA, or (y) 5.0% of its ALA (subject to the satisfaction of other terms and conditions in the MGM Grand & Mandalay Bay Whole Loan documents) upon satisfaction of clauses (iii), (iv) and (v) of the Release Conditions above and prepayment of the MGM Grand & Mandalay Bay Whole Loan in an amount equal to the net proceeds (up to an amount equal to the Release Percentage) for such individual property (“Special Release”).
THE INFORMATION IN THIS STRUCTURAL AND COLLATERAL TERM SHEET IS NOT COMPLETE AND MAY BE AMENDED PRIOR TO THE TIME OF SALE. THIS TERM SHEET IS NOT AN OFFER TO SELL THESE SECURITIES AND IT IS NOT A SOLICITATION OF AN OFFER TO BUY THESE SECURITIES IN ANY JURISDICTION WHERE THE OFFER OR SALE IS NOT PERMITTED.
| | 52 of 144 | | |
| Structural and Collateral Term Sheet | Benchmark 2020-B20 |
| 4 West 58th Street | |

THE INFORMATION IN THIS STRUCTURAL AND COLLATERAL TERM SHEET IS NOT COMPLETE AND MAY BE AMENDED PRIOR TO THE TIME OF SALE. THIS TERM SHEET IS NOT AN OFFER TO SELL THESE SECURITIES AND IT IS NOT A SOLICITATION OF AN OFFER TO BUY THESE SECURITIES IN ANY JURISDICTION WHERE THE OFFER OR SALE IS NOT PERMITTED.
| | 53 of 144 | | |
| Structural and Collateral Term Sheet | Benchmark 2020-B20 |
| 4 West 58th Street | |

THE INFORMATION IN THIS STRUCTURAL AND COLLATERAL TERM SHEET IS NOT COMPLETE AND MAY BE AMENDED PRIOR TO THE TIME OF SALE. THIS TERM SHEET IS NOT AN OFFER TO SELL THESE SECURITIES AND IT IS NOT A SOLICITATION OF AN OFFER TO BUY THESE SECURITIES IN ANY JURISDICTION WHERE THE OFFER OR SALE IS NOT PERMITTED.
| | 54 of 144 | | |
| Structural and Collateral Term Sheet | Benchmark 2020-B20 |
| 4 West 58th Street | |
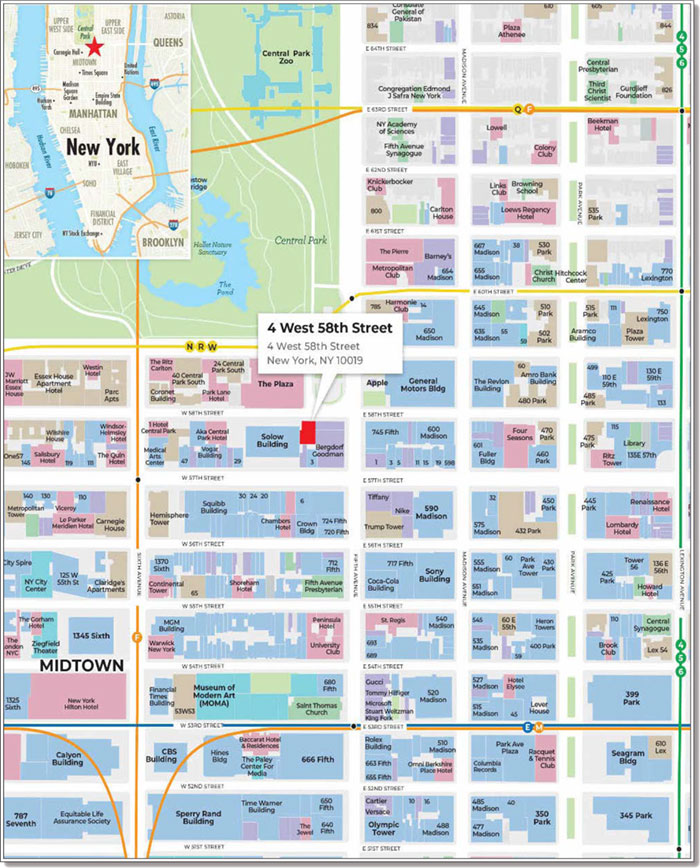
THE INFORMATION IN THIS STRUCTURAL AND COLLATERAL TERM SHEET IS NOT COMPLETE AND MAY BE AMENDED PRIOR TO THE TIME OF SALE. THIS TERM SHEET IS NOT AN OFFER TO SELL THESE SECURITIES AND IT IS NOT A SOLICITATION OF AN OFFER TO BUY THESE SECURITIES IN ANY JURISDICTION WHERE THE OFFER OR SALE IS NOT PERMITTED.
| | 55 of 144 | | |
| Structural and Collateral Term Sheet | Benchmark 2020-B20 |
| 4 West 58th Street | |
Mortgage Loan Information | Property Information | |||
Mortgage Loan Seller: Original Principal Balance(1): | JPMCB $62,500,000 | Single Asset / Portfolio: Title: | Single Asset Fee/Leasehold | |
| Cut-off Date Principal Balance(1): | $62,500,000 | Property Type - Subtype: | Mixed Use – Office/Retail | |
| % of Pool by IPB: | 6.9% | Net Rentable Area (SF): | 83,537 | |
| Loan Purpose: | Recapitalization | Location: | New York, NY | |
| Borrowers: | Ulysses Co. II, L.L.C., | Year Built / Renovated: | 1948 / 2016-2019 | |
| Solow Building Company III, L.L.C. | Occupancy(3): | 100.0% | ||
| Sponsor: | Sheldon H. Solow | Occupancy Date: | 10/1/2020 | |
| Interest Rate: | 3.68000% | Number of Tenants: | 9 | |
| Note Date: | 2/28/2020 | 2017 NOI: | $2,908,139 | |
| Maturity Date: | 3/1/2030 | 2018 NOI(2): | $2,974,304 | |
| Interest-only Period: | 120 months | 2019 NOI(2): | $3,570,977 | |
| Original Term: | 120 months | TTM NOI (as of 6/2020): | $4,519,138 | |
| Original Amortization: | None | UW Economic Occupancy: | 95.0% | |
| Amortization Type: | Interest Only | UW Revenues(4): | $11,943,386 | |
| Call Protection: | L(31),Def(83),O(6) | UW Expenses(4): | $2,701,328 | |
| Lockbox / Cash Management: | Hard / Springing | UW NOI(2)(4)(6): | $9,242,058 | |
| Additional Debt(1): | Yes | UW NCF(4)(6): | $9,059,948 | |
| Additional Debt Balance(1): | $62,500,000 | Appraised Value / Per SF(6): | $180,000,000 / $2,155 | |
| Additional Debt Type(1): | Pari Passu | Appraisal Date: | 2/1/2020 | |
| Escrows and Reserves(5) | Financial Information(1)(6) | |||||
| Initial | Monthly | Initial Cap | Cut-off Date Loan / SF: | $1,496 | ||
| Taxes: | $91,175 | $91,175 | N/A | Maturity Date Loan / SF: | $1,496 | |
| Insurance: | $4,669 | $4,669 | N/A | Cut-off Date LTV: | 69.4% | |
| Replacement Reserves: | $0 | $1,392 | $33,408 | Maturity Date LTV: | 69.4% | |
| TI/LC: | $7,811,435 | $13,932 | $835,920 | UW NCF DSCR: | 1.94x | |
| Other: | $5,799,156 | $0 | N/A | UW NOI Debt Yield: | 7.4% | |
| Excess Cash Flow Reserve: | $1,341,385 | NAP | NAP | |||
| Sources and Uses | |||||
Sources | Proceeds |
% of Total | Uses | Proceeds | % of Total |
| Whole Loan | $125,000,000 | 100.0% | Return of Equity | $107,093,482 | 85.7% |
| Upfront Reserves | 13,706,435 | 11.0 | |||
| Closing Costs | 4,200,083 | 3.4 | |||
| Total Sources | $125,000,000 | 100.0% | Total Uses | $125,000,000 | 100.0% |
| (1) | The 4 West 58th Street loan is part of a whole loan evidenced by three pari passu notes, with an aggregate outstanding principal balance as of the Cut-off Date of $125.0 million. Financial Information presented in the chart above reflects the Cut-off Date balance of the $125.0 million 4 West 58th Street Whole Loan (as defined below). For additional information, see “The Loan” herein. |
| (2) | The increase in UW NOI from 2018 NOI is primarily attributable to six of the nine tenants accounting for 40.8% of net rentable area and 65.8% of underwritten base rent taking occupancy between 2018 and July 2020. |
| (3) | Occupancy and UW NCF are inclusive of Netflix Inc., J2 Enterprises LTD., Northwell Health, Neistein Plastic Surgery and PP North America US Inc., all of which have executed their respective leases and/or taken possession of their space but are not yet in occupancy and/or paying rent. Netflix Inc. has taken possession of its’ space, is in the process of building out its’ space and is scheduled to commence paying rent in March 2021. J2 Enterprises LTD. is expected to complete its’ renovation in December 2020. Northwell Health and Neistein Plastic Surgery have taken possession of their space and are scheduled to begin paying rent in December 2020. |
| (4) | UW figures are based on the underwritten rent roll dated as of October 1, 2020 which accounts for all executed leases (whether or not tenants are in occupancy and/or have commenced paying rent with rent steps underwritten through July 2021. For avoidance of doubt, no COVID-19 specific adjustments have been incorporated into the lender underwriting. |
| (5) | For a full description of Escrows and Reserves, please refer to “Escrows and Reserves” below. |
THE INFORMATION IN THIS STRUCTURAL AND COLLATERAL TERM SHEET IS NOT COMPLETE AND MAY BE AMENDED PRIOR TO THE TIME OF SALE. THIS TERM SHEET IS NOT AN OFFER TO SELL THESE SECURITIES AND IT IS NOT A SOLICITATION OF AN OFFER TO BUY THESE SECURITIES IN ANY JURISDICTION WHERE THE OFFER OR SALE IS NOT PERMITTED.
| | 56 of 144 | | |
| Structural and Collateral Term Sheet | Benchmark 2020-B20 |
| 4 West 58th Street | |
| (6) | All NOI, NCF and occupancy information, as well as the appraised value, were determined prior to the emergence of the novel coronavirus pandemic, and the economic disruption resulting from measures to combat the pandemic, and all DSCR, LTV and Debt Yield metrics were calculated, and the 4 West 58th Street loan was underwritten, based on such prior information. See “Risk Factors—Risks Related to Market Conditions and Other External Factors—Coronavirus Pandemic Has Adversely Affected the Global Economy and Will Likely Adversely Affect the Performance of the Mortgage Loans” in the Preliminary Prospectus. |
The Loan. The 4 West 58th Street mortgage loan (the “4 West 58th Street Loan”) is part of a whole loan with an aggregate outstanding principal balance as of the Cut-off Date of $125.0 million (the “4 West 58th Street Whole Loan”), secured by the borrowers’ fee simple and leasehold interests in an approximately 83,537 square foot Class A, multi-tenant, office and retail building located in New York, New York. The controlling Note A-1, with an outstanding principal balance as of the Cut-off Date of $62.5 million, will be included in the Benchmark 2020-B20 trust. The remaining notes have been, or are expected to be, contributed to one or more future securitization trusts. The relationship between the holders of the 4 West 58th Street Whole Loan is governed by a co-lender agreement as described under “Description of the Mortgage Pool—The Whole Loans—The Serviced Pari Passu Whole Loans” in the Preliminary Prospectus. The 4 West 58th Street Whole Loan has a 10-year term and will be interest-only for the term of the loan.
| Whole Loan Summary | ||||
| Note | Original Balance | Cut-off Date Balance | Note Holder | Controlling Piece |
| Note A-1 | $62,500,000 | $62,500,000 | Benchmark 2020-B20 | Yes |
| Note A-2 | $37,500,000 | $37,500,000 | JPMCB(1) | No |
| Note A-3 | $25,000,000 | $25,000,000 | JPMCB(1) | No |
| Whole Loan | $125,000,000 | $125,000,000 | ||
| (1) | Expected to be contributed to one or more future securitization transactions. |
The Borrowers. The borrowers are Ulysses Co. II, L.L.C., and Solow Building Company III, L.L.C., each a Delaware limited liability company (collectively, the “Borrowers”), with two independent directors in their organizational structures.
The Loan Sponsor. Sheldon H. Solow is the loan sponsor and non-recourse carveout guarantor. Sheldon H. Solow, who is the founder and CEO of Solow Building Company L.L.C. (“Solow Building Company”), has been an owner and developer of residential and commercial properties in New York for over 50 years. Solow Building Company is a Manhattan-based real estate company specializing in design, construction and property management for commercial and residential properties. Founded in 1965, Solow Building Company has a real estate portfolio comprised of buildings throughout Manhattan. Sheldon Solow’s holdings include 9 West 57th Street, a 50-story black glass office tower with views of Central Park, which is located adjacent to the 4 West 58th Street property. Mr. Solow’s residential portfolio includes One and Two Sutton Place North and the Solow Townhouses in the Upper East Side.
The Property. The 4 West 58th Street property is a 14-story, 83,537 square foot mixed-use building located in New York, New York. The property is located on 58th Street between 5th Avenue and 6th Avenue and is situated across from the Plaza, on the southwest corner of the Grand Army Plaza with unobstructed views of Central Park. The property is divided between 11 stories of office, retail and theater space located on the ground-floor. As of October 1, 2020 the retail and office components are 100.0% leased. The property benefits from various nearby attractions and amenities, including Central Park, Rockefeller Center, Radio Music Hall, Columbus Circle, and the Museum of Modern Art. Additionally, the property is known for its desirable location in the Plaza District, as it is located on “Billionaire’s Row” and is adjacent to Bergdorf Goodman’s flagship store. The 4 West 58th Street property was originally constructed in 1948 and was home to the Paris Theater for over 70 years until August 2019. Since 2016, the property has undergone approximately $16.9 million in renovations and upgrades between landlord work and tenant improvements, of which approximately $11.6 million was invested in the build-out of the Neiman Marcus space. In March of 2020, the Borrowers began a comprehensive base building renovation of the space previously occupied by the Paris Theater. During this time, $1.5 million of base building improvements were made by the Borrowers for various improvements to HVAC systems, electrical equipment, sprinklers and safety equipment. The Borrowers delivered the space to Netflix in September of 2020, at which point Netflix began tenant specific buildout of its’ space. Netflix is expected to re-open in July 2021.
As of October 1, 2020, the 4 West 58th Street property is 100.0% leased to a diverse roster of nine tenants. There are three designated retail tenants and six office tenants. The tenants have a weighted average remaining lease term of approximately 10.94 years. Despite occupying approximately 23.8% of net rentable area, retail tenants will account for approximately 52.9% of underwritten base rent which is largely driven by the Netflix rent. Since November of 2019, the Borrowers have completed 34,121 square feet of new leases at the 4 West 58th Street property, of which 10,651 square feet is attributable to retail space and 23,470 square feet is attributable to office space. Each medical office tenant at the 4 West 58th Street property occupies their own floor with views of Central Park.
The largest tenant, The Neiman Marcus Group LLC. (“Neiman Marcus”), (40,170 square feet; 48.1% of net rentable area; 28.6% of underwritten base rent), is an American chain of luxury department stores owned by the Neiman Marcus Group, headquartered in Dallas, Texas. Founded in 1907, the retail company offers women's and men's apparel, handbags, shoes, cosmetics, jewelry, and home decoration products, serving customers worldwide. Neiman Marcus occupies space across six floors and has been at the property for
THE INFORMATION IN THIS STRUCTURAL AND COLLATERAL TERM SHEET IS NOT COMPLETE AND MAY BE AMENDED PRIOR TO THE TIME OF SALE. THIS TERM SHEET IS NOT AN OFFER TO SELL THESE SECURITIES AND IT IS NOT A SOLICITATION OF AN OFFER TO BUY THESE SECURITIES IN ANY JURISDICTION WHERE THE OFFER OR SALE IS NOT PERMITTED.
| | 57 of 144 | | |
| Structural and Collateral Term Sheet | Benchmark 2020-B20 |
| 4 West 58th Street | |
almost four years. The property serves as an extension of its’ flagship Berdorf Goodman store located on 5th Avenue and is interconnected to the store on five floors. Employees can walk seamlessly between the two buildings. Neiman Marcus utilizes the space for offices tailoring/alteration and excess inventory storage. Neiman Marcus executed a lease in September of 2016, which expires in February of 2033. Neiman Marcus filed for bankruptcy under chapter 11 of the Bankruptcy Code on May 7, 2020, and subsequently emerged from bankruptcy on September 25, 2020. As part of the bankruptcy filing, Neiman Marcus assumed its lease at the 4 West 58th Street property and is current with respect to all contractual rent obligations. When Neiman Marcus filed bankruptcy, this caused a Tenant Trigger Event (as defined below) pursuant to the terms set forth in the loan agreement and excess cash flow since May has been deposited in an excess cash flow reserve. The excess cash flow reserve account has a current balance as of October 1, 2020 of $1,341,385.
The second largest tenant, Netflix Inc. (“Netflix”) (10,651 square feet, 12.8% of net rentable area, 47.3% of underwritten base rent), is an internet subscription service company, providing movies and television episodes via the internet and mail. Founded in 1997, Netflix has become a leading internet streaming company, distributing movies and TV shows in a variety of genres and languages to over 167 million monthly paid subscribers in more than 190 countries as of January 2020. Netflix will keep the name Paris Theater and will utilize the space as an entertainment venue for movie screenings, grand openings and “red-carpet” events as well as media launches and theatrical releases of its movies. The Netflix space was delivered to the tenant in September 2020 with a rent commencement date in March 2021. The Netflix lease expires in December 2030 and has four, five-year renewal options.
The third largest tenant, J2 Enterprises LTD. (“J2 Enterprises”) (6,121 square feet; 7.3% of net rentable area; 3.3% of underwritten base rent), is an American restaurant business. J2 Enterprises will be opening a 6,121 square foot restaurant at the 4 West 58th Street property upon the completion of renovations. 604 square feet of storage space is in the basement and the remaining 5,517 square feet is on the mezzanine level. The J2 Enterprises lease expires in July 2028.
COVID-19 Update. As of October 1, 2020, the 4 West 58th Street property is open for operations. As of October 1 2020, the 4 West 58th Street Loan is not subject to any modification or forbearance requests. The table below outlines the current status with respect to all tenants at the property according to communications from the borrower sponsor as of October 6, 2020. See “Risk Factors—Risks Related to Market Conditions and Other External Factors—Current Coronavirus Pandemic May Adversely Affect the Global Economy and the Performance of the Mortgage Loans”.
| Tenant Specific - COVID Update | ||||
Tenant | NRA | % of NRA |
% of UW Base Rent | Commentary |
| Neiman Marcus | 40,170 | 48.1% | 28.6% | Current |
Netflix Inc.
| 10,651
| 12.8%
| 47.3%
| New Lease executed; Netflix took possession of the space in September 2020, rather than the anticipated date in July 2020 due to COVID; Rent commencement date delayed from January 2021 to March 2021. |
| J2 Enterprises | 6,121 | 7.3% | 3.3% | Restaurant renovation delayed due to COVID expected to be completed in December 2020; |
| Tenant is not currently paying rent and has requested rent forgiveness. | ||||
| Northwell Health | 5,174 | 6.2% | 4.2% | Tenant is currently in occupancy with an expected rent commencement date in December 2020. |
| Union Sq. Dermatology | 5,174 | 6.2% | 4.1% | Current. |
| EBS Enterprises | 5,174 | 6.2% | 4.0% | Current. |
| Neistein Plastic Surgery | ||||
| PLLC | 3,974 | 4.8% | 3.1% | New lease, Tenant in occupancy; rent commencement date in December 2020. |
| Navaderm Partners(4) | 3,974 | 4.8% | 3.1% | Current |
| PP North America US Inc. | 3,125 | 3.7% | 2.4% | Tenant in occupancy; Tenant is not currently paying rent and has requested rent forgiveness. |
See “Risk Factors—Risks Related to Market Conditions and Other External Factors—Current Coronavirus Pandemic May Adversely Affect the Global Economy and the Performance of the Mortgage Loans”.
The Market. The 4 West 58th Street property is located in the heart of the Plaza District in Manhattan, New York in the Plaza District office submarket within the New York office market. The boundaries of the 4 West 58th Street property’s immediate area are the Plaza Hotel and Central Park to the north, Midtown Manhattan to the south, Bergdorf Goodman to the east and 9 West 57th Street to the west. New York City’s largest employers include a diverse group of multinational corporations representing a variety of industries including healthcare, financial services, retail and education. Forty-six of the nation’s Fortune 500 corporations are headquartered in New York City including Verizon, J.P. Morgan Chase, Citigroup, MetLife, American International Group, Morgan Stanley, New York Life Insurance, Goldman Sachs Group, TIAA, American Express and Time Warner. According to CoStar, the estimated 2020 population within a one-, three- and five-mile radius of the 4 West 58th Street property was 194,480, 1,311,499 and 2,780,233, respectively. Additionally, according to CoStar, the estimated 2020 median household income within a one-, three- and five-mile radius of the 4 West 58th Street property was $129,370, $100,187 and $83,691, respectively.
THE INFORMATION IN THIS STRUCTURAL AND COLLATERAL TERM SHEET IS NOT COMPLETE AND MAY BE AMENDED PRIOR TO THE TIME OF SALE. THIS TERM SHEET IS NOT AN OFFER TO SELL THESE SECURITIES AND IT IS NOT A SOLICITATION OF AN OFFER TO BUY THESE SECURITIES IN ANY JURISDICTION WHERE THE OFFER OR SALE IS NOT PERMITTED.
| | 58 of 144 | | |
| Structural and Collateral Term Sheet | Benchmark 2020-B20 |
| 4 West 58th Street | |
According to CoStar, as of the third quarter of 2020, the New York office market consisted of approximately 945.7 million square feet of office space with an overall market vacancy of 9.5% and average market rents of approximately $58.32 per square foot. Tech tenants are a major driver of leasing activity as one of the few sectors still adding headcounts, as witnessed by notable expansions from companies in 2019. Approximately 66.6 million people visited New York City in 2019, while Central Park draws approximately 37.5 million visitors annually. The 4 West 58th Street property also benefits from its proximity to the many transportation alternatives. There are 12 different subway lines that have stops in the area encompassed by Eighth Avenue, Fifth Avenue, 57th Street and Central Park South, including a shuttle train that provides access to Grand Central Terminal. Additionally, Penn Station is located approximately 1.6 miles away from the 4 West 58th Street property and LaGuardia Airport is approximately 6.7 miles away.
The 4 West 58th Street property is located in the Plaza District office submarket in the New York office market. The Plaza District office submarket is the largest office submarket in the nation. According to CoStar, as of the third quarter of 2020, the Plaza District office submarket included over 89.5 million square feet of office space with a total vacancy rate of 11.3% and average market rents of $92.06 per square foot. The 4 West 58th Street property is located adjacent to 9 West 57th Street, a 50-story black glass office tower owned by the borrower sponsor and has convenient access to Central Park. The submarket benefits from its geographically central location, highway access, proximity to LaGuardia Airport, John F. Kennedy Airport and Newark Airport, as well as various trains and highways.
The appraisal identified six comparable office leases across the Plaza District office submarket. Base rents at the comparable properties ranged from $87.38 to $97.40 per square foot with a weighted average rent of approximately $92.40 per square foot. The appraisal identified six comparable medical office leases across the Plaza District office submarket. Base rents at the comparable properties ranged from $88.06 to $98.01 per square foot with a weighted average rent of approximately $93.49 per square foot. The concluded market rent for the six office tenants at the 4 West 58th Street property ranges from $90.00 to $100 per square foot for office and medical office tenants, which is higher than the 4 West 58th Street property’s underwritten in-place weighted average office rent of $86.81 per square foot.
The following table presents certain information relating to the appraisal’s market rent conclusion for the 4 West 58th Street property:
| Appraisal Concluded Market Rent PSF(1) | ||||
| Tenant Type | Retail/Theater | Floors 3-8 | Floors 9-13 | PH |
| Office | NAP | $90.00 | $95.00 | $105.00 |
| Theater | $473.00 | NAP | NAP | NAP |
| Retail | $75.00 | NAP | NAP | NAP |
| (1) | Based on the Appraisal. |
Historical and Current Occupancy(1) | |||
| 2017 | 2018 | 2019 | Current(2)(3) |
| 79.6% | 73.2% | 76.7% | 100.0% |
| (1) | Historical Occupancies are as of December 31 of each respective year. |
| (2) | Current Occupancy is as of October 1, 2020. Current Occupancy is inclusive of Netflix Inc., J2 Enterprises LTD., Northwell Health, Neistein Plastic Surgery and PP North America US Inc. all of which have executed their respective leases and/or taken possession of their space but are not yet in occupancy and/or paying rent. Netflix Inc. has taken possession of its’ space, is in the process of building out its’ space and is scheduled to commence paying rent in March 2021. J2 Enterprises LTD. is expected to complete renovations in December 2020. Northwell Health and Neistein Plastic Surgery have taken possession of their space and are scheduled to begin paying rent in December 2020. |
THE INFORMATION IN THIS STRUCTURAL AND COLLATERAL TERM SHEET IS NOT COMPLETE AND MAY BE AMENDED PRIOR TO THE TIME OF SALE. THIS TERM SHEET IS NOT AN OFFER TO SELL THESE SECURITIES AND IT IS NOT A SOLICITATION OF AN OFFER TO BUY THESE SECURITIES IN ANY JURISDICTION WHERE THE OFFER OR SALE IS NOT PERMITTED.
| | 59 of 144 | | |
| Structural and Collateral Term Sheet | Benchmark 2020-B20 |
| 4 West 58th Street | |
| Tenant Summary(1) | ||||||||
Tenant | Tenant Type | Ratings Fitch/S&P/Moody’s(2) | Net Rentable Area (SF) | % of | Base Rent PSF(3) | % of Total | Lease Expiration | |
| Total NRA | Base Rent(3) | |||||||
| Neiman Marcus | Office | NR / NR / NR | 40,170 | 48.10% | $83.50 | 28.60% | 2/28/2033 | |
| Netflix | Theater | NR / BB / Ba3 | 10,651 | 12.80% | $521.08 | 47.30% | 12/31/2030 | |
| J2 Enterprises | Retail | NR / NR / NR | 6,121 | 7.30% | $62.69 | 3.30% | 7/31/2028 | |
| Northwell Health | Office | NR / NR / NR | 5,174 | 6.20% | $95.00 | 4.20% | 5/31/2030 | |
| Union Sq. Dermatology | Office | NR / NR / NR | 5,174 | 6.20% | $92.25 | 4.10% | 3/31/2035 | |
| EBS Enterprises | Office | NR / NR / NR | 5,174 | 6.20% | $90.00 | 4.00% | 1/31/2030 | |
| Neistein Plastic Surgery PLLC | Office | NR / NR / NR | 3,974 | 4.80% | $93.00 | 3.10% | 7/30/2030 | |
| Navaderm Partners(4) | Office | NR / NR / NR | 3,974 | 4.80% | $92.25 | 3.10% | 11/30/2029 | |
| PP North America US Inc. | Retail(5) | NR / NR / NR | 3,125 | 3.70% | $88.50 | 2.40% | 9/30/2023 | |
| Total Occupied Space | 83,537 | 100.00% | ||||||
| Vacant | 0 | 0.00 | ||||||
| Total / Wtd. Avg. | 83,537 | 100.00% | $140.48 | 100.00% | ||||
| (1) | Based on the underwritten rent roll dated October 1, 2020. |
| (2) | Certain ratings are those of the parent company whether or not the parent company guarantees the lease. |
| (3) | Base Rent PSF and % of Total Base Rent is inclusive of contractual rent steps through July 2021. |
| (4) | Navaderm Partners has the right to terminate its lease on November 21, 2026, with nine months’ prior written notice and a termination fee equal to the unamortized amounts of brokerage commissions, rent abatements and landlord work costs related to such space. |
| (5) | PP North America is located on the 14th floor and would typically be utilized as office space but is currently utilized as retail/showroom space. |
| Lease Rollover Schedule(1)(2) | |||||||||
Year | Number | Net | % of NRA Expiring | Base Rent | % of Base | Cumulative |
Cumulative | Cumulative Base | Cumulative % of Base Rent Expiring |
| Vacant | NAP | 0 | 0.0% | NAP | NAP | 0 | 0.0% | NAP | NAP |
| 2020 & MTM | 0 | 0 | 0.0% | $0 | 0.0% | 0 | 0.0% | $0 | 0.0% |
| 2021 | 0 | 0 | 0.0% | 0 | 0.0% | 0 | 0.0% | $0 | 0.0% |
| 2022 | 0 | 0 | 0.0% | 0 | 0.0% | 0 | 0.0% | $0 | 0.0% |
| 2023 | 1 | 3,125 | 3.7% | 276,563 | 2.4% | 3,125 | 3.7% | $276,563 | 2.4% |
| 2024 | 0 | 0 | 0.0% | 0 | 0.0% | 3,125 | 3.7% | $276,563 | 2.4% |
| 2025 | 0 | 0 | 0.0% | 0 | 0.0% | 3,125 | 3.7% | $276,563 | 2.4% |
| 2026 | 0 | 0 | 0.0% | 0 | 0.0% | 3,125 | 3.7% | $276,563 | 2.4% |
| 2027 | 0 | 0 | 0.0% | 0 | 0.0% | 3,125 | 3.7% | $276,563 | 2.4% |
| 2028 | 1 | 6,121 | 7.3% | 383,721 | 3.3% | 9,246 | 11.1% | $660,283 | 5.6% |
| 2029 | 1 | 3,974 | 4.8% | 366,602 | 3.1% | 13,220 | 15.8% | $1,026,885 | 8.8% |
| 2030 | 4 | 24,973 | 29.9% | 6,876,795 | 58.6% | 38,193 | 45.7% | $7,903,680 | 67.4% |
| 2031 and Thereafter | 2 | 45,344 | 54.3% | 3,831,497 | 32.6% | 83,537 | 100.0% | $11,735,176 | 100.0% |
| Total | 9 | 83,537 | 100.0% | $11,735,176 | 100.0% | ||||
| (1) | Based on the underwritten rent roll dated October 1, 2020. |
| (2) | Certain tenants may have termination or contraction options (which may become exercisable prior to the originally stated expiration date of the tenant lease) that are not considered in the above Lease Rollover Schedule. |
| (3) | Base Rent Expiring and % of Base Rent Expiring is inclusive of contractual rent steps through July 2021. |
THE INFORMATION IN THIS STRUCTURAL AND COLLATERAL TERM SHEET IS NOT COMPLETE AND MAY BE AMENDED PRIOR TO THE TIME OF SALE. THIS TERM SHEET IS NOT AN OFFER TO SELL THESE SECURITIES AND IT IS NOT A SOLICITATION OF AN OFFER TO BUY THESE SECURITIES IN ANY JURISDICTION WHERE THE OFFER OR SALE IS NOT PERMITTED.
| | 60 of 144 | | |
| Structural and Collateral Term Sheet | Benchmark 2020-B20 |
| 4 West 58th Street | |
Underwritten Net Cash Flow | |||||||
| 2017 | 2018 | 2019 | TTM(1) | Underwritten | Per Square Foot | %(2) | |
| Base Rent(3) | $4,427,725 | $4,152,921 | $5,462,283 | $6,926,217 | $11,735,176 | $140.48 | 93.8% |
| Vacant Income | 0 | 0 | 0 | 0 | 0 | $0.00 | 0.0% |
| Gross Potential Rent | $4,427,725 | $4,152,921 | $5,462,283 | $6,926,217 | $11,735,176 | $140.48 | 93.8% |
| Total Reimbursements | 656,091 | $702,970 | 707,741 | 824,698 | 769,704 | $9.21 | 6.2% |
| Net Rental Income | $5,083,816 | $4,855,891 | $6,170,024 | $7,750,915 | $12,504,880 | $149.69 | 100.0% |
| (Vacancy / Credit Loss) | 0 | 0 | 0 | 0 | (625,244) | ($7.48) | (5.0%) |
| Other Income | (178,738) | 21,606 | (541,760) | 146,779 | 63,750 | $0.76 | 0.5% |
| Effective Gross Income | $4,905,078 | $4,877,497 | $5,628,265 | $7,879,694 | $11,943,386 | $142.97 | 95.5% |
| Total Expenses | $1,996,939 | $1,903,193 | $2,057,287 | $3,378,556 | $2,701,328 | $32.34 | 22.6% |
| Net Operating Income(4) | $2,908,139 | $2,974,304 | $3,570,977 | $4,519,138 | $9,242,058 | $110.63 | 77.4% |
| Total TI/LC, CapEx | 0 | 0 | 0 | 0 | 182,111 | $2.18 | 1.5% |
| Net Cash Flow | $2,908,139 | $2,974,304 | $3,570,977 | $4,519,138 | $9,059,948 | $108.45 | 75.9% |
| (1) | TTM column represents the trailing 12-month period ending June 30, 2020. |
| (2) | % column represents percent of Net Rental Income for all revenue lines and represents percent of Effective Gross Income for the remainder of the fields. |
| (3) | Base Rent is inclusive of contractual rent steps through July 2021. |
| (4) | The increase in Underwritten NOI from 2018 NOI is primarily attributable to six of the nine tenants accounting for 40.8% of net rentable area and 65.8% of underwritten base rent taking occupancy between 2018 and July 2020. |
Property Management. The 4 West 58th Street property is managed by Solow Management Corp., a New York corporation, and an affiliate of the Borrowers.
Escrows and Reserves. At loan origination, the Borrowers deposited (i) approximately $91,175 into a real estate tax reserve, (ii) $4,669 into an insurance reserve, (iii) $7,811,435 into an outstanding TI/LC reserve, and (iv) $5,799,156 into an outstanding free rent reserve in connection with six leases.
Tax Reserve. The Borrowers are required to deposit into a real estate tax reserve, on a monthly basis, 1/12 of the estimated annual real estate taxes (which currently equates to $91,175).
Insurance Reserve. The Borrowers are required to deposit into an insurance reserve, on a monthly basis, 1/12 of estimated insurance premiums (which currently equates to $4,669).
TI/LC Reserve. The Borrowers are required to deposit into the TI/LC reserve, on a monthly basis, $13,932 ($2.00 per square foot per annum), subject to a cap of $835,920.
Replacement Reserve. The Borrowers are required to deposit into the replacement reserve, on a monthly basis, $1,392 (which is based on $0.20 per rentable square foot per annum), subject to a cap of $33,408.
Lockbox / Cash Management. The 4 West 58th Street Whole Loan is structured with a hard lockbox and springing cash management. The Borrowers were required at origination to deliver tenant direction letters instructing all tenants to deposit rents into a lender controlled lockbox account. So long as no Trigger Period (as defined below) then exists, all funds deposited into the lockbox account are required to be transferred within one business day to or at the direction of the Borrowers. During the continuance of a Trigger Period, all funds on deposit in the lockbox account are required to be transferred to the cash management account on a daily basis, at which point, following payment of taxes and insurance, debt service, required reserves and operating expenses, all funds are required to be deposited into the excess cash flow reserve, to be held and disbursed in accordance with the terms of the loan documents. During the continuance of an event of default, the lender may apply such funds in such order and priority as the lender determines. The lender has been granted a first priority security interest in the cash management account. As a result of the bankruptcy action of Neiman Marcus in May 2020, the 4 West 58th Street Whole Loan is currently in a Trigger Period as detailed below. The excess cash flow reserve account has a current balance as of October 1, 2020 of $1,341,385
“Trigger Period” means each period commencing on the occurrence of a Trigger Event (as defined below) and continuing until the earlier of (i) the payment date next occurring following the related Trigger Event Cure (as defined below), or (ii) payment in full of all principal and interest on the 4 West 58th Street Whole Loan and all other amounts payable under the loan documents.
A “Trigger Event” means the occurrence of (i) an event of default, (ii) any bankruptcy action of the Borrowers or property manager, (iii) a DSCR Trigger Event (as defined below) or (iv) a Tenant Trigger Event (as defined below).
THE INFORMATION IN THIS STRUCTURAL AND COLLATERAL TERM SHEET IS NOT COMPLETE AND MAY BE AMENDED PRIOR TO THE TIME OF SALE. THIS TERM SHEET IS NOT AN OFFER TO SELL THESE SECURITIES AND IT IS NOT A SOLICITATION OF AN OFFER TO BUY THESE SECURITIES IN ANY JURISDICTION WHERE THE OFFER OR SALE IS NOT PERMITTED.
| | 61 of 144 | | |
| Structural and Collateral Term Sheet | Benchmark 2020-B20 |
| 4 West 58th Street | |
A “DSCR Trigger Event” means the debt service coverage ratio of the 4 West 58th Street Whole Loan (as calculated in accordance with the loan documents) based on underwritten net cash flow on a trailing three-month basis as of the date of determination is less than 1.50x.
A “Tenant Trigger Event” means that (i) Neiman Marcus or Netflix goes dark or sublets, vacates or abandons 50% or more of the premises demised to Neiman Marcus or the premises demised to Netflix, as applicable, (ii) Neiman Marcus or Netflix defaults under their respective leases, beyond any notice and cure periods, (iii) a bankruptcy action of Neiman Marcus or Netflix occurs, or (iv) Netflix gives notice of non-renewal, notice of termination, or does not renew the Netflix lease prior to 18 months prior to the expiration date or renewal period required under the Netflix lease.
A “Trigger Event Cure” means if the Trigger Event is caused solely by (a) the occurrence of a DSCR Trigger Event, the achievement of the a debt service coverage ratio, as reasonably determined by the lender based on underwritten net cash flow on a trailing three-month basis, of at least 1.50x for two consecutive calendar quarters, (b) an event of default, the acceptance by the lender of a cure of such event of default (which cure the lender may reject or accept in its sole discretion), (c) the bankruptcy or insolvency of the property manager, the Borrowers replacing such manager with a qualified manager (as fully described in the 4 West 58th Street Whole Loan documents) under a replacement management agreement in accordance with the terms under the 4 West 58th Street Whole Loan documents within 60 days or (d) a Tenant Trigger Event, the replacement of Neiman Marcus or Netflix, as applicable, with one or more replacement tenant(s) pursuant to one or more lease(s) entered into in accordance with the 4 West 58th Street Whole Loan documents; provided, however, that such Trigger Event Cure set forth in this definition will be subject to the following conditions, (i) all other Trigger Events that have occurred have been cured, (ii) the Borrowers have paid all of the lender’s reasonable expenses incurred in connection with such Trigger Event Cure including reasonable attorneys’ fees and expenses and (iii) the Borrowers have the right two (2) times in the aggregate to effect such Trigger Event Cure in any 12-month period. In no event will a Trigger Event Cure occur with respect to any Trigger Event caused in whole or in part by the bankruptcy or insolvency of the Borrowers.
Future Mezzanine or Subordinate Indebtedness Permitted. Certain direct and indirect owners of the Borrowers have the right to obtain a future mezzanine loan provided, among other conditions listed in the 4 West 58th Street Whole Loan documents, (a) the loan-to-value ratio for the total debt stack inclusive of the 4 West 58th Street mezzanine loan is no greater than a 69.4% combined loan-to-value ratio and (b) the debt service coverage ratio for the total debt stack inclusive of the 4 West 58th Street Whole Loan, is no less than 1.50x.
Partial Release. None.
THE INFORMATION IN THIS STRUCTURAL AND COLLATERAL TERM SHEET IS NOT COMPLETE AND MAY BE AMENDED PRIOR TO THE TIME OF SALE. THIS TERM SHEET IS NOT AN OFFER TO SELL THESE SECURITIES AND IT IS NOT A SOLICITATION OF AN OFFER TO BUY THESE SECURITIES IN ANY JURISDICTION WHERE THE OFFER OR SALE IS NOT PERMITTED.
| | 62 of 144 | | |
| Structural and Collateral Term Sheet | Benchmark 2020-B20 |
| Northern Trust Office | |

THE INFORMATION IN THIS STRUCTURAL AND COLLATERAL TERM SHEET IS NOT COMPLETE AND MAY BE AMENDED PRIOR TO THE TIME OF SALE. THIS TERM SHEET IS NOT AN OFFER TO SELL THESE SECURITIES AND IT IS NOT A SOLICITATION OF AN OFFER TO BUY THESE SECURITIES IN ANY JURISDICTION WHERE THE OFFER OR SALE IS NOT PERMITTED.
| | 63 of 144 | | |
| Structural and Collateral Term Sheet | Benchmark 2020-B20 |
| Northern Trust Office | |

THE INFORMATION IN THIS STRUCTURAL AND COLLATERAL TERM SHEET IS NOT COMPLETE AND MAY BE AMENDED PRIOR TO THE TIME OF SALE. THIS TERM SHEET IS NOT AN OFFER TO SELL THESE SECURITIES AND IT IS NOT A SOLICITATION OF AN OFFER TO BUY THESE SECURITIES IN ANY JURISDICTION WHERE THE OFFER OR SALE IS NOT PERMITTED.
| | 64 of 144 | | |
| Structural and Collateral Term Sheet | Benchmark 2020-B20 |
| Northern Trust Office | |
| Mortgage Loan Information | Property Information | |||
| Mortgage Loan Seller: | CREFI | Single Asset / Portfolio: | Single Asset | |
| Original Principal Balance: | $40,400,000 | Title: | Fee | |
| Cut-off Date Principal Balance: | $40,400,000 | Property Type - Subtype: | Office – CBD | |
| % of Pool by IPB: | 4.5% | Net Rentable Area (SF): | 149,371 | |
| Loan Purpose: | Refinance | Location: | Tempe, AZ | |
| Borrower: | Cello Property Arizona, L.L.C. | Year Built / Renovated: | 2015 / N/A | |
| Loan Sponsor: | The Richard L. Adams, Jr. Trust | Occupancy: | 100.0% | |
| Interest Rate: | 3.56000% | Occupancy Date: | 10/1/2020 | |
| Note Date: | 9/30/2020 | Number of Tenants: | 1 | |
| Maturity Date: | 10/1/2027 | 2017 NOI: | N/A | |
| Interest-only Period: | 84 months | 2018 NOI: | $2,802,816 | |
| Original Term: | 84 months | 2019 NOI: | $3,452,425 | |
| Original Amortization: | None | TTM NOI (as of 4/2020): | $3,640,318 | |
| Amortization Type: | Interest Only | UW Economic Occupancy: | 97.8% | |
| Call Protection: | L(24),Def(55),O(5) | UW Revenues: | $5,497,638 | |
| Lockbox / Cash Management: | Hard / Springing | UW Expenses: | $1,709,554 | |
| Additional Debt: | N/A | UW NOI(2): | $3,788,084 | |
| Additional Debt Balance: | N/A | UW NCF(2): | $3,758,210 | |
| Additional Debt Type: | N/A | Appraised Value / Per SF(2): | $64,500,000 / $432 | |
| Appraisal Date: | 5/12/2020 | |||
| Escrows and Reserves(1) | Financial Information(2) | |||||
| Initial | Monthly | Initial Cap | Cut-off Date Loan / SF: | $270 | ||
| Taxes: | $0 | Springing | N/A | Maturity Date Loan / SF: | $270 | |
| Insurance: | $0 | Springing | N/A | Cut-off Date LTV: | 62.6% | |
| Replacement Reserves: | $0 | Springing | N/A | Maturity Date LTV: | 62.6% | |
| TI/LC: | $0 | Springing | N/A | UW NCF DSCR: | 2.58x | |
| UW NOI Debt Yield: | 9.4% | |||||
| Sources and Uses | |||||
| Sources | Proceeds | % of Total | Uses | Proceeds | % of Total |
| Loan Amount | $40,400,000 | 100.0% | Payoff Existing Debt | $38,076,000 | 94.2% |
| Return of Equity | 2,180,972 | 5.4 | |||
| Closing Costs | 143,028 | 0.4 | |||
| Total Sources | $40,400,000 | 100.0% | Total Uses | $40,400,000 | 100.0% |
| (1) | For a full description of Escrows and Reserves, please refer to “Escrows and Reserves” herein. |
| (2) | While the Northern Trust Office Loan (as defined below) was originated after the emergence of the novel coronavirus pandemic and the economic disruption resulting from measures to combat the pandemic, the pandemic is an evolving situation and could impact the Northern Trust Office Loan more severely than assumed in the underwriting of the Northern Trust Office Loan and could adversely affect the NOI, NCF and occupancy information, as well as the appraised value and the DSCR, LTV and Debt Yield metrics presented above. See “Risk Factors— Risks Related to Market Conditions and Other External Factors—Coronavirus Pandemic Has Adversely Affected the Global Economy and Will Likely Adversely Affect the Performance of the Mortgage Loans” in the Preliminary Prospectus. |
THE INFORMATION IN THIS STRUCTURAL AND COLLATERAL TERM SHEET IS NOT COMPLETE AND MAY BE AMENDED PRIOR TO THE TIME OF SALE. THIS TERM SHEET IS NOT AN OFFER TO SELL THESE SECURITIES AND IT IS NOT A SOLICITATION OF AN OFFER TO BUY THESE SECURITIES IN ANY JURISDICTION WHERE THE OFFER OR SALE IS NOT PERMITTED.
| | 65 of 144 | | |
| Structural and Collateral Term Sheet | Benchmark 2020-B20 |
| Northern Trust Office | |
The Loan. The Northern Trust Office mortgage loan is a $40.4 million loan (“Northern Trust Office Loan”) secured by the borrower’s fee simple interest in a 149,371 square foot office building in Tempe, Arizona (the “Northern Trust Office Property”). The Northern Trust Office Loan has a seven-year term and will be interest-only for its entire term. The Northern Trust Office Loan was originated by Citi Real Estate Funding Inc. (“CREFI”) on September 30, 2020.
The Borrower. The borrower is Cello Property Arizona, L.L.C. (“Northern Trust Office Borrower”), a Delaware limited liability company and single purpose entity with one independent director. Legal counsel to the borrower delivered a non-consolidation opinion in connection with the origination of the Northern Trust Office Loan.
The Loan Sponsor. The loan sponsor is The Richard L. Adams, Jr. Trust, which was established by Richard Adams for the benefit of his family. Mr. Adams is the founder of UUNET Technologies, which was one of the first commercial internet service provider in the United States. Mr. Adams has been involved in real estate acquisitions since the late 1990s. The carve out guarantor under the loan is The Richard L. Adams, Jr. Trust, which holds substantially all of the sponsor’s assets.
The Property. The Northern Trust Office Property is a three-story, Class A, 149,371 square foot office building located within the Discovery Business Campus in Tempe, Arizona. The improvements are situated on a 7.22-acre site. The single-tenant building was built in 2015 and is currently 100% leased to Northern Trust Corporation.
Northern Trust Corporation (“Northern Trust”) is the 3rd largest manager of defined benefit assets and sovereign wealth assets and has been in business for more than 130 years. They are a leader in core services such as wealth management, asset servicing, asset management, and banking. The firm has a total of $1.3 trillion assets under management (as of June 30, 2020) and a presence in 22 states in the U.S. and 22 international locations. While the property was built-to-suit for the Northern Trust Corporation, the floor plan was designed to service both single and multi-tenant configurations. Northern Trust Corporation is expected to occupy 450,000 square feet across three new buildings at Discovery Business Campus. Northern Trust Corporation has already extended its lease since originally signing in 2015 and has invested significant capital into the space, building out their 24/7 operations infrastructure. The tenant has two, five-year extension options and a one-time right to terminate their lease effective after October 31, 2031.
The Northern Trust Office Property is located within Tempe and Maricopa County, Arizona. It is part of the Phoenix-Mesa-Scottsdale metro area (“Phoenix MSA”). The Northern Trust Office Property is located within Discover Business Campus. Other major uses within the neighborhood include the Arizona State University Research Park, the Tempe Sports Complex, the Tempe Autoplex, and the Stellar Airpark (an airstrip combined with a residential community and business uses). Arizona State University is located in Tempe, with enrollment of over 100,000 students across 5 campuses (more than 50,000 students at the Tempe campus).
The Northern Trust Office Property is located within the South Tempe-Ahwatukee office submarket, which has an average vacancy rate of 12.2% with gross rents at $24.81 per square foot. The Northern Trust Office Property’s rent of $23.40 per square foot is below the average office rents in the submarket. Among similar properties in the submarket, the Northern Trust Office Property ranks at the top tier in terms of occupancy at 100.0% occupancy as of October 1, 2020.
The appraisal offers six comparable lease transactions to the Northern Trust Office Property. All but one of the comparable properties are triple net leases and all comparable properties are 100% occupied. The comparable properties range in size between 149,208 and 358,800 square feet, compared to the subject’s 149,371 square feet. Adjusted rental rates at the comparable properties range from $21.89 to $26.78 per square foot per year with an average of $24.02 per square foot, compared to the subject’s rental rate of $23.40 per square foot.
COVID-19 Update. The Northern Trust Office Property fully reopened on May 18, 2020 and employees have been going into the office since. There has been no rent relief requested and Northern Trust has paid rent each month. As of October 6, 2020, no loan modification or forbearance requests have been made on the Northern Trust Office Loan. The first payment date of the Northern Trust Office Loan is November 2020. See “Risk Factors—Risks Related to Market Conditions and Other External Factors—Current Coronavirus Pandemic May Adversely Affect the Global Economy and the Performance of the Mortgage Loans”.
THE INFORMATION IN THIS STRUCTURAL AND COLLATERAL TERM SHEET IS NOT COMPLETE AND MAY BE AMENDED PRIOR TO THE TIME OF SALE. THIS TERM SHEET IS NOT AN OFFER TO SELL THESE SECURITIES AND IT IS NOT A SOLICITATION OF AN OFFER TO BUY THESE SECURITIES IN ANY JURISDICTION WHERE THE OFFER OR SALE IS NOT PERMITTED.
| | 66 of 144 | | |
| Structural and Collateral Term Sheet | Benchmark 2020-B20 |
| Northern Trust Office | |
| Historical and Current Occupancy(1) | |||
| 2017 | 2018 | 2019 | Current(2) |
| N/A | 100.0% | 100.0% | 100.0% |
| (1) | Historical occupancies are as of December 31 of each respective year. |
| (2) | Current Occupancy is as of October 1, 2020. |
| Tenant Summary(1) | ||||||
| Tenant | Ratings Moody’s/Fitch/S&P(2) | Net Rentable Area (SF) | % of Total NRA | Base Rent PSF | % of Total Base Rent | Lease Expiration Date |
| Northern Trust Corporation | A2/A+/A+ | 149,371 | 100.0% | $23.40 | 100.0% | 3/31/2032 |
| Total Occupied | 149,371 | 100.0% | $23.40 | 100.0% | ||
| Vacant | 0 | 0.0 | ||||
| Total | 149,371 | 100.0% | ||||
(1) Based on the underwritten rent roll.
(2) In certain instances, ratings provided are those of the parent company of the entity shown, whether or not the parent company guarantees the lease.
Lease Rollover Schedule(1)(2)
| |||||||||
| Year | Number of Leases Expiring | Net Rentable Area Expiring | % of NRA Expiring | Base Rent Expiring | % of Base Rent Expiring | Cumulative Net Rentable Area Expiring | Cumulative % of NRA Expiring | Cumulative Base Rent Expiring | Cumulative % of Base Rent Expiring |
| Vacant | NAP | 0 | 0.0% | NAP | NAP | 0 | 0.0% | NAP | NAP |
| 2020 & MTM | 0 | 0 | 0.0 | $0 | 0.0% | 0 | 0.0% | $0 | 0.0% |
| 2021 | 0 | 0 | 0.0 | 0 | 0.0 | 0 | 0.0% | $0 | 0.0% |
| 2022 | 0 | 0 | 0.0 | 0 | 0.0 | 0 | 0.0% | $0 | 0.0% |
| 2023 | 0 | 0 | 0.0 | 0 | 0.0 | 0 | 0.0% | $0 | 0.0% |
| 2024 | 0 | 0 | 0.0 | 0 | 0.0 | 0 | 0.0% | $0 | 0.0% |
| 2025 | 0 | 0 | 0.0 | 0 | 0.0 | 0 | 0.0% | $0 | 0.0% |
| 2026 | 0 | 0 | 0.0 | 0 | 0.0 | 0 | 0.0% | $0 | 0.0% |
| 2027 | 0 | 0 | 0.0 | 0 | 0.0 | 0 | 0.0% | $0 | 0.0% |
| 2028 | 0 | 0 | 0.0 | 0 | 0.0 | 0 | 0.0% | $0 | 0.0% |
| 2029 | 0 | 0 | 0.0 | 0 | 0.0 | 0 | 0.0% | $0 | 0.0% |
| 2030 | 0 | 0 | 0.0 | 0 | 0.0 | 0 | 0.0% | $0 | 0.0% |
| 2031 and Thereafter | 1 | 149,371 | 100.0 | 3,495,281 | 100.0 | 149,371 | 100.0% | $3,495,281 | 100.0% |
| Total | 1 | 149,371 | 100.0% | $3,495,281 | 100.0% | ||||
(1) Based on the underwritten rent roll.
(2) Lease Rollover Schedule is based on the lease expiration dates of all direct leases in place.
THE INFORMATION IN THIS STRUCTURAL AND COLLATERAL TERM SHEET IS NOT COMPLETE AND MAY BE AMENDED PRIOR TO THE TIME OF SALE. THIS TERM SHEET IS NOT AN OFFER TO SELL THESE SECURITIES AND IT IS NOT A SOLICITATION OF AN OFFER TO BUY THESE SECURITIES IN ANY JURISDICTION WHERE THE OFFER OR SALE IS NOT PERMITTED.
| | 67 of 144 | | |
| Structural and Collateral Term Sheet | Benchmark 2020-B20 |
| Northern Trust Office | |
| Operating History and Underwritten Net Cash Flow | ||||||
| 2018 | 2019 | TTM(1) | Underwritten | Per Square Foot | %(2) | |
| Base Rent | $2,831,327 | $3,406,662 | $3,587,891 | $3,495,281 | $23.40 | 62.1% |
| Contractual Rent Steps(3) | 0 | 0 | 0 | 426,846 | 2.86 | 7.6 |
| Gross Potential Rent | $2,831,327 | $3,406,662 | $3,587,891 | $3,922,128 | $26.26 | 69.7% |
| Total Reimbursements | 1,327,337 | 1,527,807 | 1,582,764 | 1,702,054 | 11.39 | 30.3 |
| Total Other Income | 0 | 0 | 0 | 0 | 0.00 | 0.0 |
| Net Rental Income | $4,158,664 | $4,934,469 | $5,170,655 | $5,624,182 | $37.65 | 100.0% |
| (Vacancy/Credit Loss) | 0 | 0 | 0 | (126,544) | (0.85) | (2.3) |
| Effective Gross Income | $4,158,664 | $4,934,469 | $5,170,655 | $5,497,638 | $36.81 | 97.8% |
| Total Expenses | 1,355,848 | 1,482,044 | 1,530,337 | 1,709,554 | 11.45 | 31.1 |
| Net Operating Income | $2,802,816 | $3,452,425 | $3,640,318 | $3,788,084 | $25.36 | 68.9% |
| Total TI/LC, CapEx/RR | 0 | 0 | 0 | 29,874 | 0.20 | 0.5 |
| Net Cash Flow | $2,802,816 | $3,452,425 | $3,640,318 | $3,758,210 | $25.16 | 68.4% |
| (1) | TTM column represents the trailing 12-month period ending April 30, 2020. |
| (2) | % column represents percent of Net Rental Income for all revenue lines and represents percent of Effective Gross Income for the remainder of the fields. |
| (3) | Underwritten Contractual Rent Steps are taken as a present value of the rent steps through the end of the loan term. |
Property Management. The Northern Trust Office Property is managed by Wentworth Property Management, LLC.
Escrows and Reserves. At loan origination, the Northern Trust Office Borrower was not required to deposit any upfront reserves.
Tax Reserve – On each payment date, the borrower is required to deposit an amount equal to 1/12 of the estimated annual real estate taxes into a tax reserve account. The monthly tax reserve requirement will be waived if (i) no event of default is continuing (ii) the Specified Tenant’s (as defined below) lease is in full force and effect with no monetary defaults thereunder, (iii) the Specified Tenant continues to make the applicable payments for which the reserve was established directly (or reimburse the Northern Trust Office Borrower for such payments) and delivers evidence of the same, and (iv) the Specified Tenant is not bankrupt or insolvent (“Reserve Waiver Conditions”).
Insurance Reserve – On each payment date, the borrower is required to deposit an amount equal to 1/12 of the amount which would be sufficient to pay the insurance premiums due for the renewal of coverage into an insurance reserve account. The monthly insurance reserve requirement will be waived if (i) the Reserve Waiver Conditions are satisfied on such monthly payment.
Replacement Reserve – On each payment date during the continuance of a Trigger Period (as defined below), the borrower is required to deposit $2,490 into a replacement reserve account.
TI/LC Reserve – On each payment date during the continuance of a Trigger Period, the borrower is required to deposit $18,671 into a tenant improvement and leasing commissions reserve account.
Lockbox / Cash Management. The Northern Trust Office Loan is structured with a hard lockbox and springing cash management. The borrower is required to deliver a tenant direction letter to Northern Trust Corporation, the sole tenant at the Northern Trust Office Property directing it to remit its rent directly into the lender-controlled lockbox. The borrower is required to cause revenue received by the borrower or the property manager from the Northern Trust Office Property to be deposited into such lockbox within one business day of receipt. All funds deposited into the lockbox are required to be transferred on each business day to or at the direction of the borrower unless a Trigger Period exists. Upon the occurrence and during the continuance of a Trigger Period, all funds in the lockbox account are required to be swept on each business day to a cash management account under the control of the lender to be applied and disbursed in accordance with the Northern Trust Office Loan documents, and all excess cash flow funds remaining in the cash management account after the application of such funds in accordance with the Northern Trust Office Loan documents are required to be held by the lender in an excess cash flow reserve account as additional collateral for the Northern Trust Office Loan. Upon the cure of the applicable Trigger Period, so long as no other Trigger Period exists, the lender is required to return any amounts remaining on deposit in the excess cash flow reserve account to the borrower. Upon an event of default under the Northern Trust Office Loan documents, the lender will apply funds to the debt in such priority as it may determine.
A “Trigger Period” means a period commencing upon the earliest to occur of (i) an event of default beyond applicable notice and/or cure periods, and (ii) a Specified Tenant Trigger Period (as defined below), and expiring upon (a) with respect to clause (i) above, the cure (if applicable) of such event of default, (b) with respect to clause (ii) above, such Specified Tenant Trigger Period ceasing to exist.
THE INFORMATION IN THIS STRUCTURAL AND COLLATERAL TERM SHEET IS NOT COMPLETE AND MAY BE AMENDED PRIOR TO THE TIME OF SALE. THIS TERM SHEET IS NOT AN OFFER TO SELL THESE SECURITIES AND IT IS NOT A SOLICITATION OF AN OFFER TO BUY THESE SECURITIES IN ANY JURISDICTION WHERE THE OFFER OR SALE IS NOT PERMITTED.
| | 68 of 144 | | |
| Structural and Collateral Term Sheet | Benchmark 2020-B20 |
| Northern Trust Office | |
A “Specified Tenant” means, as applicable, (i) Northern Trust Corporation, (ii) any other tenants of the Specified Tenant space (or any portion thereof), and (iii) any parent company of any such Specified Tenant, and any affiliate providing credit support for, or guarantor of, any such Specified Tenant lease.
A “Specified Tenant Trigger Period” means a period (A) commencing upon the first to occur of (i) the Specified Tenant being in monetary or material non-monetary default, or not paying full unabated rent, beyond applicable notice and/or cure periods, (ii) the Specified Tenant providing written notice that it is terminating its lease or subleasing more than 33% of the Specified Tenant space, (iii) any termination or cancellation of the Specified Tenant lease (including, without limitation, rejection in any bankruptcy or similar insolvency proceeding), and/or any Specified Tenant lease failing to otherwise be in full force and effect, (iv) any bankruptcy or similar insolvency of the Specified Tenant, (v) the senior unsecured credit rating of the applicable Specified Tenant failing two notches below its level as of the origination date of the Northern Trust Office Loan, and (vi) Specified Tenant failing to be in actual, physical possession of the Specified Tenant space, and (B) expiring upon the first to occur of the lender’s receipt of evidence reasonably acceptable to lender of (1) the satisfaction of the Specified Tenant Cure Conditions, or (2) the Northern Trust Office Borrower leasing the entire Specified Tenant space in accordance with the Northern Trust Office Loan documents and such tenant being in actual, physical occupancy of such space and paying the full amount of the rent due under such lease.
“Specified Tenant Cure Conditions” means each of the following, as applicable: (a) with respect to clause (i) of the definition of Specified Tenant Trigger Period , the cure of such event of default, (b) with respect to clause (ii) or (iii) of the definition of Specified Tenant Trigger Period, the Specified Tenant having revoked or rescinded all termination or cancellation notices and has re-affirmed the Specified Tenant lease or lender having approved the sublease, as applicable, (c) with respect to clause (v) of the definition of Specified Tenant Trigger Period, the applicable rating rising to at least the level it was as of the origination date of the Northern Trust Office Loan, (d) with respect to any applicable bankruptcy or insolvency proceeding involving the Specified Tenant, the applicable Specified Tenant no longer being insolvent or subject to any bankruptcy or insolvency proceedings, (e) the applicable Specified Tenant paying full, unabated rent, and (f) the applicable Specified Tenant being in actual, physical possession of Specified Tenant space.
Current Mezzanine or Subordinate Indebtedness. None.
Partial Release. None.
Future Permitted Mezzanine Indebtedness. None.
THE INFORMATION IN THIS STRUCTURAL AND COLLATERAL TERM SHEET IS NOT COMPLETE AND MAY BE AMENDED PRIOR TO THE TIME OF SALE. THIS TERM SHEET IS NOT AN OFFER TO SELL THESE SECURITIES AND IT IS NOT A SOLICITATION OF AN OFFER TO BUY THESE SECURITIES IN ANY JURISDICTION WHERE THE OFFER OR SALE IS NOT PERMITTED.
| | 69 of 144 | | |
| Structural and Collateral Term Sheet | Benchmark 2020-B20 |
| Coleman Highline | |

THE INFORMATION IN THIS STRUCTURAL AND COLLATERAL TERM SHEET IS NOT COMPLETE AND MAY BE AMENDED PRIOR TO THE TIME OF SALE. THIS TERM SHEET IS NOT AN OFFER TO SELL THESE SECURITIES AND IT IS NOT A SOLICITATION OF AN OFFER TO BUY THESE SECURITIES IN ANY JURISDICTION WHERE THE OFFER OR SALE IS NOT PERMITTED.
| | 70 of 144 | | |
| Structural and Collateral Term Sheet | Benchmark 2020-B20 |
| Coleman Highline | |
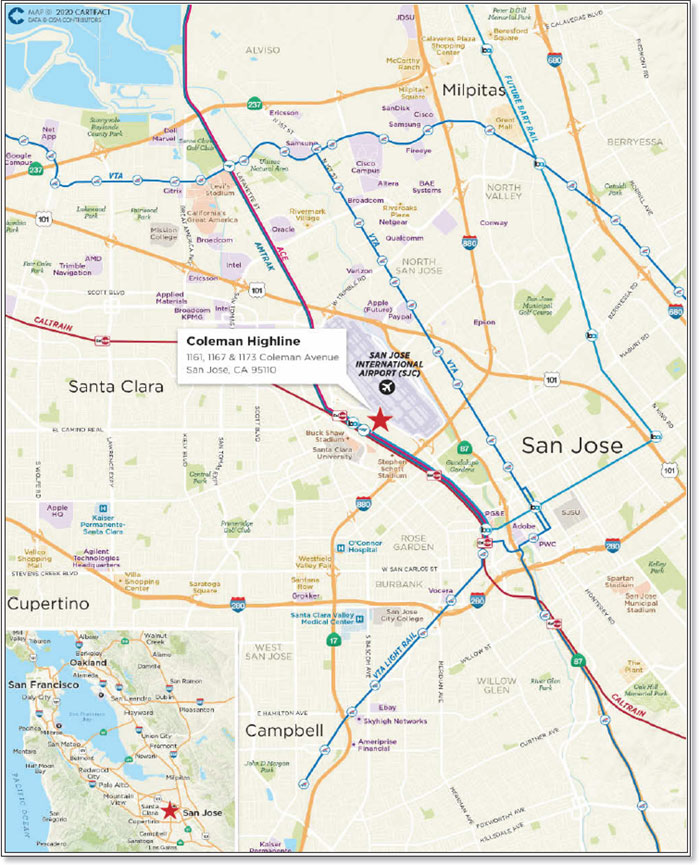
THE INFORMATION IN THIS STRUCTURAL AND COLLATERAL TERM SHEET IS NOT COMPLETE AND MAY BE AMENDED PRIOR TO THE TIME OF SALE. THIS TERM SHEET IS NOT AN OFFER TO SELL THESE SECURITIES AND IT IS NOT A SOLICITATION OF AN OFFER TO BUY THESE SECURITIES IN ANY JURISDICTION WHERE THE OFFER OR SALE IS NOT PERMITTED.
| | 71 of 144 | | |
| Structural and Collateral Term Sheet | Benchmark 2020-B20 |
| Coleman Highline | |
| Mortgage Loan Information | |
| Mortgage Loan Seller: | GACC |
| Original Principal Balance(1): | $40,000,000 |
| Cut-off Date Principal Balance(1): | $40,000,000 |
| % of Pool by IPB: | 4.4% |
| Loan Purpose: | Refinance |
| Borrower: | CAP OZ 34, LLC |
| Loan Sponsors: | LDH, LLC, Sansome Guarantor LLC |
| Interest Rate: | 2.80000% |
| Note Date: | 8/7/2020 |
| Maturity Date: | 9/6/2030 |
| Interest-only Period: | 120 months |
| Original Term: | 120 months |
| Original Amortization: | None |
| Amortization Type: | Interest Only |
| Call Protection: | L(25),Def(88),O(7) |
| Lockbox / Cash Management: | Hard / Springing |
| Additional Debt(1): | Yes |
| Additional Debt Balance(1): | $115,000,000 |
| Additional Debt Type(1): | Pari Passu |
| Escrows and Reserves(3) | |||
| Initial | Monthly | Initial Cap | |
| Taxes: | $814,077 | $203,519 | N/A |
| Insurance: | $0 | Springing | N/A |
| Replacement Reserves: | $0 | Springing | N/A |
| TI/LC: | $0 | Springing | N/A |
| Other(4): | $6,871,099 | $0 | N/A |
| Property Information | |
| Single Asset / Portfolio: | Single Asset |
| Title: | Fee |
| Property Type - Subtype: | Office – Suburban |
| Net Rentable Area (SF): | 380,951 |
| Location: | San Jose, CA |
| Year Built / Renovated: | 2020 / N/A |
| Occupancy: | 100.0% |
| Occupancy Date: | 10/6/2020 |
| Number of Tenants: | 1 |
| 2017 NOI: | N/A |
| 2018 NOI: | N/A |
| 2019 NOI: | N/A |
| UW / Economic Occupancy: | 95.0% |
| TTM NOI: | N/A |
| UW Revenues: | $21,806,104 |
| UW Expenses: | $5,806,707 |
| UW NOI(5): | $15,999,397 |
| UW NCF(5): | $15,999,397 |
| Appraised Value / Per SF(2)(5): | $305,100,000 / $801 |
| Appraisal Date: | 10/1/2020 |
| Financial Information(1)(5) | |
| Cut-off Date Loan / SF: | $407 |
| Maturity Date Loan / SF: | $407 |
| Cut-off Date LTV(2): | 50.8% |
| Maturity Date LTV(2): | 50.8% |
| UW NCF DSCR: | 3.64x |
| UW NOI Debt Yield: | 10.3% |
| Sources and Uses | |||||
| Sources | Proceeds | % of Total | Uses | Proceeds | % of Total |
| Whole Loan | $155,000,000 | 100.0% | Payoff Existing Debt | $140,528,275 | 90.7% |
| Upfront Reserves | 7,685,176 | 5.0 | |||
| Closing Costs | 4,456,905 | 2.9 | |||
| Return of Equity | 2,329,643 | 1.5 | |||
| Total Sources | $155,000,000 | 100.0% | Total Uses | $155,000,000 | 100.0% |
| (1) | The Coleman Highline Loan consists of the non-controlling Note A-4 and Note A-6 and is part of the Coleman Highline Whole Loan evidenced by six pari passu notes, with an aggregate outstanding principal balance as of the Cut-off Date of $155.0 million. For additional information, see “The Loan” herein. |
| (2) | Based on the “As Stabilized” appraised value, which assumes free rent has burned off and rent commencement has begun. The sole tenant, Roku, Inc. has begun the buildout of its space and approximately $1.9 million was reserved upfront for tenant improvements and free rent. Based on the “As-Is” appraised value as of July 13, 2020 equal to $301.1 million, the Cut-off Date LTV and Maturity Date LTV are 51.5%. In addition, the appraisal concluded to a “Hypothetical Go Dark” appraised value of $242.9 million as of July 13, 2020. Based on the “Hypothetical Go Dark” appraised value, the Cut-off Date LTV and Maturity Date LTV are 63.8%. |
| (3) | For a full description of Escrows and Reserves, please refer to “Escrows and Reserves” below. |
| (4) | The other reserve is comprised of a $5,000,000 debt service reserve and a $1,871,099 Unfunded Obligations reserve. |
| (5) | While the Coleman Highline Loan was originated after the emergence of the novel coronavirus pandemic and the economic disruption resulting from measures to combat the pandemic, the pandemic is an evolving situation and could impact the Coleman Highline Loan more severely than assumed in the underwriting of the Coleman Highline Loan and could adversely affect the NOI, NCF and occupancy information, as well as the appraised value and the DSCR, LTV and Debt Yield metrics presented above. See “Risk Factors— Risks Related to Market Conditions and Other External Factors—Coronavirus Pandemic Has Adversely Affected the Global Economy and Will Likely Adversely Affect the Performance of the Mortgage Loans” in the Preliminary Prospectus. |
THE INFORMATION IN THIS STRUCTURAL AND COLLATERAL TERM SHEET IS NOT COMPLETE AND MAY BE AMENDED PRIOR TO THE TIME OF SALE. THIS TERM SHEET IS NOT AN OFFER TO SELL THESE SECURITIES AND IT IS NOT A SOLICITATION OF AN OFFER TO BUY THESE SECURITIES IN ANY JURISDICTION WHERE THE OFFER OR SALE IS NOT PERMITTED.
| | 72 of 144 | | |
| Structural and Collateral Term Sheet | Benchmark 2020-B20 |
| Coleman Highline | |
The Loan. The Coleman Highline mortgage loan (the “Coleman Highline Loan”) is part of a whole loan with an aggregate outstanding principal balance as of the Cut-off Date of $155.0 million (the “Coleman Highline Whole Loan”), secured by the borrower’s fee interest in a 380,951 square foot office building located in San Jose, California (the “Coleman Highline Property”). The non-controlling Notes A-4 and A-6, with an outstanding principal balance as of the Cut-off Date of $40.0 million, will be included in the Benchmark 2020-B20 trust. The remaining notes have been contributed to one or more securitization trusts. The relationship between the holders of the Coleman Highline Whole Loan is governed by a co-lender agreement as described under “Description of the Mortgage Pool—The Whole Loans— The Non-Serviced Pari Passu Whole Loans” in the Preliminary Prospectus. The Coleman Highline Whole Loan will be serviced pursuant to the Benchmark 2020-B19 pooling and servicing agreement. The Coleman Highline Whole Loan has a 10-year term and will be interest-only for the term of the loan.
| Whole Loan Summary | ||||
| Note | Original Balance | Cut-off Date Balance | Note Holder | Controlling Piece |
| Note A-1, A-3, A-5 | $85,000,000 | $85,000,000 | Benchmark 2020-B19 | Yes |
| Note A-4, A-6 | $40,000,000 | $40,000,000 | Benchmark 2020-B20 | No |
| Note A-2 | $30,000,000 | $30,000,000 | DBJPM 2020-C9 | No |
| Whole Loan | $155,000,000 | $155,000,000 | ||
The Borrower. The borrower is CAP OZ 34, LLC, a Delaware limited liability company. The company is structured to be a single purpose entity with two independent directors in its organizational structure.
The Loan Sponsor. The loan sponsors and nonrecourse carve-out guarantors are Sansome Guarantor LLC (an affiliate of Sansome Partners) and LDH, LLC (an affiliate of Hunter Properties), which are liable on a several basis, at 95% and 5%, respectively. Along with the borrower and related lender, Sansome Guarantor LLC and LDH, LLC entered into an environmental indemnity agreement upon loan origination; pursuant to such agreement, the indemnitee will not seek recourse for any indemnified matters against Sansome Guarantor LLC and LDH, LLC to the extent the applicable matters (the “Indemnified Obligations”) are either covered pursuant to the environmental insurance policy required pursuant to the Coleman Highline Whole Loan documents (the “PLL Insurance”) or are the obligation of the former occupant at the Coleman Highline Property, and such former occupant is in compliance with the operative documents requiring its adherence to certain environmental covenants, obligations and restrictions applicable to the Coleman Highline Property (said covenants, obligations, and restrictions, the “Prior Owner Documents”). Notwithstanding the foregoing, Sansome Guarantor LLC and LDH, LLC will become fully liable for the foregoing Indemnified Obligations in the event that either: (a) Sansome Guarantor LLC and LDH, LLC fail to diligently pursue payment and satisfaction of the Indemnified Obligations under the PLL Insurance and/or the Prior Owner Documents (as applicable) or (b) the Indemnified Obligations are not paid and satisfied by the insurance company providing the PLL Insurance or the applicable party pursuant to the Prior Owner Documents, in either case for any reason whatsoever, within 180 days of the indemnitee making demand of Sansome Guarantor LLC and LDH, LLC for the applicable Indemnified Obligation(s).
Founded in 1997 by Sandy Dean, Sansome Partners is a San Francisco-based investment firm, with offices in Seattle, Boston, and New York, that makes long-term investments in businesses and assets. Sansome Partners is one of the main investment vehicles for the Fisher Family, the founders of both GAP and Banana Republic, and has deployed over $3.0 billion of private equity capital since inception. Additionally, Sansome Partners manages an over $1.0 billion long-only fund, targeting 10 positions in publicly-traded companies. Over the last 20 years, Hunter Properties, through the development arm Hunter Storm, LLC, has leveraged its multiple product-type development experience with its entitlement experience to complete several real estate projects. More recently, the firm has focused on transit-oriented development (TOD) and mixed-use development.
The Property. The Coleman Highline Property is a newly developed three-building, 380,951 square foot Class A office complex situated on an 8.82-acre site in San Jose, California. The Coleman Highline Property is the second phase of the greater Coleman Highline mixed-use development, which is expected to include on-site retail, a mix of restaurants, a public market, and a collection of food trucks and caterers. Built in 2020, the Coleman Highline Property features architecture with expansive glass line, large 32,000 square foot floorplates and 14’ slab-to-slab heights. The Coleman Highline Property is comprised of Building 3 (194,790 square feet; the “Building 3 Space”), Building 4 (163,272 square feet; the “Building 4 Space”), and Building A2 (22,889 square feet; the “Building A2 Space”), all of which are fully leased to Roku (as defined below). Buildings 3 and 4 are office buildings, and Building A2 is an amenities building which is expected to feature dining options, conference rooms and an auditorium. The Coleman Highline Property also includes a parking garage (the “Collateral Parking Structure”) with 1,219 parking spaces, for a parking ratio of approximately 3.2 parking spaces per 1,000 square feet of net rentable area. The Collateral Parking Structure is subject to a Declaration of Covenants, Conditions and Restrictions (the “CCR”), pursuant to which: (i) all parking structures on the Coleman Highline Property and the neighboring phase of the development (“Phase I”) are to be utilized for shared parking among the Coleman Highline Property and Phase I and (ii) all parking structures throughout the Coleman Highline development are subject to various control rights of a “Declarant” which is an affiliate of the loan sponsors. The
THE INFORMATION IN THIS STRUCTURAL AND COLLATERAL TERM SHEET IS NOT COMPLETE AND MAY BE AMENDED PRIOR TO THE TIME OF SALE. THIS TERM SHEET IS NOT AN OFFER TO SELL THESE SECURITIES AND IT IS NOT A SOLICITATION OF AN OFFER TO BUY THESE SECURITIES IN ANY JURISDICTION WHERE THE OFFER OR SALE IS NOT PERMITTED.
| | 73 of 144 | | |
| Structural and Collateral Term Sheet | Benchmark 2020-B20 |
| Coleman Highline | |
Declarant has agreed that, notwithstanding anything to the contrary contained in the CCR: (i) the parking structure on the Coleman Highline Property will be insured in accordance with the terms of the Coleman Highline Whole Loan documents, (ii) any proceeds of the foregoing insurance will be held by the lender and made available for restoration, (iii) the Coleman Highline Property will always have access to sufficient parking to satisfy all legal requirements (including zoning requirements) as well as all requirements relating to parking set forth in the Roku lease at the Coleman Highline Property, and (iv) the Coleman Highline Property will always have access to no less than (x) 65 parking spaces in the parking structures and surface parking located on the Coleman Highline Property on an exclusive basis and (y) 1,116 parking spaces in the parking structures and surface parking located on the Coleman Highline Property and Phase I on a non-exclusive basis. As of October 6, 2020, the Coleman Highline Property was 100.0% leased to Roku as its United States headquarters location.
Roku, Inc. (“Roku”) (380,951 square feet; 100.0% of net rentable area; 100.0% of underwritten base rent) was founded in 2002 and is a leading television streaming platform in the United States by base installed, representing 39% of the market share. Roku operates in two segments: Player and Platform, the first of which is a hardware-based purchase, the second of which is an ongoing paid subscription to platform access. Roku engages in “over the top” (OTT) television streaming with approximately 40 million global users as of March 2020. The platform offers approximately 5,000 domestic streaming channels and approximately 3,000 international streaming channels. Roku has expanded as a result of the increase in demand for streaming services and as of 2019, had 1,650 employees, doubling its employee count over the prior two years. The Coleman Highline Property is expected to serve as Roku’s United States headquarters, spread between the Coleman Highline Property and Coleman Highline Phase I, which includes two additional office buildings and an amenities building 100% leased to Roku. As of March 31, 2020, Roku had 39.8 million active accounts and streaming hours of 13.2 billion, increases over the prior year quarter of 37% and 49%, respectively, which helped increase revenues by 55% in the same quarter. Roku expects its new account growth, streaming hours, and employee headcount to accelerate as a result of the COVID-19 pandemic as demand for streaming content from home increases. As of December 31, 2019, Roku reported a net loss of $59.9 million and total revenue of $1.1 billion, representing an increase of 52.0% from December 31, 2018, with $515.5 million of cash and cash equivalents. In the second quarter of 2020, Roku reported a net loss of $43.1 million and added 3.2 million incremental active accounts to reach 43.0 million total accounts.
Roku recently signed a 10-year, seven-month NNN lease that will expire on September 30, 2030, with an initial annual base rent of $44.50 per square foot. In addition, Roku received six months of free rent, and its official rent commencement date is October 1, 2020. Roku has a one-time option to extend its lease for seven years at 97.5% of fair market value with 15-18 months’ notice. Roku does not have any termination or contraction options.
As of March 2020, Building 3 is fully built out and Roku began moving employees into the space prior to the start of the COVID-19 pandemic. Building 4 is fully built out except for floor coverings and cubicles, which Roku is expected to hold off on installing in the near term as they evaluate the post-COVID work environment. The landlord has satisfied all of its tenant improvement obligations and provided Roku an $82.50 per square foot tenant improvement allowance of which approximately $458,533 remained outstanding as of the origination date of the Coleman Highline Whole Loan. The borrower indicated that Roku intends to move roughly 30% of its workforce back into Building 3 by the end of 2020. The work remaining on Building 4 is expected to be completed and furnished by the end of 2020, with Roku taking occupancy by the end of the first quarter of 2021. We cannot assure you that Roku will take occupancy as expected or at all.
COVID-19 Update. As of the October 6, 2020 underwritten rent roll, the Coleman Highline Property is 100.0% leased. The sole tenant’s rent commenced October 1, 2020 and the sole tenant has not requested any lease modifications. The first payment date of the Coleman Highline Whole Loan is October 6, 2020. As of October 5 2020, the Coleman Highline Whole Loan is not subject to any modification or forbearance requests. See “Risk Factors—Risks Related to Market Conditions and Other External Factors—Current Coronavirus Pandemic May Adversely Affect the Global Economy and the Performance of the Mortgage Loans”.
THE INFORMATION IN THIS STRUCTURAL AND COLLATERAL TERM SHEET IS NOT COMPLETE AND MAY BE AMENDED PRIOR TO THE TIME OF SALE. THIS TERM SHEET IS NOT AN OFFER TO SELL THESE SECURITIES AND IT IS NOT A SOLICITATION OF AN OFFER TO BUY THESE SECURITIES IN ANY JURISDICTION WHERE THE OFFER OR SALE IS NOT PERMITTED.
| | 74 of 144 | | |
| Structural and Collateral Term Sheet | Benchmark 2020-B20 |
| Coleman Highline | |
The Market. The Coleman Highline Property is located within the San Jose Airport submarket, which is adjacent to the Mineta San Jose International Airport, and a 15-minute drive north of Downtown San Jose. The Coleman Highline Property is positioned across a pedestrian bridge from the Santa Clara Caltrain station, the most widely used mode of public transit between San Francisco and San Jose. The Santa Clara station also serves as a “Baby Bullet” stop with transit times of roughly 60 and 15 minutes to San Francisco and Palo Alto, respectively. The Coleman Highline Property is the second phase of the greater Coleman Highline mixed-use development. Phase I includes two additional office buildings, both fully leased to Roku, with a total Roku SF at the Coleman Highline mixed-use development of 738,057 SF. A fourth phase of the greater Coleman Highline mixed-use development is scheduled to be completed by 2021 and is expected to feature additional office space that is 100% leased to Verizon. The Coleman Highline Property is located in an area with a concentration of major technology companies including Google, Apple, Netflix and Facebook. According to a third-party market research report, the estimated 2020 population within a one-, three-, and five-mile radius was projected to be 10,205, 176,399, and 642,978, respectively. The population within the same radii is expected to grow 0.37%, 2.31%, and 2.14%, respectively, over the next five years. The 2020 average household income within a one-, three-, and five-mile radius was $130,114, $135,262, and $140,271.
According to the appraisal, as of the first quarter of 2020, the San Jose Airport submarket consisted of approximately 5.5 million SF of office space with an overall market vacancy of 8.6% and average asking rents of approximately $3.69 per SF.
The appraisal identified six lease comparables for the Coleman Highline Property. Comparable buildings were built between 1984 and 2021 and range in size from 42,188 SF to 643,990 SF. Initial asking rents at the comparable properties ranged between $42.00 and $49.20 per SF (net leases) with a weighted average of approximately $46.71 per SF. The appraisal concluded a market rent at the Coleman Highline Property of $46.20 per SF. The Coleman Highline Property has an in-place rent of $44.50 per SF.
| Historical and Current Occupancy(1) | |||
| 2017 | 2018 | 2019 | Current(2) |
| N/A | N/A | N/A | 100.0% |
| (1) | The historical occupancy is not available since the Coleman Highline Property was recently constructed. |
| (2) | Current Occupancy is the expected occupancy as of October 6, 2020. |
Tenant Summary(1) | ||||||
Tenant | Ratings Moody’s/Fitch/S&P | Net Rentable Area | % of | Base Rent | % of Total | Lease |
| Roku, Inc.(2)(3) | NR / NR / NR | 380,951 | 100.0% | $44.50 | 100.0% | 9/30/2030 |
| Total | 380,951 | 100.0% | $44.50 | 100.0% | ||
| Other Occupied | 0 | 0.0 | $0.00 | 0.0 | ||
| Total Occupied | 380,951 | 100.0% | $44.50 | 100.0% | ||
| Vacant | 0 | 0.0 | ||||
| Total | 380,951 | 100.0% | ||||
| (1) | Based on the underwritten rent roll as of October 6, 2020. |
| (2) | Roku has no termination or contraction options. |
| (3) | Roku is expected to take occupancy of Building 4 (163,272 square feet) of the Coleman Highline Property in the first quarter of 2021. We cannot assure you that Roku will take occupancy as expected or at all. |
THE INFORMATION IN THIS STRUCTURAL AND COLLATERAL TERM SHEET IS NOT COMPLETE AND MAY BE AMENDED PRIOR TO THE TIME OF SALE. THIS TERM SHEET IS NOT AN OFFER TO SELL THESE SECURITIES AND IT IS NOT A SOLICITATION OF AN OFFER TO BUY THESE SECURITIES IN ANY JURISDICTION WHERE THE OFFER OR SALE IS NOT PERMITTED.
| | 75 of 144 | | |
| Structural and Collateral Term Sheet | Benchmark 2020-B20 |
| Coleman Highline | |
| Lease Rollover Schedule(1) | |||||||||
Year | Number of Leases Expiring | Net Rentable Area Expiring | % of NRA Expiring | Base Rent Expiring | % of Base Rent Expiring | Cumulative Net Rentable Area Expiring | Cumulative % of NRA Expiring | Cumulative Base Rent Expiring | Cumulative % of Base Rent Expiring |
| Vacant | NAP | 0 | 0.0% | NAP | NAP | 0 | 0.0% | NAP | NAP |
| MTM & 2020 | 0 | 0 | 0.0 | $0 | 0.0% | 0 | 0.0% | $0 | 0.0% |
| 2021 | 0 | 0 | 0.0 | 0 | 0.0 | 0 | 0.0% | $0 | 0.0% |
| 2022 | 0 | 0 | 0.0 | 0 | 0.0 | 0 | 0.0% | $0 | 0.0% |
| 2023 | 0 | 0 | 0.0 | 0 | 0.0 | 0 | 0.0% | $0 | 0.0% |
| 2024 | 0 | 0 | 0.0 | 0 | 0.0 | 0 | 0.0% | $0 | 0.0% |
| 2025 | 0 | 0 | 0.0 | 0 | 0.0 | 0 | 0.0% | $0 | 0.0% |
| 2026 | 0 | 0 | 0.0 | 0 | 0.0 | 0 | 0.0% | $0 | 0.0% |
| 2027 | 0 | 0 | 0.0 | 0 | 0.0 | 0 | 0.0% | $0 | 0.0% |
| 2028 | 0 | 0 | 0.0 | 0 | 0.0 | 0 | 0.0% | $0 | 0.0% |
| 2029 | 0 | 0 | 0.0 | 0 | 0.0 | 0 | 0.0% | $0 | 0.0% |
| 2030 | 1 | 380,951 | 100.0 | 16,950,792 | 100.0 | 380,951 | 100.0% | $16,950,792 | 100.0% |
| 2031 and Thereafter | 0 | 0 | 0.0 | 0 | 0.0 | 380,951 | 100.0% | $16,950,792 | 100.0% |
| Total | 1 | 380,951 | 100.0% | $16,950,792 | 100.0% | ||||
| (1) | Based on the underwritten rent roll as of October 6, 2020. |
THE INFORMATION IN THIS STRUCTURAL AND COLLATERAL TERM SHEET IS NOT COMPLETE AND MAY BE AMENDED PRIOR TO THE TIME OF SALE. THIS TERM SHEET IS NOT AN OFFER TO SELL THESE SECURITIES AND IT IS NOT A SOLICITATION OF AN OFFER TO BUY THESE SECURITIES IN ANY JURISDICTION WHERE THE OFFER OR SALE IS NOT PERMITTED.
| | 76 of 144 | | |
| Structural and Collateral Term Sheet | Benchmark 2020-B20 |
| Coleman Highline | |
| Underwritten Net Cash Flow(1) | |||
| Underwritten(1) | Per Square Foot | %(2) | |
| Base Rent | $16,950,792 | $44.50 | 73.8% |
| Rent Steps(3) | 512,002 | 1.34 | 2.2% |
| Gross Potential Rent | $17,462,794 | $45.84 | 76.1% |
| Total Reimbursements | 5,491,000 | 14.41 | 23.9% |
| Total Other Income | 0 | 0.00 | 0.0% |
| Net Rental Income | $22,953,794 | $60.25 | 100.0% |
| (Vacancy/Credit Loss) | (1,147,690) | (3.01) | (5.0%) |
| Effective Gross Income | $21,806,104 | $57.24 | 95.0% |
| Total Expenses | $5,806,707 | $15.24 | 26.6% |
| Net Operating Income | $15,999,397 | $42.00 | 73.4% |
| Total TI/LC, Capex/RR | 0 | 0.00 | 0.00% |
| Net Cash Flow | $15,999,397 | $42.00 | 73.4% |
| (1) | Historical financial information is not available because the Coleman Highline Property was recently built in 2020 with the sole tenant commencing to take occupancy in March 2020. |
| (2) | % column represents percent of Net Rental Income for all revenue lines and represents percent of Effective Gross Income for the remainder of the fields. |
| (3) | Represents 12 months of rent steps. |
Property Management. The Coleman Highline Property is managed by Hunter Properties, Inc., an affiliate of the borrower.
Escrows and Reserves. At loan origination of the Coleman Highline Whole Loan, the borrower funded reserves of (i) approximately $814,077 for real estate taxes (equivalent to 48 months of tax payments), (ii) approximately $5,000,000 for a debt service reserve, and (iii) approximately $1,871,099 related to the remaining free rent (in the amount of $1,412,566) and tenant improvement allowance (in the amount of $458,533) pursuant to the Roku lease.
Tax Reserve – The borrower is required to deposit into a real estate tax reserve, on a monthly basis, 1/12 of the estimated annual real estate taxes (initially estimated at $203,519).
Insurance Reserve – The borrower is required to deposit into an insurance reserve, on a monthly basis, 1/12 of estimated insurance premiums, unless an acceptable blanket policy is in effect. As of the origination date, an acceptable blanket policy was in effect.
Replacement Reserve – Solely to the extent the Single Tenant Condition (as defined below) fails to be satisfied as of the applicable due date, the borrower is required to deposit approximately $6,350 into a replacement reserve account for annual capital expenditure.
Rollover Reserve – Solely to the extent the Single Tenant Condition fails to be satisfied as of the applicable due date, the borrower is required to deposit $47,620 into a rollover reserve account for tenant improvements and leasing commissions that may be incurred.
A “Single Tenant Condition” is satisfied when a single tenant lease is in full force and effect and no Trigger Period (as defined below) has occurred and is then continuing.
Lockbox / Cash Management. The Coleman Highline Whole Loan is structured with a hard lockbox and springing cash management. The borrower is required to cause the tenants to deposit rents directly into a lender-approved lockbox account (the “Clearing Account”). In addition, the borrower and the property manager are required to deposit all rents and gross revenue from the Coleman Highline Property into the Clearing Account within one business day of receipt. Provided no Trigger Period exists, funds deposited into the Clearing Account are required to be swept on a daily basis into the borrower’s operating account. If a Trigger Period exists, such funds are required to be swept on a daily basis into the deposit account and applied and disbursed in accordance with the loan documents.
THE INFORMATION IN THIS STRUCTURAL AND COLLATERAL TERM SHEET IS NOT COMPLETE AND MAY BE AMENDED PRIOR TO THE TIME OF SALE. THIS TERM SHEET IS NOT AN OFFER TO SELL THESE SECURITIES AND IT IS NOT A SOLICITATION OF AN OFFER TO BUY THESE SECURITIES IN ANY JURISDICTION WHERE THE OFFER OR SALE IS NOT PERMITTED.
| | 77 of 144 | | |
| Structural and Collateral Term Sheet | Benchmark 2020-B20 |
| Coleman Highline | |
A “Trigger Period” will commence upon the occurrence of (i) an event of default under the Coleman Highline Whole Loan (ii) the debt yield being less than 8.0% on the last day of any calendar quarter, (iii) the commencement of a Lease Sweep Period (as defined below), or (iv) the disbursement of funds from the debt service reserve account; and will end if, (A) with respect to clause (i), the event of default under the Coleman Highline Whole Loan has been cured and such cure has been accepted by the lender (and no other event of default under the Coleman Highline Whole Loan is then continuing), (B) with respect to clause (ii), the debt yield is at least 8.0% on the last day of any calendar quarter, (C) with respect to clause (iii), such Lease Sweep Period has ended pursuant to the terms thereof (and no other Lease Sweep Period is then continuing), or (D) with respect to clause (iv), the earliest to occur of (x) the satisfaction of all Debt Service Reserve Release Conditions (as defined below) and (y) the reimbursement of any portion of the debt service reserve funds that have been allocated to the monthly debt service payment.
A “Lease Sweep Period” will commence on the first monthly payment date following the occurrence of any of the following: (a) the earliest of (i) the date that is 12 months prior to the stated maturity date of the Coleman Highline Whole Loan, (ii) the date that is 15 months prior to the earliest stated expiration (including the stated expiration of any renewal term) of the Roku lease (or a replacement lease that covers all or any portion of the Roku premises) (a “Lease Sweep Lease”), provided, however, if the entirety of any “dark” portion is demised to a subtenant that is reasonably approved by the lender (which subtenant must be open and operating in the entirety of said space and must either (x) be of a credit quality and reputation that is not materially less as compared with the tenant pursuant to the applicable Lease Sweep Lease (as determined by the lender in its reasonable discretion) or (y) have an investment grade rating) pursuant to a sublease that is coterminous with the applicable Lease Sweep Lease (the “Sublease Conditions”), the foregoing 15 month period will be extended to 24 months or (iii) the date under a Lease Sweep Lease by which the tenant thereunder is required to give notice of its exercise of a renewal option thereunder (and such renewal has not been so exercised); (b) the date that a Lease Sweep Lease (or any material portion thereof) is surrendered, cancelled or terminated prior to its then current expiration date or the receipt by the borrower or the property manager of written notice from any tenant under a Lease Sweep Lease of its intent to surrender, cancel or terminate the Lease Sweep Lease (or any material portion thereof prior to its then current expiration date); (c) the occurrence of a Go Dark Trigger (as defined below); (d) a monetary or material non-monetary default under a Lease Sweep Lease by the tenant thereunder that continues beyond any applicable notice and cure period; or (e) the occurrence of an insolvency proceeding in connection with a Lease Sweep Tenant (as defined below). A Lease Sweep Period will end upon the first to occur of the following: (A) in the case of clauses (a), (b), and (c) above, (I) either (x) the entirety of the applicable premises, or applicable portion thereof, is leased pursuant to one or more qualified leases or (y) a portion of the applicable premises, or applicable portion thereof, is leased pursuant to one or more qualified leases so as to cause the Coleman Highline Property to achieve a debt yield of 8.0% and (II) sufficient funds have been accumulated (or otherwise deposited) in the lease sweep account (during the continuance of the subject Lease Sweep Period) to cover all anticipated leasing expenses, free rent periods, and/or rent abatement periods with respect to such qualified leases and any shortfalls in required payments under the loan documents or operating expenses as a result of any anticipated down time prior to the commencement of payments under such qualified leases; (B) in the case of clause (a) above, the date on which the applicable tenant (I) irrevocably exercises its renewal or extension option with respect to either (x) all of its premises or (y) a portion of the applicable premises, or applicable portion thereof, is leased pursuant to one or more qualified leases so as to cause the Coleman Highline Property to achieve a debt yield of 8.0%, and (II) sufficient funds have been accumulated (or deposited) in the lease sweep account (during the continuance of the subject Lease Sweep Period) to cover all anticipated leasing expenses, free rent periods and/or rent abatement periods with respect to such renewal or extension; (C) in the case of clause (d) above, the date on which the subject default has been cured, and no other monetary or material non-monetary default under the Lease Sweep Lease occurs for a period of six consecutive months following such cure; (D) in the case of clause (c) above, (x) Roku (or a replacement tenant that occupies all or any portion of the Roku premises) resumes operation of its business in the entirely of the applicable premises and continuously operates for at least 30 days or (y) the date on which the lease sweep funds in the lease sweep account in connection with the Go Dark Trigger (as defined below) pursuant to clause (c) above equals or exceeds the Lease Sweep Go Dark Deposit Amount (as defined below) or the borrower delivers a letter of credit (which satisfies the requirements set forth in the loan documents) in an amount equal to the Lease Sweep Go Dark Deposit Amount or (z) the date on which either the Sublease Conditions are satisfied, or the tenant achieves an investment grade rating; (E) in the case of clause (e) above, either (a) the applicable Lease Sweep Tenant’s insolvency proceeding has terminated and the applicable Lease Sweep Lease has been affirmed, assumed or assigned in a manner reasonably satisfactory to the lender or (b) the applicable Lease Sweep Lease has been assumed and assigned to a third party in a manner reasonably satisfactory to the lender; and (F) in the case of clauses (a), (b), (d), and (e) above, the date on which (x) the funds in the lease sweep account collected with respect to the Lease Sweep Lease in question (including any lease termination payments with respect to such Lease Sweep Lease deposited into the lease sweep account) is equal to the Lease Sweep Deposit Amount (as defined below) applicable to such space, (y) the borrower delivers to the lender a letter of credit in the foregoing amount or (z) the borrower deposits an amount equal to the deficient amount for deposit into the lease sweep account, unless, in any such case, the applicable premises has been leased pursuant to one or more leases which, in the aggregate, (x) require the borrower to incur expenses, including the payment of brokerage commissions, completion of tenant improvements or payment of tenant allowances, and/or (y) provide for free rent periods and/or rent abatement periods with respect to rent amounts, which, in the lender’s determination, exceed the Lease Sweep Deposit Amount applicable to such premises (in which case the Lease Sweep Period in question will continue until the borrower satisfies clause (A) above).
THE INFORMATION IN THIS STRUCTURAL AND COLLATERAL TERM SHEET IS NOT COMPLETE AND MAY BE AMENDED PRIOR TO THE TIME OF SALE. THIS TERM SHEET IS NOT AN OFFER TO SELL THESE SECURITIES AND IT IS NOT A SOLICITATION OF AN OFFER TO BUY THESE SECURITIES IN ANY JURISDICTION WHERE THE OFFER OR SALE IS NOT PERMITTED.
| | 78 of 144 | | |
| Structural and Collateral Term Sheet | Benchmark 2020-B20 |
| Coleman Highline | |
A “Lease Sweep Go Dark Deposit Amount” means (x) solely with respect to a Lease Sweep Period commencing upon the occurrence of a Go Dark Trigger prior to August 7, 2026, an amount equal to the portion of the rentable square feet of the applicable Lease Sweep Lease in which the applicable tenant has “gone dark” multiplied by $60.00 and (y) for the period from and after August 7, 2026, an amount equal to the total rentable square feet of the applicable Lease Sweep Lease multiplied by $60.00.
A “Lease Sweep Deposit Amount” means an amount equal to the total rentable square feet of the applicable Lease Sweep Lease multiplied by $60.00.
A “Lease Sweep Tenant” means a tenant under a Lease Sweep Lease or, if such tenant’s obligations are guaranteed by its direct or indirect parent company (if any), such parent company.
A “Go Dark Trigger” will be deemed to occur on the date on which any Lease Sweep Tenant discontinues its business (i.e., “goes dark”) in more than 50% of its space at the Coleman Highline Property, not including the Building A2 Space, or gives notice that it intends to discontinue its business in greater than 50% of its applicable premises at the Coleman Highline Property, not including the Building A2 Space, provided, however, that for so long as any such discontinuation of operations by a Lease Sweep Tenant satisfies any of the following conditions, no Go Dark Trigger will be deemed to occur in connection with any of the following (each a “Go Dark Exception”): (i) either: (A) such discontinuation is effectuated in order to comply with governmental restrictions which restrict the use or occupancy of the Coleman Highline Property in connection with the COVID-19 pandemic or any other pandemic or epidemic (a “SIP Order”), and the applicable Lease Sweep Tenant resumes operations in its space within 90 days after such SIP Order is lifted or (B) such discontinuation occurs prior to August 7, 2022 in connection with such Lease Sweep Tenant’s commercially reasonable safety protocols relating to the COVID-19 pandemic; provided further that the applicable Lease Sweep Tenant resumes operations in its applicable premises no later than August 7, 2022; (ii) such discontinuation is related to upgrades or renovations to the premises pursuant to the Lease Sweep Lease and lasts for a period of no longer than 180 days; (iii) such discontinuation is in connection with an ongoing restoration of the Coleman Highline Property following a casualty and lasts for a period of no longer than 12 months after receipt of all applicable governmental permits and approvals necessary to complete the applicable restoration; (iv) any cessation by the Lease Sweep Tenant of all or some of the applicable premises so long as during the period that such discontinuation of operations continues, such Lease Sweep Tenant (or any parent entity that has guaranteed all of such Lease Sweep Tenant’s obligations pursuant to the Lease Sweep Lease) maintains an investment grade rating; or (v) the Sublease Conditions are satisfied with respect to the applicable Lease Sweep Lease. In addition to the Go Dark Exceptions identified in the above, no Go Dark Trigger will have occurred with respect to Roku not yet having commenced operating in the Building B4 Space in connection with Roku performing the initial buildout and occupancy of its space (provided that the initial buildout and occupancy have completed and operations commence on or before the earlier to occur of (x) August 7, 2022 and (y) one year after the termination of any SIP Order in place as of the origination date)
A “Debt Service Reserve Release Conditions” will be met so long as each of the following conditions is satisfied after July 7, 2021: (i) no Trigger Period is then continuing (other than pursuant to clause (iv) in the definition of Trigger Period set forth above); (ii) each tenant under a Lease Sweep Lease has timely made all rental payments (including, without limitation, any payments of additional rent, common area maintenance expenses, tax assessments) due under any Lease Sweep Lease for the immediately preceding three full calendar month period; (iii) the debt service coverage ratio is equal to or exceeds 3.42x; and (iv) no portion of the debt service reserve funds has been allocated to the monthly debt service payment during the immediately preceding 11 full calendar month period.
Current Mezzanine or Subordinate Indebtedness. None.
Future Mezzanine or Subordinate Indebtedness Permitted. None.
Partial Release. None.
THE INFORMATION IN THIS STRUCTURAL AND COLLATERAL TERM SHEET IS NOT COMPLETE AND MAY BE AMENDED PRIOR TO THE TIME OF SALE. THIS TERM SHEET IS NOT AN OFFER TO SELL THESE SECURITIES AND IT IS NOT A SOLICITATION OF AN OFFER TO BUY THESE SECURITIES IN ANY JURISDICTION WHERE THE OFFER OR SALE IS NOT PERMITTED.
| | 79 of 144 | | |
| Structural and Collateral Term Sheet | Benchmark 2020-B20 |
| Point West Portfolio | |
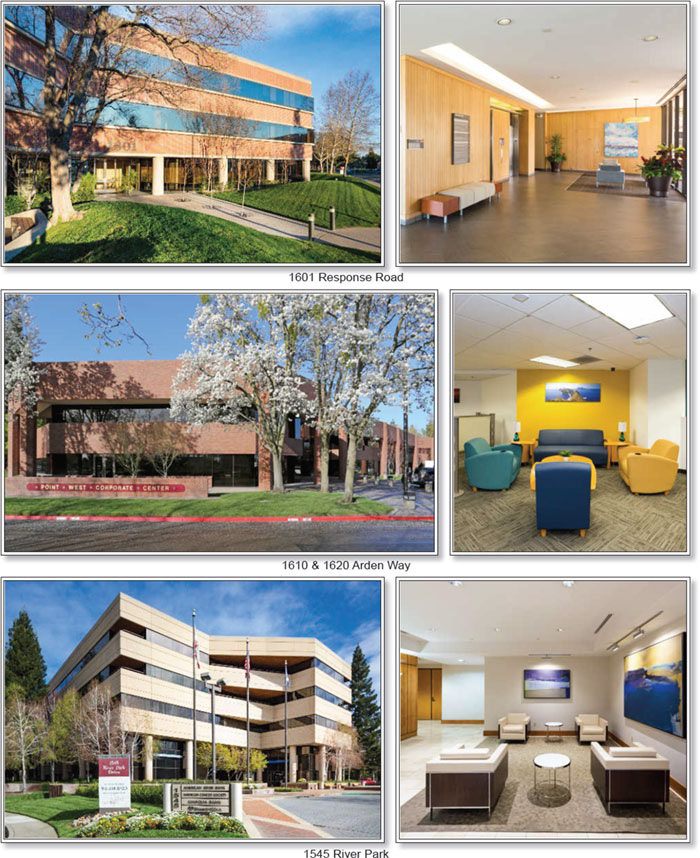
THE INFORMATION IN THIS STRUCTURAL AND COLLATERAL TERM SHEET IS NOT COMPLETE AND MAY BE AMENDED PRIOR TO THE TIME OF SALE. THIS TERM SHEET IS NOT AN OFFER TO SELL THESE SECURITIES AND IT IS NOT A SOLICITATION OF AN OFFER TO BUY THESE SECURITIES IN ANY JURISDICTION WHERE THE OFFER OR SALE IS NOT PERMITTED.
| | 80 of 144 | | |
| Structural and Collateral Term Sheet | Benchmark 2020-B20 |
| Point West Portfolio | |
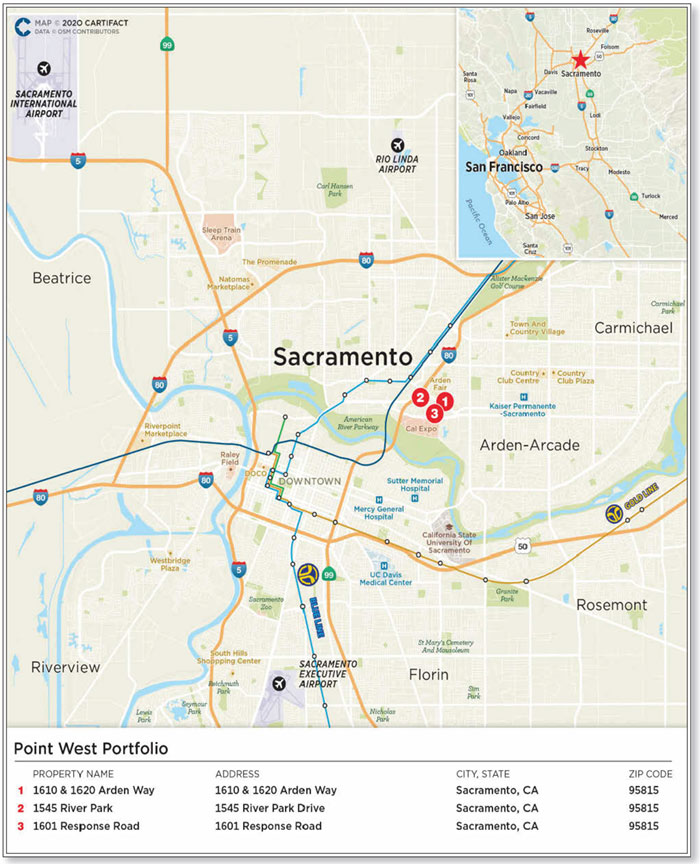
THE INFORMATION IN THIS STRUCTURAL AND COLLATERAL TERM SHEET IS NOT COMPLETE AND MAY BE AMENDED PRIOR TO THE TIME OF SALE. THIS TERM SHEET IS NOT AN OFFER TO SELL THESE SECURITIES AND IT IS NOT A SOLICITATION OF AN OFFER TO BUY THESE SECURITIES IN ANY JURISDICTION WHERE THE OFFER OR SALE IS NOT PERMITTED.
| | 81 of 144 | | |
| Structural and Collateral Term Sheet | Benchmark 2020-B20 |
| Point West Portfolio | |
| Mortgage Loan Information | Property Information | |||
| Mortgage Loan Seller: | GACC | Single Asset / Portfolio: | Portfolio | |
| Original Principal Balance: | $39,500,000 | Title: | Fee | |
| Cut-off Date Principal Balance: | $39,500,000 | Property Type - Subtype: | Office – Suburban | |
| % of Pool by IPB: | 4.4% | Net Rentable Area (SF): | 346,227 | |
| Loan Purpose: | Refinance | Location: | Sacramento, CA | |
| Borrowers: | Point West Investors LLC, Nelson | Year Built / Renovated: | Various / N/A | |
| Point West LLC, BW Point West | Occupancy: | 84.7% | ||
| Property LLC | Occupancy Date: | 8/31/2020 | ||
| Loan Sponsors: | Matthew T. White | Number of Tenants: | 52 | |
| Interest Rate: | 3.06700% | 2017 NOI: | $2,751,306 | |
| Note Date: | 9/30/2020 | 2018 NOI: | $2,684,723 | |
| Maturity Date: | 10/6/2030 | 2019 NOI: | $3,611,256 | |
| Interest-only Period: | 120 months | TTM NOI (as of 8/2020)(1): | $3,908,173 | |
| Original Term: | 120 months | UW / Economic Occupancy | 84.7% | |
| Original Amortization: | None | UW Revenues: | $7,772,716 | |
| Amortization Type: | Interest Only | UW Expenses: | $3,137,294 | |
| Call Protection: | L(24),Def(91),O(5) | UW NOI(1)(4): | $4,635,422 | |
| Lockbox / Cash Management: | Springing / Springing | UW NCF(4): | $4,048,730 | |
| Additional Debt: | N/A | Appraised Value / Per SF(2)(4): | $66,500,000 / $192 | |
| Additional Debt Balance: | N/A | Appraisal Date: | 7/23/2020 | |
| Additional Debt Type: | N/A | |||
| Escrows and Reserves(3) | Financial Information(4) | |||||
| Initial | Monthly | Initial Cap | ||||
| Taxes: | $331,747 | $47,392 | N/A | Cut-off Date Loan / SF: | $114 | |
| Insurance: | $0 | Springing | N/A | Maturity Date Loan / SF: | $114 | |
| Replacement Reserves: | $0 | $5,870 | $140,891 | Cut-off Date LTV(2): | 59.4% | |
| TI/LC: | $1,300,000 | $58,705 | $2,250,000 | Maturity Date LTV(2): | 59.4% | |
| Immediate Repairs: | $33,370 | $0 | N/A | UW NCF DSCR: | 3.30x | |
| Other: | $0 | $0 | N/A | UW NOI Debt Yield: | 11.7% | |
| Sources and Uses | |||||
| Sources | Proceeds | % of Total | Uses | Proceeds | % of Total |
| Loan Amount | $39,500,000 | 100.0% | Payoff Existing Debt | $34,168,289 | 86.5% |
| Return of Equity | 3,064,113 | 7.8 | |||
| Upfront Reserves | 1,665,117 | 4.2 | |||
| Closing Costs | 602,481 | 1.5 | |||
| Total Sources | $39,500,000 | 100.0% | Total Uses | $39,500,000 | 100.0% |
| (1) | The increase in NOI from TTM to UW is attributed to rent steps and recent leasing. |
| (2) | Based on the “As-Portfolio” value of $66,500,000. The “As-Portfolio” value applies a 20% discount to the “As Is” appraised value of the retail pad located at 1620 Arden way, The individual appraisals concluded an aggregate “As-Is” appraised value of $66,910,000, which results in a Cut-off Date LTV and Maturity Date LTV of 59.0%. |
| (3) | For a full description of Escrows and Reserves, please refer to “Escrows and Reserves” below. |
| (4) | While the Point West Portfolio Loan (as defined below) was originated after the emergence of the novel coronavirus pandemic and the economic disruption resulting from measures to combat the pandemic, the pandemic is an evolving situation and could impact the Point West Portfolio Loan more severely than assumed in the underwriting of the Point West Portfolio Loan and could adversely affect the NOI, NCF and occupancy information, as well as the appraised value and the DSCR, LTV and Debt Yield metrics presented above. See “Risk Factors— Risks Related to Market Conditions and Other External Factors—Coronavirus Pandemic Has Adversely Affected the Global Economy and Will Likely Adversely Affect the Performance of the Mortgage Loans” in the Preliminary Prospectus. |
THE INFORMATION IN THIS STRUCTURAL AND COLLATERAL TERM SHEET IS NOT COMPLETE AND MAY BE AMENDED PRIOR TO THE TIME OF SALE. THIS TERM SHEET IS NOT AN OFFER TO SELL THESE SECURITIES AND IT IS NOT A SOLICITATION OF AN OFFER TO BUY THESE SECURITIES IN ANY JURISDICTION WHERE THE OFFER OR SALE IS NOT PERMITTED.
| | 82 of 144 | | |
| Structural and Collateral Term Sheet | Benchmark 2020-B20 |
| Point West Portfolio | |
The Loan. The Point West Portfolio mortgage loan is a $39.5 million loan (the “Point West Portfolio Loan”) secured by the borrowers’ fee interest in three office buildings totaling 346,227 square feet and one retail pad site in Sacramento, California (the “Point West Portfolio Properties”). The Point West Portfolio Loan has a ten-year term and will be interest-only for its entire term. The Point West Portfolio Loan was originated by Deutsche Bank AG, New York Branch on September 30, 2020.
The Borrowers. The borrowers are three tenants-in-common, Point West Investors LLC (73.38% tenant-in-common interest), BW Point West Property LLC (18.65% tenant-in-common interest) and Nelson Point West LLC (7.97% tenant-in-common interest). Each tenant-in-common borrower is a Delaware limited liability company structured to be a single purpose entity, with the borrowers having one independent director in their organizational structure.
The Loan Sponsor. The loan sponsor is Matthew T. White and the non-recourse carveout guarantors are Matthew T. White, Deborah Dedomenico and Gary D. Nelson. Matthew T. White is the current Chief Executive Officer of Basin Street Properties, has been with the company since 2000, and owns an interest in the managing member of the Point West Investors LLC borrower. A family trust and other entities owned by Deborah Dedomenico own all of the BW Point West Property LLC borrower and a family trust related to Gary D. Nelson owns all of the Nelson Point West LLC borrower. The non-recourse carveout guaranties and environmental indemnities executed by each of Deborah Dedomenico and Gary D. Nelson are limited to certain events caused by such guarantor’s related tenant-in-common borrower, or, in certain cases, by such guarantor or its affiliates. Basin Street Properties was founded in 1974 and is a developer, owner and operator of commercial real estate. Basin Street Properties has a portfolio of approximately 5.2 million square feet which includes office, retail, residential and hospitality properties of which approximately 1.5 million square feet is in Sacramento, California.
The Properties. The Point West Portfolio Properties consist of three buildings totaling 346,227 square feet of Class A and B office space, and one retail pad site, located in Sacramento, California. The three office properties are located at 1545 River Park Drive, 1601 Response Road, and 1610 Arden Way and the retail pad is a leased fee interest located at 1620 Arden Way. The Point West Portfolio Properties are located approximately five miles northeast of downtown Sacramento in the Point West district of Sacramento, California. Point West is a well-established commercial and residential district offering shopping, dining, and office destinations for the greater Sacramento region, including Cal Exposition and Arden Fair Mall. The Point West Portfolio Properties are 84.7% leased to 52 tenants across numerous sectors, with no single tenant occupying more than 7.8% of the square feet in the portfolio.
The 1610 & 1620 Arden Way property includes (i) 1610 Arden way, a two-story Class B building built in 1983 totaling 150,188 square feet (43.4% of portfolio net rentable area) with a parking ratio of 2.42 spaces per 1,000 square feet and (ii) 1620 Arden Way, a freestanding retail pad site that is ground leased to a Jared’s Jewelry store through November 2025. The 1610 & 1620 Arden Way property represents 43.0% of portfolio underwritten base rent (inclusive of the 1620 Arden Way ground lease). The 1610 Arden Way building is currently 82.5% occupied by 19 tenants across multiple industries. The largest tenants are the Social Security Administration, UBS Financial Services and Covered California.
The 1545 River Park Drive property is a five-story Class A building built in 1982 totaling 121,606 square feet (35.1% of portfolio net rentable area), represents 36.9% of underwritten portfolio base rent, and has a parking ratio of 3.82 spaces per thousand square feet. The 1545 River Park Drive Property is 89.3% occupied by 21 tenants. The largest tenants are Clear Channel Broadcasting, Umpqua Bank, and American Cancer Society.
The 1601 Response Road property is a three-story building built in 1984 totaling 74,433 square feet (21.5% of portfolio net rentable area), represents 20.1% of portfolio base rent and has a parking ratio of 3.76 spaces per thousand square feet. The 1601 Response Road property is currently 81.4% occupied by 11 tenants. The largest tenants are CA Health Benefit Exchange and Insurance Company of the West. The three properties are summarized below.
| Portfolio Summary | |||||||
Property Name | City, State | Year Built | NRA | Property | Allocated Cut- | % Allocated | Appraised |
| 1610 & 1620 Arden Way | Sacramento, CA | 1983, 2000 | 150,188 | 82.5% | $18,129,502 | 45.9% | $30,710,000 |
| 1545 River Park Drive | Sacramento, CA | 1982 | 121,606 | 89.3% | 13,636,975 | 34.5% | 23,100,000 |
| 1601 Response Road | Sacramento, CA | 1984 | 74,433 | 81.4% | 7,733,523 | 19.6% | 13,100,000 |
| Total / Weighted Average | 346,227 | 84.7% | $39,500,000 | 100.0% | $66,910,000 | ||
| (1) | Represents the aggregate of the individual appraised values. The Appraised Value of the Point West Portfolio Properties is the “As Portfolio” value of $66,500,000, which applies a 20% discount to the “As Is” appraised value of the retail pad located at 1620 Arden Way. |
The largest tenant of the Point West Portfolio Properties, Social Security Administration (7.8% of portfolio net rentable area; 9.6% of portfolio underwritten base rent) leases 26,966 square feet at the 1610 & 1620 Arden Way property through January 2, 2026. The Sacramento Office of Adjudication and Review (GSA) provides California citizens the ability to appeal on issues related to Social Security
THE INFORMATION IN THIS STRUCTURAL AND COLLATERAL TERM SHEET IS NOT COMPLETE AND MAY BE AMENDED PRIOR TO THE TIME OF SALE. THIS TERM SHEET IS NOT AN OFFER TO SELL THESE SECURITIES AND IT IS NOT A SOLICITATION OF AN OFFER TO BUY THESE SECURITIES IN ANY JURISDICTION WHERE THE OFFER OR SALE IS NOT PERMITTED.
| | 83 of 144 | | |
| Structural and Collateral Term Sheet | Benchmark 2020-B20 |
| Point West Portfolio | |
Disability hearings and Social Security Income hearings. This office handles the adjudication procedures for all of Northern California, with 15 different administrative judges, processing an average of 30 total cases per day. The tenant may terminate its lease in whole or in part effective any time after January 2, 2024 by giving at least 90 days’ written notice. The tenant does not have any renewal options.
The second largest tenant of the Point West Portfolio Properties, Clear Channel Broadcasting (4.8% of portfolio net rentable area; 5.8% of portfolio underwritten base rent) leases 16,792 square feet through April 30, 2023. Clear Channel Broadcasting, now part of iHeartMedia, is a radio broadcaster. With over 850 stations nationwide, Clear Channel Broadcasting provides listeners with music, news, talk, sports and other content across multiple platforms including on-air and online. Clear Channel Broadcasting has two renewal options (a short term option and a long term option); (i) a six month renewal option at 115% of the base rent of the final term of the lease with at least 12 months’ written notice or (ii) two five-year renewal options at fair market value upon 12 months’ written notice.
The third largest tenant of the Point West Portfolio Properties, CA Health Benefit Exchange (4.5% of portfolio net rentable area; 4.7% of portfolio underwritten base rent) leases 15,533 square feet at the 1601 Response Road Property through April 30, 2026. CA Health Benefit Exchange is where Californians can get health insurance under the Patient Protection and Affordable Care Act from brand-name insurance with federal premium assistance. The CA Health Benefit Exchange was renamed Covered California in October 2012. Covered California is supported by the State of California as well as the California Department of Health Care Services. With the help of Covered California, nearly 35 million Californians have access to care options from providers including Anthem Blue Cross, Blue Shield of California, Health Net, and Kaiser Permanente. CA Health Benefit Exchange may terminate its lease at any time effective on or after April 30, 2022, by giving the landlord at least 60 days’ written notice. The tenant has no extension options.
COVID-19 Update. As of October 1, 2020, the Point West Portfolio is open, however most tenants have implemented a work from home policy for their employees. For August and September 2020, 97.2% and 99.7% of the occupied SF, and 99.2% and 99.9%, of the underwritten base rent, respectively, were collected. Three tenants totaling 4.9% of the underwritten base rent and 2.8% of the occupied square feet have requested rent relief. One tenant representing 0.0% of the underwritten base rent and 0.3% of the occupied square feet was granted a rent abatement from May to December 2020. One tenant representing 2.8% of the underwritten base rent and 2.6% of the occupied square feet was granted a 50% rent abatement in May, June and July in exchange for one additional year in its lease term. One tenant representing 2.1% of the underwritten base rent and 0.0% of the occupied square feet was granted a 50% rent deferral in April, May and June to be paid in three equal installments from January to March 2021. One tenant representing 1.8% of the underwritten base rent and 1.8% of the occupied square feet has yet to take occupancy of its space due to the delay in its buildout caused by the COVID- 19 pandemic. The rent commencement date is expected to be in December 2020. As of October 1, 2020, the Point West Portfolio Loan was not subject to any modification or forbearance requests. The first payment date is scheduled for November 6, 2020. See “Risk Factors—Risks Related to Market Conditions and Other External Factors—Current Coronavirus Pandemic May Adversely Affect the Global Economy and the Performance of the Mortgage Loans”.
THE INFORMATION IN THIS STRUCTURAL AND COLLATERAL TERM SHEET IS NOT COMPLETE AND MAY BE AMENDED PRIOR TO THE TIME OF SALE. THIS TERM SHEET IS NOT AN OFFER TO SELL THESE SECURITIES AND IT IS NOT A SOLICITATION OF AN OFFER TO BUY THESE SECURITIES IN ANY JURISDICTION WHERE THE OFFER OR SALE IS NOT PERMITTED.
| | 84 of 144 | | |
| Structural and Collateral Term Sheet | Benchmark 2020-B20 |
| Point West Portfolio | |
The Market. The Point West Portfolio Properties are located in the Point West submarket, in Sacramento, California. According to the appraisal, the Point West office submarket contains approximately 3.0 million square feet and recorded an average asking rent of $24.96 per square foot as of the second quarter of 2020. The submarket’s vacancy rate was noted at 11.88% which has consistently declined from 27.06% in 2012. Over the past decade, the submarket absorbed an annual average of 19,000 square feet on a net basis and reported an average vacancy rate of 20.86% during this period. As of the second quarter of 2020, the submarket saw a net absorption of approximately 31,000 square feet and posted a vacancy rate of 11.88%, down 42 basis points year-over-year.
The appraisal referenced four comparable office leases that range in base rent from approximately $22.20 - $25.80 per square foot. The appraiser concluded to a market rent of (i) $24.60 per square foot at the 1610 Arden Way building, $30.00 per square foot at the 1620 Arden Way building, (iii) $25.80 per square foot at the 1545 River Park property and (iv) $24.60 per square foot at the 1601 Response Road property.
| Historical and Current Occupancy | |||
| 2017(1) | 2018(1) | 2019(1) | Current(2) |
| 75.1% | 76.4% | 74.3% | 84.7% |
| (1) | Historical Occupancies are as of December 31 of each respective year. |
| (2) | Current Occupancy is the occupancy as of August 31, 2020. |
THE INFORMATION IN THIS STRUCTURAL AND COLLATERAL TERM SHEET IS NOT COMPLETE AND MAY BE AMENDED PRIOR TO THE TIME OF SALE. THIS TERM SHEET IS NOT AN OFFER TO SELL THESE SECURITIES AND IT IS NOT A SOLICITATION OF AN OFFER TO BUY THESE SECURITIES IN ANY JURISDICTION WHERE THE OFFER OR SALE IS NOT PERMITTED.
| | 85 of 144 | | |
| Structural and Collateral Term Sheet | Benchmark 2020-B20 |
| Point West Portfolio | |
| Tenant Summary(1) | ||||||
Tenant | Ratings |
| % of | Base Rent | % of Total | Lease |
| Social Security Administration(4) | Aaa / AAA / AA+ | 26,966 | 7.8% | $26.00 | 9.6% | 1/2/2026 |
| Clear Channel Broadcasting | NR / NR / NR | 16,792 | 4.8 | $25.50 | 5.8 | 4/30/2023 |
| CA Health Benefit Exchange(5) | Aa2 / AA / AA- | 15,533 | 4.5 | $22.04 | 4.7 | 4/30/2026 |
| UBS Financial Services | Aa3 / AA- / A+ | 15,074 | 4.4 | $24.83 | 5.1 | 8/31/2023 |
| Insurance Company of the West | NR / NR / NR | 14,335 | 4.1 | $25.90 | 5.1 | 3/31/2023 |
| Covered California(6) | Aa2 / AA / AA- | 10,796 | 3.1 | $23.62 | 3.5 | 4/30/2023 |
| Res Systems 3(7) | NR / NR / NR | 10,258 | 3.0 | $24.24 | 3.4 | 7/30/2026 |
| Umpqua Bank | NR / NR / NR | 10,179 | 2.9 | $25.85 | 3.6 | 4/30/2023 |
| American Cancer Society | NR / NR / NR | 8,978 | 2.6 | $25.20 | 3.1 | 9/30/2021 |
| Valassis Sales & Marketing | NR / NR / NR | 8,580 | 2.5 | $24.00 | 2.8 | 8/31/2021 |
| Total | 137,491 | 39.7% | $24.85 | 46.5% | ||
| Other Occupied(8) | 155,595 | 44.9 | $25.21 | 53.5 | ||
| Total Occupied | 293,086 | 84.7% | $25.04 | 100.0% | ||
| Vacant | 53,141 | 15.3 | ||||
| Total | 346,227 | 100.00% | ||||
| (1) | Based on the underwritten rent roll dated August 31, 2020. |
| (2) | Certain ratings are those of the parent or government entity whether or not the parent or government entity guarantees the lease. |
| (3) | The Base Rent PSF and % of Total Base Rent is inclusive of the retail pad site that is ground leased to a Jared’s jewelry store through November 2025. |
| (4) | The Social Security Administration may terminate its lease in whole or in part effective any time after January 2, 2024 by giving at least 90 days’ written notice. |
| (5) | The CA Health Benefit Exchange may terminate its lease at any time effective on or after April 30, 2022, by giving at least 60 days’ written notice. |
| (6) | Covered California may terminate its lease at any time effective on or after May 31, 2022 by giving at least 90 days’ written notice. |
| (7) | RES Systems 3 has a one-time right to terminate its lease on or after July 31, 2024 by giving at least 180 days’ written notice. |
| (8) | Other Occupied Net Rentable Area (SF) and Base Rent PSF includes DGS Pathology, which has not yet executed its lease but is expected to which is currently building out its space and is expected to take occupancy in December 2020. |
| Lease Rollover Schedule(1)(2) | |||||||||
Year | Number of Leases Expiring | Net Rentable Area Expiring | % of NRA Expiring | Base Rent | % of Base | Cumulative Net Rentable Area Expiring | Cumulative | Cumulative | Cumulative % of Base Rent Expiring(3) |
| Vacant | NAP | 53,141 | 15.3% | NAP | NAP | 53,141 | 15.3% | NAP | NAP |
| MTM & 2020 | 0 | 0 | 0.0 | $0 | 0.0% | 53,141 | 15.3% | $0 | 0.0% |
| 2021 | 11 | 42,564 | 12.3 | 1,052,184 | 14.3 | 95,705 | 27.6% | $1,052,184 | 14.3% |
| 2022 | 12 | 41,064 | 11.9 | 1,057,711 | 14.4 | 136,769 | 39.5% | $2,109,895 | 28.7% |
| 2023 | 10 | 95,687 | 27.6 | 2,408,801 | 32.8 | 232,456 | 67.1% | $4,518,696 | 61.6% |
| 2024 | 5 | 15,582 | 4.5 | 369,880 | 5.0 | 248,038 | 71.6% | $4,888,576 | 66.6% |
| 2025 | 5 | 17,232 | 5.0 | 550,829 | 7.5 | 265,270 | 76.6% | $5,439,405 | 74.1% |
| 2026 | 5 | 61,409 | 17.7 | 1,536,730 | 20.9 | 326,679 | 94.4% | $6,976,135 | 95.0% |
| 2027 | 0 | 0 | 0.0 | 0 | 0.0 | 326,679 | 94.4% | $6,976,135 | 95.0% |
| 2028 | 1 | 5,497 | 1.6 | 127,300 | 1.7 | 332,176 | 95.9% | $7,103,435 | 96.8% |
| 2029 | 2 | 7,309 | 2.1 | 181,816 | 2.5 | 339,485 | 98.1% | $7,285,251 | 99.3% |
| 2030 | 0 | 0 | 0.0 | 0 | 0.0 | 339,485 | 98.1% | $7,285,251 | 99.3% |
| 2031 and | |||||||||
| Thereafter(4) | 1 | 6,742 | 1.9 | 54,219 | 0.7 | 346,227 | 100.0% | $7,339,470 | 100.0% |
| Total | 52 | 346,227 | 100.0% | $7,339,470 | 100.0% | ||||
| (1) | Based on the underwritten rent roll dated August 31, 2020. |
| (2) | Certain tenants may have termination or contraction options (which may become exercisable prior to the originally stated expiration date of the tenant lease) that are not considered in the above Lease Rollover Schedule. |
| (3) | The 2025 Base Rent Expiring is inclusive of revenue generated by the retail pad site that is ground leased to a Jared’s jewelry store. The improvements are not part of the collateral and as such no square footage is allocated to this space. |
| (4) | 2031 and Thereafter square footage is inclusive of the Health Club/Conference Room space. |
THE INFORMATION IN THIS STRUCTURAL AND COLLATERAL TERM SHEET IS NOT COMPLETE AND MAY BE AMENDED PRIOR TO THE TIME OF SALE. THIS TERM SHEET IS NOT AN OFFER TO SELL THESE SECURITIES AND IT IS NOT A SOLICITATION OF AN OFFER TO BUY THESE SECURITIES IN ANY JURISDICTION WHERE THE OFFER OR SALE IS NOT PERMITTED.
| | 86 of 144 | | |
| Structural and Collateral Term Sheet | Benchmark 2020-B20 |
| Point West Portfolio | |
Operating History and Underwritten Net Cash Flow | |||||||
| 2017 | 2018 | 2019 | TTM 8/31/2020 | Underwritten(1) | Per Square | %(1) | |
Base Rent(2) | $6,071,509 | $5,928,015 | $6,323,264 | $6,631,281 | $7,485,265 | $21.62 | 81.6% |
| Vacant Income | 0 | 0 | 0 | 0 | 1,399,088 | 4.04 | 15.3% |
| Gross Potential Rent | $6,071,509 | $5,928,015 | $6,323,264 | $6,631,281 | $8,884,352 | $25.66 | 96.9% |
| Total Reimbursements | 0 | 145,794 | 199,896 | 193,137 | 198,931 | 0.57 | 2.2% |
| Total Other Income | 79,658 | 77,205 | 81,481 | 88,520 | 88,520 | 0.26 | 1.0% |
| Net Rental Income | $6,151,167 | $6,151,014 | $6,604,641 | $6,912,938 | $9,171,804 | $26.49 | 100.0% |
| (Vacancy/Credit Loss) | 0 | 0 | 0 | 0 | (1,399,088) | (4.04) | (15.3%) |
| Effective Gross Income | $6,151,167 | $6,151,014 | $6,604,641 | $6,912,938 | $7,772,716 | $22.45 | 84.7% |
| Total Expenses | $3,399,861 | $3,466,291 | $2,993,385 | $3,004,765 | $3,137,294 | $9.06 | 40.4% |
| Net Operating Income(3) | $2,751,306 | $2,684,723 | $3,611,256 | $3,908,173 | $4,635,422 | $13.39 | 59.6% |
| Total TI/LC, Capex/RR | 0 | 0 | 0 | 0 | 586,692 | 1.69 | 7.5% |
| Net Cash Flow | $2,751,306 | $2,684,723 | $3,611,256 | $3,908,173 | $4,048,730 | $11.69 | 52.1% |
| (1) | % column represents percent of Net Rental Income for all revenue lines and represents percent of Effective Gross Income for the remainder of the fields. |
| (2) | Base Rent includes $145,795 of office rent steps over the lease term for investment grade tenants and steps through August 31, 2021. |
| (3) | The increase in Net Operating Income from TTM to Underwritten is attributed to (i) $147,795 of rent steps and (ii) recent leasing. |
Property Management. The Point West Portfolio Properties are managed by Basin Street Properties, an affiliate of the loan sponsor.
Escrows and Reserves. At loan origination, the borrowers deposited (i) $1,300,000 into a tenant improvement allowances and leasing commissions reserve, (ii) $331,747 into a real estate tax reserve and (iii) $33,370 into an immediate repairs reserve.
Tax Reserve – The borrowers are required to deposit into a real estate tax reserve, on a monthly basis, 1/12 of the estimated annual real estate taxes (initially estimated at $47,392).
Insurance Reserve – The borrowers are required to deposit into an insurance reserve, on a monthly basis, 1/12 of estimated insurance premiums, unless an acceptable blanket policy is in place. As of the origination date, an acceptable blanket policy was in place.
Replacement Reserve – The borrowers are required to deposit into a replacement reserve, on a monthly basis, an amount equal to $5,870, provided that the borrowers are not required to make such deposits at any time the funds in such reserve equal or exceed $140,891.
Rollover Reserve – The borrowers are required to deposit into a rollover reserve, on a monthly basis through the monthly payment date in December 2025, an amount equal to approximately $58,705. Starting on the monthly payment date in January 2026, the borrowers are required to deposit into a rollover reserve on a monthly basis approximately $73,381. The borrowers are not required to make deposits into the rollover reserve at any time that funds in such reserve equal or exceed $2,250,000.
Lockbox / Cash Management. The Point West Portfolio Loan is structured with a springing lockbox and springing cash management. Upon the occurrence of a Cash Management Trigger Event (as defined below) the borrowers are required to establish a lender-controlled lockbox account and the borrowers are required to cause all tenants under leases at the Point West Portfolio Properties to pay all rents directly into such lockbox account, and, if despite such direction, the borrowers or manager receive any rents, they are required to deposit such rent into such lockbox account within one business day of receipt. Provided that no Trigger Period is continuing, funds in the lockbox account will be transferred to or at the direction of the borrowers. During the continuance of a Trigger Period (as defined below), all funds in the lockbox account are required to be transferred to the cash management account daily and, provided no event of default is continuing, disbursed in accordance with the Point West Portfolio Loan documents to make deposits into the tax and insurance reserves as described above, to pay debt service on the Point West Portfolio Loan, to make deposits into the replacement reserve and rollover reserve as described above, to pay the lesser of actual monthly operating expenses and monthly budgeted operating expenses as set forth in the borrowers’ annual budget (which during a Trigger Period is required to be reasonably approved by the lender) and lender-
THE INFORMATION IN THIS STRUCTURAL AND COLLATERAL TERM SHEET IS NOT COMPLETE AND MAY BE AMENDED PRIOR TO THE TIME OF SALE. THIS TERM SHEET IS NOT AN OFFER TO SELL THESE SECURITIES AND IT IS NOT A SOLICITATION OF AN OFFER TO BUY THESE SECURITIES IN ANY JURISDICTION WHERE THE OFFER OR SALE IS NOT PERMITTED.
| | 87 of 144 | | |
| Structural and Collateral Term Sheet | Benchmark 2020-B20 |
| Point West Portfolio | |
approved extraordinary expenses, and to deposit any remainder into a cash collateral account to be held as additional security for the Point West Portfolio Loan during the continuance of such Trigger Period.
A “Trigger Period” will be continuing upon (i) an event of default under the Point West Portfolio Loan until cured or (ii) the debt service coverage ratio as calculated in the Point West Portfolio Loan documents being less than 1.20x (assuming a 30-year amortization schedule) until the date the Point West Portfolio Properties achieves a debt service coverage ratio of at least 1.25x (assuming 30-year amortization) for two consecutive calendar quarters.
A “Cash Management Trigger Event” will occur upon (i) an event of default under the Point West Portfolio Loan or (ii) the debt service coverage ratio as calculated in the Point West Portfolio Loan documents being less than 1.25x (assuming a 30-year amortization schedule).
Current Mezzanine or Subordinate Indebtedness. None.
Future Mezzanine or Subordinate Indebtedness Permitted. None.
Partial Release. None.
THE INFORMATION IN THIS STRUCTURAL AND COLLATERAL TERM SHEET IS NOT COMPLETE AND MAY BE AMENDED PRIOR TO THE TIME OF SALE. THIS TERM SHEET IS NOT AN OFFER TO SELL THESE SECURITIES AND IT IS NOT A SOLICITATION OF AN OFFER TO BUY THESE SECURITIES IN ANY JURISDICTION WHERE THE OFFER OR SALE IS NOT PERMITTED.
| | 88 of 144 | | |
| Structural and Collateral Term Sheet | Benchmark 2020-B20 |
| Skywater Technology HQ | |
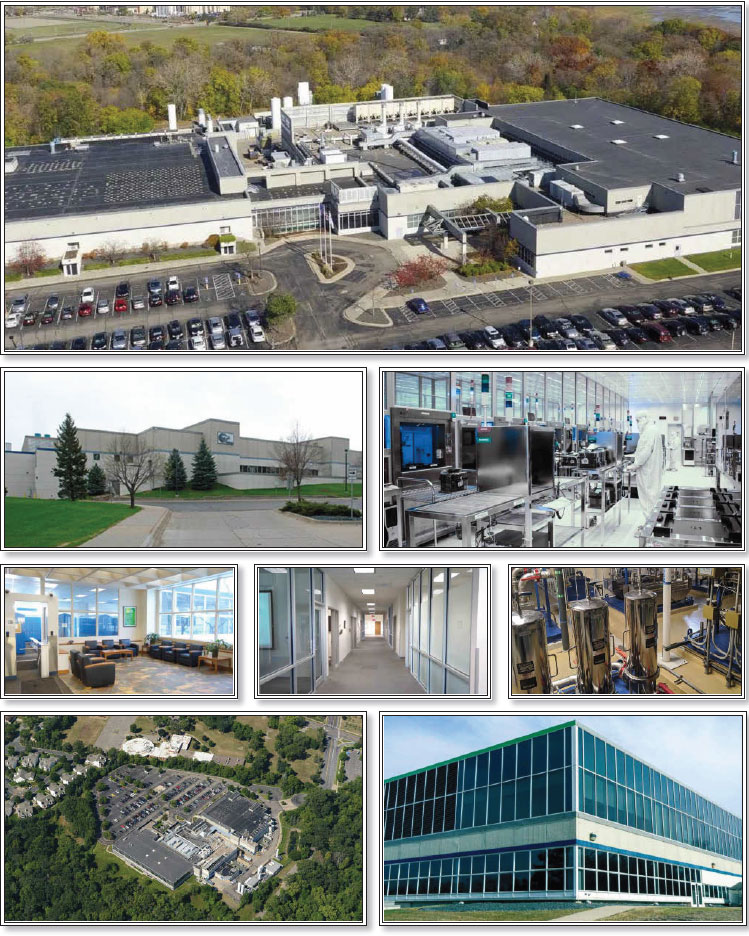
THE INFORMATION IN THIS STRUCTURAL AND COLLATERAL TERM SHEET IS NOT COMPLETE AND MAY BE AMENDED PRIOR TO THE TIME OF SALE. THIS TERM SHEET IS NOT AN OFFER TO SELL THESE SECURITIES AND IT IS NOT A SOLICITATION OF AN OFFER TO BUY THESE SECURITIES IN ANY JURISDICTION WHERE THE OFFER OR SALE IS NOT PERMITTED.
| | 89 of 144 | | |
| Structural and Collateral Term Sheet | Benchmark 2020-B20 |
| Skywater Technology HQ | |

THE INFORMATION IN THIS STRUCTURAL AND COLLATERAL TERM SHEET IS NOT COMPLETE AND MAY BE AMENDED PRIOR TO THE TIME OF SALE. THIS TERM SHEET IS NOT AN OFFER TO SELL THESE SECURITIES AND IT IS NOT A SOLICITATION OF AN OFFER TO BUY THESE SECURITIES IN ANY JURISDICTION WHERE THE OFFER OR SALE IS NOT PERMITTED.
| | 90 of 144 | | |
| Structural and Collateral Term Sheet | Benchmark 2020-B20 |
| Skywater Technology HQ | |
| Mortgage Loan Information | Property Information | |||
| Mortgage Loan Seller: | CREFI | Single Asset / Portfolio: | Single Asset | |
| Original Principal Balance: | $39,000,000 | Title: | Fee | |
| Cut-off Date Principal Balance: | $39,000,000 | Property Type - Subtype: | Industrial – Flex/R&D | |
| % of Pool by IPB: | 4.3% | Net Rentable Area (SF): | 393,765 | |
| Loan Purpose(1): | Recapitalization | Location: | Bloomington, MN | |
| Borrower: | Oxbow Realty Partners, LLC | Year Built / Renovated: | 1985, 1994, 2000, 2020 / N/A | |
| Loan Sponsor: | Loren Unterseher | Occupancy: | 100.0% | |
| Interest Rate: | 3.44000% | Occupancy Date: | 10/6/2020 | |
| Note Date: | 9/30/2020 | Number of Tenants: | 1 | |
| Maturity Date: | 10/6/2030 | 2017 NOI(2): | N/A | |
| Interest-only Period: | None | 2018 NOI(2): | N/A | |
| Original Term: | 120 months | 2019 NOI(2): | N/A | |
| Original Amortization: | 300 months | TTM NOI(2): | N/A | |
| Amortization Type: | Balloon | UW Economic Occupancy: | 95.0% | |
| Call Protection: | L(24),Def(92),O(4) | UW Revenues: | $6,300,718 | |
| Lockbox / Cash Management: | Hard / Springing | UW Expenses: | $1,812,651 | |
| Additional Debt: | N/A | UW NOI(3): | $4,488,067 | |
| Additional Debt Balance: | N/A | UW NCF(3): | $4,195,911 | |
| Additional Debt Type: | N/A | Appraised Value / Per SF(3): | $78,800,000 / $200 | |
| Appraisal Date: | 7/22/2020 | |||
| Escrows and Reserves(4) | Financial Information(3) | |||||
| Initial | Monthly | Initial Cap | Cut-off Date Loan / SF: | $99 | ||
| Taxes: | $26,659 | $26,659 | N/A | Maturity Date Loan / SF: | $70 | |
| Insurance: | $252,800 | Springing | N/A | Cut-off Date LTV: | 49.5% | |
| Replacement Reserves: | $0 | $6,563 | $393,765 | Maturity Date LTV: | 34.8% | |
| TI/LC: | $0 | $17,784 | N/A | UW NCF DSCR: | 1.80x | |
| Other: | $0 | $0 | N/A | UW NOI Debt Yield: | 11.5% | |
| Sources and Uses | |||||
| Sources | Proceeds | % of Total | Uses | Proceeds | % of Total |
| Mortgage Loan | $39,000,000 | 100.0% | Payoff Existing Debt(1) | $37,849,756 | 97.1% |
| Closing Costs | 870,786 | 1.3 | |||
| Upfront Reserves | 279,459 | 0.7 | |||
| Total Sources | $39,000,000 | 100.0% | Total Uses | $39,000,000 | 100.0% |
| (1) | The purpose of the loan was to facilitate the recapitalization of existing debt via a sale-leaseback between related parties. Oxbow Industries is the majority owner of the tenant, Skywater Technology Foundry, Inc., who sold the property and then subsequently executed a 20-year absolute net lease of the facility. Skywater Technology Foundry, Inc. utilized the loan proceeds to recapitalize existing debt against the property and existing balance sheet debt. |
| (2) | Historical NOI is not available given the nature of the subject’s sale-leaseback transaction. |
| (3) | While the Skywater Technology HQ Loan (as defined below) was originated after the emergence of the novel coronavirus pandemic and the economic disruption resulting from measures to combat the pandemic, the pandemic is an evolving situation and could impact the Skywater Technology HQ Loan more severely than assumed in the underwriting of the Skywater Technology HQ Loan and could adversely affect the NOI, NCF and occupancy information, as well as the appraised value and the DSCR, LTV and Debt Yield metrics presented above. See “Risk Factors— Risks Related to Market Conditions and Other External Factors—Coronavirus Pandemic Has Adversely Affected the Global Economy and Will Likely Adversely Affect the Performance of the Mortgage Loans” in the Preliminary Prospectus. |
| (4) | For a full description of Escrows and Reserves, please refer to “Escrows and Reserves” herein. |
THE INFORMATION IN THIS STRUCTURAL AND COLLATERAL TERM SHEET IS NOT COMPLETE AND MAY BE AMENDED PRIOR TO THE TIME OF SALE. THIS TERM SHEET IS NOT AN OFFER TO SELL THESE SECURITIES AND IT IS NOT A SOLICITATION OF AN OFFER TO BUY THESE SECURITIES IN ANY JURISDICTION WHERE THE OFFER OR SALE IS NOT PERMITTED.
| | 91 of 144 | | |
| Structural and Collateral Term Sheet | Benchmark 2020-B20 |
| Skywater Technology HQ | |
The Loan. The Skywater Technology HQ mortgage loan is a $39.0 million loan (“Skywater Technology HQ Loan”) secured by the borrower’s fee simple interest in a 393,765 square foot industrial flex R&D and office building in Bloomington, Minnesota (the “Skywater Technology HQ Property”). The Skywater Technology HQ Loan has a ten-year term and will amortize on a 25-year amortization schedule. The Skywater Technology HQ Loan was originated by Citi Real Estate Funding Inc. (“CREFI”) on September 30, 2020.
The Borrower. The borrower is Oxbow Realty Partners, LLC, a Delaware limited liability company (“Skywater Technology HQ Borrower”). The Skywater Technology HQ Borrower is a newly-formed Delaware limited liability company with a non-consolidation opinion and one independent director.
The Loan Sponsor. The loan sponsor is Loren Unterseher. Mr. Unterseher is the Managing Partner of Oxbow Industries, LLC and has completed over $2.5 billion in corporate finance transactions over the course of his career. Prior to Oxbow Industries, he was a Principal/Shareholder and Director of Mergers & Acquisitions for CraigHallum Capital Group, and prior to that he was Managing Director of Private Equity at Lazard.
The Property. The Skywater Technology HQ Property consists of a 393,765 square foot industrial flex R&D and office building in Bloomington, Minnesota. It is 100% occupied by Skywater Technology Foundry, Inc. (“Skywater Technology”) operating under a recently executed 20-year absolute net lease running through 2040. The Skywater Technology HQ Property was originally constructed in 1985 with an initial buildout of 190,000 square feet and currently serves as the headquarters for Skywater Technology Foundry, Inc. In 1994, the west side of the building was expanded by 100,000 square feet as operations continued to grow and the space was needed to service the growing demand. The next expansion occurred in 2000 with a 41,000 square foot second-story office component above the original building section. Most recently, another major expansion was announced as Skywater Technology Foundry, Inc. was awarded a $170 million investment from the United States Department of Defense for a multi-phase project to enhance its microelectronic capabilities. Approximately $50 million of the investment consists of a 63,000 square foot expansion of the building, which is in its final stages of completion. Skywater Technology Foundry, Inc. has also invested $8 million in R&D equipment upgrades for its manufacturing operation over the last two years. In total, the building is comprised of 84,457 square feet of office space (21.4% of net rentable area), with the other 78.6% utilized for R&D and manufacturing business components consisting of 107,763 square feet of cleanroom and fabrication space (27.4% of net rentable area), 56,786 square feet in sub fabrication space (14.4% of net rentable area), and 113,955 square feet of energy, make up air, and storage space (28.9% of net rentable area). The Skywater Technology HQ Property is the collateral for a sale-leaseback transaction in which Oxbow Realty Partners is acquiring the property from Skywater Technology Foundry, Inc., subject to a 20-year absolute net lease for 100% of the space, which was executed by Skywater Technology Foundry, Inc. at origination.
As of October 6, 2020, the Skywater Technology HQ Property was 100.0% leased to one tenant.
Skywater Technology Foundry, Inc. is the only domestically owned, production scaled semiconductor foundry in the United States. The company and its 400+ employees focus on the production of high-margin analog chips. The facility is the company’s only location for wafer production and possesses high volume manufacturing capabilities of approximately 12,000 wafers per month. Skywater Technology Foundry, Inc. was founded in 2017 when its predecessor company, Cypress Semiconductor Corp, sold its Minnesota wafer fabrication facility business unit to Oxbow Industries. Skywater Technology Foundry, Inc. works primarily with large, technologically advanced companies and organizations of which many carry investment grade credits. Major customers include the U.S. Department of Defense, along with multiple other aerospace and defense companies.
The Market. The Skywater Technology HQ Property is located in Bloomington and Hennepin County, Minnesota, which is part of the Minneapolis-St. Paul MSA. According to Moody’s, the Minneapolis-St. Paul MSA had a 2019 population of 3.6 million and is expected to increase by approximately 5% over the next five years. The MSA’s unemployment rate was 2.9% at YE 2019, down from 3.9% in 2014. Median household income was $81,800 for the same time period, which represents an approximately 18% increase from its 2014 level, and is expected to further increase to $94,200 by 2025. There are 16 Minnesota-based companies on the Fortune 500 list, including UnitedHealth Group Inc. (7), Target Corp. (37), Best Buy (75), 3M Co. (103), and CHS (105).
The Skywater Technology HQ Property possesses access to multiple interstate and highway systems. I-494, I-35W, I-35E, and I-94 are all in close proximity, enabling the Skywater Technology HQ Property to draw from multiple labor pools throughout the Twin Cities. The Skywater Technology HQ Property is approximately 10.6 miles from the Minneapolis/St. Paul International airport, which enables customers and suppliers to access the facility.
According to a third party report, the Skywater Technology HQ Property is located in the I-494 corridor office submarket of Minneapolis. As of second quarter 2020, the submarket contained 33.9MM square feet of existing supply, with 64,000 square feet of new supply coming online in the last 12 months. Vacancy in the submarket as of second quarter 2020 was 9.0%, which is consistent with the submarket’s historical trailing 10-year average vacancy rate of 9.4%. Asking rental rates in the submarket as of second quarter 2020 were $25.66 per square foot. Per the appraisal, the Skywater Technology HQ Property is located in the Minneapolis office market, which reports average
THE INFORMATION IN THIS STRUCTURAL AND COLLATERAL TERM SHEET IS NOT COMPLETE AND MAY BE AMENDED PRIOR TO THE TIME OF SALE. THIS TERM SHEET IS NOT AN OFFER TO SELL THESE SECURITIES AND IT IS NOT A SOLICITATION OF AN OFFER TO BUY THESE SECURITIES IN ANY JURISDICTION WHERE THE OFFER OR SALE IS NOT PERMITTED.
| | 92 of 144 | | |
| Structural and Collateral Term Sheet | Benchmark 2020-B20 |
| Skywater Technology HQ | |
asking rents of $26.07 per square foot for office properties. The appraiser identified six comparable office properties within 26 miles of the Skywater Technology HQ Property. Rental rates for the comparable properties ranged from $12.75 per square foot to $15.95 per square foot, as compared to the $12.00 per square foot in place rents at the Skywater Technology HQ Property.
COVID-19 Update. Skywater Technology Foundry, Inc. was deemed an essential business by the State of Minnesota as a result of its critical role in U.S. defense infrastructure via the Department of Defense, and is also working to provide semiconductors utilized in COVID- 19 detection devices. The property has been operating at full capacity and utilization throughout the pandemic. See “Risk Factors—Risks Related to Market Conditions and Other External Factors—Current Coronavirus Pandemic May Adversely Affect the Global Economy and the Performance of the Mortgage Loans”.
| Historical and Current Occupancy(1) | |||
| 2017 | 2018 | 2019 | Current(2) |
| N/A | N/A | N/A | 100.0% |
| (1) | Historical occupancies are not available given the nature of the subject’s sale-leaseback transaction. |
| (2) | Current Occupancy is as of October 6, 2020. |
| Tenant Summary(1) | ||||||
| Tenant | Ratings Moody’s/Fitch/S&P(2) | Net Rentable Area (SF) | % of Total NRA | Base Rent PSF | % of Total Base Rent | Lease Expiration Date |
| Skywater Technology Foundry, Inc. | NR/NR/NR | 393,765 | 100.0% | $12.00 | 100.0% | 8/31/2040 |
| Total Occupied | 393,765 | 100.0% | $12.00 | 100.0% | ||
| Vacant | 0 | 0.0 | ||||
| Total | 393,765 | 100.0% | ||||
| (1) | Based on the underwritten rent roll dated October 6, 2020. |
| (2) | In certain instances, ratings provided are those of the parent company of the entity shown, whether or not the parent company guarantees the lease. |
| Lease Rollover Schedule(1)(2) | |||||||||
| Year | Number of Leases Expiring | Net Rentable Area Expiring | % of NRA Expiring | Base Rent Expiring | % of Base Rent Expiring | Cumulative Net Rentable Area Expiring | Cumulative % of NRA Expiring | Cumulative Base Rent Expiring | Cumulative % of Base Rent Expiring |
| Vacant | NAP | 0 | 0.0% | NAP | NAP | 0 | 0.0% | NAP | NAP |
| 2020 & MTM | 0 | 0 | 0.0 | $0 | 0.0% | 0 | 0.0% | $0 | 0.0% |
| 2021 | 0 | 0 | 0.0 | 0 | 0.0 | 0 | 0.0% | $0 | 0.0% |
| 2022 | 0 | 0 | 0.0 | 0 | 0.0 | 0 | 0.0% | $0 | 0.0% |
| 2023 | 0 | 0 | 0.0 | 0 | 0.0 | 0 | 0.0% | $0 | 0.0% |
| 2024 | 0 | 0 | 0.0 | 0 | 0.0 | 0 | 0.0% | $0 | 0.0% |
| 2025 | 0 | 0 | 0.0 | 0 | 0.0 | 0 | 0.0% | $0 | 0.0% |
| 2026 | 0 | 0 | 0.0 | 0 | 0.0 | 0 | 0.0% | $0 | 0.0% |
| 2027 | 0 | 0 | 0.0 | 0 | 0.0 | 0 | 0.0% | $0 | 0.0% |
| 2028 | 0 | 0 | 0.0 | 0 | 0.0 | 0 | 0.0% | $0 | 0.0% |
| 2029 | 0 | 0 | 0.0 | 0 | 0.0 | 0 | 0.0% | $0 | 0.0% |
| 2030 | 0 | 0 | 0.0 | 0 | 0.0 | 0 | 0.0% | $0 | 0.0% |
| 2031 and Thereafter | 1 | 393,765 | 100.0 | 4,725,180 | 100.0 | 393,765 | 100.0% | $4,725,180 | 100.0% |
| Total | 1 | 393,765 | 100.0% | $4,725,180 | 100.0% | ||||
| (1) | Based on the underwritten rent roll dated October 6, 2020. |
| (2) | Lease Rollover Schedule is based on the lease expiration dates of all direct leases in place. |
THE INFORMATION IN THIS STRUCTURAL AND COLLATERAL TERM SHEET IS NOT COMPLETE AND MAY BE AMENDED PRIOR TO THE TIME OF SALE. THIS TERM SHEET IS NOT AN OFFER TO SELL THESE SECURITIES AND IT IS NOT A SOLICITATION OF AN OFFER TO BUY THESE SECURITIES IN ANY JURISDICTION WHERE THE OFFER OR SALE IS NOT PERMITTED.
| | 93 of 144 | | |
| Structural and Collateral Term Sheet | Benchmark 2020-B20 |
| Skywater Technology HQ | |
| Underwritten Net Cash Flow(1) | |||
| Underwritten | Per Square Foot | %(2) | |
| Base Rent(3) | $4,725,180 | $12.00 | 71.2% |
| Rent Steps(4) | 94,504 | 0.24 | 1.4 |
| Gross Potential Rent | $4,819,684 | $12.24 | 72.7% |
| Total Reimbursements | 1,812,651 | 4.60 | 27.3 |
| Total Other Income | 0 | 0.00 | 0.0 |
| Net Rental Income | $6,632,335 | $16.84 | 100.0% |
| (Vacancy/Credit Loss) | (331,617) | (0.84) | (5.0) |
| Effective Gross Income | $6,300,718 | $16.00 | 95.0% |
| Total Expenses | 1,812,651 | 4.60 | 28.8 |
| Net Operating Income | $4,488,067 | $11.40 | 71.2% |
| Total TI/LC, Capex/RR | 292,156 | 0.74 | 4.6 |
| Net Cash Flow | $4,195,911 | $10.66 | 66.6% |
| (1) | Operating history is not available given the nature of the subject’s sale-leaseback transaction. |
| (2) | % column represents percent of Net Rental Income for all revenue lines and represents percent of Effective Gross Income for the remainder of the fields. |
| (3) | Underwritten Base Rent is based on the underwritten rent roll as of October 6, 2020. |
| (4) | Rent Steps taken through September 1, 2021. |
Property Management. The Skywater Technology HQ Property is self-managed by the Skywater Technology HQ Borrower.
Escrows and Reserves. At loan origination, the Skywater Technology HQ Borrower deposited (i) $26,659.01 into the real estate tax reserve and (ii) $252,799.71 into the insurance reserve.
Tax Reserve – The Skywater Technology HQ Borrower is required to deposit into a real estate tax reserve, on a monthly basis, 1/12 of the estimated annual real estate taxes (initially estimated at $26,659.01).
Insurance Reserve – On each payment date, the Skywater Technology HQ Borrower is required to deposit an amount equal to 1/12 of estimated insurance premiums unless the following conditions are satisfied: (i) the Skywater Technology HQ Borrower (or Skywater Technology) finances the insurance premiums through a third-party premium finance company pursuant to a blanket premium finance agreement pursuant to which the Skywater Technology HQ Borrower (or Skywater Technology) makes payments on a monthly basis, (ii) the Skywater Technology HQ Borrower submits to the Lender proof of payment of each and every installment due, on or prior to the date each such payment is due and payable, under such premium financing agreement or installment arrangement directly to the insurance company, and (iii) the amount of funds on deposit in the insurance account is equal to or greater than an amount equal to 115% of the next two (2) months’ required monthly payments under such blanket premium finance agreement (it being agreed that if such amount is not on deposit in the insurance account, the Skywater Technology HQ Borrower shall be required to make a true up payment with respect to the amount of the deficiency in order for the monthly Insurance reserve deposits to continue to be waived).
Replacement Reserve – The Skywater Technology HQ Borrower is required to deposit into a replacement reserve, on a monthly basis, an amount equal to $6,562.75 for replacement reserves. The Skywater Technology HQ Borrower will have no obligation to make the replacement reserve monthly deposit on any monthly payment date to the extent that the amount of the replacement reserve funds then on deposit in the replacement reserve account equals or exceeds an amount equal to 60 months of replacement reserve monthly deposits.
TI/LC Reserve – The Skywater Technology HQ Borrower is required to deposit into a TI/LC reserve, on a monthly basis, an amount equal to approximately $17,783.58 for tenant improvements and leasing commissions.
Lockbox / Cash Management. The Skywater Technology HQ Loan is structured with a hard lockbox and springing cash management. The borrower is required to deliver a tenant direction letter to Skywater Technology Foundry, Inc., the existing tenant at the Skywater Technology HQ Property, directing them to remit their rent checks directly to the lender-controlled lockbox. The borrower is required to cause revenue received by the borrower or the property manager from the Skywater Technology HQ Property to be deposited into such lockbox promptly upon receipt. All funds deposited into the lockbox are required to be transferred on each business day to or at the direction of the borrower unless a Trigger Period exists. Upon the occurrence and during the continuance of a Trigger Period, all funds in the lockbox account are required to be swept on each business day to a cash management account under the control of the lender to be applied and disbursed in accordance with the Skywater Technology HQ Loan documents, and all excess cash flow funds
THE INFORMATION IN THIS STRUCTURAL AND COLLATERAL TERM SHEET IS NOT COMPLETE AND MAY BE AMENDED PRIOR TO THE TIME OF SALE. THIS TERM SHEET IS NOT AN OFFER TO SELL THESE SECURITIES AND IT IS NOT A SOLICITATION OF AN OFFER TO BUY THESE SECURITIES IN ANY JURISDICTION WHERE THE OFFER OR SALE IS NOT PERMITTED.
| | 94 of 144 | | |
| Structural and Collateral Term Sheet | Benchmark 2020-B20 |
| Skywater Technology HQ | |
remaining in the cash management account after the application of such funds in accordance with the Skywater Technology HQ Loan documents are required to be held by the lender in an excess cash flow reserve account as additional collateral for the Skywater Technology HQ Loan. Upon the cure of the applicable Trigger Period, so long as no other Trigger Period exists, the lender is required to return any amounts remaining on deposit in the excess cash flow reserve account to the borrower. Upon an event of default under the Skywater Technology HQ Loan documents, the lender will apply funds to the debt in such priority as it may determine.
A “Trigger Period” means a period commencing upon the earliest to occur of (i) an event of default, (ii) the debt service coverage ratio being less than 1.20x as of any applicable calculation date, and (iii) a Specified Tenant Trigger Period (as defined below), and expiring upon (a) with respect to clause (i) above, the cure (if applicable) of such event of default, (b) with respect to clause (ii) above, the debt service coverage ratio being equal to or greater than 1.20x for two consecutive calendar quarters, and (c) with respect to clause (iii) above, such Specified Tenant Trigger Period ceasing to exist.
A “Specified Tenant” means, as applicable, (i) Skywater Technology Foundry, Inc., together with any parent or affiliate thereof providing credit support or a guaranty, or (ii) any replacement tenant of Skywater Technology Foundry, Inc. approved in accordance with the Skywater Technology HQ Loan documents.
A “Specified Tenant Trigger Period” will (A) commence upon the first to occur of (i) Specified Tenant being in default under the applicable Specified Tenant lease beyond any applicable grace, notice and/or cure period under such Specified Tenant lease, (ii) the Specified Tenant failing to be in actual, physical possession of the Specified Tenant space (or applicable portion thereof) failing to conduct business during customary hours and/or “going dark” in the Specified Tenant Space (or applicable portion thereof), (iii) the Specified Tenant giving notice that it is terminating its lease for 10% or more of the Specified Tenant space, (iv) any termination or cancellation of the Specified Tenant lease (including, without limitation, rejection in any bankruptcy or similar insolvency proceeding), and/or any Specified Tenant Lease failing to otherwise be in full force and effect, (v) any bankruptcy or similar insolvency of the Specified Tenant, and (vi) the Specified Tenant’s EBITDAR Ratio (as defined below) being less than 5.00x (the “EBITDAR Trigger”) and (B) expire upon the first to occur of (x) the satisfaction of the Specified Tenant Cure Conditions (as defined below), or (y) the Specified Tenant space (or applicable portion thereof) being re-leased pursuant to one or more replacement leases approved by the lender in accordance with the Skywater Technology HQ Loan documents and the tenants thereunder are in actual physical occupancy of, and conducting business in, the Skywater Technology HQ Property and are paying fully unabated rent.
“Specified Tenant Cure Conditions” shall mean each of the following, as applicable (i) the Specified Tenant has cured all defaults under the Specified Tenant Lease, (ii) the Specified Tenant is in actual, physical possession of the Specified Tenant space (or applicable portion thereof), conducting business during customary hours and not “dark” in the Specified Tenant space (or applicable portion thereof), (iii) the Specified Tenant has revoked or rescinded all termination or cancellation notices with respect to the Specified Tenant Lease and has re-affirmed the Specified Tenant Lease as being in full force and effect, (iv) with respect to any applicable bankruptcy or insolvency proceedings involving the Specified Tenant and/or the Specified Tenant Lease, the Specified Tenant is no longer insolvent or subject to any bankruptcy or insolvency proceedings and has affirmed the Specified Tenant Lease pursuant to final, non-appealable order of a court of competent jurisdiction, (v) the Specified Tenant is paying full, unabated rent under the Specified Tenant Lease, and (vi) in the event the Specified Tenant Trigger Period is due to an EBITDAR Trigger, Specified Tenant’s EBITDAR Ratio being equal to or greater than 5.10x.
An “EBITDAR Ratio” means the quotient (calculated based on a trailing twelve (12) month basis) of (i) the Specified Tenant’s annual earnings before interest, taxes, depreciation, amortization and restructuring or rent costs, divided by (ii) the amount of gross rents at the Skywater Technology HQ Property attributable to the Specified Tenant.
Current Mezzanine or Subordinate Indebtedness. None.
Partial Release. None.
Future Mezzanine or Secured Subordinate Indebtedness Permitted. None.
THE INFORMATION IN THIS STRUCTURAL AND COLLATERAL TERM SHEET IS NOT COMPLETE AND MAY BE AMENDED PRIOR TO THE TIME OF SALE. THIS TERM SHEET IS NOT AN OFFER TO SELL THESE SECURITIES AND IT IS NOT A SOLICITATION OF AN OFFER TO BUY THESE SECURITIES IN ANY JURISDICTION WHERE THE OFFER OR SALE IS NOT PERMITTED.
| | 95 of 144 | | |
| Structural and Collateral Term Sheet | Benchmark 2020-B20 |
| Agellan Portfolio | |
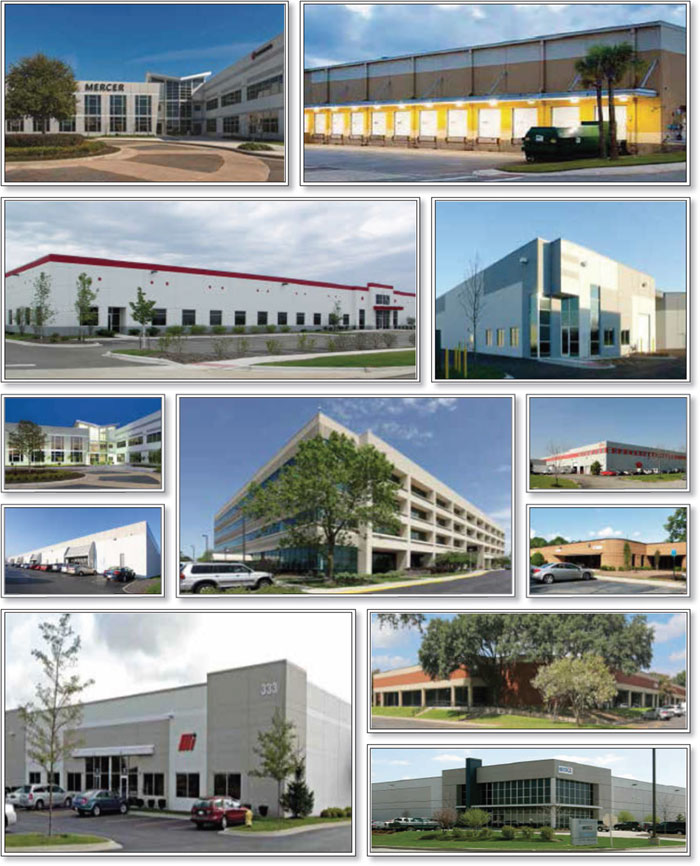
THE INFORMATION IN THIS STRUCTURAL AND COLLATERAL TERM SHEET IS NOT COMPLETE AND MAY BE AMENDED PRIOR TO THE TIME OF SALE. THIS TERM SHEET IS NOT AN OFFER TO SELL THESE SECURITIES AND IT IS NOT A SOLICITATION OF AN OFFER TO BUY THESE SECURITIES IN ANY JURISDICTION WHERE THE OFFER OR SALE IS NOT PERMITTED.
| | 96 of 144 | | |
| Structural and Collateral Term Sheet | Benchmark 2020-B20 |
| Agellan Portfolio | |

THE INFORMATION IN THIS STRUCTURAL AND COLLATERAL TERM SHEET IS NOT COMPLETE AND MAY BE AMENDED PRIOR TO THE TIME OF SALE. THIS TERM SHEET IS NOT AN OFFER TO SELL THESE SECURITIES AND IT IS NOT A SOLICITATION OF AN OFFER TO BUY THESE SECURITIES IN ANY JURISDICTION WHERE THE OFFER OR SALE IS NOT PERMITTED.
| | 97 of 144 | | |
| Structural and Collateral Term Sheet | Benchmark 2020-B20 |
| Agellan Portfolio | |
| Mortgage Loan Information | |||
| Mortgage Loan Seller: | JPMCB | ||
| Original Principal Balance(1): | $35,000,000 | ||
| Cut-off Date Principal Balance(1): | $35,000,000 | ||
| % of Pool by IPB: | 3.9% | ||
| Loan Purpose: | Refinance | ||
| Borrowers(2): | Various | ||
| Loan Sponsor(2): | Elad Canada Realty Inc. | ||
| Interest Rate(3): | 4.62820% | ||
| Note Date: | 7/15/2020 | ||
| Maturity Date: | 8/7/2025 | ||
| Interest-only Period: | 60 months | ||
| Original Term: | 60 months | ||
| Original Amortization: | None | ||
| Amortization Type: | Interest Only | ||
| Call Protection: | L(26),Def(30),O(4) | ||
| Lockbox / Cash Management: | Hard / In Place | ||
| Additional Debt(4): | Yes | ||
| Additional Debt Balance(4): | $196,000,000 / $172,000,000 / | ||
| $31,000,000 | |||
| Additional Debt Type(4): | Pari Passu / Subordinate Debt / | ||
| Mezzanine Debt | |||
| Escrows and Reserves(5) | |||
| Initial | Monthly | Initial Cap | |
| Taxes: | $0 | Springing | N/A |
| Insurance: | $0 | Springing | N/A |
| Replacement Reserves: | $0 | $101,570 | $3,656,506 |
| TI/LC: | $6,410,963 | $431,671 | $15,540,151 |
| Required Repairs: | $2,985,266 | $0 | N/A |
| Other: | $2,172,050 | Springing | N/A |
| Property Information | |
| Single Asset / Portfolio: | Portfolio |
| Title: | Fee |
| Property Type - Subtype: | Various |
| Net Rentable Area (SF)(6): | 6,094,177 |
| Location: | Various |
| Year Built / Renovated: | Various / Various |
| Occupancy: | 90.4% |
| Occupancy Date: | Various |
| Number of Tenants: | 250 |
| 2017 NOI: | $33,762,598 |
| 2018 NOI: | $38,961,287 |
| 2019 NOI: | $40,473,151 |
| TTM NOI(7): | N/A |
| UW Economic Occupancy: | 89.4% |
| UW Revenues: | $60,350,250 |
| UW Expenses: | $24,159,826 |
| UW NOI(8)(9): | $36,190,424 |
| UW NCF(8)(9): | $32,872,429 |
| Appraised Value / Per SF(9): | $551,000,000 / $90 |
| Appraisal Date: | Various |
| Financial Information(1) | |||
| Senior Notes | Whole Loan | Total Debt | |
| Cut-off Date Loan / SF: | $38 | $66 | $71 |
| Maturity Date Loan / SF: | $38 | $66 | $71 |
| Cut-off Date LTV: | 41.9% | 73.1% | 78.8% |
| Maturity Date LTV: | 41.9% | 73.1% | 78.8% |
| UW NCF DSCR: | 3.03x | 1.78x | 1.54x |
| UW NOI Debt Yield: | 15.7% | 9.0% | 8.3% |
| Sources and Uses | |||||
| Sources | Proceeds | % of Total | Uses | Proceeds | % of Total |
| Senior Notes | $231,000,000 | 53.0% | Payoff Existing Debt(10) | $418,924,922 | 96.0% |
| Subordinate Debt | 172,000,000 | 39.4 | Upfront Reserves | 11,568,279 | 2.7 |
| Mezzanine Loan | 31,000,000 | 7.1 | Closing Costs | 5,670,436 | 1.3 |
| Sponsor Equity | 2,163,638 | 0.5 | |||
| Total Sources | $436,163,638 | 100.0% | Total Uses | $436,163,638 | 100.0% |
| (1) | The Agellan Portfolio loan is part of a whole loan evidenced by seven pari passu notes and one subordinate note with an aggregate outstanding principal balance as of the Cut-off Date of $403.0 million. Financial Information presented in the chart above reflects the Cut-off Date balance of the $231.0 million Agellan Portfolio Senior Notes as defined below), the $403.0 million Agellan Portfolio Whole Loan (as defined below) and the $434.0 million Agellan Portfolio Total Debt (as defined below). For additional information, see “The Loan” herein. |
| (2) | For a description of the Borrowers (as defined below) see “The Borrowers” below. For a description of the Borrower Sponsor (as defined below), see “The Loan Sponsor” below. |
| (3) | Represents the interest rate of the Agellan Senior Notes (as defined below). The interest rate for Agellan Portfolio Subordinate Note (as defined below) is 4.4000%. |
| (4) | See “Current Mezzanine or Subordinate Indebtedness" below. |
| (5) | For a full description of Escrows and Reserves, please refer to “Escrows and Reserves” below. Initial Other reserves consist of (i) $2,000,000 for a working capital reserve and (ii) $172,050 for free rent. |
| (6) | Net Rentable Area (SF) is exclusive of 344 square feet associated with re-measurements. |
| (7) | TTM NOI is not available as the Borrowers are only required to report financials on an annual basis. |
| (8) | UW NOI and UW NCF are inclusive of contractual rent steps taken through June 1, 2021 and includes the ALDI, Inc. expansion of approximately 24,597 square feet and HCSC (as defined below) relocation at the Naperville Woods Office Center property. Underwritten base rent and reimbursements have been further adjusted to account for a 10.0% stress to tenants that missed full or partial rent payments in April, May and/or June or have requested rent relief during the COVID-19 pandemic. The total stress to underwritten base rent and reimbursements is $223,074 and $79,032, respectively. All underwritten base rent figures herein are exclusive of rent attributable to vacant space. |
THE INFORMATION IN THIS STRUCTURAL AND COLLATERAL TERM SHEET IS NOT COMPLETE AND MAY BE AMENDED PRIOR TO THE TIME OF SALE. THIS TERM SHEET IS NOT AN OFFER TO SELL THESE SECURITIES AND IT IS NOT A SOLICITATION OF AN OFFER TO BUY THESE SECURITIES IN ANY JURISDICTION WHERE THE OFFER OR SALE IS NOT PERMITTED.
| | 98 of 144 | | |
| Structural and Collateral Term Sheet | Benchmark 2020-B20 |
| Agellan Portfolio | |
| (9) | While the Agellan Portfolio Whole Loan was originated after the emergence of the novel coronavirus pandemic and the economic disruption resulting from measures to combat the pandemic, the pandemic is an evolving situation and could impact the Agellan Portfolio Whole Loan more severely than assumed in the underwriting of the Agellan Portfolio Whole Loan and could adversely affect the NOI, NCF and occupancy information, as well as the DSCR and Debt Yield metrics presented above. The appraised value was determined prior to the emergence of the novel coronavirus pandemic, and the economic disruption resulting from measures to combat the pandemic, and all LTV metrics were calculated based on such prior information. See “Risk Factors—Risks Related to Market Conditions and Other External Factors—Coronavirus Pandemic Has Adversely Affected the Global Economy and Will Likely Adversely Affect the Performance of the Mortgage Loans” in the Preliminary Prospectus. |
| (10) | Payoff Existing Debt represents the refinance of 42 of the Agellan Properties that were previously securitized in the MSC 2019-AGLN transaction and the balance sheet financing associated with the borrower sponsors’ recent acquisition of four of the Agellan Properties. |
The Loan. The Agellan Portfolio mortgage loan (the “Agellan Portfolio Loan”) is part of a fixed rate whole loan secured by first mortgages encumbering the Borrowers’ fee simple interests in a 46-property portfolio of industrial and office properties in the aggregate comprising approximately 6,094,177 square feet located throughout nine states (“Agellan Portfolio” or the “Agellan Properties”). The Agellan Portfolio Loan is evidenced by the non-controlling fixed rate Note A-5 and Note A-7 with an aggregate original principal balance and outstanding principal balance as of the Cut-off Date of $35.0 million. The Agellan Portfolio Loan is part of a $403.0 million whole loan (the “Agellan Portfolio Whole Loan”) that is evidenced by seven pari passu notes with an aggregate Cut-off Date principal balance of $231.0 million (the “Agellan Portfolio Senior Notes”) and a controlling subordinate fixed rate note (the “Agellan Portfolio Subordinate Note”), with a Cut-off Date principal balance of $172.0 million. The Agellan Portfolio Senior Notes are senior to the Agellan Portfolio Subordinate Note. The relationship between the holders of the Agellan Portfolio Whole Loan is governed by a co-lender agreement as described under “Description of the Mortgage Pool—The Whole Loans—The Non-Serviced AB Whole Loans—The Agellan Portfolio Whole Loan” in the Preliminary Prospectus. The Agellan Portfolio Whole Loan has a five-year term and will be interest-only for the entire term of the loan. 42 of the Agellan Properties were previously securitized in the MSC 2019-AGLN transaction and the balance sheet financing associated with the Sponsors’ recent acquisition of four of the Agellan Properties.
| Whole Loan Summary | ||||
| Note | Original Balance | Cut-off Date Balance | Note Holder | Controlling Piece |
| Note A-1 | $75,000,000 | $75,000,000 | Benchmark 2020-B18 | No |
| Note A-2, Note A-6 | $61,000,000 | $61,000,000 | DBJPM 2020-C9 | No |
| Note A-3, Note A-4 | $60,000,000 | $60,000,000 | Benchmark 2020-B19 | No |
| Note A-5, Note A-7 | $35,000,000 | $35,000,000 | Benchmark 2020-B20 | No |
| Total Senior Notes | $231,000,000 | $231,000,000 | ||
| Note B | $172,000,000 | $172,000,000 | Benchmark 2020-B18 | Yes(2) |
| Whole Loan | $403,000,000 | $403,000,000 | ||
| (1) | The Agellan Portfolio Subordinate Note will be subordinate in right of payment to the Agellan Portfolio Senior Notes. |
| (2) | The initial controlling note is Note B, for so long as no control appraisal period with respect to Note B is continuing. See “Description of the Mortgage Pool—The Whole Loans The Non-Serviced AB Whole Loans—The Agellan Portfolio Whole Loan” in the Preliminary Prospectus. The Agellan Portfolio Whole Loan will be serviced under the pooling and servicing agreement for the Benchmark 2020-B18 transaction. |
The Borrowers. The borrowers are Chicago Industrial Properties 1 LP, Corridor Park LP, Norcross Springs LP, 6100 McIntosh LP, 6100 McIntosh Vacant LP, Agellan Commercial REIT U.S. L.P., Continental Drive LP, 9385 Washington Blvd. L.P., Agellan Warrenville L.P., 1300 Cox Avenue LP and San Antonio Industrial One LP, each a Delaware limited partnership and single purpose entity with two independent directors in its organizational structure (collectively, the “Borrowers”). Legal counsel to the Borrowers delivered a non-consolidation opinion in connection with the origination of the Agellan Portfolio Whole Loan.
The Loan Sponsor. The sponsor is Elad Canada Realty Inc. (the “Borrower Sponsor” or ELAD Canada”), and the non-recourse carveout guarantor is Elad Genesis Limited Partnership a subsidiary of the Borrower Sponsor. ELAD Canada is a privately held, commercial real estate company specializing in the acquisition and development of commercial and residential properties. ELAD Canada was founded in 1997 and is based in Toronto, Canada. The firm operates as a subsidiary of Elad US Holding, Inc. ELAD Canada has focused its business in central Canada, acquiring income producing properties, as well as development sites. As of 2020, ELAD Canada has 7.4 million square feet of income producing space, as well as 4.4 million square feet of construction in the pipeline and over 6,000 residential units under development. Elad Genesis Limited Partnership is required to maintain a minimum net worth of $100 million during the term of the Agellan Portfolio Whole Loan. ELAD Canada is a part of the ELAD Group. Founded in 1992, ELAD Group is a real estate conglomerate with development projects in North America, Europe and Israel. ELAD Group has developed successful condominiums, hotels and mixed-use projects making its mark as a significant developer of ultra-luxury properties in New York City, like the Plaza Hotel. ELAD Group is focused on the acquisition, development and conversion of architecturally significant residential and commercial properties in key markets throughout North America.
THE INFORMATION IN THIS STRUCTURAL AND COLLATERAL TERM SHEET IS NOT COMPLETE AND MAY BE AMENDED PRIOR TO THE TIME OF SALE. THIS TERM SHEET IS NOT AN OFFER TO SELL THESE SECURITIES AND IT IS NOT A SOLICITATION OF AN OFFER TO BUY THESE SECURITIES IN ANY JURISDICTION WHERE THE OFFER OR SALE IS NOT PERMITTED.
| | 99 of 144 | | |
| Structural and Collateral Term Sheet | Benchmark 2020-B20 |
| Agellan Portfolio | |
The aggregate liability of the guarantor with respect to the matters that constitute full recourse carveouts (each, a “Full Recourse Event”) under the Agellan Portfolio Whole Loan documents may not exceed an amount equal to (x) 20% of the outstanding principal balance of the Agellan Portfolio Whole Loan as of the first occurrence of a Full Recourse Event plus (y) any and all reasonable third-party costs incurred by the lender (including reasonable and out-of-pocket attorney’s fees and costs) in connection with the enforcement of the Full Recourse Event thereunder and the collection of amounts due thereunder.
The Borrower Sponsor has notified JPMCB that, Elad Canada Operations Inc., the controlling shareholder of the entities that own ELAD Canada, has entered into a binding offer letter to sell 100% of ELAD Canada, reflecting holdings of ELAD Canada’s properties, including, among other properties, the Agellan Properties, but excluding certain assets of ELAD Canada (the “Excluded Properties”), to Rester Management Group (“Rester”). Rester is expected to pay approximately CAD 508 million, which, in addition to the value allotted to the Excluded Properties of approximately CAD 275 million, results in the total value of ELAD Canada of approximately CAD 783 million. By contrast, ELAD Canada’s equity value according to its financial statements as of the end of the first quarter was CAD 605 million. The transaction is still under negotiation and the transaction is expected to close within 45 days following the execution of such acquisition agreement. In the event the transaction moves forward, Rester is expected to continue to employ ELAD Canada’s current senior officers and key personnel. Rester Management is a Canadian family-owned real estate company that was established in early 1900s and owns, develops and manages office, retail and residential properties primarily in the greater Montreal area. Rester Management’s current portfolio includes residential, office, retail and industrial properties in Eastern Canada and the United States.
See “Risk Factors—Risks Related to the Mortgage Loans—The Performance of a Mortgage Loan and Its Related Mortgaged Property Depends in Part on Who Controls the Borrower and Mortgaged Property” in the Preliminary Prospectus.
The Properties. The Agellan Portfolio consists of the fee simple interests in a 46 property portfolio of industrial and office properties comprising approximately 6,094,177 square feet in the aggregate, located throughout nine states and 12 distinct markets. The Agellan Portfolio is comprised of 42 industrial properties (5,248,373 square feet; 86.1% of net rentable area; 71.3% of underwritten base rent) and four office properties (845,804 square feet, 13.9% of net rentable area; 28.7% of underwritten base rent). The tenancy spans a variety of industries including health care, food services, automotive parts, insurance and technology.
As of June 1, 2020, the Agellan Portfolio is 93.4% leased (90.4% leased excluding dark tenants and known vacates) to 250 unique tenants with no single tenant accounting for more than 6.9% of underwritten base rent. Four of the top 10 tenants (Health Care Service Corp., General Motors LLC, Life Technologies Corporation and Allstate Insurance Co.) have investment grade credit ratings by one or more of Moody’s, Fitch or S&P and account for approximately 12.4% and 18.2% of net rentable area and underwritten base rent, respectively. The Agellan Properties have a weighted average remaining lease term of approximately 2.6 years.
COVID-19 Update. As of October 1, 2020, the Agellan Properties have remained open; however, in many instances office tenants have opted to work remotely. For May, June, July, August and September of 2020, the Borrower Sponsor collected approximately 98.9%, 98.5%, 98.3%, 98.0% and 97.8% of underwritten base rent, respectively. The top 10 tenants, representing 38.6% of net rentable area and 41.0% of underwritten rent, experienced no disruption with respect to contractual rent obligations. 32 tenants representing approximately 5.5% of the underwritten base rent and 5.4% of the net rentable area have requested rent relief or have made partial and/or no rental payments for the months of May, June, July, August and September. The five largest tenants that have put in formal requests for relief in aggregate represent approximately 2.0% of net rentable area and approximately 1.8% of underwritten base rent. As of September 2020, one of the tenants representing 0.1% of net rentable area and 0.1% of underwritten base rent has been granted a two month rent deferral agreement to be paid back in six installments from September 2020 to February 2021. 24 tenants (totaling 5.3% of NRA) are in discussions with the Borrowers for rent relief. The Agellan Portfolio Whole Loan is current as of the October 2020 payment date. See “Risk Factors—Risks Related to Market Conditions and Other External Factors—Current Coronavirus Pandemic May Adversely Affect the Global Economy and the Performance of the Mortgage Loans”.
THE INFORMATION IN THIS STRUCTURAL AND COLLATERAL TERM SHEET IS NOT COMPLETE AND MAY BE AMENDED PRIOR TO THE TIME OF SALE. THIS TERM SHEET IS NOT AN OFFER TO SELL THESE SECURITIES AND IT IS NOT A SOLICITATION OF AN OFFER TO BUY THESE SECURITIES IN ANY JURISDICTION WHERE THE OFFER OR SALE IS NOT PERMITTED.
| | 100 of 144 | | |
| Structural and Collateral Term Sheet | Benchmark 2020-B20 |
| Agellan Portfolio | |
| Portfolio Summary | ||||||||||
No. | Property Name | City, State | Property Type | Net | Allocated | % | UW Base Rent(1) | % of UW Base Rent | Appraised Value | % of Appraised Value |
| 1 | Sarasota Distribution Hub | Sarasota, FL | Industrial | 906,449 | $4,411,042 | 12.6% | $4,804,386 | 11.7% | $70,200,000 | 12.7% |
| 2 | Naperville Woods Office Center | Naperville, IL | Office | 482,497 | $4,380,645 | 12.5% | $7,480,569 | 18.2% | $68,800,000 | 12.5% |
| 3 | Southpark Business Park FOP | Austin, TX | Industrial | 187,075 | $2,222,457 | 6.3% | $2,478,202 | 6.0% | $34,900,000 | 6.3% |
| 4 | Supervalu | Fort Worth, TX | Industrial | 253,800 | $1,677,047 | 4.8% | $1,573,560 | 3.8% | $26,720,000 | 4.8% |
| 5 | Plainfield Business Center IV | Plainfield, IN | Industrial | 434,354 | $1,534,615 | 4.4% | $1,385,853 | 3.4% | $24,100,000 | 4.4% |
| 6 | Beltway III | Houston, TX | Office | 130,566 | $1,280,149 | 3.7% | $2,347,444 | 5.7% | $20,100,000 | 3.6% |
| 7 | 4405 Continental Dr | Flint, MI | Industrial | 400,000 | $1,194,169 | 3.4% | $2,097,244 | 5.1% | $18,750,000 | 3.4% |
| 8 | Beltway IV | Houston, TX | Office | 131,702 | $1,095,161 | 3.1% | $1,714,514 | 4.2% | $17,200,000 | 3.1% |
| 9 | Sandy Plains Business Park | Marietta, GA | Industrial | 167,329 | $1,012,655 | 2.9% | $1,141,184 | 2.8% | $15,700,000 | 2.8% |
| 10 | Silber Industrial Park | Houston, TX | Industrial | 198,970 | $898,015 | 2.6% | $882,818 | 2.2% | $14,100,000 | 2.6% |
| 11 | Southpark Business Park M | Austin, TX | Industrial | 72,550 | $833,747 | 2.4% | $958,626 | 2.3% | $13,100,000 | 2.4% |
| 12 | Coliseum Distribution Center #1 | San Antonio, TX | Industrial | 208,000 | $999,628 | 2.9% | $942,656 | 2.3% | $15,900,000 | 2.9% |
| 13 | West by Northwest Business Blvd | Houston, TX | Industrial | 122,750 | $814,640 | 2.3% | $835,905 | 2.0% | $12,800,000 | 2.3% |
| 14 | Norcross Center | Norcross, GA | Industrial | 169,951 | $783,375 | 2.2% | $942,051 | 2.3% | $12,300,000 | 2.2% |
| 15 | Goshen Springs | Norcross, GA | Industrial | 152,319 | $680,893 | 1.9% | $718,035 | 1.7% | $10,700,000 | 1.9% |
| 16 | Long Point Center | Houston, TX | Industrial | 189,680 | $661,787 | 1.9% | $741,097 | 1.8% | $10,400,000 | 1.9% |
| 17 | Corridor Park D | Austin, TX | Industrial | 56,100 | $655,707 | 1.9% | $674,322 | 1.6% | $10,300,000 | 1.9% |
| 18 | Southport 1-4 | Houston, TX | Industrial | 149,401 | $636,600 | 1.8% | $684,408 | 1.7% | $10,000,000 | 1.8% |
| 19 | Jameel | Houston, TX | Industrial | 94,900 | $636,600 | 1.8% | $664,060 | 1.6% | $10,000,000 | 1.8% |
| 20 | Beltway II | Houston, TX | Office | 101,039 | $617,494 | 1.8% | $214,432 | 0.5% | $9,700,000 | 1.8% |
| 21 | Braker Center 4 | Austin, TX | Industrial | 45,913 | $598,387 | 1.7% | $579,872 | 1.4% | $9,400,000 | 1.7% |
| 22 | Northgreen 1-4 | Houston, TX | Industrial | 118,736 | $547,146 | 1.6% | $474,118 | 1.2% | $8,600,000 | 1.6% |
| 23 | Minimax | Houston, TX | Industrial | 119,821 | $515,881 | 1.5% | $568,098 | 1.4% | $8,100,000 | 1.5% |
| 24 | Southpark Business Park E | Austin, TX | Industrial | 49,966 | $477,667 | 1.4% | $587,600 | 1.4% | $7,500,000 | 1.4% |
| 25 | 9385 Washington Blvd | Laurel, MD | Industrial | 57,590 | $464,640 | 1.3% | $426,784 | 1.0% | $7,300,000 | 1.3% |
| 26 | Rothway | Houston, TX | Industrial | 75,460 | $458,561 | 1.3% | $297,597 | 0.7% | $7,200,000 | 1.3% |
| 27 | 2730 Pinnacle | Elgin, IL | Industrial | 44,990 | $388,213 | 1.1% | $454,404 | 1.1% | $6,100,000 | 1.1% |
| 28 | Columbus West - Interchange Rd | Columbus, OH | Industrial | 91,200 | $359,553 | 1.0% | $404,218 | 1.0% | $5,650,000 | 1.0% |
| 29 | 1346 Oakbrook Drive | Norcross, GA | Industrial | 71,591 | $343,921 | 1.0% | $441,662 | 1.1% | $5,400,000 | 1.0% |
| 30 | 1230-1236 Hardt Circle | Bartlett, IL | Industrial | 60,080 | $330,893 | 0.9% | $287,187 | 0.7% | $5,200,000 | 0.9% |
| 31 | Pine Forest Business Park | Houston, TX | Industrial | 80,091 | $311,787 | 0.9% | $106,122 | 0.3% | $4,900,000 | 0.9% |
| 32 | 1351 Oakbrook Drive | Norcross, GA | Industrial | 36,489 | $244,913 | 0.7% | $188,866 | 0.5% | $3,850,000 | 0.7% |
| 33 | 1325 Oakbrook Drive | Norcross, GA | Industrial | 53,120 | $242,308 | 0.7% | $299,472 | 0.7% | $3,800,000 | 0.7% |
| 34 | 490 Heartland Drive | Sugar Grove, IL | Industrial | 39,520 | $238,834 | 0.7% | $304,704 | 0.7% | $3,750,000 | 0.7% |
| 35 | 1265 Oakbrook Drive | Norcross, GA | Industrial | 51,200 | $232,754 | 0.7% | $287,275 | 0.7% | $3,650,000 | 0.7% |
| 36 | Columbus West - Business Park(2) | Columbus, OH | Industrial | 92,618 | $223,201 | 0.6% | $0 | 0.0% | $3,500,000 | 0.6% |
| 37 | 1155 Bowes Road(3) | Elgin, IL | Industrial | 34,400 | $219,727 | 0.6% | $0 | 0.0% | $3,450,000 | 0.6% |
| 38 | 1280 Oakbrook Drive | Norcross, GA | Industrial | 46,400 | $216,253 | 0.6% | $261,118 | 0.6% | $3,400,000 | 0.6% |
| 39 | Rittiman East Industrial Park #23 & 24 | San Antonio, TX | Industrial | 50,806 | $246,650 | 0.7% | $308,606 | 0.8% | $3,870,000 | 0.7% |
| 40 | 2002 Bloomingdale | Glendale Heights, IL | Industrial | 31,919 | $194,541 | 0.6% | $194,877 | 0.5% | $3,050,000 | 0.6% |
| 41 | 333 Charles Court | West Chicago, IL | Industrial | 36,623 | $191,067 | 0.5% | $277,441 | 0.7% | $3,000,000 | 0.5% |
| 42 | 483 Heartland Drive | Sugar Grove, IL | Industrial | 36,426 | $191,067 | 0.5% | $172,234 | 0.4% | $3,000,000 | 0.5% |
| 43 | Cox Business Center | Erlanger, KY | Industrial | 52,040 | $213,648 | 0.6% | $247,686 | 0.6% | $3,350,000 | 0.6% |
| 44 | 1256 Oakbrook Drive | Norcross, GA | Industrial | 40,392 | $187,593 | 0.5% | $191,411 | 0.5% | $2,950,000 | 0.5% |
| 45 | 550 Heartland | Sugar Grove, IL | Industrial | 30,328 | $168,486 | 0.5% | $203,700 | 0.5% | $2,650,000 | 0.5% |
| 46 | Rittiman East Industrial Park #22 | San Antonio, TX | Industrial | 37,026 | $165,881 | 0.5% | $184,961 | 0.5% | $2,610,000 | 0.5% |
| Total | 6,094,177 | $35,000,000 | 100.0% | $41,031,381 | 100.0% | $551,000,000 | 100.0% | |||
| (1) | UW Base Rent has been further adjusted to account for a 10.0% stress to tenants having missed full or partial rent payments in April, May and/or June and/or have requested rent relief during the COVID-19 pandemic. The total stress to UW Base Rent is $223,074. |
| (2) | The Columbus West – Business Park property is currently 100.0% vacant and has been underwritten as such. |
| (3) | The 1155 Bowes Road property is leased to a single tenant that is currently dark. The tenant is underwritten as vacant. |
THE INFORMATION IN THIS STRUCTURAL AND COLLATERAL TERM SHEET IS NOT COMPLETE AND MAY BE AMENDED PRIOR TO THE TIME OF SALE. THIS TERM SHEET IS NOT AN OFFER TO SELL THESE SECURITIES AND IT IS NOT A SOLICITATION OF AN OFFER TO BUY THESE SECURITIES IN ANY JURISDICTION WHERE THE OFFER OR SALE IS NOT PERMITTED.
| | 101 of 144 | | |
| Structural and Collateral Term Sheet | Benchmark 2020-B20 |
| Agellan Portfolio | |
| Portfolio Summary (continued) | |||||||||||
| Net | |||||||||||
| Property | Rentable | Property | Year | Year | Ceiling | Percent | Appraisal | ||||
| No. | Property Name | Market | Type | Property Sub-Type | Area | Occupancy | Built | Renovated | Height | Office | Cap Rate(1) |
| 1 | Sarasota Distribution Hub | Tampa | Industrial | Warehouse/Distribution | 906,449 | 100.0% | 1981 | 2007 | 28' | 5.0% | 6.75% |
| 2 | Naperville Woods Office Center | Chicago | Office | Suburban | 482,497 | 95.4% | 1981, 1988 | 2007 | NAP | 100.0% | 8.25% |
| 3 | Southpark Business Park FOP | Austin | Industrial | Flex | 187,075 | 100.0% | 1982 | NAP | 16' | 96.0% | 6.25% |
| 4 | Supervalu | Dallas | Industrial | Warehouse/Distribution | 253,800 | 100.0% | 1996 | NAP | 32' | 7.0% | 6.50% |
| 5 | Plainfield Business Center IV | Indianapolis | Industrial | Warehouse/Distribution | 434,354 | 100.0% | 1999 | NAP | 30' | 3.5% | 5.75% |
| 6 | Beltway III | Houston | Office | CBD | 130,566 | 100.0% | 2005 | NAP | NAP | 100.0% | 8.00% |
| 7 | 4405 Continental Dr | Flint | Industrial | Warehouse/Distribution | 400,000 | 100.0% | 1999 | 2006 | 30' | 2.0% | 9.50% |
| 8 | Beltway IV | Houston | Office | CBD | 131,702 | 72.6% | 2006 | NAP | NAP | 100.0% | 8.50% |
| 40.0% - | |||||||||||
| 9 | Sandy Plains Business Park | Atlanta | Industrial | Flex | 167,329 | 94.3% | 1986 | NAP | 20' | 95.0% | 7.00% |
| 10 | Silber Industrial Park | Houston | Industrial | Warehouse/Distribution | 198,970 | 90.4% | 1978 | NAP | 21' - 24' | 13.0% | 6.50% |
| 11 | Southpark Business Park M | Austin | Industrial | Flex | 72,550 | 100.0% | 1983 | NAP | 16' | 96.0% | 6.75% |
| 12 | Coliseum Distribution Center #1 | San Antonio | Industrial | Warehouse/Distribution | 208,000 | 100.0% | 1978 | NAP | 26.5' | 5.0% | 6.00% |
| 13 | West by Northwest Business Blvd | Houston | Industrial | Flex | 122,750 | 91.5% | 1983 | NAP | 19' | 34.0% | 7.00% |
| 14 | Norcross Center | Atlanta | Industrial | Flex | 169,951 | 100.0% | 1988 | NAP | 20' | 33.0% | 7.00% |
| 15 | Goshen Springs | Atlanta | Industrial | Flex | 152,319 | 95.3% | 1986 | NAP | 26' | 33.0% | 6.25% / 6.75% |
| 16 | Long Point Center | Houston | Industrial | Warehouse/Distribution | 189,680 | 94.3% | 1979 | NAP | 24' | 11.0% | 7.50% / 7.25% |
| 17 | Corridor Park D | Austin | Industrial | Flex | 56,100 | 100.0% | 1999 | 2016 | 24' | 100.0% | 6.50% |
| 18 | Southport 1-4 | Houston | Industrial | Flex | 149,401 | 77.7% | 1980 | NAP | 16' | 33.0% | 8.00% |
| 19 | Jameel | Houston | Industrial | Flex | 94,900 | 87.5% | 1983 | NAP | 19' | 50.0% | 6.75% |
| 20 | Beltway II | Houston | Office | CBD | 101,039 | 13.3% | 2003 | NAP | NAP | 100.0% | 9.00% |
| 21 | Braker Center 4 | Austin | Industrial | Flex | 45,913 | 90.3% | 1984 | 1999 | 16' | 95.0% | 6.50% |
| 22 | Northgreen 1-4 | Houston | Industrial | Flex | 118,736 | 61.7% | 1982 | NAP | 12’ - 18’ | 35.0% | 8.00% |
| 23 | Minimax | Houston | Industrial | Warehouse/Distribution | 119,821 | 100.0% | 1967 | NAP | 20' | 13.0% | 6.50% |
| 24 | Southpark Business Park E | Austin | Industrial | Flex | 49,966 | 100.0% | 1982 | 1992 | 16' | 100.0% | 6.75% |
| 25 | 9385 Washington Blvd | Baltimore | Industrial | Flex | 57,590 | 92.2% | 1988 | 2007 | 18' | 20.0% | 6.00% |
| 26 | Rothway | Houston | Industrial | Flex | 75,460 | 43.8% | 1983 | NAP | 14' | 90.0% | 7.00% |
| 27 | 2730 Pinnacle | Chicago | Industrial | Warehouse/Distribution | 44,990 | 100.0% | 2005 | 2007 | 20' | 45.0% | 7.50% |
| 28 | Columbus West - Interchange Rd | Columbus | Industrial | Flex | 91,200 | 89.5% | 1974 | NAP | 22' | 20.0% | 8.00% |
| 29 | 1346 Oakbrook Drive | Atlanta | Industrial | Flex | 71,591 | 100.0% | 1985 | NAP | 14' | 85.0% | 7.25% |
| 30 | 1230-1236 Hardt Circle | Chicago | Industrial | Warehouse/Distribution | 60,080 | 75.1% | 2008 | NAP | 24' | 10.0% | 6.25% |
| 31 | Pine Forest Business Park | Houston | Industrial | Warehouse/Distribution | 80,091 | 30.9% | 1980 | NAP | 20' - 22' | 14.0% | 7.00% |
| 32 | 1351 Oakbrook Drive | Atlanta | Industrial | Flex | 36,489 | 68.5% | 1985 | NAP | 12' | 72.0% | 7.00% |
| 33 | 1325 Oakbrook Drive | Atlanta | Industrial | Flex | 53,120 | 100.0% | 1986 | NAP | 20' | 21.0% | 7.00% |
| 34 | 490 Heartland Drive | Chicago | Industrial | Warehouse/Distribution | 39,520 | 100.0% | 2002 | NAP | 20' | 20.0% | 7.50% |
| 35 | 1265 Oakbrook Drive | Atlanta | Industrial | Flex | 51,200 | 100.0% | 1985 | NAP | 18' | 21.0% | 7.00% |
| 36 | Columbus West - Business Park | Columbus | Industrial | Flex | 92,618 | 0.0% | 1996 | 2005 | 25' | 20.0% | 8.00% |
| 37 | 1155 Bowes Road | Chicago | Industrial | Warehouse/Distribution | 34,400 | 0.0% | 2006 | NAP | 26' | 20.0% | 6.50% |
| 38 | 1280 Oakbrook Drive | Atlanta | Industrial | Flex | 46,400 | 100.0% | 1986 | NAP | 19' | 27.0% | 7.25% |
| 39 | Rittiman East Industrial Park #23 & 24 San | Antonio | Industrial | Flex | 50,806 | 90.6% | 1983 | NAP | 16’ - 18' | 19.0% | 7.50% |
| 40 | 2002 Bloomingdale | Chicago | Industrial | Warehouse/Distribution | 31,919 | 100.0% | 1998 | NAP | 23' | 15.0% | 6.00% |
| 41 | 333 Charles Court | Chicago | Industrial | Warehouse/Distribution | 36,623 | 100.0% | 2007 | NAP | 20' | 20.0% | 7.25% |
| 42 | 483 Heartland Drive | Chicago | Industrial | Warehouse/Distribution | 36,426 | 84.1% | 2010 | NAP | 24' | 10.0% | 6.50% |
| 43 | Cox Business Center | Cincinnati | Industrial | Warehouse/Distribution | 52,040 | 100.0% | 1987 | NAP | 15' - 19' | 10.0% | 7.25% |
| 44 | 1256 Oakbrook Drive | Atlanta | Industrial | Flex | 40,392 | 87.5% | 1985 | NAP | 20' | 28.0% | 7.00% |
| 45 | 550 Heartland | Chicago | Industrial | Warehouse | 30,328 | 100.0% | 2000 | 2007 | 20' | 15.0% | 6.50% |
| 46 | Rittiman East Industrial Park #22 | San Antonio | Industrial | Warehouse/Distribution | 37,026 | 83.8% | 1983 | NAP | 18' | 14.0% | 7.50% |
(1) Each of Naperville Woods Office Center, Goshen Spring and Long Point Center have multiple buildings that were appraised separately.
THE INFORMATION IN THIS STRUCTURAL AND COLLATERAL TERM SHEET IS NOT COMPLETE AND MAY BE AMENDED PRIOR TO THE TIME OF SALE. THIS TERM SHEET IS NOT AN OFFER TO SELL THESE SECURITIES AND IT IS NOT A SOLICITATION OF AN OFFER TO BUY THESE SECURITIES IN ANY JURISDICTION WHERE THE OFFER OR SALE IS NOT PERMITTED.
| | 102 of 144 | | |
| Structural and Collateral Term Sheet | Benchmark 2020-B20 |
| Agellan Portfolio | |
| Property Distribution | |||||||||
Property Type | No. of | Total Sq. Ft. | % of Ft. | Allocated Loan | (%) Allocated Loan Amount | UW Base Rent | % of UW Base | Appraised | % of Appraised |
| Industrial | 42 | 5,248,373 | 86.1% | $27,626,551 | 78.9% | $29,274,423 | 71.3% | $435,200,000 | 79.0% |
| Warehouse / Distribution | 18 | 3,164,189 | 51.9% | $14,337,841 | 41.0% | $15,225,330 | 37.1% | $226,680,000 | 41.1% |
| Flex | 23 | 2,053,856 | 33.7% | $13,120,223 | 37.5% | $13,845,394 | 33.7% | $205,870,000 | 37.4% |
| Warehouse | 1 | 30,328 | 0.5% | $168,486 | 0.5% | $203,700 | 0.5% | $2,650,000 | 0.5% |
| Office | 4 | 845,804 | 13.9% | $7,373,449 | 21.1% | $11,756,958 | 28.7% | $115,800,000 | 21.0% |
| Suburban | 1 | 482,497 | 7.9% | $4,380,645 | 12.5% | $7,480,569 | 18.2% | $68,800,000 | 12.5% |
| CBD | 3 | 363,307 | 6.0% | $2,992,804 | 8.6% | $4,276,389 | 10.4% | $47,000,000 | 8.5% |
| Portfolio Total | 46 | 6,094,177 | 100.0% | $35,000,000 | 100.0% | $41,031,381 | 100.0% | $551,000,000 | 100.0% |
Since May 2019, the Borrower Sponsor has executed 38 new, renewal and expansion leases for approximately 470,218 square feet. Renewal leases totaled approximately 342,447 square feet and had weighted average rent increases of approximately 8.7%. Renewal and expansion leases totaled approximately 43,983 square feet and had weighted average rent increases of 16.1%. New leases accounted for approximately 78,344 square feet and had weighted average rent increases of 8.3%.
| Portfolio Leasing Spreads(1) | ||||||
| Lease Type | Expiring sq. ft. | Expiring Rent per sq. ft. | New sq. ft. | Rent per sq. ft. | Leasing Spread $ | Leasing Spread % |
| Renew | 342,447 | $8.58 | 342,447 | $9.32(2) | $0.75 | 8.7% |
| Renew & Expansion | 28,284 | $6.23 | 43,983 | $7.24 | $1.01 | 16.1% |
| Expansion | 11,252 | $6.00 | 5,444 | $5.84 | ($0.16)(3) | (2.7%)(3) |
| New | 109,848 | $6.71 | 78,344 | $7.27 | $0.56 | 8.3% |
| (1) | Represents new and renewal leasing since May 2019. |
| (2) | The leasing spread for Dish Network, Inc. is calculated based on a gross renewal rent of $8.70 per square foot. |
| (3) | International Valve at the 483 Heartland Drive property expanded and took 5,444 square feet of the 11,252 square feet of vacated space. The expansion increased the tenant’s footprint to 11,032 square feet and the rent for the net rentable area occupied prior to the expansion (5,588 square feet) also increased $0.16 per square foot or 2.4%. |
The top five tenants occupying the Agellan Properties by underwritten base rent are Health Care Service Corp. (177,114 square feet; 2.9% of net rentable area; 6.9% of underwritten base rent), United Natural Foods, Inc. (463,172 square feet; 7.6% of net rentable area; 6.4% of underwritten base rent), ALDI, Inc. (137,986 square feet; 2.3% of net rentable area; 5.4% of underwritten base rent), General Motors LLC (400,000 square feet.; 6.6% of net rentable area; 5.1% of underwritten base rent) and Moran Foods LLC (253,800 square feet; 4.2% of net rentable area; 3.8% of underwritten base rent).
The largest tenant, Health Care Service Corp (“HCSC”) (177,114 square feet; 2.9% of net rentable area; 6.9% of underwritten base rent), is an independent licensee of the Blue Cross and Blue Shield Association. HCSC is the largest customer-owned health insurer in the United States and fifth largest overall. Health Care Service Corp operates through Blue Cross and Blue Shield Plans in Illinois, Montana, New Mexico, Oklahoma and Texas. HCSC affiliates and subsidiaries such as Dearborn National, Medecision and Dental Network of America offer group life, disability and dental solutions, as well as a range of other individual solutions. The company, founded in 1936, serves more than 16 million members across five states and employs more than 23,000 people in over 60 local offices. A portion of the space occupied by HCSC will be relocated within the Naperville Wood Office Center property in conjunction with the ALDI, Inc. expansion, which will allow HCSC to have all of its office space in one building. Additionally, HCSC’s overall footprint will increase slightly with the relocation space from 175,080 square feet to 177,114 square feet. The expansion and relocation are estimated to occur in June/July 2021. Health Care Service Corp. has one, five-year renewal option at market rent.
The second largest tenant, United Natural Foods, Inc. (463,172 square feet; 7.6% of net rentable area; 6.4% of underwritten base rent), engages in the distribution of natural, organic, and specialty foods and non-food products. The company is headquartered in Providence, Rhode Island. United Natural Foods, Inc. has one, five-year renewal option at market rent.
The third largest tenant, ALDI, Inc. (137,986 square feet; 2.3% of net rentable area; 5.4% of underwritten base rent), owns and operates grocery stores throughout the U.S. ALDI, Inc. offers grocery, meat, fresh produce, wine and beer, beverages, and other home products. ALDI, Inc. is located in Batavia, Illinois. ALDI, Inc. has approximately 3,000 total employees across all of its locations and generates approximately $4.32 billion in sales annually. ALDI, Inc. operated more than 1,900 stores in across 36 states. In February 2020, ALDI, Inc. exercised an expansion option for an additional 24,597 square feet. ALDI, Inc. has one, five-year renewal option at market rent.
The fourth largest tenant, General Motors LLC (400,000 square feet; 6.6% of net rentable area; 5.1% of underwritten base rent), is the fourth largest automaker globally and the largest in the U.S. with approximately $246.6 billion in total assets as of March 31, 2020.
THE INFORMATION IN THIS STRUCTURAL AND COLLATERAL TERM SHEET IS NOT COMPLETE AND MAY BE AMENDED PRIOR TO THE TIME OF SALE. THIS TERM SHEET IS NOT AN OFFER TO SELL THESE SECURITIES AND IT IS NOT A SOLICITATION OF AN OFFER TO BUY THESE SECURITIES IN ANY JURISDICTION WHERE THE OFFER OR SALE IS NOT PERMITTED.
| | 103 of 144 | | |
| Structural and Collateral Term Sheet | Benchmark 2020-B20 |
| Agellan Portfolio | |
Headquartered in Detroit, Michigan, General Motors LLC’s brands include Chevrolet, Buick, GMC and Cadillac. General Motors LLC has two, five-year renewal options at the greater of market rent or 90% of the then-current base rent.
The fifth largest tenant, Moran Foods LLC (253,800 square feet; 4.2% of net rentable area; 3.8% of underwritten base rent), is the parent company of Save-A-Lot Holdings, LLC (“Save-A-Lot”). Save-A-Lot is an American discount grocery store chain with approximately 1,300 stores across 36 states with over $4.0 billion in annual sales. Headquartered in St. Louis, Missouri, Save-A-Lot’s stores carry most grocery products, including an assortment of fresh, canned and frozen produce as well as meat, meal products, household items and everyday groceries. Moran Foods LLC has two, seven-year renewal options at $6.75 per square foot and market rent, respectively.
The Agellan Portfolio is geographically diverse with properties located across nine states including Texas (46.7% of allocated loan amount (“ALA”); 43.4% of underwritten base rent), Illinois (18.0% of ALA; 22.8% of underwritten base rent), Florida (12.6% of ALA; 11.7% of underwritten base rent), Georgia (11.3% of ALA; 10.9% of underwritten base rent) and Michigan (3.4% of ALA; 5.1% of underwritten base rent).
| Geographic Distribution | |||||||||
| State | Number of Properties | Total Sq. Ft. | % of Total Sq. Ft. | Allocated Loan Amount | (%) Allocated Loan Amount | UW Base Rent | % of UW Base Rent | Appraised Value | % of Appraised Value |
| Texas | 21 | 2,474,352 | 40.6% | $16,350,993 | 46.7% | $17,819,019 | 43.4% | $257,400,000 | 46.7% |
| Illinois | 9 | 796,783 | 13.1% | $6,303,474 | 18.0% | 9,375,116 | 22.8% | 99,000,000 | 18.0% |
| Florida | 1 | 906,449 | 14.9% | $4,411,042 | 12.6% | 4,804,386 | 11.7% | 70,200,000 | 12.7% |
| Georgia | 9 | 788,791 | 12.9% | $3,944,665 | 11.3% | 4,471,074 | 10.9% | 61,750,000 | 11.2% |
| Michigan | 1 | 400,000 | 6.6% | $1,194,169 | 3.4% | 2,097,244 | 5.1% | 18,750,000 | 3.4% |
| Indiana | 1 | 434,354 | 7.1% | $1,534,615 | 4.4% | 1,385,853 | 3.4% | 24,100,000 | 4.4% |
| Ohio | 2 | 183,818 | 3.0% | $582,754 | 1.7% | 404,218 | 1.0% | 9,150,000 | 1.7% |
| Maryland | 1 | 57,590 | 0.9% | $464,640 | 1.3% | 426,784 | 1.0% | 7,300,000 | 1.3% |
| Kentucky | 1 | 52,040 | 0.9% | $213,648 | 0.6% | 247,686 | 0.6% | 3,350,000 | 0.6% |
| Portfolio Total | 46 | 6,094,177 | 100.0% | $35,000,000 | 100.0% | $41,031,381 | 100.0% | $551,000,000 | 100.0% |
The Agellan Portfolio is located across 12 U.S. markets including Houston (24.2% of ALA; 23.2% of underwritten base rent), Chicago (18.0% of ALA; 22.8% of underwritten base rent), Austin (13.7% of ALA; 12.9% of underwritten base rent), Tampa (12.6% of ALA; 11.7% of underwritten base rent) and Atlanta (11.3% of ALA; 10.9% of underwritten base rent).
| Market Overview | |||||||||
| State | Number of Properties | Total Sq. Ft. | % of Total Sq. Ft. | Allocated Loan Amount | (%) Allocated Loan Amount | UW Base Rent | % of UW Base Rent | Appraised Value | % of Appraised Value |
| Houston | 12 | 1,513,116 | 24.8% | $8,473,821 | 24.2% | $9,530,614 | 23.2% | $133,100,000 | 24.2% |
| Chicago | 9 | 796,783 | 13.1% | $6,303,474 | 18.0% | 9,375,116 | 22.8% | 99,000,000 | 18.0% |
| Austin | 5 | 411,604 | 6.8% | $4,787,965 | 13.7% | 5,278,622 | 12.9% | 75,200,000 | 13.6% |
| Tampa | 1 | 906,449 | 14.9% | $4,411,042 | 12.6% | 4,804,386 | 11.7% | 70,200,000 | 12.7% |
| Atlanta | 9 | 788,791 | 12.9% | $3,944,665 | 11.3% | 4,471,074 | 10.9% | 61,750,000 | 11.2% |
| Flint | 1 | 400,000 | 6.6% | $1,194,169 | 3.4% | 2,097,244 | 5.1% | 18,750,000 | 3.4% |
| Dallas | 1 | 253,800 | 4.2% | $1,677,047 | 4.8% | 1,573,560 | 3.8% | 26,720,000 | 4.8% |
| San Antonio | 3 | 295,832 | 4.9% | $1,412,159 | 4.0% | 1,436,224 | 3.5% | 22,380,000 | 4.1% |
| Indianapolis | 1 | 434,354 | 7.1% | $1,534,615 | 4.4% | 1,385,853 | 3.4% | 24,100,000 | 4.4% |
| Baltimore | 1 | 57,590 | 0.9% | $464,640 | 1.3% | 426,784 | 1.0% | 7,300,000 | 1.3% |
| Columbus | 2 | 183,818 | 3.0% | $582,754 | 1.7% | 404,218 | 1.0% | 9,150,000 | 1.7% |
| Cincinnati | 1 | 52,040 | 0.9% | $213,648 | 0.6% | 247,686 | 0.6% | 3,350,000 | 0.6% |
| Portfolio Total | 46 | 6,094,177 | 100.0% | $35,000,000 | 100.0% | $41,031,381 | 100.0% | $551,000,000 | 100.0% |
Major Markets.
Houston. According to a third party report, the Houston Industrial market ended the first quarter 2020 with a vacancy rate of 7.6%. The reported market vacancy rates for logistics and flex properties were 8.4% and 10.0%, respectively. The existing market inventory is made up of 74.6% logistics properties and 8.1% flex properties based on total square feet. Rental rates ended the first quarter of 2020 at $7.42 per square feet. The average quoted rates for logistics and flex properties were $6.91 per square foot and $10.61 per square foot, respectively. The 12-month net absorption ending in the first quarter 2020 was 8,621,259 square feet for logistics properties and -49,931 square feet for flex properties.
THE INFORMATION IN THIS STRUCTURAL AND COLLATERAL TERM SHEET IS NOT COMPLETE AND MAY BE AMENDED PRIOR TO THE TIME OF SALE. THIS TERM SHEET IS NOT AN OFFER TO SELL THESE SECURITIES AND IT IS NOT A SOLICITATION OF AN OFFER TO BUY THESE SECURITIES IN ANY JURISDICTION WHERE THE OFFER OR SALE IS NOT PERMITTED.
| | 104 of 144 | | |
| Structural and Collateral Term Sheet | Benchmark 2020-B20 |
| Agellan Portfolio | |
According to a third party report, the Houston Office market ended the first quarter 2020 with a vacancy rate of 16.8%. The reported vacancy rates for Class A and Class B buildings were 19.6% and 17.1%, respectively. The existing market inventory is comprised of 44.5% Class A, 42.8% Class B, and 12.6% Class C based on total square feet. The average quoted rental rate in the first quarter 2020 for all classes was $28.36 per square foot. The average quoted rental rate for Class A and B was $34.07 per square foot and $24.25 per square foot, respectively. The 12-month net absorption ending in the first quarter 2020 for Class A & B in the market was 1,251,779 square feet and -1,448,622 square feet, respectively.
| Historical Market Occupancy - Industrial(1) | |||||||||||
| 2008 | 2009 | 2010 | 2011 | 2012 | 2013 | 2014 | 2015 | 2016 | 2017 | 2018 | 2019 |
| 93.9% | 93.1% | 93.7% | 94.3% | 95.0% | 94.5% | 95.1% | 94.9% | 94.6% | 94.8% | 94.3% | 93.3% |
| (1) | Source: Third party report. |
| Historical Market Occupancy - Office(1) | |||||||||||
| 2008 | 2009 | 2010 | 2011 | 2012 | 2013 | 2014 | 2015 | 2016 | 2017 | 2018 | 2019 |
| 88.4% | 86.7% | 86.9% | 87.2% | 88.4% | 88.6% | 89.4% | 87.1% | 85.5% | 84.0% | 83.8% | 83.4% |
(1) Source: Third party report.
Chicago. According to a third party report, the Chicago Industrial market ended the first quarter 2020 with a vacancy rate of 6.2%. The reported market vacancy rates for logistics and flex properties were 7.1% and 7.6%, respectively. The existing market inventory is made up of 66.1% logistics properties and 5.8% flex properties based on total square feet. Rental rates ended the first quarter of 2020 at $7.36 per square foot. The average quoted rates for logistics and flex properties were $6.87 per square foot and $12.24 per square foot, respectively. The 12-month net absorption ending in the first quarter 2020 was 535,853 square feet for flex properties and 14,631,591 square feet for logistics properties.
According to a third party report, the Chicago Office market ended the first quarter 2020 with a vacancy rate of 12.2%. The reported vacancy rates for Class A and Class B buildings were 15.2% and 11.7%, respectively. The existing market inventory is comprised of 39.0% Class A, 44.2% Class B, and 16.7% Class C based on total square feet. The average quoted rental rate in the first quarter 2020 for all classes was $29.44 per square foot. The average quoted rental rate for Class A and B was $37.39 per square foot and $25.20 per square foot, respectively. The 12-month net absorption ending in the first quarter 2020 for Class A and B in the market was 3,566,358 square feet and -457,122 square foot, respectively.
| Historical Market Occupancy - Industrial(1) | |||||||||||
| 2008 | 2009 | 2010 | 2011 | 2012 | 2013 | 2014 | 2015 | 2016 | 2017 | 2018 | 2019 |
| 89.8% | 88.1% | 88.2% | 89.1% | 90.6% | 91.3% | 92.6% | 93.2% | 93.8% | 93.7% | 94.2% | 94.1% |
(1) Source: Third party report.
| Historical Market Occupancy - Office(1) | |||||||||||
| 2008 | 2009 | 2010 | 2011 | 2012 | 2013 | 2014 | 2015 | 2016 | 2017 | 2018 | 2019 |
| 87.4% | 85.0% | 85.2% | 85.6% | 86.1% | 86.6% | 87.3% | 88.0% | 87.7% | 88.0% | 88.4% | 87.9% |
(1) Source: Third party report.
Austin. According to a third party report, the market vacancy rates for logistics and flex properties were 9.8% and 7.3%, respectively. The existing market inventory is made up of 60.5% logistics properties and 20.9% flex properties based on total square feet, Rental rates ended the first quarter of 2020 at $11.30 per square foot. The average quoted rates for logistics and flex properties were $9.93 per square foot and $14.31 per square foot, respectively. The 12-month net absorption ending in the first quarter 2020 was 1,113,224 square feet for logistics properties and 744,867 square feet for flex properties. According to a third party report, Austin is expected to outperform the state of Texas and nation in 2020, with a high number of technology companies and housing at the forefront. Long term, Austin is viewed as a market with a well-educated labor force, high concentration of technology businesses and a relatively low cost of living compared to other high technology based industries which is anticipated to fuel a high population growth for the market.
| Historical Market Occupancy - Industrial(1) | |||||||||||
| 2008 | 2009 | 2010 | 2011 | 2012 | 2013 | 2014 | 2015 | 2016 | 2017 | 2018 | 2019 |
| 90.2% | 87.8% | 88.5% | 89.6% | 91.3% | 93.5% | 93.5% | 95.6% | 95.6% | 93.6% | 93.6% | 92.8% |
(1) Source: Third party report.
THE INFORMATION IN THIS STRUCTURAL AND COLLATERAL TERM SHEET IS NOT COMPLETE AND MAY BE AMENDED PRIOR TO THE TIME OF SALE. THIS TERM SHEET IS NOT AN OFFER TO SELL THESE SECURITIES AND IT IS NOT A SOLICITATION OF AN OFFER TO BUY THESE SECURITIES IN ANY JURISDICTION WHERE THE OFFER OR SALE IS NOT PERMITTED.
| | 105 of 144 | | |
| Structural and Collateral Term Sheet | Benchmark 2020-B20 |
| Agellan Portfolio | |
Tampa. According to a third party report, the Tampa Bay Industrial market ended the first quarter 2020 with a vacancy rate of 5.0%. The reported market vacancy rates for logistics properties was 5.4%. The existing market inventory is made up of 66.3% logistics properties based on total square feet. Rental rates ended the first quarter at $7.72 per square foot. The average quoted rates for logistics properties was $7.11 per square foot. The 12-month net absorption ending in the first quarter 2020 for logistics properties was 2,025,279 square foot. According to a third party report, as of year-end 2019, Tampa’s industrial sector outpaced the industrial sectors in the state of Florida in relation to demand growth at approximately 2.8 million square feet of absorbed space. Tampa was the only market in the state that saw improved growth from approximately 2.7 million square feet of positive net absorption year over year.
| Historical Market Occupancy - Industrial(1) | |||||||||||
| 2008 | 2009 | 2010 | 2011 | 2012 | 2013 | 2014 | 2015 | 2016 | 2017 | 2018 | 2019 |
| 92.3% | 89.4% | 89.3% | 89.8% | 90.2% | 91.6% | 92.3% | 93.8% | 95.0% | 95.1% | 95.3% | 95.1% |
| (1) | Source: Third party report. |
Atlanta. According to a third party report, the Atlanta Industrial market ended the first quarter 2020 with a vacancy rate of 6.1%. The reported market vacancy rates for logistics and flex properties were 6.7% and 5.5%, respectively. The existing market inventory is made up of 77.4% logistics properties and 9.1% flex properties based on total square feet. Rental rates ended the first quarter at $6.17 per square foot. The average quoted rates for logistics and flex properties were $5.52 per square foot and $11.03 per square foot, respectively. The 12-month net absorption ending in the first quarter 2020 was 11,337,139 square feet for logistics properties and -202,543 square feet for flex properties. According to a third party report, the Atlanta market is seen as Georgia’s main growth engine and one of the strongest economies in the nation. Job growth in the Atlanta market has averaged approximately 2.0% as of year-end 2019, which has been one of the best in the nation for nine consecutive years.
| Historical Market Occupancy - Industrial(1) | |||||||||||||
| 2008 | 2009 | 2010 | 2011 | 2012 | 2013 | 2014 | 2015 | 2016 | 2017 | 2018 | 2019 | ||
| 87.5% | 86.4% | 85.6% | 86.9% | 87.5% | 88.7% | 91.5% | 93.1% | 93.0% | 94.1% | 94.6% | 94.4% | ||
| (1) | Source: Third party report. |
| Historical and Current Portfolio Occupancy(1)(2)(3) | ||||||||||
| 2013 | 2014 | 2015 | 2016 | 2017 | 2018 | 2019 | Current(4) | Current With Dark Tenants(5) | Current With Dark Tenants and Known Vacates(6) |
| # of Assets(7) | 21 | 21 | 28 | 31 | 40 | 42 | 42 | 46 | 46 | 46 |
| Portfolio NRA Sq. ft. (millions) | 3,224 | 3,224 | 3,689 | 4,917 | 5,631 | 5,745 | 5,745 | 6,094 | 6,094 | 6,094 |
| % Occupancy | 91.8% | 91.0% | 94.4% | 93.3% | 94.7% | 96.1% | 96.2% | 90.4% | 92.1% | 93.4% |
| (1) | Historical occupancy data for the four most recent acquisitions is not available. |
| (2) | Historical occupancy for 2013 – 2019 is reflective of quarterly averages for each respective year. |
| (3) | Historical occupancy for 2013 – 2019 includes any applicable leased dark space. |
| (4) | Current occupancy is based on the underwritten rent roll and excludes dark, known vacate, and bankrupt tenants. |
| (5) | Current With Dark Tenants occupancy is inclusive of dark tenants. |
| (6) | Current With Dark Tenants and Known Vacates occupancy is inclusive of dark and known vacate tenants. |
| (7) | # of Assets may vary from the “Portfolio Operating History” below as certain properties have not provided occupancy history. |
THE INFORMATION IN THIS STRUCTURAL AND COLLATERAL TERM SHEET IS NOT COMPLETE AND MAY BE AMENDED PRIOR TO THE TIME OF SALE. THIS TERM SHEET IS NOT AN OFFER TO SELL THESE SECURITIES AND IT IS NOT A SOLICITATION OF AN OFFER TO BUY THESE SECURITIES IN ANY JURISDICTION WHERE THE OFFER OR SALE IS NOT PERMITTED.
| | 106 of 144 | | |
| Structural and Collateral Term Sheet | Benchmark 2020-B20 |
| Agellan Portfolio | |
| Tenant Summary(1) | |||||||
| Ratings | Net Rentable | % of Total | Base Rent | % of Total | Lease | ||
| Tenant | Type | Moody’s/Fitch/S&P(2) | Area (SF) | NRA | PSF(3) | Base Rent(3) | Expiration Date |
| Health Care Service Corp.(4)(5) | Office | A3 / A- / AA- | 177,114 | 2.9% | $16.00 | 6.9% | 11/30/2025 |
| United Natural Foods, Inc.(6) | Industrial | B2 / NR / B | 463,172 | 7.6 | $5.66 | 6.4% | 7/31/2022 |
| ALDI, Inc.(4)(7) | Office | NR / NR / NR | 137,986 | 2.3 | $16.09 | 5.4% | 12/31/2028 |
| General Motors LLC(8) | Industrial | Baa3 / BBB- / BBB | 400,000 | 6.6 | $5.24 | 5.1% | 8/31/2021 |
| Moran Foods LLC(9) | Industrial | NR / NR / B- | 253,800 | 4.2 | $6.20 | 3.8% | 9/30/2025 |
| Life Technologies Corporation(10) | Industrial | Baa1 / BBB / BBB+ | 103,645 | 1.7 | $13.00 | 3.3% | 6/30/2025 |
| Allstate Insurance Co.(11) | Office | Aa3 / A+ / AA- | 75,623 | 1.2 | $16.00 | 2.9% | 5/31/2024 |
| Ceva Freight LLC(12) | Industrial | B1 / NR / B+ | 333,397 | 5.5 | $3.09 | 2.5% | 8/31/2022 |
| Beall’s, Inc.(13) | Industrial | NR / NR / NR | 200,000 | 3.3 | $4.80 | 2.3% | 9/30/2021 |
| VTech Communications, Inc.(14) | Industrial | NR / NR / NR | 208,000 | 3.4 | $4.53 | 2.3% | 7/31/2022 |
| Total Major Tenants | 2,352,737 | 38.6% | $7.16 | 41.0% | |||
| Other Tenants | 3,156,625 | 51.8 | $7.67 | 59.0 | |||
| Total Occupied | 5,509,362 | 90.4% | $7.45 | 100.0% | |||
| Vacant | 584,815 | 9.6 | |||||
| Total / Wtd. Avg. | 6,094,177 | 100.0% | |||||
| (1) | Based on the underwritten rent roll. |
| (2) | In certain instances, ratings provided are those of the parent company of the entity shown, whether or not the parent company guarantees the lease. |
| (3) | Base Rent PSF and % of Total Base Rent is inclusive of contractual rent steps taken through June 1, 2021. |
| (4) | ALDI, Inc. reflects an expansion option for 24,597 square feet that was exercised in February 2020. The expansion space is currently occupied by HCSC. HCSC will be relocated within the Naperville Wood Office Center property as part of the ALDI, Inc. expansion, which will allow HCSC to have all of its office space in one building. Additionally, HCSC’s overall footprint will increase slightly with the relocation space from 175,080 square feet to 177,114 square feet. The expansion and relocation are estimated to occur in June/July 2021. |
| (5) | Health Care Service Corp. has one, five-year renewal option at market rent. |
| (6) | United Natural Foods, Inc. has one, five-year renewal option at market rent. |
| (7) | ALDI, Inc. has one, five-year renewal option at market rent. |
| (8) | General Motors LLC has two, five-year renewal options at the greater of market rent or 90% of the then-current base rent |
| (9) | Moran Foods LLC has two, seven-year renewal options at $6.75 per square foot and market rent, respectively. |
| (10) | Life Technologies Corporation has one, five-year renewal option beginning at $13.00 per square foot. |
| (11) | Allstate Insurance Co. has two, five-year renewal options upon nine months’ notice at 95% of market rent. Allstate Insurance Co. also has a one-time termination option as of any month end between May 2022 and May 2023. |
| (12) | Ceva Freight LLC has two, five-year renewal options at market rent. |
| (13) | In May 2018 Beall’s, Inc. vacated and subleased their space to United Natural Foods Inc. Beall’s, Inc. has one, three-year renewal option at $5.30 per square foot. |
| (14) | VTech Communications, Inc. has one, five-year renewal option at market rent. |
THE INFORMATION IN THIS STRUCTURAL AND COLLATERAL TERM SHEET IS NOT COMPLETE AND MAY BE AMENDED PRIOR TO THE TIME OF SALE. THIS TERM SHEET IS NOT AN OFFER TO SELL THESE SECURITIES AND IT IS NOT A SOLICITATION OF AN OFFER TO BUY THESE SECURITIES IN ANY JURISDICTION WHERE THE OFFER OR SALE IS NOT PERMITTED.
| | 107 of 144 | | |
| Structural and Collateral Term Sheet | Benchmark 2020-B20 |
| Agellan Portfolio | |
| Lease Rollover Schedule(1)(2) | |||||||||
| Cumulative | |||||||||
| Net | Net | Cumulative | |||||||
| Number | Rentable | % of Base | Rentable | Cumulative | Cumulative % | of Base | |||
| of Leases | Area | % of NRA | Base Rent | Rent | Area | % of NRA | Base Rent | Rent | |
| Year | Expiring | Expiring | Expiring | Expiring(3) | Expiring(3) | Expiring | Expiring | Expiring | Expiring |
| Vacant | NAP | 584,815 | 9.6% | NAP | NAP | 584,815 | 9.60% | NAP | NAP |
| 2020 & MTM | 43 | 460,033 | 7.5 | $2,699,461 | 6.6% | 1,044,848 | 17.1% | $2,699,461 | 6.6% |
| 2021(4) | 61 | 1,264,748 | 20.8 | 7,900,783 | 19.3 | 2,309,596 | 37.9% | $10,600,244 | 25.8% |
| 2022(5) | 45 | 1,523,829 | 25.0 | 8,589,113 | 20.9 | 3,833,425 | 62.9% | $19,189,357 | 46.8% |
| 2023 | 38 | 470,932 | 7.7 | 4,123,559 | 10.0 | 4,304,357 | 70.6% | $23,312,916 | 56.8% |
| 2024 | 33 | 633,520 | 10.4 | 4,505,835 | 11.0 | 4,937,877 | 81.0% | $27,818,751 | 67.8% |
| 2025 | 18 | 786,447 | 12.9 | 7,935,153 | 19.3 | 5,724,324 | 93.9% | $35,753,904 | 87.1% |
| 2026 | 3 | 50,301 | 0.8 | 453,559 | 1.1 | 5,774,625 | 94.8% | $36,207,462 | 88.2% |
| 2027 | 5 | 112,643 | 1.8 | 1,750,362 | 4.3 | 5,887,268 | 96.6% | $37,957,824 | 92.5% |
| 2028 | 3 | 202,643 | 3.3 | 2,958,461 | 7.2 | 6,089,911 | 99.9% | $40,916,285 | 99.7% |
| 2029 | 0 | 0 | 0.0 | $0 | 0.0 | 6,089,911 | 99.9% | $40,916,285 | 99.7% |
| 2030 & Thereafter | 1 | 4,266 | 0.1 | 115,097 | 0.3 | 6,094,177 | 100.0% | $41,031,381 | 100.0% |
| Total | 250 | 6,094,177 | 100.0% | $41,031,381 | 100.0% | ||||
| (1) | Based on the underwritten rent roll. |
| (2) | Certain tenants may have lease termination options that are exercisable prior to the stated expiration date of the subject lease or leases which are not considered in the lease rollover schedule. |
| (3) | Base Rent Expiring and % of Base Rent Expiring is inclusive of (i) contractual rent steps taken through June 1, 2021 and (ii) the ALDI, Inc. expansion of approximately 24,597 square feet and HCSC relocation at the Naperville Woods Office Center property. Base Rent Expiring has been further adjusted to account for a 10.0% stress to tenants having missed full or partial April and/or May rent payments and/or requested rent relief during the COVID-19 pandemic. The total stress to underwritten base rent is $223,074. |
| (4) | General Motors LLC leases will expire in 2021 and has two, five-year renewal options at the greater of market rent or 90% of the then-current base rent. General Motors LLC has occupied the property since 1998. General Motors LLC has expressed interest to renew and is expecting to receive a formal proposal with renewal terms from the Borrower Sponsor. |
| (5) | Both United Natural Foods, Inc. and Ceva Freight LLC leases will expire in 2022. United Natural Foods, Inc. has one, five-year renewal option at market rent. Ceva Freight LLC has two, five-year renewal options at market rent. United Natural Foods Inc. and Ceva Freight LLC have both engaged the Borrower Sponsor about potentially expanding at expiration if any space were to become vacant at the respective properties. |
THE INFORMATION IN THIS STRUCTURAL AND COLLATERAL TERM SHEET IS NOT COMPLETE AND MAY BE AMENDED PRIOR TO THE TIME OF SALE. THIS TERM SHEET IS NOT AN OFFER TO SELL THESE SECURITIES AND IT IS NOT A SOLICITATION OF AN OFFER TO BUY THESE SECURITIES IN ANY JURISDICTION WHERE THE OFFER OR SALE IS NOT PERMITTED.
| | 108 of 144 | | |
| Structural and Collateral Term Sheet | Benchmark 2020-B20 |
| Agellan Portfolio | |
| Portfolio Operating History | ||||||
| 2015 | 2016 | 2017 | 2018 | 2019 | 2020 Budget | |
| 2015 Reporting Assets | ||||||
| Number of Properties | 27 | 27 | 27 | 27 | 27 | 27 |
| Effective Gross Revenue | $40,377,590 | $41,938,945 | $40,607,440 | $42,687,111 | $43,265,751 | $44,216,063 |
| Operating Expenses | $15,493,935 | $15,426,605 | $15,832,843 | $16,065,442 | $16,124,634 | $16,800,898 |
| Net Operating Income | $24,883,655 | $26,512,341 | $24,774,596 | $26,621,670 | $27,141,118 | $27,415,165 |
| Year-over-Year Change | - | 6.5% | -6.6% | 7.5% | 2.0% | 1.0% |
| 2016 Reporting Assets | ||||||
| Number of Properties | 31 | 31 | 31 | 31 | 31 | |
| Effective Gross Revenue | $43,483,706 | $50,440,354 | $52,850,050 | $54,478,273 | $55,355,348 | |
| Operating Expenses | $15,881,067 | $19,253,268 | $19,685,230 | $20,636,890 | $20,967,544 | |
| Net Operating Income | $27,602,639 | $31,187,086 | $33,164,820 | $33,841,384 | $34,387,804 | |
| Year-over-Year Change | - | 13.0% | 6.3% | 2.0% | 1.6% | |
| 2017 Reporting Assets | ||||||
| Number of Properties | 41 | 41 | 41 | 41 | ||
| Effective Gross Revenue | $53,679,748 | $58,304,052 | $60,181,340 | $61,115,986 | ||
| Operating Expenses | $19,917,149 | $20,981,732 | $22,007,429 | $22,423,094 | ||
| Net Operating Income | $33,762,598 | $37,322,320 | $38,173,911 | $38,692,892 | ||
| Year-over-Year Change | - | 10.5% | 2.3% | 1.4% | ||
| 2018 Reporting Assets | ||||||
| Number of Properties | 46 | 46 | 46 | |||
| Effective Gross Revenue | $60,700,041 | $63,486,372 | $64,626,262 | |||
| Operating Expenses | $21,738,754 | $23,013,221 | $23,452,522 | |||
| Net Operating Income | $38,961,287 | $40,473,151 | $41,173,740 | |||
| Year-over-Year Change | - | 3.9% | 1.7% | |||
THE INFORMATION IN THIS STRUCTURAL AND COLLATERAL TERM SHEET IS NOT COMPLETE AND MAY BE AMENDED PRIOR TO THE TIME OF SALE. THIS TERM SHEET IS NOT AN OFFER TO SELL THESE SECURITIES AND IT IS NOT A SOLICITATION OF AN OFFER TO BUY THESE SECURITIES IN ANY JURISDICTION WHERE THE OFFER OR SALE IS NOT PERMITTED.
| | 109 of 144 | | |
| Structural and Collateral Term Sheet | Benchmark 2020-B20 |
| Agellan Portfolio | |
| Underwritten Net Cash Flow | |||||||
| 2016 | 2017 | 2018 | 2019(1) | Underwritten(1)(2) | Per Square Foot | %(6) | |
| Agellan Properties Included | 31 | 41 | 46 | 46 | 46 | ||
| Base Rent | $30,444,923 | $36,778,978 | $40,209,368 | $42,047,666 | $41,031,381 | $6.73 | 61.3% |
| Vacant Income(3) | 0 | 0 | 0 | 0 | 5,221,640 | 0.86 | 7.8 |
| Gross Potential Rent | $30,444,923 | $36,778,978 | $40,209,368 | $42,047,666 | $46,253,021 | $7.59 | 69.1% |
| Total Reimbursements(4) | 12,782,653 | 16,793,058 | 19,551,436 | 21,118,949 | 20,640,034 | 3.39 | 30.9 |
| Gross Potential Income | $43,227,576 | $53,572,036 | $59,760,803 | $63,166,615 | $66,893,055 | $10.98 | 100.0% |
| (Vacancy / Credit Loss)(5) | (53,002) | (16,561) | (50,095) | (101,504) | (7,113,805) | (1.17) | (10.6) |
| Other Income | 309,133 | 124,273 | 989,333 | 421,261 | 571,000 | 0.09 | 0.9 |
| Effective Gross Income | $43,483,706 | $53,679,748 | $60,700,041 | $63,486,372 | $60,350,250 | $9.90 | 90.2% |
| Total Fixed Expenses | 7,331,761 | 8,981,519 | 10,147,809 | 10,478,429 | 11,650,648 | 1.91 | 19.3 |
| Total Operating Expenses | 8,549,306 | 10,935,630 | 11,590,945 | 12,534,792 | 12,509,178 | 2.05 | 20.7 |
| Total Expenses | $15,881,067 | $19,917,149 | $21,738,754 | $23,013,221 | $24,159,826 | $3.96 | 40.0% |
| Net Operating Income | $27,602,639 | $33,762,598 | $38,961,287 | $40,473,151 | $36,190,424 | $5.94 | 60.0% |
| TI/LC | 0 | 0 | 0 | 0 | 2,623,997 | 0.43 | 4.3 |
| Capital Expenditures | 0 | 0 | 0 | 0 | 693,998 | 0.11 | 1.1 |
| Net Cash Flow | $27,602,639 | $33,762,598 | $38,961,287 | $40,473,151 | $32,872,429 | $5.39 | 54.5% |
| (1) | The change from 2019 Net Operating Income to Underwritten Net Operating Income is largely attributable to adjustments made in relation to dark and known to be vacating tenants. |
| (2) | Underwritten Base Rent is inclusive of contractual rent steps taken through June 1, 2021 and includes the ALDI, Inc. expansion of approximately 24,597 square feet and HCSC relocation at the Naperville Woods Office Center property. Underwritten Base Rent has been further adjusted to account for a 10.0% stress to tenants who missed full or partial rent payments in April, May and/or June or have requested rent relief during the COVID-19 pandemic. The total stress to Underwritten Base Rent is $223,074. |
| (3) | Vacant Income includes all applicable dark tenants as well as known vacates. |
| (4) | Total Reimbursements include reimbursements to lease terms of each tenant. An additional stress loss adjustment of 10.0% was applied to any tenants that missed full rent payments in April, May and/or June. The total stress to reimbursements is $79,032. |
| (5) | Vacancy is underwritten to 10.6%, which represents the sum of economic vacancy of the Agellan Portfolio, inclusive of a minimum vacancy of 5.0% for all Agellan Properties. |
| (6) | % column represents percent of Gross Potential Income for all revenue lines and represents percent of Effective Gross Income for the remainder of the fields. |
Property Management. The Agellan Portfolio is managed by 11 individual managers which include Agellan Management LP, Colliers International Management - Atlanta, LLC, Adena Commercial LLC d/b/a Colliers International Greater Columbus Region, PCR Property Services, LLC d/b/a NAI Partners, Jones Lang LaSalle Americas, Inc., NAI Hiffman Asset Management, LLC, Stream Realty Partners- Austin, L.P., Stream Realty Partners-Houston, L.P., Stream Realty-Illinois, L.L.C., Hiffman Asset Management, LLC d/b/a Hiffman National, LLC, and Stream Realty Partners - Central TX, L.P.
Escrows and Reserves. At loan origination, the Borrowers deposited (i) $6,410,963 for outstanding TI/LC obligations and free rent, (ii) $2,985,266 into the required repair reserve for deferred maintenance, (iii) $2,000,000 into a working capital reserve for shortfalls in debt service and operating expenses and the payment of any replacements, leasing costs, taxes, other charges and/or insurance premiums and (iv) $172,050 into the gap rent reserve.
Tax Reserve. The Borrowers are required to deposit into a tax reserve, on a monthly basis, 1/12 of the estimated (a) annual real estate taxes, and (b) during a Cash Sweep Period, annual maintenance charges, impositions and any other charges levied or assessed against the Agellan Portfolio Properties, unless the Borrowers deliver evidence reasonably acceptable to lender that such amounts required for real estate taxes and maintenance charges, impositions and any other charges have or will be paid directly by a tenant. As of the origination date, the requirement for the payment of monthly real estate taxes for tenants have been paid directly by the Borrowers, with the exception of a small portion of the Supervalu property which was paid directly by the tenant.
Insurance Reserve. The Borrowers are required to deposit into an insurance reserve, on a monthly basis, 1/12 of estimated insurance premiums. In the event the borrowers obtain and maintain a blanket insurance policy that complies with the requirements of the Agellan Portfolio Whole Loan documents, the requirement for monthly deposits into the insurance reserve will be waived. As of the origination date, an acceptable blanket policy was in place.
Replacement Reserve. The Borrowers are required to deposit into the replacement reserve, on a monthly basis, approximately $101,570 (1/12 of $0.20 per square foot), subject to a cap of the amount equal to 36 times the required monthly deposit (approximately $3.7 million).
TI/LC Reserve. The Borrowers are required to deposit into the TI/LC reserve, on a monthly basis, approximately $431,671 (1/12 of $0.85 per square foot), subject to a cap of the amount equal to 36 times the required monthly deposit (approximately $15.5 million).
THE INFORMATION IN THIS STRUCTURAL AND COLLATERAL TERM SHEET IS NOT COMPLETE AND MAY BE AMENDED PRIOR TO THE TIME OF SALE. THIS TERM SHEET IS NOT AN OFFER TO SELL THESE SECURITIES AND IT IS NOT A SOLICITATION OF AN OFFER TO BUY THESE SECURITIES IN ANY JURISDICTION WHERE THE OFFER OR SALE IS NOT PERMITTED.
| | 110 of 144 | | |
| Structural and Collateral Term Sheet | Benchmark 2020-B20 |
| Agellan Portfolio | |
Working Capital Reserve. Provided no event of default exists, the lender will make disbursements from the working capital reserve for (i) the payment of shortfalls in the payment of debt service of mezzanine debt service, (ii) the payment of shortfalls for any documented operating expenses, (iii) the payment of any replacements at any Agellan Portfolio Property, (iv) the payment of any leasing costs at any Agellan Portfolio Property to the extent amounts in the TI/LC reserve are insufficient to pay such amounts and (v) the payment of taxes, other charges and insurance premiums at any Agellan Portfolio Property to the extent amounts in the taxes and insurance reserves are insufficient to pay such amounts.
Common Charges Funds Reserve. During the continuance of a Cash Sweep Period, the Borrowers are required to deposit into the common charges reserve, on a monthly basis, an amount equal to 1/12 of the fees, dues, charges and assessments payable under the condominium documents (the “Common Charges”) that the lender estimates will be payable during the next ensuing 12 months in order to accumulate sufficient funds to pay all such Common Charges at least 30 days prior to their respective due dates.
Lockbox / Cash Management. The Agellan Portfolio Whole Loan documents require a hard lockbox and in-place cash management. At loan origination, the Borrowers were required to deliver tenant direction letters within 30 days following the loan origination date to the existing tenants at the Agellan Portfolio Properties, directing each tenant to remit its rent checks directly to the lender-controlled lockbox. All funds in the lockbox account are required to be swept to a lender-controlled cash management account every business day. Provided no Cash Sweep Period (as defined below) is continuing, all funds in the cash management account will be transferred into the Borrowers’ operating account. During a Cash Sweep Period, all excess cash in the cash management account after payment of debt service, required reserves, operating expenses, approved extraordinary expenses and mezzanine debt service will be retained by the lender as additional collateral for the Agellan Portfolio Whole Loan and disbursed to the Borrowers for payment of certain permitted amounts, including the payment of shortfalls in debt service and mezzanine debt service and payment of capital expenditure work.
A “Cash Sweep Period” will commence upon the occurrence of (i) an event of default under the Agellan Portfolio Whole Loan documents, (ii) a bankruptcy action of any individual Borrower or any general partner or managing member, as applicable, of an individual Borrower, (iii) the date that is 30 days following any bankruptcy action of any property manager (unless as of such date the manager has been replaced in accordance with the Agellan Portfolio Whole Loan documents), (iv) the debt service coverage ratio for any calendar quarter (based upon Agellan Portfolio Whole Loan and Agellan Portfolio Mezzanine Loan (as defined below) assuming a 30-year amortization on the trailing three-month period immediately preceding the end of such calendar quarter) being less than 1.15x, or (v) an event of default under the Agellan Portfolio Mezzanine Loan documents.
A Cash Sweep Period will cease to exist upon the following events (each, a “Cash Sweep Event Cure”): with respect to (a) clause (i) or (v) above, a cure of such event of default, (b) clause (iii) above, the replacement of the property manager with a qualified manager under a replacement management agreement in accordance with the Agellan Portfolio Whole Loan documents, or (c) clause (iv) above, the achievement of a debt service coverage ratio of 1.15x or greater for any calendar quarter based upon a 30-year amortization on the trailing three-month period immediately preceding the end of such calendar quarter; provided (1) no other event of default is continuing under any Agellan Portfolio Whole Loan documents or Agellan Portfolio Mezzanine Loan documents, and (2) the Borrowers have paid all of the lender’s reasonable and actual out-of-pocket costs and expenses and the mezzanine borrowers have paid all of Mezzanine Lender’s (as defined below) reasonable and actual out-of-pocket costs and expenses, in each case, incurred by the lender or Mezzanine Lender, as applicable, in connection with such Cash Sweep Event Cure including, reasonable and actual out-of-pocket attorney’s fees and expenses.
Current Mezzanine or Secured Subordinate Indebtedness Permitted. Concurrently with the funding of the Agellan Portfolio Whole Loan, the lender (in such capacity, the “Mezzanine Lender”) also funded a mezzanine loan in the amount of $31.0 million (the “Agellan Portfolio Mezzanine Loan”). The Agellan Portfolio Mezzanine Loan is secured by the pledge of the direct or indirect equity interest in the Borrowers and is coterminous with the Agellan Portfolio Whole Loan. The Agellan Portfolio Mezzanine Loan accrues interest at a rate of 9.00000% per annum. Based on the Agellan Portfolio Whole Loan and the Agellan Portfolio Mezzanine Loan, the cumulative Cut-off Date LTV is 78.8%, the cumulative underwritten NCF DSCR is 1.54x and the cumulative underwritten NOI Debt Yield is 8.3%. The rights of the Mezzanine Lender under the Agellan Portfolio Mezzanine Loan are further described under “Description of the Mortgage Pool—Additional Indebtedness—Mezzanine Indebtedness” in the Preliminary Prospectus.
Other Indebtedness. Each of Agellan Commercial REIT U.S. L.P., 9385 Washington Blvd LP, 6100 McIntosh LP, Agellan Warrenville LP, Continental Drive LP, Norcross Springs LP, Corridor Park LP and Chicago Industrial Properties 1 LP (collectively, the “Intercompany Loan Lenders”) is a lender under an intercompany loan (each, an “Intercompany Loan”) to Piper Commercial Holdings LLC, an indirect parent company of the Intercompany Loan Lenders. The Intercompany Loans are fully funded, non-interest bearing, and collectively have an aggregate outstanding amount of $152,880,751. Each Intercompany Loan is unsecured and subject and subordinate to the Agellan Portfolio Loan in all respects. The borrower under each Intercompany Loan has agreed that so long as the Agellan Portfolio Loan remains outstanding, it will not (i) commence any legal or equitable proceedings against an Intercompany Loan Lender or otherwise in connection
THE INFORMATION IN THIS STRUCTURAL AND COLLATERAL TERM SHEET IS NOT COMPLETE AND MAY BE AMENDED PRIOR TO THE TIME OF SALE. THIS TERM SHEET IS NOT AN OFFER TO SELL THESE SECURITIES AND IT IS NOT A SOLICITATION OF AN OFFER TO BUY THESE SECURITIES IN ANY JURISDICTION WHERE THE OFFER OR SALE IS NOT PERMITTED.
| | 111 of 144 | | |
| Structural and Collateral Term Sheet | Benchmark 2020-B20 |
| Agellan Portfolio | |
with such Intercompany Loan or (ii) assert any claims or demands whatsoever under applicable law against the Intercompany Loan Lender. See “Description of the Mortgage Pool—Additional Indebtedness—Preferred Equity and Preferred Return Arrangements” in the Preliminary Prospectus.
Future Mezzanine or Secured Subordinate Indebtedness Permitted. None.
Partial Releases. Under the Agellan Portfolio Whole Loan documents, the Borrowers have the right to the release of an individual Agellan Portfolio property (each, an “Individual Property”) from the lien of the mortgage, provided that the Borrowers satisfy certain terms and conditions set forth in the Agellan Portfolio Whole Loan documents (the “Individual Loan Repayment Conditions”), including among other things (i) no event of default under the Agellan Portfolio Whole Loan documents has occurred and is continuing (other than an event of default that would be cured by the release of such Individual Property); (ii) the applicable individual Borrower (each such Borrower, an “Individual Borrower”) will make a voluntary prepayment of the Agellan Portfolio Whole Loan in an amount equal to the Release Price (as defined below) for the Individual Property; (iii) after giving effect to the release of the applicable Individual Property (including the portion of the Agellan Portfolio Whole Loan prepaid pursuant to the terms of the Agellan Portfolio Whole Loan documents), the debt service coverage ratio for the Agellan Portfolio properties then remaining subject to the liens of the mortgages (excluding the Individual Property requested to be released) based on the trailing 12-month period immediately preceding the release of the applicable Individual Property will be equal to or greater than the greater of (A) the Release Debt Service Coverage Ratio (as defined below), and (B) the debt service coverage ratio for all of the Agellan Portfolio properties then remaining subject to the liens of the mortgages (including the Individual Property requested to be released) immediately preceding the release of the applicable Individual Property based on the trailing 12 month period immediately preceding the release of the applicable Individual Property (such greater amount, the “Required Release DSCR”), provided that the Borrowers will have the right to do any one or a combination of the following to achieve the Required Release DSCR in accordance with the Agellan Portfolio Whole Loan documents make a prepayment of the Agellan Portfolio Whole Loan, deliver a letter of credit or deposit cash collateral with the lender; and (iv) subsequent to such release, each Individual Borrower will continue to be a special purpose entity. The Agellan Portfolio Whole Loan documents also provide that if the loan-to-value ratio exceeds or would exceed 125% immediately after the release, no release will be permitted unless the principal balance of the Agellan Portfolio Whole Loan is prepaid by an amount set forth in the Agellan Portfolio Whole Loan documents or the Borrower delivers a REMIC opinion.
“Release Debt Service Coverage Ratio” means the debt service coverage of 1.70x.
“Release Price” means, with respect to any Individual Property being released, (i) until an amount equal to $60,450,000 has been prepaid in connection with partial releases in accordance with the Agellan Portfolio Whole Loan documents, 110% of the Agellan Portfolio Whole Loan amount allocated to such Individual Property and (ii) thereafter, 115% of the Agellan Portfolio Whole Loan amount allocated to such Individual Property.
Outparcel Release. In addition, the Agellan Portfolio Whole Loan documents provide that the Borrowers may release certain non-income producing parcels comprising a portion of Sarasota Distribution Hub, Supervalu and Naperville Woods Office Center properties upon satisfaction of certain conditions set forth in the Agellan Portfolio Whole Loan documents, including, without limitation, the payment of a release price set forth herein.
Condominium Structure. One of the Agellan Properties, owned by Chicago Industrial Properties 1 LP (the “Chicago Industrial Borrower”), is subject to a condominium declaration. The Chicago Industrial Borrower has an approximately 81.15% ownership in common elements, and controls the condominium association’s board of directors. Please see “Description of the Mortgage Pool—Mortgage Pool Characteristics—Fee & Leasehold Estates; Ground Leases” in the Preliminary Prospectus for additional information.
THE INFORMATION IN THIS STRUCTURAL AND COLLATERAL TERM SHEET IS NOT COMPLETE AND MAY BE AMENDED PRIOR TO THE TIME OF SALE. THIS TERM SHEET IS NOT AN OFFER TO SELL THESE SECURITIES AND IT IS NOT A SOLICITATION OF AN OFFER TO BUY THESE SECURITIES IN ANY JURISDICTION WHERE THE OFFER OR SALE IS NOT PERMITTED.
| | 112 of 144 | | |
| Structural and Collateral Term Sheet | Benchmark 2020-B20 |
| 2010 South Lamar | |
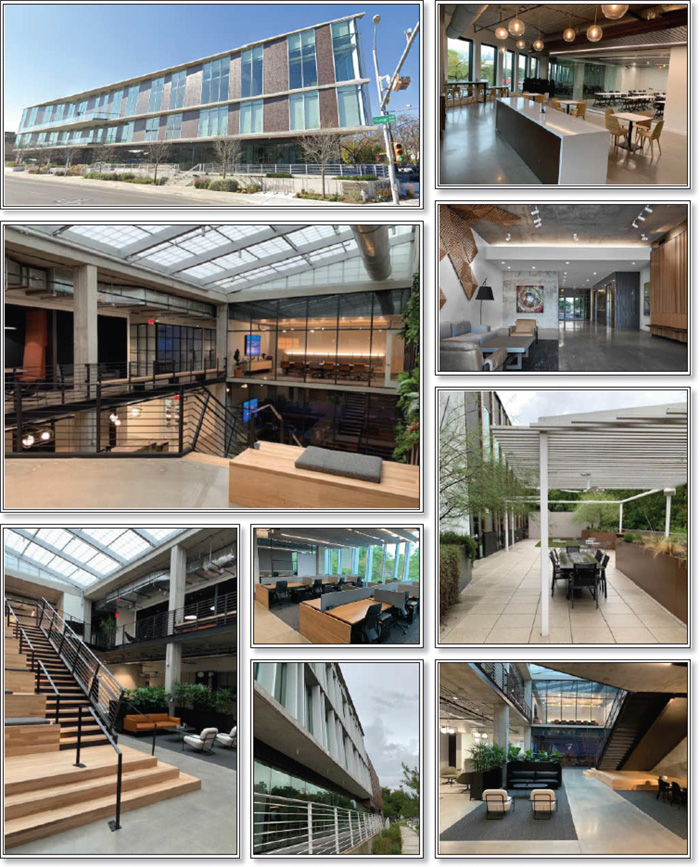
THE INFORMATION IN THIS STRUCTURAL AND COLLATERAL TERM SHEET IS NOT COMPLETE AND MAY BE AMENDED PRIOR TO THE TIME OF SALE. THIS TERM SHEET IS NOT AN OFFER TO SELL THESE SECURITIES AND IT IS NOT A SOLICITATION OF AN OFFER TO BUY THESE SECURITIES IN ANY JURISDICTION WHERE THE OFFER OR SALE IS NOT PERMITTED.
| | 113 of 144 | | |
| Structural and Collateral Term Sheet | Benchmark 2020-B20 |
| 2010 South Lamar | |

THE INFORMATION IN THIS STRUCTURAL AND COLLATERAL TERM SHEET IS NOT COMPLETE AND MAY BE AMENDED PRIOR TO THE TIME OF SALE. THIS TERM SHEET IS NOT AN OFFER TO SELL THESE SECURITIES AND IT IS NOT A SOLICITATION OF AN OFFER TO BUY THESE SECURITIES IN ANY JURISDICTION WHERE THE OFFER OR SALE IS NOT PERMITTED.
| | 114 of 144 | | |
| Structural and Collateral Term Sheet | Benchmark 2020-B20 |
| 2010 South Lamar | |
| Mortgage Loan Information | |
| Mortgage Loan Seller: | CREFI |
| Original Principal Balance: | $32,100,000 |
| Cut-off Date Principal Balance: | $32,100,000 |
| % of Pool by IPB: | 3.6% |
| Loan Purpose: | Refinance |
| Borrower: | 2010 South Lamar, LLC |
| Loan Sponsors: | Alan Sackman, Carter F. Sackman, |
| Sr., Carter F. Sackman, Jr. | |
| Interest Rate: | 4.13000% |
| Note Date: | 9/22/2020 |
| Maturity Date: | 10/6/2027 |
| Interest-only Period: | 84 months |
| Original Term: | 84 months |
| Original Amortization: | None |
| Amortization Type: | Interest Only |
| Call Protection: | L(24),Grtr1%orYM(56),O(4) |
| Lockbox / Cash Management: | Hard / Springing |
| Additional Debt: | N/A |
| Additional Debt Balance: | N/A |
| Additional Debt Type: | N/A |
| Escrows and Reserves(3) | |||
| Initial | Monthly | Initial Cap | |
| Taxes: | $525,330 | $47,757 | N/A |
| Insurance: | $30,715 | $3,072 | N/A |
| Replacement Reserves: | $0 | $1,334 | N/A |
| TI/LC: | $0 | $0 | N/A |
| Property Information | |
| Single Asset / Portfolio: | Single Asset |
| Title: | Fee |
| Property Type - Subtype: | Office – CBD |
| Net Rentable Area (SF): | 80,067 |
| Location: | Austin, TX |
| Year Built / Renovated: | 2019 / N/A |
| Occupancy: | 100.0% |
| Occupancy Date: | 10/6/2020 |
| Number of Tenants: | 1 |
| 2017 NOI(1): | N/A |
| 2018 NOI(1): | N/A |
| 2019 NOI(1): | N/A |
| TTM NOI(1): | N/A |
| UW Economic Occupancy: | 95.0% |
| UW Revenues: | $4,487,441 |
| UW Expenses: | $1,424,863 |
| UW NOI(2): | $3,062,579 |
| UW NCF(2): | $2,910,609 |
| Appraised Value / Per SF(2): | $53,600,000 / $669 |
| Appraisal Date: | 6/18/2020 |
| Financial Information(2) | |
| Cut-off Date Loan / SF: | $401 |
| Maturity Date Loan / SF: | $401 |
| Cut-off Date LTV: | 59.9% |
| Maturity Date LTV: | 59.9% |
| UW NCF DSCR: | 2.17x |
| UW NOI Debt Yield: | 9.5% |
| Sources and Uses | |||||
| Sources | Proceeds | % of Total | Uses | Proceeds | % of Total |
| Loan Amount | $32,100,000 | 100.0% | Loan Payoff | $21,322,076 | 66.4% |
| TI Disbursement(4) | 5,608,717 | 17.5 | |||
| Return of Equity | 4,200,676 | 13.1 | |||
| Upfront Reserves | 556,045 | 1.7 | |||
| Closing Costs | 412,486 | 1.3 | |||
| Total Sources | $32,100,000 | 100.0% | Total Uses | $32,100,000 | 100.0% |
| (1) | Historical financial information is not available for the 2010 South Lamar Property (as defined below) because it was constructed in 2019. |
| (2) | While the 2010 South Lamar Loan (as defined below) was originated after the emergence of the novel coronavirus pandemic and the economic disruption resulting from measures to combat the pandemic, the pandemic is an evolving situation and could impact the 2010 South Lamar Loan more severely than assumed in the underwriting of the 2010 South Lamar Loan and could adversely affect the NOI, NCF and occupancy information, as well as the appraised value and the DSCR, LTV and Debt Yield metrics presented above. See “Risk Factors— Risks Related to Market Conditions and Other External Factors—Coronavirus Pandemic Has Adversely Affected the Global Economy and Will Likely Adversely Affect the Performance of the Mortgage Loans” in the Preliminary Prospectus. |
| (3) | For a full description of Escrows and Reserves, please refer to “Escrows and Reserves” herein. |
| (4) | Represents an outstanding TI allowance paid directly to Juul Labs Inc. |
THE INFORMATION IN THIS STRUCTURAL AND COLLATERAL TERM SHEET IS NOT COMPLETE AND MAY BE AMENDED PRIOR TO THE TIME OF SALE. THIS TERM SHEET IS NOT AN OFFER TO SELL THESE SECURITIES AND IT IS NOT A SOLICITATION OF AN OFFER TO BUY THESE SECURITIES IN ANY JURISDICTION WHERE THE OFFER OR SALE IS NOT PERMITTED.
| | 115 of 144 | | |
| Structural and Collateral Term Sheet | Benchmark 2020-B20 |
| 2010 South Lamar | |
The Loan. The 2010 South Lamar mortgage loan is a $32.1 million loan (“2010 South Lamar Loan”) secured by the borrower’s fee simple interest in an 80,067 square foot office building in Austin, Texas (the “2010 South Lamar Property”). The 2010 South Lamar Loan has a seven-year term and will be interest-only for its entire term. The 2010 South Lamar Loan was originated by Citi Real Estate Funding Inc. (“CREFI”) on September 22, 2020.
The Borrower. The borrower is 2010 South Lamar, LLC (the “2010 South Lamar Borrower”), a Delaware limited liability company and single purpose entity with one independent director. Legal counsel to the borrower delivered a non-consolidation opinion in connection with the origination of the 2010 South Lamar Loan.
The Loan Sponsors. The loan sponsors are Alan Sackman, Carter F. Sackman, Sr., and Carter F. Sackman, Jr. Alan Sackman is the founder and current chairman of Sackman Enterprises, Inc. (“Sackman”), a multi-generational real estate family based in New York City. Founded in 1969, Sackman began operations by focusing on the restoration of historic brownstones on Manhattan’s Upper West Side. Today, Sackman continues to rehabilitate historic buildings and holdings include both residential and commercial properties, which are managed directly by Sackman. Sackman’s portfolio includes properties in Manhattan, Brooklyn, Bronx, New Jersey, North and South Carolina, Colorado, Texas, and Turks and Caicos. The company is led by Alan Sackman, James Hefelfinger, and Carter F. Sackman, Sr. In New York City, the Sackman family own and operate more than 25 properties. In Austin, Texas, the loan sponsors own the 2010 South Lamar Property and also recently developed 70 Rainey, a luxury residential condo building containing 164 units and 20,000 square feet of amenity space. The glass condo tower spans 35 stories in Austin’s Rainey Street neighborhood. Alan Sackman is the guarantor of the 2010 South Lamar Loan. Alan Sackman owns 27.33% of the 2010 South Lamar Borrower and is the managing member of Frontier Realty LLC, which is the managing member of the 2010 South Lamar Borrower.
The Property. The 2010 South Lamar Property consists of a three-story, newly-constructed Class A office building located in Austin, Texas. The building consists of 13,992 square feet of grade level space that functions as a lobby and security greeting area, employee cafeteria, coffee bar, and tenant lounge and gaming space. The remaining 66,075 square feet is spread across the second and third-floors and is arranged as traditional luxury office space with open bullpen-style desks, glass conference and breakout rooms, and multiple terrace areas to accommodate an outdoor working environment. All floors of the 2010 South Lamar Property feature glass and black metal construction, exposed finished concrete, and floor-to-ceiling glass windows with views of South Lamar and downtown Austin from the upper floors. The building also features a two-story atrium and green wall spanning from the second-floor landing to the roof. The 2010 South Lamar Property is situated on approximately 45,011 square feet of land with grade and two sub levels of parking totaling 206 parking spaces.
As of October 6, 2020, the 2010 South Lamar Property was 100.0% leased to one tenant.
The sole tenant, Juul Labs Inc. (“Juul”) (80,067 square feet; 100.0% of net rentable area; 100.0% of underwritten base rent) is an American electronic cigarette company founded in 2015 that is headquartered in San Francisco, California. The company aims to provide the 1.0 billion smokers worldwide with an alternative to combustible cigarettes. Juul recently raised $700 million of convertible debt and has underwritten its internal valuation at approximately $12 billion. Altria Group (Moody’s: A3; Fitch: BBB; S&P: BBB), Juul’s largest investor with a 35% stake, took a $12.8 billion stake in the company in December 2018, and has two of the nine seats on the company’s board. Other prominent investors in Juul include Tiger Global Management, LLC (approximately $41 billion in assets under management) and D1 Capital Partners LP (led by Dan Sundheim, former CIO of Viking).
The Market.The 2010 South Lamar Property is located in Austin’s South-Central Submarket, which according to the appraisal, has been undergoing revitalization for the past few years. Historically, older one- and two-story commercial buildings were located along the major roadways, however, recently there has been a significant increase in the number of luxury residential, commercial and mixed-use developments along South Lamar Boulevard, South Congress Avenue and Barton Springs Road. Over the past ten years, the appeal of centrally located areas just south of the Austin central business district has increased substantially. A recent example of the push southward is Lamar Union at 1100 South Lamar (0.5 miles north of the 2010 South Lamar Property), a newly built nine-acre mixed-use development including 440 apartment units, 86,377 square feet of retail space (including seven restaurants and Shake Shack’s first Texas location), and a more than 1,300-space parking garage. Revitalization along the South Lamar Boulevard Corridor has provided amenity-rich housing and employment options for residents who are attracted to urban-style living and the mix of shopping, restaurants, atmosphere and quality of life that the location has to offer.
According to the appraisal, as of the second quarter of 2020, the South office submarket consists of approximately 6,357,647 square feet of office space and reports a 92.6% occupancy with average asking rents of $37.91 per square foot. The greater overall Austin office market comprises approximately 115,175,063 square feet of office space and reports an occupancy rate of 90.1% with average asking rents of $39.20 per square foot gross.
THE INFORMATION IN THIS STRUCTURAL AND COLLATERAL TERM SHEET IS NOT COMPLETE AND MAY BE AMENDED PRIOR TO THE TIME OF SALE. THIS TERM SHEET IS NOT AN OFFER TO SELL THESE SECURITIES AND IT IS NOT A SOLICITATION OF AN OFFER TO BUY THESE SECURITIES IN ANY JURISDICTION WHERE THE OFFER OR SALE IS NOT PERMITTED.
| | 116 of 144 | | |
| Structural and Collateral Term Sheet | Benchmark 2020-B20 |
| 2010 South Lamar | |
When determining market rent for the 2010 South Lamar Property, the appraiser cited five comparable leases that ranged from $33.00 to $41.00 per square foot triple net and all were executed no earlier than March 2018. The appraiser concluded that the current $40.00 per square foot net rental rate is at market.
COVID-19 Update. The loan sponsors have confirmed that Juul has not requested any form of rent relief. Juul has completed their buildout and the office is open to employees with limited utilization, currently at 25%. See “Risk Factors—Risks Related to Market Conditions and Other External Factors—Current Coronavirus Pandemic May Adversely Affect the Global Economy and the Performance of the Mortgage Loans”.
| Historical and Current Occupancy | |||
| 2017(1) | 2018(1) | 2019(2) | Current(3) |
| N/A | N/A | 100.0% | 100.0% |
| (1) | There is no historical occupancy available, as the property was recently constructed in 2019. |
| (2) | 2019 Occupancy is as of December 31, 2019. |
| (3) | Current Occupancy is as of October 6, 2020. |
| Tenant Summary(1) | ||||||
Tenant | Ratings Moody’s/Fitch/S&P(2) | Net Rentable Area (SF) | % of Total NRA | Base Rent PSF | % of Total Base Rent | Lease Expiration Date |
| Juul Labs Inc. | NR/NR/NR | 80,067 | 100.0% | $40.00 | 100.0% | 3/1/2030 |
| Total Occupied | 80,067 | 100.0% | $40.00 | 100.0% | ||
| Vacant | 0 | 0.0 | ||||
| Total | 80,067 | 100.0% | ||||
| (1) | Based on the underwritten rent roll dated October 6, 2020. |
| (2) | In certain instances, ratings provided are those of the parent company of the entity shown, whether or not the parent company guarantees the lease. |
| Lease Rollover Schedule(1)(2) | |||||||||
| Year | Number of Leases Expiring | Net Rentable Area Expiring | % of NRA Expiring | Base Rent Expiring | % of Base Rent Expiring | Cumulative Net Rentable Area Expiring | Cumulative % of NRA Expiring | Cumulative Expiring | Cumulative % of Base Rent Expiring |
| Vacant | NAP | 0 | 0.0% | NAP | NAP | 0 | 0.0% | NAP | NAP |
| 2020 & MTM | 0 | 0 | 0.0 | $0 | 0.0% | 0 | 0.0% | $0 | 0.0% |
| 2021 | 0 | 0 | 0.0 | 0 | 0.0 | 0 | 0.0% | $0 | 0.0% |
| 2022 | 0 | 0 | 0.0 | 0 | 0.0 | 0 | 0.0% | $0 | 0.0% |
| 2023 | 0 | 0 | 0.0 | 0 | 0.0 | 0 | 0.0% | $0 | 0.0% |
| 2024 | 0 | 0 | 0.0 | 0 | 0.0 | 0 | 0.0% | $0 | 0.0% |
| 2025 | 0 | 0 | 0.0 | 0 | 0.0 | 0 | 0.0% | $0 | 0.0% |
| 2026 | 0 | 0 | 0.0 | 0 | 0.0 | 0 | 0.0% | $0 | 0.0% |
| 2027 | 0 | 0 | 0.0 | 0 | 0.0 | 0 | 0.0% | $0 | 0.0% |
| 2028 | 0 | 0 | 0.0 | 0 | 0.0 | 0 | 0.0% | $0 | 0.0% |
| 2029 | 0 | 0 | 0.0 | 0 | 0.0 | 0 | 0.0% | $0 | 0.0% |
| 2030 | 1 | 80,067 | 100.0 | 3,202,680 | 100.0 | 80,067 | 100.0% | $3,202,680 | 100.0% |
| 2031 and Thereafter | 0 | 0 | 0.0 | 0 | 0.0 | 80,067 | 100.0% | $3,202,680 | 100.0% |
| Total | 1 | 80,067 | 100.0% | $3,202,680 | 100.0% | ||||
| (1) | Based on the underwritten rent roll dated October 6, 2020. |
| (2) | Lease rollover schedule is based on the lease expiration dates of all direct leases in place. |
THE INFORMATION IN THIS STRUCTURAL AND COLLATERAL TERM SHEET IS NOT COMPLETE AND MAY BE AMENDED PRIOR TO THE TIME OF SALE. THIS TERM SHEET IS NOT AN OFFER TO SELL THESE SECURITIES AND IT IS NOT A SOLICITATION OF AN OFFER TO BUY THESE SECURITIES IN ANY JURISDICTION WHERE THE OFFER OR SALE IS NOT PERMITTED.
| | 117 of 144 | | |
| Structural and Collateral Term Sheet | Benchmark 2020-B20 |
| 2010 South Lamar | |
Underwritten Net Cash Flow | |||
| Underwritten | Per Square Foot | %(1) | |
| Base Rent(2) | $3,202,680 | $40.00 | 67.8% |
| Rent Steps(3) | 96,080 | 1.20 | 2.0 |
| Gross Potential Rent | $3,298,760 | $41.20 | 69.8% |
| Total Reimbursements | 1,424,863 | 17.80 | 30.2 |
| Total Other Income | 0 | 0.00 | 0.0 |
| Net Rental Income | $4,723,623 | $59.00 | 100.0% |
| (Vacancy/Credit Loss) | (236,181) | (2.95) | (5.0) |
| Effective Gross Income | $4,487,441 | $56.05 | 95.0% |
| Total Expenses | 1,424,863 | 17.80 | 31.8 |
| Net Operating Income | $3,062,579 | $38.25 | 68.2% |
| Total TI/LC, Capex/RR | 151,970 | 1.90 | 3.4 |
| Net Cash Flow | $2,910,609 | $36.35 | 64.9% |
| (1) | % column represents percent of Net Rental Income for all revenue lines and represents percent of Effective Gross Income for the remainder of the fields. |
| (2) | Underwritten Base Rent is based on the in place rent roll as of October 6, 2020. |
| (3) | Rent steps taken through October 2020. |
Property Management. The 2010 South Lamar Property is managed by Sackman Enterprises, Inc., an affiliate of the borrower.
Escrows and Reserves. At origination of the 2010 South Lamar Loan, the 2010 South Lamar Borrower deposited (i) approximately $525,330 into a real estate tax reserve and (ii) approximately $30,715 into an insurance reserve.
Tax Reserve – The 2010 South Lamar Borrower is required to deposit into a real estate tax reserve, on a monthly basis, 1/12 of the estimated annual real estate taxes (initially estimated to be approximately $47,757). Notwithstanding the foregoing, the borrower will not be required to make the monthly tax reserve deposit on any monthly payment date during which the Reserve Waiver Conditions (as defined below) are satisfied in full.
Insurance Reserve – At the option of the lender, the 2010 South Lamar Borrower will be required to deposit into an insurance reserve, on a monthly basis, an amount equal to 1/12 of estimated insurance premiums (initially estimated to be approximately $3,072). Notwithstanding the foregoing, the borrower will not be required to make the monthly tax reserve deposit on any monthly payment date during which the Reserve Waiver Conditions are satisfied in full.
Replacement Reserve – The 2010 South Lamar Borrower is required to deposit into a replacement reserve, on a monthly basis, an amount equal to approximately $1,334 for replacement reserves.
“Reserve Waiver Conditions” means each of the following: (i) no event of default has occurred and is continuing, (ii) the Specified Tenant lease is in full force and effect with no defaults thereunder, (iii) the Specified Tenant continues to make the payments and perform the obligations required under the Specified Tenant Lease, in each case, relating to the obligations and liabilities for which the applicable reserve account was established and delivers evidence of the same by no later than five days prior to the same were due, (iv) the Specified Tenant is not bankrupt or insolvent, and (v) the Specified Tenant has not expressed its intention in writing to terminate, cancel or default under the Specified Tenant lease (including, without limitation, in connection with any rejection in any bankruptcy or similar insolvency proceeding).
Lockbox / Cash Management. The 2010 South Lamar Loan is structured with a hard lockbox and springing cash management. The borrower is required to deliver a tenant direction letter to Juul, the sole tenant at the 2010 South Lamar Property directing it to remit its rent checks directly to the lender-controlled lockbox. The 2010 South Lamar Borrower is required to cause revenue received by the property manager from the 2010 South Lamar Property to be deposited into such lockbox immediately upon receipt. All funds deposited into the lockbox are required to be transferred on each business day to or at the direction of the 2010 South Lamar Borrower unless a Trigger Period (as defined below) exists. Upon the occurrence and during the continuance of a Trigger Period, all funds in the lockbox account are required to be swept on each business day to a cash management account under the control of the lender to be applied and disbursed in accordance with the 2010 South Lamar Loan documents, and all excess cash flow funds remaining in the cash management account after the application of such funds in accordance with the 2010 South Lamar Loan documents are required to be held by the lender in an excess cash flow reserve account as additional collateral for the 2010 South Lamar Loan. Provided no event of default has
THE INFORMATION IN THIS STRUCTURAL AND COLLATERAL TERM SHEET IS NOT COMPLETE AND MAY BE AMENDED PRIOR TO THE TIME OF SALE. THIS TERM SHEET IS NOT AN OFFER TO SELL THESE SECURITIES AND IT IS NOT A SOLICITATION OF AN OFFER TO BUY THESE SECURITIES IN ANY JURISDICTION WHERE THE OFFER OR SALE IS NOT PERMITTED.
| | 118 of 144 | | |
| Structural and Collateral Term Sheet | Benchmark 2020-B20 |
| 2010 South Lamar | |
occurred and is continuing, any excess cash flow funds remaining in the excess cash flow account will be disbursed to the borrower upon the expiration of any Trigger Period. Upon an event of default under the 2010 South Lamar Loan documents, the lender may apply funds to the debt in such priority as it may determine.
A “Trigger Period” means a period commencing upon the earliest to occur of (i) an event of default, (ii) the debt service coverage ratio being less than 1.20x for two consecutive calendar quarters, and (iii) a Specified Tenant Trigger Period (as defined below), and expiring upon (a) with respect to clause (i) above, the cure (if applicable) of such event of default, (b) with respect to clause (ii) above, the debt service coverage ratio being equal to or greater than 1.25x for two consecutive calendar quarters, and (c) with respect to clause (iii) above, the satisfaction of the Specified Tenant Cure Conditions (as defined below).
A “Specified Tenant” means, as applicable, (i) Juul, and (ii) any other tenants of the Specified Tenant space (or any portion thereof) and any guarantors of the applicable related Specified Tenant lease.
A “Specified Tenant Trigger Period” means a period (A) commencing upon the first to occur of (i) the Specified Tenant being in default under the applicable Specified Tenant lease beyond any applicable notice and cure periods, (ii) except for permitted subleasing and permitted assignments under the existing Specified Tenant lease, the Specified Tenant’s failure to be in actual, physical possession of the Specified Tenant space (or applicable portion thereof), (iii) the Specified Tenant giving notice that it is terminating its lease for all or any portion of the Specified Tenant space, (iv) any termination or cancellation of the Specified Tenant lease (including, without limitation, rejection in any bankruptcy or similar insolvency proceeding) and/or any Specified Tenant lease failing to otherwise be in full force and effect, (v) any bankruptcy or similar insolvency of the Specified Tenant, (vi) the occurrence of a Quick Ratio Trigger Event (as defined below), or (vii) the occurrence of a Cash & Cash Equivalents Trigger Event (as defined below) and (B) expiring upon the lender’s receipt of evidence reasonably acceptable to the lender of (1) the satisfaction of the Specified Tenant Cure Conditions or (2) the 2010 South Lamar Borrower leasing the entire Specified Tenant space (or applicable portion thereof) in accordance with the 2010 South Lamar Loan documents, the applicable tenant being in actual, physical possession of the space demised under its lease, utilizing the premises (or applicable portion thereof) and paying the full amount of rent due.
“Specified Tenant Cure Conditions” means each of the following, as applicable (i) the lender’s receipt of satisfactory evidence that the Specified Tenant has cured all defaults under the Specified Tenant lease, (ii) the lender’s receipt of satisfactory evidence that the Specified Tenant is in actual, physical possession of the Specified Tenant space (or applicable portion thereof), (iii) the Specified Tenant has revoked or rescinded all termination or cancellation notices with respect to the Specified Tenant lease and has reaffirmed the Specified Tenant lease as being in full force and effect, (iv) with respect to a Quick Ratio Trigger Event, the earlier to occur of (a) the date that the Quick Ratio of the Specified Tenant is equal to or greater than 1.50x for at least two consecutive calendar quarters or (b) a Specified Tenant Financial Trigger Cure (as defined below), (v) with respect to a Cash & Cash Equivalents Trigger Event, the earlier to occur of (a) the date that the cash and cash equivalents of the Specified Tenant are equal to or greater than $150,000,000 for two consecutive calendar quarters or (b) a Specified Tenant Financial Trigger Cure, (vi) with respect to any applicable bankruptcy or insolvency proceedings involving the Specified Tenant and/or the Specified Tenant lease, the Specified Tenant is no longer insolvent or subject to any bankruptcy or insolvency proceedings and has affirmed the Specified Tenant lease pursuant to final, nonappealable order of a court of competent jurisdiction, and (vii) the Specified Tenant is paying full, unabated rent under the Specified Tenant lease.
“Specified Tenant Financial Trigger Cure” means that the 2010 South Lamar Borrower has delivered or caused to be delivered to the lender either (i) a letter of credit acceptable to lender in its sole and absolute discretion or (ii) cash, in each case, in an amount equal to $2,001,675.
“Quick Ratio” means the ratio calculated by the lender of (i) current assets, less inventory and prepaid expenses to (ii) current liabilities, each as determined in accordance with GAAP.
“Quick Ratio Trigger Event” means the Quick Ratio of the Specified Tenant being less than 1.50 to 1.00 for two consecutive calendar quarters.
“Cash & Cash Equivalents Trigger Event” means that the cash and cash equivalents of the Specified Tenant, as reported pursuant to 2010 South Lamar Loan documents, are less than $150,000,000 for two consecutive calendar quarters.
Current Mezzanine or Subordinate Indebtedness. None.
Partial Release. None.
Future Permitted Mezzanine Indebtedness. None.
THE INFORMATION IN THIS STRUCTURAL AND COLLATERAL TERM SHEET IS NOT COMPLETE AND MAY BE AMENDED PRIOR TO THE TIME OF SALE. THIS TERM SHEET IS NOT AN OFFER TO SELL THESE SECURITIES AND IT IS NOT A SOLICITATION OF AN OFFER TO BUY THESE SECURITIES IN ANY JURISDICTION WHERE THE OFFER OR SALE IS NOT PERMITTED.
| | 119 of 144 | | |
| Structural and Collateral Term Sheet | Benchmark 2020-B20 |
| 333 South Wabash | |
| Mortgage Loan Information | |
Mortgage Loan Seller: Original Principal Balance(1): | GSMC $30,000,000 |
| Cut-off Date Principal Balance(1): | $30,000,000 |
| % of Pool by IPB: | 3.3% |
| Loan Purpose: | Acquisition |
| Borrower: | DF 333 Wabash PropCo LLC |
| Loan Sponsors: | Michael Shvo, Deutsche Finance |
| America LLC | |
| Interest Rate: | 3.53000% |
| Note Date: | 8/12/2020 |
| Maturity Date: | 9/1/2028 |
| Interest-only Period: | 96 months |
| Original Term: | 96 months |
| Original Amortization: | None |
| Amortization Type: | Interest Only |
| Call Protection: | L(47),Def(43),O(6) |
| Lockbox / Cash Management: | Hard / Springing |
| Additional Debt(1): | Yes |
| Additional Debt Balance(1): | $210,000,000 |
| Additional Debt Type(1): | Pari Passu |
| Escrows and Reserves | |||
Initial | Monthly | Initial Cap | |
| Taxes: | $1,582,185 | $527,395 | N/A |
| Insurance: | $94,591 | $47,296 | N/A |
| Replacement Reserves: | $0 | $0 | N/A |
| TI/LC: | $8,513,554 | $0 | N/A |
| Other(3): | $23,921,811 | Springing | $3,000,000 |
| Property Information | |
Single Asset / Portfolio: Title: | Single Asset Fee |
| Property Type - Subtype: | Office – CBD |
| Net Rentable Area (SF): | 1,207,380 |
| Location: | Chicago, IL |
| Year Built / Renovated: | 1972 / 2019 |
| Occupancy: | 90.5% |
| Occupancy Date: | 8/1/2020 |
| Number of Tenants: | 13 |
| 2017 NOI: | $14,833,810 |
| 2018 NOI(2): | $3,939,112 |
| 2019 NOI(2): | ($1,283,489) |
| TTM NOI (as of 5/2020)(2): | ($4,874,145) |
| UW Economic Occupancy: | 91.7% |
| UW Revenues: | $41,578,718 |
| UW Expenses: | $17,347,570 |
| UW NOI(2)(5): UW NCF(5): | $24,231,148 $23,327,488 |
| Appraised Value / Per SF(5): | $382,000,000 / $316 |
| Appraisal Date: | 7/1/2020 |
| Financial Information(1)(5) | |
| Cut-off Date Loan / SF: | $199 |
| Maturity Date Loan / SF: | $199 |
| Cut-off Date LTV: | 62.8% |
| Maturity Date LTV: | 62.8% |
| UW NCF DSCR: | 2.75x |
| UW NOI Debt Yield: | 10.1% |
| Sources and Uses | |||||
Sources | Proceeds | % of Total | Uses | Proceeds | % of Total |
| Whole Loan | $240,000,000 | 57.2% | Purchase Price(4) | $376,000,000 | 89.6% |
| Sponsor Equity | 179,786,770 | 42.8 | Upfront Reserves | 34,112,141 | 8.1 |
| Closing Costs | 9,674,629 | 2.3 | |||
| Total Sources | $419,786,770 | 100.0% | Total Uses | $419,786,770 | 100.0% |
| (1) | The 333 South Wabash Loan is part of a whole loan evidenced by nine pari passu notes, with an aggregate outstanding principal balance as of the Cut-off Date of $240.0 million. The Financial Information presented in the chart above reflects the Cut-off Date balance of the $240.0 million 333 South Wabash Whole Loan (as defined below). |
| (2) | The decrease from 2018 NOI to 2019 NOI was due to the 2019 renovation and CNA vacating a majority of its space at the 333 South Wabash Property. The renovation included a new tenant build out for Northern Trust, which now occupies 45.4% of the net rentable square footage. Northern Trust began to occupy their space in February of 2020. The increase in UW NOI from TTM NOI is due to the recently completed $167.5 million renovation and execution of a new lease with Northern Trust at the 333 South Wabash Property. The 333 South Wabash Property is 90.5% leased as of August 1, 2020, compared to 38.3% leased as of December 31, 2019. |
| (3) | At origination, the borrower reserved approximately $23.2 million for gap rent and rent concessions associated with Chicago Housing Authority, Akuna Capital LLC, Bright Horizons, The Northern Trust and Millhouse Engineering & Construction, Inc. Additionally, the borrower reserved $750,000 to be utilized in the re-tenanting of the 55 E. Jackson sublease space. |
| (4) | The Purchase Price includes seller credits totaling approximately $34.1 million, which was escrowed at origination, for outstanding obligations, including tenant improvements and leasing commissions, gap rent, rent concessions, and sublease rent. |
| (5) | While the 333 South Wabash Loan (as defined below) was originated after the emergence of the novel coronavirus pandemic and the economic disruption resulting from measures to combat the pandemic, the pandemic is an evolving situation and could impact the 333 South Wabash Loan more severely than assumed in the underwriting of the 333 South Wabash Loan and could adversely affect the NOI, NCF and occupancy information, as well as the appraised value and the DSCR, LTV and Debt Yield metrics presented above. See “Risk Factors— Risks Related to Market Conditions and Other External Factors—Coronavirus Pandemic Has Adversely Affected the Global Economy and Will Likely Adversely Affect the Performance of the Mortgage Loans” in the Preliminary Prospectus. |
THE INFORMATION IN THIS STRUCTURAL AND COLLATERAL TERM SHEET IS NOT COMPLETE AND MAY BE AMENDED PRIOR TO THE TIME OF SALE. THIS TERM SHEET IS NOT AN OFFER TO SELL THESE SECURITIES AND IT IS NOT A SOLICITATION OF AN OFFER TO BUY THESE SECURITIES IN ANY JURISDICTION WHERE THE OFFER OR SALE IS NOT PERMITTED.
| | 120 of 144 | | |
| Structural and Collateral Term Sheet | Benchmark 2020-B20 |
| 333 South Wabash | |
The Loan. The mortgage loan (the “333 South Wabash Loan”) is part of a whole loan (the “333 South Wabash Whole Loan”) consisting of nine pari passu promissory notes with an aggregate original principal balance of $240,000,000 and secured by a first mortgage encumbering the borrower’s fee simple interest in an approximately 1.2 million square foot office tower located in downtown Chicago, Illinois (the “333 South Wabash Property”).
The 333 South Wabash Loan is evidenced by the non-controlling note Tranche A-2-A and has an outstanding principal balance as of the Cut-off Date of $30,000,000, representing approximately [ ]% of the Initial Pool Balance. The controlling note, Tranche A-2-B, with an outstanding principal balance as of the Cut-off Date of $50,000,000, was contributed to the Benchmark 2020-B19 Trust. However, American International Group, Inc. (“AIG”) has been appointed as the controlling noteholder so long as certain AIG affiliates continue to hold notes aggregating at least $75,000,000 in outstanding principal balance of the 333 South Wabash Whole Loan and, accordingly, AIG will exercise control and consultation rights on behalf of the directing holder for the 333 South Wabash Whole Loan. The related pari passu companion loans, evidenced by the non-controlling notes A-1 (AGL), A-1 (AGL-Fortitude), A-1 (VALIC), A-1 (NUFI-Fortitude), A-1 (AHAC), A-1 (AHAC-Fortitude) (the “Tranche A-1 Notes”), Tranche A-2-B (controlling note) and Tranche A-2-C (together with Tranche A-2-A, the “Tranche A-2 Notes”), have an aggregate outstanding principal balance as of the Cut-off Date of $210,000,000.
The 333 South Wabash Whole Loan was co-originated by Goldman Sachs Bank USA, American General Life Insurance Company, The Variable Annuity Life Insurance Company, National Union Fire Insurance Company of Pittsburgh, PA., and American Home Assurance Company on August 12, 2020. Each note of the 333 South Wabash Whole Loan has an interest rate per annum of 3.53000%. The borrower utilized the proceeds of the 333 South Wabash Whole Loan to finance the acquisition of the 333 South Wabash Property, fund reserves and pay closing costs.
The 333 South Wabash Whole Loan had an initial term of 96 months and has a remaining term of 95 months as of the Cut-Off Date. The 333 South Wabash Whole Loan requires interest-only payments during its term; provided that, under the terms of the 333 South Wabash Whole Loan documents, principal and interest payments based on a 30-year amortization schedule may be triggered, commencing on the August 2026 payment date and the August payment date of each subsequent year, in the event that (i) net operating income (as calculated under the loan documents) for the preceding 12 calendar months does not exceed $21.0 million or (ii) the amount of aggregate square feet of the 333 South Wabash Property that is subject to leases expiring in the following 36 month period exceeds 241,348 square feet (an “Amortization Trigger Event”). The borrower can prevent the occurrence of an Amortization Trigger Event for 12 months by depositing cash or letter of credit in an amount equal to $4,582,500. The scheduled maturity date of the 333 South Wabash Whole Loan is September 1, 2028.
The borrower may obtain the release of the 333 South Wabash Property on or after the due date in September 2024 by defeasing the Tranche A-2 Notes and prepaying the Tranche A-1 Notes. Any such release prior to the due date in April 2028 requires a (i) prepayment of the Tranche A-1 Notes together with a premium payment equal to the greater of (x) 1% of the aggregate outstanding balance as of the prepayment date of the Tranche A-1 Notes and (y) the present value of the remaining 333 South Wabash Whole Loan debt service payments, less the aggregate outstanding balance of the Tranche A-1 Notes, each as of the prepayment date, and (ii) defeasance of the Tranche A-2 Notes with certain direct full faith and credit obligations of the United States of America of the entire outstanding balance of the Tranche A-2 Notes in accordance with the 333 South Wabash Whole Loan documents.
The table below summarizes the promissory notes that comprise the 333 South Wabash Whole Loan. The relationship between the holders of the 333 South Wabash Whole Loan is governed by a co-lender agreement as described under “Description of the Mortgage Pool—The Whole Loans—The Non-Serviced Pari Passu Whole Loans” in the Preliminary Prospectus.
| Whole Loan Summary | ||||
| Controlling | ||||
| Note | Original Balance | Cut-off Date Balance | Note Holder | Piece |
| Tranche A-1 (AGL) | $75,600,000 | $75,600,000 | AGL(1) | No |
| Tranche A-1 (AGL-Fortitude) | 15,400,000 | 15,400,000 | AGL(1) | No |
| Tranche A-1 (VALIC) | 35,000,000 | 35,000,000 | VALIC(1) | No |
| Tranche A-2-A | 30,000,000 | 30,000,000 | Benchmark 2020-B20 | No |
| Tranche A-2-B | 50,000,000 | 50,000,000 | Benchmark 2020-B19 | Yes(2) |
| Tranche A-2-C | 20,000,000 | 20,000,000 | DBJPM 2020-C9 | No |
| Tranche A-1 (AHAC) | 8,400,000 | 8,400,000 | AHAC(1) | No |
| Tranche A-1 (AHAC-Fortitude) | 2,800,000 | 2,800,000 | AHAC(1) | No |
| Tranche A-1 (NUFI-Fortitude) | 2,800,000 | 2,800,000 | NUFIC(1) | No |
| Total | $240,000,000 | $240,000,000 | ||
| (1) | Expected to be contributed to a future securitization. |
THE INFORMATION IN THIS STRUCTURAL AND COLLATERAL TERM SHEET IS NOT COMPLETE AND MAY BE AMENDED PRIOR TO THE TIME OF SALE. THIS TERM SHEET IS NOT AN OFFER TO SELL THESE SECURITIES AND IT IS NOT A SOLICITATION OF AN OFFER TO BUY THESE SECURITIES IN ANY JURISDICTION WHERE THE OFFER OR SALE IS NOT PERMITTED.
| | 121 of 144 | | |
| Structural and Collateral Term Sheet | Benchmark 2020-B20 |
| 333 South Wabash | |
| (2) | The controlling note is the 333 South Wabash Tranche A-2-B; however, so long as certain AIG affiliates continue to hold notes aggregating at least $75,000,000 in outstanding principal balance of the 333 South Wabash Whole Loan, an AIG affiliate has been irrevocably appointed as the controlling note holder representative entitled to exercise all control rights. |
The Borrower. The borrower is DF 333 Wabash PropCo LLC, a Delaware limited liability company and single purpose entity with two independent directors (the “333 South Wabash Borrower”). Legal counsel to the 333 South Wabash Borrower delivered a non-consolidation opinion in connection with the origination of the 333 South Wabash Whole Loan.
The borrower is affiliated with the borrower of the mortgage loan identified on Annex A-1 to the Preliminary Prospectus as 711 Fifth Avenue, which has a Cut-off Date Balance of $15.0 million.
The Loan Sponsors. The borrower sponsors and non-recourse carveout guarantors are Michael Shvo and Deutsche Finance America LLC (“DFA”). The non-recourse carveout guarantors have provided a limited non-recourse carveout guaranty that covers only certain existing litigation in which the borrower, the related borrower sponsors and several entities in the borrower’s ownership structure are defendants (the “Existing Litigation”) and, among other things, any voluntary bankruptcy as a result of such Existing Litigation. See “Description of the Mortgage Pool—Litigation and Other Legal Considerations” in the Preliminary Prospectus. Michael Shvo is the founder, chairman, and CEO of SHVO, a New York-based commercial real estate development firm with a portfolio valued at over €7 billion. DFA is the US real estate private equity platform of the Munich-based Deutsche Finance Group, a global investment management firm active since 2005 with over €6.5 billion of assets under management and investments across 49 markets as of September 2020. The partnership between SHVO and DFA has acquired seven other assets located in New York, Miami Beach, and Beverly Hills.
The Property. The 333 South Wabash Property consists of a 45-story central business district office building totaling 1,207,380 square feet located in Chicago, Illinois. The 333 South Wabash Property was built in 1972 on a 0.94-acre site, located at the intersection of South Wabash Avenue and East Van Buren Street in Chicago’s East Loop office submarket. In 2019, the prior owner completed a $167.5 million renovation and opened a new food hall, Hayden Hall, including eight quick-service restaurants plus two full-service dining experiences. Based on the underwritten rent roll dated August 1, 2020, the 333 South Wabash Property is currently 90.5% leased.
The Northern Trust Company (547,719 square feet; 45.4% of net rentable area; 48.9% of underwritten base rent) is the largest office tenant based on NRA at the 333 South Wabash Property, executing its lease in July 2017 to relocate its headquarters to the 333 South Wabash Property from the existing headquarters location at 50 South LaSalle Street, approximately a half mile west of the 333 South Wabash Property. The lease commenced on September 1, 2020 with The Northern Trust Company (“Northern Trust”) taking early occupancy of its space in phases beginning in February 2020 with an additional 56,932 square feet expected to commence on two floors in 2023. Founded in Chicago in 1889, Northern Trust is a provider of wealth management, asset servicing, and banking to corporations, institutions, affluent families, and individuals. Northern Trust has a global presence with offices in 21 US states and Washington, DC, and across 22 locations in Canada, Europe, the Middle East, and the Asia-Pacific.
Chicago Housing Authority (222,141 square feet; 18.4% of net rentable area; 17.0% of underwritten base rent ) is the second largest office tenant based on NRA at the 333 South Wabash Property and has occupied space in the 333 South Wabash Property since December 2006. The Chicago Housing Authority (“CHA”) is the third largest public housing agency in the nation in terms of households served and provides housing opportunities across Chicago. Through the provision of public housing apartments and the management of Housing Choice Vouchers, CHA serves more than 63,000 low-income families and individuals.
Continental Casualty Company (56,638 square feet; 4.7% of net rentable area; 4.3% of underwritten base rent ) is the third largest office tenant based on NRA at the 333 South Wabash Property with the 333 South Wabash Property serving as the company’s headquarters from 1972 to 2018. Continental Casualty Company (“CNA”) is one of the largest commercial property and casualty insurance companies in the United States. CNA provides a range of standard and specialized property and casualty insurance products for businesses and professionals in the United States, Canada, and Europe.
COVID-19 Update. As of September 30, 2020, the 333 South Wabash Property is open, however most tenants have implemented a work from home policy for their employees, with a small group of employees coming to the 333 South Wabash Property daily. For August and September 2020, 98.3% and 89.8% of the occupied square feet, and 97.8% and 87.4%, of the underwritten base rent, respectively, were collected. As of September 30, 2020, the 333 South Wabash Whole Loan was not subject to any modification or forbearance requests. See “Risk Factors—Risks Related to Market Conditions and Other External Factors—Current Coronavirus Pandemic May Adversely Affect the Global Economy and the Performance of the Mortgage Loans”.
The Market. The 333 South Wabash Property is located at 333 South Wabash Avenue in Chicago, Illinois. According to a third party market research report, the 333 South Wabash Property is located within Chicago’s Loop/central business district where there is a significant corporate and governmental presence. The 333 South Wabash Property is considered a Class A Office Building in this market whereas, the bulk of traditional office development in the subject neighborhood is Class C.
THE INFORMATION IN THIS STRUCTURAL AND COLLATERAL TERM SHEET IS NOT COMPLETE AND MAY BE AMENDED PRIOR TO THE TIME OF SALE. THIS TERM SHEET IS NOT AN OFFER TO SELL THESE SECURITIES AND IT IS NOT A SOLICITATION OF AN OFFER TO BUY THESE SECURITIES IN ANY JURISDICTION WHERE THE OFFER OR SALE IS NOT PERMITTED.
| | 122 of 144 | | |
| Structural and Collateral Term Sheet | Benchmark 2020-B20 |
| 333 South Wabash | |
The 333 South Wabash Property is located in the East Loop submarket. During the first quarter of 2020, asking rents in the East Loop submarket declined by 0.3% to an average of $35.22, higher than eight of the metro area’s 13 submarkets. Since the same reporting period last year, asking rents have increased by 1.7%, up from $34.63. The East Loop submarket's current asking rent levels are higher than the metro area average of $32.38, while asking rent growth in the first quarter compares unfavorably to the metro area average of 0.7%. Effective rents, which exclude the value of concessions offered to prospective tenants, declined by 0.2% during the first quarter to an average of $26.38.
A comprehensive overview of the Chicago office market suggests that the primary concentrations of competitive office space are located in the West Loop submarket, amounting to 46.4 million square feet and 18.1% of the metropolitan inventory, followed by West, with a 15.7% share, and Northwest Suburbs with 15.1%. Since the beginning of the second quarter of 2010, the fastest growing area has been the West Loop submarket, adding 3.5 million square feet over that period, or 29.7% of total metropolitan office completions. The East Loop submarket, one of thirteen distinct geographic concentrations within Chicago, contains 20.0 million market rate rental square feet, or 7.8% of the metro area’s total inventory of office space
| Historical and Current Occupancy(1) | |||
| 2017 | 2018 | 2019 | Current(2) |
| 92.1% | 69.2% | 38.3% | 90.5% |
| (1) | Historical Occupancies are as of December 31 of each respective year. |
| (2) | Current Occupancy is as of August 1, 2020. The increase in occupancy between 2019 and Current is primarily due to the new lease executed with Northern Trust. |
| Tenant Summary(1) | ||||||
| Ratings | Net Rentable | % of | Base Rent | % of Total | Lease | |
| Tenant | Moody’s/Fitch/S&P(2) | Area (SF) | Total NRA | PSF(3) | Base Rent(3) | Expiration |
| Northern Trust(4) | A2/A+/A+ | 547,719 | 45.4% | $21.03 | 48.9% | 8/31/2035 |
| CHA(5) | NR/NR/NR | 222,141 | 18.4 | 18.00 | 17.0 | 12/31/2037 |
| Akuna Capital LLC(6) | NR/NR/NR | 56,382 | 4.7 | 27.53 | 6.6 | Various |
| CNA(7) | NR/NR/NR | 56,638 | 4.7 | 18.01 | 4.3 | 11/30/2024 |
| Hayden Hall | NR/NR/NR | 26,137 | 2.2 | 38.26 | 4.2 | 8/31/2030 |
| Hellmuth, Obata & Kassabaum | NR/NR/NR | 27,034 | 2.2 | 32.40 | 3.7 | 1/31/2025 |
| United Way of Metro Chicago(8) | NR/NR/NR | 28,892 | 2.4 | 30.21 | 3.7 | 4/30/2028 |
| IFF | NR/NR/NR | 27,928 | 2.3 | 29.75 | 3.5 | 9/30/2030 |
| Milhouse Engineering & Construction, Inc.(9) | NR/NR/NR | 28,466 | 2.4 | 27.90 | 3.4 | 6/30/2030 |
| Signature Office Centers, LLC(10) | NR/NR/NR | 18,927 | 1.6 | 30.00 | 2.4 | 6/30/2030 |
| Ten Largest Owned Tenants | 1,040,264 | 86.2% | $22.14 | 97.7% | ||
| Remaining Owned Tenants(11) | 52,325 | 4.3 | $10.38 | 2.3 | ||
| Total Occupied | 1,092,589 | 90.5% | $21.58 | 100.0% | ||
| Vacant Spaces (Owned Space) | 114,791 | 9.5 | ||||
| Total / Wtd. Avg. | 1,207,380 | 100.0% | ||||
| (1) | Calculated based on the approximate square footage occupied by each owned tenant. |
| (2) | Certain ratings are those of the parent entity whether or not the parent entity guarantees the lease. |
| (3) | Base Rent PSF and % of Total Base Rent are based on the underwritten rent roll dated August 1, 2020. |
| (4) | Northern Trust includes 56,932 square feet on floors 20 and 21, commencing July 1, 2023. The Northern Trust lease provides for contraction options effective on August 31, 2027, August 31, 2030, and August 31, 2032, allowing for the contraction of up to two full floors on either the bottom of the high-rise portion or any of its floors within the mid-rise portion of the 333 South Wabash Property. Each contraction option requires (i) (a) 12 months’ notice with respect to the options exercisable in 2027 and 2032 and (b) 18 months’ notice with respect to the option exercisable in 2030, and (ii) payment of a termination fee equal to the product of (x) any unamortized leasing costs, multiplied by (y) a fraction, the numerator of which is the rentable area of the applicable contraction space, the denominator of which is the rentable area of the premises, amortized at a rate of 8.0% per annum. Northern Trust has two extension options for periods of not less than five and not more than 10 years. |
| (5) | CHA has a one-time right to terminate its lease with respect to the entire premises effective December 31, 2031, with 18 months’ prior notice and payment of a termination fee. In addition, CHA has a free rent period until December 31, 2020 that is offset by distributions from the rent concessions reserve. |
| (6) | Akuna Capital LLC (“Akuna”) has 27,916 square feet expiring on December 31, 2025 and 28,466 square feet expiring on December 31, 2029. Akuna has a one-time right to terminate its lease with respect to the entire premises effective December 31, 2027, with prior notice on or before December 31, 2026 and payment of a termination fee. In addition, Akuna has a free rent period until December 31, 2020 that is offset by distributions from the rent concessions reserve. Akuna has one option to extend the lease on the 27,916 square feet space for four years. |
| (7) | CNA has a one-time right to terminate its lease with respect to suite 400 (28,172 square feet) effective May 31, 2023, with prior notice on or before May 31, 2022 and payment of a termination fee. |
| (8) | United Way of Metro Chicago has the right to terminate its lease beginning on April 30, 2023 with 12 months’ prior notice and payment of a termination fee. |
| (9) | Solely in the event that The Northern Trust exercises its expansion rights, the borrower has the right to terminate the lease of Milhouse Engineering & Construction, Inc. effective December 31, 2024, with prior notice on or before July 31, 2023. |
| (10) | Signature Office Centers, LLC has the option to terminate its lease effective June 30, 2027, with 12 months’ prior notice and payment of a termination fee. |
| (11) | Remaining Tenants is inclusive of 33,746 square feet used as amenity space and 238 square feet used as mechanical space, which has no attributable underwritten base rent. |
THE INFORMATION IN THIS STRUCTURAL AND COLLATERAL TERM SHEET IS NOT COMPLETE AND MAY BE AMENDED PRIOR TO THE TIME OF SALE. THIS TERM SHEET IS NOT AN OFFER TO SELL THESE SECURITIES AND IT IS NOT A SOLICITATION OF AN OFFER TO BUY THESE SECURITIES IN ANY JURISDICTION WHERE THE OFFER OR SALE IS NOT PERMITTED.
| | 123 of 144 | | |
| Structural and Collateral Term Sheet | Benchmark 2020-B20 |
| 333 South Wabash | |
| Lease Rollover Schedule(1)(2) | |||||||||
| Year | Number of Leases Expiring | Net Rentable Area Expiring | % of NRA Expiring | Base Rent Expiring(3) | % of Base Rent Expiring(3) | Cumulative Net Rentable Area Expiring | Cumulative % of NRA Expiring | Cumulative Base Rent Expiring(3) | Cumulative % of Base Rent Expiring(3) |
| Vacant | NAP | 114,791 | 9.5% | NAP | NAP | 114,791 | 9.5% | NAP | NAP |
| 2020 & MTM | 1 | 1,662 | 0.1 | $44,043 | 0.2% | 116,453 | 9.6% | $44,043 | 0.2% |
| 2021 | 0 | 0 | 0.0 | 0 | 0.0 | 116,453 | 9.6% | $44,043 | 0.2% |
| 2022 | 0 | 0 | 0.0 | 0 | 0.0 | 116,453 | 9.6% | $44,043 | 0.2% |
| 2023 | 0 | 0 | 0.0 | 0 | 0.0 | 116,453 | 9.6% | $44,043 | 0.2% |
| 2024 | 2 | 56,638 | 4.7 | 1,020,072 | 4.3 | 173,091 | 14.3% | $1,064,115 | 4.5% |
| 2025 | 2 | 54,950 | 4.6 | 1,713,382 | 7.3 | 228,041 | 18.9% | $2,777,497 | 11.8% |
| 2026 | 2 | 7,299 | 0.6 | 217,691 | 0.9 | 235,340 | 19.5% | $2,995,188 | 12.7% |
| 2027 | 0 | 0 | 0.0 | 0 | 0.0 | 235,340 | 19.5% | $2,995,188 | 12.7% |
| 2028 | 2 | 28,892 | 2.4 | 872,875 | 3.7 | 264,232 | 21.9% | $3,868,063 | 16.4% |
| 2029 | 1 | 28,466 | 2.4 | 714,781 | 3.0 | 292,698 | 24.2% | $4,582,844 | 19.4% |
| 2030 | 6 | 110,838 | 9.2 | 3,474,215 | 14.7 | 403,536 | 33.4% | $8,057,059 | 34.2% |
| 2031 & Beyond(4) | 9 | 803,844 | 66.6 | 15,518,782 | 65.8 | 1,207,380 | 100.0% | $23,575,841 | 100.0% |
| Total / Wtd. Avg. | 25 | 1,207,380 | 100.0% | $23,575,841 | 100.0% | ||||
| (1) | Calculated based on the approximate square footage occupied by each owned tenant. |
| (2) | Certain tenants may have termination or contraction options (which may become exercisable prior to the originally stated expiration date of the tenant lease) that are not considered in the above Lease Rollover Schedule. |
| (3) | Base Rent Expiring, % of Base Rent Expiring, Cumulative Base Rent Expiring and Cumulative % of Base Rent Expiring are based on the underwritten rent roll dated August 1, 2020. |
| (4) | 2031 & Beyond is inclusive of 33,746 square feet used as amenity space and 238 square feet used as mechanical space, which has no attributable underwritten base rent. This space was excluded from the Number of Expiring Leases. |
| Operating History and Underwritten Net Cash Flow(1) | ||||||||||
| 2017 | 2018(2) | 2019(2) | T-12 5/31/2020(2) | Underwritten(2) | Per Square Foot(2) | %(3) | ||||
| Base Rent(4) | $19,249,428 | $14,262,067 | $9,974,877 | $8,526,667 | $26,666,957 | $22.09 | 58.8% | |||
| Vacant Income | 0 | 0 | 0 | 0 | 3,760,230 | 3.11 | 8.3 | |||
| Reimbursements(5) | 12,025,122 | 7,114,143 | 1,811,531 | 1,531,946 | 13,229,336 | 10.96 | 29.2 | |||
| Other Income(6) | 1,477,249 | 622,862 | 137,677 | 190,143 | 1,682,425 | 1.39 | 3.7 | |||
| Gross Revenue | $32,751,800 | $21,999,071 | $11,924,085 | $10,248,756 | $45,338,948 | $37.55 | 100.0% | |||
| Vacancy & Credit Loss | 0 | 0 | 0 | 0 | (3,760,230) | (3.11) | (8.3) | |||
| Effective Gross Income | $32,751,800 | $21,999,071 | $11,924,085 | $10,248,756 | $41,578,718 | $34.44 | 91.7% | |||
| Total Operating Expenses | 17,917,991 | 18,059,960 | 13,207,574 | 15,122,901 | 17,347,570 | 14.37 | 41.7 | |||
| Net Operating Income | $14,833,810 | $3,939,112 | ($1,283,489) | ($4,874,145) | $24,231,148 | $20.07 | 58.3% | |||
| TI/LC | 0 | 0 | 0 | 0 | 662,184 | 0.55 | 1.6 | |||
| Capital Expenditures | 0 | 0 | 0 | 0 | 241,476 | 0.20 | 0.6 | |||
| Net Cash Flow | $14,833,810 | $3,939,112 | ($1,283,489) | ($4,874,145) | $23,327,488 | $19.32 | 56.1% | |||
| (1) | Certain items such as straight line rent, interest expense, interest income, lease cancellation income, depreciation, amortization, debt service payments and any other non-recurring or non-operating items were excluded from the historical presentation and are not considered for the underwritten cash flow. |
| (2) | The decrease from 2018 Net Operating Income and Net Cash Flow to 2019 Net Operating Income and Net Cash Flow was due to the 2019 renovation and CNA vacating a majority of its space at the 333 South Wabash Property. The renovation included a new tenant build out for Northern Trust, which now occupies 45.4% of the net rentable square feet. Northern Trust began to occupy their space in February of 2020. The increase in Underwritten Net Operating Income and Net Cash Flow from T- 12 5/31/2020 Net Operating Income and Net Cash Flow is due to the recently completed $167.5 million renovation and execution of a new lease with Northern Trust at the 333 South Wabash Property. The 333 South Wabash Property is 90.5% leased as of August 1, 2020, compared to 38.3% leased as of December 31, 2019. |
| (3) | % column represents percent of Gross Revenue for all revenue lines and represents percent of Effective Gross Income for the remainder of the fields. |
| (4) | Underwritten Base Rent is based on the underwritten rent roll dated as of August 1, 2020 inclusive of the rent steps through August 2021 for investment grade tenants (CHA, CNA, and Northern Trust) through the lease term, utilizing a 7.0% discount rate ($3,091,117). |
| (5) | Underwritten Reimbursements include afterhours HVAC billing. |
| (6) | Underwritten Other Income includes parking revenue, tenant service income, telecom and storage income excluded from rent, and amenity income. |
Property Management. The 333 South Wabash Property is currently managed by SHVO Property Management LLC, an affiliate of Michael Shvo, one of the related borrower sponsors, and sub-managed by Jones Lang LaSalle Americas (Illinois), L.P. The 333 South Wabash Property is required to be managed by a property manager and if applicable, a sub-manager, pursuant to a property management agreement, in each case approved by the lender, such approval not to be unreasonably withheld, conditioned or delayed so long as no monetary default, material non-monetary default or event of default under the 333 South Wabash Whole Loan documents then exists.
THE INFORMATION IN THIS STRUCTURAL AND COLLATERAL TERM SHEET IS NOT COMPLETE AND MAY BE AMENDED PRIOR TO THE TIME OF SALE. THIS TERM SHEET IS NOT AN OFFER TO SELL THESE SECURITIES AND IT IS NOT A SOLICITATION OF AN OFFER TO BUY THESE SECURITIES IN ANY JURISDICTION WHERE THE OFFER OR SALE IS NOT PERMITTED.
| | 124 of 144 | | |
| Structural and Collateral Term Sheet | Benchmark 2020-B20 |
| 333 South Wabash | |
The lender pre-approved (i) SHVO Property Management LLC as the initial property manager, so long as Jones Lang LaSalle America Inc. or a replacement sub-manager appointed and approved in accordance with the terms of the 333 South Wabash Whole Loan documents, is the sub-manager, and (ii) DFA or an affiliate of DFA, as a substitute or replacement property manager, if the borrower elects to replace SHVO Property Management LLC as the property manager, so long as Jones Lang LaSalle America Inc., or a substitute or replacement sub-manager appointed and approved in accordance with the terms of the 333 South Wabash Whole Loan documents, is the sub-manager. Any substitute or replacement property manager or any other change in property manager are subject to, among other things, (a) the prior written approval of the lender, not to be unreasonably withheld, conditioned or delayed so long as no monetary default, material non-monetary default or event of default under the 333 South Wabash Whole Loan documents then exists, (b) receipt by the lender of a rating agency confirmation from each applicable rating agency with respect to the replacement property manager and its replacement property management agreement, and (c) if such property manager is an affiliate of the borrower, the borrower delivers a new non-consolidation opinion with respect to such property manager and the related property management agreement reasonably acceptable to the lender.
THE INFORMATION IN THIS STRUCTURAL AND COLLATERAL TERM SHEET IS NOT COMPLETE AND MAY BE AMENDED PRIOR TO THE TIME OF SALE. THIS TERM SHEET IS NOT AN OFFER TO SELL THESE SECURITIES AND IT IS NOT A SOLICITATION OF AN OFFER TO BUY THESE SECURITIES IN ANY JURISDICTION WHERE THE OFFER OR SALE IS NOT PERMITTED.
| | 125 of 144 | | |
| Structural and Collateral Term Sheet | Benchmark 2020-B20 |
| Redmond Town Center | |
| Mortgage Loan Information | |
| Mortgage Loan Seller: | CREFI |
| Original Principal Balance(1): | $30,000,000 |
| Cut-off Date Principal Balance(1): | $30,000,000 |
| % of Pool by IPB: | 3.3% |
| Loan Purpose: | Recapitalization |
| Borrowers: | FHR Main Retail Center, LLC |
| Loan Sponsors: | Fairbourne Partners, LLC |
| Interest Rate: | 3.85000% |
| Note Date: | 2/21/2020 |
| Maturity Date: | 3/6/2025 |
| Interest-only Period: | 24 months |
| Original Term: | 60 months |
| Original Amortization: | 360 months |
| Amortization Type: | IO-Balloon |
| Call Protection(2): | L(31),Def(25),O(4) |
| Lockbox / Cash Management: | Hard / Springing |
| Additional Debt: | Yes |
| Additional Debt Balance(1): | $71,500,000 |
| Additional Debt Type(1): | Pari Passu |
| Property Information | |
| Single Asset / Portfolio: | Single Asset |
| Title: | Fee |
| Property Type - Subtype: | Mixed Use - Retail/Office |
| Net Rentable Area (SF): | 386,415 |
| Location: | Redmond, WA |
| Year Built / Renovated: | 1996, 1999, 2013 / N/A |
| Occupancy: | 92.9% |
| Occupancy Date: | 1/15/2020 |
| Number of Tenants: | 100 |
| 2017 NOI: | $8,728,590 |
| 2018 NOI: | $9,030,971 |
| 2019 NOI: | N/A |
| TTM NOI (as of 11/2019)(3): | $9,701,409 |
| UW Economic Occupancy: | 94.0% |
| UW Revenues: | $15,096,303 |
| UW Expenses: | $4,207,821 |
| UW NOI(3)(5): | $10,888,482 |
| UW NCF(5): | $10,193,431 |
| Appraised Value / Per SF(5): | $151,000,000 / $391 |
| Appraisal Date: | 8/4/2020 |
| Escrows and Reserves | |||
| Initial | Monthly | Initial Cap | |
| Taxes: | $411,531 | $68,589 | N/A |
| Insurance: | $130,585 | $10,045 | N/A |
| Replacement Reserves: | $0 | $4,830 | N/A |
| TI/LC: | $0 | $53,090 | $2,750,000 |
| Other(4): | $2,809,532 | $0 | N/A |
| Financial Information(1)(5) | |
| Cut-off Date Loan / SF: | $263 |
| Maturity Date Loan / SF: | $248 |
| Cut-off Date LTV: | 67.2% |
| Maturity Date LTV: | 63.5% |
| UW NCF DSCR: | 1.79x |
| UW NOI Debt Yield: | 10.7% |
| Sources and Uses | |||||
| Sources | Proceeds | % of Total | Uses | Proceeds | % of Total |
| Whole Loan | $101,500,000 | 68.1% | Purchase Price | $144,882,040 | 97.1% |
| Sponsor Equity | 47,641,961 | 31.9 | Upfront Reserves | 3,351,648 | 2.2 |
| Closing Costs | 908,273 | 0.6 | |||
| Total Sources | $149,141,961 | 100.0% | Total Uses | $149,141,961 | 100.0% |
| (1) | The Redmond Town Center Loan (as defined below) is evidenced by the non-controlling Notes A-3-1 and A-4, with an original principal balance and outstanding principal balance as of the Cut-off Date of $30.0 million. The related companion loans are evidenced by the controlling Note A-2, which has an outstanding principal balance as of the Cut-off Date of $25.0 million, and has been contributed to the BMARK 2020-B19 transaction and four non-controlling Notes, A-1-1 (contributed to Benchmark 2020- B19), A-1-2-A, A-1-2-B, and A-3-2. |
| (2) | The defeasance lockout period will be at least 31 payment dates beginning with and including the first payment date in April 2020. Defeasance of the Redmond Town Center Whole Loan is permitted at any time after the earlier to occur of (i) two years after the closing date of the securitization that includes the last promissory note to be securitized and (ii) February 21, 2023. The assumed defeasance lockout period of 31 payment dates is based on the expected Benchmark 2020-B20 securitization closing date in October 2020. The actual lockout period may be longer. |
| (3) | The increase from TTM NOI as of (11/2019) to UW NOI at the Redmond Town Center Property is primarily attributable to the inclusion of contractual rent steps through February 2021. |
| (4) | The Initial Other reserve consists of a $2,809,532 unfunded obligations reserve. |
| (5) | While the Redmond Town Center Loan was originated after the emergence of the novel coronavirus pandemic and the economic disruption resulting from measures to combat the pandemic, the pandemic is an evolving situation and could impact the Redmond Town Center Loan more severely than assumed in the underwriting of the Redmond Town Center Loan and could adversely affect the NOI, NCF and occupancy information, as well as the appraised value and the DSCR, LTV and Debt Yield metrics presented above. See “Risk Factors— Risks Related to Market Conditions and Other External Factors—Coronavirus Pandemic Has Adversely Affected the Global Economy and Will Likely Adversely Affect the Performance of the Mortgage Loans” in the Preliminary Prospectus. |
THE INFORMATION IN THIS STRUCTURAL AND COLLATERAL TERM SHEET IS NOT COMPLETE AND MAY BE AMENDED PRIOR TO THE TIME OF SALE. THIS TERM SHEET IS NOT AN OFFER TO SELL THESE SECURITIES AND IT IS NOT A SOLICITATION OF AN OFFER TO BUY THESE SECURITIES IN ANY JURISDICTION WHERE THE OFFER OR SALE IS NOT PERMITTED.
| | 126 of 144 | | |
| Structural and Collateral Term Sheet | Benchmark 2020-B20 |
| Redmond Town Center | |
The Loan. The Redmond Town Center mortgage loan (the “Redmond Town Center Loan”) is a fixed rate loan secured by a first mortgage lien on the borrower’s fee interest in a 386,415 square foot mixed use center located in Redmond, Washington. The Redmond Town Center Loan is part of a whole loan comprised of seven pari passu notes in the aggregate original principal balance of $101.5 million (the “Redmond Town Center Whole Loan”). The Redmond Town Center Loan is evidenced by the non-controlling Notes A-3-1 and A-4, with an original principal balance and outstanding principal balance as of the Cut-off Date of $30.0 million. The related companion loans are evidenced by the controlling Note A-2, which has an outstanding principal balance as of the Cut-off Date of $25.0 million, and has been contributed to the Benchmark 2020-B19 transaction and four non-controlling Notes, A-1-1 (contributed to Benchmark 2020-B19), A-1-2- A, A-1-2-B and A-3-2. The Redmond Town Center Whole Loan has a five-year term with interest only payments during the first two years and will amortize on a 30-year schedule thereafter.
| Whole Loan Summary | ||||
| Controlling | ||||
| Note | Original Balance | Cut-off Date Balance | Note Holder | Piece |
| Note A-1-1 | $5,000,000 | $5,000,000 | Benchmark 2020-B19 | No |
| Note A-1-2-A | $5,000,000 | $5,000,000 | CREFI | No |
| Note A-1-2-B | $16,500,000 | $16,500,000 | CREFI | No |
| Note A-2 | $25,000,000 | $25,000,000 | Benchmark 2020-B19 | Yes |
| Note A-3-1 | $5,000,000 | $5,000,000 | Benchmark 2020-B20 | No |
| Note A-3-2 | $25,000,000 | $25,000,000 | CREFI | No |
| Note A-4 | $30,000,000 | $30,000,000 | Benchmark 2020-B20 | No |
| Total | $101,500,000 | $101,500,000 | ||
The Borrower. The borrowing entity for the Redmond Town Center Whole Loan is FHR Main Retail Center, LLC, a Delaware limited liability company and special purpose entity with one independent director in its organizational structure.
The Loan Sponsors. The loan sponsor and non-recourse carveout guarantor is Fairbourne Partners, LLC. Fairbourne Properties, LLC is 100% owned by Fairbourne Partners, LLC. Fairbourne Properties, LLC is a full-service real estate investment and property management company focusing on acquiring, managing and asset managing office, retail and mixed-use properties throughout the United States. Headquartered in Chicago, the firm’s operations are led by David W. Harvey, Vivian Fields, Zoran Urosevic and George Manojlovic each with more than 20 years of commercial real estate investment and operations experience. Fairbourne Properties, LLC has $1.47 billion total assets under management spanning approximately 6.1 million square feet.
The Property. The Redmond Town Center property (“Redmond Town Center Property”) is a mixed use retail and office center that comprises 386,415 square feet of net leasable area, located in Redmond, Washington, a suburb of the in Seattle-Tacoma-Bellevue metropolitan statistical area (“Seattle MSA”). The Seattle MSA is home to multiple Fortune 500 companies headquarters including Starbucks, Nordstrom, Costco, Microsoft, and Amazon. The Redmond Town Center Property is located on a site area of 20.47 acres and is comprised of nine different buildings. The Redmond Town Center Property is part of a large development project within Redmond, Washington that includes the Seattle Marriott Redmond Hotel, the Residence Inn by Marriott Seattle East/Redmond, and the Archer Hotel, as well as office buildings that contain Microsoft, and AT&T. A newly constructed apartment building that can be found adjacent to the Redmond Town Center Property is an expected demand driver to the Redmond Town Center Property.
The subject is 92.9% leased to a collection of 100 tenants that is partially composed of one theater and eight restaurants. The notable tenants include iPic Theaters, Guitar Center, Gap/Gap Kids, LensCrafters, and Chico’s. Additional retail line-up includes national tenants, including American Eagle Outfitters, Zumiez, Bath & Body Works, Claire's, and Sunglass Hut. Additionally, the Redmond Town Center Property includes one ground lease held by BJ's Restaurant & Brewhouse, which pays $247,500 per year. In addition, the rent roll at the Redmond Town Center Property is granular, with the top tenant representing 10.1% of net rentable area, and no other tenant exceeding over 4.0% of net rentable area. The rollover at the Redmond Town Center Property is granular, only 2021 (12.6% of net rentable area), and 2025 (26.0% of net rentable area) have net rentable area expirations above 9.6%.
The largest tenant at the Redmond Town Center Property is iPic Theaters (38,858 square feet; 10.1% of net rentable area; 5.5% of underwritten base rent), has occupied its space since 2008, the original lease term expires on September 30, 2025 with three, five year extension options. Established in 2010, iPic Theaters is America's premier luxury restaurant-and-movie theater brand, iPic Theaters currently operates in 14 locations with seven luxury restaurants and 107 screens nationwide.
The second largest tenant at the Redmond Town Center Property is Guitar Center (15,393 square feet; 4.0% of net rentable area; 2.6% of underwritten base rent) has occupied its space since January 2015. Guitar Center currently has a lease expiration date of May 31, 2025 with two, five-year extension options remaining, and no termination options. Guitar Center was founded in 1959 and is currently
THE INFORMATION IN THIS STRUCTURAL AND COLLATERAL TERM SHEET IS NOT COMPLETE AND MAY BE AMENDED PRIOR TO THE TIME OF SALE. THIS TERM SHEET IS NOT AN OFFER TO SELL THESE SECURITIES AND IT IS NOT A SOLICITATION OF AN OFFER TO BUY THESE SECURITIES IN ANY JURISDICTION WHERE THE OFFER OR SALE IS NOT PERMITTED.
| | 127 of 144 | | |
| Structural and Collateral Term Sheet | Benchmark 2020-B20 |
| Redmond Town Center | |
headquartered in Westlake Village, California. The company operates a chain of retail stores that offer a variety of instruments and other musical equipment. The company operates 297 stores in 46 states.
The third largest tenant at the Redmond Town Center Property is Haiku Seafood & Sushi Buffet (11,381 square feet; 2.9% of net rentable area; 2.5% of underwritten base rent), has occupied its space since August 2011, with an expiration date of September 30, 2021. Haiku Seafood & Sushi Buffet is a buffet style sushi and seafood restaurant that offers dine in or takeout and delivery options through DoorDash, UberEats, and Fantuan.
No other tenant at the Redmond Town Center Property accounts for over 2.8% of square feet or 4.4% of underwritten base rent at the property.
COVID-19 Update. As of October 4, 2020, the Redmond Town Center Property is open and operating under phase two of the King County safe start plan. Phase two of the reopening plan allows for the full operation of retail businesses and restaurants to operate at 50% capacity with no tables serving more than five people and indoor dining available only for members of the same household. The August and September debt service payments have been made. Approximately 60.7% of the anticipated August rent was collected, representing approximately 55.1% of the net rentable area. Approximately 64.4% of the anticipated September rent was collected, representing approximately 59.5% of the net rentable area. As of October 2, 2020, the Redmond Town Center Loan is not subject to any modification or forbearance request. See “Risk Factors—Risks Related to Market Conditions and Other External Factors—Current Coronavirus Pandemic May Adversely Affect the Global Economy and the Performance of the Mortgage Loans”.
The Market. The Redmond Town Center Property is located in Redmond, Washington, which is part of the Seattle MSA, approximately 10.0 miles from downtown Seattle. Major employers in the Seattle MSA consist of The Boeing Company, Joint Base Lewis-McChord, Microsoft Corporation, Amazon.com, and University of Washington. The Redmond Town Center Property benefits from regional linkages, State Route 50 and Interstate 405, which all converge in various locations within three-miles from the Redmond Town Center Property. Access to the Redmond Town Center Property is also provided via bus service through the King County Metro Transit, which has bus stops on Redmond Way and connecting street Bear Creek Parkway. An East Link Light Rail connecting Seattle and neighboring suburbs has been under construction since 2016 and is set to be complete by 2024.
According to the appraisal, the Redmond Town Center Property is located within the Seattle/Puget Sound retail market, which, as of the fourth quarter of 2019, consisted of approximately 179.6 million square feet of retail space with a market vacancy of rate of 3.0% and average gross asking rent of $20.46 per square foot. According to the appraisal, the Redmond Town Center Property is located in the Redmond retail submarket, which, as of the fourth quarter of 2019, consisted of approximately 3.1 million square feet of retail space representing roughly 1.74% of the total retail inventory in the Redmond submarket. The Redmond retail submarket experienced a lower vacancy rate than the Seattle/Puget Sound market, with a vacancy rate of 1.4% and a higher average gross asking rent per square foot of $33.78. The appraisals concluded a market asking rent of $35.37per square foot for 2019, compared to the Redmond Town Center Property’s underwritten weighted average base rent of $28.80 per square foot. The concluded appraisal weighted average market rent per square foot is 22.8% higher than the underwritten weighted average contract rent of the Redmond Town Center Property.
According to the appraisal, the Seattle MSA 2019 number of households was 1,490,276, with a weighted average household size of 2.64, which was 1.71% larger than the U.S. average household size of 2.6 for 2019. The City of Redmond, however, has an estimated 2019 population of 65,860, which is a 38.0% increase from the population in 2000, and is expected to grow another 16% over the next five years. The median household income for the Seattle MSA in 2019 was estimated to be $82,030, while the median household income for the Seattle MSA is expected to grow 3.4% annually over the next five years, increasing it to $97,013.
Historical and Current Occupancy(1) | |||
| 2017 | 2018 | 2019(2) | Current(3) |
| 88.2% | 89.1% | 90.0% | 92.9% |
| (1) | Historical occupancies are as of December 31 of each respective year unless otherwise specified. |
| (2) | 2019 historical occupancy is as of the trailing twelve months ending November 30, 2019. |
| (3) | Current Occupancy is as of January 15, 2020. |
THE INFORMATION IN THIS STRUCTURAL AND COLLATERAL TERM SHEET IS NOT COMPLETE AND MAY BE AMENDED PRIOR TO THE TIME OF SALE. THIS TERM SHEET IS NOT AN OFFER TO SELL THESE SECURITIES AND IT IS NOT A SOLICITATION OF AN OFFER TO BUY THESE SECURITIES IN ANY JURISDICTION WHERE THE OFFER OR SALE IS NOT PERMITTED.
| | 128 of 144 | | |
| Structural and Collateral Term Sheet | Benchmark 2020-B20 |
| Redmond Town Center | |
| Tenant Summary(1) | ||||||
| Ratings(2) |
Net Rentable |
% of |
Base Rent | % of Total Base | Lease Expiration |
| Tenant | Moody’s/S&P/Fitch | Area (SF) | Total NRA | PSF(3) | Rent(3) | Date |
| iPic Theaters | NR / NR / NR | 38,858 | 10.1% | $14.50 | 5.5% | 9/30/2025 |
| Guitar Center | NR / NR / NR | 15,393 | 4.0 | $17.36 | 2.6 | 5/31/2025 |
| Haiku Seafood & Sushi Buffet | NR / NR / NR | 11,381 | 2.9 | $22.68 | 2.5 | 9/30/2021 |
| Pediatric Associates, Inc. P.S. | NR / NR / NR | 10,996 | 2.8 | $41.50 | 4.4 | 9/30/2028 |
| Gene Juarez Salon & Spa | NR / NR / NR | 9,568 | 2.5 | $39.14 | 3.6 | 5/31/2024 |
| Gap/Gap Kids | Baa2 / BB / NR | 9,043 | 2.3 | $12.75 | 1.1 | 4/30/2021 |
| Redmond Swimming LLC | NR / NR / NR | 8,527 | 2.2 | $21.50 | 1.8 | 11/30/2029 |
| Apex Learning, Inc | NR / NR / NR | 8,174 | 2.1 | $30.67 | 2.4 | 2/28/2025 |
| Overlake Medical Clinics | NR / NR / NR | 8,167 | 2.1 | $23.36 | 1.8 | 1/31/2022 |
| Matt's Rotisserie & Oyster Lounge | NR / NR / NR | 7,731 | 2.0 | $36.88 | 2.8 | 1/31/2023 |
| Subtotal / Weighted Average | 127,838 | 33.1% | $23.04 | 28.5% | ||
| Remaining Tenants | 231,023 | 59.8 | $31.99 | 71.5 | ||
| Total Occupied | 358,861 | 92.9% | $28.80 | 100.0% | ||
| Vacant | 27,554 | 7.1 | ||||
| Total / Weighted Average | 386,415 | 100.0% | ||||
| (1) | Based on the underwritten rent roll dated January 15, 2020. |
| (2) | Ratings provided are for the parent company of the entity listed in the “Tenant” field whether or not the parent company guarantees the lease. |
| (3) | Base Rent PSF and % of Total Base Rent includes $291,455 of contractual rent steps underwritten through February 1, 2021. |
| Lease Rollover Schedule(1)(2) | |||||||||
| Cumulative | |||||||||
| Number | Net | Net | Cumulative | ||||||
| of | Rentable | % of Base | Rentable | Cumulative | Cumulative | % of Base | |||
| Leases | Area | % of NRA | Base Rent | Rent | Area | % of NRA | Base Rent | Rent | |
| Year | Expiring | Expiring | Expiring | Expiring(3) | Expiring(3) | Expiring | Expiring | Expiring | Expiring |
| Vacant | NAP | 27,554 | 7.1% | NAP | NAP | 27,554 | 7.1% | NAP | NAP |
| MTM(4) | 4 | 10,207 | 2.6 | $143,500 | 1.4% | 37,761 | 9.8% | $143,500 | 1.4% |
| 2020 | 3 | 8,571 | 2.2 | 323,778 | 3.1 | 46,332 | 12.0% | $467,278 | 4.5% |
| 2021 | 13 | 48,871 | 12.6 | 1,334,986 | 12.9 | 95,203 | 24.6% | $1,802,263 | 17.4% |
| 2022 | 11 | 25,680 | 6.6 | 782,632 | 7.6 | 120,883 | 31.3% | $2,584,895 | 25.0% |
| 2023 | 15 | 37,244 | 9.6 | 1,263,917 | 12.2 | 158,127 | 40.9% | $3,848,812 | 37.2% |
| 2024 | 5 | 24,289 | 6.3 | 941,221 | 9.1 | 182,416 | 47.2% | $4,790,033 | 46.3% |
| 2025 | 17 | 100,609 | 26.0 | 2,230,543 | 21.6 | 283,025 | 73.2% | $7,020,576 | 67.9% |
| 2026 | 2 | 6,694 | 1.7 | 73,669 | 0.7 | 289,719 | 75.0% | $7,094,245 | 68.6% |
| 2027 | 8 | 19,436 | 5.0 | 573,398 | 5.5 | 309,155 | 80.0% | $7,667,644 | 74.2% |
| 2028 | 7 | 22,928 | 5.9 | 844,362 | 8.2 | 332,083 | 85.9% | $8,512,005 | 82.4% |
| 2029 | 5 | 20,286 | 5.2 | 612,501 | 5.9 | 352,369 | 91.2% | $9,124,506 | 88.3% |
| 2030 | 6 | 18,967 | 4.9 | 510,772 | 4.9 | 371,336 | 96.1% | $9,635,278 | 93.2% |
| 2031 & Beyond | 4 | 15,079 | 3.9 | 699,465 | 6.8 | 386,415 | 100.0% | $10,334,743 | 100.0% |
| Total | 100 | 386,415 | 100.0% | $10,334,743 | 100.0% | $10,334,743 | |||
| (1) | Based on the underwritten rent roll dated January 15, 2020. |
| (2) | Certain tenants may have termination or contraction options (which may become exercisable prior to the originally stated expiration date of the tenant lease) that are not considered in the above Lease Rollover Schedule. |
| (3) | Base Rent Expiring and % of Base Rent Expiring includes $291,455 of contractual rent steps underwritten through February 1, 2021. |
| (4) | Includes RTC Storage which accounts for 1,867 square feet. |
THE INFORMATION IN THIS STRUCTURAL AND COLLATERAL TERM SHEET IS NOT COMPLETE AND MAY BE AMENDED PRIOR TO THE TIME OF SALE. THIS TERM SHEET IS NOT AN OFFER TO SELL THESE SECURITIES AND IT IS NOT A SOLICITATION OF AN OFFER TO BUY THESE SECURITIES IN ANY JURISDICTION WHERE THE OFFER OR SALE IS NOT PERMITTED.
| | 129 of 144 | | |
| Structural and Collateral Term Sheet | Benchmark 2020-B20 |
| Redmond Town Center | |
| Underwritten Net Cash Flow(1)(2) | |||||||
| TTM | Per Square | ||||||
| 2016 | 2017 | 2018 | 11/30/2019 | Underwritten | Foot | %(3) | |
| Rents in Place | $8,149,147 | $8,531,553 | $8,889,675 | $9,229,612 | $10,043,287 | $25.99 | 65.9% |
| Contractual Rent Steps(4) | 0 | 0 | 0 | 0 | 291,455 | $0.75 | 1.9 |
| Total Reimbursements | 3,350,473 | 3,522,125 | 3,786,655 | 4,009,475 | 4,900,611 | $12.68 | 32.2 |
| Net Rental Income | $11,499,620 | $12,053,678 | $12,676,330 | $13,239,087 | $15,235,354 | $39.43 | 100.0% |
| (Vacancy/Credit Loss) | (65,626) | (122,637) | (246,425) | (225,456) | (914,121) | ($2.37) | (6.0) |
| Other Income(5) | 839,540 | 641,255 | 515,904 | 753,147 | 775,071 | $2.01 | 5.1 |
| Effective Gross Income | $12,273,534 | $12,572,296 | $12,945,809 | $13,766,778 | $15,096,303 | $39.07 | 99.1% |
| Total Expenses | $3,919,053 | $3,843,706 | $3,914,837 | $4,065,369 | $4,207,821 | $10.89 | 27.9% |
| Net Operating Income(5) | $8,354,481 | $8,728,590 | $9,030,971 | $9,701,409 | $10,888,482 | $28.18 | 72.1% |
| Total TI/LC, Capex/RR | 0 | 0 | 0 | 0 | 695,051 | 1.80 | 4.6% |
| Net Cash Flow | $8,354,481 | $8,728,590 | $9,030,971 | $9,701,409 | $10,193,431 | $26.38 | 67.5% |
| (1) | Based on the underwritten rent roll dated January 15, 2020. |
| (2) | Certain items such as straight line rent, interest expense, interest income, lease cancellation income, depreciation, amortization, debt service payments and any other non-recurring or non-operating items were excluded from the historical presentation and are not considered for the underwritten cash flow. |
| (3) | % column represents percent of Net Rental Income for all revenue lines included in Net Rental Income and represents percent of Effective Gross Income for the remainder of the fields. |
| (4) | Underwritten Contractual Rent Steps includes the contractual rent steps through February 1, 2021. |
| (5) | Other Income includes water and sewer reimbursements, marketing income from booth rentals, skating rink income, holiday train and Santa income, license income, special rent income, percentage rent, vacant potential rent, and storage income. |
| (6) | The increase from TTM 11/30/2019 NOI to Underwritten NOI at the Redmond Town Center Property is primarily attributable to the inclusion of contractual rent steps through February 1, 2021. |
Property Management. The Redmond Town Center Property is managed by Fairbourne Properties, LLC.
THE INFORMATION IN THIS STRUCTURAL AND COLLATERAL TERM SHEET IS NOT COMPLETE AND MAY BE AMENDED PRIOR TO THE TIME OF SALE. THIS TERM SHEET IS NOT AN OFFER TO SELL THESE SECURITIES AND IT IS NOT A SOLICITATION OF AN OFFER TO BUY THESE SECURITIES IN ANY JURISDICTION WHERE THE OFFER OR SALE IS NOT PERMITTED.
| | 130 of 144 | | |
| Structural and Collateral Term Sheet | Benchmark 2020-B20 |
| Earhart Corporate Center | |
| Mortgage Loan Information | |
| Mortgage Loan Seller: | GSMC |
| Original Principal Balance: | $30,000,000 |
| Cut-off Date Principal Balance: | $30,000,000 |
| % of Pool by IPB: | 3.3% |
| Loan Purpose: | Refinance |
| Borrower: | Integris Ventures ECC, LLC |
| Loan Sponsors: | Jason Fine, Richard O. Fine, David |
| Tomlinson, Jason Litwack, | |
| Alex Cantu | |
| Interest Rate: | 3.57200% |
| Note Date: | 10/2/2020 |
| Maturity Date: | 10/6/2030 |
| Interest-only Period: | 60 months |
| Original Term: | 120 months |
| Original Amortization: | 360 months |
| Amortization Type: | IO-Balloon |
| Call Protection: | L(24),Def(91),O(5) |
| Lockbox / Cash Management: | Springing / Springing |
| Additional Debt: | N/A |
| Additional Debt Balance: | N/A |
| Additional Debt Type: | N/A |
| Escrows and Reserves | |||
| Initial | Monthly | Initial Cap | |
| Taxes: | $137,357 | $68,678 | N/A |
| Insurance: | $0 | Springing | N/A |
| Replacement Reserves: | $0 | $3,384 | $160,000 |
| TI/LC: | $0 | $20,833 | $1,000,000 |
| Other(2): | $1,253,294 | $0 | N/A |
| Property Information | |
| Single Asset / Portfolio: | Single Asset |
| Title: | Fee |
| Property Type - Subtype: | Office – Suburban |
| Net Rentable Area (SF): | 203,056 |
| Location: | Ann Arbor, MI |
| Year Built / Renovated: | 2006 / N/A |
| Occupancy: | 95.3% |
| Occupancy Date: | 9/30/2020 |
| Number of Tenants: | 7 |
| 2017 NOI(1): | N/A |
| 2018 NOI(1): | N/A |
| 2019 NOI(1): | N/A |
| TTM NOI (as of 6/2020): | $2,281,162 |
| UW Economic Occupancy: | 94.6% |
| UW Revenues: | $5,503,407 |
| UW Expenses: | $2,259,782 |
| UW NOI(3): | $3,243,624 |
| UW NCF(3): | $3,011,000 |
| Appraised Value / Per SF(3): | $48,000,000 / $236 |
| Appraisal Date: | 8/17/2020 |
| Financial Information(3) | |
| Cut-off Date Loan / SF: | $148 |
| Maturity Date Loan / SF: | $133 |
| Cut-off Date LTV: | 62.5% |
| Maturity Date LTV: | 56.3% |
| UW NCF DSCR: | 1.85x |
| UW NOI Debt Yield: | 10.8% |
| Sources and Uses | |||||
| Sources | Proceeds | % of Total | Uses | Proceeds | % of Total |
| Mortgage Loan | $30,000,000 | 100.0% | Payoff Existing Debt | $27,975,193 | 93.3% |
| Upfront Reserves | 1,390,651 | 4.6 | |||
| Closing Costs | 420,441 | 1.4 | |||
| Return of Equity | 213,716 | 0.7 | |||
| Total Sources | $30,000,000 | 100.0% | Total Uses | $30,000,000 | 100.0% |
| (1) | The Earhart Corporate Center property was acquired by the borrower on May 21, 2019; therefore historical financials were not available. |
| (2) | Other initial reserves includes a $747,325 unfunded obligations reserve and a $505,969 rent reserve. |
| (3) | While the Earhart Corporate Center Loan (as defined below) was originated after the emergence of the novel coronavirus pandemic and the economic disruption resulting from measures to combat the pandemic, the pandemic is an evolving situation and could impact the Earhart Corporate Center Loan more severely than assumed in the underwriting of the Earhart Corporate Center Loan and could adversely affect the NOI, NCF and occupancy information, as well as the appraised value and the DSCR, LTV and Debt Yield metrics presented above. See “Risk Factors— Risks Related to Market Conditions and Other External Factors—Coronavirus Pandemic Has Adversely Affected the Global Economy and Will Likely Adversely Affect the Performance of the Mortgage Loans” in the Preliminary Prospectus. |
THE INFORMATION IN THIS STRUCTURAL AND COLLATERAL TERM SHEET IS NOT COMPLETE AND MAY BE AMENDED PRIOR TO THE TIME OF SALE. THIS TERM SHEET IS NOT AN OFFER TO SELL THESE SECURITIES AND IT IS NOT A SOLICITATION OF AN OFFER TO BUY THESE SECURITIES IN ANY JURISDICTION WHERE THE OFFER OR SALE IS NOT PERMITTED.
| | 131 of 144 | | |
| Structural and Collateral Term Sheet | Benchmark 2020-B20 |
| Earhart Corporate Center | |
The Loan. The Earhart Corporate Center mortgage loan, with a principal balance of $30.0 million as of the Cut-off Date (the “Earhart Corporate Center Loan”), is secured by a first mortgage lien on the borrower’s fee interest in a 203,056 square foot office building located in Ann Arbor, Michigan (the “Earhart Corporate Center Property”). The Earhart Corporate Center Loan has a 10-year term and, following a five-year interest-only period, will amortize on a 30-year schedule.
The Borrower. The borrowing entity is Integris Ventures ECC, LLC, a Delaware limited liability company and special purpose entity structured to be bankruptcy remote with two independent directors (the “Earhart Corporate Center Borrower”).
The Loan Sponsors. The loan sponsors and nonrecourse carve-out guarantors are Jason Fine, Richard O. Fine, David Tomlinson, Jason Litwack and Alex Cantu, on a joint and several basis. Jason Fine, Richard O. Fine, David Tomlinson and Jason Litwack serve as the managing members of Integris Ventures – Management, LLC, a private real estate investment firm based in St. Louis, Missouri.
The Property. The Earhart Corporate Center Property consists of a three-story suburban office building totaling 203,056 square feet located in Ann Arbor, Michigan. The Earhart Corporate Center Property was built in 2006 on a 22.84-acre site, located at the intersection of Interstate 23 and Plymouth Road, in the Ann Arbor office submarket. The property was acquired by the Earhart Corporate Center Borrower on May 21, 2019. Based on the underwritten rent roll dated September 30, 2020, the Earhart Corporate Center Property is currently 95.3% leased.
XPO Logistics Freight, Inc. (138,438 square feet; 68.2% of net rentable area; 66.1% of underwritten base rent) is the largest office tenant based on net rentable area at the Earhart Corporate Center Property, executing its lease in June 2008. The original lease commenced on June 1, 2008, with an extension being executed as of June 1, 2019, resulting in a fully extended lease expiration date of June 30, 2030. The space was originally occupied by Con-way Freight, who was acquired by XPO Logistics Freight, Inc. in 2015. The Earhart Corporate Center Property serves as the headquarters for the less-than-truckload division. XPO Logistics Freight, Inc. has two five-year extension options, with 15 months’ notice.
Home Point Financial (33,309 square feet; 16.4% of net rentable area; 19.2% of underwritten base rent) is the second largest office tenant based on net rentable area at the Earhart Corporate Center Property and has occupied space in the Earhart Corporate Center Property since April 2018. Home Point Financial has two five-year extension options, with nine to 12 months’ notice.
Infor Global (8,085 square feet; 4.0% of net rentable area; 5.5% of underwritten base rent) is the third largest office tenant based on net rentable area at the Earhart Corporate Center Property and has occupied space in the Earhart Corporate Center Property since May 2012. Infor Global has one 5-year extension option, with nine to 12 months’ notice.
COVID-19 Update. As of October 2, 2020 the Earhart Corporate Center Property is open and most, if not all, office tenants are working remotely. For August and September 2020, 100% of the underwritten base rent payments were collected. As of October 2, 2020, the Earhart Corporate Center Loan is not subject to any modification or forbearance requests. See “Risk Factors—Risks Related to Market Conditions and Other External Factors—Current Coronavirus Pandemic May Adversely Affect the Global Economy and the Performance of the Mortgage Loans”.
The Market. The Earhart Corporate Center Property is located within Ann Arbor and Washtenaw County, Michigan. It is part of the Ann Arbor metro area (“Ann Arbor MSA”). The Earhart Corporate Center Property is considered a Class A office building in the northeast Ann Arbor submarket. The Earhart Corporate Center Property’s neighborhood represents a major office pocket, with office uses dominating on both number of properties and size bases. However, multi-family uses are also relatively prominent as the subject is located in a residential portion of the community.
The Ann Arbor MSA is projected to outperform the Midwest Region Metros in five of eight performance categories (gross metro product, unemployment rate, personal income growth, population, and multifamily permits) over the next five years. In the first quarter of 2020, the asking market office rent in the Ann Arbor submarket was $20.73 per square foot, a 1.71% decrease from the previous quarter. Rents quickly resurged to $21.45 per square foot in the second quarter. Occupancy rates in the Ann Arbor submarket have remained at a stable 93.7% in both quarters one and two of 2020.
The Earhart Corporate Center Property is located in the Ann Arbor MSA, which has performed very strongly over the majority of the recent past, outperforming the greater metropolitan Detroit in terms of both occupancy and rental levels. In the trailing four quarters, ending in the second quarter of 2020, Ann Arbor’s vacancy rate was 6.3% with an office gross rent of $22.47 per square foot as compared to Detroit’s 10.0% and $20.07 per square foot, respectively. Ann Arbor has office space inventory of 11,918,298 square feet.
THE INFORMATION IN THIS STRUCTURAL AND COLLATERAL TERM SHEET IS NOT COMPLETE AND MAY BE AMENDED PRIOR TO THE TIME OF SALE. THIS TERM SHEET IS NOT AN OFFER TO SELL THESE SECURITIES AND IT IS NOT A SOLICITATION OF AN OFFER TO BUY THESE SECURITIES IN ANY JURISDICTION WHERE THE OFFER OR SALE IS NOT PERMITTED.
| | 132 of 144 | | |
| Structural and Collateral Term Sheet | Benchmark 2020-B20 |
| Earhart Corporate Center | |
| Historical and Current Occupancy | |||
| 2017 | 2018 | 2019 | Current(1) |
| 82.0% | 98.2% | 93.4% | 95.3% |
| (1) | Current Occupancy is as of September 30, 2020. |
Tenant Summary(1)(2) | ||||||
| Tenant | Ratings Moody’s/Fitch/S&P(3) | Net Rentable Area (SF) | % of Total NRA | Base Rent PSF | % of Total Base Rent | Lease Expiration |
| XPO Logistics Freight, Inc.(4) | Ba2/BB/NR | 138,438 | 68.2% | $16.44 | 66.1% | 6/30/2030 |
| Home Point Financial | NR/NR/NR | 33,309 | 16.4 | $19.90 | 19.2 | 6/30/2029 |
| Infor Global | NR/NR/NR | 8,085 | 4.0 | $23.49 | 5.5 | 1/31/2023 |
| Ellis Porter PLC(5) | NR/NR/NR | 6,698 | 3.3 | $23.49 | 4.6 | 11/30/2027 |
| U. Michigan Victors Care | NR/NR/NR | 3,290 | 1.6 | $22.95 | 2.2 | 6/30/2023 |
| National Business Supply | NR/NR/NR | 2,162 | 1.1 | $23.00 | 1.4 | 3/31/2023 |
| Vision Capital(6) | NR/NR/NR | 1,504 | 0.7 | $21.93 | 1.0 | 6/30/2027 |
| Seven Largest Owned Tenants | 193,486 | 95.3% | $17.80 | 100.0% | ||
| Vacant Spaces (Owned Space) | 9,570 | 4.7 | ||||
| Total / Wtd. Avg. | 203,056 | 100.0% | ||||
| (1) | Calculated based on the approximate square footage occupied by each owned tenant. |
| (2) | Base Rent PSF and % of Total Base Rent are based on the underwritten rent roll dated September 30, 2020. |
| (3) | Certain ratings are those of the parent entity whether or not the parent entity guarantees the lease. |
| (4) | XPO Logistics Freight, Inc. has the right to contract its space by vacating the 8,673 square feet located on the first floor. XPO Logistics Freight, Inc. may retain the space by providing written notice no later than May 31, 2022. If the contraction option is exercised, the base rent will increase to $2,281,805. XPO Logistics Freight, Inc. is currently subleasing 5,280 square feet to RevSpring, Inc. through July 31, 2022 at a Base Rent PSF of $17.85. |
| (5) | Ellis Porter PLC has a one-time right to terminate its lease with respect to the entire premises effective February 2023, with 180 days’ prior notice and payment of a termination fee equal to any unamortized leasing costs. Ellis Porter PLC has one five-year extension option, with six months’ notice. |
| (6) | Vision Capital has a one-time right to terminate its lease with respect to the entire premises effective February 2025, with 180 days’ prior notice and payment of a termination fee equal to any unamortized leasing costs. Vision Capital has one five-year extension option, with six months’ notice. |
| Lease Rollover Schedule(1)(2)(3) | |||||||||
| Year | Number of Leases Expiring | Net Rentable Area Expiring | % of NRA Expiring | Base Rent Expiring | % of Base Rent Expiring | Cumulative Net Rentable Area Expiring | Cumulative % of NRA Expiring | Cumulative Base Rent Expiring | Cumulative % of Base Rent Expiring |
| Vacant | NAP | 9,570 | 4.7% | NAP | NAP | 9,570 | 4.7% | NAP | NAP |
| 2020 & MTM | 0 | 0 | 0.0 | $0 | 0.0% | 9,570 | 4.7% | $0 | 0.0% |
| 2021 | 0 | 0 | 0.0 | 0 | 0.0 | 9,570 | 4.7% | $0 | 0.0% |
| 2022 | 0 | 0 | 0.0 | 0 | 0.0 | 9,570 | 4.7% | $0 | 0.0% |
| 2023 | 3 | 13,537 | 6.7 | 315,168 | 9.2 | 23,107 | 11.4% | $315,168 | 9.2% |
| 2024 | 0 | 0 | 0.0 | 0 | 0.0 | 23,107 | 11.4% | $315,168 | 9.2% |
| 2025 | 0 | 0 | 0.0 | 0 | 0.0 | 23,107 | 11.4% | $315,168 | 9.2% |
| 2026 | 0 | 0 | 0.0 | 0 | 0.0 | 23,107 | 11.4% | $315,168 | 9.2% |
| 2027 | 2 | 8,202 | 4.0 | 190,319 | 5.5 | 31,309 | 15.4% | $505,487 | 14.7% |
| 2028 | 0 | 0 | 0.0 | 0 | 0.0 | 31,309 | 15.4% | $505,487 | 14.7% |
| 2029 | 1 | 33,309 | 16.4 | 662,801 | 19.2 | 64,618 | 31.8% | $1,168,288 | 33.9% |
| 2030 | 1 | 138,438 | 68.2 | 2,275,960 | 66.1 | 203,056 | 100.0% | $3,444,248 | 100.0% |
| 2031 & Beyond | 0 | 0 | 0.0 | 0 | 0.0 | 203,056 | 100.0% | $3,444,248 | 100.0% |
| Total / Wtd. Avg. | 7 | 203,056 | 100.0% | $3,444,248 | 100.0% | ||||
| (1) | Based on underwritten rent roll dated September 30, 2020. |
| (2) | Calculated based on the approximate square footage occupied by each owned tenant. |
| (3) | Certain tenants may have termination or contraction options (which may become exercisable prior to the originally stated expiration date of the tenant lease) that are not considered in the above Lease Rollover Schedule. |
THE INFORMATION IN THIS STRUCTURAL AND COLLATERAL TERM SHEET IS NOT COMPLETE AND MAY BE AMENDED PRIOR TO THE TIME OF SALE. THIS TERM SHEET IS NOT AN OFFER TO SELL THESE SECURITIES AND IT IS NOT A SOLICITATION OF AN OFFER TO BUY THESE SECURITIES IN ANY JURISDICTION WHERE THE OFFER OR SALE IS NOT PERMITTED.
| | 133 of 144 | | |
| Structural and Collateral Term Sheet | Benchmark 2020-B20 |
| Earhart Corporate Center | |
| Operating History and Underwritten Net Cash Flow(1)(2) | ||||
| TTM 6/30/2020 | Underwritten | Per Square Foot | %(3) | |
| Base Rent(4) | $3,436,396 | $3,444,248 | $16.96 | 59.2% |
| Vacant Income | 0 | 316,509 | 1.56 | 5.4 |
| Reimbursements | 1,769,881 | 2,050,927 | 10.10 | 35.2 |
| Other Income | 14,290 | 8,231 | 0.04 | 0.1 |
| Gross Revenue | $5,220,566 | $5,819,916 | $28.66 | 100.0% |
| Vacancy & Credit Loss(5) | (711,375) | (316,509) | (1.56) | (5.4) |
| Effective Gross Income | $4,509,192 | $5,503,407 | $27.10 | 94.6% |
| Total Operating Expenses | 2,228,029 | 2,259,782 | 11.13 | 41.1 |
| Net Operating Income | $2,281,162 | $3,243,624 | $15.97 | 58.9% |
| TI/LC | 0 | 192,013 | 0.95 | 3.5 |
| Capital Expenditures | 0 | 40,611 | 0.20 | 0.7 |
| Net Cash Flow | $2,281,162 | $3,011,000 | $14.83 | 54.7% |
| (1) | Certain items such as straight line rent, interest expense, interest income, lease cancellation income, depreciation, amortization, debt service payments and any other non-recurring or non-operating items were excluded from the historical presentation and are not considered for the underwritten cash flow. |
| (2) | The Earhart Corporate Center Property was acquired by the borrower on May 21, 2019; therefore historical financials were not available. |
| (3) | % column represents percent of Gross Revenue for all revenue lines and represents percent of Effective Gross Income for the remainder of the fields. |
| (4) | Underwritten Base Rent is based on the underwritten rent roll dated as of September 30, 2020 inclusive of the rent steps through September 2021. |
| (5) | TTM 6/30/2020 Vacancy & Credit Loss consists of $711,375 of rent concessions. |
Property Management. The Earhart Corporate Center Property is managed by Integris Ventures – Management, LLC, an affiliate of the loan sponsors.
THE INFORMATION IN THIS STRUCTURAL AND COLLATERAL TERM SHEET IS NOT COMPLETE AND MAY BE AMENDED PRIOR TO THE TIME OF SALE. THIS TERM SHEET IS NOT AN OFFER TO SELL THESE SECURITIES AND IT IS NOT A SOLICITATION OF AN OFFER TO BUY THESE SECURITIES IN ANY JURISDICTION WHERE THE OFFER OR SALE IS NOT PERMITTED.
| | 134 of 144 | | |
| Structural and Collateral Term Sheet | Benchmark 2020-B20 |
| 2665 North First | |
| Mortgage Loan Information | Property Information | |||
| Mortgage Loan Seller: | CREFI | Single Asset / Portfolio: | Single Asset | |
| Original Principal Balance: | $29,000,000 | Title: | Fee | |
| Cut-off Date Principal Balance: | $29,000,000 | Property Type - Subtype: | Office – CBD | |
| % of Pool by IPB: | 3.2% | Net Rentable Area (Rooms): | 130,723 | |
| Loan Purpose: | Refinance | Location: | San Jose, CA | |
| Borrower: | GZI First North 1, LLC | Year Built / Renovated: | 1983 / 2014 | |
| Loan Sponsor: | Zhonghuan Investment USA, LLC | Occupancy: | 82.9% | |
| Interest Rate: | 3.63000% | Occupancy Date: | 8/28/2020 | |
| Note Date: | 9/22/2020 | Number of Tenants: | 10 | |
| Maturity Date: | 10/6/2030 | 2017 NOI: | $3,298,768 | |
| Interest-only Period: | 120 months | 2018 NOI(1): | $3,293,990 | |
| Original Term: | 120 months | 2019 NOI(2): | $2,878,815 | |
| Original Amortization: | None | TTM NOI (as of 6/2020): | $2,893,291 | |
| Amortization Type: | Interest Only | UW Occupancy: | 83.4% | |
| Call Protection: | L(11),Grtr1%orYM(106),O(3) | UW Revenues: | $4,747,771 | |
| Lockbox / Cash Management: | Hard / Springing | UW Expenses: | $1,653,713 | |
| Additional Debt: | N/A | UW NOI(3): | $3,094,058 | |
| Additional Debt Balance: | N/A | UW NCF(3): | $2,903,063 | |
| Additional Debt Type: | N/A | Appraised Value / Per SF(3): | $48,600,000 / $372 | |
| Appraisal Date: | 7/27/2020 | |||
| Escrows and Reserves | Financial Information(3) | |||||
| Initial | Monthly | Initial Cap | Cut-off Date Loan / Unit: | $222 | ||
| Taxes: | $266,941 | $44,490 | N/A | Maturity Date Loan / Unit: | $222 | |
| Insurance: | $29,765 | $3,721 | N/A | Cut-off Date LTV: | 59.7% | |
| FF&E Reserves: | $0 | $2,179 | $130,740 | Maturity Date LTV: | 59.7% | |
| TI/LC: | $1,500,000 | $16,340 | $1,000,000 | UW NCF DSCR: | 2.72x | |
| Other(4): | $0 | Springing | $1,052,268 | UW NOI Debt Yield: | 10.7% | |
| Sources and Uses | ||||||
| Sources | Proceeds | % of Total | Uses | Proceeds | % of Total | |
| Mortgage Loan | $29,000,000 | 98.6% | Payoff Existing Debt | $27,118,482 | 92.2% | |
| Sponsor Equity | 407,715 | 1.4 | Upfront Reserves | 1,796,706 | 6.1 | |
| Closing Costs | 492,527 | 1.7 | ||||
| Total Sources | $29,407,715 | 100.0% | Total Uses | $29,407,715 | 100.0% | |
| (1) | 2018 NOI was based off 6 months of annualized operating financial statements because the loan sponsor acquired the 2665 North First Property (as defined below) in March 2019. |
| (2) | 2019 NOI was based off 10 months of annualized operating financial statements because the loan sponsor acquired the 2665 North First Property (as defined below) in March 2019. |
| (3) | While the 2665 North First Loan (as defined below) was originated after the emergence of the novel coronavirus pandemic and the economic disruption resulting from measures to combat the pandemic, the pandemic is an evolving situation and could impact the 2665 North First Loan more severely than assumed in the underwriting of the 2665 North First Loan and could adversely affect the NOI, NCF and occupancy information, as well as the appraised value and the DSCR, LTV and Debt Yield metrics presented above. See “Risk Factors— Risks Related to Market Conditions and Other External Factors—Coronavirus Pandemic Has Adversely Affected the Global Economy and Will Likely Adversely Affect the Performance of the Mortgage Loans” in the Preliminary Prospectus. |
| (4) | At closing, and until the borrower delivers the letter of credit to collateralize the OneLin CREM Rent Reserve (as defined in the 2665 North First Loan documents), all excess cash flow must be deposited into the OneLin CREM Rent Reserve Account on each Monthly Payment Date, subject to a cap on the swept funds of $1,052,268 (the amount of the letter of credit to be delivered). After the letter of credit is delivered, swept funds will be released to the borrower. |
THE INFORMATION IN THIS STRUCTURAL AND COLLATERAL TERM SHEET IS NOT COMPLETE AND MAY BE AMENDED PRIOR TO THE TIME OF SALE. THIS TERM SHEET IS NOT AN OFFER TO SELL THESE SECURITIES AND IT IS NOT A SOLICITATION OF AN OFFER TO BUY THESE SECURITIES IN ANY JURISDICTION WHERE THE OFFER OR SALE IS NOT PERMITTED.
| | 135 of 144 | | |
| Structural and Collateral Term Sheet | Benchmark 2020-B20 |
| 2665 North First | |
The Loan. The 2665 North First loan (the “2665 North First Loan”) is secured by a first mortgage lien on the borrower’s fee interest in a 130,723 square foot CBD office building located at 2665 North First Street San Jose, California (the “2665 North First Property”). The 2665 North First loan has a ten-year term and requires payments of interest-only for 120 months.
The Borrower. The borrowing entity for the 2665 North First Loan is GZI First North 1, LLC, a Delaware limited liability company and special purpose entity, with at least one independent director in its organizational structure. Legal counsel to the borrowers delivered a non-consolidation opinion in connection with the origination of the 2665 North First loan.
The Loan Sponsor. The loan sponsor and nonrecourse carve-out guarantor for the 2665 North First loan is Zhonghuan Investment USA, LLC, which is managed by members of the Lin Family. The Lin Family manages OneLin Capital Corporation. OneLin Capital Corporation is a global multi-asset and investment management firm that manages across different asset classes, including real estate development, and venture capital who have offices in San Jose and Seattle.
The Property. The 2665 North First Property is a 130,723 square foot central business district office located in San Jose, California on North First Street, near the intersection of North First Street and Trimble. The 2665 North First Property is located in the city of San Jose in an area known as the Golden Triangle, which is bound by US Highway 101, State Highway 237 and Interstate 880. The neighborhood is accessible via the Santa Clara Valley Transportation Authority’s light rail system and has accessibility to the San Jose International Airport, as well as the downtown core area.
The largest tenant at the 2665 North First Property is the State of CA, DGS (the “State of California”) (31,849 square feet; 24.4% of net rentable area; 31.0% of underwritten base rent). The State of California has been at the property since 2009, and it further expanded its space, in the building in 2017. The State of California comprises 24.4% of NRA at the property and has leases expiring in August and November of 2025. This space is used specifically by the State Department of Employment Development (20,125 square feet) and the Department of Franchise Tax Board (11,724 square feet).
The second largest tenant at the 2665 North First Property is OneSpace (25,417 square feet; 19.4% of net rentable area; 23.6% of underwritten base rent). OneSpace positions consumer packaged goods brands on the digital shelf with a suite of tools and on-demand services for publishing content on multiple online retailers. OneSpace was founded in 2012 and has over 250 employees, they provide services for companies like Staples, Overstock, and eBay. OneSpace recently executed a lease that commenced in September 2020 and expires in September 2033.
The third largest tenant at the 2665 North First Property is Cloudgenix, Inc (“Cloudgenix”) (18,586 square feet; 14.2% of net rentable area; 16.6% of underwritten base rent). Cloudgenix provides a comprehensive end-to-end secure software-defined wide area network. Cloudgenix was recently acquired by Palo Alto Networks for approximately $420 million. Cloudgenix’s lease commenced in March 2016 and runs through July 2021.
COVID-19 Update. As of October 6, 2020, the 2665 North First Property is open and operating, however, most tenants are working remotely. All tenants at the 2665 North First Property have made their August and September rent payments. The first payment date of the 2665 North First Loan is November 2020. See “Risk Factors—Risks Related to Market Conditions and Other External Factors— Current Coronavirus Pandemic May Adversely Affect the Global Economy and the Performance of the Mortgage Loans”.
The Market. The 2665 North First Property is located in the City of San Jose in an area called the Golden Triangle. The Golden Triangle is bounded by US Highway 101, State Highway 237 and Interstate 880. The Golden Triangle is home to many established and start-up technology companies and is known as an area that is involved with technological innovation. The area provides access to the Santa Clara Valley Transportation Authority’s light rail system and has convenient accessibility to the San Jose International Airport.
According to the appraisal, the 2665 North First Property is located in the Greater Silicon Valley market. The Greater Silicon Valley market reported a 9.2% vacancy rate as of the first quarter 2020, which is 20 basis points lower year over year. Average asking rental rates in the Greater Silicon Valley market have increased 9.1% year over year to $5.18 per square foot, while Class A office rents have increased 10.2% year over year to $5.50 per square foot. The appraisal concluded an overall vacancy/credit loss of 10.0% in 2019.
The 2665 North First Property is located within the approved general plan area known as “San Jose 2020 General Plan”. The San Jose 2020 General Plan provides the growth of North San Jose as an employment center through a planned 26.7 million square feet of industrial development. Of the 26.7 million square feet, 16.0 million square feet is designed to be located along the North First Street corridor, between Trimble Road and Montague Expressway. The plan also supports the conversion of specific sites from industrial use to high-density residential use, allowing for the development of up to 32,000 new residential units. Additionally, retail capacity for up to 1.7 million square feet of local retail use is provided within the policy to support the area’s new job and housing growth.
THE INFORMATION IN THIS STRUCTURAL AND COLLATERAL TERM SHEET IS NOT COMPLETE AND MAY BE AMENDED PRIOR TO THE TIME OF SALE. THIS TERM SHEET IS NOT AN OFFER TO SELL THESE SECURITIES AND IT IS NOT A SOLICITATION OF AN OFFER TO BUY THESE SECURITIES IN ANY JURISDICTION WHERE THE OFFER OR SALE IS NOT PERMITTED.
| | 136 of 144 | | |
| Structural and Collateral Term Sheet | Benchmark 2020-B20 |
| 2665 North First | |
| Historical Occupancy(1) | |||
| 2017 | 2018 | 2019 | Current(2) |
| 97.0% | 94.1% | 88.1% | 82.9% |
| (1) | Historical occupancies are as of December 31 of each respective year. |
| (2) | Current occupancy is as of August 28, 2020. |
| Tenant Summary(1) | |||||||
Tenant | Ratings(2) | Net Rentable | % of | Base Rent | % of Total | Lease Expiration | |
| Moody’s/S&P/Fitch | Area (SF) | Total NRA | PSF | Base Rent | Date | ||
| State of CA, DGS(3)(4) | Aa2 / AA- / AA | 31,849 | 24.4% | $43.50 | 31.0% | 8/31/2025 | |
| OneSpace | NR / NR / NR | 25,417 | 19.4 | $41.40 | 23.6 | 9/30/2033 | |
| Cloudgenix, Inc | NR / NR / NR | 18,586 | 14.2 | $39.78 | 16.6 | 7/31/2021 | |
| Beckhoff Automation | NR / NR / NR | 13,859 | 10.6 | $39.65 | 12.3 | 9/30/2025 | |
| HYC Technology Co. | NR / NR / NR | 6,879 | 5.3 | $45.60 | 7.0 | 12/31/2027 | |
| Prometric | NR / B- / NR | 4,815 | 3.7 | $41.40 | 4.5 | 9/30/2024 | |
| OneLin Capital Corp | NR / NR / NR | 3,824 | 2.9 | $36.00 | 3.1 | 9/30/2033 | |
| General Mortgage Capital Corp | NR / NR / NR | 2,185 | 1.7 | $37.50 | 1.8 | 1/31/2021 | |
| Subtotal / Weighted Average | 107,414 | 82.2% | $41.52 | 99.9% | |||
| Remaining Tenants(5) | 925 | 0.7% | 3.65 | 0.1% | |||
| Vacant | 22,384 | 17.1% | NAP | NAP | |||
| Total / Weighted Average | 130,723 | 100.0% | $41.19 | 100.0% | |||
| (1) | Based on the underwritten rent roll dated August 28, 2020. |
| (2) | Ratings provided are for the parent company of the entity listed in the “Tenant” field whether or not the parent company guarantees the lease. |
| (3) | State of CA, DGS, leases 20,125 square feet of pace that expire on August 31, 2025 and 11,724 square feet of space that expire on November 30, 2025. |
| (4) | State of CA, DGS, has the right to terminate its lease with respect to approximately 20,125 square feet of its space at any time effective on or after August 31, 2017, and with respect to approximately 11,724 square feet of its space at any time effective on or after November 30, 2021, by giving written notice to the lessor at least 30 days prior to the date when such termination shall become effective. |
| (5) | Remaining Tenants includes a fitness center (925 square feet; 0.7% of net rentable area; 0.0% of underwritten base rent) and MCIMETRO ACCESS TRANSMISSION (0 square feet; 0.0% of net rentable area; 0.1% of underwritten base rent). |
| Lease Rollover Schedule(1)(2) | |||||||||
Year | Number of | Net Rentable Area Expiring | % of NRA Expiring | Base Rent | % of Base | Cumulative |
Cumulative | Cumulative | Cumulative |
| Vacant | NAP | 22,384 | 17.1% | NAP | NAP | 22,384 | 17.1% | NAP | NAP |
| MTM | 0 | 0 | 0.0 | 0 | 0.0% | 22,384 | 17.1% | $0 | 0.0% |
| 2020 | 0 | 0 | 0.0 | 0 | 0.0 | 22,384 | 17.1% | $0 | 0.0% |
| 2021 | 2 | 20,771 | 15.9 | $821,314 | 18.4 | 43,155 | 33.0% | $821,314 | 18.4% |
| 2022 | 0 | 0 | 0.0 | 0 | 0.0 | 43,155 | 33.0% | $821,314 | 18.4% |
| 2023 | 0 | 0 | 0.0 | 0 | 0.0 | 43,155 | 33.0% | $821,314 | 18.4% |
| 2024 | 1 | 4,815 | 3.7 | 199,332 | 4.5 | 47,970 | 36.7% | $1,020,646 | 22.9% |
| 2025 | 3 | 45,708 | 35.0 | 1,935,055 | 43.4 | 93,678 | 71.7% | $2,955,701 | 66.2% |
| 2026 | 0 | 0 | 0.0 | 0 | 0.0 | 93,678 | 71.7% | $2,955,701 | 66.2% |
| 2027 | 1 | 6,879 | 5.3 | 313,682 | 7.0 | 100,557 | 76.9% | $3,269,384 | 73.3% |
| 2028 | 0 | 0 | 0.0 | 0 | 0.0 | 100,557 | 76.9% | $3,269,384 | 73.3% |
| 2029 | 0 | 0 | 0.0 | 0 | 0.0 | 100,557 | 76.9% | $3,269,384 | 73.3% |
| 2030 | 0 | 0 | 0.0 | 0 | 0.0 | 100,557 | 76.9% | $3,269,384 | 73.3% |
| 2031 & Beyond(3) | 4 | 30,166 | 23.1 | 1,193,309 | 26.7 | 130,723 | 100.0% | $4,462,692 | 100.0% |
| Total | 11 | 130,723 | 100.0% | $4,462,692 | 100.0% | ||||
| (1) | Based on the underwritten rent roll dated August 28, 2020. |
| (2) | Certain tenants may hold termination or contraction options (which may become exercisable prior to the originally stated expiration date of the tenant lease) that are not considered in the above Lease Rollover Schedule. Individual tenant termination options can be found in the footnotes under the ‘Tenant Summary’ table. |
| (3) | 2031 & Beyond includes the fitness center and MCIMETRO ACCESS TRANSMISSION spaces that do not have lease expiration dates. |
THE INFORMATION IN THIS STRUCTURAL AND COLLATERAL TERM SHEET IS NOT COMPLETE AND MAY BE AMENDED PRIOR TO THE TIME OF SALE. THIS TERM SHEET IS NOT AN OFFER TO SELL THESE SECURITIES AND IT IS NOT A SOLICITATION OF AN OFFER TO BUY THESE SECURITIES IN ANY JURISDICTION WHERE THE OFFER OR SALE IS NOT PERMITTED.
| | 137 of 144 | | |
| Structural and Collateral Term Sheet | Benchmark 2020-B20 |
| 2665 North First | |
Underwritten Net Cash Flow | |||||||
| 2017 | 2018(1) | 2019(2) | TTM(3) | Underwritten | Per Square Foot | %(4) | |
| Rents in Place | $4,524,544 | $4,597,285 | $4,181,585 | $4,231,342 | $4,462,692 | $34.14 | 78.9% |
| Contractual Rent Steps(5) | 0 | 0 | 0 | 0 | 148,321 | 1.13 | 2.6% |
| Potential Income From Vacant Space | 0 | 0 | 0 | 0 | 940,128 | 7.19 | 16.6% |
| Total Reimbursements | 148,343 | 188,578 | 147,478 | 124,514 | 107,066 | 0.82 | 1.9% |
| Net Rental Income | $4,672,887 | $4,785,863 | $4,329,063 | $4,355,856 | $5,658,208 | $43.28 | 100.0% |
| (Vacancy/Credit Loss) | (34,504) | (117,818) | 0 | 0 | (940,128) | ($7.19) | (16.6)% |
| Other Income | 0 | 0 | 21,439 | 29,691 | 29,691 | 0.23 | 0.5% |
| Effective Gross Income | $4,638,383 | $4,668,045 | $4,350,502 | $4,385,547 | $4,747,771 | $36.32 | 83.9% |
| Total Expenses | $1,339,615 | $1,374,055 | $1,471,687 | $1,492,256 | $1,653,713 | $12.65 | 34.8% |
| Net Operating Income | $3,298,768 | $3,293,990 | $2,878,815 | $2,893,291 | $3,094,058 | $23.67 | 65.2% |
| Total TI/LC, Capex/RR | 0 | 0 | 0 | 0 | 190,995 | 1.46 | 4.0% |
| Net Cash Flow | $3,298,768 | $3,293,990 | $2,878,815 | $2,893,291 | $2,903,063 | $22.21 | 61.1% |
| (1) | 2018 NOI was based off 6 months of annualized operating financial statements because the loan sponsor acquired the 2665 North First Property (as defined below) in March 2019. |
| (2) | 2019 NOI was based off 10 months of annualized operating financial statements because the loan sponsor acquired the 2665 North First Property (as defined below) in March 2019. |
| (3) | TTM represents the trailing 12-month period ending June 30, 2020. |
| (4) | % column represents percent of Net Rental Income for all revenue lines and represents percent of Effective Gross Income for the remainder of the fields. |
| (5) | Contractual Rent Steps represents of contractual rent steps underwritten through September 1, 2020. |
Property Management. The 2665 North First Property is managed by R.N. Borelli, Inc., a California Corporation.
THE INFORMATION IN THIS STRUCTURAL AND COLLATERAL TERM SHEET IS NOT COMPLETE AND MAY BE AMENDED PRIOR TO THE TIME OF SALE. THIS TERM SHEET IS NOT AN OFFER TO SELL THESE SECURITIES AND IT IS NOT A SOLICITATION OF AN OFFER TO BUY THESE SECURITIES IN ANY JURISDICTION WHERE THE OFFER OR SALE IS NOT PERMITTED.
| | 138 of 144 | | |
| Structural and Collateral Term Sheet | BENCHMARK 2020-B20 |
| KW Portfolio | |
| Mortgage Loan Information | Property Information | |||
| Mortgage Loan Seller: | CREFI | Single Asset / Portfolio: | Portfolio | |
| Original Principal Balance: | $28,330,250 | Title: | Fee | |
| Cut-off Date Principal Balance: | $28,330,250 | Property Type - Subtype: | Various - Various | |
| % of Pool by IPB: | 3.1% | Net Rentable Area (SF): | 137,412 | |
| Loan Purpose: | Acquisition | Location: | Various, CA | |
| Borrowers: | Old Grove LLC, Dow Avenue LLC | Year Built / Renovated: | 1982 / Various | |
| Loan Sponsors: | Chandru H. Wadhwani | Occupancy: | 100.0% | |
| Interest Rate: | 3.61000% | Occupancy Date: | 10/6/2020 | |
| Note Date: | 9/24/2020 | Number of Tenants: | 2 | |
| Maturity Date: | 10/6/2030 | 2017 NOI(1): | N/A | |
| Interest-only Period: | None | 2018 NOI(1): | N/A | |
| Original Term: | 120 months | 2019 NOI(1): | N/A | |
| Original Amortization: | 360 months | TTM NOI(1): | N/A | |
| Amortization Type: | Balloon | UW Economic Occupancy: | 95.0% | |
| Call Protection: | L(24),Def(92),O(4) | UW Revenues: | $3,398,183 | |
| Lockbox / Cash Management: | Springing / Springing | UW Expenses: | $823,130 | |
| Additional Debt: | N/A | UW NOI(3): | $2,575,053 | |
| Additional Debt Balance: | N/A | UW NCF(3): | $2,422,334 | |
| Additional Debt Type: | N/A | Appraised Value / Per SF(3): | $43,570,000 / $317 | |
| Appraisal Date: | Various | |||
| Escrows and Reserves | Financial Information(3) | |||||
| Initial | Monthly | Initial Cap | Cut-off Date Loan / SF: | $206 | ||
| Taxes: | $0 | Springing | N/A | Maturity Date Loan / SF: | $161 | |
| Insurance: | $4,695 | $2,347 | N/A | Cut-off Date LTV: | 65.0% | |
| Replacement Reserves: | $0 | Springing | N/A | Maturity Date LTV: | 50.9% | |
| TI/LC: | $0 | $0 | $250,000 | UW NCF DSCR: | 1.57x | |
| Other(2): | $1,224,111 | $0 | N/A | UW NOI Debt Yield: | 9.1% | |
| Sources and Uses | ||||||||||||||
| Sources | Proceeds | % of Total | Uses | Proceeds | % of Total | |||||||||
| Mortgage Loan | $28,330,250 | 62.2 | % | Purchase Price | $43,564,241 | 95.7 | % | |||||||
| Sponsor Equity | 15,740,446 | 34.6 | Upfront Reserves | 1,228,806 | 2.7 | |||||||||
| Other Uses | 1,472,963 | 3.2 | Closing Costs | 750,612 | 1.6 | |||||||||
| Total Sources | $45,543,659 | 100.0 | % | Total Uses | $45,543,659 | 100.0 | % | |||||||
| (1) | Historical Financial Information was not provided due to this being an acquisition of single tenant properties. |
| (2) | The Initial Other reserve consists of an Unfunded Obligations Reserve equal to $824,111 and a Free Rent Reserve equal to $400,000. |
| (3) | While the KW Portfolio Loan (as defined below) was originated after the emergence of the novel coronavirus pandemic and the economic disruption resulting from measures to combat the pandemic, the pandemic is an evolving situation and could impact the KW Portfolio Loan more severely than assumed in the underwriting of the KW Portfolio Loan and could adversely affect the NOI, NCF and occupancy information, as well as the appraised value and the DSCR, LTV and Debt Yield metrics presented above. See “Risk Factors— Risks Related to Market Conditions and Other External Factors—Coronavirus Pandemic Has Adversely Affected the Global Economy and Will Likely Adversely Affect the Performance of the Mortgage Loans” in the Preliminary Prospectus. |
The Loan. The KW Portfolio mortgage loan (the “KW Portfolio Loan”) has an outstanding balance as of the Cut-off Date of $28,330,250 million and is secured by the borrowers’ fee interest in a 137,412 square foot portfolio, comprised of two properties located in two locations in California, one property is located at 10054 Old Grove Road in San Diego, California, (the “10054 Old Grove Road Property”) and the other property is located at 2742 Dow Avenue in Tustin, California, (the “2742 Dow Avenue Property”, collectively the “KW Portfolio Properties”). The KW Portfolio Loan has a 10-year term and 360-month amortization schedule.
The Borrowers. The borrowing entities for the KW Portfolio Loan are Old Grove LLC and Dow Avenue LLC, each a single-purpose, single-asset entity with one independent director. Legal counsel to the borrowers delivered a non-consolidation opinion in connection with the origination of the KW Portfolio Loan.
THE INFORMATION IN THIS STRUCTURAL AND COLLATERAL TERM SHEET IS NOT COMPLETE AND MAY BE AMENDED PRIOR TO THE TIME OF SALE. THIS TERM SHEET IS NOT AN OFFER TO SELL THESE SECURITIES AND IT IS NOT A SOLICITATION OF AN OFFER TO BUY THESE SECURITIES IN ANY JURISDICTION WHERE THE OFFER OR SALE IS NOT PERMITTED.
| | 139 of 144 | | |
| Structural and Collateral Term Sheet | BENCHMARK 2020-B20 |
| KW Portfolio | |
The Loan Sponsor. The loan sponsor and nonrecourse carve-out guarantor for the KW Portfolio is Chandru H. Wadhwani. Mr. Wadhwani is the co-founder and CEO of Amrapur Overseas Inc. Amrapur Overseas Inc. supplies home decor products. The company offers products such as textile and felt goods, duvets, comforters, sheets, throws and blankets, and window coverings.
The Property. The 10054 Old Grove Road Property is an 85,824 square foot industrial/flex/R&D space located in San Diego, California. The 10054 Old Grove Road Property was built in 1982 and renovated in 2018, it consists of a two-story building and 137 parking spaces for a parking ratio of 1.60 spaces per 1,000 square feet. The building features a 30-foot clear height, eight loading doors and three drive-in doors. The 10054 Old Grove Property is 21.0% office, while the remaining 79% of the property is used as Flex/R&D space. The sole tenant at the 10054 Old Grove Property is Manscaped, Inc. (“Manscaped”). Manscaped was founded in 2017 and is headquartered in San Diego. Manscaped manufactures and sells male grooming and hygiene products while offering direct to-consumer shipping as well as in-store options across the United States. The lease to Manscaped commenced in June 2020 on a 7.5-year term expiring at the end of November 2027. Manscaped was given a $1,000,000 tenant improvement allowance, while it is estimated by the loan sponsor that Manscaped will spend an additional $1,000,000 to $2,000,000 into completing the space.
The 2742 Dow Avenue Property is a 51,588 square foot office located in Tustin, California. The subject is located in Tustin on the west side of Dow Avenue, approximately one mile west of the 5 freeway. The property was built in 1982 and renovated in 2007 and 2020, it also has 215 parking spaces giving it an overall parking ratio of 4.17 per 1,000 square feet. The sole tenant at the 2742 Dow Avenue Property is Memorial Health Services. Memorial Health Services is tax-exempt California public benefit corporation that is the parent corporation to a multi-hospital, integrated health care system headquartered in Fountain Valley, California. Memorial Health Services has been at the property since 2007 and has triple net lease that runs through December 2029 with no termination options. In February of 2020 Memorial Health Services came to an agreement to sublease to Doctor’s Best Inc. (“Doctor’s Best”),, the sublease runs concurrent to the original lease and additionally Doctor’s Best is set to invest approximately $5,400,000 into this space. Doctor's Best manufactures and distributes dietary and nutritional supplements for anti-aging, antioxidant, blood sugar support, bone health, brain and memory, circulation, digestion, energy, eye health, and heart health.
COVID-19 Update. As of October 6, 2020, the KW Portfolio Properties are open and operating. All tenants at the KW Portfolio Properties have made their August and September rent payments. The first payment date of the KW Portfolio Loan is November 2020. See “Risk Factors—Risks Related to Market Conditions and Other External Factors—Current Coronavirus Pandemic May Adversely Affect the Global Economy and the Performance of the Mortgage Loans”.
The Market. According to the appraisal, the 10054 Old Grove Property is located in the San Diego flex/industrial market. The San Diego market reported a 5.8% vacancy rate in the second quarter of 2020, with average asking rental rate of $15.69 per square foot for flex/industrial properties. There is a total inventory of 197,710,639 square feet of flex/industrial space in the San Diego market with a net absorption of negative 68,581 square feet. There has been 1,785,539 square feet of construction completed in the last year within the San Diego market. The 10054 Old Grove Property is more specifically located in the Scripps Ranch flex/industrial submarket. The Scripps Ranch submarket reported a 6.6% vacancy rate in the second quarter of 2020, with an average asking rental rate of $14.64 per square foot. There is a total inventory of 1,467,849 square feet of flex/industrial in the Scripps Ranch submarket with a net absorption of 18,570 square feet. There has been zero construction completed in the last year within the Scripps Ranch Flex/Industrial submarket.
According to the appraisal, the 2742 Dow Avenue Property is located in the Orange County Office market. The Orange County market reported a 9.7% vacancy rate in the second quarter of 2020, with average asking rental rate of $32.76 per square foot for office properties. There is a total inventory of 159,059,898 square feet of office space in the Orange County market with a net absorption of negative 154,953 square feet. There has been 1,295,053 square feet of construction completed in the last year within the Orange County office market. The 2742 Dow Avenue Property is more specifically located in the Central County office submarket. The Central County submarket reported a 10.5% vacancy rate in the second quarter of 2020, with an average asking rental rate of $28.97 per square foot for office properties. There is a total inventory of 32,721,655 square feet of office in the Central County submarket with a net absorption of negative 226,315 square feet. There has been zero construction completed in the last year within the Central County office submarket.
The below chart displays the historical and current occupancy for the 10054 Old Grove Road Property:
| Current Occupancy(1)(2) |
| 100.0% |
| (1) | Historical Occupancy was not provided due to this being an acquisition of single tenant properties. |
| (2) | Current Occupancy is as of October 6, 2020. |
THE INFORMATION IN THIS STRUCTURAL AND COLLATERAL TERM SHEET IS NOT COMPLETE AND MAY BE AMENDED PRIOR TO THE TIME OF SALE. THIS TERM SHEET IS NOT AN OFFER TO SELL THESE SECURITIES AND IT IS NOT A SOLICITATION OF AN OFFER TO BUY THESE SECURITIES IN ANY JURISDICTION WHERE THE OFFER OR SALE IS NOT PERMITTED.
| | 140 of 144 | | |
| Structural and Collateral Term Sheet | BENCHMARK 2020-B20 |
| KW Portfolio | |
The below chart displays the historical and current occupancy for the 2742 Dow Avenue Property:
| Current Occupancy(1)(2) |
| 100.0% |
| (1) | Historical occupancy was not provided due to this being an acquisition of single tenant properties. |
| (2) | Current Occupancy is as of October 6, 2020. |
The below chart displays the tenant summary for the 10054 Old Grove Road Property:
| Tenant Summary(1) |
Tenant | Ratings | Net Rentable | % of | Base Rent | % of Total | Lease Expiration |
| Moody’s/S&P/Fitch(2) | Area (SF) | Total NRA | PSF | Base Rent | Date | |
| Manscaped, Inc.(3) | NR / NR / NR | 85,824 | 100.0% | $15.15 | 100.0% | 11/30/2027 |
| Subtotal / Weighted Average | 85,824 | 100.0% | $15.15 | 100.0% | ||
| Remaining Tenants | 0 | 0.0 | NAP | NAP | ||
| Vacant | 0 | 0.0 | NAP | NAP | ||
| Total / Weighted Average | 85,824 | 100.0% | $15.15 | 100.0% |
| (1) | Based on the underwritten rent roll dated October 6, 2020. |
| (2) | In certain instances, ratings provided are those of the parent company of the entity shown, whether or not the parent guarantees the lease. |
| (3) | In February 2020 Memorial Health Services came to an agreement on a sublease to Doctor’s Best that runs concurrently to the original lease. |
The below chart displays the tenant summary for the 2742 Dow Avenue Property:
| Tenant Summary(1) |
Tenant | Ratings | Net Rentable | % of | Base Rent | % of Total | Lease Expiration |
| Moody’s/S&P/Fitch(2) | Area (SF) | Total NRA | PSF | Base Rent | Date | |
| Memorial Health Services(3) | NR / AA- / NR | 51,588 | 100.0% | $24.69 | 100.0% | 12/31/2029 |
| Subtotal / Weighted Average | 51,588 | 100.0% | $24.69 | 100.0% | ||
| Remaining Tenants | 0 | 0 | NAP | NAP | ||
| Vacant | 0 | 0.0 | NAP | NAP | ||
| Total / Weighted Average | 51,588 | 100.0% | $24.69 | 100.0% |
| (1) | Based on the underwritten rent roll dated October 6, 2020. |
| (2) | In certain instances, ratings provided are those of the parent company of the entity shown, whether or not the parent guarantees the lease. |
| (3) | In February 2020 Memorial Health Services came to an agreement on a sublease to Doctor’s Best that runs concurrently to the original lease. |
THE INFORMATION IN THIS STRUCTURAL AND COLLATERAL TERM SHEET IS NOT COMPLETE AND MAY BE AMENDED PRIOR TO THE TIME OF SALE. THIS TERM SHEET IS NOT AN OFFER TO SELL THESE SECURITIES AND IT IS NOT A SOLICITATION OF AN OFFER TO BUY THESE SECURITIES IN ANY JURISDICTION WHERE THE OFFER OR SALE IS NOT PERMITTED.
| | 141 of 144 | | |
| Structural and Collateral Term Sheet | BENCHMARK 2020-B20 |
| KW Portfolio | |
The below chart displays the Lease Rollover for the KW Portfolio:
| Lease Rollover Schedule(1)(2) | ||||||||||||||||||
| Number | Net | % of | Cumulative | Cumulative | Cumulative | |||||||||||||
| of | Rentable | % of | Base | Net Rentable | % of | Cumulative | % of Base | |||||||||||
| Leases | Area | NRA | Base Rent | Rent | Area | NRA | Base Rent | Rent | ||||||||||
| Year | Expiring | Expiring | Expiring | Expiring | Expiring | Expiring | Expiring | Expiring | Expiring | |||||||||
| Vacant | NAP | 0 | 0.0% | NAP | NAP | 0 | 0.0% | NAP | NAP | |||||||||
| MTM | 0 | 0 | 0.0 | $0 | 0.0% | 0 | 0.0% | $0 | 0.0% | |||||||||
| 2020 | 0 | 0 | 0.0 | 0 | 0.0 | 0 | 0.0% | $0 | 0.0% | |||||||||
| 2021 | 0 | 0 | 0.0 | 0 | 0.0 | 0 | 0.0% | $0 | 0.0% | |||||||||
| 2022 | 0 | 0 | 0.0 | 0 | 0.0 | 0 | 0.0% | $0 | 0.0% | |||||||||
| 2023 | 0 | 0 | 0.0 | 0 | 0.0 | 0 | 0.0% | $0 | 0.0% | |||||||||
| 2024 | 0 | 0 | 0.0 | 0 | 0.0 | 0 | 0.0% | $0 | 0.0% | |||||||||
| 2025 | 0 | 0 | 0.0 | 0 | 0.0 | 0 | 0.0% | $0 | 0.0% | |||||||||
| 2026 | 0 | 0 | 0.0 | 0 | 0.0 | 0 | 0.0% | $0 | 0.0% | |||||||||
| 2027 | 1 | 85,824 | 62.5 | 1,300,000 | 50.5 | 85,824 | 62.5% | $1,300,000 | 50.5% | |||||||||
| 2028 | 0 | 0 | 0.0 | 0 | 0.0 | 85,824 | 62.5% | $1,300,000 | 50.5% | |||||||||
| 2029 | 1 | 51,588 | 37.5 | 1,273,779 | 49.5 | 137,412 | 100.0% | $2,573,779 | 100.0% | |||||||||
| 2030 & | ||||||||||||||||||
| Thereafter | 0 | 0 | 0.0 | 0 | 0.0 | 137,412 | 100.0% | $2,573,779 | 100.0% | |||||||||
| Total | 2 | 137,412 | 100.0% | $2,573,779 | 100.0% | |||||||||||||
| (1) | Based on the underwritten rent roll dated October 6, 2020. |
| (2) | Certain tenants may hold termination or contraction options (which may become exercisable prior to the originally stated expiration date of the tenant lease) that are not considered in the above Lease Rollover Schedule. Individual tenant termination options can be found in the footnotes under the ‘Tenant Summary’ table. |
| Underwritten Net Cash Flow(1) | ||||||
| Per | ||||||
| Square | ||||||
| Underwritten | Foot | %(2) | ||||
| Rents in Place | $2,573,779 | $18.73 | 72.0% | |||
| Contractual Rent Steps(3) | 189,612 | $1.38 | 5.3% | |||
| Total Reimbursements | 813,644 | $5.92 | 22.7% | |||
| Net Rental Income | $3,577,035 | $26.03 | 100.0% | |||
| (Vacancy/Credit Loss) | (178,852) | ($1.30) | (5.0)% | |||
| Other Income | 0 | $0.00 | 0.0% | |||
| Effective Gross Income | $3,398,183 | $24.73 | 95.0% | |||
| Total Expenses | $823,130 | $5.99 | 24.2% | |||
| Net Operating Income | $2,575,053 | $18.74 | 75.8% | |||
| Total TI/LC, Capex/RR | 152,719 | $1.11 | 4.5% | |||
| Net Cash Flow | $2,422,334 | $17.63 | 71.3% | |||
| (1) | Historical Financial Information was not provided due to this being an acquisition of single tenant properties. |
| (2) | % column represents percent of Net Rental Income for all revenue lines and represents percent of Effective Gross Income for the remainder of the fields. |
| (3) | Contractual Rent Steps were underwritten through June 1, 2021. |
Property Management. The 10054 Old Grove Road Property is managed by Caprock Property Management Inc. and the 2742 Dow Avenue Property is managed by A Street Partners
THE INFORMATION IN THIS STRUCTURAL AND COLLATERAL TERM SHEET IS NOT COMPLETE AND MAY BE AMENDED PRIOR TO THE TIME OF SALE. THIS TERM SHEET IS NOT AN OFFER TO SELL THESE SECURITIES AND IT IS NOT A SOLICITATION OF AN OFFER TO BUY THESE SECURITIES IN ANY JURISDICTION WHERE THE OFFER OR SALE IS NOT PERMITTED.
| | 142 of 144 | | |
| Structural and Collateral Term Sheet | Benchmark 2020-B20 |
| Contacts | |
| J.P. Morgan CMBS Capital Markets & Banking | ||
| Contact | Phone Number | |
Kunal Singh Managing Director | kunal.k.singh@jpmorgan.com | (212) 834-5467 |
| Dwayne McNicholas | dwayne.p.mcnicholas@jpmorgan.com | (212) 834-9328 |
| Executive Director | ||
| Harris Rendelstein | harris.rendelstein@jpmorgan.com | (212) 834-6737 |
| Vice President | ||
| J.P. Morgan CMBS Trading | ||
| Contact | Phone Number | |
Avinash Sharma Managing Director | avinash.sharma@jpmorgan.com | (212) 834-3111 |
Derrick Fetzer Vice President | derrick.e.fetzer@jpmchase.com | (212) 834-3111 |
| J.P. Morgan Securitized Products Syndicate | ||
| Contact | Phone Number | |
Jennifer Kornblau Executive Director | jennifer.l.kornblau@jpmorgan.com | (212) 834-4154 |
Kailin Twomey Associate | kailin.e.twomey@jpmchase.com | (212) 834-4154 |
| Deutsche Bank CMBS Capital Markets & Banking | ||
| Contact | Phone Number | |
Lainie Kaye Managing Director | lainie.kaye@db.com | (212) 250-5270 |
Natalie Grainger Director | natalie.grainger@db.com | (212) 250-1254 |
| Deutsche Bank CMBS Trading | ||
| Contact | Phone Number | |
Ryan Horvath Director | ryan.horvath@db.com | (212) 250-5149 |
| Deutsche Bank CMBS Structuring | ||
| Contact | Phone Number | |
Shaishav Agarwal Managing Director | shaishav.agarwal@db.com | (212) 250-6290 |
Dan Penn Director | daniel.penn@db.com | (212) 250-5149 |
| Citigroup CMBS Capital Markets & Securitization | ||
| Contact | Phone Number | |
Rick Simpson Director | richard.simpson@citi.com | (212) 816-5343 |
Sana Petersen Director | sana.petersen@citi.com | (212) 816-3852 |
| Citigroup Structuring, Trading & Syndicate | ||
| Contact | Phone Number | |
Raul Orozco Director | raul.d.orozco@citi.com | (212) 723-1295 |
Mattison Perry Vice President | mattison.perry@citi.com | (212) 723-1295 |
THE INFORMATION IN THIS STRUCTURAL AND COLLATERAL TERM SHEET IS NOT COMPLETE AND MAY BE AMENDED PRIOR TO THE TIME OF SALE. THIS TERM SHEET IS NOT AN OFFER TO SELL THESE SECURITIES AND IT IS NOT A SOLICITATION OF AN OFFER TO BUY THESE SECURITIES IN ANY JURISDICTION WHERE THE OFFER OR SALE IS NOT PERMITTED.
| | 143 of 144 | | |
| Structural and Collateral Term Sheet | Benchmark 2020-B20 |
| Contacts | |
| Goldman Sachs & Co. LLC Banking | ||
| Contact | Phone Number | |
Leah Nivison Managing Director | leah.nivison@gs.com | (212) 357-2702 |
Scott Epperson Managing Director | scott.epperson@gs.com | (212) 934-2882 |
Justin Peterson Vice President | justin.peterson@gs.com | (212) 902-4283 |
| Goldman Sachs & Co. LLC Capital Markets | ||
| Contact | Phone Number | |
Mark Romanczuk Managing Director | mark.romanczuk@gs.com | (212) 902-0290 |
Nitin Jagga Vice President | nitin.jagga@gs.com | (212) 855-9035 |
| Goldman Sachs & Co. LLC Syndicate | ||
| Contact | Phone Number | |
Scott Walter Managing Director | scott.walter@gs.com | (212) 357-8910 |
Alex Smith-Constantine Vice President | alex.smith-constantine@gs.com | (212) 934-2841 |
THE INFORMATION IN THIS STRUCTURAL AND COLLATERAL TERM SHEET IS NOT COMPLETE AND MAY BE AMENDED PRIOR TO THE TIME OF SALE. THIS TERM SHEET IS NOT AN OFFER TO SELL THESE SECURITIES AND IT IS NOT A SOLICITATION OF AN OFFER TO BUY THESE SECURITIES IN ANY JURISDICTION WHERE THE OFFER OR SALE IS NOT PERMITTED.
| | 144 of 144 | | |