| FREE WRITING PROSPECTUS | ||
| FILED PURSUANT TO RULE 433 | ||
| REGISTRATION FILE NO.: 333-258342-02 | ||
| August 1, 2022 | ||||
BENCHMARK 2022-B36 Commercial Mortgage Trust | ||||
Free Writing Prospectus Structural and Collateral Term Sheet
$753,806,375 (Approximate Mortgage Pool Balance)
$630,182,000 (Approximate Offered Certificates)
| ||||
J.P. Morgan Chase Commercial Mortgage Securities Corp. Depositor | ||||
Commercial Mortgage Pass-Through Certificates Series 2022-B36
| ||||
JPMorgan Chase Bank, National Association Citi Real Estate Funding Inc. German American Capital Corporation Goldman Sachs Mortgage Company | ||||
| As Sponsors and Mortgage Loan Sellers | |||||||
| J.P. Morgan | Deutsche Bank Securities | Goldman Sachs & Co. LLC | Citigroup | ||||
| Co-Lead Managers and Joint Bookrunners | |||||||
| Academy Securities | Drexel Hamilton | ||||
| Co-Managers | |||||
THE INFORMATION IN THIS STRUCTURAL AND COLLATERAL TERM SHEET IS NOT COMPLETE AND MAY BE AMENDED PRIOR TO THE TIME OF SALE. THIS TERM SHEET IS NOT AN OFFER TO SELL THESE SECURITIES AND IT IS NOT A SOLICITATION OF AN OFFER TO BUY THESE SECURITIES IN ANY JURISDICTION WHERE THE OFFER OR SALE IS NOT PERMITTED. | |||||
| August 1, 2022 | BENCHMARK 2022-B36 |
This material is for your information, and none of J.P. Morgan Securities LLC (“JPMS”), Citigroup Global Markets Inc. (“CGMI”), Deutsche Bank Securities Inc. (“DBSI”), Goldman Sachs & Co. LLC (“GS”), Drexel Hamilton, LLC (“Drexel”) or Academy Securities, Inc. (“Academy Securities”) (each individually, an “Underwriter”, and together, the “Underwriters”) are soliciting any action based upon it. This material is not to be construed as an offer to sell or the solicitation of any offer to buy any security in any jurisdiction where such an offer or solicitation would be illegal.
The Depositor has filed a registration statement (including a prospectus) with the SEC (SEC File no. 333-258342) for the offering to which this free writing prospectus relates. Before you invest, you should read the prospectus in the registration statement and other documents the Depositor has filed with the SEC for more complete information about the Depositor, the issuing entity and this offering. You may get these documents for free by visiting EDGAR on the SEC website at www.sec.gov. Alternatively, the Depositor or any Underwriter or any dealer participating in the offering will arrange to send you the prospectus if you request it by calling (800) 408-1016 or by emailing the ABS Syndicate Desk at abs_synd@jpmorgan.com. Neither this document nor anything contained in this document shall form the basis for any contract or commitment whatsoever. The information contained in this document is preliminary as of the date of this document, supersedes any previous such information delivered to you and will be superseded by any such information subsequently delivered prior to the time of sale. These materials are subject to change, completion or amendment from time to time.
This document has been prepared by the Underwriters for information purposes only and does not constitute, in whole or in part, a prospectus for the purposes of Regulation (EU) 2017/1129 (as amended), such Regulation as it forms part of the domestic law of the United Kingdom and/or Part VI of the Financial Services and Markets Act 2000 (as amended); and does not constitute an offering document for any other purpose.
The attached information contains certain tables and other statistical analyses (the “Computational Materials”) that have been prepared in reliance upon information furnished by the Mortgage Loan Sellers. Numerous assumptions were used in preparing the Computational Materials, which may or may not be reflected in this document. The Computational Materials should not be construed as either projections or predictions or as legal, tax, financial or accounting advice. You should consult your own counsel, accountant and other advisors as to the legal, tax, business, financial and related aspects of a purchase of these certificates. Any weighted average lives, yields and principal payment periods shown in the Computational Materials are based on prepayment and/or loss assumptions, and changes in such prepayment and/or loss assumptions may dramatically affect such weighted average lives, yields and principal payment periods. In addition, it is possible that prepayments or losses on the underlying assets will occur at rates higher or lower than the rates shown in the Computational Materials. The specific characteristics of the certificates may differ from those shown in the Computational Materials due to differences between the final underlying assets and the preliminary underlying assets used in preparing the Computational Materials. The principal amount and designation of any certificate described in the Computational Materials are subject to change prior to issuance. None of the Underwriters nor any of their respective affiliates make any representation or warranty as to the actual rate or timing of payments or losses on any of the underlying assets or the payments or yield on the certificates.
This information is based upon management forecasts and reflects prevailing conditions and management’s views as of this date, all of which are subject to change.
This document contains forward-looking statements. Those statements are subject to certain risks and uncertainties that could cause the success of collections and the actual cash flow generated to differ materially from the information set forth in this document. While such information reflects projections prepared in good faith based upon methods and data that are believed to be reasonable and accurate as of their dates, the Depositor undertakes no obligation to revise these forward-looking statements to reflect subsequent events or circumstances. Investors should not place undue reliance on forward-looking statements and are advised to make their own independent analysis and determination with respect to the forecasted periods, which reflect the Depositor’s view only as of the date of this document.
J.P. Morgan is the marketing name for the investment banking businesses of JPMorgan Chase & Co. and its subsidiaries worldwide. Securities, syndicated loan arranging, financial advisory and other investment banking activities are performed by JPMS and its securities affiliates, and lending, derivatives and other commercial banking activities are performed by JPMorgan Chase Bank, National Association and its banking affiliates. JPMS is a member of SIPC and the NYSE. Securities and investment banking activities in the United States are performed by Deutsche Bank Securities Inc., a member of NYSE, FINRA and SIPC, and its broker-dealer affiliates. Lending and other commercial banking activities in the United States are performed by Deutsche Bank AG, acting through its New York Branch.
Capitalized terms used in this material but not defined herein shall have the meanings ascribed to them in the Preliminary Prospectus (as defined below).
THE CERTIFICATES REFERRED TO IN THESE MATERIALS ARE SUBJECT TO MODIFICATION OR REVISION (INCLUDING THE POSSIBILITY THAT ONE OR MORE CLASSES OF CERTIFICATES MAY BE SPLIT, COMBINED OR ELIMINATED AT ANY TIME PRIOR TO ISSUANCE OR AVAILABILITY OF A FINAL PROSPECTUS) AND ARE OFFERED ON A “WHEN, AS AND IF ISSUED” BASIS.
THE UNDERWRITERS MAY FROM TIME TO TIME PERFORM INVESTMENT BANKING SERVICES FOR, OR SOLICIT INVESTMENT BANKING BUSINESS FROM, ANY COMPANY NAMED IN THESE MATERIALS. THE UNDERWRITERS AND/OR THEIR AFFILIATES OR RESPECTIVE EMPLOYEES MAY FROM TIME TO TIME HAVE A LONG OR SHORT POSITION IN ANY CERTIFICATE OR CONTRACT DISCUSSED IN THESE MATERIALS.
THE INFORMATION IN THIS STRUCTURAL AND COLLATERAL TERM SHEET IS NOT COMPLETE AND MAY BE AMENDED PRIOR TO THE TIME OF SALE. THIS TERM SHEET IS NOT AN OFFER TO SELL THESE SECURITIES AND IT IS NOT A SOLICITATION OF AN OFFER TO BUY THESE SECURITIES IN ANY JURISDICTION WHERE THE OFFER OR SALE IS NOT PERMITTED.
2 of 143
| Structural and Collateral Term Sheet | Benchmark 2022-B36 | |
| Indicative Capital Structure | ||
Publicly Offered Certificates
| Class | Expected Ratings (Moody’s / Fitch / DBRS) | Approximate Initial Certificate Balance or Notional Amount(1) | Approximate Initial Credit Support(2) | Expected Weighted Avg. Life (years)(3) | Expected Principal Window(3) | Certificate Principal to Value Ratio(4) | Underwritten NOI Debt Yield(5) |
| A-1 | Aaa(sf) / AAAsf / AAA(sf) | $1,000,000 | 30.000% | 3.66 | 8/2024 – 6/2027 | 36.3% | 15.9% |
| A-2 | Aaa(sf) / AAAsf / AAA(sf) | $106,901,000 | 30.000% | 4.84 | 6/2027 – 7/2027 | 36.3% | 15.9% |
| A-4 | Aaa(sf) / AAAsf / AAA(sf) | (6) | 30.000% | (6) | (6) | 36.3% | 15.9% |
| A-5 | Aaa(sf) / AAAsf / AAA(sf) | (6) | 30.000% | (6) | (6) | 36.3% | 15.9% |
| A-SB | Aaa(sf) / AAAsf / AAA(sf) | $2,240,000 | 30.000% | 7.47 | 7/2027 – 5/2032 | 36.3% | 15.9% |
| X-A | NR / AAAsf / AAA(sf) | $565,731,000(7) | N/A | N/A | N/A | N/A | N/A |
| X-B | NR / A-sf / AA(low)(sf) | $64,451,000(7) | N/A | N/A | N/A | N/A | N/A |
| A-S | NR / AAAsf / AAA(sf) | $64,450,000 | 21.000% | 9.96 | 7/2032 – 8/2032 | 41.0% | 14.1% |
| B | NR / AA-sf / AA(high)(sf) | $34,016,000 | 16.250% | 9.98 | 8/2032 – 8/2032 | 43.5% | 13.3% |
| C | NR / A-sf / A(high)(sf) | $30,435,000 | 12.000% | 9.98 | 8/2032 – 8/2032 | 45.7% | 12.6% |
Privately Offered Certificates(8)
| Class | Expected Ratings (Moody’s / Fitch / DBRS) | Approximate Initial Certificate Balance or Notional Amount(1) | Approximate Initial Credit Support(2) | Expected Weighted Avg. Life (years)(3) | Expected Principal Window(3) | Certificate Principal to Value Ratio(4) | Underwritten NOI Debt Yield(5) |
| X-D | NR / BBB-sf / BBB(sf) | $35,805,000(7) | N/A | N/A | N/A | N/A | N/A |
| X-F | NR / BB+sf / BBB(low)(sf) | $8,952,000(7) | N/A | N/A | N/A | N/A | N/A |
| X-G | NR / BB-sf / BB(high)(sf) | $8,951,000(7) | N/A | N/A | N/A | N/A | N/A |
| X-H | NR / B-sf / BB(low)(sf) | $7,161,000(7) | N/A | N/A | N/A | N/A | N/A |
| X-J | NR / NR / B(sf) | $11,602,000(7) | N/A | N/A | N/A | N/A | N/A |
| X-K | NR / NR / NR | $13,463,056(7) | N/A | N/A | N/A | N/A | N/A |
| D | NR / BBBsf / BBB(high)(sf) | $19,693,000 | 9.250% | 9.98 | 8/2032 – 8/2032 | 47.1% | 12.2% |
| E | NR / BBB-sf / BBB(low)(sf) | $16,112,000 | 7.000% | 9.98 | 8/2032 – 8/2032 | 48.3% | 11.9% |
| F | NR / BB+sf / BB(high)(sf) | $8,952,000 | 5.750% | 9.98 | 8/2032 – 8/2032 | 48.9% | 11.8% |
| G | NR / BB-sf / BB(sf) | $8,951,000 | 4.500% | 9.98 | 8/2032 – 8/2032 | 49.6% | 11.6% |
| H | NR / B-sf / B(high)(sf) | $7,161,000 | 3.500% | 9.98 | 8/2032 – 8/2032 | 50.1% | 11.5% |
| J | NR / NR / B(low)(sf) | $11,602,000 | 1.880% | 9.98 | 8/2032 – 8/2032 | 50.9% | 11.3% |
| K | NR / NR / NR | $13,463,056 | 0.000% | 9.98 | 8/2032 – 8/2032 | 51.9% | 11.1% |
Non-Offered Vertical Risk Retention Interest(8)
| Non-Offered Vertical Risk Retention Interest | Expected Ratings (Moody’s / Fitch / DBRS) | Approximate Initial VRR Interest Balance (1) | Approximate Initial Credit Support(2) | Expected Weighted Avg. Life (years)(3)(9) | Expected Principal Window(3)(9) | Certificate Principal to Value Ratio(4) | Underwritten NOI Debt Yield(5) |
| Class RR Certificates(10)(11) | NR / NR / NR | $7,850,625 | N/A | 9.12 | 8/2024 – 8/2032 | N/A | N/A |
| RR Interest(10)(11) | NR / NR / NR | $29,839,694 | N/A | 9.12 | 8/2024 – 8/2032 | N/A | N/A |
| (1) | In the case of each such Class or the RR Interest, subject to a permitted variance of plus or minus 5%. The VRR interest balance of the VRR Interest is not included in the certificate balance or notional amount of any class of certificates set forth under “Publicly Offered Certificates” or “Privately Offered Certificates” in the table above, and the VRR Interest is not offered by this Term Sheet. In addition, the notional amounts of the Class X-A, Class X-B, Class X-D, Class X-F, Class X-G, Class X-H, Class X-J and Class X-K Certificates may vary depending upon the final pricing of the Classes of Principal Balance Certificates whose Certificate Balances comprise such notional amounts, and, if as a result of such pricing the pass-through rate of any Class of the Class X-A, Class X-B, Class X-D, Class X-F, Class X-G, Class X-H, Class X-J and Class X-K Certificates, as applicable, would be equal to zero at all times, such Class of Certificates will not be issued on the closing date of this securitization. |
| (2) | The approximate initial credit support percentages set forth for the certificates are approximate and for the Class A-1, Class A-2, Class A-4, Class A-5 and Class A-SB Certificates are represented in the aggregate. The VRR interest provides credit support only to the limited extent that it is allocated a portion of any losses incurred on the mortgage loans which such losses are allocated between it on the one hand, and the non-VRR certificates (other than the Class X-A, Class X-B, Class X-D, Class X-F, Class X-G, Class X-H, Class X-J and Class X-K Certificates) on the other hand, pro rata in accordance with their respective percentage allocation entitlement. See “Description of the Certificates” in the Preliminary Prospectus. |
| (3) | Assumes 0% CPR / 0% CDR and August 23, 2022 closing date. Based on modeling assumptions as described in the Preliminary Prospectus dated August 1, 2022 (the “Preliminary Prospectus”). |
| (4) | The “Certificate Principal to Value Ratio” for any Class of Principal Balance Certificates (other than the Class A-1, Class A-2, Class A-4, Class A-5 and Class A-SB Certificates) is calculated as the product of (a) the weighted average Cut-off Date LTV for the mortgage loans, and (b) a fraction, the numerator of which is the total initial Certificate Balance of such Class of Certificates and all Classes of Principal Balance Certificates senior to such Class of Certificates and the denominator of which is the total initial Certificate Balance of all of the Classes of Principal Balance Certificates. The Class A-1, Class A-2, Class A-4, Class A-5 and Class A-SB Certificate Principal to Value Ratios are calculated in the aggregate for those Classes as if they were a single class. Investors should note, however, that excess mortgaged property value associated with a mortgage loan will not be available to offset losses on any other mortgage loan. |
| (5) | The “Underwritten NOI Debt Yield” for any Class of Principal Balance Certificates (other than the Class A-1, Class A-2, Class A-4, Class A-5 and Class A-SB Certificates) is calculated as the product of (a) the weighted average UW NOI DY for the mortgage loans and (b) a fraction, the numerator of which is the total initial Certificate Balance |
THE INFORMATION IN THIS STRUCTURAL AND COLLATERAL TERM SHEET IS NOT COMPLETE AND MAY BE AMENDED PRIOR TO THE TIME OF SALE. THIS TERM SHEET IS NOT AN OFFER TO SELL THESE SECURITIES AND IT IS NOT A SOLICITATION OF AN OFFER TO BUY THESE SECURITIES IN ANY JURISDICTION WHERE THE OFFER OR SALE IS NOT PERMITTED.
3 of 143
| Structural and Collateral Term Sheet | Benchmark 2022-B36 | |
| Indicative Capital Structure | ||
| of all of the Classes of Principal Balance Certificates and the denominator of which is the total initial Certificate Balance for such Class and all Classes of Principal Balance Certificates senior to such Class of Certificates. The Underwritten NOI Debt Yield for each of the Class A-1, Class A-2, Class A-4, Class A-5 and Class A-SB Certificates is calculated in the aggregate for those Classes as if they were a single Class. Investors should note, however, that net operating income from any mortgaged property supports only the related mortgage loan and will not be available to support any other mortgage loan. |
| (6) | The exact initial certificate balances of the Class A-4 and Class A-5 certificates are unknown and will be determined based on the final pricing of those classes of certificates. However, the respective initial certificate balances, weighted average lives and principal windows of the Class A-4 and Class A-5 certificates are expected to be within the applicable ranges reflected in the following chart. The aggregate initial certificate balance of the Class A-4 and Class A-5 certificates is expected to be approximately $391,140,000, subject to a variance of plus or minus 5%. |
| Class of Certificates | Expected Range of Initial Certificate Balance | Expected Range of Weighted Avg. Life (years) | Expected Range of Principal Window |
| A-4 | $0 – $175,000,000 | NAP – 9.79 | NAP / 5/2032 – 7/2032 |
| A-5 | $216,140,000 – $391,140,000 | 9.89 – 9.85 | 7/2032 – 7/2032 / 5/2032 – 7/2032 |
| (7) | The Class X-A, Class X-B, Class X-D, Class X-F, Class X-G, Class X-H, Class X-J and Class X-K Notional Amounts are defined in the Preliminary Prospectus. |
| (8) | The Classes of Certificates set forth under “Privately Offered Certificates”, “Non-Offered Vertical Risk Retention Interest” in the tables above are not being offered by the Preliminary Prospectus or this Term Sheet. The Class R Certificates are not shown above. |
| (9) | The expected weighted average life and expected principal window during which distributions of principal would be received as set forth in the foregoing table with respect to the VRR Interest are based on the assumptions set forth under “Yield and Maturity Considerations—Weighted Average Life” in the Preliminary Prospectus and on the assumptions that there are no prepayments, modifications or losses in respect of the mortgage loans and that there are no extensions or forbearances of maturity dates of the mortgage loans. |
| (10) | JPMorgan Chase Bank, National Association, as the retaining sponsor for this securitization is expected to acquire from the depositor, on the Closing Date, an “eligible vertical interest” (as defined in Regulation RR) comprised of the Class RR Certificates and the RR Interest (collectively, the “VRR Interest”), which is expected to represent approximately 5.00% of all Principal Balance Certificates and the VRR Interest. A portion of the VRR Interest will be acquired by DBR Investments Co. Limited (or its "majority-owned affiliate") (together with JPMorgan Chase Bank, National Association, in such capacity, the “VRR Interest Owners”) in accordance with the U.S. credit risk retention rules applicable to this securitization transaction. See “Credit Risk Retention” in the Preliminary Prospectus. |
| (11) | Although it does not have a specified pass-through rate (other than for tax reporting purposes), the effective interest rate for the VRR Interest will be the WAC rate. |
THE INFORMATION IN THIS STRUCTURAL AND COLLATERAL TERM SHEET IS NOT COMPLETE AND MAY BE AMENDED PRIOR TO THE TIME OF SALE. THIS TERM SHEET IS NOT AN OFFER TO SELL THESE SECURITIES AND IT IS NOT A SOLICITATION OF AN OFFER TO BUY THESE SECURITIES IN ANY JURISDICTION WHERE THE OFFER OR SALE IS NOT PERMITTED.
4 of 143
| Structural and Collateral Term Sheet | Benchmark 2022-B36 | |
| Summary of Transaction Terms | ||
| Securities Offered: | $630,182,000 monthly pay, multi-class, commercial mortgage REMIC Pass-Through Certificates. |
| Co-Lead Managers and Joint Bookrunners: | J.P. Morgan Securities LLC, Citigroup Global Markets Inc., Goldman Sachs & Co. LLC and Deutsche Bank Securities Inc. |
| Co-Managers: | Drexel Hamilton, LLC and Academy Securities, Inc. |
| Mortgage Loan Sellers: | Citi Real Estate Funding Inc. (“CREFI”) (37.6%), German American Capital Corporation (“GACC”) (23.8%), Goldman Sachs Mortgage Company (“GSMC”) (20.4%), and JPMorgan Chase Bank, National Association (“JPMCB”) (18.1%). |
| Master Servicer: | Midland Loan Services, a Division of PNC Bank, National Association. |
| Special Servicer: | Midland Loan Services, a Division of PNC Bank, National Association. |
| Directing Certificateholder: | KKR Real Estate Credit Opportunity Partners II L.P. |
| Trustee: | Wilmington Trust, N.A. |
| Certificate Administrator: | Computershare Trust Company, N.A. |
| Operating Advisor: | Park Bridge Lender Services LLC. |
| Asset Representations Reviewer: | Park Bridge Lender Services LLC. |
| Rating Agencies: | Moody’s Investors Service, Inc. (“Moody’s”), Fitch Ratings, Inc. (“Fitch”) and DBRS, Inc. (“DBRS”). |
| U.S. Credit Risk Retention: | JPMCB is expected to act as the “retaining sponsor” for this securitization and intends to satisfy the U.S. credit risk retention requirement by acquiring (either through itself or through one or more of its “majority owned affiliates” (as defined in Regulation RR)) from the depositor, on the Closing Date, an “eligible vertical interest” which will be comprised of the VRR Interest and a portion of which will be transferred by JPMCB to DBRI (or its "majority-owned affiliate").
The restrictions on hedging and transfer under the U.S. credit risk retention rules as in effect on the closing date of this transaction will expire on and after the date that is the latest of (i) the date on which the aggregate principal balance of the mortgage loans has been reduced to 33% of the aggregate principal balance of the mortgage loans as of the Cut-off Date; (ii) the date on which the total unpaid principal obligations under the Certificates has been reduced to 33% of the aggregate total unpaid principal obligations under the Certificates as of the Closing Date; or (iii) two years after the Closing Date.
Notwithstanding any references in this term sheet to the credit risk retention rules, Regulation RR, the retaining sponsor and other risk retention related matters, in the event the credit risk retention rules and/or Regulation RR (or any relevant portion thereof) are repealed or determined by applicable regulatory agencies to be no longer applicable to this securitization transaction, none of the retaining sponsor or any other party will be required to comply with or act in accordance with the U.S. credit risk retention rules and/or Regulation RR (or such relevant portion thereof).
For additional information, see “Credit Risk Retention” in the Preliminary Prospectus.
|
| EU/UK Credit Risk Retention: | The transaction is not structured to satisfy any requirements in effect in the European Union or the United Kingdom as regards risk retention, transparency/reporting and due diligence. |
| Pricing Date: | Week of August 1st, 2022. |
| Closing Date: | On or about August 23rd, 2022. |
| Cut-off Date: | With respect to each mortgage loan, the related due date in August 2022 or with respect to any mortgage loan that has its first due date after August 2022, the date that would otherwise have been the related due date in August 2022. |
| Distribution Date: | The 4th business day after the Determination Date in each month, commencing in September 2022. |
| Determination Date: | 11th day of each month, or if the 11th day is not a business day, the next succeeding business day, commencing in September 2022. |
| Assumed Final Distribution Date: | The Distribution Date in August 2032, which is the latest anticipated repayment date of the Certificates. |
| Rated Final Distribution Date: | The Distribution Date in July 2055. |
| Tax Treatment: | The Publicly Offered Certificates are expected to be treated as REMIC “regular interests” for U.S. federal income tax purposes. |
THE INFORMATION IN THIS STRUCTURAL AND COLLATERAL TERM SHEET IS NOT COMPLETE AND MAY BE AMENDED PRIOR TO THE TIME OF SALE. THIS TERM SHEET IS NOT AN OFFER TO SELL THESE SECURITIES AND IT IS NOT A SOLICITATION OF AN OFFER TO BUY THESE SECURITIES IN ANY JURISDICTION WHERE THE OFFER OR SALE IS NOT PERMITTED.
5 of 143
| Structural and Collateral Term Sheet | Benchmark 2022-B36 | |
| Summary of Transaction Terms | ||
| Form of Offering: | The Class A-1, Class A-2, Class A-4, Class A-5, Class A-SB, Class X-A, Class X-B, Class A-S, Class B and Class C Certificates (the “Publicly Offered Certificates”) will be offered publicly. The Class X-D, Class X-F, Class X-G, Class X-H, Class X-J, Class X-K, Class D, Class E, Class F, Class G, Class H, Class J, Class K and Class R Certificates (the “Privately Offered Certificates”) will be offered domestically to Qualified Institutional Buyers and to Institutional Accredited Investors (other than the Class R Certificates) and to institutions that are not U.S. Persons pursuant to Regulation S. |
| SMMEA Status: | The Publicly Offered Certificates will not constitute “mortgage related securities” for purposes of SMMEA. |
| ERISA: | The Publicly Offered Certificates are expected to be ERISA eligible. |
| Optional Termination: | On any Distribution Date on which the aggregate principal balance of the pool of mortgage loans is less than 1% of the aggregate principal balance of the mortgage loans as of the Cut-off Date, certain entities specified in the Preliminary Prospectus will have the option to purchase all of the remaining mortgage loans (and all property acquired through exercise of remedies in respect of any mortgage loan) at the price specified in the Preliminary Prospectus. Refer to “Pooling and Servicing Agreement—Termination; Retirement of Certificates” in the Preliminary Prospectus. |
| Minimum Denominations: | The Publicly Offered Certificates (other than the Class X-A and Class X-B Certificates) will be issued in minimum denominations of $10,000 and integral multiples of $1 in excess of $10,000. The Class X-A and Class X-B Certificates will be issued in minimum denominations of $1,000,000 and in integral multiples of $1 in excess of $1,000,000. |
| Settlement Terms: | DTC, Euroclear and Clearstream Banking. |
| Analytics: | The transaction is expected to be modeled by Intex Solutions, Inc. and Trepp, LLC and is expected to be available on Bloomberg L.P., Blackrock Financial Management, Inc., Interactive Data Corporation, CMBS.com, Inc., Markit Group Limited, Moody’s Analytics, MBS Data, LLC, RealINSIGHT, KBRA Analytics, LLC, Thomson Reuters Corporation and DealView Technologies Ltd. |
| Risk Factors: | THE CERTIFICATES INVOLVE CERTAIN RISKS AND MAY NOT BE SUITABLE FOR ALL INVESTORS. REFER TO “RISK FACTORS” IN THE PRELIMINARY PROSPECTUS. |
THE INFORMATION IN THIS STRUCTURAL AND COLLATERAL TERM SHEET IS NOT COMPLETE AND MAY BE AMENDED PRIOR TO THE TIME OF SALE. THIS TERM SHEET IS NOT AN OFFER TO SELL THESE SECURITIES AND IT IS NOT A SOLICITATION OF AN OFFER TO BUY THESE SECURITIES IN ANY JURISDICTION WHERE THE OFFER OR SALE IS NOT PERMITTED.
6 of 143
| Structural and Collateral Term Sheet | Benchmark 2022-B36 | |
| Collateral Characteristics | ||
| Loan Pool | ||
| Initial Pool Balance (“IPB”): | $753,806,375 | |
| Number of Mortgage Loans: | 31 | |
| Number of Mortgaged Properties: | 69 | |
| Average Cut-off Date Balance per Mortgage Loan: | $24,316,335 | |
| Weighted Average Current Mortgage Rate: | 5.13935% | |
| 10 Largest Mortgage Loans as % of IPB: | 67.8% | |
| Weighted Average Remaining Term to Maturity: | 110 months | |
| Weighted Average Seasoning: | 1 month | |
| Credit Statistics | ||
| Weighted Average UW NCF DSCR(1): | 2.07x | |
| Weighted Average UW NOI DY(1): | 11.1% | |
| Weighted Average Cut-off Date Loan-to-Value Ratio (“LTV”)(1)(2): | 51.9% | |
| Weighted Average Maturity Date LTV(1)(2): | 51.8% | |
| Other Statistics | ||
| % of Mortgage Loans with Additional Debt(3): | 8.8% | |
| % of Mortgaged Properties with Single Tenants: | 11.7% | |
| Amortization | ||
| Weighted Average Original Amortization Term(4): | 293 months | |
| Weighted Average Remaining Amortization Term(4): | 293 months | |
| % of Mortgage Loans with Interest-Only: | 97.5% | |
| % of Mortgage Loans with Partial Interest-Only followed by Amortizing Balloon: | 2.5% | |
| Lockbox / Cash Management(5) | ||
| % of Mortgage Loans with In-Place, Hard Lockboxes: | 66.0% | |
| % of Mortgage Loans with Springing Lockboxes: | 25.2% | |
| % of Mortgage Loans with Soft (Residential) / Hard (Commercial) Lockboxes: | 8.8% | |
| % of Mortgage Loans with Springing Cash Management: | 91.2% | |
| % of Mortgage Loans with In-Place Cash Management: | 8.8% | |
| Reserves | ||
| % of Mortgage Loans Requiring Monthly Tax Reserves: | 81.2% | |
| % of Mortgage Loans Requiring Monthly Insurance Reserves: | 24.1% | |
| % of Mortgage Loans Requiring Monthly CapEx Reserves(6): | 77.3% | |
| % of Mortgage Loans Requiring Monthly TI/LC Reserves(7): | 53.8% | |
| (1) | In the case of Loan Nos. 1, 2, 3, 6, 8 and 20, UW NCF DSCR, UW NOI DY, Cut-off Date LTV and Maturity Date LTV calculations include the related Pari Passu Companion Loan(s). In the case of Loan No. 2, UW NCF DSCR, UW NOI DY, Cut-off Date LTV and Maturity Date LTV calculations exclude the related Subordinate Companion Loan(s), related mezzanine loan(s) and/or related additional secured subordinate debt. |
| (2) | In the case of Loan Nos. 4, 8, 9, 19 and 28, Cut-off Date LTV and the Maturity Date LTV are calculated by using an appraised value based on certain hypothetical assumptions. Refer to “Description of the Mortgage Pool—Assessments of Property Value and Condition” and “Description of the Mortgage Pool—Appraised Value” in the Preliminary Prospectus for additional details. |
| (3) | Excludes Loan No. 12 with respect to an exchange transaction note in connection with, and to partially fund, the acquisition of the related Mortgaged Property. For a more detailed description, refer to “Description of the Mortgage Pool—Certain Terms of the Mortgage Loans—Additional Indebtedness” in the Preliminary Prospectus. |
| (4) | Excludes 29 mortgage loans that are interest-only for the entire term. |
| (5) | For a more detailed description of Lockbox / Cash Management, refer to “Description of the Mortgage Pool—Certain Terms of the Mortgage Loans—Mortgaged Property Accounts” in the Preliminary Prospectus. |
| (6) | CapEx Reserves include FF&E reserves for hotel properties. |
| (7) | Calculated only with respect to the Cut-off Date Balance of mortgage loans secured or partially secured by retail, office, industrial and mixed use properties. |
THE INFORMATION IN THIS STRUCTURAL AND COLLATERAL TERM SHEET IS NOT COMPLETE AND MAY BE AMENDED PRIOR TO THE TIME OF SALE. THIS TERM SHEET IS NOT AN OFFER TO SELL THESE SECURITIES AND IT IS NOT A SOLICITATION OF AN OFFER TO BUY THESE SECURITIES IN ANY JURISDICTION WHERE THE OFFER OR SALE IS NOT PERMITTED.
7 of 143
| Structural and Collateral Term Sheet | Benchmark 2022-B36 | |
| Collateral Characteristics | ||
Mortgage Loan Seller | Number of | Number of | Aggregate | % of IPB |
| CREFI(1) | 7 | 14 | $260,670,000 | 34.6% |
| GACC(2) | 12 | 15 | $179,612,500 | 23.8% |
| GSMC(3) | 8 | 36 | $153,911,375 | 20.4% |
| JPMCB(1) | 3 | 3 | $88,612,500 | 11.8% |
| CREFI/JPMCB(1)(4) | 1 | 1 | $71,000,000 | 9.4% |
| Total | 31 | 69 | $753,806,375 | 100.0% |
| (1) | In the case of Loan No. 1, the whole loan was co-originated by CREFI, Wells Fargo Bank, National Association (“WFBNA”) and JPMCB. In the case of Loan No. 2, the whole loan was co-originated by CREFI, Bank of Montreal (“BMO”) and Starwood Mortgage Capital LLC (“SMC”). In the case of Loan No. 6, the whole loan was co-originated by JPMCB and Morgan Stanley Bank, N.A. (“MSBNA”). |
| (2) | Each mortgage loan being sold by German American Capital Corporation (“GACC”) (with the exception of Loan Nos. 16 and 24) was originated or co-originated by DBRI, an affiliate of GACC. Each mortgage loan being sold by GACC will be transferred to GACC on or prior to the Closing Date. With respect to Loan Nos. 16 and 24, the mortgage loans were originated by unaffiliated third-parties, BSPRT CMBS Finance, LLC and Ladder Capital Finance LLC, respectively. |
| (3) | Each mortgage loan being sold by Goldman Sachs Mortgage Company (“GSMC”) was originated or co-originated by GSBI, an affiliate of GSMC, and will be transferred to GSMC on or prior to the Closing Date. |
| (4) | In the case of Loan No. 1, the whole loan was co-originated by CREFI and JPMCB. Loan No. 1 is evidenced by four promissory notes: (i) Note A-3-1, Notes A-3-2 and Note A-3-3, with a principal balance of $48,000,000 as of the Cut-off Date, as to which JPMCB is acting as mortgage loan seller and (ii) Note A-1-3, with a principal balance of $23,000,000 as of the Cut-off Date, as to which CREFI is acting as mortgage loan seller. |
| Ten Largest Mortgage Loans | |||||||||||
| No. | Loan Name | Mortgage Loan Seller | No. of Prop. | Cut-off Date Balance | % of IPB | SF / Units | Property Type | UW NCF DSCR(1) | UW NOI DY(1) | Cut-off Date LTV(1)(2) | Maturity Date LTV(1)(2) |
| 1 | 79 Fifth Avenue | CREFI/JPMCB | 1 | $71,000,000 | 9.4% | 345,751 | Office | 1.61x | 8.4% | 60.8% | 60.8% |
| 2 | Yorkshire & Lexington Towers | CREFI | 2 | 66,000,000 | 8.8% | 808 | Multifamily | 3.61x | 11.1% | 33.3% | 33.3% |
| 3 | 39 Broadway | CREFI | 1 | 65,000,000 | 8.6% | 450,583 | Office | 2.09x | 11.6% | 38.6% | 38.6% |
| 4 | 935 & 953 Sycamore | GACC | 1 | 60,000,000 | 8.0% | 138,294 | Mixed Use | 1.72x | 9.8% | 51.3% | 51.3% |
| 5 | JANAF Shopping Yard | CREFI | 1 | 60,000,000 | 8.0% | 842,216 | Retail | 2.04x | 12.2% | 56.4% | 56.4% |
| 6 | One Campus Martius | JPMCB | 1 | 50,000,000 | 6.6% | 1,356,325 | Office | 1.74x | 11.5% | 60.1% | 60.1% |
| 7 | Gateway Plaza | GSMC | 1 | 40,000,000 | 5.3% | 333,030 | Office | 2.69x | 17.1% | 45.4% | 45.4% |
| 8 | The Lion Building | GACC | 1 | 35,000,000 | 4.6% | 172,328 | Mixed Use | 1.74x | 9.7% | 58.8% | 58.8% |
| 9 | NMC Industrial Portfolio I | GSMC | 24 | 32,076,375 | 4.3% | 606,967 | Industrial | 2.05x | 9.9% | 57.3% | 57.3% |
| 10 | Keylock Storage Portfolio II | CREFI | 5 | 32,000,000 | 4.2% | 414,658 | Self Storage | 1.60x | 9.2% | 55.1% | 55.1% |
| Top 3 Total/Weighted Average | 4 | $202,000,000 | 26.8% | 2.42x | 10.3% | 44.7% | 44.7% | ||||
| Top 5 Total/Weighted Average | 6 | $322,000,000 | 42.7% | 2.22x | 10.6% | 48.1% | 48.1% | ||||
| Top 10 Total/Weighted Average | 38 | $511,076,375 | 67.8% | 2.13x | 11.0% | 50.8% | 50.8% | ||||
| (1) | In the case of Loan Nos. 1, 2, 3, 6 and 8, UW NCF DSCR, UW NOI DY, Cut-off Date LTV and Maturity Date LTV calculations include the related Pari Passu Companion Loan(s). In the case of Loan No. 2, UW NCF DSCR, UW NOI DY, Cut-off Date LTV and Maturity Date LTV calculations exclude the related Subordinate Companion Loan(s), related mezzanine loan(s) and/or related additional secured subordinate debt. |
| (2) | In the case of Loan Nos. 4, 8 and 9, Cut-off Date LTV and the Maturity Date LTV are calculated by using an appraised value based on certain hypothetical assumptions. Refer to “Description of the Mortgage Pool—Assessments of Property Value and Condition” and “Description of the Mortgage Pool—Appraised Value” in the Preliminary Prospectus for additional details. |
THE INFORMATION IN THIS STRUCTURAL AND COLLATERAL TERM SHEET IS NOT COMPLETE AND MAY BE AMENDED PRIOR TO THE TIME OF SALE. THIS TERM SHEET IS NOT AN OFFER TO SELL THESE SECURITIES AND IT IS NOT A SOLICITATION OF AN OFFER TO BUY THESE SECURITIES IN ANY JURISDICTION WHERE THE OFFER OR SALE IS NOT PERMITTED.
8 of 143
| Structural and Collateral Term Sheet | Benchmark 2022-B36 | |
| Collateral Characteristics | ||
| Companion Loan Summary | ||||||||
| Loan No. | Mortgage Loan | Note(s) | Original Balance ($) | Cut-off Date Balance ($) | Holder of Note | Lead Servicer for Whole Loan (Y/N) | Master Servicer Under Lead Securitization | Special Servicer Under Lead Securitization |
| 1 | 79 Fifth Avenue | A-1-1 | $50,000,000 | $50,000,000 | CGCMT 2022-GC48 | Yes | Midland | Midland |
| A-1-2 | $23,000,000 | $23,000,000 | BMO 2022-C2 | No | ||||
| A-1-3, A-3-1, A-3-2, A-3-3 | $71,000,000 | $71,000,000 | Benchmark 2022-B36 | No | ||||
| A-2-1 | $70,000,000 | $70,000,000 | BANK 2022-BNK42 | No | ||||
| A-2-2 | $13,000,000 | $13,000,000 | WFB | No | ||||
| A-2-3-1 | $12,000,000 | $12,000,000 | WFB | No | ||||
| A-2-3-2 | $1,000,000 | $1,000,000 | BANK 2022-BNK42 | No | ||||
| Total | $240,000,000 | $240,000,000 | ||||||
| 2 | Yorkshire & Lexington Towers | A-1 | $25,000,000 | $25,000,000 | BMO | No | ||
| A-2 | $25,000,000 | $25,000,000 | BBCMS 2022-C16 | No | ||||
| A-3, A-12, A-15, A-18 | $66,000,000 | $66,000,000 | Benchmark 2022-B36 | No | ||||
| A-4 | $20,000,000 | $20,000,000 | CGCMT 2022-GC48 | No | ||||
| A-5 | $20,000,000 | $20,000,000 | BBCMS 2022-C16 | No | ||||
| A-6 | $20,000,000 | $20,000,000 | BMO 2022-C2 | No | ||||
| A-7 | $20,000,000 | $20,000,000 | BMO 2022-C2 | No | ||||
| A-8 | $20,000,000 | $20,000,000 | BBCMS 2022-C16 | No | ||||
| A-9 | $20,000,000 | $20,000,000 | CGCMT 2022-GC48 | No | ||||
| A-10 | $20,000,000 | $20,000,000 | BMO | No | ||||
| A-11 | $20,000,000 | $20,000,000 | CGCMT 2022-GC48 | No | ||||
| A-13 | $10,000,000 | $10,000,000 | BMO 2022-C2 | No | ||||
| A-14 | $10,000,000 | $10,000,000 | BMO 2022-C2 | No | ||||
| A-16 | $12,000,000 | $12,000,000 | BMO | No | ||||
| A-17 | $10,000,000 | $10,000,000 | BMO 2022-C2 | No | ||||
| B-1(1) | $147,666,667 | $147,666,667 | CGCMT 2022-GC48 (Loan Specific) | Yes | Midland | Rialto | ||
| B-2(1) | $73,833,333 | $73,833,333 | CGCMT 2022-GC48 (Loan Specific) | Yes | ||||
| Total | $539,500,000 | $539,500,000 | ||||||
| 3 | 39 Broadway | A-1 | $65,000,000 | $65,000,000 | Benchmark 2022-B36 | Yes | Midland | Midland |
| A-2 | $20,000,000 | $20,000,000 | CREFI | No | ||||
| Total | $85,000,000 | $85,000,000 | ||||||
| 6 | One Campus | A-1 | $50,000,000 | $50,000,000 | Benchmark 2022-B36 | Yes | Midland | Midland |
| Martius | A-2 | $30,000,000 | $30,000,000 | JPMCB | No | |||
| A-3 | $25,000,000 | $25,000,000 | JPMCB | No | ||||
| A-4 | $15,800,000 | $15,800,000 | JPMCB | No | ||||
| A-5 | $10,000,000 | $10,000,000 | JPMCB | No | ||||
| A-6 | $46,200,000 | $46,200,000 | MSBNA | No | ||||
| A-7 | $25,000,000 | $25,000,000 | MSBNA | No | ||||
| A-8 | $16,000,000 | $16,000,000 | MSBNA | No | ||||
| Total | $218,000,000 | $218,000,000 | ||||||
| 8 | The Lion Building | A-1 | $50,000,000 | $50,000,000 | BMO 2022-C2 | Yes | Midland | Rialto |
| A-2-1 | $15,000,000 | $15,000,000 | BMO 2022-C2 | No | ||||
| A-2-2, A-3, A-4 | $35,000,000 | $35,000,000 | Benchmark 2022-B36 | No | ||||
| Total | $100,000,000 | $100,000,000 | ||||||
| 20 | The Reef | A-1 | $50,000,000 | $50,000,000 | Benchmark 2022-B35 | Yes | KeyBank | KeyBank |
| A-2 | $40,000,000 | $40,000,000 | Benchmark 2022-B35 | No | ||||
| A-3 | $25,000,000 | $25,000,000 | BMO 2022-C2 | No | ||||
| A-4-1 | $15,000,000 | $15,000,000 | BMO 2022-C2 | No | ||||
| A-4-2 | $10,000,000 | $10,000,000 | Benchmark 2022-B36 | No | ||||
| A-5 | $10,000,000 | $10,000,000 | Benchmark 2022-B35 | No | ||||
| Total | $150,000,000 | $150,000,000 | ||||||
| (1) | Each note represents a subordinate companion loan. |
THE INFORMATION IN THIS STRUCTURAL AND COLLATERAL TERM SHEET IS NOT COMPLETE AND MAY BE AMENDED PRIOR TO THE TIME OF SALE. THIS TERM SHEET IS NOT AN OFFER TO SELL THESE SECURITIES AND IT IS NOT A SOLICITATION OF AN OFFER TO BUY THESE SECURITIES IN ANY JURISDICTION WHERE THE OFFER OR SALE IS NOT PERMITTED.
9 of 143
| Structural and Collateral Term Sheet | Benchmark 2022-B36 | |
| Collateral Characteristics | ||
| Additional Debt Summary |
No. | Loan Name | Trust | Subordinate Debt Cut-off Date Balance(1) | Total Debt Cut-off Date Balance | Mortgage Loan UW | Total Debt UW NCF DSCR | Mortgage Loan | Total Debt Cut-off Date | Mortgage Loan UW | Total Debt UW NOI DY |
| 2 | Yorkshire & Lexington Towers | $66,000,000 | $396,000,000 | $714,000,000 | 3.61x | 1.20x | 33.3% | 74.8% | 11.1% | 5.0% |
| (1) | In the case of Loan No. 2, Subordinate Debt Cut-off Date Balance represents one or more Subordinate Companion Loan(s) and/or related mezzanine loan(s). |
| (2) | In the case of Loan No. 2, Mortgage Loan UW NCF DSCR, Mortgage Loan UW NOI DY and Mortgage Loan Cut-off Date LTV calculations exclude the related Subordinate Companion Loan(s) and/or related mezzanine loan(s). |
THE INFORMATION IN THIS STRUCTURAL AND COLLATERAL TERM SHEET IS NOT COMPLETE AND MAY BE AMENDED PRIOR TO THE TIME OF SALE. THIS TERM SHEET IS NOT AN OFFER TO SELL THESE SECURITIES AND IT IS NOT A SOLICITATION OF AN OFFER TO BUY THESE SECURITIES IN ANY JURISDICTION WHERE THE OFFER OR SALE IS NOT PERMITTED.
10 of 143
| Structural and Collateral Term Sheet | Benchmark 2022-B36 | |
| Collateral Characteristics | ||
| Mortgaged Properties by Type(1) |
| Weighted Average | |||||||||
| Property Type | Property Subtype | Number of Properties | Cut-off Date Principal Balance | % of IPB | Occupancy | UW NCF DSCR(2) | UW NOI DY(2) | Cut-off Date LTV(2)(3) | Maturity Date LTV (2)(3) |
| Office | CBD | 4 | $226,000,000 | 30.0% | 90.4% | 1.97x | 11.5% | 51.5% | 51.5% |
| Suburban | 1 | 20,000,000 | 2.7 | 95.4% | 1.44x | 9.5% | 62.7% | 62.7% | |
| Subtotal: | 5 | $246,000,000 | 32.6% | 90.8% | 1.93x | 11.4% | 52.4% | 52.4% | |
| Retail | Anchored | 4 | $115,212,500 | 15.3% | 92.9% | 2.10x | 12.1% | 58.0% | 58.0% |
| Single Tenant | 2 | 6,600,000 | 0.9 | 100.0% | 1.61x | 9.9% | 45.7% | 45.7% | |
| Unanchored | 1 | 5,800,000 | 0.8 | 92.0% | 1.54x | 10.0% | 59.3% | 59.3% | |
| Subtotal: | 7 | $127,612,500 | 16.9% | 93.2% | 2.05x | 11.9% | 57.4% | 57.4% | |
| Mixed Use | Office/Retail | 2 | $70,000,000 | 9.3% | 93.5% | 1.81x | 10.3% | 50.1% | 50.1% |
| Industrial/Office | 3 | 47,572,500 | 6.3 | 100.0% | 1.80x | 9.9% | 57.4% | 57.4% | |
| Subtotal: | 5 | $117,572,500 | 15.6% | 96.1% | 1.80x | 10.2% | 53.1% | 53.1% | |
| Self Storage | Self Storage | 18 | $102,452,500 | 13.6% | 91.9% | 1.76x | 10.0% | 52.4% | 52.4% |
| Subtotal: | 18 | $102,452,500 | 13.6% | 91.9% | 1.76x | 10.0% | 52.4% | 52.4% | |
| Industrial | Flex | 23 | $38,259,948 | 5.1% | 99.1% | 1.89x | 10.1% | 59.5% | 58.3% |
| Warehouse/Distribution | 3 | 14,878,927 | 2.0 | 100.0% | 2.03x | 9.8% | 57.5% | 57.5% | |
| Manufacturing/Distribution | 1 | 14,317,500 | 1.9 | 100.0% | 2.03x | 9.8% | 57.5% | 57.5% | |
| Manufacturing | 3 | 10,062,500 | 1.3 | 100.0% | 2.04x | 9.9% | 57.5% | 57.5% | |
| Subtotal: | 30 | $77,518,875 | 10.3% | 99.6% | 1.96x | 10.0% | 58.5% | 57.9% | |
| Multifamily | High Rise | 2 | $66,000,000 | 8.8% | 96.4% | 3.61x | 11.1% | 33.3% | 33.3% |
| Subtotal: | 2 | $66,000,000 | 8.8% | 96.4% | 3.61x | 11.1% | 33.3% | 33.3% | |
| Hospitality | Full Service | 1 | $10,600,000 | 1.4% | 61.2% | 2.56x | 25.4% | 28.6% | 21.1% |
| Subtotal: | 1 | $10,600,000 | 1.4% | 61.2% | 2.56x | 25.4% | 28.6% | 21.1% | |
| Other | Leased Fee | 1 | $6,050,000 | 0.8% | NAP | 1.90x | 10.9% | 45.8% | 45.8% |
| Subtotal: | 1 | $6,050,000 | 0.8% | NAP | 1.90x | 10.9% | 45.8% | 45.8% | |
| Total / Weighted Average: | 69 | $753,806,375 | 100.0% | 92.4% | 2.07x | 11.1% | 51.9% | 51.8% | |
| (1) | Because this table presents information relating to the mortgaged properties and not mortgage loans, the information for mortgage loans secured by more than one mortgaged property is based on allocated loan amounts. |
| (2) | In the case of Loan Nos. 1, 2, 3, 6, 8 and 20, UW NCF DSCR, UW NOI DY, Cut-off Date LTV and Maturity Date LTV calculations include the related Pari Passu Companion Loan(s). In the case of Loan No. 2, UW NCF DSCR, UW NOI DY, Cut-off Date LTV and Maturity Date LTV calculations exclude the related Subordinate Companion Loan(s), related mezzanine loan(s) and/or related additional secured subordinate debt. |
| (3) | In the case of Loan Nos. 4, 8, 9, 19 and 28, Cut-off Date LTV and the Maturity Date LTV are calculated by using an appraised value based on certain hypothetical assumptions. Refer to “Description of the Mortgage Pool—Assessments of Property Value and Condition” and “Description of the Mortgage Pool—Appraised Value” in the Preliminary Prospectus for additional details. |
THE INFORMATION IN THIS STRUCTURAL AND COLLATERAL TERM SHEET IS NOT COMPLETE AND MAY BE AMENDED PRIOR TO THE TIME OF SALE. THIS TERM SHEET IS NOT AN OFFER TO SELL THESE SECURITIES AND IT IS NOT A SOLICITATION OF AN OFFER TO BUY THESE SECURITIES IN ANY JURISDICTION WHERE THE OFFER OR SALE IS NOT PERMITTED.
11 of 143
| Structural and Collateral Term Sheet | Benchmark 2022-B36 | |
| Collateral Characteristics | ||
| Mortgaged Properties by Location(1) | ||||||||
Weighted Average | ||||||||
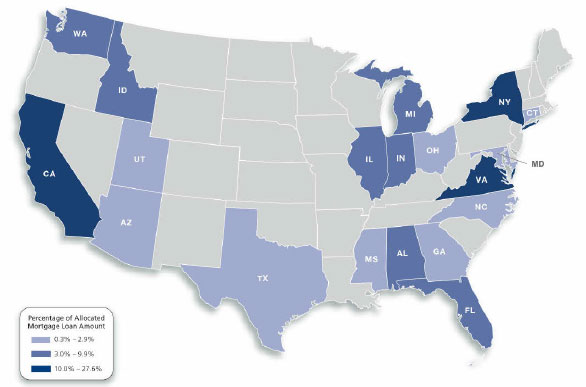
State | Number of Properties | Cut-off Date Principal Balance | % of | Occupancy | UW NCF DSCR(2) | UW NOI DY(2) | Cut-off Date LTV(2)(3) | Maturity Date LTV (2)(3) |
| New York | 5 | $208,050,000 | 27.6% | 89.5% | 2.40x | 10.3% | 44.7% | 44.7% |
| Virginia | 3 | 108,000,000 | 14.3 | 93.4% | 2.28x | 14.0% | 51.6% | 51.6% |
| California | 3 | 105,000,000 | 13.9 | 95.6% | 1.79x | 10.1% | 53.0% | 53.0% |
| Michigan | 3 | 56,792,500 | 7.5 | 88.4% | 1.75x | 11.4% | 60.7% | 60.7% |
| Florida | 8 | 51,395,712 | 6.8 | 88.6% | 1.83x | 13.0% | 50.7% | 49.2% |
| Alabama | 22 | 34,652,272 | 4.6 | 100.0% | 2.05x | 9.9% | 57.3% | 57.3% |
| Illinois | 1 | 28,012,500 | 3.7 | 95.0% | 2.21x | 11.7% | 65.9% | 65.9% |
| Idaho | 4 | 27,314,148 | 3.6 | 91.1% | 1.60x | 9.2% | 55.1% | 55.1% |
| Washington | 3 | 26,485,852 | 3.5 | 91.7% | 1.93x | 11.8% | 52.6% | 52.6% |
| Indiana | 2 | 22,787,500 | 3.0 | 98.6% | 1.77x | 10.1% | 61.1% | 59.1% |
| Texas | 3 | 20,800,000 | 2.8 | 91.9% | 1.81x | 10.1% | 47.6% | 47.6% |
| North Carolina | 2 | 16,900,000 | 2.2 | 95.9% | 1.90x | 10.3% | 53.8% | 53.8% |
| Mississippi | 1 | 12,592,500 | 1.7 | 100.0% | 2.03x | 9.8% | 57.5% | 57.5% |
| Arizona | 1 | 11,200,000 | 1.5 | 94.7% | 2.06x | 10.8% | 58.6% | 58.6% |
| Maryland | 1 | 6,190,000 | 0.8 | 100.0% | 1.88x | 11.2% | 49.5% | 49.5% |
| Connecticut | 1 | 5,700,000 | 0.8 | 77.3% | 1.56x | 9.5% | 46.0% | 46.0% |
| Georgia | 3 | 5,373,391 | 0.7 | 100.0% | 2.04x | 9.8% | 57.4% | 57.4% |
| Utah | 2 | 4,290,000 | 0.6 | 95.7% | 1.59x | 10.1% | 54.0% | 54.0% |
| Ohio | 1 | 2,270,000 | 0.3 | 95.0% | 2.18x | 12.2% | 63.1% | 63.1% |
| Total / Weighted Average: | 69 | $753,806,375 | 100.0% | 92.4% | 2.07x | 11.1% | 51.9% | 51.8% |
| (1) | Because this table presents information relating to the mortgaged properties and not mortgage loans, the information for mortgage loans secured by more than one mortgaged property is based on allocated loan amounts. |
| (2) | In the case of Loan Nos. 1, 2, 3, 6, 8 and 20, UW NCF DSCR, UW NOI DY, Cut-off Date LTV and Maturity Date LTV calculations include the related Pari Passu Companion Loan(s). In the case of Loan No. 2, UW NCF DSCR, UW NOI DY, Cut-off Date LTV and Maturity Date LTV calculations exclude the related Subordinate Companion Loan(s), related mezzanine loan(s) and/or related additional secured subordinate debt. |
| (3) | In the case of Loan Nos. 4, 8, 9, 19 and 28, Cut-off Date LTV and the Maturity Date LTV are calculated by using an appraised value based on certain hypothetical assumptions. Refer to “Description of the Mortgage Pool—Assessments of Property Value and Condition” and “Description of the Mortgage Pool—Appraised Value” in the Preliminary Prospectus for additional details. |
THE INFORMATION IN THIS STRUCTURAL AND COLLATERAL TERM SHEET IS NOT COMPLETE AND MAY BE AMENDED PRIOR TO THE TIME OF SALE. THIS TERM SHEET IS NOT AN OFFER TO SELL THESE SECURITIES AND IT IS NOT A SOLICITATION OF AN OFFER TO BUY THESE SECURITIES IN ANY JURISDICTION WHERE THE OFFER OR SALE IS NOT PERMITTED.
12 of 143
| Structural and Collateral Term Sheet | Benchmark 2022-B36 | |
| Collateral Characteristics | ||
| Cut-off Date Principal Balance |
Weighted Average | |||||||||||
| Range of Cut-off Date Principal Balances | Number of Loans | Cut-off Date Principal Balance | % of IPB | Mortgage Rate | Remaining Loan Term | UW NCF DSCR(1) | UW NOI DY(1) | Cut-off Date LTV(1)(2) | Maturity Date LTV (1)(2) | ||
| $2,270,000 | - | $9,999,999 | 11 | $63,162,500 | 8.4% | 5.80831% | 113 | 1.72x | 10.6% | 54.3% | 53.5% |
| $10,000,000 | - | $19,999,999 | 6 | 77,867,500 | 10.3 | 5.27823% | 118 | 2.15x | 13.4% | 49.4% | 48.4% |
| $20,000,000 | - | $29,999,999 | 3 | 71,512,500 | 9.5 | 5.59797% | 119 | 1.86x | 10.6% | 58.3% | 58.3% |
| $30,000,000 | - | $49,999,999 | 5 | 169,263,875 | 22.5 | 5.14976% | 105 | 2.05x | 11.4% | 54.4% | 54.4% |
| $50,000,000 | - | $71,000,000 | 6 | 372,000,000 | 49.3 | 4.90379% | 108 | 2.15x | 10.7% | 49.7% | 49.7% |
Total / Wtd. Avg: | 31 | $753,806,375 | 100.0% | 5.13935% | 110 | 2.07x | 11.1% | 51.9% | 51.8% | ||
| Mortgage Interest Rates |
Weighted Average | |||||||||||
| Range of Mortgage Interest Rates | Number of Loans | Cut-off Date Principal Balance | % of IPB | Mortgage Rate | Remaining Loan Term | UW NCF DSCR(1) | UW NOI DY(1) | Cut-off Date LTV(1)(2) | Maturity Date LTV (1)(2) | ||
| 3.04000% | - | 3.99999% | 1 | $66,000,000 | 8.8% | 3.04000% | 58 | 3.61x | 11.1% | 33.3% | 33.3% |
| 4.00000% | - | 4.99999% | 4 | 146,431,375 | 19.4 | 4.65315% | 118 | 1.83x | 9.2% | 59.1% | 59.1% |
| 5.00000% | - | 5.49999% | 11 | 314,882,500 | 41.8 | 5.26172% | 119 | 1.96x | 11.0% | 51.6% | 51.6% |
| 5.50000% | - | 6.35000% | 15 | 226,492,500 | 30.0 | 5.89530% | 107 | 1.92x | 12.5% | 53.1% | 52.6% |
| Total / Wtd. Avg: | 31 | $753,806,375 | 100.0% | 5.13935% | 110 | 2.07x | 11.1% | 51.9% | 51.8% | ||
| Original Term to Maturity in Months |
Weighted Average | |||||||||
| Original Term to Maturity in Months | Number of Loans | Cut-off Date Principal Balance | % of IPB | Mortgage Rate | Remaining Loan Term | UW NCF DSCR(1) | UW NOI DY(1) | Cut-off Date LTV(1)(2) | Maturity Date LTV (1)(2) |
| 60 | 3 | $112,600,000 | 14.9% | 4.24070% | 58 | 3.17x | 13.2% | 38.3% | 38.3% |
| 120 | 28 | 641,206,375 | 85.1 | 5.29716% | 119 | 1.87x | 10.8% | 54.3% | 54.1% |
Total / Wtd. Avg: | 31 | $753,806,375 | 100.0% | 5.13935% | 110 | 2.07x | 11.1% | 51.9% | 51.8% |
| Remaining Term to Maturity in Months |
| Weighted Average | |||||||||||
| Range of Remaining Term to Maturity in Months | Number of Loans | Cut-off Date Principal Balance | % of IPB | Mortgage Rate | Remaining Loan Term | UW NCF DSCR(1) | UW NOI DY(1) | Cut-off Date LTV(1)(2) | Maturity Date LTV (1)(2) | ||
| 58 | - | 99 | 3 | $112,600,000 | 14.9% | 4.24070% | 58 | 3.17x | 13.2% | 38.3% | 38.3% |
| 100 | - | 118 | 7 | 143,450,000 | 19.0 | 5.05893% | 117 | 1.89x | 10.2% | 59.0% | 59.0% |
| 119 | - | 119 | 12 | 284,606,375 | 37.8 | 5.33109% | 119 | 1.90x | 11.3% | 56.9% | 56.7% |
| 120 | - | 120 | 9 | 213,150,000 | 28.3 | 5.41217% | 120 | 1.82x | 10.4% | 47.7% | 47.5% |
| Total / Wtd. Avg: | 31 | $753,806,375 | 100.0% | 5.13935% | 110 | 2.07x | 11.1% | 51.9% | 51.8% | ||
| (1) | In the case of Loan Nos. 1, 2, 3, 6, 8 and 20, UW NCF DSCR, UW NOI DY, Cut-off Date LTV and Maturity Date LTV calculations include the related Pari Passu Companion Loan(s). In the case of Loan No. 2, UW NCF DSCR, UW NOI DY, Cut-off Date LTV and Maturity Date LTV calculations exclude the related Subordinate Companion Loan(s), related mezzanine loan(s) and/or related additional secured subordinate debt. |
| (2) | In the case of Loan Nos. 4, 8, 9, 19 and 28, Cut-off Date LTV and the Maturity Date LTV are calculated by using an appraised value based on certain hypothetical assumptions. Refer to “Description of the Mortgage Pool—Assessments of Property Value and Condition” and “Description of the Mortgage Pool—Appraised Value” in the Preliminary Prospectus for additional details. |
THE INFORMATION IN THIS STRUCTURAL AND COLLATERAL TERM SHEET IS NOT COMPLETE AND MAY BE AMENDED PRIOR TO THE TIME OF SALE. THIS TERM SHEET IS NOT AN OFFER TO SELL THESE SECURITIES AND IT IS NOT A SOLICITATION OF AN OFFER TO BUY THESE SECURITIES IN ANY JURISDICTION WHERE THE OFFER OR SALE IS NOT PERMITTED.
13 of 143
| Structural and Collateral Term Sheet | Benchmark 2022-B36 | |
| Collateral Characteristics | ||
| Original Amortization Term in Months |
| Weighted Average | |||||||||||
| Original Amortization Term in Months | Number of Loans | Cut-off Date Principal Balance | % of IPB | Mortgage Rate | Remaining Loan Term | UW NCF DSCR(1) | UW NOI DY(1) | Cut-off Date LTV(1)(2) | Maturity Date LTV (1)(2) | ||
Interest Only | 29 | $734,736,375 | 97.5% | 5.11883% | 110 | 2.07x | 10.9% | 52.1% | 52.1% | ||
| 240 | - | 240 | 1 | 10,600,000 | 1.4 | 5.81800% | 119 | 2.56x | 25.4% | 28.6% | 21.1% |
| 360 | - | 360 | 1 | 8,470,000 | 1.1 | 6.07000% | 120 | 1.34x | 10.7% | 67.2% | 61.9% |
| Total / Wtd. Avg: | 31 | $753,806,375 | 100.0% | 5.13935% | 110 | 2.07x | 11.1% | 51.9% | 51.8% | ||
| Remaining Amortization Term in Months |
| Weighted Average | |||||||||||
| Range of Remaining Amortization Term in Months | Number of Loans | Cut-off Date Principal Balance | % of IPB | Mortgage Rate | Remaining Loan Term | UW NCF DSCR(1) | UW NOI DY(1) | Cut-off Date LTV(1)(2) | Maturity Date LTV (1)(2) | ||
Interest Only | 29 | $734,736,375 | 97.5% | 5.11883% | 110 | 2.07x | 10.9% | 52.1% | 52.1% | ||
| 240 | - | 240 | 1 | 10,600,000 | 1.4 | 5.81800% | 119 | 2.56x | 25.4% | 28.6% | 21.1% |
| 360 | - | 360 | 1 | 8,470,000 | 1.1 | 6.07000% | 120 | 1.34x | 10.7% | 67.2% | 61.9% |
| Total / Wtd. Avg: | 31 | $753,806,375 | 100.0% | 5.13935% | 110 | 2.07x | 11.1% | 51.9% | 51.8% | ||
| Amortization Types |
Weighted Average | |||||||||
| Amortization Types | Number of Loans | Cut-off Date Principal Balance | % of IPB | Mortgage Rate | Remaining Loan Term | UW NCF DSCR(1) | UW NOI DY(1) | Cut-off Date LTV(1)(2) | Maturity Date LTV (1)(2) |
| Interest Only | 29 | $734,736,375 | 97.5% | 5.11883% | 110 | 2.07x | 10.9% | 52.1% | 52.1% |
| Interest Only, Amortizing Balloon | 2 | 19,070,000 | 2.5 | 5.92993% | 119 | 2.02x | 18.9% | 45.7% | 39.2% |
| Total / Wtd. Avg: | 31 | $753,806,375 | 100.0% | 5.13935% | 110 | 2.07x | 11.1% | 51.9% | 51.8% |
| Underwritten Net Cash Flow Debt Service Coverage Ratios(1) |
| Weighted Average | |||||||||||
| Range of Underwritten Net Cash Flow Debt Service Coverage Ratios | Number of Loans | Cut-off Date Principal Balance | % of IPB | Mortgage Rate | Remaining Loan Term | UW NCF DSCR(1) | UW NOI DY(1) | Cut-off Date LTV(1)(2) | Maturity Date LTV (1)(2) | ||
| 1.34x | - | 1.79x | 11 | $298,860,000 | 39.6% | 5.52606% | 118 | 1.65x | 9.7% | 57.5% | 57.3% |
| 1.80x | - | 2.09x | 13 | 282,063,875 | 37.4 | 5.03896% | 119 | 2.01x | 11.0% | 51.2% | 51.2% |
| 2.10x | - | 2.29x | 3 | 46,282,500 | 6.1 | 5.35503% | 118 | 2.19x | 12.2% | 60.1% | 60.1% |
| 2.30x | - | 2.59x | 2 | 20,600,000 | 2.7 | 5.62722% | 118 | 2.45x | 19.6% | 35.6% | 31.7% |
| 2.60x | 2.99x | 1 | 40,000,000 | 5.3 | 5.92100% | 59 | 2.69x | 17.1% | 45.4% | 45.4% | |
| 3.00x | - | 3.61x | 1 | 66,000,000 | 8.8 | 3.04000% | 58 | 3.61x | 11.1% | 33.3% | 33.3% |
| Total / Wtd. Avg: | 31 | $753,806,375 | 100.0% | 5.13935% | 110 | 2.07x | 11.1% | 51.9% | 51.8% | ||
| (1) | In the case of Loan Nos. 1, 2, 3, 6, 8 and 20, UW NCF DSCR, UW NOI DY, Cut-off Date LTV and Maturity Date LTV calculations include the related Pari Passu Companion Loan(s). In the case of Loan No. 2, UW NCF DSCR, UW NOI DY, Cut-off Date LTV and Maturity Date LTV calculations exclude the related Subordinate Companion Loan(s), related mezzanine loan(s) and/or related additional secured subordinate debt. |
| (2) | In the case of Loan Nos. 4, 8, 9, 19 and 28, Cut-off Date LTV and the Maturity Date LTV are calculated by using an appraised value based on certain hypothetical assumptions. Refer to “Description of the Mortgage Pool—Assessments of Property Value and Condition” and “Description of the Mortgage Pool—Appraised Value” in the Preliminary Prospectus for additional details. |
THE INFORMATION IN THIS STRUCTURAL AND COLLATERAL TERM SHEET IS NOT COMPLETE AND MAY BE AMENDED PRIOR TO THE TIME OF SALE. THIS TERM SHEET IS NOT AN OFFER TO SELL THESE SECURITIES AND IT IS NOT A SOLICITATION OF AN OFFER TO BUY THESE SECURITIES IN ANY JURISDICTION WHERE THE OFFER OR SALE IS NOT PERMITTED.
14 of 143
| Structural and Collateral Term Sheet | Benchmark 2022-B36 | |
| Collateral Characteristics | ||
| LTV Ratios as of the Cut-off Date |
| Weighted Average | |||||||||||
| Range of Cut-off Date LTVs | Number of Loans | Cut-off Date Principal Balance | % of IPB | Mortgage Rate | Remaining Loan Term | UW NCF DSCR(1) | UW NOI DY(1) | Cut-off Date LTV(1)(2) | Maturity Date LTV (1)(2) | ||
| 28.6% | - | 39.9% | 3 | $141,600,000 | 18.8% | 4.17063% | 91 | 2.83x | 12.4% | 35.4% | 34.8% |
| 40.0% | - | 49.9% | 9 | 122,040,000 | 16.2 | 5.72019% | 96 | 2.19x | 13.2% | 46.1% | 46.1% |
| 50.0% | - | 59.9% | 12 | 303,621,375 | 40.3 | 5.14245% | 119 | 1.87x | 10.3% | 55.8% | 55.8% |
| 60.0% | - | 67.2% | 7 | 186,545,000 | 24.7 | 5.48963% | 118 | 1.72x | 10.1% | 62.1% | 61.8% |
Total / Wtd. Avg: | 31 | $753,806,375 | 100.0% | 5.13935% | 110 | 2.07x | 11.1% | 51.9% | 51.8% | ||
| LTV Ratios as of the Maturity Date |
Weighted Average | |||||||||||
| Range of Maturity Date LTVs | Number of Loans | Cut-off Date Principal Balance | % of IPB | Mortgage Rate | Remaining Loan Term | UW NCF DSCR(1) | UW NOI DY(1) | Cut-off Date LTV(1)(2) | Maturity Date LTV (1)(2) | ||
| 21.1% | - | 39.9% | 3 | $141,600,000 | 18.8% | 4.17063% | 91 | 2.83x | 12.4% | 35.4% | 34.8% |
| 40.0% | - | 44.9% | 1 | 10,000,000 | 1.3 | 5.42500% | 117 | 2.34x | 13.5% | 43.0% | 43.0% |
| 45.0% | - | 49.9% | 8 | 112,040,000 | 14.9 | 5.74654% | 94 | 2.18x | 13.2% | 46.4% | 46.4% |
| 50.0% | - | 54.9% | 3 | 81,190,000 | 10.8 | 5.45108% | 120 | 1.75x | 9.9% | 52.0% | 52.0% |
| 55.0% | - | 65.9% | 16 | 408,976,375 | 54.3 | 5.23954% | 119 | 1.83x | 10.3% | 59.4% | 59.3% |
Total / Wtd. Avg: | 31 | $753,806,375 | 100.0% | 5.13935% | 110 | 2.07x | 11.1% | 51.9% | 51.8% | ||
| Prepayment Protection |
Weighted Average | |||||||||
| Prepayment Protection | Number of Loans | Cut-off Date Principal Balance | % of IPB | Mortgage Rate | Remaining Loan Term | UW NCF DSCR(1) | UW NOI DY(1) | Cut-off Date LTV(1)(2) | Maturity Date LTV (1)(2) |
| Defeasance | 24 | $642,812,500 | 85.3% | 5.20603% | 108 | 2.08x | 11.3% | 51.3% | 51.1% |
| Yield Maintenance or Defeasance | 3 | 75,431,375 | 10.0 | 4.40199% | 119 | 2.04x | 9.9% | 57.4% | 57.4% |
| Yield Maintenance | 4 | 35,562,500 | 4.7 | 5.49799% | 120 | 1.84x | 10.4% | 51.6% | 51.6% |
Total / Wtd. Avg: | 31 | $753,806,375 | 100.0% | 5.13935% | 110 | 2.07x | 11.1% | 51.9% | 51.8% |
| Loan Purpose |
Weighted Average | |||||||||
| Loan Purpose | Number of Loans | Cut-off Date Principal Balance | % of IPB | Mortgage Rate | Remaining Loan Term | UW NCF DSCR(1) | UW NOI DY(1) | Cut-off Date LTV(1)(2) | Maturity Date LTV (1)(2) |
| Refinance | 18 | $476,112,500 | 63.2% | 5.16143% | 111 | 2.12x | 11.3% | 49.4% | 49.2% |
| Recapitalization | 6 | 172,931,375 | 22.9 | 4.77707% | 118 | 1.83x | 9.3% | 57.2% | 57.2% |
| Acquisition | 7 | 104,762,500 | 13.9 | 5.63702% | 92 | 2.22x | 13.4% | 54.7% | 54.2% |
| Total / Wtd. Avg: | 31 | $753,806,375 | 100.0% | 5.13935% | 110 | 2.07x | 11.1% | 51.9% | 51.8% |
| (1) | In the case of Loan Nos. 1, 2, 3, 6, 8 and 20, UW NCF DSCR, UW NOI DY, Cut-off Date LTV and Maturity Date LTV calculations include the related Pari Passu Companion Loan(s). In the case of Loan No. 2, UW NCF DSCR, UW NOI DY, Cut-off Date LTV and Maturity Date LTV calculations exclude the related Subordinate Companion Loan(s), related mezzanine loan(s) and/or related additional secured subordinate debt. |
| (2) | In the case of Loan Nos. 4, 8, 9, 19 and 28, Cut-off Date LTV and the Maturity Date LTV are calculated by using an appraised value based on certain hypothetical assumptions. Refer to “Description of the Mortgage Pool—Assessments of Property Value and Condition” and “—Appraised Value” in the Preliminary Prospectus for additional details. |
THE INFORMATION IN THIS STRUCTURAL AND COLLATERAL TERM SHEET IS NOT COMPLETE AND MAY BE AMENDED PRIOR TO THE TIME OF SALE. THIS TERM SHEET IS NOT AN OFFER TO SELL THESE SECURITIES AND IT IS NOT A SOLICITATION OF AN OFFER TO BUY THESE SECURITIES IN ANY JURISDICTION WHERE THE OFFER OR SALE IS NOT PERMITTED.
15 of 143
| Structural and Collateral Term Sheet | Benchmark 2022-B36 | |
| Collateral Characteristics | ||
| Previous Securitization History(1) |
| No. | Mortgaged Property | Cut-off Date Principal Balance(2) | % of IPB | Location | Property Type | Previous Securitization |
| 2.01 | Yorkshire Towers | $56,798,742 | 7.5% | New York, NY | Multifamily | CSAIL 2017-CX10, UBSCM 2017-C5, UBSCM 2017-C6, CCUBS 2017-C1, UBSCM 2018-C8 |
| 2.02 | Lexington Towers | $9,201,258 | 1.2% | New York, NY | Multifamily | CSAIL 2017-CX10, UBSCM 2017-C5, UBSCM 2017-C6, CCUBS 2017-C1, UBSCM 2018-C8 |
| 3 | 39 Broadway | $65,000,000 | 8.6% | New York, NY | Office | CGCMT 2013-GC11 |
| 5 | JANAF Shopping Yard | $60,000,000 | 8.0% | Norfolk, VA | Retail | COMM 2013-CR9, COMM 2016-DC2 |
| 6 | One Campus Martius | $50,000,000 | 6.6% | Detroit, MI | Office | TRTX 2022-FL5 |
| 10.03 | Keylock Storage - Apple | $6,375,305 | 0.8% | Coeur d'Alene, ID | Self Storage | WFRBS 2013-C16 |
| 10.05 | Keylock Storage - Pasco | $4,685,852 | 0.6% | Pasco, WA | Self Storage | WFRBS 2013-C13 |
| 13.01 | Compass Self Storage - Fate | $11,100,000 | 1.5% | Fate, TX | Self Storage | GSMS 2014-GC26 |
| 21 | South Park Business Center | $8,470,000 | 1.1% | Greenwood, IN | Industrial | RCMT 2020-FL4 |
| 22 | Chantilly Self Storage | $8,000,000 | 1.1% | Chantilly, VA | Self Storage | WFRBS 2012-C9 |
| 23.01 | ABC Storage | $5,567,500 | 0.7% | Ishpeming and Negaunee, MI | Self Storage | BBCMS 2020-C6 |
| 27 | Village at Thrashers | $5,800,000 | 0.8% | Bothell, WA | Retail | JPMBB 2015-C28 |
| (1) | The table above represents the properties for which the previously existing debt was securitized, based on information provided by the related borrower or obtained through searches of a third-party database. |
| (2) | Cut-off Date Principal Balance represents the allocated loan amount for each respective mortgaged property. |
THE INFORMATION IN THIS STRUCTURAL AND COLLATERAL TERM SHEET IS NOT COMPLETE AND MAY BE AMENDED PRIOR TO THE TIME OF SALE. THIS TERM SHEET IS NOT AN OFFER TO SELL THESE SECURITIES AND IT IS NOT A SOLICITATION OF AN OFFER TO BUY THESE SECURITIES IN ANY JURISDICTION WHERE THE OFFER OR SALE IS NOT PERMITTED.
16 of 143
| Structural and Collateral Term Sheet | Benchmark 2022-B36 | |
| Class A-2(1) | ||
No. | Loan Name | Location | Cut-off Date | % of IPB | Maturity Date Balance | % of Certificate Class(2) | Original Loan Term | Remaining Loan Term | UW NCF DSCR(3) | UW NOI Debt Yield(3) | Cut-off Date LTV(3) | Maturity Date LTV(3) |
| 2 | Yorkshire & Lexington Towers | New York, NY | $66,000,000 | 8.8% | $66,000,000 | 61.7% | 60 | 58 | 3.61 | 11.1% | 33.3% | 33.3% |
| 7 | Gateway Plaza | Richmond, VA | 40,000,000 | 5.3 | 40,000,000 | 37.4% | 60 | 59 | 2.69 | 17.1% | 45.4% | 45.4% |
| 24 | Florida NNN Portfolio | Various, FL | 6,600,000 | 0.9 | 6,600,000 | 6.2% | 60 | 58 | 1.61 | 9.9% | 45.7% | 45.7% |
| Total / Weighted Average: | $112,600,000 | 14.9% | $112,600,000 | 105.3% | 60 | 58 | 3.17x | 13.2% | 38.3% | 38.3% | ||
| (1) | The table above presents the mortgage loans whose balloon payments would be applied to pay down the certificate balance of the Class A-2 Certificates, assuming a 0% CPR and applying the “Modeling Assumptions” described in the Preliminary Prospectus, including the assumptions that (i) none of the mortgage loans in the pool experience prepayments, defaults or losses; (ii) there are no extensions or forbearances of maturity dates of any mortgage loans in the pool; and (iii) each mortgage loan in the pool is paid in full on its stated maturity date. Each Class of Certificates, including the Class A-2 Certificates, evidences undivided ownership interests in the entire pool of mortgage loans. Debt service coverage ratio, debt yield and loan-to-value ratio information does not take into account subordinate debt (whether or not secured by the mortgaged property), if any, that exists or is allowed under the terms of any mortgage loan. See Annex A-1 to the Preliminary Prospectus. |
| (2) | Reflects the percentage equal to the Maturity Date Balance divided by the initial Class A-2 Certificate Balance. |
| (3) | In the case of Loan No. 2, the UW NCF DSCR, UW NOI Debt Yield, Cut-off Date LTV and Maturity Date LTV calculations include the related Pari Passu Companion Loan and exclude the related Subordinate Companion Loan(s), related mezzanine loan(s) and/or related additional secured subordinate debt. |
THE INFORMATION IN THIS STRUCTURAL AND COLLATERAL TERM SHEET IS NOT COMPLETE AND MAY BE AMENDED PRIOR TO THE TIME OF SALE. THIS TERM SHEET IS NOT AN OFFER TO SELL THESE SECURITIES AND IT IS NOT A SOLICITATION OF AN OFFER TO BUY THESE SECURITIES IN ANY JURISDICTION WHERE THE OFFER OR SALE IS NOT PERMITTED.
17 of 143
| Structural and Collateral Term Sheet | Benchmark 2022-B36 | |
| Structural Overview | ||
| ■ Accrual: | Each Class of Certificates (other than the Class R Certificates) will accrue interest on a 30/360 basis. The Class R Certificates will not accrue interest. | |
| ■ Allocation between VRR Interest and the Non-VRR Certificates: | The aggregate amount available for distribution to holders of the non-VRR Certificates and the VRR Interest Owners on each Distribution Date will be: (i) the gross amount of interest, principal, yield maintenance charges and prepayment premiums collected with respect to the Mortgage Loans in the applicable one-month collection period, net of specified expenses of the issuing entity, including fees payable therefrom to, and losses, liabilities, costs and expenses reimbursable or indemnifiable therefrom to, the Master Servicer, the Special Servicer, the Certificate Administrator, the Trustee, the Operating Advisor, the Asset Representations Reviewer and CREFC®; and (ii) allocated to amounts available for distribution to the VRR Interest Owners, on the one hand, and amounts available for distribution to the holders of the remaining Certificates ((other than the Class RR and Class R certificates) (the “Non-VRR Certificates”)), on the other hand. On each Distribution Date, the portion of such aggregate available funds allocable to: (a) the VRR Interest will at all times be the product of such aggregate available funds multiplied by a fraction, expressed as a percentage, the numerator of which is the initial VRR interest balance of the VRR Interest, and the denominator of which is the aggregate initial Certificate Balances of the Principal Balance Certificates and the initial VRR Interest Balance of the VRR Interest (the “VRR Percentage”); and (b) the Non-VRR Certificates (the “Non-VRR Available Funds”) will at all times be the product of such aggregate available funds multiplied by the difference between 100% and the VRR Percentage (such difference, the “Non-VRR Percentage”). See “Credit Risk Retention” and “Description of the Certificates” in the Preliminary Prospectus. | |
| ■ Distribution of Interest: | On each Distribution Date, accrued interest for each Class of Non-VRR Certificates at the applicable pass-through rate will be distributed in the following order of priority to the extent of the Non-VRR Available Funds: first, to the Class A-1, Class A-2, Class A-4, Class A-5, Class A-SB, Class X-A, Class X-B, Class X-D, Class X-F, Class X-G, Class X-H, Class X-J and Class X-K Certificates (the “Senior Certificates”), on a pro rata basis, based on the interest entitlement for each such Class on such date, and then to the Class A-S, Class B, Class C, Class D, Class E, Class F, Class G, Class H, Class J and Class K Certificates, in that order, in each case until the interest entitlement for such date payable to each such Class is paid in full. | |
The pass-through rate applicable to the Class A-1, Class A-2, Class A-4, Class A-5, Class A-SB, Class A-S, Class B, Class C, Class D, Class E, Class F, Class G, Class H, Class J and Class K Certificates on each Distribution Date, will be a per annum rate equal to one of (i) a fixed rate, (ii) the weighted average of the net mortgage rates on the mortgage loans (in each case adjusted, if necessary, to accrue on the basis of a 360-day year consisting of twelve 30-day months), (iii) a variable rate equal to the lesser of a specified fixed pass-through rate and the rate described in clause (ii) above or (iv) the rate described in clause (ii) above less a specified percentage.
The pass-through rate for the Class X-A Certificates for any Distribution Date will be a per annum rate equal to the excess, if any, of (a) the weighted average of the net mortgage rates on the mortgage loans (in each case adjusted, if necessary, to accrue on the basis of a 360-day year consisting of twelve 30-day months), over (b) the weighted average of the pass-through rates on the Class A-1, Class A-2, Class A-4, Class A-5, Class A-SB and Class A-S Certificates for the related Distribution Date, weighted on the basis of their respective Certificate Balances outstanding immediately prior to that Distribution Date.
The pass-through rate for the Class X-B Certificates for any Distribution Date will be a per annum rate equal to the excess, if any, of (a) the weighted average of the net mortgage rates on the mortgage loans (in each case adjusted, if necessary, to accrue on the basis of a 360-day year consisting of twelve 30-day months), over (b) the weighted average of the pass-through rates on the Class B and Class C Certificates for the related Distribution Date weighted on the basis of their respective Certificate Balances outstanding immediately prior to that Distribution Date.
The pass-through rate for the Class X-D Certificates for any Distribution Date will be a per annum rate equal to the excess, if any, of (a) the weighted average of the net mortgage rates on the mortgage loans (in each case adjusted, if necessary, to accrue on the basis of a 360-day year consisting of twelve 30-day months), over (b) the weighted average of the pass-through rates on the Class D and Class E Certificates for the related Distribution Date weighted on the basis of their respective Certificate Balances outstanding immediately prior to that Distribution Date.
The pass-through rate for the Class X-F Certificates for any Distribution Date will be a per annum rate equal to the excess, if any, of (a) the weighted average of the net mortgage rates on the mortgage loans (in each case adjusted, if necessary, to accrue on the basis of a 360-day year |
THE INFORMATION IN THIS STRUCTURAL AND COLLATERAL TERM SHEET IS NOT COMPLETE AND MAY BE AMENDED PRIOR TO THE TIME OF SALE. THIS TERM SHEET IS NOT AN OFFER TO SELL THESE SECURITIES AND IT IS NOT A SOLICITATION OF AN OFFER TO BUY THESE SECURITIES IN ANY JURISDICTION WHERE THE OFFER OR SALE IS NOT PERMITTED.
18 of 143
| Structural and Collateral Term Sheet | Benchmark 2022-B36 | |
| Structural Overview | ||
consisting of twelve 30-day months), over (b) the pass-through rate on the Class F Certificates for the related Distribution Date.
The pass-through rate for the Class X-G Certificates for any Distribution Date will be a per annum rate equal to the excess, if any, of (a) the weighted average of the net mortgage rates on the mortgage loans (in each case adjusted, if necessary, to accrue on the basis of a 360-day year consisting of twelve 30-day months), over (b) the pass-through rate on the Class G Certificates for the related Distribution Date.
The pass-through rate for the Class X-H Certificates for any Distribution Date will be a per annum rate equal to the excess, if any, of (a) the weighted average of the net mortgage rates on the mortgage loans (in each case adjusted, if necessary, to accrue on the basis of a 360-day year consisting of twelve 30-day months), over (b) the pass-through rate on the Class H Certificates for the related Distribution Date.
The pass-through rate for the Class X-J Certificates for any Distribution Date will be a per annum rate equal to the excess, if any, of (a) the weighted average of the net mortgage rates on the mortgage loans (in each case adjusted, if necessary, to accrue on the basis of a 360-day year consisting of twelve 30-day months), over (b) the pass-through rate on the Class J Certificates for the related Distribution Date.
The pass-through rate for the Class X-K Certificates for any Distribution Date will be a per annum rate equal to the excess, if any, of (a) the weighted average of the net mortgage rates on the mortgage loans (in each case adjusted, if necessary, to accrue on the basis of a 360-day year consisting of twelve 30-day months), over (b) the pass-through rate on the Class K Certificates for the related Distribution Date.
See “Description of the Certificates—Distributions” in the Preliminary Prospectus. | ||
| ■ Distribution of Principal: | On any Distribution Date prior to the Cross-Over Date, payments in respect of the Non-VRR Percentage of principal on the Non-VRR Certificates will be distributed, up to the Non-VRR Available Funds:
first, to the Class A-SB Certificates until the Certificate Balance of the Class A-SB Certificates is reduced to the Class A-SB planned principal balance for the related Distribution Date set forth in Annex H to the Preliminary Prospectus, second, to the Class A-1 Certificates, until the Certificate Balance of such Class is reduced to zero, third, to the Class A-2 Certificates, until the Certificate Balance of such Class is reduced to zero, fourth, to the Class A-4 Certificates, until the Certificate Balance of such Class is reduced to zero, fifth, to the Class A-5 Certificates, until the Certificate Balance of such Class is reduced to zero, sixth, to the Class A-SB Certificates, until the Certificate Balance of such Class is reduced to zero and then to the Class A-S, Class B, Class C, Class D, Class E, Class F, Class G, Class H, Class J and Class K Certificates, in that order, until the Certificate Balance of each such Class is reduced to zero.
On any Distribution Date on or after the Cross-Over Date, payments in respect of the Non-VRR Percentage of principal on the Non-VRR Certificates will be distributed, up to the Non-VRR Available Funds, to the Class A-1, Class A-2, Class A-4, Class A-5 and Class A-SB Certificates, pro rata based on the Certificate Balance of each such Class until the Certificate Balance of each such Class is reduced to zero.
The “Cross-Over Date” means the Distribution Date on which the Certificate Balances of the Class A-S, Class B, Class C, Class D, Class E, Class F, Class G, Class H, Class J and Class K Certificates have been reduced to zero as a result of the allocation of realized losses to such Classes.
The Class X-A, Class X-B, Class X-D, Class X-F, Class X-G, Class X-H, Class X-J and Class X-K Certificates (the “Class X Certificates”) will not be entitled to receive distributions of principal; however, the notional amount of the Class X-A Certificates will be reduced by the aggregate amount of principal distributions, realized losses and trust fund expenses, if any, allocated to the Class A-1, Class A-2, Class A-4, Class A-5, Class A-SB and Class A-S Certificates, the notional amount of the Class X-B Certificates will be reduced by the aggregate amount of principal distributions, realized losses and trust fund expenses, if any, allocated to the Class B and Class C Certificates, the notional amount of the Class X-D Certificates will be reduced by the aggregate amount of principal distributions, realized losses and trust fund expenses, if any, allocated to the Class D and Class E Certificates, the notional amount of the Class X-F Certificates will be reduced by the aggregate amount of principal distributions, realized losses and trust fund expenses, if any, allocated to the Class F Certificates, the notional amount of the Class X-G Certificates will be |
THE INFORMATION IN THIS STRUCTURAL AND COLLATERAL TERM SHEET IS NOT COMPLETE AND MAY BE AMENDED PRIOR TO THE TIME OF SALE. THIS TERM SHEET IS NOT AN OFFER TO SELL THESE SECURITIES AND IT IS NOT A SOLICITATION OF AN OFFER TO BUY THESE SECURITIES IN ANY JURISDICTION WHERE THE OFFER OR SALE IS NOT PERMITTED.
19 of 143
| Structural and Collateral Term Sheet | Benchmark 2022-B36 | |
| Structural Overview | ||
| reduced by the aggregate amount of principal distributions, realized losses and trust fund expenses, if any, allocated to the Class G Certificates, the notional amount of the Class X-H Certificates will be reduced by the aggregate amount of principal distributions, realized losses and trust fund expenses, if any, allocated to the Class H Certificates, the notional amount of the Class X-J Certificates will be reduced by the aggregate amount of principal distributions, realized losses and trust fund expenses, if any, allocated to the Class J Certificates and the notional amount of the Class X-K Certificates will be reduced by the aggregate amount of principal distributions, realized losses and trust fund expenses, if any, allocated to the Class K Certificates. | ||
See “Description of the Certificates—Distributions” in the Preliminary Prospectus. | ||
| ■ Yield Maintenance / Fixed Penalty Allocation: | For purposes of the distribution of Yield Maintenance Charges on any Distribution Date, the Non-VRR Percentage of any Yield Maintenance Charges collected in respect of the mortgage loans will be allocated pro rata among certain groups (based on the aggregate amount of principal distributed to the Principal Balance Certificates in each group), consisting of (a) the Class A-1, Class A-2, Class A-4, Class A-5, Class A-SB, Class A-S and Class X-A Certificates ("YM Group A"), (b) the Class X-B, Class B and Class C Certificates (“YM Group B”), (c) the Class X-D, Class D and Class E Certificates (“YM Group D”), (d) the Class X-F and Class F Certificates (“YM Group F”), (e) the Class X-G and Class G Certificates (“YM Group G”) (f) the Class X-H and Class H Certificates (“YM Group H”), (G) the Class X-J and Class J Certificates (“YM Group J”), and (H) the Class X-K and Class K Certificates (“YM Group K”). As among the Classes of Certificates in each YM Group, each Class of Certificates entitled to distributions of principal will receive an amount calculated generally in accordance with the following formula and as more specifically described in the Preliminary Prospectus, with any remaining Yield Maintenance Charges on such Distribution Date being distributed to the class of Class X Certificates in such YM Group. |
| YM Charge | X | Principal Paid to Class | X | (Pass-Through Rate on Class – Discount Rate) |
| Total Principal Paid to the related YM Group | (Mortgage Rate on Loan – Discount Rate) |
No Yield Maintenance Charges will be distributed to the Class R Certificates. | ||
| ■ Realized Losses: | On each Distribution Date, the Non-VRR Percentage of losses on the mortgage loans will be allocated first to the Class K, Class J, Class H, Class G, Class F, Class E, Class D, Class C, Class B and Class A-S Certificates, in that order, in each case until the Certificate Balance of all such Classes have been reduced to zero, and then, to the Class A-1, Class A-2, Class A-4, Class A-5 and Class A-SB Certificates, pro rata, based on the Certificate Balance of each such Class, until the Certificate Balance of each such Class has been reduced to zero. The notional amounts of the Class X-A, Class X-B, Class X-D, Class X-F, Class X-G, Class X-H, Class X-J and Class X-K Certificates will be reduced by the aggregate amount of realized losses allocated to Certificates that are components of the notional amounts of the Class X-A, Class X-B, Class X-D, Class X-F, Class X-G, Class X-H, Class X-J and Class X-K Certificates, respectively.
Losses on each Whole Loan will be allocated first, to any related subordinate companion loan(s) (if any) until reduced to zero and then to the related mortgage loan and any related pari passu companion loans, pro rata, based on their respective principal balances.
See “Description of the Certificates—Distributions” in the Preliminary Prospectus. | |
| ■ Interest Shortfalls: | A shortfall with respect to the amount of available funds distributable in respect of interest can result from, among other sources: (a) delinquencies and defaults by borrowers; (b) shortfalls resulting from the application of appraisal reductions to reduce P&I Advances; (c) shortfalls resulting from interest on Advances made by the Master Servicer, the Special Servicer or the Trustee; (d) shortfalls resulting from the payment of Special Servicing Fees and other additional compensation that the Special Servicer is entitled to receive; (e) shortfalls resulting from extraordinary expenses of the trust, including indemnification payments payable to the Depositor, the Master Servicer, the Special Servicer, the Certificate Administrator, the Trustee, the Operating Advisor and the Asset Representations Reviewer; (f) shortfalls resulting from a modification of a mortgage loan’s interest rate or principal balance; and (g) shortfalls resulting from other unanticipated or default-related expenses of the trust. Any such shortfalls that decrease the amount of available funds distributable in respect of interest to the Certificateholders will reduce distributions to the classes of Certificates (other than the Class R Certificates) beginning with those with the lowest payment priorities, in reverse sequential order. See “Description of the Certificates—Distributions—Priority of Distributions” in the Preliminary Prospectus. |
THE INFORMATION IN THIS STRUCTURAL AND COLLATERAL TERM SHEET IS NOT COMPLETE AND MAY BE AMENDED PRIOR TO THE TIME OF SALE. THIS TERM SHEET IS NOT AN OFFER TO SELL THESE SECURITIES AND IT IS NOT A SOLICITATION OF AN OFFER TO BUY THESE SECURITIES IN ANY JURISDICTION WHERE THE OFFER OR SALE IS NOT PERMITTED.
20 of 143
| Structural and Collateral Term Sheet | Benchmark 2022-B36 | |
| Structural Overview | ||
| ■ Appraisal Reduction Amounts: | With respect to mortgage loans serviced under the Pooling and Servicing Agreement, upon the occurrence of certain trigger events with respect to a mortgage loan, which are generally tied to certain events of default under the related mortgage loan documents, the Special Servicer will be obligated to obtain an appraisal of the related mortgaged property and the Special Servicer (prior to the occurrence of a Consultation Termination Event and only with respect to any Mortgage Loan other than an Excluded Loan, in consultation with the Directing Certificateholder) will calculate the Appraisal Reduction Amount. The “Appraisal Reduction Amount” is generally the amount by which the current principal balance of the related mortgage loan or serviced whole loan, plus outstanding advances, real estate taxes, unpaid servicing fees and certain similar amounts exceeds the sum of (a) 90% of the appraised value of the related mortgaged property, (b) the amount of any escrows, letters of credit and reserves as of the date of calculation and (c) all insurance and casualty proceeds and condemnation awards that are collateral for the related mortgage loan or serviced whole loan.
With respect to the Non-Serviced Whole Loans, any Appraisal Reduction Amount will be similarly determined pursuant to the related trust and servicing agreement or pooling and servicing agreement, as applicable, under which it is serviced.
In general, the Non-VRR Percentage of any Appraisal Reduction Amount that is allocated to a mortgage loan is notionally allocated to reduce, in reverse sequential order, the Certificate Balance of each Class of Certificates (other than the Class A-1, Class A-2, Class A-4, Class A-5 and Class A-SB Certificates) beginning with the Class K Certificates for certain purposes, including certain voting rights and the determination of the controlling class. As a result of calculating one or more Appraisal Reduction Amounts (and, in the case of any Whole Loan, to the extent allocated to the related mortgage loan), the amount of any required P&I Advance will be reduced, which will have the effect of reducing the amount of interest available to the most subordinate class of certificates then-outstanding (i.e., first, to Class K Certificates; second, to the Class J Certificates; third, to the Class H Certificates; fourth, to the Class G Certificates; fifth, to the Class F Certificates; sixth, to the Class E Certificates; seventh, to the Class D Certificates; eighth, to the Class C Certificates; ninth to the Class B Certificates; tenth, to the Class A-S Certificates; and finally, pro rata based on their respective interest entitlements, to the Senior Certificates).
With respect to each Serviced Whole Loan, the Appraisal Reduction Amount is notionally allocated, first, to any related serviced subordinate companion loan(s), (if any), then pro rata, between the related mortgage loan and any related serviced pari passu companion loan(s), based upon their respective principal balances.
Except as described in the Preliminary Prospectus, no event, circumstance or action that has occurred or will occur with respect to a COVID modified loan or the entry into of a COVID modification agreement will constitute an appraisal reduction event, but only if, and for so long as, the related borrower and each related obligor is in compliance with the terms of the related COVID modification agreement. See “Pooling and Servicing Agreement—Appraisal Reduction Amounts” in the Preliminary Prospectus. | |
| ■ Master Servicer Advances: | The Master Servicer will be required to advance certain delinquent scheduled mortgage loan payments of principal and interest and certain property protection advances, in each case, to the extent the Master Servicer deems such advances to be recoverable. At any time that an Appraisal Reduction Amount exists, the amount that would otherwise be required to be advanced by the Master Servicer in respect of delinquent payments of interest on any mortgage loan will be reduced to equal the product of (x) the interest portion of the amount that would be advanced without regard to any Appraisal Reduction Amount and (y) a fraction, expressed as a percentage, the numerator of which is the then-outstanding principal balance of the mortgage loan, as applicable, minus the Appraisal Reduction Amount and the denominator of which is the then-outstanding principal balance of the mortgage loan. The Master Servicer will not make any principal or interest advances with respect to any companion loan that is not held by the issuing entity. | |
| ■ Whole Loans: | Six mortgage loans are each evidenced by one mortgage loan and one or more companion loans (each a “Companion Loan” and collectively with the related mortgage loan, a “Whole Loan”), secured by the same mortgage(s) on the related mortgaged property(ies). Each such mortgage loan and its related Companion Loan(s) are subject to an intercreditor agreement. None of these Companion Loans will be part of the trust. |
THE INFORMATION IN THIS STRUCTURAL AND COLLATERAL TERM SHEET IS NOT COMPLETE AND MAY BE AMENDED PRIOR TO THE TIME OF SALE. THIS TERM SHEET IS NOT AN OFFER TO SELL THESE SECURITIES AND IT IS NOT A SOLICITATION OF AN OFFER TO BUY THESE SECURITIES IN ANY JURISDICTION WHERE THE OFFER OR SALE IS NOT PERMITTED.
21 of 143
| Structural and Collateral Term Sheet | Benchmark 2022-B36 | |
| Structural Overview | ||
In the case of all of the Whole Loans, referred to as the “79 Fifth Avenue Whole Loan”, “Yorkshire & Lexington Towers Whole Loan”, “39 Broadway Whole Loan”, “One Campus Martius Whole Loan”, “The Lion Building Whole Loan” and “The Reef Whole Loan” one or more related Companion Loans are pari passu with the related mortgage loan (these Companion Loans are also referred to as the “Pari Passu Companion Loans”). In the case of the Yorkshire & Lexington Towers Whole Loan, one or more related Companion Loans are subordinate in right of payment to the related mortgage loan and any related Pari Passu Companion Loans (these Companion Loans are also referred to as the “Subordinate Companion Loans”).
The 79 Fifth Avenue Whole Loan, the Yorkshire & Lexington Towers Whole Loan, The Lion Building Whole Loan and The Reef Whole Loan (each, a “Non-Serviced Whole Loan”) are being serviced and administered pursuant to the applicable trust and servicing agreement or pooling and servicing agreement, as applicable, as described under “Description of the Mortgage Pool—The Whole Loans—The Non-Serviced Pari Passu Whole Loans”, “—The Non-Serviced AB Whole Loans” and “Pooling and Servicing Agreement—Servicing of the Non-Serviced Mortgage Loans” in the Preliminary Prospectus. | ||
| ■ Highlighted Servicing Provisions: | The following are certain servicing provisions of note:
A mortgage loan may become a specially serviced loan as a result of an imminent or reasonably foreseeable default only if the Master Servicer or, if Midland is not both the Special Servicer and the Master Servicer, the Special Servicer determines such default is not likely to be cured by the related borrower within 60 days.
A mortgage loan will not become a specially serviced loan for up to 120 days in circumstances where the related borrower does not make its balloon payment at maturity upon satisfaction of certain conditions, including that the borrower has, prior to such maturity date, provided documentation from an acceptable lender, including, without limitation, an executed term sheet or refinancing commitment or an executed purchase and sale agreement, in each case, that is consistent with CMBS market practices and is reasonably satisfactory in form and substance to the Master Servicer or the Special Servicer evidencing an expected refinancing of the mortgage loan or sale of the related mortgaged property.
The Special Servicer will not be entitled to any fees from the securitization trust or the related borrower during a fee restricted period, other than a special servicing fee, and, in certain circumstances described in the succeeding paragraph, a liquidation fee, if the Special Servicer elects to cause a mortgage loan to be transferred to special servicing as a result of an imminent or reasonably foreseeable default when the Master Servicer has not independently transferred the mortgage loan to special servicing for that reason.
Notwithstanding the foregoing, the special servicer may be entitled to a liquidation fee if it transfers a mortgage loan into special servicing as described above and a default occurs that leads to a liquidation of the applicable mortgage loan.
In order to streamline the servicing and administration of the mortgage loans with the goal of reducing the amount of time a CMBS borrower has to wait for certain approvals from the lender, “major decisions” will be administered solely by the Special Servicer, thereby reducing the number of parties involved in the approval process. Under these updated terms, the Special Servicer will be directly responsible for obtaining the consent of the Directing Certificateholder for “major decisions” involving all mortgage loans, rather than requiring the Master Servicer’s involvement in the approval process for Non-Specially Serviced Loans. In prior CMBS transactions, the master servicer would commonly prepare a recommendation related to a particular approval and be required to obtain the consent of the special servicer (who, in turn, would commonly be required to obtain the consent of the Directing Certificateholder before providing its consent to the master servicer) prior to taking any action with respect to that “major decision”.
In addition, certain revisions have been incorporated in the scope of the “major decisions” in the Preliminary Prospectus, that limit the involvement of the Directing Certificateholder in (1) the replacement of the related property management company, (2) the approval of releases of certain performance escrows and earnouts, and (3) the consent to modifications of any mezzanine intercreditor agreement in circumstances when the Directing Certificateholder is affiliated with the mezzanine lender.
The Certificate Administrator will be required to identify the then-current Directing Certificateholder as part of its monthly distribution date statement. |
THE INFORMATION IN THIS STRUCTURAL AND COLLATERAL TERM SHEET IS NOT COMPLETE AND MAY BE AMENDED PRIOR TO THE TIME OF SALE. THIS TERM SHEET IS NOT AN OFFER TO SELL THESE SECURITIES AND IT IS NOT A SOLICITATION OF AN OFFER TO BUY THESE SECURITIES IN ANY JURISDICTION WHERE THE OFFER OR SALE IS NOT PERMITTED.
22 of 143
| Structural and Collateral Term Sheet | Benchmark 2022-B36 | |
| Structural Overview | ||
| See “Description of the Certificates” and “Pooling and Servicing Agreement” in the Preliminary Prospectus. | ||
| ■ Liquidated Loan Waterfall: | On liquidation of any mortgage loan, all net liquidation proceeds related to the mortgage loan (but not any related Companion Loan) will be applied so that amounts allocated as a recovery of accrued and unpaid interest will not, in the first instance, include any delinquent interest that was not advanced as a result of Appraisal Reduction Amounts or interest that accrued on any junior note(s) if such mortgage loan is an AB Modified Loan. After the adjusted interest amount is so allocated, any remaining liquidation proceeds will be allocated to offset certain advances and to pay principal on the mortgage loan until the unpaid principal amount of the mortgage loan has been reduced to zero. Any remaining liquidation proceeds will then be allocated to pay delinquent interest that was not advanced as a result of Appraisal Reduction Amounts and any interest that accrued on any junior note(s) if such mortgage loan is an AB Modified Loan. Any liquidation proceeds in respect of each such mortgage loan in excess of the related outstanding balance will first be applied to offset any interest shortfalls allocated to the Certificates (other than the Class R Certificates), in sequential order, and then to offset any realized losses allocated to the Certificates (other than the Class R Certificates), in sequential order. Any liquidation proceeds remaining after such applications will be distributed to the Class R Certificates. | |
| ■ Sale of Defaulted Loans and REO Properties: | The Special Servicer is required to solicit offers for any defaulted loan (other than a non-serviced mortgage loan) in such a manner as will be reasonably likely to maximize the value of the defaulted loan on a net present value basis, if the Special Servicer determines that no satisfactory arrangements can be made for collection of delinquent payments and the sale would be in the best economic interests of the Certificateholders and the RR Interest Owners (or, in the case of any Serviced Whole Loan, the Certificateholders, the RR Interest Owners and any holders of the related serviced Companion Loans, as a collective whole, taking into account the pari passu or subordinate nature of such serviced Companion Loans), on a net present value basis. Additionally, the Special Servicer may offer to sell any REO property if, and when, the Special Servicer determines that such a sale would be in the best economic interest of the issuing entity and the holders of any related Companion Loans, on a net present value basis.
In the case of each non-serviced mortgage loan, under certain circumstances permitted under the related intercreditor agreement, to the extent that such non-serviced mortgage loan is not sold together with the related non-serviced companion loan by the special servicer for the related Non-Serviced Whole Loans, the Special Servicer will be entitled to sell (with respect to any mortgage loan other than an Excluded Loan, with the consent of the Directing Certificateholder if no Control Termination Event has occurred and is continuing) such non-serviced mortgage loan if it determines in accordance with the servicing standard that such action would be in the best interests of the Certificateholders and the RR Interest Owners.
The Special Servicer is required to accept a cash offer received from any person for any defaulted loan or REO property in an amount at least equal to par plus accrued interest plus all other outstanding amounts due under such mortgage loan and any outstanding expenses of the trust relating to such mortgage loan (the “Purchase Price”) except as described in the Preliminary Prospectus.
With respect to the Serviced Whole Loans, any such sale of the related defaulted loan is required to also include any related Companion Loans, if any, and the prices will be adjusted accordingly.
Within 30 days of a defaulted loan becoming a specially serviced loan, the Special Servicer is required to order an appraisal and, within 30 days of receipt of such appraisal, is required to determine the fair value of such defaulted loan in accordance with the applicable servicing standard. If, however, the Special Servicer is already in the process of obtaining an appraisal with respect to the related mortgaged property, the Special Servicer is required to make its fair value determination as soon as reasonably practicable (but in any event within 30 days) after its receipt of such appraisal. Additionally, with respect to the mortgage loans that have mezzanine debt or permit mezzanine debt in the future, the mezzanine lenders may have the option to purchase the related mortgage loan after certain events of default under such mortgage loan.
The Directing Certificateholder will not have a right of first refusal to purchase a defaulted loan.
If the Special Servicer does not receive a cash offer at least equal to the Purchase Price, the Special Servicer may purchase the defaulted loan or REO property at the Purchase Price. If the Special Servicer does not purchase the defaulted loan or REO property at the Purchase Price, the Special Servicer is required to accept the highest offer received from any person that is determined to be a fair price (supported by an appraisal required to be obtained by the Special |
THE INFORMATION IN THIS STRUCTURAL AND COLLATERAL TERM SHEET IS NOT COMPLETE AND MAY BE AMENDED PRIOR TO THE TIME OF SALE. THIS TERM SHEET IS NOT AN OFFER TO SELL THESE SECURITIES AND IT IS NOT A SOLICITATION OF AN OFFER TO BUY THESE SECURITIES IN ANY JURISDICTION WHERE THE OFFER OR SALE IS NOT PERMITTED.
23 of 143
| Structural and Collateral Term Sheet | Benchmark 2022-B36 | |
| Structural Overview | ||
| Servicer within 30 days of a mortgage loan becoming a specially serviced loan) for such defaulted loan or REO property, if the highest offeror is a person other than an Interested Person. If the highest offer is made by an Interested Person, the Trustee will determine (based upon the most recent appraisal or updated appraisal conducted in accordance with the terms of the Pooling and Servicing Agreement) whether the offer constitutes a fair price for the defaulted loan or REO property provided that no offer from an Interested Person will constitute a fair price unless (A) it is the highest offer received and (B) if the offer is less than the applicable Purchase Price, at least two other offers are received from independent third parties and the Trustee may conclusively rely on the opinion of an independent appraiser or other independent expert retained by the Trustee in connection with making such determination. Neither the Trustee nor any of its affiliates may make an offer for or purchase any specially serviced loan or REO property. An “Interested Person” is any person that is (i) a party to the Pooling and Servicing Agreement, the Directing Certificateholder, any Risk Retention Consultation Party, any sponsor, any Borrower Party, any independent contractor engaged by the Special Servicer, any holder of a mezzanine loan (but only with respect to the related mortgage loan) or any known affiliate of any such person or, (ii) with respect to a defaulted whole loan, the depositor, the master servicer, the special servicer (or independent contractor engaged by such special servicer) or the trustee for any securitization that includes a related Companion Loan and each holder of any related Companion Loan, or any known affiliate of any such person. The Special Servicer is not required to accept the highest offer for a defaulted loan or REO property if the Special Servicer determines, in accordance with the servicing standard (and subject to the requirements of any related intercreditor agreement), that a rejection of such offer would be in the best interests of the Certificateholders, the RR Interest Owners and, with respect to any Serviced Whole Loan, the holder of the related Companion Loans, as a collective whole, as if such Certificateholders, the RR Interest Owners and, if applicable, the related Companion Loan Holder(s) constituted a single lender, and may accept a lower offer (so long as such lower offer was not made by the Special Servicer or any of its affiliates) if it determines that acceptance of such lower offer would be in the best interests of the Certificateholders, the RR Interest Owners and, with respect to any Serviced Whole Loan, the holder of the related Companion Loans, as a collective whole, as if such Certificateholders and, if applicable, the related Companion Loan Holder(s) constituted a single lender. If title to any mortgaged property is acquired by the trust fund, the Special Servicer will be required to sell such mortgaged property prior to the close of the third calendar year beginning after the year of acquisition, unless (a) the IRS grants (or has not denied) a qualifying extension of time to sell such mortgaged property or (b) the Special Servicer obtains for the Trustee, the Certificate Administrator and the Master Servicer an opinion of independent counsel to the effect that the holding of the property by the trust longer than the above-referenced three-year period will not result in the imposition of a tax on any REMIC of the trust fund or cause any REMIC of the trust fund to fail to qualify as a REMIC. The foregoing applies to mortgage loans serviced under the Pooling and Servicing Agreement. With respect to each Non-Serviced Whole Loan, if the special servicer under the applicable trust and servicing agreement or pooling and servicing agreement determines to sell the related Companion Loan(s) as described above, then the applicable special servicer will be required to sell the related non-serviced mortgage loan included in the Benchmark 2022-B36 trust, and the related Companion Loan(s), as a single loan. In connection with any such sale, the then-applicable special servicer will be required to follow procedures substantially similar to those set forth above. | ||
| ■ Control Eligible Certificates: | Class H, Class J and Class K (the “Control Eligible Certificates”). | |
| ■ Control Rights: | The Control Eligible Certificates will have certain control rights attached to them. The “Directing Certificateholder” will be, with respect to each serviced mortgage loan, the Controlling Class Certificateholder (or its representative) selected by more than 50% of the Controlling Class Certificateholders; provided, however, that (1) absent that selection, (2) until a Directing Certificateholder is so selected or (3) upon receipt of a notice from a majority of the Controlling Class Certificateholders that a Directing Certificateholder is no longer designated, the Controlling Class Certificateholder that owns the largest aggregate Certificate Balance of the Controlling Class (or its representative) will be the Directing Certificateholder; provided, however, that in the case of this clause (3), in the event no one holder owns the largest aggregate Certificate Balance of the Controlling Class, then there will be no Directing Certificateholder until appointed in accordance with the terms of the Pooling and Servicing Agreement. With respect to any mortgage loan (other than any Excluded Loan), unless a Control Termination Event has occurred and is |
THE INFORMATION IN THIS STRUCTURAL AND COLLATERAL TERM SHEET IS NOT COMPLETE AND MAY BE AMENDED PRIOR TO THE TIME OF SALE. THIS TERM SHEET IS NOT AN OFFER TO SELL THESE SECURITIES AND IT IS NOT A SOLICITATION OF AN OFFER TO BUY THESE SECURITIES IN ANY JURISDICTION WHERE THE OFFER OR SALE IS NOT PERMITTED.
24 of 143
| Structural and Collateral Term Sheet | Benchmark 2022-B36 | |
| Structural Overview | ||
continuing, the Directing Certificateholder will be entitled to direct the Special Servicer to take, or refrain from taking, certain actions with respect to such mortgage loan. Furthermore, the Directing Certificateholder will also have the right to receive notice and provide consent with respect to certain material actions that the Master Servicer and the Special Servicer plan on taking with respect to a mortgage loan (other than any non-serviced mortgage loan or any Excluded Loan). With respect to any mortgage loan that has or may in the future have mezzanine debt, pursuant to the related intercreditor agreement, the related mezzanine lender may have certain consent rights with respect to certain modifications related to such mortgage loan.
A “Borrower Party” means a borrower, a mortgagor, a manager of a mortgaged property, an Accelerated Mezzanine Loan Lender, or any Borrower Party Affiliate.
A “Borrower Party Affiliate” means, with respect to a borrower, a mortgagor, a manager of a Mortgaged Property or an Accelerated Mezzanine Loan Lender, (a) any other person controlling or controlled by or under common control with such borrower, mortgagor, manager or Accelerated Mezzanine Loan Lender, as applicable, or (b) any other person owning, directly or indirectly, 25% (or in the case of the Yorkshire & Lexington Towers Whole Loan, 10%) or more of the beneficial interests in such borrower, mortgagor, manager or Accelerated Mezzanine Loan Lender, as applicable. For purposes of this definition, “control” when used with respect to any specified person means the power to direct the management and policies of such person, directly or indirectly, whether through the ownership of voting securities, by contract or otherwise and the terms “controlling” and “controlled” have meanings correlative to the foregoing.
An “Accelerated Mezzanine Loan Lender” means a mezzanine lender under a mezzanine loan that has been accelerated or as to which foreclosure or enforcement proceedings have been commenced against the equity collateral pledged to secure such mezzanine loan (or in the case of the Yorkshire & Lexington Towers Whole Loan, if an event of default has occurred under such mezzanine loan giving rise to the right of the related mezzanine lender to accelerate such mezzanine loan).
An “Excluded Loan” means a Mortgage Loan or Whole Loan as to which the Directing Certificateholder would otherwise be entitled to exercise control rights (not taking into account the effect of any Control Termination Event) and with respect to which , as of any date of determination, (a) with respect to the Directing Certificateholder, a Mortgage Loan or Whole Loan with respect to which the Directing Certificateholder or the holder of the majority of the Controlling Class is a Borrower Party or (b) with respect to any Risk Retention Consultation Party, a Mortgage Loan or Whole Loan with respect to which, as of the applicable date of determination, such Risk Retention Consultation Party or the person entitled to appoint such Risk Retention Consultation Party or the applicable VRR Interest owner is a Borrower Party. As of the Closing Date, it is expected that there will be no Excluded Loans in this securitization.
With respect to the Serviced Whole Loans, direction, consent and consultation rights with respect to the related Whole Loan are subject to certain consultation rights of the holders of the related Pari Passu Companion Loans pursuant to the related intercreditor agreement.
With respect to any Non-Serviced Whole Loan, direction, consent and consultation rights with respect to the related Whole Loan will be exercised by the directing certificateholder or controlling class representative under the applicable trust and servicing agreement or pooling and servicing agreement or the holder of the related controlling Companion Loan, as applicable. In the case of a Non-Serviced Mortgage Loan as to which the Directing Certificateholder or the holder of the majority of the Controlling Class has consultation rights, such party may be required to certify that they are not a borrower party, borrower restricted party, restricted holder or any other similar term as defined under the related intercreditor agreement, and for such purpose references to “Borrower Party” will be deemed to refer to such analogous term in the related intercreditor agreement. | ||
| ■ Directing Certificateholder: | KKR Real Estate Credit Opportunity Partners II L.P. (or an affiliate) is expected to be appointed as the initial directing certificateholder with respect to all serviced mortgage loans (other than any Excluded Loans). | |
| ■ Controlling Class: | The “Controlling Class” will at any date of determination be the most subordinate Class of Control Eligible Certificates then outstanding that has an aggregate Certificate Balance, as notionally reduced by any Cumulative Appraisal Reduction Amounts allocable to such Class, equal to no less than 25% of the initial Certificate Balance for such Class; provided that if at any time the Certificate Balances of the certificates (other than the Control Eligible Certificates and the Class RR Certificates) have been reduced to zero as a result of the allocation of principal payments on |
THE INFORMATION IN THIS STRUCTURAL AND COLLATERAL TERM SHEET IS NOT COMPLETE AND MAY BE AMENDED PRIOR TO THE TIME OF SALE. THIS TERM SHEET IS NOT AN OFFER TO SELL THESE SECURITIES AND IT IS NOT A SOLICITATION OF AN OFFER TO BUY THESE SECURITIES IN ANY JURISDICTION WHERE THE OFFER OR SALE IS NOT PERMITTED.
25 of 143
| Structural and Collateral Term Sheet | Benchmark 2022-B36 | |
| Structural Overview | ||
the mortgage loans, then the Controlling Class will be the most subordinate Class among the Control Eligible Certificates that has an aggregate Certificate Balance greater than zero without regard to any Cumulative Appraisal Reduction Amounts. The Controlling Class as of the Closing Date will be the Class K Certificates.
Each holder of a certificate of the Controlling Class is referred to herein as a “Controlling Class Certificateholder”. | ||
| ■ Control Termination Event: | A “Control Termination Event” will occur with respect to any serviced Mortgage Loan, when the Class H Certificates have a Certificate Balance (taking into account the application of any Cumulative Appraisal Reduction Amounts to notionally reduce the Certificate Balance of such class) of less than 25% of the initial Certificate Balance of that class; provided that a Control Termination Event will not be deemed to be continuing in the event the Certificate Balances of all Classes of Principal Balance Certificates (other than the Control Eligible Certificates and the Class RR Certificates) have been reduced to zero.
The “Cumulative Appraisal Reduction Amount” as of any date of determination, is equal to the sum of (i) with respect to any mortgage loan, all Appraisal Reduction Amounts then in effect, and (ii) with respect to any AB Modified Loan, any Collateral Deficiency Amount then in effect.
An “AB Modified Loan” means any corrected loan (1) that became a corrected loan (which includes for purposes of this definition any non-serviced mortgage loan that became a “corrected loan” (or any term substantially similar thereto) pursuant to the trust and servicing agreement or pooling and servicing agreement, as applicable, governing such non-serviced mortgage loan) due to a modification thereto that resulted in the creation of an A/B note structure (or similar structure) and as to which the new junior note(s) did not previously exist or the principal amount of the new junior note(s) was previously part of either an A note held by the issuing entity or the original unmodified mortgage loan and (2) as to which an Appraisal Reduction Amount is not in effect.
The “Collateral Deficiency Amount” means, with respect to any AB Modified Loan as of any date of determination, the excess of (i) the principal balance of such AB Modified Loan (taking into account the related junior note(s) and any pari passu notes included therein), over (ii) the sum of (in the case of a Whole Loan, solely to the extent allocable to the subject mortgage loan) (x) the most recent Appraised Value for the related mortgaged property or mortgaged properties, plus (y) solely to the extent not reflected or taken into account in such Appraised Value and to the extent on deposit with, or otherwise under the control of, the lender as of the date of such determination, any capital or additional collateral contributed by the related borrower at the time the mortgage loan became (and as part of the modification related to) such AB Modified Loan for the benefit of the related mortgaged property or mortgaged properties (provided that in the case of a non-serviced mortgage loan, the amounts set forth in this clause (y) will be taken into account solely to the extent relevant information is received by the Special Servicer), plus (z) any other escrows or reserves (in addition to any amounts set forth in the immediately preceding clause (y)) held by the lender in respect of such AB Modified Loan as of the date of such determination.
Upon the occurrence and during the continuance of a Control Termination Event, the Controlling Class will no longer have any control rights and the Directing Certificateholder will relinquish its right to direct certain actions of the Special Servicer and will no longer have consent rights with respect to certain actions that the Master Servicer or the Special Servicer plan on taking with respect to a mortgage loan. Following the occurrence and during the continuance of a Control Termination Event, the Directing Certificateholder will retain consultation rights with the Special Servicer with respect to certain material actions that the Special Servicer plans on taking with respect to any mortgage loan other than an Excluded Loan. Such consultation rights will continue until the occurrence of a Consultation Termination Event. | |
| ■ Consultation Termination Event: | A “Consultation Termination Event” will occur with respect to any serviced Mortgage Loan, when there is no class of Control Eligible Certificates that has a then-outstanding Certificate Balance at least equal to 25% of the initial Certificate Balance of that class, in each case, without regard to the application of any Cumulative Appraisal Reduction Amounts; provided, that a Consultation Termination Event will not be deemed to be continuing in the event the Certificate Balances of all Classes of Principal Balance Certificates (other than the Control Eligible Certificates and the Class RR Certificates) have been reduced to zero.
Upon the occurrence of a Consultation Termination Event, there will be no Class of Certificates that will act as the Controlling Class and the Directing Certificateholder will have no rights under the Pooling and Servicing Agreement, other than those rights generally available to all Certificateholders. |
THE INFORMATION IN THIS STRUCTURAL AND COLLATERAL TERM SHEET IS NOT COMPLETE AND MAY BE AMENDED PRIOR TO THE TIME OF SALE. THIS TERM SHEET IS NOT AN OFFER TO SELL THESE SECURITIES AND IT IS NOT A SOLICITATION OF AN OFFER TO BUY THESE SECURITIES IN ANY JURISDICTION WHERE THE OFFER OR SALE IS NOT PERMITTED.
26 of 143
| Structural and Collateral Term Sheet | Benchmark 2022-B36 | |
| Structural Overview | ||
| ■ Risk Retention Consultation Parties: | The risk retention consultation parties will have certain non-binding consultation rights with respect to certain material servicing actions. The owners of the VRR Interest, which is expected to be transferred by the depositor on the Closing Date to JPMCB and DBRI or its respective “majority-owned affiliate”, will each be entitled to appoint a risk retention consultation party. JPMCB and Deutsche Bank, AG, New York Branch are expected to be appointed as the initial risk retention consultation parties. | |
| ■ Appraised-Out Class: | A Class of Control Eligible Certificates that has been determined, as a result of Appraisal Reduction Amounts or Collateral Deficiency Amounts allocable to such Class, to no longer be the Controlling Class. | |
| ■ Remedies Available to Holders of an Appraised-Out Class: | Holders of the majority of any Appraised-Out Class will have the right, at their sole expense, to require the Special Servicer to order a supplemental appraisal report from an MAI appraiser (selected by the Special Servicer) for any mortgage loan (or Serviced Whole Loan) that results in the Class becoming an Appraised-Out Class.
Upon receipt of that supplemental appraisal, the Special Servicer will be required to determine, in accordance with the Servicing Standard, whether, based on its assessment of the supplemental appraisal, any recalculation of the Appraisal Reduction Amount or Collateral Deficiency Amount is warranted, and if so warranted, the Master Servicer will be required to recalculate the Appraisal Reduction Amount or Collateral Deficiency Amount, as applicable, based on the supplemental appraisal and if required by such recalculation, the Appraised-Out Class will be reinstated as the Controlling Class. The holders of an Appraised-Out Class requesting a supplemental appraisal are not permitted to exercise any control or consent rights of the Controlling Class until such time, if any, as the Class is reinstated as the Controlling Class. | |
| ■ Operating Advisor: | The Operating Advisor will initially be Park Bridge Lender Services LLC. The Operating Advisor will have access to any final asset status report and information available with respect to the transaction on the certificate administrator’s website and will have certain monitoring responsibilities on behalf of the entire issuing entity. During the continuance of a Control Termination Event, the Operating Advisor will be entitled to consult with the Special Servicer with respect to certain major decisions on behalf of the issuing entity and in the best interest of, and for the benefit of, the certificateholders, the RR Interest Owners and, in the case of a serviced whole loan, the related companion loan holder(s), as a collective whole, as if those certificateholders, RR Interest Owners and, if applicable, such companion loan holder(s) constituted a single lender (taking into account the pari passu or subordinate nature of any related companion loan(s)).
In addition, if during the continuance of a Control Termination Event, the Operating Advisor determines, in its sole discretion exercised in good faith, that (1) the Special Servicer is not performing its duties as required under the Pooling and Servicing Agreement or is otherwise not acting in accordance with the Servicing Standard and (2) the replacement of the Special Servicer would be in the best interest of the certificateholders and the RR Interest Owners as a collective whole, then, the Operating Advisor will have the right to recommend the replacement of the Special Servicer and will submit its formal recommendation to the Trustee and the Certificate Administrator (along with its rationale, its proposed replacement special servicer and other relevant information justifying its recommendation).
The Operating Advisor’s recommendation to replace the Special Servicer must be confirmed by an affirmative vote of holders of Principal Balance Certificates and Class RR Certificates evidencing at least a majority of a quorum of certificateholders (which, for this purpose, is the holders of Certificates that (i) evidence at least 20% of the Voting Rights (taking into account the application of any Appraisal Reduction Amounts to notionally reduce the respective Certificate Balances) of all Principal Balance Certificates and the Class RR Certificates on an aggregate basis and (ii) consist of at least three Certificateholders or certificate owners that are not affiliated with each other). In the event the holders of Principal Balance Certificates and Class RR Certificates evidencing at least a majority of a quorum of certificateholders elect to remove and replace the Special Servicer (which requisite affirmative votes must be received within 180 days of the posting of the notice of the Operating Advisor’s recommendation to replace the Special Servicer to the Certificate Administrator's website), the Certificate Administrator will be required to receive a Rating Agency Confirmation from each of the Rating Agencies at that time. | |
| ■ Replacement of Operating Advisor: | The Operating Advisor may be terminated or removed under certain circumstances and a replacement operating advisor appointed as described in the Preliminary Prospectus. |
THE INFORMATION IN THIS STRUCTURAL AND COLLATERAL TERM SHEET IS NOT COMPLETE AND MAY BE AMENDED PRIOR TO THE TIME OF SALE. THIS TERM SHEET IS NOT AN OFFER TO SELL THESE SECURITIES AND IT IS NOT A SOLICITATION OF AN OFFER TO BUY THESE SECURITIES IN ANY JURISDICTION WHERE THE OFFER OR SALE IS NOT PERMITTED.
27 of 143
| Structural and Collateral Term Sheet | Benchmark 2022-B36 | |
| Structural Overview | ||
Any replacement operating advisor (or the personnel responsible for supervising the obligations of the replacement operating advisor) must be an institution (A) that is a special servicer or operating advisor on a commercial mortgage-backed securities transaction rated by the Rating Agencies (including, in the case of the Operating Advisor, this transaction) but has not been special servicer or operating advisor on a transaction for which any of the Rating Agencies has qualified, downgraded or withdrawn its rating or ratings of, one or more classes of certificates for such transaction publicly citing servicing concerns with the operating advisor in its capacity as special servicer or operating advisor on such commercial mortgage-backed securities transaction as the sole or a material factor in such rating action; (B) that can and will make the representations and warranties of the operating advisor set forth in the Pooling and Servicing Agreement; (C) that is not (and is not affiliated with) the Depositor, the Trustee, the Certificate Administrator, the Master Servicer, the Special Servicer, a Mortgage Loan Seller, the Directing Certificateholder, a Risk Retention Consultation Party, a depositor, a trustee, a certificate administrator, a master servicer or special servicer with respect to any securitization that includes a Companion Loan, or any of their respective affiliates; (D) that has not been paid by any Special Servicer or successor special servicer any fees, compensation or other remuneration (x) in respect of its obligations hereunder or (y) for the appointment or recommendation for replacement of a successor special servicer to become the Special Servicer; (E) that (x) has been regularly engaged in the business of analyzing and advising clients in commercial mortgage-backed securities matters and that has at least five years of experience in collateral analysis and loss projections and (y) has at least five years of experience in commercial real estate asset management and experience in the workout and management of distressed commercial real estate assets; and (F) that does not directly or indirectly, through one or more affiliates or otherwise, own or have derivative exposure in any interest in any certificates, any mortgage loans, any Companion Loan or any securities backed by a Companion Loan or otherwise have any financial interest in the securitization transaction to which the Pooling and Servicing Agreement relates, other than in fees from its role as operating advisor and asset representations reviewer (to the extent it also acts as the asset representations reviewer). | ||
| ■ Asset Representations Reviewer: | The Asset Representations Reviewer will be required to review certain delinquent mortgage loans after a specified delinquency threshold has been exceeded and notification from the Certificate Administrator that the required percentage of Certificateholders have voted to direct a review of such delinquent mortgage loans. An “Asset Review Trigger” will occur when either (1) mortgage loans with an aggregate outstanding principal balance of 25.0% or more of the aggregate outstanding principal balance of all of the mortgage loans (including any REO Loans (or a portion of any REO Loan in the case of a Whole Loan)) held by the issuing entity as of the end of the applicable Collection Period are Delinquent Loans, (2)(A) prior to and including the second anniversary of the Closing Date, at least 10 mortgage loans are Delinquent Loans and the outstanding principal balance of such Delinquent Loans in the aggregate constitutes at least 15.0% of the aggregate outstanding principal balance of all of the mortgage loans (including any REO Loans (or a portion of any REO Loan in the case of a Whole Loan)) held by the issuing entity as of the end of the applicable Collection Period or (B) after the second anniversary of the Closing Date, at least 15 mortgage loans are Delinquent Loans and the outstanding principal balance of such Delinquent Loans in the aggregate constitutes at least 20.0% of the aggregate outstanding principal balance of all of the mortgage loans (including any REO Loans (or a portion of any REO Loan in the case of a Whole Loan)) held by the issuing entity as of the end of the applicable Collection Period.
Following the determination that an Asset Review Trigger has occurred, the Certificate Administrator will include in the Form 10-D relating to the distribution period in which the Asset Review Trigger occurred a description of the events that caused the Asset Review Trigger to occur. Once an Asset Review Trigger has occurred, Certificateholders evidencing not less than 5% of the voting rights may deliver to the Certificate Administrator a written direction requesting a vote on whether to commence an Asset Review within 90 days after the filing of the Form 10-D reporting the occurrence of the Asset Review Trigger (an “Asset Review Vote Election”). If directed by such Certificateholders, a vote of all Certificateholders will commence and an Asset Review will occur if a majority of Certificateholders voting (assuming Certificateholders representing a minimum of 5% of the voting rights respond) vote affirmatively within 150 days of the Asset Review Vote Election. If the vote does not pass, then no Certificateholder may request a vote or cast a vote for an Asset Review and the Asset Representations Reviewer will not be required to review any delinquent mortgage loan until an additional mortgage loan becomes a Delinquent Loan, an Asset Review Trigger occurs as a result or is otherwise in effect, another Asset Review Vote Election is made and a majority of Certificateholders voting (assuming |
THE INFORMATION IN THIS STRUCTURAL AND COLLATERAL TERM SHEET IS NOT COMPLETE AND MAY BE AMENDED PRIOR TO THE TIME OF SALE. THIS TERM SHEET IS NOT AN OFFER TO SELL THESE SECURITIES AND IT IS NOT A SOLICITATION OF AN OFFER TO BUY THESE SECURITIES IN ANY JURISDICTION WHERE THE OFFER OR SALE IS NOT PERMITTED.
28 of 143
| Structural and Collateral Term Sheet | Benchmark 2022-B36 | |
| Structural Overview | ||
Certificateholders representing a minimum of 5% of the voting rights respond) vote affirmatively within 150 days of such Asset Review Vote Election.
Delinquent Loan means a mortgage loan that is delinquent at least 60 days in respect of its periodic payments or balloon payment, if any, in either case such delinquency to be determined without giving effect to any grace period. For the avoidance of doubt, a delinquency that would have existed but for a COVID modification will not constitute a delinquency for so long as the related borrower is complying with the terms of such COVID modification. | ||
| ■ Replacement of the Asset Representations Reviewer: | The Asset Representations Reviewer may be terminated and replaced without cause. Upon (i) the written direction of Certificateholders evidencing not less than 25% of the voting rights (without regard to the application of any Cumulative Appraisal Reduction Amounts) requesting a vote to terminate and replace the Asset Representations Reviewer with a proposed successor asset representations reviewer that is an Eligible Asset Representations Reviewer, and (ii) payment by such holders to the Certificate Administrator of the reasonable fees and expenses to be incurred by the Certificate Administrator in connection with administering such vote, the Certificate Administrator will promptly provide notice to all Certificateholders and the Asset Representations Reviewer of such request by posting such notice on its website, and by mailing to all Certificateholders, the RR Interest Owners and the Asset Representations Reviewer. Upon the written direction of holders of Principal Balance Certificates and Class RR Certificates evidencing at least 75% of a Certificateholder Quorum (without regard to the application of any Cumulative Appraisal Reduction Amounts), the Trustee will terminate all of the rights and obligations of the Asset Representations Reviewer under the Pooling and Servicing Agreement by written notice to the Asset Representations Reviewer, and the proposed successor asset representations reviewer will be appointed. | |
| ■ Appointment and Replacement of Special Servicer: | The Directing Certificateholder will appoint the initial Special Servicer as of the Closing Date. Prior to the occurrence and continuance of a Control Termination Event, the Special Servicer may generally be replaced at any time, with or without cause by the Directing Certificateholder.
If the Special Servicer obtains knowledge that it is a Borrower Party with respect to any mortgage loan or Serviced Whole Loan (any such mortgage loan or Serviced Whole Loan, an “Excluded Special Servicer Loan”), the Special Servicer will be required to resign as Special Servicer of that Excluded Special Servicer Loan. Prior to the occurrence and continuance of a Control Termination Event, if the applicable Excluded Special Servicer Loan is not also an Excluded Loan, the controlling class certificateholders or the Directing Certificateholder on their behalf will be required to select a successor special servicer that is not a Borrower Party in accordance with the terms of the Pooling and Servicing Agreement (an “Excluded Special Servicer”) for the related Excluded Special Servicer Loan. After the occurrence and during the continuance of a Control Termination Event or if at any time the applicable Excluded Special Servicer Loan is also an Excluded Loan, the resigning Special Servicer will be required to use reasonable efforts to select the related Excluded Special Servicer.
Upon the occurrence and during the continuance of a Control Termination Event, the Directing Certificateholder will no longer have the right to replace the Special Servicer and such replacement will occur based on a vote of holders of all voting eligible Classes of Certificates as described below.
The Operating Advisor may also recommend the replacement of the Special Servicer at any time as described in “—Operating Advisor” above. | |
| ■ Replacement of Special Servicer by Vote of Certificateholders: | After the occurrence and during the continuance of a Control Termination Event and upon (a) the written direction of holders of Principal Balance Certificates and/or Class RR Certificates evidencing not less than 25% of the Voting Rights (taking into account the application of Cumulative Appraisal Reduction Amounts to notionally reduce the Certificate Balances of the Principal Balance Certificates and/or Class RR Certificates) requesting a vote to replace the Special Servicer with a replacement special servicer, (b) payment by such requesting holders to the Certificate Administrator of all reasonable fees and expenses to be incurred by the Certificate Administrator in connection with administering such vote and (c) delivery by such holders to the Certificate Administrator and the Trustee of written confirmations from each Rating Agency that the appointment of such replacement special servicer will not result in a downgrade, withdrawal or qualification of the Certificates (which confirmations will be obtained at the expense of such holders), the Certificate Administrator will be required to post notice of such direction on its website and by mail, and conduct the solicitation of votes of all Certificates in such regard, which such vote must occur within 180 days of the posting of such notice. Upon the written direction of |
THE INFORMATION IN THIS STRUCTURAL AND COLLATERAL TERM SHEET IS NOT COMPLETE AND MAY BE AMENDED PRIOR TO THE TIME OF SALE. THIS TERM SHEET IS NOT AN OFFER TO SELL THESE SECURITIES AND IT IS NOT A SOLICITATION OF AN OFFER TO BUY THESE SECURITIES IN ANY JURISDICTION WHERE THE OFFER OR SALE IS NOT PERMITTED.
29 of 143
| Structural and Collateral Term Sheet | Benchmark 2022-B36 | |
| Structural Overview | ||
holders of Principal Balance Certificates and/or Class RR Certificates evidencing at least 50% of a Certificateholder Quorum, the Trustee will immediately replace the Special Servicer with a qualified replacement special servicer designated by such holders of Certificates.
A “Certificateholder Quorum” means, in connection with any solicitation of votes in connection with the replacement of the Special Servicer or the Asset Representations Reviewer described above, the holders of Certificates evidencing at least 50% of the aggregate Voting Rights (taking into account the application of realized losses and, other than with respect to the termination of the Asset Representations Reviewer, the application of any Cumulative Appraisal Reduction Amounts to notionally reduce the Certificate Balance of the Certificates) of all Principal Balance Certificates and the Class RR Certificates on an aggregate basis.
With respect to each of the Serviced Whole Loan, subject to the related intercreditor agreement, the holders of the related Pari Passu Companion Loans, under certain circumstances following a servicer termination event with respect to the Special Servicer, will be entitled to direct the Trustee (and the Trustee will be required) to terminate the Special Servicer solely with respect to such Serviced Whole Loan. A replacement special servicer will be selected by the Trustee or, prior to a Control Termination Event, by the Directing Certificateholder; provided, however, that any successor special servicer appointed to replace the Special Servicer with respect to such Whole Loan can generally not be the person (or its affiliate) that was terminated at the direction of the holder of the related Pari Passu Companion Loan.
With respect to any Non-Serviced Whole Loan, subject to the related intercreditor agreement, the Benchmark 2022-B36 trust as holder of the related mortgage loan has similar termination rights in the event of a servicer termination event with respect to the special servicer under the applicable trust and servicing agreement or pooling and servicing agreement, as applicable, as described above, which may be exercised by the Directing Certificateholder prior to the Control Termination Event. However, the successor special servicer will be selected pursuant to the applicable trust and servicing agreement or pooling and servicing agreement, as applicable, by the related directing holder prior to a control event under such trust and servicing agreement or pooling and servicing agreement, as applicable. The Master Servicer and Special Servicer are entitled to certain fees in connection with the servicing and administration of the mortgage loans as more fully described in “Pooling and Servicing Agreement—Servicing and Other Compensation and Payment of Expenses” in the Preliminary Prospectus. | ||
| ■ Dispute Resolution Provisions: | Each Mortgage Loan Seller will be subject to the dispute resolution provisions set forth in the Pooling and Servicing Agreement to the extent those provisions are triggered with respect to any mortgage loan sold to the Depositor by a Mortgage Loan Seller and such Mortgage Loan Seller will be obligated under the related mortgage loan purchase agreement to comply with all applicable provisions and to take part in any mediation or arbitration proceedings that may result.
Generally, in the event that a request to repurchase a mortgage loan (a “Repurchase Request”) is not “Resolved” (as defined below) within 180 days after the related Mortgage Loan Seller receives such Repurchase Request (a “Resolution Failure”), then the Enforcing Servicer (as defined below) will be required to send a notice to the “Initial Requesting Certificateholder” (if any) indicating the Enforcing Servicer’s intended course of action with respect to the Repurchase Request. If (a) the Enforcing Servicer’s intended course of action with respect to the Repurchase Request does not involve pursuing further action to exercise rights against the related Mortgage Loan Seller with respect to the Repurchase Request and the Initial Requesting Certificateholder, if any, or any other Certificateholder or Certificate Owner wishes to exercise its right to refer the matter to mediation (including nonbinding arbitration) or arbitration, or (b) the Enforcing Servicer’s intended course of action is to pursue further action to exercise rights against the related Mortgage Loan Seller with respect to the Repurchase Request but the Initial Requesting Certificateholder, if any, or any other Certificateholder or Certificate Owner does not agree with the dispute resolution method selected by the Enforcing Servicer, then the Initial Requesting Certificateholder, if any, or such other Certificateholder or Certificate Owner may deliver a written notice to the Enforcing Servicer indicating its intent to exercise its right to refer the matter to either mediation or arbitration.
The Enforcing Servicer will be required to consult with any Certificateholder or Certificate Owner that delivers a notice of its intent to exercise its dispute resolution rights (a “Requesting Certificateholder”) so that a Requesting Certificateholder may consider the views of the Enforcing Servicer as to the claims underlying the Repurchase Request and possible dispute resolution methods. If a Requesting Certificateholder elects to exercise its right to refer the matter to either mediation or arbitration, then it will become the party responsible for enforcing the Repurchase |
THE INFORMATION IN THIS STRUCTURAL AND COLLATERAL TERM SHEET IS NOT COMPLETE AND MAY BE AMENDED PRIOR TO THE TIME OF SALE. THIS TERM SHEET IS NOT AN OFFER TO SELL THESE SECURITIES AND IT IS NOT A SOLICITATION OF AN OFFER TO BUY THESE SECURITIES IN ANY JURISDICTION WHERE THE OFFER OR SALE IS NOT PERMITTED.
30 of 143
| Structural and Collateral Term Sheet | Benchmark 2022-B36 | |
| Structural Overview | ||
Request and must promptly submit the matter to mediation (including nonbinding arbitration) or arbitration. Failure to make an election to exercise that right or failure to begin the elected form of proceedings within the certain timeframe set forth in the Pooling and Servicing Agreement will generally waive the Certificateholders’ or Certificate Owners’ rights with respect to the related Repurchase Request.
The “Enforcing Servicer” will be (a) with respect to a specially serviced loan, the Special Servicer, and (b) with respect to a non-specially serviced loan, (i) in the case of a Repurchase Request made by the Special Servicer, the Directing Certificateholder or a Controlling Class Certificateholder, the Master Servicer, and (ii) in the case of a Repurchase Request made by any person other than the Special Servicer, the Directing Certificateholder or a Controlling Class Certificateholder, (A) prior to a Resolution Failure relating to such non-specially serviced loan, the Master Servicer, and (B) from and after a Resolution Failure relating to such non-specially serviced Loan, the Special Servicer.
“Resolved” means, with respect to a Repurchase Request, (i) that the related Material Defect has been cured, (ii) the related mortgage loan has been repurchased in accordance with the related mortgage loan purchase agreement, (iii) a mortgage loan has been substituted for the related mortgage loan in accordance with the related mortgage loan purchase agreement, (iv) the applicable Mortgage Loan Seller has made a Loss of Value Payment, (v) a contractually binding agreement is entered into between the Enforcing Servicer, on behalf of the issuing entity, and the related Mortgage Loan Seller that settles the related Mortgage Loan Seller’s obligations under the related mortgage loan purchase agreement, or (vi) the related mortgage loan is no longer property of the issuing entity as a result of a sale or other disposition in accordance with the Pooling and Servicing Agreement. | ||
| ■ Investor Communications: | The Certificate Administrator is required to include on any Form 10–D any request received from a Certificateholder to communicate with other Certificateholders related to Certificateholders exercising their rights under the terms of the Pooling and Servicing Agreement. Any Certificateholder wishing to communicate with other Certificateholders regarding the exercise of its rights under the terms of the Pooling and Servicing Agreement should deliver a written request signed by an authorized representative of the requesting investor to the Certificate Administrator at the address below:
9062 Old Annapolis Road
Columbia, Maryland 21045
Attention: Corporate Trust Administration Group – Benchmark 2022-B36
With a copy to: trustadministrationgroup@wellsfargo.com | |
| ■ Master Servicer and Special Servicer Compensation: | The Master Servicer is entitled to a fee (the “Servicing Fee”) payable monthly from interest received in respect of each mortgage loan, any related REO loan and any related serviced Companion Loan that will accrue at the related servicing fee rate described in the Preliminary Prospectus. The Special Servicer is also entitled to a fee (the “Special Servicing Fee”) with respect to each specially serviced loan and REO loan (other than a non-serviced mortgage loan) at the special servicing fee rate described in the Preliminary Prospectus.
In addition to the Servicing Fee, Special Servicing Fee and certain other fees described below, the Master Servicer and Special Servicer are entitled to retain and share certain additional servicing compensation, including assumption application fees, assumption fees, defeasance fees, processing fees and certain Excess Modification Fees and consent fees with respect to the mortgage loans. The Special Servicer may also be entitled to either a Workout Fee or Liquidation Fee, but not both, from recoveries in respect of any particular mortgage loan.
An “Excess Modification Fee” with respect to any mortgage loan (other than the non-serviced mortgage loans) or Serviced Whole Loan is the sum of (A) the excess, if any, of (i) any and all Modification Fees with respect to a mortgage loan or Serviced Whole Loan, as applicable, over (ii) all unpaid or unreimbursed additional expenses described in the Preliminary Prospectus (excluding Special Servicing Fees, Workout Fees and Liquidation Fees) outstanding or previously incurred on behalf of the issuing entity with respect to the related mortgage loan or Serviced Whole Loan, as applicable, and reimbursed from such Modification Fees and (B) expenses previously paid or reimbursed from Modification Fees as described in clause (A), which expenses have been recovered from the related borrower or otherwise. |
THE INFORMATION IN THIS STRUCTURAL AND COLLATERAL TERM SHEET IS NOT COMPLETE AND MAY BE AMENDED PRIOR TO THE TIME OF SALE. THIS TERM SHEET IS NOT AN OFFER TO SELL THESE SECURITIES AND IT IS NOT A SOLICITATION OF AN OFFER TO BUY THESE SECURITIES IN ANY JURISDICTION WHERE THE OFFER OR SALE IS NOT PERMITTED.
31 of 143
| Structural and Collateral Term Sheet | Benchmark 2022-B36 | |
| Structural Overview | ||
With respect to the Master Servicer and Special Servicer, the Excess Modification Fees collected and earned by such servicer from the related borrower (taken in the aggregate with any other Excess Modification Fees collected and earned by such servicer from the related borrower within the prior 18 months of the collection of the current Excess Modification Fees) will be subject to a cap of 1.00% of the outstanding principal balance of the related mortgage loan or Serviced Whole Loan, as applicable, on the closing date of the related modification, extension, waiver or amendment. A “Modification Fee” with respect to any mortgage loan (other than the non-serviced mortgage loans) or serviced Companion Loan is generally any fee with respect to a modification, extension, waiver or amendment of any mortgage loan and/or related serviced Companion Loan (other than all assumption fees, assumption application fees, consent fees, defeasance fees, Special Servicing Fees, Liquidation Fees or Workout Fees).
A “Workout Fee” will generally be payable with respect to each corrected loan (except with respect to a corrected loan that was a fee restricted specially serviced loan and became a corrected loan while it was a fee restricted specially serviced loan) (as more specifically described in the Preliminary Prospectus) and will be calculated at a rate of 1.00% of payments of principal and interest on the respective mortgage loan for so long as it remains a corrected loan, subject to a maximum of $1,000,000 in the aggregate with respect to any particular corrected loan. After receipt by the Special Servicer of Workout Fees with respect to a corrected loan in an amount equal to $25,000, any Workout Fees in excess of such amount will be reduced by the Excess Modification Fee Amount; provided that in the event the Workout Fee, collected over the course of such workout calculated at the Workout Fee Rate is less than $25,000, then the Special Servicer will be entitled to an amount from the final payment on the related corrected loan (including any related serviced Companion Loan) that would result in the total Workout Fees payable to the Special Servicer in respect of that corrected loan (including any related serviced Companion Loan) to be $25,000.
The “Excess Modification Fee Amount” for any corrected loan is an amount equal to any Excess Modification Fees paid by or on behalf of the related borrower with respect to the related mortgage loan (including the related serviced Companion Loan, unless prohibited under the related intercreditor agreement) and received and retained by the Master Servicer or the Special Servicer, as applicable, as compensation within the prior 18 months of the related modification, waiver, extension or amendment resulting in the mortgage loan or REO loan being a corrected loan, but only to the extent those fees have not previously been deducted from a Workout Fee or Liquidation Fee.
A “Liquidation Fee” will generally be payable with respect to (i) each specially serviced loan (except, under certain circumstances, with respect to any fee restricted specially serviced loan) or REO property (except with respect to any non-serviced mortgage loan), (ii) each Mortgage Loan repurchased by a Mortgage Loan Seller or (iii) each defaulted Mortgage Loan that is a Non-Serviced Mortgage Loan sold by the Special Servicer in accordance with the Pooling and Servicing Agreement, in each case, as to which the Special Servicer obtains a full or partial recovery of the related asset. The Liquidation Fee for each specially serviced loan will be payable at a rate of 1.00% of the liquidation proceeds (exclusive of default interest) subject to a maximum of $1,000,000; provided, however, that no Liquidation Fee will be less than $25,000.
The Liquidation Fees will be reduced by the amount of any Excess Modification Fees received by the Special Servicer with respect to the related mortgage loan (including a serviced Companion Loan) or REO property as additional compensation within the prior 18 months, but only to the extent those fees have not previously been deducted from a Workout Fee or Liquidation Fee.
Similar fees to those described above will be payable to the applicable special servicer for the Non-Serviced Whole Loans under the related trust and servicing agreement or pooling and servicing agreement, as applicable.
Subject to certain limited exceptions, in connection with its duties under the Pooling and Servicing Agreement, the Special Servicer and its affiliates are prohibited from receiving or retaining any compensation (other than compensation specifically provided for under the Pooling and Servicing Agreement) from anyone in connection with the disposition, workout or foreclosure of any mortgage loan, the management or disposition of any REO property, or the performance of any other special servicing duties under the Pooling and Servicing Agreement. In the event the Special Servicer does receive any such compensation, it will be required to disclose those fees to the Certificate Administrator who will include it as part of the statement to Certificateholders. |
THE INFORMATION IN THIS STRUCTURAL AND COLLATERAL TERM SHEET IS NOT COMPLETE AND MAY BE AMENDED PRIOR TO THE TIME OF SALE. THIS TERM SHEET IS NOT AN OFFER TO SELL THESE SECURITIES AND IT IS NOT A SOLICITATION OF AN OFFER TO BUY THESE SECURITIES IN ANY JURISDICTION WHERE THE OFFER OR SALE IS NOT PERMITTED.
32 of 143
| Structural and Collateral Term Sheet | Benchmark 2022-B36 | |
| Structural Overview | ||
In addition, no liquidation fee will be payable to the Special Servicer if a mortgage loan or Serviced Whole Loan becomes a specially serviced loan only because of a maturity default and the related liquidation proceeds are received within 90 days following the related maturity date as a result of the related mortgage loan or Serviced Whole Loan being refinanced or otherwise repaid in full.
See “Pooling and Servicing Agreement—Servicing and Other Compensation and Payment of Expenses” in the Preliminary Prospectus. | ||
| ■ Deal Website: | The Certificate Administrator will maintain a deal website to which certain persons will have access to certain information including, but not limited to the following, which will be posted: ▪ special notices; ▪ summaries of any final asset status reports; ▪ appraisals in connection with Appraisal Reductions plus any second appraisals ordered; ▪ an “Investor Q&A Forum”; ▪ a voluntary investor registry; ▪ SEC EDGAR filings; and ▪ risk retention. |
THE INFORMATION IN THIS STRUCTURAL AND COLLATERAL TERM SHEET IS NOT COMPLETE AND MAY BE AMENDED PRIOR TO THE TIME OF SALE. THIS TERM SHEET IS NOT AN OFFER TO SELL THESE SECURITIES AND IT IS NOT A SOLICITATION OF AN OFFER TO BUY THESE SECURITIES IN ANY JURISDICTION WHERE THE OFFER OR SALE IS NOT PERMITTED.
33 of 143
| Structural and Collateral Term Sheet | Benchmark 2022-B36 | |
| 79 Fifth Avenue | ||
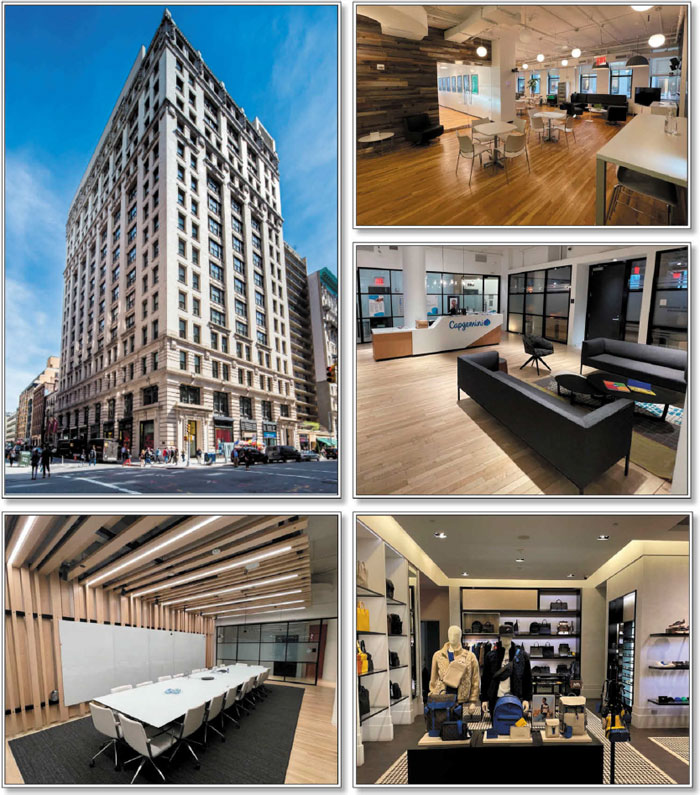
THE INFORMATION IN THIS STRUCTURAL AND COLLATERAL TERM SHEET IS NOT COMPLETE AND MAY BE AMENDED PRIOR TO THE TIME OF SALE. THIS TERM SHEET IS NOT AN OFFER TO SELL THESE SECURITIES AND IT IS NOT A SOLICITATION OF AN OFFER TO BUY THESE SECURITIES IN ANY JURISDICTION WHERE THE OFFER OR SALE IS NOT PERMITTED.
34 of 143
| Structural and Collateral Term Sheet | Benchmark 2022-B36 | |
| 79 Fifth Avenue | ||
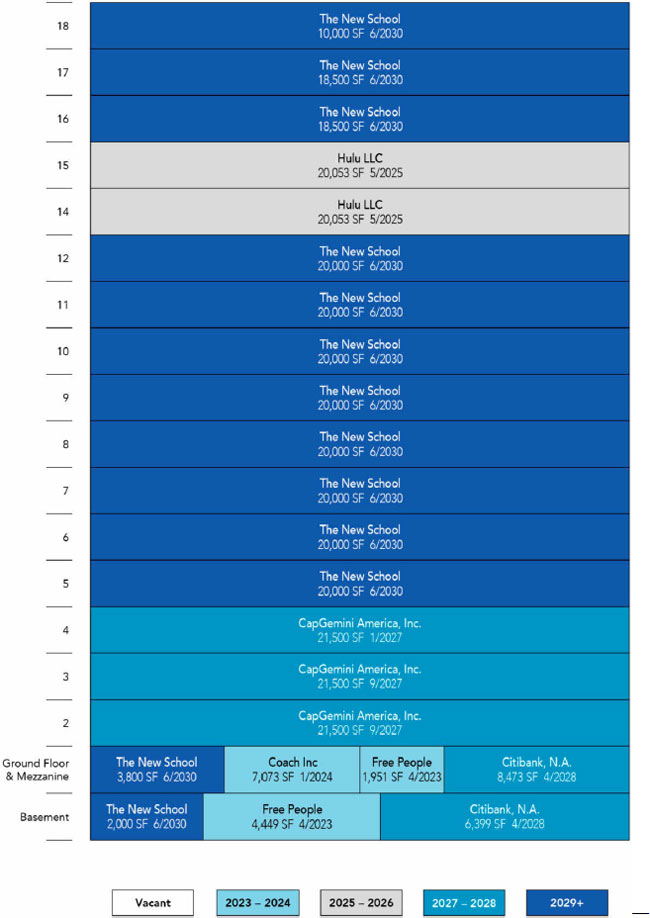
THE INFORMATION IN THIS STRUCTURAL AND COLLATERAL TERM SHEET IS NOT COMPLETE AND MAY BE AMENDED PRIOR TO THE TIME OF SALE. THIS TERM SHEET IS NOT AN OFFER TO SELL THESE SECURITIES AND IT IS NOT A SOLICITATION OF AN OFFER TO BUY THESE SECURITIES IN ANY JURISDICTION WHERE THE OFFER OR SALE IS NOT PERMITTED.
35 of 143
| Structural and Collateral Term Sheet | Benchmark 2022-B36 | |
| 79 Fifth Avenue | ||
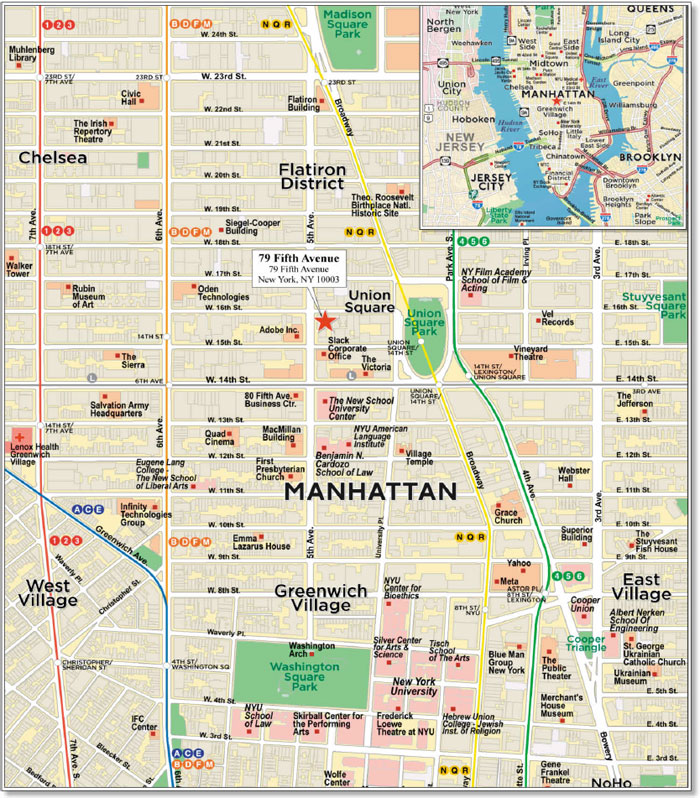
THE INFORMATION IN THIS STRUCTURAL AND COLLATERAL TERM SHEET IS NOT COMPLETE AND MAY BE AMENDED PRIOR TO THE TIME OF SALE. THIS TERM SHEET IS NOT AN OFFER TO SELL THESE SECURITIES AND IT IS NOT A SOLICITATION OF AN OFFER TO BUY THESE SECURITIES IN ANY JURISDICTION WHERE THE OFFER OR SALE IS NOT PERMITTED.
36 of 143
| Structural and Collateral Term Sheet | Benchmark 2022-B36 | |
| 79 Fifth Avenue | ||
| Mortgage Loan Information | Property Information | |||
| Mortgage Loan Sellers(1): | CREFI/JPMCB | Single Asset / Portfolio: | Single Asset | |
| Original Principal Balance(2): | $71,000,000 | Title: | Fee | |
| Cut-off Date Principal Balance(2): | $71,000,000 | Property Type - Subtype: | Office – CBD | |
| % of Pool by IPB: | 9.4% | Net Rentable Area (SF): | 345,751 | |
| Loan Purpose: | Recapitalization | Location: | New York, NY | |
| Borrowers: | AK 79 Fifth LLC, SAK 79 Fifth LLC | Year Built / Renovated: | 1906 / 2016 | |
| and DAK 79 Fifth LLC | Occupancy: | 100.0% | ||
| Guarantor: | Albert Kalimian | Occupancy Date: | 2/15/2022 | |
| Interest Rate: | 4.92000% | Number of Tenants: | 6 | |
| Note Date: | 4/29/2022 | Fourth Most Recent NOI: | $16,646,769 (12/31/2018) | |
| Maturity Date: | 5/6/2032 | Third Most Recent NOI: | $17,085,519 (12/31/2019) | |
| Interest-only Period: | 120 months | Second Most Recent NOI: | $17,160,810 (12/31/2020) | |
| Original Term: | 120 months | Most Recent NOI: | $18,362,181 (TTM 12/31/2021) | |
| Original Amortization: | None | UW Economic Occupancy: | 95.0% | |
| Amortization Type: | Interest Only | UW Revenues: | $29,320,118 | |
| Call Protection(3): | L(27),D(88),O(5) | UW Expenses: | $9,216,627 | |
| Lockbox / Cash Management: | Hard / Springing | UW NOI: | $20,103,491 | |
| Additional Debt(2): | Yes | UW NCF: | $19,331,988 | |
| Additional Debt Balance(2): | $169,000,000 | Appraised Value / Per SF: | $395,000,000 / $1,142 | |
| Additional Debt Type(2): | Pari Passu | Appraisal Date: | 2/24/2022 | |
| Escrows and Reserves | Financial Information(4) | |||||
| Initial | Monthly | Initial Cap | Cut-off Date Loan / SF: | $694 | ||
| Taxes: | $2,815,969 | $469,328 | N/A | Maturity Date Loan / SF: | $694 | |
| Insurance: | $0 | Springing | N/A | Cut-off Date LTV: | 60.8% | |
| Replacement Reserves: | $0 | $5,763 | $207,468 | Maturity Date LTV: | 60.8% | |
| TI/LC: | $1,000,000 | $57,760 | $3,500,000 | UW NCF DSCR: | 1.61x | |
| Other: | $0 | $0 | N/A | UW NOI Debt Yield: | 8.4% | |
| Sources and Uses | ||||||
| Sources | Proceeds | % of Total | Uses | Proceeds | % of Total | |
| Whole Loan | $240,000,000 | 63.1% | Purchase Price(4) | $369,000,000 | 97.0% | |
| Sponsor Equity | 140,421,540 | 36.9 | Closing Costs | 7,605,571 | 2.0 | |
| Upfront Reserves | 3,815,969 | 1.0 | ||||
| Total Sources | $380,421,540 | 100.0% | Total Uses | $380,421,540 | 100.0% | |
| (1) | The 79 Fifth Avenue Whole Loan (as defined below) was co-originated by Citi Real Estate Funding Inc. (“CREFI”), Wells Fargo Bank, National Association (“WFBNA”) and JPMorgan Chase Bank, National Association (“JPMCB”). |
| (2) | The 79 Fifth Avenue Mortgage Loan (as defined below) is part of a whole loan evidenced by 10 pari passu notes with an aggregate outstanding balance of $240,000,000. The financial information in the chart above reflects the cut-off date balance of the 79 Fifth Avenue Whole Loan (as defined below). |
| (3) | The defeasance lockout period, with respect to a defeasance of the 79 Fifth Avenue Whole Loan, will be at least 27 payment dates beginning with and including the first payment date on June 6, 2022. Defeasance of the 79 Fifth Avenue Whole Loan is permitted after the date that is the earlier of (i) April 29, 2026 and (ii) the second anniversary of the closing date of the securitization that includes the last note of the 79 Fifth Avenue Whole Loan to be securitized. |
| (4) | The 79 Fifth Avenue Property (as defined below) was recapitalized at a price of $369,000,000. At origination, the loan sponsor bought out the former equity partners’ 75% interest and paid off prior debt of $62,053,414. |
The Loan. The mortgage loan (the “79 Fifth Avenue Mortgage Loan”) is part of a whole loan (the “79 Fifth Avenue Whole Loan”) consisting of ten pari passu promissory notes in the aggregate outstanding principal balance of $240,000,000 and is secured by a first mortgage encumbering the borrowers’ fee interest in a 345,751 square foot office property, which includes 28,345 square feet of ground floor retail, in New York, New York (the “79 Fifth Avenue Property”). The 79 Fifth Avenue Mortgage Loan, evidenced by the non-controlling Notes A-1-3, A-3-1, A-3-2, and A-3-3 has an outstanding principal balance as of the Cut-off Date of $71,000,000 and represents approximately 9.3% of the Initial Pool Balance. The controlling note A-1-1 and the non-controlling notes A-1-2, A-2-1, A-2-2, A-2-3-1, and A-2-3-2 had an original principal balance and have an outstanding balance as of the Cut-off Date of $169,000,000. The 79 Fifth Avenue Whole Loan was co-originated by Citi Real Estate Funding Inc. (“CREFI”), Wells Fargo Bank, National Association (“WFBNA”) and JPMorgan Chase Bank, National Association (“JPMCB”). The 79 Fifth Avenue Whole Loan has an interest rate of 4.92000% per annum. The proceeds of the 79 Fifth Avenue Mortgage Loan were used to recapitalize the 79 Fifth Avenue Property, fund upfront reserves and pay origination costs.
THE INFORMATION IN THIS STRUCTURAL AND COLLATERAL TERM SHEET IS NOT COMPLETE AND MAY BE AMENDED PRIOR TO THE TIME OF SALE. THIS TERM SHEET IS NOT AN OFFER TO SELL THESE SECURITIES AND IT IS NOT A SOLICITATION OF AN OFFER TO BUY THESE SECURITIES IN ANY JURISDICTION WHERE THE OFFER OR SALE IS NOT PERMITTED.
37 of 143
| Structural and Collateral Term Sheet | Benchmark 2022-B36 | |
| 79 Fifth Avenue | ||
The 79 Fifth Avenue Whole Loan has an initial term of 120 months and has a remaining term of 117 months as of the Cut-off Date. The 79 Fifth Avenue Whole Loan requires payments of interest only for the entire term of the 79 Fifth Avenue Whole Loan. The stated maturity date of the 79 Fifth Avenue Whole Loan is the payment date in May 2032.
Voluntary prepayment of the 79 Fifth Avenue Whole Loan is prohibited prior to the due date occurring in January 2032. Defeasance of the 79 Fifth Avenue Whole Loan in whole (but not in part) is permitted at any time after the earlier of (i) April 29, 2026 and (ii) the second anniversary of the closing date of the securitization that includes the last note of the 79 Fifth Avenue Whole Loan to be securitized.
The table below summarizes the promissory notes that comprise the 79 Fifth Avenue Whole Loan. The relationship between the holders of the 79 Fifth Avenue Whole Loan is governed by a co-lender agreement as described under “Description of the Mortgage Pool—The Whole Loans—The Non-Serviced Pari Passu Whole Loans” in the Preliminary Prospectus.
| Whole Loan Summary | ||||
| Note | Original Balance | Cut-off Date Balance | Note Holder | Controlling Piece |
| A-1-1 | $50,000,000 | $50,000,000 | CGCMT 2022-GC48 | Yes |
| A-1-2 | $23,000,000 | $23,000,000 | BMO 2022-C2 | No |
| A-1-3 | $23,000,000 | $23,000,000 | Benchmark 2022-B36 | No |
| A-2-1, A-2-3-2 | $71,000,000 | $71,000,000 | BANK 2022-BNK42 | No |
| A-2-2, A-2-3-1 | $25,000,000 | $25,000,000 | WFB(1) | No |
| A-3-1, A-3-2, A-3-3 | $48,000,000 | $48,000,000 | Benchmark 2022-B36 | No |
| Whole Loan | $240,000,000 | $240,000,000 | ||
| (1) | The related note is currently held by the Note Holder identified in the table above and is expected to be contributed to one or more future securitization transactions. |
The Borrowers. The borrowers comprise three tenants in common, AK 79 Fifth LLC, SAK 79 Fifth LLC, and DAK 79 Fifth LLC, each a Delaware limited liability company and single purpose entity with one independent director. Legal counsel to the borrower delivered a non-consolidation opinion in connection with the origination of the 79 Fifth Avenue Whole Loan
The Loan Sponsor. The loan sponsor and nonrecourse carveout guarantor is Albert Kalimian. Albert Kalimian owns Kalimian Properties, a fully integrated privately held real estate investment firm with ownership interests in 10 commercial and multifamily properties in Manhattan, New York. Albert Kalimian had a 25% ownership stake in the 79 Fifth Avenue Property and is using the 79 Fifth Avenue Whole Loan proceeds to buy out his equity partners to increase his ownership share to 100%.
The Property. The 79 Fifth Avenue Property consists of an 18-story office building totaling 345,751 square feet, which includes 28,345 square feet of ground floor retail space located in New York, New York. The 79 Fifth Avenue Property, which sits on an 0.4-acre parcel of land, was built in 1906 and renovated in 2016. According to the appraisal, the borrowers provided a $9.4 million capital improvement budget, which included landlord work on floors 2 through 4, new lot line windows on floors 2 through 4, sidewalk vault repairs, and general base building enhancements. As of February 24, 2022, there was $3.3 million of outstanding renovation costs. The 79 Fifth Avenue Property features a lobby with marble finishes and vaulted ceilings, functional, rectangular shaped floor plates, and views of the surrounding Manhattan skyline. The retail units have frontage and visibility along Fifth Avenue with floor to ceiling glass storefronts. Five of the tenants (or their parent companies), comprising 98.1% of net rentable area and 96.6% of underwritten base rent, are investment grade rated. As of February 15, 2022, the 79 Fifth Avenue Property is 100% leased to six tenants and, according to a third-party market research report, has averaged 96.4% occupancy from 2011 through 2021.
Major Tenants.
The largest tenant is The New School (Moody’s: A3; 212,800 square feet; 61.5% of NRA; 51.7% of UW Base Rent). The New School is a private research university in New York City. Founded in 1919, the university has grown to five colleges with courses in emerging social sciences, international affairs, liberal arts, history, and philosophy as well as art, design, management and performing arts. In 2021, The New School generated $319.1 million in operating revenue and, similar to other private universities, did not receive significant funding from the federal or state government. According to a third-party report, The New School achieved record enrollment with 10,168 students in 2021. The New School has been at the 79 Fifth Avenue Property since 2004, has expanded multiple times and currently occupies 13 floors (5 through 12, 16 through 18, and ground floor and basement space). The New School’s lease expires on June 30, 2030. The New School has two, 10-year renewal options and no termination options. There is currently ongoing arbitration between The New School and the borrowers. Between 2017 and 2021, an administrative error occurred whereby The New School was not charged its contractual rental increases. A mediation hearing over the back rent and rent escalations was recently held, and the final outcome of the hearing is pending. Underwritten base rent is based on the lower amount currently being paid by The New School. In the event the borrowers are successful in the arbitration, The New School’s base rent would increase by approximately $1.3 million annually. See “Description of the Mortgage Pool—Litigation and Other Legal Considerations” in the Preliminary Prospectus.
THE INFORMATION IN THIS STRUCTURAL AND COLLATERAL TERM SHEET IS NOT COMPLETE AND MAY BE AMENDED PRIOR TO THE TIME OF SALE. THIS TERM SHEET IS NOT AN OFFER TO SELL THESE SECURITIES AND IT IS NOT A SOLICITATION OF AN OFFER TO BUY THESE SECURITIES IN ANY JURISDICTION WHERE THE OFFER OR SALE IS NOT PERMITTED.
38 of 143
| Structural and Collateral Term Sheet | Benchmark 2022-B36 | |
| 79 Fifth Avenue | ||
The second largest tenant is CapGemini America, Inc. (“CapGemini”) (S&P: BBB; 64,500 square feet; 18.7% of NRA; 20.7% of UW Base Rent). CapGemini is a French multinational information technology services and consulting company. Headquartered in Paris, France, CapGemini was founded in 1967 as an enterprise management and data processing company and launched US operations in 1981 following the acquisition of DASD Corporation. Today, CapGemini operates in 42 countries and reported 2021 revenues of €18,160 million, a 14.6% increase over 2020. CapGemini has been at the 79 Fifth Avenue Property since 2016 and currently occupies floors 2 through 4. The lease for the second and third floor space (collectively 43,000 square feet) expires on September 30, 2027, and the lease on the fourth floor (21,500 square feet) expires on January 31, 2027. CapGemini has one, 5-year renewal option on all of their space. CapGemini may terminate its lease with respect to the second and third floors at any time after October 13, 2024 upon at least 12 months’ notice and payment of a termination fee of approximately $3,065,866.
The third largest tenant is Hulu LLC (“Hulu”) (Moody’s/Fitch/S&P: A2/A-/BBB+; 40,106 square feet; 11.6% of NRA; 12.9% of UW Base Rent). Hulu is an American streaming platform that launched in 2007 and offers a library of films and television series. Hulu is majority owned by The Walt Disney Company with NBCUniversal holding a minority stake. For the fiscal year ending September 2021, Hulu reported $2.1 billion in ad revenue. Hulu has been at the 79 Fifth Avenue Property since 2014, doubled its space in 2018 and currently occupies the 14th and 15th floors. Hulu’s lease expires on May 31, 2025. Hulu has one, 5-year renewal option and no termination options.
| Historical and Current Occupancy(1) | |||
| 2019 | 2020 | 2021 | Current(2) |
| 100.0% | 100.0% | 100.0% | 100.0% |
| (1) | Historical occupancies are the annual average physical occupancy of each respective year. |
| (2) | Current Occupancy is as of February 15, 2022. |
| Tenant Summary(1) | |||||||
| Tenant | Type | Ratings Moody’s/Fitch/S&P(2) | Net Rentable Area (SF) | % of Total NRA | UW Base Rent PSF(3) | % of Total UW Base Rent(3) | Lease Expiration Date |
| The New School(4) | Office | A3/NR/NR | 212,800(4) | 61.5% | $64.02 | 51.7% | 6/30/2030 |
| CapGemini(5) | Office | NR/NR/BBB | 64,500 | 18.7 | 84.65 | 20.7 | Various(6) |
| Hulu | Office | A2/A-/BBB+ | 40,106 | 11.6 | 85.00 | 12.9 | 5/31/2025 |
| Citibank, N.A.(7) | Retail | Aa3/A+/A+ | 14,872 | 4.3 | 50.43 | 2.8 | 4/30/2028 |
| Coach Inc(8) | Retail | Baa2/NR/BBB- | 7,073 | 2.0 | 311.76 | 8.4 | 1/31/2024 |
| Free People(9) | Retail | NR/NR/NR | 6,400 | 1.9 | 140.69 | 3.4 | 4/30/2023 |
| Total Occupied | 345,751 | 100.0% | $76.20 | 100.0% | |||
| Vacant | 0 | 0.0 | |||||
| Total / Wtd. Avg. | 345,751 | 100.0% | |||||
| (1) | Based on the underwritten rent roll dated February 15, 2022. |
| (2) | Ratings are those of the parent company whether or not the parent guarantees the lease. |
| (3) | UW Base Rent PSF and % of Total UW Base Rent include straight-line rent averaging for certain investment grade tenants (The New School and CapGemini) through lease maturity totaling $2,450,889 and contractual rent steps through February 2023 totaling $157,294 but does not reflect any outcome of the arbitration between The New School and the borrowers with respect to certain back rent and rent escalations. See “Underwritten Net Cash Flow” below. |
| (4) | The New School currently subleases a portion of the 18th floor totaling 8,820 square feet (2.6% of NRA; 4.1% of The New School NRA) to Gene Kaufman Architect, P.C. |
| (5) | CapGemini may terminate its lease with respect to the second and third floors any time after October 13, 2024 upon at least 12 months’ notice and payment of a termination fee of approximately $3,065,866. |
| (6) | CapGemini’s lease with respect to the fourth floor (21,500 square feet) expires on January 31, 2027, and with respect to the second and third floors (43,000 square feet) expires on September 30, 2027. |
| (7) | Citibank, N.A., which is an affiliate of CREFI, occupies 52.5% of the ground floor retail space. |
| (8) | Coach Inc occupies 25.0% of the ground floor retail space and is expected to vacate at lease expiration. |
| (9) | Free People occupies 22.6% of the ground floor retail space. |
THE INFORMATION IN THIS STRUCTURAL AND COLLATERAL TERM SHEET IS NOT COMPLETE AND MAY BE AMENDED PRIOR TO THE TIME OF SALE. THIS TERM SHEET IS NOT AN OFFER TO SELL THESE SECURITIES AND IT IS NOT A SOLICITATION OF AN OFFER TO BUY THESE SECURITIES IN ANY JURISDICTION WHERE THE OFFER OR SALE IS NOT PERMITTED.
39 of 143
| Structural and Collateral Term Sheet | Benchmark 2022-B36 | |
| 79 Fifth Avenue | ||
| Lease Rollover Schedule(1)(2) | |||||||||
| Year | Number of Leases Expiring | Net Rentable Area Expiring | % of NRA Expiring | UW Base Rent Expiring(3) | % of UW Base Rent Expiring(3) | Cumulative Net Rentable Area Expiring | Cumulative % of NRA Expiring | Cumulative UW Base Rent Expiring(3) | Cumulative % of UW Base Rent Expiring(3) |
| Vacant | NAP | 0 | 0.0% | NAP | NAP | 0 | 0.0% | NAP | NAP |
| MTM | 0 | 0 | 0.0 | $0 | 0.0% | 0 | 0.0% | $0 | 0.0% |
| 2022 | 0 | 0 | 0.0 | 0 | 0.0 | 0 | 0.0% | $0 | 0.0% |
| 2023 | 1 | 6,400 | 1.9 | 900,407 | 3.4 | 6,400 | 1.9% | $900,407 | 3.4% |
| 2024 | 1 | 7,073 | 2.0 | 2,205,067 | 8.4 | 13,473 | 3.9% | $3,105,474 | 11.8% |
| 2025 | 1 | 40,106 | 11.6 | 3,408,977 | 12.9 | 53,579 | 15.5% | $6,514,451 | 24.7% |
| 2026 | 0 | 0 | 0.0 | 0 | 0.0 | 53,579 | 15.5% | $6,514,451 | 24.7% |
| 2027 | 2 | 64,500 | 18.7 | 5,460,117 | 20.7 | 118,079 | 34.2% | $11,974,568 | 45.4% |
| 2028 | 1 | 14,872 | 4.3 | 750,000 | 2.8 | 132,951 | 38.5% | $12,724,568 | 48.3% |
| 2029 | 0 | 0 | 0.0 | 0 | 0.0 | 132,951 | 38.5% | $12,724,568 | 48.3% |
| 2030 | 1 | 212,800 | 61.5 | 13,622,601 | 51.7 | 345,751 | 100.0% | $26,347,169 | 100.0% |
| 2031 | 0 | 0 | 0.0 | 0 | 0.0 | 345,751 | 100.0% | $26,347,169 | 100.0% |
| 2032 & Beyond | 0 | 0 | 0.0 | 0 | 0.0 | 345,751 | 100.0% | $26,347,169 | 100.0% |
| Total | 7 | 345,751 | 100.0% | $26,347,169 | 100.0% | ||||
| (1) | Based on the underwritten rent roll dated February 15, 2022. |
| (2) | Certain leases may have termination options that are exercisable prior to the originally stated expiration date of the lease and that are not considered in this Lease Rollover Schedule. |
| (3) | UW Base Rent Expiring, % of UW Base Rent Expiring, Cumulative UW Base Rent Expiring and Cumulative % of UW Base Rent Expiring include straight-line rent averaging for certain investment grade tenants (The New School and CapGemini) through lease maturity totaling $2,450,889 and contractual rent steps through February 2023 totaling $157,294 but does not reflect any outcome of the arbitration between The New School and the borrowers with respect to certain back rent and rent escalations. See “Underwritten Net Cash Flow” below. |
| Operating History and Underwritten Net Cash Flow(1) | ||||||
| 2019 | 2020 | 2021 | Underwritten | PSF | %(2) | |
| Rents in Place | $21,523,248 | $21,892,938 | $22,660,998 | $23,738,986 | $68.66 | 76.9% |
| Rent Steps(3) | 0 | 0 | 0 | 2,608,183 | 7.54 | 8.5% |
| Other Income(4) | 158,823 | 54,402 | 0 | 0 | 0.00 | 0.0% |
| Gross Potential Revenue | $21,682,071 | $21,947,340 | $22,660,998 | $26,347,169 | $76.20 | 85.4% |
| Total Reimbursements | 3,688,603 | 3,730,411 | 4,273,141 | 4,516,113 | 13.06 | 14.6% |
| Net Rental Income | $25,370,674 | $25,677,751 | $26,934,139 | $30,863,283 | $89.26 | 100.0% |
| (Vacancy/Credit Loss) | 0 | 0 | 0 | (1,543,164) | (4.46) | (5.0)% |
| Effective Gross Income | $25,370,674 | $25,677,751 | $26,934,139 | $29,320,118 | $84.80 | 95.0% |
| Total Expenses | $8,285,155 | $8,516,941 | $8,571,958 | $9,216,627 | $26.66 | 31.4% |
| Net Operating Income | $17,085,519 | $17,160,810 | $18,362,181 | $20,103,491 | $58.14 | 68.6% |
| Total TI/LC, RR | 0 | 0 | 0 | 771,503 | 2.23 | 2.6% |
| Net Cash Flow | $17,085,519 | $17,160,810 | $18,362,181 | $19,331,988 | $55.91 | 65.9% |
| (1) | Based on the underwritten rent roll dated February 15, 2022. |
| (2) | % column represents percent of Net Rental Income for all revenue lines and represents percent of Effective Gross Income for the remainder of the fields. |
| (3) | Rent Steps include straight-line rent averaging for certain investment grade tenants (The New School and CapGemini) through lease maturity totaling $2,450,889 and contractual rent steps through February 2023 totaling $157,294 but does not reflect any outcome of the arbitration between The New School and the borrowers with respect to certain back rent and rent escalations. |
| (4) | Other Income includes items such as parking income, HVAC after-hours income, and miscellaneous operating income. |
The Market. The 79 Fifth Avenue Property is situated in the Flatiron neighborhood of New York, New York, which neighborhood is bordered by Park Avenue South to the east, Sixth Avenue to the west, 25th Street to the north and 13th Street to the south. The 79 Fifth Avenue Property is located directly west of Union Square and is three blocks northwest of the Union Square subway station, which services the L, N, Q, R, W, 4, 5, and 6 subway lines.
According to a third-party market research report, the 79 Fifth Avenue Property is located in the Gramercy Park office submarket of the New York City market. As of April 2022, the Gramercy Park submarket reported total inventory of approximately 28.5 million square feet with a 10.3% vacancy rate and average asking rent of $72.08 per square foot. The appraiser concluded to a market rent for the office space at the 79 Fifth Avenue Property of $80.00 per square foot for floors 2 to 10, $85.00 per square foot for floors 11 to 15, and $90.00 per square foot for floors 16 to 18, all on a modified gross basis.
THE INFORMATION IN THIS STRUCTURAL AND COLLATERAL TERM SHEET IS NOT COMPLETE AND MAY BE AMENDED PRIOR TO THE TIME OF SALE. THIS TERM SHEET IS NOT AN OFFER TO SELL THESE SECURITIES AND IT IS NOT A SOLICITATION OF AN OFFER TO BUY THESE SECURITIES IN ANY JURISDICTION WHERE THE OFFER OR SALE IS NOT PERMITTED.
40 of 143
| Structural and Collateral Term Sheet | Benchmark 2022-B36 | |
| 79 Fifth Avenue | ||
The following table presents certain information relating to the appraisal’s market rent conclusions for the 79 Fifth Avenue Property:
Market Rent Summary(1) | |||||||
| Office Floors | Office Floors | Office Floors | Retail Corner | Retail Fifth Avenue | Retail Fifth Avenue | Retail Lower | |
| 2-10 | 11-15 | 16-18 | Large | Small | |||
| Market Rent (PSF) | $80.00 | $85.00 | $90.00 | $275.00 | $175.00 | $225.00 | $50.00 |
| Lease Term (Years) | 10 | 10 | 10 | 10 | 10 | 10 | 10 |
| Lease Type | MG | MG | MG | MG | MG | MG | Gross |
| (1) | Source: Appraisal. |
The following table presents information relating to comparable office property sales for the 79 Fifth Avenue Property:
| Comparable Sales Summary(1) | ||||||
| Property Name/Location | Sale Date | Year Built / Renovated | Total NRA (SF) | Occupancy | Sale Price | Sale Price PSF |
| 79 Fifth Avenue | N/A | 1906/2016 | 345,751(2) | 100.0%(2) | NAP | NAP |
| 475 Fifth Avenue | Dec-2021 | 1965/2017 | 276,000 | 97.0% | $299,460,000 | $1,085.00 |
| 375 West Broadway | Feb-2022 | 1863/2014 | 76,605 | 100.0% | $130,000,000 | $1,697.02 |
| 11 Madison Park North | Apr-2021 | 1913/NAP | 260,140 | 90.1% | $275,000,000 | $1,057.12 |
| 315 Park Avenue South | Dec-2021 | 1910/2016 | 332,614 | 97.3% | $361,700,000 | $1,087.45 |
| 245-249 West 17th Street | Dec-2021 | 1902-1909/2016 | 281,253 | 98.7% | $389,200,000 | $1,383.81 |
| 218 West 18th Street | Dec-2021 | 1912/2009 | 165,255 | 100.0% | $170,000,000 | $1,028.71 |
| 635-641 Avenue of the Americas | June-2021 | 1902/2015 | 273,983 | 94.0% | $325,000,000 | $1,186.20 |
| 1375 Broadway | July-2020 | 1927/NAP | 518,578 | 100.0% | $435,000,000 | $838.83 |
| (1) | Source: Appraisal. |
| (2) | Based on Underwritten Rent Roll dated February 15, 2022. |
The following table presents information relating to comparable office properties for the 79 Fifth Avenue Property:
| Comparable Office Properties Summary(1) | ||||||
| Property Name/Location | Office Area | Year Built / Renovated | Stories | Sublease SF Available | % Occupied (Direct) | Average Asking Rent |
| 79 Fifth Avenue | 317,406(2) | 1906/2016 | 18 | - | 100.0%(2) | $70.86(2)(3) |
| 55 Fifth Avenue | 270,685 | 1926/NAP | 19 | 0 | 94.1% | $90.00 |
| 71 Fifth Avenue | 165,000 | 1907/NAP | 11 | 0 | 91.0% | $90.00 |
| 80 Fifth Avenue | 132,000 | 1908/NAP | 18 | 0 | 100.0% | NAP |
| 90 Fifth Avenue | 138,211 | 1903/NAP | 11 | 0 | 100.0% | NAP |
| 91 Fifth Avenue | 61,500 | 1894/NAP | 8 | 0 | 87.0% | $68.00 |
| 100-104 Fifth Avenue | 305,000 | 1905/NAP | 20 | 42,807 | 93.7% | $75.00 |
| 110 Fifth Avenue | 200,378 | 1890/NAP | 11 | 0 | 100.0% | NAP |
| 111 Fifth Avenue | 234,700 | 1877/NAP | 13 | 0 | 100.0% | NAP |
| 114-116 Fifth Avenue | 351,666 | 1910/NAP | 19 | 0 | 100.0% | NAP |
| 122 Fifth Avenue | 294,730 | 1900/NAP | 10 | 0 | 75.0% | $100.00 |
| (1) | Source: Appraisal. |
| (2) | Based on Underwritten Rent Roll dated February 15, 2022. |
| (3) | Represents Underwritten Base Rent per square feet. |
Property Management. The 79 Fifth Avenue Property is managed by AMK Holdings Inc., a Delaware corporation, an affiliate of the borrowers.
Escrows and Reserves. At origination of the 79 Fifth Avenue Whole Loan, the borrowers deposited (i) approximately $2,815,969 into a real estate tax reserve account and (ii) $1,000,000 into a TI/LC reserve account
Tax Escrows – The borrowers are required to deposit into a real estate tax reserve, on a monthly basis, 1/12 of the taxes that the lender reasonably estimates will be payable over the next-ensuing 12-month period (initially estimated to be approximately $469,328).
Insurance Escrows – The borrowers are required to deposit into an insurance reserve, on a monthly basis, 1/12 of the amount which will be sufficient to pay the insurance premiums due for the renewal of coverage afforded by such policies; provided, however, such insurance reserve has been conditionally waived so long as the borrowers maintain a blanket policy meeting the requirements of the 79 Fifth Avenue Whole Loan documents.
THE INFORMATION IN THIS STRUCTURAL AND COLLATERAL TERM SHEET IS NOT COMPLETE AND MAY BE AMENDED PRIOR TO THE TIME OF SALE. THIS TERM SHEET IS NOT AN OFFER TO SELL THESE SECURITIES AND IT IS NOT A SOLICITATION OF AN OFFER TO BUY THESE SECURITIES IN ANY JURISDICTION WHERE THE OFFER OR SALE IS NOT PERMITTED.
41 of 143
| Structural and Collateral Term Sheet | Benchmark 2022-B36 | |
| 79 Fifth Avenue | ||
TI/LC Reserve – The borrowers are required to deposit into a tenant improvement and leasing commissions reserve, on a monthly basis, an amount equal to approximately $57,760; provided, however, the borrowers will not be required to make such monthly deposit into the tenant improvement and leasing reserve so long as the amount then on deposit in the tenant improvements and leasing commissions reserve account equals or exceeds $3,500,000. The borrowers may substitute a letter of credit for all or any portion of funds on deposit in the tenant improvement and leasing commissions account, which letter of credit will be increased by the borrowers in lieu of making the required monthly deposits into such reserve account.
Replacement Reserve – The borrowers are required to deposit into a replacement reserve, on a monthly basis, an amount equal to approximately $5,763; provided, however, the borrowers will not be required to make such monthly deposit into the replacement reserve so long as the amount then on deposit in the replacement reserve account equals or exceeds $207,468. The borrowers may substitute a letter of credit for all or any portion of funds on deposit in the replacement reserve account, which letter of credit will be increased by the borrowers in lieu of making the required monthly deposits into such reserve account.
Lockbox / Cash Management. The 79 Fifth Avenue Whole Loan is structured with a hard lockbox and springing cash management. At origination of the 79 Fifth Avenue Whole Loan, the borrowers were required to deliver a notice to each tenant directing each tenant to remit all payments under the applicable lease directly to the lender- controlled lockbox. All funds received by the borrowers or the property manager are required to be deposited in a lockbox account immediately following receipt. All funds deposited into the lockbox are required to be released to the borrowers on each business day unless a Trigger Period (as defined below) exists. Upon the occurrence and during the continuance of a Trigger Period, all funds in the lockbox account are required to be swept on each business day to a lender-controlled cash management account to be applied and disbursed in accordance with the 79 Fifth Avenue Whole Loan documents, and all excess cash flow funds remaining in the cash management account after the application of such funds in accordance with the 79 Fifth Avenue Whole Loan documents are required to be held by the lender in an excess cash flow reserve account as additional collateral for the 79 Fifth Avenue Whole Loan. Upon the cure of the applicable Trigger Period, so long as no other Trigger Period exists, the lender is required to return any amounts remaining on deposit in the excess cash flow reserve account to the borrowers. Upon an event of default under the 79 fifth Avenue whole loan documents, the lender will apply funds to the debt in such priority as it may determine.
A “Trigger Period” means a period (A) commencing upon (i) the occurrence of an event of default under the 79 Fifth Avenue Whole Loan documents, (ii) the debt service coverage ratio falling below 1.15x (tested on a hypothetical 30-year amortization basis), or (iii) the occurrence and continuance of Specified Tenant Trigger Period (as defined below); and (B) expiring upon (x) with regard to clause (i), the cure of such event of default or waiver thereof by the lender, (y) with regard to clause (ii), the debt service coverage ratio being above 1.15x (tested on a hypothetical 30-year amortization basis) for 2 consecutive calendar quarters, or (z) with regard to clause (iii), a Specified Tenant Trigger Period ceasing to exist. Notwithstanding the foregoing, the failure to maintain a debt service coverage ratio of at least 1.15x will not result in a Trigger Period if, within 15 days of the borrowers’ receipt of notice of the Trigger Period caused in connection with clause (ii), the borrowers make a deposit into a reserve account held by the lender or deliver a letter of credit, in either case in an amount which, if deducted from the outstanding principal balance of the 79 Fifth Avenue Whole Loan, would cause the debt service coverage ratio to be at least 1.15x (tested on a hypothetical 30-year amortization basis).
A “Specified Tenant” means, as applicable, (i) The New School, (ii) any guarantor(s) of the applicable related Specified Tenant Lease(s) (as defined below), and (iii) any replacement tenant for a Specified Tenant that leases 107,500 square feet or more at the 79 Fifth Avenue Property.
A “Specified Tenant Trigger Period” means a period (A) commencing upon the first to occur of (i) Specified Tenant being in monetary or material non-monetary default under the applicable Specified Tenant Lease, in each case, beyond applicable notice, grace and cure periods (provided that the existing rent dispute between the borrowers and The New School as described in an estoppel certificate provided by The New School will not be deemed a default by The New School for the purposes of commencing a Specified Tenant Trigger Period; and provided further that a Specified Tenant will be deemed to be in default under this clause (i) if The New School fails to deliver a letter of credit when and as required under such tenant’s lease), (ii) a Specified Tenant giving notice that it is terminating its lease for all or any portion of the Specified Tenant Space (as defined below) (or applicable portion thereof), (iii) any termination or cancellation of any Specified Tenant Lease (including, without limitation, rejection in any bankruptcy or similar insolvency proceeding) and/or any Specified Tenant Lease failing to otherwise be in full force and effect, (iv) any bankruptcy or similar insolvency of Specified Tenant, and (v) Specified Tenant failing to extend or renew the applicable Specified Tenant Lease on or prior to June 30, 2028 in accordance with the applicable terms and conditions thereof and the 79 Fifth Avenue Whole Loan documents for the applicable Specified Tenant Renewal Term; and (B) expiring upon the first to occur of the lender’s receipt of evidence reasonably acceptable to the lender (which such evidence shall include, without limitation, a duly executed estoppel certificate from the applicable Specified Tenant in form and substance reasonably acceptable to the lender) of (1) the satisfaction of the Specified Tenant Cure Conditions or (2) the borrowers leasing the entire Specified Tenant Space (or applicable portion thereof) in accordance with the applicable terms and conditions of the 79 Fifth Avenue Whole Loan documents, and the applicable tenant under such lease occupying the space demised under its lease and paying the full amount of the rent due under the applicable lease.
The “Specified Tenant Cure Conditions” means (i) the applicable Specified Tenant has cured all defaults under the applicable Specified Tenant Lease, (ii) the applicable Specified Tenant has revoked or rescinded all termination or cancellation notices with respect to the
THE INFORMATION IN THIS STRUCTURAL AND COLLATERAL TERM SHEET IS NOT COMPLETE AND MAY BE AMENDED PRIOR TO THE TIME OF SALE. THIS TERM SHEET IS NOT AN OFFER TO SELL THESE SECURITIES AND IT IS NOT A SOLICITATION OF AN OFFER TO BUY THESE SECURITIES IN ANY JURISDICTION WHERE THE OFFER OR SALE IS NOT PERMITTED.
42 of 143
| Structural and Collateral Term Sheet | Benchmark 2022-B36 | |
| 79 Fifth Avenue | ||
applicable Specified Tenant Lease and has re-affirmed the applicable Specified Tenant Lease as being in full force and effect, (iii) in the event the Specified Tenant Trigger Period is due to the applicable Specified Tenant’s failure to extend or renew the applicable Specified Tenant Lease in accordance with clause (v) of the definition of “Specified Tenant Trigger Period”, the applicable Specified Tenant has renewed or extended the applicable Specified Tenant Lease in accordance with the terms of such lease and of the 79 Fifth Avenue Whole Loan documents for the applicable Specified Tenant Renewal Term, (iv) with respect to any applicable bankruptcy or insolvency proceedings involving the applicable Specified Tenant and/or the applicable Specified Tenant Lease, the applicable Specified Tenant is no longer insolvent or subject to any bankruptcy or insolvency proceedings and has affirmed the applicable Specified Tenant Lease pursuant to final, non-appealable order of a court of competent jurisdiction, and (v) the applicable Specified Tenant is paying full, unabated rent under the applicable Specified Tenant Lease.
A “Specified Tenant Renewal Term” means five years.
A “Specified Tenant Space” means the entirety of that portion of the 79 Fifth Avenue Property demised as of the date of origination of the 79 Fifth Avenue Whole Loan to the initial Specified Tenant pursuant to The New School’s lease.
A “Specified Tenant Lease” means collectively and/or individually (as the context requires), each lease at the 79 Fifth Avenue Property with Specified Tenant (including, without limitation, any guaranty or similar instrument furnished thereunder), as the same may have been or may hereafter be amended, restated, extended, renewed, replaced and/or otherwise modified.
Current Mezzanine or Subordinate Indebtedness. None.
Future Mezzanine or Subordinate Indebtedness Permitted. None.
Partial Release. None.
THE INFORMATION IN THIS STRUCTURAL AND COLLATERAL TERM SHEET IS NOT COMPLETE AND MAY BE AMENDED PRIOR TO THE TIME OF SALE. THIS TERM SHEET IS NOT AN OFFER TO SELL THESE SECURITIES AND IT IS NOT A SOLICITATION OF AN OFFER TO BUY THESE SECURITIES IN ANY JURISDICTION WHERE THE OFFER OR SALE IS NOT PERMITTED.
43 of 143
| Structural and Collateral Term Sheet | Benchmark 2022-B36 | |
| Yorkshire & Lexington Towers | ||

THE INFORMATION IN THIS STRUCTURAL AND COLLATERAL TERM SHEET IS NOT COMPLETE AND MAY BE AMENDED PRIOR TO THE TIME OF SALE. THIS TERM SHEET IS NOT AN OFFER TO SELL THESE SECURITIES AND IT IS NOT A SOLICITATION OF AN OFFER TO BUY THESE SECURITIES IN ANY JURISDICTION WHERE THE OFFER OR SALE IS NOT PERMITTED.
44 of 143
| Structural and Collateral Term Sheet | Benchmark 2022-B36 | |
| Yorkshire & Lexington Towers | ||
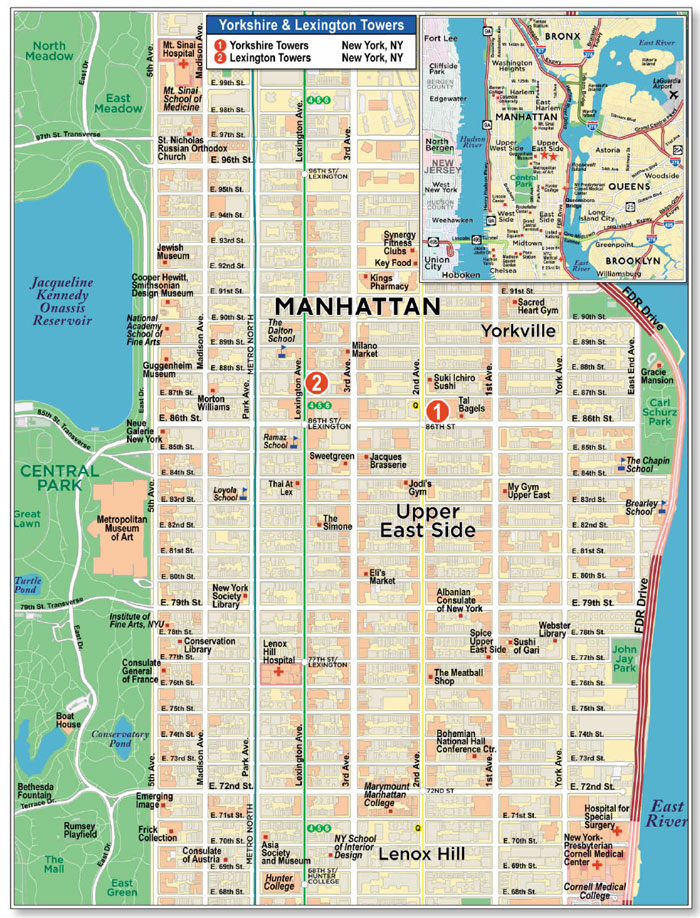
THE INFORMATION IN THIS STRUCTURAL AND COLLATERAL TERM SHEET IS NOT COMPLETE AND MAY BE AMENDED PRIOR TO THE TIME OF SALE. THIS TERM SHEET IS NOT AN OFFER TO SELL THESE SECURITIES AND IT IS NOT A SOLICITATION OF AN OFFER TO BUY THESE SECURITIES IN ANY JURISDICTION WHERE THE OFFER OR SALE IS NOT PERMITTED.
45 of 143
| Structural and Collateral Term Sheet | Benchmark 2022-B36 | |
| Yorkshire & Lexington Towers | ||
| Mortgage Loan Information | Property Information | |||
| Mortgage Loan Seller: | CREFI | Single Asset / Portfolio: | Portfolio | |
| Original Principal Balance(1): | $66,000,000 | Title: | Fee | |
| Cut-off Date Principal Balance(1): | $66,000,000 | Property Type - Subtype: | Multifamily – High Rise | |
| % of Pool by IPB: | 8.8% | Net Rentable Area (Units): | 808 | |
| Loan Purpose: | Refinance | Location: | New York, NY | |
| Borrowers(2): | Various | Year Built / Renovated: | Various / Various | |
Guarantors: | Meyer Chetrit and The Gluck | Occupancy: | 96.4% | |
| Family Trust U/A/D July 16, 2009 | Occupancy Date: | 3/1/2022 | ||
| Interest Rate: | 3.04000% | Number of Tenants: | N/A | |
| Note Date: | 5/12/2022 | Fourth Most Recent NOI: | $27,343,815 (December 31, 2019) | |
| Maturity Date: | 6/6/2027 | Third Most Recent NOI: | $25,617,949 (December 31, 2020) | |
| Interest-only Period: | 60 months | Second Most Recent NOI: | $24,254,281 (December 31, 2021) | |
| Original Term: | 60 months | Most Recent NOI(5): | $25,322,439 (TTM February 28, 2022) | |
| Original Amortization: | None | UW Economic Occupancy: | 97.2% | |
| Amortization Type: | Interest Only | UW Revenues: | $51,394,888 | |
| Call Protection(3): | L(26),D(29),O(5) | UW Expenses: | $16,019,126 | |
| Lockbox / Cash Management: | Hard (Commercial); | UW NOI(5): | $35,375,762 | |
| Soft (Multifamily) / In Place | UW NCF(5): | $35,375,762 | ||
| Additional Debt(1): | Yes | Appraised Value / Per Unit: | $954,000,000 / $1,180,693 | |
| Additional Debt Balance(1): | $252,000,000 / $221,500,000 / | Appraisal Date: | 1/20/2022 | |
| $174,500,000 | ||||
| Additional Debt Type(1): | Pari Passu / Subordinate / | |||
| Mezzanine | ||||
| Escrows and Reserves(4) | Financial Information(1) | |||||||
| Initial | Monthly | Initial Cap | Senior Loan | Whole Loan | Total Debt | |||
| Taxes: | $5,390,917 | $898,486 | N/A | Cut-off Date Loan / Unit: | $393,564 | $667,698 | $883,663 | |
| Insurance: | $367,868 | Springing | N/A | Maturity Date Loan / Unit: | $393,564 | $667,698 | $883,663 | |
| Replacement Reserves: | $1,100,000 | $0 | N/A | Cut-off Date LTV: | 33.3% | 56.6% | 74.8% | |
| TI/LC: | $1,000,000 | $0 | N/A | Maturity Date LTV: | 33.3% | 56.6% | 74.8% | |
| Other: | $12,400,000 | Springing | N/A | UW NCF DSCR(5): | 3.61x | 2.13x | 1.20x | |
| UW NOI Debt Yield(5): | 11.1% | 6.6% | 5.0% | |||||
| Sources and Uses | ||||||
| Sources | Proceeds | % of Total | Uses | Proceeds | % of Total | |
| Senior Loan | $318,000,000 | 44.5% | Loan Payoff | $545,268,671 | 76.4% | |
| Subordinate Notes | 221,500,000 | 31.0 | Closing Costs | 93,214,219 | 13.1 | |
| Mezzanine Loans | 174,500,000 | 24.4 | Principal Equity Distribution | 55,258,325 | 7.7 | |
| Upfront Reserves | 20,258,785 | 2.8 | ||||
| Total Sources | $714,000,000 | 100.0% | Total Uses | $714,000,000 | 100.0% | |
| (1) | The Yorkshire & Lexington Towers Senior Loan (as defined below), with an original aggregate principal balance of $318,000,000, is part of the Yorkshire & Lexington Towers Whole Loan (as defined below). The Financial Information in the chart above reflects the Yorkshire & Lexington Towers Senior Loan, the Yorkshire & Lexington Towers Whole Loan and the Yorkshire & Lexington Towers Total Debt (as defined below). For additional information, see “The Loan” below. |
| (2) | The borrowers under the Yorkshire & Lexington Towers Whole Loan are CF E 88 LLC, SM E 88 LLC, CF E 86 LLC, SM E 86 LLC and LSG E 86 LLC. |
| (3) | Defeasance of the Yorkshire & Lexington Towers Whole Loan is permitted at any time after the earlier to occur of (a) the end of the two-year period commencing on the closing date of the securitization of the last promissory note representing a portion of the Yorkshire & Lexington Towers Whole Loan and (b) July 6, 2025. The assumed defeasance lockout period of 26 payments is based on the closing date of this transaction in August 2022. The actual lockout period may be longer. |
| (4) | For a full description of Escrows and Reserves, please refer to “Escrows and Reserves” below. |
| (5) | UW NOI is greater than Most Recent NOI due in part to (i) the loan sponsors recently renovating 57 units, which has increased rents at the Yorkshire & Lexington Towers Properties (as defined below) and (ii) underwritten straight-lined rent for CVS Pharmacy. Additionally, the UW NOI and UW NCF include disbursements from a Supplemental Income Reserve (as defined below) of $5,226,004. The Yorkshire & Lexington Towers Senior Loan UW NCF DSCR, Yorkshire & Lexington Towers Whole Loan UW NCF DSCR, and Yorkshire & Lexington Towers Total Debt UW NCF DSCR excluding credit for the upfront Supplemental Income Reserve are 3.08x, 1.81x and 1.02x, respectively. The Yorkshire & Lexington Towers Senior Loan UW NOI Debt Yield, Yorkshire & Lexington Towers Whole Loan UW NOI Debt Yield, and Yorkshire & Lexington Towers Total Debt UW NOI Debt Yield excluding credit for the upfront Supplemental Income Reserve are 9.5%, 5.6% and 4.2%, respectively. Please refer to “Escrows and Reserves” below. |
THE INFORMATION IN THIS STRUCTURAL AND COLLATERAL TERM SHEET IS NOT COMPLETE AND MAY BE AMENDED PRIOR TO THE TIME OF SALE. THIS TERM SHEET IS NOT AN OFFER TO SELL THESE SECURITIES AND IT IS NOT A SOLICITATION OF AN OFFER TO BUY THESE SECURITIES IN ANY JURISDICTION WHERE THE OFFER OR SALE IS NOT PERMITTED.
46 of 143
| Structural and Collateral Term Sheet | Benchmark 2022-B36 | |
| Yorkshire & Lexington Towers | ||
The Loan. The mortgage loan (the “Yorkshire & Lexington Towers Mortgage Loan”) is part of a whole loan (the “Yorkshire & Lexington Towers Whole Loan”) that is evidenced by eighteen pari passu senior promissory notes in the aggregate original principal amount of $318,000,000 (collectively, the “Yorkshire & Lexington Towers Senior Loan”) and two pari passu subordinate promissory notes in the aggregate original principal amount of $221,500,000 (collectively, the “Yorkshire & Lexington Towers Subordinate Companion Loan”). The Yorkshire & Lexington Towers Whole Loan was co-originated on May 12, 2022 by Bank of Montreal (“BMO”), Starwood Mortgage Capital LLC (“SMC”) and Citi Real Estate Funding Inc. (“CREFI”). The Yorkshire & Lexington Towers Whole Loan is secured by a first priority mortgage on the borrowers’ fee simple interest in two, high-rise multifamily properties totaling 808 units located in the Upper East Side neighborhood of New York, New York (the “Yorkshire & Lexington Towers Properties”). The Yorkshire & Lexington Towers Mortgage Loan is evidenced by the non-controlling promissory Notes A-3, A-12, A-15 and A-18, with an aggregate principal balance as of the Cut-off Date of $66,000,000. The remaining notes have been contributed – or are expected to be contributed – to other securitization trusts, as set forth in the table below. The Yorkshire & Lexington Towers Whole Loan is serviced pursuant to the pooling and servicing agreement for the CGCMT 2022-GC48 securitization. The “Yorkshire & Lexington Towers Total Debt” consists of the Yorkshire & Lexington Towers Whole Loan and four mezzanine loans with an aggregate Cut-off Date balance of $174,500,000. For additional information, see “Current Mezzanine or Subordinate Indebtedness” below. The relationship between the note holders of the Yorkshire & Lexington Towers Whole Loan is governed by a co-lender agreement as described under “Description of the Mortgage Pool—The Whole Loans—The Non-Serviced AB Whole Loans—The Yorkshire & Lexington Towers Pari Passu-AB Whole Loan” in the Preliminary Prospectus.
| Whole Loan Summary | |||||
| Note | Original Balance | Cut-off Date Balance | Note Holder | Controlling Piece | |
| A-1(1) | $25,000,000 | $25,000,000 | BMO | No | |
| A-2 | $25,000,000 | $25,000,000 | BBCMS 2022-C16 | No | |
| A-3 | $25,000,000 | $25,000,000 | Benchmark 2022-B36 | No | |
| A-4(2)(3) | $20,000,000 | $20,000,000 | CGCMT 2022-GC48 | No | |
| A-5 | $20,000,000 | $20,000,000 | BBCMS 2022-C16 | No | |
| A-6 | $20,000,000 | $20,000,000 | BMO 2022-C2 | No | |
| A-7 | $20,000,000 | $20,000,000 | BMO 2022-C2 | No | |
| A-8 | $20,000,000 | $20,000,000 | BBCMS 2022-C16 | No | |
| A-9 | $20,000,000 | $20,000,000 | CGCMT 2022-GC48 | No | |
| A-10(1) | $20,000,000 | $20,000,000 | BMO | No | |
| A-11 | $20,000,000 | $20,000,000 | CGCMT 2022-GC48 | No | |
| A-12 | $20,000,000 | $20,000,000 | Benchmark 2022-B36 | No | |
| A-13 | $10,000,000 | $10,000,000 | BMO 2022-C2 | No | |
| A-14 | $10,000,000 | $10,000,000 | BMO 2022-C2 | No | |
| A-15 | $10,000,000 | $10,000,000 | Benchmark 2022-B36 | No | |
| A-16(1) | $12,000,000 | $12,000,000 | BMO | No | |
| A-17 | $10,000,000 | $10,000,000 | BMO 2022-C2 | No | |
| A-18 | $11,000,000 | $11,000,000 | Benchmark 2022-B36 | No | |
| Total Senior Loan | $318,000,000 | $318,000,000 | |||
| B-1(3) | $147,666,667 | $147,666,667 | CGCMT 2022-GC48 (Loan Specific) | Yes | |
| B-2(3) | $73,833,333 | $73,833,333 | CGCMT 2022-GC48 (Loan Specific) | Yes | |
| Whole Loan | $539,500,000 | $539,500,000 | |||
| (1) | Expected to be contributed to one or more future securitization(s). |
| (2) | The Yorkshire & Lexington Towers Whole Loan is serviced pursuant to the pooling and servicing agreement for the securitization of Note A-4, which is the lead note. |
| (3) | The initial controlling note is Note B-1, but if any interest in Note B-1 is held by a borrower restricted party (as defined in the related co-lender agreement), the controlling note is Note B-2. Following a Yorkshire & Lexington Towers Control Appraisal Period (as defined in the related co-lender agreement), the controlling note will be Note A-4. See “Description of the Mortgage Pool—The Whole Loans—The Non-Serviced AB Whole Loans—The Yorkshire & Lexington Towers Pari Passu-AB Whole Loan” in the Preliminary Prospectus. |
The Borrowers. The borrowers under the Yorkshire & Lexington Towers Whole Loan are CF E 88 LLC, SM E 88 LLC, CF E 86 LLC, SM E 86 LLC and LSG E 86 LLC, as tenants in common (the first two as tenants in common for the Lexington Towers Property (as defined below), and the last three as tenants in common for the Yorkshire Towers Property (as defined below)), each a single-purpose Delaware limited liability company with two independent directors. Legal counsel to the borrowers delivered a non-consolidation opinion in connection with the origination of the Yorkshire & Lexington Towers Whole Loan.
The Loan Sponsors. The loan sponsors and non-recourse carveout guarantors are Meyer Chetrit and The Gluck Family Trust U/A/D July 16, 2009. Meyer Chetrit is one of the controllers of The Chetrit Group. The Chetrit Group is an experienced, privately held New York City real estate development firm controlled by two brothers: Joseph and Meyer Chetrit. The Chetrit Group, which is headquartered in Manhattan, has ownership interests in over 14 million square feet of commercial and residential real estate across the United States, including New York, Chicago, Miami, and Los Angeles, as well as internationally. Laurence Gluck is the founder of Stellar Management, a real estate development and management firm founded in 1985. Based in New York City, Stellar Management owns and manages a portfolio of over 12,000 apartments in 100 buildings located across New York City and over two million square feet of office space. Prior
THE INFORMATION IN THIS STRUCTURAL AND COLLATERAL TERM SHEET IS NOT COMPLETE AND MAY BE AMENDED PRIOR TO THE TIME OF SALE. THIS TERM SHEET IS NOT AN OFFER TO SELL THESE SECURITIES AND IT IS NOT A SOLICITATION OF AN OFFER TO BUY THESE SECURITIES IN ANY JURISDICTION WHERE THE OFFER OR SALE IS NOT PERMITTED.
47 of 143
| Structural and Collateral Term Sheet | Benchmark 2022-B36 | |
| Yorkshire & Lexington Towers | ||
to founding Stellar Management, Laurence Gluck served as a real estate attorney at Proskauer, Rose, Goetz & Mendelsohn and later as a partner at Dreyer & Traub. Laurence Gluck also formerly served as a member of the Board of Governors of the Real Estate Board of New York.
The Properties. The Yorkshire & Lexington Towers Properties consist of (i) a multifamily building comprised of 681 residential units totaling 615,641 square feet, a 33,000 square foot parking garage with 168 parking spaces and six commercial and retail units totaling 29,451 square feet (the “Yorkshire Towers Property”) and (ii) a multifamily building comprised of 127 residential units totaling 115,188 square feet, a 8,886 square foot parking garage with 36 parking spaces and six commercial and retail units totaling 9,998 square feet (the “Lexington Towers Property”). The Yorkshire & Lexington Towers Properties have 808 residential units totaling 730,829 square feet, 204 parking spaces totaling 41,886 square feet, and 12 commercial and retail units totaling 39,449 square feet. The commercial tenants (excluding City Parking) at the Yorkshire & Lexington Towers Properties have a remaining weighted average lease term of 8.5 years. The Yorkshire Towers Property is located in the Upper East Side neighborhood, proximate to the Second Avenue subway station with access to the Q subway line. The Lexington Towers Property is located in the Upper East Side neighborhood, proximate to the Lexington Avenue/East 86th Street subway station with access to the 4, 5, and 6 subway lines.
The Yorkshire Towers Property and the Lexington Towers Property were built in 1964 and 1963 respectively. The residential portion of the Yorkshire & Lexington Towers Properties feature a range of studio, one-bedroom, two-bedroom, three-bedroom, and four-bedroom units. Of the 808 residential units, 305 of the units are rent-stabilized. The Yorkshire & Lexington Towers Properties’ residential units all feature hardwood flooring, full kitchen appliances, and many units include a private balcony. Bathrooms feature marble flooring in the renovated units and vinyl tile in the unrenovated units. Renovated units feature marble countertop kitchens, stainless steel appliances, including a refrigerator, dishwasher, microwave, gas-fired stove and oven, and washer and dryer. Community spaces include a 24-hour attended lobby lounge, health club and fitness center, children’s playroom, and outdoor seating area.
Major Tenants.
The largest tenant by underwritten base rent, CVS Pharmacy (“CVS”), occupies 15,813 square feet (19.4% of the commercial NRA, 58.1% of the underwritten commercial base rent) with a lease expiration of January 31, 2033. CVS is a consumer retail and health solutions company with over 9,900 locations in 49 states, the District of Columbia and Puerto Rico. CVS has approximately 300,000 employees in the United States. The remaining 65,522 square feet of commercial space is 98.3% occupied by ten tenants.
| Portfolio Summary | ||||||||
| Property Name | City | Year Built / Renovated | Units | % of Units | Allocated Cut-off Date Whole Loan Amount (“ALA”) | % of ALA | Appraised Value | % of Appraised Value |
| Yorkshire Towers | New York | 1964 / 2014, 2022 | 681 | 84.3% | $464,286,688 | 86.1% | $821,000,000 | 86.1% |
| Lexington Towers | New York | 1963 / 2014 | 127 | 15.7% | 75,213,312 | 13.9 | 133,000,000 | 13.9 |
| Total | 808 | 100.0% | $539,500,000 | 100.0% | $954,000,000 | 100.0% | ||
Loan Sponsors’ Renovation Plan. The information set forth below regarding the loan sponsors’ renovation plans reflects forward-looking statements and certain projections provided by the loan sponsors, assuming, among other things, that the borrowers will complete certain projected renovations by December 1, 2024 and that all of the newly renovated and currently unoccupied units will be leased at current market rate rent and all of the currently occupied units will continue to be leased at the current contractual rent. We cannot assure you that such assumptions and projections provided by the loan sponsors will materialize in the future as expected or at all.
The loan sponsors have identified 311 units that will be renovated, which consist of 283 units that are projected to receive a light renovation and 28 units that are projected to receive a major renovation. The 28 major renovation units will be combined into 13 units post-renovation. Of the 28 units projected to receive major renovations, 17 units are rent stabilized, all of which are currently vacant. Major renovations will feature the combination of two or three units into one larger unit or a significant floor plan alteration and are expected to take approximately four to six months to complete. Light renovation units will feature aesthetic and systems upgrades, such as new appliances, countertops, removal of carpeting and lighting upgrades. The borrowers deposited $6,500,000 into a unit upgrade reserve with the lender at origination of the Yorkshire & Lexington Towers Whole Loan, to be disbursed to pay or reimburse the borrowers for unit renovation costs pursuant to the Yorkshire & Lexington Towers Whole Loan documents. See “Escrows and Reserves” below.
The major renovation units are projected to receive an average renovation of approximately $37,143 per unit and are anticipated to increase rent from $53.20 per square foot in-place to $82.67 per square foot. The loan sponsors have executed major renovations on 41 units to date, which have been combined into a total of 23 units. These major renovations have achieved average annual rent increases from $32.93 per square foot to $75.37 per square foot.
THE INFORMATION IN THIS STRUCTURAL AND COLLATERAL TERM SHEET IS NOT COMPLETE AND MAY BE AMENDED PRIOR TO THE TIME OF SALE. THIS TERM SHEET IS NOT AN OFFER TO SELL THESE SECURITIES AND IT IS NOT A SOLICITATION OF AN OFFER TO BUY THESE SECURITIES IN ANY JURISDICTION WHERE THE OFFER OR SALE IS NOT PERMITTED.
48 of 143
| Structural and Collateral Term Sheet | Benchmark 2022-B36 | |
| Yorkshire & Lexington Towers | ||
The light renovation units are projected to receive an average renovation of $19,382 per unit and are anticipated to increase rent from $62.01 per square foot in-place to $82.79 per square foot. The loan sponsors have executed light renovations on 16 units to date. These light renovations have achieved average annual rent increases from $50.33 per square foot to $82.04 per square foot.
The following table presents detailed information with respect to the current market rate units at the Yorkshire Towers Property:
| As Is Market Rate Unit Summary | |||||||
| Unit Type | No. of Units(1) | % of Total | Average Unit Size (SF)(1) | Average Monthly Rental Rate(1) | Average Monthly Rental Rate per SF(1) | Average Monthly Market Rental Rate(2) | Average Monthly Market Rental Rate per SF(2) |
| Studio | 63 | 14.3% | 547 | $3,100 | $5.67 | $3,121 | $5.52 |
| 1 Bedroom | 244 | 55.2 | 778 | $4,301 | $5.53 | $4,319 | $5.50 |
| 2 Bedroom | 81 | 18.3 | 1,152 | $6,122 | $5.31 | $6,355 | $5.31 |
| 3 Bedroom | 53 | 12.0 | 1,299 | $7,707 | $5.93 | $7,682 | $5.91 |
| 4 Bedroom | 1 | 0.2 | 2,087 | $12,995 | $6.23 | $12,995 | $6.23 |
| Total/Wtd. Avg. | 442 | 100.0% | 879 | $4,891 | $5.56 | $4,941 | $5.54 |
| (1) | Based on the underwritten rent roll dated March 1, 2022. |
| (2) | Source: Appraisal. |
The following table presents detailed information with respect to the current market rate units at the Lexington Towers Property:
| As Is Market Rate Unit Summary | |||||||
| Unit Type | No. of Units(1) | % of Total | Average Unit Size (SF)(1) | Average Monthly Rental Rate(1) | Average Monthly Rental Rate per SF(1) | Average Monthly Market Rental Rate(2) | Average Monthly Market Rental Rate per SF(2) |
| Studio | 10 | 16.4% | 619 | $3,270 | $5.29 | $3,270 | $5.29 |
| 1 Bedroom | 33 | 54.1 | 776 | $4,306 | $5.55 | $4,286 | $5.53 |
| 2 Bedroom | 10 | 16.4 | 1,045 | $6,339 | $6.06 | $6,287 | $6.01 |
| 3 Bedroom | 6 | 9.8 | 1,392 | $8,823 | $6.34 | $8,823 | $6.34 |
| 4 Bedroom | 2 | 3.3 | 1,889 | $13,123 | $6.95 | $12,935 | $6.85 |
| Total/Wtd. Avg. | 61 | 100.0% | 892 | $5,203 | $5.83 | $5,192 | $5.81 |
| (1) | Based on the underwritten rent roll dated March 1, 2022. |
| (2) | Source: Appraisal. |
The following table presents detailed information with respect to the current rent stabilized units at the Yorkshire Towers Property:
| As Is Rent Stabilized Unit Summary | |||||||
| Unit Type | No. of Units(1) | % of Total | Average Unit Size (SF)(1) | Average Monthly Rental Rate(1) | Average Monthly Rental Rate per SF(1) | Average Monthly Market Rental Rate(2) | Average Monthly Market Rental Rate per SF(2) |
| Studio | 31 | 13.0% | 545 | $1,915 | $3.51 | $2,370 | $3.52 |
| 1 Bedroom | 116 | 48.5 | 792 | $1,980 | $2.50 | $2,182 | $2.49 |
| 2 Bedroom | 81 | 33.9 | 1,230 | $2,916 | $2.37 | $2,989 | $2.36 |
| 3 Bedroom | 8 | 3.3 | 1,638 | $3,714 | $2.27 | $3,714 | $2.27 |
| 4 Bedroom | 3 | 1.3 | 1,859 | $12,167 | $6.55 | $12,167 | $6.55 |
| Total/Wtd. Avg. | 239 | 100.0% | 950 | $2,475 | $2.60 | $2,710 | $2.59 |
| (1) | Based on the underwritten rent roll dated March 1, 2022. |
| (2) | Source: Appraisal. |
THE INFORMATION IN THIS STRUCTURAL AND COLLATERAL TERM SHEET IS NOT COMPLETE AND MAY BE AMENDED PRIOR TO THE TIME OF SALE. THIS TERM SHEET IS NOT AN OFFER TO SELL THESE SECURITIES AND IT IS NOT A SOLICITATION OF AN OFFER TO BUY THESE SECURITIES IN ANY JURISDICTION WHERE THE OFFER OR SALE IS NOT PERMITTED.
49 of 143
| Structural and Collateral Term Sheet | Benchmark 2022-B36 | |
| Yorkshire & Lexington Towers | ||
The following table presents detailed information with respect to the current rent stabilized units at the Lexington Towers Property:
| As Is Rent Stabilized Unit Summary | |||||||
| Unit Type | No. of Units(1) | % of Total | Average Unit Size (SF)(1) | Average Monthly Rental Rate(1) | Average Monthly Rental Rate per SF(1) | Average Monthly Market Rental Rate(2) | Average Monthly Market Rental Rate per SF(2) |
| Studio | 19 | 28.8% | 660 | $1,923 | $2.91 | $2,056 | $2.97 |
| 1 Bedroom | 31 | 47.0 | 830 | $2,033 | $2.45 | $2,014 | $2.43 |
| 2 Bedroom | 11 | 16.7 | 1,254 | $3,591 | $2.86 | $3,589 | $2.86 |
| 3 Bedroom | 3 | 4.5 | 1,536 | $9,564 | $6.23 | $3,128 | $2.32 |
| 4 Bedroom | 2 | 3.0 | 2,055 | $19,750 | $9.61 | NAV | NAV |
| Total/Wtd. Avg. | 66 | 100.0% | 921 | $3,140 | $3.41 | $2,500 | $2.66 |
| (1) | Based on the underwritten rent roll dated March 1, 2022. |
| (2) | Source: Appraisal. |
The following table presents detailed information with respect to the projected post-renovation market rate units at the Yorkshire Towers Property:
| Projected Post-Renovation Market Rate Unit Summary | |||||||
| Unit Type | No. of Units(1) | % of Total | Average Unit Size (SF)(1) | Average Monthly Rental Rate(1) | Average Monthly Rental Rate per SF(1) | Average Monthly Market Rental Rate(2) | Average Monthly Market Rental Rate per SF(2) |
| Studio | 61 | 14.1% | 547 | $3,489 | $6.38 | $3,121 | $5.52 |
| 1 Bedroom | 240 | 55.6 | 778 | $5,108 | $6.57 | $4,319 | $5.50 |
| 2 Bedroom | 77 | 17.8 | 1,148 | $7,784 | $6.78 | $6,355 | $5.31 |
| 3 Bedroom | 53 | 12.3 | 1,299 | $8,582 | $6.60 | $7,682 | $5.91 |
| 4 Bedroom | 1 | 0.2 | 2,087 | $12,995 | $6.23 | $12,995 | $6.23 |
| Total/Wtd. Avg. | 432 | 100.0% | 878 | $5,801 | $6.61 | $4,941 | $5.54 |
| (1) | Based on the underwritten rent roll dated March 1, 2022. |
| (2) | Source: Appraisal. |
The following table presents detailed information with respect to the projected post-renovation market rate units at the Lexington Towers Property:
| Projected Post-Renovation Market Rate Unit Summary | |||||||
| Unit Type | No. of Units(1) | % of Total | Average Unit Size (SF)(1) | Average Monthly Rental Rate(1) | Average Monthly Rental Rate per SF(1) | Average Monthly Market Rental Rate(2) | Average Monthly Market Rental Rate per SF(2) |
| Studio | 10 | 16.7% | 619 | $4,309 | $6.97 | $3,270 | $5.29 |
| 1 Bedroom | 32 | 53.3 | 775 | $5,347 | $6.90 | $4,286 | $5.53 |
| 2 Bedroom | 10 | 16.7 | 1,045 | $7,072 | $6.77 | $6,287 | $6.01 |
| 3 Bedroom | 6 | 10.0 | 1,392 | $9,101 | $6.54 | $8,823 | $6.34 |
| 4 Bedroom | 2 | 3.3 | 1,889 | $12,935 | $6.85 | $12,935 | $6.85 |
| Total/Wtd. Avg. | 60 | 100.0% | 893 | $6,090 | $6.82 | $5,192 | $5.81 |
| (1) | Based on the underwritten rent roll dated March 1, 2022. |
| (2) | Source: Appraisal. |
THE INFORMATION IN THIS STRUCTURAL AND COLLATERAL TERM SHEET IS NOT COMPLETE AND MAY BE AMENDED PRIOR TO THE TIME OF SALE. THIS TERM SHEET IS NOT AN OFFER TO SELL THESE SECURITIES AND IT IS NOT A SOLICITATION OF AN OFFER TO BUY THESE SECURITIES IN ANY JURISDICTION WHERE THE OFFER OR SALE IS NOT PERMITTED.
50 of 143
| Structural and Collateral Term Sheet | Benchmark 2022-B36 | |
| Yorkshire & Lexington Towers | ||
The following table presents detailed information with respect to the projected post-renovation rent stabilized units at the Yorkshire Towers Property:
| Projected Post-Renovation Rent Stabilized Unit Summary | |||||||
| Unit Type | No. of Units(1) | % of Total | Average Unit Size (SF)(1) | Average Monthly Rental Rate(1) | Average Monthly Rental Rate per SF(1) | Average Monthly Market Rental Rate(2) | Average Monthly Market Rental Rate per SF(2) |
| Studio | 27 | 11.5% | 544 | $1,925 | $3.54 | $2,370 | $3.52 |
| 1 Bedroom | 106 | 45.1 | 793 | $1,976 | $2.49 | $2,182 | $2.49 |
| 2 Bedroom | 85 | 36.2 | 1,246 | $3,371 | $2.71 | $2,989 | $2.36 |
| 3 Bedroom | 12 | 5.1 | 1,729 | $6,858 | $3.97 | $3,714 | $2.27 |
| 4 Bedroom | 5 | 2.1 | 2,167 | $14,531 | $6.71 | $12,167 | $6.55 |
| Total/Wtd. Avg. | 235 | 100.0% | 1005 | $2,991 | $2.97 | $2,710 | $2.59 |
| (1) | Based on the underwritten rent roll dated March 1, 2022. |
| (2) | Source: Appraisal. |
The following table presents detailed information with respect to the projected post-renovation rent stabilized units at the Lexington Towers Property:
| Projected Post-Renovation Rent Stabilized Unit Summary | |||||||
| Unit Type | No. of Units(1) | % of Total | Average Unit Size (SF)(1) | Average Monthly Rental Rate(1) | Average Monthly Rental Rate per SF(1) | Average Monthly Market Rental Rate(2) | Average Monthly Market Rental Rate per SF(2) |
| Studio | 18 | 27.3% | 655 | $1,898 | $2.90 | $2,056 | $2.97 |
| 1 Bedroom | 31 | 47.0 | 830 | $2,014 | $2.42 | $2,014 | $2.43 |
| 2 Bedroom | 12 | 18.2 | 1,281 | $4,225 | $3.30 | $3,589 | $2.86 |
| 3 Bedroom | 3 | 4.5 | 1,536 | $8,828 | $5.75 | $3,128 | $2.32 |
| 4 Bedroom | 2 | 3.0 | 2,055 | $14,728 | $7.17 | NAV | NAV |
| Total/Wtd. Avg. | 66 | 100.0% | 934 | $3,079 | $3.30 | $2,500 | $2.66 |
| (1) | Based on the underwritten rent roll dated March 1, 2022. |
| (2) | Source: Appraisal. |
| Historical and Current Multifamily Occupancy(1) | |||
| 2019 | 2020 | 2021 | Current(2) |
| 94.7% | 81.2% | 94.7% | 96.4% |
| (1) | Historical occupancies are as of December 31 of each respective year. |
| (2) | Current occupancy is as of March 1, 2022. |
THE INFORMATION IN THIS STRUCTURAL AND COLLATERAL TERM SHEET IS NOT COMPLETE AND MAY BE AMENDED PRIOR TO THE TIME OF SALE. THIS TERM SHEET IS NOT AN OFFER TO SELL THESE SECURITIES AND IT IS NOT A SOLICITATION OF AN OFFER TO BUY THESE SECURITIES IN ANY JURISDICTION WHERE THE OFFER OR SALE IS NOT PERMITTED.
51 of 143
| Structural and Collateral Term Sheet | Benchmark 2022-B36 | |
| Yorkshire & Lexington Towers | ||
| Operating History and Underwritten Net Cash Flow | |||||||
| 2019 | 2020 | 2021 | TTM 2/28/2022(3) | Underwritten | Per Unit | %(1) | |
| Residential Rents in Place | $34,429,262 | $32,908,021 | $33,023,336 | $34,184,092 | $39,497,416 | $48,883 | 74.9% |
| Commercial Rents in Place | 6,197,568 | 5,981,339 | 5,764,022 | 5,810,592 | 6,984,828 | 8,645 | 13.3% |
| Gross Potential Rent | $40,626,830 | $38,889,360 | $38,787,358 | $39,994,684 | $46,482,244 | $57,528 | 88.2% |
| Total Reimbursements | 297,713 | 410,419 | 284,498 | 324,797 | 327,568 | 405 | 0.6% |
| Supplemental Income Reserve(2) | 0 | 0 | 0 | 0 | 5,226,004 | 6,468 | 9.9% |
| Total Other Income | 702,657 | 863,978 | 694,304 | 675,664 | 675,664 | 836 | 1.3% |
| Net Rental Income | $41,627,200 | $40,163,756 | $39,766,160 | $40,995,144 | $52,711,480 | $65,237 | 100.0% |
| (Vacancy/Credit Loss) | (99,272) | (35,705) | 0 | 0 | (1,316,592) | (1,629) | (2.5)% |
| Effective Gross Income | $41,527,928 | $40,128,052 | $39,766,160 | $40,995,144 | $51,394,888 | $63,608 | 97.5% |
| Total Expenses | $14,184,113 | $14,510,102 | $15,511,878 | $15,672,705 | $16,019,126 | $19,826 | 31.2% |
| Net Operating Income(2) | $27,343,815 | $25,617,949 | $24,254,281 | $25,322,439 | $35,375,762 | $43,782 | 68.8% |
| Total TI/LC, Capex/RR(4) | 0 | 0 | 0 | 0 | 0 | 0 | 0.0% |
| Net Cash Flow | $27,343,815 | $25,617,949 | $24,254,281 | $25,322,439 | $35,375,762 | $43,782 | 68.8% |
| (1) | % column represents percent of Net Rental Income for all revenue lines and represents percent of Effective Gross Income for the remainder of the fields. |
| (2) | The Underwritten Net Operating Income is greater than the TTM Net Operating Income due in part to (i) the loan sponsors recently renovating 57 units, which increased rents at the Yorkshire & Lexington Towers Properties, (ii) underwritten straight-lined rent for CVS and (iii) disbursements from the Supplemental Income Reserve. Please refer to “Escrows and Reserves” below. |
| (3) | TTM represents the trailing 12 months ending February 2022. |
| (4) | The loan sponsors funded five years’ worth of TI/LC and Capex/RR at origination. |
The Market. The Yorkshire & Lexington Towers Properties are located in New York, New York, within the New York, NY-NJ-PA Metropolitan Statistical Area. According to the appraisal, the unemployment rate from 2011 through 2021 in New York City increased at an annual rate of 0.3% and is expected to decrease at an average annual rate of 4.7% between 2022 and 2026. The estimated 2021 median annual household income in New York City was $68,261. The leading industries are education and health, professional and business, government, trade, transportation and utilities. The largest employer in New York City is Northwell Health, which employs 68,088 people. The Yorkshire Towers Property is located on the northeast corner of Second Avenue and East 86th Street. The Lexington Towers Property is located on the southeast corner of Lexington Avenue and East 88th Street. The Upper East Side is generally considered the area that extends from East 59th to East 110th Streets, east of Central Park and Fifth Avenue to the East River. The Upper East Side is known for its many art galleries such as the Metropolitan Museum of Art and Hunter College of the City University of New York which occupies several modern high-rise buildings at 68th Street and Lexington Avenue. The largest institutions of higher learning on the Upper East Side are along York Avenue and the FDR Drive, including Rockefeller University and the Cornell Medical Center. The Yorkshire & Lexington Towers Properties benefit from their proximity to Fifth Avenue, which forms the eastern border of Central Park, as well as Madison Avenue, which is dense with prime retail and commercial space.
The Yorkshire & Lexington Towers Properties are situated in the Upper East Side multifamily submarket. According to CoStar, as of February 2022, the Upper East Side multifamily submarket had an overall vacancy rate of 2.0%, with net absorption totaling 17 units. The vacancy rate decreased 2.2% over the past 12 months. Rental rates increased by 3.1% for the past 12 months and ended at $4,096 per unit per month. A total of 46 units were still under construction at the end of the first quarter of 2022.
According to the appraisal, the 2021 population for New York City was approximately 8,305,600 and is forecasted to grow to approximately 8,317,700 in 2022, and approximately 8,335,900 in 2026.
Property Management. The Yorkshire & Lexington Towers Properties are managed by Jumeaux Management LLC, an affiliate of the borrowers.
Escrows and Reserves. At origination of the Yorkshire & Lexington Towers Whole Loan, the borrowers deposited (i) approximately $5,390,917 into a real estate tax reserve account, (ii) approximately $367,868 into an insurance premiums reserve account, (iii) $1,100,000 into a replacement reserve account, (iv) $1,000,000 into a tenant improvement and leasing commissions reserve account, (v) $6,500,000 into a unit upgrade reserve account and (vi) $5,900,000 into a supplemental income reserve account.
Tax Escrows – The borrowers are required to deposit into a real estate tax reserve, on a monthly basis, 1/12th of the taxes that the lender estimates will be payable over the next-ensuing 12-month period (initially estimated to be approximately $898,486).
Insurance Escrows – The borrowers are required to deposit into an insurance reserve, on a monthly basis, 1/12th of the amount which will be sufficient to pay the insurance premiums due for the renewal of coverage afforded by such policies; provided, however, such insurance reserve is conditionally waived so long as (i) no event of default is continuing and (ii) the borrowers maintain a blanket policy
THE INFORMATION IN THIS STRUCTURAL AND COLLATERAL TERM SHEET IS NOT COMPLETE AND MAY BE AMENDED PRIOR TO THE TIME OF SALE. THIS TERM SHEET IS NOT AN OFFER TO SELL THESE SECURITIES AND IT IS NOT A SOLICITATION OF AN OFFER TO BUY THESE SECURITIES IN ANY JURISDICTION WHERE THE OFFER OR SALE IS NOT PERMITTED.
52 of 143
| Structural and Collateral Term Sheet | Benchmark 2022-B36 | |
| Yorkshire & Lexington Towers | ||
meeting the requirements of the Yorkshire & Lexington Towers Whole Loan documents. The borrowers are currently maintaining a blanket policy.
Supplemental Income Reserve – The Yorkshire & Lexington Towers Properties are currently undergoing certain renovations, and the borrowers deposited $5,900,000 into a supplemental income reserve account (the “Supplemental Income Reserve”) at origination of the Yorkshire & Lexington Towers Whole Loan. Unless and until the Yorkshire & Lexington Towers Properties (excluding the amount on deposit in the Supplemental Income Reserve) achieve a 5.0% transient Yorkshire & Lexington Towers Total Debt debt yield (calculated on the basis of annualized net cash flow for a three-month period ending with the most recently completed month), the lender may require the borrowers to make additional Supplemental Income Reserve deposits if and to the extent the lender determines, in its reasonable discretion on a quarterly basis after May 6, 2023 during the Yorkshire & Lexington Towers Whole Loan term, that additional supplemental income reserve deposits are required in order to achieve (when the additional deposit and all other deposits in the Supplemental Income Reserve account are added to net cash flow for the Yorkshire & Lexington Towers Properties) a 5.0% transient Yorkshire & Lexington Towers Total Debt debt yield for the following 12, 9, 6 or 3 months (such applicable 12-, 9-, 6- or 3-month period depending on the quarter with respect to which such determination by the lender is made). The guarantors provided a related carry guaranty of certain carry costs, including real estate taxes, insurance premiums, debt service and operating expenses, for any period until the Yorkshire & Lexington Towers Properties achieve a 5.0% transient Yorkshire & Lexington Towers Total Debt debt yield (excluding the amount on deposit in the Supplemental Income Reserve). The obligations of the guarantors under such carry guaranty are limited to the additional Supplemental Income Reserve deposit amount as and when due.
So long as no event of default under the Yorkshire & Lexington Towers Whole Loan is continuing, on each payment date, the lender is required to transfer the Monthly Supplemental Income Reserve Disbursement Amount (as defined below) from the Supplemental Income Reserve to the cash management account. Such funds deposited into the cash management account will be required to be applied with all other funds then on deposit in the cash management account in the order of priority set forth in the Yorkshire & Lexington Towers Whole Loan documents, as described under “Lockbox / Cash Management” below. So long as no event of default under the Yorkshire & Lexington Towers Whole Loan is continuing, upon such time as the lender has reasonably determined that the Yorkshire & Lexington Towers Properties (excluding the amount on deposit in the Supplemental Income Reserve) have achieved a 5.0% transient Yorkshire & Lexington Towers Total Debt debt yield (calculated on the basis of annualized net cash flow for a three-month period ending with the most recently completed month), then upon the borrowers’ written request, all of the funds in the Supplemental Income Reserve will be required to be disbursed to the borrowers; provided, however, if a Cash Trap Period (as defined below) is then continuing, then such funds will not be disbursed to the borrowers, and such funds will instead be deposited into the excess cash reserve account, to be applied in accordance with the terms of the Yorkshire & Lexington Towers Whole Loan documents.
“Monthly Supplemental Income Reserve Disbursement Amount” means 1/12th of (x) the initial Supplemental Income Reserve deposit with respect to the first 12 payment dates occurring during the term of the Yorkshire & Lexington Towers Whole Loan, and (y) each Supplemental Income Reserve additional deposit amount with respect to the 12 payment dates following the date that the borrowers are required to deposit such Supplemental Income Reserve additional deposit amount pursuant to the terms of the Yorkshire & Lexington Towers Whole Loan documents; provided that, if at any time the lender reassesses the Supplemental Income Reserve additional deposit amount in accordance with the terms of the Yorkshire & Lexington Towers Whole Loan documents, the Monthly Supplemental Income Reserve Disbursement Amount will be adjusted so that all of funds in the Supplemental Income Reserve will be disbursed in equal monthly installments ending on such Supplemental Income Reserve reassessment date (i.e., so that there will be no funds in the Supplemental Income Reserve on deposit on such Supplemental Income Reserve reassessment date).
Lockbox / Cash Management. The Yorkshire & Lexington Towers Whole Loan is structured with a hard lockbox for commercial tenants and a soft lockbox for residential tenants, and in place cash management. The borrowers are required to deposit all rents collected from residential tenants into the lockbox account within three days of receipt. The borrowers are required to deliver a tenant direction letter to commercial tenants to deposit all rents directly to the lockbox account. The borrowers are required to cause all amounts deposited into the lockbox account to be transferred on each business day to a cash management account controlled by the lender. Absent an event of default under the Yorkshire & Lexington Towers Whole Loan documents, funds on deposit in the cash management account are applied on each monthly payment date in amounts and in the order of priority set forth in the Yorkshire & Lexington Towers Whole Loan documents, including any required tax and insurance reserve deposits, deposit account bank fees, monthly debt service on the Yorkshire & Lexington Towers Whole Loan, other amounts payable to the lender under the Yorkshire & Lexington Towers Whole Loan, operating expenses reflected in the annual budget or otherwise approved by the lender, and debt service under the mezzanine loans, with the remaining funds in the cash management account to be disbursed to the borrowers unless a Cash Trap Period is then continuing, in which event the remaining funds will be deposited into an excess cash reserve account under the lender’s control, and released to the borrower when the Cash Trap Period ends. Upon an event of default under the Yorkshire & Lexington Towers Whole Loan documents, the lender will apply funds in such priority as it may determine.
A “Cash Trap Period” means a period commencing upon the earliest to occur of (i) an event of default; (ii) any bankruptcy action of the borrowers, principal, guarantor or manager has occurred; (iii) the failure by the borrowers, after stabilization (i.e. until a Yorkshire & Lexington Towers Total Debt debt yield of at least 5.0% has been achieved (without taking into account any disbursement of Supplemental Income Reserve funds) for one calendar quarter, provided no event of default then exists), to maintain a Yorkshire & Lexington Towers
THE INFORMATION IN THIS STRUCTURAL AND COLLATERAL TERM SHEET IS NOT COMPLETE AND MAY BE AMENDED PRIOR TO THE TIME OF SALE. THIS TERM SHEET IS NOT AN OFFER TO SELL THESE SECURITIES AND IT IS NOT A SOLICITATION OF AN OFFER TO BUY THESE SECURITIES IN ANY JURISDICTION WHERE THE OFFER OR SALE IS NOT PERMITTED.
53 of 143
| Structural and Collateral Term Sheet | Benchmark 2022-B36 | |
| Yorkshire & Lexington Towers | ||
Total Debt debt yield of at least 4.25%; or (iv) a Yorkshire & Lexington Towers Mezzanine Loan (as defined below) event of default. A Cash Trap Period will be cured upon (a) with respect to clause (i) above, the lender accepts a cure of the event of default; (b) in the case of a bankruptcy action by or against the manager only, the borrowers replace the manager with a qualified replacement as defined in the Yorkshire & Lexington Towers Whole Loan documents; (c) with respect to clause (iii) above, the Yorkshire & Lexington Towers Total Debt debt yield is equal to or greater than 4.75% for one calendar quarter; or (d) with respect to clause (iv) above, the applicable Yorkshire & Lexington Towers Mezzanine Loan lender accepts a cure of such Yorkshire & Lexington Towers Mezzanine Loan event of default.
Current Mezzanine or Subordinate Indebtedness. The Yorkshire & Lexington Towers Properties also secure the Yorkshire & Lexington Towers Subordinate Companion Loan, which has an aggregate Cut-off Date principal balance of $221,500,000. The Yorkshire & Lexington Towers Subordinate Companion Loan accrues interest at 3.04000% per annum. The Yorkshire & Lexington Towers Senior Loan is senior in right of payment to the Yorkshire & Lexington Towers Subordinate Companion Loan.
Concurrently with the funding of the Yorkshire & Lexington Towers Whole Loan, BMO and Citigroup Global Markets Realty Corp. (“CGMRC”) co-originated a mezzanine A loan in the amount of $80,000,000 to be secured by the mezzanine A borrowers’ interests in the borrowers, as collateral for the mezzanine A loan (the “Mezzanine A Loan”). The Mezzanine A Loan is coterminous with the Yorkshire & Lexington Towers Whole Loan. The Mezzanine A Loan accrues interest at a rate of 5.80000% per annum and requires interest-only payments until its maturity date.
Concurrently with the funding of the Yorkshire & Lexington Towers Whole Loan, BMO and CGMRC co-originated a mezzanine B loan in the amount of $23,100,000 to be secured by the mezzanine B borrowers’ interests in the mezzanine A borrowers, as collateral for the mezzanine B loan (the “Mezzanine B Loan”). The Mezzanine B Loan is coterminous with the Yorkshire & Lexington Towers Whole Loan. The Mezzanine B Loan accrues interest at a rate of 7.14000% per annum and requires interest-only payments until its maturity date.
Concurrently with the funding of the Yorkshire & Lexington Towers Whole Loan, BMO and CGMRC co-originated a mezzanine C loan in the amount of $25,000,000 to be secured by the mezzanine C borrowers’ interests in the mezzanine B borrowers, as collateral for the mezzanine C loan (the “Mezzanine C Loan”). The Mezzanine C Loan is coterminous with the Yorkshire & Lexington Towers Whole Loan. The Mezzanine C Loan accrues interest at a rate of 8.00000% per annum and requires interest-only payments until its maturity date.
Concurrently with the funding of the Yorkshire & Lexington Towers Whole Loan, BMO and CGMRC co-originated a mezzanine D loan in the amount of $46,400,000 to be secured by the mezzanine D borrowers’ interests in the mezzanine C borrowers, as collateral for the mezzanine D loan (the “Mezzanine D Loan”, collectively with the Mezzanine A Loan, the Mezzanine B Loan and the Mezzanine C Loan, the “Yorkshire & Lexington Towers Mezzanine Loans”). The Mezzanine D Loan is coterminous with the Yorkshire & Lexington Towers Whole Loan. The Mezzanine D Loan accrues interest at a rate of 9.46185345% per annum and requires interest-only payments until its maturity date.
| Total Loan Metrics | ||||
| % of Total Loan | Cut-off Date LTV | UW NOI Debt Yield(1) | UW NCF DSCR(1) | |
| A Notes | 44.5% | 33.3% | 11.1% | 3.61x |
| B Notes | 31.0% | 56.6% | 6.6% | 2.13x |
| Mezzanine Loans | 24.4% | 74.8% | 5.0% | 1.20x |
| (1) | The UW NOI and UW NCF includes disbursements from a Supplemental Income Reserve of $5,226,004. Please refer to “Escrows and Reserves” above. |
Future Mezzanine or Subordinate Indebtedness Permitted. None.
Partial Release. None
THE INFORMATION IN THIS STRUCTURAL AND COLLATERAL TERM SHEET IS NOT COMPLETE AND MAY BE AMENDED PRIOR TO THE TIME OF SALE. THIS TERM SHEET IS NOT AN OFFER TO SELL THESE SECURITIES AND IT IS NOT A SOLICITATION OF AN OFFER TO BUY THESE SECURITIES IN ANY JURISDICTION WHERE THE OFFER OR SALE IS NOT PERMITTED.
54 of 143
| Structural and Collateral Term Sheet | Benchmark 2022-B36 | |
| 39 Broadway | ||

THE INFORMATION IN THIS STRUCTURAL AND COLLATERAL TERM SHEET IS NOT COMPLETE AND MAY BE AMENDED PRIOR TO THE TIME OF SALE. THIS TERM SHEET IS NOT AN OFFER TO SELL THESE SECURITIES AND IT IS NOT A SOLICITATION OF AN OFFER TO BUY THESE SECURITIES IN ANY JURISDICTION WHERE THE OFFER OR SALE IS NOT PERMITTED.
55 of 143
| Structural and Collateral Term Sheet | Benchmark 2022-B36 | |
| 39 Broadway | ||
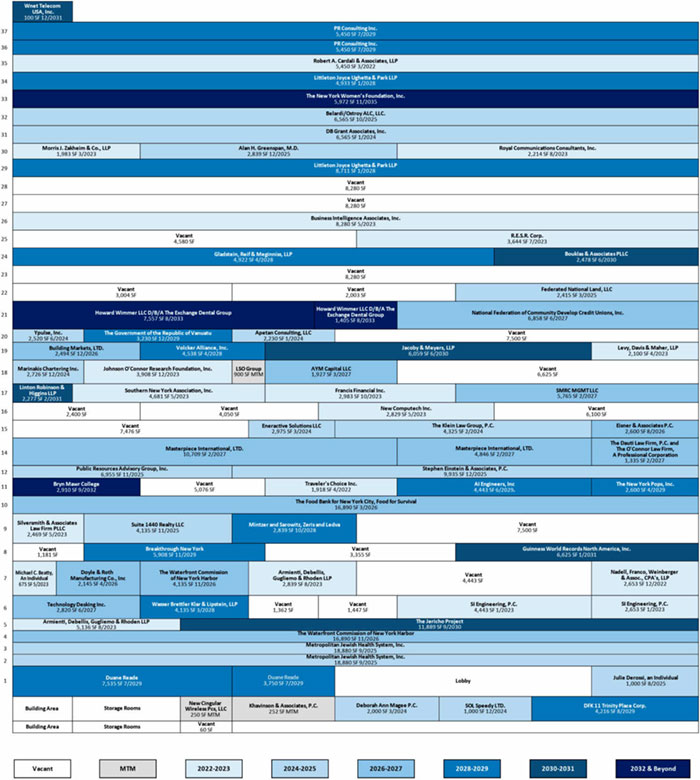
THE INFORMATION IN THIS STRUCTURAL AND COLLATERAL TERM SHEET IS NOT COMPLETE AND MAY BE AMENDED PRIOR TO THE TIME OF SALE. THIS TERM SHEET IS NOT AN OFFER TO SELL THESE SECURITIES AND IT IS NOT A SOLICITATION OF AN OFFER TO BUY THESE SECURITIES IN ANY JURISDICTION WHERE THE OFFER OR SALE IS NOT PERMITTED.
56 of 143
| Structural and Collateral Term Sheet | Benchmark 2022-B36 | |
| 39 Broadway | ||

THE INFORMATION IN THIS STRUCTURAL AND COLLATERAL TERM SHEET IS NOT COMPLETE AND MAY BE AMENDED PRIOR TO THE TIME OF SALE. THIS TERM SHEET IS NOT AN OFFER TO SELL THESE SECURITIES AND IT IS NOT A SOLICITATION OF AN OFFER TO BUY THESE SECURITIES IN ANY JURISDICTION WHERE THE OFFER OR SALE IS NOT PERMITTED.
57 of 143
| Structural and Collateral Term Sheet | Benchmark 2022-B36 | |
| 39 Broadway | ||
| Mortgage Loan Information | Property Information | |||
| Mortgage Loan Seller: | CREFI | Single Asset / Portfolio: | Single Asset | |
| Original Principal Balance(1): | $65,000,000 | Title: | Fee | |
| Cut-off Date Principal Balance(1): | $65,000,000 | Property Type - Subtype: | Office – CBD | |
| % of Pool by IPB: | 8.6% | Net Rentable Area (SF): | 450,583 | |
| Loan Purpose: | Refinance | Location: | New York, NY | |
| Borrower: | 39 CAM LLC | Year Built / Renovated: | 1927 / 2005 | |
| Guarantors: | Avi Schron, Mark Schron and Eli | Occupancy: | 79.4% | |
| Schron | Occupancy Date: | 5/12/2022 | ||
| Interest Rate: | 5.05000% | Number of Tenants: | 86 | |
| Note Date: | 7/7/2022 | Fourth Most Recent NOI: | $9,430,693 (12/31/2019) | |
| Maturity Date: | 8/6/2032 | Third Most Recent NOI: | $10,294,158 (12/31/2020) | |
| Interest-only Period: | 120 months | Second Most Recent NOI: | $9,986,059 (12/31/2021) | |
| Original Term: | 120 months | Most Recent NOI: | $9,484,037 (TTM 3/31/2022) | |
| Original Amortization: | None | UW Economic Occupancy: | 80.3% | |
| Amortization Type: | Interest Only | UW Revenues: | $17,886,614 | |
| Call Protection(2): | L(24),D(92),O(4) | UW Expenses: | $7,991,071 | |
| Lockbox / Cash Management: | Hard / Springing | UW NOI: | $9,895,543 | |
| Additional Debt(1): | Yes | UW NCF: | $9,087,117 | |
| Additional Debt Balance(1): | $20,000,000 | Appraised Value / Per SF: | $220,000,000 / $488 | |
| Additional Debt Type(1): | Pari Passu | Appraisal Date: | 5/1/2022 | |
| Escrows and Reserves(3) | Financial Information(1) | ||||||
| Initial | Monthly | Initial Cap | Cut-off Date Loan / SF: | $189 | |||
| Taxes: | $300,805 | $300,805 | N/A | Maturity Date Loan / SF: | $189 | ||
| Insurance: | $0 | Springing | N/A | Cut-off Date LTV: | 38.6% | ||
| Replacement Reserves: | $0 | $8,443 | N/A | Maturity Date LTV: | 38.6% | ||
| TI/LC: | $0 | $75,097 | $1,802,332 | UW NCF DSCR: | 2.09x | ||
| Other: | $1,355,477 | $0 | N/A | UW NOI Debt Yield: | 11.6% | ||
| Sources and Uses | ||||||
| Sources | Proceeds | % of Total | Uses | Proceeds | % of Total | |
| Whole Loan | $85,000,000 | 100.0% | Loan Payoff | $79,563,384 | 93.6% | |
| Sponsor Equity | 2,141,911 | 2.5 | ||||
| Upfront Reserves | 1,656,282 | 1.9 | ||||
| Closing Costs | 1,638,423 | 1.9 | ||||
| Total Sources | $85,000,000 | 100.0% | Total Uses | $85,000,000 | 100.0% | |
| (1) | The 39 Broadway Loan (as defined below) is part of a whole loan evidenced by two pari passu notes, with an aggregate outstanding principal balance as of the Cut-off Date of $85.0 million. The Financial Information in the chart above reflects the Cut-off Date Balance of the 39 Broadway Whole Loan (as defined below). |
| (2) | The defeasance lockout period, with respect to a defeasance of the 39 Broadway Whole Loan, will be at least 24 payment dates beginning with and including the first payment date on September 6, 2022. Defeasance of the full $85.0 million 39 Broadway Whole Loan is permitted after the date that is earlier of (i) two years from the closing date of the securitization that includes the last note to be securitized and (ii) July 7, 2026. |
| (3) | For a full description of Escrows and Reserves, please refer to “Escrows and Reserves” below. |
The Loan. The mortgage loan (the “39 Broadway Mortgage Loan”) is part of a whole loan (the “39 Broadway Whole Loan”) consisting of two pari passu promissory notes in the aggregate outstanding principal balance of $85,000,000 and is secured by a first mortgage encumbering the borrower’s fee interest in a 450,583 square feet office property in New York, New York (the “39 Broadway Property”). The 39 Broadway Mortgage Loan, evidenced by the controlling A-1 note, has an outstanding principal balance as of the Cut-off Date of $65,000,000 and represents approximately 8.6% of the Initial Pool Balance. The non-controlling A-2 note had an original principal balance and has an outstanding balance as of the Cut-off Date of $20,000,000. The borrower primarily utilized proceeds of the 39 Broadway Whole Loan to refinance existing debt on the 39 Broadway Property. The 39 Broadway Whole Loan was previously securitized in CGCMT 2013-GC11. The 39 Broadway Whole Loan was originated by Citi Real Estate Funding Inc. (“CREFI”) and has an interest rate of 5.05000% per annum.
The 39 Broadway Whole Loan has an initial term of 120 months and has a remaining term of 120 months as of the Cut-off Date. The 39 Broadway Whole Loan requires payments of interest only for the entire term of the 39 Broadway Whole Loan. The stated maturity date
THE INFORMATION IN THIS STRUCTURAL AND COLLATERAL TERM SHEET IS NOT COMPLETE AND MAY BE AMENDED PRIOR TO THE TIME OF SALE. THIS TERM SHEET IS NOT AN OFFER TO SELL THESE SECURITIES AND IT IS NOT A SOLICITATION OF AN OFFER TO BUY THESE SECURITIES IN ANY JURISDICTION WHERE THE OFFER OR SALE IS NOT PERMITTED.
58 of 143
| Structural and Collateral Term Sheet | Benchmark 2022-B36 | |
| 39 Broadway | ||
of the 39 Broadway Whole Loan is the payment date in August 2032. Legal counsel to the borrower delivered a non-consolidation opinion in connection with the origination of the 39 Broadway Whole Loan.
Voluntary prepayment of the 39 Broadway Whole Loan is prohibited prior to the due date occurring in May 2032. Defeasance of the 39 Broadway Whole Loan in whole (but not in part) is permitted at any time after the earlier of (i) July 7, 2026 and (ii) the second anniversary of the closing date of the securitization that includes the last note of the 39 Broadway Whole Loan to be securitized.
The table below summarizes the promissory notes that comprise the 39 Broadway Whole Loan. The relationship between the holders of the 39 Broadway Whole Loan is governed by a co-lender agreement as described under “Description of the Mortgage Pool—The Whole Loans—The Serviced Pari Passu Whole Loans” in the Preliminary Prospectus.
| Whole Loan Summary | ||||
| Note | Original Balance | Cut-off Date Balance | Note Holder | Controlling Piece |
| A-1 | $65,000,000 | $65,000,000 | Benchmark 2022-B36 | Yes |
| A-2 | 20,000,000 | 20,000,000 | CREFI(1) | No |
| Whole Loan | $85,000,000 | $85,000,000 | ||
| (1) | The related note is expected to be contributed to one or more future securitization transactions. |
The Borrower. The borrower is 39 CAM LLC, a Delaware limited liability company. The borrower is structured to be a single purpose bankruptcy-remote entity, having at least one independent director in its organizational structure.
The Loan Sponsors. The borrower sponsors and nonrecourse carveout guarantors are Avi Schron, Mark Schron, and Eli Schron. Avi Schron, Mark Schron, and Eli Schron currently lead Cammeby’s International, a real estate investment company founded in 1967. Cammeby’s International acquired the property in 1998. Operating primarily in New York City, Cammeby’s International owns interests in more than 12,000 rental units in New York City.
The Property. The 39 Broadway Property is a 450,853 square foot, 37-story, multi-tenant office building with 19,501 square feet of ground floor retail space located in the Financial District of New York, New York. Built in 1927 and renovated in 2005, the 39 Broadway Property is situated on approximately 0.4 acres between Morris Street and Exchange Alley in the Financial West office submarket of Downtown Manhattan. Since 2017, the borrower has invested in capital improvements, which included renovation to the HVAC systems, elevator, hallways, bathrooms, lobby, and sprinkler system. Since January 2021, the 39 Broadway Property signed 10 new leases comprising of 37,010 square feet and renewed 13 leases which includes 49,012 square feet of net rentable area. The 2nd through 37th floors contain 430,420 square feet of rentable office space. As of May 12, 2022, the office space is 78.4% occupied which represents 88.3% of underwritten base rent. Additionally, the 39 Broadway Property consists of five ground floor retail tenants which are accessible from the lobby or via Trinity Place. The retail space at the 39 Broadway Property is 100.0% occupied and accounts for approximately 10.5% of underwritten base rent. Duane Reade (Walgreens Co.) is the largest retail tenant at the 39 Broadway Property and accounts for approximately 7.5% of underwritten base rent on a lease that expires in July 2029. Based on the underwritten rent roll dated May 12, 2022, as a whole, the 39 Broadway Property is 79.4% leased to 86 unique tenants with no tenant accounting for more than 9.2% of underwritten base rent and 8.4% of net rentable area.
Major Tenants.
The largest tenant, Metropolitan Jewish Health System, Inc. (“MJHS”) (37,760 square feet; 8.4% of NRA; 9.2% of underwritten base rent), offers medical services and operates as a non-profit organization. Founded in 1907, the Company provides home health care, hospice and palliative care, rehabilitation, and nursing services in the United States. The research based MJHS Institute for Innovation in Palliative Care is located at the 39 Broadway Property. MJHS has been at the 39 Broadway Property since 2015, expanded in 2018 and currently occupies the second and third floor. MJHS’s lease expires on September 21, 2025 and does not have any renewal or termination options.
The second largest tenant, The Waterfront Commission of New York Harbor (“Waterfront Commission”) (21,025 square feet; 4.7% of NRA; 5.4% of underwritten base rent) is a bi-state regulatory agency that was created in 1953. The mission of the Waterfront Commission is to investigate, deter, combat, and remedy criminal activity and ensures fair hiring and employment practices. The Waterfront Commission has been at the 39 Broadway Property since 2000 and extended its lease in 2016. The lease for the office space (21,025 square feet) expires on November 26, 2026 and the Waterfront Commission does not have any renewal or termination options.
The third largest tenant, The Food Bank for New York City, Food for Survival (“NYC Food Bank”) (16,890 square feet; 3.7% of NRA; 3.8% of underwritten base rent) is an independent nonprofit founded in 1983. The NYC Food Bank is New York City’s largest hunger-relief organization and has provided over 1.2 billion free meals, served approximately 1,800 charities, and has returned over one billion dollars to the community. The NYC Food Bank has been at the 39 Broadway Property since 1999 and extended its lease in 2011. The NYC Food Banks’s lease for the office space (16,890 square feet) expires on March 31, 2026 and does not have any renewal or termination options.
THE INFORMATION IN THIS STRUCTURAL AND COLLATERAL TERM SHEET IS NOT COMPLETE AND MAY BE AMENDED PRIOR TO THE TIME OF SALE. THIS TERM SHEET IS NOT AN OFFER TO SELL THESE SECURITIES AND IT IS NOT A SOLICITATION OF AN OFFER TO BUY THESE SECURITIES IN ANY JURISDICTION WHERE THE OFFER OR SALE IS NOT PERMITTED.
59 of 143
| Structural and Collateral Term Sheet | Benchmark 2022-B36 | |
| 39 Broadway | ||
The Market. The 39 Broadway Property is located between Morris Street and Exchange Alley and is five blocks south of the Fulton Transit Center, which services the 2, 3, 4, 5, A, C, J, R and Z subway lines. According to a third-party market research report, the 39 Broadway Property is located in the Financial West submarket of the New York City market, which is bordered by Financial East to the east and World Trade to the north. As of the first quarter of 2022, the Financial West submarket reported total Class B office inventory of approximately 3.8 million square feet with a 22.6% vacancy rate and average asking rent of $56.19 per square foot. The appraiser concluded to a market rent for the office space at the 39 Broadway Property of $44.00 per square foot for floors 2 to 9, $46.00 per square foot for floors 10 to 21, $49.00 per square foot for floors 22 to 30 and $52.00 per square foot for floors 31 to 37, all on a modified gross basis.
| Historical Occupancy(1) | |||
| 2019 | 2020 | 2021 | Current(2) |
| 89.5% | 92.2% | 84.4% | 79.4% |
| (1) | Historical Occupancies are the annual average physical occupancy of each respective year. |
| (2) | Current Occupancy is as of May 12, 2022. |
The following table presents information relating to comparable office properties for the 39 Broadway Property:
| Comparable Office Properties Summary(1) | ||||||
| Property Name/Location | Year Built/ Renovated | Office Area | Stories | Vacant SF Available | % Occupied | Average Asking Rent |
| 39 Broadway, New York, NY | 1927/2005 | 450,583(2) | 37 | 93,032(2) | 79.4%(2) | $46.51(2)(3) |
| 25 Broadway, New York, NY | 1921/NAP | 775,000 | 23 | 177,034 | 77.2% | $49.00 |
| 26 Broadway, New York, NY | 1922/NAP | 630,000 | 31 | 178,319 | 71.7% | $55.00 |
| 42 Broadway, New York, NY | 1904/NAP | 301,230 | 22 | 58,391 | 80.6% | $37.50 |
| 65 Broadway, New York, NY | 1917/1985 | 300,000 | 21 | 26,770 | 91.1% | $42.50 |
| 111 Broadway, New York, NY | 1894/NAP | 427,598 | 21 | 97,195 | 77.3% | $54.00 |
| 115 Broadway, New York, NY | 1905/1989 | 409,596 | 22 | 45,118 | 89.0% | $56.50 |
| 75 Broad Street, New York, NY | 1928/NAP | 650,000 | 33 | 93,446 | 85.6% | $46.50 |
| 40 Rector Street, New York, NY | 1920/NAP | 575,187 | 19 | 64,851 | 88.7% | $44.00 |
| (1) | Source: Appraisal. |
| (2) | Based on underwritten rent roll dated May 12, 2022. |
| (3) | Represents underwritten base rent per square foot. |
THE INFORMATION IN THIS STRUCTURAL AND COLLATERAL TERM SHEET IS NOT COMPLETE AND MAY BE AMENDED PRIOR TO THE TIME OF SALE. THIS TERM SHEET IS NOT AN OFFER TO SELL THESE SECURITIES AND IT IS NOT A SOLICITATION OF AN OFFER TO BUY THESE SECURITIES IN ANY JURISDICTION WHERE THE OFFER OR SALE IS NOT PERMITTED.
60 of 143
| Structural and Collateral Term Sheet | Benchmark 2022-B36 | |
| 39 Broadway | ||
| Tenant Summary(1) | |||||||
| Tenant | Type | Ratings | Net Rentable | % of Total | Base Rent | % of Total | Lease |
| Moody’s/Fitch/S&P(2) | Area (SF) | NRA | PSF(3) | Base Rent(3) | Expiration Date | ||
| Metropolitan Jewish Health System, Inc. | Office | NR/NR/NR | 37,760 | 8.4% | $40.30 | 9.2% | 9/21/2025 |
| The Waterfront Commission of New York Harbor | Office(4) | NR/NR/NR | 21,025 | 4.7 | $42.72 | 5.4 | Various(5) |
| The Food Bank for New York City, Food for Survival | Office(4) | NR/NR/NR | 16,890 | 3.7 | $37.63 | 3.8 | Various(5) |
| Masterpiece International, Ltd. | Office | NR/NR/NR | 15,555 | 3.5 | $51.41 | 4.8 | 2/20/2027 |
| Littleton Joyce Ughetta & Park LLP | Office | NR/NR/NR | 13,644 | 3.0 | $49.78 | 4.1 | 1/31/2028 |
| The Jericho Project | Office | NR/NR/NR | 11,889 | 2.6 | $38.55 | 2.8 | 9/30/2030(6) |
| Duane Reade (Walgreens Co.) | Retail | Baa2/NR/BBB | 11,285 | 2.5 | $111.12 | 7.5 | 7/31/2029 |
| Stephen Einstein & Associates, P.C. | Office | NR/NR/NR | 9,935 | 2.2 | $50.41 | 3.0 | 12/16/2025 |
| Business Intelligence Associates, Inc. | Office | NR/NR/NR | 8,280 | 1.8 | $42.24 | 2.1 | 5/8/2023 |
| Armienti, Debellis, Gugliemo & Rhoden LLP | Office | NR/NR/NR | 7,975 | 1.8 | $35.67 | 1.7 | 8/31/2023 |
| Total | 154,238 | 34.2% | $47.86 | 44.4% | |||
| Remaining Tenants | 203,313 | 45.1 | $45.48 | 55.6 | |||
| Total Occupied | 357,551 | 79.4% | |||||
| Vacant | 93,032 | 20.6 | |||||
| Total | 450,583 | 100.0% | $46.51 | 100.0% | |||
| (1) | Based on the underwritten rent roll dated May 12, 2022. |
| (2) | In certain instances, ratings provided are those of the parent company of the entity shown, whether or not the parent company guarantees the lease. |
| (3) | Base Rent PSF, and % of Total Base Rent are inclusive of contractual rent steps underwritten through June 15, 2023. |
| (4) | The Waterfront Commission of New York Harbor’s lease includes an office space of 21,025 square feet and a storage unit. The Food Bank for New York City, Food for Survival’s lease includes an office space of 16,890 square feet and a storage unit. |
| (5) | The Waterfront Commission of New York Harbor’s lease with respect to the office space (21,025 square feet) expires on November 26, 2026, and its lease with respect to the storage unit is month to month. The Food Bank for New York City, Food for Survival’s lease with respect to the office space (16,890 square feet) expires on March 31, 2026, and its lease with respect to the storage unit is month to month. |
| (6) | The Jericho Project may terminate its lease on September 30, 2025 or September 30, 2028 in the event the Jericho Project loses its government funding source. The Jericho Project must provide at least 6 months’ written notice and pay a termination fee of: (i) approximately $139,147 if exercised on September 30, 2025; and (ii) approximately $17,187 if exercised on September 30, 2028. |
THE INFORMATION IN THIS STRUCTURAL AND COLLATERAL TERM SHEET IS NOT COMPLETE AND MAY BE AMENDED PRIOR TO THE TIME OF SALE. THIS TERM SHEET IS NOT AN OFFER TO SELL THESE SECURITIES AND IT IS NOT A SOLICITATION OF AN OFFER TO BUY THESE SECURITIES IN ANY JURISDICTION WHERE THE OFFER OR SALE IS NOT PERMITTED.
61 of 143
| Structural and Collateral Term Sheet | Benchmark 2022-B36 | |
| 39 Broadway | ||
| Lease Rollover Schedule(1) | |||||||||
| Year | Number of Leases Expiring | Net Rentable Area Expiring | % of NRA Expiring | Base Rent Expiring(2)(3) | % of Base Rent Expiring(2)(3) | Cumulative Net Rentable Area Expiring | Cumulative % of NRA Expiring | Cumulative Base Rent Expiring(2)(3) | Cumulative % of Base Rent Expiring(2)(3) |
| Vacant | NAP | 93,032 | 20.6% | NAP | NAP | 93,032 | 20.6% | NAP | NAP |
| MTM | 22 | 8,770 | 1.9 | $550,782 | 3.3% | 101,802 | 22.6% | $550,782 | 3.3% |
| 2022 | 1 | 2,653 | 0.6 | 103,467 | 0.6% | 104,455 | 23.2% | $654,249 | 3.9% |
| 2023 | 15 | 50,837 | 11.3 | 2,028,589 | 12.2% | 155,292 | 34.5% | $2,682,838 | 16.1% |
| 2024 | 8 | 24,341 | 5.4 | 1,211,221 | 7.3% | 179,633 | 39.9% | $3,894,059 | 23.4% |
| 2025 | 8 | 71,604 | 15.9 | 3,147,707 | 18.9% | 251,237 | 55.8% | $7,041,766 | 42.3% |
| 2026 | 6 | 45,154 | 10.0 | 1,844,964 | 11.1% | 296,391 | 65.8% | $8,886,730 | 53.4% |
| 2027 | 7 | 34,260 | 7.6 | 1,571,686 | 9.5% | 330,651 | 73.4% | $10,458,416 | 62.9% |
| 2028 | 7 | 30,078 | 6.7 | 1,457,598 | 8.8% | 360,729 | 80.1% | $11,916,014 | 71.7% |
| 2029 | 7 | 42,582 | 9.5 | 2,703,696 | 16.3% | 403,311 | 89.5% | $14,619,710 | 87.9% |
| 2030 | 3 | 20,426 | 4.5 | 858,455 | 5.2% | 423,737 | 94.0% | $15,478,166 | 93.1% |
| 2031 | 3 | 9,002 | 2.0 | 407,207 | 2.4% | 432,739 | 96.0% | $15,885,373 | 95.5% |
| 2032 & Beyond | 3 | 17,844 | 4.0 | 743,538 | 4.5% | 450,583 | 100.0% | $16,628,911 | 100.0% |
| Total | 90 | 450,583 | 100.0% | $16,628,911 | 100.0% | ||||
| (1) | Based on the underwritten rent roll dated May 12, 2022. |
| (2) | Certain leases may have termination options that are exercisable prior to the originally stated expiration date of the lease and that are not considered in this Lease Rollover Schedule. |
| (3) | Base Rent Expiring, % of Base Rent Expiring, Cumulative Base Rent Expiring and Cumulative % of Base Rent Expiring are inclusive of contractual rent steps underwritten through June 15, 2023. |
| Operating History and Underwritten Net Cash Flow(1) | |||||||
| 2019 | 2020 | 2021 | TTM 3/31/2022 | Underwritten | Per Square Foot | %(2) | |
| Rents in Place | $16,386,103 | $16,857,932 | $16,351,521 | $16,013,925 | $16,284,696 | $36.14 | 73.3% |
| Rent Steps(3) | 0 | 0 | 0 | 0 | 344,215 | 0.76 | 1.5% |
| Gross Potential Revenue | $16,386,103 | $16,857,932 | $16,351,521 | $16,013,925 | $16,628,911 | $36.91 | 74.8% |
| Other Income(4) | 58,383 | 92,808 | 114,786 | 182,093 | 156,000 | 0.35 | 0.7% |
| Vacant Income | 0 | 0 | 0 | 0 | 4,341,357 | 9.63 | 19.5% |
| Total Reimbursements | 1,962,955 | 1,811,828 | 1,553,937 | 1,208,654 | 1,101,702 | 2.45 | 5.0% |
| Net Rental Income | $18,407,442 | $18,762,568 | $18,020,244 | $17,404,673 | $22,227,971 | $49.33 | 100.0% |
| (Vacancy/Credit Loss) | 0 | 0 | 0 | 0 | (4,341,357) | (9.63) | (19.5%) |
| Effective Gross Income | $18,407,442 | $18,762,568 | $18,020,244 | $17,404,673 | $17,886,614 | $39.70 | 80.5% |
| Real Estate Taxes | 3,837,200 | 3,996,243 | 3,647,861 | 3,401,875 | 3,437,771 | 7.63 | 19.2% |
| Insurance | 133,241 | 153,129 | 186,516 | 190,268 | 191,360 | 0.42 | 1.1% |
| Management Fee | 552,223 | 562,877 | 540,607 | 522,140 | 536,598 | 1.19 | 3.0% |
| Other Operating Expenses | 4,454,085 | 3,756,161 | 3,659,200 | 3,806,353 | 3,825,341 | 8.49 | 21.4% |
| Total Expenses | $8,976,749 | $8,468,410 | $8,034,185 | $7,920,636 | $7,991,071 | $17.73 | 44.7% |
| Net Operating Income | $9,430,693 | $10,294,158 | $9,986,059 | $9,484,037 | $9,895,543 | $21.96 | 55.3% |
| Total TI/LC, RR | 0 | 0 | 0 | 0 | 808,425 | 1.79 | 4.5% |
| Net Cash Flow | $9,430,693 | $10,294,158 | $9,986,059 | $9,484,037 | $9,087,117 | $20.17 | 50.8% |
| (1) | Based on the underwritten rent roll dated May 12, 2022. |
| (2) | % column represents percent of Net Rental Income for all revenue lines and represents percent of Effective Gross Income for the remainder of the fields. |
| (3) | Contractual rent steps are underwritten through June 15, 2023. |
| (4) | Other Income includes income from NSF checks, late fees, legal fees income, cancellation fees income, and other miscellaneous income. |
Property Management. The 39 Broadway Property is managed by Cammeby’s Management Company, LLC, a New York limited liability company that is an affiliate of the borrower.
Escrows and Reserves. At origination of the 39 Broadway Whole Loan, the borrower deposited (i) approximately $300,805 into a real estate tax reserve account and (ii) $1,355,477 into an outstanding tenant obligations reserve account.
THE INFORMATION IN THIS STRUCTURAL AND COLLATERAL TERM SHEET IS NOT COMPLETE AND MAY BE AMENDED PRIOR TO THE TIME OF SALE. THIS TERM SHEET IS NOT AN OFFER TO SELL THESE SECURITIES AND IT IS NOT A SOLICITATION OF AN OFFER TO BUY THESE SECURITIES IN ANY JURISDICTION WHERE THE OFFER OR SALE IS NOT PERMITTED.
62 of 143
| Structural and Collateral Term Sheet | Benchmark 2022-B36 | |
| 39 Broadway | ||
Tax Escrows – The borrower is required to deposit into a real estate tax reserve, on a monthly basis, 1/12 of the taxes that the lender reasonably estimates will be payable over the next-ensuing 12-month period (initially estimated to be approximately $300,805).
Insurance Escrows – The borrower is required to deposit into an insurance reserve, on a monthly basis, 1/12 of the amount which will be sufficient to pay the insurance premiums due for the renewal of coverage afforded by such policies; provided, however, such insurance reserve has been conditionally waived so long as the borrower maintains a blanket policy meeting the requirements of the 39 Broadway Whole Loan documents. At loan origination, an acceptable blanket policy was in place.
TI/LC Reserve – The borrower is required to deposit into a tenant improvement and leasing commissions reserve, on a monthly basis, an amount equal to approximately $75,097; provided, however, the borrower will not be required to make such monthly deposit into the tenant improvement and leasing reserve so long as no event of default under the 39 Broadway Property Whole Loan documents has occurred and is continuing and the amount then on deposit in the tenant improvements and leasing commissions reserve account equals or exceeds $1,802,332.
Replacement Reserve – The borrower is required to deposit into a replacement reserve, on a monthly basis, an amount equal to approximately $8,443.
Lockbox / Cash Management. The 39 Broadway Whole Loan is structured with a hard lockbox and springing cash management. At origination of the 39 Broadway Whole Loan, the borrower was required to deliver a notice to each tenant directing each tenant to remit all payments under the applicable lease directly to the lender-controlled lockbox. The borrower is required to cause all revenue derived from the 39 Broadway Property to be deposited directly into a lender approved lockbox account immediately following receipt. All funds deposited into the lockbox are required to be released to the borrower on each business day unless a Trigger Period (as defined below) exists. Upon the occurrence and during the continuance of a Trigger Period, all funds in the lockbox account are required to be swept on each business day to a lender-controlled cash management account to be applied and disbursed in accordance with the 39 Broadway Whole Loan documents, and all excess cash flow funds remaining in the cash management account after the application of such funds in accordance with the 39 Broadway Whole Loan documents are required to be held by the lender in an excess cash flow reserve account as additional collateral for the 39 Broadway Whole Loan. Upon the cure of the applicable Trigger Period, so long as no other Trigger Period exists, the lender is required to return any amounts remaining on deposit in the excess cash flow reserve account to the borrower. Notwithstanding the foregoing, provided no event of default has occurred or is continuing under the 39 Broadway Whole Loan documents, the lender will disburse amounts on deposit in the excess cash flow reserve account to the borrower for approved leasing expenses (to the extent there are insufficient funds in the lease reserve account). Upon an event of default under the 39 Broadway Whole Loan documents, the lender may apply funds to the debt in such priority as it may determine.
A “Trigger Period” means a period (A) commencing upon (i) the occurrence of an event of default under the 39 Broadway Whole Loan documents, and (ii) the debt service coverage ratio being less than 1.35x (provided, however, that no Trigger Period will be deemed to exist pursuant to this clause (ii) during any period that the Collateral Cure Conditions (defined below) are satisfied), and (B) expiring upon (x) with regard to any Trigger Period with regard to clause (i), the cure (if applicable) of such event of default or, (y) with regard to clause (ii), the debt service coverage ratio being equal to or greater than 1.35x for one calendar quarter.
The “Collateral Cure Conditions” will be satisfied if and for so long as the borrower has deposited cash into an account with the lender or delivers to the lender a letter of credit which, in either case, serves as additional collateral for the 39 Broadway Whole Loan, in an amount equal to the amount which, if applied to prepay the outstanding principal balance of the debt as of the applicable date of calculation, would cause the debt service coverage ratio to equal or exceed 1.35x.
Current Mezzanine or Subordinate Indebtedness: None.
Future Mezzanine or Subordinate Indebtedness Permitted: None.
Partial Release. None.
THE INFORMATION IN THIS STRUCTURAL AND COLLATERAL TERM SHEET IS NOT COMPLETE AND MAY BE AMENDED PRIOR TO THE TIME OF SALE. THIS TERM SHEET IS NOT AN OFFER TO SELL THESE SECURITIES AND IT IS NOT A SOLICITATION OF AN OFFER TO BUY THESE SECURITIES IN ANY JURISDICTION WHERE THE OFFER OR SALE IS NOT PERMITTED.
63 of 143
| Structural and Collateral Term Sheet | Benchmark 2022-B36 | |
| 935 & 953 Sycamore | ||

THE INFORMATION IN THIS STRUCTURAL AND COLLATERAL TERM SHEET IS NOT COMPLETE AND MAY BE AMENDED PRIOR TO THE TIME OF SALE. THIS TERM SHEET IS NOT AN OFFER TO SELL THESE SECURITIES AND IT IS NOT A SOLICITATION OF AN OFFER TO BUY THESE SECURITIES IN ANY JURISDICTION WHERE THE OFFER OR SALE IS NOT PERMITTED.
64 of 143
| Structural and Collateral Term Sheet | Benchmark 2022-B36 | |
| 935 & 953 Sycamore | ||

THE INFORMATION IN THIS STRUCTURAL AND COLLATERAL TERM SHEET IS NOT COMPLETE AND MAY BE AMENDED PRIOR TO THE TIME OF SALE. THIS TERM SHEET IS NOT AN OFFER TO SELL THESE SECURITIES AND IT IS NOT A SOLICITATION OF AN OFFER TO BUY THESE SECURITIES IN ANY JURISDICTION WHERE THE OFFER OR SALE IS NOT PERMITTED.
65 of 143
| Structural and Collateral Term Sheet | Benchmark 2022-B36 | |
| 935 & 953 Sycamore | ||
| Mortgage Loan Information | Property Information | |||
| Mortgage Loan Seller: | GACC | Single Asset / Portfolio: | Single Asset | |
| Original Principal Balance: | $60,000,000 | Title: | Fee | |
| Cut-off Date Principal Balance: | $60,000,000 | Property Type - Subtype: | Mixed Use – Office/Retail | |
| % of Pool by IPB: | 8.0% | Net Rentable Area (SF): | 138,294 | |
| Loan Purpose: | Refinance | Location: | Los Angeles, CA | |
| Borrower: | 953 N. Sycamore (LA), LLC | Year Built / Renovated: | 2019 / NAP | |
| Guarantor: | SKR Holdings, LLC | Occupancy: | 96.0% | |
| Interest Rate: | 5.44000% | Occupancy Date: | 7/25/2022 | |
| Note Date: | 7/27/2022 | Number of Tenants: | 16 | |
| Maturity Date: | 8/6/2032 | Fourth Most Recent NOI: | NAV | |
| Interest-only Period: | 120 months | Third Most Recent NOI: | $2,217,327 (12/31/2020) | |
| Original Term: | 120 months | Second Most Recent NOI: | $4,285,439 (12/31/2021) | |
| Original Amortization: | None | Most Recent NOI(1): | $4,723,991 (TTM 5/31/2022) | |
| Amortization Type: | Interest Only | UW Economic Occupancy: | 95.0% | |
| Call Protection: | L(24),D(89),O(7) | UW Revenues: | $8,469,425 | |
| Lockbox / Cash Management: | Hard / Springing | UW Expenses: | $2,580,137 | |
| Additional Debt: | N/A | UW NOI(1): | $5,889,288 | |
| Additional Debt Balance: | N/A | UW NCF: | $5,688,762 | |
| Additional Debt Type: | N/A | Appraised Value / Per SF(2): | $117,000,000 / $846 | |
| Appraisal Date: | 2/1/2023 | |||
| Escrows and Reserves(3) | Financial Information | ||||||
| Initial | Monthly | Initial Cap | |||||
| Taxes: | $0 | Springing | N/A | Cut-off Date Loan / SF: | $434 | ||
| Insurance: | $0 | Springing | N/A | Maturity Date Loan / SF: | $434 | ||
| Replacement Reserves: | $0 | $2,305 | N/A | Cut-off Date LTV(2): | 51.3% | ||
| TI/LC: | $893,537 | $14,406 | $691,470 | Maturity Date LTV(2): | 51.3% | ||
| Other: | $165,500 | $0 | N/A | UW NCF DSCR: | 1.72x | ||
| UW NOI Debt Yield: | 9.8% | ||||||
| Sources and Uses | |||||||
| Sources | Proceeds | % of Total | Uses | Proceeds | % of Total | ||
| Loan Amount | $60,000,000 | 100.0% | Loan Payoff | 52,664,080 | 87.8% | ||
| Upfront Reserves | 1,059,037 | 1.8 | |||||
| Closing Costs | 335,091 | 0.6 | |||||
| Return of Equity | 5,941,792 | 9.9 | |||||
| Total Sources | $60,000,000 | 100.0% | Total Uses | $60,000,000 | 100.0% | ||
| (1) | The increase from the Most Recent NOI to Underwritten Net Operating Income is primarily attributable to contractual increases in base rent and rent steps. |
| (2) | The Appraised Value is based on the “As Complete/Upon Lease Commencement” value, which assumes contractual tenant improvement and leasing obligations (“TI/LCs”) have been fulfilled with no outstanding free rent. At loan closing, all outstanding all TI/LCs and free rent were reserved. The “As-is” appraised value is $114,000,000 as of July 7, 2022, which equates to a Cut-off Date LTV and Maturity Date LTV of 52.6%. |
| (3) | For a full description of Escrows and Reserves, please refer to “Escrows and Reserves” below. |
The Loan. The 935 & 953 Sycamore mortgage loan (the “935 & 953 Sycamore Loan”) is secured by the borrower’s fee interest in a 138,294 square foot collection of buildings comprised of creative office and retail space located in the Hollywood District of Los Angeles, California (the “935 & 953 Sycamore Property”). The 935 & 953 Sycamore Loan has a 10-year term and accrues interest at a rate of 5.44000% per annum.
The Borrower. The borrower is 953 N. Sycamore (LA), LLC, a Delaware limited liability company and single purpose bankruptcy-remote entity, with one independent director. Legal counsel to the borrower delivered a non-consolidation opinion in connection with the origination of the 935 & 953 Sycamore Loan.
The Loan Sponsors. The loan sponsors are Richard Scott Ressler, Avraham Shemesh and Shaul Kuba and the non-recourse carve-out guarantor is SKR Holdings, LLC. SKR Holdings, LLC is an entity controlled by Shaul Kuba, Richard Scott Ressler and Avraham Shemesh, the three cofounders of CIM Group (“CIM”). Founded in 1994, CIM is a community-focused real estate and infrastructure
THE INFORMATION IN THIS STRUCTURAL AND COLLATERAL TERM SHEET IS NOT COMPLETE AND MAY BE AMENDED PRIOR TO THE TIME OF SALE. THIS TERM SHEET IS NOT AN OFFER TO SELL THESE SECURITIES AND IT IS NOT A SOLICITATION OF AN OFFER TO BUY THESE SECURITIES IN ANY JURISDICTION WHERE THE OFFER OR SALE IS NOT PERMITTED.
66 of 143
| Structural and Collateral Term Sheet | Benchmark 2022-B36 | |
| 935 & 953 Sycamore | ||
owner, operator, lender and developer. As of December 31, 2021, CIM had approximately $31.2 billion of assets owned and operated and over 1,000 employees across ten corporate office locations.
The Property. The 935 & 953 Sycamore Property is a collection of creative office and storefront retail buildings totaling 138,294 square feet in Hollywood’s Media/Creative District. The 953 Sycamore property (the “953 Sycamore Property”) is an eight-story 79,831 square foot mixed-use office/retail building that was redeveloped by CIM in 2019. The 935 Sycamore property (the “935 Sycamore Property”) is a collection of five single-story Class A retail and creative office warehouse buildings totaling 58,463 square feet that was developed by CIM in 2019. The borrower sponsor purchased the 953 Sycamore Property in 2017 and acquired the underlying land at the 935 Sycamore Property in 2018 and has a total cost basis of approximately $74.2 million. The borrower sponsor owns various buildings along this Sycamore block (the “Sycamore District”), which has experienced a rejuvenation with various creative/media offices and new restaurants following the borrower sponsor’s redevelopment in the area. The 935 & 953 Sycamore Property is walking distance to hundreds of production companies, restaurants and the West Hollywood Gateway Center.
The 953 Sycamore Property consists of 68,223 square feet of creative office space on the upper three floors and 10,204 square feet of retail space on the ground floor, with parking on the second through fifth floors. The 953 Sycamore Property has a total of 403 spaces (approximately 2.9 spaces per 1,000 square feet) of which 203 parking spaces are for its tenants, 100 parking spaces for tenants and visitors of the 935 Sycamore Property and 100 parking spaces for tenants at other buildings in the area. As of July 25, 2022, the office portion of the 953 Sycamore Property is 100% leased to five tenants (Sirius XM, Roc Nation, Wix.com, Azure Lab and Imprint) and the retail portion is 100% leased to five tenants (Motor Cars, Platefit, SandSpa, Nili Lotan and Mr. T).
Major Tenants.
The 935 Sycamore Property is a collection of five single-story retail and creative office warehouse buildings with 53,765 square feet of retail space and 4,698 square feet of office space. As of July 25, 2022, the office portion is currently 100% leased to Sirius XM and the retail portion is 89.9% leased to five tenants (Just One Eye, Sightglass Coffee, Tartine, Jacques Marie Mage and Pause). Tartine (2,550 square feet), a high-end, San Francisco based bakery chain with 14 locations, is partially owned by the principals of CIM through a joint venture equity investment.
The largest tenant, Sirius XM (26,512 square feet; 19.2% of net rentable area; 23.3% of underwritten base rent) is an audio entertainment company that operates through two audio entertainment segments: Sirius XM and Pandora. Sirius XM features music, sports, entertainment, comedy, talk, news, traffic, weather channels, podcasts and infotainment services to consumers in the United States on a subscription fee basis. Sirius XM’s services are distributed through its two satellite radio systems and streamed via applications for mobile devices, home devices and other consumer electronic equipment. Pandora operates as a music, comedy and podcast streaming discovery platform and offers a personalized experience through mobile devices, car speakers or connected devices. Sirius XM (NASDAQ: SIRI) is a publicly traded company on the NASDAQ. Per the full year 2022 guidance, Sirius XM had a total revenue of approximately $9.0 billion and $2.8 billion in adjusted EBITDA
Sirius XM uses the 935 & 953 Sycamore Property as its west coast headquarters, which includes studios for its shows and a performance space for production and celebrity events. Sirius XM has invested approximately $7.6 million ($288 per square foot) of its own money into its space and received approximately $2.5 million ($95 per square foot) in tenant improvement allowance. Sirius XM has two 5-year renewal options and no termination options.
The second largest tenant, Roc Nation (24,489 square feet; 17.7% of net rentable area; 22.6% of underwritten base rent) is an entertainment agency founded by Jay-Z in 2008. The company has offices in New York, London and Los Angeles. It includes a talent agency, sports agency, record label, television and film production, a clothing line, media relations, publishing, school, a philanthropy organization and an exhibition network. Roc Nation’s client list across the entertainment industry includes recognizable names such as recording artists Rihanna, Megan Thee Stallion, J. Cole, and Big Sean and athletes LaMelo Ball, Kevin De Bruyne and Robinson Cano. Roc Nation has partnerships with the world’s leading experts in artist management, technology, fashion, and philanthropy.
Roc Nation has invested approximately $2.0 million ($82 per square foot) of its own money into its space and received approximately $2.5 million in tenant improvement allowance from the borrower. Roc Nation has one five-year renewal option. Additionally, Roc Nation has a $1.0 million outstanding letter of credit for the duration of its lease. Roc Nation has a one-time right to terminate its lease effective the end of the 84th month of the lease term with notice between the 69th – 72nd month of the lease term. As a condition to early termination, Roc Nation must pay a termination fee of $1,752,761.82, plus three months of base rent as of the date of termination.
The third largest tenant, Just One Eye (23,367 square feet; 16.9% of net rentable square feet; 10.2% of underwritten base rent) is a luxury clothing boutique known for its edgy high-fashion products. Just One Eye’s sole location is at the 935 & 953 Sycamore Property and offers a variety of men’s and women’s apparel, accessories, jewelry, and beauty products. It boasts a range of art pieces, sculptures, and books for sale, including pieces on display from Andy Warhol and Damien Hirst. Just One Eye has invested approximately $1.4 million ($60 per square foot) of its own money into its space and received $734,605 in tenant improvement allowance.
THE INFORMATION IN THIS STRUCTURAL AND COLLATERAL TERM SHEET IS NOT COMPLETE AND MAY BE AMENDED PRIOR TO THE TIME OF SALE. THIS TERM SHEET IS NOT AN OFFER TO SELL THESE SECURITIES AND IT IS NOT A SOLICITATION OF AN OFFER TO BUY THESE SECURITIES IN ANY JURISDICTION WHERE THE OFFER OR SALE IS NOT PERMITTED.
67 of 143
| Structural and Collateral Term Sheet | Benchmark 2022-B36 | |
| 935 & 953 Sycamore | ||
The Market. The 935 & 953 Sycamore Property is located in the Hollywood Media District, a business improvement district that features numerous restaurants and production studios. The 935 & 953 Sycamore Property is one block east of West Hollywood and less than 0.5 miles from the Sunset Las Palmas Studios. At the cross street of Santa Monica Boulevard and N. Sycamore Avenue, over approximately 56,000 vehicles per day drive along Santa Monica Boulevard. According to the appraisal the estimated 2022 population within a 1-, 3- and 5-mile radius of the 935 & 953 Sycamore Property, the population is 48,748, 393,159 and 930,301, respectively. The 935 & 953 Sycamore Property received a Walk Score of 93 with its proximity to Hollywood’s restaurants, nightclubs, shopping centers, tourist attractions and, nearby parks including Poinsettia Playground, Poinsettia Recreation Center and Plummer Park.
The Hollywood market consists of a strong base of entertainment related companies, traditional Class A office tenants, and an increasing number of creative-space tenants. Tech and media companies such as Netflix, ViacomCBS, Fender, Sunset Bronson, Sunset Gower Studios, and Paramount continue to expand and invest in the area.
The 935 & 953 Sycamore Property is located in the West Hollywood office submarket. As of the second quarter of 2022, the West Hollywood office submarket had an overall and Class A inventory of approximately 8.2 million and 2.9 million square feet, respectively. The submarket had an overall and Class A vacancy rate of 9.8% and 15.0%, respectively, and an overall and Class A average asking rent of $57.24 and $66.84, respectively. The weighted average underwritten base rent of the office space ($62.68 per square foot) at the 935 & 953 Sycamore Property is approximately 6.2% below the Class A average asking rent.
The appraisal identified six competitive office lease comparables. The lease comparables range in size from 3,155 square feet to 97,742 square feet. The average asking rent for the lease comparables ranged from $50.16 to $67.80 with an average of $61.77.
The 935 & 953 Sycamore Property is located in the West Hollywood retail submarket. As of the second quarter of 2022, the West Hollywood retail submarket had an inventory of approximately 10.3 million square feet. The submarket had a vacancy rate of 6.6% and an average asking rate of $67.08. The weighted average UW Base Rent of the retail space ($38.74 per square foot) at the 935 & 953 Sycamore Property is approximately 42.2% below the average asking rent.
The appraisal identified seven competitive retail comparables. The lease comparables range in size from 1,996 square feet to 7,700 square feet. The average asking rent for the lease comparables ranged from $48.00 to $63.00 with an average of $53.31.
| Historical and Current Occupancy | ||
| 2020(1) | 2021(1) | Current(2) |
| 86.7% | 76.7% | 96.0% |
| (1) | Historical Occupancies are as of December 31 of each respective year. |
| (2) | Current Occupancy is as of July 25, 2022. |
THE INFORMATION IN THIS STRUCTURAL AND COLLATERAL TERM SHEET IS NOT COMPLETE AND MAY BE AMENDED PRIOR TO THE TIME OF SALE. THIS TERM SHEET IS NOT AN OFFER TO SELL THESE SECURITIES AND IT IS NOT A SOLICITATION OF AN OFFER TO BUY THESE SECURITIES IN ANY JURISDICTION WHERE THE OFFER OR SALE IS NOT PERMITTED.
68 of 143
| Structural and Collateral Term Sheet | Benchmark 2022-B36 | |
| 935 & 953 Sycamore | ||
| Tenant Summary(1) | |||||||
| Tenant | Tenant Type | Ratings Moody’s/Fitch/S&P(2) | Net Rentable Area (SF) | % of Total NRA | Base Rent PSF | % of Total Base Rent | Lease Expiration Date |
| Sirius XM | Office | NR/NR/BB | 26,512 | 19.2% | $60.46 | 23.3% | 1/31/2030 |
| Roc Nation(3) | Office | NR/NR/NR | 24,489 | 17.7% | $63.60 | 22.6% | 9/30/2029 |
| Just One Eye | Retail | NR/NR/NR | 23,367 | 16.9% | $30.09 | 10.2% | 4/30/2026 |
| Wix.com(4) | Office | NR/NR/NR | 15,504 | 11.2% | $64.25 | 14.5% | 2/28/2027 |
| Sightglass Coffee | Retail | NR/NR/NR | 10,560 | 7.6% | $41.34 | 6.3% | 5/30/2029 |
| Jacques Marie Mage | Retail | NR/NR/NR | 8,048 | 5.8% | $40.27 | 4.7% | 7/30/2032 |
| Motor Cars(5) | Retail | NR/NR/NR | 5,702 | 4.1% | $33.60 | 2.8% | 2/1/2032 |
| Pause | Retail | NR/NR/NR | 3,691 | 2.7% | $49.44 | 2.6% | 3/30/2031 |
| Azure Labs | Office | NR/NR/NR | 3,424 | 2.5% | $63.66 | 3.2% | 9/30/2025 |
| Imprint | Office | NR/NR/NR | 2,992 | 2.2% | $65.56 | 2.8% | 1/31/2026 |
| Total | 124,289 | 89.9% | $51.56 | 93.0% | |||
| Remaining Tenants | 8,456 | 6.1% | $56.75 | 7.0% | |||
| Total Occupied | 132,745 | 96.0% | $51.89 | 100.0% | |||
| Vacant | 5,549 | 4.0% | |||||
| Total | 138,294 | 100.0% | |||||
| (1) | Based on the underwritten rent roll dated July 25, 2022. |
| (2) | In certain instances, ratings provided are those of the parent company of the entity shown, whether or not the parent company guarantees the lease. |
| (3) | Roc Nation has a one-time right to terminate its lease effective the end of the 84th month of the lease term with notice between the 69th – 72nd month of the lease term. As a condition to early termination, Roc Nation must pay a termination fee of $1,752,761.82, plus three months of base rent as of the date of termination |
| (4) | Wix.com has a one-time right to terminate its lease effective as of the end of the 60th month of the lease term by written notice between the 45th and 48th month of the lease term. As a condition to early termination, Wix.com must pay a termination fee in the amount of approximately $1,264,855, plus six months of base rent as of the date of termination. |
| (5) | The Motor Cars space is currently being built out and is expected to be delivered by the end of 2022. Motor Cars can only terminate its lease if the space is not delivered by March 2023. The tenant is not currently paying rent and the gap rent has been reserved upfront. |
| Lease Rollover Schedule(1)(2) | |||||||||||
| Year | Number of Tenant Leases Expiring | Net Rentable Area Expiring | % of NRA Expiring | Base Rent Expiring | % of Base Rent Expiring | Cumulative Net Rentable Area Expiring | Cumulative % of NRA Expiring | Cumulative Base Rent Expiring | Cumulative % of Base Rent Expiring | ||
| Vacant | NAP | 5,549 | 4.0% | NAP | NAP | 5,549 | 4.0% | NAP | NAP | ||
| MTM | 0 | 0 | 0.0% | $0 | 0.0% | 5,549 | 4.0% | $0 | 0.0% | ||
| 2022 | 0 | 0 | 0.0% | 0 | 0.0% | 5,549 | 4.0% | 0 | 0.0% | ||
| 2023 | 0 | 0 | 0.0% | 0 | 0.0% | 5,549 | 4.0% | 0 | 0.0% | ||
| 2024 | 1 | 1,347 | 1.0% | 73,224 | 1.1% | 6,896 | 5.0% | 73,224 | 1.1% | ||
| 2025 | 1 | 3,424 | 2.5% | 217,956 | 3.2% | 10,320 | 7.5% | 291,180 | 4.2% | ||
| 2026 | 2 | 26,359 | 19.1% | 899,280 | 13.1% | 36,679 | 26.5% | 1,190,460 | 17.3% | ||
| 2027 | 2 | 16,908 | 12.2% | 1,069,316 | 15.5% | 53,587 | 38.7% | 2,259,776 | 32.8% | ||
| 2028 | 0 | 0 | 0.0% | 0 | 0.0% | 53,587 | 38.7% | 2,259,776 | 32.8% | ||
| 2029 | 3 | 37,599 | 27.2% | 2,175,084 | 31.6% | 91,186 | 65.9% | 4,434,860 | 64.4% | ||
| 2030 | 2 | 26,512 | 19.2% | 1,603,044 | 23.3% | 117,698 | 85.1% | 6,037,904 | 87.7% | ||
| 2031 | 3 | 6,846 | 5.0% | 334,872 | 4.9% | 124,544 | 90.1% | 6,372,776 | 92.5% | ||
| 2032 & Thereafter | 2 | 13,750 | 9.9% | 515,688 | 7.5% | 138,294 | 100.0% | 6,888,464 | 100.0% | ||
| Total | 16 | 138,294 | 100.0% | $6,888,464 | 100.0% | ||||||
| (1) | Based on the underwritten rent roll dated July 25, 2022. |
| (2) | Certain tenants may have termination or contraction options (which may become exercisable prior to the originally stated expiration date of the tenant lease) that are not considered in the above Lease Rollover Schedule. See “Tenant Summary” above. |
THE INFORMATION IN THIS STRUCTURAL AND COLLATERAL TERM SHEET IS NOT COMPLETE AND MAY BE AMENDED PRIOR TO THE TIME OF SALE. THIS TERM SHEET IS NOT AN OFFER TO SELL THESE SECURITIES AND IT IS NOT A SOLICITATION OF AN OFFER TO BUY THESE SECURITIES IN ANY JURISDICTION WHERE THE OFFER OR SALE IS NOT PERMITTED.
69 of 143
| Structural and Collateral Term Sheet | Benchmark 2022-B36 | |
| 935 & 953 Sycamore | ||
| Operating History and Underwritten Net Cash Flow | ||||||
| 2020 | 2021 | TTM 5/31/2022 | Underwritten | Per Square Foot | %(1) | |
| Rents in Place(2) | $5,515,815 | $5,950,384 | $6,077,709 | $6,888,464 | $49.81 | 77.3% |
| Rent Steps | 0 | 0 | 0 | 185,615 | 1.34 | 2.1% |
| Vacant Income | 0 | 0 | 0 | 308,961 | 2.23 | 3.5% |
| Gross Potential Rent | $5,515,815 | $5,950,384 | $6,077,709 | $7,383,040 | $53.39 | 82.8% |
| Total Reimbursements | 292,981 | 320,796 | 353,278 | 663,051 | 4.79 | 7.4% |
| Parking Income | 639,525 | 751,583 | 823,493 | 823,493 | 5.95 | 9.2% |
| Other Income | 240,851 | 293,714 | 165,813 | 45,600 | 0.33 | 0.5% |
| Net Rental Income | $6,689,171 | $7,316,477 | $7,420,294 | $8,915,185 | $64.47 | 100.0% |
| (Abatements) | (2,453,847) | (852,992) | (380,426) | 0 | 0.00 | 0.0% |
| (Vacancy/Credit Loss) | 0 | 0 | 0 | (445,759) | (3.22) | (5.0%) |
| Effective Gross Income | $4,235,324 | $6,463,485 | $7,039,868 | $8,469,425 | $61.24 | 95.0% |
| Real Estate Taxes | 552,209 | 477,640 | 488,424 | 803,551 | 5.81 | 9.5% |
| Insurance | 101,964 | 126,996 | 88,037 | 51,018 | 0.37 | 0.6% |
| Management Fee | 91,042 | 179,681 | 192,720 | 275,256 | 1.99 | 3.3% |
| Other Operating Expenses | 1,272,783 | 1,393,729 | 1,546,696 | 1,450,312 | 10.49 | 17.1% |
| Total Expenses | $2,017,997 | $2,178,046 | $2,315,877 | $2,580,137 | $18.66 | 30.5% |
| Net Operating Income(3) | $2,217,327 | $4,285,439 | $4,723,991 | $5,889,288 | $42.59 | 69.5% |
| TI/LC | 0 | 0 | 0 | 172,868 | 1.25 | 2.0% |
| Capital Expenditures | 0 | 0 | 0 | 27,659 | 0.20 | 0.3% |
| Net Cash Flow | $2,217,327 | $4,285,439 | $4,723,991 | $5,688,762 | $41.14 | 67.2% |
| (1) | % column represents percent of Net Rental Income for all revenue lines and represents percent of Effective Gross Income for the remainder of the fields. |
| (2) | Underwritten Rents in Place is based on the underwritten rent roll as of July 25, 2022. |
| (3) | The increase from TTM 5/31/2022 Net Operating Income to Underwritten Net Operating Income is primarily attributable to contractual increases in base rent and rent steps. |
Property Management. The 935 & 953 Sycamore Property is managed by CIM Management, Inc., an affiliate of the borrower.
Escrows and Reserves.
At origination, the borrower deposited (i) $893,597 into a TI/LC reserve, (ii) approximately $80,122 into a Motor Car Gap Rent Reserve, (iii) $57,051 into a Free Rent Obligations Reserve and (iv) approximately $28,328 into a Nili Lotan Gap Rent reserve.
Tax Reserve – On each monthly payment date, the borrower is required to deposit into a real estate tax reserve, 1/12 of the estimated annual real estate taxes. This is waived as long as no Trigger Period (as defined below) is continuing.
Insurance Reserve – On each monthly payment date, the borrower is required to deposit into an insurance reserve, 1/12 of estimated insurance premiums. This is waived as long as a blanket policy meeting the requirements of the 935 & 953 Sycamore Loan documents is in place.
Capital Expenditures Reserve – On each monthly payment date, the borrower is required to deposit into a replacement reserve approximately $2,305.
TI/LC Reserve – On each monthly payment date, the borrower is required to deposit into a TI/LC reserve in the amount of approximately $14,406 capped at $691,470.
Lockbox / Cash Management. The 935 & 953 Sycamore Loan is structured with a hard lockbox and springing cash management. All funds in the lockbox accounts will be swept to an account designated by the borrower, unless a Trigger Period (as defined below) is continuing, in which case such funds are required to be swept on a daily basis into a cash management account controlled by the lender within three business days, at which point, following taxes and insurance reserve deposits, debt service, operating expenses, other required reserves deposits, approved leasing expenses reimbursements, and mezzanine debt service (if applicable), all funds are required to be deposited (i) if a Lease Sweep Period (as defined below) is continuing into a lease sweep reserve, (ii) if no Lease Sweep Period is continuing, and provided that a Trigger Period is not ongoing solely due to a mezzanine loan being outstanding, into a cash
THE INFORMATION IN THIS STRUCTURAL AND COLLATERAL TERM SHEET IS NOT COMPLETE AND MAY BE AMENDED PRIOR TO THE TIME OF SALE. THIS TERM SHEET IS NOT AN OFFER TO SELL THESE SECURITIES AND IT IS NOT A SOLICITATION OF AN OFFER TO BUY THESE SECURITIES IN ANY JURISDICTION WHERE THE OFFER OR SALE IS NOT PERMITTED.
70 of 143
| Structural and Collateral Term Sheet | Benchmark 2022-B36 | |
| 935 & 953 Sycamore | ||
collateral account to be held as additional collateral for the 935 & 953 Sycamore Loan, (iii) if the only Trigger Period is a mezzanine loan being outstanding, to an account for the benefit of the mezzanine lender, and (iv) otherwise, to the borrower.
A “Trigger Period” means the occurrence of (a) an event of default under the 935 & 953 Sycamore Loan documents, (b) the bankruptcy or insolvency of the affiliated property manager, (c) if the debt yield for the 935 & 953 Sycamore Loan falls below 7.75% at the end of any calendar quarter, (d) a Lease Sweep Period or (e) any time a mezzanine loan is outstanding.
A Trigger Period may be cured, (i) in the case of clause (a) above, if a cure of the event of default has been accepted by the lender, (ii) in the case of clause (b) above, if the property manager is replaced with an unaffiliated qualified property manager approved by the lender, (iii) in the case of clause (c) above, if the debt yield (calculated based on the outstanding principal balance of the 935 & 953 Sycamore Loan minus the amount of funds deposited in the cash collateral account) exceeds 8.0% at the end of any calendar quarter, (iv) in the case of clause (d) above, such Lease Sweep Period has ended, and (v) in the case of clause (e) above, a mezzanine loan is no longer outstanding.
A “Lease Sweep Period” will commence (a) upon the earlier of (i) the date that is 12 months prior to the expiration of a Lease Sweep Lease (as defined below), (ii) upon the date required under the Lease Sweep Lease by which the tenant is required to give notice of its exercise of a renewal option thereunder (and such renewal has not been so exercised) (January 31, 2029 in connection to the Sirius XM lease and December 4, 2028 in connection to the ROC Nation lease), or (iii) 12 months prior to loan maturity (if a Lease Sweep Lease expires less than 12 months beyond loan maturity); (b) upon the early termination, early cancellation or early surrender of a Lease Sweep Lease or upon the borrower’s receipt of notice by a tenant of its intent to effect an early termination, early cancellation or early surrender of its Lease Sweep Lease; (c) if a tenant has ceased operating its business at the 935 & 953 Sycamore Property (i.e., “goes dark”) in a majority of its space at the 935 & 953 Sycamore Property; (d) upon a monetary or material, non-monetary default under a Lease Sweep Lease by a tenant beyond any applicable notice and cure period, (e) upon a bankruptcy or insolvency proceeding of a tenant under a Lease Sweep Lease or its guarantor and (f) the receipt by the borrower or the property manager of notice from any tenant under a Lease Sweep Lease exercising its right to terminate its Lease Sweep Lease.
A “Lease Sweep Lease” means the Sirius XM lease, the ROC Nation lease, and any replacement lease covering a majority of the space currently demised under such lease.
Current Mezzanine or Subordinate Indebtedness. None.
Future Mezzanine or Subordinate Indebtedness Permitted. A mezzanine loan secured by equity in the borrower is permitted to be incurred once during the term of the 935 & 953 Sycamore Loan, as long as the combined loan-to-value ratio is no higher than 51.3%, the combined debt service coverage ratio is no lower than 1.40x, the mezzanine loan is coterminous with the 935 & 953 Sycamore Loan and an intercreditor agreement reasonably acceptable to the lender and acceptable to the rating agencies rating the certificates is in place.
Partial Release. None.
THE INFORMATION IN THIS STRUCTURAL AND COLLATERAL TERM SHEET IS NOT COMPLETE AND MAY BE AMENDED PRIOR TO THE TIME OF SALE. THIS TERM SHEET IS NOT AN OFFER TO SELL THESE SECURITIES AND IT IS NOT A SOLICITATION OF AN OFFER TO BUY THESE SECURITIES IN ANY JURISDICTION WHERE THE OFFER OR SALE IS NOT PERMITTED.
71 of 143
| Structural and Collateral Term Sheet | Benchmark 2022-B36 | |
| JANAF Shopping Yard | ||

THE INFORMATION IN THIS STRUCTURAL AND COLLATERAL TERM SHEET IS NOT COMPLETE AND MAY BE AMENDED PRIOR TO THE TIME OF SALE. THIS TERM SHEET IS NOT AN OFFER TO SELL THESE SECURITIES AND IT IS NOT A SOLICITATION OF AN OFFER TO BUY THESE SECURITIES IN ANY JURISDICTION WHERE THE OFFER OR SALE IS NOT PERMITTED.
72 of 143
| Structural and Collateral Term Sheet | Benchmark 2022-B36 | |
| JANAF Shopping Yard | ||

THE INFORMATION IN THIS STRUCTURAL AND COLLATERAL TERM SHEET IS NOT COMPLETE AND MAY BE AMENDED PRIOR TO THE TIME OF SALE. THIS TERM SHEET IS NOT AN OFFER TO SELL THESE SECURITIES AND IT IS NOT A SOLICITATION OF AN OFFER TO BUY THESE SECURITIES IN ANY JURISDICTION WHERE THE OFFER OR SALE IS NOT PERMITTED.
73 of 143
| Structural and Collateral Term Sheet | Benchmark 2022-B36 | |
| JANAF Shopping Yard | ||

THE INFORMATION IN THIS STRUCTURAL AND COLLATERAL TERM SHEET IS NOT COMPLETE AND MAY BE AMENDED PRIOR TO THE TIME OF SALE. THIS TERM SHEET IS NOT AN OFFER TO SELL THESE SECURITIES AND IT IS NOT A SOLICITATION OF AN OFFER TO BUY THESE SECURITIES IN ANY JURISDICTION WHERE THE OFFER OR SALE IS NOT PERMITTED.
74 of 143
| Structural and Collateral Term Sheet | Benchmark 2022-B36 | |
| JANAF Shopping Yard | ||
| Mortgage Loan Information | Property Information | |||
| Mortgage Loan Seller: | CREFI | Single Asset / Portfolio: | Single Asset | |
| Original Principal Balance: | $60,000,000 | Title(1): | Fee / Leasehold | |
| Cut-off Date Principal Balance: | $60,000,000 | Property Type - Subtype: | Retail - Anchored | |
| % of Pool by IPB: | 8.0% | Net Rentable Area (SF): | 842,216 | |
| Loan Purpose: | Refinance | Location: | Norfolk, VA | |
| Borrowers: | WHLR-JANAF, LLC, WHLR- | Year Built / Renovated: | 1959 / 2003 | |
| JANAF-BRAVO, LLC, | Occupancy: | 91.2% | ||
| WHLR-JANAF-BJ’S, LLC and | Occupancy Date: | 6/27/2022 | ||
| WHLR-JANAF-OFFICE, LLC | Number of Tenants: | 103 | ||
| Guarantor: | Wheeler REIT, L.P. | Fourth Most Recent NOI: | $6,986,698 (December 31, 2019) | |
| Interest Rate: | 5.31000% | Third Most Recent NOI: | $6,587,392 (December 31, 2020) | |
| Note Date: | 7/6/2022 | Second Most Recent NOI: | $7,065,561 (December 31, 2021) | |
| Maturity Date: | 7/6/2032 | Most Recent NOI: | $7,421,837 (TTM May 31, 2022) | |
| Interest-only Period: | 120 months | UW Economic Occupancy: | 91.6% | |
| Original Term: | 120 months | UW Revenues: | $11,022,608 | |
| Original Amortization: | None | UW Expenses: | $3,690,168 | |
| Amortization Type: | Interest Only | UW NOI: | $7,332,440 | |
| Call Protection: | L(25),D(91),O(4) | UW NCF: | $6,591,168 | |
| Lockbox / Cash Management: | Springing / Springing | Appraised Value / Per SF(2): | $106,400,000 / $126 | |
| Additional Debt: | N/A | Appraisal Date: | 5/2/2022 | |
| Additional Debt Balance: | N/A | |||
| Additional Debt Type: | N/A | |||
| Escrows and Reserves(3) | Financial Information | ||||||
| Initial | Monthly | Initial Cap | |||||
| Taxes: | $218,640 | $72,880 | N/A | Cut-off Date Loan / SF: | $71 | ||
| Insurance: | $228,872 | $28,609 | N/A | Maturity Date Loan / SF: | $71 | ||
| Replacement Reserves: | $0 | $30,179 | N/A | Cut-off Date LTV(2): | 56.4% | ||
| TI/LC: | $0 | $35,092 | $1,850,000 | Maturity Date LTV(2): | 56.4% | ||
| Other: | $645,147 | $24,204 | N/A | UW NCF DSCR: | 2.04x | ||
| UW NOI Debt Yield: | 12.2% | ||||||
| Sources and Uses | ||||||
| Sources | Proceeds | % of Total | Uses | Proceeds | % of Total | |
| Loan Amount | $60,000,000 | 99.9% | Loan Payoff | $57,669,090 | 96.1% | |
| Sponsor Equity | 34,116 | 0.1 | Closing Costs | 1,272,367 | 2.1 | |
| Upfront Reserves | 1,092,659 | 1.8 | ||||
| Total Sources | $60,034,116 | 100.0% | Total Uses | $60,034,116 | 100.0% | |
| (1) | Of the 842,216 square feet, approximately 308,573 square feet are subject to a ground lease. The remaining balance of approximately 533,643 square feet is owned fee simple. For a description of the ground lease space, please refer to “Ground Leases” below. |
| (2) | The Appraised Value, Appraised Value Per SF, Cut-off Date LTV and Maturity Date LTV calculations all exclude the value of the Eligible Release Parcel (as defined below). The Appraised Value As Is, Cut-off Date LTV and Maturity Date LTV including the Eligible Release Parcel would be $107,900,000, 55.6% and 55.6% respectively. |
| (3) | For a full description of Escrows and Reserves, please refer to “Escrows and Reserves” below. |
The Loan. The JANAF Shopping Yard loan (the “JANAF Shopping Yard Loan”) is secured by a first mortgage lien on the borrowers’ fee simple / leasehold interest in an 842,216 square foot retail property located in Norfolk, Virginia (the “JANAF Shopping Yard Property”). The JANAF Shopping Yard Loan accrues interest at an interest rate of 5.31000% per annum, had an original term 120 months, has a remaining term of 119 months as of the Cut-off Date and is interest-only for the entire term. The scheduled maturity date of the JANAF Shopping Yard Loan is the due date in July 2032.
The Borrowers. The borrowers are WHLR-JANAF, LLC, WHLR-JANAF-BRAVO, LLC, WHLR-JANAF-BJ’S, LLC and WHLR-JANAF-OFFICE, LLC, each a Delaware limited liability company. The borrowers are structured to be single purpose bankruptcy-remote entities, each having one independent director in its organizational structure. Legal counsel to the borrowers delivered a non-consolidation opinion in connection with the origination of the JANAF Shopping Yard Loan.
THE INFORMATION IN THIS STRUCTURAL AND COLLATERAL TERM SHEET IS NOT COMPLETE AND MAY BE AMENDED PRIOR TO THE TIME OF SALE. THIS TERM SHEET IS NOT AN OFFER TO SELL THESE SECURITIES AND IT IS NOT A SOLICITATION OF AN OFFER TO BUY THESE SECURITIES IN ANY JURISDICTION WHERE THE OFFER OR SALE IS NOT PERMITTED.
75 of 143
| Structural and Collateral Term Sheet | Benchmark 2022-B36 | |
| JANAF Shopping Yard | ||
The Loan Sponsors. The loan sponsors are Wheeler Real Estate Investment Trust, Inc. (“WHLR”) and Wheeler REIT, L.P. (“Wheeler”), a subsidiary of WHLR. The non-recourse carveout guarantor is Wheeler. At origination of the JANAF Shopping Yard Loan, WHLR owned approximately 98.59% of Wheeler. WHLR is a fully integrated commercial real estate investment company formed in 2011 that is focused on owning and operating income-producing retail properties with a primary focus on grocery-anchored centers. WHLR is headquartered in Virginia Beach, Virginia and is in close proximity to the JANAF Shopping Yard Property.
The Property. The JANAF Shopping Yard Property is an anchored retail center consisting of eight buildings totaling 842,216 square feet of space, located at 5900 East Virginia Beach Boulevard, Norfolk, Virginia. The JANAF Shopping Yard Property was developed by a group of military veterans on the site of a former airfield, resulting in the JANAF name, which stands for Joint Army Navy Air Force. The JANAF Shopping Yard Property occupies more than 80 acres. The improvements were constructed in 1959 with additions through 2003. Additionally, there are 4,629 onsite parking spaces, reflecting an overall parking ratio of approximately 5.50 spaces per 1,000 square feet of gross leasable area. A small portion of the JANAF Shopping Yard Property is comprised of office space, consisting of approximately 62,213 square feet, representing 7.4% of net rentable area and 3.6% of underwritten base rent. The JANAF Shopping Yard Property has had an average occupancy of approximately 87% from 2018-2021. The JANAF Shopping Yard Property is located in the eastern area of Norfolk, Virginia. Furthermore, the site is situated on the northeast corner of the intersection of N. Military Highway and East Virginia Beach Boulevard. The JANAF Shopping Yard Property is centrally located between Virginia’s three most populous cities: Virginia Beach, Chesapeake and Norfolk. The JANAF Shopping Yard Property is bordered by the Chesapeake Bay and Newport News to the north, Virginia Beach to the east, Chesapeake to the south and Portsmouth to the west.
As of June 27, 2022, the JANAF Shopping Yard Property was 91.2% occupied by 103 unique tenants.
Major Tenants
The largest tenant, BJ’s Wholesale Club (“BJ’s”) (151,345 square feet; 18.0% of net rentable area; 8.0% of underwritten base rent) is a membership-only warehouse club. BJ’s operates 229 clubs and 160 gas stations across 17 states with approximately six and a half million members and employing approximately 34,000 full-time and part-time employees. As of fiscal year end 2021, BJ’s reported approximately $16.67 billion in total revenue and approximately $426.65 million in net income. BJ’s offers a variety of special benefits to its members including members pricing and name-brand products at wholesale prices. In addition, to name-brand products, BJ’s markets and sells various products under its own private labels. The borrowers lease 147,400 square feet to UE Norfolk Property LLC (“Urban Edge”), who in turn subleases such space to BJ’s. Urban Edge’s master lease originally commenced at the JANAF Shopping Yard Property in 2000, and the term of BJ’s sublease commenced in 2005. BJ’s renewed its sublease in 2019 for an additional 10-year term and has a sublease expiration date of March 23, 2030. In addition, in 2015, BJ’s entered into a lease for a gas station that is set to expire in 2030.
The second largest tenant, Big Lots (“Big Lots”) (42,500 square feet, 5.0% of net rentable area, 3.9% of underwritten base rent), is a home discount retailer operating in the United States. As of January 2022, Big Lots operated over 1,400 stores in 47 states and an e-commerce platform along with employing approximately 36,200 associates. As of fiscal year end 2021, Big Lots reported approximately $6.15 billion in net sales and $177.78 million in net income. Big Lots was founded in 1967 as Consolidated International, Inc. and is headquartered in Columbus, Ohio. Big Lots offers an extensive assortment of products including food, furniture, electronics and toys, among other items. Big Lots’ lease term commenced in 2017 at the JANAF Shopping Yard Property and has a current lease expiration in January 2028. Big Lots has three, five-year extension options.
The third largest tenant, All Star Sports (“All Stars”) (41,043 square feet, 4.9% of net rentable area, 2.7% of underwritten base rent), is a sporting goods company that sells sportswear apparel including jackets, jerseys, shoes, shorts, pants, hats and accessories under a variety of sports categories including basketball, football, baseball and soccer, among others. The company also manufactures and sells sportswear items from television, film, music and pop culture and offers custom-designed items for local businesses and athletic teams. The company has stores located across the country in addition to an online catalog. All Stars commenced its lease in March 2021 and has a current lease expiration in July 2025. All Stars has one, two-year extension option.
The Market. The JANAF Shopping Yard Property is located in Norfolk, Virginia within the Virginia Beach-Norfolk-Newport metro area (“MSA”). Norfolk is bordered by the Chesapeake Bay and Newport News to the north, Virginia Beach to the east, Chesapeake to the south and Portsmouth to the west. The JANAF Shopping Yard Property is located approximately 15 minutes from downtown Norfolk as well as the Norfolk International Airport. The JANAF Shopping Yard Property is accessible via US Highway 58 and US Highway 13 and connects to the surrounding areas of Virginia through the I-264 and I-64 major thoroughfares. The most prominent influence in Norfolk is the Norfolk Naval Air Station. The Norfolk Naval Air Station is the world’s largest naval base housing the largest concentration of U.S. Navy forces. Other attractions in the area include Lambert’s Point Terminal and the Craney Island Supply Depot for the U.S. Navy. The reported unemployment rate within the MSA was 3.4% as of February 2022 led by employment within the government sector accounting for approximately 20% of all jobs locally.
The JANAF Shopping Yard Property is within the Military Submarket (the “Military Submarket”) within the larger Norfolk market. The Military Submarket reported average retail asking rents of $17.46 per square foot as of the first quarter of 2022. The average asking retail rental rate per square foot was $15.27 in the Norfolk market as of the first quarter of 2022. The retail vacancy rate in the Military Submarket at the end of the first quarter of 2022 was 1.5%, and the retail vacancy rate of the greater Norfolk market was 5.1%.
THE INFORMATION IN THIS STRUCTURAL AND COLLATERAL TERM SHEET IS NOT COMPLETE AND MAY BE AMENDED PRIOR TO THE TIME OF SALE. THIS TERM SHEET IS NOT AN OFFER TO SELL THESE SECURITIES AND IT IS NOT A SOLICITATION OF AN OFFER TO BUY THESE SECURITIES IN ANY JURISDICTION WHERE THE OFFER OR SALE IS NOT PERMITTED.
76 of 143
| Structural and Collateral Term Sheet | Benchmark 2022-B36 | |
| JANAF Shopping Yard | ||
According to the appraisal, the 2021 population, population growth from 2010-2021 and average household income are presented in the chart below:
| 1 Mile Radius | 3 Mile Radius | 5 Mile Radius | |
| Population | 7,174 | 95,312 | 302,125 |
| Population Growth | 5.80% | 4.30% | 4.15% |
| Average Household Income | $70,774 | $74,082 | $76,880 |
| Historical and Current Occupancy | |||
| 2019(1) | 2020(1) | 2021(1) | Current(2) |
| 84.0% | 84.8% | 90.6% | 91.2% |
| (1) | Historical Occupancies are the annual average physical occupancy of each respective year. |
| (2) | Current Occupancy is as of June 27, 2022. |
| Tenant Summary(1) | ||||||
| Tenant | Ratings Moody’s/Fitch/S&P(2) | Net Rentable Area (SF) | % of Total NRA | UW Base Rent PSF(3) | % of Total UW Base Rent(3) | Lease Expiration Date |
| BJ’s Wholesale Club(4)(5) | NR/NR/BB | 151,345 | 18.0% | $4.30 | 8.0% | 3/23/2030 |
| Big Lots(6) | NR/NR/NR | 42,500 | 5.0% | $7.50 | 3.9% | 1/31/2028 |
| All Star Sports(6) | NR/NR/NR | 41,043 | 4.9% | $5.34 | 2.7% | 7/31/2025 |
| T.J. Maxx(6) | A2/NR/A | 37,383 | 4.4% | $7.75 | 3.5% | 1/31/2024 |
| OfficeMax(6) | NR/NR/NR | 23,150 | 2.7% | $11.00 | 3.1% | 1/31/2024 |
| K&G Men’s Company(6) | NR/NR/NR | 21,360 | 2.5% | $9.89 | 2.6% | 1/31/2023 |
| United States Postal Service | Aaa/AAA/AA+ | 21,213 | 2.5% | $14.95 | 3.9% | 8/31/2029 |
| Citi Trends, Inc. | NR/NR/NR | 20,858 | 2.5% | $2.87 | 0.7% | 2/28/2031 |
| Northern Tool & Equipment(6) | NR/NR/NR | 20,695 | 2.5% | $12.00 | 3.0% | 10/31/2026 |
| Family Dollar(6) | Baa2/NR/NR | 19,599 | 2.3% | $8.25 | 2.0% | 3/31/2031 |
| Total | 399,146 | 47.4% | $6.84 | 33.5% | ||
| Remaining Tenants | 369,058 | 43.8% | $14.73 | 66.5% | ||
| Total Occupied | 768,204 | 91.2% | $10.63 | 100.0% | ||
| Vacant | 74,012 | 8.8% | ||||
| Total | 842,216 | 100.0% | ||||
| (1) | Based on the underwritten rent roll dated June 27, 2022. |
| (2) | In certain instances, ratings provided are those of the parent company of the entity shown, whether or not the parent company guarantees the lease. |
| (3) | UW Base Rent PSF and % of Total UW Base Rent are inclusive of approximately $177,161 of contractual rent steps through July 1, 2023. |
| (4) | BJ’s Wholesale Club has two, ten-year extension options followed by one 19-year and eight-month extension option for 147,400 square feet of space. BJ’s Wholesale Club has four, five-year extension options for 3,945 square feet of space representing its gas station. |
| (5) | Under the sublease agreement between BJ’s and Urban Edge for 147,400 square feet of space, BJ’s is paying approximately $884,179 or $6.00 per square foot to Urban Edge. The underwritten rent roll dated June 27, 2022, includes the rent received from Urban Edge to the sponsor. The expiration of the sublease is co-terminus with the master lease with Urban Edge and the sponsor. |
| (6) | Big Lots has three, five-year extension options. All Star Sports has one, two-year extension option. T.J. Maxx, K&G Men’s Company, Northern Tool & Equipment and Family Dollar all have two, five-year extension options. OfficeMax has one, five-year extension option remaining. |
THE INFORMATION IN THIS STRUCTURAL AND COLLATERAL TERM SHEET IS NOT COMPLETE AND MAY BE AMENDED PRIOR TO THE TIME OF SALE. THIS TERM SHEET IS NOT AN OFFER TO SELL THESE SECURITIES AND IT IS NOT A SOLICITATION OF AN OFFER TO BUY THESE SECURITIES IN ANY JURISDICTION WHERE THE OFFER OR SALE IS NOT PERMITTED.
77 of 143
| Structural and Collateral Term Sheet | Benchmark 2022-B36 | |
| JANAF Shopping Yard | ||
| Lease Rollover Schedule(1)(2) | |||||||||
| Number of Leases Expiring | Net Rentable Area Expiring | % of NRA Expiring | Base Rent Expiring(3) | % of Base Rent Expiring(3) | Cumulative NRA Expiring | Cumulative NRA % Expiring | Cumulative Base Rent Expiring(3) | Cumulative % of Base Rent Expiring(3) |
| Vacant | NAP | 74,012 | 8.8% | NAP | NAP | 74,012 | 8.8% | NAP | NAP |
| 2022 | 8 | 40,714 | 4.8% | 278,802 | 3.4% | 114,726 | 13.6% | 278,802 | 3.4% |
| 2023 | 18 | 72,905 | 8.7% | 1,136,527 | 13.9% | 187,631 | 22.3% | 1,415,329 | 17.3% |
| 2024 | 21 | 135,671 | 16.1% | 1,547,203 | 18.9% | 323,302 | 38.4% | 2,962,532 | 36.3% |
| 2025 | 15 | 69,537 | 8.3% | 809,480 | 9.9% | 392,839 | 46.6% | 3,772,012 | 46.2% |
| 2026 | 13 | 69,156 | 8.2% | 1,075,800 | 13.2% | 461,995 | 54.9% | 4,847,813 | 59.4% |
| 2027 | 11 | 36,809 | 4.4% | 763,894 | 9.4% | 498,804 | 59.2% | 5,611,707 | 68.7% |
| 2028 | 5 | 64,589 | 7.7% | 664,707 | 8.1% | 563,393 | 66.9% | 6,276,414 | 76.9% |
| 2029 | 3 | 39,713 | 4.7% | 453,159 | 5.5% | 603,106 | 71.6% | 6,729,573 | 82.4% |
| 2030 | 6(4) | 161,179 | 19.1% | 835,178 | 10.2% | 764,285 | 90.7% | 7,564,751 | 92.6% |
| 2031 | 3 | 54,761 | 6.5% | 378,892 | 4.6% | 819,046 | 97.2% | 7,943,644 | 97.3% |
| 2032 & Thereafter | 3(5) | 23,170 | 2.8% | 222,930 | 2.7% | 842,216 | 100.0% | 8,166,574 | 100.0% |
| Total | 106 | 842,216 | 100.0% | 8,166,574 | 100.0% | ||||
| (1) | Based on the underwritten rent roll as of June 27, 2022. |
| (2) | Certain tenants may have termination or contraction options (which may become exercisable prior to the originally stated expiration date of the tenant lease) that are not considered in the above Lease Rollover Schedule. |
| (3) | Base Rent Expiring, % of Base Rent Expiring, Cumulative Base Rent Expiring and Cumulative % of Base Rent Expiring include contractual rent steps of approximately $177,161 through July 1, 2023. |
| (4) | Includes 232 square feet of vending machines with no underwritten rent and two separate leases for BJ’s. |
| (5) | Includes 111 square feet of common area space with no underwritten rent. |
| Operating History and Underwritten Net Cash Flow | |||||||
2019 | 2020 | 2021 | TTM 5/31/2022 | Underwritten(1) | Per Square Foot | %(2) | |
| Rents in Place | $7,954,837 | $7,901,204 | $8,154,763 | $8,481,239 | $7,989,413 | $9.49 | 68.1% |
| Rent Steps(3) | 0 | 0 | 0 | 0 | 177,161 | 0.21 | 1.5% |
| Vacant Income | 0 | 0 | 0 | 0 | 991,999 | 1.18 | 8.5% |
| Gross Potential Rent | $7,954,837 | $7,901,204 | $8,154,763 | $8,481,239 | $9,158,573 | $10.87 | 78.1% |
| Total Reimbursements | 2,386,743 | 2,525,870 | 2,421,739 | 2,618,230 | 2,573,126 | 3.06 | 21.9% |
| Net Rental Income | $10,341,580 | $10,427,074 | $10,576,502 | $11,099,469 | $11,731,699 | $13.93 | 100.0% |
| (Vacancy/Credit Loss) | (104,696) | (470,494) | (31,922) | (19,635) | (991,999) | (1.18) | (8.5)% |
| Other Income | 206,131 | 232,241 | 232,969 | 333,474 | 282,909 | 0.34 | 2.4% |
| Effective Gross Income | $10,443,015 | $10,188,821 | $10,777,549 | $11,413,308 | $11,022,608 | $13.09 | 94.0% |
| Real Estate Taxes | 895,214 | 951,565 | 965,783 | 965,026 | 945,275 | 1.12 | 8.6% |
| Insurance | 179,977 | 213,981 | 217,154 | 251,651 | 326,960 | 0.39 | 3.0% |
| Management Fee | 433,695 | 439,606 | 403,763 | 460,555 | 330,678 | 0.39 | 3.0% |
| Ground Rent | 284,543 | 281,448 | 268,305 | 266,089 | 290,444 | 0.34 | 2.6% |
| Other Operating Expenses | 1,662,888 | 1,714,830 | 1,856,983 | 2,048,150 | 1,796,811 | 2.13 | 16.3% |
| Total Expenses | $3,456,317 | $3,601,429 | $3,711,988 | $3,991,471 | $3,690,168 | $4.38 | 33.5% |
| Net Operating Income | $6,986,698 | $6,587,392 | $7,065,561 | $7,421,837 | $7,332,440 | $8.71 | 66.5% |
| TI/LC | 0 | 0 | 0 | 0 | 379,119 | 0.45 | 3.4% |
| Capital Expenditures | 0 | 0 | 0 | 0 | 362,153 | 0.43 | 3.3% |
| Net Cash Flow | $6,986,698 | $6,587,392 | $7,065,561 | $7,421,837 | $6,591,168 | $7.83 | 59.8% |
| (1) | Underwritten Base Rent is based on the underwritten rent roll as of June 27, 2022. |
| (2) | % column represents percent of Net Rental Income for all revenue lines and represents percent of Effective Gross Income for the remainder of the fields. |
| (3) | Underwritten Rent Steps totaling $177,161 are underwritten through July 1, 2023. |
Property Management. The JANAF Shopping Yard Property is managed by Wheeler Real Estate, LLC, d/b/a Wheeler Real Estate Company, a borrower affiliated management company.
Escrows and Reserves. At origination, the borrowers deposited (i) approximately $218,640 into a real estate tax reserve, (ii) $228,872 into an insurance reserve, (iii) $360,379 into an outstanding obligations reserve related to certain tenant improvement allowances for existing tenants, (iv) $201,250 into an immediate repairs reserve and (v) approximately $83,518 into a ground rent reserve.
Tax Reserve – The borrowers are required to deposit into a real estate tax reserve, on a monthly basis, 1/12th of the taxes that the lender reasonably estimates will be payable over the next-ensuing 12-month period (initially estimated to be approximately $72,880).
THE INFORMATION IN THIS STRUCTURAL AND COLLATERAL TERM SHEET IS NOT COMPLETE AND MAY BE AMENDED PRIOR TO THE TIME OF SALE. THIS TERM SHEET IS NOT AN OFFER TO SELL THESE SECURITIES AND IT IS NOT A SOLICITATION OF AN OFFER TO BUY THESE SECURITIES IN ANY JURISDICTION WHERE THE OFFER OR SALE IS NOT PERMITTED.
78 of 143
| Structural and Collateral Term Sheet | Benchmark 2022-B36 | |
| JANAF Shopping Yard | ||
Insurance Reserve – The borrowers are required to deposit into an insurance reserve, on a monthly basis, 1/12th of the estimated annual insurance premiums (initially estimated at $28,609).
TI/LC Reserve – The borrowers are required to deposit into a tenant improvement and leasing commission reserve, on a monthly basis, an amount equal to approximately $35,092, subject to a cap of $1,850,000.
Replacement Reserve – The borrowers are required to deposit into a replacement reserve, on a monthly basis, an amount equal to approximately $30,179 for replacement reserves.
Ground Rent Reserve – The borrowers are required to deposit into a ground rent reserve, on a monthly basis, an amount equal to approximately $24,204 for ground rent.
Lockbox / Cash Management. The JANAF Shopping Yard Loan is structured with a springing lockbox and springing cash management. Upon the first occurrence of a Trigger Period (as defined below), the borrowers are required to cause all revenues derived from the JANAF Shopping Yard Property to be immediately deposited into a lender-controlled lockbox. The borrowers are required, upon the occurrence of a Trigger Period, to deliver a tenant direction letter to all tenants at the JANAF Shopping Yard Property, directing each to remit its rent directly to the lender-controlled lockbox. On each business day during the continuance of a Trigger Period, all amounts in the lockbox account are required to be remitted to a lender-controlled cash management account, to be applied and disbursed in accordance with the JANAF Shopping Yard Loan documents. Once the lockbox has been established, on each business day that no Trigger Period is continuing, all funds in the lockbox account are required to be transferred to or at the direction of the borrowers. Upon an event of default under the JANAF Shopping Yard Loan documents, the lender will apply funds to the debt in such priority as it may determine.
A “Trigger Period” means a period (A) commencing upon the earliest of (i) the occurrence and continuance of an event of default, (ii) the debt yield falling below 8.0% (unless borrowers immediately satisfy (and, to the extent any future deposits are required under the definition of “Avoidance Conditions” (as defined below), continues to satisfy), within five business days thereof, the Avoidance Conditions in full), and (B) expiring upon (x) with regard to any Trigger Period commenced in connection with clause (i) above, the cure (if applicable) of such event of default, (y) with regard to any Trigger Period commenced in connection with clause (ii) above, the date that (I) the debt yield is equal to or greater than 8.25% for two consecutive calendar quarters or (II) borrowers satisfy (and, to the extent any future deposits are required under the definition of “Avoidance Conditions”, continues to satisfy), the Avoidance Conditions in full.
“Avoidance Conditions” means the satisfaction of each of the following as determined by lender: (A) no other Trigger Period exists (i.e. the Avoidance Conditions will not apply and cannot be satisfied by borrowers if (x) any event of default exists, and (y) a Trigger Period exists for any reason other than those specified in clause (B) of this definition), and (B) borrowers deposit an amount in cash or letter of credit to the excess cash flow account (or such amount accumulates in the excess cash flow account), solely as it pertains to a Trigger Period under subclause (A)(ii) of the definition of “Trigger Period”, equal to lender’s calculation of six months of excess cash flow assuming a debt yield of 8.25%, for each six month period which borrowers desire to avoid the existence of such Trigger Period (i.e. borrowers must make such deposits in six month increments, upon the initial commencement thereof and then again every six months thereafter to the extent such event still exists and borrowers desire to continue the avoidance thereof).
Current Mezzanine or Subordinate Indebtedness. None.
Future Mezzanine or Subordinate Indebtedness Permitted. None.
Partial Release. At any time after the date that is two years after the Closing Date, the borrowers may obtain a release of the lien of the related mortgage with respect to the approximately 25,000 square foot, three-story improved portion of the JANAF Shopping Yard Property known as the “Executive Building” as identified on the survey delivered to lender at origination of the JANAF Shopping Yard Loan, along with a small but commercially reasonable surrounding area of parking and/or access drive for purposes of redevelopment and construction activities on such parcel (“Eligible Release Parcel”) without payment of a release price, upon the satisfaction of the following conditions, among other conditions more fully set forth in the JANAF Shopping Yard Loan documents, (i) no event of default has occurred and is continuing, (ii) as of the date of notice of the partial release and the consummation of the partial release, after giving effect to the release, the debt yield with respect to the remaining portion of the JANAF Shopping Yard Property is greater than the greater of (a) the debt yield of the JANAF Shopping Yard Property immediately prior to the date of notice of the partial release or the consummation of the partial release, as applicable and (b) the debt yield of the JANAF Shopping Yard Property at the origination of the JANAF Shopping Yard Loan, (iii) as of the date of notice of the partial release and the consummation of the partial release, after giving effect to the release, the loan-to-value ratio with respect to the remaining portion of the JANAF Shopping Yard Property is no greater than the lesser of (a) the loan-to-value ratio with respect to the JANAF Shopping Yard Property at the origination of the JANAF Shopping Yard Loan, and (b) the loan-to-value ratio with respect to the JANAF Shopping Yard Property immediately prior to the date of notice of the partial release or the consummation of the partial release, as applicable, (iv) that the Eligible Release Parcel will be assessed as a separate tax parcel, (v) if required by lender, the borrowers delivers a rating agency confirmation, and (vi) the delivery of a REMIC opinion.
THE INFORMATION IN THIS STRUCTURAL AND COLLATERAL TERM SHEET IS NOT COMPLETE AND MAY BE AMENDED PRIOR TO THE TIME OF SALE. THIS TERM SHEET IS NOT AN OFFER TO SELL THESE SECURITIES AND IT IS NOT A SOLICITATION OF AN OFFER TO BUY THESE SECURITIES IN ANY JURISDICTION WHERE THE OFFER OR SALE IS NOT PERMITTED.
79 of 143
| Structural and Collateral Term Sheet | Benchmark 2022-B36 | |
| JANAF Shopping Yard | ||
Ground Leases. A portion of the JANAF Shopping Yard Loan is encumbered by six ground leases. Five of the ground leases, for parcels GL-1A, GL-1B, GL-2, GL-3, GL-5, GL-6, GL-7, and Lot 20 of the JANAF Shopping Yard Property, are leased from The American Heart Association, Inc., d/b/a The American Heart Association, Inc. Mid-Atlantic Affiliate (“AHA”) as ground lessor to the respective borrowers as ground lessees. The initial term of the AHA ground leases for parcels GL-1A, GL-1B, GL-2, GL-3, GL-5, GL-6, GL-7 commenced on December 1, 1969 and the initial term of the AHA ground lease for Lot 20 commenced on March 1, 1982, and all five ground leases expired on November 30, 2019. The ground leases have been extended for a term of 50 years. The extension term of the ground leases commenced on December 1, 2019 and will expire on November 30, 2069. The current aggregate base rent of the five AHA ground leases is $150,000 per annum, plus annual percentage rent. The sixth ground lease, the office ground lease, is leased from one borrower (WHLR-JANAF, LLC), as landlord, to another borrower (WHLR-JANAF-OFFICE, LLC), as tenant. The office ground lease was extended for a period of 13 years on January 1, 2013 and is scheduled to expire in December 2025.
THE INFORMATION IN THIS STRUCTURAL AND COLLATERAL TERM SHEET IS NOT COMPLETE AND MAY BE AMENDED PRIOR TO THE TIME OF SALE. THIS TERM SHEET IS NOT AN OFFER TO SELL THESE SECURITIES AND IT IS NOT A SOLICITATION OF AN OFFER TO BUY THESE SECURITIES IN ANY JURISDICTION WHERE THE OFFER OR SALE IS NOT PERMITTED.
80 of 143
| Structural and Collateral Term Sheet | Benchmark 2022-B36 | |
| One Campus Martius | ||
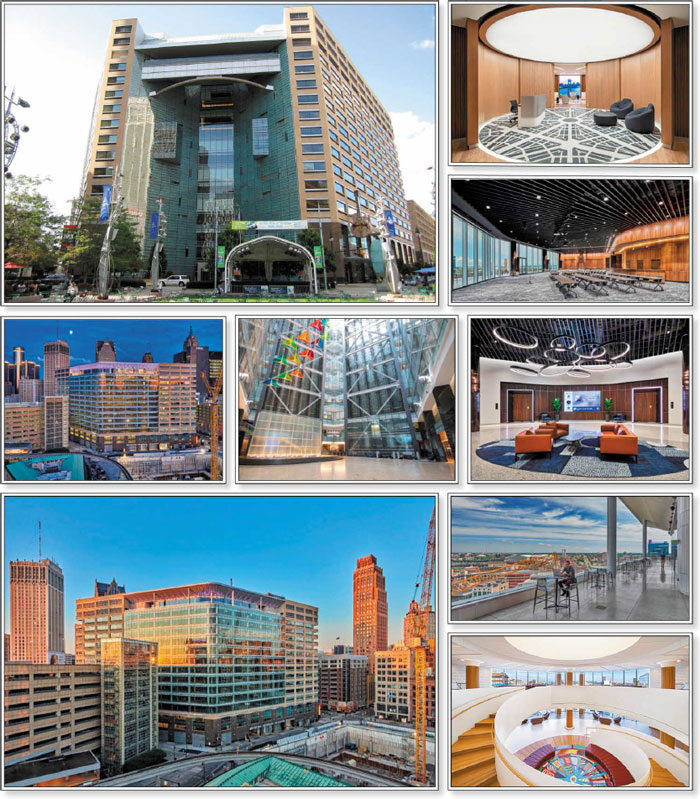
THE INFORMATION IN THIS STRUCTURAL AND COLLATERAL TERM SHEET IS NOT COMPLETE AND MAY BE AMENDED PRIOR TO THE TIME OF SALE. THIS TERM SHEET IS NOT AN OFFER TO SELL THESE SECURITIES AND IT IS NOT A SOLICITATION OF AN OFFER TO BUY THESE SECURITIES IN ANY JURISDICTION WHERE THE OFFER OR SALE IS NOT PERMITTED.
81 of 143
| Structural and Collateral Term Sheet | Benchmark 2022-B36 | |
| One Campus Martius | ||
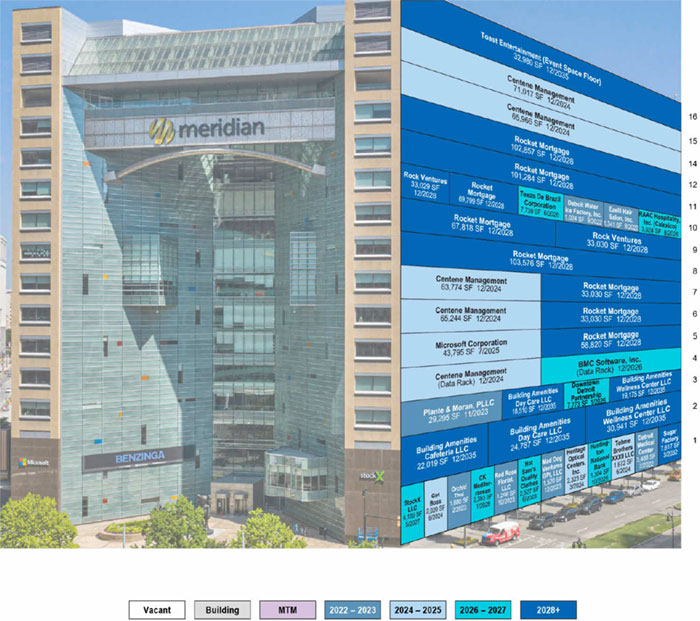
THE INFORMATION IN THIS STRUCTURAL AND COLLATERAL TERM SHEET IS NOT COMPLETE AND MAY BE AMENDED PRIOR TO THE TIME OF SALE. THIS TERM SHEET IS NOT AN OFFER TO SELL THESE SECURITIES AND IT IS NOT A SOLICITATION OF AN OFFER TO BUY THESE SECURITIES IN ANY JURISDICTION WHERE THE OFFER OR SALE IS NOT PERMITTED.
82 of 143
| Structural and Collateral Term Sheet | Benchmark 2022-B36 | |
| One Campus Martius | ||
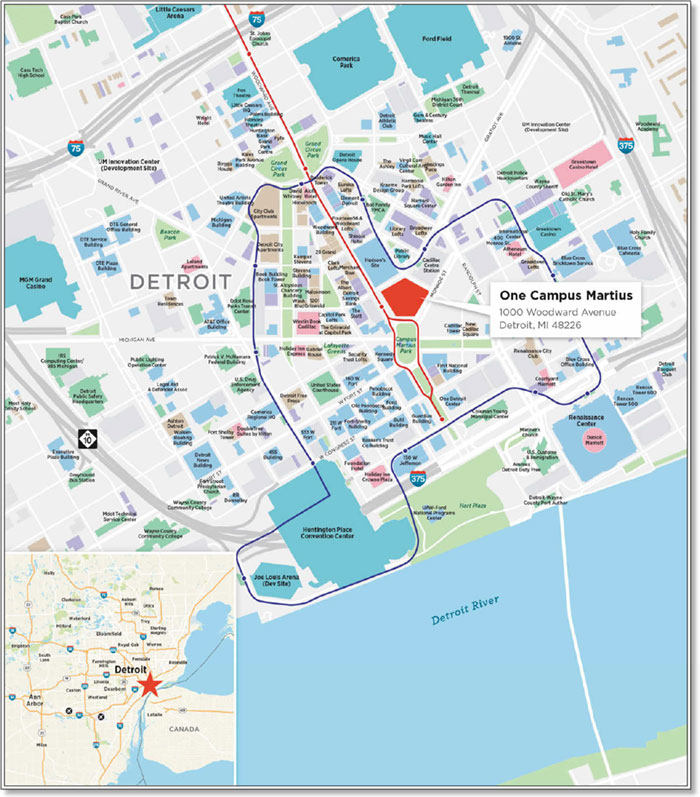
THE INFORMATION IN THIS STRUCTURAL AND COLLATERAL TERM SHEET IS NOT COMPLETE AND MAY BE AMENDED PRIOR TO THE TIME OF SALE. THIS TERM SHEET IS NOT AN OFFER TO SELL THESE SECURITIES AND IT IS NOT A SOLICITATION OF AN OFFER TO BUY THESE SECURITIES IN ANY JURISDICTION WHERE THE OFFER OR SALE IS NOT PERMITTED.
83 of 143
| Structural and Collateral Term Sheet | Benchmark 2022-B36 | |
| One Campus Martius | ||
| Mortgage Loan Information | Property Information | |||
| Mortgage Loan Seller: | JPMCB | Single Asset / Portfolio: | Single Asset | |
| Original Principal Balance(1): | $50,000,000 | Title: | Fee | |
| Cut-off Date Principal Balance(1): | $50,000,000 | Property Type – Subtype: | Office - CBD | |
| % of Pool by IPB: | 6.6% | Net Rentable Area (SF): | 1,356,325 | |
| Loan Purpose: | Refinance | Location: | Detroit, MI | |
| Borrower: | 1000 Webward LLC | Year Built / Renovated: | 2003 / 2019-2020 | |
| Guarantor(2): | Rock Backer LLC | Occupancy: | 86.8% | |
| Interest Rate: | 6.02000% | Occupancy Date: | 6/27/2022 | |
| Note Date: | 6/28/2022 | Number of Tenants: | 27 | |
| Maturity/ARD Date: | 7/1/2032 | Fourth Most Recent NOI: | $19,338,306 (December 31, 2019) | |
| Interest-only Period: | 120 months | Third Most Recent NOI(6): | $18,537,846 (December 31, 2020) | |
| Original Term: | 120 months | Second Most Recent NOI(6): | $25,025,321 (December 31, 2021) | |
| Original Amortization: | None | Most Recent NOI: | $25,554,085 (TTM March 31, 2022) | |
| Amortization Type: | Interest Only | UW Economic Occupancy: | 86.6% | |
| Call Protection(3): | L(25),D(91),O(4) | UW Revenues: | $46,224,574 | |
| Lockbox / Cash Management(4): | Hard / Springing | UW Expenses: | $21,145,889 | |
| Additional Debt(1): | Yes | UW NOI: | $25,078,685 | |
| Additional Debt Balance(1): | $168,000,000 | UW NCF: | $23,186,453 | |
| Additional Debt Type(1): | Pari Passu | Appraised Value / Per SF: | $362,500,000 / $267 | |
| Appraisal Date: | 5/4/2022 | |||
| Escrows and Reserves(5) | Financial Information(1) | ||||||
| Initial | Monthly | Initial Cap | Cut-off Date Loan / SF: | $161 | |||
| Taxes: | $3,926,163 | $560,880 | N/A | Maturity Date Loan / SF: | $161 | ||
| Insurance: | $0 | Springing | N/A | Cut-off Date LTV: | 60.1% | ||
| Replacement Reserves: | $28,230 | $28,230 | $677,530 | Maturity Date LTV: | 60.1% | ||
| TI/LC: | $1,500,000 | $169,541 | $4,000,000 | UW NCF DSCR: | 1.74x | ||
| Other: | $3,851,373 | $0 | N/A | UW NOI Debt Yield: | 11.5% | ||
| Sources and Uses | |||||||
| Sources | Proceeds | % of Total | Uses | Proceeds | % of Total | ||
| Mortgage Loan | $218,000,000 | 100.0% | Payoff Existing Debt | $187,609,949 | 86.1% | ||
| Return of Equity | 19,720,871 | 9.0% | |||||
| Upfront Reserves | 9,305,766 | 4.3% | |||||
| Closing Costs | 1,363,413 | 0.6% | |||||
| Total Sources | $218,000,000 | 100.0% | $218,000,000 | 100.0% | |||
| (1) | The One Campus Martius loan is part of a whole loan evidenced by eight pari passu notes, with an aggregate outstanding principal balance as of the Cut-off Date of $218.0 million. The Financial Information in the chart above reflects the Cut-off Date Balance of the One Campus Martius Whole Loan (as defined below). |
| (2) | The sponsor of the One Campus Martius Whole Loan is Bedrock Detroit. |
| (3) | The lockout period for the One Campus Martius Whole Loan will be at least 25 payment dates beginning with and including the first payment date on August 1, 2022. The One Campus Martius Whole Loan may be (a) defeased in whole on or after the date that is two years from the closing date of the securitization that includes the last note to be securitized (the “Permitted Defeasance Date”) or (b) if the Permitted Defeasance Date has not occurred by August 1, 2025, prepaid in whole with the payment of a yield maintenance premium. The assumed lockout period of 25 months is based on the expected closing date of the Benchmark 2022-B36 securitization in August 2022. The actual lockout period may be longer. |
| (4) | The One Campus Martius Whole Loan is structured with a hard lockbox for the One Campus Martius property other than with respect to the Parking Garage Portion (as defined below), the income from which is not required to be deposited into a lockbox account until the occurrence of a Cash Sweep Event (as defined below). |
| (5) | For a full description of Escrows and Reserves, please refer to “Escrows and Reserves” below. |
| (6) | The increase from Third Most Recent NOI to Second Most Recent NOI is primarily attributable to delivery of the expansion space and subsequent lease up. |
The Loan. The One Campus Martius mortgage loan is secured by the borrower’s fee interest in a 1,356,325 square foot office property located in Detroit, Michigan. The whole loan has an outstanding principal balance as of the Cut-off Date of $218.0 million (the “One Campus Martius Whole Loan”) and is evidenced by eight pari passu notes as described below. The controlling note A-1 with an aggregate outstanding principal balance as of the Cut-off Date of $50,000,000 will be included in the Benchmark 2022-B36 trust. The remaining notes are expected to be contributed to one or more future securitization trusts. The One Campus Martius Whole Loan was co-originated by JPMCB and Morgan Stanley Bank, N.A (“MSBNA”). The relationship between the holders of the One Campus Martius Whole Loan is governed by a co-lender agreement as described under “Description of the Mortgage Pool—The Whole Loans—The Serviced Pari Passu Whole Loans—One Campus Martius Whole Loan” in the Preliminary Prospectus.
THE INFORMATION IN THIS STRUCTURAL AND COLLATERAL TERM SHEET IS NOT COMPLETE AND MAY BE AMENDED PRIOR TO THE TIME OF SALE. THIS TERM SHEET IS NOT AN OFFER TO SELL THESE SECURITIES AND IT IS NOT A SOLICITATION OF AN OFFER TO BUY THESE SECURITIES IN ANY JURISDICTION WHERE THE OFFER OR SALE IS NOT PERMITTED.
84 of 143
| Structural and Collateral Term Sheet | Benchmark 2022-B36 | |
| One Campus Martius | ||
| Whole Loan Summary | ||||
| Note | Original Balance | Cut-off Date Balance | Note Holder | Controlling Piece |
| A-1 | $50,000,000 | $50,000,000 | BMARK 2022-B36 | Yes |
| A-2 | $30,000,000 | $30,000,000 | JPMCB | No |
| A-3 | $25,000,000 | $25,000,000 | JPMCB | No |
| A-4 | $15,800,000 | $15,800,000 | JPMCB | No |
| A-5 | $10,000,000 | $10,000,000 | JPMCB | No |
| A-6 | $46,200,000 | $46,200,000 | MSBNA | No |
| A-7 | $25,000,000 | $25,000,000 | MSBNA | No |
| A-8 | $16,000,000 | $16,000,000 | MSBNA | No |
| Whole Loan | $218,000,000 | $218,000,000 | ||
The Borrower. The borrower for the One Campus Martius Whole Loan is 1000 Webward LLC, a Delaware limited liability company and a single purpose bankruptcy-remote entity with two independent directors in its organizational structure. Legal counsel to the borrower delivered a non-consolidation opinion in connection with the origination of the One Campus Martius Whole Loan.
The Loan Sponsor. The loan sponsor is Bedrock Detroit, which is owned and controlled by Dan Gilbert and affiliated entities, and the non-recourse carveout guarantor is Rock Backer LLC. Founded in 2011, Bedrock Detroit is a full service commercial real estate firm based in downtown Detroit, specializing in the strategic development of urban cores. With a portfolio of more than 100 properties totaling over 18 million square feet, Bedrock Detroit is one of the largest real estate partners in downtown Detroit. Since its founding, Bedrock Detroit and its affiliates have invested and committed more than $5.6 billion to acquiring and developing more than 100 properties, including new construction of ground up developments in downtown Detroit and Cleveland totaling more than 20 million square feet. Bedrock Detroit’s real estate personnel provide a full range of services with in-house teams for each area of expertise, including leasing, acquisition, finance, construction, architecture, historic rehab and property management. Bedrock Detroit’s tenants include leading technology companies and startups, world-renowned restaurants and national retailers, as well as Detroit locals. Bedrock Detroit also leases mixed-income residential properties to individuals, and acquires and renovates properties for new development. Bedrock Detroit and Dan Gilbert’s family of companies have been critical in the urban revival of Detroit and have demonstrated a strong commitment to the continued growth and stability of the market.
The Property. The One Campus Martius property is a Class A, 16-story, 1,356,325 square foot trophy office building that is well located in Detroit’s financial district. Built in 2003 and further expanded between 2019-2020, the One Campus Martius property contains a full height atrium with a dramatic water feature, onsite retail and restaurants, a fitness and wellness center, a second-floor cafeteria, a day care facility led by Bright Horizons, along with a 12-story parking garage with 2,667 parking spaces, resulting in a parking ratio of approximately 2.0 per 1,000 square feet of net rentable area. The One Campus Martius property includes 40,538 square feet of ground floor retail (approximately 3.0% of net rentable area and 2.8% of underwritten base rent), featuring tenants including Sugar Factory, Tohme Brothers XXXII LLC (Jimmy Johns) and Detroit Water Ice Factory, Inc. The loan sponsor acquired the One Campus Martius property in 2014 for approximately $142.0 million and has since invested approximately $120.5 million in capital improvements. More recently, between 2019 and 2020, the One Campus Martius property completed an approximately 351,338 square foot expansion at an estimated cost of approximately $93.0 million. The recent expansion added modern office space, expansive event space and new amenity space to the One Campus Martius property. From 2015 through 2019, prior to the expansion, average occupancy at the One Campus Martius property was approximately 97.5%. As of June 27, 2022, the One Campus Martius property was 86.8% leased, as the One Campus Martius property continues to lease up following the addition of approximately 351,338 square feet (approximately 25.9% of net rentable area) in 2020.
The One Campus Martius property is subject to a condominium structure which is wholly owned and controlled by the borrower. Under the One Campus Martius Whole Loan documents, at all times during the term of the One Campus Martius Whole Loan, the condominium is required to be owned and controlled by the borrower.
As of June 27, 2022, the One Campus Martius property was 86.8% leased to 27 tenants, comprised largely of institutional quality and investment grade rated tenants. Approximately 22.9% of net rentable area and 27.2% of underwritten rent are attributable to investment grade rated tenants including Microsoft Corporation, Centene Management and Huntington National Bank. The tenant roster at the One Campus Martius property is predominantly comprised of tenants in the financial and healthcare sector. Loan sponsor affiliated tenants including Rocket Mortgage, Rock Ventures, StockX LLC., Toast Entertainment (event space floor) and building amenities account for approximately 58.2% of the One Campus Martius property net rentable area and 65.8% of underwritten base rent.
Major Tenants.
The largest tenant, Rocket Mortgage (NYSE: RKT) (Moody’s/S&P/Fitch: Ba1/BB+/BB+; 42.0% of net rentable area; 47.4% of underwritten base rent), is the largest mortgage lending company in the United States and operates its corporate headquarters out of the One Campus Martius property. Rocket Mortgage was formerly known as Quicken Loans prior to changing its name in 2021. Rocket Mortgage was founded by Dan Gilbert in 1985 and is affiliated with the loan sponsor. In 2010, Dan Gilbert moved Rocket Mortgage’s headquarters from Livonia, Michigan to downtown Detroit. Rocket Mortgage operates a number of subsidiary companies such as Amrock, Rocket Auto, Core
THE INFORMATION IN THIS STRUCTURAL AND COLLATERAL TERM SHEET IS NOT COMPLETE AND MAY BE AMENDED PRIOR TO THE TIME OF SALE. THIS TERM SHEET IS NOT AN OFFER TO SELL THESE SECURITIES AND IT IS NOT A SOLICITATION OF AN OFFER TO BUY THESE SECURITIES IN ANY JURISDICTION WHERE THE OFFER OR SALE IS NOT PERMITTED.
85 of 143
| Structural and Collateral Term Sheet | Benchmark 2022-B36 | |
| One Campus Martius | ||
Digital Media and Rock Connections, among others. In 2021, Rocket Mortgage generated approximately $12.9 billion in revenue and posted net income of approximately $6.1 billion. Rocket Mortgage has four, five-year renewal options with a lease expiration date occurring in December 2028.
The second largest tenant, Centene Management (NYSE: CNC) (Moody’s/S&P/Fitch: Baa1/BBB+/NR; 19.6% of net rentable area; 23.5% of underwritten base rent), provides a full spectrum of managed healthcare products and services, primarily through Medicaid, Medicare, and commercial products. Centene Management operates at the One Campus Martius property through its subsidiary, Meridian Health, who is a leader in government-sponsored healthcare programs, providing health plans such as Medicare, Medicaid and the Health Insurance Marketplace functions in Michigan, Illinois and Ohio. Meridian Health was purchased by WellCare Health Plans in 2018 for an estimated $2.5 billion. WellCare Health Plans later merged with Centene Corporation in 2020 for $17.3 billion, allowing Centene Corporation to expand its footprint to reach over 24 million members in all 50 states. Centene Corporation is headquartered in St. Louis, Missouri, while its subsidiary Meridian Health is headquartered at the One Campus Martius property. On June 29, 2022, shortly after the origination of the One Campus Martius Whole Loan, Meridian Health, which has been at the One Campus Martius property since December 2014, assigned its entire interest in its lease to Centene Management. In 2021, Centene Corporation generated over $125.9 billion in revenue and posted net income of approximately $1.3 billion. Centene Management has four, five-year renewal options with a lease expiration date occurring in December 2024.
The third largest tenant, Rock Ventures (4.9% of net rentable area; 6.0% of underwritten base rent), is a loan sponsor affiliated holding company for Dan Gilbert’s portfolio of companies (which includes, but is not limited to, companies such as the Cleveland Cavaliers, Rocket Mortgage, StockX and Vroom) and operates its headquarters out of the One Campus Martius property. The companies owned by Rock Ventures span various industries including fintech, professional services, charitable/community relations, sports/media/entertainment, hotels and venture capital/private equity. Rock Ventures was founded in 1985 and since has committed approximately $5.6 billion over 103 investments. Rock Ventures has four, five-year renewal options with a lease expiration date occurring in December 2028.
The One Campus Martius property is one of four properties (the “Transformational Project Sites”) developed or re-developed by Bedrock Management Services, LLC, a loan sponsor affiliate, which has entered into a reimbursement agreement (the “Reimbursement Agreement”), with the City of Detroit Brownfield Redevelopment Authority, the Michigan Strategic Fund and the Michigan Department of Treasury. The Reimbursement Agreement entitles the developer to receive reimbursements for a certain portion of the cost of the developments of the Transformational Project Sites from certain tax revenues as well as sales and use tax exemptions. The lender underwriting and all metrics shown herein are exclusive of the benefits afforded to the sponsor affiliate pursuant to the Reimbursement Agreement. See “Description of the Mortgage Pool – Real Estate and Other Tax Considerations” in the Preliminary Prospectus for additional information.
The Market. The One Campus Martius property is located in the Detroit central business district (“Detroit CBD”) submarket within the Detroit-Dearborn-Livonia metropolitan statistical area (“Detroit MSA”). The One Campus Martius property is located in the One Campus Martius Park neighborhood which is commonly considered to be the financial district of the city of Detroit. The boundaries of the immediate area are Gratiot Avenue to the north, Jefferson Avenue to the south, Randolph Street to the east and Cass Avenue to the west.
The Detroit MSA has recovered in the months following the pandemic, restoring about 90% of jobs lost, as compared to the overall Midwest region of the United States which has only recovered approximately 75% of jobs lost. As of November 2021, the unemployment rate in the Detroit MSA was 4.2%, with the largest employment sectors being services (46.2%), manufacturing (18.9%) and retail trade (10.1%). The largest employers in the area include The General Motors Co. (52,113 employees), Ford Motor Co. (48,000 employees) and the University of Michigan (34,904 employees).
As of first quarter 2022, the Detroit CBD office submarket had a total inventory of approximately 15 million square feet, with 513,000 additional square feet under construction. The Detroit CBD office submarket had an overall vacancy rate of 14.7%, below the Detroit suburban area vacancy rate of 19.2%. The Class A office asking rents in the Detroit CBD were $28.87 per square foot, compared to the Detroit suburban area class A office asking rents of $22.05. Between 2011 and 2019, the Detroit CBD averaged over 370,000 square feet of net absorption per year. Despite the pandemic, absorption in 2020 was 72,000 square feet.
Furthermore, the appraiser provides an analysis detailing a more focused subset of properties in Detroit’s financial district representing larger properties with affiliated parking structures, similar to that of the One Campus Martius property. In the first quarter of 2022, this subset of properties had an overall vacancy rate of 5.8%, in-line with the One Campus Martius property historical vacancy prior to expansion.
The appraisal identified eight comparable office leases with rents ranging from $28.65 and $39.78 per square foot, which factor in adjustments for expense structure, location, age/condition and parking, among other factors to normalize various lease types for a comparison under a modified gross lease basis. According to the appraisal, the concluded market rent is $30.00 per square foot on a modified gross basis, which is in excess of than the average underwritten base rents across the office component of the One Campus Martius property.
THE INFORMATION IN THIS STRUCTURAL AND COLLATERAL TERM SHEET IS NOT COMPLETE AND MAY BE AMENDED PRIOR TO THE TIME OF SALE. THIS TERM SHEET IS NOT AN OFFER TO SELL THESE SECURITIES AND IT IS NOT A SOLICITATION OF AN OFFER TO BUY THESE SECURITIES IN ANY JURISDICTION WHERE THE OFFER OR SALE IS NOT PERMITTED.
86 of 143
| Structural and Collateral Term Sheet | Benchmark 2022-B36 | |
| One Campus Martius | ||
| Office Rent Comparables(1) | ||||||||
| Property | Address | Year Built/Renovated | Building Size (SF) | Tenant Name | Lease (SF) | Lease Date | Lease Term | Rent PSF(2) |
| One Campus Martius | 1000 Woodward Avenue | 2003/2019-2020 | 1,356,325(3) | Various | 988,846(3) | Various | Various | $28.96(3) |
| Ally Detroit Center(4) | 500 Woodward Avenue | 1993 | 1,000,000(3) | Confidential | 10,571 | Mar-19 | 60 | $31.97 |
| Office Building | 230 East Grand River Avenue | 1911/2017 | 57,592(3) | Confidential | 7,156 | Dec-21 | 48 | $35.35 |
| Marquette Building | 243 West Congress Street | 1899/2020 | 170,000(3) | Confidential | 138,000 | Jan-21 | 120 | $39.78 |
| First National Building(4) | 660 Woodward Avenue | 1924/2015 | 840,436(3) | Confidential | 1,945 | Mar-20 | 51 | $33.42 |
| 150 West Jefferson | 150 West Jefferson Avenue | 1989 | 489,601(3) | Confidential | 20,465 | Jul-17 | NAP | $28.65 |
| 220 Congress | 220 West Congress Street | 1920/2020 | 41,000(3) | Confidential | 22,000 | May-20 | 144 | $30.26 |
| Grand Park Centre | 28 West Adams Avenue | 1921/2004 | 150,000(3) | Confidential | 2,438 | Nov-19 | 63 | $32.45 |
| The 607 | 607 Shelby Street | 1925/2018 | 47,500(3) | Confidential | 4,263 | May-19 | 61 | $32.08 |
| Total / Avg. / Wtd. Avg.(5) | 349,516(3) | 25,855 | 78 | $36.81 | ||||
| (1) | Source: Appraisal. |
| (2) | Rent PSF for comparable properties have been normalized by the appraiser to reflect modified gross leases due to the variety of comparable lease structures. |
| (3) | Based on the underwritten rent roll dated June 27, 2022, inclusive of contractual rent steps through June 1, 2023 and straight-line average rent over the lease term for Microsoft due to its investment grade rating. Lease Size (SF) and Rent PSF for the One Campus Martius property are solely based on the occupied office tenants. |
| (4) | Ally Detroit Center and First National Building are owned by the loan sponsor or an affiliate thereof. |
| (5) | Total / Avg. / Wtd. Avg. exclude the One Campus Martius property. |
| Market Rent Conclusion(1) | |
| Market Rent | $30.00 |
| Lease Term (months) | 60 |
| Lease Type (reimbursements) | MG (Office), NNN (Retail) |
| (1) | Source: Appraisal. |
Historical Occupancy(1) | |||||||
| 2015 | 2016 | 2017 | 2018 | 2019 | 2020(2) | 2021(2) | Current(3) |
| 99.0% | 95.0% | 98.0% | 98.0% | 97.4% | 76.5% | 86.1% | 86.8% |
| (1) | Historical occupancies are as of December 31 of each respective year. |
| (2) | Expansion space was delivered in 2020, artificially inflating vacancy. |
| (3) | Current occupancy is based on the June 27, 2022 rent roll. |
| Tenant Summary(1) | |||||||
| Tenant | Tenant Type | Credit Rating Moody’s/S&P/ | Net Rentable Area (SF) | % of Total NRA | UW Base Rent PSF | % of Total UW Base Rent | Lease Expiration Date |
| Rocket Mortgage(3) | Office | Ba1/BB+/BB+ | 570,214 | 42.0% | $28.81(3) | 47.4% | 12/31/2028 |
| Centene Management(4)(5) | Office | Baa1/BBB+/NR | 266,001 | 19.6% | $30.62(3) | 23.5 | 12/31/2024 |
| Rock Ventures | Office | NR/NR/NR | 66,059 | 4.9% | $31.50(3) | 6.0% | 12/31/2028 |
| Building Amenities Wellness Center LLC(6) | Amenity | NR/NR/NR | 50,116 | 3.7% | $28.00(3) | 4.0% | 12/31/2035 |
| Microsoft Corporation | Office | Aaa/AAA/AAA | 43,795 | 3.2% | $28.56(3) | 3.6% | 7/31/2025 |
| Building Amenities Day Care LLC(6) | Amenity | NR/NR/NR | 43,297 | 3.2% | $28.00(3) | 3.5% | 12/31/2035 |
| Toast Entertainment (Event Space Floor)(6) | Amenity | NR/NR/NR | 32,980 | 2.4% | $28.00(3) | 2.7% | 12/31/2035 |
| Plante & Moran, PLLC | Office | NR/NR/NR | 29,295 | 2.2% | $36.33(3) | 3.1% | 11/30/2023 |
| Building Amenities Cafeteria LLC(6) | Amenity | NR/NR/NR | 22,019 | 1.6% | $28.00(3) | 1.8% | 12/31/2035 |
| Downtown Detroit Partnership | Office | NR/NR/NR | 7,773 | 0.6 | $25.75(3) | 0.6 | 1/31/2026 |
| Ten Largest Tenants | 1,131,549 | 83.4% | $29.45(3) | 96.1% | |||
| Remaining Occupied Office Tenants | 5,709 | 0.4% | $29.18(3) | 0.5 | |||
| Remaining Occupied Retail Tenants | 40,538 | 3.0% | $23.82(3) | 2.8 | |||
| Remaining Occupied Other Tenants(7) | 0 | 0.0% | NAP(3) | 0.6 | |||
| Total Occupied | 1,177,796 | 86.8% | $29.43(3) | 100.0% | |||
| Vacant | 178,529 | 13.2 | |||||
| Total / Wtd. Avg. | 1,356,325 | 100.0% | |||||
| (1) | Based on the underwritten rent roll dated June 27, 2022, inclusive of contractual rent steps through June 1, 2023 and straight-line average rent over the lease term for Microsoft due to its investment grade rating. |
| (2) | In certain instances, ratings provided are those of the parent company of the entity shown, whether or not the parent company guarantees the lease. |
| (3) | StockX currently subleases 29,648 square feet of office space from Rocket Mortgage through December 2024 at $27.50 per square foot, with $0.50 per square foot annual rent steps. |
| (4) | Centene Management UW Base Rent PSF is inclusive of an approximately $700,000 per year data rack usage fee. |
| (5) | Meridian Health, which has been at the One Campus Martius property since December 2014, assigned its entire interest in its lease to Centene Management on June 29, 2022, shortly after loan origination. |
| (6) | Amenity spaces are associated with affiliates of the loan sponsor. |
| (7) | Remaining Occupied Other Tenants includes signage space leased to StockX and a data rack leased to BMC Software, Inc. with no attributable net rentable area. |
THE INFORMATION IN THIS STRUCTURAL AND COLLATERAL TERM SHEET IS NOT COMPLETE AND MAY BE AMENDED PRIOR TO THE TIME OF SALE. THIS TERM SHEET IS NOT AN OFFER TO SELL THESE SECURITIES AND IT IS NOT A SOLICITATION OF AN OFFER TO BUY THESE SECURITIES IN ANY JURISDICTION WHERE THE OFFER OR SALE IS NOT PERMITTED.
87 of 143
| Structural and Collateral Term Sheet | Benchmark 2022-B36 | |
| One Campus Martius | ||
| Lease Rollover Schedule(1)(2) | |||||||||
| Year | Number of Leases Expiring | Net Rentable Area Expiring | % of NRA Expiring | Base Rent Expiring | % of Base Rent Expiring | Cumulative Net Rentable Area Expiring | Cumulative % of NRA Expiring | Cumulative Base Rent Expiring(3) | Cumulative % of Base Rent Expiring |
| Vacant | NAP | 178,529 | 13.2% | NAP | NAP | 178,529 | 13.2% | NAP | NAP |
| 2022 & MTM | 4 | 5,853 | 0.4% | $124,904 | 0.4% | 184,382 | 13.6% | $124,904 | 0.4% |
| 2023 | 4 | 33,991 | 2.5% | 1,169,437 | 3.4% | 218,373 | 16.1% | $1,294,342 | 3.7% |
| 2024 | 4 | 272,016 | 20.1% | 8,268,942 | 23.9% | 490,389 | 36.2% | $9,563,283 | 27.6% |
| 2025 | 1 | 43,795 | 3.2% | 1,250,759 | 3.6% | 534,184 | 39.4% | $10,814,042 | 31.2% |
| 2026 | 7 | 25,650 | 1.9% | 831,819 | 2.4% | 559,834 | 41.3% | $11,645,861 | 33.6% |
| 2027 | 1 | 4,189 | 0.3% | 119,638 | 0.3% | 564,023 | 41.6% | $11,765,499 | 33.9% |
| 2028 | 2 | 636,273 | 46.9% | 18,508,687 | 53.4% | 1,200,296 | 88.5% | $30,274,186 | 87.3% |
| 2029 | 0 | 0 | 0.0% | 0 | 0.0% | 1,200,296 | 88.5% | $30,274,186 | 87.3% |
| 2030 | 0 | 0 | 0.0% | 0 | 0.0% | 1,200,296 | 88.5% | $30,274,186 | 87.3% |
| 2031 | 0 | 0 | 0.0% | 0 | 0.0% | 1,200,296 | 88.5% | $30,274,186 | 87.3% |
| 2032 & Beyond(3) | 5 | 156,029 | 11.5% | 4,388,616 | 12.7% | 1,356,325 | 100.0% | $34,662,802 | 100.0% |
| Total | 28 | 1,356,325 | 100.0% | $34,662,802 | 100.0% | ||||
| (1) | Based on the underwritten rent roll dated June 27, 2022, inclusive of contractual rent steps through June 1, 2023 and straight-line average rent over the lease term for Microsoft due to its investment grade rating. |
| (2) | Certain tenants may have termination or contraction options (which may become exercisable prior to the originally stated expiration date of the tenant lease) that are not considered in the above Lease Rollover Schedule. |
| (3) | 2032 & Beyond is inclusive of 148,412 square feet of cafeteria, wellness, day care and event amenity space that is associated with affiliates of the loan sponsor. All amenity spaces are set subject to leases through December 2035. |
| Operating History and Underwritten Net Cash Flow | |||||||
2019 | 2020 | 2021 | TTM(1) | Underwritten | Per Square Foot | %(2) | |
| Rents in Place(3) | $26,180,074 | $25,935,421 | $33,372,181 | $34,425,490 | $34,662,802 | $25.56 | 65.0% |
| Vacant Income | 0 | 0 | 0 | 0 | 5,355,870 | $3.95 | 10.0% |
| Gross Potential Rent | $26,180,074 | $25,935,421 | $33,372,181 | $34,425,490 | $40,018,672 | $29.51 | 75.0% |
| Total Reimbursements | 5,028,329 | 3,377,400 | 2,912,952 | 2,944,892 | 3,992,858 | $2.94 | 7.5% |
| Parking Income | 8,218,268 | 7,604,926 | 7,790,884 | 8,038,187 | 9,296,981 | $6.85 | 17.4% |
| Rental Storage Income | 23,255 | 33,057 | 33,297 | 33,548 | 39,680 | $0.03 | 0.1% |
| Gross Potential Income | $39,449,927 | $36,950,803 | $44,109,314 | $45,442,117 | $53,348,190 | $39.33 | 100.0% |
| Vacancy/Credit Loss(4) | ($141,202) | ($111,036) | $82,000 | $176,768 | ($7,139,816) | ($5.26) | (13.4%) |
| Other Income(5) | 80,135 | 6,164 | 7,646 | 1,015 | 16,200 | $0.01 | 0.0% |
| Effective Gross Income | $39,388,859 | $36,845,931 | $44,198,961 | $45,619,900 | $46,224,574 | $34.08 | 86.6% |
| Total Expenses | 20,050,553 | 18,308,085 | 19,173,640 | 20,065,815 | 21,145,889 | $15.59 | 45.7% |
| Net Operating Income | $19,338,306 | $18,537,846 | $25,025,321 | $25,554,085 | $25,078,685 | $18.49 | 54.3% |
| TI/LC | 0 | 0 | 0 | 0 | 1,703,467 | $1.26 | 3.7% |
| Capital Expenditures | 0 | 0 | 0 | 0 | 188,765 | $0.14 | 0.4% |
| Net Cash Flow | $19,338,306 | $18,537,846 | $25,025,321 | $25,554,085 | $23,186,453 | $17.10 | 50.2% |
| (1) | TTM figures are as of March 31, 2022. |
| (2) | % column represents percent of Gross Potential Income for all revenue lines and represents percent of Effective Gross Income for the remainder of the fields. |
| (3) | Underwritten Rents In Place is inclusive of contractual rent steps through June 1, 2023 and straight-line average rent over the lease term for Microsoft due to its investment grade rating. |
| (4) | 2021 and TTM Vacancy/Credit Loss reflect adjustments relating to historically written off bad debt expenses which have since been recovered. |
| (5) | Other income is inclusive of miscellaneous income, tenant extras, late fees and NSF fees. |
Property Management. The One Campus Martius property is managed by Bedrock Management Services LLC, an affiliate of the borrower. The parking garage is sub-managed by Ultimate Parking Management LLC, a third-party management company.
Escrows and Reserves. At loan origination, the borrower deposited (i) $3,926,163 into a real estate tax reserve, (ii) approximately $3,851,373 into an outstanding TI/LC reserve, (iii) $1,500,000 into a rollover reserve and (iv) $28,230 into a replacement reserve.
Tax Reserve – On each monthly due date, the borrower is required to deposit an amount equal to 1/12th of the estimated annual real estate taxes into the tax reserve account, which is estimated to be $560,880 into a tax reserve.
Insurance Reserve – On each monthly due date, the borrower is required to deposit into an insurance reserve an amount equal to 1/12th of estimated insurance premiums, unless the borrower maintains a blanket insurance policy in accordance with the One Campus Martius Whole Loan documents.
Replacement Reserve – On each monthly due date, the borrower is required to deposit $28,230 into a replacement reserve, subject to a cap of $677,530.
THE INFORMATION IN THIS STRUCTURAL AND COLLATERAL TERM SHEET IS NOT COMPLETE AND MAY BE AMENDED PRIOR TO THE TIME OF SALE. THIS TERM SHEET IS NOT AN OFFER TO SELL THESE SECURITIES AND IT IS NOT A SOLICITATION OF AN OFFER TO BUY THESE SECURITIES IN ANY JURISDICTION WHERE THE OFFER OR SALE IS NOT PERMITTED.
88 of 143
| Structural and Collateral Term Sheet | Benchmark 2022-B36 | |
| One Campus Martius | ||
Rollover Reserve – On each monthly due date, the borrower is required to deposit $169,541 into a rollover reserve, subject to a cap of $4,000,000.
Meridian/Rocket Reserve – On each monthly due date during the continuance of a Cash Sweep Event (as defined below) caused by a Meridian Health Trigger Event (as defined below) and/or a Rocket Mortgage Trigger Event (as defined below), all sums remaining in the cash management account after payment of debt service on the One Campus Martius Whole Loan, required reserves, budgeted operating expenses and approved non-budgeted operating expenses must be deposited with and held by the lender for tenant improvement and leasing commission obligations that may be incurred following the loan origination date with respect to the applicable leases at the One Campus Martius property pursuant to the One Campus Martius Whole Loan documents (the “Meridian/Rocket Reserve”).
Lockbox / Cash Management. The One Campus Martius Whole Loan is structured with a hard lockbox for the One Campus Martius property except with respect to the parking garage portion (the “Parking Garage Portion”), for which the borrower is required to establish and maintain a lockbox account during the continuance of a Cash Sweep Event, and springing cash management with respect to the parking garage portion. Upon the establishment of a lockbox account, the borrower is required to, or cause the property manager to, deliver tenant direction letters to all tenants under leases (other than parking passes obtained from the Parking Garage Portion) at the One Campus Martius property to deliver all rents payable directly to the applicable lockbox account. The borrower is required to, or cause the manager to, (i) at all times during the term of the One Campus Martius Whole Loan, deposit all amounts received by the borrower or the property manager constituting rents (other than rents from the Parking Garage Portion) into the lockbox account within one business day after receipt thereof and (ii) during the continuance of a Cash Sweep Event, deposit all amounts received by the borrower or the property manager constituting rents from the Parking Garage Portion into the lockbox account within seven days after receipt. On each due date during the continuance of a Cash Sweep Event, all funds on deposit in the cash management account after payment of debt service on the One Campus Martius Whole Loan, required reserves, budgeted operating expenses and approved non-budgeted operating expenses (“Excess Cash”) are required to be deposited into an excess cash flow reserve account as additional collateral for the One Campus Martius Whole Loan, except that during a Cash Sweep Event caused by a Meridian Health Trigger Event and/or a Rocket Mortgage Trigger Event, Excess Cash is required to be deposited into the Meridian/Rocket Reserve and held by the lender for tenant improvement and leasing commission obligations that may be incurred following the loan origination date with respect to the applicable leases at the One Campus Martius property pursuant to the One Campus Martius Whole Loan documents.
A “Cash Sweep Event” means the occurrence of: (a) an event of default; (b) any bankruptcy action of the borrower, (c) any bankruptcy action of the property manager, (d) the debt coverage ratio based on the trailing three-month period immediately preceding the date of determination being less than 1.15x, (e) a Meridian Health Trigger Event or (f) a Rocket Mortgage Trigger Event.
A Cash Sweep Event may be cured upon the occurrence of the following: (i) with respect to clause (a) above, the acceptance by the lender of a cure of such event of default (provided, however, if the lender has applied for the appointment of a receiver for the One Campus Martius property, declared the debt to be immediately due and payable or commenced a foreclosure action, the lender is not obligated to accept such cure and may reject or accept such cure in its sole and absolute discretion); (ii) with respect to clause (b) above, if the bankruptcy action is due to a person or persons filing an involuntary petition against the borrower and the borrower has not colluded with, or otherwise assisted, such person or persons, and has not solicited creditors for any involuntary petition against the borrower from any person and the bankruptcy action is dismissed within 90 days from the filing of such bankruptcy action; (iii) with respect to clause (c) above, if the borrower replaces such manager with a qualified manager under a replacement management agreement acceptable to the lender in accordance with the One Campus Martius Whole Loan documents; (iv) with respect to clause (d) above, the achievement of a debt service coverage ratio based on the trailing three-month period immediately preceding the date of determination for two consecutive quarters of not less than 1.15x; (v) with respect to clause (e) above, the achievement of a Meridian Health Trigger Cure (as defined below); and (vi) with respect to clause (f) above, the achievement of a Rocket Mortgage Trigger Cure (as defined below); provided, however, that, such Cash Sweep Event cure set forth in this definition will be subject to the following conditions: (A) no event of default has occurred and is continuing (except for any event of default cured pursuant to subclause (i) above), (B) the borrower has paid all of the lender’s reasonable expenses incurred in connection with such Cash Sweep Event cure including reasonable attorney’s fees and expenses, and (C) in no event may the borrower have the right to cure a Cash Sweep Event caused by a bankruptcy action of the borrower if (x) such bankruptcy action is caused by the borrower filing a voluntary petition or (y) the bankruptcy action is due to a person or persons filing an involuntary petition against the borrower and the borrower has colluded with, or otherwise assisted such person or persons, or has solicited creditors for any involuntary petition against the borrower from any person.
“Meridian Health Trigger Event” means (i) a bankruptcy action of Centene Management, as successor-in-interest of Meridian Health by lease assignment, (ii) Centene Management failing to enter into a new lease or renew its then-existing lease, in either case, on substantially similar terms to its then-existing lease (or otherwise on market terms in accordance with the terms of the One Campus Martius property Whole Loan documents) on or prior to the date that is seven months prior to the then-current expiration of the lease with the initial term of such new lease or renewal being no less than three years, or (iii) Centene Management “goes dark” or takes a similar action as more fully described in the One Campus Martius property Whole Loan documents (other than for commercially reasonable periods of time such as a result of fire, casualty and/or condemnation).
THE INFORMATION IN THIS STRUCTURAL AND COLLATERAL TERM SHEET IS NOT COMPLETE AND MAY BE AMENDED PRIOR TO THE TIME OF SALE. THIS TERM SHEET IS NOT AN OFFER TO SELL THESE SECURITIES AND IT IS NOT A SOLICITATION OF AN OFFER TO BUY THESE SECURITIES IN ANY JURISDICTION WHERE THE OFFER OR SALE IS NOT PERMITTED.
89 of 143
| Structural and Collateral Term Sheet | Benchmark 2022-B36 | |
| One Campus Martius | ||
“Meridian Health Trigger Cure” means either (i) the amount on deposit in the Meridian/Rocket Reserve being equal to or greater than $6,650,025 ($25.00 per square foot based on Centene Management occupied square feet), including any amounts deposited directly by the borrower from any source, or (ii) the Centene Management leased space (or an alternative space that either (i) has substantially the same square footage as the Centene Management leased space or (ii) has sufficient square footage to provide for at a minimum, substantially similar rent as under the Centene Management lease and that is reasonably approved by the lender) is re-leased to a replacement tenant that is reasonably acceptable to the lender, pursuant to a lease reasonably approved by the lender, and such replacement tenant delivers to the lender an estoppel certificate satisfactory to the lender in accordance with the One Campus Martius property Whole Loan documents.
“Rocket Mortgage Trigger Event” means (i) a bankruptcy action of Rocket Mortgage or (ii) if the debt service coverage ratio based on the trailing three-month period immediately preceding the date of such determination is less than 1.15x and (x) Rocket Mortgage has not entered into a new lease or renewal of its existing lease (a “Rocket Mortgage Lease Extension”), in either case, on substantially similar terms to its existing lease (or otherwise on market terms in accordance with the terms of the One Campus Martius property Whole Loan documents) on or prior to the date that is 12 months prior to the then-current expiration of the lease with the initial term of such new lease or renewal being no less than three years and/or (y) Rocket Mortgage “goes dark” or takes a similar action as more fully described in the One Campus Martius property Whole Loan documents (other than for commercially reasonable periods of time such as a result of fire, casualty and/or condemnation).
“Rocket Mortgage Trigger Cure” means the Rocket Mortgage leased space (or an alternative space that either (i) has substantially the same square footage as the Rocket Mortgage leased space or (ii) has sufficient square footage to provide for at a minimum, substantially similar rent as under the Rocket Mortgage lease and that is reasonably approved by the lender) is re-leased to a replacement tenant that is reasonably acceptable to the lender, pursuant to a lease reasonably approved by the lender, and such replacement tenant delivers to the lender an estoppel satisfactory to the lender in accordance with the One Campus Martius property Whole Loan documents.
Current Mezzanine or Subordinate Indebtedness. None.
Future Mezzanine or Secured Subordinate Indebtedness Permitted. None.
Partial Release. None.
THE INFORMATION IN THIS STRUCTURAL AND COLLATERAL TERM SHEET IS NOT COMPLETE AND MAY BE AMENDED PRIOR TO THE TIME OF SALE. THIS TERM SHEET IS NOT AN OFFER TO SELL THESE SECURITIES AND IT IS NOT A SOLICITATION OF AN OFFER TO BUY THESE SECURITIES IN ANY JURISDICTION WHERE THE OFFER OR SALE IS NOT PERMITTED.
90 of 143
| Structural and Collateral Term Sheet | Benchmark 2022-B36 | |
| Gateway Plaza | ||
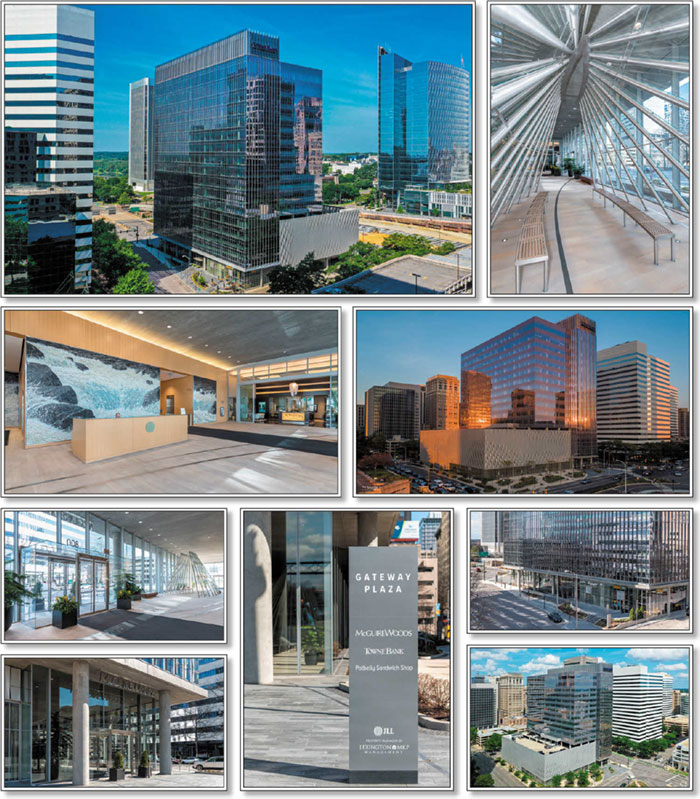
THE INFORMATION IN THIS STRUCTURAL AND COLLATERAL TERM SHEET IS NOT COMPLETE AND MAY BE AMENDED PRIOR TO THE TIME OF SALE. THIS TERM SHEET IS NOT AN OFFER TO SELL THESE SECURITIES AND IT IS NOT A SOLICITATION OF AN OFFER TO BUY THESE SECURITIES IN ANY JURISDICTION WHERE THE OFFER OR SALE IS NOT PERMITTED.
91 of 143
| Structural and Collateral Term Sheet | Benchmark 2022-B36 | |
| Gateway Plaza | ||
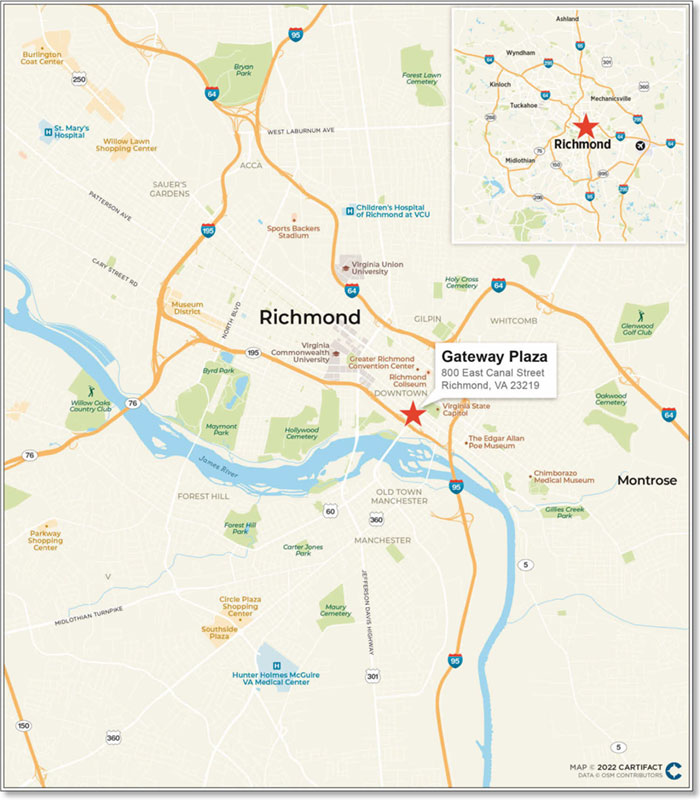
THE INFORMATION IN THIS STRUCTURAL AND COLLATERAL TERM SHEET IS NOT COMPLETE AND MAY BE AMENDED PRIOR TO THE TIME OF SALE. THIS TERM SHEET IS NOT AN OFFER TO SELL THESE SECURITIES AND IT IS NOT A SOLICITATION OF AN OFFER TO BUY THESE SECURITIES IN ANY JURISDICTION WHERE THE OFFER OR SALE IS NOT PERMITTED.
92 of 143
| Structural and Collateral Term Sheet | Benchmark 2022-B36 | |
| Gateway Plaza | ||
Mortgage Loan Information | Property Information | |||
| Mortgage Loan Seller: | GSMC | Single Asset / Portfolio: | Single Asset | |
| Original Principal Balance: | $40,000,000 | Title: | Leasehold | |
| Cut-off Date Principal Balance: | $40,000,000 | Property Type - Subtype: | Office - CBD | |
| % of Pool by IPB: | 5.3% | Net Rentable Area (SF): | 333,030 | |
| Loan Purpose: | Acquisition | Location: | Richmond, VA | |
| Borrower: | GPlaza Property Company LLC | Year Built / Renovated: | 2015 / NAP | |
| Guarantors: | Northridge Capital, LLC and NCA Holdings, LLC | Occupancy: | 95.9% | |
| Interest Rate: | 5.92100% | Occupancy Date: | 4/20/2022 | |
| Note Date: | 6/30/2022 | Number of Tenants: | 9 | |
| Maturity/ARD Date: | 7/6/2027 | Fourth Most Recent NOI: | $8,672,023 (December 31, 2019) | |
| Interest-only Period: | 60 months | Third Most Recent NOI: | $8,770,846 (December 31, 2020) | |
| Original Term: | 60 months(1) | Second Most Recent NOI: | $9,171,958 (December 31, 2021) | |
| Original Amortization: | None | Most Recent NOI: | $9,246,748 (TTM May 31, 2022) | |
| Amortization Type: | Interest Only | UW Economic Occupancy: | 95.0% | |
| Call Protection: | L(25),D(32),O(3) | UW Revenues: | $13,657,965 | |
| Lockbox / Cash Management: | Hard / Springing | UW Expenses: | $6,831,271 | |
| Additional Debt: | N/A | UW NOI: | $6,826,694 | |
| Additional Debt Balance: | N/A | UW NCF: | $6,461,328 | |
| Additional Debt Type: | N/A | Appraised Value / Per SF: | $88,100,000 / $265 | |
| Appraisal Date: | 6/10/2022 | |||
| Escrows and Reserves(2) | Financial Information | ||||||||
| Initial | Monthly | Initial Cap | |||||||
| Taxes: | $232,997 | $116,498 | N/A | Cut-off Date Loan / SF: | $120 | ||||
| Insurance: | $0 | Springing | N/A | Maturity Date Loan / SF: | $120 | ||||
| Replacement Reserves: | $0 | $4,163 | N/A | Cut-off Date LTV: | 45.4% | ||||
| TI/LC: | $0 | $0 | N/A | Maturity Date LTV: | 45.4% | ||||
| Other(3): | $934,013 | $252,458 | N/A | UW NCF DSCR: | 2.69x | ||||
| UW NOI Debt Yield: | 17.1% | ||||||||
| Sources and Uses | |||||||||
| Sources | Proceeds | % of Total | Uses | Proceeds | % of Total | ||||
| Principal’s New Cash Contribution | $111,443,371 | 73.6% | Purchase Price | $150,000,000 | 99.0% | ||||
| Loan Amount | 40,000,000 | 26.4 | Reserves | 1,167,010 | 0.8 | ||||
| Closing Costs | 276,361 | 0.2 | |||||||
| Total Sources | $151,443,371 | 100.0% | Total Uses | $151,443,371 | 100.0% | ||||
| (1) | The Gateway Plaza Loan documents provide the borrower with one, five-day grace period in any 12-month period on the imposition of a late fee for any payments due on a payment date (other than the payment due on the maturity date). |
| (2) | For a full description of Escrows and Reserves, please refer to “Escrows and Reserves” below. |
| (3) | Other reserves consists of an initial unfunded obligations reserve of approximately $681,555 and an initial and monthly ground rent reserve of approximately $252,458. |
The Loan. The mortgage loan (the “Gateway Plaza Loan”) is secured by a first deed of trust encumbering the borrower’s leasehold interest in the office component and 201 collateral parking spaces (the “Gateway Plaza Property”) of a two-unit condominium regime located in Richmond, Virginia comprised of the Gateway Plaza Property and the remaining non-collateral parking spaces within a 511-unit parking garage. The Gateway Plaza Loan is evidenced by a promissory note with an original principal balance and outstanding principal balance as of the Cut-off Date of $40,000,000, representing approximately 5.3% of the initial pool balance. The Gateway Plaza Loan was originated by Goldman Sachs Bank USA on June 30, 2022. The Gateway Plaza Loan has an interest rate of 5.92100% per annum. The borrower utilized the proceeds of the Gateway Plaza Loan to acquire the Gateway Plaza Property, fund upfront reserves and pay origination costs.
The Gateway Plaza Loan had an initial term of 60 months and has a remaining term of 59 months as of the Cut-off Date. The Gateway Plaza Loan requires payments of interest only for the entire term of the Gateway Plaza Loan. The stated maturity date is the due date in July 2027. Voluntary prepayment of the Gateway Plaza Loan is prohibited prior to the due date in May 2027. The borrower has the option
THE INFORMATION IN THIS STRUCTURAL AND COLLATERAL TERM SHEET IS NOT COMPLETE AND MAY BE AMENDED PRIOR TO THE TIME OF SALE. THIS TERM SHEET IS NOT AN OFFER TO SELL THESE SECURITIES AND IT IS NOT A SOLICITATION OF AN OFFER TO BUY THESE SECURITIES IN ANY JURISDICTION WHERE THE OFFER OR SALE IS NOT PERMITTED.
93 of 143
| Structural and Collateral Term Sheet | Benchmark 2022-B36 | |
| Gateway Plaza | ||
to defease the entire principal balance of the Gateway Plaza Loan in whole (but not in part) at any time after the date that is two years from the Closing Date.
The Borrower. The borrower is GPlaza Property Company LLC, a Delaware limited liability company. The borrower is structured to be a single purpose bankruptcy-remote entity, having two independent directors in its organizational structure. Legal counsel to the borrower delivered a non-consolidation opinion in connection with the origination of the Gateway Plaza Loan.
The Loan Sponsors. The loan sponsors are Northridge Capital, LLC (“Northridge”), a Delaware limited liability company, and Qatar First Bank. The non-recourse carveout guarantors are Northridge and NCA Holdings, LLC, each a Delaware limited liability company. Northridge is an independent real estate asset management firm based in Washington, DC. Since its founding in 1997, the firm has invested in over 50 assets with a combined value of approximately $1.62 billion. The firm invests in all asset types across the United States with a particular emphasis on gateway and secondary markets. Northridge primarily works with overseas institutional and individual investors, especially those from the Middle East. Qatar First Bank (“QFB”) is the first independent Shari’ah compliant bank authorized by the Qatar Financial Center Regulatory Authority (“QFCRA”). QFB offers investment management, private banking, wealth management, and private equity and corporate banking services. QFB requires all investment vehicles to be entirely Shari’ah compliant.
The Property. The Gateway Plaza Property includes the office component and 201 collateral parking spaces of an 18-story, 333,030 square foot LEED Gold-certified office building in downtown Richmond comprised of two leasehold condominium units including the Gateway Plaza Property and the remaining non-collateral parking spaces within a 511-unit parking garage. The Gateway Plaza Property is currently 95.9% occupied by nine tenants with a weighted average lease term of 8.15 years. The Gateway Plaza Property was delivered in 2015 and was developed as a “build-to-suit” for the largest tenant, McGuireWoods LLP. The loan sponsor entered into a purchase agreement to acquire the fee simple interest in the Gateway Plaza Property for a gross purchase price of $150.0 million. At origination, the loan sponsor assigned its right to acquire the fee simple interest to Woodbranch Investments Corp. (“Woodbranch”), and Woodbranch purchased the fee simple interest for $150.0 million, and then immediately ground leased the leasehold condominium unit to the Sponsor for a leasehold purchase price of $77.0 million ($231 per square foot), yielding the gross purchase price to the seller of $150.0 million (net a fee simple purchase price of $73.0 million ($219 per square foot). The ground lease has a 99-year term with a June 30, 2121 expiration date, year-one rent of $3,029,500 ($9.10 per square foot), 2.50% annual increases for the first 20 years, and 2.00% increases thereafter.
Condominium. The Gateway Plaza Property is subject to a two-unit leasehold condominium regime comprised of (i) the Gateway Plaza Property, which includes an office building and 201 collateral parking spaces, and (ii) the remaining non-collateral parking spaces within a 511-unit parking garage that is part of the related improvements. The borrower holds a 75% undivided leasehold ownership interest in the related common elements. The related condominium board is comprised of three members, two of which are appointed by the borrower and the borrower controls the condominium board.
Major Tenants.
The largest tenant, McGuireWoods LLP (224,537 square feet; 67.4% of net rentable square feet; 73.6% of underwritten base rent), is a law firm whose history dates back to 1834. McGuire Woods LLP ranks 54th on the 2022 AM Law 200 and according to the 2021 Global 200 survey, they ranked as the 67th highest grossing law firm in the world. The Gateway Plaza Property is the firm’s headquarters and is their largest office with approximately 250 lawyers, including the chairman and managing partner. McGuireWoods LLP has a contraction option that is exercisable in September 2026 for up to two floors (51,246 square feet) and requires payment of a fee of approximately $4.9 million ($95.89 per square foot). Additionally, McGuireWoods LLP is reportedly back in office and completely utilizing its space.
The Market. The Gateway Plaza Property is located in the Richmond, Virginia office market and the CBD Richmond Submarket. As of the second quarter of 2022, the market included a total of 22,186,000 square feet of office space, with approximately 340,000 square feet currently under construction. Additionally, the market vacancy was 15.3%. The CBD Richmond Submarket included 7,434,000 square feet of office space, approximately 120,000 square feet of office under construction, and a vacancy rate of 14.2%.
| Historical and Current Occupancy(1) | ||
| 2020 | 2021 | Current(2) |
| 87.8% | 91.2% | 95.9% |
| (1) | Historical Occupancies are as of December 31 of each respective year. |
| (2) | Current Occupancy is as of April 20, 2022. |
THE INFORMATION IN THIS STRUCTURAL AND COLLATERAL TERM SHEET IS NOT COMPLETE AND MAY BE AMENDED PRIOR TO THE TIME OF SALE. THIS TERM SHEET IS NOT AN OFFER TO SELL THESE SECURITIES AND IT IS NOT A SOLICITATION OF AN OFFER TO BUY THESE SECURITIES IN ANY JURISDICTION WHERE THE OFFER OR SALE IS NOT PERMITTED.
94 of 143
| Structural and Collateral Term Sheet | Benchmark 2022-B36 | |
| Gateway Plaza | ||
| Tenant Summary(1) | ||||||
| Tenant | Ratings Moody’s/Fitch/S&P | Net Rentable Area (SF) | % of Total NRA | Base Rent PSF(2) | % of Total Base Rent | Lease Expiration Date |
| McGuireWoods LLP(3) | NR/NR/NR | 224,537 | 67.4% | $32.70 | 73.6% | 8/31/2030 |
| Towne Bank(4) | NR/NR/NR | 26,047 | 7.8 | $29.38 | 7.7% | 3/1/2031 |
| CCA Industries, Inc. | NR/NR/NR | 25,707 | 7.7 | $25.77 | 6.6% | 9/30/2030 |
| Mercer (US), Inc.(5) | NR/NR/NR | 14,330 | 4.3 | $28.12 | 4.0% | 5/31/2032 |
| Pacific Summit Energy LLC | NR/NR/NR | 8,503 | 2.6 | $20.06 | 1.7% | 2/28/2027 |
| Matrix Capital Markets Group, Inc.(6) | NR/NR/NR | 7,105 | 2.1 | $30.21 | 2.2% | 9/30/2031 |
| Irongate Capital Advisors LLC(7) | NR/NR/NR | 6,137 | 1.8 | $32.57 | 2.0% | 10/31/2030 |
| The Greater Richmond Partnership Inc. | NR/NR/NR | 4,333 | 1.3 | $28.25 | 1.2% | 11/30/2032 |
| Richmond Belly Ventures, LLC | NR/NR/NR | 2,568 | 0.8 | $35.19 | 0.9% | 4/30/2029 |
| Total | 319,267 | 95.9% | $31.23 | 100.0% | ||
| Remaining Tenants | 0 | 0 | $0.00 | 0.0 | ||
| Total Occupied | 319,267 | 95.9% | ||||
| Vacant | 13,763 | 4.1 | ||||
| Total | 333,030 | 100.0% | $31.23 | 100.0% | ||
| (1) | Based on the underwritten rent roll dated April 20, 2022 with contractual rent steps through August 31, 2023. |
| (2) | Base Rent PSF is inclusive of contractual rent steps underwritten through the termination option per the tenant’s lease. |
| (3) | McGuire Woods LLP has one remaining contraction option for up to two full floors exercisable on September 1, 2026 with a minimum 12-24 month notice and payment of a corresponding $95.89 per rentable square foot fee for any space reduced. |
| (4) | The Towne Bank lease includes 13,705 square feet of office space, 9,657 square feet of commercial bank space and 2,685 square feet of retail bank space. |
| (5) | Mercer (US), Inc. has the right to terminate its lease or contract its leased space for not less than 25% of its premises on May 31, 2029 with 12 months’ notice and payment of a fee equal to three months base rent and any unamortized leasing costs. |
| (6) | Matrix Capital Markets Group, Inc. has the right to terminate its lease on September 30, 2028 with 12 months’ notice and payment of a fee equal to three months of base rent and any unamortized leasing costs. |
| (7) | Irongate Capital Advisors LLC has the right to terminate its lease on January 31, 2028 with 12 months’ notice and a payment of a fee equal to three months of base rent and any unamortized leasing costs. |
| Lease Rollover Schedule(1)(2)(3) | ||||||||||
| Year | Number of Tenant Leases Expiring | Net Rentable Area Expiring | % of NRA Expiring | Base Rent Expiring(4) | % of Base Rent Expiring | Cumulative Net Rentable Area Expiring | Cumulative % of NRA Expiring | Cumulative Base Rent Expiring | Cumulative % of Base Rent Expiring | |
| Vacant | NAP | 13,763 | 4.1% | NAP | NAP | 13,763 | 4.1% | NAP | NAP | |
| MTM | 0 | 0 | 0.0% | $0 | 0.0% | 13,763 | 4.1% | $0 | 0.0% | |
| 2023 | 0 | 0 | 0.0% | $0 | 0.0% | 13,763 | 4.1% | $0 | 0.0% | |
| 2024 | 0 | 0 | 0.0% | $0 | 0.0% | 13,763 | 4.1% | $0 | 0.0% | |
| 2025 | 0 | 0 | 0.0% | $0 | 0.0% | 13,763 | 4.1% | $0 | 0.0% | |
| 2026 | 0 | 0 | 0.0% | $0 | 0.0% | 13,763 | 4.1% | $0 | 0.0% | |
| 2027 | 1 | 8,503 | 2.6% | $170,570 | 1.7% | 22,266 | 6.7% | $170,570 | 1.7% | |
| 2028 | 0 | 0 | 0.0% | $0 | 0.0% | 22,266 | 6.7% | $170,570 | 1.7% | |
| 2029 | 1 | 2,568 | 0.8% | $90,355 | 0.9% | 24,834 | 7.5% | $260,926 | 2.6% | |
| 2030 | 3 | 256,381 | 77.0% | $8,205,559 | 82.3% | 281,215 | 84.4% | $8,466,485 | 84.9% | |
| 2031 | 2 | 33,152 | 10.0% | $979,840 | 9.8% | 314,367 | 94.4% | $9,446,325 | 94.7% | |
| 2032 | 2 | 18,663 | 5.6% | $525,349 | 5.3% | 333,030 | 100.0% | $9,971,674 | 100.0% | |
| 2033 and Thereafter | 0 | 0 | 0.0% | $0 | 0.0% | 333,030 | 100.0% | $9,971,674 | 100.0% | |
| Total | 9 | 333,030 | 100.0% | $9,971,674 | 100.0% | |||||
| (1) | Based on the underwritten rent roll dated April 20, 2022 with contractual rent steps through August 31, 2023. |
| (2) | Lease Rollover Schedule is based on the lease expiration dates of all direct leases in place. |
| (3) | Certain tenants may have termination or contraction options (which may become exercisable prior to the originally stated expiration date of the tenant lease) that are not considered in the above Lease Rollover Schedule. See “Tenant Summary” above. |
| (4) | Base Rent Expiring is inclusive of contractual rent steps underwritten through the termination option per the tenant’s lease. |
THE INFORMATION IN THIS STRUCTURAL AND COLLATERAL TERM SHEET IS NOT COMPLETE AND MAY BE AMENDED PRIOR TO THE TIME OF SALE. THIS TERM SHEET IS NOT AN OFFER TO SELL THESE SECURITIES AND IT IS NOT A SOLICITATION OF AN OFFER TO BUY THESE SECURITIES IN ANY JURISDICTION WHERE THE OFFER OR SALE IS NOT PERMITTED.
95 of 143
| Structural and Collateral Term Sheet | Benchmark 2022-B36 | |
| Gateway Plaza | ||
| Operating History and Underwritten Net Cash Flow | |||||||
| 2019 | 2020 | 2021 | TTM 5/31/2022 | Underwritten | Per Square Foot | %(1) | |
| Rents in Place(2) | $8,251,701 | $8,412,232 | $9,000,617 | $9,200,362 | $9,971,674 | $29.94 | 69.4% |
| Commercial Reimbursement Revenue | 2,968,970 | 2,998,745 | 3,015,072 | 3,049,262 | 3,181,544 | 9.55 | 22.1% |
| Vacant Income | 0 | 0 | 0 | 0 | 407,220 | 1.22 | 2.8% |
| Parking Income | 378,640 | 380,120 | 387,940 | 391,680 | 391,680 | 1.18 | 2.7% |
| Other Revenue | 426,721 | 419,220 | 419,665 | 424,687 | 424,687 | 1.28 | 3.0% |
| Gross Potential Revenue | $12,026,032 | $12,210,317 | $12,823,294 | $13,065,991 | $14,376,805 | $43.17 | 100.0% |
| (Vacancy Loss) | 0 | 0 | 0 | 0 | (718,840) | ($2.16) | (5.0%) |
| (Concessions) | 0 | (21,881) | (196,982) | (265,127) | 0 | $0.00 | 0.0% |
| Effective Gross Income | $12,026,032 | $12,188,436 | $12,626,312 | $12,800,864 | $13,657,965 | $41.01 | 95.0% |
| Total Expenses(3) | 3,354,009 | 3,417,590 | 3,454,354 | 3,554,116 | 6,831,271 | 20.51 | 50.0% |
| Net Operating Income | $8,672,023 | $8,770,846 | $9,171,958 | $9,246,748 | $6,826,694 | $20.50 | 50.0% |
| TI/LC | 0 | 0 | 0 | 0 | 315,411 | 0.95 | 2.3% |
| Replacement Reserves | 0 | 0 | 0 | 0 | 49,955 | 0.15 | 0.4% |
| Net Cash Flow | $8,672,023 | $8,770,846 | $9,171,958 | $9,246,748 | $6,461,328 | $19.40 | 47.3% |
| (1) | % column represents percent of Gross Potential Revenue for all revenue lines and represents percent of Effective Gross Income for the remainder of the fields. |
| (2) | Underwritten Rents in Place is based on the underwritten rent roll dated April 20, 2022 with contractual rent steps through August 31, 2023. |
| (3) | Underwritten Total Expenses are 97.8% higher than full-year 2021 Total Expenses due to $3,029,500 of annual Ground Rent. |
Property Management. The Gateway Plaza Property is managed by Jones Lang LaSalle Americas, Inc., a Maryland corporation.
Escrows and Reserves. At loan origination, the borrower deposited (i) approximately $232,997 into a tax reserve, (ii) approximately $681,555 into an unfunded obligations reserve in connection with unpaid tenant improvement allowances and free rent for certain tenants at the Gateway Plaza Property, including The Greater Richmond Partnership, Inc., Irongate Capital Advisors LLC and Mercer (US) Inc., and (iii) $252,458 into a ground rent reserve.
Tax Reserve. On each due date, the borrower is required to deposit into a tax reserve an amount equal to 1/12 of the taxes that the lender reasonably estimates will be payable in the next ensuing 12 months (initially estimated to be approximately $116,498).
Insurance Reserve. On each due date, the borrower is required to deposit into an insurance reserve an amount equal to 1/12 of the insurance premiums that the lender reasonably estimates will be payable for the renewal of the coverage of the related insurance policies upon the expiration thereof, unless the borrower is maintaining a blanket insurance policy in accordance with the related Gateway Plaza Loan documents.
Replacement Reserve. On each due date during which the Tenant Replacements Conditions (as defined below) are not satisfied as to any individual tenant at the Gateway Plaza Property, the borrower is required to deposit into a replacement reserve an amount equal to 1/12 of the product of (x) the square footage of the leased premises for such tenant and (y) $0.15. The term “Tenant Replacements Conditions” means the satisfaction of each of the following: (a) no event of default under the Gateway Plaza Loan or the applicable lease is continuing and (b) a tenant is required to repair and pay for all replacements related to its leased premises, performs its repair and payment obligations in conformance with its lease and provides evidence thereof (or the borrower provides such evidence) to the lender as reasonably requested.
Unfunded Obligations Reserve. Whenever a lease is terminated in whole or in part, or the tenant thereunder defaults, the borrower is required to promptly remit to the lender any related lease termination or contraction fee for deposit into an unfunded obligations reserve.
Ground Rent Reserve. On each due date, the borrower is required to deposit an amount equal to 1/12 of the ground rents that the lender reasonably estimates will be payable in the next ensuing 12 months (initially estimated to be approximately $252,458).
“Gateway Plaza Cash Trap Event Period” means each period (i) during an event of default under the Gateway Plaza Loan agreement, (ii) commencing when the debt yield (as calculated under the Gateway Plaza Loan documents), determined as of the first day of any calendar quarter for the immediately preceding calendar quarter, is less than 9.50%, and concluding when the debt yield, determined as of the first day of each of two consecutive calendar quarters for each immediately preceding calendar quarter, is at least equal to 9.50%, and (iii) during the continuance of a Gateway Plaza Lease Sweep Period (as defined below). A Gateway Plaza Cash Trap Event Period will also commence upon the borrower’s third (and any subsequent) failure to deliver annual, quarterly or monthly financial reports as and when required under the Gateway Plaza Loan documents, and will conclude when such reports are delivered.
THE INFORMATION IN THIS STRUCTURAL AND COLLATERAL TERM SHEET IS NOT COMPLETE AND MAY BE AMENDED PRIOR TO THE TIME OF SALE. THIS TERM SHEET IS NOT AN OFFER TO SELL THESE SECURITIES AND IT IS NOT A SOLICITATION OF AN OFFER TO BUY THESE SECURITIES IN ANY JURISDICTION WHERE THE OFFER OR SALE IS NOT PERMITTED.
96 of 143
| Structural and Collateral Term Sheet | Benchmark 2022-B36 | |
| Gateway Plaza | ||
“Gateway Plaza Lease Sweep Period” means the period commencing upon, (a) either (i) the early termination (via exercise of a termination option or otherwise), early cancellation or early surrender of the McGuireWoods LLP lease or any replacement Gateway Plaza Major Lease, as defined below, (each such lease, a “Sweep Lease”) or (ii) upon the borrower’s or the Master Lessee’s, as defined below, receipt of notice by a tenant under a Sweep Lease (each, a “Sweep Tenant”) of its intent to effect an early termination, cancellation or surrender of all or substantially all of the space demised under the applicable Sweep Lease unless, in the case of either item (i) or (ii), the borrower or the Master Lessee has executed a Qualified Replacement Lease (as defined below) with a different tenant that, together with any existing lease in effect (including the McGuireWoods LLP lease) that was entered in accordance with the terms of the Gateway Plaza Loan documents, covers all or substantially all of the space demised under the applicable Sweep Lease and which Qualified Replacement Lease does not contain any termination options prior to such tenant taking occupancy of the space demised under such Qualified Replacement Lease and opening for business; (b) the date upon which a Sweep Tenant has ceased operating its business, provided that a Gateway Plaza Lease Sweep Period will not be deemed to have commenced under this item (b) to the extent (x) the related Sweep Tenant is in compliance with the terms of its Sweep Lease, and (y) either (i) the Sweep Tenant has ceased its operations as a result of events related to a casualty or condemnation as permitted under its Sweep Lease; (ii) the Sweep Tenant has ceased its operations to undertake an active repurposing or repositioning of its operations in accordance with its Sweep Lease, and such cessation does not continue for a consecutive period in excess of 90 days; or (iii) the Sweep Tenant has ceased its operations for any other reason, and such cessation does not continue for a consecutive period in excess of 30 days; or (c) a Sweep Tenant or the related lease guarantor, if applicable, is a debtor under a voluntary or involuntary petition under the bankruptcy code or any other creditors rights laws that is not dismissed or stayed within 90 days of such filing (provided that the Gateway Plaza Lease Sweep Period will cease if the applicable Sweep Lease is affirmed in bankruptcy).
A Gateway Plaza Lease Sweep Period will end upon the occurrence of any of the following: (A) in the case of clause (a) above, a Sweep Lease Re-Tenanting Event (as defined below) has occurred; (B) in the case of clause (b) above, either (1) a Sweep Lease Re-Tenanting Event has occurred, or (2) such Sweep Tenant has resumed occupancy and is operating its business in at least 60% of the space demised under its Sweep Lease for a period of two consecutive calendar quarters, including the payment of all required rental amounts and expense reimbursements; and (C) in the case of clause (c) above, either (1) a Sweep Lease Re-Tenanting Event has occurred, or (2) the bankruptcy proceeding or other proceeding under creditors rights laws has been dismissed or otherwise terminated in a manner reasonably satisfactory to the lender and the related lease has been affirmed.
“Gateway Plaza Major Lease” means (i) the McGuireWoods LLP lease, (ii) any lease that, individually or when aggregated with all other leases with the same tenant or its affiliate, and assuming the exercise of all expansion rights and all preferential rights to lease additional space contained in such lease, demises more than 50,000 rentable square feet at the Gateway Plaza Property, (iii) any lease that contains any option, offer, right of first refusal or other similar entitlement to acquire all or any portion of the Gateway Plaza Property, (iv) any lease with an affiliate of the borrower or the Master Lessee as a tenant and (v) any instrument guaranteeing or providing credit support for any lease meeting the requirements of items (i)-(iv) above.
A “Qualified Replacement Lease” is any lease with a third party tenant of comparable or better credit (in the reasonable discretion of the lender) to the applicable Sweep Tenant being replaced, which lease (i) materially conforms to the requirements of the Gateway Plaza Loan agreement, (ii) provides for minimum rent, expense reimbursements and other economic terms that, taken as a whole, are at least equivalent to then-existing market rates for the applicable leased premises, (iii) contains commercially reasonable terms and conditions that are reasonably acceptable to the lender in all material respects and (iv) has a minimum primary term of five years.
“Sweep Lease Re-Tenanting Event” means that the lender has received reasonably satisfactory evidence that (i) all or substantially all of the space demised under the Sweep Lease that is the subject of a Gateway Plaza Lease Sweep Period (as defined below) has been leased to one or more replacement tenants that are reasonably satisfactory to the lender, each pursuant to a Qualified Replacement Lease, (ii) each such tenant has taken occupancy of its demised space, (iii) each such tenant is paying full, unabated rent pursuant to the terms of its Qualified Replacement Lease and (iv) all tenant improvement costs and leasing commissions provided in each such Qualified Replacement Lease have been paid (or adequately reserved for by the lender).
Lockbox / Cash Management. The Gateway Plaza Loan is structured with a hard lockbox and springing cash management. The borrower is required to cause all funds and other income from the Gateway Plaza Property to be deposited into a lender-controlled lockbox account. On a daily basis during the continuance of a Gateway Plaza Cash Trap Event Period or event of default under the Gateway Plaza Loan, all amounts in the lockbox account in excess of $5,000 are required to be remitted to a lender-controlled cash management account. On each business day that no Gateway Plaza Cash Trap Event Period or event of default under the Gateway Plaza Loan is continuing, all funds in the lockbox account in excess of $5,000 are required to be swept into a master lessee/borrower-controlled operating account.
On each due date during the continuance of a Gateway Plaza Cash Trap Event Period, all funds on deposit in the cash management account in excess of $5,000 after payment of debt service, required reserves and budgeted operating expenses are required to be held by the lender in an excess cash flow reserve account as additional collateral for the Gateway Plaza Loan (except to the extent such Gateway Plaza Cash Trap Event Period is solely the result of a Gateway Plaza Lease Sweep Period, in which case such funds are required to be deposited in a tenant sweep account).
THE INFORMATION IN THIS STRUCTURAL AND COLLATERAL TERM SHEET IS NOT COMPLETE AND MAY BE AMENDED PRIOR TO THE TIME OF SALE. THIS TERM SHEET IS NOT AN OFFER TO SELL THESE SECURITIES AND IT IS NOT A SOLICITATION OF AN OFFER TO BUY THESE SECURITIES IN ANY JURISDICTION WHERE THE OFFER OR SALE IS NOT PERMITTED.
97 of 143
| Structural and Collateral Term Sheet | Benchmark 2022-B36 | |
| Gateway Plaza | ||
Master Leases. The Gateway Plaza Loan was structured with two master leases to be a Shari’ah compliant loan. The borrower entered into master leases with each of (i) GPlaza Northridge LLC, for the purpose of entering into end-user leases for all suites at the Gateway Plaza Property, other than suites 100, 101, 710 and 900, and (ii) NS GPlaza Northridge LLC, for the purpose of entering into end-user leases for suites 100, 101, 710 and 900 at the Gateway Plaza Property (collectively, the “Master Leases”). Each master lessee is indirectly owned by certain investors. The rent payable pursuant to each master lease is intended to cover the debt service payments required under the Gateway Plaza Loan, as well as reserve payments and any other sums due under the Gateway Plaza Loan. At origination, the lender received a leasehold deed of trust from the borrower on its leasehold interest in the Gateway Plaza Property. The lender also secured a full subordination of the Master Leases. See “Description of the Mortgage Pool—Statistical Characteristics of the Mortgage Loans—Shari’ah Compliant Loans” in the Preliminary Prospectus. See “Description of the Mortgage Pool—Statistical Characteristics of the Mortgage Loans Shari’ah Compliant Loans” in the Preliminary Prospectus.
Current Mezzanine or Subordinate Indebtedness. None.
Future Mezzanine or Subordinate Indebtedness Permitted. The beneficial owners of the borrower are permitted during the term of the Gateway Plaza Loan to obtain mezzanine financing (each, a “Gateway Plaza Permitted Mezzanine Loan”) from one or more lenders meeting certain requirements under the Gateway Plaza Loan documents secured by a pledge of the equity interests in the borrower, provided that, among other conditions: (a) the Gateway Plaza Permitted Mezzanine Loan is in an amount not to exceed an amount that, when added to the Gateway Plaza Loan will result in (A) a combined loan-to-value ratio of the Gateway Plaza Property of no more than 51.9%, (B) a combined adjusted debt service coverage ratio (based on the Gateway Plaza Loan documents) of no less than 2.32x, and (C) a combined debt yield of no less than 16.57%; (b) the Gateway Plaza Permitted Mezzanine Loan is secured by an equity pledge encumbering direct and indirect ownership interests in the borrower (and not any collateral securing the Gateway Plaza Loan); (c) to the extent any “balloon” payment is due at the maturity of the Gateway Plaza Permitted Mezzanine Loan, (A) such maturity may not occur prior to the maturity of the Gateway Plaza Loan and will allow at least two one-year extension options, or (B) any “balloon” payment may be paid following the maturity of the Gateway Plaza Loan without the payment of any prepayment premium or prepayment fee; and (d) the mezzanine lender (i) is not an affiliate of the borrower and (ii) enters into an intercreditor agreement with the lender satisfactory in all respects to the lender in its reasonable discretion and any applicable rating agency. Additionally, such financing will be subject to receipt by the lender of rating agency confirmations from the applicable rating agencies.
Partial Release. None.
Terrorism Insurance. The borrower is required to maintain terrorism insurance in an amount equal to the full replacement cost of the Gateway Plaza Property, as well as 18 months of rental loss and/or business interruption coverage, together with a six-month extended period of indemnity following restoration. If TRIPRA is no longer in effect, then the borrower’s requirement will be capped at insurance premiums equal to two times the amount of insurance premiums payable in respect of the property and business interruption/rental loss insurance required under the Gateway Plaza Loan documents. See “Risk Factors—Risks Relating to the Mortgage Loans—Terrorism Insurance May Not Be Available for All Mortgaged Properties” in the Preliminary Prospectus.
THE INFORMATION IN THIS STRUCTURAL AND COLLATERAL TERM SHEET IS NOT COMPLETE AND MAY BE AMENDED PRIOR TO THE TIME OF SALE. THIS TERM SHEET IS NOT AN OFFER TO SELL THESE SECURITIES AND IT IS NOT A SOLICITATION OF AN OFFER TO BUY THESE SECURITIES IN ANY JURISDICTION WHERE THE OFFER OR SALE IS NOT PERMITTED.
98 of 143
| Structural and Collateral Term Sheet | Benchmark 2022-B36 | |
| The Lion Building | ||
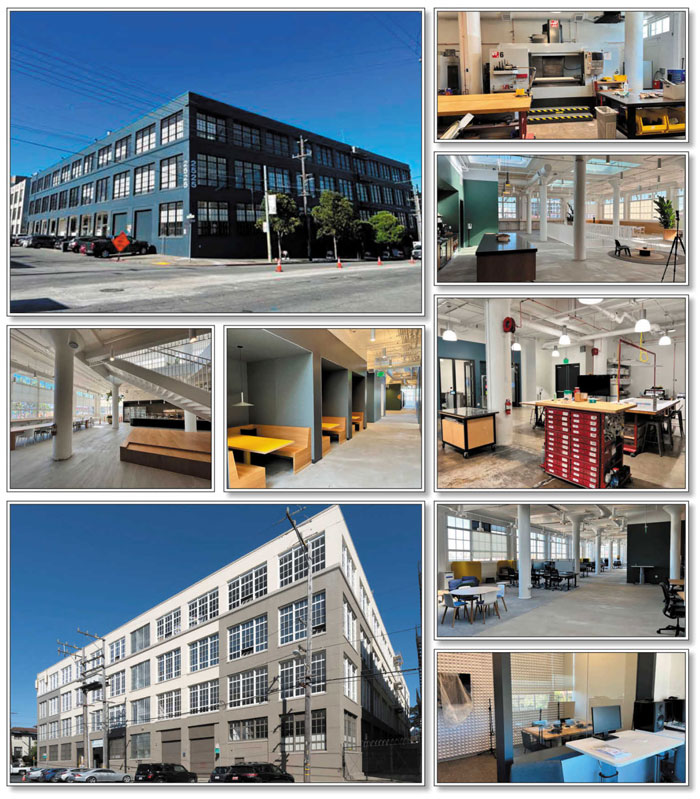
THE INFORMATION IN THIS STRUCTURAL AND COLLATERAL TERM SHEET IS NOT COMPLETE AND MAY BE AMENDED PRIOR TO THE TIME OF SALE. THIS TERM SHEET IS NOT AN OFFER TO SELL THESE SECURITIES AND IT IS NOT A SOLICITATION OF AN OFFER TO BUY THESE SECURITIES IN ANY JURISDICTION WHERE THE OFFER OR SALE IS NOT PERMITTED.
99 of 143
| Structural and Collateral Term Sheet | Benchmark 2022-B36 | |
| The Lion Building | ||
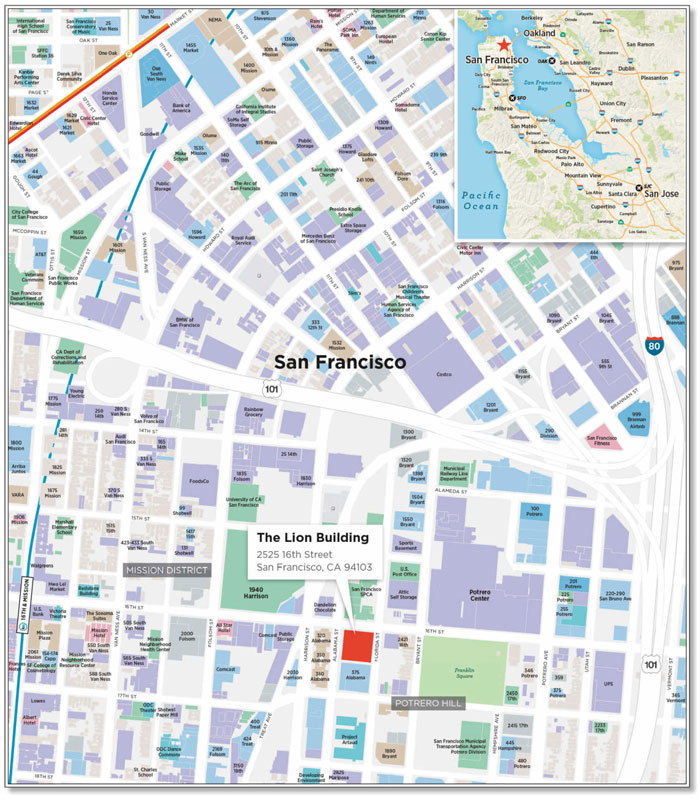
THE INFORMATION IN THIS STRUCTURAL AND COLLATERAL TERM SHEET IS NOT COMPLETE AND MAY BE AMENDED PRIOR TO THE TIME OF SALE. THIS TERM SHEET IS NOT AN OFFER TO SELL THESE SECURITIES AND IT IS NOT A SOLICITATION OF AN OFFER TO BUY THESE SECURITIES IN ANY JURISDICTION WHERE THE OFFER OR SALE IS NOT PERMITTED.
100 of 143
| Structural and Collateral Term Sheet | Benchmark 2022-B36 | |
| The Lion Building | ||
| Mortgage Loan Information | Property Information | |||
| Mortgage Loan Seller: | GACC | Single Asset / Portfolio: | Single Asset | |
| Original Principal Balance(1): | $35,000,000 | Title: | Fee | |
| Cut-off Date Principal Balance(1): | $35,000,000 | Property Type – Subtype: | Mixed Use – Industrial/Office | |
| % of Pool by IPB: | 4.6% | Net Rentable Area (SF): | 172,328 | |
| Loan Purpose: | Refinance | Location: | San Francisco, CA | |
| Borrower: | 2525 16th St Property LLC | Year Built / Renovated: | 1924 / 2021 | |
| Guarantors: | Angus McCarthy and | Occupancy(5): | 100.0% | |
| Michael Moritz | Occupancy Date(5): | 6/1/2022 | ||
| Interest Rate: | 5.19750% | Fourth Most Recent NOI(2): | NAV | |
| Note Date: | 6/8/2022 | Third Most Recent NOI(2): | NAV | |
| Maturity/ARD Date: | 7/6/2032 | Second Most Recent NOI(2): | NAV | |
| Interest-only Period: | 120 months | Most Recent NOI(2): | NAV | |
| Original Term: | 120 months | UW Economic Occupancy: | 95.0% | |
| Original Amortization: | None | UW Revenues: | $11,675,921 | |
| Amortization Type: | Interest Only | UW Expenses: | $2,022,534 | |
| Call Protection: | L(25),D(90),O(5) | UW NOI: | $9,653,388 | |
| Lockbox / Cash Management: | Hard / Springing | UW NCF: | $9,188,102 | |
| Additional Debt(1): | Yes | Appraised Value / Per SF(3): | $170,000,000 / $986 | |
| Additional Debt Balance(1): | $65,000,000 | Appraisal Date(3): | 3/30/2022 | |
| Additional Debt Type(1): | Pari Passu | |||
| Escrows and Reserves(4) | Financial Information(1) | ||||||||
| Initial | Monthly | Initial Cap | Senior Notes | ||||||
| Taxes: | $289,274 | $72,319 | N/A | Cut-off Date Loan / SF: | $580 | ||||
| Insurance: | $37,550 | $7,510 | N/A | Maturity Date Loan / SF: | $580 | ||||
| Replacement Reserves: | $130,000 | $3,590 | $86,164 | Cut-off Date LTV(3): | 58.8% | ||||
| TI/LC: | $4,946,132 | Springing | N/A | Maturity Date LTV(3): | 58.8% | ||||
| Other(4)(5): | $45,289,968 | $0 | N/A | UW NCF DSCR: | 1.74x | ||||
| UW NOI Debt Yield: | 9.7% | ||||||||
| Sources and Uses | |||||||||
| Sources | Proceeds | % of Total | Uses | Proceeds | % of Total | ||||
| Whole Loan(1) | $100,000,000 | 100.0% | Loan Payoff(6) | $47,967,606 | 47.9% | ||||
| Sponsor Equity | 50,000 | 0.0 | Upfront Reserves | 50,692,924 | 50.7 | ||||
| Closing Costs | 1,389,470 | 1.4 | |||||||
| Total Sources | $100,050,000 | 100.0% | Total Uses | $100,050,000 | 100.0% | ||||
| (1) | The Lion Building Mortgage Loan (as defined below) is part of The Lion Building Whole Loan (as defined below) evidenced by five pari passu notes with an aggregate outstanding principal balance as of the Cut-off Date of $100,000,000. The Financial Information presented above is calculated based on the outstanding balance of The Lion Building Whole Loan. |
| (2) | The Lion Building Property (as defined below) does not have any operating history as it recently underwent a full renovation. |
| (3) | The appraisal for The Lion Building Property concluded an “As Complete and Stabilized” value of $167,000,000 (dated October 1, 2022) and an “As-Is Assuming No Landlord Obligations” value of $170,000,000 (dated March 30, 2022). The As-Complete and Stabilized value reflects contractual free rents being deducted throughout the respective lease terms, while the “As-Is Assuming No Landlord Obligations” value assumes no free rents. Given that The Lion Building Whole Loan requires full reserves for all outstanding landlord obligations inclusive of free rents, Cut-off Date LTV and Maturity Date LTV are calculated based on the “As-Is Assuming No Landlord Obligations” value. These appraised values assume that the tenant build-outs are completed and the tenants are in occupancy. The as is appraised value is $161,000,000 which represents a Cut-off Date LTV and Maturity Date LTV of 62.1%. |
| (4) | For a full description of Escrows and Reserves, see “Escrows and Reserves” below. |
| (5) | At loan origination, an economic holdback of $31,000,000 (the “Embark Holdback Reserve”) was reserved equal to the value of the income stream for the tenant, Embark Trucks, (“Embark”), which has executed its lease but has not yet taken occupancy of its space. The Embark Holdback Reserve will be released (less the amount of free rent under the Embark lease) to the borrower when Embark takes physical occupancy of its space and commences paying rent for the leased premises (anticipated to be August 1, 2022). We cannot assure you that Embark will take occupancy or commence paying rent as expected or at all. In addition, IDEO has not taken occupancy of the Second Phase Space (as defined under “The Property” below) and is not required to pay rent with respect to the Second Phase Space until January 1, 2023. We cannot assure you that IDEO will take occupancy of, or commence paying rent with respect to, the Second Phase Space as expected or at all. |
| (6) | Prior to origination, The Lion Building Property was encumbered by a construction loan with an outstanding principal balance of $25,000,000 and an Intra-Company Loan (as defined below) with an outstanding principal balance of $60,891,856. The “Intra-Company Loan” was between Le Lion Building LLC (the sole member of the borrower), as borrower, and The Crankstart Foundation (the 70% owner of Le Lion Building LLC), as lender, had a scheduled maturity date of March 12, 2025, and was secured by a second lien on The Lion Building Property. At origination, The Lion Building Whole Loan proceeds were used, in part, to pay off the construction loan in full (including outstanding interest and fees) and to pay off the Intra-Company Loan for a discounted amount of approximately $22,901,272. |
THE INFORMATION IN THIS STRUCTURAL AND COLLATERAL TERM SHEET IS NOT COMPLETE AND MAY BE AMENDED PRIOR TO THE TIME OF SALE. THIS TERM SHEET IS NOT AN OFFER TO SELL THESE SECURITIES AND IT IS NOT A SOLICITATION OF AN OFFER TO BUY THESE SECURITIES IN ANY JURISDICTION WHERE THE OFFER OR SALE IS NOT PERMITTED.
101 of 143
| Structural and Collateral Term Sheet | Benchmark 2022-B36 | |
| The Lion Building | ||
The Loan. The Lion Building Mortgage Loan is secured by a first mortgage lien on the borrower’s fee simple interest in a 172,328 square foot, four-story mixed use PDR/office building located in the Potrero Hill district of San Francisco, California (“The Lion Building Property”). The Lion Building Mortgage Loan is part of a whole loan, which has an aggregate outstanding balance as of the Cut-off Date of $100.0 million (“The Lion Building Whole Loan”) and is comprised of (i) five pari passu senior notes with an aggregate initial principal balance of $100.0 million. The Lion Building Mortgage Loan evidenced by the non-controlling notes A-2-2, A-3 and A-4 which have an aggregate outstanding principal balance as of the Cut-off Date of $35.0 million, will be included in the BMARK 2022-B36 securitization trust (“The Lion Building Mortgage Loan”) and represents approximately 4.6% of the Initial Pool Balance. The remaining $65.0 million of The Lion Building Whole Loan was contributed to the BMO 2022-C2 securitized trust (“The Lion Building Companion Loan”) The relationship between the holders of The Lion Building Whole Loan is governed by a co-lender agreement as described under “Description of the Mortgage Pool—The Whole Loans—The Non-Serviced AB Whole Loans—The Lion Building Whole Loan” in the Preliminary Prospectus.
| Whole Loan Summary | ||||
| Note | Original Balance | Cut-off Date Balance | Note Holder | Controlling Piece |
| A-1, A-2-1 | $65,000,000 | $65,000,000 | BMO 2022-C2 | Yes |
| A-2-2, A-3, A-4 | $35,000,000 | $35,000,000 | Benchmark 2022-B36 | No |
| Whole Loan | $100,000,000 | $100,000,000 | ||
The Borrower. The borrower is 2525 16th St Property LLC, a Delaware limited liability company and single purpose entity with two independent directors. Legal counsel to the borrower delivered a non-consolidation opinion in connection with the origination of The Lion Building Whole Loan.
The Loan Sponsors. The loan sponsors and non-recourse carveout guarantors for The Lion Building Whole Loan are Angus McCarthy and Michael Moritz. Mr. McCarthy began working in the construction industry in the early 1990s and has operated his company since the mid-1990s. Mr. McCarthy’s current portfolio includes The Lion Building Property and three other commercial buildings (totaling roughly 110,000 square feet) in San Francisco. In addition, Mr. McCarthy also owns seven rental units. Mr. Moritz is a Welsh billionaire venture capitalist. Mr. Moritz is currently the chairman of Sequoia Capital where he has worked since 1986. Mr. Moritz represented Sequoia in its investments in Google, Yahoo, LinkedIn, PayPal, Flextronics, Instacart, Stripe, Kayak, Pure Digital, and Zappos.com.
The Property. The Lion Building Property is a 172,328 square foot four-story mixed use PDR/office building located in the Potrero Hill district and the “Mission/Potrero Hill” PDR submarket of San Francisco, California. The Lion Building Property was originally built in 1924 to house the manufacturing operations of local syrup maker Lyons-Magnus, which continued on-site through the early 1970’s and underwent a renovation and repositioning in 2021 to Class A PDR and office building. The Lion Building Property offers traditional office, media production, design, experimental marketing, event, sales, warehousing, fulfillment and showroom space. The Lion Building Property features 15’ to 17’ ceiling heights, large open floor plates, four roll-up doors, two brand new elevators (1 passenger/1 freight), heavy power (2,000-4,000 amp/277/480 volts), new HVAC and a new rooftop deck.
The loan sponsors purchased The Lion Building Property in March 2018 and subsequently began renovations in the fall of 2018. In total, the loan sponsors have invested approximately $14.9 million ($86.40 per square foot) on base building renovations, $13.6 million ($78.80 per square foot) on tenant improvements and $3.1 million ($17.80 per square foot) on leasing commissions, and approximately $460,000 on legitimizing permitted office use. Concurrent with the renovation efforts, the loan sponsors began marketing The Lion Building Property for lease and in July 2019 signed a lease with IDEO, a globally recognized design and consulting firm. In May 2021, the loan sponsors signed a lease with Embark (NASDAQ: EMBK), a self-driving truck company, for the remainder of the space at The Lion Building Property.
The Lion Building Property is zoned PDR-1-G, which allows for a wide variety of uses including traditional industrial uses of manufacturing, construction, and repair to more modern industrial uses including lab, food service, media production, robotics and autonomous vehicles. PDR-1-G limits office use to accessory office space that supports the PDR use up to 1/3 of the overall PDR space. Due to the historic partial office use at The Lion Building Property, the loan sponsors worked with the City of San Francisco and legitimized 43,569 square feet of space for pure office use at The Lion Building Property.
As of June 1, 2022, The Lion Building Property was 100.0% leased to two tenants: IDEO (69.4% of NRA) and Embark (30.6% of NRA, NASDAQ: EMBK); however, Embark has not yet taken occupancy of its space and is not yet paying rent. We cannot assure you that Embark will take occupancy or commence paying rent as expected or at all. The IDEO leased premises is comprised of two phases of buildouts: (i) the first phase space (the “First Phase Space”, consisting of 85,104 square feet in the aggregate and comprised of the entire 2nd floor, 10,000 square feet of the 3rd floor, 4th floor, and rooftop deck)), and (ii) the second phase space (the “Second Phase Space”, consisting of 34,409 square feet of the 3rd floor. IDEO has taken occupancy of the First Phase Space and rent commenced on paying rent on April 18, 2022. IDEO has not taken occupancy of the Second Phase Space and is not required to commence paying rent on the Second Phase Space until January 1, 2023. We cannot assure you that IDEO will take occupancy of, or commence paying rent on, the Second Phase Space as expected or at all.
THE INFORMATION IN THIS STRUCTURAL AND COLLATERAL TERM SHEET IS NOT COMPLETE AND MAY BE AMENDED PRIOR TO THE TIME OF SALE. THIS TERM SHEET IS NOT AN OFFER TO SELL THESE SECURITIES AND IT IS NOT A SOLICITATION OF AN OFFER TO BUY THESE SECURITIES IN ANY JURISDICTION WHERE THE OFFER OR SALE IS NOT PERMITTED.
102 of 143
| Structural and Collateral Term Sheet | Benchmark 2022-B36 | |
| The Lion Building | ||
Major Tenants.
The two largest tenants based on underwritten base rent are IDEO and Embark.
IDEO (119,513 square feet, 69.4% of NRA; 67.8% underwritten base rent) is a privately held, design and consulting firm with offices in the U.S. (Cambridge, Chicago, New York, Palo Alto, San Francisco), England (London), Germany (Munich), Japan (Tokyo), and China (Shanghai). IDEO was founded in Palo Alto, California in 1978. The company uses a design thinking approach to design products, services, environments, and digital experiences. The firm currently employs over 600 people across 23 design capabilities including digital, environment, government and health and wellness. As of December 31, 2021, IDEO reported $158 million in total revenue and $26 million in net income (an increase from $10.8 million in 2020). In addition, IDEO reported $7.2 million in cash and $21 million in accounts receivables.
IDEO signed a 12-year lease which initially expires in April 2034 with two, five-year renewal options and no termination options. The rent commencement date for the First Phase Space was April 18, 2022 and rent commencement for the Second Phase Space (34,409 square feet of the 3rd floor) will be on January 1, 2023. Base Rent is required to increase 2.75% annually. The tenant provided to the landlord a security deposit equal to $4,631,047.21 as security for the full and faithful performance by IDEO of its obligations under the lease. So long as the tenant is not in default, at the end of the 60th month of the lease term, the amount of the security deposit will be reduced to $2,778,628.32. The lease is guaranteed by Kyu Investment Incorporated, a New York corporation.
The Lion Building Property is expected to serve as IDEO’s new headquarters location for design, production, R&D, and corporate office uses. According to the loan sponsors, IDEO has invested approximately $7.2 million ($60 per square foot) into their space. All of the equipment is in place and operational at The Lion Building Property. The First Phase Space of IDEO’s buildout was designed for 450 people to be on site. As of the week of May 9, 2022, approximately one-fourth to one-third of the maximum occupancy is on site at any given moment and is expected to increase in phases. The First Phase Space includes:
| ■ | 2nd floor – The wood shop, metal shop, spray booth, and 3D print room are all located on the 2nd floor. The metal shop has a dock-high roll up door which allows for the movement of materials and equipment. The second floor also has a flex project room which allows for the custom configuration for the assembly and production of prototypes, etc. |
| ■ | 3rd floor (10,000 square feet, which are not part of the Second Phase Space) – this floor includes the photo studio and audio/video production rooms. This allows for on-site capture and pot production of content. |
| ■ | 4th floor – this floor includes additional video and audio production rooms. It is also home to IDEO’s test kitchen and play lab, where prototypes for toys and children’s games are tested. The CEO’s office is on the 4th floor. The office space is all open plan with the majority on the 4th floor. |
Embark (52,815 square feet, 30.6% of NRA; 32.2% underwritten base rent), Embark develops technologically advanced autonomous driving software for the truck freight industry. Embark’s products include Embark Driver (a per-mile software license), Embark Guardian (an autonomous fleet management solution that provides remote vehicle monitoring, dispatching, and access to real-time data), and Embark Universal Interface (a set of standardized self-driving components).
In May 2021, Embark signed a seven-year lease with one, five-year renewal option and a termination option on the last day of the sixth year of the lease term. Embark is not yet in occupancy of its space. Rent will commence upon substantial completion and delivery of the ground floor/mezzanine space, which is anticipated to be in August 2022. If the landlord fails to deliver the premises in the condition required under the lease on or before January 7, 2023, Embark will be granted a credit equal to one day of base rent for each day of delay until completion of the landlord’s base building work for the ground floor/mezzanine space. Delays resulting from changes to plans requested by the tenant, force majeure or delay by the tenant in furnishing information or responding to requests will not extend the rent commencement date. If the landlord fails to deliver the premises in the condition required under the lease on or before October 7, 2022, Embark may terminate the lease at any time prior to substantial completion of the required work, in which case the landlord will be required to refund the security deposit to Embark. We cannot assure you that the premises will be delivered or the rent will commence as expected or at all.
At loan closing, an Embark Holdback Reserve in the amount of $31,000,000 was reserved with an amount equal to the income stream from Embark. When Embark takes physical occupancy and commences paying rent for the leased premises (anticipated to be August 1, 2022), the Embark Holdback Reserve net of Embark’s free rents ($2,321,111) will be released to the borrower. We cannot assure you that Embark will take occupancy or commence paying rent as expected or at all. If the loan sponsors fail to deliver the leased premises and rent has not commenced by the date 36 months after the loan closing, the borrower has the right (but not obligation) to partially defease the loan in an amount equal to the Embark Holdback Reserve.
The Market. The Lion Building Property is located between San Francisco’s Mission, SoMa, Potrero Hill, and Showplace Square districts and is walking distance to many amenities, including some of San Francisco’s most critically acclaimed restaurants and shops. The Lion Building Property is easily accessible and served by multiple modes of transportation including the San Francisco Municipal Railway and
THE INFORMATION IN THIS STRUCTURAL AND COLLATERAL TERM SHEET IS NOT COMPLETE AND MAY BE AMENDED PRIOR TO THE TIME OF SALE. THIS TERM SHEET IS NOT AN OFFER TO SELL THESE SECURITIES AND IT IS NOT A SOLICITATION OF AN OFFER TO BUY THESE SECURITIES IN ANY JURISDICTION WHERE THE OFFER OR SALE IS NOT PERMITTED.
103 of 143
| Structural and Collateral Term Sheet | Benchmark 2022-B36 | |
| The Lion Building | ||
the Bay Area Rapid Transit system, and is within a five-minute drive of both Highway 101 and Interstate 80. In addition, The Lion Building Property is within a five-minute walk of multiple public transit lines, including four bus lines that stop within one block of The Lion Building Property.
The Lion Building Property is located in the Mission area within the city of San Francisco. The Lion Building Property’s neighborhood represents a center of commerce, recreation, and diversity. The region features outdoor activities, cultural institutions, Michelin-starred restaurants, and a bustling art and music scene. Further, the area greatly benefits from the city's transportation linkages and infrastructure.
The Lion Building Property is located in San Francisco, California within the Mission/Potrero office submarket. As of November 2021, the Mission/Potrero submarket contained nearly 3.6 million square feet of office space. Through the third quarter of 2021, the Mission/Potrero submarket witnessed 184,050 square feet of negative net absorption. This corresponded with a vacancy rate of 12.7%, up from 7.8% at the end of 2020.
The Lion Building Property is also located within the Mission/Potrero industrial submarket. As of May 2022, the Mission/Potrero submarket contained nearly 10.1 million square feet of industrial space. Through the third quarter of 2021, the Mission/Potrero submarket witnessed 44,935 square feet of positive net absorption. This corresponded with a vacancy rate of 7.7%, down from 7.9% at the end of 2021.
The comparable PDR/Lab leases indicated starting rental rates that ranged from $3.83 to $7.16 per square foot per month on an industrial gross basis, averaging $5.72 per square foot per month. The comparable leases ranged in size from 14,601 to 235,000 square feet. In-term rent increases are being achieved, with three percent annual increases most common.
The following table summarizes the comparable PDR leases in the surrounding market.
| Office Lease Comparables(1) | ||||||||||
| Property/Address | Location | Year Built / Renovated | Tenant Name | Lease Start Date | Term (mos.) | Lease Type | Tenant Size (square feet) | UW Base Rent Per square feet | ||
| The Lion Building(2) | San Francisco, CA | 1924/2021 | Embark | 8/2022 | 84 | IG | 52,815 | $71.50 | ||
| Mariposa Square | San Francisco, CA | 1923/NAP | Open AI | 1/2022 | 120 | IG | 106,000 | $66.00 | ||
| Alexandia Center - B1 | San Francisco, CA | 2008/NAP | Fibrogen | 9/2021 | 60 | IG | 235,000 | $72.00 | ||
| 1155 Bryant | San Francisco, CA | 1919/2016 | Mission Barns | 8/2021 | 120 | IG | 32,451 | $77.04 | ||
| Pier 70 | San Francisco, CA | 1900/2017 | Astranis | 7/2021 | 81 | IG | 130,000 | $63.00 | ||
| De Haro Place | San Francisco, CA | 1927/2013 | Initae | 5/2021 | 120 | IG | 51,855 | $85.92 | ||
| 2101 Mission | San Francisco, CA | 1916/2020 | Dandelion Chocolate | 3/2021 | 102 | IG | 14,601 | $45.96 | ||
| Total/Wtd. Avg.(3) | 86 | 569,907 | $70.00 | |||||||
| (1) | Source: Appraisal |
| (2) | Based on the underwritten rent roll dated June 1, 2022. |
| (3) | Total/Wtd.Avg. does not include The Lion Building Property. |
| Historical Occupancy | |||
| 2019(1) | 2020(1) | 2021(1) | Current(2)(3) |
| NAV | NAV | NAV | 100.0% |
| (1) | The historical occupancy is not available because of recent renovation. |
| (2) | Based on the underwritten rent roll dated June 1, 2022. |
| (3) | Embark and IDEO are included in the current occupancy, although Embark is not currently in occupancy and IDEO is not currently in occupancy with respect to Second Phase Space. |
THE INFORMATION IN THIS STRUCTURAL AND COLLATERAL TERM SHEET IS NOT COMPLETE AND MAY BE AMENDED PRIOR TO THE TIME OF SALE. THIS TERM SHEET IS NOT AN OFFER TO SELL THESE SECURITIES AND IT IS NOT A SOLICITATION OF AN OFFER TO BUY THESE SECURITIES IN ANY JURISDICTION WHERE THE OFFER OR SALE IS NOT PERMITTED.
104 of 143
| Structural and Collateral Term Sheet | Benchmark 2022-B36 | |
| The Lion Building | ||
| Tenant Summary(1) | ||||||
| Tenant | Ratings Moody’s/S&P/Fitch(2) | Net Rentable Area (SF) | % of Total NRA | Base Rent PSF | % of Total Base Rent | Lease Expiration Date |
| IDEO(3)(4) | NR/NR/NR | 119,513 | 69.4% | $66.60 | 67.8% | 4/30/2034 |
| Embark(5)(6) | NR/NR/NR | 52,815 | 30.6 | $71.50 | 32.2 | 7/31/2029 |
| Total Occupied Space | 172,328 | 100.0% | $68.10 | 100.0% | ||
| Vacant | 0 | 0.0% | ||||
| Total / Wtd. Avg. | 172,328 | 100.0% | ||||
| (1) | Based on the underwritten rent roll dated June 1, 2022. |
| (2) | In some instances, ratings provided are those of the parent company or government of the entity shown, whether or not the parent company or government guarantees the lease. |
| (3) | All of the Second Phase Space (defined below, consisting of 34,409 square feet of 3rd floor) is built out with drop ceilings, offices and conference rooms, carpet and tiles. IDEO has agreed to a firm rent commencement date of January 1, 2023 for the Second Phase Space. The Second Phase Space can be occupied immediately. There are no termination options tied to the Second Phase Space. |
| (4) | UW Base Rent is inclusive of IDEO’s Second Phase Space that is not currently in occupancy. This Second Phase Space accounts for approximately 20.0% of NRA and 18.5% of UW Base Rent. |
| (5) | Embark has a termination option on the last day of the sixth year of the lease term (which lease is anticipated to commence on August 1, 2022). Additionally, if the landlord fails to deliver the premises in the condition required under the lease on or before October 7, 2022, Embark may terminate the lease at any time prior to substantial completion of the required work, in which case the landlord will be required to refund the security deposit to Embark. |
| (6) | UW Base Rent is inclusive of the Embarks Trucks space, although Embark is not currently in occupancy or paying rent. We cannot assure you that Embark will occupy the premises or commence paying rent as expected or at all. The Embark space accounts for approximately 30.6% of NRA and 32.2% of UW Base Rent. |
| Lease Rollover Schedule(1)(2)(3) | |||||||||
| Year | Number of Leases Expiring | Net Rentable Area Expiring | % of NRA Expiring | Base Rent Expiring(3) | % of Base Rent Expiring(3) | Cumulative Net Rentable Area Expiring | Cumulative % of NRA Expiring | Cumulative Base Rent Expiring(3) | Cumulative % of Base Rent Expiring(3) |
| Vacant | NAP | 0 | 0.0% | NAP | NAP | 0 | 0.0% | NAP | NAP |
| 2022 | 0 | 0 | 0.0 | $0 | 0.0% | 0 | 0.0% | $0 | 0.0% |
| 2023 | 0 | 0 | 0.0 | 0 | 0.0 | 0 | 0.0% | $0 | 0.0% |
| 2024 | 0 | 0 | 0.0 | 0 | 0.0 | 0 | 0.0% | $0 | 0.0% |
| 2025 | 0 | 0 | 0.0 | 0 | 0.0 | 0 | 0.0% | $0 | 0.0% |
| 2026 | 0 | 0 | 0.0 | 0 | 0.0 | 0 | 0.0% | $0 | 0.0% |
| 2027 | 0 | 0 | 0.0 | 0 | 0.0 | 0 | 0.0% | $0 | 0.0% |
| 2028 | 0 | 0 | 0.0 | 0 | 0.0 | 0 | 0.0% | $0 | 0.0% |
| 2029 | 1 | 52,815 | 30.6 | 3,776,273 | 32.2 | 52,815 | 30.6% | $3,776,273 | 32.2% |
| 2030 | 0 | 0 | 0.0 | 0 | 0.0 | 52,815 | 30.6% | $3,776,273 | 32.2% |
| 2031 | 0 | 0 | 0.0 | 0 | 0.0 | 52,815 | 30.6% | $3,776,273 | 32.2% |
| 2032 | 0 | 0 | 0.0 | 0 | 0.0 | 52,815 | 30.6% | $3,776,273 | 32.2% |
| 2033 & Thereafter | 1 | 119,513 | 69.4 | 7,959,540 | 67.8 | 172,328 | 100.0% | $11,735,813 | 100.0% |
| Total | 2 | 172,328 | 100.0% | $11,735,813 | 100.0% | ||||
| (1) | Based on the underwritten rent roll dated June 1, 2022. |
| (2) | Certain tenants may have termination or contraction options (which may become exercisable prior to the originally stated expiration date of the tenant lease) that are not considered in the above Lease Rollover Schedule. |
| (3) | Base Rent Expiring, % of Base Rent Expiring, Cumulative Base Rent Expiring and Cumulative % of Base Rent Expiring are inclusive of the Embark space and IDEO’s Second Phase Space that are not currently in occupancy. The Embark space accounts for approximately 30.6% of NRA and 32.2% of UW Base Rent, and IDEO’s Second Phase Space accounts for approximately 20.0% of NRA and 18.5% of Base Rent. |
THE INFORMATION IN THIS STRUCTURAL AND COLLATERAL TERM SHEET IS NOT COMPLETE AND MAY BE AMENDED PRIOR TO THE TIME OF SALE. THIS TERM SHEET IS NOT AN OFFER TO SELL THESE SECURITIES AND IT IS NOT A SOLICITATION OF AN OFFER TO BUY THESE SECURITIES IN ANY JURISDICTION WHERE THE OFFER OR SALE IS NOT PERMITTED.
105 of 143
| Structural and Collateral Term Sheet | Benchmark 2022-B36 | |
| The Lion Building | ||
| Operating History and Underwritten Net Cash Flow(1)(2) | |||
| Underwritten | Per Square Foot | %(3) | |
| Rents in Place(4) | $11,735,813 | $68.10 | 98.7% |
| Rent Step | 155,599 | 0.90 | 1.3% |
| Gross Potential Rent | $11,891,412 | $69.00 | 100.0% |
| Total Reimbursements | 399,032 | 2.32 | 3.4% |
| Gross Rental Income | $12,290,443 | $71.32 | 103.4% |
| (Vacancy/Credit Loss) | (614,522) | (3.57) | (5.2)% |
| Total Other Income | 0 | $0.00 | 0.0%% |
| Effective Gross Income | $11,675,921 | $67.75 | 98.2% |
| Total Expenses | $2,022,534 | $11.74 | 17.0% |
| Net Operating Income | $9,653,388 | $56.02 | 81.2% |
| TI/LC | 430,820 | $2.50 | 3.6%% |
| Replacement Reserves | 34,466 | $0.20 | 0.3%% |
| Net Cash Flow | $9,188,102 | $53.32 | 77.3% |
| (1) | Certain items such as interest expense, interest income, lease cancellation income, depreciation, amortization, debt service payments and any other non-recurring were excluded from the historical presentation and are not considered for the underwritten cash flow. |
| (2) | Historical financials are unavailable due to recent renovation of The Lion Building Property. |
| (3) | % represents the percentage of Gross Potential Rent. |
| (4) | Underwritten Rents in Place is inclusive of the Embark and IDEO Second Phase Space that are not currently in occupancy. The Embark space accounts for approximately 30.6% of NRA and 32.2% of Underwritten Base Rent, and IDEO’s Second Phase Space accounts for approximately 20.0% of NRA and 18.5% of Underwritten Base Rent. |
Property Management. The Lion Building Property is managed by W2 Property Management, Inc., a third party property management company.
Escrows and Reserves. At loan origination, the borrower deposited (i) approximately $289,274 into a tax reserve, (ii) approximately $37,550 into an insurance reserve, (iii) approximately $130,000 into a capital expenditure reserve, (iv) approximately $7,720,741 into a security deposit comprised of $4,631,047 for IDEO and $3,089,694 for Embark, (v) approximately $5,304,696 into a free rent reserve, (vi) approximately $1,264,531 into a gap rent reserve, (vii) approximately $4,946,132 into a TI/LC reserve and (viii) approximately $31,000,000 into the Embark Holdback Reserve.
Tax Reserve – On each due date, the borrower is required to fund 1/12 of the taxes (initially approximately $72,319), that the lender reasonably estimates will be payable over the next-ensuing 12-month period.
Insurance Reserve – On each due date, the borrower is required to fund 1/12 of the insurance premiums that the lender reasonably estimates will be required for the renewal of the insurance coverage (initially approximately $7,510).
Capital Expenditure Reserve – On each due date, the borrower is required to fund a capital expenditure reserve in the amount of approximately $3,590. The deposits are capped at $86,164, exclusive of the initial deposit until the related sidewalk work is completed.
TI / LC Reserve — On a monthly basis during the continuance of a Trigger Period (as defined below), the borrower is required to escrow an amount equal to $21,541.00 for tenant improvement and leasing costs.
Embark Holdback Reserve – The Embark Holdback Reserve in the amount of $31,000,000 was reserved at origination with the holdback amount being equivalent to the income stream from Embark. When Embark takes physical occupancy and commences paying rent for the leased premises (anticipated to be August 1, 2022), economic holdback net of Embark’s free rents ($2,321,111) will be released to the borrower. If the borrower sponsor fails to deliver the leased premises and rent has not commenced by the date that is 36 months after The Lion Building Whole Loan closing date, the borrower has the right (but not obligation) to defease The Lion Building Whole Loan in an amount equal to the economic holdback funds.
Lockbox / Cash Management. The Lion Building Whole Loan is structured with a hard lockbox and springing cash management. The borrower is required to cause all rents to be deposited directly into the lender-controlled lockbox account. The Lion Building Whole Loan documents also require that all rents received by the borrower or property manager be deposited into the lockbox account within one business day of receipt. During the continuance of a Trigger Period (as defined below), funds on deposit in the lockbox account are required to be swept on a daily basis into a lender-controlled cash management account and applied on each payment date (i) to make deposits into the tax and insurance reserves, (ii) to pay debt service on The Lion Building Whole Loan, (iii) to make deposits into the capital expenditure and TI / LC reserves, (iv) to pay (I) the lesser of lender-approved budgeted operating expenses and actual operating expenses, minus (II) the amount by which lender-approved budgeted operating expenses exceeded actual operating expenses in prior
THE INFORMATION IN THIS STRUCTURAL AND COLLATERAL TERM SHEET IS NOT COMPLETE AND MAY BE AMENDED PRIOR TO THE TIME OF SALE. THIS TERM SHEET IS NOT AN OFFER TO SELL THESE SECURITIES AND IT IS NOT A SOLICITATION OF AN OFFER TO BUY THESE SECURITIES IN ANY JURISDICTION WHERE THE OFFER OR SALE IS NOT PERMITTED.
106 of 143
| Structural and Collateral Term Sheet | Benchmark 2022-B36 | |
| The Lion Building | ||
months, to the extent not previously deducted pursuant to this clause (II), and (v) to pay lender-approved extraordinary expenses, if any, with any excess cash after such application required to be deposited (A) if a Lease Sweep Period (as defined below) is continuing, into a lease sweep reserve (the “Lease Sweep Reserve”) to be applied to pay the costs of re-tenanting the applicable space, or (B) if no Lease Sweep Period is continuing, and any other Trigger Period is continuing, into a lender-controlled account to be held as additional collateral for The Lion Building Whole Loan during such Trigger Period.
A “Trigger Period” will commence upon (i) the occurrence of an event of default under The Lion Building Whole Loan, (ii) a Low DSCR Period (as defined below) or (iii) the commencement of a Lease Sweep Period, and will end, if (A) with respect to a Trigger Period continuing pursuant to clause (i), the event of default commencing the Trigger Period has been cured and such cure has been accepted by the lender, (B) with respect to a Trigger Period continuing due to clause (ii), the Low DSCR Period has ended, or (C) with respect to a Trigger Period continuing due to clause (iv), the Lease Sweep Period has ended.
A “Low DSCR Period” will commence if the debt service coverage ratio (“DSCR”) of The Lion Building Whole Loan is less than 1.20x based on The Lion Building Whole Loan documents as of the last day of any calendar quarter, however if any tenant is subject to a Tenant Adjustment Event (as defined below), then the underwritten net cash flow as of the most recent calendar quarter may be immediately adjusted downward by the lender and to the extent said adjustment results in a DSCR that is below 1.20x, a Low DSCR Period will immediately commence, and will end upon The Lion Building Property achieving a DSCR of at least 1.25x for two consecutive calendar quarters.
A “Tenant Adjustment Event” will mean the exclusion of (i) amounts representing non-recurring items and (ii) amounts received from (1) tenants not currently in occupancy and paying full, unabated rent (unless all abated rent has been deposited with the lender), (2) tenants affiliated with the borrower or non-recourse guarantor, (3) tenants in default or in bankruptcy, (4) tenants under (x) month-to-month leases and (y) leases where the term is set to expire in the next two (2) succeeding calendar quarters or (5) tenants under leases where the tenant thereunder has a renewal option and has failed to exercise such renewal option within the time period set forth in the lease or has given notice of intent to vacate.
A “Lease Sweep Period” will commence (a) upon the earlier of (i) the date that is 12 months prior to the expiration of a Sweep Lease (defined below) or the date on which a termination option thereunder may be exercised or (ii) upon the date required under the Sweep Lease by which the sweep tenant is required to give notice of its exercise of a renewal option thereunder (and such renewal has not been so exercised) or (iii) 12 months prior to The Lion Building Whole Loan maturity date (if a sweep tenant’s lease expires within 12 months after the maturity date); (b) upon the early termination, early cancellation or early surrender of a Sweep Lease or upon the borrower’s receipt of notice by a sweep tenant of its intent to effectuate an early termination, early cancellation or early surrender of its Sweep Lease; (c) if a sweep tenant has ceased operating its business (i.e., “goes dark”) in its space (or any material portion thereof) at The Lion Building Property (a “Go Dark Event”); (d) upon a default under a Sweep Lease by a sweep tenant beyond any applicable notice and cure period, or (e) upon a bankruptcy or insolvency proceeding of a sweep tenant or its parent.
A Lease Sweep Period will end once the applicable Lease Sweep Period has been cured or the space demised under the Sweep Lease has been re-tenanted pursuant to one or more qualified leases as defined in The Lion Building Whole Loan documents (or, if applicable, the applicable Sweep Lease has been renewed pursuant to its terms) and, in the lender’s reasonable judgment, sufficient funds have been accumulated in the Lease Sweep Reserve to cover all anticipated tenant improvements and leasing commissions and free and/or abated rent in connection therewith (and in the case of replacement leases, any debt service and operating shortfalls relating to the delay in the commencement of full rent payments) (the “Lease Sweep Re-tenanting Costs”). A Lease Sweep Period will also cease on the date on which the following amounts have accumulated in the Lease Sweep Reserve: (x) $50 per square foot with respect to any portion of the space demised under the applicable Sweep Lease that has not been re-tenanted; and (y) to the extent a portion of the space demised under the applicable Sweep Lease has been re-tenanted pursuant to one or more qualified leases, in the lender’s judgment, sufficient funds to cover all anticipated Lease Sweep Re-tenanting Costs related to the space that has been re-tenanted.
A “Sweep Lease” means (i) the IDEO lease, (ii) the Embark lease, or (iii) any replacement lease of the foregoing leases that, either individually, or when taken together with any other lease with the same tenant or its affiliates, and assuming the exercise of all expansion rights and all preferential rights to lease additional space contained in such lease, covers the majority of the applicable Lease Sweep Space.
A “Lease Sweep Space” means the space demised under the applicable Sweep Lease.
Current Mezzanine or Subordinate Indebtedness. None.
Future Mezzanine or Subordinate Indebtedness Permitted. None.
Partial Release. None.
THE INFORMATION IN THIS STRUCTURAL AND COLLATERAL TERM SHEET IS NOT COMPLETE AND MAY BE AMENDED PRIOR TO THE TIME OF SALE. THIS TERM SHEET IS NOT AN OFFER TO SELL THESE SECURITIES AND IT IS NOT A SOLICITATION OF AN OFFER TO BUY THESE SECURITIES IN ANY JURISDICTION WHERE THE OFFER OR SALE IS NOT PERMITTED.
107 of 143
| Structural and Collateral Term Sheet | Benchmark 2022-B36 | |
| NMC Industrial Portfolio I | ||
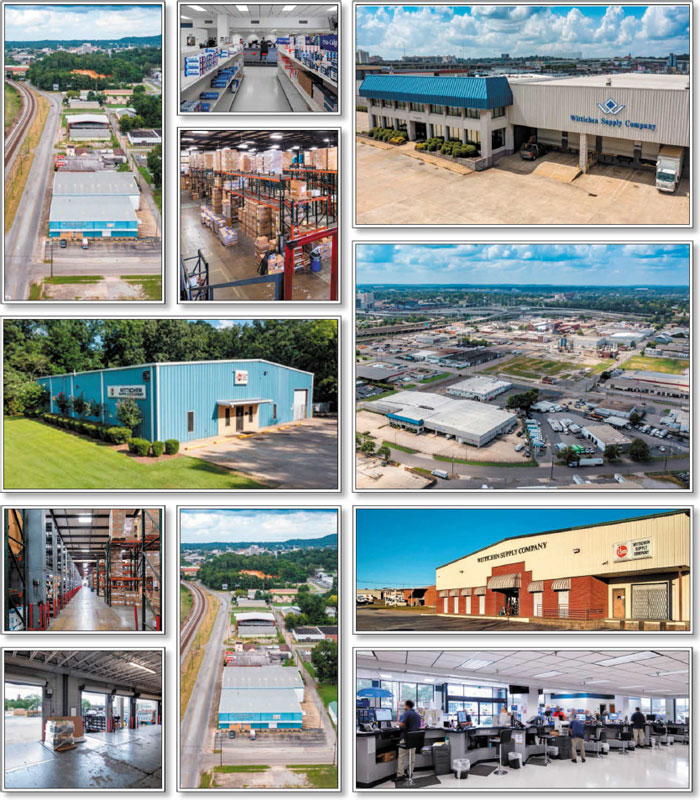
THE INFORMATION IN THIS STRUCTURAL AND COLLATERAL TERM SHEET IS NOT COMPLETE AND MAY BE AMENDED PRIOR TO THE TIME OF SALE. THIS TERM SHEET IS NOT AN OFFER TO SELL THESE SECURITIES AND IT IS NOT A SOLICITATION OF AN OFFER TO BUY THESE SECURITIES IN ANY JURISDICTION WHERE THE OFFER OR SALE IS NOT PERMITTED.
108 of 143
| Structural and Collateral Term Sheet | Benchmark 2022-B36 | |
| NMC Industrial Portfolio I | ||
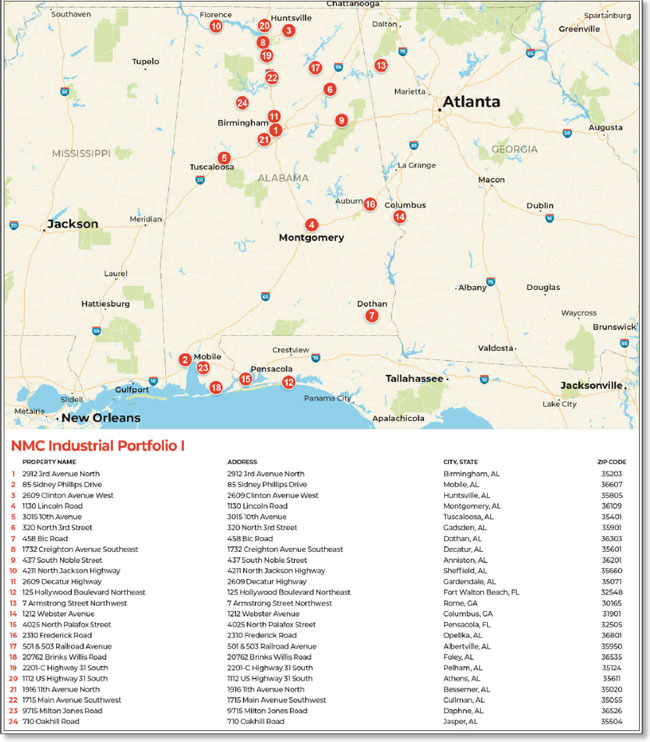
THE INFORMATION IN THIS STRUCTURAL AND COLLATERAL TERM SHEET IS NOT COMPLETE AND MAY BE AMENDED PRIOR TO THE TIME OF SALE. THIS TERM SHEET IS NOT AN OFFER TO SELL THESE SECURITIES AND IT IS NOT A SOLICITATION OF AN OFFER TO BUY THESE SECURITIES IN ANY JURISDICTION WHERE THE OFFER OR SALE IS NOT PERMITTED.
109 of 143
| Structural and Collateral Term Sheet | Benchmark 2022-B36 | |
| NMC Industrial Portfolio I | ||
| Mortgage Loan Information | Property Information | |||
| Mortgage Loan Seller: | GSMC | Single Asset / Portfolio: | Portfolio | |
| Original Principal Balance: | $32,076,375 | Title: | Fee | |
| Cut-off Date Principal Balance: | $32,076,375 | Property Type - Subtype: | Industrial – Various | |
| % of Pool by IPB: | 4.3% | Net Rentable Area (SF): | 606,967 | |
| Loan Purpose: | Recapitalization | Location(1): | Various | |
| Borrower: | NM WIT, L.L.C. | Year Built / Renovated(1): | Various / Various | |
| Guarantors: | New Mountain Net Lease Partners | Occupancy: | 100.0% | |
| Corporation and New Mountain | Occupancy Date: | 8/1/2022 | ||
| Net Lease Corporation | Number of Tenants: | 1 | ||
| Interest Rate: | 4.43000% | Fourth Most Recent NOI(2): | NAV | |
| Note Date: | 6/8/2022 | Third Most Recent NOI(2): | NAV | |
| Maturity Date: | 7/6/2032 | Second Most Recent NOI(2): | NAV | |
| Interest-only Period: | 120 months | Most Recent NOI(2): | NAV | |
| Original Term: | 120 months | UW Economic Occupancy: | 95.0% | |
| Original Amortization: | None | UW Revenues: | $3,976,190 | |
| Amortization Type: | Interest Only | UW Expenses: | $795,238 | |
| Call Protection: | L(23),YM1(2),DorYM1(90),O(5) | UW NOI: | $3,180,952 | |
| Lockbox / Cash Management: | Hard / Springing | UW NCF: | $2,955,710 | |
| Additional Debt: | N/A | Appraised Value / Per SF(3): | $56,000,000 / $92 | |
| Additional Debt Balance: | N/A | Appraisal Date: | 5/23/2022 | |
| Additional Debt Type: | N/A | |||
| Escrows and Reserves(4) | Financial Information | ||||||
| Initial | Monthly | Initial Cap | Mortgage Loan | ||||
| Taxes: | $0 | Springing | N/A | Cut-off Date Loan / SF: | $53 | ||
| Insurance: | $0 | Springing | N/A | Maturity Date Loan / SF: | $53 | ||
| Replacement Reserves: | $0 | Springing | $182,090 | Cut-off Date LTV(3): | 57.3% | ||
| TI/LC: | $0 | Springing | $910,451 | Maturity Date LTV(3): | 57.3% | ||
| Other: | $0 | $0 | N/A | UW NCF DSCR: | 2.05x | ||
| UW NOI Debt Yield: | 9.9% | ||||||
| |||||||
| Sources and Uses | |||||||
| Sources | Proceeds | % of Total | Uses | Proceeds | % of Total | ||
| Loan Amount | $32,076,375 | 100.0% | Principal Equity Distribution | $28,480,836 | 88.8% | ||
| Closing Costs | 3,595,539 | 11.2 | |||||
| Total Sources | $32,076,375 | 100.0% | Total Uses | $32,076,375 | 100.0% | ||
| (1) | See “Portfolio Summary – Top 20” table herein. |
| (2) | No historical financials were provided by the loan sponsor as part of the recapitalization, since the NMC Industrial Portfolio I Properties (as defined below) are leased to a single tenant under a triple net lease. |
| (3) | The Appraised Value is based on the “As Is Portfolio” value, inclusive of a 0.8% portfolio premium. The sum of the individual appraised values is $55,555,000, which equates to a Cut-off Date LTV and Maturity Date LTV of 57.7%. There is an aggregate Go-Dark appraisal value of $32,665,000, which equates to a Cut-Off Date LTV and Maturity Date LTV of 98.2%. |
| (4) | For a full description of Escrows and Reserves, please refer to “Escrows and Reserves” below. |
The Loan. The NMC Industrial Portfolio I mortgage loan (the “NMC Industrial Portfolio I Loan”) is a fixed rate loan secured by first lien deeds of trust and mortgages encumbering the borrower’s fee interests in a portfolio of 24 industrial properties located across Alabama, Florida and Georgia (each a “NMC Industrial Portfolio I Property”, and collectively the “NMC Industrial Portfolio I Properties”). The NMC Industrial Portfolio I Loan is evidenced by a promissory note with an original principal balance and outstanding principal balance as of the Cut-off Date of $32,076,375, representing approximately 4.3% of the Initial Pool Balance.
The NMC Industrial Portfolio I Loan was originated by Goldman Sachs Bank USA on June 8, 2022. The NMC Industrial Portfolio I Loan has a 10-year interest only term and accrues interest at a fixed rate of 4.43000% per annum. The NMC Industrial Portfolio I Loan proceeds were used to recapitalize the NMC Industrial Portfolio I Properties and pay origination costs.
THE INFORMATION IN THIS STRUCTURAL AND COLLATERAL TERM SHEET IS NOT COMPLETE AND MAY BE AMENDED PRIOR TO THE TIME OF SALE. THIS TERM SHEET IS NOT AN OFFER TO SELL THESE SECURITIES AND IT IS NOT A SOLICITATION OF AN OFFER TO BUY THESE SECURITIES IN ANY JURISDICTION WHERE THE OFFER OR SALE IS NOT PERMITTED.
110 of 143
| Structural and Collateral Term Sheet | Benchmark 2022-B36 | |
| NMC Industrial Portfolio I | ||
The NMC Industrial Portfolio I Loan had an initial term of 120 months and has a remaining term of 119 months as of the Cut-off Date. The scheduled maturity date of the NMC Industrial Portfolio I Loan is July 6, 2032. Voluntary prepayment of the NMC Industrial Portfolio I Loan in whole (or in part as described below under “—Partial Release”) is permitted on or after the due date occurring in March 2032 without payment of any prepayment premium. In addition, voluntary prepayment of the NMC Industrial Portfolio I Loan in whole (or in part as described below under “—Partial Release”) is permitted at any time on or after the second anniversary of the origination date (or, solely in connection with a partial release as described below under “—Partial Release,” prior to the second anniversary of the origination date) with payment of a prepayment premium. Defeasance of the NMC Industrial Portfolio I Loan in whole (or in part as described below under “—Partial Release”) is permitted at any time after the second anniversary of the Closing Date.
The Borrower. The borrower is NM WIT, L.L.C., a Delaware limited liability company and single purpose entity with one independent director in its organizational structure. Legal counsel to the borrower delivered a non-consolidation opinion in connection with the origination of the NMC Industrial Portfolio I Loan.
The Loan Sponsors. The loan sponsors and non-recourse carveout guarantors are, jointly and severally, New Mountain Net Lease Partners Corporation and New Mountain Net Lease Corporation, each a Maryland corporation.
The Property. The NMC Industrial Portfolio I Properties are comprised of 24 flex and warehouse/distribution industrial properties, aggregating to 606,967 square feet. The NMC Industrial Portfolio I Properties are located in Alabama (20 assets / 538,187 square feet), Florida (two assets / 30,254 square feet) and Georgia (two assets / 38,526 square feet). The NMC Industrial Portfolio I Properties have an average footprint of approximately 25,000 square feet, a weighted average by square feet of approximately 26’ clear heights, and age of 40 years. The NMC Industrial Portfolio I Properties are occupied by a single tenant, Wittichen Supply Company LLC (the “Wittichen Master Tenant”), which is headquartered in Birmingham, Alabama and is a wholesale distributor of HVAC/R equipment, parts & supplies holding approximately 46% of total market share in Alabama.
Sole Tenant.
The sole tenant at the NMC Industrial Portfolio I Properties is the Wittichen Master Tenant, a wholesale distributor of HVAC/R equipment, parts, supplies and customer service provider. Founded in 1914 and headquartered in Birmingham, Alabama, the Wittichen Master Tenant is the industry leader in the state and has a growing presence in the Florida panhandle, as well as western Georgia.
All 24 facilities comprising the NMC Industrial Portfolio I Properties are subject to an absolute triple-net master lease agreement with the Wittichen Master Tenant. The lease has an initial term of 20 years and two, 10-year renewal options, for a fully extended term of 40 years, and contains no termination options (outside of casualty and condemnation). The base rent will escalate by 2.0% each year for the entire initial lease term and any extension option. The lease is guaranteed by WSC Holdings Holdco LLC.
90% of the Wittichen Master Tenant revenue is generated from the repair, maintenance and improvement (RMI) segment of the HVAC/R wholesale distribution market and the remaining 10% of revenue is generated from new construction. The Wittichen Master Tenant maintains long-standing relationships with vendors and distributes products from more than 100 HVAC/R manufacturers.
In August 2021, the Wittichen Master Tenant was acquired by Gryphon Investors, a private equity firm that has managed over $5.0 billion of equity investments and capital since 1997. Gryphon Investors opted to sell the facilities to pay down approximately $22.0 million of debt and to fund additional acquisitions.
The Market. The NMC Industrial Portfolio I Properties are comprised of 24 properties in three states. The following highlights the five largest markets by allocated loan amount:
Birmingham, Alabama (17.6% of Cut-off Date Allocated Loan Amount): The Birmingham warehouse market has approximately 67.9 million square feet of industrial space and an average rent of $5.65 per square foot per year with vacancy of 3.2%, as of the fourth quarter of 2021.
Mobile, Alabama (12.2% of Cut-off Date Allocated Loan Amount): The Mobile - AL warehouse market has approximately 34.5 million square feet of industrial space and an average rent of $6.28 per square foot per year with vacancy of 5.0%, as of the fourth quarter of 2021.
Huntsville, Alabama (5.1% of Cut-off Date Allocated Loan Amount): The Huntsville warehouse market currently has approximately 6.7 million square feet of industrial space and an average rent of $12.29 per square foot per year with vacancy of 2.1% as the of fourth quarter of 2021.
Montgomery, Alabama (5.0% of Cut-off Date Allocated Loan Amount): The Montgomery industrial market has approximately 34.5 million square feet of industrial space and an average rent of $5.07 per square foot per year with vacancy of 3.6%, as of the fourth quarter of 2021.
THE INFORMATION IN THIS STRUCTURAL AND COLLATERAL TERM SHEET IS NOT COMPLETE AND MAY BE AMENDED PRIOR TO THE TIME OF SALE. THIS TERM SHEET IS NOT AN OFFER TO SELL THESE SECURITIES AND IT IS NOT A SOLICITATION OF AN OFFER TO BUY THESE SECURITIES IN ANY JURISDICTION WHERE THE OFFER OR SALE IS NOT PERMITTED.
111 of 143
| Structural and Collateral Term Sheet | Benchmark 2022-B36 | |
| NMC Industrial Portfolio I | ||
Tuscaloosa, Alabama (4.7% of Cut-off Date Allocated Loan Amount): The Tuscaloosa - AL warehouse market has approximately 1.1 million square feet of industrial space and an average rent of $9.70 per square foot per year with vacancy of 3.0% as of the fourth quarter of 2021.
| Historical and Current Occupancy(1) | |||
| 2019 | 2020 | 2021 | Current(2) |
| NAV | NAV | NAV | 100.0% |
| (1) | No historical financials were provided by the loan sponsor as part of the recapitalization, since the NMC Industrial Portfolio I Properties are leased to a single tenant under a triple net lease. |
| (2) | Current Occupancy is as of August 1, 2022. |
| Tenant Summary(1) | |||||||
| Tenant | Ratings Moody’s/Fitch/S&P | Net Rentable Area (SF) | % of Total NRA | Base Rent PSF | % of Total Base Rent | Lease Expiration Date | |
| Wittichen Supply Company LLC | NR/NR/NR | 606,967 | 100.0% | $5.48 | 100.0% | 12/31/2041(2) | |
| Total Occupied | 606,967 | 100.0% | $5.48 | 100.0% | |||
| Vacant | 0 | 0.0% | |||||
| Total | 606,967 | 100.0% | $5.48 | 100.0% | |||
| (1) | Based on the underwritten rent roll dated April 8, 2022. |
| (2) | The Wittichen Master Tenant occupies the entire portfolio under an absolute triple-net master lease agreement. The lease has an initial term of 20 years and two, 10-year renewal options, for a fully extended term of 40 years, and contains no termination options (outside of casualty and condemnation). The base rent will escalate by 2.0% each year for the entire initial lease term and any extension option. The lease is guaranteed by WSC Holdings Holdco LLC. |
| Lease Rollover Schedule(1) | |||||||||
| Year | Number of Tenant Leases Expiring | Net Rentable Area Expiring | % of NRA Expiring | Base Rent Expiring | % of Base Rent Expiring | Cumulative Net Rentable Area Expiring | Cumulative % of NRA Expiring | Cumulative Base Rent Expiring | Cumulative % of Base Rent Expiring |
| Vacant | NAP | 0 | 0.0% | NAP | NAP | 0 | 0.0% | NAP | NAP |
| MTM | 0 | 0 | 0.0% | $0 | 0.0% | 0 | 0.0% | $0 | 0.0% |
| 2022 | 0 | 0 | 0.0% | $0 | 0.0% | 0 | 0.0% | $0 | 0.0% |
| 2023 | 0 | 0 | 0.0% | $0 | 0.0% | 0 | 0.0% | $0 | 0.0% |
| 2024 | 0 | 0 | 0.0% | $0 | 0.0% | 0 | 0.0% | $0 | 0.0% |
| 2025 | 0 | 0 | 0.0% | $0 | 0.0% | 0 | 0.0% | $0 | 0.0% |
| 2026 | 0 | 0 | 0.0% | $0 | 0.0% | 0 | 0.0% | $0 | 0.0% |
| 2027 | 0 | 0 | 0.0% | $0 | 0.0% | 0 | 0.0% | $0 | 0.0% |
| 2028 | 0 | 0 | 0.0% | $0 | 0.0% | 0 | 0.0% | $0 | 0.0% |
| 2029 | 0 | 0 | 0.0% | $0 | 0.0% | 0 | 0.0% | $0 | 0.0% |
| 2030 | 0 | 0 | 0.0% | $0 | 0.0% | 0 | 0.0% | $0 | 0.0% |
| 2031 | 0 | 0 | 0.0% | $0 | 0.0% | 0 | 0.0% | $0 | 0.0% |
| 2032 and Thereafter(2) | 1 | 606,967 | 100.0% | $3,323,750 | 100.0% | 606,967 | 100.0% | $3,323,750 | 100.0% |
| Total | 1 | 606,967 | 100.0% | $3,323,750 | 100.0% | ||||
| (1) | Based on the underwritten rent roll dated April 8, 2022. |
| (2) | The Wittichen Master Tenant occupies the entire NMC Industrial Portfolio I Properties under an absolute triple-net master lease agreement with the Wittichen Master Tenant. The lease has an initial term of 20 years and two 10-year renewal options, for a fully extended term of 40 years, and contains no termination options (outside of casualty and condemnation). The base rent will escalate by 2.0% each year for the entire initial lease term and any extension option. The lease is guaranteed by WSC Holdings Holdco LLC. |
THE INFORMATION IN THIS STRUCTURAL AND COLLATERAL TERM SHEET IS NOT COMPLETE AND MAY BE AMENDED PRIOR TO THE TIME OF SALE. THIS TERM SHEET IS NOT AN OFFER TO SELL THESE SECURITIES AND IT IS NOT A SOLICITATION OF AN OFFER TO BUY THESE SECURITIES IN ANY JURISDICTION WHERE THE OFFER OR SALE IS NOT PERMITTED.
112 of 143
| Structural and Collateral Term Sheet | Benchmark 2022-B36 | |
| NMC Industrial Portfolio I | ||
| Portfolio Summary – Top 20 | |||||||
| Property Name | City, State | Year Built / Renovated | SF | Clear Height(1) | Occupancy(2) | Allocated Loan Amount ($) | % of Allocated Loan Amount |
| 2912 3rd Avenue North | Birmingham, AL | 1980 / 1990 | 84,147 | 33’ | 100.0% | $5,629,460 | 17.6% |
| 85 Sidney Phillips Drive | Mobile, AL | 1980 / NAP | 67,829 | 24.2’ | 100.0% | 3,926,188 | 12.2% |
| 2609 Clinton Avenue West | Huntsville, AL | 1961 / 1992 | 28,488 | 29.8’ | 100.0% | 1,633,987 | 5.1% |
| 1130 Lincoln Road | Montgomery, AL | 1990 / 2007 | 36,763 | 27.7’ - 28.4’ | 100.0% | 1,587,796 | 5.0% |
| 3015 10th Avenue | Tuscaloosa, AL | 1985 / NAP | 31,578 | 19.3’ - 24.4’ | 100.0% | 1,518,511 | 4.7% |
| 320 North 3rd Street | Gadsden, AL | 1968 / 1991 | 30,916 | 25.3’ | 100.0% | 1,483,868 | 4.6% |
| 458 Bic Road | Dothan, AL | 1986 / 2020 | 34,173 | 28.2’ | 100.0% | 1,437,677 | 4.5% |
| 1732 Creighton Avenue Southeast | Decatur, AL | 1975 / 1991 | 28,070 | 20.2’ | 100.0% | 1,379,939 | 4.3% |
| 437 South Noble Street | Anniston, AL | 1973 / 2002 | 27,878 | 22.7’ | 100.0% | 1,385,713 | 4.3% |
| 4211 North Jackson Highway | Sheffield, AL | 1978 / 1998 | 25,851 | 28.6’ | 100.0% | 1,287,559 | 4.0% |
| 2609 Decatur Highway | Gardendale, AL | 1975 / 2018 | 19,891 | 21.7’ | 100.0% | 1,140,327 | 3.6% |
| 125 Hollywood Boulevard Northeast | Fort Walton Beach, FL | 1991 / NAP | 15,839 | 28.8’ | 100.0% | 1,114,344 | 3.5% |
| 7 Armstrong Street Northwest | Rome, GA | 1991 / NAP | 20,110 | 20.6’ | 100.0% | 1,056,606 | 3.3% |
| 1212 Webster Avenue | Columbus, GA | 2003 / NAP | 18,416 | 23.5’ | 100.0% | 1,039,285 | 3.2% |
| 4025 North Palafox Street | Pensacola, FL | 1971 / NAP | 14,415 | 30.3’ | 100.0% | 998,868 | 3.1% |
| 2310 Frederick Road | Opelika, AL | 1995 / NAP | 17,494 | 17.2’ | 100.0% | 808,333 | 2.5% |
| 501 & 503 Railroad Avenue | Albertville, AL | 1991 / NAP | 17,816 | 23.5’ | 100.0% | 802,559 | 2.5% |
| 20762 Brinks Willis Road | Foley, AL | 2003 / NAP | 14,894 | 17’ - 23.4’ | 100.0% | 721,726 | 2.3% |
| 2201-C Highway 31 South | Pelham, AL | 1980 / NAP | 16,936 | 32.3’ | 100.0% | 678,422 | 2.1% |
| 1112 US Highway 31 South | Athens, AL | 1970 / NAP | 15,649 | 24.5’ | 100.0% | 623,571 | 1.9% |
| Subtotal | 567,153 | 100.0% | $30,254,739 | 94.3% | |||
| Remaining Properties | 39,814 | 100.0% | $1,821,636 | 5.7% | |||
| Total / Wtd. Avg. | 606,967 | 100.0% | $32,076,375 | 100.0% | |||
| (1) | Source: Appraisal. |
| (2) | Current Occupancy is as of August 1, 2022. |
| Geographic Summary(1) | ||||||||
| State | # of Properties | SF | % of SF | Occupancy(3) | Allocated Loan Amount | % of Allocated Loan Amount | Base Rent(2) | % of Base Rent |
| Alabama | 20 | 538,187 | 88.7% | 100.0% | $27,867,272 | 86.9% | $2,887,850 | 86.9% |
| Florida | 2 | 30,254 | 5.0% | 100.0% | $2,113,212 | 6.6% | $219,100 | 6.6% |
| Georgia | 2 | 38,526 | 6.3% | 100.0% | $2,095,891 | 6.5% | $216,800 | 6.5% |
| Total / Wtd. Avg. | 24 | 606,967 | 100.0% | 100.0% | $32,076,375 | 100.0% | $3,323,750 | 100.0% |
| (1) | Source: Appraisal. |
| (2) | Based on the underwritten rent roll dated April 8, 2022. |
| (3) | Current Occupancy is as of August 1, 2022. |
THE INFORMATION IN THIS STRUCTURAL AND COLLATERAL TERM SHEET IS NOT COMPLETE AND MAY BE AMENDED PRIOR TO THE TIME OF SALE. THIS TERM SHEET IS NOT AN OFFER TO SELL THESE SECURITIES AND IT IS NOT A SOLICITATION OF AN OFFER TO BUY THESE SECURITIES IN ANY JURISDICTION WHERE THE OFFER OR SALE IS NOT PERMITTED.
113 of 143
| Structural and Collateral Term Sheet | Benchmark 2022-B36 | |
| NMC Industrial Portfolio I | ||
| Operating History and Underwritten Net Cash Flow(1)(2) | |||
| Underwritten | Per Square Foot | %(3) | |
| Rents in Place(1) | $3,323,750 | $5.48 | 79.4% |
| Contractual Rent Steps | 66,475 | $0.11 | 1.6% |
| Reimbursement Revenue | 795,238 | $1.31 | 19.0% |
| Gross Potential Revenue | $4,185,463 | $6.90 | 100.0% |
| (Vacancy/Credit Loss) | 209,273 | $0.34 | 5.0% |
| Effective Gross Income | $3,976,190 | $6.55 | 95.0% |
| Total Expenses | 795,238 | $1.31 | 20.0% |
| Net Operating Income | $3,180,952 | $5.24 | 80.0% |
| TI/LC(4) | 134,196 | $0.22 | 3.4% |
| Replacement Reserves(5) | 91,045 | $0.15 | 2.3% |
| Net Cash Flow | $2,955,710 | $4.87 | 74.3% |
| (1) | Based on the underwritten rent roll dated April 8, 2022. |
| (2) | No historical financials were provided by the loan sponsor as part of the recapitalization, since the NMC Industrial Portfolio I Properties are leased to a single tenant under a triple net lease. |
| (3) | % column represents percent of Gross Potential Revenue for all revenue lines and represents percent of Effective Gross Income for the remainder of the fields. |
| (4) | TI/LC is underwritten at $0.22 per square foot. |
| (5) | Replacement Reserves are underwritten at $0.15 per square foot. |
Property Management. The NMC Industrial Portfolio I Properties are managed by the Wittichen Master Tenant.
Escrows and Reserves. At loan origination, the borrower was not required to make any upfront deposits.
Tax Reserve – On each due date during a NMC Industrial Portfolio I Trigger Period (as defined below), the borrower is required to deposit into a real estate tax reserve an amount equal to 1/12 of the amount that the lender reasonably estimates will be necessary to pay real estate taxes over the next 12-month period (such reserve will be conditionally waived so long as no event of default under the related loan documents (the “NMC Industrial I Portfolio Loan documents”) has occurred and is continuing, the Wittichen Master Tenant is required to pay such taxes and, upon the request of the lender, the borrower has provided evidence that taxes have been paid in accordance with the requirements of the NMC Industrial Portfolio I Loan documents).
Insurance Reserve – On each due date during a NMC Industrial Portfolio I Trigger Period (as defined below), the borrower is required to deposit into an insurance reserve an amount equal to 1/12 of the amount that the lender reasonably estimates will be necessary to cover premiums over the next 12-month period (such reserve will be conditionally waived so long as no event of default under the NMC Industrial Portfolio I Loan documents has occurred and is continuing, the Wittichen Master Tenant is required to pay such insurance premiums and, upon the request of the lender, the borrower has provided evidence that insurance premiums have been paid in accordance with the requirements of the NMC Industrial Portfolio I Loan documents).
TI/LC Reserve – On each due date during a NMC Industrial Portfolio I Trigger Period (as defined below), the borrower is required to deposit approximately $50,581 into a tenant improvement and leasing commissions reserve, capped at $1.50 per square foot (excluding amounts deposited therein in respect of lease termination proceeds).
Capital Expenditure Reserve – On each due date during a NMC Industrial Portfolio I Trigger Period, the borrower is required to deposit approximately $7,587 into a capital expenditure reserve, capped at $0.30 per square foot.
Master Lease Reserve – Upon the occurrence of a NMC Industrial Portfolio I Master Lease Trigger Event (as defined below), the borrower is required to deposit all excess cash flow to a master lease reserve account as described below under “—Lockbox/Cash Management;” provided, however, any amounts required to be deposited in the master lease reserve account may, at the borrower’s election, be provided instead in the form of one or more letters of credit up to an aggregate amount of 10% of the then outstanding principal balance of the NMC Industrial Portfolio I Loan.
Lockbox / Cash Management. The NMC Industrial Portfolio I Loan documents require a hard lockbox and springing cash management. The borrower was required to deliver a tenant direction letter to the Wittichen Master Tenant directing the Wittichen Master Tenant to remit its rent directly to the lender-controlled lockbox. The borrower is also required to deliver a tenant direction letter to each future tenant. So long as no NMC Industrial Portfolio I Trigger Period or event of default under the NMC Industrial Portfolio I Loan documents then exists, all funds deposited into the lockbox account are required to be transferred on each business day to a borrower-controlled operating account. Upon the occurrence and during the continuance of a NMC Industrial Portfolio I Trigger Period or event of default
THE INFORMATION IN THIS STRUCTURAL AND COLLATERAL TERM SHEET IS NOT COMPLETE AND MAY BE AMENDED PRIOR TO THE TIME OF SALE. THIS TERM SHEET IS NOT AN OFFER TO SELL THESE SECURITIES AND IT IS NOT A SOLICITATION OF AN OFFER TO BUY THESE SECURITIES IN ANY JURISDICTION WHERE THE OFFER OR SALE IS NOT PERMITTED.
114 of 143
| Structural and Collateral Term Sheet | Benchmark 2022-B36 | |
| NMC Industrial Portfolio I | ||
under the NMC Industrial Portfolio I Loan documents, all funds in the lockbox account are required to be swept on each business day to a cash management account under the control of the lender.
During the continuance of a NMC Industrial Portfolio I Trigger Period or, at the lender’s sole discretion, during an event of default under the NMC Industrial Portfolio I Loan documents, funds in the cash management account will be applied and disbursed for payment of taxes, insurance premiums, operating expenses, debt service, reserves, and other amounts payable in accordance with the NMC Industrial Portfolio I Loan documents, and all excess cash flow funds remaining in the cash management account after the application of such funds in accordance with the NMC Industrial Portfolio I Loan documents are required to be held by the lender (a) during the continuance of a NMC Industrial Portfolio I Trigger Period caused by a NMC Industrial Portfolio I Master Lease Trigger Event, in the master lease reserve account or (b) during the continuance of a NMC Industrial Portfolio I Trigger Period during which a NMC Industrial Portfolio I Master Lease Trigger Event is not in effect, (x) to the extent that the balance in the excess cash flow reserve account is less than an amount equal to the monthly base rent under the master lease or any replacement master lease (as of the date of the commencement of the applicable NMC Industrial Portfolio I Trigger Period) multiplied by 18 (the “NMC Industrial Portfolio I Excess Cash Flow Threshold Amount”), in an excess cash flow reserve account as additional collateral for the NMC Industrial Portfolio I Loan and (y) to the extent that the balance in the excess cash flow reserve account equals or exceeds the NMC Industrial Portfolio I Excess Cash Flow Threshold Amount, in a borrower-controlled operating account. Upon the occurrence and during the continuance of an event of default under the NMC Industrial Portfolio I Loan documents or any bankruptcy action of the borrower, the lender may apply funds to the debt in such priority as it may determine.
A “NMC Industrial Portfolio I Trigger Period” means each period that commences when (a) the Wittichen Master Tenant files for bankruptcy and concludes when (x) the Wittichen Master Tenant assumes the master lease in connection with such bankruptcy or (y) the borrower has relet any applicable NMC Industrial Portfolio I Property pursuant to an approved substitute lease resulting in a debt yield of at least 8.25%; (b) the Wittichen Master Tenant has ceased its business operations in more than 25% (in the aggregate) of any applicable NMC Industrial Portfolio I Property or terminated the master lease (a “Go-Dark Event”) and concludes when (x) (1) a Go-Dark Event is no longer continuing and (2) the Wittichen Master Tenant has provided an estoppel certificate confirming its intent to occupy the applicable NMC Industrial Portfolio I Property in accordance with the master lease, or (y) the borrower has relet any applicable NMC Industrial Portfolio I Property pursuant to an approved substitute lease resulting in a debt yield of at least 8.25% (any of the events described in clauses (a) and (b), a “NMC Industrial Portfolio I Master Lease Trigger Event”); and/or (c) the debt yield, as of the last day of any two consecutive fiscal quarters, is less than 8.25% and concludes when the debt yield, as of the last day of any two consecutive fiscal quarters, is equal to or greater than 8.25%.
Current Mezzanine or Subordinate Indebtedness. None.
Future Mezzanine or Subordinate Indebtedness Permitted. None.
Partial Release. The NMC Industrial Portfolio I Loan documents permit the borrower to obtain the release of any individual NMC Industrial Portfolio I Property from the lien of the NMC Industrial Portfolio I Loan documents following the occurrence of either (x) a casualty or condemnation that results in the Wittichen Master Tenant terminating its master lease with respect to such NMC Industrial Portfolio Property (a “Permitted Release Casualty Event”) or (y) (a) a default or an event of default under the NMC Industrial Portfolio I Loan documents that is solely caused by the Wittichen Master Tenant or (b) a monetary or material non-monetary default by the Wittichen Master Tenant under the master lease that would (1) give the borrower the right under the master lease to terminate the master lease or (2) result in the occurrence of a default or event of default under the NMC Industrial Portfolio I Loan documents (a “Permitted Release Default Event”), provided that, among other conditions, (i) the borrower prepays or defeases a portion of the NMC Industrial Portfolio I Loan in an amount equal to (x) 115% of the allocated NMC Industrial Portfolio I Loan amount for such NMC Industrial Portfolio I Property with respect to a release due to a Permitted Release Casualty Event or (y) 120% of the allocated NMC Industrial Portfolio I Loan amount for such NMC Industrial Portfolio I Property with respect to a release due to a Permitted Release Default Event, plus the payment of a yield maintenance premium (if applicable), (ii) no event of default is continuing, or in the case of a release due to a Permitted Release Default Event, (w) the release would cure such event of default, (x) such event of default is not the result of the borrower’s gross negligence or willful misconduct, (y) no other event of default is continuing, and (z) the release will be completed prior to the expiration of the cure period for such event of default (which may be extended if the borrower is diligently pursuing such cure), and (iii) the borrower delivers to the lender a REMIC opinion if required by the lender.
Property Addition. The NMC Industrial Portfolio I Loan documents permit the borrower to acquire a parcel of undeveloped land (the “NMC Industrial Portfolio I Gap Parcel”) situated adjacent to the 4211 North Jackson Highway Property provided, among other conditions, (i) the borrower and the lender enter into an amendment to the NMC Industrial Portfolio I Loan documents in order to subject the NMC Industrial Portfolio I Gap Parcel to the NMC Industrial Portfolio I Loan, (ii) the borrower pays to the lender all costs and expenses (including, without limitation, all third party reports, title charges and reasonable attorney’s fees and disbursements) paid or incurred by the lender in connection with the borrower’s rights to acquire the NMC Industrial Portfolio I Gap Parcel, and (iii) the borrower delivers to the lender a REMIC opinion. The lender has approved a request from the borrower to acquire the NMC Industrial Portfolio I Gap Parcel and the deed and mortgage spreader agreement accomplishing such property acquisition and expansion of the lender’s lien are in the process of being recorded.
THE INFORMATION IN THIS STRUCTURAL AND COLLATERAL TERM SHEET IS NOT COMPLETE AND MAY BE AMENDED PRIOR TO THE TIME OF SALE. THIS TERM SHEET IS NOT AN OFFER TO SELL THESE SECURITIES AND IT IS NOT A SOLICITATION OF AN OFFER TO BUY THESE SECURITIES IN ANY JURISDICTION WHERE THE OFFER OR SALE IS NOT PERMITTED.
115 of 143
| Structural and Collateral Term Sheet | Benchmark 2022-B36 | |
| Keylock Storage Portfolio II | ||
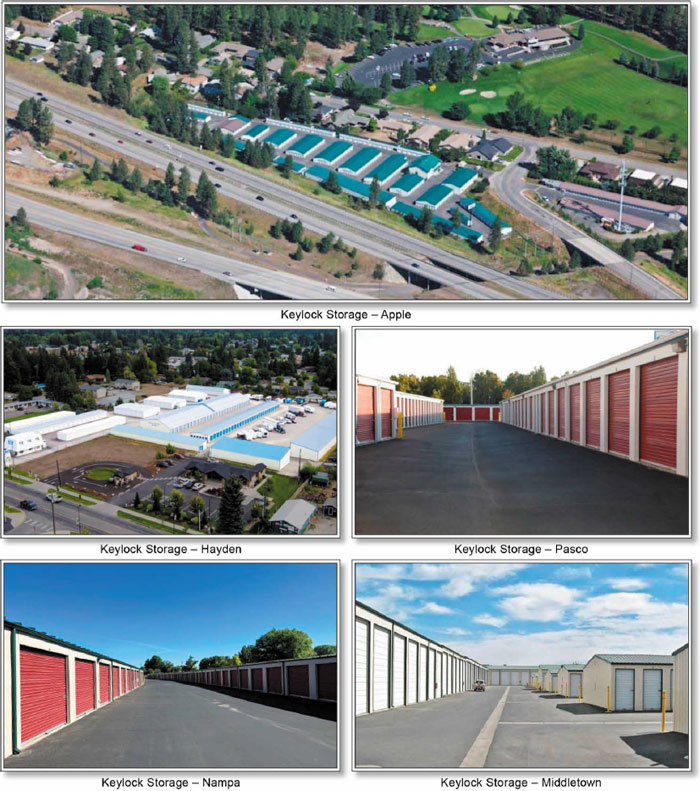
THE INFORMATION IN THIS STRUCTURAL AND COLLATERAL TERM SHEET IS NOT COMPLETE AND MAY BE AMENDED PRIOR TO THE TIME OF SALE. THIS TERM SHEET IS NOT AN OFFER TO SELL THESE SECURITIES AND IT IS NOT A SOLICITATION OF AN OFFER TO BUY THESE SECURITIES IN ANY JURISDICTION WHERE THE OFFER OR SALE IS NOT PERMITTED.
116 of 143
| Structural and Collateral Term Sheet | Benchmark 2022-B36 | |
| Keylock Storage Portfolio II | ||
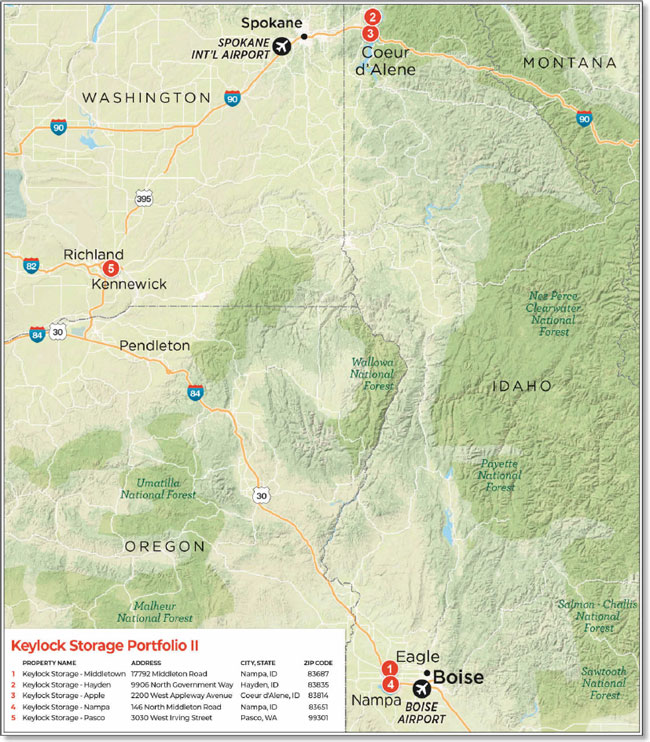
THE INFORMATION IN THIS STRUCTURAL AND COLLATERAL TERM SHEET IS NOT COMPLETE AND MAY BE AMENDED PRIOR TO THE TIME OF SALE. THIS TERM SHEET IS NOT AN OFFER TO SELL THESE SECURITIES AND IT IS NOT A SOLICITATION OF AN OFFER TO BUY THESE SECURITIES IN ANY JURISDICTION WHERE THE OFFER OR SALE IS NOT PERMITTED.
117 of 143
| Structural and Collateral Term Sheet | Benchmark 2022-B36 | |
| Keylock Storage Portfolio II | ||
| Mortgage Loan Information | Property Information | |||
| Mortgage Loan Seller: | CREFI | Single Asset / Portfolio: | Portfolio | |
| Original Principal Balance: | $32,000,000 | Title: | Fee | |
| Cut-off Date Principal Balance: | $32,000,000 | Property Type - Subtype: | Self-storage | |
| % of Pool by IPB: | 4.2% | Net Rentable Area (SF): | 414,658 | |
| Loan Purpose: | Refinance | Location(1): | Various | |
| Borrowers: | KS Middleton LLC, KS Nampa LLC, KS Appleway LLC, KS Hayden LLC and KS Pasco LLC | Year Built / Renovated(1): | Various / Various | |
| Guarantors: | Austin J. Osborne and Ronald L. Osborne | Occupancy: | 89.2% | |
| Interest Rate: | 5.60000% | Occupancy Date: | 5/31/2022 | |
| Note Date: | 7/27/2022 | Number of Tenants: | N/A | |
| Maturity Date: | 8/6/2032 | Fourth Most Recent NOI: | $1,770,064 (December 31, 2019) | |
| Interest-only Period: | 120 months | Third Most Recent NOI: | $1,908,702 (December 31, 2020) | |
| Original Term: | 120 months | Second Most Recent NOI: | $2,692,808 (December 31, 2021) | |
| Original Amortization: | None | Most Recent NOI: | $2,902,439 (TTM May 31, 2022) | |
| Amortization Type: | Interest Only | UW Economic Occupancy: | 85.3% | |
| Call Protection: | L(24),D(93),O(3) | UW Revenues: | $4,205,160 | |
| Lockbox / Cash Management: | Springing / Springing | UW Expenses: | $1,259,707 | |
| Additional Debt: | N/A | UW NOI: | $2,945,453 | |
| Additional Debt Balance: | N/A | UW NCF: | $2,903,987 | |
| Additional Debt Type: | N/A | Appraised Value / Per SF(2): | $58,040,000 / $140 | |
| Appraisal Date(2): | Various | |||
| Escrows and Reserves(3) | Financial Information | |||||||
| Initial | Monthly | Initial Cap | Cut-off Date Loan / SF: | $77 | ||||
| Taxes: | $65,918 | $21,973 | N/A | Maturity Date Loan / SF: | $77 | |||
| Insurance: | $10,752 | $1,792 | N/A | Cut-off Date LTV(2): | 55.1% | |||
| Replacement Reserves: | $0 | $41,466 | N/A | Maturity Date LTV(2): | 55.1% | |||
| TI/LC: | $0 | $0 | N/A | UW NCF DSCR: | 1.60x | |||
| Other: | $35,469 | $0 | N/A | UW NOI Debt Yield: | 9.2% | |||
| Sources and Uses | ||||||
| Sources | Proceeds | % of Total | Uses | Proceeds | % of Total | |
| Mortgage Loan | $32,000,000 | 100.0% | Loan Payoff | $16,498,975 | 51.6% | |
| Sponsor Equity | 14,554,909 | 45.5 | ||||
| Closing Costs | 833,976 | 2.6 | ||||
| Upfront Reserves | 112,139 | 0.4 | ||||
| Total Sources | $32,000,000 | 100.0% | Total Uses | $32,000,000 | 100.0% | |
| (1) | See “Portfolio Summary & Unit Mix” table herein. |
| (2) | Appraisal reports dated as of June 15, 2022 and June 16, 2022. |
| (3) | For a full description of Escrows and Reserves, please refer to “Escrows and Reserves” herein. |
The Loan. The Keylock Storage Portfolio II loan (the “Keylock Storage Portfolio II Loan”) is secured by a first mortgage lien on the borrowers’ fee interests in a portfolio of five self-storage properties comprising 414,658 square feet located in Idaho and Washington (collectively, the “Keylock Storage Portfolio II Portfolio” or “Keylock Storage Portfolio II Properties”). The Keylock Storage Portfolio II Loan accrues interest at a rate of 5.60000% per annum, has an original and remaining term of 120 months, and is interest only for the entire term.
The Borrowers. The borrowing entities for the Keylock Storage Portfolio II Loan are KS Middleton LLC, KS Nampa LLC, KS Appleway LLC, KS Hayden LLC and KS Pasco LLC. The borrowers are Delaware limited liability companies and special purpose entities. Each borrower is structured to be a single purpose bankruptcy-remote entity, having one independent director in its organizational structure. Keylock Storage Holdings LLC, an Idaho limited liability company, is the sole member of each borrower and is 100% owned by Bitterroot Holdings LLC (“Bitterroot Holdings”). Legal counsel to the borrowers delivered a non-consolidation opinion in connection with the origination of the Keylock Storage Portfolio II Loan.
THE INFORMATION IN THIS STRUCTURAL AND COLLATERAL TERM SHEET IS NOT COMPLETE AND MAY BE AMENDED PRIOR TO THE TIME OF SALE. THIS TERM SHEET IS NOT AN OFFER TO SELL THESE SECURITIES AND IT IS NOT A SOLICITATION OF AN OFFER TO BUY THESE SECURITIES IN ANY JURISDICTION WHERE THE OFFER OR SALE IS NOT PERMITTED.
118 of 143
| Structural and Collateral Term Sheet | Benchmark 2022-B36 | |
| Keylock Storage Portfolio II | ||
The Loan Sponsors. The loan sponsors and non-recourse carveout guarantors are Austin J. Osborne and Ronald L. Osborne. Austin J. Osborne and Ronald L. Osborne founded Bitterroot Holdings, a privately held real estate company that owns and operates self-storage facilities and other commercial real estate across Idaho, Oregon, Nevada and Washington.
The Properties. The Keylock Storage Portfolio II Properties consist of five self-storage properties located in Idaho and Washington. The Keylock Storage Portfolio II Properties were built between 1976 and 2007 and in aggregate are situated on approximately 24.7 acres and include 75 buildings. The Keylock Storage Portfolio II Portfolio encompasses 2,408 total units across 414,658 square feet. No single property accounts for more than 25.2% of the portfolio’s underwritten net cash flow. Each property includes 24-hour surveillance, electronic gate access, perimeter fencing and an on-site office with retail supplies. The properties include three unit types: drive-up units, standard units, and climate controlled units. Additionally, the Keylock Storage Portfolio II Properties include 61 uncovered surface parking spaces (2.0% of underwritten base rent) which are primarily used for RV storage. As of May 31, 2022, the Keylock Storage Portfolio II Properties were 89.2% occupied. The Keylock Storage Portfolio II Properties recently added 254 units during a 2021 expansion which occurred at the Keylock Storage – Hayden Property and Keylock Storage – Nampa Property.
The following table presents certain information relating to the Keylock Storage Portfolio II Properties:
| Portfolio Summary and Unit Mix(1) | ||||||||
| Property Name | City/State | Allocated Cut-off Date Loan Amount | % of ALA | Year Built/ Renovated | Total Units | Occupancy(1) | UW NCF | % of UW NCF |
| Keylock Storage - Middleton | Nampa, ID | $8,097,474 | 25.3% | Various(2)/NAP | 583 | 86.6% | $731,259 | 25.2% |
| Keylock Storage - Hayden | Hayden, ID | 7,201,601 | 22.5 | Various(2)/2021 | 431 | 95.6% | $654,694 | 22.5 |
| Keylock Storage - Apple | Coeur D’Alene, ID | 6,375,305 | 19.9 | 1976/2004 | 395 | 93.2% | $579,552 | 20.0 |
| Keylock Storage - Nampa | Nampa, ID | 5,639,768 | 17.6 | Various(2)/NAP | 531 | 89.3% | $511,735 | 17.6 |
| Keylock Storage - Pasco | Pasco, WA | 4,685,852 | 14.6 | 2001/NAP | 468 | 82.2% | $426,747 | 14.7 |
| Total / Wtd. Avg. | $32,000,000 | 100.0% | 2,408 | 89.2% | $2,903,987 | 100.0% | ||
| (1) | Based on the rent roll dated May 31, 2022. |
| (2) | Keylock Storage - Middleton was built in stages between 2007 and 2015. Keylock Storage - Hayden was initially built in 1984 and expanded in 2021, adding an additional 142 units. Keylock Storage - Nampa was initially built in 2006 and expanded in 2021, adding an additional 112 units. |
| Historical Occupancy(1) | |||
| 2019 | 2020 | 2021 | Current(2) |
| 88.7% | 89.2% | 92.0% | 89.2% |
| (1) | Historical Occupancies are the annual average physical occupancy of each respective year. |
| (2) | Current Occupancy is as of May 31, 2022. |
The Market. The Keylock Storage Portfolio II Properties are comprised of five properties across two different states. Properties located in Idaho represent 85.3% of UW NCF and the property located in Washington represent 14.7% of UW NCF.
The Keylock Storage – Middleton and Keylock Storage – Nampa properties are located in Nampa, Canyon County, Idaho, which is part of the Boise City Metropolitan Statistical Area. The properties are situated three miles northwest of downtown Nampa and 20 miles west of the Boise Central Business District. Access to both properties are off Interstate 84, a primary highway that runs northwest to southeast through Nampa. The area has a population of 796,784 which has increased by 180,223 since 2010, reflecting an annual increase of 2.4%. According to the appraisal, the Keylock Storage – Middleton and Keylock Storage – Nampa properties have eight direct competitors (excluding each other) within Nampa and the surrounding area. The comparable properties were built between 1976 and 2019, range from 36,772 to 94,316 square feet. The Keylock Storage – Middleton comparable properties have a weighted average occupancy of 92.0% and the Keylock Storage – Nampa comparable properties have a weighted average occupancy of 89.0%.
The Keylock Storage – Hayden and Keylock Storage – Apple properties are located in Kootenai County, Idaho which is part of the Coeur d’Alene Metropolitan Statistical Area. The Keylock Storage – Hayden property is located in Hayden, Idaho, a city in northwest Idaho north of Coeur d’Alene. The Keylock Storage – Hayden property is located about twenty five miles east of downtown Spokane, Washington. The Keylock Storage – Hayden property is located off US Route 95, a major highway that runs through Hayden. The Keylock Storage – Apple property is located in Coeur d’Alene which is about three miles northwest of downtown Nampa and thirty two miles east of Spokane, Washington Central Business District. Access to the Keylock Storage – Apple property is provided by Interstate 90, which connects the Keylock Storage – Apple neighborhood to Spokane, Washington. The Coeur d’Alene Metropolitan Statistical Area has a population of 174,666 which has increased by 36,172 since 2010, reflecting an annual increase of 2.1%. According to the
THE INFORMATION IN THIS STRUCTURAL AND COLLATERAL TERM SHEET IS NOT COMPLETE AND MAY BE AMENDED PRIOR TO THE TIME OF SALE. THIS TERM SHEET IS NOT AN OFFER TO SELL THESE SECURITIES AND IT IS NOT A SOLICITATION OF AN OFFER TO BUY THESE SECURITIES IN ANY JURISDICTION WHERE THE OFFER OR SALE IS NOT PERMITTED.
119 of 143
| Structural and Collateral Term Sheet | Benchmark 2022-B36 | |
| Keylock Storage Portfolio II | ||
appraisals, the Keylock Storage – Hayden and Keylock Storage – Apple properties have five direct competitors (excluding each other) within Coeur d’Alene and the surrounding area. The comparable properties were built between 1989 and 2011, ranging from 21,505 to 71,706 square feet, and have a weighted average occupancy of 96.1%.
The Keylock Storage – Pasco property is located in Pasco, Franklin County, Washington and is part of the Kennewick-Richland Metropolitan Statistical Area. The property is located in a suburban location in Washington’s Tri-Cities region. The area has a population of 313,591, which has increased by 60,251 since 2010, reflecting an annual increase of 2.0%. According to the appraisal, the Keylock Storage – Pasco property has five direct competitors within Pasco and the surrounding area. The comparable properties were built between 1976 and 2005, ranging from 39,410 to 110,000 square feet, and have a weighted average occupancy of 91.4%.
The following table presents market demographic, vacancy and rent information relating to the Keylock Storage Portfolio II Portfolio:
| Demographic Summary(1) | |||||||
| Property Name | City/State | 1-mile Population | 3-mile Population | 5-mile Population | 1-mile Avg. Household Income | 3-mile Avg. Household Income | 5-mile Avg. Household Income |
| Keylock Storage - Middleton | Nampa, ID | 5,137 | 42,517 | 126,876 | $89,655 | $70,122 | $66,292 |
| Keylock Storage - Hayden | Hayden, ID | 8,473 | 38,519 | 72,852 | $78,233 | $85,420 | $77,245 |
| Keylock Storage - Apple | Coeur D’Alene, ID | 5,788 | 52,985 | 94,087 | $59,141 | $69,775 | $74,669 |
| Keylock Storage - Nampa | Nampa, ID | 11,657 | 63,843 | 139,314 | $65,993 | $63,657 | $66,842 |
| Keylock Storage - Pasco | Pasco, WA | 11,910 | 87,911 | 164,982 | $58,389 | $65,518 | $77,531 |
| (1) | Source: Appraisal. |
| Operating History and Underwritten Net Cash Flow(1) | |||||||
| 2019 | 2020 | 2021 | TTM 5/31/2022 | Underwritten(1) | Per Square | %(2) | |
| Foot | |||||||
| Rents in Place | $2,735,661 | $2,899,396 | $3,783,548 | $4,025,335 | $4,107,641 | $9.91 | 84.1% |
| Vacant Income | 0 | 0 | 0 | 0 | 492,243 | $1.19 | 10.1% |
| Gross Potential Rent | $2,735,661 | $2,899,396 | $3,783,548 | $4,025,335 | $4,599,884 | $11.09 | 94.2% |
| Other Income(3) | 211,480 | 225,825 | 271,091 | 283,584 | 282,369 | $0.68 | 5.8% |
| Net Rental Income | $2,947,141 | $3,125,221 | $4,054,639 | $4,308,919 | $4,882,253 | $11.77 | 100.0% |
| (Vacancy/Credit Loss) | (131,048) | (133,898) | (184,277) | (164,776) | (677,093) | ($1.63) | (13.9%) |
| Effective Gross Income | $2,816,093 | $2,991,323 | $3,870,361 | $4,144,143 | $4,205,160 | $10.14 | 86.1% |
| Real Estate Taxes | 252,137 | 269,066 | 263,238 | 243,725 | 263,673 | $0.64 | 6.3% |
| Insurance | 19,603 | 26,099 | 29,605 | 24,866 | 20,480 | $0.05 | 0.5% |
| Management Fee | 112,644 | 119,653 | 154,814 | 165,766 | 168,206 | $0.41 | 4.0% |
| Other Operating Expenses | 661,645 | 667,804 | 729,896 | 807,347 | 807,347 | $1.95 | 19.2% |
| Total Expenses | $1,046,029 | $1,082,621 | $1,177,554 | $1,241,704 | $1,259,707 | $3.04 | 30.0% |
| Net Operating Income(4) | $1,770,064 | $1,908,702 | $2,692,808 | $2,902,439 | $2,945,453 | $7.10 | 70.0% |
| Replacement Reserves | 0 | 0 | 0 | 0 | 41,466 | $0.10 | 1.0% |
| Net Cash Flow | $1,770,064 | $1,908,702 | $2,692,808 | $2,902,439 | $2,903,987 | $7.00 | 69.1% |
| (1) | Based on the underwritten rent roll dated May 31, 2022. |
| (2) | % column represents percent of Net Rental Income for all revenue lines and represents percent of Effective Gross Income for the remainder of the fields. |
| (3) | Other Income includes protection income, late fees, administrative fees and miscellaneous other income. |
| (4) | The increase in Net Operating Income from 2020 to 2021 is primarily driven by the expansion of the Keylock Storage - Hayden and Keylock Storage - Nampa properties, which occurred in 2021 and added 254 units to the Keylock Storage Portfolio II Properties. |
Property Management. The Keylock Storage Portfolio II Properties are managed by Self-Storage Admin LLC, a borrow-affiliated property management company.
THE INFORMATION IN THIS STRUCTURAL AND COLLATERAL TERM SHEET IS NOT COMPLETE AND MAY BE AMENDED PRIOR TO THE TIME OF SALE. THIS TERM SHEET IS NOT AN OFFER TO SELL THESE SECURITIES AND IT IS NOT A SOLICITATION OF AN OFFER TO BUY THESE SECURITIES IN ANY JURISDICTION WHERE THE OFFER OR SALE IS NOT PERMITTED.
120 of 143
| Structural and Collateral Term Sheet | Benchmark 2022-B36 | |
| Keylock Storage Portfolio II | ||
Escrows and Reserves. At loan origination, the borrowers deposited with the lender (i) a real estate tax reserve in the amount of approximately $65,918, (ii) a deferred maintenance reserve in the amount of approximately $35,469, and (iii) an insurance reserve in the amount of approximately $10,752.
Replacement Reserves – On each monthly payment date, the borrowers are required to deposit approximately $41,466 into a replacement reserve.
Tax Reserve – On each monthly payment date, the borrowers are required to deposit into a tax reserve, 1/12th of the amount that the lender estimates will be payable over the next-ensuing 12-month period (initially estimated to be equal to approximately $21,973).
Insurance Reserve – On each monthly payment date, the borrowers are required to deposit into an insurance reserve, 1/12th of the amount that the lender estimates will be necessary to pay insurance premiums over the then succeeding 12-month period (initially estimated to be equal to approximately $1,792).
Lockbox / Cash Management. The Keylock Storage Portfolio II Loan is structured with a springing lockbox and springing cash management. Upon the first occurrence of a Trigger Period (as defined below), the borrowers are required to cause all revenues derived from the Keylock Storage Portfolio II Properties to be immediately deposited into a lender-controlled lockbox. The borrowers are required, within five days after the occurrence of a Trigger Period, to deliver a payment direction letter to credit card companies directing each to remit all payment directly to the lender-controlled lockbox. On each business day during the continuance of a Trigger Period, all amounts in the lockbox account are required to be remitted to a lender-controlled cash management account, to be applied and disbursed in accordance with the Keylock Storage Portfolio II Loan documents, and all excess cash flow funds remaining in the cash management account after the application of such funds in accordance with the Keylock Storage Portfolio II Loan documents are required to be held by the lender in an excess cash flow reserve account as additional collateral for the Keylock Storage Portfolio II Loan. Upon the cure of the applicable Trigger Period, so long as no other Trigger Period exists, the lender is required to return any amounts remaining on deposit in the excess cash flow reserve account to the borrower. Upon an event of default under the Keylock Storage Portfolio II Loan documents, the lender will apply funds to the debt in such priority as it may determine.
A “Trigger Period” means a period (A) commencing upon the earliest of (i) the occurrence and continuance of an event of default, and (ii) the debt service coverage ratio (based on a 30-year amortization schedule) being less than 1.15x, and (B) expiring upon (x) with regard to any Trigger Period commenced in connection with (i) above, the cure (if applicable) of such event of default, and (y) with regard to any Trigger Period commenced in connection with clause (ii) above, the date that the debt service coverage ratio is equal to or greater than 1.20x for two consecutive calendar quarters.
Current Mezzanine or Subordinate Indebtedness. None.
Future Mezzanine or Secured Subordinate Indebtedness Permitted. None.
Partial Release. None.
THE INFORMATION IN THIS STRUCTURAL AND COLLATERAL TERM SHEET IS NOT COMPLETE AND MAY BE AMENDED PRIOR TO THE TIME OF SALE. THIS TERM SHEET IS NOT AN OFFER TO SELL THESE SECURITIES AND IT IS NOT A SOLICITATION OF AN OFFER TO BUY THESE SECURITIES IN ANY JURISDICTION WHERE THE OFFER OR SALE IS NOT PERMITTED.
121 of 143
| Structural and Collateral Term Sheet | Benchmark 2022-B36 | |
| NMC Industrial Portfolio II | ||
| Mortgage Loan Information | Property Information | |||
| Mortgage Loan Seller: | GSMC | Single Asset / Portfolio(1): | Portfolio | |
| Original Principal Balance: | $30,187,500 | Title(2): | Various | |
| Cut-off Date Principal Balance: | $30,187,500 | Property Type – Subtype: | Industrial – Various | |
| % of Pool by IPB: | 4.0% | Net Rentable Area (SF)(1): | 861,600 | |
| Loan Purpose: | Recapitalization | Location(1): | Various | |
| Borrower: | NM VYT, L.L.C. | Year Built / Renovated(1): | Various / NAP | |
| Guarantors: | New Mountain Net Lease Partners | Occupancy(1): | 100.0% | |
| Corporation and New Mountain | Occupancy Date: | 8/1/2022 | ||
| Net Lease Corporation | Number of Tenants: | 1 | ||
| Interest Rate: | 4.36000% | Fourth Most Recent NOI(3): | NAV | |
| Note Date: | 6/7/2022 | Third Most Recent NOI(3): | NAV | |
| Maturity Date: | 7/6/2032 | Second Most Recent NOI(3): | NAV | |
| Interest-only Period: | 120 months | Most Recent NOI(3): | NAV | |
| Original Term: | 120 months | UW Economic Occupancy: | 95.0% | |
| Original Amortization: | None | UW Revenues: | $3,709,236 | |
| Amortization Type: | Interest Only | UW Expenses: | $741,847 | |
| Call Protection: | L(23),YM1(2),DorYM1(90),O(5) | UW NOI: | $2,967,389 | |
| Lockbox / Cash Management: | Hard / Springing | UW NCF: | $2,714,631 | |
| Additional Debt: | N/A | Appraised Value / Per SF(4): | $52,500,000 / $61 | |
| Additional Debt Balance: | N/A | Appraisal Date: | Various | |
| Additional Debt Type: | N/A | |||
| Escrows and Reserves | Financial Information | ||||||
| Initial | Monthly | Initial Cap | Mortgage Loan | ||||
| Taxes: | $0 | Springing | N/A | Cut-off Date Loan / SF: | $35 | ||
| Insurance: | $0 | Springing | N/A | Maturity Date Loan / SF: | $35 | ||
| Replacement Reserves: | $0 | Springing | $258,480 | Cut-off Date LTV: | 57.5% | ||
| TI/LC: | $0 | Springing | $1,292,400 | Maturity Date LTV: | 57.5% | ||
| Other(5): | $0 | Springing | N/A | UW NCF DSCR: | 2.03x | ||
| UW NOI Debt Yield: | 9.8% | ||||||
| Sources and Uses | ||||||||
| Sources | Proceeds | % of Total | Uses | Proceeds | % of Total | |||
| Loan Amount | $30,187,500 | 100.0% | Principal Equity Distribution | $26,974,093 | 89.4% | |||
| Closing Costs | 3,213,407 | 10.6 | ||||||
| Total Sources | $30,187,500 | 100.0% | Total Uses | $30,187,500 | 100.0% | |||
| (1) | See “Portfolio Summary – Top 20” table herein. |
| (2) | The 11170 Green Valley Drive and 1919 Superior Street properties are fee interests, while the 2030 Old Candler Road property is a fee / leasehold interest. |
| (3) | No historical financials were provided by the loan sponsor as part of the recapitalization, since the NMC Industrial Portfolio II Properties (as defined below) are leased to a single tenant under a triple net lease. |
| (4) | The aggregate Go-Dark appraised values of the three individual NMC Industrial Portfolio II Properties is $35,650,000, which equates to a Cut-Off Date LTV and Maturity Date LTV of approximately 84.7%. |
| (5) | Other Reserve is a ground rent reserve pertaining to the 2030 Old Candler Road property, a portion of which is subject to a ground lease with annual payments of approximately $88,701 through November 30, 2041. The ground lease has four, 5-year extension options, with a fully-extended ground lease expiration date of November 30, 2061. |
The Loan. The NMC Industrial Portfolio II mortgage loan (the “NMC Industrial Portfolio II Loan”) is a fixed rate loan secured by first lien deeds of trust and mortgages encumbering the borrower’s fee and fee / leasehold interests in a portfolio of three industrial properties located in Georgia, Indiana and Mississippi (each a “NMC Industrial Portfolio II Property” and collectively the “NMC Industrial Portfolio II Properties”). The NMC Industrial Portfolio II Loan has a 10-year interest only term and accrues interest at a fixed rate of 4.36000% per annum. The NMC Industrial Portfolio II Loan is evidenced by a promissory note with an original principal balance and outstanding principal balance as of the Cut-off Date of $30,187,500, representing approximately 4.0% of the Initial Pool Balance.
THE INFORMATION IN THIS STRUCTURAL AND COLLATERAL TERM SHEET IS NOT COMPLETE AND MAY BE AMENDED PRIOR TO THE TIME OF SALE. THIS TERM SHEET IS NOT AN OFFER TO SELL THESE SECURITIES AND IT IS NOT A SOLICITATION OF AN OFFER TO BUY THESE SECURITIES IN ANY JURISDICTION WHERE THE OFFER OR SALE IS NOT PERMITTED.
122 of 143
| Structural and Collateral Term Sheet | Benchmark 2022-B36 | |
| NMC Industrial Portfolio II | ||
The Borrower. The borrower is NM VYT, L.L.C., a Delaware limited liability company and single purpose entity with one independent director in its organizational structure. Legal counsel to the borrower delivered a non-consolidation opinion in connection with the origination of the NMC Industrial Portfolio II Loan.
The Loan Sponsors. The loan sponsors and non-recourse carveout guarantors are, jointly and severally, New Mountain Net Lease Partners Corporation and New Mountain Net Lease Corporation, each a Maryland corporation.
The Property. The NMC Industrial Portfolio II Properties are comprised of three mixed industrial centers (861,600 square feet). The NMC Industrial Portfolio II Properties are located in Olive Branch, Mississippi (340,000 square feet), Elkhart, Indiana (423,800 square feet), and Gainesville, Georgia (97,800 square feet). The NMC Industrial Portfolio II Properties have a weighted average year built of 1966 and weighted average clear heights of 22’ based on the purchase price. The NMC Industrial Portfolio II Properties house approximately $29.5 million of equipment value in total.
Sole Tenant.
The sole tenant, Voyant Beauty (the “Voyant Master Tenant”), is a contract manufacturer of beauty and personal care products in North America. The Voyant Master Tenant is headquartered in Hodgkins, Illinois and has an international footprint with 15 owned manufacturing facilities in the U.S., Canada, and Europe and more than 5 million square feet of manufacturing space.
The Voyant Master Tenant’s end market exposure, by revenue, is comprised of 43% personal care, 28% home beauty, 23% prestige beauty, and 4% hotel. The beauty and personal care contract manufacturing market is growing at an average of approximately 5-6% per annum. Key end-markets include traditional consumer packaged goods (household, personal care and beauty), premium and emerging beauty, as well as hotel customers. Traditional consumer packaged goods are typically noncyclical and represent a majority portion of revenue within the subject facilities. Additionally, the contractual nature of the business and the ability to pass through costs of raw materials to customers provides inflation protection.
The Voyant Master Tenant is a provider in the North American hotel cosmetics market and has a presence with global hotel chains. The Voyant Master Tenant has manufacturing and supply chain capabilities and diversified product types and packaging formats as well as long-term relationships with hotels and brands. Three of the Voyant Master Tenant’s largest customers include Marriott (39% of total revenue), Wyndham (18% of revenue) and Aveda (16% of revenue). The Voyant Master Tenant is the sole provider of hotel cosmetic products for the CFRST Marriot flags (Courtyard Fairfield Inn, Residence Inn, Springhill Suites and Townplace Suites) through December 2023.
The Market. The NMC Industrial Portfolio II Properties are located in three separate industrial markets. The Elkhart, Indiana facility is located approximately 100 miles east of Chicago, with approximately 77.0 million square feet of market inventory as of the fourth quarter of 2021. The Elkhart market has a market vacancy rate of 1.0% as of the fourth quarter of 2021. The Gainesville, Georgia facility is located approximately 50 miles northeast of Atlanta, with approximately 31.9 million square feet of market inventory as of the fourth quarter of 2021. The current market vacancy is 2.5% as of the fourth quarter of 2021. The third facility is in Olive Branch, Mississippi, an industrial market situated less than 20 miles southeast of Memphis, with approximately 305.1 million square feet of market inventory as of the fourth quarter of 2021. The market vacancy is 5.9% as of the fourth quarter of 2021.
| Historical and Current Occupancy(1) | |||
| 2019 | 2020 | 2021 | Current(2) |
| NAV | NAV | NAV | 100.0% |
| (1) | No historical financials were provided by the loan sponsor as part of the recapitalization, since the NMC Industrial Portfolio II Properties are leased to a single tenant under a triple net lease. |
| (2) | Current Occupancy is as of August 1, 2022. |
| Tenant Summary(1) | |||||||
| Tenant | Ratings Moody’s/Fitch/S&P | Net Rentable Area (SF) | % of Total NRA | Base Rent PSF(2) | % of Total Base Rent(2) | Lease Expiration Date | |
| Voyant Beauty | NR/NR/NR | 861,600 | 100.0% | $3.67 | 100.0% | 11/30/2041(2) | |
| Total Occupied | 861,600 | 100.0% | |||||
| Vacant | 0 | 0% | |||||
| Total | 861,600 | 100.0% | $3.67 | 100.0% | |||
| (1) | As of August 1, 2022, with rent steps through December 1, 2022. |
| (2) | The Voyant Master Tenant occupies the entire portfolio under an absolute triple-net master lease agreement. The lease has an initial term of 20 years and four, 5-year renewal options, for a fully extended term of 40 years, and contains no termination options (outside of casualty and |
THE INFORMATION IN THIS STRUCTURAL AND COLLATERAL TERM SHEET IS NOT COMPLETE AND MAY BE AMENDED PRIOR TO THE TIME OF SALE. THIS TERM SHEET IS NOT AN OFFER TO SELL THESE SECURITIES AND IT IS NOT A SOLICITATION OF AN OFFER TO BUY THESE SECURITIES IN ANY JURISDICTION WHERE THE OFFER OR SALE IS NOT PERMITTED.
123 of 143
| Structural and Collateral Term Sheet | Benchmark 2022-B36 | |
| NMC Industrial Portfolio II | ||
| condemnation). The base rent will escalate by 2.0% each year for the entire initial lease term and any extension option. The lease is guaranteed by Voyant Beauty Holdings, Inc. |
| Lease Rollover Schedule(1) | |||||||||
| Year | Number of Tenant Leases Expiring | Net Rentable Area Expiring | % of NRA Expiring | Base Rent Expiring | % of Base Rent Expiring | Cumulative Net Rentable Area Expiring | Cumulative % of NRA Expiring | Cumulative Base Rent Expiring | Cumulative % of Base Rent Expiring |
| Vacant | NAP | 0 | 0.0% | NAP | NAP | 0 | 0.0% | NAP | NAP |
| MTM | 0 | 0 | 0.0% | $0 | 0.0% | 0 | 0.0% | $0 | 0.0% |
| 2022 | 0 | 0 | 0.0% | $0 | 0.0% | 0 | 0.0% | $0 | 0.0% |
| 2023 | 0 | 0 | 0.0% | $0 | 0.0% | 0 | 0.0% | $0 | 0.0% |
| 2024 | 0 | 0 | 0.0% | $0 | 0.0% | 0 | 0.0% | $0 | 0.0% |
| 2025 | 0 | 0 | 0.0% | $0 | 0.0% | 0 | 0.0% | $0 | 0.0% |
| 2026 | 0 | 0 | 0.0% | $0 | 0.0% | 0 | 0.0% | $0 | 0.0% |
| 2027 | 0 | 0 | 0.0% | $0 | 0.0% | 0 | 0.0% | $0 | 0.0% |
| 2028 | 0 | 0 | 0.0% | $0 | 0.0% | 0 | 0.0% | $0 | 0.0% |
| 2029 | 0 | 0 | 0.0% | $0 | 0.0% | 0 | 0.0% | $0 | 0.0% |
| 2030 | 0 | 0 | 0.0% | $0 | 0.0% | 0 | 0.0% | $0 | 0.0% |
| 2031 | 0 | 0 | 0.0% | $0 | 0.0% | 0 | 0.0% | $0 | 0.0% |
| 2032 and Thereafter(2) | 1 | 861,600 | 100.0% | $3,162,612 | 100.0% | 861,600 | 100.0% | $3,162,612 | 100.0% |
| Total | 1 | 861,600 | 100.0% | $3,162,612 | 100.0% | ||||
| (1) | As of August 1, 2022, with rent steps through December 1, 2022. |
| (2) | The Voyant Master Tenant occupies the entire portfolio under an absolute triple-net master lease agreement. The lease has an initial term of 20 years and four, 5-year renewal options, for a fully extended term of 40 years, and contains no termination options (outside of casualty and condemnation). The base rent will escalate by 2.0% each year for the entire initial lease term and any extension option. The lease is guaranteed by Voyant Beauty Holdings, Inc. |
| Portfolio Summary | |||||||
| Property Name | City, State | Year Built / Renovated | Sq. Ft. | Clear Height | Occupancy | Allocated Loan Amount ($) | % of Allocated Loan Amount |
| 1919 Superior Street | Elkhart, IN | 1946 / NAP | 423,800 | 10’ - 21' | 100.0% | $14,317,500 | 47.4% |
| 11170 Green Valley Drive | Olive Branch, MS | 1986 / NAP | 340,000 | 18’ - 24' | 100.0% | 12,592,500 | 41.7% |
| 2030 Old Candler Road(1) | Gainesville, GA | 1984 / NAP | 97,800 | 22' | 100.0% | 3,277,500 | 10.9% |
| Total | Various | 861,600 | 100.0% | $30,187,500 | 100.0% | ||
| (1) | A portion of the 2030 Old Candler Road property is subject to a ground lease with annual payments of approximately $88,701 through November 30, 2041. The ground lease has four, 5-year extension options, with a fully-extended ground lease expiration date of November 30, 2061. |
THE INFORMATION IN THIS STRUCTURAL AND COLLATERAL TERM SHEET IS NOT COMPLETE AND MAY BE AMENDED PRIOR TO THE TIME OF SALE. THIS TERM SHEET IS NOT AN OFFER TO SELL THESE SECURITIES AND IT IS NOT A SOLICITATION OF AN OFFER TO BUY THESE SECURITIES IN ANY JURISDICTION WHERE THE OFFER OR SALE IS NOT PERMITTED.
124 of 143
| Structural and Collateral Term Sheet | Benchmark 2022-B36 | |
| NMC Industrial Portfolio II | ||
| Geographic Summary | ||||||||
| State | # of Properties | Sq. Ft. | % of Total | Occupancy | Allocated Loan Amount | % of Total | U/W Base Rent | % of Total |
| Indiana | 1 | 423,800 | 49.2% | 100.0% | $14,317,500 | 47.4% | $1,512,966 | 47.8% |
| Mississippi | 1 | 340,000 | 39.5% | 100.0% | 12,592,500 | 41.7% | 1,300,500 | 41.1% |
| Georgia | 1 | 97,800 | 11.4% | 100.0% | 3,277,500 | 10.9% | 349,146 | 11.0% |
| Total | 3 | 861,600 | 100.0% | 100.0% | $30,187,500 | 100.0% | $3,162,612 | 100.0% |
| (1) | As of August 1, 2022, with rent steps through December 1, 2022. |
| Operating History and Underwritten Net Cash Flow(1)(2) | |||
| Underwritten | Per Square Foot | %(3) | |
| Base Rent | $3,100,600 | $3.60 | 79.4% |
| Contractual Rent Steps | 62,012 | 0.07 | 1.6% |
| Reimbursement Revenue | 741,847 | 0.86 | 19.0% |
| Gross Potential Revenue | $3,904,459 | $4.53 | 100.0% |
| (Vacancy/Credit Loss) | (195,223) | (0.23) | (5.0%) |
| Effective Gross Income | $3,709,236 | $4.31 | 95.0% |
| Total Expenses | 741,847 | 0.86 | 20.0% |
| Net Operating Income | $2,967,389 | $3.44 | 80.0% |
| TI/LC(4) | 123,518 | 0.14 | 3.3% |
| Replacement Reserves | 129,240 | 0.15 | 3.5% |
| Net Cash Flow | $2,714,631 | $3.15 | 73.2% |
| (1) | As of the August 1, 2022 rent roll, with rent steps through December 1, 2022. |
| (2) | No historical financials were provided by the loan sponsor as part of the recapitalization, since the NMC Industrial Portfolio II Properties are leased to a single tenant under a triple net lease. |
| (3) | % column represents percent of Gross Potential Revenue for all revenue lines and represents percent of Effective Gross Income for the remainder of the fields. |
| (4) | TI/LC is underwritten at $0.14 per square foot. Replacement Reserves are underwritten at $0.15 per square foot. |
Property Management. The NMC Industrial Portfolio II Properties are managed by the Voyant Master Tenant.
THE INFORMATION IN THIS STRUCTURAL AND COLLATERAL TERM SHEET IS NOT COMPLETE AND MAY BE AMENDED PRIOR TO THE TIME OF SALE. THIS TERM SHEET IS NOT AN OFFER TO SELL THESE SECURITIES AND IT IS NOT A SOLICITATION OF AN OFFER TO BUY THESE SECURITIES IN ANY JURISDICTION WHERE THE OFFER OR SALE IS NOT PERMITTED.
125 of 143
| Structural and Collateral Term Sheet | Benchmark 2022-B36 | |
| Lincoln Place | ||
| Mortgage Loan Information | Property Information | |||
| Mortgage Loan Seller: | JPMCB | Single Asset / Portfolio: | Single Asset | |
| Original Principal Balance: | $28,012,500 | Title: | Fee | |
| Cut-off Date Principal Balance: | $28,012,500 | Property Type – Subtype: | Retail - Anchored | |
| % of Pool by IPB: | 3.7% | Net Rentable Area (SF): | 272,060 | |
| Loan Purpose: | Acquisition | Location: | Fairview Heights, IL | |
| Borrowers: | Alneil Jo-Ash LLC, Lincoln Place | Year Built / Renovated(1): | 1986-2002 / NAP | |
| Capital LLC, 2044 Ocean Parkway | Occupancy: | 95.0% | ||
| LLC and CS Lincoln Place LLC | Occupancy Date: | 6/1/2022 | ||
| Guarantor: | David Dushey | Number of Tenants | 17 | |
| Interest Rate: | 5.16000% | Fourth Most Recent NOI: | $2,506,682 (December 31, 2019) | |
| Note Date: | 5/25/2022 | Third Most Recent NOI: | $3,198,646 (December 31, 2020) | |
| Maturity/ARD Date: | 6/5/2032 | Second Most Recent NOI: | $2,727,591 (December 31, 2021) | |
| Interest-only Period: | 120 months | Most Recent NOI: | $2,912,743 (TTM February 28, 2022) | |
| Original Term: | 120 months | UW Economic Occupancy: | 90.6% | |
| Original Amortization: | None | UW Revenues(4): | $4,361,310 | |
| Amortization Type: | Interest Only | UW Expenses: | $1,070,152 | |
| Call Protection: | L(26),D(88),O(6) | UW NOI: | $3,291,159 | |
| Lockbox / Cash Management: | Hard / Springing | UW NCF(4): | $3,242,005 | |
| Additional Debt(2): | N/A | Appraised Value / Per SF: | $42,500,000 / $156 | |
| Additional Debt Balance(2): | N/A | Appraisal Date: | 3/14/2022 | |
| Additional Debt Type(2): | N/A | |||
| Escrows and Reserves | Financial Information | ||||||
| Initial | Monthly | Initial Cap | |||||
| Taxes: | $476,133 | $47,613 | N/A | Cut-off Date Loan / SF: | $103 | ||
| Insurance: | $0 | Springing | N/A | Maturity Date Loan / SF: | $103 | ||
| Replacement Reserves: | $2,318 | $2,318 | $83,464 | Cut-off Date LTV: | 65.9% | ||
| TI/LC: | $331,336 | $11,336 | $680,150 | Maturity Date LTV: | 65.9% | ||
| Other(3): | $830,000 | $0 | N/A | UW NCF DSCR: | 2.21x | ||
| UW NOI Debt Yield: | 11.7% | ||||||
| Sources and Uses | |||||||
| Sources | Proceeds | % of Total | Uses | Proceeds | % of Total | ||
| Mortgage Loan | $28,012,500 | 64.0% | Purchase Price | $41,500,000 | 94.8% | ||
| Sponsor Equity | 15,779,164 | 36.0% | Upfront Reserves | 1,639,787 | 3.7% | ||
| Closing Costs | 651,877 | 1.5% | |||||
| Total Sources | $43,791,664 | 100.0% | Total Uses | $43,791,664 | 100.0% | ||
| (1) | The Lincoln Place property was built in phases beginning in 1986 with the final phase being completed in 2002. The weighted average year built is 2001. |
| (2) | One of the four TIC Borrowers (as defined below) has incurred an unsecured and subordinated note in the amount of $2,000,000 payable to Jo-Ash Realty Corp., which is an affiliate of the Exchange Borrower (as defined below), to use the proceeds under the Subordinated Note (as defined below) solely as additional funds for acquisition of the Lincoln Place property. |
| (3) | Initial Other Escrows and Reserves is comprised of a (i) rent replacement reserve in the amount of $750,000 and (ii) an outstanding tenant improvement reserve in the amount of $80,000 to cover outstanding tenant improvements and leasing commissions. Provided no event of default has occurred and is continuing, on each payment date beginning in July 2022 through and including the payment date in June 2024, the lender is required to disburse $31,250 to mimic the monthly rent from the vacant units from the rent replacement reserve account to the lockbox account to be further disbursed, (i) if no cash sweep period is in effect, to the borrower or (ii) if a cash sweep period is in effect, to the cash management account. |
| (4) | UW Revenues and UW NCF are inclusive of $375,000 in annualized disbursements from the Rent Replacement Reserve described in the foregoing footnote (3). |
The Loan. The Lincoln Place loan has an outstanding principal balance as of the Cut-Off Date of approximately $28.0 million and is secured by a first mortgage lien on the borrowers’ fee interest in a 272,060 square foot retail property located in Fairview Heights, Illinois. The loan has a 10-year term and is interest only for the entire term of the loan.
The Borrowers. The borrowers of the Lincoln Place loan are Alneil Jo-Ash LLC, Lincoln Place Capital LLC, 2044 Ocean Parkway LLC and CS Lincoln Place LLC, each a bankruptcy remote, Delaware limited liability company and special purpose entity with one independent director, as tenants-in-common.
The Loan Sponsor. The loan sponsor is Jenel Management, a New York-based private real estate investment company with over 30 years of experience. Jenel Management owns and manages over 90 properties totaling more than three million square feet. The loan sponsor has approximately $2.0 billion in assets under management, which include urban high-street retail, hotel and other mixed-use
THE INFORMATION IN THIS STRUCTURAL AND COLLATERAL TERM SHEET IS NOT COMPLETE AND MAY BE AMENDED PRIOR TO THE TIME OF SALE. THIS TERM SHEET IS NOT AN OFFER TO SELL THESE SECURITIES AND IT IS NOT A SOLICITATION OF AN OFFER TO BUY THESE SECURITIES IN ANY JURISDICTION WHERE THE OFFER OR SALE IS NOT PERMITTED.
126 of 143
| Structural and Collateral Term Sheet | Benchmark 2022-B36 | |
| Lincoln Place | ||
properties. David Dushey, a Vice President at Jenel Management, serves as the non-recourse carveout guarantor for the Lincoln Place loan.
The Property. The Lincoln Place property is a single story, 272,060 square foot anchored retail center located in Fairview Heights, Illinois. Built in phases between 1986 and 2002, the Lincoln Place property is leased to a diversified roster of national anchor and regional tenants. Primary anchor tenant Kohl’s and junior anchor tenant Aldi collectively comprise approximately 40.2% of net rentable area and approximately 23.2% of underwritten base rent. Additionally, the Lincoln Place property is shadow anchored by Lowe’s Home Improvement, which serves as an additional demand driver to the retail center. The Lincoln Place property has 1,462 surface parking spaces, resulting in a parking ratio of 5.37 per 1,000 square feet of net rentable area. The Lincoln Place property is located within a major retail cluster in the St. Louis metro area with convenient access to primary traffic at the intersection of Route 159 and Lincoln Highway, approximately 11.0 miles from the St. Louis central business district. Furthermore, the Lincoln Place property is located approximately 8.0 miles from the Scott Air Force Base, which is the largest employer in Southwest Illinois and has a total work force of over 13,000 personnel.
As of June 1, 2022, the Lincoln Place property was 95.0% occupied by 17 tenants, comprised largely of institutional quality tenants. Approximately 53.8% of net rentable area and 33.6% of underwritten base rent are attributable to investment grade rated tenants including Kohl’s, Marshalls, Ross Dress For Less and Valvoline. The Lincoln Place property benefits from a unique tenant roster featuring retail and grocery tenants. The Lincoln Place property has a weighted average remaining lease term of approximately 7.14 years as of the Cut-off Date.
The largest tenant, Kohl’s (NYSE: KSS) (Moody’s/S&P/Fitch: Baa2/BBB-/BBB-; 31.8% NRA; 15.9% UW Base Rent), is a department store retail chain that offers moderately-priced private and national brand apparel, footwear, accessories beauty, and home products. Kohl’s operates over 1,100 department stores and, as of 2021, employs approximately 99,000 people. As of year-end 2021, Kohl’s was the second largest department store chain in the United States based on sales, operating in 49 states. For the fiscal year 2021, Kohl’s reported a total revenue of approximately $19.4 billion, a 21.8% increase from fiscal year 2020. As of June 28, 2022, Kohl’s had a market capitalization of approximately $4.7 billion. Kohl’s owns its improvements and has occupied its leased space since November 1998 pursuant to a ground lease with the borrower. Kohl’s recently executed a seven-year lease extension through January 2032 and has four, five-year renewal options remaining.
The second largest tenant, Marshalls (NYSE: TJX) (Moody’s/S&P: A2/A; 11.0% NRA; 10.1% UW Base Rent), is an American chain of off-price department stores owned by TJX Companies. Marshalls has over 1,000 American stores, including larger stores named Marshalls Mega Store, covering 42 states and Puerto Rico, along with 61 stores in Canada. Marshalls is one of the largest United States family apparel retailers. As of June 28, 2022, TJX Companies had a market capitalization of approximately $67.4 billion. Marshalls has occupied its leased space since August 2002 and has a current lease expiration in January 2028, along with one, five-year renewal option remaining.
The third largest tenant, Ross Dress For Less (NYSE: ROST) (Moody’s/S&P A2/BBB+; 10.2% NRA; 5.8% UW Base Rent), is an American chain of discount department stores, offering primarily apparel, accessories, footwear, and home fashions. Ross Dress For Less sells products primarily to middle income households. In 2021, Ross Dress For Less operated approximately 1,648 off-price apparel and home fashion stores in 40 states, the District of Columbia, and Guam. The company was incorporated in 1982 and is headquartered in Dublin, California. In 2021, Ross Dress For Less generated $18.9 billion in revenue, and as of June 28, 2022 had a market capitalization of approximately $25.5 billion. Ross Dress For Less has occupied its leased space since October 2011 and has a current lease expiration in January 2027, along with three, five-year renewal options remaining.
The Market. The Lincoln Place property is located in Fairview Heights, Illinois, in St. Clair County and in the St. Louis metro area. The boundaries of the immediate area are O’Fallon Drive to the north, Interstate 64 to the east, Frank Scott Parkway to the south, and Union Hill Road to the west. The Lincoln Place property is located approximately 8.0 miles northwest of Scott Air Force Base and about 11.0 miles east of the St. Louis Central Business District. Both the St. Louis metro area and St. Louis Central Business District are bi-state spanning between Missouri and Illinois, with significant portions located in Illinois.
With an approximately $161 billion economy, the St. Louis metro area is the 4th largest economy in the Midwest. The economy of the St. Louis metro area continues to grow and remains attractive to enterprises due to the region’s below average living and business costs, along with its central location within the United States. As of May 20, 2020, the St. Louis metro area is home to eight Fortune 500 companies, such as Centene, Emerson Electric and Reinsurance Group of America.
The Lincoln Place property is located within the St. Louis retail market and the East St. Louis/Illinois retail submarket. As of year-end 2021, the St. Louis retail market contained approximately 28,913,000 square feet of space, with asking rents of $15.90 on a NNN basis and a vacancy rate of 13.2%. As of year-end 2021, the East St. Louis/Illinois retail submarket had asking rents of $12.19 on a NNN basis and a vacancy rate of 14.1%. Current asking rents are in line with 2019 average rents on an NNN basis of $12.18 and $15.88 for the East St. Louis/Illinois submarket and St. Louis market, respectively, demonstrating a full recapture of pre-COVID-19 pandemic rental rates.
THE INFORMATION IN THIS STRUCTURAL AND COLLATERAL TERM SHEET IS NOT COMPLETE AND MAY BE AMENDED PRIOR TO THE TIME OF SALE. THIS TERM SHEET IS NOT AN OFFER TO SELL THESE SECURITIES AND IT IS NOT A SOLICITATION OF AN OFFER TO BUY THESE SECURITIES IN ANY JURISDICTION WHERE THE OFFER OR SALE IS NOT PERMITTED.
127 of 143
| Structural and Collateral Term Sheet | Benchmark 2022-B36 | |
| Lincoln Place | ||
| Anchor Rent Comparables(1) | |||||||
Property | City / State | Year Built / Renovated | Building Size (SF) | Tenant Name | Lease Size (SF)(3) | Lease Term (Years) | Rent PSF(3) |
| Lincoln Place | Fairview Heights, IL | 1986-2002 / NAP | 272,060(2) | Kohl’s | 86,584(2) | 20 | $6.38(2) |
| Southpoint Plaza | St. Louis, MO | 1974 / 1992 | 175,000 | Floor & Décor | 88,138 | 10 | $8.25 |
| Ballwin Plaza | Ballwin, MO | 1960 / 2018 | 203,299 | Hobby Lobby | 55,000 | 15 | $8.00 |
| Confidential Center | St. Louis, MO | 1987 / NAP | 110,000 | Confidential | 63,000 | 15 | $10.00 |
| Manchester Meadows | Ballwin, MO | 1994 / NAP | 283,892 | Full Throttle | 46,260 | 10 | $7.00 |
| Crestwood Shopping Center | Crestwood, MO | 1994 / 2016 | 44,870 | Planet Fitness | 44,870 | 20 | $7.50 |
| Total / Wtd. Avg(4) | 163,412 | 59,454 | 14 | $8.27 | |||
| (1) | Source: Appraisal. |
| (2) | Based on the underwritten rent roll dated June 1, 2022, inclusive of contractual rent steps taken through February 1, 2023. |
| (3) | Lease Size (SF) and Rent PSF for the Lincoln Place property is solely based on the anchor occupied tenant. |
| (4) | Total / Wtd. Avg excludes the Lincoln Place property. |
| Major & Junior Rent Comparables(1) | |||||||
Property | City / State | Year Built / Renovated | Building Size (SF) | Tenant Name | Lease Size (SF)(3) | Lease Term (Years) | Rent PSF(3) |
| Lincoln Place | Fairview Heights, IL | 1986-2002 / NAP | 272,060(2) | Various | 145,157(2) | Various | $13.03(2) |
| Manchester Meadows | Ballwin, MO | 1995 / NAP | 462,352 | Harbor Freight | 15,000 | 10 | $10.00 |
| Country Club Plaza | Belleville, IL | 1975 / 2002 | 86,867 | Goodwill | 14,067 | 10 | $7.00 |
| Ballwin Plaza | Ballwin, MO | 1960 / 2018 | 203,299 | Marshalls | 20,000 | 10 | $8.50 |
| Swansea Plaza | Swansea, IL | 1988 / NAP | 118,892 | Dollar Tree | 9,999 | 5 | $9.00 |
| Fairview Heights Centre | Fairview Heights, IL | 1976 / 2014 | 193,217 | Dick’s Sporting Goods | 45,085 | 10 | $14.00 |
| The Center at Kenrick Plaza | St. Louis, MO | 1987 / 2017 | 79,959 | Rockin’ Jump | 24,947 | 10 | $9.02 |
| Confidential Center | St. Louis, MO | 1976 / 2016 | 160,000 | Confidential | 30,000 | 10 | $15.00 |
| Olde Towne Plaza | Ballwin, MO | 1996 / NAP | 288,074 | Circus Trix | 31,000 | 10 | $10.00 |
| Total / Wtd. Avg(4) | 199,083 | 23,762 | 9 | $11.18 | |||
| (1) | Source: Appraisal. |
| (2) | Based on the underwritten rent roll dated June 1, 2022, inclusive of (i) contractual rent steps through February 1, 2023 and (ii) straight-line average rent over the lease term for investment grade rated tenants. |
| (3) | Lease Size (SF) and Rent PSF for the Lincoln Place property is solely based on the major and junior occupied tenants. |
| (4) | Total / Wtd. Avg excludes the Lincoln Place property. |
| Market Rent Conclusion(1) | ||||||||
| Anchor | Junior | Major | Shop - Freestanding | Shop - Large | Shop - Small | Restaurant | Quick Lube | |
| Market Rent | $8.00 | $12.50 | $19.00 | $30.00 | $28.00 | $28.00 | $20.00 | $30.00 |
| Lease Term (months) | 120 | 120 | 120 | 120 | 60 | 60 | 120 | 120 |
| Lease Type (reimbursements) | Net | Net | Net | Net | Net | Net | Net | Net |
| (1) | Source: Appraisal. |
| Historical Occupancy(1) | |||
| 2019 | 2020 | 2021 | Current(2) |
| 90.1% | 98.3% | 98.9% | 95.0% |
| (1) | Historical occupancies are based on rent rolls dated as of July of each respective year provided by the Borrowers. |
| (2) | Current Occupancy is based on the underwritten rent roll dated June 1, 2022. |
THE INFORMATION IN THIS STRUCTURAL AND COLLATERAL TERM SHEET IS NOT COMPLETE AND MAY BE AMENDED PRIOR TO THE TIME OF SALE. THIS TERM SHEET IS NOT AN OFFER TO SELL THESE SECURITIES AND IT IS NOT A SOLICITATION OF AN OFFER TO BUY THESE SECURITIES IN ANY JURISDICTION WHERE THE OFFER OR SALE IS NOT PERMITTED.
128 of 143
| Structural and Collateral Term Sheet | Benchmark 2022-B36 | |
| Lincoln Place | ||
| Tenant Summary(1) | ||||||||||
| Tenant | Credit Rating Moody’s/ S&P/ Fitch(2) | Net Rentable Area (SF) | % of Total NRA | UW Base Rent PSF | % of Total UW Base Rent | Lease Date | Most Recent Sales PSF(3) | Occupancy Cost | ||
| Kohl’s(4) | Baa2/BBB-/BBB- | 86,584 | 31.8 | % | $6.38 | 15.9 | % | 1/31/2032 | $203.12 | 3.1% |
| Marshalls | A2/A/NR | 30,000 | 11.0 | $11.68 | 10.1 | 1/31/2028 | $168.89 | 6.9% | ||
| Ross Dress For Less | A2/BBB+/NR | 27,718 | 10.2 | $7.26 | 5.8 | 1/31/2027 | NAV | NAV | ||
| Aldi | NR/NR/NR | 22,858 | 8.4 | $11.10 | 7.3 | 1/31/2034 | NAV | NAV | ||
| Total Wine, Beer, Spirits and More | NR/NR/NR | 20,769 | 7.6 | $14.35 | 8.6 | 1/31/2030 | $690.67 | 2.1% | ||
| Old Navy | Ba3/BB/NR | 20,000 | 7.4 | $17.16 | 9.9 | 7/31/2027 | NAV | NAV | ||
| Shoe Carnival | NR/NR/NR | 15,344 | 5.6 | $18.50 | 8.2 | 1/31/2029 | NAV | NAV | ||
| Five Below | NR/NR/NR | 8,468 | 3.1 | $19.00 | 4.6 | 1/31/2032 | NAV | NAV | ||
| Longhorn Steakhouse(5) | NR/NR/NR | 7,200 | 2.6 | $11.81 | 2.4 | 6/30/2023 | NAV | NAV | ||
| Carter’s(6) | NR/BB+/NR | 5,000 | 1.8 | $26.00 | 3.7 | 1/31/2030 | NAV | NAV | ||
| Ten Largest Tenants | 243,941 | 89.7 | % | $10.90 | 76.5 | % | ||||
| Remaining Occupied Tenants | 14,522 | 5.3 | % | $30.52 | 12.7 | % | ||||
| Rent Replacement Reserve(7) | 0 | 0.0 | % | NAP | 10.8 | % | ||||
| Total Occupied | 258,463 | 95.0 | % | $13.45 | 100.0 | % | ||||
| Vacant | 13,597 | 5.0 | % | |||||||
| Total / Wtd. Avg. | 272,060 | 100.0 | % | |||||||
| (1) | Based on the underwritten rent roll dated June 1, 2022, inclusive of (i) contractual rent steps through February 2023 and (ii) straight-line average rent over the lease term for investment grade rated tenants. |
| (2) | In certain instances, ratings provided are those of the parent company of the entity shown, whether or not the parent company guarantees the lease. |
| (3) | Based on data provided by the loan sponsor. Kohl’s most recent reported sales is as of January 2022, Marshalls most recent reported sales is as of January 2021 and Total Wine, Beer, Spirits and More most recent reported sales is as of November 2021. |
| (4) | Kohl’s occupies its lease space pursuant to a ground lease expiring in January 2032. Kohl’s ground lease has four, five-year renewal option remaining. |
| (5) | Longhorn Steakhouse occupies its lease space pursuant to a ground lease expiring in June 2023. Longhorn Steakhouse’s ground lease has one, five-year renewal option remaining. |
| (6) | Carter’s has a one-time right to terminate its lease contingent upon gross sales falling below $1.2 million during the twelve month period ending September 3, 2024, by giving the borrower notice no later than April 30, 2025. If notice is given, Carter’s lease will terminate six months after the notice is received by the borrower. Carter’s has two, five-year lease renewal options. |
| (7) | Rent Replacement Reserve is comprised of $375,000 of a $750,000 upfront rent replacement reserve to be disbursed to the lockbox account over a 24-month period beginning in July 2022 in order to mimic projected rent payments otherwise attributed to yet to be leased vacant retail space. |
Lease Rollover Schedule(1)(2) | ||||||||||
| Year | Number of Leases Expiring | Net Rentable Area Expiring | % of NRA Expiring | Base Rent Expiring | % of Base Rent Expiring | Cumulative Net Rentable Area Expiring | Cumulative % of NRA Expiring | Cumulative Base Rent Expiring(1) | Cumulative % of Base Rent Expiring(1) | |
| Vacant | NAP | 13,597 | 5.0% | NAP | NAP | 13,597 | 5.0% | NAP | NAP | |
| 2022 | 0 | 0 | 0.0% | $0 | 0.0% | 13,597 | 5.0% | $0 | 0.0% | |
| 2023 | 2 | 8,450 | 3.1% | $120,032 | 3.5% | 22,047 | 8.1% | 120,032 | 3.5% | |
| 2024(3) | 1 | 1,357 | 0.5% | %412,996 | 11.9% | 23,404 | 8.6% | 533,028 | 15.3% | |
| 2025 | 1 | 2100 | 0.8% | 65,331 | 1.9% | 25,504 | 9.4% | 598,359 | 17.2% | |
| 2026 | 1 | 1250 | 0.5% | 44,088 | 1.3% | 26,754 | 9.8% | 642,447 | 18.5% | |
| 2027 | 3 | 49833 | 18.3% | 600,269 | 17.3% | 76,587 | 28.2% | 1,242,715 | 35.7% | |
| 2028 | 1 | 30,000 | 11.0% | 350,326 | 10.1% | 106,587 | 39.2% | 1,593,041 | 45.8% | |
| 2029 | 1 | 15,344 | 5.6% | 283,864 | 8.2% | 121,931 | 44.8% | 1,876,905 | 54.0% | |
| 2030 | 3 | 27,719 | 10.2% | 470,935 | 13.5% | 149,650 | 55.0% | 2,347,840 | 67.5% | |
| 2031 | 0 | 0 | 0.0% | 0 | 0.0% | 149,650 | 55.0% | 2,347,840 | 67.5% | |
| 2032 & Beyond | 4 | 122,410 | 45.0% | 1,129,022 | 32.5% | 272,060 | 100.0% | 3,476,862 | 100.0% | |
| Total | 17 | 272,060 | 100.0% | $3,476,862 | 100.0% | |||||
| (1) | Based on the underwritten rent roll dated June 1, 2022, inclusive of (i) contractual rent steps through February 2023 and (ii) straight-line average rent over the lease term for investment grade rated tenants. |
| (2) | Certain tenants may have termination or contraction options (which may become exercisable prior to the originally stated expiration date of the tenant lease) that are not considered in the above Lease Rollover Schedule. See “Tenant Summary” above. |
| (3) | 2024 is inclusive of $375,000 in annualized disbursements from the Rent Replacement Reserve. See footnotes (3) and (4) to Escrows and Reserves on the first page of this Lincoln Place summary for additional information. |
THE INFORMATION IN THIS STRUCTURAL AND COLLATERAL TERM SHEET IS NOT COMPLETE AND MAY BE AMENDED PRIOR TO THE TIME OF SALE. THIS TERM SHEET IS NOT AN OFFER TO SELL THESE SECURITIES AND IT IS NOT A SOLICITATION OF AN OFFER TO BUY THESE SECURITIES IN ANY JURISDICTION WHERE THE OFFER OR SALE IS NOT PERMITTED.
129 of 143
| Structural and Collateral Term Sheet | Benchmark 2022-B36 | |
| Lincoln Place | ||
| Operating History and Underwritten Net Cash Flow | |||||||
| 2019 | 2020 | 2021 | TTM 2/28/2022 | Underwritten | Per Square Foot | %(1) | |
| Rents in Place(2) | $2,922,449 | $3,236,237 | $2,966,527 | $3,088,284 | $3,101,862 | $11.40 | 64.4% |
| Rent Replacement Reserve(3) | 0 | 0 | 0 | 0 | 375,000 | $1.38 | 7.8% |
| Vacant Income(4) | 0 | 0 | 0 | 0 | 454,146 | $1.67 | 9.4% |
| Gross Potential Rent | $2,922,449 | $3,236,237 | $2,966,527 | $3,088,284 | $3,931,008 | $14.45 | 81.6% |
| Total Reimbursements | 528,084 | 849,586 | 725,154 | 791,403 | 884,448 | $3.25 | 18.4% |
| Gross Potential Income | $3,450,534 | $4,085,823 | $3,691,681 | $3,879,687 | $4,815,456 | $17.70 | 100.0% |
| (Vacancy/Credit Loss)(4)(5) | 0 | 0 | 0 | 0 | (454,146) | ($1.67) | (9.4%) |
| Effective Gross Income | $3,450,534 | $4,085,823 | $3,691,681 | $3,879,687 | $4,361,310 | $16.03 | 90.6% |
| Total Expenses | 943,851 | 887,177 | 964,090 | 966,944 | 1,070,152 | $3.93 | 24.5% |
| Net Operating Income | $2,506,682 | $3,198,646 | $2,727,591 | $2,912,743 | $3,291,159 | $12.10 | 75.5% |
| TI/LC | 0 | 0 | 0 | 0 | 22,412 | $0.08 | 0.5% |
| Capital Expenditures | 0 | 0 | 0 | 0 | 26,741 | $0.10 | 0.6% |
| Net Cash Flow | $2,506,682 | $3,198,646 | $2,727,591 | $2,912,743 | $3,242,005 | $11.92 | 74.3% |
| (1) | % column represents percent of Gross Potential Income for all revenue lines and percent of Effective Gross Income for the remainder of the fields. |
| (2) | Underwritten Rents in Place is inclusive of (i) contractual rent steps through February 2023 and (ii) straight-line average rent over the lease term for investment grade rated tenants. |
| (3) | Rent Replacement Reserve is comprised of $375,000 of a $750,000 upfront rent replacement reserve to be disbursed to the lockbox account over a 24-month period beginning in July 2022 in order to mimic projected rent payments otherwise attributed to yet to be leased vacant retail space. |
| (4) | Vacant Income is underwritten to $28.00 per square foot and $44.11 per square foot for vacant freestanding and vacant small box retail spaces, respectively. |
| (5) | Concessions, free rent and credit loss have been normalized in the historical periods. |
Property Management. The Lincoln Place property is managed by Jenel Management Corp., an affiliate of the borrowers.
Current Mezzanine or Subordinate Indebtedness. One of the four tenants-in-common borrowers (“TIC Borrowers”), Alneil Jo-Ash LLC (“Exchange Borrower”), has incurred an unsecured and subordinated note in the amount of $2,000,000 (the “Subordinated Note”) payable to Jo-Ash Realty Corp. (“Subordinate Lender”), which is an affiliate of the Exchange Borrower, to use the proceeds under the Subordinated Note solely as additional funds for acquisition of the Lincoln Place property. The Subordinate Lender has entered into a Qualified Exchange Accommodation Agreement (“Exchange Agreement”) with Legal 1031 EAT Holdings, LLC (“Exchange Company”) and Exchange Borrower. The Subordinate Note is required to be repaid, extinguished or otherwise discharged in full simultaneously with the completion of a reverse 1031 transfer, required to be consummated on or before November 21, 2022 (the “Reverse 1031 Transfer”), by Exchange Company of 100% of its direct membership interest in Exchange Borrower (but not title to the Lincoln Place property, which is not permitted) to Subordinate Lender and, subsequently thereto, the transfer of up to 15% of such direct ownership interest in Exchange Borrower to Lincoln Place Manager LLC, which currently owns 15% equity in Lincoln Place Capital LLC, one of the other three TIC Borrowers, in accordance with the Lincoln Place loan documents. Exchange Company’s 100% membership interest in Exchange Borrower will be transferred from Exchange Company to Subordinate Lender regardless of whether the Reverse 1031 Transfer is complete on or before November 21, 2022.
THE INFORMATION IN THIS STRUCTURAL AND COLLATERAL TERM SHEET IS NOT COMPLETE AND MAY BE AMENDED PRIOR TO THE TIME OF SALE. THIS TERM SHEET IS NOT AN OFFER TO SELL THESE SECURITIES AND IT IS NOT A SOLICITATION OF AN OFFER TO BUY THESE SECURITIES IN ANY JURISDICTION WHERE THE OFFER OR SALE IS NOT PERMITTED.
130 of 143
| Structural and Collateral Term Sheet | Benchmark 2022-B36 | |
| Amsdell Southern Storage Portfolio | ||
| Mortgage Loan Information | Property Information | |||
| Mortgage Loan Seller: | CREFI | Single Asset / Portfolio: | Portfolio | |
| Original Principal Balance: | $23,500,000 | Title: | Fee | |
| Cut-off Date Principal Balance: | $23,500,000 | Property Type - Subtype: | Self-Storage | |
| % of Pool by IPB: | 3.1% | Net Rentable Area (SF): | 311,774 | |
| Loan Purpose: | Recapitalization | Location: | Various | |
| Borrowers: | Amsdell Storage Ventures XXVIII, | Year Built / Renovated(1): | Various / Various | |
| LLC, Amsdell Storage Ventures | Occupancy: | 89.9% | ||
| XXXII, LLC and Amsdell Storage | Occupancy Date: | 5/11/2022 | ||
| Ventures 58, LLC | Number of Tenants: | N/A | ||
| Guarantor: | Todd C. Amsdell | Fourth Most Recent NOI: | NAV | |
| Interest Rate: | 5.48000% | Third Most Recent NOI(3): | $1,535,043 (December 31, 2020) | |
| Note Date: | 7/14/2022 | Second Most Recent NOI(3): | $2,101,408 (December 31, 2021) | |
| Maturity Date: | 8/6/2032 | Most Recent NOI(3): | $2,525,829 (TTM June 30, 2022) | |
| Interest-only Period: | 120 months | UW Economic Occupancy: | 82.7% | |
| Original Term: | 120 months | UW Revenues: | $3,875,351 | |
| Original Amortization: | None | UW Expenses: | $1,475,921 | |
| Amortization Type: | Interest Only | UW NOI: | $2,399,431 | |
| Call Protection: | L(24),YM1(92),O(4) | UW NCF: | $2,357,453 | |
| Lockbox / Cash Management: | Springing / Springing | Appraised Value / Per SF: | $51,500,000 / $165 | |
| Additional Debt: | N/A | Appraisal Date: | Various | |
| Additional Debt Balance: | N/A | |||
| Additional Debt Type: | N/A | |||
| Escrows and Reserves | Financial Information | |||||||
| Initial | Monthly | Initial Cap | Cut-off Date Loan / SF: | $75 | ||||
| Taxes: | $199,585 | $24,948 | N/A | Maturity Date Loan / SF: | $75 | |||
| Insurance: | $0 | Springing | N/A | Cut-off Date LTV: | 45.6% | |||
| Replacement Reserves: | $0 | $3,498 | $125,933 | Maturity Date LTV: | 45.6% | |||
| TI/LC: | $0 | $0 | N/A | UW NCF DSCR: | 1.81x | |||
| Other(2): | $73,205 | $0 | N/A | UW NOI Debt Yield: | 10.2% | |||
| Sources and Uses | |||||||
| Sources | Proceeds | % of Total | Uses | Proceeds | % of Total | ||
| Loan Amount | $23,500,000 | 100.0% | Sponsor Equity | $16,958,092 | 72.2% | ||
| Loan Payoff | 5,729,637 | 24.4 | |||||
| Closing Costs | 539,481 | 2.3 | |||||
| Upfront Reserves | 272,790 | 1.2 | |||||
| Total Sources | $23,500,000 | 100.0% | Total Uses | $23,500,000 | 100.0% | ||
| (1) | The Amsdell Southern Storage Portfolio is secured by the borrowers’ fee interests in three self-storage properties that were built between 1995 and 2016. One of the three mortgaged properties, the Compass Self Storage – Fate property, was renovated in 2016. See “Portfolio Summary” table herein. |
| (2) | Other reserves consists of an immediate repairs reserve of $73,205. |
| (3) | The increase from the Third Most Recent NOI to Most Recent NOI is primarily attributable to increases in base rent. |
The Loan. The Amsdell Southern Storage Portfolio loan (the “Amsdell Southern Storage Portfolio Loan”) is secured by a first mortgage lien on the borrowers’ fee interests in a portfolio of three self-storage properties consisting of 1,946 storage units (including parking spaces) totaling 311,774 square feet across Texas and Florida (collectively, the “Amsdell Southern Storage Portfolio Properties”). The Amsdell Southern Storage Portfolio Loan accrues interest at an interest rate of 5.48000% per annum, has an original term of 120 months, has a remaining term of 120 months as of the Cut-off Date, and is interest only for the entire term.
The Borrowers. The borrowers are Amsdell Storage Ventures XXVIII, LLC, Amsdell Storage Ventures XXXII, LLC and Amsdell Storage Ventures 58, LLC, each a Delaware limited liability company and single purpose entity with one independent director.
The Loan Sponsor. The loan sponsor is Amsdell Group, LLC and the non-recourse carveout guarantor is Todd C. Amsdell, the President and CEO of Amsdell Companies. Amsdell Companies was founded in 1928 and is a full service, privately owned real estate company,
THE INFORMATION IN THIS STRUCTURAL AND COLLATERAL TERM SHEET IS NOT COMPLETE AND MAY BE AMENDED PRIOR TO THE TIME OF SALE. THIS TERM SHEET IS NOT AN OFFER TO SELL THESE SECURITIES AND IT IS NOT A SOLICITATION OF AN OFFER TO BUY THESE SECURITIES IN ANY JURISDICTION WHERE THE OFFER OR SALE IS NOT PERMITTED.
131 of 143
| Structural and Collateral Term Sheet | Benchmark 2022-B36 | |
| Amsdell Southern Storage Portfolio | ||
specializing in the construction, development and management of business parks, industrial parks and related commercial real estate including self-storage facilities. Amsdell Companies has owned and operated more than 500 storage centers under various trade names in more than 27 states.
The Properties. The Amsdell Southern Storage Portfolio Properties consist of three self-storage assets located in Texas and Florida. The Amsdell Southern Storage Portfolio Properties were built between 1995 and 2016 and are situated on approximately 44.0 acres and include 43 buildings. The Amsdell Southern Storage Portfolio Properties encompass 1,946 total units totaling 311,774 square feet. As of May 11, 2022, the Amsdell Southern Storage Portfolio Properties were 89.9% occupied.
The Compass Self Storage – Fate property is a 143,169 square foot facility situated on an approximately 31.6-acre site located in Fate, Texas, totaling 656 storage and parking units across 13 single-level buildings. The Compass Self Storage – Fate property was built in 2008 and was most recently renovated in 2016. The facility amenities include surveillance cameras, individual unit locks, climate control units, keypad entry and on-site management. The Compass Self Storage – Fate property was 92.2% occupied as of May 11, 2022.
The Compass Self Storage – Mansfield property is a 100,200 square foot facility situated on an approximately 7.8-acre site located in Mansfield, Texas, totaling 679 storage and parking units across 24 single-level buildings. The property was built in 2016 and facility amenities include surveillance cameras, individual unit locks, climate control units, keypad entry and on-site management. The Compass Self Storage – Mansfield property was 89.4% occupied as of May 11, 2022.
The Compass Self Storage – Leesburg property is a 68,405 square foot facility situated on an approximately 4.6-acre site located in Leesburg, Florida totaling 611 storage units across six, single-level buildings and was built in 1995. The facility amenities include surveillance cameras, individual unit locks, climate control units, keypad entry and on-site management. The Compass Self Storage – Leesburg property was 85.6% occupied as of May 11, 2022.
The following table presents certain information relating to the Amsdell Southern Storage Portfolio Properties:
| Portfolio Summary | |||||||||
Property Name | City, State | Allocated Cut-off Date Loan Amount | Appraised Value(2) | Year Built/Renovated | Total Storage Units(1) | UW NOI | % UW NOI | Total SF | Occ. (%)(1) |
| Compass Self Storage - Fate | Fate, Texas | $11,100,000 | $24,100,000 | 2008/2016 | 656 | $1,174,774 | 49.0% | 143,169 | 92.2% |
| Compass Self Storage - Mansfield | Mansfield, Texas | 6,700,000 | 14,600,000 | 2016/NAP | 679 | 670,673 | 28.0 | 100,200 | 89.4% |
| Compass Self Storage - Leesburg | Leesburg, Florida | 5,700,000 | 12,800,000 | 1995/NAP | 611 | 553,984 | 23.1 | 68,405 | 85.6% |
| Total / Wtd. Avg. | $23,500,000 | $51,500,000 | 1,946 | $2,399,431 | 100.0% | 311,774 | 89.9% | ||
| (1) | Based on the underwritten rent rolls dated May 11, 2022. |
| (2) | Source: Appraisal. |
| Historical and Current Occupancy(1) | ||
| 2020 | 2021 | Current(2) |
| 82.9% | 88.1% | 89.9% |
| (1) | Historical occupancies are the annual average physical occupancy of each respective year. |
| (2) | Current Occupancy is as of May 11, 2022. |
THE INFORMATION IN THIS STRUCTURAL AND COLLATERAL TERM SHEET IS NOT COMPLETE AND MAY BE AMENDED PRIOR TO THE TIME OF SALE. THIS TERM SHEET IS NOT AN OFFER TO SELL THESE SECURITIES AND IT IS NOT A SOLICITATION OF AN OFFER TO BUY THESE SECURITIES IN ANY JURISDICTION WHERE THE OFFER OR SALE IS NOT PERMITTED.
132 of 143
| Structural and Collateral Term Sheet | Benchmark 2022-B36 | |
| Amsdell Southern Storage Portfolio | ||
The Market.
| Market Summary | |||||
| Property Name | City/State | Market(1) | Submarket(1) | Inventory (per Unit)(1) | Vacancy(1) |
| Compass Self Storage - Fate | Fate, Texas | Southwestern Region | Northeast/Garland/Richardson | 37,516 | 16.9% |
| Compass Self Storage - Mansfield | Mansfield, Texas | Southwestern Region | Fort Worth | 57,359 | 10.9% |
| Compass Self Storage - Leesburg | Leesburg, Florida | South Atlantic Region | Lake County | 6,022 | 9.4% |
| (1) | Source: REIS. |
The Amsdell Southern Storage Portfolio Properties are comprised of three properties across Texas and Florida. The properties located in Texas represent approximately 78.3% of the Amsdell Southern Storage Portfolio Properties by underwritten base rent while the property in Florida accounts for approximately 21.7% of the Amsdell Southern Storage Portfolio Properties by underwritten base rent.
The Compass Self Storage – Fate property is located in Fate, Rockwall County, Texas and is part of the Dallas-Plano-Irving Metropolitan Statistical Area (the “Dallas MSA”) approximately 26 miles northeast of downtown Dallas. The Dallas MSA has a diverse economy, which includes health care, education, technology, trade, and professional services. The Dallas MSA is growing at an above-average pace with financial services and core professionals leading the way. According to a third-party report, the asking rents in the submarket is $132 per unit on 10x10 climate control units and $96 per unit on 10X10 non-climate control units with a vacancy rate of 16.9% as of the fourth quarter of 2021.
The Compass Self Storage – Mansfield property is located in Mansfield, Tarrant County, Texas and is part of the Fort Worth-Arlington’s Metropolitan Statistical Area (the “Fort Worth MSA”) 28 miles southeast of the Dallas Central Business District. The Fort Worth MSA job growth has kept pace with the nation’s and has returned to its pre pandemic level a bit sooner than the nation’s. The region houses several Fortune 1000 companies including American Airlines Group. According to a third-party report, the asking rents in the submarket is $128 per unit on 10x10 climate control units and $96 per unit on 10X10 non-climate control units with a vacancy rate of 10.9% as of the fourth quarter of 2021.
The Compass Self Storage – Leesburg property is located in Leesburg, Lake County, Florida and is part of the Orlando-Kissimmee-Sanford Metropolitan Statistical Area (the “Orlando MSA”). The Orlando MSA is best known for its tourism industry which is driven by many attractions including Walt Disney World, SeaWorld and Universal Orlando. According to a third-party report, the asking rents in the market is $144 per unit on 10x10 climate control units and $124 per unit on 10X10 non-climate control units with a vacancy rate of 9.4% as of the fourth quarter of 2021.
The following table presents market demographic information relating to the Amsdell Southern Storage Portfolio Properties in 2021:
| Demographic Summary(1) | |||||||
| Property Name | City/State | 1-mile Population | 3-mile Population | 5-mile Population | 1-mile Avg. Household Income | 3-mile Avg. Household Income | 5-mile Avg. Household Income |
| Compass Self Storage - Fate | Fate, Texas | 1,481 | 39,370 | 78,600 | $112,355 | $119,779 | $130,789 |
| Compass Self Storage - Mansfield | Mansfield, Texas | 14,900 | 91,553 | NAV | $135,173 | $116,342 | NAV |
| Compass Self Storage - Leesburg | Leesburg, Florida | NAV | 16,101 | 46,555 | NAV | $68,331 | $61,732 |
| (1) | Source: Appraisal. |
THE INFORMATION IN THIS STRUCTURAL AND COLLATERAL TERM SHEET IS NOT COMPLETE AND MAY BE AMENDED PRIOR TO THE TIME OF SALE. THIS TERM SHEET IS NOT AN OFFER TO SELL THESE SECURITIES AND IT IS NOT A SOLICITATION OF AN OFFER TO BUY THESE SECURITIES IN ANY JURISDICTION WHERE THE OFFER OR SALE IS NOT PERMITTED.
133 of 143
| Structural and Collateral Term Sheet | Benchmark 2022-B36 | |
| Amsdell Southern Storage Portfolio | ||
| Underwritten Net Cash Flow(1) | ||||||
| 2020 | 2021 | TTM 6/30/2022 | Underwritten | Per Square Foot | %(2) | |
| Base Rent | $3,126,012 | $4,359,471 | $4,737,777 | $3,999,834 | $12.83 | 89.0% |
| Potential Income from Vacant Units | 0 | 0 | 0 | 493,356 | 1.58 | 11.0% |
| Rent Steps | 0 | 0 | 0 | 0 | 0.00 | 0.0% |
| Gross Potential Rent | $3,126,012 | $4,359,471 | $4,737,777 | $4,493,190 | $14.41 | 100.0% |
| Total Reimbursements | 0 | 0 | 0 | 0 | 0.00 | 0.0% |
| Net Rental Income | $3,126,012 | $4,359,471 | $4,737,777 | $4,493,190 | $14.41 | 100.0% |
| (Vacancy/Credit Loss) | (594,332) | (1,101,518) | (1,061,835) | (776,274) | (2.49) | (17.3)% |
| Other Income | 128,206 | 145,322 | 158,153 | 158,435 | 0.51 | 3.5% |
| Effective Gross Income | $2,659,886 | $3,403,275 | $3,834,095 | $3,875,351 | $12.43 | 86.2% |
| Real Estate Taxes | 361,269 | 402,321 | 408,159 | 571,093 | 1.83 | 14.7% |
| Insurance | 54,586 | 62,682 | 69,930 | 73,000 | 0.23 | 1.9% |
| Management Fee | 106,395 | 136,131 | 153,364 | 155,014 | 0.50 | 4.0% |
| Other Operating Expenses | 602,592 | 700,733 | 676,814 | 676,814 | 2.17 | 17.5% |
| Total Expenses | $1,124,843 | $1,301,867 | $1,308,266 | $1,475,921 | $4.73 | 38.1% |
| Net Operating Income | $1,535,043 | $2,101,408 | $2,525,829 | $2,399,431 | $7.70 | 61.9% |
| TI/LC | 0 | 0 | 0 | 0 | 0.00 | 0.0% |
| Capital Expenditures | 0 | 0 | 0 | 41,978 | 0.13 | 1.1% |
| Net Cash Flow | $1,535,043 | $2,101,408 | $2,525,829 | $2,357,453 | $7.56 | 60.8% |
| (1) | Based on the underwritten rent rolls dated May 11, 2022. |
| (2) | % column represents percent of Net Rental Income for all revenue lines and represents percent of Effective Gross Income the remainder of the fields. |
Property Management. The Amsdell Southern Storage Portfolio Properties are managed by Compass Self Storage, LLC, an affiliate of the borrower.
THE INFORMATION IN THIS STRUCTURAL AND COLLATERAL TERM SHEET IS NOT COMPLETE AND MAY BE AMENDED PRIOR TO THE TIME OF SALE. THIS TERM SHEET IS NOT AN OFFER TO SELL THESE SECURITIES AND IT IS NOT A SOLICITATION OF AN OFFER TO BUY THESE SECURITIES IN ANY JURISDICTION WHERE THE OFFER OR SALE IS NOT PERMITTED.
134 of 143
| Structural and Collateral Term Sheet | Benchmark 2022-B36 | |
| 7800 Red Road | ||
Mortgage Loan Information | Property Information | |||
| Mortgage Loan Seller: | GSMC | Single Asset / Portfolio: | Single Asset | |
| Original Principal Balance: | $20,000,000 | Title: | Fee | |
| Cut-off Date Principal Balance: | $20,000,000 | Property Type - Subtype: | Office - Suburban | |
| % of Pool by IPB: | 2.7% | Net Rentable Area (SF): | 57,128 | |
| Loan Purpose: | Refinance | Location: | South Miami, FL | |
| Borrower: | 7800 Red Road LLC | Year Built / Renovated: | 1971 / 2017 | |
| Guarantors: | Robert Oppenheim, Allan | Occupancy: | 95.4% | |
| Serviansky and Daniel Warman | Occupancy Date: | 6/1/2022 | ||
| Interest Rate: | 6.35000% | Number of Tenants: | 33 | |
| Note Date: | 6/16/2022 | Fourth Most Recent NOI: | $1,322,373 (December 31, 2019) | |
| Maturity/ARD Date: | 7/6/2032 | Third Most Recent NOI: | $1,724,853 (December 31, 2020) | |
| Interest-only Period: | 120 months | Second Most Recent NOI: | $1,771,810 (December 31, 2021) | |
| Original Term: | 120 months | Most Recent NOI: | $1,814,043 (TTM March 31, 2022) | |
| Original Amortization: | None | UW Economic Occupancy: | 95.0% | |
| Amortization Type: | Interest Only | UW Revenues: | $2,864,174 | |
| Call Protection: | L(25),D(91),O(4) | UW Expenses: | $969,653 | |
| Lockbox / Cash Management: | Hard / Springing | UW NOI: | $1,894,522 | |
| Additional Debt: | N/A | UW NCF: | $1,848,825 | |
| Additional Debt Balance: | N/A | Appraised Value / Per SF: | $31,900,000 / $558 | |
| Additional Debt Type: | N/A | Appraisal Date: | 5/4/2022 | |
| Escrows and Reserves | Financial Information | |||||||
| Initial | Monthly | Initial Cap | ||||||
| Taxes: | $87,171 | $17,434 | N/A | Cut-off Date Loan / SF: | $350 | |||
| Insurance: | $0 | Springing | N/A | Maturity Date Loan / SF: | $350 | |||
| Replacement Reserves: | $0 | $965 | N/A | Cut-off Date LTV: | 62.7% | |||
| TI/LC: | $200,000 | $4,826 | $500,000 | Maturity Date LTV: | 62.7% | |||
| Other: | $0 | $0 | N/A | UW NCF DSCR: | 1.44x | |||
| UW NOI Debt Yield: | 9.5% | |||||||
| Sources and Uses | |||||||
| Sources | Proceeds | % of Total | Uses | Proceeds | % of Total | ||
| Loan Amount | $20,000,000 | 100.0% | Loan Payoff | $16,585,255 | 82.9% | ||
| Principal Equity Distribution | 2,295,731 | 11.5 | |||||
| Closing Costs | 831,843 | 4.2 | |||||
| Reserves | 287,171 | 1.4 | |||||
| Total Sources | $20,000,000 | 100.0% | Total Uses | $20,000,000 | 100.0% | ||
The Loan. The 7800 Red Road mortgage loan (the “7800 Red Road Loan”), with a principal balance of $20,000,000 as of the Cut-off Date, is secured by a first mortgage lien on the borrower’s fee simple interest in a 57,128 square foot office building located in South Miami, Florida (the “7800 Red Road Property”). The 7800 Red Road Loan has a 10-year term and requires payments of interest only for its entire term.
The Borrower. The borrowing entity is 7800 Red Road LLC, a Delaware limited liability company and special purpose entity structured to be bankruptcy remote (the “7800 Red Road Borrower”).
The Loan Sponsors. The loan sponsors and nonrecourse carve-out guarantors are Robert Oppenheim, Allan Serviansky and Daniel Warman. Robert Oppenheim, Daniel Warman and Allan Serviansky are principals of Market Street Real Estate Partners, LLC (“MSREP”), a fully integrated real estate investment firm based in South Miami, Florida.
The Property. The 7800 Red Road Property was built in 1971 and underwent an extensive multi-year renovation starting in 2017 after being acquired by the loan sponsors in April 2016 for $9.86 million. Total capital improvements, tenant improvements, and leasing commissions to date equate to $5.10 million ($89.27 per square foot). Renovations at the 7800 Red Road Property included significant updates to the building façade, a full lobby renovation, and an extensive building system update. The contractor finished the third floor in
THE INFORMATION IN THIS STRUCTURAL AND COLLATERAL TERM SHEET IS NOT COMPLETE AND MAY BE AMENDED PRIOR TO THE TIME OF SALE. THIS TERM SHEET IS NOT AN OFFER TO SELL THESE SECURITIES AND IT IS NOT A SOLICITATION OF AN OFFER TO BUY THESE SECURITIES IN ANY JURISDICTION WHERE THE OFFER OR SALE IS NOT PERMITTED.
135 of 143
| Structural and Collateral Term Sheet | Benchmark 2022-B36 | |
| 7800 Red Road | ||
mid-2017, which allowed tenants to sign leases and the borrower to begin the landlord work to fit out the respective space on that floor. During construction, MSREP was able to lease up an additional 27% of the building on the 1st and 2nd floors, despite not launching a comprehensive marketing strategy for the asset and experiencing significant construction and zoning delays. Construction was finished by the end of 2018, which allowed for landlord work to begin on all other leases that were signed prior to completion of construction. The 7800 Red Road Property is currently 95.4% occupied as of June 1, 2022 and features a diverse group of professionals paying an average rent of $45.51 per square foot, over twice the average pre-renovation rent of $19.12 per square foot.
Major Tenants.
The largest tenant, OrganaBio (7,992 square feet; 14.0% of net rentable square feet; 14.5% of underwritten base rent), is a Miami-based contract development and manufacturing organization that manufactures clinical (cGMP) grade cells for cancer immunotherapy and regenerative medicine drug developers. They have been at the 7800 Red Road Property since July 2019 and have one, 5-year renewal option. OrganaBio has continued to expand with the latest expansion in March 2021, representing approximately 25% of their current footprint.
The second largest tenant, DermCare Management, LLC (4,101 square feet; 7.2% of net rentable square feet; 8.1% of underwritten base rent), is a dermatologist office run by Dr. Varee N. Poochaeron. DermCare Management, LLC has been at the 7800 Red Road Property since May 2017 and has two, 3-year renewal options.
The third largest tenant, Executive Health of CG (3,303 square feet; 5.8% of net rentable square feet; 5.9% of underwritten base rent), is a specialty doctor focusing on cardiovascular disease, internal medicine, and other specialties. Executive Health of CG has been at the 7800 Red Road Property since March 2019 and has one, 5-year renewal option.
The Market. The 7800 Red Road Property is in the Kendall submarket. Per CoStar, as of the third quarter of 2022, the submarket has a 6.3% vacancy rate, which is below the Miami metropolitan average of 10.0%. The Kendall submarket has an average rental rate of $39.19 and approximately 13.2 million square feet of office inventory, as of the third quarter of 2022.
| Historical and Current Occupancy(1) | |||
| 2019 | 2020 | 2021 | Current(2) |
| 85.8% | 90.8% | 89.0% | 95.4% |
| (1) | Historical Occupancies are as of December 31 of each respective year. |
| (2) | Current Occupancy is as of June 1, 2022. |
THE INFORMATION IN THIS STRUCTURAL AND COLLATERAL TERM SHEET IS NOT COMPLETE AND MAY BE AMENDED PRIOR TO THE TIME OF SALE. THIS TERM SHEET IS NOT AN OFFER TO SELL THESE SECURITIES AND IT IS NOT A SOLICITATION OF AN OFFER TO BUY THESE SECURITIES IN ANY JURISDICTION WHERE THE OFFER OR SALE IS NOT PERMITTED.
136 of 143
| Structural and Collateral Term Sheet | Benchmark 2022-B36 | |
| 7800 Red Road | ||
| Tenant Summary(1) | ||||||
| Tenant | Ratings Moody’s/Fitch/S&P | Net Rentable Area (SF) | % of Total NRA | Base Rent PSF(2) | % of Total Base Rent | Lease Expiration Date |
| OrganaBio | NR/NR/NR | 7,992 | 14.0% | $45.02 | 14.5% | 10/31/2024 |
| DermCare Management, LLC | NR/NR/NR | 4,101 | 7.2% | $48.69 | 8.1% | 4/30/2024 |
| Executive Health of CG | NR/NR/NR | 3,303 | 5.8% | $44.57 | 5.9% | 4/30/2024 |
| MoonAmie Productions | NR/NR/NR | 2,725 | 4.8% | $44.46 | 4.9% | 4/30/2023 |
| Kids Therapy Connection, Inc. | NR/NR/NR | 2,460 | 4.3% | $43.92 | 4.4% | 6/6/2023 |
| MSREP | NR/NR/NR | 2,276 | 4.0% | $44.01 | 4.0% | 3/31/2027 |
| Day & Night Pediatric | NR/NR/NR | 2,243 | 3.9% | $47.45 | 4.3% | 4/30/2027 |
| Shell & Fish Import | NR/NR/NR | 2,170 | 3.8% | $46.96 | 4.1% | 11/30/2024 |
| Physical Therapy and Wellness | NR/NR/NR | 2,024 | 3.5% | $39.92 | 3.3% | 12/21/2022 |
| Teal Labs | NR/NR/NR | 1,800 | 3.2% | $28.21 | 2.0% | 10/31/2023 |
| Total | 31,094 | 54.4% | $44.25 | 55.5% | ||
| Remaining Tenants | 23,383 | 40.9% | $47.19 | 44.5% | ||
| Total Occupied | 54,477 | 95.4% | $45.51 | 100.0% | ||
| Vacant | 2,651 | 4.6 | ||||
| Total | 57,128 | 100.0% |
| (1) | Based on the underwritten rent roll dated June 1, 2022 with contractual rent steps through July 31, 2023. |
| (2) | Base Rent PSF is inclusive of contractual rent steps underwritten through the termination option per the tenant’s lease. |
| Lease Rollover Schedule(1)(2) | |||||||||
| Year | Number of Tenant Leases Expiring | Net Rentable Area Expiring | % of NRA Expiring | Base Rent Expiring(3) | % of Base Rent Expiring | Cumulative Net Rentable Area Expiring | Cumulative % of NRA Expiring | Cumulative Base Rent Expiring | Cumulative % of Base Rent Expiring |
| Vacant | NAP | 2,651 | 4.6% | NAP | NAP | 2,651 | 4.6% | NAP | NAP |
| MTM & 2022 | 3 | 3,703 | 6.5% | $160,454 | 6.5% | 6,354 | 11.1% | $160,454 | 6.5% |
| 2023 | 6 | 9,987 | 17.5% | $420,485 | 17.0% | 16,341 | 28.6% | $580,939 | 23.4% |
| 2024 | 12 | 25,272 | 44.2% | $1,167,459 | 47.1% | 41,613 | 72.8% | $1,748,398 | 70.5% |
| 2025 | 6 | 6,465 | 11.3% | $303,897 | 12.3% | 48,078 | 84.2% | $2,052,295 | 82.8% |
| 2026 | 1 | 545 | 1.0% | $25,261 | 1.0% | 48,623 | 85.1% | $2,077,555 | 83.8% |
| 2027 | 5 | 8,505 | 14.9% | $401,825 | 16.2% | 57,128 | 100.0% | $2,479,381 | 100.0% |
| 2028 | 0 | 0 | 0.0% | $0 | 0.0% | 57,128 | 100.0% | $2,479,381 | 100.0% |
| 2029 | 0 | 0 | 0.0% | $0 | 0.0% | 57,128 | 100.0% | $2,479,381 | 100.0% |
| 2030 | 0 | 0 | 0.0% | $0 | 0.0% | 57,128 | 100.0% | $2,479,381 | 100.0% |
| 2031 | 0 | 0 | 0.0% | $0 | 0.0% | 57,128 | 100.0% | $2,479,381 | 100.0% |
| 2032 | 0 | 0 | 0.0% | $0 | 0.0% | 57,128 | 100.0% | $2,479,381 | 100.0% |
| 2033 and Thereafter | 0 | 0 | 0.0% | $0 | 0.0% | 57,128 | 100.0% | $2,479,381 | 100.0% |
| Total | 33 | 57,128 | 100.0% | $2,479,381 | 100.0% | ||||
| (1) | Based on the underwritten rent roll dated June 1, 2022 with contractual rent steps through July 31, 2023. |
| (2) | Lease Rollover Schedule is based on the lease expiration dates of all direct leases in place. |
| (3) | Base Rent Expiring is inclusive of contractual rent steps underwritten through the termination option per the tenant’s lease. |
THE INFORMATION IN THIS STRUCTURAL AND COLLATERAL TERM SHEET IS NOT COMPLETE AND MAY BE AMENDED PRIOR TO THE TIME OF SALE. THIS TERM SHEET IS NOT AN OFFER TO SELL THESE SECURITIES AND IT IS NOT A SOLICITATION OF AN OFFER TO BUY THESE SECURITIES IN ANY JURISDICTION WHERE THE OFFER OR SALE IS NOT PERMITTED.
137 of 143
| Structural and Collateral Term Sheet | Benchmark 2022-B36 | |
| 7800 Red Road | ||
Operating History and Underwritten Net Cash Flow | |||||||
| 2019 | 2020 | 2021 | TTM 3/31/2022 | Underwritten | Per Square Foot | %(1) | |
| Base Rent(2) | $1,768,028 | $2,203,192 | $2,295,416 | $2,335,318 | $2,479,381 | $43.40 | 82.2% |
| Commercial Reimbursement Revenue | 14,387 | 29,911 | 94,812 | 91,262 | 354,345 | 6.20 | 11.8% |
| Market Revenue from Vacant Units | 0 | 0 | 0 | 0 | 135,836 | 2.38 | 4.5% |
| Parking Income | 28,063 | 33,950 | 32,350 | 32,850 | 35,400 | 0.62 | 1.2% |
| Other Revenue | 103,013 | 47,514 | 9,958 | 1,409 | 9,958 | 0.17 | 0.3% |
| Gross Potential Revenue | $1,913,491 | $2,314,567 | $2,432,537 | $2,460,838 | $3,014,920 | $52.77 | 100.0% |
| (Vacancy Loss)(3) | (28,342) | (19,151) | (33,842) | (40,142) | (150,746) | (2.64) | (5.0%) |
| (Commercial Credit Loss) | (7,139) | 0 | (14,240) | (1,832) | 0 | 0.00 | 0.0% |
| Effective Gross Income | $1,878,010 | $2,295,416 | $2,384,455 | $2,418,864 | $2,864,174 | $50.14 | 95.0% |
| Total Expenses | 555,637 | 570,563 | 612,645 | 604,820 | 969,653 | 16.97 | 33.9% |
| Net Operating Income | $1,322,373 | $1,724,853 | $1,771,810 | $1,814,043 | $1,894,522 | $33.16 | 66.1% |
| TI/LC | 0 | 0 | 0 | 0 | 34,272 | 0.60 | 1.2% |
| Replacement Reserves | 0 | 0 | 0 | 0 | 11,426 | 0.20 | 0.4% |
| Net Cash Flow | $1,322,373 | $1,724,853 | $1,771,810 | $1,814,043 | $1,848,825 | $32.36 | 64.6% |
| (1) | % column represents percent of Gross Potential Revenue for all revenue lines and represents percent of Effective Gross Income for the remainder of the fields. |
| (2) | Based on the underwritten rent roll dated June 1, 2022 with contractual rent steps through July 31, 2023. |
| (3) | Vacancy Loss is based on an estimated market vacancy of 5%. |
Property Management. The 7800 Red Road Property is managed by ABC Management Services, Inc., d/b/a Tilia Real Estate, a Florida corporation.
THE INFORMATION IN THIS STRUCTURAL AND COLLATERAL TERM SHEET IS NOT COMPLETE AND MAY BE AMENDED PRIOR TO THE TIME OF SALE. THIS TERM SHEET IS NOT AN OFFER TO SELL THESE SECURITIES AND IT IS NOT A SOLICITATION OF AN OFFER TO BUY THESE SECURITIES IN ANY JURISDICTION WHERE THE OFFER OR SALE IS NOT PERMITTED.
138 of 143
| Structural and Collateral Term Sheet | Benchmark 2022-B36 | |
| NC Self Storage Portfolio | ||
| Mortgage Loan Information | Property Information | |||
| Mortgage Loan Seller: | GACC | Single Asset / Portfolio: | Portfolio | |
| Original Principal Balance: | $16,900,000 | Title: | Fee | |
| Cut-off Date Principal Balance: | $16,900,000 | Property Type - Subtype: | Self-Storage – Self-Storage | |
| % of Pool by IPB: | 2.2% | Net Rentable Area (SF)(1): | 157,374 | |
| Loan Purpose: | Refinance | Location: | Various, NC | |
| Borrowers: | 1004 A Greensboro LLC and | Year Built / Renovated: | Various / Various | |
28 MT Gilead LLC | Occupancy: | 95.9% | ||
| Guarantor: | Brian M. Maginnis | Occupancy Date: | 6/6/2022 | |
| Interest Rate: | 5.31300% | Number of Tenants: | N/A | |
| Note Date: | 7/6/2022 | Fourth Most Recent NOI: | $893,425 (December 31, 2019) | |
| Maturity Date: | 7/6/2032 | Third Most Recent NOI: | $1,031,736 (December 31,2020) | |
| Interest-only Period: | 120 months | Second Most Recent NOI: | $1,371,384 (December 31, 2021) | |
| Original Term: | 120 months | Most Recent NOI: | $1,615,101 (TTM June 30, 2022) | |
| Original Amortization: | None | UW Economic Occupancy: | 90.0% | |
| Amortization Type: | Interest Only | UW Revenues: | $2,258,446 | |
| Call Protection: | L(25),D(91),O(4) | UW Expenses: | $512,930 | |
| Lockbox / Cash Management: | Springing / Springing | UW NOI: | $1,745,516 | |
| Additional Debt: | N/A | UW NCF: | $1,728,437 | |
| Additional Debt Balance: | N/A | Appraised Value / Per SF: | $31,400,000 / $200 | |
| Additional Debt Type: | N/A | Appraisal Date: | Various | |
| Escrows and Reserves | Financial Information | |||||||
| Initial | Monthly | Initial Cap | Cut-off Date Loan / SF: | $107 | ||||
| Taxes: | $55,894 | $5,081 | N/A | Maturity Date Loan / SF: | $107 | |||
| Insurance: | $0 | Springing | N/A | Cut-off Date LTV: | 53.8% | |||
| Replacement Reserves: | $0 | $1,423 | N/A | Maturity Date LTV: | 53.8% | |||
| TI/LC: | $0 | $0 | N/A | UW NCF DSCR: | 1.90x | |||
| Other(1): | $18,250 | $0 | N/A | UW NOI Debt Yield: | 10.3% | |||
| Sources and Uses | ||||||
| Sources | Proceeds | % of Total | Uses | Proceeds | % of Total | |
| Loan Amount | $16,900,000 | 100.0% | Loan Payoff | $11,516,613 | 68.1% | |
| Principal Equity Distribution | 4,992,008 | 29.5 | ||||
| Closing Costs | 317,236 | 1.9 | ||||
| Upfront Reserves | 74,144 | 0.4 | ||||
| Total Sources | $16,900,000 | 100.0% | Total Uses | $16,900,000 | 100.0% | |
| (1) | Net Rentable Area (SF) includes 48 unapproved moveable additional self-storage units that are not included in the lender’s underwriting. See “The Property” section herein. |
| (2) | The Other Initial reserve consists of a MASS Units Reserve. |
The Loan. The NC Self Storage Portfolio loan (the “NC Self Storage Portfolio Loan”) is secured by a first mortgage lien on the borrowers’ fee interests in a portfolio of two self-storage properties comprised of 1,548 storage units excluding parking, cell tower and 48 unapproved movable additional self-storage (“MASS”) units totaling 157,374 square feet in North Carolina (collectively, the “NC Self Storage Portfolio” or “NC Self Storage Portfolio Properties”). The NC Self Storage Portfolio Loan accrues interest at an interest rate of 5.31300% per annum, had an original term of 120 months, has a remaining term of 119 months as of the Cut-off Date, and is interest only for the entire term.
The Borrowers. The borrowers for the NC Self Storage Portfolio Loan are 1004 A Greensboro LLC and 28 MT Gilead LLC, both Delaware limited liability companies and special purpose entities.
The Loan Sponsor. The loan sponsor is Adam Jarrell and the non-recourse carveout guarantor is Brian M. Maginnis. Brian M. Maginnis is one of the founders of American Self Storage, Inc. American Self Storage, Inc. and its affiliates currently own and manage a portfolio of 11 self-storage properties totaling 549,708 square feet, of which approximately 93% are leased. American Self Storage, Inc.’s portfolio is located in various cities in North Carolina.
THE INFORMATION IN THIS STRUCTURAL AND COLLATERAL TERM SHEET IS NOT COMPLETE AND MAY BE AMENDED PRIOR TO THE TIME OF SALE. THIS TERM SHEET IS NOT AN OFFER TO SELL THESE SECURITIES AND IT IS NOT A SOLICITATION OF AN OFFER TO BUY THESE SECURITIES IN ANY JURISDICTION WHERE THE OFFER OR SALE IS NOT PERMITTED.
139 of 143
| Structural and Collateral Term Sheet | Benchmark 2022-B36 | |
| NC Self Storage Portfolio | ||
The Property. The NC Self Storage Portfolio Properties consist of two self-storage properties located at 1000 and 1004 Greensboro Road, High Point, North Carolina (the “Greensboro Property”) and 30 Mount Gilead Church Road, Pittsboro, North Carolina (the “Mt. Gilead Property”). The NC Self Storage Portfolio Properties are comprised of 1,548 units excluding parking, cell towers and 48 unapproved MASS units, totaling 157,374 square feet. As of June 6, 2022, the NC Self Storage Portfolio had an overall occupancy of 95.9%.
The Greensboro Property is a Class B+, self-storage facility totaling 779 units and 75,060 net rentable square feet located on an approximately 4.82-acre site. The Greensboro Property underwent improvements, which were constructed in phases beginning in 2000. The Greensboro Property was originally purchased by the borrower sponsor in 2015. At the time, there were 156 self-storage units that were 25% climate controlled. Since that time, the borrower sponsor has developed an additional 623 units by expanding in 2016 (122 units), 2018 (119 units), 2019 (290 units), and 2020 (88 units). The Greensboro Property is comprised of 464 climate-controlled units (59.6%), 262 exterior storage units (33.6%), 34 interior storage units (4.4%), 12 locker storage units (1.5%), and seven parking spaces, for a total of 779 units. The Greensboro Property’s parking space occupancy is approximately 85.7% as of June 6, 2022. On-site amenities include a leasing office, exterior lighting, keypad entry, on-site manager, parking, perimeter fence, video cameras and an electronic gate.
The Mt. Gilead Property is a Class B, self-storage facility totaling 839 units and 82,314 net rentable square feet located on an approximately 7.44-acre site. The Mt. Gilead Property improvements were first built in 1994 and then expanded several times. The Mt. Gilead Property was originally purchased by the borrower sponsor in 2001. At the time, there were 172 self-storage units that were 0% climate controlled. Since that time, the borrower sponsor has developed an additional 667 units by expanding in 2006 (100 units), 2015 (169 units), 2017 (284 units), 2018 (66 units), and 2021 (48 units). The Mt. Gilead Property is comprised of 522 climate-controlled units (62.2%), 302 exterior storage units (36.0%), 14 parking spaces, and a cell tower space, for a total of 839 units. On-site amenities include a leasing office, building mounted lights, keypad entry, on-site manager, perimeter fencing, video cameras, electronic gate and rental kiosk. The Mt. Gilead Property has 48 units that need to be approved by Chatham County (the “County”), which are not included in the appraisal.
The Mt. Gilead Property is zoned for light industrial use and is operating as a self-storage facility based on a conditional use permit (“CUP”) that was originally obtained for that use in August 1995. In 2016 and 2019, the County’s board of commissioners approved two amendments to the CUP that reconfigured the site and added additional storage units. According to the borrower, at some point after the 2019 CUP amendment, the borrower installed approximately 48 MASS units not shown on the 2019 approved site plan. The borrower did not obtain any permits from the County before installing these additional MASS units. The borrower claims that the additional MASS units are not in violation of the CUP because they are “moveable” units and are not actual structures. The County disagreed and filed a complaint in March 2022. According to the borrower’s zoning consultant, the County’s zoning administrator indicated there may be a request to have the conditional use permit revoked, subject to a vote by the County’s board of commissioners in favor of such revocation. We cannot assure you that the County’s board of commissioners would vote against a request by the County’s zoning administrator to revoke the CUP, which, if granted, would preclude operation of the Mt. Gilead Property as a self-storage facility. The borrower’s litigation counsel indicated the borrower would be provided advance notice of the County’s intent to revoke the CUP if it is seeking such revocation. The borrower is represented by local litigation counsel and is negotiating a settlement with the County to resolve the litigation. See “Description of the Mortgage Pool—Litigation and Other Legal Considerations” in the Preliminary Prospectus.
The following table presents certain information relating to the NC Self Storage Portfolio Properties:
| Portfolio Summary | |||||||
| Property Name | City/State | Allocated Cut-off Date Loan Amount | % of ALA | Appraised Value | Year Built/Renovated | Total Units(1) | Storage NRA |
| 1004 Greensboro Road | High Point, NC | $7,588,854 | 44.9% | $14,100,000 | 2000, 2016, 2018, 2019 / NAP | 779 | 75,060 |
| 30 Mount Gilead Church Road | Pittsboro, NC | $9,311,146 | 55.1% | $17,300,000 | 1994, 1995, 2012, 2013, 2015 / 2017 | 839 | 82,314 |
| Total / Wtd. Avg. | $16,900,000 | 100.0% | $31,400,000 | 1,618 | 157,374 | ||
| (1) | Based on the underwritten rent roll dated June 6, 2022. |
| Unit Mix - Self Storage(1)(2) | |||||||
| Unit Type | # of Units | Occupancy | Total SF | Avg Unit SF | Avg Rent per Unit | Avg Rent PSF | Base Rent |
| Non-Climate Controlled Storage | 598 | 94.1% | 59,935 | 100 | $111 | $1.11 | $750,360 |
| Climate-Controlled Storage | 998 | 96.9% | 97,439 | 98 | $116 | $1.19 | $1,347,180 |
| Total / Wtd. Avg.(3) | 1,596 | 95.9% | 157,374 | 99 | $114 | $1.16 | $2,097,540 |
| (1) | Based on the underwritten rent roll dated June 6, 2022. |
| (2) | Excludes Parking and Cell Tower |
| (3) | Includes 48 unapproved MASS Units. Please see disclosure above for more information. |
THE INFORMATION IN THIS STRUCTURAL AND COLLATERAL TERM SHEET IS NOT COMPLETE AND MAY BE AMENDED PRIOR TO THE TIME OF SALE. THIS TERM SHEET IS NOT AN OFFER TO SELL THESE SECURITIES AND IT IS NOT A SOLICITATION OF AN OFFER TO BUY THESE SECURITIES IN ANY JURISDICTION WHERE THE OFFER OR SALE IS NOT PERMITTED.
140 of 143
| Structural and Collateral Term Sheet | Benchmark 2022-B36 | |
| NC Self Storage Portfolio | ||
The Market.
The Greensboro Property is located in the Greensboro-High Point, North Carolina Metropolitan Statistical Area (the “Greensboro MSA”). The Greensboro MSA had a 2021 total population of 781,608 and experienced an annual growth rate of 0.7% since 2010, which was lower than the North Carolina annual growth rate of 1.1%. The Greensboro MSA accounted for 7.3% of the total 2021 North Carolina population (10,705,557).
The Mt. Gilead Property is located in the Durham-Chapel Hill, North Carolina Metropolitan Statistical Area (the “Durham MSA”). The Durham MSA had a 2021 total population of 661,488 and experienced an annual growth rate of 1.5% since 2010, which was higher than the North Carolina annual growth rate of 1.1%. The Durham MSA accounted for 6.2% of the total 2021 North Carolina population (10,705,557).
The following table presents market demographic, vacancy and rent information relating to the NC Self Storage Portfolio:
| Demographic Summary(1) | |||||||||||
| Property Name | City/State | 1-mile Population | 3-mile Population | 5-mile Population | 1-mile Avg. Household Income | 3-mile Avg. Household Income | 5-mile Avg. Household Income | Market Vacancy | Market Rent per SF(2) | ||
| 1004 Greensboro Road | High Point, NC | 5,390 | 54,037 | 128,684 | $56,560 | $62,699 | $74,779 | 12.8% | $0.72 | ||
| 30 Mount Gilead Church Road | Pittsboro, NC | 208 | 3,643 | 11,162 | $96,129 | $136,781 | $129,718 | 13.7% | $0.88 | ||
| (1) | Source: Appraisal. |
| (2) | The Market Rent PSF is based on the asking rent for a non-climate controlled 10x10 unit. |
| Operating History and Underwritten Net Cash Flow | |||||||
| 2019 | 2020 | 2021 | TTM 6/30/2022 | Underwritten | Per Square Foot | %(1) | |
| Gross Potential Rent | $1,002,656 | $1,194,093 | $1,593,586 | $1,837,730 | $2,247,792 | $14.28 | 100.0% |
| Vacancy | 0 | 0 | 0 | 0 | (224,779) | ($1.43) | (10.0%) |
| Concessions | 0 | 0 | 0 | 0 | (55,289) | ($0.35) | (2.5%) |
| Net Rental Income | $1,002,656 | $1,194,093 | $1,593,586 | $1,837,730 | $1,967,724 | $12.50 | 87.5% |
| Other Income(2) | 202,865 | 222,137 | 266,273 | 290,722 | 290,722 | $1.85 | 12.9% |
| Effective Gross Income | $1,205,521 | $1,416,230 | $1,859,859 | $2,128,452 | $2,258,446 | $14.35 | 100.0% |
| Total Expenses | 312,096 | 384,494 | 488,475 | 513,351 | 512,930 | $3.26 | 22.7% |
| Net Operating Income | $893,425 | $1,031,736 | $1,371,384 | $1,615,101 | $1,745,516 | $11.09 | 77.3% |
| Total TI/LC, CapEx | 0 | 0 | 0 | 0 | 17,079 | $0.11 | 0.8% |
| Net Cash Flow | $893,425 | $1,031,736 | $1,371,384 | $1,615,101 | $1,728,437 | $10.98 | 76.5% |
| (1) | % column represents percent of Gross Potential Rent for all revenue lines (except Effective Gross Income) and represents percent of Effective Gross Income for the remainder of the fields. |
| (2) | Other Income includes tenant insurance revenue associated with the properties, merchandise income, late fees, application fees and other miscellaneous income. |
Property Management. The NC Self Storage Portfolio is managed by Storage Asset Management, Inc, an affiliate of the borrowers
THE INFORMATION IN THIS STRUCTURAL AND COLLATERAL TERM SHEET IS NOT COMPLETE AND MAY BE AMENDED PRIOR TO THE TIME OF SALE. THIS TERM SHEET IS NOT AN OFFER TO SELL THESE SECURITIES AND IT IS NOT A SOLICITATION OF AN OFFER TO BUY THESE SECURITIES IN ANY JURISDICTION WHERE THE OFFER OR SALE IS NOT PERMITTED.
141 of 143
| Structural and Collateral Term Sheet | Benchmark 2022-B36 | |
| Contacts | ||
| J.P. Morgan CMBS Capital Markets & Banking | ||
| Contact | Phone Number | |
Kunal Singh Managing Director | kunal.k.singh@jpmorgan.com | (212) 834-5467 |
| Harris Rendelstein Vice President | harris.rendelstein@jpmorgan.com | (212) 834-6737 |
| J.P. Morgan CMBS Trading | ||
| Contact | Phone Number | |
Avinash Sharma Managing Director | avinash.sharma@jpmorgan.com | (212) 834-3111 |
Brian Carey Executive Director | brian.carey@jpmorgan.com | (212) 834-3111 |
Derrick Fetzer Vice President | derrick.e.fetzer@jpmchase.com | (212) 834-3111 |
| J.P. Morgan Securitized Products Syndicate | ||
| Contact | Phone Number | |
Jennifer Kornblau Executive Director | jennifer.l.kornblau@jpmorgan.com | (212) 834-4154 |
Morgan Roach Executive Director | morgan.c.roach@jpmchase.com | (212) 834-4154 |
| Deutsche Bank CMBS Capital Markets & Banking | ||
| Contact | Phone Number | |
Lainie Kaye Managing Director | lainie.kaye@db.com | (212) 250-5270 |
Michael Miller Vice President | michael.miller@db.com | (917) 244-2901 |
| Deutsche Bank CMBS Trading | ||
| Contact | Phone Number | |
Ryan Horvath Director | ryan.horvath@db.com | (212) 250-5149 |
| Deutsche Bank CMBS Structuring | ||
| Contact | Phone Number | |
Shaishav Agarwal Managing Director | shaishav.agarwal@db.com | (212) 250-6290 |
Dan Penn Managing Director | daniel.penn@db.com | (212) 250-5149 |
| Citigroup CMBS Capital Markets & Securitization | ||
| Contact | Phone Number | |
Rick Simpson Managing Director | richard.simpson@citi.com | (212) 816-5343 |
Jason Mercandetti Director | jason.mercandetti@citi.com | (212) 816-6384 |
| Citigroup Structuring, Trading & Syndicate | ||
| Contact | Phone Number | |
Raul Orozco Managing Director | raul.d.orozco@citi.com | (212) 723-1295 |
Mattison Perry Director | mattison.perry@citi.com | (212) 723-1295 |
THE INFORMATION IN THIS STRUCTURAL AND COLLATERAL TERM SHEET IS NOT COMPLETE AND MAY BE AMENDED PRIOR TO THE TIME OF SALE. THIS TERM SHEET IS NOT AN OFFER TO SELL THESE SECURITIES AND IT IS NOT A SOLICITATION OF AN OFFER TO BUY THESE SECURITIES IN ANY JURISDICTION WHERE THE OFFER OR SALE IS NOT PERMITTED.
142 of 143
| Structural and Collateral Term Sheet | Benchmark 2022-B36 | |
| Contacts | ||
| Goldman Sachs & Co. LLC Banking | |||
| Contact | Phone Number | ||
Leah Nivison Managing Director | leah.nivison@gs.com | (212) 357-2702 | |
Scott Epperson Managing Director | scott.epperson@gs.com | (212) 934-2882 | |
Justin Peterson Vice President | justin.peterson@gs.com | (212) 902-4283 | |
| Goldman Sachs & Co. LLC Capital Markets | |||
| Contact | Phone Number | ||
Mark Romanczuk Managing Director | mark.romanczuk@gs.com | (212) 902-0290 | |
Nitin Jagga Vice President | nitin.jagga@gs.com | (212) 855-9035 | |
| Goldman Sachs & Co. LLC Syndicate | |||
| Contact | Phone Number | ||
Scott Walter Managing Director | scott.walter@gs.com | (212) 357-8910 | |
THE INFORMATION IN THIS STRUCTURAL AND COLLATERAL TERM SHEET IS NOT COMPLETE AND MAY BE AMENDED PRIOR TO THE TIME OF SALE. THIS TERM SHEET IS NOT AN OFFER TO SELL THESE SECURITIES AND IT IS NOT A SOLICITATION OF AN OFFER TO BUY THESE SECURITIES IN ANY JURISDICTION WHERE THE OFFER OR SALE IS NOT PERMITTED.
143 of 143