JP Morgan Chase Commercial Mortgage Securities
Filed: 15 Apr 24, 2:57pm
| FREE WRITING PROSPECTUS | ||
| FILED PURSUANT TO RULE 433 | ||
| REGISTRATION FILE NO.: 333-258342-04 |
| BANK5 Trust 2024-5YR6 |
 |  |  |  |
BANK5 Trust 2024-5YR6
Free Writing Prospectus
Structural and Collateral Term Sheet
$984,317,834
(Approximate Total Mortgage Pool Balance)
$888,346,000
(Approximate Offered Certificates)
J.P. Morgan Chase Commercial Mortgage Securities Corp.
as Depositor
JPMorgan Chase Bank, National Association
Morgan Stanley Mortgage Capital Holdings LLC
Wells Fargo Bank, National Association
Bank of America, National Association
as Sponsors and Mortgage Loan Sellers
Commercial Mortgage Pass-Through Certificates
Series 2024-5YR6
April 15, 2024
| J.P. MORGAN | WELLS FARGO SECURITIES | BofA SECURITIES | MORGAN STANLEY |
| Co-Lead Bookrunner Manager | Co-Lead Bookrunner Manager | Co-Lead Bookrunner Manager | Co-Lead Bookrunner Manager |
| Academy Securities Co-Manager | Drexel Hamilton Co-Manager | ||
| THE INFORMATION IN THIS STRUCTURAL AND COLLATERAL TERM SHEET IS NOT COMPLETE AND MAY BE AMENDED PRIOR TO THE TIME OF SALE. THIS TERM SHEET IS NOT AN OFFER TO SELL THESE SECURITIES AND IT IS NOT A SOLICITATION OF AN OFFER TO BUY THESE SECURITIES IN ANY JURISDICTION WHERE THE OFFER OR SALE IS NOT PERMITTED. |
| BANK5 Trust 2024-5YR6 |
This material is for your information, and none of J.P. Morgan Securities LLC, Morgan Stanley & Co. LLC, Wells Fargo Securities, LLC, BofA Securities, Inc., Drexel Hamilton, LLC or Academy Securities, Inc. (each individually, an “Underwriter”, and together, the “Underwriters”) are soliciting any action based upon it. This material is not to be construed as an offer to sell or the solicitation of any offer to buy any security in any jurisdiction where such an offer or solicitation would be illegal.
The Depositor has filed a registration statement (including a prospectus) with the SEC (SEC File no. 333-258342) for the offering to which this free writing prospectus relates. Before you invest, you should read the prospectus in the registration statement and other documents the Depositor has filed with the SEC for more complete information about the Depositor, the issuing entity and this offering. You may get these documents for free by visiting EDGAR on the SEC website at www.sec.gov. Alternatively, the Depositor or any Underwriter or any dealer participating in the offering will arrange to send you the prospectus if you request it by calling (800) 408-1016 or by emailing the ABS Syndicate Desk at abs_synd@jpmorgan.com. Neither this document nor anything contained in this document shall form the basis for any contract or commitment whatsoever. The information contained in this document is preliminary as of the date of this document, supersedes any previous such information delivered to you and will be superseded by any such information subsequently delivered prior to the time of sale. These materials are subject to change, completion or amendment from time to time.
This document has been prepared by the Underwriters for information purposes only and does not constitute, in whole or in part, a prospectus for the purposes of Regulation (EU) 2017/1129 (as amended), such Regulation as it forms part of the domestic law of the United Kingdom and/or Part VI of the Financial Services and Markets Act 2000 (as amended); and does not constitute an offering document for any other purpose.
The attached information contains certain tables and other statistical analyses (the “Computational Materials”) that have been prepared in reliance upon information furnished by the Mortgage Loan Sellers. Numerous assumptions were used in preparing the Computational Materials, which may or may not be reflected in this document. The Computational Materials should not be construed as either projections or predictions or as legal, tax, financial or accounting advice. You should consult your own counsel, accountant and other advisors as to the legal, tax, business, financial and related aspects of a purchase of these certificates. Any weighted average lives, yields and principal payment periods shown in the Computational Materials are based on prepayment and/or loss assumptions, and changes in such prepayment and/or loss assumptions may dramatically affect such weighted average lives, yields and principal payment periods. In addition, it is possible that prepayments or losses on the underlying assets will occur at rates higher or lower than the rates shown in the Computational Materials. The specific characteristics of the certificates may differ from those shown in the Computational Materials due to differences between the final underlying assets and the preliminary underlying assets used in preparing the Computational Materials. The principal amount and designation of any certificate described in the Computational Materials are subject to change prior to issuance. None of the Underwriters nor any of their respective affiliates make any representation or warranty as to the actual rate or timing of payments or losses on any of the underlying assets or the payments or yield on the certificates.
This information is based upon management forecasts and reflects prevailing conditions and management’s views as of this date, all of which are subject to change.
This document contains forward-looking statements. Those statements are subject to certain risks and uncertainties that could cause the success of collections and the actual cash flow generated to differ materially from the information set forth in this document. While such information reflects projections prepared in good faith based upon methods and data that are believed to be reasonable and accurate as of their dates, the Depositor undertakes no obligation to revise these forward-looking statements to reflect subsequent events or circumstances. Investors should not place undue reliance on forward-looking statements and are advised to make their own independent analysis and determination with respect to the forecasted periods, which reflect the Depositor’s view only as of the date of this document.
J.P. Morgan is the marketing name for the investment banking businesses of JPMorgan Chase & Co. and its subsidiaries worldwide. Securities, syndicated loan arranging, financial advisory and other investment banking activities are performed by JPMS and its securities affiliates, and lending, derivatives and other commercial banking activities are performed by JPMorgan Chase Bank, National Association and its banking affiliates. JPMS is a member of SIPC and the NYSE.
Wells Fargo Securities is the trade name for the capital markets and investment banking services of Wells Fargo & Company and its subsidiaries, including but not limited to Wells Fargo Securities, LLC, a member of the New York Stock Exchange, Financial Industry Regulatory Authority (“FINRA”), the National Futures Association (“NFA”) and the Securities Investor Protection Corporation (“SIPC”), Wells Fargo Prime Services, LLC, a member of FINRA, NFA and SIPC, and Wells Fargo Bank, National Association. Wells Fargo Securities, LLC and Wells Fargo Prime Services, LLC are distinct entities from affiliated banks and thrifts.
“BofA Securities” is the marketing name for the global banking and global markets businesses of Bank of America Corporation. Lending, derivatives, and other commercial banking activities are performed globally by banking affiliates of Bank of America Corporation, including Bank of America, N.A., member FDIC. Securities, strategic advisory, and other investment banking activities are performed globally by investment banking affiliates of Bank of America Corporation, including, in the United States, BofA Securities, Inc., which is a registered broker-dealer and member of FINRA and SIPC, and, in other jurisdictions, locally registered entities.
Capitalized terms used in this material but not defined herein shall have the meanings ascribed to them in the Preliminary Prospectus (as defined below).
THE CERTIFICATES REFERRED TO IN THESE MATERIALS ARE SUBJECT TO MODIFICATION OR REVISION (INCLUDING THE POSSIBILITY THAT ONE OR MORE CLASSES OF CERTIFICATES MAY BE SPLIT, COMBINED OR ELIMINATED AT ANY TIME PRIOR TO ISSUANCE OR AVAILABILITY OF A FINAL PROSPECTUS) AND ARE OFFERED ON A “WHEN, AS AND IF ISSUED” BASIS.
THE UNDERWRITERS MAY FROM TIME TO TIME PERFORM INVESTMENT BANKING SERVICES FOR, OR SOLICIT INVESTMENT BANKING BUSINESS FROM, ANY COMPANY NAMED IN THESE MATERIALS. THE UNDERWRITERS AND/OR THEIR AFFILIATES OR RESPECTIVE EMPLOYEES MAY FROM TIME TO TIME HAVE A LONG OR SHORT POSITION IN ANY CERTIFICATE OR CONTRACT DISCUSSED IN THESE MATERIALS.
| THE INFORMATION IN THIS STRUCTURAL AND COLLATERAL TERM SHEET IS NOT COMPLETE AND MAY BE AMENDED PRIOR TO THE TIME OF SALE. THIS TERM SHEET IS NOT AN OFFER TO SELL THESE SECURITIES AND IT IS NOT A SOLICITATION OF AN OFFER TO BUY THESE SECURITIES IN ANY JURISDICTION WHERE THE OFFER OR SALE IS NOT PERMITTED. | ||
| T-2 | ||
| BANK5 Trust 2024-5YR6 | Structural Overview |
Offered Certificates
| Class | Expected Ratings (Fitch/KBRA/Moody’s)(1) | Approximate Initial Certificate Balance or Notional Amount(2) | Approximate Initial Credit Support(3) | Pass-Through Rate Description | Expected Weighted Average Life (Years)(4) | Expected Principal Window (Months)(4) | Certificate Principal UW NOI Debt Yield(5) | Certificate Principal to Value Ratio(6) |
| Class A-1 | AAAsf/AAA(sf)/Aaa(sf) | $1,922,000 | 30.000% | (7) | 2.73 | 1 - 55 | 18.9% | 39.2% |
| Class A-3(8) | AAAsf/AAA(sf)/Aaa(sf) | $687,100,000(8) | 30.000% | (7)(8) | 4.81 | 55 - 59 | 18.9% | 39.2% |
| Class X-A | AAAsf/AAA(sf)/Aaa(sf) | $689,022,000(9) | N/A | Variable IO(10) | N/A | N/A | N/A | N/A |
| Class X-B | A-sf/AAA(sf)/NR | $199,324,000(9) | N/A | Variable IO(10) | N/A | N/A | N/A | N/A |
| Class A-S(8) | AAAsf/AAA(sf)/Aa2(sf) | $115,657,000(8) | 18.250% | (7)(8) | 4.94 | 59 - 59 | 16.1% | 45.8% |
| Class B(8) | AA-sf/AA-(sf)/NR | $45,525,000(8) | 13.625% | (7)(8) | 4.94 | 59 - 59 | 15.3% | 48.4% |
| Class C(8) | A-sf/A-(sf)/NR | $38,142,000(8) | 9.750% | (7)(8) | 4.94 | 59 - 59 | 14.6% | 50.5% |
Privately Offered Certificates(11)
| Class | Expected Ratings (Fitch/KBRA/Moody’s)(1) | Approximate Initial Certificate Balance or Notional Amount(2) | Approximate Initial Credit Support(3) | Pass-Through Rate Description | Expected Weighted Average Life (Years)(4) | Expected Principal Window (Months)(4) | Certificate Principal UW NOI Debt Yield(5) | Certificate Principal to Value Ratio(6) |
| Class X-D | BBB+sf/BBB+(sf)/NR | $10,336,000(9)(12) | N/A | Variable IO(10) | N/A | N/A | N/A | N/A |
| Class D | BBB+sf/BBB+(sf)/NR | $10,336,000(12) | 8.700% | (7) | 4.94 | 59 - 59 | 14.5% | 51.1% |
| Class XERR | BBB-sf/BBB-(sf)/NR | $17,963,000(9)(12) | N/A | Variable IO(10) | N/A | N/A | N/A | N/A |
| Class XFRR | BB-sf/BB(sf)/NR | $17,226,000(9) | N/A | Variable IO(10) | N/A | N/A | N/A | N/A |
| Class XGRR | B-sf/B+(sf)/NR | $11,074,000(9) | N/A | Variable IO(10) | N/A | N/A | N/A | N/A |
| Class XJRR | NR/NR/NR | $39,372,833(9) | N/A | Variable IO(10) | N/A | N/A | N/A | N/A |
| Class E-RR | BBB-sf/BBB-(sf)/NR | $17,963,000(12) | 6.875% | (7) | 5.01 | 59 - 60 | 14.2% | 52.1% |
| Class F-RR | BB-sf/BB(sf)/NR | $17,226,000 | 5.125% | (7) | 5.03 | 60 - 60 | 13.9% | 53.1% |
| Class G-RR | B-sf/B+(sf)/NR | $11,074,000 | 4.000% | (7) | 5.03 | 60 - 60 | 13.8% | 53.8% |
| Class J-RR | NR/NR/NR | $39,372,833 | 0.000% | (7) | 5.03 | 60 - 60 | 13.2% | 56.0% |
| (1) | Ratings shown are those of Fitch Ratings, Inc. (“Fitch”), Kroll Bond Rating Agency, LLC (“KBRA”) and Moody’s Investors Service, Inc. (“Moody’s”). Certain nationally recognized statistical rating organizations that were not hired by the depositor may use information they receive pursuant to Rule 17g-5 under the Securities Exchange Act of 1934, as amended, or otherwise to rate the certificates. There can be no assurance as to what ratings a non-hired nationally recognized statistical rating organization would assign. See “Risk Factors—Other Risks Relating to the Certificates—Nationally Recognized Statistical Rating Organizations May Assign Different Ratings to the Certificates; Ratings of the Certificates Reflect Only the Views of the Applicable Rating Agencies as of the Dates Such Ratings Were Issued; Ratings May Affect ERISA Eligibility; Ratings May Be Downgraded” and “Ratings” in the Preliminary Prospectus to be dated on or about the date hereof (the “Preliminary Prospectus”). Capitalized terms used but not defined herein have the meanings assigned to such terms in the Preliminary Prospectus. |
| (2) | Approximate, subject to a variance of plus or minus 5%. In addition, the notional amounts of the Class X-A, Class X-B, Class X-D, Class XERR, Class XFRR, Class XGRR, and Class XJRR certificates (collectively, the “Class X certificates”) may vary depending upon the final pricing of the classes of principal balance certificates or trust components whose certificate or principal balances comprise such notional amounts, and, if as a result of such pricing the pass-through rate of any class of the Class X-A, Class X-B, Class X-D, Class XERR, Class XFRR, Class XGRR and Class XJRR certificates, as applicable, would be equal to zero at all times, such class of certificates will not be issued on the closing date of this securitization. |
| (3) | The approximate initial credit support percentages set forth for the certificates are approximate and, for the Class A-1 and Class A-3 certificates, are presented in the aggregate, taking into account the principal balance of the Class A-3 trust component. The approximate initial credit support percentage set forth for each class of the Class A-S, Class B and Class C certificates represents the approximate credit support for the underlying trust component with the same alphanumeric designation. |
| (4) | The Expected Weighted Average Life and Expected Principal Window during which distributions of principal would be received as set forth in the foregoing table with respect to each class of principal balance certificates are based on the assumptions set forth under “Yield and Maturity Considerations—Weighted Average Life” in the Preliminary Prospectus and on the assumptions that there are no prepayments, modifications or losses in respect of the mortgage loans and that there are no extensions or forbearances of maturity dates of the mortgage loans. |
| (5) | Certificate Principal UW NOI Debt Yield for any class of principal balance certificates shown in the table above is calculated as the product of (a) the weighted average UW NOI Debt Yield for the mortgage pool, multiplied by (b) a fraction, the numerator of which is the aggregate initial certificate balance of all the principal balance certificates, and the denominator of which is the aggregate initial certificate balance of the subject class of principal balance certificates (or, with respect to the Class A-3, Class A-S, Class B or Class C certificates, the initial principal balance of the trust component with the same alphanumeric designation) and all other classes of principal balance certificates, if any, that are senior to such class. The Certificate Principal UW NOI Debt Yields of the Class A-1 and Class A-3 certificates are calculated in the aggregate for those classes as if they were a single class. |
| (6) | Certificate Principal to Value Ratio for any class of principal balance certificates shown in the table above is calculated as the product of (a) the weighted average Cut-off Date LTV Ratio of the mortgage pool, multiplied by (b) a fraction, the numerator of which is the aggregate initial certificate balance of the subject |
| THE INFORMATION IN THIS STRUCTURAL AND COLLATERAL TERM SHEET IS NOT COMPLETE AND MAY BE AMENDED PRIOR TO THE TIME OF SALE. THIS TERM SHEET IS NOT AN OFFER TO SELL THESE SECURITIES AND IT IS NOT A SOLICITATION OF AN OFFER TO BUY THESE SECURITIES IN ANY JURISDICTION WHERE THE OFFER OR SALE IS NOT PERMITTED. | ||
| T-3 | ||
| BANK5 Trust 2024-5YR6 | Structural Overview |
class of principal balance certificates (or, with respect to the Class A-3, Class A-S, Class B or Class C certificates, the initial principal balance of the trust component with the same alphanumeric designation) and all other classes of principal balance certificates, if any, that are senior to such class, and the denominator of which is the aggregate initial certificate balance of all the principal balance certificates. The Certificate Principal to Value Ratios of the Class A-1 and Class A-3 certificates are calculated in the aggregate for those classes as if they were a single class.
| (7) | The pass-through rate for each class of the Class A-1, Class A-3, Class A-S, Class B, Class C, Class D, Class E-RR, Class F-RR, Class G-RR and Class J-RR certificates for any distribution date will be one of the following: (i) a fixed rate per annum, (ii) a variable rate per annum equal to the weighted average of the net mortgage interest rates on the mortgage loans for the related distribution date, (iii) a variable rate per annum equal to the lesser of (a) a fixed rate and (b) the weighted average of the net mortgage interest rates on the mortgage loans for the related distribution date or (iv) a variable rate per annum equal to the weighted average of the net mortgage interest rates on the mortgage loans for the related distribution date minus a specified percentage. For purposes of the calculation of the weighted average of the net mortgage interest rates on the mortgage loans for each distribution date, the mortgage interest rates will be adjusted as necessary to a 30/360 basis. |
| (8) | The Class A-3-1, Class A-3-2, Class A-3-X1, Class A-3-X2, Class A-S-1, Class A-S-2, Class A-S-X1, Class A-S-X2, Class B-1, Class B-2, Class B-X1, Class B-X2, Class C-1, Class C-2, Class C-X1 and Class C-X2 certificates are also offered certificates. Such classes of certificates, together with the Class A-3, Class A-S, Class B and Class C certificates, constitute the “Exchangeable Certificates”. The Class A-1, Class D, Class E-RR, Class F-RR, Class G-RR, Class and J-RR certificates and the Exchangeable Certificates with a certificate balance are referred to as the “principal balance certificates.” Each Class of Exchangeable Certificates will have the certificate balance or notional amount and pass-through rate described below under “Exchangeable Certificates.” Each class of Class A-3, Class A-S, Class B and Class C Exchangeable Certificates will have the same ratings as the Class A-3, Class A-S, Class B and Class C certificates, respectively, shown in the table above. |
| (9) | The Class X certificates are notional amount certificates and will not be entitled to distributions of principal. The notional amount of the Class X-A certificates will be equal to the aggregate certificate or principal balance of the Class A-1 certificates and the Class A-3 trust component outstanding from time to time. The notional amount of the Class X-B certificates will be equal to the aggregate principal balance of the Class A-S, Class B and Class C trust components outstanding from time to time. The notional amount of the Class X-D certificates will be equal to the certificate balance of the Class D certificates outstanding from time to time. The notional amount of the Class XERR certificates will be equal to the certificate balance of the Class E-RR certificates outstanding from time to time. The notional amount of the Class XFRR certificates will be equal to the certificate balance of the Class F-RR certificates outstanding from time to time. The notional amount of the Class XGRR certificates will be equal to the certificate balance of the Class G-RR certificates outstanding from time to time. The notional amount of the Class XJRR certificates will be equal to the certificate balance of the Class J-RR certificates outstanding from time to time. |
| (10) | The pass-through rate for the Class X-A certificates for any distribution date will be a per annum rate equal to the excess, if any, of (a) the weighted average of the net mortgage interest rates on the mortgage loans for the related distribution date, over (b) the weighted average of the pass-through rates on the Class A-1 certificates and the Class A-3, Class A-3-X1 and Class A-3-X2 trust components for the related distribution date, weighted on the basis of their respective certificate or principal balances or notional amounts outstanding immediately prior to that distribution date (but excluding trust components with a notional amount in the denominator of such weighted average calculation). The pass-through rate for the Class X-B certificates for any distribution date will be a per annum rate equal to the excess, if any, of (a) the weighted average of the net mortgage interest rates on the mortgage loans for the related distribution date, over (b) the weighted average of the pass-through rates on the Class A-S, Class A-S-X-1, Class A-S-X-2 ,Class B, Class B-X1, Class B-X2, Class C, Class C-X-1 and Class C-X-2 trust components for the related distribution date, weighted on the basis of their respective certificate or principal balances or notional amounts outstanding immediately prior to that distribution date (but excluding trust components with a notional amount in the denominator of such weighted average calculation). The pass-through rate for the Class X-D certificates for any distribution date will be a per annum rate equal to the excess, if any, of (a) the weighted average of the net mortgage interest rates on the mortgage loans for the related distribution date, over (b) the pass-through rate on the Class D certificates for the related distribution date. The pass-through rate for the Class XERR certificates for any distribution date will be a per annum rate equal to the excess, if any, of (a) the weighted average of the net mortgage interest rates on the mortgage loans for the related distribution date, over (b) the pass-through rate on the Class E-RR certificates for the related distribution date. The pass-through rate for the Class XFRR certificates for any distribution date will be a per annum rate equal to the excess, if any, of (a) the weighted average of the net mortgage interest rates on the mortgage loans for the related distribution date, over (b) the pass-through rate on the Class F-RR certificates for the related distribution date. The pass-through rate for the Class XGRR certificates for any distribution date will be a per annum rate equal to the excess, if any, of (a) the weighted average of the net mortgage interest rates on the mortgage loans for the related distribution date, over (b) the pass-through rate on the Class G-RR certificates for the related distribution date. The pass-through rate for the Class XJRR certificates for any distribution date will be a per annum rate equal to the excess, if any, of (a) the weighted average of the net mortgage interest rates on the mortgage loans for the related distribution date, over (b) the pass-through rate on the Class J-RR certificates for the related distribution date. For purposes of the calculation of the weighted average of the net mortgage interest rates on the mortgage loans for each distribution date, the mortgage interest rates will be adjusted as necessary to a 30/360 basis. |
| (11) | Not offered pursuant to the Preliminary Prospectus or this Term Sheet. Information provided in this Term Sheet regarding the characteristics of these certificates is provided only to enhance your understanding of the offered certificates. The privately offered certificates also include the Class R certificates, which do not have a certificate balance, notional amount, credit support, pass-through rate, rating, assumed final distribution date or rated final distribution date, and which are not shown in the chart. The Class R certificates represent the beneficial ownership of the residual interest in each of the real estate mortgage investment conduits, as further described in the Preliminary Prospectus. |
| (12) | The approximate initial Certificate Balances of the Class D and Class E-RR certificates (and correspondingly, the initial notional amount of the Class X-D and Class XERR certificates) are based in part on the estimated ranges of initial certificate balances and estimated fair values described in “Credit Risk Retention” in the Preliminary Prospectus. The approximate initial certificate balances of the Class D and Class E-RR certificates are subject to change based on the final pricing of the certificates, with the ultimate initial certificate balances determined such that the fair value of the Class XERR, Class XFRR, Class XGRR, Class XJRR, Class E-RR, Class F-RR, Class G-RR, and Class J-RR certificates will equal at least 5% of the fair value of all of the classes of certificates issued by the issuing entity (other than the Class R certificates). |
| THE INFORMATION IN THIS STRUCTURAL AND COLLATERAL TERM SHEET IS NOT COMPLETE AND MAY BE AMENDED PRIOR TO THE TIME OF SALE. THIS TERM SHEET IS NOT AN OFFER TO SELL THESE SECURITIES AND IT IS NOT A SOLICITATION OF AN OFFER TO BUY THESE SECURITIES IN ANY JURISDICTION WHERE THE OFFER OR SALE IS NOT PERMITTED. | ||
| T-4 | ||
| BANK5 Trust 2024-5YR6 | Structural Overview |
Issue Characteristics
| Offered Certificates: | $888,346,000 (approximate) monthly pay, multi-class, commercial mortgage pass-through certificates, consisting of 13 principal balance classes (Class A-1, Class A-3, Class A-3-1, Class A-3-2, Class A-S, Class A-S-1, Class A-S-2, Class B, Class B-1, Class B-2, Class C, Class C-1 and Class C-2) and 10 interest-only classes (Class A-3-X1, Class A-3-X2, Class X-A, Class X-B, Class A-S-X1, Class A-S-X2, Class B-X1, Class B-X2, Class C-X1 and Class C-X2) |
| Co-Lead Managers and Joint Bookrunners: | J.P. Morgan Securities LLC, Morgan Stanley & Co. LLC, Wells Fargo Securities, LLC and BofA Securities, Inc. |
| Co-Managers: | Drexel Hamilton, LLC and Academy Securities, Inc. |
| Mortgage Loan Sellers: | JPMorgan Chase Bank, National Association Morgan Stanley Mortgage Capital Holdings LLC, Wells Fargo Bank, National Association and Bank of America, National Association. |
| Rating Agencies: | Fitch, KBRA and Moody’s |
| Master Servicer: | Wells Fargo Bank, National Association |
| Special Servicer: | LNR Partners, LLC |
| Trustee/Certificate Administrator/ Certificate Registrar/Custodian: | Computershare Trust Company, National Association |
| Operating Advisor: | Park Bridge Lender Services LLC |
| Asset Representations Reviewer: | Park Bridge Lender Services LLC |
| Initial Directing Certificateholder: | Eightfold Real Estate Capital Fund VI, L.P. (or an affiliate) is expected to be appointed as the initial directing certificateholder with respect to all serviced mortgage loans (other than any Excluded Loans). |
| U.S. Credit Risk Retention: | For a discussion on the manner in which the U.S. credit risk retention requirements will be addressed by JPMorgan Chase Bank, National Association, as the retaining sponsor, see “Credit Risk Retention” in the Preliminary Prospectus. This transaction is being structured with a “third-party purchaser” that will acquire an “eligible horizontal residual interest” comprised of the Class XERR, Class XFRR, Class XGRR, Class XJRR, Class E-RR, Class F-RR, Class G-RR, and Class J-RR certificates (collectively, the “horizontal risk retention certificates”). Eightfold Real Estate Capital Fund VI, L.P. (in satisfaction of the retention obligations of JPMorgan Chase Bank, National Association, as the retaining sponsor) will be contractually obligated to retain (or to cause its “majority-owned affiliate” to retain) the horizontal risk retention certificates for a minimum of five years after the closing date, subject to certain permitted exceptions provided for under the risk retention rules. During this time, Eightfold Real Estate Capital Fund VI, L.P. will agree to comply with hedging, transfer and financing restrictions that are applicable to third-party purchasers under the credit risk retention rules. For additional information, see “Credit Risk Retention” in the Preliminary Prospectus. |
| EU/UK Risk Retention: | None of the sponsors, the depositor or the underwriters or their respective affiliates, or any other person, intends to retain a material net economic interest in the securitization constituted by the issue of the certificates, or to take any other action in respect of such securitization, in a manner prescribed or contemplated by the EU Securitization Regulation or the UK Securitization Regulation. In particular, no such person undertakes to take any action which may be required by any potential investor or certificateholder for the purposes of its compliance with any requirement of the EU Securitization Regulation or the UK Securitization Regulation. In addition, the arrangements described under “Credit Risk Retention” in the Preliminary Prospectus have not been structured with the objective of ensuring compliance by any person with any requirement of the EU Securitization Regulation or the UK Securitization Regulation. Consequently, the Offered Certificates may not be a suitable investment for investors that are subject to any requirement of the EU Securitization Regulation or the UK Securitization Regulation. See “Risk Factors—Other Risks Relating to the Certificates—EU Securitization Regulation and UK Securitization Regulation” in the Preliminary Prospectus. |
| Cut-off Date: | The mortgage loans will be considered part of the trust fund as of their respective cut-off dates. The cut-off date with respect to each mortgage loan is the respective due date for the monthly debt service payment that is due in May 2024 (or, in the case of any mortgage loan that has its first due date after May 2024, the date that would have been its due date in May 2024 under the terms of that mortgage loan if a monthly debt service payment were scheduled to be due in that month). |
| Expected Pricing Date: | Week of April 15, 2024 |
| Expected Closing Date: | May 6, 2024 |
| Determination Dates: | The 11th day of each month or, if the 11th day is not a business day, then the business day immediately following such 11th day. |
| Distribution Dates: | The 4th business day following each determination date. The first distribution date will be in June 2024. |
| Rated Final Distribution Date: | The distribution date in May 2057 |
| Interest Accrual Period: | Preceding calendar month |
| THE INFORMATION IN THIS STRUCTURAL AND COLLATERAL TERM SHEET IS NOT COMPLETE AND MAY BE AMENDED PRIOR TO THE TIME OF SALE. THIS TERM SHEET IS NOT AN OFFER TO SELL THESE SECURITIES AND IT IS NOT A SOLICITATION OF AN OFFER TO BUY THESE SECURITIES IN ANY JURISDICTION WHERE THE OFFER OR SALE IS NOT PERMITTED. | ||
| T-5 | ||
| BANK5 Trust 2024-5YR6 | Structural Overview |
| Payment Structure: | Sequential pay |
| Tax Treatment: | REMIC, except that the Exchangeable Certificates will evidence interests in a grantor trust |
| Optional Termination: | 1.00% clean-up call |
| Minimum Denominations: | $10,000 for each class of Offered Certificates (other than Class X-A and Class X-B certificates); $1,000,000 for the Class X-A and Class X-B certificates |
| Settlement Terms: | DTC, Euroclear and Clearstream |
| Legal/Regulatory Status: | Each class of Offered Certificates is expected to be eligible for exemptive relief under ERISA. Until the SEC adopts rules establishing a different creditworthiness standard, the Class A-1 certificates, the Class A-3 Exchangeable Certificates, the Class X-A certificates, the Class X-B certificates, the Class A-S Exchangeable Certificates and the Class B Exchangeable Certificates will constitute “mortgage related securities” for purposes of SMMEA, so long as they are rated in one of the two highest rating categories by one of the rating agencies or another NRSRO, and the other classes of certificates will not constitute “mortgage related securities” for purposes of SMMEA. |
| Analytics: | The certificate administrator is expected to make available all distribution date statements, CREFC® reports and supplemental notices received by it to certain modeling financial services as described in the Preliminary Prospectus. |
| Bloomberg Ticker: | BANK5 Trust 2024-5YR6<MTGE><GO> |
| Risk Factors: | THE CERTIFICATES INVOLVE CERTAIN RISKS AND MAY NOT BE SUITABLE FOR ALL INVESTORS. SEE THE “RISK FACTORS” SECTION OF THE PRELIMINARY PROSPECTUS. |
| THE INFORMATION IN THIS STRUCTURAL AND COLLATERAL TERM SHEET IS NOT COMPLETE AND MAY BE AMENDED PRIOR TO THE TIME OF SALE. THIS TERM SHEET IS NOT AN OFFER TO SELL THESE SECURITIES AND IT IS NOT A SOLICITATION OF AN OFFER TO BUY THESE SECURITIES IN ANY JURISDICTION WHERE THE OFFER OR SALE IS NOT PERMITTED. | ||
| T-6 | ||
| BANK5 Trust 2024-5YR6 | Structural Overview |
Structural Overview
| Accrual: | Each class of Offered Certificates will accrue interest on a 30/360 basis. |
| Amount and Order of Distributions: | On each distribution date, funds available for distribution from the mortgage loans, net of (i) any yield maintenance charges and prepayment premiums and (ii) any excess interest, will be distributed in the following amounts and order of priority: First, to the Class A-1, Class X-A, Class X-B and Class X-D certificates and the Class A-3, Class A-3-X1 and Class A-3-X2 trust components, in respect of interest, up to an amount equal to, and pro rata in accordance with, the interest entitlements for those classes of certificates and trust components; Second, to the Class A-1 certificates and the Class A-3 trust components, as follows: (i) to the extent of funds allocated to principal and available for distribution: (a) first, to principal on the Class A-1 certificates, until the certificate balance of the Class A-1 certificates has been reduced to zero, and (b) second, to principal on the Class A-3 trust component, until the principal balance of the Class A-3 trust component has been reduced to zero, or (ii) if the certificate or principal balance of each class of certificates and trust component other than the Class A-1 certificates and Class A-3 trust component has been reduced to zero as a result of the allocation of mortgage loan losses to those classes of certificates or trust components, funds available for distributions of principal will be distributed to the Class A-1 certificates and Class A-3 trust component remaining outstanding, pro rata, without regard to the distribution priorities described above; Third, to the Class A-1 certificates and Class A-3 trust component, to reimburse the Class A-1 certificates and Class A-3 trust component, first, (i) up to an amount equal to, and pro rata in accordance with, the aggregate previously unreimbursed losses on the mortgage loans allocable to principal that were previously borne by each such class or trust component, then, (ii) up to an amount equal to, and pro rata in accordance with, all accrued and unpaid interest on the amount set forth in clause (i) at the pass-through rate for such class or trust component; Fourth, to the Class A-S, Class A-S-X1 and Class A-S-X2 trust components as follows: (a) to each such trust component in respect of interest, up to an amount equal to, and pro rata in accordance with, the interest entitlements for those trust components; (b) to the extent of funds allocable to principal remaining after distributions in respect of principal to each class of certificates or trust component with a higher priority (as set forth in prior enumerated clauses set forth above), to principal on the Class A-S trust component until its certificate or principal balance has been reduced to zero; and (c) to reimburse the Class A-S trust component, first, in an amount equal to any previously unreimbursed losses on the mortgage loans allocable to principal that were previously borne by those certificates or trust components, and then in an amount equal to interest on that amount at the pass-through rate for such trust component ; Fifth, to the Class B, Class B-X1 and Class B-X2 trust components as follows: (a) to each such trust component in respect of interest, up to an amount equal to, and pro rata in accordance with, the interest entitlements for those trust components; (b) to the extent of funds allocable to principal remaining after distributions in respect of principal to each class of certificates or trust component with a higher priority (as set forth in prior enumerated clauses set forth above), to principal on the Class B trust component until its certificate or principal balance has been reduced to zero; and (c) to reimburse the Class B trust component, first, in an amount equal to any previously unreimbursed losses on the mortgage loans allocable to principal that were previously borne by those certificates or trust components, and then in an amount equal to interest on that amount at the pass-through rate for such trust component; Sixth, to the Class C, Class C-X1 and Class C-X2 trust components as follows: (a) to each such trust component in respect of interest, up to an amount equal to, and pro rata in accordance with, the interest entitlements for those trust components; (b) to the extent of funds allocable to principal remaining after distributions in respect of principal to each class of certificates or trust component with a higher priority (as set forth in prior enumerated clauses set forth above), to principal on the Class C trust component until its certificate or principal balance has been reduced to zero; and (c) to reimburse the Class C trust component, first, in an amount equal to any previously unreimbursed losses on the mortgage loans allocable to principal that were previously borne by those certificates or trust components, and then in an amount equal to interest on that amount at the pass-through rate for such trust component; Seventh, to the Class D, Class XERR, Class XFRR, Class XGRR, Class XJRR, Class E-RR, Class F-RR, Class G-RR and Class J-RR certificates in the amounts and order of priority described in “Description of the Certificates—Distributions” in the Preliminary Prospectus; and Eighth, to the Class R certificates, any remaining amounts. Principal and interest payable on each trust component will be distributed pro rata to the corresponding classes of Exchangeable Certificates representing interests therein in accordance with their Class Percentage Interests therein as described below under “Exchangeable Certificates.” |
| Interest and Principal Entitlements: | The interest entitlement of each class of Offered Certificates on each distribution date generally will be the interest accrued during the related interest accrual period on the related certificate balance or notional amount at the related pass-through rate, net of any prepayment interest shortfalls allocated to that class for such distribution date as described below. If prepayment interest shortfalls arise from voluntary prepayments on serviced mortgage loans during any collection period, the master servicer is required to make a limited |
| THE INFORMATION IN THIS STRUCTURAL AND COLLATERAL TERM SHEET IS NOT COMPLETE AND MAY BE AMENDED PRIOR TO THE TIME OF SALE. THIS TERM SHEET IS NOT AN OFFER TO SELL THESE SECURITIES AND IT IS NOT A SOLICITATION OF AN OFFER TO BUY THESE SECURITIES IN ANY JURISDICTION WHERE THE OFFER OR SALE IS NOT PERMITTED. | ||
| T-7 | ||
| BANK5 Trust 2024-5YR6 | Structural Overview |
compensating interest payment to offset those shortfalls. See “Description of the Certificates—Prepayment Interest Shortfalls” in the Preliminary Prospectus. The remaining amount of prepayment interest shortfalls will be allocated among the classes of certificates (other than the Exchangeable Certificates) and trust components that are entitled to interest, on a pro rata basis, based on their respective amounts of accrued interest for the related distribution date, to reduce the interest entitlement on each such class of certificates and trust components. For any distribution date, prepayment interest shortfalls allocated to a trust component will be allocated among the related classes of Exchangeable Certificates, pro rata, in accordance with their respective class percentage interests for that distribution date. If a class of certificates or trust component receives less than the entirety of its interest entitlement on any distribution date, then the shortfall (excluding any shortfall due to prepayment interest shortfalls), together with interest thereon, will be added to its interest entitlement for the next succeeding distribution date. The principal distribution amount for each distribution date generally will be the aggregate amount of principal received or advanced in respect of the mortgage loans, net of any non-recoverable advances and interest thereon and any workout-delayed reimbursement amounts that are reimbursed to the master servicer or the trustee during the related collection period. Non-recoverable advances and interest thereon are reimbursable from principal collections before reimbursement from other amounts. Workout-delayed reimbursement amounts will be reimbursable from principal collections. | |
| Exchangeable Certificates: | Certificates of each class of Exchangeable Certificates may be exchanged for certificates of the corresponding classes of Exchangeable Certificates set forth next to such class in the table below, and vice versa. Following any exchange of certificates of one or more classes of Exchangeable Certificates (the applicable “Surrendered Classes”) for certificates of one or more classes of other Exchangeable Certificates (the applicable “Received Classes”), the Class Percentage Interests (as defined below) of the outstanding principal balances or notional amounts of the Corresponding Trust Components that are represented by the Surrendered Classes (and consequently their related certificate balances or notional amounts) will be decreased, and those of the Received Classes (and consequently their related certificate balances or notional amounts) will be increased. The dollar denomination of the certificates of each of the Received Classes must be equal to the dollar denomination of the certificates of each of the Surrendered Classes. No fee will be required with respect to any exchange of Exchangeable Certificates. |
| Surrendered Classes (or Received Classes) of Certificates | Received Classes (or Surrendered Classes) of Certificates | |
| Class A-3 | Class A-3-1, Class A-3-X1 | |
| Class A-3 | Class A-3-2, Class A-3-X2 | |
| Class A-S | Class A-S-1, Class A-S-X1 | |
| Class A-S | Class A-S-2, Class A-S-X2 | |
| Class B | Class B-1, Class B-X1 | |
| Class B | Class B-2, Class B-X2 | |
| Class C | Class C-1, Class C-X1 | |
| Class C | Class C-2, Class C-X2 |
| THE INFORMATION IN THIS STRUCTURAL AND COLLATERAL TERM SHEET IS NOT COMPLETE AND MAY BE AMENDED PRIOR TO THE TIME OF SALE. THIS TERM SHEET IS NOT AN OFFER TO SELL THESE SECURITIES AND IT IS NOT A SOLICITATION OF AN OFFER TO BUY THESE SECURITIES IN ANY JURISDICTION WHERE THE OFFER OR SALE IS NOT PERMITTED. | ||
| T-8 | ||
| BANK5 Trust 2024-5YR6 | Structural Overview |
| On the closing date, the issuing entity will issue the following “trust components,” each with the initial principal balance (or, if such trust component has an “X” suffix, notional amount) and pass-through rate set forth next to it in the table below. Each trust component with an “X” suffix will not be entitled to distributions of principal. |
| Trust Component | Initial Principal Balance or Notional Amount | Pass-Through Rate | |
| Class A-3 | $687,100,000 | Class A-3 certificate pass-through rate minus 1.00% | |
| Class A-3-X1 | Equal to Class A-3 trust component principal balance | 0.50% | |
| Class A-3-X2 | Equal to Class A-3 trust component principal balance | 0.50% | |
| Class A-S | $115,657,000 | Class A-S certificate pass-through rate minus 1.00% | |
| Class A-S-X1 | Equal to Class A-S trust component principal balance | 0.50% | |
| Class A-S-X2 | Equal to Class A-S trust component principal balance | 0.50% | |
| Class B | $45,525,000 | Class B certificate pass-through rate minus 1.00% | |
| Class B-X1 | Equal to Class B trust component principal balance | 0.50% | |
| Class B-X2 | Equal to Class B trust component principal balance | 0.50% | |
| Class C | $38,142,000 | Class C certificate pass-through rate minus 1.00% | |
| Class C-X1 | Equal to Class C trust component principal balance | 0.50% | |
| Class C-X2 | Equal to Class C trust component principal balance | 0.50% |
| Each class of Exchangeable Certificates represents an undivided beneficial ownership interest in the trust components set forth next to it in the table below (the “Corresponding Trust Components”). Each class of Exchangeable Certificates has a pass-through rate equal to the sum of the pass-through rates of the Corresponding Trust Components and represents a percentage interest (the related “Class Percentage Interest”) in each Corresponding Trust Component, including principal and interest payable thereon (and reimbursements of losses allocable thereto), equal to (x) the certificate balance (or, if such class has an “X” suffix, notional amount) of such class of certificates, divided by (y) the principal balance of the Class A-3 trust component (if such class of Exchangeable Certificates has an “A-3” designation), the Class A-S trust component (if such class of Exchangeable Certificates has an “A-S” designation), the Class B trust component (if such class of Exchangeable Certificates has a “B” designation), or the Class C trust component (if such class of Exchangeable Certificates has a “C” designation). |
| Group of Exchangeable Certificates | Class of Exchangeable Certificates | Corresponding Trust Components | |
| “Class A-3 Exchangeable Certificates” | Class A-3 | Class A-3, Class A-3-X1, Class A-3-X2 | |
| Class A-3-1 | Class A-3, Class A-3-X2 | ||
| Class A-3-2 | Class A-3 | ||
| Class A-3-X1 | Class A-3-X1 | ||
| Class A-3-X2 | Class A-3-X1, Class A-3-X2 | ||
| “Class A-S Exchangeable Certificates” | Class A-S | Class A-S, Class A-S-X1, Class A-S-X2 | |
| Class A-S-1 | Class A-S, Class A-S-X2 | ||
| Class A-S-2 | Class A-S | ||
| Class A-S-X1 | Class A-S-X1 | ||
| Class A-S-X2 | Class A-S-X1, Class A-S-X2 | ||
| “Class B Exchangeable Certificates” | Class B | Class B, Class B-X1, Class B-X2 | |
| Class B-1 | Class B, Class B-X2 | ||
| Class B-2 | Class B | ||
| Class B-X1 | Class B-X1 | ||
| Class B-X2 | Class B-X1, Class B-X2 | ||
| “Class C Exchangeable Certificates” | Class C | Class C, Class C-X1, Class C-X2 | |
| Class C-1 | Class C, Class C-X2 | ||
| Class C-2 | Class C | ||
| Class C-X1 | Class C-X1 | ||
| Class C-X2 | Class C-X1, Class C-X2 |
| THE INFORMATION IN THIS STRUCTURAL AND COLLATERAL TERM SHEET IS NOT COMPLETE AND MAY BE AMENDED PRIOR TO THE TIME OF SALE. THIS TERM SHEET IS NOT AN OFFER TO SELL THESE SECURITIES AND IT IS NOT A SOLICITATION OF AN OFFER TO BUY THESE SECURITIES IN ANY JURISDICTION WHERE THE OFFER OR SALE IS NOT PERMITTED. | ||
| T-9 | ||
| BANK5 Trust 2024-5YR6 | Structural Overview |
The maximum certificate balance or notional amount of each class of Class A-3 Exchangeable Certificates, Class A-S Exchangeable Certificates, Class B Exchangeable Certificates or Class C Exchangeable Certificates that could be issued in an exchange is equal to the principal balance of the Class A-3, Class A-S, Class B or Class C trust component, respectively. The maximum certificate balances of Class A-3, Class A-S, Class B and Class C certificates will be issued on the closing date, and the certificate balance or notional amount of each other class of Exchangeable Certificates will be equal to zero on the closing date. Each class of Class A-3 Exchangeable Certificates, Class A-S Exchangeable Certificates, Class B Exchangeable Certificates and Class C Exchangeable Certificates will have a certificate balance or notional amount equal to its Class Percentage Interest multiplied by the principal balance of the Class A-3, Class A-S, Class B or Class C trust component, respectively. Each class of Class A-3 Exchangeable Certificates, Class A-S Exchangeable Certificates, Class B Exchangeable Certificates and Class C Exchangeable Certificates with a certificate balance will have the same approximate initial credit support percentage, Expected Weighted Average Life, Expected Principal Window, Certificate Principal UW NOI Debt Yield and Certificate Principal to Value Ratio as the Class A-3, Class A-S, Class B or Class C certificates, respectively, shown above. | |
| Special Servicer Compensation: | The principal compensation to be paid to a special servicer in respect of its special servicing activities will be the special servicing fee, the workout fee and the liquidation fee. The special servicing fee for each distribution date is calculated based on the outstanding principal balance of each serviced mortgage loan that is a specially serviced mortgage loan (and any related serviced companion loan) or as to which the related mortgaged property has become an REO property at the special servicing fee rate, which will be a rate equal to the greater of 0.25% per annum and the per annum rate that would result in a special servicing fee for the related month of $5,000. The special servicing fee will be payable monthly, first, from liquidation proceeds, insurance and condemnation proceeds, and other collections in respect of the related specially serviced mortgage loan or REO property and, then, from general collections on all the mortgage loans and any REO properties. The special servicer will also be entitled to (i) liquidation fees generally equal to the lesser of (x) 1.0% (or, in any case, if such rate would result in an aggregate liquidation fee less than $25,000, then the liquidation fee rate will be equal to such higher rate as would result in an aggregate liquidation fee equal to $25,000) and (y) $1,000,000 of liquidation proceeds and certain other collections in respect of each non-specially serviced loan with respect to which it acts as the enforcing servicer or each specially serviced mortgage loan (and any related serviced companion loan) or related REO property and of amounts received in respect of mortgage loan repurchases by the related mortgage loan sellers and (ii) workout fees generally equal to the lesser of (x) 1.0% of interest (other than default interest) and principal payments made in respect of a rehabilitated mortgage loan (and any related serviced companion loan) and (y) $1,000,000, subject to a floor of $25,000 with respect to any mortgage loan, whole loan or related REO property, and in the case of each of clause (i) and (ii), subject to certain adjustments and exceptions as described in the Preliminary Prospectus under “Pooling and Servicing Agreement—Servicing and Other Compensation and Payment of Expenses—Special Servicing Compensation”. With respect to any non-serviced mortgage loan, the related special servicer under the related other pooling and servicing agreement pursuant to which such mortgage loan is being serviced will be entitled to similar compensation as that described above with respect to such non-serviced mortgage loan under such other pooling and servicing agreement as further described in the Preliminary Prospectus, although any related fees may accrue at a different rate and there may be a higher (or no) cap on liquidation and workout fees. |
| Prepayment Premiums/Yield Maintenance Charges: | If any yield maintenance charge or prepayment premium is collected during any collection period with respect to any mortgage loan, then on the immediately succeeding distribution date, the certificate administrator will pay: (1) to the holders of each class of the Class A-1, Class A-3, Class A-3-1, Class A-3-2, Class A-S, Class A-S-1, Class A-S-2, Class B, Class B-1, Class B-2, Class C, Class C-1, Class C-2 and Class D certificates, the product of (x) such yield maintenance charge or prepayment premium, (y) the related Base Interest Fraction for such class and the applicable principal prepayment, and (z) a fraction, the numerator of which is equal to the amount of principal distributed to such class for that distribution date, and the denominator of which is the YM Denominator for that distribution date, (2) to the holders of the Class A-3-X1 certificates, the product of (x) such yield maintenance charge or prepayment premium, (y) a fraction, the numerator of which is equal to the amount of principal distributed to the Class A-3-1 certificates for that distribution date, and the denominator of which is the YM Denominator for that distribution date, and (z) the difference between (1) the Base Interest Fraction for the Class A-3 certificates and the applicable principal prepayment and (2) the Base Interest Fraction for the Class A-3-1 certificates and the applicable principal prepayment, (3) to the holders of the Class A-3-X2 certificates, the product of (x) such yield maintenance charge or prepayment premium, (y) a fraction, the numerator of which is equal to the amount of principal distributed to the Class A-3-2 certificates for that distribution date, and the denominator of which is the YM Denominator for that distribution date, and (z) the difference between (1) the Base Interest Fraction for the Class A-3 certificates and the applicable principal prepayment and (2) the Base Interest Fraction for the Class A-3-2 certificates and the applicable principal prepayment, |
| THE INFORMATION IN THIS STRUCTURAL AND COLLATERAL TERM SHEET IS NOT COMPLETE AND MAY BE AMENDED PRIOR TO THE TIME OF SALE. THIS TERM SHEET IS NOT AN OFFER TO SELL THESE SECURITIES AND IT IS NOT A SOLICITATION OF AN OFFER TO BUY THESE SECURITIES IN ANY JURISDICTION WHERE THE OFFER OR SALE IS NOT PERMITTED. | ||
| T-10 | ||
| BANK5 Trust 2024-5YR6 | Structural Overview |
(4) to the holders of the Class A-S-X1 certificates, the product of (x) such yield maintenance charge or prepayment premium, (y) a fraction, the numerator of which is equal to the amount of principal distributed to the Class A-S-1 certificates for that distribution date, and the denominator of which is the YM Denominator for that distribution date, and (z) the difference between (1) the Base Interest Fraction for the Class A-S certificates and the applicable principal prepayment and (2) the Base Interest Fraction for the Class A-S-1 certificates and the applicable principal prepayment, (5) to the holders of the Class A-S-X2 certificates, the product of (x) such yield maintenance charge or prepayment premium, (y) a fraction, the numerator of which is equal to the amount of principal distributed to the Class A-S-2 certificates for that distribution date, and the denominator of which is the YM Denominator for that distribution date, and (z) the difference between (1) the Base Interest Fraction for the Class A-S certificates and the applicable principal prepayment and (2) the Base Interest Fraction for the Class A-S-2 certificates and the applicable principal prepayment, (6) to the holders of the Class B-X1 certificates, the product of (x) such yield maintenance charge or prepayment premium, (y) a fraction, the numerator of which is equal to the amount of principal distributed to the Class B-1 certificates for that distribution date, and the denominator of which is the YM Denominator for that distribution date, and (z) the difference between (1) the Base Interest Fraction for the Class B certificates and the applicable principal prepayment and (2) the Base Interest Fraction for the Class B-1 certificates and the applicable principal prepayment, (7) to the holders of the Class B-X2 certificates, the product of (x) such yield maintenance charge or prepayment premium, (y) a fraction, the numerator of which is equal to the amount of principal distributed to the Class B-2 certificates for that distribution date, and the denominator of which is the YM Denominator for that distribution date, and (z) the difference between (1) the Base Interest Fraction for the Class B certificates and the applicable principal prepayment and (2) the Base Interest Fraction for the Class B-2 certificates and the applicable principal prepayment, (8) to the holders of the Class C-X1 certificates, the product of (x) such yield maintenance charge or prepayment premium, (y) a fraction, the numerator of which is equal to the amount of principal distributed to the Class C-1 certificates for that distribution date, and the denominator of which is the YM Denominator for that distribution date, and (z) the difference between (1) the Base Interest Fraction for the Class C certificates and the applicable principal prepayment and (2) the Base Interest Fraction for the Class C-1 certificates and the applicable principal prepayment, (11) to the holders of the Class C-X2 certificates, the product of (x) such yield maintenance charge or prepayment premium, (y) a fraction, the numerator of which is equal to the amount of principal distributed to the Class C-2 certificates for that distribution date, and the denominator of which is the YM Denominator for that distribution date, and (z) the difference between (1) the Base Interest Fraction for the Class C certificates and the applicable principal prepayment and (2) the Base Interest Fraction for the Class C-2 certificates and the applicable principal prepayment, (12) to the holders of the Class X-A certificates, the excess, if any, of (x) the product of (1) such yield maintenance charge or prepayment premium and (2) a fraction, the numerator of which is equal to the total amount of principal distributed to the Class A-1 certificates and the Class A-3 Exchangeable Certificates for that distribution date, and the denominator of which is the YM Denominator for that distribution date, over (y) the total amount of such yield maintenance charge or prepayment premium distributed to the Class A-1 certificates and the Class A-3 Exchangeable Certificates as described above, (13) to the holders of the Class X-B certificates, the excess, if any, of (x) the product of (1) such yield maintenance charge or prepayment premium and (2) a fraction, the numerator of which is equal to the total amount of principal distributed to the Class A-S Exchangeable Certificates, Class B Exchangeable Certificates and the Class C Exchangeable Certificates for that distribution date, and the denominator of which is the YM Denominator for that distribution date, over (y) the total amount of such yield maintenance charge or prepayment premium distributed to the Class A-S Exchangeable Certificates, Class B Exchangeable Certificates and the Class C Exchangeable Certificates as described above, and (14) to the holders of the Class X-D certificates, any remaining portion of such yield maintenance charge or prepayment premium not distributed as described above. “YM Denominator” means, for any distribution date, the total amount of principal distributed to the Class A-1, Class D, Class E-RR, Class F-RR, Class G-RR and Class J-RR certificates and the Class A-3 Exchangeable Certificates, the Class A-S Exchangeable Certificates, the Class B Exchangeable Certificates and the Class C Exchangeable Certificates. All yield maintenance charges and prepayment premiums referred to above will be net of any liquidation fees or workout fees payable therefrom. Notwithstanding any of the foregoing to the contrary, if at any time the certificate balances of the principal balance certificates (other than the Control Eligible Certificates) have been reduced to zero as a result of the allocation of principal payments on the mortgage loans, the certificate administrator will be required to pay to the holders of each remaining class of principal balance certificates then entitled to distributions of principal on such distribution date the product of (a) any yield maintenance charge or prepayment premium distributable on the subject distribution date (net of any liquidation fees payable therefrom) and (b) a fraction, the numerator of |
| THE INFORMATION IN THIS STRUCTURAL AND COLLATERAL TERM SHEET IS NOT COMPLETE AND MAY BE AMENDED PRIOR TO THE TIME OF SALE. THIS TERM SHEET IS NOT AN OFFER TO SELL THESE SECURITIES AND IT IS NOT A SOLICITATION OF AN OFFER TO BUY THESE SECURITIES IN ANY JURISDICTION WHERE THE OFFER OR SALE IS NOT PERMITTED. | ||
| T-11 | ||
| BANK5 Trust 2024-5YR6 | Structural Overview |
which is equal to the amount of principal distributed to such class for that distribution date, and the denominator of which is the total amount of principal distributed to all principal balance certificates for that distribution date. No yield maintenance charges or prepayment premiums will be distributed to the holders of the Class R Certificates. “Base Interest Fraction” means, with respect to any principal prepayment of any mortgage loan that provides for the payment of a yield maintenance charge or prepayment premium, and with respect to any class of principal balance certificates, a fraction (A) the numerator of which is the greater of (x) zero and (y) the difference between (i) the pass‑through rate on that class, and (ii) the applicable discount rate and (B) the denominator of which is the difference between (i) the mortgage interest rate on the related mortgage loan and (ii) the applicable discount rate; provided, that: under no circumstances will the Base Interest Fraction be greater than one; if the discount rate referred to above is greater than or equal to both the mortgage interest rate on the related mortgage loan and the pass-through rate on that class, then the Base Interest Fraction will equal zero; and if the discount rate referred to above is greater than or equal to the mortgage interest rate on the related mortgage loan and is less than the pass‑through rate on that class, then the Base Interest Fraction will be equal to 1.0. Consistent with the foregoing, the Base Interest Fraction is equal to: |
| (Pass-Through Rate – Discount Rate) | |||
| (Mortgage Rate – Discount Rate) |
| Realized Losses: | On each distribution date, immediately following the distributions to be made to the certificateholders on that date, the certificate administrator is required to calculate the amount, if any, by which (i) the aggregate stated principal balance of the mortgage loans, including any successor REO loans, expected to be outstanding immediately following that distribution date is less than (ii) the then aggregate certificate balance of the principal balance certificates after giving effect to distributions of principal on that distribution date, which amount will be applied to the Class J-RR, Class G-RR, Class F-RR, Class E-RR and Class D certificates, the Class C, Class B and Class A-S trust components, in that order, in each case until the related certificate or principal balance has been reduced to zero, and then to the Class A-1 certificates and the Class A-3 trust component, pro rata, based upon their respective certificate or principal balances, until their respective certificate or principal balances have been reduced to zero. Any portion of such amount applied to the Class A-3, Class A-S, Class B or Class C trust component will reduce the certificate balance or notional amount of each class of certificates in the related group of Exchangeable Certificates by an amount equal to the product of (x) its certificate balance or notional amount, divided by the principal balance of such trust component prior to the applicable reduction, and (y) the amount applied to such trust component. The Notional Amount of the Class X-A Certificates will be reduced by the amount of all losses that are allocated to the Class A-1 certificates or Class A-3 trust component as write-offs in reduction of their principal balances. The Notional Amount of the Class X-B Certificates will be reduced by the amount of all losses that are allocated to the Class A-S, Class B or Class C trust components as write-offs in reduction of their principal balances. |
| Serviced Whole Loans: | Each of the following mortgaged properties or portfolios of mortgaged properties secures a mortgage loan and one or more pari passu promissory notes and, in some cases, one or more generally subordinate promissory notes (each, a “serviced companion loan”) that will be serviced pursuant to the related intercreditor agreement and the pooling and servicing agreement for this transaction: Kenwood Towne Center, Jordan Creek, Galleria at Tyler and Respara. With respect to each such mortgaged property or portfolio of mortgaged properties, the related mortgage loan, together with the related serviced companion loan(s), is referred to herein (for so long as it is serviced under the pooling and servicing agreement for this transaction) as a “serviced whole loan.” Each serviced companion loan is not part of the mortgage pool and may be contributed to one or more future securitization transactions (if not already securitized) or may be otherwise transferred at any time, subject to compliance with the related intercreditor agreement. See the tables below entitled “Mortgage Loans with Pari Passu Companion Loans” and “Mortgage Loans with Subordinate Debt,” as well as “Description of the Mortgage Pool—The Whole Loans” in the Preliminary Prospectus, for additional information regarding each such whole loan. With respect to each “servicing shift whole loan”, the pooling and servicing agreement for this transaction will govern servicing of such whole loan until the securitization of the related lead servicing note; however, servicing of such whole loan will generally be directed by the holder of the related control note (which is not included in this securitization), and such holder will have the right to replace the special servicer with respect to the related whole loan with or without cause. After the securitization of the related lead servicing note, such whole loan will cease to be a serviced whole loan and will be serviced pursuant to the pooling and servicing agreement for another securitization transaction (see “—Non-Serviced Whole Loans” below). There will be no servicing shift mortgage loans related to the trust as of the Closing Date. |
| Non-Serviced Whole Loans: | Each of the following mortgaged properties or portfolios of mortgaged properties secures a mortgage loan (each, a “non-serviced mortgage loan”), one or more pari passu promissory notes and, in some cases, one or more generally subordinate promissory notes (each such promissory note, a “non-serviced companion loan”) that will be serviced pursuant to the related intercreditor agreement and the pooling and servicing agreement or trust and servicing agreement (referred to herein as a related “pooling and servicing agreement”) for another |
| THE INFORMATION IN THIS STRUCTURAL AND COLLATERAL TERM SHEET IS NOT COMPLETE AND MAY BE AMENDED PRIOR TO THE TIME OF SALE. THIS TERM SHEET IS NOT AN OFFER TO SELL THESE SECURITIES AND IT IS NOT A SOLICITATION OF AN OFFER TO BUY THESE SECURITIES IN ANY JURISDICTION WHERE THE OFFER OR SALE IS NOT PERMITTED. | ||
| T-12 | ||
| BANK5 Trust 2024-5YR6 | Structural Overview |
| securitization transaction: Western Digital Milpitas Campus, Staten Island Mall, Casa Cipriani, 11755 Wilshire and Tysons Corner Center. With respect to each such mortgaged property or portfolio of mortgaged properties, the related mortgage loan, together with the related non-serviced companion loan(s), is referred to herein (for so long as it is serviced under the pooling and servicing agreement for another securitization transaction) as a “non-serviced whole loan.” Each non-serviced companion loan is not part of the mortgage pool and may be contributed to one or more future securitization transactions (if not already securitized) or may be otherwise transferred at any time, subject to compliance with the related intercreditor agreement. Servicing of each non-serviced whole loan will generally be directed by the holder of the related control note (or, if such control note is included in a securitization, the directing certificateholder thereunder (or other party designated thereunder to exercise the rights of such control note)), and such holder will have the right to replace the special servicer with respect to the related whole loan with or without cause. See the tables below entitled “Mortgage Loans with Pari Passu Companion Loans” and “Mortgage Loans with Subordinate Debt,” as well as “Description of the Mortgage Pool—The Whole Loans” in the Preliminary Prospectus, for additional information regarding each such whole loan. | |
| Directing Certificateholder/ Controlling Class: | The “Directing Certificateholder” will be (i) with respect to a servicing shift mortgage loan, the related Loan-Specific Directing Certificateholder, and (ii) with respect to each other mortgage loan, the Controlling Class Certificateholder (or its representative) selected by more than 50% (by certificate balance) of the Controlling Class Certificateholders; provided, that (1) absent that selection, (2) until a Directing Certificateholder is so selected or (3) upon receipt of a notice from a majority of the Controlling Class Certificateholders (by certificate balance) that a Directing Certificateholder is no longer designated, the Controlling Class Certificateholder that owns the largest aggregate certificate balance of the Controlling Class (or its representative) will be the Directing Certificateholder; provided, that (a) in the case of clause (3), if no one holder owns the largest aggregate certificate balance of the Controlling Class, then there will be no Directing Certificateholder until appointed in accordance with the terms of the pooling and servicing agreement, and (b) the certificate administrator and the other parties to the pooling and servicing agreement will be entitled to assume that the identity of the Directing Certificateholder has not changed until such parties receive written notice of a replacement of the Directing Certificateholder from a party holding the requisite interest in the Controlling Class (as confirmed by the certificate registrar), or the resignation of the then current Directing Certificateholder. As used herein, the term “Directing Certificateholder,” unless used in relation to a Servicing Shift Mortgage Loan, means the entity determined pursuant to clause (ii) of the definition of such term. The “Loan-Specific Directing Certificateholder” with respect to a servicing shift mortgage loan is the “controlling holder”, the “directing certificateholder”, the “directing holder”, “directing lender” or any analogous concept under the related intercreditor agreement. Prior to the securitization of the related lead servicing note, the Loan-Specific Directing Certificateholder with respect to a servicing shift mortgage loan will be the holder of the related control note. On and after the securitization of the related lead servicing note, there will be no Loan-Specific Directing Certificateholder under the pooling and servicing agreement for this transaction (the “PSA”) with respect to such servicing shift mortgage loan. The “Controlling Class” will be, as of any time of determination, the most subordinate class of Control Eligible Certificates then outstanding that has an aggregate certificate balance (as notionally reduced by any Cumulative Appraisal Reduction Amounts (as defined below) allocable to such class) at least equal to 25% of the initial certificate balance of that class; provided, that if at any time the certificate balances of the principal balance certificates (other than the Control Eligible Certificates) have been reduced to zero as a result of principal payments on the mortgage loans, then the Controlling Class will be the most subordinate class of Control Eligible Certificates that has a certificate balance greater than zero without regard to any Cumulative Appraisal Reduction Amounts. The Controlling Class as of the closing date will be the Class J-RR certificates. The “Control Eligible Certificates” will be any of the Class E-RR, Class F-RR, Class G-RR, and Class J-RR certificates. |
| Control Rights: | Prior to a Control Termination Event, the Directing Certificateholder will have certain consent and consultation rights under the pooling and servicing agreement with respect to certain major decisions and other matters. A “Control Termination Event” will occur when the Class E-RR certificates have a certificate balance (taking into account the application of any Cumulative Appraisal Reduction Amounts to notionally reduce the certificate balance thereof) of less than 25% of the initial certificate balance of that class; provided, that no Control Termination Event may occur with respect to a Loan-Specific Directing Certificateholder, and the term “Control Termination Event” will not be applicable to a Loan-Specific Directing Certificateholder; provided, further, that a Control Termination Event will be not deemed continuing in the event that the certificate balances of the principal balance certificates (other than the Control Eligible Certificates) have been reduced to zero as a result of principal payments on the mortgage loans. After the occurrence of a Control Termination Event but prior to the occurrence of a Consultation Termination Event, the Directing Certificateholder will not have any consent rights, but the Directing Certificateholder will have certain non-binding consultation rights under the pooling and servicing agreement with respect to certain major decisions and other matters. A “Consultation Termination Event” will occur when no class of Control Eligible Certificates has a certificate balance (without regard to the application of any Cumulative Appraisal Reduction Amounts) at least equal to 25% of the initial certificate balance of that class; provided, that no Consultation Termination Event may occur with respect to a Loan-Specific Directing Certificateholder, and the term “Consultation Termination Event” will not be applicable to a Loan-Specific Directing Certificateholder; |
| THE INFORMATION IN THIS STRUCTURAL AND COLLATERAL TERM SHEET IS NOT COMPLETE AND MAY BE AMENDED PRIOR TO THE TIME OF SALE. THIS TERM SHEET IS NOT AN OFFER TO SELL THESE SECURITIES AND IT IS NOT A SOLICITATION OF AN OFFER TO BUY THESE SECURITIES IN ANY JURISDICTION WHERE THE OFFER OR SALE IS NOT PERMITTED. | ||
| T-13 | ||
| BANK5 Trust 2024-5YR6 | Structural Overview |
provided, further, that a Consultation Termination Event will be deemed not continuing in the event that the certificate balances of the principal balance certificates (other than the Control Eligible Certificates) have been reduced to zero as a result of principal payments on the mortgage loans. After the occurrence of a Consultation Termination Event, the Directing Certificateholder will not have any consent or consultation rights, except with respect to any rights expressly set forth in the pooling and servicing agreement. If an Operating Advisor Consultation Event has occurred and is continuing, the operating advisor will have certain non-binding consultation rights under the PSA with respect to certain major decisions and other matters. Notwithstanding any proviso to, or any other contrary provision in, the definitions of “Control Termination Event”, “Consultation Termination Event” and “Operating Advisor Consultation Event”, a Control Termination Event, a Consultation Termination Event and an Operating Advisor Consultation Event will each be deemed to have occurred with respect to any Excluded Loan with respect to the Directing Certificateholder or the holder of the majority of the Controlling Class, and neither the Directing Certificateholder nor any Controlling Class Certificateholder will have any consent or consultation rights with respect to the servicing of such Excluded Loan. An “Excluded Loan” means a Mortgage Loan or Whole Loan with respect to which, as of any date of determination, the Directing Certificateholder or the holder of the majority of the Controlling Class is a Borrower Party. It is expected that there will be no Excluded Loans with respect to this securitization on the closing date. “Borrower Party” means a borrower, a mortgagor, a manager of a mortgaged property, the holder of a mezzanine loan that has been accelerated or as to which foreclosure or enforcement proceedings have been commenced against the equity collateral pledged to secure the related mezzanine loan, or any Borrower Party Affiliate. “Borrower Party Affiliate” means, with respect to a borrower, a mortgagor, a manager of a mortgaged property or the holder of a mezzanine loan that has been accelerated or as to which foreclosure or enforcement proceedings have been commenced against the equity collateral pledged to secure the related mezzanine loan, (a) any other person controlling or controlled by or under common control with such borrower, mortgagor, manager or mezzanine lender, as applicable, or (b) any other person owning, directly or indirectly, 25% or more of the beneficial interests in such borrower, mortgagor, manager or mezzanine lender, as applicable. For the purposes of this definition, “control” when used with respect to any specified person means the power to direct the management and policies of such person, directly or indirectly, whether through the ownership of voting securities, by contract or otherwise and the terms “controlling” and “controlled” have meanings correlative to the foregoing. Notwithstanding any of the foregoing to the contrary, if any mortgage loan is part of a whole loan, the Directing Certificateholder’s consent and/or consultation rights with respect thereto may be limited as described in the Preliminary Prospectus. In particular, with respect to each non-serviced whole loan and each servicing shift whole loan, the Directing Certificateholder (other than a Loan-Specific Directing Certificateholder) will only have certain consultation rights with respect to certain major decisions and other matters related to such whole loan, in each case only prior to a Consultation Termination Event, and the Loan-Specific Directing Certificateholder will be entitled to similar consent and/or consultation rights with respect to such whole loan. | |
| Appraisal Reduction Amounts and Collateral Deficiency Amounts: | An “Appraisal Reduction Amount” generally will be created in the amount, if any, by which the principal balance of a required appraisal loan (which is a mortgage loan with respect to which certain defaults, modifications or insolvency events have occurred as further described in the Preliminary Prospectus) plus other amounts overdue or advanced in connection with such mortgage loan exceeds 90% of the appraised value of the related mortgaged property plus certain escrows and reserves (including letters of credit) held with respect to the mortgage loan. A mortgage loan will cease to be subject to an Appraisal Reduction Amount when it has been brought current for at least three consecutive months, no additional event of default is foreseeable in the reasonable judgment of the applicable special servicer and no other circumstances exist that would cause such mortgage loan or any related companion loan to be a specially serviced loan; however, a “Collateral Deficiency Amount” may exist with respect to any mortgage loan that is modified into an AB loan structure (an “AB Modified Loan”) and remains a corrected mortgage loan and, if so, will generally equal the excess of (i) the stated principal balance of such AB Modified Loan (taking into account the related junior note(s) and any pari passu notes included therein), over (ii) the sum of (in the case of a whole loan, solely to the extent allocable to the subject mortgage loan) (x) the most recent appraised value for the related mortgaged property or mortgaged properties, plus (y) solely to the extent not reflected or taken into account in such appraised value (or in the calculation of any related Appraisal Reduction Amount) and to the extent on deposit with, or otherwise under the control of, the lender as of the date of such determination, any capital or additional collateral contributed by the related borrower at the time the mortgage loan became (and as part of the modification related thereto) such AB Modified Loan for the benefit of the related mortgaged property or mortgaged properties (provided that in the case of an non-serviced mortgage loan, the amounts set forth in this clause (y) will be taken into account solely to the extent relevant information is received by the master servicer), plus (z) any other escrows or reserves (in addition to any amounts set forth in the immediately preceding clause (y) and solely to the extent not reflected or taken into account in the calculation of any related Appraisal Reduction Amount) held by the lender in respect of such AB Modified Loan as of the date of such determination, which such excess, for the avoidance of doubt, will be determined separately from and exclude any related Appraisal Reduction Amounts. As used herein, a “Cumulative Appraisal Reduction Amount” will be the sum of any Appraisal Reduction Amounts and any Collateral Deficiency Amounts. |
| THE INFORMATION IN THIS STRUCTURAL AND COLLATERAL TERM SHEET IS NOT COMPLETE AND MAY BE AMENDED PRIOR TO THE TIME OF SALE. THIS TERM SHEET IS NOT AN OFFER TO SELL THESE SECURITIES AND IT IS NOT A SOLICITATION OF AN OFFER TO BUY THESE SECURITIES IN ANY JURISDICTION WHERE THE OFFER OR SALE IS NOT PERMITTED. | ||
| T-14 | ||
| BANK5 Trust 2024-5YR6 | Structural Overview |
Any Appraisal Reduction Amount in respect of any non-serviced mortgage loan generally will be calculated in accordance with the other servicing agreement pursuant to which such mortgage loan is being serviced, which calculations are expected to be generally similar to those provided for in the pooling and servicing agreement for this transaction. If any mortgage loan is part of a whole loan, any Appraisal Reduction Amount or Collateral Deficiency Amount will (or effectively will) be calculated in respect of such whole loan taken as a whole and allocated, to the extent provided in the related intercreditor agreement and the related pooling and servicing agreement, first, to any related subordinate companion loan, and second, to the related mortgage loan and any pari passu companion loan on a pro rata basis by unpaid principal balance. Appraisal Reduction Amounts will proportionately reduce the interest portion of debt service advances required to be made in respect of the related mortgage loan. Appraisal Reduction Amounts and Collateral Deficiency Amounts will be (i) taken into account in determining the identity of the controlling class entitled to appoint the Directing Certificateholder, the existence of a Control Termination Event or an Operating Advisor Consultation Event and the allocation and/or exercise of voting rights for certain purposes (see “Directing Certificateholder/Controlling Class” above) and (ii) allocated to the following classes of certificates and trust components, in each case to notionally reduce their certificate balances or principal balances until the certificate balance or principal balance of each such class or trust component is notionally reduced to zero: the Class J-RR, Class G-RR, Class F-RR, Class E-RR and Class D certificates and the Class C, Class B and Class A-S trust components, in that order, and then pro rata to the Class A-1 certificates and Class A-3 trust component. Appraisal Reduction Amounts and Collateral Deficiency Amounts allocated to the Class A-3, Class A-S, Class B or Class C trust components will be allocated to the corresponding classes of Exchangeable Certificates with certificate balances pro rata to notionally reduce their certificate balances in accordance with their Class Percentage Interests therein. | |
| Appraised-Out Class: | An “Appraised-Out Class” is any class of Control Eligible Certificates, the certificate balance of which (taking into account the application of any Appraisal Reduction Amounts or Collateral Deficiency Amounts to notionally reduce the certificate balance of such class) has been reduced to less than 25% of its initial certificate balance. Any Appraised-Out Class may not exercise any direction, control, consent and/or similar rights of the Controlling Class until such time, if any, as such class is reinstated as the Controlling Class, and the rights of the Controlling Class will be exercised by the next most senior class of Control Eligible Certificates that is not an Appraised-Out Class, if any, during such period. Any Appraised Out Class will no longer be the Controlling Class; provided, however, that if at any time, the Certificate Balances of the certificates other than the Control Eligible Certificates have been reduced to zero as a result of principal payments on the mortgage loans, then the Controlling Class will be the most subordinate class of Control Eligible Certificates that has a certificate balance greater than zero without regard to any Appraisal Reduction Amounts. |
| Appraisal Remedy: | The holders of the majority (by certificate balance) of an Appraised-Out Class (such holders, the “Requesting Holders”) will have the right, at their sole expense, to require the special servicer to order (or, with respect to a non-serviced mortgage loan, require the master servicer to request from the applicable non-serviced special servicer) a second appraisal of any mortgage loan (or serviced whole loan) for which an appraisal reduction event has occurred or as to which there exists a Collateral Deficiency Amount. With respect to any serviced mortgage loan, the special servicer will be required to use its reasonable efforts to cause that such appraisal is delivered within 30 days from receipt of the Requesting Holders’ written request and will be required to cause such appraisal to be prepared on an “as-is” basis by an MAI appraiser. With respect to any non-serviced mortgage loan, the master servicer will be required to use commercially reasonable efforts to obtain such second appraisal from the applicable non-serviced special servicer. Upon receipt of such supplemental appraisal, the master servicer (for Collateral Deficiency Amounts on any non-serviced mortgage loans), the non-serviced special servicer (for Appraisal Reduction Amounts on non-serviced mortgage loans to the extent provided for in the applicable non-serviced servicing agreement and applicable intercreditor agreement) and the special servicer (for any mortgage loan (other than a non-serviced mortgage loan) will be required to determine, in accordance with the Servicing Standard, whether, based on its assessment of such supplemental appraisal, any recalculation of the applicable Appraisal Reduction Amount or Collateral Deficiency Amount is warranted and, if so warranted, such person will recalculate such Appraisal Reduction Amount or Collateral Deficiency Amount, as applicable, based upon such supplemental appraisal as described above. If required by any such recalculation, the applicable Appraised-Out Class will be reinstated as the Controlling Class and each Appraised-Out Class will, if applicable, have its related certificate balance notionally restored to the extent required by such recalculation of the Appraisal Reduction Amount or Collateral Deficiency Amount, if applicable. |
| Sale of Defaulted Loans: | Under certain circumstances the special servicer may be required to use reasonable efforts to solicit offers for a defaulted serviced mortgage loan (and any related companion loan (to the extent provided under the related intercreditor agreement) and/or related REO properties). The Directing Certificateholder will not have a right of first refusal to purchase a defaulted loan. If the special servicer does not receive an offer at least equal to the outstanding principal balance plus all accrued and unpaid interest and outstanding costs and expenses and certain other amounts specified in the pooling and servicing agreement (the “Par Purchase Price”), the special servicer may purchase the defaulted loan or REO property at the Par Purchase Price or may accept the first cash offer received from any person |
| THE INFORMATION IN THIS STRUCTURAL AND COLLATERAL TERM SHEET IS NOT COMPLETE AND MAY BE AMENDED PRIOR TO THE TIME OF SALE. THIS TERM SHEET IS NOT AN OFFER TO SELL THESE SECURITIES AND IT IS NOT A SOLICITATION OF AN OFFER TO BUY THESE SECURITIES IN ANY JURISDICTION WHERE THE OFFER OR SALE IS NOT PERMITTED. | ||
| T-15 | ||
| BANK5 Trust 2024-5YR6 | Structural Overview |
that is determined to be a fair price for such defaulted loan or REO property. If multiple offers are received during the period designated by the special servicer for receipt of offers, the special servicer is generally required to select the highest offer. The special servicer will be required to determine whether any cash offer constitutes a fair price for any defaulted loan or REO property if the highest offeror is a person other than a party to the PSA, the Directing Certificateholder, any sponsor, any Borrower Party, any independent contractor engaged by a special servicer or any known affiliate of any of the preceding entities, and, with respect to a whole loan if it is a defaulted loan, the depositor, the master servicer, the special servicer (or any independent contractor engaged by the special servicer) or the trustee for the securitization of a companion loan, and each related companion loan holder or its representative, any holder of a related mezzanine loan or any known affiliate of any of the preceding entities (each, an “Interested Person”). If the offer is made by an Interested Person (provided that the trustee may not be an offeror), then the trustee will be required to determine whether the offer constitutes a fair price unless (i) the offer is equal to or greater than the applicable Par Purchase Price and (ii) the offer is the highest offer received. Absent an offer at least equal to the Par Purchase Price, no offer from an Interested Person will constitute a fair price unless (x) it is the highest offer received and (y) at least two other offers are received from independent third parties. Neither the trustee nor any of its affiliates may make an offer for or purchase any specially serviced loan or REO property. Notwithstanding any of the foregoing to the contrary, the special servicer is not required to accept the highest offer and may accept a lower offer for a defaulted loan or REO property if the special servicer determines, in accordance with the Servicing Standard (and subject to the requirements of any related intercreditor agreement), that a rejection of such offer would be in the best interests of the certificateholders and any related companion loan holders as a collective whole as if they constituted a single lender, so long as such lower offer was not made by such special servicer or any of its affiliates. If title to any mortgaged property is acquired by the trust fund, the special servicer will generally be required to sell such mortgaged property prior to the close of the third calendar year beginning after the year of acquisition. The foregoing applies to mortgage loans serviced under the PSA. With respect to any non-serviced whole loan, if the special servicer under the applicable pooling and servicing agreement determines to sell the related controlling companion loan if it becomes a defaulted loan, then the special servicer will be required to sell the related whole loan, including the related mortgage loan included in the BANK5 Trust 2024-5YR6 securitization trust and the related pari passu companion loan(s) and, under certain circumstances, any subordinate companion loan(s), as a single loan. In connection with any such sale, the special servicer under the applicable pooling and servicing agreement will be required to follow procedures substantially similar to those set forth above. | |
| Appointment and Replacement of each Special Servicer: | The Directing Certificateholder will appoint the initial special servicer as of the closing date. Prior to the occurrence and continuance of a Control Termination Event, the special servicer may generally be replaced by the Directing Certificateholder with or without cause at any time. After the occurrence and during the continuance of a Control Termination Event and upon (a) the written direction of holders of principal balance certificates evidencing not less than 25% of the voting rights (taking into account the application of Cumulative Appraisal Reduction Amounts to notionally reduce the certificate balances of classes to which such Cumulative Appraisal Reduction Amounts are allocable) requesting a vote to replace the special servicer with a replacement special servicer, (b) payment by such requesting holders to the certificate administrator of all reasonable fees and expenses to be incurred by the certificate administrator in connection with administering such vote and (c) delivery by such holders of a rating agency confirmation from each applicable rating agency, the certificate administrator will be required to promptly post such notice on its internet website and by mail and conduct the solicitation of votes of all certificates in such regard, which requisite affirmative votes must be received within 180 days of the posting of such notice. Upon the written direction of holders of at least 66 2/3% of a Certificateholder Quorum, the trustee will be required to immediately replace the applicable special servicer with a qualified replacement special servicer designated by such holders of certificates. If the operating advisor determines, in its sole discretion exercised in good faith, that (i) the special servicer is not performing its duties as required under the pooling and servicing agreement or is otherwise not acting in accordance with the Servicing Standard and (ii) the replacement of the special servicer would be in the best interests of the certificateholders as a collective whole, then the operating advisor will have the right to recommend the replacement of such special servicer. The operating advisor’s recommendation to replace such special servicer must be confirmed by an affirmative vote of holders of certificates representing at least a majority of a quorum of certificateholders (which, for this purpose, is the holders of certificates that (i) evidence at least 20% of the voting rights (taking into account the application of any Appraisal Reduction Amounts to notionally reduce the respective certificate balances) of all principal balance certificates on an aggregate basis and (ii) consist of at least three certificateholders or certificate owners that are not “affiliated with” (as defined in Regulation RR) each other). A “Certificateholder Quorum” means, in connection with any solicitation of votes in connection with the replacement of a special servicer or the asset representations reviewer, the holders of certificates evidencing at least 50% of the aggregate voting rights (taking into account the application of realized losses and, other than with respect to the termination of the asset representations reviewer, any Cumulative Appraisal Reduction Amounts to notionally reduce the certificate balance of the certificates) of all classes of certificates entitled to principal on an aggregate basis. |
| THE INFORMATION IN THIS STRUCTURAL AND COLLATERAL TERM SHEET IS NOT COMPLETE AND MAY BE AMENDED PRIOR TO THE TIME OF SALE. THIS TERM SHEET IS NOT AN OFFER TO SELL THESE SECURITIES AND IT IS NOT A SOLICITATION OF AN OFFER TO BUY THESE SECURITIES IN ANY JURISDICTION WHERE THE OFFER OR SALE IS NOT PERMITTED. | ||
| T-16 | ||
| BANK5 Trust 2024-5YR6 | Structural Overview |
With respect to each serviced whole loan, any holder of a related pari passu companion loan, following a servicer termination event with respect to the special servicer that affects such holder, will be entitled to direct the trustee (and the trustee will be required) to terminate such special servicer solely with respect to such serviced whole loan. A replacement special servicer will be selected by the trustee or, prior to a Control Termination Event, by the Directing Certificateholder; provided, that any successor special servicer appointed to replace the special servicer with respect to such whole loan cannot be the entity (or its affiliate) that was terminated at the direction of the holder of the related pari passu companion loan. Notwithstanding any of the foregoing to the contrary, with respect to each servicing shift whole loan, the holder of the related control note will be entitled to replace the special servicer with respect to such whole loan at any time, with or without cause, and while it is a serviced whole loan, no other party may replace the applicable special servicer for such whole loan unless there is a servicer termination event with respect thereto. With respect to any non-serviced whole loan, subject to conditions or restrictions in the applicable intercreditor agreement, the BANK5 Trust 2024-5YR6 trust, as holder of the related mortgage loan, has the right to terminate the special servicer under the related pooling and servicing agreement if a servicer termination event occurs with respect to the special servicer that affects the trust in its capacity as such holder. Such rights may be exercised by the Directing Certificateholder prior to a Consultation Termination Event (or the applicable special servicer, following the occurrence and during the continuance of a Consultation Termination Event). The successor special servicer will be selected pursuant to the applicable pooling and servicing agreement by the related directing holder prior to a control termination event under such pooling and servicing agreement. | |
| Servicing Standard: | Each of the master servicer and the special servicer are obligated to service and administer the mortgage loans (and, if applicable, the serviced companion loans) in accordance with the definition of the “Servicing Standard” described in the Preliminary Prospectus and the terms of the pooling and servicing agreement, provided that each non-serviced mortgage loan, if any, will be serviced by another master servicer or special servicer under the pooling and servicing agreement with respect to the securitization of a related companion loan, which entities will be obligated to service and administer such non-serviced mortgage loan pursuant to a similar standard set forth in the related pooling and servicing agreement. |
| Excluded Special Servicer: | If the special servicer obtains knowledge that it has become a Borrower Party with respect to any mortgage loan or serviced whole loan (an “Excluded Special Servicer Loan”), the special servicer will be required to resign as special servicer of that Excluded Special Servicer Loan, and prior to the occurrence and continuance of a Control Termination Event, the Directing Certificateholder will be required to appoint (and may remove and replace with or without cause) a separate special servicer that is not a Borrower Party (an “Excluded Special Servicer”) with respect to any Excluded Special Servicer Loan, unless such Excluded Special Servicer Loan is also an Excluded Loan with respect to the Directing Certificateholder or the holder of the majority of the Controlling Class. At any time after the occurrence and during the continuance of a Control Termination Event, or if at any time the applicable Excluded Special Servicer Loan is also an Excluded Loan with respect to the Directing Certificateholder or the holder of the majority of the Controlling Class or if the Directing Certificateholder is entitled to appoint the Excluded Special Servicer but does not so appoint a replacement special servicer within 30 days of notice of such resignation (provided that the conditions required to be satisfied for the appointment of the replacement special servicer to be effective are not required to be completed within such 30-day period but in any event are to be completed within 120 days), the resigning special servicer will be required to use reasonable efforts to select the related Excluded Special Servicer. Any Excluded Special Servicer will be required to perform all of the obligations of the special servicer and will be entitled to all special servicing compensation with respect to such Excluded Special Servicer Loan earned while the related mortgage loan is an Excluded Special Servicer Loan. |
| Liquidated Loan Waterfall: | On liquidation of any mortgage loan, all net liquidation proceeds related to the mortgage loan (but not any related companion loan) will be applied so that amounts allocated as a recovery of accrued and unpaid interest will not, in the first instance, include any delinquent interest that was not advanced as a result of Appraisal Reduction Amounts (or would not have been advanced in the absence of a non-recoverability determination) or accrued on the portion of the stated principal balance thereof equal to any related Collateral Deficiency Amount in effect from time to time and as to which no advance was made (collectively, the “Subordinated Interest Amount”). After the adjusted interest amount is so allocated, any remaining liquidation proceeds will be allocated to pay principal on the mortgage loan until the unpaid principal amount of the mortgage loan has been reduced to zero. Any remaining liquidation proceeds will then be allocated to pay the Subordinated Interest Amount. |
| Operating Advisor: | The operating advisor will have certain review and consultation rights relating to the performance of the special servicer and with respect to its actions taken in connection with the resolution and/or liquidation of specially serviced loans. With respect to each serviced mortgage loan or serviced whole loan, the operating advisor will be responsible for: ● reviewing the actions of the special servicer with respect to any specially serviced loan; ● reviewing (i) all reports by the special servicer made available to privileged persons that are posted on the certificate administrator’s website that are relevant to the operating advisor’s obligations under the PSA and (ii) each asset status report (after the occurrence and during the continuance of an Operating Advisor Consultation Event) and final asset status report; ● reviewing for accuracy and consistency with the PSA the mathematical calculations by the special servicer and the corresponding application of the non-discretionary portion of the applicable formulas |
| THE INFORMATION IN THIS STRUCTURAL AND COLLATERAL TERM SHEET IS NOT COMPLETE AND MAY BE AMENDED PRIOR TO THE TIME OF SALE. THIS TERM SHEET IS NOT AN OFFER TO SELL THESE SECURITIES AND IT IS NOT A SOLICITATION OF AN OFFER TO BUY THESE SECURITIES IN ANY JURISDICTION WHERE THE OFFER OR SALE IS NOT PERMITTED. | ||
| T-17 | ||
| BANK5 Trust 2024-5YR6 | Structural Overview |
required to be utilized in connection with Appraisal Reduction Amounts, Collateral Deficiency Amounts, Cumulative Appraisal Reduction Amount and any net present value calculations used in the special servicer’s determination of what course of action to take in connection with the workout or liquidation of a specially serviced loan; and ● preparing an annual report (if any serviced mortgage loan or serviced whole loan was a specially serviced loan or if an Operating Advisor Consultation Event occurred during the prior calendar year) that sets forth whether the operating advisor believes, in its sole discretion exercised in good faith, that the special servicer is operating in compliance with the Servicing Standard with respect to its performance of its duties under the PSA with respect to specially serviced loans (and, after the occurrence and continuance of an Operating Advisor Consultation Event, with respect to major decisions on non-specially serviced loans) during the prior calendar year on an “asset-level basis”. The operating advisor will be required to identify (1) which, if any, standards the operating advisor believes, in its sole discretion exercised in good faith, the special servicer has failed to comply with and (2) any material deviations from such special servicer’s obligations under the PSA with respect to the resolution or liquidation of any specially serviced loan or REO property (other than with respect to any REO property related to any non-serviced mortgage loan). In preparing any operating advisor annual report, the operating advisor will not be required to report on instances of non-compliance with, or deviations from, the Servicing Standard or the special servicer’s obligations under the PSA that the operating advisor determines, in its sole discretion exercised in good faith, to be immaterial. With respect to each serviced mortgage loan or serviced whole loan, after the operating advisor has received notice that an Operating Advisor Consultation Event has occurred and is continuing, in addition to the duties described above, the operating advisor will be required to perform the following additional duties: ● to consult (on a non-binding basis) with the special servicer in respect of asset status reports; and ● to consult (on a non-binding basis) with the special servicer with respect to major decisions processed by such special servicer. An “Operating Advisor Consultation Event” will occur when either (i) the aggregate certificate balance of the Class E-RR, Class F-RR, Class G-RR and Class J-RR certificates (taking into account the application of any Cumulative Appraisal Reduction Amounts to notionally reduce the certificate balances of such classes) is 25% or less of the initial aggregate certificate balance of such portions of such classes or (ii) a Control Termination Event has occurred and is continuing. | |
| Asset Representations Reviewer: | The asset representations reviewer will be required to review certain delinquent mortgage loans after a specified delinquency threshold has been met and the required percentage of certificateholders vote to direct a review as described below. The asset representations reviewer will be entitled to the Asset Representations Reviewer Fee with respect to such review. See “Pooling and Servicing Agreement—The Asset Representations Reviewer” in the Preliminary Prospectus. The certificate administrator will be required to notify certificateholders if the specified delinquency threshold has been met as described in the Preliminary Prospectus under “—The Asset Representations Reviewer”. If certificateholders evidencing not less than 5.0% of the voting rights request a vote to commence an asset review, and if subsequently (i) a majority of those certificateholders who cast votes and (ii) a majority of an Asset Review Quorum authorizes an asset review within 150 days of the request for a vote, the asset representations reviewer will be required to conduct an asset review of delinquent loans. The asset representations reviewer may be terminated and replaced without cause. Upon (i) the written direction of certificateholders evidencing not less than 25% of the voting rights (without regard to the application of any Cumulative Appraisal Reduction Amounts) requesting a vote to terminate and replace the asset representations reviewer with a proposed successor asset representations reviewer that is an eligible asset representations reviewer, and (ii) payment by such holders to the certificate administrator of the reasonable fees and expenses to be incurred by the certificate administrator in connection with administering such vote, the certificate administrator will be required to promptly provide notice to all certificateholders and the asset representations reviewer of such request by posting such notice on its internet website, and by mailing such notice to all certificateholders and the asset representations reviewer. Upon the written direction of certificateholders evidencing at least 75% of a Certificateholder Quorum (without regard to the application of any Cumulative Appraisal Reduction Amounts), the trustee will be required to terminate all of the rights and obligations of the asset representations reviewer under the pooling and servicing agreement (other than any rights or obligations that accrued prior to the date of such termination and other than indemnification rights arising out of events occurring prior to such termination) by written notice to the asset representations reviewer, and the proposed successor asset representations reviewer will be appointed. See “Pooling and Servicing Agreement—The Asset Representations Reviewer” in the Preliminary Prospectus. An “Asset Review Quorum” means, in connection with any solicitation of votes to authorize an Asset Review as described above, the holders of certificates evidencing at least 5.0% of the aggregate voting right. |
| Dispute Resolution Provisions: | The mortgage loan sellers will be subject to the dispute resolution provisions set forth in the PSA to the extent those provisions are triggered with respect to any mortgage loan sold to the depositor by a mortgage loan seller, and such mortgage loan seller will be obligated under the related mortgage loan purchase agreement to comply with all applicable provisions and to take part in any mediation or arbitration proceedings that may result. Generally, in the event that a Repurchase Request is not “Resolved” within 180 days after the related mortgage loan seller receives such Repurchase Request, then the enforcing servicer will be required to send a notice to |
| THE INFORMATION IN THIS STRUCTURAL AND COLLATERAL TERM SHEET IS NOT COMPLETE AND MAY BE AMENDED PRIOR TO THE TIME OF SALE. THIS TERM SHEET IS NOT AN OFFER TO SELL THESE SECURITIES AND IT IS NOT A SOLICITATION OF AN OFFER TO BUY THESE SECURITIES IN ANY JURISDICTION WHERE THE OFFER OR SALE IS NOT PERMITTED. | ||
| T-18 | ||
| BANK5 Trust 2024-5YR6 | Structural Overview |
the first certificateholder (or beneficial owner) to deliver a certificateholder repurchase request with respect to the mortgage loan (the “Initial Requesting Certificateholder”) (if any) and to the certificate administrator (which will be required to make such notice available to certificateholders via the certificate administrator’s website) indicating the enforcing servicer’s intended course of action with respect to the Repurchase Request. If (a) the enforcing servicer’s intended course of action with respect to the Repurchase Request does not involve pursuing further action to exercise rights against the related mortgage loan seller with respect to the Repurchase Request and the Initial Requesting Certificateholder, if any, or any other certificateholder, or certificate owner wishes to exercise its right to refer the matter to mediation (including non-binding arbitration) or arbitration, or (b) the enforcing servicer’s intended course of action is to pursue further action to exercise rights against the related mortgage loan seller with respect to the Repurchase Request but the Initial Requesting Certificateholder, if any, or any other certificateholder or certificate owner does not agree with the dispute resolution method selected by the enforcing servicer, then the Initial Requesting Certificateholder, if any, or such other certificateholder or certificate owner may deliver a written notice to the enforcing servicer indicating its intent to exercise its right to refer the matter to either mediation or arbitration. “Resolved” means, with respect to a Repurchase Request, (i) that the related material defect or breach has been cured, (ii) the related mortgage loan has been repurchased in accordance with the related mortgage loan purchase agreement, (iii) a mortgage loan has been substituted for the related mortgage loan in accordance with the related mortgage loan purchase agreement, (iv) the applicable mortgage loan seller has made a loss of value payment, (v) a contractually binding agreement has been entered into between the enforcing servicer, on behalf of the issuing entity, and the related mortgage loan seller that settles the related mortgage loan seller’s obligations under the related mortgage loan purchase agreement, or (vi) the related mortgage loan is no longer property of the issuing entity as a result of a sale or other disposition in accordance with the pooling and servicing agreement. See “Pooling and Servicing Agreement—Dispute Resolution Provisions” in the Preliminary Prospectus. | |
| Investor Communications: | The certificate administrator is required to include on any Form 10-D any request received from a certificateholder to communicate with other certificateholders related to certificateholders exercising their rights under the terms of the PSA. Any certificateholder wishing to communicate with other certificateholders regarding the exercise of its rights under the terms of the PSA will be able to deliver a written request signed by an authorized representative of the requesting investor to the certificate administrator. |
| Deal Website: | The certificate administrator will be required to maintain a deal website which will include, among other items: (a) summaries of asset status reports prepared by a special servicer, (b) inspection reports, (c) appraisals, (d) various “special notices” described in the Preliminary Prospectus, (e) the “Investor Q&A Forum” and (f) a voluntary “Investor Registry”. Investors may access the deal website following execution of a certification and confidentiality agreement. |
| THE INFORMATION IN THIS STRUCTURAL AND COLLATERAL TERM SHEET IS NOT COMPLETE AND MAY BE AMENDED PRIOR TO THE TIME OF SALE. THIS TERM SHEET IS NOT AN OFFER TO SELL THESE SECURITIES AND IT IS NOT A SOLICITATION OF AN OFFER TO BUY THESE SECURITIES IN ANY JURISDICTION WHERE THE OFFER OR SALE IS NOT PERMITTED. | ||
| T-19 | ||
| BANK5 Trust 2024-5YR6 | Collateral Overview |
| Mortgage Loan Sellers | No. of Mortgage Loans | No. of Mortgaged Properties | Aggregate Cut-off Date Balance | % of Pool(1) |
| JPMorgan Chase Bank, National Association | 5 | 5 | $179,619,334 | 18.2% |
| Morgan Stanley Mortgage Capital Holdings LLC | 23 | 31 | $340,162,500 | 34.6% |
| Wells Fargo Bank, National Association | 11 | 11 | $285,378,000 | 29.0% |
| Bank of America, National Association | 6 | 6 | $118,158,000 | 12.0% |
| Morgan Stanley Mortgage Capital Holdings LLC/JPMorgan Chase Bank, National Association | 1 | 1 | $61,000,000 | 6.2% |
| Total: | 46 | 54 | $984,317,834 | 100.0% |
Pool Statistics
| Aggregate Cut-off Date Balance: | $984,317,834 |
| Number of Mortgage Loans: | 46 |
| Average Cut-off Date Balance per Mortgage Loan: | $21,398,214 |
| Number of Mortgaged Properties: | 54 |
| Average Cut-off Date Balance per Mortgaged Property: | $18,228,108 |
| Weighted Average Mortgage Rate: | 6.9858% |
| % of Pool Secured by 5 Largest Mortgage Loans: | 32.9% |
| % of Pool Secured by 10 Largest Mortgage Loans: | 53.2% |
| % of Pool Secured by ARD Loans: | 0.0% |
| Weighted Average Original Term to Maturity (months): | 60 |
| Weighted Average Remaining Term to Maturity (months): | 58 |
| Weighted Average Seasoning (months): | 2 |
| % of Pool Secured by Single Tenant Mortgaged Properties: | 11.4% |
| % of Pool Secured by Refinance Loans: | 82.1% |
| % of Pool Secured by Recapitalization Loans: | 10.7% |
| % of Pool Secured by Acquisition Loans: | 6.2% |
| % of Pool Secured by Refinance/Acquisition Loans: | 1.0% |
Additional Debt
| % of Pool with Pari Passu Mortgage Debt: | 37.7% |
| % of Pool with Subordinate Debt: | 0.4% |
| % of Pool with Mezzanine Mortgage Debt: | 0.0% |
Credit Statistics(2)
| Weighted Average UW NOI DSCR: | 1.84x |
| Weighted Average UW NOI Debt Yield: | 13.2% |
| Weighted Average UW NCF DSCR: | 1.73x |
| Weighted Average UW NCF Debt Yield: | 12.3% |
| Weighted Average Cut-off Date LTV Ratio(3): | 56.0% |
| Weighted Average Maturity Date LTV Ratio(3): | 55.9% |
Footnotes are set forth on the following page.
| THE INFORMATION IN THIS STRUCTURAL AND COLLATERAL TERM SHEET IS NOT COMPLETE AND MAY BE AMENDED PRIOR TO THE TIME OF SALE. THIS TERM SHEET IS NOT AN OFFER TO SELL THESE SECURITIES AND IT IS NOT A SOLICITATION OF AN OFFER TO BUY THESE SECURITIES IN ANY JURISDICTION WHERE THE OFFER OR SALE IS NOT PERMITTED. | ||
| T-20 | ||
| BANK5 Trust 2024-5YR6 | Collateral Overview |
Amortization
| Weighted Average Original Amortization Term (months)(4): | 360 |
| Weighted Average Remaining Amortization Term (months)(4): | 359 |
| % of Pool Interest Only through Maturity: | 94.5% |
| % of Pool Amortizing Balloon: | 3.0% |
| % of Pool Interest Only, Amortizing Balloon: | 2.4% |
Lockboxes
| % of Pool with Hard Lockboxes: | 69.4% |
| % of Pool with Springing Lockboxes: | 21.7% |
| % of Pool with Soft Lockboxes: | 7.5% |
| % of Pool with No Lockboxes: | 1.4% |
Reserves
| % of Pool Requiring Tax Reserves: | 63.6% |
| % of Pool Requiring Insurance Reserves: | 22.7% |
| % of Pool Requiring Replacement Reserves: | 62.3% |
| % of Pool Requiring TI/LC Reserves(5): | 66.2% |
Call Protection
| % of Pool with lockout period, followed by defeasance until open period: | 71.6% |
| % of Pool with lockout period, followed by the greater of a prepayment premium and yield maintenance until open period: | 13.8% |
| % of Pool with lockout period, followed by defeasance or the greater of a prepayment premium and yield maintenance until open period: | 8.0% |
| % of Pool with lockout period, followed by the greater of a prepayment premium and yield maintenance, followed by defeasance or the greater of a prepayment premium and yield maintenance until open period: | 6.7% |
| (1) | Unless otherwise indicated, all references to “% of Pool” in this Term Sheet reflect a percentage of the aggregate principal balance of the mortgage pool as of the Cut-off Date, after application of all payments of principal due during or prior to May 2024. |
| (2) | With respect to any mortgage loan that is part of a whole loan, unless otherwise indicated, all LTV, DSCR and Debt Yield calculations in this Term Sheet include any related pari passu companion loans and exclude any subordinate companion loans and/or mezzanine loans, as applicable. Additionally, LTV, DSCR and Debt Yield figures in this Term Sheet are calculated for mortgage loans without regard to any additional indebtedness that may be incurred at a future date. For mortgaged properties securing residential cooperative mortgage loans all LTV, DSCR and Debt Yield calculations do not take into account any subordinate debt (whether or not secured by the related mortgaged property), that currently exists or is allowed under the terms of any mortgage loan. |
| (3) | The LTV ratios set forth in this Term Sheet are generally based on the “as-is” values of the related mortgaged properties; provided that the “as-is” value for a portfolio of mortgaged properties may include a premium relating to the valuation of the mortgaged properties as a whole rather than as the sum of individually valued mortgaged properties; provided, further, that such LTV ratios may be based on “as-stabilized”, “as complete” or other contingent values in certain cases in which reserves have been established at origination for the applicable condition or circumstance that is expected to result in stabilization provided, further, that such LTV ratios may have been calculated based on a principal balance that is net of a holdback or earnout reserve. See the definition of “Appraised Value” under “Description of the Mortgage Pool—Certain Calculations and Definitions” in the Preliminary Prospectus. |
| (4) | Excludes mortgage loans that provide for payments of interest only through the related maturity date. |
| (5) | Excludes multifamily, self storage, manufactured housing and hospitality properties. |
| THE INFORMATION IN THIS STRUCTURAL AND COLLATERAL TERM SHEET IS NOT COMPLETE AND MAY BE AMENDED PRIOR TO THE TIME OF SALE. THIS TERM SHEET IS NOT AN OFFER TO SELL THESE SECURITIES AND IT IS NOT A SOLICITATION OF AN OFFER TO BUY THESE SECURITIES IN ANY JURISDICTION WHERE THE OFFER OR SALE IS NOT PERMITTED. | ||
| T-21 | ||
| BANK5 Trust 2024-5YR6 | Characteristics of the Mortgage Loans |
| Top 10 Mortgage Loans(1) | |||||||||||||
| Loan No. | Mortgage Loan Seller | Property Name | City | State | Property Type | Cut-off Date Balance | % of Pool | SF/Rooms /Beds | Cut-off Date Balance per SF/Room/Bed | UW NCF DSCR | UW NOI Debt Yield | Cut-off Date LTV | Maturity Date LTV |
| 1 | WFB | Kenwood Towne Centre | Cincinnati | OH | Retail | $70,000,000 | 7.1% | 1,033,141 | $251.66 | 2.19x | 14.6% | 45.5% | 45.5% |
| 2 | MSMCH | Kleban Retail Portfolio | Various | Various | Retail | $69,800,000 | 7.1% | 538,646 | $129.58 | 1.30x | 9.8% | 65.6% | 65.6% |
| 3 | JPMCB | Western Digital Milpitas Campus | Milpitas | CA | Mixed Use | $63,000,000 | 6.4% | 577,956 | $218.01 | 1.63x | 12.0% | 64.0% | 64.0% |
| 4 | MSMCH/JPMCB | Jordan Creek Town Center | West Des Moines | IA | Retail | $61,000,000 | 6.2% | 940,038 | $180.84 | 1.93x | 14.4% | 53.0% | 53.0% |
| 5 | BANA | Galleria at Tyler | Riverside | CA | Retail | $60,000,000 | 6.1% | 565,913 | $265.06 | 1.96x | 16.7% | 50.0% | 50.0% |
| 6 | JPMCB | Aliz Hotel Times Square | New York | NY | Hospitality | $49,900,000 | 5.1% | 287 | $173,867.60 | 2.98x | 22.5% | 34.9% | 34.9% |
| 7 | MSMCH | Bethesda Marriott | Bethesda | MD | Hospitality | $39,800,000 | 4.0% | 407 | $97,788.70 | 1.50x | 14.2% | 51.0% | 51.0% |
| 8 | WFB | The Vista | Turlock | CA | Multifamily | $38,500,000 | 3.9% | 670 | $57,462.69 | 1.38x | 9.5% | 64.7% | 64.7% |
| 9 | WFB | Respara | Los Angeles | CA | Multifamily | $36,500,000 | 3.7% | 54 | $1,138,888.89 | 1.25x | 8.0% | 66.1% | 66.1% |
| 10 | BANA | Highland Village | Jackson | MS | Mixed Use | $35,000,000 | 3.6% | 214,977 | $162.81 | 1.55x | 11.1% | 62.2% | 62.2% |
| Total/Wtd. Avg. | $523,500,000 | 53.2% | 1.80x | 13.5% | 55.2% | 55.2% | |||||||
| (1) | With respect to any mortgage loan that is part of a whole loan, unless otherwise indicated, all LTV, DSCR, Debt Yield and Balance per SF/Room calculations in this Term Sheet include any related pari passu companion loans and exclude any subordinate companion loans and/or mezzanine loans, as applicable. Additionally, LTV, DSCR, Debt Yield and Balance per SF/Room figures in this Term Sheet are calculated for mortgage loans without regard to any additional indebtedness that may be incurred at a future date. |
| THE INFORMATION IN THIS STRUCTURAL AND COLLATERAL TERM SHEET IS NOT COMPLETE AND MAY BE AMENDED PRIOR TO THE TIME OF SALE. THIS TERM SHEET IS NOT AN OFFER TO SELL THESE SECURITIES AND IT IS NOT A SOLICITATION OF AN OFFER TO BUY THESE SECURITIES IN ANY JURISDICTION WHERE THE OFFER OR SALE IS NOT PERMITTED. | ||
| T-22 | ||
| BANK5 Trust 2024-5YR6 | Characteristics of the Mortgage Loans |
| Mortgage Loans with Pari Passu Companion Loans | ||||||||||||
| Loan No. | Mortgage Loan Seller | Property Name | Mortgage Loan Cut-off Date Balance | Aggregate Pari Passu Companion Loan Cut-off Date Balance | Combined Cut-off Date Balance | Lead Servicing Agreement | Master Servicer | Special Servicer | Control Rights | Combined UW NCF DSCR(1) | Combined UW NOI Debt Yield(1) | Combined Cut-off Date LTV(1) |
| 1 | WFB | Kenwood Towne Centre | $70,000,000 | $190,000,000 | $260,000,000 | BANK5 Trust 2024-5YR6 | Wells Fargo | LNR | BANK5 Trust 2024-5YR6 | 2.19x | 14.6% | 45.5% |
| 3 | JPMCB | Western Digital Milpitas Campus | $63,000,000 | $63,000,000 | $126,000,000 | BBCMS 2024-5C25 | Midland | 3650 REIT | BBCMS 2024-5C25 | 1.63x | 12.0% | 64.0% |
| 4 | MSMCH/JPMCB | Jordan Creek Town Center | $61,000,000 | $109,000,000 | $170,000,000 | BANK5 Trust 2024-5YR6 | Wells Fargo | LNR | BANK5 Trust 2024-5YR6 | 1.93x | 14.4% | 53.0% |
| 5 | BANA | Galleria at Tyler | $60,000,000 | $90,000,000 | $150,000,000 | BANK5 Trust 2024-5YR6 | Wells Fargo | LNR | BANK5 Trust 2024-5YR6 | 1.96x | 16.7% | 50.0% |
| 9 | WFB | Respara | $36,500,000 | $25,000,000 | $61,500,000 | BANK5 Trust 2024-5YR6 | Wells Fargo | LNR | BANK5 Trust 2024-5YR6 | 1.25x | 8.0% | 66.1% |
| 15 | WFB | Staten Island Mall | $30,000,000 | $170,000,000 | $200,000,000 | BBCMS 2024-5C25 | Midland | 3650 REIT | BBCMS 2024-5C25 | 2.09x | 16.5% | 42.8% |
| 16 | JPMCB | Casa Cipriani | $29,959,334 | $72,901,046 | $102,860,379 | Benchmark 2024-V6 | Midland | LNR | Benchmark 2024-V6 | 2.38x | 22.0% | 49.9% |
| 18 | WFB | 11755 Wilshire | $18,500,000 | $51,500,000 | $70,000,000 | BANK5 2024-5YR5 | Wells Fargo | K-Star | BANK5 2024-5YR5 | 1.80x | 14.1% | 42.7% |
| 46 | JPMCB | Tysons Corner Center | $2,460,000 | $707,540,000 | $710,000,000 | TYSN 2023-CRNR | Berkadia | Situs | TYSN 2023-CRNR | 2.00x | 13.7% | 39.4% |
| (1) | DSCR, Debt Yield and LTV calculations include any related pari passu companion loans and exclude any subordinate companion loans and/or mezzanine loans, as applicable. |
| (2) | The primary servicer for the Jordan Creek Town Center and Galleria at Tyler mortgage loans is Midland Loan Services, a Division of PNC Bank, National Association. |
| THE INFORMATION IN THIS STRUCTURAL AND COLLATERAL TERM SHEET IS NOT COMPLETE AND MAY BE AMENDED PRIOR TO THE TIME OF SALE. THIS TERM SHEET IS NOT AN OFFER TO SELL THESE SECURITIES AND IT IS NOT A SOLICITATION OF AN OFFER TO BUY THESE SECURITIES IN ANY JURISDICTION WHERE THE OFFER OR SALE IS NOT PERMITTED. | ||
| T-23 | ||
| BANK5 Trust 2024-5YR6 | Characteristics of the Mortgage Loans |
| Prior Securitization History(1) | ||||||||||||||
| Loan No. | Mortgage Loan Seller | Property Name | City | State | Property Type | Cut-off Date Balance | % of Pool | SF/Units | Cut-off Date Balance per SF/Unit | UW NCF DSCR | UW NOI Debt Yield | Cut-off Date LTV | Maturity Date LTV | Prior Securitization |
| 1 | WFB | Kenwood Towne Centre | Cincinnati | OH | Retail | $70,000,000 | 7.1% | 1,033,141 | $251.66 | 2.19x | 14.6% | 45.5% | 45.5% | BPR 2021-KEN |
| 2.02 | MSMCH | Altamira Shopping Village | Port Orange | FL | Retail | $20,211,230 | 2.1% | 149,480 | $129.58 | 1.30x | 9.8% | 65.6% | 65.6% | JPMBB 2014-C22 |
| 2.04 | MSMCH | Walgreens - Garden City | Garden City | MI | Retail | $4,566,961 | 0.5% | 14,560 | $129.58 | 1.30x | 9.8% | 65.6% | 65.6% | JPMBB 2014-C22 |
| 9 | WFB | Respara | Los Angeles | CA | Multifamily | $36,500,000 | 3.7% | 54 | $1,138,888.89 | 1.25x | 8.0% | 66.1% | 66.1% | MF1 2022-B1 |
| 10 | BANA | Highland Village | Jackson | MS | Mixed Use | $35,000,000 | 3.6% | 214,977 | $162.81 | 1.55x | 11.1% | 62.2% | 62.2% | MSBAM 2014-C17 |
| 11 | JPMCB | Hampton Inn & Suites National Harbor | Oxon Hill | MD | Hospitality | $34,300,000 | 3.5% | 154 | $222,727.27 | 1.58x | 13.7% | 70.0% | 70.0% | BX 2017-SLCT |
| 12.01 | MSMCH | Westgate Shopping Center | Metairie | LA | Retail | $22,000,000 | 2.2% | 208,580 | $116.60 | 1.58x | 12.5% | 53.3% | 53.3% | COMM 2014-UBS3 |
| 12.02 | MSMCH | Airline Shopping Center | Metairie | LA | Retail | $12,000,000 | 1.2% | 83,009 | $116.60 | 1.58x | 12.5% | 53.3% | 53.3% | COMM 2014-UBS2 |
| 17 | WFB | Canyon Park West | Twin Falls | ID | Retail | $24,053,000 | 2.4% | 152,327 | $157.90 | 1.33x | 9.2% | 67.0% | 67.0% | FORT 2022-FL3 |
| 27 | MSMCH | Gateway Square Shopping Center | Pleasanton | CA | Retail | $9,750,000 | 1.0% | 87,328 | $111.65 | 2.84x | 21.2% | 30.2% | 30.2% | MSBAM 2014-C16 |
| 31 | BANA | US Storage Centers - La Crescenta, CA | La Crescenta | CA | Self Storage | $8,300,000 | 0.8% | 68,605 | $120.98 | 3.16x | 21.1% | 28.8% | 28.8% | MSBAM 2014-C15 |
| 32.01 | MSMCH | Swifts MHC | North Fort Myers | FL | Manufactured Housing | $4,441,000 | 0.5% | 87 | $52,884.62 | 1.31x | 8.6% | 58.9% | 58.9% | MSC 2019-H6 |
| 34 | BANA | Superior Building | Pasadena | CA | Mixed Use | $7,000,000 | 0.7% | 45,902 | $152.50 | 2.03x | 15.0% | 43.2% | 43.2% | MSBAM 2014-C16 |
| 37 | WFB | Park Place Apartments | Dalton | GA | Multifamily | $5,250,000 | 0.5% | 86 | $61,046.51 | 1.35x | 11.0% | 58.1% | 58.1% | FRESB 2020-SB75 |
| 43 | MSMCH | Taylors Square | Taylors | SC | Retail | $3,250,000 | 0.3% | 28,982 | $112.14 | 1.68x | 12.7% | 58.0% | 58.0% | CGCMT 2014-GC19 |
| Total | $296,622,191 | 30.1% | ||||||||||||
| (1) | Includes mortgage loans for which all or a portion of the previously existing debt was most recently securitized in conduit securitizations, based on information provided by the related borrower or obtained through searches of a third-party database. The information has not otherwise been confirmed by the mortgage loan sellers. With respect to any mortgage loan that is part of a whole loan, unless otherwise indicated, all LTV, DSCR, Debt Yield and Cut-off Date Balance per SF/Unit calculations include any related pari passu companion loans and exclude any related subordinate companion loans and/or mezzanine loans, as applicable. |
| THE INFORMATION IN THIS STRUCTURAL AND COLLATERAL TERM SHEET IS NOT COMPLETE AND MAY BE AMENDED PRIOR TO THE TIME OF SALE. THIS TERM SHEET IS NOT AN OFFER TO SELL THESE SECURITIES AND IT IS NOT A SOLICITATION OF AN OFFER TO BUY THESE SECURITIES IN ANY JURISDICTION WHERE THE OFFER OR SALE IS NOT PERMITTED. | ||
| T-24 | ||
| BANK5 Trust 2024-5YR6 | Characteristics of the Mortgage Loans |

| Property Type Distribution(1) | ||||||||
| Property Type | Number of Mortgaged Properties | Aggregate Cut-off Date Balance | % of Pool | Wtd. Avg. Mortgage Rate | Wtd. Avg. UW NCF DSCR | Wtd. Avg. UW NOI Debt Yield | Wtd. Avg. Cut-off Date LTV | Wtd. Avg. Maturity Date LTV |
| Retail | 22 | $454,513,000 | 46.2% | 7.0808% | 1.75x | 13.3% | 54.5% | 54.5% |
| Super Regional Mall | 5 | $223,460,000 | 22.7% | 7.0911% | 2.04x | 15.4% | 48.3% | 48.3% |
| Anchored | 8 | $133,914,230 | 13.6% | 7.0277% | 1.42x | 10.9% | 61.9% | 61.9% |
| Single Tenant | 3 | $49,588,770 | 5.0% | 7.0900% | 1.30x | 9.8% | 65.6% | 65.6% |
| Unanchored | 3 | $32,850,000 | 3.3% | 7.3750% | 1.83x | 14.6% | 46.5% | 46.0% |
| Shadow Anchored | 3 | $14,700,000 | 1.5% | 6.7186% | 1.63x | 11.9% | 62.3% | 62.3% |
| Multifamily | 8 | $135,672,500 | 13.8% | 6.4349% | 1.32x | 8.8% | 64.1% | 64.1% |
| Garden | 4 | $50,517,500 | 5.1% | 6.3760% | 1.29x | 8.5% | 62.6% | 62.6% |
| Mid Rise | 3 | $46,655,000 | 4.7% | 6.3798% | 1.29x | 8.4% | 65.1% | 65.1% |
| Student Housing | 1 | $38,500,000 | 3.9% | 6.5790% | 1.38x | 9.5% | 64.7% | 64.7% |
| Mixed Use | 4 | $134,959,334 | 13.7% | 6.9232% | 1.80x | 14.1% | 59.3% | 58.8% |
| R&D/Office | 1 | $63,000,000 | 6.4% | 6.8440% | 1.63x | 12.0% | 64.0% | 64.0% |
| Retail/Office | 1 | $35,000,000 | 3.6% | 6.7950% | 1.55x | 11.1% | 62.2% | 62.2% |
| Hospitality/Event Space | 1 | $29,959,334 | 3.0% | 7.2700% | 2.38x | 22.0% | 49.9% | 47.6% |
| Office/Retail | 1 | $7,000,000 | 0.7% | 6.7930% | 2.03x | 15.0% | 43.2% | 43.2% |
| Hospitality | 5 | $134,000,000 | 13.6% | 7.2971% | 2.11x | 17.5% | 50.7% | 50.5% |
| Full Service | 2 | $89,700,000 | 9.1% | 7.1076% | 2.32x | 18.8% | 42.0% | 42.0% |
| Limited Service | 3 | $44,300,000 | 4.5% | 7.6807% | 1.68x | 14.7% | 68.1% | 67.7% |
| Office | 3 | $59,360,000 | 6.0% | 7.2784% | 1.59x | 13.0% | 52.7% | 52.7% |
| CBD | 2 | $52,000,000 | 5.3% | 7.2456% | 1.61x | 13.1% | 50.6% | 50.6% |
| Medical | 1 | $7,360,000 | 0.7% | 7.5100% | 1.44x | 12.1% | 67.5% | 67.5% |
| Self Storage | 5 | $26,683,000 | 2.7% | 6.8862% | 1.91x | 13.3% | 49.8% | 49.8% |
| Self Storage | 5 | $26,683,000 | 2.7% | 6.8862% | 1.91x | 13.3% | 49.8% | 49.8% |
| Industrial | 2 | $20,315,000 | 2.1% | 6.8108% | 1.45x | 10.6% | 59.5% | 59.5% |
| Warehouse | 1 | $17,000,000 | 1.7% | 6.8000% | 1.40x | 10.2% | 58.4% | 58.4% |
| Flex | 1 | $3,315,000 | 0.3% | 6.8660% | 1.68x | 12.5% | 65.0% | 65.0% |
| Manufactured Housing | 5 | $18,815,000 | 1.9% | 6.3025% | 1.30x | 8.4% | 63.4% | 63.4% |
| Manufactured Housing | 5 | $18,815,000 | 1.9% | 6.3025% | 1.30x | 8.4% | 63.4% | 63.4% |
| Total/Wtd. Avg. | 54 | $984,317,834 | 100.00% | 6.9858% | 1.73x | 13.2% | 56.0% | 55.9% |
| (1) | All numerical information concerning the mortgage loans is approximate and, in the case of mortgage loans secured by multiple properties, is based on allocated loan amounts with respect to such properties. All weighted average information regarding the mortgage loans reflects the weighting of the mortgage loans based on their outstanding principal balances as of the Cut-off Date or, in the case of mortgage loans secured by multiple properties, allocated loan amounts. The sum of numbers and percentages in columns may not match the “Total” due to rounding. With respect to any mortgage loan that is part of a whole loan, unless otherwise indicated, all LTV, DSCR and Debt Yield calculations include any related pari passu companion loans and exclude any related subordinate companion loans and/or mezzanine loans, as applicable. For mortgaged properties securing residential cooperative mortgage loans, the UW NCF DSCR and UW NOI Debt Yield for each such mortgaged property is calculated using underwritten net operating income or underwritten net cash flow, as applicable, for the related residential cooperative property which is the projected net operating income or net cash flow, as applicable, reflected in the most recent appraisal obtained by or otherwise in the possession of the related mortgage loan seller as of the Cut-off Date. LTV calculations are based upon the appraised value of the residential cooperative property determined as if such residential cooperative property is operated as a residential cooperative, inclusive of the amount of the underlying debt encumbering such residential cooperative property. The UW NCF DSCR, UW NOI Debt Yield and LTV calculations do not take into account any subordinate debt (whether or not secured by the related mortgaged property), that currently exists or is allowed under the terms of any mortgage loan. |
| THE INFORMATION IN THIS STRUCTURAL AND COLLATERAL TERM SHEET IS NOT COMPLETE AND MAY BE AMENDED PRIOR TO THE TIME OF SALE. THIS TERM SHEET IS NOT AN OFFER TO SELL THESE SECURITIES AND IT IS NOT A SOLICITATION OF AN OFFER TO BUY THESE SECURITIES IN ANY JURISDICTION WHERE THE OFFER OR SALE IS NOT PERMITTED. | ||
| T-25 | ||
| BANK5 Trust 2024-5YR6 | Characteristics of the Mortgage Loans |
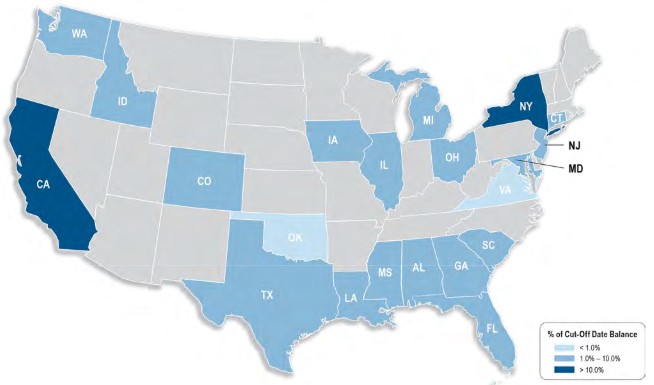
| Geographic Distribution(1) | ||||||||
| State or Other Jurisdiction | Number of Mortgaged Properties | Aggregate Cut-off Date Balance | % of Pool | Wtd. Avg. Mortgage Rate | Wtd. Avg. UW NCF DSCR | Wtd. Avg. UW NOI Debt Yield | Wtd. Avg. Cut-off Date LTV | Wtd. Avg. Maturity Date LTV |
| California | 13 | $299,615,000 | 30.4% | 7.0381% | 1.68x | 12.8% | 55.9% | 55.9% |
| California – Southern(2) | 10 | $188,365,000 | 19.1% | 7.2157% | 1.70x | 13.4% | 52.8% | 52.7% |
| California – Northern(2) | 3 | $111,250,000 | 11.3% | 6.7375% | 1.65x | 11.9% | 61.3% | 61.3% |
| New York | 6 | $129,114,334 | 13.1% | 7.1155% | 2.40x | 19.2% | 44.3% | 43.8% |
| Maryland | 2 | $74,100,000 | 7.5% | 7.6382% | 1.54x | 14.0% | 59.8% | 59.8% |
| Ohio | 1 | $70,000,000 | 7.1% | 6.2710% | 2.19x | 14.6% | 45.5% | 45.5% |
| Louisiana | 3 | $68,851,415 | 7.0% | 7.1419% | 1.44x | 11.1% | 59.5% | 59.5% |
| Iowa | 1 | $61,000,000 | 6.2% | 7.0200% | 1.93x | 14.4% | 53.0% | 53.0% |
| Florida | 4 | $46,961,230 | 4.8% | 7.0124% | 1.32x | 9.9% | 65.2% | 65.2% |
| Mississippi | 1 | $35,000,000 | 3.6% | 6.7950% | 1.55x | 11.1% | 62.2% | 62.2% |
| Illinois | 1 | $31,000,000 | 3.1% | 6.2000% | 1.29x | 8.2% | 61.8% | 61.8% |
| Idaho | 1 | $24,053,000 | 2.4% | 6.4260% | 1.33x | 9.2% | 67.0% | 67.0% |
| Texas | 2 | $22,438,500 | 2.3% | 7.0059% | 1.72x | 13.9% | 61.8% | 61.4% |
| South Carolina | 3 | $17,517,500 | 1.8% | 6.3837% | 1.35x | 9.2% | 64.5% | 64.5% |
| New Jersey | 1 | $17,000,000 | 1.7% | 6.8000% | 1.40x | 10.2% | 58.4% | 58.4% |
| Connecticut | 2 | $16,860,000 | 1.7% | 7.3015% | 1.37x | 11.0% | 63.3% | 63.3% |
| Michigan | 3 | $16,016,961 | 1.6% | 6.7877% | 1.53x | 11.2% | 64.1% | 64.1% |
| Georgia | 4 | $13,538,000 | 1.4% | 7.2079% | 1.44x | 11.0% | 63.0% | 63.0% |
| Washington | 1 | $11,050,000 | 1.1% | 7.4500% | 1.32x | 11.0% | 62.8% | 62.8% |
| Colorado | 1 | $11,000,000 | 1.1% | 7.0690% | 1.33x | 9.7% | 54.7% | 54.7% |
| Alabama | 1 | $10,170,394 | 1.0% | 7.0900% | 1.30x | 9.8% | 65.6% | 65.6% |
| Virginia | 2 | $4,870,000 | 0.5% | 6.9715% | 1.65x | 11.8% | 52.1% | 52.1% |
| Oklahoma | 1 | $4,161,500 | 0.4% | 7.1650% | 2.04x | 18.3% | 61.7% | 60.0% |
| Total/Wtd. Avg. | 54 | $984,317,834 | 100.0% | 6.9858% | 1.73x | 13.2% | 56.0% | 55.9% |
| (1) | All numerical information concerning the mortgage loans is approximate and, in the case of mortgage loans secured by multiple properties, is based on allocated loan amounts with respect to such properties. All weighted average information regarding the mortgage loans reflects the weighting of the mortgage loans based on their outstanding principal balances as of the Cut-off Date or, in the case of mortgage loans secured by multiple properties, allocated loan amounts. The sum of numbers and percentages in columns may not match the “Total” due to rounding. With respect to any mortgage loan that is part of a whole loan, unless otherwise indicated, all LTV, DSCR and Debt Yield calculations include any related pari passu companion loans and exclude any related subordinate companion loans and/or mezzanine loans, as applicable. For mortgaged properties securing residential cooperative mortgage loans, the UW NCF DSCR and UW NOI Debt Yield for each such mortgaged property is calculated using underwritten net operating income or underwritten net cash flow, as applicable, for the related residential cooperative property which is the projected net operating income or net cash flow, as applicable, reflected in the most recent appraisal obtained by or otherwise in the possession of the related mortgage loan seller as of the Cut-off Date. LTV calculations are based upon the appraised value of the residential cooperative property determined as if such residential cooperative property is operated as a residential cooperative, inclusive of the amount of the underlying debt encumbering such residential cooperative property. |
| (2) | “California – Northern” includes zip codes above 93600, and “California – Southern” includes zip codes at or below 93600. |
| THE INFORMATION IN THIS STRUCTURAL AND COLLATERAL TERM SHEET IS NOT COMPLETE AND MAY BE AMENDED PRIOR TO THE TIME OF SALE. THIS TERM SHEET IS NOT AN OFFER TO SELL THESE SECURITIES AND IT IS NOT A SOLICITATION OF AN OFFER TO BUY THESE SECURITIES IN ANY JURISDICTION WHERE THE OFFER OR SALE IS NOT PERMITTED. | ||
| T-26 | ||
| BANK5 Trust 2024-5YR6 | Collateral Statistics |
Collateral Statistics(1)
Cut-off Date Balance ($)
| No. of Mortgage Loans | Aggregate Cut-off Date Balance ($) | % of Pool |
| ||
| 2,460,000 - 9,999,999 | 20 | 117,163,000 | 11.9 | ||
| 10,000,000 - 19,999,999 | 9 | 126,842,500 | 12.9 | ||
| 20,000,000 - 29,999,999 | 2 | 54,012,334 | 5.5 | ||
| 30,000,000 - 39,999,999 | 9 | 312,600,000 | 31.8 | ||
| 40,000,000 - 49,999,999 | 1 | 49,900,000 | 5.1 | ||
| 50,000,000 - 70,000,000 | 5 | 323,800,000 | 32.9 | ||
| Total: | 46 | $984,317,834 | 100.0 | % | |
| Min: $2,460,000 | Max: $70,000,000 | Avg: $21,398,214 | |||
State or Other Jurisdiction(2)
No. of Mortgaged Properties | Aggregate Cut-off Date Balance ($) |
% of Pool |
| |
| California | 13 | 299,615,000 | 30.4 | |
| California – Southern(3) | 10 | 188,365,000 | 19.1 | |
| California – Northern(3) | 3 | 111,250,000 | 11.3 | |
| New York | 6 | 129,114,334 | 13.1 | |
| Maryland | 2 | 74,100,000 | 7.5 | |
| Ohio | 1 | 70,000,000 | 7.1 | |
| Louisiana | 3 | 68,851,415 | 7.0 | |
| Iowa | 1 | 61,000,000 | 6.2 | |
| Florida | 4 | 46,961,230 | 4.8 | |
| Mississippi | 1 | 35,000,000 | 3.6 | |
| Illinois | 1 | 31,000,000 | 3.1 | |
| Idaho | 1 | 24,053,000 | 2.4 | |
| Texas | 2 | 22,438,500 | 2.3 | |
| South Carolina | 3 | 17,517,500 | 1.8 | |
| New Jersey | 1 | 17,000,000 | 1.7 | |
| Connecticut | 2 | 16,860,000 | 1.7 | |
| Michigan | 3 | 16,016,961 | 1.6 | |
| Georgia | 4 | 13,538,000 | 1.4 | |
| Washington | 1 | 11,050,000 | 1.1 | |
| Colorado | 1 | 11,000,000 | 1.1 | |
| Alabama | 1 | 10,170,394 | 1.0 | |
| Virginia | 2 | 4,870,000 | 0.5 | |
| Oklahoma | 1 | 4,161,500 | 0.4 | |
| Total: | 54 | $984,317,834 | 100.0 | % |
Property Type(2)
| No. of Mortgaged Properties | Aggregate Cut-off Date Balance ($) |
% of Pool |
|
| Retail | 22 | 454,513,000 | 46.2 | |
| Super Regional Mall | 5 | 223,460,000 | 22.7 | |
| Anchored | 8 | 133,914,230 | 13.6 | |
| Single Tenant | 3 | 49,588,770 | 5.0 | |
| Unanchored | 3 | 32,850,000 | 3.3 | |
| Shadow Anchored | 3 | 14,700,000 | 1.5 | |
| Multifamily | 8 | 135,672,500 | 13.8 | |
| Garden | 4 | 50,517,500 | 5.1 | |
| Mid Rise | 3 | 46,655,000 | 4.7 | |
| Student Housing | 1 | 38,500,000 | 3.9 | |
| Mixed Use | 4 | 134,959,334 | 13.7 | |
| R&D/Office | 1 | 63,000,000 | 6.4 | |
| Retail/Office | 1 | 35,000,000 | 3.6 | |
| Hospitality/Event Space | 1 | 29,959,334 | 3.0 | |
| Office/Retail | 1 | 7,000,000 | 0.7 | |
| Hospitality | 5 | 134,000,000 | 13.6 | |
| Full Service | 2 | 89,700,000 | 9.1 | |
| Limited Service | 3 | 44,300,000 | 4.5 | |
| Office | 3 | 59,360,000 | 6.0 | |
| CBD | 2 | 52,000,000 | 5.3 | |
| Medical | 1 | 7,360,000 | 0.7 | |
| Self Storage | 5 | 26,683,000 | 2.7 | |
| Self Storage | 5 | 26,683,000 | 2.7 | |
| Industrial | 2 | 20,315,000 | 2.1 | |
| Warehouse | 1 | 17,000,000 | 1.7 | |
| Flex | 1 | 3,315,000 | 0.3 | |
| Manufactured Housing | 5 | 18,815,000 | 1.9 | |
| Manufactured Housing | 5 | 18,815,000 | 1.9 | |
| Total: | 54 | $984,317,834 | 100.0 | % |
Mortgage Rate (%)
| No. of Mortgage Loans | Aggregate Cut-off Date Balance ($) | % of Pool |
| ||
| 5.9850 - 6.4990 | 8 | 190,560,500 | 19.4 | ||
| 6.5000 - 6.9990 | 18 | 284,298,000 | 28.9 | ||
| 7.0000 - 7.4990 | 14 | 358,549,334 | 36.4 | ||
| 7.5000 - 7.9190 | 6 | 150,910,000 | 15.3 | ||
| Total: | 46 | $984,317,834 | 100.0 | % | |
| Min: 5.9850% | Max: 7.9190% | Wtd Avg: 6.9858% | |||
Original Term to Maturity or ARD (mos.)
| No. of Mortgage Loans | Aggregate Cut-off Date Balance ($) | % of Pool |
| ||
| 60 | 46 | 984,317,834 | 100.0 | ||
| Total: | 46 | $984,317,834 | 100.0 | % | |
| Min: 60 mos. | Max: 60 mos. | Wtd Avg: 60 mos. | |||
Remaining Term to Maturity or ARD (mos.)
| No. of Mortgage Loans | Aggregate Cut-off Date Balance ($) | % of Pool |
| ||
| 55 - 57 | 14 | 377,328,000 | 38.3 | ||
| 58 - 60 | 32 | 606,989,834 | 61.7 | ||
| Total: | 46 | $984,317,834 | 100.0 | % | |
| Min: 55 mos. | Max: 60 mos. | Wtd Avg: 58 mos. | |||
Original Amortization Term (mos.)
| No. of Mortgage Loans | Aggregate Cut-off Date Balance ($) | % of Pool |
| ||
| Interest Only | 43 | 930,358,500 | 94.5 | ||
| 360 | 3 | 53,959,334 | 5.5 | ||
| Total: | 46 | $984,317,834 | 100.0 | % | |
| Min: 360 | Max: 360 | Wtd Avg: 360 | |||
Remaining Amortization Term (mos.)
| No. of Mortgage Loans | Aggregate Cut-off Date Balance ($) | % of Pool |
| ||
| Interest Only | 43 | 930,358,500 | 94.5 | ||
| 358- 360 | 3 | 53,959,334 | 5.5 | ||
| Total: | 46 | $984,317,834 | 100.0 | % | |
| Min: 358 | Max: 360 | Wtd Avg: 359 | |||
Mortgage Loan Sellers
| No. of Mortgage Loans | Aggregate Cut-off Date Balance ($) | % of Pool | ||
| JPMCB | 5 | 179,619,334 | 18.2 | |
| MSMCH | 23 | 340,162,500 | 34.6 | |
| WFB | 11 | 285,378,000 | 29.0 | |
| BANA | 6 | 118,158,000 | 12.0 | |
| MSMCH/JPMCB | 1 | 61,000,000 | 6.2 | |
| Total: | 46 | $984,317,834 | 100.0% |
Amortization Type
| No. of Mortgage Loans | Aggregate Cut-off Date Balance ($) | % of Pool |
| |
| Interest Only | 43 | 930,358,500 | 94.5 | |
| Amortizing Balloon | 1 | 29,959,334 | 3.0 | |
| Interest Only, Amortizing Balloon | 2 | 24,000,000 | 2.4 | |
| Total: | 46 | $984,317,834 | 100.0 | % |
Cut-off Date LTV Ratio (%)
| No. of Mortgage Loans | Aggregate Cut-off Date Balance ($) | % of Pool |
| ||
| 28.8 - 49.9 | 10 | 239,869,334 | 24.4 | ||
| 50.0 - 54.9 | 7 | 242,050,000 | 24.6 | ||
| 55.0 - 59.9 | 4 | 33,750,000 | 3.4 | ||
| 60.0 - 64.9 | 12 | 237,980,000 | 24.2 | ||
| 65.0 – 70.0 | 13 | 230,668,500 | 23.4 | ||
| Total: | 46 | $984,317,834 | 100.0 | % | |
| Min: 28.8% | Max: 70.0% | Wtd Avg: 56.0 | % | ||
Maturity Date or ARD LTV Ratio (%)
| No. of Mortgage Loans | Aggregate Cut-off Date Balance ($) | % of Pool |
| ||
| 28.8 - 49.9 | 10 | 239,869,334 | 24.4 | ||
| 50.0 - 59.9 | 11 | 275,800,000 | 28.0 | ||
| 60.0 - 64.9 | 12 | 237,980,000 | 24.2 | ||
| 65.0 - 70.0 | 13 | 230,668,500 | 23.4 | ||
| Total: | 46 | $984,317,834 | 100.0 | % | |
| Min: 28.8% | Max: 70.0% | Wtd Avg: 55.9 | % | ||
UW NCF DSCR (x)
| No. of Mortgage Loans | Aggregate Cut-off Date Balance ($) | % of Pool |
| ||
| 1.25 - 1.49 | 23 | 357,808,500 | 36.4 | ||
| 1.50- 1.99 | 13 | 406,390,000 | 41.3 | ||
| 2.00 - 2.49 | 7 | 152,169,334 | 15.5 | ||
| 2.50 - 3.16 | 3 | 67,950,000 | 6.9 | ||
| Total: | 46 | $984,317,834 | 100.0 | % | |
| Min: 1.25x | Max: 3.16x | Wtd Avg: 1.7 | 3x | ||
UW NOI Debt Yield (%)
| No. of Mortgage Loans | Aggregate Cut-off Date Balance ($) | % of Pool | |||
| 8.0% - 8.9% | 6 | 96,507,500 | 9.8 | ||
| 9.0% - 9.9% | 8 | 160,841,000 | 16.3 | ||
| 10.0% - 10.9% | 6 | 66,925,000 | 6.8 | ||
| 11.0% - 11.9% | 3 | 51,300,000 | 5.2 | ||
| 12.0% - 12.9% | 8 | 175,025,000 | 17.8 | ||
| 13.0% 13.9% | 2 | 36,760,000 | 3.7 | ||
| 14.0% 14.9% | 5 | 192,050,000 | 19.5 | ||
| 15.0% 15.9% | 1 | 7,000,000 | 0.7 | ||
| 16.0% 22.5% | 7 | 197,909,334 | 20.1 | ||
| Total: | 46 | $984,317,834 | 100.0 | % | |
| Min: 8.0% | Max: 22.5% | Wtd Avg: 13.2 | % | ||
| (1) | All numerical information concerning the mortgage loans is approximate. All weighted average information regarding the mortgage loans reflects the weighting of the mortgage loans based on their outstanding principal balances as of the Cut-off Date. The sum of numbers and percentages in columns may not match the “Total” due to rounding. With respect to any mortgage loan that is part of a whole loan, unless otherwise indicated, all LTV, DSCR and Debt Yield calculations include any related pari passu companion loans and exclude any related subordinate companion loans and/or mezzanine loans, as applicable. For mortgaged properties securing residential cooperative mortgage loans, the UW DSCR and UW NOI Debt Yield for each such mortgaged property is calculated using underwritten net operating income or underwritten net cash flow, as applicable, for the related residential cooperative property which is the projected net operating income or net cash flow, as applicable, reflected in the most recent appraisal obtained by or otherwise in the possession of the related mortgage loan seller as of the Cut-off Date. LTV calculations are based upon the appraised value of the residential cooperative property determined as if such residential cooperative property is operated as a residential cooperative, inclusive of the amount of the underlying debt encumbering such residential cooperative property. The UW NCF DSCR, UW NOI Debt Yield and LTV calculations do not take into account any subordinate debt (whether or not secured by the related mortgaged property), that currently exists or is allowed under the terms of any mortgage loan. |
| (2) | In the case of mortgage loans secured by multiple properties, cut-off date balance information is based on allocated loan amounts with respect to such properties. |
| (3) | “California – Northern” includes zip codes above 93600, and “California – Southern” includes zip codes at or below 93600. |
| THE INFORMATION IN THIS STRUCTURAL AND COLLATERAL TERM SHEET IS NOT COMPLETE AND MAY BE AMENDED PRIOR TO THE TIME OF SALE. THIS TERM SHEET IS NOT AN OFFER TO SELL THESE SECURITIES AND IT IS NOT A SOLICITATION OF AN OFFER TO BUY THESE SECURITIES IN ANY JURISDICTION WHERE THE OFFER OR SALE IS NOT PERMITTED. | ||
| T-27 | ||
| Retail – Super Regional Mall | Loan #1 | Cut-off Date Balance: | $70,000,000 | |
| 7875 Montgomery Road | Kenwood Towne Centre | Cut-off Date LTV: | 45.5% | |
| Cincinnati, OH 45236 | UW NCF DSCR: | 2.19x | ||
| UW NOI Debt Yield: | 14.6% |

| THE INFORMATION IN THIS STRUCTURAL AND COLLATERAL TERM SHEET IS NOT COMPLETE AND MAY BE AMENDED PRIOR TO THE TIME OF SALE. THIS TERM SHEET IS NOT AN OFFER TO SELL THESE SECURITIES AND IT IS NOT A SOLICITATION OF AN OFFER TO BUY THESE SECURITIES IN ANY JURISDICTION WHERE THE OFFER OR SALE IS NOT PERMITTED. | ||
| T-28 | ||
| Retail – Super Regional Mall | Loan #1 | Cut-off Date Balance: | $70,000,000 | |
| 7875 Montgomery Road | Kenwood Towne Centre | Cut-off Date LTV: | 45.5% | |
| Cincinnati, OH 45236 | UW NCF DSCR: | 2.19x | ||
| UW NOI Debt Yield: | 14.6% |
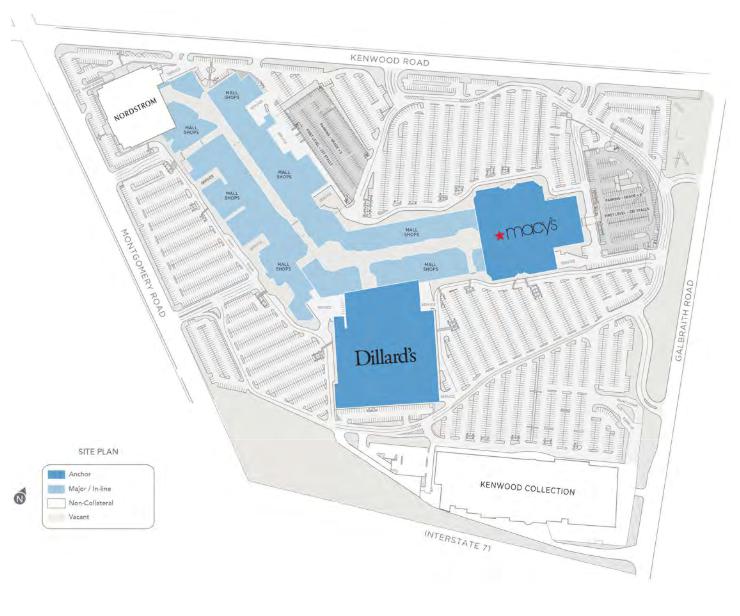
| THE INFORMATION IN THIS STRUCTURAL AND COLLATERAL TERM SHEET IS NOT COMPLETE AND MAY BE AMENDED PRIOR TO THE TIME OF SALE. THIS TERM SHEET IS NOT AN OFFER TO SELL THESE SECURITIES AND IT IS NOT A SOLICITATION OF AN OFFER TO BUY THESE SECURITIES IN ANY JURISDICTION WHERE THE OFFER OR SALE IS NOT PERMITTED. | ||
| T-29 | ||
| Retail – Super Regional Mall | Loan #1 | Cut-off Date Balance: | $70,000,000 | |
| 7875 Montgomery Road | Kenwood Towne Centre | Cut-off Date LTV: | 45.5% | |
| Cincinnati, OH 45236 | UW NCF DSCR: | 2.19x | ||
| UW NOI Debt Yield: | 14.6% |
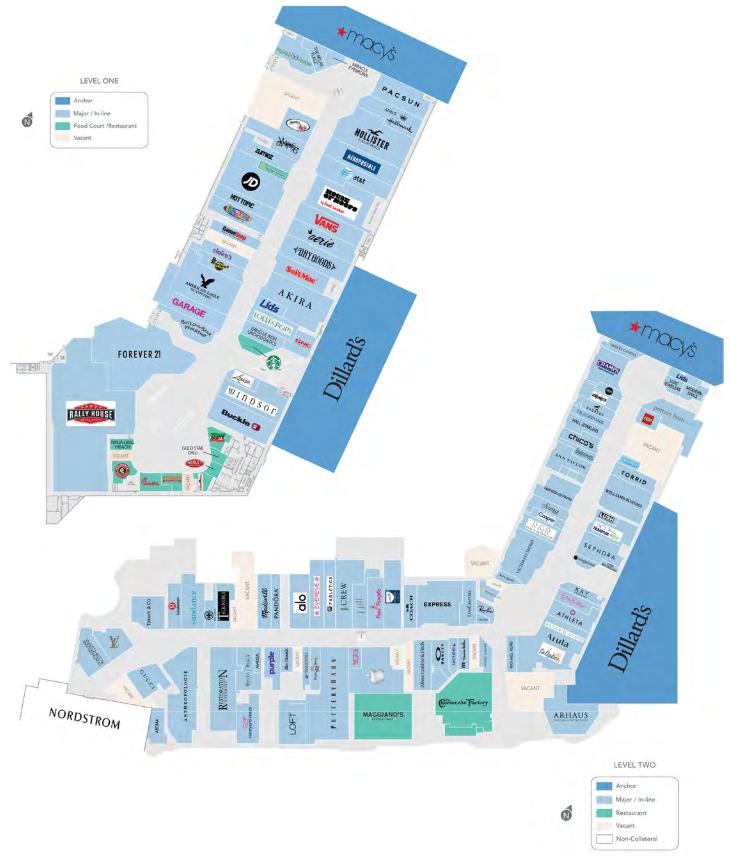
| THE INFORMATION IN THIS STRUCTURAL AND COLLATERAL TERM SHEET IS NOT COMPLETE AND MAY BE AMENDED PRIOR TO THE TIME OF SALE. THIS TERM SHEET IS NOT AN OFFER TO SELL THESE SECURITIES AND IT IS NOT A SOLICITATION OF AN OFFER TO BUY THESE SECURITIES IN ANY JURISDICTION WHERE THE OFFER OR SALE IS NOT PERMITTED. | ||
| T-30 | ||
| Retail – Super Regional Mall | Loan #1 | Cut-off Date Balance: | $70,000,000 | |
| 7875 Montgomery Road | Kenwood Towne Centre | Cut-off Date LTV: | 45.5% | |
| Cincinnati, OH 45236 | UW NCF DSCR: | 2.19x | ||
| UW NOI Debt Yield: | 14.6% |
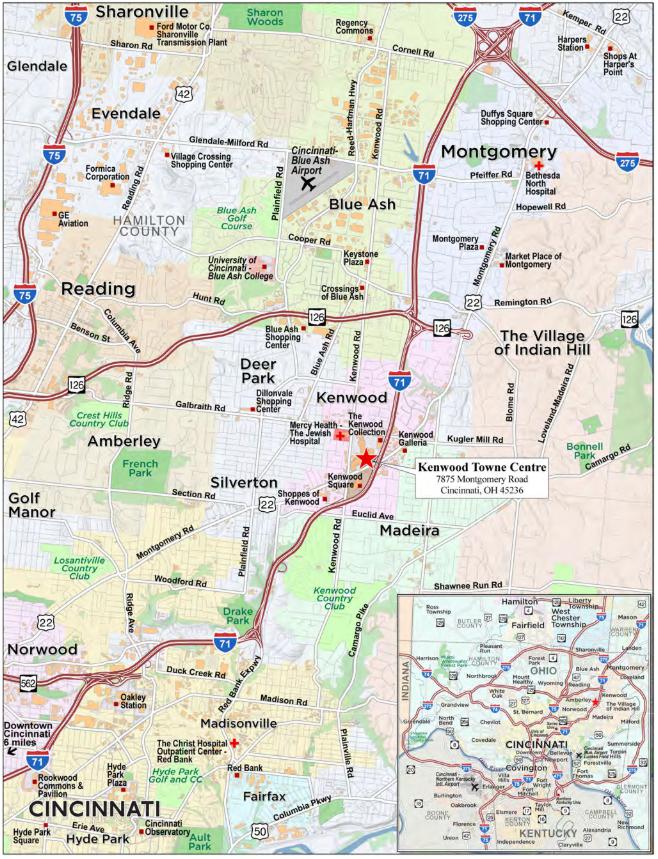
| THE INFORMATION IN THIS STRUCTURAL AND COLLATERAL TERM SHEET IS NOT COMPLETE AND MAY BE AMENDED PRIOR TO THE TIME OF SALE. THIS TERM SHEET IS NOT AN OFFER TO SELL THESE SECURITIES AND IT IS NOT A SOLICITATION OF AN OFFER TO BUY THESE SECURITIES IN ANY JURISDICTION WHERE THE OFFER OR SALE IS NOT PERMITTED. | ||
| T-31 | ||
| Mortgage Loan No. 1 – Kenwood Towne Centre |
| Mortgage Loan Information | Property Information | ||||||
| Mortgage Loan Seller: | WFB | Single Asset/Portfolio: | Single Asset | ||||
| Credit Assessment (Fitch/KBRA/Moody’s): | BBB/BBB+/A1 | Location: | Cincinnati, OH 45236 | ||||
| Original Balance(1): | $70,000,000 | General Property Type: | Retail | ||||
| Cut-off Date Balance(1): | $70,000,000 | Detailed Property Type: | Super Regional Mall | ||||
| % of Initial Pool Balance: | 7.1% | Title Vesting: | Fee | ||||
| Loan Purpose: | Refinance | Year Built/Renovated: | 1958 / 1988, 2003, 2009, 2019- | ||||
| Borrower Sponsors(2): | Brookfield Properties Retail Holding | 2023 | |||||
| LLC and Teachers' Retirement System | Size: | 1,033,141 SF | |||||
| of the State of Illinois | Cut-off Date Balance Per SF(1): | $252 | |||||
| Guarantor: | GGP-TRS L.L.C. | Maturity Date Balance Per SF(1): | $252 | ||||
| Mortgage Rate: | 6.27100% | Property Manager: | Brookfield Properties Retail Inc. | ||||
| Note Date: | 2/9/2024 | ||||||
| Maturity Date: | 3/1/2029 | ||||||
| Term to Maturity: | 60 months | ||||||
| Amortization Term: | 0 months | Underwriting and Financial Information | |||||
| IO Period: | 60 months | UW NOI: | $37,950,692 | ||||
| Seasoning: | 2 months | UW NCF: | $36,139,189 | ||||
| Prepayment Provisions(3): | L(26),D(27),O(7) | UW NOI Debt Yield(1): | 14.6% | ||||
| Lockbox/Cash Mgmt Status: | Hard/Springing | UW NCF Debt Yield(1): | 13.9% | ||||
| Additional Debt Type(1): | Pari Passu | UW NOI Debt Yield at Maturity(1): | 14.6% | ||||
| Additional Debt Balance(1): | $190,000,000 | UW NCF DSCR(1): | 2.19x | ||||
| Future Debt Permitted (Type): | No (NAP) | Most Recent NOI: | $37,685,851 (12/31/2023) | ||||
| 2nd Most Recent NOI(5): | $37,154,574 (12/31/2022) | ||||||
Reserves(4) | 3rd Most Recent NOI(5): | $33,772,475 (12/31/2021) | |||||
| Type | Initial | Monthly | Cap | Most Recent Occupancy: | 95.2% (12/31/2023) | ||
| RE Tax: | $0 | Springing | NAP | 2nd Most Recent Occupancy: | 96.1% (12/31/2022) | ||
| Insurance: | $0 | Springing | NAP | 3rd Most Recent Occupancy: | 93.9% (12/31/2021) | ||
| Replacement Reserve: | $0 | Springing | $516,571 | Appraised Value (as of): | $571,200,000 (1/23/2024) | ||
| TI/LC: | $0 | $129,143 | $3,099,423 | Appraised Value Per SF: | $553 | ||
| Gap Rent/Free Rent Reserve: | $234,558 | $0 | NAP | Cut-off Date LTV Ratio(1): | 45.5% | ||
| Outstanding TI/LC: | $3,732,395 | $0 | NAP | Maturity Date LTV Ratio(1): | 45.5% | ||
| Sources and Uses | ||||||
| Sources | Proceeds | % of Total | Uses | Proceeds | % of Total | |
| Whole Loan(1): | $260,000,000 | 100.0% | Loan Payoff: | $211,601,763 | 81.4% | |
| Return of Equity | $41,225,745 | 15.9% | ||||
| Reserves: | $3,966,953 | 1.5% | ||||
| Closing Costs: | $3,205,539 | 1.2% | ||||
| Total Sources: | $260,000,000 | 100.0% | Total Uses: | $260,000,000 | 100.0% | |
| (1) | The Kenwood Towne Centre Mortgage Loan (as defined below) is part of The Kenwood Towne Centre Whole Loan (as defined below) which is comprised of 11 pari passu promissory notes, with an aggregate original principal balance and Cut-off Date Balance of $260,000,000. The Kenwood Towne Centre Whole Loan was co-originated by Wells Fargo Bank, National Association (“WFB”), Goldman Sachs Bank USA (“GS”) and Societe Generale Financial Corporation (“SGFC”). The Cut-off Date Balance Per SF, Maturity Date Balance Per SF, UW NOI Debt Yield, UW NCF Debt Yield, UW NOI Debt Yield at Maturity, UW NCF DSCR, Cut-off Date LTV Ratio, and Maturity Date LTV Ratio numbers presented above are based on the Kenwood Towne Centre Whole Loan. |
| (2) | Brookfield Properties Retail Holding LLC, one of the borrower sponsors, is related to the borrower sponsor for the Jordan Creek Town Center Whole Loan, the Galleria at Tyler Whole Loan, and the Staten Island Mall Whole Loan. |
| (3) | The lockout period will be at least 26 payment dates beginning with and including the first payment date on April 1, 2024. Defeasance of the Kenwood Towne Centre Whole Loan in full is permitted at any time after the earlier to occur of (i) the date that is two years from the closing date of the securitization that includes the last pari passu note of the Kenwood Towne Centre Whole Loan to be securitized and (ii) February 9, 2027. The assumed lockout period of 26 payment dates is based on the expected BANK5 Trust 2024-5YR6 securitization closing date in May 2024. The actual lockout period may be longer. |
| (4) | For a full description of escrows and reserves, please refer to “Escrows and Reserves” below. |
| (5) | The increase in NOI from 2021 to 2022 is primarily attributed to the borrower sponsor signing new leases and lease renewals during 2021 and 2022 for approximately 21 tenants with associated underwritten rents (8.2% of Total Collateral NRA (as defined below) and 20.1% of the underwritten base rent). |
The Mortgage Loan. The largest mortgage loan (the “Kenwood Towne Centre Mortgage Loan”) is part of a whole loan (the “Kenwood Towne Centre Whole Loan”) secured by the borrower’s fee interest in the Kenwood Towne Centre, a super regional mall located in Cincinnati, Ohio (the “Kenwood Towne Centre Property”). The Kenwood Towne Centre Whole Loan is comprised of 11 pari passu notes, with an aggregate outstanding principal balance as of the Cut-off Date of $260,000,000 and accrues interest at a rate of 6.27100% per annum. The Kenwood Towne Centre Whole Loan has a five-year term and is interest-only for the full term of the loan. The Kenwood Towne Centre Mortgage Loan is evidenced by the controlling Note A-1-1, and non-controlling Note A-1-2-A, with an aggregate outstanding principal balance as of the Cut-off Date of $70,000,000. The Kenwood Towne Centre Whole Loan will be serviced pursuant to the pooling and servicing agreement for the BANK5 Trust 2024-5YR6 securitization trust. See “Description of the Mortgage Pool—The Whole Loans—The Serviced Pari Passu Whole Loans” and “Pooling and Servicing Agreement” in the prospectus.
| THE INFORMATION IN THIS STRUCTURAL AND COLLATERAL TERM SHEET IS NOT COMPLETE AND MAY BE AMENDED PRIOR TO THE TIME OF SALE. THIS TERM SHEET IS NOT AN OFFER TO SELL THESE SECURITIES AND IT IS NOT A SOLICITATION OF AN OFFER TO BUY THESE SECURITIES IN ANY JURISDICTION WHERE THE OFFER OR SALE IS NOT PERMITTED. | ||
| T-32 | ||
| Retail – Super Regional Mall | Loan #1 | Cut-off Date Balance: | $70,000,000 | |
| 7875 Montgomery Road | Kenwood Towne Centre | Cut-off Date LTV: | 45.5% | |
| Cincinnati, OH 45236 | UW NCF DSCR: | 2.19x | ||
| UW NOI Debt Yield: | 14.6% |
The promissory notes comprising the Kenwood Towne Centre Whole Loan are summarized in the below table:
| Whole Loan Summary | ||||
| Note | Original Balance | Cut-off Date Balance | Note Holder | Controlling Note |
| A-1-1 | $55,000,000 | $55,000,000 | BANK5 Trust 2024-5YR6 | Yes |
| A-1-2-A | $15,000,000 | $15,000,000 | BANK5 Trust 2024-5YR6 | No |
| A-1-2-B(1) | $30,000,000 | $30,000,000 | WFB | No |
| A-1-3(1) | $20,000,000 | $20,000,000 | WFB | No |
| A-1-4(1) | $10,000,000 | $10,000,000 | WFB | No |
| A-2-1 | $40,000,000 | $40,000,000 | Benchmark 2024-V6 | No |
| A-2-2 | $15,000,000 | $15,000,000 | Benchmark 2024-V6 | No |
| A-2-3 | $10,000,000 | $10,000,000 | Benchmark 2024-V6 | No |
| A-3-1 | $30,000,000 | $30,000,000 | BBCMS 2024-5C25 | No |
| A-3-2 | $20,000,000 | $20,000,000 | BBCMS 2024-5C25 | No |
| A-3-3(1) | $15,000,000 | $15,000,000 | SGFC | No |
| Total | $260,000,000 | $260,000,000 | ||
| (1) | Expected to be contributed to one or more future securitization trust(s). |
The Borrower and the Borrower Sponsor. The borrower for the Kenwood Towne Centre Whole Loan is Kenwood Mall L.L.C., a Delaware limited liability company and single purpose entity with two independent directors.
The borrower sponsors are Brookfield Properties Retail Holding LLC (“Brookfield Retail”) and Teachers’ Retirement System of the State of Illinois (“TRSIL”), each of which indirectly owns a 50% interest in the borrower. The non-recourse carveout guarantor is GGP-TRS L.L.C., an affiliate of Brookfield Retail and the 100% owner of the borrower. Brookfield Retail is a fully integrated, diversified global real estate services company that has portfolio management and development capabilities across the real estate investment strategies of Brookfield Corporation. Brookfield Property Partners owns, operates and develops a large portfolio of office, retail, multifamily, industrial, hospitality, triple net lease, student housing and manufactured housing assets. Brookfield Retail owns over 160 retail properties totaling over 130 million square feet throughout the United States.
TRSIL is an Illinois state government agency dealing with pensions and other financial benefits for teachers and other workers in education in Illinois. The Illinois General Assembly created TRSIL in 1939 for the purpose of providing retirement annuities and disability and survivor benefits for educators employed in public schools outside the city of Chicago. As of December 31, 2023, TRSIL had approximately $68.5 billion of assets under management.
The Property. The Kenwood Towne Centre Property is a three-story, Class A super regional mall, comprising an approximately 1,033,141 SF (the “Total Collateral NRA”) portion of a larger 1,170,977 SF (the “Total Mall NRA”) center situated on an approximately 154-acre site in Cincinnati, Ohio. Kenwood Towne Centre was built in 1958 and renovated multiple times between 1988 and 2023 and is anchored by (i) Macy’s, which owns its improvements and ground leases the underlying land from the borrower, (ii) Dillard’s and (iii) Nordstrom, which owns its improvements and the underlying land and is not part of the collateral. Other notable retailers include Louis Vuitton, Gucci, Tiffany & Co., Apple, Pottery Barn, Lululemon Athletica and Restoration Hardware.
As of December 31, 2023, the Kenwood Towne Centre Property was 95.2% occupied by 129 tenants (including temporary tenants, comprising approximately 2.7% of the Total Collateral NRA and 0.0% of the underwritten base rent). Since 2019, the borrower sponsors have invested over $30.0 million into the Kenwood Towne Centre Property for renovations and capital improvements including HVAC repairs, roof repairs, escalator repairs, pavement restoration, garage restoration, security camera replacements and irrigation system upgrades among other improvements to individual tenant spaces. In-line sales for tenants comprising less than 10,000 square feet as of December 2023 were $1,018 per SF (10.8% occupancy cost) including Apple and $779 per SF (14.0% occupancy cost) excluding Apple. The Kenwood Towne Centre Property provides parking via 5,881 surface parking and parking garage spaces, resulting in a parking ratio of approximately 5.02 spaces per 1,000 square feet of the Total Mall NRA.
The following tables presents certain information relating to the tenant sales of the Kenwood Towne Centre Property:
| Sales History(1)(2) | |||||
| Tenancy Type | 2019 | 2020(3) | 2021 | 2022 | 2023 |
| Gross Mall Sales(4) | $356.1 million | $252.8 million | $370.1 million | $392.9 million | $395.0 million |
| Gross Mall Sales (Ex-Apple)(4) | $267.9 million | $207.7 million | $293.1 million | $311.7 million | $312.2 million |
| Comparable Sales PSF (Inline < 10,000 SF) | $881 | $618 | $995 | $1,034 | $1,018 |
| Comparable Sales PSF (Inline < 10,000 SF, Ex- Apple) | $637 | $489 | $767 | $786 | $779 |
| Occupancy Cost (Inline < 10,000 SF) | 11.6% | 15.7% | 9.6% | 10.3% | 10.8% |
| Occupancy Cost (Inline < 10,000 SF, Ex-Apple) | 16.0% | 19.6% | 12.3% | 13.5% | 14.0% |
| (1) | Information is as provided by the borrower sponsors and only includes tenants reporting sales. Certain tenants may not have been in occupancy during the entire reporting period. |
| (2) | All figures are approximate. |
| (3) | The Kenwood Towne Centre Property was closed from March 24, 2020 until May 12, 2020, due to the COVID-19 pandemic. |
| (4) | Excludes sales for Dillard’s, Macy’s and Nordstrom (non-collateral anchor). |
| THE INFORMATION IN THIS STRUCTURAL AND COLLATERAL TERM SHEET IS NOT COMPLETE AND MAY BE AMENDED PRIOR TO THE TIME OF SALE. THIS TERM SHEET IS NOT AN OFFER TO SELL THESE SECURITIES AND IT IS NOT A SOLICITATION OF AN OFFER TO BUY THESE SECURITIES IN ANY JURISDICTION WHERE THE OFFER OR SALE IS NOT PERMITTED. | ||
| T-33 | ||
| Retail – Super Regional Mall | Loan #1 | Cut-off Date Balance: | $70,000,000 | |
| 7875 Montgomery Road | Kenwood Towne Centre | Cut-off Date LTV: | 45.5% | |
| Cincinnati, OH 45236 | UW NCF DSCR: | 2.19x | ||
| UW NOI Debt Yield: | 14.6% |
Anchor & Major Tenant Sales Hostory (1) (2) | ||||||||||
Tenancy Type | 2019 Sales | 2019 | 2020 Sales | 2020 PSF | 2021 Sales | 2021 PSF | 2022 Sales | 2022 PSF | 2023 | 2023 |
| Anchor Tenants(3) | ||||||||||
| Macy’s | $53.3 million | $203 | $31.3 million | $119 | $52.4 million | $199 | $62.2 million | $237 | $49.1 million | $187 |
| Dillard’s | $26.7 million | $111 | $16.6 million | $69 | $28.6 million | $119 | $30.5 million | $127 | $28.3 million | $118 |
| Inline Tenants > 10,000 SF | ||||||||||
| Arhaus Furniture | $5.6 million | $333 | $5.1 million | $299 | $7.4 million | $439 | $10.9 million | $643 | $10.6 million | $627 |
| Forever 21 | $3.7 million | $225 | $2.7 million | $161 | $4.8 million | $290 | $3.7 million | $221 | $2.7 million | $162 |
| Pottery Barn | $8.1 million | $511 | $7.4 million | $466 | $9.1 million | $574 | $11.6 million | $729 | $9.9 million | $620 |
| Anthropologie | $2.9 million | $243 | $3.0 million | $249 | $2.1 million | $177 | $5.0 million | $420 | $5.0 million | $420 |
| Restoration Hardware | $9.0 million | $840 | $9.5 million | $881 | $12.2 million | $1,133 | $10.2 million | $952 | $7.4 million | $683 |
| (1) | Information is provided by the borrower sponsors. |
| (2) | All figures are approximate. |
| (3) | Represents estimated gross sales figures between 2019 and 2022. |
Major Tenants. The three largest tenants based on underwritten base rent are Apple, Altar’d State/Arula/Tulla and Pottery Barn.
Apple (9,383 SF; 0.9% of Total Collateral NRA; 4.3% of underwritten base rent): Apple is a retailer that designs, manufactures and markets smartphones, personal computers, tablets, wearables and accessories, and sells a variety of related services. Apple has been a tenant at the Kenwood Towne Centre Property since 2001 under a lease with an expiration date of January 31, 2026 and no renewal options or termination options.
Altar'd State/Arula/Tulla (12,838 SF; 1.2% of Total Collateral NRA; 3.3% of underwritten base rent): Altar’d State/Arula/Tulla operates within the Stand Out For Good, Inc. parent company, which is a purpose-based, lifestyle and fashion family of brands that was founded in 2009 and operates 176 stores and boutiques across its three brands in 38 states. Altar'd State/Arula/Tulla has been a tenant at the Kenwood Towne Centre Property since opening in 2022 under a lease with an expiration date of March 31, 2032, with one, five-year renewal option remaining and a termination option that is exercisable if the tenant’s net sales fail to exceed $7,509,607 during the period between either December 1, 2026 and November 30, 2027 or December 1, 2027 and November 30, 2028, along with payment of a termination fee.
Pottery Barn (15,913 SF; 1.5% of Total Collateral NRA; 2.4% of underwritten base rent): Pottery Barn is a home furnishing retailer that was founded in 1948 and operates 184 stores as of 2023. Pottery Barn is a wholly owned subsidiary of Williams-Sonoma, Inc. Pottery Barn has been a tenant at the Kenwood Towne Centre Property since 2003 under a lease with an expiration date of January 31, 2030 and has no renewal or termination options.
| THE INFORMATION IN THIS STRUCTURAL AND COLLATERAL TERM SHEET IS NOT COMPLETE AND MAY BE AMENDED PRIOR TO THE TIME OF SALE. THIS TERM SHEET IS NOT AN OFFER TO SELL THESE SECURITIES AND IT IS NOT A SOLICITATION OF AN OFFER TO BUY THESE SECURITIES IN ANY JURISDICTION WHERE THE OFFER OR SALE IS NOT PERMITTED. | ||
| T-34 | ||
| Retail – Super Regional Mall | Loan #1 | Cut-off Date Balance: | $70,000,000 | |
| 7875 Montgomery Road | Kenwood Towne Centre | Cut-off Date LTV: | 45.5% | |
| Cincinnati, OH 45236 | UW NCF DSCR: | 2.19x | ||
| UW NOI Debt Yield: | 14.6% |
The following table presents certain information relating to the major tenants at the Kenwood Towne Centre Property:
| Top Tenant Summary(1) | |||||||||||
| Tenant Name | Credit Rating (Moody’s/Fitch/ S&P)(2) | Tenant SF | % of Total SF(3) | Annual UW Rent(4) | % of Total Annual UW Rent(4) | Annual UW Rent PSF(4) | Sales PSF(5) | Occ Cost(6) | Lease Expiration | Renewal Options | Term. Option (Y/N) |
| Non-Collateral Anchor Tenant | |||||||||||
| Nordstrom(7) | Ba1/BB+/BB+ | 137,836 | NAP | $0 | 0.0% | $0.00 | NAV | NAV | NAV | NAV | NAV |
| Non-Collateral Anchor Tenant Subtotal / Wtd. Avg. | 137,836 | NAP | $0 | 0.0% | $0.00 | ||||||
| Anchors | |||||||||||
| Macy’s(8) | Ba1/BB+/BBB- | 262,829 | 25.4% | 0 | 0.0% | $0.00 | $187 | 0.7% | 9/10/2028 | 5 x 5 yr | N |
| Dillard’s | Baa3/BB+/BBB- | 240,656 | 23.3% | $604,525 | 2.0% | $2.51 | $118 | 2.5% | 1/31/2029 | 1 x 10 yr | Y(9) |
| Major Tenants | |||||||||||
| Apple | Aaa/AA+/NR | 9,383 | 0.9% | $1,266,730 | 4.3% | $135.00 | $8,827 | 1.50% | 1/31/2026 | None | N |
| Altar’d State/Arula/Tulla | NR/NR/NR | 12,838 | 1.2% | $989,681 | 3.3% | $77.09 | $447 | 21.20% | 3/31/2032 | 1 x 5 yr | Y(10) |
| Pottery Barn | NR/NR/NR | 15,913 | 1.5% | $720,339 | 2.4% | $45.27 | $620 | 15.20% | 1/31/2030 | None | N |
| Anthropologie | NR/NR/NR | 11,890 | 1.2% | $653,854 | 2.2% | $54.99 | $420 | 13.10% | 1/31/2026 | None | N |
| Arhaus Furniture | NR/NR/NR | 16,925 | 1.6% | $619,455 | 2.1% | $36.60 | $627 | 9.80% | 1/31/2032 | None | N |
| American Eagle Outfitters | NR/NR/NR | 6,044 | 0.6% | $596,905 | 2.0% | $98.76 | $677 | 14.60% | 3/31/2032 | None | Y(11) |
| Maggiano’s Little Italy | B1/BB-/NR | 12,611 | 1.2% | $581,115 | 2.0% | $46.08 | $783 | 9.00% | 9/30/2034 | 1 x 5 yr | N |
| Watches of Switzerland | NR/NR/NR | 4,902 | 0.5% | $580,691 | 2.0% | $118.46 | $1,945 | 8.80% | 11/30/2031 | 1 x 5 yr | Y(12) |
| The Cheesecake Factory | NR/NR/NR | 12,243 | 1.2% | $550,935 | 1.9% | $45.00 | $1,001 | 8.60% | 1/31/2025 | 1 x 5 yr | N |
| Largest Tenants | 606,234 | 58.7% | $7,164,230 | 24.2% | $11.82 | ||||||
| Non-Major Tenants | 377,278 | 36.5% | $22,443,982 | 75.8% | $59.49 | ||||||
| Occupied Collateral Total | 983,512 | 95.2% | $29,608,212 | 100.0% | $30.10 | ||||||
| Vacant Space | 49,629 | 4.8% | $0 | 0.0% | $0.00 | ||||||
| Total/Wtd. Avg. | 1,033,141 | 100.0% | $29,608,212 | 100.0% | $30.10 | ||||||
| (1) | Based on the underwritten rent roll dated December 31, 2023. |
| (2) | In certain instances, ratings provided are those of the parent company of the entity shown, whether or not the parent company guarantees the lease. |
| (3) | % of Total SF refers only to the Kenwood Towne Centre Property collateral and does not include the portion of the Kenwood Towne Centre Property occupied by Nordstrom, which owns its improvements and the underlying land. |
| (4) | Annual UW Rent, Annual UW Rent PSF and % of Total Annual UW Rent include $674,713 in contractual rent steps through February 2025. |
| (5) | Sales PSF are presented as of the 12 months ended December 2023, as provided by the borrower sponsors. |
| (6) | Occupancy costs are calculated by the annual gross rent divided by the respective tenant annual sales. |
| (7) | Nordstrom (non-collateral anchor) does not pay rent but pays certain reimbursements. |
| (8) | Macy’s owns its improvements and ground leases the underlying land from the borrower sponsors. Macy’s pays the greater of: (i) Minimum Rent (as defined below) or (ii) 1% of the amount by which Macy’s gross sales exceed $30,000,000 during such fiscal year (“Percentage Rent”). “Minimum Rent” equals $0, except if Macy’s ceases operations as a department store for more than 12 months and thereafter exercises any renewal option, then during the five-year renewal period, the annual Minimum Rent will be the sum of $50,000 plus the greater of: (i) the annual Minimum Rent in effect at the time of exercising the extension option or (ii) 200,000. Currently, Macy’s pays Percentage Rent, currently underwritten as $190,590 per year ($0.73 per SF) and certain reimbursements that in the aggregate totals 0.7% of total UW gross rent. |
| (9) | Dillard’s has a one-time option to surrender the expansion premises (approximately 90,000 square feet). |
| (10) | Altar'd State/Arula/Tulla has a termination option that is exercisable if the tenant’s net sales fail to exceed $7,509,607 during the period between either December 1, 2026 and November 30, 2027 or December 1, 2027 and November 30, 2028, along with payment of a termination fee. |
| (11) | American Eagle Outfitters has a termination option that is exercisable if the tenant’s net sales fail to exceed $3,688,916 during the period between April 2027 and March 2028, along with payment of a termination fee. |
| (12) | Watches of Switzerland has a termination option that is exercisable if the tenant’s net sales fail to exceed $5,000,000 during the period between October 2025 and September 2026, along with payment of a termination fee. |
| THE INFORMATION IN THIS STRUCTURAL AND COLLATERAL TERM SHEET IS NOT COMPLETE AND MAY BE AMENDED PRIOR TO THE TIME OF SALE. THIS TERM SHEET IS NOT AN OFFER TO SELL THESE SECURITIES AND IT IS NOT A SOLICITATION OF AN OFFER TO BUY THESE SECURITIES IN ANY JURISDICTION WHERE THE OFFER OR SALE IS NOT PERMITTED. | ||
| T-35 | ||
| Retail – Super Regional Mall | Loan #1 | Cut-off Date Balance: | $70,000,000 | |
| 7875 Montgomery Road | Kenwood Towne Centre | Cut-off Date LTV: | 45.5% | |
| Cincinnati, OH 45236 | UW NCF DSCR: | 2.19x | ||
| UW NOI Debt Yield: | 14.6% |
The following table presents certain information relating to the lease rollover schedule at the Kenwood Towne Centre Property:
| Lease Rollover Schedule(1)(2) | ||||||||
| Year | # of Leases Rolling | SF Rolling | Approx. % of SF Rolling | Approx. Cumulative % of SF Rolling | Total UW Rent Rolling(3) | Approx. % of Total UW Rent Rolling(3) | Approx. Cumulative % of Total UW Rent Rolling(3) | UW Rent PSF Rolling(3) |
| MTM/ 2024 | 13 | 74,671 | 7.2% | 7.2% | $1,708,181 | 5.8% | 5.8% | $22.88 |
| 2025 | 18 | 70,050 | 6.8% | 14.0% | $4,112,221 | 13.9% | 19.7% | $58.70 |
| 2026 | 21 | 74,060 | 7.2% | 21.2% | $5,574,367 | 18.8% | 38.5% | $75.27 |
| 2027 | 12 | 37,792 | 3.7% | 24.8% | $2,153,733 | 7.3% | 45.8% | $56.99 |
| 2028 | 14 | 294,188 | 28.5% | 53.3% | $2,511,303 | 8.5% | 54.2% | $8.54 |
| 2029 | 13 | 270,173 | 26.2% | 79.5% | $2,864,580 | 9.7% | 63.9% | $10.60 |
| 2030 | 7 | 27,885 | 2.7% | 82.2% | $1,678,725 | 5.7% | 69.6% | $60.20 |
| 2031 | 9 | 38,049 | 3.7% | 85.8% | $2,469,759 | 8.3% | 77.9% | $64.91 |
| 2032 | 11 | 61,220 | 5.9% | 91.8% | $3,869,773 | 13.1% | 91.0% | $63.21 |
| 2033 | 5 | 14,271 | 1.4% | 93.1% | $1,103,347 | 3.7% | 94.7% | $77.31 |
| 2034 | 6 | 21,153 | 2.0% | 95.2% | $1,562,223 | 5.3% | 100.0% | $73.85 |
| 2035 & Beyond | 0 | 0 | 0.0% | 95.2% | $0 | 0.0% | 100.0% | $0.00 |
| Vacant | NAP | 49,629 | 4.8% | 100.0% | NAP | NAP | NAP | $0.00 |
| Total/Wtd. Avg.(4) | 129 | 1,033,141 | 100.0% | $29,608,212 | 100.0% | $30.10 | ||
| (1) | Based on the underwritten rent roll dated December 31, 2023. | |
| (2) | Certain leases may have termination options that are exercisable prior to the originally stated expiration date of the lease and that are not considered in this Lease Rollover Schedule. |
| (3) | Total UW Rent Rolling, Approx. % of Total UW Rent Rolling, Approx. Cumulative % of Total UW Rent Rolling, and UW Rent PSF Rolling include contractual rent steps totaling $674,713 through February 2025. |
| (4) | Wtd. Avg. UW Rent PSF Rolling excludes vacant space. |
The Market. The Kenwood Towne Centre Property is located in Cincinnati, Ohio, within the Cincinnati core-based statistical area (the “Cincinnati CBSA”). The Cincinnati CBSA spans 15 counties across Ohio, Kentucky and Indiana and is home to seven Fortune 500 companies including Kroger, Proctor & Gamble, Fifth Third Bancorp, Western & Southern Financial Group, American Financial Group Inc., Cincinnati Financial Corp. and Cintas. The Cincinnati CBSA’s largest employment sectors include trade, transportation & utilities (20.6% of the regional workforce), professional & business services (15.7%) and education & health services (14.9%). The largest employers in the Cincinnati CBSA are Kroger Co., Cincinnati Children’s Hospital, TriHealth, University of Cincinnati and St. Elizabeth Healthcare.
The Kenwood Towne Centre Property is situated at the northeast corner of Kenwood and Montgomery Roads, approximately 10 miles from the Cincinnati central business district. Interstate 71 is located adjacent to the Kenwood Towne Centre Property and provides north/south regional access through Cincinnati. Interstate 71 has an average daily traffic count of approximately 123,971 vehicles per day. The Kenwood Towne Centre Property serves a 10-mile trade area and is a major shopping destination for this portion of the region, which acts as a commercial/retail hub for the area, anchoring retail and commercial development along Montgomery and Kenwood Roads.
According to the appraisal, the 2022 population within a five-, 10- and 15-mile radius of the Kenwood Towne Centre Property was 169,911, 703,702 and 1,308,287, respectively, and the average household income within the same radii was $105,507, $102,106 and $98,654, respectively. According to a third-party market research report, the Kenwood Towne Centre Property is located in the Kenwood retail submarket, which contained 5,569,882 square feet of retail space as of the first quarter of 2024. The Kenwood retail submarket reported a vacancy rate of 6.7% and an average rental rate of $23.29 per SF.
| THE INFORMATION IN THIS STRUCTURAL AND COLLATERAL TERM SHEET IS NOT COMPLETE AND MAY BE AMENDED PRIOR TO THE TIME OF SALE. THIS TERM SHEET IS NOT AN OFFER TO SELL THESE SECURITIES AND IT IS NOT A SOLICITATION OF AN OFFER TO BUY THESE SECURITIES IN ANY JURISDICTION WHERE THE OFFER OR SALE IS NOT PERMITTED. | ||
| T-36 | ||
| Retail – Super Regional Mall | Loan #1 | Cut-off Date Balance: | $70,000,000 | |
| 7875 Montgomery Road | Kenwood Towne Centre | Cut-off Date LTV: | 45.5% | |
| Cincinnati, OH 45236 | UW NCF DSCR: | 2.19x | ||
| UW NOI Debt Yield: | 14.6% |
The following table presents certain information relating to comparable retail centers for the Kenwood Towne Centre Property:
| Competitive Property Summary(1) | ||||||
Property Name | Year Built/Renovated | Total NRA | Total Occupancy | Distance to Subject | Sales PSF | Anchor / Major Tenants |
Kenwood Towne Centre 7875 Montgomery Road | 1958 / 1988, 2003, 2009, 2019-2023 | 1,033,141(2) | 95.2%(3) | NAP | $779(4)(5) | Macy’s Dillard’s Nordstrom (non-collateral anchor) |
Eastgate Mall 4601-200 Eastgate Boulevard Cincinnati, OH | 1980 / 2003 | 858,783 | 86.0% | 8.5 miles | $377 | Dillard's JC Penney Kohl's |
Northgate Mall 9501 Colerain Avenue Cincinnati, OH | 1972 / 2015 | 1,100,000 | 79.0% | 12.0 miles | $259 | Ashley Furniture Burlington DSW Marshalls Overstock Furniture Xscape Theatres |
Florence Mall 2028 Florence Mall Florence, KY
| 1976 / 2011 | 940,967 | 86.0% | 21.0 miles | $447 | JC Penney Macy's Macy's Home |
| (1) | Source: Appraisal, unless stated otherwise. The retail properties displayed in the chart reflect the primary competition for the Kenwood Towne Centre Property. |
| (2) | Total NRA for the Kenwood Towne Centre Property excludes the SF for Nordstrom (non-collateral anchor). |
| (3) | Based on the underwritten rent roll dated December 31, 2023 excluding Nordstrom (non-collateral anchor). |
| (4) | Represents comparable sales per SF as of the 12 months ended December 2023 for in-line tenants (excluding Apple). |
| (5) | Information is as provided by the borrower sponsors and only includes tenants reporting sales. |
Appraisal. According to the appraisal, Kenwood Towne Centre Property had an “as-is” appraised value of $571,200,000 as of January 23, 2024.
Environmental Matters. According to the Phase I environmental assessment dated January 17, 2024, there was no evidence of any recognized environmental conditions at the Kenwood Towne Centre Property.
| THE INFORMATION IN THIS STRUCTURAL AND COLLATERAL TERM SHEET IS NOT COMPLETE AND MAY BE AMENDED PRIOR TO THE TIME OF SALE. THIS TERM SHEET IS NOT AN OFFER TO SELL THESE SECURITIES AND IT IS NOT A SOLICITATION OF AN OFFER TO BUY THESE SECURITIES IN ANY JURISDICTION WHERE THE OFFER OR SALE IS NOT PERMITTED. | ||
| T-37 | ||
| Retail – Super Regional Mall | Loan #1 | Cut-off Date Balance: | $70,000,000 | |
| 7875 Montgomery Road | Kenwood Towne Centre | Cut-off Date LTV: | 45.5% | |
| Cincinnati, OH 45236 | UW NCF DSCR: | 2.19x | ||
| UW NOI Debt Yield: | 14.6% |
Operating History and Underwritten Net Cash Flow. The following table presents certain information relating to the operating history and underwritten cash flows of the Kenwood Towne Centre Property:
| Cash Flow Analysis(1) | |||||||
| 2019 | 2020 | 2021 | 2022 | 2023 | UW | UW PSF(2) | |
| Base Rent | $28,077,213 | $26,265,745 | $23,925,987 | $26,120,002 | $27,822,362 | $28,933,499 | $28.01 |
| Rent Steps(3) | $0 | $0 | $0 | $0 | $0 | $674,713 | $0.65 |
| Percent Rent | $1,629,756 | $1,688,542 | $4,688,543 | $6,133,051 | $4,437,293 | $2,990,230 | $2.89 |
| Grossed Up Vacant Space | $0 | $0 | $0 | $0 | $0 | $2,799,141 | $2.71 |
| Gross Potential Rent | $29,706,969 | $27,954,287 | $28,614,530 | $32,253,053 | $32,259,655 | $35,397,583 | $34.26 |
| Reimbursement Revenue | $15,881,057 | $15,036,147 | $12,925,944 | $13,725,762 | $14,242,630 | $14,008,669 | $13.56 |
| Temporary Tenants | $3,537,191 | $2,511,184 | $3,678,791 | $3,701,297 | $3,468,467 | $3,725,061 | $3.61 |
| Lease Termination Income | $0 | $823,989 | $908,941 | $163,925 | $702,334 | $0 | $0.00 |
| Other Income(4) | $516,526 | $360,323 | $440,807 | $462,098 | $400,361 | $389,272 | $0.38 |
| Net Rental Income | $49,641,743 | $46,685,930 | $46,569,013 | $50,306,135 | $51,073,447 | $53,520,585 | $51.80 |
| (Vacancy) | ($322,345) | ($1,223,127) | $55,455 | $142,623 | $83,265 | ($2,799,141) | ($2.71) |
| Effective Gross Income | $49,319,398 | $45,462,803 | $46,624,468 | $50,448,758 | $51,156,712 | $50,721,444 | $49.09 |
| Total Expenses | $12,297,984 | $11,598,539 | $12,851,993 | $13,294,184 | $13,470,861 | $12,770,752 | $12.36 |
| Net Operating Income | $37,021,414 | $33,864,264 | $33,772,475(5) | $37,154,574(5) | $37,685,851 | $37,950,692 | $36.73 |
| Capital Expenditures | 0 | 0 | 0 | 0 | 0 | $206,628 | $0.20 |
| TI/LC | 0 | 0 | 0 | 0 | 0 | $1,604,875 | $1.55 |
| Net Cash Flow | $37,021,414 | $33,864,264 | $33,772,475 | $37,154,574 | $37,685,851 | $36,139,189 | $34.98 |
| Occupancy (%) | 97.1% | 90.6% | 93.9% | 96.1% | 95.2% | 92.8%(6) | |
| NOI DSCR(7) | 2.24x | 2.05x | 2.04x | 2.25x | 2.28x | 2.30x | |
| NCF DSCR(7) | 2.24x | 2.05x | 2.04x | 2.25x | 2.28x | 2.19x | |
| NOI Debt Yield(7) | 14.2% | 13.0% | 13.0% | 14.3% | 14.5% | 14.6% | |
| NCF Debt Yield(7) | 14.2% | 13.0% | 13.0% | 14.3% | 14.5% | 13.9% | |
| (1) | Certain items such as capital expenditures and TI/LC were excluded from the historical presentation and are not considered for the underwritten cash flow. |
| (2) | UW PSF is based on the Total Collateral NRA. |
| (3) | Contractual rent steps are through February 2025. |
| (4) | Other Income includes revenue from trash pad rental and valet parking income. |
| (5) | The increase in Net Operating Income from 2021 to 2022 is primarily attributed to the borrower sponsors signing new leases and lease renewals during 2021 and 2022 for approximately 21 tenants with associated underwritten rents (8.2% of Total Collateral NRA and 20.1% of the underwritten base rent). |
| (6) | The underwritten economic occupancy is 92.8%. The Kenwood Towne Centre Property was 95.2% leased based on the December 31, 2023, underwritten rent roll. |
| (7) | Debt Service Coverage Ratios and Debt Yields are based on the Kenwood Towne Centre Whole Loan. |
Escrows and Reserves.
At origination, the borrower deposited into escrow approximately (i) $3,732,395 into an existing tenant improvement allowances reserve and (ii) $234,558 for a gap rent reserve in connection with Ray Ban (approximately $206,556) and Rowan (approximately $28,002).
Real Estate Taxes – During the continuance of a Reserve Trigger Period (as defined below) or Cash Management Period (as defined below), the borrower is required make monthly deposits equal to 1/12th of the annual estimated tax payments during the next ensuing 12 months.
Insurance – During the continuance of a Reserve Trigger Period or Cash Management Period, the borrower is required to make monthly deposits equal to 1/12th of the annual estimated insurance payments, except if the Kenwood Towne Centre Property is insured under a blanket policy meeting the requirements set forth in the related Kenwood Towne Centre Whole Loan documents (in which case, no insurance escrows will be required).
Replacement Reserve – During the continuance of a Reserve Trigger Period or Cash Management Period, the borrower is required to escrow $21,524 per month, capped at $516,571.
TI/LC Reserve – On each monthly payment date, the borrower is required to escrow an amount equal to approximately $129,143 for rollover reserves, capped at $3,099,423.
Anchor Tenant Funds – During the continuance of an Anchor Trigger Event (as defined below), the borrower is required deposit an amount equal to all initial excess cash flow with respect to any particular interest period for tenant improvements and leasing commissions, construction costs, required landlord work and other related costs associated with re-tenanting the applicable space or any other space at the Kenwood Towne Centre Property; provided, that deposits be capped at the amount equal to the product of (x) $50.00 and (y) the aggregate amount of gross leasable square footage of the applicable Anchor Parcel (as defined below) (the “Individual Anchor Threshold Amount”). The reserve will not be replenished if the funds in the anchor reserve account allocable to such individual Anchor Trigger Event falls below the related Individual Anchor Threshold Amount thereafter due to any disbursement to the borrower in accordance with the terms of the Kenwood Towne Centre Whole Loan documents).
| THE INFORMATION IN THIS STRUCTURAL AND COLLATERAL TERM SHEET IS NOT COMPLETE AND MAY BE AMENDED PRIOR TO THE TIME OF SALE. THIS TERM SHEET IS NOT AN OFFER TO SELL THESE SECURITIES AND IT IS NOT A SOLICITATION OF AN OFFER TO BUY THESE SECURITIES IN ANY JURISDICTION WHERE THE OFFER OR SALE IS NOT PERMITTED. | ||
| T-38 | ||
| Retail – Super Regional Mall | Loan #1 | Cut-off Date Balance: | $70,000,000 | |
| 7875 Montgomery Road | Kenwood Towne Centre | Cut-off Date LTV: | 45.5% | |
| Cincinnati, OH 45236 | UW NCF DSCR: | 2.19x | ||
| UW NOI Debt Yield: | 14.6% |
Lockbox and Cash Management. The Kenwood Towne Centre Whole Loan is structured with a hard lockbox and springing cash management. The borrower is required to cause all tenants at the Kenwood Towne Centre Property (other than tenants under Seasonal Leases (as defined below)) to pay rents (other than Non-Core Income (as defined below)) directly into the account controlled by the lender (the “Lockbox Account”), and to deposit any rents otherwise received by the manager or the property manager (other than Non-Core Income) into such Lockbox Account within two business days after receipt. Prior to a Cash Management Period, all funds in the Lockbox Account will be swept daily to the borrower’s operating account. During the continuance of a Cash Management Period, all funds deposited into the Lockbox Account are required to be swept each business day into a deposit account controlled by the lender (the “Cash Management Account”) to be applied and disbursed in accordance with the Kenwood Towne Centre Whole Loan documents to pay, including but not limited to, (i) the tax and insurance escrow deposits, if any, described above, (ii) provided that no default exists as to which the lender has initiated an enforcement action, budgeted operating expenses (or actual operating expenses to the extent not more than 115% of budgeted operating expenses), budgeted capital expenses (or actual capital expenses to the extent not more than 110% of budgeted capital expenses) and lender-approved extraordinary expenses and (iii) the replacement and rollover reserve deposits, if any, described above. During the continuance of a Cash Management Period, any excess cash is required to be deposited into an excess cash reserve account to be held by the lender as additional security for the Kenwood Towne Centre Whole Loan; provided, that, funds on deposit in such account will be made available to the borrower for the payment of certain property-level expenses and other uses, including REIT distributions up to $200,000.
“Non-Core Income” means (i) certain de minimis amounts of rents from miscellaneous revenue items such as holiday photos and change retrieved from fountains (but will not include rent from Seasonal Leases) and (ii) certain rents generated pursuant to multi-property sponsorship and advertising programs which are directly attributable to the Kenwood Towne Centre Property.
“Seasonal Leases” means leases and/or license agreements having a maximum term of one year or less.
A “Reserve Trigger Period” will commence upon the net operating income debt yield (“NOI DY”) falling below 10.5% for two consecutive calendar quarters and will end upon the NOI DY being at least 10.5% for two consecutive calendar quarters.
A “Cash Management Period” will commence upon the occurrence of any of the following events:
(i) an event of default,
(ii) the debt yield is less than 9.75% as of the end of any two consecutive calendar quarters or
(iii) the commencement of an Anchor Trigger Event. A Cash Management Period will end as applicable with respect to: (1) clause (i) above, if such event of default is cured or waived (provided that no Cash Management Period remains in effect pursuant to clauses (ii) or (iii) above), (2) clause (ii) above, either (a) upon the date that the debt yield is equal to or in excess of the 9.75% for two consecutive calendar quarters (provided that no Cash Management Period remains in effect pursuant to clauses (i) or (iii) above) or (b) the borrower has either (x) partially prepaid the Kenwood Towne Centre Whole Loan (with payment of a yield maintenance if partial prepayment occurs prior to September 1, 2028), (y) delivered cash to the lender or (z) delivered a letter of credit to the lender, in each case in an amount that if subtracted from the outstanding principal balance of the Kenwood Towne Centre Whole Loan would cause the debt yield to equal or exceed 9.75% for two consecutive calendar quarters, or (3) clause (iii) above, an applicable Anchor Trigger Cessation Event (as defined below) has occurred.
An ”Anchor Trigger Event” will occur if Dillard’s, Macy’s, Nordstrom or any replacement tenant (each an “Anchor” and the premises occupied, the “Anchor Parcel”): (i) has (A) “gone dark” (other than a temporary closure in connection with: (w) a restoration, repair or renovation, (x) compliance with applicable law, regulations and/or governmental mandates, (y) an event of force majeure or (z) any reason not to exceed 60 days) or (B) vacated its Anchor Parcel, (ii) is the subject of certain bankruptcy or insolvency events, (iii) terminates, surrenders or cancels its lease (or gives notice of its intent to do any of the foregoing) or (iv) to the extent such Anchor Parcel is owned by the borrower, the Anchor fails to renew its lease prior to the earlier of: (x) the date specified in such lease and (y) the date that is 12 months prior to such Anchor’s lease expiration.
An “Anchor Trigger Cessation Event” means for any Anchor Trigger Event: (1) described in clause (i) of the definition of Anchor Trigger Event, such Anchor operates the demised premises (to the extent not subject to any permitted subletting) for a period of no less than 30 consecutive operating days; (2) described in clause (ii) of the definition of Anchor Trigger Event, (x) if such premises occupied by the Anchor are then owned by the Anchor, such bankruptcy action is dismissed or the Anchor has emerged from such bankruptcy action and is continuing to occupy its premises or a substantial portion thereof, and (y) if such premises occupied by the Anchor are then leased by the borrower to the Anchor, such lease is accepted and affirmed by the Anchor in the bankruptcy action; (3) described in clause (iii) of the definition of Anchor Trigger Event, such Anchor rescinds its notice of cancellation, termination or non-renewal in writing; (4) described in clause (iv) of the definition of Anchor Trigger Event, such Anchor renews and/or extends its lease pursuant to the terms thereof; (5) if such Anchor Parcel is owned by the borrower, the entire Anchor Parcel or not less than 75% of the aggregate gross leasable square footage of the Anchor Parcel becomes owned or leased by one or more replacement tenants pursuant to leases entered into in accordance with the terms of the Kenwood Towne Centre Whole Loan documents or otherwise, in each case, reasonably approved by the lender (such approval not to be unreasonably withheld, conditioned or delayed); or (6) the borrower will have satisfied the conditions set forth in the Kenwood Towne Centre Whole Loan documents.
Release of Property. The borrower may obtain the release of (A) one or more vacant, non-income producing and unimproved (or improved only by landscaping, surface parking or utility facilities that are either readily re-locatable or will continue to serve the Kenwood Towne Centre Property) parcels (including “air rights” parcels) or outlots (provided, however, that this condition will not apply to any Kenwood Towne Centre Expansion Parcel (as defined below), or (B) any Kenwood Towne Centre Acquired Parcel (as defined below), including, if applicable, any Anchor Parcel, upon satisfaction of specified conditions including, among other things, that (i) there is no event of default, (ii) the borrower delivers evidence that the parcel subject to release is not necessary for the borrower’s operation or use of the remaining Kenwood Towne Centre Property and may be readily separated from the Kenwood Towne Centre Property without a material diminution in value, (iii) the parcel subject to release has been legally subdivided and after giving effect to such transfer, the release parcel and the remaining Kenwood Towne Centre Property conform to legal requirements and constitute separate tax lots (or all action has been taken to effectuate the same), (iv) the parcel subject to the release is not necessary for the remaining portion of the Kenwood Towne Centre Property to comply with zoning or legal requirements, (v) receipt of a rating agency confirmation from the applicable rating agencies (provided that such confirmation
| THE INFORMATION IN THIS STRUCTURAL AND COLLATERAL TERM SHEET IS NOT COMPLETE AND MAY BE AMENDED PRIOR TO THE TIME OF SALE. THIS TERM SHEET IS NOT AN OFFER TO SELL THESE SECURITIES AND IT IS NOT A SOLICITATION OF AN OFFER TO BUY THESE SECURITIES IN ANY JURISDICTION WHERE THE OFFER OR SALE IS NOT PERMITTED. | ||
| T-39 | ||
| Retail – Super Regional Mall | Loan #1 | Cut-off Date Balance: | $70,000,000 | |
| 7875 Montgomery Road | Kenwood Towne Centre | Cut-off Date LTV: | 45.5% | |
| Cincinnati, OH 45236 | UW NCF DSCR: | 2.19x | ||
| UW NOI Debt Yield: | 14.6% |
will not be required for release of a Kenwood Towne Centre Expansion Parcel or if the rating agency has waived review or failed to respond within 30 days to a request for such confirmation) and (vi) the release will comply with REMIC requirements.
In addition, the borrower has the right, at its own expense, to acquire one or more parcels of land that constitutes an integral part of, adjoins or is proximately located near, the shopping center of which the Kenwood Towne Centre Property is a part, which land was not owned by the borrower on the origination date of the Kenwood Towne Centre Whole Loan and is not a Kenwood Towne Centre Acquired Parcel (such acquired land, a “Kenwood Towne Centre Expansion Parcel”), to become additional collateral for the Kenwood Towne Centre Whole Loan, upon satisfaction of specified conditions including, among other things, that (i) there is no event of default, (ii) the borrower acquires a fee simple or leasehold interest in the applicable Kenwood Towne Centre Expansion Parcel and (iii) the borrower delivers, among other things, (a) an environmental report indicating no hazardous substances except for nominal amounts (except as permitted under clause (d) below), unless the Kenwood Towne Centre Expansion Parcel is already covered by the environmental report delivered at origination, (b) security documents creating a mortgage lien on the Kenwood Towne Centre Expansion Parcel and title insurance, (c) a property condition report indicating that the Kenwood Towne Centre Expansion Parcel is in good condition if the Kenwood Towne Centre Expansion Parcel is improved, subject to certain exceptions, and (d) if repairs are recommended by the property condition report or if the environmental report discloses the presence of hazardous materials at the Kenwood Towne Centre Expansion Parcel, and the cost of such repairs or remediation is reasonably likely to exceed 10% of the original principal balance of the Kenwood Towne Centre Whole Loan, cash or an indemnity from the guarantor, certain of its affiliates or an entity otherwise meeting ratings or financial tests set forth in the Kenwood Towne Centre Whole Loan documents, in an amount equal to 125% of any estimated repairs or remediation costs, as applicable.
The borrower is also permitted to obtain the release of collateral parcels (each, a “Kenwood Towne Centre Exchange Parcel”) from the lien of the mortgage in exchange for the substitution of new parcels of real property in which the borrower acquires a fee or leasehold interest (each, a “Kenwood Towne Centre Acquired Parcel”) as collateral for the Kenwood Towne Centre Whole Loan upon 20 days’ prior notice, subject to the satisfaction of certain conditions, including, among other things, that: (i) the Kenwood Towne Centre Exchange Parcel (unless it is a Kenwood Towne Centre Expansion Parcel) is vacant, non-income producing and unimproved or improved only by landscaping, surface parking or utility facilities that are readily re-locatable or that will continue to serve the Kenwood Towne Centre Property (and the borrower is able to make certain zoning representations as to the Kenwood Towne Centre Acquired Parcel to the same extent as made with respect to the Kenwood Towne Centre Exchange Parcel), (ii) the Kenwood Towne Centre Acquired Parcel is reasonably equivalent in value to the Kenwood Towne Centre Exchange Parcel, as established by a letter of value from the appraiser that appraised the Kenwood Towne Centre Property or an appraiser of comparable experience selected by the borrower, (iii) with respect to the Kenwood Towne Centre Acquired Parcel, the borrower has delivered, among other things, (a) an environmental report indicating no hazardous substances except for nominal amounts (except as permitted under clause (d) below), unless the Kenwood Towne Centre Acquired Parcel is already covered by the environmental report delivered at origination, (b) security documents creating a mortgage lien on the Kenwood Towne Centre Acquired Parcel and title insurance, (c) a property condition report indicating that the Kenwood Towne Centre Acquired Parcel is in good condition if the Kenwood Towne Centre Acquired Parcel is improved, subject to certain exceptions, (d) if repairs are recommended by the property condition report or if the environmental report discloses the presence of hazardous materials at the Kenwood Towne Centre Acquired Parcel, and the cost of such repairs or remediation is likely to exceed 10% of the original principal balance of the Kenwood Towne Centre Whole Loan, cash or an indemnity from the guarantor, certain of its affiliates or an entity otherwise meeting ratings or financial tests set forth in the Kenwood Towne Centre Whole Loan documents, in an amount equal to 125% of any estimated repairs or remediation costs, as applicable, (e) the release will comply with REMIC requirements and (f) the lender has received a rating agency confirmation from the applicable rating agencies.
Terrorism Insurance. The loan documents require that the “all risk” insurance policy required to be maintained by the borrower provides coverage for terrorism in an amount equal to the full replacement cost of the property, as well as business interruption insurance covering no less than the 24-month period following the occurrence of a casualty event plus a 12 month extended period of indemnity (provided that if the Terrorism Risk Insurance Program Reauthorization Act of 2019 or a similar statute is not in effect, the borrower will not be obligated to pay terrorism insurance premiums in excess of two times the annual premium for the property and business interruption/rental loss insurance coverage). See “Risk Factors—Risks Relating to the Mortgage Loans—Terrorism Insurance May Not Be Available for All Mortgaged Properties” in the prospectus.
| THE INFORMATION IN THIS STRUCTURAL AND COLLATERAL TERM SHEET IS NOT COMPLETE AND MAY BE AMENDED PRIOR TO THE TIME OF SALE. THIS TERM SHEET IS NOT AN OFFER TO SELL THESE SECURITIES AND IT IS NOT A SOLICITATION OF AN OFFER TO BUY THESE SECURITIES IN ANY JURISDICTION WHERE THE OFFER OR SALE IS NOT PERMITTED. | ||
| T-40 | ||
| Retail – Various | Loan #2 | Cut-off Date Balance: | $69,800,000 | |
| Various | Kleban Retail Portfolio | Cut-off Date LTV: | 65.6% | |
| Various | UW NCF DSCR: | 1.30x | ||
| UW NOI Debt Yield: | 9.8% |

| THE INFORMATION IN THIS STRUCTURAL AND COLLATERAL TERM SHEET IS NOT COMPLETE AND MAY BE AMENDED PRIOR TO THE TIME OF SALE. THIS TERM SHEET IS NOT AN OFFER TO SELL THESE SECURITIES AND IT IS NOT A SOLICITATION OF AN OFFER TO BUY THESE SECURITIES IN ANY JURISDICTION WHERE THE OFFER OR SALE IS NOT PERMITTED. | ||
| T-41 | ||
| Retail – Various | Loan #2 | Cut-off Date Balance: | $69,800,000 | |
| Various | Kleban Retail Portfolio | Cut-off Date LTV: | 65.6% | |
| Various | UW NCF DSCR: | 1.30x | ||
| UW NOI Debt Yield: | 9.8% |

| THE INFORMATION IN THIS STRUCTURAL AND COLLATERAL TERM SHEET IS NOT COMPLETE AND MAY BE AMENDED PRIOR TO THE TIME OF SALE. THIS TERM SHEET IS NOT AN OFFER TO SELL THESE SECURITIES AND IT IS NOT A SOLICITATION OF AN OFFER TO BUY THESE SECURITIES IN ANY JURISDICTION WHERE THE OFFER OR SALE IS NOT PERMITTED. | ||
| T-42 | ||
| Retail – Various | Loan #2 | Cut-off Date Balance: | $69,800,000 | |
| Various | Kleban Retail Portfolio | Cut-off Date LTV: | 65.6% | |
| Various | UW NCF DSCR: | 1.30x | ||
| UW NOI Debt Yield: | 9.8% |
| THE INFORMATION IN THIS STRUCTURAL AND COLLATERAL TERM SHEET IS NOT COMPLETE AND MAY BE AMENDED PRIOR TO THE TIME OF SALE. THIS TERM SHEET IS NOT AN OFFER TO SELL THESE SECURITIES AND IT IS NOT A SOLICITATION OF AN OFFER TO BUY THESE SECURITIES IN ANY JURISDICTION WHERE THE OFFER OR SALE IS NOT PERMITTED. | ||
| T-43 | ||
| Mortgage Loan No. 2 – Kleban Retail Portfolio |
| Mortgage Loan Information | Mortgaged Property Information | ||||||
| Mortgage Loan Seller: | MSMCH | Single Asset/Portfolio: | Portfolio | ||||
| Credit Assessment (Fitch/KBRA/Moody’s): | NR/NR/NR | Location: | Various | ||||
| Original Balance: | $69,800,000 | General Property Type: | Retail | ||||
| Cut-off Date Balance: | $69,800,000 | Detailed Property Type: | Various | ||||
| % of Initial Pool Balance: | 7.1% | Title Vesting: | Fee | ||||
| Loan Purpose: | Refinance | Year Built/Renovated(2): | Various/NAP | ||||
| Borrower Sponsors: | Kenneth Kleban and | Size: | 538,646 SF | ||||
| Kleban Properties, LLC | Cut-off Date Balance Per SF: | $130 | |||||
| Guarantor: | Kenneth Kleban | Maturity Date Balance Per SF: | $130 | ||||
| Mortgage Rate: | 7.0900% | Property Manager: | Kleban Properties, LLC | ||||
| Note Date: | 4/3/2024 | (borrower-affiliated) | |||||
| Maturity Date: | 5/1/2029 | ||||||
| Term to Maturity: | 60 months | Underwriting and Financial Information | |||||
| Amortization Term: | 0 months | UW NOI: | $6,838,209 | ||||
| IO Period: | 60 months | UW NCF: | $6,525,373 | ||||
| Seasoning: | 0 months | UW NOI Debt Yield: | 9.8% | ||||
| Prepayment Provisions: | L(24),D(29),O(7) | UW NCF Debt Yield: | 9.3% | ||||
| Lockbox/Cash Mgmt Status: | Hard/Springing | UW NOI Debt Yield at Maturity: | 9.8% | ||||
| Additional Debt Type: | NAP | UW NCF DSCR: | 1.30x | ||||
| Additional Debt Balance: | NAP | Most Recent NOI: | $6,780,077 (12/31/2023) | ||||
| Future Debt Permitted (Type): | No (NAP) | 2nd Most Recent NOI: | $6,922,662 (12/31/2022) | ||||
| 3rd Most Recent NOI: | $6,725,216 (12/31/2021) | ||||||
| Reserves(1) | Most Recent Occupancy: | 100.0% (Various) | |||||
| Type | Initial | Monthly | Cap | 2nd Most Recent Occupancy: | 100.0% (12/31/2022) | ||
| RE Taxes: | $199,696 | $33,283 | NAP | 3rd Most Recent Occupancy: | 100.0% (12/31/2021) | ||
| Insurance: | $173,787 | $14,482 | NAP | Appraised Value (as of): | $106,450,000 (Various) | ||
| Deferred Maintenance: | $87,681 | $0 | NAP | Appraised Value per SF: | $198 | ||
| Replacement Reserve: | $0 | $4,552 | $54,619 | Cut-off Date LTV Ratio: | 65.6% | ||
| TI/LC Reserve: | $0 | $7,586 | $182,062 | Maturity Date LTV Ratio: | 65.6% | ||
| Sources and Uses | ||||||
| Sources | Proceeds | % of Total | Uses | Proceeds | % of Total | |
| Loan Amount: | $69,800,000 | 97.6% | Loan Payoff: | $69,716,808 | 97.5% | |
| Borrower Equity: | $1,720,977 | 2.4% | Closing Costs: | $1,343,004 | 1.9% | |
| Reserves: | $461,164 | 0.6% | ||||
| Total Sources: | $71,520,977 | 100.0% | Total Uses: | $71,520,977 | 100.0% | |
| (1) | See “Escrows and Reserves” below for further discussion of reserve information. |
| (2) | See the “Portfolio Summary” chart below. |
The Mortgage Loan. The second largest mortgage loan (the “Kleban Retail Portfolio Mortgage Loan”) is evidenced by a promissory note in the original principal amount of $69,800,000 and secured by a first priority mortgage encumbering the borrowers’ fee interests in four retail properties totaling 538,646 SF located across four states including Louisiana, Florida, Alabama and Michigan (collectively, the “Kleban Retail Portfolio Properties”).
The Borrowers and the Borrower Sponsors. The borrowers for the Kleban Retail Portfolio Mortgage Loan are comprised of 23 separate Delaware limited liability companies, each organized as a tenants-in-common structure. The borrower entities are each member managed by WOS B Manager, LLC (0.5%), which is wholly owned by Kenneth Kleban and Evan Kleban. The borrower sponsors for the Kleban Retail Portfolio Mortgage Loan are Kenneth Kleban and Kleban Properties, LLC. Kenneth Kleban is also the non-recourse carveout guarantor. Kenneth Kleban serves as the President of Kleban Properties, LLC, a real estate development firm headquartered in Fairfield Connecticut. The firm manages the properties of the Kleban family and their partners in Connecticut, as well as real estate nationwide. Kleban Properties, LLC currently manages over 1.5 million SF of commercial and residential property.
The Properties. The Kleban Retail Portfolio Properties comprise a 174,522 SF single-tenant retail property located in Kenner, Louisiana (the “Home Depot – Kenner Property”), a 149,480 SF anchored retail property located in Port Orange, Florida (the “Altamira Shopping Village Property”), a 200,084 SF single-tenant retail property located in Mobile, Alabama (the “Walmart – Mobile Property”) and a 14,560 SF single-tenant retail property located in Garden City, Michigan (the ”Walgreens – Garden City Property”). As of January 1, 2024 (as to the Altamira Shopping Village Property) and May 1, 2024 (as to the other Kleban Retail Portfolio Properties), the portfolio is 100.0% leased to 14 tenants. The Kleban Retail Portfolio Properties were originally built between 1997 and 2015, and were acquired by the borrower sponsors in 2014.
| THE INFORMATION IN THIS STRUCTURAL AND COLLATERAL TERM SHEET IS NOT COMPLETE AND MAY BE AMENDED PRIOR TO THE TIME OF SALE. THIS TERM SHEET IS NOT AN OFFER TO SELL THESE SECURITIES AND IT IS NOT A SOLICITATION OF AN OFFER TO BUY THESE SECURITIES IN ANY JURISDICTION WHERE THE OFFER OR SALE IS NOT PERMITTED. | ||
| T-44 | ||
| Retail – Various | Loan #2 | Cut-off Date Balance: | $69,800,000 | |
| Various | Kleban Retail Portfolio | Cut-off Date LTV: | 65.6% | |
| Various | UW NCF DSCR: | 1.30x | ||
| UW NOI Debt Yield: | 9.8% |
Home Depot – Kenner Property
The Home Depot – Kenner Property is a single-tenant retail building totaling 174,522 SF, located in Kenner, Louisiana, approximately 12 miles west of the New Orleans central business district. The Home Depot – Kenner Property was built in 2013 and is situated on an approximately 12.9-acre site, with 784 surface parking spaces (4.5 spaces per 1,000 SF). As of May 1, 2024, the Home Depot – Kenner Property is 100.0% ground leased to the sole tenant, Home Depot U.S.A., Inc. (“Home Depot”).
Altamira Shopping Village Property
The Altamira Shopping Village Property is an anchored retail property located in Port Orange, Florida approximately 9 miles southwest of downtown Daytona Beach, Florida, totaling 149,480 SF. The Altamira Shopping Village Property was built in 2012, 2013 and 2015, and is situated on an approximately 14.1-acre site. The Altamira Shopping Village Property is anchored by BJ’s Wholesale Club and LA Fitness, with no other tenant occupying more than 2.3% of NRA at the Altamira Shopping Village Property. The Altamira Shopping Village Property includes 572 parking spaces (3.8 spaces per 1,000 SF). As of January 1, 2024, the Altamira Shopping Village Property is 100.0% leased to 11 tenants.
Walmart – Mobile Property
The Walmart – Mobile Property is a single-tenant retail building totaling 200,084 SF, located in Mobile, Alabama, approximately 18 miles west of the Mobile central business district. The Walmart – Mobile Property was built in 1997 and is situated on an approximately 19.4-acre site, with 985 surface parking spaces (4.9 spaces per 1,000 SF). As of May 1, 2024, the Walmart – Mobile Property is 100.0% leased to the sole tenant, Wal-Mart Real Estate Business Trust (“Walmart”).
Walgreens – Garden City Property
The Walgreens – Garden City Property is a single-tenant retail building totaling 14,560 SF, located in Garden City, Michigan, approximately 18 miles west of the Detroit central business district. The Walgreens – Garden City Property was built in 2004 and is situated on an approximately 1.6-acre site, with 71 surface parking spaces (4.9 spaces per 1,000 SF). As of May 1, 2024, the Walgreens – Garden City Property is 100.0% leased to the sole tenant, Walgreen Co. (“Walgreens”).
The following table presents certain information relating to the Kleban Retail Portfolio Properties.
| Portfolio Summary | |||||||||
| Property Name | City, State | Year Built / Renovated | Tenant SF(1) | Occupancy(1) | Allocated Mortgage Loan Cut-off Date Balance | % of Allocated Mortgage Loan Cut-off Date Balance | Appraised Value | UW NOI(1) | % of UW NOI(1) |
| Home Depot – Kenner | Kenner, LA | 2013 / NAP | 174,522 | 100.0% | $34,851,415 | 49.9% | $53,800,000 | $3,269,558 | 47.8% |
| Altamira Shopping Village | Port Orange, FL | 2012; 2013; 2015 / NAP | 149,480 | 100.0% | $20,211,230 | 29.0% | $30,200,000 | $2,165,709 | 31.7% |
| Walmart – Mobile | Mobile, AL | 1997 / NAP | 200,084 | 100.0% | $10,170,394 | 14.6% | $15,700,000 | $964,308 | 14.1% |
| Walgreens – Garden City | Garden City, MI | 2004 / NAP | 14,560 | 100.0% | $4,566,961 | 6.5% | $6,750,000 | $438,634 | 6.4% |
| Total/Wtd. Avg. | 538,646 | 100.0% | $69,800,000 | 100.0% | $106,450,000 | $6,838,209 | 100.0% | ||
Source: Appraisals, unless otherwise noted
| (1) | Information is based on the underwritten rent roll dated January 1, 2024. |
Major Tenants.
Walmart (200,084 SF, 37.1% of NRA, 14.2% of UW rent). Walmart (NYSE: WMT) is an American multinational retail corporation that operates a chain of hypermarkets, discount department stores, and grocery stores in the United States. Founded in 1962, and headquartered in Bentonville, Arkansas, Walmart operates more than 10,500 stores and numerous eCommerce websites in 19 countries. Walmart employs approximately 2.1 million associates around the world, with nearly 1.6 million employees in the United States. Walmart has been the sole tenant at the Walmart – Mobile Property since 1997, has a lease expiration date of July 31, 2028 and has eight, 5-year renewal options remaining.
Home Depot (174,522 SF, 32.4% of NRA, 46.9% of UW rent). Home Depot is a subsidiary of The Home Depot Inc. (NYSE:HD) and is an American multinational home improvement retail corporation that sells various building materials, home improvement products, lawn and garden products, tools, construction products, appliances, and services, including fuel and transportation rentals. Founded in 1978, The Home Depot, Inc. operates 2,336 stores, employing approximately 475,000 associates. The typical Home Depot store averages 105,000 SF of indoor space interconnected with an e-commerce business that offers more than one million products for the customers. Home Depot has been the sole tenant at the Home Depot – Kenner Property since 2013, has a lease expiration date of May 31, 2032, and has 10, 5-year renewal options remaining. Each renewal option will be automatically exercised, unless the tenant delivers written notice of termination on or before 365 days before the expiration of the then current term.
BJ’s (86,280 SF, 16.0% of NRA, 13.9% of UW rent). BJ’s WholeSale Club (“BJ’s”) (NYSE: BJ) is an American membership-only warehouse club chain that sells groceries, general merchandise, gasoline and other ancillary services, coupon books, and promotions. BJ’s also sells its products through its three eCommerce sites, as well as the BJ’s mobile app. Founded in 1984, BJ’s is based in Marlborough Massachusetts, and operates 244 stores across the eastern United States in addition to Alabama, Ohio, Michigan, Indiana, and Tennessee. BJ’s has anchored the Altamira Shopping Village Property since 2013, has a lease expiration date of October 31, 2033, and has six, 5-year renewal options remaining.
LA Fitness (45,000 SF, 8.4% of NRA, 11.1% of UW rent). LA Fitness is an American gym chain with approximately 550 clubs across the United States and Canada. LA Fitness was founded in 1984 and is based in Irvine, California. LA Fitness clubs operates with a membership program, offering their members personal training, and access to over 25 group exercise classes. LA Fitness has anchored the Altamira Shopping Village Property since 2015, has a lease expiration date of April 30, 2030, and has three, 5-year renewal options remaining.
| THE INFORMATION IN THIS STRUCTURAL AND COLLATERAL TERM SHEET IS NOT COMPLETE AND MAY BE AMENDED PRIOR TO THE TIME OF SALE. THIS TERM SHEET IS NOT AN OFFER TO SELL THESE SECURITIES AND IT IS NOT A SOLICITATION OF AN OFFER TO BUY THESE SECURITIES IN ANY JURISDICTION WHERE THE OFFER OR SALE IS NOT PERMITTED. | ||
| T-45 | ||
| Retail – Various | Loan #2 | Cut-off Date Balance: | $69,800,000 | |
| Various | Kleban Retail Portfolio | Cut-off Date LTV: | 65.6% | |
| Various | UW NCF DSCR: | 1.30x | ||
| UW NOI Debt Yield: | 9.8% |
Walgreens (14,560 SF, 2.7% of NRA, 6.4% of UW rent). Walgreens is an American company that operates one of the largest pharmacy store chains in the United States, specializing in filling prescriptions, health and wellness products, health information, and photo services. Founded in 1901, the U.S. Retail Pharmacy segment of the parent company, Walgreens Boots Alliance, Inc. (NYSE: WBA), operates under two brands, Walgreens and Duane Reade. Together, Walgreens Boots Alliance, Inc. operates 8,701 drugstores in 50 states, the District of Columbia, Puerto Rico and the U.S. Virgin Islands. Walgreens has been the sole tenant at the Walgreens – Garden City Property since 2004, and has a lease expiration date of June 30, 2029, with 10, 5-year renewal options remaining.
The following table presents a summary regarding the tenants at the Kleban Retail Portfolio Properties:
| Tenant Summary(1) | ||||||||||
| Tenant Name | Property | Credit Rating (Fitch/Moody’s/ S&P)(2) | Tenant SF | Approx.% of SF | Annual UW Rent | % of Total Annual UW Rent | Annual UW Rent PSF | |||
| Lease Expiration | Renewal Options | Term. Option (Y/N) | ||||||||
| Major Tenants | ||||||||||
| Walmart | Walmart – Mobile | AA/Aa2/AA | 200,084 | 37.1% | $1,062,946 | 14.2% | $5.31 | 7/31/2028 | 8 x 5 yr | N |
| Home Depot | Home Depot – Kenner | A/A2/A | 174,522 | 32.4% | $3,500,000 | 46.9% | $20.05 | 5/31/2032 | (3) | N |
| BJ’s | Altamira Shopping Village | NR/NR/BB+ | 86,280 | 16.0% | $1,035,360 | 13.9% | $12.00 | 10/31/2033 | 6 x 5 yr | N |
| LA Fitness | Altamira Shopping Village | NR/NR/NR | 45,000 | 8.4% | $829,125 | 11.1% | $18.43 | 4/30/2030 | 3 x 5 yr | N |
| Walgreens | Walgreens – Garden City | NR/Ba2/BBB- | 14,560 | 2.7% | $476,000 | 6.4% | $32.69 | 6/30/2029 | 10 x 5 yr | N |
| Major Tenants Subtotal/Wtd. Avg. | 520,446 | 96.6% | $6,903,431 | 92.5% | $13.26 | |||||
| Other Tenants | 18,200 | 3.4% | $559,049 | 7.5% | $30.72 | |||||
| Vacant Space | 0 | 0.0% | $0 | 0.0% | $0 | |||||
| Total/Wtd. Avg. | 538,646 | 100.0% | $7,462,481 | 100.0% | $13.85 | |||||
| (1) | Information is based on the underwritten rent roll dated January 1, 2024. |
| (2) | Certain ratings are those of the parent company, whether or not the parent company guarantees the lease. |
| (3) | Home Depot has 10 automatic 5-year renewal options remaining. |
The following table presents certain information with respect to the lease rollover at the Kleban Retail Portfolio Properties:
| Lease Rollover Schedule(1) | ||||||||
| Year | # of Leases Rolling | SF Rolling | Approx. % of SF Rolling | Approx. Cumulative % of SF Rolling | Total UW Rent Rolling | Approx. % of Total UW Rent Rolling | Approx. Cumulative % of Total UW Rent Rolling | UW Rent PSF Rolling |
| MTM | 0 | 0 | 0.0% | 0.0% | $0 | 0.0% | 0.0% | $0.00 |
| 2024 | 0 | 0 | 0.0% | 0.0% | $0 | 0.0% | 0.0% | $0.00 |
| 2025 | 3 | 6,200 | 1.2% | 1.2% | $188,104 | 2.5% | 2.5% | $30.34 |
| 2026 | 1 | 1,400 | 0.3% | 1.4% | $31,206 | 0.4% | 2.9% | $22.29 |
| 2027 | 1 | 3,200 | 0.6% | 2.0% | $116,160 | 1.6% | 4.5% | $36.30 |
| 2028 | 3 | 204,109 | 37.9% | 39.9% | $1,190,526 | 16.0% | 20.4% | $5.83 |
| 2029 | 2 | 16,060 | 3.0% | 42.9% | $523,250 | 7.0% | 27.5% | $32.58 |
| 2030 | 1 | 45,000 | 8.4% | 51.2% | $829,125 | 11.1% | 38.6% | $18.43 |
| 2031 | 1 | 1,875 | 0.3% | 51.6% | $48,750 | 0.7% | 39.2% | $26.00 |
| 2032 | 1 | 174,522 | 32.4% | 84.0% | $3,500,000 | 46.9% | 86.1% | $20.05 |
| 2033 | 1 | 86,280 | 16.0% | 100.0% | $1,035,360 | 13.9% | 100.0% | $12.00 |
| 2034 | 0 | 0 | 0.0% | 100.0% | $0 | 0.0% | 100.0% | $0.00 |
| 2035 & Thereafter | 0 | 0 | 0.0% | 100.0% | $0 | 0.0% | 100.0% | $0.00 |
| Vacant | 0 | 0 | 0.0% | 100.0% | $0 | 0.0% | 100.0% | $0.00 |
| Total/Wtd. Avg. | 14 | 538,646 | 100.0% | $7,462,481 | 100.0% | |||
| (1) | Information is based on the underwritten rent roll dated January 1, 2024. |
| THE INFORMATION IN THIS STRUCTURAL AND COLLATERAL TERM SHEET IS NOT COMPLETE AND MAY BE AMENDED PRIOR TO THE TIME OF SALE. THIS TERM SHEET IS NOT AN OFFER TO SELL THESE SECURITIES AND IT IS NOT A SOLICITATION OF AN OFFER TO BUY THESE SECURITIES IN ANY JURISDICTION WHERE THE OFFER OR SALE IS NOT PERMITTED. | ||
| T-46 | ||
| Retail – Various | Loan #2 | Cut-off Date Balance: | $69,800,000 | |
| Various | Kleban Retail Portfolio | Cut-off Date LTV: | 65.6% | |
| Various | UW NCF DSCR: | 1.30x | ||
| UW NOI Debt Yield: | 9.8% |
The Market.
The Home Depot – Kenner Property is located in Kenner, Louisiana within the Kenner retail submarket of the New Orleans metropolitan statistical area (“New Orleans MSA”) retail market. The Home Depot – Kenner Property is located approximately 2.8 miles east of the Louis Armstrong New Orleans International Airport, and approximately 11.6 miles away from the New Orleans central business district. Primary access to the Home Depot – Kenner Property is provided by Loyola Drive, Vintage Drive, and Chateau Boulevard, with secondary access provided by Interstate 10. Major employers in the area include Ochsner Health System, East Jefferson General Hospital, ACME Truck Line Inc. and Laitram LLC, employing 22,009, 2,700, 2,100 and 2,032 employees, respectively. According to the appraisal, as of the fourth quarter of 2023, the vacancy rate in the New Orleans MSA retail market was 2.9% with average asking rents of $17.54 PSF and inventory of approximately 85.1 million SF. According to the appraisal, as of the fourth quarter of 2023, the vacancy rate in the Kenner retail submarket was 16.6% with average asking rents of $22.11 PSF and inventory of approximately 5.1 million SF. According to the appraisal, the 2023 population within a one-, three- and five-mile radius of the Home Depot – Kenner Property was 16,030, 126,206 and 216,399, respectively. According to the appraisal, the 2023 average household income within the same radii was $81,508, $88,064 and $89,291, respectively.
The Altamira Shopping Village Property is located in Port Orange, Florida, within the South Beach Cities retail submarket of the Volusia County retail market. The Altamira Shopping Village Property is located approximately 8.3 miles south of the Daytona Beach International Airport, and approximately 9.1 miles south of Daytona Beach. Primary access is provided to the Altamira Shopping Village Property by Interstate 95 and Interstate 4. According to the appraisal, as of the fourth quarter of 2023, the vacancy rate in the Volusia County retail market was 3.7% with average asking rents of $16.76 PSF and inventory of approximately 36.7 million SF. According to the appraisal, as of the fourth quarter of 2023, the vacancy rate in the South Beach Cities retail submarket was 1.8% with average asking rents of $20.30 PSF and inventory of approximately 5.3 million SF. According to the appraisal, the 2023 population within a one-, three- and five-mile radius of the Altamira Shopping Village Property was 7,645, 57,851 and 105,779, respectively. According to the appraisal, the 2023 average household income within the same radii was $89,720, $79,167 and $78,762, respectively.
The Walmart – Mobile Property is located in Mobile, Alabama, within the Outlying Mobile County retail submarket of the Mobile retail market. The Walmart – Mobile Property is located approximately 13.7 miles northwest from the Mobile International Airport, and approximately 17.0 miles west of the Mobile central business district. Primary access is provided to the Walmart – Mobile Property by Interstate 65 and US Highway 98. According to the appraisal, as of the fourth quarter of 2023, the vacancy rate in the Mobile retail market was 3.6% with average asking rents of $12.91 PSF and inventory of approximately 30.2 million SF. According to the appraisal, as of the fourth quarter of 2023, the vacancy rate in the Outlying Mobile County retail submarket was 2.4% with average asking rents of $12.82 PSF and inventory of approximately 9.1 million SF. According to the appraisal, the 2023 population within a one-, three- and five-mile radius of the Walmart – Mobile Property was 4,923, 52,039 and 125,300, respectively. According to the appraisal, the 2023 average household income within the same radii was $70,953, $75,063 and $83,757, respectively.
The Walgreens – Garden City Property is located in Garden City, Michigan, within the Southern I-275 Corridor retail submarket of the Detroit retail market. The Walgreens – Garden City Property is located approximately 6.4 miles north of the Detroit Metropolitan Wayne County Airport, and approximately 17.4 miles west of the Detroit central business district. Primary access is provided to the Walgreens – Garden City Property by Interstate 275. According to the appraisal, as of the fourth quarter of 2023, the vacancy rate in the Detroit retail market was 5.2% with average asking rents of $14.89 PSF and inventory of approximately 307.1 million SF. According to the appraisal, as of the fourth quarter of 2023, the vacancy rate in the Southern I-275 Corridor retail submarket was 5.3% with average asking rents of $14.69 PSF and inventory of approximately 28.2 million SF. According to the appraisal, the 2023 population within a one-, three- and five-mile radius of the Walgreens – Garden City Property was 12,803, 130,577 and 299,326, respectively. According to the appraisal, the 2023 average household income within the same radii was $82,397, $77,363 and $84,089, respectively.
The following table presents certain information relating to the appraisal’s market rent conclusion for the Home Depot – Kenner Property:
| Market Rent Summary | ||||||
| Tenant Type | Market Rent (PSF) | Reimbursements | Rent Escalation | Lease Term (Months) | Tenant Improvements (PSF) (New/Renewal) | Leasing Commissions (New/Renewal) |
| Retail: | $21.00 | Absolute Net | 10% every 5 years | 180 | $10.00 / $2.00 | 6.0% / 3.0% |
The following table presents certain information relating to the appraisal’s market rent conclusion for the Altamira Shopping Village Property:
| Market Rent Summary | ||||||
| Tenant Type | Market Rent (PSF) | Reimbursements | Rent Escalation | Lease Term (Months) | Tenant Improvements (PSF) (New/Renewal) | Leasing Commissions (New/Renewal) |
| Anchor: | $13.00 | Tax, Ins, CAM | 10% every 5 years | 186 | $25.00 / $5.00 | 5.0% / 2.5% |
| Fitness: | $20.00 | Tax, Ins, CAM | 10% every 5 years | 186 | $25.00 / $5.00 | 5.0% / 2.5% |
| Retail - Primary: | $34.00 | NNN, 15% Admin on CAM | 3.0%/Year | 63 | $15.00 / $0.00 | 5.0% / 2.5% |
| Retail: | $32.00 | NNN, 15% Admin on CAM | 3.0%/Year | 63 | $15.00 / $0.00 | 5.0% / 2.5% |
The following table presents certain information relating to the appraisal’s market rent conclusion for the Walmart - Mobile Property:
| Market Rent Summary | ||||||
| Tenant Type | Market Rent (PSF) | Reimbursements | Rent Escalation | Lease Term (Months) | Tenant Improvements (PSF) (New/Renewal) | Leasing Commissions (New/Renewal) |
| Retail: | $5.50 | Net | None | 180 | $3.00 / $1.00 | 4.0% / 2.0% |
| THE INFORMATION IN THIS STRUCTURAL AND COLLATERAL TERM SHEET IS NOT COMPLETE AND MAY BE AMENDED PRIOR TO THE TIME OF SALE. THIS TERM SHEET IS NOT AN OFFER TO SELL THESE SECURITIES AND IT IS NOT A SOLICITATION OF AN OFFER TO BUY THESE SECURITIES IN ANY JURISDICTION WHERE THE OFFER OR SALE IS NOT PERMITTED. | ||
| T-47 | ||
| Retail – Various | Loan #2 | Cut-off Date Balance: | $69,800,000 | |
| Various | Kleban Retail Portfolio | Cut-off Date LTV: | 65.6% | |
| Various | UW NCF DSCR: | 1.30x | ||
| UW NOI Debt Yield: | 9.8% |
The following table presents certain information relating to the appraisal’s market rent conclusion for the Walgreens – Garden City Property:
| Market Rent Summary | ||||
| Tenant Type | Market Rent (PSF) | Reimbursements | Rent Escalation | Lease Term (Months) |
| Drug Store: | $25.00 - $30.00 | NNN | Flat | 120 |
The following table presents recent anchor space leasing data at comparable retail properties with respect to the Home Depot – Kenner Property:
| Comparable Leases Summary | |||||||
| Property/Location | Year Built / Renovated | SF | Tenant Name | Tenant Size (SF) | Lease Date | Rent PSF | Lease Type |
Home Depot – Kenner Property (subject)(1) 2625 Veterans Memorial Boulevard Kenner, LA | 2013 / NAP | 174,522 | Home Depot | 174,522 | Jan. 2013 | $20.05 | NNN |
Sears Appliance Repair – Baton Rouge 6501 Bluebonnet Boulevard Baton Rouge, LA | 1997 / NAP | 113,626 | Dick’s Sporting Goods | 110,996 | Aug. 2024 | $14.86 | Gross + TE |
Home Depot 2450 East Willow Street Signal Hill, CA | 1992 / NAP | 103,423 | Home Depot | 103,424 | Feb. 2020 | $20.52 | NNN |
Juban Crossing 10100 Crossing Way Denham Springs, LA | 2014 / NAP | 641,691 | Hobby Lobby | 55,000 | Oct. 2019 | $10.50 | NNN |
Home Depot 21218 Roscoe Boulevard Canoga Park, CA | 1990 / NAP | 99,200 | Home Depot | 99,200 | May 2019 | $17.88 | NNN |
Dick’s Sporting Goods – Woodland Mall 1201 Lake Woodlands Drive The Woodlands, TX | 1994 / 2004 | 81,600 | Dick’s Sporting Goods | 81,600 | Jan. 2022 | $24.85 | NNN |
Source: Appraisal, unless otherwise indicated.
| (1) | Information based on the underwritten rent roll dated January 1, 2024, other than Year Built / Renovated. |
The following table presents recent anchor space leasing data at comparable retail properties with respect to the Altamira Shopping Village Property:
| Comparable Leases Summary | |||||
| Property/Location | Tenant Name | Tenant Size (SF) | Lease Date | Rent PSF | Lease Type |
Altamira Shopping Village (subject)(1) Port Orange, FL | BJ’s | 86,280 | Oct. 2013 | $12.00 | NNN |
Plaza at Coral Springs III Coral Springs, FL | BJ’s Wholesale | 86,576 | 2014 | $10.00 | NNN |
West Gables Plaza Miami, FL | BJ’s Wholesale | 100,000 | 2014 | $15.70 | NNN |
Coral Sky Plaza Royal Palm Beach, FL | BJ’s Wholesale | 108,532 | 1999 | $10.88 | NNN |
Alamance West Burlington, NC | BJ’s Wholesale | 85,188 | 2021 | $9.75 | NNN |
Newberry Square Gainesville, FL | Floor & Décor | 84,146 | 2020 | $8.50 | NNN |
Volusia Marketplace Daytona Beach, FL | Asking Rate | 50,075 | NAP | $10.00-$14.00 | NNN |
Cortez Plaza Bradenton, FL | Conn’s HomePlus | 41,278 | 2021 | $12.50 | NNN |
Melbourne Shopping Center Melbourne, FL | Conn’s HomePlus | 28,963 | 2023 | $10.00 | NNN |
| Source: Appraisal, unless otherwise indicated. | ||
| (1) | Information based on the underwritten rent roll dated January 1, 2024. | |
| THE INFORMATION IN THIS STRUCTURAL AND COLLATERAL TERM SHEET IS NOT COMPLETE AND MAY BE AMENDED PRIOR TO THE TIME OF SALE. THIS TERM SHEET IS NOT AN OFFER TO SELL THESE SECURITIES AND IT IS NOT A SOLICITATION OF AN OFFER TO BUY THESE SECURITIES IN ANY JURISDICTION WHERE THE OFFER OR SALE IS NOT PERMITTED. | ||
| T-48 | ||
| Retail – Various | Loan #2 | Cut-off Date Balance: | $69,800,000 | |
| Various | Kleban Retail Portfolio | Cut-off Date LTV: | 65.6% | |
| Various | UW NCF DSCR: | 1.30x | ||
| UW NOI Debt Yield: | 9.8% |
The following table presents recent inline space leasing data at comparable retail properties with respect to the Altamira Shopping Village Property:
| Comparable Leases Summary | |||||||
| Property/Location | Year Built | SF | Tenant Name | Tenant Size (SF) | Lease Date | Rent PSF | Lease Type |
Altamira Shopping Village (subject)(1) 1800-1820 Dunlawton Avenue Port Orange, FL | 2012; 2013; 2015 | 149,480 | Red Bowl Aspen Dental | 3,400 3,200 | Feb. 2015 Dec. 2012 | $29.96 $36.30 | NNN NNN |
Park Place Plaza 3761 South Nova Road Port Orange, FL | 1983 | 87,056 | Ava Massage and Therapy | 1,050 | Jul. 2022 | $27.50 | NNN |
Volusia Square 2455 West International Speedway Boulevard Daytona Beach, FL | 1993 | 10,800 | Asking Rent | 1,600 | NAP | $32.00 | NNN |
Speedway Village 2254 West International Speedway Boulevard Daytona Beach, FL | 2008 | 28,075 | Asking Rent | 2,655 | NAP | $34.00 | NNN |
Tuscan Village Shoppes 3510 Nova Road Port Orange, FL | 2008 | 30,541 | Asking Rent | 1,580 | NAP | $24.00 | NNN |
Source: Appraisal, unless otherwise indicated.
| (1) | Information based on the underwritten rent roll dated January 1, 2024, other than Year Built. |
The following table presents recent anchor space leasing data at comparable retail properties with respect to the Walmart – Mobile Property:
| Comparable Leases Summary | |||||||
| Property/Location | Year Built / Renovated | SF | Tenant Name | Tenant Size (SF) | Lease Date | Rent PSF | Lease Type |
Walmart – Mobile Property (subject)(1) 685 Schillinger Road South Mobile, AL | 1997 / NAP | 200,084 | Walmart | 200,084 | Aug. 2017 | $5.31 | NNN |
Danbury Fair Mall 7 Backus Avenue Danbury, CT | 1986 / 2007 | 925,063 | Target | 126,562 | May 2024 | $5.66 | Net |
Sam’s Club 1237 32nd Street Port Huron, MI | 1993 / 2010 | 137,720 | Sam’s Club | 137,720 | Dec. 2023 | $5.24 | Absolute Net |
Former Kmart 3801 Harmont Avenue Northeast Canton, OH | 1966 / NAP | 136,666 | M@C Discount | 105,800 | Sep. 2023 | $4.25 | NNN |
At Home – Fort Wayne 3810 Illinois Road Fort Wayne, IN | 1977 / 2023 | 96,339 | At Home | 96,339 | Apr. 2023 | $7.15 | Net |
Kohl’s – Knoxville TN 5312 Washington Pike Knoxville, TN | 1997 / NAP | 86,900 | Kohl’s | 86,900 | Feb. 2023 | $6.63 | Absolute Net |
The Plaza At Biltmore Square 980 Brevard Road Asheville, NC | 1990 / 2022 | 104,231 | At Home | 104,231 | Feb. 2022 | $8.00 | NNN |
Walmart SuperCenter 7001 Concourse Parkway Douglasville, GA | 1999 / NAP | 222,511 | Walmart | 222,511 | Oct. 2019 | $6.13 | Absolute Net |
Source: Appraisal, unless otherwise indicated.
| (1) | Information based on the underwritten rent roll dated January 1, 2024, other than Year Built / Renovated. |
| THE INFORMATION IN THIS STRUCTURAL AND COLLATERAL TERM SHEET IS NOT COMPLETE AND MAY BE AMENDED PRIOR TO THE TIME OF SALE. THIS TERM SHEET IS NOT AN OFFER TO SELL THESE SECURITIES AND IT IS NOT A SOLICITATION OF AN OFFER TO BUY THESE SECURITIES IN ANY JURISDICTION WHERE THE OFFER OR SALE IS NOT PERMITTED. | ||
| T-49 | ||
| Retail – Various | Loan #2 | Cut-off Date Balance: | $69,800,000 | |
| Various | Kleban Retail Portfolio | Cut-off Date LTV: | 65.6% | |
| Various | UW NCF DSCR: | 1.30x | ||
| UW NOI Debt Yield: | 9.8% |
The following table presents recent anchor space leasing data at comparable retail properties with respect to the Walgreens – Garden City Property:
| Comparable Leases Summary | |||||||
| Property/Location | Year Built / Renovated | SF | Tenant Name | Tenant Size (SF) | Lease Date | Rent PSF | Lease Type |
Walgreens – Garden City (subject)(1) 31415 Ford Road Garden City, MI | 2004 / NAP | 14,560 | Walgreens | 14,560 | Jul. 2004 | $32.69 | NNN |
Walgreens 24100 Novi Road Novi, MI | 1998 / NAP | 13,905 | Walgreens | 13,905 | Jun. 2022 | $20.12 | NNN |
Rite Aid 18430 Fenkell Street Detroit, MI | 2006 / NAP | 14,686 | Rite Aid | 14,686 | Apr. 2022 | $28.69 | NNN |
Walgreens 1570 East Pierson Road Flushing, MI | 2000 / NAP | 15,120 | Walgreens | 15,120 | Jul. 2021 | $23.88 | NNN |
CVS Pharmacy 18130 West 10 Mile Road Southfield, MI | 2004 / NAP | 10,880 | CVS Pharmacy | 10,880 | Jan. 2021 | $28.03 | NNN |
Walgreens 29520 Harper Avenue St. Clair Shores, MI | 2002 / NAP | 13,428 | Walgreens | 13,428 | May 2020 | $33.47 | NNN |
Source: Appraisal, unless otherwise indicated.
| (1) | Information based on the underwritten rent roll dated January 1, 2024, other than Year Built / Renovated. |
Appraisals. The appraisal concluded to an “as-is” value for the Home Depot – Kenner Property of $53,800,000 as of March 27, 2024. The appraisal concluded to an “as-is” value for the Altamira Shopping Village Property of $30,200,000 as of April 1, 2024. The appraisal concluded to an “as-is” value for the Walmart - Mobile Property of $15,700,000 as of March 26, 2024. The appraisal concluded to an “as-is” value for the Walgreens – Garden City Property of $6,750,000 as of March 25, 2024. Together, the Kleban Retail Portfolio Properties have an aggregate “as-is” value of $106,450,000.
Environmental Matters. According to the Phase I environmental site assessments dated September 29, 2023, there was no evidence of any recognized environmental conditions at the Kleban Retail Portfolio Properties.
Operating History and Underwritten Net Cash Flow. The following table presents certain information relating to the historical operating performance and Underwritten Net Cash Flow at the Kleban Retail Portfolio Properties:
| Cash Flow Analysis | ||||||
| 2020 | 2021 | 2022 | 2023 | UW | UW PSF | |
| Gross Potential Rent(1) | $7,190,543 | $7,441,749 | $7,431,232 | $7,404,988 | $7,462,481 | $13.85 |
| Reimbursements | $650,930 | $388,632 | $647,591 | $557,330 | $687,439 | $1.28 |
| Other Income | $0 | $0 | $0 | $0 | ||
| (Vacancy / Credit Loss) | $0 | $0 | $0 | $0 | ($337,496) | ($0.63) |
| Effective Gross Income | $7,841,474 | $7,830,380 | $8,078,823 | $7,962,318 | $7,812,423 | $14.50 |
| Real Estate Taxes | $365,421 | $365,721 | $353,127 | $375,834 | $387,760 | $0.72 |
| Insurance | $40,690 | $49,818 | $46,471 | $113,889 | $168,725 | $0.31 |
| Other Operating Expenses | $773,589 | $689,626 | $756,564 | $692,517 | $417,729 | $0.78 |
| Total Operating Expenses | $1,179,699 | $1,105,164 | $1,156,161 | $1,182,241 | $974,214 | $1.81 |
| Net Operating Income | $6,661,775 | $6,725,216 | $6,922,662 | $6,780,077 | $6,838,209 | $12.70 |
| Replacement Reserves | $0 | $0 | $0 | $0 | $80,797 | $0.15 |
| TI/LC | $0 | $0 | $0 | $0 | $232,039 | $0.43 |
| Net Cash Flow | $6,661,775 | $6,725,216 | $6,922,662 | $6,780,077 | $6,525,373 | $12.11 |
| Occupancy (%)(2) | 100.0% | 100.0% | 100.0% | 100.0% | 95.9% | |
| NOI DSCR | 1.33x | 1.34x | 1.38x | 1.35x | 1.36x | |
| NCF DSCR | 1.33x | 1.34x | 1.38x | 1.35x | 1.30x | |
| NOI Debt Yield | 9.5% | 9.6% | 9.9% | 9.7% | 9.8% | |
| NCF Debt Yield | 9.5% | 9.6% | 9.9% | 9.7% | 9.3% | |
| (1) | UW Gross Potential Rent is based on the underwritten rent roll dated January 1, 2024, and includes rent steps underwritten through June 2024 totaling $2,866. |
| (2) | UW Occupancy (%) represents economic occupancy. Historical occupancies represent physical occupancies. 2023 Occupancy (%) is based on the underwritten rent roll dated January 1, 2024. |
| THE INFORMATION IN THIS STRUCTURAL AND COLLATERAL TERM SHEET IS NOT COMPLETE AND MAY BE AMENDED PRIOR TO THE TIME OF SALE. THIS TERM SHEET IS NOT AN OFFER TO SELL THESE SECURITIES AND IT IS NOT A SOLICITATION OF AN OFFER TO BUY THESE SECURITIES IN ANY JURISDICTION WHERE THE OFFER OR SALE IS NOT PERMITTED. | ||
| T-50 | ||
| Retail – Various | Loan #2 | Cut-off Date Balance: | $69,800,000 | |
| Various | Kleban Retail Portfolio | Cut-off Date LTV: | 65.6% | |
| Various | UW NCF DSCR: | 1.30x | ||
| UW NOI Debt Yield: | 9.8% |
Escrows and Reserves.
Required Repairs – On the loan origination date, the borrowers were required to make an upfront deposit of $87,681 into a reserve for required repairs, including repair of (i) asphalt seal coating, (ii) concrete paving repair, (iii) roofing repair, (iv) and repair of fire sprinkler, (v) walls and (vi) the building’s awning.
Real Estate Taxes – On the loan origination date, the borrowers were required to make an upfront deposit of approximately $199,696 into a reserve for real estate taxes. In addition, the Kleban Retail Portfolio Mortgage Loan documents require ongoing monthly deposits into a reserve for real estate taxes in an amount equal to 1/12 of the real estate taxes that the lender estimates will be payable during the next twelve months for the Kleban Retail Portfolio Properties.
Insurance – On the loan origination date, the borrowers were required to make an upfront deposit of approximately $173,787 into a reserve for real estate taxes. In addition, the Kleban Retail Portfolio Mortgage Loan documents require ongoing monthly deposits into a reserve for insurance premiums in an amount equal to 1/12 of the insurance premiums that the lender estimates will be payable for the renewal of coverage upon the expiration of the insurance policies. Notwithstanding the foregoing, the borrowers are not required to make deposits into the insurance premium reserve so long as (i) no event of default is continuing under the Kleban Retail Portfolio Mortgage Loan, (ii) the liability and casualty insurance policies covering the Kleban Retail Portfolio Properties are part of a blanket or umbrella policy approved by the lender in its reasonable discretion, and (iii) the borrower provides the lender with evidence of renewal of such insurance policies and paid receipts for the insurance premiums no later than 10 days prior to their expiration.
Replacement Reserve –The Kleban Retail Portfolio Mortgage Loan documents require ongoing monthly deposits of approximately $4,552 into a reserve for capital expenditures; provided that so long as no event of default is continuing under the Kleban Retail Portfolio Mortgage Loan, such deposits will not be required at any time that they would cause the amount then on deposit in such reserve to exceed approximately $54,619.
Rollover Reserve –The Kleban Retail Portfolio Mortgage Loan documents require ongoing monthly deposits of approximately $7,586 into a reserve for future tenant improvements and leasing commissions; provided that so long as no event of default is continuing under the Kleban Retail Portfolio Mortgage Loan, such deposits will not be required at any time that they would cause the amount in such reserve to exceed $182,062.
Lockbox and Cash Management. The Kleban Retail Portfolio Mortgage Loan is structured with a hard lockbox and springing cash management. The borrowers are required to cause all tenants at the Kleban Retail Portfolio Properties to pay rents directly into a lockbox account controlled by the lender, and to deposit any rents otherwise received by the borrowers or property manager into the lockbox account within one business day after receipt. If no Cash Sweep Event Period (as defined below) is continuing, all funds in the lockbox account will be disbursed to the borrowers’ operating account. Upon the occurrence of a Cash Sweep Event Period, the lender is required to establish a lender-controlled cash management account. During a Cash Sweep Event Period, the lender will have the right to direct that all funds in the lockbox account be swept to the cash management account and, provided no event of default is continuing under the Kleban Retail Portfolio Mortgage Loan documents, applied on each monthly payment date: (i) to make the monthly deposits into the real estate tax reserve and insurance reserve, if any, as described above under “Escrows and Reserves,” (ii) to pay debt service on the Kleban Retail Portfolio Mortgage Loan, (iii) to make the monthly deposits into the capital expenditure reserve and rollover reserve, if any, as described above under “Escrows and Reserves,” (iv) to pay operating expenses set forth in the lender-approved annual budget and lender-approved extraordinary expenses, and (v) to deposit any remainder into an excess cash flow reserve to be held as additional security for the Kleban Retail Portfolio Mortgage Loan during such Cash Sweep Event Period. If no Cash Sweep Event Period exists, all funds in the lockbox account will be transferred to the borrower’s account.
“Cash Sweep Event Period” means a period:
| (i) | commencing upon an event of default under the Kleban Retail Portfolio Mortgage Loan documents, and ending upon the cure, if applicable, of such event of default; or |
| (ii) | commencing upon the debt service coverage ratio falling below 1.10x (a “DSCR Event”) as of the end of any calendar quarter based upon the trailing 12 months operating statements and current in place rent rolls and ending upon either (1) the date the debt service coverage ratio has been at least 1.10x for the immediately preceding two consecutive calendar quarters or (2) the borrowers have deposited with the lender either cash or a letter of credit in an amount that if applied to the debt would result in a debt service coverage ratio of 1.10x (a “DSCR Deposit”); provided that on each anniversary of a DSCR Event that the DSCR is less than 1.10x, a DSCR Event will exist unless borrowers make an additional DSCR Deposit; or |
| (iii) | commencing upon certain voluntary bankruptcy or insolvency events of a Major Tenant (as defined below) or its lease guarantor and ending upon either (1) such Major Tenant’s lease has been either assumed by the applicable borrowers in bankruptcy or assumed by the borrowers and assigned to one or more replacement tenants acceptable to the lender under a lease acceptable to the lender (“Replacement Tenants”), and the borrowers deliver to the lender a reasonably acceptable tenant estoppel from such Major Tenant or Replacement Tenant stating that it is in occupancy of its space, open for business and paying full unabated contractual rent (an “Acceptable Estoppel”) or (2) the entirety of such Major Tenant’s space has been re-let to one or more Replacement Tenant(s), and the borrowers deliver to the lender an Acceptable Estoppel from the Replacement Tenant(s) (a “Retenanting Cure”); or |
| (iv) | commencing upon the date a Major Tenant (or its subtenant or assignee) has for all or a part of its space “gone dark,” vacated its space, not opened for business or terminated its lease (or given notice it will do so) and ending upon either (1) such Major Tenant is in occupancy of the entirety of its space and the borrowers deliver to the lender an Acceptable Estoppel from such Major Tenant or (2) a Retenanting Cure occurs; or |
| (v) | commencing upon a Major Tenant giving written notice to vacate its space or exercising any termination option or canceling or terminating its lease (in each case in whole or part) and ending upon either (1) such Major Tenant renews or extends its lease on terms acceptable to the lender and the borrowers deliver to the lender an Acceptable Estoppel from such Major Tenant or (2) a Retenanting Cure occurs; or |
| (vi) | commencing upon the failure of a Major Tenant to renew its lease on or before the earlier of the renewal deadline under the lease and the date that is six months prior to the expiration of the lease upon the terms and conditions of such lease, or upon terms and conditions reasonably acceptable to the lender, and ending upon either (1) such Major Tenant renews or extends its lease on terms acceptable to the lender and the borrowers deliver to the lender an Acceptable Estoppel from such Major Tenant or (2) a Retenanting Cure occurs. |
| THE INFORMATION IN THIS STRUCTURAL AND COLLATERAL TERM SHEET IS NOT COMPLETE AND MAY BE AMENDED PRIOR TO THE TIME OF SALE. THIS TERM SHEET IS NOT AN OFFER TO SELL THESE SECURITIES AND IT IS NOT A SOLICITATION OF AN OFFER TO BUY THESE SECURITIES IN ANY JURISDICTION WHERE THE OFFER OR SALE IS NOT PERMITTED. | ||
| T-51 | ||
| Retail – Various | Loan #2 | Cut-off Date Balance: | $69,800,000 | |
| Various | Kleban Retail Portfolio | Cut-off Date LTV: | 65.6% | |
| Various | UW NCF DSCR: | 1.30x | ||
| UW NOI Debt Yield: | 9.8% |
“Major Tenant” means (i) Wal-Mart Real Estate Business Trust, (ii) Home Depot U.S.A., Inc. and (iii) any other lessees of the space leased to the foregoing tenants as of the origination date.
Release of Properties. The borrower has the right, at any time after the date that is two years after the Closing Date and prior to the payment date in November 2028, to obtain the release of any one or more of the related individual Kleban Retail Portfolio Properties upon defeasance of an amount equal to 115% of the allocated loan amount of the property being released, and satisfaction of the following conditions, among others: (i) the loan-to-value ratio after the release must be no greater than the lesser of the loan-to-value ratio at origination (65.6%) and the loan to value ratio immediately prior to the release, (ii) the debt service coverage ratio (assuming the Kleban Retail Portfolio Mortgage Loan amortizes based on a 30-year amortization schedule) must be greater than the greater of the debt service coverage ratio (based on the same assumption regarding amortization) at origination (1.16x) and the debt service coverage ratio (based on the same assumption regarding amortization) immediately prior to the release, (iii) the debt yield must be greater than the greater of the debt yield at origination (9.8%) and the debt yield immediately prior to the release, and (iv) satisfaction of REMIC related conditions.
Letter of Credit. None. However, the borrower may provide a letter of credit to cure a Cash Sweep Event Period caused by a DSCR Event, as described above under “Lockbox and Cash Management.”
Right of First Offer/Right of First Refusal. With respect to each of the Walmart—Mobile Property and the Walgreens—Garden City Property, the sole tenants have a right of first refusal to purchase each respective property. With respect to the Walmart—Mobile Property, the related lease provides that such right will not apply to a foreclosure of a mortgage or like security instrument, or the delivery to the mortgagee or beneficiary under such security instrument of a deed-in-lieu of foreclosure or the sale of the leased premises by a mortgagee (or its nominee) that has taken title to the leased premises after a foreclosure or deed-in-lieu of foreclosure. However, such right will apply to subsequent transfers. With respect to the Walgreens—Garden City Property, the sole tenant agreed in a subordination, non-disturbance, and attornment agreement that such right would not apply to the mortgagee or any other party acquiring title or right of possession of the leased premises through foreclosure, deed-in-lieu of foreclosure or other enforcement action; provided however, such right will apply to subsequent purchasers of the leased premises.
Terrorism Insurance. The borrowers are required to obtain and maintain an “all risk” property insurance policy that covers perils of terrorism and acts of terrorism in an amount equal to the “full replacement cost” of the Kleban Retail Portfolio Properties together with 18 months of business income insurance with a 12 month extended period of indemnity. For so long as the Terrorism Risk Insurance Act of 2002, as amended and modified by the Terrorism Risk Insurance Program Reauthorization Act of 2015 (“TRIPRA”) (including any extensions thereof or if another federal governmental program is in effect relating to "acts of terrorism" which provides substantially similar protections) is in effect, the lender is required to accept terrorism insurance which covers against “covered acts” as defined by TRIPRA (or such other program), so long as TRIPRA (or such other program) continues to cover both domestic and foreign acts of terrorism. See “Risk Factors—Risks Relating to the Mortgage Loans—Terrorism Insurance May Not Be Available for All Mortgaged Properties” in the prospectus.
| THE INFORMATION IN THIS STRUCTURAL AND COLLATERAL TERM SHEET IS NOT COMPLETE AND MAY BE AMENDED PRIOR TO THE TIME OF SALE. THIS TERM SHEET IS NOT AN OFFER TO SELL THESE SECURITIES AND IT IS NOT A SOLICITATION OF AN OFFER TO BUY THESE SECURITIES IN ANY JURISDICTION WHERE THE OFFER OR SALE IS NOT PERMITTED. | ||
| T-52 | ||
| Mixed Use – R&D/Office | Loan #3 | Cut-off Date Balance: | $63,000,000 | |
| 901, 951, 1001, 1051, and 1101 | Western Digital Milpitas Campus | Cut-off Date LTV: | 64.0% | |
| Sandisk Drive | UW NCF DSCR: | 1.63x | ||
| Milpitas, CA 95035 | UW NOI Debt Yield: | 12.0% |

| THE INFORMATION IN THIS STRUCTURAL AND COLLATERAL TERM SHEET IS NOT COMPLETE AND MAY BE AMENDED PRIOR TO THE TIME OF SALE. THIS TERM SHEET IS NOT AN OFFER TO SELL THESE SECURITIES AND IT IS NOT A SOLICITATION OF AN OFFER TO BUY THESE SECURITIES IN ANY JURISDICTION WHERE THE OFFER OR SALE IS NOT PERMITTED. | ||
| T-53 | ||
| Mixed Use – R&D/Office | Loan #3 | Cut-off Date Balance: | $63,000,000 | |
| 901, 951, 1001, 1051, and 1101 | Western Digital Milpitas Campus | Cut-off Date LTV: | 64.0% | |
| Sandisk Drive | UW NCF DSCR: | 1.63x | ||
| Milpitas, CA 95035 | UW NOI Debt Yield: | 12.0% |
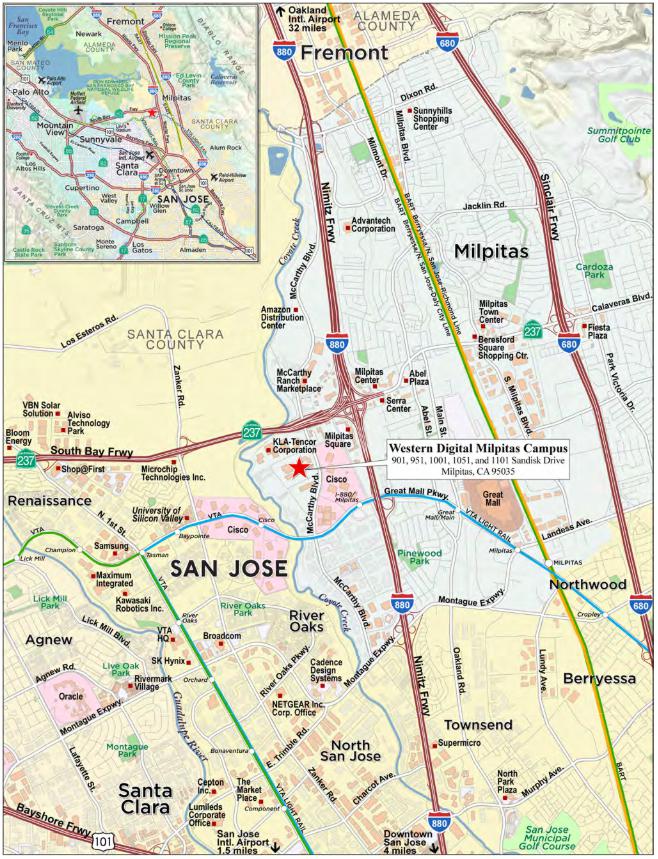
| THE INFORMATION IN THIS STRUCTURAL AND COLLATERAL TERM SHEET IS NOT COMPLETE AND MAY BE AMENDED PRIOR TO THE TIME OF SALE. THIS TERM SHEET IS NOT AN OFFER TO SELL THESE SECURITIES AND IT IS NOT A SOLICITATION OF AN OFFER TO BUY THESE SECURITIES IN ANY JURISDICTION WHERE THE OFFER OR SALE IS NOT PERMITTED. | ||
| T-54 | ||
| Mortgage Loan No. 3 – Western Digital Milpitas Campus |
| Mortgage Loan Information | Property Information | ||||||||
| Mortgage Loan Seller: | JPMCB | Single Asset/Portfolio: | Single Asset | ||||||
| Credit Assessment (Fitch/KBRA/ Moody’s): | NR/NR/NR | Location: | Milpitas, CA 95035 | ||||||
| Original Balance(1): | $63,000,000 | General Property Type: | Mixed Use | ||||||
| Cut-off Date Balance(1): | $63,000,000 | Detailed Property Type: | R&D/Office | ||||||
| % of Initial Pool Balance: | 6.4% | Title Vesting: | Fee | ||||||
| Loan Purpose: | Recapitalization | Year Built/Renovated: | 1991-1995 / 2012 | ||||||
| Borrower Sponsors: | Blue Owl Capital, Inc. and Blue Owl Real | Size: | 577,956 SF | ||||||
| Estate Capital, LLC | Cut-off Date Balance Per SF(1): | $218 | |||||||
| Guarantors: | Blue Owl Real Estate Fund VI LP, | Maturity Date Balance Per SF(1): | $218 | ||||||
| Blue Owl Real Estate Fund VI (A) LP and | Property Manager: | Self-Managed | |||||||
| Blue Owl Real Estate Fund VI (B) LP | |||||||||
| Mortgage Rate: | 6.8440% | ||||||||
| Note Date: | 2/9/2024 | Underwriting and Financial Information | |||||||
| Maturity Date: | 2/11/2029 | UW NOI: | $15,099,464 | ||||||
| Term to Maturity: | 60 months | UW NCF: | $14,231,829 | ||||||
| Amortization Term: | 0 months | UW NOI Debt Yield(1): | 12.0% | ||||||
| IO Period: | 60 months | UW NCF Debt Yield(1): | 11.3% | ||||||
| Seasoning: | 3 months | UW NOI Debt Yield at Maturity(1): | 12.0% | ||||||
| Prepayment Provisions: | L(12),YM1(14),DorYM1(27),O(7) | UW NCF DSCR(1): | 1.63x | ||||||
| Lockbox/Cash Mgmt Status: | Hard / Springing | Most Recent NOI(3): | NAV | ||||||
| Additional Debt Type(1): | Pari Passu | 2nd Most Recent NOI(3): | NAV | ||||||
| Additional Debt Balance(1): | $63,000,000 | 3rd Most Recent NOI(3): | NAV | ||||||
| Future Debt Permitted (Type): | No (NAP) | Most Recent Occupancy: | 100.0% (5/11/2024) | ||||||
| Reserves(2) | 2nd Most Recent Occupancy: | 100.0% (12/31/2023) | |||||||
| Type | Initial | Monthly | Cap | 3rd Most Recent Occupancy: | 100.0% (12/31/2022) | ||||
| RE Taxes: | $0 | Springing | NAP | Appraised Value (as of): | $197,000,000 (9/5/2023) | ||||
| Insurance: | $0 | Springing | NAP | Appraised Value PSF: | $341 | ||||
| Replacement Reserve: | $0 | Springing | NAP | Cut-off Date LTV Ratio(1): | 64.0% | ||||
| Maturity Date LTV Ratio(1): | 64.0% | ||||||||
| Sources and Uses | ||||||
| Sources | Proceeds | % of Total | Uses | Proceeds | % of Total | |
| Whole Loan Amount(1): | $126,000,000 | 64.1% | Purchase Price(4): | $192,450,000 | 97.9% | |
| Borrower Sponsors’ Equity(4): | $70,581,281 | 35.9% | Closing Costs(4): | $4,131,281 | 2.1% | |
| Total Sources: | $196,581,281 | 100.0% | Total Uses: | $196,581,281 | 100.0% | |
| (1) | The Western Digital Milpitas Campus Mortgage Loan (as defined below) is part of the Western Digital Milpitas Campus Whole Loan (as defined below), which is comprised of seven pari passu promissory notes. Cut-off Date Balance Per SF, Maturity Date Balance Per SF, UW NOI Debt Yield, UW NCF Debt Yield, UW NOI Debt Yield at Maturity, UW NCF DSCR, Cut-off Date LTV Ratio and Maturity Date LTV presented above are based on the principal balance of the Western Digital Milpitas Campus Whole Loan. |
| (2) | See “Escrows and Reserves” section below for further discussion. |
| (3) | Historical cash flows are unavailable as the Western Digital Milpitas Campus Property (as defined below) was acquired in September 2023 as part of a sale leaseback transaction with Western Digital simultaneously executing its lease. |
| (4) | The borrower acquired the Western Digital Milpitas Campus Property in September 2023 with financing provided via a bridge loan from UBS AG, by and through its branch office at 1285 Avenue of the Americas, New York, New York (“UBS AG”). Approximately $124.9 million of Western Digital Milpitas Campus Whole Loan proceeds were used to pay off the prior bridge loan. Purchase Price above is reflective of the total purchase price in connection with the September 2023 acquisition. Borrower Sponsors’ Equity and Closing Costs reflect the aggregate equity contribution and closing costs, respectively, in connection with the initial September 2023 acquisition and refinancing via the Western Digital Whole Loan. |
The Mortgage Loan. The third largest mortgage loan (the “Western Digital Milpitas Campus Mortgage Loan”) is part of a whole loan (the “Western Digital Milpitas Campus Whole Loan”) evidenced by seven pari passu promissory notes in the aggregate original principal amount of $126,000,000. The Western Digital Milpitas Campus Whole Loan was co-originated by JPMorgan Chase Bank, National Association and UBS AG. The Western Digital Milpitas Campus Whole Loan is secured by the borrower’s fee interest in a multi-building R&D and office campus consisting of 577,956 SF located in Milpitas, California (the “Western Digital Milpitas Campus Property”).
The Western Digital Milpitas Campus Mortgage Loan is evidenced by the non-controlling Notes A-5, A-6 and A-7 with an aggregate original principal amount of $63,000,000. The remaining promissory notes comprising the Western Digital Milpitas Campus Whole Loan are summarized in the below table. The Western Digital Milpitas Campus Whole Loan will be serviced pursuant to the pooling and servicing agreement for the BBCMS 2024-5C25 securitization trust. See “Description of the Mortgage Pool—The Whole Loans—The Non-Serviced Pari Passu Whole Loans” and “Pooling and Servicing Agreement—Servicing of the Non-Serviced Mortgage Loans” in the prospectus.
| THE INFORMATION IN THIS STRUCTURAL AND COLLATERAL TERM SHEET IS NOT COMPLETE AND MAY BE AMENDED PRIOR TO THE TIME OF SALE. THIS TERM SHEET IS NOT AN OFFER TO SELL THESE SECURITIES AND IT IS NOT A SOLICITATION OF AN OFFER TO BUY THESE SECURITIES IN ANY JURISDICTION WHERE THE OFFER OR SALE IS NOT PERMITTED. | ||
| T-55 | ||
| Mixed Use – R&D/Office | Loan #3 | Cut-off Date Balance: | $63,000,000 | |
| 901, 951, 1001, 1051, and 1101 | Western Digital Milpitas Campus | Cut-off Date LTV: | 64.0% | |
| Sandisk Drive | UW NCF DSCR: | 1.63x | ||
| Milpitas, CA 95035 | UW NOI Debt Yield: | 12.0% |
| Western Digital Milpitas Campus Whole Loan Summary | |||||
Note | Original Balance | Cut-off Date Balance | Note Holder | Controlling Piece | |
| A-1 | $30,000,000 | $30,000,000 | BBCMS 2024-5C25 | Yes | |
| A-2 | $10,000,000 | $10,000,000 | BBCMS 2024-5C25 | No | |
| A-3 | $10,000,000 | $10,000,000 | BBCMS 2024-5C25 | No | |
| A-4 | $13,000,000 | $13,000,000 | BBCMS 2024-5C25 | No | |
| A-5 | $30,000,000 | $30,000,000 | BANK5 Trust 2024-5YR6 | No | |
| A-6 | $28,000,000 | $28,000,000 | BANK5 Trust 2024-5YR6 | No | |
| A-7 | $5,000,000 | $5,000,000 | BANK5 Trust 2024-5YR6 | No | |
| Whole Loan | $126,000,000 | $126,000,000 | |||
The Borrower and the Borrower Sponsors. The borrower is WDMICA001 LP, a special purpose, bankruptcy-remote entity and a Delaware limited partnership with one independent director in its organizational structure.
The borrower sponsors of the Western Digital Milpitas Campus Whole Loan are Blue Owl Capital, Inc., a Delaware corporation, and Blue Owl Real Estate Capital, LLC, a Delaware limited liability company. The non-recourse carveout guarantors of the Western Digital Milpitas Campus Whole Loan are Blue Owl Real Estate Fund VI LP, Blue Owl Real Estate Fund VI (A) LP and Blue Owl Real Estate Fund VI (B) LP. Blue Owl Real Estate, a division of Blue Owl, offers flexible capital solutions to investment-grade and creditworthy tenants across asset classes and geographies. Blue Owl Real Estate has completed over 180 deals and the firm has over $26.9 billion in assets under management across over 1,875 real estate assets owned. Blue Owl Real Estate’s products are offered primarily through permanent capital vehicles, including its recently launched real estate investment trusts and long-dated private funds. Blue Owl is a global alternative asset manager with over $165.0 billion in assets under management as of December 31, 2023. Blue Owl deploys private capital across three divisions: Direct Lending, GP Capital Solutions and Real Estate. As of December 31, 2023, Blue Owl employs over 685 people across over 10 offices globally.
The Property. The Western Digital Milpitas Campus Property is a multi-building R&D and office campus utilized for various R&D, office, cleanroom and wet/dry lab uses. The Western Digital Milpitas Campus Property is comprised of five, two-story interconnected buildings totaling 577,956 SF located in Milpitas, California. As of May 11, 2024, the Western Digital Milpitas Campus Property was 100.0% leased to Western Digital Technologies, Inc. (“Western Digital”) (Moody’s/Fitch/S&P: Ba2/BB+/BB). As part of a sale-leaseback transaction in September 2023, Western Digital executed an approximately 15-year lease with a starting annual base rental rate of approximately $15.6 million and a scheduled expiration date in January 2039. Western Digital Corporation, the parent company of Western Digital, delivered a guaranty of such lease. Western Digital has no early termination or purchase options and has three, five-year and one, four-year renewal option remaining.
The Western Digital Milpitas Campus Property is operated as a high-tech R&D and office facility for Western Digital’s flash memory R&D operations. The Western Digital Milpitas Campus Property was constructed in phases between 1991 and 1995, renovated in 2012, and is situated on an approximately 37.1-acre site with 1,971 parking spaces, resulting in a parking ratio of 3.41 spaces per 1,000 SF. The Western Digital Milpitas Campus Property features office space, comprising approximately 25.5% of net rentable area, ceiling clear heights ranging from 16’-5” to 22’-11”, four dock-high doors and three drive-in doors.
The following table presents certain information relating to the buildings at the Western Digital Milpitas Campus Property:
| Western Digital Milpitas Campus Building Summary(1) | ||||||||
| Address | Subtype | Net Rentable Area (SF) | % of Total NRA | Year Built | Building Height (Ft.) | Dock-High Doors | Drive-In Doors | |
| 951 Sandisk Drive | Administrative / Office | 170,716 | 29.5 | % | 1991 | 16’-5” | 0 | 0 |
| 1051 Sandisk Drive | R&D / Office | 153,821 | 26.6 | 1991 | 22’-11” | 1 | 1 | |
| 901 Sandisk Drive | R&D / Office | 60,885 | 10.5 | 1993 | 16’-5” | 0 | 0 | |
| 1001 Sandisk Drive | R&D / Office | 98,145 | 17.0 | 1993 | 16’-5” | 1 | 1 | |
| 1101 Sandisk Drive | R&D / Office | 94,389 | 16.3 | 1995 | 16’-5” | 2 | 1 | |
| Total | 577,956 | 100.0 | % | 4 | 3 | |||
| (1) | Information obtained from the appraisal unless otherwise indicated. |
Western Digital acquired the Western Digital Milpitas Campus Property upon acquisition of SanDisk Corporation (“SanDisk”) in May 2016. The Western Digital Milpitas Campus Property consists of approximately 74.5% of R&D space, inclusive of laboratory, telecom and vacuum chamber space (in addition to certain ancillary amenity, common and storage spaces), with the remaining approximately 25.5% consisting of administrative office space. Since acquisition, Western Digital has spent approximately $372.8 million (approximately $645 PSF) in land and building costs, machinery, software, information technology and furniture/fixtures. Western Digital invested approximately $211.6 million in property improvements in 2016 in connection with the acquisition and has subsequently invested an average of $23.0 million per year into the facilities from 2017 to 2023. Recent building improvements consist of roof replacements at the 1051 Sandisk Drive building, the addition of chamber lab rooms in the 1001 Sandisk Drive building and a new auditorium and conference center/event space with new AV equipment, among other mission critical R&D items. Additionally, Western Digital secured $350.0 million from the “CHIPS” Act of 2022 with proceeds going towards expanding and improving existing sites.
| THE INFORMATION IN THIS STRUCTURAL AND COLLATERAL TERM SHEET IS NOT COMPLETE AND MAY BE AMENDED PRIOR TO THE TIME OF SALE. THIS TERM SHEET IS NOT AN OFFER TO SELL THESE SECURITIES AND IT IS NOT A SOLICITATION OF AN OFFER TO BUY THESE SECURITIES IN ANY JURISDICTION WHERE THE OFFER OR SALE IS NOT PERMITTED. | ||
| T-56 | ||
| Mixed Use – R&D/Office | Loan #3 | Cut-off Date Balance: | $63,000,000 | |
| 901, 951, 1001, 1051, and 1101 | Western Digital Milpitas Campus | Cut-off Date LTV: | 64.0% | |
| Sandisk Drive | UW NCF DSCR: | 1.63x | ||
| Milpitas, CA 95035 | UW NOI Debt Yield: | 12.0% |
Sole Tenant.
Western Digital (577,956 SF, 100.0% of NRA, 100.0% of UW Rent). Founded in 1970 in Santa Ana, California, Western Digital is a developer, manufacturer and provider of data storage devices and solutions based on both rotating magnetic or non-volatile memory storage (“NAND”) flash and hard disk drive technologies. Western Digital is headquartered in San Jose, California providing dedicated flash-based products (“Flash”) and hard disk drives (“HDD”) technologies and delivering Flash and HDD storage solutions for students, gamers, home offices, large enterprises and public clouds in order to capture, preserve, access and transform diversity of data. Western Digital has a patent portfolio of approximately 13,000 active patents worldwide.
Western Digital has been in occupancy at the Western Digital Milpitas Campus Property since acquiring SanDisk in 2016. As part of a sale-leaseback transaction, Western Digital executed a 15-year lease effective September 2023, with a starting annual base rental rate of $27.00 PSF, increasing to $27.81 PSF on January 1, 2025, and by 3.0% on January 1st of each year thereafter. Western Digital’s current lease has a scheduled expiration date in January 2039, with three, five-year and one, four-year renewal option remaining and no termination options. The Western Digital Milpitas Campus Whole Loan is structured with certain tenant specific trigger events, including those specific to a downgrade of the underlying tenant’s credit rating. See “Lockbox and Cash Management” below.
The following table presents certain information relating to the tenancy at the Western Digital Milpitas Campus Property:
| Tenant Summary(1) | |||||||||
| Tenant Name | Credit Rating (Moody’s/ Fitch/S&P)(2) | Tenant SF | Approx. % of SF | Annual UW Rent | % of Total Annual UW Rent | Annual UW Rent PSF | Lease Exp. | Renewal Options | Term. Option (Y/N) |
| Western Digital Technologies, Inc. | Ba2 / BB+ / BB | 577,956 | 100.0% | $16,072,956 | 100.0% | $27.81 | 1/1/2039 | Various(3) | N |
| Total/Wtd. Avg. | 577,956 | 100.0% | $16,072,956 | 100.0% | $27.81 | ||||
| Occupied Subtotal/Wtd. Avg. | 577,956 | 100.0% | $16,072,956 | 100.0% | $27.81 | ||||
| Vacant Space | 0 | 0 | |||||||
| Total/Wtd. Avg. | 577,956 | 100.0% | |||||||
| (1) | Information is based on the underwritten rent roll dated May 11, 2024 inclusive of rent steps through January 2025 totaling $468,144. |
| (2) | Certain ratings are those of the parent company whether or not the parent guarantees the lease. |
| (3) | Western Digital has three, five-year and one, four-year renewal options. |
The following table presents certain information relating to the lease rollover schedule at the Western Digital Milpitas Campus Property:
| Lease Rollover Schedule(1) | ||||||||
| Year | # of Leases Rolling | SF Rolling | Approx. % of SF Rolling | Approx. Cumulative % of SF Rolling | Total UW Rent Rolling | Approx. % of Total UW Rent Rolling | Approx. Cumulative % of Total UW Rent Rolling | UW Rent PSF Rolling |
| MTM/2024 | 0 | 0 | 0.0% | 0.0% | $0 | 0.0% | 0.0% | $0.00 |
| 2025 | 0 | 0 | 0.0% | 0.0% | $0 | 0.0% | 0.0% | $0.00 |
| 2026 | 0 | 0 | 0.0% | 0.0% | $0 | 0.0% | 0.0% | $0.00 |
| 2027 | 0 | 0 | 0.0% | 0.0% | $0 | 0.0% | 0.0% | $0.00 |
| 2028 | 0 | 0 | 0.0% | 0.0% | $0 | 0.0% | 0.0% | $0.00 |
| 2029 | 0 | 0 | 0.0% | 0.0% | $0 | 0.0% | 0.0% | $0.00 |
| 2030 | 0 | 0 | 0.0% | 0.0% | $0 | 0.0% | 0.0% | $0.00 |
| 2031 | 0 | 0 | 0.0% | 0.0% | $0 | 0.0% | 0.0% | $0.00 |
| 2032 | 0 | 0 | 0.0% | 0.0% | $0 | 0.0% | 0.0% | $0.00 |
| 2033 | 0 | 0 | 0.0% | 0.0% | $0 | 0.0% | 0.0% | $0.00 |
| 2034 | 0 | 0 | 0.0% | 0.0% | $0 | 0.0% | 0.0% | $0.00 |
| 2035 & Thereafter | 1 | 577,956 | 100.0% | 100.0% | $16,072,956 | 100.0% | 100.0% | $27.81 |
| Vacant | 0 | 0 | 0.0% | 100.0% | $0 | 0.0% | 100.0% | $0.00 |
| Total/Wtd. Avg. | 1 | 577,956 | 100.0% | $16,072,956 | 100.0% | $27.81 | ||
| (1) | Information is based on the underwritten rent roll dated May 11, 2024 inclusive of rent steps through January 2025, totaling $468,144. |
| THE INFORMATION IN THIS STRUCTURAL AND COLLATERAL TERM SHEET IS NOT COMPLETE AND MAY BE AMENDED PRIOR TO THE TIME OF SALE. THIS TERM SHEET IS NOT AN OFFER TO SELL THESE SECURITIES AND IT IS NOT A SOLICITATION OF AN OFFER TO BUY THESE SECURITIES IN ANY JURISDICTION WHERE THE OFFER OR SALE IS NOT PERMITTED. | ||
| T-57 | ||
| Mixed Use – R&D/Office | Loan #3 | Cut-off Date Balance: | $63,000,000 | |
| 901, 951, 1001, 1051, and 1101 | Western Digital Milpitas Campus | Cut-off Date LTV: | 64.0% | |
| Sandisk Drive | UW NCF DSCR: | 1.63x | ||
| Milpitas, CA 95035 | UW NOI Debt Yield: | 12.0% |
The Market. The Western Digital Milpitas Campus Property is located in Milpitas, California, within Silicon Valley, which consists of San Mateo County and Santa Clara County. Silicon Valley is part of the greater San Jose-San Francisco-Oakland CA combined statistical area, according to the appraisal. The Western Digital Milpitas Campus Property is located along the north side of Sandisk Drive, between McCarthy Boulevard to the east and Murphy Ranch Road to the west, within the city limits of Milpitas, Santa Clara County, California. Technology Drive forms the northern boundary of the Western Digital Milpitas Campus Property. The Western Digital Milpitas Campus Property is situated approximately six miles north of Downtown San Jose and approximately 40 miles southeast of San Francisco. According to the appraisal, Milpitas is home to the headquarters of Adaptec, Aerohive Networks, FireEye, Intersil, SonicWall, IXYS Corporation, Viavi Solutions, Lumentum Holdings (formerly JDSU), KLA-Tencor, Linear Technology, LTX-Credence, SCA, Sigma Designs and Flex. Many other companies have corporate offices in Milpitas including Hewlett Packard Enterprise, Cisco Systems, Renesas, Infineon Technologies, Varian Medical Systems, Teledyne, Quantum, LifeScan and International Microsystems Inc.
The Western Digital Milpitas Campus Property is 2.4 miles west of the Milpitas BART Station, part of the San Francisco Bay Area Rapid Transit District, a heavy-rail public transit system with 131 miles of track and 50 stations operating in five counties (San Francisco, San Mateo, Alameda, Contra Costa and Santa Clara) and connecting the San Francisco Peninsula with communities in the East Bay and South Bay. The Western Digital Milpitas Campus Property is approximately 5.1 miles north of the San Jose Mineta International Airport, approximately 28 miles southeast of the San Francisco International Airport and approximately 26 miles south of the Oakland International Airport.
According to a third-party market research report, the estimated 2024 population within a one-, three- and five-mile radius of the Western Digital Milpitas Campus Property was 10,357, 149,907 and 309,053, respectively. The estimated 2024 average household income within the same radii was $275,960, $235,463 and $223,048, respectively. Furthermore, the top two employment industries within the Silicon Valley area are education and health services, and manufacturing sectors accounting for 15.1% and 12.8% of total employment, respectively.
According to the appraisal, the Western Digital Milpitas Campus Property is situated in the Milpitas R&D submarket, which contained approximately 12.3 million SF of R&D space as of the second quarter of 2023. The Milpitas R&D submarket reported a vacancy rate of 12.9% with an average asking rental rate of $29.88 PSF. The appraiser concluded a market rent of $27.00 PSF for the Western Digital Milpitas Campus Property.
The following table presents recent leasing data at comparable properties to the Western Digital Milpitas Campus Property:
| Summary of Comparable Industrial Leases | ||||||||||
| Property | Location | Year Built/ Renovated |
Tenant Name | Lease Start Date | Term (yrs.) | Lease Type | Tenant Size (SF) | Base Rent PSF | Rent Steps | TI PSF |
| Western Digital Milpitas Campus(1) | Milpitas, CA | 1991-1995 / 2012 | Western Digital | Sep-23 | 15.3 | TripleNet | 577,956 | $27.81 | 3% Annually | NAP |
| 3151 Zanker Road | San Jose, CA | 1990 / 2020 | NIO | Oct-23 | 10.0 | Net | 201,500 | $31.80 | 3% Annually | $100.0 |
| 170 Baytech Drive | San Jose, CA | 1997 / NAP | Procept BioRobotics | Dec-22 | 10.2 | Net | 158,211 | $27.24 | 3% Annually | $50.0 |
| 1750 Automation Parkway | San Jose, CA | 1998 / NAP | Quantumscape | Jan-22 | 10.5 | Net | 222,381 | $23.88 | 3% Annually | $0.0 |
| 90 Rio Robles | San Jose, CA | 1984 / 2020 | ADI/Maxim | Jan-22 | 11.0 | Net | 102,375 | $29.40 | 3% Annually | $60.0 |
| 1710 Automation Parkway | San Jose, CA | 1997 / 2020 | QuantumScape Battery | Dec-21 | 10.8 | Net | 196,647 | $24.36 | 3% Annually | $0.0 |
| 3850 North First Street | San Jose, CA | 1991 / NAP | Microchip Technology | Sep-20 | 10.0 | Net | 179,232 | $30.00 | 3% Annually | $20.0 |
| Total/Wtd. Avg.(2) | 10.4 | 1,060,346 | $27.54 | $35.64 | ||||||
Source: Appraisal (unless otherwise indicated)
| (1) | Information is based on the underwritten rent roll dated May 11, 2024, inclusive of rent steps through January 2025 totaling $468,144. |
| (2) | The Total/Wtd. Avg. excludes the Western Digital Milpitas Campus. |
Appraisal. The appraisal concluded to an “as-is” appraised value of $197,000,000 as of September 5, 2023. The “as-is” appraised value results in a Cut-off Date LTV Ratio and Maturity Date LTV Ratio of 64.0% for the Western Digital Milpitas Campus Whole Loan.
Environmental Matters. According to the Phase I environmental report dated June 26, 2023, there was no evidence of any recognized environmental conditions at the Western Digital Milpitas Campus Property.
| THE INFORMATION IN THIS STRUCTURAL AND COLLATERAL TERM SHEET IS NOT COMPLETE AND MAY BE AMENDED PRIOR TO THE TIME OF SALE. THIS TERM SHEET IS NOT AN OFFER TO SELL THESE SECURITIES AND IT IS NOT A SOLICITATION OF AN OFFER TO BUY THESE SECURITIES IN ANY JURISDICTION WHERE THE OFFER OR SALE IS NOT PERMITTED. | ||
| T-58 | ||
| Mixed Use – R&D/Office | Loan #3 | Cut-off Date Balance: | $63,000,000 | |
| 901, 951, 1001, 1051, and 1101 | Western Digital Milpitas Campus | Cut-off Date LTV: | 64.0% | |
| Sandisk Drive | UW NCF DSCR: | 1.63x | ||
| Milpitas, CA 95035 | UW NOI Debt Yield: | 12.0% |
Operating History and Underwritten Net Cash Flow. The following table presents certain information relating to the Underwritten Net Cash Flow at the Western Digital Milpitas Campus Property:
| Cash Flow Analysis(1)(2) | ||
| UW | UW PSF | |
| Base Rent | $15,604,812 | $27.00 |
| Rent Steps(3) | $468,144 | $0.81 |
| Gross Potential Rent | $16,072,956 | $27.81 |
| Recoveries | $4,552,807 | $7.88 |
| Net Rentable Income | $20,625,764 | $35.69 |
| (Vacancy / Credit Loss) | ($1,031,288) | ($1.78) |
| Effective Gross Income | $19,594,476 | $33.90 |
| Management Fee | $391,890 | $0.68 |
| Real Estate Taxes | $2,339,848 | $4.05 |
| Insurance | $607,362 | $1.05 |
| Repairs and Maintenance | $1,155,912 | $2.00 |
| Other Operating Expenses | $0 | $0.00 |
| Total Operating Expenses | $4,495,012 | $7.78 |
| Net Operating Income | $15,099,464 | $26.13 |
| Capital Expenditures | $57,796 | $0.10 |
| TI/LC | $809,839 | $1.40 |
| Net Cash Flow | $14,231,829 | $24.62 |
| Occupancy (%)(4) | 95.0% | |
| NOI DSCR(5) | 1.73x | |
| NCF DSCR(5) | 1.63x | |
| NOI Debt Yield(5) | 12.0% | |
| NCF Debt Yield(5) | 11.3% | |
| (1) | Information is based on the underwritten rent roll dated May 11, 2024. |
| (2) | Historical cash flows are unavailable as the Western Digital Milpitas Campus Property was acquired in September 2023 as part of a sale leaseback transaction with Western Digital simultaneously executing its lease. |
| (3) | Includes contractual rent steps through January 2025. |
| (4) | Represents UW economic occupancy. The Western Digital Milpitas Campus Property was 100.0% occupied as of May 11, 2024. |
| (5) | NOI DSCR, NCF DSCR, NOI Debt Yield and NCF Debt Yield are based on the principal balance of the Western Digital Milpitas Campus Whole Loan. |
Escrows and Reserves.
Real Estate Taxes – On each monthly payment date, the borrower is required to make monthly payments into the real estate tax reserve in an amount equal to 1/12th of the property taxes that the lenders reasonably estimate will be payable during the ensuing 12 months, unless the Reserve Waiver Conditions (as defined below) are satisfied.
Insurance – On each monthly payment date during a Material Tenant Trigger Event (as defined below), the borrower is required to escrow 1/12th of the annual estimated insurance payments, unless a blanket policy is in place or the Reserve Waiver Conditions are satisfied.
Replacement Reserve – On each monthly payment date, the borrower is required to escrow approximately $7,224 for replacement reserves, unless (a) no event of default has occurred and is continuing, (b) the Western Digital lease (or a replacement qualified lease) is in full force and effect and no Material Tenant Trigger Event exists and is continuing and (c) Western Digital maintains the Western Digital Milpitas Campus Property in clean, sanitary, safe and working order, condition and repair.
The “Reserve Waiver Conditions” means each of the following conditions: (i) no event of default has occurred and is continuing, (ii) the Western Digital lease (or a replacement qualified lease) is in full force and effect and (x) no material monetary (including, without limitation, any failure to pay rent due thereunder) or material non-monetary event of default, beyond any applicable notice and cure periods, under the Western Digital lease (or a replacement qualified lease) exists and (y) no other Material Tenant Trigger Event exists, (iii) Western Digital (or a Material Tenant (as defined below) under a replacement qualified lease) is required under its lease to make the payments relating to the obligations and liabilities for which the applicable reserve account was established, (iv) Western Digital (or a Material Tenant under a replacement qualified lease) continues to make the payments relating to the obligations and liabilities for which the applicable reserve account was established and the borrower delivers evidence of the same to the lenders in a timely manner and (v) solely with respect to the insurance escrows reserve, the borrower maintains such supplemental insurance coverage (including any supplemental terrorism insurance policies).
| THE INFORMATION IN THIS STRUCTURAL AND COLLATERAL TERM SHEET IS NOT COMPLETE AND MAY BE AMENDED PRIOR TO THE TIME OF SALE. THIS TERM SHEET IS NOT AN OFFER TO SELL THESE SECURITIES AND IT IS NOT A SOLICITATION OF AN OFFER TO BUY THESE SECURITIES IN ANY JURISDICTION WHERE THE OFFER OR SALE IS NOT PERMITTED. | ||
| T-59 | ||
| Mixed Use – R&D/Office | Loan #3 | Cut-off Date Balance: | $63,000,000 | |
| 901, 951, 1001, 1051, and 1101 | Western Digital Milpitas Campus | Cut-off Date LTV: | 64.0% | |
| Sandisk Drive | UW NCF DSCR: | 1.63x | ||
| Milpitas, CA 95035 | UW NOI Debt Yield: | 12.0% |
Lockbox and Cash Management. The Western Digital Milpitas Campus Whole Loan is structured with a hard lockbox and springing cash management. The borrower and property manager are required to direct the tenants to pay rent directly into the lockbox account, and to deposit any rents otherwise received in such account within three business days after receipt. Prior to the occurrence of a Cash Management Trigger Event (as defined below), all funds in the lockbox account will be released to the borrower every business day. During the continuance of a Cash Management Trigger Event, all funds in the lockbox account are required to be swept each business day to a lender-controlled cash management account and disbursed in accordance with the Western Digital Milpitas Campus Whole Loan documents, and all excess funds on deposit in the cash management account (after payment of required monthly reserve deposits, the debt service payment on the Western Digital Milpitas Campus Whole Loan, operating expenses, cash management bank fees and required REIT distributions (not to exceed the greater of $250,000 or 10% of all deposits made into an excess cash account during a calendar year)) are required to be applied as follows: (a) if a Material Tenant Trigger Event has occurred and is continuing, to a Material Tenant rollover account (subject to the following caps: to (A) if a Material Tenant Trigger Event is caused by the occurrence of clause (i), (ii), (iii), (iv) or (viii) in the definition of “Material Tenant Trigger Event,” the 24-Month Rent Amount (as defined below) or (B) if a Material Tenant Trigger Event is caused by the occurrence of clause (v), (vi) or (vii) in the definition of “Material Tenant Trigger Event,” the 36-Month Rent Amount (as defined below). If a Material Tenant Trigger Event is caused by the occurrence of clause (ix) in the definition of “Material Tenant Trigger Event,” there will be no cap.) or (b) if no Material Tenant Trigger Event has occurred and is continuing, to the lender-controlled excess cash flow account.
A “Cash Management Trigger Event” means a period commencing upon the occurrence of (i) an event of default, (ii) any bankruptcy action involving the borrower, the borrower’s general partner or the guarantors, (iii) the trailing 12-month period adjusted net operating income debt yield falling below 10.0% for two consecutive calendar quarters or (iv) a Material Tenant Trigger Event, and expiring upon with respect to (a) clause (i) above, the cure of such event of default and the acceptance of such cure by the lenders, (b) clause (ii) above, the filing being discharged or dismissed within 90 days, and the lenders’ determination that such filing does not materially increase the borrower’s, the borrower’s general partner’s or the guarantors’ monetary obligations, or materially and adversely affect the borrower’s general partner’s or the guarantors’ ability to carry out their obligations under the Western Digital Milpitas Campus Whole Loan documents, as applicable, (c) clause (iii) above, the trailing 12-month period adjusted net operating income debt yield being at least 10.0% for two calendar quarters or (d) clause (iv) above, the cure of such Material Tenant Trigger Event.
A “Material Tenant Trigger Event” means a period commencing upon the occurrence of (i) a Material Tenant giving notice of its intention to terminate, cancel or not to extend or renew its lease, (ii) on or prior to the date that is 12 months prior to the then-applicable expiration date under its respective Material Tenant lease, if the applicable Material Tenant does not extend or renew such Material Tenant lease, (iii) on or prior to the date by which a Material Tenant is required under its Material Tenant lease to notify the borrower of its election to extend such Material Tenant lease, if the Material Tenant does not extend or renew such Material Tenant lease, (iv) an event of default under a Material Tenant lease occurring and continuing beyond any applicable notice and cure period, (v) a bankruptcy action of a Material Tenant or guarantor of any Material Tenant lease occurring, (vi) a Material Tenant lease being terminated or no longer being in full force and effect, (vii) a Material Tenant “going dark”, vacating, ceasing to occupy or ceasing to conduct business in the ordinary course at all or a portion exceeding 20% of its Material Tenant space, (viii) if both Material Tenant and guarantor of any Material Tenant lease fail to maintain any two of the following credit ratings: (A) a long term local issuer credit rating of at least “BB-” by S&P, (B) a senior unsecured debt rating of at least “Ba3” by Moody’s and (C) a senior unsecured debt rating of at least “BB-” by Fitch, or (ix) if both Material Tenant and guarantor of any Material Tenant lease fail to maintain all of the following credit ratings: (A) a long term local issuer credit rating of at least “B+” by S&P, (B) a senior unsecured debt rating of at least “B1” by Moody’s and (C) a senior unsecured debt rating of at least “B+” by Fitch, provided, however, that if only two rating agencies assign a particular required rating then only two of such ratings will be required to satisfy the above criteria, and expiring upon (a) with respect to clause (i), (ii), (iii) or (vi) above, the date that (x) other than with respect to clause (vi) above, the applicable Material Tenant lease is extended on terms satisfying the requirements of the Western Digital Milpitas Campus Whole Loan documents or (y) all or substantially all of the applicable Material Tenant space is leased to a replacement tenant satisfying the requirements of the Western Digital Milpitas Campus Whole Loan documents, (b) with respect to solely clause (i) above, the date that the applicable Material Tenant revokes or rescinds all termination or cancellation notices, (c) with respect to solely clause (iv) above, a cure of the applicable event of default, (d) with respect to solely clause (v) above, the affirmation of the Material Tenant lease in the applicable bankruptcy proceeding and confirmation that the Material Tenant is actually paying all rents and other amounts under its lease (or, if applicable, the discharge or dismissal of the applicable Material Tenant lease guarantor from the applicable bankruptcy proceeding; provided that such bankruptcy (after dismissal or discharge) does not have an adverse effect on such Material Tenant lease guarantor’s ability to perform its obligations under its lease guaranty), (e) with respect to solely clause (vii) above, the Material Tenant re-commencing its normal business operations at its Material Tenant space or the applicable portion thereof as the case may be, such that less than 20% of such Material Tenant space at the Western Digital Milpitas Campus Property, in each case, is no longer dark, and has not vacated or ceased to conduct business in the ordinary course at the Western Digital Milpitas Campus Property or a portion thereof, (f) with respect to solely clause (viii) above, the borrower either (1) delivers one or more letters of credit in an aggregate amount equal to the aggregate base rent scheduled to be paid by the Material Tenant to the borrower under such Material Tenant lease from the date of delivery of such letter of credit until the date that is 24 months thereafter (the “24-Month Rent Amount”) or (2) delivers to the lenders cash collateral (from funds other than rents payable from and after the date of such Material Tenant Trigger Event) in an amount equal to the 24-Month Rent Amount and (g) with respect to solely clause (ix) above, the borrower either (1) delivers one or more letters of credit in an aggregate amount equal to the aggregate base rent scheduled to be paid by the Material Tenant to the borrower under such Material Tenant lease from the date of delivery of such letter of credit until the date that is 36 months thereafter (the “36-Month Rent Amount”) or (2) delivers to the lenders cash collateral (from funds other than rents payable from and after the date of such Material Tenant Trigger Event) in an amount equal to the 36-Month Rent Amount.
A “Material Tenant” means (i) Western Digital or (ii) any tenant at the Western Digital Milpitas Campus Property that, individually or together with its affiliates, either (a) leases (or would lease) 20% or more of the total rentable square footage at the Western Digital Milpitas Campus Property or (b) accounts for (or would account for) 20% or more of the total in-place base rent at the Western Digital Milpitas Campus Property.
Terrorism Insurance. The borrower is required to obtain and maintain, or cause to be maintained, property insurance for 100% of full replacement cost and business interruption insurance for 18 months plus a 12-month extended period of indemnity. Such insurance is required to cover perils of terrorism and acts of terrorism. See “Risk Factors—Risks Relating to the Mortgage Loans—Terrorism Insurance May Not Be Available for All Mortgaged Properties” in the prospectus.
| THE INFORMATION IN THIS STRUCTURAL AND COLLATERAL TERM SHEET IS NOT COMPLETE AND MAY BE AMENDED PRIOR TO THE TIME OF SALE. THIS TERM SHEET IS NOT AN OFFER TO SELL THESE SECURITIES AND IT IS NOT A SOLICITATION OF AN OFFER TO BUY THESE SECURITIES IN ANY JURISDICTION WHERE THE OFFER OR SALE IS NOT PERMITTED. | ||
| T-60 | ||
| Retail – Super Regional Mall | Loan #4 | Cut-off Date Balance: | $61,000,000 | |
| 101 Jordan Creek Parkway | Jordan Creek Town Center | Cut-off Date LTV: | 53.0% | |
| West Des Moines, IA 50266 | UW NCF DSCR: | 1.93x | ||
| UW NOI Debt Yield: | 14.4% |

| THE INFORMATION IN THIS STRUCTURAL AND COLLATERAL TERM SHEET IS NOT COMPLETE AND MAY BE AMENDED PRIOR TO THE TIME OF SALE. THIS TERM SHEET IS NOT AN OFFER TO SELL THESE SECURITIES AND IT IS NOT A SOLICITATION OF AN OFFER TO BUY THESE SECURITIES IN ANY JURISDICTION WHERE THE OFFER OR SALE IS NOT PERMITTED. | ||
| T-61 | ||
| Retail – Super Regional Mall | Loan #4 | Cut-off Date Balance: | $61,000,000 | |
| 101 Jordan Creek Parkway | Jordan Creek Town Center | Cut-off Date LTV: | 53.0% | |
| West Des Moines, IA 50266 | UW NCF DSCR: | 1.93x | ||
| UW NOI Debt Yield: | 14.4% |

| THE INFORMATION IN THIS STRUCTURAL AND COLLATERAL TERM SHEET IS NOT COMPLETE AND MAY BE AMENDED PRIOR TO THE TIME OF SALE. THIS TERM SHEET IS NOT AN OFFER TO SELL THESE SECURITIES AND IT IS NOT A SOLICITATION OF AN OFFER TO BUY THESE SECURITIES IN ANY JURISDICTION WHERE THE OFFER OR SALE IS NOT PERMITTED. | ||
| T-62 | ||
| Retail – Super Regional Mall | Loan #4 | Cut-off Date Balance: | $61,000,000 | |
| 101 Jordan Creek Parkway | Jordan Creek Town Center | Cut-off Date LTV: | 53.0% | |
| West Des Moines, IA 50266 | UW NCF DSCR: | 1.93x | ||
| UW NOI Debt Yield: | 14.4% |
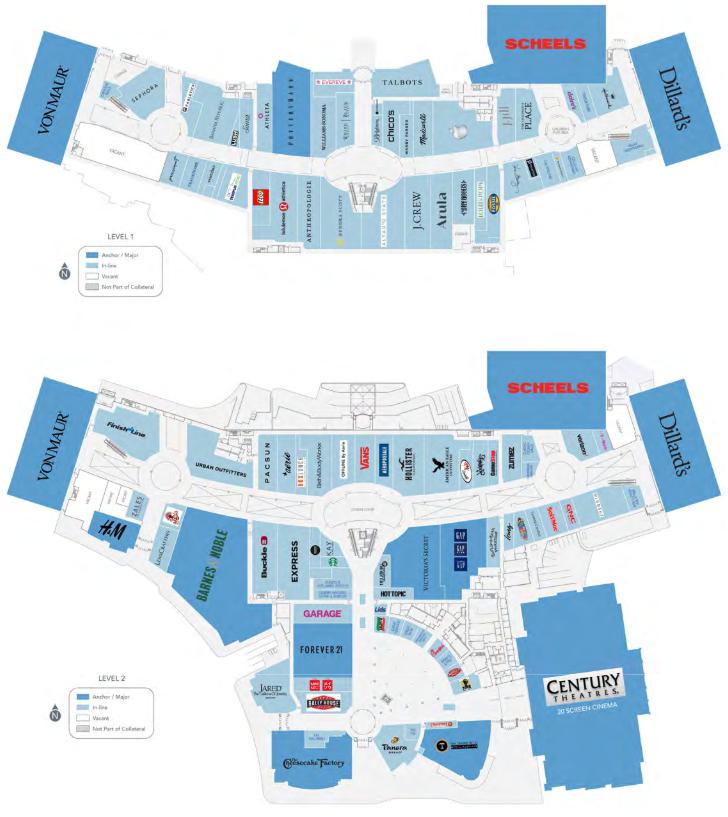
| THE INFORMATION IN THIS STRUCTURAL AND COLLATERAL TERM SHEET IS NOT COMPLETE AND MAY BE AMENDED PRIOR TO THE TIME OF SALE. THIS TERM SHEET IS NOT AN OFFER TO SELL THESE SECURITIES AND IT IS NOT A SOLICITATION OF AN OFFER TO BUY THESE SECURITIES IN ANY JURISDICTION WHERE THE OFFER OR SALE IS NOT PERMITTED. | ||
| T-63 | ||
| Retail – Super Regional Mall | Loan #4 | Cut-off Date Balance: | $61,000,000 | |
| 101 Jordan Creek Parkway | Jordan Creek Town Center | Cut-off Date LTV: | 53.0% | |
| West Des Moines, IA 50266 | UW NCF DSCR: | 1.93x | ||
| UW NOI Debt Yield: | 14.4% |
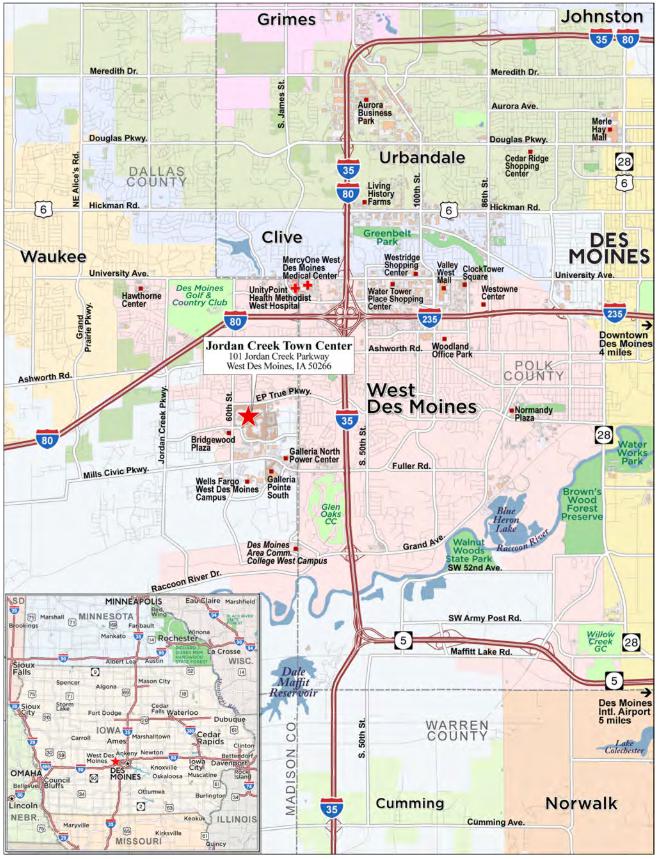
| THE INFORMATION IN THIS STRUCTURAL AND COLLATERAL TERM SHEET IS NOT COMPLETE AND MAY BE AMENDED PRIOR TO THE TIME OF SALE. THIS TERM SHEET IS NOT AN OFFER TO SELL THESE SECURITIES AND IT IS NOT A SOLICITATION OF AN OFFER TO BUY THESE SECURITIES IN ANY JURISDICTION WHERE THE OFFER OR SALE IS NOT PERMITTED. | ||
| T-64 | ||
| Mortgage Loan No. 4 – Jordan Creek Town Center |
| Mortgage Loan Information | Property Information | ||||||
| Mortgage Loan Seller: | MSMCH/JPMCB | Single Asset/Portfolio: | Single Asset | ||||
| Credit Assessment (Fitch/KBRA/Moody’s): | NR/NR/NR | Location: | West Des Moines, IA 50266 | ||||
| Original Balance(1): | $61,000,000 | General Property Type: | Retail | ||||
| Cut-off Date Balance(1): | $61,000,000 | Detailed Property Type: | Super Regional Mall | ||||
| % of Initial Pool Balance: | 6.2% | Title Vesting: | Fee | ||||
| Loan Purpose: | Refinance | Year Built/Renovated: | 2004/NAP | ||||
| Borrower Sponsor(2): | Brookfield Properties Retail Holding LLC | Size(5): | 940,038 SF | ||||
| Guarantor: | BPR Nimbus LLC | Cut-off Date Balance Per SF(1): | $181 | ||||
| Mortgage Rate: | 7.0200% | Maturity Date Balance Per SF(1): | $181 | ||||
| Note Date: | 2/1/2024 | Property Manager: | Brookfield Properties Retail Inc. | ||||
| Maturity Date: | 2/1/2029 | (borrower-related) | |||||
| Term to Maturity: | 60 months | ||||||
| Amortization Term: | 0 months | Underwriting and Financial Information | |||||
| IO Period: | 60 months | UW NOI: | $24,522,606 | ||||
| Seasoning: | 3 months | UW NCF: | $23,319,357 | ||||
| Prepayment Provisions: | L(27),D(29),O(4) | UW NOI Debt Yield(1): | 14.4% | ||||
| Lockbox/Cash Mgmt Status: | Hard/Springing | UW NCF Debt Yield(1): | 13.7% | ||||
| Additional Debt Type(1): | Pari Passu | UW NOI Debt Yield at Maturity(1): | 14.4% | ||||
| Additional Debt Balance(1): | $109,000,000 | UW NCF DSCR(1): | 1.93x | ||||
| Future Debt Permitted (Type): | No (NAP) | Most Recent NOI: | $24,047,225 (12/31/2023) | ||||
| Reserves(3) | 2nd Most Recent NOI: | $21,849,444 (12/31/2022) | |||||
| Type | Initial | Monthly | Cap | 3rd Most Recent NOI: | $18,578,424 (12/31/2021) | ||
| RE Taxes: | $0 | Springing | NAP | Most Recent Occupancy: | 97.1% (12/31/2023) | ||
| Insurance: | $0 | Springing | NAP | 2nd Most Recent Occupancy: | 95.5% (12/31/2022) | ||
| Replacement Reserve: | $0 | Springing | $470,019 | 3rd Most Recent Occupancy: | 95.6% (12/31/2021) | ||
| TI/LC Reserve: | (4) | Springing | $1,880,076 | Appraised Value (as of): | $321,000,000 (12/1/2023) | ||
| General Reserve: | $5,000,000 | $0 | NAP | Appraised Value Per SF: | $341 | ||
| Gap Rent Reserve: | (4) | $0 | NAP | Cut-off Date LTV Ratio(1): | 53.0% | ||
| Anchor Tenant Reserve: | $0 | Springing | NAP | Maturity Date LTV Ratio(1): | 53.0% | ||
| Sources and Uses | ||||||
| Sources | Proceeds | % of Total | Uses | Proceeds | % of Total | |
| Whole Loan Amount(1): | $170,000,000 | 95.2% | Loan Payoff: | $173,058,858 | 96.9% | |
| Borrower Equity: | $8,657,092 | 4.8% | Reserves: | $5,000,000 | 2.8% | |
| Closing Costs: | $598,234 | 0.3% | ||||
| Total Sources: | $178,657,092 | 100.0% | Total Uses: | $178,657,092 | 100.0% | |
| (1) | The Jordan Creek Town Center Mortgage Loan (as defined below) is part of the Jordan Creek Town Center Whole Loan (as defined below), with an aggregate original principal amount of $170,000,000. The Cut-off Date Balance Per SF, Maturity Date Balance Per SF, UW NOI Debt Yield, UW NCF Debt Yield, UW NOI Debt Yield at Maturity, UW NCF DSCR, Cut-off Date LTV Ratio and Maturity Date LTV Ratio numbers presented above are based on the Jordan Creek Town Center Whole Loan. |
| (2) | Brookfield Properties Retail holding LLC, the borrower sponsor, is related to the borrower sponsor for the Kenwood Towne Center Whole Loan, the Galleria at Tyler Whole Loan, and the Staten Island Mall Whole Loan. |
| (3) | See “Escrows and Reserves” below for further discussion of reserve requirements. |
| (4) | On the origination date, the borrowers provided a Guaranty of Limited Payment (as defined below) from the non-recourse carveout guarantor in lieu of depositing $7,584,188 into a TI/LC reserve and $260,628 into a gap rent reserve. See “Escrows and Reserves” below for further discussion of the Guaranty of Limited Payment. |
| (5) | Size does not include 197,760 SF of space associated with Dillard’s, a non-collateral anchor tenant. |
The Mortgage Loan. The fourth largest mortgage loan (the “Jordan Creek Town Center Mortgage Loan”) is part of a whole loan (the “Jordan Creek Town Center Whole Loan”) evidenced by 12 pari passu promissory notes with an aggregate original principal amount of $170,000,000. The Jordan Creek Town Center Whole loan is secured by a first priority fee mortgage encumbering a 940,038 SF retail property located in West Des Moines, Iowa (the “Jordan Creek Town Center Property”). The Jordan Creek Town Center Whole Loan was co-originated by Morgan Stanley Bank, N.A. (“MSBNA”), JPMorgan Chase Bank, National Association (“JPMCB”) and Barclays Capital Real Estate Inc. (“Barclays”) on February 1, 2024. The Jordan Creek Town Center Mortgage Loan is evidenced by the controlling Note A-1-1, and non-controlling Notes A-5, A-6, A-7 and A-8, with an aggregate original principal amount of $61,000,000. MSMCH is contributing the controlling Note A-1-1 in the original principal amount of $10,000,000 and JPMCB is contributing the non-controlling Note A-5, Note A-6, Note A-7 and Note A-8, in the aggregate original principal amount of $51,000,000. The Jordan Creek Town Center Whole Loan will be serviced pursuant to the pooling and servicing agreement for the BANK5 Trust 2024-5YR6 securitization trust. See “Description of the Mortgage Pool-The Whole Loans-The Serviced Pari Passu Whole Loans”, and “Pooling and Servicing Agreement” in the prospectus.
| THE INFORMATION IN THIS STRUCTURAL AND COLLATERAL TERM SHEET IS NOT COMPLETE AND MAY BE AMENDED PRIOR TO THE TIME OF SALE. THIS TERM SHEET IS NOT AN OFFER TO SELL THESE SECURITIES AND IT IS NOT A SOLICITATION OF AN OFFER TO BUY THESE SECURITIES IN ANY JURISDICTION WHERE THE OFFER OR SALE IS NOT PERMITTED. | ||
| T-65 | ||
| Retail – Super Regional Mall | Loan #4 | Cut-off Date Balance: | $61,000,000 | |
| 101 Jordan Creek Parkway | Jordan Creek Town Center | Cut-off Date LTV: | 53.0% | |
| West Des Moines, IA 50266 | UW NCF DSCR: | 1.93x | ||
| UW NOI Debt Yield: | 14.4% |
The table below summarizes the promissory notes that comprise the Jordan Creek Town Center Whole Loan.
| Jordan Creek Town Center Whole Loan Summary | ||||
| Note | Original Balance | Cut-off Date Balance | Note Holder | Controlling Note |
| A-1-1 | $10,000,000 | $10,000,000 | BANK5 Trust 2024-5YR6 | Yes |
| A-1-2(1) | $28,000,000 | $28,000,000 | MSBNA | No |
| A-2(1) | $16,000,000 | $16,000,000 | MSBNA | No |
| A-3(1) | $10,000,000 | $10,000,000 | MSBNA | No |
| A-4(1) | $4,000,000 | $4,000,000 | MSBNA | No |
| A-5 | $28,500,000 | $28,500,000 | BANK5 Trust 2024-5YR6 | No |
| A-6 | $12,000,000 | $12,000,000 | BANK5 Trust 2024-5YR6 | No |
| A-7 | $7,500,000 | $7,500,000 | BANK5 Trust 2024-5YR6 | No |
| A-8 | $3,000,000 | $3,000,000 | BANK5 Trust 2024-5YR6 | No |
| A-9 | $17,000,000 | $17,000,000 | BBCMS 2024-5C25 | No |
| A-10 | $17,000,000 | $17,000,000 | BBCMS 2024-5C25 | No |
| A-11 | $17,000,000 | $17,000,000 | BBCMS 2024-5C25 | No |
| Total | $170,000,000 | $170,000,000 | ||
| (1) | Expected to be contributed to one or more future securitization transactions or may otherwise be transferred at any time. |
The Borrowers and the Borrower Sponsor. The borrowers are Jordan Creek Town Center, LLC and Jordan Creek Anchor Acquisition, LLC, each a single-purpose, Delaware limited liability company with two independent directors in its organizational structure. The non-recourse carveout guarantor is BPR Nimbus LLC. The borrower sponsor is Brookfield Properties Retail Holding LLC. Brookfield Properties Retail Holding LLC is an affiliate of Brookfield Property Partners L.P., the public real estate vehicle for Brookfield Asset Management Inc. Brookfield Property Partners, L.P. is a large global real estate company, with more than 800 managed properties and 350 million SF of managed space worldwide. Brookfield Property Partners, L.P. owns and operates properties in the world’s major markets, with a global portfolio that includes office, retail, multifamily, logistics, hospitality, and development opportunities.
The Property. The Jordan Creek Town Center Property is a 940,038 SF super regional shopping center, which is part of a larger 1,137,798 SF super regional shopping center (the “Jordan Creek Town Center Regional Shopping Center”) located in West Des Moines, Iowa. The Jordan Creek Town Center Property was built in 2004 on a 140-acre site. The Jordan Creek Town Center Property offers 5,950 surface parking spaces, resulting in a parking ratio of 5.2 spaces per 1,000 SF of net rentable area. The Jordan Creek Town Center Property is comprised of three primary elements: an enclosed regional mall, a lifestyle center, and the “Lake District”, highlighting a three-acre lake surrounded by bike trails, waterfront dining, a hotel and an amphitheater. The Jordan Creek Town Center Property is 97.1% leased to over 120 tenants as of December 31, 2023. The Jordan Creek Town Center Property features a diverse mix of retail, dining, and entertainment tenants and is anchored by national retailers including Von Maur and Scheels. The Jordan Creek Town Center Regional Shopping Center is also anchored by Dillard’s, which is not part of the collateral. The Jordan Creek Town Center Property features a variety of upscale retailers including Anthropologie, Apple, Kendra Scott, Lululemon Athletica, Lush Fresh Handmade Cosmetics, Pottery Barn and Sephora, as well as a variety of outparcel tenants including P.F. Chang’s Asian Bistro, Bravo! Italian Kitchen, On the Border Mexican Grill, Fleming’s Prime Steakhouse, and Dave & Busters. Waterfront dining is available at Fleming’s Prime Steakhouse and P.F. Chang’s Asian Bistro.
The Jordan Creek Town Center Property also includes a 2.66 acre outparcel that is ground leased to a Residence Inn by Marriott (“Residence Inn”), a 122-key hotel. The Residence Inn has been ground leased and open for business at the Jordan Creek Town Center Property since 2004, has a lease expiration date of November 30, 2029, and has five, five-year renewal options remaining, and currently pays $147,018 in ground rent. The Jordan Creek Town Center Property also features a 20-screen Century Theatres movie theater.
The following table presents sales history at the Jordan Creek Town Center Property:
| Tenant Sales PSF(1)(2) | ||||||||
| Tenant Type | 2019 Sales | 2019 Sales PSF | 2021 Sales | 2021 Sales PSF | 2022 Sales | 2022 Sales PSF | TTM 11/30/2023 Sales | TTM 11/30/2023 Sales PSF |
| Inline (<10,000 SF) | $182,742,493 | $720 | $189,676,067 | $691 | $208,246,943 | $735 | $219,165,644 | $759 |
| Occupancy Cost(3) | 12.5% | 12.7% | 11.9% | 11.5% | ||||
| Inline (<10,000 SF Excluding Apple) | $134,688,897 | $550 | $150,631,535 | $568 | $164,696,047 | $600 | $172,022,780 | $615 |
| Occupancy Cost(3) | 16.5% | 15.5% | 14.7% | 14.3% | ||||
| (1) | Information is based on the underwritten rent roll as of December 31, 2023. |
| (2) | 2020 Sales History was not included due to incomplete sales reporting by tenants during the COVID-19 pandemic. |
| (3) | Occupancy Cost is based on current underwritten total rent (the sum of underwritten base rent, percentage rent, overage rent and underwritten reimbursements). |
| THE INFORMATION IN THIS STRUCTURAL AND COLLATERAL TERM SHEET IS NOT COMPLETE AND MAY BE AMENDED PRIOR TO THE TIME OF SALE. THIS TERM SHEET IS NOT AN OFFER TO SELL THESE SECURITIES AND IT IS NOT A SOLICITATION OF AN OFFER TO BUY THESE SECURITIES IN ANY JURISDICTION WHERE THE OFFER OR SALE IS NOT PERMITTED. | ||
| T-66 | ||
| Retail – Super Regional Mall | Loan #4 | Cut-off Date Balance: | $61,000,000 | |
| 101 Jordan Creek Parkway | Jordan Creek Town Center | Cut-off Date LTV: | 53.0% | |
| West Des Moines, IA 50266 | UW NCF DSCR: | 1.93x | ||
| UW NOI Debt Yield: | 14.4% |
Major Tenants.
Von Maur (152,000 SF, 16.2% of NRA, 0.0% of underwritten base rent) Von Maur is an American chain of department stores founded in 1872 and headquartered in Davenport, Iowa. Von Maur operates 33 stores across 15 states, primarily throughout the Midwest and the South. Von Maur is a privately owned company, still operated today by the founding family. Von Maur has anchored the Jordan Creek Town Center Property since 2022, has a lease expiration date of January 31, 2043, and has six, five-year extension options remaining. Such extension options are automatic unless Von Maur provides notice of non-renewal to borrower between 90 and 180 days prior to the beginning of the renewal term. Von Maur pays percentage rent equal to 2.5% of net sales in excess of $40,000,000. No rent was underwritten for Von Maur.
Scheels (122,025 SF, 13.0% of NRA, 2.6% of underwritten base rent) Scheels is an American privately held, employee-owned and operated sporting goods and entertainment chain store, founded in 1902 and headquartered in Fargo, North Dakota. Scheels operates 32 stores across 16 states, primarily throughout the Midwest and the South. Scheels is a tenant at the Jordan Creek Town Center Property under a ground lease. Scheels has anchored the Jordan Creek Town Center Property since 2004, has a lease expiration date of July 31, 2029, and has six, five-year extension options remaining. Scheels currently pays an annual base rent of $551,553 ($4.52 PSF) through July 31, 2024. From August 1, 2024 through July 31, 2029, annual base rent increases to $579,619 ($4.75 PSF). $579,619 of rent was underwritten for Scheels.
Century Theatres (69,914 SF, 7.4% of NRA, 8.8% of underwritten base rent) Century Theatres is a movie theater chain that operates multiplexes in the western United States, primarily in California, Colorado, Nevada, Utah, New Mexico, and Arizona. Founded in 1941, Century Theatres was headquartered in San Rafael, California until 2006, when it was purchased by Cinemark Holdings, Inc. (“Cinemark”). The acquisition of Century Theatres added over 80 theatres to Cinemark. Cinemark retains the Century Theatres banner and continues to open and operate under this name. Cinemark is headquartered in Plano, Texas, and operates 309 theatres and 4,324 screens across 42 states, along with 192 theatres and 1,395 screens in 13 countries across Latin America. Century Theatres has been a tenant at the Jordan Creek Town Center Property since 2004, has a lease expiration date of August 31, 2029, and has two, five-year extension options remaining. Century Theatres currently pays $1,945,007 ($97,250 per screen) in annual base rent.
Barnes & Noble Bookseller (29,969 SF, 3.2% of NRA, 1.9% of underwritten base rent) Barnes & Noble Bookseller is a large retail bookseller and retailer of content, digital media, and educational products. Founded in 1971, and headquartered in New York, New York, Barnes & Noble Bookseller operates approximately 600 bookstores across the United States, as well as an e-commerce site. Barnes & Noble Bookseller also operates through its Nook Digital business, which offers an expansive collection of digital reading content and an audiobook subscription service to complement its product, the Nook tablet. Barnes & Noble Bookseller has been a tenant at the Jordan Creek Town Center Property since 2004, has a lease expiration date of January 31, 2025, and has one, five-year extension option remaining. Barnes & Noble Bookseller currently pays $425,000 ($14.18 PSF) in annual base rent.
| THE INFORMATION IN THIS STRUCTURAL AND COLLATERAL TERM SHEET IS NOT COMPLETE AND MAY BE AMENDED PRIOR TO THE TIME OF SALE. THIS TERM SHEET IS NOT AN OFFER TO SELL THESE SECURITIES AND IT IS NOT A SOLICITATION OF AN OFFER TO BUY THESE SECURITIES IN ANY JURISDICTION WHERE THE OFFER OR SALE IS NOT PERMITTED. | ||
| T-67 | ||
| Retail – Super Regional Mall | Loan #4 | Cut-off Date Balance: | $61,000,000 | |
| 101 Jordan Creek Parkway | Jordan Creek Town Center | Cut-off Date LTV: | 53.0% | |
| West Des Moines, IA 50266 | UW NCF DSCR: | 1.93x | ||
| UW NOI Debt Yield: | 14.4% |
The following table presents a summary regarding the major stores at the Jordan Creek Town Center Property:
| Tenant Summary(1) | |||||||||
| Tenant Name | Credit Rating (Fitch/Moody’s/ S&P)(2) | Tenant SF | Approx.% of SF | Annual UW Base Rent | % of Total Annual UW Base Rent | Annual UW Base Rent PSF | Lease Expiration | Renewal Options | Term. Option (Y/N) |
| Anchor Stores | |||||||||
| Dillard’s (non-collateral)(3) | BBB-/Baa3/BB+ | 0 | 0.0% | $0 | NAP | NAP | NAP | NAV | NAV |
| Von Maur | NR/NR/NR | 152,000 | 16.2% | $0(4) | 0.0% | $0.00 | 1/31/2043 | 6 x 5 year(5) | N |
| Scheels | NR/NR/NR | 122,025 | 13.0% | $579,619 | 2.6% | $4.75 | 7/31/2029 | 6 x 5 year | N |
| Subtotal/Wtd. Avg. | 274,025 | 29.2% | $579,619 | 2.6% | $4.75(6) | ||||
| Major Tenants | |||||||||
| Century Theatres | B+/NR/BB- | 69,914 | 7.4% | $1,945,007 | 8.8% | $27.82 | 8/31/2029 | 2 x 5 year | N |
| Barnes & Noble Bookseller | NR/NR/NR | 29,969 | 3.2% | $425,000 | 1.9% | $14.18 | 1/31/2025 | 1 x 5 year | N |
| H&M | NR/NR/BBB | 22,608 | 2.4% | $541,009 | 2.4% | $23.93 | 1/31/2032 | (7) | Y(8) |
| Dave & Busters | NR/NR/NR | 21,947 | 2.3% | $548,675 | 2.5% | $25.00 | 6/30/2038 | 2 x 5 year | N |
| Pottery Barn | NR/NR/NR | 11,677 | 1.2% | $466,029 | 2.1% | $39.91 | 1/31/2027 | None | N |
| Victoria’s Secret | NR/B1/BB- | 11,476 | 1.2% | $642,656 | 2.9% | $56.00 | 1/31/2026 | None | Y(9) |
| The Cheesecake Factory | NR/NR/NR | 11,141 | 1.2% | $501,345 | 2.3% | $45.00 | 1/31/2025 | 1 x 5 year | N |
| Forever 21 | NR/NR/NR | 10,951 | 1.2% | $0(10) | 0.0% | $0.00 | 1/31/2027 | (11) | (11) |
| Gap/GapKids/BabyGap | NR/B1/BB | 10,402 | 1.1% | $343,266 | 1.5% | $33.00 | 1/31/2025 | None | N |
| Tavern Grill | NR/NR/NR | 10,186 | 1.1% | $285,004 | 1.3% | $27.98 | 3/31/2033 | 2 x 5 year | N |
| Subtotal/Wtd. Avg. | 210,271 | 22.4% | $5,697,992 | 25.7% | $28.59(6) | ||||
| In-line Tenants <10,000 SF(12) | 334,030 | 35.5% | $15,771,450 | 71.1% | $47.22 | ||||
| Hotel Ground Lease(13) | 94,037 | 10.0% | $147,018 | 0.7% | $1.56 | ||||
| Occupied Subtotal/Wtd. Avg. | 912,363 | 97.1% | $22,196,080 | 100.0% | $24.33 | ||||
| Vacant Space | 27,675 | 2.9% | |||||||
| Total/Wtd. Avg. | 940,038 | 100.0% | |||||||
| (1) | Information is based on the underwritten rent roll as of December 31, 2023. |
| (2) | Certain ratings are those of the parent company whether or not the parent company guarantees the lease. |
| (3) | Dillard’s occupies 197,760 SF and anchors the Jordan Creek Town Center Regional Shopping Center. Dillard’s is not part of the Jordan Creek Town Center Property collateral. Dillard’s’ operating covenants have expired. |
| (4) | Von Maur pays percentage rent equal to 2.5% of net sales in excess of $40,000,000. No rent was underwritten for Von Maur. |
| (5) | Von Maur’s six, 5-year renewal options are automatic, unless Von Maur provides notice of non-renewal to borrower between 90 and 180 days prior to the beginning of the renewal term. |
| (6) | Excludes Von Maur and Forever 21, as applicable, since such tenants pay percentage rent instead of base rent. |
| (7) | H&M has two, 3-year renewal options followed by one, 4-year renewal option remaining. |
| (8) | H&M has the right to terminate its lease upon 365 days‘ notice if the tenant’s net sales fail to exceed $3,850,000 between January 1, 2025 through December 31, 2025, or $4,005,540 between January 1, 2027 through December 31, 2027. H&M is required to pay a termination fee equal to 50% of the then unamortized portion of the construction allowance. H&M’s sales for the TTM November 2023 period were $3,457,085. |
| (9) | Victoria’s Secret has the right to terminate its lease with 90 days’ notice if the Jordan Creek Town Center Regional Shopping Center is no longer under the ownership or management of Brookfield Properties, or an affiliate thereof and Victoria’s Secret’s change in annual net sales for any 12-month period after such management change is more than 10% less than the average percentage change in Victoria’s Secret’s comparable sales for all other stores in Victoria’s Secret’s retail chain operating under the same name for the same 12-month period. |
| (10) | Forever 21 pays percentage rent instead of base rent. Based on the November 2023 TTM period, Forever 21 percentage in lieu rent was $376,679. $376,679 of percentage rent was underwritten for Forever 21. |
| (11) | Forever 21’s original lease expired in January, 2024. The tenant is currently in the process of negotiating a lease extension until January 31, 2027. There can be no assurance that a lease extension will be entered into. |
| (12) | Includes 3,885 SF of storage space with no underwritten base rent; 15,596 SF of inline tenants that pay a total of $292,547 in percentage rent and $0 in base rent; 5,995 SF of specialty leasing space with no underwritten base rent; and 250 SF of other tenants with no underwritten base rent. Additionally, this includes 13,946 SF of signed not occupied tenants. Of the signed not occupied space, 8,227 SF of space does not have any underwritten base rent attributed to it. In total, there is $265,561 of underwritten base rent attributed to signed not occupied tenants. |
| (13) | Represents a ground leased 122-key Residence Inn, that has a lease expiration date of November 30, 2029, and has five, five-year renewal options remaining. |
| THE INFORMATION IN THIS STRUCTURAL AND COLLATERAL TERM SHEET IS NOT COMPLETE AND MAY BE AMENDED PRIOR TO THE TIME OF SALE. THIS TERM SHEET IS NOT AN OFFER TO SELL THESE SECURITIES AND IT IS NOT A SOLICITATION OF AN OFFER TO BUY THESE SECURITIES IN ANY JURISDICTION WHERE THE OFFER OR SALE IS NOT PERMITTED. | ||
| T-68 | ||
| Retail – Super Regional Mall | Loan #4 | Cut-off Date Balance: | $61,000,000 | |
| 101 Jordan Creek Parkway | Jordan Creek Town Center | Cut-off Date LTV: | 53.0% | |
| West Des Moines, IA 50266 | UW NCF DSCR: | 1.93x | ||
| UW NOI Debt Yield: | 14.4% |
The following table presents certain information relating to stores with the highest overall sales in order of their November 30, 2023 TTM Sales:
| Top Tenants by Total Sales(1) | ||||||||
| Tenant Name | Tenant SF | 2021 Sales | 2021 Sales PSF | 2022 Sales | 2022 Sales PSF | TTM 11/30/2023 Sales(2) | TTM 11/30/2023 Sales PSF(2) | TTM 11/30/2023 Occupancy Cost(2)(3) |
| Scheels | 122,025 | $73,954,999 | $606 | $112,015,115 | $918 | $111,999,999 | $918 | 0.7% |
| Apple | 9,005 | $39,044,532 | $4,336 | $43,550,896 | $4,836 | $47,142,864 | $5,235 | 1.3% |
| Von Maur(4) | 152,000 | NAP | NAP | NAP | NAP | $40,000,000 | $263 | 0.2% |
| Dillard’s(5) | 197,760 | $26,800,000 | $136 | $27,900,000 | $141 | $27,900,000 | $141 | 0.4% |
| Lululemon Athletica | 7,500 | $9,234,045 | $1,231 | $12,840,419 | $1,712 | $14,403,921 | $1,921 | 6.3% |
| The Cheesecake Factory | 11,141 | $9,315,233 | $836 | $10,086,821 | $905 | $10,705,999 | $961 | 9.6% |
| Sephora | 5,921 | $5,478,932 | $925 | $6,991,067 | $1,181 | $9,855,213 | $1,664 | 8.8% |
| Century Theatres | 69,914 | $1,985,999 | $99,300(6) | $1,985,999 | $99,300(6) | $8,347,068 | $417,353(6) | 32.3% |
| Bath & Body Works | 5,500 | $7,295,664 | $1,326 | $7,429,318 | $1351 | $7,263,120 | $1,321 | 8.2% |
| Pottery Barn | 11,677 | $5,796,825 | $496 | $6,787,898 | $581 | $6,679,272 | $572 | 10.6% |
| (1) | Information obtained from the borrower. |
| (2) | TTM Sales for Century Theatres are as of year-end 2023. |
| (3) | Occupancy Cost is based on current underwritten total rent (the sum of underwritten base rent, percentage rent, overage rent and underwritten reimbursements). |
| (4) | Von Maur’s lease began on November 1, 2022. |
| (5) | Dillard’s is not part of the Jordan Creek Town Center Property collateral. |
| (6) | Represents sales per screen. Century Theatres operates 20 screens at the Jordan Creek Town Center Property. |
The following table presents certain information relating to the lease rollover at the Jordan Creek Town Center Property:
| Lease Rollover Schedule(1)(2) | ||||||||
| Year | # of Leases Rolling | SF Rolling | Approx. % of SF Rolling | Approx. Cumulative % of SF Rolling | Total UW Base Rent Rolling | Approx. % of Total UW Base Rent Rolling | Approx. Cumulative % of Total UW Base Rent Rolling | UW Base Rent PSF Rolling(3) |
| MTM/2024 | 30 | 38,952 | 4.1% | 4.1% | $1,386,450 | 6.2% | 6.2% | $35.59 |
| 2025 | 31 | 133,015 | 14.1% | 18.3% | $5,701,947 | 25.7% | 31.9% | $42.87 |
| 2026 | 7 | 34,648 | 3.7% | 22.0% | $1,494,713 | 6.7% | 38.7% | $43.14 |
| 2027 | 13 | 58,071 | 6.2% | 28.2% | $2,341,390 | 10.5% | 49.2% | $40.32 |
| 2028 | 12 | 49,688 | 5.3% | 33.4% | $2,885,497 | 13.0% | 62.2% | $58.07 |
| 2029 | 12 | 319,217 | 34.0% | 67.4% | $4,189,854 | 18.9% | 81.1% | $13.13 |
| 2030 | 3 | 4,065 | 0.4% | 67.8% | $204,585 | 0.9% | 82.0% | $50.33 |
| 2031 | 4 | 11,634 | 1.2% | 69.1% | $351,905 | 1.6% | 83.6% | $30.25 |
| 2032 | 14 | 53889 | 5.7% | 74.8% | $2,402,299 | 10.8% | 94.4% | $44.58 |
| 2033 | 4 | 14,626 | 1.6% | 76.4% | $457,193 | 2.1% | 96.5% | $31.26 |
| 2034 | 5 | 18261 | 1.9% | 78.3% | $231,571 | 1.0% | 97.5% | $12.68 |
| 2035 & Thereafter | 4 | 176,297 | 18.8% | 97.1% | $548,675 | 2.5% | 100.0% | $3.11 |
| Vacant | 0 | 27,675 | 2.9% | 100.0% | $0 | 0.0% | 100.0% | $0.00 |
| Total/Wtd. Avg.(4) | 139 | 940,038 | 100.0% | $22,196,080 | 100.0% | $24.33 | ||
| (1) | Information is based on the underwritten rent roll as of December 31, 2023. |
| (2) | Certain tenants may have lease termination options that are exercisable prior to the stated expiration date of the subject lease or leases which are not considered in the Lease Rollover Schedule. |
| (3) | Includes the following SF as to which no base rent was underwritten: 152,000 SF occupied by Von Maur, as to which only percentage rent is due, 15,596 SF of inline tenant space as to which only percentage rent is due, 8,227 SF of signed not occupied tenant space, 5,995 SF of specialty leasing space, 3,885 SF of storage space and 250 SF of other space as to which there is no underwritten rent. Total/Wtd. Avg. UW Base Rent PSF Rolling excluding these tenants is $30.56. |
| (4) | Total/Wtd. Avg. UW Base Rent PSF Rolling excludes vacant space. |
The Market. The Jordan Creek Town Center Property is located in West Des Moines, Iowa, approximately 8.5 miles west of the central business district of Des Moines and approximately 7.0 miles northwest of the Des Moines International Airport. The Jordan Creek Town Center Property is bounded by the Jordan Creek Parkway, the area’s primary commercial roadway, and Mills Civic Parkway. Interstate 35 is approximately 1.5 miles southeast of the Jordan Creek Town Center Property and is accessible via Mills Civic Parkway. Interstate 80 is accessible approximately 1.3 miles north of the Jordan Creek Town Center Property via the Jordan Creek Parkway. The Jordan Creek Town Center Property is located in the Western Suburbs retail submarket within the Des Moines retail market. Local industry drivers that support the trade area include insurance, financial services, healthcare, agriculture innovation, technology, data centers, advanced manufacturing, and logistics. The Jordan Creek Town Center Property is located across the street from the Wells Fargo Home Mortgage campus, which employs approximately 13,000 employees. Des Moines is considered one of the top cities in the United States for the insurance business, and serves as the headquarters for Principal Financial Group, Inc. Some of the larger employers in the area include Wells Fargo & Co., Hy-Vee, Inc., Principal Financial Group, MercyOne, UnityPoint Health Partners, Amazon, John Deere Companies, and Nationwide.
| THE INFORMATION IN THIS STRUCTURAL AND COLLATERAL TERM SHEET IS NOT COMPLETE AND MAY BE AMENDED PRIOR TO THE TIME OF SALE. THIS TERM SHEET IS NOT AN OFFER TO SELL THESE SECURITIES AND IT IS NOT A SOLICITATION OF AN OFFER TO BUY THESE SECURITIES IN ANY JURISDICTION WHERE THE OFFER OR SALE IS NOT PERMITTED. | ||
| T-69 | ||
| Retail – Super Regional Mall | Loan #4 | Cut-off Date Balance: | $61,000,000 | |
| 101 Jordan Creek Parkway | Jordan Creek Town Center | Cut-off Date LTV: | 53.0% | |
| West Des Moines, IA 50266 | UW NCF DSCR: | 1.93x | ||
| UW NOI Debt Yield: | 14.4% |
According to the appraisal, as of the third quarter of 2023, the vacancy rate in the Western Suburbs retail submarket was approximately 3.7% with average asking rents of $18.36 PSF and inventory of approximately 20.3 million SF. According to the appraisal, as of the third quarter of 2023, the vacancy rate in the Des Moines retail market was approximately 3.5%, with average asking rents of $17.69 PSF and inventory of approximately 44.4 million SF. According to the appraisal, the 2022 population within a 10-, 20- and 30- mile radius of the Jordan Creek Town Center Property was 330,148, 631,873 and 700,018, respectively. The 2022 average household income within the same 10-, 20- and 30- mile radius was $103,954, $97,536 and $96,792, respectively.
The appraisal identified three shopping centers in the Jordan Creek Town Center Property’s primary competitive set, and one shopping center in the Jordan Creek Town Center Property’s secondary competitive set, as outlined below:
| Competitive Set Summary | |||||
| Name | Jordan Creek Town Center (subject) | Valley West Mall | Merle Hay Mall | Outlets of Des Moines | Village at Jordan Creek(1) |
| Address | 101 Jordan Creek Parkway | 1551 Valley West Drive | 3800 Merle Hay Road | 801 Bass Pro Drive NW | 6805 Mills Civic Parkway |
| City, State | West Des Moines, IA | West Des Moines, IA | Des Moines, IA | Altoona, IA | West Des Moines, IA |
| Rentable Area (SF) | 1,137,798(2)(3) | 1,005,054 | 1,149,779 | 479,217 | 420,752 |
| Year Built/ Renovated | 2004 / NAP | 1975 / 2009 | 1959 / 2005 | 2017 / NAP | 2004 / NAP |
| Anchor Tenants | Dillard’s(3) Von Maur Scheels Century Theaters | JCPenney Vacant (Former Von Maur) Vacant (Former Younkers) | Kohl’s, Target, Ross Dress, Kids Empire, Dink’s Pickleball, Flix Brewhouse, White Rabbit VR & Gameday Arcade | Bass Pro (Adjacent Anchor), Under Armour, F21, Polo Ralph Lauren, Nike, Old Navy, Loft, Lee Wrangler, J. Crew | Costco, Nike, Aveda Institute, Blue Zoo Aquarium, DSW, Best Buy, Petco, Old Navy, Bob’s, Kid’s Empire |
| Sales PSF | $812 | $422 | $289 | NAV | NAV |
| Occupancy | 97.1%(2) | 51% | 80% | 85% | 97% |
| Distance to Subject | NAP | 3.5 miles | 6.8 miles | 16.2 miles | 0.1 miles |
Source: Appraisal.
| (1) | Village at Jordan Creek is in the Jordan Creek Town Center Property’s secondary competitive set. |
| (2) | Information is based on the underwritten rent roll dated December 31, 2023. |
| (3) | The Jordan Creek Town Center Property is comprised of 940,038 SF. Dillard’s (197,760 SF) is not part of the collateral. |
The following table presents information relating to the appraisal’s market rent conclusion for the Jordan Creek Town Center Property:
| Market Rent Summary | ||||||
| Market Rent | Escalations | Term (years) | Reimbursements | Tenant Allowances (New/Renewal) | Leasing Commissions (New/Renewal) | |
| <1,200 SF | $155.00 | 2.5%/year | 7 | Net | $70.00 / $0.00 | 6.0% / 3.0% |
| 1,200-2,500 SF | $66.00 | 2.5%/year | 7 | Net | $70.00 / $0.00 | 6.0% / 3.0% |
| 2,501-5,000 SF | $48.00 | 2.5%/year | 7 | Net | $70.00 / $0.00 | 6.0% / 3.0% |
| 5,001-10,000 SF | $44.00 | 2.5%/year | 7 | Net | $70.00 / $0.00 | 6.0% / 3.0% |
| 10,000+ SF | $43.00 | 10.0% Midterm | 10 | Gross | $70.00 / $0.00 | $4.00 / $2.00 |
| Food Court | $140.00 | 2.0%/year | 10 | Net | $10.00 / $0.00 | 6.0% / 3.0% |
| Outparcel Restaurant | $25.00 | 2.0%/year | 10 | Net | $40.00 / $0.00 | 6.0% / 3.0% |
| Outparcel Big Box | $25.00 | 10.0% Midterm | 10 | Net | $30.00 / $0.00 | $4.00 / $2.00 |
| Theater | $20.00 | 10.0% Midterm | 10 | Gross | $20.00 / $0.00 | $4.00 / $2.00 |
| Anchor | $12.00 | 10.0% Midterm | 10 | Gross | $10.00 / $0.00 | $4.00 / $2.00 |
Appraisal. The appraisal concluded to an “As-is” value for the Jordan Creek Town Center Property of $321,000,000 as of December 1, 2023.
Environmental Matters. According to the Phase I environmental site assessment dated December 1, 2023, there was no evidence of any recognized environmental conditions at the Jordan Creek Town Center Property.
| THE INFORMATION IN THIS STRUCTURAL AND COLLATERAL TERM SHEET IS NOT COMPLETE AND MAY BE AMENDED PRIOR TO THE TIME OF SALE. THIS TERM SHEET IS NOT AN OFFER TO SELL THESE SECURITIES AND IT IS NOT A SOLICITATION OF AN OFFER TO BUY THESE SECURITIES IN ANY JURISDICTION WHERE THE OFFER OR SALE IS NOT PERMITTED. | ||
| T-70 | ||
| Retail – Super Regional Mall | Loan #4 | Cut-off Date Balance: | $61,000,000 | |
| 101 Jordan Creek Parkway | Jordan Creek Town Center | Cut-off Date LTV: | 53.0% | |
| West Des Moines, IA 50266 | UW NCF DSCR: | 1.93x | ||
| UW NOI Debt Yield: | 14.4% |
Operating History and Underwritten Net Cash Flow. The following table presents certain information relating to the historical operating performance and the Underwritten Net Cash Flow at the Jordan Creek Town Center Property:
| Cash Flow Analysis | |||||||
| 2019 | 2020 | 2021 | 2022 | 2023 | UW | UW PSF | |
| Gross Potential Rent(1) | $20,777,942 | $20,446,690 | $20,084,124 | $22,678,511 | $24,885,319 | $25,781,279 | $27.43 |
| Reimbursements | $12,379,775 | $10,986,139 | $10,247,015 | $10,736,648 | $12,183,741 | $13,208,389 | $14.05 |
| Other Income | $1,752,809 | $1,229,384 | $1,438,599 | $1,465,640 | $1,430,400 | $1,430,400 | $1.52 |
| (Vacancy / Credit Loss) | $0 | $0 | $0 | $0 | $0 | ($801,616) | ($0.85) |
| Effective Gross Income | $34,910,525 | $32,662,213 | $31,769,738 | $34,880,800 | $38,499,461 | $39,618,452 | $42.15 |
| Real Estate Taxes | $5,847,387 | $5,702,710 | $6,059,425 | $5,954,876 | $7,137,003 | $7,629,083 | $8.12 |
| Insurance | $145,200 | $167,086 | $199,608 | $203,684 | $256,225 | $290,651 | $0.31 |
| Other Operating Expenses | $7,404,716 | $7,327,559 | $6,932,280 | $6,872,796 | $7,059,008 | $7,176,112 | $7.63 |
| Total Operating Expenses | $13,397,302 | $13,197,355 | $13,191,313 | $13,031,356 | $14,452,236 | $15,095,846 | $16.06 |
| Net Operating Income | $21,513,223 | $19,464,858 | $18,578,424 | $21,849,444 | $24,047,225 | $24,522,606 | $26.09 |
| Replacement Reserves | $0 | $0 | $0 | $0 | $0 | $263,211 | $0.28 |
| TI/LC | $0 | $0 | $0 | $0 | $0 | $940,038 | $1.00 |
| Net Cash Flow | $21,513,223 | $19,464,858 | $18,578,424 | $21,849,444 | $24,047,225 | $23,319,357 | $24.81 |
| Occupancy (%) | 96.5% | 93.1% | 95.6% | 95.5% | 97.1%(2) | 98.0% | |
| NOI DSCR(3) | 1.78x | 1.61x | 1.54x | 1.81x | 1.99x | 2.03x | |
| NCF DSCR(3) | 1.78x | 1.61x | 1.54x | 1.81x | 1.99x | 1.93x | |
| NOI Debt Yield(3) | 12.7% | 11.4% | 10.9% | 12.9% | 14.1% | 14.4% | |
| NCF Debt Yield(3) | 12.7% | 11.4% | 10.9% | 12.9% | 14.1% | 13.7% | |
| (1) | UW Gross Potential Rent is based on the underwritten rent roll as of December 31, 2023 and includes (i) rent increases totaling $320,346 through December 31, 2024, (ii) signed not occupied rent totaling $607,572 (iii) percentage rent totaling $962,833, (iv) overage rent totaling $924,854, (v) specialty leasing rent totaling $548,866 and (vi) kiosk revenue totaling $541,074. |
| (2) | 2023 Occupancy (%) is based on the underwritten rent roll dated December 31, 2023. |
| (3) | The debt service coverage ratios and debt yields are based on the Jordan Creek Town Center Whole Loan. |
Escrows and Reserves.
Real Estate Taxes – During the continuance of a Cash Management Period (as defined below) and/or from and after the date on which the borrowers first request a disbursement from the General Reserve (a “General Reserve Disbursement Date”), the borrowers are required to deposit monthly 1/12th of the annual estimated tax payments payable during the next ensuing 12 months into a real estate tax reserve.
Insurance Reserve – During the continuance of a Cash Management Period, and/or from and after a General Reserve Disbursement Date, the borrowers are required to deposit monthly into an insurance reserve 1/12th of the annual estimated insurance payments on a monthly basis, unless the Jordan Creek Town Center Property is insured under a blanket policy meeting the requirements of the related loan agreement (in which case no insurance escrows will be required).
Replacement Reserve – During the continuance of a Cash Management Period and/or from and after a General Reserve Disbursement Date, the borrowers are required to deposit monthly into a replacement reserve an amount equal to 1/12th of $0.25 per owned leasable square foot at the Jordan Creek Town Center Property (initially $19,584) (the “Replacement Reserve Monthly Deposit”) for repairs and replacements required to be made to the Jordan Creek Town Center Property during the calendar year. The borrowers’ obligation to make deposits into the replacement reserve will be suspended during any period in which the amounts in such reserve equal or exceed an amount equal to the product of (x) 24 and (y) the Replacement Reserve Monthly Deposit (which amount will initially be $470,019).
TI/LC Reserve – On the origination date, the borrowers provided a Guaranty of Limited Payment (as described below) from the non-recourse carveout guarantor in lieu of depositing $7,584,188 into a reserve for existing tenant improvements, landlord work, tenant improvement allowances and leasing commissions. During the continuance of a Cash Management Period and/or from and after a General Reserve Disbursement Date, the borrowers are required to deposit into a TI/LC reserve an amount equal to 1/12 of $1.00 per owned leasable square foot at the Jordan Creek Town Center Property (initially $78,337) (the “TI/LC Reserve Monthly Deposit”) for New Leases Rollover Expenditures (as defined below). The borrowers’ obligation to make deposits into the TI/LC reserve will be suspended during any period in which the amounts in such reserve equal or exceed an amount equal to the product of (x) 24 and (y) the TI/LC Reserve Monthly Deposit (which amount will initially be $1,880,076). Amounts in the TI/LC reserve that are funded by the TI/LC Reserve Monthly Deposit are required to be released to the borrowers if the applicable Cash Management Period has terminated (and the General Reserve Disbursement Date has not occurred).
General Reserve – At origination the borrowers were required to deposit $5,000,000 into a general reserve to be used for replacements and repairs to the Jordan Creek Town Center Property and for tenant improvements, landlord work, tenant improvement allowances, leasing commission obligations, reasonable legal fees and related tenant capital costs incurred following the origination date (“New Leases Rollover Expenditures”).
| THE INFORMATION IN THIS STRUCTURAL AND COLLATERAL TERM SHEET IS NOT COMPLETE AND MAY BE AMENDED PRIOR TO THE TIME OF SALE. THIS TERM SHEET IS NOT AN OFFER TO SELL THESE SECURITIES AND IT IS NOT A SOLICITATION OF AN OFFER TO BUY THESE SECURITIES IN ANY JURISDICTION WHERE THE OFFER OR SALE IS NOT PERMITTED. | ||
| T-71 | ||
| Retail – Super Regional Mall | Loan #4 | Cut-off Date Balance: | $61,000,000 | |
| 101 Jordan Creek Parkway | Jordan Creek Town Center | Cut-off Date LTV: | 53.0% | |
| West Des Moines, IA 50266 | UW NCF DSCR: | 1.93x | ||
| UW NOI Debt Yield: | 14.4% |
Gap Rent Reserve – On the origination date, the borrowers provided a Guaranty of Limited Payment from the non-recourse carveout guarantor in lieu of depositing $260,628 into a gap rent reserve for outstanding free and gap rent and rent abatements.
Guaranty of Limited Payment – On the origination date, the borrowers provided a Guaranty of Limited Payment from the non-recourse carveout guarantor in the aggregate amount of the required upfront deposits into the TI/LC reserve and gap rent reserve. The amounts guaranteed by the Guaranty of Limited Payment (x) with respect to the upfront TI/LC reserve deposit, are required to be reduced on a dollar-for-dollar basis by the aggregate amount of equity capital actually expended by the borrowers on the existing tenant improvements, landlord work, tenant improvement allowances and leasing commissions as of the origination date, and (y) with respect to the upfront gap rent reserve, are required to be reduced on a monthly basis by an amount equal to the monthly amount of rent that would have been received by borrowers if rent was paid by the applicable tenant.
Anchor Tenant Reserve – During the continuance of an Anchor Tenant Trigger (as defined below), the borrowers are required to deposit an amount equal to all excess cash flow (as described below under “Lockbox and Cash Management”) for tenant improvements and leasing commissions, budgeted construction costs, required landlord work and other related costs associated with re-tenanting the applicable space or any other space at the Jordan Creek Town Center Property. The borrowers’ obligation to make deposits into the anchor tenant reserve with respect to any individual Anchor Tenant Trigger will terminate once the aggregate amount deposited into the anchor tenant reserve with respect to such individual Anchor Tenant Trigger equals or exceeds the Individual Anchor Threshold Amount (as defined below).
An “Anchor Tenant Trigger” means that any of Dillard’s, Scheels or Von Maur (together with any replacement tenants of the foregoing, each an “Anchor”) (A) has “gone dark” (i.e., ceased to utilize its space for business purposes), other than a temporary closure that is less than 60 days or is in connection with (x) a restoration, repair or renovation, (y) compliance with applicable law, regulations and/or governmental mandates or (z) civil unrest, (B) is the subject of a bankruptcy proceeding, (C) has vacated its premises, (D) has terminated, cancelled or surrendered its lease, or (E) has failed to renew and/or extend its lease within the applicable renewal period.
An Anchor Tenant Trigger will end if (i) for any Anchor Tenant Trigger described in clause (A) of the definition of Anchor Tenant Trigger, the Anchor has operated its business for no less than 30 consecutive days during normal business hours, (ii) for any Anchor Tenant Trigger described in clause (B) of the definition of Anchor Tenant Trigger, the bankruptcy is dismissed or the Anchor has emerged from such bankruptcy, and if the Anchor premises are leased by the borrowers to the Anchor, such lease is accepted and affirmed by the Anchor in the bankruptcy or assumed by a replacement Anchor; (iii) for any Anchor Tenant Trigger described in clause (C) of the definition of Anchor Tenant Trigger, the Anchor has reoccupied its premises, (iv) for any Anchor Tenant Trigger described in clause (D) of the definition of Anchor Tenant Trigger, the Anchor has rescinded any notice to terminate, cancel or surrender its lease, (v) for any Anchor Tenant Trigger described in clause (E) of the definition of Anchor Tenant Trigger, the Anchor has renewed its lease pursuant to the terms thereof, or (vi) for all Anchor Tenant Triggers, the Anchor space or a substantial portion thereof becomes owned or leased by one or more replacement occupants pursuant to the terms of the loan documents.
An ”Individual Anchor Threshold Amount” means, with respect to any Anchor, an amount equal to the product of (x) $50.00 and (y) the aggregate amount of gross leasable square footage of the applicable Anchor space as of the origination date.
Lockbox and Cash Management. The Jordan Creek Town Center Whole Loan is structured with a hard lockbox and springing cash management. The borrowers are required to cause all tenants at the Jordan Creek Town Center Property (other than tenants under Seasonal Leases (as defined below)) to pay rents (other than Non-Core Income (as defined below) directly into a lockbox account controlled by the lender, and to deposit any rents otherwise received by the borrowers (other than Non-Core Income) into the lockbox account within two business days after receipt. Prior to a Cash Management Period, all funds in the lockbox account will be disbursed to the borrowers’ operating account. During the continuance of a Cash Management Period or an Anchor Tenant Trigger, all funds deposited into the lockbox account are required to be swept each business day into a cash management account controlled by the lender, to be applied and disbursed to pay (i) the tax and insurance escrow deposits, if any, described above, (ii) debt service under the Jordan Creek Town Center Whole Loan, (iii) provided that no default exists as to which the lender has initiated an enforcement action, to pay budgeted operating expenses (or actual operating expenses to the extent not more than 115% of budgeted expenses), and budgeted capital expenses (or actual capital expenses to the extent not more than 110% of budgeted expenses), and lender-approved extraordinary expenses, (iv) subject to clause (v) below, the replacement and rollover reserve deposits, if any, described above, (v) (x) if both an Anchor Tenant Trigger Event and a Cash Management Period are continuing, to deposit all excess cash flow after the disbursements under clauses (i) through (iv) above, or (y) if only an Anchor Tenant Trigger Event is continuing, to deposit all excess cash flow after the disbursements under clauses (i) through (iii) above, in each case, up to the Individual Anchor Threshold Amount, into the anchor tenant reserve, and (vi) (x) if no Cash Sweep Period (as defined below) is continuing, to the borrowers’ operating account, and (y) if a Cash Sweep Period is continuing, to an excess cash flow reserve to be held as additional collateral during the continuance of such Cash Sweep Period; provided that funds on deposit in such account will be made available to the borrowers for the payment of certain property-level expenses and other uses, including REIT distributions up to $200,000.
“Non-Core Income” means (i) certain de minimis amounts of rents from miscellaneous revenue items such as holiday photos and change retrieved from fountains (but will not include rent from Seasonal Leases) and (ii) certain rents generated pursuant to multi-property sponsorship and advertising programs which are directly attributable to the Jordan Creek Town Center Property.
“Seasonal Leases” means leases or license agreements having a maximum term of one year or less.
A “Cash Management Period” means a period commencing upon (i) an event of default under the Jordan Creek Town Center Whole Loan or (ii) the debt yield is less than 12% (the “CM Target Debt Yield”) as of the end of any two consecutive calendar quarters.
A “Cash Sweep Period” means a period commencing upon (i) an event of default under the Jordan Creek Town Center Whole Loan or (ii) the debt yield is less than 11% (the “CS Target Debt Yield,” and, together with the CM Target Debt Yield, each a “Target Debt Yield”) as of the end of any two consecutive calendar quarters.
A Cash Management Period or Cash Sweep Period resulting from an event of default will end if the lender has waived or the borrowers have cured such event of default.
| THE INFORMATION IN THIS STRUCTURAL AND COLLATERAL TERM SHEET IS NOT COMPLETE AND MAY BE AMENDED PRIOR TO THE TIME OF SALE. THIS TERM SHEET IS NOT AN OFFER TO SELL THESE SECURITIES AND IT IS NOT A SOLICITATION OF AN OFFER TO BUY THESE SECURITIES IN ANY JURISDICTION WHERE THE OFFER OR SALE IS NOT PERMITTED. | ||
| T-72 | ||
| Retail – Super Regional Mall | Loan #4 | Cut-off Date Balance: | $61,000,000 | |
| 101 Jordan Creek Parkway | Jordan Creek Town Center | Cut-off Date LTV: | 53.0% | |
| West Des Moines, IA 50266 | UW NCF DSCR: | 1.93x | ||
| UW NOI Debt Yield: | 14.4% |
A Cash Management Period or Cash Sweep Period resulting from a decline below the applicable Target Debt Yield will end if the borrowers have maintained a debt yield equal to or in excess of the applicable Target Debt Yield for two consecutive calendar quarters or have either (i) prepaid the Jordan Creek Town Center Whole Loan, (ii) delivered cash to the lender, or (iii) delivered a letter of credit to the lender, in each case in an amount which if subtracted from the outstanding principal balance of the Jordan Creek Town Center Whole Loan would cause the debt yield to equal or exceed the applicable Target Debt Yield.
For purposes of determining whether a Cash Sweep Period due to a decline in debt yield has been cured, the debt yield will be calculated net of funds in the excess cash flow reserve, provided that following any such calculation such funds may not be released unless a Cash Sweep Period no longer exists without giving credit to such amounts.
Upon the end of a Cash Sweep Period, all remaining funds in the Cash Management Account will be disbursed to the borrowers.
Release of Property. The borrowers may obtain the release of (A) one or more parcels (including “air rights” parcels but excluding certain anchor tenant premises identified in the Jordan Creek Town Center Whole Loan documents (each, an “Anchor Parcel”)) or outlots, or (B) one or more Acquired Parcels or Expansion Parcels (each as defined below), including, if applicable, any Anchor Parcel that is an Expansion Parcel (each, a “Release Parcel”), upon satisfaction of specified conditions including, among other things, that (i) there is no event of default, (ii) the Release Parcel (unless it is an Expansion Parcel) is vacant, non-income producing and unimproved or non-income producing and improved only by landscaping, utility facilities that are either readily re-locatable or will continue to service the remaining Jordan Creek Town Center Property or surface parking areas, (iii) the borrowers deliver evidence that the parcel subject to release is not necessary for the borrowers’ operation or use of the remaining Jordan Creek Town Center Property and may be readily separated from the Jordan Creek Town Center Property without a material diminution in value, (iv) the parcel subject to release has been legally subdivided from the Jordan Creek Town Center Property and after giving effect to such transfer, the release parcel and the remaining Jordan Creek Town Center Property conform to legal requirements and constitute separate tax lots (or all action has been taken to effectuate the same), (v) the parcel subject to the release is not necessary for the remaining portion of the Jordan Creek Town Center Property to comply with zoning or legal requirements, (vi) receipt of a rating agency confirmation from the applicable rating agencies (provided that such confirmation will not be required for release of an Expansion Parcel or if the rating agency has waived review or failed to respond within 30 days to a request for such confirmation), and (vii) the release will not result in a loan-to-value ratio that does not comply with REMIC guidelines provided that the borrowers may prepay the Jordan Creek Town Center Whole Loan to meet such condition (without payment of a yield maintenance premium), unless the lender receives an opinion of counsel that the issuing entity will not fail to maintain its status as a REMIC trust as a result of the release of the release parcel.
Substitution. The borrowers are also permitted to obtain the release of collateral parcels (each, an “Exchange Parcel”) from the lien of the mortgage in exchange for the substitution of new parcels in which the borrowers acquire a fee or leasehold interest (each, an “Acquired Parcel”) as collateral for the Jordan Creek Town Center Whole Loan upon 20 days’ prior notice, subject to the satisfaction of certain conditions, including among other things, that: (i) there is no event of default, (ii) the Exchange Parcel (unless it is an Expansion Parcel) is vacant, non-income producing and unimproved or improved only by landscaping, surface parking or utility facilities that are readily re-locatable or that will continue to serve the Jordan Creek Town Center Property (and the borrowers are able to make certain zoning representations as to the Acquired Parcel to the same extent as made with respect to the Exchange Parcel), (iii) the Acquired Parcel is reasonably equivalent in value to the Exchange Parcel, as established by a letter of value from the appraiser which appraised the Jordan Creek Town Center Property or an appraiser of comparable experience selected by the borrowers, (iv) with respect to the Acquired Parcel, the borrowers have delivered, among other things (a) unless the Acquired Parcel is already covered by the environmental report delivered at origination, an environmental report indicating no hazardous substances except for nominal amounts (except as permitted under clause (d) below), (b) security documents creating a mortgage lien on the Acquired Parcel, and title insurance, (c) if the Acquired Parcel is improved, subject to certain exceptions, a property condition report indicating that the Acquired Parcel is in good condition, and (d) if repairs are recommended by the property condition report or if the environmental report discloses the presence of hazardous materials at the Acquired Parcel, and the cost of such repairs or remediation is reasonably likely to exceed $8,500,000, cash or an indemnity from the guarantor, certain of its affiliates, or an entity otherwise meeting ratings or financial tests set forth in the related Whole Loan documents, in an amount equal to 125% of any estimated repairs or remediation costs, as applicable, (e) the loan-to-value ratio of the remaining property (after giving effect to such substitution) is equal to or less than 125% (in compliance with REMIC guidelines), provided that the borrowers may prepay the Jordan Creek Town Center Whole Loan in order to meet such condition (without payment of a yield maintenance premium), unless the lender receives an opinion of counsel that the issuing entity will not fail to maintain its status as a REMIC trust as a result of the release of the substitution, and (f) the lender has received a rating agency confirmation from the applicable rating agencies.
Right of First Offer/Right of First Refusal. In the event Century Theatres exercises its right to propose a change in the primary use of its space to another use compatible with the other uses then existing at the related shopping center, the borrower has the right to terminate the related lease and recapture such space. However, in the event of a proposed lease or sale by the borrower (or an affiliate) of any premises within the Jordan Creek Town Center Property for the operation of a motion picture theater at any time within three years after the date of such termination, Century Theatres will have a right of first refusal to lease or purchase (as the case may be) such space.
Addition of Parcels. In addition the borrowers have the right, at their own expense, to acquire one or more parcels of land that constitutes an integral part of, or adjoins or is proximately located near, the shopping center of which the Jordan Creek Town Center Property is a part, including any anchor tenant premises, which land was not owned by the borrowers on the origination date (such acquired land, an “Expansion Parcel”), to become additional collateral for the Jordan Creek Town Center Whole Loan, upon satisfaction of specified conditions including, among other things, that (i) there is no event of default, (ii) the borrowers acquire a fee simple or leasehold interest in the applicable Expansion Parcel, and (iii) the borrowers deliver, among other things, (a) unless the Expansion Parcel is already covered by the environmental report delivered at origination, an environmental report indicating no hazardous substances except for nominal amounts (except as permitted under clause (d) below), (b) security documents creating a mortgage lien on the Expansion Parcel, and title insurance, (c) if the Expansion Parcel is improved, subject to certain exceptions, a property condition report indicating that the Expansion Parcel is in good condition and (d) if repairs are recommended by the property condition report or if the environmental report discloses the presence of hazardous materials at the Expansion Parcel, and the cost of such repairs or remediation is reasonably likely to exceed $8,500,000, cash or an indemnity from the guarantor, certain of its affiliates, or an entity otherwise meeting ratings or financial tests set forth in the loan documents, in an amount equal to 125% of any estimated repairs or remediation costs, as applicable.
| THE INFORMATION IN THIS STRUCTURAL AND COLLATERAL TERM SHEET IS NOT COMPLETE AND MAY BE AMENDED PRIOR TO THE TIME OF SALE. THIS TERM SHEET IS NOT AN OFFER TO SELL THESE SECURITIES AND IT IS NOT A SOLICITATION OF AN OFFER TO BUY THESE SECURITIES IN ANY JURISDICTION WHERE THE OFFER OR SALE IS NOT PERMITTED. | ||
| T-73 | ||
| Retail – Super Regional Mall | Loan #4 | Cut-off Date Balance: | $61,000,000 | |
| 101 Jordan Creek Parkway | Jordan Creek Town Center | Cut-off Date LTV: | 53.0% | |
| West Des Moines, IA 50266 | UW NCF DSCR: | 1.93x | ||
| UW NOI Debt Yield: | 14.4% |
Letter of Credit. None, provided that the borrower is permitted to deliver a letter of credit to cure a Cash Management Period or Cash Sweep Period caused by a decline in debt yield, as described above under “Lockbox and Cash Management.”
Terrorism Insurance. The Jordan Creek Town Center Whole Loan permits permit a terrorism insurance deductible of up to $1,000,000. In addition, the loan documents permit terrorism insurance to be obtained through a captive insurance program with Liberty IC Casualty LLC (“Liberty”), subject to satisfaction of the conditions set forth in the loan documents, including that, subject to the deductible above, all risk terrorism coverage in an amount equal to 100% of full replacement cost, and business interruption insurance coverage for 24 months, is provided, and that, subject to the deductible above, covered losses which are not reinsured by the federal government under the Terrorism Risk Insurance Reauthorization Act of 2019 (“TRIPRA”) and paid to Liberty are reinsured with a cut through endorsement acceptable to the lender and the rating agencies by insurance companies which satisfy the rating requirements set forth in the loan agreement. In addition, if TRIPRA is no longer in effect, the borrower will not be required to pay an annual premium for terrorism coverage in excess of two times the annual allocable amount of the total insurance premium that is then payable with respect to the property and business income insurance policies required under the loan documents (but without giving effect to the cost of the terrorism components of such insurance policies) obtained as of the date the applicable new terrorism insurance is being obtained. For so long as TRIPRA (A) remains in full force and effect and (B) continues to cover both foreign and domestic acts of terror, the lender must accept terrorism insurance for certified acts of terrorism as such terms are defined in TRIPRA.
| THE INFORMATION IN THIS STRUCTURAL AND COLLATERAL TERM SHEET IS NOT COMPLETE AND MAY BE AMENDED PRIOR TO THE TIME OF SALE. THIS TERM SHEET IS NOT AN OFFER TO SELL THESE SECURITIES AND IT IS NOT A SOLICITATION OF AN OFFER TO BUY THESE SECURITIES IN ANY JURISDICTION WHERE THE OFFER OR SALE IS NOT PERMITTED. | ||
| T-74 | ||
| Retail – Super Regional Mall | Loan #5 | Cut-off Date Balance: | $60,000,000 | |
| 1299 Galleria at Tyler | Galleria at Tyler | Cut-off Date LTV: | 50.0% | |
| Riverside, CA 92503 | UW NCF DSCR: | 1.96x | ||
| UW NOI Debt Yield: | 16.7% |
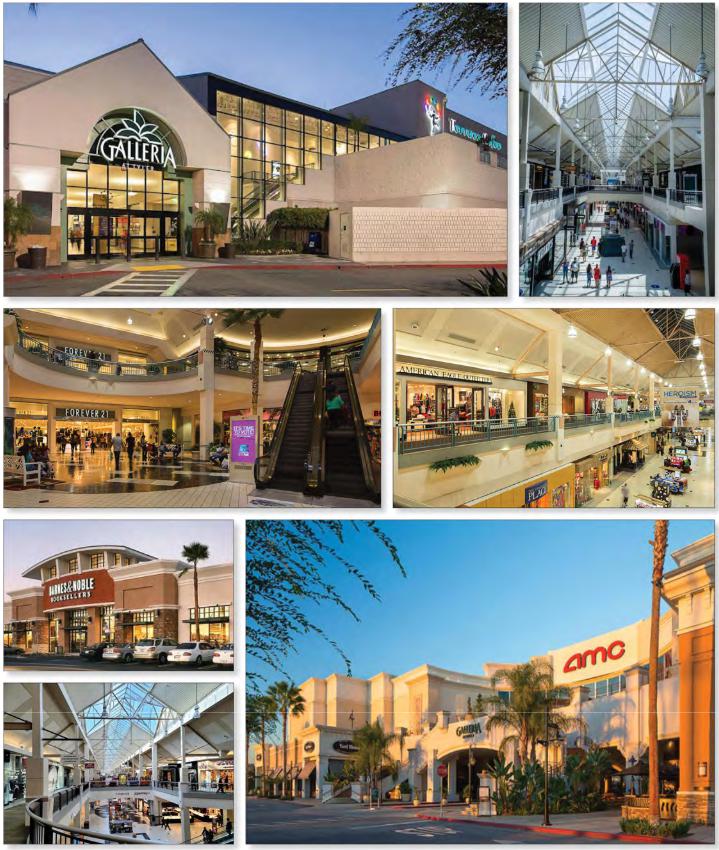
| THE INFORMATION IN THIS STRUCTURAL AND COLLATERAL TERM SHEET IS NOT COMPLETE AND MAY BE AMENDED PRIOR TO THE TIME OF SALE. THIS TERM SHEET IS NOT AN OFFER TO SELL THESE SECURITIES AND IT IS NOT A SOLICITATION OF AN OFFER TO BUY THESE SECURITIES IN ANY JURISDICTION WHERE THE OFFER OR SALE IS NOT PERMITTED. | ||
| T-75 | ||
| Retail – Super Regional Mall | Loan #5 | Cut-off Date Balance: | $60,000,000 | |
| 1299 Galleria at Tyler | Galleria at Tyler | Cut-off Date LTV: | 50.0% | |
| Riverside, CA 92503 | UW NCF DSCR: | 1.96x | ||
| UW NOI Debt Yield: | 16.7% |
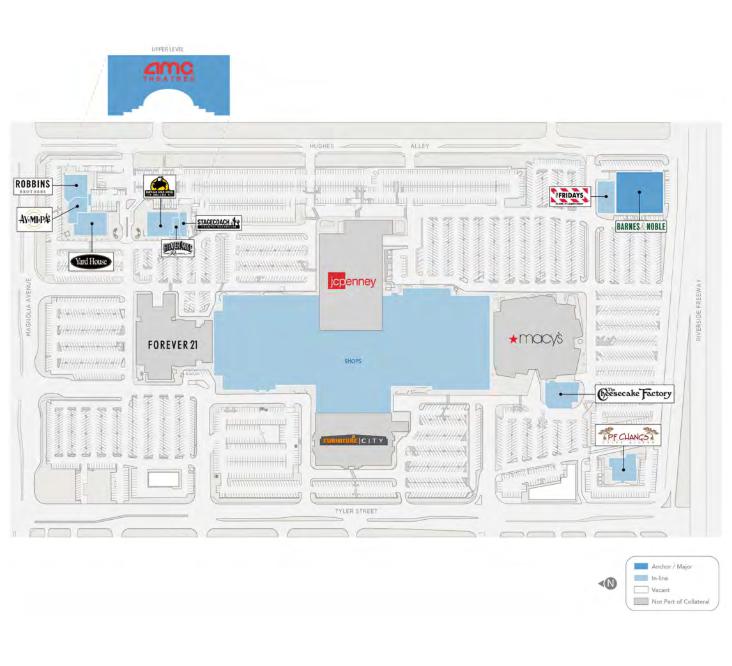
| THE INFORMATION IN THIS STRUCTURAL AND COLLATERAL TERM SHEET IS NOT COMPLETE AND MAY BE AMENDED PRIOR TO THE TIME OF SALE. THIS TERM SHEET IS NOT AN OFFER TO SELL THESE SECURITIES AND IT IS NOT A SOLICITATION OF AN OFFER TO BUY THESE SECURITIES IN ANY JURISDICTION WHERE THE OFFER OR SALE IS NOT PERMITTED. | ||
| T-76 | ||
| Retail – Super Regional Mall | Loan #5 | Cut-off Date Balance: | $60,000,000 | |
| 1299 Galleria at Tyler | Galleria at Tyler | Cut-off Date LTV: | 50.0% | |
| Riverside, CA 92503 | UW NCF DSCR: | 1.96x | ||
| UW NOI Debt Yield: | 16.7% |
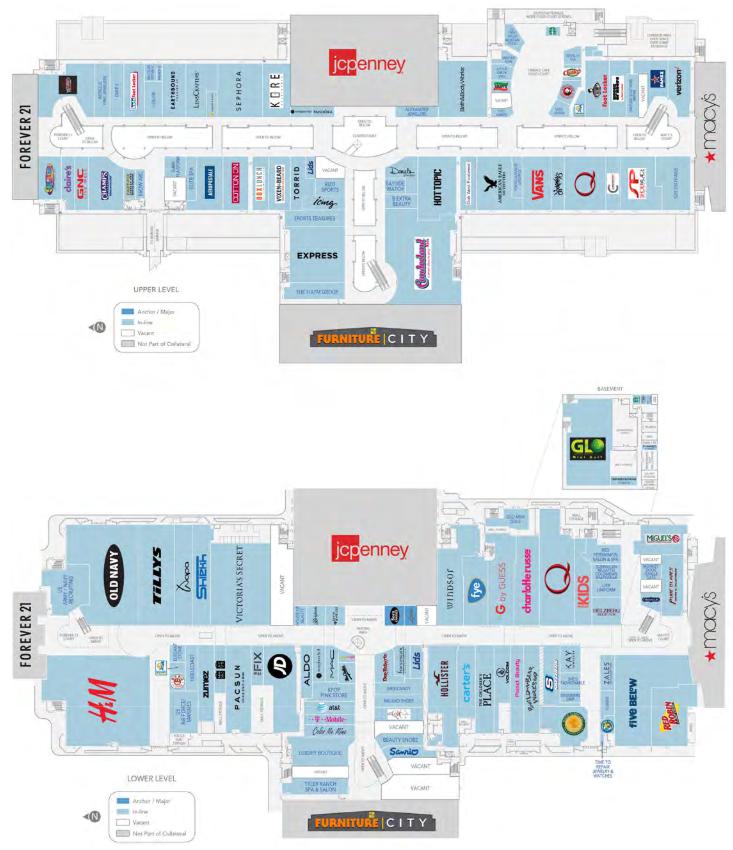
| THE INFORMATION IN THIS STRUCTURAL AND COLLATERAL TERM SHEET IS NOT COMPLETE AND MAY BE AMENDED PRIOR TO THE TIME OF SALE. THIS TERM SHEET IS NOT AN OFFER TO SELL THESE SECURITIES AND IT IS NOT A SOLICITATION OF AN OFFER TO BUY THESE SECURITIES IN ANY JURISDICTION WHERE THE OFFER OR SALE IS NOT PERMITTED. | ||
| T-77 | ||
| Retail – Super Regional Mall | Loan #5 | Cut-off Date Balance: | $60,000,000 | |
| 1299 Galleria at Tyler | Galleria at Tyler | Cut-off Date LTV: | 50.0% | |
| Riverside, CA 92503 | UW NCF DSCR: | 1.96x | ||
| UW NOI Debt Yield: | 16.7% |

| THE INFORMATION IN THIS STRUCTURAL AND COLLATERAL TERM SHEET IS NOT COMPLETE AND MAY BE AMENDED PRIOR TO THE TIME OF SALE. THIS TERM SHEET IS NOT AN OFFER TO SELL THESE SECURITIES AND IT IS NOT A SOLICITATION OF AN OFFER TO BUY THESE SECURITIES IN ANY JURISDICTION WHERE THE OFFER OR SALE IS NOT PERMITTED. | ||
| T-78 | ||
| Mortgage Loan No. 5 – Galleria at Tyler |
| Mortgage Loan Information | Property Information | ||||||
| Mortgage Loan Seller: | BANA | Single Asset/Portfolio: | Single Asset | ||||
| Credit Assessment (Fitch/KBRA/Moody’s): | NR/NR/Baa1 | Location: | Riverside, CA 92503 | ||||
| Original Balance(1): | $60,000,000 | General Property Type: | Retail | ||||
| Cut-off Date Balance(1): | $60,000,000 | Detailed Property Type: | Super Regional Mall | ||||
| % of Initial Pool Balance: | 6.1% | Title Vesting: | Fee | ||||
| Loan Purpose: | Refinance | Year Built/Renovated: | 1970/1991; 2007 | ||||
| Borrower Sponsors(2): | Brookfield Properties Retail | Size: | 565,913 SF | ||||
| Holding LLC and Teachers' | Cut-off Date Balance Per SF(1): | $265 | |||||
| Retirement System of the State of | Maturity Date Balance Per SF(1): | $265 | |||||
| Illinois | Property Manager: | Brookfield Properties Retail Inc. | |||||
| Guarantor: | GGP-TRS L.L.C. | (borrower-related) | |||||
| Mortgage Rate: | 7.9190% | ||||||
| Note Date: | 12/13/2023 | ||||||
| Maturity Date: | 1/1/2029 | ||||||
| Term to Maturity: | 60 months | Underwriting and Financial Information | |||||
| Amortization Term: | 0 months | UW NOI: | $24,985,593 | ||||
| IO Period: | 60 months | UW NCF: | $23,644,379 | ||||
| Seasoning: | 4 months | UW NOI Debt Yield(1): | 16.7% | ||||
| Prepayment Provisions: | L(28),D(25),O(7) | UW NCF Debt Yield(1): | 15.8% | ||||
| Lockbox/Cash Mgmt Status: | Hard/Springing | UW NOI Debt Yield at Maturity(1): | 16.7% | ||||
| Additional Debt Type(1): | Pari Passu | UW NCF DSCR(1): | 1.96x | ||||
| Additional Debt Balance(1): | $90,000,000 | Most Recent NOI: | $23,997,964 (11/30/2023 TTM) | ||||
| Future Debt Permitted (Type): | No (NAP) | 2nd Most Recent NOI: | $24,423,689 (12/31/2022) | ||||
| 3rd Most Recent NOI: | $19,509,271 (12/31/2021) | ||||||
| Reserves(3) | Most Recent Occupancy(5): | 90.3% (12/18/2023) | |||||
| Type | Initial | Monthly | Cap | 2nd Most Recent Occupancy: | 83.7% (12/31/2022) | ||
| RE Taxes: | $0 | Springing | NAP | 3rd Most Recent Occupancy: | 82.3% (12/31/2021) | ||
| Insurance: | $0 | Springing | NAP | Appraised Value (as of): | $300,000,000 (10/12/2023) | ||
| Replacement Reserve: | $0 | Springing | NAP | Appraised Value PSF: | $530 | ||
| TI/LC Reserve: | $0 | Springing | NAP | Cut-off Date LTV Ratio(1): | 50.0% | ||
| Other Reserves(4): | $9,924,378 | $0 | NAP | Maturity Date LTV Ratio(1): | 50.0% | ||
| Sources and Uses | ||||||
| Sources | Proceeds | % of Total | Uses | Proceeds | % of Total | |
| Whole Loan Amount(1): | $150,000,000 | 91.8% | Loan Payoff: | $152,794,561 | 93.5% | |
| Borrower Sponsor Equity: | $13,330,744 | 8.2% | Upfront Reserves: | $9,924,378 | 6.1% | |
| Closing Costs: | $611,806 | 0.4% | ||||
| Total Sources: | $163,330,744 | 100.0% | Total Uses: | $163,330,744 | 100.0% | |
| (1) | The Galleria at Tyler Mortgage Loan (as defined below) is part of the Galleria at Tyler Whole Loan (as defined below), which is evidenced by nine pari passu promissory notes with an aggregate principal balance of $150,000,000. The Cut-off Date Balance PSF, Maturity Date Balance PSF, UW NOI Debt Yield, UW NCF Debt Yield, UW NOI Debt Yield at Maturity, UW NCF DSCR, Cut-off Date LTV Ratio and Maturity Date LTV Ratio numbers presented above are based on the aggregate principal balance of the promissory notes comprising the Galleria at Tyler Whole Loan. |
| (2) | Brookfield Properties Retail Holding LLC, one of the borrower sponsors, is related to the borrower sponsor for the Kenwood Towne Center Whole Loan, the Jordan Creek Town Center Whole Loan, and the Staten Island Mall Whole Loan. |
| (3) | See “Escrows and Reserves” below for further discussion. |
| (4) | Other Reserves is comprised of $4,687,691 for outstanding landlord obligations, $236,687 for gap rent and a $5,000,000 general reserve for replacements and lease rollover expenditures. |
| (5) | The Galleria at Tyler Property (as defined below) was 96.2% occupied including temporary tenants. |
The Mortgage Loan. The fifth largest mortgage loan (the “Galleria at Tyler Mortgage Loan”) is part of a whole loan (the “Galleria at Tyler Whole Loan”) that is evidenced by nine pari passu promissory notes in the aggregate original principal amount of $150,000,000 and secured by a first priority fee mortgage encumbering a 565,913 SF super regional mall located in Riverside, California (the “Galleria at Tyler Property”). The Galleria at Tyler Whole Loan was co-originated by Bank of America, N.A., Deutsche Bank AG, New York Branch and Societe Generale Financial Corporation. The Galleria at Tyler Mortgage Loan is evidenced by the controlling Note A-1-1, non-controlling Note A-1-2 and non-controlling Note A-1-3 with an aggregate original principal balance of $60,000,000. The remaining promissory notes comprising the Galleria at Tyler Whole Loan are summarized in the below table. The Galleria at Tyler Whole Loan will be serviced pursuant to the pooling and servicing agreement for the BANK5 Trust 2024-5YR6 securitization trust. See “Description of the Mortgage Pool—The Whole Loans—The Serviced Pari Passu Whole Loans” and “Pooling and Servicing Agreement” in the prospectus.
| THE INFORMATION IN THIS STRUCTURAL AND COLLATERAL TERM SHEET IS NOT COMPLETE AND MAY BE AMENDED PRIOR TO THE TIME OF SALE. THIS TERM SHEET IS NOT AN OFFER TO SELL THESE SECURITIES AND IT IS NOT A SOLICITATION OF AN OFFER TO BUY THESE SECURITIES IN ANY JURISDICTION WHERE THE OFFER OR SALE IS NOT PERMITTED. | ||
| T-79 | ||
| Retail – Super Regional Mall | Loan #5 | Cut-off Date Balance: | $60,000,000 | |
| 1299 Galleria at Tyler | Galleria at Tyler | Cut-off Date LTV: | 50.0% | |
| Riverside, CA 92503 | UW NCF DSCR: | 1.96x | ||
| UW NOI Debt Yield: | 16.7% |
| Galleria at Tyler Whole Loan Summary | |||||
| Note | Original Balance | Cut-off Date Balance | Note Holder | Controlling Piece | |
| A-1-1 | $30,000,000 | $30,000,000 | BANK5 Trust 2024-5YR6 | Yes | |
| A-1-2 | $20,000,000 | $20,000,000 | BANK5 Trust 2024-5YR6 | No | |
| A-1-3 | $10,000,000 | $10,000,000 | BANK5 Trust 2024-5YR6 | No | |
| A-2-1 | $20,000,000 | $20,000,000 | Benchmark 2024-V5 | No | |
| A-2-2 | $15,000,000 | $15,000,000 | Benchmark 2024-V5 | No | |
| A-2-3 | $10,000,000 | $10,000,000 | BMO 2024-5C3 | No | |
| A-3-1 | $20,000,000 | $20,000,000 | BMO 2024-5C3 | No | |
| A-3-2 | $20,000,000 | $20,000,000 | BMO 2024-5C3 | No | |
| A-3-3 | $5,000,000 | $5,000,000 | BBCMS 2024-5C25 | No | |
| Whole Loan | $150,000,000 | $150,000,000 | |||
The Borrower and the Borrower Sponsors. The borrower is Tyler Mall Limited Partnership, a Delaware limited partnership and single purpose entity with two independent directors. The non-recourse carveout guarantor is GGP-TRS L.L.C. The borrower sponsors are a joint venture between Brookfield Properties Retail Holding LLC (50.0%) and Teachers' Retirement System of the State of Illinois (“TRSIL”) (50.0%).
Brookfield Properties Retail Holding LLC is a subsidiary of Brookfield Corporation, a diversified global real estate company that owns, operates and develops office, retail, multifamily, industrial, hospitality, triple net lease, student housing and manufactured housing assets. Brookfield owns more than 160 retail assets across seven countries, totaling approximately 130 million SF.
TRSIL is an Illinois state government agency that assists teachers and other educational workers in Illinois with pensions and other financial benefits. The Illinois General Assembly created TRSIL in 1939 for the purpose of providing retirement annuities and disability and survivor benefits for educators employed in public schools outside the city of Chicago. As of December 31, 2023, TRSIL had approximately $68.5 billion of assets under management.
The Property. The Galleria at Tyler Property is a 565,913 SF super regional mall located in Riverside, California. The Galleria at Tyler Property opened in 1970, was most recently renovated in 2007 and provides parking via 5,700 surface parking and parking garage spaces (approximately 10.1 spaces per 1,000 SF). The Galleria at Tyler Property is anchored by non-collateral tenants JC Penney, Macy’s, Forever 21, Furniture City and collateral tenant AMC and has many other well-known national tenants including Barnes & Noble, Old Navy, Victoria’s Secret and H&M. Additionally, the Galleria at Tyler Property has a diverse mix of dining offerings, with operators such as Ay Mi Pa, Yard House, TGI Friday’s, Buffalo Wild Wings, and The Cheesecake Factory.
The Galleria at Tyler Property has a granular rent roll, with no tenant occupying more than 12.4% of total rentable SF or contributing greater than 9.0% of the total underwritten rent. The top 10 tenants at the Galleria at Tyler Property represent 36.4% of total SF and generate 26.3% of total underwritten rent. The Galleria at Tyler Property was 90.3% occupied as of December 18, 2023 (96.2% occupied including temporary tenants) by over 120 unique tenants. The Galleria at Tyler Property has maintained a 5-year average occupancy of 95.3%, including temporary tenants.
The borrower sponsors have owned the Galleria at Tyler Property since 2002 and since 2019, they have invested approximately $16.2 million in capital expenditures, tenant improvements and leasing commissions. The borrower sponsors have plans to invest an additional $2.5 million through 2025. In 2021 and 2022, the borrower sponsors executed 37 leases (8 new and 29 renewals) comprising 68,638 SF.
Over the trailing-12 months ended October 31, 2023, the Galleria at Tyler Property generated total sales of approximately $217 million. Over the same time period, inline tenants (less than 10,000 SF) generated sales of approximately $561 PSF (occupancy cost of 14.6%).
The following table contains sales history for the Galleria at Tyler Property:
| Sales History(1) | ||||
| 2020(2) | 2021 | 2022 | TTM October 2023 | |
| Gross Mall Sales(3) | $129,668,503 | $223,554,180 | $222,098,118 | $216,594,512 |
| Estimated Macy’s Sales(4) | $23,500,000 | $39,900,000 | $46,500,000 | NAV |
| Estimated JC Penney Sales(4) | $9,800,000 | $15,900,000 | $14,700,000 | NAV |
| Sales PSF (Inline < 10,000 SF) | $315 | $631 | $605 | $561 |
| Occupancy Cost (Inline < 10,000 SF) | 23.8% | 10.7% | 13.3% | 14.6% |
| (1) | Information is as of October 31, 2023, as provided by the borrower sponsors, and only includes tenants reporting sales. |
| (2) | The Galleria at Tyler Property closed due to the COVID-19 pandemic from March 16, 2020 through May 26, 2020. |
| (3) | Excludes estimated sales for the non-collateral tenants, JC Penney and Macy’s. |
| (4) | Represents estimated sales as per the appraisal. |
| THE INFORMATION IN THIS STRUCTURAL AND COLLATERAL TERM SHEET IS NOT COMPLETE AND MAY BE AMENDED PRIOR TO THE TIME OF SALE. THIS TERM SHEET IS NOT AN OFFER TO SELL THESE SECURITIES AND IT IS NOT A SOLICITATION OF AN OFFER TO BUY THESE SECURITIES IN ANY JURISDICTION WHERE THE OFFER OR SALE IS NOT PERMITTED. | ||
| T-80 | ||
| Retail – Super Regional Mall | Loan #5 | Cut-off Date Balance: | $60,000,000 | |
| 1299 Galleria at Tyler | Galleria at Tyler | Cut-off Date LTV: | 50.0% | |
| Riverside, CA 92503 | UW NCF DSCR: | 1.96x | ||
| UW NOI Debt Yield: | 16.7% |
The following table contains anchor and major tenant sales history at the Galleria at Tyler Property:
| Major Tenant Sales History(1) | |||||
| Tenant | SF | 2020 Sales(2) PSF/Screen | 2021 Sales PSF/Screen | 2022 Sales PSF/Screen | TTM October 2023 Sales PSF/Screen |
| AMC(3) | 70,000 | $122,879 | $407,093 | $645,462 | $748,645 |
| Barnes & Noble | 25,000 | $153 | $247 | $261 | $248 |
| H&M | 20,799 | $144 | $271 | $274 | $237 |
| Glo Mini Golf | 14,961 | $15 | $75 | $119 | $151 |
| Old Navy | 14,504 | $298 | $434 | $395 | $388 |
| Q | 14,113 | $39 | $175 | $117 | $132 |
| Victoria's Secret | 12,000 | $316 | $880 | $728 | $552 |
| The Cheesecake Factory | 10,047 | $666 | $1,061 | $1,282 | $1,297 |
| Yard House | 10,001 | $622 | $1,040 | $1,156 | $1,118 |
| P.F. Chang's | 8,861 | $411 | $569 | $590 | $555 |
| Tilly's | 8,505 | $310 | $614 | $533 | $450 |
| TGI Friday's | 7,801 | $252 | $460 | $487 | $450 |
| Buffalo Wild Wings | 7,800 | $694 | $546 | $689 | $680 |
| Robbins Brothers | 7,498 | $639 | $847 | $708 | $533 |
| Express | 7,033 | $97 | $219 | $216 | $175 |
| (1) | Information is as of October 31, 2023, as provided by the borrower sponsors. |
| (2) | The Galleria at Tyler Property closed due to the COVID-19 pandemic from March 16, 2020 through May 26, 2020. |
| (3) | TTM Sales for AMC are as of September 2023, and are provided by the tenant. AMC Sales are based on 16 screens. |
Major Tenants.
AMC (70,000 SF, 12.4% of NRA, 9.0% of UW Rent). AMC (Moody’s/S&P: Caa1/CCC+) is the largest movie theater chain in the United States and in the world. With best-in-class amenities including AMC Signature Recliners, expanded and enhanced food and beverage menus, premium presentation experiences and a robust rewards program, AMC is recognized as an industry leader. AMC currently operates 7,712 total screens at 591 locations, with an average of 13.0 screens per site. AMC has been a tenant at the Galleria at Tyler Property since 2007 and in 2023, AMC exercised its first renewal option from January 1, 2024 through December 31, 2028. AMC has two 5-year renewal options remaining with six months' notice at fixed rents. AMC has 16 screens at Galleria at Tyler Property and reported sales of $748,645 per screen for the trailing-12 months ended October 31, 2023. Reported sales per screen were $645,462, $407,093 and $122,879 for 2022, 2021 and 2020, respectively.
Barnes & Noble (25,000 SF, 4.4% of NRA, 2.7% of UW Rent). Barnes & Noble is the world's largest retail bookseller and a leading retailer of content, digital media and educational products. The company operates approximately 600 Barnes & Noble bookstores across the United States and one of the web's largest e-commerce sites, BN.com. Barnes & Noble has been a tenant at the Galleria at Tyler Property since 2001 and, in 2023, extended its lease for five years from February 1, 2024 through January 31, 2029. Barnes & Noble reported sales at the Galleria at Tyler Property of $248 PSF for the trailing-12 months ended October 31, 2023. Reported sales PSF were $261, $247 and $153 for 2022, 2021 and 2020, respectively.
H&M (20,799 SF, 3.7% of NRA, 2.8% of UW Rent). H&M (Hennes & Mauritz) (S&P: BBB) is a global retailer offering affordable apparel for men, women and children. H&M was incorporated in 1947 and remains under the control of the family of founder Erling Persson. H&M group’s brands are H&M, H&M Home, COS, Weekday, Monki, & Other Stories, ARKET, Afound and Singular Society. H&M operates approximately 4,375 stores across 77 markets with approximately 150,000 employees. H&M has been a tenant at the Galleria at Tyler Property since 2007 and, in 2022, extended its lease for ten years to an expiration date of January 31, 2032. H&M has two 3-year renewal options with 180 days' notice at fixed rents. H&M reported sales at the Galleria at Tyler Property of $237 PSF for the trailing-12 months ended October 31, 2023. Reported sales PSF were $274, $271 and $144 for 2022, 2021 and 2020, respectively.
| THE INFORMATION IN THIS STRUCTURAL AND COLLATERAL TERM SHEET IS NOT COMPLETE AND MAY BE AMENDED PRIOR TO THE TIME OF SALE. THIS TERM SHEET IS NOT AN OFFER TO SELL THESE SECURITIES AND IT IS NOT A SOLICITATION OF AN OFFER TO BUY THESE SECURITIES IN ANY JURISDICTION WHERE THE OFFER OR SALE IS NOT PERMITTED. | ||
| T-81 | ||
| Retail – Super Regional Mall | Loan #5 | Cut-off Date Balance: | $60,000,000 | |
| 1299 Galleria at Tyler | Galleria at Tyler | Cut-off Date LTV: | 50.0% | |
| Riverside, CA 92503 | UW NCF DSCR: | 1.96x | ||
| UW NOI Debt Yield: | 16.7% |
The following table presents certain information relating to the tenancy at the Galleria at Tyler Property:
| Tenant Summary(1) | ||||||||||||
| October 2023 TTM Sales(3) | ||||||||||||
| Tenant Name | Credit Rating (Moody’s /Fitch/S&P)(2) | Tenant SF | Approx% of SF | Annual UW Rent | % of Total Annual UW Rent | Annual UW Rent PSF | Sales $ | Sales PSF/ Screen | Occ Cost % | Lease Exp. |
Renewal Options | Term. Options (Y/N) |
| Non-Collateral Anchors | ||||||||||||
| JC Penney | NR/NR/NR | 165,566 | 26.6% | $0 | N/A | N/A | $14,700,000 | $89 | N/A | N/A | N/A | N/A |
| Macy’s | Ba1/BBB- /BB+ | 157,384 | 25.3% | $0 | N/A | N/A | $46,500,000 | $295 | N/A | N/A | N/A | N/A |
| Forever 21 | NR/NR/NR | 153,500 | 24.7% | $0 | N/A | N/A | NAV | NAV | N/A | N/A | N/A | N/A |
| Furniture City | NR/NR/NR | 145,258 | 23.4% | $0 | N/A | N/A | NAV | NAV | N/A | N/A | N/A | N/A |
| Non-Collateral Anchors Subtotal/Wtd. Avg. | 621,708 | 100.0% | $0 | |||||||||
| Anchors/Major Tenants | ||||||||||||
| AMC(4) | Caa1/NR/CCC+ | 70,000 | 12.4% | $2,098,250 | 9.0% | $29.97 | $11,978,317 | $748,645 | 22.0% | 12/31/2028 | 2, 5-year | N |
| Barnes & Noble | NR/NR/NR | 25,000 | 4.4% | $625,000 | 2.7% | $25.00 | $6,210,723 | $248 | 10.1% | 1/31/2029 | None | N |
| H&M | NR/NR/BBB | 20,799 | 3.7% | $663,000 | 2.8% | $31.88 | $4,929,042 | $237 | 14.4% | 1/31/2032 | 2, 3-year | N |
| Glo Mini Golf | NR/NR/NR | 14,961 | 2.6% | $237,868 | 1.0% | $15.90 | $2,254,864 | $151 | 18.0% | 5/31/2028 | None | N |
| Old Navy | Ba3/NR/BB | 14,504 | 2.6% | $386,725 | 1.7% | $26.66 | $5,628,525 | $388 | 8.7% | 6/30/2029 | None | Y(5) |
| Q(6) | NR/NR/NR | 14,113 | 2.5% | $249,159 | 1.1% | $17.65 | $1,866,238 | $132 | 17.5% | Various | None | N |
| Candeeland Kids | NR/NR/NR | 13,545 | 2.4% | $286,612 | 1.2% | $21.16 | NAV | NAP | NAP | 5/31/2030 | None | N |
| Victoria's Secret | Ba3/NR/BB- | 12,000 | 2.1% | $644,880 | 2.8% | $53.74 | $6,625,913 | $552 | 15.8% | 1/31/2033 | None | N |
| Five Below | NR/NR/NR | 11,169 | 2.0% | $357,408 | 1.5% | $32.00 | NAV | NAP | NAP | 1/31/2034 | 3, 5-year | N |
| The Cheesecake Factory | NR/NR/NR | 10,047 | 1.8% | $586,468 | 2.5% | $58.37 | $13,032,632 | $1,297 | 5.9% | 1/31/2027 | 1, 5-year | N |
| Major Tenants Subtotal/Wtd. Avg. | 206,138 | 36.4% | $6,135,371 | 26.3% | $29.76 | |||||||
| Other Tenants | 304,904 | 53.9% | $17,218,588 | 73.7% | $56.47 | |||||||
| Occupied Collateral Total / Wtd. Avg. | 511,042 | 90.3% | $23,353,958 | 100.0% | $45.70 | |||||||
| Vacant Space | 54,871 | 9.7% | $0 | 0.0% | $0.00 | |||||||
| Total/Wtd. Avg. | 565,913 | 100.0% | $23,353,958 | 100.0% | $45.70(7) | |||||||
| (1) | Information is based on the underwritten rent roll dated December 18, 2023, inclusive of rent steps through December 2024 and overage and percent in lieu rent as of the trailing twelve months ended October 2023 sales for certain tenants. Non-Collateral Anchors only pay expense reimbursements. |
| (2) | Certain ratings are those of the parent company whether or not the parent guarantees the lease. |
| (3) | All sales information presented herein with respect to the Galleria at Tyler Property is based upon information provided by the borrower sponsors. In certain instances, sales figures represent estimates because the tenants are not required to report, or otherwise may not have reported, sales information on a timely basis. Further, because sales are self-reported by tenants, such information is not independently verified by the borrower sponsors. Sales for JC Penney and Macy’s are estimates, as per the appraisal, and TTM October 2023 sales are shown as of year-end 2022. |
| (4) | TTM Sales for AMC are as of September 2023, and are provided by the tenant. AMC Sales are based on 16 screens. |
| (5) | Old Navy has the right to terminate the lease, if their sales for the period from July 1, 2023 through June 30, 2024 do not exceed $4,700,000 ($324 PSF), provided prior written notice is given by September 28, 2024. |
| (6) | Q represents Q Fashion and occupies 9,000 SF expiring on December 31, 2025 and 5,113 SF expiring on May 31, 2026. |
| (7) | Wtd. Avg. Annual UW Rent PSF excludes vacant space. |
| THE INFORMATION IN THIS STRUCTURAL AND COLLATERAL TERM SHEET IS NOT COMPLETE AND MAY BE AMENDED PRIOR TO THE TIME OF SALE. THIS TERM SHEET IS NOT AN OFFER TO SELL THESE SECURITIES AND IT IS NOT A SOLICITATION OF AN OFFER TO BUY THESE SECURITIES IN ANY JURISDICTION WHERE THE OFFER OR SALE IS NOT PERMITTED. | ||
| T-82 | ||
| Retail – Super Regional Mall | Loan #5 | Cut-off Date Balance: | $60,000,000 | |
| 1299 Galleria at Tyler | Galleria at Tyler | Cut-off Date LTV: | 50.0% | |
| Riverside, CA 92503 | UW NCF DSCR: | 1.96x | ||
| UW NOI Debt Yield: | 16.7% |
The following table presents certain information relating to the lease rollover schedule at the Galleria at Tyler Property:
| Lease Rollover Schedule(1)(2) | ||||||||
| Year | # of Leases Rolling | SF Rolling | Approx. % of SF Rolling | Approx. Cumulative % of SF Rolling | Total UW Rent Rolling | Approx. % of Total UW Rent Rolling | Approx. Cumulative % of Total UW Rent Rolling RollRolling | UW Rent PSF Rolling |
| MTM / 2023 | 6 | 13,055 | 2.3% | 2.3% | $400,433 | 1.7% | 1.7% | $30.67 |
| 2024 | 28 | 74,917 | 13.2% | 15.5% | $3,477,075 | 14.9% | 16.6% | $46.41 |
| 2025 | 16 | 37,350 | 6.6% | 22.1% | $2,449,166 | 10.5% | 27.1% | $65.57 |
| 2026 | 18 | 41,185 | 7.3% | 29.4% | $2,089,274 | 8.9% | 36.0% | $50.73 |
| 2027 | 13 | 46,819 | 8.3% | 37.7% | $2,487,894 | 10.7% | 46.7% | $53.14 |
| 2028 | 14 | 113,861 | 20.1% | 57.8% | $4,418,292 | 18.9% | 65.6% | $38.80 |
| 2029(3) | 5 | 56,031 | 9.9% | 67.7% | $1,995,303 | 8.5% | 74.2% | $35.61 |
| 2030 | 7 | 35,988 | 6.4% | 74.1% | $1,399,744 | 6.0% | 80.1% | $38.89 |
| 2031 | 1 | 1,663 | 0.3% | 74.4% | $125,333 | 0.5% | 80.7% | $75.37 |
| 2032 | 5 | 37,540 | 6.6% | 81.0% | $1,777,398 | 7.6% | 88.3% | $47.35 |
| 2033 | 6 | 20,884 | 3.7% | 84.7% | $1,333,208 | 5.7% | 94.0% | $63.84 |
| 2034 & Beyond | 7 | 31,749 | 5.6% | 90.3% | $1,400,838 | 6.0% | 100.0% | $44.12 |
| Vacant | 0 | 54,871 | 9.7% | 100.0% | $0 | 0.0% | 100.0% | $0.00 |
| Total/Wtd. Avg. | 126 | 565,913 | 100.0% | $23,353,958 | 100.0% | $45.70(4) | ||
| (1) | Information is based on the underwritten rent roll dated December 18, 2023, inclusive of rent steps through December 2024 and overage and percent in lieu rent as of the trailing twelve months ended October 2023 sales for certain tenants. |
| (2) | Certain tenants may have lease termination options that are exercisable prior to the originally stated expiration date of the related lease and are not considered in the rollover schedule. |
| (3) | Galleria at Tyler Whole Loan has a maturity date of January 1, 2029. |
| (4) | Wtd. Avg. UW Rent PSF Rolling excludes vacant space. |
The Market. The Galleria at Tyler Property is located in Riverside, California, approximately 55 miles east of Los Angeles International Airport, adjacent to Riverside Freeway and four miles east of I-15. Riverside is the largest city in the Inland Empire, the metropolitan region inland of and adjacent to coastal Southern California, bordering Los Angeles County to the west. The Inland Empire is home to over 4.7 million residents, a population base greater than that of 26 states. The Southern California Association of Governments expects the Inland Empire to grow to nearly 5.7 million residents through 2048 (roughly twice as fast as the rest of Southern California) due to its potential for more housing and job creation compared to other parts of the region.
The Galleria at Tyler Property’s trade area consists of a population of over 1.1 million residents with an average household income over $100,000. Workers in the area boost daytime spending downtown and in the surrounding area. Local industry drivers with the largest labor forces include local county and school officials, March Air Force Reserve base, UC Riverside, Kaiser Permanente, and Riverside Community hospital, totaling approximately 50,000 employees.
The Galleria at Tyler Property benefits from proximity to multiple colleges and universities within a fifteen-minute drive, including the University of California, Riverside, with a student population of approximately 21,500. Additionally, California Air Resource Board, the primary government regulating agency for emissions, opened a new state-of-the-art Southern California headquarters in Riverside in 2022. Kaiser Permanente, the largest private employer in Riverside, is located a block west of the Galleria at Tyler Property.
According to the 2022 population within a 1-, 3- and 5-mile radius of the Galleria at Tyler Property was 18,955, 137,599 and 251,187, respectively. The 2022 average household income within the same radii was $80,749, $97,717 and $104,065, respectively.
The following table presents certain information relating to the appraisal’s market rent conclusions for the Galleria at Tyler Property:
| Market Rent Summary | |||
| Tenant Type | Market Rent (PSF) | Lease Term (Yrs) | Rental Increase Projection |
| 0 – 1,000 SF | $127.50 | 7 | 3.0% per annum |
| 1,000 – 2,499 SF | $60.00 | 7 | 3.0% per annum |
| 2,500 – 4,999 SF | $36.50 | 7 | 3.0% per annum |
| 5,000 – 9,900 SF | $37.50 | 7 | 3.0% per annum |
| Over 10,000 SF | $39.00 | 7 | 3.0% per annum |
| Jewelry | $120.00 | 7 | 3.0% per annum |
| Food Court | $152.50 | 7 | 3.0% per annum |
| Restaurants | $45.00 | 7 | 3.0% per annum |
| Kiosk | $250.00 | 7 | 3.0% per annum |
| Jr. Anchor | $28.50 | 10 | 10.0% Mid-term |
| Movie Theater | $29.50 | 10 | 10.0% Mid-term |
| THE INFORMATION IN THIS STRUCTURAL AND COLLATERAL TERM SHEET IS NOT COMPLETE AND MAY BE AMENDED PRIOR TO THE TIME OF SALE. THIS TERM SHEET IS NOT AN OFFER TO SELL THESE SECURITIES AND IT IS NOT A SOLICITATION OF AN OFFER TO BUY THESE SECURITIES IN ANY JURISDICTION WHERE THE OFFER OR SALE IS NOT PERMITTED. | ||
| T-83 | ||
| Retail – Super Regional Mall | Loan #5 | Cut-off Date Balance: | $60,000,000 | |
| 1299 Galleria at Tyler | Galleria at Tyler | Cut-off Date LTV: | 50.0% | |
| Riverside, CA 92503 | UW NCF DSCR: | 1.96x | ||
| UW NOI Debt Yield: | 16.7% |
The following table presents information regarding certain competitive properties to the Galleria at Tyler Property:
Competitive Property Summary(1)
| ||||||
| Galleria at Tyler | Moreno Valley Mall | Ontario Mills | Victoria Gardens | Inland Center | Outlets at Lake Elsinore | |
Year Built/ Renovated | 1970/1991/2007 | 1968/2008 | 1996/2007/2016 | 2004/2020 | 1966/2004 | 1992 |
| Total GLA (SF) | 1,187,616 | 1,064,318 | 1,421,635 | 1,403,000 | 630,000 | 318,000 |
| Ownership | Brookfield Properties Retail Holding LLC (50.0%), Teachers' Retirement System of the State of Illinois (50.0%) | International Growth Properties (100%) | JP Morgan Fleming (50%), Simon Property Group (50%) | QIC Limited (100%) | Macerich (MAC) (100%) | Private Owner (100%) |
| Distance to Property | N/A | 17.1 miles | 20.0 miles | 22.2 miles | 16.9 miles | 24.0 miles |
| Occupancy % | 90.3%(2) | 80.0% | 100.0% | 95.0% | 94.0% | 87.0% |
| Inline Sales PSF(3) | $561 | $427 | $737 | $1,108 | $623 | $316 |
| Anchors | JC Penney, Macy's, Furniture City, Forever 21, AMC Theatres | JC Penney, Macy's, Hibbett Sports | Burlington, Columbia Factory, Nordstrom Rack, Marshalls | JC Penney, Macy's, Sports Treasures, Lululemon | JC Penney, Macy's, H&M, Forever 21 | Famous Footwear Outlet, Bath & Body Outlet, Guess Factory Store |
| (1) | Source: Third Party Reports, unless otherwise indicated. |
| (2) | Information is based on the underwritten rent roll dated December 18, 2023. |
| (3) | Inline Sales PSF excludes Apple/Tesla as applicable. Galleria at Tyler Property Inline Sales PSF information is as of October 31, 2023, as provided by the borrower sponsor. |
Appraisal. The appraiser concluded to an “as-is” value for the Galleria at Tyler Property of $300,000,000 as of October 12, 2023.
Environmental Matters. According to the Phase I environmental site assessment dated October 12, 2023, there was no evidence of any recognized environmental conditions at the Galleria at Tyler Property.
| THE INFORMATION IN THIS STRUCTURAL AND COLLATERAL TERM SHEET IS NOT COMPLETE AND MAY BE AMENDED PRIOR TO THE TIME OF SALE. THIS TERM SHEET IS NOT AN OFFER TO SELL THESE SECURITIES AND IT IS NOT A SOLICITATION OF AN OFFER TO BUY THESE SECURITIES IN ANY JURISDICTION WHERE THE OFFER OR SALE IS NOT PERMITTED. | ||
| T-84 | ||
| Retail – Super Regional Mall | Loan #5 | Cut-off Date Balance: | $60,000,000 | |
| 1299 Galleria at Tyler | Galleria at Tyler | Cut-off Date LTV: | 50.0% | |
| Riverside, CA 92503 | UW NCF DSCR: | 1.96x | ||
| UW NOI Debt Yield: | 16.7% |
Operating History and Underwritten Net Cash Flow. The following table presents certain information relating to the historical operating performance and Underwritten Net Cash Flow at the Galleria at Tyler Property:
| Cash Flow Analysis | |||||||
| 2019 | 2020 | 2021 | 2022 | TTM November 2023 | UW(1) | UW PSF | |
| Base Rent | $21,286,629 | $19,588,464 | $16,032,131 | $18,149,491 | $20,074,413 | $21,777,012 | $38.48 |
| Overage Rent(2) | 677,626 | 191,399 | 1,929,273 | 3,020,101 | 2,148,900 | 1,576,946 | 2.79 |
| Percent In Lieu Rent | 51,704 | 270,840 | 786,315 | 230,683 | 83,273 | 0 | 0.00 |
| Gross Up of Vacant Space | 0 | 0 | 0 | 0 | 0 | 4,369,816 | 7.72 |
| Gross Potential Rent | $22,015,959 | $20,050,703 | $18,747,719 | $21,400,275 | $22,306,586 | $27,723,774 | $48.99 |
| Reimbursements | 11,622,000 | 11,301,120 | 7,997,303 | 8,797,039 | 8,326,854 | 8,750,398 | 15.46 |
| Specialty Leasing Income(3) | 3,548,392 | 2,384,991 | 4,059,320 | 4,086,308 | 4,057,312 | 4,135,711 | 7.31 |
| Other Income(4) | 709,847 | 221,383 | 237,625 | 378,850 | 468,399 | 241,610 | 0.43 |
| Net Rental Income | $37,896,198 | $33,958,197 | $31,041,967 | $34,662,472 | $35,159,151 | $40,851,493 | $72.19 |
| (Vacancy & Credit Loss) | (76,984) | (3,118,798) | (837,226) | 797,111 | 114,734 | (4,431,154) | (7.83) |
| Effective Gross Income | $37,819,214 | $30,839,398 | $30,204,741 | $35,459,583 | $35,273,885 | $36,420,340 | $64.36 |
| Real Estate Taxes(5) | 3,464,886 | 3,457,597 | 3,528,748 | 3,565,886 | 3,771,601 | 3,703,438 | 6.54 |
| Insurance | 231,728 | 283,173 | 473,191 | 605,908 | 594,172 | 652,715 | 1.15 |
| Other Operating Expenses | 6,957,543 | 6,169,325 | 6,693,531 | 6,864,099 | 6,910,148 | 7,078,594 | 12.51 |
| Total Operating Expenses | $10,654,157 | $9,910,094 | $10,695,470 | $11,035,894 | $11,275,921 | $11,434,747 | $20.21 |
| Net Operating Income | $27,165,057 | $20,929,304 | $19,509,271 | $24,423,689 | $23,997,964 | $24,985,593 | $44.15 |
| Replacement Reserves | 0 | 0 | 0 | 0 | 0 | 209,388 | 0.37 |
| TI/LC | 0 | 0 | 0 | 0 | 0 | 1,131,826 | 2.00 |
| Net Cash Flow | $27,165,057 | $20,929,304 | $19,509,271 | $24,423,689 | $23,997,964 | $23,644,379 | $41.78 |
| Occupancy % | 93.7% | 87.9% | 82.3% | 83.7% | 90.3%(6) | 87.9%(7) | |
| NOI DSCR(8) | 2.26x | 1.74x | 1.62x | 2.03x | 1.99x | 2.07x | |
| NCF DSCR(8) | 2.26x | 1.74x | 1.62x | 2.03x | 1.99x | 1.96x | |
| NOI Debt Yield(8) | 18.1% | 14.0% | 13.0% | 16.3% | 16.0% | 16.7% | |
| NCF Debt Yield(8) | 18.1% | 14.0% | 13.0% | 16.3% | 16.0% | 15.8% | |
| (1) | Based on the underwritten rent roll dated December 18, 2023, inclusive of rent steps through December 2024. |
| (2) | UW Overage Rent is based on the terms of applicable leases using TTM October 2023 sales figures. |
| (3) | Specialty Leasing Income includes rents from temporary tenants and revenue from kiosks, storage, vending and other miscellaneous revenue. |
| (4) | UW Other Income includes miscellaneous income and excludes lease termination income. |
| (5) | The UW real estate tax obligations for the Galleria at Tyler Property include assessments to pay debt service on revenue bonds with an original principal amount of $15,980,000 that relate to construction of parking improvements at the Galleria at Tyler Property. See “Description of the Mortgage Pool—Real Estate and Other Tax Considerations” in the prospectus. |
| (6) | Represents occupancy per the underwritten rent roll dated December 18, 2023. |
| (7) | Based on in-place vacancy and includes any known lease terminations or tenants known with high probability to be vacating. |
| (8) | Debt service coverage ratios and debt yields are based on the Galleria at Tyler Whole Loan. |
Escrows and Reserves.
Real Estate Taxes – During a Reserve Period (as defined below), the borrower is required to deposit monthly to a real estate tax reserve 1/12 of the annual estimated real estate taxes.
Insurance – During a Reserve Period, the borrower is required to deposit monthly 1/12 of the annual estimated insurance premiums to the insurance reserve unless the Galleria at Tyler Property is maintained under a blanket policy.
Replacement Reserve – During a Reserve Period, the borrower is required to deposit monthly approximately $17,449 to a reserve for replacements to the Galleria at Tyler Property.
TI/LC Reserve – During a Reserve Period, the borrower is required to deposit monthly approximately $94,318 for lease rollover expenditures.
Landlord Obligations Reserve – The Galleria at Tyler Whole Loan documents provide for an upfront reserve of $4,687,691 for outstanding tenant improvement allowances and leasing commissions.
Gap Rent Reserve – The Galleria at Tyler Whole Loan documents provide for an upfront reserve of $236,687 for gap rent reserves.
General Reserve – The Galleria at Tyler Whole Loan documents provide for an upfront reserve of $5,000,000 for replacements and lease rollover expenditures. Provided that no event of default exists, the lender will disburse to borrower the general reserve funds for replacements and rollover expenditures in accordance with the terms and conditions set forth in the Galleria at Tyler Whole Loan documents.
| THE INFORMATION IN THIS STRUCTURAL AND COLLATERAL TERM SHEET IS NOT COMPLETE AND MAY BE AMENDED PRIOR TO THE TIME OF SALE. THIS TERM SHEET IS NOT AN OFFER TO SELL THESE SECURITIES AND IT IS NOT A SOLICITATION OF AN OFFER TO BUY THESE SECURITIES IN ANY JURISDICTION WHERE THE OFFER OR SALE IS NOT PERMITTED. | ||
| T-85 | ||
| Retail – Super Regional Mall | Loan #5 | Cut-off Date Balance: | $60,000,000 | |
| 1299 Galleria at Tyler | Galleria at Tyler | Cut-off Date LTV: | 50.0% | |
| Riverside, CA 92503 | UW NCF DSCR: | 1.96x | ||
| UW NOI Debt Yield: | 16.7% |
A “Reserve Period” will commence upon a (i) Cash Management Period (as defined below) or (ii) General Reserve Disbursement Date (as defined below).
“General Reserve Disbursement Date” means the first date on which the borrower requests a disbursement from the general reserve account.
Lockbox and Cash Management. The Galleria at Tyler Whole Loan is structured with a hard lockbox and springing cash management. All rents from the Galleria at Tyler Property are required to be deposited directly to the lockbox by tenants upon delivery of a tenant direction letter. During a Cash Management Period (as defined below), funds will be transferred to the lender-controlled cash management account on each business day and disbursed according to the Galleria at Tyler Whole Loan documents. During a Cash Management Period, all excess cash is required to be held by the lender as additional security for the Galleria at Tyler Whole Loan; provided that excess cash will be disbursed at the direction of the borrower in the event of shortfalls in certain monthly expense items, so long as no event of event is continuing for which the lender has initiated an enforcement action.
A “Cash Management Period” will occur during the existence of any of: (i) an event of default, (ii) a Debt Yield Event (as defined below), or (iii) an Anchor Trigger Event (as defined below).
A “Debt Yield Event” will commence when, as of any date of determination, the debt yield based on the trailing two calendar quarter period immediately preceding such date of determination is less than 14.0% for two consecutive calendar quarters and will expire (x) on the date that the debt yield is 14.0% or greater for two consecutive calendar quarters, or (y) by partially prepaying the Galleria at Tyler Whole Loan or by delivering cash or a letter of credit, in each case, in an amount which, if applied to prepay the Galleria at Tyler Whole Loan, would cause the debt yield to be 14.0% or greater for two consecutive calendar quarters.
An “Anchor Trigger Event” will commence when any Anchor Tenant (as defined below): (i) (A) has “gone dark”, other than a temporary closure in connection with (x) restoration, repair or renovation, (y) compliance with applicable law, regulations and/or governmental mandates or (z) an event of force majeure or (B) has vacated its anchor parcel; or (ii) is the subject of a bankruptcy action, and will expire (i) with respect to a trigger under clause (i) above, such Anchor Tenant operates the demised premises (to the extent not subject to any permitted subletting) for a period of no less than 30 consecutive operating days; (ii) with respect to a trigger under clause (ii) above, such bankruptcy action is dismissed or the Anchor Tenant has emerged from such bankruptcy action; or (iii) for any trigger event, the Anchor Tenant parcel or a substantial portion thereof becomes owned or leased by one or more replacement occupants reasonably approved by the lender.
“Anchor Tenant” includes (i) non-collateral anchors, JC Penney, Macy’s, Forever 21 and Furniture City, (ii) collateral anchor AMC, and (iii) any replacement tenant who occupies all or substantially all of any such anchor space.
Release of Property. The borrower is entitled to release (i) one or more parcels or outlots, or (ii) one or more Acquired Parcels (as defined below) or Acquired Expansion Parcels (as defined below) (each a “Release Parcel”) in connection with the expansion or other development of the Galleria at Tyler Property upon satisfaction of the following conditions by the borrower: (a) the borrower provides notice of the details of the proposed release to the lender not less than ten days prior to the date of the release; (b) the Release Parcel is (i) not necessary for the borrower’s operation or use of the remaining Galleria at Tyler Property and (ii) may be readily separated from the applicable Galleria at Tyler Property without a material diminution in the value of the Galleria at Tyler Property; (c) no event of default is continuing; (d) the borrower delivers evidence to the lender that (i) the Release Parcel has been legally subdivided from the remainder of the Galleria at Tyler Property, (ii) the balance of the property after the release conforms to all legal requirements and constitutes a separate tax lot and (iii) the Release Parcel is not necessary for the Galleria at Tyler Property to comply in any material respect with any zoning, building, land use, parking or other legal requirements; (e) a title insurance endorsement is obtained with respect to the remainder of the Galleria at Tyler Property; (f) the borrower provides evidence that any such release of a Release Parcel will not result in an event of default or breach by the borrower under any material leases; (g) the remaining Galleria at Tyler Property remains physically open and available to the public; (h) except with respect to a release of the Acquired Expansion Parcel (as defined below), the Release Parcel is vacant, non-income producing and unimproved (unless these requirements are waived by the lender) or non-income producing and improved only by landscaping, utility facilities that are not required for the use of the remaining property (or such utility facilities will continue to serve the remaining property in place or be readily relocatable) or non-income producing surface parking areas; (i) the loan-to-value ratio immediately after the release of the Release Parcel remains less than or equal to 125%; and (j) the borrower has paid all reasonable out-of-pocket costs and expenses incurred by the lender in connection with the release of the Release Parcel and, after a securitization, the borrower pays to the lender a fee in the amount of $10,000.
An “Acquired Parcel” is a fee simple or leasehold interest to a parcel of the Galleria at Tyler Property that is acquired in a substitution in accordance with the loan documents.
An “Acquired Expansion Parcel” means any parcel of land, together with any improvements thereon located, (a) constituting an integral part of, or adjoining to, or proximately located near, the shopping center of which the Galleria at Tyler Property is a part, (b) that is not owned by the borrower on the origination date and (c) is not an Acquired Parcel and is acquired by the borrower after the origination date.
Terrorism Insurance. The borrower is required to obtain and maintain property insurance and business interruption insurance for 24 months plus a 365-day extended period of indemnity. Such insurance is required to cover perils of terrorism and acts of terrorism; provided that (a) the borrower is permitted to maintain terrorism coverage with a licensed captive insurance company that is affiliated with the borrower sponsors if certain conditions set forth in the related Galleria at Tyler Whole Loan documents are satisfied, and (b) the borrower will only be required to pay for terrorism insurance a maximum of two times the annual insurance premiums payable for the Galleria at Tyler Property at the time with respect to the property and business income or rental income insurance interruption policies (excluding the terrorism and earthquake components of such premiums). See “Risk Factors—Risks Relating to the Mortgage Loans—Terrorism Insurance May Not Be Available for All Mortgaged Properties” in the prospectus.
| THE INFORMATION IN THIS STRUCTURAL AND COLLATERAL TERM SHEET IS NOT COMPLETE AND MAY BE AMENDED PRIOR TO THE TIME OF SALE. THIS TERM SHEET IS NOT AN OFFER TO SELL THESE SECURITIES AND IT IS NOT A SOLICITATION OF AN OFFER TO BUY THESE SECURITIES IN ANY JURISDICTION WHERE THE OFFER OR SALE IS NOT PERMITTED. | ||
| T-86 | ||
| Hospitality – Full Service | Loan #6 | Cut-off Date Balance: | $49,900,000 | |
| 310 West 40th Street | Aliz Hotel Times Square | Cut-off Date LTV: | 34.9% | |
| New York, NY 10018 | UW NCF DSCR: | 2.98x | ||
| UW NOI Debt Yield: | 22.5% |

| THE INFORMATION IN THIS STRUCTURAL AND COLLATERAL TERM SHEET IS NOT COMPLETE AND MAY BE AMENDED PRIOR TO THE TIME OF SALE. THIS TERM SHEET IS NOT AN OFFER TO SELL THESE SECURITIES AND IT IS NOT A SOLICITATION OF AN OFFER TO BUY THESE SECURITIES IN ANY JURISDICTION WHERE THE OFFER OR SALE IS NOT PERMITTED. | ||
| T-87 | ||
| Hospitality – Full Service | Loan #6 | Cut-off Date Balance: | $49,900,000 | |
| 310 West 40th Street | Aliz Hotel Times Square | Cut-off Date LTV: | 34.9% | |
| New York, NY 10018 | UW NCF DSCR: | 2.98x | ||
| UW NOI Debt Yield: | 22.5% |
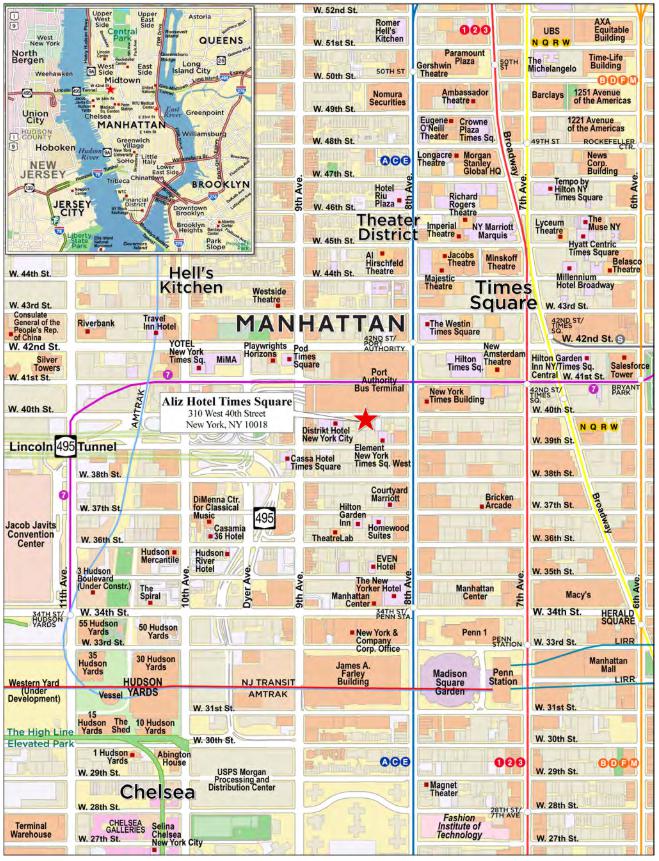
| THE INFORMATION IN THIS STRUCTURAL AND COLLATERAL TERM SHEET IS NOT COMPLETE AND MAY BE AMENDED PRIOR TO THE TIME OF SALE. THIS TERM SHEET IS NOT AN OFFER TO SELL THESE SECURITIES AND IT IS NOT A SOLICITATION OF AN OFFER TO BUY THESE SECURITIES IN ANY JURISDICTION WHERE THE OFFER OR SALE IS NOT PERMITTED. | ||
| T-88 | ||
| Mortgage Loan No. 6 – Aliz Hotel Times Square |
| Mortgage Loan Information | Property Information | |||||||
| Mortgage Loan Seller: | JPMCB | Single Asset/Portfolio: | Single Asset | |||||
| Credit Assessment (Fitch/KBRA/Moody’s): | A-/A/Aa2 | Location: | New York, NY 10018 | |||||
| Original Balance: | $49,900,000 | General Property Type: | Hospitality | |||||
| Cut-off Date Balance: | $49,900,000 | Detailed Property Type: | Full Service | |||||
| % of Initial Pool Balance: | 5.1% | Title Vesting: | Fee(2) | |||||
| Loan Purpose: | Refinance | Year Built/Renovated: | 2018/NAP | |||||
| Borrower Sponsor: | Helm Management, Inc. | Size: | 287 Rooms | |||||
| Guarantor: | Abraham Noy | Cut-off Date Balance Per Room: | $173,868 | |||||
| Mortgage Rate: | 6.8170% | Maturity Date Balance Per Room: | $173,868 | |||||
| Note Date: | 3/12/2024 | Property Manager: | Hersha Hospitality | |||||
| Maturity Date: | 4/1/2029 | Management L.P. | ||||||
| Term to Maturity: | 60 months | Underwriting and Financial Information | ||||||
| Amortization Term: | 0 months | UW NOI: | $11,209,379 | |||||
| IO Period: | 60 months | UW NCF: | $10,265,752 | |||||
| Seasoning: | 1 month | UW NOI Debt Yield: | 22.5% | |||||
| Prepayment Provisions: | L(25),D(29),O(6) | UW NCF Debt Yield: | 20.6% | |||||
| Lockbox/Cash Mgmt Status: | Hard / Springing | UW NOI Debt Yield at Maturity: | 22.5% | |||||
| Additional Debt Type: | NAP | UW NCF DSCR: | 2.98x | |||||
| Additional Debt Balance: | NAP | Most Recent NOI: | $11,413,670 (12/31/2023) | |||||
| Future Debt Permitted (Type): | No (NAP) | 2nd Most Recent NOI: | $9,032,179 (12/31/2022) | |||||
| Reserves(1) | 3rd Most Recent NOI: | $1,764,840 (12/31/2021) | ||||||
| Type | Initial | Monthly | Cap | Most Recent Occupancy: | 81.2% (12/31/2023) | |||
| RE Taxes: | $439,256 | $109,814 | NAP | 2nd Most Recent Occupancy: | 71.2% (12/31/2022) | |||
| Insurance: | $0 | Springing | NAP | 3rd Most Recent Occupancy: | 48.5% (12/31/2021) | |||
| FF&E Reserve: | $0 | 4% of Revenues | NAP | Appraised Value (as of): | $143,000,000 (12/11/2023) | |||
| Appraised Value Per Room: | $498,258 | |||||||
| Cut-off Date LTV Ratio: | 34.9% | |||||||
| Maturity Date LTV Ratio: | 34.9% | |||||||
| Sources and Uses | ||||||
| Sources | Proceeds | % of Total | Uses | Proceeds | % of Total | |
| Mortgage Loan Amount: | $49,900,000 | 100.0% | Loan Payoff(3): | $44,546,160 | 89.3% | |
| Return of Equity(4): | $3,422,056 | 6.9% | ||||
| Closing Costs: | $1,492,528 | 3.0% | ||||
| Upfront Reserves: | $439,256 | 0.9% | ||||
| Total Sources: | $49,900,000 | 100.0% | Total Uses: | $49,900,000 | 100.0% | |
| (1) | See “Escrows and Reserves” section below for further discussion. |
| (2) | The Aliz Hotel Times Square Property (as defined below) is subject to a master lease between the borrower, as landlord, and an affiliate of the borrower, as Master Tenant (as defined below). Both the borrower’s fee simple interest and the Master Tenant’s leasehold interest have been pledged as the collateral for the Aliz Hotel Times Square Mortgage Loan. See “Master Lease” section below. |
| (3) | A portion of the proceeds from the Aliz Hotel Times Square Mortgage Loan was used to pay off in full a prior secured loan (with an outstanding principal balance of $39,500,000) that went into maturity default in November 2020 and was subject to a foreclosure action that was subsequently discontinued by the parties at the time of origination of the Aliz Hotel Times Square Mortgage Loan in March 2024. As of the Cut-off date, there were no outstanding claims against the borrower by the prior lender with respect to the prior loan. |
| (4) | Return of Equity is inclusive of approximately $2.1 million allocated by the borrower sponsor towards the resolution of certain mechanics liens related to the Aliz Hotel Times Square Property. See “Mechanics Liens” below and “Description of the Mortgage Pool— Litigation and Other Considerations” in the prospectus. |
The Mortgage Loan. The sixth largest mortgage loan (the “Aliz Hotel Times Square Mortgage Loan”) is evidenced by a promissory note in the original principal amount of $49,900,000 and secured by a first priority fee mortgage encumbering a 287 room, full-service hospitality property located in New York, New York (the “Aliz Hotel Times Square Property”).
The Borrower and the Borrower Sponsor. The borrower for the Aliz Hotel Times Square Mortgage Loan is 310 Group, LLC, a special purpose, New York limited liability company. The borrower’s sole member is a Delaware limited liability company with one independent director and is required to be a special purpose entity during the term of the Aliz Hotel Times Square Mortgage Loan. The non-recourse carve-out guarantor of the Aliz Hotel Times Square Mortgage Loan is Abraham Noy, who is affiliated with the borrower sponsor. The borrower sponsor for the Aliz Hotel Times Square Mortgage Loan is Helm Management, Inc. (“Helm Management”), a New York corporation. Helm Management is a privately owned and operated property management, acquisition and development company with over 35 years of experience. Helm Management primarily focuses on New York City, with investments across several prominent Manhattan neighborhoods.
| THE INFORMATION IN THIS STRUCTURAL AND COLLATERAL TERM SHEET IS NOT COMPLETE AND MAY BE AMENDED PRIOR TO THE TIME OF SALE. THIS TERM SHEET IS NOT AN OFFER TO SELL THESE SECURITIES AND IT IS NOT A SOLICITATION OF AN OFFER TO BUY THESE SECURITIES IN ANY JURISDICTION WHERE THE OFFER OR SALE IS NOT PERMITTED. | ||
| T-89 | ||
| Hospitality – Full Service | Loan #6 | Cut-off Date Balance: | $49,900,000 | |
| 310 West 40th Street | Aliz Hotel Times Square | Cut-off Date LTV: | 34.9% | |
| New York, NY 10018 | UW NCF DSCR: | 2.98x | ||
| UW NOI Debt Yield: | 22.5% |
The Property. The Aliz Hotel Times Square Property is a AAA three-diamond rated, independently operated hospitality property built on a 0.11-acre site in New York, New York. Ground up construction for the Aliz Hotel Times Square Property started in 2015 and the property was delivered in 2018 as a 41-story, 287-room full-service hotel. The Aliz Hotel Times Square Property is located at 310 West 40th Street, within the Manhattan borough of New York City. Current hotel amenities include two food and beverage outlets, a concierge desk, business center, market and fitness center, which features an indoor cycling studio with peloton stationary bikes. Of the 287 guestrooms, 145 rooms are king suites, 128 are doubles and 14 are compliant with the Americans with Disabilities Act. Additionally, four of the guestrooms feature private outdoor terraces. Standard room amenities include a flat screen television, a work area, a sofa chair, a coffee maker, internet, and an iron and ironing board. Although there is no parking available at the Aliz Hotel Times Square Property, valet parking is provided to guests by a third party at a daily rate of $75.00. Within its first year of opening in 2018, the Aliz Hotel Times Square Property was named one of the top fifteen hotels in New York City by Travel+Leisure Magazine. The Aliz Hotel Times Square Property is the newest property within its competitive set as identified by an industry report with other properties within its competitive set having an average age in excess of 45 years. Furthermore, the Aliz Hotel Times Square Property is the largest hotel in its competitive set by room count.
Performance at the Aliz Hotel Times Square Property has rebounded from the COVID-19 pandemic, with 2023 ADR, RevPAR and NOI outperforming 2019 by 19.4%, 14.1% and 37.0%, respectively. In 2020, Helm Management replaced the prior manager, Crescent Resorts, with Hersha Hospitality Management L.P., a Pennsylvania limited partnership (“Hersha”), which has 30 years of experience specializing in the property management of non-union hotels located within New York City. Hersha currently manages a portfolio of 240 properties across the United States and Canada. Hersha is well versed in turn-key management, branding and construction, and has partnered with several private equity firms and publicly traded REITs to acquire, develop and reposition hotels. Hersha’s range of experience includes managing major hotel brands, including Renaissance, Marriott, Hilton, Hyatt and Moxy Hotels, among others.
The Aliz Hotel Times Square Property features two food and beverage outlets on site: FARMTOBURGER and Dear Irving on Hudson. FARMTOBURGER is available on the ground floor in the rear of the lobby, occupying 1,700 SF. The restaurant has 65 seats and focuses on serving burgers sourced from smaller grass-fed producers paired with organic vegetables and local bread. Dear Irving on Hudson occupies 2,400 SF on the 40th and 41st floors at the Aliz Hotel Times Square Property, the highest open-air hotel bar & lounge in Manhattan. The Dear Irving on Hudson menu is focused on cocktails, sommelier-selected wines, beers, as well as small plates. Dear Irving on Hudson has 150 seats available for daily use and the capacity to expand to accommodate up to 300 guests across the two floors during private events. Both food and beverage outlets are run by the same management team, Yves Restaurant Group, which currently owns and operates 11 establishments in Manhattan and employs a team of over 350 people. Both food and beverage outlets are responsible for paying on a monthly basis, the greater of (i) $15,000 or (ii) percentage rent equal to 11.0% of gross sales.
According to the appraisal, the property segmentation at the Aliz Hotel Times Square Property is estimated at 60% leisure, 35% commercial and 5% meeting and group. In 2023, excluding the National Guard (14.0% of total revenue), no other corporate account represents more than 0.9% of total revenue.
The following table presents certain information relating to the Occupancy, ADR and RevPAR of the Aliz Hotel Times Square Property, and its competitive set:
| Historical Occupancy, ADR, RevPAR | |||||||||
| Competitive Set(1) | Aliz Hotel Times Square Property(2) | Penetration Factor | |||||||
| Year | Occupancy | ADR | RevPAR | Occupancy | ADR | RevPAR | Occupancy | ADR | RevPAR |
| 12/31/2020 | 46.5% | $141.68 | $65.89 | 31.9% | $106.47 | $33.95 | 68.6% | 75.1% | 51.5% |
| 12/31/2021 | 58.2% | $194.79 | $113.29 | 48.5% | $139.04 | $67.42 | 83.4% | 71.4% | 59.5% |
| 12/31/2022 | 75.5% | $265.32 | $200.38 | 71.2% | $224.83 | $160.05 | 94.3% | 84.7% | 79.9% |
| 12/31/2023 | 79.4% | $289.63 | $229.95 | 81.2% | $241.23 | $195.81 | 102.3% | 83.3% | 85.2% |
Source: Industry Report
| (1) | The 2020, 2021 and 2022 competitive sets include The Time New York, Dream Midtown, The Muse, Hotel Mela, Distrikt Hotel New York City, Tapestry Collection by Hilton, citizenM New York Times Square and Archer Hotel New York. The 2023 competitive set includes The Time New York, Dream Midtown, The Muse, Distrikt Hotel New York City, Tapestry Collection by Hilton, citizenM New York Times Square and Archer Hotel New York. |
| (2) | Occupancy, ADR and RevPAR figures for the subject property are based on historical operating statements provided by the borrower sponsor. |
The Market. The Aliz Hotel Times Square Property is located in New York, New York, within the Midtown West area of Manhattan. Prominent attractions within walking distance include Times Square (which accounted for 11% of the city’s economic output and 10% of its jobs prior to COVID-19), Herald Square, Madison Square Garden, Hudson Yards and Bryant Park. Due to its location, the Aliz Hotel Times Square Property benefits from accessibility to all of New York City and is within a half-mile of the following major public subway lines: N-Q-R, B-D-F-M, 1-2-3 and the A-C-E. Additionally, the Times Square subway station provides access to the 7 and S trains, with connectivity to Grand Central Station, a popular commuter hub serving 750,000 visitors each day. Port Authority is also located across the street from the Aliz Hotel Times Square Property and provides interstate bus services to and from New York City. Furthermore, three major international airports are located within a 20-mile radius of the Aliz Hotel Times Square Property: LaGuardia International Airport (8.5 miles), John F. Kennedy International Airport (17.4 miles) and Newark Liberty International Airport (13.9 miles). According to a third-party market research provider, the Aliz Hotel Times Square Property has a 99 walk score and a perfect 100 transit score.
Midtown Manhattan is among the largest central business districts in the world and is home to several renowned attractions, including the Empire State Building, the Museum of Modern Art and Rockefeller Center. More than half of the office space in New York City’s total inventory is housed within Midtown Manhattan (approximately 300 million SF of office space). According to the appraisal, hotel demand for the neighborhood is largely driven by a heavy concentration of surrounding office developments and employers, such as Barclays Capital, Bank of America, Akin, Gump & Strauss, PricewaterhouseCoopers, Ernst & Young, Viacom, H&M, Morgan Stanley, MetLife and the New York Times Company. According to the appraisal, year-end visitation to New York City approximately doubled to 56.7 million from 2021 to 2022 and was expected to increase to 63.3 million in 2023, contributing to an increase in occupancy, ADR and RevPar across full-service hotels in Manhattan throughout Q2 2023.
| THE INFORMATION IN THIS STRUCTURAL AND COLLATERAL TERM SHEET IS NOT COMPLETE AND MAY BE AMENDED PRIOR TO THE TIME OF SALE. THIS TERM SHEET IS NOT AN OFFER TO SELL THESE SECURITIES AND IT IS NOT A SOLICITATION OF AN OFFER TO BUY THESE SECURITIES IN ANY JURISDICTION WHERE THE OFFER OR SALE IS NOT PERMITTED. | ||
| T-90 | ||
| Hospitality – Full Service | Loan #6 | Cut-off Date Balance: | $49,900,000 | |
| 310 West 40th Street | Aliz Hotel Times Square | Cut-off Date LTV: | 34.9% | |
| New York, NY 10018 | UW NCF DSCR: | 2.98x | ||
| UW NOI Debt Yield: | 22.5% |
According to a third-party market research report, the estimated 2023 population within a one-, three-, and five-mile radius of the Aliz Hotel Times Square Property was 144,327, 1,276,651 and 2,619,742, respectively. According to the same third-party report, the 2023 average household income within the same radii was $153,735, $153,008 and $134,488, respectively. New York City is home to nearly 124,000 hotel rooms, of which over 92,000 are situated in Manhattan. According to the appraisal, the current pipeline anticipates approximately 11,000 rooms to come online in the next three years in New York City. New York supply growth has averaged 2.9% since 2000, just above the national average. According to a third-party provider, supply growth rates are expected to decelerate starting in 2024. In December 2021, New York City Council passed a bill that requires all short-term rentals within all five boroughs to register with the city. The legislation included fines of up to $15,000 and, according to the appraisal, greatly curtailed short-term rental supply, with the executive director of the Office of Special Enforcement stating they believe at least 10,000 listings will be removed from inventory. Moreover, the COVID-19 pandemic resulted in the permanent closure of several prominent hotels in the area, including the Excelsior Hotel, Courtyard Marriott Herald Square and The Hudson.
The following table presents the primary competitive properties to the Aliz Hotel Times Square Property:
| Competitive Property Summary | ||||||||
| Property | Year Built | Rooms | Commercial | Group | Leisure | 2023 Occupancy(1) | 2023 ADR(1) | 2023 RevPAR(1) |
| Aliz Hotel Times Square (Subject)(2) | 2018 | 287 | 35% | 5% | 60% | 81.2% | $241.23 | $195.81 |
| The Time New York | 1927 | 193 | 40% | 10% | 50% | 75% - 80% | $330 - $350 | $255 - $275 |
| Dream Midtown | 1904 | 219 | 35% | 10% | 55% | 75% - 80% | $235 - $245 | $170 - $190 |
| The Muse | 2000 | 200 | 35% | 15% | 50% | 80% - 85% | $315 - $335 | $250 - $270 |
| Hotel Mela Times Square | 2007 | 234 | 30% | 10% | 60% | N/A | N/A | N/A |
| Distrikt Hotel New York City, Tapestry Collection by Hilton | 2010 | 155 | 25% | 5% | 70% | 80% - 85% | $215 - $225 | $170 - $190 |
| citizenM New York Times Square Hotel | 2014 | 230 | 35% | 15% | 50% | 85% - 90% | $275 - $285 | $230 - $250 |
| Archer Hotel New York | 2014 | 180 | 30% | 5% | 65% | 80% - 85% | $310 - $330 | $250 - $270 |
| Total/Average | 1,698 | 33% | 9% | 57% | 80% | $263.02 | $211.37 | |
Source: Appraisal
| (1) | Variances between the appraisal and industry report data with respect to occupancy, ADR and RevPAR are attributable in part to variances in reporting methodologies and/or timing differences. |
| (2) | 2023 Occupancy, 2023 ADR and 2023 RevPAR figures represent the year-end period ending December 2023 based on historical operating statements provided by the borrower sponsor. |
Appraisal. The appraiser concluded to an “as-is” value for the Aliz Hotel Times Square Property of $143,000,000 as of December 11, 2023.
Environmental Matters. According to the Phase I environmental site assessment, dated December 18, 2023, there was no evidence of any recognized environmental conditions at the Aliz Hotel Times Square Property.
| THE INFORMATION IN THIS STRUCTURAL AND COLLATERAL TERM SHEET IS NOT COMPLETE AND MAY BE AMENDED PRIOR TO THE TIME OF SALE. THIS TERM SHEET IS NOT AN OFFER TO SELL THESE SECURITIES AND IT IS NOT A SOLICITATION OF AN OFFER TO BUY THESE SECURITIES IN ANY JURISDICTION WHERE THE OFFER OR SALE IS NOT PERMITTED. | ||
| T-91 | ||
| Hospitality – Full Service | Loan #6 | Cut-off Date Balance: | $49,900,000 | |
| 310 West 40th Street | Aliz Hotel Times Square | Cut-off Date LTV: | 34.9% | |
| New York, NY 10018 | UW NCF DSCR: | 2.98x | ||
| UW NOI Debt Yield: | 22.5% |
Operating History and Underwritten Net Cash Flow. The following table presents certain information relating to the historical operating performance and the Underwritten Net Cash Flow at the Aliz Hotel Times Square Property:
| Cash Flow Analysis(1)(2) | |||||||
| 2019 | 2020 | 2021 | 2022 | 2023 | UW | UW per Room | |
| Occupancy | 85.0% | 31.9% | 48.5% | 71.2% | 81.2% | 81.2% | |
| ADR | $201.97 | $106.47 | $139.04 | $224.83 | $241.23 | $241.23 | |
| RevPAR | $171.62 | $33.95 | $67.42 | $160.05 | $195.81 | $195.81 | |
| Room Revenue | $17,977,777 | $3,556,524 | $7,063,093 | $16,766,529 | $20,512,437 | $20,512,437 | $71,471.91 |
| Food & Beverage Revenue(3) | $516,774 | $111,000 | $422,000 | $649,523 | $843,126 | $843,126 | $2,937.72 |
| Amenity/Resort Fee | $1,464,329 | $474,000 | $1,260,000 | $1,965,237 | $1,931,512 | $1,931,512 | $6,730.01 |
| Other Departmental Income | $170,163 | $36,000 | $130,000 | $274,011 | $303,609 | $303,609 | $1,057.87 |
| Total Revenue | $20,129,043 | $4,177,524 | $8,875,093 | $19,655,300 | $23,590,685 | $23,590,685 | $82,197.51 |
| Room Expense | $5,636,145 | $1,741,000 | $2,604,000 | $5,113,993 | $5,782,818 | $5,782,818 | $20,149.19 |
| Food & Beverage Expense | $0 | $0 | $0 | $0 | $0 | $0 | $0.00 |
| Other Departmental Expense | $163,796 | $28,000 | $45,000 | $127,959 | $154,055 | $154,055 | $536.78 |
| Management Fee | $603,871 | $125,326 | $266,253 | $589,659 | $707,721 | $943,627 | $3,287.90 |
| Real Estate Taxes | $1,402,756 | $1,766,000 | $1,532,000 | $1,224,910 | $1,267,485 | $1,262,333 | $4,398.37 |
| Insurance | $132,312 | $199,000 | $254,000 | $138,691 | $185,002 | $158,537 | $552.39 |
| Other Expenses | $3,856,135 | $2,256,000 | $2,409,000 | $3,427,909 | $4,079,936 | $4,079,936 | $14,215.80 |
| Total Expenses | $11,795,015 | $6,115,326 | $7,110,253 | $10,623,121 | $12,177,016 | $12,381,306 | $43,140.44 |
| Net Operating Income | $8,334,028 | ($1,937,802) | $1,764,840 | $9,032,179 | $11,413,670 | $11,209,379 | $39,057.07 |
| FF&E | $805,162 | $167,101 | $355,004 | $786,212 | $943,627 | $943,627 | $3,287.90 |
| Net Cash Flow | $7,528,866 | ($2,104,903) | $1,409,836 | $8,245,967 | $10,470,042 | $10,265,752 | $35,769.17 |
| NOI DSCR | 2.42x | (0.56x) | 0.51x | 2.62x | 3.31x | 3.25x | |
| NCF DSCR | 2.18x | (0.61x) | 0.41x | 2.39x | 3.04x | 2.98x | |
| NOI Debt Yield | 16.7% | (3.9%) | 3.5% | 18.1% | 22.9% | 22.5% | |
| NCF Debt Yield | 15.1% | (4.2%) | 2.8% | 16.5% | 21.0% | 20.6% | |
| (1) | Certain items such as interest expense, interest income, depreciation, amortization, debt service payments and any other non-recurring items were excluded from the historical presentation and are not considered for the underwritten cash flow. |
| (2) | The decrease in Occupancy and Net Operating Income from 2019 to 2020, as well as the recovery from 2021 through 2023, was primarily due to the effects of the COVID-19 pandemic on the hospitality industry. |
| (3) | Food & Beverage Revenue is attributable to two leases and is equal to the greater of (i) $15,000 in monthly fixed base rent and (ii) 11.0% of gross sales as percentage rent of each lease month. |
Escrows and Reserves.
Real Estate Taxes – At origination, the borrower deposited approximately $439,256 into a real estate tax reserve. The borrower is required to deposit into a real estate tax reserve, on a monthly basis, an amount equal to 1/12 of the real estate taxes that the mortgage lender estimates will be payable during the next 12 months (initially, $109,814).
Insurance – The borrower is required to deposit into an insurance reserve, on a monthly basis, an amount equal to 1/12 of the insurance premiums that the mortgage lender estimates will be payable for the renewal of the insurance coverage; provided, however, that such monthly reserves for insurance premiums will not be required as long as (i) no event of default has occurred and is continuing and (ii) the insurance coverage for the Aliz Hotel Times Square Property is included in a blanket policy approved by the lender in its reasonable discretion.
FF&E Reserve – The borrower is required to deposit into an FF&E reserve, on a monthly basis, an amount equal to 4% of the sum of (a) operating income plus (b) gross rents for the calendar month two months prior.
Lockbox and Cash Management. The Aliz Hotel Times Square Mortgage Loan is structured with a hard lockbox and springing cash management. At origination, the borrower, property manager and Master Tenant were required to direct credit card companies to deposit all credit card receipts with respect to the Aliz Hotel Times Square Property into a lockbox account controlled by the mortgage lender. Notwithstanding the foregoing direction, if the borrower or property manager receives any hotel or other rents from the Aliz Hotel Times Square Property, it is required to deposit such amounts into the lockbox account within two business days of receipt. In the absence of a Cash Sweep Period (as defined below), the funds in the lockbox account will be swept each business day into an account controlled by the borrower. If a Cash Sweep Period is continuing, all funds in the lockbox account are required to be swept to a mortgage lender-controlled cash management account and applied in accordance with the Aliz Hotel Times Square Mortgage Loan documents. Provided that a Cash Sweep Period is continuing under the Aliz Hotel Times Square Mortgage Loan, funds on deposit in the excess cash flow reserve account will be held as additional security for the Aliz Hotel Times Square Mortgage loan as set forth in the Aliz Hotel Times Square Mortgage Loan
| THE INFORMATION IN THIS STRUCTURAL AND COLLATERAL TERM SHEET IS NOT COMPLETE AND MAY BE AMENDED PRIOR TO THE TIME OF SALE. THIS TERM SHEET IS NOT AN OFFER TO SELL THESE SECURITIES AND IT IS NOT A SOLICITATION OF AN OFFER TO BUY THESE SECURITIES IN ANY JURISDICTION WHERE THE OFFER OR SALE IS NOT PERMITTED. | ||
| T-92 | ||
| Hospitality – Full Service | Loan #6 | Cut-off Date Balance: | $49,900,000 | |
| 310 West 40th Street | Aliz Hotel Times Square | Cut-off Date LTV: | 34.9% | |
| New York, NY 10018 | UW NCF DSCR: | 2.98x | ||
| UW NOI Debt Yield: | 22.5% |
documents. All sums remaining on deposit in the excess cash flow reserve account will be disbursed to the borrower on the earlier to occur of (i) payment in full of the debt or (ii) defeasance of the mortgage loan.
A “Cash Sweep Period” means a period commencing upon the occurrence of (i) an event of default, (ii) any bankruptcy action of the property manager, (iii) any bankruptcy action of the borrower or Aliz Group, LLC or (iv) the debt service coverage ratio falling below 1.60x based on the trailing 12-month period immediately preceding the date of such determination (“DSCR Trigger Event”); and expiring upon (a) with respect to clause (i) above, the cure of such event of default and the acceptance of such cure by the lender, (b) with respect to clause (ii) above, the borrower replacing the property manager with a qualified property manager under a replacement management agreement within 60 days following the occurrence of such bankruptcy action, (c) with respect to clause (iii) above, but solely with respect to a bankruptcy action involving the filing of an involuntary petition against the borrower or Aliz Group, LLC, and the borrower, Aliz Group, LLC, the guarantor or any of their respective affiliates have not colluded with or otherwise solicited the petitioning creditors for any such insolvency petition, such filing being discharged or dismissed within 60 days, and the mortgage lenders’ determination that such filing does have material adverse consequences to the Aliz Hotel Times Square Mortgage Loan, and (d) with respect to clause (iv) above, either (x) the achievement of a debt service coverage ratio of 1.60x or greater for two consecutive quarters based upon the trailing 12-month period immediately preceding the date of determination or (y) the receipt by the mortgage lender of an amount, which if used to reduce the outstanding principal balance of the Aliz Hotel Times Square Mortgage Loan upon the occurrence of a DSCR Trigger Event, would be sufficient to cause the calculation of the debt service coverage ratio for such period to equal or exceed 1.60x; provided that, (A) a Cash Sweep Period may be cured no more than a total of five times in the aggregate during the term of the Aliz Hotel Times Square Mortgage Loan, (B) the borrower is required to have paid all of the mortgage lender’s reasonable out-of-pocket expenses incurred in connection with such Cash Sweep Period cure, including reasonable out-of-pocket attorneys’ fees and expenses; and (C) except as set forth in clause (c) above, the borrower has no right to cure a Cash Sweep Period caused by a bankruptcy action of the borrower or of Aliz Group, LLC.
Master Lease. The borrower, as landlord, and an affiliate of the borrower, Aliz Group, LLC, as tenant (the “Master Tenant”), have executed, effective as of January 1, 2024, that certain Amended and Restated Ground Lease (the “Master Lease”), under which the Master Tenant operates the Aliz Hotel Times Square Property. The Master Lease is scheduled to expire December 31, 2035, with no extension options. The Master Tenant and its sole member (which is a Delaware limited liability company with an independent director) are required to be special purpose entities during the term of the Aliz Hotel Times Square Mortgage Loan. Pursuant to the Aliz Hotel Times Square Mortgage Loan documents, the Master Tenant has pledged its leasehold interest in the Aliz Hotel Times Square Property, and further, in the event of a foreclosure by lender or the acceptance of a deed in lieu of foreclosure, lender has the right, at its option, to enforce or terminate the Master Lease. The Master Tenant has licensed from Aliz International, LLC, an affiliate of the borrower, the right to use certain registered trademarks related to the ALIZ brand under a license agreement. The borrower is prohibited from using or licensing, or otherwise permitting the guarantor, Master Tenant, licensor or any affiliate thereof to use or license, without lender’s prior written consent, any related intellectual property within a half-mile radius of the Aliz Hotel Times Square Property. All rents payable by the Master Tenant under the Master Lease during the continuance of a Cash Sweep Period will accrue for the duration of the Cash Sweep Period and such accrued amounts are required to be paid upon the conclusion of the Cash Sweep Period out of excess cash flow.
Terrorism Insurance. The borrower is required to obtain and maintain property insurance for 100% of full replacement cost and business interruption insurance for 18 months plus a six-month extended period of indemnity. Such insurance is required to cover perils of terrorism and acts of terrorism. See “Risk Factors—Risks Relating to the Mortgage Loans—Terrorism Insurance May Not Be Available for All Mortgaged Properties” in the prospectus.
Mechanics Liens. There exist certain mechanics liens related to the Aliz Hotel Times Square Property with an aggregate balance of $1.9 million. Prior to the origination of the Aliz Hotel Times Square Mortgage Loan, the borrower posted 110% of the aggregate claimed amount of the existing mechanics liens with a bond company and, subsequently, a clean title policy was issued with respect to the Aliz Hotel Times Square Property. See “Description of the Mortgage Pool— Litigation and Other Considerations” in the prospectus.
| THE INFORMATION IN THIS STRUCTURAL AND COLLATERAL TERM SHEET IS NOT COMPLETE AND MAY BE AMENDED PRIOR TO THE TIME OF SALE. THIS TERM SHEET IS NOT AN OFFER TO SELL THESE SECURITIES AND IT IS NOT A SOLICITATION OF AN OFFER TO BUY THESE SECURITIES IN ANY JURISDICTION WHERE THE OFFER OR SALE IS NOT PERMITTED. | ||
| T-93 | ||
| Hospitality – Full Service | Loan #7 | Cut-off Date Balance: | $39,800,000 | |
| 5151 Pooks Hill Road | Bethesda Marriott | Cut-off Date LTV: | 51.0% | |
| Bethesda, MD 20814 | UW NCF DSCR: | 1.50x | ||
| UW NOI Debt Yield: | 14.2% |
| THE INFORMATION IN THIS STRUCTURAL AND COLLATERAL TERM SHEET IS NOT COMPLETE AND MAY BE AMENDED PRIOR TO THE TIME OF SALE. THIS TERM SHEET IS NOT AN OFFER TO SELL THESE SECURITIES AND IT IS NOT A SOLICITATION OF AN OFFER TO BUY THESE SECURITIES IN ANY JURISDICTION WHERE THE OFFER OR SALE IS NOT PERMITTED. | ||
| T-94 | ||
| Hospitality – Full Service | Loan #7 | Cut-off Date Balance: | $39,800,000 | |
| 5151 Pooks Hill Road | Bethesda Marriott | Cut-off Date LTV: | 51.0% | |
| Bethesda, MD 20814 | UW NCF DSCR: | 1.50x | ||
| UW NOI Debt Yield: | 14.2% |
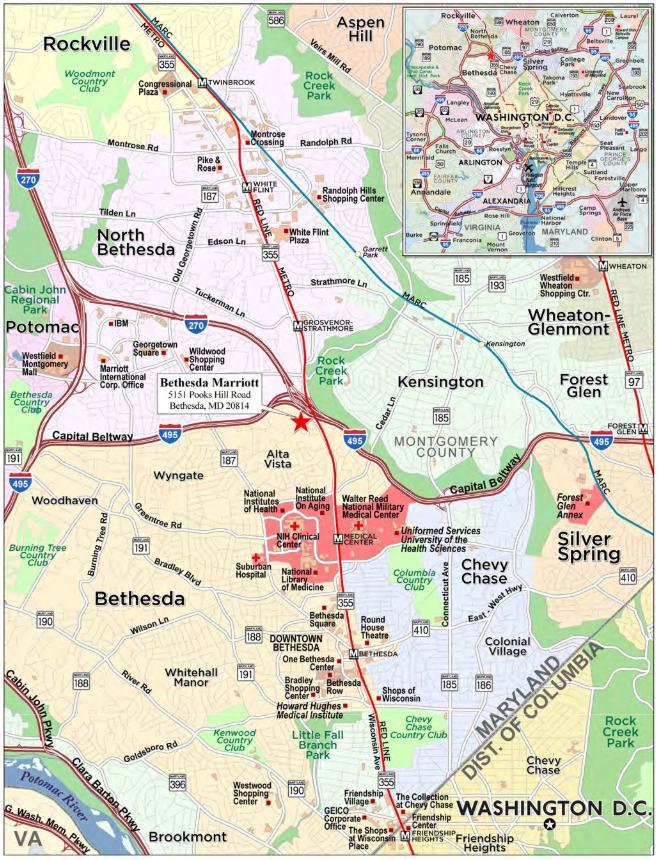
| THE INFORMATION IN THIS STRUCTURAL AND COLLATERAL TERM SHEET IS NOT COMPLETE AND MAY BE AMENDED PRIOR TO THE TIME OF SALE. THIS TERM SHEET IS NOT AN OFFER TO SELL THESE SECURITIES AND IT IS NOT A SOLICITATION OF AN OFFER TO BUY THESE SECURITIES IN ANY JURISDICTION WHERE THE OFFER OR SALE IS NOT PERMITTED. | ||
| T-95 | ||
| Mortgage Loan No. 7 – Bethesda Marriott |
| Mortgage Loan Information | Property Information | ||||||
| Mortgage Loan Seller: | MSMCH | Single Asset/Portfolio: | Single Asset | ||||
| Credit Assessment (Fitch/KBRA/Moody’s): | NR/NR/NR | Location: | Bethesda, MD 20814 | ||||
| Original Balance: | $39,800,000 | General Property Type: | Hospitality | ||||
| Cut-off Date Balance: | $39,800,000 | Detailed Property Type: | Full Service | ||||
| % of Initial Pool Balance: | 4.0% | Title Vesting: | Fee | ||||
| Loan Purpose: | Recapitalization | Year Built/Renovated: | 1979 / 2015 | ||||
| Borrower Sponsor: | John J. Mullen | Size: | 407 Rooms | ||||
| Guarantor: | John J. Mullen | Cut-off Date Balance Per Room: | $97,789 | ||||
| Mortgage Rate: | 7.4720% | Maturity Date Balance Per Room: | $97,789 | ||||
| Note Date: | 1/24/2024 | Property Manager: | Marriott Hotel Services, Inc. | ||||
| Maturity Date: | 2/1/2029 | Underwriting and Financial Information | |||||
| Term to Maturity: | 60 months | UW NOI: | $5,632,972 | ||||
| Amortization Term: | 0 months | UW NCF: | $4,528,521 | ||||
| IO Period: | 60 months | UW NOI Debt Yield: | 14.2% | ||||
| Seasoning: | 3 months | UW NCF Debt Yield: | 11.4% | ||||
| Prepayment Provisions: | L(27),D(26),O(7) | UW NOI Debt Yield at Maturity: | 14.2% | ||||
| Lockbox/Cash Mgmt Status: | Hard/Springing | UW NCF DSCR: | 1.50x | ||||
| Additional Debt Type: | NAP | Most Recent NOI: | $5,759,382 (12/31/2023) | ||||
| Additional Debt Balance: | NAP | 2nd Most Recent NOI(3): | $3,796,024 (12/31/2022) | ||||
| Future Debt Permitted (Type)(1): | Yes (Mezzanine) | 3rd Most Recent NOI(3): | ($1,486,490) (12/31/2021) | ||||
| Reserves(2) | Most Recent Occupancy: | 55.6% (12/31/2023) | |||||
| Type | Initial | Monthly | Cap | 2nd Most Recent Occupancy(3): | 48.7% (12/31/2022) | ||
| RE Tax: | $0 | Springing | NAP | 3rd Most Recent Occupancy(3): | 30.4% (12/31/2021) | ||
| Insurance: | $0 | Springing | NAP | Appraised Value (as of): | $78,000,000 (12/1/2023) | ||
| FF&E Reserve: | $0 | Springing | NAP | Appraised Value Per Room: | $191,646 | ||
| Future PIP Reserve: | $0 | Springing | NAP | Cut-off Date LTV Ratio: | 51.0% | ||
| Common Charges Reserve: | $0 | Springing | NAP | Maturity Date LTV Ratio: | 51.0% | ||
| Sources and Uses | ||||||
| Sources | Proceeds | % of Total | Uses | Proceeds | % of Total | |
| Mortgage Loan Amount: | $39,800,000 | 100.0% | Return of Equity: | $36,682,801 | 92.2% | |
| Closing Costs: | $3,117,199 | 7.8% | ||||
| Total Sources: | $39,800,000 | 100.0% | Total Uses: | $39,800,000 | 100.0% | |
| (1) | See “Mezzanine Loan and Preferred Equity” below for further discussion. |
| (2) | See “Escrows and Reserves” below for further discussion of reserve requirements. |
| (3) | The increase in Occupancy and NOI from 2021 to 2022 was primarily due to the effect of the novel coronavirus on the hospitality industry in 2020, and the continued recovery in 2021 and 2022. |
The Mortgage Loan. The seventh largest mortgage loan (the “Bethesda Marriott Mortgage Loan”) is evidenced by a promissory note in the original principal amount of $39,800,000 and secured by a fee mortgage encumbering a condominium parcel improved with a 407-room full service hospitality property located in Bethesda, Maryland (the “Bethesda Marriott Property”).
The Borrower and the Borrower Sponsor. The borrower for the Bethesda Marriott Mortgage Loan is MarBeth Acquisition, LLC, a single-purpose, Delaware limited liability company with one independent director in its organizational structure. The sole member of the borrower is co-managed by Jeffrey M. Mullen and by the borrower sponsor and non-recourse carve-out guarantor, John J. Mullen. John J. Mullen is the founder, president, and chief executive officer of Mullen Real Estate Capital. Founded by John J. Mullen in the 1960s, Mullen Real Estate Capital is a hospitality-focused real estate firm created to oversee the Mullen family’s real estate investments. The Mullen family has over 20 years of experience in direct hotel investments. In the late 1960s, John J. Mullen started a travel and tour company focused on chartering trips that eventually grew into the Apple Leisure Group, an American travel and hospitality conglomerate, with distribution, destination management services, resort management services, loyalty programs, among other industry oriented services. Apple Leisure Group was sold to Hyatt in November 2021 for $2.7 billion. Mullen Real Estate Capital presently oversees investments in eight hotels, encompassing over 3,000 rooms, plus a variety of other holdings in office, industrial, multi-family, and developable land.
The Property. The Bethesda Marriott Property is a 407-room, full service hospitality property built on an 11.9-acre land condominium parcel in Bethesda, Maryland. The Bethesda Marriott Property was built in 1979 and renovated in 2015. The borrower sponsor purchased the Bethesda Marriott Property in September 2018 for $79.0 million ($194,103 per room) and has since invested approximately $4.06 million ($10,000 per room) in various capital projects for a total cost basis of $83.1 million ($204,000 per room). Featured amenities include approximately 18,820 SF of meeting and event space, including a 4,592 SF Grand Ballroom, the Cooper’s Mill restaurant and bar, an outdoor pool, a business center, a fitness center, a sundry shop, a Bethesda local shuttle, complimentary high-speed internet access, and an M Club accessible to Marriott Bonvoy Platinum members. The Bethesda Marriott Property also offers parking across 407 spaces (approximately 1.0 spaces per room) at a current rate of $19.00 per night.
| THE INFORMATION IN THIS STRUCTURAL AND COLLATERAL TERM SHEET IS NOT COMPLETE AND MAY BE AMENDED PRIOR TO THE TIME OF SALE. THIS TERM SHEET IS NOT AN OFFER TO SELL THESE SECURITIES AND IT IS NOT A SOLICITATION OF AN OFFER TO BUY THESE SECURITIES IN ANY JURISDICTION WHERE THE OFFER OR SALE IS NOT PERMITTED. | ||
| T-96 | ||
| Hospitality – Full Service | Loan #7 | Cut-off Date Balance: | $39,800,000 | |
| 5151 Pooks Hill Road | Bethesda Marriott | Cut-off Date LTV: | 51.0% | |
| Bethesda, MD 20814 | UW NCF DSCR: | 1.50x | ||
| UW NOI Debt Yield: | 14.2% |
The guestroom mix at the Bethesda Marriott Property is comprised of 233 bedrooms with two double beds, 161 bedrooms with king beds, and 13 ADA bedrooms. Guestrooms are accessible via five passenger elevators, and room amenities feature a work area, a nightstand, a dresser, a sofa chair, a flat screen television, internet, an iron and ironing board, and a coffee maker.
The Bethesda Marriott Property is one of two units in a land condominium, each of which has a 50% interest in the common elements of the condominium. The other condominium unit is being developed with a multifamily community. The owner of the Bethesda Marriott Property unit has the right to appoint two of the three members of the Board of Directors of the condominium; however, unanimous consent of directors is needed for any budget, determination of common expenses, annual and special assessments, adoption of rules by the condominium board, and any other act that has a material adverse effect on the operations of the business of the other unit, or materially increases the costs of operation to the other unit.
The Bethesda Marriott Property is a flag-managed hotel, located approximately 2.2 miles north of Marriott’s central business district headquarters in Bethesda, Maryland. The Bethesda Marriott Property is managed by Marriott Hotel Services, Inc. (the “Hotel Manager”) pursuant to a hotel management agreement that expires December 31, 2036 (the “Hotel Management Agreement”).
According to the appraisal, the property segmentation at the Bethesda Marriott Property is estimated at 35% commercial, 35% meeting and group and 30% leisure.
The Market. The Bethesda Marriott Property is located in Bethesda, Maryland. The Bethesda Marriott Property is located adjacent to the intersection of Interstate 495 (the Capital Beltway) and Route 355 (Rockville Pike), providing direct access to the Bethesda central business district 2 miles south, and to Washington DC 8 miles south. The Bethesda Marriott Property is located next to a number of demand drivers. The 2.3 million SF Walter E. Washington Convention Center is located approximately 9.0 miles south of the Bethesda Marriott Property and generates compression demand at the Bethesda Marriott Property throughout the year. The 10.0 million SF National Institute of Health medical campus, the nation's medical research agency, supports biomedical and behavioral research domestically and abroad, employing approximately 20,000 people and is located approximately 1.5 miles from the Bethesda Marriott Property. The National Institute of Health has used the Bethesda Marriott Property for over 30 years which contributes to meeting space, food and beverage, and transient room revenue. Both the Bethesda Marriott Property and the National Institute of Health offer shuttle services to and from one another. The National Institute of Health received approval in 2013 to move forward with a 20-year master plan project that is expected to add more than 1.6 million SF of new development, including 28 projects. The plan is anticipated to bring more than 4,150 new employees and contractors to the campus by the time the entire project is completed in 2033, however we cannot assure you such plan will be completed, or that the expected demand driver will be realized as expected or at all. The Walter Reed Military Medical Center is located approximately 1.5 miles away from the Bethesda Marriott Property. The Walter Reed National Military Medical Center, a 244-bed hospital employing 7,100 people, is the flagship medical facility for the three branches of the United States military and typically provides medical care to United States presidents. It is also expected to soon begin the final phase of its campus expansion initiative planning to increase its footprint with a 575,000 SF new healthcare facility; however we cannot assure you such expansion will be completed as expected, or at all.
According to the appraisal, the estimated 2023 population within a one-, three-, and five-mile radius of the Bethesda Marriott Property was 21,318, 147,138, and 410,081, respectively. According to the appraisal, the 2023 average household income within the same radii was $162,057, $165,652, and $157,507, respectively.
The following table presents the primary competitive properties to the Bethesda Marriott Property:
| Competitive Property Summary(1) | ||||||||
| Property | Year Built | Rooms | Commercial | Group | Leisure | 2023 Occupancy | 2023 ADR | 2023 RevPAR |
| Bethesda Marriott (subject) | 1979 | 407 | 35% | 35% | 30% | 56.8% | $163.06 | $92.66 |
| The Bethesdan Hotel, Tapestry Collection by Hilton | 1971 | 270 | 50% | 20% | 30% | 60%-65% | $155-$165 | $90-$100 |
| Hyatt Regency Bethesda | 1985 | 390 | 40% | 35% | 25% | 70%-75% | $165-$175 | $115-$125 |
| Embassy Suites by Hilton Bethesda Washington DC | 1990 | 272 | 45% | 40% | 15% | 70%-75% | $175-$185 | $120-$130 |
| Hilton Washington DC/Rockville Hotel & Executive Meeting Center | 1983 | 315 | 45% | 40% | 15% | 65%-70% | $145-$155 | $95-$105 |
| Marriott Bethesda North Hotel & Conference Center | 2004 | 455 | 25% | 50% | 25% | 65%-70% | $185-$195 | $120-$130 |
| Subtotal/Average | 2,109 | 38% | 38% | 24% | 65% | $170.11 | $110.76 | |
Source: Appraisal.
| (1) | The variances between the underwriting, the appraisal and industry report data with respect to occupancy, ADR and RevPAR at the Bethesda Marriott Property are attributable to variances in reporting methodologies and/or timing differences. |
| THE INFORMATION IN THIS STRUCTURAL AND COLLATERAL TERM SHEET IS NOT COMPLETE AND MAY BE AMENDED PRIOR TO THE TIME OF SALE. THIS TERM SHEET IS NOT AN OFFER TO SELL THESE SECURITIES AND IT IS NOT A SOLICITATION OF AN OFFER TO BUY THESE SECURITIES IN ANY JURISDICTION WHERE THE OFFER OR SALE IS NOT PERMITTED. | ||
| T-97 | ||
| Hospitality – Full Service | Loan #7 | Cut-off Date Balance: | $39,800,000 | |
| 5151 Pooks Hill Road | Bethesda Marriott | Cut-off Date LTV: | 51.0% | |
| Bethesda, MD 20814 | UW NCF DSCR: | 1.50x | ||
| UW NOI Debt Yield: | 14.2% |
The following table presents certain information relating to the Occupancy, ADR and RevPAR of the Bethesda Marriott Property and its competitive set:
| Historical Occupancy, ADR, RevPAR(1)(2) | |||||||||
| Competitive Set | Bethesda Marriott Property | Penetration Factor | |||||||
| Year | Occupancy | ADR | RevPAR | Occupancy | ADR | RevPAR | Occupancy | ADR | RevPAR |
| 12/31/2020 | 25.1% | $114.17 | $28.69 | 17.2% | $143.75 | $24.74 | 68.5% | 125.9% | 86.2% |
| 12/31/2021 | 40.6% | $112.79 | $45.80 | 30.4% | $112.87 | $34.30 | 74.8% | 100.1% | 74.9% |
| 12/31/2022 | 53.6% | $140.50 | $75.33 | 48.7% | $146.79 | $71.54 | 90.9% | 104.5% | 95.0% |
| 12/31/2023 | 62.8% | $151.50 | $95.09 | 55.5% | $164.11 | $91.16 | 88.5% | 108.3% | 95.9% |
Source: Industry Report.
| (1) | The competitive set includes The Bethesdan Hotel, Tapestry Collection by Hilton, The Rockville Hotel, a Ramada by Wyndham, Hilton Washington DC Rockville Hotel & Executive Meeting Center, Hyatt Regency Bethesda Near Washington DC and Sheraton Hotel Rockville. |
| (2) | The variances between the underwriting, the appraisal and the industry report data with respect to Occupancy, ADR and RevPAR at the Bethesda Marriott Property are attributable to variances in reporting methodologies and/or timing differences. |
Appraisal. The appraisal concluded to an “as is” value for the Bethesda Marriott Property of $78,000,000 as of December 1, 2023.
Environmental Matters. According to the Phase I environmental site assessment dated December 7, 2023, there was no evidence of any recognized environmental conditions at the Bethesda Marriott Property.
Operating History and Underwritten Net Cash Flow. The following table presents certain information relating to the historical operating performance and the Underwritten Net Cash Flow at the Bethesda Marriott Property:
| Cash Flow Analysis | |||||||
| 2019(1) | 2020(1) | 2021(1) | 2022(1) | 2023 | UW | UW per Room | |
| Occupancy(2) | 66.3% | 17.2% | 30.4% | 48.7% | 55.6% | 55.6% | |
| ADR(2) | $165.91 | $143.75 | $112.87 | $146.73 | $163.98 | $163.98 | |
| RevPAR(2) | $109.96 | $24.74 | $34.30 | $71.51 | $91.16 | $91.16 | |
| Room Revenue | $16,335,102 | $3,684,797 | $5,094,851 | $10,623,471 | $13,542,162 | $13,542,162 | $33,273.13 |
| Food & Beverage Revenue | $9,447,022 | $1,825,178 | $2,256,420 | $6,618,103 | $7,460,277 | $7,460,277 | $18,329.92 |
| Other Departmental Income: | $637,275 | $206,590 | $203,454 | $511,866 | $666,353 | $666,353 | $1,637.23 |
| Miscellaneous Income: | $334,058 | $117,232 | $109,827 | $306,401 | $420,220 | $420,220 | $1,032.48 |
| Total Revenue | $26,753,456 | $5,833,797 | $7,664,551 | $18,059,841 | $22,089,012 | $22,089,012 | $54,272.76 |
| Room Expense | $3,918,847 | $1,604,615 | $1,894,539 | $3,207,045 | $3,872,705 | $3,872,705 | $9,515.25 |
| Food & Beverage Expense | $5,534,111 | $1,951,286 | $1,864,306 | $3,796,761 | $4,539,078 | $4,539,078 | $11,152.53 |
| Real Estate Taxes | $644,203 | $440,145 | $518,513 | $566,721 | $599,830 | $688,590 | $1,691.87 |
| Insurance | $76,288 | $90,018 | $192,148 | $272,113 | $234,146 | $271,796 | $667.80 |
| Other Expenses | $8,236,067 | $4,253,549 | $4,681,535 | $6,421,178 | $7,083,871 | $7,083,871 | $17,405.09 |
| Total Expenses | $18,409,516 | $8,339,612 | $9,151,041 | $14,263,818 | $16,329,630 | $16,456,040 | $40,432.53 |
| Net Operating Income | $8,343,941 | ($2,505,815) | ($1,486,490) | $3,796,024 | $5,759,382 | $5,632,972 | $13,840.23 |
| FF&E | $1,337,673 | $167,387 | $383,228 | $902,992 | $1,104,451 | $1,104,451 | $2,713.64 |
| Net Cash Flow | $7,006,268 | ($2,673,202) | ($1,869,717) | $2,893,032 | $4,654,931 | $4,528,521 | $11,126.59 |
| NOI DSCR | 2.77x | (0.83x) | (0.49x) | 1.26x | 1.91x | 1.87x | |
| NCF DSCR | 2.32x | (0.89x) | (0.62x) | 0.96x | 1.54x | 1.50x | |
| NOI Debt Yield | 21.0% | (6.3%) | (3.7%) | 9.5% | 14.5% | 14.2% | |
| NCF Debt Yield | 17.6% | (6.7%) | (4.7%) | 7.3% | 11.7% | 11.4% | |
| (1) | The decrease in Occupancy and NOI from 2019 to 2020, and the increase in Occupancy and NOI from 2020 to 2021, and from 2021 to 2022 were primarily due to the effect of the novel coronavirus on the hospitality industry in 2020, and the continued recovery in 2021 and 2022. |
| (2) | The variances between the underwriting, the appraisal, and the industry report data with respect to Occupancy, ADR and RevPAR at the Bethesda Marriott Property are attributable to variances in reporting methodologies and/or timing differences. |
| THE INFORMATION IN THIS STRUCTURAL AND COLLATERAL TERM SHEET IS NOT COMPLETE AND MAY BE AMENDED PRIOR TO THE TIME OF SALE. THIS TERM SHEET IS NOT AN OFFER TO SELL THESE SECURITIES AND IT IS NOT A SOLICITATION OF AN OFFER TO BUY THESE SECURITIES IN ANY JURISDICTION WHERE THE OFFER OR SALE IS NOT PERMITTED. | ||
| T-98 | ||
| Hospitality – Full Service | Loan #7 | Cut-off Date Balance: | $39,800,000 | |
| 5151 Pooks Hill Road | Bethesda Marriott | Cut-off Date LTV: | 51.0% | |
| Bethesda, MD 20814 | UW NCF DSCR: | 1.50x | ||
| UW NOI Debt Yield: | 14.2% |
Escrows and Reserves.
Real Estate Taxes– Upon the occurrence of a Taxes Trigger Event (as defined below), the Bethesda Marriott Mortgage Loan documents require ongoing monthly reserves for real estate taxes in an amount equal to 1/12 of the real estate taxes that the lender estimates will be payable during the next twelve months.
A “Taxes Trigger Event” will occur upon the earliest date upon which (i) the Hotel Management Agreement is terminated or cancelled or the Hotel Manager is no longer managing the Bethesda Marriott Property, (ii) a default beyond applicable notice and cure periods exists under the Hotel Management Agreement or any other management agreement (either (i) or (ii) a “Hotel Management Termination/Default”) and/or (iii) the Hotel Manager fails to pay any real estate taxes when due and proof of such payment is not delivered to the lender at least 10 days prior to the date such taxes would be delinquent.
Insurance– Upon the occurrence of an Insurance Trigger Event (as defined below), the Bethesda Marriott Mortgage Loan documents require ongoing monthly reserves for insurance premiums in an amount equal to 1/12 of the insurance premiums that the lender estimates will be payable for the renewal of the insurance coverage; provided however, that such monthly reserves for insurance premiums will not be required as long as (i) no event of default has occurred and is continuing, (ii) the liability and casualty insurance coverage for the Bethesda Marriott Property is included in a blanket or umbrella policy approved by the lender in its reasonable discretion, and (iii) the borrower provides the lender with evidence of renewal of the insurance policies not later than five days, and paid receipts for insurance premiums no later than 10 days, prior to the expiration dates of the policies.
An “Insurance Trigger Event” will occur upon the earliest date upon which (i) a Hotel Management Termination/Default occurs, (ii) the borrower ceases to participate in the Hotel Manager’s insurance programs and/or (iii) the Hotel Manager fails to pay any insurance premium for insurance required to be maintained by the borrower under the loan documents or by the Hotel Manager under the Hotel Management Agreement and in each instance proof of such payment is not delivered to the lender at least five business days prior to the date when due.
FF&E Reserve– After the occurrence of an FF&E Trigger Event (as defined below), the Bethesda Marriott Mortgage Loan documents provide for ongoing monthly reserves for furniture, fixtures and equipment (“FF&E”) in an amount equal to the greater of (i) 5% of the projected operating income for the Bethesda Marriott Property for the prior month as set forth in the most recent annual budget and (ii) the amount of the deposit required by the Hotel Management Agreement or any franchise agreement on account of FF&E. The monthly deposit may be adjusted annually by the lender based on the foregoing. An “FF&E Trigger Event” will occur on the earliest date upon which (i) a Hotel Management Termination/Default occurs, (ii) an event of default exists under the Bethesda Marriott Mortgage Loan and/or (iii) the Bethesda Marriott Property is sold or transferred.
Common Charge Reserve– If the borrower is ever required to pay condominium common charges, the borrower is required to deposit into a reserve for the same, within five business days after such common charges are imposed (and thereafter to maintain in such reserve), an amount equal to three months of such condominium charges.
Future PIP Reserve– After the occurrence of a Hotel Property Management/Franchise Agreement Cash Management Trigger Event (as defined below) and until a Hotel Property Management/Franchise Agreement Cash Management Termination Event (as defined below) occurs, the Bethesda Marriott Mortgage Loan documents require the borrower to deposit all Excess Cash Flow (as defined below) into a reserve for any future property improvement plan (“PIP”).
“Hotel Property Management/Franchise Agreement Cash Management Trigger Event” means the earliest to occur of (a)(i) the Hotel Manager gives notice of its intention to, or the Hotel Management Agreement is, terminated, cancelled or expired or the date that is one year prior to the earliest stated expiration date of the Hotel Management Agreement or any replacement thereof (unless renewed or extended prior to such date) or (ii) if applicable, any franchisor gives notice of its intention to, or any franchise agreement is, terminated or cancelled; (b) the date upon which the borrower discontinues to operate a “Marriott” hotel at the Bethesda Marriott Property, unless expressly approved by the lender in writing; (c) a breach by the borrower of, or a failure by either party to comply with the terms and provisions of, the Hotel Management Agreement or, if applicable, any franchise agreement, and such failure continues beyond any applicable notice and/or cure periods which would then allow the related Hotel Manager or franchisor, as applicable, to terminate the Hotel Management Agreement or franchise agreement; or (d) the date upon which the borrower enters into an agreement with a Hotel Manager or franchisor to perform a PIP, unless (1) such agreement is entered into with the Hotel Manager in connection with an extension or renewal of the Hotel Management Agreement and (2) the borrower deposits into the future PIP reserve funds required to pay in full all of the PIP expenditures required by such agreement, as determined by the lender in good faith from the budget set forth in such agreement.
“Hotel Property Management/Franchise Agreement Cash Management Termination Event” means satisfaction of the following conditions: (i) a replacement hotel management agreement either substantially the same as the Hotel Management Agreement or otherwise in form and substance reasonably acceptable to the lender is entered into by and between the borrower and the original Hotel Manager or another Hotel Manager approved by the lender, or a franchise agreement either in the form published by Marriott Hotel Services, LLC or an affiliate in its then current franchise disclosure documents or a franchise agreement otherwise in form and substance reasonably acceptable to the lender is entered into between the borrower and a franchisor (which is either Marriott Hotel Services, LLC or an affiliate, or a reputable and experienced franchisor which in lender’s reasonable judgement possesses experience in flagging hotel properties similar in location, size, class, use, operation and value as the Marriott Bethesda Property (and as to which borrower has obtained a rating confirmation)), in either case for a term extending at least two years after the stated maturity date of the Marriott Bethesda Mortgage Loan, and the Marriott Bethesda Property; (ii) any agreement for a future PIP and related budget are approved by the lender and (iii) the conditions for release of any remaining funds in the future PIP reserve to the borrower (which include completion of any future PIP) have been fully satisfied. If the sole reason for the occurrence of a Hotel Property Management/Franchise Agreement Cash Management Trigger Event is a result of subclause (c) of the definition of such term, then if the borrower cures the applicable breach or default, the Hotel Property Management/Franchise Agreement Cash Management Trigger Event will be deemed cured and terminated.
| THE INFORMATION IN THIS STRUCTURAL AND COLLATERAL TERM SHEET IS NOT COMPLETE AND MAY BE AMENDED PRIOR TO THE TIME OF SALE. THIS TERM SHEET IS NOT AN OFFER TO SELL THESE SECURITIES AND IT IS NOT A SOLICITATION OF AN OFFER TO BUY THESE SECURITIES IN ANY JURISDICTION WHERE THE OFFER OR SALE IS NOT PERMITTED. | ||
| T-99 | ||
| Hospitality – Full Service | Loan #7 | Cut-off Date Balance: | $39,800,000 | |
| 5151 Pooks Hill Road | Bethesda Marriott | Cut-off Date LTV: | 51.0% | |
| Bethesda, MD 20814 | UW NCF DSCR: | 1.50x | ||
| UW NOI Debt Yield: | 14.2% |
Lockbox and Cash Management. The Bethesda Marriott Mortgage Loan is structured with a hard lockbox and springing cash management. At origination, subject to the terms of the Hotel Manager SNDA (as defined below), the borrower and Hotel Manager were required to direct credit card companies and credit card banks to deposit all credit card receipts with respect to the Bethesda Marriott Property into a lockbox account controlled by the lender. If notwithstanding the foregoing direction, the borrower or Hotel Manager receives any hotel or other rents from the Bethesda Marriott Property, it is required to deposit such amounts into the lockbox account within one business day of receipt, provided that the Hotel Manager is not required to deposit any funds which it is entitled to retain pursuant to the terms of the Hotel Management Agreement and Hotel Manager SNDA. The Hotel Manager SNDA provides that the lender recognizes the Hotel Manager’s rights under the Hotel Management Agreement. Pursuant to the Hotel Management Agreement, the Hotel Manager supervises, directs and controls the operation of the Bethesda Marriott Property, including the collection of accounts receivable, and is only required to distribute to the borrower operating profit (gross revenues less permitted deductions, which deductions include the Hotel Manager’s fees and costs, including but not limited to real estate taxes, insurance and deposits of 5.0% of gross revenues into an FF&E reserve maintained by the Hotel Manager. Accordingly, so long as the Hotel Management Agreement is in effect, credit card receipts and other hotel rents will not be deposited into the lockbox, but instead are expected to be collected by the Hotel Manager and deposited into a Hotel Manager account. At origination, the borrower was required to direct the Hotel Manager to deposit into the lockbox account all distributions that the Hotel Manager is required to pay to the borrower pursuant to the Hotel Management Agreement and the Hotel Manager SNDA (i.e. the operating profit payable to the borrower). In the absence of a Cash Sweep Event Period (as defined below), the funds in the lockbox account are required to be released to an account controlled by the borrower. If a Cash Sweep Event Period is continuing, all funds in the lockbox account are required to be swept to a lender-controlled cash management account, and applied, provided that no event of default is continuing under the Bethesda Marriott Mortgage Loan, (i) to fund the required tax and insurance reserves deposits, if any, as described above under “Escrows and Reserves,” (ii) to fund the payment of debt service on the Bethesda Marriott Mortgage Loan, (iii) to pay the required monthly deposit, if any, into the FF&E reserve and the common charge reserve, as described above under “Escrows and Reserves,” (iv) to the extent not paid by the Hotel Manager pursuant to the Hotel Management Agreement, to pay monthly operating expenses referenced in the lender-approved annual budget, and extraordinary expenses approved by the lender, (v) provided no event of default is continuing if a mezzanine loan is outstanding and a Cash Sweep Event Period is continuing (other than due to a Mezzanine Trigger Period (as defined below)), to pay the mezzanine lender the monthly debt service payment under the mezzanine loan, and (vi) to pay all amounts remaining after payment of the amounts set forth in the preceding clauses (the “Excess Cash Flow”) in the following order of priority: (A) if a Hotel Property Management/Franchise Agreement Cash Management Trigger Event is continuing, to the future PIP reserve, (B) during a Cash Sweep Event Period (other than one continuing solely because a Mezzanine Trigger Period or a Hotel Property Management/Franchise Agreement Cash Management Trigger Event is continuing, to an excess cash flow sweep account to be held as additional collateral for the Bethesda Marriott Mortgage Loan during the continuance of such Cash Sweep Event Period or (C) if no Cash Sweep Event Period is then continuing, to the borrower’s operating account or an account of the Hotel Manager if permitted under the terms of the Hotel Management Agreement.
A “Cash Sweep Event Period” will commence upon:
| (i) | the occurrence of an event of default and continue until the cure of such event of default; |
| (ii) | the date that the aggregate debt service coverage ratio for the Bethesda Marriott Mortgage Loan and, if applicable, any mezzanine loan, as of the end of the immediately preceding calendar quarter falls below 1.40x at the end of any calendar quarter and continue until such time as the aggregate debt service coverage ratio has been at least 1.40x for two consecutive calendar quarters; |
| (iii) | the occurrence of a Hotel Property Management/Franchise Agreement Cash Management Trigger Event and continue until a Hotel Property Management/Franchise Agreement Cash Management Termination Event; and |
| (iv) | a mezzanine loan being outstanding and continue for so long as a mezzanine loan is outstanding (a “Mezzanine Trigger Period”). |
“Hotel Manager SNDA” means a subordination, non-disturbance and attornment agreement among Marriott Hotel Services, LLC, as hotel manager, the borrower and the lender.
Mezzanine Loan and Preferred Equity. The owners of the borrower are permitted to incur a mezzanine loan secured by 100% of the equity interests in the borrower upon satisfaction of certain conditions, including but not limited to an aggregate loan-to-value ratio not more than 51.0%, an aggregate debt service coverage ratio not less than 1.50x, an aggregate debt yield not less than 11.38%, delivery of an intercreditor agreement, and rating agency confirmation.
Right of First Offer/Right of First Refusal. The related Hotel Manager, Marriott Hotel Services, Inc., has a right of first negotiation pursuant to which, if the hotel owner desires to enter into a transfer of the Bethesda Marriott Property, it must notify the Hotel Manager of such decision and negotiate in good faith for a period of 45 days to transfer the Bethesda Marriott Property to the Hotel Manager. Such right not does apply to a sale at foreclosure under a mortgage that meets the requirements of the hotel management agreement but will apply to subsequent transfers thereafter. See “Description of the Mortgage Loan—Purchase Options and Rights of First Refusal” in the prospectus.
Terrorism Insurance. The Bethesda Marriott Mortgage Loan documents require that the “all risk” insurance policy required to be maintained by the borrower provide coverage for terrorism in an amount not less than 100% of the full replacement cost of the Bethesda Marriott Property. The Bethesda Marriott Mortgage Loan documents also require business income/loss of rents insurance for a period of no less than the 18-month period commencing at the time of loss, together with a twelve-month extended period of indemnity. Notwithstanding the foregoing, for so long as the Terrorism Risk Insurance Act of 2002, as extended and modified by the Terrorism Risk Insurance Program Reauthorization Act of 2015 (“TRIPRA”) is in effect (including any extensions thereof or if another federal governmental program is in effect relating to “acts of terrorism” which provides substantially similar protections as TRIPRA), and covers both domestic and foreign acts of terrorism, the lender is required to accept terrorism insurance which insures against “covered acts” as defined by TRIPRA (or such other program). See “Risk Factors—Risks Relating to the Mortgage Loans—Terrorism Insurance May Not Be Available for All Mortgaged Properties” in the prospectus.
| THE INFORMATION IN THIS STRUCTURAL AND COLLATERAL TERM SHEET IS NOT COMPLETE AND MAY BE AMENDED PRIOR TO THE TIME OF SALE. THIS TERM SHEET IS NOT AN OFFER TO SELL THESE SECURITIES AND IT IS NOT A SOLICITATION OF AN OFFER TO BUY THESE SECURITIES IN ANY JURISDICTION WHERE THE OFFER OR SALE IS NOT PERMITTED. | ||
| T-100 | ||
| Multifamily – Student Housing | Loan #8 | Cut-off Date Balance: | $38,500,000 | |
| 900 West Monte Vista Avenue | The Vista | Cut-off Date LTV: | 64.7% | |
| Turlock, CA 95382 | UW NCF DSCR: | 1.38x | ||
| UW NOI Debt Yield: | 9.5% |
| THE INFORMATION IN THIS STRUCTURAL AND COLLATERAL TERM SHEET IS NOT COMPLETE AND MAY BE AMENDED PRIOR TO THE TIME OF SALE. THIS TERM SHEET IS NOT AN OFFER TO SELL THESE SECURITIES AND IT IS NOT A SOLICITATION OF AN OFFER TO BUY THESE SECURITIES IN ANY JURISDICTION WHERE THE OFFER OR SALE IS NOT PERMITTED. | ||
| T-101 | ||
| Multifamily – Student Housing | Loan #8 | Cut-off Date Balance: | $38,500,000 | |
| 900 West Monte Vista Avenue | The Vista | Cut-off Date LTV: | 64.7% | |
| Turlock, CA 95382 | UW NCF DSCR: | 1.38x | ||
| UW NOI Debt Yield: | 9.5% |

| THE INFORMATION IN THIS STRUCTURAL AND COLLATERAL TERM SHEET IS NOT COMPLETE AND MAY BE AMENDED PRIOR TO THE TIME OF SALE. THIS TERM SHEET IS NOT AN OFFER TO SELL THESE SECURITIES AND IT IS NOT A SOLICITATION OF AN OFFER TO BUY THESE SECURITIES IN ANY JURISDICTION WHERE THE OFFER OR SALE IS NOT PERMITTED. | ||
| T-102 | ||
| Mortgage Loan No. 8 – The Vista |
| Mortgage Loan Information | Property Information | ||||||
| Mortgage Loan Seller: | WFB | Single Asset/Portfolio: | Single Asset | ||||
| Credit Assessment (Fitch/KBRA/Moody’s): | NR/NR/NR | Location: | Turlock, CA 95382 | ||||
| Original Balance: | $38,500,000 | General Property Type: | Multifamily | ||||
| Cut-off Date Balance: | $38,500,000 | Detailed Property Type: | Student Housing | ||||
| % of Initial Pool Balance: | 3.9% | Title Vesting: | Fee | ||||
| Loan Purpose: | Refinance | Year Built/Renovated: | 2017/NAP | ||||
| Borrower Sponsors: | Percival Vaz and Luxmi Vaz | Size: | 224,640 SF, 670 beds, 180 Units | ||||
| Guarantor: | AMCAL Multi-Housing Inc. | Cut-off Date Balance per Bed: | $57,463 | ||||
| Mortgage Rate: | 6.5790% | Maturity Balance per Bed: | $57,463 | ||||
| Note Date: | 4/1/2024 | Property Manager: | Asset Campus USA, LLC | ||||
| Maturity Date: | 4/11/2029 | ||||||
| Term to Maturity: | 60 months | Underwriting and Financial Information | |||||
| Amortization Term: | 0 months | UW NOI: | $3,639,891 | ||||
| IO Period: | 60 months | UW NCF: | $3,547,522 | ||||
| Seasoning: | 1 month | UW NOI Debt Yield: | 9.5% | ||||
| Prepayment Provisions: | L(24),YM1(32),O(4) | UW NCF Debt Yield: | 9.2% | ||||
| Lockbox/Cash Mgmt Status: | Soft / Springing | UW NOI Debt Yield at Maturity: | 9.5% | ||||
| Additional Debt Type: | NAP | UW NCF DSCR: | 1.38x | ||||
| Additional Debt Balance: | NAP | Most Recent NOI: | $3,584,474 (12/31/2023) | ||||
| Future Debt Permitted (Type): | No (NAP) | 2nd Most Recent NOI(1): | $3,341,296 (12/31/2022) | ||||
| 3rd Most Recent NOI(1): | $2,628,082 (12/31/2021) | ||||||
| Reserves | Most Recent Occupancy: | 88.1% (3/20/2024) | |||||
| Type | Initial | Monthly | Cap | 2nd Most Recent Occupancy: | 85.4% (12/31/2023) | ||
| RE Taxes: | $42,281 | $42,281 | NAP | 3rd Most Recent Occupancy: | 88.4% (12/31/2022) | ||
| Insurance: | $0 | Springing | NAP | Appraised Value (as of) : | $59,500,000 (1/31/2024) | ||
| Replacement Reserve: | $0 | $7,697 | NAP | Appraised Value per Bed: | $88,806 | ||
| Debt Service Reserve: | $291,500 | $41,700 | $500,000 | Cut-off Date LTV Ratio: | 64.7% | ||
| Maturity Date LTV Ratio: | 64.7% | ||||||
Sources and Uses | ||||||
| Sources | Proceeds | % of Total | Uses | Proceeds | % of Total | |
| Mortgage Loan Amount: | $38,500,000 | 93.4% | Primary Loan Payoff: | $38,831,704 | 94.2% | |
| Borrower Equity: | $2,731,046 | 6.6% | Closing Costs: | $2,065,561 | 5.0% | |
| Upfront Reserves: | $333,781 | 0.8% | ||||
| Total Sources: | $41,231,046 | 100.0% | Total Uses: | $41,231,046 | 100.0% | |
| (1) | The increase from the 3rd Most Recent NOI to the 2nd Most Recent NOI is primarily driven by occupancy increasing from 78.4% as of 12/31/2021 to 88.4% as of 12/31/2022 at The Vista Property (as defined below). |
The Mortgage Loan. The eighth largest mortgage loan (“The Vista Mortgage Loan”) is evidenced by a promissory note in the original principal amount of $38,500,000 and secured by the fee interest in a 180-unit, 670-bed student housing property, located in Turlock, CA (“The Vista Property”).
The Borrower and the Borrower Sponsors. The borrower is AMCAL Stanislaus, LLC (“AMCAL”), a Delaware limited liability company. The borrower is structured to be a single purpose bankruptcy-remote entity with one independent director. The borrower sponsors are Percival Vaz and Luxmi Vaz, and the non-recourse carveout guarantor of The Vista Mortgage Loan is AMCAL Multi-Housing Inc.
AMCAL is a California real estate development and management company founded in 1978. AMCAL develops affordable, workforce, market-rate, and university rental housing in California, Texas and Washington. AMCAL has built more than 14,000 multifamily units, 70 public/private partnerships, and has developed five student housing communities.
Affiliates of the borrower sponsors have been involved in a prior mortgage default on an Emeryville, CA multifamily project for which a deed-in-lieu is in process with the related lender. For additional information please see “Description of the Mortgage Pool - Loan Purpose; Default History, Bankruptcy Issues and Other Proceedings” in the prospectus.
The Property. The Vista Property is a garden style student housing property comprising 670-beds in 180-units located in Turlock, California. The Vista Property is located directly across the street from the main entrance of California State University, Stanislaus (“CSU Stanislaus”). Built in 2017, The Vista Property includes a resort style an outdoor pool, an outdoor TV lounge, a volleyball court, a game room, private study rooms, a theatre, outdoor grills, a basketball court, a clubhouse, a computer lab, a fitness center, and a cybercafe. Situated on 9.1-acres, the unit mix includes studios, two-bedroom, three-bedroom, and four-bedroom apartment units. Each unit has a full kitchen, and is fully furnished including beds, desks, sofa, living room chair, television, and washer/dryers.
| THE INFORMATION IN THIS STRUCTURAL AND COLLATERAL TERM SHEET IS NOT COMPLETE AND MAY BE AMENDED PRIOR TO THE TIME OF SALE. THIS TERM SHEET IS NOT AN OFFER TO SELL THESE SECURITIES AND IT IS NOT A SOLICITATION OF AN OFFER TO BUY THESE SECURITIES IN ANY JURISDICTION WHERE THE OFFER OR SALE IS NOT PERMITTED. | ||
| T-103 | ||
| Multifamily – Student Housing | Loan #8 | Cut-off Date Balance: | $38,500,000 | |
| 900 West Monte Vista Avenue | The Vista | Cut-off Date LTV: | 64.7% | |
| Turlock, CA 95382 | UW NCF DSCR: | 1.38x | ||
| UW NOI Debt Yield: | 9.5% |
The Vista Property is rented on a per bed basis with 12-month leases (parental guarantee or acceptable FICO score required) and is currently 88.1% occupied as of March 20, 2024. Additionally, as of April 10, 2024, The Vista Property is 50.1% pre-leased for the 2024-2025 school year, as compared to 42.2% pre-leased at the same time last year.
The Vista Property consists of 224,640 residential SF spread across 12 studios, 84 two-bedrooms, 36 three-bedrooms and 538 four-bedrooms, with 560 parking spaces (this equates to a parking ratio of 0.84 per bed).
The following table presents certain information relating to the unit mix of The Vista Property:
| Unit Mix(1) | ||||||||
| Unit Type | Total No. of Beds | Occupied Beds | % of Total Beds | Occupancy | Average Bed Size (SF) | Average Underwritten Monthly Rent per Bed(2) | ||
| Studio | 12 | 9 | 1.8% | 75.0% | 490 | $1,690 | ||
| Two Bedroom | 84 | 78 | 12.5% | 92.9% | 379 | $944 | ||
| Three Bedroom | 36 | 35 | 5.4% | 97.2% | 400 | $983 | ||
| Four Bedroom | 538 | 468 | 80.3% | 87.0% | 321 | $826 | ||
| Total/Weighted Average | 670 | 590 | 100.0% | 88.1% | 335 | $864 | ||
| (1) | Information based on the underwritten rent roll. |
| (2) | Average Underwritten Monthly Rent per Bed excludes vacant units. |
The Market. The Vista Property is located in the city of Turlock, California. It is 12.1 miles south of Modesto and across the street from CSU Stanislaus. The Vista Property is situated directly across the street from CSU Stanislaus, providing residents immediate access to all campus classrooms and extracurricular facilities. CSU Stanislaus was founded in 1957 and currently has 48 undergraduate programs, 26 graduate programs, and a 2023 enrollment of 10,481 students. CSU has approximately 600 beds available in its dorms, which represents approximately 5.7% of the 2023 enrollment.
The 2023 total population within a 3- and 5- mile radius of The Vista Property is 72,382 and 94,032, respectively. The 2023 average household income within in the same radius is $99,512 and $99,077, respectively. As of the second quarter of 2023, the Turlock multifamily submarket had 5,859 units with an overall vacancy rate of 1.8% and average asking rents of $1,349 per unit.
There are no other purpose built student housing properties in the market, and no other student housing project planned or under development. The appraisal identified four comparables which are unfurnished apartments. Rent for the CSU Stanislaus dorms is approximately $725 per bed for three-bedroom units (six beds per unit) and $900 per bed for four-bedroom units, versus the average three-bedroom of $983 and four-bedroom of $826 at The Vista Property.
Appraisal. The appraiser concluded to an “As-Is” value for The Vista Property of $59,500,000 as of January 31, 2024.
Environmental Matters. According to the Phase I environmental site assessment dated January 30, 2024, there was no evidence of any recognized environmental conditions at The Vista Property.
| THE INFORMATION IN THIS STRUCTURAL AND COLLATERAL TERM SHEET IS NOT COMPLETE AND MAY BE AMENDED PRIOR TO THE TIME OF SALE. THIS TERM SHEET IS NOT AN OFFER TO SELL THESE SECURITIES AND IT IS NOT A SOLICITATION OF AN OFFER TO BUY THESE SECURITIES IN ANY JURISDICTION WHERE THE OFFER OR SALE IS NOT PERMITTED. | ||
| T-104 | ||
| Multifamily – Student Housing | Loan #8 | Cut-off Date Balance: | $38,500,000 | |
| 900 West Monte Vista Avenue | The Vista | Cut-off Date LTV: | 64.7% | |
| Turlock, CA 95382 | UW NCF DSCR: | 1.38x | ||
| UW NOI Debt Yield: | 9.5% |
Operating History and Underwritten Net Cash Flow. The following table presents certain information relating to the Underwritten Net Cash Flow at The Vista Property:
| Cash Flow Analysis | |||||
| 2021 | 2022 | 2023 | UW | UW per Bed | |
| Base Rent | $4,821,536 | $5,674,175 | $5,960,663 | $6,038,246 | $9,012 |
| Grossed Up Vacant Space | $1,366,913 | $826,501 | $798,223 | $933,466 | $1,393 |
| Gross Potential Rent | $6,188,449 | $6,500,676 | $6,758,886 | $6,971,712 | $10,406 |
| Vending | $27,134 | $27,016 | $36,364 | $36,364 | $54 |
| Other Income | $164,423 | $181,127 | $235,931 | $235,931 | $352 |
| Net Rentable Income | $6,380,006 | $6,708,819 | $7,031,181 | $7,244,007 | $10,812 |
| (Concessions) | ($22,620) | ($22,746) | ($37,819) | ($37,819) | ($56) |
| (Collection Loss) | ($117,182) | ($125,327) | ($153,918) | ($128,177) | ($191) |
| (Vacancy) | ($1,366,913) | ($826,501) | ($798,223) | ($933,466) | ($1,393) |
| Effective Gross Income | $4,873,291 | $5,734,245 | $6,041,221 | $6,144,545 | $9,171 |
| Real Estate Taxes | $469,641 | $473,211 | $479,869 | $523,848 | $782 |
| Insurance | $52,998 | $56,156 | $60,007 | $62,500 | $93 |
| Other Operating Expenses | $1,722,570 | $1,863,582 | $1,916,870 | $1,918,307 | $2,863 |
| Total Operating Expenses | $2,245,209 | $2,392,949 | $2,456,746 | $2,504,654 | $3,738 |
| Net Operating Income | $2,628,082(1) | $3,341,296(1) | $3,584,474 | $3,639,891 | $5,433 |
| Replacement Reserves | $0 | $0 | $0 | $92,369 | $138 |
| Net Cash Flow | $2,628,082 | $3,341,296 | $3,584,474 | $3,547,522 | $5,295 |
| Occupancy (%) | 78.4% | 88.4% | 85.4% | 86.6%(2) | |
| NOI DSCR | 1.02x | 1.30x | 1.40x | 1.42x | |
| NCF DSCR | 1.02x | 1.30x | 1.40x | 1.38x | |
| NOI Debt Yield | 6.8% | 8.7% | 9.3% | 9.5% | |
| NCF Debt Yield | 6.8% | 8.7% | 9.3% | 9.2% | |
| (1) | The increase in Net Operating Income from 2021 to 2022 is primarily driven by occupancy increasing from 78.4% as of 12/31/2021 to 88.4% as of 12/31/2022 at The Vista Property. |
| (2) | Represents economic occupancy. Physical occupancy as of 3/20/2024 is 88.1%. |
| THE INFORMATION IN THIS STRUCTURAL AND COLLATERAL TERM SHEET IS NOT COMPLETE AND MAY BE AMENDED PRIOR TO THE TIME OF SALE. THIS TERM SHEET IS NOT AN OFFER TO SELL THESE SECURITIES AND IT IS NOT A SOLICITATION OF AN OFFER TO BUY THESE SECURITIES IN ANY JURISDICTION WHERE THE OFFER OR SALE IS NOT PERMITTED. | ||
| T-105 | ||
| Multifamily – Student Housing | Loan #8 | Cut-off Date Balance: | $38,500,000 | |
| 900 West Monte Vista Avenue | The Vista | Cut-off Date LTV: | 64.7% | |
| Turlock, CA 95382 | UW NCF DSCR: | 1.38x | ||
| UW NOI Debt Yield: | 9.5% |
Escrows and Reserves.
Real Estate Taxes – The loan documents require an upfront reserve of $42,281 for real estate taxes and ongoing monthly reserves equal to 1/12th of the annual estimated tax payments payable during the next ensuing 12 months, initially $42,281.
Insurance – The loan documents do not require ongoing monthly insurance reserves; provided no event of default is continuing, the borrower maintains insurance coverage for The Vista Property as part of blanket or umbrella coverage reasonably approved by the lender, and the borrower provides the lender with evidence of the renewals of the insurance policies and paid receipts for the payment of the insurance premiums no later than 10 business days prior to the expiration dates of the policies. If such conditions are not satisfied, the loan documents require ongoing monthly insurance reserves in an amount equal to 1/12 of the insurance premiums that the lender reasonably estimates will be payable during the following 12 months.
Replacement Reserve – The loan documents require ongoing monthly deposits of $7,697 for replacement reserves.
Debt Service Reserve –The loan documents require an upfront reserve of $291,500 for debt service and ongoing monthly reserves of $41,700, capped at $500,000; provided, however, that the borrower is only required to make the debt service monthly deposit to the extent that sufficient cash flow exists, for the applicable month, after payment of debt service, operating expenses, and all other sums due under the loan documents.
On September 30th of each year, following the origination date, the lender will disburse up to $250,000 from the debt service reserve to the borrower; provided there is (i) no event of default continuing, (ii) the physical occupancy rate at The Vista Property is equal to or greater than 85% and (iii) the debt service coverage ratio is equal to or greater than 1.20x.
Lockbox and Cash Management. The Vista Mortgage Loan is structured with a soft lockbox and springing cash management. The borrower and manager are required to deposit all rents into an established deposit account within five business days of receipt. After the occurrence of a Cash Trap Event Period (as defined below) all funds in the deposit account are required to be transferred periodically to a lender controlled cash management account to be disbursed in accordance with the cash management waterfall set forth in the loan documents. Any excess funds after the waterfall are required to be deposited (a) into the Debt Service Reserve account if the balance is less than $500,000, and (b) into an excess cash flow account if the Debt Service Reserve account balance is greater than $500,000.
A “Cash Trap Event Period” will commence upon the earlier of the following:
| (i) | the occurrence and continuance of an event of default; or |
| (ii) | the net cash flow debt service coverage ratio (“NCF DSCR”), tested quarterly, falling below 1.10x. |
A Cash Trap Event Period will end upon the occurrence of the following:
| ● | with regard to clause (i) above, the cure of such event of default; or |
| ● | with regard to clauses (ii) above, the NCF DSCR is equal to or greater than 1.10x for one calendar quarter. |
Terrorism Insurance. The borrowers are required to obtain and maintain property insurance for 100% of full replacement cost and business interruption insurance for 18 months plus a 6-month extended period of indemnity. Such insurance is required to cover perils of terrorism and acts of terrorism as required by the Terrorism Risk Insurance Program Reauthorization Act of 2019 (“TRIPRA”); however, if TRIPRA or any subsequent statute, extension, or reauthorization is no longer in effect, the borrowers will not be required to pay any annual insurance premiums solely with respect to such terrorism coverage in excess of 200% of the amount of the then annual premiums paid by the borrowers for all-risk coverage under a stand-alone all-risk policy. See “Risk Factors—Risks Relating to the Mortgage Loans—Terrorism Insurance May Not Be Available for All Mortgaged Properties” in the prospectus.
| THE INFORMATION IN THIS STRUCTURAL AND COLLATERAL TERM SHEET IS NOT COMPLETE AND MAY BE AMENDED PRIOR TO THE TIME OF SALE. THIS TERM SHEET IS NOT AN OFFER TO SELL THESE SECURITIES AND IT IS NOT A SOLICITATION OF AN OFFER TO BUY THESE SECURITIES IN ANY JURISDICTION WHERE THE OFFER OR SALE IS NOT PERMITTED. | ||
| T-106 | ||
| Multifamily – Mid Rise | Loan #9 | Cut-off Date Balance: | $36,500,000 | |
| 11610 Dunstan Way | Respara | Cut-off Date LTV: | 66.1% | |
| Los Angeles, CA 90049 | UW NCF DSCR: | 1.25x | ||
| UW NOI Debt Yield: | 8.0% |
| THE INFORMATION IN THIS STRUCTURAL AND COLLATERAL TERM SHEET IS NOT COMPLETE AND MAY BE AMENDED PRIOR TO THE TIME OF SALE. THIS TERM SHEET IS NOT AN OFFER TO SELL THESE SECURITIES AND IT IS NOT A SOLICITATION OF AN OFFER TO BUY THESE SECURITIES IN ANY JURISDICTION WHERE THE OFFER OR SALE IS NOT PERMITTED. | ||
| T-107 | ||
| Multifamily – Mid Rise | Loan #9 | Cut-off Date Balance: | $36,500,000 | |
| 11610 Dunstan Way | Respara | Cut-off Date LTV: | 66.1% | |
| Los Angeles, CA 90049 | UW NCF DSCR: | 1.25x | ||
| UW NOI Debt Yield: | 8.0% |

| THE INFORMATION IN THIS STRUCTURAL AND COLLATERAL TERM SHEET IS NOT COMPLETE AND MAY BE AMENDED PRIOR TO THE TIME OF SALE. THIS TERM SHEET IS NOT AN OFFER TO SELL THESE SECURITIES AND IT IS NOT A SOLICITATION OF AN OFFER TO BUY THESE SECURITIES IN ANY JURISDICTION WHERE THE OFFER OR SALE IS NOT PERMITTED. | ||
| T-108 | ||
| Mortgage Loan No. 9 – Respara |
| Mortgage Loan Information | Property Information | ||||||
| Mortgage Loan Sellers: | WFB | Single Asset/Portfolio: | Single Asset | ||||
| Credit Assessment (Fitch/KBRA/Moody’s): | NR/NR/NR | Location: | Los Angeles, CA 90049 | ||||
| Original Balance(1): | $36,500,000 | General Property Type: | Multifamily | ||||
| Cut-off Date Balance(1): | $36,500,000 | Detailed Property Type: | Mid Rise | ||||
| % of Initial Pool Balance: | 3.7% | Title Vesting: | Fee | ||||
| Loan Purpose: | Refinance | Year Built/Renovated: | 2022 / NAP | ||||
| Borrower Sponsors: | Christopher M. Liebes and | Size: | 54 Units | ||||
| Hugh H. Evans, III | Cut-off Date Balance per Unit(1): | $1,138,889 | |||||
| Guarantors: | Christopher M. Liebes and | Maturity Balance per Unit(1): | $1,138,889 | ||||
| Hugh H. Evans, III | Property Manager: | Sentral Management | |||||
| Mortgage Rate: | 6.3000% | ||||||
| Note Date: | 2/6/2024 | ||||||
| Maturity Date: | 2/11/2029 | Underwriting and Financial Information | |||||
| Term to Maturity: | 60 months | UW NOI: | $4,918,926 | ||||
| Amortization Term: | 0 months | UW NCF: | $4,905,426 | ||||
| IO Period: | 60 months | UW NOI Debt Yield(1): | 8.0% | ||||
| Seasoning: | 3 months | UW NCF Debt Yield(1): | 8.0% | ||||
| Prepayment Provisions(2): | L(26),DorYM1(27),O(7) | UW NOI Debt Yield at Maturity(1): | 8.0% | ||||
| Lockbox/Cash Mgmt Status: | Springing | UW NCF DSCR(1): | 1.25x | ||||
| Additional Debt Type(1): | Pari Passu | Most Recent NOI(4): | NAV | ||||
| Additional Debt Balance(1): | $25,000,000 | 2nd Most Recent NOI(4): | NAV | ||||
| Future Debt Permitted (Type): | No (NAP) | 3rd Most Recent NOI(4): | NAV | ||||
| Most Recent Occupancy: | 96.3% (2/1/2024) | ||||||
| 2nd Most Recent Occupancy(4): | NAV | ||||||
| Reserves(3) | 3rd Most Recent Occupancy(4): | NAV | |||||
| Type | Initial | Monthly | Cap | Appraised Value (as of): | $93,000,000 (1/5/2024) | ||
| RE Taxes: | $55,544 | $55,544 | NAP | Appraised Value per Unit: | $1,722,222 | ||
| Insurance: | $0 | Springing | NAP | Cut-off Date LTV Ratio(1): | 66.1% | ||
| Replacement Reserve: | $0 | $1,125 | $40,500 | Maturity Date LTV Ratio(1): | 66.1% | ||
Sources and Uses | ||||||
| Sources | Proceeds | % of Total | Uses | Proceeds | % of Total | |
| Whole Loan Amount(1): | $61,500,000 | 100.0% | Loan Payoff: | $54,463,006 | 88.6% | |
| Upfront Reserves: | $55,544 | 0.1% | ||||
| Closing Costs: | $1,174,578 | 1.9% | ||||
| Return of Equity: | $5,806,872 | 9.4% | ||||
| Total Sources: | $61,500,000 | 100.0% | Total Uses: | $61,500,000 | 100.0% | |
| (1) | The Respara Mortgage Loan (as defined below) is part of the Respara Whole Loan (as defined below) with an original aggregate principal balance of $61,500,000. The Cut-off Date Balance per Unit, Maturity Balance per Unit, UW NOI Debt Yield, UW NCF Debt Yield, UW NOI Debt Yield at Maturity, UW NCF DSCR, Cut-off Date LTV Ratio and Maturity Date LTV Ratio numbers presented above are based on the Respara Whole Loan. |
| (2) | Prepayment of the Respara Whole Loan is permitted at any time after the earlier to occur of (a) the end of the two-year period commencing on the closing date of the securitization of the last promissory note representing a portion of the Respara Whole Loan to be securitized and (b) February 11, 2027. The assumed prepayment lockout period of 26 payments is based on the closing date of this transaction in May 2024. The actual lockout period may be longer. |
| (3) | See “Escrows and Reserves” section below. |
| (4) | Historical occupancies and NOI figures are not presented as the Respara Property (as defined below) was delivered in December 2022 and has been undergoing lease up. |
The Mortgage Loan. The ninth largest mortgage loan (the “Respara Mortgage Loan”) is part of a whole loan (the “Respara Whole Loan”) evidenced by two pari passu promissory notes in the aggregate original principal amount of $61,500,000 and secured by a first priority fee mortgage encumbering a 54-unit luxury multifamily apartment complex located in Los Angeles, CA (the “Respara Property”). The controlling Note A-1, in the original principal amount of $36,500,000, represents the Respara Mortgage Loan and will be contributed to the BANK5 Trust 2024-5YR6 securitization trust. The non-controlling Note A-2, in the original principal amount of $25,000,000, is expected to be contributed to one or more future securitizations. The Respara Whole Loan will be serviced pursuant to the pooling and servicing agreement for the BANK5 Trust 2024-5YR6 securitization trust. See “Description of the Mortgage Pool—The Whole Loans—The Serviced Pari Passu Whole Loans” and “Pooling and Servicing Agreement” in the prospectus.
| Respara Whole Loan Summary | ||||
| Note | Original Balance | Cut-off Date Balance | Note Holder | Controlling Note |
| A-1 | $36,500,000 | $36,500,000 | BANK5 Trust 2024-5YR6 | Yes |
| A-2 | $25,000,000 | $25,000,000 | WFB | No |
| Total | $61,500,000 | $61,500,000 | ||
| THE INFORMATION IN THIS STRUCTURAL AND COLLATERAL TERM SHEET IS NOT COMPLETE AND MAY BE AMENDED PRIOR TO THE TIME OF SALE. THIS TERM SHEET IS NOT AN OFFER TO SELL THESE SECURITIES AND IT IS NOT A SOLICITATION OF AN OFFER TO BUY THESE SECURITIES IN ANY JURISDICTION WHERE THE OFFER OR SALE IS NOT PERMITTED. | ||
| T-109 | ||
| Multifamily – Mid Rise | Loan #9 | Cut-off Date Balance: | $36,500,000 | |
| 11610 Dunstan Way | Respara | Cut-off Date LTV: | 66.1% | |
| Los Angeles, CA 90049 | UW NCF DSCR: | 1.25x | ||
| UW NOI Debt Yield: | 8.0% |
The Borrower and the Borrower Sponsors. The borrower is 11601 Dunstan Partners, L.P., a California limited partnership. The borrower is structured to be a single purpose bankruptcy-remote entity with one independent director. The borrower sponsors and the non-recourse carveout guarantors are Christopher M. Liebes and Hugh H. Evans, III.
Christopher M. Liebes has over 30 years of real estate investment, development , and property management experience. In 2015, Mr. Liebes succeeded his father as one of the Managing Partners of Moss & Company, one of the largest residential property managers in Southern California. Founded in 1960, Moss & Co, has 12,000+ units under management, all in the Los Angeles metro area.
Hugh H. Evans III founded Partners Trust in 2009, which ultimately merged with Compass, where Mr. Evans is a founding partner of the Southern California team. Mr. Evans has contributed to the brokerage's more than $10 billion in sales and expansion to 240 associates across Los Angeles since its inception. Mr. Evans has over 25 years of real estate experience and was most recently named in The Hollywood Reporter's Top 25 Real Estate Agents and among Variety's Showbiz Real Estate Elite.
The Property. The Respara Property is a four-story, luxury apartment building totaling 54 units located in the Brentwood neighborhood of Los Angeles, California. Constructed in 2022, the property is situated on a 1.1-acre site on a private cul-de-sac. Amenities include an interior courtyard, a swimming pool and spa with cabanas, barbeque areas, and a pizza oven, two rooftop decks, a private screening room, a resident lounge, a conference room, a fitness center, bicycle storage, on-site overnight courtesy patrol, concierge, controlled access, security surveillance, two elevators, on-site management, and a subterranean parking with 134 spaces (2.5 spaces per unit). The property includes 1 studio unit, 14 one-bedroom units, 35 two-bedroom units, and four, three-bedrooms units. Unit amenities include white oak flooring in living and bedroom areas, quartz countertops with waterfall edges, custom cabinetry, built-in Fisher-Paykel appliances, wine coolers, Grohe and Toto fixtures, floor-to ceiling sliding glass doors in living areas, in-unit washer/dryers, central HVAC, and private patios/balconies. As of February 1, 2024, the property was 96.3% occupied.
The following table presents certain information relating to the unit mix of the Respara Property:
| Unit Mix(1) | |||||||||
| Unit Type | Total No. of Units | Occupied Units | % of Total Units | Occupancy | Average Unit Size (SF) | Average Underwritten Monthly Rent per Unit | |||
| Studio | 1 | 1 | 1.9% | 100.0% | 428 | $3,850 | |||
| 1 Bedroom | 14 | 14 | 25.9% | 100.0% | 910 | $7,118 | |||
| 2 Bedrooms(2) | 35 | 34 | 64.8% | 97.1% | 1,366 | $11,537 | |||
| 3 Bedrooms | 4 | 3 | 7.4% | 75.0% | 1,978 | $18,567 | |||
| Total/Weighted Average | 54 | 52 | 100.0% | 96.3% | 1,276 | $10,605 | |||
| (1) | Information based on the underwritten rent roll. |
| (2) | One of the borrower sponsors leases a 2 bedroom unit at the Respara Property. |
The Market. The Respara Property is located in the Brentwood neighborhood of Los Angeles, California. The median household income in Brentwood ($146,507) is 91% higher than Los Angeles County ($76,610) and the median home value in Brentwood ($2,000,001) is 138% higher than the average Los Angeles County ($842,000). The property is located less than 0.5 miles from a number of restaurants and retail destinations along Sunset Boulevard and San Vicente Boulevard, approximately 1 mile northwest of I-405, 4.0 miles northeast of Santa Monica, and 6.4 miles northwest of Century City.
According to a third party market research report, the property is located in the West Los Angeles/Westwood/Brentwood submarket of the Los Angeles apartment market. As of October 2023, the submarket reported total inventory of 38,087 units with a 4.2% vacancy rate and average asking rents of $3,240 per month. The appraisal identified six directly competitive multifamily comparables with average asking rents ranging from $3,376 to $22,731 per unit and are further detailed in the table below:
| Competitive Set | |||||||
| Respara (Subject) | The Landmark Los Angeles Apartments | The Park | Ten Thousand | 8500 Burton | 1221 Ocean Avenue | Sway | |
| Location | Los Angeles, CA | Los Angeles, CA | Santa Monica, CA | Los Angeles, CA | Los Angeles, CA | Santa Monica, CA | Santa Monica, CA |
| Distance to Subject | -- | 0.9 miles | 3.3 miles | 3.1 Miles | 5.3 miles | 3.5 Miles | 3.3 miles |
| Property Type | Multifamily / Mid Rise | Multifamily / High Rise | Multifamily / Mid Rise | Multifamily / High Rise | Multifamily / Mid Rise | Multifamily / High Rise | Multifamily / Mid Rise |
| Year Built/Renovated | 2022/NAP | 2022/NAP | 2021/NAP | 2016/NAP | 2012/NAP | 1971/2018 | 2015/NAP |
| Number of Units | 54(1) | 376 | 249 | 283 | 87 | 120 | 122 |
| Average Monthly Rent (per unit) | |||||||
| Studio | $3,850(1) | $3,376 | $4,414 | NAP | NAP | NAP | $3,465 |
| 1 Bedroom | $7,118(1) | $5,299 | $5,657 | $9,380 | $7,845 | $12,664 | $4,909 |
| 2 Bedrooms | $11,537(1) | $10,238 | $9,380 | $18,539 | $13,356 | $14,846 | $6,919 |
| 3 Bedrooms | $18,567(1) | NAP | $12,794 | $22,241 | NAP | $22,731 | NAP |
| Occupancy | 96.3%(1) | 97.0% | 93.0% | 98.0% | 88.0% | 96.0% | 93.0% |
Source: Appraisal, unless otherwise indicated.
| (1) | Information obtained from the underwritten rent roll. |
| THE INFORMATION IN THIS STRUCTURAL AND COLLATERAL TERM SHEET IS NOT COMPLETE AND MAY BE AMENDED PRIOR TO THE TIME OF SALE. THIS TERM SHEET IS NOT AN OFFER TO SELL THESE SECURITIES AND IT IS NOT A SOLICITATION OF AN OFFER TO BUY THESE SECURITIES IN ANY JURISDICTION WHERE THE OFFER OR SALE IS NOT PERMITTED. | ||
| T-110 | ||
| Multifamily – Mid Rise | Loan #9 | Cut-off Date Balance: | $36,500,000 | |
| 11610 Dunstan Way | Respara | Cut-off Date LTV: | 66.1% | |
| Los Angeles, CA 90049 | UW NCF DSCR: | 1.25x | ||
| UW NOI Debt Yield: | 8.0% |
Appraisal. The appraiser concluded to an “as-is” value for the Respara Property of $93,000,000 as of January 5, 2024.
Environmental Matters. According to the Phase I environmental site assessment dated January 10, 2024, there was no evidence of any recognized environmental l conditions at the Respara Property.
Underwritten Net Cash Flow. The following table presents certain information relating to the Underwritten Net Cash Flow at the Respara Property:
| Cash Flow Analysis(1) | ||
| UW | UW per Unit | |
| Base Rent(2) | $6,617,580 | $122,548 |
| Grossed Up Vacant Space | $355,200 | $6,578 |
| Gross Potential Rent | $6,972,780 | $129,126 |
| Concessions | ($94,800) | ($1,756) |
| Other Income(3) | $199,452 | $3,694 |
| Net Rentable Income | $7,077,432 | $131,064 |
| (Vacancy / Credit Loss) | ($355,200) | ($6,578) |
| Effective Gross Income | $6,722,232 | $124,486 |
| Real Estate Taxes | $739,841 | $13,701 |
| Insurance | $98,000 | $1,815 |
| Other Operating Expenses | $965,465 | $17,879 |
| Total Operating Expenses | $1,803,306 | $33,395 |
| Net Operating Income | $4,918,926 | $91,091 |
| Replacement Reserves | $13,500 | $250 |
| Net Cash Flow | $4,905,426 | $90,841 |
| Occupancy (%) | 94.9%(4) | |
| NOI DSCR(5) | 1.25x | |
| NCF DSCR(5) | 1.25x | |
| NOI Debt Yield(5) | 8.0% | |
| NCF Debt Yield(5) | 8.0% | |
| (1) | Historical operating history is not presented as the Respara Property was delivered in December 2022 and has been undergoing lease up. |
| (2) | Based on the underwritten rent roll as of February 1, 2024. |
| (3) | UW Other Income includes parking, vending, late fees, application fees, pet fees, cancellation/termination fees, MTM fees, storage, renters insurance, cable/satellite TV charges, and miscellaneous income. |
| (4) | Represents economic occupancy. |
| (5) | Debt service coverage ratios and debt yields are based on the Respara Whole Loan. |
Escrows and Reserves.
Real Estate Taxes – The loan documents require an upfront reserve of $55,544 for real estate taxes and ongoing monthly reserves equal to 1/12th of the annual estimated tax payments payable during the next ensuing 12 months, initially $55,544.
Insurance – The loan documents do not require ongoing monthly insurance reserves; provided no event of default is continuing, the borrower maintains insurance coverage for the Respara Property as part of blanket or umbrella coverage reasonably approved by the lender, and provides the lender with evidence of the renewals of the insurance policies and paid receipts for the payment of the insurance premiums no later than 10 business days prior to the expiration dates of the policies. If such conditions are not satisfied, the loan documents require ongoing monthly insurance reserves in an amount equal to 1/12 of the insurance premiums that the lender reasonably estimates will be payable during the next ensuing 12 months.
Replacement Reserve – The loan documents require ongoing monthly deposits of $1,125 for replacement reserves, subject to a cap of $40,500 ($750/unit)
Lockbox and Cash Management. Upon the occurrence of a Cash Trap Event Period (as defined below), the borrower and property manager are required to establish a lender-controlled lockbox account and deposit all rents directly into such lockbox account. During the continuance of a Cash Trap Event Period, all funds in the lockbox account are required to be swept into the cash management account controlled by the lender and disbursed on each payment date in accordance with the Respara Whole Loan documents and all excess funds are required to be swept to an excess cash flow subaccount controlled by the lender.
A “Cash Trap Event Period” will commence upon the occurrence and continuance of an event of default under the Respara Whole Loan documents.
A Cash Trap Event Period will end upon the cure of such event of default.
| THE INFORMATION IN THIS STRUCTURAL AND COLLATERAL TERM SHEET IS NOT COMPLETE AND MAY BE AMENDED PRIOR TO THE TIME OF SALE. THIS TERM SHEET IS NOT AN OFFER TO SELL THESE SECURITIES AND IT IS NOT A SOLICITATION OF AN OFFER TO BUY THESE SECURITIES IN ANY JURISDICTION WHERE THE OFFER OR SALE IS NOT PERMITTED. | ||
| T-111 | ||
| Multifamily – Mid Rise | Loan #9 | Cut-off Date Balance: | $36,500,000 | |
| 11610 Dunstan Way | Respara | Cut-off Date LTV: | 66.1% | |
| Los Angeles, CA 90049 | UW NCF DSCR: | 1.25x | ||
| UW NOI Debt Yield: | 8.0% |
Terrorism Insurance. The loan documents require that the “all risk” insurance policy required to be maintained by the borrower provide coverage for terrorism in an amount equal to the full replacement cost of the Respara Property, as well as business interruption insurance covering not less than 18 months following the occurrence of a casualty, together with an extended period of indemnity of 6 months.
| THE INFORMATION IN THIS STRUCTURAL AND COLLATERAL TERM SHEET IS NOT COMPLETE AND MAY BE AMENDED PRIOR TO THE TIME OF SALE. THIS TERM SHEET IS NOT AN OFFER TO SELL THESE SECURITIES AND IT IS NOT A SOLICITATION OF AN OFFER TO BUY THESE SECURITIES IN ANY JURISDICTION WHERE THE OFFER OR SALE IS NOT PERMITTED. | ||
| T-112 | ||
| Mixed Use – Retail/Office | Loan #10 | Cut-off Date Balance: | $35,000,000 | |
| 4500 Interstate 55 North | Highland Village | Cut-off Date LTV: | 62.2% | |
| Jackson, MS 39211 | UW NCF DSCR: | 1.55x | ||
| UW NOI Debt Yield: | 11.1% |

| THE INFORMATION IN THIS STRUCTURAL AND COLLATERAL TERM SHEET IS NOT COMPLETE AND MAY BE AMENDED PRIOR TO THE TIME OF SALE. THIS TERM SHEET IS NOT AN OFFER TO SELL THESE SECURITIES AND IT IS NOT A SOLICITATION OF AN OFFER TO BUY THESE SECURITIES IN ANY JURISDICTION WHERE THE OFFER OR SALE IS NOT PERMITTED. | ||
| T-113 | ||
| Mixed Use – Retail/Office | Loan #10 | Cut-off Date Balance: | $35,000,000 | |
| 4500 Interstate 55 North | Highland Village | Cut-off Date LTV: | 62.2% | |
| Jackson, MS 39211 | UW NCF DSCR: | 1.55x | ||
| UW NOI Debt Yield: | 11.1% |

| THE INFORMATION IN THIS STRUCTURAL AND COLLATERAL TERM SHEET IS NOT COMPLETE AND MAY BE AMENDED PRIOR TO THE TIME OF SALE. THIS TERM SHEET IS NOT AN OFFER TO SELL THESE SECURITIES AND IT IS NOT A SOLICITATION OF AN OFFER TO BUY THESE SECURITIES IN ANY JURISDICTION WHERE THE OFFER OR SALE IS NOT PERMITTED. | ||
| T-114 | ||
| Mixed Use – Retail/Office | Loan #10 | Cut-off Date Balance: | $35,000,000 | |
| 4500 Interstate 55 North | Highland Village | Cut-off Date LTV: | 62.2% | |
| Jackson, MS 39211 | UW NCF DSCR: | 1.55x | ||
| UW NOI Debt Yield: | 11.1% |
| THE INFORMATION IN THIS STRUCTURAL AND COLLATERAL TERM SHEET IS NOT COMPLETE AND MAY BE AMENDED PRIOR TO THE TIME OF SALE. THIS TERM SHEET IS NOT AN OFFER TO SELL THESE SECURITIES AND IT IS NOT A SOLICITATION OF AN OFFER TO BUY THESE SECURITIES IN ANY JURISDICTION WHERE THE OFFER OR SALE IS NOT PERMITTED. | ||
| T-115 | ||
| Mortgage Loan No. 10 – Highland Village |
| Mortgage Loan Information | Property Information | |||||||
| Mortgage Loan Seller: | BANA | Single Asset/Portfolio: | Single Asset | |||||
| Credit Assessment (Fitch/KBRA/Moody’s): | NR/NR/NR | Location: | Jackson, MS 39211 | |||||
| Original Balance: | $35,000,000 | General Property Type: | Mixed Use | |||||
| Cut-off Date Balance: | $35,000,000 | Detailed Property Type: | Retail/Office | |||||
| % of Initial Pool Balance: | 3.6% | Title Vesting: | Fee | |||||
| Loan Purpose: | Refinance | Year Built/Renovated: | 1983/2019 | |||||
| Borrower Sponsor: | WS Development | Size: | 214,977 SF | |||||
| Guarantor: | SDM Holdings LLC | Cut-off Date Balance Per SF: | $163 | |||||
| Mortgage Rate: | 6.7950% | Maturity Date Balance Per SF: | $163 | |||||
| Note Date: | 4/1/2024 | Property Manager: | WS Asset Management, Inc. | |||||
| Maturity Date: | 4/1/2029 | (borrower-related) | ||||||
| Term to Maturity: | 60 months | Underwriting and Financial Information | ||||||
| Amortization Term: | 0 months | UW NOI: | $3,901,189 | |||||
| IO Period: | 60 months | UW NCF: | $3,731,297 | |||||
| Seasoning: | 1 month | UW NOI Debt Yield: | 11.1% | |||||
| Prepayment Provisions: | L(25),DorYM1(31),O(4) | UW NCF Debt Yield: | 10.7% | |||||
| Lockbox/Cash Mgmt Status: | Hard/Springing | UW NOI Debt Yield at Maturity: | 11.1% | |||||
| Additional Debt Type: | No | UW NCF DSCR: | 1.55x | |||||
| Additional Debt Balance: | NAP | Most Recent NOI: | $3,160,409 (12/31/2023) | |||||
| Future Debt Permitted (Type): | No (NAP) | 2nd Most Recent NOI: | $3,143,196 (12/31/2022) | |||||
| 3rd Most Recent NOI: | $2,326,971 (12/31/2021) | |||||||
| Reserves(1) | Most Recent Occupancy: | 88.8% (3/23/2024) | ||||||
| Type | Initial | Monthly | Cap | 2nd Most Recent Occupancy: | 89.4% (12/31/2023) | |||
| RE Taxes: | $112,725 | $37,575 | NAP | 3rd Most Recent Occupancy: | 90.5% (12/31/2022) | |||
| Insurance: | $0 | Springing | NAP | Appraised Value (as of): | $56,300,000 (3/8/2024) | |||
| Replacement Reserve: | $0 | $2,687 | $100,000 | Appraised Value PSF: | $262 | |||
| TI/LC Reserve: | $500,000 | Springing | $500,000 | Cut-off Date LTV Ratio: | 62.2% | |||
| Outstanding Landlord Obligations: | $2,004,140 | $0 | NAP | Maturity Date LTV Ratio: | 62.2% | |||
| Sources and Uses | ||||||
| Sources | Proceeds | % of Total | Uses | Proceeds | % of Total | |
| Mortgage Loan Amount: | $35,000,000 | 100.0% | Loan Payoff: | $29,235,798 | 83.5% | |
| Upfront Reserves: | $2,616,865 | 7.5% | ||||
| Return of Equity: | $2,075,044 | 5.9% | ||||
| Closing Costs: | $1,072,293 | 3.1% | ||||
| Total Sources: | $35,000,000 | 100.0% | Total Uses: | $35,000,000 | 100.0% | |
| (1) | See “Escrows and Reserves” section below for further discussion. |
The Mortgage Loan. The tenth largest mortgage loan (the “Highland Village Mortgage Loan”) is evidenced by a single promissory note in the original principal amount of $35,000,000 and secured by the borrower’s fee interest in a mixed use office and retail center totaling 214,977 SF located in Jackson, Mississippi (the “Highland Village Property”).
The Borrower and the Borrower Sponsor. The borrower is Highland Village Properties LLC, a Delaware limited liability company and single purpose entity with one independent director. The borrower sponsor is WS Development. Established in 1990, WS Development owns, operates and leases more than 100 properties across eleven states. WS Development owns over 22 million SF of retail, office and residential properties and has nine million additional SF under development. The borrower sponsor acquired the Highland Village Property in 2012.
The non-recourse carveout guarantor for the Highland Village Mortgage Loan is SDM Holdings LLC, which is owned by Jeremy Sclar, Thomas DeSimone and Richard Marks. Mr. Sclar, Mr. DeSimone and Mr. Marks are also the principal owners of WS Development.
The Property. The Highland Village Property is a retail and office property located in Jackson, Mississippi, consisting of twelve buildings totaling 214,977 SF. As of March 23, 2024, the Highland Village Property was 88.8% occupied by 61 retail tenants and 24 office and storage tenants. Other than the anchor tenants, Whole Foods Market and Maison Weiss, no tenant occupies more than 5.1% of NRA or represents more than 6.2% of underwritten base rent. The retail tenancy is primarily comprised of high-end and local specialty tenants. The Highland Village Property also features several full-service restaurants, including Char, Bravo! and Aplos, and several office tenants, consisting of primarily specialty medical and professional spaces which are located on the buildings’ second levels, above the retail. Several of the tenants at the Highland Village Property are the first and only locations in the entire state of Mississippi for the national retailer, including Whole Foods, Sur La Table, Kendra Scott, J. McLaughlin, Vineyard Vines and Warby Parker. The Highland Village Property regularly hosts community events, including workouts, trivia nights and seasonal events.
| THE INFORMATION IN THIS STRUCTURAL AND COLLATERAL TERM SHEET IS NOT COMPLETE AND MAY BE AMENDED PRIOR TO THE TIME OF SALE. THIS TERM SHEET IS NOT AN OFFER TO SELL THESE SECURITIES AND IT IS NOT A SOLICITATION OF AN OFFER TO BUY THESE SECURITIES IN ANY JURISDICTION WHERE THE OFFER OR SALE IS NOT PERMITTED. | ||
| T-116 | ||
| Mixed Use – Retail/Office | Loan #10 | Cut-off Date Balance: | $35,000,000 | |
| 4500 Interstate 55 North | Highland Village | Cut-off Date LTV: | 62.2% | |
| Jackson, MS 39211 | UW NCF DSCR: | 1.55x | ||
| UW NOI Debt Yield: | 11.1% |
The following table presents certain information relating to the sales history at the Highland Village Property:
| Tenant Sales(1) | |||
| 2022 | 2023 | February 2024 TTM | |
| Gross Sales | $44,937,255 | $47,236,342 | $43,167,693 |
| Sales PSF | $404 | $425 | $404 |
| (1) | All sales information presented herein with respect to the Highland Village Property is based upon information provided by the borrower sponsor. In certain instances, sales figures represent estimates because the tenants are not required to report, or otherwise may not have reported sales information on a timely basis. Further, because sales are self-reported, such information is not independently verified by the borrower sponsor. |
Major Tenants.
Whole Foods Market (30,050 SF, 14.0% of NRA, 12.9% of UW Rent). Whole Foods Market is a natural and organic food retailer that operates over 500 stores in the U.S., Canada and the United Kingdom. Since June 2017, Whole Foods Market has been owned by Amazon. The Whole Foods Market at the Highland Village Property was developed by the borrower sponsor at an estimated cost of approximately $5.7 million. When its lease commenced in February 2014, the Whole Foods Market at the Highland Village Property became the first (and remains the only) Whole Foods Market to open in the state of Mississippi. Whole Foods Market occupies 30,050 SF on a lease that expires on February 28, 2034, with six, five-year renewal options at fixed rents and no termination options. Whole Foods Market currently pays $20.79 per SF. Whole Foods Market is not required to report sales at the Highland Village Property.
Maison Weiss (11,710 SF, 5.4% of NRA, 3.1% of UW Rent). Maison Weiss, a high-end women’s fashion retailer, was founded in 1975 by local residents of Jackson, Mississippi. Maison Weiss continues to be a privately held, family-run business and currently has two store locations, both in Mississippi. Maison Weiss has been a tenant at the Highland Village Property since 1975 and occupies 11,710 SF on a lease that expires on July 31, 2026, with no renewal options. Maison Weiss currently pays base rent of $13.00 per SF plus 2.5% percentage rent on gross sales that exceed a breakpoint of $3,805,750 up to $8,000,000. Maison Weiss has a termination right in the event its gross sales are less than $4,000,000 for any consecutive 12-month period, effective no less than 12 months after delivering notice. Maison Weiss reported sales at the Highland Village Property of $671 per SF, $660 per SF, $599 per SF and $437 per SF for the years 2023, 2022, 2021 and 2020 (COVID-impacted), respectively.
Buffalo Peak Outfitters (11,000 SF, 5.1% of NRA, 6.2% of UW Rent). Buffalo Peak Outfitters is an outdoor lifestyle retailer founded in 1986. Buffalo Peak Outfitters has been a tenant at the Highland Village Property since 2010 and occupies 9,109 SF of retail space and 976 SF of office space on a lease that expires on April 30, 2028, with no renewal options, and 915 SF of office space on a month-to-month basis. Buffalo Peak Outfitters currently pays $27.08 per SF, with a scheduled rent increase to $28.33 per SF on May 1, 2024. Buffalo Peak Outfitters reported sales at the Highland Village Property of $378 per SF, $416 per SF, $342 per SF and $242 per SF for the years 2023, 2022, 2021 and 2020 (COVID-impacted), respectively.
The following table presents certain information relating to the tenancy at the Highland Village Property:
| Tenant Summary(1) | ||||||||||||||
| February 2024 TTM Sales(3) | ||||||||||||||
| Tenant Name | Credit Rating (Moody’s/ Fitch/S&P)(2) | Tenant SF | Approx. % of SF | Annual UW Rent | % of Total Annual UW Rent | Annual UW Rent PSF | Sales $ | Sales PSF | Occ Cost % | Lease Exp. | Renewal Options | Term. Option (Y/N) | ||
| Major Tenants | ||||||||||||||
| Whole Foods Market | A1 / AA- / AA | 30,050 | 14.0% | $624,740 | 12.9% | $20.79 | NAV | NAV | NAV | 2/28/2034 | 6 x 5 yr | N | ||
| Maison Weiss | NAP | 11,710 | 5.4% | $152,230 | 3.1% | $13.00 | $7,194,723 | $614 | 2.1% | 7/31/2026 | N/A | Y(4) | ||
| Buffalo Peak Outfitters | NAP | 11,000 | 5.1% | $297,830 | 6.2% | $27.08 | $3,008,440 | $330 | 9.9% | 4/30/2028(5) | N/A | N | ||
| Char | NAP | 9,407 | 4.4% | $263,276 | 5.4% | $27.99 | $7,000,091 | $751 | 3.8% | 4/30/2027 | 1 x 5 yr | N | ||
| Sur La Table | NAP | 5,752 | 2.7% | $234,049 | 4.8% | $40.69 | NAV(6) | NAV(6) | NAV(6) | 3/31/2031 | N/A | N | ||
| Major Tenants Subtotal/Wtd. Avg. | 67,919 | 31.6% | $1,572,125 | 32.5% | $23.15 | |||||||||
| Other Tenants | 122,882 | 57.2% | $3,262,532 | 67.5% | $26.55 | |||||||||
| Occupied Subtotal/Wtd. Avg. | 190,801 | 88.8% | $4,834,657 | 100.0% | $25.34 | |||||||||
| Vacant Space(7) | 24,176 | 11.2% | $0 | 0.0% | $0.00 | |||||||||
| Total/Wtd. Avg. | 214,977 | 100.0% | $4,834,657 | 100.0% | $25.34 | |||||||||
| (1) | Information is based on the underwritten rent roll dated March 23, 2024 and is inclusive of rent steps through May 1, 2025. |
| (2) | Certain ratings are those of the parent company whether or not the parent guarantees the lease. |
| (3) | All sales information presented herein with respect to the Highland Village Property is based upon information provided by the borrower sponsor as of the 12 months ended February 2024. In certain instances, sales figures represent estimates because the tenants are not required to report, or otherwise may not have reported sales information on a timely basis. Further, because sales are self-reported, such information is not independently verified by the borrower sponsor. |
| (4) | Maison Weiss has a termination right in the event gross sales are less than $4,000,000 for any consecutive 12-month period. |
| (5) | Buffalo Peak Outfitters occupies 9,109 SF of retail space and 976 SF of office space on a lease that expires on April 30, 2028, and 915 SF of office space on a month-to-month basis. |
| THE INFORMATION IN THIS STRUCTURAL AND COLLATERAL TERM SHEET IS NOT COMPLETE AND MAY BE AMENDED PRIOR TO THE TIME OF SALE. THIS TERM SHEET IS NOT AN OFFER TO SELL THESE SECURITIES AND IT IS NOT A SOLICITATION OF AN OFFER TO BUY THESE SECURITIES IN ANY JURISDICTION WHERE THE OFFER OR SALE IS NOT PERMITTED. | ||
| T-117 | ||
| Mixed Use – Retail/Office | Loan #10 | Cut-off Date Balance: | $35,000,000 | |
| 4500 Interstate 55 North | Highland Village | Cut-off Date LTV: | 62.2% | |
| Jackson, MS 39211 | UW NCF DSCR: | 1.55x | ||
| UW NOI Debt Yield: | 11.1% |
| (6) | Sur La Table’s lease commenced on April 1, 2024. |
| (7) | Vacant Space is comprised of 15,672 SF of retail space, 8,234 SF of office space and 200 SF of storage space. |
The following table presents certain information relating to the lease rollover schedule at the Highland Village Property:
| Lease Rollover Schedule(1)(2) | ||||||||
| Year | # of Leases Rolling | SF Rolling | Approx. % of SF Rolling | Approx. Cumulative % of SF Rolling | Total UW Rent Rolling | Approx. % of Total UW Rent Rolling | Approx. Cumulative % of Total UW Rent Rolling | UW Rent PSF Rolling |
| MTM/2024(3) | 36 | 46,299 | 21.5% | 21.5% | $1,005,962 | 20.8% | 20.8% | $21.73 |
| 2025 | 12 | 11,591 | 5.4% | 26.9% | $287,495 | 5.9% | 26.8% | $24.80 |
| 2026 | 11 | 23,030 | 10.7% | 37.6% | $410,712 | 8.5% | 35.2% | $17.83 |
| 2027 | 6 | 19,039 | 8.9% | 46.5% | $583,784 | 12.1% | 47.3% | $30.66 |
| 2028 | 8 | 25,802 | 12.0% | 58.5% | $801,566 | 16.6% | 63.9% | $31.07 |
| 2029(4) | 5 | 11,309 | 5.3% | 63.8% | $344,365 | 7.1% | 71.0% | $30.45 |
| 2030 | 2 | 2,335 | 1.1% | 64.8% | $89,603 | 1.9% | 72.9% | $38.37 |
| 2031 | 3 | 10,327 | 4.8% | 69.7% | $416,855 | 8.6% | 81.5% | $40.37 |
| 2032 | 3 | 6,666 | 3.1% | 72.8% | $161,968 | 3.4% | 84.9% | $24.30 |
| 2033 | 2 | 4,353 | 2.0% | 74.8% | $107,606 | 2.2% | 87.1% | $24.72 |
| 2034 | 1 | 30,050 | 14.0% | 88.8% | $624,740 | 12.9% | 100.0% | $20.79 |
| 2035 & Thereafter | 0 | 0 | 0.0% | 88.8% | $0 | 0.0% | 100.0% | $0.00 |
| Vacant | 0 | 24,176 | 11.2% | 100.0% | $0 | 0.0% | 100.0% | $0.00 |
| Total/Wtd. Avg.(5) | 89 | 214,977 | 100.0% | $4,834,657 | 100.0% | $25.34 | ||
| (1) | Information is based on the underwritten rent roll dated March 23, 2024 and is inclusive of rent steps through May 1, 2025. |
| (2) | Certain tenants may have lease termination options that are exercisable prior to the originally stated expiration date of the related lease and are not considered in the lease rollover schedule. |
| (3) | Several office and storage tenants have historically been and continue to be on short-term or month-to-month leases. |
| (4) | The Highland Village Mortgage Loan maturity date is in April 2029. |
| (5) | Total/Wtd. Avg. UW Rent PSF Rolling excludes vacant space. |
The Market. The Highland Village Property is located approximately four miles north of downtown Jackson, directly off of Interstate 55, north of St. Dominic Hospital, the Mississippi Agriculture and Forestry Museum, the Mississippi Children’s Museum, the Mississippi Museum of Natural Science and Belhaven University.
The Highland Village Property is located within the North Jackson retail submarket. According to the appraisal, the North Jackson retail submarket had a vacancy rate of 5.4%, a total inventory of 7,518 SF, and quoted rental rate of $13.38 per SF as of the fourth quarter of 2023.
According to the appraisal, the estimated 2023 population within a one-, three- and five-mile radius of the Highland Village Property was 8,178, 50,804 and 102,082, respectively. The neighborhood surrounding the Highland Village Property consists of an affluent community. Within a one-, three- and five-mile radius of the Highland Village Property, the estimated 2023 average annual household income was $94,516, $75,854 and $68,599, respectively, as compared to the estimated average annual household income of broader Jackson, which was $58,782.
The following table summarizes competitive properties to the Highland Village Property:
| Summary of Competitive Properties | ||||||
| Property / Location | Center Type | Distance | Year Built/ Renovated | Size (SF) | Occupancy | Anchors |
Highland Village Jackson, MS | Lifestyle Center | N/A | 1983/2019 | 214,977(1) | 88.8%(1) | Whole Foods Market, Maison Weiss(1) |
Northpark Mall Ridgeland, MS | Super Regional Mall | 4.6 miles | 1984/1998 | 923,880 | 80.0% | Dillard’s, JCPenney, Belk |
Renaissance at Colony Park Ridgeland, MS | Lifestyle Center | 6.5 miles | 2008/NAP | 590,448 | 98.2% | The Fresh Market, Malco Renaissance Cinema Grill, Barnes & Noble |
The Outlets of Mississippi Pearl, MS | Outlet Center | 8.2 miles | 2013/NAP | 300,156 | 90.0% | Marshalls, Lane Bryant Outlet, Under Armour Factory House |
Dogwood Festival Market Flowood, MS | Lifestyle Center | 7.3 miles | 2000/NAP | 307,565 | 75.9% | Belk, HomeGoods, T.J. Maxx, Old Navy |
Source: Appraisal
| (1) | Information is based on the underwritten rent roll dated March 23, 2024. |
| THE INFORMATION IN THIS STRUCTURAL AND COLLATERAL TERM SHEET IS NOT COMPLETE AND MAY BE AMENDED PRIOR TO THE TIME OF SALE. THIS TERM SHEET IS NOT AN OFFER TO SELL THESE SECURITIES AND IT IS NOT A SOLICITATION OF AN OFFER TO BUY THESE SECURITIES IN ANY JURISDICTION WHERE THE OFFER OR SALE IS NOT PERMITTED. | ||
| T-118 | ||
| Mixed Use – Retail/Office | Loan #10 | Cut-off Date Balance: | $35,000,000 | |
| 4500 Interstate 55 North | Highland Village | Cut-off Date LTV: | 62.2% | |
| Jackson, MS 39211 | UW NCF DSCR: | 1.55x | ||
| UW NOI Debt Yield: | 11.1% |
The following table presents certain information relating to the appraisal’s market rent conclusion for the Highland Village Property:
| Market Rent Summary | |||
| Space Type | Market Rent PSF | Lease Term (Years) | Rent Increase Projection |
| Inline < 2,500 SF | $28.25 | 5 | 2% per annum |
| Inline > 2,500 SF | $27.50 | 5 | 2% per annum |
| Restaurant | $26.50 | 5 | 3% per annum |
| Anchor | $22.00 | 5 | 3% per annum |
| Grocery Anchor | $20.00 | 10 | 10% mid-term |
| Office | $20.00 | 5 | 3% per annum |
Appraisal. The appraiser concluded to an “as-is” value for the Highland Village Property of $56,300,000 as of March 8, 2024.
Environmental Matters. According to the Phase I environmental site assessment dated March 6, 2024, there was no evidence of any recognized environmental conditions at the Highland Village Property.
Operating History and Underwritten Net Cash Flow. The following table presents certain information relating to the historical operating performance and Underwritten Net Cash Flow at the Highland Village Property:
| Cash Flow Analysis | ||||||
| 2020 | 2021 | 2022 | 2023(2) | UW(1)(2) | UW PSF | |
| Gross Potential Rent | $3,753,025 | $3,905,276 | $4,108,862 | $4,345,158 | $5,433,901 | $25.28 |
| Expense Reimbursement | $522,598 | $566,519 | $860,827 | $877,890 | $1,001,633 | $4.66 |
| Percentage Rent in Lieu(3) | $74,722 | $261,623 | $743,620 | $549,604 | $720,792 | $3.35 |
| Other Income(4) | $126,729 | $131,498 | $118,363 | $116,866 | $118,676 | $0.55 |
| Net Rentable Income | $4,477,074 | $4,864,916 | $5,831,672 | $5,889,518 | $7,275,002 | $33.84 |
| (Vacancy / Credit Loss) | $0 | ($138,003) | ($5,568) | ($7,490) | $(599,244) | ($2.79) |
| Effective Gross Income | $4,477,074 | $4,726,913 | $5,826,104 | $5,882,028 | $6,675,758 | $31.05 |
| Real Estate Taxes | $428,320 | $433,715 | $424,281 | $433,557 | $446,777 | $2.08 |
| Insurance | $70,910 | $82,537 | $92,277 | $80,484 | $79,021 | $0.37 |
| Other Operating Expenses | 1,396,746 | $1,883,690 | $2,166,350 | $2,207,578 | $2,248,771 | $10.46 |
| Total Operating Expenses | $1,895,976 | $2,399,942 | $2,682,908 | $2,721,619 | $2,774,569 | $12.91 |
| Net Operating Income | $2,581,098 | $2,326,971 | $3,143,196 | $3,160,409 | $3,901,189 | $18.15 |
| Replacement Reserves | $0 | $0 | $0 | $0 | $32,247 | $0.15 |
| TI/LC | $0 | $0 | $0 | $0 | $137,645 | $0.64 |
| Net Cash Flow | $2,581,098 | $2,326,971 | $3,143,196 | $3,160,409 | $3,731,297 | $17.36 |
| Occupancy (%) | 85.6% | 89.2% | 90.5% | 89.4% | 89.0%(5) | |
| NOI DSCR | 1.07x | 0.97x | 1.30x | 1.31x | 1.62x | |
| NCF DSCR | 1.07x | 0.97x | 1.30x | 1.31x | 1.55x | |
| NOI Debt Yield | 7.4% | 6.6% | 9.0% | 9.0% | 11.1% | |
| NCF Debt Yield | 7.4% | 6.6% | 9.0% | 9.0% | 10.7% | |
| (1) | Based on the underwritten rent roll as of March 23, 2024 including rent steps through May 1, 2025. |
| (2) | The increase in Net Operating Income from 2023 to UW is due primarily to increased percentage rent and expense reimbursements, and new leasing since mid-2023. |
| (3) | UW Percentage Rent in Lieu is based on the borrower’s budget. |
| (4) | UW Other Income includes marketing fund revenue and other miscellaneous income. |
| (5) | Represents economic occupancy. |
Escrows and Reserves.
Real Estate Taxes – At origination, the borrower deposited approximately $112,725 for real estate taxes. On a monthly basis, the borrower is required to escrow 1/12th of the annual estimated tax payments, which currently equates to approximately $37,575.
Insurance – If there is no approved blanket policy in place, the borrower is required to escrow 1/12th of the annual estimated insurance payments on a monthly basis. An approved blanket policy was in place at origination.
| THE INFORMATION IN THIS STRUCTURAL AND COLLATERAL TERM SHEET IS NOT COMPLETE AND MAY BE AMENDED PRIOR TO THE TIME OF SALE. THIS TERM SHEET IS NOT AN OFFER TO SELL THESE SECURITIES AND IT IS NOT A SOLICITATION OF AN OFFER TO BUY THESE SECURITIES IN ANY JURISDICTION WHERE THE OFFER OR SALE IS NOT PERMITTED. | ||
| T-119 | ||
| Mixed Use – Retail/Office | Loan #10 | Cut-off Date Balance: | $35,000,000 | |
| 4500 Interstate 55 North | Highland Village | Cut-off Date LTV: | 62.2% | |
| Jackson, MS 39211 | UW NCF DSCR: | 1.55x | ||
| UW NOI Debt Yield: | 11.1% |
Replacement Reserve – On a monthly basis, the borrower is required to escrow approximately $2,687 for replacement reserves, subject to a cap of $100,000.
TI/LC Reserve – At origination, the borrower deposited $500,000 for TI/LC reserves. Upon the balance of the TI/LC reserve falling below $250,000, the borrower is required to make monthly deposits of approximately $13,436, subject to a cap of $500,000.
Outstanding Landlord Obligation Reserve – At origination, the borrower deposited $2,004,140 into a reserve account to fund certain outstanding tenant improvements, tenant allowances and leasing commissions relating to nine tenants as set forth in the Highland Village Mortgage Loan documents.
Lockbox and Cash Management. The Highland Village Mortgage Loan is structured with a hard lockbox and springing cash management. All rents from the Highland Village Property are required to be deposited directly to the lockbox account and, so long as a Cash Sweep Period (as defined below) is not continuing, funds in the lockbox account will be transferred to the borrower on each business day. During a Cash Sweep Period, the borrower will not have access to the funds in the lockbox account, and such funds will be transferred to the lender-controlled cash management account and disbursed according to the Highland Village Mortgage Loan documents. During a Cash Sweep Period, all excess cash is required to be held by the lender as additional security for the Highland Village Mortgage Loan; provided no event of default exists, excess cash will be available to the borrower to fund operating expenses and capital expenditures set forth in the annual budget, as well as extraordinary expenses, leasing commissions, tenant improvements, repairs, replacements and other capital expenditures, in each case, that are approved by the lender.
A “Cash Sweep Period” will commence upon (i) the occurrence of an event of default under the Highland Village Mortgage Loan documents or (ii) the debt service coverage ratio falling below 1.25x on a trailing 12 month basis (tested quarterly), and will terminate upon (a) with respect to clause (i) above, the cure (or waiver by the lender) of such event of default or (b) with respect to clause (ii) above, the debt service coverage ratio being at least 1.25x on a trailing 12 month basis (tested quarterly). Notwithstanding the foregoing, the borrower may make a prepayment, deliver cash collateral or post an acceptable letter of credit in each case, in an amount which if applied to prepay the Highland Village Mortgage Loan, would achieve a debt service coverage ratio above 1.25x in order to avoid a Cash Sweep Period.
Terrorism Insurance. The borrower is required to obtain and maintain property insurance and business interruption insurance for 18 months plus a 6-month extended period of indemnity. Such insurance is required to cover perils of terrorism and acts of terrorism; provided that if TRIPRA is not in effect and terrorism insurance is commercially available, the borrower will not be required to spend on the premium for terrorism insurance coverage more than two times the amount of the insurance premium that is payable at such time in respect of the casualty and business interruption/rental loss insurance required under the Highland Village Mortgage Loan documents. See “Risk Factors—Risks Relating to the Mortgage Loans—Terrorism Insurance May Not Be Available for All Mortgaged Properties” in the prospectus.
| THE INFORMATION IN THIS STRUCTURAL AND COLLATERAL TERM SHEET IS NOT COMPLETE AND MAY BE AMENDED PRIOR TO THE TIME OF SALE. THIS TERM SHEET IS NOT AN OFFER TO SELL THESE SECURITIES AND IT IS NOT A SOLICITATION OF AN OFFER TO BUY THESE SECURITIES IN ANY JURISDICTION WHERE THE OFFER OR SALE IS NOT PERMITTED. | ||
| T-120 | ||
| Mortgage Loan No. 11 – Hampton Inn & Suites National Harbor |
| Mortgage Loan Information | Property Information | ||||||
| Mortgage Loan Seller: | JPMCB | Single Asset/Portfolio: | Single Asset | ||||
| Credit Assessment (Fitch/KBRA/Moody’s): | NR/NR/NR | Location: | Oxon Hill, MD 20745 | ||||
| Original Balance: | $34,300,000 | General Property Type: | Hospitality | ||||
| Cut-off Date Balance: | $34,300,000 | Detailed Property Type: | Limited Service | ||||
| % of Initial Pool Balance: | 3.5% | Title Vesting: | Fee | ||||
| Loan Purpose: | Acquisition | Year Built/Renovated: | 2008 / 2018-2019 | ||||
| Borrower Sponsor: | SAK Developers | Size: | 154 Rooms | ||||
| Guarantor: | Waheed Ashiq | Cut-off Date Balance Per Room: | $222,727 | ||||
| Mortgage Rate: | 7.8310% | Maturity Date Balance Per Room: | $222,727 | ||||
| Note Date: | 3/8/2024 | Property Manager: | Pollin/Miller Hospitality | ||||
| Maturity Date: | 4/1/2029 | Strategies, Inc. | |||||
| Term to Maturity: | 60 months | Underwriting and Financial Information | |||||
| Amortization Term: | 0 months | UW NOI: | $4,703,785 | ||||
| IO Period: | 60 months | UW NCF: | $4,298,659 | ||||
| Seasoning: | 1 month | UW NOI Debt Yield: | 13.7% | ||||
| Prepayment Provisions: | L(25),YM1(30),O(5) | UW NCF Debt Yield: | 12.5% | ||||
| Lockbox/Cash Mgmt Status: | Hard / Springing | UW NOI Debt Yield at Maturity: | 13.7% | ||||
| Additional Debt Type: | NAP | UW NCF DSCR: | 1.58x | ||||
| Additional Debt Balance: | NAP | Most Recent NOI: | $4,573,863 (TTM 1/31/2024) | ||||
| Future Debt Permitted (Type): | No (NAP) | 2nd Most Recent NOI: | $4,549,345 (12/31/2023) | ||||
| Reserves | 3rd Most Recent NOI: | $3,131,676 (12/31/2022) | |||||
| Type | Initial | Monthly | Cap | Most Recent Occupancy: | 78.9% (1/31/2024) | ||
| RE Taxes: | $10,000 | $45,299 | NAP | 2nd Most Recent Occupancy: | 79.0% (12/31/2023) | ||
| Insurance: | $0 | Springing | NAP | 3rd Most Recent Occupancy: | 63.2% (12/31/2022) | ||
| FF&E Reserve: | $0 | Springing | NAP | Appraised Value (as of)(1): | $49,000,000 (12/19/2023) | ||
| PIP Reserve: | $1,800,000 | $0 | NAP | Appraised Value Per Room(1): | $318,182 | ||
| Cut-off Date LTV Ratio(1): | 70.0% | ||||||
| Maturity Date LTV Ratio(1): | 70.0% | ||||||
| Sources and Uses | ||||||
| Sources | Proceeds | % of Total | Uses | Proceeds | % of Total | |
| Mortgage Loan Amount: | $34,300,000 | 68.7% | Purchase Price: | $47,000,000 | 94.2% | |
| Borrower Sponsor Equity: | $15,614,710 | 31.3% | Upfront Reserves: | $1,810,000 | 3.6% | |
| Closing Costs: | $1,104,710 | 2.2% | ||||
| Total Sources: | $49,914,710 | 100.0% | Total Uses: | $49,914,710 | 100.0% | |
| (1) | The Appraised Value of $49,000,000 represents the “As-If PIP Escrowed” appraised value based on the hypothetical assumption that the franchise required property improvement plan (“PIP”) would be funded by a cash reserve held in escrow and that such reserved funds would be available for any potential purchase. At origination of the Hampton Inn & Suites National Harbor Mortgage Loan, the borrower deposited $1,800,000 into a PIP reserve to fund a franchise required change of control PIP. Based on the “As-Is” appraised value of $47,000,000, the Hampton Inn & Suites National Harbor Mortgage Loan results in a Cut-Off Date LTV Ratio and Maturity Date LTV Ratio of 73.0%. |
The Mortgage Loan. The eleventh largest mortgage loan (the “Hampton Inn & Suites National Harbor Mortgage Loan”) is evidenced by a promissory note in the original principal amount of $34,300,000 and secured by a first priority fee mortgage encumbering a 154-room, limited service hospitality property located in Oxon Hill, Maryland (the “Hampton Inn & Suites National Harbor Property”).
The Borrower and the Borrower Sponsor. The borrower for the Hampton Inn & Suites National Harbor Mortgage Loan is Sak Harbor LLC, a Delaware limited liability company with one independent director. The borrower sponsor for the Hampton Inn & Suites National Harbor Mortgage Loan is SAK Developers, a Washington D.C. based hospitality investment firm owned and managed by the non-recourse carve-out guarantor, Waheed Ashiq.
Collectively, the founding partners of SAK Developers have over 70 years of experience in developing and operating hospitality businesses. In addition to the Hampton Inn & Suites National Harbor Property, SAK Developers’ hospitality portfolio includes Homewood Suites Wilmington, DE (120 rooms), Hyatt Place Chesapeake, VA (119 rooms) and Residence Inn Waldorf, MD (98 rooms).
The Property. The Hampton Inn & Suites National Harbor Property is a 154-room, limited service hospitality property built on a 0.51-acre site in Oxon Hill, Maryland. The hotel was originally built in 2008 and most recently renovated in 2018 and 2019. Further, the borrower sponsor has reserved an additional $1.8 million to be used towards a post-closing change of control PIP. The 2018 and 2019 renovations were focused on replacing soft goods, as well as adding three additional guestrooms by converting existing meeting space on the second floor. Approximately $4.0 million has been invested towards capital improvements since 2014. The Hampton Inn & Suites National Harbor Property is within close proximity to several demand generators, including Gaylord National Resort and Convention Center, the MGM National Harbor Hotel & Casino and the National Harbor Waterfront District. The ground floor of the Hampton Inn & Suites National Harbor Property features an indoor pool, a business center, a complimentary breakfast area and a sundry shop. The Hampton Inn & Suites National Harbor Property has 154 guestrooms across 12 floors, accessible through each of the two passenger elevators. The
| THE INFORMATION IN THIS STRUCTURAL AND COLLATERAL TERM SHEET IS NOT COMPLETE AND MAY BE AMENDED PRIOR TO THE TIME OF SALE. THIS TERM SHEET IS NOT AN OFFER TO SELL THESE SECURITIES AND IT IS NOT A SOLICITATION OF AN OFFER TO BUY THESE SECURITIES IN ANY JURISDICTION WHERE THE OFFER OR SALE IS NOT PERMITTED. | ||
| T-121 | ||
| Hospitality – Limited Service | Loan #11 | Cut-off Date Balance: | $34,300,000 | |
| 250 Waterfront Street | Hampton Inn & Suites National Harbor | Cut-off Date LTV: | 70.0% | |
| Oxon Hill, MD 20745 | UW NCF DSCR: | 1.58x | ||
| UW NOI Debt Yield: | 13.7% |
guestroom mix consists of 63 king suites, 44 queen/queen suites and 47 normal suites. Guestrooms average 244 SF in size and come equipped with standard amenities, including a work area, a nightstand, a sofa chair, a flat screen television, internet, a coffee maker, an iron and ironing board. The Hampton Inn & Suites National Harbor Property also has one 391 SF meeting room. While the Hampton Inn & Suites National Harbor Property has no formal agreement with the adjacent parking garage, guests are able to park there at a cost of $24 a night.
SAK Developers purchased the Hampton Inn & Suites National Harbor Property for an aggregate purchase price of $47.0 million, contributing approximately $15.6 million in cash equity. In connection with the acquisition, $1.8 million ($11,688 per room) was reserved at loan origination to be allocated towards a change of control PIP. The anticipated PIP is expected to include work on the exterior building and grounds, entrance, lobby, restrooms, F&B outlets, recreation facilities, pool, laundry, elevator and elevator lobbies, as well as the rooms, generally to be completed within six to twenty-four months. The Hampton Inn & Suites National Harbor Property is currently subject to a newly executed franchise agreement, expiring on March 31, 2039 with Hilton Franchise Holding LLC, an affiliate of Hilton Worldwide. The Hampton Inn & Suites National Harbor Property benefits from being the only hotel in the National Harbor market affiliated with Hilton Worldwide, allowing the Hampton Inn & Suites National Harbor Property the unique ability to capture demand from Hilton honor members and through the Hilton loyalty program.
According to the appraisal, the property segmentation at the Hampton Inn & Suites National Harbor Property is estimated at 40% leisure, 30% meeting and group and 30% commercial. The Hampton Inn & Suites National Harbor Property features a granular breakout of group/corporate accounts with no one account accounting for more than 1% of total revenue in the last four years.
The following table presents certain information relating to the Occupancy, ADR and RevPAR of the Hampton Inn & Suites National Harbor Property and its competitive set:
| Historical Occupancy, ADR, RevPAR | |||||||||
| Competitive Set(1) | Hampton Inn & Suites National Harbor Property(2) | Penetration Factor | |||||||
| Year | Occupancy | ADR | RevPAR | Occupancy | ADR | RevPAR | Occupancy | ADR | RevPAR |
| 12/31/2020 | 29.5% | $159.78 | $47.19 | 35.6% | $154.94 | $55.21 | 120.6% | 97.0% | 117.0% |
| 12/31/2021 | 50.8% | $132.65 | $67.37 | 51.3% | $172.79 | $88.73 | 101.1% | 130.3% | 131.7% |
| 12/31/2022 | 65.4% | $168.01 | $109.89 | 63.2% | $217.31 | $137.32 | 96.6% | 129.3% | 125.0% |
| 12/31/2023 | 74.0% | $184.82 | $136.84 | 79.0% | $222.57 | $175.72 | 106.7% | 120.4% | 128.4% |
| 1/31/2024(3) | 73.9% | $185.21 | $136.79 | 78.9% | $224.78 | $177.34 | 106.8% | 121.4% | 129.6% |
Source: Industry Report
| (1) | The 2020 competitive set includes Comfort Inn Oxon Hill, Harborside Hotel, Westin Washington National Harbor, Residence Inn National Harbor Washington DC and AC Hotels by Marriott National Harbor. The 2021, 2022, 2023 and 2024 competitive sets include Hampton by Hilton Inn & Suites Alexandria Old Town Area South, Comfort Inn Oxon Hill, AC Hotels by Marriott National Harbor, Holiday Inn Express & Suites Alexandria Fort Belvoir and Hyatt Place National Harbor Washington DC Area. |
| (2) | Occupancy, ADR and RevPAR figures for the subject property are based on historical operating statements provided by the borrower sponsor. |
| (3) | Represents the trailing 12 months ending January 31, 2024. |
The Market. The Hampton Inn & Suites National Harbor Property is located in Oxon Hill, within National Harbor in Prince George’s County, Maryland. Oxon Hill is located approximately 15 miles southeast of Arlington, Virginia, 12 miles south of Washington D.C. and 45 miles southwest of Baltimore, Maryland. The Hampton Inn & Suites National Harbor Property is provided access to other surrounding areas such as the Washington D.C. metropolitan area, northern Maryland, Richmond, Virginia and North Carolina. Three major airports are located within 40 miles of the Hampton Inn & Suites National Harbor Property: Ronald Reagan Washington National Airport (7.7 miles), Washington Dulles International Airport (36 miles) and Baltimore/Washington International Thurgood Marshall Airport (39 miles). Additionally, the Hampton Inn & Suites National Harbor Property is located within the Washington-Arlington-Alexandria metropolitan statistical area (“Washington, D.C. MSA”). The sixth largest MSA in the country, the Washington, D.C. MSA is largely driven by tourism and federal employment. Unemployment in the Washington, D.C. MSA peaked at 9.9% in April 2020 and is currently at 2.3% as of April 2023, with 99.5% of the jobs lost during the COVID-19 pandemic having returned. According to the appraisal, the compounded annual growth rate for the area is expected to grow at 2.3%, slightly above the national average of 2.2%. The appraisal also notes that beginning in 2021, market occupancy began to recover as travel, consumer activity and group demand slowly rebounded from COVID-19. Year-to-date metrics through November 2023 compared to the same period in 2022 showed growth across all metrics, and as such, trailing twelve-month ADR has surpassed 2019 levels. According to the appraisal, the market is expected to stabilize with occupancy normalizing around the high-70s. According to a third-party market research report, the Washington D.C. MSA entered 2024 after experiencing a 19.0% increase in 2023 RevPar, the fastest year-over-year growth among STR’s top 25 markets, as well as a 10% increase in 2023 demand, also the fastest growth among top markets. The market’s strong performance was largely driven by growth in business travel and group meetings. This growth reflects an 11.0% increase in weekday occupancy, and operators hope that government agencies will continue to push for less work from home and continue to drive up midweek occupancy growth.
Local demand generators include the Gaylord National Resort and Convention Center, the MGM National Harbor Hotel & Casino and the National Harbor Waterfront District. The Gaylord National Resort and Convention Center is located adjacent to the Hampton Inn & Suites National Harbor Property. Since opening in April 2008, the convention center has been the largest convention center on the east coast of the United States as measured by combined lodging, meeting, conference and convention space. The 2.5 million SF convention center hosts approximately 600,000 SF of meeting space, 1,996 guestrooms, and seven food and beverage outlets, including a two-story rooftop lounge. Opened in December 2016, the MGM National Harbor Hotel & Casino spans 24 stories, with 308 rooms, 125,000 SF of gaming space, 18,000 SF of high-end retail, a spa, 12 restaurants, a 3,000 seat theater with seven VIP suites and approximately 27,000 SF of meeting and event space. Further, BetMGM announced the arrival of legalized live sports betting within the complex in December of 2021, introducing a 110-foot long wraparound video screen and 17 betting kiosks. Developed by the Peterson Companies, the National Harbor Waterfront District is a 350-acre destination that encompasses six square blocks along the Potomac River. Located within the complex are over 40 restaurants and 160 retail outlets. Notable attractions include a street lined with artwork by Albert Paley and Ivan Schwartz, among others, as well as a 180-foot observation wheel with 42-climate controlled gondolas that offer views of Washington, D.C., Virginia and Maryland skylines. Additionally, the waterfront features year-round events and attractions.
| THE INFORMATION IN THIS STRUCTURAL AND COLLATERAL TERM SHEET IS NOT COMPLETE AND MAY BE AMENDED PRIOR TO THE TIME OF SALE. THIS TERM SHEET IS NOT AN OFFER TO SELL THESE SECURITIES AND IT IS NOT A SOLICITATION OF AN OFFER TO BUY THESE SECURITIES IN ANY JURISDICTION WHERE THE OFFER OR SALE IS NOT PERMITTED. | ||
| T-122 | ||
| Hospitality – Limited Service | Loan #11 | Cut-off Date Balance: | $34,300,000 | |
| 250 Waterfront Street | Hampton Inn & Suites National Harbor | Cut-off Date LTV: | 70.0% | |
| Oxon Hill, MD 20745 | UW NCF DSCR: | 1.58x | ||
| UW NOI Debt Yield: | 13.7% |
According to a third-party market research report, the estimated 2023 population within a one-, three-, and five-mile radius of the Hampton Inn & Suites National Harbor was 9,881, 85,289, and 298,550, respectively. According to the appraisal, the 2023 average household income within the same radii was $110,844, $136,673, and $131,485, respectively.
The Washington, D.C. market faces high barriers to entry due to high land costs, difficult entitlement processes, lack of developable land and existing supply. According to the appraisal, there are no proposed hotels anticipated to enter the Hampton Inn & Suites National Harbor Property’s immediate area in the immediate near future that would be considered competitive with the Hampton Inn & Suites National Harbor Property. Furthermore, since the onset of the COVID-19 pandemic, nearly 4,000 rooms across the Washington, D.C. area have been permanently closed.
The following table presents the primary competitive properties to the Hampton Inn & Suites National Harbor Property:
| Competitive Property Summary | ||||||||
| Property | Year Built | Rooms | Commercial | Group | Leisure | 2023 Occupancy(1)(2) | 2023 ADR(1)(2) | 2023 RevPAR(1)(2) |
| Hampton Inn & Suites National Harbor (Subject)(2) | 2008 | 154 | 30% | 30% | 40% | 79.0% | $222.57 | $175.72 |
| Residence Inn National Harbor | 2008 | 162 | 35% | 30% | 35% | 75% - 80% | $235 - $245 | $175 - $185 |
| AC Hotel by Marriott National Harbor | 2009 | 192 | 30% | 35% | 35% | 70% - 75% | $250 - $260 | $185 - $195 |
| The Westin Washington National Harbor | 2008 | 195 | 35% | 30% | 35% | 75% - 80% | $255 - $265 | $190 - $200 |
| Hyatt Place National Harbor | 2020 | 156 | 30% | 30% | 40% | 70% - 75% | $235 - $245 | $170 - $180 |
| Total/Average | 859 | 32% | 31% | 37% | 75% | $244.23 | $184.15 | |
| Source: | Appraisal |
| (1) | The variances between the underwriting and the appraisal with respect to occupancy, ADR and RevPAR are attributable in part to variances in reporting methodologies and/or timing differences. |
| (2) | 2023 Occupancy, 2023 ADR and 2023 RevPAR figures represent the year-end period ending December 2023 based on historical operating statements provided by the borrower sponsor. |
Appraisal. The appraiser concluded to an “As-If PIP Escrowed” value of $49,000,000 as of December 19, 2023, which assumes that the franchise required PIP would be funded by a cash reserve held in escrow and that such reserved funds would be available for any potential purchase. The “As-If PIP Escrowed” appraised value results in a Cut-off Date LTV Ratio and Maturity Date LTV Ratio of 70.0% for the Hampton Inn & Suites National Harbor Property Mortgage Loan. The appraisal concluded to an “As-Is” appraised value of $47,000,000 as of December 19, 2023, resulting in a Cut-Off Date LTV Ratio and Maturity Date LTV Ratio of 73.0%.
Environmental Matters. According to the Phase I environmental site assessment dated March 7, 2024, there was no evidence of any recognized environmental conditions at the Hampton Inn & Suites National Harbor Property.
| THE INFORMATION IN THIS STRUCTURAL AND COLLATERAL TERM SHEET IS NOT COMPLETE AND MAY BE AMENDED PRIOR TO THE TIME OF SALE. THIS TERM SHEET IS NOT AN OFFER TO SELL THESE SECURITIES AND IT IS NOT A SOLICITATION OF AN OFFER TO BUY THESE SECURITIES IN ANY JURISDICTION WHERE THE OFFER OR SALE IS NOT PERMITTED. | ||
| T-123 | ||
| Hospitality – Limited Service | Loan #11 | Cut-off Date Balance: | $34,300,000 | |
| 250 Waterfront Street | Hampton Inn & Suites National Harbor | Cut-off Date LTV: | 70.0% | |
| Oxon Hill, MD 20745 | UW NCF DSCR: | 1.58x | ||
| UW NOI Debt Yield: | 13.7% |
Operating History and Underwritten Net Cash Flow. The following table presents certain information relating to the historical operating performance and the Underwritten Net Cash Flow at the Hampton Inn & Suites National Harbor Property:
| Cash Flow Analysis(1) | |||||||||||
| 2019(2) | 2020(2) | 2021(2) | 2022(2) | 2023 | TTM (1/31/2024) | UW | UW per Room | ||||
| Occupancy | 74.7% | 35.6% | 51.3% | 63.2% | 79.0% | 78.9% | 78.9% | ||||
| ADR | $226.78 | $154.94 | $172.79 | $217.31 | $222.57 | $224.78 | $224.78 | ||||
| RevPAR | $169.50 | $55.21 | $88.73 | $137.32 | $175.72 | $177.34 | $177.34 | ||||
| Room Revenue | $9,372,756 | $3,111,747 | $4,987,237 | $7,718,806 | $9,877,266 | $9,968,293 | $9,968,293 | $64,729.18 | |||
| Other Departmental Income | $183,590 | $140,272 | $135,181 | $138,452 | $163,372 |
| $159,867 |
| $159,867 |
| $1,038.10 |
| Total Revenue | $9,556,346 | $3,252,019 | $5,122,418 | $7,857,258 | $10,040,638 | $10,128,161 | $10,128,161 | $65,767.28 | |||
| Room Expense | $1,408,328 | $713,743 | $995,902 | $1,349,810 | $1,617,029 | $1,635,770 | $1,635,770 | $10,621.88 | |||
| Other Departmental Expenses | $28,207 | $19,813 | $24,429 | $32,216 | $39,083 | $34,829 | $34,829 | $226.16 | |||
| Undistributed Expenses | $2,508,438 | $1,357,630 | $1,661,858 | $2,219,380 | $2,581,431 | $2,624,611 | $2,624,611 | $17,042.93 | |||
| Management Fee | $286,690 | $97,561 | $153,673 | $235,718 | $301,219 | $303,845 | $303,845 | $1,973.02 | |||
| Real Estate Taxes | $540,821 | $591,861 | $640,459 | $628,887 | $571,019 | $567,586 | $543,586 | $3,529.78 | |||
| Insurance | $64,427 | $171,723 | $174,212 | $199,391 | $269,537 | $284,551 | $162,735 | $1,056.72 | |||
| Other Expenses | $110,773 | $111,614 | $111,909 | $60,180 | $111,975 |
| $103,107 |
| $119,000 |
| $772.73 |
| Total Expenses | $4,947,684 | $3,063,945 | $3,762,442 | 4,725,581 | $5,491,293 | $5,554,298 | $5,424,375 | $35,223.22 | |||
| Net Operating Income | $4,608,662 | $188,075 | $1,359,977 | $3,131,676 | $4,549,345 | $4,573,863 | $4,703,785 | $30,544.06 | |||
| FF&E | $382,254 | $130,081 | $204,897 | $314,290 | $401,626 |
| $405,126 |
| $405,126 |
| $2,630.69 |
| Net Cash Flow | $4,226,408 | $57,994 | $1,155,080 | $2,817,386 | $4,147,720 | $4,168,737 | $4,298,659 | $27,913.37 | |||
| NOI DSCR | 1.69x | 0.07x | 0.50x | 1.15x | 1.67x | 1.68x | 1.73x | ||||
| NCF DSCR | 1.55x | 0.02x | 0.42x | 1.03x | 1.52x | 1.53x | 1.58x | ||||
| NOI Debt Yield | 13.4% | 0.5% | 4.0% | 9.1% | 13.3% | 13.3% | 13.7% | ||||
| NCF Debt Yield | 12.3% | 0.2% | 3.4% | 8.2% | 12.1% | 12.2% | 12.5% | ||||
| (1) | Certain items such as interest expense, interest income, depreciation, amortization, debt service payments and any other non-recurring items were excluded from the historical presentation and are not considered for the underwritten cash flow. | |
| (2) | The decrease in Occupancy and Net Operating Income from 2019 to 2020, as well as the subsequent recovery, is primarily attributable to the effect of the COVID-19 pandemic on the hospitality industry. |
| THE INFORMATION IN THIS STRUCTURAL AND COLLATERAL TERM SHEET IS NOT COMPLETE AND MAY BE AMENDED PRIOR TO THE TIME OF SALE. THIS TERM SHEET IS NOT AN OFFER TO SELL THESE SECURITIES AND IT IS NOT A SOLICITATION OF AN OFFER TO BUY THESE SECURITIES IN ANY JURISDICTION WHERE THE OFFER OR SALE IS NOT PERMITTED. | ||
| T-124 | ||
| Mortgage Loan No. 12 – Victory Louisiana Real Estate Portfolio |
| Mortgage Loan Information | Mortgaged Property Information | ||||||
| Mortgage Loan Seller: | MSMCH | Single Asset/Portfolio: | Portfolio | ||||
| Credit Assessment (Fitch/KBRA/Moody’s): | NR/NR/Baa3 | Location: | Metairie, LA Various | ||||
| Original Balance: | $34,000,000 | General Property Type: | Retail | ||||
| Cut-off Date Balance: | $34,000,000 | Detailed Property Type: | Anchored | ||||
| % of Initial Pool Balance: | 3.5% | Title Vesting: | Fee | ||||
| Loan Purpose: | Refinance | Year Built/Renovated(2): | Various/Various | ||||
| Borrower Sponsor: | Victory Real Estate Investments, LLC | Size: | 291,589 SF | ||||
| Guarantor: | Victory Real Estate Investments, LLC | Cut-off Date Balance Per SF: | $117 | ||||
| Mortgage Rate: | 7.1950% | Maturity Date Balance Per SF: | $117 | ||||
| Note Date: | 2/16/2024 | Property Manager: | Victory Commercial Real Estate, Inc. | ||||
| Maturity Date: | 3/1/2029 | (borrower-affiliated) | |||||
| Term to Maturity: | 60 months | Underwriting and Financial Information | |||||
| Amortization Term: | 0 months | UW NOI: | $4,250,011 | ||||
| IO Period: | 60 months | UW NCF: | $3,924,595 | ||||
| Seasoning: | 2 months | UW NOI Debt Yield: | 12.5% | ||||
| Prepayment Provisions: | L(23),YM1(33),O(4) | UW NCF Debt Yield: | 11.5% | ||||
| Lockbox/Cash Mgmt Status: | Springing/Springing | UW NOI Debt Yield at Maturity: | 12.5% | ||||
| Additional Debt Type: | No | UW NCF DSCR: | 1.58x | ||||
| Additional Debt Balance: | NAP | Most Recent NOI: | $4,354,201 (12/31/2023) | ||||
| Future Debt Permitted (Type): | No (NAP) | 2nd Most Recent NOI: | $3,830,421 (12/31/2022) | ||||
| 3rd Most Recent NOI: | $4,151,728 (12/31/2021) | ||||||
| Reserves | Most Recent Occupancy: | 100.0% (1/23/2024) | |||||
| Type | Initial | Monthly | Cap | 2nd Most Recent Occupancy: | 100.0% (12/31/2022) | ||
| RE Taxes: | $285,938 | $71,485 | NAP | 3rd Most Recent Occupancy: | 97.0% (12/31/2021) | ||
| Insurance: | $0 | Springing(1) | NAP | Appraised Value (as of): | $63,800,000 (12/18/2023) | ||
| Deferred Maintenance: | $21,250 | $0 | NAP | Appraised Value per SF: | $219 | ||
| Replacement Reserve: | $0 | $3,645 | NAP | Cut-off Date LTV Ratio: | 53.3% | ||
| TI/LC Reserve: | $200,000 | $24,299 | $1,000,000 | Maturity Date LTV Ratio: | 53.3% | ||
| Sources and Uses | ||||||
| Sources | Proceeds | % of Total | Uses | Proceeds | % of Total | |
| Loan Amount: | $34,000,000 | 100.0% | Loan Payoff: | $31,681,915 | 93.2% | |
| Return of Equity: | $1,173,219 | 3.5% | ||||
| Closing Costs: | $637,678 | 1.9% | ||||
| Reserves: | $507,188 | 1.5% | ||||
| Total Sources: | $34,000,000 | 100.0% | Total Uses: | $34,000,000 | 100.0% | |
| (1) | The borrower is not required to make monthly deposits into a reserve for insurance premiums so long as (i) the liability and casualty insurance policies covering the Victory Louisiana Real Estate Portfolio Properties (as defined below) are part of a blanket or umbrella policy approved by the lender in its reasonable discretion, (ii) no event of default is continuing under the Victory Louisiana Real Estate Portfolio Mortgage Loan (as defined below) documents and (iii) the borrower provides the lender with evidence of renewal of such insurance policies and paid receipts for the insurance premiums no later than 10 days prior to their expiration. If such conditions are not satisfied, the Victory Louisiana Real Estate Portfolio Mortgage Loan documents require ongoing monthly deposits into a reserve for insurance premiums in an amount equal to 1/12 of the insurance premiums that the lender estimates will be payable for the renewal of coverage upon the expiration of the insurance policies. |
| (2) | See the ”Portfolio Summary” chart below. |
The Mortgage Loan. The twelfth largest mortgage loan (the “Victory Louisiana Real Estate Portfolio Mortgage Loan”) is evidenced by a promissory note in the original principal amount of $34,000,000 and secured by a first priority mortgage encumbering the borrower’s fee interest in two retail properties totaling 291,589 SF located in Metairie, Louisiana (collectively, the “Victory Louisiana Real Estate Portfolio Properties”).
The Borrowers and the Borrower Sponsor. The borrowers for the Victory Louisiana Real Estate Portfolio Mortgage Loan are Airline Manhattan Investors, LLC and Westgate Investors No, LLC, each a Delaware limited liability company, which are 100% owned by the borrower sponsor and non-recourse carveout guarantor, Victory Real Estate Investments, LLC. Victory Real Estate Investments, LLC is a Delaware limited liability company, 56.0% owned by Victory Investments, Inc., a Georgia Corporation and 44.0% owned by 30 other investors, none of which own more than 6.0% individually. Victory Investments, Inc. is owned by Alton Darby (42.4%) and 31 other investors (57.6%), none of which own more than 9.4% individually.
Victory Real Estate Investment, LLC is a privately held commercial real estate company founded in 1992 by Alton Darby and Kent Cost, based in Columbus, Georgia. Victory Real Estate Investments, LLC’s primary focus is the acquisition, redevelopment, leasing and management of shopping centers. Victory Real Estate Investments, LLC’s current portfolio is comprised of over 4 million SF of retail space concentrated in eleven states in the southeastern United States. The management team has over 90 years of combined experience in the real estate industry.
| THE INFORMATION IN THIS STRUCTURAL AND COLLATERAL TERM SHEET IS NOT COMPLETE AND MAY BE AMENDED PRIOR TO THE TIME OF SALE. THIS TERM SHEET IS NOT AN OFFER TO SELL THESE SECURITIES AND IT IS NOT A SOLICITATION OF AN OFFER TO BUY THESE SECURITIES IN ANY JURISDICTION WHERE THE OFFER OR SALE IS NOT PERMITTED. | ||
| T-125 | ||
| Retail – Anchored | Loan #12 | Cut-off Date Balance: | $34,000,000 | |
| Various | Victory Louisiana Real Estate Portfolio | Cut-off Date LTV: | 53.3% | |
| Metairie, LA Various | UW NCF DSCR: | 1.58x | ||
| UW NOI Debt Yield: | 12.5% |
The Properties. The Victory Louisiana Real Estate Portfolio Properties comprise a 208,580 SF anchored retail property (the “Westgate Shopping Center Property”) and an 83,009 SF anchored retail property (the “Airline Shopping Center Property”) located in Metairie, Louisiana. As of January 23, 2024, the Victory Louisiana Real Estate Portfolio Properties are 100.0% leased to 36 tenants. The borrower sponsor acquired the Westgate Shopping Center Property in 2005, and the Airline Shopping Center Property in 1998. The Victory Louisiana Real Estate Portfolio Properties are approximately 6.4 miles away from one another.
Westgate Shopping Center Property
The Westgate Shopping Center Property is an anchored retail property located in Metairie, Louisiana totaling 208,580 SF. The Westgate Shopping Center Property was built in 1986, renovated in 2013, and is situated on an approximately 16.2-acre site. The Westgate Shopping Center Property is anchored by Academy Sports, Marshalls, Aldi and Michaels, with other major tenants including Scandinavia Furniture, Five Below and Bath & Body Works. The Westgate Shopping Center Property includes 1,110 surface parking spaces (5.3 spaces per 1,000 SF). As of January 23, 2024, the Westgate Shopping Center Property was 100.0% leased to 16 tenants.
Airline Shopping Center Property
The Airline Shopping Center Property is a grocery-anchored retail property located in Metairie, Louisiana totaling 83,009 SF. The Airline Shopping Center Property was built in 2001, and is situated on an approximately 7.6-acre site. The Airline Shopping Center Property is anchored by Rouses Market (63.4% of NRA of the Airline Shopping Center Property), with no other tenant comprising over 7.1% of NRA. The Airline Shopping Center Property includes 410 surface parking spaces (4.9 spaces per 1,000 SF). As of January 23, 2024, the Airline Shopping Center Property was 100.0% leased to 21 tenants.
The following table presents certain information relating to the Victory Louisiana Real Estate Portfolio Properties.
| Portfolio Summary | ||||||||||
| Property Name | City, State | Year Built / Renovated | Tenant SF(1) | Occupancy(1) | Allocated Mortgage Loan Cut-off Date Balance | % of Allocated Mortgage Loan Cut-off Date Balance | Appraised Value | UW NOI(1) | % of UW NOI(1) | |
| Westgate Shopping Center | Metairie, LA | 1986 / 2013 | 208,580 | 100.0% | $22,000,000 | 64.7% | $44,400,000 | $2,838,571 | 66.8% | |
| Airline Shopping Center | Metairie, LA | 2001 / NAP | 83,009 | 100.0% |
| $12,000,000 | 35.3% | $19,400,000 | $1,411,440 | 33.2% |
| Total/Wtd. Avg. | 291,589 | 100.0% | $34,000,000 | 100.0% | $63,800,000 | $4,250,011 | 100.0% | |||
Source: Appraisals, unless otherwise noted
| (1) | Information is based on the underwritten rent roll dated January 23, 2024. |
Major Tenants.
Academy Sports (77,386 SF, 26.5% of NRA, 18.5% of UW rent). Academy Sports is an American sporting goods and outdoors store chain founded in 1938 in San Antonio, Texas. Academy Sports offers a variety of hunting, fishing, and camping gear in addition to other sports products and apparel. Academy Sports is headquartered in Texas and has over 280 locations across 18 states. Academy Sports has anchored the Westgate Shopping Center Property since 2012, has a lease expiration date of January 31, 2028, and has three, 5-year renewal options remaining.
Rouses Market (52,655 SF, 18.1% of NRA, 16.1% of UW rent). Rouses Market is a grocery store chain founded in 1960 in Houma, Louisiana. Rouses Market has a total of 64 stores: 53 in Louisiana, three in Mississippi, and eight in Alabama. Rouses Market supports local growers, producers, and suppliers with the goal of providing customers with the best quality food at the lowest price. Rouses Market has anchored the Airline Shopping Center Property since 1999, has a lease expiration date of November 30, 2025, and has seven, 5-year renewal options remaining.
Marshalls (29,070 SF, 10.0% of NRA, 7.5% of UW rent). Marshalls is an American department store chain, and one of the main subsidiaries of the TJX Companies, Inc., an off-price apparel and home fashions retailer in the United States and worldwide. At the end of fiscal year 2023, the TJX Companies, Inc. reported over 4,800 stores across nine countries and three continents, and six branded e-commerce sites, with approximately 329,000 associates. Along with Marshalls, the TJX Companies, Inc. operates as T.J. Maxx, HomeGoods, Sierra, and HomeSense. Marshalls has anchored the Westgate Shopping Center Property since 2018, has a lease expiration date of May 31, 2028, and has four, 5-year renewal options remaining.
Michaels (27,200 SF, 9.3% of NRA, 9.4% of UW rent). Michaels is a privately held chain of American and Canadian arts and craft stores. Founded in 1973 in Irving, TX, Michaels provides arts, crafts, framing, floral and wall decor, and merchandise for makers and do-it-yourself home decorators. Michaels operates 1,290 stores in 49 states and Canada. Michaels has anchored the Westgate Shopping Center Property since 1985, has a lease expiration date of October 31, 2032, and has two, 5-year renewal options remaining.
Aldi (26,821 SF, 9.2% of NRA, 7.6% of UW rent). Aldi is a multinational, family-owned, discount supermarket chain that operates over 10,000 stores in over 10 countries. Aldi employs over 25,000 people and opened its first US store in Iowa in 1976. In August 2023, Aldi announced it would acquire Winn-Dixie and Harvey’s Supermarkets, which includes over 400 stores across the Southeast United States. Aldi has anchored the Westgate Shopping Center Property since 2022, has a lease expiration date of September 30, 2032, and has five, 5-year automatic renewal options remaining.
| THE INFORMATION IN THIS STRUCTURAL AND COLLATERAL TERM SHEET IS NOT COMPLETE AND MAY BE AMENDED PRIOR TO THE TIME OF SALE. THIS TERM SHEET IS NOT AN OFFER TO SELL THESE SECURITIES AND IT IS NOT A SOLICITATION OF AN OFFER TO BUY THESE SECURITIES IN ANY JURISDICTION WHERE THE OFFER OR SALE IS NOT PERMITTED. | ||
| T-126 | ||
| Retail – Anchored | Loan #12 | Cut-off Date Balance: | $34,000,000 | |
| Various | Victory Louisiana Real Estate Portfolio | Cut-off Date LTV: | 53.3% | |
| Metairie, LA Various | UW NCF DSCR: | 1.58x | ||
| UW NOI Debt Yield: | 12.5% |
The following table presents a summary regarding the tenants at the Victory Louisiana Real Estate Portfolio Properties:
| Tenant Summary(1) | ||||||||||
| Tenant Name | Property | Credit Rating (Fitch/Moody’s/ S&P)(2) | Tenant SF | Approx.% of SF | Annual UW Rent | % of Total Annual UW Rent | Annual UW Rent PSF | |||
| Lease Expiration | Renewal Options | Term. Option (Y/N) | ||||||||
| Major Tenants | ||||||||||
| Academy Sports | Westgate Shopping Center | NR/NR/BB | 77,386 | 26.5% | $877,070 | 18.5% | $11.33 | 1/31/2028 | 3 x 5 yr | N |
| Rouses Market | Airline Shopping Center | NR/NR/NR | 52,655 | 18.1% | $763,498 | 16.1% | $14.50 | 11/30/2025 | 7 x 5 yr | N |
| Marshalls | Westgate Shopping Center | NR/A2/A | 29,070 | 10.0% | $356,108 | 7.5% | $12.25 | 5/31/2028 | 4 x 5 yr | N |
| Michaels | Westgate Shopping Center | NR/NR/NR | 27,200 | 9.3% | $448,800 | 9.4% | $16.50 | 10/31/2032 | 2 x 5 yr | N |
| Aldi | Westgate Shopping Center | NR/NR/NR | 26,821 | 9.2% | $362,084 | 7.6% | $13.50 | 9/30/2032 | 5 x 5 yr | N |
| Major Tenants Subtotal/Wtd. Avg. | 213,132 | 73.1% | $2,807,559 | 59.1% | $13.17 | |||||
| Other Tenants | 78,457 | 26.9% | $1,941,967 | 40.9% | $24.75 | |||||
| Vacant Space | 0 | 0.0% | $0 | 0.0% | $0 | |||||
| Total/Wtd. Avg. | 291,589 | 100.0% | $4,749,526 | 100.0% | $16.29 | |||||
| (1) | Information is based on the underwritten rent roll dated January 23, 2024. |
| (2) | Certain ratings are those of the parent company, whether or not the parent company guarantees the lease. |
The following table presents certain information with respect to the lease rollover at the Victory Louisiana Real Estate Portfolio Properties:
| Lease Rollover Schedule(1) | ||||||||
| Year | # of Leases Rolling | SF Rolling | Approx. % of SF Rolling | Approx. Cumulative % of SF Rolling | Total UW Rent Rolling | Approx. % of Total UW Rent Rolling | Approx. Cumulative % of Total UW Rent Rolling | UW Rent PSF Rolling |
| MTM | 0 | 0 | 0.0% | 0.0% | $0 | 0.0% | 0.0% | $0.00 |
| 2024 | 4 | 9,764 | 3.3% | 3.3% | $161,231 | 3.4% | 3.4% | $16.51 |
| 2025 | 9 | 64,834 | 22.2% | 25.6% | $1,069,080 | 22.5% | 25.9% | $16.49 |
| 2026 | 8 | 7,935 | 2.7% | 28.3% | $298,715 | 6.3% | 32.2% | $37.65 |
| 2027 | 1 | 1,200 | 0.4% | 28.7% | $44,568 | 0.9% | 33.1% | $37.14 |
| 2028 | 5 | 125,378 | 43.0% | 71.7% | $1,611,308 | 33.9% | 67.1% | $12.85 |
| 2029 | 1 | 4,000 | 1.4% | 73.1% | $128,720 | 2.7% | 69.8% | $32.18 |
| 2030 | 1 | 9,608 | 3.3% | 76.4% | $158,532 | 3.3% | 73.1% | $16.50 |
| 2031 | 2 | 4,835 | 1.7% | 78.0% | $131,820 | 2.8% | 75.9% | $27.26 |
| 2032 | 4 | 60,755 | 20.8% | 98.9% | $966,232 | 20.3% | 96.2% | $15.90 |
| 2033 | 1 | 1,280 | 0.4% | 99.3% | $48,640 | 1.0% | 97.2% | $38.00 |
| 2034 | 1 | 2,000 | 0.7% | 100.0% | $130,680 | 2.8% | 100.0% | $65.34 |
| 2035 & Thereafter | 0 | 0 | 0.0% | 100.0% | $0 | 0.0% | 100.0% | $0.00 |
| Vacant | 0 | 0 | 0.0% | 100.0% | $0 | 0.0% | 100.0% | $0.00 |
| Total/Wtd. Avg. | 37 | 291,589 | 100.0% | $4,749,526 | 100.0% | $16.29 | ||
| (1) | Information is based on the underwritten rent roll dated January 23, 2024. Certain tenants may have lease termination options that are not reflected in the Lease Rollover Schedule. |
| THE INFORMATION IN THIS STRUCTURAL AND COLLATERAL TERM SHEET IS NOT COMPLETE AND MAY BE AMENDED PRIOR TO THE TIME OF SALE. THIS TERM SHEET IS NOT AN OFFER TO SELL THESE SECURITIES AND IT IS NOT A SOLICITATION OF AN OFFER TO BUY THESE SECURITIES IN ANY JURISDICTION WHERE THE OFFER OR SALE IS NOT PERMITTED. | ||
| T-127 | ||
| Retail – Anchored | Loan #12 | Cut-off Date Balance: | $34,000,000 | |
| Various | Victory Louisiana Real Estate Portfolio | Cut-off Date LTV: | 53.3% | |
| Metairie, LA Various | UW NCF DSCR: | 1.58x | ||
| UW NOI Debt Yield: | 12.5% |
The Market. The Victory Louisiana Real Estate Portfolio Properties are located in Metairie, Louisiana, within the Metairie retail submarket of the New Orleans metropolitan statistical area (“New Orleans MSA”) retail market. The Westgate Shopping Center Property and Airline Shopping Center Property are approximately 11.3 miles and 5.6 miles away from the New Orleans central business district, respectively. The Westgate Shopping Center Property is located along Veterans Boulevard, within 3.0 miles of the Louis Armstrong New Orleans International Airport and several hotels and retailers. A Walmart Supercenter anchored shopping center, and several auto dealerships are located across the street from the Westgate Shopping Center Property. The Airline Shopping Center Property is located along Airline Drive (US Highway 61), a major east-west traffic corridor. The Airline Shopping Center Property is located across the street from a Planet Fitness and Dollar Tree and is located within three miles of Metairie Country Club. According to the appraisal, as of the third quarter of 2023, the vacancy rate in the New Orleans MSA retail market was 2.9% with average asking rents of $17.37 PSF and inventory of approximately 85.2 million SF. According to the appraisal, as of the third quarter of 2023, the vacancy rate in the Metairie retail submarket was 1.8% with average asking rents of $26.48 PSF and inventory of approximately 12.0 million SF. According to the appraisal, the 2023 population within a one-, three- and five-mile radius of the Westgate Shopping Center Property was 19,220, 130,940 and 223,587, respectively, and the 2023 average household income within the same radii was $86,773, $88,157 and $90,067, respectively. According to the appraisal, the 2023 population within a one-, three- and five-mile radius of the Airline Shopping Center Property was 13,092, 142,560 and 343,721, respectively and the average household income within the same radii was $113,608, $95,166, and $97,342, respectively.
The following table presents certain information relating to the appraisal’s market rent conclusion for the Westgate Shopping Center Property:
| Market Rent Summary | ||||||
| Tenant Type | Market Rent (PSF) | Reimbursements | Rent Escalation | Lease Term (Months) | Tenant Improvements (PSF) (New/Renewal) | Leasing Commissions (New/Renewal) |
| Anchor: | $14.00 | NNN | 10.0% Year 6 | 180 | $15.00 / $3.00 | 6.0% / 3.0% |
| Major: | $18.00 | NNN | 10.0% Year 6 | 180 | $15.00 / $3.00 | 6.0% / 3.0% |
| 4,000-11,000 SF: | $24.00 | NNN | 2.0%/Year | 120 | $10.00 / $2.00 | 6.0% / 3.0% |
| <4,000 SF: | $28.00 | NNN | 2.0%/Year | 120 | $10.00 / $2.00 | 6.0% / 3.0% |
| Freestanding: | $55.00 | NNN | 2.0%/Year | 120 | $10.00 / $2.00 | 6.0% / 3.0% |
The following table presents certain information relating to the appraisal’s market rent conclusion for the Airline Shopping Center Property:
| Market Rent Summary | ||||||
| Tenant Type | Market Rent (PSF) | Reimbursements | Rent Escalation | Lease Term (Months) | Tenant Improvements (PSF) (New/Renewal) | Leasing Commissions (New/Renewal) |
| Anchor: | $17.50 | NNN | 10.0% Year 6 | 180 | $15.00 / $3.00 | 6.0% / 3.0% |
| Inline: | $35.00 | NNN | 2.0%/Year | 60 | $10.00 / $2.00 | 6.0% / 3.0% |
| Auto Service: | $15.00 | NNN | 2.0%/Year | 120 | $10.00 / $2.00 | 6.0% / 3.0% |
The following table presents recent anchor space leasing data at comparable retail properties with respect to the Victory Louisiana Real Estate Portfolio Properties:
| Comparable Leases Summary | |||||||
| Property/Location | Year Built / Renovated | SF | Tenant Name | Tenant Size (SF) | Lease Date | Rent PSF | Lease Type |
Victory Louisiana Real Estate Various Metairie, LA | Various / Various | 291,589 | Academy Sports Rouses Market | 77,386 52,655 | Apr. 2012 Dec. 2020 | $11.33 $14.50 | NNN NNN |
Sears Appliance Repair – Baton Rouge 6501 Bluebonnet Boulevard Baton Rouge, LA | 1997 / NAP | 113,626 | Dick’s Sporting Goods | 110,996 | Aug. 2024 | $14.86 | Gross + TE |
Woodlawn Park Shopping Center 6600 Jones Creek Road Baton Rouge, LA | 1983 / NAP | 122,787 | Club 4 Fitness | 33,387 | Oct. 2021 | $9.50 | NNN |
Broadmoor Center 9782-9800 Florida Boulevard Baton Rouge, LA | 1955 / 2012 | 140,000 | Club 4 Fitness | 36,600 | Jul. 2022 | $11.00 | NNN |
Magnolia Square 1729 Martin Luther King Jr Boulevard Houma, LA | 2004 / 2022 | 107,806 | PetSmart | 20,000 | Apr. 2020 | $14.00 | NNN |
Elmwood Shopping Center 1200 South Clearview Parkway Elmwood, LA | 1977 / NAP | 803,617 | Barnes & Noble | 12,649 | Mar. 2023 | $28.50 | Net |
Source: Appraisal, unless otherwise indicated.
| (1) | Information based on the underwritten rent roll dated January 23, 2024, other than Year Built / Renovated. |
| THE INFORMATION IN THIS STRUCTURAL AND COLLATERAL TERM SHEET IS NOT COMPLETE AND MAY BE AMENDED PRIOR TO THE TIME OF SALE. THIS TERM SHEET IS NOT AN OFFER TO SELL THESE SECURITIES AND IT IS NOT A SOLICITATION OF AN OFFER TO BUY THESE SECURITIES IN ANY JURISDICTION WHERE THE OFFER OR SALE IS NOT PERMITTED. | ||
| T-128 | ||
| Retail – Anchored | Loan #12 | Cut-off Date Balance: | $34,000,000 | |
| Various | Victory Louisiana Real Estate Portfolio | Cut-off Date LTV: | 53.3% | |
| Metairie, LA Various | UW NCF DSCR: | 1.58x | ||
| UW NOI Debt Yield: | 12.5% |
The following table presents recent inline space leasing data at comparable retail properties with respect to the Victory Louisiana Real Estate Portfolio Properties:
| Comparable Leases Summary | |||||||
| Property/Location | Year Built / Renovated | SF | Tenant Name | Tenant Size (SF) | Lease Date | Rent PSF | Lease Type |
Victory Louisiana Real Estate Various Metairie, LA | Various / Various | 291,589 | Taco Bell McAlisters Deli | 2,000 3,840 | Dec. 2014 Jun. 2023 | $65.34 $28.33 | NNN NNN |
Starbucks 8871 Florida Boulevard Baton Rouge, LA | 2023 / NAP | 2,165 | Starbucks | 2,165 | Oct. 2023 | $63.49 | NNN |
401 North Carrollton Avenue New Orleans, LA | NAV | 3,235 | Mr. Ed’s Oyster Bar | 3,235 | Oct. 2021 | $46.00 | NNN |
2101 South Claiborne Avenue New Orleans, LA | NAV | 2,405 | Wing Stop | 2,405 | May 2020 | $20.50 | NNN |
Pinnacle Nord du Lac Shopping Center 6102 Pinnacle Parkway Covington, LA | 2008 / 2013 | 219,519 | NOLA Sunglass Company | 1,625 | Nov. 2022 | $20.00 | NNN |
Kenner Marketplace 4041 Williams Boulevard Kenner, LA | 1985 / NAP | 93,927 | Smoothie King | 1,000 | Jun. 2021 | $20.00 | NNN |
Elmwood Shopping Center 1200 South Clearview Parkway Elmwood, LA | 1977 / NAP | 803,617 | Jersey Mike’s | 2,035 | Dec. 2023 | $40.00 | Net |
Source: Appraisal, unless otherwise indicated.
| (1) | Information based on the underwritten rent roll dated January 23, 2024, other than Year Built / Renovated. |
The following table presents recent auto service space leasing data at comparable retail properties with respect to the Airline Shopping Center Property:
| Comparable Leases Summary | |||||||
| Property/Location | Year Built / Renovated | SF | Tenant Name | Tenant Size (SF) | Lease Date | Rent PSF | Lease Type |
Airline Shopping Center (subject)(1) 2701 Airline Drive Metairie, LA | 2001 / NAP | 83,009 | Goodyear | 5,899 | Jun. 2019 | $13.54 | NNN |
Bravos Auto Care 14353 Northwest Military Highway San Antonio, TX | 1991 / 2022 | 6,075 | Bravos Auto Care | 6,075 | Sep. 2022 | $15.00 | NNN |
Caliber Collision 6600 South 31st Street Fort Smith, AR | 2023 / NAP | 16,100 | Caliber Collision | 16,100 | Aug. 2023 | $20.56 | Absolute Net |
Auto Repair Center – Highway 6 4494 North Highway 6 Houston, TX | 1982 / NAP | 4,434 | NAP | 4,434 | Jan. 2023 | $15.00 | NNN |
Caliber Collision – Hernando, MS 463 East Commerce Street Hernando, MS | 2020 / NAP | 14,718 | Caliber Collision | 14,718 | Jul. 2021 | $19.55 | Absolute Net |
Source: Appraisal, unless otherwise indicated.
| (1) | Information based on the underwritten rent roll dated January 23, 2024, other than Year Built / Renovated. |
Appraisal. The appraisal concluded to an “as-is” value for the Westgate Shopping Center Property of $44,400,000 as of December 18, 2023. The appraisal concluded to an “as-is” value for the Airline Shopping Center Property of $19,400,000 as of December 18, 2023. The aggregate “as-is” appraised value of the Victory Louisiana Real Estate Portfolio Properties is $63,800,000 as of December 18, 2023.
Environmental Matters. According to the Phase I environmental site assessments dated December 28, 2023, there was no evidence of any recognized environmental conditions at the Victory Louisiana Real Estate Portfolio Properties.
| THE INFORMATION IN THIS STRUCTURAL AND COLLATERAL TERM SHEET IS NOT COMPLETE AND MAY BE AMENDED PRIOR TO THE TIME OF SALE. THIS TERM SHEET IS NOT AN OFFER TO SELL THESE SECURITIES AND IT IS NOT A SOLICITATION OF AN OFFER TO BUY THESE SECURITIES IN ANY JURISDICTION WHERE THE OFFER OR SALE IS NOT PERMITTED. | ||
| T-129 | ||
| Retail – Anchored | Loan #12 | Cut-off Date Balance: | $34,000,000 | |
| Various | Victory Louisiana Real Estate Portfolio | Cut-off Date LTV: | 53.3% | |
| Metairie, LA Various | UW NCF DSCR: | 1.58x | ||
| UW NOI Debt Yield: | 12.5% |
Operating History and Underwritten Net Cash Flow. The following table presents certain information relating to the historical operating performance and Underwritten Net Cash Flow at the Victory Louisiana Real Estate Portfolio Properties:
| Cash Flow Analysis | |||||
| 2021 | 2022 | 2023 | UW | UW PSF | |
| Gross Potential Rent(1) | $4,275,548 | $4,095,734 | $4,620,614 | $4,687,101 | $16.07 |
| Reimbursements | $1,155,814 | $1,222,008 | $1,617,269 | $1,960,716 | $6.72 |
| Other Income | $0 | $1,000 | $0 | $62,425 | $0.21 |
| (Vacancy / Credit Loss) | $0 | $0 | $0 | ($332,391) | ($1.14) |
| Effective Gross Income | $5,431,362 | $5,318,742 | $6,237,884 | $6,377,851 | $21.87 |
| Real Estate Taxes | $655,640 | $710,516 | $832,830 | $832,830 | $2.86 |
| Insurance | $339,402 | $407,894 | $747,079 | $799,901 | $2.74 |
| Other Operating Expenses | $284,592 | $369,911 | $303,774 | $495,109 | $1.70 |
| Total Operating Expenses | $1,279,634 | $1,488,321 | $1,883,683 | $2,127,840 | $7.30 |
| Net Operating Income | $4,151,728 | $3,830,421 | $4,354,201 | $4,250,011 | $14.58 |
| Replacement Reserves | $0 | $0 | $0 | $43,738 | $0.15 |
| TI/LC | $0 | $0 | $0 | $281,677 | $0.97 |
| Net Cash Flow | $4,151,728 | $3,830,421 | $4,354,201 | $3,924,595 | $13.46 |
| Occupancy (%)(2) | 97.0% | 100.0% | 100.0% | 95.0% | |
| NOI DSCR | 1.67x | 1.54x | 1.76x | 1.71x | |
| NCF DSCR | 1.67x | 1.54x | 1.76x | 1.58x | |
| NOI Debt Yield | 12.2% | 11.3% | 12.8% | 12.5% | |
| NCF Debt Yield | 12.2% | 11.3% | 12.8% | 11.5% | |
| (1) | UW Gross Potential Rent is based on the underwritten rent roll dated January 23, 2024, and includes rent steps underwritten through January 2025 totaling $40,041. |
| (2) | UW Occupancy (%) represents economic occupancy. Historical occupancies represent physical occupancies. 2023 Occupancy (%) is based on the underwritten rent roll dated January 23, 2024. |
| THE INFORMATION IN THIS STRUCTURAL AND COLLATERAL TERM SHEET IS NOT COMPLETE AND MAY BE AMENDED PRIOR TO THE TIME OF SALE. THIS TERM SHEET IS NOT AN OFFER TO SELL THESE SECURITIES AND IT IS NOT A SOLICITATION OF AN OFFER TO BUY THESE SECURITIES IN ANY JURISDICTION WHERE THE OFFER OR SALE IS NOT PERMITTED. | ||
| T-130 | ||
| Mortgage Loan No. 13 – Wilshire Colonnade |
| Mortgage Loan Information | Property Information | ||||||
| Mortgage Loan Seller: | WFB | Single Asset/Portfolio: | Single Asset | ||||
| Credit Assessment (Fitch/KBRA/Moody’s): | NR/NR/NR | Location: | Los Angeles, CA 90010 | ||||
| Original Balance: | $33,500,000 | General Property Type: | Office | ||||
| Cut-off Date Balance: | $33,500,000 | Detailed Property Type: | CBD | ||||
| % of Initial Pool Balance: | 3.4% | Title Vesting: | Fee | ||||
| Loan Purpose: | Refinance | Year Built/Renovated: | 1968 / NAP | ||||
| Borrower Sponsor: | Tai Sing Lam | Size: | 369,454 SF | ||||
| Guarantor: | Tai Sing Lam | Cut-off Date Balance per SF: | $91 | ||||
| Mortgage Rate: | 7.3680% | Maturity Balance per SF: | $91 | ||||
| Note Date: | 4/3/2024 | Property Manager: | Charles Dunn Real Estate Services, | ||||
| Maturity Date: | 4/11/2029 | Inc. | |||||
| Term to Maturity: | 60 months | Underwriting and Financial Information | |||||
| Amortization Term: | 0 months | UW NOI: | $4,235,573 | ||||
| IO Period: | 60 months | UW NCF: | $3,757,501 | ||||
| Seasoning: | 1 month | UW NOI Debt Yield: | 12.6% | ||||
| Prepayment Provisions: | L(24),D(32),O(4) | UW NCF Debt Yield: | 11.2% | ||||
| Lockbox/Cash Mgmt Status: | Hard/Springing | UW NOI Debt Yield at Maturity: | 12.6% | ||||
| Additional Debt Type: | NAP | UW NCF DSCR: | 1.50x | ||||
| Additional Debt Balance: | NAP | Most Recent NOI: | $4,407,001 (12/31/2023) | ||||
| Future Debt Permitted (Type): | No (NAP) | 2nd Most Recent NOI: | $5,016,208 (12/31/2022) | ||||
| 3rd Most Recent NOI: | $5,401,705 (12/31/2021) | ||||||
| Reserves | Most Recent Occupancy: | 78.2% (3/18/2024) | |||||
| Type | Initial | Monthly | Cap | 2nd Most Recent Occupancy: | 88.1% (12/31/2023) | ||
| RE Taxes: | $38,923 | $38,923 | NAP | 3rd Most Recent Occupancy: | 85.4% (12/31/2022) | ||
| Insurance: | $0 | Springing(1) | NAP | Appraised Value (as of): | $61,000,000 (11/16/2023) | ||
| Replacement Reserve: | $0 | $6,158 | NAP | Appraised Value per SF: | $165 | ||
| TI/LC: | $1,500,000 | $46,182 | $2,500,000 | Cut-off Date LTV Ratio: | 54.9% | ||
| Rent Concession Reserve: | $573,665 | $0 | NAP | Maturity Date LTV Ratio: | 54.9% | ||
| Existing TI/LC: | $337,025 | $0 | NAP | ||||
| Sources and Uses | ||||||
| Sources | Proceeds | % of Total | Uses | Proceeds | % of Total | |
| Loan Amount: | $33,500,000 | 63.5% | Loan Payoff: | $49,410,501 | 93.6% | |
| Sponsor Equity: | $19,289,266 | 36.5% | Reserves: | $2,449,613 | 4.6% | |
| Closing Costs: | $929,153 | 1.8% | ||||
| Total Sources: | $52,789,266 | 100.0% | Total Uses: | $52,789,266 | 100.0% | |
| (1) | The loan documents do not require ongoing monthly insurance reserves; provided (i) no event of default is continuing, (ii) the borrower maintains insurance coverage for the Wilshire Colonnade Property (as defined below) as part of blanket or umbrella coverage reasonably approved by the lender, and (iii) the borrower provides the lender with evidence of the renewals of the insurance policies and paid receipts for the payment of the insurance premiums no later than 10 business days prior to the expiration dates of the policies. If such conditions are not satisfied, the loan documents require ongoing monthly deposits in an amount equal to 1/12th of the insurance premiums that the lender reasonably estimates will be payable during the next ensuing 12 months. |
The Mortgage Loan. The 13th largest mortgage loan (the “Wilshire Colonnade Mortgage Loan”) is evidenced by a promissory note in the original principal amount of $33,500,000 and secured by the fee interest in a 369,454 SF office property, located in Los Angeles, CA (“The Wilshire Colonnade Property”).
The Borrower and the Borrower Sponsor. The borrower is Colonnade Wilshire Corp., a California corporation and single purpose entity. The borrower sponsor and non-recourse carve out guarantor is Tai Sing Lam.
Tai Sing Lam, as an owner-builder, has completed five apartment projects in Los Angeles, each containing 18-21 units, as well as ground-up construction for a 28-unit apartment in Seattle, WA. Mr. Lam also founded and led an architectural, engineering, and consulting firm in the early 1990s which focused on projects in Asia, designing six high rise buildings totaling 1.3 million SF, including Plaza Bapindo Tower, a 300,000 SF high-rise in Jakarta, Indonesia.
The Property. The Wilshire Colonnade Property comprises two 11-story twin office buildings totaling 369,454 SF of net rentable area located in Los Angeles, California. Situated on a 3.94 acre site, the Wilshire Colonnade Property was constructed in 1968 and the borrower sponsor has owned the asset since 1996. Recent upgrades to the property include updating the HVAC system and fountain repairs, as well as LED lighting upgrades. The Wilshire Colonnade Property has 842 parking spaces on site, resulting in a parking ratio of approximately 2.28 spaces per 1,000 SF. As of March 18, 2024, the property was 78.2% leased to 69 tenants and has averaged 90% occupancy over the past five years.
| THE INFORMATION IN THIS STRUCTURAL AND COLLATERAL TERM SHEET IS NOT COMPLETE AND MAY BE AMENDED PRIOR TO THE TIME OF SALE. THIS TERM SHEET IS NOT AN OFFER TO SELL THESE SECURITIES AND IT IS NOT A SOLICITATION OF AN OFFER TO BUY THESE SECURITIES IN ANY JURISDICTION WHERE THE OFFER OR SALE IS NOT PERMITTED. | ||
| T-131 | ||
| Office – CBD | Loan #13 | Cut-off Date Balance: | $33,500,000 | |
| 3701 and 3731 Wilshire Boulevard | Wilshire Colonnade | Cut-off Date LTV: | 54.9% | |
| Los Angeles, CA 90010 | UW NCF DSCR: | 1.50x | ||
| UW NOI Debt Yield: | 12.6% |
Major Tenants.
PCB Bank (53,032 SF, 14.4% of NRA; 18.9% of underwritten base rent). PCB Bank opened for business in 2003 with the goal of serving as a community bank focused on Korean-Americans in the greater Los Angeles area. On August 10, 2018, PCB Bancorp began trading on the NASDAQ Global Select Market under the ticker symbol PCB. PCB Bank has been at the property, which serves as its headquarters, since 2003 and occupies 6,446 SF of retail space and 46,586 SF of office space. The tenant’s current lease expires on September 30, 2033, with 2, 5-year renewal options and no termination options.
Bank of Hope (36,920 SF, 10.0% of NRA; 11.2% of underwritten base rent). Founded in 1986, Bank of Hope is based in Los Angeles, California and operates as a subsidiary of Hope Bancorp, Inc. Bank of Hope currently operates with 52 branches located in 8 states. Bank of Hope has been at the property, which serves as its headquarters, since 2006 and the current lease expires on April 30, 2027, with one, 5-year renewal option and no termination options. Bank of Hope is currently subleasing 8,720 SF of space on the fourth floor to two tenants on leases co-terminus with the master lease and is marketing the remaining 9,808 SF of space on the fourth floor for sublease.
The Korea Times Los Angeles (11,646 SF, 3.2% of NRA; 3.5% of underwritten base rent). The Korea Times Los Angeles is a Korean language newspaper published Monday-Saturday in Los Angeles, California. It is the largest Korean language newspaper in the United States. The Korea Times Los Angeles has been at the property since 2022, and the current lease expires on June 30, 2027, with one, 5-year renewal option. The Korea Times Los Angeles can terminate its lease after April 30, 2025 with 9 months prior notice and a termination fee of unamortized TI/LCs.
The following table presents certain information relating to the tenancy at the Wilshire Colonnade Property:
| Tenant Summary(1) | ||||||||||
| Tenant Name | Credit Rating Fitch/Moody's/S&P(2) | Tenant SF | % of Total SF | Annual UW Rent | % of Total Annual UW Rent | Annual UW Rent PSF | Lease Expiration | Term. Option (Y/N) | Renewal Options | |
| PCB Bank | NR/NR/NR | 53,032 | 14.4% | $1,595,233 | 18.9% | $30.08 | 9/30/2033 | N | 2 x 5 yr | |
| Bank of Hope(3) | NR/NR/NR | 36,920 | 10.0% | $940,042 | 11.2% | $25.46 | 4/30/2027 | N | 1 x 5 yr | |
| The Korea Times Los Angeles | NR/NR/NR | 11,646 | 3.2% | $296,526 | 3.5% | $25.46 | 6/30/2027 | Y(4) | 1 x 5 yr | |
| Shawn Matian | NR/NR/NR | 11,635 | 3.1% | $342,069 | 4.1% | $29.40 | 4/30/2025 | Y(5) | 2 x 5 yr | |
| HUB Insurance Services Inc | NR/NR/NR | 8,275 | 2.2% | $273,903 | 3.3% |
| $33.10 | 6/30/2031 | Y(6) | 2 x 5 yr |
| Subtotal/Wtd. Avg. | 121,508 | 32.9% | $3,447,774 | 40.9% | $28.37 | |||||
| Other Tenants | 167,289 | 45.3% | $4,975,517 | 59.1% |
| $29.74 | ||||
| Occupied Collateral Total | 288,797 | 78.2% | $8,423,291 | 100.0% | $29.17 | |||||
| Vacant Space | 80,657 | 21.8% | ||||||||
| Total/Wtd. Avg. | 369,454 | 100.0% | ||||||||
| (1) | Information based on the underwritten rent roll dated March 18, 2024. |
| (2) | Credit ratings are those of the parent company, whether or not the parent company guarantees the lease. |
| (3) | Bank of Hope is currently subleasing 7,349 SF on 4th floor to Central City Neighborhood at a rental rate of $15.84 PSF on a lease expiring 4/30/2027 and 1,371 SF on 4th floor to Artist Worldwide Agency at a rental rate of $24.51 PSF on a lease expiring 4/30/2027. Bank of Hope is currently marketing the remaining 9,808 SF of space on the fourth floor for sublease. |
| (4) | The Korea Times Los Angeles can terminate after month 36 (4/30/2025) with 9 months prior notice and a termination fee of unamortized TI/LCs. |
| (5) | Shawn Matian has a one time right to terminate after year 6 (4/30/2024) with 6 months prior notice. As of 3/18/2024, no notice has been given. |
| (6) | HUB Insurance Services Inc can terminate after month 72 (11/30/2028) with 9 months prior notice and a termination fee of unamortized TI/LCs and 3 months’ rent. |
| THE INFORMATION IN THIS STRUCTURAL AND COLLATERAL TERM SHEET IS NOT COMPLETE AND MAY BE AMENDED PRIOR TO THE TIME OF SALE. THIS TERM SHEET IS NOT AN OFFER TO SELL THESE SECURITIES AND IT IS NOT A SOLICITATION OF AN OFFER TO BUY THESE SECURITIES IN ANY JURISDICTION WHERE THE OFFER OR SALE IS NOT PERMITTED. | ||
| T-132 | ||
| Office – CBD | Loan #13 | Cut-off Date Balance: | $33,500,000 | |
| 3701 and 3731 Wilshire Boulevard | Wilshire Colonnade | Cut-off Date LTV: | 54.9% | |
| Los Angeles, CA 90010 | UW NCF DSCR: | 1.50x | ||
| UW NOI Debt Yield: | 12.6% |
The following table presents certain information relating to the lease rollover schedule at the Wilshire Colonnade Property:
| Lease Rollover Schedule(1)(2) | ||||||||
| Year | # of Leases Rolling | SF Rolling | Annual UW Rent PSF Rolling(3) | % of Total SF Rolling | Cumulative % of SF Rolling | Annual UW Rent Rolling | % of Annual Rent Rolling | Cumulative % of Annual Rent Rolling |
| MTM | 2 | 4,940 | $12.11 | 1.3% | 1.3% | $59,809 | 0.7% | 0.7% |
| 2024 | 9 | 20,717 | $28.67 | 5.6% | 6.9% | $593,935 | 7.1% | 7.8% |
| 2025 | 10 | 36,918 | $29.18 | 10.0% | 16.9% | $1,077,090 | 12.8% | 20.5% |
| 2026 | 13 | 32,352 | $32.81 | 8.8% | 25.7% | $1,061,576 | 12.6% | 33.2% |
| 2027 | 14 | 79,561 | $27.86 | 21.5% | 47.2% | $2,216,920 | 26.3% | 59.5% |
| 2028 | 11 | 34,500 | $29.06 | 9.3% | 56.6% | $1,002,411 | 11.9% | 71.4% |
| 2029 | 7 | 11,475 | $30.07 | 3.1% | 59.7% | $345,094 | 4.1% | 75.5% |
| 2030 | 0 | 0 | $0.00 | 0.0% | 59.7% | $0 | 0.0% | 75.5% |
| 2031 | 1 | 8,275 | $33.10 | 2.2% | 61.9% | $273,903 | 3.3% | 78.7% |
| 2032 | 1 | 7,027 | $28.08 | 1.9% | 63.8% | $197,318 | 2.3% | 81.1% |
| 2033 | 1 | 53,032 | $30.08 | 14.4% | 78.2% | $1,595,233 | 18.9% | 100.0% |
| 2034 | 0 | 0 | 0.00 | 0.0% | 78.2% | $0 | 0.0% | 100.0% |
| 2035 & Beyond | 0 | 0 | $0.00 | 0.0% | 78.2% | $0 | 0.0% | 100.0% |
| Vacant | 0 | 80,657 | $0.00 | 21.8% | 100.0% | $0 | 0.0% | 100.0% |
| Total/Wtd. Avg. | 69 | 369,454 | $29.17 | 100.0% | $8,423,291 | 100.0% | ||
| (1) | Information is based on the underwritten rent roll dated March 18, 2024 |
| (2) | Certain tenants may have lease termination options that are exercisable prior to the originally stated expiration date of the related lease and are not considered in the rollover schedule. |
| (3) | Total/Wtd. Avg. Annual UW Rent PSF Rolling excludes vacant space. |
The Market. The Wilshire Colonnade Property is located within the Koreatown neighborhood, within the western portion of Wilshire District in Los Angeles. The area is served by one primary freeway, the Hollywood Freeway (State Highway 101) which runs in a northwest/southeast direction along the northern boundary of the community. Additionally, the Santa Monica Freeway I-10 is located approximately 2.0-miles to the south; the Harbor Freeway I-110 is located approximately 2.5-miles to the east; and the San Diego Freeway I-405 is approximately 8.5-miles to the west.
According to the appraisal, the 2023 population and average household income within a one-, three- and five-mile radius of the Wilshire Colonnade Property was 104,480, 631,476, and 1,213,198 and $77,369, $88,738, and $101,771 respectively.
According to a third party market research report, the property is located in the Koreatown submarket of the Los Angeles office market. The Koreatown submarket reported a total inventory of approximately 16.59 million SF with a 18.5% vacancy rate and average asking rent of $33.61 PSF.
The following table presents certain information relating to the appraisal’s market rent conclusions for the Wilshire Colonnade Property:
| Market Rent Summary | ||
| Office MLA | Retail MLA | |
| Market Rent (PSF) | $28.20 | $36.00 |
| Lease Term (Years) | 5 | 5 |
| Lease Type | Base Year Stop | Net |
| Escalations | 3.0% annually | 3.0% annually |
| Tenant Improvements (New/Renewal) | $15 / $5 | $15 / $5 |
| Leasing Commissions (New/Renewal) | 6.0% / 3.0% | 6.0% / 3.0% |
| Free Rent (Months) (New/Renewal) | 2/1 | 2/1 |
| Source: | Appraisal. |
| THE INFORMATION IN THIS STRUCTURAL AND COLLATERAL TERM SHEET IS NOT COMPLETE AND MAY BE AMENDED PRIOR TO THE TIME OF SALE. THIS TERM SHEET IS NOT AN OFFER TO SELL THESE SECURITIES AND IT IS NOT A SOLICITATION OF AN OFFER TO BUY THESE SECURITIES IN ANY JURISDICTION WHERE THE OFFER OR SALE IS NOT PERMITTED. | ||
| T-133 | ||
| Office – CBD | Loan #13 | Cut-off Date Balance: | $33,500,000 | |
| 3701 and 3731 Wilshire Boulevard | Wilshire Colonnade | Cut-off Date LTV: | 54.9% | |
| Los Angeles, CA 90010 | UW NCF DSCR: | 1.50x | ||
| UW NOI Debt Yield: | 12.6% |
The following table presents information relating to comparable office leases for the Wilshire Colonnade Property:
| Comparable Office Leases | |||||||
| Property Name/Location | Year Built/ Renovated | Tenant | Lease Start Date | Term (Mos.) | Size (SF) | Annual Base Rent PSF | Lease Type |
Wilshire Park Place 3700 Wilshire Boulevard, Los Angeles, CA 90010 | 1966/2005 | ASKING ASKING – RETAIL New Lease New Lease | Nov-23 Nov-23 Jun-22 May-22 | 60 60 36 36 | 2,468 3,900 866 1,396 | $30.00 $30.00 $27.00 $25.80 | FSG NNN FSG FSG |
Wilshire Hobart Building 3660 Wilshire Boulevard, Los Angeles, CA 90010 | 1973/NAP | Primewest Management Byeong Yong Cho Cimple Insurance Taiwan Trade Center | Jun-23 May-23 Apr-23 Jan-23 | 60 60 36 36 | 2,503 932 968 1,991 | $25.92 $25.20 $30.60 $26.22 | FSG FSG FSG FSG |
Metroplex Wilshire 3530 Wilshire Boulevard, Los Angeles, CA 90010 | 1985/NAP | New York Life Rapport Property Philmont Sparks | Jun-23 Jan-23 Dec-22 Nov-22 | 84 36 24 36 | 19,039 1,979 6,407 13,236 | $31.80 $27.60 $28.80 $28.80 | FSG FSG FSG FSG |
Wilshire Centre Building 3055 Wilshire Boulevard, Los Angeles, CA 90010 | 1974/1992 | Asking Office Tenant | Oct-23 Mar-23 | 60 60 | 9,543 2,119 | $21.60 $27.60 | FSG FSG |
One Park Plaza 3250 Wilshire Boulevard, Los Angeles, CA 90010 | 1971/NAP | Office – 16thFL Office | Feb-23 Feb-22 | 60 84 | 2,742 5,031 | $28.80 $29.40 | FSG FSG |
| Source: | Appraisal. |
Appraisal. The appraiser concluded to an “as-is” value for the Wilshire Colonnade Property of $61,000,000 as of November 16, 2023.
Environmental Matters. According to the Phase I environmental site assessment dated December 11, 2023, there was no evidence of any recognized environmental conditions at the Wilshire Colonnade Property.
| THE INFORMATION IN THIS STRUCTURAL AND COLLATERAL TERM SHEET IS NOT COMPLETE AND MAY BE AMENDED PRIOR TO THE TIME OF SALE. THIS TERM SHEET IS NOT AN OFFER TO SELL THESE SECURITIES AND IT IS NOT A SOLICITATION OF AN OFFER TO BUY THESE SECURITIES IN ANY JURISDICTION WHERE THE OFFER OR SALE IS NOT PERMITTED. | ||
| T-134 | ||
| Office – CBD | Loan #13 | Cut-off Date Balance: | $33,500,000 | |
| 3701 and 3731 Wilshire Boulevard | Wilshire Colonnade | Cut-off Date LTV: | 54.9% | |
| Los Angeles, CA 90010 | UW NCF DSCR: | 1.50x | ||
| UW NOI Debt Yield: | 12.6% |
Operating History and Underwritten Net Cash Flow. The following table presents certain information relating to the historical operating performance and Underwritten Net Cash Flow at the Wilshire Colonnade Property:
| Cash Flow Analysis(1) | ||||||
| 2020 | 2021 | 2022 | 2023 | UW | UW PSF | |
| Base Rent | $8,760,905 | $8,920,444 | $8,776,997 | $8,559,732 | $8,423,291 | $22.8 |
| Grossed Up Vacant Space | $0 | $0 | $0 | $0 | $2,317,074 | $6.27 |
| Gross Potential Rent | $8,760,905 | $8,920,444 | $8,776,997 | $8,559,732 | $10,740,365 | $29.07 |
| Less: Free Rent Adjustment | ($55,187) | ($56,335) | ($66,805) | ($152,964) | $0 | $0.00 |
| Recoveries | $742,353 | $642,511 | $506,303 | $306,197 | $107,408 | $0.29 |
| Other Income(2) | $1,106,079 | $1,056,235 | $1,076,297 | $1,139,076 | $1,139,076 | $3.08 |
| Net Rental Income | $10,554,150 | $10,562,855 | $10,292,792 | $9,852,041 | $11,986,849 | $32.44 |
| Less Vacancy & Credit Loss | $0 | $0 | $0 | $0 | ($2,317,074) | ($6.27) |
| Effective Gross Income | $10,554,150 | $10,562,855 | $10,292,792 | $9,852,041 | $9,669,775 | $26.17 |
| Real Estate Taxes | $436,098 | $442,429 | $444,312 | $458,552 | $444,831 | $1.20 |
| Insurance | $109,231 | $129,251 | $144,917 | $187,323 | $213,754 | $0.58 |
| Management Fee | $316,241 | $307,362 | $316,507 | $313,641 | $290,093 | $0.79 |
| Other Operating Expenses | $4,138,983 | $4,282,108 | $4,370,848 | $4,485,524 | $4,485,524 | $12.14 |
| Total Expenses | $5,000,554 | $5,161,150 | $5,276,584 | $5,445,040 | $5,434,202 | $14.71 |
| Net Operating Income | $5,553,595 | $5,401,705 | $5,016,208(4) | $4,407,001(4) | $4,235,573 | $11.46 |
| CapEx | $0 | $0 | $0 | $0 | $73,891 | $0.20 |
| TI/LC | $0 | $0 | $0 | $0 | $404,181 | $1.29 |
| Net Cash Flow | $5,553,595 | $5,401,705 | $5,016,208 | $4,407,001 | $3,757,501 | $10.17 |
| Occupancy % | 94.3% | 91.7% | 85.4% | 88.1% | 78.4%(3) | |
| NOI DSCR | 2.22x | 2.16x | 2.00x | 1.76x | 1.69x | |
| NCF DSCR | 2.22x | 2.16x | 2.00x | 1.76x | 1.50x | |
| NOI Debt Yield | 16.6% | 16.1% | 15.0% | 13.2% | 12.6% | |
| NCF Debt Yield | 16.6% | 16.1% | 15.0% | 13.2% | 11.2% | |
| (1) | Based on the underwritten rent roll dated March 18, 2024. | |
| (2) | Other Income includes parking income, garage income, etc. |
| (3) | The underwritten economic vacancy is 21.6%. The Wilshire Colonnade Property was 78.2% leased as of March 18, 2024. |
| (4) | The decrease in Net Operating Income from 2022 to 2023 is primarily due to a decrease in gross potential rent and an increase in free rent, as well as an increase in utilities, repairs and maintenance expenses. |
| THE INFORMATION IN THIS STRUCTURAL AND COLLATERAL TERM SHEET IS NOT COMPLETE AND MAY BE AMENDED PRIOR TO THE TIME OF SALE. THIS TERM SHEET IS NOT AN OFFER TO SELL THESE SECURITIES AND IT IS NOT A SOLICITATION OF AN OFFER TO BUY THESE SECURITIES IN ANY JURISDICTION WHERE THE OFFER OR SALE IS NOT PERMITTED. | ||
| T-135 | ||
| Mortgage Loan No. 14 – Drexel Terraces |
| Mortgage Loan Information | Property Information | ||||||
| Mortgage Loan Seller: | MSMCH | Single Asset/Portfolio: | Single Asset | ||||
| Credit Assessment (Fitch/KBRA/Moody’s): | NR/NR/NR | Location: | Chicago, IL 60615 | ||||
| Original Balance: | $31,000,000 | General Property Type: | Multifamily | ||||
| Cut-off Date Balance: | $31,000,000 | Detailed Property Type: | Garden | ||||
| % of Initial Pool Balance: | 3.1% | Title Vesting: | Fee | ||||
| Loan Purpose: | Refinance | Year Built/Renovated: | 1902 / 2023 | ||||
| Borrower Sponsors: | Raphael Lowenstein and | Size: | 116 Units | ||||
| John Lowenstein | Cut-off Date Balance per Unit: | $267,241 | |||||
| Guarantors: | Raphael Lowenstein and | Maturity Date Balance per Unit: | $267,241 | ||||
| John Lowenstein | Property Manager: | 312 Property Management, Inc. | |||||
| Mortgage Rate: | 6.2000% | (borrower-related) | |||||
| Note Date: | 2/29/2024 | Underwriting and Financial Information(2) | |||||
| Maturity Date: | 3/1/2029 | UW NOI: | $2,541,554 | ||||
| Term to Maturity: | 60 months | UW NCF: | $2,512,554 | ||||
| Amortization Term: | 0 months | UW NOI Debt Yield: | 8.2% | ||||
| IO Period: | 60 months | UW NCF Debt Yield: | 8.1% | ||||
| Seasoning: | 2 months | UW NOI Debt Yield at Maturity: | 8.2% | ||||
| Prepayment Provisions: | L(26),D(29),O(5) | UW NCF DSCR: | 1.29x | ||||
| Lockbox/Cash Mgmt Status: | Springing/Springing | Most Recent NOI(2): | NAP | ||||
| Additional Debt Type: | NAP | 2nd Most Recent NOI(2): | NAP | ||||
| Additional Debt Balance: | NAP | 3rd Most Recent NOI(2): | NAP | ||||
| Future Debt Permitted (Type): | No (NAP) | Most Recent Occupancy: | 100.0% (1/24/2024) | ||||
| Reserves | 2nd Most Recent Occupancy(2): | NAP | |||||
| Type | Initial | Monthly | Cap | 3rd Most Recent Occupancy(2): | NAP | ||
| RE Taxes: | $7,812 | $7,812 | NAP | Appraised Value (as of): | $50,200,000 (1/30/2024) | ||
| Insurance: | $86,912 | $10,864 | NAP | Appraised Value per Unit: | $432,759 | ||
| Replacement Reserve: | $0 | $1,933 | NAP | Cut-off Date LTV Ratio: | 61.8% | ||
| Kenwood Dispute Reserve: | $12,500(1) | $0 | NAP | Maturity Date LTV Ratio: | 61.8% | ||
| Sources and Uses | ||||||
| Sources | Proceeds | % of Total | Uses | Proceeds | % of Total | |
| Mortgage Loan Amount: | $31,000,000 | 100.0% | Loan Payoff: | $21,282,633 | 68.7% | |
| Return of Equity: | $7,599,867 | 24.5% | ||||
| Closing Costs: | $2,010,276 | 6.5% | ||||
| Reserves: | $107,224 | 0.3% | ||||
| Total Sources: | $31,000,000 | 100.0% | Total Uses: | $31,000,000 | 100.0% | |
| (1) | The Kenwood Dispute Reserve relates to litigation related to a building owned by the borrower sponsors located on South Kenwood Avenue in Chicago, Illinois (the “Kenwood Building”) and is required to be released upon satisfaction of various conditions, including but not limited to documentary evidence that all open violations applicable to the Kenwood Building have been cleared and that a settlement amount set forth in a dismissal order from a case filed against the Kenwood Building by the City of Chicago has been timely paid. |
| (2) | Historical financial and occupancy information is not available as the Drexel Terraces Property was leased up following completion of renovations in 2023. |
The Mortgage Loan. The fourteenth largest mortgage loan (the “Drexel Terraces Mortgage Loan) is evidenced by a promissory note in the original principal amount of $31,000,000. The Drexel Terraces Mortgage Loan is secured by a first priority fee mortgage encumbering a multifamily property located in Chicago, Illinois (the “Drexel Terraces Property”).
The Borrower and the Borrower Sponsors. The borrower for the Drexel Terraces Mortgage Loan is 4830-4840 S Drexel Residences LLC, a single-purpose Delaware limited liability company, with one independent director in its organizational structure. The borrower sponsors and non-recourse carveout guarantors for the Drexel Terraces Mortgage Loan are Raphael Lowenstein and John Lowenstein. Raphael Lowenstein and John Lowenstein both serve as general partners of 312 Property Management, Inc. a real estate management firm founded in 2015 that specializes in managing multifamily assets on the south side of Chicago. 312 Property Management, Inc. has ownership interests in and manages a portfolio of 18 apartment buildings, totaling 578 units located throughout the Kenwood, Bronzeville, Woodlawn and South Shore neighborhoods of Chicago.
The Property. The Drexel Terraces Property is a three-story, 116-unit garden multifamily apartment complex located on a 1.86-acre (81,070 SF) site in Chicago, Illinois. The borrower acquired the Drexel Terraces Property in March 2021 for a purchase price of approximately $11,500,000. At acquisition, the site was improved with an older residential building that was constructed in 1902, operated as a co-op and was primarily owner-occupied. The borrower sponsors subsequently completed a gut-renovation of the Drexel Terraces Property in 2023 at a cost of approximately $19,870,000, excluding developer fees. The renovation increased the rentable square footage of the Drexel Terraces Property by approximately 30%. The apartment unit mix is comprised of 12 one-bedroom units, 60 two-bedroom units, and 44 three-bedroom units. The one-bedroom units all feature one bathroom. 26 of the 60 two-bedroom units feature one bathroom, and 34 of the 60 two-bedroom units feature two bathrooms. 20 of the 44 three-bedroom units feature two bathrooms, and 24 of the 44 three-bedroom units feature three bathrooms. The one-bedroom units are all 520 SF. The two-bedroom units’ range in size from 520-980 SF
| THE INFORMATION IN THIS STRUCTURAL AND COLLATERAL TERM SHEET IS NOT COMPLETE AND MAY BE AMENDED PRIOR TO THE TIME OF SALE. THIS TERM SHEET IS NOT AN OFFER TO SELL THESE SECURITIES AND IT IS NOT A SOLICITATION OF AN OFFER TO BUY THESE SECURITIES IN ANY JURISDICTION WHERE THE OFFER OR SALE IS NOT PERMITTED. | ||
| T-136 | ||
| Multifamily – Garden | Loan #14 | Cut-off Date Balance: | $31,000,000 | |
| 4830 South Drexel Boulevard | Drexel Terraces | Cut-off Date LTV: | 61.8% | |
| Chicago, IL 60615 | U/W NCF DSCR: | 1.29x | ||
| U/W NOI Debt Yield: | 8.2% |
with an average unit size of 741 SF. The three-bedroom units’ range in size from 980-1410 SF with an average unit size of 1,344 SF. Unit amenities feature modern finishes, in-unit washer and dryer and stainless-steel kitchen appliances.
All of the tenants at the Drexel Terraces Property receive vouchers issued by the Chicago Housing Authority (“CHA”) pursuant to the Section 8 tenant based assistance rental certificate program of the United States Department of Housing and Urban Development. The initial contract rental rates are determined by market rent and are subject to an operating cost adjustment factor as well as periodic adjustments. Tenants generally sign 12-month leases and the appraiser concluded that the lease rates are reflective of market rents. As of the rent roll dated January 24, 2024, approximately 88% of the rent was paid for with the CHA vouchers.
Furthermore, the Drexel Terraces Property participates in the Affordable Housing Special Assessment Program (“AHSAP”), a tax benefit designed to incentivize the rehabilitation and new construction of multi-family residential properties to create and maintain affordable housing. AHSAP establishes assessment reductions for multifamily rental developments subjected to certain rent, tenant income, and related restrictions. The Drexel Terraces Property qualifies for the 35% tier of the AHSAP property tax benefit which requires that at least 35% of units be rented to households qualifying at or below 60% of the area median income and that those tenants pay affordable rent as published annually by the Illinois Housing Development Authority (“IHDA”) among other criteria. Accordingly, the real estate taxes for the Drexel Terraces Property will be reduced by 35% for each year that the Drexel Terraces Property remains in compliance with the requirements of the AHSAP program. The benefit was implemented beginning with the 2023 assessment year and will automatically end after the 2032 assessment year. However, if the borrower remains in in compliance with the requirements of the AHSAP program, it may file for a maximum of two 10-year renewals. The maximum term length of the tax benefit is 30 years from the tax year 2023.
The following table presents detailed information with respect to the units at the Drexel Terraces Property:
| Apartment Unit Mix(1) | |||||||||
| Unit Mix / Type | Total Units | Leased Units | % Leased | Average SF per Unit | Monthly Average Rent per Unit | Monthly Average Rent PSF | |||
| 1 BR | 12 | 12 | 100.0% | 520 | $1,714 | $3.30 | |||
| 2 BR | 60 | 60 | 100.0% | 741 | $2,166 | $2.92 | |||
| 3 BR | 44 | 44 | 100.0% | 1,344 | $2,804 | $2.09 | |||
| Total/Wtd. Average | 116 | 116 | 100.0% | 947 | $2,361 | $2.49 | |||
| (1) | Information is based on the borrower rent roll dated January 24, 2024. |
The Market. The Drexel Terraces Property is located in Cook County, within the Chicago-Naperville-Elgin, IL-IN-WI metropolitan statistical area (the “Chicago MSA”), approximately 6.6 miles south of the Chicago central business district. The Drexel Terraces Property is situated approximately 0.5 miles north of Washington Park, a 372-acre recreational destination, and approximately 3.2 miles southeast of Guaranteed Rate Field, home of the Major League Baseball’s Chicago White Sox baseball team. Primary access to the neighborhood is provided by South Lake Shore Drive (US Highway 41) and East 47th Street. Additionally, Interstate-90 is approximately 1.7 miles west of the Drexel Terraces Property. The Chicago Transit Authority operates the “L” train system and bus network throughout the city. The closest station to the Drexel Terraces Property is located approximately one-mile from the Drexel Terraces Property.
The Drexel Terraces Property is located within the Bronzeville multifamily submarket of the Chicago multifamily market. The University of Chicago is a consistent driver of employment and housing demand within the submarket. The submarket’s proximity to Chicago’s downtown area, recent infrastructure improvements and the presence of the University of Chicago and related medical system in Hyde Park have all combined to increase demand over the past decade. Major employers in the Chicago MSA include Amazon.com Inc., Advocate Health Care System, Northwestern Memorial Healthcare, the University of Chicago, Walgreens Boots Alliance Inc., Walmart Inc., and United Airlines Holdings Inc.
According to the appraisal, as of the fourth quarter of 2023, the vacancy rate in the Chicago multifamily market was 5.3%, with average asking rents of $1,607 per unit and inventory of approximately 734,885 units. According to the appraisal, as of the fourth quarter of 2023, the vacancy rate in the Bronzeville multifamily submarket was 5.2%, with average asking rents of $1,184 per unit and inventory of approximately 18,191 units. According to the appraisal, the estimated 2023 population within a one-, three-, and five-mile radius of the Drexel Terraces Property was 49,955, 214,188 and 617,804, respectively. According to the appraisal, the 2023 average household income within the same radii was $86,395, $72,295 and $77,842, respectively.
| THE INFORMATION IN THIS STRUCTURAL AND COLLATERAL TERM SHEET IS NOT COMPLETE AND MAY BE AMENDED PRIOR TO THE TIME OF SALE. THIS TERM SHEET IS NOT AN OFFER TO SELL THESE SECURITIES AND IT IS NOT A SOLICITATION OF AN OFFER TO BUY THESE SECURITIES IN ANY JURISDICTION WHERE THE OFFER OR SALE IS NOT PERMITTED. | ||
| T-137 | ||
| Multifamily – Garden | Loan #14 | Cut-off Date Balance: | $31,000,000 | |
| 4830 South Drexel Boulevard | Drexel Terraces | Cut-off Date LTV: | 61.8% | |
| Chicago, IL 60615 | U/W NCF DSCR: | 1.29x | ||
| U/W NOI Debt Yield: | 8.2% |
The following table presents certain information relating to comparable multifamily rental properties to the Drexel Terraces Property:
| Comparable Rental Properties | ||||||
| Property | Year Built | # Total Units | Unit Mix | # of Units | Unit Size (SF) | Average Monthly Rent per Unit |
Drexel Terraces (subject property)(1) 4830 South Drexel Boulevard Chicago, IL | 1902 / 2023 | 116 | 1BR 2BR 3BR | 12 60 44 | 520 741 1,344 | $1,714 $2,166 $2,804 |
City Hyde Park 5105 South Harper Avenue Chicago, IL | 2015 / NAP | 180 | 1BR 2BR 3BR | 45 44 44 | 684 966 1,250 | $2,381 $3,483 $3,602 |
5557 South University Avenue Chicago, IL | 1910 / 2005 | 7 | 1BR 2BR 3BR | 1 5 1 | 500 910 943 | $2,013 $3,202 $4,480 |
Twin Towers Apartments 1649 East 50th Place Chicago, IL | 1951 / NAP | 253 | 1BR 2BR 3BR | 84 94 17 | 661 735 987 | $1,612 $1,971 $2,451 |
5326-5336 South Greenwood Apartments Chicago, IL | 1923 / 2000 | 42 | 1BR 2BR 3BR | 12 22 2 | 579 832 881 | $1,532 $2,030 $2,104 |
4740 South Greenwood Avenue Chicago, IL | 1922 / 2013 | 31 | 1BR 2BR 3BR | 12 13 6 | 720 943 1,125 | $1,560 $2,083 $2,099 |
5222 South Drexel Apartments 5222-5238 South Drexel Avenue Chicago, IL | 1917 / 2011 | 63 | 1BR 2BR 3BR | 26 29 7 | 846 1,192 1,385 | $1,485 $1,850 $2,033 |
Source: Appraisal, unless otherwise indicated.
| (1) | Based on the borrower rent roll dated January 24, 2024, other than Year Built / Renovated. |
The following table presents certain information relating to the appraisal’s market rent conclusion for the Drexel Terraces Property:
| Market Rent Summary | |||||||
| Unit Mix/Type | Units(1) | Average Size (SF) (1) | Avg. Monthly Rent per Unit(1) | Avg. Monthly Rent PSF(1) | Avg. Monthly Market Rent per Unit(2) | Avg. Monthly Market Rent PSF(2) | |
| 1 BR | 12 | 520 | $1,714 | $3.30 | $1,750 | $3.37 | |
| 2 BR | 60 | 741 | $2,166 | $2.92 | $2,311 | $3.12 | |
| 3 BR | 44 | 1,344 | $2,804 | $2.09 | $2,855 | $2.12 | |
| Total/Wtd. Average | 116 | 947 | $2,361 | $2.49 | $2,459 | $2.60 | |
| (1) | Based on the borrower rent roll dated January 24, 2024. |
| (2) | Based on the appraisal. |
Appraisal. The appraisal concluded to an “as-is” value for the Drexel Terraces Property of $50,2000,000 as of January 30, 2024.
Environmental Matters. According to the Phase I environmental site assessment dated February 8, 2024, there was no evidence of any recognized environmental conditions at the Drexel Terraces Property.
| THE INFORMATION IN THIS STRUCTURAL AND COLLATERAL TERM SHEET IS NOT COMPLETE AND MAY BE AMENDED PRIOR TO THE TIME OF SALE. THIS TERM SHEET IS NOT AN OFFER TO SELL THESE SECURITIES AND IT IS NOT A SOLICITATION OF AN OFFER TO BUY THESE SECURITIES IN ANY JURISDICTION WHERE THE OFFER OR SALE IS NOT PERMITTED. | ||
| T-138 | ||
| Multifamily – Garden | Loan #14 | Cut-off Date Balance: | $31,000,000 | |
| 4830 South Drexel Boulevard | Drexel Terraces | Cut-off Date LTV: | 61.8% | |
| Chicago, IL 60615 | U/W NCF DSCR: | 1.29x | ||
| U/W NOI Debt Yield: | 8.2% |
Underwritten Net Cash Flow. The following table presents certain information relating to the Underwritten Net Cash Flow for the Drexel Terraces Property:
| Cash Flow Analysis(1) | ||
| UW | UW per Unit | |
| Gross Potential Rent(2) | $3,286,740 | $28,333.97 |
| Other Income(3) | $97,080 | $836.90 |
| Discounts Concessions | $0 | $0.00 |
| Vacancy & Credit Loss | ($169,191) | ($1,458.54) |
| Effective Gross Income | $3,214,629 | $27,712.32 |
| Real Estate Taxes(4) | $149,051 | $1,284.92 |
| Insurance | $126,565 | $1,091.08 |
| Other Expenses | 397,459 | $3,426.37 |
| Total Expenses | $673,075 | $5,802.37 |
| Net Operating Income | $2,541,554 | $21,909.95 |
| Capital Expenditures | $29,000 | $250.00 |
| Net Cash Flow | $2,512,554 | $21,659.95 |
| Occupancy % | 95.0%(5) | |
| NOI DSCR | 1.30x | |
| NCF DSCR | 1.29x | |
| NOI Debt Yield | 8.2% | |
| NCF Debt Yield | 8.1% | |
| (1) | Historical financial and occupancy information is not available as the Drexel Terraces Property was leased up following completion of renovations in 2023. | |
| (2) | UW Gross Potential Rent has been underwritten based on the contractual rent in place based on the borrower rent roll dated January 24, 2024. |
| (3) | Other Income is primarily comprised of parking income ($81,200) but also includes miscellaneous income ($15,080). |
| (4) | Real Estate Taxes are calculated including the AHSAP property tax benefit. According to the appraisal, the estimated annual real estate tax for 2023 would be $229,310 without the AHSAP property tax benefit. |
| (5) | Vacancy has been underwritten at 5.0%. The Drexel Terraces Property is 100.0% occupied based on the rent roll dated January 24, 2024. |
| THE INFORMATION IN THIS STRUCTURAL AND COLLATERAL TERM SHEET IS NOT COMPLETE AND MAY BE AMENDED PRIOR TO THE TIME OF SALE. THIS TERM SHEET IS NOT AN OFFER TO SELL THESE SECURITIES AND IT IS NOT A SOLICITATION OF AN OFFER TO BUY THESE SECURITIES IN ANY JURISDICTION WHERE THE OFFER OR SALE IS NOT PERMITTED. | ||
| T-139 | ||
| Mortgage Loan No. 15 – Staten Island Mall |
| Mortgage Loan Information | Property Information | |||||||
| Mortgage Loan Seller: | WFB | Single Asset/Portfolio: | Single Asset | |||||
| Credit Assessment (Fitch/KBRA/Moody’s): | NR/NR/NR | Location: | Staten Island, NY 10314 | |||||
| Original Balance(1): | $30,000,000 | General Property Type: | Retail | |||||
| Cut-off Date Balance(1): | $30,000,000 | Detailed Property Type: | Super Regional Mall | |||||
| % of Initial Pool Balance: | 3.0% | Title Vesting: | Fee | |||||
| Loan Purpose: | Refinance | Year Built/Renovated: | 1972 / 1993, 2018 | |||||
| Borrower Sponsor(2): | BPR Nimbus LLC | Size(9): | 995,900 SF | |||||
| Guarantor: | BPR Nimbus LLC | Cut-off Date Balance Per SF(1): | $201 | |||||
| Mortgage Rate: | 7.5340% | Maturity Date Balance Per SF(1): | $201 | |||||
| Note Date: | 1/18/2024 | Property Manager: | Brookfield Properties Retail Inc. | |||||
| Maturity Date: | 2/1/2029 | |||||||
| Term to Maturity: | 60 months | |||||||
| Amortization Term: | 0 months | |||||||
| IO Period: | 60 months | Underwriting and Financial Information | ||||||
| Seasoning: | 3 months | UW NOI: | $33,065,961 | |||||
| Prepayment Provisions(3): | L(27),D(26),O(7) | UW NCF: | $31,870,881 | |||||
| Lockbox/Cash Mgmt Status: | Hard/Springing | UW NOI Debt Yield(1): | 16.5% | |||||
| Additional Debt Type(1): | Pari Passu | UW NCF Debt Yield(1): | 15.9% | |||||
| Additional Debt Balance(1): | $170,000,000 | UW NOI Debt Yield at Maturity(1): | 16.5% | |||||
| Future Debt Permitted (Type): | No (NAP) | UW NCF DSCR(1): | 2.09x | |||||
| Most Recent NOI: | $36,582,216 (10/31/2023 TTM) | |||||||
| 2nd Most Recent NOI: | $33,279,822 (12/31/2022) | |||||||
Reserves | 3rd Most Recent NOI: | $23,965,918 (12/31/2021) | ||||||
| Type | Initial | Monthly | Cap | Most Recent Occupancy: | 87.3% (11/30/2023) | |||
| RE Tax: | $0 | Springing(4) | NAP | 2nd Most Recent Occupancy: | 84.0% (12/31/2022) | |||
| Insurance: | $0 | Springing(5) | NAP | 3rd Most Recent Occupancy: | 83.8% (12/31/2021) | |||
| Replacement Reserve: | $0 | Springing(6) | $497,950 | Appraised Value (as of): | $467,000,000 (8/22/2023) | |||
| TI/LC: | $4,580,787 | Springing(7) | $1,991,800 | Appraised Value Per SF: | $469 | |||
| Gap Rent Reserve: | $403,197 | $0 | NAP | Cut-off Date LTV Ratio(1): | 42.8% | |||
| Anchor Tenant Reserve: | $0 | Springing(8) | NAP | Maturity Date LTV Ratio(1): | 42.8% | |||
| Sources and Uses | ||||||
| Sources | Proceeds | % of Total | Uses | Proceeds | % of Total | |
| Whole Loan Amount(1): | $200,000,000 | 94.7% | Loan Payoff: | $204,429,707 | 96.8% | |
| Equity Contribution: | $11,179,744 | 5.3% | Reserves: | $4,983,984 | 2.4% | |
| Closing Costs: | $1,766,053 | 0.8% | ||||
| Total Sources: | $211,179,744 | 100.0% | Total Uses: | $211,179,744 | 100.0% | |
| (1) | The Staten Island Mall Mortgage Loan (as defined below) is part of the Staten Island Mall Whole Loan (as defined below) which is comprised of twelve pari passu notes with an aggregate original principal balance and Cut-off Date Balance of $200,000,000. The Staten Island Mall Whole Loan was co-originated by Deutsche Bank AG, New York Branch (“DBNY”), Wells Fargo Bank, National Association (“WFB”) and Barclays Capital Real Estate Inc. (“Barclays”). The Cut-off Date Balance Per SF, Maturity Balance Per SF, UW NOI Debt Yield, UW NCF Debt Yield, UW NOI Debt Yield at Maturity, UW NCF DSCR, Cut-off Date LTV Ratio and Maturity Date LTV Ratio numbers presented above are based on the aggregate outstanding principal balance as of the Cut-off Date and the Maturity Date of the Staten Island Mall Whole Loan. |
| (2) | The borrower sponsor is related to the borrower sponsor for the Kenwood Towne Centre Whole Loan, Jordan Creek Town Center Whole Loan, and the Galleria at Tyler Whole Loan. |
| (3) | The lockout period will be at least 27 payment dates beginning with and including the first payment date on March 1, 2024. Defeasance of the Staten Island Mall Whole Loan in full (but not in part) is permitted at any time following the earlier to occur of (i) January 18, 2027, or (ii) the date that is two years from the closing date of the securitization that includes that last pari passu note to be securitized. The assumed lockout period of 27 payments is based on the expected closing date of this transaction in May 2024. The actual lockout period may be longer. The Staten Island Mall Whole Loan may be partially prepaid at any time to cure a debt yield event, provided that any prepayment prior to the payment date occurring in August 2028 will be subject to payment of the yield maintenance premium. |
| (4) | The loan documents do not require ongoing monthly tax reserves; provided, no cash management period is continuing. If such condition is not satisfied, the loan documents require ongoing monthly tax reserves in an amount equal to 1/12 of the tax payments that the lender reasonably estimates will be payable during the next ensuing 12 months. |
| (5) | The loan documents do not require ongoing monthly insurance reserves; provided, during the continuance of a cash management period, the borrower is required to maintain insurance coverage for the Staten Island Mall Property as part of blanket or umbrella coverage reasonably approved by the lender and provides the lender with evidence of the renewals of the insurance policies and paid receipts for the payment of the insurance premiums prior to the expiration dates of the policies. If such conditions are not satisfied, the loan documents require ongoing monthly insurance reserves equal to 1/12 of the insurance premiums that the lender estimates will be payable for the renewal of coverage. |
| (6) | The loan documents do not require ongoing replacement reserves; provided, no cash management period is continuing. During the continuance of a cash management period , the loan documents require ongoing monthly deposits equal to 1/12th of $0.25 per owned leasable SF (initially $20,748) subject to a cap of 24 months of collections (initially $497,950). |
| (7) | The loan documents require an upfront deposit of $4,580,787 for outstanding tenant improvements and leasing commissions related to 12 tenants. During the continuance of a cash management period, the loan documents require ongoing monthly deposits equal to 1/12th of $1.00 per owned leasable SF (which initially will be $82,992 for TI/LCs subject to a cap of 24 months collections ($1,991,800). |
| (8) | During the continuance of an anchor tenant trigger event, the loan documents require monthly deposits equal to all excess cash flows until the balance of the account is equal to $50 multiplied by the aggregate amount of gross leasable SF of the applicable Anchor Tenant space for tenant improvements and leasing commissions, budgeted construction costs, required landlord work and other related costs associated with re-tenanting the applicable space. |
| (9) | The Staten Island Mall Property (as defined below) is the collateral portion of a larger mall containing 1,462,822 SF. |
The Mortgage Loan. The fifteenth largest mortgage loan (the “Staten Island Mall Mortgage Loan”) is part of a whole loan (the “Staten Island Mall Whole Loan”) originated by DBNY, WFB and Barclays on January 18, 2024, that is evidenced by 12 pari passu notes with an aggregate outstanding principal
| THE INFORMATION IN THIS STRUCTURAL AND COLLATERAL TERM SHEET IS NOT COMPLETE AND MAY BE AMENDED PRIOR TO THE TIME OF SALE. THIS TERM SHEET IS NOT AN OFFER TO SELL THESE SECURITIES AND IT IS NOT A SOLICITATION OF AN OFFER TO BUY THESE SECURITIES IN ANY JURISDICTION WHERE THE OFFER OR SALE IS NOT PERMITTED. | ||
| T-140 | ||
| Retail – Super Regional Mall | Loan #15 | Cut-off Date Balance: | $30,000,000 | |
| 2655 Richmond Avenue | Staten Island Mall | Cut-off Date LTV: | 42.8% | |
| Staten Island, NY 10314 | UW NCF DSCR: | 2.09x | ||
| UW NOI Debt Yield: | 16.5% |
balance as of the Cut-off Date of $200,000,000 and accrues interest at a fixed rate of 7.53400% per annum. The Staten Island Mall Whole Loan is secured by the fee simple interest in a 995,900 SF portion (the “Staten Island Mall Property”) of the Staten Island Mall, an enclosed, 1,462,822 SF super-regional mall located at 2655 Richmond Avenue in Staten Island, New York (the “Staten Island Mall”). The Staten Island Mall Mortgage Loan, which is evidenced by the non-controlling notes A-9 and A-12, has an outstanding principal balance as of the Cut-off Date of $30,000,000.
The Staten Island Mall Whole Loan will be serviced under the pooling and servicing agreement for the BBCMS 2024-5C25 transaction. See “Description of the Mortgage Pool—The Whole Loans—The Non-Serviced Pari Passu Whole Loans” and “Pooling and Servicing Agreement – Servicing of the Non-Serviced Mortgage Loans” in the prospectus.
Pursuant to the Staten Island Mall Whole Loan documents the non-recourse carveout guarantor’s liability is limited to 20.0% ($40,000,000) of the outstanding principal balance of the Staten Island Mall Whole Loan in the aggregate, plus all of the reasonable out-of-pocket costs and expenses (including court costs and reasonable attorneys’ fees) incurred by the lender in the enforcement of the related guaranty or the preservation of the lender’s rights under such guaranty.
The table below identifies the promissory notes that comprise the Staten Island Mall Whole Loan:
| Whole Loan Summary | |||||
| Note | Original Balance | Cut-off Date Balance | Note Holder | Controlling Note | |
| A-1 | $28,500,000 | $28,500,000 | BMO 2024-5C3 | No | |
| A-2 | $25,000,000 | $25,000,000 | BBCMS 2024-5C25 | Yes | |
| A-3 | $15,000,000 | $15,000,000 | Benchmark 2024-V6 | No | |
| A-4 | $11,500,000 | $11,500,000 | BBCMS 2024-5C25 | No | |
| A-5 | $30,000,000 | $30,000,000 | BBCMS 2024-5C25 | No | |
| A-6 | $15,000,000 | $15,000,000 | Benchmark 2024-V6 | No | |
| A-7 | $10,000,000 | $10,000,000 | Benchmark 2024-V6 | No | |
| A-8 | $5,000,000 | $5,000,000 | BBCMS 2024-5C25 | No | |
| A-9 | $25,000,000 | $25,000,000 | BANK5 Trust 2024-5YR6 | No | |
| A-10(1) | $20,000,000 | $20,000,000 | WFB | No | |
| A-11(1) | $10,000,000 | $10,000,000 | WFB | No | |
| A-12 | $5,000,000 | $5,000,000 | BANK5 Trust 2024-5YR6 | No | |
| Total | $200,000,000 | $200,000,000 | |||
| (1) | Expected to be contributed to one or more future securitizations. |
The Borrowers and the Borrower Sponsor. The borrowers are GGP Staten Island Mall, LLC and Staten Island FS Anchor Parcel LLC, each a Delaware limited liability company with two independent directors. The borrower sponsor and non-recourse carveout guarantor of the Staten Island Mall Whole Loan is BPR Nimbus LLC, which is a subsidiary of Brookfield Asset Management (“Brookfield”).
The non-recourse carveout guarantor’s recourse obligations with respect to bankruptcy or insolvency related events is capped at 20% of the outstanding principal balance of the Staten Island Mall Whole Loan, plus third party costs actually incurred by the lender (including reasonable attorneys’ fees and costs) in connection with collection of amounts due under the non-recourse carveout guaranty.
Brookfield Properties (“BPR”) is one of the largest fully integrated, global real estate services companies in the world with over $900 billion in assets under management. BPR ranks among the largest retail real estate companies in the United States with a portfolio of malls that spans across more than 150 retail centers, representing over 130 million SF of retail space. The company is focused exclusively on managing, leasing and redeveloping high-quality retail properties. Brookfield Properties Retail Group is headquartered in Chicago, Illinois and owned by affiliates of Brookfield Asset Management (NYSE:BAM).
The Property. The Staten Island Mall Property is a 995,900 SF collateral portion of the Staten Island Mall, a 1,462,822 SF super regional mall located in Staten Island, New York. Staten Island Mall was built in 1972 and is anchored by Macy’s and JCPenney (non-collateral), along with a line-up of junior anchors including Dave & Buster’s, AMC Theatres, Primark, Lidl, and Hobby Lobby. Macy’s (289,512 SF) and JCPenney (177,410 SF) both own their respective boxes and are not included as part of the Staten Island Mall Property. The Staten Island Mall is comprised of five buildings located on 78.54 acres, has 167 tenants and has 6,900 parking spaces in total for a ratio of 4.72 spaces per 1,000 SF. In 2018, the Staten Island Mall underwent a $231 million redevelopment and expansion, which added a lifestyle component to the mall. The expansion included a new food court, new plaza area, and additional decked parking.
The Staten Island Mall benefits from being the only regional mall on Staten Island. The Staten Island Mall sees more than 12 million shoppers every year, due in part a road network that places it within an approximately 15-mile radius of every resident on the island. The Staten Island Mall Property caters to a trade area of over 485,000 people with an average household income of over $110,000. Staten Island is accessed by the nearby metropolitan areas through the Staten Island Ferry, which serves over 22 million people annually, combined with accessibility through motor traffic from New Jersey and Brooklyn.
As part of the redevelopment and expansion, the borrower sponsor executed leases with retailers such as AMC Theatres, Barnes & Noble, Dave & Buster’s, Chipotle, Shake Shack, Ulta Beauty, and Zara, which have helped diversify the tenant mix and product offerings at the Staten Island Mall Property. Most recently, the borrower signed a new 10-year lease with Hobby Lobby, an arts and crafts retailer, which took occupancy of 42,768 SF in June 2023. Earlier in 2023, The Mighty Crab, a Cajun seafood restaurant, opened a 5,536 SF restaurant, adding another food offering at the Staten Island Mall Property. In addition to these newly signed leases, the borrower has signed a 10-year lease with Uniqlo to occupy 10,929 SF.
| THE INFORMATION IN THIS STRUCTURAL AND COLLATERAL TERM SHEET IS NOT COMPLETE AND MAY BE AMENDED PRIOR TO THE TIME OF SALE. THIS TERM SHEET IS NOT AN OFFER TO SELL THESE SECURITIES AND IT IS NOT A SOLICITATION OF AN OFFER TO BUY THESE SECURITIES IN ANY JURISDICTION WHERE THE OFFER OR SALE IS NOT PERMITTED. | ||
| T-141 | ||
| Retail – Super Regional Mall | Loan #15 | Cut-off Date Balance: | $30,000,000 | |
| 2655 Richmond Avenue | Staten Island Mall | Cut-off Date LTV: | 42.8% | |
| Staten Island, NY 10314 | UW NCF DSCR: | 2.09x | ||
| UW NOI Debt Yield: | 16.5% |
As of October 31, 2023, TTM, sales for the in-line (<10,000 SF) tenant category are $765 PSF, with an occupancy cost ratio of 13.9%. Excluding Apple, the in-line (<10,000 SF) tenant sales are $628 PSF, with an occupancy cost ratio of 17.0%. The major tenants (>10,000 SF) have experienced growth since the COVID-19 pandemic, reaching October 31, 2023, TTM sales of $37.9 million ($236 PSF), a 5.2% increase from 2019 sales of $36.1 million ($225 PSF).The following table presents tenant sales history for the Staten Island Mall Property:
Tenant Sales by Tenancy Type(1) | ||||||||||||
Tenancy Type | 2019 Sales | 2019 PSF | 2020 Sales | 2020 PSF | 2021 Sales | 2021 PSF | 2022 Sales | 2022 PSF | TTM Sales(2) | TTM PSF(2) | ||
| Anchor | $19,348,080 | $203 | $11,665,021 | $122 | $4,812,283 | $51 | $14,946,714 | $157 | $18,112,475 | $190 | ||
| Major (> 10,000 SF) | $36,053,132 | $225 | $28,514,242 | $178 | $27,589,556 | $172 | $39,111,833 | $244 | $37,935,043 | $236 | ||
| Inline (< 10,000 SF) | $198,823,588 | $816 | $109,228,240 | $435 | $197,610,950 | $775 | $198,565,374 | $762 | $197,182,104 | $765 | ||
| Inline (< 10,000 SF) excluding Apple | $156,300,975 | $654 | $86,304,641 | $350 | $159,814,024 | $638 | $160,124,694 | $625 | $158,932,145 | $628 | ||
| Total Sales | $254,224,800 | $509 | $149,407,502 | $295 | $230,012,789 | $450 | $252,623,922 | $489 | $253,229,623 | $493 | ||
| (1) | Based on the underwritten rent roll dated November 30, 2023. |
| (2) | TTM is as of October 31, 2023. |
Major Tenants. The three largest tenants based on underwritten base rent are AMC Theatres, Zara and Primark.s
AMC Theatres (54,000 SF; 5.4% of NRA; 6.8% of UW Rent). AMC Theatres is a large movie exhibition company in the United States and worldwide. The company operates over 2,800 screens in over 350 European theatres along with over 7,500 screens in 586 American theatres. At the Staten Island Mall Property, AMC Theatres features 11 screens, has a lease expiration in February 2034, and produced October 31, 2023, TTM sales of $10,181,272 ($925,570 per screen) versus the 2019 sales of $9,464,419 ($860,402 per screen). AMC has 3, 5-year extension options and no termination options.
Zara (29,141 SF; 2.9% of NRA; 5.1% of UW Rent). Zara is a Spanish multi-national clothing chain with operations in over 90 countries that was founded in 1974. Headquartered in Arteixo, Spain the company acts as the flagship brand of the Inditex Group with over 547 stores in Spain, 229 stores in China, 145 stores in France and 98 stores in the United States. In May 2021, Zara expanded its product offerings with its first beauty line, ZARA Beauty. Zara has a lease expiration in April 2028. The tenant had sales of $419 PSF as of October 31, 2023 TTM. Zara has the right to terminate its lease if its net sales from the leased premises fail to exceed $12,000,000 during the measuring period beginning on the first day of the 49th full calendar month following the date the tenant opened for business, (the “Open Date”) and ending on the last day of the 60th full calendar month following the Open Date, upon written notice delivered on or before the 120th day following the end of the measuring period. If such notice is given, the lease will terminate 365 days after such notice is received by the landlord. Zara has no extension options.
Primark (73,647 SF; 7.4% of NRA; 4.9% of UW Rent). Primark is an international clothing retailer headquartered in Dublin, Ireland with outlets across Europe and the United States. The company was established in 1969 and in 2006 began expanding into the rest of Europe by opening stores in Spain, The Netherlands, Portugal, Germany, Belgium, and other countries. In 2015, the company opened its first store in the United States in Boston. The company operates with 72,000 team members in 15 countries. At the Staten Island Mall Property, Primark has occupied its 73,647 SF location since 2017, has a lease expiration in June 2027 and no termination options. Primark does not report sales. Primark has 4, 5-year extension options.
The following table presents certain information relating to the major tenants at the Staten Island Mall Property:
| Tenant Summary(1) | |||||||||
| Tenant Name | Credit Rating (Fitch/Moody's/ S&P)(2) | Tenant SF | % of Total SF | Annual UW Rent | % of Total Annual UW Rent | Annual UW Rent PSF | |||
| Lease Expiration | Renewal Options | Term. Option (Y/N) | |||||||
| Major Tenants | |||||||||
| AMC Theatres | NR/Caa2/CCC+ | 54,000 | 5.4% | $2,256,000 | 6.8% | $41.78 | 2/28/2034 | 3 x 5 years | N |
| Zara | NR/NR/NR | 29,141 | 2.9% | 1,689,120 | 5.1% | $57.96 | 4/30/2028 | None | Y(3) |
| Primark | NR/NR/A | 73,647 | 7.4% | 1,620,234 | 4.9% | $22.00 | 6/30/2027 | 4 x 5 years | N |
| Lidl | NR/NR/NR | 37,403 | 3.8% | 1,584,017 | 4.8% | $42.35 | 1/31/2039 | 4 x 5 years | N |
| Dave & Buster’s | NR/NR/NR | 41,241 | 4.1% | 1,567,158 | 4.7% | $38.00 | 1/31/2033 | 2 x 5 years | N |
| The Container Store | NR/NR/B | 24,075 | 2.4% | 1,006,335 | 3.0% | $41.80 | 2/28/2033 | 2 x 5 years | N |
| H&M | NR/NR/BBB | 25,471 | 2.6% | 945,420 | 2.9% | $37.12 | 1/31/2030 | Various(4) | Y(5) |
| Barnes & Noble Bookseller | NR/NR/NR | 20,084 | 2.0% | 853,570 | 2.6% | $42.50 | 1/31/2029 | 2 x 5 years | N |
| Hobby Lobby | NR/NR/NR | 42,768 | 4.3% | 727,056 | 2.2% | $17.00 | 5/31/2033 | 3 x 5 years | N |
| Express | NR/NR/NR | 12,928 | 1.3% | 662,560 | 2.0% | $51.25 | 1/31/2025 | None | N |
| Total/Wtd. Avg. | 360,758 | 36.2% | $12,911,470 | 39.1% | $35.79 | ||||
| Non-Major Tenants | 508,219 | 51.0% | $20,108,716 | 60.9% | $39.57 | ||||
| Occupied Collateral Total | 868,977 | 87.3% | $33,020,186 | 100.0% | $38.00 | ||||
| Vacant Space | 126,923 | 12.7% | $0 | 0.0% | $0.00 | ||||
| Total/Wtd. Avg. | 995,900 | 100.0% | $33,020,186 | 100.0% | $38.00 | ||||
| THE INFORMATION IN THIS STRUCTURAL AND COLLATERAL TERM SHEET IS NOT COMPLETE AND MAY BE AMENDED PRIOR TO THE TIME OF SALE. THIS TERM SHEET IS NOT AN OFFER TO SELL THESE SECURITIES AND IT IS NOT A SOLICITATION OF AN OFFER TO BUY THESE SECURITIES IN ANY JURISDICTION WHERE THE OFFER OR SALE IS NOT PERMITTED. | ||
| T-142 | ||
| Retail – Super Regional Mall | Loan #15 | Cut-off Date Balance: | $30,000,000 | |
| 2655 Richmond Avenue | Staten Island Mall | Cut-off Date LTV: | 42.8% | |
| Staten Island, NY 10314 | UW NCF DSCR: | 2.09x | ||
| UW NOI Debt Yield: | 16.5% |
| (1) | Based on the underwritten rent roll dated November 30, 2023. |
| (2) | In certain instances, ratings provided are those of the parent company of the entity shown, whether or not the parent company guarantees the lease. |
| (3) | Zara has the right to terminate its lease if its net sales from the leased premises fail to exceed $12,000,000 during the measuring period beginning on the first day of the 49th full calendar month following the date the tenant opened for business, (the “Open Date”) and ending on the last day of the 60th full calendar month following the Open Date, upon written notice delivered on or before the 120th day following the end of the measuring period. If such notice is given, the lease will terminate 365 days after such notice is received by the landlord. |
| (4) | H&M has 2, 3-year renewal options and 1, 4-year renewal option. |
| (5) | H&M has the right to terminate its lease if (i) its net sales from the leased premises fail to exceed $6,874,269 in the fourth full lease year after the rental commencement date or (ii) its net sales from the leased premises fail to exceed $7,151,989.47 in the sixth full lease year after the rental commencement date, in each case upon not less than 365 days’ notice given within 180 days following the end of the applicable measuring period. |
| Top Tenants by Total Sales(1) | |||||||||
| Tenant Name | Tenant SF | 2021 Sales | 2021 Sales PSF | 2022 Sales | 2022 Sales PSF | TTM 10/31/2023 Sales | TTM 11/30/2023 Sales PSF | TTM 11/30/2023 Occupancy Cost | |
| Dave & Busters | 41,241 | $4,585,015 | $111 | $6,798,354 | $165 | $7,931,203 | $192 | 30.3% | |
| AMC Theatres | 54,000 | $227,268 | $4 | $8,148,360 | $151 | $10,181,272 | $189 | 22.2% | |
| Primark | 73,647 | NAV | NAV | NAV | NAV | NAV | NAV | NAV | |
| LIDL | 37,403 | NAV | NAV | NAV | NAV | NAV | NAV | NAV | |
| XXI Forever | 17,143 | $3,181,970 | $186 | $2,736,207 | $160 | $2,339,787 | $136 | 0.0% | |
| H&M | 25,471 | $5,454,584 | $214 | $5,771,924 | $227 | $5,666,392 | $222 | 18.8% | |
| Ulta Beauty | 10,170 | $2,428,999 | $239 | $2,428,999 | $239 | $2,428,999 | $239 | 24.4% | |
| Uniqlo | 10,929 | NAV | NAV | NAV | NAV | NAV | NAV | NAV | |
| Zara | 29,141 | $2,295,898 | $79 | $11,937,958 | $410 | $12,202,782 | $419 | 14.5% | |
| Barnes & Noble Bookseller | 20,084 | $2,580,992 | $129 | $3,766,049 | $188 | $3,756,858 | $187 | 22.8% | |
| (1) | All sales information presented herein with respect to the Staten Island Mall Property is sourced from the underwritten rent roll as of November 30, 2023. Such information is based upon information provided by the borrower sponsor. |
The following table presents certain information relating to the lease rollover schedule at the Staten Island Mall Property:
| Lease Rollover Schedule(1)(2) | |||||||||
| Year | # of Leases Rolling | SF Rolling | Approx. % of SF Rolling | Approx. Cumulative % of SF Rolling | Total UW Rent Rolling | Approx. % of Total UW Rent Rolling | Approx. Cumulative % of Total UW Rent Rolling | UW Rent PSF Rolling | |
| MTM/2024 | 39 | 127,620 | 12.8% | 12.8% | $2,313,310 | 7.0% | 7.0% | $18.13 | |
| 2025 | 38 | 107,281 | 10.8% | 23.6% | $5,059,889 | 15.3% | 22.3% | $47.16 | |
| 2026 | 17 | 60,152 | 6.0% | 29.6% | $2,401,754 | 7.3% | 29.6% | $39.93 | |
| 2027 | 19 | 142,425 | 14.3% | 43.9% | $4,218,491 | 12.8% | 42.4% | $29.62 | |
| 2028 | 25 | 82,873 | 8.3% | 52.2% | $4,852,666 | 14.7% | 57.1% | $58.56 | |
| 2029(3) | 10 | 54,184 | 5.4% | 57.7% | $3,371,346 | 10.2% | 67.3% | $62.22 | |
| 2030 | 5 | 41,232 | 4.1% | 61.8% | $1,406,524 | 4.3% | 71.5% | $34.11 | |
| 2031 | 2 | 1,030 | 0.1% | 61.9% | $85,602 | 0.3% | 71.8% | $83.11 | |
| 2032 | 6 | 16,981 | 1.7% | 63.6% | $735,198 | 2.2% | 74.0% | $43.30 | |
| 2033 | 6 | 117,014 | 11.7% | 75.4% | $3,743,953 | 11.3% | 85.4% | $32.00 | |
| 2034 | 5 | 69,853 | 7.0% | 82.4% | $2,754,935 | 8.3% | 93.7% | $39.44 | |
| 2035 & Thereafter | 2 | 48,332 | 4.9% | 87.3% | $2,076,517 | 6.3% | 100.0% | $42.96 | |
| Vacant | 0 | 126,923 | 12.7% | 100.0% | $0 | 0.0% | 100.0% | $0.00 | |
| Total/Wtd. Avg.(4) | 17 | 4 | 995,900 | 100.0% | $33,020,186 | 100.0% | $38.00 | ||
| (1) | Based on the underwritten rent roll dated November 30, 2023. |
| (2) | Certain tenants may have termination options that are not considered in the above lease rollover schedule. |
| (3) | Staten Island Mall Whole Loan maturity date. |
| (4) | Total/Wtd. Avg. UW Rent PSF Rolling excludes vacant space. |
The Market. The Staten Island Mall Property is located in Staten Island, the southernmost of New York City’s five boroughs. The Staten Island Mall Property is located along Richmond Avenue between Platinum Road and Richmond Hill Road in the New Springville neighborhood of Staten Island. New Springville is located within the central portion of Staten Island, which is a primary residential neighborhood with access to Richmond Avenue, the prime retail / commercial area in Staten Island.
Being located in the New York City market, the Staten Island Mall Property benefits from a large local consumer base. There are a variety of large industries in Staten Island, with top employers including Global Container Terminal, Amazon Fulfillment Center, Matrix Global Logistics Park, Pratt Mill Paper Industry, and the Corporate Park of Staten Island. Collectively, these companies employ over 25,000 people. According to the appraisal, as of 2022,
| THE INFORMATION IN THIS STRUCTURAL AND COLLATERAL TERM SHEET IS NOT COMPLETE AND MAY BE AMENDED PRIOR TO THE TIME OF SALE. THIS TERM SHEET IS NOT AN OFFER TO SELL THESE SECURITIES AND IT IS NOT A SOLICITATION OF AN OFFER TO BUY THESE SECURITIES IN ANY JURISDICTION WHERE THE OFFER OR SALE IS NOT PERMITTED. | ||
| T-143 | ||
| Retail – Super Regional Mall | Loan #15 | Cut-off Date Balance: | $30,000,000 | |
| 2655 Richmond Avenue | Staten Island Mall | Cut-off Date LTV: | 42.8% | |
| Staten Island, NY 10314 | UW NCF DSCR: | 2.09x | ||
| UW NOI Debt Yield: | 16.5% |
within a 10 and 20 minute drive of the Staten Island Mall Property, the population was 53,743 and 390,102, respectively with a median household income of $127,282 and $121,680, respectively.
The Staten Island Mall Property is located within the New York City retail market and the Staten Island retail submarket. According to a third party report, as of December 2023, the vacancy rate in the submarket was 5.1%. The total submarket is comprised of 20,474,522 SF with only 3,015 SF currently under construction. Average rents as of December 2023 were $37.08 per SF, which is a 2.7% increase from a year ago. In the past three years, rents have increased a cumulative 8.3%.
The following table presents certain information relating to competitive retail centers for the Staten Island Mall Property:
Competitive Property Summary(1) | |||||
Property Name | Year Built/Renovated | Total NRA | Total Occupancy(1) | Estimated # of Customers | Anchor / Major Tenants |
| Staten Island Mall | 1972 / 1993, 2018 | 1,462,822(2) | 87.3%(2) | 11,800,000 | AMC, Zara, Primark |
| Woodbridge Center | 1971 / 2003 | 1,661,324 | 67.0% | 6,400,000 | Boscov’s, JC Penney, Macy’s |
| Menlo Park Mall | 1960 / 2015 | 1,323,156 | 90.0% | 10,400,000 | Macy’s, Nordstrom, AMC |
| The Mills at Jersey Gardens | 1999 / NAP | 1,301,776 | 100.0% | 10,100,000 | Bed, Bath & Beyond, Burlington, Cohoes, Forever XXI, Lowes Cineplex, Marshalls, Neiman Marcus, Portabella, Saks Off Fifth Avenue |
| Newport Centre | 1987 / 2002 | 1,149,147 | 92.0% | 5,900,000 | JCPenney, Sears, Macy’s, Kohl’s, AMC |
| Kings Plaza | 1970 / 2018 | 1,146,000 | 99.0% | 7,600,000 | Lowe’s, Macy’s, Primark, Target |
| Wtd. Avg. | 88.1%(3) | ||||
| (1) | Source: Appraisal, unless otherwise specified. |
| (2) | Based on the underwritten rent roll as of November 30, 2023. Occupancy for the Staten Island Mall Property is as of November 30, 2023. |
| (3) | Excludes subject property. |
Appraisal. The appraiser concluded to an “as-is” value for the Staten Island Mall Property of $467,000,000 as of August 22, 2023.
Environmental Matters. According to the Phase I environmental site assessment dated September 5, 2023, there was a recognized environmental condition associated with prior airport and gas station uses, including soil, soil-gas and groundwater contamination. All remedial work has been completed, subject to the New York City Office of Environmental Remediation’s final approval and issuance of a notice of completion. See “Description of the Mortgage Pool – Environmental Considerations” in the prospectus.
| THE INFORMATION IN THIS STRUCTURAL AND COLLATERAL TERM SHEET IS NOT COMPLETE AND MAY BE AMENDED PRIOR TO THE TIME OF SALE. THIS TERM SHEET IS NOT AN OFFER TO SELL THESE SECURITIES AND IT IS NOT A SOLICITATION OF AN OFFER TO BUY THESE SECURITIES IN ANY JURISDICTION WHERE THE OFFER OR SALE IS NOT PERMITTED. | ||
| T-144 | ||
| Retail – Super Regional Mall | Loan #15 | Cut-off Date Balance: | $30,000,000 | |
| 2655 Richmond Avenue | Staten Island Mall | Cut-off Date LTV: | 42.8% | |
| Staten Island, NY 10314 | UW NCF DSCR: | 2.09x | ||
| UW NOI Debt Yield: | 16.5% |
Operating History and Underwritten Net Cash Flow. The following table presents certain information relating to the operating history and underwritten cash flows of the Staten Island Mall Property:
| Cash Flow Analysis | |||||||
| 2019 | 2020 | 2021 | 2022 | TTM 10/31/2023 | UW | UW PSF | |
| Base Rent(1) | $38,297,987 | $35,160,641 | $31,511,074 | $33,302,007 | $33,191,879 | $33,020,186 | $33.16 |
| Rent Steps(2) | $0 | $0 | $0 | $0 | $0 | 647,911 | $0.65 |
| Grossed Up Vacant Space | $0 | $0 | $0 | $0 | $0 | 9,103,273 | $9.14 |
| Gross Potential Rent | $38,297,987 | $35,160,641 | $31,511,074 | $33,302,007 | $33,191,879 | $42,771,370 | $42.95 |
| Reimbursement Revenue | 28,837,736 | 26,841,040 | 18,268,336 | 19,230,163 | 21,224,797 | 21,343,090 | $21.43 |
| Net Rental Income | $67,135,723 | $62,001,681 | $49,779,410 | $52,532,170 | $54,416,676 | $64,114,460 | $64.38 |
| Other Income | 9,849,626 | 5,151,946 | 8,136,933 | 9,628,520 | 9,322,478 | 8,850,085 | $8.89 |
| (Vacancy) | (448,500) | (4,564,271) | (1,862,967) | 2,597,330 | (1,037,038) | (9,103,273) | ($9.14) |
| Effective Gross Income | $76,536,848 | $62,589,356 | $56,053,376 | $64,758,020 | $62,702,116 | $63,861,272 | $64.12 |
| Total Expenses(3) | 35,170,586 | 31,986,808 | 32,087,459 | 31,478,198 | 26,119,900 | 30,795,311 | $30.92 |
| Net Operating Income | $41,366,262 | $30,602,548 | $23,965,918 | $33,279,822 | $36,582,216 | $33,065,961 | $33.20 |
| TI/LC , Capex/RR | $0 | $0 | $0 | $0 | $0 | $1,195,080 | $1.20 |
| Net Cash Flow | $41,366,262 | $30,602,548 | $23,965,918 | $33,279,822 | $36,582,216 | $31,870,881 | $32.00 |
| Occupancy (%) | 85.8% | 83.1% | 83.8% | 84.0% | 87.3%(4) | 87.5% | |
| NOI DSCR(5) | 2.71x | 2.00x | 1.57x | 2.18x | 2.39x | 2.16x | |
| NCF DSCR(5) | 2.71x | 2.00x | 1.57x | 2.18x | 2.39x | 2.09x | |
| NOI Debt Yield(5) | 20.7% | 15.3% | 12.0% | 16.6% | 18.3% | 16.5% | |
| NCF Debt Yield(5) | 20.7% | 15.3% | 12.0% | 16.6% | 18.3% | 15.9% | |
| (1) | Based on the underwritten rent roll dated November 30, 2023. | |
| (2) | Includes underwritten rent steps through January 1, 2025. |
| (3) | Expenses include real estate taxes. Portions of the Staten Island Mall Property benefit from a New York City Industrial and Commercial Incentive Program (“ICIP”) exemption or a New York City Industrial & Commercial Abatement Program (“ICAP”) abatement. Real estate taxes were underwritten based on the appraisal real estate taxes for the 2023/2024 tax year, less the ICIP/ICAP abatement amounts shown in the appraisal for such tax year. There is one parcel (Block 2400 Lot 77) for which real estate taxes were not underwritten as the tenant is directly responsible for taxes. |
| (4) | Occupancy (%) as of November 30, 2023. |
| (5) | Based on the Staten Island Mall Whole Loan. |
| THE INFORMATION IN THIS STRUCTURAL AND COLLATERAL TERM SHEET IS NOT COMPLETE AND MAY BE AMENDED PRIOR TO THE TIME OF SALE. THIS TERM SHEET IS NOT AN OFFER TO SELL THESE SECURITIES AND IT IS NOT A SOLICITATION OF AN OFFER TO BUY THESE SECURITIES IN ANY JURISDICTION WHERE THE OFFER OR SALE IS NOT PERMITTED. | ||
| T-145 | ||