| | | FREE WRITING PROSPECTUS |
| | | FILED PURSUANT TO RULE 433 |
| | | REGISTRATION FILE NO.: 333-258342-05 |
| | | |
BANK5 2024-5YR9
Free Writing Prospectus Collateral Term Sheet
J.P. Morgan Chase Commercial Mortgage Securities Corp.
as Depositor
JPMorgan Chase Bank, National Association
Morgan Stanley Mortgage Capital Holdings LLC
Wells Fargo Bank, National Association
as Sponsors and Mortgage Loan Sellers
Commercial Mortgage Pass-Through Certificates
Series 2024-5YR9
August 9, 2024
J.P. MORGAN
Co-Lead Bookrunner
Manager | MORGAN STANLEY
Co-Lead Bookrunner
Manager | WELLS FARGO
SECURITIES
Co-Lead Bookrunner
Manager |
Academy Securities Co-Manager | | Drexel Hamilton Co-Manager |
STATEMENT REGARDING THIS FREE WRITING PROSPECTUS
This material is for your information, and none of J.P. Morgan Securities LLC, Morgan Stanley & Co. LLC, Wells Fargo Securities, LLC, Drexel Hamilton, LLC and Academy Securities, Inc. (each individually, an “Underwriter”, and together, the ‘‘Underwriters’’) are soliciting any action based upon it. This material is not to be construed as an offer to sell or the solicitation of any offer to buy any security in any jurisdiction where such an offer or solicitation would be illegal.
| THE INFORMATION IN THIS COLLATERAL TERM SHEET IS NOT COMPLETE AND MAY BE AMENDED PRIOR TO THE TIME OF SALE. THIS TERM SHEET IS NOT AN OFFER TO SELL THESE SECURITIES AND IT IS NOT A SOLICITATION OF AN OFFER TO BUY THESE SECURITIES IN ANY JURISDICTION WHERE THE OFFER OR SALE IS NOT PERMITTED. |
| | T-1 | |
The Depositor has filed a registration statement (including a prospectus) with the SEC (SEC File no. 333-258342) for the offering to which this free writing prospectus relates. Before you invest, you should read the prospectus in the registration statement and other documents the Depositor has filed with the SEC for more complete information about the Depositor, the issuing entity and this offering. You may get these documents for free by visiting EDGAR on the SEC website at www.sec.gov. Alternatively, the Depositor or any Underwriter or any dealer participating in the offering will arrange to send you the prospectus if you request it by calling (800) 408-1016 or by emailing the ABS Syndicate Desk at abs_synd@jpmorgan.com.
THE SECURITIES TO WHICH THIS INFORMATION RELATES WILL BE MORE FULLY DESCRIBED IN A PROSPECTUS (THE “PROSPECTUS”), WHICH IS NOT YET AVAILABLE. THE PROSPECTUS WILL CONTAIN MATERIAL INFORMATION THAT IS NOT CONTAINED IN THESE MATERIALS (INCLUDING WITHOUT LIMITATION A DETAILED DISCUSSION OF RISKS ASSOCIATED WITH AN INVESTMENT IN THE CERTIFICATES, UNDER THE HEADING “RISK FACTORS” IN THE PROSPECTUS).
Neither this document nor anything contained in this document shall form the basis for any contract or commitment whatsoever. The information contained in this document is preliminary as of the date of this document, supersedes any previous such information delivered to you and will be superseded by any such information subsequently delivered prior to the time of sale. These materials are subject to change, completion or amendment from time to time.
This document has been prepared by the Underwriters for information purposes only and does not constitute, in whole or in part, a prospectus for the purposes of Regulation (EU) 2017/1129 (as amended), such Regulation as it forms part of the domestic law of the United Kingdom and/or Part VI of the Financial Services and Markets Act 2000 (as amended); and does not constitute an offering document for any other purpose.
The attached information contains certain tables and other statistical analyses (the “Computational Materials”) that have been prepared in reliance upon information furnished by the Mortgage Loan Sellers. Numerous assumptions were used in preparing the Computational Materials, which may or may not be reflected in this document. The Computational Materials should not be construed as either projections or predictions or as legal, tax, financial or accounting advice. You should consult your own counsel, accountant and other advisors as to the legal, tax, business, financial and related aspects of a purchase of these certificates. Any weighted average lives, yields and principal payment periods shown in the Computational Materials are based on prepayment and/or loss assumptions, and changes in such prepayment and/or loss assumptions may dramatically affect such weighted average lives, yields and principal payment periods. In addition, it is possible that prepayments or losses on the underlying assets will occur at rates higher or lower than the rates shown in the Computational Materials. The specific characteristics of the certificates may differ from those shown in the Computational Materials due to differences between the final underlying assets and the preliminary underlying assets used in preparing the Computational Materials. The principal amount and designation of any certificate described in the Computational Materials are subject to change prior to issuance. None of the Underwriters nor any of their respective affiliates make any representation or warranty as to the actual rate or timing of payments or losses on any of the underlying assets or the payments or yield on the certificates.
This information is based upon management forecasts and reflects prevailing conditions and management’s views as of this date, all of which are subject to change.
This document contains forward-looking statements. Those statements are subject to certain risks and uncertainties that could cause the success of collections and the actual cash flow generated to differ materially from the information set forth in this document. While such information reflects projections prepared in good faith based upon methods and data that are believed to be reasonable and accurate as of their dates, the Depositor undertakes no obligation to revise these forward-looking statements to reflect subsequent events or circumstances. Investors should not place undue reliance on forward-looking statements and are advised to make their own independent analysis and determination with respect to the forecasted periods, which reflect the Depositor’s view only as of the date of this document.
J.P. Morgan is the marketing name for the investment banking businesses of JPMorgan Chase & Co. and its subsidiaries worldwide. Securities, syndicated loan arranging, financial advisory and other investment banking activities are performed by JPMS and its securities affiliates, and lending, derivatives and other commercial banking activities are performed by JPMorgan Chase Bank, National Association and its banking affiliates. JPMS is a member of SIPC and the NYSE.
Wells Fargo Securities is the trade name for the capital markets and investment banking services of Wells Fargo & Company and its subsidiaries, including but not limited to Wells Fargo Securities, LLC, a member of the New York Stock Exchange, Financial Industry Regulatory Authority (“FINRA”), the National Futures Association (“NFA”) and the Securities Investor Protection Corporation (“SIPC”), Wells Fargo Prime Services, LLC, a member of FINRA, NFA and SIPC, and Wells Fargo Bank, National Association. Wells Fargo Securities, LLC and Wells Fargo Prime Services, LLC are distinct entities from affiliated banks and thrifts.
Capitalized terms used in this material but not defined herein shall have the meanings ascribed to them in the Prospectus.
THE UNDERWRITERS MAY FROM TIME TO TIME PERFORM INVESTMENT BANKING SERVICES FOR, OR SOLICIT INVESTMENT BANKING BUSINESS FROM, ANY COMPANY NAMED IN THESE MATERIALS. THE UNDERWRITERS AND/OR THEIR AFFILIATES OR RESPECTIVE EMPLOYEES MAY FROM TIME TO TIME HAVE A LONG OR SHORT POSITION IN ANY CERTIFICATE OR CONTRACT DISCUSSED IN THESE MATERIALS.
| THE INFORMATION IN THIS COLLATERAL TERM SHEET IS NOT COMPLETE AND MAY BE AMENDED PRIOR TO THE TIME OF SALE. THIS TERM SHEET IS NOT AN OFFER TO SELL THESE SECURITIES AND IT IS NOT A SOLICITATION OF AN OFFER TO BUY THESE SECURITIES IN ANY JURISDICTION WHERE THE OFFER OR SALE IS NOT PERMITTED. |
| | T-2 | |
| BANK5 2024-5YR9 | Collateral Statistics |
| Mortgage Loan Sellers | No. of
Mortgage
Loans | No. of
Mortgaged
Properties | Aggregate
Cut-off Date
Balance | % of
Pool |
| Morgan Stanley Mortgage Capital Holdings LLC | 16 | 16 | $356,309,688 | 39.1% |
| Wells Fargo Bank, National Association | 10 | 14 | $243,515,526 | 26.8% |
| JPMorgan Chase Bank, National Association | 6 | 6 | $230,390,000 | 25.3% |
| JPMorgan Chase Bank, National Association / Wells Fargo Bank, National Association | 1 | 8 | $80,000,000 | 8.8% |
| Total: | 33 | 44 | $910,215,214 | 100.0% |
| Pool Statistics | |
| Aggregate Cut-off Date Balance: | $910,215,214 |
| Number of Mortgage Loans: | 33 |
| Average Cut-off Date Balance per Mortgage Loan: | $27,582,279 |
| Number of Mortgaged Properties: | 44 |
| Average Cut-off Date Balance per Mortgaged Property: | $20,686,709 |
| Weighted Average Mortgage Rate: | 6.5867% |
| % of Pool Secured by 5 Largest Mortgage Loans: | 44.0% |
| % of Pool Secured by 10 Largest Mortgage Loans: | 65.9% |
| % of Pool Secured by ARD Loans: | 0.0% |
| Weighted Average Original Term to Maturity (months): | 60 |
| Weighted Average Remaining Term to Maturity (months): | 60 |
| Weighted Average Seasoning (months): | 0 |
| % of Pool Secured by Single Tenant Mortgaged Properties: | 4.0% |
| % of Pool Secured by Refinance Loans: | 78.5% |
| % of Pool Secured by Acquisition Loans: | 20.4% |
| % of Pool Secured by Recapitalization Loans: | 1.1% |
| Additional Debt | |
| % of Pool with Pari Passu Mortgage Debt: | 50.1% |
| % of Pool with Mezzanine Mortgage Debt: | 16.3% |
| % of Pool with Subordinate Debt: | 14.3% |
| Credit Statistics | |
| Weighted Average UW NOI DSCR: | 1.73x |
| Weighted Average UW NOI Debt Yield: | 11.8% |
| Weighted Average UW NCF DSCR: | 1.65x |
| Weighted Average UW NCF Debt Yield: | 11.3% |
| Weighted Average Cut-off Date LTV Ratio: | 57.2% |
| Weighted Average Maturity Date LTV Ratio: | 56.7% |
| THE INFORMATION IN THIS COLLATERAL TERM SHEET IS NOT COMPLETE AND MAY BE AMENDED PRIOR TO THE TIME OF SALE. THIS TERM SHEET IS NOT AN OFFER TO SELL THESE SECURITIES AND IT IS NOT A SOLICITATION OF AN OFFER TO BUY THESE SECURITIES IN ANY JURISDICTION WHERE THE OFFER OR SALE IS NOT PERMITTED. |
| | T-3 | |
| BANK5 2024-5YR9 | Collateral Statistics |
| Property Type Distribution(1) |
| Property Type | Number of
Mortgaged
Properties | Aggregate
Cut-off Date
Balance | % of
Pool | Wtd. Avg. Mortgage Rate | Wtd. Avg. UW NCF DSCR | Wtd. Avg.
UW NOI
Debt Yield | Wtd. Avg. Cut-off
Date LTV | Wtd. Avg. Maturity
Date LTV |
| Retail | 13 | $323,300,526 | 35.5% | 6.5897% | 1.65x | 11.8% | 58.2% | 57.4% |
| Anchored | 9 | $193,950,526 | 21.3% | 6.3876% | 1.65x | 11.1% | 59.8% | 59.8% |
| Super Regional Mall | 1 | $88,000,000 | 9.7% | 6.8160% | 1.72x | 13.7% | 56.0% | 53.0% |
| Unanchored | 2 | $29,000,000 | 3.2% | 7.1007% | 1.54x | 11.7% | 59.9% | 59.9% |
| Single Tenant | 1 | $12,350,000 | 1.4% | 6.9500% | 1.36x | 10.3% | 44.1% | 44.1% |
| Mixed Use | 13 | $195,134,161 | 21.4% | 6.0379% | 2.01x | 14.1% | 50.1% | 49.1% |
| Lab/Office | 7 | $77,789,474 | 8.5% | 5.4876% | 2.34x | 13.1% | 50.1% | 50.1% |
| Retail/Office | 2 | $61,494,688 | 6.8% | 6.1659% | 2.03x | 18.5% | 42.6% | 39.3% |
| Office/Retail | 1 | $33,750,000 | 3.7% | 6.6340% | 1.67x | 11.4% | 57.7% | 57.7% |
| Multifamily/Retail | 2 | $18,750,000 | 2.1% | 6.7100% | 1.25x | 8.9% | 59.5% | 59.5% |
| Multifamily/Retail/Office | 1 | $3,350,000 | 0.4% | 6.7000% | 1.54x | 10.7% | 60.9% | 60.9% |
| Office | 3 | $160,000,000 | 17.6% | 7.4470% | 1.51x | 11.8% | 60.4% | 60.4% |
| CBD | 2 | $109,000,000 | 12.0% | 7.4979% | 1.46x | 11.5% | 59.7% | 59.7% |
| Suburban | 1 | $51,000,000 | 5.6% | 7.3380% | 1.62x | 12.4% | 61.7% | 61.7% |
| Multifamily | 5 | $139,900,000 | 15.4% | 6.1275% | 1.39x | 8.8% | 65.8% | 65.8% |
| Mid Rise | 1 | $90,000,000 | 9.9% | 5.9100% | 1.35x | 8.2% | 65.0% | 65.0% |
| High Rise | 1 | $31,500,000 | 3.5% | 6.1000% | 1.42x | 8.9% | 67.9% | 67.9% |
| Garden | 2 | $12,900,000 | 1.4% | 7.0840% | 1.51x | 11.2% | 64.7% | 64.7% |
| Student Housing | 1 | $5,500,000 | 0.6% | 7.6000% | 1.65x | 13.3% | 68.6% | 68.6% |
| Self Storage | 5 | $41,255,000 | 4.5% | 6.7617% | 1.66x | 11.6% | 48.2% | 48.2% |
| Self Storage | 5 | $41,255,000 | 4.5% | 6.7617% | 1.66x | 11.6% | 48.2% | 48.2% |
| Hospitality | 1 | $33,400,000 | 3.7% | 7.4700% | 1.46x | 13.1% | 46.1% | 46.1% |
| Full Service | 1 | $33,400,000 | 3.7% | 7.4700% | 1.46x | 13.1% | 46.1% | 46.1% |
| Manufactured Housing | 2 | $7,785,000 | 0.9% | 6.0454% | 1.43x | 8.8% | 65.9% | 65.9% |
| Manufactured Housing | 2 | $7,785,000 | 0.9% | 6.0454% | 1.43x | 8.8% | 65.9% | 65.9% |
| Industrial | 1 | $7,230,000 | 0.8% | 6.9520% | 1.44x | 10.9% | 59.8% | 59.8% |
| Manufacturing | 1 | $7,230,000 | 0.8% | 6.9520% | 1.44x | 10.9% | 59.8% | 59.8% |
| Other | 1 | $2,210,526 | 0.2% | 5.4876% | 2.34x | 13.1% | 50.1% | 50.1% |
| Parking Garage | 1 | $2,210,526 | 0.2% | 5.4876% | 2.34x | 13.1% | 50.1% | 50.1% |
| Total/Wtd. Avg. | 44 | $910,215,214 | 100.0% | 6.5867% | 1.65x | 11.8% | 57.2% | 56.7% |
| (1) | All numerical information concerning the mortgage loans is approximate and, in the case of mortgage loans secured by multiple properties, is based on allocated loan amounts with respect to such properties. All weighted average information regarding the mortgage loans reflects the weighting of the mortgage loans based on their outstanding principal balances as of the Cut-off Date or, in the case of mortgage loans secured by multiple properties, allocated loan amounts. The sum of numbers and percentages in columns may not match the “Total” due to rounding. With respect to any mortgage loan that is part of a whole loan, unless otherwise indicated, all LTV, DSCR and Debt Yield calculations include any related pari passu companion loans and exclude any related subordinate companion loans and/or mezzanine loans, as applicable. For mortgaged properties securing residential cooperative mortgage loans, the UW NCF DSCR and UW NOI Debt Yield for each such mortgaged property is calculated using underwritten net operating income or underwritten net cash flow, as applicable, for the related residential cooperative property which is the projected net operating income or net cash flow, as applicable, reflected in the most recent appraisal obtained by or otherwise in the possession of the related mortgage loan seller as of the Cut-off Date. LTV calculations are based upon the appraised value of the residential cooperative property determined as if such residential cooperative property is operated as a residential cooperative, inclusive of the amount of the underlying debt encumbering such residential cooperative property. The UW NCF DSCR, UW NOI Debt Yield and LTV calculations do not take into account any subordinate debt (whether or not secured by the related mortgaged property), that currently exists or is allowed under the terms of any mortgage |
| THE INFORMATION IN THIS COLLATERAL TERM SHEET IS NOT COMPLETE AND MAY BE AMENDED PRIOR TO THE TIME OF SALE. THIS TERM SHEET IS NOT AN OFFER TO SELL THESE SECURITIES AND IT IS NOT A SOLICITATION OF AN OFFER TO BUY THESE SECURITIES IN ANY JURISDICTION WHERE THE OFFER OR SALE IS NOT PERMITTED. |
| | T-4 | |
| Multifamily – Mid Rise | Loan #1 | Cut-off Date Balance: | | $90,000,000 |
| 1001-13 North 2nd Street, 1015 North | The Piazza | Cut-off Date LTV: | | 65.0% |
| 2nd Street, 1010 North Hancock | | UW NCF DSCR: | | 1.35x |
| Street, 1050 North Hancock Street | | UW NOI Debt Yield: | | 8.2% |
| and 145 West Wildey Street, Unit 1 | | | | |
| Philadelphia, PA 19123 | | | | |
| This is not a research report and was not prepared by any Underwriter’s research department. Please see additional important information and qualifications at the end of this Term Sheet. |
| | T-5 | |
| Multifamily – Mid Rise | Loan #1 | Cut-off Date Balance: | | $90,000,000 |
| 1001-13 North 2nd Street, 1015 North | The Piazza | Cut-off Date LTV: | | 65.0% |
| 2nd Street, 1010 North Hancock | | UW NCF DSCR: | | 1.35x |
| Street, 1050 North Hancock Street | | UW NOI Debt Yield: | | 8.2% |
| and 145 West Wildey Street, Unit 1 | | | | |
| Philadelphia, PA 19123 | | | | |
| This is not a research report and was not prepared by any Underwriter’s research department. Please see additional important information and qualifications at the end of this Term Sheet. |
| | T-6 | |
| Mortgage Loan No. 1 – The Piazza |
| Mortgage Loan Information | | Property Information |
| Mortgage Loan Seller: | JPMCB | | Single Asset/Portfolio: | Single Asset |
| Credit Assessment (Fitch/Moody’s/KBRA): | NR/NR/NR | | Location: | Philadelphia, PA 19123 |
| Original Balance(1): | $90,000,000 | | General Property Type(4): | Multifamily |
| Cut-off Date Balance(1): | $90,000,000 | | Detailed Property Type: | Mid Rise |
| % of Initial Pool Balance: | 9.9% | | Title Vesting: | Fee |
| Loan Purpose: | Refinance | | Year Built/Renovated: | 2006-2007/2019 |
| Borrower Sponsor: | Post Brothers | | Size(3)(4): | 332 Units |
| Guarantors: | Michael A. Pestronk and Matthew | | Cut-off Date Balance per Unit(1): | $326,958 |
| | I. Pestronk | | Maturity Balance per Unit(1): | $326,958 |
| Mortgage Rate: | 5.9100% | | Property Manager: | Post Commercial Real Estate, LLC |
| Note Date: | 8/5/2024 | | | |
| Maturity Date: | 8/5/2029 | | Underwriting and Financial Information |
| Term to Maturity: | 60 months | | UW NOI(5)(6): | $8,887,612 |
| Amortization Term: | 0 months | | UW NCF: | $8,800,305 |
| IO Period: | 60 months | | UW NOI Debt Yield(1): | 8.2% |
| Seasoning: | 0 months | | UW NCF Debt Yield(1): | 8.1% |
| Prepayment Provisions: | L(24),YM1(30),O(6) | | UW NOI Debt Yield at Maturity(1): | 8.2% |
| Lockbox/Cash Mgmt Status: | Soft/In Place | | UW NCF DSCR(1): | 1.35x |
| Additional Debt Type(1): | (Pari Passu/Mezzanine) | | Most Recent NOI(5): | $7,187,606 (4/30/2024 TTM) |
| Additional Debt Balance(1): | $18,550,000/$18,500,000 | | 2nd Most Recent NOI: | $7,112,438 (12/31/2023) |
| Future Debt Permitted (Type): | No (NAP) | | 3rd Most Recent NOI: | $6,157,265 (12/31/2022) |
| Reserves(2) | | Most Recent Occupancy(3)(6): | 97.6% (6/20/2024) |
| Type | Initial | Monthly | Cap | | 2nd Most Recent Occupancy: | 93.0% (4/30/2024 TTM) |
| RE Taxes: | $625,851 | $128,170 | NAP | | 3rd Most Recent Occupancy: | 93.6% (12/31/2023) |
| Insurance: | $0 | Springing | NAP | | Appraised Value (as of)(7): | $167,000,000 (5/22/2024) |
| Replacement Reserve: | $7,276 | $7,276 | NAP | | Appraised Value per Unit: | $503,012 |
| TI/LC Reserve: | $2,393 | $2,393 | $86,145 | | Cut-off Date LTV Ratio(1): | 65.0% |
| Unfunded Obligations Reserve: | $3,330,271 | $0 | NAP | | Maturity Date LTV Ratio(1): | 65.0% |
| Gap Rent Reserve: | $730,806 | $0 | NAP | | | |
| Coworking Space Conversion Reserve(3): | $2,400,000 | $0 | NAP | | | |
| | | | | | | | |
Sources and Uses |
| Sources | Proceeds | % of Total | | Uses | Proceeds | % of Total |
| Whole Loan Amount(1): | $108,550,000 | 72.6% | | Loan Payoff: | $134,615,404 | 90.0% |
| Borrower Equity: | $22,500,468 | 15.0% | | Closing Costs: | $7,838,467 | 5.2% |
| Mezzanine Loan Amount(8): | $18,500,000 | 12.4% | | Upfront Reserves: | $7,096,597 | 4.7% |
| Total Sources: | $149,550,468 | 100.0% | | Total Uses: | $149,550,468 | 100.0% |
| (1) | The Piazza Mortgage Loan (as defined below) is part of The Piazza Whole Loan (as defined below) with an original aggregate principal balance of $108,550,000. The Cut-off Date Balance per Unit, Maturity Balance per Unit, UW NOI Debt Yield, UW NCF Debt Yield, UW NOI Debt Yield at Maturity, UW NCF DSCR, Cut-off Date LTV Ratio and Maturity Date LTV Ratio presented above are based on The Piazza Whole Loan. |
| (2) | See “Escrows and Reserves” section below. |
| (3) | Size and Most Recent Occupancy are inclusive of the 16 residential units required to be delivered on or before March 5, 2025 and upon conversion of the recently vacated WeWork commercial space. In connection with the conversion, the borrower sponsor has received all necessary permits and approvals from the city. Although the units are yet to be completed, funds have been reserved for the related estimated cost of construction and an affiliate of the borrowers has executed a master lease for rents associated with the yet to be constructed units, to remain in place until such time each unit has been completed and leased to a third-party tenant. |
| (4) | The Piazza Property (as defined below) includes 28,715 SF of commercial retail space (exclusive of SF associated with the recently vacated WeWork commercial space), which is 100.0% leased as of the origination date of The Piazza Whole Loan. |
| (5) | The increase from Most Recent NOI to UW NOI is primarily attributable to (i) the construction of the 16 residential units required to be delivered on or before March 5, 2025 and upon conversion of the recently vacated WeWork commercial space and (ii) 100.0% leased commercial space. |
| (6) | UW NOI and Most Recent Occupancy is inclusive of certain executed residential leases commencing in August and September of 2024. |
| (7) | Appraised Value of $167,000,000 represents the “hypothetical as-if-stabilized” appraised value based on the hypothetical assumption that the three retail leases are signed and the conversion of the WeWork space is completed. The borrowers were required at loan origination to deposit (i) $3,330,271 into the Unfunded Obligations Reserve and $730,806 into the Gap Rent Reserve related to the three retail leases, and (ii) $2,400,000 into the Coworking Space Conversion Reserve related to the estimated cost of construction associated with conversion of the WeWork space. The appraisal also provides for an “as is” value of $155,800,000. The “as is” appraised value results in a Cut-off Date LTV Ratio and Maturity Date LTV Ratio of 69.7% for The Piazza Whole Loan. |
| (8) | Concurrently with the funding of The Piazza Whole Loan, RCG LV Debt VII REIT, LLC funded a mezzanine loan in the amount of $18,500,000 (“The Piazza Mezzanine Loan” and, together with The Piazza Whole Loan, “The Piazza Total Debt”). The Piazza Total Debt results in a Cut-off Date LTV Ratio and Maturity Date LTV Ratio of 76.1%, a UW NCF DSR of 1.05x and an UW NOI DY of 7.0%. See “Mezzanine Loan” below. |
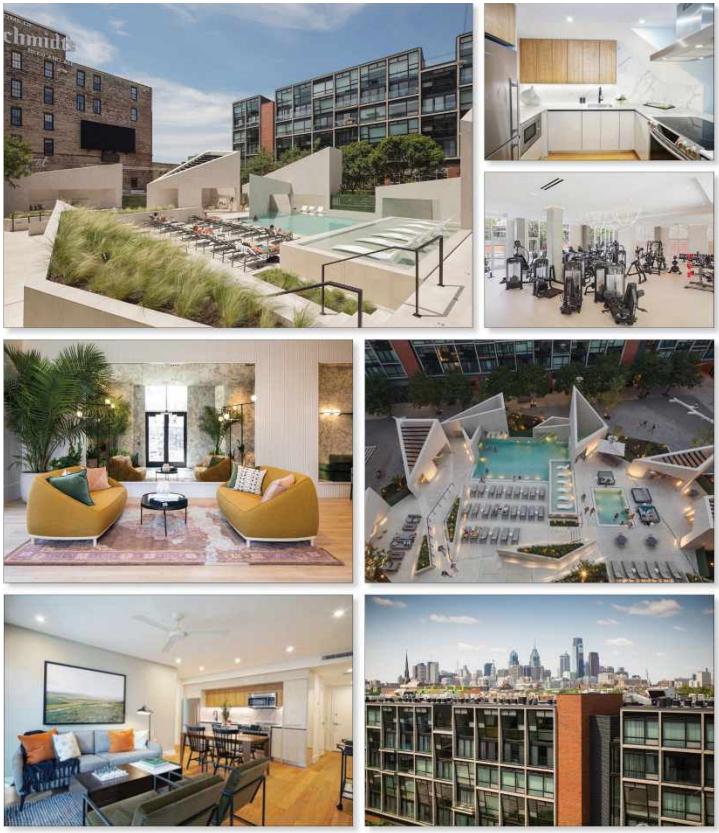
The Mortgage Loan. The largest mortgage loan (“The Piazza Mortgage Loan”) is part of a whole loan (“The Piazza Whole Loan”) evidenced by three pari passu promissory notes in the aggregate original principal amount of $108,550,000. The Piazza Whole Loan is secured by a first priority fee mortgage encumbering a 332-unit luxury multifamily apartment complex, inclusive of 28,715 SF of commercial retail space, located in Philadelphia, PA (“The Piazza Property”).
| This is not a research report and was not prepared by any Underwriter’s research department. Please see additional important information and qualifications at the end of this Term Sheet. |
| | T-7 | |
| Multifamily – Mid Rise | Loan #1 | Cut-off Date Balance: | | $90,000,000 |
| 1001-13 North 2nd Street, 1015 North | The Piazza | Cut-off Date LTV: | | 65.0% |
| 2nd Street, 1010 North Hancock | | UW NCF DSCR: | | 1.35x |
| Street, 1050 North Hancock Street | | UW NOI Debt Yield: | | 8.2% |
| and 145 West Wildey Street, Unit 1 | | | | |
| Philadelphia, PA 19123 | | | | |
The Piazza Mortgage Loan is evidenced by the controlling senior Note A-1 with an original principal amount of $75,000,000 and the non-controlling Note A-2-1 with an original principal amount of $15,000,000. The remaining promissory note comprising The Piazza Whole Loan is summarized in the below table. The Piazza Whole Loan will be serviced pursuant to the pooling and servicing agreement for the BANK5 2024-5YR9 securitization trust. See “Description of the Mortgage Pool—The Whole Loans—The Serviced Pari Passu Whole Loans” and “Pooling and Servicing Agreement” in the prospectus.
| The Piazza Whole Loan Summary |
Note | Original Balance | Cut-off Date Balance | Note Holder | Controlling
Piece |
| A-1 | $75,000,000 | $75,000,000 | BANK5 2024-5YR9 | Yes |
| A-2-1 | $15,000,000 | $15,000,000 | BANK5 2024-5YR9 | No |
| A-2-2(1) | $18,550,000 | $18,550,000 | JPMCB | No |
| Whole Loan | $108,550,000 | $108,550,000 | | |
| (1) | Expected to be contributed to one or more future securitization trusts. |
The Borrowers and the Borrower Sponsor. The borrowers are 1010 North Hancock Partners, LP, Piazza Partners I, LP, 1050 North Hancock Partners, LP and 145 W. Wildey Lot Associates, LP, each a Pennsylvania limited partnership, each structured to be a special purpose entity with two independent directors, and Piazza LLC, a Pennsylvania limited liability company, structured to be a special purpose entity with two independent directors. The borrower sponsor is Post Brothers which is jointly owned by the non-recourse carveout guarantors, Michael A. Pestronk and Matthew I. Pestronk.
Founded in 2006 by brothers Matthew and Michal Pestronk, Post Brothers was formed to exclusively focus on creating and operating infill, class-A, “best-in-class” Philadelphia apartment buildings. Since its founding, Post Brothers has developed more than 30 properties, 8,000 apartments and 700,000 SF of complimentary office and retail space. Consistent with its goals of offering upscale living at an accessible price point, Post Brothers constructed the first LEED-certified residential high-rise in Philadelphia, making Post Brothers the largest private buyer of wind-generated electricity in the Philadelphia region. Post Brothers employs over 200 vertically integrated employees, providing the company deep in-house expertise in design, construction, leasing and property management, allowing for the company to focus on product quality.
The Property. The Piazza Property is a mid-rise, luxury apartment complex comprised of three distinct buildings, as well as 28,715 SF of commercial space. Located in the Northern Liberties neighborhood, the appraisal notes that The Piazza Property was the premier property that began the Northern Liberties renaissance. Each of the three buildings that comprise The Piazza Property (Erbe, Navona and Montesino), features its own unique style and offerings. Full of amenities, The Piazza Property offers residents access to apartment features such as spas, expansive and fully equipped fitness facilities with tanning beds, steam rooms, hydro massage tables and a sauna, as well as two exclusive pool clubs. Other public and private amenities include an on-site dog park, access to a kid’s playground and concierge and valet services. Additionally, residents of The Piazza Property have access to the amenities available at the neighboring sponsor-owned Piazza Alta property, which features a 25,000 SF rooftop pool club with interconnected sets of large pools, a hot tub, splash pad, fire pits, kitchens and lounge space, as well as additional fitness centers and a terrace and sun deck with cabanas, outdoor lounges and a golf simulator. Located on the adjacent block, there is a 302-space parking garage that is part of The Piazza Property. As of June 25, 2024, the parking garage was 98.7% percent leased at an average rental rate of $298, representing an approximately $100 discount per space to the nearby Piazza Alta.
The borrower sponsor acquired The Piazza Property in 2018 for approximately $97.9 million and has since invested approximately $40.0 million in capital expenditures, including a full gut-renovation of 60 of the 316 units currently available, termed “Palazzo” units. Renovated Palazzo units incorporate upgraded Brazilian oak flooring throughout the units, brand new kitchen appliances and finishes as well as updated bathroom features. The remaining 256 units are labeled as “Authentic”. The Piazza Property’s current multifamily unit mix is comprised of 158 one-bed and 158 two-bed units. WeWork previously rented, and recently vacated, approximately 30,000 SF of commercial space at The Piazza Property. The borrower sponsor plans to transform 20,951 SF of the space into 16 new residential multifamily units, consisting of 13 one bedroom and three two-bedroom units. The new units, averaging 1,309 SF, are expected to be larger than the existing Palazzo units, averaging 885 SF, and are expected to command higher rental rates. In connection with the WeWork conversion, for which the borrower sponsor has already obtained all necessary permits and approvals from the City, $2,400,000 was reserved at loan origination for the estimated cost of construction. The 16 new residential units are required to be delivered on or before March 5, 2025 and upon conversion of the recently vacated WeWork commercial space and an affiliate of the borrowers has executed a master lease for the 16 anticipated units. The master lease has a term of 63 months and requires a total rent of $58,220 per month. The master lease will be backstopped by the guarantors and burn off as leases are converted and leased to third-party tenants.
| This is not a research report and was not prepared by any Underwriter’s research department. Please see additional important information and qualifications at the end of this Term Sheet. |
| | T-8 | |
| Multifamily – Mid Rise | Loan #1 | Cut-off Date Balance: | | $90,000,000 |
| 1001-13 North 2nd Street, 1015 North | The Piazza | Cut-off Date LTV: | | 65.0% |
| 2nd Street, 1010 North Hancock | | UW NCF DSCR: | | 1.35x |
| Street, 1050 North Hancock Street | | UW NOI Debt Yield: | | 8.2% |
| and 145 West Wildey Street, Unit 1 | | | | |
| Philadelphia, PA 19123 | | | | |
The following table presents certain information relating to the residential unit mix of The Piazza Property:
| Unit Mix(1) |
| Unit Type | Total No. of Units | Leased Units | % of Total Units | Occupancy | Average Unit Size (SF) | Average Underwritten Monthly Rent per Unit | Average Monthly Rent per Unit(2) |
| 1 Bedroom – Authentic | 129 | | 128 | | 38.9% | | 99.2% | 728 | $2,246 | $2,475 |
| 1 Bedroom – Palazzo | 29 | | 28 | | 8.7% | | 96.6% | 694 | $2,832 | $2,950 |
| 1 Bedroom – New Units(3) | 13 | | 13 | | 3.9% | | 100.0% | 1,068 | $3,310(4) | $3,300 |
| 2 Bedroom – Authentic | 127 | | 124 | | 38.3% | | 97.6% | 1,092 | $2,939 | $3,175 |
| 2 Bedroom – Palazzo | 31 | | 28 | | 9.3% | | 90.3% | 1,064 | $3,992 | $4,000 |
| 2 Bedroom – New Units(3) | 3 | | 3 | | 0.9% | | 100.0% | 2,354 | $5,062(4) | $5,000 |
| Total/Weighted Average | 332 | | 324 | | 100.0% | | 97.6% | 923 | $2,782 | $2,982 |
| (1) | Information based on the underwritten rent roll inclusive of (i) certain executed residential leases commencing in August and September of 2024 and (ii) the yet to be constructed WeWork units for which an affiliate of the borrowers has executed a master lease. |
| (2) | Information obtained from the appraisal. |
| (3) | Represents the 16 residential units required to be delivered on or before March 5, 2025 and upon conversion of the recently vacated WeWork commercial space. In connection with the conversion, the borrower sponsor has received all necessary permits and approvals from the city. Although the units are yet to be completed, funds have been reserved for the related estimated cost of construction and an affiliate of the borrowers has executed a master lease for rents associated with the yet to be constructed units, to remain in place until such time each unit has been completed and leased to a third-party tenant. |
| (4) | Average Underwritten Monthly Rent per Unit reflects rents to be collected per the terms of the master lease agreement. |
The following table presents certain information relating to the rent growth since acquisition of The Piazza Property:
| Rent Growth(1) |
| Date | 1 Bedroom – Authentic | 1 Bedroom - Palazzo | 2 Bedroom – Authentic | 2 Bedroom - Palazzo |
| Jun-2018 | $1,572 | NAP | $1,981 | NAP |
| Jun-2019 | $1,723 | NAP | $2,085 | NAP |
| Jun-2020 | $1,890 | $2,336 | $2,316 | $3,200 |
| Jun-2021 | $1,939 | $2,420 | $2,458 | $3,305 |
| Jun-2022 | $2,091 | $2,587 | $2,657 | $3,642 |
| Jun-2023 | $2,144 | $2,674 | $2,817 | $3,805 |
| Jun-2024 | $2,244 | $2,842 | $2,940 | $4,014 |
| Total / Average Annual Growth | 42.8% / 7.1% | 21.7% / 5.4% | 48.4% / 8.1% | 25.4% / 6.4% |
| (1) | Information obtained from the borrower sponsor. |
The commercial component at The Piazza Property is currently 100.0% leased to nine tenants, three of which were recently executed in July and August 2024. The three largest tenants by underwritten rent are Atrium, which is an affiliate of the borrowers, Dollar General and Urban Village Brewing Co. Atrium is a restaurant and coffee shop, Dollar General is a low-cost grocery store and Urban Village Brewing Co. is a bar serving craft beers and other artisan specialties. For the trailing twelve months as of November 2023, Urban Village Brewing Co. recorded approximately $650 in sales PSF. Other retail tenants include: Orangetheory Fitness, a commercial gym specializing in fitness classes; SweatHouz, an infrared sauna and cold plunge recovery studio; Anejo, an upscale Mexican restaurant and bar; Sugared + Bronzed, a skin care services provider focusing on tanning and hair removal; Hudson Table, a kitchen studio that hosts cooking demonstrations and classes and Bagels & Co, a family owned “roast to order” coffee shop.
On or prior to origination, an affiliate of the borrower, Place Hospitality LLC, entered into two separate leases at The Piazza Property. One of the borrower-affiliated leases is for space that is ultimately intended, but not contractually required, to be assigned to SweatHouz, on the same terms and conditions as the Place Hospitality LLC lease that is currently in-place. The Atrium lease was also executed by Place Hospitality LLC, an affiliate of the borrowers, who intends to operate the space under the name Atrium. The tenants’ obligations under the borrower-affiliated leases are guaranteed by the non-recourse carveout guarantors pursuant to the related guaranty agreement and are personally guaranteed by the borrowers. The guaranteed obligations with respect to the Atrium space will terminate upon the achievement of a debt service coverage ratio (accounting for both The Piazza Whole Loan and The Piazza Mezzanine Loan) of 1.10x or greater for two consecutive calendar quarters, excluding rent associated with the Atrium lease. The guaranteed obligations with respect to the SweatHouz space will terminate upon the earlier to occur of (i) an assignment of Place Hospitality LLC’s interest in its lease to a tenant that is not an affiliate of the borrowers in accordance with The Piazza Whole Loan documents, (ii) the occurrence of each of the following: (A) the commencement of such non-affiliated tenant’s lease term, (B) the tendering of possession of the leased space to the applicable non-affiliated tenant and (C) the commencement of such non-affiliated tenant paying full unabated rent under such lease (except for market-standard rent abatements or free rent periods, in which case, the borrowers will be required to deposit into a free rent reserve an amount equal to such rent abatement or free rent), in each case, in accordance with The Piazza Whole Loan documents and (iii) the date that is 63 months after origination.
| This is not a research report and was not prepared by any Underwriter’s research department. Please see additional important information and qualifications at the end of this Term Sheet. |
| | T-9 | |
| Multifamily – Mid Rise | Loan #1 | Cut-off Date Balance: | | $90,000,000 |
| 1001-13 North 2nd Street, 1015 North | The Piazza | Cut-off Date LTV: | | 65.0% |
| 2nd Street, 1010 North Hancock | | UW NCF DSCR: | | 1.35x |
| Street, 1050 North Hancock Street | | UW NOI Debt Yield: | | 8.2% |
| and 145 West Wildey Street, Unit 1 | | | | |
| Philadelphia, PA 19123 | | | | |
The following table presents certain information relating to the commercial tenancy at The Piazza Property:
| Tenant Summary(1) |
| Tenant Name | Credit Rating (Moody's/Fitch S&P)(2) | Tenant SF | % of Total SF | Annual UW Rent | % of Total Annual UW Rent | Annual UW Rent PSF(2) | Lease Expiration | Renewal Options | Term. Option (Y/N) |
| Atrium(3)(4) | NR/NR/NR | 5,640 | 19.6% | $451,200 | 32.2% | $80.00 | 7/4/2035 | 1 x 5 Yr | N |
| Dollar General | Baa2/NR/BBB | 5,692 | 19.8% | $219,142 | 15.6% | $38.50 | 2/28/2027 | 2 x 5 Yr | N |
| Urban Village Brewing Co. | NR/NR/NR | 4,825 | 16.8% | $197,190 | 14.1% | $40.87 | 11/30/2026 | 2 x 5 Yr | N |
| SweatHouz(3)(4) | NR/NR/NR | 2,395 | 8.3% | $131,725 | 9.4% | $55.00 | 7/4/2035 | 1 x 5 Yr | N |
| Anejo | NR/NR/NR | 2,800 | 9.8% | $112,000 | 8.0% | $40.00 | 12/31/2029 | 2 x 5 Yr | N |
| Subtotal/Wtd. Avg. | | 21,352 | 74.4% | $1,111,257 | 79.2% | $52.04 | | | |
| | | | | | | | | | |
| Other Tenants | | 7,363 | 25.6% | $291,075 | 20.8% | $39.53 | | | |
| Occupied Collateral Total(3) | | 28,715 | 100.0% | $1,402,332 | 100.0% | $48.84 | | | |
| Vacant Space | | 0 | 0.0% | | | | | | |
| Total/Wtd. Avg. | | 28,715 | 100.0% | | | | | | |
| (1) | Information based on the underwritten rent roll as of June 20, 2024. |
| (2) | Certain ratings are those of the parent company whether or not the parent guarantees the lease. |
| (3) | Leases have been executed but the tenant is not yet in occupancy or paying rent. |
| (4) | Prior to origination, an affiliate of the borrower, Place Hospitality LLC, entered into two separate leases at The Piazza Property. One of the borrower-affiliated leases is for space that is ultimately intended to be assigned to SweatHouz, on the same terms and conditions of the Place Hospitality LLC lease that is currently in-place. Atrium is an affiliate of the borrower, which lease was executed by Place Hospitality LLC and is intended to operate the space under the name Atrium. The tenants’ obligations under the borrower-affiliated leases are guaranteed by the non-recourse carveout guarantors pursuant to the related guaranty of recourse obligations and are personally guaranteed by the borrowers. |
The following table presents certain information relating to the commercial lease rollover schedule at The Piazza Property:
| Lease Rollover Schedule(1)(2) |
| Year | # of Leases Rolling | SF Rolling | Approx % of SF Rolling | Approx Cumulative % of SF Rolling | Total UW Rent Rolling | Approx % of Total UW Rent Rolling | Approx Cumulative % of Total UW Rent Rolling | UW Rent PSF Rolling |
| MTM/2024 | 0 | 0 | 0.0% | 0.0% | $0 | 0.0% | 0.0% | $0.00 |
| 2025 | 0 | 0 | 0.0% | 0.0% | $0 | 0.0% | 0.0% | $0.00 |
| 2026 | 1 | 4,825 | 16.8% | 16.8% | $197,190 | 14.1% | 14.1% | $40.87 |
| 2027 | 2 | 8,962 | 31.2% | 48.0% | $328,217 | 23.4% | 37.5% | $36.62 |
| 2028 | 0 | 0 | 0.0% | 48.0% | $0 | 0.0% | 37.5% | $0.00 |
| 2029 | 2 | 4,355 | 15.2% | 63.2% | $175,000 | 12.5% | 49.9% | $40.18 |
| 2030 | 1 | 1,138 | 4.0% | 67.1% | $42,000 | 3.0% | 52.9% | $36.91 |
| 2031 | 0 | 0 | 0.0% | 67.1% | $0 | 0.0% | 52.9% | $0.00 |
| 2032 | 0 | 0 | 0.0% | 67.1% | $0 | 0.0% | 52.9% | $0.00 |
| 2033 | 0 | 0 | 0.0% | 67.1% | $0 | 0.0% | 52.9% | $0.00 |
| 2034 | 0 | 0 | 0.0% | 67.1% | $0 | 0.0% | 52.9% | $0.00 |
| 2035 & Thereafter | 3 | 9,435 | 32.9% | 100.0% | $659,925 | 47.1% | 100.0% | $69.94 |
| Vacant | 0 | 0 | 0.0% | 100.0% | $0 | 0.0% | 100.0% | $0.00 |
| Total/Wtd. Avg. | 9 | 28,715 | 100.0% | | $1,402,332 | 100.0% | | $48.84 |
| (1) | Information is based on the underwritten rent roll as of June 20, 2024. |
| (2) | Certain tenants may have lease termination options that are exercisable prior to the originally stated expiration date of the related lease and are not considered in the rollover schedule. |
| This is not a research report and was not prepared by any Underwriter’s research department. Please see additional important information and qualifications at the end of this Term Sheet. |
| | T-10 | |
| Multifamily – Mid Rise | Loan #1 | Cut-off Date Balance: | | $90,000,000 |
| 1001-13 North 2nd Street, 1015 North | The Piazza | Cut-off Date LTV: | | 65.0% |
| 2nd Street, 1010 North Hancock | | UW NCF DSCR: | | 1.35x |
| Street, 1050 North Hancock Street | | UW NOI Debt Yield: | | 8.2% |
| and 145 West Wildey Street, Unit 1 | | | | |
| Philadelphia, PA 19123 | | | | |
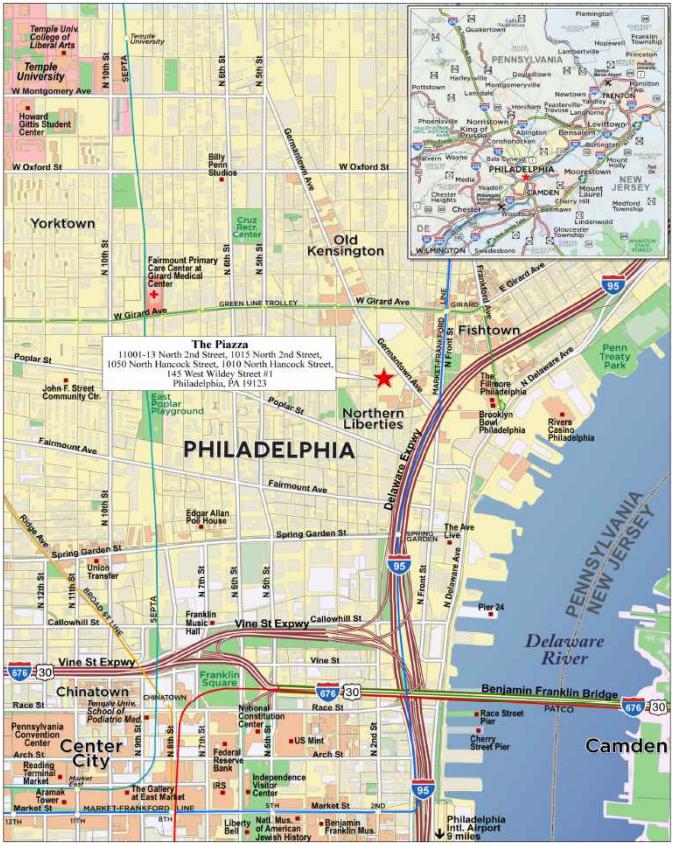
The Market. The Piazza Property is located in the Northern Liberties neighborhood of Philadelphia. Northern Liberties has experienced a significant amount of redevelopment over the past two decades. In recent years, the area has seen a steady influx of residents which helped propel additional demand and additional development of the area. Today, the submarket appeals to households of all types, with many seeking higher quality housing at more affordable prices than at the heart of Center City. Being less densely developed with high rise buildings also helps to provide a more neighborhood like atmosphere. The submarket benefits from accessible public transit as The Piazza Property is located within walking distance of two subway stops providing direct access to core locations within Center City. Moreover, the subway also provides access to the primary regional rail lines serving numerous Pennsylvania suburban communities. Popular demand generators for Northern Liberties include its artistic, culinary and entertainment activity. According to the appraisal, approximately 4.0% of submarket inventory and 4.9% of the market inventory represents newer construction. Furthermore, absorption for the last 12 months was positive for the overall market area and at the submarket level, with a healthy approximate 1:1 ratio.
Northern Liberties is part of the Philadelphia-Camden-Wilmington metropolitan statistical area (“MSA”), the eighth most populated MSA in the United States. The MSA is highlighted by a dynamic mix of key industries, including education and health services, finance, biotechnology, manufacturing and tourism. According to the appraisal, there are 13 Fortune 500 companies located in the MSA; the MSA is one of the top three bioscience regions in the northeast and seventh nationally. Additionally, according to the appraisal, approximately 40% of the United States population can be reached within a day’s drive and approximately 60% of the United States population is situated within a two-hour flight radius. As the seventh largest MSA in employment, the MSA maintains an unemployment rate of 3.3% as of the fourth quarter of 2023. The MSA features an expansive logistics ecosystem, which includes several major highways, railways, international airports and public transit systems. Additionally, local manufacturers have been a recent source of strength, with payrolls climbing in the MSA despite losing momentum nationally. Economic reliance on manufacturing, as well as food and pharmaceuticals has led to the MSA seeing more stable demand.
According to the appraisal, the zip code that The Piazza Property is located in has an average household income of $134,334 as of 2023, with almost 50% of households having income levels supporting the average market rent of The Piazza Property. Additionally, the zip code recorded a 2023 population of 21,206 individuals. The demographic profile of Northern Liberties has increased rapidly since 2010, with the zip code seeing an approximately 54.6% increase to its population between 2010 and 2023. Moreover, according to the appraisal, annual population growth in The Piazza Property’s zip code is projected to be 5.8% in the future.
According to the appraisal, the Northern Liberties submarket is considered a top tier market area, with an average rental rate well above that of the overall metro markets and city of Philadelphia overall. As of the first quarter of 2024, the submarket reported total inventory of 3,729 units with a 15.3% vacancy rate and average asking rents of $2,281 per month. The appraisal identified five directly competitive multifamily properties as detailed in the table below:
| Competitive Set |
| | The Piazza (Subject) | The Poplar | Piazza Alta | The Carson | The Battery | Corner 2nd |
| Year Built/Renovated | 2006-2007/2019 | 1929/2021 | 2022/NAP | 2023/NAP | 1920/2023 | 2023/NAP |
| Number of Units | 332(1)(2) | 285 | 695 | 373 | 235 | 71 |
| Average Monthly Rent (per unit) | | | | | | |
| 1 Bedroom | $2,425(1)(3) | $2,548 | $3,090 | $2,693 | $3,300 | $3,085 |
| 1 Bedroom PSF | $3.24(1)(3) | $2.94 | $4.12 | $3.42 | $4.50 | $3.93 |
| 2 Bedroom | $3,170(1)(3) | $4,565 | $4,695 | $4,060 | $4,367 | $4,395 |
| 2 Bedroom PSF | $2.85(1)(3) | $3.06 | $4.51 | $3.74 | $3.39 | $3.61 |
| Occupancy | 97.6%(1)(2) | 93.0% | 93.0% | 51.0%(4) | 63.0%(4) | 97.0% |
Source: Appraisal, unless otherwise indicated.
| (1) | Information based on the underwritten rent roll inclusive of (i) certain residential leases commencing in August and September of 2024 and (ii) the yet to be constructed WeWork units for which an affiliate of the borrowers has executed a master lease. |
| (2) | Number of Units is inclusive of the 16 residential units required to be delivered on or before March 5, 2025 and upon conversion of the recently vacated WeWork commercial space. In connection with the conversion, the borrower sponsor has received all necessary permits and approvals from the city. Although the units are yet to be completed, funds have been reserved for the related estimated cost of construction and an affiliate of the borrowers has executed a master lease for rents associated with the yet to be constructed units, to remain in place until such time each unit has been completed and leased to a third-party tenant. |
| (3) | Calculated as a weighted average between Authentic, Palazzo and new units. |
| (4) | The Carson and The Battery were recently delivered and are still in an initial lease-up period. |
Appraisal. The appraiser concluded to a “hypothetical as-if-stabilized” value for The Piazza Property of $167,000,000 as of May 22, 2024, based on the hypothetical assumption that the three retail leases are executed and the conversion of the WeWork space is completed. Prior to the origination date, three retail leases were executed resulting in 100.0% commercial occupancy. The borrowers were required at loan origination to deposit (i) $3,330,271 into the Unfunded Obligations Reserve and $730,806 into the Gap Rent Reserve, in order to fully capitalize outstanding obligations associated with the three retail leases, and (ii) $2,400,000 into the Coworking Space Conversion Reserve for estimated cost of construction associated with conversion of the WeWork units. Further, an affiliate of the borrowers executed a master lease for the 16 new anticipated units. The appraisal also provides for an “as is” appraised value of $155,800,000. The “as is” appraised value results in a Cut-off Date LTV Ratio and Maturity Date LTV Ratio of 69.7% for The Piazza Whole Loan.
Environmental Matters. According to the Phase I environmental site assessment dated June 6, 2024, there was no evidence of any recognized environmental l conditions at The Piazza Property.
| This is not a research report and was not prepared by any Underwriter’s research department. Please see additional important information and qualifications at the end of this Term Sheet. |
| | T-11 | |
| Multifamily – Mid Rise | Loan #1 | Cut-off Date Balance: | | $90,000,000 |
| 1001-13 North 2nd Street, 1015 North | The Piazza | Cut-off Date LTV: | | 65.0% |
| 2nd Street, 1010 North Hancock | | UW NCF DSCR: | | 1.35x |
| Street, 1050 North Hancock Street | | UW NOI Debt Yield: | | 8.2% |
| and 145 West Wildey Street, Unit 1 | | | | |
| Philadelphia, PA 19123 | | | | |
Operating History and Underwritten Net Cash Flow. The following table presents certain information relating to the historical operating performance and Underwritten Net Cash Flow at The Piazza Property:
| Cash Flow Analysis |
| | 2021 | 2022 | 2023 | TTM April 2024 | UW(1) | UW per Unit(1) |
| Base Rent | $8,838,021 | $9,495,375 | $9,919,605 | $10,050,456 | $10,116,694 | $30,472 |
| Vacant Income (New Units) | $0 | $0 | $0 | $0 | $698,640(2) | $2,104 |
| Vacant Income (Existing) | $0 | $0 | $0 | $0 | $339,060 | $1,021 |
| Commercial Rental Income | $1,177,984 | $1,197,815 | $1,065,414 | $924,142 | $1,402,332 | $4,224 |
| Commercial Other Income | $71,777 | $72,787 | $86,181 | $86,405 | $124,355 | $375 |
| Gross Potential Rent | $10,087,782 | $10,765,977 | $11,071,200 | $11,061,003 | $12,681,080 | $38,196 |
| (Vacancy / Concessions) | ($1,601,099) | ($1,514,318) | ($1,193,819) | ($1,182,922) | ($1,114,034)(3) | ($3,356) |
| Net Rentable Income | $8,486,683 | $9,251,659 | $9,877,381 | $9,878,081 | $11,567,046 | $34,840 |
| Other Income | $646,694 | $835,776 | $1,065,399 | $1,134,081 | $1,246,049 | $3,753 |
| Effective Gross Income | $9,133,377 | $10,087,435 | $10,942,780 | $11,012,162 | $12,813,095 | $38,594 |
| | | | | | | |
| Real Estate Taxes | $1,405,957 | $1,473,207 | $1,437,773 | $1,429,394 | $1,460,511 | $4,399 |
| Insurance | $218,280 | $254,640 | $252,855 | $256,539 | $275,665 | $830 |
| Other Operating Expenses | $2,032,283 | $2,202,324 | $2,139,713 | $2,138,623 | $2,189,307 | $6,594 |
| Total Operating Expenses | $3,656,520 | $3,930,171 | $3,830,341 | $3,824,557 | $3,925,483 | $11,824 |
| | | | | | | |
| Net Operating Income | $5,476,857 | $6,157,265 | $7,112,438 | $7,187,606 | $8,887,612 | $26,770 |
| Replacement Reserves | $0 | $0 | $0 | $0 | $87,307 | $263 |
| Net Cash Flow | $5,476,857 | $6,157,265 | $7,112,438 | $7,187,606 | $8,800,305 | $26,507 |
| | | | | | | |
| Occupancy (%) | 88.1% | 90.0% | 93.6% | 93.0% | 97.6%(4) | |
| NOI DSCR(5) | 0.84x | 0.95x | 1.09x | 1.11x | 1.37x | |
| NCF DSCR(5) | 0.84x | 0.95x | 1.09x | 1.11x | 1.35x | |
| NOI Debt Yield(5) | 5.0% | 5.7% | 6.6% | 6.6% | 8.2% | |
| NCF Debt Yield(5) | 5.0% | 5.7% | 6.6% | 6.6% | 8.1% | |
|
| (1) | Information based on the underwritten rent roll inclusive of (i) certain residential leases commencing in August and September of 2024 and (ii) the yet to be constructed WeWork units for which an affiliate of the borrowers has executed a master lease. |
| (2) | Inclusive of rent attributable to the 16 additional units required to be delivered on or before Mach 5, 2025 and upon conversion of the recently vacated WeWork commercial space. In connection with the conversion, the borrower sponsor has received all necessary permits and approvals from the city. Although the units are yet to be completed, funds have been reserved for the related estimated cost of construction and an affiliate of the borrowers has executed a master lease for rents associated with the yet to be constructed units, to remain in place until such time each unit has been completed and leased to a third-party tenant. |
| (3) | UW (Vacancy/Concessions) is inclusive of (i) in-place vacancy (as of June 20, 2024 including certain executed residential leases commencing in August and September of 2024) for the current residential unit inventory, (ii) all rents associated with the yet to be constructed WeWork units and (iii) 5.0% economic vacancy for the commercial rental space. |
| (4) | Represents residential occupancy inclusive of (i) 16 yet to be constructed residential units required to be delivered on or before March 5, 2025 and upon conversion of the WeWork space, for which an affiliate of the borrowers has executed a master lease and (ii) certain residential leases commencing in August and September of 2024. |
| (5) | Debt service coverage ratios and debt yields are based on The Piazza Whole Loan. |
Escrows and Reserves.
Real Estate Taxes – On the loan origination date, the borrowers were required to make an upfront deposit of $625,851 into a reserve for real estate taxes. In addition, the borrowers are required to deposit into a real estate tax reserve, on a monthly basis, an amount equal to 1/12 of the real estate taxes that the mortgage lender estimates will be payable during the next ensuing twelve months (initially estimated to be $128,170).
Insurance – The borrowers are required to deposit into an insurance reserve, on a monthly basis, an amount equal to 1/12 of the insurance premiums that the mortgage lender estimates will be payable for the renewal of the insurance coverage; provided, however, that such monthly reserves for insurance premiums have been conditionally suspended so long as (i) no event of default has occurred and is continuing and (ii) the insurance coverage for The Piazza Property is included in a blanket policy approved by the lender in its reasonable discretion.
Replacement Reserve – On the loan origination date, the borrowers were required to make an upfront deposit of $7,276 into a reserve for replacement reserves. In addition, the borrowers are required to deposit into a replacement reserve, on a monthly basis, $7,276.
TI/LC Reserve – On the loan origination date, the borrowers were required to make an upfront deposit of $2,393 into a reserve for TI/LC reserves. In addition, the borrowers are required to deposit into a TI/LC reserve, on a monthly basis, $2,393, along with any lease termination fees or other payments received by the borrowers in connection with the termination or modification of any non-residential lease at The Piazza Property. The TI/LC reserve is subject to a cap of $86,145.
Unfunded Obligations Reserve – On the loan origination date, the borrowers were required to make an upfront deposit of $3,330,271 into a reserve for unfunded obligations reserves associated with the TI/LC costs of three recently executed retail leases.
| This is not a research report and was not prepared by any Underwriter’s research department. Please see additional important information and qualifications at the end of this Term Sheet. |
| | T-12 | |
| Multifamily – Mid Rise | Loan #1 | Cut-off Date Balance: | | $90,000,000 |
| 1001-13 North 2nd Street, 1015 North | The Piazza | Cut-off Date LTV: | | 65.0% |
| 2nd Street, 1010 North Hancock | | UW NCF DSCR: | | 1.35x |
| Street, 1050 North Hancock Street | | UW NOI Debt Yield: | | 8.2% |
| and 145 West Wildey Street, Unit 1 | | | | |
| Philadelphia, PA 19123 | | | | |
Gap Rent Reserve – On the loan origination date, the borrowers were required to make an upfront deposit of $730,806 into a gap rent reserve associated with three recently executed retail leases.
Coworking Space Conversion Reserve – On the loan origination date, the borrowers were required to make an upfront deposit of $2,400,000 into a reserve for the estimated costs of construction associated with the conversion of the WeWork space to 16 new residential units.
Lockbox and Cash Management. The Piazza Whole Loan is structured with a soft lockbox and in place cash management. The borrowers and the property manager are required to direct the non-residential tenants to pay rent directly into the lockbox account, and to deposit any rents otherwise received into such account within two business days after receipt. All funds in the lockbox account are required to be swept once every business day to a lender-controlled cash management account. Funds in the cash management account are required to be applied to debt service and the reserves and escrows described above and applied to debt service under The Piazza Mezzanine Loan in accordance with The Piazza Whole Loan documents, with any excess funds (i) during the continuance of a Cash Sweep Event (as defined below)(other than a Cash Sweep Event that occurs solely as a result of a mezzanine event of default), to be deposited into an excess cash flow reserve account held by the lender as cash collateral for The Piazza Whole Loan, or (ii) if a Cash Sweep Event is in effect solely as a result of a mezzanine event of default, (x) first, to the mezzanine lender in an amount equal to any deferred interest that was not paid during such Cash Sweep Period and (y) second, into an excess cash flow reserve account held by the lender as cash collateral for The Piazza Whole Loan, or (iii) to the extent no Cash Sweep Event is in effect, disbursed to the borrower.
A “Cash Sweep Event” means the occurrence of (i) an event of default, (ii) any bankruptcy action of a borrower or the property manager, (iii) the debt service coverage ratio (x) with respect to The Piazza Whole Loan and The Piazza Mezzanine Loan, falling below 1.05x based on the trailing three-month period preceding the date of such determination, or (y) solely with respect to The Piazza Whole Loan, falling below 1.34x based on the trailing three-month period preceding the date of such determination (collectively, a “DSCR Trigger Event”) or (iv) any mezzanine event of default. As of the origination date, a Cash Sweep Event is in effect due to the occurrence of a DSCR Trigger Event.
A Cash Sweep Event will no longer be continuing (a) with respect to clause (iii) above, upon (1) the achievement of a debt service coverage ratio (accounting for both The Piazza Whole Loan and The Piazza Mezzanine Loan) of 1.10x or greater for two consecutive calendar quarters based upon the trailing three-month period immediately preceding the date of determination, and (2) the achievement of a debt service coverage ratio (accounting for The Piazza Whole Loan only) of 1.40x or greater for two consecutive calendar quarters based upon the trailing three-month period immediately preceding the date of determination, (b) with respect to clause (i) above, upon the acceptance by the lender of a cure of such event of default or an express waiver of such event of default in writing by the lender in its sole and absolute discretion, (c) with respect to clause (ii) above, solely with respect to the property manager, if, within 60 days of the occurrence thereof, the borrowers replace the applicable property manager with a qualified property manager under a replacement management agreement, or (d) with respect to clause (iv) above, such mezzanine event of default has been cured in accordance with the terms of the related The Piazza Mezzanine Loan documents; provided, however, (i) no event of default under The Piazza Whole Loan documents has occurred and be continuing, and (ii) the borrowers have paid all of the lender’s reasonable, out-of-pocket expenses incurred in connection with such cure including reasonable, out-of-pocket attorney’s fees and expenses. In no event may the borrowers be entitled to cure a Cash Sweep Event caused by a bankruptcy action of any of the borrowers.
Mezzanine Loan. Concurrently with the funding of The Piazza Whole Loan, RCG LV Debt VII REIT, LLC funded a mezzanine loan in the amount of $18,500,000 to be secured by the mezzanine borrowers’ interests in the borrowers as collateral for The Piazza Mezzanine Loan. The Piazza Mezzanine Loan is coterminous with The Piazza Whole Loan. The Piazza Mezzanine Loan accrues interest at an all-in rate of 12.5000% per annum, of which 10.000% is to be paid as part of each monthly debt service payment amount, and of which 2.5000% per annum is added to the debt to the extent not paid on each monthly payment date. The Piazza Mezzanine Loan is interest-only through the loan term. A mezzanine intercreditor agreement was executed at loan origination.
| | Mezzanine
Original Principal
Balance | Mezzanine Interest Rate | Loan Term
(Original) | Amortization
Term
(Original) | IO Period | Total Debt U/W
DSCR based on NOI/NCF(1) | Total Debt U/W
Debt Yield
based
on NOI/NCF | Total Debt
Cut-off Date
LTV Ratio | Total Debt LTV
Ratio at
Maturity |
Piazza Mezzanine
Loan | $18,500,000 | 12.50% | 60 | 0 | 60 | 1.06x / 1.05x | 7.0% / 6.9% | 76.1% | 76.1% |
| (1) | Total Debt U/W DSCR based on NOI/NCF is calculated exclusive of the 2.5000% per annum added to the debt to the extent not paid on each monthly payment date. |
Condominium: One parcel of The Piazza Property (the 145 W. Wildey Street parcel) is subject to a condominium structure comprised of (i) a garage unit (80% ownership of the condominium), and (ii) a roof unit (20% ownership of the condominium). The 145 W. Wildey Lot Associates, LP borrower owns the garage unit, which controls the condominium.
Terrorism Insurance. The borrowers are required to obtain and maintain property insurance for 100% of full replacement cost and business interruption insurance for 18 months plus a 12-month extended period of indemnity. Such insurance is required to cover perils of terrorism and acts of terrorism. See “Risk Factors—Risks Relating to the Mortgage Loans—Terrorism Insurance May Not Be Available for All Mortgaged Properties” in the prospectus.
| This is not a research report and was not prepared by any Underwriter’s research department. Please see additional important information and qualifications at the end of this Term Sheet. |
| | T-13 | |
| Retail – Super Regional Mall | Loan #2 | Cut-off Date Balance: | | $88,000,000 |
| 500 Baybrook Mall | Baybrook Mall | Cut-off Date LTV: | | 56.0% |
| Friendswood, TX 77546 | | UW NCF DSCR: | | 1.72x |
| | | UW NOI Debt Yield: | | 13.7% |
| This is not a research report and was not prepared by any Underwriter’s research department. Please see additional important information and qualifications at the end of this Term Sheet. |
| | T-14 | |
| Retail – Super Regional Mall | Loan #2 | Cut-off Date Balance: | | $88,000,000 |
| 500 Baybrook Mall | Baybrook Mall | Cut-off Date LTV: | | 56.0% |
| Friendswood, TX 77546 | | UW NCF DSCR: | | 1.72x |
| | | UW NOI Debt Yield: | | 13.7% |
| This is not a research report and was not prepared by any Underwriter’s research department. Please see additional important information and qualifications at the end of this Term Sheet. |
| | T-15 | |
| Retail – Super Regional Mall | Loan #2 | Cut-off Date Balance: | | $88,000,000 |
| 500 Baybrook Mall | Baybrook Mall | Cut-off Date LTV: | | 56.0% |
| Friendswood, TX 77546 | | UW NCF DSCR: | | 1.72x |
| | | UW NOI Debt Yield: | | 13.7% |
| This is not a research report and was not prepared by any Underwriter’s research department. Please see additional important information and qualifications at the end of this Term Sheet. |
| | T-16 | |
| Retail – Super Regional Mall | Loan #2 | Cut-off Date Balance: | | $88,000,000 |
| 500 Baybrook Mall | Baybrook Mall | Cut-off Date LTV: | | 56.0% |
| Friendswood, TX 77546 | | UW NCF DSCR: | | 1.72x |
| | | UW NOI Debt Yield: | | 13.7% |
| This is not a research report and was not prepared by any Underwriter’s research department. Please see additional important information and qualifications at the end of this Term Sheet. |
| | T-17 | |
| Mortgage Loan No. 2 – Baybrook Mall |
| Mortgage Loan Information | | Property Information |
| Mortgage Loan Seller: | MSMCH | | Single Asset/Portfolio: | Single Asset |
| Credit Assessment (Fitch/Moody’s/KBRA): | NR/NR/NR | | Location: | Friendswood, TX 77546 |
| Original Balance(1): | $88,000,000 | | General Property Type: | Retail |
| Cut-off Date Balance(1): | $88,000,000 | | Detailed Property Type: | Super Regional Mall |
| % of Initial Pool Balance: | 9.7% | | Title Vesting: | Fee |
| Loan Purpose: | Refinance | | Year Built/Renovated: | 1978/2016 |
| Borrower Sponsors: | Brookfield Properties Retail Holding LLC | | Size(4): | 540,986 SF |
| | and SMRF Baybrook Investor Member | | Cut-off Date Balance Per SF(1): | $407 |
| | LLC | | Maturity Date Balance Per SF(1): | $385 |
| Guarantor: | BPR Nimbus LLC | | Property Manager: | Brookfield Properties Retail Inc. |
| Mortgage Rate: | 6.8160% | | | (borrower-related) |
| Note Date: | 7/19/2024 | | | |
| Maturity Date: | 8/1/2029 | | | |
| Term to Maturity: | 60 months | | Underwriting and Financial Information |
| Amortization Term: | 360 months | | UW NOI: | $30,209,945 |
| IO Period: | 0 months | | UW NCF: | $29,652,729 |
| Seasoning: | 0 months | | UW NOI Debt Yield(1): | 13.7% |
| Prepayment Provisions: | L(24),D(32),O(4) | | UW NCF Debt Yield(1): | 13.5% |
| Lockbox/Cash Mgmt Status: | Hard/Springing | | UW NOI Debt Yield at Maturity(1): | 14.5% |
| Additional Debt Type(1): | Pari Passu | | UW NCF DSCR(1): | 1.72x |
| Additional Debt Balance(1): | $132,000,000 | | Most Recent NOI: | $29,848,392 (5/31/2024 TTM) |
| Future Debt Permitted (Type): | No (NAP) | | 2nd Most Recent NOI: | $29,919,970 (12/31/2023) |
| Reserves(2) | | 3rd Most Recent NOI: | $28,591,885 (12/31/2022) |
| Type | Initial | Monthly | Cap | | Most Recent Occupancy: | 95.4% (6/30/2024) |
| RE Taxes: | $0 | Springing | NAP | | 2nd Most Recent Occupancy: | 99.3% (12/31/2023) |
| Insurance: | $0 | Springing | NAP | | 3rd Most Recent Occupancy: | 97.5% (12/31/2022) |
| Replacement Reserve: | $0 | Springing | $270,493 | | Appraised Value (as of)(5): | $392,659,260 (6/4/2024) |
| TI/LC Reserve: | (3) | Springing | $1,081,972 | | Appraised Value Per SF(5): | $726 |
| Anchor Tenant Reserve: | $0 | Springing | NAP | | Cut-off Date LTV Ratio(1)(5): | 56.0% |
| | | | | | Maturity Date LTV Ratio(1)(5): | 53.0% |
| | | | | | | | |
| Sources and Uses |
| Sources | Proceeds | % of Total | | Uses | Proceeds | % of Total |
| Whole Loan Amount(1): | $220,000,000 | 100.0% | | Loan Payoff: | $213,488,234 | 97.0% |
| | | | | Return of Equity: | $5,037,736 | 2.3% |
| | | | | Closing Costs: | $1,474,030 | 0.7% |
| Total Sources: | $220,000,000 | 100.0% | | Total Uses: | $220,000,000 | 100.0% |
| (1) | The Baybrook Mall Mortgage Loan (as defined below) is part of the Baybrook Mall Whole Loan (as defined below), with an aggregate original principal amount of $220,000,000. The Cut-off Date Balance Per SF, Maturity Date Balance Per SF, UW NOI Debt Yield, UW NCF Debt Yield, UW NOI Debt Yield at Maturity, UW NCF DSCR, Cut-off Date LTV Ratio and Maturity Date LTV Ratio numbers presented above are based on the Baybrook Mall Whole Loan. |
| (2) | See “Escrows and Reserves” below for further discussion of reserve requirements. |
| (3) | On the origination date, the borrower provided a Guaranty of Limited Payment (as described below) from the non-recourse carveout guarantor in lieu of depositing approximately $1,984,194 into a TI/LC reserve. See “Escrows and Reserves” below for further discussion of the Guaranty of Limited Payment. |
| (4) | Size does not include 720,931 SF of space associated with Dillard’s, Macy’s and Living Space, all non-collateral anchor tenants. |
| (5) | The Appraised Value is the Market Value “As Is” with Escrow Reserve, which assumes that $2,659,260.33 will be reserved for tenant improvements. The Market Value “As Is” Appraised Value without the reserve is $390,000,000, which results in a Cut-off Date LTV Ratio and Maturity Date LTV Ratio of 56.4% and 53.3% respectively, and an Appraised Value Per SF of $720.91. Since the date of the appraisal, some of the outstanding tenant improvements have been paid. At origination, the outstanding tenant improvements of approximately $1,984,194 were guaranteed by the guarantor under the Guaranty of Limited Payment in lieu of a reserve. |
The Mortgage Loan. The second largest mortgage loan (the “Baybrook Mall Mortgage Loan”) is part of a whole loan (the “Baybrook Mall Whole Loan”) evidenced by eleven pari passu promissory notes with an aggregate original principal amount of $220,000,000. The Baybrook Mall Whole Loan is secured by a first priority fee mortgage encumbering a 540,986 SF retail property located in Friendswood, Texas (the “Baybrook Mall Property”). The Baybrook Mall Whole Loan was co-originated by Morgan Stanley Bank, N.A. (“MSBNA”), Societe Generale Financial Corporation (“SGFC”) and Barclays Capital Real Estate Inc. (“BCREI”) on July 19, 2024. The Baybrook Mall Mortgage Loan is evidenced by the controlling Note A-1 and the non-controlling Note A-2 with an aggregate original principal amount of $88,000,000. The Baybrook Mall Whole Loan will be serviced pursuant to the pooling and servicing agreement for the BANK5 2024-5YR9 securitization trust. See “Description of the Mortgage Pool-The Whole Loans-The Serviced Pari Passu Whole Loans”, and “Pooling and Servicing Agreement” in the prospectus.
| This is not a research report and was not prepared by any Underwriter’s research department. Please see additional important information and qualifications at the end of this Term Sheet. |
| | T-18 | |
| Retail – Super Regional Mall | Loan #2 | Cut-off Date Balance: | | $88,000,000 |
| 500 Baybrook Mall | Baybrook Mall | Cut-off Date LTV: | | 56.0% |
| Friendswood, TX 77546 | | UW NCF DSCR: | | 1.72x |
| | | UW NOI Debt Yield: | | 13.7% |
The table below summarizes the promissory notes that comprise the Baybrook Mall Whole Loan.
| Baybrook Mall Whole Loan Summary |
| Note | Original Balance | Cut-off Date Balance | Note Holder | Controlling Note |
| A-1 | $60,000,000 | $60,000,000 | BANK5 2024-5YR9 | Yes |
| A-2 | $28,000,000 | $28,000,000 | BANK5 2024-5YR9 | No |
| A-3(1) | $10,000,000 | $10,000,000 | MSMCH | No |
| A-4(1) | $10,000,000 | $10,000,000 | MSMCH | No |
| A-5(1) | $25,000,000 | $25,000,000 | BCREI | No |
| A-6(1) | $18,000,000 | $18,000,000 | BCREI | No |
| A-7(1) | $8,000,000 | $8,000,000 | BCREI | No |
| A-8(1) | $5,000,000 | $5,000,000 | BCREI | No |
| A-9(1) | $30,000,000 | $30,000,000 | SGFC | No |
| A-10(1) | $16,000,000 | $16,000,000 | SGFC | No |
| A-11(1) | $10,000,000 | $10,000,000 | SGFC | No |
| Total | $220,000,000 | $220,000,000 | | |
| (1) | Expected to be contributed to one or more future securitization transactions or may otherwise be transferred at any time. |
The Borrower and the Borrower Sponsors. The borrower is Baybrook Mall, LLC, a single-purpose, Delaware limited liability company with two independent directors in its organizational structure. Legal counsel to the borrower delivered a non-consolidation opinion in connection with the origination of the Baybrook Mall Whole Loan. The non-recourse carveout guarantor is BPR Nimbus LLC. The borrower sponsors are Brookfield Properties Retail Holding LLC and SMRF Baybrook Investor Member LLC, which is owned by Nuveen Asset Management, LLC (“Nuveen”). Brookfield Properties Retail Holding LLC is an affiliate of Brookfield Property Partners L.P., the public real estate vehicle for Brookfield Asset Management Inc. Brookfield Property Partners, L.P. is a large global real estate company, with more than 1,000 managed properties and 380 million SF of managed space worldwide. Brookfield Property Partners, L.P. owns and operates properties in the world’s major markets, with a global portfolio that includes office, retail, multifamily, logistics, hospitality, and development opportunities. The borrower is owned by a joint venture between Brookfield Properties Retail Holdings LLC (51%) and Nuveen (49%). Nuveen is an asset manager and wholly owned subsidiary of Teachers Insurance and Annuity Association.
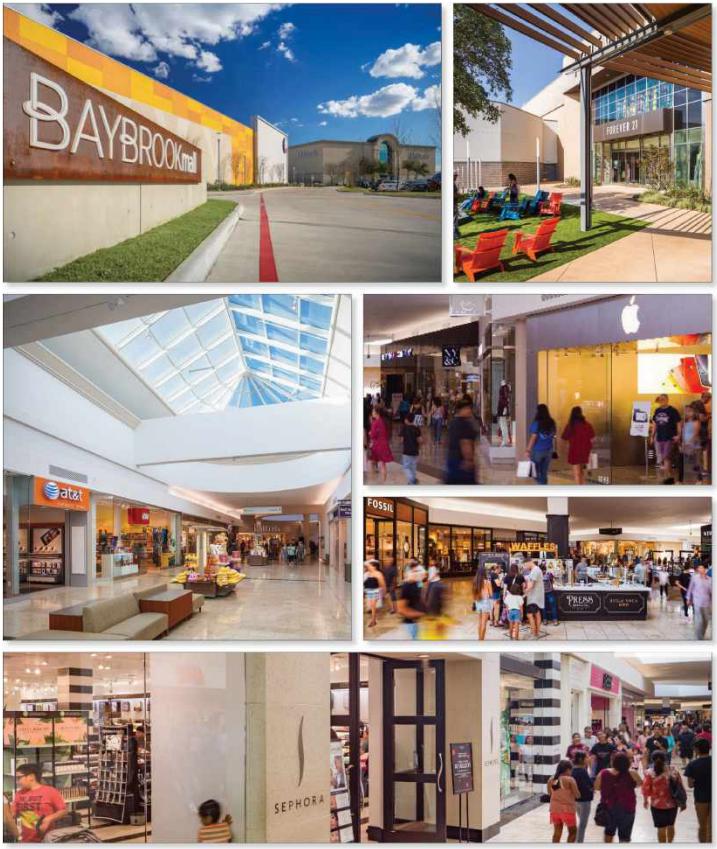
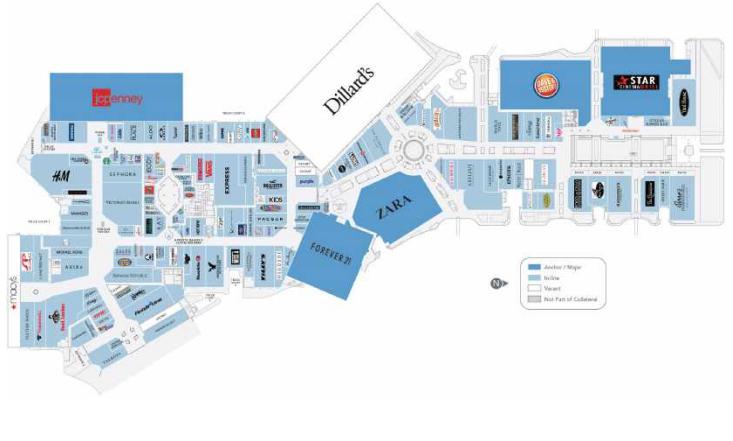
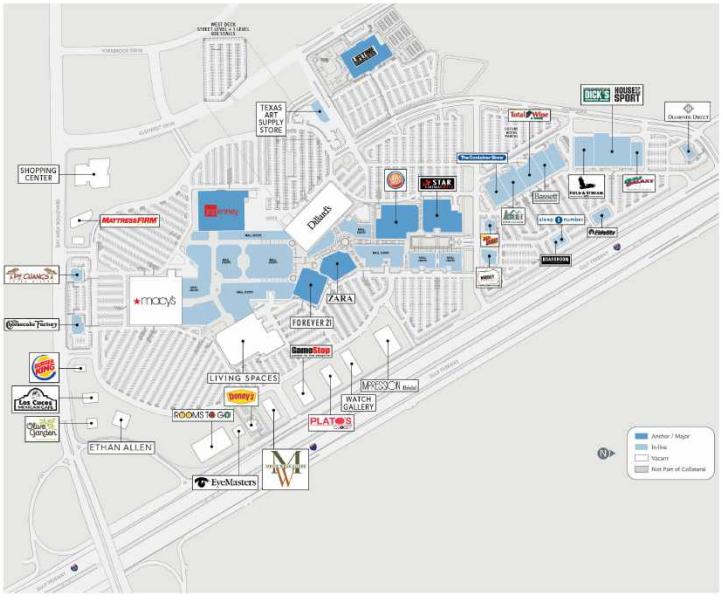
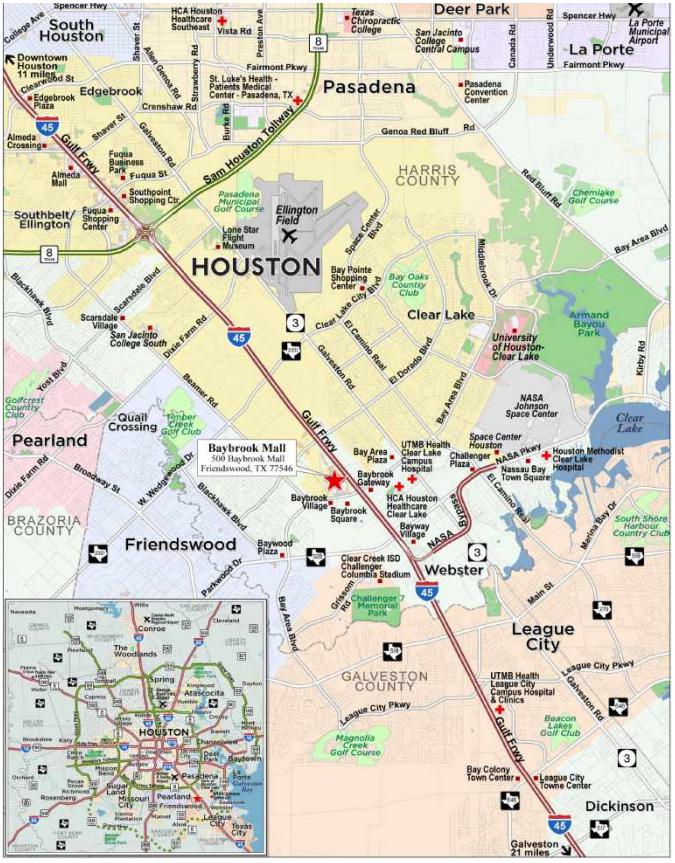
The Property. The Baybrook Mall Property is a 540,986 SF super regional shopping center, which is part of a larger 1,261,917 SF super regional shopping center (the “Baybrook Mall Regional Shopping Center”) located in Friendswood, Texas. As of June 30, 2024, the Baybrook Mall Property was 95.4% leased to a granular rent roll comprised of approximately 140 tenants. The five largest tenants by SF at the Baybrook Mall Property comprise approximately 13.8% of underwritten rent, and no single tenant makes up more than 5.7% of the underwritten rent. Additionally, the ten largest tenants by SF account for 23.7% of the aggregate underwritten rent. Notable national tenants at the Baybrook Mall Property include Apple, Sephora, Foot Locker, Buckle, Lego, Shoe Palace, Victoria’s Secret, and Finish Line. The Baybrook Mall Property is anchored by Dillard’s, Macy’s, Living Spaces and JCPenney. The Dillard’s, Macy’s and Living Spaces tenants are separately owned and are not part of the collateral. Additionally, the borrower sponsor owns the remainder of the Baybrook Mall Regional Shopping Center, which includes an adjacent outdoor lifestyle center as well as a power center anchored by Dick’s Sporting Goods, neither of which are part of the collateral. The Baybrook Mall Property includes three restaurant outparcels: Denny’s, The Cheesecake Factory and P.F. Changs. The Baybrook Mall Regional Shopping Center has seen completed expansion projects including an additional lifestyle expansion and power center, adding more than 30 retailers, 10 restaurants, and entertainment venues including The Lawn, a spacious grassy area providing a gathering spot for the community. Since 2019, the borrower sponsor invested approximately $16.8 million in capital expenditures at the Baybrook Mall Property, including property development and tenant improvements.
The following table presents inline sales history at the Baybrook Mall Property:
| Tenant Sales PSF(1) | |
| Tenant Type | 2021 Sales | 2021 Sales PSF | 2022 Sales | 2022 Sales PSF | 2023 Sales | 2023 Sales PSF | TTM 5/31/2024 Sales | TTM 5/31/2024 Sales PSF | TTM 5/31/2024 Occupancy Cost(2) |
| Inline (<10,000 SF) | $189,773,031 | $976 | $203,360,206 | $881 | $203,295,153 | $855 | $206,637,422 | $863 | 14.2% |
| Inline (<10,000 SF excl. Apple) | $148,088,487 | $782 | $156,222,056 | $692 | $164,350,170 | $706 | $168,012,667 | $717 | 17.2% |
| (1) | Information is based on sales information provided by the borrower sponsor. |
| (2) | Occupancy Cost is based on current underwritten total rent (the sum of underwritten base rent, percentage rent, overage rent and underwritten reimbursements). |
Major Tenants.
JCPenney (96,605 SF, 17.9% of NRA, 1.3% of underwritten base rent) Founded in 1902 and headquartered in Plano, Texas, JC Penney is a department store chain with approximately 50,000 employees. JC Penney serves customers at more than 650 stores across the United States and Puerto Rico. JC Penney is one of the nation’s largest retailers of apparel, home, jewelry, and beauty merchandise with a growing portfolio of private and national brands. JC Penney has anchored the Baybrook Mall Property since 2005, has a lease expiration date of January 31, 2026, and has six, five-year extension options remaining. JC Penney filed for bankruptcy in 2020 during the beginning of the COVID -19 pandemic and emerged from bankruptcy in December 2020.
| This is not a research report and was not prepared by any Underwriter’s research department. Please see additional important information and qualifications at the end of this Term Sheet. |
| | T-19 | |
| Retail – Super Regional Mall | Loan #2 | Cut-off Date Balance: | | $88,000,000 |
| 500 Baybrook Mall | Baybrook Mall | Cut-off Date LTV: | | 56.0% |
| Friendswood, TX 77546 | | UW NCF DSCR: | | 1.72x |
| | | UW NOI Debt Yield: | | 13.7% |
Forever 21 (81,772 SF, 15.1% of NRA, 0.0% of underwritten base rent) Founded in 1984 and headquartered in Los Angeles, California, Forever 21 sells men's and women's clothing and accessories. Forever 21 is located in more than 540 locations globally and online throughout the United States and in Canada, Europe, Japan, Korea, and the Philippines. Forever 21 has been a tenant at the Baybrook Mall Property since 2009, has a lease expiration date of December 31, 2026, and has no extension options remaining. Forever 21 pays percentage rent instead of base rent. Based on the May 2024 TTM period, Forever 21 percentage in lieu rent was $519,744. $519,744 of percentage rent was underwritten for Forever 21. Forever 21 filed for bankruptcy in 2019 and emerged from bankruptcy in 2020.
H&M (17,510 SF, 3.2% of NRA, 3.0% of underwritten base rent) H&M is a global retailer offering affordable apparel for men, women and children. H&M was incorporated in 1947 and remains under the control of the family of founder Erling Persson. H&M group’s brands are H&M, H&M Home, COS, Weekday, Monki, & Other Stories, ARKET, Afound and Singular Society. H&M operates approximately 4,338 stores across 77 markets with approximately 143,000 employees. H&M has been a tenant at the Baybrook Mall Property since 2022, has a lease expiration date of January 31, 2032, and has two, three-year extension options remaining. H&M has the right to terminate its lease upon 365 days‘ notice if the tenant’s net sales fail to exceed $5,440,386 between January 1, 2026 through December 31, 2026, or $5,984,425 between January 1, 2028 through December 31, 2028. H&M is required to pay a termination fee equal to 50% of the then unamortized portion of the construction allowance. H&M’s sales for the TTM May 2024 period were $4,596,073.
Victoria’s Secret (14,115 SF, 2.6% of NRA, 3.7% of underwritten base rent) Victoria’s Secret is a Fortune 500 specialty retailer of modern, fashion-inspired collections including signature bras, panties, lingerie, casual sleepwear, athleisure and swimwear, as well as fragrances and body care. Victoria’s Secret/Pink comprises two brands, Victoria’s Secret and PINK. Victoria’s Secret employs over 30,000 associates across approximately 1,350 retail stores in approximately 70 countries. Victoria’s Secret has been a tenant at the Baybrook Mall Property since 2022, has a lease expiration date of January 31, 2032, and has no extension options remaining. Victoria’s Secret’s parent company filed for bankruptcy in 2020, and Victoria’s Secret was spun off as an independent business in 2021.
| This is not a research report and was not prepared by any Underwriter’s research department. Please see additional important information and qualifications at the end of this Term Sheet. |
| | T-20 | |
| Retail – Super Regional Mall | Loan #2 | Cut-off Date Balance: | | $88,000,000 |
| 500 Baybrook Mall | Baybrook Mall | Cut-off Date LTV: | | 56.0% |
| Friendswood, TX 77546 | | UW NCF DSCR: | | 1.72x |
| | | UW NOI Debt Yield: | | 13.7% |
The following table presents a summary regarding the major stores at the Baybrook Mall Property:
| Tenant Summary(1) |
| Tenant Name | Credit Rating (Fitch/Moody’s/ S&P)(2) | Tenant SF | Approx.% of SF | Annual UW Rent | % of Total Annual UW Rent | Annual UW Rent PSF | | | |
| Lease Expiration | Renewal Options | Term. Option (Y/N) |
| Anchor Stores | | | | | | | | | |
| JC Penney | NR / NR / NR | 96,605 | 17.9% | $325,000 | 1.3% | $3.36 | 1/31/2026 | 6, 5-year | N |
| Macy’s (non-collateral)(3) | BBB / Ba3 / BBB- | 0 | 0.0% | $0 | NAP | NAP | NAP | NAP | NAP |
| Dillard’s (non-collateral) (3) | BBB- / Baa3 / BB+ | 0 | 0.0% | $0 | NAP | NAP | NAP | NAP | NAP |
| Living Spaces (non-collateral)(3) | NR / NR / NR | 0 | 0.0% | $0 | NAP | NAP | NAP | NAP | NAP |
| Subtotal/Wtd. Avg. | | 96,605 | 17.9% | $325,000 | 1.3% | $3.36 | | | |
| | | | | | | | | | |
| Major Tenants | | | | | | | | | |
| Forever 21(4) | NR / NR / NR | 81,772 | 15.1% | $0 | 0.0% | $0.00 | 12/31/2026 | None | N |
| Foot Locker(5) | NR / Ba2 / BB+ | 18,376 | 3.4% | $1,383,569 | 5.7% | $75.29 | Various | None | N |
| H&M(6) | NR / NR / BBB | 17,510 | 3.2% | $728,241 | 3.0% | $41.59 | 1/31/2032 | 2, 3-year | Y |
| Victoria’s Secret | NR / B1 / BB- | 14,115 | 2.6% | $904,630 | 3.7% | $64.09 | 1/31/2032 | None | N |
| The Cheesecake Factory | NR / NR /NR | 11,393 | 2.1% | $517,698 | 2.1% | $45.44 | 1/31/2033 | 2, 5-year | N |
| Finish Line | NR / NR /NR | 9,000 | 1.7% | $479,970 | 2.0% | $53.33 | 1/31/2028 | None | N |
| Akira | NR / NR /NR | 7,845 | 1.5% | $404,018 | 1.7% | $51.50 | 8/31/2029 | None | N |
| Tilly’s(7) | NR / NR /NR | 7,530 | 1.4% | $246,231 | 1.0% | $32.70 | 2/28/2033 | None | Y |
| American Eagle Outfitters(8) | NR / NR /NR | 6,723 | 1.2% | $721,311 | 3.0% | $107.29 | 3/31/2032 | None | Y |
| Buckle | NR / NR /NR | 6,502 | 1.2% | $310,275 | 1.3% | $47.72 | 7/31/2028 | None | N |
| Subtotal/Wtd. Avg. | | 180,766 | 33.4% | $5,695,943 | 23.6% | $31.51 | | | |
| | | | | | | | | | |
| Other Tenants(9) | 238,914 | 44.2% | $18,124,370 | 75.1% | $75.86 | | | |
| Occupied Subtotal/Wtd. Avg. | 516,285 | 95.4% | $24,145,313 | 100.0% | $46.77(10) | | | |
| | | | | | | | | | |
| Vacant Space | | 24,701 | 4.6% | | | | | | |
| Total/Wtd. Avg. | | 540,986 | 100.0% | | | | | | |
| (1) | Information is based on the underwritten rent roll as of June 30, 2024 and includes (i) rent increases totaling $463,228 through June 1, 2025 and (ii) signed not occupied rent totaling $946,662. |
| (2) | Certain ratings are those of the parent company whether or not the parent company guarantees the lease. |
| (3) | Macy’s, Dillard’s and Living Spaces occupy 720,931 SF and anchor the Baybrook Mall Regional Shopping Center. They are not part of the Baybrook Mall Property collateral. |
| (4) | Forever 21 pays percentage rent instead of base rent. Based on the May 2024 TTM period, Forever 21 percentage in lieu rent was $519,744. $519,744 of percentage rent was underwritten for Forever 21. |
| (5) | Includes 13,936 SF of Foot Locker space that expires on April 30, 2032 and 4,440 SF of Kids Foot Locker space that expires on May 31, 2027. |
| (6) | H&M has the right to terminate its lease upon 365 days‘ notice if the tenant’s net sales fail to exceed approximately $5,440,386 between January 1, 2026 through December 31, 2026, or approximately $5,984,425 between January 1, 2028 through December 31, 2028. H&M is required to pay a termination fee equal to 50% of the then unamortized portion of its construction allowance. H&M’s sales for the TTM May 2024 period were $4,596,073. |
| (7) | Tilly’s has the right to terminate its lease upon 365 days‘ notice if the tenant’s net sales fail to exceed $2,000,000 between November 1, 2027 through December 31, 2027. Tilly’s is required to pay a termination fee equal to 100% of the then unamortized portion of its construction allowance. Tilly’s sales for the TTM May 2024 period were $2,380,972. |
| (8) | American Eagle Outfitters has the right to terminate its lease upon 180 days‘ notice if the tenant’s net sales fail to exceed $4,349,071 between April 1, 2027 through March 31, 2028. American Eagle Outfitters is required to pay a termination fee equal to $117,652.50. American Eagle Outfitters sales for the TTM May 2024 period were $4,647,955. |
| (9) | Includes 5,151 SF of inline tenant space as to which only percentage rent is due, 302 SF of tenant space as to which only overage rent is due and 3,411 SF of other space as to which there is no underwritten rent. |
| (10) | Includes the following SF as to which no base rent was underwritten: 81,772 SF occupied by Forever 21, as to which only percentage rent is due, 5,151 SF of inline tenant space as to which only percentage rent is due, 302 SF of tenant space as to which only overage rent is due and 3,411 SF of other space as to which there is no underwritten rent. Total/Wtd. Avg. UW Base Rent PSF Rolling excluding these tenants is $56.73. |
| This is not a research report and was not prepared by any Underwriter’s research department. Please see additional important information and qualifications at the end of this Term Sheet. |
| | T-21 | |
| Retail – Super Regional Mall | Loan #2 | Cut-off Date Balance: | | $88,000,000 |
| 500 Baybrook Mall | Baybrook Mall | Cut-off Date LTV: | | 56.0% |
| Friendswood, TX 77546 | | UW NCF DSCR: | | 1.72x |
| | | UW NOI Debt Yield: | | 13.7% |
The following table presents certain information relating to stores with the highest overall sales in order of their May 31, 2024 TTM Sales:
| Top Tenants by Total Sales(1) |
| Tenant Name | Tenant SF | 2022 Sales | 2021 Sales PSF | 2023 Sales | 2023 Sales PSF | TTM 5/31/2024 Sales | TTM 5/31/2024 Sales PSF | TTM 5/31/2024 Occupancy Cost(2) |
| Macy’s(3) | 254,000 | $57,100,000 | $225 | $48,500,000 | $191 | $48,500,000 | $191 | 0.2% |
| Dillard’s(3) | 299,681 | $51,500,000 | $172 | $51,200,000 | $171 | $51,200,000 | $171 | 0.2% |
| Apple | 5,176 | $47,138,150 | $9,107 | $38,944,983 | $7,524 | $38,624,755 | $7,462 | 1.1% |
| Sephora | 5,876 | $9,194,514 | $1,565 | $12,049,893 | $2,051 | $12,789,992 | $2,177 | 8.3% |
| Foot Locker | 18,376(4) | $11,908,582 | $648 | $12,329,184 | $671 | $12,452,889 | $678 | 14.3% |
| JC Penney | 96,605 | $11,700,000 | $121 | $11,300,000 | $117 | $11,300,000 | $117 | 2.9% |
| Victoria’s Secret | 14,115 | $9,186,162 | $651 | $10,320,677 | $731 | $10,210,080 | $723 | 15.7% |
| The Cheescake Factory | 11,393 | $9,806,788 | $861 | $9,899,056 | $869 | $9,845,401 | $864 | 5.8% |
| Forever 21 | 81,772 | $7,596,815 | $93 | $6,230,995 | $76 | $6,496,805 | $79 | 8.0% |
| H&M | 17,510 | $6,099,815 | $348 | $5,413,053 | $309 | $4,596,073 | $262 | 17.0% |
| (1) | Information obtained from the borrower. |
| (2) | Occupancy Cost is based on current underwritten total rent (the sum of underwritten base rent, percentage rent, overage rent and underwritten reimbursements). |
| (3) | Not part of the Baybrook Mall Property collateral. |
| (4) | Includes 13,936 SF of Foot Locker space and 4,400 SF of Kids Foot Locker Space. |
The following table presents certain information relating to the lease rollover at the Baybrook Mall Property:
| Lease Rollover Schedule(1)(2) |
| Year | # of Leases Rolling | SF Rolling | Approx. % of SF Rolling | Approx. Cumulative % of SF Rolling | Total UW Rent Rolling | Approx. % of Total UW Rent Rolling | Approx. Cumulative % of Total UW Rent Rolling | UW Rent PSF Rolling(3) |
| MTM | 4 | 5,896 | 1.1% | 1.1% | $308,043 | 1.3% | 1.3% | $52.25 |
| 2024 | 8 | 8,611 | 1.6% | 2.7% | $1,005,321 | 4.2% | 5.4% | $116.75 |
| 2025 | 18 | 21,559 | 4.0% | 6.7% | $1,816,951 | 7.5% | 13.0% | $84.28 |
| 2026 | 24 | 240,690 | 44.5% | 51.2% | $4,458,740 | 18.5% | 31.4% | $18.52 |
| 2027 | 22 | 43,312 | 8.0% | 59.2% | $4,177,820 | 17.3% | 48.7% | $96.46 |
| 2028 | 21 | 54,663 | 10.1% | 69.3% | $3,321,909 | 13.8% | 62.5% | $60.77 |
| 2029 | 15 | 42,280 | 7.8% | 77.1% | $2,640,420 | 10.9% | 73.4% | $62.45 |
| 2030 | 7 | 11,461 | 2.1% | 79.2% | $833,557 | 3.5% | 76.9% | $72.73 |
| 2031 | 2 | 1,208 | 0.2% | 79.4% | $214,791 | 0.9% | 77.8% | $177.81 |
| 2032 | 6 | 54,798 | 10.1% | 89.6% | $3,511,886 | 14.5% | 92.3% | $64.09 |
| 2033 | 7 | 28,476 | 5.3% | 94.8% | $1,645,052 | 6.8% | 99.1% | $57.77 |
| 2034 | 3 | 3,331 | 0.6% | 95.4% | $210,822 | 0.9% | 100.0% | $63.29 |
| 2035 & Thereafter | 4 | 0 | 0.0% | 95.4% | $0 | 0.0% | 100.0% | $0.00 |
| Vacant | 0 | 24,701 | 4.6% | 100.0% | $0 | 0.0% | 100.0% | $0.00 |
| Total/Wtd. Avg.(4) | 141 | 540,986 | 100.0% | | $24,145,313 | 100.0% | | $46.77 |
| (1) | Information is based on the underwritten rent roll as of June 30, 2024 and includes (i) rent increases totaling $463,228 through June 1, 2025 and (ii) signed not occupied rent totaling $946,662. |
| (2) | Certain tenants may have lease termination options that are exercisable prior to the stated expiration date of the subject lease or leases which are not considered in the Lease Rollover Schedule. |
| (3) | Includes the following SF as to which no base rent was underwritten: 81,772 SF occupied by Forever 21, as to which only percentage rent is due, 5,151 SF of inline tenant space as to which only percentage rent is due, 302 SF of tenant space as to which only overage rent is due and 3,411 SF of other space as to which there is no underwritten rent. Total/Wtd. Avg. UW Base Rent PSF Rolling excluding these tenants is $56.73. |
| (4) | Total/Wtd. Avg. UW Base Rent PSF Rolling excludes vacant space. |
The Market. The Baybrook Mall Property is located in Friendswood, Texas, west of the central business district of Houston and northwest of the George Bush Intercontinental Airport. Major industries include energy, aerospace, specialty chemical, healthcare, and maritime. The city is also home to the Texas Medical Center, the largest medical center in the world, and the world’s largest concentration of health care and research institutions. Primary access to the local area is provided by Interstate 45, a major north-south arterial highway in the immediate area. State Route 35 and Gulf Freeway are the major north-south highways in the immediate area. Bay Area Boulevard and Long Prairie Road are the primary east-west roadways in the area. The subject property is not accessible via public transportation. The primary mode of transportation in the immediate area is through automobile. Neighboring areas and the larger Houston metropolitan region are served by the Metropolitan Transit Authority of Harris County (METRO), which includes bus routes and park-and-ride services that Friendswood residents can access for commutes to Houston. According to the appraisal, as of the first quarter of 2024, the vacancy rate in the Southeast Outlier retail submarket was approximately 3.6% with average asking rents of $28.82 PSF and inventory of approximately 16.6 million SF. According to the appraisal, as of the first quarter of 2024, the vacancy rate in the Houston market was approximately 5.0%, with average asking rents of $21.08 PSF and inventory of approximately 440.3 million SF. According to the appraisal, the 2023 population within a one-mile-, three-mile and five- mile radius of the Baybrook Mall Property was 6,603, 76,142 and 211,728, respectively. The 2023 average household income within the same one-mile-, three-mile and five- mile radius was $93,263, $102,629 and $122,801, respectively.
| This is not a research report and was not prepared by any Underwriter’s research department. Please see additional important information and qualifications at the end of this Term Sheet. |
| | T-22 | |
| Retail – Super Regional Mall | Loan #2 | Cut-off Date Balance: | | $88,000,000 |
| 500 Baybrook Mall | Baybrook Mall | Cut-off Date LTV: | | 56.0% |
| Friendswood, TX 77546 | | UW NCF DSCR: | | 1.72x |
| | | UW NOI Debt Yield: | | 13.7% |
The appraisal identified three shopping centers in the Baybrook Mall Property’s primary competitive set as outlined below:
| Competitive Set Summary |
| Name | Baybrook Mall (subject) | Houston Galleria | Memorial City | Pearland Town Center |
| Address | 500 Baybrook Mall | 5075 Westheimer Road | 303 Memorial City | 11200 Broadway |
| City, State | Friendswood, TX | Houston, TX | Houston, TX | Pearland, TX |
| Rentable Area (SF) | 1,261,917(1) | 2,011,293 | 1,700,000 | N/A |
| Year Built | 1978 | 1970 | 1966 | N/A |
| Anchor Tenants | Dillard's, Macy's, JCPenney | Macy's, Neiman Marcus, Nordstrom, Saks Fifth Avenue | Dillard's JCPenney, Macy's | Dillard's, Macy's, Dick's Sporting Goods |
| Sales PSF | $863(2) | $980 | $700 | $406 |
| Occupancy | 95.4%(3) | 95.0% | 89.0% | 94.0% |
Source: Appraisal.
| (1) | Information is based on the underwritten rent roll dated June 30, 2024. |
| (2) | Based on TTM 5/31/2024 sales period. |
| (3) | Occupancy is not inclusive of non-collateral tenants. The Baybrook Mall Property is comprised of 540,986 SF. Dillard’s, Macy’s and Living Spaces (720,931 SF) are not part of the collateral. |
The following table presents information relating to the appraisal’s market rent conclusion for the Baybrook Mall Property:
| Market Rent Summary |
| | Market Rent | Escalations | Term (Months) | Reimbursements | Tenant Allowances (New/Renewal) | Leasing Commissions (New/Renewal) |
| 0 to 1,500 SF Space: | $80.00 | 3.00%/year | 60 | Triple Net | $40.00 / $10.00 | 6.0% / 3.0% |
| 1,501 to 2,500 SF Space: | $70.00 | 3.00%/year | 60 | Triple Net | $40.00 / $10.00 | 6.0% / 3.0% |
| 2,501 to 4,000 SF Space: | $55.00 | 3.00%/year | 60 | Triple Net | $40.00 / $10.00 | 6.0% / 3.0% |
| 4,001 to 6,500 SF Space: | $80.00 | 3.00%/year | 60 | Triple Net | $40.00 / $10.00 | 6.0% / 3.0% |
| 6,501 to 10,000 SF Space: | $55.00 | 3.00%/year | 60 | Triple Net | $40.00 / $10.00 | 6.0% / 3.0% |
| Snack Bars Space: | $135.00 | 3.00%/year | 60 | Triple Net | $60.00 / $15.00 | 6.0% / 3.0% |
| Food Court Space: | $145.00 | 3.00%/year | 60 | Triple Net | $60.00 / $15.00 | 6.0% / 3.0% |
| Restaurant Space: | $55.00 | 3.00%/year | 60 | Triple Net | $30.00 / $10.00 | 6.0% / 3.0% |
| Kiosk Space: | $360.00 | 3.00%/year | 60 | Gross | $10.00 / $2.00 | 6.0% / 3.0% |
| Large Tenants Over 10,000 SF Space: | $55.00 | 10% Midterm | 120 | Triple Net | $20.00 / $5.00 | 6.0% / 3.0% |
| Anchor Space: | $9.50 | 10% Midterm | 120 | Gross | $5.00 / $1.00 | 4.0% / 2.0% |
| Restaurant Outparcel Space: | $35.00 | 10% Midterm | 120 | Triple Net | $20.00 / $5.00 | 6.0% / 3.0% |
| Jewelry Space: | $150.00 | 3.00%/year | 60 | Triple Net | $40.00 / $10.00 | 6.0% / 3.0% |
Appraisal. The appraisal concluded to a Market Value “As-is” With Escrow Reserve for the Baybrook Mall Property of $392,659,260 as of June 4, 2024. Such Appraised Value assumes that $2,659,260.33 will be reserved for tenant improvements. Since the date of the appraisal, some of the outstanding tenant improvements have been paid. At origination, the outstanding tenant improvements of approximately $1,984,194 were guaranteed by the guarantor under the Guaranty of Limited Payment in lieu of a reserve.
Environmental Matters. According to the Phase I environmental site assessment dated May 20, 2024, there was no evidence of any recognized environmental conditions at the Baybrook Mall Property.
| This is not a research report and was not prepared by any Underwriter’s research department. Please see additional important information and qualifications at the end of this Term Sheet. |
| | T-23 | |
| Retail – Super Regional Mall | Loan #2 | Cut-off Date Balance: | | $88,000,000 |
| 500 Baybrook Mall | Baybrook Mall | Cut-off Date LTV: | | 56.0% |
| Friendswood, TX 77546 | | UW NCF DSCR: | | 1.72x |
| | | UW NOI Debt Yield: | | 13.7% |
Operating History and Underwritten Net Cash Flow. The following table presents certain information relating to the historical operating performance and the Underwritten Net Cash Flow at the Baybrook Mall Property:
| Cash Flow Analysis |
| | 2020 | 2021 | 2022 | 2023 | 5/31/2024 TTM | UW | UW PSF |
| Gross Potential Rent(1) | $24,446,369 | $25,720,119 | $27,524,849 | $28,432,717 | $28,194,698 | $28,171,016 | $52.07 |
| Reimbursements | $12,235,727 | $10,638,392 | $10,895,133 | $11,417,589 | $11,172,921 | $11,141,965 | $20.60 |
| Other Income | $1,516,160 | $1,860,280 | $2,119,328 | $2,297,302 | $2,301,138 | $2,168,140 | $4.01 |
| Effective Gross Income | $38,198,255 | $38,218,791 | $40,539,309 | $42,147,608 | $41,668,756 | $41,481,121 | $76.68 |
| | | | | | | | |
| Real Estate Taxes | $5,440,425 | $5,035,298 | $4,702,799 | $4,420,599 | $4,217,902 | $4,899,635 | $9.06 |
| Insurance | $247,003 | $323,413 | $366,254 | $541,679 | $614,253 | $687,119 | $1.27 |
| Other Operating Expenses | $7,679,031 | $6,915,653 | $6,878,371 | $7,265,360 | $6,988,209 | $5,684,423 | $10.51 |
| Total Operating Expenses | $13,366,460 | $12,274,364 | $11,947,424 | $12,227,638 | $11,820,364 | $11,271,177 | $20.83 |
| | | | | | | | |
| Net Operating Income | $24,831,795 | $25,944,427 | $28,591,885 | $29,919,970 | $29,848,392 | $30,209,945 | $55.84 |
| Replacement Reserves | $0 | $0 | $0 | $0 | $0 | $232,624 | $0.43 |
| TI/LC | $0 | $0 | $0 | $0 | $0 | $324,592 | $0.60 |
| Net Cash Flow | $24,831,795 | $25,944,427 | $28,591,885 | $29,919,970 | $29,848,392 | $29,652,729 | $54.81 |
| | | | | | | | |
| Occupancy (%) | 98.0% | 97.9% | 97.5% | 99.3% | 96.1% | 95.4% | |
| NOI DSCR(2) | 1.44x | 1.50x | 1.66x | 1.74x | 1.73x | 1.75x | |
| NCF DSCR(2) | 1.44x | 1.50x | 1.66x | 1.74x | 1.73x | 1.72x | |
| NOI Debt Yield(2) | 11.3% | 11.8% | 13.0% | 13.6% | 13.6% | 13.7% | |
| NCF Debt Yield(2) | 11.3% | 11.8% | 13.0% | 13.6% | 13.6% | 13.5% | |
| (1) | UW Gross Potential Rent is based on the underwritten rent roll as of June 30, 2024 and includes (i) rent increases totaling $463,228 through June 1, 2025, (ii) signed not occupied rent totaling $946,662 (iii) percentage rent totaling $808,724, (iv) overage rent totaling $1,237,029, (v) specialty leasing rent totaling $408,693 and (vi) kiosk revenue totaling $1,571,257. |
| (2) | The debt service coverage ratios and debt yields are based on the Baybrook Mall Whole Loan. |
Escrows and Reserves. Real Estate Taxes – During the continuance of a Cash Management Period (as defined below), the Baybrook Mall Whole Loan documents require ongoing monthly deposits into a reserve for real estate taxes in an amount equal to 1/12 of the real estate taxes that the lender estimates will be payable during the next twelve months for the Baybrook Mall Property. Upon the termination of a Cash Management Period, all funds in such account will be returned to the borrower.
Insurance – During the continuance of a Cash Management Period, the Baybrook Mall Whole Loan documents provide for ongoing monthly deposits into a reserve for insurance premiums in an amount equal to 1/12 of the insurance premiums that the lender estimates will be payable for the renewal of coverage upon the expiration of the insurance policies. Notwithstanding the foregoing, upon delivery to the lender of satisfactory evidence that the insurance policies required by the loan documents are maintained pursuant to blanket insurance policies and the insurance premiums have been paid not less than one year in advance (or in the case of policies delivered at origination, for the period of coverage under such policies, if less than one year), the requirement to make deposits into the insurance reserve will be waived. Upon the termination of a Cash Management Period, all funds in such account will be returned to the borrower.
Replacement Reserve – During the continuance of a Cash Management Period, the Baybrook Mall Whole Loan documents provide for ongoing monthly deposits of 1/12 of $0.25 per owned leasable square foot at the Baybrook Mall Property (initially approximately $11,271) into a reserve for capital expenditures, provided that the borrower’s obligation to make such deposits will be suspended during any period in which the amounts on deposit in such reserve equal or exceed the product of (x) 24 and (y) the required monthly deposit amount (initially, such product will equal $270,493). Upon the termination of a Cash Management Period, all funds in such account will be returned to the borrower.
TI/LC Reserve – On the origination date, the borrower provided a Guaranty of Limited Payment (as described below) from the non-recourse carveout guarantor in lieu of depositing approximately $1,984,194 (the “Upfront Rollover Amount”) into a reserve for existing tenant improvements, landlord work, tenant improvement allowances and leasing commissions. In addition, during a Cash Management Period, the Baybrook Mall Whole Loan documents provide for ongoing monthly deposits of 1/12 of $1.00 per owned leasable square foot at the Baybrook Mall Property (initially approximately $45,082) into a reserve for future tenant improvements, landlord work, tenant improvement allowances and leasing commissions, provided that the borrower’s obligation to make such deposits will be suspended during any period in which the amounts on deposit in such reserve equal or exceed the product of (x) 24 and (y) the required monthly deposit amount (initially, such product will equal $1,081,972). Upon the termination of a Cash Management Period, all funds in such account will be returned to the borrower.
Guaranty of Limited Payment. At origination, the non-recourse carveout guarantor executed a Guaranty of Limited Payment, pursuant to which it guaranteed payment of the Baybrook Mall Whole Loan in an amount equal to the Upfront Rollover Amount. The amount guaranteed under such guaranty will be reduced on a dollar-for-dollar basis by an amount equal to the aggregate amount of expenditures actually made by the borrower or its affiliates for the outstanding amounts related to the Upfront Rollover Amount or for certain other costs permitted pursuant to the Baybrook Mall Whole Loan documents.
| This is not a research report and was not prepared by any Underwriter’s research department. Please see additional important information and qualifications at the end of this Term Sheet. |
| | T-24 | |
| Retail – Super Regional Mall | Loan #2 | Cut-off Date Balance: | | $88,000,000 |
| 500 Baybrook Mall | Baybrook Mall | Cut-off Date LTV: | | 56.0% |
| Friendswood, TX 77546 | | UW NCF DSCR: | | 1.72x |
| | | UW NOI Debt Yield: | | 13.7% |
Anchor Tenant Reserve – During the continuance of an Anchor Tenant Trigger (as defined below), the borrower is required to deposit an amount equal to all excess cash flow (as described below under “Lockbox and Cash Management”) for tenant improvements and leasing commissions, budgeted construction costs, required landlord work and other related costs associated with re-tenanting the applicable space or any other space at the Baybrook Mall Property. The borrower’s obligation to make deposits into the anchor tenant reserve with respect to any individual Anchor Tenant Trigger will terminate once the aggregate amount deposited into the anchor tenant reserve with respect to such individual Anchor Tenant Trigger equals or exceeds the Individual Anchor Threshold Amount (as defined below).
“Anchor” means any of Macy’s, Dillard’s, JCPenney or Living Spaces, or any replacement tenant(s) of the foregoing which are subject to replacement leases for which (i) not less than (x) 75% of the space previously occupied by the respective Anchor is re-let if the aggregate annual gross rent under such replacement lease(s) is not less than 75% of annual gross rent under the original Anchor lease and (y) 50% of the space previously occupied by the respective Anchor is re-let if the aggregate annual gross rent under such replacement lease(s) is not less than 100% of annual gross rent under the original Anchor lease.
An “Anchor Tenant Trigger” means that any Anchor (A) has “gone dark” (i.e., ceased to be in occupancy or ceased to utilize its space for business purposes), other than a temporary closure that is less than 60 days or is in connection with (x) a restoration, repair or renovation, (y) compliance with applicable law, regulations and/or governmental mandates or (z) civil unrest, (B) is the subject of a bankruptcy proceeding, (C) has vacated its premises, (D) has terminated, cancelled or surrendered its lease, or (E) has failed to renew and/or extend its lease within the applicable renewal period.
An Anchor Tenant Trigger will end if (i) for any Anchor Tenant Trigger described in clause (A) of the definition of Anchor Tenant Trigger, the Anchor has operated its business for no less than 30 consecutive days during normal business hours, (ii) for any Anchor Tenant Trigger described in clause (B) of the definition of Anchor Tenant Trigger, the bankruptcy is dismissed or the Anchor has emerged from such bankruptcy, or if the Anchor premises are leased by the borrower to the Anchor, such lease is accepted and affirmed by the Anchor in the bankruptcy or assumed by a replacement Anchor, (iii) for any Anchor Tenant Trigger described in clause (C) of the definition of Anchor Tenant Trigger, the Anchor has reoccupied its premises, (iv) for any Anchor Tenant Trigger described in clause (D) of the definition of Anchor Tenant Trigger, the Anchor has rescinded any notice to terminate, cancel or surrender its lease, (v) for any Anchor Tenant Trigger described in clause (E) of the definition of Anchor Tenant Trigger, the Anchor has renewed its lease pursuant to the terms thereof, or (vi) for all Anchor Tenant Triggers, (x) if the Anchor space is owned by the borrower, the Anchor space is leased by one or more replacement Anchors, and (y) if the Anchor space is not owned by the borrower, the borrower delivers an officer’s certificate reasonably satisfactory to the lender stating that the Anchor Tenant Trigger does not result in the violation of co-tenancy requirements in leases representing more than 15% of the aggregate rent payable under in-line leases at the Baybrook Mall Property (or if such violation did occur, such violation has now been cured) .
An ”Individual Anchor Threshold Amount” means, with respect to any Anchor, an amount equal to the product of (x) $50.00 and (y) the aggregate amount of gross leasable square footage of the applicable Anchor space as of the origination date.
Lockbox and Cash Management.
The Baybrook Mall Whole Loan is structured with a hard lockbox and springing cash management. The borrower is required to cause all tenants at the Baybrook Mall Property (other than tenants under Seasonal Leases (as defined below)) to pay rents (other than Non-Core Income (as defined below) directly into a lockbox account controlled by the lender, and to deposit any rents otherwise received by the borrower (other than Non-Core Income) into the lockbox account within two business days after receipt. Prior to a Cash Management Period, all funds in the lockbox account will be disbursed to the borrower’s operating account. Within two business days of written notification of the commencement of a Cash Management Period, the borrower is required to establish a lender controlled cash management account. During the continuance of a Cash Management Period or an Anchor Tenant Trigger, all funds deposited into the lockbox account are required to be swept each business day into the cash management account, to be applied and disbursed to pay (i) the tax and insurance escrow deposits, if any, described above, (ii) debt service under the Baybrook Mall Whole Loan, (iii) provided that no default exists as to which the lender has initiated an enforcement action, to pay budgeted operating expenses (or actual operating expenses to the extent not more than 115% of budgeted expenses), and budgeted capital expenses (or actual capital expenses to the extent not more than 110% of budgeted expenses), and extraordinary expenses for which the borrower has delivered a reasonably detailed explanation, (iv) subject to clause (v) below, the replacement and rollover reserve deposits, if any, described above, (v) (x) if both an Anchor Tenant Trigger and a Cash Management Period are continuing, to deposit all excess cash flow after the disbursements under clauses (i) through (iv) above, or (y) if only an Anchor Tenant Trigger is continuing, to deposit all excess cash flow after the disbursements under clauses (i) through (iii) above, in each case, up to the Individual Anchor Threshold Amount, into the anchor tenant reserve, and (vi) (x) if no Cash Sweep Period (as defined below) is continuing, to the borrower’s operating account, and (y) if a Cash Sweep Period is continuing, to an excess cash flow reserve to be held as additional collateral during the continuance of such Cash Sweep Period; provided that funds on deposit in such account will be made available to the borrower for the payment of certain property-level expenses and other uses, including REIT distributions up to $250,000.
“Non-Core Income” means (i) certain de minimis amounts of rents from miscellaneous revenue items such as holiday photos and change retrieved from fountains (but will not include rent from Seasonal Leases) and (ii) certain rents generated pursuant to multi-property sponsorship and advertising programs which are directly attributable to the Baybrook Mall Property.
“Seasonal Leases” means leases or license agreements having a maximum term of one year or less.
A “Cash Management Period” means a period commencing upon the debt yield being less than 11.0% (the “CM Target Debt Yield”) as of the end of any two consecutive calendar quarters.
A “Cash Sweep Period” means a period commencing upon (i) an event of default under the Baybrook Mall Whole Loan or (ii) the debt yield being less than 10.0% (the “CS Target Debt Yield,” and, together with the CM Target Debt Yield, each a “Target Debt Yield”) as of the end of any two consecutive calendar quarters.
A Cash Sweep Period resulting from an event of default will end if such event of default is thereafter cured or waived.
| This is not a research report and was not prepared by any Underwriter’s research department. Please see additional important information and qualifications at the end of this Term Sheet. |
| | T-25 | |
| Retail – Super Regional Mall | Loan #2 | Cut-off Date Balance: | | $88,000,000 |
| 500 Baybrook Mall | Baybrook Mall | Cut-off Date LTV: | | 56.0% |
| Friendswood, TX 77546 | | UW NCF DSCR: | | 1.72x |
| | | UW NOI Debt Yield: | | 13.7% |
A Cash Management Period or Cash Sweep Period resulting from a decline below the applicable Target Debt Yield will end if the borrower has maintained a debt yield equal to or in excess of the applicable Target Debt Yield for two consecutive calendar quarters or has either (i) prepaid the Baybrook Mall Whole Loan together with any then applicable prepayment fee, (ii) delivered cash to the lender, or (iii) delivered a letter of credit to the lender, in each case in an amount which if subtracted from the outstanding principal balance of the Baybrook Mall Whole Loan would cause the debt yield to equal or exceed the applicable Target Debt Yield.
For purposes of determining whether a Cash Sweep Period due to a decline in debt yield has been cured, the debt yield shall be calculated net of funds in the excess cash flow reserve, provided that following any such calculation such funds may not be released unless a Cash Sweep Period no longer exists without giving credit to such amounts.
Upon the end of a Cash Sweep Period, all remaining funds in the Cash Management Account will be disbursed to the borrower.
Release of Property. The borrower may obtain the release of (A) one or more parcels (including “air rights” parcels but excluding the Anchor parcels (each, an “Anchor Parcel”)) or outlots, or (B) one or more Acquired Parcels or Expansion Parcels (each as defined below), including, if applicable, any Anchor Parcel that is an Expansion Parcel (each, a “Release Parcel”), upon satisfaction of specified conditions including, among other things, that (i) there is no event of default, (ii) the Release Parcel (unless it is an Expansion Parcel) is vacant, non-income producing and unimproved or non-income producing and improved only by landscaping, utility facilities that are not required for the use of the remaining Baybrook Mall Property (the “Remaining Property”) or are either readily re-locatable or will continue to service the Remaining Property, or surface parking areas, (iii) the borrower delivers evidence that the parcel subject to release is not necessary for the operation or use of the Remaining Property and may be readily separated from the Remaining Property without a material diminution in value, (iv) the parcel subject to release has been legally subdivided from the Remaining Property and after giving effect to such transfer, the release parcel and the Remaining Property conform to legal requirements and constitute separate tax lots (or all action has been taken to effectuate the same), (v) the parcel subject to the release is not necessary for the Remaining Property to comply with zoning or legal requirements, (vi) receipt of a rating agency confirmation from the applicable rating agencies (provided that such confirmation will not be required for release of an Expansion Parcel or if the rating agency has waived review or failed to respond within 30 days to a request for such confirmation), and (vii) the release will not result in a loan-to-value ratio that does not comply with REMIC guidelines provided that the borrower may prepay the Baybrook Mall Whole Loan to meet such condition (without payment of a yield maintenance premium), unless the lender receives an opinion of counsel that the issuing entity will not fail to maintain its status as a REMIC trust as a result of the release of the Release Parcel.
Substitution. The borrower is also permitted to obtain the release of collateral parcels (each, an “Exchange Parcel”) from the lien of the mortgage in exchange for the substitution of new parcels in which the borrower acquires a fee or leasehold interest at or adjacent to the shopping center of which the Exchange Parcel is a part (each, an “Acquired Parcel”) as collateral for the Baybrook Mall Whole Loan upon 20 days’ prior notice, subject to the satisfaction of certain conditions, including among other things, that: (i) there is no event of default, (ii) the Exchange Parcel (unless it is an Expansion Parcel) is vacant, non-income producing and unimproved or improved only by landscaping, surface parking or utility facilities that are not required for the use of the Remaining Property or are readily re-locatable or will continue to serve the Remaining Property (and the borrower is able to make certain zoning representations as to the Acquired Parcel to the same extent as made with respect to the Exchange Parcel), (iii) the Acquired Parcel is reasonably equivalent in value to the Exchange Parcel, as established by a letter of value from the appraiser which appraised the Baybrook Mall Property or an appraiser of comparable experience selected by the borrower, (iv) with respect to the Acquired Parcel, the borrower has delivered, among other things (a) unless the Acquired Parcel is already covered by the environmental report delivered at origination, an addendum or supplement to such environmental report or new environmental report indicating no hazardous substances except for nominal amounts (except as permitted under clause (d) below), (b) security documents creating a mortgage lien on the Acquired Parcel, and title insurance, (c) if the Acquired Parcel is improved, subject to certain exceptions, a property condition report indicating that the Acquired Parcel is in good condition, and (d) if repairs are recommended by the property condition report or if the environmental report discloses the presence of hazardous materials at the Acquired Parcel, and the cost of such repairs or remediation is reasonably likely to exceed $11,750,000, cash or an indemnity from the guarantor, certain of its affiliates, or an entity otherwise meeting ratings or financial tests set forth in the related Whole Loan documents, in an amount equal to 125% of any estimated repairs or remediation costs, as applicable, (e) the loan-to-value ratio of the remaining property (after giving effect to such substitution) is equal to or less than 125% (in compliance with REMIC guidelines), provided that the borrower may prepay the Baybrook Mall Whole Loan in order to meet such condition (without payment of a yield maintenance premium), unless the lender receives an opinion of counsel that the issuing entity will not fail to maintain its status as a REMIC trust as a result of the release of the substitution, and (f) the lender has received a rating agency confirmation from the applicable rating agencies (unless the rating agencies waive review).
Addition of Parcels. In addition, the borrower has the right, at its own expense, to acquire one or more parcels of land, together with any improvements thereon located, that constitutes an integral part of, or adjoins or is proximately located near, the shopping center of which the Baybrook Mall Property is a part, which land was not owned by the borrower on the origination date and is not an Acquired Parcel (such acquired land, an “Expansion Parcel”), to become additional collateral for the Baybrook Mall Whole Loan, upon satisfaction of specified conditions including, among other things, that (i) there is no event of default, (ii) the borrower acquires a fee simple or leasehold interest in the applicable Expansion Parcel, and (iii) the borrower delivers, among other things, (a) unless the Expansion Parcel is already covered by the environmental report delivered at origination, an addendum or supplement to such environmental report or new environmental report indicating no hazardous substances except for nominal amounts (except as permitted under clause (d) below), (b) security documents creating a mortgage lien on the Expansion Parcel, and title insurance, (c) if the Expansion Parcel is improved, subject to certain exceptions, a property condition report indicating that the Expansion Parcel is in good condition and (d) if repairs are recommended by the property condition report or if the environmental report discloses the presence of hazardous materials at the Expansion Parcel, and the cost of such repairs or remediation is reasonably likely to exceed $11,750,000, cash or an indemnity from the guarantor, certain of its affiliates, or an entity otherwise meeting ratings or financial tests set forth in the loan documents, in an amount equal to 125% of any estimated repairs or remediation costs, as applicable.
| This is not a research report and was not prepared by any Underwriter’s research department. Please see additional important information and qualifications at the end of this Term Sheet. |
| | T-26 | |
| Retail – Super Regional Mall | Loan #2 | Cut-off Date Balance: | | $88,000,000 |
| 500 Baybrook Mall | Baybrook Mall | Cut-off Date LTV: | | 56.0% |
| Friendswood, TX 77546 | | UW NCF DSCR: | | 1.72x |
| | | UW NOI Debt Yield: | | 13.7% |
Terrorism Insurance. The Baybrook Mall Whole Loan require all risk terrorism coverage in an amount equal to 100% of full replacement cost, and business interruption insurance coverage for 18 months. For so long as the Terrorism Risk Insurance Act of 2002, as extended and modified by the Terrorism Risk Insurance Program Reauthorization Acts of 2007 and 2019 (including any extensions thereof or if another federal governmental program is in effect relating to “acts of terrorism” which provides substantially similar protections as such act, “TRIPRA”) is in effect and continues to cover both foreign and domestic acts of terrorism, the lender must accept terrorism insurance for “covered acts” as defined in TRIPRA. In addition, the loan documents permit terrorism insurance to be obtained through a captive insurance program with Liberty IC Casualty LLC (“Liberty”), subject to satisfaction of the conditions set forth in the loan documents, including that, subject to a $1,000,000 deductible, covered losses which are not reinsured by the federal government under TRIPRA and paid to Liberty are reinsured with a cut through endorsement acceptable to the lender and the rating agencies by insurance companies which satisfy the rating requirements set forth in the loan agreement. In addition, if TRIPRA is no longer in effect, the borrower will not be required to pay an annual premium for terrorism coverage in excess of two times the annual allocable amount of the total insurance premium that is then payable with respect to the property and business income insurance policies required under the loan documents (but without giving effect to the cost of the terrorism and earthquake components of such insurance policies) as of the date the applicable new terrorism insurance is being obtained.
| This is not a research report and was not prepared by any Underwriter’s research department. Please see additional important information and qualifications at the end of this Term Sheet. |
| | T-27 | |
| Office – CBD | Loan #3 | Cut-off Date Balance: | | $84,000,000 |
| 1001 North 19th Street | Potomac Tower | Cut-off Date LTV: | | 60.0% |
| Arlington, VA 22209 | | UW NCF DSCR: | | 1.48x |
| | | UW NOI Debt Yield: | | 11.9% |

| This is not a research report and was not prepared by any Underwriter’s research department. Please see additional important information and qualifications at the end of this Term Sheet. |
| | T-28 | |
| Office – CBD | Loan #3 | Cut-off Date Balance: | | $84,000,000 |
| 1001 North 19th Street | Potomac Tower | Cut-off Date LTV: | | 60.0% |
| Arlington, VA 22209 | | UW NCF DSCR: | | 1.48x |
| | | UW NOI Debt Yield: | | 11.9% |

| This is not a research report and was not prepared by any Underwriter’s research department. Please see additional important information and qualifications at the end of this Term Sheet. |
| | T-29 | |
| Office – CBD | Loan #3 | Cut-off Date Balance: | | $84,000,000 |
| 1001 North 19th Street | Potomac Tower | Cut-off Date LTV: | | 60.0% |
| Arlington, VA 22209 | | UW NCF DSCR: | | 1.48x |
| | | UW NOI Debt Yield: | | 11.9% |
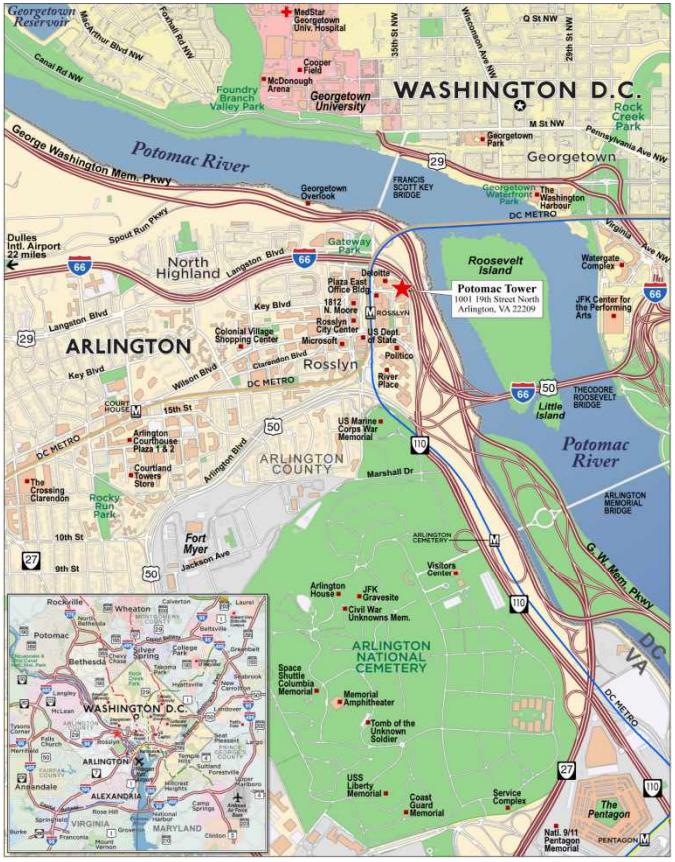
| This is not a research report and was not prepared by any Underwriter’s research department. Please see additional important information and qualifications at the end of this Term Sheet. |
| | T-30 | |
| Mortgage Loan No. 3 – Potomac Tower |
| Mortgage Loan Information | | Property Information |
| Mortgage Loan Seller: | JPMCB | | Single Asset/Portfolio: | Single Asset |
| Credit Assessment (Fitch/Moody’s/KBRA): | NR/NR/NR | | Location: | Arlington, VA 22209 |
| Original Balance: | $84,000,000 | | General Property Type: | Office |
| Cut-off Date Balance: | $84,000,000 | | Detailed Property Type: | CBD |
| % of Initial Pool Balance: | 9.2% | | Title Vesting: | Fee |
| Loan Purpose: | Acquisition | | Year Built/Renovated: | 1989/2015 |
| Borrower Sponsor: | Venture Global LNG, Inc. | | Size: | 241,710 SF |
| Guarantor: | Venture Global LNG, Inc. | | Cut-off Date Balance PSF: | $348 |
| Mortgage Rate: | 7.6000% | | Maturity Balance PSF: | $348 |
| Note Date: | 8/8/2024 | | Property Manager: | Jones Lang Lasalle Americas, Inc. |
| Maturity Date: | 9/5/2029 | | | |
| Term to Maturity: | 61 months | | | |
| Amortization Term: | 0 months | | Underwriting and Financial Information |
| IO Period: | 61 months | | UW NOI: | $9,989,931(1) |
| Seasoning: | 0 months | | UW NCF | $9,579,024(1) |
| Prepayment Provisions: | L(25),YM1(32),O(4) | | UW NOI Debt Yield: | 11.9% |
| Lockbox/Cash Mgmt Status: | Hard/Springing | | UW NCF Debt Yield: | 11.4% |
| Additional Debt Type: | NAP | | UW NOI Debt Yield at Maturity: | 11.9% |
| Additional Debt Balance: | NAP | | UW NCF DSCR: | 1.48x |
| Future Debt Permitted (Type): | NAP | | Most Recent NOI: | $10,464,288 (12/31/2023) |
| Reserves | | 2nd Most Recent NOI: | $8,574,070 (12/31/2022) |
| Type | Initial | Monthly | Cap | | 3rd Most Recent NOI: | $6,559,318 (12/31/2021) |
| RE Taxes: | $804,850 | $134,142 | NAP | | Most Recent Occupancy: | 100.0% (8/8/2024) |
| Insurance: | $0 | Springing | NAP | | 2nd Most Recent Occupancy: | 100.0% (12/31/2023) |
| Replacement Reserve: | $0 | $6,005 | NAP | | 3rd Most Recent Occupancy: | 97.7% (12/31/2022) |
| Rollover Reserve: | $0 | $30,214 | NAP | | Appraised Value (as of): | $140,000,000 (6/27/2024) |
| Free Rent Reserve: | $130,659 | $0 | NAP | | Appraised Value PSF: | $579 |
| | | | | | Cut-off Date LTV Ratio: | 60.0% |
| | | | | | Maturity Date LTV Ratio: | 60.0% |
| | | | | | | | |
| Sources and Uses |
| Sources | Proceeds | % of Total | | Uses | Proceeds | % of Total |
| Loan Amount: | $84,000,000 | 57.1% | | Purchase Price: | $143,000,000 | 97.3% |
| Borrower Sponsor Equity: | $62,988,770 | 42.9% | | Closing Costs: | $3,053,261 | 2.1% |
| | | | | Upfront Reserves: | $935,509 | 0.6% |
| Total Sources: | $146,988,770 | 100.0% | | Total Uses: | $146,988,770 | 100.0% |
| (1) | Venture Global is currently subleasing 33,295 SF of space from three tenants: ESRI, Advantia and Tributary. Venture Global will automatically convert to prime leases on its current sublease space upon the expiration of the ESRI, Advantia and Tributary leases. At the time that each of the respective subleases expire, the rent for the corresponding currently subleased space will be the same as the then escalated Venture Global rent for the existing prime lease suites at that date. The term of the prime lease for all of Venture Global’s premises will be extended through September 2034. |
The Mortgage Loan. The third largest mortgage loan (the “Potomac Tower Mortgage Loan”) is evidenced by the controlling Note A-1 in the original principal amount of $70,000,000 and the non-controlling Note A-2 with an original principal amount of $14,000,000. The Potomac Tower Mortgage Loan was originated by JPMorgan Chase Bank, National Association on August 8, 2024. The Potomac Tower Mortgage Loan is secured by a first priority fee mortgage encumbering a 241,710 SF Class A, office property located in Arlington, Virginia (the “Potomac Tower Property”).
The Borrower and the Borrower Sponsor. The borrower is HQ 1001 19 North, LLC, a Delaware limited liability company and single purpose entity with two independent directors. The borrower sponsor and non-recourse carveout guarantor is Venture Global LNG, Inc. (“Venture Global”), which is the largest tenant at the Potomac Tower Property.
Venture Global is a long-term, low-cost provider of North American liquified natural gas (“LNG”). The company operates as a producer of LNG pipelines, developing and constructing LNG export projects. In order to provide low-cost, long-term LNG from the United States, Venture Global is in the process of developing four LNG export facilities across North America. Additionally, Venture Global also commands partnerships with Shell, BP, Edison, EDF, Galp, Repsol, PGNiG and Sinopec, which enabled the company to secure approximately $13.2 billion in financing for another U.S. LNG export project in 2022, representing the largest project financing in the world closed to date in 2022. With plans for further expansion, Venture Global has goals of becoming the world’s largest LNG exporter by production capacity. Venture Global is currently headquartered at the Potomac Tower Property, with other satellite offices located in Houston, London, Tokyo and Singapore. Since 2022, Venture Global has generated over $14 billion in revenue in connection with its production of LNG.
| This is not a research report and was not prepared by any Underwriter’s research department. Please see additional important information and qualifications at the end of this Term Sheet. |
| | T-31 | |
| Office – CBD | Loan #3 | Cut-off Date Balance: | | $84,000,000 |
| 1001 North 19th Street | Potomac Tower | Cut-off Date LTV: | | 60.0% |
| Arlington, VA 22209 | | UW NCF DSCR: | | 1.48x |
| | | UW NOI Debt Yield: | | 11.9% |
The Property. The Potomac Tower Property comprises a 20-story, Class A, office building totaling 241,710 SF. Situated on a 0.57 acre site, the Potomac Tower Property was constructed in 1989 and most recently renovated in 2015. Designed by I.M. PEI, the Potomac Tower Property features window exposure on all sides and views across the Potomac River towards Washington, D.C. There is parking on the first five levels of the building, with 440 parking spaces and a parking space per 1,000 SF ratio of 1.82x. The building contains office space on floors six through 20. Amenities at the Potomac Tower Property include a rooftop terrace, tenant lounge and a fitness center. Furthermore, the Potomac Property was 100.0% occupied by ten tenants as of August 8, 2024, with a weighted average remaining lease term of 8.2 years. Additionally, the Property has an average occupancy of approximately 97.1% and 92.9% over the preceding three and five years, respectively. The Potomac Tower Property is located on the Potomac River in Rosslyn, Virginia and benefits from direct access into downtown D.C., which can be accessed via the Key Bridge or Rosslyn Metrorail Station.
The Potomac Tower Property serves as Venture Global’s U.S. corporate headquarters, with its Houston office primarily serving as a field office used by engineering teams. As such, the entirety of Venture Global’s C-suite, ownership and corporate development teams reside at the Potomac Tower Property. Moreover, the Potomac Tower Property is considered mission critical due to its close proximity to Washington D.C., granting Venture Global’s leadership with convenient access to necessary legislative and lobbying stakeholders in the energy industry. Venture Global committed approximately $63.0 million of equity in connection with the acquisition of the Potomac Tower Property, in order to allow for continued expansion. Over the last five years, prior ownership upgraded the asset with approximately $7.0 million in capital expenditures, including over $2.0 million towards a full elevator modernization and over $2.2 million on a rooftop terrace and fitness center renovation. Since its initial occupancy in 2017, Venture Global has invested approximately $25.0 million of capital towards the buildout of its space. Moreover, Venture Global has expanded its footprint via sublease on a number of occasions and currently occupies over five floors (approximately 39.2% of SF). Any amendments or future expansions to the Venture Global lease are required to be in the same form as the current Venture Global lease, or in a form reasonably approved by the Lender.
Major Tenants.
Venture Global (94,744 SF; 39.2% of NRA; 39.9% of underwritten base rent). Headquartered at the Potomac Tower Property, Venture Global was founded in 2013 by Bob Pender and Michael Sabel. Pender previously served as a partner at Hogan Lovells and was co-leader of the firm’s global energy and natural resources team. Sabel was previously executive vice-president of First Sierra Financial, a publicly-traded commercial finance company. Venture Global is a long-term, low-cost provider of North American LNG sourced from natural gas basins. Venture Global’s first facility, Calcasieu Pass, commenced producing LNG in January 2022. In addition, the company is in the process of constructing or developing additional production capacity in Louisiana and is developing carbon capture projects at each of its LNG facilities. Venture Global enters into forward contracts with its customers and provides physical delivery of the contracted quantities indexed to the Henry Hub price for natural gas. Since initially taking occupancy at the Potomac Tower Property in 2017, Venture Global has expanded at the Potomac Tower Property seven times and now occupies over five floors; moreover, Venture Global is currently subleasing 33,295 SF from three tenants: ESRI, Advantia and Tributary. Venture Global will automatically convert to prime leases on its current sublease space upon the expiration of the ESRI, Advantia and Tributary leases. At the time that each of the respective subleases expire, the rent for the corresponding currently subleased space will be the same as the then escalated Venture Global rent for the existing prime lease suites at that date. The term of the prime lease for all of Venture Global’s premises will be extended through September 2034, over five years beyond loan maturity. Additionally, Venture Global has invested over approximately $25.0 million of capital to continuously build out its suite space for its over 200 employees located at the Potomac Tower Property. Venture Global’s lease expires in September 2034, with one, five year renewal option.
Strategic Investment Management (36,641 SF; 15.2% of NRA; 15.8% of underwritten base rent). Founded in 1987 by former senior investment team members at the World Bank, Strategic Investment Management (“Strategic”) was created to provide investment solutions to other institutional investors who chose not to manage investments internally. Strategic’s founders saw the need for a new firm to help institutions manage growing assets pools in a growing and complicated environment. Strategic currently staffs 34 professionals and acts as an Outsourced Chief Investment Officer (“OCIO”) for 35 discretionary clients, in excess of $28 billion in discretionary assets under management. The firm’s client mix includes pensions, nonprofits, sovereign wealth funds and family assets, with an average client size of approximately $812.8 million. Strategic has leased space at the Potomac Tower Property since August 1992. Strategic’s current lease commenced in September 2020 and expires in March 2034, with one termination option available and one, five year renewal option.
Insight Global (22,811 SF; 9.4% of NRA; 9.7% of underwritten base rent). Insight Global, LLC (“Insight”) was founded as an entrepreneurial start-up in 2001 and has grown exponentially since. Insight acts as more than just a staffing agency, serving as a full-service partner who also offers staff augmentation, professional services and executive search services, among others. Today, Insight has a global reach, specializing in sourcing IT, accounting, finance, healthcare and engineering roles to Fortune 1000 clients across over 70 office locations globally. Aside from staffing, Insight provides culture consulting, DEI training, specialized healthcare staffing and resources and an array of client programs through its professional services division, Evergreen. Insight is ranked as the 5th largest staffing firm in the United States by Staffing Industry Analysts. In 2023, Insight Global generated over $3.7 billion in staffing revenue from the US alone. Insight has occupied its space at the Potomac Tower Property since January 2018 and its lease expires in December 2027, with no termination options and one, five-year renewal option.
| This is not a research report and was not prepared by any Underwriter’s research department. Please see additional important information and qualifications at the end of this Term Sheet. |
| | T-32 | |
| Office – CBD | Loan #3 | Cut-off Date Balance: | | $84,000,000 |
| 1001 North 19th Street | Potomac Tower | Cut-off Date LTV: | | 60.0% |
| Arlington, VA 22209 | | UW NCF DSCR: | | 1.48x |
| | | UW NOI Debt Yield: | | 11.9% |
The following table presents certain information relating to the tenancy at the Potomac Tower Property:
| Tenant Summary(1) |
| Tenant Name | Credit Rating (Fitch/Moody's/ S&P)(2) | Tenant SF | Approx % of Total SF | Annual UW Rent(3) | % of Total Annual UW Rent | Annual UW Rent PSF(3) | Lease Expiration | Renewal Options | Term. Option (Y/N) |
| Major Tenants | | | | | | | | | |
| Venture Global | B+/B1/BB- | 94,744(4) | 39.2% | $6,087,545 | 39.9% | $66.00(5) | 9/30/2034 | 1 x 5 yr | N |
| Strategic Investment Management | NR/NR/NR | 36,641 | 15.2% | $2,410,978 | 15.8% | $65.80 | 3/31/2034 | 1 x 5 yr | Y(6) |
| Insight Global | NR/NR/NR | 22,811 | 9.4% | $1,475,644 | 9.7% | $64.69 | 12/31/2027 | 1 x 5 yr | N |
| Consumer Brands Association (GMA) | NR/NR/NR | 18,913 | 7.8% | $1,026,822 | 6.7% | $54.29 | 7/31/2034 | 1 x 5 yr | N |
| KIMC Inc. | NR/NR/NR | 18,898 | 7.8% | $1,256,717 | 8.2% | $66.50 | 4/30/2029 | 1 x 5 yr | N |
| Axis Communications, Inc. | NR/NR/NR | 16,661 | 6.9% | $1,049,643 | 6.9% | $63.00 | 2/9/2034 | 1 x 5 yr | Y(7) |
| Subtotal/Wtd. Avg. | | 208,668 | 86.3% | $13,307,348 | 87.1% | $63.77 | | | |
| | | | | | | | | | |
| Other Tenants | | 33,042 | 13.7% | $1,968,426 | 12.9% | 59.57 | | | |
| Occupied Collateral Total | | 241,710 | 100.0% | $15,275,774 | 100.0% | $63.20 | | | |
| | | | | | | | | | |
| Vacant Space | | 0 | 0.0% | | | | | | |
| Total/Wtd. Avg. | | 241,710 | 100.0% | | | | | | |
| (1) | Information based on the underwritten rent roll as of August 8, 2024. |
| (2) | Certain ratings are those of the parent company whether or not the parent guarantees the lease. |
| (3) | The Annual UW Rent and Annual UW Rent PSF shown above include contractual rent steps through September 2025. |
| (4) | Venture Global Tenant SF is inclusive of 33,295 SF of sublease space that Venture Global currently leases from three tenants: ESRI, Advantia and Tributary. Venture Global will automatically convert to prime leases on its current sublease space upon the expiration of the ESRI, Advantia and Tributary leases. At the time that each of the respective subleases expire, the rent for the corresponding currently subleased space will be the same as the then escalated Venture Global rent for the existing prime lease suites at that date. The term of the prime lease for all of Venture Global’s premises will be extended through September 2034. |
| (5) | Venture Global Annual UW Rent PSF represents the rent associated with the original Venture Global lease and not any currently subleased space. |
| (6) | Strategic Investment Management has the option to terminate its lease effective as of March 31, 2029 upon written notice by no later than December 31, 2027 and the payment of a termination fee in an amount equal to the following unamortized costs (a) the free rent allowance under Strategic’s lease, (b) the difference in rent under Strategic’s current lease and its prior lease, which was terminated in 2020 in connection with the execution of its current lease that commenced in September 2020 that would have been paid between September 1, 2020 and February 28, 2023, (c) any tenant allowances paid to Strategic, and (d) leasing commissions paid by landlord, such costs to be amortized over the period of time between September 1, 2020 and March 31, 2034 (without regard for any exercise of such termination option) at an annual interest rate of 6%. |
| (7) | Axis Communications, Inc. will have the right, exercisable by written notice to the landlord no later than August 9, 2029, to terminate the lease subject to a fee of $1,197,062. |
The following table presents certain information relating to the lease rollover schedule at the Potomac Tower Property:
| Lease Rollover Schedule(1)(2) |
| Year | # of Leases Rolling | SF Rolling | Approx. % of Total SF Rolling | Approx. Cumulative % of SF Rolling | Total UW Rent Rolling | Approx. % of Total Rent Rolling | Approx. Cumulative % of Total Rent Rolling | UW Rent PSF Rolling |
| MTM/2024 | 0 | 0 | 0.0% | 0.0% | $0 | 0.0% | 0.0% | $0.00 |
| 2025 | 1 | 3,250 | 1.3% | 1.3% | $224,055 | 1.5% | 1.5% | $68.94 |
| 2026 | 0 | 0 | 0.0% | 1.3% | $0 | 0.0% | 1.5% | $0.00 |
| 2027 | 2 | 31,694 | 13.1% | 14.5% | $1,988,903 | 13.0% | 14.5% | $62.75 |
| 2028 | 1 | 9,222 | 3.8% | 18.3% | $568,107 | 3.7% | 18.2% | $61.60 |
| 2029 | 1 | 18,898 | 7.8% | 26.1% | $1,256,717 | 8.2% | 26.4% | $66.50 |
| 2030 | 1 | 11,687 | 4.8% | 30.9% | $663,004 | 4.3% | 30.8% | $56.73 |
| 2031 | 0 | 0 | 0.0% | 30.9% | $0 | 0.0% | 30.8% | $0.00 |
| 2032 | 0 | 0 | 0.0% | 30.9% | $0 | 0.0% | 30.8% | $0.00 |
| 2033 | 0 | 0 | 0.0% | 30.9% | $0 | 0.0% | 30.8% | $0.00 |
| 2034 | 8 | 166,959 | 69.1% | 100.0% | $10,574,988 | 69.2% | 100.0% | $63.34 |
| 2035 & Thereafter | 0 | 0 | 0.0% | 100.0% | $0 | 0.0% | 100.0% | $0.00 |
| Vacant | 0 | 0 | 0.0% | 100.0% | $0 | 0.0% | 100.0% | $0.00 |
| Total/Wtd. Avg. | 14 | 241,710 | 100.0% | 100.0% | $15,275,774 | 100.0% | 100.0% | $63.20 |
| (1) | Information is based on the underwritten rent roll as of August 8, 2024. |
| (2) | Certain tenants may have lease termination options that are exercisable prior to the originally stated expiration date of the related lease and are not considered in the rollover schedule. |
| This is not a research report and was not prepared by any Underwriter’s research department. Please see additional important information and qualifications at the end of this Term Sheet. |
| | T-33 | |
| Office – CBD | Loan #3 | Cut-off Date Balance: | | $84,000,000 |
| 1001 North 19th Street | Potomac Tower | Cut-off Date LTV: | | 60.0% |
| Arlington, VA 22209 | | UW NCF DSCR: | | 1.48x |
| | | UW NOI Debt Yield: | | 11.9% |
The Market. The Potomac Tower Property is located in Arlington, Virginia, within the Washington-Arlington-Alexandria, DC-VA-MD-WV Metropolitan Statistical Area (“MSA”) and the Rosslyn/Ballston Corridor submarket. According to the appraisal, the MSA contains a total of 3,606,845 employees and a 2.6% unemployment rate. The largest three represented industries are prof/scientific/tech services, public administration and health care/social assistance, which represents a combined 43% of the workforce. The appraisal also concludes that the MSA is forecasted to experience an increase in population and household income. Tenants in Rosslyn include a mix of federal government, association and private-sector tenants. Federal agencies include the US Postal Service, the US State Department, Homeland Security and the Department of Defense. Other companies occupying large spaces in the neighborhood include the Boeing Company, Corporate Executive Board and Raytheon. According to the appraisal, Rosslyn boasts over eight million SF of office space, over 6,600 households, 2,100 hotel rooms, several urban parks and many diverse restaurants. Additionally, the appraisal concludes that growth in the area is expected to occur primarily around metro stations with the Potomac Tower Property located about two blocks southwest of the Rosslyn Metro Station. Other throughfares in close proximity to the Potomac Tower Property include I-66, U.S. Route 29 and U.S. Route 50.
According to the appraisal, the Washington D.C. office market consists of approximately 526,073,950 SF of office space and as of the first quarter of 2024, had an occupancy ratio of 83.3%. Furthermore, according to the appraisal, the area has achieved an asking rent of $39.16 per SF, reflecting a small increase over the previous quarter. According to the appraisal, the Potomac Tower Property is located within the Rosslyn office submarket, which consists of approximately 9,984,569 SF of office space and represents just approximately 1.9% of the overall market inventory. The submarket recorded no completions for the first quarter of 2024, an occupancy of 76.6% and average asking rent of $42.00 per SF. According to one third-party research report, overall submarket vacancy is largely skewed by lower tier office inventory. There is approximately 2.1 million SF of 1960s-90s vintage product in the Rosslyn submarket, of which many are located further west, therefore lacking views of the Potomac River, and many are without renovation or amenities. Further, many Class B and Class C office buildings may be deemed functionally obsolete with 14 of 17 in the Rosslyn submarket already slated for conversion or development. According to the same third-party research report, tier 1, Class A office buildings in the Rosslyn submarket, totaling approximately 3.9 million SF, see an average vacancy of 9.1%, as compared to 35.8% and 26.1% for tier 2 and tier 3 buildings, respectively.
According to the appraisal, the 2023 population and average household income within a one-, three- and five-mile radius of the Potomac Tower Property was 42,376, 347,895, 822,462 and $174,325, $185,802, and $184,241, respectively. Between 2010 and 2023, the population within a one-, three-, and five-mile radius increased by 18.8%, 17.9%, and 17.9%, respectively.
The following table presents certain information relating to the appraisal’s market rent conclusions for the Potomac Tower Property:
| Market Rent Summary |
| | Floors 6-8 | Floors 9-14 | Floors 15-20 |
| Market Rent (PSF) | $57.50 | $59.00 | $63.00 |
| Reimbursement Type | FS (BY) | FS (BY) | FS (BY) |
| Average Lease Term (Months) | 130 | 130 | 130 |
| Escalations | 2.5% annually | 2.5% annually | 2.5% annually |
| Tenant Improvements (New/Renewal) | $100 / $50 | $100 / $50 | $100 / $50 |
| Leasing Commissions (New/Renewal) | 6.0% / 4.0% | 6.0% / 4.0% | 6.0% / 4.0% |
The following table presents information relating to comparable sales pertaining to the Potomac Tower Property:
| Sales Comparable(1) |
| Property Name/Location | Year Built/Renovated | Size (SF) | Occupancy | Sale Date | Sale Price | Sale Price (PSF) |
Potomac Tower Arlington, VA | 1989/2015 | 241,710(2) | 100.0%(2) | Aug-24 | $143,000,000 | $591.62 |
Central Place / CEB Tower Arlington, VA | 2017/NAP | 552,781 | 97.8% | Feb-24 | $339,200,000 | $613.62 |
1776 Wilson Boulevard Arlington, VA | 2012/NAP | 137,826 | 87.0% | Oct-22 | $59,450,000 | $431.34 |
Commonwealth Tower Arlington, VA | 1995/2021 | 344,533 | 91.0% | Feb-22 | $245,000,000 | $711.11 |
1400 Crystal Arlington, VA | 1970/2013 | 300,822 | 91.9% | Dec-21 | $188,500,000 | $626.62 |
| (1) | Information obtained from appraisal. |
| (2) | Information is based on the underwritten rent roll as of August 8, 2024. |
| This is not a research report and was not prepared by any Underwriter’s research department. Please see additional important information and qualifications at the end of this Term Sheet. |
| | T-34 | |
| Office – CBD | Loan #3 | Cut-off Date Balance: | | $84,000,000 |
| 1001 North 19th Street | Potomac Tower | Cut-off Date LTV: | | 60.0% |
| Arlington, VA 22209 | | UW NCF DSCR: | | 1.48x |
| | | UW NOI Debt Yield: | | 11.9% |
The following table presents certain information relating to the comparable office leases for the Potomac Tower Property:
| Comparable Office Properties(1) |
| Property Name/Location | Year Built/Renovated | Total NRA (SF) | Tenant Name | Tenant Size (SF) | Lease Date | Rent PSF | Lease Term (years) |
Potomac Tower Arlington, VA | 1989/2015 | 241,710(2)(3) | Venture Global(2) | 94,744(2) | Dec-17(2) | $66.00(2)(4) | 16.8(2)(5) |
1000 Wilson Boulevard Arlington, VA | 1981/NAP | 546,368 | Raytheon Technologies Corp. | 19,089 | Oct-23 | $55.00 | 9.9 |
Central Place / CEB Tower Arlington, VA | 2017/NAP | 552,781 | Shield AI | 6,593 | Dec-20 | $52.00 | 2.8 |
1100 Wilson Boulevard Arlington, VA | 1985/2002 | 527,721 | Shift 5, Inc. | 19,840 | Jul-23 | $52.00 | 7.8 |
1500 Wilson Boulevard Arlington, VA | 1971/2014 | 261,360 | DT Global | 20,818 | Apr-23 | $57.00 | 11.5 |
Commonwealth Tower Arlington, VA | 1995/NAP | 344,533 | Microsoft | 180,000 | Nov-20 | $52.00 | 11.5 |
Arlington Tower Arlington, VA | 1980/NAP | 388,598 | Fletcher, Herald & Hildreth | 11,505 | Mar-22 | $57.00 | 11.0 |
| (1) | Information obtained from the appraisal. |
| (2) | Information is based on the underwritten rent roll as of August 8, 2024. |
| (3) | Includes 33,295 SF of sublease space that Venture Global currently leases from three tenants: ESRI, Advantia and Tributary. Venture Global will convert to prime leases on its current sublease space upon the expiration of the ESRI, Advantia and Tributary leases. At that time, the corresponding sublease rent will be the same as the then escalated Venture Global rent for the existing prime suites at that date. The leases for all premises will be extended through September 2034. |
| (4) | Rent PSF represents the rent associated with the original Venture Global lease and not any currently subleased space. |
| (5) | Lease Term (years) represents the lease term associated with the original Venture Global lease. |
Appraisal. The appraisal concluded to an “as-is” value for the Potomac Tower Property of $140,000,000 as of June 27, 2024.
Environmental Matters. According to the Phase I environmental site assessment dated May 17, 2024, there was no evidence of any recognized environmental conditions at the Potomac Tower Property.
| This is not a research report and was not prepared by any Underwriter’s research department. Please see additional important information and qualifications at the end of this Term Sheet. |
| | T-35 | |
| Office – CBD | Loan #3 | Cut-off Date Balance: | | $84,000,000 |
| 1001 North 19th Street | Potomac Tower | Cut-off Date LTV: | | 60.0% |
| Arlington, VA 22209 | | UW NCF DSCR: | | 1.48x |
| | | UW NOI Debt Yield: | | 11.9% |
Operating History and Underwritten Net Cash Flow. The following table presents certain information relating to the historical operating performance and Underwritten Net Cash Flow at the Potomac Tower Property:
| Cash Flow Analysis |
| | 2021 | 2022 | 2023 | UW | UW PSF |
| Rents in Place | $10,344,144 | $12,190,864 | $13,995,983 | $14,989,521(2) | $62.01 |
| Rent Steps(1) | $0 | $0 | $0 | $286,253 | $1.18 |
| Gross Potential Rent | $10,344,144 | $12,190,864 | $13,995,983 | $15,275,774 | $63.20 |
| CAM | $176,496 | $364,385 | $408,558 | $439,631 | $1.82 |
| Gross Potential Income | $10,520,640 | $12,555,249 | $14,404,541 | $15,715,405 | $65.02 |
| Parking | $486,863 | $764,957 | $956,444 | $993,894 | $4.11 |
| Other Income | $74,256 | $31,476 | $56,517 | $37,579 | $0.16 |
| (Vacancy & Credit Loss) | $0 | $0 | $0 | ($1,733,302) | ($7.17) |
| Effective Gross Income | $11,081,759 | $13,351,683 | $15,417,502 | $15,013,576 | $62.11 |
| | | | | | |
| Real Estate Taxes | $1,539,961 | $1,580,229 | $1,706,270 | $1,609,700 | $6.66 |
| Insurance | $84,880 | $82,180 | $101,940 | $254,892 | $1.05 |
| Management Fee | $337,015 | $406,467 | $417,518 | $450,407 | $1.86 |
| Other Operating Expenses | $2,560,586 | $2,708,737 | $2,727,486 | $2,708,646 | $11.21 |
| Total Expenses | $4,522,442 | $4,777,613 | $4,953,214 | $5,023,645 | $20.78 |
| | | | | | |
| Net Operating Income | $6,559,318 | $8,574,070 | $10,464,288 | $9,989,931 | $41.33 |
| Replacement Reserves | $0 | $0 | $0 | $48,342 | $0.20 |
| TI/LC | $0 | $0 | $0 | $362,565 | $1.50 |
| Net Cash Flow | $6,559,318 | $8,574,070 | $10,464,288 | $9,579,024 | $39.63 |
| | | | | | |
| Occupancy % | 93.5% | 97.7% | 100.0% | 89.7%(3) | |
| NOI DSCR | 1.01x | 1.32x | 1.62x | 1.54x | |
| NCF DSCR | 1.01x | 1.32x | 1.62x | 1.48x | |
| NOI Debt Yield | 7.8% | 10.2% | 12.5% | 11.9% | |
| NCF Debt Yield | 7.8% | 10.2% | 12.5% | 11.4% | |
| (1) | UW Rent Steps shown above includes contractual rent steps through September 2025. |
| (2) | Venture Global is currently subleasing 33,295 SF of space from three tenants: ESRI, Advantia and Tributary. Venture Global will automatically convert to prime leases on its current sublease space upon the expiration of the ESRI, Advantia and Tributary leases. At the time that each of the respective subleases expire, the rent for the corresponding currently subleased space will be the same as the then escalated Venture Global rent for the existing prime lease suites at that date. The term of the prime lease for all Venture Global’s premises will be extended through September 2034. |
| (3) | The underwritten economic vacancy is 10.35%. The Potomac Tower Property was 100.0% leased as of August 8, 2024. |
Escrows and Reserves.
Real Estate Taxes – On the loan origination date, the borrower was required to make an upfront deposit of $804,850 into a reserve for real estate taxes. In addition, the borrower is required to deposit into a real estate tax reserve, on a monthly basis, an amount equal to 1/12 of the real estate taxes that the mortgage lender estimates will be payable during the next twelve months (initially estimated to be $134,142).
Insurance – The borrower is required to deposit into an insurance reserve, on a monthly basis, an amount equal to 1/12 of the insurance premiums that the mortgage lender estimates will be payable for the renewal of the insurance coverage; provided, however, that such monthly reserves for insurance premiums will not be required so long as (i) no event of default has occurred and is continuing and (ii) the insurance coverage for the Potomac Tower Property is included in a blanket policy approved by the lender in its reasonable discretion.
Replacement Reserve – The borrower is required to deposit into a replacement reserve, on a monthly basis, an amount equal to $6,005.
Rollover Reserve – The borrower is required to deposit into a rollover reserve, on a monthly basis, an amount equal to $30,214, as well as any lease termination fees or other payments received by the borrower in connection with the termination of any lease at the Potomac Tower Property in excess of $250,000.
Free Rent Reserve – On the loan origination date, the borrower was required to make an upfront deposit of $130,659 into a reserve for free rent, associated with three months of concessions for the FD Stonewater tenant.
| This is not a research report and was not prepared by any Underwriter’s research department. Please see additional important information and qualifications at the end of this Term Sheet. |
| | T-36 | |
| Office – CBD | Loan #3 | Cut-off Date Balance: | | $84,000,000 |
| 1001 North 19th Street | Potomac Tower | Cut-off Date LTV: | | 60.0% |
| Arlington, VA 22209 | | UW NCF DSCR: | | 1.48x |
| | | UW NOI Debt Yield: | | 11.9% |
Lockbox and Cash Management. The Potomac Tower Mortgage Loan is structured with a hard lockbox and springing cash management. The borrower and property manager are required to direct the tenants to pay rent directly into the lockbox account, and to deposit any rents otherwise received into such lockbox account within two business day after receipt. If no Cash Sweep Event is continuing, all funds in the lockbox account will be swept each business day to the borrower’s operating account. During the continuance of a Cash Sweep Event, all funds in the lockbox account are required to be swept on each business day to a lender-controlled cash management account and applied in accordance with the Potomac Tower Mortgage Loan documents. During the continuance of a Cash Sweep Period, any excess cash is required to be deposited into an excess cash flow reserve account to be held as additional security for the Potomac Tower Mortgage Loan in accordance with the Potomac Tower Mortgage Loan documents. During the continuance of an event of default or a Bankruptcy Trigger Event (as defined below), all funds in the cash management account may be applied by the lender in such order and priority as the lender determines. Upon payment in full of the debt, all sums remaining on deposit in the excess cash flow reserve account will be disbursed to the borrower.
A “Cash Sweep Event” means the period commencing upon the occurrence of (i) an event of default, (ii) a bankruptcy action of the borrower, (iii) the debt service coverage ratio falling below 1.30x for one calendar quarter based on the trailing three month period immediately preceding the date of such determination, or (iv) the commencement of a Lease Sweep Period (as defined below). A Cash Sweep Event will be cured with respect to clause (i) above, upon the acceptance by the lender of a cure of such event of default (which cure the lender is not obligated to accept and the lender may reject or accept in its sole and absolute discretion), with respect to clause (iii) above, upon the achievement of a debt service coverage ratio of 1.30x or greater for one calendar quarter based upon the trailing three month period (annualized) immediately preceding the date of determination, with respect to clause (iv) above, upon the end of such Lease Sweep Period, provided, however, no event of default has occurred and is continuing. In no event is the borrower entitled to cure a Cash Sweep Event caused by a bankruptcy action of the borrower.
A “Lease Sweep Period” means (a) the period commencing on the first day following the occurrence of any of the following (i) the date that is 12 months prior to the earliest stated expiration (including the stated expiration of any renewal term) of (i) the Venture Global lease or (ii) any replacement lease, either individually, or when taken together with any other lease with the same tenant or its affiliates, covers more than 20% of the net rentable area of the Potomac Tower Property ((i) or (ii), each a “Lease Sweep Lease”), (ii) the date any tenant under a Lease Sweep Lease subleases more than 30% in the aggregate of the space demised under the applicable Lease Sweep Lease (the “Lease Sweep Space”) at the Potomac Tower Property, (iii) the date that a Lease Sweep Lease (or any material portion thereof) is surrendered, cancelled or terminated prior to its then current expiration date or the receipt by the borrower or property manager of notice from any tenant under a Lease Sweep Lease of its intent to surrender, cancel or terminate such Lease Sweep Lease (or any material portion thereof prior to its then current expiration date), (iv) the date that any tenant under a Lease Sweep Lease publicly announces its intent to surrender, cancel or terminate such Lease Sweep Lease (or any material portion thereof prior to its then current expiration date), (v) the date that any tenant under a Lease Sweep Lease discontinues its business (i.e., “goes dark”), vacates or abandons more than 30% in the aggregate of the Lease Sweep Space at the Potomac Tower Property (other than in connection with an ongoing force majeure for a period not to exceed ninety (90) days), (vi) the occurrence of a Lease Sweep Lease tenant insolvency proceeding, (vii) the date that any tenant, or any guarantor of a tenant, under a Lease Sweep Lease makes a disclosure in any Form 10-Q or Form 10-K, or otherwise makes a public announcement or disclosure, that such tenant (or its guarantor or parent entity) doubts it will continue operating as a going concern, and (b) ends upon the first to occur of the following: (i) in the case of clauses (a)(i), (a)(ii), (a)(iii), (a)(iv), (a)(v), (a)(vi) or (a)(vii) above, the entirety of the Lease Sweep Space (or applicable portion thereof) is leased pursuant to one or more qualified leases and the borrower has satisfied the occupancy conditions with respect to each such qualified lease in accordance with the Potomac Tower Mortgage Loan documents, or (ii) in the case of clause (a)(vi) above, either (a) the applicable Lease Sweep tenant insolvency proceeding has terminated and the applicable Lease Sweep Lease has been affirmed, assumed or assigned in a manner reasonably satisfactory to the lender (and the applicable Lease Sweep tenant has delivered an estoppel acceptable to the lender confirming the same) or (b) the applicable Lease Sweep Lease has been assumed and assigned to a third party in a manner reasonably satisfactory to the lender (and such third party has delivered an estoppel acceptable to the lender confirming the same).
Terrorism Insurance. The borrower is required to obtain and maintain property insurance for 100% of full replacement cost and business interruption insurance for 18 months plus a 6-month extended period of indemnity. Such insurance is required to cover perils of terrorism and acts of terrorism. See “Risk Factors—Risks Relating to the Mortgage Loans—Terrorism Insurance May Not Be Available for All Mortgaged Properties” in the prospectus.
| This is not a research report and was not prepared by any Underwriter’s research department. Please see additional important information and qualifications at the end of this Term Sheet. |
| | T-37 | |
| Various – Various | Loan #4 | Cut-off Date Balance: | | $80,000,000 |
| Various | BioMed 2024 Portfolio 2 | Cut-off Date LTV: | | 50.1% |
| Various | | UW NCF DSCR: | | 2.34x |
| | | UW NOI Debt Yield: | | 13.1% |
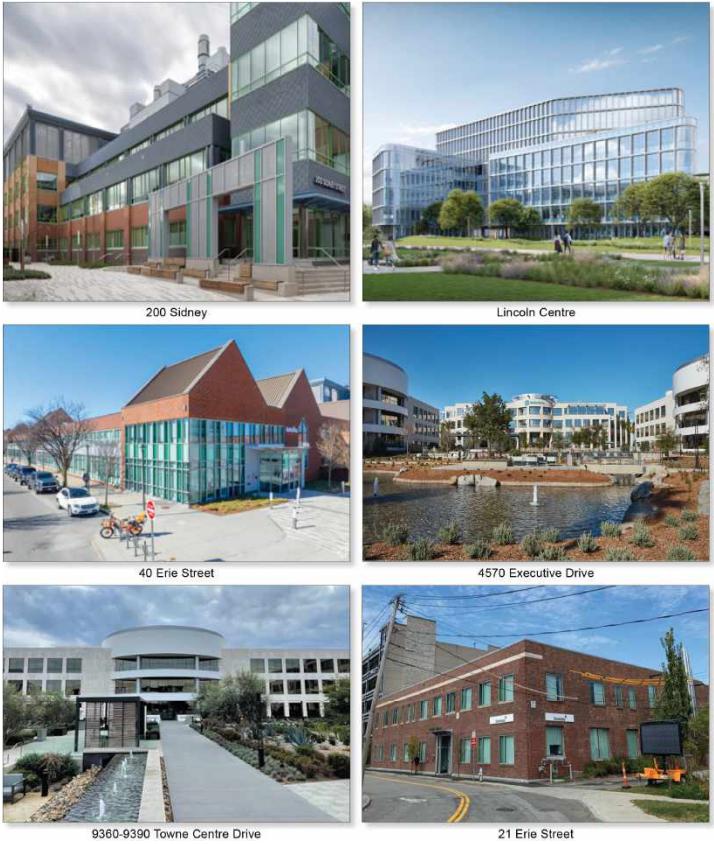
| This is not a research report and was not prepared by any Underwriter’s research department. Please see additional important information and qualifications at the end of this Term Sheet. |
| | T-38 | |
| Various – Various | Loan #4 | Cut-off Date Balance: | | $80,000,000 |
| Various | BioMed 2024 Portfolio 2 | Cut-off Date LTV: | | 50.1% |
| Various | | UW NCF DSCR: | | 2.34x |
| | | UW NOI Debt Yield: | | 13.1% |
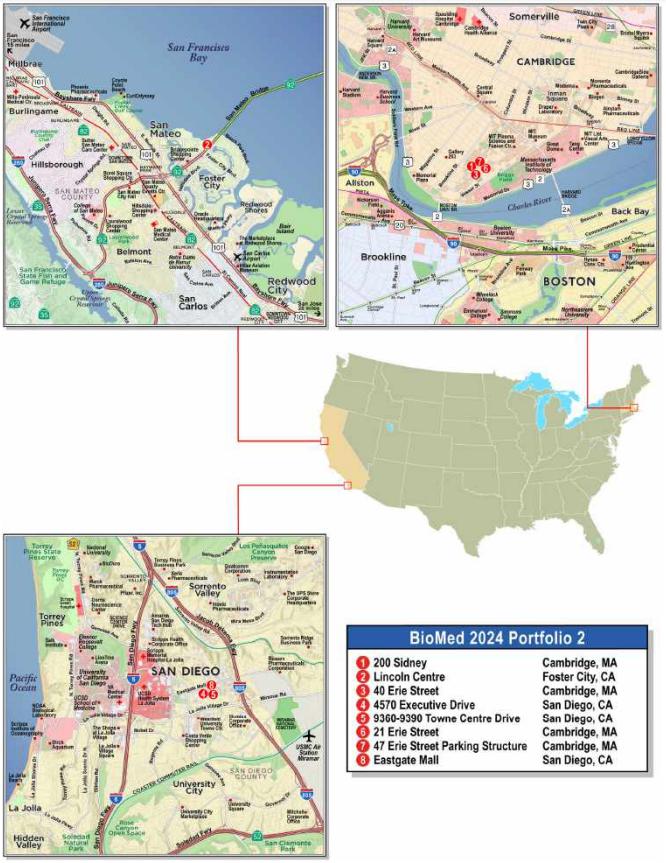
| This is not a research report and was not prepared by any Underwriter’s research department. Please see additional important information and qualifications at the end of this Term Sheet. |
| | T-39 | |
| Mortgage Loan No. 4 – BioMed 2024 Portfolio 2 |
| Mortgage Loan Information | | Property Information |
| Mortgage Loan Sellers: | JPMCB/WFB | | Single Asset/Portfolio: | Portfolio |
| Credit Assessment (Fitch/Moody’s/KBRA): | NR/NR/NR | | Location(4): | Various |
| Original Balance(1): | $80,000,000 | | General Property Type(4): | Various |
| Cut-off Date Balance(1): | $80,000,000 | | Detailed Property Type(4): | Various |
| % of Initial Pool Balance: | 8.8% | | Title Vesting: | Fee |
| Loan Purpose: | Refinance | | Year Built/Renovated(4): | Various / Various |
| Borrower Sponsor: | BioMed Realty, L.P. | | Size(5): | 995,458 SF |
| Guarantor: | BRE Edison L.P. | | Cut-off Date Balance Per SF(1)(6): | $552 |
| Mortgage Rate: | 5.48760% | | Maturity Date Balance Per SF(1)(6): | $552 |
| Note Date: | 8/9/2024 | | Property Managers: | BioMed Realty LLC and Pro Park, LLC |
| Maturity Date: | 8/9/2029 | | | |
| Term to Maturity: | 60 months | | Underwriting and Financial Information |
| Amortization Term: | 0 months | | UW NOI(7): | $72,082,166 |
| IO Period: | 60 months | | UW NCF: | $71,517,523 |
| Seasoning: | 0 months | | UW NOI Debt Yield(1): | 13.1% |
| Prepayment Provisions: | YM0.5%(24),DorYM0.5%(29),O(7) | | UW NCF Debt Yield(1): | 13.0% |
| Lockbox/Cash Mgmt Status: | Hard/Springing | | UW NOI Debt Yield at Maturity(1): | 13.1% |
| Additional Debt Type(1): | Pari Passu / Subordinate | | UW NCF DSCR(1): | 2.34x |
| Additional Debt Balance(1): | $469,894,737 / $166,842,106 | | Most Recent NOI: | $60,248,205 (3/31/2024 TTM) |
| Future Debt Permitted (Type): | Yes (Mezzanine) | | 2nd Most Recent NOI: | $59,155,334 (12/31/2023) |
| Reserves(2) | | 3rd Most Recent NOI: | $58,687,190 (12/31/2022) |
| Type | Initial | Monthly | Cap | | Most Recent Occupancy: | 93.8% (Various) |
| RE Taxes: | $0 | Springing | NAP | | 2nd Most Recent Occupancy: | 98.8% (12/31/2023) |
| Insurance: | $0 | Springing | NAP | | 3rd Most Recent Occupancy: | 100.0% (12/31/2022) |
| Replacement Reserve: | $0 | $0 | NAP | | Appraised Value (as of)(8): | $1,098,200,000 (Various) |
| Rollover Reserve: | $0 | Springing | (3) | | Appraised Value PSF(9): | $1,075 |
| Outstanding TI/LC: | $0 | $0 | NAP | | Cut-off Date LTV Ratio(1): | 50.1% |
| Unfunded Obligations Reserve: | $3,569,740 | $0 | NAP | | Maturity Date LTV Ratio(1): | 50.1% |
| | | | | | | | |
| Sources and Uses |
| Sources | Proceeds | % of Total | | Uses | Proceeds | % of Total |
| Mortgage Loan Amount: | $549,894,737 | 64.0% | | Loan Payoff: | $845,920,651 | 98.5% |
| Subordinate Debt: | $166,842,106 | 19.4% | | Closing Costs: | 9,648,775 | 1.1% |
| Borrower Sponsor Equity: | 142,402,323 | 16.6% | | Upfront Reserves: | 3,569,740 | 0.4% |
| Total Sources: | $859,139,166 | 100.0% | | Total Uses: | 859,139,166 | 100.0% |
| (1) | The BioMed 2024 Portfolio 2 Mortgage Loan (as defined below) is part of the BioMed 2024 Portfolio 2 Whole Loan (as defined below), which is comprised of eight pari passu senior promissory notes and four junior promissory notes. The Cut-off Date Balance Per SF, Maturity Date Balance Per SF, UW NOI Debt Yield, UW NCF Debt Yield, UW NOI Debt Yield at Maturity, UW NCF DSCR, Cut-off Date LTV Ratio and Maturity Date LTV Ratio presented above are based on the principal balance of the BioMed 2024 Portfolio 2 Senior Notes (as defined below). |
| (2) | See “Escrows and Reserves” section below. |
| (3) | The Rollover Reserve is capped at an amount equal to the aggregate square footage (excluding the rentable square footage attributable to the 47 Erie Street Parking Structure property) multiplied by $1. |
| (4) | See “Portfolio Summary” section below. |
| (5) | The BioMed 2024 Portfolio 2 Properties are inclusive of 447 parking stalls located at the 47 Erie Street Parking Structure property. |
| (6) | Cut-off Date Balance Per SF and Maturity Date Balance Per SF exclude the 447 parking stalls located at the 47 Erie Street Parking Structure property. |
| (7) | Increase in UW NOI compared to Most Recent NOI is primarily attributable to (i) rent increases through May 31, 2025 and (ii) straight line rent credit for investment grade tenants. |
| (8) | The appraisals were completed on various dates between April 22, 2024 and April 30, 2024. |
| (9) | Appraised Value PSF excludes the value of the 47 Erie Street Parking Structure property as there is not attributable square feet. |
The Mortgage Loan. The fourth largest mortgage loan is part of a whole loan with an aggregate outstanding balance of $716,736,843 (the “BioMed 2024 Portfolio 2 Whole Loan”) and is comprised of (i) eight pari passu senior notes with an aggregate outstanding balance of $549,894,737 (collectively the “BioMed 2024 Portfolio 2 Senior Notes”) and (ii) four junior notes with an outstanding balance of $166,842,106 (the “BioMed 2024 Portfolio 2 Junior Notes”). Among the BioMed 2024 Portfolio 2 Senior Notes are the non-controlling Notes A-6 and A-8, with an aggregate initial principal balance of $80,000,000, which will be contributed to the BANK5 2024-5YR9 securitization trust. The BioMed 2024 Portfolio 2 Junior Notes are generally subordinate in right of payment to the BioMed 2024 Portfolio 2 Senior Notes. The BioMed 2024 Portfolio 2 Whole Loan was co-originated by JPMorgan Chase Bank, National Association, Citi Real Estate Funding Inc. (“CREFI”), Goldman Sachs Bank USA (“GS BANK”) and Wells Fargo Bank, National Association on August 9, 2024. The BioMed 2024 Portfolio 2 Whole Loan is secured by a first priority fee mortgage encumbering a portfolio of seven life science lab/office properties and one parking garage, totaling 995,458 square feet and 447 parking stalls located across California and Massachusetts (collectively, the “BioMed 2024 Portfolio 2 Properties”, and individually, a “BioMed 2024 Portfolio 2 Property”).
The promissory notes comprising the BioMed 2024 Portfolio 2 Whole Loan are summarized in the below table. The BioMed 2024 Portfolio 2 Whole Loan will be serviced pursuant to the pooling and servicing agreement for the BX 2024-BIO2 securitization. See “Description of the Mortgage Pool—The Whole Loans—The Non-Serviced Pari Passu Whole Loans” and “Pooling and Servicing Agreement” in the prospectus.
| This is not a research report and was not prepared by any Underwriter’s research department. Please see additional important information and qualifications at the end of this Term Sheet. |
| | T-40 | |
| Various – Various | Loan #4 | Cut-off Date Balance: | | $80,000,000 |
| Various | BioMed 2024 Portfolio 2 | Cut-off Date LTV: | | 50.1% |
| Various | | UW NCF DSCR: | | 2.34x |
| | | UW NOI Debt Yield: | | 13.1% |
| BioMed 2024 Portfolio 2 Whole Loan Summary |
Note | Original Balance | Cut-off Date Balance | Note Holder | Controlling
Piece |
| A-1 | $139,957,896 | $139,957,896 | BX 2024-BIO2 | Yes |
| A-2 | $69,978,947 | $69,978,947 | BX 2024-BIO2 | No |
| A-3 | $69,978,947 | $69,978,947 | BX 2024-BIO2 | No |
| A-4 | $69,978,947 | $69,978,947 | BX 2024-BIO2 | No |
| A-5 | $80,000,000 | $80,000,000 | CREFI(1) | No |
| A-6 | $40,000,000 | $40,000,000 | BANK5 2024-5YR9 | No |
| A-7 | $40,000,000 | $40,000,000 | GS Bank(1) | No |
| A-8 | $40,000,000 | $40,000,000 | BANK5 2024-5YR9 | No |
| Total Senior Notes | $549,894,737 | $549,894,737 | | |
| B-1(2) | $66,736,843 | $66,736,843 | BX 2024-BIO2 | No |
| B-2(2) | $33,368,421 | $33,368,421 | BX 2024-BIO2 | No |
| B-3(2) | $33,368,421 | $33,368,421 | BX 2024-BIO2 | No |
| B-4(2) | $33,368,421 | $33,368,421 | BX 2024-BIO2 | No |
| Total Junior Notes | $166,842,106 | $166,842,106 | | |
| Whole Loan | $716,736,843 | $716,736,843 | | |
| (1) | Expected to be contributed to one or more future securitization transactions or may otherwise be transferred at any time. |
| (2) | The BioMed 2024 Portfolio 2 Junior Notes will be subordinate in right of payment to the BioMed 2024 Portfolio 2 Senior Notes. |
The Borrowers and the Borrower Sponsor. The borrowers are BMR-21 Erie Street LLC, BMR-Lincoln Centre LP, BMR-Sidney Research Campus LLC and BRE-BMR Campus at Towne Centre LP, each a special purpose entity indirectly owned and controlled by BioMed Realty, L.P (the “Borrower Sponsor”). The non-recourse carveout guarantor for the BioMed 2024 Portfolio 2 Whole Loan is BRE Edison L.P. Legal counsel to the borrowers delivered a non-consolidation opinion in connection with origination of the BioMed 2024 Portfolio 2 Whole Loan.
BioMed Realty (“BioMed”), a Blackstone portfolio company, is a leading provider of real estate solutions to the life science and technology industries. BioMed owns and operates high quality life science real estate comprising 16.1 million square feet concentrated in leading innovation markets throughout the United States and United Kingdom, including Boston/Cambridge, San Francisco, San Diego, Seattle, Boulder and Cambridge, U.K. In addition, BioMed maintains a premier development platform with 2.7 million square feet of Class A properties in active construction, to meet the growing demand of the life science industry.
The Properties. The BioMed 2024 Portfolio 2 Properties are comprised of eight properties totaling approximately 995,458 square feet and 447 parking stalls, including seven lab/office properties and one parking garage property. Geographically, the BioMed 2024 Portfolio 2 Properties span two states and three key life science submarkets: Mid Cambridge, Boston (four properties, 58.8% of UW NOI), Peninsula, San Francisco (one property, 21.5% of UW NOI), and University Towne Center, San Diego (3 properties, 19.7% of UW NOI).
As of the underwritten rent roll dated April 12, 2024, the BioMed 2024 Portfolio 2 Properties are 93.8% leased to 14 individual tenants, with a weighted average remaining lease term of 5.9 years. Tenancy across the BioMed 2024 Portfolio 2 Properties is generally comprised of biotech and life science companies including a mix of publicly traded, investment grade rated and privately held companies. Approximately 48.2% of the BioMed 2024 Portfolio 2 Properties NRA is leased to investment-grade tenants, with the largest tenant, Illumina, Inc. (rated Baa3/BBB/BBB by Moody’s/S&P/Fitch), representing 20.8% of underwritten rent. Several of the BioMed 2024 Portfolio 2 Properties serve as mission critical research and development facilities for the underlying tenancy as certain properties serve as domestic headquarters for companies such as Intellia Therapeutics, Inc. and Poseida Therapeutics, Inc.
Additionally, the BioMed 2024 Portfolio 2 Properties benefit from their rollover profile as evidenced by only 26.7% of NRA and 36.4% of underwritten rent expiring during the term of the BioMed 2024 Portfolio 2 Whole Loan. No greater than 9.9% of Portfolio NRA or 15.3% of underwritten rent is subject to roll during any single year during the term of the BioMed 2024 Portfolio 2 Whole Loan. Additionally, 36.2% of the BioMed 2024 Portfolio 2 Properties’ NRA is comprised of leases expiring in 2033. More importantly, among those tenants rolling during the term of the BioMed 2024 Portfolio 2 Whole Loan, UW rent is on average approximately 12.0% below the appraiser concluded market rents, offering potential mark-to-market opportunity.
The BioMed 2024 Portfolio 2 Properties are further categorized into three groups: (i) two properties included in the LIFE 2021-BMR securitization transaction (the “BMR Same-Store Properties”), (ii) three properties included in the DBGS 2018-BIOD securitization transaction (the “BIOD Same-Store Properties”), and (iii) three properties currently encumbered with balance sheet financing. Since the closing of the LIFE 2021-BMR securitization transaction, the BMR Same-Store Properties have achieved UW NOI growth of approximately 42.7%. Similarly, the BIOD Same-Store Properties have achieved UW NOI growth of approximately 27.7% since the DBGS 2018-BIOD securitization transaction.
| This is not a research report and was not prepared by any Underwriter’s research department. Please see additional important information and qualifications at the end of this Term Sheet. |
| | T-41 | |
| Various – Various | Loan #4 | Cut-off Date Balance: | | $80,000,000 |
| Various | BioMed 2024 Portfolio 2 | Cut-off Date LTV: | | 50.1% |
| Various | | UW NCF DSCR: | | 2.34x |
| | | UW NOI Debt Yield: | | 13.1% |
The following table presents a portfolio summary with respect to the BioMed 2024 Portfolio 2 Mortgage Loan.
| Portfolio Summary |
| Property Name | City, State | Property Sub-Type | Year Built / Year Renovated | NRA(1) | % of Portfolio NRA(1) | Leased %(1) | Wtd. Avg. Remaining Lease Term (Yrs)(1) | UW NOI ($MM)(1) | % of Portfolio UW NOI(1) |
| 200 Sidney | Cambridge, MA | Lab/Office | 2000 / 2016 | 188,616 | 18.9% | 100.0% | 4.9 | $24.3 | 33.7% |
| Lincoln Centre | Foster City, CA | Lab/Office | 2017 / NAP | 360,000 | 36.2% | 100.0% | 8.8 | $15.5 | 21.5% |
| 40 Erie Street | Cambridge, MA | Lab/Office | 1996 / 2015 | 106,638 | 10.7% | 100.0% | 2.5 | $10.6 | 14.7% |
| 4570 Executive Drive | San Diego, CA | Lab/Office | 2000 / 2019 | 125,550 | 12.6% | 91.6% | 1.7 | $8.4 | 11.6% |
| 21 Erie Street | Cambridge, MA | Lab/Office | 1925 / 2018 | 51,914 | 5.2% | 100.0% | 6.3 | $5.3 | 7.4% |
9360-9390 Towne Centre
Drive | San Diego, CA | Lab/Office | 1990 / 2020 | 147,577 | 14.8% | 65.6%(2) | 5.6 | $4.9 | 6.8% |
47 Erie Street Parking
Structure | Cambridge, MA | Parking Garage | 1997 / NAP | NAP | NAP | NAP | NAP | $2.2 | 3.0% |
| Eastgate Mall | San Diego, CA | Lab/Office | 1989 / 2020 | 15,163 | 1.5% | 100.0% | 5.4 | $0.9 | 1.2% |
| Total/Wtd. Avg. | | | | 995,458 | 100.0% | 93.8% | 5.9 | $72.1 | 100.0% |
| (1) | Information is based on the underwritten rent roll as of April 12, 2024. |
| (2) | Biosplice Therapeutics, Inc. currently leases 76,172 SF at 9360-9390 Towne Centre Drive and subleases 25,391 SF to BioMed Realty, L.P. The remaining 50,781 square feet of non-subleased space was not being utilized by Biosplice Therapeutics, Inc. at the time or origination and, therefore, the lender underwriting considers this 50,781 square feet to be vacant. |
Major Tenants.
Illumina, Inc. (“Illumina”) (Baa3/BBB/BBB by Moody’s/S&P/Fitch; 360,000 square feet; 36.2% of NRA; 20.8% of underwritten rent) (NASDAQ: ILMN) is considered a global leader in sequencing and array-based solutions for genetic and genomic analysis with products servicing customers across several markets. Illumina’s customers include leading genomic research centers, academic institutions, government laboratories and hospitals, as well as pharmaceutical, biotechnology, commercial molecular diagnostic laboratories and consumer genomics companies. Illumina’s leases expire in January 2033 and November 2033.
Illumina subleases a total of 133,800 square feet to three distinct sub-tenants at the Lincoln Center property. The weighted average sub-lease rent represents a premium to the in-place contractual rent under the Illumina lease. The lender underwriting is reflective of the in-place contractual rent under the Illumina prime lease. Though not accounted for in the lender underwriting, this premium in sublease rents underscores the strong demand and robust market conditions in the area, as well as a significant mark-to-market opportunity.
AbbVie Inc. (“AbbVie”) (A3/A-/NR by Moody’s/S&P/Fitch; 119,980 square feet; 12.1% of NRA) (NYSE: AABV) is a global, research-based pharmaceutical company with products across immunology, oncology, aesthetics, neuroscience and eye care. AbbVie serves patients in over 175 countries and provides treatments for over 75 conditions. AbbVie employed approximately 50,000 employees in over 70 countries as of January 31, 2024. AbbVie leases 57,850 square feet with a lease expiration of July 2028 and 62,130 square feet with a lease expiration of October 2029. A portion of the space leased through October 2029 was a recent extension by AbbVie.
Seres Therapeutics, Inc. (“Seres Therapeutics”) (68,636 square feet; 6.9% of NRA; 13.1% of underwritten rent) (NASDAQ: MCRB) operates as a microbiome therapeutics platform company that focuses on developing biological drugs designed to treat disease by modulating the microbiome to restore health and repair the function of a disrupted microbiome to a non-disease state. Seres Therapeutics’ first drug VOWST was approved by the U.S. Food and Drug Administration to prevent Clostridioides difficile infection. Seres Therapeutics current lease expires in January 2030.
| This is not a research report and was not prepared by any Underwriter’s research department. Please see additional important information and qualifications at the end of this Term Sheet. |
| | T-42 | |
| Various – Various | Loan #4 | Cut-off Date Balance: | | $80,000,000 |
| Various | BioMed 2024 Portfolio 2 | Cut-off Date LTV: | | 50.1% |
| Various | | UW NCF DSCR: | | 2.34x |
| | | UW NOI Debt Yield: | | 13.1% |
The following table presents certain information relating to the tenancy at the BioMed 2024 Portfolio 2 Properties:
| Tenant Summary(1)(2)(3) |
| Tenant Name | Property | Credit Rating (Moody’s/ S&P/Fitch)(4) | Tenant SF | Approx. % of SF | Annual UW Rent | % of Annual UW Rent | Annual UW Rent PSF | Lease Exp.(5) |
| Major Tenants | | | | | | | | |
| Illumina | Lincoln Centre | Baa3/BBB/BBB | 360,000 | 36.2% | $13,694,400 | 20.8% | $38.04 | 1/15/2033 |
| AbbVie | 200 Sidney | A3/A-/NR | 119,980 | 12.1% | (6) | (6) | (6) | (6) |
| Seres Therapeutics | 200 Sidney | NR/NR/NR | 68,636 | 6.9% | $8,624,800 | 13.1% | $125.66 | 1/13/2030 |
| Intellia Therapeutics, Inc. | 40 Erie Street | NR/NR/NR | 65,319 | 6.6% | $5,626,579 | 8.5% | $86.14 | 9/30/2026 |
| MIL 21E, LLC | 21 Erie Street | NR/NR/NR | 51,914 | 5.2% | $5,081,861 | 7.7% | $97.89 | 11/30/2030 |
| Poseida Therapeutics, Inc. | Various(7) | NR/NR/NR | 86,568 | 8.7% | $4,858,415 | 7.4% | $56.12 | 12/31/2029 |
| Human Longevity, Inc. | 4570 Executive Drive | NR/NR/NR | 48,049 | 4.8% | $3,882,840 | 5.9% | $80.81 | 9/12/2025 |
| BioMed Realty, L.P. | 4570 Executive Drive | NR/NR/NR | 49,912 | 5.0% | $2,696,246 | 4.1% | $54.02 | 6/22/2025 |
| Subtotal/Wtd. Avg. | | | 850,378 | 85.4% | | | | |
| | | | | | | | | |
| Other Tenants(8) | | | 83,716(9) | 8.4%(9) | (6) | (6) | (6) | |
| Occupied Subtotal/Wtd. Avg. | | | 934,094 | 93.8% | $65,911,829 | 100.0% | $70.56 | |
| | | | | | | | | |
| Vacant Space | | | 61,364 | 6.2% | | | | |
| Total/Wtd. Avg. | | | 995,458 | 100.0% | | | | |
| (1) | Information is based on the underwritten rent roll as of April 12, 2024, inclusive of rent steps through May 31, 2025. |
| (2) | Certain tenants reflected in the chart above, although paying rent, are not in occupancy with respect to all or a portion of their leased space and in those cases such space is currently “dark”, and/or have the option to terminate all or a portion of their leased space prior to the lease expiration date. See “RISK FACTORS—Certain Tenants Have the Right to Terminate Their Leases or Go “Dark” at Any Time” and “Description of the Mortgage Pool-Mortgage Pool Characteristics-Tenant Issues-Lease Expirations and Terminations” in the Prospectus for more information regarding the foregoing and related tenant issues. |
| (3) | Certain tenants reflected in the chart above may sublease square feet with respect to all or a portion of their leased space. See “RISK FACTORS—Certain Tenants Have the Right to Terminate Their Leases or Go “Dark” at Any Time” and “Description of the Mortgage Pool-Mortgage Pool Characteristics-Tenant Issues-Other” in the Prospectus for more information regarding the foregoing and related tenant issues. Illumina, Inc. subleases 87,205 square feet to Confidential Subtenant 1 and 41,600 square feet to Confidential Subtenant 2, each at the Lincoln Centre property. Human Longevity, Inc. subleases 25,394 square feet at the 4570 Executive Drive property to Neogenomics at a rental rate of $64.56 per square foot NNN. |
| (4) | Certain ratings are those of the parent company whether or not the parent guarantees the lease. |
| (5) | For tenants with multiple leases throughout the BioMed 2024 Portfolio 2 Properties, the Lease Exp. shown represents the earliest expiration. |
| (6) | UW Rent and Lease Exp. information for AbbVie Inc. and the Other Tenants has been redacted for confidentiality reasons. |
| (7) | Poseida Therapeutics, Inc. occupies approximately 71,405 square feet at 9360-9390 Towne Centre Drive and approximately 15,163 square feet at Eastgate Mall. |
| (8) | Other Tenant SF is inclusive of 25,391 square feet subleased to BioMed Realty by Biosplice Therapeutics, Inc. Biosplice Therapeutics, Inc. currently leases 76,172 SF at 9360-9390 Towne Centre Drive but at the time of origination, was not utilizing the non-subleased space (50,781 square feet). For underwriting purposes, the lender has treated the non-subleased space as vacant. |
| (9) | Includes Biosplice Therapeutics, Inc., which subleases 25,391 square feet at 9360-9390 Towne Centre Drive to BioMed Realty, L.P. at a rental rate of approximately $56.37 per square foot NNN. |
The following table presents certain information relating to the lease rollover schedule at the BioMed 2024 Portfolio 2 Properties:
| Lease Rollover Schedule(1)(2) |
| Year | # of Leases Rolling | SF Rolling | Approx. % of SF Rolling | Approx. Cumulative % of SF Rolling | Total UW Rent Rolling | Approx. % of Total UW Rent Rolling | Approx. Cumulative % of Total UW Rent Rolling | UW Rent PSF Rolling |
| MTM/2024 | 0 | 0 | 0.0% | 0.0% | $0 | 0.0% | 0.0% | $0.00 |
| 2025 | 3 | 98,435 | 9.9% | 9.9% | $7,190,219 | 10.9% | 10.9% | $73.05 |
| 2026 | 3 | 82,325 | 8.3% | 18.2% | $6,774,994 | 10.3% | 21.2% | $82.30 |
| 2027 | 0 | 0 | 0.0% | 18.2% | $0 | 0.0% | 21.2% | $0.00 |
| 2028 | 2 | 84,656 | 8.5% | 26.7% | $10,055,763 | 15.3% | 36.4% | $118.78 |
| 2029 | 3 | 149,304 | 15.0% | 41.7% | $11,972,980 | 18.2% | 54.6% | $80.19 |
| 2030 | 4 | 159,374 | 16.0% | 57.7% | $16,223,473 | 24.6% | 79.2% | $101.79 |
| 2031 | 0 | 0 | 0.0% | 57.7% | $0 | 0.0% | 79.2% | $0.00 |
| 2032 | 0 | 0 | 0.0% | 57.7% | $0 | 0.0% | 79.2% | $0.00 |
| 2033 | 2 | 360,000 | 36.2% | 93.8% | $13,694,400 | 20.8% | 100.0% | $38.04 |
| 2034 & Thereafter | 0 | 0 | 0.0% | 93.8% | $0 | 0.0% | 100.0% | $0.00 |
| Vacant | 0 | 61,364 | 6.2% | 100.0% | $0 | 0.0% | 100.0% | $0.00 |
| Total/Wtd. Avg. | 17 | 995,458 | 100.0% | | $65,911,829 | 100.0% | | $66.21 |
| (1) | Information is based on the underwritten rent roll as of April 12, 2024, inclusive of contractual rent steps through May 31, 2025. |
| (2) | Certain tenants may have lease termination options that are exercisable prior to the originally stated expiration date of the related lease and are not considered in the lease rollover schedule. |
| This is not a research report and was not prepared by any Underwriter’s research department. Please see additional important information and qualifications at the end of this Term Sheet. |
| | T-43 | |
| Various – Various | Loan #4 | Cut-off Date Balance: | | $80,000,000 |
| Various | BioMed 2024 Portfolio 2 | Cut-off Date LTV: | | 50.1% |
| Various | | UW NCF DSCR: | | 2.34x |
| | | UW NOI Debt Yield: | | 13.1% |
The Markets.
Boston – Cambridge Market. Four properties, comprising a total of 347,168 square feet, are located in the Boston – Cambridge life science market, comprising a total of 347,168 square feet and contributing approximately $42.4 million (approximately 58.8%) of UW NOI. The Boston – Cambridge life science market includes the largest property in the BioMed 2024 Portfolio 2 Whole Loan, 200 Sidney (33.7% of UW NOI), which is 100.0% leased to AbbVie Inc. (rated A3/A-/NR by Moody’s/S&P/Fitch, 63.6% of the property’s NRA) and Seres Therapeutics, Inc. (36.4% of the property’s NRA).
The Boston - Cambridge market has been considered one of the most innovative life science cities in the world according to a third-party market report. Cambridge has provided leading healthcare and biotechnology firms with supportive infrastructure, access to top academic institutions, state-of-the-art laboratories and funding from leading venture capital firms. The life science corridor within the greater Boston area is home to over 500 companies, including some of the largest biopharmaceutical companies in the world. In 2023, biopharma companies with headquarters in Massachusetts received approximately $7.7 billion in venture capital funding, which is an increase from the pre-COVID-19 pandemic amount of $5.5 billion. The 2023 venture capital funding for biopharma companies with headquarters in Massachusetts represented approximately 31% of all national venture capital investments, an increase from the 2022 total of approximately 25%. Across Massachusetts, nearly 2,000 drugs are in the development pipeline, and over 800 drugs are in stages of clinical trials, which represents 14.9% of the national pipeline (second only to California). Access to talent differentiates the Boston market. With over 80 colleges and universities nearby, the Boston market represents the largest concentration of college students in the nation. Boston is also home to 22 world-renowned hospitals and some of the top medical schools in the country, including Harvard Medical School, Tufts University School of Medicine and Boston University Chobanian & Avedisian School of Medicine. In the first quarter of 2024, triple-net market rents within the East and Mid Cambridge submarket were reported at $110.20 per square foot. Due to the lack of available and developable land, the vacancy rates within the East and Mid Cambridge submarket remain low as the submarket appears insulated from new supply.
San Francisco Market. Located within the San Francisco life science market, the Lincoln Centre property comprises a total of 360,000 square feet and contributes approximately $15.5 million (approximately 21.5%) of UW NOI.
Centrally located in the San Francisco Peninsula submarket, the Lincoln Centre property provides access to leading biotech clusters and research institutions in the Bay Area. According to a third-party market report, San Francisco is the second largest life science market in the United States and encompasses approximately 36 million square feet of lab space. The Bay Area is considered the “birthplace of biotechnology.” In 1976, Genetech, the world’s first biotech company, was founded in San Francisco. The Bay Area has since been home to one of the largest biotech clusters in the world as it comprises over 250 companies and features a workforce developed from top academic institutions nearby. The largest companies in the life science industry, including Roche (Genentech), Gilead, Illumina, Merck, Amgen, Abbott and the life science arm of Google (Verily), have established a presence in the Bay Area. The San Francisco life science market features one of the densest concentrations of qualified life science professionals and has benefitted from the research, innovation, and talent pool from nearby universities with life science incubators, such as Stanford, UC San Francisco, and UC Berkeley. As of the fourth quarter of 2023, the monthly average asking rents in the Bay Area life science market remain near all-time highs. As of the second quarter of 2023, life science companies in the San Francisco Bay Area life science market employed over 116,000. Biotech venture capital funding in the Bay Area market increased in the fourth quarter of 2023, recording $2.06 billion in capital raised, which is an increase from the $1.91 billion in the third quarter of 2023 and $2.01 billion in the fourth quarter of 2022.
San Diego Market. Three properties within the BioMed 2024 Portfolio 2 Mortgage Loan are located in the San Diego life science market, comprising a total of 288,290 square feet and contributing approximately $14.2 million (approximately 19.7%) of UW NOI.
According to a third-party market report, the San Diego life science market, often referred to as “Biotech Beach,” is recognized as one of the leading life science markets globally. As the third largest biotech cluster in the United States, the San Diego market has been a focus of major life science REITs and real estate investment due to its research institutions and investment activity from venture capital. The San Diego life science cluster is anchored by UC San Diego and the Scripps Research Institute, among other research institutes. The life science industry remains a cornerstone of San Diego’s economic landscape as the industry employs over 77,000 individuals across over 2,000 companies. The San Diego market’s demand for life science facilities, along with the lack of available space and rising constructions costs, has led to several office and flex conversion plans in order to repurpose properties into life science space. In March 2024, Pfizer signed a 15-year, approximately 230,000 SF lease for its oncology division at a complex along the San Diego coast. Pfizer’s lease marks the largest life science lease in 2024 and the lease is more than twice the size of 2023’s largest lease in the San Diego life science market. Since 2019, San Diego has received at least $1 billion in NIH funding per year. In 2022, San Diego received a record $1.2 billion.
| This is not a research report and was not prepared by any Underwriter’s research department. Please see additional important information and qualifications at the end of this Term Sheet. |
| | T-44 | |
| Various – Various | Loan #4 | Cut-off Date Balance: | | $80,000,000 |
| Various | BioMed 2024 Portfolio 2 | Cut-off Date LTV: | | 50.1% |
| Various | | UW NCF DSCR: | | 2.34x |
| | | UW NOI Debt Yield: | | 13.1% |
The following table presents certain market rent conclusions for the BioMed 2024 Portfolio 2 Properties:
| Market Rent Conclusions(1) |
| Property | Appraiser Concluded Market Rent | UW Rent PSF(2) | Delta |
| 200 Sidney | $115.00 | $121.13 | 5.3% |
| Lincoln Centre | $75.00 | $38.04 | -49.3% |
| 40 Erie Street | $110.00 | $96.32 | -12.4% |
| 4570 Executive Drive | $79.20 | $67.21 | -15.1% |
| 21 Erie Street | $105.00 | $97.89 | -6.8% |
| 9360-9390 Towne Centre Drive | $78.00 | $56.05 | -28.1% |
| Eastgate Mall | $78.00 | $57.00 | -26.9% |
| Wtd. Avg.(3) | $97.41 | $85.69 | -12.0% |
|
| (1) | Information obtained from the appraisal. |
| (2) | Based on the underwritten rent roll as of April 12, 2024, inclusive of contractual rent increases through May 31, 2025. |
| (3) | Wtd. Avg. is calculated based on UW rent of the respective property. |
Appraisals. The appraisals concluded an aggregate “as-is” value of $1,098,200,000 as of various dates in April 2024, which reflects the aggregate as-is appraised value of the individual BioMed 2024 Portfolio 2 Properties, exclusive of any portfolio premium.
Environmental Matters. According to the Phase I environmental site assessments, as of various dates in April 2024, there was no evidence of any recognized environmental l conditions at the BioMed 2024 Portfolio 2 Properties.
Operating History and Underwritten Net Cash Flow. The following table presents certain information relating to the historical operating performance and Underwritten Net Cash Flow at the BioMed 2024 Portfolio 2 Properties:
| Cash Flow Analysis(1) |
| | 2021(2) | 2022(2) | 2023(2) | TTM March 2024(2) | Lender UW(3) | UW PSF |
| Base Rent | $53,692,596 | $56,896,650 | $57,041,567 | $58,184,829 | $62,811,907 | $63.10 |
| Rent Steps | $0 | $0 | $0 | $0 | $3,099,922 | $3.11 |
| Credit Tenant Rent Steps | $0 | $0 | $0 | $0 | $2,861,326 | $2.87 |
| Vacant Income | $0 | $0 | $0 | $0 | $6,259,328 | $6.29 |
| Gross Potential Rent | $53,692,596 | $56,896,650 | $57,041,567 | $58,184,829 | $75,032,482 | $75.37 |
| Recoveries | $21,774,462 | $21,833,220 | $23,186,569 | $23,003,034 | $24,652,742 | $24.77 |
| Gross Income | $75,467,058 | $78,729,870 | $80,228,136 | $81,187,863 | $99,685,224 | $100.14 |
| Vacancy | $0 | $0 | $0 | $0 | ($6,259,328) | ($6.29) |
| Parking | $3,479,391 | $3,767,727 | $4,244,294 | $4,282,083 | $4,282,083 | $4.30 |
| Effective Gross Income | $78,946,449 | $82,497,597 | $84,472,430 | $85,469,946 | $97,707,980 | $98.15 |
| | | | | | | |
| Real Estate Taxes | $11,269,448 | $10,764,291 | $10,923,225 | $10,775,914 | $11,684,665 | $11.74 |
| Insurance | $993,631 | $913,919 | $992,586 | $1,087,161 | $591,533 | $0.59 |
| Other Operating Expenses | $11,400,571 | $12,132,197 | $13,401,285 | $13,358,667 | $13,349,615 | $13.41 |
| Total Operating Expenses | $23,663,650 | $23,810,406 | $25,317,096 | $25,221,741 | $25,625,813 | $25.74 |
| | | | | | | |
| Net Operating Income | $55,282,799 | $58,687,190 | $59,155,334 | $60,248,205 | $72,082,166 | $72.41 |
| Replacement Reserves | $0 | $0 | $0 | $0 | $66,915 | $0.07 |
| TI/LC | $0 | $0 | $0 | $0 | $497,729 | $0.50 |
| Net Cash Flow | $55,282,799 | $58,687,190 | $59,155,334 | $60,248,205 | $71,517,523 | $71.84 |
| | | | | | | |
| Occupancy (%) | 100.0% | 100.0% | 98.8% | 98.9% | 93.7% | |
| NOI DSCR(4) | 1.81x | 1.92x | 1.93x | 1.97x | 2.36x | |
| NCF DSCR(4) | 1.81x | 1.92x | 1.93x | 1.97x | 2.34x | |
| NOI Debt Yield(4) | 10.1% | 10.7% | 10.8% | 11.0% | 13.1% | |
| NCF Debt Yield(4) | 10.1% | 10.7% | 10.8% | 11.0% | 13.0% | |
| (1) | Based on the underwritten rent roll as of April 12, 2024, inclusive of (i) contractual rent increases through May 31, 2025, and (ii) straight line rent for investment grade tenants. |
| (2) | Historical and underwritten cash flows have been adjusted to remove free rent and concessions. |
| (3) | Lender UW Base Rent accounts for newly executed lease signings and excludes any free rent. |
| (4) | NOI DSCR, NCF DSCR, NOI Debt Yield and NCF Debt Yield are based on the BioMed 2024 Portfolio 2 Senior Notes. |
| This is not a research report and was not prepared by any Underwriter’s research department. Please see additional important information and qualifications at the end of this Term Sheet. |
| | T-45 | |
| Various – Various | Loan #4 | Cut-off Date Balance: | | $80,000,000 |
| Various | BioMed 2024 Portfolio 2 | Cut-off Date LTV: | | 50.1% |
| Various | | UW NCF DSCR: | | 2.34x |
| | | UW NOI Debt Yield: | | 13.1% |
Escrows and Reserves.
Real Estate Taxes – During the continuance of a Cash Sweep Period (as defined below), the borrowers are required to deposit on each payment date 1/12th of an amount that the lender reasonably estimates will be payable for taxes during the next ensuing 12 months.
Insurance – During the continuance of a Cash Sweep Period, the borrowers are required to escrow 1/12th of the annual estimated insurance payments on a monthly basis, unless no event of default is continuing and the BioMed 2024 Portfolio 2 Properties are insured under a blanket policy meeting the requirements set forth in the related loan agreement (in which case, no insurance escrows will be required).
Unfunded Obligations Reserve – On the loan origination date, the borrowers were required to make an upfront deposit of $3,569,740 into a reserve for unfunded obligations for the amounts of outstanding free rent, unfunded tenant improvement allowances and leasing commissions.
Rollover Reserve - During the continuance of a Cash Sweep Period, if the amount in the rollover reserve account is less than an amount equal to $1 multiplied by the aggregate square footage (excluding the rentable square footage attributable to the parking garage property) (the “Rollover Reserve Cap”), the borrowers will be required to deposit on each payment date an amount equal to 1/12th of the Rollover Reserve Cap (or such lesser amount which would cause the amounts on deposit in the rollover reserve account to equal the Rollover Reserve Cap).
Lockbox and Cash Management. The BioMed 2024 Portfolio 2 Whole Loan is structured with a hard lockbox and springing cash management. The borrowers are required to deposit, or cause to be deposited, all revenues derived from the BioMed 2024 Portfolio 2 Properties into restricted accounts (each, a “Lockbox Account”) in the name of certain of the borrowers for the benefit of the lender to the extent set forth in the BioMed 2024 Portfolio 2 Whole Loan documents. During a Cash Sweep Period, funds on deposit in the Lockbox Accounts are required to be transferred to a single segregated account held in trust and for the benefit of the lender (the “Cash Management Account”). If a Cash Sweep Period does not exist, the borrowers have access to the Lockbox Account and may direct funds be transferred to an account designated by the borrowers which is not pledged as security for the BioMed 2024 Portfolio 2 Whole Loan or the mezzanine loan.
“Cash Sweep Period” means a period commencing upon the earliest to occur of: (i) an event of default; (ii) certain bankruptcy or insolvency events with respect to the borrowers; (iii) the debt yield falling below 7.00% for two consecutive calendar quarters immediately preceding the applicable debt yield determination date set forth in the BioMed 2024 Portfolio 2 Whole Loan documents (a “Debt Yield Trigger Event”) or (iv) an event of default under the mezzanine loan documents; and expiring upon (w) with respect to clause (i) above, such event of default is no longer continuing; (x) with respect to clause (ii) above, and only in the event of an involuntary bankruptcy action that was not consented to by a borrower or its general partner or managing member, as applicable, such bankruptcy action is discharged, stayed or dismissed within 90 days of the filing of such bankruptcy action; (y) with respect to clause (iii) above, (1) the debt yield is equal to or greater than 7.00% on the first day of each of two consecutive calendar quarters, (2) immediately upon the borrowers’ and/or the mezzanine borrower’s prepayment of the BioMed 2024 Portfolio 2 Whole Loan and/or the mezzanine loan, as applicable, in an amount (the “Trigger Prepayment Amount”) such that the debt yield is equal to 7.00% without any obligation to wait two consecutive quarters or (3) borrowers deliver to lender cash or a letter of credit in an amount equal to the amount by which net operating income would need to increase in order to achieve a debt yield equal to 7.00% (as applicable, “Debt Yield Cure Collateral”), which such Debt Yield Cure Collateral will be held by lender in escrow as additional collateral for the BioMed 2024 Portfolio 2 Whole Loan and the mezzanine borrower delivers to the mezzanine lender cash or a letter of credit in an amount equal to lender’s allocation (as defined in the mezzanine loan agreement) of the Debt Yield Cure Collateral amount (the “Mezzanine Debt Yield Cure Collateral”), which Debt Yield Cure Collateral will be held by mezzanine lender in escrow as additional collateral for the mezzanine loan, and is required to be returned to the borrowers by the lender and be returned to the mezzanine borrower by mezzanine lender upon the earlier of (A) the occurrence of a Debt Yield Trigger Event cure pursuant to clause (1) or (2) above or (4) below (provided that no other Cash Sweep Period is then in effect), and (B) the repayment of the BioMed 2024 Portfolio 2 Whole Loan or the mezzanine loan debt, as applicable, in full or (4) the guarantor delivers to the lender a guaranty in an amount equal to the lender’s allocation of the Trigger Prepayment Amount, and (z) with respect to clause (iv) above, such mezzanine loan default is no longer continuing. For the avoidance of doubt, the Debt Yield Cure Collateral cannot be applied by the Lender and the debt yield guaranty may not be drawn on by the lender to satisfy any portion of the BioMed 2024 Portfolio 2 Whole Loan other than during the continuance of a Priority Payment Cessation Event (as defined below). In the event the Debt Yield Trigger Event cure is achieved by delivery of the Debt Yield Cure Collateral to the lender and delivery of the Mezzanine Debt Yield Cure Collateral to the mezzanine lender, the applicable Debt Yield Trigger Event will cease upon delivery of such Debt Yield Cure Collateral to the lender and such Mezzanine Debt Yield Cure Collateral to the mezzanine lender without any obligation to wait two consecutive calendar quarters.
“Priority Payment Cessation Event” means (a) the acceleration of the BioMed 2024 Portfolio 2 Whole Loan during the continuance of an event of default, (b) the initiation of (x) judicial or nonjudicial foreclosure proceedings, (y) proceedings for appointment of a receiver or (z) similar remedies permitted by the BioMed 2024 Portfolio 2 Whole Loan documents relating to all or a material portion of the applicable BioMed 2024 Portfolio 2 Property, and/or (c) the imposition of a stay, an injunction or a similar judicially imposed device that has the effect of preventing the lender from exercising its remedies under the BioMed 2024 Portfolio 2 Whole Loan documents.
| This is not a research report and was not prepared by any Underwriter’s research department. Please see additional important information and qualifications at the end of this Term Sheet. |
| | T-46 | |
| Various – Various | Loan #4 | Cut-off Date Balance: | | $80,000,000 |
| Various | BioMed 2024 Portfolio 2 | Cut-off Date LTV: | | 50.1% |
| Various | | UW NCF DSCR: | | 2.34x |
| | | UW NOI Debt Yield: | | 13.1% |
Release of Properties. The borrowers may at any time obtain the release of an individual BioMed 2024 Portfolio 2 Property from the lien of the BioMed 2024 Portfolio 2 Whole Loan and the release of the applicable borrower’s obligations under the BioMed 2024 Portfolio 2 Whole Loan documents with respect to the released BioMed 2024 Portfolio 2 Property, subject to the satisfaction of certain conditions, including, but not limited to, (i) payment of the applicable Release Amount (as defined below) together with any Yield Maintenance Premium (defined below) then required, (ii) after giving effect to such release, the debt yield of the BioMed 2024 Portfolio 2 Whole Loan as of the determination date immediately preceding such release is greater than or equal to 9.66% and (iii) compliance with certain REMIC provisions. Notwithstanding the foregoing, if the foregoing debt yield requirement is not satisfied and the release of such BioMed 2024 Portfolio 2 Property is in connection with an arms-length transaction to a third party, the borrowers may release such BioMed 2024 Portfolio 2 Property upon payment to the lender of an amount equal to the lesser of (i) 100% of the net sales proceeds derived from the sale of such BioMed 2024 Portfolio 2 Property and (ii) the greater of (x) the applicable Release Amount for such BioMed 2024 Portfolio 2 Property together with any Yield Maintenance Premium then required and (y) an amount necessary to, after giving effect to such release, satisfy the foregoing debt yield requirement, together with any Yield Maintenance Premium then required. In connection with any release where the amount to be prepaid is less than the Mortgage ALA (defined below) for such BioMed 2024 Portfolio 2 Property, the Mortgage ALA for each BioMed 2024 Portfolio 2 Property that will remain subject to the lien of the BioMed 2024 Portfolio 2 Whole Loan documents will each be increased on a pro rata basis by the amount of such shortfall, provided that to the extent such increase will require amending any mortgage which contains a cap on the amount secured by such mortgage that is less than the reallocated Mortgage ALA, the borrowers will pay the cost of any mortgage recording tax.
“Release Amount” means, for a BioMed 2024 Portfolio 2 Property, the lesser of (a) the outstanding principal amount of the BioMed 2024 Portfolio 2 Whole Loan (plus interest and any other amounts that may be due) and (b) the product of the allocated mortgage loan amount (“Mortgage ALA”) for such BioMed 2024 Portfolio 2 Property (as adjusted pursuant to the BioMed 2024 Portfolio 2 Whole Loan documents if applicable), multiplied by (i) 105%, until such time as the outstanding BioMed 2024 Portfolio 2 Whole Loan amount has been reduced to $501,715,790, and (ii) thereafter, 110%.
“Yield Maintenance Premium” means an amount equal to the greater of (a) one-half of one percent (0.50%) of the outstanding principal amount of such Note to be prepaid or satisfied and (b) the excess, if any, of (i) the sum of the present values of all then-scheduled payments of principal and interest in respect of the principal amount being prepaid under the Whole Loan assuming that all scheduled payments are made timely and that the remaining outstanding principal and interest on the BioMed 2024 Portfolio 2 Whole Loan is paid on February 9, 2029 (the “Permitted Par Prepayment Date”) (with each such payment and assumed payment discounted to its present value at the date of prepayment at the rate which, when compounded monthly, is equivalent to the prepayment rate when compounded semi-annually and deducting from the sum of such present values any short-term interest paid from the date of prepayment to the next succeeding payment date in the event such payment is not made on a payment date), over (ii) the principal amount being prepaid provided, with respect to any prepayment of any portion of the BioMed 2024 Portfolio 2 Whole Loan that is made after the payment date in January 2029 but prior to the Permitted Par Prepayment Date, the Yield Maintenance Premium will be zero.
Terrorism Insurance. The borrowers are required to obtain and maintain property insurance for 100% of full replacement cost and business interruption insurance for 24 months plus a 12-month extended period of indemnity. Such insurance is required to cover perils of terrorism and acts of terrorism. See “Risk Factors—Risks Relating to the Mortgage Loans—Terrorism Insurance May Not Be Available for All Mortgaged Properties” in the prospectus.
| This is not a research report and was not prepared by any Underwriter’s research department. Please see additional important information and qualifications at the end of this Term Sheet. |
| | T-47 | |
| Mixed Use – Office/Retail | Loan #5 | Cut-off Date Balance: | | $58,414,688 |
| 640 5th Avenue | 640 5th Avenue | Cut-off Date LTV: | | 41.6% |
| New York, NY 10022 | | UW NCF DSCR: | | 2.05x |
| | | UW NOI Debt Yield: | | 18.8% |

| This is not a research report and was not prepared by any Underwriter’s research department. Please see additional important information and qualifications at the end of this Term Sheet. |
| | T-48 | |
| Mixed Use – Office/Retail | Loan #5 | Cut-off Date Balance: | | $58,414,688 |
| 640 5th Avenue | 640 5th Avenue | Cut-off Date LTV: | | 41.6% |
| New York, NY 10022 | | UW NCF DSCR: | | 2.05x |
| | | UW NOI Debt Yield: | | 18.8% |
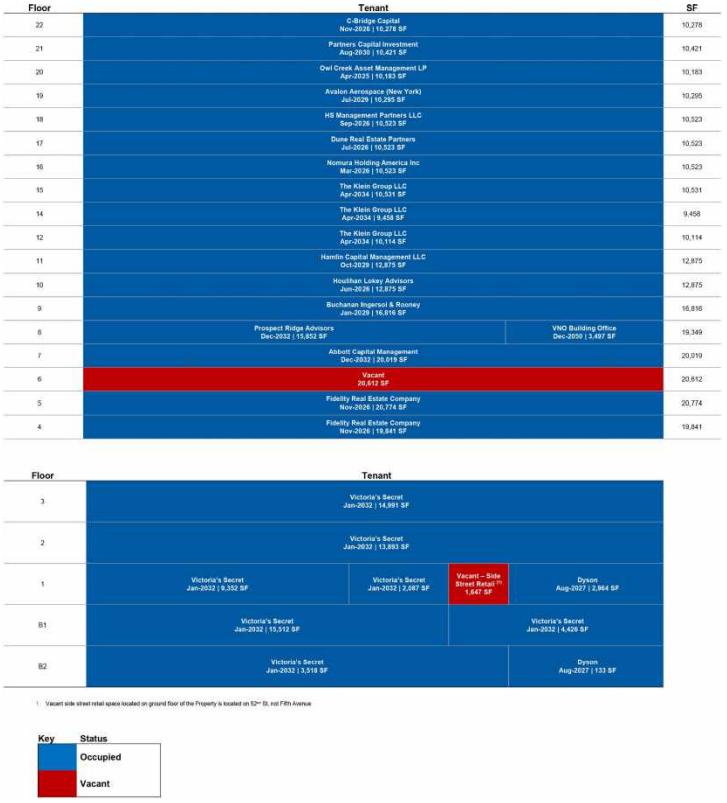
| This is not a research report and was not prepared by any Underwriter’s research department. Please see additional important information and qualifications at the end of this Term Sheet. |
| | T-49 | |
| Mixed Use – Office/Retail | Loan #5 | Cut-off Date Balance: | | $58,414,688 |
| 640 5th Avenue | 640 5th Avenue | Cut-off Date LTV: | | 41.6% |
| New York, NY 10022 | | UW NCF DSCR: | | 2.05x |
| | | UW NOI Debt Yield: | | 18.8% |
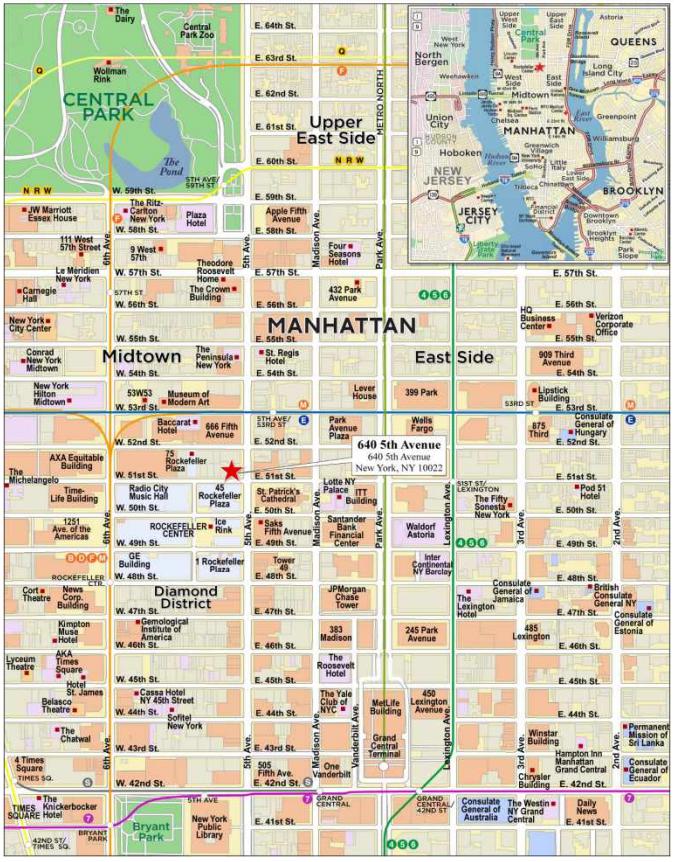
| This is not a research report and was not prepared by any Underwriter’s research department. Please see additional important information and qualifications at the end of this Term Sheet. |
| | T-50 | |
| Mortgage Loan No. 5 – 640 5th Avenue |
| Mortgage Loan Information | | Property Information |
| Mortgage Loan Seller: | MSMCH | | Single Asset/Portfolio: | Single Asset |
| Credit Assessment (Fitch/Moody’s/KBRA): | NR/NR/NR | | Location: | New York, NY 10022 |
| Original Balance(1): | $58,500,000 | | General Property Type: | Mixed Use |
| Cut-off Date Balance(1): | $58,414,688 | | Detailed Property Type: | Retail/Office |
| % of Initial Pool Balance: | 6.4% | | Title Vesting(4): | Fee/Leasehold |
| Loan Purpose: | Refinance | | Year Built/Renovated: | 1949/2003 |
| Borrower Sponsor: | Vornado Realty Trust | | Size: | 314,533 SF |
| Guarantor: | Manhattan High Street Holdings LP | | Cut-off Date Balance Per SF(1): | $952 |
| Mortgage Rate: | 6.1293333% | | Maturity Date Balance Per SF(1): | $872 |
| Note Date: | 6/10/2024 | | Property Manager: | Vornado Office Management LLC |
| Maturity Date: | 7/1/2029 | | | (borrower-related) |
| Term to Maturity: | 60 months | | Underwriting and Financial Information |
| Amortization Term(2): | NAP | | UW NOI: | $56,185,614 |
| IO Period: | 0 months | | UW NCF: | $48,532,770 |
| Seasoning: | 1 month | | UW NOI Debt Yield(1): | 18.8% |
| Prepayment Provisions: | L(25),D(28),O(7) | | UW NCF Debt Yield(1): | 16.2% |
| Lockbox/Cash Mgmt Status: | Hard/In Place | | UW NOI Debt Yield at Maturity(1): | 20.5% |
| Additional Debt Type(1): | Pari Passu / Mezzanine | | UW NCF DSCR(1): | 2.05x |
| Additional Debt Balance(1): | $241,500,000 / $100,000,000 | | Most Recent NOI: | $53,799,655 (12/31/2023) |
| Future Debt Permitted (Type): | No (NAP) | | 2nd Most Recent NOI: | $47,771,835 (12/31/2022) |
| | | 3rd Most Recent NOI: | $48,824,168 (12/31/2021) |
| Reserves(3) | | Most Recent Occupancy: | 92.9% (6/1/2024) |
| Type | Initial | Monthly | Cap | | 2nd Most Recent Occupancy: | 92.6% (12/31/2023) |
| RE Taxes: | $0 | Springing | NAP | | 3rd Most Recent Occupancy: | 93.4% (12/31/2022) |
| Insurance: | $0 | Springing | NAP | | Appraised Value (as of): | $720,000,000 (2/28/2024) |
| Replacement Reserve: | $0 | Springing | $195,217 | | Appraised Value per SF: | $2,289 |
| TI/LC Reserve: | $1,567,900 | $500,000 | $15,000,000 | | Cut-off Date LTV Ratio(1): | 41.6% |
| Free Rent Reserve: | $1,648,112 | $0 | NAP | | Maturity Date LTV Ratio(1): | 38.1% |
| | | | | | | | |
| Sources and Uses |
| Sources | Proceeds | % of Total | | Uses | Proceeds | % of Total |
| Whole Loan Amount(1): | $300,000,000 | 59.3% | | Loan Payoff: | $501,608,063 | 99.1% |
| Borrower Sponsor Equity: | $106,245,190 | 21.0% | | Upfront Reserves: | $3,216,012 | 0.6% |
| Mezzanine Loan Amount: | $100,000,000 | 19.8% | | Closing Costs: | $1,421,115 | 0.3% |
| Total Sources: | $506,245,190 | 100.0% | | Total Uses: | $506,245,190 | 100.0% |
| (1) | The 640 5th Avenue Mortgage Loan (as defined below) is part of the 640 5th Avenue Whole Loan (as defined below), with an aggregate original principal amount of $300,000,000. The Cut-off Date Balance Per SF, Maturity Date Balance Per SF, UW NOI Debt Yield, UW NCF Debt Yield, UW NOI Debt Yield at Maturity, UW NCF DSCR, Cut-off Date LTV Ratio and Maturity Date LTV Ratio numbers presented above are based on the 640 5th Avenue Whole Loan. The 640 5th Avenue Whole Loan and the 650 5th Avenue Mezzanine Loan (as defined below) are referred to herein as the “640 5th Avenue Total Debt.” With respect to the 640 5th Avenue Total Debt, the Cut-off Date Balance Per SF is $1,270, the Maturity Date Balance Per SF is $1,162, the UW NOI Debt Yield is 14.1%, the UW NOI Debt Yield at Maturity is 15.4%, the UW NCF DSCR is 1.31x, the Cut-off Date LTV Ratio is 55.5% and the Maturity Date LTV Ratio is 50.8%. |
| (2) | The 640 5th Avenue Whole Loan and the 640 5th Avenue Mezzanine Loan have fixed amortization for their entire 60-month loan terms. With respect to the 640 5th Avenue Whole Loan, the borrower is required to make payments on each monthly payment date, as follows: (x) principal in the amount of $437,500 and (y) the monthly interest payment. With respect to the 640 5th Avenue Mezzanine Loan, the mezzanine borrower is required to make payments on each monthly payment date as follows: (x) principal in the amount of approximately $145,833 and (y) the monthly interest payment. |
| (3) | See “Escrows and Reserves” below for further discussion of reserve information. |
| (4) | A prior owner of the 640 5th Avenue Property (as defined below) ground leased the 640 5th Avenue Property to the owner of the property located at 650 5th Avenue (the “Air Rights Tenant”), who subleased the 640 5th Avenue Property (other than development rights relating to one of the two buildings comprising the 640 5th Avenue Property, which were retained by the Air Rights Tenant) back to such prior owner of the 640 5th Avenue Property, solely for purposes of satisfying certain zoning requirements in connection with the transfer of such development rights to the Air Rights Tenant, as further described under “Description of the Mortgage Pool—Mortgage Pool Characteristics—Fee & Leasehold Estates; Ground Leases” in the prospectus. |
The Mortgage Loan. The fifth largest mortgage loan (the “640 5th Avenue Mortgage Loan”) is part of a whole loan (the “640 5th Avenue Whole Loan”) evidenced by eleven pari passu promissory notes with an aggregate original principal amount of $300,000,000. The 640 5th Avenue Whole Loan is secured by the borrower’s fee and leasehold interest in a 314,533 SF mixed-use property comprised of two abutting and interconnected buildings facing Fifth Avenue and West 52nd Street (other than development rights relating to the West 52nd Street building), respectively, located in New York, New York (the “640 5th Avenue Property”). The 640 5th Avenue Whole Loan was originated by Goldman Sachs Bank USA (“GSBI”), Bank of Montreal (“BMO”) and Morgan Stanley Bank, N.A. (“MSBNA”) on June 10, 2024. The 640 5th Avenue Mortgage Loan is evidenced by the non-controlling Note A-2-2, non-controlling Note A-3, and non-controlling Note A-4, with an aggregate original principal amount of $58,500,000. The 640 5th Avenue Whole Loan has fixed amortization, as described below, for the entire term and accrues interest on an actual/360 basis. The borrower is required to make payments on each monthly payment date for the 640 5th Avenue Whole Loan as follows: (x) principal in the amount of $437,500 and (y) the monthly interest payment. The 640 5th Avenue Whole Loan will be serviced pursuant to the pooling and servicing agreement for the BANK5 2024-5YR8 securitization trust. See “Description of the Mortgage Pool-The Whole Loans-The Serviced Pari Passu Whole Loans”, and “Pooling and Servicing Agreement” in the prospectus.
| This is not a research report and was not prepared by any Underwriter’s research department. Please see additional important information and qualifications at the end of this Term Sheet. |
| | T-51 | |
| Mixed Use – Office/Retail | Loan #5 | Cut-off Date Balance: | | $58,414,688 |
| 640 5th Avenue | 640 5th Avenue | Cut-off Date LTV: | | 41.6% |
| New York, NY 10022 | | UW NCF DSCR: | | 2.05x |
| | | UW NOI Debt Yield: | | 18.8% |
A prior owner of the 640 5th Avenue Property ground leased the 640 5th Avenue Property to the Air Rights Tenant, who subleased the 640 5th Avenue Property (other than development rights relating to the West 52nd Street building, which were retained by the Air Rights Tenant) back to such prior owner of the 640 5th Avenue Property, solely for the purpose of satisfying certain zoning requirements in connection with the transfer of such development rights to the Air Rights Tenant, as further described under “Description of the Mortgage Pool—Mortgage Pool Characteristics—Fee & Leasehold Estates; Ground Leases” in the prospectus.
The table below summarizes the promissory notes that comprise the 640 5th Avenue Whole Loan.
| 640 5th Avenue Whole Loan Summary |
| Note | Original Balance | Cut-off Date Balance | Note Holder | Controlling Note |
| A-1 | $40,000,000 | $39,941,667 | BANK5 2024-5YR8 | Yes |
| A-2-1 | $29,000,000 | $28,957,708 | BANK5 2024-5YR8 | No |
| A-2-2 | $8,500,000 | $8,487,604 | BANK5 2024-5YR9 | No |
| A-3 | $30,000,000 | $29,956,250 | BANK5 2024-5YR9 | No |
| A-4 | $20,000,000 | $19,970,833 | BANK5 2024-5YR9 | No |
| A-5 | $69,600,000 | $69,498,500 | Benchmark 2024-V8 | No |
| A-6 | $40,000,000 | $39,941,667 | WFCM 2024-5C1 | No |
| A-7 | $10,400,000 | $10,384,833 | WFCM 2024-5C1 | No |
| A-8 | $25,000,000 | $24,963,542 | BBCMS 2024-5C27 | No |
| A-9 | $17,500,000 | $17,474,479 | Benchmark 2024-V8 | No |
| A-10 | $10,000,000 | $9,985,417 | Benchmark 2024-V8 | No |
| Whole Loan | $300,000,000 | $299,562,500 | | |
The Borrower and the Borrower Sponsor. The borrower is 640 Fifth Avenue Owner LLC, a Delaware limited liability company structured as a single purpose, bankruptcy-remote entity, with one independent director. The borrower sponsor is Vornado Realty Trust (“Vornado”). Vornado is a real estate investment firm that owns and manages over 26 million SF of LEED certified buildings and received the Energy Star Partner of the Year Award, Sustained Excellence 2022. Vornado commemorated 50 years on the New York Stock Exchange in 2012 and is a member of the S&P MidCap 400. Vornado’s portfolio is concentrated on office and retail properties in New York. Vornado has 57 Manhattan operating properties consisting of approximately 18.9 million SF of office space in 30 of the properties, approximately 2.4 million SF of street retail space in 50 of the properties and 338 residential units in four Manhattan properties, as of June 2024. The non-recourse carveout guarantor is Manhattan High Street Holdings LP, a subsidiary of Vornado. The non-recourse carveout guarantor’s recourse obligations with respect to bankruptcy or insolvency related events is capped at 25% of the outstanding principal balance of the 640 5th Avenue Whole Loan, plus the lender’s enforcement costs under the guaranty, including reasonable attorneys’ fees. Additionally, recourse for losses relating to a transfer of the related mortgaged property or interests in the borrower is limited as described under “Description of the Mortgage Pool—Non-Recourse Carveout Limitations” in the prospectus.
The Property. The 640 5th Avenue Property consists of both (i) a 22-story, Class A office building with multi-level retail space commonly known as 640 Fifth Avenue (the “Fifth Avenue Building”), and (ii) a two-story commercial building on the south side commonly known as 6 West 52nd Street (the “6 West 52nd Street Building”). The Fifth Avenue Building and the 6 West 52nd Street Building are interconnected and share certain paths of ingress and egress. The 640 5th Avenue Property (inclusive of the 6 West 52nd Street Building) totals 314,533 SF, which consists of 245,740 SF of office space (78.1% of NRA and 30.9% of underwritten base rent), 58,359 SF of retail space (18.6% of NRA and 67.8% of underwritten base rent) and 10,434 SF of storage space (3.3% of NRA and 1.2% of underwritten base rent). As of June 1, 2024, 91.7% of the office space (“Office NRA”) is leased to 15 tenants and 97.2% of the retail space (“Retail NRA”) and 97.4% of the storage space is leased to two tenants, Victoria’s Secret and Dyson. The Fifth Avenue Building includes retail spaces located on the first three levels of the building and office spaces on the remaining 19 levels of the building.
The following table presents certain information relating to the 640 5th Avenue Property.
| Property Summary(1) |
| Space Type | Total SF | % Total SF | Occupancy | UW Base Rent | % of UW Base Rent | UW Base Rent PSF(2) |
| Office: | 245,740 | 78.1% | 91.7% | $20,885,412 | 30.9% | $92.66 |
| Retail: | 58,359 | 18.6% | 97.2% | $45,771,452 | 67.8% | $807.09 |
| Storage: | 10,434 | 3.3% | 97.4% | $831,121 | 1.2% | $81.77 |
| Total/Wtd. Avg. | 314,533 | 100.0% | 92.9% | $67,487,985 | 100.0% | $230.91 |
| (1) | Information is based on the underwritten rent roll dated June 1, 2024. |
| (2) | UW Base Rent PSF excludes vacant space. |
| This is not a research report and was not prepared by any Underwriter’s research department. Please see additional important information and qualifications at the end of this Term Sheet. |
| | T-52 | |
| Mixed Use – Office/Retail | Loan #5 | Cut-off Date Balance: | | $58,414,688 |
| 640 5th Avenue | 640 5th Avenue | Cut-off Date LTV: | | 41.6% |
| New York, NY 10022 | | UW NCF DSCR: | | 2.05x |
| | | UW NOI Debt Yield: | | 18.8% |
The 640 5th Avenue Property has been the recipient of an Industrial and Commercial Tax Abatement (the “ICAP Tax Abatement”) that commenced on July 1, 2019 and is scheduled to end on July 1, 2029, and is set to be phased out beginning in July 2024. The ICAP Tax Abatement originally provided a 100% tax abatement of the 640 5th Avenue Property’s assessment value, which abatement amount will be reduced to 80.0% of such assessment value in July 2024, 60.0% in July 2025, 40.0% in July 2026 and 20.0% in July 2027 until termination. The total benefit from the ICAP Tax Abatement is estimated in the table below:
| ICAP Tax Abatement |
| Tax Year | ICAP Year | ICAP Phase-
out | ICAP Benefit | Reduction in Benefit |
| 2019/2020 | 1 | 100% | $3,074,549 | $588,138 |
| 2020/2021 | 2 | 100% | $3,074,549 | $588,138 |
| 2021/2022 | 3 | 100% | $3,074,549 | $588,138 |
| 2022/2023 | 4 | 100% | $3,074,549 | $588,138 |
| 2023/2024 | 5 | 100% | $3,074,549 | $588,138 |
| 2024/2025 | 6 | 80% | $2,459,639 | $470,511 |
| 2025/2026 | 7 | 60% | $1,844,729 | $352,883 |
| 2026/2027 | 8 | 40% | $1,229,820 | $235,255 |
| 2027/2028 | 9 | 20% | $614,910 | $117,628 |
| 2028/2029 | 10 | 20% | $614,910 | $117,628 |
| Total/Wtd. Avg. | | | $22,136,752 | $4,234,597 |
Major Tenants.
Victoria’s Secret (63,779 SF, 20.3% of NRA, 54.5% of underwritten base rent): Victoria’s Secret (NYSE: VSCO) is a clothing retailer specializing in selling intimate garments and undergarments. The company is the largest intimates retailer in the world and produces a range of products such as bras, panties, lingerie, swimwear and sleepwear, which are sold to customers across the United States and globally. Victoria’s Secret spun off L Brands in 2021 and reported a net income of $109 million on $6.182 billion of net sales in 2023. The 640 5th Avenue Property is the flagship location for Victoria’s Secret. Victoria’s Secret’s lease at the 640 5th Avenue Property commenced in February 2016, expires January 31, 2032 and has one, 10-year renewal option and no termination options.
Dyson (3,097 SF 1.0% of NRA, 14.6% of underwritten base rent): Dyson is a multi-national Singapore based appliances company. Dyson produces a range of products such as vacuum cleaners, hair care, air purifiers, headphones and lighting. Dyson was founded in 1991 and employs approximately 14,000 people. Dyson’s lease at the 640 5th Avenue Property commenced in March 2017, expires August 27, 2027 and has no renewal or termination options.
The Klein Group LLC (30,103 SF, 9.6% of NRA, 5.1% of underwritten base rent): The Klein Group LLC is a provider of brokerage services. The Klein Group LLC offers investment banking, trading, private placement of securities and investment advisory services. The Klein Group LLC’s lease at the 640 5th Avenue Property commenced in June 2015 and was amended in June 2018 and August 2022 to expand its leased space at the 640 5th Avenue Property. The lease is scheduled to expire on April 14, 2034, and the tenant has no renewal option. The Klein Group LLC has a two-time right to terminate its lease, effective either (i) December 31, 2027 or (ii) December 31, 2029, subject to, among other things, providing notice to the borrower no later than a year before the effective date of each such termination right, satisfaction of certain minimum occupancy and demise requirements under the lease, no event of default having occurred and continuing under the lease and the payment of a termination fee.
| This is not a research report and was not prepared by any Underwriter’s research department. Please see additional important information and qualifications at the end of this Term Sheet. |
| | T-53 | |
| Mixed Use – Office/Retail | Loan #5 | Cut-off Date Balance: | | $58,414,688 |
| 640 5th Avenue | 640 5th Avenue | Cut-off Date LTV: | | 41.6% |
| New York, NY 10022 | | UW NCF DSCR: | | 2.05x |
| | | UW NOI Debt Yield: | | 18.8% |
The following table presents certain information relating to the tenancy at the 640 5th Avenue Property:
| Tenant Summary(1) |
| Tenant Name | Credit Rating (Fitch/Moody’s/ S&P)(2) | Tenant SF | Approx.% of SF | Annual UW Base Rent | % of Total Annual UW Base Rent | Annual UW Base Rent PSF | Lease Expiration | Renewal Options | Term. Option (Y/N) |
| Major Tenants | | | | | | | | | |
| Victoria's Secret | NR/Ba3/BB- | 63,779 | 20.3% | $36,763,592 | 54.5% | $576.42 | 1/31/2032 | 1 x 10 yr | N |
| Dyson | NR/NR/NR | 3,097 | 1.0% | $9,838,981 | 14.6% | $3,176.94 | 8/27/2027 | None | N |
| The Klein Group LLC(3) | NR/NR/NR | 30,103 | 9.6% | $3,461,845 | 5.1% | $115.00 | 4/14/2034 | None | Y |
| Fidelity Real Estate Company(4) | NR/NR/NR | 40615 | 12.9% | $3,249,200 | 4.8% | $80.00 | 11/30/2026 | None | N |
| Houlihan Lokey Advisors(5) | NR/NR/NR | 12,875 | 4.1% | $1,442,000 | 2.1% | $112.00 | 6/30/2026 | 1 x 5 yr | N |
| Abbot Capital Management | NR/NR/NR | 20,019 | 6.4% | $1,361,292 | 2.0% | $68.00 | 12/31/2032 | 1 x 5 yr | N |
| Subtotal/Wtd. Avg. | | 170,488 | 54.2% | $56,116,910 | 83.2% | $329.15 | | | |
| | | | | | | | | | |
| Other Tenants | 121,786 | 38.7% | $11,371,075 | 16.8% | $93.37 | | | |
| Occupied Subtotal/Wtd. Avg. | 292,274 | 92.9% | $67,487,985 | 100.0% | $230.91 | | | |
| | | | | | | | | | |
| Vacant Space | | 22,259 | 7.1% | | | | | | |
| Total/Wtd. Avg. | | 314,533 | 100.0% | | | | | | |
| (1) | Information is based on the underwritten rent roll dated June 1, 2024. |
| (2) | Certain ratings are those of the parent company, whether or not the parent company guarantees the lease |
| (3) | The Klein Group LLC is entitled to $1,648,112 in free rent through February 2025. At origination, the borrower deposited $1,648,112 into the free rent reserve, which will be disbursed in accordance with the schedule set forth in the related loan documents. In addition, the tenant has a two-time right to terminate its lease, effective either (i) December 31, 2027 or (ii) December 31, 2029, subject to, among other things, providing notice to the borrower no later than a year before the effective date of each such termination right, satisfaction of certain minimum occupancy and demise requirements under the lease, no event of default having occurred and continuing under the lease and the payment of a termination fee. |
| (4) | Fidelity Real Estate Company has subleased 19,841 SF to Advisor Group in Suite 401, which commenced on October 1, 2020, is scheduled to expire on October 31, 2026 and provides for approximately $907,726 in annual rent to Fidelity Real Estate Company. |
| (5) | Houlihan Lokey Advisors has subleased all of its 12,875 SF to Triple P Services LLC in Suite 1000, which commenced on June 7, 2023, is scheduled to expire on June 29, 2026 and provides for $965,625 in annual rent to Houlihan Lokey Advisors. |
The following table presents certain information with respect to the lease rollover at the 640 5th Avenue Property:
| Lease Rollover Schedule(1)(2) |
| Year | # of Leases Rolling | SF Rolling | Approx. % of SF Rolling | Approx. Cumulative % of SF Rolling | Total UW Rent Rolling | Approx. % of Total UW Rent Rolling | Approx. Cumulative % of Total UW Rent Rolling | UW Rent PSF Rolling |
| MTM | 2 | 0 | 0.0% | 0.0% | $0 | 0.0% | 0.0% | $0.00 |
| 2024 | 2 | 0 | 0.0% | 0.0% | $0 | 0.0% | 0.0% | $0.00 |
| 2025 | 1 | 10,183 | 3.2% | 3.2% | $855,372 | 1.3% | 1.3% | $84.00 |
| 2026 | 8 | 95,337 | 30.3% | 33.5% | $9,439,242 | 14.0% | 15.3% | $99.01 |
| 2027 | 1 | 3,097 | 1.0% | 34.5% | $9,838,981 | 14.6% | 29.8% | $3,176.94 |
| 2028 | 1 | 0 | 0.0% | 34.5% | $0 | 0.0% | 29.8% | $0.00 |
| 2029(3) | 3 | 39,986 | 12.7% | 47.2% | $3,672,575 | 5.4% | 35.3% | $91.85 |
| 2030 | 1 | 10,421 | 3.3% | 50.6% | $937,890 | 1.4% | 36.7% | $90.00 |
| 2031 | 0 | 0 | 0.0% | 50.6% | $0 | 0.0% | 36.7% | $0.00 |
| 2032 | 3 | 99,650 | 31.7% | 82.2% | $39,282,080 | 58.2% | 94.9% | $394.20 |
| 2033 | 0 | 0 | 0.0% | 82.2% | $0 | 0.0% | 94.9% | $0.00 |
| 2034 | 1 | 30,103 | 9.6% | 91.8% | $3,461,845 | 5.1% | 100.0% | $115.00 |
| 2035 & Thereafter | 1 | 3,497 | 1.1% | 92.9% | $0 | 0.0% | 100.0% | $0.00 |
| Vacant | 0 | 22,259 | 7.1% | 100.0% | $0 | 0.0% | 100.0% | $0.00 |
| Total/Wtd. Avg.(4) | 24 | 314,533 | 100.0% | | $67,487,985 | 100.0% | | $230.91 |
| (1) | Information is based on the underwritten rent roll dated June 1, 2024. |
| (2) | Certain tenants may have lease termination options that are not reflected in the Lease Rollover Schedule. |
| (3) | The 640 5th Avenue Whole Loan matures on July 1, 2029. |
| (4) | Total/Wtd. Avg. UW Rent PSF Rolling excludes vacant space. |
| This is not a research report and was not prepared by any Underwriter’s research department. Please see additional important information and qualifications at the end of this Term Sheet. |
| | T-54 | |
| Mixed Use – Office/Retail | Loan #5 | Cut-off Date Balance: | | $58,414,688 |
| 640 5th Avenue | 640 5th Avenue | Cut-off Date LTV: | | 41.6% |
| New York, NY 10022 | | UW NCF DSCR: | | 2.05x |
| | | UW NOI Debt Yield: | | 18.8% |
The Market. The 640 5th Avenue Property is located in New York, New York, more specifically in the Manhattan retail market. The Manhattan retail market has regressed since the pandemic, but not as strongly as the office market. The retail market is driven by Manhattan’s pedestrians and tourists. According to the appraisal, New York City expected to welcome 63.2 million visitors in 2023, and total city visitors were expected to surpass 2019 levels by 2024. The 640 5th Avenue Property is situated on upper Fifth Avenue, one of the most well-known retail areas in the United States. Notable features in the proximate area of the 640 5th Avenue Property include Rockefeller Center, 4.7 million SF of Class A office space, the New York Public Library, a Ritz-Carlton hotel and conference center, Central Park and luxury residential buildings. As of the fourth quarter of 2023, total leasing velocity in the market increased 6.6% year-over-year with an average annual leasing velocity of 2.9 million SF. The 640 5th Avenue Property is also located in the Manhattan office market, which has been practically brought to a halt since March 2020. According to the appraisal, as of the fourth quarter of 2023, the Manhattan office vacancy rate reached 12.8% with an availability rate of 18.5%. According to the appraisal, the 2023 total population within a 0.25-, 0.5- and one-mile radii of the 640 5th Avenue Property was 1,772, 25,066 and 200,745, respectively, and the 2023 median household income within the same radii was $129,959, $135,306 and $124,189, respectively.
According to a third-party report, the 640 5th Avenue Property is located in the Fifth Avenue retail submarket, ranging from Saks Fifth Avenue (East 50th Street) to the GM Building (East 60th Street). According to the appraisal, this area is identified as one of the top five most expensive retail corridors in the world. As of the fourth quarter of 2023, the Fifth Avenue retail submarket had an availability rate of 17.1%, which is consistent with the previous quarter. The average asking rent was $1,201 per SF, a decrease over the asking rent of $1,345 per SF from the previous quarter. According to a third-party report, the 640 5th Avenue Property is located in the Plaza District office submarket. As of the fourth quarter of 2023, the Plaza District office submarket had an inventory of 26.2 million SF with a 13.6% vacancy rate. The average asking rent was $111.15 per SF, an increase over the asking rent of $95.83 per SF from the previous year.
The following table presents recent retail leasing data at comparable retail properties with respect to the 640 5th Avenue Property:
| Comparable Leases Summary |
| Property/Location | Year Built / Renovated | SF | Tenant Name | Tenant Size (SF) | Lease Date | Rent PSF | Lease Term (months) |
640 5th Avenue (subject)(1) New York, NY | 1949 / 2003 | 314,533 | Victoria’s Secret | 63,779 | Feb. 2016 | $576.42 | 192 |
691 Madison Avenue
New York, NY | NAV | NAV | Dolce & Gabbana | 23,339 | Q4 2023 | $514.16 | 180 |
693 Fifth Avenue
New York, NY | NAV | NAV | Burberry | 14,761 | Q1 2023 | $372.60 | 20 |
690 Madison Avenue
New York, NY | NAV | NAV | Van Cleef and Arpels | 7,848 | Q1 2023 | $573.39 | 120 |
140 West 57th Street
New York, NY | NAV | NAV | Morton Williams | 15,482 | Q3 2022 | $108.15 | 180 |
645 Fifth Avenue
New York, NY | NAV | NAV | Tag Heuer | 2,320 | Q3 2022 | $1,185.34 | 132 |
680 Fifth Avenue
New York, NY | NAV | NAV | Swarovski | 14,000 | Q1 2022 | $500.00 | 132 |
144 West 46th Street
New York, NY | NAV | NAV | Gossip Bar | 4,500 | Q3 2021 | $93.33 | 144 |
660 Fifth Avenue
New York, NY | NAV | NAV | Citibank (Side Street) | 8,071 | Q1 2021 | $164.75 | 123 |
721-725 Fifth Avenue
New York, NY | NAV | NAV | Gucci | 48,167 | Q1 2021 | $519.03 | 84 |
730 Fifth Avenue
New York, NY | NAV | NAV | Chopard Mikimoto | 2,808 4,505 | Q3 2020 Q2 2019 | $1,673.79 $958.94 | 120 120 |
685 Fifth Avenue
New York, NY | NAV | NAV | Tag Heuer | 896 | Q1 2020 | $3,000 | 36 |
Source: Appraisal, unless otherwise indicated.
| (1) | Information based on the underwritten rent roll dated June 1, 2024, other than Year Built / Renovated. |
| This is not a research report and was not prepared by any Underwriter’s research department. Please see additional important information and qualifications at the end of this Term Sheet. |
| | T-55 | |
| Mixed Use – Office/Retail | Loan #5 | Cut-off Date Balance: | | $58,414,688 |
| 640 5th Avenue | 640 5th Avenue | Cut-off Date LTV: | | 41.6% |
| New York, NY 10022 | | UW NCF DSCR: | | 2.05x |
| | | UW NOI Debt Yield: | | 18.8% |
The following table presents recent office lasing data at comparable office properties with respect to the 640 5th Avenue Property:
| Comparable Leases Summary |
| Property/Location | Year Built / Renovated | SF | Tenant Name | Tenant Size (SF) | Lease Date | Rent PSF | Lease Term (months) |
640 5th Avenue (subject)(1)
New York, NY | 1949 / 2003 | 314,533 | Fidelity Real Estate Company | 40,615 | Dec. 2016 | $80.00 | 120 |
745 Fifth Avenue
New York, NY | 1930 / 1989 | 535,451 | Fundamental Advisors
Hakluyt and Company
Hildred Capital | 11,227 12,400 12,307 | Feb. 2024 Dec. 2023 Jul. 2023 | $105.45 $95.91 $69.31 | 130 135 132 |
360 Madison Avenue
New York, NY | 1981 / 2002 | 373,000 | Vestwell | 14,883 | Nov. 2023 | $64.38 | 135 |
40 West 57th Street
New York, NY | 1972 / NAP | 712,000 | Access Industries | 25,000 | Nov. 2023 | $88.31 | 134 |
1 Rockefeller Plaza
New York, NY | 1936 / NAP | 655,350 | Ingalls & Snyder | 19,468 | Oct. 2023 | $66.36 | 132 |
767 Fifth Avenue
New York, NY | 1968 / 2019 | 1,965,003 | Balyasny Asset Management L.P.
CVC Capital Partners
Grosvenor Capital | 15,445 48,000 38,100 | Sep. 2023 Sep. 2023 Jun. 2023 | $101.82 $87.84 $94.67 | 130 200 180 |
510 Madison Avenue
New York, NY | 2009 / 2012 | 355,089 | Granger Management Holdings LLC | 5,891 | Sep. 2023 | $100.29 | 82 |
545 Madison Avenue
New York, NY | 1955 / 2021 | 153,583 | Helix Partners Management | 7,000 | May 2023 | $79.20 | 60 |
595 Madison Avenue
New York, NY | 1929 / 2011 | 331,000 | Matouk | 13,227 | Apr. 2023 | $55.48 | 120 |
590 Madison Avenue
New York, NY | 1982 / 2006 | 1,049,759 | Schonfeld Securities, LLC | 25,030 | Mar. 2023 | $79.52 | 96 |
535 Madison Avenue
New York, NY | 1982 / NAP | 548,530 | The Lanier Law Firm | 14,875 | Jan. 2023 | $69.39 | 130 |
Source: Appraisal, unless otherwise indicated.
| (1) | Information based on the underwritten rent roll dated June 1, 2024, other than Year Built / Renovated. |
Appraisal. According to the appraisal dated May 7, 2024, the 640 5th Avenue Property had an “As-Is” appraised value of $720,000,000 as of February 28, 2024.
Environmental Matters. According to the Phase I environmental assessment dated April 17, 2024, there was no evidence of any recognized environmental conditions at the 640 5th Avenue Property.
| This is not a research report and was not prepared by any Underwriter’s research department. Please see additional important information and qualifications at the end of this Term Sheet. |
| | T-56 | |
| Mixed Use – Office/Retail | Loan #5 | Cut-off Date Balance: | | $58,414,688 |
| 640 5th Avenue | 640 5th Avenue | Cut-off Date LTV: | | 41.6% |
| New York, NY 10022 | | UW NCF DSCR: | | 2.05x |
| | | UW NOI Debt Yield: | | 18.8% |
Operating History and Underwritten Net Cash Flow. The following table presents certain information relating to the historical operating performance and Underwritten Net Cash Flow at the 640 5th Avenue Property:
| Cash Flow Analysis |
| | 2020 | 2021 | 2022 | 2023 | UW | UW PSF |
| Gross Potential Rent(1) | $61,607,022 | $59,918,692 | $61,922,806 | $64,089,076 | $67,487,985 | $214.57 |
| Free Rent: | $0 | ($334,847) | ($2,247,718) | ($730,003) | $0 | $0.00 |
| Percentage Rent: | $0 | $0 | $0 | $0 | $0 | $0.00 |
| Reimbursements | $5,394,737 | $5,869,822 | $6,714,695 | $7,448,692 | $8,824,722 | $28.06 |
| Other Income(2) | $1,200,647 | $1,197,940 | $1,181,296 | $1,229,121 | $1,166,319 | $3.71 |
| (Vacancy / Credit Loss) | ($1,465) | $0 | $0 | $0 | $0 | $0.00 |
| Effective Gross Income | $68,200,940 | $66,651,606 | $67,571,078 | $72,036,886 | $77,479,026 | $246.33 |
| | | | | | | |
| Real Estate Taxes(3) | $10,622,785 | $11,921,499 | $12,726,288 | $11,196,742 | $14,405,944 | $45.80 |
| Insurance | $218,555 | $396,326 | $279,742 | $284,533 | $314,845 | $1.00 |
| Other Operating Expenses | $5,835,119 | $5,509,613 | $6,793,215 | $6,755,956 | $6,572,623 | $20.90 |
| Total Operating Expenses | $16,676,459 | $17,827,438 | $19,799,244 | $18,237,231 | $21,293,412 | $67.70 |
| | | | | | | |
| Net Operating Income(4)(5) | $51,524,481 | $48,824,168 | $47,771,835 | $53,799,655 | $56,185,614 | $178.63 |
| Replacement Reserves | $0 | $0 | $0 | $0 | $78,633 | $0.25 |
| TI/LC | $0 | $0 | $0 | $0 | $7,574,210 | $24.08 |
| Net Cash Flow | $51,524,481 | $48,824,168 | $47,771,835 | $53,799,655 | $48,532,770 | $154.30 |
| | | | | | | |
| Occupancy (%)(6) | 95.7% | 85.8% | 93.4% | 92.6% | 92.9% | |
| NOI DSCR(7) | 2.17x | 2.06x | 2.01x | 2.27x | 2.37x | |
| NCF DSCR(7) | 2.17x | 2.06x | 2.01x | 2.27x | 2.05x | |
| NOI Debt Yield(7) | 17.2% | 16.3% | 15.9% | 18.0% | 18.8% | |
| NCF Debt Yield(7) | 17.2% | 16.3% | 15.9% | 18.0% | 16.2% | |
| (1) | UW Gross Potential Rent is based on the underwritten rent roll dated June 1, 2024, and includes rent steps underwritten through June 2025 totaling $1,490,537. |
| (2) | Other Income is based on the borrower’s 2024 budget and is largely comprised of the Air Rights Lease income paid in the form of a fixed annual lease payment to the borrower from the adjacent building. Income from the Air Rights Lease as of the end of 2023 was approximately $1.2 million. |
| (3) | Tax benefits from the ICAP Tax Abatement were underwritten based on the borrower provided ICAP tax abatement schedule. |
| (4) | The 640 5th Avenue Property receives an annual fixed rent payment from the Air Rights Tenant (the fee owner of the real property known as 650 5th Avenue), pursuant to the related ground leases (collectively, the “Air Rights Lease”) that expire on July 30, 2070. The annual rent from the Air Rights Lease as of July 1, 2024, is $1,166,319 per annum, payable monthly in instalments of $97,193.25. Annual rent must reset as of August 1, 2024 and must be in an amount equal to the greater of the rental rate for the prior period (i.e., $1,166,319 per annum) or an amount equal to 1.6065% of the fair value of the combined land under the 650 5th Avenue building and the 6 West 52nd Street Building as determined by a qualified, third-party appraisal (the “Appraised Rental”) which valuation is required to be as of February 1, 2024. As of the date of the loan agreement, the borrower and the Air Rights Tenant are in continuing negotiations regarding the amount of the Appraised Rental, provided, however, that such amount may not be no lower than the rental rate for the prior period (i.e., $1,166,319 per annum). If the Appraised Rental is not finalized by August 1, 2024, the Air Rights Tenant will be required to continue to pay rent at the prior rental rate (i.e., $1,166,319 per annum), and upon determination of the Appraised Rental (assuming such rate is higher than the rental rate for the prior period), the Air Rights Tenant will be required to pay the difference between the Appraised Rental and the rent paid on account for all months elapsed theretofore on the first day of the month following such determination. Upon resolution of the final rental rate, such rental rate will remain in effect through July 31, 2047, after which time the rental rate will again be the greater of the rental for the prior period or 1.6065% of the fair value of the combined land under the 650 Fifth Avenue building and the 6 West 52nd Street Building. |
| (5) | Base rent for two of the retail suites is above market. Based on the appraiser’s market rents for these two suites, the Underwritten Net Operating Income would be approximately $46,959,997. The 640 5th Avenue Whole Loan underwritten NOI Debt Yield would decrease from 18.8% to 15.7% and the underwritten NOI Debt Service Coverage Ratio would decrease from 2.37x to 1.98x. |
| (6) | UW Occupancy (%) represents the in-place occupancy based on the underwritten rent roll dated June 1, 2024. Historical occupancies represent physical occupancies. |
| (7) | DSCR and Debt Yield are based on the 640 5th Avenue Whole Loan. |
Escrows and Reserves. At origination of the 640 5th Avenue Whole Loan, the borrower deposited $1,567,900 for tenant improvements and leasing commissions and approximately $1,648,112 for free rent reserves. The borrower may provide a letter of credit for all or a portion of such deposits.
Tax Escrows – On a monthly basis during a Trigger Period (as defined below), the borrower is required to escrow 1/12th of the estimated annual real estate tax payments. The borrower may provide a letter of credit for all or a portion of such deposits.
Insurance Escrows – On a monthly basis during a Trigger Period, the borrower is required to escrow 1/12th of the annual estimated insurance payments. The borrower may provide a letter of credit for all or a portion of such deposits. Such reserve has been conditionally waived so long as the borrower maintains a blanket policy meeting the requirements of the 640 5th Avenue Whole Loan documents.
Replacement Reserve – On a monthly basis during a Trigger Period, the borrower is required to escrow approximately $8,134 for the payment or reimbursement of approved capital expenses. Such monthly deposits will not be required during such time that the balance of the capital expense reserve exceeds approximately $195,217.
Rollover Reserve – On a monthly basis, the borrower is required to escrow $500,000 for approved leasing expenses. Such monthly deposits will not be required during such time that the balance of the capital expense reserve exceeds approximately $15,000,000. The borrower may provide a letter of credit for all or a portion of such deposits.
Free Rent Reserve – Provided that no event of default exists, on each monthly payment date, the free rent funds deposited for each applicable lease will be disbursed in the amounts equal to the applicable monthly rent credits or free rent amounts set forth in the 640 5th Avenue Whole Loan documents.
| This is not a research report and was not prepared by any Underwriter’s research department. Please see additional important information and qualifications at the end of this Term Sheet. |
| | T-57 | |
| Mixed Use – Office/Retail | Loan #5 | Cut-off Date Balance: | | $58,414,688 |
| 640 5th Avenue | 640 5th Avenue | Cut-off Date LTV: | | 41.6% |
| New York, NY 10022 | | UW NCF DSCR: | | 2.05x |
| | | UW NOI Debt Yield: | | 18.8% |
Lease Sweep Reserve – During a Lease Sweep Period (as defined below), funds will be deposited into a lease sweep account as set forth below under “Lockbox and Cash Management” to be used for expenses of retenanting the space leased to the Dyson’s Tenant.
Lockbox and Cash Management. The 640 5th Avenue Whole Loan is structured with a hard lockbox and in-place cash management. The borrower is required to deliver tenant direction letters to all tenants at the 640 5th Avenue Property, directing them to remit their rent directly to the lender-controlled lockbox. The borrower is required to cause revenue received by the borrower or the property manager, as applicable, from the 640 5th Avenue Property to be deposited into such lockbox within 10 business days after receipt. All funds in the lockbox account are required to be swept each business day into the lender-controlled cash management account and applied and disbursed (i) if a Trigger Period is continuing, to make the required deposits (if any) into the tax escrow and insurance escrow as described under “Escrows and Reserves” above, (ii) to pay monthly interest and principal amortization payments on the 640 5th Avenue Whole Loan, (iii) to pay operating and capital expenditures in accordance with the annual budget (which is required to be reasonably approved by the lender during a Trigger Period, but is deemed approved for the fiscal year in which the Trigger Period first occurs), (iv) to make the required deposit, if any, into the rollover reserve, as described under “Escrows and Reserves” above, (v) during a Trigger Period, to make the required deposit, if any, into the replacement reserve, as described under “Escrows and Reserves” above, (vi) if a Lease Sweep Period is continuing, regardless of whether a Trigger Period is continuing, to deposit all remaining cash into the lease sweep reserve, and (vii) to the mezzanine lender, to pay monthly interest and principal amortization payments on the 640 5th Avenue Mezzanine Loan, subject to the terms of the intercreditor agreement. All excess cash flow remaining following the foregoing disbursements will be deposited, (A) provided no Trigger Period is continuing (i) for so long as the 640 5th Avenue Mezzanine Loan remains outstanding, into an account for the 640 5th Avenue Mezzanine Loan, or (ii) following the repayment in full of the 640 5th Avenue Mezzanine Loan, into the borrower’s account, or (B) during the continuance of a Trigger Period, into a cash collateral account held by the lender.
A “Trigger Period” means a period commencing upon the earliest to occur of (i) an event of default under the 640 5th Avenue Whole Loan, (ii) a Low Debt Yield Trigger Period (as defined below) or (iii) a Victoria’s Secret Event Period (as defined below), and ending if, with respect to a Trigger Period continuing pursuant to (A) clause (i), the event of default commencing the Trigger Period has been cured or waived and such cure has been accepted by the lender or the lender has waived such event of default in writing, and no other event of default is then continuing, (B) clause (ii), the Low Debt Yield Trigger Period has ended and (C) clause (iii), the Victoria’s Secret Event Period has ended.
A “Low Debt Yield Trigger Period” means a period commencing if, as of the last day of any calendar quarter, the NOI Debt Yield (as defined below) is less than 10.0%, and ending if the NOI Debt Yield is equal to or in excess of 10.0% on any subsequent calculation date; provided, however, that a Low Debt Yield Trigger Period will be deemed not to exist if, not later than 15 business days after the borrower’s receipt of notice from the lender that a Low Debt Yield Trigger Period has commenced, the borrower (a) prepays a portion of the 640 5th Avenue Whole Loan, along with any yield maintenance premium, and the 640 5th Avenue Mezzanine Loan in accordance with the terms of the 640 5th Avenue Mezzanine Loan documents, which amount will be applied, in each case, on a pro rata basis to the 640 5th Avenue Whole Loan and the 640 5th Avenue Mezzanine Loan, or (b) delivers to the lender as additional collateral for the 640 5th Avenue Whole Loan, either (i) cash, which must be deposited into, or retained in, the cash collateral account, or (ii) a letter of credit in lieu of cash, in each case, in an amount equal to the Low Debt Yield Avoidance Amount (as defined below) (the “Low Debt Yield Avoidance Collateral”). If the borrower delivers to the lender such Low Debt Yield Avoidance Collateral, then for so long as the lender holds such Low Debt Yield Avoidance Collateral, the NOI Debt Yield will be calculated based on the assumption that the outstanding principal balance of the 640 5th Avenue Whole Loan has been reduced by the value of the Low Debt Yield Avoidance Collateral, such value being the amount of cash or notional amount of any letter of credit.
The “NOI Debt Yield” means, as of any date of determination, a fraction, expressed as a percentage, of which (a) the numerator is the underwritten net operating income as of such date; and (b) the denominator is the sum of the outstanding principal balances, as of such date, of (A) the 640 5th Avenue Whole Loan and (B) the 640 5th Avenue Mezzanine Loan.
A “Low Debt Yield Avoidance Amount” means, at any point in time, the amount that when applied on a pro rata basis to the reduction of the then-current outstanding principal balance of the 640 5th Avenue Whole Loan and the then-current outstanding principal balance of the 640 5th Avenue Mezzanine Loan would cause the NOI Debt Yield to equal at least 10.0%, taking into account the aggregate amount of Low Debt Yield Avoidance Collateral previously provided by the borrower and then held by the lender.
A ”Victoria’s Secret Event Period” will (i) commence upon the occurrence, as applicable, of (x) a bankruptcy or other insolvency proceeding, whether voluntary or involuntary, with respect to the Victoria’s Secret tenant or any guarantor of the Victoria’s Secret lease, or (y) the Victoria’s Secret tenant discontinues normal business operations at the Victoria’s Secret leased space, other than a temporary cessation of business operations for permitted alterations, renovations, necessary repairs or restoration following casualty, provided that in any such case the Victoria’s Secret tenant continues to pay all contractual rent, and (ii) will end upon the first to occur of (a) in the event the Victoria’s Secret Event Period commenced due to a bankruptcy or other insolvency proceeding, the affirmation of the Victoria’s Secret lease in such applicable proceeding, provided that the Victoria’s Secret tenant is actually paying all rents and other amounts due under the Victoria’s Secret lease, (b) in the event the Victoria’s Secret Event Period commenced due to a vacancy at the Victoria’s Secret leased space, the Victoria’s Secret tenant re-commences normal business operations at the Victoria’s Secret leased space in accordance with the terms and conditions of the Victoria’s Secret lease and (c) the date on which the entirety of the Victoria’s Secret space is leased to one or more replacement tenants that are reasonably acceptable to the lender.
A “Lease Sweep Period” means a period that (i) will commence if the lease for Dyson Direct, Inc. (the “Dyson Tenant,”) (or any material portion thereof) is not extended or renewed at least 12 months prior to the expiration date thereof for at least an additional five year period as evidenced by a written acknowledgement executed by Dyson Tenant in a form reasonably acceptable to the lender and (ii) will end upon the first to occur of the following: (a) the date on which the Dyson Tenant extends or renews its existing lease for at least an additional five years as evidenced by a written acknowledgement executed by the Dyson Tenant in a form reasonably acceptable to the lender; (b) the date on which the entirety of the space leased by the Dyson Tenant is leased pursuant to one or more replacement tenants that are reasonably acceptable to the lender; and (c) the date on which the funds in the lease sweep reserve (1) collected with respect to the Dyson Tenant’s lease (including any lease termination payments) or (2) deposited by the borrower with the lender, equals or exceeds $3,000,000 (measured on a cumulative basis for the term of the 640 5th Avenue Whole Loan); provided that in lieu of a deposit by the borrower pursuant to clause (2) above, the borrower may provide to the lender a letter of credit for all or a portion of the amount described above; but a letter of credit may not be used as a substitute for any cash collected pursuant to clause (1) above.
| This is not a research report and was not prepared by any Underwriter’s research department. Please see additional important information and qualifications at the end of this Term Sheet. |
| | T-58 | |
| Mixed Use – Office/Retail | Loan #5 | Cut-off Date Balance: | | $58,414,688 |
| 640 5th Avenue | 640 5th Avenue | Cut-off Date LTV: | | 41.6% |
| New York, NY 10022 | | UW NCF DSCR: | | 2.05x |
| | | UW NOI Debt Yield: | | 18.8% |
Mezzanine Loan. Concurrently with the origination of the 640 5th Avenue Whole Loan, a $100,000,000 mezzanine loan (the “640 5th Avenue Mezzanine Loan” and together with the 640 5th Avenue Whole Loan, the “640 5th Avenue Total Debt”) was funded by MSBNA and GSBI, which is secured by the mezzanine borrower’s direct equity interests in the borrower. The mezzanine borrower is required under the 640 5th Avenue Mezzanine Loan to make monthly payments to the mezzanine lenders equal to (x) principal in the amount of approximately $145,833 and (y) the monthly interest payment. The 640 5th Avenue Mezzanine Loan accrues interest at a rate of 11.50000% per annum and is coterminous with the 640 5th Avenue Whole Loan.
| 640 5th Avenue Total Debt Summary |
| Loan | Original Balance | | Interest Rate | Cumulative UW NCF DSCR | Cumulative UW NOI Debt Yield | Cumulative Cut-off Date LTV Ratio |
| Whole Loan | $300,000,000 | | 6.1293333% | 2.05x | 18.8% | 41.6% |
| Mezzanine Loan | $100,000,000 | | 11.500000% | 1.31x | 14.1% | 55.5% |
| Total/Weighted Average: | $400,000,000 | | 7.4720000% | | | |
Ground Lease. A prior owner of the 640 5th Avenue Property ground leased the 640 5th Avenue Property to the Air Rights Tenant, and the Air Rights Tenant who subleased the 640 5th Avenue Property (other than development rights relating to one of the two buildings comprising the 640 5th Avenue Property, which were retained by the Air Rights Tenant) back to such prior owner of the 640 5th Avenue Property, solely for purposes of satisfying certain zoning requirements in connection with the transfer of such development rights to the Air Rights Tenant. The borrower receives an annual fixed rent payment from the Air Rights Tenant pursuant to the Air Rights Lease that expires on July 30, 2070. The annual rent from the Air Rights Lease is calculated as described in “Operating History and Underwritten Net Cash Flow” above. See “Description of the Mortgage Pool—Mortgage Pool Characteristics—Fee & Leasehold Estates; Ground Leases” in the prospectus.
Terrorism Insurance. The borrower is required to obtain and maintain property insurance in an amount equal to 100% of full replacement cost and business interruption insurance for 24 months plus a 12-month extended period of indemnity, in each case which covers perils of terrorism and acts of terrorism, except for nuclear, biological, chemical or radiological terrorism events, which may be excluded to the extent such coverage is not available. For so long as TRIPRA is in effect and continues to cover both foreign and domestic acts of terrorism, the lender is required to accept terrorism insurance with coverage against acts which are “certified” within the meaning of TRIPRA. So long as TRIPRA is in effect, the borrower may obtain terrorism coverage from an unrated captive insurance company, so long as certain conditions are satisfied, including but not limited to that, except with respect to the permitted deductible of $150,000, any portion of such coverage not covered by the federal government under TRIPRA will be reinsured with a cut through endorsement by an insurance company with a financial strength and claims paying ability rating of at least “A-” with S&P and “A2” with Moody’s, or if Moody’s does not rate such insurance company, a rating of “A:VIII” or better in the current A.M. Best’s Insurance Reports. If TRIPRA is not in effect, the borrower will not be obligated to pay terrorism insurance premiums in excess of the greater of (i) two times the premium then payable in respect of the property and business interruption coverages (without giving effect to the cost of terrorism coverage) and (ii) the product of the rate of $0.10 per $100 times the lesser of (A) the outstanding principal balance of the 640 5th Avenue Whole Loan and (B) the sum of 100% of the full replacement cost and the required amount of rental loss and/or business income interruption insurance. See “Risk Factors—Risks Relating to the Mortgage Loans—Terrorism Insurance May Not Be Available for All Mortgaged Properties” in the prospectus.
| This is not a research report and was not prepared by any Underwriter’s research department. Please see additional important information and qualifications at the end of this Term Sheet. |
| | T-59 | |
| Office - Suburban | Loan #6 | Cut-off Date Balance: | | $51,000,000 |
| One Town Center | One Town Center | Cut-off Date LTV: | | 61.7% |
| Boca Raton, FL 33486 | | UW NCF DSCR: | | 1.62x |
| | | UW NOI Debt Yield: | | 12.4% |

| This is not a research report and was not prepared by any Underwriter’s research department. Please see additional important information and qualifications at the end of this Term Sheet. |
| | T-60 | |
| Office - Suburban | Loan #6 | Cut-off Date Balance: | | $51,000,000 |
| One Town Center | One Town Center | Cut-off Date LTV: | | 61.7% |
| Boca Raton, FL 33486 | | UW NCF DSCR: | | 1.62x |
| | | UW NOI Debt Yield: | | 12.4% |
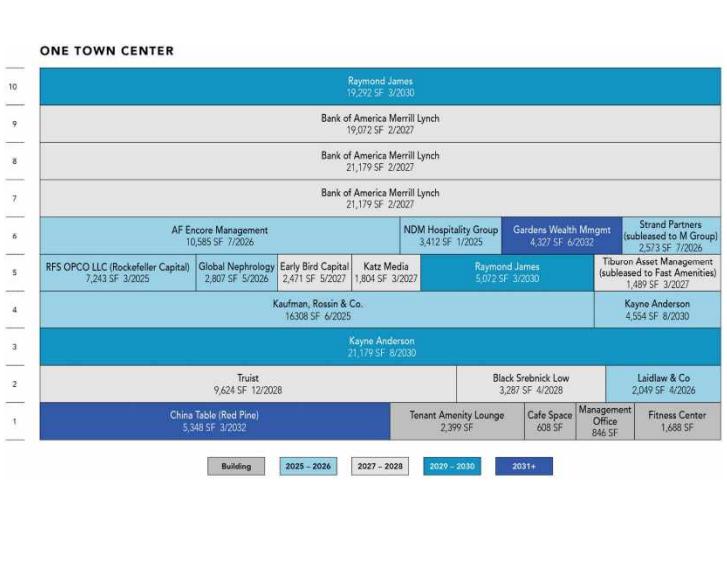
| This is not a research report and was not prepared by any Underwriter’s research department. Please see additional important information and qualifications at the end of this Term Sheet. |
| | T-61 | |
| Office - Suburban | Loan #6 | Cut-off Date Balance: | | $51,000,000 |
| One Town Center | One Town Center | Cut-off Date LTV: | | 61.7% |
| Boca Raton, FL 33486 | | UW NCF DSCR: | | 1.62x |
| | | UW NOI Debt Yield: | | 12.4% |
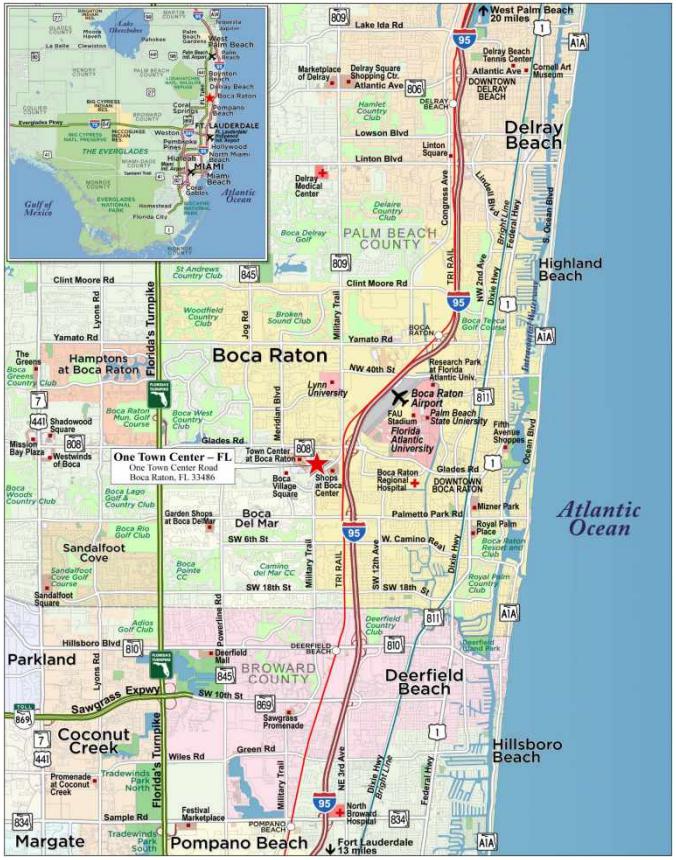
| This is not a research report and was not prepared by any Underwriter’s research department. Please see additional important information and qualifications at the end of this Term Sheet. |
| | T-62 | |
| Mortgage Loan No. 6 – One Town Center |
| Mortgage Loan Information | | Property Information |
| Mortgage Loan Seller: | WFB | | Single Asset/Portfolio: | Single Asset |
| Credit Assessment (Fitch/Moody’s/KBRA): | NR/NR/NR | | Location: | Boca Raton, FL 33486 |
| Original Balance: | $51,000,000 | | General Property Type: | Office |
| Cut-off Date Balance: | $51,000,000 | | Detailed Property Type: | Suburban |
| % of Initial Pool Balance: | 5.6% | | Title Vesting: | Fee |
| Loan Purpose: | Acquisition | | Year Built/Renovated: | 1990/NAP |
| Borrower Sponsor: | Nader Ohebshalom | | Size: | 190,395 SF |
| Guarantor: | Nader Ohebshalom | | Cut-off Date Balance PSF: | $268 |
| Mortgage Rate: | 7.33800% | | Maturity Balance PSF: | $268 |
| Note Date: | 7/9/2024 | | Property Manager: | Gatsby Florida, LLC |
| Maturity Date: | 7/11/2029 | | | |
| Term to Maturity: | 60 months | | Underwriting and Financial Information |
| Amortization Term: | 0 months | | UW NOI: | $6,314,776 |
| IO Period: | 60 months | | UW NCF | $6,136,302 |
| Seasoning: | 1 month | | UW NOI Debt Yield: | 12.4% |
| Prepayment Provisions: | L(25), D(28),O(7) | | UW NCF Debt Yield: | 12.0% |
| Lockbox/Cash Mgmt Status: | Hard/Springing | | UW NOI Debt Yield at Maturity: | 12.4% |
| Additional Debt Type: | NAP | | UW NCF DSCR: | 1.62x |
| Additional Debt Balance: | NAP | | Most Recent NOI: | $6,635,309 (4/30/2024 TTM) |
| Future Debt Permitted (Type): | No (NAP) | | 2nd Most Recent NOI: | $6,390,479 (12/31/2023) |
| Reserves | | 3rd Most Recent NOI: | $5,638,171 (12/31/2022) |
| Type | Initial | Monthly | Cap | | Most Recent Occupancy: | 100.0% (5/16/2024) |
| RE Taxes: | $580,236 | $145,059 | NAP | | 2nd Most Recent Occupancy: | 99.7% (12/31/2023) |
| Insurance: | $73,934 | $73,934 | NAP | | 3rd Most Recent Occupancy: | 97.0% (12/31/2022) |
| Replacement Reserve: | $0 | $2,424 | NAP | | Appraised Value (as of): | $82,600,000 (5/30/2024) |
| Deferred Maintenance: | $0 | $0 | NAP | | Appraised Value PSF: | $434 |
| TI/LC Reserve: | $500,000 | $15,866 | NAP | | Cut-off Date LTV Ratio: | 61.7% |
| Existing TI/LC Reserve: | $47,865 | $0 | NAP | | Maturity Date LTV Ratio: | 61.7% |
| | | | | | | | |
| Sources and Uses |
| Sources | Proceeds | % of Total | | Uses | Proceeds | % of Total |
| Loan Amount: | $51,000,000 | 60.4% | | Purchase Price: | $82,000,000 | 97.2% |
| Sponsor Equity: | $29,396,973 | 34.8% | | Upfront Reserves: | $1,202,035 | 1.4% |
| Seller Credit(1): | $4,000,000 | 4.7% | | Closing Costs: | $1,194,938 | 1.4% |
| Total Sources: | $84,396,973 | 100.0% | | Total Uses: | $84,396,973 | 100.0% |
| (1) | Seller credit of $4,000,000 was provided for future leasing and capital expenditures. Taking into consideration the seller credit the borrower sponsor’s loan-to-cost ratio is 65.4% |
The Mortgage Loan. The sixth largest mortgage loan (the “One Town Center Mortgage Loan”) is evidenced by a single promissory note in the original principal amount of $51,000,000 and secured by a first priority fee interest in a 190,395 square foot class A Office property located in Boca Raton, Florida (the “One Town Center Property”).
The Borrower and the Borrower Sponsor. The borrower is Miles Capital, LLC, a Delaware limited liability company and single purpose entity with one independent director. Legal counsel to the borrower delivered a non-consolidation opinion in connection with the origination of the One Town Center Mortgage Loan.
The borrower sponsor is Nader Ohebshalom, the president of Gatsby Enterprises, a real estate investment, management and development company, headquartered in New York City. Gatsby Enterprises is a privately owned real estate investment and management company, with an extensive portfolio of office, hotel and residential properties in New York City as well as South Florida.
The Property. The One Town Center Property comprises a 10-story Class A, office building totaling 190,395 SF of net rentable area located in Boca Raton, Florida. Situated on a 9.93 acre site, the One Town Center Property was constructed in 1990. Amenities at the property include a restaurant, parking garage, on-site management, fitness center, and café. The One Town Center Property has 613 parking spaces on site, resulting in a parking ratio of approximately 3.22 spaces per 1,000 SF. As of May 16, 2024, the One Town Center Property is 100.0% leased to 21 tenants and has averaged 98.9% occupancy since 2022.
| This is not a research report and was not prepared by any Underwriter’s research department. Please see additional important information and qualifications at the end of this Term Sheet. |
| | T-63 | |
| Office - Suburban | Loan #6 | Cut-off Date Balance: | | $51,000,000 |
| One Town Center | One Town Center | Cut-off Date LTV: | | 61.7% |
| Boca Raton, FL 33486 | | UW NCF DSCR: | | 1.62x |
| | | UW NOI Debt Yield: | | 12.4% |
Major Tenants.
Bank of America Merrill Lynch (“Bank of America”) (A1/AA-/A- by M/F/S; 61,430 SF, 32.3% of NRA; 32.3% of underwritten base rent). Bank of America is one of the world’s leading financial institutions, serving individuals, small- and middle-market businesses, large corporations, and governments with a full range of banking, investment management and other financial and risk management products and services. Bank of America has been at the property since 2015 and has a lease expiring in February 2027 with two, five-year renewal options remaining and no termination options.
Raymond James (A3/A-/A- by M/F/S; 24,364 SF, 12.8% of NRA; 15.5% of underwritten base rent). Raymond James is a leading diversified financial services company providing private client group, capital markets, asset management, banking, and other services to individuals, corporations, and municipalities. Raymond James has been at the property since 2019 and has a lease expiring in March 2030 with one, five-year options remaining and no termination options.
Kayne Anderson (25,733 square feet, 13.5% of NRA; 14.0% of underwritten base rent). Founded in 1984 and headquartered in Florida, Kayne Anderson is a leading alternative investment management firm focused on real estate, credit, infrastructure, energy, and growth capital. Kayne Anderson has $36 billion in assets under management as of June 30, 2024. Kayne Anderson has been at the property since 2013 and has a lease expiring in August 2030 with two, five-year options remaining and no termination options.
The following table presents certain information relating to the tenancy at the One Town Center Property:
| Tenant Summary) (1) |
| Tenant Name | Credit Rating (Moody's/Fitch/S&P) (2) | Tenant SF | Approx % of Total SF | Annual UW Rent(3) | % of Total Annual UW Rent | Annual UW Rent PSF(3) | Lease Expiration | Renewal Options | Term. Option (Y/N) |
| Bank of America Merrill Lynch | A1/AA-/A- | 61,430 | 32.3% | $2,398,322 | 32.3% | $39.04 | 02/28/2027 | | 2 x 5 yr | N |
| Raymond James | A3/A-/A- | 24,364 | 12.8% | $1,153,402 | 15.5% | $47.34 | 03/31/2030 | | 1 x 5 yr | N |
| Kayne Anderson | NR/NR/NR | 25,733 | 13.5% | $1,042,701 | 14.0% | $40.52 | 08/31/2030 | | 2 x 5 yr | N |
| Kaufman, Rossin & Co. | NR/NR/NR | 16,308 | 8.6% | $527,873 | 7.1% | $32.37 | 06/30/2030 | | 2 x 5 yr | N |
| Truist | Baa1/A-/A- | 9,624 | 5.1% | $440,049 | 5.9% | $45.72 | 12/31/2028 | | 2 x 5 yr | N |
| AF Encore Management | NR/NR/NR | 10,585 | 5.6% | $324,559 | 4.4% | $30.66 | 07/31/2026 | | 1 x 5 yr | N |
| Subtotal/Wtd. Avg. | | 148,044 | 77.8% | $5,886,907 | 79.2% | $39.76 | | | |
| | | | | | | | | | |
| Other Tenants | | 42,351 | 22.2% | $1,544,201 | 20.8% | $36.46 | | | |
| Occupied Collateral Total | | 190,395 | 100.0% | $7,431,108 | 100.0% | $39.03 | | | |
| | | | | | | | | | |
| Vacant Space | | 0 | 0.0% | | | | | | |
| Total/Wtd. Avg. | | 190,395 | 100.0% | | | | | | |
| (1) | Based on the underwritten rent roll dated May 16, 2024. |
| (2) | Certain ratings are those of the parent company whether or not the parent guarantees the lease. |
| (3) | The Annual UW Rent and Annual UW Base Rent PSF shown above include contractual rent steps through June 2025 and straight-line rent averaging for certain investment grade tenants through the earlier of lease or loan maturity. |
| This is not a research report and was not prepared by any Underwriter’s research department. Please see additional important information and qualifications at the end of this Term Sheet. |
| | T-64 | |
| Office - Suburban | Loan #6 | Cut-off Date Balance: | | $51,000,000 |
| One Town Center | One Town Center | Cut-off Date LTV: | | 61.7% |
| Boca Raton, FL 33486 | | UW NCF DSCR: | | 1.62x |
| | | UW NOI Debt Yield: | | 12.4% |
The following table presents certain information relating to the lease rollover schedule at the One Town Center Property:
| Lease Rollover Schedule(1)(2) |
| Year | # of Leases Rolling | SF Rolling | Approx. % of Total SF Rolling | Approx.
Cumulative %
of SF Rolling | Total UW Rent Rolling | Approx. % of Total Rent Rolling | Approx. Cumulative % of Total Rent Rolling | UW Rent PSF Rolling |
| MTM | 4 | 5,541 | 2.9% | 2.9% | $0 | 0.0% | 0.0% | $0.00 |
| 2024 | 0 | 0 | 0.0% | 2.9% | $0 | 0.0% | 0.0% | $0.00 |
| 2025 | 2 | 10,655 | 5.6% | 8.5% | $492,588 | 6.6% | 6.6% | $46.23 |
| 2026 | 4 | 18,014 | 9.5% | 18.0% | $605,751 | 8.2% | 14.8% | $33.63 |
| 2027 | 4 | 67,194 | 35.3% | 53.3% | $2,650,266 | 35.7% | 50.5% | $39.44 |
| 2028 | 2 | 12,911 | 6.8% | 60.1% | $577,248 | 7.8% | 58.3% | $44.71 |
| 2029 | 0 | 0 | 0.0% | 60.1% | $0 | 0.0% | 58.3% | $0.00 |
| 2030 | 3 | 66,405 | 34.9% | 95.0% | $2,723,977 | 36.7% | 95.0% | $41.02 |
| 2031 | 0 | 0 | 0.0% | 95.0% | $0 | 0.0% | 95.0% | $0.00 |
| 2032 | 2 | 9,675 | 5.1% | 100.0% | $381,277 | 5.1% | 100.0% | $39.41 |
| 2033 | 0 | 0 | 0.0% | 100.0% | $0 | 0.0% | 100.0% | $0.00 |
| 2034 | 0 | 0 | 0.0% | 100.0% | $0 | 0.0% | 100.0% | $0.00 |
| 2035 & Thereafter | 0 | 0 | 0.0% | 100.0% | $0 | 0.0% | 100.0% | $0.00 |
| Vacant | 0 | 0 | 0.0% | 100.0% | $0 | 0.0% | 100.0% | $0.00 |
| Total/Wtd. Avg. | 21 | 190,395 | 100.0% | 100.0% | $7,431,108 | 100.0% | | $39.03 |
| (1) | Based on the underwritten rent roll dated May 16, 2024. |
| (2) | Certain tenants may have termination options that are not accounted for in the lease rollover schedule. |
The Market. The One Town Center Property is located in the southeastern Palm Beach County, Florida, in the city of Boca Raton. The property is located 24.8 miles to the north of Fort Lauderdale-Hollywood International Airport and 0.3 miles to the GreenStreet rated A+ Boca Town Center. Major employers include Tenet Healthcare Corp, NextEra Energy/Florida Power & Light Co, Florida Atlantic University, Hospital Corp. of America and Boca Raton Regional Hospital. The local neighborhood contains a mix of office, retail and residential properties with approximately 44,479 household with a 3-mile radius. Primary access to the property market area is provided by Interstate 95, the primary north-south freeway traveling through the region that connects the property neighborhood to the West Palm Beach and Fort Lauderdale CBD.
According to the appraisal, the 2023 population and average household income within a one-, three- and five-mile radius of the One Town Center Property was 11,015, 104,583, 272,692 and $114,597, $133,924, and $119,472, respectively. Between 2010 and 2023, the population within a one-, three-, and five-mile radius increased by 12.8%, 17.5%, and 15.2%, respectively.
According to the appraisal, the property is located in the Boca Raton West submarket of the Palm Beach-FL office market. As of Q1 2024, the submarket reported a total inventory of approximately 5.31 million SF with a 7.2% vacancy rate and average asking rent of $45.10 PSF.
The following table presents certain information relating to the appraisal’s market rent conclusions for the One Town Center Property:
| Market Rent Summary |
| | Office 1-5 Multi | Office 1-5 Full | Office 6-9 Multi | Office 6-9 Full | Office 10 Penthouse | Restaurant Space | Amenity Space |
| Market Rent (PSF) | $44.50 | $43.00 | $45.50 | $44.00 | $46.00 | $40.00 | $0.00 |
| Lease Term (Years) | 5 | 7 | 5 | 7 | 11 | 7 | 0 |
| Lease Type | Net | Net | Net | Net | Net | Net | None |
| Escalations | 3.0% annually | 3.0% annually | 3.0% annually | 3.0% annually | 3.0% annually | 3.0% annually | None |
| Tenant Improvements (New/Renewal) | $50 / $10 | $60 / $10 | $50 / $10 | $60 / $10 | $75 / $10 | $75 / $10 | $0 / $0 |
| Leasing Commissions (New/Renewal) | 6.0% / 3.0% | 6.0% / 3.0% | 6.0% / 3.0% | 6.0% / 3.0% | 6.0% / 3.0% | 6.0% / 3.0% | None |
| Free Rent (Months) (New) | 3 | 4 | 3 | 4 | 6 | 3 | 0 |
Source: Appraisal.
| This is not a research report and was not prepared by any Underwriter’s research department. Please see additional important information and qualifications at the end of this Term Sheet. |
| | T-65 | |
| Office - Suburban | Loan #6 | Cut-off Date Balance: | | $51,000,000 |
| One Town Center | One Town Center | Cut-off Date LTV: | | 61.7% |
| Boca Raton, FL 33486 | | UW NCF DSCR: | | 1.62x |
| | | UW NOI Debt Yield: | | 12.4% |
The following table presents information relating to comparable sales pertaining to the One Town Center Property:
| | | Sales Comparable(1) | | | | |
| Property Name/Location | Year Built/ Renovated | Size (SF) | Occupancy | Sale Date | Sale Price | Sale Price (PSF) |
One Town Center Boca Raton, FL | 1990 / NAP | 190,395(2) | 100.0%(2) | | | |
Phillips Point Office Complex West Palm Beach, FL | 1985 / 1988 | 437,188 | 90.0% | Jan-2021 | $282,000,000 | $645 |
Bank of America Tower Boca Raton, FL | 1969 / 2013 | 109,497 | 79.0% | Jul-2021 | $44,600,000 | $407 |
Palmetto Park City Center Boca Raton, FL | 1997 / NAP | 66,606 | 60.0% | Mar-2022 | $25,200,000 | $378 |
Boca Centre Office Park Boca Raton, FL | 1986 / 2000 | 368,046 | 64.0% | Mar-2022 | $171,500,000 | $466 |
CUBE Wynwd Miami, FL | 2018 / NAP | 92,552 | 98.0% | Dec-2022 | $62,000,000 | $670 |
Cornerstone One Plantation, FL | 1991 / 2022 | 170,172 | 80.0% | Mar-2023 | $37,935,000 | $223 |
355 Alhambra Coral Gables, FL | 2001 / 2017 | 222,757 | 84.0% | Sep-2023 | $88,750,000 | $398 |
Aventura Corporate Center Aventura, FL | 1986 / 2019 | 254,975 | 90.0% | Jun-2024 | $140,000,000 | $549 |
|
| (1) | Information obtained from appraisal. |
| (2) | Information obtained from the underwritten rent roll dated May 16, 2024. |
The following table presents certain information relating to the appraiser’s market rent conclusions for the One Town Center Property:
| Comparable Office Properties(1) |
| Property Name/Location | Total NRA (SF) | Year Built/Renovated | Stories | % Occupied |
One Town Center Boca Raton, FL | 190,395(2) | 1990 / NAP | 10 | 100.0%(2) |
Boca Village Corporate Boca Raton, FL | 104,569 | 2008 / NAP | 7 | 100.0% |
1800 Boca Center Boca Raton, FL | 145,171 | 2008 / 2022 | 4 | 90.0% |
Boca Centre Towers I & II Boca Raton, FL | 232,817 | 1986 / 2000 | 6 | 81.0% |
Boca Centre Towers I & II Boca Raton, FL | 232,817 | 1986 / 2000 | 6 | 81.0% |
Two Town Center Boca Raton, FL | 145,344 | 1986 / 1999 | 11 | 90.0% |
|
| (1) | Information obtained from the appraisal. |
| (2) | Information obtained from the underwritten rent roll dated May 16, 2024. |
| This is not a research report and was not prepared by any Underwriter’s research department. Please see additional important information and qualifications at the end of this Term Sheet. |
| | T-66 | |
| Office - Suburban | Loan #6 | Cut-off Date Balance: | | $51,000,000 |
| One Town Center | One Town Center | Cut-off Date LTV: | | 61.7% |
| Boca Raton, FL 33486 | | UW NCF DSCR: | | 1.62x |
| | | UW NOI Debt Yield: | | 12.4% |
Operating History and Underwritten Net Cash Flow. The following table presents certain information relating to the historical operating performance and Underwritten Net Cash Flow at the One Town Center Property:
| Cash Flow Analysis |
| | 2021 | 2022 | 2023 | TTM 04/30/2024 | UW | | UW PSF |
| Base Rent | $5,714,035 | $6,213,822 | $6,700,010 | $6,797,480 | $6,687,997 | | $35.13 |
| Grossed Up Vacant Space | $0 | $0 | $0 | $0 | $743,111 | | $3.90 |
| (Free Rent Adjustment) | $(128,384) | $(259,137) | $(129,724) | $(111,012) | $0 | | $0.00 |
| Gross Potential Rent | $5,585,651 | $5,954,685 | $6,570,286 | $6,686,468 | $7,431,108 | | $39.03 |
| Other Income | $16,460 | $34,130 | $30,679 | $32,977 | $32,977 | | $0.17 |
| Parking/Garage/Other | $47,213 | $61,063 | $56,573 | $53,723 | $53,723 | | $0.28 |
| Total Recoveries | $2,361,383 | $3,376,934 | $3,635,993 | $3,838,354 | $4,113,154 | | $21.60 |
| Net Rental Income | $8,010,707 | $9,426,812 | $10,293,531 | $10,611,522 | $11,630,962 | | $61.09 |
| (Vacancy & Credit Loss) | $0 | $0 | $0 | $0 | $(743,111)(1) | | $(3.90) |
| Effective Gross Income | $8,010,707 | $9,426,812 | $10,293,531 | $10,611,522 | $10,887,851 | | $57.19 |
| | | | | | | |
| Real Estate Taxes | $691,207 | $1,494,161 | $1,517,719 | $1,479,176 | $1,479,176 | | $7.77 |
| Insurance | $195,478 | $235,676 | $249,887 | $257,696 | $844,955 | | $4.44 |
| Management Fee | $232,413 | $281,759 | $307,320 | $317,033 | $326,636 | | $1.72 |
| Other Operating Expenses | $1,610,710 | $1,777,044 | $1,828,126 | $1,922,308 | $1,922,308 | | $10.10 |
| Total Expenses | $2,729,808 | $3,788,641 | $3,903,052 | $3,976,213 | $4,573,075 | | $24.02 |
| | | | | | | |
| Net Operating Income(2) | $5,280,899 | $5,638,171 | $6,390,479 | $6,635,309 | $6,314,776 | | $33.17 |
| Replacement Reserves | $0 | $0 | $0 | $0 | $38,079 | | $0.20 |
| TI/LC | $0 | $0 | $0 | $0 | $190,395 | | $1.00 |
| Non-Recurring Items | $0 | $0 | $0 | $0 | $(50,000) | | $(0.26) |
| Net Cash Flow | $5,280,899 | $5,638,171 | $6,390,479 | $6,635,309 | $6,136,302 | | $32.23 |
| | | | | | | |
| Occupancy % | 94.7% | 97.0% | 99.7% | 100.0% | 90.0% | (1) | |
| NOI DSCR(2) | 1.39x | 1.49x | 1.68x | 1.75x | 1.66x | | |
| NCF DSCR(2) | 1.39x | 1.49x | 1.68x | 1.75x | 1.62x | | |
| NOI Debt Yield(2) | 10.4% | 11.1% | 12.5% | 13.0% | 12.4% | | |
| NCF Debt Yield(2) | 10.4% | 11.1% | 12.5% | 13.0% | 12.0% | | |
| (1) | The underwritten economic vacancy is 10.0%. The One Town Center Property was 100.0% leased as of May 16, 2024. |
| (2) | The Base Rent shown above includes contractual rent steps through June 2025 and straight-line rent averaging for certain investment grade tenants through the earlier of lease or loan maturity. |
Escrows and Reserves.
Real Estate Taxes –The loan documents require an upfront deposit of $580,236 and ongoing monthly real estate tax reserves in an amount equal to 1/12th of the real estate taxes that the lender estimates will be payable during the next 12 months, initially $145,059.
Insurance – The loan documents require an upfront deposit of $73,934 and ongoing monthly insurance reserves in an amount equal to 1/12th of the insurances premiums that the lender estimates will be payable during the next 12 months, initially $73,934. Notwithstanding the above, the borrower’s obligation to make insurance reserve payments will be waived so long as (i) no event of default is continuing, (ii) the insurance policies maintained by borrower are part of a blanket or umbrella policy approved by the lender in its reasonable discretion, and (iii) borrower provides lender evidence of renewal of policies and paid receipts no later than 10 business days prior to policy expiration.
Replacement Reserve – The loan documents require monthly deposits of $2,424 for replacement reserves.
Leasing Reserve – The loan documents require an upfront reserve of $500,000 for leasing costs and ongoing monthly reserves in an amount equal to approximately $15,866.
Existing TI/LC Reserve – The loan documents require an upfront deposit of $47,865 for existing tenant improvements and leasing commissions related to existing leases at the property.
Lockbox and Cash Management. The One Town Center Mortgage Loan is structured with a hard lockbox and springing cash management. The borrower is required to direct the tenants to pay rent directly into the lockbox account. On each business day during the continuance of a Cash Trap Event Period, the lockbox bank is required to transfer amounts on deposit in the lockbox account into a lender-controlled cash management account, which amounts are to be applied in accordance with the loan documents. If no Cash Trap Event Period (as defined below) exists, all excess cash flow will be disbursed to the borrower. During the continuance of a Cash Trap Event Period, excess cash flow is required to be held by the lender as additional collateral.
| This is not a research report and was not prepared by any Underwriter’s research department. Please see additional important information and qualifications at the end of this Term Sheet. |
| | T-67 | |
| Office - Suburban | Loan #6 | Cut-off Date Balance: | | $51,000,000 |
| One Town Center | One Town Center | Cut-off Date LTV: | | 61.7% |
| Boca Raton, FL 33486 | | UW NCF DSCR: | | 1.62x |
| | | UW NOI Debt Yield: | | 12.4% |
A “Cash Trap Event Period” will commence of the following:
| (i) | the occurrence and continuance of an event of default under the One Town Center Mortgage Loan; or |
| (ii) | the net cash flow debt service coverage ratio (“NCF DSCR”) on the One Town Center Mortgage Loan falling below 1.15x (tested quarterly); |
| (iii) | the commencement and continuance of a Major Tenant Event Period (as defined below). |
A Cash Trap Event Period will end upon the occurrence of the following:
| ● | with regard to clause (i), the cure of such event of default; |
| ● | with regard to clause (ii), upon the date that the debt service coverage ratio has been equal to or greater than 1.15x for two (2) consecutive calendar quarters; |
| ● | with regard to clause (iii), upon the termination of all Major Tenant Event Periods. |
A “Major Tenant Event Period” means the occurrence of any of the following:
| (i) | a Major Tenant fails to renew or extend the term of its lease, pursuant to the terms of such Major Tenant’s lease; |
| (ii) | a Major Tenant “goes dark,” vacates or otherwise fails to continuously occupy the entirety of its space; |
| (iii) | a Major Tenant files, as a debtor, bankruptcy or similar insolvency proceeding; |
| (iv) | a Major Tenant terminates or cancels its lease or gives notice to do so. |
A “Major Tenant Event Period” will end upon:
| ● | with regard to clause (i) above, lender has received evidence that all of the space has been leased to one or more replacement tenants and that each tenant is in occupancy, open for business, paying full, unabated rent (or is reserved with lender), and all tenant improvements and leasing commissions have been paid (or are reserved with lender); |
| ● | with regard to clause (ii), the applicable Major Tenant has resumed its normal business operations in its entire Major Tenant Space and is open during customary hours for a period of two (2) consecutive calendar quarters; |
| ● | with regard to clause (iii), the bankruptcy or insolvency proceeding has been dismissed or the bankruptcy has been terminated in a manner satisfactory to lender; |
| ● | with regard to clause (iv), the Major Tenant Re-Tenanting Event (as defined below) has occurred. |
A “Major Tenant Re-Tenanting Event” means that lender has received satisfactory evidence that all of the applicable major tenant space has been leased to one or more satisfactory replacement tenants, each pursuant to a satisfactory replacement lease, that each such tenant is in occupancy of its premises, open for business and is then paying full, unabated rent pursuant to the terms of its lease.
Terrorism Insurance. The One Town Center Mortgage Loan documents require an “all risk” insurance policy on a replacement cost basis, together with (i) business interruption insurance covering no less than the 12-month period following the occurrence of a casualty event, together with a 6-month extended period of indemnity, (ii) windstorm and/or named storm coverage with a deductible up to 5% of the total insurable value, and (iii) terrorism coverage as defined by TRIPRA. See “Risk Factors—Risks Relating to the Mortgage Loans—Terrorism Insurance May Not Be Available for All Mortgaged Properties” in the prospectus.
| This is not a research report and was not prepared by any Underwriter’s research department. Please see additional important information and qualifications at the end of this Term Sheet. |
| | T-68 | |
| Retail – Anchored | Loan #7 | Cut-off Date Balance: | | $50,210,256 |
| 610 Exterior Street | Bronx Terminal Market | Cut-off Date LTV: | | 43.2% |
| Bronx, NY 10451 | | UW NCF DSCR: | | 2.18x |
| | | UW NOI Debt Yield: | | 11.9% |
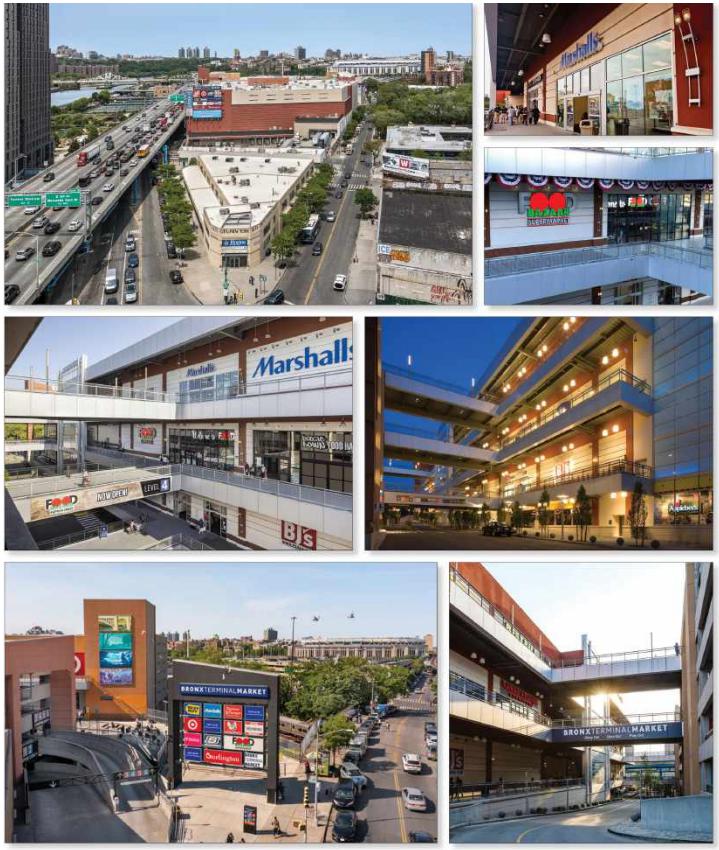
| This is not a research report and was not prepared by any Underwriter’s research department. Please see additional important information and qualifications at the end of this Term Sheet. |
| | T-69 | |
| Retail – Anchored | Loan #7 | Cut-off Date Balance: | | $50,210,256 |
| 610 Exterior Street | Bronx Terminal Market | Cut-off Date LTV: | | 43.2% |
| Bronx, NY 10451 | | UW NCF DSCR: | | 2.18x |
| | | UW NOI Debt Yield: | | 11.9% |
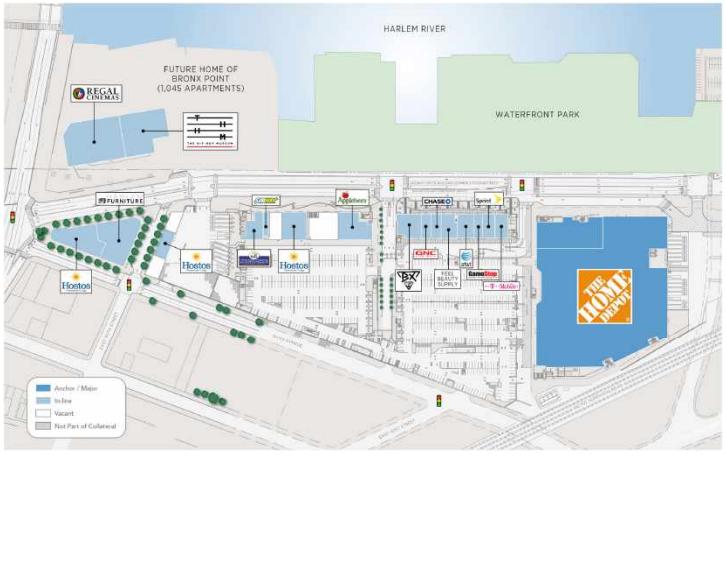
| This is not a research report and was not prepared by any Underwriter’s research department. Please see additional important information and qualifications at the end of this Term Sheet. |
| | T-70 | |
| Retail – Anchored | Loan #7 | Cut-off Date Balance: | | $50,210,256 |
| 610 Exterior Street | Bronx Terminal Market | Cut-off Date LTV: | | 43.2% |
| Bronx, NY 10451 | | UW NCF DSCR: | | 2.18x |
| | | UW NOI Debt Yield: | | 11.9% |
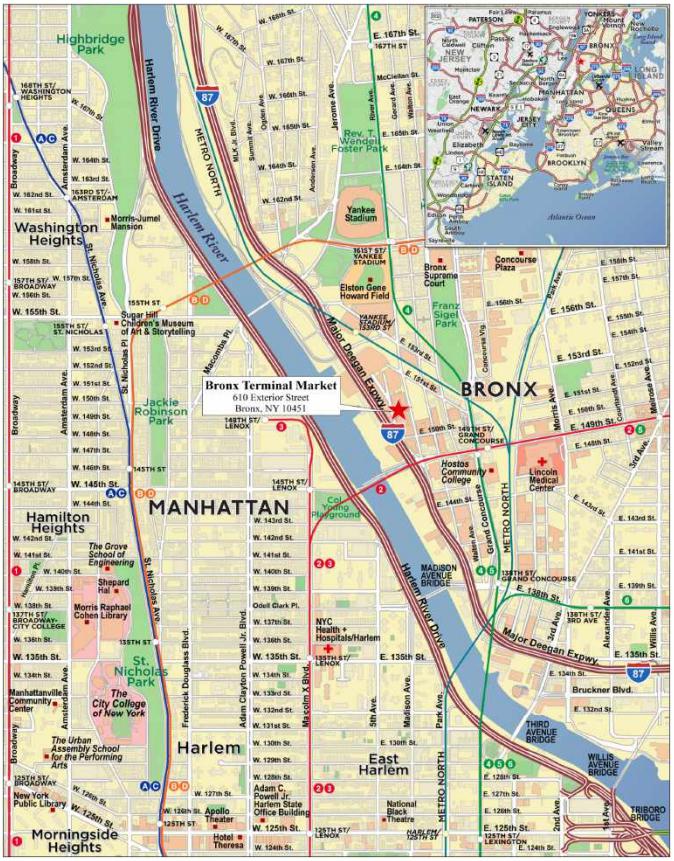
| This is not a research report and was not prepared by any Underwriter’s research department. Please see additional important information and qualifications at the end of this Term Sheet. |
| | T-71 | |
| Mortgage Loan No. 7 – Bronx Terminal Market |
| Mortgage Loan Information | | Property Information |
| Mortgage Loan Seller: | WFB | | Single Asset/Portfolio: | Single Asset |
| Credit Assessment (Fitch/Moody’s/KBRA): | NR/NR/NR | | Location: | Bronx, NY 10451 |
| Original Balance(1): | $50,210,526 | | General Property Type: | Retail |
| Cut-off Date Balance(1): | $50,210,526 | | Detailed Property Type: | Anchored |
| % of Initial Pool Balance: | 5.5% | | Title Vesting: | Leasehold |
| Loan Purpose: | Refinance | | Year Built/Renovated: | 2009 / NAP |
| Borrower Sponsors: | The Related Companies, L.P. | | Size: | 918,779 SF |
| Guarantor: | The Related Companies, L.P. | | Cut-off Date Balance Per SF(1): | $261 |
| Mortgage Rate: | 5.18100% | | Maturity Date Balance Per SF(1): | $261 |
| Note Date: | 8/6/2024 | | Property Manager: | BTM Development Partners, LLC |
| Maturity Date: | 8/6/2029 | | | |
| Term to Maturity: | 60 months | | Underwriting and Financial Information |
| Amortization Term: | 0 months | | UW NOI: | $28,594,688 |
| IO Period: | 60 months | | UW NCF: | $27,492,153 |
| Seasoning: | 0 months | | UW NOI Debt Yield(1): | 11.9% |
| Prepayment Provisions(2): | L(23),YM1(1),DorYM(32),O(4) | | UW NCF Debt Yield(1): | 11.5% |
| Lockbox/Cash Mgmt Status: | Hard/Springing | | UW NOI Debt Yield at Maturity(1): | 11.9% |
| Additional Debt Type(1): | Pari Passu / B Note | | UW NCF DSCR(1): | 2.18x |
| Additional Debt Balance(1): | $189,789,474 / $140,000,000 | | Most Recent NOI: | $30,377,981 (TTM 3/31/2024) |
| Future Debt Permitted (Type): | No (NAP) | | 2nd Most Recent NOI(5): | $30,756,078 (12/31/2023) |
Reserves(3) | | 3rd Most Recent NOI(5): | $31,251,930 (12/31/2022) |
| Type | Initial | Monthly | Cap | | Most Recent Occupancy: | 90.2% (4/19/2024) |
| RE Tax: | $0 | Springing | NAP | | 2nd Most Recent Occupancy: | 98.4% (12/31/2023) |
| Insurance: | $0 | Springing | NAP | | 3rd Most Recent Occupancy: | 98.4% (12/31/2022) |
| Replacement Reserve: | $0 | Springing | $547,400 | | Appraised Value (as of): | $555,000,000 (4/30/2024) |
| TI/LC: | $874,981 | Springing | $1,696,118 | | Appraised Value Per SF: | $604 |
| Ground Rent Reserve: | $0 | Springing | NAP | | Cut-off Date LTV Ratio(1): | 43.2% |
| DMV Space Reserve: | $9,000,000 | $0 | NAP | | Maturity Date LTV Ratio(1): | 43.2% |
| | | | | | | | |
| Sources and Uses |
| Sources | Proceeds | % of Total | | Uses | Proceeds | % of Total |
| Senior Loan(1) | $240,000,000 | 61.0% | | Loan Payoff | $376,708,834 | 95.8 | % |
| Subordinate Companion Loan(1) | $140,000,000 | 35.6% | | Upfront Reserves | $9,874,981 | 2.5 | % |
| Borrower Sponsor Equity | $13,238,721 | 3.4% | | Closing Costs | $6,654,906 | 1.7 | % |
| Total Sources: | $393,238,721 | 100.00% | | Total Uses: | $393,238,721 | 100.00% | |
| (1) | The Bronx Terminal Market Mortgage Loan (as defined below) is part of The Bronx Terminal Market Whole Loan (as defined below) which is comprised of 21 senior pari passu promissory notes and four subordinate B-notes, with an aggregate original principal balance and Cut-off Date Balance of $380,000,000. The Financial Information in the chart above is based on the aggregate outstanding principal balance as of the Cut-off Date of the Bronx Terminal Market Senior Loan (as defined below). The Cut-off Date Loan / SF, Maturity Date Loan / SF, Cut-off Date LTV, Maturity Date LTV, UW NCF DSCR and UW NOI Debt Yield figures presented above are based on the Bronx Terminal Market Senior Loan. The Cut-off Date Loan / SF, Maturity Date Loan / SF, Cut-off Date LTV, Maturity Date LTV, UW NCF DSCR and UW NOI Debt Yield figures based upon the Bronx Terminal Market Whole Loan are $414, $414, 68.5%, 68.5%, 1.07x and 7.5%, respectively. |
| (2) | The lockout period will be at least 23 payment dates beginning with and including the first payment date on September 6, 2024. Defeasance of the Bronx Terminal Market Whole Loan in full is permitted at any time after the earlier to occur of (i) September 6, 2027 or (ii) the date that is two years from the closing date of the securitization that includes the last pari passu note to be securitized. In addition, on any business day on and after August 6, 2026 voluntary prepayment of the Bronx Terminal Market Whole Loan is permitted in whole (but not in part), together with, if such voluntary prepayment occurs prior to the Open Prepayment Date, a prepayment fee equal to the greater of (x) 1.00% of the principal amount of the Bronx Terminal Market Whole Loan being prepaid and (y) a yield maintenance premium. The assumed lockout period of 23 payments is based on the expected BANK 2024-5YR9 securitization closing date in August 2024. The actual lockout period may be longer. |
| (3) | For a full description of escrows and reserves, please refer to “Escrows and Reserves” below. |
The Mortgage Loan. The seventh largest mortgage loan (the “Bronx Terminal Market Mortgage Loan”) is part of a whole loan (the “Bronx Terminal Market Whole Loan”) evidenced by 21 senior pari passu promissory notes totaling $240,000,000 (the “Bronx Terminal Market Senior Loan”) and four subordinate B-notes totaling $140,000,000 (the “Bronx Terminal Market Subordinate Companion Loan”), with an aggregate principal balance of $380,000,000. The Bronx Terminal Market Whole Loan was co-originated by German American Capital Corporation (“GACC”), Wells Fargo Bank, National Association (“WFB”), Bank of America, National Association (“BANA”) and Starwood Mortgage Capital LLC (“SMC”) on August 6, 2024. The Bronx Terminal Mortgage Loan is evidenced by the non-controlling notes A-12, A-13, A-14, A-15 and A-16, with an aggregate original principal balance of $50,210,526. The Bronx Terminal Market Whole Loan is secured by a leasehold interest in a 918,779 SF, multi-level, anchored retail center, connected via a six-level, 2,602 stall parking garage located in Bronx, New York (the “Bronx Terminal Market Property”).
| This is not a research report and was not prepared by any Underwriter’s research department. Please see additional important information and qualifications at the end of this Term Sheet. |
| | T-72 | |
| Retail – Anchored | Loan #7 | Cut-off Date Balance: | | $50,210,256 |
| 610 Exterior Street | Bronx Terminal Market | Cut-off Date LTV: | | 43.2% |
| Bronx, NY 10451 | | UW NCF DSCR: | | 2.18x |
| | | UW NOI Debt Yield: | | 11.9% |
The table below identifies the promissory notes that comprise the Bronx Terminal Market Whole Loan. The relationship between the holders of the Bronx Terminal Market Whole Loan is governed by a co-lender agreement as described under “Description of the Mortgage Pool—The Whole Loans—The Serviced Pari Passu Whole Loans” and “—The Non-Serviced Pari Passu Whole Loans” in the Prospectus. The Bronx Terminal Market Whole Loan is an AB whole loan, and the controlling note as of the date hereof is the Note B-1. Upon the occurrence of certain trigger events specified in the co-lender agreement, however, control will generally shift first, to the Note A-1. The Bronx Terminal Market Whole Loan will initially be serviced pursuant to the pooling and servicing agreement for the BANK 2024-5YR9 securitization until the lead A-1 note is securitized, whereupon the Bronx Terminal Market Whole Loan will be serviced pursuant to the pooling and servicing agreement for the transaction in which the controlling Note A-1 is securitized. See “The Pooling and Servicing Agreement—Servicing of the Servicing Shift Mortgage Loans” in the Prospectus.
The promissory notes comprising the Bronx Terminal Market Whole Loan are summarized in the below table:
| Whole Loan Summary |
| Note | Original Balance | Cut-off Date Balance | Note Holder | Controlling Note |
| A-1(1) | $40,000,000 | $40,000,000 | GACC | No(2) |
| A-2(1) | $20,000,000 | $20,000,000 | GACC | No |
| A-3(1) | $15,000,000 | $15,000,000 | GACC | No |
| A-4(1) | $11,578,947 | $11,578,947 | GACC | No |
| A-5(1) | $5,000,000 | $5,000,000 | GACC | No |
| A-6(1) | $10,000,000 | $10,000,000 | SMC | No |
| A-7(1) | $10,000,000 | $10,000,000 | SMC | No |
| A-8(1) | $10,000,000 | $10,000,000 | SMC | No |
| A-9(1) | $10,000,000 | $10,000,000 | SMC | No |
| A-10(1) | $4,000,000 | $4,000,000 | SMC | No |
| A-11(1) | $4,000,000 | $4,000,000 | SMC | No |
| A-12 | $30,000,000 | $30,000,000 | BANK 2024-5YR9 | No(2) |
| A-13 | $10,000,000 | $10,000,000 | BANK 2024-5YR9 | No(2) |
| A-14 | $4,500,000 | $4,500,000 | BANK 2024-5YR9 | No(2) |
| A-15 | $3,210,526 | $3,210,526 | BANK 2024-5YR9 | No(2) |
| A-16 | $2,500,000 | $2,500,000 | BANK 2024-5YR9 | No(2) |
| A-17(1) | $30,000,000 | $30,000,000 | BANA | No |
| A-18(1) | $10,000,000 | $10,000,000 | BANA | No |
| A-19(1) | $4,500,000 | $4,500,000 | BANA | No |
| A-20(1) | $3,210,526 | $3,210,526 | BANA | No |
| A-21(1) | $2,500,000 | $2,500,000 | BANA | No |
| Senior Loan | $240,000,000 | $240,000,000 | | |
| B-1 | $53,421,053 | $53,421,053 | CPPIB Credit Investments III Inc. | Yes(2) |
| B-2 | $29,289,474 | $29,289,474 | CPPIB Credit Investments III Inc. | No |
| B-3 | $29,289,474 | $29,289,474 | CPPIB Credit Investments III Inc. | No |
| B-4 | $28,000,000 | $28,000,000 | CPPIB Credit Investments III Inc. | No |
| Whole Loan | $380,000,000 | $380,000,000 | | |
| (1) | Expected to be contributed to one or more securitization trust(s) or may otherwise be transferred at any time. |
| (2) | The Bronx Terminal Market Whole Loan is an AB whole loan, and the controlling note as of the date hereof is the Note B-1. Upon the occurrence of certain trigger events specified in the co-lender agreement, however, control will generally shift first, to the Note A-1. See “Description of the Mortgage Pool— The Whole Loans—The Non-Serviced AB Whole Loan—The Bronx Terminal Market Whole Loan” in the Preliminary Prospectus for more information regarding the manner in which control shifts under the Bronx Terminal Market Whole Loan. |
The Borrower and the Borrower Sponsor. The borrower for the Bronx Terminal Market Whole Loan is BTM Development Partners, LLC, a New York limited liability company and single purpose entity with a Delaware limited liability company sole member that is a single purpose entity with two independent directors. Legal counsel to the borrower delivered a non-consolidation opinion in connection with the origination of the Bronx Terminal Market Whole Loan.
The borrower sponsor is The Related Companies, L.P. (“Related’). Founded in 1972, Related is a privately-owned, fully integrated global real estate and lifestyle company with experience in virtually every aspect of development, acquisition, management, finance, marketing, and sales. Headquartered in New York City, Related has offices and major developments in Boston, Chicago, Los Angeles, San Francisco, West Palm Beach, Miami, Washington, D.C., Abu Dhabi and London, and boasts a team of approximately 4,000 professionals. Related has over $60 billion in assets owned or under development.
| This is not a research report and was not prepared by any Underwriter’s research department. Please see additional important information and qualifications at the end of this Term Sheet. |
| | T-73 | |
| Retail – Anchored | Loan #7 | Cut-off Date Balance: | | $50,210,256 |
| 610 Exterior Street | Bronx Terminal Market | Cut-off Date LTV: | | 43.2% |
| Bronx, NY 10451 | | UW NCF DSCR: | | 2.18x |
| | | UW NOI Debt Yield: | | 11.9% |
The Property. The Bronx Terminal Market Property is a four building, 918,779 SF, multi-level, anchored retail center, connected via a six-level, 2,602 space parking garage located in Bronx, New York. Completed in 2009, the Bronx Terminal Market Property features a well-known anchor tenant profile along with street level retail, restaurant and mixed-use space. The top 5 tenants at the Property account for 595,744 SF (64.8% NRA) and include Target, BJ’s Wholesale Club, Home Depot, Food Bazaar and Burlington Coat Factory. The Bronx Terminal Market Property is located on the Bronx riverfront and a short distance from Yankee Stadium within a residential neighborhood with access to public transportation nodes including the Major Deegan Expressway and the Yankees East 153rd Street Metro North Station, which is one stop away on three train lines from Grand Central Station.
Bronx Terminal Market is anchored by Target (Moody’s: A2, Fitch: A, S&P: A), BJ’s Wholesale Club (S&P: BB+), and Home Depot (Moody’s: A2, Fitch: A, S&P: A ), all three of which have been in occupancy at the Property since delivery. The Property’s tenant mix also includes other well-established national retailers (such as Burlington Coat Factory, Best Buy, and Skechers), the largest supermarket location in the Bronx (Food Bazaar), and numerous cultural, educational, and lifestyle offerings (Universal Hip Hop Museum, City University of NY, Chuck E. Cheese, GameStop, and GNC, among others). Overall, the Property is currently 90.2% leased to 21 tenants with a 7.6-year weighted average remaining lease term.
Major Tenants.
Target (188,446 square feet; 20.5% of net rentable area; 4.6% of underwritten base rent) – Target (Moody’s: A2 / Fitch: A / S&P: A) operates as a general merchandise retailer selling products to its guests through its stores and digital channels. Founded in 1962, Target is headquartered in Minneapolis, Minnesota and have 1,963 stores in all 50 states and the District of Columbia. Prior to original opening of the property, Target elected to prepay approximately $46.4 million of base rent (residual in-place base rent is 80.9% below appraiser’s market rent). At Bronx Terminal Market, Target has consecutive, five-year renewal options until the ground lease maturity.
BJ’s Wholesale Club (130,099 square feet; 14.2% of net rentable area; 19.9% of underwritten base rent) – BJ's Wholesale Club Holdings, Inc. (S&P: BB+) is a warehouse club operator concentrated primarily in the eastern half of the United States. Founded in 1984, the company has more than 6.5 million members paying annual fees to gain access to savings on groceries and general merchandise and services. At the Bronx Terminal Market Property, BJ’s has four, five-year renewal options until ground lease maturity.
Home Depot (124,955 SF; 13.6% of NRA; 24.1% of underwritten base rent) – The Home Depot, Inc. (Moody’s: A2 / Fitch: A / S&P: A) is a home improvement retailer offering an assortment of building materials, home improvement products, lawn and garden products, décor products, and facilities maintenance, repair, and operations products. The company also provides a number of services, including home improvement installation services and tool and equipment rental. At Bronx Terminal Market Home Depot has four, five-year renewal options.
The following table presents certain information relating to the major tenants at the Bronx Terminal Market Property:
| Top Tenant Summary(1) |
| Tenant Name | Credit Rating (Moody’s/Fitch/
S&P)(2) | Tenant SF | % of Total SF | Annual UW Rent | % of Total Annual UW Rent | Annual UW Rent PSF | Sales PSF(3) | Occ Cost(3) | Lease Expiration | Renewal Options | Term. Option (Y/N) |
| Anchors | | | | | | | | | | | |
| Target | A2/A/A | 188,446 | 20.5% | 1,262,964 | 4.6% | $6.70(4) | NAV | NAV | 10/14/2033 | (5) | N |
| BJ's Wholesale Club | NR/NR/BB+ | 130,099 | 14.2% | 5,481,721 | 19.9% | $42.14 | NAV | NAV | 8/2/2029 | 4 x 5 yr | N |
| Home Depot | A2/A/A | 124,955 | 13.6% | 6,652,604 | 24.1% | $53.24 | NAV | NAV | 2/28/2034 | 4 x 5 yr | N |
| Major Tenants | | | | | | | | | | | |
| Food Bazaar | NR/NR/NR | 77,915 | 8.5% | 2,488,352 | 9.0% | $31.94 | NAV | NAV | 9/30/2039 | 4 x 5 yr | N |
| Burlington Coat Factory | NR/NR/BB+ | 74,329 | 8.1% | 2,338,390 | 8.5% | $31.46 | $345 | 14.8% | 1/31/2028 | 3 x 5 yr | N |
| Best Buy | A3/NR/BBB+ | 52,086 | 5.7% | 1,927,182 | 7.0% | $37.00 | NAV | NAV | 3/31/2030 | 1 x 5 yr | N |
| Raymour & Flanigan | NR/NR/NR | 46,253 | 5.0% | 1,200,000 | 4.3% | $25.94 | NAV | NAV | 10/31/2027 | None | N |
| LIDL | NR/NR/NR | 23,204 | 2.5% | 1,000,000 | 3.6% | $43.10 | NAV | NAV | 10/31/2039 | 3 x 5 yr | N |
| Chuck E. Cheese | NR/NR/NR | 19,834 | 2.2% | 791,972 | 2.9% | $39.93 | $185 | 30.8% | 12/31/2028 | 3 x 5 yr | N |
| Dollar Discount | NR/NR/NR | 15,490 | 1.7% | 300,000 | 1.1% | $19.37 | NAV | NAV | 6/30/2028 | None | N |
| Largest Tenants | | 752,611 | 82.0% | $23,443,186 | 85.0% | $31.15 | | | | | |
| | | | | | | | | | | | |
| Non-Major Tenants | | 76,541 | 8.3% | $4,168,315 | 15.1% | $54.46 | | | | | |
| | | | | | | | | | | | |
| Occupied Collateral Total | | 829,152 | 90.2% | $27,611,501 | 100.0% | $33.30 | | | | | |
| Vacant Space | | 89,627 | 9.8% | $0 | 0.0% | $0.00 | | | | | |
| Total/Wtd. Avg. | | 918,779 | 100.0% | $27,611,501 | 100.0% | $33.30 | | | | | |
| (1) | Based on the underwritten rent roll dated April 19, 2024. |
| (2) | In certain instances, ratings provided are those of the parent company of the entity shown, whether or not the parent company guarantees the lease. |
| (3) | Sales PSF are presented as of the 12 months ended December 2023, as provided by the borrower sponsors. Occupancy costs are calculated by the annual gross rent divided by the respective tenant annual sales. |
| (4) | Target’s one-time rent prepayment of approximately $46.4 million significantly reduced its contractual rent obligations. |
| (5) | Target has consecutive, five-year renewal options until the ground lease maturity. |
| This is not a research report and was not prepared by any Underwriter’s research department. Please see additional important information and qualifications at the end of this Term Sheet. |
| | T-74 | |
| Retail – Anchored | Loan #7 | Cut-off Date Balance: | | $50,210,256 |
| 610 Exterior Street | Bronx Terminal Market | Cut-off Date LTV: | | 43.2% |
| Bronx, NY 10451 | | UW NCF DSCR: | | 2.18x |
| | | UW NOI Debt Yield: | | 11.9% |
The following table presents certain information relating to tenant sales history with respect to the Bronx Terminal Market Property.
| Tenant Sales |
| | | 2021 | 2022 | 2023 |
| | Square Feet | Sales | Sales PSF | Sales | Sales PSF | Sales | Sales PSF |
| Burlington Coat Factory | 74,329 | $33,696,922 | $453.35 | $23,464,920 | $315.69 | $25,668,704 | $345.34 |
| Chuck E. Cheese | 19,834 | $2,049,413 | $103.33 | $3,132,931 | $157.96 | $3,670,435 | $185.06 |
| Skechers U.S.A. | 8,741 | $3,242,409 | $370.94 | $2,635,698 | $301.53 | $2,872,708 | $328.65 |
| Applebee's | 6,661 | $5,688,990 | $854.07 | $5,504,388 | $826.36 | $6,399,111 | $960.68 |
| GNC | 1,980 | $503,972 | $254.53 | $463,644 | $234.16 | $436,550 | $220.48 |
The following table presents certain information relating to the lease rollover schedule at the Bronx Terminal Market Property:
| Lease Rollover Schedule(1)(2) |
| Year | # of Leases Rolling | SF Rolling | Approx. % of SF Rolling | Approx. Cumulative % of SF Rolling | Total UW Rent Rolling | Approx. % of Total UW Rent Rolling | Approx. Cumulative % of Total UW Rent Rolling | UW Rent PSF Rolling(3) |
| MTM/ 2024 | 1 | 1,980 | 0.2% | 0.2% | $70,000 | 0.3% | 0.30% | $35.35 |
| 2025 | 2 | 5,218 | 0.6% | 0.8% | $302,740 | 1.1% | 1.3% | $58.02 |
| 2026 | 1 | 8,741 | 1.0% | 1.7% | $349,640 | 1.3% | 2.6% | $40.00 |
| 2027 | 3 | 84,880 | 9.2% | 11.0% | $3,406,986 | 12.3% | 15.0% | $40.14 |
| 2028 | 4 | 112,381 | 12.2% | 23.2% | $3,594,042 | 13.0% | 28.0% | $31.98 |
| 2029 | 2 | 136,760 | 14.9% | 38.1% | $6,045,908 | 21.9% | 49.9% | $44.21 |
| 2030 | 1 | 52,086 | 5.7% | 43.8% | $1,927,182 | 7.0% | 56.8% | $37.00 |
| 2031 | 0 | 0 | 0.0% | 43.8% | $0 | 0.0% | 56.8% | $0.00 |
| 2032 | 0 | 0 | 0.0% | 43.8% | $0 | 0.0% | 56.8% | $0.00 |
| 2033 | 1 | 188,446 | 20.5% | 64.3% | $1,262,964 | 4.6% | 61.4% | $6.70 |
| 2034 | 3 | 129,048 | 14.0% | 78.3% | $6,823,967 | 24.7% | 86.1% | $52.88 |
| 2035 & Beyond | 3 | 109,612 | 11.9% | 90.2% | $3,828,072 | 13.9% | 100.0% | $34.92 |
| Vacant | NAP | 89,627 | 9.8% | 100.0% | NAP | NAP | NAP | NAP |
| Total/Wtd. Avg. | 21 | 918,779 | 100.0% | | $27,611,501 | 100.0% | | $33.30 |
| (1) | Based on the underwritten rent roll dated April 19, 2024. |
| (2) | Certain leases may have termination options that are exercisable prior to the originally stated expiration date of the lease and that are not considered in this Lease Rollover Schedule. |
| (3) | Wtd. Avg. UW Rent PSF Rolling excludes vacant space. |
The Market. Bronx Terminal Market is located within the Concourse neighborhood of the Bronx, which has been improved by several development projects in recent years. According to a third party report, the Bronx is currently the third most densely populated county across New York with the fastest observed population growth since 2010. Additionally, the Penn Station Access Project is expected to be completed in 2027, which will bring four new rail stations to the Bronx, improve existing tracks and bridges, and cut travel times from the Bronx to Manhattan by as much as 50 minutes.
The Bronx Terminal Market Property is located adjacent to the Bronx Point development, which will include 540 affordable multifamily units (projected delivery in 2024), educational community facilities, cultural space, and several food and beverage outlets. Additional development underway adjacent to Bronx Terminal Market includes the 300,000 SF Success Academy Charter School, which will serve 2,400 children grades K-12 and strengthen foot traffic at the Property upon delivery in 2025.
According to the appraisal, the property is located in the Bronx submarket, which contains 5.3 million SF of retail space across 27 shopping center as of the first quarter of 2024. The submarket reported average asking rents of $51.95 with a vacancy rate of 5.8%.
According to the appraisal, the 2022 population within a 0.5-, 1-, and 1.5 mile radius of the Bronx Terminal Market Property was 23,422, 194,242, and 464,962, respectively, and the average household income within the same radii was $59,248, $64,363 and $60,775, respectively.
| This is not a research report and was not prepared by any Underwriter’s research department. Please see additional important information and qualifications at the end of this Term Sheet. |
| | T-75 | |
| Retail – Anchored | Loan #7 | Cut-off Date Balance: | | $50,210,256 |
| 610 Exterior Street | Bronx Terminal Market | Cut-off Date LTV: | | 43.2% |
| Bronx, NY 10451 | | UW NCF DSCR: | | 2.18x |
| | | UW NOI Debt Yield: | | 11.9% |
The following table presents certain information relating to the appraisal’s market rent conclusion for the Bronx Terminal Market Property:
| Market Rent Summary(1) |
| | Anchor | Junior Anchor | Inline (Large, 8K SF) | Inline (Small to Mid) |
| Market Rent (PSF) | $35-$40 | $35-$45 | $40-$55 | $40-$70 |
| Lease Term (Years) | 15 | 15 | 10 | 10 |
| Lease Type (Reimbursements) | Net | Net | Net | Net |
| Rent Increase Projection | 10% every 6 years | 10% every 6 years | 3% per year | 3% per year |
| (1) | Source: Appraisal, unless stated otherwise |
The following table presents certain information relating to comparable retail centers for the Bronx Terminal Market Property:
| Competitive Property Summary(1) |
Property Name | Year Built/Renovated | Total NRA | Total Occupancy | Distance to Subject | Anchor / Major Tenants |
Bronx Terminal Market 610 Exterior Street Bronx, NY | 2009/NAP | 918,779(2) | 90.2%(2) | | Target BJ’s Wholesale Club Home Depot |
Bay Plaza Shopping Center 2136-2210 Bartow Avenue Bronx, NY | 1998/2004 | 1,313,640 | 100% | 10.2 miles | AMC Theaters Stop & Shop Burlington P,C Richards & Sons Marshalls Bob’s Discount Furniture Ashley Home Store Staples |
East River Plaza 520 East 117th Street Bronx, NY | 2009/NAP | 531,541 | 93% | 1.0 mile | Target Costco Burlington |
The Shops at Marble Hill 40 West 225th Street Bronx, NY | 2004/NAP | 238,549 | 100% | 4.8 miles | Target Marshalls |
Bruckner Commons 1998 Bruckner Boulevard Bronx, NY | 1964/1989 | 369,301 | 89% | 4.4 miles | Target Burlington Leonardo Furniture |
| (1) | Source: Appraisal, unless stated otherwise. The retail properties displayed in the chart reflect the primary competition for the Bronx Terminal Market Property. |
| (2) | Information based on the underwritten rent roll dated April 19, 2024. |
Appraisal. According to the appraisal, Bronx Terminal Market Property had an “as-is” appraised value of $555,000,000 as of April 30, 2024.
Environmental Matters. According to the Phase I environmental site assessment dated May 1, 2024, there was no evidence of any recognized environmental conditions at the Bronx Terminal Market Property.
Property Management. The Bronx Terminal Market Property is managed by BTM Development Partners, LLC.
| This is not a research report and was not prepared by any Underwriter’s research department. Please see additional important information and qualifications at the end of this Term Sheet. |
| | T-76 | |
| Retail – Anchored | Loan #7 | Cut-off Date Balance: | | $50,210,256 |
| 610 Exterior Street | Bronx Terminal Market | Cut-off Date LTV: | | 43.2% |
| Bronx, NY 10451 | | UW NCF DSCR: | | 2.18x |
| | | UW NOI Debt Yield: | | 11.9% |
Operating History and Underwritten Net Cash Flow. The following table presents certain information relating to the operating history and underwritten cash flows of the Bronx Terminal Market Property:
| Cash Flow Analysis |
| | 2021 | 2022 | 2023 | TTM
3/31/2024 | UW | UW P
SF |
| Rents in Place | $29,922,700 | $30,411,117 | $29,994,500 | $29,571,181 | $27,611,501 | $30.05 |
| Vacant Income | $0 | $0 | $0 | $0 | $5,098,835 | $5.55 |
| Rent Steps | $0 | $0 | $0 | $0 | $651,989(1) | $0.71 |
| Rent averaging | $0 | $0 | $0 | $0 | $61,190(2) | $0.07 |
| Reimbursements | $11,887,079 | $11,990,961 | $12,369,626 | $11,746,374 | $11,799,331 | $12.84 |
| Other Income(3) | $5,646,293 | $5,765,693 | $5,693,876 | $6,103,944 | $6,196,018 | $6.74 |
| Gross Potential Income | $47,456,072 | $48,167,771 | $48,058,002 | $47,421,498 | $51,418,865 | $55.96 |
| (Vacancy) | $0 | $0 | $0 | $0 | ($5,098,835) | ($5.55) |
| Effective Gross Income | $47,456,072 | $48,167,771 | $48,058,002 | $47,421,498 | $46,320,029 | $50.41 |
| | | | | | | |
| Real Estate Taxes | $1,951,556 | $1,970,892 | $2,021,028 | $2,036,650 | $3,261,247 | $3.55 |
| Insurance | $607,856 | $803,176 | $1,075,421 | $1,144,688 | $1,071,032 | $1.17 |
| Ground Rent Expense | $935,452 | $961,531 | $1,078,546 | $1,061,574 | $1,371,008 | $1.49 |
| Other Operating Expenses | $13,421,802 | $13,180,241 | $13,126,929 | $12,800,606 | $12,022,055 | $13.08 |
| Total Operating Expenses | $16,916,667 | $16,915,840 | $17,301,924 | $17,043,518 | $17,725,341 | $19.29 |
| Net Operating Income | $30,539,405 | $31,251,930 | $30,756,078 | $30,377,981 | $28,594,688 | $31.12 |
| Capital Expenditures | $0 | $0 | $0 | $0 | $183,756 | $0.20 |
| TI/LC | $0 | $0 | $0 | $0 | $918,779 | $1.00 |
| Net Cash Flow | $30,539,405 | $31,251,930 | $30,756,078 | $30,377,981 | $27,492,153 | $29.92 |
| | | | | | | |
| Occupancy (%) | 98.6% | 98.4% | 98.4% | 98.4% | 90.2%(4) | |
| NOI DSCR(5) | 2.42x | 2.48x | 2.44x | 2.41x | 2.27x | |
| NCF DSCR(5) | 2.42x | 2.48x | 2.44x | 2.41x | 2.18x | |
| NOI Debt Yield(5) | 12.7% | 13.0% | 12.8% | 12.7% | 11.9% | |
| NCF Debt Yield(5) | 12.7% | 13.0% | 12.8% | 12.7% | 11.5% | |
| (1) | Contractual rent steps are through July 23, 2025. |
| (2) | Represents straight line rent averaging for investment grade tenants. |
| (3) | Other Income includes revenue from percentage rent, parking income and other miscellaneous income. |
| (4) | The underwritten economic occupancy is 90.1%. The Bronx Terminal Market Property was 90.2% leased based on the April 19, 2024 underwritten rent roll. The DMV lease is not included in the underwritten economic or physical occupancy. |
| (5) | Debt Service Coverage Ratios and Debt Yields are based on the Bronx Terminal Market Senior Loan. The UW NOI and NCF DSCR and UW NOI and NCF Debt Yield figures based upon the Bronx Terminal Market Whole Loan are 1.11x. 1.07x, 7.5%, and 7.2%, respectively. |
Escrows and Reserves.
Real Estate Taxes – During the continuance of a Cash Sweep Event Period (as defined below), the borrower is required make monthly deposits equal to 1/12th of the annual estimated tax payments during the next ensuing 12 months.
Insurance – During the continuance of a Cash Sweep Event Period (as defined below), the borrower is required to make monthly deposits equal to 1/12th of the annual estimated insurance payments, however, provided no event of default is continuing, the borrower will not be required to make monthly deposits so long as the Bronx Terminal Market Property is insured under a blanket policy and borrower provides evidence of renewal and proof of payment of insurance premiums.
Replacement Reserve – During the continuance of a Cash Sweep Event Period, the borrower is required to escrow $22,808 per month, capped at $547,400.
TI/LC Reserve – The loan documents required the borrower to deposit $874,981 at loan closing for outstanding leasing expenses related to LIDL, Modern Nails, Wingstop and Best Buy. During the continuance of a Cash Sweep Event Period, the borrower is required to escrow an amount equal to approximately $70,672 per month for rollover reserves, capped at $1,696,118.
Ground Rent Funds – During the continuance of a Cash Sweep Event Period, the borrower is required to make monthly deposits equal to the ground rent that will be payable under the ground lease for the month immediately following the month in which such monthly payment date occurs.
| This is not a research report and was not prepared by any Underwriter’s research department. Please see additional important information and qualifications at the end of this Term Sheet. |
| | T-77 | |
| Retail – Anchored | Loan #7 | Cut-off Date Balance: | | $50,210,256 |
| 610 Exterior Street | Bronx Terminal Market | Cut-off Date LTV: | | 43.2% |
| Bronx, NY 10451 | | UW NCF DSCR: | | 2.18x |
| | | UW NOI Debt Yield: | | 11.9% |
DMV Space Funds – The loan documents required the borrower to deposit $9,000,000 at loan closing. Lender will be required to disburse funds to the borrower:
| ● | Upon the DMV lease being fully executed by all parties within 180 days of loan closing; provided, if a Cash Sweep Period is occurring, the lender shall disburse the funds to pay for leasing expenses related to the DMV space, |
| ● | If the DMV lease is not fully executed within 180 days of closing, the lender shall disburse funds to pay for leasing expenses related to one or more qualifying substitute leases. If and when all the premises to be leased under the DMV lease has been leased under one or more qualifying substitute leases and leasing expenses related to qualifying substitute leases have been paid in full, lender shall release any remaining DMV Space Funds to the borrower; provided, no Cash Sweep Event is continuing. |
| ● | If the DMV lease is not fully executed by all parties within the earlier of 180 days of loan closing or the date it is determined that the DMV lease will not be executed (the “DMV Negotiation End Date”), upon 5 days notice, Borrower can use the DMV Space Funds to prepay the B Note without payment of yield maintenance provided that the prepayment is made within 30 days of the DMV Negotiation End Date. |
Lockbox and Cash Management. The Bronx Terminal Market Whole Loan is structured with a hard lockbox and springing cash management. The borrower is required to cause all tenants at the Bronx Terminal Market to pay rents directly into the account controlled by the lender (the “Lockbox Account”), and to deposit any rents otherwise received by the manager or the property manager into such Lockbox Account within two business days after receipt. Prior to a Cash Sweep Event Period, all funds in the Lockbox Account will be swept daily to the borrower’s operating account. During the continuance of a Cash Sweep Event Period, all funds deposited into the Lockbox Account are required to be swept each business day into a deposit account controlled by the lender (the “Cash Management Account”) to be applied and disbursed in accordance with the Bronx Terminal Market Whole Loan documents.
A “cash sweep event period” will commence upon the occurrence of any of the following events:
| (ii) | the borrower filing for bankruptcy; or |
| (iii) | the net cash flow debt service coverage ratio (“NCF DSCR”) on the Bronx Terminal Market Whole Loan being less than 1.10x. |
A “Cash Sweep Event Period” will end upon:
| ● | with respect to clause (i) above, the cure of such event of default; |
| ● | with respect to clause (ii) above, upon the bankruptcy proceeding being discharged; or |
| ● | with respect to clause (iii) above, the NCF DSCR being greater than 1.10x for one calendar quarter. |
Subordinate Debt. The Bronx Terminal Market Property also secures the Bronx Terminal Market Subordinate Companion Loan, which has an aggregate Cut-off Date principal balance of $140,000,000. The Bronx Terminal Market Subordinate Companion Loan is coterminous with the with Bronx Terminal Market Senior Loan and accrues interest at 9.2000%. The Bronx Terminal Market Senior Loan is senior in right of payment to the Bronx Terminal Market Subordinate Companion Loan The holders of the Bronx Terminal Market Mortgage Loan, the Bronx Terminal Market Non-Serviced Pari Passu Companion Loans and the Bronx Terminal Market Subordinate Companion Loan have entered into a co-lender agreement which sets forth the allocation of collections on the Bronx Terminal Market Whole Loan. See “Description of the Mortgage Pool—The Whole Loans— The Non-Serviced A/B Whole Loans—The Bronx Terminal Market Pari Passu-A/B Whole Loan”.
| Subordinate Note Summary |
| | B-Note Original Principal Balance | B-Note Interest Rate | Original Term (mos.) | Original Amort. Term (mos.) | Original IO Term (mos.) | Whole Loan UW NCF DSCR | Whole Loan UW NOI DY | Whole Loan Cutoff Date LTV |
| Bronx Terminal Market Subordinate Companion Loan | $140,000,000 | 9.20000% | 60 | 0 | 60 | 1.07x | 7.5% | 68.5% |
Release of Property. On any business day after February 6, 2025, provided that no event of default is continuing under the Bronx Terminal Market Whole Loan documents, the borrower may obtain release of a parcel of the property depicted under the ground lease as the “Hotel Site” provided that, among other conditions, (i) the Hotel Site is a legally subdivided parcel separate from the remainder of the Property and is on a separate tax lot from the remainder of the Property; (ii) the Hotel Site is severed from the ground lease in accordance with the terms thereof and leased by the ground lessor to another tenant other than the borrower; and (iii) if a securitization of the Loan has occurred, lender receives a REMIC opinion with respect to the release.
Ground Lease. The property is subject to a 49-year ground lease from the City of New York with five consecutive ten year renewal options. The borrowers are required to pay ground rent equal to the greater of, (i) 105% of the immediately preceding adjusted base amount ($394,691) or (ii) 4.0% of gross revenue (percent ground rent), excluding certain expense items and deductions. Commencing August 2024 and every 5-years thereafter, the tenant will be responsible for paying ground rent equal to the greater of (i) 105% of the immediately preceding adjusted base amount ($376,153.73) or (ii) 5.0% of gross revenues (defined as all rent received from subtenants minus (a) a management fee in the amount of 3% of rent from subtenants received by Tenant and (b) aggregate compensation and associated costs and expenses for 2 on-site personnel engaged in the operation of the Bronx Terminal Market Property). As part of Target's lease, the tenant paid an upfront buydown of $46,394,000. Gross revenues utilized to calculate percent ground rent include an amortized imputed annual gross revenue amount from the tenant's buydown, calculated at an annual rate of 6.9% of the total buydown. The ground lease expires on September 13, 2055 and has five, 10-year renewal options.
In addition, the property is subject to a PILOT abatement which runs through 2033. Pursuant to the estoppel delivered by the City of New York at loan origination, the amount of the PILOT payable by Tenant under the ground lease was $1,964,723 for the tax year ending June 30, 2023.
| This is not a research report and was not prepared by any Underwriter’s research department. Please see additional important information and qualifications at the end of this Term Sheet. |
| | T-78 | |
| Retail – Anchored | Loan #7 | Cut-off Date Balance: | | $50,210,256 |
| 610 Exterior Street | Bronx Terminal Market | Cut-off Date LTV: | | 43.2% |
| Bronx, NY 10451 | | UW NCF DSCR: | | 2.18x |
| | | UW NOI Debt Yield: | | 11.9% |
Terrorism Insurance. The loan documents require that the “all risk” insurance policy required to be maintained by the borrower provides coverage for terrorism in an amount equal to the full replacement cost of the property, as well as business interruption insurance covering no less than the 24-month period following the occurrence of a casualty event plus a 6 month extended period of indemnity (provided that if the Terrorism Risk Insurance Program Reauthorization Act of 2019 or a similar statute is not in effect, the borrower will not be obligated to pay terrorism insurance premiums in excess of two times the annual premium for the property and business interruption/rental loss insurance coverage). The loan documents allow Relsure Vermont Inc., a licensed captive insurance company (“RVI”) to provide terrorism coverage, so long as (i) the policy issued by RVI has (A) no aggregate limit, and (B) a deductible of no greater than $250,000, and (ii) certain conditions are satisfied, including that RVI obtains reinsurance with a cut through endorsement acceptable to Lender and the rating agencies from an insurance company meeting the rating requirements set forth in the loan documents for the portion of terrorism coverage not subject to the applicable federal backstop, the Terrorism Risk Insurance Program Reauthorization Act of 2019 or a similar statute is in effect and except with respect to the $250,000 deductible permitted, those covered losses which are not reinsured by the federal government under the Terrorism Risk Insurance Program Reauthorization Act of 2019 and paid to RVI shall be reinsured with a cut through endorsement acceptable to Lender and the Rating Agencies by insurance companies that are qualified insurers or maintain such higher rating as may be required by a rating agency, not to exceed “AA-” with S&P and “A2” with Moody’s. The Loan documents also allow the Borrower to utilize a “Retention Amount” which is funded by RVI ) in addition to the required deductible for all losses, excluding wind and earthquake related losses, so long as (1) the retention amount is aggregated annually, (2) the retention amount remain prefunded at all times during the Loan and (3) Borrower has submitted evidence satisfactory to Lender and rating agencies of such prefunded arrangement at the request of Lender or rating agency. The “Retention Amount” is $5,000,000 aggregate deductible, subject to a $2,500,000 per occurrence deductible. See “Risk Factors—Risks Relating to the Mortgage Loans—Terrorism Insurance May Not Be Available for All Mortgaged Properties” in the prospectus.
| This is not a research report and was not prepared by any Underwriter’s research department. Please see additional important information and qualifications at the end of this Term Sheet. |
| | T-79 | |
| Mixed Use – Office/Retail | Loan #8 | Cut-off Date Balance: | | $33,750,000 |
| 9300 Culver Boulevard | Culver Steps | Cut-off Date LTV: | | 57.7% |
| Culver City, CA 90232 | | UW NCF DSCR: | | 1.67x |
| | | UW NOI Debt Yield: | | 11.4% |

| This is not a research report and was not prepared by any Underwriter’s research department. Please see additional important information and qualifications at the end of this Term Sheet. |
| | T-80 | |
| Mixed Use – Office/Retail | Loan #8 | Cut-off Date Balance: | | $33,750,000 |
| 9300 Culver Boulevard | Culver Steps | Cut-off Date LTV: | | 57.7% |
| Culver City, CA 90232 | | UW NCF DSCR: | | 1.67x |
| | | UW NOI Debt Yield: | | 11.4% |
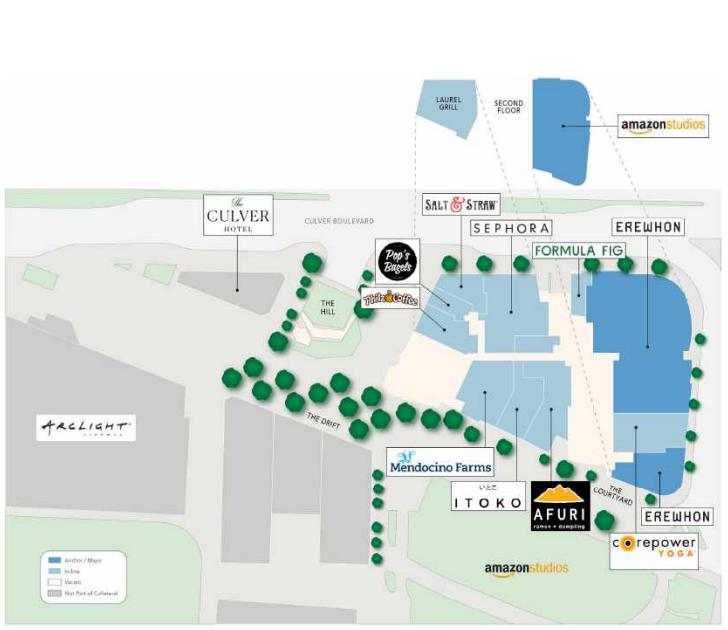
| This is not a research report and was not prepared by any Underwriter’s research department. Please see additional important information and qualifications at the end of this Term Sheet. |
| | T-81 | |
| Mixed Use – Office/Retail | Loan #8 | Cut-off Date Balance: | | $33,750,000 |
| 9300 Culver Boulevard | Culver Steps | Cut-off Date LTV: | | 57.7% |
| Culver City, CA 90232 | | UW NCF DSCR: | | 1.67x |
| | | UW NOI Debt Yield: | | 11.4% |
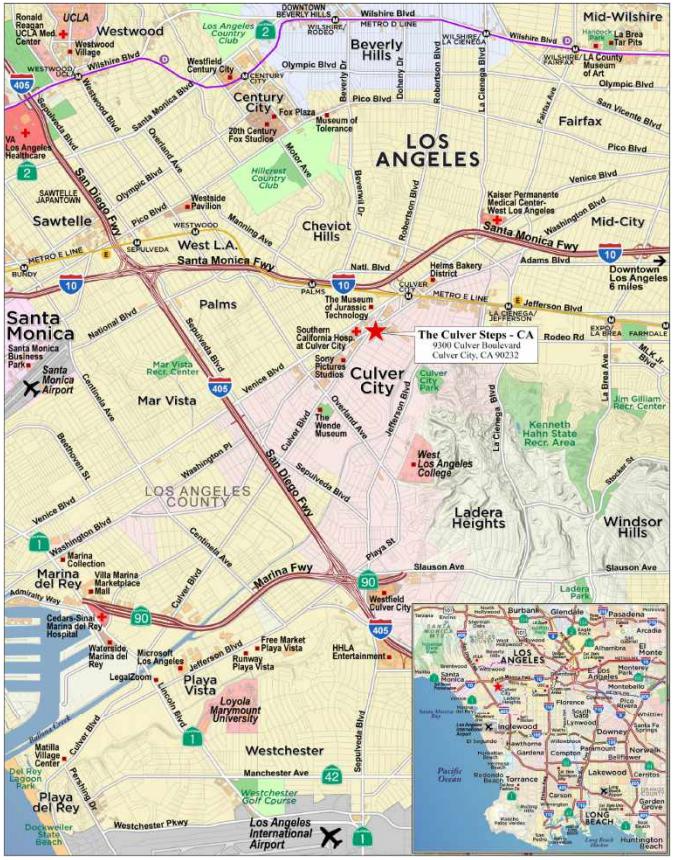
| This is not a research report and was not prepared by any Underwriter’s research department. Please see additional important information and qualifications at the end of this Term Sheet. |
| | T-82 | |
| Mortgage Loan No. 8 – Culver Steps |
| Mortgage Loan Information | | Property Information |
| Mortgage Loan Seller: | WFB | | Single Asset/Portfolio: | Single Asset |
| Credit Assessment (Fitch/Moody’s/KBRA): | NR/NR/NR | | Location: | Culver City, CA 90232 |
| Original Balance(1): | $33,750,000 | | General Property Type: | Mixed Use |
| Cut-off Date Balance(1): | $33,750,000 | | Detailed Property Type: | Office/Retail |
| % of Initial Pool Balance: | 3.7% | | Title Vesting: | Fee |
| Loan Purpose: | Refinance | | Year Built/Renovated: | 2019 / NAP |
| Borrower Sponsor: | Hackman Capital Partners, LLC | | Size: | 121,736 SF |
| Guarantor: | Hackman Capital Partners, LLC | | Cut-off Date Balance PSF(1): | $616 |
| Mortgage Rate: | 6.63400% | | Maturity Date Balance PSF(1): | $616 |
| Note Date: | 7/26/2024 | | Property Manager: | IDS Real Estate Group |
| Maturity Date: | 8/6/2029 | | Underwriting and Financial Information |
| Term to Maturity: | 60 months | | UW NOI: | $8,584,900 |
| Amortization Term: | 0 months | | UW NCF | $8,438,816 |
| IO Period: | 60 months | | UW NOI Debt Yield(1): | 11.4% |
| Seasoning: | 0 months | | UW NCF Debt Yield(1): | 11.3% |
| Prepayment Provisions(2): | L(24),D(29),O(7) | | UW NOI Debt Yield at Maturity(1): | 11.4% |
| Lockbox/Cash Mgmt Status: | Hard/Springing | | UW NCF DSCR(1): | 1.67x |
| Additional Debt Type(1): | Pari Passu | | Most Recent NOI: | $7,115,403 (4/30/2024 TTM) |
| Additional Debt Balance(1): | $41,250,000 | | 2nd Most Recent NOI: | $6,138,109 (12/31/2023) |
| Future Debt Permitted (Type): | No (NAP) | | 3rd Most Recent NOI: | $4,349,198 (12/31/2022) |
| Reserves(3) | | Most Recent Occupancy: | 100.0% (7/1/2024) |
| Type | Initial | Monthly | Cap | | 2nd Most Recent Occupancy: | 88.0% (12/31/2023) |
| RE Taxes: | $0 | Springing | NAP | | 3rd Most Recent Occupancy: | 87.0% (12/31/2022) |
| Insurance: | $0 | Springing | NAP | | Appraised Value (as of): | $130,000,000 (6/4/2024) |
| Replacement Reserve: | $0 | Springing | $48,696 | | Appraised Value PSF: | $1,068 |
| TI/LC Reserves: | $1,179,329 | Springing | $243,480 | | Cut-off Date LTV Ratio(1): | 57.7% |
| Other Reserve: | $0 | $0 | NAP | | Maturity Date LTV Ratio(1): | 57.7% |
| | | | | | | | |
| Sources and Uses |
| Sources | Proceeds | % of Total | | Uses | Proceeds | % of Total |
| Whole Loan Amount(1): | $75,000,000 | 100.0% | | Loan Payoff | $68,575,407 | 91.4% |
| | | | | Return of Equity | 4,063,901 | 5.4% |
| | | | | Closing Costs | 1,181,363 | 1.6% |
| | | | | Upfront Reserves | 1,179,329 | 1.6% |
| Total Sources: | $75,000,000 | 100.0% | | Total Uses: | $75,000,000 | 100.0% |
| (1) | The Culver Steps Mortgage Loan (as defined below) is part of the Culver Steps Whole Loan (as defined below) evidenced by two pari passu promissory notes with an aggregate outstanding principal balance as of the Cut-off Date of $75,000,000. The Cut-off Date Balance PSF, Maturity Date Balance PSF, UW NOI Debt Yield, UW NCF Debt Yield, UW NOI Debt Yield at Maturity, UW NCF DSCR, Cut-off Date LTV Ratio and Maturity Date LTV Ratio numbers presented above are based on the Culver Steps Whole Loan. |
| (2) | The lockout period for prepayment of the Culver Steps Whole Loan will be at least 24 months beginning with and including the first payment date on September 6, 2024. Defeasance of the Culver Steps Whole Loan, in whole but not in part, is permitted after the date that is the earlier of (i) two years from the closing date of the securitization that includes the last note to be securitized and (ii) July 26, 2027. The assumed lockout period of 24 payments is based on the anticipated closing date of the BANK 2024-5YR9 securitization in August 2024. The actual lockout period may be longer. |
| (3) | See “Escrows and Reserves” below. |
The Mortgage Loan. The eighth largest mortgage loan (the “Culver Steps Mortgage Loan”) is part of a whole loan (the “Culver Steps Whole Loan”) secured by the borrower’s fee interest in a 121,736 SF mixed-use office and retail property located in Culver City, California (the “Culver Steps Property”). The Culver Steps Whole Loan was originated by DBRI Investments Co. Limited (“DBRI”) and Wells Fargo Bank, National Association (“WFB”) and is comprised of two pari passu notes, with an aggregate outstanding principal balance as of the Cut-off Date of $75,000,000. The Culver Steps Mortgage Loan is evidenced by the non-controlling Note A-2 with an outstanding principal balance as of the Cut-off Date of $33,750,000.
| This is not a research report and was not prepared by any Underwriter’s research department. Please see additional important information and qualifications at the end of this Term Sheet. |
| | T-83 | |
| Mixed Use – Office/Retail | Loan #8 | Cut-off Date Balance: | | $33,750,000 |
| 9300 Culver Boulevard | Culver Steps | Cut-off Date LTV: | | 57.7% |
| Culver City, CA 90232 | | UW NCF DSCR: | | 1.67x |
| | | UW NOI Debt Yield: | | 11.4% |
The table below identifies the promissory notes that comprise the Culver Steps Whole Loan. The Culver Steps Whole Loan will initially be serviced pursuant to the pooling and servicing agreement for the BANK 2024-5YR9 securitization trust until the controlling Note A-1 is securitized, whereupon the Culver Steps Whole Loan will be serviced pursuant to the pooling and servicing agreement for the transaction in which the controlling Note A-1 is securitized. See “Description of the Mortgage Pool—The Whole Loans—The Serviced Pari Passu Whole Loans” in the prospectus.
| Culver Steps Whole Loan Summary |
| Note | Original Balance | Cut-off Date Balance | Note Holder | Controlling Note |
| A-1(1) | $41,250,000 | $41,250,000 | DBRI | Yes |
| A-2 | $33,750,000 | $33,750,000 | BANK 2024-5YR9 | No |
| Total | $75,000,000 | $75,000,000 | | |
| (1) | Expected to be securitized in a future transaction. |
The Borrower and the Borrower Sponsor. The borrower is HC 9300 Culver, LLC, a Delaware limited liability company structured as a single purpose entity with two independent directors. Legal counsel to the borrower delivered a non-consolidation opinion in connection with the origination of the Culver Steps Whole Loan.
The borrower sponsor and non-recourse carveout guarantor is Hackman Capital Partners, LLC (“HCP”). HCP is a private, asset-based investment firm based in Los Angeles, California. Since inception, HCP has invested in more than 330 properties, representing approximately 37 million square feet across the United States, Canada, and Europe. HCP’s real estate portfolio has included nearly 5.8 million square feet located in California, with more than 4.4 million square feet located in Southern California. HCP currently has over $10 billion in overall assets under management. The firm is recognized as one of the most prominent owners and developers in Culver City, having owned or redeveloped some of Culver City’s preeminent projects such as The Culver Studios, several industrial conversions now home to Apple’s (Beat by Dre) Southern California headquarters and Westwood One Studios, Sony Pictures Animation Campus, and 5500 Jefferson, amongst others.
The Property. The Culver Steps Property is comprised of a Class A office building and retail campus totaling 121,736 SF located in Culver City, California. The borrower sponsor constructed the Culver Steps Property in 2019. The Culver Steps Property consists of 79,369 SF of creative office space (65.2% of NRA; 63.1% of underwritten base rent), which is 100.0% leased to Amazon Studios LLC (“Amazon”) (guaranteed by Amazon.com, Inc. (rated A1/AA-/AA- by Moody’s/Fitch/S&P)) and 42,367 SF of retail (34.8% of NRA; 36.9% of underwritten base rent). The Culver Steps Property features an architectural 50-foot-wide staircase that cascades down the four-story building which opens into a one-acre public plaza, which includes green lawns, shade trees and seating area. The public plaza connects the Culver Steps Property to The Culver Studios, the Amazon-operated Culver Theater, The Culver Hotel, and other surrounding shops and restaurants in Downtown Culver City. The Culver Steps Property features 290 parking spaces in a subterranean garage and has the right to use 317 parking spaces at an adjacent garage. As of July 1, 2024, the Culver Steps Property was 100.0% leased to 12 tenants.
Major Tenants.
Amazon (79,369 SF, 65.2% of NRA; 100.0% of Office NRA; 63.1% of underwritten base rent). Founded in 1994 and headquartered in Seattle, Washington, Amazon is an online retailer and web service provider offering a wide range of products and services. Product offerings include merchandise and content purchased for resale and those offered by third-party sellers through its international fulfillment network known as Fulfillment by Amazon. Service offerings include Amazon Prime, a media streaming subscription service, Amazon Web Services, an on-demand cloud computing platform, and Amazon Ads, a multimedia advertising service. Amazon designs, manufactures, and sells electronic devices, including Echo, Fire TV, Kindle, and Ring, and also develops and produces media content. Amazon services its customers via websites, mobile apps, Alexa, streaming, and physical stores with a focus on low prices and convenience.
The Culver Steps Property is used for Amazon’s corporate and executive creative office space located immediately adjacent to The Culver Studios which is 100.0% leased to Amazon. The Culver Studios is known as Amazon Studios for streaming content and media production purposes. Additionally, the Culver Steps Property houses executives and departments such as Amazon Prime (specifically Prime Video) and Audible teams. Amazon has two, five-year renewal options and no termination options. The lease is guaranteed by Amazon.com, Inc. (rated A1/AA-/AA by Moody’s/Fitch/S&P).
Erewhon Market (14,558 SF, 12.0% of NRA; 34.4% of Retail NRA; 12.0% of underwritten base rent). Erewhon Market (“Erewhon”) is a California high-end organic and natural food supermarket chain with 10 locations all within Los Angeles County. Erewhon focuses on niche, locally produced, quality organic products offering foods appealing to raw, vegan, keto, kosher and other alternative diets, helping to inspire healthier communities. Erewhon is family owned, a Certified Organic Retailer and a Certified B Corp. Erewhon Market has three, five-year renewal options and no termination options.
Laurel Grill (7,541 square feet; 6.2% of Total NRA; 17.8% of Retail NRA; 5.7% of underwritten base rent). Laurel Grill is a new restaurant owned and operated by Dean McKillen, who is known for the popular West Hollywood restaurants, Laurel Hardware and Ysabel. Laurel Grill is currently building out its space, commenced rent payments on July 1, 2024. Laurel Grill has two renewal options, the first renewal option for a 10-year term and the second renewal option for a 5-year term, and no termination options.
| This is not a research report and was not prepared by any Underwriter’s research department. Please see additional important information and qualifications at the end of this Term Sheet. |
| | T-84 | |
| Mixed Use – Office/Retail | Loan #8 | Cut-off Date Balance: | | $33,750,000 |
| 9300 Culver Boulevard | Culver Steps | Cut-off Date LTV: | | 57.7% |
| Culver City, CA 90232 | | UW NCF DSCR: | | 1.67x |
| | | UW NOI Debt Yield: | | 11.4% |
The following table presents certain information relating to the tenancy at the Culver Steps Property:
| Tenant Summary(1) |
| Tenant Name | Tenant Type | Credit Rating (Fitch/Moody's/S&P) | Tenant SF | Approx. % of Total SF | Annual UW Rent | % of Total Annual UW Rent | Annual UW Rent PSF | Lease Expiration | Term. Option (Y/N) | Renewal Options |
| Amazon | Office | AA-/A1/AA | 79,369 | 65.2% | $5,469,088 | 63.1% | $68.91 | 7/31/2031 | N | 2 x 5 Yr |
| Erewhon Market | Retail | NR/NR/NR | 14,558 | 12.0% | $1,037,376 | 12.0% | $71.26 | 5/31/2038 | N | 3 x 5 Yr |
| Laurel Grill | Retail | NR/NR/NR | 7,541 | 6.2% | $497,448 | 5.7% | $65.97 | 6/30/2034 | N | Various(2) |
| Mendocino Farms | Retail | NR/NR/NR | 3,001 | 2.5% | $264,714 | 3.1% | $88.21 | 12/31/2030 | N | 2 x 5 Yr |
| Sephora | Retail | NR/NR/NR | 4,166 | 3.4% | $251,997 | 2.9% | $60.49 | 1/31/2031 | N | 2 x 5 Yr |
| Afuri Ramen | Retail | NR/NR/NR | 3,015 | 2.5% | $235,170 | 2.7% | $78.00 | 3/1/2034 | N | 1 x 5 Yr |
| CorePower Yoga | Retail | NR/NR/NR | 2,701 | 2.2% | $222,141 | 2.6% | $82.24 | 12/31/2029 | N | 1 x 5 Yr |
| Philz Coffee | Retail | NR/NR/NR | 1,896 | 1.6% | $171,602 | 2.0% | $90.51 | 12/31/2030 | N | 1 x 5 Yr |
| Itoko Group (Yunomi Handroll) | Retail | NR/NR/NR | 2,067 | 1.7% | $164,451 | 1.9% | $79.56 | 4/1/2034 | N | 1 x 5 Yr |
| Salt & Straw | Retail | NR/NR/NR | 1,247 | 1.0% | $151,255 | 1.7% | $121.30 | 11/30/2031 | N | 1 x 5 Yr |
| Subtotal/Wtd. Avg. | | | 119,561 | 98.2% | $8,465,241 | 97.6% | $70.80 | | | |
| | | | | | | | | | | |
| Other Tenants | | | 2,175 | 1.8% | $207,903 | 2.4% | $95.59 | | | |
| Occupied Collateral Total | | | 121,736 | 100.0% | $8,673,145 | 100.0% | $71.25 | | | |
| | | | | | | | | | | |
| Vacant Space | | | 0 | 0.0% | | | | | | |
| Total/Wtd. Avg. | | | 121,736 | 100.0% | | | | | | |
| (1) | Based on the underwritten rent roll dated July 1, 2024. |
| (2) | Laurel Grill has two renewal options, the first renewal option for a 10-year term and the second renewal option for a 5-year term. |
The following table presents certain information relating to the lease rollover schedule at the Culver Steps Property:
| Lease Rollover Schedule(1)(2) |
| Year | # of Leases Rolling | SF Rolling | Approx. % of Total SF Rolling | Approx. Cumulative % of SF Rolling | Total UW Rent Rolling | Approx. % of Total Rent Rolling | Approx. Cumulative % of Total Rent Rolling | UW Rent PSF Rolling |
| MTM / 2024 | 0 | 0 | 0.0% | 0.0% | $0 | 0.0% | 0.00% | $0.00 |
| 2025 | 0 | 0 | 0.0% | 0.0% | $0 | 0.0% | 0.00% | $0.00 |
| 2026 | 0 | 0 | 0.0% | 0.0% | $0 | 0.0% | 0.00% | $0.00 |
| 2027 | 0 | 0 | 0.0% | 0.0% | $0 | 0.0% | 0.00% | $0.00 |
| 2028 | 0 | 0 | 0.0% | 0.0% | $0 | 0.0% | 0.00% | $0.00 |
| 2029 | 1 | 2,701 | 2.2% | 2.2% | $222,141 | 2.6% | 2.6% | $82.24 |
| 2030 | 2 | 4,897 | 4.0% | 6.2% | $436,316 | 5.0% | 7.6% | $89.10 |
| 2031 | 4 | 85,597 | 70.3% | 76.6% | $5,944,969 | 68.5% | 76.1% | $69.45 |
| 2032 | 0 | 0 | 0.0% | 76.6% | $0 | 0.0% | 76.1% | $0.00 |
| 2033 | 1 | 1360 | 1.1% | 77.7% | $135,274 | 1.6% | 77.7% | $99.47 |
| 2034 | 3 | 12,623 | 10.4% | 88.0% | $897,069 | 10.3% | 88.0% | $71.07 |
| 2035 & Beyond | 1 | 14,558 | 12.0% | 100.0% | $1,037,376 | 12.0% | 100.0% | $71.26 |
| Vacant | NAP | 0 | 0.0% | 100.0% | $0 | 0.0% | 100.0% | $0.00 |
| Total/Wtd. Avg. | 12 | 121,736 | 100.0% | | $8,673,145 | 100.0% | | $71.25 |
| (1) | Based on the underwritten rent roll dated July 1, 2024. |
| (2) | Certain tenants may have termination or contraction options that are not considered in the above Lease Rollover Schedule. |
The Market. The Culver Steps Property is centrally located between West Los Angeles and Downtown Los Angeles, California. The Culver Steps Property has access to transportation linkages such as IH-405, SR-90, SR-187, Jefferson Boulevard, Washington Boulevard, and Culver Boulevard. Public transportation is available within proximity to the Culver Steps Property including Culver CityBus, Big Blue Bus, LADOT transit, and the LA Metro. In addition, the Expo/Crenshaw Metro stop provides access to the LA Metro E Line (connects the Culver Steps Property to Santa Monica, Downtown Los Angeles, Hollywood, the South Bay, Long Beach, Pasadena, and the San Fernando Valley) and the LA Metro K Line (provides residents of West Adams direct access to the Los Angeles International Airport (“LAX”)). The Culver Steps Property is an approximate 8-minute walk from the Culver City LA Metro E Line and an approximate 16-minute walk from Palms LA Metro E Line. Lastly, LAX is approximately 7 miles from the Culver Steps Property.
According to the appraisal, the Culver Steps Property is located in the Culver City/Fox Hills office submarket. As of 2023, the office submarket had an inventory of 4.7 million square feet with a 25.8% vacancy rate and asking rent of $44.38 per square foot.
| This is not a research report and was not prepared by any Underwriter’s research department. Please see additional important information and qualifications at the end of this Term Sheet. |
| | T-85 | |
| Mixed Use – Office/Retail | Loan #8 | Cut-off Date Balance: | | $33,750,000 |
| 9300 Culver Boulevard | Culver Steps | Cut-off Date LTV: | | 57.7% |
| Culver City, CA 90232 | | UW NCF DSCR: | | 1.67x |
| | | UW NOI Debt Yield: | | 11.4% |
According to the appraisal, the Culver Steps Property is located in the Westside retail submarket. As of 2023, the retail submarket had an inventory of 8.7 million square feet with a 8.2% vacancy rate and asking rent of $65.65 per square foot.
According to the appraisal, the 2023 population and average household income within a one-, three- and five-mile radius of the Culver Steps Property was 38,979, 307,578, and 875,542 and $136,400, $140,955, and $144,650, respectively.
The following table presents certain information relating to the appraisal’s market rent conclusions for the Culver Steps Property:
| Market Rent Summary(1) |
| | Amazon Office | Grocery | Restaurant | Shop $78 | Shop $85 | Shop $90 | Storage |
| Market Rent (PSF) | $63 | $69 | $66 | $78 | $85 | $90 | $42 |
| Lease Term (Years) | 10 | 10 | 5 | 5 | 5 | 5 | 5 |
| Lease Type | NNN | NNN | NNN | NNN | NNN | NNN | None |
| Escalations | 3.0% annually | 10.0% every 5 years | 3.0% annually | 3.0% annually | 3.0% annually | 3.0% annually | 3.0% annually |
| Tenant Improvements (New/Renewal) | $55 / $35 | $35 / $10 | $100 / $25 | $25 / 10 | $25 / 10 | $25 / 10 | $0 / $0 |
| Leasing Commissions (New/Renewal) | 6.0% / 3.0% | 6.0% / 3.0% | 6.0% / 3.0% | 6.0% / 3.0% | 6.0% / 3.0% | 6.0% / 3.0% | None |
| Free Rent (Months) (New/Renewal) | None | None | None | None | None | None | None |
| (1) | Information obtained from the appraisal. |
The following table presents certain information relating to the appraiser’s office market rent conclusions for the Culver Steps Property:
| Comparable Office Rental Summary(1) |
| Property Name/Location | Total NRA (SF) | Year Built | Tenant Size (SF) | Tenant Name | Annual Base Rent PSF | Commencement | Lease Term (Years) |
Culver Steps Culver City, CA | 121,736(2) | 2019 / NAP | 79,369(2) | Amazon(2) | $68.91(2) | Jul-19(2) | 12.0(2) |
9735 Washington Boulevard Culver City, CA | 91,025 | 2021 / NAP | 70,628 | Apple | $64.20 | May-22 | 10.6 |
8970 - 9000 Washington Boulevard Culver City, CA | 15,034 | 1928 / 2023 | 10,000 | Sandbox USA | $61.80 | May-23 | 10 |
8830-8840 National Boulevard Culver City, CA | 241,205 | 2021 / NAP | 241,205 | HBO | $59.40 | Jan-21 | 15 |
8740 Washington Boulevard Culver City, CA | 79,590 | 1953 / 2022 | 79,590 | Apple | $72.00 | Jul-22 | 10.4 |
3516 Schaefer Street Culver City, CA | 24,997 | 2022 / NAP | 24,997 | Vayner Media | $67.20 | Jan-24 | 6.5 |
3030 La Cienega Boulevard Culver City, CA | 18,031 | 1956 / 2022 | 18,031 | Altruist | $60.00 | Feb-22 | 7 |
5833 Perry Drive & 5860 West Adams Boulevard Culver City, CA | 21,704 | 1953 / 2024 | 21,704 | Altruist | $66.60 | Apr-24 | 9.8 |
| (1) | Information obtained from the appraisal unless otherwise indicated. |
| (2) | Based on the underwritten rent roll dated July 1, 2024. |
The following table presents certain information relating to the appraiser’s retail market rent conclusions for the Culver Steps Property:
| Comparable Retail Rental Summary(1) |
| Property Name/Location | Total NRA (SF) | Year Built | Tenant Size (SF) | Tenant Name | Annual Base Rent PSF | Commencement | Lease Term (Years) |
Culver Steps Culver City, CA | 121,736(2) | 2019 / NAP | Various | Various | $75.63(2) | Various | Various |
| 9426-9432 Washington Boulevard Culver City, CA | 10,000 | 1921 / NAP | 1,635 | Wrapstar | $96.00 | Jan-23 | 5.0 |
9901 Washington Boulevard Culver City, CA | 12,500 | 2016 / NAP | 2,650 | Breakfast Republic | $63.00 | Aug-21 | 10.0 |
| 8543-8545 Washington Boulevard Culver City, CA | 2,750 | 1948 / NAP | 626 | Monroe Place | $67.20 | Mar-21 | 5.0 |
191 S. Beverly Drive Culver City, CA | 14,089 | 1950 / NAP | 1,358 | Beverly Hills Bikini Shop | $78.15 | Jan-24 | 5.0 |
233 S. Beverly Drive Culver City, CA | N/A | 1950 / 1996 | 2,504 | Layla Bagels | $71.00 | Dec-23 | 10.0 |
8400 Wilshire Boulevard Culver City, CA | 2,596 | 1935 / NAP | 2,596 | Panera Inc. | $81.24 | Jan-23 | 10.1 |
3032 Wilshire Boulevard Culver City, CA | 11,097 | 2020 / NAP | 2,235 | Carbon Health | $104.13 | Jan-22 | 10.0 |
| (1) | Information obtained from the appraisal unless otherwise indicated. |
| (2) | Based on the underwritten rent roll dated July 1, 2024. |
| This is not a research report and was not prepared by any Underwriter’s research department. Please see additional important information and qualifications at the end of this Term Sheet. |
| | T-86 | |
| Mixed Use – Office/Retail | Loan #8 | Cut-off Date Balance: | | $33,750,000 |
| 9300 Culver Boulevard | Culver Steps | Cut-off Date LTV: | | 57.7% |
| Culver City, CA 90232 | | UW NCF DSCR: | | 1.67x |
| | | UW NOI Debt Yield: | | 11.4% |
Operating History and Underwritten Net Cash Flow. The following table presents certain information relating to the historical operating performance and Underwritten Net Cash Flow at the Culver Steps Property:
| Cash Flow Analysis |
| | 2021 | 2022 | 2023 | TTM 4/30/2024 | UW | UW PSF |
| Base Rent | $5,523,283 | $6,022,152 | $6,841,872 | $7,829,028 | $8,673,145 | $71.25 |
| Credit Rent Steps | $0 | $0 | $0 | $0 | $346,875(1) | $2.85 |
| Rent Steps | $0 | $0 | $0 | $0 | $42,727(2) | $0.35 |
| Grossed Up Vacant Space | $0 | $0 | $0 | $0 | $0 | $0 |
| Gross Potential Rent | $5,523,283 | $6,022,152 | $6,841,872 | $7,829,028 | $9,062,746 | $74.45 |
| Other Income | $343,840 | $309,517 | $168,070 | $134,640 | $148,324 | $1.22 |
| Total Recoveries | $1,973,253 | $2,247,035 | $3,001,580 | $3,171,563 | $4,261,660 | $35.01 |
| Net Rental Income | $7,840,377 | $8,578,704 | $10,011,522 | $11,135,231 | $13,472,730 | $110.67 |
| (Vacancy & Credit Loss) | $0 | $0 | $0 | $0 | ($411,801) | ($3.38) |
| Effective Gross Income | $7,840,377 | $8,578,704 | $10,011,522 | $11,135,231 | $13,060,930 | $107.29 |
| | | | | | | |
| Management Fee | $263,167 | $267,489 | $302,837 | $327,850 | $391,828 | $3.22 |
| Real Estate Taxes | $883,521 | $1,146,295 | $403,298 | $491,363 | $943,916 | $7.75 |
| Insurance | $126,158 | $115,042 | $134,894 | $151,408 | 85,630 | 0.70 |
| Other Operating Expenses | $1,826,173 | $2,700,679 | $3,032,383 | $3,049,207 | 3,054,656 | 25.09 |
| Total Expenses | $3,099,018 | $4,229,505 | $3,873,413 | $4,019,828 | $4,476,030 | $36.77 |
| | | | | | | |
| Net Operating Income | $4,741,359 | $4,349,198 | $6,138,109 | $7,115,403 | $8,584,900 | $70.52 |
| Replacement Reserves | $0 | $0 | $0 | $0 | 24,347 | 0.20 |
| TI/LC | $0 | $0 | $0 | $0 | 121,736 | 1.00 |
| Net Cash Flow | $4,741,359 | $4,349,198 | $6,138,109 | $7,115,403 | $8,438,816 | $69.32 |
| | | | | | | |
| Occupancy % | 86.0% | 87.0% | 88.0% | 93.9% | 96.9%(3) | |
| NOI DSCR(4) | 0.94x | 0.86x | 1.22x | 1.41x | 1.70x | |
| NCF DSCR(4) | 0.94x | 0.86x | 1.22x | 1.41x | 1.67x | |
| NOI Debt Yield(4) | 6.3% | 5.8% | 8.2% | 9.5% | 11.4% | |
| NCF Debt Yield(4) | 6.3% | 5.8% | 8.2% | 9.5% | 11.3% | |
| (1) | Represents straight line rent averaging for Amazon through the end of the loan term. |
| (2) | Represents contractual rent steps taken through July 2025. |
| (3) | The underwritten economic occupancy is 96.9%. The Culver Steps Property was 100.0% leased based on the July 1, 2024, underwritten rent roll. |
| (4) | NOI DSCR, NCF DSCR, NOI Debt Yield and NCF Debt Yield are based on the Culver Steps Whole Loan. |
Environmental. According to the Phase I environmental assessment dated June 3, 2024, there was no evidence of any recognized environmental conditions at the Culver Steps Property.
Appraisal. According to the appraisal dated July 23, 2024, the Culver Steps Property had an “As-Is” appraised value of $130,000,000 as of June 4, 2024.
Property Management. The Culver Steps Property is managed by IDS Real Estate Group, a borrower sponsor affiliate.
Escrows and Reserves.
Real Estate Taxes – On a monthly basis during a Trigger Period (as defined below), the borrower is required to escrow 1/12th of the estimated annual real estate tax payments.
Insurance – On a monthly basis, the borrower is required to escrow 1/12th of the annual estimated insurance payments. Such reserve has been conditionally waived so long as the borrower maintains a blanket policy meeting the requirements of the Culver Steps Whole Loan documents and the borrower provides evidence of the renewal of any insurance policy prior to the expiration thereof and receipts for the payment of the applicable premiums.
Replacement Reserve – On a monthly basis during a Trigger Period, the borrower is required to escrow approximately $2,029 for the payment or reimbursement of approved capital expenses, capped at $48,696.
Rollover Reserve – At loan origination, the borrower deposited $1,179,329 for outstanding tenant improvements and leasing commissions related to Laurel Grill and Afuri Ramen. On a monthly basis during a Trigger Period, the borrower is required to escrow $10,145 for approved leasing expenses, capped at $243,480.
| This is not a research report and was not prepared by any Underwriter’s research department. Please see additional important information and qualifications at the end of this Term Sheet. |
| | T-87 | |
| Mixed Use – Office/Retail | Loan #8 | Cut-off Date Balance: | | $33,750,000 |
| 9300 Culver Boulevard | Culver Steps | Cut-off Date LTV: | | 57.7% |
| Culver City, CA 90232 | | UW NCF DSCR: | | 1.67x |
| | | UW NOI Debt Yield: | | 11.4% |
Lockbox and Cash Management. The Culver Steps Whole Loan is structured with a hard lockbox and springing cash management. The borrower is required to cause all tenants at the Culver Steps Property to pay rents directly into the account controlled by the lender (the “Lockbox Account”), and to deposit any rents otherwise received by the manager or the property manager into such Lockbox Account within two business days after receipt. Prior to a Trigger Period, all funds in the Lockbox Account will be swept daily to the borrower’s operating account. Upon the occurrence and during the continuance of a Trigger Period, all funds in the Lockbox Account are required to be swept daily to a cash management account under the control of the lender to be applied and disbursed in accordance with the Culver Steps Whole Loan documents, and all excess cash flow funds remaining in the cash management account after the application of such funds in accordance with the Culver Steps Whole Loan documents are required to be held by the lender in an excess cash flow reserve account as additional collateral for the Culver Steps Whole Loan. To the extent that no Trigger Period is continuing, all excess cash flow funds are required to be disbursed to the borrower.
A “Trigger Period” will commence upon the occurrence of:
| (ii) | the net cash flow debt service coverage ratio (“NCF DSCR”) falling below 1.10x at the end of any calendar quarter (a “Low DSCR Trigger Period”); or |
| (iii) | a Lease Sweep Period (as defined below). |
A ”Lease Sweep Period” means a period commencing upon the first monthly payment date following the occurrence of any of the following (a) the earlier of (i) the date that is 12 months prior to the expiration of a Lease Sweep Lease (as defined below) and (ii) the date required under the Lease Sweep Lease by which the Lease Sweep Lease tenant is required to give notice of its exercise of a renewal option thereunder (and such renewal has not been so exercised); (b) receipt by borrower or manager from any Lease Sweep Lease tenant exercising its right to terminate its lease; (c) upon the early termination, early cancellation or early surrender of a Lease Sweep Lease (or 15% or more of the Lease Sweep Lease space) or upon the borrower’s receipt of written notice by a Lease Sweep Lease tenant of its intent to effect an early termination, early cancellation or early surrender of its Lease Sweep Lease (15% or more of the Lease Sweep Lease space); (d) if a Lease Sweep Lease discontinues its business (i.e., “goes dark”) in 25% or more of the Lease Sweep Lease space unless (i) if such Tenant is an investment grade tenant and continues to pay all rent and additional rent due under such Lease Sweep Lease when due, or (ii) for so long as the Lease Sweep Lease tenant is discontinuing operations solely to comply with emergency law mandating closure; (e) any default in the payment of base rent, any material monetary obligation, or material non-monetary default under the lease; or (f) the Lease Sweep Lease tenant files bankruptcy.
A “Lease Sweep Lease” means (i) the Amazon lease or (ii) any replacement lease that, either individually, or when taken together with any other lease with the same tenant or its affiliates, and assuming the exercise of all expansion rights and all preferential rights to lease additional space contained in such lease, covers the majority of the space that was demised pursuant to the Amazon lease.
A Trigger Period will end upon:
| ● | with regard to clause (i), the event of default has been cured or waived and such cure has been accepted by the lender; |
| ● | with regard to clause (ii), the Low DSCR Trigger Period has ended, including the posting of cash collateral or a letter of credit in an amount to achieve a 1.10x NCF DSCR, or otherwise waived by lender; |
| ● | with regard to clause (iii), a Lease Sweep Period will terminate upon: (A) in the case of clauses (a)-(e) above, (1) the entirety of the Lease Sweep Lease space (or applicable portion thereof) is leased pursuant to one or more qualified leases (which must be on market terms and extend at least two years beyond the loan term and are on terms at least as favorable to landlord as those in the Lease Sweep Lease being replaced) and in the lender’s reasonable judgement there are sufficient funds in the lease sweep reserve to cover all anticipated leasing expenses approved by the lender, and free or abated rent periods for such qualified leases (collectively, “Leasing Costs”), and any shortfalls in loan agreement payments or operating expenses resulting from anticipated down time prior to the commencement of payments under such qualified leases; or (2) a portion of the Lease Sweep Lease space (or applicable portion thereof) is leased pursuant to one or more qualified leases (which must have terms that are for extend at least two years beyond the loan term and are on terms at least as favorable to landlord as those in the Lease Sweep Lease being replaced and in the lender’s reasonable judgement there are sufficient funds in the lease sweep reserve to cover all Leasing Costs, and any shortfalls in loan agreement payments or operating expenses resulting from anticipated down time prior to the commencement of payments under such qualified leases and the funds accumulated in the lease sweep account and rollover account is equal or greater than the sum of the amount required to cover all Leasing Costs and an amount equal to $40 per square foot for the portion of the Lease Sweep Lease space not leased; (B) in the case of clause (a) above, the Lease Sweep Lease tenant irrevocably exercises its renewal or extension option with respect to all of its space, and in the lender’s judgement there are sufficient funds in the lease sweep reserve to cover all Leasing Costs in connection with such renewal or extension; (C) in the case of clause (b) above, the termination option is not validly exercised by the tenant by the latest exercise date or is waived in writing by tenant; (D) in the case of clause (d) the date that the tenant re-commences the operating of its space; (E) in the case of clause (e) above, the subject default has been cured and no other default occurs for a period of three consecutive months following the cure; or (F) with respect to clause (f) above, the applicable Lease Sweep tenant party insolvency proceeding has terminated and the applicable Lease Sweep Lease, and each guaranty of the Lease Sweep Lease (if any), has been affirmed, assumed or assigned in a manner reasonably satisfactory to the Lender; (G) in the case of clauses (c) and (d) above, to the extent that less 50% of the lease sweep space demised to such tenant under all Lease Sweep Leases (in the aggregate) at the property triggered such Lease Sweep Period, the date on which the Lease Sweep funds in the lease sweep account collected with respect to the triggering lease sweep space and the rollover account, in the aggregate, equal to $40 PSF for the applicable tenant space; and (H) with respect to clauses (a)-(g) above, the date on which the lease sweep funds in the lease sweep account collected with respect to the Lease Sweep Lease in question (including any Lease Sweep Lease termination payments with respect to such Lease Sweep Lease deposited into the lease sweep account) and any funds in the rollover account, in the aggregate, are equal to the $40 PSF for the applicable space. |
Terrorism Insurance. The Culver Steps Whole Loan documents require that the “all risk” insurance policy required to be maintained by the borrower provides coverage for terrorism in an amount equal to the full replacement cost of the Culver Steps Property, as well as business interruption insurance covering no less than the 24-month period following the occurrence of a casualty event, together with a 12-month extended period of indemnity, as well as terrorism coverage as defined by TRIPRA. See “Risk Factors—Risks Relating to the Mortgage Loans—Terrorism Insurance May Not Be Available for All Mortgaged Properties” in the prospectus.
| This is not a research report and was not prepared by any Underwriter’s research department. Please see additional important information and qualifications at the end of this Term Sheet. |
| | T-88 | |
| Hospitality – Full Service | Loan #9 | Cut-off Date Balance: | | $33,400,000 |
| 1100 Texas Avenue | Magnolia Houston | Cut-off Date LTV: | | 46.1% |
| Houston, TX 77002 | | UW NCF DSCR: | | 1.46x |
| | | UW NOI Debt Yield: | | 13.1% |
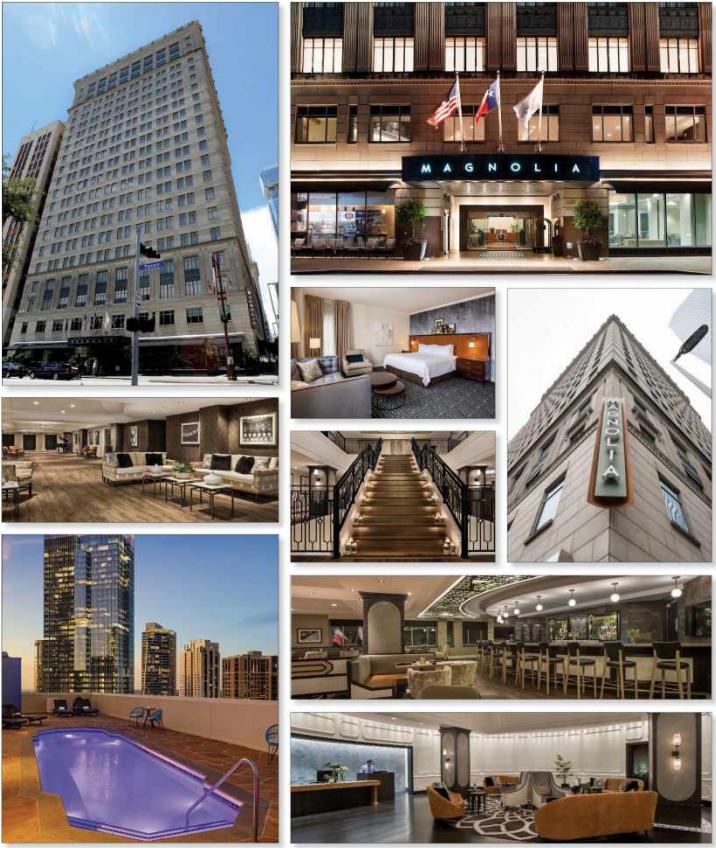
| This is not a research report and was not prepared by any Underwriter’s research department. Please see additional important information and qualifications at the end of this Term Sheet. |
| | T-89 | |
| Hospitality – Full Service | Loan #9 | Cut-off Date Balance: | | $33,400,000 |
| 1100 Texas Avenue | Magnolia Houston | Cut-off Date LTV: | | 46.1% |
| Houston, TX 77002 | | UW NCF DSCR: | | 1.46x |
| | | UW NOI Debt Yield: | | 13.1% |

| This is not a research report and was not prepared by any Underwriter’s research department. Please see additional important information and qualifications at the end of this Term Sheet. |
| | T-90 | |
| Mortgage Loan No. 9 – Magnolia Houston |
| Mortgage Loan Information | | Property Information |
| Mortgage Loan Seller: | MSMCH | | Single Asset/Portfolio: | Single Asset |
| Credit Assessment (Fitch/Moody’s/KBRA): | NR/NR/NR | | Location: | Houston, TX 77002 |
| Original Balance: | $33,400,000 | | General Property Type: | Hospitality |
| Cut-off Date Balance: | $33,400,000 | | Detailed Property Type: | Full Service |
| % of Initial Pool Balance: | 3.7% | | Title Vesting: | Fee |
| Loan Purpose: | Refinance | | Year Built/Renovated: | 1926 / 2003, 2017-2019 |
| Borrower Sponsor: | H. Stevens Holtze III | | Size: | 314 Rooms |
| Guarantor: | H. Stevens Holtze III | | Cut-off Date Balance Per Room: | $106,369 |
| Mortgage Rate: | 7.4700% | | Maturity Date Balance Per Room: | $106,369 |
| Note Date: | 6/5/2024 | | Property Manager: | CTH Houston Manager LLC |
| Maturity Date: | 7/1/2029 | | Underwriting and Financial Information |
| Term to Maturity: | 60 months | | UW NOI: | $4,388,519 |
| Amortization Term: | 0 months | | UW NCF: | $3,701,073 |
| IO Period: | 60 months | | UW NOI Debt Yield: | 13.1% |
| Seasoning: | 1 month | | UW NCF Debt Yield: | 11.1% |
| Prepayment Provisions: | L(25),D(28),O(7) | | UW NOI Debt Yield at Maturity: | 13.1% |
| Lockbox/Cash Mgmt Status: | Springing/Springing | | UW NCF DSCR: | 1.46x (IO) |
| Additional Debt Type: | NAP | | Most Recent NOI: | $4,484,344 (5/31/2024 TTM) |
| Additional Debt Balance: | NAP | | 2nd Most Recent NOI: | $4,282,248 (12/31/2023) |
| Future Debt Permitted (Type): | No (NAP) | | 3rd Most Recent NOI(3): | $2,369,169 (12/31/2022) |
| | | Most Recent Occupancy: | 61.1% (5/31/2024) |
| Reserves(1) | | 2nd Most Recent Occupancy: | 57.2% (12/31/2023) |
| Type | Initial | Monthly | Cap | | 3rd Most Recent Occupancy: | 49.3% (12/31/2022) |
| RE Tax: | $330,421 | $47,203 | NAP | | Appraised Value (as of): | $72,500,000 (4/10/2024) |
| Insurance: | $0 | Springing | NAP | | Appraised Value Per Room: | $230,892 |
| FF&E Reserve: | $0 | $56,490 | NAP | | Cut-off Date LTV Ratio: | 46.1% |
| Future PIP Reserve: | $0 | $Springing | NAP | | Maturity Date LTV Ratio: | 46.1% |
| | | | | | | | |
| Sources and Uses |
| Sources | Proceeds | % of Total | | Uses | Proceeds | % of Total |
| Mortgage Loan Amount: | $33,400,000 | 94.6% | | Loan Payoff: | $32,360,925 | 91.7% |
| Borrower Equity: | $1,888,973 | 5.4% | | Closing Costs: | $2,597,627 | 7.4% |
| | | | | Reserves | $330,421 | 0.9% |
| Total Sources: | $35,288,973 | 100.00% | | Total Uses: | $35,288,973 | 100.0% |
| (1) | See “Escrows and Reserves” below. |
The Mortgage Loan. The ninth largest mortgage loan (the “Magnolia Houston Mortgage Loan”) is evidenced by a promissory note in the original principal amount of $33,400,000 and secured by a first-priority fee mortgage encumbering a 314-room full service hospitality property located in Houston, Texas (the “Magnolia Houston Property”).
The Borrower and the Borrower Sponsor. The borrower for the Magnolia Houston Mortgage Loan is Holtze Houston, LLLP, a single-purpose, Colorado limited liability limited partnership with one independent director in its organizational structure. The borrower is 99.9% owned by Stevens Holtze Real Estate Holding Co., LLLP and 0.1% owned by its general partner, Holtze Houston Associates, LLLP (the “General Partner”). The General Partner is 74.9% owned by Stevens Holtze Corporation (dba Stout Street Hospitality), 25% owned by a private investor and 0.1% owned (indirect) by Stevens Holtze Real Estate Holding Co., LLLP. The sponsor and non-recourse carveout guarantor is H. Stevens Holtze III (the “Sponsor”). Stevens Holtze Corporation is 51.7% owned by the Sponsor and Stevens Holtze Real Estate Holding Co., LLLP is owned 20.1% by the Sponsor as to the general partnership interest and 79.9% by other Holtze family members and trusts as to the limited partnership interest. The Sponsor founded Stout Street Hospitality, a family hotel management company, in 1993. Throughout its history, Stout Street Hospitality has developed six Magnolia branded hotels, converted one branded hotel to an independent and three others from independent hotels to soft brands. The company has also managed properties for two major brands, as well as two independent hotels ranging in size from 55–327 rooms.
| This is not a research report and was not prepared by any Underwriter’s research department. Please see additional important information and qualifications at the end of this Term Sheet. |
| | T-91 | |
| Hospitality – Full Service | Loan #9 | Cut-off Date Balance: | | $33,400,000 |
| 1100 Texas Avenue | Magnolia Houston | Cut-off Date LTV: | | 46.1% |
| Houston, TX 77002 | | UW NCF DSCR: | | 1.46x |
| | | UW NOI Debt Yield: | | 13.1% |
The Property. The Magnolia Houston Property is a 22-story, 314-room, full service hospitality property built on a 0.36-acre site in Houston, Texas. The Magnolia Houston Property originally opened in 1926 as an office building for the Houston Post-Dispatch and KRPC radio station. The Magnolia Houston Property served as the headquarters of Shell Oil throughout much of the mid-1900s and was most recently converted to hotel use in 2003. Shortly after opening in 2003, the Magnolia Houston Property was added to the National Register of Historical Places. The Magnolia Houston Property subsequently underwent a property-wide renovation between 2017 and 2019 and became affiliated with the Tribute Collection by Marriott in February 2017. As part of the conversion to the Tribute Collection, the borrower sponsor completed an approximately $9.6 million ($30,666 per key) capital program, with significant enhancements to the rooms/suites, meeting spaces, ballroom, and public spaces. The Magnolia Houston Property amenities include a breakfast and dinner restaurant (Dispatch), a leased coffee shop (Cafe Paris), 10,179 SF of meeting space, an outdoor swimming pool, billiards rooms, a fitness center, and a business kiosk. Room amenities include executive-style work areas with dual line phones, in-room safes, and marble bathrooms with oversized garden tubs. The guestroom mix at the Magnolia Houston Property is comprised of 159 king rooms, eight king accessible rooms, 80 double queen rooms, two queen accessible rooms and 65 suites. The Magnolia Houston Property has access to 125 parking spaces in an adjacent non-collateral parking garage through a Declaration of Parking and Easement Agreement. The borrower may elect to use such spaces on either a daily or monthly basis and is required to pay the owner of such parking garage an amount equal to the daily or monthly rate, as applicable, charged by the parking garage owner to the general public.
The Magnolia Houston Property is currently subject to a franchise agreement expiring February 27, 2037 with S Collection, Inc., which is wholly owned by Marriott International, Inc.
According to the appraisal, the property segmentation at the Magnolia Houston Property is estimated at 40% commercial, 25% meeting and group and 36% leisure.
The Market. The Magnolia Houston Property is located in Downtown Houston, with nearby attractions including Discovery Green – a 12-acre urban park, the Toyota center – home to the Houston Rockets, Minute Maid Park – home to the Houston Astros, the Shell Energy Stadium – home to the Houston Dynamo FC, as well as the Houston Theater District – an entertainment zone that hosts four theater venues supporting the Houston Ballet, the Houston Grand Opera, the Houston Symphony Orchestra, and The Alley Theatre. Houston’s George R. Brown Convention center ranks among the 10 largest convention centers in America, featuring seven exhibit halls, 100 meeting rooms, and a 3,600-seat amphitheater. Conventions and conferences are a major attraction to downtown Houston.
According to the appraisal, the estimated 2023 population within a two-, five-, and ten-mile radius of the Magnolia Houston Property was 101,936, 462,867, and 1,413,018, respectively. According to the appraisal, the 2023 average household income within the same radii was $104,867, $108,538, and $90,836, respectively.
The following table presents the primary competitive properties to the Magnolia Houston Property:
| Competitive Property Summary(1) |
| Property | Year Built | Rooms | Commercial | Group | Leisure | 2023 Occupancy | 2023 ADR | 2023 RevPAR |
| Magnolia Houston Property (subject) | 1926 | 314 | 40% | 25% | 36% | 57% | $190.19 | $108.82 |
| The Lancaster Hotel | 1926 | 93 | 55% | 10% | 35% | 70-75% | 280-285 | 200-205 |
| The Whitehall | 2001 | 259 | 40% | 25% | 35% | 50-55% | 180-185 | 90-95 |
| The Sam Houston, Curio Collection by Hilton | 1924 | 100 | 50% | 15% | 35% | 55-60% | 225-230 | 130-135 |
| Autograph Collection Hotel ICON | 2004 | 135 | 40% | 20% | 40% | 50-55% | 185-190 | 90-95 |
| Westin Houston Downtown | 2004 | 200 | 45% | 20% | 35% | 55-60% | 240-245 | 135-140 |
| Embassy Suites Houston Downtown | 2011 | 262 | 40% | 15% | 45% | 60-65% | 215-220 | 130-135 |
| Le Meridien Houston Downtown | 2017 | 255 | 40% | 25% | 35% | 55-60% | 200-205 | 115-120 |
Source: Appraisal.
| (1) | The variances between the underwriting, the appraisal and industry report data with respect to occupancy, ADR and RevPAR at the Magnolia Houston Property are attributable to variances in reporting methodologies and/or timing differences. |
The following table presents certain information relating to the Occupancy, ADR and RevPAR of the Magnolia Houston Property and its competitive set:
| Historical Occupancy, ADR, RevPAR(1)(2) |
| | Competitive Set | Magnolia Houston Property | Penetration Factor |
| Year | Occupancy | ADR | RevPAR | Occupancy | ADR | RevPAR | Occupancy | ADR | RevPAR |
| 12/31/2022 | 53.8% | $197.81 | $106.43 | 49.2% | $174.46 | $85.75 | 91.4% | 88.2% | 80.6% |
| 12/31/2023 | 57.6% | $213.65 | $123.02 | 57.2% | $190.19 | $108.82 | 99.4% | 89.0% | 88.5% |
| 3/31/2024 (3) | 58.2% | $218.38 | $127.19 | 58.4% | $193.68 | $113.10 | 100.3% | 88.7% | 88.9% |
Source: Industry Report.
| (1) | The competitive set includes The Lancaster Hotel, The Whitehall, The Sam Houston, Curio Collection by Hilton, Autograph Collection Hotel ICON, Westin Houston Downtown, Embassy Suites Houston Downtown and Le Meridien Houston Downtown. |
| (2) | The variances between the underwriting, the appraisal and the industry report data with respect to Occupancy, ADR and RevPAR at the Magnolia Houston Property are attributable to variances in reporting methodologies and/or timing differences. |
Appraisal. The appraisal concluded to an “as is” value for the Magnolia Houston Property of $72,500,000 as of April 10, 2024.
| This is not a research report and was not prepared by any Underwriter’s research department. Please see additional important information and qualifications at the end of this Term Sheet. |
| | T-92 | |
| Hospitality – Full Service | Loan #9 | Cut-off Date Balance: | | $33,400,000 |
| 1100 Texas Avenue | Magnolia Houston | Cut-off Date LTV: | | 46.1% |
| Houston, TX 77002 | | UW NCF DSCR: | | 1.46x |
| | | UW NOI Debt Yield: | | 13.1% |
Environmental Matters. According to the Phase I environmental site assessment dated April 11, 2024, there was no evidence of any recognized environmental conditions at the Magnolia Houston Property.
Operating History and Underwritten Net Cash Flow. The following table presents certain information relating to the historical operating performance and the Underwritten Net Cash Flow at the Magnolia Houston Property:
| Cash Flow Analysis |
| | 2021 | 2022 | 2023 | 5/31/2024 TTM | UW | UW per Room |
| Occupancy(1) | 34.2% | 49.3% | 57.2% | 61.1% | 61.3% | |
| ADR(1) | $148.70 | $174.46 | $177.03 | $189.20 | $188.30 | |
| RevPAR(1) | $50.87 | $85.96 | $104.50 | $115.58 | $115.35 | |
| | | | | | | |
| Room Revenue | $5,795,198 | $9,828,054 | $12,472,202 | $13,219,736 | $13,219,736 | $42,101.07 |
| Food & Beverage Revenue | $848,017 | $2,038,669 | $2,678,437 | $2,793,794 | $2,793,794 | $8,897.43 |
| Other Departmental Income: | $508,457 | $713,260 | $882,641 | $904,649 | $904,649 | $2,881.05 |
| Miscellaneous Income: | $64,379 | $139,827 | $309,147 | $267,973 | $267,973 | $853.42 |
| Total Revenue | $7,216,051 | $12,719,810 | $16,342,427 | $17,186,152 | $17,186,152 | $54,732.97 |
| | | | | | | |
| Room Expense | $1,103,171 | $1,882,879 | $2,246,793 | $2,293,081 | $2,293,081 | $7,302.81 |
| Food & Beverage Expense | $656,930 | $1,582,295 | $1,908,964 | $2,042,301 | $2,042,301 | $6,504.14 |
| Real Estate Taxes | $537,092 | $546,608 | $540,397 | $540,397 | $541,805 | $1,725.49 |
| Insurance | $135,948 | $174,387 | $303,106 | $402,904 | $543,133 | $1,729.72 |
| Other Expenses | $4,223,771 | $6,164,472 | $7,060,919 | $7,423,125 | $7,377,314 | $23,494.63 |
| Total Expenses | $6,656,912 | $10,350,641 | $12,060,179 | $12,701,808 | $12,797,633 | $40,756.79 |
| | | | | | | |
| Net Operating Income | $559,139 | $2,369,169 | $4,282,248 | $4,484,344 | $4,388,519 | $13,976.17 |
| FF&E | $0 | $0 | $0 | $0 | $687,446 | $2,189.32 |
| Net Cash Flow | $559,139 | $2,369,169 | $4,282,248 | $4,484,344 | $3,701,073 | $11,786.86 |
| | | | | | | |
| NOI DSCR | 0.22x | 0.94x | 1.69x | 1.77x | 1.73x | |
| NCF DSCR | 0.22x | 0.94x | 1.69x | 1.77x | 1.46x | |
| NOI Debt Yield | 1.7% | 7.1% | 12.8% | 13.4% | 13.1% | |
| NCF Debt Yield | 1.7% | 7.1% | 12.8% | 13.4% | 11.1% | |
| (1) | The variances between the underwriting, the appraisal and the industry report data with respect to Occupancy, ADR and RevPAR at the Magnolia Houston Property are attributable to variances in reporting methodologies and/or timing differences. |
Escrows and Reserves.
Tax – The Magnolia Houston Mortgage Loan documents provide for an upfront reserve of approximately $330,421 for real estate taxes, and ongoing monthly reserves equal to 1/12 of the real estate taxes the lender estimates will be payable during the next twelve months (initially estimated to be $47,203)
Insurance – The Magnolia Houston Mortgage Loan documents do not require monthly reserves for insurance premiums as long as (i) no event of default is continuing under the Magnolia Houston Mortgage Loan, (ii) the liability and casualty insurance coverage for the Magnolia Houston Property is included in a blanket or umbrella policy approved by the lender in its reasonable discretion, and (iii) the borrower provides the lender with certificates of insurance for such policies and paid receipts for insurance premiums no later than 10 days prior to the expiration dates of the policies. If such conditions are not satisfied, the Magnolia Houston Mortgage Loan documents provide for ongoing monthly reserves for insurance premiums in an amount equal to 1/12 of the insurance premiums that the lender estimates will be payable for the renewal of the insurance coverage.
FF&E – The Magnolia Houston Mortgage Loan documents provide for ongoing monthly reserves for furniture, fixtures and equipment (“FF&E”) in an amount equal to the greater of (A) 1/12th of 4% of the operating income for the Magnolia Houston Property for the preceding calendar year and (B) the amount of the deposit (if any) required by the franchisor under the franchise agreement for FF&E (initially estimated to be $56,490).
PIP – On the date that any new property improvement plan (“PIP”) is imposed by the franchisor, the borrower is required to deposit an amount equal to 125% of the sum required to pay for such new PIP into a PIP reserve.
| This is not a research report and was not prepared by any Underwriter’s research department. Please see additional important information and qualifications at the end of this Term Sheet. |
| | T-93 | |
| Hospitality – Full Service | Loan #9 | Cut-off Date Balance: | | $33,400,000 |
| 1100 Texas Avenue | Magnolia Houston | Cut-off Date LTV: | | 46.1% |
| Houston, TX 77002 | | UW NCF DSCR: | | 1.46x |
| | | UW NOI Debt Yield: | | 13.1% |
Lockbox and Cash Management. The Magnolia Houston Mortgage Loan is structured with a springing lockbox and springing cash management. Upon the occurrence of a Cash Sweep Event Period (as defined below), the borrower is required to establish a lockbox for the benefit of the lender and to direct credit card companies and credit card banks to deposit all credit card receipts with respect to the Magnolia Houston Property into the lockbox account during such Cash Sweep Event Period. If, notwithstanding the foregoing direction, the borrower or property manager receives any rents or revenues from the Magnolia Houston Property during a Cash Sweep Event Period, it is required to deposit such amounts into the lockbox account within one business day of receipt. In addition, upon the occurrence of a Cash Sweep Event Period the lender is required to establish, and the borrower is required to cooperate to establish, a cash management account, into which all funds on deposit in the lockbox account will be required to be transferred during such Cash Sweep Event Period, and applied, provided no event of default is continuing under the Magnolia Houston Mortgage Loan, (i) to fund the required tax and insurance reserves deposits, if any, as described above under “Escrows and Reserves,” (ii) to fund the payment of debt service on the Magnolia Houston Mortgage Loan, (iii) to fund the required monthly deposit into the FF&E reserve, as described above under “Escrows and Reserves,” (iv) to pay sales and occupancy taxes and tips, monthly operating expenses referenced in the lender-approved annual budget, and extraordinary expenses approved by the lender, (v) to pay operating expenses set forth in the lender-approved annual budget and lender-approved extraordinary expenses, and (vi) to disburse the remainder into an excess cash flow account to be held as additional collateral for the Magnolia Houston Mortgage Loan during the continuance of such Cash Sweep Event Period.
A “Cash Sweep Event Period” means a period:
| (A) | commencing upon the earliest of: |
| (i) | The occurrence of an event of default under the Magnolia Houston Mortgage Loan; |
| (ii) | The debt service coverage ratio being less than 1.25x at the end of any calendar quarter (such event, a “DSCR Event”); |
| (iii) | The occurrence of a Franchise Default Event (as defined below); and/or |
| (iv) | The occurrence of a Franchise Termination Event (as defined below). |
and (B) expiring upon:
| (i) | regarding any Cash Sweep Event Period commenced in connection with clause (A)(i) above, the cure of such event of default to the lender’s satisfaction or the lender’s waiver of such event of default; |
| (ii) | regarding any DSCR Event, the date that the debt service coverage ratio is equal to or greater than 1.25x for one calendar quarter; |
| (iii) | regarding any Franchise Default Event, such default has been remedied by the borrower to the reasonable satisfaction of the lender and the franchisor; and |
| (iv) | regarding any Franchise Termination Event, the borrower has entered into a franchise, trademark and license agreement with a reputable and experienced franchisor possessing experience in flagging hotel properties similar in size, scope, use and value as the Magnolia Houston Property and approved by the lender, which agreement is either in substantially the same form and substance as the franchise agreement in place at origination or is reasonably acceptable to the lender. |
“Franchise Default Event” means written notice to the borrower or lender that (i) the borrower is in default under the franchise agreement, or (ii) the borrower is no longer in good standing with the franchisor due to the failure of the Magnolia Houston Property to be operated and maintained in accordance with the standards set forth in the franchise agreement, and in each such case such default or failure has not been cured to the satisfaction of the lender and the franchisor within 30 days of the earlier of (x) the date of notice or (y) the earliest date set forth in such notice to borrower or lender.
“Franchise Termination Event” means the date which is the earlier of (x) the date either the franchisor or the borrower gives written notice to terminate the franchise agreement or (y) the date the franchise agreement is terminated or otherwise ceases to exist.
Terrorism Insurance. The Magnolia Houston Mortgage Loan documents require that the borrower maintain comprehensive “all risk” or “special form” insurance in an amount equal to 100% of full replacement cost and 12 months of business income/loss of rents insurance with a 6 month extended period of indemnity, which includes coverage for perils of terrorism and acts of terrorism. If “acts of terrorism” or other similar acts or events or “fire following” such acts or events are excluded from such policies, the borrower is required to obtain an endorsement to such policy or policies, or a separate policy, in each case to the extent available, insuring against all such excluded acts or events and “fire following” in the amounts set forth above. Notwithstanding the foregoing, for so long as the Terrorism Risk Insurance Act of 2002, as extended and modified by the Terrorism Risk Insurance Program Reauthorization Act of 2015 (“TRIPRA”) (including any extensions thereof or if another federal governmental program is in effect relating to “acts of terrorism” which provides substantially similar protections as TRIPRA) is in effect, and continues to cover both domestic and foreign acts of terrorism, the lender is required to accept terrorism insurance which covers against “covered acts” as defined by TRIPRA (or such other program). See “Risk Factors—Risks Relating to the Mortgage Loans—Terrorism Insurance May Not Be Available for All Mortgaged Properties” in the prospectus.
| This is not a research report and was not prepared by any Underwriter’s research department. Please see additional important information and qualifications at the end of this Term Sheet. |
| | T-94 | |
| Multifamily – High Rise | Loan #10 | Cut-off Date Balance: | | $31,500,000 |
| 120 Beach 26th Street | 120 Beach 26th Street | Cut-off Date LTV: | | 67.9% |
| Far Rockaway, NY 11691 | | U/W NCF DSCR: | | 1.42x |
| | | U/W NOI Debt Yield: | | 8.9% |
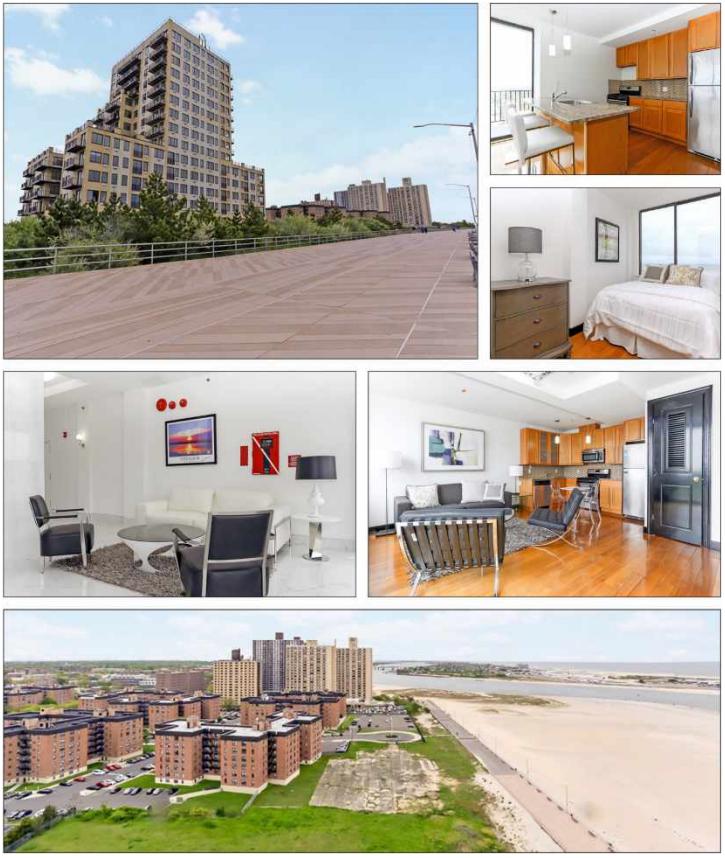
| This is not a research report and was not prepared by any Underwriter’s research department. Please see additional important information and qualifications at the end of this Term Sheet. |
| | T-95 | |
| Multifamily – High Rise | Loan #10 | Cut-off Date Balance: | | $31,500,000 |
| 120 Beach 26th Street | 120 Beach 26th Street | Cut-off Date LTV: | | 67.9% |
| Far Rockaway, NY 11691 | | U/W NCF DSCR: | | 1.42x |
| | | U/W NOI Debt Yield: | | 8.9% |
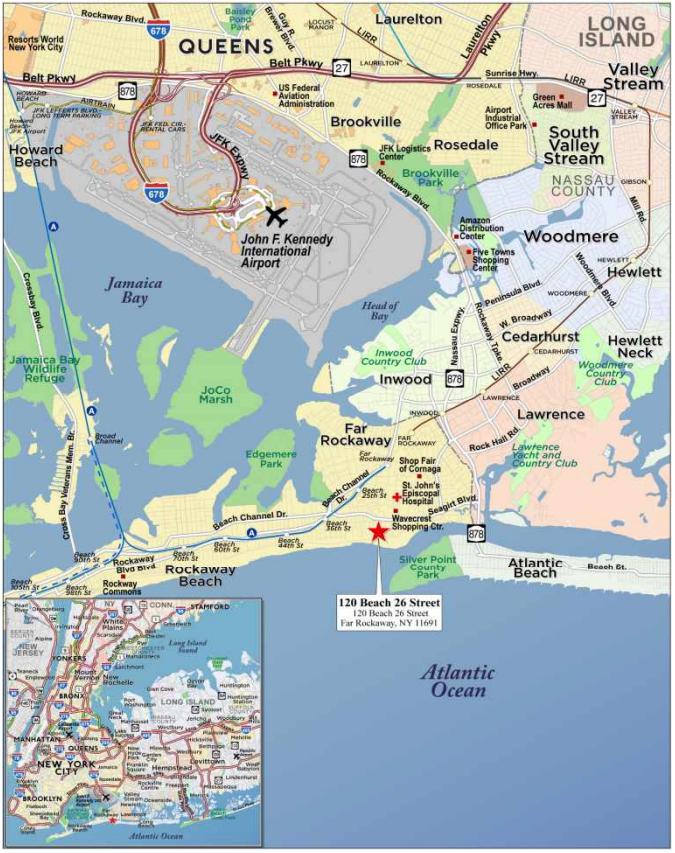
| This is not a research report and was not prepared by any Underwriter’s research department. Please see additional important information and qualifications at the end of this Term Sheet. |
| | T-96 | |
| Mortgage Loan No. 10 – 120 Beach 26th Street |
| Mortgage Loan Information | | Property Information |
| Mortgage Loan Seller: | MSMCH | | Single Asset/Portfolio: | Single Asset |
| Credit Assessment (Fitch/Moody’s/KBRA): | NR/NR/NR | | Location: | Far Rockaway, NY 11691 |
| Original Balance: | $31,500,000 | | General Property Type: | Multifamily |
| Cut-off Date Balance: | $31,500,000 | | Detailed Property Type: | High Rise |
| % of Initial Pool Balance: | 3.5% | | Title Vesting: | Fee |
| Loan Purpose: | Refinance | | Year Built/Renovated: | 2006/2016 |
| Borrower Sponsor: | Doron Pergament | | Size: | 126 Units |
| Guarantor: | Doron Pergament | | Cut-off Date Balance per Unit: | $250,000 |
| Mortgage Rate: | 6.1000% | | Maturity Date Balance per Unit: | $250,000 |
| Note Date: | 7/31/2024 | | Property Manager: | Capitale PM LLC |
| Maturity Date: | 8/1/2029 | | | (borrower-related) |
| Term to Maturity: | 60 months | | Underwriting and Financial Information |
| Amortization Term: | 0 months | | UW NOI: | $2,794,000 |
| IO Period: | 60 months | | UW NCF: | $2,762,500 |
| Seasoning: | 0 months | | UW NOI Debt Yield: | 8.9% |
| Prepayment Provisions: | L(24),D(32),O(4) | | UW NCF Debt Yield: | 8.8% |
| Lockbox/Cash Mgmt Status: | Springing/Springing | | UW NOI Debt Yield at Maturity: | 8.9% |
| Additional Debt Type: | NAP | | UW NCF DSCR: | 1.42x |
| Additional Debt Balance: | NAP | | Most Recent NOI: | $2,965,647 (6/30/2024 TTM) |
| Future Debt Permitted (Type): | No (NAP) | | 2nd Most Recent NOI: | $2,829,509 (12/31/2023) |
| Reserves(1) | | 3rd Most Recent NOI: | $2,607,332 (12/31/2022) |
| Type | Initial | Monthly | Cap | | Most Recent Occupancy: | 99.2% (7/1/2024) |
| RE Taxes: | $14,947 | $7,474 | NAP | | 2nd Most Recent Occupancy: | 98.8% (12/31/2023) |
| Insurance: | $101,766 | $20,353 | NAP | | 3rd Most Recent Occupancy: | 98.7% (12/31/2022) |
| Deferred Maintenance: | $34,723 | $0 | NAP | | Appraised Value (as of): | $46,400,000 (5/1/2024) |
| Replacement Reserve: | $0 | $2,625 | $63,000 | | Appraised Value per Unit: | $368,254 |
| Local Law 11 Reserve: | $91,702 | $0 | NAP | | Cut-off Date LTV Ratio: | 67.9% |
| Local Law 126 Reserve: | $6,000 | $0 | NAP | | Maturity Date LTV Ratio: | 67.9% |
| | | | | | | | |
| Sources and Uses |
| Sources | Proceeds | % of Total | | Uses | Proceeds | % of Total |
| Mortgage Loan Amount: | $31,500,000 | 100.0% | | Loan Payoff: | $29,481,605 | 93.6% |
| | | | | Closing Costs: | $1,209,500 | 3.8% |
| | | | | Return of Equity: | $559,757 | 1.8% |
| | | | | Reserves: | $249,138 | 0.8% |
| Total Sources: | $31,500,000 | 100.0% | | Total Uses: | $31,500,000 | 100.00% |
| (1) | See “Escrows and Reserves” below for further discussion of reserve information. |
The Mortgage Loan. The tenth largest mortgage loan (the “120 Beach 26th Street Mortgage Loan”) is evidenced by a promissory note in the original principal amount of $31,500,000. The 120 Beach 26th Street Mortgage Loan is secured by a first priority fee mortgage encumbering a multifamily property located in Far Rockaway, New York (the “120 Beach 26th Street Property”).
The Borrower and the Borrower Sponsors. The borrower for the 120 Beach 26th Street Mortgage Loan is 120 Beach 26th Street LLC, a single-purpose New York limited liability company, with one independent director in its organizational structure. The borrower sponsor and non-recourse carveout guarantor for the 120 Beach 26th Street Mortgage Loan is Doron Pergament. Doron Pergament is the founding principal of Capitale Property Management, a privately held real estate development and property management company that specializes in design, development, construction, maintenance, and management of residential properties. Doron Pergament currently has ownership interest in three multifamily properties totaling 314 units (including the 120 Beach 26th Street Property), one office building, and three parcels of undeveloped land.
The Property. The 120 Beach 26th Street Property is a 15-story, 126-unit high rise multifamily apartment located on a 1.8-acre site in Far Rockaway, New York. The 120 Beach 26th Street Property was built in 2006, and was purchased by the borrower sponsor in April 2016 in a foreclosure auction after the prior owner filed for Chapter 11 bankruptcy. At the time of acquisition the property was vacant and in need of renovation. The borrower sponsor subsequently gut-renovated the interior of the 120 Beach 26th Street Property at a cost of $4.5 million. From 2018-2020, the borrower sponsor added a recreation area along the beach front side of the 120 Beach 26th Street Property and upgraded the plumbing and the heating, ventilation and air conditioning systems for a cost of $44,427, $119,530, and $301,377, respectively.
The 120 Beach 26th Street Property is known as “Ocean Blue Luxury Apartments”. The residential units consist of 58 one-bedroom one-bathroom units averaging 697 SF and leased at rents of between $1,754 and $2,398 per month, with an average of $2,020 per month, 46 two-bedroom one-bathroom units averaging 831 SF and leased at rents of between $2,046 and $2,653 per month with an average of $2,340 per month, and 22 two-bedroom two-bathroom units averaging 1,050 SF and leased at rents of between $2,300 and $2,847 per month with an average of $2,574 per month. All of the units at the 120 Beach 26th Street Property are rent stabilized in connection with a 421a tax abatement which expires in the 2034/2035 tax year. 9 units are
| This is not a research report and was not prepared by any Underwriter’s research department. Please see additional important information and qualifications at the end of this Term Sheet. |
| | T-97 | |
| Multifamily – High Rise | Loan #10 | Cut-off Date Balance: | | $31,500,000 |
| 120 Beach 26th Street | 120 Beach 26th Street | Cut-off Date LTV: | | 67.9% |
| Far Rockaway, NY 11691 | | U/W NCF DSCR: | | 1.42x |
| | | U/W NOI Debt Yield: | | 8.9% |
leased to tenants with Section 8 vouchers. The 120 Beach 26th Street Property includes one 200 SF commercial unit located on the second floor leased to ALT Medical LLC, a physical therapy office, that has a separate entrance. Alt Medical LLC’s lease provides for annual rent of $36,000 in 2024 (with 3.0% annual increases) and has a lease expiration date of April 30, 2029. Amenities at the 120 Beach 26th Street Property include a game room, bike storage, two elevators, a fitness center, balconies with ocean views, and beach access. The 120 Beach 26th Street Property includes a two-story parking garage with 89 spaces located on the grade level and second level of the building, and a surface lot with 94 parking spaces. Additionally, there is a third-party which has a commercial parking lease for 80 parking spaces to be utilized for vehicle storage, through August 31, 2028. The 120 Beach 26th Street Property was 99.2% leased as of July 1, 2024. The 120 Beach 26th Street Property was originally developed as a condominium and is subject to a condominium regime, however, the borrower owns all of the condominium units and operates the 120 Beach 26th Street Property as a rental property.
The following table presents detailed information with respect to the units at the 120 Beach 26th Street Property:
| Apartment Unit Mix(1) |
| Unit Mix / Type | Total Units | Leased Units | % Leased | Average SF per Unit | Monthly Average Rent per Unit | Monthly Wtd. Average Rent PSF |
| 1 BR | 58 | 58 | 100.0% | 697 | $2,020 | $2.90 |
| 2 BR / 1 BA | 46 | 45 | 97.8% | 831 | $2,340 | $2.81 |
| 2 BR / 2 BA | 22 | 22 | 100.0% | 1,050 | $2,574 | $2.45 |
| Total/ Wtd. Average | 126 | 125 | 99.2% | 808 | $2,233 | $2.76 |
| (1) | Information is based on the borrower rent roll dated July 1, 2024. |
The Market. The 120 Beach 26th Street Property is located in Far Rockaway, New York. Far Rockaway is part of the Queens borough of New York City, and is located on the eastern part of the Rockaway Peninsula. The Rockaway Peninsula, situated between the Jamaica Bay and the Atlantic Ocean, is the southernmost part of all Queens and features 7 miles of beaches. The 120 Beach 26th Street Property is adjacent to the Rockaway Beach Boardwalk, which overlooks the Atlantic Ocean. Public transportation to Far Rockaway and the Rockaway Peninsula are provided by both the MTA and the Long Island Rail Road (“LIRR”). The A train is accessible at the Beach 25th Street station and the Beach 26th Street station, both of which are located approximately one mile away from the 120 Beach 26th Street Property. The A train provides subway service to Manhattan and Brooklyn. The LIRR is accessible 1.5 miles north of the 120 Beach 26th Street Property at the Far Rockaway Station, which provides service to Penn Station and Grand Central. The major thoroughfares providing vehicular access to the neighborhood include Rockaway Parkway, Nassau Expressway and Seagirt Boulevard
According to the appraisal, as of the first quarter of 2024, the vacancy rate in the New York metropolitan multifamily market was 3.5%, with average asking rents of $3,925 per unit and inventory of approximately 486,875 units. According to the appraisal, as of the first quarter of 2024, the vacancy rate in the Queens County apartment submarket was 2.1%, with average asking rents of $3,697 per unit, with approximately 78,462 units. According to the appraisal, the estimated 2023 population within a one-, three-, and five-mile radius of the 120 Beach 26th Street Property was 44,958, 118,755, and 223,634, respectively. According to the appraisal, the 2023 average household income within the same radii was $86,187, $103,988, and $128,496, respectively.
The following table presents certain information relating to comparable multifamily rental properties to the 120 Beach 26th Street Property:
| Comparable Rental Properties |
| Property | Year Built | # Total Units | Unit Mix | Unit Size (SF) | Average Monthly Rent per Unit |
120 Beach 26th Street Property(1) Far Rockaway, NY | 2006 | 126 | 1 BR 2 BR | 697 901 | $2,020 $2,415 |
20-10/41 Seagirt Boulevard Far Rockaway, NY | 1950 | 1,653 | 1 BR 2 BR | 756 876 | $2,599 $2,784 |
190 Beach 69th Street Arverne, NY | 2017 | 126 | 1 BR 2 BR | 637 940 | $2,900 $3,800 |
79-14 Rockaway Beach Boulevard Rockaway, NY | 2006 | 127 | 1 BR 2 BR | 700 900 | $3,000 $3,700 |
101-19 Rockaway Beach Boulevard Rockaway Beach, NY | 2023 | 41 | 1 BR 2 BR | NAV NAV | $3,075 $3,750 |
Source: Appraisal, unless otherwise indicated.
| (1) | Based on the borrower rent roll dated July 1, 2024, other than Year Built. |
| This is not a research report and was not prepared by any Underwriter’s research department. Please see additional important information and qualifications at the end of this Term Sheet. |
| | T-98 | |
| Multifamily – High Rise | Loan #10 | Cut-off Date Balance: | | $31,500,000 |
| 120 Beach 26th Street | 120 Beach 26th Street | Cut-off Date LTV: | | 67.9% |
| Far Rockaway, NY 11691 | | U/W NCF DSCR: | | 1.42x |
| | | U/W NOI Debt Yield: | | 8.9% |
The following table presents certain information relating to the appraisal’s market rent conclusion for the 120 Beach 26th Street Property:
| Market Rent Summary |
| Unit Mix/Type | Units(1) | Average Size (SF) (1) | Avg. Monthly Rent per Unit(1) | Avg. Monthly Rent PSF(1) | Avg. Monthly Market Rent per Unit(2) | Avg. Monthly Market Rent PSF(2) |
| 1 BR | 58 | 697 | $2,020 | $2.90 | $2,750 | $3.94 |
| 2 BR | 68 | 901 | $2,415 | $2.68 | $3,000 | $3.33 |
| Total/ Wtd. Average | 126 | 808 | $2,233 | $2.76 | $2,885 | $3.61 |
| (1) | Based on the borrower rent roll dated July 1, 2024. |
| (2) | Based on the appraisal. |
Appraisal. The appraisal concluded to an “as-is” value for the 120 Beach 26th Street Property of $46,400,000 as of May 1, 2024.
Environmental Matters. According to the Phase I environmental site assessment dated May 13, 2024, there was no evidence of any recognized environmental conditions at the 120 Beach 26th Street Property.
Operating History and Underwritten Net Cash Flow. The following table presents certain information relating to the historical operating performance and Underwritten Net Cash Flow for the 120 Beach 26th Street Property:
| Cash Flow Analysis(1) |
| | 2021 | 2022 | 2023 | 6/30/2024 TTM | UW | UW per Unit |
| Gross Potential Rent | $2,890,080 | $3,125,404 | $3,213,541 | $3,281,344 | $3,376,962 | $26,801 |
| Other Income(2) | $213,391 | $261,187 | $373,597 | $430,196 | $515,396 | $4,090 |
| Discounts Concessions | $0 | $0 | $0 | $0 | $0 | $0 |
| Vacancy & Credit Loss | $0 | $0 | $0 | $0 | ($194,618) | ($1,545) |
| Effective Gross Income | $3,103,471 | $3,386,591 | $3,587,138 | $3,711,540 | $3,697,740 | $29,347 |
| | | | | | | |
| Real Estate Taxes(3) | $28,335 | $85,428 | $85,833 | $86,012 | $84,862 | $674 |
| Insurance | $90,654 | $160,249 | $191,968 | $193,143 | $241,208 | $1,914 |
| Other Expenses | $420,416 | $533,582 | $479,828 | $466,738 | $577,670 | $4,585 |
| Total Expenses | $539,405 | $779,259 | $757,629 | $745,893 | $903,740 | $7,173 |
| | | | | | | |
| Net Operating Income | $2,564,066 | $2,607,332 | $2,829,509 | $2,965,647 | $2,794,000 | $22,175 |
| Capital Expenditures | $0 | $0 | $0 | $0 | $31,500 | $250 |
| Net Cash Flow | $2,564,066 | $2,607,332 | $2,829,509 | $2,965,647 | $2,762,500 | $21,925 |
| | | | | | | |
| Occupancy % | 98.9% | 98.7% | 98.8% | 99.2% | 95.0% | |
| NOI DSCR | 1.32x | 1.34x | 1.45x | 1.52x | 1.43x | |
| NCF DSCR | 1.32x | 1.34x | 1.45x | 1.52x | 1.42x | |
| NOI Debt Yield | 8.1% | 8.3% | 9.0% | 9.4% | 8.9% | |
| NCF Debt Yield | 8.1% | 8.3% | 9.0% | 9.4% | 8.8% | |
| (1) | UW Gross Potential Rent has been underwritten based on the contractual rent in place based on the borrower rent roll dated July 1, 2024 |
| (2) | Other Income is comprised of the single commercial tenant, Alt Medical LLC ($36,000 annually, with 3.0% annual increases) , parking income from the third party parking agreement and from residential parking, and miscellaneous income. |
| (3) | The 120 Beach 26th Street Property benefits from a 25-year 421-a tax exemption that will end after the 2034/2035 tax year. The exemption phases out at the rate of 20% per year starting in the 2031/2032 tax year. Real estate taxes were underwritten based on (i) current abated taxes of $5,126 for the tax parcels comprising the multifamily building at the 120 Beach 26th Street Property and (ii) current taxes of $79,737 for the surface parking lot at the 120 Beach 26th Street Property, which does not have a tax abatement. The appraisal for the 120 Beach 26th Street Property estimates that unabated taxes for the 120 Beach 26th Street Property for the upcoming year would be $785,956 (including both the multifamily building and surface parking lot, and estimates the net present value of the tax abatement to be approximately $5,510,000). |
| This is not a research report and was not prepared by any Underwriter’s research department. Please see additional important information and qualifications at the end of this Term Sheet. |
| | T-99 | |
| Multifamily – High Rise | Loan #10 | Cut-off Date Balance: | | $31,500,000 |
| 120 Beach 26th Street | 120 Beach 26th Street | Cut-off Date LTV: | | 67.9% |
| Far Rockaway, NY 11691 | | U/W NCF DSCR: | | 1.42x |
| | | U/W NOI Debt Yield: | | 8.9% |
Escrows and Reserves.
Real Estate Taxes – The 120 Beach 26 Street Mortgage Loan documents require the borrower to deposit $14,947 into an upfront reserve for real estate taxes on the origination date. In addition, the 120 Beach 26 Street Mortgage Loan documents require ongoing monthly deposits into a reserve for real estate taxes in an amount equal to $7,474 (provided that the lender may require the borrower to increase the amount of such deposits if it reasonably determines that the amount in such reserve fund will not be sufficient to pay the real estate taxes for the 120 Beach 26 Street Property).
Insurance – The 120 Beach 26 Street Mortgage Loan documents require the borrower to deposit $101,766 into an upfront reserve for insurance premiums on the origination date and to make ongoing monthly deposits into a reserve for insurance premiums in an amount equal to 1/12 of the insurance premiums that the lender estimates will be payable for the renewal of coverage upon the expiration of the insurance policies (initially, $20,353). Notwithstanding the foregoing, the borrower is not required to make deposits into such reserve so long as (i) the liability and casualty insurance policies covering the 120 Beach 26 Street Property are part of a blanket or umbrella policy approved by the lender in its reasonable discretion, (ii) no event of default is continuing under the 120 Beach 26 Street Mortgage Loan documents and (iii) the borrower provides the lender with evidence of renewal of such insurance policies and paid receipts for the insurance premiums no later than 10 days prior to their expiration.
Replacement Reserve – The 120 Beach 26 Street Mortgage Loan documents provide for ongoing monthly deposits of $2,625 into a reserve for capital expenditures, provided that such deposits will not be required at any time the amount in such reserve is equal to or greater than $63,000.
Local Law 11 Reserves – The 120 Beach 26 Street Mortgage Loan documents require the borrower to deposit $91,702 into an upfront reserve for repairs, replacements or maintenance to the 120 Beach 26 Street Property required under Local Law 11.
Local Law 126 Reserves – The 120 Beach 26 Street Mortgage Loan documents require the borrower to deposit $6,000 into an upfront reserve to pay the estimated cost of any fines or penalties arising from the borrower’s failure to comply with Local Law 126 and have an initial observation of the parking garage file with the City of New York. In addition, the borrower is required to hire a New York State licensed and registered professional engineer to inspect the parking garage on the 120 Beach 26 Street Property periodically as required by Local Law 126 and file a report with the NYC Department of Buildings documenting the inspection, including any corrective action and pay any associated fines or penalties as a result of the borrower’s failure to do so by August 1, 2024. If the foregoing report indicates repairs, replacement or other maintenance to the 120 Beach 26 Street Property, the borrower is required to promptly, and in compliance with Local Law 126, cause such repairs, replacement or other maintenance to be completed and paid for. In the event that the lender reasonably determines that the cost of completing such repairs, replacement or other maintenance will exceed $50,000, upon 10 days demand from the lender, the borrower must deposit such cost with the lender.
Condominium Reserves – The 120 Beach 26 Street Mortgage Loan documents provide that if the borrower operates a condominium, during any period that the condominium board is authorized to, and does, collect condominium assessments, the borrower will be required to make deposits into a condominium reserve so that the lender is always holding an amount equal to 1/12th of the estimated condominium charges.
Lockbox and Cash Management. The 120 Beach 26 Street Mortgage Loan is structured with a springing lockbox and springing cash management. Upon the first occurrence of a Cash Sweep Event Period, the borrower is required to establish and maintain a lockbox account for the benefit of the lender, and to deposit any funds received by the borrower or property manager into the lockbox account within one business day of receipt. In addition, upon the first occurrence of a Cash Sweep Event Period, the lender is required to establish, and the borrower is required to cooperate with the lender to establish, a lender-controlled cash management account. At the lender’s option, during the continuance of a Cash Sweep Event Period, all funds in the lockbox account are required to be swept to the cash management account and, provided no event of default is continuing under the 120 Beach 26 Street Mortgage Loan documents, applied on each monthly payment date: (i) to make the monthly deposits into the real estate tax reserve and insurance reserve, if any, as described above under “Escrows and Reserves,” (ii) to pay debt service on the 120 Beach 26 Street Mortgage Loan, (iii) to make the monthly deposits into the replacement reserve, if any, as described above under “Escrows and Reserves,” (iv) to pay operating expenses set forth in the lender-approved annual budget and lender-approved extraordinary expenses, and (vi) to deposit all remaining amounts (“Excess Cash Flow”) into an excess cash flow reserve, to be held as additional security for the 120 Beach 26 Street Mortgage Loan during such Cash Sweep Event Period, or if a Cash Sweep Event Period no longer exists, to be disbursed to the borrower.
“Cash Sweep Event Period” means a period:
| (i) | commencing upon an event of default under the 120 Beach 26 Street Mortgage Loan documents, and ending upon the cure (if applicable) of such event of default; or |
| (ii) | commencing upon the debt service coverage ratio of the 120 Beach 26 Street Mortgage Loan being less than 1.15x at the end of any calendar quarter and ending upon the date such debt service coverage ratio is equal to or greater than 1.15x for two consecutive calendar quarters. |
Terrorism Insurance. The borrower is required to obtain and maintain an “all risk” property insurance policy that covers perils of terrorism and acts of terrorism in an amount equal to the “full replacement cost” of the 120 Beach 26 Street Property together with 12 months of business income insurance with a six-month extended period of indemnity. For so long as the Terrorism Risk Insurance Act of 2002, as extended and modified by the Terrorism Risk Insurance Program Reauthorization Act of 2015 (“TRIPRA”) (including any extensions thereof or if another federal governmental program is in effect relating to “acts of terrorism” which provides substantially similar protections as TRIPRA) (i) is in effect and (ii) continues to cover both foreign and domestic acts of terrorism, the lender is required to accept terrorism insurance which covers against “covered acts” as defined by TRIPRA (or such other program). See “Risk Factors—Risks Relating to the Mortgage Loans—Terrorism Insurance May Not Be Available for All Mortgaged Properties” in the prospectus.
| This is not a research report and was not prepared by any Underwriter’s research department. Please see additional important information and qualifications at the end of this Term Sheet. |
| | T-100 | |