Exhibit D
TABLE OF CONTENTS
D-1
INTRODUCTION
References herein to “U.S. $”, “$”, “U.S. dollars” or “dollars” are to United States dollars. References herein to “pesos” or “Ps.” are to the lawful currency of the United Mexican States (Mexico). References herein to “nominal” data are to data expressed in pesos that have not been adjusted for inflation, and references to “real” data are to data expressed in inflation-adjusted pesos. Unless otherwise indicated, U.S. dollar equivalents of peso amounts as of a specified date are based on the exchange rate for such date announced by Banco de México for the payment of obligations denominated in currencies other than pesos and payable within Mexico, and U.S. dollar equivalents of peso amounts for a specified period are based on the average of such announced daily exchange rates for such period. Banco de México calculates such announced rate daily on the basis of an average of rates obtained in a representative sample of financial institutions whose quotations reflect market conditions for wholesale operations. Banco de México uses this rate when calculating Mexico’s official economic statistics. The exchange rate announced by Banco de México on October 25, 2012 (to take effect on the second business day thereafter) was Ps. 12.9669 = U.S. $1.00. See “External Sector of the Economy—Exchange Controls and Foreign Exchange Rates.” Due to the volatility of the peso/dollar exchange rate, the exchange rate on any date subsequent to the date hereof could be materially different from the rate indicated above.
Under the Ley Monetaria de los Estados Unidos Mexicanos (Mexican Monetary Law), payments which should be made in Mexico in foreign currency, whether by agreement or upon a judgment of a Mexican court, may be discharged in pesos at the rate of exchange for pesos prevailing at the time of payment.
The fiscal year of the Federal Government of Mexico (the Government) ends December 31. The fiscal year ended December 31, 2011 is referred to herein as “2011” and other years are referred to in a similar manner.
D-2
SUMMARY
The following summary does not purport to be complete and is qualified in its entirety by the more detailed information appearing elsewhere herein.
United Mexican States
| | | | | | | | | | | | | | | | | | | | | | | | |
| | | 2007 | | | 2008(1) | | | 2009(1) | | | 2010(1) | | | 2011(1) | | | First six
months of
2012(1) | |
| | | (in millions of dollars or pesos, except percentages) | |
The Economy | | | | | | | | | | | | | | | | | | | | | | | | |
Gross domestic product (GDP): | | | | | | | | | | | | | | | | | | | | | | | | |
Nominal | | Ps. | 11,320,836 | | | Ps. | 12,181,256 | | | Ps. | 11,937,250 | | | Ps. | 13,089,712 | | | Ps. | 14,342,321 | | | Ps. | 15,063,933 | (2) |
Real(3) | | Ps. | 8,810,136 | | | Ps. | 8,915,030 | | | Ps. | 8,384,235 | | | Ps. | 8,848,082 | | | Ps. | 9,194,096 | | | Ps. | 9,321,940 | (2) |
Real GDP growth | | | 3.3 | % | | | 1.2 | % | | | (6.0 | )% | | | 5.5 | % | | | 3.9 | % | | | 4.3 | % |
Increase in national consumer price index | | | 3.8 | % | | | 6.5 | % | | | 3.6 | % | | | 4.4 | % | | | 3.8 | % | | | 0.8 | % |
Merchandise export growth(4) | | | 8.8 | % | | | 7.2 | % | | | (21.2 | )% | | | 29.9 | % | | | 17.1 | % | | | 7.6 | % |
Non-oil merchandise export growth(4) | | | 8.5 | % | | | 5.2 | % | | | (17.4 | )% | | | 29.1 | % | | | 14.1 | % | | | 9.7 | % |
Oil export growth | | | 10.2 | % | | | 17.7 | % | | | (39.1 | )% | | | 35.2 | % | | | 35.2 | % | | | (2.9 | )% |
Oil exports as % of merchandise exports(4) | | | 15.8 | % | | | 17.4 | % | | | 13.4 | % | | | 14.0 | % | | | 16.1 | % | | | 14.7 | % |
Balance of payments: | | | | | | | | | | | | | | | | | | | | | | | | |
Current account | | $ | (11,069 | ) | | $ | (17,334 | ) | | $ | (5,064 | ) | | $ | (4,456 | ) | | $ | (11,073 | ) | | $ | 1,624 | |
Trade balance | | $ | (10,074 | ) | | $ | (17,261 | ) | | $ | (4,681 | ) | | $ | (3,009 | ) | | $ | (1,468 | ) | | $ | 3,290 | |
Capital account | | $ | 23,812 | | | $ | 24,459 | | | $ | 26,894 | | | $ | 44,875 | | | $ | 41,961 | | | $ | 22,835 | |
Change in international reserves(5) | | $ | 10,311 | | | $ | 7,450 | | | $ | 5,397 | | | $ | 22,759 | | | $ | 28,879 | | | $ | 14,862 | |
International reserves (end of period)(6) | | $ | 77,991 | | | $ | 85,441 | | | $ | 90,838 | | | $ | 113,597 | | | $ | 142,476 | | | $ | 157,337 | |
Net international assets(7) | | $ | 87,235 | | | $ | 95,232 | | | $ | 99,870 | | | $ | 120,621 | | | $ | 149,242 | | | $ | 162,754 | |
Ps./$ representative market exchange rate (end of period)(8) | | | 10.9157 | | | | 13.8325 | | | | 13.0659 | | | | 12.3496 | | | | 13.9476 | | | | 13.4084 | |
28-day Cetes (Treasury bill) rate (% per annum)(9) | | | 7.2 | % | | | 7.7 | % | | | 5.4 | % | | | 4.4 | % | | | 4.2 | % | | | 4.3 | % |
Unemployment rate (end of period) | | | 3.4 | % | | | 4.3 | % | | | 4.8 | % | | | 4.9 | % | | | 4.5 | % | | | 4.8 | % |
| | | | | | | | | | | | | | | | | | | | | | | | | | | | |
| | | 2007(3) | | | 2008(3) | | | 2009(3) | | | 2010(3) | | | 2011(1)(3) | | | First six
months of
2012(1)(3) | | | Budget
2012(10)(3) | |
| | | (in billions of constant pesos, except percentages) | |
Public Finance(11) | | | | | | | | | | | | | | | | | | | | | | | | | | | | |
Budgetary public sector revenues | | Ps. | 1,935 | | | Ps. | 2,094 | | | Ps. | 1,979 | | | Ps. | 2,001 | | | Ps. | 2,097 | | | Ps. | 1,067 | | | Ps. | 1,986 | |
As % of GDP | | | 22.0 | % | | | 23.5 | % | | | 23.6 | % | | | 22.6 | % | | | 22.8 | % | | | 22.6 | % | | | 21.9 | % |
Budgetary public sector expenditures | | Ps. | 1,933 | | | Ps. | 2,103 | | | Ps. | 2,170 | | | Ps. | 2,254 | | | Ps. | 2,328 | | | Ps. | 1,158 | | | Ps. | 2,208 | |
As % of GDP | | | 21.9 | % | | | 23.6 | % | | | 25.9 | % | | | 25.5 | % | | | 25.3 | % | | | 24.5 | % | | | 24.3 | % |
Public sector balance as % of GDP(12) | | | 0.0 | % | | | (0.1 | )% | | | (2.3 | )% | | | (2.8 | )% | | | (2.5 | )% | | | (1.9 | )% | | | (2.4 | )% |
Primary balance as % of GDP(12) | | | 2.2 | % | | | 1.8 | % | | | (0.1 | )% | | | (0.9 | )% | | | (0.5 | )% | | | 0.3 | % | | | (0.3 | )% |
Operational balance as % of GDP(12) | | | 0.6 | % | | | 1.0 | % | | | (1.6 | )% | | | (2.0 | )% | | | (1.6 | )% | | | (0.8 | )% | | | (1.7 | )% |
D-3
| | | | | | | | | | | | | | | | | | | | | | | | | | | | | | |
| | | December 31, | | June 30,
2012(1) |
| | | 2007 | | 2008 | | 2009 | | 2010(1) | | 2011(1) | |
| | | (in billions of dollars or pesos, except percentages) |
Public Debt(13) | | | | | | | | | | | | | | | | | | | | | | | | | | | | | | |
Net internal Government debt(14) | | | | Ps. 1,788.3 | | | | | Ps. 2,332.7 | | | | | Ps. 2,471.3 | | | | | Ps. 2,808.9 | | | | | Ps. 3,112.1 | | | | | Ps. 3,299.5 | |
Gross external public debt(15) | | | | $ 55.4 | | | | | $ 56.9 | | | | | $ 96.4 | | | | | $ 110.4 | | | | | $ 116.4 | | | | | $ 122.1 | |
Long-term | | | | $ 54.4 | | | | | $ 55.7 | | | | | $ 94.6 | | | | | $ 108.1 | | | | | $ 113.7 | | | | | $ 119.5 | |
Short-term | | | | $ 0.9 | | | | | $ 1.3 | | | | | $ 1.8 | | | | | $ 2.3 | | | | | $ 2.8 | | | | | $ 2.6 | |
Public debt as % of nominal GDP: | | | | | | | | | | | | | | | | | | | | | | | | | | | | | | |
Net internal Government debt(14) | | | | 15.0 | % | | | | 19.1 | % | | | | 19.5 | % | | | | 20.4 | % | | | | 20.3 | % | | | | 21.7 | % |
Gross external public debt(15) | | | | 5.0 | % | | | | 6.3 | % | | | | 9.9 | % | | | | 9.9 | % | | | | 10.6 | % | | | | 11.0 | % |
Total public debt as % of nominal GDP(16) | | | | 20.0 | % | | | | 25.4 | % | | | | 29.4 | % | | | | 30.3 | % | | | | 30.9 | % | | | | 32.7 | % |
Interest on external public debt as % of merchandise exports(4) | | | | 2.5 | % | | | | 2.1 | % | | | | 2.3 | % | | | | 1.7 | % | | | | 1.6 | % | | | | 1.5 | % |
Note: Numbers may not total due to rounding.
| (1) | Preliminary. Unemployment figures for 2008 and 2009, as well as GDP figures for 2009, remain subject to periodic revision. |
| (3) | Constant pesos with purchasing power as of December 31, 2003. |
| (4) | Merchandise export figures include the maquiladora (or in-bond industry) and exclude tourism. |
| (5) | Due to the impact of errors and omissions, as well as the purchases, sales and revaluation of bullion, figures for changes in total reserves do not reflect the sum of the current and capital accounts. |
| (6) | “International reserves” are equivalent to gross international reserves minus international liabilities of Banco de México with maturities of less than six months. |
| (7) | “Net international assets” are defined as (a) gross international reserves plus (b) assets with a maturity longer than six months derived from credit agreements with central banks, less (x) liabilities outstanding to the International Monetary Fund (IMF) and (y) liabilities with a maturity of less than six months derived from credit agreements with central banks. |
| (8) | “Representative market rate” represents the end-of-period exchange rate announced by Banco de México for the payment of obligations denominated in currencies other than pesos and payable within Mexico. |
| (9) | Annual average of weekly rates, calculated on a month-by-month basis. |
| (10) | 2012 Budget figures represent budgetary estimates, based on the economic assumptions contained in the Criterios Generales de Política Económica 2012 (General Economic Policy Guidelines for 2012) and in the Programa Económico 2012 (Economic Program 2012), and do not reflect actual results for 2012 or updated estimates of Mexico’s 2012 economic results. Percentages of GDP were calculated with a GDP projection made in 2011 using the method of calculation in effect since April 2008. |
| (11) | Includes aggregate revenues and expenditures for the Government and budget controlled and administratively controlled agencies (each as defined below) but not off-budget revenues or expenditures. |
| (12) | The definitions of “public sector balance,” “primary balance” and “operational balance” are discussed under “Public Finance—General—Measures of Fiscal Balance.” Each of the public sector balance, primary balance and operational balance excludes proceeds of privatizations. |
| (13) | Includes direct debt of the Government, public sector debt guaranteed by the Government and other public sector debt, except as indicated. |
| (14) | “Net internal debt” represents the internal debt directly incurred by the Government at the end of the period indicated, including Banco de México’s General Account Balance and the assets of the Fondo de Ahorro Para el Retiro (Retirement Savings System Fund), but excluding debt of budget controlled and administratively controlled agencies and debt guaranteed by the Government. In addition, net internal debt is comprised of securities sold to the public in primary auctions, but does not include debt allocated to Banco de México for its use in Regulación Monetaria (regulating the money supply). Banco de México’s sales of debt pursuant to Regulación Monetaria does not increase the Government’s overall level of internal debt, since Banco de México must reimburse the Government for any allocated debt that Banco de México sells in the secondary market and that is presented to the Government for payment. However, if Banco de México carries out a high volume of sales of allocated debt in the secondary market, this can result in the Government’s outstanding internal debt being higher than its outstanding net internal debt. |
| (15) | External debt is presented herein on a “gross” basis and includes external obligations of the public sector at their full outstanding face or principal amounts at the end of the period indicated. For informational and statistical purposes, Mexico sometimes reports its external public sector debt on a “net” or “economic” basis, which is calculated as gross debt net of certain financial assets held abroad. These financial assets include the value of collateral securing principal and interest on bonds, as well as Mexican public sector external debt that is held by public sector entities but that has not been canceled. External public sector debt does not include (a) repurchase obligations of Banco de México with the IMF, none of which were outstanding at June 30, 2012; (b) external borrowings by the public sector after June 30, 2012; and (c) loans from the Commodity Credit Corporation to private sector Mexican banks. |
| (16) | Total public debt refers to net internal Government debt plus gross external public sector debt. See “Public Debt—External Public Debt” for total public debt calculated using net internal public sector debt plus gross external public sector debt. |
Source: Ministry of Finance and Public Credit.
D-4
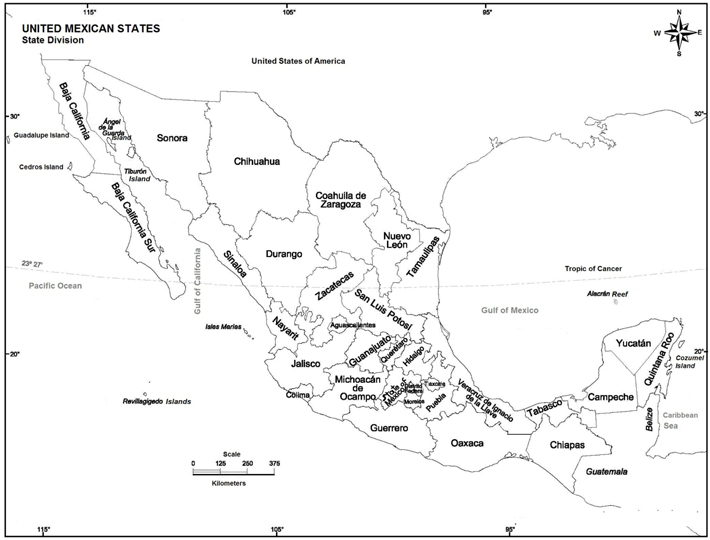
MAP OF MEXICO
D-5
UNITED MEXICAN STATES
Area, Population and Society
Mexico, a nation formed by 31 states and the Distrito Federal (Federal District) (comprising Mexico City), is the fifth largest nation in the Americas and the fourteenth largest in the world, occupying a territory of 758,446 square miles (1,964,375 square kilometers). To the north, Mexico shares a border of 1,933 miles (3,112 km) with the United States of America (the United States), and to the south it has borders with Guatemala and Belize. Its coastline extends over 5,797 miles (9,330 km) along the Gulf of Mexico and the Pacific Ocean.
Mexico is the third most populous nation in the Americas, with a population of 112.34 million as reported by the Instituto Nacional de Estadística, Geografía e Informática (National Institute of Statistics, Geography and Informatics, or INEGI) in its 2010 housing and population census. Based on this census, approximately 77.8% of Mexico’s population lives in urban areas. Mexico’s three largest cities are Mexico City, Guadalajara and Monterrey, with estimated populations in 2005 of 19.2 million, 4.1 million and 3.7 million, respectively. The annual rate of population growth averaged 3.3% in the 1960s and 1970s. Beginning in the 1980s, the Government’s family planning and birth control efforts, together with declining birth rates among women under 35 and those living in urban areas, resulted in a reduction of the population growth rate. According to the Consejo Nacional de Población (National Population Council, or CONAPO), the estimated population growth rate for 2012 is 0.72%.
Mexico is generally classified as an upper middle-income developing country. The following table sets forth the latest selective comparative statistics published by the International Bank for Reconstruction and Development (the World Bank).
Selected Comparative Statistics
| | | | | | | | | | | | | | | | | | | | |
| | | Mexico | | | Brazil | | | Chile | | | Venezuela | | | United States | |
| | | | | |
Per capita GDP (2011)(1) | | $ | 15,340.1 | | | $ | 11,719.2 | | | $ | 17,125.0 | | | $ | 12,836.1 | | | $ | 48,441.6 | |
Life expectancy at birth (2010) | | | 76.7 | | | | 73.1 | | | | 78.9 | | | | 74.1 | | | | 78.2 | |
Youth illiteracy rate (2009)(2) | | | | | | | | | | | | | | | | | | | | |
Male | | | 1.3 | % | | | 2.8 | % | | | 0.9 | % | | | n.a. | | | | n.a. | |
Female | | | 1.6 | % | | | 1.5 | % | | | 0.8 | % | | | n.a. | | | | n.a. | |
Infant mortality rate (2011)(3) | | | 13.4 | | | | 13.9 | | | | 7.7 | | | | 12.9 | | | | 6.4 | |
| (1) | Figures are in U.S. dollars adjusted for purchasing power parity. |
| (2) | Ages 15-24. The figures for Brazil and Chile correspond to 2008. |
| (3) | Infant mortality per 1,000 live births. |
Source: World Development Indicators 2011.
Form of Government
The present form of government was established by the Political Constitution of Mexico (the Constitution), which took effect on May 1, 1917. The Constitution provides that Mexico is a federal republic with separation of powers. The three branches of government are the executive, judicial and legislative branches. The President and the members of the Congreso de la Unión (Congress) are elected by popular vote of Mexican citizens who are 18 years of age or older. Members of Congress are elected either directly or through a system of proportional representation as described below.
The President is the chief of the executive branch of the Government. In accordance with Mexico’s electoral law, on August 31, 2012, the Tribunal Electoral del Poder Judicial de la Federación (Federal Electoral Court) officially validated the results of the presidential election held in Mexico on July 1, 2012, and declared Mr. Enrique Peña Nieto, a member of the Partido Revolucionario Institucional (Institutional Revolutionary Party, or PRI), President-elect. Mr. Peña Nieto will take office on December 1, 2012, replacing Mr. Felipe Calderón Hinojosa, a member of the Partido Acción Nacional (National Action Party, or PAN). The new President’s term will expire on November 30, 2018.
D-6
The Constitution limits the President to one six-year term and does not allow re-election for any additional terms. The executive branch of the Government consists of 18 ministries and the Procuraduría General de la República (Office of the Federal Attorney General). The President appoints the principal officials of all the ministries. The appointment of the empleados superiores (senior employees) of the Secretaría de Hacienda y Crédito Público (Ministry of Finance and Public Credit) is subject to ratification by the Senado de la República (Senate). On September 9, 2011, President Calderón appointed Mr. José Antonio Meade Kuribeña as Secretary of Finance and Public Credit.
The Federal Judiciary consists of the Suprema Corte de Justicia (Supreme Court), the Tribunales de Circuito (Circuit Courts), the Juzgados de Distrito (District Courts) and the Consejo de la Judicatura Federal (Council of the Federal Judiciary). The Supreme Court is composed of 11 justices, who serve 15-year staggered terms (except those justices appointed immediately after the constitutional amendments that took effect on December 31, 1994, who were appointed for varying terms of up to 20 years). The justices of the Supreme Court are elected by a vote of two-thirds of the Senate from a pool of three candidates nominated by the President. The position of Chief Justice of the Supreme Court is rotated among the justices, with each Chief Justice serving one four-year term. The Council of the Federal Judiciary, which is composed of seven members, one of whom is the Chief Justice of the Supreme Court, administers the Federal Judiciary and appoints magistrados (Circuit Court judges and District Court judges). The President appoints the Procurador General (Attorney General), subject to ratification by the Senate. The Office of the Federal Attorney General is autonomous.
On June 2008, the Constitution was amended to reform the criminal justice system. The reforms, which will be implemented over a period of eight years, include the following:
| | • | | Mexico will transition to an accusatory system of criminal justice, in which defendants are presumed innocent until proven guilty. Closed-door proceedings conducted almost exclusively through written briefs will be replaced with oral trials open to the public. A specific judge will be named to follow each criminal proceeding through the sentencing phase and will be required to be present at every hearing. |
| | • | | In order to fight organized crime more effectively, local and state police departments will be granted powers of investigation, which were previously reserved to federal authorities. In addition, suspects of organized crimes may be held up to 80 days without being charged, and property used for organized criminal activities is subject to seizure by the government. Witness protection programs will be implemented to protect those who testify in trials of organized crime suspects and defendants who cooperate with prosecutors will be eligible for sentence reduction and other benefits. |
| | • | | The victims of criminal activity will be more directly involved in their proceedings and will also benefit from increased protection of their personal data, as well as access to legal assistance and medical and psychological assistance, when necessary. |
| | • | | A Sistema Nacional de Seguridad Pública (National Public Safety System) will be created. The new system is intended to ensure consistency across the federal, state and municipal levels of government, as well as in the rules for hiring, training, evaluating and certifying the country’s police officers. |
| | • | | The public defender system will be improved in order to ensure that all defendants are granted access to a suitable defense. |
On June 6, 2011 the Constitution was amended to reform the constitutional right to appeal judicial actions (amparo) in Federal Courts in Mexico in order to improve the efficacy of amparo in the protection of human rights established in the Constitution. The principal reforms include the following:
| | • | | The scope of amparo was expanded to provide a right to appeal not only violations of human rights contemplated by the Constitution but also those listed in international treaties to which Mexico is a signatory. |
D-7
| | • | | The action of collective amparo was introduced whereby claims can be brought not only by individuals but also by groups of people. |
| | • | | Amparo rights were extended to persons not only with “judicial interests” but also with “legitimate interests” in a proceeding. |
| | • | | In addition to issuing judgments on the merits of an amparo proceeding, the Supreme Court of Justice was empowered to declare a law unconstitutional and have its application terminated if voted on by eight of the 11 members of the Court. |
| | • | | Parties who obtain favorable legal dispositions can now join amparo proceedings initiated by their counter parties in order to protect the original judgment granted. |
| | • | | The Executive and the Legislature were empowered to request that the Federal Judiciary resolve amparos, constitutional controversies and judgments of unconstitutionality expeditiously when the urgency of such resolution is justified on the grounds of social interest or public policy. |
| | • | | Statutes of limitations for amparo appeals were eliminated. |
| | • | | Sanctions were established for authorities that do not adhere to amparo judgments. |
Legislative authority is vested in Congress, which is composed of the Senate and the Cámara de Diputados (Chamber of Deputies). Senators serve a six-year term, deputies serve a three-year term, and neither may serve consecutive terms in the same chamber. The Senate is composed of 128 members, 96 of whom are elected directly while the other 32 are elected through a system of proportional representation. The Chamber of Deputies is composed of 500 members, 300 of whom are elected directly by national electoral districts and 200 of whom are elected through a system of proportional representation that allocates those seats to political party representatives based on the proportion of the votes cast for those parties that receive at least 2.0% of the national vote. The Constitution provides that the President may veto bills and that Congress may override such vetoes with a two-thirds majority vote of each chamber.
From 1929 to 1994, the PRI won all presidential elections, and, from 1929 until July 1997, the PRI held a majority of the seats in both chambers of Congress. Until 1989, the PRI also won all of the state gubernatorial elections. In July 2000, the candidate from the Alianza por el Cambio (Alliance for Change), a coalition of the PAN, the oldest opposition party in the country, and the Partido Verde Ecologista de México (Ecological Green Party), won the presidential election. In addition, in 2006, Mr. Felipe de Jesús Calderón Hinojosa, a member of the PAN, was elected President. However, in July 2012, the PRI candidate was once again elected President.
An election for the mayorship of the Federal District and local elections for state governorships in Chiapas, Guanajuato, Jalisco, Morelos, Tabasco and Yucatán were held most recently on July 1, 2012. The PRI retained the governorship of Yucatán and won additional governorships in Jalisco and Chiapas but lost the governorship of Tabasco. PAN retained the governorship of Guanajuato but lost the governorships of Jalisco and Morelos. The Partido de la Revolución Democrática (Democratic Revolution Party, or PRD) retained the mayorship of the Federal District and won two additional governorships in Tabasco and Morelos but lost the governorship of Chiapas. After giving effect to these elections, the PRD holds two state governorships and the mayorship of the Federal District, the PAN holds three state governorships, an alliance formed by the PAN and the PRD holds two state governorships, an alliance formed by the PAN and the Partido Nueva Alianza (New Alliance Party) holds one state governorship, an alliance formed by the PRD, the Partido del Trabajo (Labor Party) and the Movimiento Ciudadano (Citizen Movement Party) holds two state governorships, an alliance formed by the PRI and the Ecological Green Party holds one state governorship, an alliance formed by the PRI, the New Alliance Party and the Ecological Green Party holds one state governorship, an alliance formed by the PRI, the Partido Socialdemocrata de Yucatán (Social Democratic Party of Yucatan, or PSD) and the Ecological Green Party holds one state governorship and the PRI holds the remaining 18 of the 31 state governorships.
D-8
In the mid-1990’s, the federal electoral process underwent changes aimed at increasing impartiality and political neutrality through the implementation of certain institutional mechanisms in 1994 and the ratification of several constitutional amendments in 1996. The changes included:
| | • | | the establishment of the Instituto Federal Electoral (Federal Electoral Institute), an autonomous state agency in which the President may not participate and which the Constitution empowers to organize elections and resolve electoral disputes; |
| | • | | the elimination of the Electoral Committee of the Chamber of Deputies, which had been responsible for ratifying the results of presidential elections; |
| | • | | the introduction of holographic, tamper-proof photo voter identification cards, which discourage voter fraud and aid detection of fraud; |
| | • | | the invitation of Mexican and foreign election observers to certify the electoral process; |
| | • | | the imposition of limits on expenditures on political campaigns and controls on the sources and uses of funds contributed to a political party; |
| | • | | the reduction from 315 to 300 of the maximum number of congressional representatives who may belong to a single party and the establishment of the current electoral procedure of proportional representation in the Senate; and |
| | • | | the integration into the judicial branch of the Federal Electoral Court, which had previously been part of the executive branch. |
In 2005, Congress granted Mexican citizens residing abroad the right to vote in presidential elections via absentee ballot.
Congressional elections for all 128 seats in the Senate and 500 seats in the Chamber of Deputies were held on July 1, 2012. The following table provides the current distribution of congressional seats, reflecting certain post-election changes in the party affiliations of certain senators and deputies.
Party Representation in the Mexican Congress
| | | | | | | | | | | | | | | | |
| | | Senate | | | Chamber of Deputies | |
| | | Seats | | | % of Total | | | Seats | | | % of Total | |
National Action Party | | | 38 | | | | 29.7 | % | | | 114 | | | | 22.8 | % |
Institutional Revolutionary Party | | | 54 | | | | 42.2 | | | | 212 | | | | 42.4 | |
Democratic Revolution Party | | | 22 | | | | 17.2 | | | | 104 | | | | 20.8 | |
Ecological Green Party of Mexico | | | 7 | | | | 5.5 | | | | 29 | | | | 5.8 | |
Citizen Movement Party | | | 0 | | | | 0.0 | | | | 16 | | | | 3.2 | |
Labor Party | | | 5 | | | | 3.9 | | | | 15 | | | | 3.0 | |
New Alliance | | | 0 | | | | 0.0 | | | | 10 | | | | 2.0 | |
Unaffiliated | | | 2 | | | | 1.6 | | | | 0 | | | | 0.0 | |
| | | | | | | | | | | | | | | | |
Total | | | 128 | | | | 100.0 | % | | | 500 | | | | 100.0 | % |
| | | | | | | | | | | | | | | | |
Note: Numbers may not total due to rounding.
Source: Chamber of Deputies and Senate.
Foreign Affairs
Mexico has diplomatic ties with 193 countries. It is a charter member of the United Nations and a founding member of the Organization of American States, the International Monetary Fund (IMF), the World Bank, the International Finance Corporation and the Inter-American Development Bank (IADB). Mexico is also a non-borrowing regional member of the Caribbean Development
D-9
Bank. In 1986, Mexico became a party to the General Agreement on Tariffs and Trade (GATT). In 1991, Mexico became a founding member of the European Bank for Reconstruction and Development and was admitted into the Pacific Basin Economic Co-operation Conference. Mexico is a signatory, along with Canada and the United States, of the North American Free Trade Agreement (NAFTA), which went into effect on January 1, 1994. On April 14, 1994, Mexico was admitted as a member of the Organization for Economic Cooperation and Development (OECD), making it the first new member to be admitted into that organization since 1973. Mexico became a member of the World Trade Organization (WTO) on January 1, 1995, the date on which the WTO superseded GATT. On July 1, 2000, a free trade agreement between Mexico and the European Union went into effect. Mexico also served as rotating member of the United Nations Security Council from January 1, 2002 to December 31, 2003 and presided over the Security Council during April 2003.
Political Reform
In the domestic political arena, the Government has from time to time renewed its efforts to resolve its differences with insurgents in the Chiapas region by facilitating their participation in the political process. On September 11, 1995, the Government and the insurgents reached an agreement pursuant to which both sides accepted a common political agenda and procedural rules and agreed to the creation of a working committee regarding the rights of indigenous peoples. An agreement on a series of measures aimed at enhancing and guaranteeing the rights of the indigenous population was signed on February 16, 1996. On August 14, 2001, amendments to certain articles of the Constitution related to indigenous cultures became effective. The amendments recognize the rights of indigenous villages and communities in Mexico and grant indigenous populations increased autonomy over their internal systems of social, economic, political and cultural organization. On May 21, 2003, the Comisión Nacional para el Desarrollo de los Pueblos Indígenas (National Commission for the Development of Indigenous Peoples) was created with the objective of promoting the autonomy of indigenous communities, subject to constitutional limitations.
Internal Security
During recent years, the Government has gradually heightened its efforts to combat organized crime, particularly as it relates to the activities of producing, processing and trafficking in narcotics. Specifically, the Government has implemented various security measures and has strengthened its military and police forces. During 2012, the Government appropriated Ps. 40.5 billion for expenditures related to internal security, an increase of 10.3% in real terms as compared to 2011. No government studies have been completed regarding the effect on the Mexican economy of narcotics trafficking and drug-related violence, including their effect on Mexican electoral politics or Mexican public finances. Nonetheless, the Government does not believe that narcotics trafficking and drug-related violence have had a material effect on the Mexican economy or on foreign investment flows to Mexico.
In 2012, the INEGI published the Encuesta Nacional de Victimización y Percepción sobre Seguridad Pública 2011 (National Poll on Victimization and Perception of Public Security 2012, or ENVIPE), which, excluding federal crimes such as narcotics trafficking and organized crime, estimated that local crimes and related security measures cost Mexican households approximately Ps. 212 billion in 2011, or 1.38% of GDP.
D-10
THE ECONOMY
National Development Plan
The Plan Nacional de Desarrollo 2007-2012 (National Development Plan), announced on May 31, 2007, established the basic goals and objectives of President Calderón during his six-year term.
The goals of the plan are to:
| | • | | guarantee national security, as well as safeguard national peace, territorial integrity, independence and sovereignty, and to ensure the continued viability of Mexico and its democratic form of government; |
| | • | | ensure the full application of the rule of law, fortify the institutional framework and strengthen a culture of respect for the law; |
| | • | | achieve sustained economic growth at a higher rate than in the past several years, and increase employment in the formal sector; |
| | • | | promote a competitive economy that offers quality goods and services at affordable prices; |
| | • | | reduce extreme poverty, assuring equality of opportunity for all Mexicans to improve their quality of life and access to basic services; |
| | • | | significantly reduce the persistent social, economic and cultural gaps among the population; |
| | • | | provide effective opportunities for Mexicans to exercise their rights as citizens, as well as to actively participate in the political, cultural, economic and social lives of their communities and nation; |
| | • | | ensure environmental sustainability; |
| | • | | consolidate a democratic regime; and |
| | • | | utilize the benefits of a globalized world to spur national development, while also promoting Mexico’s interests worldwide. |
The basic strategy that the Government expects to employ in connection with the plan is based on a principle of “sustainable human development” and has the following objectives:
| | • | | improve the quality of the educational system, making it relevant at all levels to employment and extending access to education to a greater percentage of the population; |
| | • | | promote economic growth and the competitiveness of the economy, and enhance the Government’s ability to collect taxes in order to provide social programs for human development; |
| | • | | strengthen government institutions through viable and responsible citizen participation that reaches all public affairs and involves diverse forms of social and political organization; |
| | • | | observe policies aimed at political transparency and accountability; |
| | • | | promote policies contributing to the strengthening of families in matters of health, education, housing, culture and recreation; and |
| | • | | change Mexico’s environmental culture in order to conserve national resources. |
D-11
Program for Growth and Employment
The Programa para Impulsar el Crecimiento y el Empleo (Program for Growth and Employment), announced on October 8, 2008, was intended to mitigate the impact of the deterioration of the international economic environment on the Mexican economy. In creating this program, the Government expected that the severe decrease in the liquidity of the international financial markets, the high volatility in the equity, debt and foreign exchange markets, and the economic recessions experienced by Mexico’s trading partners would likely have adverse effects on the Mexican economy, including:
| | • | | a decrease in exports, remittances, tourism revenues and foreign direct investment inflows; |
| | • | | reduced availability of credit, as financial intermediaries adopted more conservative lending policies, thereby diminishing access to foreign credit; and |
| | • | | lower oil prices, leading to decreased public sector revenues. |
The specific goals of the Program for Growth and Employment were to:
| | • | | compensate for the expected lower Government revenues, which would ordinarily require a reduction in programmable expenditures; |
| | • | | stimulate economic activity and create jobs through a variety of infrastructure projects aimed at specific sectors such as education, housing and highways; |
| | • | | increase the availability of financing and credit, for financing infrastructure and for supporting small- and medium-sized firms, through the Mexican development banks; and |
| | • | | foster long-term economic growth. |
The Mexican Government proposes to take or has already taken the following concrete measures in order to achieve the foregoing goals:
| | • | | The Ley Federal de Presupuesto y Responsabilidad Hacendaria (Federal Law of Budget and Fiscal Accountability, or the LFPRH) was amended, effective with the 2009 fiscal year, to remove Petróleos Mexicanos and its four principal operating subsidiaries from the Government’s program for certain long-term productive infrastructure-related projects (Infraestructura Productiva de Largo Plazo, or PIDIREGAS), so that the PIDIREGAS-related debt incurred by Petróleos Mexicanos’ finance subsidiaries was assumed as direct public debt of Petróleos Mexicanos during 2009. These amendments also provided that the future infrastructure expenditures of Petróleos Mexicanos and its four principal operating subsidiaries would not be considered for purposes of the balanced budget principle set forth in the LFPRH, and would therefore be excluded from any comprehensive budget cuts required should public sector revenues decline. The purpose of these amendments was to create room for additional expenditures in 2009 and subsequent years. |
| | • | | Petróleos Mexicanos is permitted to apply resources held in the PEMEX Infrastructure Investment Stabilization Fund to begin the process for the construction of a new refinery and for other infrastructure projects. At June 30, 2012, the PEMEX Infrastructure Investment Stabilization Fund totaled approximately Ps. 1.3 billion. |
| | • | | The Mexican national development banks were authorized to employ their capital to increase the availability of credit by up to Ps. 35 billion – Ps. 23 billion through credit lines made available to financial intermediaries and Ps. 12 billion through guarantees of commercial bank loans, with Ps. 6 billion of the latter to be allocated as credit to small- and medium-sized enterprises. In addition, Nacional Financiera, S.N.C. (NAFIN) and Banco Nacional de Comercio Exterior, S.N.C. (Bancomext) were authorized to support the refinancing of commercial paper by issuing guarantees of up to Ps. 50 billion. |
D-12
| | • | | Banco Nacional de Obras y Servicios Públicos, S.N.C. (Banobras) and the National Infrastructure Fund facilitated infrastructure projects, including new roads and suburban transit. |
| | • | | Credit to the agricultural sector was facilitated by (1) a temporary increase in the limits of indebtedness of financial intermediaries with development banks from 60% to 75% of the total liabilities of the intermediaries, (2) the creation of new guarantee programs through the National Fund of Guarantees to promote more than Ps. 20 billion of additional financing and (3) the provision of subsidies to lower the guarantee premiums normally applicable to medium- and long-term loans to finance the acquisition of fixed assets. |
| | • | | Approximately Ps. 40 billion of additional credit was made available to the housing sector through Sociedad Hipotecaria Federal, S.N.C. and NAFIN. In addition, Sociedad Hipotecaria Federal, S.N.C. in coordination with the IADB and the International Finance Corporation, continued to buy and sell mortgage-backed securities in order to add liquidity to the market. |
| | • | | The investment restrictions applicable to the private pension funds, or Sociedades de Inversión Especializadas de Fondos para el Retiro (Specialized Retirement Mutual Investment Funds, or SIEFORES) were liberalized in order to channel a greater amount of resources to infrastructure projects and housing, as well as to finance small- and medium-sized enterprises, by permitting investments in subordinated debt and other structured instruments and strengthening conflicts of interest rules and risk concentration regulations. |
| | • | | The Programa de Compras del Gobierno Federal (Federal Government Purchase Program), which is administered by NAFIN, was established to promote the participation of small- and medium-sized enterprises in purchases made by Government entities. Through this program, the Government provides financing, training, technical assistance and information, including access to Licitaldía, NAFIN’s electronic government contract bidding system, to aid small- and medium-sized enterprises in their procurement of government contracts. During 2011, the Government’s purchases of goods and services from small- and medium-size enterprises amounted to Ps. 83.4 billion, which exceeded the Government’s annual goal by 15.4%. |
| | • | | With the objective of supporting employment, access of businesses and households to credit, economic stability and growth, on April 1, 2009, Mexico’s Comisión de Cambios (Foreign Exchange Commission) requested from the IMF a one-year contingent credit line in the amount of approximately U.S. $48 billion. On April 17, 2009, the IMF formally granted Mexico’s request. On March 25, 2010, the IMF approved a one-year renewal of the contingent credit line due to continued uncertainties related to global economic conditions and credit availability. On January 10, 2011, the IMF approved an advance renewal and amendment of the contingent credit line, which extended the term of the credit line to two years and increased the amount available under the line to approximately U.S. $72 billion. As of the date of this report, no amounts have been disbursed under this contingent credit line. |
The Role of the Government in the Economy; Privatization
Overview
Over the past two decades, the Government has taken steps to increase the productivity and competitiveness of the economy through deregulation, privatization and increased private-sector investment. These measures have included constitutional amendments and related legislation that have allowed the Government to privatize railways and satellite communications, legislation permitting Mexican private-sector companies to take part in the storage, distribution and transportation of natural gas, privatization of airports, ports and highways and legislation on civil aviation that allows private companies to secure 30-year concessions to operate commercial air transportation services within Mexico.
D-13
Since 1983, the Government has made divesting government stakes in all non-strategic private sector commercial enterprises a priority. In 1982, the Government owned or controlled 1,155 enterprises. At August 14, 2012, the number of Government-owned or controlled entities stood at 202, 12 of which were in the process of being privatized. Of the 190 entities not in the process of being privatized, 68 were enterprises that are majority-owned by the Government (empresas de participación estatal mayoritaria), 103 were decentralized entities (organismos decentralizados) and 19 were trusts (fideicomisos).
In January 1995, the Government announced a comprehensive privatization program intended to give new impetus to the Government’s privatization efforts, which the Government views as a key element of Mexico’s structural economic reforms. Under the privatization program, the Government has achieved more effective regulatory reforms and improved coordination among the relevant agencies as compared to previous privatizations. In addition, Congress has enacted a series of laws that increase the scope for private and foreign participation in key sectors of the Mexican economy.
In September 1995, the Government created the Fondo de Inversión en Infraestructura (Infrastructure Investment Fund, or FINFRA), with the objective of encouraging greater private-sector participation in the construction of basic infrastructure, such as toll roads, ports, water-treatment plants, drainage and sanitation facilities. FINFRA participated with private investors in several infrastructure development projects in several states, including Guanajuato, México, Nuevo León, Veracruz, Coahuila, Puebla, Chiapas, Jalisco, Hidalgo, Sinaloa, Tlaxcala, Baja California Sur and Querétaro. In addition, in 2003 the Government created the Fondo Carretero (Highway Fund, or FONCAR), a sub-fund of FINFRA designed to set aside funds allocated specifically to the development of road and highway infrastructure throughout the country.
On February 6, 2008 the Government announced the creation of the Fondo Nacional de Infraestructura (the National Infrastructure Fund, or FONADIN) to serve as a financial platform for developing infrastructure projects with the participation of the public, private and social sectors in the highway, ports, airports, railroads, urban mass transit, environment, tourism and water sectors. FONADIN was created through the merger of FINFRA and the Fideicomiso de Apoyo para el Rescate de Autopistas Concesionadas (the Trust for the Rescue of Concessioned Highways, or FARAC).
FONADIN’s main goals are to:
| | • | | support the National Infrastructure Program; |
| | • | | maximize and facilitate the movement of private capital; |
| | • | | take risks that the market is not willing to take; |
| | • | | develop financially viable projects that have high social benefits and modest economic profitability; and |
| | • | | achieve competitive long-term financing. |
In order to maximize its effectiveness, FONADIN offers and utilizes a variety of financial products that can be divided into two main categories: (i) grants and (ii) investments, such as venture capital, subordinated debt, guarantees and credit. From May 2008 to September 2012, FONADIN committed more than Ps. 102.6 billion of its resources to 94 infrastructure projects. This financing is expected to stimulate an additional Ps. 235 billion of investments, including private sector investments. In addition, Ps. 2.5 billion of grants for 77 feasibility studies for the development of future projects have been authorized to date. At October 15, 2012, FONADIN had Ps. 43.3 billion in available assets.
D-14
From September 2009 to September 2012, FONADIN authorized approximately Ps. 6.4 billion to ten private equity funds. These funds, together with debt financing, are expected to finance more than Ps. 30 billion in future infrastructure investments in different sectors. For 2012, FONADIN has a total budget of Ps. 10 billion for investments in private equity funds, Ps. 6.5 billion of which had been allocated as of September 2012. The remaining Ps. 3.5 billion is available for disbursement to fund managers who meet FONADIN’s criteria for approval.
Telecommunications
In June 1995, Congress enacted legislation to liberalize telecommunications in Mexico upon the expiration in August 1996 of the exclusive concession granted to Teléfonos de México, S.A. de C.V. (Telmex) to provide domestic and international telephone services in Mexico. Pursuant to the legislation, the Secretaría de Comunicaciones y Transportes (Ministry of Communications and Transportation) granted 30-year concessions (which may be extended for an additional 30 years) for the establishment and operation of public fixed-line telecommunications networks. No license fees were charged in connection with the granting of these concessions. In addition, the Government conducted auctions for 20-year concessions (which may be extended for an additional 20 years) to use portions of the radio spectrum to operate cellular telephone networks and for concessions to operate satellite telecommunications systems. Although the various concessions may only be granted to Mexican individuals and companies, foreigners generally may own up to 49% of the capital stock of these companies. In the case of concessions to operate cellular telephone systems, foreigners may increase their ownership beyond 49% with the approval of the Comisión Nacional de Inversiones Extranjeras (National Foreign Investment Commission). Concessionaires are free to establish rates for the services they provide. From January 1, 2003 through July 23, 2012, the Government granted 12 concessions for local fixed-line telecommunications networks, 83 concessions to operate fixed or mobile wireless networks and 15 concessions for long-distance telephone services. No concessions for cellular mobile telephone services have been granted since 2000.
On August 9, 1996, the Ministry of Communications and Transportation announced the creation of the Comisión Federal de Telecomunicaciones (Federal Telecommunications Commission), a decentralized administrative entity. This commission is responsible for the regulation and supervision of telecommunications services in Mexico, with goals of promoting competition, expanding available services and improving efficiency in this sector. The commission has been involved in the design and supervision of administrative policies, the issuance of technical standards and the undertaking of specialized analyses relating to telecommunications issues. In addition, the commission is coordinating processes to use and operate geo-stationary orbital positions and satellite orbits assigned to Mexico, including their frequency bands and rights to broadcast and receive signals. The commission has four members, including a chairman, appointed by the President of Mexico.
On October 24, 1997, Telefónica Autrey S.A. de C.V. and Loral Space & Communications Ltd. successfully bid to acquire 75% of the shares of Satélites Mexicanos (the Mexican national satellite company, or SATMEX), with the Government retaining the remaining 25% of the shares. In May 2005, certain creditors of the SATMEX filed an involuntary bankruptcy proceeding against the company in the United States under Chapter 11 of the United States Bankruptcy Code (Chapter 11) and, in June 2005, the company filed a voluntary Concurso Mercantil (Reorganization) proceeding in Mexico. The company and its creditors reached an agreement in July 2005, and in June 2006 the company announced that the required percentage of its creditors had approved an agreement regarding the company’s debt restructuring plan. The restructuring plan was approved in July 2006 in the Reorganization proceeding in Mexico. A Chapter 11 plan of reorganization implementing the restructuring was approved by the U.S. Bankruptcy Court in October 2006. Subsequent to SATMEX’s emergence from Chapter 11 in 2006, the Government retained approximately 4% of the equity shares of the company and, if the company were sold, the Government would have economic interests in an additional 16% of the shares. On April 6, 2011 SATMEX and its subsidiaries filed voluntary petitions for a prepackaged plan of reorganization under Chapter 11 of the U.S. Bankruptcy Code. The plan was confirmed by the U.S. Bankruptcy Court in the District of Delaware on May 11, 2011 and became effective on May 26, 2011. Under the company’s new capital structure, the Government does not own any shares of the company’s common stock.
D-15
Natural Gas Industry
Effective May 12, 1995, Congress enacted amendments to the Ley de la Comisión Reguladora de Energía y Reglamento de Gas Natural (Energy Regulatory Commission and Natural Gas Regulation Law). The amendments provide that Mexican private sector companies (which may be owned by non-Mexican companies or individuals) may take part in the storage, distribution and transportation of natural gas and, to that end, may construct, own and operate natural gas pipelines, installations and equipment. From January 1, 2003 through June 28, 2012, the Government granted 99 natural gas transport concessions, four natural gas storage concessions and five natural gas distribution concessions.
Railways
In 1995, Congress enacted the Ley Reglamentaria del Servicio Ferroviario (Law Regulating Railway Services), pursuant to which 50-year concessions may be granted (which may be extended for up to an additional 50 years) to operate sections of Mexico’s railway system. Although only Mexican individuals or companies may hold railway concessions, foreigners may own up to 49% of the capital stock of these companies and may increase their ownership beyond this limit with the approval of the National Foreign Investment Commission. Pursuant to the 1995 law, the Government divided the railway system into three regional lines and one terminal in the Valley of Mexico, as well as several short lines. By the end of 1999, the three regional lines were sold and 75% of the capital stock of the terminal in the Valley of Mexico was sold to the new owners of the three regional lines, with the Government retaining a 25% ownership interest in the terminal. Through this process, the Government granted concessions to private sector participants covering 98% of the country’s railway freight services (in terms of the volume of transportation services) and covering 81% of the railway network. No additional concessions have been granted since 1999.
During 2011, private and public investment in railway infrastructure totaled Ps. 10.7 billion, which represents an increase of 41.7% in real terms as compared with 2010. A portion of these funds were used for the construction of a rail yard in Tepalcates.
Aviation
The Ley de Aviación Civil (Civil Aviation Law) provides that the Government may award 30-year concessions (which may be extended for an additional 30 years) to operate regularly scheduled commercial air transportation services within Mexico. Concessions may only be granted to Mexican companies, but foreigners may own up to 25% of the capital stock of these companies.
The Ley de Aeropuertos (Airports Law) allows for up to 49% foreign investment in Mexico’s airports, although higher participation percentages may be obtained with the approval of the National Foreign Investment Commission. In order to operate, maintain and develop an airport, a concession granted by the Secretaría de Comunicaciones y Transportes (Ministry of Communications and Transportation) is required. Beginning in 1998, the Government privatized the operation of most of the commercial airports in the country, through grants of these concessions. The concessions to operate, maintain and develop 34 of the 43 airports in the country are held by three large private sector companies, one of which holds the concessions to operate, maintain and develop the nine airports in the Southeast region of Mexico, one of which holds the concessions to the 12 airports in the Pacific region and one of which holds the concessions to the 13 airports in Mexico’s Central and Northern region. Grupo Aeroportuario de la Ciudad de México, S.A. de C.V., a Government owned corporation, operates the Aeropuerto Internacional de la Ciudad de México (Mexico City International Airport) and the eight remaining airports are operated by smaller private sector companies.
In June 1996, the Government formed Cintra, S.A. de C.V. as a holding company for the shares of several airlines. In 2002, the company underwent a restructuring that resulted in the creation of two subsidiaries, Grupo Aeroméxico, S.A. de C.V. and Grupo Mexicana de Aviación, S.A. de C.V. In December 2005, Cintra, S.A. de C.V. sold its interests in Grupo Mexicana de Aviación, S.A. de C.V. to Grupo Posadas, S.A.B. de C.V. for approximately U.S. $165 million plus debt and other liabilities. As a result of the sale, Grupo Aeroméxico, S.A. de C.V. became the principal asset of Cintra, S.A. de C.V., and Cintra, S.A. de C.V. changed its name to Consorcio Aeroméxico, S.A.B. de C.V.
D-16
In October 2007, the Instituto para la Protección del Ahorro Bancario (Bank Savings Protection Institute, or IPAB) and the Government sold their interests in Consorcio Aeroméxico, S.A.B. de C.V. to a group of investors organized as a trust constituted at Banco Nacional de México, S.A., for approximately Ps. 2.7 billion. As a result of this acquisition, Grupo Aeroméxico, S.A. de C.V. ceased to be a subsidiary of Consorcio Aeroméxico, S.A.B. de C.V. In October 2011, Grupo Aeroméxico, S.A. de C.V. became Grupo Aeroméxico, S.A.B. de C.V. as a result of an initial public offering of 125.5 million shares.
In August 2010, Compañía Mexicana de Aviación, S.A. de C.V. (formerly a subsidiary of Grupo Mexicana, S.A. de C.V.) filed for bankruptcy and ceased its operations, which resulted in a reduction in the number of international flights to and from Mexico.
During 2011 the number of airline passengers on international flights to and from Mexico increased by 4.6% as compared to 2010.
Electricity
The Government continues to promote private sector participation in various forms of electricity generation. A 1992 law allows private companies to generate electricity only for their own use or for sale to the Comisión Federal de Electricidad (Federal Electricity Commission, or CFE). In mid-1996, the first large co-generation project started in the state of Tamaulipas, opening the field for similar endeavors. With an estimated cost of over U.S. $650 million, a consortium of domestic and foreign investors built the Samalayuca II power plant in the state of Chihuahua, which is leased to CFE. The Government believes that increased private investment in the generation, distribution and transmission of electrical energy is necessary in order to increase Mexico’s electrical capacity and to ensure that Mexico will have a sufficient and reliable supply of adequately priced electricity in the long term.
In November 2008, Mexico passed the Ley para el Aprovechamiento de Energias Renovables y el Financiamiento de la Transición Energética (Renewable Energy Development and Financing for Energy Transition Law), in order to regulate and promote the development and use of clean and renewable energy technologies in Mexico, including the establishment of the Estrategia Nacional para la Transición Energética y el Aprovechamiento Sustentable de la Energía (National Strategy for Energy Transition and the Development of Sustainable Energy). As a result, at August 31, 2012, electricity capacity generated by fossil fuels represented 72.9% of the country’s total electricity generation capacity, down from the 73.6% at December 31, 2006. Mexico plans to increase the amount of electricity generated by renewable sources by 3.95% by the end of 2012.
Insurance
On May 24, 2002, the Government completed its privatization of Aseguradora Hidalgo, S.A. (AHISA), an insurance company formerly owned by the Government and Petróleos Mexicanos. The Comisión Intersecretarial de Desincorporación (Inter-secretarial Privatization Commission) approved the sale of AHISA shares owned by the Government and by Petróleos Mexicanos to MetLife Inc. for Ps. 9.2 billion.
At December 31, 2012, there were 72 privately owned insurance companies licensed by the Comisión Nacional de Seguros y Fianzas (Insurance and Surety National Commission, or CNSF).
Banking
On June 19, 2002, the Government and IPAB jointly carried out the sale of nearly all of their shares of Grupo Financiero BBVA Bancomer, S.A. de C.V. (BBVA Bancomer) in the domestic and international markets. On July 3, 2002, the Government and IPAB sold additional shares pursuant to an over-allotment option. The Government had retained a minority interest in BBVA Bancomer at the time of its privatization in 1991. IPAB had acquired its shares in connection with the purchase by BBVA Bancomer of Banca Promex, S.A. in 2000. The proceeds to the Government as a result of the sale totaled Ps. 6.5 billion for the shares sold internationally, Ps. 574 million for the shares sold in Mexico and U.S. $11 million for the shares sold in the United States in the form of American Depositary Shares (ADSs). The proceeds to IPAB as a result of the sale totaled Ps. 1.0 billion for the shares sold internationally, Ps. 88 million for the shares sold in Mexico and U.S. $2 million for the ADSs sold in the United States. From November 2002 through January 2003, the Government and IPAB sold their remaining shares of BBVA Bancomer for total net proceeds of Ps. 444 million for the Government and Ps. 68 million for IPAB.
D-17
On December 12, 2002, Congress approved the dissolution and liquidation of Banco Nacional de Crédito Rural, S.N.C., a governmental development bank.
Gross Domestic Product
Mexico’s gross domestic product (GDP) grew by 1.2% in real terms during 2008, as compared with 2007. The reduction in GDP growth was caused by a decrease in external demand, which resulted in decreased production of commercial and non-commercial goods and a reduction in domestic spending. The agriculture, forestry, fishing and hunting sector grew by 1.2%; the construction sector grew by 3.1%; the wholesale and retail trade sector grew by 0.9%; the transportation and warehousing sector remained unaltered; the information sector grew by 8.0%; the finance and insurance sector grew by 12.8%; the real estate, rental and leasing sector grew by 3.0%; professional, scientific and technical services grew by 3.0%; management of companies and enterprises grew by 14.0%; administrative and support and waste management and remediation services grew by 1.6%; education services grew by 0.8%; arts, entertainment and recreation grew by 1.5%; accommodation and food services grew by 0.9%; other services (except public administration) grew by 0.7%; and public administration grew by 1.1%, each in real terms as compared to 2007. However, the production of the mining sector decreased by 1.7%; the utilities sector decreased by 2.3%; the manufacturing sector decreased by 0.7%; and health care and social assistance decreased by 1.5%, each in real terms as compared to 2007.
According to preliminary figures, Mexico’s GDP decreased by 6.0% in real terms during 2009, as compared with 2008. This contraction in GDP was caused by a decrease in external demand resulting from the global economic recession, which led to a significant reduction in Mexican exports, mainly in the automobile and electronics sectors. In addition, during the second quarter of 2009, the A/H1N1 influenza outbreak temporarily affected economic activity in several sectors, especially those related to tourism and leisure. Global economic activity began to recover beginning in the second half of 2009, after a deep contraction observed in the previous six months. This growth was driven by fiscal and monetary stimulus programs implemented in many advanced economies and in some emerging market countries, as well as the several measures taken to stabilize the international financial system. The Mexican Government undertook a number of measures to mitigate the effects of the global financial crisis in Mexico beginning in 2008.
During 2009, the utilities sector grew by 1.8%; the information sector increased by 0.8%; the finance and insurance sector increased by 1.7%; education services grew by 0.5%; health care and social assistance increased by 0.8%; and public administration increased by 3.8%, each in real terms as compared to 2008. In contrast, the agriculture, forestry, fishing and hunting sector decreased by 3.2%; the mining sector decreased by 2.9%; the construction sector decreased by 7.3%; the manufacturing sector decreased by 9.9%; the wholesale and retail trade sector decreased by 14.2%; the transportation and warehousing sector decreased by 5.9%; the real estate, rental and leasing sector decreased by 1.9%; professional, scientific and technical services decreased by 5.1%; management of companies and enterprises decreased by 8.1%; administrative support, waste management and remediation services decreased by 4.8%; arts, entertainment and recreation decreased by 4.6%; accommodation and food services decreased by 7.7%; and other services (except public administration) decreased by 1.0%, each in real terms as compared to 2008.
According to preliminary figures, Mexico’s GDP increased by 5.5% in real terms during 2010, as compared with 2009, as a result of the positive impact of increased external demand on the manufacturing and services sectors. The agriculture, forestry, fishing and hunting sector grew by 2.9%; the mining sector grew by 1.2%; the utilities sector grew by 10.3%; the manufacturing sector grew by 9.9%; the wholesale and retail trade sector grew by 13.1%; the transportation and warehousing sector grew by 7.5%; the information sector grew by 1.5%; the finance and insurance sector grew by 13.1%; the real estate, rental and leasing sector grew by 1.9%; management of companies and enterprises grew by 5.5%; administrative and support and waste management and remediation services grew by 1.6%; education services grew by 0.1%; the health care and social assistance sector increased by 0.8%; arts, entertainment and recreation grew by 6.0%; accommodation and food services grew by 3.2%; other services (except public administration) grew by 1.0%; and public administration grew by 3.1%, each in real terms as compared to 2009. However, the construction sector decreased by 0.1% and professional, scientific and technical services decreased by 1.0%; each in real terms as compared to 2009.
D-18
According to preliminary figures, Mexico’s GDP increased by 3.9% in real terms during 2011, as compared with 2010. Global economic activity began to recover at the beginning of the second half of 2009 and continued in 2010, after a deep contraction in the first half of 2009. However, this recovery lost momentum during 2011 due to natural disasters in Asia, increases in cost of primary products in the first half of 2011 and the sovereign debt crisis in the Eurozone. Less favorable global economic conditions than expected in the first half of 2011, especially decreased external demand in the United States, hindered the growth of the Mexican economy. The utilities sector grew by 5.6%; the construction sector grew by 4.8%; the manufacturing sector grew by 5.2%; the wholesale and retail trade sector grew by 7.6%; the transportation and warehousing sector grew by 3.4%; the information sector grew by 6.6%; the finance and insurance sector grew by 5.4%; the real estate, rental and leasing sector grew by 2.1%; professional, scientific and technical services grew by 5.9%; management of companies and enterprises grew by 5.7%; administrative and support and waste management and remediation services grew by 4.3%; education services grew by 1.5%; health care and social assistance grew by 1.6%; arts, entertainment and recreation grew by 6.4%; accommodation and food services grew by 2.6% and other services (except public administration) grew by 4.0%, each in real terms as compared to 2010. However, the agriculture, forestry, fishing and hunting sector decreased by 3.0%; the mining sector decreased by 1.9%; and public administration decreased by 0.8%, each in real terms as compared to 2010.
According to preliminary figures, GDP grew by 4.3% in real terms during the first six months of 2012, as compared with the same period of 2011 as a result of increases in exports and domestic demand. The agriculture, forestry, fishing and hunting sector grew by 7.6%; the mining sector remained unchanged; the utilities sector grew by 2.0%; the construction sector grew by 5.0%; the manufacturing sector grew by 4.9%; the wholesale and retail trade sector grew by 6.1%; the transportation and warehousing sector grew by 4.4%; the information sector grew by 5.4%; the finance and insurance sector grew by 12.3%; the real estate, rental and leasing sector grew by 2.3%; professional, scientific and technical services grew by 2.6%; management of companies and enterprises grew by 5.2%; administrative and support and waste management and remediation services grew by 4.0%; education services grew by 1.0%; health care and social assistance grew by 1.8%; arts, entertainment and recreation grew by 2.8%; accommodation and food services grew by 4.4%; other services (except public administration) grew by 4.7%; and public administration grew by 2.6%, each in real terms as compared to the first six months of 2011.
D-19
The following tables set forth real GDP and expenditures, in constant pesos and percentage terms, for the periods indicated.
Real GDP and Expenditures
| | | | | | | | | | | | | | | | | | | | | | | | |
| | | 2007 | | | 2008 | | | 2009(1) | | | 2010(1) | | | 2011(1) | | | First six
months of
2012(1) | |
| | | (in billions of constant pesos)(2) | |
GDP | | Ps. | 8,810.1 | | | Ps. | 8,915.0 | | | Ps. | 8,384.2 | | | Ps. | 8,848.1 | | | Ps. | 9,194.1 | | | Ps. | 9,321.9 | |
Add: Imports of goods and services | | | 2,934.0 | | | | 3,008.9 | | | | 2,456.0 | | | | 2,958.9 | | | | 3,157.7 | | | | 3,185.5 | |
| | | | | | | | | | | | | | | | | | | | | | | | |
Total supply of goods and services | | | 11,744.1 | | | | 11,923.9 | | | | 10,840.2 | | | | 11,807.0 | | | | 12,351.8 | | | | 12,507.4 | |
Less: Exports of goods and services | | | 2,675.1 | | | | 2,687.2 | | | | 2,324.1 | | | | 2,827.5 | | | | 3,017.8 | | | | 3,152.5 | |
| | | | | | | | | | | | | | | | | | | | | | | | |
Total goods and services available for domestic expenditure | | Ps. | 9,069.0 | | | Ps. | 9,236.7 | | | Ps. | 8,516.1 | | | Ps. | 8,979.4 | | | Ps. | 9,333.9 | | | Ps. | 9,354.9 | |
Allocation of total goods and services: | | | | | | | | | | | | | | | | | | | | | | | | |
Private consumption | | | 6,133.1 | | | | 6,238.7 | | | | 5,789.2 | | | | 6,079.3 | | | | 6,352.2 | | | | 6,303.0 | |
Public consumption | | | 935.7 | | | | 945.8 | | | | 976.2 | | | | 999.7 | | | | 1,005.8 | | | | 1,018.3 | |
| | | | | | | | | | | | | | | | | | | | | | | | |
Total consumption | | | 7,068.7 | | | | 7,184.6 | | | | 6,765.4 | | | | 7,079.0 | | | | 7,358.0 | | | | 7,321.3 | |
Total gross fixed investment | | | 1,951.6 | | | | 2,058.1 | | | | 1,815.9 | | | | 1,929.4 | | | | 2,100.3 | | | | 2,174.3 | |
Changes in inventory | | | 48.7 | | | | (5.9 | ) | | | (65.2 | ) | | | (29.0 | ) | | | (124.3 | ) | | | (140.6 | ) |
| | | | | | | | | | | | | | | | | | | | | | | | |
Total domestic expenditures | | Ps. | 9,069.0 | | | Ps. | 9,236.7 | | | Ps. | 8,516.1 | | | Ps. | 8,979.4 | | | Ps. | 9,333.9 | | | Ps. | 9,354.9 | |
| | | | | | | | | | | | | | | | | | | | | | | | |
Note: Numbers may not total due to rounding.
| (1) | Preliminary. GDP figures for the first six months of 2012 have been annualized. |
| (2) | Constant pesos with purchasing power at December 31, 2003. |
Source: INEGI.
Real GDP and Expenditures
| | | | | | | | | | | | | | | | | | | | | | | | |
| | | 2007 | | | 2008 | | | 2009(1) | | | 2010(1) | | | 2011(1) | | | First six
months of
2012(1) | |
| | | (as a percentage of total GDP)(2) | |
GDP | | | 100.0 | % | | | 100.0 | % | | | 100.0 | % | | | 100.0 | % | | | 100.0 | % | | | 100.0 | % |
Add: Imports of goods and services | | | 33.3 | | | | 33.8 | | | | 29.3 | | | | 33.4 | | | | 34.3 | | | | 34.2 | |
| | | | | | | | | | | | | | | | | | | | | | | | |
Total supply of goods and services | | | 133.3 | | | | 133.8 | | | | 129.3 | | | | 133.4 | | | | 134.3 | | | | 134.2 | |
Less: Exports of goods and services | | | 30.4 | | | | 30.1 | | | | 27.7 | | | | 32.0 | | | | 32.8 | | | | 33.8 | |
| | | | | | | | | | | | | | | | | | | | | | | | |
Total goods and services available for domestic expenditures | | | 102.9 | % | | | 103.6 | % | | | 101.6 | % | | | 101.5 | % | | | 101.5 | % | | | 100.4 | % |
Allocation of total goods and services: | | | | | | | | | | | | | | | | | | | | | | | | |
Private consumption | | | 69.6 | % | | | 70.0 | % | | | 69.0 | % | | | 68.7 | % | | | 69.1 | % | | | 67.6 | % |
Public consumption | | | 10.6 | | | | 10.6 | | | | 11.6 | | | | 11.3 | | | | 10.9 | | | | 10.9 | |
| | | | | | | | | | | | | | | | | | | | | | | | |
Total consumption | | | 80.2 | | | | 80.6 | | | | 80.7 | | | | 80.0 | | | | 80.0 | | | | 78.5 | |
Total gross fixed investment | | | 22.2 | | | | 23.1 | | | | 21.7 | | | | 21.8 | | | | 22.8 | | | | 23.3 | |
Changes in inventory | | | 0.6 | | | | (0.1 | ) | | | (0.8 | ) | | | (0.3 | ) | | | (1.4 | ) | | | (1.5 | ) |
| | | | | | | | | | | | | | | | | | | | | | | | |
Total domestic expenditures | | | 102.9 | % | | | 103.6 | % | | | 101.6 | % | | | 101.5 | % | | | 101.5 | % | | | 100.4 | % |
| | | | | | | | | | | | | | | | | | | | | | | | |
Annual percentage increase (decrease) in GDP in constant 2003 prices(2) | | | 3.3 | % | | | 1.2 | % | | | (6.0 | )% | | | 5.5 | % | | | 3.9 | % | | | 4.3 | % |
Note: Numbers may not total due to rounding.
| (1) | Preliminary. GDP figures for the first six months of 2012 have been annualized. |
| (2) | Constant pesos with purchasing power at December 31, 2003. |
Source: INEGI.
D-20
The following table sets forth the composition of Mexico’s real GDP by economic sector for the periods indicated.
Real GDP by Sector
| | | | | | | | | | | | | | | | | | | | | | | | |
| | | 2007 | | | 2008 | | | 2009(1) | | | 2010(1) | | | 2011(1) | | | First six
months of
2012(1) | |
| | | (in billions of constant pesos)(2) | |
Primary Activities: | | | | | | | | | | | | | | | | | | | | | | | | |
Agriculture, forestry, fishing and hunting(3) | | Ps. | 310.4 | | | Ps. | 314.2 | | | Ps. | 304.2 | | | Ps. | 313.1 | | | Ps. | 303.5 | | | Ps. | 315.1 | |
Secondary Activities: | | | | | | | | | | | | | | | | | | | | | | | | |
Mining | | | 452.8 | | | | 445.3 | | | | 432.4 | | | | 437.8 | | | | 429.5 | | | | 431.0 | |
Utilities | | | 117.6 | | | | 114.9 | | | | 117.0 | | | | 129.1 | | | | 136.3 | | | | 135.4 | |
Construction | | | 578.4 | | | | 596.2 | | | | 552.6 | | | | 552.2 | | | | 578.8 | | | | 597.3 | |
Manufacturing | | | 1,560.5 | | | | 1,549.1 | | | | 1,396.0 | | | | 1,534.0 | | | | 1,613.5 | | | | 1,664.6 | |
Tertiary activities: | | | | | | | | | | | | | | | | | | | | | | | | |
Wholesale and retail trade | | | 1,367.0 | | | | 1,379.8 | | | | 1,183.3 | | | | 1,338.3 | | | | 1,440.5 | | | | 1,492.0 | |
Transportation and warehousing | | | 616.8 | | | | 616.9 | | | | 580.3 | | | | 623.9 | | | | 645.2 | | | | 656.4 | |
Information | | | 298.4 | | | | 322.4 | | | | 325.0 | | | | 330.0 | | | | 351.8 | | | | 357.4 | |
Finance and insurance | | | 346.2 | | | | 390.3 | | | | 397.0 | | | | 449.1 | | | | 473.2 | | | | 513.0 | |
Real estate, rental and leasing | | | 908.1 | | | | 935.3 | | | | 917.7 | | | | 935.1 | | | | 954.4 | | | | 941.7 | |
Professional, scientific and technical services | | | 298.6 | | | | 307.6 | | | | 292.0 | | | | 289.0 | | | | 305.9 | | | | 280.4 | |
Management of companies and enterprises | | | 34.6 | | | | 39.4 | | | | 36.2 | | | | 38.2 | | | | 40.4 | | | | 38.1 | |
Administrative and support and waste management and remediation services | | | 223.8 | | | | 227.5 | | | | 216.4 | | | | 219.9 | | | | 229.3 | | | | 213.7 | |
Education services | | | 395.0 | | | | 398.4 | | | | 400.3 | | | | 400.8 | | | | 406.9 | | | | 403.2 | |
Health care and social assistance | | | 252.0 | | | | 248.1 | | | | 250.0 | | | | 252.0 | | | | 256.1 | | | | 254.3 | |
Arts, entertainment and recreation | | | 34.0 | | | | 34.5 | | | | 32.9 | | | | 34.9 | | | | 37.1 | | | | 30.8 | |
Accommodation and food services | | | 230.8 | | | | 232.7 | | | | 214.9 | | | | 221.7 | | | | 227.5 | | | | 235.8 | |
Other services (except public administration) | | | 230.8 | | | | 232.3 | | | | 229.9 | | | | 232.3 | | | | 241.5 | | | | 245.5 | |
Public administration | | | 325.3 | | | | 328.9 | | | | 341.4 | | | | 352.0 | | | | 349.1 | | | | 359.3 | |
| | | | | | | | | | | | | | | | | | | | | | | | |
Subtotal | | | 8,581.0 | | | | 8,713.9 | | | | 8,219.8 | | | | 8,683.4 | | | | 9,020.7 | | | | 9,165.0 | |
Less adjustment for banking services | | | 230.2 | | | | 263.7 | | | | 272.5 | | | | 296.7 | | | | 306.0 | | | | 329.1 | |
| | | | | | | | | | | | | | | | | | | | | | | | |
Gross value added at basic values | | | 8,350.8 | | | | 8,450.2 | | | | 7,947.3 | | | | 8,386.7 | | | | 8,714.7 | | | | 8,835.9 | |
Taxes on products, net of subsidies | | | 459.3 | | | | 464.8 | | | | 436.9 | | | | 461.4 | | | | 479.4 | | | | 486.0 | |
| | | | | | | | | | | | | | | | | | | | | | | | |
GDP | | Ps. | 8,810.1 | | | Ps. | 8,915.0 | | | Ps. | 8,384.2 | | | Ps. | 8,848.1 | | | Ps. | 9,194.1 | | | Ps. | 9,321.9 | |
| | | | | | | | | | | | | | | | | | | | | | | | |
Note: Numbers may not total due to rounding.
| (1) | Preliminary. GDP figures for the first six months of 2012 have been annualized. |
| (2) | Constant pesos with purchasing power at December 31, 2003. |
| (3) | GDP figures relating to agricultural production set forth in this table and elsewhere herein are based on figures for “agricultural years,” with the definition of the relevant “agricultural year” varying from crop to crop based on the season during which it is grown. Calendar year figures are used for the other components of GDP. |
Source: INEGI.
D-21
The following table sets forth the change in Mexico’s real GDP growth by sector for the periods indicated.
Real GDP Growth by Sector(1)
| | | | | | | | | | | | | | | | | | | | | | | | |
| | | 2007 | | | 2008 | | | 2009(2) | | | 2010(2) | | | 2011(2) | | | First six
months of
2012(2)(3) | |
GDP (constant 2003 prices) | | | 3.3 | % | | | 1.2 | % | | | (6.0 | )% | | | 5.5 | % | | | 3.9 | % | | | 4.3 | % |
Primary Activities: | | | | | | | | | | | | | | | | | | | | | | | | |
Agriculture, forestry, fishing and hunting | | | 2.3 | | | | 1.2 | | | | (3.2 | ) | | | 2.9 | | | | (3.0 | ) | | | 7.6 | |
Secondary Activities: | | | | | | | | | | | | | | | | | | | | | | | | |
Mining | | | (0.2 | ) | | | (1.7 | ) | | | (2.9 | ) | | | 1.2 | | | | (1.8 | ) | | | 0.0 | |
Utilities | | | 3.7 | | | | (2.3 | ) | | | 1.8 | | | | 10.3 | | | | 5.6 | | | | 2.0 | |
Construction | | | 4.4 | | | | 3.1 | | | | (7.3 | ) | | | (0.1 | ) | | | 4.8 | | | | 5.0 | |
Manufacturing | | | 1.7 | | | | (0.7 | ) | | | (9.9 | ) | | | 9.9 | | | | 5.2 | | | | 4.9 | |
Tertiary activities: | | | | | | | | | | | | | | | | | | | | | | | | |
Wholesale and retail trade | | | 5.0 | | | | 0.9 | | | | (14.2 | ) | | | 13.1 | | | | 7.6 | | | | 6.1 | |
Transportation and warehousing | | | 3.7 | | | | 0.0 | | | | (5.9 | ) | | | 7.5 | | | | 3.4 | | | | 4.4 | |
Information | | | 11.6 | | | | 8.0 | | | | 0.8 | | | | 1.5 | | | | 6.6 | | | | 5.4 | |
Finance and insurance | | | 13.9 | | | | 12.8 | | | | 1.7 | | | | 13.1 | | | | 5.4 | | | | 12.3 | |
Real estate, rental and leasing | | | 3.1 | | | | 3.0 | | | | (1.9 | ) | | | 1.9 | | | | 2.1 | | | | 2.3 | |
Professional, scientific and technical services | | | 3.1 | | | | 3.0 | | | | (5.1 | ) | | | (1.0 | ) | | | 5.9 | | | | 2.6 | |
Management of companies and enterprises | | | (3.0 | ) | | | 14.0 | | | | (8.1 | ) | | | 5.5 | | | | 5.7 | | | | 5.2 | |
Administrative and support and waste management and remediation services | | | 3.1 | | | | 1.6 | | | | (4.8 | ) | | | 1.6 | | | | 4.3 | | | | 4.0 | |
Education services | | | 1.9 | | | | 0.8 | | | | 0.5 | | | | 0.1 | | | | 1.5 | | | | 1.0 | |
Health care and social assistance | | | 2.5 | | | | (1.5 | ) | | | 0.8 | | | | 0.8 | | | | 1.6 | | | | 1.8 | |
Arts, entertainment and recreation | | | 3.1 | | | | 1.5 | | | | (4.6 | ) | | | 6.0 | | | | 6.4 | | | | 2.8 | |
Accommodation and food services | | | 2.6 | | | | 0.9 | | | | (7.7 | ) | | | 3.2 | | | | 2.6 | | | | 4.4 | |
Other services (except public administration) | | | 3.9 | | | | 0.7 | | | | (1.0 | ) | | | 1.0 | | | | 4.0 | | | | 4.7 | |
Public administration | | | 1.7 | | | | 1.1 | | | | 3.8 | | | | 3.1 | | | | (0.8 | ) | | | 2.6 | |
Note: Numbers may not total due to rounding.
| (1) | Based on GDP calculated in constant 2003 pesos. |
| (2) | Preliminary. GDP figures for the first six months of 2012 have been annualized. |
| (3) | First six months of 2012 results as compared to the same period of 2011. |
Source: INEGI.
Prices and Wages
Over the medium term, the Government is committed to reversing the decline in real wages experienced in the 1990s through control of inflation, a controlled gradual upward adjustment of wages and a reduction in income taxes for the lower income brackets. The fiscal and monetary policies implemented by the Government following the 1995 peso devaluation and subsequent crisis succeeded in lowering inflation (as measured by the increase in the national consumer price index, or NCPI) from 52.0% in 1995 to 15.7% in 1997.
Consumer inflation during 2009 was 3.6%, 0.3 percentage points higher than inflation as estimated in the budget for that year and 3.0 percentage points lower than during 2008. Inflation in 2009 followed a downward trend due to the relatively low economic activity and an environment characterized by the absence of demand pressures.
Consumer inflation during 2010 was 4.4%, 1.1 percentage points higher than inflation as estimated in the budget for that year and 0.8 percentage points higher than during 2009. Inflation in 2010 was higher than the amount estimated in the budget for that year due to (1) the appreciation of the Mexican peso against the U.S. dollar; (2) a positive output gap (growth of aggregate demand exceeds growth of aggregate supply); and (3) moderate wage increases, among other factors.
D-22
Consumer inflation during 2011 was 3.8%, within the expected deviation from the inflation target for the year of 3.0% (plus or minus one percentage point) and 0.6 percentage points lower than consumer inflation during 2010. The lower inflation in 2011 as compared with 2010 resulted primarily from (1) ongoing slack conditions in the Mexican economy; (2) increased competition in some sectors of the economy; and (3) a downward trend in unit labor costs, among other factors.
Consumer inflation for the eight months ended August 31, 2012 was 1.7%, 0.7 percentage points higher than during the same period of 2011.
Producer prices (excluding oil prices) rose by 5.7% during 2011, 2.0 percentage points higher than the increase observed during 2010.
The following table shows, in percentage terms, the changes in price indices and annual increases in the minimum wage for the periods indicated.
Changes in Price Indices
| | | | | | |
| | | National Producer
Price Index(1) | | National Consumer
Price Index(1) | | Increase in
Minimum Wage |
| | | |
2007 | | 3.6% | | 3.8% | | 3.9% |
2008 | | 7.8 | | 6.5 | | 4.0 |
2009 | | 3.3 | | 3.6 | | 4.6 |
2010 | | 3.7 | | 4.4 | | 4.9 |
2011 | | 5.7 | | 3.8 | | 4.1 |
2012 | | | | | | |
January | | 0.1 | | 0.7 | | 4.2 |
February | | 0.0 | | 0.2 | | 0.0 |
March | | 0.4 | | 0.1 | | 0.0 |
April | | 0.1 | | (0.3) | | 0.0 |
May | | 0.5 | | (0.3) | | 0.0 |
June | | 0.6 | | 0.5 | | 0.0 |
July | | (0.3) | | 0.6 | | 0.0 |
August | | (0.1) | | 0.3 | | 0.0 |
September | | 0.3 | | 0.4 | | 0.0 |
| (1) | For annual figures, changes in price indices are calculated from December to December. For monthly figures, changes in price indices are measured from the end of the previous month. |
| (2) | National Producer Price Index figures represent the changes the index comprised of the prices for basic merchandise and services (excluding oil prices). The index is based on the new methodology implemented in June 2012. |
Sources: Banco de México; Ministry of Labor.
Interest Rates
During 2008, interest rates on 28-day Cetes (Treasury bills) averaged 7.7% and interest rates on 91-day Cetes averaged 7.9%, as compared with average rates on 28-day and 91-day Cetes of 7.2% and 7.4%, respectively, during 2007.
During 2009, interest rates on 28-day Cetes averaged 5.4% and interest rates on 91-day Cetes averaged 5.5%, as compared with average rates on 28-day and 91-day Cetes of 7.7% and 7.9%, respectively, during 2008. The decline in interest rates was primarily due to several reductions by Banco de México of the minimum overnight funding rate during the first seven months of 2009.
D-23
During 2010, interest rates on 28-day Cetes averaged 4.4% and interest rates on 91-day Cetes averaged 4.6%, as compared with average rates on 28-day and 91-day Cetes of 5.4% and 5.5%, respectively, during 2009.
During 2011, interest rates on 28-day Cetes averaged 4.2% and interest rates on 91-day Cetes averaged 4.4%, as compared with average rates on 28-day and 91-day Cetes of 4.4% and 4.6%, respectively, during 2010.
During the first nine months of 2012, interest rates on 28-day Cetes averaged 4.3% and interest rates on 91-day Cetes averaged 4.4%, as compared with average rates on 28-day and on 91-day Cetes of 4.2% and 4.3%, respectively during the same period of 2011. On October 25, 2012, the 28-day Cetes rate was 4.22% and the 91-day Cetes rate was 4.37%.
Since March 1995, Banco de México has published an interest rate called the tasa de interés interbancaria de equilibrio (the equilibrium interbank interest rate, or TIIE). The TIIE is calculated for 28 days and 91 days as the interest rate at which the supply and demand for funds in the domestic financial market reach equilibrium. By contrast, the costo porcentual promedio (the average weighted cost of term deposits for commercial banks, or CPP), an alternative measure of interest rates, lags somewhat behind current market conditions.
The following table sets forth the average interest rates per annum on 28-day and 91-day Cetes, the CPP and the 28-day and 91-day TIIE for the periods indicated.
Average Cetes, CPP and TIIE Rates
| | | | | | | | | | | | | | | | | | | | |
| | | 28-Day
Cetes | | | 91-Day
Cetes | | | CPP | | | 28-Day
TIIE | | | 91-Day
TIIE | |
2007: | | | | | | | | | | | | | | | | | | | | |
January-June | | | 7.1 | % | | | 7.3 | % | | | 4.9 | % | | | 7.5 | % | | | 7.7 | % |
July-December | | | 7.3 | | | | 7.5 | | | | 5.1 | | | | 7.8 | | | | 7.9 | |
2008: | | | | | | | | | | | | | | | | | | | | |
January-June | | | 7.5 | | | | 7.6 | | | | 5.4 | | | | 7.9 | | | | 8.0 | |
July-December | | | 7.9 | | | | 8.2 | | | | 6.0 | | | | 8.6 | | | | 8.7 | |
2009: | | | | | | | | | | | | | | | | | | | | |
January-June | | | 6.3 | | | | 6.4 | | | | 5.0 | | | | 7.0 | | | | 6.9 | |
July-December | | | 4.5 | | | | 4.6 | | | | 3.5 | | | | 4.9 | | | | 5.0 | |
2010: | | | | | | | | | | | | | | | | | | | | |
January-June | | | 4.5 | | | | 4.6 | | | | 3.4 | | | | 4.9 | | | | 5.0 | |
July-December | | | 4.3 | | | | 4.5 | | | | 3.4 | | | | 4.9 | | | | 5.0 | |
2011: | | | | | | | | | | | | | | | | | | | | |
January-June | | | 4.2 | | | | 4.4 | | | | 3.3 | | | | 4.9 | | | | 4.9 | |
July-December | | | 4.3 | | | | 4.3 | | | | 3.3 | | | | 4.8 | | | | 4.8 | |
2012: | | | | | | | | | | | | | | | | | | | | |
January | | | 4.3 | | | | 4.5 | | | | 3.2 | | | | 4.8 | | | | 4.8 | |
February | | | 4.3 | | | | 4.4 | | | | 3.3 | | | | 4.8 | | | | 4.8 | |
March | | | 4.2 | | | | 4.4 | | | | 3.3 | | | | 4.8 | | | | 4.8 | |
April | | | 4.3 | | | | 4.4 | | | | 3.3 | | | | 4.7 | | | | 4.8 | |
May | | | 4.4 | | | | 4.4 | | | | 3.3 | | | | 4.8 | | | | 4.8 | |
June | | | 4.3 | | | | 4.5 | | | | 3.2 | | | | 4.8 | | | | 4.8 | |
July | | | 4.2 | | | | 4.4 | | | | 3.2 | | | | 4.8 | | | | 4.8 | |
August | | | 4.1 | | | | 4.3 | | | | 3.2 | | | | 4.8 | | | | 4.8 | |
September | | | 4.2 | | | | 4.3 | | | | 3.3 | | | | 4.8 | | | | 4.8 | |
Source: Banco de México.
D-24
Employment and Labor
The number of workers insured by the Instituto Mexicano del Seguro Social (the Mexican Institute of Social Security, or IMSS), which is an indicator of employment in the “formal” sector of the economy, was 15,028,686 at December 31, 2011, an increase of 623,379 from the level recorded at the end of 2010. According to preliminary information, the Tasa de Desocupación Abierta (open unemployment rate)1 was 4.5% at December 31, 2011, or 0.4 percentage points lower than the rate registered at December 31, 2010. In 2011, the average unemployment rate was 5.2%, a decrease of 0.2 percentage points from the average unemployment rate in 2010.
According to preliminary figures, the unemployment rate was 5.4% at August 31, 2012, which represents an decrease of 0.4 percentage points as compared to the unemployment rate at August 31, 2011.
Unemployment has been, and continues to be, particularly widespread in rural areas, where, according to the 2010 housing and population census, approximately 22.2% of the population resides. Since the early 1990s, Mexico’s trade liberalization policies and the implementation of NAFTA have produced structural changes in the economy that have generated unemployment. Mexico does not have an unemployment benefits scheme or a fully developed social welfare system. The Government is committed to fostering an economic environment that will generate employment opportunities for the large number of people expected to enter the labor force in the medium term. However, the Government recognizes that addressing Mexico’s significant unemployment and underemployment problem is likely to continue to be an important challenge.
In some regions of Mexico, especially where industrial growth has been rapid, industry has experienced a shortage of skilled labor and management personnel, as well as high turnover rates. Since 1978, the Government has sought to address these problems through legislation requiring in-house training programs, the costs of which are tax deductible. The Government recognizes that further significant investment in worker training will be required.
A significant portion of the Mexican work force is unionized. Mexican labor legislation requires that collective bargaining agreements be renewed at least every two years (with wages subject to renegotiation annually) and contains certain legal limitations on strikes. Approximately 0.001% of total working days in 2011 were lost due to strikes, unchanged from 2010.
Mexico’s minimum wage is set by the Comisión Nacional de los Salarios Mínimos (National Minimum Wage Commission), which consists of representatives of business, labor and the Government. The minimum wage was increased by 4.2% on January 1, 2012, from Ps. 58.1 to Ps. 60.5 per day. Mexican law also requires industry to provide substantial worker benefits, including mandatory profit sharing through a distribution of 10% of pre-tax profits to workers. Other benefits include mandatory participation in the pension fund and worker housing fund systems.
The Ley del Seguro Social (Social Security Law) and Ley del Instituto de Seguridad y Servicios Sociales de los Trabajadores del Estado (Law of the Institute for Social Security and Social Services of Government Workers, or ISSSTE Law), which we refer to collectively as the Social Security Laws, require employers (including government entity employers) to deposit with a credit institution selected by the employer an amount equal to 2% of each worker’s base salary. The amount contributed on behalf of each worker forms a retirement sub-account that, together with the housing sub-account described below, constitutes a single account for each worker. Sums contributed to a worker’s retirement sub-account may be withdrawn only when the worker retires or becomes permanently disabled. In addition, since 1997, each worker has been allowed to maintain an independent retirement account managed by Administradoras de Fondos de Ahorro para el Retiro (pension fund management companies, or AFORES). The AFORES are financial institutions established, subject to Government approval, to administer individual pension accounts and manage SIEFORES. A majority of the outstanding shares of each retirement fund manager must be owned by Mexican persons, and no single person may acquire control over more than 10% of any class of shares. This retirement savings system was designed both to improve the economic condition of Mexican workers and to promote long-term savings in the economy, providing financing for investment projects in both the public and private sectors.
| 1 | The unemployment rate is a measure of the proportion of unemployed persons during the reference period that are older than 14 years of age and actively sought work during the preceding month, relative to the economically active population, i.e., all persons older than 14 who worked during the reference period, or were unemployed during the reference period and actively sought work during the preceding month. |
D-25
The ISSSTE Law became effective on March 31, 2007. Federal employees hired after the enactment of the law were required to join a new fully funded pension system created by the law, while then-current federal employees were allowed to choose between that new system and the existing pay-as-you-go pension system. These changes to the ISSSTE pension system have been essential in helping the Government address the difficult financial situation of the Instituto de Seguridad y Servicios Sociales de los Trabajadores del Estado (Institute for Social Security and Services for State Employees, or ISSSTE), and of the healthcare and pension systems for federal employees.
The ISSSTE Law provides ISSSTE with additional means to accomplish its goals. In addition, the Government expects the ISSSTE Law to contribute to economic growth and social welfare by increasing domestic savings, especially long-term savings, and should reduce ISSSTE’s costs over time. This law gives workers the right to transfer their retirement contributions and seniority credits between the private and public healthcare and pension systems, encouraging movement between the private and public sectors.
The ISSSTE Law is also expected to improve the effectiveness of the healthcare and pension systems for federal employees and their families. Among the most significant changes resulting from the ISSSTE Law is the clustering of 21 existing insurance programs into the following four accounts: (1) retirement, (2) life and disability, (3) worker’s compensation, and (4) healthcare. It also created PENSIONISSSTE, a state-owned entity that, together with the AFORES, manages federal employees’ individual accounts.
On July 19, 2007, the Comisión Nacional del Sistema de Ahorro para el Retiro (the National Commission of the System of Savings for Retirement, or CONSAR) approved a new investment regime (Circular CONSAR 15-19) through which each AFORE is allowed to offer five different types of funds (instead of two) with varying levels of risk designed for certain age groups. These new funds range from Fund 5 (intended for workers aged 26 or less), which may invest up to 30% of its assets in equities, to Fund 1 (targeted toward workers aged 56 or more), which is limited to fixed income and international investments, broadening the investment options that AFORES may offer.
At December 31, 2011, 42.5 million individual retirement accounts had been established with AFORES. At December 31, 2011, the total amount of funds accumulated in the individual accounts of workers with AFORES (including transfers from the pension sub-accounts established with banks under the old Social Security Laws, direct contributions under the new pension system and recognition bonuses for ISSSTE beneficiaries that opted for the defined contribution system) and in housing sub-accounts managed by the Instituto del Fondo Nacional de la Vivienda para los Trabajadores (National Workers’ Housing Fund Institute, or INFONAVIT) was Ps. 2,388.5 billion.
At December 31, 2011, the assets managed by AFORES totaled Ps. 1,566.2 billion. AFORES may invest up to 100% of the funds they manage in Government debt securities or in securities issued by private sector companies, depending on the credit rating of the issuer, and up to 20% in foreign securities, with specific limits on the credit rating of debt securities. At December 31, 2011, 58.8% of the total portfolio was invested in Government securities, while the remaining 41.2% was invested in private sector, bank, local government and foreign securities.
INFONAVIT was created in 1972 in order to administer housing programs for workers and address the shortage of housing. This shortage was estimated at 7.4 million housing units over the period from 2006 to 2012, based on data from the 2000 census. INFONAVIT acts as a financial intermediary, extending credit to workers for the construction and purchase of homes. Currently, employers are required to contribute an amount equal to 5% of each worker’s base salary to a housing sub-account with a banking institution. As with the retirement sub-accounts, the funds contributed are deductible from the employer’s current income for tax purposes. These funds are in turn required to be deposited to an account of INFONAVIT at Banco de México. Upon a worker’s receipt of a loan from INFONAVIT for the purchase or construction of a home, any amounts in the worker’s housing sub-account are available for financing the down payment on the home. Unused amounts may be withdrawn by the worker upon retirement or permanent disability.
D-26
During 2011, a total of Ps. 176.5 billion was deposited in the pension and housing funds, Ps. 125.5 billion of which corresponded to deposits made to workers’ retirement sub-accounts and Ps. 51.0 billion of which corresponded to deposits made to workers’ housing sub-accounts.
D-27
PRINCIPAL SECTORS OF THE ECONOMY
Manufacturing
According to preliminary figures, the manufacturing sector contracted by 9.9% in real terms during 2009, as compared to 2008, mainly due to a decrease in manufacturing exports as a result of the global economic recession and the severe contraction of the U.S. automobile industry. All twenty-one of Mexico’s manufacturing sectors contracted during 2009: food manufacturing decreased by 0.5%; beverage and tobacco product manufacturing decreased by 0.1%; the production of textile mills decreased by 9.8%; the production of textile product mills decreased by 6.7%; apparel manufacturing decreased by 11.4%; leather and allied product manufacturing decreased by 6.0%; wood product manufacturing decreased by 4.4%; paper manufacturing decreased by 0.5%; printing and related support activities decreased by 6.7%; petroleum and coal products manufacturing decreased by 1.6%; chemical manufacturing decreased by 3.9%; plastic and rubber products manufacturing decreased by 9.9%; nonmetallic mineral product manufacturing decreased by 8.4%; primary metal manufacturing decreased by 17.3%; fabricated metal product manufacturing decreased by 15.8%; machinery manufacturing decreased by 16.6%; computer and electronic product manufacturing decreased by 11.3%; electrical equipment, appliance and component manufacturing decreased by 14.3%; transportation equipment manufacturing decreased by 27.9%; furniture and related product manufacturing decreased by 5.5% and miscellaneous manufacturing decreased by 0.7%, each in real terms.
According to preliminary figures, the manufacturing sector expanded by 9.9% in real terms during 2010, as compared to 2009, primarily due to a 29.5% increase in manufacturing exports. Eighteen manufacturing sectors experienced growth during 2010: food manufacturing grew by 2.0%; the production of textile mills grew by 9.8%; the production of textile product mills grew by 1.5%; apparel manufacturing grew by 5.2%; leather and allied product manufacturing grew by 9.8%; wood product manufacturing grew by 6.4%; paper manufacturing grew by 4.7%; printing and related support activities grew by 9.6%; plastic and rubber products manufacturing grew by 9.3%; nonmetallic mineral product manufacturing grew by 3.5%; primary metal manufacturing grew by 13.0%; fabricated metal product manufacturing grew by 10.1%; machinery manufacturing grew by 33.3%; computer and electronic products manufacturing grew by 8.4%; electrical equipment, appliance and component manufacturing grew by 10.5%; transportation equipment manufacturing grew by 42.2%; furniture and related product manufacturing grew by 6.3%; and miscellaneous manufacturing grew by 2.6%, each in real terms. In contrast, beverage and tobacco product manufacturing decreased by 0.4%; petroleum and coal products manufacturing decreased by 3.5% and chemical manufacturing decreased by 1.1%, each in real terms.
According to preliminary figures, the manufacturing sector expanded by 5.2% in real terms during 2011, as compared to 2010, primarily due to increased demand for manufacturing exports. Fifteen manufacturing sectors experienced growth during 2011 as compared to 2010: food manufacturing grew by 1.7%; beverage and tobacco product manufacturing grew by 4.7%; leather and allied product manufacturing grew by 0.01%; wood product manufacturing grew by 6.3%; printing and related support activities grew by 2.3%; chemical manufacturing grew by 0.7%; plastics and rubber products manufacturing grew by 8.5%; nonmetallic mineral product manufacturing grew by 3.5%; primary metal manufacturing grew by 4.8%; fabricated metal product manufacturing grew by 11.9%; machinery manufacturing grew by 10.9%; computer and electronic product manufacturing grew by 2.8%; transportation equipment manufacturing grew by 17.0%; furniture and related product manufacturing grew by 0.4%; and miscellaneous manufacturing grew by 3.0%, each in real terms. However, the production of textile mills decreased by 5.4%; the production of textile product mills decreased by 2.7%; apparel manufacturing decreased by 2.7%; paper manufacturing decreased by 0.8%; petroleum and coal products manufacturing decreased by 4.8%; and electrical equipment, appliance and component manufacturing decreased by 0.6%, each in real terms.
According to preliminary figures, the manufacturing sector expanded by 4.9% in real terms during the first six months of 2012, as compared to the same period of 2011, primarily due to increased demand for manufacturing exports. Eighteen manufacturing sectors experienced growth during the first six month of 2012 as compared to the same period of 2011: food manufacturing grew by 2.3%; beverage and tobacco product manufacturing grew by 2.2%; the production of textile mills grew by 0.3%; leather and allied product manufacturing grew by 4.4%; wood product manufacturing grew by 5.6%; paper manufacturing increased by 2.9%; printing and related support activities grew by 7.9%; petroleum and coal products manufacturing grew by 1.3%; chemical manufacturing grew
D-28
by 0.2%; plastic and rubber products manufacturing grew by 7.0%; nonmetallic mineral product manufacturing grew by 3.6%; primary metal manufacturing grew by 4.7%; fabricated metal product manufacturing grew by 6.5%; machinery manufacturing grew by 10.5%; electrical equipment, appliance and component manufacturing grew by 2.4%; transportation equipment manufacturing grew by 14.2%; furniture and related product manufacturing grew by 5.6%; and miscellaneous manufacturing grew by 2.5%, each in real terms. However, the production of textile product mills decreased by 4.0%; the production of apparel manufacturing decreased by 0.6%; and computer and electronic products manufacturing decreased by 5.2%, each in real terms.
The following table shows the value of industrial manufacturing output in constant 2003 prices and the percentage of total output accounted for by each manufacturing sector for the years indicated.
Industrial Manufacturing Output
| | | | | | | | | | | | | | | | | | | | | | | | | | | | |
| | | 2007 | | | 2008 | | | 2009(1) | | | 2010(1) | | | 2011(1) | | | 2007 | | | 2011(1) | |
| | | (in billions of pesos)(2) | | | (% of total) | |
Food | | Ps. | 332.8 | | | Ps. | 337.4 | | | Ps. | 335.5 | | | Ps. | 342.4 | | | Ps. | 348.1 | | | | 21.3 | % | | | 21.6 | % |
Beverage and tobacco products | | | 96.1 | | | | 98.4 | | | | 98.4 | | | | 98.0 | | | | 102.6 | | | | 6.2 | | | | 6.4 | |
Textile mills | | | 15.8 | | | | 14.7 | | | | 13.3 | | | | 14.6 | | | | 13.8 | | | | 1.0 | | | | 0.9 | |
Textile product mills | | | 7.1 | | | | 6.5 | | | | 6.0 | | | | 6.1 | | | | 6.0 | | | | 0.5 | | | | 0.4 | |
Apparel | | | 39.5 | | | | 40.4 | | | | 35.8 | | | | 37.7 | | | | 36.6 | | | | 2.5 | | | | 2.3 | |
Leather and allied products | | | 20.3 | | | | 19.7 | | | | 18.5 | | | | 20.3 | | | | 20.3 | | | | 1.3 | | | | 1.3 | |
Wood products | | | 18.1 | | | | 16.7 | | | | 16.0 | | | | 17.0 | | | | 18.1 | | | | 1.2 | | | | 1.1 | |
Paper | | | 33.4 | | | | 34.3 | | | | 34.1 | | | | 35.7 | | | | 35.4 | | | | 2.1 | | | | 2.2 | |
Printing and related support activities | | | 13.5 | | | | 14.2 | | | | 13.2 | | | | 14.5 | | | | 14.8 | | | | 0.9 | | | | 0.9 | |
Petroleum and coal products | | | 44.6 | | | | 44.9 | | | | 44.2 | | | | 43.0 | | | | 40.5 | | | | 2.9 | | | | 2.5 | |
Chemicals | | | 152.3 | | | | 149.0 | | | | 143.1 | | | | 141.6 | | | | 142.5 | | | | 9.8 | | | | 8.8 | |
Plastics and rubber products | | | 42.6 | | | | 41.9 | | | | 37.7 | | | | 41.3 | | | | 44.8 | | | | 2.7 | | | | 2.8 | |
Nonmetallic mineral products | | | 105.8 | | | | 101.9 | | | | 93.3 | | | | 96.5 | | | | 99.9 | | | | 6.8 | | | | 6.2 | |
Primary metals | | | 88.5 | | | | 88.0 | | | | 72.8 | | | | 82.3 | | | | 86.2 | | | | 5.7 | | | | 5.3 | |
Fabricated metal products | | | 52.6 | | | | 53.2 | | | | 44.8 | | | | 49.3 | | | | 55.1 | | | | 3.4 | | | | 3.4 | |
Machinery | | | 36.9 | | | | 36.8 | | | | 30.7 | | | | 40.9 | | | | 45.3 | | | | 2.4 | | | | 2.8 | |
Computers and electronic products | | | 83.7 | | | | 73.6 | | | | 65.3 | | | | 70.8 | | | | 72.8 | | | | 5.4 | | | | 4.5 | |
Electrical equipment, appliances and components | | | 52.7 | | | | 52.7 | | | | 45.1 | | | | 49.9 | | | | 49.5 | | | | 3.4 | | | | 3.1 | |
Transportation equipment | | | 269.4 | | | | 270.7 | �� | | | 195.2 | | | | 277.5 | | | | 324.8 | | | | 17.3 | | | | 20.1 | |
Furniture and related products | | | 21.3 | | | | 20.4 | | | | 19.3 | | | | 20.5 | | | | 20.6 | | | | 1.4 | | | | 1.3 | |
Miscellaneous | | | 33.4 | | | | 34.0 | | | | 33.7 | | | | 34.6 | | | | 35.6 | | | | 2.1 | | | | 2.2 | |
| | | | | | | | | | | | | | | | | | | | | | | | | | | | |
Total | | Ps. | 1,560.5 | | | Ps. | 1,549.1 | | | Ps. | 1,396.0 | | | Ps. | 1,534.0 | | | Ps. | 1,613.5 | | | | 100.0 | % | | | 100.0 | % |
| | | | | | | | | | | | | | | | | | | | | | | | | | | | |
Note: Numbers may not total due to rounding.
| (2) | Constant pesos with purchasing power at December 31, 2003. |
Source: National Institute of Statistics Geography and Informatics.
In order to take advantage of lower manufacturing overhead, particularly with respect to labor costs, and Mexico’s common border with the United States, the Government has encouraged the development of in-bond industries since the early 1980s. Companies in these industries are permitted to import all machinery, equipment and materials used to produce goods for re-export on a duty-free basis. The products produced by the in-bond industry include auto parts, electronic items, food, household appliances, finished textiles and toys. See “External Sector of the Economy—In-bond Industry.”
Most of the growth in Mexico’s manufacturing output since 1987 has resulted from increased production by plants located outside of the Valley of Mexico (where Mexico City is located). However, a significant portion of Mexico’s manufacturing output still originates from plants located in this area. In an effort to address the high pollution levels in the Valley of Mexico, the authorities have implemented regulations that require certain types of plants to reduce operations or close temporarily when the concentration of pollutants in the air rises to certain levels.
D-29
The authorities ordered industrial plants in the Valley of Mexico to reduce operations for three days in 2007, for two days in 2008, for two days in 2009, for three days in 2010 and for five days in 2011 due to high pollution levels. The Government has also followed a general policy of discouraging industry from constructing new plants in the Valley of Mexico or other major industrial cities, such as Monterrey and Guadalajara.
The concentration of industry in the Valley of Mexico, together with Mexico City’s climatic and demographic characteristics, contribute to high levels of suspended particles, sulfur dioxide (a gaseous by-product of the combustion of diesel fuel and fuel oil), airborne lead (released as a gas when leaded gasoline is burned and released in particulate form by industry), carbon monoxide (produced by the incomplete combustion of gasoline) and ozone (resulting from the combination of nitrous oxides, hydrocarbons and solar radiation). While the various means of transportation in and around Mexico City account for the vast majority of the air pollution in Mexico City and, indirectly, for the vast majority of ozone present in the atmosphere (and are thus the main target of anti-pollution programs), industry also produces a significant amount of pollution.
In addition to the existing anti-pollution regulations issued pursuant to the Ley General del Equilibrio Ecológico y la Protección al Ambiente (Law of Ecologic Equilibrium and the Protection of the Environment), on March 11, 1992, the Government, through the Metropolitan Pollution Commission of the Valley of Mexico, entered into an agreement with representatives of industries located in the Valley of Mexico to coordinate and intensify measures to control and reduce the pollution generated by these industries.
Moreover, the use of catalytic converters in cars has been phased in, and, beginning with the 1993 model year, all new cars driven in Mexico City are required to be equipped with emissions control equipment that meets U.S. performance standards. In 1989, Mexico City instituted a program entitled Hoy No Circula (No Driving Today), requiring that one-fifth of the city’s private vehicles be kept out of circulation each weekday. The program has periodically been expanded to remove cars from circulation two times each week, when the Government has detected high levels of pollution in the city. On July 5, 2008, this program was expanded to regulate driving on Saturdays. This program currently remains in effect in Mexico City for certain vehicles, and has been introduced in several other cities. Finally, the government of Mexico City has begun using a mobile laboratory that measures the air quality of four locations within Mexico City by monitoring the sulfur dioxide, nitrogen dioxide, carbon monoxide and ozone levels in the atmosphere.
Petroleum and Petrochemicals
General
Since 1938, Mexican federal laws and regulations have entrusted Petróleos Mexicanos with the central planning and management of Mexico’s petroleum industry. Petróleos Mexicanos, Pemex-Exploración y Producción (Pemex-Exploration and Production), Pemex-Refinación (Pemex-Refining), Pemex-Gas y Petroquímica Básica (Pemex-Gas and Basic Petrochemicals) and Pemex-Petroquímica (Pemex-Petrochemicals) (collectively, the subsidiary entities and, together with Petróleos Mexicanos and its subsidiary companies, PEMEX) comprise Mexico’s state oil and gas company. Each of Petróleos Mexicanos and the subsidiary entities is a decentralized public entity of the Government and is a legal entity empowered to own property and carry on business in its own name. PEMEX is the largest company in Mexico, and according to the December 12, 2011 issue of Petroleum Intelligence Weekly, PEMEX is the fourth largest crude oil producer and the eleventh largest oil and gas company in the world based on data from the year 2010.
The activities of PEMEX are regulated primarily by:
| | • | | the Ley Reglamentaria del Artículo 27 Constitucional en el Ramo del Petróleo (Regulatory Law to Article 27 of the Constitution of the United Mexican States Concerning Petroleum Affairs, or the Regulatory Law); and |
| | • | | the Ley de Petróleos Mexicanos (Petróleos Mexicanos Law). |
D-30
The Regulatory Law and the Petróleos Mexicanos Law grant Petróleos Mexicanos and certain of the subsidiary entities the exclusive right to:
| | • | | explore, exploit, refine, transport, store, distribute and sell (first-hand) crude oil; |
| | • | | explore, exploit, produce and sell (first-hand) natural gas and transport and store natural gas, to the extent the transportation and storage activities are inextricably linked with such exploitation and production; and |
| | • | | produce, store, transport, distribute and sell (first-hand) the derivatives of petroleum (including petroleum products) and natural gas used as basic industrial raw materials that constitute basic petrochemicals, which include ethane, propane, butanes, pentanes, hexanes, heptanes, naphthas, carbon black feedstocks and methane, but, in the case of methane, only if obtained from hydrocarbons used as basic raw materials by the petrochemical industry and obtained from deposits located in Mexico. |
As a result of various legal reforms that became effective on November 29, 2008, PEMEX is now permitted to have a more flexible contracting structure for its core production activities. In order to strengthen PEMEX’s ability to enter into these contracts, PEMEX is authorized to offer cash incentives to contractors that provide access to new technologies, faster execution or greater profits, subject to the requirements that PEMEX’s payment obligations under construction and services contracts must always be satisfied in cash and that in no case may PEMEX grant ownership rights over hydrocarbons to contractors.
Results of Operations
Based on its audited consolidated financial statements prepared in accordance with Mexican Financial Reporting Standards, PEMEX’s total sales revenues amounted to Ps. 1,558.4 billion during 2011, an increase of 21.6% as compared with total sales revenues during 2010 of Ps. 1,282.1 billion. Total sales revenues for 2011 include the Impuesto Especial sobre Producción y Servicios (Special Tax on Production and Services, or the IEPS tax). However, the IEPS tax rate was negative in the years ended December 31, 2010 and 2011, resulting in no IEPS tax payable during those years.
Domestic sales increased by 13.9% in 2011, from Ps. 683.9 billion in 2010 to Ps. 779.2 billion in 2011, primarily due to increases in the prices and volumes of sales of petroleum products and petrochemicals sold by PEMEX. Domestic sales of petroleum products increased by 15.9% and domestic sales of petrochemicals (including sales of certain by-products of the petrochemical production process) increased by 17.5%, while domestic sales of natural gas decreased by 4.2% in 2011. Total consolidated export sales (with dollar-denominated export revenues translated to pesos at the exchange rate on the date on which each export sale was made) increased by 30.4% in peso terms in 2011, from Ps. 592.9 billion in 2010 to Ps. 773.0 billion in 2011, primarily as a result of higher crude oil and product prices, which were partially offset by a decrease in the volume of crude oil exports. The weighted average price per barrel of crude oil that the PMI Group (which is comprised of P.M.I. Comercio Internacional, S.A. de C.V., P.M.I. Trading, Ltd. and their affiliates) sold to third parties in 2011 was U.S. $101.01, 39.4% higher than the weighted average price of U.S. $72.46 in 2010. The volume of crude oil exports decreased by 1.7%, from 1,361 thousand barrels per day in 2010 to 1,338 thousand barrels per day in 2011.
During 2011, PEMEX incurred a net loss, as calculated in accordance with Mexican Financial Reporting Standards, of Ps. 91.5 billion, as compared with a net loss of Ps. 46.5 billion during 2010. This increase in net loss in 2011 is primarily explained by a Ps. 79.7 billion increase in PEMEX’s loss associated with comprehensive financing result and a Ps. 221.9 billion increase in duties and taxes paid, which were only partially offset by a Ps. 135.0 billion increase in PEMEX’s operating income and Ps. 124.0 billion increase in other revenues.
Based on its unaudited condensed consolidated interim financial statements for the first six months of 2011 and 2012, which were prepared under International Financial Reporting Standards (IFRS) as issued by the International Accounting Standards Board,2 PEMEX’s total revenues increased by 9.6%, from Ps. 746.0 billion in the first six months of 2011 to Ps. 817.4 billion in the first six months of 2012. The increase in total revenues resulted primarily from higher crude oil prices and increases in the sales volume and prices of petroleum products.
| 2 | Note: 2012 is PEMEX’s first year reporting under IFRS. IFRS differ in certain significant respects from Mexican Financial Reporting Standards, and as a result, certain financial information presented in PEMEX’s interim financial statements issued in 2012 is not comparable to the financial information presented in its audited year-end financial statements and its unaudited interim financial statements for 2011 and prior periods. |
D-31
PEMEX’s domestic sales increased by 10.9% in the first six months of 2012, from Ps. 375.5 billion in the first six months of 2011 to Ps. 416.6 billion in the first six months of 2012, primarily due to an increase in the sale price and greater volumes of domestic sales of gasoline, diesel, fuel oil and jet fuel. Domestic sales of petroleum products increased by 16.0% in the first six months of 2012, from Ps. 322.6 billion in the first six months of 2011 to Ps. 374.2 billion in the first six months of 2012, primarily due to higher sales prices and greater volumes of sales of gasoline, fuel oil, diesel and jet fuel. Domestic sales of dry natural gas decreased by 32.2% in the first six months of 2012, from Ps. 33.8 billion in the first six months of 2011 to Ps. 22.9 billion in the first six months of 2012, primarily due to lower natural gas prices of domestic sales. Domestic petrochemical sales (including sales of certain by-products of the petrochemical production process) increased by 2.1%, from Ps. 19.1 billion in the first six months of 2011 to Ps. 19.5 billion in the first six months of 2012, primarily due to higher sales prices and greater volumes of sales of petrochemical products such as propylene, toluene, vinyl chloride and polyethylene.
Total export sales (with dollar-denominated export revenues translated to pesos at the exchange rate on the date on which the export sale was made) increased by 8.0%, from Ps. 367.8 billion in the first six months of 2011 to Ps. 397.3 billion in the first six months of 2012, primarily due to higher crude oil prices. The weighted average price of the Mexican crude oil basket exported by PEMEX increased by 6.4%, from U.S. $99.24 per barrel in the first six months of 2011 to U.S. $105.60 per barrel in the first six months of 2012.
In the first six months of 2012, PEMEX reported a net income of Ps. 8.0 billion on Ps. 817.4 billion in total revenues, as compared to a net income of Ps. 17.6 billion on Ps. 746.0 billion in total revenues in the first six months of 2011. This decrease in net income is primarily explained by the increase in PEMEX’s cost of sales as a result of higher petroleum product prices and volumes, a decrease in comprehensive financing result due to greater losses on derivative financial instruments and an increase in PEMEX’s taxes and duties.
Reserves
Under the Constitution and the Regulatory Law, all oil and other hydrocarbon reserves within Mexico are owned by the Mexican nation and not by PEMEX. Under the Petróleos Mexicanos Law, Pemex-Exploration and Production has the exclusive right to extract, but not own, these reserves, and to sell the resulting production. The exploration and development activities of Petróleos Mexicanos and the subsidiary entities are limited to reserves located in Mexico.
Proved oil and natural gas reserves are those estimated quantities of crude oil, natural gas and natural gas liquids which geological and engineering data demonstrate with reasonable certainty to be economically producible from a given date forward, from known reservoirs and under existing economic conditions, operating methods and government regulations.
Pemex-Exploration and Production estimates Mexico’s reserves based on generally accepted petroleum engineering and evaluation methods and procedures, which are based primarily on applicable SEC regulations and, as necessary, the Society of Petroleum Engineers’ (or the SPE) publication entitled “Standards Pertaining to the Estimating and Auditing of Oil and Gas Reserves Information,” dated February 19, 2007 and other SPE publications, including the SPE’s publication entitled Petroleum Resources Management System, as well as other technical sources, including Estimation and Classification of Reserves of Crude Oil, Natural Gas, and Condensate, by Chapman Cronquist, and Determination of Oil and Gas Reserves, Petroleum Society Monograph Number 1, published by the Canadian Institute of Mining and Metallurgy & Petroleum. The choice of method or combination of methods employed in the analysis of each reservoir is determined by experience in the area, stage of development, quality and completeness of basic data and production and pressure histories.
Reserves data set forth herein represent only estimates. Reserves valuation is a subjective process of estimating underground accumulations of crude oil and natural gas that cannot be measured in an exact manner. The accuracy of any reserves estimate depends on the quality of available data, engineering and geological interpretation and professional judgment. As a result, estimates of different engineers may vary. In addition, the results of drilling, testing and producing subsequent to the date of an estimate may lead to the revision of an estimate.
D-32
Mexico’s total proved developed and undeveloped reserves of crude oil, condensates and liquefiable hydrocarbons recoverable from field processing plants decreased by 0.3% in 2011, from 11,394 million barrels at December 31, 2010 to 11,362 million barrels at December 31, 2011. Mexico’s proved developed reserves of crude oil, condensates and liquefiable hydrocarbons recoverable from processing plants decreased by 2.2% in 2011, from 7,793 million barrels at December 31, 2010 to 7,618 million barrels at December 31, 2011. These decreases were principally due to decreased crude oil and condensates production during 2011, which was largely offset by field development activities that led to reclassifications from proved undeveloped, probable and possible reserves to proved developed reserves, as well as exploratory additions.
Mexico’s total proved developed and undeveloped dry gas reserves increased by 1.9% in 2011, from 12,494 billion cubic feet at December 31, 2010 to 12,734 billion cubic feet at December 31, 2011. Mexico’s proved developed dry gas reserves increased by 0.2% in 2011, from 7,941 billion cubic feet at December 31, 2010 to 7,957 billion cubic feet at December 31, 2011. Mexico’s proved undeveloped dry gas reserves increased by 4.9% in 2011, from 4,553 billion cubic feet at December 31, 2010 to 4,776 billion cubic feet at December 31, 2011. These increases were principally due to field development activities in the Burgos basin.
D-33
The following three tables of crude oil and dry gas reserves set forth PEMEX’s estimates of Mexico’s proved reserves determined in accordance with Rule 4-10(a) of Regulation S-X of the Securities Act of 1933.
Summary of Oil and Gas(1) Proved Reserves as of December 31, 2011
Based on Average Fiscal Year Prices
| | | | | | | | |
| | | Crude Oil and Condensates(2) | | | Dry Gas(3) | |
| | | (in millions of barrels) | | | (in billions of cubic feet) | |
Proved developed and undeveloped reserves | | | | | | | | |
Proved developed reserves | | | 7,618 | | | | 7,957 | |
Proved undeveloped reserves | | | 3,744 | | | | 4,776 | |
| | | | | | | | |
Total proved reserves | | | 11,362 | | | | 12,734 | |
| | | | | | | | |
Note: Numbers may not total due to rounding.
| (1) | PEMEX does not produce synthetic oil or synthetic gas, or other natural resources from which synthetic oil or synthetic gas can be produced. |
| (2) | Crude oil and condensate reserves include the fraction of liquefiable hydrocarbons recoverable in natural gas processing plants located at fields. |
| (3) | Reserve volumes reported in this table are volumes of dry gas, although natural gas production reported in other tables refers to sour wet gas. There is a shrinkage in volume when natural gas liquids and impurities are extracted to obtain dry gas. Therefore, reported natural gas volumes are greater than dry gas volumes. |
Source: Pemex-Exploration and Production.
Crude Oil and Condensate Reserves
(including natural gas liquids)(1)
| | | | | | | | | | | | | | | | | | | | |
| | | 2007 | | | 2008 | | | 2009 | | | 2010 | | | 2011 | |
| | | (in millions of barrels) | |
Proved developed and undeveloped reserves | | | | | | | | | | | | | | | | | | | | |
At January 1 | | | 12,849 | | | | 12,187 | | | | 11,865 | | | | 11,691 | | | | 11,394 | |
Revisions(2) | | | 455 | | | | 444 | | | | 577 | | | | 515 | | | | 824 | |
Extensions and discoveries | | | 150 | | | | 370 | | | | 311 | | | | 246 | | | | 194 | |
Production | | | (1,268 | ) | | | (1,135 | ) | | | (1,062 | ) | | | (1,059 | ) | | | (1,050 | ) |
| | | | | | | | | | | | | | | | | | | | |
At December 31 | | | 12,187 | | | | 11,865 | | | | 11,691 | | | | 11,394 | | | | 11,362 | |
| | | | | | | | | | | | | | | | | | | | |
Proved developed reserves at December 31 | | | 8,436 | | | | 8,618 | | | | 8,167 | | | | 7,793 | | | | 7,618 | |
Proved undeveloped reserves at December 31 | | | 3,751 | | | | 3,247 | | | | 3,524 | | | | 3,601 | | | | 3,744 | |
Note: Numbers may not total due to rounding.
| (1) | Crude oil and condensate reserves include the fraction of liquefiable hydrocarbons recoverable in natural gas processing plants located at fields. |
| (2) | Revisions include positive and negative changes due to new data from well drilling, and revisions made when actual reservoir performance differs from expected performance. |
Source: Pemex-Exploration and Production.
Dry Gas Reserves
| | | | | | | | | | | | | | | | | | | | |
| | | 2007 | | | 2008 | | | 2009 | | | 2010 | | | 2011 | |
| | | (in billions of cubic feet) | |
Proved developed and undeveloped reserves | | | | | | | | | | | | | | | | | | | | |
At January 1 | | | 13,856 | | | | 13,162 | | | | 12,702 | | | | 11,966 | | | | 12,494 | |
Revisions(1) | | | 879 | | | | 730 | | | | 504 | | | | 1,449 | | | | 1,592 | |
Extensions and discoveries | | | 171 | | | | 454 | | | | 404 | | | | 770 | | | | 249 | |
Production(2) | | | (1,744 | ) | | | (1,643 | ) | | | (1,644 | ) | | | (1,691 | ) | | | (1,601 | ) |
| | | | | | | | | | | | | | | | | | | | |
At December 31 | | | 13,162 | | | | 12,702 | | | | 11,966 | | | | 12,494 | | | | 12,734 | |
| | | | | | | | | | | | | | | | | | | | |
Proved developed reserves at December 31 | | | 8,163 | | | | 8,206 | | | | 7,586 | | | | 7,941 | | | | 7,957 | |
Proved undeveloped reserves at December 31 | | | 4,999 | | | | 4,496 | | | | 4,380 | | | | 4,553 | | | | 4,776 | |
Note: Numbers may not total due to rounding.
| (1) | Revisions include positive and negative changes due to new data from well drilling, and revisions made when actual reservoir performance differs from expected performance. |
| (2) | Reserve volumes reported in this table are volumes of dry gas, although natural gas production reported in other tables refers to sour wet gas. There is a shrinkage in volume when natural gas liquids and impurities are extracted to obtain dry gas. Therefore, reported natural gas volumes are greater than dry gas volumes. |
Source: Pemex-Exploration and Production.
D-34
Exploration and Drilling
PEMEX seeks to identify new oil reservoirs through its exploration program in order to increase the future replacement rate of proved reserves. While the replacement rate for proved hydrocarbon reserves has increased in recent years, from 77.1% in 2009 to 85.8% in 2010, the overall replacement rate remained less than 100% until 2011, which represents a decline in Mexico’s proved hydrocarbon reserves. Nevertheless, in 2011 the replacement rate for proved hydrocarbon reserves was 101.1%. From 1990 to 2011, PEMEX completed 10,091 exploration and development wells. During 2011, PEMEX’s average success rate for exploratory wells was 48% and its average success rate for development wells was 95%. From 2007 to 2011, PEMEX discovered 20 new crude oil fields and 32 new natural gas fields, bringing the total number of its crude oil and natural gas producing fields to 416 at the end of 2011.
PEMEX’s 2011 exploration program was comprised of exploration in both onshore and offshore regions, including the deep waters in the Gulf of Mexico, where it discovered new reservoirs that represent new drilling opportunities. These exploratory activities yielded 153.1 million barrels of oil equivalent of proved reserves in 2011. A total of seven fields were discovered, four of which contain non-associated gas and three of which contain crude oil. In addition, within PEMEX’s currently producing fields, four reservoirs were discovered, one of which contains non-associated gas and three of which contain crude oil. Moreover, two fields were delineated, a process that involves the drilling of several wells to determine the extent of the reserves found at each field. PEMEX also continued its main seismic data acquisition activities, in particular, those related to three-dimensional seismic data. PEMEX acquired 44,288 square kilometers of three-dimensional seismic data in 2011, of which 39,892 square kilometers or 90% was in the deep waters of the Gulf of Mexico.
D-35
The following table summarizes PEMEX’s drilling activity for the five years ended December 31, 2011, all of which occurred in Mexican territory.
| | | | | | | | | | | | | | | | | | | | |
| | | Year ended December 31, | |
| | | 2007 | | | 2008 | | | 2009 | | | 2010 | | | 2011 | |
Wells initiated(1) | | | 615 | | | | 822 | | | | 1,490 | | | | 994 | | | | 1,000 | |
Exploratory wells initiated(1) | | | 49 | | | | 68 | | | | 71 | | | | 40 | | | | 32 | |
Development wells initiated(1) | | | 566 | | | | 754 | | | | 1,419 | | | | 954 | | | | 968 | |
Wells drilled(2) | | | 659 | | | | 729 | | | | 1,150 | | | | 1,303 | | | | 1,034 | |
Exploratory wells | | | 49 | | | | 65 | | | | 75 | | | | 39 | | | | 33 | |
Productive exploratory wells(3) | | | 24 | | | | 21 | | | | 27 | | | | 23 | | | | 16 | |
Dry exploratory wells | | | 25 | | | | 44 | | | | 48 | | | | 16 | | | | 17 | |
Success rate % | | | 49 | | | | 32 | | | | 36 | | | | 59 | | | | 48 | |
Development wells | | | 610 | | | | 664 | | | | 1,075 | | | | 1,264 | | | | 1,001 | |
Productive development wells | | | 569 | | | | 612 | | | | 1,014 | | | | 1,200 | | | | 955 | |
Dry development wells | | | 41 | | | | 52 | | | | 61 | | | | 64 | | | | 46 | |
Success rate %(4) | | | 94 | | | | 92 | | | | 94 | | | | 95 | | | | 95 | |
Producing wells (annual averages)(5) | | | 6,280 | | | | 6,382 | | | | 6,890 | | | | 7,476 | | | | 8,315 | |
Marine region | | | 434 | | | | 453 | | | | 469 | | | | 477 | | | | 500 | |
Southern region | | | 926 | | | | 947 | | | | 1,005 | | | | 1,067 | | | | 1,136 | |
Northern region | | | 4,920 | | | | 4,982 | | | | 5,416 | | | | 5,932 | | | | 6,679 | |
Producing wells (at year end)(6) | | | 5,942 | | | | 6,247 | | | | 6,814 | | | | 7,414 | | | | 8,271 | |
Crude oil | | | 2,884 | | | | 3,127 | | | | 3,713 | | | | 4,382 | | | | 5,139 | |
Natural gas | | | 3,058 | | | | 3,120 | | | | 3,101 | | | | 3,032 | | | | 3,132 | |
Producing fields | | | 352 | | | | 345 | | | | 394 | | | | 405 | | | | 416 | |
Marine region | | | 30 | | | | 30 | | | | 33 | | | | 34 | | | | 36 | |
Southern region | | | 87 | | | | 93 | | | | 97 | | | | 98 | | | | 99 | |
Northern region | | | 235 | | | | 222 | | | | 264 | | | | 273 | | | | 281 | |
Drilling rigs | | | 116 | | | | 143 | | | | 176 | | | | 130 | | | | 128 | |
Kilometers drilled | | | 1,798 | | | | 2,199 | | | | 3,770 | | | | 2,352 | | | | 2,494 | |
Average depth by well (meters) | | | 2,744 | | | | 2,748 | | | | 2,494 | | | | 2,605 | | | | 2,418 | |
Discovered fields(7) | | | 14 | | | | 13 | | | | 13 | | | | 5 | | | | 7 | |
Crude oil | | | 4 | | | | 5 | | | | 6 | | | | 2 | | | | 3 | |
Natural gas | | | 10 | | | | 8 | | | | 7 | | | | 3 | | | | 4 | |
Crude oil and natural gas output by well (barrels of oil equivalent per day) | | | 699 | | | | 621 | | | | 548 | | | | 508 | | | | 450 | |
Total developed acreage (km2)(8) | | | 8,132 | | | | 8,088 | | | | 8,376 | | | | 8,463 | | | | 8,536 | |
Total undeveloped acreage (km2)(8) | | | 616 | | | | 690 | | | | 953 | | | | 828 | | | | 987 | |
Note: Numbers may not total due to rounding.
| (1) | “Wells initiated” refers to the number of wells the drilling of which commenced in a given year, regardless of when the well was or will be completed. |
| (2) | “Wells drilled” refers to the number of wells the drilling of which was completed in a given year, regardless of when the drilling of the well commenced. |
| (3) | Excludes non-commercial productive wells. |
| (4) | Excludes injector wells. |
| (5) | In March 2012, the monthly average of total producing wells, which are wells that are not only capable of production but are actually producing during the relevant period, was 9,209. |
| (6) | All productive wells, and all other wells referred to in this table, are “net,” because PEMEX does not grant others any fractional working interests in any wells that it owns; PEMEX also has not acquired any fractional working interest in wells owned by others. |
| (7) | Includes only fields with proved reserves. |
| (8) | All acreage is net, because PEMEX has the exclusive right to exploit Mexico’s oil and gas reserves, i.e., it neither grants others fractional interests nor enters into other types of production sharing arrangements. |
Source: Pemex-Exploration and Production.
Production and Refining
PEMEX produces four types of crude oil: Maya, a heavy crude oil; Altamira, a heavy crude oil; Isthmus, a light crude oil and Olmeca, an extra-light crude oil. Most of Pemex-Exploration and Production’s production consists of Isthmus and Maya crude oil. In 2011, 55.6% of Pemex-Exploration and Production’s total production of crude oil consisted of heavy crude oil and 44.4% consisted of light and extra-light crude oil. In 2011, PEMEX produced an average of 2,550 thousand barrels per day of crude oil, 1.0% less than its average daily production in 2010 of 2,576 thousand barrels per day of crude oil. The decrease in 2011 production was due mainly to the decline of production in the Cantarell project, which was only partially offset by an increase in crude oil production in the Ku-Maloob-Zaap, Delta del Grijalva, Yaxché, Ixtal Manik and Ogarrio-Magallanes projects.
D-36
Pemex-Exploration and Production’s average natural gas production (excluding natural gas liquids) decreased by 6.1% in 2011, from 7,020 million cubic feet per day in 2010 to 6,594 million cubic feet per day in 2011, while the average wet natural gas processed by Pemex-Gas and Basic Petrochemicals increased by 1.2%, from 4,472 million cubic feet per day in 2010 to 4,527 million cubic feet per day in 2011.
In 2011, Pemex-Refining produced 1,190 thousand barrels per day of refined products (including dry gas by-products of the refining process) as compared to 1,229 thousand barrels per day of refined products in 2010. The 3.2% decrease in refined products production was mainly due to several operational issues faced by the national refining system.
The following table sets forth production rates for crude oil, natural gas, refined products and petrochemicals for the five years ended December 31, 2011.
Production
| | | | | | | | | | | | | | | | | | | | |
| | | Year Ended December 31, | |
| | | 2007 | | | 2008 | | | 2009 | | | 2010 | | | 2011 | |
Crude oil(1) (tbpd) | | | 3,076 | | | | 2,792 | | | | 2,602 | | | | 2,576 | | | | 2,550 | |
Natural gas(2) (mmcfpd) | | | 6,059 | | | | 6,919 | | | | 7,031 | | | | 7,020 | | | | 6,594 | |
Refined products(2) (tbpd) | | | 1,312 | | | | 1,307 | | | | 1,343 | | | | 1,229 | | | | 1,190 | |
Petrochemicals(3) (ttpy) | | | 11,757 | | | | 11,973 | | | | 11,956 | | | | 13,188 | | | | 12,384 | |
Notes: Numbers may not total due to rounding.
mmcfpd = million cubic feet per day.
tbpd = thousand barrels per day.
ttpy = thousand tons per year.
| (1) | Includes natural gas liquids. |
| (2) | Reflects natural gas production by Pemex-Exploration and Production. |
| (3) | Includes petrochemical production by Pemex-Petrochemicals, Pemex-Refining, and Pemex-Gas and Basic Petrochemicals. |
Source: Pemex-Exploration and Production and Base de Datos Institucional de Pemex (Pemex’s Institutional Database).
Petrochemicals
PEMEX produces basic inputs into the petrochemical production process (such as ethane, butane, natural gas liquids and pentanes), other inputs (such as oxygen, nitrogen and hydrogen), petrochemicals (such as methane derivatives, ethylene and its derivatives, aromatics and their derivatives and propylene and its derivatives) and by-products obtained in the petrochemical production process (such as hydrochloric acid and muriatic acid). PEMEX’s total petrochemical production decreased by 6.1% in 2011, from 13,188 thousand tons in 2010 to 12,384 thousand tons in 2011.
Under Mexican law, the right to manufacture basic petrochemical products is vested solely in the Mexican nation, which may produce them only through PEMEX or any other decentralized public entity established by law for this purpose. The Regulatory Law limits basic petrochemicals to the following nine products that are used in the petrochemical production process: ethane, propane, butanes, pentanes, hexanes, heptanes, carbon black, napthas and methane, but in the case of methane, only if obtained from hydrocarbon reservoirs in Mexico and used as raw material for petrochemical industrial processes. All other petrochemical products may be produced by Pemex-Petrochemicals, by Pemex-Refining or by private sector companies. However, the Regulatory Law also allows companies that produce basic petrochemicals as by-products of non-basic petrochemical production to sell them either internally, within plants in the same unit or complex, or to sell them to Petróleos Mexicanos and the subsidiary entities.
Since the end of 1993, Mexican law has permitted private investment in the manufacture of “secondary” petrochemical products. These are defined to include all petrochemical products not designated “basic” by the Ministry of Energy. Both foreign and domestic private investors may own 100% of any petrochemical plant producing secondary petrochemicals, and companies engaged in the production of secondary petrochemicals which produce basic petrochemicals as by-products may now sell them in the production process within plants in the same unit or complex, or deliver them to PEMEX pursuant to an agreement and under terms established by the Ministry of Energy. As a result, PEMEX no longer has a monopoly on the production and initial sale of most petrochemicals in Mexico.
D-37
Commercial Activities
Besides crude oil and natural gas, PEMEX markets a full range of oil and gas derivatives in Mexico, including gasoline, jet fuel, diesel, fuel oil and petrochemicals. PEMEX supplies the majority of Mexico’s primary energy requirements. PEMEX is one of a few major producers of crude oil worldwide that experiences significant domestic demand for its refined products.
PEMEX sells approximately 47.5% of its crude oil in the domestic market in the form of refined products and petrochemicals; it exports the remainder of the crude oil (1.36 million barrels per day in 2010 and 1.34 million barrels per day in 2011). Net exports of crude oil, natural gas, petroleum products and petrochemical products averaged U.S. $22.2 billion per year between 2007 and 2010, and were U.S. $26.3 billion in 2011.
The following table sets forth the average volume of PEMEX’s exports and imports of crude oil (exports only), natural gas, petroleum products and petrochemical products for the five years ended December 31, 2011 and the percentage change between 2010 and 2011.
Volume of Exports and Imports
| | | | | | | | | | | | | | | | | | | | | | | | |
| | | Year ended December 31, | | | 2011 | |
| | | 2007 | | | 2008 | | | 2009 | | | 2010 | | | 2011 | | | vs. 2010 | |
| | | (in thousands of barrels per day, except as noted) | | | (%) | |
Exports | | | | | | | | | | | | | | | | | | | | | | | | |
Crude Oil: | | | | | | | | | | | | | | | | | | | | | | | | |
Olmeca | | | 172.7 | | | | 129.6 | | | | 143.5 | | | | 211.7 | | | | 202.9 | | | | (4.2 | ) |
Isthmus | | | 41.1 | | | | 23.0 | | | | 14.2 | | | | 74.9 | | | | 99.3 | | | | 32.6 | |
Altamira | | | 12.7 | | | | 10.6 | | | | 12.5 | | | | 8.6 | | | | 14.1 | | | | 64.0 | |
Maya | | | 1,459.6 | | | | 1,240.0 | | | | 1,052.0 | | | | 1,065.3 | | | | 1,021.7 | | | | (4.1 | ) |
| | | | | | | | | | | | | | | | | | | | | | | | |
Total crude oil | | | 1,686.1 | | | | 1,403.4 | | | | 1,222.1 | | | | 1,360.5 | | | | 1,337.9 | | | | (1.7 | ) |
| | | | | | | | | | | | | | | | | | | | | | | | |
Natural gas(1) | | | 138.7 | | | | 107.4 | | | | 66.5 | | | | 19.3 | | | | 1.3 | | | | (93.3 | ) |
Petroleum products | | | 176.9 | | | | 184.1 | | | | 244.8 | | | | 194.5 | | | | 176.6 | | | | (9.2 | ) |
Petrochemical products(2)(3) | | | 746.0 | | | | 539.6 | | | | 779.4 | | | | 697.6 | | | | 442.9 | | | | (36.5 | ) |
Imports | | | | | | | | | | | | | | | | | | | | | | | | |
Natural gas(1) | | | 385.6 | | | | 447.1 | | | | 422.0 | | | | 535.8 | | | | 790.8 | | | | 47.6 | |
Petroleum products | | | 494.0 | | | | 548.2 | | | | 506.4 | | | | 627.9 | | | | 632.6 | | | | 0.7 | |
Petrochemical products(2)(4) | | | 425.1 | | | | 439.8 | | | | 568.3 | | | | 394.9 | | | | 225.0 | | | | (43.0 | ) |
Note: Numbers subject to adjustment because crude oil exports may be adjusted to reflect the percentage of water in each shipment.
| (1) | Numbers expressed in millions of cubic feet per day. |
| (2) | Thousands of metric tons. |
| (4) | Includes isobutane, butane and N-butane. |
Source: P.M.I. Comercio Internacional, S.A. de C.V. (PMI) operating statistics as of February 15, 2012, and Pemex-Gas and Basic Petrochemicals.
D-38
The following table sets forth the value of exports and imports of crude oil (exports only), natural gas, petroleum products and petrochemical products for the five years ended December 31, 2011 and the percentage change between 2010 and 2011.
Value of Exports and Imports(1)
| | | | | | | | | | | | | | | | | | | | | | | | |
| | | Year ended December 31, | | | 2011 | |
| | | 2007 | | | 2008 | | | 2009 | | | 2010 | | | 2011 | | | vs. 2010 | |
| | | (in millions of U.S. dollars) | | | (%) | |
Exports | | | | | | | | | | | | | | | | | | | | | | | | |
Olmeca | | U.S.$ | 4,469.1 | | | U.S.$ | 4,712.2 | | | U.S.$ | 3,444.8 | | | U.S.$ | 6,149.2 | | | U.S.$ | 8,132.6 | | | | 32.3 | |
Isthmus | | | 1,049.9 | | | | 683.1 | | | | 327.4 | | | | 2,148.9 | | | | 3,849.9 | | | | 79.2 | |
Altamira | | | 248.7 | | | | 309.2 | | | | 244.3 | | | | 216.3 | | | | 497.0 | | | | 129.8 | |
Maya | | | 32,169.9 | | | | 37,637.1 | | | | 21,588.9 | | | | 27,471.1 | | | | 36,846.0 | | | | 34.1 | |
| | | | | | | | | | | | | | | | | | | | | | | | |
Total crude oil(2) | | U.S.$ | 37,937.5 | | | U.S.$ | 43,341.5 | | | U.S.$ | 25,605.4 | | | U.S.$ | 35,985.4 | | | U.S.$ | 49,325.5 | | | | 37.1 | |
Natural gas | | | 350.5 | | | | 316.3 | | | | 103.5 | | | | 31.9 | | | | 1.6 | | | | (95.0 | ) |
Petroleum products | | | 4,116.6 | | | | 5,706.6 | | | | 4,891.8 | | | | 5,133.3 | | | | 6,304.4 | | | | 22.8 | |
Petrochemical products | | | 297.1 | | | | 384.1 | | | | 175.7 | | | | 272.1 | | | | 298.6 | | | | 9.7 | |
| | | | | | | | | | | | | | | | | | | | | | | | |
Total natural gas and products | | U.S.$ | 4,764.2 | | | U.S.$ | 6,407.0 | | | U.S.$ | 5,171.0 | | | U.S.$ | 5,437.3 | | | U.S.$ | 6,604.6 | | | | 21.5 | |
| | | | | | | | | | | | | | | | | | | | | | | | |
Total exports | | U.S.$ | 42,701.7 | | | U.S.$ | 49,748.5 | | | U.S.$ | 30,776.4 | | | U.S.$ | 41,422.7 | | | U.S.$ | 55,930.1 | | | | 35.0 | |
| | | | | | | | | | | | | | | | | | | | | | | | |
Imports | | | | | | | | | | | | | | | | | | | | | | | | |
Natural gas | | U.S.$ | 995.7 | | | U.S.$ | 1,423.6 | | | U.S.$ | 632.8 | | | U.S.$ | 939.2 | | | U.S.$ | 1,272.2 | | | | 35.5 | |
Petroleum products | | | 15,700.0 | | | | 21,882.5 | | | | 12,884.9 | | | | 20,317.3 | | | | 28,036.5 | | | | 38.0 | |
Petrochemical products | | | 278.9 | | | | 350.5 | | | | 301.4 | | | | 302.5 | | | | 278.1 | | | | (8.1 | ) |
| | | | | | | | | | | | | | | | | | | | | | | | |
Total imports | | U.S.$ | 16,974.6 | | | U.S.$ | 23,656.6 | | | U.S.$ | 13,819.0 | | | U.S.$ | 21,559.0 | | | U.S.$ | 29,586.8 | | | | 37.2 | |
| | | | | | | | | | | | | | | | | | | | | | | | |
Net exports | | U.S.$ | 25,727.1 | | | U.S.$ | 26,091.9 | | | U.S.$ | 16,957.4 | | | U.S.$ | 19,863.7 | | | U.S.$ | 26,343.3 | | | | 32.6 | |
| | | | | | | | | | | | | | | | | | | | | | | | |
Note: Numbers may not total due to rounding.
| (1) | Does not include crude oil, refined products and petrochemicals purchased by P.M.I. Trading, Ltd. or P.M.I. Norteamérica, S.A. de C.V. from third parties outside of Mexico and resold in the international markets. The figures expressed in this table differ from the amounts contained under the line item “Net Sales” in PEMEX’s financial statements because of differences in methodology associated with the calculation of the exchange rates and other minor adjustments. |
| (2) | Crude oil exports are subject to adjustment to reflect the percentage of water in each shipment. |
Source: PMI operating statistics as of February 15, 2012, which are based on information in bills of lading, and Pemex-Gas and Basic Petrochemicals.
The following table sets forth the average price per barrel of crude oil exported by PEMEX for the years indicated.
Crude Oil Prices
| | | | | | | | | | | | | | | | | | | | |
| | | Year ended December 31, | |
| | | 2007 | | | 2008 | | | 2009 | | | 2010 | | | 2011 | |
| | | (U.S. dollars per barrel) | |
Crude Oil Prices | | | | | | | | | | | | | | | | | | | | |
Olmeca | | U.S.$ | 70.89 | | | U.S.$ | 99.37 | | | U.S.$ | 65.79 | | | U.S.$ | 79.58 | | | U.S.$ | 109.83 | |
Isthmus | | | 69.92 | | | | 81.09 | | | | 63.38 | | | | 78.63 | | | | 106.22 | |
Maya | | | 60.38 | | | | 82.92 | | | | 56.22 | | | | 70.65 | | | | 98.81 | |
Altamira | | | 53.71 | | | | 79.69 | | | | 53.50 | | | | 68.80 | | | | 96.63 | |
Weighted average realized price | | U.S.$ | 61.64 | | | U.S.$ | 84.38 | | | U.S.$ | 57.42 | | | U.S.$ | 72.46 | | | U.S.$ | 101.01 | |
Source: PMI operating statistics as of February 15, 2012.
D-39
The following table sets forth PEMEX’s crude oil export sales by country for the five years ended December 31, 2011.
Crude Oil Exports by Country
| | | | | | | | | | | | | | | | | | | | |
| | | Percentage of Exports | |
| | | 2007 | | | 2008 | | | 2009 | | | 2010 | | | 2011 | |
United States | | | 80.2 | % | | | 81.3 | % | | | 86.8 | % | | | 83.8 | % | | | 81.8 | % |
Spain | | | 7.4 | | | | 8.8 | | | | 6.6 | | | | 8.9 | | | | 8.3 | |
Netherlands Antilles | | | 4.1 | | | | 2.6 | | | | — | | | | — | | | | — | |
India | | | 2.1 | | | | 2.5 | | | | 2.5 | | | | 1.7 | | | | 2.8 | |
China | | | — | | | | — | | | | — | | | | 1.9 | | | | 2.7 | |
Canada | | | 1.8 | | | | 1.8 | | | | 1.7 | | | | 1.8 | | | | 1.5 | |
Others | | | 4.4 | | | | 3.1 | | | | 2.4 | | | | 2.0 | | | | 2.8 | |
| | | | | | | | | | | | | | | | | | | | |
Total | | | 100.0 | % | | | 100.0 | % | | | 100.0 | % | | | 100.0 | % | | | 100.0 | % |
| | | | | | | | | | | | | | | | | | | | |
Note: Numbers may not total due to rounding.
Source: PMI operating statistics as of February 15, 2012.
Although Mexico is not a member of the Organization of Petroleum Exporting Countries (OPEC), it has on certain occasions announced increases and decreases in PEMEX’s crude oil exports in line with production revisions made by other oil producing countries, in order to contribute to crude oil prices stabilization. However, PEMEX has not changed its export goals because of announcements by OPEC since 2004, and Mexico has no current plans to change PEMEX’s current level of crude oil exports.
Crude oil exports decreased by 1.7% in 2011, from 1,360.5 thousand barrels per day in 2010 to 1,337.9 thousand barrels per day in 2011, mainly due to a 1.0% decrease in crude oil production.
PEMEX imports natural gas to satisfy shortfalls in production and to meet demand in areas of northern Mexico which, due to the distance from PEMEX’s fields, can be supplied more efficiently through imports from the United States. PEMEX imported 790.8 million cubic feet per day of natural gas in 2011, an increase of 47.6% from the 535.8 million cubic feet per day imported in 2010, due to increased domestic consumption of natural gas, which made it necessary to increase natural gas imports. PEMEX exported 1.3 million cubic feet per day of natural gas in 2011, a decrease of 93.3% as compared to natural gas exports in 2010 of 19.3 million cubic feet per day, mainly due to the decrease in production in Mexico and increased domestic demand for natural gas.
In 2011, imports of petroleum products increased in value by 38.0%, while exports of petroleum products increased in value by 22.8%, due to higher prices and increased domestic demand for ultra-low sulfur gasoline and diesel. PEMEX’s net imports of petroleum products for 2011 totaled U.S. $21,732.1 million, a 43.1% increase from the net imports of petroleum products of U.S. $15,184.0 million in 2010. In 2011, imports of petroleum products increased in volume by 0.7%, from 627.9 thousand barrels per day in 2010 to 632.6 thousand barrels per day in 2011, while exports of petroleum products decreased in volume by 9.2%, from 194.5 thousand barrels per day in 2010 to 176.6 thousand barrels per day in 2011.
During 2012, imports of petroleum products, specifically gasoline, aviation gasoline, low and ultra-low sulfur diesel and low-sulfur fuel oil, are expected to decrease because the Minatitlán refinery began operating a coker unit in January 2012, which transforms residual heavy oil by-products into high-quality gasolines and diesel. As a result, PEMEX also expects exports of most petroleum products to decrease during 2012, since the coker unit will reduce the amount of residual products such as fuel oil available for export.
In 2011, exports of petrochemical products decreased by 36.5%, from 697.6 thousand metric tons in 2010 to 442.9 thousand metric tons in 2011, while imports of petrochemical products also decreased by 43.0%, from 394.9 thousand metric tons in 2010 to 225.0 thousand metric tons in 2011. Petrochemical exports decreased in 2011 due to lower sales of ethylene, ammonia and sulfur. Imports of petrochemical products decreased in 2011, due to lower demand for methanol and propylene.
D-40
Capital Expenditures and Investments
The following table shows PEMEX’s capital expenditures, excluding maintenance, for each of the five years ended December 31, 2011, and the budget for such expenditures for 2012 and 2013. Capital expenditure amounts are derived from PEMEX’s budgetary records, which record such amounts on a cash basis. Accordingly, these capital expenditure amounts do not correspond to capital expenditure amounts included in PEMEX’s financial statements prepared in accordance with Mexican Financial Reporting Standards.
Capital Expenditures
| | | | | | | | | | | | | | | | | | | | | | | | | | | | |
| | | Year ended December 31,(1) | | | Budget | | | Budget | |
| | | 2007 | | | 2008 | | | 2009 | | | 2010 | | | 2011 | | | 2012 | | | 2013 | |
| | | (in millions of pesos)(2) | |
Pemex-Exploration and Production | | Ps. | 115,563 | | | Ps. | 136,102 | | | Ps. | 180,507 | | | Ps. | 194,838 | | | Ps. | 177,059 | | | Ps. | 192,953 | | | Ps. | 208,575 | |
Pemex-Refining | | | 15,979 | | | | 17,380 | | | | 18,526 | | | | 22,636 | | | | 25,157 | | | | 45,930 | | | | 58,871 | |
Pemex-Gas and Basic Petrochemicals | | | 4,004 | | | | 4,203 | | | | 3,941 | | | | 3,887 | | | | 3,019 | | | | 6,126 | | | | 8,074 | |
Pemex-Petrochemicals | | | 1,139 | | | | 1,614 | | | | 2,053 | | | | 2,462 | | | | 2,426 | | | | 4,212 | | | | 15,130 | |
Petróleos Mexicanos | | | 227 | | | | 439 | | | | 560 | | | | 206 | | | | 717 | | | | 700 | | | | 2,137 | |
| | | | | | | | | | | | | | | | | | | | | | | | | | | | |
Total capital expenditures | | Ps. | 136,913 | | | Ps. | 159,738 | | | Ps. | 205,587 | | | Ps. | 224,029 | | | Ps. | 208,378 | | | Ps. | 249,921 | | | Ps. | 292,787 | |
| | | | | | | | | | | | | | | | | | | | | | | | | | | | |
Note: Numbers may not total due to rounding.
| (1) | Includes capitalized interest during construction period for the years 2007, 2008 and 2009. Does not include capitalized interest for the years 2010, 2011, 2012 and 2013. |
| (2) | Figures for 2007, 2008, 2009, 2010 and 2011 are stated in nominal pesos. Figures for 2012 and 2013 are stated in constant 2012 pesos. |
Source: Petróleos Mexicanos.
In nominal peso terms, PEMEX’s capital expenditures for exploration and production were Ps. 177,059 million in 2011, as compared to Ps. 194,838 million in 2010, representing a 9.1% decrease in nominal terms. Of PEMEX’s total capital expenditures for exploration and development, Ps. 36,303 million was directed to the Cantarell fields, Ps. 27,790 million was directed to the Strategic Gas Program, Ps. 21,919 million was directed to the Aceite Terciario del Golfo project, Ps. 21,554 million was directed to the Ku-Maloob-Zaap fields, Ps. 19,564 million was used for development of the Burgos natural gas fields (including Ps. 9,606 million of investments made through PEMEX’s Financed Public Works Contracts program), Ps. 11,218 million was directed to the Antonio J. Bermúdez fields, Ps. 6,501 million was directed to the Delta del Grijalva fields, Ps. 4,912 million was directed to the Bellota-Chinchorro fields, Ps. 4,687 million was directed to the Integral Poza Rica fields, Ps. 3,800 million was directed to the Tamaulipas Constituciones project and Ps. 3,730 million was directed to the Chuc project. During 2011, expenditures for these 11 projects amounted to 91.5% of all PEMEX’s capital expenditures for exploration and production. The remaining 8.5% amounted to Ps. 15,082 million in nominal terms, which was directed to the 12 remaining projects as well as administrative and technical support.
For 2012, Pemex-Exploration and Production has a total capital expenditures budget of Ps. 192,953 million, as compared to Ps. 177,059 million of capital expenditures made in 2011, representing an increase of 9.0%. The 2012 budget includes all of the 23 ongoing strategic exploration and production projects and Ps. 4,856 million in other exploratory projects. Approximately Ps. 159,298 million, or 82.6% of Pemex-Exploration and Production’s 2012 capital expenditures budget is to be allocated to projects relating to field development and pipelines. Approximately Ps. 33,655 million, or 17.4% of the total budget, will be allocated to exploration activities.
PEMEX’s 2012 exploration and production budget includes Ps. 48,249 million for investments in the Cantarell project, Ps. 34,819 million for the Strategic Gas Program, Ps. 22,804 million for the Ku-Maloob-Zaap project, Ps. 15,378 million for the Aceite Terciario del Golfo project, Ps. 13,311 million for the Antonio J. Bermúdez project, Ps. 11,128 million for the Burgos project, Ps. 8,205 million for the Chuc project, Ps. 5,326 million for the Delta del Grijalva project, Ps. 4,342 million for the Integral Yaxché project, Ps. 4,053 million for the Bellota-Chinchorro project, Ps. 3,779 million for the Jujo-Tecominoacán project and Ps. 21,559 million for the remaining projects as well as administrative and technical support.
D-41
In 2011, Pemex-Refining invested Ps. 25,157 million in capital expenditures, 11.1% more than its Ps. 22,636 million of capital expenditures in 2010. Of this total investment, Pemex-Refining allocated Ps. 2,850 million to the Minatitlán project, Ps. 2,130 million to its investments to expand and upgrade refineries and related installations, Ps. 8,506 million to environmental and industrial safety projects, Ps. 9,279 million to rehabilitation projects, Ps. 2,332 million to other projects and acquisitions and Ps. 60 million to the new refinery in Tula, Hidalgo, of which Ps. 35 million was for preinvestment studies and Ps. 25 million was for other expenses related to this refinery.
In nominal peso terms, Pemex-Gas and Basic Petrochemicals invested Ps. 3,019 million in 2011, as compared to Ps. 3,887 million in 2010, in projects primarily related to natural gas and condensates processing, transportation and storage. For 2012, the Government has approved Ps. 6,126 million in nominal terms of capital expenditures for Pemex-Gas and Basic Petrochemicals, including Ps. 601 million for the cryogenic plant at the Poza Rica gas processing complex.
Equity and Dividends
In March 1990, as part of the 1989-92 Financing Package for Mexico described under “Public Debt—External Debt Restructuring and Debt and Debt Service Reduction Transactions,” U.S. $7.58 billion of the external commercial bank debt of Petróleos Mexicanos was exchanged for new 30-year bonds issued by the Government. Petróleos Mexicanos’ indebtedness to the Government was increased by the same amount and subsequently capitalized as equity or Certificates of Contributions “A” (equity participation certificates). As a condition to the capitalization, PEMEX agreed to pay a minimum guaranteed dividend to the Government equivalent to the debt service on the capitalized debt. The total dividend to the Government in respect of the Certificates of Contribution “A” was approved annually by the board of directors of Petróleos Mexicanos after the close of each fiscal year. In each quarter until January 2007, Petróleos Mexicanos made advance payments to the Government that totaled a prorated portion of the minimum guaranteed dividend. Following a payment of Ps. 4,270 million in January 2007, and because PEMEX’s obligation to pay minimum guaranteed dividends was fully performed in 2007, no further advance payments on the minimum guaranteed dividend are payable to the Government.
However, the Government may still require Petróleos Mexicanos to declare and pay dividends to it at any time.
In December 2009, Petróleos Mexicanos capitalized interest on funds provided by the Government in the amount of Ps. 467.2 million. In December 2010, Petróleos Mexicanos capitalized interest in the amount of Ps. 0.122 million, corresponding to interest earned at the end of 2010 on funds provided by the Government for use in infrastructure works. During 2011, there was no capitalization of interest.
Taxes and Duties
PEMEX pays a number of special hydrocarbon taxes and duties to the Government, in addition to the other taxes and duties paid by some of the subsidiary companies. PEMEX contributed approximately 32.9% of the Government’s revenues in 2010 and 33.7% in 2011. Until 2006, the rates at which the Mexican Congress assessed hydrocarbon taxes and duties could vary from year to year, and were set after taking into consideration PEMEX’s operating budget, its capital expenditure program and its financing needs.
D-42
The Mexican Congress approved a new fiscal regime for Petróleos Mexicanos and the subsidiary entities on November 10, 2005. The new fiscal regime went into effect on January 1, 2006, but was modified in 2007, with effect from January 1, 2008; in 2008, with effect from January 1, 2009; in 2009, with effect from January 1, 2010; and in 2010, with effect from January 1, 2011. Under the current fiscal regime, the taxation of Pemex-Exploration and Production is governed by the Ley Federal de Derechos (Federal Duties Law), while the taxation of the other subsidiary entities is governed by the Ley de Ingresos de la Federación (Federal Revenue Law) for the applicable fiscal year. The Federal Revenue Law is discussed and approved on an annual basis by the Mexican Congress.
In 2011 and 2012, the fiscal regime for Pemex-Exploration and Production consisted of the following duties:
| | |
Derecho Ordinario sobre Hidrocarburos
(Ordinary Hydrocarbons Duty) | | This duty is applied to the annual value of extracted production of crude oil and natural gas minus certain permitted deductions (including specific investments, certain costs and expenses, and the other duties referred to below, subject to certain conditions), and applies to all crude oil and natural gas production other than (1) production from fields located in the Paleocanal de Chicontepec and the deep waters in the Gulf of Mexico and (2) production in excess of annual “base” levels of production from specified marginal fields. The applicable rate for this duty was 72.5% in 2011, and is 71.5% in 2012 and thereafter. Deduction of costs must not exceed U.S. $6.50 per barrel of crude oil and U.S. $2.70 per thousand cubic feet of non-associated natural gas. Production of oil and gas extracted from fields located in Paleocanal de Chicontepec and the deep waters in the Gulf of Mexico, and production in excess of base production from marginal fields, is subject to the Special Hydrocarbons Duty, the Extraction of Hydrocarbons Duty and the Additional Duty on Hydrocarbons. |
| |
Derecho Especial sobre Hidrocarburos
(Special Hydrocarbons Duty) | | A rate ranging from 30% to 36% is applied to the value of extracted production of crude oil and natural gas for the year from the fields located in the Paleocanal de Chicontepec and the deep waters in the Gulf of Mexico, and the value of production in excess of base production from marginal fields, minus in each case certain permitted deductions (including specific investments, certain expenses and costs, among others, subject to certain conditions). |
| |
Derecho sobre la Extracción de Hidrocarburos
(Extraction of Hydrocarbons Duty) | | A rate of 15% is applied to the value of extracted production of crude oil and natural gas for the year from fields located in the Paleocanal de Chicontepec and the deep waters in the Gulf of Mexico, and to the value of production in excess of base production from marginal fields. |
D-43
| | |
Derecho Adicional sobre Hidrocarburos
(Additional Duty on Hydrocarbons) | | A rate of 52% is applied to the value resulting from the multiplication of (i) the difference between the annual Mexican crude oil export price corresponding to the field from which such crude oil is extracted, and a threshold price of U.S. $63.91 for 2011, by (ii) the extracted volume for the relevant year. This duty is applied only to fields located in the Paleocanal de Chicontepec and the deep waters in the Gulf of Mexico and to production in excess of base production from marginal fields, and only if the Mexican crude oil export price per barrel of the extracted crude oil is greater than the threshold price. Each year, the threshold price at which this duty takes effect is adjusted to take account of inflation, as measured by the change in the U.S. producer price index. |
| |
Derecho sobre Hidrocarburos para el
Fondo de Estabilización (Hydrocarbons
Duty for the Stabilization Fund) | | Rates between 1% and 10% are applied to the value of the extracted crude oil production when the weighted average Mexican crude oil export price for a certain year exceeds between U.S. $22.00 and U.S. $31.00 per barrel. |
| |
Derecho para la Investigación Científica y
Tecnológica en Materia de Energía (Duty
for Scientific and Technological
Research on Energy) | | A rate of 0.50% of the value of extracted crude oil and natural gas production applied in 2011. This rate increased to 0.65% for 2012 and subsequent years. |
| |
Derecho para la Fiscalización Petrolera
(Duty for Oil Monitoring) | | A rate of 0.003% is applied to the value of extracted production of crude oil and natural gas for the year. |
| |
Derecho Extraordinario sobre la
Exportación de Petróleo Crudo
(Extraordinary Duty on Crude Oil
Exports) | | A rate of 13.1% is applied to the value resulting from the multiplication of (i) the difference between the annual weighted average Mexican crude oil export price and the budgeted crude oil price, by (ii) the annual export volume. The budgeted crude oil price for 2011 was U.S. $65.40 per barrel and for 2012 is U.S. $84.90 per barrel. |
| |
Derecho para Regular y Supervisar la
Exploración y Explotación de Hidrocarburos
(Duty to Regulate and Supervise the
Exploration and Exploitation of Hydrocarbons) | | A rate of 0.03% is applied to the value of extracted production of crude oil and natural gas, beginning on January 1, 2012. |
D-44
The Federal Duties Law, for purposes of the duties mentioned above, defines the deep water fields as those located in waters with an average depth of 500 meters or greater, and the Paleocanal de Chicontepec fields as those located in the following areas: Castillo de Teayo, Coatzintla, Coyutla, Chicontepec, Espinal, Ixhuatlán de Madero, Temapache, Papantla, Poza Rica de Hidalgo, Tepetzintla and Tihuatlán, in the state of Veracruz; and Francisco Z. Mena, Pantepec and Venustiano Carranza, in the state of Puebla.
The Federal Duties Law defines marginal fields as those fields that are abandoned or in the process of being abandoned. The following fields were categorized as marginal fields for the 2011 fiscal year: the Blasillo, Cinco Presidentes, La Venta, Magallanes, Ogarrio, Otates, Rodador, San Alfonso and San Ramón fields, located in the area of Magallanes Cinco Presidentes; the Arenque, Atún, Bagre, Carpa, Escualo, Isla de Lobos, Jurel, Lobina, Marsopa, Mejillón, Morsa, Náyade and Tiburón fields, located in the area of Arenque; and the Altamira, Barcodón, Cacalilao, Corcovado, Ébano, Limón, Pánuco, Salinas, Tamaulipas Constituciones and Topila fields, located in the area of Altamira. The following additional fields were categorized as marginal fields beginning with the 2012 fiscal year: San Andrés, Remolino, Tierra Blanca, Potrero del llano-Horcones, Hallazgo, Cerro Viejo, Temapache, Alazán, Vara Alta, Kach, Amoca, Alak, Tecoalli and Ichalkil.
On January 1, 2011, an amendment to the Federal Duties Law became effective, which revoked the Derecho Único sobre Hidrocarburos (Sole Hydrocarbons Duty). In its place, the Ordinary Hydrocarbons Duty, the Duty for Scientific and Technological Research on Energy, the Duty for Oil Monitoring, the Hydrocarbons Duty for the Stabilization Fund and the Extraordinary Duty on Crude Oil Exports are applied to the annual base production (production below a certain threshold) from each of the marginal fields in accordance with the Federal Duties Law. Once the annual base production level is reached, any production above that threshold is subject to the Extraction of Hydrocarbons Duty, the Special Hydrocarbons Duty and the Additional Duty on Hydrocarbons.
As described above, fluctuating crude oil price levels directly affect the level of certain taxes and duties that PEMEX pays. In 2011, the Extraordinary Duty on Crude Oil Exports did not have an impact on PEMEX’s cash outflow because it was credited against the Hydrocarbons Duty for the Stabilization Fund.
The fiscal regime for Petróleos Mexicanos and its subsidiary entities, with the exception of Pemex-Exploration and Production, consists of the following taxes and duties:
| | |
Impuesto a los Rendimientos Petroleros
(Hydrocarbons Income Tax) | | A tax rate of 30% is applied to net income, as determined in accordance with the Federal Revenue Law for the applicable fiscal year. |
| |
| IEPS tax | | The IEPS tax is an indirect tax on domestic sales of gasoline and diesel that Pemex-Refining collects on behalf of the Government. The IEPS tax on the sale of gasoline and diesel is equivalent to the difference between the international reference price of each product (adjusted by freight costs and quality factors) and the retail price of the product (not including value added tax, the retailers’ margin and freight costs). Thus, the Government ensures that PEMEX retains an amount reflecting the international prices (adjusted as described above) of these products, while the Government collects the difference between the international prices and the prices at which these products are sold in Mexico. |
D-45
| | |
| | Since 2005, as a result of the new rules to calculate this tax rate, some rates have been negative. The Federal Revenue Law for each of the 2006 to 2011 Fiscal Years provided that the IEPS tax amounts resulting from applying negative rates could be credited against the IEPS tax liability, and, if in excess, could be credited against the value added tax. Any remaining amount could be credited against the Ordinary Hydrocarbons Duty. Negative IEPS taxes, if any, in 2012 may also be credited in accordance with the same rules. |
Petróleos Mexicanos and the subsidiary entities are exempt from Mexican corporate income tax; however, some of its subsidiary companies are Mexican corporations and are subject to the tax regime applicable to all other Mexican corporations. Since 1994, interest payments by PEMEX on its external debt have been subject to Government withholding taxes. Nevertheless, these taxes do not represent a substantial portion of PEMEX’s total tax liabilities.
PEMEX is also subject to municipal and state taxes, such as real property and payroll taxes. However, because most of PEMEX’s facilities are located on federal property, which is not subject to municipal taxation, real property taxes are not a significant part of PEMEX’s total tax burden. Similarly, payroll taxes do not represent a substantial portion of PEMEX’s total tax liability.
In 2011, PEMEX paid total taxes and duties in the amount of Ps. 876.0 billion (56.2% of net sales), as compared to the Ps. 654.1 billion (51.0% of sales revenues) of taxes and duties that were paid in 2010, mainly due to the increase in Mexican crude oil export prices in 2011.
No assurance can be given that PEMEX’s tax regime will not change in the future.
Petroleum Workers’ Union
The Petroleum Workers’ Union represents approximately 72% of the work force of Petróleos Mexicanos and the subsidiary entities. The members of the Petroleum Workers’ Union are PEMEX employees and they elect their own leadership from among their ranks. PEMEX’s relationship with its employees is regulated by the Ley Federal del Trabajo (Federal Labor Law) and a collective bargaining agreement between Petróleos Mexicanos and the Petroleum Workers’ Union. The collective bargaining agreement is subject to renegotiation every two years, although salaries are reviewed annually. Since the Petroleum Workers’ Union was officially established in 1938, PEMEX has not experienced labor strikes; it has experienced work stoppages for short periods of time, but none of these stoppages had a material adverse effect on operations.
On July 27, 2011, PEMEX and the Petroleum Workers’ Union entered into a new collective bargaining agreement, which became effective on August 1, 2011. The agreement provides for a 4.75% increase in wages and a 1.15% increase in benefits. By its terms, the collective bargaining agreement is scheduled to expire on July 31, 2013. Pursuant to the agreement, PEMEX and the Petroleum Workers’ Union agreed on July 31, 2012 to a further 4.25% increase in wages and a 1.5% increase in other benefits, which became effective on August 1, 2012.
Legal Proceedings
In March 2005, the Secretaría de la Función Pública (General Comptroller’s Office of the Government, or SFP) announced that it had fined several former officers of Petróleos Mexicanos, alleging that these officers had illegally diverted Petróleos Mexicanos’ funds to members of the Petroleum Workers’ Union. In December 2009, the SFP announced it had fined Mr. Montemayor, former Director General of Petróleos Mexicanos, for Ps. 1,421.1 million. In April 2010, Mr. Montemayor filed an appeal against this penalty before the Tribunal Federal de Justicia Fiscal y Administrativa (Federal Court of Fiscal and Administrative Justice). A final resolution of this appeal is still pending.
D-46
In July 2007, the SFP announced that it had fined each of Mr. Raúl Muñoz Leos, ex-Director General of Petróleos Mexicanos and Mr. Juan Carlos Soriano Rosas, ex-General Counsel of Petróleos Mexicanos, an amount of Ps. 862.2 million and banned each of them from holding public sector positions for ten years for allegedly breaking budgetary laws and regulations in connection with a side agreement (No. 10275/04) dated August 1, 2004, between Petróleos Mexicanos and the Petroleum Workers’ Union. On August 25, 2005, Petróleos Mexicanos and the Petroleum Workers’ Union amended this side agreement in order to make certain adjustments required by applicable regulations. These penalties have been appealed by the former officers. On August 4, 2010, the Federal Court of Fiscal and Administrative Justice issued a resolution confirming Mr. Muñoz Leos’ liability for executing this side agreement, but declared the economic penalty null and void. The former officers filed a motion to review this resolution and an amparo. A final resolution of Mr. Muñoz Leos’ claim is still pending. On September 21, 2011, a judgment was issued confirming that the resolution against Mr. Soriano Rosas was null and void. Therefore, the proceedings against Mr. Soriano Rosas have concluded.
In December 2007, the SFP announced that it had fined Mr. Jaime Mario Willars Andrade, former Director General of Pemex-Refining, and Mr. Luis Ricardo Bouchot Guerrero, former Head of the Legal Department of Pemex-Refining, each for an amount of Ps. 1,390.3 million for administrative negligence related to the early termination of a long-term supply and services contract for the construction of a methyl tert-butyl ether plant, and that it had banned these officers from holding public sector positions in the future. In April 2009, these former officers appealed these penalties before the Federal Court of Fiscal and Administrative Justice. On September 27, 2011, the court issued a judgment that confirmed the administrative penalty banning these former officers from holding public sector positions in the future. In addition, the Court declared the economic penalty null and void, requesting the SFP to provide sufficient arguments to support it. The SFP filed a motion to appeal this decision, a final resolution of which is still pending.
In March and April 2010, the SFP filed 15 criminal complaints against officers and employees of Pemex-Refining in connection with a pipeline rupture in Nanchital, Veracruz, the investigation of which is still pending. In addition, the SFP imposed administrative penalties against these officers and employees, as well as certain contractors. The officers, employees and contractors filed appeals to the 25 administrative penalties, six of which have concluded with the following results: three penalties were confirmed, two penalties were declared null and void and one penalty was granted an amparo, which now requires a new resolution to be issued. As of the date of this report, final resolutions of the other 19 administrative penalties are still pending.
In May 2010, the SFP filed two criminal complaints and initiated several administrative proceedings against María Karen Miyazaki Hara, who served as PMI’s Deputy Director of Trading of Intermediate Distillates, for allegedly committing acts of corruption pursuant to which PMI lost revenues of approximately U.S. $13 million. The alleged acts involved the unauthorized sale of ultra low sulfur diesel, for the economic benefit of foreign companies, including Blue Oil Trading Ltd. During November 2010, the administrative proceedings concluded, resulting in Ms. Miyazaki Hara being fined Ps. 164.2 million and receiving a 20-year ban from public sector employment. Ms. Miyazaki Hara filed a claim before the Federal Court of Fiscal and Administrative Justice seeking that this resolution be declared null and void. As of the date of this report, a final resolution is still pending. The investigation of the criminal complaints is still underway.
In December 2010, the SFP announced that it had fined 14 officers and employees of Pemex-Refining and banned them from holding public sector positions for ten years for their alleged involvement in an illegal bidding process for the leasing of four tankers. These officers and employees have appealed these penalties, and a final resolution is pending.
On October 11, 2011, the SFP announced that it had fined three former officers of PMI an aggregate amount of Ps. 267.8 million and had dismissed and fined the Director General of PMI, Ms. María del Rocío Cárdenas Zubieta, an amount of Ps. 238.9 million, for allegedly committing acts of corruption during the period from January 2008 to January 2009. The alleged acts involved the use of improper contracting practices in the purchase and/or sale of petroleum products, which allegedly benefited certain of PMI’s commercial counterparties and resulted in financial harm to PMI in the amount of U.S. $25.7 million. Ms. Cárdenas Zubieta and the implicated ex-officers of PMI were also barred from public sector employment for a period of 10 years and might face criminal charges. These former officers have appealed these penalties and a final resolution is pending.
D-47
Actions Against the Illicit Market in Fuels
In conjunction with the Ministry of Finance and Public Credit and the Ministry of Energy, PEMEX has implemented several actions to combat the illegal market in fuels, with the objective of eliminating associated risks to personnel, facilities, the general population and the environment, as well as minimizing losses of PEMEX’s refined products, crude oil and condensates. In addition, PEMEX seeks to prevent or deter theft in the workplace by analyzing information provided by certain measurement systems, field surveillance and control instruments. These include mobile laboratories, volumetric control at service stations, terminal operations measurement, satellite tracking, integrated control systems, closed circuit television and online measurement systems.
In connection with the effort to combat the incidence of theft in the national pipeline system, and in coordination with the Ministry of National Defense, the Secretary of the Navy and the Federal Attorney General’s Office, PEMEX carried out the identification and sealing of 1,419 illegal pipeline taps in 2011, as compared to 710 illegal pipeline taps identified and sealed in 2010.
In the first three months of 2012, PEMEX carried out the identification and sealing of 384 illegal pipeline taps (351 in Pemex-Refining pipelines, 22 in Pemex-Exploration and Production pipelines and 11 in Pemex-Gas and Basic Petrochemicals pipelines). The states with the highest incidence of illegal taps in this period were: Tamaulipas with 54, Veracruz with 50, Sinaloa with 42, Nuevo León with 34 and Puebla with 26. A corresponding criminal report was filed in each of these cases, which resulted in 52 individuals being charged with hydrocarbons theft. In addition, during the first three months of 2012, PEMEX implemented several strategic measures in order to decrease incidents of theft in its facilities, including the performance of one technical operational assessment in PEMEX facilities, in order to verify the proper application of operating procedures regarding the measurement and distribution of products and to detect those areas most vulnerable to illegal activities.
Theft and illegal trade in fuels reduce PEMEX’s revenues by the amount that would have been generated from the sale of the stolen products, and reduce its net income, because the production cost of stolen products is included in PEMEX’s cost of sales. In addition, these criminal acts threaten the integrity of PEMEX’s pipeline system, thereby increasing the associated risks to its personnel, facilities, the general population and the environment and can interfere with PEMEX’s product quality, which can negatively impact consumers and PEMEX’s reputation. The estimated lost volume of gasoline and diesel due to illicit activities during 2011 was 3.5 million barrels, 150% greater than the 1.4 million barrels of estimated lost volume during 2010. In addition, the estimated lost volume of crude oil and condensates during 2011 was 3.3 million barrels, 5.7% less than the 3.5 million barrels of estimated lost volume during 2010.
On June 7, 2010, Pemex-Exploration and Production filed a civil claim before the United States District Court for the Southern District of Texas against BASF Corporation; Murphy Energy Corporation; Trammo Petroleum Inc.; BIO-UN Southwest Inc.; Valley Fuels LTD; U.S. Petroleum Depot, Inc.; Continental Fuels Inc.; and High Sierra Crude Oil Marketing, L.P., as well as against several individuals who were charged in criminal investigations related to theft of natural gas condensate from the Burgos basin and its subsequent illegal sale. The purpose of this and subsequent claims is to prevent the illegal purchase and resale of PEMEX’s products in the United States and to recover damages caused by such activities in an amount up to the value of the stolen natural gas condensate that it alleges was purchased and then resold by the defendants. Subsequently, Pemex-Exploration and Production identified other parties allegedly involved in the illegal purchase and resale of stolen petroleum products originating in Mexico. On May 29, 2011, Pemex-Exploration and Production filed an additional civil claim before the U.S. District Court for the Southern District of Texas against Big Star Gathering LTD L.L.P.; F&M Transportation, Inc.; Joplin Energy, LLC, f/k/a Hutchison Hayes Energy, LLC; Plains All-American Pipeline, L.P.; SemCrude, L.P.; Saint James Oil, Inc.; Superior Crude Gathering Inc.; TransMontaigne Partners, L.P.; Western Refining Company, L.P; and two individuals. These claims were subsequently joined into one claim, which is referred to herein as the initial illegal sale claim. On January 27, 2012, Pemex-Exploration and Production filed an amendment to this civil claim to include nine new defendants, including Shell Trading (US) Company (STUSCO), and also sought to add new claims for breach of contracts, breach of warranty of title and fraud, which it was able to assert after entering into agreements with AGE Refinery, Flint Hills Resources and Valero Marketing whereby these companies assigned to Pemex-Exploration and Production all of their claims related to their alleged purchase of stolen Mexican condensate. Pemex-Exploration and Production therefore sued individually and as an assignee. The United States District Court for the Southern District of Texas ruled on April 10, 2012 that only three of the new defendants could be added, and that six of the new defendants, including STUSCO, as well as the assigned claims, could not be added to this civil claim. As of the date of this report, the initial illegal sale claim remains in the evidentiary stage, and it is expected that a jury will be selected in the first six months of 2013.
D-48
As a result, on April 11, 2012, Pemex-Exploration and Production filed a new civil claim, which is referred to herein as the subsequent illegal sale claim, before the United States District Court for the Southern District of Texas against twelve parties: STUSCO and Shell Chemical Co.; ConocoPhillips; Big Star Gathering LTD, L.L.P.; F&M Transportation, Inc.; Superior Crude Gathering Inc.; Murphy Energy Corporation; High Sierra Crude Oil & Marketing LLC; St. James Energy Operating Inc.; Plains Marketing L.P.; Sunoco Partners Marketing & Terminals L.P.; FR Midstream Transport L.P.; and Marathon Petroleum Co. L.P. The subsequent illegal sale claim alleges largely the same conversion-based claims asserted in the initial illegal sale claim, as well as the assigned claims for breach of contracts, breach of warranty of title and fraud that it attempted to add in the initial illegal sale claim. This action also remains in the evidentiary stage.
Tourism
During the last three decades, the Government has implemented measures to promote the growth of the tourism industry. Through the Fondo Nacional de Fomento al Turismo (the National Fund for Tourism Development, or FONATUR), the Government has established tourist centers in Cancún, Ixtapa, Puerto Vallarta, Cabo San Lucas, Bahías de Huatulco and elsewhere. Mexico has increased its hotel and other lodging capacity from 132,701 rooms in 1970 to 637,232 in 2010, according to preliminary figures.
After merchandise exports (including in-bond industries) and worker remittances from abroad, tourism is Mexico’s third largest contributor of foreign exchange. During 2011, revenues from international travelers (including both tourists and visitors who enter and leave the country on the same day) decreased, totaling U.S. $11.9 billion, a 1.0% decrease from the level during 2010. Revenues from tourists to the interior (as opposed to border cities) totaled U.S. $9.4 billion in 2011, a 0.1% increase from the level during 2010. The number of tourists to the interior in 2011, 13.2 million, represented a 0.7% decrease from the level in 2010, while the average expenditure per tourist to the interior increased by 0.7%, to U.S. $713.8. During 2011, expenditures by Mexican tourists abroad amounted to U.S. $4.7 billion, a 12.1% increase from the level during 2010, while expenditures by Mexicans traveling abroad (which include both tourists and one-day visitors) amounted to U.S. $7.8 billion during 2011, an 8.0% increase from the expenditures in 2010. The tourism balance recorded a surplus of U.S. $4.0 billion in 2011, a 14.8% decrease from the U.S. $4.7 billion surplus recorded in 2010.
During the first six months of 2012, revenues from international travelers (including both tourists and visitors who enter and leave the country on the same day) totaled U.S. $6.6 billion, representing a 6.2% increase as compared to the same period of 2011. Revenues from tourists to the interior of Mexico (as opposed to border cities) totaled U.S. $5.3 billion during the first six months of 2012, a 7.1% increase as compared to the same period of 2011. The number of tourists to the interior of Mexico during the first six months of 2012, 7.0 million, represented a 5.4% increase as compared to the same period of 2011. During the first six months of 2012, the average expenditure per tourist to the interior of Mexico increased by 1.7% to U.S. $760.9, as compared to the same period of 2011. During the first six months of 2012, expenditures by Mexican tourists abroad amounted to U.S. $2.1 billion, a 1.6% increase as compared to the same period of 2011, while expenditures by Mexicans traveling abroad (which include both tourists and one-day visitors) totaled U.S. $3.7 billion during the first six months of 2012, a 3.0% increase as compared to the same period of 2011. The tourism balance recorded a surplus of U.S. $2.9 billion during the first six months of 2012, an increase of 10.6% from the U.S. $2.6 billion surplus recorded during the same period of 2011.
Agriculture
During 2011, approximately 54.7 million acres were cultivated, or about 11.3% of the country’s total area. In the same period, approximately 44.7 million acres were harvested, of which approximately 30.1% were irrigated.
According to preliminary figures, agriculture, livestock, fishing and forestry employed approximately 13.9% of the economically active population as of December 31, 2011 and accounted for 3.3% of Mexico’s GDP in 2011. According to preliminary figures, the output of the agriculture, livestock, fishing and forestry sector decreased by 3.0% in real terms in 2011 as compared to 2010, primarily due to frost in the early part of 2011 and extreme drought conditions in several regions of Mexico during the final part of the year.
D-49
According to preliminary figures, agriculture, livestock, fishing and forestry employed approximately 13.6% of the economically active population as of June 30, 2012 and accounted for 3.4% of Mexico’s GDP during the first six months of 2012. According to preliminary figures, the output of the agriculture, livestock, fishing and forestry sector increased by 7.6% in real terms during the first six months of 2012 as compared to the same period of 2011.
Agricultural exports accounted for 3.0% of Mexico’s merchandise exports in 2011 (including in-bond industry), placing Mexico as the third largest source of agricultural imports into the United States, behind only Canada and the European Union. Agricultural exports increased in nominal terms by 19.7% in 2011 as compared to 2010. The main agricultural exports in 2011 were tomatoes, wheat, avocado and coffee.
The Government considers the agricultural sector a national priority, and has instituted various measures aimed at enhancing agricultural productivity and improving the living standards of the rural population. Productivity increases are expected as a result of the consolidation of production into larger units, the expansion of the national irrigation system and the increased availability of credit. In order to improve the standard of living in rural areas, agricultural prices are reviewed by the Government to ensure they do not fall below cost. The Government has also encouraged private investment in the agricultural sector in the form of partnerships, joint ventures and supply arrangements between farmers and private sector companies.
The Secretaría de Agricultura, Ganadería, Desarrollo Rural, Pesca y Alimentación (Ministry of Agriculture, Livestock, Rural Development, Fisheries and Food, or SAGARPA) is responsible for developing policies aimed at increasing food production, maximizing the comparative advantages of the agricultural sector, integrating the activities of rural environment production chains with the rest of the economy and encouraging collaboration among producers. SAGARPA also sets the objectives for the agricultural sector and the National Development Plan.
The Comisión Nacional de las Zonas Áridas (National Commission of Arid Zones, or CONAZA) is a decentralized public institution of the Government operating under the auspices of SAGARPA. CONAZA was created by presidential decree on December 5, 1970, and is charged with the development of arid and uncultivated regions in Mexico. Since 2004, and under the direction of SAGARPA, CONAZA expanded to other regions affected by harsh weather conditions through comprehensive projects to restore productivity and promote practices for soil conservation and rainfall harvesting.
CONAZA has developed a program known as Componente de Conservación y Uso Sustentable del Suelo y Agua (Conservation and Sustainable Use of Soil and Water, or COUSSA), which is a part of the Programa de Sustentabilidad de Recursos Naturales (Program for the Sustainability of Natural Resources). COUSSA promotes the conservation, sustainable use and management of soil, water and vegetation used in primary production. COUSSA accomplishes this by encouraging rural communities to: (1) invest in conservation projects; (2) establish and develop procedures for the collection, storage and treatment of rainwater; and (3) employ the use of vegetation cover.
In 2011, COUSSA continued to support agricultural communities affected by soil erosion, degradation of vegetation cover or lack of water. For example, COUSSA collaborated with these communities to build small hydraulic works to collect and store rainwater that would have otherwise caused soil erosion. During 2011, COUSSA invested in 1,590 of these projects for a total of Ps. 1,759.2 million, of which Ps. 194.3 million was funded by the government of Mexico City and Ps. 1,565.2 million was funded by the Government.
Agricultural Reform
In 1990, roughly half of Mexico’s agricultural lands were held through the ejido system of land tenure. Ejidos developed as a direct result of the agrarian uprisings that were an important element of the Mexican Revolution of 1910 and are provided for and protected under the Constitution. Under the ejido system, peasant farmers work individual parcels of land to which title is held by the ejido, or peasant community. As discussed below, ejido farmers had the right to use communal lands, but, prior to January 1992, could not rent or otherwise transfer their rights to use such lands except to direct descendants.
D-50
In response to the slow growth of production by the ejido sector, attributable in part to increasing ejido populations, the subdivision of parcels into smaller and smaller units of production and disincentives to investment inherent in the ejido system, the Constitution was amended, effective as of January 1992, to permit more efficient use of ejido lands and the achievement of economies of scale. The amendments, together with the Ley Agraria (Agrarian Law) enacted by Congress and effective February 27, 1992, halted further redistribution of land and permitted ejido farmers to rent their parcels, to transfer the right to use their parcels to obtain financing and, in certain cases, to sell their land. In addition, corporations are now permitted to own agricultural lands, subject to certain limitations.
The modernization of the system of land tenure has and will continue to foster greater investment in agriculture by permitting landowners to access new sources of capital, to transfer land to more efficient producers and to make more efficient use of inputs. Although some ejido farmers have chosen to transfer possession of economically nonviable parcels of land and the Government anticipates that a number of ejido farmers will continue to do so, the increased productivity of the sector that has resulted and is expected to continue to result from the agricultural reform, as well as the growth of agribusiness, should generate employment opportunities for many of these workers outside of major urban areas. Nonetheless, the Government has increased its expenditures for investment in rural infrastructure and modernization of the agricultural sector to aid the process of agricultural reform and expects that further significant investments will be needed in the future to further modernize the agricultural sector.
Historically, the Government has intervened in the agricultural economy in order to assure adequate supplies of staples of the Mexican diet and maintain farm incomes through price supports. The Government’s policy has changed from one of active participation in the chain of distribution to one of encouraging the market-oriented development of the agricultural sector.
Apoyos y Servicios a la Comercialización Agropecuaria. (Support and Services for Agricultural Trading, or ASERCA), which was created by presidential decree on April 16, 1991 is a decentralized administrative branch of SAGARPA. ASERCA was created to enhance the export of Mexican agricultural products, and to reduce competitive disadvantages facing Mexican agricultural producers. ASERCA has two main functions, the first of which is to support the agricultural sector by: (1) subsidizing grains and oilseed producers; (2) facilitating access to commodities futures markets in order to stabilize product prices and thereby encourage increased production; (3) generating and disseminating market information; and (4) promoting exports. The second function is to operate and administer the Programa de Apoyos Directos al Campo (Direct Field Support Program, or PROCAMPO), which was created in 1993. PROCAMPO provides local agricultural producers with government funds, which are intended to help offset the subsidies that foreign competitors receive through their governments. Each year, more than four million applications are filed for aid under PROCAMPO, resulting in payments to three million producers and covering an area of approximately 14 million hectares. PROCAMPO grants support for the harvest of any legal crop or any ecological project crop authorized by the Secretaría de Medio Ambiente y Recursos Naturales (Department of Environment and Natural Resources, or SEMARNAT). Support under PROCAMPO is provided only to producers that are owners, holders in good faith or tenants of eligible land enrolled in PROCAMPO. Domestic producers may voluntarily enroll in the PROCAMPO program, regardless of farm size, type of land, method of irrigation, mode of production or political affiliation.
On October 31, 1995, the Government, the state governments and representatives of Mexico’s agricultural and rural sectors established a national rural development program known as Alianza para el Campo (Rural Alliance). In 2002, this program was renamed Alianza Contigo (Alliance with You). Initially, the program was intended to increase productivity, fight poverty, raise the income of families living in Mexico’s rural areas, produce enough basic foods for the population, promote exports of agricultural products and provide support to rural investment projects. However, this program has since been reoriented to improving agricultural production and productivity, promoting investment and the capitalization of the agricultural sector, promoting strategic agricultural products, developing a tropical and subtropical agricultural system, as well as investigating and transferring technology. This program has played a key role in the Government’s strategy to improve the economic and social conditions of less developed sectors of Mexican society.
D-51
Sugar Industry
In September 2001, the Government announced its decision to expropriate 27 sugar mills, roughly 46.7% of the sugar industry of the country, that were experiencing structural and financial problems. The expropriated mills are being administered by a government-owned development bank as trustee for the Fondo de Empresas Expropiadas del Sector Azucarero (Expropriated Sugar Companies Fund), a trust established to administer the expropriated assets of the sugar mills.
The Mexican sugar industry is heavily indebted. Accordingly, the Government is attempting to reorganize and restructure the industry while preserving employment in the industry during the restructuring process.
On February 19, 2004, the Supreme Court ruled in favor of claims originally filed by four of the subsidiaries of Grupo Azucarero México, S.A. de C.V. (GAM) asserting that the 2001 expropriations of four of the 27 total sugar mills were unconstitutional. The Court ordered the Government to return the four unconstitutionally expropriated mills to the shareholders of each mill as of the date of the original expropriations. A claim initiated by a fifth subsidiary of GAM was voluntarily withdrawn prior to the Court’s ruling. Other parties, including creditors of certain of the sugar companies whose mills were expropriated, have also filed claims against the Government (mainly Grupo Machado and Grupo Santos, former owners of 10 of the expropriated mills).
Between 2004 and 2011, the Government complied with the Supreme Court resolution by returning four mills to GAM. Regarding the remaining 23 expropriated mills, 14 have been sold and are operating under private administration, and the others are expected to be sold shortly. Currently, there are nine pending proceedings regarding the expropriated mills.
In August 2007, the Government announced the amendment of the Statutory Contract (Contrato-Ley) that regulates workers in the sugar industry. The main objective of the amendment is to modernize the labor relations of the sugar industry, thereby making the industry more competitive. Among the most relevant changes are new rules for the promotion of workers based on merit and productivity, as well as additional retirement benefits.
The 2010-2011 harvest yielded 5.2 million tons of sugar, as compared to the 2009-2010 harvest, which yielded 4.8 million tons of sugar.
Through June 30, 2012, which corresponds to week 40 of the 2011-2012 sugar production cycle, 1.7 million acres had been harvested and 5.0 million tons of sugar had been produced.
Transportation and Communications
According to preliminary figures, Mexico’s road network, in large part built and maintained by the Government, totaled an estimated 231,248 miles (372,158 km) at December 31, 2011, approximately 88,094 miles (141,774 km) of which were paved and approximately 5,287 miles (8,508 km) of which were toll expressways. The main Mexican cities are serviced by domestic and international airlines while many of the smaller communities benefit from scheduled service by domestic airlines. The Government operates some of the facilities at the principal seaports. During 2011, the amount of cargo transported via Mexican ports totaled 282.9 million tons, a 3.7% increase as compared to 2010.
The Government has promoted an increased role for the private sector in the development, management and improvement of Mexico’s port facilities over the last decade. The 1993 Ley de Puertos (Ports Law) permits the Government to grant concessions of up to 50 years for the construction and operation of port facilities. In exchange for these concessions, the concessionaires are expected to develop and modernize the port facilities and surrounding transportation infrastructure. During 1993, 64 concessions were granted for the construction, management and operation of such port facilities. Since 1993, an additional 127 concessions have been granted, including seven in 2011.
D-52
By the end of the 1980s, the length and condition of Mexico’s road infrastructure was insufficient to support the growth and modernization of the Mexican economy and the increased traffic resulting from the opening of the economy to foreign trade and investment. Lacking public resources to finance the expansion of the roads and highways, the Government embarked on a program under which private sector companies were granted long-term concessions for construction, operation and maintenance of toll roads. The program helped expand Mexico’s toll expressways by approximately 4,192 miles (6,747 km) from 1990 to 2011, according to preliminary figures.
However, the new toll expressways financed by the private sector experienced financial problems almost immediately due to high tolls (which discouraged their use), higher than expected construction costs and traffic volumes that were lower than originally projected. In response to this problem, in 1997 the Government approved a toll road restructuring program aimed at providing financial relief for toll road concessionaires to guarantee the maintenance of the toll roads and to establish the foundation for further development of the country’s highway infrastructure. Under this program, the Government reacquired 23 of the 52 concessions for construction, operation and maintenance of toll roads granted through 1994. Between May 2003 and April 2011, the Government auctioned 18 of the reacquired concessions to private sector operators. In August 2011, the Government awarded one additional 30-year concession to a private sector for the construction, maintenance and administration of the Libramiento Sur de Guadalajara and Libramiento de Tepic toll expressways. The Government is currently considering auctioning the concession for the development and administration of the Palmillas—Apaseo El Grande toll expressway. The period for the submission of proposals from private sector operators began on September 19, 2012.
On February 6, 2008, the Government announced the creation of the FONADIN, which was intended to support the Programa Nacional de Infraestructura (National Infrastructure Program) by facilitating financing for the modernization and expansion of the country’s infrastructure. FONADIN authorized approximately Ps. 29.0 billion of investments in 2009, approximately Ps. 32.0 billion in 2010 and approximately Ps. 36.0 billion in 2011, mainly for infrastructure projects in sectors such as transportation and communications, environmental protection and tourism. It is projected that from December 2007 to November 2012, the Government will have invested about Ps. 3.9 trillion in the modernization and expansion of the country’s infrastructure, which would represent an increase of 49.2% as compared to the amount invested from December 2001 to November 2006. From January to June 2012, the Infrastructure Fund made investments totaling Ps. 15.9 billion to develop infrastructure. In addition, during the period from January to June 2012, FONADIN’s Technical Committee authorized Ps. 12.8 billion of investments for the maintenance and modernization of the toll expressways network.
Until 1995, Mexico’s railroad system, which carries an estimated 26% of all freight moved in Mexico, was operated through the state-owned railroad monopoly, Ferrocarriles Nacionales de México (Ferronales). Pursuant to a 1995 law governing railways, the Government divided the railway system into three regional lines and one terminal in the Valley of Mexico, as well as several short lines. By the end of 1999, the three regional lines were sold and 75% of the capital stock of the terminal in the Valley of Mexico was sold to the new owners of the three regional lines, with the Government retaining a 25% ownership interest in the terminal. In connection with this process, the Government granted concessions to private sector participants corresponding to 98% of the country’s railway freight services (in terms of the volume of transportation services) and covering 81% of the railway network. In August 2005, the Government granted a concession to Ferrocarriles Suburbanos, S.A. de C.V. to provide railway passenger transportation services. In October 2005, the Government allowed Ferrosur, S.A. de C.V. to provide freight and passenger railway transportation services. The Government has not auctioned any other concessions since 2005. See “The Economy—The Role of the Government in the Economy; Privatization—Railways.”
In June 2007, Compañia de Ferrocarriles Chiapas-Mayab, S.A. de C.V., abandoned its concession to operate the Chiapas-Mayab railway and provide railway freight transportation services. The Government seized the assets of Compañia de Ferrocarriles Chiapas-Mayab to protect its rights and guarantee the provision of railway freight transportation services. In addition, the Government designated the government-owned Ferrocarril del Itsmo de Tehuantepec, S.A. de C.V. to operate the railway and provide railway freight transportation services on an interim basis. Compañia de Ferrocarriles Chiapas-Mayab filed a claim against the Government’s seizure, which was dismissed in May 2008.
D-53
According to preliminary figures, at December 31, 2011, Mexico had an estimated 17.6 telephone lines in service per 100 inhabitants, as compared to an estimated 15.5 telephone lines in service per 100 inhabitants at December 31, 2003. Telmex, which held the exclusive concession for domestic and international long-distance telephone services in Mexico until August 1996, was privatized in December 1990. In June 1995, Congress enacted a telecommunications liberalization law, and the Federal Telecommunications Commission has regulated and supervised telecommunications services since 1996. See “The Economy—The Role of the Government in the Economy; Privatization—Telecommunications.”
According to preliminary figures, the transportation and warehousing sector increased by 3.4% in real terms during 2011, as compared to a 7.5% increase in real terms during 2010.
Construction
The construction sector is subject to cyclical trends and has been among the sectors most affected by the changes in Government and private sector expenditures. The construction sector benefited from the reconstruction, modernization and expansion of the federal highway network, as well as from other infrastructure, residential and industrial plant construction projects. According to preliminary figures, the output of the construction sector increased by 4.8% in real terms during 2011, as compared to a 0.1% decrease in real terms during 2010.
Mining
Mexico has a substantial and varied array of mineral resources. Mexico is one of the world’s leading producers of silver, bismuth, antimony, fluorite, graphite, barite, molybdenum, lead and zinc. Mexico’s production of minerals satisfies most of its industrial needs and enables it to export silver, copper, sulfur and iron. According to preliminary figures, the mining, petroleum and gas sector decreased by 1.8% in real terms during 2011, as compared to an increase of 1.2% in 2010, mainly due to a decrease in the production of heavy crude oil and natural gas. Extractive mineral exports (excluding oil) increased by 67.6% in nominal terms in 2011 as compared to 2010, mainly due to the increase in the international prices of gold (16.3%) and iron (14.1%), as well as increased demand for these minerals in the metal markets. Extractive mineral exports (including oil and oil products) accounted for 17.3% of total merchandise exports (including in-bond industry exports) in 2011.
Under the Constitution and applicable Mexican laws, mineral mining activities may only be carried out by the Government or by Mexican individuals or corporations, pursuant to concessions granted by the Government. However, foreign investment in Mexican mining companies is permitted, with the exception of the exploitation of radioactive minerals. The foreign investment and mining regulations permit foreign investors to hold, on a temporary basis, majority interests in companies engaged in mining activities. These regulations are aimed at promoting the development of the mining industry by increasing and broadening exploration, finding new sources of financing and investment and fostering the development of domestic technology. Mexico’s Ley Minera (Mining Law) permits exploration concessions of up to six years and exploitation concessions of up to 50 years.
Electric Power
As of December 31, 2011, approximately 99.2% of Mexico’s urban population and 93.6% of Mexico’s rural population (or 97.9% of the total population) had access to electric power. Providing additional access to electric power remains a Government priority. At December 31, 2011, installed generating capacity was 52,511.5 megawatts, a decrease of 0.8% from 2010. Electric production for 2011 was 259,155.3 gigawatt hours, an increase of 6.9% as compared to 2010 and an overall increase of 11.4% since 2007. Of the total energy generated in 2011, 12.0% was produced by hydroelectric plants, 2.3% by geothermal plants, 6.4% by coal-fired plants, 3.4% by nuclear power plants, 0.03% by aeolian (wind) plants, 44.7% by hydrocarbons plants and 31.2% by independent producers. Diversification of energy resources is an important objective of the Government. Domestic energy generation in 2011 was supplemented by imports of electric power totaling 596 gigawatt hours. Mexico exported 1,292.5 gigawatt hours of electricity in 2011.
The Constitution and applicable Mexican laws provide that the generation, transmission, transformation and distribution of electric power constitute a public service, and are therefore reserved solely to the Mexican nation. At December 31, 2011, approximately 91.0% of electric generating capacity was held by the public sector through CFE. The balance of generating capacity is in privately owned facilities.
D-54
Private investors are allowed to participate in the electric energy sector in several ways. Under the 1992 Ley del Servicio Público de Energía Eléctrica (Electric Energy Public Service Law, or Electric Energy Law), electric energy can be produced by self-suppliers, cogenerators, independent producers and de minimis producers. However, self-suppliers and cogenerators must sell all excess production to CFE, independent producers must sell their production to CFE or export it (when authorized) and de minimis producers must sell their production to CFE, to small rural communities or to isolated areas without electric energy. The Electric Energy Law also contemplates the possibility of foreign investment in the Mexican electric energy industry, although only limited foreign investment has been made in this sector to date.
A consortium of U.S. and Mexican companies built the first independent power plant, the Samalayuca II 700 megawatt combined cycle thermoelectric power generation facility near Ciudad Juarez, Mexico, which is now being leased to CFE. From January 2007 to June 2012, pursuant to the National Infrastructure Program, the Government invested a total of Ps. 237.4 billion in the electric energy sector, an increase of 15.7% as compared to the period from January 2001 to June 2006. From September 1, 2011 to August 31, 2012, the Government invested Ps. 614.0 million in new electricity generation, transmission and distribution infrastructure. CFE continually invests in electricity generation, transmission and distribution infrastructure in order to address Mexico’s growing demand for electricity. CFE’s financing and investment plans are updated annually and require the approval of the Mexican Congress.
On October 11, 2009, President Calderón issued a decree, which was published in the Official Gazette of the Federation, ordering the dissolution and liquidation of Luz y Fuerza del Centro. Previously, Luz y Fuerza del Centro was the decentralized entity responsible for providing electricity to Mexico City and certain regions in the states of Hidalgo, Morelos and Puebla. CFE is now responsible for providing electricity in those areas previously serviced by Luz y Fuerza del Centro.
D-55
FINANCIAL SYSTEM
Mexico’s financial system is composed of commercial banks, national development banks, securities brokerage houses, development trust funds and other non-bank institutions, such as insurance companies, bonding companies, foreign exchange houses, factoring companies, bonded warehouses, financial leasing companies and limited-scope financial institutions. Pursuant to the Financial Groups Law, multiple financial service companies may operate as part of a single group, provided that each financial service company is organized as a separate company owned by a single financial service holding company. In addition, each financial service holding company must own at least three different types of financial service companies. However, a financial service holding company may own only two financial service companies if each of those companies is a commercial bank, a securities firm or an insurance company.
The principal authorities that regulate Mexican financial institutions are the Ministry of Finance and Public Credit, Banco de México, the Comisión Nacional Bancaria y de Valores (National Banking and Securities Commission, CNBV), the Comisión Nacional del Sistema del Ahorro para el Retiro (Retirement Savings Commission) and the Comisión Nacional de Seguros y Fianzas (National Insurance and Surety Bonds Commission).
Under the Organic Law of the Federal Public Administration, the Ministry of Finance and Public Credit is responsible for the coordination and supervision of Mexico’s financial system and for the formulation of Mexico’s fiscal policy.
Central Bank and Monetary Policy
Banco de México, chartered in 1925, is the central bank of Mexico and, at December 31, 2011, had assets totaling Ps. 2,167.6 billion (U.S. $154.9 billion). Banco de México is Mexico’s primary authority for the execution of monetary policy and the regulation of currency and credit. It is authorized by law to regulate interest rates payable on time deposits, to establish minimum reserve requirements for credit institutions and to provide discount facilities for certain types of bank loans.
In 1993, a constitutional amendment relating to the activities and role of Banco de México in the economy came into effect. The amendment strengthened the authority of Banco de México with respect to monetary policy, foreign exchange and related activities, as well as the regulation of the financial services industry. The amendment’s purpose was to reinforce the independence of Banco de México, allowing it to act as a counterbalance to the executive and legislative branches in monetary policy matters. In 1994, a new law governing the activities of Banco de México put into effect the greater degree of autonomy granted to it under the constitutional amendment and established the Foreign Exchange Commission, which is charged with determining the nation’s exchange rate policies. Under the 1994 law, Banco de México is managed by a five-member Junta de Gobierno (Board of Governors), consisting of one Governor and four Deputy Governors, appointed by the President of Mexico and confirmed by the Senate. The Governor of Banco de México is appointed for a six-year term beginning on January 1 of the fourth year of each Presidential administration. On December 28, 2009, President Calderón appointed Mr. Agustín Guillermo Carstens Carstens as Governor of Banco de México for a six-year term that commenced on January 1, 2010.
The principal objective of the Government’s monetary policy has been and continues to be the reduction of inflation. Accordingly, in the past, Banco de México has decreased the availability of domestic credit when the exchange rate depreciated, capital outflows occurred or inflation was higher than projected. In 1995, Banco de México introduced new reserve requirements (which were intended to limit the amount of overdrafts by banks of their accounts at Banco de México) to facilitate the regulation of liquidity and reduce Banco de México’s daily net extension of credit. In addition, Banco de México has established quarterly targets for the expansion of net domestic credit for each quarter since 1996.
D-56
Banco de México’s definitions of Mexico’s monetary aggregates, introduced in July 1999, measure financial savings provided by the internal and external financial markets, separating savings of residents and nonresidents of the country in both markets. In addition, the monetary aggregates permit a differentiation of financial savings generated by the public and private sectors. The monetary aggregates can be described as follows:
| | • | | M1 consists of bills and coins held by the public, plus checking accounts denominated in local currency and foreign currency, plus interest-bearing deposits denominated in pesos and operated by debit cards, plus savings and loan deposits; |
| | • | | M2 consists of M1, plus bank deposits, securities issued by the Government, securities issued by firms and non-bank financial intermediaries and liabilities of the Government and INFONAVIT related to the Retirement Savings System; |
| | • | | M3 consists of M2, plus financial assets issued in Mexico and held by non-residents; and |
| | • | | M4 consists of M3, plus deposits abroad at foreign branches and agencies of Mexican banks. |
The following table shows Mexico’s M1 and M4 money supply aggregates at each of the dates indicated.
Money Supply
| | | | | | | | | | | | | | | | | | | | | | | | |
| | | December 31, | | | August 31,
2012(1) | |
| | | 2007 | | | 2008 | | | 2009 | | | 2010 | | | 2011(1) | | |
| | | (in millions of nominal pesos) | |
M1: | | | | |
Bills and coins | | Ps. | 430,084 | | | Ps. | 494,400 | | | Ps. | 537,070 | | | Ps. | 599,363 | | | Ps. | 665,916 | | | Ps. | 658,457 | |
Checking deposits | | | | | | | | | | | | | | | | | | | | | | | | |
In domestic currency | | | 604,757 | | | | 623,403 | | | | 654,923 | | | | 794,128 | | | | 934,698 | | | | 895,707 | |
In foreign currency | | | 97,679 | | | | 117,784 | | | | 139,506 | | | | 128,134 | | | | 132,854 | | | | 150,172 | |
Interest-bearing peso deposits | | | 214,195 | | | | 244,105 | | | | 276,680 | | | | 304,404 | | | | 341,113 | | | | 353,703 | |
Savings and loan deposits | | | 3,338 | | | | 3,229 | | | | 6,464 | | | | 7,289 | | | | 8,554 | | | | 8,784 | |
| | | | | | | | | | | | | | | | | | | | | | | | |
Total M1 | | Ps. | 1,350,053 | | | Ps. | 1,482,920 | | | Ps. | 1,614,642 | | | Ps. | 1,833,317 | | | Ps. | 2,083,134 | | | Ps. | 2,066,822 | |
| | | | | | | | | | | | | | | | | | | | | | | | |
M4 | | Ps. | 5,719,994 | | | Ps. | 6,680,585 | | | Ps. | 7,126,818 | | | Ps. | 8,036,759 | | | Ps. | 9,330,267 | | | Ps. | 10,192,481 | |
Note: Numbers may not total due to rounding.
Source: Banco de México.
2011 and 2012 Monetary Programs
Consistent with Mexico’s monetary program for 2011, Mexico’s monetary program for 2012 has as its principal objective the achievement of an inflation rate at or below its permanent target of 3.0% (+/-1.0%), which is intended to stabilize the purchasing power of the Mexican peso. Consumer inflation during 2011 was 3.8%, which was within the expected deviation from the inflation target for the year and 0.6 percentage points lower than consumer inflation during 2010. Mexico’s monetary programs for 2011 and 2012 were comprised of the following features:
| | • | | the announcement of an explicit, multi-year plan to control inflation; |
| | • | | a systematic analysis of the economy and inflationary pressures; |
| | • | | a description of the instruments used by Banco de México to achieve its objectives; and |
| | • | | a policy of communication that promotes transparency, credibility and effective monetary policy. |
D-57
Prior to 2008, Banco de México used a corto or “short” mechanism to induce the changes in interest rates needed to achieve its inflation objectives. Under this mechanism, Banco de México set a predetermined amount at which the daily average of the net total balance of all current accounts of banks accumulated during a certain period would close, and controlled that amount by restricting the amount of credit it auctioned to banks on a daily basis.
Since January 21, 2008, Banco de México has used the Tasa de Fondeo Bancario (overnight interbank funding rate) instead of the corto mechanism as its primary monetary policy instrument. The overnight interbank funding rate is adjusted when the medium-term inflation projections deviate from the inflation target of 3.0% (+/-1.0%). Banco de México increased the minimum overnight interbank funding rate from 7.50% to 7.75%, on June 20, 2008, to 8.00% on July 18, 2008 and to 8.25% on August 15, 2008. In response to the global economic crisis, Banco de México decreased the minimum overnight interbank funding rate to 7.75% on January 16, 2009, to 7.50% on February 20, 2009, to 6.75% on March 20, 2009, to 6.00% on April 17, 2009, to 5.25% on May 15, 2009, to 4.75% on June 19, 2009 and to 4.50% on July 17, 2009. Since July 17, 2009, the minimum overnight interbank funding rate has remained at 4.50%.
At December 31, 2011, the monetary base totaled Ps. 763.5 billion, a 10.1% increase in nominal terms as compared to Ps. 693.4 billion at December 31, 2010, as compared to a 9.7% increase from December 31, 2009 to December 31, 2010. The net domestic credit of Banco de México registered a negative balance of Ps. 1,318.1 billion at December 31, 2011, as compared to a negative balance of Ps. 796.2 billion at the end of 2010. The 65.5% increase in nominal terms in the negative balance was attributable primarily to the increase in the net international assets of Banco de México, which exceeded the increase in the monetary base during the year.
During 2011, the M1 money supply increased by 9.5% in real terms, as compared with a growth of 8.8% in real terms in 2010. This increase in growth in the M1 money supply was driven by a 13.4% increase in checking account deposits denominated in pesos and a 7.0% increase in the amount of bills and coins held by the public, each in real terms as compared to 2010.
Financial savings—defined as the difference between the monetary aggregate M4 and bills and coins held by the public—increased by 12.2% in real terms in 2011, as compared to 8.1% real growth in 2010. This growth was attributable to a 51.0% increase in savings generated by non-residents and a 7.6% increase in savings generated by Mexican residents in 2011, each in real terms and as compared to 2010.
At August 31, 2012, the M1 money supply was 11.5% greater in real terms, as compared to the level at August 31, 2011. The amount of bills and coins held by the public at August 31, 2012 was 12.2% greater in real terms than at August 31, 2011, while the aggregate amount of checking account deposits denominated in pesos at August 31, 2012 was 9.2% greater in real terms than at August 31, 2011.
At August 31, 2012, financial savings—defined as the difference between the monetary aggregate M4 and bills and coins held by the public—were 11.3% greater in real terms than financial savings at August 31, 2011. Savings generated by Mexican residents increased by 7.5% and savings generated by non-residents increased by 35.4%, both in real terms and as compared to August 31, 2011.
At October 14, 2012, the monetary base totaled Ps. 732.5 billion, a 4.1% nominal decrease from the level of Ps. 763.5 billion at December 31, 2011, due to lower demand for bills and coins held by the public.
Banking System
In September 1982, the Government decreed the nationalization of private Mexican commercial banks. In November 1982, the Constitution was amended to implement the nationalization, under which the Government was granted a monopoly on the provision of banking and credit services. From 1982 to 1988, the number of banking institutions was reduced from 68 to 18.
Effective June 28, 1990, the Constitution was amended to permit Mexican individuals and financial holding companies to own controlling interests in Mexican commercial banks. Subsequently, the Ley de Instituciones de Crédito (Law of Credit Institutions, or the Banking Law) was enacted to regulate the ownership and operation of Mexican commercial banks. Pursuant to the Banking Law, Mexico began the process of privatizing commercial banks. By July 6, 1992, the Government had privatized all 18 state-owned commercial banks, with the proceeds from the sale of the banks exceeding U.S. $12 billion.
D-58
In connection with the implementation of NAFTA, amendments to several laws relating to financial services, such as the Banking Law and the Ley del Mercado de Valores (Securities Market Law), became effective on January 1, 1994. These amendments permitted non-Mexican financial groups and financial intermediaries, through Mexican subsidiaries, to engage in various activities in the Mexican financial system, including banking and securities activities. In April 1994, the Ministry of Finance and Public Credit issued regulations that implemented these provisions. These regulations set forth rules under which Canadian and U.S. financial institutions (and other foreign financial institutions acting through Canadian or U.S. affiliates) are permitted to establish or acquire Mexican financial institutions and financial holding companies. Pursuant to these rules, the aggregate net capital of Mexican commercial banks controlled by foreign financial institutions was not permitted to exceed 25% of the total net capitalization of all Mexican banks prior to January 1, 2000 (excluding certain acquisitions pursuant to a program approved by the Ministry of Finance and Public Credit).
In December 1998, Congress approved legislation introducing additional financial and banking reforms. These reforms did not affect the general foreign ownership restrictions under the Banking Law, but removed the remaining restrictions on foreign ownership of the largest Mexican banks.
At October 25, 2012, there were 42 commercial banks registered with the CNBV.
Development Banks
The Mexican banking system includes various development banks, the substantial majority of the capital of which is owned by the Government. The most important development banks are NAFIN, Bancomext and Banobras. NAFIN’s principal activities include the granting of credit to small- and medium-sized businesses, promoting the development of the securities market and serving as a financial agent of the Government in certain international transactions. Bancomext’s principal activities are the granting of export- and import-related credit and the issuance of guaranties to private- and public-sector entities in the promotion of foreign trade. On June 13, 2007, ProMéxico, a new public trust, was created. This trust, which is supervised by the Ministry of Economy, has assumed certain responsibilities from Bancomext with respect to the promotion of foreign trade and foreign investment. Banobras’ principal activities consist of providing short, medium- and long-term financing to public enterprises and federal, state and municipal governments, as well as granting credit for low-income housing.
Under the laws establishing NAFIN, Bancomext and Banobras, the Government is responsible, at all times, for the transactions entered into by these development banks with foreign private, governmental and inter-governmental institutions, among others.
At October 25, 2012, the system of governmental development banks was composed of six institutions: NAFIN, Banobras, Bancomext, Sociedad Hipotecaria Federal, S.N.C. (SHF), Banco del Ahorro Nacional y Servicios Financieros, S.N.C. (BANSEFI), and Banco Nacional del Ejército, Fuerza Aérea y Armada, S.N.C. (BANJERCITO).
Banking Supervision and Support
Under the Banking Law, the CNBV is responsible for the supervision of commercial and development banks. The CNBV has the authority to impose sanctions for the failure to comply with the Banking Law or the regulations promulgated thereunder. The CNBV is administered by a board of directors composed of ten members in addition to its president and two of its vice presidents. Five of the members are appointed by the Ministry of Finance and Public Credit, three members are appointed by Banco de México, one member is appointed by the National Commission for the Retirement Savings System and one member is appointed by the National Insurance and Surety Bonds Commission.
D-59
The CNBV has the power to declare an intervención (managerial intervention) in the management of financial holding companies, banks and securities dealers. Pursuant to this power, the CNBV may intervene in the management of a financial group at either the holding company or operating company level.
Background
From 1991 through 1994, the Government promulgated rules that, among other things, established procedures for classifying loans as “non-performing” and established loan loss reserve requirements and capital adequacy standards for Mexican commercial and development banks, pursuant to which Mexican banks are required to maintain capitalization levels consistent with international standards.
The 1994-1995 peso devaluation and ensuing financial crisis created concerns about the stability of the Mexican banking system. The combination of devaluation, higher domestic interest rates and contraction in real GDP weakened the quality of the assets held by Mexican banks, thereby causing the capitalization of several banks to fall below the minimum required levels and creating funding difficulties for many banks.
The weakening of the banking system prompted the Government to enact policies aimed at increasing the capitalization requirements for Mexican banks. New capital reserve requirements were introduced by Banco de México in March 1995 to facilitate the regulation of liquidity. Pursuant to these requirements, a bank that overdraws its account with Banco de México must subsequently deposit funds and maintain amounts on deposit at least equal to the amount of the overdraft. Substantial fines may be imposed if a bank fails to make and maintain such deposits. The new reserve requirements were intended to reduce Banco de México’s daily net extension of credit. In addition, in 1997 the CNBV adopted significant changes in the accounting practices applicable to Mexican commercial banks and development banks, with the intent of making those practices more consistent with international accounting standards, including U.S. generally accepted accounting principles.
In response to the 1994-1995 financial crisis, the Government took a number of additional steps to support the banking system. These measures included broadening the scope for permissible investment by foreign and domestic investors in the equity of Mexican financial institutions, enhancing the power of the CNBV to supervise and intervene in the activities of financial holding companies and creating a number of debtor support programs to restructure past-due loans caused by the crisis, then-rising interest rates and the ongoing recession. From 1994 to 1996, the CNBV exercised its authority to intervene in the management of a number of Mexican financial institutions, including the Cremi/Union financial group, Grupo Financiero Asemex Banpaís, S.A. de C.V. and its banking and insurance subsidiaries, Banco Capital, S.A. and Banco del Sureste, S.A.
In addition, the Government established the Programa de Capitalización Temporal de la Banca (Temporary Capitalization Program, or PROCAPTE), a voluntary program to assist viable but undercapitalized banks, under which the Fondo Bancario de Protección de Ahorro (Banking Fund for the Protection of Savings, or FOBAPROA) advanced funds to participating banks in exchange for five-year, mandatorily convertible bonds. By May 1995, the value of bonds issued through PROCAPTE reached Ps. 7,008 million. In February 1997, the last bank participating in PROCAPTE liquidated its total participation, thus concluding the PROCAPTE program.
Through FOBAPROA, the Government made foreign exchange available through a foreign exchange credit window to help banks meet dollar liquidity needs. Outstanding drawings under this program reached their highest point of U.S. $3.8 billion in April 1995 and were completely repaid by August 31, 1995. No drawings were made after that date.
In 1995 and 1996, the Ministry of Finance and Public Credit approved recapitalization plans for twelve of Mexico’s financial institutions, many of which involved strategic investments by foreign financial institutions and the purchase by FOBAPROA of large portions of the loan portfolios of the affected banks.
IPAB
In 1999, the Government’s program to rescue troubled banks, first implemented in 1995, was restructured. Under the revised scheme, FOBAPROA was replaced by the Instituto para la Protección al Ahorro Bancario (Bank Savings Protection Institute, or IPAB), which assumed FOBAPROA’s assets and liabilities, except for certain liabilities that were explicitly excluded under the financial reforms.
D-60
IPAB also manages a deposit insurance program. During 1999, IPAB commenced a transition program under which deposit insurance limits were introduced gradually. Deposit insurance is now limited to 400,000 Unidades de Inversión (UDIs), units of account whose value in pesos is indexed to inflation on a daily basis, as measured by the change in the NCPI, per person or entity, per institution. At October 25, 2012, one UDI was worth Ps. 4.82.
Congress allocates funds to IPAB on an annual basis to manage and service IPAB’s net liabilities, but those liabilities have not become public sector debt as had been originally proposed. In emergency situations, IPAB is permitted to contract, without congressional authorization, additional financing every three years in an amount not to exceed 6% of the total liabilities of Mexican banking institutions. At June 30, 2012, IPAB’s debt totaled Ps. 867.6 billion, as compared to Ps. 862.4 billion at December 31, 2011.
In addition to Mexico’s auctions of debt securities in the domestic market, IPAB also sells, through auctions conducted by Banco de México, peso-denominated debt securities in Mexico, known as Bonos de Protección al Ahorro (Savings Protection Bonds). IPAB uses the proceeds of these sales to service its maturing obligations, improve the maturity profile of its indebtedness and reduce its financing costs. Three types of Savings Protection Bonds are offered by IPAB: BPAs, BPATs and BPA182s. BPAs have a three-year maturity and pay interest monthly at a rate (reset monthly) equal to the greater of the 28-day Cetes rate and the rate applicable to one-month bank notes (Pagarés con Rendimiento Liquidable al Vencimiento). IPAB placed a total of Ps. 49.4 billion of BPAs in the market in 2011, as compared to a total of Ps. 62.4 billion of BPAs sold in 2010. BPATs have a five-year maturity and pay interest every 91 days at a rate (reset quarterly) equal to the 91-day Cetes rate. IPAB placed a total of Ps. 98.8 billion of BPATs in the market in 2011, as compared to a total of Ps. 87.1 billion of BPATs sold in 2010. BPA182s, which were first offered in May 2004, have a seven-year maturity and pay interest every 182 days at a rate (reset every six months) equal to the 182-day Cetes rate. IPAB placed a total of Ps. 80.6 billion of BPA182s in the market in 2011, as compared to a total of Ps. 68.9 billion of BPA182s sold in 2010.
In addition to its other activities, IPAB is now in the process of selling loan portfolios and other assets acquired by FOBAPROA during the 1994-1996 period. Significant sales of commercial loan assets since the beginning of 2009 include the following:
| | • | | In February 2009, IPAB auctioned a bundle of commercial loans of Estrategia Bursátil S.A. de C.V. Casa de Bolsa. The amount received for the loan portfolio was Ps. 1.7 million. The net proceeds from this transaction represented 190.4% of the portfolio’s face value of Ps. 0.9 million. |
| | • | | In September 2010, IPAB auctioned a bundle of trusts of Banco del Centro S.A. and Banpaís, S.A. The amount received for the trust portfolio was Ps. 26.9 million. The net proceeds from this transaction represented 7.2% of the portfolio’s face value of Ps. 374.6 million. |
| | • | | In December 2011, IPAB auctioned a bundle of commercial loans of Banco Unión, S. A. The amount received for the loan portfolio was Ps. 0.1 million. The net proceeds from this transaction represented 4.0% of the portfolio’s face value of Ps. 2.6 million. |
| | • | | In February 2012, IPAB auctioned a bundle of trusts of Fideicomiso de Activos Corporativos Estratégicos. The amount received for the trust portfolio was Ps. 34.0 million. The net proceeds from this transaction represented 97.0% of the portfolio’s face value of Ps. 35.1 million. |
Since the IPAB’s last auction of a loan portfolio in February 2012, there has been no further activity in this area.
D-61
Global Financial Crisis
In response to the global financial crisis, the Government and Banco de México announced on October 27, October 29 and October 30, 2008, a series of joint actions aimed at reducing liquidity problems and stabilizing domestic financial markets, including:
| | • | | a reduction in the amount of long-term fixed rate peso- and UDI-denominated bonds and an increase in the amount of Cetes offered through Government securities auctions during the fourth quarter of 2008; |
| | • | | a reduction in the weekly issuances of Savings Protection Bonds by IPAB in the fourth quarter of 2008; |
| | • | | a program conducted by Banco de México to repurchase up to Ps. 150 billion of debt securities issued by IPAB, resulting in the repurchase of Ps. 145.9 billion of debt securities in three auctions held on November 4, November 11 and November 18, 2008; |
| | • | | auctions carried out by Banco de México of interest rate swaps of up to Ps. 50 billion, through which market participants were able to exchange their exposure to long-term fixed interest rates for short-term variable interest rates, thereby allowing investors holding long-term fixed rate instruments to reduce their vulnerability to interest rate fluctuations. Banco de México used the 28-day TIIE as the reference rate for the variable interest rate. The auctions were held on November 14 and November 19, 2008, resulting in the allocation of Ps. 4.4 billion of swaps; |
| | • | | a request made by the Foreign Exchange Commission to the IMF on April 1, 2009, for a one-year contingent credit line in the amount of approximately U.S. $48 billion. On April 17, 2009, the IMF formally granted Mexico’s request. On March 25, 2010, the IMF approved a one-year renewal of the contingent credit line due to continued uncertainties related to global economic conditions and credit availability. On January 10, 2011, the IMF approved an advance renewal and amendment of the contingent credit line, which extended the term of the credit line to two years and increased the amount available under the line to approximately U.S. $72 billion. As of the date of this report, no amounts have been disbursed under this contingent credit line; |
| | • | | an agreement between Banco de México and the Federal Reserve Bank of New York to establish temporary swap facilities of up to U.S. $30 billion effective until February 1, 2010. These facilities were designed to provide financial institutions in Mexico with liquidity in U.S. dollars and provide Banco de México with greater flexibility in addressing the demand for U.S. dollars in the Mexican financial markets. On April 21, 2009, Banco de México utilized this swap facility to provide U.S. $3.2 billion in dollar-denominated loans, with 264-day terms and interest resetting every 88 days, to commercial and development banks in Mexico. This swap facility expired in February 2010 and was not renewed; and |
| | • | | the repurchase by Banco de México and the Ministry of Finance and Public Credit of Ps. 4.3 billion of MBonos (fixed rate peso-denominated government bonds) and UDI 713 million (Ps. 3.0 billion) of Udibonos (government bonds denominated in UDIs) through auctions conducted in December 2008. |
Regulation
The Ministry of Finance and Public Credit adopted new rules governing the capitalization requirements for Mexican commercial banks effective January 1, 2000. These rules require Mexican commercial banks to:
| | • | | limit to 20% the amount of deferred taxes arising from fiscal losses that may be included as Tier 1 capital; |
| | • | | classify all new issuances of subordinated convertible debt as Tier 2 capital. Outstanding subordinated mandatorily convertible debt, subject to current limitations, will remain as Tier 1 capital until its maturity or conversion; |
D-62
| | • | | exclude investments in non-financial companies and companies whose shares are not traded on the Mexican Stock Exchange from Tier 1 capital, except where those investments result from the capitalization of restructured loans; and |
| | • | | exclude from Tier 2 capital certain specific assets, including credit card debt, mortgages and commercial loans, and establish general loan loss reserves for these types of assets. |
The rules also allow Mexican commercial banks, as part of a capitalization program, to issue cumulative and noncumulative subordinated debt securities through a special purpose vehicle, thereby providing them with a new financing alternative in international markets. These securities must have a minimum maturity of ten years, be designated as unsecured and deeply subordinated debt of the bank and provide for the deferral (cumulative) or cancellation (noncumulative) of interest payments in certain circumstances, as well as payment of the face value on the maturity date. Subject to certain limitations, noncumulative instruments may be included as Tier 1 capital.
In October 2010, the Basel Committee on Banking Supervision established, among other items, stricter capital reserve requirements for banks of member countries to help ensure that these banks would be able to withstand the type of stress experienced during the recent global financial crisis. Beginning on January 1, 2013, member countries must implement these new capital requirements, which banks will be required to comply with by the end of 2018. As a result of the strict capital reserve requirements already in place in Mexico, Mexican banks should not need to significantly modify their capital structures in order to comply with the new capital requirements by the stated deadline.
During the second half of 2000, the Government continued to establish rules and criteria for the regulation of banking institutions in accordance with accepted international practices. In September 2000, the Government issued new rules for classifying the quality of loan portfolios of commercial banking institutions. At the same time, the rules governing the capitalization requirements of commercial banks were modified. In October 2000 and again in September 2003, the Government announced new rules for classifying the credit portfolios of development banks.
Under these rules, development banks are required to:
| | • | | maintain a minimum net capital that reflects the market and credit risks of their operations; |
| | • | | gather the information necessary to grant or restructure various types of credit, both guaranteed and non-guaranteed; |
| | • | | maintain adequate records, implement procedures by which to verify recorded information and make such records available to certain identified creditors; |
| | • | | establish procedures by which to manage risk and perform their credit activity; and |
| | • | | implement a system of internal controls on operations. |
The Banking Law was amended on June 4, 2001 to:
| | • | | enhance corporate governance by (1) expanding minority shareholders’ rights, (2) introducing independent board members and (3) requiring an audit committee of the board of directors; |
| | • | | improve the framework for banking operations by (1) providing adequate regulation regarding the provision of banking services using new technologies, (2) allowing banks to offer additional services and (3) setting a new framework for related operations; and |
| | • | | strengthen regulation and surveillance while reducing costs by (1) introducing prompt corrective actions based on banks’ capitalization levels, (2) defining responsibilities and activities of the various financial authorities and (3) expanding the role of external auditors. |
D-63
The Banking Law was further amended on February 2, 2008 to:
| | • | | enhance the CNBV’s authority to supervise financial services companies (specifically, the CNBV may perform visits to banks to review, verify, test and evaluate their operations, processes and internal control and risk management systems); |
| | • | | increase the conditions for the granting of credit to customers, including the requirement that banks analyze and evaluate—using quantitative and qualitative information—the creditworthiness of their customers; |
| | • | | improve transparency and reliability by requiring banks to periodically disclose certain corporate, financial, administrative, operational, economic and legal information on their websites and in a national newspaper; |
| | • | | provide the CNBV with the power to inspect and supervise entities that provide external audit services to banks, including members of the audit team, in order to verify auditors’ compliance with the Banking Law; and |
| | • | | introduce bancos de nicho (limited-purpose banks), which are permitted to engage in only a limited amount of banking activities as set forth in their by-laws. |
On July 28, 2010, the Consejo de Estabilidad del Sistema Financiero (Financial System Stability Council) was created by the President of Mexico. It is composed of members from the supervisory and regulatory authorities of the Mexican financial system. The main functions of the Financial System Stability Council are to:
| | • | | identify risks that could interrupt or disrupt the function of the financial system; |
| | • | | recommend and coordinate any measures to be taken by the Mexican financial authorities to avoid risks to the financial market; |
| | • | | advise the Executive Branch in matters related to financial stability; and |
| | • | | prepare an annual report discussing the stability of the Mexican financial markets and describing any activities and measures taken by the Council during the preceding year to promote financial stability. |
At December 31, 2011, the total amount of past-due loans of commercial banks (excluding banks under Government intervention and those in special situations) was Ps. 60.2 billion, as compared to Ps. 49.5 billion at December 31, 2010. At December 31, 2011, the total loan portfolio of the banking system was 11.5% greater in real terms than the total loan portfolio at December 31, 2010. The past-due loan ratio of commercial banks was 2.5% at December 31, 2011, as compared to a ratio of 2.3% at December 31, 2010. The amount of loan loss reserves held by commercial banks (excluding banks under Government intervention and those in special situations) totaled Ps. 115.0 billion at December 31, 2011, as compared to Ps. 99.0 billion at December 31, 2010. As a result, commercial banks had reserves covering 191.0% of their past-due loans at December 31, 2011, exceeding the minimum reserve level of 45%.
At August 31, 2012, the total amount of past-due loans of commercial banks (excluding banks under Government intervention and those in special situations) was Ps. 68.0 billion, as compared with Ps. 60.2 billion at December 31, 2011. At August 31, 2012, the total loan portfolio of the banking system was 1.9% greater in real terms than the total loan portfolio at December 31, 2011. The past-due loan ratio of commercial banks was 2.6% at August 31, 2012, as compared to a ratio of 2.5% at December 31, 2011. The amount of loan loss reserves held by commercial banks (excluding banks under Government intervention and those in special situations) totaled Ps. 124.1 billion at August 31, 2012, as compared to Ps. 115.0 billion at December 31, 2011. As a result, commercial banks had reserves covering 182.6% of their past-due loans at August 31, 2012, exceeding the minimum reserve level of 45%.
D-64
Credit Allocation by Sector
The following table shows the allocation by sector of credit extended by commercial and development banks at each of the dates indicated.
Credit Allocation by Sector(1)
| | | | | | | | | | | | | | | | | | | | | | | | | | | | | | | | | | | | | | | | | | | | | | | | |
| | | December 31, | | | August 31,
2012(2) | |
| | | 2007 | | | 2008 | | | 2009 | | | 2010 | | | 2011(2) | | |
| | | (in billions of pesos and as % of total) | | | | | | | |
Agriculture, forestry and fishing | | Ps. | 28.0 | | | | 1 | % | | Ps. | 33.9 | | | | 2 | % | | Ps. | 29.9 | | | | 1 | % | | Ps. | 33.9 | | | | 1 | % | | Ps. | 40.8 | | | | 1 | % | | Ps. | 44.7 | | | | 1 | % |
Industry | | | 324.5 | | | | 16 | | | | 420.6 | | | | 19 | | | | 449.2 | | | | 19 | | | | 512.1 | | | | 20 | | | | 602.5 | | | | 21 | | | | 645.8 | | | | 21 | |
Services and other activities | | | 375.0 | | | | 19 | | | | 452.5 | | | | 20 | | | | 462.3 | | | | 20 | | | | 494.6 | | | | 19 | | | | 583.8 | | | | 20 | | | | 597.9 | | | | 19 | |
Housing credit | | | 289.8 | | | | 15 | | | | 326.3 | | | | 15 | | | | 355.6 | | | | 15 | | | | 395.4 | | | | 16 | | | | 428.0 | | | | 15 | | | | 455.5 | | | | 15 | |
Spending credit | | | 492.1 | | | | 25 | | | | 489.4 | | | | 22 | | | | 409.5 | | | | 17 | | | | 426.5 | | | | 17 | | | | 527.8 | | | | 18 | | | | 594.0 | | | | 19 | |
Statistical adjustment | | | 0.3 | | | | 0 | | | | 0.1 | | | | 0 | | | | 0.5 | | | | 0 | | | | 0.2 | | | | 0 | | | | 6.6 | | | | 0 | | | | 0.6 | | | | 0 | |
Financial sector | | | 151.0 | | | | 8 | | | | 169.5 | | | | 8 | | | | 185.0 | | | | 8 | | | | 173.1 | | | | 7 | | | | 199.5 | | | | 7 | | | | 200.3 | | | | 7 | |
Public sector | | | 197.7 | | | | 10 | | | | 226.2 | | | | 10 | | | | 371.4 | | | | 16 | | | | 413.4 | | | | 16 | | | | 469.0 | | | | 16 | | | | 501.0 | | | | 16 | |
Others | | | 99.7 | | | | 5 | | | | 69.8 | | | | 3 | | | | 47.0 | | | | 2 | | | | 44.2 | | | | 2 | | | | 10.8 | | | | 0 | | | | 9.5 | | | | 0 | |
External sector | | | 21.6 | | | | 1 | | | | 41.6 | | | | 2 | | | | 46.1 | | | | 2 | | | | 51.6 | | | | 2 | | | | 52.2 | | | | 2 | | | | 45.7 | | | | 2 | |
| | | | | | | | | | | | | | | | | | | | | | | | | | | | | | | | | | | | | | | | | | | | | | | | |
Total | | Ps. | 1,979.7 | | | | 100 | % | | Ps. | 2,229.8 | | | | 100 | % | | Ps. | 2,356.4 | | | | 100 | % | | Ps. | 2,545.0 | | | | 100 | % | | Ps. | 2,914.4 | | | | 100 | % | | Ps. | 3,094.4 | | | | 100 | % |
| | | | | | | | | | | | | | | | | | | | | | | | | | | | | | | | | | | | | | | | | | | | | | | | |
| | | | | | | | | | | | |
Interbank sector | | | 2.0 | | | | | | | | 1.7 | | | | | | | | 1.2 | | | | | | | | 1.8 | | | | | | | | 2.0 | | | | | | | | 2.4 | | | | | |
Note: Numbers may not total due to rounding.
| (1) | Includes commercial and development banks. |
Source: Banco de México.
Insurance Companies, Mutual Funds and Auxiliary Credit Institutions
As discussed above, in connection with the implementation of NAFTA, amendments to several laws relating to the financial services industry became effective on January 1, 1994, and were implemented through regulations issued by the Ministry of Finance and Public Credit on April 20, 1994. Under these rules, non-Mexican financial groups and financial intermediaries are permitted, through Mexican subsidiaries, to engage in various activities, including the provision of insurance, in Mexico.
In addition, pursuant to the 1995 amendments to the Ley General de Instituciones y Sociedades Mutualistas de Seguros (Mexican Insurance Company Law), foreign investors may purchase up to 49% of the capital stock of Mexican insurance companies. Moreover, foreign financial institutions domiciled in countries that have entered into trade agreements with Mexico may, with the approval of the Ministry of Finance and Public Credit, acquire a majority of the capital stock of a Mexican insurance company. Mexican insurance companies may use the services of intermediaries located in Mexico or abroad for their reinsurance transactions and may issue non-voting or limited voting shares, as well as subordinated debt obligations. Finally, foreign insurance companies are permitted, with the prior approval of the Ministry of Finance and Public Credit, to establish representative offices in Mexico.
The Ley General de Organizaciones y Actividades Auxiliares del Crédito (Auxiliary Credit Organizations Law), as amended, governs financial intermediaries. Pursuant to the law:
| | • | | no individual or entity is permitted to hold directly or indirectly more than 10% of the paid-in capital of financial intermediaries without the prior authorization of the Ministry of Finance and Public Credit; |
D-65
| | • | | auxiliary credit institutions and foreign exchange brokers are required to allocate 10% of their profits to a capital reserve fund until that fund equals their paid-in capital; |
| | • | | financial leasing companies are entitled to judicially enforce the repossession of goods leased in the event of a default by the lessee; and |
| | • | | the CNBV is authorized to prevent auxiliary credit institutions from using misleading documentation. |
Pursuant to the 1995 amendments to the Auxiliary Credit Organizations Law, foreign investors may purchase up to 49% of the capital stock of auxiliary credit institutions. In addition, foreign financial institutions domiciled in countries that have entered into trade agreements with Mexico may, with the approval of the Ministry of Finance and Public Credit, acquire a majority of the shares representing capital stock of an auxiliary credit institution.
On June 4, 2001, the Ley de Sociedades de Inversión (Mutual and Investment Funds Law) went into effect. This law was designed to develop financial intermediaries other than banks, thereby allowing retail investors to participate in a more transparent and liquid securities market. Other objectives of the law include introducing the concept of investment fund distributors, and avoiding conflicts of interest between investment funds and operating companies by (1) requiring that one third of the members of the board of directors of each investment fund be independent and (2) precluding brokerage houses and banks from acting directly as operating companies.
The Securities Markets
The Bolsa Mexicana de Valores, S.A.B. de C.V. (Mexican Stock Exchange, or BMV) is the only authorized stock exchange involved in the listing and trading of equity and debt securities in Mexico. Upon the consummation of the initial public offering of its shares on June 18, 2008, the Mexican Stock Exchange was transformed from a sociedad anónima de capital variable (a private company) to a sociedad anónima bursátil de capital variable (a public company). In connection with the initial public offering of its shares, certain former stockholders of the Mexican Stock Exchange (banks and brokerage houses) created a control trust into which they deposited more than 50% of the issued and outstanding shares of the Mexican Stock Exchange with the purpose of voting such shares as a single block in the future. Both debt and equity securities are listed and traded on the Mexican Stock Exchange, including stocks and bonds of private sector corporations, equity certificates or shares issued by banks, commercial paper, bankers’ acceptances, certificates of deposit, Government debt and special hedging instruments linked to the dollar. Currently, institutional investors are the most active participants in the Mexican Stock Exchange, although retail investors also play a role in the market. The Mexican equity market is one of Latin America’s largest in terms of market capitalization, but it remains relatively small and illiquid compared to major world markets.
The Ley del Mercado de Valores (Securities Market Law) was enacted in 1975 and has been amended on several occasions since. It was amended in 1993 to include more flexible rules for the repurchase by Mexican companies of their own shares and new rules relating to privileged information, as well as to permit the listing of foreign securities on the Mexican Stock Exchange upon the authorization of the Ministry of Finance and Public Credit, the CNBV and Banco de México. The 1993 amendments also provided for the creation of an international quotation system. In addition, since July 1994, foreign securities firms have been permitted to establish representative offices in Mexico with the prior approval of the Ministry of Finance and Public Credit. As of December 31, 2011, five foreign securities firms were authorized by the Ministry of Finance and Public Credit to maintain representative offices in Mexico.
In conjunction with the 1995 and 1998 amendments to the Banking Law, certain restrictions on the shareholding structure of securities firms were relaxed. These restrictions mirror those that apply to Mexican commercial banks. See “—Banking System” for a discussion of the current shareholding structure and foreign ownership restrictions.
In December 2005, the Mexican Congress passed a new Securities Market Law to enhance the institutional framework of the securities market in Mexico. The new law, which entered into effect on June 28, 2006, clarified several aspects of the existing law, including disclosure requirements and the reach of the law’s application to holding companies and subsidiaries. In addition, the new law improved minority shareholders’ rights and introduced new requirements and fiduciary duties applicable to board members, officers and external auditors of publicly traded companies. The new law also redefined certain corporate responsibilities, requiring the creation of audit and corporate governance committees with independent board members.
D-66
The market capitalization of the Mexican Stock Exchange was U.S. $453.5 billion at the end of 2010, representing a 28.8% increase in dollar terms from its year-end 2009 level. The value of transactions on the Mexican Stock Exchange totaled U.S. $190.3 billion in 2010, 68.4% higher than in 2009. Fixed income securities (i.e., commercial paper, notes, bonds and ordinary participation certificates) accounted for 0.1% of transactions, capital development certificates accounted for 0.9% of transactions and equity securities (i.e., shares and certificates of patrimonial contribution) accounted for the remaining 99.0% of transactions.
The market capitalization of the Mexican Stock Exchange was U.S. $407.7 billion at the end of 2011, representing a 10.1% decrease in dollar terms from its year-end 2010 level. The value of transactions on the Mexican Stock Exchange totaled U.S. $177.6 billion in 2011, 5.8% lower than in 2010. Fixed income securities (i.e., commercial paper, notes, bonds and ordinary participation certificates) accounted for 0.2% of transactions, capital development certificates accounted for 0.3% of transactions and equity securities (i.e., shares and certificates of patrimonial contribution) accounted for the remaining 99.5% of transactions.
The Mexican Stock Exchange publishes the Índice de Precios y Cotizaciones (Stock Market Index) based on a group of the 35 most actively traded shares. At December 31, 2011, the Stock Market Index stood at 37,077.5 points, representing a 3.8% decrease from the level of 38,550.8 at December 31, 2010.
At October 25, 2012, the Stock Market Index stood at 41,877.3 points, representing a 12.9% nominal increase from the level at December 31, 2011.
D-67
The following graph illustrates the Stock Market Index for the periods indicated.
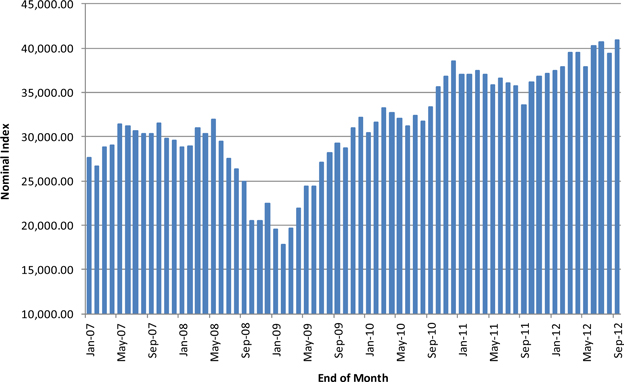
D-68
EXTERNAL SECTOR OF THE ECONOMY
Foreign Trade
Since the late 1980’s, Mexico has utilized an outward-looking approach to facilitate economic development, concentrating on export-led growth. This approach replaced the import substitution economic development model adopted by Mexico in the 1940’s to promote industrialization through the protection of local industries, which in its latter stages was financed by the expansion of oil exports and debt accumulation.
In order to encourage the growth of non-oil exports, the Government has advanced a comprehensive set of trade, fiscal, financial and promotional measures designed to create a macroeconomic environment that will increase the competitiveness of Mexican exports. The Government’s decision to join GATT (which was later superseded by the WTO) in 1986 resulted in, among other things, an important reduction in the protection traditionally given to domestic producers. A five-tier tariff structure was established at the end of 1987 with a maximum rate of 20%. Average tariff rates declined from 22.6% in 1986 to 13.1% in 1992 and 6.4% in 2011. As of December 2011, approximately 99.1% of tariff items and 87.7% of imports by value were exempt from import permit requirements and other non-tariff barriers.
The following table provides information about the value of Mexico’s merchandise exports and imports (excluding tourism) for the periods indicated.
Exports and Imports
| | | | | | | | | | | | | | | | | | | | | | | | |
| | | 2007 | | | 2008 | | | 2009 | | | 2010 | | | 2011 | | | First seven
months of
2012(1) | |
| | | (in millions of dollars, except average price of the Mexican crude oil mix) | |
Merchandise exports (f.o.b.) | | | | | | | | | | | | | | | | | | | | | | | | |
Oil and oil products | | $ | 43,014 | | | $ | 50,635 | | | $ | 30,831 | | | $ | 41,693 | | | $ | 56,385 | | | $ | 30,837 | |
Crude oil | | | 37,937 | | | | 43,342 | | | | 25,614 | | | | 35,919 | | | | 49,322 | | | | 26,994 | |
Other | | | 5,077 | | | | 7,294 | | | | 5,217 | | | | 5,775 | | | | 7,063 | | | | 3,842 | |
Non-oil products | | | 228,861 | | | | 240,707 | | | | 198,872 | | | | 256,780 | | | | 292,990 | | | | 183,577 | |
Agricultural | | | 7,415 | | | | 7,895 | | | | 7,726 | | | | 8,610 | | | | 10,309 | | | | 7,128 | |
Mining | | | 1,737 | | | | 1,931 | | | | 1,448 | | | | 2,424 | | | | 4,063 | | | | 2,703 | |
Manufactured goods(2) | | | 219,709 | | | | 230,882 | | | | 189,698 | | | | 245,745 | | | | 278,617 | | | | 173,745 | |
| | | | | | | | | | | | | | | | | | | | | | | | |
Total merchandise exports | | | 271,875 | | | | 291,343 | | | | 229,704 | | | | 298,473 | | | | 349,375 | | | | 214,414 | |
Merchandise imports (f.o.b.) | | | | | | | | | | | | | | | | | | | | | | | | |
Consumer goods | | | 43,055 | | | | 47,941 | | | | 32,828 | | | | 41,423 | | | | 51,790 | | | | 30,230 | |
Intermediate goods(2) | | | 205,295 | | | | 221,565 | | | | 170,912 | | | | 229,812 | | | | 264,020 | | | | 159,900 | |
Capital goods | | | 33,599 | | | | 39,097 | | | | 30,645 | | | | 30,247 | | | | 35,032 | | | | 21,422 | |
| | | | | | | | | | | | | | | | | | | | | | | | |
Total merchandise imports | | | 281,949 | | | | 308,603 | | | | 234,385 | | | | 301,482 | | | | 350,843 | | | | 211,551 | |
| | | | | | | | | | | | | | | | | | | | | | | | |
Trade balance | | $ | (10,074 | ) | | $ | (17,261 | ) | | $ | (4,681 | ) | | $ | (3,009 | ) | | $ | (1,468 | ) | | $ | 2,863 | |
| | | | | | | | | | | | | | | | | | | | | | | | |
Average price of Mexican oil mix(3) | | $ | 61.64 | | | $ | 84.38 | | | $ | 57.40 | | | $ | 72.46 | | | $ | 101.00 | | | $ | 103.91 | |
Note: Numbers may not total due to rounding.
| (2) | Includes the in-bond industry. |
| (3) | In U.S. dollars per barrel. |
Source: Banco de México.
As a result of the export promotion strategy referred to above, Mexico’s non-oil exports have increased more than thirty-fold since 1982, reaching U.S. $293.0 billion (or 83.9% of total merchandise exports including in-bond industries) in 2011. Over the last twenty years, the composition of Mexico’s non-oil exports has also changed, reflecting the increasing importance of manufactured goods relative to agricultural products. In 2011, U.S. $278.6 billion (or 95.1%) of Mexico’s non-oil exports (including the in-bond industry) were represented by manufactured goods, as compared with U.S. $5.8 billion (or 77.1%) in 1982.
D-69
During 2009, Mexico registered a trade deficit of U.S. $4.7 billion, as compared with a trade deficit of U.S. $17.3 billion for 2008. Merchandise exports decreased by 21.2%, to U.S. $229.7 billion during 2009, as compared to U.S. $291.3 billion in 2008. During 2009, petroleum exports decreased by 39.1%, from U.S. $50.6 billion in 2008 to U.S. $30.8 billion in 2009, mainly as a result of lower crude oil production by PEMEX, which resulted from the decline in production from the Cantarell fields, lower international crude oil prices and petroleum product prices, and decreased demand for petroleum products. During 2009, non-petroleum exports decreased by 17.4%, from U.S. $240.7 billion in 2008 to U.S. $198.9 billion in 2009. Exports of manufactured goods, which represented 82.6% of total merchandise exports, decreased by 17.8% during 2009, from U.S. $230.9 billion in 2008 to U.S. $189.7 billion in 2009, due to lower demand for manufactured goods as a result of the global economic crisis and the consequent recession in Mexico’s key export markets, including the United States.
During 2009, total imports decreased by 24.0% to U.S. $234.4 billion, as compared to U.S. $308.6 billion in 2008, due to decreased domestic demand. In particular, imports of intermediate goods decreased by 22.9%, imports of capital goods decreased by 21.6% and imports of consumer goods decreased by 31.5%, each as compared to 2008.
During 2010, Mexico registered a trade deficit of U.S. $3.0 billion, as compared with a trade deficit of U.S. $4.7 billion for 2009. Merchandise exports increased by 29.9% during 2010 to U.S. $298.5 billion, as compared to U.S. $229.7 billion for 2009. During 2010, petroleum exports increased by 35.2%, due to both higher crude oil and product prices and an increase in the volume of crude oil exports. During 2010, non-petroleum exports increased by 29.1%, from U.S. $198.9 billion in 2009 to U.S. $256.8 billion in 2010, mainly due to the recovery of demand for exports of manufactured goods. Exports of manufactured goods, which represented 82.3% of total merchandise exports, increased by 29.5% during 2010, as compared with exports of manufactured goods during 2009, primarily due to the recovery of economic activity in the United States.
During 2010, total imports increased by 28.6%, from U.S. $234.4 billion in 2009 to U.S. $301.5 billion in 2010. In particular, imports of intermediate goods increased by 34.5%, imports of capital goods decreased by 1.3% and imports of consumer goods increased by 26.2%, each as compared to 2009.
During 2011, Mexico registered a trade deficit of U.S. $1.5 billion, as compared with a trade deficit of U.S. $3.0 billion for 2010. This improved trade balance was caused by increased U.S. industrial production, especially during the first half of 2011, which led to greater demand for Mexico’s non-petroleum exports, which increased by 14.1% in 2011 as compared to 2010. Additionally, during 2011, petroleum exports increased by 35.2% as compared to 2010 as a result of higher crude oil prices. Merchandise exports increased by 17.1% during 2011, to U.S. $349.4 billion, as compared to U.S. $298.5 billion in 2010. Exports of manufactured goods, which represented 79.7% of total merchandise exports, increased by 13.4% during 2011, as compared with exports of manufactured goods during 2010.
During 2011, total imports increased by 16.4% to U.S. $350.8 billion, as compared to U.S. $301.5 billion in 2010, due to increased domestic demand for imported goods, which resulted primarily from an increase in average household incomes during 2011. In particular, imports of intermediate goods increased by 14.9%, imports of capital goods increased by 15.8% and imports of consumer goods increased by 25.0%, each as compared to imports in the same period of 2010.
According to preliminary figures, during the first seven months of 2012, Mexico registered a trade surplus of U.S. $2.9 billion, as compared with a trade surplus of U.S. $2.0 billion for the same period of 2011. Merchandise exports increased by 7.8% during the first seven months of 2012, to U.S. $214.4 billion, as compared to U.S. $199.0 billion in the same period of 2011. During the first seven months of 2012, petroleum exports decreased by 4.8% while non-petroleum exports increased by 10.2%, each as compared with the petroleum and non-petroleum export totals, respectively, in the same period of 2011. Exports of manufactured goods, which represented 81.0% of total merchandise exports, increased by 10.0% during the first seven months of 2012, as compared with exports of manufactured goods during the same period of 2011.
According to preliminary figures, during the first seven months of 2012, total imports increased by 7.4%, to U.S. $211.6 billion, as compared to U.S. $197.0 billion for the same period of 2011. During the first seven months of 2012, imports of intermediate goods increased by 7.2%, imports of capital goods increased by 10.6% and imports of consumer goods increased by 6.5%, each as compared to imports in the same period of 2011.
D-70
Geographic Distribution of Trade
The United States is Mexico’s most important trading partner. In 2011, trade with the United States accounted for approximately 78.5% of Mexico’s total exports and 49.7% of Mexico’s total imports.
The following table shows the distribution of Mexico’s external trade for the periods indicated:
Distribution of Trade(1)
| | | | | | | | | | | | | | | | | | | | |
| | | 2007 | | | 2008 | | | 2009 | | | 2010 | | | 2011(2) | |
Exports (f.o.b.): | | | | | | | | | | | | | | | | | | | | |
U.S.A. | | | 82.1 | % | | | 80.2 | % | | | 80.6 | % | | | 80.0 | % | | | 78.5 | % |
Canada | | | 2.4 | | | | 2.4 | | | | 3.6 | | | | 3.6 | | | | 3.1 | |
EU | | | 5.4 | | | | 5.9 | | | | 5.1 | | | | 4.8 | | | | 5.4 | |
Of which: | | | | | | | | | | | | | | | | | | | | |
Spain | | | 1.4 | | | | 1.5 | | | | 1.1 | | | | 1.3 | | | | 1.4 | |
U.K. | | | 0.6 | | | | 0.6 | | | | 0.5 | | | | 0.6 | | | | 0.6 | |
Germany | | | 1.5 | | | | 1.7 | | | | 1.4 | | | | 1.2 | | | | 1.2 | |
Netherlands | | | 0.7 | | | | 0.9 | | | | 0.7 | | | | 0.6 | | | | 0.6 | |
China | | | 0.7 | | | | 0.7 | | | | 1.0 | | | | 1.4 | | | | 1.7 | |
Japan | | | 0.7 | | | | 0.7 | | | | 0.7 | | | | 0.6 | | | | 0.6 | |
Others | | | 8.8 | | | | 10.1 | | | | 9.1 | | | | 9.6 | | | | 10.6 | |
| | | | | | | | | | | | | | | | | | | | |
Total | | | 100.0 | % | | | 100.0 | % | | | 100.0 | % | | | 100.0 | % | | | 100.0 | % |
| | | | | | | | | | | | | | | | | | | | |
| | | | | |
Imports (f.o.b.): | | | | | | | | | | | | | | | | | | | | |
U.S.A. | | | 49.5 | % | | | 49.0 | % | | | 48.0 | % | | | 48.1 | % | | | 49.7 | % |
Canada | | | 2.8 | | | | 3.1 | | | | 3.1 | | | | 2.9 | | | | 2.7 | |
EU | | | 12.0 | | | | 12.7 | | | | 11.6 | | | | 10.8 | | | | 10.7 | |
Of which: | | | | | | | | | | | | | | | | | | | | |
Spain | | | 1.4 | | | | 1.3 | | | | 1.3 | | | | 1.1 | | | | 1.1 | |
U.K. | | | 0.8 | | | | 0.8 | | | | 0.8 | | | | 0.7 | | | | 0.6 | |
Germany | | | 3.8 | | | | 4.1 | | | | 4.2 | | | | 3.7 | | | | 3.7 | |
Netherlands | | | 0.9 | | | | 1.4 | | | | 0.9 | | | | 0.9 | | | | 0.9 | |
China | | | 10.5 | | | | 11.2 | | | | 13.9 | | | | 15.1 | | | | 14.9 | |
Japan | | | 5.8 | | | | 5.3 | | | | 4.9 | | | | 5.0 | | | | 4.7 | |
Others | | | 19.4 | | | | 18.7 | | | | 18.6 | | | | 18.2 | | | | 17.2 | |
| | | | | | | | | | | | | | | | | | | | |
Total | | | 100.0 | % | | | 100.0 | % | | | 100.0 | % | | | 100.0 | % | | | 100.0 | % |
| | | | | | | | | | | | | | | | | | | | |
Note: Numbers may not total due to rounding.
| (1) | Includes the in-bond industry on a gross basis. |
Source: Banco de México.
NAFTA entered into force on January 1, 1994. NAFTA:
| | • | | removed most customs duties imposed on goods traded among Mexico, the United States and Canada; |
| | • | | removed or relaxed many investment restrictions, including restrictions on foreign investment in banking, insurance and other financial service activities; |
| | • | | liberalized trade in services and provides for protection of intellectual property rights; |
| | • | | provided a specialized means for resolution of trade disputes arising under NAFTA; and |
| | • | | promoted trilateral, regional and multilateral cooperation. |
D-71
The three parties to NAFTA also negotiated and entered into supplemental accords to this agreement relating to labor and environmental issues, as well as separate understandings on emergency actions in response to import surges and the funding of environmental infrastructure projects in the Mexico-U.S. border region. In addition, different combinations of the three countries have also reached understandings on various specific issues.
Since NAFTA entered into force in 1994, trade between Mexico, the United States and Canada has increased. Mexican exports to the United States increased from U.S. $238.7 billion in 2010 to U.S. $274.4 billion in 2011, mainly due to higher demand for Mexican goods in the United States as a result of the recovery of economic activity in the United States. Nevertheless, Mexican exports to the United States increased at a lower rate (15.0%) than did United States exports to Mexico (20.2%).
A free trade agreement between Mexico and Chile went into effect on August 1, 1999, expanding the terms of the trade agreement originally entered into by these countries in 1992. Mexico’s free trade agreement with Colombia and Venezuela and a similar agreement with Bolivia entered into force on January 1, 1995, although Venezuela withdrew from this agreement on November 19, 2006. Mexico entered into a free trade agreement with Costa Rica on January 1, 1995 and with Nicaragua on July 1, 1998. In April 2000, Mexico and Israel signed a free trade agreement, which took effect on July 1, 2000. The agreement covers tariffs on industrial and agricultural products exported by Mexico to Israel and on agricultural technology, medical and agricultural equipment and agricultural products exported by Israel to Mexico. In November 2000, Mexico and the European Union signed a free trade agreement, which took effect in October 2001. The agreement covers industrial tariffs, agricultural goods, services, public procurement, rules of competition and investment, intellectual property, rules of origin and dispute resolution. In June 2000, Mexico signed a free trade agreement with Guatemala, Honduras and El Salvador, which took effect on March 14, 2001, for Guatemala and El Salvador, and on June 1, 2001, for Honduras. The agreement covers tariffs on industrial and agricultural products traded among the four countries, as well as rules governing the export and import of services among the four countries. On November 15, 2003, Mexico signed a free trade agreement with Uruguay, which entered into effect on July 15, 2004. On September 17, 2004, Mexico signed a free trade agreement with Japan, which entered into effect on April 1, 2005. On June 11, 2010, Mexico signed a free trade agreement with Colombia, which entered into effect on August 2, 2011. In addition, Mexico is participating in the negotiations for the Free Trade Area of the Americas (FTAA), and is negotiating a free trade agreement with the four members of the Common Market of the South (MERCOSUR), Argentina, Brazil, Paraguay and Uruguay.
On November 18, 1993, Mexico was admitted as a member of the Asian Pacific Economic Cooperation Association. In addition, Mexico became a member of the WTO on January 1, 1995, the date on which the WTO superseded the GATT.
The Ley de Comercio Exterior (Foreign Trade Law), enacted in 1993, grants broad powers to the President to establish import and export duties and other trade restrictions. Under the law, the Ministry of Economy is authorized to resolve trade-related disputes and establish procedures for the imposition of countervailing duties. The Foreign Trade Law created the Comisión de Comercio Exterior (Foreign Trade Commission), an agency that operates within the Ministry of Economy, to administer these procedures. In addition, the Foreign Trade Law specifically defines and regulates unfair trade practices, thereby more closely aligning Mexico’s trade regulatory framework with current international practices and standards.
In-bond Industry
Mexico’s in-bond industry imports components and raw materials free of duties and, in turn, exports finished products with the manufacturer paying tariffs only on the value added in Mexico. Initially established along the border with the United States, in-bond plants now operate in other regions of the country, where they have access to a larger and more diverse labor pool and are able to take greater advantage of inputs available from Mexican suppliers. According to preliminary figures, more than half of the value added by the in-bond industry in 2011 related to the production of auto parts, transportation equipment and electronic products.
As of December 31, 2011, the number of in-bond plants totaled 5,079, down from 5,108 as of December 31, 2010. According to preliminary figures, as of December 31, 2011, in-bond plants employed 1,880,254 workers, an increase from the 1,806,055 workers employed as of December 31, 2010. This increase in employment was primarily due to an increase in private and public investment, which compensated for the volatility in external demand. According to preliminary figures, revenues from in-bond operations during 2011 increased by 11.3%, from Ps. 2,350.4 billion in 2010 to Ps. 2,615.2 billion in 2011, Ps. 1,485.3 billion of which was generated from export sales and Ps. 1,130.0 billion was generated from domestic sales.
D-72
As of May 31, 2012, the number of in-bond plants totaled 5,093, up from 5,079 as of December 31, 2011. According to preliminary figures, as of May 31, 2012, in-bond plants employed 1,963,158 workers, a 4.4% increase from 1,880,254 workers employed as of December 31, 2011, primarily due to an increase in private and public investment in the in-bond industry. According to preliminary figures, revenues from in-bond operations during the first five months of 2012 increased by 16.3% as compared to the same period of 2011, from Ps. 1,035.1 billion in the first five months of 2011 to Ps. 1,204.0 billion during the same period of 2012, of which Ps. 694.3 billion was generated from export sales and Ps. 509.6 billion was generated from domestic sales.
Balance of International Payments
Since 1988, Mexico has registered a deficit in its current account, primarily due to increases in imports by the private sector and the Government’s liberalization of trade policies.
During 2009, Mexico’s current account registered a deficit of 0.6% of GDP, or U.S. $5.1 billion, as compared to a deficit of U.S. $17.3 billion in 2008. The capital account registered a surplus of U.S. $26.9 billion in 2009, as compared to a surplus of U.S. $24.5 billion in 2008, primarily due to increased external indebtedness of the public sector, Banco de México’s utilization of U.S. $3.2 billion in dollar-denominated loans under temporary swap facilities established with the Federal Reserve Bank of New York and the cessation of the Government’s oil revenue hedging activities in international markets. Foreign investment in Mexico totaled U.S. $24.0 billion in 2009, and was composed of direct foreign investment inflows totaling U.S. $16.3 billion and net foreign portfolio investment inflows (including securities placed abroad) totaling U.S. $7.6 billion.
During 2010, Mexico’s current account registered a deficit of 0.4% of GDP, or U.S. $4.5 billion, as compared to a deficit of U.S. $5.1 billion in 2009. The capital account registered a surplus of U.S. $44.9 billion in 2010, as compared to a surplus of U.S. $26.9 billion in 2009, primarily due to increased foreign investment inflows to Mexico, which resulted from: (i) increased liquidity in the international financial markets; and (ii) the inclusion of Mexican Government long-term bonds in the Citigroup’s World Government Bonds Index (WGBI) in October 2010, which led to increased foreign investment in the Government’s peso-denominated debt securities. Foreign investment in Mexico totaled U.S. $44.6 billion in 2010, and was composed of direct foreign investment inflows totaling U.S. $20.9 billion and net foreign portfolio investment inflows (including securities placed abroad) totaling U.S. $23.8 billion.
During 2011, Mexico’s current account registered a deficit of 1.0% of GDP, or U.S. $11.1 billion, as compared to a deficit of U.S. $4.5 billion in 2010. The capital account registered a surplus of U.S. $42.0 billion in 2011, as compared to a surplus of U.S. $44.9 billion in 2010, due to decreased inflows of loans and deposits to commercial banks and nonfinancial public and private sector borrowers, which resulted from risk aversion among investors due to: (1) deteriorating global economic confidence; (2) uncertainty surrounding the sovereign debt crisis in the Eurozone; and (3) the debt ceiling crisis in the United States. Foreign investment in Mexico totaled U.S. $45.8 billion in 2011, and was composed of direct foreign investment inflows totaling U.S. $20.4 billion and net foreign portfolio investment inflows (including securities placed abroad) totaling U.S. $25.4 billion.
According to preliminary figures, during the first six months of 2012, Mexico’s current account registered a surplus of 0.1% of GDP, or U.S. $1.6 billion, as compared to a deficit of U.S. $3.8 billion for the same period of 2011. The capital account registered a surplus of U.S. $22.8 billion during the first six months of 2012, as compared to a surplus of U.S. $32.9 billion in the same period of 2011. Foreign investment in Mexico totaled U.S. $32.0 billion during the first six months of 2012 and was composed of direct foreign investment inflows totaling U.S. $9.6 billion and net foreign portfolio investment inflows (including securities placed abroad) totaling U.S. $22.4 billion.
D-73
The following table sets forth Mexico’s balance of payments for the periods indicated:
Balance of Payments
| | | | | | | | | | | | | | | | | | | | | | | | |
| | | 2007 | | | 2008 | | | 2009 | | | 2010 | | | 2011 | | | First six
months of
2012(1) | |
| | | (in millions of dollars) | |
I. Current account(2) | | $ | (11,069 | ) | | $ | (17,334 | ) | | $ | (5,064 | ) | | $ | (4,456 | ) | | $ | (11,073 | ) | | $ | 1,624 | |
Credits | | | 323,532 | | | | 343,475 | | | | 273,293 | | | | 343,233 | | | | 397,560 | | | | 212,765 | |
Merchandise exports (f.o.b.) | | | 271,875 | | | | 291,343 | | | | 229,704 | | | | 298,473 | | | | 349,375 | | | | 184,137 | |
Non-factor services | | | 17,567 | | | | 18,119 | | | | 15,001 | | | | 15,554 | | | | 15,868 | | | | 8,703 | |
Tourism | | | 12,919 | | | | 13,370 | | | | 11,513 | | | | 11,992 | | | | 11,869 | | | | 6,632 | |
Others | | | 4,648 | | | | 4,749 | | | | 3,489 | | | | 3,562 | | | | 4,000 | | | | 2,071 | |
Factor Services | | | 7,577 | | | | 8,417 | | | | 6,934 | | | | 7,583 | | | | 9,165 | | | | 7,915 | |
Interest | | | 6,130 | | | | 6,015 | | | | 4,236 | | | | 3,376 | | | | 3,551 | | | | 1,558 | |
Others | | | 1,446 | | | | 2,402 | | | | 2,699 | | | | 4,206 | | | | 5,613 | | | | 6,357 | |
Transfers | | | 26,513 | | | | 25,597 | | | | 21,653 | | | | 21,623 | | | | 23,152 | | | | 12,010 | |
Debits | | | 334,600 | | | | 360,809 | | | | 278,357 | | | | 347,689 | | | | 408,633 | | | | 211,141 | |
Merchandise imports (f.o.b.) | | | 281,949 | | | | 308,603 | | | | 234,385 | | | | 301,482 | | | | 350,843 | | | | 180,847 | |
Non-factor services | | | 23,881 | | | | 25,480 | | | | 23,284 | | | | 25,010 | | | | 29,319 | | | | 13,731 | |
Insurance and freight | | | 8,297 | | | | 10,000 | | | | 7,510 | | | | 8,723 | | | | 10,225 | | | | 4,760 | |
Tourism | | | 8,462 | | | | 8,568 | | | | 7,207 | | | | 7,255 | | | | 7,832 | | | | 3,731 | |
Others | | | 7,122 | | | | 6,912 | | | | 8,567 | | | | 9,031 | | | | 11,262 | | | | 5,240 | |
Factor services | | | 28,662 | | | | 26,598 | | | | 20,627 | | | | 21,112 | | | | 28,293 | | | | 16,457 | |
Interest | | | 16,294 | | | | 16,133 | | | | 12,306 | | | | 13,973 | | | | 17,547 | | | | 9,657 | |
Others | | | 12,368 | | | | 10,465 | | | | 8,321 | | | | 7,139 | | | | 10,746 | | | | 6,801 | |
Transfers | | | 108 | | | | 128 | | | | 60 | | | | 86 | | | | 178 | | | | 105 | |
II. Capital account | | | 23,812 | | | | 24,459 | | | | 26,894 | | | | 44,875 | | | | 41,961 | | | | 22,835 | |
Liabilities | | | 56,226 | | | | 36,051 | | | | 40,154 | | | | 95,261 | | | | 56,774 | | | | 45,380 | |
Loans and deposits | | | 17,111 | | | | 6,382 | | | | 16,191 | | | | 50,624 | | | | 11,010 | | | | 13,356 | |
Development banks | | | (1,040 | ) | | | (496 | ) | | | 794 | | | | 648 | | | | (283 | ) | | | (433 | ) |
Commercial banks | | | 3,449 | | | | (3,273 | ) | | | 2,235 | | | | 30,572 | | | | 283 | | | | 2,626 | |
U.S. Federal Reserve swap facility | | | — | | | | — | | | | 7,229 | | | | (3,221 | ) | | | — | | | | — | |
Non-financial public sector | | | (5,908 | ) | | | (3,432 | ) | | | 9,638 | | | | 13,021 | | | | 5,910 | | | | 6,268 | |
Non-financial private sector | | | 7,385 | | | | 730 | | | | (3,705 | ) | | | 9,604 | | | | 5,099 | | | | 4,895 | |
PIDIREGAS(3) | | | 13,225 | | | | 12,853 | | | | — | | | | — | | | | — | | | | — | |
Foreign investment | | | 39,114 | | | | 29,669 | | | | 23,963 | | | | 44,637 | | | | 45,764 | | | | 32,024 | |
Direct | | | 31,785 | | | | 27,239 | | | | 16,316 | | | | 20,868 | | | | 20,357 | | | | 9,622 | |
Portfolio | | | 7,329 | | | | 2,430 | | | | 7,648 | | | | 23,769 | | | | 25,407 | | | | 22,402 | |
Equity securities | | | (482 | ) | | | (3,503 | ) | | | 4,169 | | | | 641 | | | | (6,244 | ) | | | 2,791 | |
Debt securities | | | 7,811 | | | | 5,933 | | | | 3,479 | | | | 23,127 | | | | 31,651 | | | | 19,612 | |
Assets | | | (32,413 | ) | | | (11,592 | ) | | | (13,260 | ) | | | (50,386 | ) | | | (14,813 | ) | | | (22,545 | ) |
III. Errors and omissions | | | (2,458 | ) | | | 313 | | | | (16,496 | ) | | | (17,739 | ) | | | (2,450 | ) | | | (9,729 | ) |
IV. Change in net international reserves(4) | | | 10,311 | | | | 7,450 | | | | 5,397 | | | | 22,759 | | | | 28,879 | | | | 14,862 | |
Note: Numbers may not total due to rounding.
| (2) | Current account figures are calculated according to a methodology developed to conform to new international standards under which merchandise exports and merchandise imports include the in-bond industry. |
| (3) | As of January 1, 2009, external financing of PIDIREGAS-related projects are recorded as non-financial public sector indebtedness. |
| (4) | The sum of items I, II and III does not equal item IV because purchases and sales of gold and silver, as well as adjustments in their value are not reflected in items I, II and III. |
Source: Banco de México.
Mexico’s Foreign Exchange Commission, composed of members of the Ministry of Finance and Public Credit and Banco de México, establishes Mexico’s exchange rate policy, as well as Mexico’s policies for the accumulation of international reserves.
D-74
The Government establishes quarterly targets for the expansion of net domestic credit, and has done so since 1996. At that time, the definition of “net domestic credit” was changed to be more consistent with international standards. “Net domestic credit” is now defined as the variation of the monetary base (currency in circulation plus bank deposits at the central bank) less the variation of Banco de México’s “net international assets.” “Net international assets” is defined as (a) gross international reserves plus (b) assets with a maturity longer than six months derived from credit agreements with central banks, less (x) liabilities outstanding to the IMF and (y) liabilities with a maturity shorter than six months derived from credit agreements with central banks.
On March 20, 2003, the Foreign Exchange Commission adopted a mechanism to moderate the rate of accumulation of international reserves. Under this mechanism, Banco de México announced at the beginning of each quarter, beginning in May 2003, the total amount of dollars to be supplied to the currency market during the quarter. The amount of dollars to be sold, which was sold exclusively to Mexican credit institutions, equaled 50% of the increase in net international reserves registered during the previous quarter less the total amount of dollars sold through this mechanism during the previous quarter. The total amount of dollars to be sold in a quarter was sold through daily auctions, each for an amount equal to the total for the quarter divided by the number of business days in the quarter.
On March 12, 2004, the Foreign Exchange Commission announced that, effective May 3, 2004, it would adjust the mechanism used to moderate the rate of accumulation of international reserves described in the preceding paragraph. Under the adjusted mechanism, Banco de México continued to make quarterly announcements regarding the daily amounts of dollars to be supplied to the currency market pursuant to the same formula, but the total amount announced was divided into four equal portions to be sold in the following four quarters. The total amount of dollars to be sold in a quarter was accomplished through daily auctions, each for an amount equal to the total for the quarter divided by the number of business days in the quarter. The amount of dollars auctioned during the quarter from February through April 2007 was U.S. $26 million and from May through July 2007 was U.S. $21 million. On July 17, 2007, Banco de México announced that it would suspend its daily auctions of dollars for the quarter from August through October 2007, because there had been an accumulation of net international reserves registered during the preceding four quarters. The amount of dollars auctioned during the quarter from November 2007 through January 2008 was U.S. $9 million, from February 2008 through April 2008 was U.S. $20 million, and from May 2008 through July 2008 was U.S. $32 million. On July 25, 2008, the Foreign Exchange Commission announced that, effective August 1, 2008, it was suspending the auction mechanism until further notice in order to compensate for the decrease in the balance of international reserves caused by the Ministry of Finance and Public Credit’s purchase of U.S. $8 billion of U.S. dollars from Banco de México.
On October 8, 2008, Banco de México announced a new policy under which it would conduct an auction of U.S. $400 million on any day during which the depreciation of the peso exceeded 2%, as compared to the previous day’s exchange rate. On March 5, 2009, Banco de México announced that it was reducing the value of these auctions to U.S. $300 million. In addition, Banco de México announced that beginning on March 9, 2009, it would auction U.S. $100 million each day through additional auctions. These additional auctions would be conducted by Banco de México irrespective of whether the peso had depreciated as compared to the previous day’s exchange rate. On May 29, 2009, Banco de México announced that the value of the depreciation-contingent auctions would be reduced to U.S. $250 million each day and, beginning on June 9, 2009, the value of the daily additional auctions would be reduced to U.S. $50 million. On September 1, 2009, Banco de México announced that beginning on October 1, 2009, the daily additional auctions would be suspended; however, the depreciation-contingent auctions would continue. On April 9, 2010, Banco de México announced that it was suspending the depreciation-contingent auctions as of April 12, 2010. From March 9, 2009 through September 30, 2009, Mexico sold an aggregate of U.S. $10.3 billion through the special daily auctions. From October 9, 2008 through April 9, 2010, Mexico sold an aggregate of U.S. $8.3 billion through the depreciation-contingent auctions.
In addition to the regular auctions described above, from October 8, 2008 to September 17, 2009, Banco de México conducted the following special auctions of dollars for a total amount of U.S. $11 billion: (i) on October 8 and October 9, 2008 a special auction of U.S. $2.5 billion; (ii) on October 10, 2008, two special auctions, each for an aggregate amount of U.S. $3.0 billion; (iii) on October 16, 2008, a special auction of U.S. $1.5 billion; and (iv) on October 23, 2008, a special auction of U.S. $1.0 billion.
On February 4, February 5 and February 6, 2009, in response to abnormal exchange rate volatility and a scarcity of liquidity in the foreign exchange market, Banco de México carried out extraordinary sales of U.S. dollars to Mexican banks for an aggregate amount of U.S. $1.1 billion. Banco de México carried out additional extraordinary sales of dollars on February 20, February 23 and February 27, 2009 for an aggregate amount of U.S. $0.9 billion.
D-75
On February 22, 2010, the Foreign Exchange Commission announced that it would conduct auctions of options, which would allow the holder of the option to sell U.S. dollars to Banco de México. This system was designed to allow Mexico to gradually accumulate international reserves without affecting the exchange rate.
Pursuant to the new auction policy and commencing in February 2010, Banco de México began conducting an auction on the last business day of each month, in which participating financial institutions can purchase options to sell U.S. dollars to Banco de México. These options remained exercisable on any day of the month immediately following the auction. The holders of these options were able to sell U.S. dollars to Banco de México at the tipo de cambio interbancario de referencia (reference interbank exchange rate, or FIX) as determined by Banco de México on the business day immediately prior to the exercise of the option, so long as the applicable rate did not exceed the observed average of the FIX over the 20 business days preceding the exercise date. The amount of options available for auction each month was U.S. $600 million. On November 29, 2011, the Foreign Exchange Commission announced that, effective immediately, it was suspending temporarily this auction mechanism. From February 26, 2010 through November 30, 2011, Banco de México auctioned an aggregate of U.S. $12.6 billion in options through this mechanism, and through November 30, 2011, Banco de México had purchased an aggregate of U.S. $9.1 billion from holders upon the exercise of these options.
On November 29, 2011, the Foreign Exchange Commission announced that Banco de México would conduct an auction of U.S. $400 million on each business day, at a peso/dollar exchange rate that is, at a minimum, 2% weaker than the peso/dollar exchange rate on the previous business day. The daily auction will result in a sale only when the exchange rate depreciates more than 2% against the previous day’s exchange rate. This tool has been used in the past to promote liquidity in the foreign exchange market. From November 30, 2011 through October 23, 2012, the daily auctions resulted in a sale on only three different days, for a total amount of U.S. $646 million.
In December 2010, Banco de México submitted a request to the IMF for an advanced renewal and amendment of Mexico’s contingent credit line with the IMF, which would extend the term of the credit line to two years and increase the amount available under the line to approximately U.S. $72 billion. On January 10, 2011, the IMF granted this request. As of the date of this report, no amounts have been disbursed under the contingent credit line.
At December 31, 2011, Mexico’s international reserves totaled U.S. $142.5 billion, an increase of U.S. $28.9 billion from the amount at December 31, 2010. The net international assets of Banco de México totaled U.S. $149.2 billion at December 31, 2011, an increase of U.S. $28.6 billion from the amount at December 31, 2010.
At September 30, 2012, Mexico’s international reserves totaled U.S. $161.8 billion, an increase of U.S. $19.4 billion from the amount at December 31, 2011. The net international assets of Banco de México totaled U.S. $165.6 billion at September 30, 2012, an increase of U.S. $16.4 billion from the amount at December 31, 2011.
D-76
The following table sets forth the international reserves and net international assets of Banco de México at the end of each period indicated.
International Reserves and Net International Assets(3)
| | | | | | | | |
Year | | End-of-Period
International Reserves(1)(2) | | | End-of-Period
Net International Assets | |
| | | (in millions of dollars) | |
2007 | | $ | 77,991 | | | $ | 87,235 | |
2008 | | | 85,441 | | | | 95,232 | |
2009 | | | 90,838 | | | | 99,870 | |
2010 | | | 113,597 | | | | 120,621 | |
2011 | | | 142,476 | | | | 149,242 | |
2012 | | | | | | | | |
January | | | 148,315 | | | | 154,149 | |
February | | | 149,159 | | | | 155,031 | |
March | | | 150,264 | | | | 155,983 | |
April | | | 154,308 | | | | 159,374 | |
May | | | 154,858 | | | | 158,643 | |
June | | | 157,337 | | | | 162,754 | |
July | | | 160,158 | | | | 165,161 | |
August | | | 161,319 | | | | 165,393 | |
September | | | 161,882 | | | | 165,624 | |
| (1) | International reserves of Banco de México include gold, Special Drawing Rights and foreign exchange holdings. |
| (2) | International reserves are equivalent to gross international reserves minus international liabilities of the central bank with maturities of less than six months. |
| (3) | Net international assets are defined as (a) gross international reserves plus (b) assets with maturities greater than six months derived from credit agreements with central banks, less (x) liabilities outstanding to the IMF and (y) liabilities with maturities of less than six months derived from credit agreements with central banks. |
Source: Banco de México.
Direct Foreign Investment in Mexico
Mexico’s Ley de Inversión Extranjera (Foreign Investment Law) establishes a set of rules designed to provide foreign investors with legal certainty and encourage foreign investment in Mexico. The law, which became effective in December 1993, liberalized certain restrictions on foreign investment in Mexico, permitting the ownership by foreign investors of 100% of the capital stock of a Mexican company, if certain conditions are satisfied. The law also sets forth certain economic activities that are reserved for the Government or for Mexican investors and the different activities in which foreign investment may not exceed 10%, 25%, 30% or 49% of the total investment. While the Government recognizes that Mexico is competing for capital with many other countries, including China and nations in Eastern and Central Europe, the Government believes that, because of the increased competitiveness and productivity of Mexico’s economy, it will be able to maintain access to sources of investment capital.
In addition, the Foreign Investment Law allows foreign investors to purchase equity securities traded on the Mexican Stock Exchange that would otherwise be restricted to Mexican investors, provided that certain conditions are satisfied. With the authorization of the Ministry of Economy, investment trusts may be established by Mexican banks, with the banks acting as trustees to purchase these securities. These trusts, in turn, issue ordinary participation certificates that may be acquired by foreign investors, which grant only economic rights to their holders and do not confer voting rights in the companies whose stock is held by the trusts (such voting rights being exercisable only by the trustee).
According to preliminary figures, during 2011, net foreign investment in Mexico, as recorded in the balance of payments, totaled U.S. $45.8 billion, and was composed of direct foreign investment of U.S. $20.4 billion and net foreign portfolio investment (including securities placed abroad) inflows of U.S. $25.4 billion. Total accumulated direct foreign investment in Mexico, excluding the direct foreign investment that has not been registered with the Registro Nacional de Inversiones Extranjeras (National Foreign Investment Registry), during the 2007-2011 period totaled approximately U.S. $116.6 billion. Of the total direct foreign investment accumulated during the 2007-2011 period, excluding that in securities, 0.3% has been channeled to agriculture, livestock, fishing and forestry, 8.1% to mining, 0.8% to electricity and water, 5.2% to construction, 41.6% to manufacturing, 8.5% to commerce, 1.0% to transportation, 2.8% to mass media, 16.9% to financial services, 5.9% to real estate and rental services, 0.2% to educational services, 0.1% to health services and 8.7% to other services.
D-77
According to preliminary figures, net foreign investment in Mexico, as recorded in the balance of payments, totaled U.S. $32.0 billion during the first six months of 2012, and was composed of direct foreign investment of U.S. $9.6 billion and net portfolio foreign investment (including securities placed abroad) inflows of U.S. $22.4 billion.
The following table shows, by country of origin, direct foreign investment in Mexico, as notified to the National Foreign Investment Registry, and the cumulative totals from January 1, 2007 through December 31, 2011.
Direct Foreign Investment(1)
| | | | | | | | | | | | | | | | |
| | | Direct Foreign
Investment in 2011(2) | | | Cumulative Total
2007-2011(2) | |
| | | (in millions of dollars, except percentages) | |
United States | | $ | 10,490.1 | | | | 51.5 | % | | $ | 48,012.3 | | | | 41.2 | % |
Canada | | | 729.2 | | | | 3.6 | | | | 7,442.3 | | | | 6.4 | |
Brazil | | | 323.7 | | | | 1.6 | | | | 948.2 | | | | 0.8 | |
Spain | | | 3,151.7 | | | | 15.5 | | | | 17,625.7 | | | | 15.1 | |
United Kingdom | | | 59.0 | | | | 0.3 | | | | 3,047.7 | | | | 2.6 | |
Germany | | | 328.0 | | | | 1.6 | | | | 1,984.0 | | | | 1.7 | |
Luxembourg | | | 144.2 | | | | 0.7 | | | | 1,572.5 | | | | 1.3 | |
Ireland | | | 263.6 | | | | 1.3 | | | | 647.8 | | | | 0.6 | |
Switzerland | | | 1,157.7 | | | | 5.7 | | | | 2,313.2 | | | | 2.0 | |
Japan | | | 772.6 | | | | 3.8 | | | | 1,957.6 | | | | 1.7 | |
Others | | | 2,937.1 | | | | 14.4 | | | | 31,014.0 | | | | 26.6 | |
| | | | | | | | | | | | | | | | |
Total | | $ | 20,356.9 | | | | 100.0 | % | | $ | 116,565.3 | | | | 100.0 | % |
| | | | | | | | | | | | | | | | |
Note: Numbers may not total due to rounding.
| (2) | Excludes direct foreign investment that has not been registered with the National Foreign Investment Registry. |
Source: National Foreign Investment Commission (Informe Estadístico sobre el Comportamiento de la Inversión Extranjera Directa en México).
Subscriptions to International Institutions
At May 31, 2012, Mexico’s subscription to the IMF was 3,625.7 million Special Drawing Rights (SDR) (equal to approximately U.S. $5.5 billion as of that date). As of the date of this report, Banco de México has no outstanding loans from or repurchase obligations with the IMF.
Mexico’s subscription to the capital of the World Bank was U.S. $2.27 billion at June 30, 2012. Of this amount, U.S. $139.0 million has been paid in, and the balance is callable only if required by the World Bank to meet its obligations for borrowed funds or guaranteed loans. At June 30, 2012, excluding cancellations, the World Bank had authorized gross loans to Mexico totaling U.S. $47.8 billion, of which U.S. $44.7 billion has been disbursed.
At June 30, 2012, Mexico’s contribution to the capital of the International Development Association was U.S. $185 million and its subscription to the capital of the International Finance Corporation was U.S. $27.6 million, all of which has been paid. Both the International Development Association and the International Finance Corporation are part of the World Bank Group. At June 30, 2012, the International Finance Corporation had authorized credits to and made investments in Mexico totaling U.S. $7.2 billion.
At December 31, 2011, Mexico’s subscription to the capital of the Inter-American Development Bank (IADB) was U.S. $7.0 billion, one of the largest subscriptions of the IADB’s Latin American members. Of that subscription, U.S. $299.0 million has been paid in and the balance is callable if required to meet the IADB’s obligations. Mexico’s contribution to the IADB Fund for Special Operations was U.S. $329.0 million. The IADB had authorized gross loans to Mexico totaling U.S. $29.4 billion (excluding cancellations) as of December 31, 2011, of which U.S. $27.2 billion has been disbursed. At December 31, 2011, Mexico’s contribution to the capital of the Inter-American Investment Corporation (IAIC), an affiliate of the IADB, was U.S. $50 million. As of December 31, 2008, the IAIC had invested an aggregate amount of U.S. $394.7 million in Mexico and had approved investments of U.S. $44 million, U.S. $61 million and U.S. $17 million for 2009, 2010 and 2011, respectively.
D-78
At December 31, 2011, Mexico had subscribed to a total of U.S. $225 million of capital (totally paid in) of the North American Development Bank (NADBANK), whose purpose is to improve environmental conditions along the United States-Mexico border. Through March 31, 2012, a total of U.S. $762.5 million in loans had been disbursed to Mexico by the NADBANK.
At December 31, 2011, Mexico had also contributed U.S. $29.3 million in capital to the Special Development Fund of the Caribbean Development Bank. Banco de México has also been a member of the Bank for International Settlements since 1996.
Exchange Controls and Foreign Exchange Rates
Since December 22, 1994, the Government has maintained a floating exchange rate policy, with Banco de México intervening in the foreign exchange market from time to time to minimize volatility and ensure an orderly market. The Government has also promoted market-based mechanisms for stabilizing the exchange rate, such as over-the-counter forward and options contracts between banks and their clients in Mexico, as well as the authorization of peso futures trading on the Chicago Mercantile Exchange. In addition, since October 1996, Banco de México has permitted foreign financial institutions to open peso-denominated accounts and to borrow and lend pesos (subject to general restrictions on conducting banking activities in Mexico).
The peso/dollar exchange rate closed at Ps. 13.0659 = U.S. $1.00 on December 31, 2009, a 5.9% appreciation in dollar terms as compared with the rate on December 31, 2008. From the end of 2008 and during the first three months of 2009, the peso depreciated considerably against the dollar, mainly as a result of the global economic crisis and investors’ aversion to emerging market risk. Subsequently, in the second, third and fourth quarters of 2009, the peso appreciated against the dollar, primarily as a result of the improved external economic conditions and the exchange rate policies implemented by Banco de México.
The peso/dollar exchange rate closed at Ps. 12.3496 = U.S. $1.00 on December 31, 2010, a 5.8% appreciation in dollar terms as compared with the rate on December 31, 2009. During 2010, the peso appreciated considerably against the dollar, mainly as a result of the improving economic growth forecasts for the United States, a better outlook for internal expenditure in Mexico and the liquidity in the international financial market given the monetary policy strategies of the advanced economies.
The peso/dollar exchange rate closed at Ps. 13.9476 = U.S. $1.00 on December 31, 2011, an 11.5% depreciation in dollar terms as compared with the rate on December 31, 2010. During the first half of 2011, the peso appreciated against the dollar, mainly as a result of the solid fundamentals of the Mexican economy and increased liquidity in the international financial markets. However, during the second half of 2011, the peso depreciated against the dollar as a result of increased volatility in the international financial markets, which, in turn, caused investor aversion toward currencies of emerging economies.
During the first nine months of 2012, the average peso/U.S. dollar exchange rate was Ps. 13.5039 = U.S. $1.00. The peso/U.S. dollar exchange rate announced by Banco de México on October 25, 2012 (to take effect on the second business day thereafter) was Ps. 12.9669 = U.S. $1.00.
D-79
The following table sets forth, for the periods indicated, the daily peso/dollar exchange rates announced by Banco de México for the payment of obligations denominated in dollars and payable in pesos within Mexico.
Exchange Rates
| | | | |
| | | Representative Market Rate |
Year | | End-of-Period | | Average |
2007 | | 10.9157 | | 10.9288 |
2008 | | 13.8325 | | 11.1520 |
2009 | | 13.0659 | | 13.5076 |
2010 | | 12.3496 | | 12.6303 |
2011 | | 13.9476 | | 12.4354 |
2012 | | | | |
January | | 13.0077 | | 13.4178 |
February | | 12.7891 | | 12.7831 |
March | | 12.8093 | | 12.7567 |
April | | 12.9942 | | 13.0697 |
May | | 14.3047 | | 13.6634 |
June | | 13.4084 | | 13.9192 |
July | | 13.2833 | | 13.3661 |
August | | 13.2571 | | 13.1845 |
September | | 12.9170 | | 13.5039 |
Source: Banco de México.
D-80
PUBLIC FINANCE
General
Budget Process
The Government’s fiscal year is the calendar year. The budget process involves the participation and coordination of all the Governmental ministries and agencies on both an overall and a sectoral basis. The Ministry of Finance and Public Credit prepares the revenue bill each fiscal year, which sets forth the revenues projected to be received by the Government and certain agencies and enterprises whose budgets require specific legislative approval (budget -controlled agencies) during the succeeding fiscal year. In addition, the various Governmental ministries prepare expenditure estimates for their own operations and for all of the budget-controlled agencies under their jurisdiction, utilizing the policy orientation and program guidelines established by the Ministry of Finance and Public Credit. Subsequently, the Ministry of Finance and Public Credit reviews these expenditure requests and prepares the expenditure bill for the Government and the budget-controlled agencies.
Upon passage by both houses of Congress, the revenue bill becomes the Federal Annual Revenue Law, which provides the Governmental ministries and budget-controlled agencies the requisite authority for collecting taxes and other revenues, as well as for contracting loans. Unlike the revenue bill, the Constitution only requires the approval of the Chamber of Deputies for the passage of the expenditure bill. Upon passage by the Chamber of Deputies, the expenditure bill becomes the Federal Expenditure Budget, which authorizes the Governmental ministries and budget-controlled agencies to incur expenses during the relevant fiscal year. In addition, the Chamber of Deputies is obligated to review on a yearly basis the Public Account, which sets forth the expenditures actually made by the Governmental ministries and the budget-controlled agencies during the previous fiscal year.
Under the Constitution, expenditures may only be made by Governmental ministries or budget-controlled agencies if the expenditures are included in the Federal Expenditure Budget or approved under a law subsequently passed by Congress. The Federal Annual Revenue Law for 2012, as approved by Congress, and the Federal Expenditure Budget for 2012, as passed by the Chamber of Deputies, were published in the Official Gazette of the Federation on October 27, 2011 and November 15, 2011, respectively (together, the 2012 Budget). The 2012 Budget allows Governmental ministries and budget-controlled agencies to request additional expenditures to the extent that oil revenues earned by PEMEX exceed the projected oil revenues set forth in the 2012 Budget. Further, the 2012 Budget provides that the Executive Branch, acting through the Ministry of Finance and Public Credit, is authorized to approve, if certain conditions are met, additional expenditures by certain Governmental ministries or agencies in the event that those Governmental ministries or agencies realize revenues greater than those projected in the 2012 Budget.
Treatment of Public Sector Agencies and Enterprises
The federal budget includes the revenues and expenditures of the Government and of budget-controlled agencies, including, for example, Petróleos Mexicanos. The information included herein regarding the overall public sector budget, revenues and expenditures is prepared on a consolidated basis and includes not only the revenues and expenditures of the Government and budget-controlled agencies, but also that of other public sector agencies and enterprises whose budgets are not subject to legislative approval (administratively controlled agencies), such as NAFIN and Bancomext. The budgets of administratively controlled agencies are subject to Governmental review and, as with the budget-controlled agencies, the Ministry of Finance and Public Credit must approve their borrowings. In some instances, borrowings of budget and administratively controlled agencies are guaranteed by Mexico, either by law or pursuant to contractual arrangements.
Measures of Fiscal Balance
Mexico reports its fiscal balance using three principal measures:
| | • | | Public sector balance, which is equal to consolidated public sector revenues minus expenditures, including public sector interest expense but excluding proceeds from privatizations and the effects of financial intermediation. A deficit in the public sector balance is also referred to as the public sector borrowing requirement. |
D-81
| | • | | Primary balance, which is equal to the public sector balance less the net borrowing costs of the Government, that is, the balance of revenues and expenditures of the non-financial public sector, excluding interest payments on public debt. The primary balance is also reported without giving effect to proceeds of privatizations. This balance is used to measure the effect of discretionary actions taken to control expenditures and increase revenues. |
| | • | | Operational balance, which is equal to the primary balance but excludes only the inflationary component of interest payments on domestic debt of the non-financial public sector. This balance is used to correct the distortions that affect the measurement of public finances in an inflationary environment. |
The following table sets forth the performance of public finance indicators as a percentage of GDP for the years indicated. Figures presented in the following table and throughout this section have been calculated with GDP figures using 2003 as the base year.
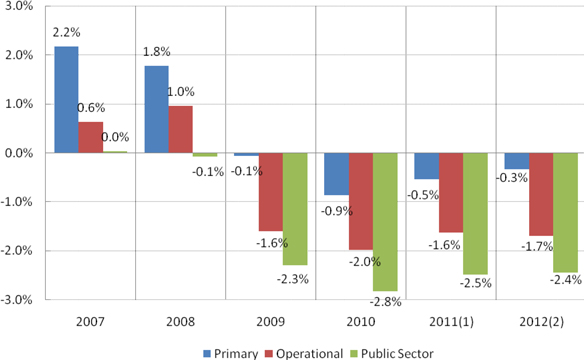
| (2) | 2012 Budget figures represent budgetary estimates based on the economic assumptions contained in the Criterios Generales de Política Económica (General Economic Policy Guidelines) for 2012 and in the Programa Económico 2012 (Economic Program for 2012), and do not reflect actual results for the year or updated estimates of Mexico’s 2012 economic results. |
Source: Ministry of Finance and Public Credit.
Fiscal Policy
A rational allocation of public expenditures and the augmentation of revenue have been important components of the Government’s economic stabilization strategy, which has two fundamental objectives: (1) to reduce the poverty rate and (2) to increase the rate of economic growth and employment.
D-82
The Government’s principal fiscal policy objectives to promote economic growth and employment opportunity are as follows:
| | • | | reduce the costs and risks associated with investment in Mexico; |
| | • | | improve the ability of Mexican businesses to compete in global markets; and |
| | • | | reduce the costs of goods and services to the consumer. |
To achieve these objectives, the Government plans to implement the following:
| | • | | strengthen the rule of law and improve public security; |
| | • | | simplify the administration of the Mexican tax system and facilitate the consistent application of the various tax laws; |
| | • | | improve the efficiency of the public sector through enhanced coordination among government entities and increased transparency of public spending, in order to permit increased spending on social development and infrastructure; |
| | • | | further develop the Mexican equity and debt markets; |
| | • | | improve the pension system for public sector workers; |
| | • | | consolidate macroeconomic stability through fiscal discipline and the effective use of petroleum resources, as well as the utilization of transparent and efficient budgetary procedures; |
| | • | | improve the regulation (or pursue deregulation) of various sectors of the economy, as appropriate; and |
| | • | | continue trade liberalization policies. |
The Programa Nacional de Financiamiento al Desarrollo 2008-2012 (National Program to Finance Development 2008-2012, or PRONAFIDE), announced on May 27, 2008, establishes Government fiscal policy goals consistent with those described above, including increased spending on social and economic development and greater investment in infrastructure, while maintaining a stable and responsible approach to public finances. To this end, the PRONAFIDE has outlined the following specific objectives:
| | • | | strengthen the framework of fiscal responsibility to ensure a responsible and efficient fiscal policy, including a balanced budget and a prudent management of debt, each of which are core components of Mexico’s development strategy, with the goals of reducing the historical balance of the public sector borrowing requirement and strengthening the mechanisms to carry out counter-cyclical policies; |
| | • | | continue to simplify the Mexican taxation system, seeking additional mechanisms to facilitate compliance with tax obligations and reduce tax evasion, in order to improve tax collection; |
| | • | | ensure the proper implementation of public finance reforms, in particular the Flat Rate Business Tax, in order to increase non-oil tax revenues and reduce the volatility of total government revenues; |
| | • | | improve the allocation and use of expenditures by evaluating their results, based on greater transparency and accountability, including the implementation of an evaluation system for expenditure programs, integrating the Government’s accounting systems at all three levels of government and giving priority in the allocation of expenditures to sectors and programs that produce better results; and |
| | • | | promote the development of local financial markets and achieve savings in the financial costs of the public sector through the active management of public debt, while maintaining a level of risk consistent with the natural evolution of public finances and the development of local financial markets. |
D-83
2012 Budget
The 2012 Budget provides for a public sector budget deficit of Ps. 95.6 billion, or 0.4% of GDP (excluding PEMEX’s investment program), based on an estimated weighted average Mexican crude oil export price of U.S. $84.9 per barrel, which together with an estimated volume of oil exports of 1,177 thousand barrels per day, would result in approximately Ps. 1,172.3 billion of projected oil revenues for 2012. Including PEMEX’s investment program, the 2012 Budget provides for a public sector budget deficit of 2.4% of GDP.
The 2012 Budget contemplates public sector budgetary revenues totaling Ps. 3,310.5 billion, a 4.7% increase in real terms as compared to public sector budgetary revenues estimated in the Ley de Ingresos de la Federación para el Ejercicio Fiscal de 2011 (the Federal Revenue Law for 2011).
The 2012 Budget estimates that expenditures will total Ps. 3,405.7 billion during 2012 (excluding estimated physical investment expenditures by PEMEX totaling Ps. 301.2 billion), a 4.4% increase in real terms as compared to the amount approved in the Presupuesto de Egresos de la Federación para el Ejercicio Fiscal de 2011 (the Federal Expenditure Budget for 2011).
Under the 2012 Budget as adopted by Congress, the Government estimates that it will expend Ps. 515.2 billion (18.0% of total budgetary programmable expenditures) on education and Ps. 900.3 billion (31.4% of total budgetary programmable expenditures) on health and social security. The Government also expects to expend Ps. 184.0 billion (6.4% of total budgetary programmable expenditures) on housing and community development. The 2012 Budget also allows the Government to increase expenditures for social development by 6.4%, national security by 9.4% and science technology and innovation by 18.6%, each as compared to 2011. Investment expenditures in the period 2007-2012 are expected to be 47.7% higher in real terms than during the 2001-2006 period.
In addition, the 2012 Budget contemplates that Ps. 270.1 billion will be allocated for the servicing of Government debt, including the servicing of IPAB debt, and Ps. 48.0 billion for the servicing of CFE and PEMEX debt.
D-84
The table below sets forth the assumptions and targets underlying the 2012 Budget, as embodied in the General Economic Policy Guidelines for 2012 presented by the President to the Congress for approval and in the Economic Program for 2012 approved by the Congress, the results for 2010, and the preliminary results for 2011 and the first six months of 2012.
2010, 2011 and First Six Months of 2012 Results;
2012 Budget Assumptions and Targets
| | | | | | | | | | | | | | | | |
| | | 2010
Results | | | 2011
Results(1) | | | First Six
Months of
2012
Results(1) | | | 2012
Budget(2) | |
Real GDP growth (%) | | | 5.5 | % | | | 3.9 | % | | | 4.3 | % | | | 3.3 | % |
Increase in the national consumer price index (%) | | | 4.4 | % | | | 3.8 | % | | | 0.8 | % | | | 3.0 | % |
Average export price of Mexican oil mix (U.S. $/barrel) | | $ | 72.46 | | | $ | 101.00 | | | $ | 105.32 | | | $ | 84.90 | (3) |
Current account deficit as % of GDP | | | (0.4 | )% | | | (1.0 | )% | | | 0.1 | % | | | n.a. | |
Average exchange rate (Ps./$1.00) | | | 12.6 | | | | 12.4 | | | | 13.3 | | | | 12.8 | |
Average rate on 28-day Cetes (%) | | | 4.4 | % | | | 4.2 | % | | | 4.3 | % | | | 4.6 | % |
Public sector balance as % of GDP(4) | | | (2.8 | %) | | | (2.5 | %) | | | (1.9 | )% | | | (2.4 | )% |
Primary balance as % of GDP(4) | | | (0.9 | %) | | | (0.5 | %) | | | 0.3 | % | | | (0.3 | )% |
n.a. = Not available.
| (2) | 2012 Budget figures represent budgetary estimates, based on the economic assumptions contained in the General Economic Policy Guidelines for 2012 and in the Economic Program for 2012, and do not reflect actual results for the year or updated estimates of Mexico’s 2012 economic results. |
| (3) | The Mexican Government entered into hedging agreements to protect against the effects of a potential decline in oil prices with respect to the level that was assumed in the Federal Revenue Law for 2012. Therefore, the approved expenditures level should not be affected if the weighted average price of crude oil exported by PEMEX for the year falls below the price assumed in the 2012 Budget. |
| (4) | Includes the effect of expenditures related to the issuance of bonds pursuant to reforms to the ISSSTE Law and recognition as public sector debt of certain PIDIREGAS obligations, as discussed under “—Revenues and Expenditures—General” below. |
Source: Ministry of Finance and Public Credit.
D-85
Revenues and Expenditures
General
The following table sets forth revenues and expenditures, as well as total borrowing requirements for the consolidated public sector in constant pesos for the five fiscal years ended December 31, 2011 and for the first six months of 2012, as well as budgetary estimates for 2012.
Selected Public Finance Indicators
| | | | | | | | | | | | | | | | | | | | | | | | | | | | | | | | | | | | | | | | | | | | | | | | | | | | | | | | |
| | | 2007 | | | As a
% of
GDP | | | 2008 | | | As a
% of
GDP | | | 2009(1) | | | As a
% of
GDP(1) | | | 2010(1) | | | As a
% of
GDP(1) | | | 2011(1) | | | As a
% of
GDP(1) | | | First
Six
Months of
2012(1) | | | As a
% of
GDP(1) | | | 2012
Budget(2) | | | As a
% of
GDP(2) | |
| | | (in billions of constant pesos(3) or percentage of GDP) | |
| | | | | | | | | | | | | | |
1. Budgetary revenues | | | Ps. 1,935.2 | | | | 22.0 | % | | | Ps. 2,094.1 | | | | 23.5 | % | | | Ps. 1,979.1 | | | | 23.6 | % | | | Ps. 2,001.4 | | | | 22.6 | % | | | Ps. 2,096.8 | | | | 22.8 | % | | | Ps. 1,067.1 | | | | 22.6 | % | | | Ps. 1,986.3 | | | | 21.9 | % |
Federal Government | | | 1,332.2 | | | | 15.1 | | | | 1,500.5 | | | | 16.8 | | | | 1,405.4 | | | | 16.8 | | | | 1,406.2 | | | | 15.9 | | | | 1,488.0 | | | | 16.2 | | | | 766.0 | | | | 16.2 | | | | 1,388.3 | | | | 15.3 | |
Public enterprises and agencies | | | 603.0 | | | | 6.8 | | | | 593.6 | | | | 6.7 | | | | 573.8 | | | | 6.8 | | | | 595.2 | | | | 6.7 | | | | 608.8 | | | | 6.6 | | | | 301.2 | | | | 6.4 | | | | 597.9 | | | | 6.6 | |
2. Budgetary expenditures | | | 1,932.7 | | | | 21.9 | | | | 2,102.7 | | | | 23.6 | | | | 2,170.0 | | | | 25.9 | | | | 2,253.9 | | | | 25.5 | | | | 2,327.8 | | | | 25.3 | | | | 1,158.0 | | | | 24.5 | | | | 2,207.6 | | | | 24.3 | |
(a) Budgetary primary expenditures (excluding interest payments) | | | 1,746.6 | | | | 19.8 | | | | 1,936.4 | | | | 21.7 | | | | 1,985.4 | | | | 23.7 | | | | 2,081.0 | | | | 23.5 | | | | 2,152.1 | | | | 23.4 | | | | 1,061.5 | | | | 22.5 | | | | 2,016.7 | | | | 22.2 | |
| | | | | | | | | | | | | | |
Programmable | | | 1,475.2 | | | | 16.7 | | | | 1,617.8 | | | | 18.2 | | | | 1,711.7 | | | | 20.4 | | | | 1,770.5 | | | | 20.0 | | | | 1,834.0 | | | | 20.0 | | | | 891.0 | | | | 18.9 | | | | 1,705.2 | | | | 18.8 | |
Non-programmable | | | 271.4 | | | | 3.1 | | | | 318.6 | | | | 3.6 | | | | 273.6 | | | | 3.3 | | | | 310.5 | | | | 3.5 | | | | 318.1 | | | | 3.5 | | | | 170.5 | | | | 3.6 | | | | 311.6 | | | | 3.4 | |
(b) Interest payments (budgetary sector) | | | 186.0 | | | | 2.1 | | | | 166.2 | | | | 1.9 | | | | 184.6 | | | | 2.2 | | | | 172.9 | | | | 2.0 | | | | 175.7 | | | | 1.9 | | | | 96.5 | | | | 2.0 | | | | 190.9 | | | | 2.1 | |
3. Budgetary primary balance (1-2(a)) | | | 188.6 | | | | 2.1 | | | | 157.7 | | | | 1.8 | | | | (6.2 | ) | | | (0.1 | ) | | | (79.6 | ) | | | (0.9 | ) | | | (55.3 | ) | | | (0.6 | ) | | | 5.6 | | | | 0.1 | | | | (30.5 | ) | | | (0.3 | ) |
4. Non-budgetary primary balance | | | 3.7 | | | | 0.0 | | | | 0.8 | | | | 0.0 | | | | 0.8 | | | | 0.0 | | | | 2.7 | | | | 0.0 | | | | 5.2 | | | | 0.1 | | | | 8.9 | | | | 0.2 | | | | 0.3 | | | | 0.0 | |
5. Total primary balance (3+4) | | | 192.3 | | | | 2.2 | | | | 158.5 | | | | 1.8 | | | | (5.4 | ) | | | (0.1 | ) | | | (76.9 | ) | | | (0.9 | ) | | | (50.1 | ) | | | (0.5 | ) | | | 14.5 | | | | 0.3 | | | | (30.2 | ) | | | (0.3 | ) |
6. Total interest payments (budgetary and non-budgetary) | | | 186.0 | | | | 2.1 | | | | 166.3 | | | | 1.9 | | | | 184.6 | | | | 2.2 | | | | 172.9 | | | | 2.0 | | | | 175.7 | | | | 1.9 | | | | 96.5 | | | | 2.0 | | | | 191.2 | | | | 2.1 | |
| | | | | | | | | | | | | | |
7. Statistical discrepancy | | | (2.5 | ) | | | (0.0 | ) | | | 2.0 | | | | 0.0 | | | | (2.1 | ) | | | 0.0 | | | | (0.7 | ) | | | 0.0 | | | | (2.2 | ) | | | (0.0 | ) | | | (6.3 | ) | | | (0.1 | ) | | | — | | | | — | |
8. Public sector balance (on a cash basis) (5-6+7) | | | 3.7 | | | | 0.0 | | | | (5.8 | ) | | | (0.1 | ) | | | (192.1 | ) | | | (2.3 | ) | | | (250.5 | ) | | | (2.8 | ) | | | (228.0 | ) | | | (2.5 | ) | | | (88.3 | ) | | | (1.9 | ) | | | (221.4 | ) | | | (2.4 | ) |
Note: Numbers may not total due to rounding.
| (2) | Budgetary estimates as of October 2011. Budgetary estimates were converted into constant pesos using the GDP deflator for 2012 estimated as of October 2012. Percentages of GDP were calculated based on budgetary assumptions listed in the immediately preceding table. |
| (3) | Constant pesos with purchasing power at December 31, 2003. |
Source: Ministry of Finance and Public Credit.
During 2009, the public sector balance registered a deficit of Ps. 273.5 billion, or 2.3% of GDP, as compared to a deficit of Ps. 7.9 billion in nominal pesos in 2008. The increase in the public sector deficit was primarily due to an increase in physical investment expenditures by PEMEX as a result of the depreciation of the Mexican peso against the U.S. dollar. Excluding physical investments by PEMEX, the public sector registered a deficit of Ps. 22.1 billion.
During 2009, the primary balance registered a deficit of Ps. 7.7 billion in nominal pesos, or 0.1% of GDP, as compared to a surplus of Ps. 216.5 billion in nominal pesos recorded in 2008. This change from a primary balance surplus to a primary balance deficit was mainly due to the elimination of the PIDIREGAS program, which now requires budgetary entities to recognize their investment expenditures when incurred.
D-86
During 2010, the public sector balance registered a deficit of Ps. 370.5 billion in nominal pesos, or 2.8% of GDP, as compared to a deficit of Ps. 273.5 billion in nominal pesos in 2009, a result consistent with the approved budget deficit and applicable guidelines for the fiscal year. Excluding physical investments by PEMEX, the public sector registered a deficit of Ps. 102.0 billion.
During 2010, the primary balance registered a deficit of Ps. 113.7 billion in nominal pesos, or 0.9 % of GDP, as compared to a deficit of Ps. 7.7 billion in nominal pesos recorded in 2009.
According to preliminary figures, during 2011, the public sector balance registered a deficit of Ps. 355.5 billion, or 2.5% of GDP, as compared to a deficit of Ps. 370.5 billion in nominal pesos in 2010, a result consistent with the approved budget deficit and applicable guidelines for the fiscal year. Excluding physical investments by PEMEX, the public sector registered a deficit of Ps. 88.3 billion, or 0.6% of GDP, which exceeded the deficit programmed for the public sector by Ps. 18.1 billion, but remained within the limits established by the Federal Budget and Fiscal Responsibility Law.
According to preliminary figures, during 2011, the primary balance registered a deficit of Ps. 78.1 billion in nominal pesos, or 0.5% of GDP, as compared to a deficit of Ps. 113.7 billion in nominal pesos recorded in 2010.
According to preliminary figures, including physical investment expenditures by PEMEX, the public sector balance registered a deficit of Ps. 142.6 billion in nominal pesos, or 1.9% of GDP, during the first six months of 2012, as compared with a deficit of Ps. 125.4 billion in nominal pesos registered for the same period of 2011. Excluding physical investment by PEMEX, the public sector balance registered a deficit of Ps. 24.1 billion in nominal pesos, as compared to Ps. 35.1 billion surplus registered for the same period of 2011.
According to preliminary figures, including physical investment expenditures by PEMEX, the primary balance registered a surplus of Ps. 23.4 billion in nominal pesos for the first six months of 2012, 28.9% higher in real terms than for the first six months of 2011.
D-87
Revenues
The following table shows the composition of public sector budgetary revenues for each of the five fiscal years ended December 31, 2011 and for the first six months of 2012, as well as the projected revenues set forth in the 2012 Budget.
Public Sector Budgetary Revenues
| | | | | | | | | | | | | | | | | | | | | | | | | | | | |
| | | 2007 | | | 2008 | | | 2009(1) | | | 2010(1) | | | 2011(1) | | | First Six
Months of
2012(1) | | | 2012
Budget(2) | |
| | | (in billions of constant pesos)(3) | |
Budgetary revenues | | | Ps. 1,935.2 | | | | Ps. 2,094.1 | | | | Ps. 1,979.1 | | | | Ps. 2,001.4 | | | | Ps. 2,096.8 | | | | Ps. 1,067.1 | | | | Ps. 1,986.3 | |
Federal government | | | 1,332.2 | | | | 1,500.5 | | | | 1,405.4 | | | | 1,406.2 | | | | 1,488.0 | | | | 766.0 | | | | 1,388.3 | |
Taxes | | | 780.6 | | | | 728.0 | | | | 793.5 | | | | 852.1 | | | | 829.9 | | | | 407.1 | | | | 880.5 | |
Income tax | | | 410.4 | | | | 410.7 | | | | 375.3 | | | | 423.6 | | | | 462.2 | | | | 248.0 | | | | 448.8 | |
Value-added tax | | | 318.4 | | | | 334.7 | | | | 286.5 | | | | 341.1 | | | | 344.4 | | | | 172.8 | | | | 333.8 | |
Excise taxes | | | (5.3 | ) | | | (123.2 | ) | | | 35.5 | | | | 3.0 | | | | (49.1 | ) | | | (46.9 | ) | | | 27.6 | |
Import duties | | | 25.1 | | | | 26.2 | | | | 21.2 | | | | 16.6 | | | | 17.2 | | | | 8.3 | | | | 16.4 | |
Export duties | | | 0.0 | | | | 0.0 | | | | 0.0 | | | | 0.0 | | | | 0.0 | | | | 0.0 | | | | 0.0 | |
Luxury goods and services | | | 0.0 | | | | 0.0 | | | | 0.0 | | | | 0.0 | | | | 0.0 | | | | 0.0 | | | | 0.0 | |
Other | | | 32.0 | | | | 79.6 | | | | 75.0 | | | | 67.9 | | | | 55.2 | | | | 25.0 | | | | 53.9 | |
Non-tax revenue | | | 551.6 | | | | 772.5 | | | | 611.8 | | | | 554.1 | | | | 658.1 | | | | 358.8 | | | | 507.8 | |
Fees and tolls | | | 446.9 | | | | 684.0 | | | | 363.8 | | | | 455.3 | | | | 567.7 | | | | 317.6 | | | | 473.5 | |
Rents, interest and proceeds of assets sales | | | 5.3 | | | | 5.0 | | | | 4.7 | | | | 2.8 | | | | 2.9 | | | | 2.2 | | | | 2.3 | |
Fines and surcharges | | | 99.5 | | | | 83.4 | | | | 243.3 | | | | 95.9 | | | | 87.4 | | | | 39.1 | | | | 32.0 | |
Other | | | 0.0 | | | | 0.0 | | | | 0.0 | | | | 0.0 | | | | 0.0 | | | | 0.0 | | | | 0.0 | |
Public enterprises and agencies | | | 603.0 | | | | 593.6 | | | | 573.8 | | | | 595.2 | | | | 608.8 | | | | 301.2 | | | | 597.9 | |
PEMEX | | | 291.8 | | | | 265.4 | | | | 268.3 | | | | 260.6 | | | | 252.5 | | | | 132.7 | | | | 257.4 | |
Others | | | 311.2 | | | | 328.3 | | | | 305.4 | | | | 334.6 | | | | 356.3 | | | | 168.5 | | | | 340.6 | |
Note: Numbers may not total due to rounding.
| (2) | Budgetary estimates as of October 2011. Budgetary estimates for 2012 were converted into constant pesos using the GDP deflator for 2012, estimated as of October 2011. |
| (3) | Constant pesos with purchasing power at December 31, 2003. |
Source: Ministry of Finance and Public Credit.
According to preliminary figures, public sector budgetary revenues increased by 6.9% in real terms during 2011, as compared to 2010. In particular, crude oil revenues increased by 9.5%, non-oil tax revenues increased by 5.7%, while non-oil, non-tax revenues decreased by 4.0%, each in real terms and as compared to 2010. Non-oil tax revenues increased by 5.7% as a result of an 8.0% increase in income tax revenues, a 10.5% increase in non-oil excise tax (primarily the IEPS tax), and a 3.0% increase in value-added tax revenues. Crude oil prices increased by 39.4% in 2011, from an average price of U.S. $72.46 per barrel in 2010 to an average price of U.S. $101.00 per barrel in 2011, while non-tax revenues from PEMEX as a percentage of total public sector budgetary revenues decreased from approximately 13.0% in 2010 to approximately 12.0% in 2011.
According to preliminary figures, during the first six months of 2012, public sector budgetary revenues amounted to Ps. 1,724.5 billion in nominal pesos, 9.0% greater in real terms as compared to the same period of 2011. During the first six months of 2012, crude oil revenues increased by 12.0% and non-oil tax revenues increased by 7.4%, both in real terms and as compared to the same period of 2011. Non-tax revenues from PEMEX as a percentage of total public sector budgetary revenues increased from approximately 10.6% in the first six months of 2011 to approximately 12.4% in the same period of 2012.
Public sector budgetary revenues increased as a percentage of GDP over the past five years, from 22.0% of GDP in 2007 to 22.8% of GDP in 2011.
D-88
Taxation
Mexico’s federal tax structure includes both direct taxation in the form of income taxes and indirect taxation in the form of the value-added tax (VAT) and excise taxes, such as the IEPS tax. The value-added tax is imposed at a fixed rate of 16% (11% in border regions) and is passed through the manufacturing and distribution chain until it becomes part of the purchase price to the consumer. Certain goods and services, such as exports, qualify for an exemption from or a reduced rate of the value-added tax. Maquila services provided by maquiladoras are considered exports for purposes of the VAT, and are therefore subject to a 0% rate.
Income taxes consist of the individual tax and the corporate tax. The individual income tax is levied at progressive rates. The highest marginal tax rate for individuals (those having annual incomes over Ps. 392,842.0) was increased temporarily to 30% in 2010, and will be reduced to 29% in 2013 and to 28% in 2014. The corporate tax is levied at a flat rate of 30%, and will be reduced to 29% for 2013 and 28% for 2014 and thereafter. Until 2008, corporations and individuals engaged in business activities were also subject to an asset tax, which was a minimum income tax aimed at reducing tax evasion. This asset tax was assessed at a rate of 1.5% on the aggregate book value of the assets owned by a corporation in each fiscal year. Income taxes payable by corporations were creditable against the asset tax. Effective January 1, 2008, the asset tax was replaced by the single-rate corporate tax, described below.
Impuesto Empresarial a Tasa Única (IETU), a new single rate corporate tax, became effective on January 1, 2008, and imposed a minimum tax equal to 16.5% of a corporation’s sales revenues (less certain deductions, including wages, social security contributions and certain investment expenditures) in 2008, 17.0% in 2009 and 17.5% in 2010 and thereafter. This new tax replaced the asset tax and is intended to discourage tax evasion. Income tax liability may be credited against flat tax liability, so it is paid only to the extent it exceeds income tax. In contrast to the abolished asset tax, any flat tax paid is not creditable for Mexican income tax purposes in subsequent years.
Withholding taxes related to interest payments made by Mexican companies to non-residents of Mexico are generally imposed at a rate of 30% (or at a lower rate if specified in a tax treaty between Mexico and the country of the applicable non-resident). The withholding tax on interest payments made to a foreign financial institution is 4.9%, provided the financial institution is registered with the Ministry of Finance and Public Credit and is a resident of a country that is party to a treaty with Mexico for the avoidance of double taxation; otherwise the rates are 10%, unless otherwise reduced under a tax treaty. A 15% withholding rate is imposed on the interest portion of payments made on financial leases. Mexico does not impose a withholding tax on dividends.
All federal states in Mexico apply a tax on salaries that ranges from 1% to 3%. In addition, employers must contribute an amount equivalent to 5% of payroll to a housing fund, and 2% of payroll to an employee retirement fund. A transfer tax applies to the transfer of real estate at rates that range between 2% and 5%. A cash deposit tax at a rate of 3% applies on the amount of any cash deposits made in a taxpayer’s bank which exceed Ps. 15,000 per month. This tax, which was intended to subject payments made in the informal sector of the economy to the tax system, can be credited against income taxes, retained earnings tax and other federal contributions.
Since 1990, Mexico has negotiated bilateral treaties with various countries to avoid double taxation. Tax treaties are currently in force between Mexico and Canada, the United States, Germany, France, Sweden, Spain, the Netherlands, the United Kingdom, Switzerland, Italy, Bahrain, Norway, Belgium, South Korea, Japan, Denmark, India, Singapore, Indonesia, Finland, Ireland, Chile, China, Greece, Ecuador, Argentina, Uruguay, Panama, Australia, Austria, the Czech Republic, Poland, Luxembourg, Portugal, Romania, Israel, Brazil, Russia, New Zealand, Iceland, Barbados, South Africa, Venezuela, Hungary and Slovakia. Tax treaties have been signed but are in each case pending ratification by at least one party with respect to Hong Kong, Latvia, Lithuania, Qatar, Ukraine, Peru, Kuwait and Colombia. Tax treaties are under negotiation with Lebanon, Liechtenstein, Saudi Arabia, Monaco, Malaysia, Gibraltar, Morocco, Malta, Nicaragua, Pakistan, Thailand, Turkey, Jamaica, St. Lucia, the Turks and Caicos Islands, Vanuatu, Estonia, United Arab Emirates, Slovenia and Aruba. In addition, Mexico shares tax information with the Bahamas, Belize, the Cook Islands, Costa Rica, the Marshall Islands, the British Virgin Islands, the Netherlands Antilles,the Guernsey Islands, the Jersey Islands, the Cayman Islands, Samoa, the Isle of Man and Bermuda.
D-89
The following graphs illustrate the changes in the composition of tax revenues between 2007 and 2011.
Composition of Tax Revenues
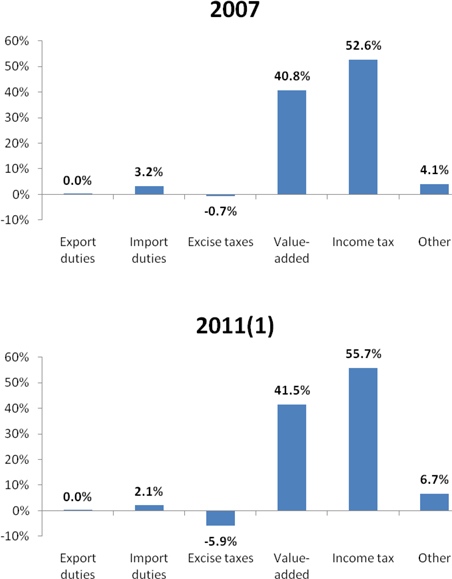
Note: Numbers may not total due to rounding.
Source: Ministry of Finance and Public Credit.
The Government does not have exclusive power to impose certain special taxes as a result of changes made in the tax laws during the 1990’s to strengthen the income of the states and their participation in the tax system. Since 1997, local governments have been permitted to impose taxes on lodging services and new vehicles (in addition to the federal taxes on these items). Moreover, local governments are able to require retail commercial establishments that sell alcoholic beverages to purchase local licenses. Finally, a percentage of excise tax collections is directly allocated to the states.
D-90
On November 5, 2009, in addition to passing the Federal Annual Revenue Law for 2010, Congress approved the following changes to the tax laws, effective January 1, 2010.
| | | | |
| | | Modification in rate | | Principal Elements of Tax Reform |
A. Excise Taxes | | | | |
| Beer | | Increased from 25% to 26.5% | | |
| Alcoholic Beverages | | Increased from 50% to 53% | | Only applies to alcoholic beverages with more than 20 degrees Gay-Lussac (20% Alcohol by volume). |
| Tobacco | | Increased from Ps. 1.20 to Ps. 1.60 per pack of 20 cigarettes. VAT of 160% of the price from wholesaler to retailer. | | The tax on cigarettes was scheduled to be phased in from 2010 to 2013, but the phase-in has now been eliminated. The requirement to print a security code on cigarette packs was implemented to combat illegal smuggling. |
| Games and Lotteries | | Increased from 20% to 30% | | |
| Telecommunications | | 3% (new) | | Applies to services provided in Mexico through a public telecommunications network. Public and rural telephone services, interconnection services and internet access telecommunication services are exempt. |
B. Value Added Tax | | | | |
| General Tax | | Increased from 15% to 16% | | Remains at 0% for food and medicine. |
| Border Area | | Increased from 10% to 11% | | |
C. Income Tax | | | | |
| Individuals | | 30% maximum | | Temporary increase for the highest tax bracket; will return to 28% in 2014. |
| Corporations | | 30% | | Temporary increase; will return to 28% in 2014. |
| Tax Consolidation Rules | | | | Income tax deferred for more than five years (i.e., from 2004 and in subsequent years) by tax consolidation groups will be paid as of the sixth year in which it was originated—25% in the first year; 25% in the second fiscal year; 20% in the third fiscal year; 15% in the fourth fiscal year; and 15% in the fifth fiscal year. |
| Primary Sector | | Increased from 19% to 21% | | |
D. Tax on cash deposits | | | | |
| Tax on Cash Deposits (IDE) | | Increased from 2% to 3% | | The monthly limit on tax-free cash deposits was reduced from Ps. 25,000 to Ps. 15,000 per month. The tax is imposed only on the amount exceeding Ps. 15,000. |
D-91
The key changes proposed by the Executive Branch and approved by the Congress in the Federal Revenue Law for 2011 included:
| | • | | 41 fees associated with obtaining various services provided by the Government were eliminated, most notably those related to certain public registries such as the National Registry of Foreign Investment and the Public Registry of Commerce, to the notification of concentrations in accordance with the Federal Antitrust Law, to visit and photograph protected natural areas and those associated with temporary imports of medical devices. |
| | • | | The excise tax on cigarettes was increased to Ps. 7.0 per pack as of 2011 and the transition period legislated for 2010-2013 was eliminated. |
| | • | | A 25% IEPS tax was imposed on sales and imports of energy drinks, as well as on concentrates, powders and syrups to prepare these beverages. The tax does not apply to hydrating and rehydrating beverages. |
| | • | | Congress approved a fiscal stimulus aimed at promoting first-time formal employment, in the form of a tax deduction related to the hiring of workers that have a formal job for the first time, as long as those positions are maintained for a minimum of 36 months and the first-time workers remain occupied for 18 consecutive months. The deduction applies only to workers who earn up to eight times the minimum wage, and the maximum amount of the additional deduction is 40% of the payroll cost of these employees. The deduction will be reduced to 25% of the payroll cost during the first-time employee’s second year of employment. |
| | • | | A fiscal stimulus to promote theatrical production was approved. This consists of an income tax credit equivalent to the amount that is invested in theatrical production projects. The amount of the credit is limited to Ps. 50.0 million per fiscal year or Ps. 2.0 million per taxpayer. |
| | • | | The provision establishing maximum amounts that could be accumulated in the Government’s revenue stabilization funds was eliminated, in order to accommodate a higher amount of resources that may be used to manage any future economic shocks. |
Expenditures
Pursuant to the 2012 Budget as approved by Congress, public sector budgetary revenues, excluding resources from domestic and external financings, are estimated to total Ps. 3,310.5 billion in nominal pesos (21.9% of GDP), which is 0.3 percentage points higher than the amount approved for 2011, Ps. 28.7 billion above the Executive Branch’s proposal and 4.7% higher than those approved for 2011. Oil revenues were estimated at Ps. 1,172.3 billion in nominal pesos, an increase of 12.7% in real terms as compared to the amount approved for 2011. Non-oil tax revenues were estimated at Ps. 2,137.8 billion, Ps. 3.6 billion more than the amount of non-oil tax revenues as proposed by the Executive Branch.
The 2012 Budget authorizes the Government to incur net domestic debt in the amount of Ps. 435 billion in nominal pesos, which exceeds the level requested in the proposal by Ps. 40 billion. This increase is due to the upward revision of public deficit as well as the changes in the Government’s balance derived from the adjustments in revenues and expenditures. In addition, the 2012 Budget permits the Government to incur net external debt totaling U.S. $7.0 billion, including financing from international financial institutions.
D-92
The following table shows the composition of public sector budgetary expenditures for each of the five fiscal years ended December 31, 2011 and the first six months of 2012, as well as the projected expenditures set forth in the 2012 budget.
Public Sector Budgetary Expenditures
| | | | | | | | | | | | | | | | | | | | | | | | | | | | |
| | | 2007 | | | 2008 | | | 2009(1) | | | 2010(1) | | | 2011(1) | | | First Six
Months
of 2012(1) | | | 2012
Budget(2) | |
| | | (in billions of constant pesos(3)) | |
| | | | | | | |
Budgetary expenditures | | Ps. | 1,932.7 | | | Ps. | 2,102.7 | | | Ps. | 2,170.0 | | | Ps. | 2,253.9 | | | Ps. | 2,327.8 | | | Ps. | 1,158.0 | | | Ps. | 2,207.6 | |
Current expenditures | | | 1,617.4 | | | | 1,713.3 | | | | 1,743.8 | | | | 1,807.7 | | | | 1,876.1 | | | | 957.3 | | | | 1,820.8 | |
Salaries | | | 304.7 | | | | 309.0 | | | | 325.2 | | | | 322.9 | | | | 333.5 | | | | 160.3 | | | | 334.5 | |
Federal Government | | | 111.9 | | | | 119.3 | | | | 130.6 | | | | 132.6 | | | | 133.5 | | | | 61.9 | | | | 135.6 | |
Public agencies | | | 192.9 | | | | 189.8 | | | | 194.6 | | | | 190.3 | | | | 200.0 | | | | 98.5 | | | | 198.9 | |
Interest | | | 186.0 | | | | 166.2 | | | | 184.6 | | | | 172.9 | | | | 175.7 | | | | 96.5 | | | | 190.9 | |
Federal Government | | | 146.9 | | | | 146.5 | | | | 162.5 | | | | 146.2 | | | | 154.3 | | | | 81.2 | | | | 162.1 | |
Public agencies | | | 39.1 | | | | 19.8 | | | | 22.2 | | | | 26.7 | | | | 21.4 | | | | 15.2 | | | | 28.8 | |
Current transfers, net | | | 440.9 | | | | 481.2 | | | | 501.9 | | | | 515.1 | | | | 549.2 | | | | 286.9 | | | | 547.9 | |
Total | | | 609.1 | | | | 656.6 | | | | 689.4 | | | | 708.6 | | | | 742.7 | | | | 400.0 | | | | 722.6 | |
To public sector | | | 168.2 | | | | 175.4 | | | | 187.6 | | | | 193.4 | | | | 193.5 | | | | 113.1 | | | | 174.7 | |
States’ revenue sharing | | | 259.1 | | | | 310.0 | | | | 264.0 | | | | 295.7 | | | | 306.1 | | | | 158.2 | | | | 303.0 | |
Acquisitions | | | 129.7 | | | | 161.2 | | | | 133.9 | | | | 146.5 | | | | 154.7 | | | | 68.0 | | | | 125.8 | |
Federal Government | | | 9.9 | | | | 12.6 | | | | 12.6 | | | | 12.6 | | | | 13.5 | | | | 5.4 | | | | 11.2 | |
Public agencies | | | 119.8 | | | | 148.6 | | | | 121.3 | | | | 133.8 | | | | 141.2 | | | | 62.7 | | | | 114.7 | |
Other current expenditures | | | 297.0 | | | | 285.6 | | | | 334.3 | | | | 354.6 | | | | 357.0 | | | | 187.4 | | | | 318.7 | |
Federal Government | | | 92.2 | | | | 71.8 | | | | 95.3 | | | | 102.2 | | | | 107.7 | | | | 62.7 | | | | 94.0 | |
Public agencies | | | 204.8 | | | | 213.8 | | | | 239.0 | | | | 252.4 | | | | 249.3 | | | | 124.7 | | | | 224.7 | |
Capital expenditures | | | 315.3 | | | | 389.4 | | | | 426.2 | | | | 446.2 | | | | 451.7 | | | | 200.7 | | | | 403.6 | |
Federal Government | | | 249.8 | | | | 281.8 | | | | 217.3 | | | | 236.2 | | | | 249.8 | | | | 119.6 | | | | 202.4 | |
Public agencies | | | 65.5 | | | | 107.6 | | | | 208.9 | | | | 210.1 | | | | 201.9 | | | | 81.0 | | | | 201.2 | |
Payments due in previous years | | | — | | | | — | | | | — | | | | — | | | | — | | | | — | | | | (16.8 | ) |
Note: Numbers may not total due to rounding.
| (2) | Budgetary estimates as of November 2011. Budgetary estimates were converted into constant pesos using the GDP deflator for 2012 estimated as of October 2011. |
| (3) | Constant pesos with purchasing power at December 31, 2003. |
Source: Ministry of Finance and Public Credit.
According to preliminary figures, net public sector budgetary expenditures increased by 5.3% in real terms during 2011 as compared to 2010. Excluding physical investment by PEMEX, net public sector budgetary programmable expenditures increased by 6.7% in real terms during 2011 as compared to 2010. Net paid programmable budgetary expenditures increased by 5.6%, which exceeded the budgetary level by 10.2%. Net paid non-programmable budgetary expenditures increased by 4.1%, which was 5.7% lower than the budgetary level. The financial cost of public sector debt increased by 3.6% in real terms during 2011 as compared to 2010.
Public sector expenditure policy in 2011 focused on 3 main aspects: economic activity, competitiveness and generation of employment; support for social development focused on education, health, poverty alleviation and eradication of organized crime. During 2011, spending on social programs, such as education, public health and social security, accounted for 56.7% of total programmable expenditures.
According to preliminary figures, in 2011 (in nominal pesos), expenditures for agriculture, forests, fishing, natural resources and environmental development totaled Ps. 105.2 billion and expenditures for residential and community development totaled Ps. 202.8 billion, as compared with expenditures of Ps. 99.2 billion and Ps. 168.7 billion, respectively, in 2010.
D-93
According to preliminary figures, during the first six months of 2012, net public sector budgetary expenditures increased by 8.8% in real terms as compared to the first six months of 2011. Excluding physical investment by PEMEX, net public sector budgetary programmable expenditures increased by 9.6% in real terms as compared to the first six months of 2011. During the same period, the financial cost of public sector debt increased by 10.3% in real terms as compared to the same period of 2011.
Health and Labor, Education and Other Social Welfare Expenditures
The Government administers the majority of the country’s social service and welfare programs. The Government directly funds social service programs, primarily from current revenues, and also transfers funds to social service agencies with separate sources of income. According to preliminary figures, the principal social welfare expenditures of the Government in 2011 were for health and social security, on which Ps. 787.3 billion in nominal pesos (or 27.3% of programmable expenditures) was spent, and for education, on which Ps. 539.2 billion in nominal pesos (or 18.7% of programmable expenditures) was spent.
The principal social security institutions are the IMSS, the ISSSTE and the Lotería Nacional para la Asistencia Pública (National Lottery for Public Assistance). Programs provided by these entities include medical and hospital services, health and maternity insurance and preventive health services. In seeking to provide health services to a larger portion of the population, the Government is coordinating the activities of various public agencies and is organizing a national system of health services. The Government also provides pension payments, which represent a small portion of social security outlays. Despite this progress, Mexico does not have an unemployment benefits scheme or a fully-developed social welfare system. See “The Economy—Employment and Labor.”
The Government devotes a significant share of its resources to education and vocational training. The Government’s immediate goals include providing elementary and secondary education to all children and providing increased technical training tailored to the changing demands of the Mexican economy. Based on estimates from EFA Global Monitoring Report 2011 published by the United Nations Educational, Scientific and Cultural Organization (UNESCO), 93.0% of the Mexican population of 15 years of age or older is literate.
The structure of the Mexican educational system is based on educational federalism, with the premise that it is the responsibility of each state to provide for the education of its population. The education law also encourages the participation of teachers, parents and social workers in improving the educational system. The education law requires every Mexican to attend school for at least nine years (primary and secondary school) and establishes basic directives concerning educational programs.
In order to improve living conditions for the low-income population and provide loans for property and housing on reasonable terms, the Government established INFONAVIT in 1972. The fund which is managed by INFONAVIT is supported by contributions from all Mexican employers, which correspond to 5% of all salaries paid. In 2011, INFONAVIT granted approximately 501,292 loans for housing purchases, construction and repair, as compared to approximately 475,072 loans provided in 2010. See “The Economy—Employment and Labor.”
D-94
Government Agencies and Enterprises
The following table shows, for each principal Governmental agency and enterprise outside of the financial sector, its principal business, the percentage of Government ownership, its size (based on total assets at its latest fiscal year end), its net contribution or expense to the public sector primary balance and the amount of its outstanding borrowings that is guaranteed or otherwise the responsibility of the Government.
Principal Government Agencies and Enterprises
at December 31, 2011
| | | | | | | | | | | | | | | | | | |
Agency/Enterprise | | Principal Business | | % of
Government
Ownership | | | Total
Assets(2) | | | Contribution or
Expense
to Primary
Balance(2)(3) | | | Outstanding
Guaranteed
Debt(2) | |
| | | | | | | | (in millions of dollars) | |
| | | | | |
PEMEX | | Production, refining and distribution of crude oil and derivatives | | | 100.0 | % | | $ | 106,828.9 | | | $ | 4,041.6 | | | $ | — | |
| | | | | |
Federal Electricity Commission | | Production and sale of electricity | | | 100.0 | | | | 59,945.6 | | | | 1,409.3 | | | | — | |
| | | | | |
Federal Roads and Bridges(4) | | Administration of toll highways | | | 100.0 | | | | 226.5 | | | | 10.0 | (1) | | | — | |
| | | | | |
Airports and Auxiliary Services(4) | | Airport services | | | 100.0 | | | | 1,028.3 | | | | 70.5 | | | | — | |
| (2) | Financial data calculated in accordance with Mexican financial reporting standards applicable to public sector entities, which differ in material respects from U.S. GAAP and IFRS. Accordingly, data may not be comparable with financial data calculated in accordance with Mexican financial reporting standards presented elsewhere herein. |
| (3) | Surplus after Government transfers, less interest payments. |
| (4) | Primary surplus before transfers to the Tesorería de la Federación (Treasury of the Federation). |
Source: Ministry of Finance and Public Credit.
For a discussion on the Government’s privatization program see “The Economy—The Role of the Government in the Economy; Privatization.”
D-95
PUBLIC DEBT
General
Under Mexico’s Ley General de Deuda Pública (General Law of Public Debt), public borrowing programs contained in the Federal Annual Revenue Law must be submitted annually to Congress for approval. Once this approval is obtained, the Executive Branch, through the Ministry of Finance and Public Credit, creates a financing program within the parameters of the Congressional approval. The General Law of Public Debt also requires that the President (a) inform Congress annually of the status of the indebtedness of the Government and budget-controlled agencies when presenting the Public Account and proposing the Federal Annual Revenue Law and (b) report the status of such indebtedness to Congress on a quarterly basis. See “Public Finance—General—Budget Process.”
The General Law of Public Debt specifies that Government ministries may only incur debt through the Ministry of Finance and Public Credit. However, budget-controlled and administratively controlled agencies may incur external indebtedness but only after obtaining the authorization of the Ministry of Finance and Public Credit.
Internal Public Debt
Internal debt of the Government includes only the internal portion of indebtedness incurred directly by the Government, Banco de México’s general account balance (which was positive at June 30, 2012, indicating monies owed to the Government) and the assets of the Fondo del Sistema de Ahorro Para el Retiro (Retirement Savings System Fund). Net internal debt includes Cetes and other securities sold to the public in primary auctions but not such debt allocated to Banco de México for its use in regulating liquidity (Regulación Monetaria). See footnote 1 to the table “Internal Debt of the Government” below. Internal debt does not include the debt of the IPAB or the debt of budget-controlled or administratively-controlled agencies. At December 31, 2011, all of the Government’s internal debt was denominated in UDIs or pesos and was payable in pesos.
Over the last two decades, the Government has adhered to an internal debt strategy aimed at increasing the average maturity of its debt in order to reduce its refinancing risk. Accordingly, the Government has issued new debt instruments bearing longer maturities than those previously issued by it. Through the issuances of these securities, the Government has established a long-dated benchmark yield curve. These issuances have also encouraged:
| | • | | the increased use of long-term fixed-rate contracts; |
| | • | | the issuance of long-term peso-denominated securities by Mexican companies; |
| | • | | the development of long-term financial hedging products in Mexico; and |
| | • | | the potential to direct long-term savings toward the financing of long-term investment projects. |
In the last quarter of 1999, the Government began offering 10-year securities denominated in UDIs and 30-year UDI-indexed bonds, as well as three-year, five-year, seven-year, ten-year, 20-year and 30-year fixed-rate peso-denominated bonds. However, since the first quarter of 2008, the Government no longer offers 20-year UDI-denominated bonds.
During the last quarter of 2008, in response to the global economic crisis, the Government increased the amount of 182-day Cetes and 364-day Cetes that it auctioned and decreased the amount of long-term bonds that it auctioned, in order to stabilize domestic financial markets.
The Federal Revenue Law for 2011 provided for a budget deficit that corresponded to approximately 2.5% of GDP (including investments by PEMEX) and permitted the Government to conduct new debt issuances in order to finance this deficit. Specifically, the Federal Revenue Law for 2011 authorized the Government to incur up to Ps. 375.0 billion of net internal debt and up to U.S. $5.0 billion of net external debt, including external borrowings from international financial institutions, in order to finance this budget deficit.
D-96
At December 31, 2011, the net internal debt of the Government totaled Ps. 3,112.1 billion (including liabilities associated with the ISSSTE Law of Ps. 171.9 billion), a 10.8% increase in nominal terms as compared to Ps. 2,808.9 billion outstanding at December 31, 2010. This increase in net internal debt was due to the Government having financed the budget deficit primarily through borrowings in the domestic market. The gross internal debt of the Government at December 31, 2011 totaled Ps. 3,197.7 billion, a 10.7% increase in nominal terms as compared to Ps. 2,888.3 billion outstanding at December 31, 2010. The Government’s financing costs on internal debt totaled Ps. 193.4 billion in 2011, or 1.3% of GDP, a 7.4% increase in nominal terms and a decrease of less than 0.1 percentage points of GDP as compared to Ps. 180.1 billion, or 1.4% of GDP, in 2010.
According to preliminary figures, at June 30, 2012, the net internal debt of the Government totaled Ps. 3,299.5 billion (including liabilities associated with the ISSSTE Law of Ps. 165.0 billion), a 6.0% increase in nominal terms as compared to Ps. 3,112.1 billion outstanding at December 31, 2011. The gross internal debt of the Government at June 30, 2012 totaled Ps. 3,381.5 billion, a 5.7% increase in nominal terms as compared to Ps. 3,197.7 billion outstanding at December 31, 2011. Of the total gross internal debt of the Government at June 30, 2012, Ps. 389.6 billion represented short-term debt and Ps. 2,991.9 billion represented long-term debt, as compared to Ps. 349.8 billion and Ps. 2,847.9 billion of short- and long-term debt, respectively, at December 31, 2011. For purposes of this “Public Debt” section, long-term debt is defined as all debt with maturities of one year or more from the date of issue, while short-term debt is defined as all debt with maturities of less than one year from the date of issue. The Government’s financing costs on internal debt totaled Ps. 101.6 billion for the first six months of 2012, or 1.3% of GDP, a 7.4% increase in nominal terms and a decrease of less than 0.1 percentage points of GDP as compared to the same period of 2011.
At December 31, 2011, the net internal debt of the public sector totaled Ps. 3,258.5 billion, an 11.6% increase in nominal terms as compared to Ps. 2,920.3 billion outstanding at December 31, 2010. The gross internal debt of the public sector at December 31, 2011 totaled Ps. 3,446.8 billion, an 11.9% increase in nominal terms as compared to Ps. 3,080.9 billion outstanding at December 31, 2010. For purposes of this “Public Debt” section, public sector debt consists of the long-term indebtedness incurred directly by the Government, the long-term indebtedness incurred by budget-controlled agencies, the long-term indebtedness incurred directly or guaranteed by administratively controlled agencies (including but not limited to national development banks) and the short-term debt of the public sector. Public sector debt does not include private sector debt guaranteed by the Government, unless and until the Government is called upon to make payment under any of these guarantees.
According to preliminary figures, at June 30, 2012, the net internal debt of the public sector totaled Ps. 3,486.3 billion, a 7.0% increase in nominal terms as compared to Ps. 3,258.5 billion outstanding at December 31, 2011. The gross internal debt of the public sector at June 30, 2012 totaled Ps. 3,630.6 billion, a 5.3% increase in nominal terms as compared to Ps. 3,446.8 billion outstanding at December 31, 2011.
As a result of the Government’s debt policy, the average maturity of the Government’s internal debt increased from 6.5 years at December 31, 2008 to 7.2 years at December 31, 2010. In addition, during 2011, the average maturity of the Government’s internal debt increased by 0.4 years to 7.6 years at December 31, 2011. During the first six months of 2012, the average maturity of the Government’s internal debt increased by 0.2 years, to 7.8 years at June 30, 2012.
D-97
The following table summarizes the amount (in billions of pesos) and structure (as percentage of total debt) of the internal debt of the Government at each of the dates indicated.
Internal Debt of the Government(1)
| | | | | | | | | | | | | | | | | | | | | | | | | | | | | | | | | | | | | | | | | | | | | | | | |
| | | December 31, | | | June 30, | |
| | | 2007 | | | 2008 | | | 2009 | | | 2010 | | | 2011 | | | 2012(2) | |
| | | (in billions of pesos, except percentages) | |
Gross Debt | | | | | | | | | | | | | | | | | | | | | | | | | | | | | | | | | | | | | | | | | | | | | | | | |
Government Securities | | Ps. | 1,795.8 | | | | 94.7 | % | | Ps. | 2,021.2 | | | | 84.2 | % | | Ps. | 2,379.3 | | | | 88.0 | % | | Ps. | 2,553.9 | | | | 88.4 | % | | Ps. | 2,882.8 | | | | 90.2 | % | | Ps. | 3,072.2 | | | | 90.9 | % |
Cetes | | | 340.5 | | | | 18.0 | | | | 357.1 | | | | 14.9 | | | | 498.8 | | | | 18.5 | | | | 394.0 | | | | 13.6 | | | | 456.6 | | | | 14.3 | | | | 512.0 | | | | 15.1 | |
Floating-Rate Bonds | | | 325.0 | | | | 17.1 | | | | 243.6 | | | | 10.1 | | | | 243.5 | | | | 9.0 | | | | 183.1 | | | | 6.3 | | | | 202.5 | | | | 6.3 | | | | 201.6 | | | | 6.0 | |
Inflation-Linked Bonds | | | 235.3 | | | | 12.4 | | | | 334.9 | | | | 13.9 | | | | 430.6 | | | | 15.9 | | | | 530.1 | | | | 18.4 | | | | 642.1 | | | | 20.1 | | | | 693.4 | | | | 20.5 | |
Fixed-Rate Bonds | | | 895.1 | | | | 47.2 | | | | 1,085.6 | | | | 45.2 | | | | 1,206.5 | | | | 44.6 | | | | 1,446.8 | | | | 50.1 | | | | 1,581.6 | | | | 49.5 | | | | 1,665.1 | | | | 49.2 | |
Other(3) | | | 100.7 | | | | 5.3 | | | | 380.1 | | | | 15.8 | | | | 323.4 | | | | 12.0 | | | | 334.4 | | | | 11.6 | | | | 314.9 | | | | 9.8 | | | | 309.3 | | | | 9.1 | |
| | | | | | | | | | | | | | | | | | | | | | | | | | | | | | | | | | | | | | | | | | | | | | | | |
Total Gross Debt | | Ps. | 1,896.6 | | | | 100.0 | % | | Ps. | 2,401.3 | | | | 100.0 | % | | Ps. | 2,702.8 | | | | 100.0 | % | | Ps. | 2,888.3 | | | | 100.0 | % | | Ps. | 3,197.7 | | | | 100.0 | % | | Ps. | 3,381.5 | | | | 100.0 | % |
| | | | | | | | | | | | | | | | | | | | | | | | | | | | | | | | | | | | | | | | | | | | | | | | |
Net Debt | | | | | | | | | | | | | | | | | | | | | | | | | | | | | | | | | | | | | | | | | | | | | | | | |
Financial Assets(4) | | | (107.9 | ) | | | | | | | (68.6 | ) | | | | | | | (231.4 | ) | | | | | | | (79.4 | ) | | | | | | | (85.6 | ) | | | | | | | (82.0 | ) | | | | |
| | | | | | | | | | | | | | | | | | | | | | | | | | | | | | | | | | | | | | | | | | | | | | | | |
Total Net Debt | | Ps. | 1,788.3 | | | | | | | Ps. | 2,332.7 | | | | | | | Ps. | 2,471.3 | | | | | | | Ps. | 2,808.9 | | | | | | | Ps. | 3,112.1 | | | | | | | Ps. | 3,299.5 | | | | | |
| | | | | | | | | | | | | | | | | | | | | | | | | | | | | | | | | | | | | | | | | | | | | | | | |
| | | | | | | | | | | | |
Gross Debt/GDP | | | | | | | 16.1 | % | | | | | | | 19.8 | % | | | | | | | 21.4 | % | | | | | | | 21.0 | % | | | | | | | 20.9 | % | | | | | | | 22.2 | % |
Net Debt/GDP | | | | | | | 15.1 | % | | | | | | | 19.2 | % | | | | | | | 19.6 | % | | | | | | | 20.4 | % | | | | | | | 20.3 | % | | | | | | | 21.7 | % |
Note: Numbers may not total due to rounding.
| (1) | Internal debt figures do not include securities sold by Banco de México in open-market operations pursuant to Regulación Monetaria, none of which were outstanding at December 31, 2011. Regulación Monetaria does not increase the Government’s overall level of internal debt because Banco de México must reimburse the Government for any allocated debt that Banco de México sells into the secondary market and that is presented to the Government for payment. If Banco de México undertakes extensive sales of allocated debt in the secondary market, however, Regulación Monetaria can result in the level of outstanding internal debt being higher than the Government’s figure for net internal debt. |
| (3) | Includes Ps. 270.5 billion, Ps. 193.9 billion, Ps. 193.0, Ps. 171.9 and Ps. 165.0 billion in liabilities associated with the ISSSTE Law (see “The Economy—Employment and Labor”) at December 31, 2008, December 31, 2009, December 31, 2010, December 31, 2011 and June 30, 2012, respectively. |
| (4) | Includes the net balance denominated in pesos of the General Account of the Federal Treasury with Banco de México. |
Source: Ministry of Finance and Public Credit.
D-98
External Public Debt
The following tables set forth a summary of the external public debt of Mexico as well as a categorization of such debt by currency. External public debt as used in this section does not include, among other things, repurchase obligations of Banco de México with the IMF or the debt of the IPAB. See “Financial System—Banking Supervision and Support” and footnote 1 to the table “Summary of External Public Debt” below.
Summary of External Public Debt(1)
By Type
| | | | | | | | | | | | | | | | | | | | | | | | |
| | | Long-Term Direct
Debt of the Federal
Government | | | Long-Term
Debt of
Budget-
Controlled
Agencies | | | Other Long-
Term Public
Debt(2) | | | Total Long-
Term Debt | | | Total Short-
Term Debt | | | Total Long-
and Short-
Term Debt | |
| | | (in millions of dollars) | |
December 31, | | | | | | | | | | | | | | | | | | | | | | | | |
2007 | | U.S. $ | 40,114 | | | U.S. $ | 7,745 | | | U.S. $ | 6,576 | | | U.S. $ | 54,435 | | | U.S. $ | 920 | | | U.S. $ | 55,355 | |
2008 | | | 39,997 | | | | 9,782 | | | | 5,885 | | | | 55,664 | | | | 1,275 | | | | 56,939 | |
2009 | | | 47,350 | | | | 41,048 | | | | 6,202 | | | | 94,600 | | | | 1,754 | | | | 96,354 | |
2010 | | | 56,168 | | | | 45,536 | | | | 6,385 | | | | 108,089 | | | | 2,339 | | | | 110,428 | |
2011(3) | | | 60,590 | | | | 47,436 | | | | 5,625 | | | | 113,651 | | | | 2,769 | | | | 116,420 | |
June 30, 2012(3) | | | 64,707 | | | | 49,327 | | | | 5,465 | | | | 119,499 | | | | 2,633 | | | | 122,132 | |
By Currency(4)
| | | | | | | | | | | | | | | | | | | | | | | | | | | | | | | | | | | | | | | | | | | | | | | | |
| | | December 31, | | | June 30, | |
| | | 2007 | | | 2008 | | | 2009 | | | 2010 | | | 2011(3) | | | 2012(3) | |
| | | (in millions of dollars, except percentages) | |
U.S. dollars | | | U.S.$44,309 | | | | 80.0 | % | | | U.S.$47,851 | | | | 84.1 | % | | | U.S.$77,919 | | | | 80.9 | % | | | U.S. $90,882 | | | | 82.3 | % | | | U.S. $97,048 | | | | 83.4 | % | | | U.S.$102,080 | | | | 83.6 | % |
Japanese yen | | | 1,157 | | | | 2.1 | | | | 1,095 | | | | 1.9 | | | | 4,541 | | | | 4.7 | | | | 6,864 | | | | 6.2 | | | | 6,793 | | | | 5.8 | | | | 7,514 | | | | 6.1 | |
Pounds sterling | | | 1,040 | | | | 1.9 | | | | 687 | | | | 1.2 | | | | 1,981 | | | | 2.1 | | | | 1,920 | | | | 1.7 | | | | 1,906 | | | | 1.6 | | | | 1,924 | | | | 1.6 | |
Swiss francs | | | 423 | | | | 0.8 | | | | 410 | | | | 0.7 | | | | 716 | | | | 0.7 | | | | 953 | | | | 0.9 | | | | 910 | | | | 0.8 | | | | 938 | | | | 0.8 | |
Others | | | 8,426 | | | | 15.2 | | | | 6,896 | | | | 12.1 | | | | 11,197 | | | | 11.6 | | | | 9,809 | | | | 8.9 | | | | 9,763 | | | | 8.4 | | | | 9,676 | | | | 7.9 | |
| | | | | | | | | | | | | | | | | | | | | | | | | | | | | | | | | | | | | | | | | | | | | | | | |
Total | | | U.S.$55,355 | | | | 100.0 | % | | | U.S.$56,939 | | | | 100.0 | % | | | U.S. $96,354 | | | | 100.0 | % | | | U.S. $110,428 | | | | 100.0 | % | | | U.S. $116,420 | | | | 100.0 | % | | | U.S. $122,132 | | | | 100.0 | |
| | | | | | | | | | | | | | | | | | | | | | | | | | | | | | | | | | | | | | | | | | | | | | | | |
Note: Numbers may not total due to rounding.
| (1) | External debt denominated in foreign currencies other than dollars has been translated into dollars at exchange rates as of each of the dates indicated. External public debt does not include (a) repurchase obligations of Banco de México with the IMF (none of these were outstanding at June 30, 2012) or (b) loans from the Commodity Credit Corporation to public sector Mexican banks. External debt is presented herein on a “gross” basis, and includes external obligations of the public sector at their full outstanding face or principal amount. For certain informational and statistical purposes, Mexico sometimes reports its external public sector debt on a “net” basis, which is calculated as the gross debt net of certain financial assets held abroad. These financial assets include Mexican public sector external debt that is held by public sector entities but that has not been cancelled. |
| (2) | Includes debt of development banks and other administratively controlled agencies whose finances are consolidated with those of the Government. |
| (4) | Adjusted to reflect the effect of currency swaps. |
Source: Ministry of Finance and Public Credit.
Since 1990, the majority of the public sector’s new external borrowings have consisted of debt securities placed in international capital markets. However, during Mexico’s 1995 financial crisis, official and multilateral creditors provided significant amounts of financing to Mexico. At December 31, 2011, commercial banks and suppliers held approximately 17.0% of Mexico’s total public sector external debt; multilateral and bilateral creditors (excluding the IMF) held 23.6%; bondholders held 59.2%; and other creditors held the remaining 0.2%.
At December 31, 2011, outstanding public sector gross external debt equaled U.S. $116.4 billion, an increase of approximately U.S. $6.0 billion from U.S. $110.4 billion at December 31, 2010. This increase in public sector gross external debt was due to a U.S. $6.0 billion increase in net external indebtedness and accounting adjustments of negative U.S. $24.2 million as a result of the appreciation of the U.S. dollar against other foreign currencies in which Mexico’s external debt is dominated. Overall, total public debt (gross external debt plus net internal public sector debt) at December 31, 2011 represented approximately 31.9% of GDP, approximately 0.8 percentage points higher than the level at the end of 2010.
D-99
The Government’s debt policy during the past several years, combined with the dynamic performance of exports, has significantly reduced external public sector debt financing costs as a percentage of total exports. Specifically, interest payments on external public sector debt have decreased from 2.9% of total exports in 2006 to 1.6% of total exports in 2011. According to preliminary figures, in 2011, public sector external debt financing costs totaled U.S. $5.4 billion, as compared to U.S. $5.0 billion in 2010, a 7.8% increase in nominal terms. However, as a percentage of GDP, debt service payments (principal and interest) on public sector external debt decreased from 3.2% of GDP in 2010 to 2.4% of GDP in 2011.
According to preliminary figures, outstanding public sector gross external debt increased by approximately U.S. $5.7 billion during the first six months of 2011, from U.S. $116.4 billion at December 31, 2011, to U.S. $122.1 billion at June 30, 2012. Of this amount, U.S. $119.5 billion represented long-term debt and U.S. $2.6 billion represented short-term debt.
According to preliminary figures, total public debt (gross external debt plus net internal public sector debt) at June 30, 2012 represented approximately 33.9% of nominal GDP, 2.0 percentage points higher than at December 31, 2011.
According to preliminary figures, at June 30, 2012, commercial banks held approximately 13.6% of Mexico’s total public sector external debt; multilateral and bilateral creditors (excluding the IMF) held approximately 22.5%; bondholders (including commercial banks holding bonds issued in debt exchange transactions) held approximately 63.5%; and other creditors held the remaining 0.4%.
Recent Securities Offerings
| | • | | On January 6, 2012, Mexico issued U.S. $2 billion of its 3.625% Global Notes due 2022. The notes were issued under Mexico’s U.S. $80 billion Global Medium-Term Notes (MTN) program at a yield to maturity of 3.706%. |
| | • | | On February 15, 2012, Mexico issued Ps. 25 billion of domestic fixed-rate bonds due 2022 in the Mexican market. These bonds gave investors a yield to maturity of 6.30% for a tenor of 10 years. |
| | • | | On March 8, 2012, Mexico issued U.S. $2 billion of its 4.750% Global Notes due 2044. The notes were issued under Mexico’s U.S. $80 billion MTN program at a yield to maturity of 4.839%. |
| | • | | On April 18, 2012, Mexico issued Ps. 15 billion of domestic fixed-rate bonds due 2042 in the Mexican market. These bonds gave investors a yield to maturity of 7.46% for a tenor of 30 years. |
| | • | | On June 8, 2012, Mexico issued Japanese yen 50 billion of notes due 2015 and Japanese Yen 30 billion of notes due 2017. The bonds were placed in the Japanese public market and bear interest of 1.29% and 1.56%, respectively. |
| | • | | On July 18, 2012, Mexico issued Ps. 30 billion of domestic fixed-rate bonds due 2017 in the Mexican market. These bonds gave investors a yield to maturity of 4.88% for a tenor of 5 years. |
| | • | | On August 20, 2012, Mexico issued U.S. $0.6 billion of its 3.625% Global Notes due 2022, U.S. $1.0 billion of its 4.750% Global Notes due 2044 and U.S. $0.7 billion of its 5.750% Global Notes due 2110. The transaction was part of a debt exchange offer in which holders of certain series of Mexico’s outstanding U.S. dollar-denominated debt securities exchanged those debt securities for new notes with a longer maturity and U.S. $19 million in cash consideration. The notes were issued under Mexico’s U.S. $80 billion MTN program and gave investors a yield to maturity of 2.52%, 3.93% and 4.67% for a tenor of 10 years, 32 years and 98 years, respectively. |
| | • | | On September 5, 2012, Mexico issued UDI 3 billion of fixed-rate UDIbonos due 2022 in the Mexican market. These UDIbonos gave investors a yield to maturity in UDIs of 1.55% for a tenor of 10 years. |
D-100
Amortization Schedule of Total Public Sector External Debt(1)
| | | | | | | | | | | | | | | | | | | | | | | | | | | | | | | | | | | | | | | | | | | | | | | | | | | | | | | | | | | | | | | | | | | | |
| | | Outstanding
as of June 30,
2012 (1) | | | 2012 | | | 2013 | | | 2014 | | | 2015 | | | 2016 | | | 2017 | | | 2018 | | | 2019 | | | 2020 | | | 2021 | | | 2022 | | | 2023 | | | 2024 | | | 2025 | | | Other
Years | | | Total | |
| | | (in millions of dollars) | |
| | | | | | | | | | | | | | | | | |
A. Private Creditors(2) | | $ | 85,427 | | | $ | 2,871 | | | $ | 5,413 | | | $ | 5,276 | | | $ | 6,520 | | | $ | 2,838 | | | $ | 6,904 | | | $ | 2,654 | | | $ | 8,491 | | | $ | 7,389 | | | $ | 4,009 | | | $ | 5,532 | | | $ | 517 | | | $ | 756 | | | $ | 1,276 | | | $ | 24,984 | | | $ | 85,427 | |
Capital Markets (Bonds) | | | 77,613 | | | | 691 | | | | 3,605 | | | | 3,682 | | | | 4,449 | | | | 2,767 | | | | 6,853 | | | | 2,614 | | | | 8,491 | | | | 7,389 | | | | 4,009 | | | | 5,532 | | | | 517 | | | | 756 | | | | 1,276 | | | | 24,984 | | | | 77,613 | |
Commercial Banks | | | 7,815 | | | | 2,179 | | | | 1,808 | | | | 1,594 | | | | 2,071 | | | | 71 | | | | 51 | | | | 40 | | | | 0 | | | | 0 | | | | 0 | | | | 0 | | | | 0 | | | | 0 | | | | 0 | | | | 0 | | | | 7,815 | |
Direct | | | 2,908 | | | | 2,154 | | | | 384 | | | | 294 | | | | 22 | | | | 22 | | | | 22 | | | | 11 | | | | 0 | | | | 0 | | | | 0 | | | | 0 | | | | 0 | | | | 0 | | | | 0 | | | | 0 | | | | 2,908 | |
Syndicated | | | 4,906 | | | | 25 | | | | 1,424 | | | | 1,300 | | | | 2,050 | | | | 50 | | | | 29 | | | | 29 | | | | 0 | | | | 0 | | | | 0 | | | | 0 | | | | 0 | | | | 0 | | | | 0 | | | | 0 | | | | 4,906 | |
| | | | | | | | | | | | | | | | | |
B.Multilateral Creditors | | | 23,653 | | | | 416 | | | | 853 | | | | 971 | | | | 799 | | | | 842 | | | | 857 | | | | 1,353 | | | | 785 | | | | 742 | | | | 2,144 | | | | 785 | | | | 895 | | | | 969 | | | | 2,471 | | | | 8,772 | | | | 23,653 | |
IADB | | | 10,009 | | | | 231 | | | | 432 | | | | 436 | | | | 461 | | | | 524 | | | | 539 | | | | 539 | | | | 532 | | | | 524 | | | | 523 | | | | 523 | | | | 523 | | | | 523 | | | | 522 | | | | 3,174 | | | | 10,009 | |
World Bank | | | 13,644 | | | | 185 | | | | 421 | | | | 535 | | | | 338 | | | | 318 | | | | 318 | | | | 813 | | | | 253 | | | | 219 | | | | 1,621 | | | | 261 | | | | 371 | | | | 445 | | | | 1,949 | | | | 5,598 | | | | 13,644 | |
| | | | | | | | | | | | | | | | | |
C. External Trade | | | 12,598 | | | | 1,355 | | | | 2,552 | | | | 2,229 | | | | 1,423 | | | | 1,336 | | | | 974 | | | | 773 | | | | 657 | | | | 420 | | | | 223 | | | | 95 | | | | 36 | | | | 33 | | | | 25 | | | | 467 | | | | 12,598 | |
Eximbanks | | | 3,814 | | | | 209 | | | | 405 | | | | 394 | | | | 404 | | | | 559 | | | | 336 | | | | 322 | | | | 320 | | | | 178 | | | | 86 | | | | 44 | | | | 33 | | | | 33 | | | | 25 | | | | 467 | | | | 3,814 | |
Commercial Banks(3) | | | 6,962 | | | | 803 | | | | 1,462 | | | | 1,237 | | | | 994 | | | | 752 | | | | 613 | | | | 426 | | | | 312 | | | | 216 | | | | 111 | | | | 34 | | | | 3 | | | | 0 | | | | 0 | | | | 0 | | | | 6,962 | |
Suppliers | | | 1,821 | | | | 343 | | | | 685 | | | | 599 | | | | 26 | | | | 26 | | | | 26 | | | | 26 | | | | 26 | | | | 26 | | | | 26 | | | | 17 | | | | 0 | | | | 0 | | | | 0 | | | | 0 | | | | 1,821 | |
| | | | | | | | | | | | | | | | | |
D.Restructured Debt | | | 0 | | | | 0 | | | | 0 | | | | 0 | | | | 0 | | | | 0 | | | | 0 | | | | 0 | | | | 0 | | | | 0 | | | | 0 | | | | 0 | | | | 0 | | | | 0 | | | | 0 | | | | 0 | | | | 0 | |
| | | | | | | | | | | | | | | | | |
E. Other(4) | | | 455 | | | | 149 | | | | 305 | | | | 0 | | | | 0 | | | | 0 | | | | 0 | | | | 0 | | | | 0 | | | | 0 | | | | 0 | | | | 0 | | | | 0 | | | | 0 | | | | 0 | | | | 0 | | | | 455 | |
| | | | | | | | | | | | | | | | | | | | | | | | | | | | | | | | | | | | | | | | | | | | | | | | | | | | | | | | | | | | | | | | | | | | |
Public Sector Total | | $ | 122,132 | | | $ | 4,791 | | | $ | 9,124 | | | $ | 8,476 | | | $ | 8,742 | | | $ | 5,016 | | | $ | 8,735 | | | $ | 4,780 | | | $ | 9,933 | | | $ | 8,551 | | | $ | 6,375 | | | $ | 6,412 | | | $ | 1,447 | | | $ | 1,757 | | | $ | 3,771 | | | $ | 34,223 | | | $ | 122,132 | |
| | | | | | | | | | | | | | | | | | | | | | | | | | | | | | | | | | | | | | | | | | | | | | | | | | | | | | | | | | | | | | | | | | | | |
Note: Numbers may not total due to rounding.
| (1) | Preliminary. External debt of Mexico is presented herein on a “gross” basis, and includes external obligations of the public sector at their full outstanding face or principal amounts. For certain informational and statistical purposes, Mexico sometimes reports its external public sector debt on a “net” or “economic” basis, which is calculated as the gross debt net of certain financial assets held abroad. These financial assets include the value of principal and interest collateral on restructured debt and Mexican public sector external debt that is held by public sector entities but that has not been canceled. External public debt in this table does not include (a) repurchase obligations of Banco de México with the IMF (none of which were outstanding at June 30, 2012), (b) external borrowings by the public sector after June 30, 2012, or (c) loans from the Commodity Credit Corporation to private sector Mexican banks. Mexico only updates this table semi-annually (in June and December); for this reason data included in the public debt section may not be reflected in this table. |
| (2) | Excludes foreign trade and restructured debt. |
| (3) | Includes foreign trade lines, revolving credits and other short-term credits. |
| (4) | Refers to changes in direct debt related to PIDIREGAS. |
Source: Ministry of Finance and Public Credit.
D-101
External Debt Restructuring and Debt and Debt Service Reduction Transactions
In August 1982, Mexico requested and received from its major commercial bank creditors 90-day rollovers of principal payments on most of its external public sector debt and bilateral credits. No such requests were made of bondholders or multilateral financial institutions (primarily the World Bank, the IMF and the IADB) and no restructuring of bond debt or debt owed to multilateral institutions has taken place since then.
During the five years following 1982, Mexico and its commercial bank creditors concluded three separate debt restructurings and new money exercises. In 1983, 1985 and 1987, Mexico and the banks agreed to extend the maturities of certain portions of Mexico’s then-outstanding external public sector debt and, in some cases, to alter the interest rates and currencies applicable to the restructured debt. In connection with each restructuring (and with the 1989-92 Financing Package referred to below), Mexico requested and received 90-day rollovers of maturing principal payments pending finalization of documentation relating to each restructuring. During this period, Mexico also entered into agreements with the Paris Club to reschedule payments on loans made or guaranteed by official, bilateral creditors to the Mexican public sector and received support from its multilateral creditors in the form of structural adjustment and project loans from the World Bank and the IADB, as well as standby facilities, extended fund arrangements and contingency facilities with the IMF.
The 1989-1992 Financing Package for Mexico, which was implemented in March 1990, was intended to reduce the principal amount of, and the debt service burden associated with, Mexico’s commercial bank debt and to secure sufficient future financing to allow Mexico to resume sustained economic growth. The Financing Package offered commercial banks options for debt reduction, interest reduction and new money. Under the interest reduction option, existing indebtedness was exchanged for 30-year bonds (Par Bonds) that, in the case of bonds denominated in dollars, bore interest at the fixed-rate of 6.25% per annum. Under the principal reduction option, existing indebtedness was exchanged for 30-year bonds (Discount Bonds) having a principal amount equal to 65% of the principal amount of such existing indebtedness and an interest rate of LIBOR plus 13/16% per annum. The Par Bonds and the Discount Bonds were collectively known as Brady Bonds. Under the new money option, certain banks committed to provide Mexico with new money (through a combination of bonds, traditional bank credits and bank credits prepayable to fund trade credits or public sector loans) over three years in an aggregate amount equal to 25% of their holdings of then-existing indebtedness. Of the approximately U.S. $48 billion of external debt held by Mexico’s commercial bank creditors in 1989, approximately U.S. $43 billion participated in the principal and interest reduction options; approximately U.S. $21 billion of this debt was exchanged for Discount Bonds with the balance exchanged for Par Bonds. As a result of the 1989-1992 Financing Package, Mexico was able to reduce the principal amount of its external debt by approximately U.S. $7 billion. The balance of Mexico’s commercial bank creditors agreed to participate in the new money option and to lend Mexico approximately U.S. $1 billion in new credits over four years.
As a result of the Government’s external debt reduction initiatives discussed below, Mexico completed the redemption of all of its outstanding Brady Bonds on July 28, 2003.
The Discount Bonds and Par Bonds were issued with 17 series of Value Recovery Rights, which provided for certain additional, limited contingent payments based on the performance of Mexico’s oil export revenues. Eleven series of Value Recovery Rights were cancelled together with the Brady Bonds to which they were attached. Six series of Value Recovery Rights were separated from the related Discount Bonds and Par Bonds prior to their cancellation and traded independently. These series represented contingent payment obligations payable through June 30, 2008. On June 30, 2008, Mexico paid the final payment due on the Series F Value Recovery Rights, which expired on that date. Series F was the last series of Value Recovery Rights outstanding. No further payments will be due on the Value Recovery Rights.
In addition to Mexico’s strong commitment to work closely with its commercial bank and multilateral creditors to sustain economic growth, debt reduction has been and continues to be one of its goals. In mid-1986, Mexico began authorizing the conversion of debt into equity investment as a means of reducing its stock of external obligations. The total value of debt-equity swaps grew from U.S. $363.2 million in 1986 to U.S. $1.5 billion in 1987, when the debt-equity conversion program was suspended in order to evaluate the impact on the economy of the program as then structured.
D-102
In March 1990, Mexico introduced a new debt-equity swap program that was implemented through two auctions of transferable debt conversion rights held in July and October 1990. Proceeds of the conversions could only be used to acquire public sector assets being privatized and to finance infrastructure projects. Pursuant to the program, a total of U.S. $3.5 billion of conversion rights was awarded in the auctions at a discount of approximately 52% of the nominal value of the eligible debt to be converted. Only approximately one third of these rights (which expired in April 1992) were exercised, since Mexico’s debt generally traded well above 52% after the issuance of the rights. In addition, from 1989 through October 6, 2005 (the date on which the program ended), approximately U.S. $1.4 billion of debt was acquired by the Government in exchange for peso deposits in this principal amount to non-profit private or public organizations, to be used to finance approved education, environmental, housing, public works and other social projects undertaken by nonprofit organizations.
Under a debt-for-debt exchange that took place in the first quarter of 1988, Mexico retired a net amount of U.S. $1.1 billion of commercial bank debt at an average discount of 30.3% through the issuance of 20-year collateralized bonds offered to its bank creditors on an auction basis. Mexico redeemed all of those outstanding collateralized bonds at par in March 1997. In the third quarter of 1991, Mexico issued U.S. $1.2 billion of 10-year floating rate notes, called “Floating Rate Privatization Notes,” in exchange for the cancellation of U.S. $1.2 billion of deposits held by international commercial banks with foreign branches and agencies of Mexican banks. Virtually all of the Floating Rate Privatization Notes were tendered at par in payment for shares of Mexican commercial banks that were privatized in 1991 and 1992.
In 1992, the Government canceled U.S. $7.2 billion of its external debt acquired through the exercise of the conversion rights described above, through exchanges of debt to fund social projects and through various debt-for-debt exchanges and cash purchases during the 1990-1992 period.
In May 1996, the Government issued U.S. $1.8 billion in 30-year bonds in exchange for the cancellation of U.S. $2.1 billion of its outstanding U.S. dollar-denominated Discount Bonds and U.S. $306 million of its outstanding U.S. dollar-denominated Par Bonds pursuant to an exchange offer open to all of the holders of those bonds. The price at which the bonds were exchanged was determined through a modified Dutch auction.
The Government’s liability management transactions since January 1, 2007 include:
| | • | | a January 2007 exchange and cash tender offer pursuant to which the holders of five series of Mexico’s U.S. dollar-denominated external bonds maturing in 2019, 2022, 2026, 2031 and 2033 were invited to submit offers, in a modified Dutch auction, to exchange their bonds for reopened 6.75% Global Notes due 2034 plus a cash payment, or to sell their bonds for cash. Following settlement, approximately U.S. $2.8 billion of outstanding bonds including Mexico’s 8.125% Global Bonds due 2019, 8.00% Global Notes due 2022, 11.50% Global Bonds due May 15, 2026, 8.30% Global Notes due 2031 and 7.50% Global Notes due 2033 were canceled. An aggregate principal amount of U.S. $2.3 billion in reopened 6.75% Global Notes due 2034 was issued to holders participating in the exchange, and Mexico also made cash payments from available funds totaling approximately U.S. $1.1 billion. Following the cancellation of the bonds tendered and accepted for exchange or purchase by Mexico, approximately U.S. $1.7 billion principal amount of 8.125% Global Bonds due 2019, U.S. $753 million principal amount of 8.00% Global Notes due 2022, U.S. $339 million principal amount of 11.50% Global Bonds due May 15, 2026, U.S. $1.9 billion principal amount of 8.30% Global Notes due 2031 and U.S. $1.3 billion principal amount of 7.500% Global Notes due 2033 remained outstanding; |
| | • | | a March 21, 2007 issuance of 500,000 Series XWE07 Warrants and 1,000,000 XWD07 Units, each Unit consisting of one Series XWDA07 Warrant and one Series XWDB07 Warrant, which traded separately after September 24, 2007. The Series XWE07, XWDA07 and XWDB07 Warrants entitled the holders to exchange, on September 19, October 11 and November 7, 2007, respectively, up to approximately U.S. $2.7 billion of various series of outstanding U.S. dollar-, euro-, Italian lira- and Deutsche Mark-denominated bonds issued by Mexico for peso-denominated bonds issued by Mexico maturing in either 2014 or 2024; |
D-103
| | • | | a February-March 2008 repurchase of U.S. $714 million of ten series of Mexico’s fixed-rate, U.S. dollar-denominated bonds with maturity dates from 2009 to 2034; |
| | • | | an April 9, 2008 issuance of 1,000,000 Series XWA08 Debt Exchange Warrants and 250,000 Series XWB08 Debt Exchange Warrants. The Series XWA08 Warrants entitled the holders to exchange, on October 9, 2008, up to approximately U.S. $1 billion of various series of outstanding U.S. dollar-, euro-, Italian lira- and Deutsche Mark-denominated bonds issued by Mexico for peso-denominated bonds issued by Mexico maturing in either 2014 or 2036. The Series XWB08 Warrants entitled the holders to exchange, on October 9, 2008, up to approximately U.S. $0.25 billion of various series of outstanding U.S. dollar-, euro-, Italian lira- and Deutsche Mark-denominated bonds issued by Mexico for UDI-denominated bonds issued by Mexico maturing in either 2017 or 2035; |
| | • | | a December 15, 2010 issuance of 1,000,000 Series XW11 Units, consisting of 1,000,000 Series XWA11 Debt Exchange Warrants and 1,000,000 Series XWB11 Debt Exchange Warrants. The Series XWA11 Warrants entitled the holders to exchange, on April 8, 2011 or April 27, 2011, up to approximately U.S. $1 billion of various series of outstanding U.S. dollar-, euro-, Italian lira- and British pound-denominated bonds issued by Mexico for Mexican peso-denominated MBonos maturing in either 2020, 2029 or 2038. The Series XWB11 Warrants entitled the holders to exchange, on May 4, 2011 or May 19, 2011, up to approximately U.S. $1 billion of various series of outstanding U.S. dollar-, euro-, Italian lira- and British pounds-denominated bonds issued by Mexico for Mexican peso-denominated MBonos maturing in 2020, 2029 or 2038. Holders of approximately 12% of the Series XWA11 Warrants elected to exercise their warrants on either the first or second exercise date for such warrants. As a result of the exercise of the Series XWA11 Warrants, Mexico cancelled approximately U.S. $102.6 million or equivalent of outstanding debt denominated in foreign currencies and issued approximately Ps. 1.3 billion of MBonos. Holders of approximately 31.4% of the Series XWB11 Warrants elected to exercise their warrants on either the first or second exercise date for such warrants. As a result of the exercise of the Series XWB11 warrants, Mexico cancelled approximately U.S. $210.2 million and EUR 59.7 million of outstanding debt denominated in such currencies and issued approximately Ps. 3.5 billion of MBonos; and |
| | • | | an August 2012 exchange offer pursuant to which the holders of fifteen series of Mexico’s U.S. dollar-denominated external bonds maturing in 2013, 2014, 2015, 2016, 2017, 2019, 2020, 2022, 2026, 2031, 2033, 2034 and 2040 were invited to submit offers, in a modified Dutch auction, to exchange their bonds for reopened 3.625% Global Notes due 2022, 4.750% Global Notes due 2044 or 5.750% Global Notes due 2110 plus, in certain cases, a cash payment. Pursuant to the exchange offer, approximately U.S. $1.9 billion of outstanding bonds were canceled, and approximately U.S. $2.2 billion aggregate principal amount of reopened notes were issued, as follows: |
| | | | | | | | | | | | |
| | | Principal Amount of Old Bonds (in millions) Exchanged for: | |
Series of Old Bonds | | Reopened
2022 Notes | | | Reopened
2044 Notes | | | Reopened
2110 Notes | |
6.375% Global Notes due 2013 | | U.S.$ | 83.5 | | | U.S.$ | 0.5 | | | U.S.$ | 5.3 | |
5.875% Global Notes due January 2014 | | U.S.$ | 15.8 | | | U.S.$ | — | | | U.S.$ | 2.8 | |
5.875% Global Notes due February 2014 | | U.S.$ | 57.1 | | | U.S.$ | 2.4 | | | U.S.$ | 2.3 | |
6.625% Global Notes due 2015 | | U.S.$ | 39.3 | | | U.S.$ | 12.8 | | | U.S.$ | 5.5 | |
11.375% Global Bonds due 2016 | | U.S.$ | 95.4 | | | U.S.$ | 0.1 | | | U.S.$ | — | |
5.625% Global Notes due 2017 | | U.S.$ | 230.9 | | | U.S.$ | 54.9 | | | U.S.$ | 5.0 | |
5.95% Global Notes due 2019 | | | — | | | U.S.$ | 88.7 | | | U.S.$ | 17.2 | |
8.125% Global Bonds due 2019 | | | — | | | U.S.$ | 5.6 | | | U.S.$ | 3.1 | |
5.125% Global Notes due 2020 | | | — | | | U.S.$ | 90.7 | | | U.S.$ | 102.4 | |
8% Global Notes due 2022 | | | — | | | U.S.$ | 39.4 | | | U.S.$ | 63.8 | |
11.50% Global Bonds due 2026 | | | — | | | U.S.$ | 10.3 | | | U.S.$ | 0.4 | |
8.30% Global Notes due 2031 | | | — | | | U.S.$ | 68.8 | | | U.S.$ | 223.7 | |
7.50% Global Notes due 2033 | | | — | | | U.S.$ | 48.6 | | | U.S.$ | 43.0 | |
6.75% Global Notes due 2034 | | | — | | | U.S.$ | 369.2 | | | U.S.$ | 51.6 | |
6.05% Global Notes due 2040 | | | — | | | U.S.$ | — | | | U.S.$ | 41.5 | |
D-104
Debt Record
Following the 1946 rescheduling of debt incurred prior to the Revolution of 1910, Mexico has not defaulted in the payment of principal or interest on any of its external indebtedness. See “—External Debt Restructuring and Debt and Debt Service Reduction Transactions” above.
D-105
TABLES AND SUPPLEMENTARY INFORMATION
PUBLIC DEBT OF THE GOVERNMENT
A. DIRECT DEBTOFTHE GOVERNMENT
Table I. Floating Internal Debt at June 30, 2012
(payable in pesos)
| | | | | | | | | | |
Title | | Interest
Rate | | Maturity
Date | | Outstanding
Principal
Amount | | | Amortization or
Sinking Fund
Provision |
| | | | | | | (in millions of pesos) | | | |
| | | | |
Short-term Treasury Certificates (Cetes) | | Various | | Various | | Ps. | 389,312.3 | | | None |
| | | | | | | | | | |
Total Floating Internal Debt | | | | | | Ps. | 389,312.3 | | | |
| | | | | | | | | | |
Table II. Funded Internal Debt at June 30, 2012
(payable in pesos)
| | | | | | | | | | |
Title | | Interest
Rate | | Maturity
Date | | Outstanding
Principal
Amount | | | Amortization or
Sinking Fund
Provision |
| | | | | | | (in millions of pesos) | | | |
| | | | |
Fixed-Rate Bonds | | Fixed | | Various | | Ps. | 1,665,075.3 | | | None |
Development Bonds (Bondes D) | | Various | | Various | | | 201,590.5 | | | None |
UDI-denominated Development Bonds (UDI bonds) | | Various | | Various | | | 693,441.7 | | | None |
Retirement Saving System Fund (Fondo de Ahorro/SAR) | | Various | | Various | | | 82,356.5 | | | None |
One-year Treasury Certificates (Cetes)(1) | | Various | | Various | | | 122,736.6 | | | None |
Others(2) | | Various | | Various | | | 226,945.7 | | | None |
| | | | | | | | | | |
Total Funded Internal Debt | | | | | | Ps. | 2,992,146.3 | | | |
| | | | | | | | | | |
| (1) | One-year Cetes are the only long-term Treasury Certificates issued by the Government. |
| (2) | Includes Ps. 165.0 billion of liabilities associated with the ISSSTE Law. See “The Economy—Employment and Labor.” |
Table III. Net Internal Debt at June 30, 2012
(payable in pesos)
| | | | | | | | | | |
Title | | Interest
Rate | | Maturity
Date | | Outstanding
Principal
Amount | | | Amortization or
Sinking Fund
Provision |
| | | | | | | (in millions of pesos) | | | |
| | | | |
Total Floating Internal Debt | | | | | | Ps. | 389,312.3 | | | |
Total Funded Internal Debt | | | | | | | 2,992,146.3 | | | |
Assets(1) | | Various | | Various | | | (81,983.0 | ) | | None |
| | | | | | | | | | |
Total Net Internal Debt | | | | | | Ps. | 3,299,475.6 | | | |
| | | | | | | | | | |
| (1) | Includes Banco de México’s General Account Balance, which is positive (indicating monies owed to the Government). |
D-106
Table IV. Funded External Debt at June 30, 2012
Bond Issues at June 30, 2012
| | | | | | | | | | | | | | | | | | | | | | | | |
Title | | Interest
Rate (%) | | | Date of
Issue | | | Maturity
Date | | | Currency(1) | | Original
Principal
Amount | | | Principal
Amount
Outstanding | | | Remarks |
| | | | | | | | (in thousands) | | | |
| | | | | | | |
11.50% Global Bonds due 2026 | | | 11.50 | | | | May 1996 | | | | May 2026 | | | USD | | | 1,750,000 | | | | 338,580 | | | |
11.375% Global Bonds due 2016 | | | 11.375 | | | | Sep. 1996 | | | | Sep. 2016 | | | USD | | | 1,000,000 | | | | 702,066 | | | |
Notes due 2017 | | | 11.0 | | | | May 1997 | | | | May 2017 | | | LRA/€ | | | 500,000,000 | | | | 170,914 | | | (2) |
Step-Down Notes due 2013 | | | 10.0-7.375 | | | | Apr. 1998 | | | | Apr. 2013 | | | LRA/€ | | | 750,000,000 | | | | 303,917 | | | (2) |
11.375% Global Bonds due 2016 | | | 11.375 | | | | Aug. 1999 | | | | Sep. 2016 | | | USD | | | 400,000 | | | | 280,826 | | | |
Global Bonds due 2016 | | | 11.375 | | | | Feb. 2000 | | | | Feb. 2016 | | | USD | | | 994,641 | | | | 698,304 | | | |
Notes due 2019 | | | 8.125 | | | | Mar. 2001 | | | | Dec. 2019 | | | USD | | | 3,300,000 | | | | 1,352,366 | | | |
Notes due 2031 | | | 8.300 | | | | Aug. 2001 | | | | Aug. 2031 | | | USD | | | 1,500,000 | | | | 750,548 | | | |
Notes due 2031 | | | 8.300 | | | | Dec. 2001 | | | | Aug. 2031 | | | USD | | | 1,000,000 | | | | 500,365 | | | |
Notes due 2022 | | | 8.000 | | | | Sep. 2002 | | | | Sep. 2022 | | | USD | | | 1,750,000 | | | | 714,348 | | | |
Notes due 2031 | | | 8.300 | | | | Dec. 2002 | | | | Aug. 2031 | | | USD | | | 750,000 | | | | 375,274 | | | |
Notes due 2013 | | | 6.375 | | | | Jan. 2003 | | | | Jan. 2013 | | | USD | | | 2,000,000 | | | | 1,168,414 | | | |
Notes due 2015 | | | 6.625 | | | | Mar. 2003 | | | | Mar. 2015 | | | USD | | | 1,000,000 | | | | 671,824 | | | |
Notes due 2033 | | | 7.500 | | | | Apr. 2003 | | | | Apr. 2033 | | | USD | | | 1,000,000 | | | | 361,554 | | | |
Notes due 2013 | | | 5.375 | | | | June 2003 | | | | Jun. 2013 | | | € | | | 750,000 | | | | 614,977 | | | (2) |
Notes due 2014 | | | 5.875 | | | | Oct. 2003 | | | | Jan. 2014 | | | USD | | | 1,000,000 | | | | 719,975 | | | |
Notes due 2024 | | | 6.75 | | | | Jan. 2004 | | | | Feb. 2024 | | | STG | | | 500,000 | | | | 476,526 | | | |
Notes due 2014 | | | 5.875 | | | | Apr. 2004 | | | | Jan. 2014 | | | USD | | | 793,267 | | | | 571,133 | | | |
Notes due 2033 | | | 7.500 | | | | Apr. 2004 | | | | Apr. 2033 | | | USD | | | 2,056,822 | | | | 743,653 | | | |
Notes due 2034 | | | 6.75 | | | | Sep. 2004 | | | | Sep. 2034 | | | USD | | | 1,500,000 | | | | 1,146,487 | | | |
Notes due 2020 | | | 5.50 | | | | Nov. 2004 | | | | Feb. 2020 | | | € | | | 750,000 | | | | 545,101 | | | (2) |
Notes due 2015 | | | 6.625 | | | | Jan. 2005 | | | | Mar. 2015 | | | USD | �� | | 1,000,000 | | | | 671,825 | | | |
Notes due 2015 | | | 4.5 | | | | June 2005 | | | | June 2015 | | | € | | | 750,000 | | | | 578,714 | | | |
Internotes due 2013 | | | 5.1 | | | | Feb. 2006 | | | | Feb. 2013 | | | USD | | | 3,030 | | | | 3,030 | | | |
Notes due 2017 | | | 5.625 | | | | Mar. 2006 | | | | Jan. 2017 | | | USD | | | 3,000,000 | | | | 3,000,000 | | | |
Notes due 2034 | | | 6.75 | | | | Jan. 2007 | | | | Sep. 2034 | | | USD | | | 2,266,566 | | | | 1,732,394 | | | |
Notes due 2034 | | | 6.75 | | | | Sep. 2007 | | | | Sep. 2034 | | | USD | | | 500,000 | | | | 382,163 | | | |
Notes due 2017 | | | 5.625 | | | | Sep. 2007 | | | | Jan. 2017 | | | USD | | | 500,000 | | | | 500,000 | | | |
Notes due 2040 | | | 6.06 | | | | Jan. 2008 | | | | Jan. 2040 | | | USD | | | 1,500,000 | | | | 1,500,000 | | | |
Notes due 2019 | | | 5.95 | | | | Dec. 2008 | | | | Mar. 2019 | | | USD | | | 2,000,000 | | | | 2,000,000 | | | |
Notes due 2014 | | | 5.875 | | | | Mar. 2009 | | | | Feb. 2014 | | | USD | | | 1,500,000 | | | | 1,490,000 | | | |
Notes due 2019 | | | 5.95 | | | | Sep. 2009 | | | | Mar. 2019 | | | USD | | | 1,000,000 | | | | 928,103 | | | |
Notes due 2040 | | | 6.055 | | | | Sep. 2009 | | | | Jan. 2040 | | | USD | | | 750,000 | | | | 750,000 | | | |
Notes due 2019 | | | 2.22 | | | | Dec. 2009 | | | | Dec. 2019 | | | ¥ | | | 150,000,000 | | | | 150,000,000 | | | |
Notes due 2020 | | | 5.125 | | | | Jan. 2010 | | | | Jan. 2020 | | | USD | | | 1,000,000 | | | | 1,000,000 | | | |
Notes due 2020 | | | 5.125 | | | | Mar. 2010 | | | | Jan. 2020 | | | USD | | | 1,000,000 | | | | 1,000,000 | | | |
Notes due 2040 | | | 6.055 | | | | Apr. 2010 | | | | Jan. 2040 | | | USD | | | 1,000,000 | | | | 1,000,000 | | | |
Notes due 2017 | | | 4.25 | | | | Jul. 2010 | | | | Jul. 2017 | | | € | | | 850,000 | | | | 850,000 | | | |
Notes due 2110 | | | 5.75 | | | | Oct. 2010 | | | | Oct. 2110 | | | USD | | | 1,000,000 | | | | 1,000,000 | | | |
Notes due 2020 | | | 1.51 | | | | Oct. 2010 | | | | Oct. 2020 | | | ¥ | | | 150,000,000 | | | | 150,000,000 | | | |
Notes due 2020 | | | 5.125 | | | | Feb. 2011 | | | | Jan. 2020 | | | USD | | | 1,000,000 | | | | 1,000,000 | | | |
Notes due 2040 | | | 6.055 | | | | Apr. 2011 | | | | Jan. 2040 | | | USD | | | 1,000,000 | | | | 1,000,000 | | | |
Notes due 2110 | | | 5.75 | | | | Aug. 2011 | | | | Oct. 2110 | | | USD | | | 1,000,000 | | | | 1,000,000 | | | |
Notes due 2022 | | | 3.625 | | | | Jan. 2012 | | | | Mar. 2022 | | | USD | | | 2,000,000 | | | | 2,000,000 | | | |
Notes due 2044 | | | 4.750 | | | | Mar. 2012 | | | | Mar. 2044 | | | USD | | | 2,000,000 | | | | 2,000,000 | | | |
Notes due 2015 | | | 1.29 | | | | June 2012 | | | | Jun. 2015 | | | ¥ | | | 50,000,000 | | | | 50,000,000 | | | |
Notes due 2017 | | | 1.56 | | | | June 2012 | | | | Jun. 2017 | | | ¥ | | | 30,000,000 | | | | 30,000,000 | | | |
D-107
Loans from Multilateral and Bilateral Organizations
at June 30, 2012
| | | | | | | | | | | | | | |
Title | | Interest Rate (%) | | Date of
Issue | | Maturity
Date | | Currency(1) | | Principal Amount
Outstanding(5) | | | Remarks |
| | | | | | | | | | | (in thousands of
dollars) | | | |
| | | | | | |
Loans from the World Bank and the IADB | | Fixed from 7.25 to 11.6 and some variable | | Various | | Various | | C$, CHF, Dirham, KD, LD, Markka, NK, PE, Rand, Riyal, SDR, SK, STG, USD, VB, ¥, € | | $ | 19,826,323 | | | (3)(4) |
Loans from Banks and Suppliers
at June 30, 2012
| | | | | | | | | | | | | | | | | | |
Title | | Interest
Rate (%) | | Date of
Issue | | Maturity
Date | | Currency(1) | | Original
Principal
Amount | | | Principal
Amount
Outstanding | | | Remarks |
| | | | | | | | | | | (in thousands of dollars) | | | |
| | | | | | | |
Various | | Various | | Various | | Various | | USD | | $ | 1,090,318 | | | $ | 970,617 | | | |
Total Funded External Debt | | | | | | | | | | | | | | $ | 64,706,943 | | | (6) |
| | | | | | | | | | | | | | | | | | |
| (1) | The currencies are defined as: ATS, Austrian shillings; Bfr, Belgian franc; C$, Canadian dollar; CHF, Swiss franc; DM, Deutsche mark; DFL, Dutch guilder; Dirham, United Arab Emirates dirham; Escudo, Portuguese escudo; FF, French franc; LRA, Italian lira; KD, Kuwait dinar; LD, Libyan dinar; Markka, Finnish markka; NK, Norwegian krone; PE, Spanish peseta; Rand, South African rand; STG, Pound sterling; Riyal, Saudi Arabian riyal; SDR, Special Drawing Rights; SK, Swedish krona; USD, United States dollar; VB, Venezuelan bolivar; ¥, Japanese yen; and €, Euro. |
| (2) | In connection with these issuances, Mexico entered into currency swaps of LRA 500 billion into U.S. $300,836,144; LRA 750 billion into U.S. $427,316,438; €750,000,000 into U.S. $892,500,000; and €750,000,000 into U.S. $921,825,000. |
| (3) | Semi-annual, quarterly or monthly amortization calculated to retire loans or securities by maturity. |
| (4) | The direct obligors in respect of U.S. $548,872,000 of these loans are Banobras (U.S. $204,973,000), NAFIN (U.S. $301,417,000) and Sociedad Hipotecaria Federal (Federal Mortgage Society, which we refer to as SHF) (U.S. $42,482,000), acting in their capacities as financing agents for the Government. The Government is the direct borrower of the remainder of these loans (U.S. $19,277,451,000). The outstanding amount of the portion of these loans as to which the Government is not the direct obligor is not included in the total of this Table IV, but rather is included in Table VI. |
| (5) | Includes revaluation due to changes in parity of foreign currencies. |
| (6) | This total is expressed in U.S. dollars and differs from the total of the amounts provided due to certain items having been presented in other currencies. |
D-108
B. EXTERNAL DEBTOF BUDGET CONTROLLED AGENCIESAND OTHER PUBLIC SECTOR EXTERNAL DEBT
Table V. External Debt of Budget Controlled Agencies at June 30, 2012
(payable in foreign currencies)
| | | | | | | | |
Borrower | | Dollar Equivalent of
Principal Amount
Outstanding | | | Dollar Equivalent of
Amount Having an
Original Maturity of
Less than One Year | |
| | | (in millions of dollars) | |
| | |
CFE | | $ | 4,701.9 | | | $ | 149.1 | |
PEMEX | | | 44,774.8 | | | | 0.0 | |
| | | | | | | | |
Total External Debt of Budget Controlled Agencies | | $ | 49,476.7 | | | $ | 149.1 | |
| | | | | | | | |
Table VI. Other Public Sector External Debt at June 30, 2012 (1)
(payable in foreign currencies)
| | | | | | | | |
Borrower | | Dollar Equivalent of
Principal Amount
Outstanding | | | Dollar Equivalent of
Amount Having an
Original Maturity of
Less than One Year | |
| | | (in millions of dollars) | |
| | |
Financial Sector | | $ | 7,948.5 | | | $ | 2,483.8 | |
NAFIN | | | 1,732.0 | | | | 1,045.8 | |
Banobras | | | 2,126.2 | | | | 25.0 | |
Bancomext | | | 1,542.8 | | | | 1,413.0 | |
SHF | | | 2,547.5 | | | | 0.0 | |
Non-Financial Sector | | | 0.0 | | | | 0.0 | |
| | | | | | | | |
Total | | $ | 7,948.5 | | | $ | 2,483.8 | |
| | | | | | | | |
| (1) | This table includes debt of national development banks that is guaranteed by Mexico, as well as other public sector debt registered with the Dirección de Deuda Pública (Management Office of Public Debt), but does not include debt of entities whose finances are not included in the Government’s budget. In addition, private sector debt guaranteed by the Government or other public sector entities is not considered external public sector debt unless and until the guaranty is called. |
D-109