Exhibit D
TABLE OF CONTENTS
| | | | |
INTRODUCTION | | | D-1 | |
| |
SUMMARY | | | D-2 | |
| |
RECENT DEVELOPMENTS | | | D-4 | |
| |
UNITED MEXICAN STATES | | | D-21 | |
| |
Geography and Population | | | D-21 | |
Form of Government | | | D-22 | |
Legal and Political Reforms | | | D-24 | |
Foreign Affairs, International Organizations and International Economic Cooperation | | | D-26 | |
Internal Security | | | D-26 | |
Environment | | | D-26 | |
| |
THE ECONOMY | | | D-29 | |
| |
General | | | D-29 | |
The Role of the Government in the Economy; Privatization | | | D-29 | |
Gross Domestic Product | | | D-30 | |
Employment and Labor | | | D-33 | |
Principal Sectors of the Economy | | | D-36 | |
| |
FINANCIAL SYSTEM | | | D-46 | |
| |
Monetary Policy, Inflation and Interest Rates | | | D-46 | |
Exchange Controls and Foreign Exchange Rates | | | D-49 | |
Banking System | | | D-50 | |
Banking Supervision and Support | | | D-52 | |
Credit Allocation by Sector | | | D-54 | |
Insurance Companies, Mutual Funds and Auxiliary Credit Institutions | | | D-54 | |
Securities Markets | | | D-55 | |
| |
FOREIGN TRADE AND BALANCE OF PAYMENTS | | | D-56 | |
| |
Foreign Trade | | | D-56 | |
Geographic Distribution of Trade | | | D-58 | |
In-bond Industry | | | D-58 | |
Balance of Payments and International Reserves | | | D-60 | |
Direct Foreign Investment in Mexico | | | D-61 | |
Memberships in International Institutions | | | D-63 | |
| |
PUBLIC FINANCE | | | D-64 | |
| |
General | | | D-64 | |
Fiscal Policy | | | D-66 | |
2016 Budget | | | D-66 | |
Revenues and Expenditures | | | D-69 | |
Government Agencies and Enterprises | | | D-75 | |
| |
PUBLIC DEBT | | | D-76 | |
| |
General | | | D-76 | |
Internal Public Debt | | | D-76 | |
External Public Debt | | | D-78 | |
External Debt Restructuring and Debt Service Reduction Transactions | | | D-83 | |
Debt Record | | | D-83 | |
IMF Credit Lines | | | D-83 | |
i
LIST OF TABLES
| | | | |
Table No. 1 - United Mexican States | | | D-2 | |
Table No. 2 - Real GDP and Expenditures in Billions of Constant Pesos | | | D-6 | |
Table No. 3 - Real GDP and Expenditures as a Percentage of Total GDP | | | D-6 | |
Table No. 4 - Real GDP by Sector in Billions of Constant Pesos | | | D-7 | |
Table No. 5 - Real GDP Growth by Sector Percent Change Against Prior Years | | | D-8 | |
Table No. 6 - Industrial Manufacturing Output Differential by Sector | | | D-9 | |
Table No. 7 - Money Supply | | | D-10 | |
Table No. 8 - Changes in Price Indices | | | D-11 | |
Table No. 9 - Average Cetes, CPP and TIIE Rates | | | D-11 | |
Table No. 10 - Exchange Rates | | | D-12 | |
Table No. 11 - Exports and Imports | | | D-13 | |
Table No. 12 - Balance of Payments | | | D-14 | |
Table No. 13 - International Reserves and Net International Assets | | | D-15 | |
Table No. 14 - 2014-2015 and First Six Months of 2016 Budgetary Expenditures; 2016 Expenditure Budgets | | | D-15 | |
Table No. 15 - 2011-2015 and First Six Months of 2016 Budgetary Results; 2016 Budget Assumptions and Targets | | | D-16 | |
Table No. 16 - 2016 Public Sector Budgetary Revenues | | | D-17 | |
Table No. 17 - Gross and Net Internal Debt of the Government | | | D-18 | |
Table No. 18 - Summary of External Public Debt By Type | | | D-19 | |
Table No. 19 - By Currency | | | D-19 | |
Table No. 20 - Net External Debt of the Public Sector | | | D-19 | |
Table No. 21 - Gross External Debt of the Federal Government | | | D-19 | |
Table No. 22 - Net External Debt of the Federal Government | | | D-20 | |
Table No. 23 - Net Debt of the Federal Government | | | D-20 | |
Table No. 24 - Selected Comparative Statistics | | | D-21 | |
Table No. 25 - Party Representation in Congress | | | D-24 | |
Table No. 26 - Real GDP and Expenditures in Billions of Constant Pesos | | | D-31 | |
Table No. 27 - Real GDP and Expenditures as a Percentage of Total GDP | | | D-31 | |
Table No. 28 - Real GDP by Sector | | | D-32 | |
Table No. 29 - Real GDP Growth by Sector | | | D-33 | |
Table No. 30 - Unemployed Population by Age and Gender | | | D-34 | |
Table No. 31 - Economically Active Population by Sector | | | D-34 | |
Table No. 32 - Industrial Manufacturing Output | | | D-37 | |
Table No. 33 - Industrial Manufacturing Output Differential by Sector | | | D-38 | |
Table No. 34 - Tourism Revenues and Expenditures | | | D-40 | |
Table No. 35 - Development of Mexico’s Road Network | | | D-42 | |
Table No. 36 - Communications | | | D-43 | |
Table No. 37 - Mining | | | D-44 | |
Table No. 38 - Composition of Main Energy Sources | | | D-45 | |
Table No. 39 - Money Supply | | | D-47 | |
Table No. 40 - Changes in Price Indices | | | D-48 | |
Table No. 41 - Average Cetes, CPP and TIIE Rates | | | D-49 | |
Table No. 42 - Exchange Rates | | | D-50 | |
Table No. 43 - Commercial Banking System | | | D-51 | |
Table No. 44 - Credit Allocation by Sector | | | D-54 | |
Table No. 45 - Mexican Stock Exchange Performance | | | D-55 | |
Table No. 46 - Exports and Imports | | | D-57 | |
Table No. 47 - Distribution of Mexican Merchandise Exports | | | D-58 | |
Table No. 48 - Distribution of Mexican Merchandise Imports | | | D-58 | |
Table No. 49 - In-bond Industry | | | D-59 | |
Table No. 50 - In-bond Industry Revenues | | | D-59 | |
Table No. 51 - Balance of Payments | | | D-60 | |
Table No. 52 - International Reserves and Net International Assets | | | D-61 | |
Table No. 53 - 2015 Foreign Investment by Sector | | | D-62 | |
Table No. 54 - Direct Foreign Investment | | | D-63 | |
ii
| | | | |
Table No. 55 - Public Sector Balance | | | D-65 | |
Table No. 56 - Public Sector Borrowing Requirements | | | D-65 | |
Table No. 57 - Selected 2011-2015 Budgetary Expenditures; 2016 Expenditure Budget | | | D-67 | |
Table No. 58 - 2011-2015 Budgetary Results; 2016 Budget Assumptions and Targets | | | D-68 | |
Table No. 59 - Selected Public Finance Indicators | | | D-69 | |
Table No. 60 - Public Sector Budgetary Revenues | | | D-70 | |
Table No. 61 - Composition of Tax Revenues 2011 vs. 2015 | | | D-72 | |
Table No. 62 - Public Sector Budgetary Expenditures | | | D-73 | |
Table No. 63 - Principal Government Agencies, Productive State-Owned Companies and Enterprises at December 31, 2015 | | | D-75 | |
Table No. 64 - Gross and Net Internal Debt of the Government | | | D-77 | |
Table No. 65 - Public Debt Creditors at December 31, 2015 | | | D-79 | |
Table No. 66 - Summary of External Public Debt By Type | | | D-80 | |
Table No. 67 - Net External Debt of the Public Sector | | | D-80 | |
Table No. 68 - Gross External Debt of the Federal Government | | | D-80 | |
Table No. 69 - Net External Debt of the Federal Government | | | D-81 | |
Table No. 70 - Net Debt of the Federal Government | | | D-81 | |
Table No. 71 - Amortization Schedule of Total Public Sector External Debt | | | D-82 | |
Table No. 72 - Liability Management Transactions | | | D-83 | |
iii
INTRODUCTION
References herein to “U.S. $”, “$”, “U.S. dollars” or “dollars” are to United States dollars. References herein to “pesos” or “Ps.” are to the lawful currency of the United Mexican States (Mexico). References herein to “nominal” data are to data expressed in pesos that have not been adjusted for inflation, and references to “real” data are to data expressed in inflation-adjusted pesos. Unless otherwise indicated, U.S. dollar equivalents of peso amounts as of a specified date are based on the exchange rate for such date announced by Banco de México for the payment of obligations denominated in currencies other than pesos and payable within Mexico, and U.S. dollar equivalents of peso amounts for a specified period are based on the average of such announced daily exchange rates for such period. Note that due to fluctuations in the peso/dollar exchange rate, the exchange rate on any subsequent date could be materially different from the rate provided in this document.
Banco de México calculates the announced peso/dollar exchange rate daily, on the basis of an average of rates obtained in a representative sample of financial institutions whose quotations reflect market conditions for wholesale operations. Banco de México uses this rate when calculating Mexico’s official economic statistics. The exchange rate announced by Banco de México on October 20, 2016 (which took effect on the second business day thereafter) was Ps. 18.5945 = U.S. $1.00. See “Foreign Trade and Balance of Payments—Exchange Controls and Foreign Exchange Rates.”
Under the Ley Monetaria de los Estados Unidos Mexicanos (Mexican Monetary Law), payments which are required to be made in Mexico in a foreign currency, whether by agreement or upon a judgment of a Mexican court, may be discharged in pesos at the prevailing peso exchange rate at the time of payment.
The fiscal year of the Federal Government of Mexico (the Government) is aligned with the calendar year. Thus, the Government’s fiscal year ends on December 31 of each year. The fiscal year ended December 31, 2015 is referred to as “2015” and all other years are referred to in a similar manner.
The information included herein reflects the most recent information available at the time of filing.
D-1
SUMMARY
The following is a summary of Mexico’s economic information for the period 2011-2015 and the first six months of 2016. This summary does not purport to be complete and is qualified by the more detailed information appearing elsewhere in this document. Certain figures, most prominently those calculated by the Instituto Nacional de Estadística y Geografía (National Institute of Statistics and Geography, or INEGI), including figures relating to Mexico’s Gross Domestic Product (GDP), were formerly calculated by INEGI in constant 2003 pesos from 2008 to 2012 and were updated in this document to reflect constant 2008 pesos in 2013, thereby also modifying figures of prior years.
Table No. 1 – United Mexican States
| | | | | | | | | | | | | | | | | | | | | | | | | | | | |
| | | 2011(1) | | | 2012(1) | | | 2013(1) | | | 2014(1) | | | 2015(1) | | | Second
quarter 2015(1) | | | Second quarter
2016(1) | |
| | | (in millions of dollars or pesos, except percentages) | |
The Economy | | | | | | | | | | | | | | | | | | | | | | | | | | | | |
GDP: | | | | | | | | | | | | | | | | | | | | | | | | | | | | |
Nominal | | Ps. | 14,550,014 | | | Ps. | 15,626,907 | | | Ps. | 16,118,031 | | | Ps. | 17,256,000 | | | Ps. | 18,127,178 | | | Ps. | 17,734,212 | (2) | | Ps. | 18,780,100 | (2) |
Real(3) | | Ps. | 12,774,243 | | | Ps. | 13,287,534 | | | Ps. | 13,468,255 | | | Ps. | 13,770,659 | | | Ps. | 14,110,099 | | | Ps. | 13,844,027 | (2) | | Ps. | 14,187,890 | (2) |
Real GDP growth(3) | | | 4 | .0% | | | 4 | .0% | | | 1 | .4% | | | 2 | .2% | | | 2 | .5% | | | 2 | .4 % | | | 2 | .5% |
Increase in national consumer price index | | | 3 | .8% | | | 3 | .6% | | | 4 | .0% | | | 4 | .1% | | | 2 | .1% | | | 2 | .9% | | | 2 | .9% |
Merchandise export growth(4) | | | 17 | .1% | | | 6 | .1% | | | 2 | .5% | | | 4 | .4% | | | (4 | .1)% | | | (2 | .2)% | | | (5 | .1)% |
Non-oil merchandise export growth(4) | | | 14 | .1% | | | 8 | .5% | | | 4 | .0% | | | 7 | .3% | | | 0 | .8% | | | 3 | .5% | | | (2 | .8)% |
Oil export growth | | | 35 | .4% | | | (6 | .2)% | | | (6 | .6)% | | | (14 | .4)% | | | (45 | .3)% | | | (44 | .3)% | | | (36 | .7)% |
Oil exports as % of merchandise exports(4) | | | 16 | .2% | | | 14 | .3% | | | 13 | .0% | | | 10 | .7% | | | 6 | .1% | | | 6 | .8% | | | 4 | .5% |
Balance of payments: | | | | | | | | | | | | | | | | | | | | | | | | | | | | |
Current account | | $ | (13,985 | ) | | $ | (16,957 | ) | | $ | (30,978 | ) | | $ | (26,249 | ) | | $ | (32,707 | ) | | $ | (17,256 | ) | | $ | (15,449 | ) |
Trade balance | | $ | (1,409 | ) | | $ | 18 | | | $ | (1,195 | ) | | $ | (3,065 | ) | | $ | (14,609 | ) | | $ | (4,153 | ) | | $ | (7,116 | ) |
Capital account | | $ | 50,716 | | | $ | 53,677 | | | $ | 58,330 | | | $ | 68,752 | | | $ | 61,379 | | | $ | 21.056 | | | $ | 15,259 | |
Change in international reserves(5) | | $ | 28,879 | | | $ | 21,040 | | | $ | 13,006 | | | $ | 16,717 | | | $ | (16,503 | ) | | $ | (729 | ) | | $ | 673 | |
International reserves (end of period)(6) | | $ | 142,476 | | | $ | 163,592 | | | $ | 176,579 | | | $ | 193,045 | | | $ | 176,735 | | | $ | 192,403 | | | $ | 177,291 | |
Net international assets(7) | | $ | 149,242 | | | $ | 166,472 | | | $ | 178,686 | | | $ | 196,288 | | | $ | 177,629 | | | $ | 193,803 | | | $ | 180,561 | |
Ps./$ representative market exchange rate (end of period)(8) | | Ps. | 13.9476 | | | Ps. | 12.9658 | | | Ps. | 13.0843 | | | Ps. | 14.7414 | | | Ps. | 17.2487 | | | Ps. | 15.6854 | | | Ps. | 18.4646 | |
28-day Cetes (Treasury bill) rate (% per annum)(9) | | | 4 | .2% | | | 4 | .2% | | | 3 | .8% | | | 3 | .0% | | | 3 | .0% | | | 2 | .9% | | | 3 | .6% |
Unemployment rate (end of period) | | | 4 | .5% | | | 4 | .4% | | | 4 | .3% | | | 3 | .8% | | | 4 | .0% | | | 4 | .4% | | | 3 | .9% |
| | | | | | | | | | | | | | | | | | | | | | | | | | | | | | | | |
| | | 2011(3) | | | 2012(3) | | | 2013(3) | | | 2014(3) | | | 2015(1) (3) | | | Second
quarter
2015(1)(3) | | | Second
quarter
2016(1)(3) | | | 2016
Budget (10)(3) | |
| | | (in billions of constant pesos, except percentages) | |
Public Finance(11) | | | | | | | | | | | | | | | | | | | | | | | | | | | | | | | | |
Public sector revenues | | | Ps. 3,271 | | | | Ps. 3,515 | | | | Ps. 3,800 | | | | Ps. 3,983 | | | | Ps. 4,267 | | | | Ps. 2,046 | | | | Ps. 2,339 | | | | Ps. 4,155 | |
As % of GDP | | | 24 | .6% | | | 25 | .5% | | | 27 | .3% | | | 27 | .8% | | | 30 | .2% | | | 14 | .8% | | | 16 | .5% | | | 28 | .8% |
Public sector expenditures | | | Ps. 3,631 | | | | Ps. 3,920 | | | | Ps. 4,178 | | | | Ps. 4,528 | | | | Ps. 4,893 | | | | Ps. 2,3408 | | | | Ps. 2,465 | | | | Ps. 4,732 | |
As % of GDP | | | 25 | .0% | | | 25 | .1% | | | 25 | .9% | | | 26 | .3% | | | 27 | .0% | | | 13 | .6% | | | 13 | .1% | | | 24 | .7% |
Public sector balance as % of GDP(12) | | | (2 | .4)% | | | (2 | .6)% | | | (2 | .3)% | | | (3 | .2)% | | | (3 | .5)% | | | (2 | .5)% | | | (0 | .8)% | | | (0 | .5)% |
D-2
| | | | | | | | | | | | | | | | | | | | | | | | | | | | |
| | | December 31, | | | Second
quarter
2015(1) | | | Second
quarter
2016(1) | |
| | | 2011 | | | 2012 | | | 2013 | | | 2014(1) | | | 2015(1) | | | |
| | | (in billions of dollars or pesos, except percentages) | |
Public Debt(13) | | | | | | | | | | | | | | | | | | | | | | | | | | | | |
Net internal Government debt(14) | | Ps. | 3,112 | .1 | | Ps. | 3,501 | .1 | | Ps. | 3,893 | .9 | | Ps. | 4,324 | .1 | | Ps. | 4,814 | .1 | | Ps. | 4,554 | .5 | | Ps. | 4,857 | .6 |
Gross external public debt(15) | | $ | 116 | .4 | | $ | 125 | .7 | | $ | 134 | .4 | | $ | 147 | .7 | | $ | 162 | .2 | | $ | 162 | .4 | | $ | 179 | .9 |
Long-term | | $ | 113 | .7 | | $ | 122 | .6 | | $ | 130 | .9 | | $ | 142 | .9 | | $ | 159 | .1 | | $ | 157 | .0 | | $ | 176 | .7 |
Short-term | | $ | 2 | .8 | | $ | 3 | .1 | | $ | 3 | .5 | | $ | 4 | .8 | | $ | 3 | .2 | | $ | 5 | .4 | | $ | 3 | .2 |
Public debt as % of nominal GDP: | | | | | | | | | | | | | | | | | | | | | | | | | | | | |
Net internal Government debt(14) | | | 19 | .9% | | | 21 | .6% | | | 23 | .1% | | | 24 | .0% | | | 25 | .5% | | | 25 | .9% | | | 25 | .7% |
Gross external public debt(15) | | | 10 | .4% | | | 10 | .1% | | | 10 | .4% | | | 12 | .1% | | | 14 | .8% | | | 13 | .9% | | | 18 | .0% |
Total public debt as % of nominal GDP(16) | | | 30 | .3% | | | 31 | .7% | | | 33 | .5% | | | 36 | .1% | | | 40 | .3 | | | 39 | .8% | | | 43 | .7% |
Interest on external public debt as % of merchandise exports(4) | | | 1 | .6% | | | 1 | .6% | | | 1 | .6% | | | 1 | .6% | | | 1 | .8% | | | 1 | .9% | | | 2 | .2% |
| Note: | Numbers may not total due to rounding. |
| (1) | Preliminary figures. Note that, in particular, unemployment figures from 2010 to 2015 and GDP figures from 2012 to 2015 remain subject to periodic revision. Further, nominal GDP figures for 2014 reflect the latest INEGI release of such figures on June 30, 2015. |
| (2) | Annualized. Actual second quarter nominal GDP data has been annualized by multiplying it by four, is included for comparison purposes only, and is not necessarily indicative of performance for the full fiscal year. |
| (3) | Constant pesos with purchasing power as of December 31, 2008. |
| (4) | Merchandise export figures include the maquiladora (or the in-bond industry) and exclude tourism. |
| (5) | Due to the impact of errors and omissions, as well as the purchase, sale and revaluation of bullion, figures for changes in total reserves do not reflect the sum of the current and capital accounts. |
| (6) | “International reserves” are equivalent to gross international reserves minus international liabilities of Banco de México with maturities of less than six months. |
| (7) | “Net international assets” are defined as (a) gross international reserves plus (b) assets with a maturity longer than six months derived from credit agreements with central banks, less (x) liabilities outstanding to the International Monetary Fund (IMF) and (y) liabilities with a maturity of less than six months derived from credit agreements with central banks. |
| (8) | “Representative market rate” represents the end-of-period exchange rate announced by Banco de México for the payment of obligations denominated in currencies other than pesos and payable within Mexico. |
| (9) | Annual average of weekly rates, calculated on a month-by-month basis. |
| (10) | The figures provided for Mexico’s budget for 2016 represent budgetary estimates, based on the economic assumptions contained in the Criterios Generales de Política Económica 2016 (General Economic Policy Guidelines for 2016) and in the Programa Económico 2015 (Economic Program for 2016), and do not reflect actual results for 2016 or updated estimates of Mexico’s 2016 economic results. Percentages of GDP were calculated with a GDP projection made in 2015, using the method of calculation in effect since April 2008. |
| (11) | Includes the Government’s aggregate revenues and expenditures, as well as the aggregate revenues and expenditures of budget-controlled and administratively-controlled agencies (each as defined in “Public Finance–General”). This does not include off-budget revenues or expenditures. |
| (12) | The definition of “public sector balance” is discussed in “Public Finance—General—Methods for Reporting Fiscal Balance.” See this section for further information regarding the calculation of the public sector balance. |
| (13) | Includes the Government’s direct debt, public sector debt guaranteed by the Government and other public sector debt, except as indicated. |
| (14) | “Net internal debt” represents the internal debt directly incurred by the Government at the end of the period indicated, including Banco de México’s General Account Balance and the assets of the Fondo de Ahorro Para el Retiro (Retirement Savings System Fund). It does not include the debt of budget-controlled and administratively-controlled agencies or any debt guaranteed by the Government. In addition, “net internal debt” is comprised of Cetes and other securities sold to the public in auctions for new issuances (primary auctions), but does not include any debt allocated to Banco de México for its use in Regulación Monetaria (regulating the money supply). This is because Banco de México’s sales of debt pursuant to Regulación Monetaria does not increase the Government’s overall level of internal debt; Banco de México must reimburse the Government for any allocated debt that Banco de México sells in the secondary market and that is presented to the Government for payment. However, if Banco de México carries out a high volume of sales of allocated debt in the secondary market, this can result in the Government’s outstanding internal debt being higher than its outstanding net internal debt. |
| (15) | External debt is presented herein on a “gross” basis and includes the public sector’s external obligations at its full outstanding face or principal amounts at the end of the period indicated. For informational and statistical purposes, Mexico sometimes reports its external public sector debt on a “net” or “economic” basis, which is calculated as gross debt net of certain financial assets held abroad. These financial assets include the value of collateral securing principal and interest on bonds, as well as Mexican public sector external debt that is held by public sector entities but that has not been canceled. “External public sector debt” does not include (a) repurchase obligations of Banco de México with the IMF (none of which were outstanding at June 30, 2016); (b) external borrowings by the public sector after June 30, 2015; and (c) loans from the Commodity Credit Corporation to private sector Mexican banks. |
| (16) | “Total public debt” refers to net internal Government debt plus gross external public sector debt. See “Public Debt—External Public Debt” for total public debt calculated using net internal public sector debt plus gross external public sector debt. |
Source: Ministry of Finance and Public Credit.
D-3
RECENT DEVELOPMENTS
The following information provides a summary of selected recent developments relating to each section of this report since December 31, 2015.
UNITED MEXICAN STATES
Form of Government
On September 7, 2016, Jose Antonio Meade Kuribreña was appointed as the Secretary of Finance and Public Credit of the Ministry of Finance and Public Credit of Mexico.
Legal and Political Reforms
Anti-Corruption
On July 18, 2016, the Sistema Nacional Anticorrupción (National Anti-Corruption System or NAS) went into force. The NAS is an institutional framework that seeks to combat corruption and bribery in public administration and governmental accounting.
Access to Information and Government Transparency
On May 9, 2016 the Ley de Federal de Transparencia y Acceso a la Información Pública (Federal Law for Transparency and Access to Public Information) was published in the Diario Oficial de la Federación (Official Gazette of the Federation), abrogating the former law of the same name. This law continues to ensure the right to access to information held by governmental entities and, additionally, was expanded to include transparency obligations for the armed forces, the Agencia Nacional de Seguridad Industrial y de Protección al Medio Ambiente del Sector Hidrocarburos (National Agency for Industrial Safety and Environmental Protection on Hydrocarbons Sector), the Comisión Nacional the Hidrocarburos (National Hydrocarbons Commission), the Comisión Reguladora de Energía (Regulatory Energy Commission), the Fondo Mexicano del Petróleo para la Estabilización y el Desarrollo (Mexican Petroleum Fund for Stabilization and Development) and the productive state-owned companies. The new law sets forth the authority of the Instituto Nacional de Transparencia, Acceso a la Información y Protección de Datos Personales (National Institute of Transparency, Information Access and Protection of Private Data or INAI) to impose sanctions.
Criminal Justice
In June 2008, the Constitución Política de los Estados Unidos Mexicanos (the Political Constitution of Mexico, or the Constitution) was amended to reform the criminal justice system. The reforms were implemented over a period of eight years and went into force on June 18, 2016. Under the reforms, Mexico transitioned to an accusatory system of criminal justice, in which defendants are presumed innocent until proven guilty. Closed-door proceedings, previously conducted almost exclusively through written briefs, will be replaced with oral trials open to the public. A specific judge will be named to each criminal proceeding and will follow that proceeding through the sentencing phase and will be required to be present at every hearing. The victims of criminal activity are more directly involved in criminal proceedings and benefit from increased protection of their personal data, as well as access to legal, medical and psychological assistance.
Local Government Finance
On April 27, 2016, the Ley de Disciplina Financiera de las Entidades Federativas y los Municipios (Law for the Financial Discipline of the States and the Municipalities) was published in the Official Gazette of the Federation. Pursuant to the law, states and municipalities will need the authorization of the local congress to incur additional indebtedness if their outstanding indebtedness is higher than six percent of the revenues approved by the Legislative branch for the applicable fiscal year. The law also imposes a new set of requirements that must be met prior to having the Federal Government of Mexico (the Federal Government or the Government) guarantee debt issued by
D-4
states and municipalities. This legislation follows a May 2015 decree amending various provisions of the Constitution, creating a new legal framework to control the borrowing practices of the states and municipalities.
Economic Development
On June 1, 2016, the Ley de Zonas Económicas Especiales (Law of Special Economic Zones) was published in the Official Gazette of the Federation. This law is part of the Plan Nacional de Desarrollo 2013-2018 (National Development Plan or the Plan), described under “United Mexican States – Form of Government – The Government,” and its purpose is to regulate the establishment and operation of the Zonas Economica Especiales (Special Economic Zones) and promote sustainable economic growth in the undeveloped regions of the country, particularly the southern region of Mexico. The Special Economic Zones are designated geographic areas subject to special incentives to promote business, attract new investment and generate employment opportunities through infrastructure development projects.
Internal Security
In September 2016, the Instituto Nacional de Estadística y Geografía (INEGI) published the Encuesta Nacional de Victimización y Percepción sobre Seguridad Pública 2016 (National Poll on Victimization and Perception of Public Security 2016). The poll found that, excluding federal crimes such as narcotics trafficking and organized crime, which are not subject to such polling, local crimes and related security measures cost Mexican households approximately Ps. 236.8 billion in 2015, or 1.25% of GDP, as compared to Ps. 226.7 billion in 2014, or 1.27% of GDP. This cost is the equivalent of Ps. 5,905 per person affected by local crimes.
Environment
In September 2016, the Senado de la República (Senate) issued a decree endorsing the Paris Agreement. The Paris Agreement seeks to establish long-term objectives in order to stop the increase in global temperature caused by greenhouse gases.
D-5
THE ECONOMY
Gross Domestic Product
The following tables set forth Mexico’s real GDP and expenditures, in constant 2008 pesos and in percentage terms, for the periods indicated. Note that these figures were formerly calculated in constant 2003 pesos and have since been updated to constant 2008 pesos, thereby also modifying prior year figures. Quarterly GDP data has been multiplied by four to state on an annualized basis. Quarterly real GDP data for the period presented is not necessarily indicative of performance for the full fiscal year.
Table No. 2 – Real GDP and Expenditures in Billions of Constant Pesos
| | | | | | | | |
| | | Second quarter (annualized)(2) | |
| | | 2015(1) | | | 2016(1) | |
| | | (in billions of constant pesos)(3) | |
GDP | | | Ps. 13,844.0 | | | | Ps. 14,187.9 | |
Add: Imports of goods and services | | | 4,581.0 | | | | 4,644.6 | |
| | | | | | | | |
Total supply of goods and services | | | 18,425.0 | | | | 18,832.5 | |
Less: Exports of goods and services | | | 4,789.1 | | | | 4,836.2 | |
| | | | | | | | |
Total goods and services available for domestic expenditure | | | Ps. 13,635.9 | | | | Ps. 13,996.3 | |
Allocation of total goods and services: | | | | | | | | |
Private consumption | | | 9,280.7 | | | | 9,552.7 | |
Public consumption | | | 1,540.0 | | | | 1,549.6 | |
| | | | | | | | |
Total consumption | | | 10,820.6 | | | | 11,102.2 | |
Total gross fixed investment | | | 2,963.7 | | | | 2,981.7 | |
Changes in inventory | | | 88.3 | | | | 82.4 | |
| | | | | | | | |
Total domestic expenditures | | | Ps. 13,872.7 | | | | Ps. 14,166.4 | |
| | | | | | | | |
Errors and Omissions | | | 236.7 | | | | 170.0 | |
| | | | | | | | |
| Note: | Numbers may not total due to rounding. |
| (2) | Annualized. Actual second quarter nominal GDP data has been annualized by multiplying it by four, is included for comparison purposes only, and is not necessarily indicative of performance for the full fiscal year. |
| (3) | Constant pesos with purchasing power as of December 31, 2008. |
Source: INEGI.
Table No. 3 – Real GDP and Expenditures as a Percentage of Total GDP
| | | | | | | | |
| | | Second quarter (annualized)(2) | |
| | | 2015(1) | | | 2016(1) | |
| | | (as a percentage of total GDP)(3) | |
GDP | | | 100.0 | % | | | 100.0 | % |
Add: Imports of goods and services | | | 33.1 | | | | 32.7 | |
| | | | | | | | |
Total supply of goods and services | | | 133.1 | | | | 132.7 | |
Less: Exports of goods and services | | | 34.6 | | | | 34.1 | |
| | | | | | | | |
Total goods and services available for domestic expenditures | | | 98.5 | % | | | 98.6 | % |
Allocation of total goods and services: | | | | | | | | |
Private consumption | | | 67.0 | % | | | 67.3 | % |
Public consumption | | | 11.1 | | | | 10.9 | |
| | | | | | | | |
Total consumption | | | 78.2 | | | | 78.3 | |
Total gross fixed investment | | | 21.4 | | | | 21.0 | |
Changes in inventory | | | 0.6 | | | | 0.6 | |
| | | | | | | | |
Total domestic expenditures | | | 100.2 | % | | | 99.8 | % |
| | | | | | | | |
Errors and Omissions | | | 1.7 | % | | | 1.2 | % |
| Note: | Numbers may not total due to rounding. |
| (2) | Annualized. Actual second quarter nominal GDP data has been annualized by multiplying it by four, is included for comparison purposes only, and is not necessarily indicative of performance for the full fiscal year. |
| (3) | Constant pesos with purchasing power as of December 31, 2008. |
Source: INEGI.
D-6
The following tables set forth the composition of Mexico’s real GDP by economic sector and percentage change by economic sector, in constant 2008 pesos and in percentage terms, for the periods indicated. These figures were calculated in constant 2003 pesos from 2008 to 2012 and were updated to constant 2008 pesos in 2013, thereby also modifying prior year figures.
Table No. 4 – Real GDP by Sector in Billions of Constant Pesos
| | | | | | | | |
| | | Second quarter (annualized)(2) | |
| | | 2015(1) | | | 2016(1) | |
| | | (in billions of constant pesos)(3) | |
Primary Activities: | | | | | | | | |
Agriculture, forestry, fishing, hunting and livestock(4) | | Ps. | 426.7 | | | Ps. | 441.2 | |
Secondary Activities: | | | | | | | | |
Mining | | | 948.8 | | | | 913.3 | |
Utilities | | | 311.4 | | | | 324.1 | |
Construction | | | 990.1 | | | | 1,014.0 | |
Manufacturing | | | 2,356.6 | | | | 2,386.3 | |
Tertiary Activities: | | | | | | | | |
Wholesale and retail trade | | | 2,147.6 | | | | 2,210.0 | |
Transportation and warehousing | | | 815.3 | | | | 838.2 | |
Information | | | 476.9 | | | | 522.2 | |
Finance and insurance | | | 607.9 | | | | 650.2 | |
Real estate, rental and leasing | | | 1,669.9 | | | | 1,703.2 | |
Professional, scientific and technical services | | | 296.7 | | | | 320.3 | |
Management of companies and enterprises | | | 80.4 | | | | 84.0 | |
Administrative and support and waste management and remediation services | | | 433.7 | | | | 447.5 | |
Education services | | | 489.5 | | | | 496.4 | |
Health care and social assistance | | | 267.6 | | | | 270.7 | |
Arts, entertainment and recreation | | | 58.0 | | | | 59.9 | |
Accommodation and food services | | | 293.4 | | | | 306.9 | |
Other services (except public administration) | | | 278.4 | | | | 295.5 | |
Public administration | | | 513.6 | | | | 505.0 | |
| | | | | | | | |
Gross value added at basic values | | | 13,462.5 | | | | 13,788.8 | |
Taxes on products, net of subsidies | | | 381.5 | | | | 399.1 | |
| | | | | | | | |
GDP | | Ps. | 13,844.0 | | | Ps. | 14,187.9 | |
| | | | | | | | |
| Note: | Numbers may not total due to rounding. |
| (2) | Annualized. Actual second quarter nominal GDP data has been annualized by multiplying it by four, is included for comparison purposes only, and is not necessarily indicative of performance for the full fiscal year. |
| (3) | Based on GDP calculated in constant 2008 pesos. |
| (4) | GDP figures relating to agricultural production set forth in this table and elsewhere herein are based on figures for “agricultural years,” with the definition of the relevant “agricultural year” varying from crop to crop based on the season during which it is grown. Calendar year figures are used for the other components of GDP. |
Source: INEGI.
D-7
Table No. 5 – Real GDP Growth by Sector Percent Change Against Prior Year(1)
| | | | | | | | |
| | | Second quarter
2015
(annualized) (2)(3) | | | Second quarter
2016
(annualized) (2)(3) | |
GDP (constant 2008 prices) | | | 2.4 | % | | | 2.5 | % |
Primary Activities: | | | | | | | | |
Agriculture, forestry, fishing, hunting and livestock | | | 1.5 | | | | 3.4 | |
Secondary Activities: | | | | | | | | |
Mining | | | (6.6 | ) | | | (3.7 | ) |
Utilities | | | 4.4 | | | | 4.1 | |
Construction | | | 3.9 | | | | 2.4 | |
Manufacturing | | | 3.1 | | | | 1.3 | |
Tertiary Activities: | | | | | | | | |
Wholesale and retail trade | | | 4.7 | | | | 2.9 | |
Transportation and warehousing | | | 3.1 | | | | 2.8 | |
Information | | | 5.1 | | | | 9.5 | |
Finance and insurance | | | (0.4 | ) | | | 6.9 | |
Real estate, rental and leasing | | | 2.5 | | | | 2.0 | |
Professional, scientific and technical services | | | 3.8 | | | | 8.0 | |
Management of companies and enterprises | | | (0.7 | ) | | | 4.5 | |
Administrative support, waste management and remediation services | | | 1.6 | | | | 3.2 | |
Education services | | | 0.3 | | | | 1.4 | |
Health care and social assistance | | | 1.4 | | | | 1.2 | |
Arts, entertainment and recreation | | | 4.3 | | | | 3.3 | |
Accommodation and food services | | | 4.1 | | | | 4.6 | |
Other services (except public administration) | | | 2.3 | | | | 6.1 | |
Public administration | | | 4.6 | | | | (1.7 | ) |
| Note: | Numbers may not total due to rounding. |
| (1) | Based on GDP calculated in constant 2008 pesos. |
| (3) | Annualized. Actual second quarter nominal GDP data has been annualized by multiplying it by four, is included for comparison purposes only, and is not necessarily indicative of performance for the full fiscal year. |
Source: INEGI.
Employment and Labor
According to preliminary Tasa de Desocupación Abierta (open unemployment rate) figures, Mexico’s unemployment rate was 3.9% as of June 30, 2016, a 0.3% decrease from the rate registered on December 31, 2015. As of June 30, 2016, the economically active population in Mexico older than 15 years of age consisted of 53.5 million individuals.
D-8
Principal Sectors of the Economy
Manufacturing
The following table shows the value of industrial manufacturing output in constant 2008 pesos and the percentage of total output accounted for by each manufacturing sector for the periods indicated.
Table No. 6 – Industrial Manufacturing Output Differential by Sector
(in billions of pesos(1) and percent change against prior year(2))
| | | | | | | | | | | | | | | | |
| | | First six
months of
2015(3) | | | First six
months of
2015(3) | | | First six
months of
2016(3) | | | First six
months of
2016(3)(4) | |
Food | | Ps. | 498.5 | | | | 1.7 | % | | Ps. | 510.1 | | | | 2.5 | % |
Beverage and tobacco products | | | 114.5 | | | | 3.5 | | | | 122.5 | | | | 7.2 | |
Textile mills | | | 15.9 | | | | 0.3 | | | | 16.0 | | | | 0.4 | |
Textile product mills | | | 13.9 | | | | 10.6 | | | | 14.1 | | | | 1.2 | |
Apparel | | | 54.1 | | | | 3.7 | | | | 56.0 | | | | 3.2 | |
Leather and allied products | | | 18.0 | | | | 2.3 | | | | 18.0 | | | | 0.0 | |
Wood products | | | 23.6 | | | | 6.1 | | | | 22.0 | | | | (6.7 | ) |
Paper | | | 47.4 | | | | 3.6 | | | | 49.3 | | | | 4.1 | |
Printing and related support activities | | | 14.7 | | | | 0.7 | | | | 14.4 | | | | (2.1 | ) |
Petroleum and coal products | | | 71.6 | | | | (9.9 | ) | | | 70.2 | | | | (2.0 | ) |
Chemicals | | | 250.2 | | | | (1.6 | ) | | | 245.7 | | | | (1.9 | ) |
Plastics and rubber products | | | 71.0 | | | | 4.4 | | | | 74.9 | | | | 4.8 | |
Nonmetallic mineral products | | | 116.6 | | | | 4.4 | | | | 120.3 | | | | 3.3 | |
Primary metals | | | 160.6 | | | | (4.6 | ) | | | 159.3 | | | | (0.6 | ) |
Fabricated metal products | | | 80.3 | | | | 8.2 | | | | 83.4 | | | | 3.6 | |
Machinery | | | 97.0 | | | | 0.9 | | | | 101.8 | | | | 4.6 | |
Computers and electronic products | | | 103.2 | | | | 8.3 | | | | 110.7 | | | | 7.6 | |
Electrical equipment, appliances and components | | | 71.6 | | | | 7.9 | | | | 73.3 | | | | 2.6 | |
Transportation equipment | | | 456.5 | | | | 8.9 | | | | 444.8 | | | | (2.4 | ) |
Furniture and related products | | | 26.7 | | | | 13.4 | | | | 26.8 | | | | 0.3 | |
Miscellaneous | | | 50.8 | | | | 4.7 | | | | 52.7 | | | | 3.6 | |
Total expansion/contraction | | Ps. | 2,356.6 | | | | 3.1 | | | Ps. | 2,386.3 | | | | 1.3 | |
| (1) | Constant pesos with purchasing power as of December 31, 2008. |
| (2) | Percent change reflects differential in constant 2008 pesos. |
| (4) | First six months of 2016 results as compared to the corresponding period of 2015. |
Source: INEGI
Transportation and Communications
On August 18, 2016, the new Agencia Reguladora del Transporte Ferroviario (Regulatory Agency for Railway Transportation) was created by federal decree, to regulate, among other matters, the operation of railways, passage and trackage rights, competition among carriers, and the tariffs that may be charged.
As part of several amendments to the Mexican Constitutional Framework, in respect of telecommunications matters, on January 29, 2016, the Ministry of Communications (Secretaría de Comunicaciones y Transportes) and the Federal Telecommunications Institute (Instituto Federal de Telecomunicaciones) initiated a public bidding process for the installation of a wholesale telecommunications shared public network that will provide national coverage.
With this project, the Mexican government seeks to promote effective access to broadband telecommunication services for the public. In addition, the Mexican government seeks to increase the coverage and quality of mobile services in the country, as well as to create greater competition in the telecommunications market.
D-9
FINANCIAL SYSTEM
Monetary Policy, Inflation and Interest Rates
Money Supply and Financial Savings
The following table shows Mexico’s M1 and M4 money supply aggregates at each of the dates indicated. The methodology for the calculation of Mexico’s M1 and M4 money supply is discussed in “Financial System—Monetary Policy, Inflation and Interest Rates—Money Supply and Financial Savings.”
Table No. 7 – Money Supply
| | | | | | | | |
| | | June 30, | |
| | | 2015 | | | 2016(1) | |
| | | (in millions of nominal pesos) | |
M1: | | | | |
Bills and coins | | Ps. | 947,431 | | | Ps. | 1,106,216 | |
Checking deposits | | | | | | | | |
In domestic currency | | | 1,174,778 | | | | 1,279,568 | |
In foreign currency | | | 283,074 | | | | 408,370 | |
Interest-bearing peso deposits | | | 551,420 | | | | 634,078 | |
Savings and loan deposits | | | 13,128 | | | | 15,747 | |
| | | | | | | | |
Total M1 | | Ps. | 2,969,831 | | | Ps. | 3,443,979 | |
| | | | | | | | |
M4 | | Ps. | 13,492,748 | | | Ps. | 14,263,218 | |
| Note: | Numbers may not total due to rounding. |
Source: Banco de México.
D-10
Inflation
Consumer inflation for the first half of 2016 was 2.5%, which was below the 3.0% target inflation for the year and 0.4% percentage points higher than the 2.1% consumer inflation for 2015. According to Banco de México, inflation has remained at levels below the permanent 3.0% target mainly due to the conduct of monetary policy and the absence of aggregate demand-related pressures on prices.
The following table shows, in percentage terms, the changes in price indices and annual increases in the minimum wage for the periods indicated. For additional information on Mexico’s minimum wage policy, see “The Economy — Employment and Labor.”
Table No. 8 – Changes in Price Indices
| | | | | | | | | | | | |
| | | National Producer
Price Index(1)(2)(3) | | | National Consumer
Price Index(1) | | | Increase in
Minimum Wage | |
2015 | | | 2.1 | | | | 2.8 | | | | 6.9 | |
2016 | | | | | | | | | | | | |
January | | | 2.6 | | | | 3.9 | | | | 4.2 | |
February | | | 2.9 | | | | 4.8 | | | | — | |
March | | | 2.6 | | | | 4.0 | | | | — | |
April | | | 2.5 | | | | 4.1 | | | | — | |
May | | | 2.6 | | | | 5.0 | | | | — | |
June | | | 2.5 | | | | 5.6 | | | | — | |
July | | | 2.7 | | | | 5.5 | | | | — | |
August | | | 2.7 | | | | 5.5 | | | | — | |
September | | | 3.0 | | | | 6.4 | | | | — | |
| (1) | For annual figures, changes in price indices are calculated each December. |
| (2) | National Producer Price Index figures represent the changes in the prices for basic merchandise and services (excluding oil prices). The index is based on a methodology implemented in June 2012. |
| (3) | Preliminary figures for 2015-2016. |
Sources: INEGI; Ministry of Labor.
Interest Rates
The following table sets forth the average interest rates per annum on 28-day and 91-day Cetes, the CPP and the 28-day and 91-day TIIE for the periods indicated.
Table No. 9 – Average Cetes, CPP and TIIE Rates
| | | | | | | | | | | | | | | | | | | | |
| | | 28-Day
Cetes | | | 91-Day
Cetes | | | CPP | | | 28-Day
TIIE | | | 91-Day
TIIE | |
2015: | | | | | | | | | | | | | | | | | | | | |
January-June | | | 2.9 | | | | 3.0 | | | | 2.2 | | | | 3.3 | | | | 3.3 | |
July-December | | | 3.1 | | | | 3.2 | | | | 2.1 | | | | 3.3 | | | | 3.4 | |
2016: | | | | | | | | | | | | | | | | | | | | |
January | | | 3.1 | | | | 3.3 | | | | 2.2 | | | | 3.6 | | | | 3.6 | |
February | | | 3.4 | | | | 3.5 | | | | 2.2 | | | | 3.8 | | | | 3.8 | |
March | | | 3.8 | | | | 3.9 | | | | 2.4 | | | | 4.1 | | | | 4.1 | |
April | | | 3.7 | | | | 3.8 | | | | 2.5 | | | | 4.1 | | | | 4.1 | |
May | | | 3.8 | | | | 3.9 | | | | 2.5 | | | | 4.1 | | | | 4.1 | |
June | | | 3.8 | | | | 4.1 | | | | 2.6 | | | | 4.1 | | | | 4.2 | |
July | | | 4.2 | | | | 4.4 | | | | 2.7 | | | | 4.6 | | | | 4.7 | |
August | | | 4.2 | | | | 4.4 | | | | 2.8 | | | | 4.6 | | | | 4.7 | |
September | | | 4.3 | | | | 4.5 | | | | 2.8 | | | | 4.6 | | | | 4.7 | |
Source: Banco de México.
D-11
Exchange Controls and Foreign Exchange Rates
Foreign Exchange Policy
From January 1, 2016 through February 17, 2016, the daily auctions of the sale of U.S. dollars to moderate the rate of Mexico’s accumulation of international reserves, as further described in “Financial System—Exchange Controls and Foreign Exchange Rages—Foreign Exchange Policy,” resulted in a total sale of U.S. $3,556 million.
The following table sets forth, for the periods indicated, the daily peso/dollar exchange rates announced by Banco de México for the payment of obligations denominated in dollars and payable in pesos within Mexico.
Table No. 10 – Exchange Rates
| | | | | | | | |
| | | Representative Market Rate | |
Year | | End-of-Period | | | Average | |
2015 | | | 17.2487 | | | | 15.8680 | |
2016 | | | | | | | | |
January | | | 18.1935 | | | | 18.0728 | |
February | | | 18.1020 | | | | 18.4731 | |
March | | | 17.2370 | | | | 17.6490 | |
April | | | 17.1767 | | | | 17.4877 | |
May | | | 18.4118 | | | | 18.1542 | |
June | | | 18.4646 | | | | 18.6530 | |
July | | | 18.7837 | | | | 18.6014 | |
August | | | 18.8611 | | | | 18.4749 | |
September | | | 19.3776 | | | | 19.1924 | |
Source: Banco de México.
D-12
FOREIGN TRADE AND BALANCE OF PAYMENTS
Foreign Trade
Foreign Relations
The Mexican economy and the market value of securities issued by Mexico are, to varying degrees, affected by economic and market conditions in the United States. Economic conditions in Mexico are highly correlated with economic conditions in the United States. In November 2016, elections will take place in the United States that will result in a change of the nation’s leadership, and the outcome is still uncertain. It is impossible to predict at this time what a new U.S. administration and U.S. Congress will seek to do or the impact of any measures they may adopt.
Foreign Trade Performance
The following table provides information about the value of Mexico’s merchandise exports and imports (excluding tourism) for the periods indicated.
Table No. 11 – Exports and Imports
| | | | | | | | |
| | | First six
months of
2015 | | | First six
months of
2016(1) | |
Merchandise exports (f.o.b.) | | | | | | | | |
Oil and oil products | | U.S.$ | 12,810,726.0 | | | U.S.$ | 8,102,862.0 | |
Crude oil | | | 10,293,230.0 | | | | 6,435,335.0 | |
Other | | | 2,517,496.0 | | | | 1,667,527.0 | |
Non-oil products | | | 175,626,136.0 | | | | 170,728,082.0 | |
Agricultural | | | 7,205,478.0 | | | | 7,905,910.0 | |
Mining | | | 2,449,424.0 | | | | 1,892,790.0 | |
Manufactured goods(2) | | | 165,971,234.0 | | | | 160,929,382.0 | |
| | | | | | | | |
Total merchandise exports | | | 188,436,862.0 | | | | 178,830,944.0 | |
Merchandise imports (f.o.b.) | | | | | | | | |
Consumer goods | | | 26,127,766.0 | | | | 24,227,603.0 | |
Intermediate goods(2) | | | 146,275,208.0 | | | | 142,749,960.0 | |
Capital goods | | | 20,187,150.0 | | | | 18,969,413.0 | |
| | | | | | | | |
Total merchandise imports | | | 192,590,124.0 | | | | 185,946,977.0 | |
| | | | | | | | |
Trade balance | | U.S.$ | (4,153,262.0 | ) | | U.S.$ | (7,116,033.0 | ) |
| | | | | | | | |
Average price of Mexican oil mix(3) | | U.S.$ | 49.2 | | | U.S.$ | 31.2 | |
| Note: | Numbers may not total due to rounding. |
| (2) | Includes the in-bond industry. |
| (3) | In U.S. dollars per barrel. |
Source: Banco de México / PEMEX.
Trans-Pacific Partnership
On April 27, 2016, the Senate received and began to review the official documentation relating to the Trans-Pacific Partnership Agreement (TPP), a proposed international trade agreement among twelve Pacific Rim countries. The TPP will become effective once ratified by the Senate, which is expected to occur in 2017.
D-13
Balance of Payments and International Reserves
The following table sets forth Mexico’s balance of payments for the periods indicated:
Table No. 12 – Balance of Payments
| | | | | | | | | | |
| | | | | First six
months of
2015 | | | First six
months of
20161) | |
| | | | | (in millions of dollars) | |
I. | | Current account(2) | | $ | (17,256 | ) | | $ | (15,449 | ) |
| | Credits | | | 217,685 | | | | 207,979 | |
| | Merchandise exports (f.o.b.) | | | 188,437 | | | | 178,831 | |
| | Non-factor services | | | 12,756 | | | | 12,336 | |
| | Tourism | | | 9,320 | | | | 10,063 | |
| | Others | | | 3,436 | | | | 2,273 | |
| | Factor Services | | | 4,188 | | | | 3,448 | |
| | Interest | | | 1,176 | | | | 1,300 | |
| | Others | | | 3,012 | | | | 2,149 | |
| | Transfers | | | 12,304 | | | | 13,364 | |
| | Debits | | | 234,941 | | | | 223,428 | |
| | Merchandise imports (f.o.b.) | | | 192,590 | | | | 185,947 | |
| | Non-factor services | | | 16,514 | | | | 15,031 | |
| | Insurance and freight | | | 4,936 | | | | 4,953 | |
| | Tourism | | | 4,751 | | | | 4,681 | |
| | Others | | | 6,826 | | | | 5,397 | |
| | Factor services | | | 25,389 | | | | 22,086 | |
| | Interest | | | 12,908 | | | | 13,280 | |
| | Others | | | 12,481 | | | | 8,806 | |
| | Transfers | | | 448 | | | | 365 | |
II. | | Capital account | | | 21,056 | | | | 15,259 | |
| | Liabilities | | | 30,107 | | | | 32,304 | |
| | Loans and deposits | | | 9,654 | | | | 25,528 | |
| | Development banks | | | 1,109 | | | | (465 | ) |
| | Commercial banks | | | (5,829 | ) | | | 6,158 | |
| | U.S. Federal Reserve swap facility | | | — | | | | — | |
| | Non-financial public sector | | | 14,225 | | | | 17,217 | |
| | Non-financial private sector | | | 150 | | | | 2,618 | |
| | PIDIREGAS(3) | | | — | | | | — | |
| | Foreign investment | | | 20,453 | | | | 6,776 | |
| | Direct | | | 16,186 | | | | 14,385 | |
| | Portfolio | | | 4,267 | | | | (7,609 | ) |
| | Equity securities | | | 3,389 | | | | 3,759 | |
| | Debt securities | | | 878 | | | | (11,367 | ) |
| | Assets | | | (9,052 | ) | | | (17,045 | ) |
III. | | Errors and omissions | | | (3,308 | ) | | | (1,371 | ) |
IV. | | Change in net international reserves(4) | | | (729 | ) | | | 673 | |
| Note: | Numbers may not total due to rounding. |
| (2) | Current account figures are calculated according to a methodology developed to conform to new international standards under which merchandise exports and merchandise imports include the in-bond industry. |
| (3) | Since January 1, 2009, external financing of long-term infrastructure projects (PIDIREGAS) are recorded as non-financial public sector indebtedness. |
| (4) | The sum of items I, II and III does not equal item IV because purchases and sales of gold and silver, as well as adjustments in their value, are not reflected in items I, II and III. |
Source: Banco de México.
The capital account reduction during the first half of 2016 was mainly due to a considerable reduction in foreign investors’ holdings of government bonds, which is attributable primarily to a reduction in holdings of short-term instruments by foreign investors, which was partially offset by a slight increase in their holdings of medium- and long-term instruments. Short-term instruments are generally held by temporary investors that take advantage of arbitrage opportunities in markets to generate profits in the short-term, while the increase in the holding of long-term instruments indicates the confidence of foreign investors in the macroeconomic conditions and stability of the Mexican economy.
D-14
International Reserves and Assets
The following table sets forth Banco de México’s international reserves and net international assets at the end of each period indicated.
Table No. 13 – International Reserves and Net International Assets(3)
| | | | | | | | |
Year | | End-of-Period
International Reserves(1)(2) | | | End-of-Period
Net International Assets | |
| | | (in millions of dollars) | |
2015 | | | 176,735.4 | | | | 177,628.9 | |
2016(4) | | | | | | | | |
January | | | 175,387.3 | | | | 176,353.6 | |
February | | | 176,015.5 | | | | 179,751.8 | |
March | | | 176,665.1 | | | | 180,210.5 | |
April | | | 177,968.8 | | | | 182,150.2 | |
May | | | 176,994.4 | | | | 179,631.7 | |
June | | | 177,334.9 | | | | 181,510.5 | |
July | | | 177,388.6 | | | | 179,684.8 | |
August | | | 176,348.3 | | | | 177,650.6 | |
September | | | 175,831.3 | | | | 180,531.6 | |
| (1) | Includes gold, Special Drawing Rights (international reserve assets created by the International Monetary Fund (IMF)) and foreign exchange holdings. |
| (2) | “International reserves” are equivalent to: (a) gross international reserves, minus (b) international liabilities of Banco de México with maturities of less than six months. |
| (3) | “Net international assets” are defined as: (a) gross international reserves, plus (b) assets with maturities greater than six months derived from credit agreements with central banks, less (x) liabilities outstanding to the IMF and (y) liabilities with maturities of less than six months derived from credit agreements with central banks. |
Source: Banco de México.
PUBLIC FINANCE
2017 Budget
On September 8, 2016, the President of Mexico submitted the proposed Ley de Ingresos de la Federación para el Ejercicio Fiscal de 2017 (Federal Revenue Law for 2017, or the 2017 Revenue Law) and the proposed Presupuesto de Egresos de la Federación para el Ejercicio Fiscal de 2017 (Federal Expenditure Budget for 2017, or the 2017 Expenditure Budget) to the Congreso de la Unión (Congress) for its approval. According to the Federal Law of Budget and Fiscal Accountability, the 2017 Revenue Law must be approved by the Cámara de Diputados (Chamber of Deputies) no later than October 20, 2016, which approval has been granted as of this date, and by the Senate no later than October 31, 2016. The 2017 Expenditure Budget must be approved by the Chamber of Deputies no later than November 15, 2016.
Selected estimated budget expenditures are set forth in the table below.
Table No. 14 – 2014-2015 and First Six Months of 2016 Budgetary Expenditures; 2016 Expenditure Budget
| | | | | | | | | | | | | | | | |
| | | 2014
Results(1) | | | 2015
Results(1) | | | First six
months of
2016
Results(1) | | | 2016
Budget(2) | |
| | | (in billions of Pesos) | |
Health | | | Ps. 114.3 | | | | Ps. 121.1 | | | Ps. | 63.7 | | | Ps. | 132.2 | |
Education | | | 308.7 | | | | 323.1 | | | | 153.3 | | | | 303.0 | |
Housing and community development | | | 25.8 | | | | 29.2 | | | | 11.4 | | | | 25.6 | |
Government debt servicing | | | 291.4 | | | | 322.2 | | | | 189.0 | | | | 357.4 | |
CFE and Pemex debt servicing | | | 54.1 | | | | 86.0 | | | | 48.5 | | | | 84.4 | |
Pemex | | | 42.6 | | | | 72.5 | | | | 40.7 | | | | 69.3 | |
CFE | | | 11.5 | | | | 13.5 | | | | 7.8 | | | | 15.2 | |
Other | | | 0.0 | | | | 0.0 | | | | 0.0 | | | | 0.0 | |
D-15
The table below sets forth the budgetary results for 2011-2015 and the first six months of 2016. It also sets forth the assumptions and targets underlying Mexico’s 2016 Budget.
Table No. 15 – 2011-2015 and First Six Months of 2016 Budgetary Results; 2016 Budget Assumptions and Targets
| | | | | | | | | | | | | | | | | | | | | | | | | | | | |
| | | 2011
Results(1) | | | 2012
Results(1) | | | 2013
Results(1) | | | 2014
Results(1) | | | 2015
Results(1) | | | First six
months
of 2016
Results(1) | | | 2016
Budget(2) | |
Real GDP growth (%) | | | 4.0 | % | | | 4.0 | % | | | 1.4 | % | | | 2.2 | % | | | 2.5 | % | | | 2.5 | % | | | 3.1 | % |
Increase in the national consumer price
index (%) | | | 3.8 | % | | | 3.6 | % | | | 4.0 | % | | | 4.1 | % | | | 2.1 | % | | | 2.5 | % | | | 3.0 | % |
Average export price of Mexican oil mix (U.S. $/barrel) | | $ | 101.1 | 3 | | $ | 101.9 | 6 | | $ | 98.4 | 4 | | $ | 85.4 | 8 | | $ | 43.2 | 9 | | $ | 31.2 | 4 | | $ | 50.0 | 0(3) |
Average exchange rate (Ps. /$1.00) | | | 12.4 | | | | 13.2 | | | | 12.8 | | | | 13.3 | | | | 15.9 | | | | 18.1 | | | | 16.4 | |
Average rate on 28-day Cetes (%) | | | 4.2 | % | | | 4.2 | % | | | 3.8 | % | | | 3.0 | % | | | 3.0 | % | | | 3.6 | % | | | 4.5 | % |
Public sector balance as % of GDP(4) | | | (2.4 | )% | | | (2.6 | )% | | | (2.3 | )% | | | (3.2 | )% | | | (3.5 | )% | | | (0.8 | )% | | | n.a. | |
Primary balance as % of GDP(4) | | | (0.6 | )% | | | (0.6 | )% | | | (0.4 | )% | | | (1.1 | )% | | | (1.2 | )% | | | 0.9 | % | | | (0.6 | )% |
Current account deficit as % of GDP | | | (1.2 | )% | | | (1.4 | )% | | | (2.5 | )% | | | (2.1 | )% | | | (2.9 | )% | | | (1.5 | )% | | | (2.6 | )% |
| (2) | 2016 Budget figures represent budgetary estimates, based on the economic assumptions contained in the General Economic Policy Guidelines and in the Economic Program for 2016. These figures do not reflect actual results for the year or updated estimates of Mexico’s 2016 economic results. |
| (3) | The Government entered into hedging agreements to protect against the effects of a potential decline in oil prices with respect to the level that was assumed in the 2016 Revenue Law. Therefore, the approved expenditures level should not be affected if the weighted average price of crude oil exported by PEMEX for the year falls below the price assumed in the 2015 Budget. |
| (4) | Includes the effect of expenditures related to the issuance of bonds pursuant to reforms to the ISSSTE Law and the recognition as public sector debt of certain PIDIREGAS obligations, as discussed under “Public Finance—Revenues and Expenditures—General.” |
Source: Ministry of Finance and Public Credit.
D-16
Revenues and Expenditures
The following table illustrates the composition of public sector budgetary revenues for the first six months of 2015 and 2016 in constant 2008 pesos.
Table No. 16 – 2016 Public Sector Budgetary Revenues
| | | | | | | | | | | | |
| | | First six months
of 2015(1) | | | First six months
of 2016(1) | | | 2016
Budget(2) | |
| | | (in billions of constant pesos)(3) | |
Budgetary revenues | | | 2,046.3 | | | | 2,339.2 | | | | 4,154.6 | |
Federal government | | | 1,582.5 | | | | 1,868.5 | | | | 3,102.4 | |
Taxes | | | 1,225.7 | | | | 1,393.2 | | | | 2,407.7 | |
Income tax | | | 659.2 | | | | 763.5 | | | | 1,244.2 | |
Value-added tax | | | 346.3 | | | | 373.8 | | | | 742.0 | |
Excise taxes | | | 180.5 | | | | 211.8 | | | | 348.9 | |
Import duties | | | 19.7 | | | | 23.5 | | | | 36.3 | |
Export duties | | | 0.0 | | | | 0.0 | | | | 0.0 | |
Luxury goods and services | | | 0.0 | | | | 0.0 | | | | 0.0 | |
Other | | | 18.3 | | | | 18.3 | | | | 36.3 | |
Non-tax revenue | | | 356.9 | | | | 475.3 | | | | 694.7 | |
Fees and tolls | | | 246.8 | | | | 176.5 | | | | 47.4 | |
Transfers from the Mexican Petroleum Fund for Stabilization and Development | | | 0.0 | | | | 0.0 | | | | 485.5 | |
Rents, interest and proceeds of
assets sales | | | 0.0 | | | | 0.0 | | | | 0.0 | |
Fines and surcharges | | | 107.3 | | | | 294.2 | | | | 161.7 | |
Other | | | 2.8 | | | | 4.6 | | | | 0.0 | |
Public enterprises and agencies | | | 463.7 | | | | 470.7 | | | | 1,052.2 | |
PEMEX | | | 165.4 | | | | 172.8 | | | | 398.4 | |
Others | | | 298.4 | | | | 297.9 | | | | 653.8 | |
| Note: | Numbers may not total due to rounding. |
| (2) | Budgetary estimates as of December 2015. Budgetary estimates for 2016 were converted into constant pesos using the GDP deflator for 2016, estimated as of December 2015. |
| (3) | Constant pesos with purchasing power as of December 31, 2008. |
Source: Ministry of Finance and Public Credit.
On April 13, 2016, Mexican government officials announced several measures to support the financial position of Petróleos Mexicanos (Mexican Petroleum or PEMEX) in view of the challenges posed by low oil prices. These measures include, among others, (i) direct capital contributions of approximately Ps. 26.5 billion that were financed in part through savings generated by spending cuts announced in February 2016, and (ii) issuing Ps. 47 billion short-term Mexican government debt securities in exchange for the Ps. 50.0 billion promissory note issued by the Mexican Government to PEMEX in 2015 to ensure pension and retirement payments. Additionally, the Mexican Government announced adjustments to PEMEX’s tax regime in order to enable PEMEX to deduct more of its exploration and production costs.
Recent information regarding the financial condition of PEMEX and the continuing challenges posed by low oil prices can be found in the current report furnished by PEMEX to the SEC on Form 6-K on September 13, 2016, which can be found on the SEC website at www.sec.gov. The information contained in that current report is not incorporated by reference in this report.
Financial Stability
On September 30, 2016, the Financial Stability Board (FSB) analyzed the recent evolution of the external and internal environment and updated the risks in the Mexican financial system. The members of the FSB agreed that global economic activity remains weak and highlighted that the outlook for economic growth are being revised down, especially as the growth expectations in the United States decreased.
The FSB also stated that the Mexican peso’s volatility was due to various factors, such as the referendum held in the United Kingdom, the uncertainty of the electoral process in the United States and the uncertainty about the standardization process of the monetary policy by the Federal Reserve of the United States, among others. The FSB agreed that, to face the international risk environment, countries must strengthen their macroeconomic fundamentals.
D-17
PUBLIC DEBT
Internal Public Debt
The following table summarizes the gross and net internal debt of the Government at each of the dates indicated.
Table No. 17 – Gross and Net Internal Debt of the Government(1)
| | | | | | | | | | | | | | | | |
| | | At June 30, 2015 | | | At June 30, 2016(2) | |
| | | (in billions of pesos, except percentages) | |
Gross Debt | | | | | | | | | | | | | | | | |
Government Securities | | Ps. | 4,397.7 | | | | 93.3 | % | | | 4,700.5 | | | | 92.9 | % |
Cetes | | | 652.9 | | | | 13.8 | | | | 662.6 | | | | 13.1 | % |
Floating Rate Bonds | | | 250.5 | | | | 5.3 | | | | 327.8 | | | | 6.5 | % |
Inflation-Linked Bonds | | | 1,093.4 | | | | 23.2 | | | | 1,122.1 | | | | 22.2 | % |
Fixed Rate Bonds | | | 2,395.3 | | | | 50.8 | | | | 2,581.3 | | | | 51.0 | % |
STRIPS of Udibonos | | | 5.5 | | | | 0.1 | | | | 6.6 | | | | 0.1 | % |
Other(3) | | | 317.9 | | | | 6.7 | | | | 358.4 | | | | 7.1 | % |
| | | | | | | | | | | | | | | | |
Total Gross Debt | | | 4,715.6 | | | | 100.0 | % | | | 5058.9 | | | | 100.0 | % |
| | | | | | | | | | | | | | | | |
Net Debt | | | | | | | | | | | | | | | | |
Financial Assets(4) | | | (161.1 | ) | | | | | | | (201.4 | ) | | | | |
| | | | | | | | | | | | | | | | |
Total Net Debt | | Ps. | 4,554.5 | | | | | | | Ps. | 4,857.6 | | | | | |
| | | | | | | | | | | | | | | | |
Gross Internal Debt/GDP | | | 26.3 | % | | | | | | | 26.8 | % | | | | |
Net Internal Debt/GDP | | | 25.4 | % | | | | | | | 25.7 | % | | | | |
| Note: | Numbers may not total due to rounding. |
| (1) | Internal debt figures do not include securities sold by Banco de México in open-market operations to manage liquidity levels pursuant to Regulación Monetaria. This is because this does not increase the Government’s overall level of internal debt. Banco de México must reimburse the Government for any allocated debt that Banco de México sells into the secondary market and that is presented to the Government for payment. If Banco de México undertakes extensive sales of allocated debt in the secondary market, however, this can result in an elevated level of outstanding internal debt as compared to the Government’s figure for net internal debt. |
| (3) | Includes Ps. 151.6 billion at June 30, 2015 and Ps. 144.5 billion at June 30, 2016 in liabilities associated with social security under the ISSSTE Law. |
| (4) | Includes the net balance (denominated in pesos) of the Federal Treasury’s General Account in Banco de México. |
Source: Ministry of Finance and Public Credit.
External Public Debt
The 2016 Budget authorized the Government to incur up to U.S. $6 billion in additional net external debt, which includes external borrowings incurred from international financial institutions, the same amount as authorized in the 2015 Budget.
According to preliminary figures, at June 30, 2016, outstanding gross public sector external debt totaled U.S. $179.9 billion, an approximate U.S. $17.7 billion increase from the U.S. $162.2 billion outstanding at December 31, 2015. Of this amount, U.S. $176.7 billion represented long-term debt and U.S. $3.2 billion represented short-term debt. Net external indebtedness also increased by U.S. $13.8 billion during the first six months of 2016, mainly due to the incurrence of new external indebtedness and the depreciation of the Mexican peso. Overall, at June 30, 2016, total public debt (gross external debt plus net internal public sector debt) represented approximately 46.2% of nominal GDP, an increase of 3.0% from December 31, 2015.
D-18
The following tables set forth a summary of Mexico’s external public debt, including a breakdown of such debt by currency, net external public sector debt, the Government’s gross external debt, the Government’s net external debt and the Government’s net debt at the dates indicated.
Table No. 18 – Summary of External Public Debt(1)
By Type
| | | | | | | | | | | | | | | | | | | | | | | | |
| | | Long-Term
Direct Debt
of the
Government | | | Long-Term
Debt
of Budget-
Controlled
Agencies | | | Other
Long-Term
Public
Debt(2) | | | Total Long-
Term Debt | | | Total Short-
Term Debt | | | Total Long- and
Short-Term Debt | |
| | | (in millions of U.S. dollars) | |
At December 31, 2015 | | | 82,493 | | | | 69,621 | | | | 6,943 | | | | 159,057 | | | | 3,152 | | | | 162,209 | |
At June 30, 2016(3) | | | 90,202 | | | | 80,174 | | | | 6,332 | | | | 176,708 | | | | 3,197 | | | | 179,905 | |
Table No. 19 – By Currency
| | | | | | | | | | | | | | | | |
| | | | |
| | | December 31, 2015 | | | June 30, 2016(3) | |
| | | (in millions of U.S. dollars, except for percentages) | |
U.S. Dollars | | U.S.$ | 131,702 | | | | 81.2 | % | | U.S.$ | 141,306 | | | | 78.5 | % |
Japanese Yen | | | 4,857 | | | | 3.0 | | | | 7.004 | | | | 3.9 | |
Swiss Francs | | | 1,011 | | | | 0.6 | | | | 1,406 | | | | 0.8 | |
Pounds Sterling | | | 2,694 | | | | 1.7 | | | | 2,451 | | | | 1.4 | |
Euro | | | 18,834 | | | | 11.6 | | | | 25,281 | | | | 14.1 | |
Others | | | 3,113 | | | | 1.9 | | | | 2,458 | | | | 1.4 | |
| | | | | | | | | | | | | | | | |
Total | | U.S.$ | 162,209 | | | | 100.0 | % | | U.S.$ | 179,905 | | | | 100.0 | % |
| | | | | | | | | | | | | | | | |
Table No. 20 – Net External Debt of the Public Sector
| | | | | | | | |
| | | | |
| | | December 31, 2015 | | | June 30, 2016(3) | |
| | | (in millions of U.S. dollars, except for percentages) | |
Total Net Debt | | U.S.$ | 161,609.5 | | | U.S.$ | 175,386.7 | |
Gross External Debt/GDP | | | 14.8 | % | | | 18.0 | % |
Net External Debt/GDP | | | 14.7 | % | | | 17.6 | % |
Table No. 21 – Gross External Debt of the Federal Government
| | | | | | | | | | | | | | | | |
| | | | |
| | | December 31, 2015 | | | June 30, 2016(3) | |
| | | (in millions of U.S. dollars, except for percentages) | |
U.S. dollars | | U.S.$ | 66,298 | | | | 80.3 | % | | U.S.$ | 69,051 | | | | 76.5 | % |
Japanese yen | | | 3.672 | | | | 4.4 | | | | 5,612 | | | | 6.2 | |
Swiss francs | | | — | | | | — | | | | — | | | | — | |
Pounds sterling | | | 2,177 | | | | 2.6 | | | | 1,982 | | | | 2.2 | |
Euros | | | 10,422 | | | | 12.6 | | | | 13,625 | | | | 15.1 | |
Others | | | 19 | | | | 0.0 | | | | 19 | | | | 0.0 | |
| | | | | | | | | | | | | | | | |
Total | | U.S.$ | 82,588 | | | | 100.0 | % | | U.S.$ | 90,288 | | | | 100.0 | % |
| | | | | | | | | | | | | | | | |
D-19
Table No. 22 – Net External Debt of the Federal Government
| | | | | | | | |
| | | | |
| | | December 31, 2015 | | | June 30, 2016(3) | |
| | | (in millions of U.S. dollars, except for percentages) | |
Total Net Debt | | U.S.$ | 82,320 | | | U.S.$ | 87,905 | |
Gross External Debt/GDP | | | 7.5 | % | | | 9.0 | % |
Net External Debt/GDP | | | 7.5 | % | | | 8.8 | % |
Table No. 23 – Net Debt of the Federal Government
| | | | | | | | |
| | | | |
| | | December 31, 2015 | | | June 30, 2016(3) | |
External Debt | | | 22.7 | % | | | 25.5 | % |
Internal Debt | | | 77.3 | % | | | 74.5 | % |
| Note: | Numbers may not total due to rounding. |
| (1) | External debt denominated in foreign currencies other than U.S. dollars has been translated into dollars at exchange rates as of each of the dates indicated. External public debt does not include (a) repurchase obligations of Banco de México with the IMF (none of which was outstanding as of December 31, 2015) or (b) loans from the Commodity Credit Corporation to public sector Mexican banks. External debt is presented herein on a “gross” basis, and includes external obligations of the public sector at their full outstanding face or principal amount. For certain informational and statistical purposes, Mexico sometimes reports its external public sector debt on a “net” basis, which is calculated as the gross debt net of certain financial assets held abroad. These financial assets include Mexican public sector external debt that is held by public sector entities but that has not been cancelled. |
| (2) | Includes development banks’ debt and the debt of other administratively-controlled agencies whose finances are consolidated with those of the Government. |
| (3) | Adjusted to reflect the effect of currency swaps. |
Source: Ministry of Finance and Public Credit.
Securities Offerings During 2016
On January 21, 2016, Mexico issued U.S. $2.25 billion of its 4.125% Global Notes due 2026. The notes were issued under Mexico’s U.S. $110 billion Global Medium-Term Notes Program.
On February 23, 2016, Mexico issued €1.5 billion of its 1.875% Global Notes due 2022 and €1.0 billion of its 3.375% Global Notes due 2031.
On June 16, 2016, Mexico issued ¥45.9 billion of notes due 2019, ¥50.9 billion of notes due 2021, ¥16.3 billion of notes due 2026 and ¥21.9 billion of notes due 2036. These notes were placed in the Japanese public market and bear interest at 0.40%, 0.70%, 1.09% and 2.40%, respectively.
On August 11, 2016, Mexico issued U.S. $0.76 billion of its 4.125% Global Notes due 2026 and U.S. $2.0 billion of its 4.350% Global Notes due 2047.
IMF Credit Lines
On May 27, 2016, the Executive Board of the International Monetary Fund (IMF approved a successor two year arrangement for Mexico under the Flexible Credit Line (FCL) in an amount equivalent to U.S. $88 billion.
D-20
UNITED MEXICAN STATES
Geography and Population
Mexico is a nation consisting of 31 states and Mexico City. It is the fifth largest nation in the Americas and the fourteenth largest nation in the world, occupying a territory of 1,964,375 square kilometers (km). To the north, Mexico shares a border of 3,112 km with the United States of America (the United States, or the U.S.). To the south, Mexico shares a border of 871 km with Guatemala and a border of 250 km with Belize. Its coastline extends over 9,330 km along the Gulf of Mexico and the Pacific Ocean.
Mexico is a country of great geographical diversity. It contains mountain ranges and large coastal plains as well as valleys, canyons, plateaus and depressions, among other features. Among Mexico’s most notable geographical features are the Sierra Madre Occidental and Oriental, the Península de Baja California, the Mesa del Centro and the Península de Yucatán. At the north of the country, Mexico shares a border with the United States that extends for 3,175 kilometers; to the southeast Mexico has a border with Guatemala and Belize that is 1,250 kilometers long. To the east Mexico has the Gulf of Mexico with an extension of 2,429 kilometers and 865 kilometers of the coastline of the Caribbean Sea, finally, Mexico on the west side of the country has a border with the Pacific Ocean that’s over 7,828 kilometers. Approximately 11% of Mexico’s land is arable, approximately 14% is suitable for grazing and about 11% is forested.
Mexico is the third most populous nation in the Americas, with a population of 112.34 million, as reported by INEGI in its 2010 housing and population census. Based on this census, a projected 77.8% of Mexico’s population lives in urban areas and 22.2% lives in rural areas. Mexico’s three largest cities are Mexico City, Guadalajara and Monterrey, with populations of 20.1 million, 4.4 million and 4.1 million, respectively. According to the Consejo Nacional de Población (National Population Council), the estimated population growth rate for 2015 is 1.1%.
Mexico is generally classified as an upper middle-income developing country. The following table sets forth the latest selective comparative statistics published by the International Bank for Reconstruction and Development (the World Bank) for Mexico and other countries in the Americas.
Table No. 24 – Selected Comparative Statistics
| | | | | | | | | | | | | | | | | | | | |
| | | Mexico | | | Brazil | | | Chile | | | Venezuela | | | United States | |
Per capita GDP(1) | | U.S.$ | 9,009 | | | U.S.$ | 8,584 | | | U.S.$ | 13,384 | | | | N.A. | | | | U.S.$55,837 | |
Life expectancy at birth (2014) | | | 77 | | | | 74 | | | | 81 | | | | 74 | | | | 79 | |
Youth literacy rate(2) | | | | | | | | | | | | | | | | | | | | |
Male | | | 98.7 | % | | | 98.5 | % | | | 99.1 | % | | | 97.1 | % | | | N.A. | |
Female | | | 98.8 | % | | | 99.4 | % | | | 99.2 | % | | | 98.3 | % | | | N.A. | |
Infant mortality rate(3) | | | 11.3 | | | | 14.6 | | | | 7.0 | | | | 12.9 | | | | 5.6 | |
n.a. = Not available.
| (1) | Figures are in U.S. dollars adjusted for purchasing power parity. |
| (3) | Infant mortality per 1,000 live births. |
Source: World Development Indicators 2015.
D-21
Form of Government
Mexico’s current form of government was established by the Political Constitution of Mexico, which took effect on May 1, 1917. The Constitution provides that Mexico’s government is to be established as a federal republic, consisting of both the Government and state governments.
The Government
The Constitution provides for the separation of powers by dividing the Government into three distinct branches: the executive branch; the judicial branch; and the legislative branch.
As of December 31, 2015, there were 10 political parties with representatives serving on the executive and legislative branches, as well as in the state governments. From 1929 to 1994, the Partido Revolucionario Institucional (Institutional Revolutionary Party, or PRI) won every presidential election, and, from 1929 until July 1997, the PRI held a majority of the seats in both chambers of the Congress. From 1929 until 1989, the PRI also won every state gubernatorial election. In July 2000, the candidate from the Alianza por el Cambio (Alliance for Change), a coalition of the Partido Acción Nacional (National Action Party, or PAN), the oldest opposition party in the country, and the Partido Verde Ecologista de México (Ecological Green Party), won the presidential election.
The President of Mexico, or the President, is the chief of the executive branch. The President is elected by the popular vote of Mexican citizens who are 18 years of age or older. The Constitution limits the President to one six-year term; the President may not run for reelection.
In the most recent presidential election, on August 31, 2012, the Tribunal Electoral del Poder Judicial de la Federación (Federal Electoral Court) officially validated the results of the presidential election held in Mexico on July 1, 2012 and declared Mr. Enrique Peña Nieto, a member of the PRI, President-elect. President Peña Nieto took office on December 1, 2012, replacing President Felipe Calderón Hinojosa of the PAN. President Peña Nieto’s term will end on November 30, 2018.
The executive branch further consists of 18 ministries, the Consejería Jurídica del Ejecutivo Federal (Legal Counsel to the Presidency) and the Procuraduría General de la República (Office of the Federal Attorney General), which will be known as the Fiscalía General de la República (National Prosecutor’s Office) beginning in 2018 as a constitutional body, and two regulatory bodies for the Energy Sector: the National Hydrocarbons Commission and the Comisión Reguladora de Energía (Regulatory Energy Commission). The President appoints the principal officials of every ministry. The President also appoints the Procurador General (Attorney General), subject to ratification by the Senado de la República (Senate). Similarly, the President’s appointment of the empleados superiores (senior employees) of the Ministry of Finance and Public Credit is subject to ratification by the Senate.
On May 20, 2013, the Government published in the Official Gazette of the Federation the National Development Plan, which establishes the main goals and objectives of President Peña Nieto during his six-year term. The Plan includes the achievement of peace in Mexico, the promotion of social inclusivity and protection of citizens’ social rights, the improvement of and accessibility to Mexico’s education system, the promotion of sustainable economic growth with emphasis on equality of opportunities, a focus on external policy goals and the promotion of free international trade.
In addition, the National Development Plan proposes three general strategies that will be incorporated in all Government policies. First, the Plan aims to democratize productivity by facilitating the growth and competitiveness of the Mexican economy, eliminating obstacles that limit the productivity of Mexican individuals and corporations and encouraging participants in the Mexican economy to efficiently use resources. Second, the Plan seeks to foster an effective and modern Government by guaranteeing access to information and protection of personal data, expanding information and communication technologies and automated administrative systems, allocating resources efficiently and promoting individuals based on merit. Finally, the Plan incorporates the principle of gender equality in all Government policies and actions.
D-22
Mexico’s judicial branch, or the Federal Judiciary, consists of the Suprema Corte de Justicia (Supreme Court), the Tribunales Colegiados de Circuito (Circuit Courts), the Juzgados de Distrito (District Courts) and the Consejo de la Judicatura Federal (Council of the Federal Judiciary). The Supreme Court is composed of 11 justices who serve 15-year staggered terms Each justice of the Supreme Court is elected by a two-thirds majority vote of the Senate from a pool of three candidates nominated by the President. The position of Chief Justice of the Supreme Court is rotated among the justices, with each Chief Justice serving one four-year term. The Council of the Federal Judiciary, which is composed of seven members, one of whom is the Chief Justice of the Supreme Court, administers the Federal Judiciary and appoints magistrados (Circuit Court judges and District Court judges).
Legislative authority is vested in Congress, which is composed of the Senate and the Chamber of Deputies. Members of Congress are elected either directly or through a system of proportional representation by the popular vote of Mexican citizens who are 18 years of age or older. The Senate is composed of 128 members, 96 of whom are elected directly, while the other 32 are elected through a system of proportional representation. The Chamber of Deputies is composed of 500 members, 300 of whom are elected directly by national electoral districts, while the other 200 are elected through a system of proportional representation. Under this proportional representation system, seats are allocated to political party representatives based on the proportion of the votes cast for those parties that receive at least 3.0% of the national vote, among other requirements.
The Constitution provides that the President may veto bills and that Congress may override such vetoes with a two-thirds majority vote of each chamber.
D-23
Senators serve a six-year term and deputies serve a three-year term. Federal deputies are eligible for immediate reelection for up to four term periods and senators are eligible for immediate reelection for up to two term periods. Congressional elections for all 500 seats in the Chamber of Deputies were last held on June 7, 2015. The following table provides the distribution as of December 31, 2015 of Congressional seats reflecting certain post-election changes in the party affiliations of certain senators and deputies.
Table No. 25 – Party Representation in Congress
| | | | | | | | | | | | | | | | |
| | | Senate | | | Chamber of Deputies | |
| | | Seats | | | % of Total | | | Seats | | | % of Total | |
Institutional Revolutionary Party | | | 55 | | | | 43.0 | % | | | 208 | | | | 41.6 | % |
National Action Party | | | 38 | | | | 29.7 | | | | 109 | | | | 21.8 | |
Democratic Revolution Party | | | 18 | | | | 14.1 | | | | 60 | | | | 12.0 | |
Ecological Green Party of Mexico | | | 7 | | | | 5.5 | | | | 42 | | | | 8.4 | |
Social Encounter Party | | | 0 | | | | 0 | | | | 9 | | | | 1.8 | |
Labor Party | | | 7 | | | | 5.5 | | | | 0 | | | | 0 | |
Citizen Movement Party | | | 0 | | | | 0.0 | | | | 24 | | | | 4.8 | |
New Alliance Party | | | 0 | | | | 0.0 | | | | 11 | | | | 2.2 | |
Unaffiliated | | | 2 | | | | 1.6 | | | | 1 | | | | 0.2 | |
National Regeneration Movement (New) | | | 0 | | | | 0 | | | | 36 | | | | 7.2 | |
| | | | | | | | | | | | | | | | |
Total | | | 127 | | | | 99.4 | % | | | 500 | | | | 100.0 | % |
| | | | | | | | | | | | | | | | |
Note: Numbers may not total due to rounding. According to official sources, there is one vacant seat in the Senate.
Source: Senate and Chamber of Deputies.
State Government
Each of Mexico’s 31 states is headed by a state governor. Mexico City is headed by a mayor.
Legal and Political Reforms
Since 2011, Mexico has implemented various legal and political reforms that affect the Government, with the goal of improving the justice and public education systems, increasing governmental transparency and creating more efficient public administration.
Electoral Reform
On February 10, 2014, a Constitutional amendment covering a political and electoral reform was published in the Official Gazette of the Federation. Under this political and electoral reform, the President shall be entitled to create government programs and common agendas with any of the parties represented in Congress. Moreover, the first day of the President’s term was altered from December 1 to October 1. In addition, federal deputies are now eligible for immediate reelection for up to four term periods and members of the Senate are eligible for immediate reelection for two additional term periods. Previously, federal deputies and senators were not allowed to serve consecutive terms in the same chamber. Local congresses will be allowed to establish consecutive reelection terms for mayoral, alderman or syndic posts for an additional term period, provided that such term period is no longer than three years. Lastly, the total federal electoral votes required for national parties to maintain registration status in federal elections increased from 2% to 3%.
The Constitutional amendment also established and restructured some political institutions. The Consejo Nacional de Evaluación de la Política Social (National Council for the Evaluation of Social Development Policy, or CONEVAL) will be established as a separate legal entity with technical and managerial autonomy and budgetary self-sufficiency. CONEVAL will be responsible for measuring poverty levels and evaluating the programs, goals, objectives and actions relating to social development policy in Mexico. The Office of the Federal Attorney General will become the National Prosecutor’s Office, and will be established as a separate legal entity with technical and managerial autonomy and budgetary self-sufficiency. Lastly, the Instituto Nacional Electoral (National Electoral Institute) will perform the functions of the former Instituto Federal Electoral (Federal Electoral Institute) and will be created as a separate legal entity with technical and managerial autonomy and budgetary self-sufficiency. The National Electoral Institute is responsible for organizing federal and local elections and determining the election procedures of self-governed electoral federal bodies.
D-24
On May 23, 2014, a decree that supplements this political and electoral reform was published in the Official Gazette of the Federation. Among other things, the decree created a system that will oversee transparency concerns with respect to federal and local elections by prohibiting political parties from withholding information regarding the allocation and expenditures of, among others, campaign funds and individual contributions. The decree also created additional oversight and outreach mechanisms for electoral institutions. Additionally, the decree allows the President to establish a coalition at any time during his term with one or more Congressionally-represented political parties to form a relative majority that can ratify, among others, certain government programs, legislative agendas in support of these government programs and a coalition cabinet to oversee these government programs, subject to certain Congressional approvals.
Access to Information and Government Transparency
The Government has enacted a number of legal and political reforms to improve access to information and government transparency. For example, the Constitution was reformed on February 7, 2014 to create the Instituto Federal de Acceso a la Información y Protección de Datos (Federal Institute for Access to Information and Data Protection, or the IFAI) as a separate legal entity with technical and managerial autonomy and budgetary self-sufficiency, among other reforms. In addition, the Reglamento Interior del Instituto Federal de Acceso a la Información y Protección de Datos (Internal Regulation of the Federal Institute for Access to Information and Data Protection), which aims to establish the structure, functions and operations of the IFAI was published on February 20, 2014.
On May 4, 2015, the Ley General de Transparencia y Acceso a la Información Pública (General Law of Transparency and Access to Public Information) was published in the Official Gazette of the Federation. A wide range of entities are subject to this law, which establishes principles and proceedings to ensure the right to access information held by any authorities, entities, governmental agencies and bodies, autonomous public bodies, trusts and public funds, as well as individuals, companies or labor unions that receive and manage public resources or act on behalf of the Federal Government, states and municipalities.
Criminal Justice
On March 5, 2014, the Código Nacional de Procedimientos Penales (the National Criminal Procedure Code) was published in the Official Gazette of the Federation, which was aimed at creating uniform criminal procedure rules throughout the country, following principles set forth in the Constitution and in international treaties to which Mexico is party. Goals of this reform include, promoting a more expedited legal process; and increasing protection of victims and their rights, implementing the presumption of innocence and increasing respect for due process.
Taxation
On November 18, 2015, a law was published providing that individuals and companies that had investments abroad until December 2014 and that did not report such investments to the Mexican tax authority will have the option to repatriate their investments and their earnings during the first six months of 2016 without penalties, adjustments or late fees. In addition, individuals and companies availing themselves of this repatriation of funds program will only be obligated to pay income tax based on the current year, provided that such payment is made within fifteen days of the repatriation and those funds are reinvested in specified activities or used for debt payments, among other conditions. This incentive came about as a result of a bilateral agreement between the Internal Revenue Service of the United States of America (IRS) and the Servicio de Administracíon Tributaria (SAT), which provides for the exchange of information with respect to accounts held abroad by either Mexican or American residents.
Public Accounting
Amendments to the Ley General de Contabilidad Gubernamental (General Law on Governmental Accounting) and to the Federal Law of Budget and Fiscal Accountability were published in the Official Gazette of the Federation on December 30, 2015. These amendments require each state to create accounting councils in order to standardize public accounting throughout the different levels of government.
D-25
Foreign Affairs, International Organizations and International Economic Cooperation
Mexico has diplomatic ties with 193 countries. Mexico is a charter member of the United Nations. Mexico is a signatory, along with Canada and the U.S., of the North American Free Trade Agreement (NAFTA), and it is a founding member of the European Bank for Reconstruction and Development (EBRD), the Inter-American Development Bank (IADB), the International Finance Corporation, the IMF, the Organization of American States (OAS) and the World Bank. It is also a non-borrowing regional member of the Caribbean Development Bank.
Mexico also has a number of international agreements in place that promote economic cooperation. For examples of this international economic cooperation, see “Foreign Trade and Balance of Payments—Foreign Trade Agreements.”
Internal Security
During recent years, the Government has gradually heightened its efforts to combat organized crime, particularly as it relates to the activities of producing, processing and trafficking in narcotics. Specifically, the Government has implemented various security measures and has strengthened its military and police forces. No government studies have been completed regarding the effect on the Mexican economy of narcotics trafficking and drug-related violence, including their effect on Mexican electoral politics or Mexican public finances. Nonetheless, the Government does not believe that narcotics trafficking and drug-related violence have had a material effect on the Mexican economy or on foreign investment flows to Mexico.
On September 27, 2016, INEGI published the Encuesta Nacional de Victimización y Percepción sobre Seguridad Pública 2016 (National Poll on Victimization and Perception of Public Security 2016). The poll found that, excluding federal crimes such as narcotics trafficking and organized crime, which are not subject to victimization polling, local crimes and related security measures cost Mexican households approximately Ps. 236.8 billion in 2015, or 1.25% of GDP, as compared to Ps. 226.8 billion in 2013, or 1.27% of GDP. This cost is the equivalent of Ps. 5,905 per person affected by local crimes.
Environment
Mexico has enacted a framework of laws and regulations that address the protection of the environment.
The Constitution grants all citizens the right to a healthy environment for their development and welfare. This right is guaranteed through an established framework of laws, regulations, decrees and municipal ordinances that address the protection of the environment. Furthermore, Mexican law also dictates that the economic growth will be conditioned on the protection of the environment.
In 1988, Mexico enacted the Ley General del Equilibrio Ecológico y la Protección al Ambiente (General Law of Ecological Balance and Environmental Protection) which has been the base for environmental policy in the country. The General Law of Ecological Balance and Environmental Protection seeks to, among other things: (1) guarantee the right of every person to live in a healthy environment for their development and welfare; (2) define the principles of environmental policy and mechanisms for its execution; and (3) preserve and protect biodiversity and administer protected natural areas.
The Secretaría de Medio Ambiente y Recursos Naturales (Ministry of Environment and Natural Resources, or SEMARNAT), was created in 2000. SEMARNAT is charged with creating and advising on government policies implicating the environment in response to the growing national expectation for protecting natural resources, as well as to address causes of pollution and the loss of ecosystems and biodiversity.
In 2003, the Ley General para la Prevención y Gestión Integral de los Residuos (General Law for Prevention and Management of Waste) was published in the Official Gazette of the Federation, which aimed to regulate and prevent the management of hazardous waste and waste in general.
D-26
Mexico is party to the Kyoto Protocol to the United Nations Framework Convention on Climate Change (UNFCCC).
In addition to SEMARNAT, the Procuraduría Federal de Protección al Ambiente (Federal Attorney for Environmental Protection, or PROFEPA) was created in 1992 as a deconcentrated administrative entity with technical and operational autonomy. Among other responsibilities, PROFEPA monitors compliance with environmental regulations, protects the interest of the population in environmental matters and sanctions individuals and entities who violate the legal precepts. In 2000, the Comisión Nacional de Áreas Naturales Protegidas (National Comission of Protected Natural Areas, or CONANP) was created as a deconcentrated entity of the SEMARNAT. CONANP’s mission is to preserve the most representative ecosystems of Mexico and its biodiversity through protected natural areas and other conservation forms, fostering a culture of conservation and promoting sustainable development. The Comisión Nacional Forestal (National Forestry Commission, or CONAFOR) was created in 2001 as a public agency in order to develop, encourage and promote productive activities of conservation and restoration in forestry matters, as well as to participate in the formulation of plans, programs, and implementation of the sustainable forest development policy. Moreover, in 2012, the Ley General de Cambio Climático (General Law for Climate Change) created the Instituto Nacional de Ecología y Cambio Climátido (National Ecology and Climate Change Institute) a decentralized public entity with legal, managerial and economic autonomy that aims to generate and integrate scientific and technical knowledge for the formulation, conduction and evaluation of public policies aimed at the protection of the environment, ecological preservation and restoration, green growth and mitigation of climate change concerns in the country.
Mexico’s principal environmental concerns include the promotion and generation of resources and benefits through the conservation, restoration and exploitation of the natural heritage with innovative economic, financial and public policy instruments, as well as promoting the consumption of environmental goods and services. Among its goals, Mexico seeks to: recuperate ecosystems and damaged areas in order to improve environmental quality; expand the infrastructure and environmental programs’ coverage that protect the public health and guarantee the conservation of ecosystems and natural resources; promote and strengthen the regional and international cooperation in climate change matters, biodiversity and environment; and promote financial and investment arrangements that multiply the resources available for the protection of the environment and natural resources.
Transportation-related pollution accounts for the vast majority of air pollution in Mexico City and, indirectly, for the vast majority of ozone emissions present in the atmosphere. As a result, curbing transportation-related pollution is a primary objective of the Government’s anti-pollution programs. Since the 1993 model year, all new cars driven in Mexico City are required to be equipped with emissions control equipment that meets U.S. performance standards (following the phasing in of catalytic converters). For many years, Mexico City has instituted Hoy No Circula (No Driving Today), a program requiring one-fifth of the city’s private vehicles to be kept out of circulation each weekday. This program has periodically been expanded to remove cars from circulation two times each week when the Government has detected high levels of pollution in the city and to regulate driving on weekends. This program remains in effect in Mexico City for certain vehicles and has been introduced in several other cities. Under the current program, vehicles satisfying emissions standards may be used daily if certain emissions standards tests are satisfied. In addition, the Mexico City government has also begun using a mobile laboratory to measure the air quality of four locations within Mexico City by monitoring the sulfur dioxide, nitrogen dioxide, carbon monoxide and ozone levels in the atmosphere as part of its efforts to curb air pollution within the city.
In addition to transportation-related pollution, industry-related pollution, mostly caused by industries located within the Valley of Mexico, has also greatly contributed to Mexico’s air pollution levels. While most of the manufacturing sector has relocated to areas outside of the Valley of Mexico, a significant percentage of Mexico’s manufacturing output still originates from plants within this area. The concentration of industry in the Valley of Mexico, together with Mexico City’s variable climate and its surrounding mountains, contribute to high emission levels of: (1) suspended particles; (2) sulfur dioxide (a gaseous by-product of the combustion of diesel fuel and fuel oil); (3) airborne lead (released as a gas when leaded gasoline is burned and released in particulate form by industry); (4) carbon monoxide (produced by the incomplete combustion of gasoline); and (5) ozone (resulting from the combination of nitrous oxides, hydrocarbons and solar radiation).
D-27
Authorities have attempted to address this industry-related pollution levels in several ways. For example, the Government has a general policy of discouraging the construction of new plants in the Valley of Mexico or other major industrial cities, such as Monterrey and Guadalajara. Authorities have also implemented regulations that require certain types of plants to reduce operations or temporarily close when the concentration of pollutants in the air rises to certain levels. Under this policy initiative, authorities have, from time to time, ordered industrial plants in the Valley of Mexico to reduce operations due to high pollution levels.
The Secretaría de Agricultura, Ganadería, Desarrollo Rural, Pesca y Alimentación (Ministry of Agriculture, Livestock, Rural Development, Fisheries and Food, or the Ministry of Agriculture) has also undertaken to promote environmental initiatives in rural settings. The Comisión Nacional de las Zonas Áridas (National Commission of Arid Zones, or the Arid Zones Commission), which is charged with the development of arid and uncultivated regions in Mexico. The Arid Zones Commission’s programs are now focused on restoring productivity and promoting practices for soil conservation and rainfall harvesting. One such program is the Programa de Sustentabilidad de Recursos Naturales (Program for the Sustainability of Natural Resources), which focuses on promoting the conservation, sustainable use and management of soil, water and vegetation used in primary production. These goals are accomplished by encouraging rural communities to: (1) invest in conservation projects; (2) establish and develop procedures for the collection, storage and treatment of rainwater; and (3) employ the use of vegetation cover.
On December 24, 2015, a new energy transition law was published in the Official Gazette of the Federation. The law aims to combat climate change by promoting cleaner energy sources. The law establishes a program of clean energy certificates and sets a goal that at least 35% of the country’s electricity supply must be generated from clean energy sources by 2024.
D-28
THE ECONOMY
General
According to World Bank data, the Mexican economy, as measured by 2015 GDP (at current prices in U.S. dollars), is the 15th largest in the world. The Mexican economy had a real GDP of Ps. 14,110.1 billion in 2015 and an increase in GDP of Ps. 1,335.9 billion between 2011 and 2015.
The Role of the Government in the Economy; Privatization
Over the past two decades, the Government has taken steps to increase the productivity and competitiveness of the economy through deregulation, privatization and increased private-sector investment. These measures have included: (1) Constitutional amendments and legislation allowing the Government to privatize railways and satellite communications; (2) legislation permitting Mexican private-sector companies to take part in the storage, distribution and transportation of natural gas; (3) the privatization of airports, seaports and highways; and (4) legislation relating to civil aviation allowing private companies to secure 30-year concesiones (concessions) to operate commercial air transportation services within Mexico.
As of December 31, 2015, there were 201 Government-owned or controlled entities, of which two are in the process of being privatized. These entities include (i) empresas de participación estatal mayoritaria (enterprises that are majority-owned by the Government), some of which are considered banking development institutions, such as the Banco del Ahorro Nacional y Servicios Financieros, S.N.C. (National Savings and Financial Services Bank, S.N.C.), an institution that promotes savings, financial education, financial and gender inclusion to individuals and companies that have limited access to credit, (ii) organismos descentralizados (decentralized instrumentalities), such as the Instituto para la Protección al Ahorro Bancario (Institute for the Protection of Bank Savings, or IPAB), which seeks to guarantee bank deposits, mainly for small and medium-sized savers and give solutions to banks with solvency issues, contributing to the stability of the banking system and safeguarding the national payment system, (iii) fideicomisos públicos (public trusts), such as the Fondo Nacional de Fomento al Turismo (National Fund for Tourism Development), which seeks to identify sustainable investment projects in the tourism sector oriented toward the regional development, job creation, economic development, social welfare and the improvement of quality of life; and (iv) empresas productivas del estado (productive state-owned companies), such as PEMEX and the Comisión Federal de Electricidad (Federal Commission of Electricity, or CFE), which aim to participate in the open market and generate economic value and their subsidiaries or empresas productivas subsidiarias (productive state-owned subsidiaries), such as Pemex Exploración y Producción (Pemex Exploration and Production) and Pemex Cogeneración y Servicios (Pemex Cogeneration and Services).
In 2013, PEMEX and the CFE were transformed from decentralized public entities into productive state-owned companies and were granted additional technical, managerial and budgetary autonomy. As productive state-owned companies, PEMEX and CFE seek to create economic value using both industry best practices and sound corporate governance.
On August 11, 2014, the former Ley de la Comisión Reguladora de Energía (Energy Regulatory Commission Law) and the Reglamento de Gas Natural (Natural Gas Regulation Law) were abrogated and superseded by the Ley de Hidrocarburos (Hydrocarbons Law), which aims to regulate the activities ranging from exploration, extraction and refining to distribution, storage, sales and marketing of hydrocarbons in Mexico. On August 28, 2014, the Centro Nacional de Control de Gas Natural (National Center for Natural Gas Control) was created and is now responsible for managing, coordinating and efficiently overseeing the network of pipelines and storage of natural gas in Mexico.
Also on August 11, 2014, secondary legislation opened the bidding processes to Mexican and non-Mexican investors for participation in the exploration, production and transportation of oil and gas. The Government also enacted, on October 31, 2014, the Reglamento de la Ley de la Industria Eléctrica (Rules for the Electric Industry Law) detailing the bidding process for participation in the electric power sector. The Government views privatization efforts as a key element of Mexico’s structural economic reforms. In addition, Congress has enacted a series of laws that increase the scope for private and foreign participation in key sectors of the Mexican economy.
D-29
For example, on April 29, 2014, the Decreto por el que se aprueba el Programa Nacional de Infraestructura 2014 – 2018 (National Infrastructure Program 2014-2018) authorized infrastructure expenditures for various sectors of the Mexican economy. The Infrastructure Investment Fund supports the National Infrastructure Program with activities related to Mexico’s infrastructure investments in: (1) communications; (2) roads; and (3) energy and tourism, among others.
Gross Domestic Product
The following tables set forth Mexico’s real GDP and expenditures, in constant 2008 pesos and in percentage terms, for the periods indicated. These figures were calculated in constant 2003 pesos from 2008 to 2012 and were updated to constant 2008 pesos in 2013, thereby also modifying prior year figures.
D-30
Table No. 26 – Real GDP and Expenditures in Billions of Constant Pesos
| | | | | | | | | | | | | | | | | | | | |
| | | 2011 | | | 2012 | | | 2013 | | | 2014 | | | 2015(1) | |
| | | (in billions of constant pesos)(2) | |
GDP | | | Ps. 12,774.2 | | | | Ps. 13,287.5 | | | | Ps. 13,468.3 | | | | Ps. 13,770.7 | | | | Ps. 14,110.1 | |
Add: Imports of goods and services | | | 3,967.0 | | | | 4,183.8 | | | | 4,291.9 | | | | 4,548.1 | | | | 4,776.9 | |
| | | | | | | | | | | | | | | | | | | | |
Total supply of goods and services | | | 16,741.2 | | | | 17,471.4 | | | | 17,760.1 | | | | 18,318.7 | | | | 18,887.0 | |
Less: Exports of goods and services | | | 3,935.1 | | | | 4,164.9 | | | | 4,263.5 | | | | 4,559.9 | | | | 4,969.8 | |
| | | | | | | | | | | | | | | | | | | | |
Total goods and services available for domestic expenditure | | | Ps. 12,806.1 | | | | Ps. 13,306.4 | | | | Ps. 13,496.6 | | | | Ps. 13,758.8 | | | | Ps. 13,917.2 | |
Allocation of total goods and services: | | | | | | | | | | | | | | | | | | | | |
Private consumption | | | 8,493.2 | | | | 8,912.8 | | | | 9,103.6 | | | | 9,265.4 | | | | 9,552.4 | |
Public consumption | | | 1,421.1 | | | | 1,470.6 | | | | 1,485.9 | | | | 1,517.7 | | | | 1,552.8 | |
| | | | | | | | | | | | | | | | | | | | |
Total consumption | | | 9,914.3 | | | | 10,383.4 | | | | 10,589.5 | | | | 10,783.1 | | | | 11,105.3 | |
Total gross fixed investment | | | 2,804.2 | | | | 2,938.2 | | | | 2,892.6 | | | | 2,976.9 | | | | 3,089.7 | |
Changes in inventory | | | 56.1 | | | | 90.0 | | | | 74.5 | | | | 79.9 | | | | 66.9 | |
| | | | | | | | | | | | | | | | | | | | |
Total domestic expenditures | | | Ps. 12,774.6 | | | | Ps. 13,411.6 | | | | Ps. 13,556.6 | | | | Ps. 13,840.0 | | | | Ps. 14,261.9 | |
| | | | | | | | | | | | | | | | | | | | |
Errors and Omissions | | | (31.5 | ) | | | 105.1 | | | | 60.0 | | | | 81.1 | | | | 344.7 | |
| | | | | | | | | | | | | | | | | | | | |
| Note: | Numbers may not total due to rounding. |
| (2) | Constant pesos with purchasing power as of December 31, 2008. |
Source: INEGI.
Table No. 27 – Real GDP and Expenditures as a Percentage of Total GDP
| | | | | | | | | | | | | | | | | | | | |
| | | 2011 | | | 2012 | | | 2013 | | | 2014 | | | 2015(1) | |
| | | (as a percentage of total GDP)(2) | |
GDP | | | 100.0 | % | | | 100.0 | % | | | 100.0 | % | | | 100.0 | % | | | 100.0 | % |
Add: Imports of goods and services | | | 31.1 | | | | 31.5 | | | | 31.9 | | | | 33.0 | | | | 33.9 | |
| | | | | | | | | | | | | | | | | | | | |
Total supply of goods and services | | | 131.1 | | | | 131.5 | | | | 131.9 | | | | 133.0 | | | | 133.9 | |
Less: Exports of goods and services | | | 30.8 | | | | 31.3 | | | | 31.7 | | | | 33.1 | | | | 35.2 | |
| | | | | | | | | | | | | | | | | | | | |
Total goods and services available for domestic expenditures | | | 100.2 | % | | | 100.1 | % | | | 100.2 | % | | | 99.9 | % | | | 98.6 | % |
Allocation of total goods and services: | | | | | | | | | | | | | | | | | | | | |
Private consumption | | | 66.5 | % | | | 67.1 | % | | | 67.6 | % | | | 67.3 | % | | | 67.7 | % |
Public consumption | | | 11.1 | | | | 11.1 | | | | 11.0 | | | | 11.0 | | | | 11.0 | |
| | | | | | | | | | | | | | | | | | | | |
Total consumption | | | 77.6 | | | | 78.1 | | | | 78.6 | | | | 78.3 | | | | 78.7 | |
Total gross fixed investment | | | 22.0 | | | | 22.1 | | | | 21.5 | | | | 21.6 | | | | 21.9 | |
Changes in inventory | | | 0.4 | | | | 0.7 | | | | 0.6 | | | | 0.6 | | | | 0.5 | |
| | | | | | | | | | | | | | | | | | | | |
Total domestic expenditures | | | 100.0 | % | | | 100.9 | % | | | 100.7 | % | | | 100.5 | % | | | 101.1 | % |
| | | | | | | | | | | | | | | | | | | | |
Errors and Omissions | | | (0.2 | )% | | | 0.8 | % | | | 0.4 | % | | | 0.6 | % | | | 2.4 | % |
| Note: | Numbers may not total due to rounding. |
| (2) | Constant pesos with purchasing power as of December 31, 2008. |
Source: INEGI.
D-31
The following tables set forth the composition of Mexico’s real GDP by economic sector, in constant 2008 pesos and in percentage terms, for the periods indicated. These figures were calculated in constant 2003 pesos from 2008 to 2012, and were updated to constant 2008 pesos in 2013, thereby also modifying prior year figures.
Table No. 28 – Real GDP by Sector
| | | | | | | | | | | | | | | | | | | | |
| | | 2011 | | | 2012 | | | 2013 | | | 2014(1) | | | 2015(1) | |
| | | (in billions of constant pesos)(2) | |
Primary Activities: | | | | | | | | | | | | | | | | | | | | |
Agriculture, forestry, fishing, hunting and livestock(3) | | Ps. | 377.2 | | | Ps. | 405.3 | | | Ps. | 409.1 | | | Ps. | 426.2 | | | Ps. | 427.8 | |
Secondary Activities: | | | | | | | | | | | | | | | | | | | | |
Mining | | | 1,017.2 | | | | 1,026.0 | | | | 1,024.5 | | | | 1,009.1 | | | | 950.2 | |
Utilities | | | 286.0 | | | | 292.1 | | | | 293.6 | | | | 317.7 | | | | 330.6 | |
Construction | | | 1,015.1 | | | | 1,040.0 | | | | 990.3 | | | | 1,010.2 | | | | 1,036.2 | |
Manufacturing | | | 2,109.3 | | | | 2,196.1 | | | | 2,222.7 | | | | 2,314.6 | | | | 2,378.8 | |
Tertiary Activities: | | | | | | | | | | | | | | | | | | | | |
Wholesale and retail trade | | | 1,919.1 | | | | 2,010.6 | | | | 2,055.7 | | | | 2,120.0 | | | | 2,215.7 | |
Transportation and warehousing | | | 728.4 | | | | 758.0 | | | | 776.4 | | | | 801.5 | | | | 828.8 | |
Information | | | 371.1 | | | | 431.6 | | | | 453.1 | | | | 454.1 | | | | 500.1 | |
Finance and insurance | | | 523.3 | | | | 563.4 | | | | 622.0 | | | | 616.5 | | | | 622.3 | |
Real estate, rental and leasing | | | 1,548.5 | | | | 1,587.2 | | | | 1,603.1 | | | | 1,635.7 | | | | 1,673.7 | |
Professional, scientific and technical services | | | 288.3 | | | | 291.4 | | | | 294.8 | | | | 299.7 | | | | 310.0 | |
Management of companies and enterprises | | | 74.4 | | | | 80.8 | | | | 79.4 | | | | 85.1 | | | | 86.8 | |
Administrative and support and waste management and remediation services | | | 395.7 | | | | 412.9 | | | | 430.7 | | | | 429.8 | | | | 434.3 | |
Education services | | | 481.3 | | | | 492.0 | | | | 495.9 | | | | 496.2 | | | | 499.6 | |
Health care and social assistance | | | 260.3 | | | | 265.9 | | | | 267.4 | | | | 265.9 | | | | 269.4 | |
Arts, entertainment and recreation | | | 56.9 | | | | 58.5 | | | | 60.6 | | | | 59.7 | | | | 62.4 | |
Accommodation and food services | | | 259.8 | | | | 273.9 | | | | 279.0 | | | | 287.0 | | | | 304.0 | |
Other services (except public administration) | | | 261.5 | | | | 270.0 | | | | 275.7 | | | | 280.2 | | | | 286.8 | |
Public administration | | | 472.1 | | | | 489.5 | | | | 487.3 | | | | 496.4 | | | | 509.4 | |
| | | | | | | | | | | | | | | | | | | | |
Gross value added at basic values | | | 12,445.4 | | | | 12,945.2 | | | | 13,121.2 | | | | 13,405.6 | | | | 13,726.9 | |
Taxes on products, net of subsidies | | | 328.8 | | | | 342.3 | | | | 347.7 | | | | 365.0 | | | | 383.2 | |
| | | | | | | | | | | | | | | | | | | | |
GDP | | Ps. | 12,774.2 | | | Ps. | 13,287.5 | | | Ps. | 13,468.3 | | | Ps. | 13,770.7 | | | Ps. | 14,110.1 | |
| | | | | | | | | | | | | | | | | | | | |
| Note: | Numbers may not total due to rounding. |
| (2) | Based on GDP calculated in constant 2008 pesos. |
| (3) | GDP figures relating to agricultural production set forth in this table and elsewhere herein are based on figures for “agricultural years,” with the definition of the relevant “agricultural year” varying from crop to crop based on the season during which it is grown. Calendar year figures are used for the other components of GDP. |
Source: INEGI.
D-32
Table No. 29 – Real GDP Growth by Sector
(percent change against prior years(1))
| | | | | | | | | | | | | | | | | | | | |
| | | 2011 | | | 2012 | | | 2013 | | | 2014(2) | | | 2015(2) | |
GDP (constant 2008 prices) | | | 4.0 | % | | | 4.0 | % | | | 1.4 | % | | | 2.2 | % | | | 2.5 | % |
Primary Activities: | | | | | | | | | | | | | | | | | | | | |
Agriculture, forestry, fishing, hunting and livestock | | | (2.3 | ) | | | 7.4 | | | | 0.9 | | | | 4.2 | | | | 0.4 | |
Secondary Activities: | | | | | | | | | | | | | | | | | | | | |
Mining | | | (0.4 | ) | | | 0.9 | | | | (0.1 | ) | | | (1.5 | ) | | | (5.8 | ) |
Utilities | | | 6.9 | | | | 2.1 | | | | 0.5 | | | | 8.2 | | | | 4.1 | |
Construction | | | 4.1 | | | | 2.5 | | | | (4.8 | ) | | | 2.0 | | | | 2.6 | |
Manufacturing | | | 4.6 | | | | 4.1 | | | | 1.2 | | | | 4.1 | | | | 2.8 | |
Tertiary Activities: | | | | | | | | | | | | | | | | | | | | |
Wholesale and retail trade | | | 9.7 | | | | 4.8 | | | | 2.2 | | | | 3.1 | | | | 4.5 | |
Transportation and warehousing | | | 4.0 | | | | 4.1 | | | | 2.4 | | | | 3.2 | | | | 3.4 | |
Information | | | 4.4 | | | | 16.3 | | | | 5.0 | | | | 0.2 | | | | 10.1 | |
Finance and insurance | | | 7.1 | | | | 7.7 | | | | 10.4 | | | | (0.9 | ) | | | 0.9 | |
Real estate, rental and leasing | | | 2.9 | | | | 2.5 | | | | 1.0 | | | | 2.0 | | | | 2.3 | |
Professional, scientific and technical services | | | 5.1 | | | | 1.1 | | | | 1.2 | | | | 1.7 | | | | 3.4 | |
Management of companies and enterprises | | | 3.6 | | | | 8.6 | | | | (1.8 | ) | | | 7.2 | | | | 2.1 | |
Administrative support, waste management and remediation services | | | 6.0 | | | | 4.4 | | | | 4.3 | | | | (0.2 | ) | | | 1.0 | |
Education services | | | 1.6 | | | | 2.2 | | | | 0.8 | | | | 0.1 | | | | 0.7 | |
Health care and social assistance | | | 2.1 | | | | 2.2 | | | | 0.6 | | | | (0.6 | ) | | | 1.3 | |
Arts, entertainment and recreation | | | (0.7 | ) | | | 2.9 | | | | 3.4 | | | | (1.5 | ) | | | 4.6 | |
Accommodation and food services | | | 1.5 | | | | 5.4 | | | | 1.8 | | | | 2.9 | | | | 5.9 | |
Other services (except public administration) | | | 1.9 | | | | 3.3 | | | | 2.1 | | | | 1.6 | | | | 2.3 | |
Public administration | | | (1.4 | ) | | | 3.7 | | | | (0.5 | ) | | | 1.9 | | | | 2.6 | |
| Note: | Numbers may not total due to rounding. |
| (1) | Based on GDP calculated in constant 2008 pesos. |
Source: INEGI.
After the 2009 global financial and economic crisis, economic activity began to recover at the beginning of the second half of 2009 and continued its recovery during 2010. Economic activity continued to recover from 2011 through 2014 but began to lose some momentum in 2011 due to: (1) natural disasters in Asia; (2) increases in cost of primary products in the first half of 2011; and (3) the sovereign debt crisis in the Eurozone. The increase of Mexico’s GDP by 2.5% in real terms in 2015, as compared to 2014, was due to growth in all sectors except mining. Tertiary activities posted particularly strong increases in real terms during 2015 as compared to 2014. For information on inflation in Mexico, see “Financial System – Monetary Policy, Inflation and Interest Rates.”
Employment and Labor
Employment
Since the early 1990s, Mexico’s trade liberalization policies and the implementation of NAFTA have produced structural changes in the economy that have generated unemployment. Mexico does not have a comprehensive unemployment benefits scheme or a fully developed social welfare system. The Government is committed to fostering an economic environment that will generate employment opportunities for the large number of people expected to enter the labor force in the medium term. However, the Government also recognizes that addressing Mexico’s significant unemployment and underemployment problem is likely to continue to be an important challenge.
As of December 31, 2015, the number of workers covered by the Instituto Mexicano del Seguro Social (the Mexican Institute of Social Security, or IMSS), which is an indicator of employment in the “formal” sector of the economy, was 17,724,222, an increase of 4.3% from the level recorded at the end of 2014. IMSS provides medical benefits and pensions for retired employees.
D-33
According to preliminary Tasa de Desocupación Abierta (open unemployment rate) figures, Mexico’s unemployment rate was 4.2% as of December 31, 2015, a 0.2% decrease from the rate registered on December 31, 2014.
As of December 31, 2015, the economically active population in Mexico older than 15 years of age consisted of 53.8 million individuals. The table below sets forth the total, as well as the percentage, of unemployed individuals in Mexico based on age and gender as of December 31, 2015.
Table No. 30 – Unemployed Population by Age and Gender
| | | | | | | | | | | | | | | | | | | | | | | | |
| | | Total | | | % | | | Men | | | % | | | Women | | | % | |
Total | | | 2,240,498 | | | | 100.0 | | | | 1,342,302 | | | | 59.9 | | | | 898,196 | | | | 40.1 | |
| | | | | | |
15-24 years | | | 792,298 | | | | 35.4 | | | | 456,990 | | | | 34.0 | | | | 335,308 | | | | 37.3 | |
| | | | | | |
25-44 years | | | 1,043,596 | | | | 46.6 | | | | 594,976 | | | | 44.3 | | | | 448,620 | | | | 49.9 | |
| | | | | | |
45-64 years | | | 372,088 | | | | 16.6 | | | | 261,096 | | | | 19.5 | | | | 110,992 | | | | 12.4 | |
| | | | | | |
65+ years | | | 32,426 | | | | 1.4 | | | | 29,150 | | | | 2.2 | | | | 3,276 | | | | 0.4 | |
Source: INEGI
The services sector employs the largest percentage of Mexico’s economically active population. The following table sets forth the percentage of Mexico’s economically active population by sector of the Mexican economy as of December 31, 2015, according to preliminary figures.
Table No. 31 – Economically Active Population by Sector
| | | | |
| | | Percentage | |
Services | | | 42.1 | % |
Commerce | | | 15.7 | |
Manufacturing | | | 15.7 | |
Agriculture | | | 13.5 | |
Construction | | | 7.5 | |
Other | | | 0.8 | |
Unspecified | | | 0.5 | |
Source: INEGI and National Population Council
Labor
In some regions of Mexico, especially where industrial growth has been rapid, industry has experienced a shortage of skilled laborers and management personnel, as well as high turnover rates. The Government has sought to address these problems through legislation requiring in-house training programs, the costs of which are tax deductible.
As of December 31, 2015, approximately 8.2% of the Mexican work force is unionized. Mexican labor legislation requires that collective bargaining agreements be renewed at least every two years (with wages subject to renegotiation annually) and contains legal limitations on strikes. During 2015, no strikes affected the federal jurisdiction.
D-34
Social Security Laws
The Ley del Seguro Social (Social Security Law) and Ley del Instituto de Seguridad y Servicios Sociales de los Trabajadores del Estado (Law of the Institute for Social Security and Social Services of Government Workers, or ISSSTE Law), to which we refer collectively as the Social Security Laws, require employers (including government entity employers) to deposit with a banking institution selected by the employer an amount equal to 2% of each worker’s base salary to be contributed to an account that is opened for withdrawals upon such worker’s retirement or permanent disability.
Under the ISSSTE Law, federal employees hired after the enactment of the law were required to join a new fully funded pension system created by the law. Any then-current federal employees were allowed to choose between the new ISSSTE pension system and the existing pay-as-you-go pension system. These changes to the ISSSTE pension system have been essential in helping the Government address the difficult financial situation of the healthcare and pension systems for federal employees and of the Instituto de Seguridad y Servicios Sociales de los Trabajadores del Estado (Institute for Social Security and Services for State Employees, or ISSSTE). The ISSSTE Law provides ISSSTE with additional means to accomplish its goals and contributes to economic growth and social welfare by increasing domestic savings, especially long-term savings. This change should reduce ISSSTE’s costs over time.
The ISSSTE Law also gives workers the right to transfer their retirement contributions and seniority credits between the private and public healthcare and pension systems, encouraging movement between the private and public sectors.
Pension and Housing Funds
Since 1997, each worker has been allowed to maintain an independent retirement account managed by Administradoras de Fondos para el Retiro (Retirement Fund Administrators, or AFORES), which are private sector entities. AFORES are fund managers established, subject to Government approval, to manage individual pension accounts and manage mutual funds known as Sociedades de Inversión Especializadas de Fondos para el Retiro (Specialized Retirement Mutual Investment Funds, or SIEFORES). A majority of the outstanding shares of each AFORE must be owned by Mexican persons, and no single person may acquire control over more than 10% of any class of shares, investment in AFORES by foreign financial institutions is permissible. This retirement savings system was designed both to improve the economic condition of Mexican workers and to promote long-term savings in the economy, providing financing for investment projects in both the public and private sectors. AFORES may invest up to 100% of the funds they manage in Government debt securities or in debt securities issued by private sector companies, depending on the credit rating of the issuer, and up to 20% in foreign securities, with specific limits on the credit rating of debt securities. AFORES are also permitted to invest in equity securities issued by Mexican entities.
The Instituto del Fondo Nacional de la Vivienda para los Trabajadores (National Workers’ Housing Fund Institute, or INFONAVIT) was created in 1972 in order to administer housing programs for workers and address the shortage of housing. INFONAVIT acts as a financial intermediary, extending credit to workers for the construction and purchase of homes. Currently, employers are required to contribute an amount equal to 5% of each worker’s base salary to a housing sub-account with a banking institution. As with the retirement sub-accounts, the funds contributed are deductible from the employer’s current income for tax purposes. These funds are, in turn, required to be deposited to an INFONAVIT account at Banco de México. Upon a worker’s receipt of an INFONAVIT loan for the purchase or construction of a home, any amounts in the worker’s housing sub-account are available for financing the down payment on the home. Unused amounts may be withdrawn by the worker upon retirement or permanent disability.
D-35
As of December 31, 2015, INFONAVIT’s total equity amounted to Ps. 153.0 billion, an increase of 15.1% as compared to 2014. Also as of December 2015, INFONAVIT’s total loan portfolio was Ps. 1,074.7 billion, an increase of 8.4% as compared to 2014.
| | iii. | Pension and Housing Fund Totals |
According to preliminary figures, as of December 31, 2015, 54.4 million individual retirement accounts had been established with, and managed by, AFORES. As of December 31, 2015, the assets managed by AFORES totaled Ps. 2,550.9 billion, 50.2% of which was invested in Government securities and 49.8% of which was invested in private sector, bank, local government and foreign securities.
As of December 31, 2015, the total amount of funds accumulated in housing sub-accounts managed by INFONAVIT and individual accounts of workers with AFORES was Ps. 3,644.8 billion. This figure includes: (1) transfers from the pension sub-accounts established with banks under the old Social Security Laws; and (2) direct contributions under the new pension system and recognition bonuses for ISSSTE beneficiaries that opted for the defined contribution system.
During 2014, Ps. 241.6 billion was deposited in the pension and housing funds, Ps. 175.7 billion of which corresponded to deposits made to workers’ retirement sub-accounts and Ps. 65.9 billion of which corresponded to deposits made to workers’ housing sub-accounts.
Wages
Mexico’s minimum wage is set by the Comisión Nacional de los Salarios Mínimos (National Minimum Wage Commission), which consists of representatives of the business and labor sectors and the Government. On December 31, 2015, the minimum wage was Ps. 70.10 per day and applied uniformly across Mexico. For a table comparing minimum wage increases and changes in price indices, see “Financial System – Monetary Policy, Inflation and Interest Rates.”
Mexican law requires any businesses operating in Mexico to provide substantial worker benefits, including mandatory profit sharing through a distribution of 10% of pre-tax profits to workers. Other benefits include mandatory participation in the pension fund and worker housing fund systems.
Principal Sectors of the Economy
The principal sectors of the Mexican economy are manufacturing, petroleum and petrochemicals, tourism, agriculture, transportation and communications, construction, mining, and electric power.
Manufacturing
Mexico has developed its manufacturing sector with the dual goals of capitalizing on: (1) lower manufacturing overhead, particularly with respect to labor costs; and (2) its common border with the U.S., its major export trading partner. Mexico’s current policies seek to strengthen the domestic market, encourage entrepreneurs and strengthen micro, small and medium enterprises, while fostering the social economy through improved access to financing.
Since 2010, Mexico’s total industrial manufacturing output has increased significantly. This expansion was primarily due to an increase in the manufacturing of primary metals and in the fabricated metal products and transportation equipment sectors, as well as an increase in manufacturing exports to the United States. Although automotive exports maintained a positive trend, other manufacturing exports continued to have slower growth.
The following table illustrates the value of industrial manufacturing output in constant 2008 pesos and the percentage of total output accounted for by each manufacturing sector for the years indicated.
D-36
Table No. 32 – Industrial Manufacturing Output
| | | | | | | | | | | | | | | | | | | | | | | | | | | | |
| | | 2011 | | | 2012(1) | | | 2013(1) | | | 2014(1) | | | 2015(1) | | | 2014(1) | | | 2015(1) | |
| | | (in billions of pesos)(2) | | | (% of total) | |
Food | | Ps. | 467.6 | | | Ps. | 479.7 | | | Ps. | 483.9 | | | Ps. | 487.1 | | | Ps. | 494.9 | | | | 21.0 | % | | | 20.8 | % |
Beverage and tobacco products | | | 109.4 | | | | 112.2 | | | | 111.7 | | | | 115.1 | | | | 122.0 | | | | 5.0 | | | | 5.1 | |
Textile mills | | | 16.3 | | | | 16.8 | | | | 16.4 | | | | 16.1 | | | | 16.4 | | | | 0.7 | | | | 0.7 | |
Textile product mills | | | 11.8 | | | | 11.8 | | | | 12.2 | | | | 13.1 | | | | 14.4 | | | | 0.6 | | | | 0.6 | |
Apparel | | | 54.2 | | | | 54.0 | | | | 55.7 | | | | 54.2 | | | | 58.1 | | | | 2.3 | | | | 2.4 | |
Leather and allied products | | | 17.6 | | | | 18.2 | | | | 18.1 | | | | 17.8 | | | | 18.2 | | | | 0.8 | | | | 0.8 | |
Wood products | | | 20.3 | | | | 22.9 | | | | 22.4 | | | | 22.7 | | | | 23.4 | | | | 1.0 | | | | 1.0 | |
Paper | | | 41.6 | | | | 43.6 | | | | 44.6 | | | | 45.9 | | | | 47.4 | | | | 2.0 | | | | 2.0 | |
Printing and related support activities | | | 17.6 | | | | 16.9 | | | | 15.7 | | | | 15.3 | | | | 15.5 | | | | 0.7 | | | | 0.7 | |
Petroleum and coal products | | | 77.9 | | | | 78.8 | | | | 81.4 | | | | 77.7 | | | | 71.8 | | | | 3.4 | | | | 3.0 | |
Chemicals | | | 259.1 | | | | 258.4 | | | | 260.4 | | | | 257.1 | | | | 253.6 | | | | 11.1 | | | | 10.7 | |
Plastics and rubber products | | | 60.3 | | | | 65.7 | | | | 64.5 | | | | 68.7 | | | | 71.6 | | | | 3.0 | | | | 3.0 | |
Nonmetallic mineral products | | | 111.8 | | | | 114.4 | | | | 110.9 | | | | 113.9 | | | | 119.7 | | | | 4.9 | | | | 5.0 | |
Primary metals | | | 143.7 | | | | 149.1 | | | | 152.5 | | | | 165.3 | | | | 158.8 | | | | 7.1 | | | | 6.7 | |
Fabricated metal products | | | 70.6 | | | | 73.3 | | | | 70.9 | | | | 76.4 | | | | 80.9 | | | | 3.3 | | | | 3.4 | |
Machinery | | | 88.0 | | | | 92.9 | | | | 93.0 | | | | 94.5 | | | | 94.1 | | | | 4.1 | | | | 4.0 | |
Computers and electronic products | | | 89.2 | | | | 89.6 | | | | 92.9 | | | | 103.2 | | | | 110.2 | | | | 4.5 | | | | 4.6 | |
Electrical equipment, appliances and components | | | 63.9 | | | | 65.0 | | | | 63.7 | | | | 69.3 | | | | 73.4 | | | | 3.0 | | | | 3.1 | |
Transportation equipment | | | 313.6 | | | | 357.2 | | | | 378.0 | | | | 424.8 | | | | 454.1 | | | | 18.4 | | | | 19.1 | |
Furniture and related products | | | 27.7 | | | | 28.5 | | | | 26.8 | | | | 26.3 | | | | 28.3 | | | | 1.1 | | | | 1.2 | |
Miscellaneous | | | 47.0 | | | | 47.2 | | | | 47.2 | | | | 50.2 | | | | 52.1 | | | | 2.2 | | | | 2.2 | |
| | | | | | | | | | | | | | | | | | | | | | | | | | | | |
Total | | Ps. | 2.109.3 | | | Ps. | 2,196.1 | | | Ps. | 2,222.7 | | | Ps. | 2,314.6 | | | Ps. | 2,378.8 | | | | 100.0 | % | | | 100.0 | % |
| | | | | | | | | | | | | | | | | | | | | | | | | | | | |
| Note: | Numbers may not total due to rounding. |
| (2) | Constant pesos with purchasing power at December 31, 2008. |
Source: Banco de México.
D-37
The following table shows the percentage change from year to year of industrial manufacturing output by manufacturing sector.
Table No. 33 – Industrial Manufacturing Output Differential by Sector
(percent change against prior years)(1)
| | | | | | | | | | | | | | | | | | | | |
| | | 2011 | | | 2012(2) | | | 2013(2) | | | 2014(2) | | | 2015(2) | |
Food | | | 2.2 | % | | | 2.6 | % | | | 0.9 | % | | | 0.6 | % | | | 1.6 | % |
Beverage and tobacco products | | | 4.6 | | | | 2.6 | | | | (0.5 | ) | | | 3.1 | | | | 6.0 | |
Textile mills | | | (4.4 | ) | | | 3.1 | | | | (2.7 | ) | | | (1.7 | ) | | | 2.1 | |
Textile product mills | | | (2.9 | ) | | | (0.1 | ) | | | 3.5 | | | | 7.0 | | | | 9.9 | |
Apparel | | | 0.2 | | | | (0.5 | ) | | | 3.3 | | | | (2.8 | ) | | | 7.2 | |
Leather and allied products | | | (0.7 | ) | | | 3.5 | | | | (0.6 | ) | | | (1.7 | ) | | | 2.2 | |
Wood products | | | 5.1 | | | | 13.0 | | | | (2.2 | ) | | | 1.0 | | | | 3.1 | |
Paper | | | (0.8 | ) | | | 4.8 | | | | 2.1 | | | | 3.1 | | | | 3.2 | |
Printing and related support activities | | | 4.2 | | | | (4.1 | ) | | | (6.9 | ) | | | (2.7 | ) | | | 1.1 | |
Petroleum and coal products | | | (3.6 | ) | | | 1.1 | | | | 3.3 | | | | (4.5 | ) | | | (7.6 | ) |
Chemicals | | | (0.1 | ) | | | (0.3 | ) | | | 0.8 | | | | (1.3 | ) | | | (1.4 | ) |
Plastics and rubber products | | | 6.7 | | | | 9.0 | | | | (1.9 | ) | | | 6.5 | | | | 4.3 | |
Nonmetallic mineral products | | | 3.7 | | | | 2.3 | | | | (3.1 | ) | | | 2.7 | | | | 5.2 | |
Primary metals | | | 4.3 | | | | 3.8 | | | | 2.3 | | | | 8.4 | | | | (4.0 | ) |
Fabricated metal products | | | 7.0 | | | | 3.9 | | | | (3.3 | ) | | | 7.8 | | | | 5.9 | |
Machinery | | | 13.3 | | | | 5.5 | | | | 0.2 | | | | 1.6 | | | | (0.5 | ) |
Computers and electronic products | | | 6.7 | | | | 0.5 | | | | 3.6 | | | | 11.1 | | | | 6.8 | |
Electrical equipment, appliances and components | | | (1.1 | ) | | | 1.7 | | | | (2.0 | ) | | | 8.8 | | | | 6.0 | |
Transportation equipment | | | 16.6 | | | | 13.9 | | | | 5.8 | | | | 12.4 | | | | 6.9 | |
Furniture and related products | | | 1.2 | | | | 2.8 | | | | (5.8 | ) | | | (1.8 | ) | | | 7.5 | |
Miscellaneous | | | 5.1 | | | | 0.4 | | | | 0.0 | | | | 6.4 | | | | 3.7 | |
Total expansion/contraction | | | 4.6 | | | | 4.1 | | | | 1.2 | | | | 4.1 | | | | 2.8 | |
| (1) | Percent change reflects differential in constant 2008 pesos. |
Source: INEGI.
Petroleum and Petrochemicals
General
For much of its history, Mexico’s state-owned oil and gas company, made up of PEMEX and its subsidiary entities, has been the sole participant in the Mexican oil and gas industry. As of December 31, 2015, PEMEX remained the largest participant in the industry.
Energy Reform and Public Bidding
In 2013, amendments to Articles 25, 27 and 28 of the Constitution introduced reforms to Mexico’s role in regulating and supervising the Mexican oil and gas industry, allowing the Government to carry out exploration and extraction activities through assignments to, or agreements with, PEMEX and through assignments to or agreements with other oil and gas companies.
The secondary legislation giving effect to the energy reform was approved by Congress and signed into law by President Peña Nieto in August 2014. As part of this energy reform, PEMEX has undergone a corporate reorganization in which Petróleos Mexicanos was transformed from a decentralized public entity into a productive state-owned company, and the transitional articles transformed the four existing subsidiary entities of Petróleos Mexicanos into two new productive state-owned subsidiaries and created five new productive state-owned subsidiaries. In addition, the Hydrocarbons Law and the Ley de Ingresos sobre Hidrocarburos (Hydrocarbons Revenue Law) establish a new legal framework for the exploration and extraction of hydrocarbons that allows third parties to enter into the Mexican market through assignments and contracts and a new fiscal regime through which the Mexican government will collect payments from participants in the Mexican hydrocarbon industry.
D-38
The energy reform outlined a process, commonly referred to as Round Zero, for the determination of the initial allocation of rights to PEMEX for it to continue to carry out exploration and production activities in Mexico. On August 13, 2014, the Ministry of Energy granted PEMEX the right to continue to explore and develop areas that together contain 95.9% of Mexico’s estimated proved reserves of crude oil and natural gas. In December 2014, the Ministry of Energy launched the process commonly referred to as Round One, pursuant to which the areas that PEMEX did not request or were not assigned to PEMEX through Round Zero (including the areas assigned to PEMEX on a temporary basis) are to be subject to bidding by PEMEX and other companies, subject to certain requirements.
PEMEX
PEMEX is the largest company in Mexico, the eighth-largest crude oil producer in the world and the fifteenth largest oil and gas company in the world based on 2014 data. Its subsidiary entities are Pemex Exploración y Producción (Pemex Exploration and Production, or PEP), Pemex Transformación Industrial (Pemex Industrial Transformation), Pemex Perforación y Servicios (Pemex Drilling and Services), Pemex Logística (Pemex Logistics), Pemex Cogeneración y Servicios (Pemex Cogeneration and Services), Pemex Fertilizantes (Pemex Fertilizers) and Pemex Etileno (Pemex Ethylene). Petróleos Mexicanos is a productive state-owned company of the Government, and each of the subsidiary entities is a productive state-owned subsidiary. Each of Petróleos Mexicanos and the subsidiary entities is a legal entity empowered to own property and carry on business in its own name.
PEMEX’s activities are regulated primarily by the Hydrocarbons Law, the Ley de Petróleos Mexicanos (Petróleos Mexicanos Law), and the Reglamento de la Ley de Petróleos Mexicanos (Regulations to the Petróleos Mexicanos Law), all of which took effect in 2014.
| | i. | Reserves Assigned to PEMEX |
Under the Constitution, all oil and other hydrocarbon reserves located in the subsoil of Mexico are owned by the Mexican nation. As of December 31, 2014, PEMEX had been assigned rights to extract and sell hydrocarbon reserves through Round Zero corresponding to areas that together contain 95.2% of Mexico’s total proved reserves. PEMEX has the right to extract, but not own, these reserves, and to sell the resulting production.
Besides crude oil and natural gas, PEMEX markets a full range of refined products in Mexico, including gasoline, jet fuel, diesel, fuel oil, asphalts, lubricants and petrochemicals. PEMEX supplies the majority of Mexico’s primary energy requirements. PEMEX is one of a few major producers of crude oil worldwide that experiences significant domestic demand for its refined products.
During 2015, PEMEX sold 1,426.7 thousand barrels per day of its crude oil in the domestic market in the form of refined products. It exported the remainder of the crude oil (1,142.3 thousand barrels per day in 2014 and 1,172.5 thousand barrels per day in 2015). Net exports of crude oil, natural gas, petroleum products and petrochemical products averaged U.S. $21.8 billion per year between 2011 and 2014, and were U.S. $1.8 billion in 2015. Crude oil exports increased in volume by 2.6% in 2015, from 1,142.3 thousand barrels per day in 2014 to 1,172.5 thousand barrels per day in 2015.
As of December 31, 2015, P.M.I. Comercio Internacional, S.A. de C.V. (PMI), the company that manages international crude oil product imports and exports for PEMEX, had 36 customers in 15 countries. Among these countries, the largest proportion of PEMEX’s exports has consistently been to customers in the United States, Spain, India, Canada, South Korea, Japan and China. In response to the increased availability of light crude oil in the U.S. Gulf of Mexico and other developing trends in international demand for imported crude oil, PEMEX has expanded the scope of its geographic distribution and renewed its strategy to diversify and strengthen the presence of Mexican crude oil in the international market.
D-39
Although Mexico is not a member of the Organization of the Petroleum Exporting Countries (OPEC), it has periodically announced increases and decreases in PEMEX’s crude oil exports reflecting production revisions made by other oil producing countries, in order to contribute to the stabilization of crude oil prices. However, PEMEX has not changed its export goals because of announcements by OPEC since 2004, and Pemex believes that Mexico has no current plans to change PEMEX’s current level of crude oil exports.
PEMEX imported 1,418.4 million cubic feet per day of natural gas in 2015, an increase of 4.5% from the 1,357.8 million cubic feet per day imported in 2014, and exported 2.8 million cubic feet per day of natural gas in 2015, an decrease of 33.5% as compared to natural gas exports in 2014 of 4.1 million cubic feet per day.
Tourism
Tourism plays a prominent role in the Mexican economy. Through initiatives such as the National Fund for Tourism Development, the Government has established tourist centers in several beach towns such as Huatulco, Cancún, Cabo San Lucas, Ixtapa and Puerto Vallarta.
The Mexican tourism sector recorded a U.S. $7.6 billion surplus in the balance of payments in 2015, a 15.6% increase from the U.S. $6.6 billion surplus recorded in 2014. Mexico’s tourism sector expanded in 2015, as set forth in the table below.
Table No. 34 – Tourism Revenues and Expenditures
(in billions, except average expenditure and number of tourists)(1)
| | | | | | | | | | | | | | | | | | | | |
| | | 2011 | | | 2012 | | | 2013 | | | 2014 | | | 2015 | |
Revenues from international
travelers(1)2) | | Ps. | 11.9 | | | Ps. | 12.7 | | | Ps. | 13.9 | | | Ps. | 16.2 | | | Ps. | 17.7 | |
Revenues from tourists to the interior(1) | | Ps. | 9.4 | | | Ps. | 10.2 | | | Ps. | 11.3 | | | Ps. | 13.6 | | | Ps. | 15.0 | |
Average expenditure per tourist to the interior | | U.S.$ | 713.8 | | | U.S.$ | 746.3 | | | U.S.$ | 776.8 | | | U.S.$ | 848.8 | | | U.S.$ | 821.2 | |
Number of tourists to the interior (millions of people) | | | 13.2 | | | | 13.7 | | | | 14.6 | | | | 16.0 | | | | 18.3 | |
Expenditures by Mexican tourists abroad | | U.S.$ | 4.7 | | | U.S.$ | 5.2 | | | U.S.$ | 5.8 | | | U.S.$ | 6.2 | | | U.S.$ | 6.5 | |
Expenditures by Mexicans traveling abroad(3) | | U.S.$ | 7.8 | | | U.S.$ | 8.4 | | | U.S.$ | 9.1 | | | U.S.$ | 9.6 | | | U.S.$ | 4.7 | |
| (1) | Constant pesos with purchasing power at December 31, 2008. |
| (2) | Includes both tourists and visitors who enter and leave the country on the same day. |
| (3) | Includes both tourists and one-day visitors. |
Agriculture
Historically, the Government has intervened in the agricultural sector to ensure adequate supplies of certain staples of the Mexican diet and to maintain the average income of farming communities. While some of these practices persist, the Government generally no longer intervenes in the agricultural distribution chain and instead encourages the market-oriented development of the agricultural sector. This policy shift is reflected in changes to the land ownership structure and in the Government’s agriculture policy initiatives.
Since 1992 when Mexico changed its ejido system of community ownership with restrictions on land transfers, Mexico has continued to modernize its land ownership system. These efforts have fostered increases in agricultural investment by permitting landowners to: (1) access new sources of capital; (2) transfer land to more efficient producers, subject to certain requirements; and (3) make more efficient use of inputs. The increased productivity of the agricultural sector caused by these reforms has also generated employment opportunities for many farm workers outside of major urban areas.
D-40
The Government considers its agricultural sector a national priority and has instituted various measures aimed at increasing agricultural productivity and improving the rural population’s standard of living. With respect to increasing agricultural productivity, targeted Government policies include: (1) the consolidation of production into larger units; (2) the expansion of the national irrigation system; and (3) increased availability of credit to farmers and of government sponsored hedges to cover risks affecting agricultural commodities. With respect to improving the rural population’s standard of living, the Government has instituted a policy of reviewing agricultural prices to ensure that these prices do not fall below cost.
Within the Government, the Ministry of Agriculture is responsible for developing policies aimed at: (1) increasing food production; (2) maximizing the comparative advantages of the agricultural sector; (3) integrating the activities of rural environment production chains with the rest of the economy; and (4) encouraging collaboration among producers.
Operating under the direction of the Ministry of Agriculture is the Apoyos y Servicios a la Comercialización Agropecuaria (Support and Services for Agricultural Trading), which was created to enhance the export of Mexican agricultural products and to reduce the competitive disadvantages facing Mexican agricultural producers. The Support and Services for Agricultural Trading also operates and administers the Programa de Apoyos Directos al Campo (Direct Field Support Program), also known as PROCAMPO Productivo. This program provides local agricultural producers with Government funds to help offset the subsidies that foreign competitors receive from their respective governments. According to preliminary figures, the program reaches over two million producers, covering a total area of approximately 11.3 million hectares.
According to preliminary figures, the agriculture sector (including livestock, fishing, forestry and hunting) accounted for approximately 3.0% of Mexico’s total GDP in 2015, a 1.1% decrease as compared to 2014. Despite decreasing as a percentage of GDP, agricultural output during 2015 actually increased by 0.4% as compared to 2014.
According to preliminary figures, approximately 13.4% of Mexico’s economically active population was employed within the agriculture industry as of December 31, 2015. These workers cultivated approximately 54.7 million acres of land, totaling approximately 11.3% of the country’s total area. Approximately 51.4 million acres were harvested by these workers, of which approximately 27.8% were irrigated.
Mexico accounted for 12.9% of total U.S. agricultural export and 18.1% of agricultural imports from the U.S. Along with Canada, Mexico is one of the largest agricultural trading partners of the U.S. The main agricultural exports in 2015 were avocados, peppers and berries.
Transportation and Communications
The modernization and expansion of the country’s transportation and communications infrastructure is a national priority. Pursuant to the National Infrastructure Program 2014 – 2018, the Government has authorized infrastructure expenditures of Ps. 1.3 trillion for the transportation and communications sector.
During 2015, the transportation and storage industry decreased by 3.1% in real terms as compared to a 3.7% increase in real terms in 2014.
The Government builds and maintains a large part of Mexico’s road network, but since 2003 the Government has granted long-term concessions to private sector companies, allowing these companies to construct, operate and maintain toll roads.
According to preliminary figures, at December 31, 2015, Mexico’s road network totaled an estimated 389,345 km, of which 155,239 km consisted of paved roads and of which 9,457 km consisted of toll expressways.
D-41
The following table illustrates the development of Mexico’s road network from 2012 to 2015.
Table No. 35 – Development of Mexico’s Road Network
| | | | | | | | | | | | | | | | | | | | |
| | | 2011 | | | 2012 | | | 2013 | | | 2014 | | | 2015 | |
Road network (total) (km) | | | 374,262 | | | | 377,660 | | | | 378,922 | | | | 389,435 | | | | 389,435 | |
Paved roads (km) | | | 141,361 | | | | 146,221 | | | | 148,329 | | | | 155,239 | | | | 155,239 | |
Expressways and toll roads (km) | | | 8,459 | | | | 8,900 | | | | 9,174 | | | | 9,457 | | | | 9,457 | |
Source: Banco de México
During 2015, the amount of cargo transported via Mexican seaports totaled 289.7 million tons, a 1.1% increase as compared to 2014.
As with its road network, the Government has promoted an increased role for the private sector in the development, management and improvement of Mexico’s seaport facilities over the last decade. Since 1993, the Government has granted 207 50-year concessions for the construction and operation of port facilities. In exchange, private sector operators are expected to develop and modernize the seaport facilities, as well as any surrounding transportation infrastructure. Notwithstanding the recent large-scale grant of concessions, the Government still operates a significant portion of Mexico’s principal seaport facilities.
Airports located in major Mexican cities, such as Mexico City, Guadalajara and Monterrey, are serviced by both domestic and international airlines, while airports located in smaller cities are limited to scheduled service by domestic airlines. There are 76 airports in Mexico, of which 63 service both domestic and international flights. A Government-owned company operates the Aeropuerto Internacional de la Ciudad de México (Mexico City International Airport). During 2015, the number of airline passengers on international and domestic flights to and from Mexico increased by 12.3% as compared to 2014, while the number of airline passengers on international flights to and from Mexico increased by 12.0% as compared to 2014.
In 2014, the Mexican government announced the construction of a new airport in the Mexico City vicinity, which will replace the airport currently in operations. Contracts for the design and operation of the new airport have been awarded and construction is expected to start in 2017.
Under applicable Mexican law, foreigners may own up to 49% of Mexico’s airports, although higher participation percentages may be obtained with the approval of the National Foreign Investment Commission. A concession granted by the Ministry of Communications and Transportation is required in order to operate, maintain and develop an airport.
During 2015, Mexico’s railway system carried 119.6 million tons of freight, a 2.3% increase as compared with 2014. Transportation of exports by train increased by 41.4%, from 12.8 million tons in 2014 to 18.2 million tons in 2015, while transportation of imports increased by 32.9%, from 41.3 tons in 2014 to 54.9 million tons in 2015. In total, Mexico’s railway system carried 25% of all freight moved by land in Mexico.
D-42
Mexico’s railway system is divided into three regional lines, several short lines and one railway terminal in the Valley of Mexico. Private sector companies own the three regional lines as well as 75% of the terminal in the Valley of Mexico.
As of December 31, 2015, the Government had granted a total of 18 concessions to own and operate sections of Mexico’s railway system.
The Government has also granted private sector companies the right to provide passenger railway transportation services as well as an allocation to the state of Jalisco to provide railway transport for tourism purposes on a portion of the Pacific-North railway route.
The table below demonstrates the growth in telephone, cellular mobile and internet connectivity in Mexico between 2011 and 2015.
Table No. 36 – Communications
(figures per 100 inhabitants)
| | | | | | | | | | | | | | | | | | | | |
| | | As of December 31, | |
| | | 2011 | | | 2012 | | | 2013 | | | 2014 | | | 2015 | |
Telephone lines in service* | | | 66.5 | | | | 67.3 | | | | 63.9 | | | | 64.4 | | | | 61.0 | |
Cellular telephones in service | | | 81.3 | | | | 86.1 | | | | 90.2 | | | | 84.9 | | | | 89.0 | |
Inhabitants with internet connectivity | | | 42.2 | | | | 43.9 | | | | 40.9 | | | | 41.4 | | | | 45.0 | |
Source: Instituto Federal de Telecomunicaciones (IFT)
* Figure per 100 homes
In 2014, the Government implemented reforms to provide Mexican citizens with access to better and cheaper telecommunications services and to increase competition and investment in these industries. Under these reforms, up to 100% foreign investment is allowed within the telecommunications and satellite communication sector (including cable television). Foreign direct investment in broadcasting is capped at 49%, subject to any reciprocity agreement between Mexico and the investor’s or operator’s country of origin.
On July 14, 2014, a decree enacted the Ley Federal de Telecomunicaciones y Radiodifusión (Federal Telecommunications and Broadcasting Act) and the Ley del Sistema Público de Radiodifusión del Estado Mexicano (Public Broadcasting System in the Mexican State Law). The Federal Telecommunications and Broadcasting Act provides concrete measures that both increase access to telecommunications and broadcasting generally and eliminate or alleviate certain cell phone carrier charges, including long distance charges (roaming). The Public Broadcasting System in the Mexican State Law establishes the Sistema Público de Rafiodifusión del Estado Mexicano (Public Broadcasting System of the Mexican State), a decentralized public entity, to ensure steady access to broadcasting services in each Mexican state. This entity replaces the former Organismo Promotor de Medios Audiovisuales (Broadcasting Agency Promoter).
From 2013 through 2015, the Government did not grant any active concessions in the telecommunications sector.
Construction
During 2015, construction sector output decreased by 0.54% in real terms, as compared to a 5.6% increase in real terms during 2014. The construction sector is subject to cyclical trends and is one of the sectors most affected by changes in Governmental and private sector expenditures; it has thus largely benefited from the recent reconstruction, modernization and expansion of the federal highway network, as well as other infrastructure-, residential- and industrial-related construction projects.
D-43
Mining
The following table represents mining sector developments in 2015.
Table No. 37 – Mining
| | | | | | | | | | | | | | | | | | | | |
| | | As of December 31, | |
| | | 2011 | | | 2012 | | | 2013 | | | 2014 | | | 2015 | |
Mining, petroleum and gas sector output (% change over prior year) | | | 1.9 | | | | 0.7 | | | | 0.5 | | | | (5.7 | ) | | | (4.5 | ) |
Extractive mineral exports (excluding oil) (% change over prior year) | | | 67.6 | | | | 20.7 | | | | (3.9 | ) | | | 7.4 | | | | (11.0 | ) |
Extractive mineral exports (including oil and oil products) as a percentage of total merchandise exports | | | 17.3 | | | | 15.6 | | | | 14.3 | | | | 12.0 | | | | 6.1 | |
Source: Banco de México
During 2015 as compared to 2014, the decrease in mining, petroleum and gas sector output was due mainly to a contraction in oil mining as a result of a decline in the oil production platform and in services related to oil extraction.
Mexico has a substantial and varied array of mineral resources and is one of the world’s leading producers of silver, bismuth, antimony, fluorite, graphite, barite, molybdenum, lead and zinc. Mexico’s domestic production of minerals satisfies most of its industrial needs and enables it to export silver, copper, sulfur and iron.
Under the Constitution and applicable Mexican laws, mineral mining activities may only be carried out by the Government or, alternatively, by Mexican individuals or corporations if issued a Government concession. Foreign investment, including controlling interests, in Mexican mining companies is permitted under Mexican laws, with the exception of any mining of radioactive minerals. Foreign investment and mining regulations permit foreign investors to hold a majority interest in any Mexican company engaged in mining activities for the period of the concession. These foreign investment regulations promote the development of the mining industry, as they allow for: (1) broader exploration; (2) the discovery of new financing sources; and (3) further domestic technology development. Under Mexico’s Ley Minera (Mining Law), private companies are granted concessions to explore for up to six years and to mine for up to 50 years.
Electric Power
Increased access to electricity is a Government priority. As of December 31, 2015, approximately 98.5% of the total population had access to electric power. As a percentage of the total population, approximately 99.5% of Mexico’s urban population and 95.1% of Mexico’s rural population had access to electricity as of December 31, 2015.
The Government continues to invest in electricity generation, transmission and distribution infrastructure to address Mexico’s growing demand for electricity. Between 2014 and 2018, the Government expects to invest approximately Ps. 310.8 billion in energy generation infrastructure, Ps. 58.1 billion in energy transmission infrastructure and Ps. 189.1 billion in energy distribution.
These energy sources produced 309,553 gigawatt hours of electricity in 2015, an increase of 2.7% as compared to 2014 (and an overall increase of 19.4% since 2011). Mexico exported 2,194.6 gigawatt hours of this electricity in 2015, as compared to 2,652.7 gigawatt hours in 2014. As of December 31, 2015, installed generating capacity was 68,044 megawatts, an increase of 4.0% from 2014. Domestic energy generation in 2015 was further supplemented by imports of electricity totaling 1,650.0 gigawatt hours.
D-44
The above-mentioned domestic energy generation does take into account self-supply energy generation, which is private sector-based and which has rapidly increased over the course of the last several years. For instance, in 2015, self-supply energy generation totaled 23,983 gigawatt hours, an increase of 63.8% from the 14,638 gigawatt hours generated in 2014.
The diversification of energy resources is also an important objective of the Government. The following table provides certain information regarding the composition of the main energy sources in Mexico for the years 2011 through 2015.
Table No. 38 – Composition of Main Energy Sources
| | | | | | | | | | | | | | | | |
| | | 2012(1) | | | 2013(1) | | | 2014(1) | | | 2015(1) | |
| | | (% of total) | |
Hydrocarbons plants | | | 68.4 | % | | | 69.0 | % | | | 62.1 | % | | | 62.6 | % |
Hydroelectric plants | | | 21.8 | % | | | 21.3 | % | | | 22.5 | % | | | 21.9 | % |
Coal-fired plants | | | 5.0 | % | | | 4.9 | % | | | 9.9 | % | | | 9.8 | % |
Nuclear power plants | | | 3.1 | % | | | 3.0 | % | | | 3.0 | % | | | 2.8 | % |
Geothermal plants | | | 1.6 | % | | | 1.6 | % | | | 1.5 | % | | | 1.6 | % |
Wind plants | | | 0.2 | % | | | 0.2 | % | | | 1.1 | % | | | 1.3 | % |
| | | | | | | | | | | | | | | | |
Total | | | 100.0 | % | | | 100.0 | % | | | 100.0 | % | | | 100.0 | % |
| | | | | | | | | | | | | | | | |
| Note: | Numbers may not total due to rounding. Data from 2011 is not presented due to a difference in categories used beginning with 2012 data. |
On August 11, 2014, Congress enacted secondary legislation, including the Ley de la Industria Eléctrica (Electric Power Industry Law) and the Ley de la Comision Federal de Electricidad (Federal Electricity Commission Law). The Electric Power Industry Law creates a new regulatory framework that enables private-sector companies to obtain permits for the generation and commercialization of electric power in a new wholesale electricity market. The Federal Electricity Commission Law converted CFE from a decentralized public entity to a productive state-owned company. CFE now acts through its productive state-owned subsidiaries to undertake the generation, transmission, distribution and commercialization of electric power. The Government granted four permits for the transport of natural gas and one permit for the distribution of natural gas in 2015.
The Government continues to promote private sector participation in the electric power sector and in electricity production. As of December 2015, electricity generation capacity by fossil fuels represented 71.7% of the country’s total electricity generation capacity, as compared to 76.0% as of December 31, 2008. Mexico plans to generate at least 35% of its electricity from non-fossil fuels by 2024.
D-45
FINANCIAL SYSTEM
Mexico’s financial system consists of commercial banks, development banks, securities brokerage houses and public trusts, as well as non-bank institutions such as bonded warehouses, bonding companies, factoring companies, financial leasing companies, foreign exchange houses, insurance companies and limited-scope financial institutions.
Monetary Policy, Inflation and Interest Rates
Monetary Policy
Banco de México, chartered in 1925, is Mexico’s central bank and its functions and administration are governed by the provisions of the Ley del Banco de México (Bank of Mexico Law) and are subject to Article 28 of the Constitution.
Banco de México’s main purpose is to provide the country’s economy with domestic currency. In pursuing this purpose, its primary objective is to seek the stability of the purchasing power of said currency.
Banco de México is authorized to issue regulations aimed at monetary and foreign exchange management, the sound development of the financial system, the proper functioning of the payment systems, and the protection of the public interest.
Banco de México is authorized to perform the following functions, among others: (i) regulate the issuance and circulation of currency, foreign currency exchange, financial, intermediation and services, as well as payment systems; (ii) operate as reserve bank and lender of last resort for credit institutions; (iii) provide treasury services to the Government and act as its financial agent; (iv) counsel the Government on economic and financial issues; (v) participate in the International Monetary Fund and other international financial cooperation institutions.
As of December 31, 2015, Banco de México had assets totaling Ps. 3,679.7 billion (U.S. $213.3 billion).
Banco de México is managed by a five-member Junta de Gobierno (Board of Governors) appointed by the President and confirmed by the Senate. Mr. Agustín Guillermo Carstens Carstens is the current Governor of Banco de México. Mr. Carstens Carstens assumed office on January 1, 2010 and will serve through December 31, 2022.
The principal objective of the Government’s monetary policy is to create an environment of low and stable inflation. These objectives are achieved through actions taken by Banco de México to influence interest rates and inflation expectations to conform price behavior with the overarching goals of the Government’s monetary policy. By creating an environment of law and stable inflation, Banco de México encourages appropriate conditions for both sustained growth and the creation of permanent jobs. Accordingly, in the past, Banco de México has decreased the availability of domestic credit when: (1) the value of the peso depreciated; (2) capital outflows occurred; or (3) inflation was higher than projected. In 1995, Banco de México introduced new reserve requirements to facilitate the regulation of liquidity and reduce Banco de México’s daily net extension of credit. Banco de México has also established quarterly targets for the expansion of net domestic credit for each quarter.
Since 2008, Banco de México has used the Tasa de Fondeo Bancario (overnight interbank funding rate) as its primary monetary policy instrument. Under this policy, Mexico’s overnight interbank funding rate changes when medium-term inflation projections deviate from the target of 3.0% (+/-1.0%). Since the 2009 global economic crisis, the minimum overnight interbank funding rate has consistently decreased.
The principal objective of Mexico’s 2015 monetary program is to achieve an inflation rate at or below the permanent target of 3.0% (+/-1.0%), which is intended to stabilize the purchase power of the Mexican peso. As of December 31, 2015, the overnight funding rate remained at 3.25% as set on December 17, 2015.
D-46
At December 31, 2015, Banco de México’s net domestic credit, which signifies the sum of net claims on the central government and claims on other sectors of the domestic economy, registered a negative balance of Ps. 1,822.2 billion, as compared to a negative balance of Ps. 1,822.2 billion at December 31, 2014.
Money Supply and Financial Savings
Banco de México’s monetary aggregates measure monetary supply provided by both internal and external financial sources, separating residents’ and nonresidents’ savings in both markets. The monetary aggregates also differentiate public and private sector financial savings. Banco de México’s M1 monetary aggregate consists of bills and coins held by the public, plus: (1) checking accounts denominated in local currency and foreign currency; (2) interest-bearing deposits denominated in pesos and operated by debit cards; and (3) savings and loan deposits. M2 consists of M1, plus: (1) bank deposits; (2) Government-issued securities; (3) securities issued by firms and non-bank financial intermediaries; and (4) Government and INFONAVIT liabilities related to the Retirement Savings System. M3 consists of M2, plus financial assets issued in Mexico and held by non-residents. M4 consists of M3, plus deposits abroad at foreign branches and agencies of Mexican banks.
The following table shows Mexico’s M1 and M4 money supply aggregates at each of the dates indicated.
Table No. 39 – Money Supply
| | | | | | | | | | | | | | | | | | | | |
| | | December 31, | |
| | | 2011 | | | 2012 | | | 2013 | | | 2014 | | | 2015 | |
| | | (in millions of nominal pesos) | |
M1: | | | | |
Bills and coins | | Ps. | 665,916 | | | Ps. | 734,034 | | | Ps. | 792,928 | | | Ps. | 928,777 | | | Ps. | 1,088,106 | |
Checking deposits | | | | | | | | | | | | | | | | | | | | |
In domestic currency | | | 934,698 | | | | 979,413 | | | | 1,082,702 | | | | 1,170,381 | | | | 1,301,904 | |
In foreign currency | | | 132,854 | | | | 163,611 | | | | 189,020 | | | | 232,467 | | | | 333,094 | |
Interest-bearing peso deposits | | | 341,113 | | | | 393,231 | | | | 438,012 | | | | 534,973 | | | | 614,312 | |
Savings and loan deposits | | | 8,599 | | | | 9,760 | | | | 11,097 | | | | 12,598 | | | | 14,558 | |
| | | | | | | | | | | | | | | | | | | | |
Total M1 | | Ps. | 2,083,179 | | | Ps. | 2,280,049 | | | Ps. | 2,513,758 | | | Ps. | 2,879,196 | | | Ps. | 3,351,974 | |
| | | | | | | | | | | | | | | | | | | | |
M4 | | Ps. | 9,330,572 | | | Ps. | 10,684,898 | | | Ps. | 11,658,729 | | | Ps. | 13,107,550 | | | Ps. | 13,858,297 | |
Note: Numbers may not total due to rounding.
Source: Banco de México.
The 2015 M1 money supply increased by 14.0% in real terms. This increase was mainly due to increases in real terms in all of its components during 2015, specifically, checking deposits in foreign currency and bills and coins, which increased by 40.3% and 14.7%, respectively, as compared to 2014.
Financial savings—defined as the difference between the monetary aggregate M4 and bills and coins held by the public—grew steadily in 2015 (2.7% greater in real terms than financial savings in 2014). This increase was attributable to the fact that the bills and coins component increased by 14.7% in real terms, as compared to growth of 3.5% in the aggregate M4 component. From 2014 to 2015, there was a 4.1% increase in real terms in savings generated by residents, as compared to a 6.0% increase from the prior annual period, while savings generated by non-residents decreased by 2.6% in real terms. The decrease in non-residents’ savings was primarily attributable to a slight decrease in foreign holdings of government instruments and also a marginal decrease in other investments.
The 2015 monetary base totaled Ps. 1,214.7 billion, which represents a 16.8% nominal increase from the 2014 monetary base total. This expansion in the monetary base was due to a 16.6% nominal increase in the bills and coins in circulation component as well as an increase in the banking deposits component.
D-47
Inflation
During 2015, consumer inflation was 2.1%, which was below the 3.0 – 4.0% target inflation for the year and 2.0% lower than consumer inflation during 2014. Annual inflation was in the lower range of the expected deviation (+/-1.0%) from the 3.0% target. This was mainly due to (1) monetary policy which anticipated the fading effects over prices given fiscal changes enforced in 2014, (2) declining prices in services such as telecommunications and energy, (3) structural reforms which may have contributed directly or indirectly, and (4) the lack of pressure from the side of aggregate demand.
The following table shows, in percentage terms, the changes in price indices and annual increases in the minimum wage for the periods indicated. For additional information on Mexico’s minimum wage policy, see “The Economy – Employment and Labor.”
Table No. 40 – Changes in Price Indices
| | | | | | | | | | | | |
| | | National Producer
Price Index(1)(2) | | | National Consumer
Price Index(1) | | | Increase in
Minimum Wage | |
2011 | | | 6.9 | | | | 3.8 | | | | 4.1 | |
2012 | | | 1.8 | | | | 3.6 | | | | 4.6 | |
2013 | | | 1.6 | | | | 4.0 | | | | 3.9 | |
2014 | | | 3.3 | | | | 4.1 | | | | 3.9 | |
2015 | | | 2.8 | | | | 2.1 | | | | 6.9 | |
| (1) | For annual figures, changes in price indices are calculated each December. |
| (2) | National Producer Price Index figures represent the changes in the prices for basic merchandise and services (excluding oil prices). The index is based on a methodology implemented in June 2012. |
Sources: INEGI; Ministry of Labor.
Interest Rates
One indicator used to measure Mexico’s interest rates is the interest rate accrued on Certificados de la Tesororía de la Federación (Federal Treasury Certificates or Cetes), which are zero-coupon bonds issued by the Government. During 2015, interest rates on 28-day Cetes averaged 3.0%, as compared to 3.0% during 2014. Interest rates on 91-day Cetes averaged 3.1%, as compared to 3.1% during 2014.
Banco de México publishes an interest rate called the tasa de interés interbancaria de equilibrio (the equilibrium interbank interest rate, or TIIE). The TIIE is calculated for 28 days and 91 days as the interest rate at which the supply and demand for funds in the domestic financial market reach equilibrium. In contrast, the costo porcentual promedio (the average weighted cost of term deposits for commercial banks, or CPP), an alternative measure of interest rates, tends to lag somewhat behind current market conditions.
D-48
The following table sets forth the average interest rates per annum on 28-day and 91-day Cetes, the CPP and the 28-day and 91-day TIIE for the periods indicated.
Table No. 41 – Average Cetes, CPP and TIIE Rates
| | | | | | | | | | | | | | | | | | | | |
| | | 28-Day
Cetes | | | 91-Day
Cetes | | | CPP | | | 28-Day
TIIE | | | 91-Day
TIIE | |
2011: | | | | | | | | | | | | | | | | | | | | |
January-June | | | 4.2 | | | | 4.4 | | | | 3.3 | | | | 4.8 | | | | 4.9 | |
July-December | | | 4.2 | | | | 4.3 | | | | 3.3 | | | | 4.8 | | | | 4.8 | |
2012: | | | | | | | | | | | | | | | | | | | | |
January-June | | | 4.3 | | | | 4.4 | | | | 3.3 | | | | 4.8 | | | | 4.8 | |
July-December | | | 4.2 | | | | 4.3 | | | | 3.3 | | | | 4.8 | | | | 4.8 | |
2013: | | | | | | | | | | | | | | | | | | | | |
January-June | | | 3.9 | | | | 4.0 | | | | 3.1 | | | | 4.5 | | | | 4.5 | |
July-December | | | 3.6 | | | | 3.6 | | | | 2.8 | | | | 4.1 | | | | 4.1 | |
2014: | | | | | | | | | | | | | | | | | | | | |
January-June | | | 3.2 | | | | 3.3 | | | | 2.6 | | | | 3.7 | | | | 3.7 | |
July-December | | | 2.8 | | | | 2.9 | | | | 2.3 | | | | 3.3 | | | | 3.3 | |
2015: | | | | | | | | | | | | | | | | | | | | |
January-June | | | 2.9 | | | | 3.0 | | | | 2.2 | | | | 3.3 | | | | 3.3 | |
July-December | | | 3.1 | | | | 3.2 | | | | 2.1 | | | | 3.3 | | | | 3.4 | |
Source: Banco de México.
Exchange Controls and Foreign Exchange Rates
Foreign Exchange Policy
The Foreign Exchange Commission, made up of officials from the Ministry of Finance and Banco de México, is responsible for foreign exchange policy, as well as policies for the accumulation of international reserves in Mexico. The Foreign Exchange Commission (1) authorizes loans from the IMF, agencies of international financial cooperation, central banks, foreign legal persons that exercise authority in financial matters and foreign financial institutions for purposes of currency regulation, (2) sets the criteria for Banco de México’s foreign currency operations, (3) determines the exchange rate for foreign exchange, (4) establishes the limits on the amount of active and passive transactions involving exchange risks of development banks, and (5) creates guidelines for the management and valuation of international reserve assets. Since the 1990s, the Commission has mandated that the exchange rate be determined by market forces (a floating exchange rate or free float regime).
The Government directly establishes the quarterly targets for the expansion of net domestic credit. “Net domestic credit” is defined as the variation of the monetary base (currency in circulation plus bank deposits at Banco de México) less the variation of Banco de México’s “net international assets.” “Net international assets” is, in turn, defined as Mexico’s gross international reserves plus its assets with a maturity longer than six months that are derived from its credit agreements with central banks, minus (1) liabilities outstanding to the IMF; and (2) liabilities with a maturity shorter than six months that are derived from credit agreements with central banks.
Since the early 2000s, the Foreign Exchange Commission has adopted different mechanisms to moderate the rate of Mexico’s accumulation of international reserves through the auctioned sale of U.S. dollars. However, on July 25, 2008, the Foreign Exchange Commission announced that, effective August 1, 2008, it was suspending its modified auction mechanism indefinitely. This suspension was effected in order to compensate for the decrease in the net international reserves balance caused by the Ministry of Finance and Public Credit’s purchase of U.S. $8 billion from Banco de México.
On March 11, 2015, the Foreign Exchange Commission established an additional protective mechanism by which the rate of accumulation of international reserves of Banco de México would be reduced during the following months through a daily sale of U.S. $52 million by auction conducted by Banco de México.
On July 30, 2015, the Foreign Exchange Commission amended both daily auction mechanisms by decreasing the peso/dollar exchange rate required for auction sales on any business day to 1% weaker than the peso/dollar exchange rate on the previous business day and increasing the amount offered in the daily auctions aimed at reducing the rate of accumulation of Banco de México’s international reserves from U.S. $52 million to U.S. $200 million.
From December 8, 2014 through December 31, 2015, the daily auctions resulted in sales totaling U.S. $24,721 million.
D-49
Foreign Exchange Rates
The Government maintains a floating exchange rate policy, with Banco de México intervening in the foreign exchange market from time to time in order to minimize volatility and ensure an orderly market. The Government also promotes market-based mechanisms for stabilizing the exchange rate, including offering over-the-counter forward and options contracts between banks and their clients in Mexico, as well as authorizing peso futures trading on the Chicago Mercantile Exchange. In addition, Banco de México permits foreign financial institutions to open peso-denominated accounts and to borrow and lend pesos (subject to general restrictions on operating banking activities in Mexico).
At December 31, 2015, the peso/dollar exchange rate closed at Ps. 17.2487 = U.S. $1.00, a 17.0% depreciation in dollar terms as compared to the rate at December 31, 2014. The peso depreciated against the dollar in 2015 mainly as a result of reductions in oil production and production platforms along with internationally declining oil prices, as well as the expectations of an interest rate hike in the United States.
The following table sets forth, for the periods indicated, the daily peso/dollar exchange rates announced by Banco de México for the payment of obligations denominated in dollars and payable in pesos within Mexico.
Table No. 42 – Exchange Rates
| | | | | | | | |
| | | Representative Market Rate | |
Year | | End-of-Period | | | Average | |
2011 | | | 13.9476 | | | | 12.4354 | |
2012 | | | 12.9658 | | | | 13.1613 | |
2013 | | | 13.0843 | | | | 12.7724 | |
2014 | | | 14.7414 | | | | 13.3056 | |
2015 | | | 17.2487 | | | | 15.8680 | |
Source: Banco de México.
Banking System
In accordance with the Ley de Instituciones de Crédito (Credit Institutions Law, or LIC), the Mexican Banking System is composed of Banco de México, commercial banks, development banks and public trusts created by the Federal Government, as well as self-regulatory banking entities. The LIC regulates the banking and credit activities in Mexico, particularly the organization and operation of credit institutions, as well as the activities and transactions that credit institutions may perform. Pursuant to the LIC, banking and credit services can only be provided by credit institutions. The LIC provides that credit institutions are: (i) commercial banks, and (ii) development banks.
On January 10, 2014, the Ministry of Finance published in the Official Gazette of the Federation a financial reform (January 2014 Financial Reform), which amended over 34 statutes, strengthening the overall banking institutional framework and allowing for more robust and sustainable credit.
The January 2014 Financial Reform established a new Ley para Regular las Agrupaciones Financieras (Law to Regulate Financial Groups) and increased the compliance of the Mexican legal framework with the Key Attributes of Effective Resolution Regimes for Financial Institutions put forth by the Financial Stability Board, an international organization.
The January 2014 Financial Reform had four core goals: (1) to foster competition among financial services providers; (2) to strengthen development banks; (3) to create new products and services that are better suited for financial services customers; and (4) to ensure both soundness and prudence in the financial sector. Pursuant to the Law to Regulate Financial Groups, multiple financial service companies may operate as a single group in certain circumstances.
D-50
In order to achieve these goals, the January 2014 Financial Reform increased financial institution transparency and enhanced enforcement capabilities by giving the Comisión Nacional para la Protección y Defensa de los Usuarios de Servicios Financieros (National Commission for the Protection and Defense of Users of Financial Services, or CONDUSEF) additional authority. For example, CONDUSEF is now able to issue and publish recommendations to financial institutions.
The January 2014 Financial Reform also simplified the process by which people switch banks and make modifications between accounts. As a result, conditional sales are now prohibited. Development banks are also mandated to improve their operations and to favor the extension of credit. These development banks are also encouraged to develop new programs and financial products that broaden access to financial opportunities.
Furthermore, the January 2014 Financial Reform gave financial authorities additional capabilities to periodically evaluate bank performance and the overextension of credit and reinforced the coordination mechanisms between financial authorities. The legal framework governing the acceptance and execution of loan guarantees, risk and credit cost reductions has been further simplified.
Commercial Banks
In accordance with the LIC, commercial banks are required to obtain authorization from the Federal Government in order to be organized and operate as such. Authorization may be granted by the Comisión Nacional Bancaria y de Valores (National Banking and Securities Commission, or CNBV), upon prior approval of its Board of Governors and the favorable opinion of Banco de México. These authorizations are non-transferable due to their particular nature.
Foreign financial firms operate in Mexico through subsidiaries, not branches. Therefore, all banks operating in Mexico constitute separate legal entities, which are locally incorporated and subject to local regulation and supervision. The resolution regime applies to all commercial banks established in Mexico, including subsidiaries of foreign banks.
The following table shows selected metrics of the performance of the commercial banking system.
Table No. 43 – Commercial Banking System
(in billions) (1)
| | | | | | | | | | | | | | | | | | | | |
| | | 2011 | | | 2012 | | | 2013 | | | 2014 | | | 2015 | |
Total loan portfolio | | | Ps. 2,415.1 | | | | Ps. 2,711.7 | | | | Ps. 2,976.3 | | | | Ps. 3,268.6 | | | | Ps. 3,716.9 | |
Past-due commercial bank loans(2) | | | 54.3 | | | | 61.4 | | | | 91.2 | | | | 91.3 | | | | 85.4 | |
Commercial bank loan loss reserves(2) | | | 99.3 | | | | 109.7 | | | | 127.4 | | | | 115.6 | | | | 114.1 | |
| (1) | Constant pesos with purchasing power at December 31, 2008. |
| (2) | Excluding banks under Government intervention and those in special situations. |
Source: Comisión Nacional Bancaria y de Valores
As of December 31, 2014, there were 44 commercial banks registered with the National Banking and Securities Commission.
Development Banks
Development banks are entities of the Federal Public Administration that have distinct legal capacity and budgets. Development banks are incorporated as national credit entities, which compose a portion of the Mexican Banking System. Congress determines the area of focus of each development bank according to its respective organic laws. The development banks’ main objective is to provide access to savings and financing for individuals and corporations in their respective areas of focus, as well as to provide technical assistance and training.
D-51
There are currently six institutions that constitute the Mexican Development Bank System, with a wide spectrum in terms of areas of focus, including: small and medium enterprises, public infrastructure, support for foreign trade, housing, savings improvement and credit to the military. These institutions are:
| | • | | Nacional Financiera, S.N.C. (NAFIN), |
| | • | | National Bank of Public Works and Services, SNC (BANOBRAS), |
| | • | | National Foreign Trade Bank, S.N.C. (BANCOMEXT), |
| | • | | Federal Mortgage Society, S.N.C. (SHF), |
| | • | | National Savings and Financial Services Bank, S.N.C (BANSEFI) and |
| | • | | National Bank of the Army, Air Force and Navy, S.N.C (BANJERCITO). |
NAFIN’s principal activities include: (1) granting credit to small- and medium-sized businesses; (2) promoting the development of the securities market; and (3) serving as the Government’s financial agent in certain international transactions.
Banobras’ principal activities include: (1) providing short-, medium- and long-term financing to public enterprises and federal, state and municipal governments; and (2) granting credit for low-income housing.
Bancomext’s principal activities include: (1) granting export- and import-related credit; and (2) issuing guaranties to private- and public-sector entities in the promotion of foreign trade. On June 13, 2007, a public trust known as ProMéxico was created to assume certain of Bancomext’s foreign trade and foreign investment responsibilities. This trust is supervised by the Ministry of Economy.
The Government owns a substantial majority of each development bank’s capital. In addition, under the laws establishing NAFIN, Banobras and Bancomext, the Government is responsible, at all times, for the transactions between these development banks and foreign private, governmental and inter-governmental institutions, among others. Such statutory responsibility does not extend to transactions between each of the development banks and non-Mexican individuals. There is no specific procedure, including time periods, to enforce the Government’s statutory responsibility. Additionally, the Government’s statutory responsibility is subject to its legal and budgetary restrictions.
Banking Supervision and Support
National Banking and Securities Commission
Under the Banking Law, the National Banking and Securities Commission authorizes both commercial and development banks’ incorporation as instituciones de banca múltiple (multiple banking institutions) and is responsible for their supervision. The National Banking and Securities Commission has the authority to make inspection visits and impose sanctions for a bank’s failure to comply with the Banking Law or any regulations thereunder. The National Banking and Securities Commission also oversees financial holding companies, banks and securities dealers, and has the power to declare an intervención (managerial intervention) and manage a financial group at either the holding or operating company level.
Bank Supervision Policy
Since 2010, the Government has instituted various programs to supervise the banking system. These programs and measures include, among others, the strengthening of the National Banking and Securities Commission’s power to supervise and intervene in the activities of financial holding companies and the National Banking and Securities Commission’s adoption of significant changes to the accounting practices applicable to Mexican commercial banks and development banks, with the intent of making those practices more consistent with international accounting standards, including U.S. generally accepted accounting principles.
D-52
On October 17, 2012, the Ley Federal para la Prevención de Identificación de Operaciones con Recursos de Procedencia Ilícita (Federal Law for the Prevention and Identification of Transactions with Illicit Resources) was published in the Official Gazette of the Federation. The principal objective of the law is to identify specific operations outside of the financial sector between individuals that could raise a risk that illicit resources are used.
In December 2010, the Basel Committee on Banking Supervision issued the Third Basel Accord (Basel III), which provides global regulatory standards with respect to adequate bank capital and liquidity. Mexico’s new capital requirements became effective on January 1, 2013, prior to the implementation of the Basel III framework completion date. On March 23, 2013, the National Banking and Securities Commission decided to extend the deadline to comply with Basel III requirements to 2016.
Bank Savings Protection Institute
IPAB rescues troubled banks. Congress allocates funds to IPAB on an annual basis to manage and service IPAB’s net liabilities, but those liabilities are not considered public sector debt. In emergency situations, IPAB is permitted to obtain additional financing every three years, in an amount not to exceed 6% of Mexican banking institutions’ total liabilities, without Congressional authorization. In addition to Mexico’s auctions of debt securities in the domestic market, IPAB also sells, through auctions conducted by Banco de México, peso-denominated debt securities in Mexico known as Bonos de Protección al Ahorro (Savings Protection Bonds, or BPAs).
IPAB also manages a deposit insurance program, which is assessed per person or entity, per banking institution. Currently, deposit insurance is limited to 400,000 Unidades de Inversión (UDIs), an index unit of funds that can be traded in currency markets and whose value in pesos is indexed to inflation on a daily basis as measured by the change in the NCPI. IPAB has also undertaken the sale of loan portfolios, with significant sales of commercial loan assets since the beginning of 2009.
Bank Support Policy
The Government has instituted various programs to rescue troubled banks and a number of additional measures to generally support the banking system. These programs and measures include, among others: an increase in the capitalization requirements for Mexican banks, including new capital reserve requirements introduced by Banco de México; an increase in permitted foreign and domestic investment in Mexican financial institutions; the creation of a number of debtor support programs to restructure past-due loans; the establishment of the Programa de Capitalización Temporal de la Banca (Temporary Capitalization Program), a voluntary program designed to assist viable but undercapitalized banks; and the provision of foreign exchange credit windows through the Fondo Bancario de Protección de Ahorro (Banking Fund for the Protection of Savings, or FOBAPROA) to help banks meet U.S. dollar liquidity needs.
The 2014 financial reform modified bankruptcy procedures, including through the institution of a joint concurso mercantil procedure for entities of the same corporate group and the creation of a new liquidation procedure for credit institutions that is supervised by IPAB.
The 2014 financial reform also changed the Credit Institutions Law, which led to improvements in the Banking Resolution Regime. The key modifications to the Banking Resolution Regime include, among others: (1) improved regulation for granting and execution of loan guarantees, resulting in greater legal certainty for credit grantors which impacts favorably on the expansion of credit; (2) improved commercial frameworks which reduces procedural times in trials; (3) streamlined bankruptcy processes by empowering merchants to enter suits collectively when the company is part of a same corporate group; and (4) the development of an arbitration system for disputes pertaining to financial matters between institutions and individuals.
D-53
Credit Allocation by Sector
The following table shows the allocation, by sector, of credit extended by commercial and development banks at each of the dates indicated.
Table No. 44 – Credit Allocation by Sector(1)
| | | | | | | | | | | | | | | | | | | | | | | | | | | | | | | | | | | | | | | | |
| | | December 31, | |
| | | 2011 | | | 2012 | | | 2013 | | | 2014 | | | 2015(2) | |
| | | (in billions of pesos and as % of total) | |
Agriculture, forestry and fishing | | Ps. | 40.8 | | | | 1 | % | | Ps. | 50.8 | | | | 2 | % | | Ps. | 55.2 | | | | 2 | % | | Ps. | 58.4 | | | | 1 | % | | Ps. | 72.7 | | | | 2 | % |
Industry | | | 602.5 | | | | 21 | | | | 668.0 | | | | 20 | | | | 725.7 | | | | 20 | | | | 796.8 | | | | 20 | | | | 931.9 | | | | 20 | |
| | | | | | | | | | |
Services and other activities | | | 583.8 | | | | 20 | | | | 618.0 | | | | 19 | | | | 722.4 | | | | 20 | | | | 800.8 | | | | 20 | | | | 943.6 | | | | 21 | |
Housing credit | | | 428.0 | | | | 15 | | | | 468.2 | | | | 14 | | | | 504.4 | | | | 14 | | | | 546.2 | | | | 14 | | | | 612.9 | | | | 13 | |
Spending credit | | | 527.8 | | | | 18 | | | | 630.9 | | | | 19 | | | | 699.4 | | | | 19 | | | | 744.9 | | | | 19 | | | | 823.7 | | | | 18 | |
| | | | | | | | | | |
Statistical adjustment | | | 0.0 | | | | 0 | | | | 0.0 | | | | 0 | | | | 0.0 | | | | 0 | | | | 0.0 | | | | 0 | | | | 0.0 | | | | 0 | |
Financial sector | | | 199.5 | | | | 7 | | | | 219.0 | | | | 7 | | | | 254.8 | | | | 7 | | | | 295.7 | | | | 7 | | | | 337.2 | | | | 7 | |
Public sector | | | 469.0 | | | | 16 | | | | 546.6 | | | | 17 | | | | 587.5 | | | | 16 | | | | 716.8 | | | | 18 | | | | 778.7 | | | | 17 | |
Others | | | 10.8 | | | | 0 | | | | 19.3 | | | | 1 | | | | 15.0 | | | | 0 | | | | 17.1 | | | | 0 | | | | 28.0 | | | | 1 | |
External sector | | | 52.2 | | | | 2 | | �� | | 38.4 | | | | 1 | | | | 32.4 | | | | 1 | | | | 46.3 | | | | 1 | | | | 58.8 | | | | 1 | |
| | | | | | | | | | | | | | | | | | | | | | | | | | | | | | | | | | | | | | | | |
Total | | Ps. | 2,914.4 | | | | 100 | % | | Ps. | 3,259.1 | | | | 100 | % | | Ps. | 3,596.8 | | | | 100 | % | | Ps. | 4,023.1 | | | | 100 | % | | Ps. | 4,587.5 | | | | 100 | % |
| | | | | | | | | | | | | | | | | | | | | | | | | | | | | | | | | | | | | | | | |
Interbank sector | | | 2.0 | | | | — | | | | 2.3 | | | | — | | | | 3.8 | | | | — | | | | 1.2 | | | | — | | | | 2.3 | | | | — | |
| Note: | Numbers may not total due to rounding. |
| (1) | Includes both commercial and development banks. |
Source: Banco de México.
Insurance Companies, Mutual Funds and Auxiliary Credit Institutions
As discussed above, in connection with the implementation of NAFTA, amendments to several laws relating to the financial services industry became effective. Under these rules, non-Mexican financial groups and financial intermediaries are permitted, through Mexican subsidiaries, to engage in various activities in Mexico, including providing insurance.
In addition, pursuant to the amendments to the Ley General de Instituciones y Sociedades Mutualistas de Seguros (Mexican Insurance Company Law), foreign investors may purchase up to 49% of Mexican insurance companies’ capital stock. In addition, foreign financial institutions domiciled in countries that have entered into trade agreements with Mexico may, with the approval of the Ministry of Finance and Public Credit, acquire a majority of the capital stock of a Mexican insurance company. Mexican insurance companies may use the services of intermediaries located in Mexico or abroad for their reinsurance transactions and may issue non-voting or limited voting shares, as well as subordinated debt obligations. Finally, foreign insurance companies are permitted, with the prior approval of the Ministry of Finance and Public Credit, to establish representative offices in Mexico.
The Ley General de Organizaciones y Actividades Auxiliares del Crédito (General Law on Auxiliary Credit Organizations and Activities), as amended, governs financial intermediaries. The law provides that: (1) no individual or entity is permitted to hold, both directly or indirectly, more than 10% of the paid-in capital of financial intermediaries without the Ministry of Finance and Public Credit’s prior authorization; (2) auxiliary credit institutions and foreign exchange brokers are required to allocate 10% of their profits to a capital reserve fund until that fund equals their paid-in capital; (3) financial leasing companies are entitled to judicial remedies to enforce the repossession of goods leased in the event of a default by the lessee; and (4) the National Banking and Securities Commission is authorized to prevent auxiliary credit institutions from using misleading documentation.
Foreign investors may purchase up to 49% of the capital stock of auxiliary credit institutions. Foreign financial institutions domiciled in countries that have entered into trade agreements with Mexico may, with the approval of the Ministry of Finance and Public Credit, acquire a majority of the capital stock of auxiliary credit institutions.
As part of the 2014 financial reform, the law that regulates mutual funds and other investment funds, the Ley de Fondos de Inversión (Investment Funds Law), was amended. One of these modifications was to change the title of the investment companies to investment funds. The main goal of these measures was to make the regulation of investment funds more efficient by improving corporate governance and internal procedures and controls. The amendments recognized the role and responsibility of independent external auditors by establishing the rules governing their interaction with investment funds and underscoring the need for both impartiality and the avoidance of conflicts of interest. The National Banking and Securities Commission can also impose higher sanctions on an investment fund.
D-54
Securities Markets
The Mexican Stock Exchange
The Bolsa Mexicana de Valores, S.A.B. de C.V. (Mexican Stock Exchange, or BMV) is the only authorized stock exchange involved in the listing and trading of equity and debt securities in Mexico. The securities listed and traded on the Mexican Stock Exchange include: (1) stocks and bonds of private sector corporations; (2) equity certificates or shares issued by banks; (3) commercial paper; (4) bankers’ acceptances; (5) certificates of deposit; (6) Government debt; and (7) special hedging instruments linked to the U.S. dollar.
Upon the consummation of the initial public offering of its shares on June 18, 2008, the Mexican Stock Exchange was transformed from a sociedad anónima de capital variable (a private company) to a sociedad anónima bursátil de capital variable (a public company). In connection with the initial public offering of its shares, certain former stockholders of the Mexican Stock Exchange (banks and brokerage houses) created a control trust into which they deposited more than 50% of the issued and outstanding shares of the Mexican Stock Exchange with the purpose of voting such shares as a single block in the future.
The Mexican equity market is one of Latin America’s largest in terms of market capitalization. Currently, institutional investors are the most active participants in the Mexican Stock Exchange, although retail investors also play a role in the market.
Mexican Stock Exchange Performance
The Mexican Stock Exchange publishes the Índice de Precios y Cotizaciones (Stock Market Index) based on a group of the 35 most actively traded shares. The following table provides the index along with two other metrics for the performance of the Mexican Stock Exchange.
Table No. 45 – Mexican Stock Exchange Performance
(in billions of U.S. dollars, except Index)(1)
| | | | | | | | | | | | | | | | | | | | |
| | | 2011 | | | 2012 | | | 2013 | | | 2014 | | | 2015 | |
Index (points) | | | 37,077.5 | | | | 43,705.8 | | | | 42,727.1 | | | | 43,145.7 | | | | 42,977.5 | |
Market capitalization | | | 407.7 | | | | 524.1 | | | | 522.2 | | | | 480.2 | | | | 403.2 | |
Value of transactions | | | 177.6 | | | | 215.7 | | | | 259.1 | | | | 186.4 | | | | 148.5 | |
| (1) | Constant pesos with purchasing power at December 31, 2008. |
Source: Banco de México/Bolsa Mexicana de Valores.
Equity securities, including shares and certificates of patrimonial contribution, accounted for 99.6% of transactions on the Mexican Stock Exchange. Capital development certificates accounted for 0.2% of transactions while fixed income securities, including commercial paper, notes, bonds and ordinary participation certificates, accounted for 0.1% of transactions.
Securities Law Reforms
The 2005 Securities Market Law governs the sale and purchase of securities in Mexico. The 2014 financial reform included an amendment to the Securities Market Law, which was enacted to further improve the efficiency the dynamics of the market. The amendment created an Oferta Restringida (Restricted Offer) regime which allows issuers of securities to engage in public offerings directed exclusively at certain classes of investors. The amendment also established that placement programs, previously exclusively applicable to debt instruments, can now be used by all issuers, thereby facilitating the security inscription process and certain public offerings. Furthermore, the amendment enabled the inclusion of several control processes to improve transparency and better protect investors.
D-55
FOREIGN TRADE AND BALANCE OF PAYMENTS
Foreign Trade
Foreign Trade Policy
Since the late 1980s, Mexico has moved to a model of economic development based on increasing its foreign trade returns. In order to do so, Mexico has primarily focused on expanding its total exports. For example, the Government has designed various trade, fiscal, financial and promotional measures to grow and increase the competitiveness of its non-oil exports. One such measure includes the Government’s decision to join the General Agreement on Tariffs and Trade (GATT), which was later superseded by the World Trade Organization (WTO), in 1986. This decision resulted in, among other things, an important reduction in the protection traditionally given to domestic producers. Under the GATT, a five-tier tariff structure was established at the end of 1987 with a maximum rate of 20%. Soon thereafter, average tariff rates began to decline.
As a result of this strategy, Mexico’s non-oil exports have increased more than thirty-fold since 1982, reaching U.S. $357.4 billion (or 93.9% of total merchandise exports including the in-bond industry) in 2015. Over the last thirty years, the composition of Mexico’s non-oil exports has also changed, reflecting the increased importance of manufactured goods relative to agricultural products. In 2015, U.S. $340.0 billion (or 95.1%) of Mexico’s non-oil exports (including the in-bond industry) consisted of manufactured goods, as compared to U.S. $5.8 billion (or 77.1%) in 1982.
The Ley de Comercio Exterior (Foreign Trade Law), enacted in 1993, grants the President broad powers to establish import and export duties, as well as other trade restrictions. Under this law, the Ministry of Economy is authorized to resolve trade-related disputes. The Ministry of Economy is also authorized to establish procedures for the imposition of “countervailing duties,” which are import duties imposed under the WTO rules to neutralize the effect of a foreign country’s subsidy of its exports. The Foreign Trade Law also created the Comisión de Comercio Exterior (Foreign Trade Commission), an agency that operates within the Ministry of Economy to administer each of these procedures. In addition, this law specifically defines and regulates unfair trade practices, thereby more closely aligning Mexico’s regulatory trade framework with current international practices and standards.
Foreign Trade Performance
According to preliminary figures, during 2015, Mexico registered a trade deficit of U.S. $14.6 billion, as compared to a trade deficit of U.S. $3.1 billion during 2014. This was caused by weakness in U.S. industrial activity and lower external demand which limited export growth. In particular, petroleum exports decreased by 45.3% as compared to 2014, primarily due to a decrease in crude oil production.
According to preliminary figures, during 2015, total imports decreased by 3.5% as compared to 2014. This was mainly caused by a decrease in non-oil exports such as consumer and capital goods, as well as a decrease in oil imports.
According to preliminary figures, during 2015, total exports decreased by 4.1% as compared to 2014. This was mainly caused by weak U.S. industrial activity and decreased demand from other countries.
D-56
The following table provides information about the value of Mexico’s merchandise exports and imports (excluding tourism) for the periods indicated.
Table No. 46 – Exports and Imports
| | | | | | | | | | | | | | | | | | | | |
| | | 2011 | | | 2012 | | | 2013 | | | 2014 | | | 2015(1) | |
| | | (in millions of dollars, except average price of the Mexican crude oil mix) | |
Merchandise exports (f.o.b.) | | | | | | | | | | | | | | | | | | | | |
Oil and oil products | | $ | 56,443 | | | $ | 52,956 | | | $ | 49,482 | | | $ | 42,586 | | | $ | 23,173 | |
Crude oil | | | 49,381 | | | | 46,852 | | | | 42,712 | | | | 35,855 | | | | 18,524 | |
Other | | | 7,063 | | | | 6,103 | | | | 6,770 | | | | 6,731 | | | | 4,648 | |
Non-oil products | | | 292,990 | | | | 317,814 | | | | 330,534 | | | | 354,542 | | | | 357,450 | |
Agricultural | | | 10,309 | | | | 10,914 | | | | 11,246 | | | | 12,181 | | | | 12,971 | |
Mining | | | 4,063 | | | | 4,906 | | | | 4,714 | | | | 5,064 | | | | 4,505 | |
Manufactured goods(2) | | | 278,617 | | | | 301,993 | | | | 314,573 | | | | 337,297 | | | | 339,975 | |
| | | | | | | | | | | | | | | | | | | | |
Total merchandise exports | | | 349,433 | | | | 370,770 | | | | 380,015 | | | | 397,129 | | | | 380,623 | |
Merchandise imports (f.o.b.) | | | | | | | | | | | | | | | | | | | | |
Consumer goods | | | 51,790 | | | | 54,272 | | | | 57,329 | | | | 58,299 | | | | 56,279 | |
Intermediate goods(2) | | | 264,020 | | | | 277,911 | | | | 284,823 | | | | 302,031 | | | | 297,253 | |
Capital goods | | | 35,032 | | | | 38,568 | | | | 39,057 | | | | 39,647 | | | | 41,700 | |
| | | | | | | | | | | | | | | | | | | | |
Total merchandise imports | | | 350,843 | | | | 370,752 | | | | 381,210 | | | | 399,977 | | | | 395,232 | |
| | | | | | | | | | | | | | | | | | | | |
Trade balance | | $ | (1,409 | ) | | $ | 18 | | | $ | (1,195 | ) | | $ | (2,849 | ) | | $ | (14,609 | ) |
| | | | | | | | | | | | | | | | | | | | |
Average price of Mexican oil mix(3) | | $ | 101.13 | | | $ | 101.96 | | | $ | 98.44 | | | $ | 86.00 | | | $ | 43.29 | |
| Note: | Numbers may not total due to rounding. |
| (2) | Includes the in-bond industry. |
| (3) | In U.S. dollars per barrel. |
Source: Banco de México / PEMEX.
Foreign Trade Agreements
Mexico has a number of international agreements in place that promote free trade and economic cooperation at the multilateral, regional and bilateral levels.
Mexico became a member of the WTO on January 1, 1995, when the WTO superseded the GATT. Mexico actively participates in WTO’s multilateral trade negotiations. Mexico has also been a member of the Asian Pacific Economic Cooperation Association since 1993.
At the regional level, Mexico is a member of the NAFTA, a trade agreement among Canada, Mexico and the U.S. This agreement is directed at: (i) removing virtually all tariffs on goods originating in and traded among the three countries; (ii) removing or relaxing many investment restrictions; (iii) liberalizing trade in services and increasing the protection of intellectual property rights; (iv) providing a specialized means for the resolution of trade disputes arising under NAFTA; and (v) promoting trilateral, regional and multilateral cooperation among the three countries.
Mexico has also entered into free trade agreements, and other similar agreements, with the following countries/unions: Bolivia, Chile, Colombia, Costa Rica, the Northern Triangle (El Salvador, Guatemala and Honduras), the European Union, the European Free Trade Association (Iceland, Liechtenstein, Norway and Switzerland), Israel, Japan, Nicaragua, Peru and Uruguay.
Mexico has participated in negotiations for the Free Trade Area of the Americas (FTAA), which would eliminate tariffs and employ common investment and trading rules for the proposed 34 member countries. Mexico has also been individually negotiating free trade agreements with each of the four founding member countries (Argentina, Brazil, Paraguay and Uruguay) of the Common Market of the South (also known as MERCOSUR).
D-57
Geographic Distribution of Trade
The U.S. is Mexico’s most important trading partner. The U.S. share of Mexico’s exports and imports remained relatively unchanged on a year-to-date basis from 2011 through 2015.
The following table shows the distribution of Mexico’s external trade for the periods indicated:
Table No. 47 – Distribution of Mexican Merchandise Exports(1)
| | | | | | | | | | | | | | | | | | | | |
| | | 2011 | | | 2012 | | | 2013 | | | 2014 | | | 2015(2) | |
Exports (f.o.b.): | | | | | | | | | | | | | | | | | | | | |
U.S. | | | 78.5 | % | | | 77.6 | % | | | 78.8 | % | | | 80.2 | % | | | 81.1 | % |
Canada | | | 3.1 | | | | 3.0 | | | | 2.8 | | | | 2.7 | | | | 2.8 | |
EU | | | 5.4 | | | | 5.9 | | | | 5.2 | | | | 5.1 | | | | 4.8 | |
Of which: | | | | | | | | | | | | | | | | | | | | |
Spain | | | 1.4 | | | | 1.9 | | | | 1.8 | | | | 1.5 | | | | 0.9 | |
U.K. | | | 0.6 | | | | 0.7 | | | | 0.4 | | | | 0.5 | | | | 0.5 | |
Germany | | | 1.2 | | | | 1.2 | | | | 1.0 | | | | 0.9 | | | | 0.9 | |
Netherlands | | | 0.6 | | | | 0.5 | | | | 0.4 | | | | 0.6 | | | | 0.5 | |
China | | | 1.7 | | | | 1.5 | | | | 1.7 | | | | 1.5 | | | | 1.3 | |
Japan | | | 0.6 | | | | 0.7 | | | | 0.6 | | | | 0.7 | | | | 0.8 | |
Others | | | 10.6 | | | | 11.3 | | | | 11.0 | | | | 9.8 | | | | 9.2 | |
| | | | | | | | | | | | | | | | | | | | |
Total | | | 100.0 | % | | | 100.0 | % | | | 100.0 | % | | | 100.0 | % | | | 100.0 | % |
| | | | | | | | | | | | | | | | | | | | |
| Note: | Numbers may not total due to rounding. |
| (1) | Includes the in-bond industry on a gross basis. |
Source: Banco de México.
Table No. 48 – Distribution of Mexican Merchandise Imports(1)
| | | | | | | | | | | | | | | | | | | | |
| | | 2011 | | | 2012 | | | 2013 | | | 2014 | | | 2015(2) | |
Imports (f.o.b.): | | | | | | | | | | | | | | | | | | | | |
U.S. | | | 49.7 | % | | | 49.9 | % | | | 49.1 | % | | | 48.8 | % | | | 47.3 | % |
Canada | | | 2.7 | | | | 2.7 | | | | 2.6 | | | | 2.5 | | | | 2.5 | |
EU | | | 10.7 | | | | 11.0 | | | | 11.3 | | | | 11.2 | | | | 11.1 | |
Of which: | | | | | | | | | | | | | | | | | | | | |
Spain | | | 1.1 | | | | 1.1 | | | | 1.1 | | | | 1.2 | | | | 1.2 | |
U.K. | | | 0.6 | | | | 0.6 | | | | 0.7 | | | | 0.6 | | | | 0.6 | |
Germany | | | 3.7 | | | | 3.6 | | | | 3.5 | | | | 3.4 | | | | 3.5 | |
Netherlands | | | 0.9 | | | | 1.0 | | | | 1.1 | | | | 0.9 | | | | 0.8 | |
China | | | 14.9 | | | | 15.4 | | | | 16.1 | | | | 16.6 | | | | 17.7 | |
Japan | | | 4.7 | | | | 4.8 | | | | 4.5 | | | | 4.4 | | | | 4.4 | |
Others | | | 17.2 | | | | 16.3 | | | | 16.4 | | | | 16.6 | | | | 17.0 | |
| | | | | | | | | | | | | | | | | | | | |
Total | | | 100.0 | % | | | 100.0 | % | | | 100.0 | % | | | 100.0 | % | | | 100.0 | % |
| | | | | | | | | | | | | | | | | | | | |
| Note: | Numbers may not total due to rounding. |
| (1) | Includes the in-bond industry on a gross basis. |
Source: Banco de México.
In-bond Industry
The Mexican in-bond industry is comprised of entities that import raw materials and component parts on a duty-free basis and, in turn, export their finished products, with suppliers only paying tariffs on a value-added basis for work done in Mexico. Initially established mostly along the Mexico-U.S. border, in-bond plants now operate in other regions of the country. By expanding production to these other regions, in-bond plants and suppliers have greater access to a larger and more diverse labor pool. This expansion has also provided in-bond plants with greater access to raw materials made available by Mexican suppliers. According to preliminary figures, more than half of the value added by the in-bond industry in 2015 involved the production of auto parts, transportation equipment and electronic products.
D-58
The following tables set forth the number of in-bond plants, the number of workers employed at in-bond plants and the revenues from in-bond operations at the end of each period indicated.
Table No. 49 – In-bond Industry(1)
| | | | | | | | | | | | | | | | | | | | | | | | | | | | | | | | | | | | | | | | |
| | | December 31, | |
| | | 2011 | | | 2012 | | | 2013 | | | 2014 | | | 2015(1) | |
| | | (yearly figures and percent change over prior year) | |
In-bond plants | | | 5,079 | | | | (0.6 | )% | | | 5,049 | | | | (0.6 | )% | | | 5,142 | | | | (1.8 | )% | | | 5,020 | | | | (2.4 | )% | | | 5,006 | | | | (0.3 | ) |
Workers employed by in-bond plants | | | 1,879,114 | | | | 3.8 | % | | | 1,989,862 | | | | 5.9 | % | | | 2,116,022 | | | | 6.3 | % | | | 2,242,865 | | | | 6.0 | % | | | 2,358,532 | | | | 5.2 | % |
Note: Numbers may not total due to rounding.
Source: INEGI.
Table No. 50 – In-bond Industry Revenues(1)
| | | | | | | | | | | | | | | | | | | | | | | | | | | | | | | | | | | | | | | | |
| | | December 31, | |
| | | 2011 | | | 2012 | | | 2013 | | | 2014 | | | 2015(1) | |
| | | | (in billions of pesos and percent change over prior year) | |
Export Sales | | | Ps. 1,469.9 | | | | 13.3 | % | | | Ps. 1,687.8 | | | | 14.8 | % | | | Ps. 1,819.4 | | | | 7.8 | % | | | Ps. 1,991.7 | | | | 9.5 | % | | | Ps. 2,311.4 | | | | 16.1 | % |
Domestic Sales | | | Ps. 1,129.7 | | | | 9.7 | % | | | Ps. 1,241.9 | | | | 9.9 | % | | | Ps. 1,305.5 | | | | 5.1 | % | | | Ps. 1,362.6 | | | | 4.4 | % | | | Ps. 1,521.9 | | | | 11.7 | % |
| | | | | | | | | | | | | | | | | | | | | | | | | | | | | | | | | | | | | | | | |
Total Revenues | | | Ps. 2,599.6 | | | | 11.8 | % | | | Ps. 2,929.8 | | | | 12.7 | % | | | Ps. 3,124.9 | | | | 6.7 | % | | | Ps. 3,354.3 | | | | 7.3 | % | | | Ps. 3,833.3 | | | | 14.3 | % |
| | | | | | | | | | | | | | | | | | | | | | | | | | | | | | | | | | | | | | | | |
| Note: | Numbers may not total due to rounding. |
Source: INEGI.
D-59
Balance of Payments and International Reserves
The balance of payments is a system of recording all of a country’s economic transactions with the rest of the world over a one-year period. In every year since 1988, Mexico has registered a deficit in its current account, primarily due to the Government’s liberalization of trade policies that have increased private sector imports. Most recently, a reduction in Mexican oil exports and lower oil price dynamics in the international markets have caused the current account deficit to increase. Historically, Mexico has registered a surplus in its capital account, primarily due to foreign direct investment. The following table sets forth Mexico’s balance of payments for the periods indicated.
Table No. 51 – Balance of Payments
| | | | | | | | | | | | | | | | | | | | | | |
| | | | | 2011 | | | 2012 | | | 2013 | | | 2014 | | | 2015(1) | |
| | | | | | | | (in millions of dollars) | |
I. | | Current account(2) | | $ | (13,985 | ) | | $ | (16,957 | ) | | $ | (30,978 | ) | | $ | (26,249 | ) | | $ | (32,707 | ) |
| | Credits | | | 399,306 | | | | 423,510 | | | | 434,891 | | | | 454,080 | | | | 437,309 | |
| | Merchandise exports (f.o.b.) | | | 349,433 | | | | 370,770 | | | | 380,015 | | | | 396,912 | | | | 380,623 | |
| | Non-factor services | | | 16,153 | | | | 16,817 | | | | 20,908 | | | | 21,824 | | | | 23,313 | |
| | Tourism | | | 11,869 | | | | 12,739 | | | | 13,949 | | | | 16,208 | | | | 17,734 | |
| | Others | | | 4,284 | | | | 4,078 | | | | 6,959 | | | | 5,615 | | | | 5,579 | |
| | Factor Services | | | 10,569 | | | | 13,154 | | | | 11,320 | | | | 11,319 | | | | 8,168 | |
| | Interest | | | 3,475 | | | | 2,671 | | | | 2,391 | | | | 2,309 | | | | 2,470 | |
| | Others | | | 7,094 | | | | 10,483 | | | | 8,929 | | | | 9,010 | | | | 5,698 | |
| | Transfers | | | 23,152 | | | | 22,768 | | | | 22,649 | | | | 24,026 | | | | 25,206 | |
| | Debits | | | 413,291 | | | | 440,467 | | | | 465,870 | | | | 480,329 | | | | 470,016 | |
| | Merchandise imports (f.o.b.) | | | 350,843 | | | | 370,752 | | | | 381,210 | | | | 399,977 | | | | 395,232 | |
| | Non-factor services | | | 30,289 | | | | 30,277 | | | | 31,377 | | | | 33,673 | | | | 32,095 | |
| | Insurance and freight | | | 10,225 | | | | 9,726 | | | | 9,755 | | | | 11,604 | | | | 10,048 | |
| | Tourism | | | 7,832 | | | | 8,449 | | | | 9,122 | | | | 9,606 | | | | 10,098 | |
| | Others | | | 12,232 | | | | 12,103 | | | | 12,499 | | | | 12,464 | | | | 11,948 | |
| | Factor services | | | 31,981 | | | | 39,229 | | | | 52,287 | | | | 45,567 | | | | 41,783 | |
| | Interest | | | 17,819 | | | | 20,458 | | | | 23,426 | | | | 25,701 | | | | 25,864 | |
| | Others | | | 14,162 | | | | 18,771 | | | | 28,861 | | | | 19,867 | | | | 15,920 | |
| | Transfers | | | 178 | | | | 209 | | | | 995 | | | | 1,111 | | | | 905 | |
II. | | Capital account | | | 53,677 | | | | 58,330 | | | | 68,782 | | | | 61,379 | | | | 34,211 | |
| | Liabilities | | | 64,406 | | | | 92,369 | | | | 111,399 | | | | 89,251 | | | | 50,013 | |
| | Loans and deposits | | | 14,768 | | | | 15,305 | | | | 43,466 | | | | 34,407 | | | | 13,095 | |
| | Development banks | | | (283 | ) | | | 398 | | | | 426 | | | | 870 | | | | 850 | |
| | Commercial banks | | | (953 | ) | | | (3,206 | ) | | | 15,112 | | | | 8,156 | | | | (3,508 | ) |
| | U.S. Federal Reserve swap facility | | | — | | | | — | | | | — | | | | — | | | | — | |
| | Non-financial public sector | | | 5,910 | | | | 8,397 | | | | 8,204 | | | | 15,219 | | | | 15,133 | |
| | Non-financial private sector | | | 10,094 | | | | 9,717 | | | | 19,724 | | | | 10,162 | | | | 621 | |
| | PIDIREGAS(3) | | | — | | | | — | | | | — | | | | — | | | | — | |
| | Foreign investment | | | 49,638 | | | | 77,065 | | | | 67,933 | | | | 54,844 | | | | 36,917 | |
| | Direct | | | 24,552 | | | | 20,548 | | | | 46,903 | | | | 26,948 | | | | 32,056 | |
| | Portfolio | | | 25,086 | | | | 56,517 | | | | 21,030 | | | | 27,896 | | | | 4,861 | |
| | Equity securities | | | (6,566 | ) | | | 9,877 | | | | (943 | ) | | | 4,833 | | | | 3,601 | |
| | Debt securities | | | 31,651 | | | | 46,640 | | | | 21,973 | | | | 23,062 | | | | 1,260 | |
| | Assets | | | (10,728 | ) | | | (34,039 | ) | | | (42,647 | ) | | | (28,872 | ) | | | (15,802 | ) |
III. | | Errors and omissions | | | (11,255 | ) | | | (20,651 | ) | | | (20,128 | ) | | | (17,566 | ) | | | (15,589 | ) |
IV. | | Change in net international reserves(4) | | | 28,879 | | | | 21,040 | | | | 13,006 | | | | 16,717 | | | | (16,503 | ) |
| Note: | Numbers may not total due to rounding. |
| (2) | Current account figures are calculated according to a methodology developed to conform to new international standards under which merchandise exports and merchandise imports include the in-bond industry. |
| (3) | Since January 1, 2009, external financing of long-term infrastructure projects (PIDIREGAS) are recorded as non-financial public sector indebtedness. |
| (4) | The sum of items I, II and III does not equal item IV because purchases and sales of gold and silver, as well as adjustments in their value, are not reflected in items I, II and III. |
Source: Banco de México.
D-60
Current Account
The decrease in the current account deficit from 2013 to 2014 was attributable to an increase in merchandise exports and non-factor services. In 2015, Mexico’s current account registered a deficit of 2.9% of GDP, or U.S. $32.7 billion, due to a decrease in the oil production balance.
Capital Account
In general, Mexico’s capital account has been positive over the past five years, due primarily to stable and increasing investments in Mexico, including direct foreign investment. From 2010 through 2013, Mexico registered capital account surplus increases, as set forth in the table above. These capital account surplus increases were primarily due to an increase in foreign direct investment as a result of the strength of Mexico’s economic fundamentals. The increase in new investments, including the acquisition of Grupo Modelo by Anheuser-Busch InBev, contributed to a significant increase in net foreign direct investment in 2012 and 2013.
In 2015, Mexico registered a capital account surplus of U.S. $34.2 billion. This decrease compared to 2014 was due to a reduction in the holdings of government securities by non-residents. Despite this reduction, the rest of the items of the financial account, including direct foreign investment, received sufficient resources to finance the capital account balance.
International Reserves and Assets
The following table sets forth Banco de México’s international reserves and net international assets at the end of each period indicated.
Table No. 52 – International Reserves and Net International Assets(3)
| | | | | | | | |
Year | | End-of-Period
International Reserves(1)(2) | | | End-of-Period
Net International Assets | |
| | | (in millions of dollars) | |
2010 | | $ | 113,597 | | | $ | 120,621 | |
2011 | | | 142,476 | | | | 149,242 | |
2012 | | | 163,515 | | | | 167,082 | |
2013 | | | 176,522 | | | | 180,232 | |
2014 | | | 193,239 | | | | 195,714 | |
2015 | | | 176,735 | | | | 177,629 | |
| (1) | Includes gold, Special Drawing Rights (international reserve assets created by the IMF) and foreign exchange holdings. |
| (2) | “International reserves” are equivalent to: (a) gross international reserves, minus (b) international liabilities of Banco de México with maturities of less than six months. |
| (3) | “Net international assets” are defined as: (a) gross international reserves, plus (b) assets with maturities greater than six months derived from credit agreements with central banks, less (x) liabilities outstanding to the IMF and (y) liabilities with maturities of less than six months derived from credit agreements with central banks. |
Source: Banco de México.
In general, Banco de México’s international reserves have demonstrated a positive trend over the past five years. At December 31, 2015, Banco de México’s international reserves decreased U.S. $16.5 billion from the amount at December 31, 2014 due to, among other things, a deficit in Banco de México’s current account and a surplus in Banco de México’s financial account. Banco de México’s net international assets also decreased U.S. $18.0 billion from the amount at December 31, 2014, primarily due to a reduction in international reserves.
Direct Foreign Investment in Mexico
While the Government recognizes that Mexico competes for foreign investment with many other countries, including China and nations in Eastern and Central Europe, it believes that it will be able to maintain continued access to foreign investment because of the increased competitiveness and productivity of Mexico’s economy.
D-61
Foreign Investment Policy
Mexico’s Ley de Inversión Extranjera (Foreign Investment Law) established a legal framework designed to encourage foreign investment in Mexico. This law has been in effect since December 1993 and promotes certain limited restrictions on foreign investment in Mexico. For example, the Foreign Investment Law permits foreign investors to own 100% of a Mexican company’s capital stock if certain conditions are satisfied. The Foreign Investment Law also sets forth which economic activities are reserved exclusively for the Government or for Mexican investors. It also delineates certain activities in which foreign investment may not exceed either 10%, 25%, 30% or 49% of the total investment without the approval of the Foreign Investment Commission.
In addition, the Foreign Investment Law allows foreign investors to purchase equity securities, known as ordinary participation certificates, traded on the Mexican Stock Exchange that would otherwise be restricted to Mexican investors, provided that certain conditions are satisfied. With the authorization of the Ministry of Economy, Mexican banks may establish investment trusts, with the banks acting as trustees to purchase these securities on behalf of foreign investors. These trusts, in turn, issue ordinary participation certificates, which only grant economic rights to their holders, that may be acquired by foreign investors. Any and all voting rights are exercisable only by the trustee.
Foreign Investment in Mexico
From 1999 to December 31, 2015, total accumulated direct foreign investment in Mexico, excluding any direct foreign investment not registered with Mexico’s Registro Nacional de Inversiones Extranjeras (National Foreign Investment Registry), totaled approximately U.S. $425.7 billion. In 2015 direct foreign investment funds, which exclude investments in Mexico-based securities, were allocated to the following sectors of the Mexican economy.
Table No. 53 – 2015 Foreign Investment by Sector
| | | | |
Area | | Percentage | |
Agriculture, Livestock, Fishing and Forestry | | | 0.5 | % |
Business Support Services | | | 0.6 | % |
Commerce | | | 7.3 | % |
Construction | | | 7.2 | % |
Educational Services | | | 0.0 | % |
Electricity and Water | | | 2.0 | % |
Financial Services | | | 8.0 | % |
Health Services | | | 0.0 | % |
Manufacturing | | | 49.4 | % |
Mass Media | | | 8.3 | % |
Mining | | | 3.3 | % |
Other Services | | | 0.0 | % |
Professional Services | | | 1.3 | % |
Real Estate and Rental Services | | | 0.8 | % |
Recreational Services | | | 0.4 | % |
Temporary Accommodations | | | 1.8 | % |
Transportation | | | 9.0 | % |
Source: Ministry of Economy
According to preliminary figures, during 2015, net foreign investment in Mexico, as recorded in the balance of payments (Table No. 51) decreased 32.7% as compared to 2014. Direct foreign investment (investment in real assets such as land, buildings or plants in Mexico) increased by 19.0% and net foreign portfolio investment (investment activity that involves the purchase of Mexico-based stocks, bonds, commodities or money market instruments, including securities placed abroad) decreased by 82.6%, as compared to 2014. These decreases were due to a reduction in the holdings of government securities by non-residents.
D-62
The following table illustrates direct foreign investment in Mexico as contained in the National Foreign Investment Registry by country of origin, and the cumulative totals from January 1, 2011 through December 31, 2015.
Table No. 54 – Direct Foreign Investment(1)
| | | | | | | | | | | | | | | | |
| | | Direct Foreign
Investment in 2015(2) | | | Cumulative Total
2011-2015(2) | |
| | | (in millions of dollars, except percentages) | |
United States | | $ | 16,587.6 | | | | 51.7 | % | | $ | 62,348.8 | | | | 41.3 | % |
Canada | | | 1,186.7 | | | | 3.7 | % | | | 11,988.2 | | | | 7.9 | % |
Brazil | | | 1,119.0 | | | | 3.5 | % | | | 2,558.1 | | | | 1.7 | % |
Spain | | | 3,223.0 | | | | 10.1 | % | | | 11,124.8 | | | | 7.4 | % |
United Kingdom | | | 588.7 | | | | 1.8 | % | | | 3,688.7 | | | | 2.4 | % |
Germany | | | 1,417.7 | | | | 4.4 | % | | | 6,338.1 | | | | 4.2 | % |
Luxembourg | | | 280.5 | | | | 0.9 | % | | | 3,853.0 | | | | 2.6 | % |
Ireland | | | 16.0 | | | | 0.0 | % | | | 228.8 | | | | 0.2 | % |
Switzerland | | | (49.0 | ) | | | (0.2 | )% | | | 636.3 | | | | 0.4 | % |
Japan | | | 1,633.2 | | | | 5.1 | % | | | 7,672.2 | | | | 5.1 | % |
Others | | | 6,053.1 | | | | 18.9 | % | | | 40,570.3 | | | | 26.9 | % |
| | | | | | | | | | | | | | | | |
Total | | $ | 32,056.5 | | | | 100.0 | % | | $ | 151,007.3 | | | | 100.0 | % |
| | | | | | | | | | | | | | | | |
| Note: | Numbers may not total due to rounding. |
| (2) | Excludes direct foreign investment that has not been registered with the National Foreign Investment Registry. |
Source: National Foreign Investment Commission.
Memberships in International Institutions
Mexico is currently a member of the following international institutions: the Caribbean Development Bank, the Central American Bank of Economic Integration, the European Bank for Reconstruction and Development, the Global Environmental Facility, the Inter-American Development Bank, the International Monetary Fund, the North American Development Bank, the Special Development Fund and the World Bank (including the International Development Association and the International Finance Corporation).
D-63
PUBLIC FINANCE
General
Mexico’s annual budget includes revenues and expenditures of the Government, of its ministries and of the budget-controlled agencies (the Budget). The Budget jointly comprises the Ley de Ingresos (Revenue Law) and the Presupuesto de Egresos de la Federación para el Ejercicio Fiscal (Federal Expenditure Budget, or the Expenditure Budget).
Budget Process
The preparation of the Budget requires the participation and coordination of all Government ministries and agencies. The Ministry of Finance and Public Credit prepares the revenue bill each fiscal year, which sets forth the revenues projected to be received by: (1) the Government; and (2) certain of its agencies and enterprises whose budgets require specific legislative approval during the succeeding fiscal year (budget-controlled agencies). In addition, the various ministries prepare expenditure estimates for their own operations and for all of the budget-controlled agencies under their jurisdiction, using the policy orientation and program guidelines established by the Ministry of Finance and Public Credit. Subsequently, the Ministry of Finance and Public Credit reviews these expenditure requests and prepares the expenditure bill for both the Government and the budget-controlled agencies.
The revenue bill must be presented and passed by both houses of Congress. Upon passage by both houses of Congress, the revenue bill becomes the Revenue Law, which provides ministries and budget-controlled agencies with the requisite authority for collecting taxes and other revenues, as well as for entering into loan agreements.
In contrast, the expenditure bill only requires the approval of the Chamber of Deputies under the Constitution. Upon passage by the Chamber of Deputies, the expenditure bill becomes the Expenditure Budget, which authorizes ministries and budget-controlled agencies to incur expenses during the relevant fiscal year. In addition, the Chamber of Deputies must, through its Auditoría Superior de la Federación (Senior Audit Office), annually review the Cuenta Pública (Public Account), which sets forth the expenditures made by ministries and budget-controlled agencies during the previous fiscal year. Under the Constitution, expenditures may only be made by ministries or budget-controlled agencies if the expenditures are included in the Expenditure Budget or approved under a law subsequently passed by Congress.
Treatment of Public Sector Agencies and Enterprises
The information included in this document regarding the overall public sector budget, revenues and expenditures is prepared on a consolidated basis and includes not only the revenues and expenditures of the Government, its ministries and the budget-controlled agencies but also that of other public sector agencies and enterprises whose budgets are not subject to legislative approval (administratively-controlled agencies). Administratively-controlled agencies include NAFIN and Bancomext, among others. Administratively-controlled agencies’ budgets are subject to Government review and, as with the budget-controlled agencies, the Ministry of Finance and Public Credit must approve all of their external borrowings.
Methods for Reporting Fiscal Balance
Fiscal balance measures a government’s total revenues minus government spending. Mexico reports its fiscal balance using separate methods to calculate: (i) Financial Requirements of the Public Sector, and (ii) Public Sector Balance.
Mexico calculates Financial Requirements of the Public Sector by subtracting income from those expenses that are distinct from net acquisitions of financial assets and liabilities. This method is used to evaluate fiscal year development and is presented in primary terms, excluding the financial cost of the public sector. This formula covers the federal public sector but excludes Banco de México. During inflationary periods, the formula can be corrected by using the inflationary debt component to evaluate inflation’s impact on the economy.
D-64
Public Sector Balance is calculated by subtracting consolidated revenues from those public sector expenditures that are not financial expenditures. Like the Financial Requirements of the Public Sector method, this method is also an indicator to evaluate fiscal year development and is presented in primary terms, excluding the financial cost of the public sector. However, this formula only covers the non-financial public sector. Also like the Financial Requirements of the Public Sector method, during inflationary periods, the formula can be corrected by using the inflationary debt component to evaluate inflation’s impact on the economy.
The following charts set forth, pursuant to the principal reporting methods described above, Mexico’s public sector borrowing requirements and the performance of Mexico’s public sector balance as a percentage of GDP for the years indicated. Figures presented in the following tables and throughout this section have been calculated using GDP figures based on constant 2008 pesos.
Table No. 55 – Public Sector Balance
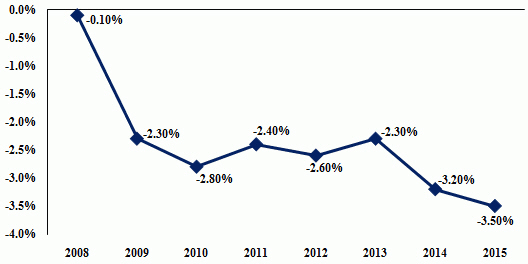
Source: Ministry of Finance and Public Credit.
Table No. 56 – Public Sector Borrowing Requirements
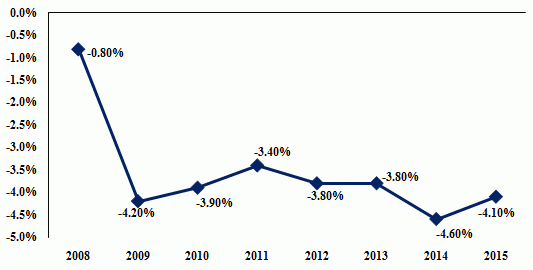
Source: Ministry of Finance and Public Credit.
D-65
Fiscal Policy
The Government’s economic stabilization strategy is focused on the efficient allocation of public expenditures and on increasing revenues in order to: (1) reduce the poverty rate; and (2) increase the rate of economic growth and employment.
In order to better promote economic growth and employment opportunities, the Government’s principal fiscal policy objectives are to reduce the barriers and risks associated with investments in Mexico, improve the ability of Mexican businesses to compete in the global markets and reduce the costs of goods and services to the consumer.
To achieve these objectives, the Government has a multi-faceted plan, which includes simplifying the administration of the Mexican tax system and facilitating the consistent application of the various tax laws. Moreover, the Government plans to improve the efficiency of the public sector through enhanced coordination among government entities and through increased transparency in public spending, thereby permitting increased spending on both social development and infrastructure. The Government plans to continue to develop the Mexican equity and debt markets and to consolidate macroeconomic stability through fiscal discipline, the effective use of petroleum resources and the use of transparent and efficient budgetary procedures. The Government will also make certain changes to improve the pension system for public sector workers. Finally, it will endeavor to improve the regulation (or pursue deregulation) of various sectors of the economy, as appropriate, and to institute trade liberalization policies, while promoting public policy and the rule of law.
The Programa Nacional de Financiamiento del Desarrollo 2013-2018 (National Program to Finance Development 2013-2018, or PRONAFIDE), which was announced on December 16, 2013 and approved and published in the Official Gazette of the Federation on May 20, 2013, establishes the Government’s fiscal policy goals. These goals include securing sufficient fiscal resources to strengthen social infrastructure and productivity. To this end, PRONAFIDE has outlined several specific objectives, including the promotion of economic development and macroeconomic stability on a federal and state level, as well as the improvement of the financial system to generate additional resources and to transform it into a simpler, more progressive and transparent system through spending efficiency and the facilitation of access to financial services.
2016 Budget
On September 8, 2015, the President of Mexico submitted the proposed Ley de Ingresos de la Federación para el Ejercicio Fiscal de 2016 (Federal Revenue Law for 2016, or the 2016 Revenue Law) and the proposed Presupuesto de Egresos de la Federación para el Ejercicio Fiscal de 2016 (Federal Expenditure Budget for 2016, or the 2016 Expenditure Budget) to the Congress for its approval. The 2016 Revenue Law was approved by the Senate on October 29, 2015, and the 2016 Expenditure Budget was approved by the Chamber of Deputies on November 13, 2015. They were published in the Official Gazette of the Federation on November 18, 2015, and November 27, 2015, respectively. We refer to these two bills together as Mexico’s 2016 budget (the 2016 Budget).
If certain conditions are met, the Federal Law for Budget and Fiscal Accountability authorizes the executive branch, acting through the Ministry of Finance and Public Credit, to approve additional expenditures above those adopted by the 2016 Expenditure Budget. Those expenditures could be approved if the budgetary balance is not negatively affected and if they would not increase a budgetary deficit.
A new provision of the Federal Law of Budget and Fiscal Accountability (article 19 Bis, which became effective on January 1, 2016), sets forth the obligation of the Government to use Banco de México’s operational surplus as follows: i) not less than 70% to pre-pay previously assumed public debt or to reduce the current year’s financing needs; and ii) the remainder to strengthen the Budget Income Stabilization Fund, or to acquire assets to improve the Government’s financial position.
D-66
The 2016 Budget provides for a public sector budget deficit excluding physical investments by PEMEX of 0.5% of GDP. Including PEMEX’s physical investment program, the 2016 Budget provides for a public sector budget deficit of 3.0% of GDP. The 2016 Budget contemplates public sector budgetary revenues totaling Ps. 4,763.9 billion, a 1.6% decrease in real terms as compared to public sector budgetary revenues estimated for Mexico’s 2015 budget (the 2015 Budget). The 2016 Budget estimates are based on an estimated volume of oil exports of 1.1 million barrels per day. Oil revenues are estimated at Ps. 884.4 billion in nominal pesos, a 28.3% decrease in real terms as compared to the estimated amount for the 2015 Budget. In addition, approved non-oil revenues are Ps. 3,270.2 billion, a 12.2% increase as compared to the estimated amount for the 2015 Budget. Finally, projected non-oil tax revenues also increased by 18.7% in real terms as compared to the amount approved for the 2015 Budget.
The 2016 Expenditure Budget provides for a total of Ps. 4,285.6 billion in expenditures (excluding estimated physical investment expenditures by PEMEX totaling Ps. 478.2 billion), a 14.2% decrease in real terms as compared to the amount approved in the Presupuesto de Egresos de la Federación para el Ejercicio Fiscal de 2015 (Federal Expenditure Budget for 2015, or the 2015 Expenditure Budget). Selected estimated budget expenditures are set forth in the table below.
Table No. 57 – Selected 2011-2015 Budgetary Expenditures; 2016 Expenditure Budget
| | | | | | | | | | | | | | | | | | | | | | | | |
| | | 2011
Results | | | 2012
Results | | | 2013
Results | | | 2014
Results | | | 2015
Results(1) | | | 2016
Budget(2) | |
| | | (in billions of nominal Pesos) | |
Health | | | 99.0 | | | | 110.0 | | | | 116.8 | | | | 114.3 | | | | 121.2 | | | | 132.2 | |
Education | | | 247.0 | | | | 277.2 | | | | 285.2 | | | | 308.7 | | | | 323.1 | | | | 303.0 | |
Housing and community development | | | 5.3 | | | | 5.3 | | | | 21.4 | | | | 25.8 | | | | 29.2 | | | | 25.6 | |
Government debt servicing | | | 240.5 | | | | 256.9 | | | | 270.3 | | | | 291.8 | | | | 322.2 | | | | 357.4 | |
CFE and Pemex debt servicing | | | 33.4 | | | | 48.2 | | | | 44.3 | | | | 54.1 | | | | 86.1 | | | | 84.4 | |
| (2) | 2015 Budget figures represent budgetary estimates, based on the economic assumptions contained in the General Economic Policy Guidelines for 2015 and in the Economic Program for 2015. These figures do not reflect actual results for the year or updated estimates of Mexico’s 2015 economic results |
Source: Ministry of Finance and Public Credit.
The 2016 Budget authorizes the Government to incur net domestic debt in the amount of Ps. 535.0 billion in nominal pesos, or 2.8% of GDP. The 2016 Budget also authorizes the Government to incur an additional U.S. $6.0 billion in external indebtedness, which includes financing from international financial organizations.
On November 18, 2015, amendments to several laws were published, along with the 2016 Budget. Those amendments include the following:
| | • | | Asset acceleration deduction: companies that realize capital investments in areas such as road and transportation infrastructure, energy production and energy distribution will be eligible for accelerated deduction in 2016 and 2017. |
| | • | | Repatriation of funds: individuals and companies that had investments abroad until December 2014 and that did not report such investments to the Mexican tax authority will have the option to repatriate their investments and their earnings during the first six months of 2016 without penalties, adjustments or late fees. In addition, individuals and companies availing themselves of this repatriation of funds program will only be obligated to pay income tax based on the current year, provided that such payment is made within fifteen days of the repatriation and those funds are reinvested in specified activities or used for debt payments, among other conditions. This incentive came about as a result of a bilateral agreement between the IRS and the SAT, which provides for the exchange of information with respect to accounts held abroad by either Mexican or American residents. |
| | • | | Products and services: taxes on gasoline will be fixed and then updated on an annual basis. |
| | • | | Capitalization rules: an exemption from thin capitalization rules will be allowed for debt contracted with the purpose of making capital expenditures for electricity generation. |
D-67
The table below sets forth the budgetary results for 2011-2015. It also sets forth the assumptions and targets underlying Mexico’s 2016 Budget.
Table No. 58 – 2011-2015 Budgetary Results; 2016 Budget Assumptions and Targets
| | | | | | | | | | | | | | | | | | | | | | | | |
| | | 2011
Results(1) | | | 2012
Results(1) | | | 2013
Results(1) | | | 2014
Results(1) | | | 2015
Results(1) | | | 2016
Budget(2) | |
Real GDP growth (%) | | | 4 | .0% | | | 4 | .0% | | | 1 | .4% | | | 2 | .2% | | | 2 | .5% | | | 3 | .1% |
Increase in the national consumer price index (%) | | | 3 | .8% | | | 3 | .6% | | | 4 | .0% | | | 4 | .1% | | | 2 | .1% | | | 3 | .0% |
Average export price of Mexican oil mix (U.S. $/barrel) | | $ | 101 | .13 | | $ | 101 | .96 | | $ | 98 | .44 | | $ | 85 | .48 | | $ | 43 | .29 | | $ | 50 | .00(3) |
Average exchange rate (Ps. /$1.00) | | | 12 | .4 | | | 13 | .2 | | | 12 | .8 | | | 13 | .3 | | | 15 | .9 | | | 16 | .4 |
Average rate on 28-day Cetes (%) | | | 4 | .2% | | | 4 | .2% | | | 3 | .8% | | | 3 | .0% | | | 3 | .0% | | | 4 | .5% |
Public sector balance as % of GDP(4) | | | (2 | .4)% | | | (2 | .6)% | | | (2 | .3)% | | | (3 | .2)% | | | (3 | .5)% | | | n.a. | |
Primary balance as % of GDP(4) | | | (0 | .6)% | | | (0 | .6)% | | | (0 | .4)% | | | (1 | .1)% | | | (1 | .2)% | | | (0 | .6)% |
Current account deficit as % of GDP | | | (1 | .2)% | | | (1 | .4)% | | | (2 | .5)% | | | (2 | .1)% | | | (2 | .9)% | | | (2 | .6)% |
| (2) | 2015 Budget figures represent budgetary estimates, based on the economic assumptions contained in the General Economic Policy Guidelines for 2015 and in the Economic Program for 2015. These figures do not reflect actual results for the year or updated estimates of Mexico’s 2015 economic results. |
| (3) | The Government entered into hedging agreements to protect against the effects of a potential decline in oil prices with respect to the level that was assumed in the 2015 Revenue Law. Therefore, the approved expenditures level should not be affected if the weighted average price of crude oil exported by PEMEX for the year falls below the price assumed in the 2015 Budget. |
| (4) | Includes the effect of expenditures related to the issuance of bonds pursuant to reforms to the ISSSTE Law and the recognition as public sector debt of certain PIDIREGAS obligations, as discussed under “Public Finance—Revenues and Expenditures—General.” |
Source: Ministry of Finance and Public Credit.
D-68
Revenues and Expenditures
General
The following table sets forth revenues and expenditures, as well as total borrowing requirements for the consolidated public sector in constant 2008 pesos for the fiscal years 2011-2015.
Table No. 59 – Selected Public Finance Indicators
| | | | | | | | | | | | | | | | | | | | | | | | | | | | | | | | | | | | | | | | | | | | | | | | |
| | | 2011(1) | | | As a
% of
GDP(1) | | | 2012(1) | | | As a
% of
GDP(1) | | | 2013(1) | | | As a
% of
GDP(1) | | | 2014(1) | | | As a
% of
GDP(1) | | | 2015(1) | | | As a
% of
GDP(1) | | | 2016
Budget(2) | | | As a
% of
GDP(2) | |
| | | (in billions of constant pesos(3) or percentage of GDP) | |
| | | | | | | | | | | | |
1. Budgetary revenues | | | Ps. 3,271.1 | | | | 25.6 | % | | | Ps. 3,514.5 | | | | 26.4 | % | | | Ps. 3,800.4 | | | | 28.2 | % | | | Ps. 3,983.1 | | | | 28.9 | % | | | Ps. 4,267.0 | | | | 30.2 | % | | | Ps. 4,154.6 | | | | 28.8 | |
| | | | | | | | | | | | |
Federal Government | | | 2,320.2 | | | | 18.2 | | | | 2,452.5 | | | | 18.5 | | | | 2,703.6 | | | | 20.1 | | | | 2.888.1 | | | | 21.0 | | | | 3,180.1 | | | | 22.5 | | | | 3,102.4 | | | | 21.5 | |
| | | | | | | | | | | | |
Public enterprises and agencies | | | 950.8 | | | | 7.4 | | | | 1,062.0 | | | | 8.0 | | | | 1,096.8 | | | | 8.1 | | | | 1,095.0 | | | | 8.0 | | | | 1,086.9 | | | | 7.7 | | | | 1,052.2 | | | | 7.3 | |
| | | | | | | | | | | | |
2. Budgetary expenditures | | | 3,631.3 | | | | 28.4 | | | | 3,920.3 | | | | 29.5 | | | | 4,178.3 | | | | 31.0 | | | | 4,528.0 | | | | 32.9 | | | | 4,892.9 | | | | 34.7 | | | | 4,731.8 | | | | 32.8 | |
| | | | | | | | | | | | |
(a) Budgetary primary expenditures
(excluding interest payments) | | | 3,357.4 | | | | 26.3 | | | | 3,615.2 | | | | 27.2 | | | | 3,863.8 | | | | 28.7 | | | | 4,182.1 | | | | 30.4 | | | | 4,484.6 | | | | 31.8 | | | | 4,269.5 | | | | 29.6 | |
| | | | | | | | | | | | |
Programmable | | | 2,860.9 | | | | 22.4 | | | | 3,102.2 | | | | 23.3 | | | | 3,316.6 | | | | 24.6 | | | | 3,577.8 | | | | 26.0 | | | | 3,826.6 | | | | 27.1 | | | | 3,574.7 | | | | 24.7 | |
| | | | | | | | | | | | |
Non-programmable | | | 496.4 | | | | 3.9 | | | | 513.0 | | | | 3.9 | | | | 547.2 | | | | 4.1 | | | | 604.3 | | | | 4.4 | | | | 658.0 | | | | 4.7 | | | | 694.8 | | | | 4.8 | |
| | | | | | | | | | | | |
(b) Interest payments (budgetary sector) | | | 273.9 | | | | 2.1 | | | | 305.1 | | | | 2.3 | | | | 314.6 | | | | 2.3 | | | | 346.0 | | | | 2.5 | | | | 408.3 | | | | 2.9 | | | | 462.4 | | | | 3.2 | |
| | | | | | | | | | | | |
3. Budgetary primary balance (1-2(a)) | | | (86.3 | ) | | | (0.7 | ) | | | (100.7 | ) | | | (0.8 | ) | | | (63.4 | ) | | | (0.5 | ) | | | (199.0 | ) | | | (1.4 | ) | | | (217.6 | ) | | | (1.5 | ) | | | (114.8 | ) | | | (0.8 | ) |
| | | | | | | | | | | | |
4. Non-budgetary primary balance | | | 5.2 | | | | 0.0 | | | | 3.2 | | | | 0.0 | | | | 3.1 | | | | 0.0 | | | | 7.2 | | | | 0.1 | | | | (0.9 | ) | | | 0.0 | | | | 0.5 | | | | 0.0 | |
| | | | | | | | | | | | |
5. Total interest payments (budgetary and
non-budgetary) | | | 273.9 | | | | 2.1 | | | | 305.1 | | | | 2.3 | | | | 314.8 | | | | 2.3 | | | | 346.3 | | | | 2.5 | | | | 408.4 | | | | 2.9 | | | | 462.9 | | | | 3.2 | |
| | | | | | | | | | | | |
6. Statistical discrepancy | | | 1.6 | | | | 0.0 | | | | (0.6 | ) | | | (0.0 | ) | | | 0.8 | | | | 0.0 | | | | (4.9 | ) | | | (0.0 | ) | | | (10.7 | ) | | | (0.1 | ) | | | 0.0 | | | | 0.0 | |
| | | | | | | | | | | | |
| 7. Public sector balance (on a cash basis) | | | (353.5 | ) | | | (2.8 | ) | | | (403.2 | ) | | | (3.0 | ) | | | (374.2 | ) | | | (2.8 | ) | | | (543.1 | ) | | | (3.9 | ) | | | (637.7 | ) | | | (4.5 | ) | | | (577.2 | ) | | | (4.0 | ) |
Note: Numbers may not total due to rounding.
| (2) | Budgetary estimates as of December 2015. Budgetary estimates were converted into constant pesos using the GDP deflator for 2016 estimated as of December 2015. Percentages of GDP were calculated based on budgetary assumptions listed in the immediately preceding table. |
| (3) | Constant pesos with purchasing power as of December 31, 2008. |
Source: Ministry of Finance and Public Credit.
Revenues
Public sector budgetary revenues have increased as a percentage of GDP over the past five years, from 25.6% of GDP in 2011 to 30.2% of GDP in 2015. Public sector budgetary revenues have also increased by 7.1% in nominal terms during 2015, as compared to 2014.
According to preliminary figures, public sector budgetary revenues increased by 7.1% in nominal terms during 2015, as compared to 2014. Crude oil revenues decreased by 30.9% while the average export price of Mexican oil mix decreased by 49.4%. Non-oil tax revenues increased by 30.9% and non-oil, non-tax revenues decreased by 24.7%. Non-tax PEMEX revenues, as a percentage of total public sector budgetary revenues, decreased by 1.0% to 10.1%, as compared to 2014. The following table illustrates the composition of public sector budgetary revenues for the fiscal years 2011-2015 in constant 2008 pesos.
D-69
Table No. 60 – Public Sector Budgetary Revenues
| | | | | | | | | | | | | | | | | | | | | | | | |
| | | 2011 | | | 2012 | | | 2013 | | | 2014 | | | 2015 | | | 2016
Budget(1) | |
| | | (in billions of constant pesos)(2) | |
Budgetary revenues | | | 3,271.1 | | | | 3,514.5 | | | | 3,800.4 | | | | 3,983.1 | | | | 4,267.0 | | | | 4,154.6 | |
Federal government | | | 2,320.2 | | | | 2,452.5 | | | | 2,703.6 | | | | 2,888.1 | | | | 3,180.1 | | | | 3,102.4 | |
Taxes | | | 1,294.1 | | | | 1,314.4 | | | | 1,561.8 | | | | 1,807.8 | | | | 2,366.5 | | | | 2,407.7 | |
Income tax | | | 759.2 | | | | 803.9 | | | | 946.7 | | | | 959.8 | | | | 1,222.5 | | | | 1,244.2 | |
Value-added tax | | | 537.1 | | | | 580.0 | | | | 556.8 | | | | 667.1 | | | | 707.2 | | | | 742.0 | |
Excise taxes | | | (76.4 | ) | | | (130.1 | ) | | | (7.4 | ) | | | 111.6 | | | | 354.3 | | | | 348.9 | |
Import duties | | | 26.9 | | | | 27.9 | | | | 29.3 | | | | 33.9 | | | | 44.1 | | | | 36.3 | |
Export duties | | | 0.0 | | | | 0.0 | | | | 0.0 | | | | 0.0 | | | | 0.0 | | | | 0.0 | |
Luxury goods and services | | | 0.0 | | | | 0.0 | | | | 0.0 | | | | 0.0 | | | | 0.0 | | | | 0.0 | |
Other | | | 47.3 | | | | 32.8 | | | | 36.4 | | | | 35.3 | | | | 38.4 | | | | 36.3 | |
Non-tax revenue | | | 1,026.2 | | | | 1,138.1 | | | | 1,141.8 | | | | 1,080.2 | | | | 813.6 | | | | 694.7 | |
Fees and tolls | | | 885.2 | | | | 965.9 | | | | 905.7 | | | | 825.4 | | | | 58.6 | | | | 41.8 | |
Transfers from the Mexican Petroleum Fund for Stabilization and Development(3) | | | — | | | | — | | | | — | | | | — | | | | 398.8 | | | | 485.5 | |
Rents, interest and proceeds of assets sales | | | 0.0 | | | | 0.0 | | | | 0.0 | | | | 0.0 | | | | 0.0 | | | | 0.0 | |
Fines and surcharges | | | 136.3 | | | | 166.0 | | | | 228.1 | | | | 249.3 | | | | 350.7 | | | | 161.7 | |
Other | | | 4.7 | | | | 6.2 | | | | 8.1 | | | | 5.6 | | | | 5.5 | | | | 5.7 | |
Public enterprises and agencies | | | 950.8 | | | | 1,062.0 | | | | 1,096.8 | | | | 1,095.0 | | | | 1,086.9 | | | | 1,052.2 | |
PEMEX | | | 395.2 | | | | 463.1 | | | | 482.9 | | | | 440.7 | | | | 429.0 | | | | 398.4 | |
Others | | | 555.6 | | | | 598.9 | | | | 613.9 | | | | 654.2 | | | | 657.9 | | | | 653.8 | |
| Note: | Numbers may not total due to rounding. |
| (1) | Budgetary estimates as of December 2015. Budgetary estimates for 2016 were converted into constant pesos using the GDP deflator for 2016, estimated as of December 2015. |
| (2) | Constant pesos with purchasing power as of December 31, 2008. |
| (3) | No data available prior to 2015. The Mexican Petroleum Fund for Stabilization and Development was created pursuant to the 2013 energy reform. |
Source: Ministry of Finance and Public Credit.
| | ii. | Taxation and Tax Revenues |
On December 21, 2013, a fiscal reform decree was enacted, amending and supplementing the Ley del Impuesto al Valor Agregado (Value Added Tax Law), the Ley del Impuesto Especial Sobre Producción y Servicios (the Special Production and Services Tax, or the IEPS Law) and the Ley del Impuestos sobre la Renta (the Income Tax Law, or the ISR Law). This decree eliminated the Ley del Impuesto Empresarial a Tasa Única (the Corporate Tax Law, or the IETU Law) and the Ley del Impuesto a los Depósitos en Efectivo (Cash Deposit Tax Law, or the IDE Law).
Mexico’s federal tax structure includes both direct taxation, mostly in the form of income taxes, and indirect taxation, mostly in the form of an Impuesto al Valor Agregado (value-added tax or VAT) and excise taxes, such as the IEPS tax. Mexico’s VAT is imposed at a fixed rate of 16%. The VAT is passed through the manufacturing and distribution chain and is passed along as part of the purchase price to the consumer.
Income is taxed at both the individual and corporate level. The individual income tax is levied at progressive rates. Pursuant to the 2014 fiscal reform, individual income tax is assessed in relation to annual income. The corporate income tax for 2014 was 30% pursuant to Article 9 of the Income Tax Law.
Mexico also imposes withholding taxes for certain qualified interest payments. Withholding taxes from interest payments made by Mexican companies to non-residents of Mexico are generally imposed at a rate of 30%. Withholding taxes on interest payments made to a foreign financial institution are imposed at a rate of 4.9%, provided the financial institution is a resident of a country that is party to a bilateral tax treaty with Mexico for the avoidance of double taxation, among other requirements. If those requirements are not met by a financial institution, the applicable withholding rate is 10%. A 15% withholding rate is imposed on the interest portion of payments made on financial leases.
D-70
Each of the states in Mexico also applies a tax on salaries that ranges from 1% to 3%. In addition, employers must contribute an amount equivalent to 5% of payroll to a housing fund and 2% of payroll to an employee retirement fund. A transfer tax applies to the transfer of real estate at rates that range between 2% and 5% of the value of the property. A cash deposit tax, which was formerly assessed at a rate of 3% and applied to the amount of any cash deposits made in a taxpayer’s bank that exceed Ps. 15,000 per month, was eliminated pursuant to the 2014 financial reform.
For nearly three decades, Mexico has negotiated bilateral tax treaties with over 92 countries to avoid double taxation. For more detail on these tax treaties, see: http://www.sat.gob.mx/informacion_fiscal/normatividad/ Documents/cuadro_04022016.pdf.
D-71
The following graphs illustrate the composition of tax revenues in 2011 and in 2015.
Table No. 61 – Composition of Tax Revenues 2011 vs. 2015
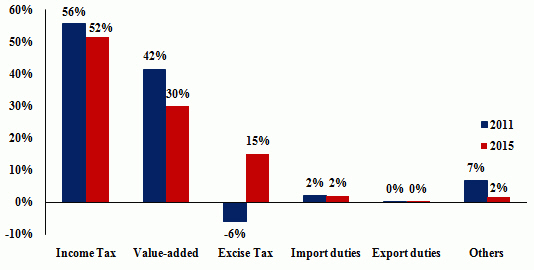
Source: Ministry of Finance and Public Credit.
The Government does not have exclusive power to impose certain special taxes as a result of changes made in the tax laws during the 1990s to strengthen the income of the states and their participation in the tax system. Since 1997, local governments have been permitted to impose taxes on lodging services and the possession of vehicles (in addition to the federal taxes on the first item). Moreover, local governments are able to require retail commercial establishments that sell alcoholic beverages to purchase local licenses. Finally, a percentage of excise tax collections is directly allocated to the states. Since January 1, 2014 and pursuant to the 2014 fiscal reform, some of Mexico’s tax laws have changed.
There are currently four federal income tax brackets for individuals: (i) a 30% tax rate applies to individuals with annual incomes up to Ps. 750,000; (ii) a 32% tax rate applies to individuals with annual incomes between Ps. 750,000 and Ps. 1.0 million; (iii) a 34% tax rate applies to individuals with annual incomes between Ps. 1.0 million and Ps. 3.0 million; and (iv) a 35% tax rate applies to individuals with annual incomes of more than Ps. 3.0 million.
Expenditures
According to preliminary figures, budgetary expenditures during 2015 increased as follows, each in nominal terms and as compared to 2014: (i) net public sector budgetary expenditures increased by 8.1%; (ii) net public sector budgetary programmable expenditures (excluding physical investment by PEMEX) increased by 9.3%; (iii) net paid programmable budgetary expenditures increased by 7.0%; (iv) net paid non-programmable budgetary expenditures increased by 12.2%; (v) the financial cost of public sector debt increased by 18.0%; and (vi) public sector expenditures on economic and social development increased by 1.7% and 8.0%, respectively.
D-72
The following table shows the composition of public sector budgetary expenditures for the fiscal years 2011-2015, as well as the projected expenditures set forth in the 2016 Budget. This table also includes the budgetary expenditures of various public agencies such as PEMEX, CFE, IMSS and ISSSTE.
Table No. 62 – Public Sector Budgetary Expenditures
| | | | | | | | | | | | | | | | | | | | | | | | |
| | | 2011 | | | 2012 | | | 2013 | | | 2014 | | | 2015(1) | | | 2016
Budget(1)(2) | |
| | | (in billions of constant pesos(3)) | |
Budgetary expenditures | | | 3,631.3 | | | | 3,920.3 | | | | 4,178.3 | | | | 4,528.0 | | | | 4,892.9 | | | | 4,731.8 | |
Current expenditures | | | 2,927.8 | | | | 3,178.8 | | | | 3,302.5 | | | | 3,632.3 | | | | 3,956.9 | | | | 4,025.0 | |
Salaries | | | 519.2 | | | | 564.5 | | | | 589.1 | | | | 633.6 | | | | 679.7 | | | | 711.3 | |
Federal Government | | | 207.0 | | | | 228.2 | | | | 229.4 | | | | 245.4 | | | | 267.4 | | | | 281.4 | |
Public agencies | | | 312.2 | | | | 336.3 | | | | 359.6 | | | | 388.3 | | | | 412.3 | | | | 429.9 | |
PEMEX | | | 99.6 | | | | 106.6 | | | | 113.8 | | | | 122.9 | | | | 132.3 | | | | 138.4 | |
CFE | | | 58.3 | | | | 65.1 | | | | 70.7 | | | | 79.4 | | | | 84.2 | | | | 88.0 | |
IMSS | | | 124.9 | | | | 133.7 | | | | 142.5 | | | | 152.2 | | | | 160.6 | | | | 168.5 | |
ISSSTE | | | 29.4 | | | | 30.9 | | | | 32.6 | | | | 33.8 | | | | 35.2 | | | | 35.0 | |
Interest | | | 273.9 | | | | 305.1 | | | | 314.6 | | | | 346.0 | | | | 408.3 | | | | 462.4 | |
Federal Government | | | 240.5 | | | | 256.9 | | | | 270.3 | | | | 291.8 | | | | 322.2 | | | | 377.9 | |
Public agencies | | | 33.4 | | | | 48.2 | | | | 44.3 | | | | 54.1 | | | | 86.1 | | | | 84.4 | |
PEMEX | | | 25.2 | | | | 38.4 | | | | 32.6 | | | | 42.7 | | | | 72.6 | | | | 69.3 | |
CFE | | | 8.2 | | | | 9.8 | | | | 11.7 | | | | 11.5 | | | | 13.5 | | | | 15.2 | |
IMSS | | | 0.0 | | | | 0.0 | | | | 0.0 | | | | 0.0 | | | | 0.0 | | | | 0.0 | |
ISSSTE | | | 0.0 | | | | 0.0 | | | | 0.0 | | | | 0.0 | | | | 0.0 | | | | 0.0 | |
Current transfers, net | | | 857.5 | | | | 931.2 | | | | 992.5 | | | | 1,109.5 | | | | 1,190.0 | | | | 1,200.7 | |
Total | | | 1,159.2 | | | | 1,279.4 | | | | 1,367.8 | | | | 1,514.3 | | | | 1,636.1 | | | | 1,689.0 | |
To public sector | | | 301.7 | | | | 348.2 | | | | 375.3 | | | | 404.8 | | | | 446.1 | | | | 488.3 | |
States’ revenue sharing | | | 477.3 | | | | 494.3 | | | | 532.5 | | | | 584.9 | | | | 629.1 | | | | 678.7 | |
Acquisitions | | | 240.9 | | | | 266.3 | | | | 270.4 | | | | 239.8 | | | | 230.3 | | | | 223.1 | |
Federal Government | | | 21.2 | | | | 20.3 | | | | 18.4 | | | | 19.9 | | | | 23.6 | | | | 21.6 | |
Public agencies | | | 219.7 | | | | 246.0 | | | | 252.0 | | | | 219.8 | | | | 206.8 | | | | 201.5 | |
PEMEX | | | 9.7 | | | | 10.2 | | | | 8.8 | | | | 7.9 | | | | 8.1 | | | | 6.8 | |
CFE | | | 153.1 | | | | 173.9 | | | | 183.1 | | | | 151.5 | | | | 131.1 | | | | 122.5 | |
IMSS | | | 39.1 | | | | 46.0 | | | | 44.9 | | | | 48.0 | | | | 52.1 | | | | 56.4 | |
ISSSTE | | | 17.9 | | | | 15.9 | | | | 15.2 | | | | 12.4 | | | | 15.5 | | | | 15.9 | |
Other current expenditures | | | 559.0 | | | | 617.5 | | | | 603.4 | | | | 718.5 | | | | 819.5 | | | | 748.8 | |
Federal Government | | | 168.6 | | | | 176.3 | | | | 149.8 | | | | 194.7 | | | | 230.7 | | | | 166.4 | |
Public agencies | | | 390.4 | | | | 441.1 | | | | 453.6 | | | | 523.9 | | | | 588.8 | | | | 582.3 | |
PEMEX | | | 34.2 | | | | 35.4 | | | | 33.7 | | | | 45.1 | | | | 59.6 | | | | 40.1 | |
CFE | | | 38.4 | | | | 51.4 | | | | 36.7 | | | | 45.2 | | | | 49.6 | | | | 51.7 | |
IMSS | | | 202.1 | | | | 227.8 | | | | 246.6 | | | | 277.7 | | | | 305.7 | | | | 314.4 | |
ISSSTE | | | 115.7 | | | | 126.5 | | | | 136.6 | | | | 156.0 | | | | 173.8 | | | | 176.1 | |
Capital expenditures | | | 703.5 | | | | 741.5 | | | | 875.8 | | | | 895.7 | | | | 936.0 | | | | 738.9 | |
Federal Government | | | 388.8 | | | | 387.2 | | | | 502.5 | | | | 495.7 | | | | 591.3 | | | | 400.6 | |
Public agencies | | | 314.8 | | | | 354.3 | | | | 373.3 | | | | 400.0 | | | | 344.7 | | | | 338.2 | |
PEMEX | | | 266.0 | | | | 309.9 | | | | 331.3 | | | | 356.9 | | | | 303.4 | | | | 293.1 | |
CFE | | | 36.0 | | | | 34.1 | | | | 33.8 | | | | 40.3 | | | | 36.9 | | | | 37.2 | |
IMSS | | | 8.4 | | | | 8.1 | | | | 3.2 | | | | 2.5 | | | | 3.1 | | | | 5.0 | |
ISSSTE | | | 4.4 | | | | 2.2 | | | | 4.9 | | | | 0.4 | | | | 1.3 | | | | 2.9 | |
Payments due in previous years | | | — | | | | — | | | | — | | | | — | | | | — | | | | (32.0 | ) |
| Note: | Numbers may not total due to rounding. |
| (2) | Budgetary estimates are as of December 2015. Budgetary estimates were converted into constant pesos using the GDP deflator for 2016 estimated as of December 2015. |
| (3) | Constant pesos with purchasing power as of December 31, 2008. |
Source: Ministry of Finance and Public Credit.
D-73
During 2015, spending on social development programs, such as education, public health and social security, reached a total of Ps. 2,250.9 billion (accounting for 58.8% of total programmable expenditures) while spending on economic development reached a total of Ps. 1,179.1 billion (accounting for 30.8% of total programmable expenditures). According to preliminary figures, expenditures for agriculture, forests, fishing and hunting totaled Ps. 95.4 billion in nominal pesos, as compared to Ps. 97.8 billion in 2014. Expenditures for residential and community development totaled Ps. 330.6 billion in nominal pesos, as compared to Ps. 307.2 billion in 2014.
The Government has created several stabilization funds that aim to reduce the volatility in its revenues. As of December 31, 2015, the Fondo de Estabilización de los Ingresos Petroleros (Oil Revenues Stabilization Fund) totaled Ps. 16.6 billion, the Fondo de Estabilización de los Ingresos de las Entidades Federativas (Federal Entities Revenue Stabilization Fund) totaled Ps. 4.8 billion while the Fondo de Estabilización para la Inversión en Infraestructura de Petróleos Mexicanos (Infrastructure Investment Stabilization Fund of Petróleos Mexicanos) and the Fondo de Apoyo para la Reestructura de Pensiones (Fund to Support Pension Restructuring) did not have any remaining funds.
Health and Labor, Education and Other Social Welfare Expenditures
The Government administers the majority of the country’s social service and welfare programs. The Government directly funds social service programs, primarily from current revenues, and also transfers funds to social service agencies with separate sources of income. According to preliminary figures, the principal social welfare expenditures of the Government in 2015 were used on health, social security and education.
The Government spent Ps. 1,192.8 billion in nominal pesos (or 31.2% of programmable expenditures) on health and social security in 2015. The principal social security institutions are the IMSS, the ISSSTE and the Lotería Nacional para la Asistencia Pública (National Lottery for Public Assistance). Programs provided by these entities include medical and hospital-related services, health and maternity insurance and preventive health services. The Government coordinates the activities of various public agencies and organizes a national system of health services in order to provide these services to a larger portion of the population.
The Government devotes a significant share of its resources to education and vocational training. In 2015, the Government spent Ps. 671.5 billion in nominal pesos (or 17.5% of programmable expenditures) on education. The Government’s immediate goals include providing elementary and secondary education to all Mexican children and providing increased technical training tailored to the changing demands of the Mexican economy. According to the UNESCO Institute for Statistics, published by the World Bank, approximately 94.6% of the Mexican population that is 15 years of age or older was literate in 2015.
The structure of the Mexican educational system is based on the concept of “educational federalism,” with the underlying premise that it is the responsibility of each state to provide for the education of its population.
A Constitutional reform of education went into effect on February 27, 2013. This reform is intended to improve the public educational system of Mexico and provides federal funding for extended learning hours and the improvement of school-related infrastructure. For more information about this reform, see “The Economy—Principal Sectors of the Economy—Education.”
The Government established INFONAVIT in 1972 in order to both improve living conditions for Mexico’s low-income population and provide access to property and housing loans. INFONAVIT is supported by contributions from all Mexican employers, which correspond to approximately 5% of all paid salaries. In 2015, INFONAVIT granted approximately 690,050 loans for the funding of housing purchases, construction and repairs, as compared to the approximately 555,861 loans provided in 2014. For further information regarding INFONAVIT, see “The Economy—Employment and Labor.”
D-74
Government Agencies and Enterprises
The following table shows, for each principal Governmental agency or enterprise outside of the financial sector, its principal business, its percentage of Government ownership, its size (based on total assets at its latest fiscal year end), its net contribution or expense to the public sector primary balance and the amount of its outstanding borrowings for which the Government is responsible.
Table No. 63 – Principal Government Agencies, Productive State-Owned Companies and Enterprises at December 31, 2015
| | | | | | | | | | | | | | | | | | |
Agency/Enterprise | | Principal Business | | % of
Government
Ownership | | | Total
Assets(2) | | | Contribution or
Expense to
Primary
Balance(2)(3) | | | Outstanding
Guaranteed
Debt(2) | |
| | | | | | | | (in millions of dollars) | |
PEMEX | | Production, refining and distribution of crude oil and derivatives | | | 100 | % | | $ | 75,807.0 | | | $ | 2,801.1 | | | $ | — | |
CFE | | Production and sale of electricity | | | 100 | | | | 69,434.6 | | | | 2,460.0 | | | | — | |
Federal Roads and Bridges(4) | | Administration of toll highways | | | 100 | | | | 211.8 | | | | 9.7 | (1) | | | — | |
Airports and Auxiliary Services(4) | | Airport services | | | 100 | | | | 879.4 | | | | (11.1 | ) | | | — | |
| (2) | Financial data is calculated herein in accordance with Mexican financial reporting standards applicable to public sector entities, which differ in material respects from U.S. GAAP and IFRS. Accordingly, data may not be comparable with financial data calculated in accordance with Mexican financial reporting standards presented elsewhere herein. |
| (3) | Surplus after Government transfers, less interest payments. |
| (4) | Primary surplus before transfers to the Tesorería de la Federación (Treasury of the Federation). |
Source: Ministry of Finance and Public Credit.
D-75
PUBLIC DEBT
General
“Public sector debt” refers to any short-term debt incurred by the public sector and any long-term debt incurred by: (1) the Government; (2) productive state-owned companies; (3) budget-controlled agencies; and (4) administratively-controlled agencies. Public sector debt does not include any private sector debt guaranteed by the Government, unless and until the Government is called upon to make a payment under any such guaranty. “Long-term debt” refers to all debt with maturities of one year or more from the issuance date, while “short-term debt” is defined as all debt with maturities of less than one year from the issuance date.
All public debt borrowings are authorized or contracted pursuant to Mexico’s Ley Federal de Deuda Pública (Federal Law of Public Debt) or to other specific laws (as in the case of productive state-owned companies).
Under the Federal Law of Public Debt, public borrowing programs contained in the Revenue Law must be submitted annually to Congress for approval. Once this approval is obtained, the executive branch, through the Ministry of Finance and Public Credit, creates a financing program within the parameters of the Congressional approval.
The Federal Law of Public Debt also requires that the President: (1) inform Congress annually of the status of the indebtedness of the Government and budget-controlled agencies when presenting the annual Public Account and when proposing the Revenue Law; and (2) report the status of such indebtedness to Congress on a quarterly basis. See “Public Finance—General—Budget Process.”
The Federal Law of Public Debt specifies that Government ministries may only incur debt through the Ministry of Finance and Public Credit. However, budget-controlled and administratively-controlled agencies may incur external indebtedness, after obtaining the authorization of the Ministry of Finance and Public Credit. Pursuant to the energy secondary legislation reform of August 2014, PEMEX and CFE will no longer need to obtain the authorization of the Ministry of Finance and Public Credit in order to incur external indebtedness. See “The Economy—Principal Sectors of the Economy—Petroleum and Petrochemicals” and “The Economy—Principal Sectors of the Economy—Electric Power” for further discussion of the energy reform.
Internal Public Debt
The Government’s “net internal debt” includes only the internal portion of indebtedness incurred directly by the Government and the assets of the Retirement Savings System Fund. In addition, “net internal debt” is comprised of Cetes and other securities sold to the public in auctions for new issuances (primary auctions) but does not include any debt allocated to Banco de México for its use in Regulación Monetaria (regulating the money supply). It also does not include IPAB debt or the debt of budget-controlled or administratively-controlled agencies. At December 31, 2015, all of the Government’s internal debt was denominated in pesos or UDIs and was payable in pesos.
Internal Public Debt Policy
Over the last two decades, the Government has actively sought to increase its average debt maturity date. Accordingly, the Government has issued new debt instruments bearing longer maturities than those previously issued. In doing so, the Government hopes to mitigate any risk associated with the refinancing of its internal public debt. This practice has had the effect of establishing a long-dated benchmark yield curve (the line that plots interest rates across different contract lengths for bonds having equal credit quality). These issuances have also encouraged long-term investments in the following areas: (1) fixed-rate contracts; (2) peso-denominated securities by Mexican companies; (3) Mexican financial hedging products; and (4) the use of long-term savings in financing long-term investment projects.
D-76
As a result of this policy, the average maturity of the Government’s internal debt increased from 7.2 years at December 31, 2010 to 8 years at December 31, 2015.
The Government also retains flexibility in managing the average maturity of its debt in order to better stabilize domestic financial markets. For example, during the last quarter of 2008 and in response to the global financial crisis, the Government increased the auctioned amount of 182-day Cetes and 364-day Cetes and decreased the auctioned amount of long-term bonds.
With respect to its internal public debt, the Government currently offers the following types of securities: (i) 28-day, 91-day, 182-day and 364-day Cetes; (ii) three-year, 10-year and 30-year UDI-denominated bonds; (iii) three-year, five-year, 10-year, 20-year and 30-year fixed-rate peso-denominated bonds; and (iv) five-year floating rate notes.
Internal Public Debt Levels
The 2015 Budget contemplated a budget deficit of approximately 1.0% of GDP (excluding investment projects with high social and economic impact). In order to finance this deficit, the 2015 Budget permitted the Government to issue new internal debt up to Ps. 595 billion.
The following table summarizes the gross and net internal debt of the Government at each of the dates indicated.
Table No. 64 – Gross and Net Internal Debt of the Government(1)
| | | | | | | | | | | | | | | | | | | | | | | | | | | | | | | | | | | | | | | | |
| | | At December 31, | |
| | | 2011 | | | 2012 | | | 2013 | | | 2014 | | | 2015 | |
| | | (in billions of pesos, except percentages) | |
Gross Debt | | | | | | | | | | | | | | | | | | | | | | | | | | | | | | | | | | | | | | | | |
Government Securities | | Ps. | 2,882.8 | | | | 90.2 | % | | Ps. | 3,257.8 | | | | 91.1 | % | | Ps. | 3,734.1 | | | | 91.9 | % | | Ps. | 4,223.3 | | | | 92.9 | % | | Ps. | 4,701.2 | | | | 92.7 | % |
Cetes | | | 456.6 | | | | 14.3 | | | | 531.3 | | | | 14.9 | | | | 635.6 | | | | 15.6 | | | | 678.7 | | | | 14.9 | | | | 655.8 | | | | 12.9 | |
Floating Rate Bonds | | | 202.5 | | | | 6.3 | | | | 200.4 | | | | 5.6 | | | �� | 216.6 | | | | 5.3 | | | | 232.6 | | | | 5.1 | | | | 296.5 | | | | 5.8 | |
Inflation-Linked Bonds | | | 642.1 | | | | 20.1 | | | | 747.2 | | | | 20.9 | | | | 888.7 | | | | 21.9 | | | | 1,011.1 | | | | 22.2 | | | | 1,196.6 | | | | 23.6 | |
Fixed Rate Bonds | | | 1,581.6 | | | | 49.5 | | | | 1,777.9 | | | | 49.7 | | | | 1,989.6 | | | | 49.0 | | | | 2,295.8 | | | | 50.5 | | | | 2,546.2 | | | | 50.2 | |
STRIPS of Udibonos | | | — | | | | — | | | | 1.0 | | | | 0.0 | | | | 3.6 | | | | 0.1 | | | | 5.1 | | | | 0.1 | | | | 6.1 | | | | 0.1 | |
Other(2) | | | 314.9 | | | | 9.8 | | | | 317.6 | | | | 8.9 | | | | 329.1 | | | | 8.1 | | | | 323.3 | | | | 7.1 | | | | 372.8 | | | | 7.3 | |
| | | | | | | | | | | | | | | | | | | | | | | | | | | | | | | | | | | | | | | | |
Total Gross Debt | | Ps. | 3,197.7 | | | | 100.0 | % | | Ps. | 3,575.3 | | | | 100.0 | % | | Ps. | 4,063.2 | | | | 100.0 | % | | Ps. | 4,546.6 | | | | 100.0 | % | | Ps. | 5,074.0 | | | | 100.0 | % |
| | | | | | | | | | | | | | | | | | | | | | | | | | | | | | | | | | | | | | | | |
Net Debt | | | | | | | | | | | | | | | | | | | | | | | | | | | | | | | | | | | | | | | | |
Financial Assets(3) | | | (85.6 | ) | | | | | | | (74.2 | ) | | | | | | | (169.3 | ) | | | | | | | (222.5 | ) | | | | | | | (259.9 | ) | | | | |
| | | | | | | | | | | | | | | | | | | | | | | | | | | | | | | | | | | | | | | | |
Total Net Debt | | Ps. | 3,112.1 | | | | | | | Ps. | 3,501.1 | | | | | | | Ps. | 3,893.9 | | | | | | | Ps. | 4,324.1 | | | | | | | Ps. | 4,814.1 | | | | | |
| | | | | | | | | | | | | | | | | | | | | | | | | | | | | | | | | | | | | | | | |
| | | | | | | | | | |
Gross Internal Debt/GDP | | | 20.5 | % | | | | | | | 22.1 | % | | | | | | | 24.2 | % | | | | | | | 25.3 | % | | | | | | | 26.9 | % | | | | |
Net Internal Debt/GDP | | | 19.9 | % | | | | | | | 21.6 | % | | | | | | | 23.2 | % | | | | | | | 24.0 | % | | | | | | | 25.5 | % | | | | |
Note: Numbers may not total due to rounding.
| (1) | Internal debt figures do not include securities sold by Banco de México in open-market operations to manage liquidity levels pursuant to Regulación Monetaria. This is because this does not increase the Government’s overall level of internal debt. Banco de México must reimburse the Government for any allocated debt that Banco de México sells into the secondary market and that is presented to the Government for payment. If Banco de México undertakes extensive sales of allocated debt in the secondary market, however, this can result in an elevated level of outstanding internal debt as compared to the Government’s figure for net internal debt. |
| (2) | Includes Ps. 169.0 billion for 2012, Ps. 165.5 billion for 2013, Ps. 161.5 billion for 2014 and Ps. 153.8 billion for December 31, 2015 in liabilities associated with social security under the ISSSTE Law. |
| (3) | Includes the net balance (denominated in pesos) of the Federal Treasury’s General Account in Banco de México. |
Source: Ministry of Finance and Public Credit.
The 2015 Budget also contemplated issuances of internal debt by public sector entities, such as Pemex and CFE, which were authorized to incur net internal debt of up to Ps. 110.5 billion and Ps. 8.0 billion, respectively.
D-77
At December 31, 2015, the Government’s net internal debt was 11.3% higher in nominal terms as compared to the Government’s net internal debt at December 31, 2014. This includes the Ps. 153.8 billion liability associated with social security under the ISSSTE Law. The net internal debt of the public sector, on the other hand, totaled Ps. 5,379.9 billion, a 12.0% increase in nominal terms as compared to the net internal debt of the public sector outstanding at December 31, 2014.
At December 31, 2015, the Government’s gross internal debt represented an 11.6% increase in nominal terms as compared to December 31, 2014. Of the total Government gross internal debt at December 31, 2015, Ps. 490.6 billion represented short-term debt, as compared to Ps. 520.8 billion at the end of 2014, and Ps. 4,583.4 billion represented long-term debt, as compared to Ps. 4,025.8 billion at the end of 2014. In comparison, the gross internal debt of the public sector totaled Ps. 5,639.5 billion at December 31, 2015, an 11.7% increase in nominal terms as compared to the gross internal debt of the public sector outstanding at December 31, 2014.
The Government’s financing costs on its internal debt during 2015 represented a 6.9% nominal increase as compared to its financing costs during 2014.
The 2016 Budget contemplates a budget deficit of approximately 0.5% of GDP (excluding investment projects with high social and economic impact). The 2016 Budget permits the Government to issue additional net internal debt in an amount up to Ps. 535.0 billion.
External Public Debt
“External public sector debt” consists of the external portion of the long-term indebtedness incurred directly by the Government, the external long-term indebtedness incurred by budget-controlled agencies and productive state-owned companies, the external long-term indebtedness incurred directly or guaranteed by administratively-controlled agencies (including but not limited to national development banks) and the short-term external debt of the public sector. Private sector debt guaranteed by the Government is not included, unless and until the Government is called upon to make payment under any such guaranty. “External public debt” does not include, among other things, repurchase obligations of Banco de México with the IMF (none of which were outstanding as of December 31, 2015). See “Financial System—Banking Supervision” and footnote 1 to the table “Summary of External Public Debt” below.
External Public Debt Policy
Since 1990, the majority of the public sector’s external borrowings have consisted of debt securities placed into the securities market. However, during Mexico’s 1995 financial crisis, official creditors and creditors of multilateral institutions provided Mexico with significant amounts of financing.
The Government’s debt policy during the past several years, combined with the performance of exports, has increased interest payments on external public sector debt, which have increased from 1.69% of total exports in 2010 to 1.8% of total exports in 2015. Public sector external debt financing costs totaled U.S. $6.8 billion in 2015, as compared to U.S. $6.5 billion in 2014, representing a 5.2% increase in nominal terms. Service payments of both principal and interest on public sector external debt constituted 1.2% of GDP in 2014, a 0.1%decrease compared to 2014.
Mexico’s external public debt goals are intended to provide the Government with flexibility to finance its stated needs, while also accounting for market volatility and unforeseen developments. The policy also seeks to maintain costs and risks at stable levels. Mexico primarily seeks debt financing through local markets, supplemented by external financing from the U.S., Europe and Japan. Mexico’s principal objectives in connection with its external financing include improving the terms and conditions of Mexico’s external liabilities, as well as strengthening and diversifying Mexico’s investor base, with specific consideration to Mexico’s continued presence in the most influential international markets. Objectives also include strengthening Mexico’s benchmark bonds and maintaining a constant relationship with international investors in order to ensure transparency and to promote investment in Mexico.
D-78
External Public Debt Levels
The 2015 Budget authorized the Government to incur up to U.S. $6.0 billion in additional net external debt, which includes external borrowings incurred from international financial institutions and external debt issuances in international markets.
For 2015, Congress authorized PEMEX and CFE to incur a net external indebtedness of up to U.S. $6.5 billion and U.S. $700 million, respectively, including through the issuance of securities and exchange or refinancing of its constituent sovereign debt obligations. For 2016, Congress authorized PEMEX to incur a net external indebtedness of up to U.S. $8.5 billion but did not authorize CFE to incur any additional net external indebtedness.
The following graphic represents the identities of Mexico’s public debt creditors, including Government and public sector creditors.
Table No. 65 – Public Debt Creditors at December 31, 2015
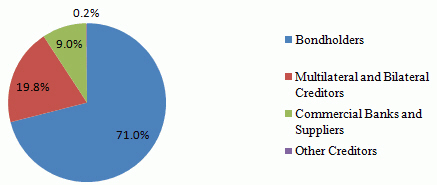
Source: Ministry of Finance and Public Credit.
D-79
The following tables set forth a summary of Mexico’s external public debt, including a breakdown of such debt by currency, net external public sector debt, the Government’s gross external debt, the Government’s net external debt and the Government’s net debt.
Table No. 66 – Summary of External Public Debt(1)
By Type
| | | | | | | | | | | | | | | | | | | | | | | | |
| | | Long-Term
Direct Debt of
the
Government | | | Long-Term
Debt
of Budget-
Controlled
Agencies | | | Other
Long-Term
Public
Debt(2) | | | Total Long-
Term Debt | | | Total Short-
Term Debt | | | Total Long- and
Short-Term Debt | |
| | | (in millions of U.S. dollars) | |
At December 31, | | | | | | | | | | | | | | | | | | | | | | | | |
2011 | | U.S.$ | 60,590 | | | U.S.$ | 47,436 | | | U.S.$ | 5,625 | | | U.S.$ | 113,651 | | | U.S.$ | 2,769 | | | U.S.$ | 116,420 | |
2012 | | | 66,912 | | | | 50,063 | | | | 5,626 | | | | 122,601 | | | | 3,125 | | | | 125,726 | |
2013 | | | 71,817 | | | | 53,358 | | | | 5,734 | | | | 130,909 | | | | 3,527 | | | | 134,436 | |
2014 | | | 78,379 | | | | 58,863 | | | | 5,627 | | | | 142,869 | | | | 4,797 | | | | 147,666 | |
2015 | | | 82,493 | | | | 69,621 | | | | 6,943 | | | | 159,057 | | | | 3,152 | | | | 162,209 | |
By Currency
| | | | | | | | | | | | | | | | | | | | | | | | | | | | | | | | | | | | | | | | |
| | | At December 31, | |
| | | 2011 | | | 2012 | | | 2013 | | | 2014 | | | 2015 | |
| | | (in millions of U.S. dollars, except for percentages) | |
U.S. Dollars | | U.S.$ | 97,048 | | | | 83.4 | % | | U.S.$ | 105,836 | | | | 84.2 | % | | U.S.$ | 111,647 | | | | 83.0 | % | | U.S.$ | 121,927 | | | | 82.6 | % | | U.S.$ | 131,702 | | | | 81.2 | % |
Japanese Yen | | | 6,793 | | | | 5.8 | | | | 6,847 | | | | 5.4 | | | | 5,519 | | | | 4.1 | | | | 5,058 | | | | 3.4 | | | | 4,857 | | | | 3.0 | |
Swiss Francs | | | 910 | | | | 0.8 | | | | 961 | | | | 0.8 | | | | 969 | | | | 0.7 | | | | 401 | | | | 0.3 | | | | 1,011 | | | | 0.6 | |
Pounds Sterling | | | 1,906 | | | | 1.6 | | | | 1,993 | | | | 1.6 | | | | 1,369 | | | | 1.0 | | | | 2,848 | | | | 1.9 | | | | 2,694 | | | | 1.7 | |
Euro | | | 9,377 | | | | 8.1 | | | | 9,530 | | | | 7.6 | | | | 11,489 | | | | 8.5 | | | | 13,986 | | | | 9.5 | | | | 18,834 | | | | 11.6 | |
Others | | | 385 | | | | 0.3 | | | | 558 | | | | 0.4 | | | | 3,443 | | | | 2.6 | | | | 3,445 | | | | 2.3 | | | | 3,3113 | | | | 1.9 | |
| | | | | | | | | | | | | | | | | | | | | | | | | | | | | | | | | | | | | | | | |
Total | | U.S.$ | 116,420 | | | | 100.0 | % | | U.S.$ | 125,726 | | | | 100.0 | % | | U.S.$ | 134,436 | | | | 100.0 | % | | U.S.$ | 147,666 | | | | 100.0 | % | | U.S.$ | 162,209 | | | | 100.0 | % |
| | | | | | | | | | | | | | | | | | | | | | | | | | | | | | | | | | | | | | | | |
Table No. 67 – Net External Debt of the Public Sector
| | | | | | | | | | | | | | | | | | | | |
| | | At December 31, | |
| | | 2011 | | | 2012 | | | 2013 | | | 2014 | | | 2015 | |
| | | (in millions of U.S. dollars, except for percentages) | |
Total Net Debt | | U.S. $ | 113,631.6 | | | U.S. $ | 121,659.0 | | | U.S. $ | 130,949.7 | | | U.S. $ | 145,617.4 | | | U.S.$ | 161,609.5 | |
Gross External Debt/GDP | | | 10.43 | % | | | 10.09 | % | | | 10.48 | % | | | 12.13 | % | | | 14.8 | % |
Net External Debt/GDP | | | 10.18 | % | | | 9.77 | % | | | 10.21 | % | | | 11.97 | % | | | 14.7 | % |
Table No. 68 – Gross External Debt of the Federal Government
| | | | | | | | | | | | | | | | | | | | | | | | | | | | | | | | | | | | | | | | |
| | | At December 31, | |
| | | 2011 | | | 2012 | | | 2013 | | | 2014 | | | 2015 | |
| | | (in millions of U.S. dollars, except for percentages) | |
U.S. dollars | | U.S.$ | 51,704 | | | | 84.3 | % | | U.S.$ | 57,465 | | | | 85.2 | % | | U.S.$ | 62,285 | | | | 86.3 | % | | U.S.$ | 65,127 | | | | 82.9 | % | | U.S.$ | 66,298 | | | | 80.3 | % |
Japanese yen | | | 3,933 | | | | 6.4 | | | | 4,433 | | | | 6.6 | | | | 3,643 | | | | 5.0 | | | | 3,686 | | | | 4.7 | | | | 3,672 | | | | 4.4 | |
Swiss francs | | | 267 | | | | 0.4 | | | | — | | | | — | | | | — | | | | — | | | | — | | | | — | | | | — | | | | — | |
Pounds sterling | | | 741 | | | | 1.2 | | | | 774 | | | | 1.1 | | | | 789 | | | | 1.1 | | | | 2,302 | | | | 2.9 | | | | 2,177 | | | | 2.6 | |
Euros | | | 4,694 | | | | 7.7 | | | | 4,771 | | | | 7.1 | | | | 5,447 | | | | 7.6 | | | | 7,437 | | | | 9.5 | | | | 10,422 | | | | 12.6 | |
Others | | | 14 | | | | 0.0 | | | | 18 | | | | 0.0 | | | | 16 | | | | 0.0 | | | | 20 | | | | 0.0 | | | | 19 | | | | 0.0 | |
| | | | | | | | | | | | | | | | | | | | | | | | | | | | | | | | | | | | | | | | |
Total | | U.S.$ | 61,352 | | | | 100.0 | % | | U.S.$ | 67,461 | | | | 100.0 | % | | U.S.$ | 72,180 | | | | 100.0 | % | | U.S. $ | 78,573 | | | | 100.0 | % | | U.S. $ | 82,588 | | | | 100.0 | % |
| | | | | | | | | | | | | | | | | | | | | | | | | | | | | | | | | | | | | | | | |
D-80
Table No. 69 – Net External Debt of the Federal Government
| | | | | | | | | | | | | | | | | | | | |
| | | At December 31, | |
| | | 2011 | | | 2012 | | | 2013 | | | 2014 | | | 2015 | |
| | | (in millions of U.S. dollars, except for percentages) | |
Total Net Debt | | U.S. $ | 59,642.5 | | | U.S. $ | 66,016.5 | | | U.S. $ | 69,910.4 | | | U.S. $ | 77,352.4 | | | U.S. $ | 82,320.3 | |
Gross External Debt/GDP | | | 5.50% | | | | 5.42% | | | | 5.63% | | | | 6.46% | | | | 7.50% | |
Net External Debt/GDP | | | 5.35% | | | | 5.30% | | | | 5.45% | | | | 6.36% | | | | 7.50% | |
Table No. 70 – Net Debt of the Federal Government
| | | | | | | | | | | | | | | | | | | | |
| | | At December 31, | |
| | | 2011 | | | 2012 | | | 2013 | | | 2014 | | | 2015 | |
External Debt | | | 21.14 | % | | | 19.70 | % | | | 19.01 | % | | | 20.84 | % | | | 22.73 | % |
Internal Debt | | | 78.86 | % | | | 80.30 | % | | | 80.99 | % | | | 79.16 | % | | | 77.27 | % |
Note: Numbers may not total due to rounding.
| (1) | External debt denominated in foreign currencies other than U.S. dollars has been translated into dollars at exchange rates as of each of the dates indicated. External public debt does not include (a) repurchase obligations of Banco de México with the IMF (none of which was outstanding as of December 31, 2015) or (b) loans from the Commodity Credit Corporation to public sector Mexican banks. External debt is presented herein on a “gross” basis, and includes external obligations of the public sector at their full outstanding face or principal amount. For certain informational and statistical purposes, Mexico sometimes reports its external public sector debt on a “net” basis, which is calculated as the gross debt net of certain financial assets held abroad. These financial assets include Mexican public sector external debt that is held by public sector entities but that has not been cancelled. |
| (2) | Includes development banks’ debt and the debt of other administratively-controlled agencies whose finances are consolidated with those of the Government. |
Source: Ministry of Finance and Public Credit.
The increase of approximately U.S. $14.5 billion in outstanding gross public sector external debt as of December 31, 2015 was mainly due to: (1) an increase in net external indebtedness of U.S. $16.2 billion; (2) a decrease of U.S. $1.5 billion in the federal public sector’s international assets relating to external debt denominated in other foreign currencies; and (3) negative adjustments of U.S. $1.6 billion, related to liability management transactions and the variation of the dollar with respect to other currencies. Of the total outstanding gross public sector external debt as of December 31, 2015, U.S. $159,057.2 billion represented long-term debt and U.S. $3,152.3 billion represented short-term debt.
Net external indebtedness of the Federal Government also increased by U.S. $4.0 billion during 2015 due to the incurrence of additional external indebtedness. Overall, total public debt (gross external debt plus net internal public sector debt) represented approximately 43.2% of nominal GDP, an increase of 4.6% from the end of 2014.
D-81
Table No. 71 – Amortization Schedule of Total Public Sector External Debt(1)
| | | | | | | | | | | | | | | | | | | | | | | | | | | | | | | | | | | | | | | | | | | | | | | | | | | | | | | | | | | | | | | | | | | | | | |
| | | Outstanding
as of
December 31,
2015(2) | | | 2016 | | | 2017 | | | 2018 | | | 2019 | | | 2020 | | | 2021 | | | 2022 | | | 2023 | | | 2024 | | | 2025 | | | 2026 | | | 2027 | | | 2028 | | | 2029 | | | Other
years | | | Total | |
| A. | | Private Creditors(3) | | | 124,947 | | | | 7,797 | | | | 5,870 | | | | 4,701 | | | | 7,938 | | | | 14,701 | | | | 6,518 | | | | 7,465 | | | | 8,431 | | | | 5,144 | | | | 6,198 | | | | 2,916 | | | | 1,695 | | | | 9 | | | | 1,096 | | | | 44,469 | | | | 124,947 | |
| | Capital Markets (Bonds) | | | 115,203 | | | | 3,346 | | | | 5,786 | | | | 4,661 | | | | 7,889 | | | | 9,581 | | | | 6,518 | | | | 7,465 | | | | 8,431 | | | | 5,144 | | | | 6,198 | | | | 2,916 | | | | 1,695 | | | | 9 | | | | 1,096 | | | | 44,469 | | | | 115,203 | |
| | Commercial Banks | | | 9,745 | | | | 4,452 | | | | 84 | | | | 40 | | | | 49 | | | | 5,120 | | | | 0 | | | | 0 | | | | 0 | | | | 0 | | | | 0 | | | | 0 | | | | 0 | | | | 0 | | | | 0 | | | | 0 | | | | 9,745 | |
| | Direct | | | 3,257 | | | | 3,147 | | | | 50 | | | | 10 | | | | 49 | | | | 0 | | | | 0 | | | | 0 | | | | 0 | | | | 0 | | | | 0 | | | | 0 | | | | 0 | | | | 0 | | | | 0 | | | | 0 | | | | 3,257 | |
| | Syndicated | | | 6,488 | | | | 1,304 | | | | 34 | | | | 30 | | | | 0 | | | | 5,120 | | | | 0 | | | | 0 | | | | 0 | | | | 0 | | | | 0 | | | | 0 | | | | 0 | | | | 0 | | | | 0 | | | | 0 | | | | 6,488 | |
| | | | | | | | | | | | | | | | | | |
| B. | | Multilateral Creditors | | | 28,647 | | | | 927 | | | | 941 | | | | 1,506 | | | | 877 | | | | 856 | | | | 2,717 | | | | 1,080 | | | | 2,147 | | | | 1,901 | | | | 4,208 | | | | 2,203 | | | | 2,907 | | | | 2,330 | | | | 1,366 | | | | 2,682 | | | | 28,647 | |
| | IADB | | | 13,784 | | | | 615 | | | | 630 | | | | 638 | | | | 634 | | | | 647 | | | | 798 | | | | 667 | | | | 1,097 | | | | 1,253 | | | | 2,260 | | | | 610 | | | | 594 | | | | 588 | | | | 573 | | | | 2,181 | | | | 13,784 | |
| | World Bank | | | 14,863 | | | | 312 | | | | 311 | | | | 869 | | | | 243 | | | | 209 | | | | 1,920 | | | | 413 | | | | 1,049 | | | | 648 | | | | 1,948 | | | | 1,593 | | | | 2,313 | | | | 1,741 | | | | 793 | | | | 501 | | | | 14,863 | |
| | | | | | | | | | | | | | | | | | |
| C. | | External Trade | | | 8,313 | | | | 1,825 | | | | 1,483 | | | | 1,350 | | | | 937 | | | | 690 | | | | 475 | | | | 316 | | | | 201 | | | | 241 | | | | 139 | | | | 137 | | | | 354 | | | | 28 | | | | 28 | | | | 108 | | | | 8,313 | |
| | Eximbanks | | | 3,405 | | | | 573 | | | | 632 | | | | 636 | | | | 356 | | | | 214 | | | | 117 | | | | 60 | | | | 40 | | | | 94 | | | | 28 | | | | 137 | | | | 354 | | | | 28 | | | | 28 | | | | 108 | | | | 3,405 | |
| | Commercial Banks(4) | | | 4,425 | | | | 1,160 | | | | 763 | | | | 626 | | | | 521 | | | | 423 | | | | 305 | | | | 222 | | | | 149 | | | | 146 | | | | 111 | | | | 0 | | | | 0 | | | | 0 | | | | 0 | | | | 0 | | | | 4,425 | |
| | Suppliers | | | 483 | | | | 93 | | | | 89 | | | | 88 | | | | 60 | | | | 54 | | | | 52 | | | | 35 | | | | 12 | | | | 1 | | | | 0 | | | | 0 | | | | 0 | | | | 0 | | | | 0 | | | | 0 | | | | 483 | |
| | | | | | | | | | | | | | | | | | |
| D. | | Other(5) | | | 303 | | | | 303 | | | | 0 | | | | 0 | | | | 0 | | | | 0 | | | | 0 | | | | 0 | | | | 0 | | | | 0 | | | | 0 | | | | 0 | | | | 0 | | | | 0 | | | | 0 | | | | 0 | | | | 303 | |
Public Sector Total | | | 162,210 | | | | 10,851 | | | | 8,293 | | | | 7,557 | | | | 9,753 | | | | 16,247 | | | | 9,710 | | | | 8,861 | | | | 10,778 | | | | 7,286 | | | | 10,545 | | | | 5,256 | | | | 4,957 | | | | 2,367 | | | | 2,489 | | | | 47,258 | | | | 162,210 | |
| Note: | Numbers may not total due to rounding. |
| (1) | The external debt of Mexico is presented herein on a “gross” basis, and includes external obligations of the public sector at their full outstanding face or principal amounts. For certain informational and statistical purposes, Mexico sometimes reports its external public sector debt on a “net” or “economic” basis, which is calculated as the gross debt net of certain financial assets held abroad. These financial assets include the value of principal and interest collateral on restructured debt and Mexican public sector external debt that is held by public sector entities but that has not been canceled. External public debt in this table does not include (a) repurchase obligations of Banco de México with the IMF (none of which were outstanding as of December 31, 2015), (b) external borrowings by the public sector after June 30, 2016, or (c) loans from the Commodity Credit Corporation to private sector Mexican banks. Mexico only updates this table semi-annually (in June and December); for this reason data included in the public debt section may not be reflected in this table. |
| (3) | Excludes foreign trade and restructured debt. |
| (4) | Includes foreign trade lines, revolving credits and other short-term credits. |
| (5) | Refers to changes in direct debt related to certain long-term infrastructure-related projects (PIDIREGAS). |
Source: Ministry of Finance and Public Credit.
D-82
External Debt Restructuring and Debt Service Reduction Transactions
In addition to Mexico’s strong commitment to working closely with its commercial bank and multilateral creditors to sustain economic growth, debt reduction has been and continues to be one of Mexico’s main goals.
Mexico has also engaged in debt-for-debt exchanges in order to reduce its total outstanding debt. Under these debt-for-debt exchanges, Mexico was able to refinance its existing debt by replacing it with new debt.
For the past twenty years, Mexico has conducted periodic ordinary course liability management transactions for the reduction of its total outstanding debt. In January 2015, the Government conducted one liability management transaction.
Table No. 72 – Liability Management Transactions
| | |
| January 2015 | | Tender offer pursuant to which the holders of ten series of Mexico’s U.S. dollar-denominated external bonds maturing in 2016, 2017, 2018, 2020, 2022, 2026, 2031, 2033, 2034 and 2040 were invited to submit offers to sell their bonds to Mexico for cash. Pursuant to the tender offer, approximately U.S. $1.6 billion of outstanding bonds were cancelled. A portion of the proceeds of Mexico’s offering of U.S. $1.0 billion of 3.600% Global Notes due 2025 and U.S. $3.0 billion of 4.600% Global Notes due 2046 was used to finance the tender offer. A summary of the tender offer results follows. |
| | | | | | | | | | |
Old Notes Series | | CUSIP | | Outstanding Amount
Repurchased in
Tender Offer | | | Outstanding Amount
After
Tender Offer | |
11.375% Global Bonds due 2016 | | 593048BA8 | | | N/A | | | U.S.$ | 1,585,706,000 | |
5.625% Global Bonds due 2017 | | 91086QAU2 | | U.S.$ | 77,900,000 | | | U.S.$ | 2,760,633,000 | |
5.950% Global Notes due 2019 | | 91086QAW8 | | U.S.$ | 286,718,000 | | | U.S.$ | 1,643,518,000 | |
5.125% Global Notes due 2020 | | 91086QAY4 | | U.S.$ | 79,912,000 | | | U.S.$ | 1,922,812,000 | |
8.000% Global Notes due 2022 | | 91086QAJ7 | | | N/A | | | U.S.$ | 611,193,000 | |
11.500% Global Notes due 2026 | | 593048AX9 | | | N/A | | | U.S.$ | 320,945,000 | |
8.300% Global Notes due 2031 | | 91086QAG3 | | U.S.$ | 21,307,000 | | | U.S.$ | 1,158,045,000 | |
7.500% Global Notes due 2033 | | 91086QAN8 | | U.S.$ | 36,100,000 | | | U.S.$ | 787,361,000 | |
6.750% Global Notes due 2034 | | 91086QAS7 | | U.S.$ | 505,700,000 | | | U.S.$ | 1,806,712,000 | |
6.050% Global Notes due 2040 | | 91086QAV0 | | U.S.$ | 588,788,000 | | | U.S.$ | 3,317,359,000 | |
Debt Record
Following the 1946 rescheduling of debt incurred prior to the Revolution of 1910, Mexico has not defaulted in the payment of principal or interest on any of its external indebtedness.
IMF Credit Lines
The IMF has worked with Mexico to secure its economy since the 1980s debt crisis in Latin America. In 2009, Mexico was the first country to use the IMF’s contingent credit line program, the FCL, which allows countries with strong policy frameworks and track records in economic performance to seek assistance and borrow from the IMF when faced with potential or actual balance of payments pressures. Mexico has maintained an FCL arrangement with the IMF since 2009.
D-83
On November 7, 2014, the Foreign Exchange Commission submitted a new request to the IMF for an advanced renewal and amendment of Mexico’s contingent credit line with the IMF. On November 26, 2014, the IMF approved this request and extended the term of the credit line. The amount available under the credit line is approximately U.S. $70.0 billion.
D-84