| |
Management s Discussion and Analysis |
The following Management s Discussion and Analysis ( MD&A ) of the financial condition and results of our operations should be read in conjunction with our consolidated financial statements and notes relating thereto that are included elsewhere in this report. Our financial statements have been prepared in accordance with Canadian generally accepted accounting principles ( GAAP ). This discussion and analysis contains forward-looking statements, which involve risks and uncertainties. Our actual results could differ materially from those anticipated in the forward-looking statements.
These forward-looking statements can generally be identified by the use of statements that include phrases such as believe , expect , anticipate , intend , plan , likely , will or similar words or phrases. Similarly, statements that describe our objectives, plans or goals are or may be forward-looking statements. These forward-looking statements are based on our current expectations and projections about future events. However, whether actual results and developments will conform with our expectations and projections is subject to a number of risks and uncertainties, including, among other things, the risks and uncertainties described under section Risk Analysis and the risk factors described in our Annual Information Form for the year ended December 31, 2004 under the heading Risk Factors . These are not necessarily all of the important factors that could cause actual results to differ materially from those expressed in any of our forward-looking statements. Other known or unpredictable factors could also harm our results. Consequently, there can be no assurance that the actual results or developments anticipated by us will be realized or, even if substantially realized, that they will have the expected consequences to, or affects on, us. Unless otherwise required by applicable securities law, we disclaim any intention or obligation to publicly update or revise any forward-looking statements, whether as a result of new information, future events or otherwise.
In our MD&A we use certain terms, which are specific to the oil and gas industry, including net return and cash flow . These are non-GAAP terms defined within our MD&A.
Except as otherwise required by the context, reference in this MD&A to our , we or us refer to the combined business of PetroKazakhstan Inc. and all of its subsidiaries and joint ventures.
Additional information filed with Canadian securities commissions and the United States Securities and Exchange Commission, including our quarterly and annual reports and our Annual Information Form (AIF/40-F), are available on line at www.sedar.com and www.sec.gov.
All numbers are in U.S. Dollars unless otherwise indicated.
OVERVIEW AND STRATEGY
PetroKazakhstan Inc. is an integrated oil company that owns and operates oil and gas production and a refinery in Kazakhstan. We use the term Upstream to refer to the exploration for and production of oil and gas from our licenses in the South Turgai Basin, Kazakhstan. We use the term Downstream to refer to the operations of our refinery located in Shymkent, Kazakhstan and the marketing and transportation of refined products and the management of the marketing and transportation of crude oil for Upstream.
BUSINESS STRATEGY
PetroKazakhstan strives to be the leading integrated oil and gas company in the Former Soviet Union and an exemplary corporate citizen. Our goal is to create superior value for our shareholders and the Republic of Kazakhstan while protecting the health and safety of our people and the environment.
The primary elements of our strategy are to:
| 4 | Explore our undeveloped properties.We have approximately 3,400,000 acres of land that we intend to explore and develop. |
| | |
| 4 | Capitalize on development opportunities.We intend to bring our proved undeveloped reserves into production in a timely, efficient and profitable manner. |
| | |
| 4 | Fully exploit our reserves.We intend to focus on the complete reserve base and continue to develop and bring more reserves into the proved category. |
| | |
| 4 | Seek selective acquisition opportunities. As part of our strategy to increase reserves and production, we are pursuing opportunities to acquire additional reserves from third parties. Our acquisition strategy has focused on acreage and assets, both producing and of exploration potential, within the vicinity of our current oil fields and throughout Kazakhstan. |
| | |
| 4 | Open new transportation routes to international markets and reduce our transportation costs.In 2004, approximately 55% of crude oil sales went to export markets. Though we have been successful in reducing our transportation costs to these markets, they still remain our single largest cost of operations. |
| | |
| 4 | Improve the operational performance of our refinery. Since the acquisition of the refinery in 2000, we have been implementing projects designed to increase product quality and production yields and to improve the refinery s product mix. |
| | |
| 4 | Control and reduce our overhead and operating costs.Overlaps in the operations of our principal operating subsidiaries, PKKR and PKOP, have been essentially eliminated by establishing a joint marketing and transportation team. We have divested non-core activities and continue to aim at reduction of our operating costs. |
| | |
| 4 | Manage our environmental and social responsibilities to ensure that we earn support from all stakeholders for PetroKazakhstan s growth and operating plans.In late 2003 we commissioned our gas utilization project designed to reduce the flaring of gas produced from our Kumkol fields and the consequential release of pollutants into the environment. We also plan to complete the construction of a gas processing plant in our Akshabulak field in 2005, which will further reduce gas flaring. |
HIGHLIGHTS
| | | Years ended December 31 | |
| | | | | | | | | 2004 | | 2003 | |
| | | 2004 | | 2003 | | 2002 | | vs 2003 | | vs 2002 | |
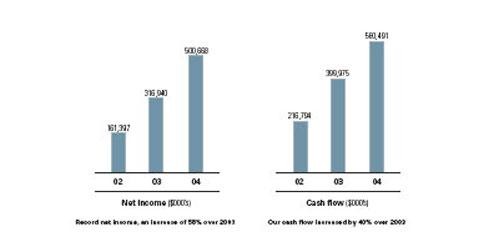
Net income ($000 s) | | | 500,668 | | | 316,940 | | | 161,397 | | | 58 | % | | 96 | % |
Cash flow($000 s)1 | | | 560,491 | | | 399,975 | | | 216,794 | | | 40 | % | | 84 | % |
| Basic net income per share | | | 6.40 | | | 4.06 | | | 2.00 | | | 58 | % | | 103 | % |
| Basic cash flow per share | | | 7.16 | | | 5.12 | | | 2.68 | | | 40 | % | | 91 | % |
Production, bopd2 | | | 151,102 | | | 151,349 | | | 135,842 | | | - | | | 11 | % |
| Capital expenditures | | | 165,952 | | | 203,213 | | | 140,102 | | | (18 | %) | | 45 | % |
| Total assets | | | 1,269,081 | | | 1,041,451 | | | 709,723 | | | 22 | % | | 47 | % |
| Long-term debt | | | 134,862 | | | 246,655 | | | 281,797 | | | (45 | %) | | (12 | %) |
| Cash dividends declared | | | 39,253 | | | - | | | - | | | 100 | % | | - | |
| Common shares outstanding | | | 76,223,130 | | | 77,920,226 | | | 78,956,875 | | | (2 | %) | | (1 | %) |
1 | Cash flow: We evaluate our operations based upon our net income and cash flow. Cash flow is a non-GAAP measure that represents cash generated from operating activities before changes in non-cash working capital. We consider this to be a key measure as we use this measure to evaluate our ability to generate cash to fund our growth through capital expenditures and our ability to repay debt. The comparable GAAP measure is cash flow from operating activities. The following table reconciles our non-GAAP measure cash flow to the comparable GAAP measure Cash flow from operating activities . Cash flow does not have any standardized meaning prescribed by Canadian GAAP and is, therefore, unlikely to be comparable to similar measures presented by other issuers. |
| | | Years ended December 31 | |
($000 s) | | 2004 | | 2003 | | 2002 | |
| Cash flow | | | 560,491 | | | 399,975 | | | 216,794 | |
| Changes in non-cash operating working capital items | | | (24,899 | ) | | (60,625 | ) | | (37,816 | ) |
| Cash flow from operating activities | | | 535,592 | | | 339,350 | | | 178,978 | |
2 | We report production before royalties as we measure our Upstream operations on this basis, which is consistent with industry practice in Canada. |
NET INCOME VARIANCES
| | | $ millions | |
| Net income for the year ended December 31, 2002: | | | 161 | |
| Increase in the price of crude oil | | | 76 | |
| Increase in net return at Kumkol for refined products | | | 72 | |
| Increase in refined products sales volumes | | | 23 | |
| Increase in crude oil export sales volumes | | | 16 | |
| Increase in depletion and depreciation | | | (16 | ) |
| Other variances | | | (15 | ) |
| Net income for the year ended December 31, 2003: | | | 317 | |
| Increase in the price of crude oil | | | 200 | |
| Increase in net return at Kumkol for refined products | | | 92 | |
| Improvement in differential | | | 32 | |
| Increase in crude oil export sales volumes | | | 24 | |
| Increase in prices for crude oil purchases | | | (38 | ) |
| Excess profit tax | | | (35 | ) |
| Hedging | | | (26 | ) |
| Decrease in refined products sales volumes | | | (22 | ) |
| Increase in depletion and depreciation | | | (16 | ) |
| Higher income tax rate for Kazgermunai | | | (12 | ) |
| Other variances | | | (15 | ) |
Net income for the year ended December 31, 2004: | | | 501 | |
Higher prices for crude oil and refined products in 2003 and 2004 were the major reason for our record results. Our efforts to improve our differential in 2004 added an additional $32.0 million to our net income. These gains were partially offset by the foregone revenue from our hedging program and the increased prices paid for crude oil purchased from third parties. Lower throughput volumes and the refinery turnaround led to lower sales of refined products in 2004.
KEY PERFORMANCE INDICATORS
We measure the performance of our Upstream and Downstream operations using the following key performance indicators:
| | | Years ended December 31 | |
| | | 2004 | | 2003 | | 2002 | |
| Production, bopd | | | 151,102 | | | 151,349 | | | 135,842 | |
Differential ($/bbl) | | | 12.62 | | | 14.11 | | | 13.97 | |
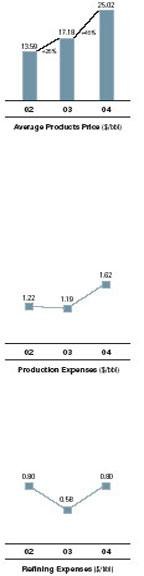
Average refined products price($/bbl) | | | 25.02 | | | 17.18 | | | 13.59 | |
Production expense($/bbl) | | | 1.62 | | | 1.19 | | | 1.22 | |
Refining cost($/bbl) | | | 0.80 | | | 0.58 | | | 0.80 | |
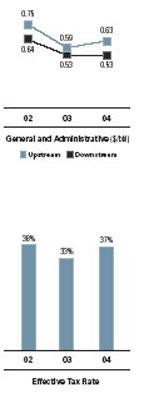
General and administrative($/bbl) | | | 1.16 | | | 1.12 | | | 1.39 | |
Effective income tax rate(%) | | | 37.5 | | | 32.8 | | | 38.0 | |
Production. SeeVolumetrics for a discussion of our production.
Strategy: Open new transportation routes to international markets and reduce our transportation costs
Differentials. The graph below shows the evolution of our differential.

* | Our differential is calculated as the difference between the average Brent price for crude oil export sales received by PKKR and Turgai, and our net return at Kumkol. Differential is a non-GAAP measure that is the sum of the costs and discounts incurred in order to transport and sell our crude oil to international markets. The sales revenue used in this measure differs from sales revenue in the statement of net income and the net return table for the following reasons: |
| | |
| | 4 | The differential does not include Kazgermunai sales over which we have limited control. Kazgermunai is excluded because the differential is used to measure the performance of our internal marketing group. |
| | 4 | The differential is calculated using finalized sales transactions. Our financial statements include estimates that may or may not reflect the finalized transactions. |
| | | |
| | The term differential does not have a standardized meaning prescribed by Canadian GAAP and is, therefore, unlikely to be comparable to similar measures presented by other companies. |
Our differential constitutes our single largest expenditure and the management of this cost is one of our primary objectives. To achieve this, we have a dedicated crude oil marketing and logistics team whose objective is to sell our crude oil to end users and to obtain a greater understanding and control over our export routes. To accomplish this, we have acquired a fleet of approximately 5,000 purchased and leased rail cars, obtained access to loading facilities and ports and we have opened new transportation routes.
We export crude oil in all geographical directions, north to Atyrau through our Dzhusaly terminal and then onward through the CPC pipeline, east to China via the Atasu terminal, south to Uzbekistan and Iran and west through Aktau to the port of Batumi and some onward shipments to ports in the Mediterranean.
We have made greater use of pipelines thereby reducing our rail costs. Specifically, our KAM pipeline and the KTO pipeline to Atasu with onward rail to China.
In the third quarter of 2004, the combination of different routes, increased utilisation of pipelines, having railcars under our control, and reduced discounts negotiated with buyers led to our overall crude differential reaching its lowest level in four years at $11.66/bbl.
In the fourth quarter of 2004 our differential increased by $0.79/bbl over the fourth quarter of 2003 and increased by $2.17/bbl over the third quarter of 2004.
Increased demand for sour crudes in the Mediterranean as a result of increases in the differential between sweet and sour crudes, changed the average premium of Kumkol over Brent of $0.68/bbl in the third quarter of 2004 to a discount of $0.38/bbl by the fourth quarter of 2004, an impact of $1.06/bbl.
Increased shipping rates and demurrage costs for vessels, a seasonal factor, were exacerbated by the hurricanes in the United States during the fall of 2004, which led to worldwide increased shipping rates charged by crude oil purchasers during the fourth quarter of 2004. For cargoes of approximately 80,000 metric tonnes average freight and demurrage rates increased from $1.06/bbl in the third quarter of 2004 to $3.37/bbl in the fourth quarter of 2004. Approximately 68% of completed sales during the fourth quarter of 2004 were affected by these rate increases.
To address this issue, we have chartered our own vessels on better terms than those obtained through our crude oil purchasers, and our cargoes are being delivered by us directly into the Mediterranean. We have also concentrated our efforts on selling into markets that are not affected by this increase in shipping rates, including Central Asia and China.
The Kumkol premium to Brent during the fourth quarter of 2003 was $0.37/bbl. The improved discounts we have negotiated on our sales and the impact of increased volumes on routes with better differentials were offset by the year over year $0.75/bbl change in the premium/discount of Kumkol crude oil to Brent, and our increased shipping and demurrage costs when comparing the fourth quarter of 2004 with 2003.
Outlook: Expectations going forward are that the differential will remain between $13.50/bbl and $14.00/bbl until the end of the first quarter of 2005, with a return to the $12.00/bbl mark for the second and third quarters of 2005. The seasonal factors discussed above will likely increase our fourth quarter differential in 2005, though it is difficult to predict by how much and we will take all possible steps to mitigate these factors.
| Average refined products price Our average refined product price received in 2004 was $7.84 higher than the average price we received in 2003. This was due to improvements in our yield such that we obtain greater volumes of higher value products per each barrel of crude oil refined. In addition, international crude oil prices influence refined product prices, as does economic growth within Kazakhstan. The price of refined products in Russia has a significant impact on the market price in Kazakhstan as products from Russia move across the border with relative ease and if refined product prices rise above Russian prices the Kazakhstan market is oversupplied with refined products from Russia. Outlook: Refined product prices will be determined by market prices, including refined product prices in Russia and world oil prices. Strategy: Control and reduce our overhead and operation costs Production expenses Production expenses were higher in 2004 compared to 2003 due to a number of factors. We continued to use temporary power generators to operate single well batteries in the KAM fields pending construction of infrastructure. The water cut in a number of our fields including our joint venture Turgai continued to increase resulting in higher production expenses. The number of wells and facilities commissioned in 2004 was higher compared to 2003. During 2004, we drilled 54 new production wells, including 25 wells that were drilled by our joint ventures. Outlook: During 2005 we will be installing flowlines to tie in the single wells at the KAM fields to our main facilities and we are also planning to increase the capacity of existing facilities to handle the increasing water production. Our Upstream operations have embarked on a program focused on reducing production expenses. A number of initiatives have been identified and we are in the process of implementation. Refining cost Refining costs in 2004 reflected the impact of the first major turnaround since 2002. Major repairs were performed on the main crude processing units, visbreaker and storage facilities. Annual purchased energy costs were also marginally higher due to the operation of the Vacuum Distillation Unit (VDU) brought online in January 2004. Outlook: We do not plan to have a major turnaround in 2005. Refining costs should therefore be lower. |
| General and administrative expenses Our general and administrative expenses are virtually unchanged in 2004, as most of our expenses are fixed in nature. The per barrel decrease in 2003 compared to 2002 was mainly due to increased production levels. Our Upstream field office is in Kyzylorda, the majority of our Upstream staff is located there, and all related costs are classified as general and administrative as opposed to production expenses. Outlook: We do not expect a significant change in our general and administrative expenses in 2005. Effective income tax rate The statutory tax rate in Kazakhstan, where all of our operations are located, is 30%. Our effective tax rate differs due to certain expenses, which cannot be deducted for statutory tax purposes. Our tax rate as a percentage of net income before tax of 37.5% in 2004 increased from 32.8% in 2003, mainly due to excess profit tax provided for in Turgai and the higher marginal tax rate in Kazgermunai. Our tax rate as a percentage of net income before tax of 32.8% in 2003 decreased from 38.0% in 2002, mainly because we refinanced our debt, increasing the deductibility of our interest expense. Outlook: It remains our goal to minimize our non-deductible expenses and manage our excess profit tax exposure. Our goal is to maximize deductions, consistent with the applicable tax legislation for each of our hydrocarbon production contracts. SensitivitiesThe following table sets forth our estimate of the impact on net income and cash flow to changes in the following. |
| | | | | Net income and | |
| | | Change | | cash flow after tax | |
| | | | | ($ millions) | |
| Crude oil | | $ | 1/bbl in Brent | | | 28.5 | |
| Differential | | $ | 1/bbl change | | | 24.5 | |
| Refined products price | | $ | 1/bbl in overall average | | | 15.7 | |
| Production volume | | | 5,000 bopd | | | 14.0 | |
| Production cost | | | 10 | % | | 6.1 | |
| General and administrative expenses | | | 10 | % | | 4.0 | |
| Refining cost | | | 10 | % | | 1.9 | |
| 4 | The variable with the most significant impact on our business is the international price for crude oil. This directly impacts the value of our exports, and has a significant influence on refined product prices. |
| 4 | The differential has an equivalent per barrel impact as Brent on our exports of crude oil, while average refined product prices impact the value obtained for refined products sales. |
| 4 | Production volumes impact our results as we have more or less crude oil to sell or refine. |
| 4 | Changes in our production, general and administrative and refining costs are less significant because these costs represent a relatively low percentage of our total costs. |
| | VOLUMETRICS UPSTREAM Production The following table sets forth our barrels of oil produced per day by field: |
Field (bopd) | | 2004 | | 2003 | | 2002 | |
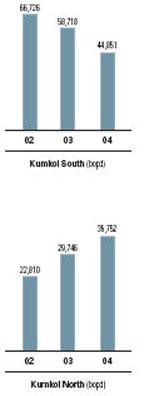
| Kumkol South | | | 44,851 | | | 58,718 | | | 66,726 | |
| Kumkol North | | | 35,752 | | | 29,746 | | | 22,810 | |
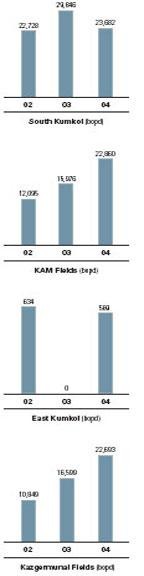
| South Kumkol | | | 23,682 | | | 29,846 | | | 22,728 | |
| Kyzylkiya | | | 9,895 | | | 7,925 | | | 6,941 | |
| Aryskum | | | 10,835 | | | 7,000 | | | 4,330 | |
| Maibulak | | | 2,130 | | | 1,051 | | | 824 | |
| North Nurali | | | 398 | | | 464 | | | - | |
| East Kumkol | | | 589 | | | - | | | 634 | |
| License #952 | | | 270 | | | - | | | - | |
| License #951 | | | 7 | | | - | | | - | |
| Kazgermunai Fields | | | 22,693 | | | 16,599 | | | 10,849 | |
| Total | | | 151,102 | | | 151,349 | | | 135,842 | |
| Strategy: Fully and effectively exploit our reserves 2004 versus 2003 Kumkol South - decrease of 13,867 bopd. The decrease in Kumkol South production in 2004 was mainly due to 19 wells that border the Kumkol North field that were shut-in for the first four months of 2004 and are now on a reduced production scheme designed to equalize the reservoir pressure between the fields. The net impact of the reduced production scheme on our average annual rate of production was a decrease of 8,500 bopd. Additionally, during the fourth quarter of 2004 water injection capacity was a limiting factor in optimizing our production due to increased water production from our Kumkol South, South Kumkol and Kumkol North fields. Outlook: We expect to produce 39,200 bopd per day from Kumkol South in 2005 and plan to improve our surface water handling facilities by looping lines, adding further injection pumping capacity and debottlenecking existing facilities. Kumkol North- increase of 6,006 bopd. Increases in production from our Kumkol North field were due to an increase in the number of production wells and installation of artificial lift. Outlook: We do not plan to increase the level of production in 2005, and our expectation for the next year is 35,800 bopd. |
| South Kumkol- decrease of 6,164 bopd. South Kumkol production decreased due to declining reservoir pressure which necessitated the conversion of three of our producing wells to water injection wells. Unexpected failures of electrical pumps had an impact of 4,500 bopd on our rate of production. During the fourth quarter of 2004, pumps were optimized and field production resumed at normal rates. Outlook: We plan to maintain our production levels at 22,800 bopd in 2005 by constructing a new water injection facility to maintain reservoir pressure. KAM fields - increase of 6,884 bopd. The increase in production from our KAM fields (Kyzylkiya, Aryskum, Maibulak) was due to the increased number of wells put on production and implementation of our artificial lift program. A significant delay in the arrival of a drilling rig reduced the number of Aryskum development wells resulting in a negative impact of 2,300 bopd on our average annual forecasted production rate. Outlook: We expect to further increase production to 38,900 bopd in 2005 through continued investment in these fields including new development drilling and infrastructure investment. East Kumkol - increase of 589 bopd. East Kumkol volume was produced on an extended production test, pending completion of a hydrocarbon production contract. Outlook: Our expectation is to start commercial production in the second quarter of 2005 with our share of production from this field to average 900 bopd over the year. Kazgermunai fields - increase of 6,094 bopd. Kazgermunai completed surface facility debottlenecking measures in late 2003, leading to the increase in 2004 production. Outlook: We expect the production level in our Kazgermunai fields to be at 30,000 bopd in 2005, which will be achieved due to the installation of parallel production facilities. 2003 versus 2002: Production levels in 2003 were affected by a number of factors unrelated to the technical performance of our fields. These included weather related issues in the Caspian and Black Seas, which reduced producers ability to export crude oil, restrictions in the transportation system and the temporary suspension of production at the Aryskum field in mid-year. The fourth quarter also saw a temporary reduction of production in order to harmonize the operation of certain wells at the border of Kumkol South and Kumkol North fields. |
Crude oil volumetrics
The following table sets forth the movements in inventory for our Upstream operations for the years ended December 31:
(mmbbls) | | 2004 | | 2003 | | 2002 | |
| Opening inventory of crude oil | | | 2.87 | | | 2.72 | | | 0.70 | |
| Production | | | 55.31 | | | 55.24 | | | 49.58 | |
| Crude oil purchased from third parties | | | 1.09 | | | 0.03 | | | 0.68 | |
Crude oil purchased from joint ventures(50%) | | | 0.11 | | | 0.25 | | | 2.92 | |
| Sales or transfers | | | (55.15 | ) | | (54.53 | ) | | (51.08 | ) |
| Field and transportation losses | | | (0.28 | ) | | (0.19 | ) | | (0.08 | ) |
| Return of purchased crude | | | - | | | (0.65 | ) | | - | |
| Closing inventory of crude oil | | | 3.95 | | | 2.87 | | | 2.72 | |
In 2002, our Upstream operations purchased 2.9 mmbbls of crude oil from Turgai. In 2004 and 2003 almost all crude oil acquired from Turgai was purchased by our Downstream operations.
Under the terms of an agreement with the company assigned by the government to market royalty-in-kind volumes for 2002 we purchased 0.65 mmbbls of crude oil, which was in our inventory at December 31, 2002. This oil was returned in the first quarter of 2003.
The following table sets out our total crude oil sales and transfers from Upstream operations for the years ended December 31:
| | | 2004 | | 2003 | | 2002 | |
| | | mmbbls | | % | | mmbbls | | % | | mmbbls | | % | |
| Crude oil exports | | | 30.30 | | | 54.9 | | | 27.99 | | | 51.3 | | | 25.89 | | | 50.7 | |
Crude oil transferred to Downstream | | | 14.93 | | | 27.1 | | | 18.85 | | | 34.6 | | | 16.82 | | | 32.9 | |
Crude oil transferred to Downstream by joint ventures(50%) | | | 5.82 | | | 10.6 | | | 5.31 | | | 9.7 | | | 4.39 | | | 8.6 | |
Crude oil tolled by joint ventures (50%) | | | - | | | - | | | 0.35 | | | 0.7 | | | - | | | - | |
| Royalty payments | | | 4.10 | | | 7.4 | | | 2.03 | | | 3.7 | | | 3.48 | | | 6.8 | |
Crude oil domestic sales | | | - | | | - | | | - | | | - | | | 0.50 | | | 1.0 | |
Total crude oil sales or transfers | | | 55.15 | | | 100.0 | | | 54.53 | | | 100.0 | | | 51.08 | | | 100.0 | |
DOWNSTREAM
Refining
The refinery at Shymkent has a total operating capacity of 6.6 million tonnes per year or about 51.1 million barrels per year. Crude oil feedstock for our refinery is primarily acquired from our Upstream operations, but purchases are also made from third parties. Feedstock is refined into a number of products, which are generally sold domestically. The refinery also refines crude oil on behalf of third parties for a processing fee. Due to the size of the available market for refined products in Kazakhstan, the refinery operated at 53% of capacity or 27.2 million barrels in 2004, 60% capacity or 30.6 million barrels in 2003 and 53% capacity or 27.1 million barrels in 2002.
Our total processed volumes were as follows:
(mmbbls) | | 2004 | | 2003 | | 2002 | |
| Feedstock refined into product | | | 26.70 | | | 30.01 | | | 25.77 | |
| Tolled volumes | | | 0.53 | | | 0.59 | | | 1.33 | |
| Total processed volumes * | | | 27.23 | | | 30.60 | | | 27.10 | |
* | The total processed volumes are used for our per barrel calculations |
Strategy: Improve the operational performance of our refinery
The refinery continued to focus on the improvement of yields while minimizing the production of heavier end and lower value products. The production of mazut (heavy fuel oil), a low value product, has been further reduced year-over-year. Mazut yield in 2004 averaged 23.1% versus 32.5% in 2003 (35.9% in 2002). Our Vacuum Distillation Unit was brought on stream in January 2004, resulting in a significant decline in mazut production.
Outlook: We continue working on the improvement of our refinery yields and quality of products. In 2005 we expect to increase the quality of our high-grade gasoline by using high-value additives.
Sources of feedstock supplies for our refinery were as follows:
(mmbbls) | | 2004 | | 2003 | | 2002 | |
| Acquired from PKKR | | | 14.93 | | | 18.85 | | | 16.82 | |
Purchased from joint ventures(100%) | | | 11.65 | | | 10.62 | | | 8.78 | |
Tolled by joint ventures(50%)* | | | - | | | 0.35 | | | - | |
| Purchased from third parties | | | 0.02 | | | 0.08 | | | - | |
| Total feedstock acquired | | | 26.60 | | | 29.90 | | | 25.60 | |
* | 50% of volumes tolled by our joint ventures are attributable to our joint venture partners and are not included in our inventory movements and ending inventory. |
Feedstock and refined products volumetrics
The movements in our feedstock inventory at our refinery were as follows:
(mmbbls) | | 2004 | | 2003 | | 2002 | |
| Opening inventory of crude oil feedstock | | | 0.03 | | | 0.20 | | | 0.34 | |
| Purchase and acquisition of feedstock | | | 26.60 | | | 29.90 | | | 25.60 | |
| Recoverable feedstock from traps * | | | 0.10 | | | (0.06 | ) | | 0.03 | |
| Feedstock refined into product | | | (26.70 | ) | | (30.01 | ) | | (25.77 | ) |
| Closing inventory of feedstock | | | 0.03 | | | 0.03 | | | 0.20 | |
* | This represents trapped oil processed, net of trapped oil recovered. During 2003 the trapped oil tank was emptied for repairs. |
The movement in inventory of refined products was as follows:
(mmtonnes)* | | 2004 | | 2003 | | 2002 | |
| Opening inventory of refined product | | | 0.26 | | | 0.22 | | | 0.20 | |
| Refined product from feedstock** | | | 3.23 | | | 3.64 | | | 3.09 | |
| Refined product purchased | | | 0.05 | | | 0.02 | | | 0.09 | |
| Refined product sold | | | (3.30 | ) | | (3.62 | ) | | (3.16 | ) |
| Refined product internal use and yield losses | | | (0.03 | ) | | - | | | - | |
| Closing inventory of refined product | | | 0.21 | | | 0.26 | | | 0.22 | |
* | The inventory of products represents a mix of products for which no unique conversion from barrels to tonnes exists. The standard conversion used by us for crude oil is 7.746 barrels to the tonne. |
** | Refined products from feedstock are presented as actual output from refined volumes of crude oil. |
NET RETURN PER BARREL
Set forth below are the details of the average net return achieved for crude oil export sales and sales derived from the refining of our own crude. Net return per barrel is a non-GAAP measure that shows averages across all types of sales contracts and illustrates the relationship between exports of crude oil versus refining our own crude oil and marketing refined crude oil products. Net return per barrel does not have a standardized meaning prescribed by Canadian GAAP and is therefore unlikely to be comparable to similar measures presented by other companies.
| | | Crude oil | | Own crude oil | |
($/bbl) | | exports | | refined and sold | |
Year ended December 31, 2004 | | | | | | | |
| Net realized price | | | 30.12 | | | 25.02 | |
| Transportation costs | | | (6.94 | ) | | (2.66 | ) |
| Selling costs | | | (0.60 | ) | | (0.78 | ) |
| Crude utilized in refining ** | | | - | | | (1.36 | ) |
| Refining cost | | | - | | | (0.80 | ) |
| Royalties and taxes - Downstream | | | - | | | (0.71 | ) |
General and administrative costs - Downstream | | | - | | | (0.53 | ) |
| Net return at Kumkol *** | | | 22.58 | | | 18.18 | |
| Production cost | | | (1.62 | ) | | (1.62 | ) |
| Royalties and taxes - Upstream | | | (1.94 | ) | | (1.94 | ) |
| General and administrative costs - Upstream | | | (0.63 | ) | | (0.63 | ) |
| Net return per barrel | | | 18.39 | | | 13.99 | |
Year ended December 31, 2003 | | | | | | | |
| Net realized price | | | 21.32 | | | 17.20* | |
| Transportation costs | | | (7.21 | ) | | (1.09 | ) |
| Selling costs | | | (0.38 | ) | | (0.64 | ) |
| Crude utilized in refining ** | | | - | | | (0.94 | ) |
| Refining cost | | | - | | | (0.58 | ) |
| Royalties and taxes - Downstream | | | - | | | (0.40 | ) |
| General and administrative costs - Downstream | | | - | | | (0.53 | ) |
| Net return at Kumkol *** | | | 13.73 | | | 13.02 | |
| Production cost | | | (1.19 | ) | | (1.19 | ) |
| Royalties and taxes - Upstream | | | (1.27 | ) | | (1.27 | ) |
| General and administrative costs - Upstream | | | (0.59 | ) | | (0.59 | ) |
| Net return per barrel | | | 10.68 | | | 9.97 | |
See notes on page 46
| | | Crude oil | | Own crude oil | |
($/bbl) | | exports | | refined and sold | |
Year ended December 31, 2002 | | | | | | | |
| Net realized price | | | 17.20 | | | 13.81* | |
| Transportation costs | | | (5.04 | ) | | (0.94 | ) |
| Selling costs | | | (0.23 | ) | | (0.67 | ) |
| Crude utilized in refining ** | | | - | | | (0.98 | ) |
| Refining cost | | | - | | | (0.80 | ) |
| Royalties and taxes - Downstream | | | - | | | (0.41 | ) |
| General and administrative costs - Downstream | | | - | | | (0.64 | ) |
| Net return at Kumkol *** | | | 11.93 | | | 9.37 | |
| Production cost | | | (1.22 | ) | | (1.22 | ) |
| Royalties and taxes - Upstream | | | (1.16 | ) | | (1.16 | ) |
| General and administrative costs - Upstream | | | (0.75 | ) | | (0.75 | ) |
| Net return per barrel | | | 8.80 | | | 6.24 | |
* | Net realized price shown in these tables does not include the price received for purchased refined products resold. |
** | Crude utilized in refining is our fuel consumption and yield loss percentage from refining our crude oil applied to the overall sales price received for our products. |
*** | Average Brent or a similar index for each respective period does not reflect our average realized Brent price because of the timing of recognition of sales for financial statement purposes and the terms of the sales. Financial statement sales revenue is the basis used to determine the net sales price achieved in these tables. Therefore, a comparison of average Brent or similar index to our net return at Kumkol cannot be used to determine our differential. |
2004 versus 2003:
Net return for crude oil exports increased by $7.71/bbl in 2004 primarily due to:
| 4 | Significant increase in market prices, with average Brent in 2004 of $38.27/bbl compared to $28.83/bbl in 2003. This was partially offset by: |
| | 4 | Foregone revenue due to our hedging program, which had a negative impact of $1.39 per barrel sold in 2004 compared to $0.16/bbl for 2003. See Note 15 to our consolidated financial statements. |
| | 4 | Royalties and taxes, which increased by $0.67/bbl due to the increase in royalties as a result of higher crude oil prices. |
Net return for own crude oil refined and sold increased by $4.02/bbl in 2004 primarily due to:
| 4 | Higher sales prices on all products and an improved yield, whereby more higher value products were produced. |
| 4 | The sale of VGO, a new high value product, accounted for 8% of total sales volumes in 2004. |
| 4 | Transportation costs increased by $1.57/bbl with a corresponding increase in our sales price due to refined products export sales on non-FCA terms. |
2003 versus 2002:
During 2003, our net return for crude oil exports increased by $1.88/bbl compared to 2002 due to an increase in market prices (average Brent was $28.83/bbl compared to $25.02/bbl in 2002) and transportation cost reductions after the start up of the KAM pipeline. These were partially offset by an increase in pipeline and railway tariffs. The increase in non-FCA sales of 19.40 million barrels or 90% in 2003 versus 2002, increased both the net sales price achieved and our transportation costs, as our sales point for crude oil, where title is transferred, was closer to the final destination. Our net return for own crude oil refined and sold increased by $3.73/bbl compared to 2002 due to an improvement in yields and higher sales prices.
REVENUE
| | | | | | | 2004 | | | |
Year ended December 31 ($000 s) | | 2004 | | 2003 | | vs 2003 | | % | |
| Crude oil | | | 992,880 | | | 621,126 | | | 371,754 | | | 59.9 | |
| Refined products | | | 639,405 | | | 481,326 | | | 158,079 | | | 32.8 | |
| Service fees | | | 6,484 | | | 11,532 | | | (5,048 | ) | | (43.8 | ) |
| Interest income | | | 3,658 | | | 3,340 | | | 318 | | | 9.5 | |
| Total revenue | | | 1,642,427 | | | 1,117,324 | | | 525,103 | | | 47.0 | |
| | | | | | | 2003 | | | |
Year ended December 31 ($000 s) | | 2003 | | 2002 | | vs 2002 | | % | |
| Crude oil | | | 621,126 | | | 481,114 | | | 140,012 | | | 29.1 | |
| Refined products | | | 481,326 | | | 332,639 | | | 148,687 | | | 44.7 | |
| Service fees | | | 11,532 | | | 9,646 | | | 1,886 | | | 19.6 | |
| Interest income | | | 3,340 | | | 1,951 | | | 1,389 | | | 71.2 | |
| Total revenue | | | 1,117,324 | | | 825,350 | | | 291,974 | | | 35.4 | |
We derive our revenues principally from the sale of crude oil and refined products. To a much lesser extent, we also derive revenue from refining crude oil on behalf of third parties for which we receive processing fees, and production and ancillary support services provided to our joint venture Turgai Petroleum on a fee basis. Our results are dependent on the levels of our oil production and on prevailing world prices for crude oil and Kazakhstani prices for refined products. Prices for crude oil and refined products are subject to large fluctuations in response to a variety of factors beyond our control.
Crude oil
We market and sell our crude oil for export under a variety of contracts. Crude production can be sold to third parties within Kazakhstan, normally at rail terminals in Kazakhstan. Under these contracts, called Free Carrier Agreements ( FCA ) sales title to the crude oil passes to the buyer at the point of loading the crude into rail cars. The price achieved for these export sales is shown net of a differential to the prevailing Brent price at the time of the sale. The differential reflects a number of factors, the most significant of which relates to rail transportation costs. In the following tables included in our MD&A, these sales are shown as Crude sales sold FCA .
Alternatively, we can sell crude at points closer to a final delivery point. Under this type of sale, whereby contracts are concluded on various alternative bases, including delivery at frontier ( DAF ), delivered duty unpaid ( DDU ), cost, insurance and freight ( CIF ), cost and freight ( CFR ), delivered ex ship ( DES ), carriage paid to ( CPT ) and free on board ( FOB ), we arrange and assume all of the costs and obligations of transportation. The sales price reflects the Brent price less a differential. As with FCA sales, this differential reflects a number of factors, the most significant being remaining transportation costs to the final delivery point. With this type of sale, title to the crude oil does not pass to the buyer until the crude is loaded into an oil tanker at a port or the rail cars pass the borders of Kazakhstan or reach a specific destination point. We do not record the associated revenue until title to the crude oil passes to the buyer. This leads to significant volumes in transit, recorded as inventory. These sales are shown in the tables as Crude sales sold non-FCA .
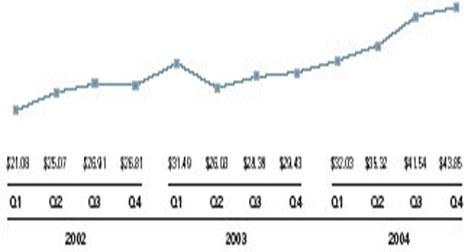
For 2004 there were large fluctuations in world crude oil prices due to increased demand for crude oil and various political instabilities. The benchmark price that we use on all of our crude sales contracts, regardless of destination and the sales or Incoterms used, is Brent. Brent closed the year over the $40.00/bbl mark, with an average for the year of $38.27/bbl. For 2003 the average was $28.83/bbl. There was a lot of volatility, with the spread between high and low daily Platts quotes of some $22.96/bbl in 2004 with a much lower spread in 2003 of $11.90/bbl.
The average quarterly quotes for Brent were as follows:
The table below sets out the crude oil revenue, volumes sold and net realized prices:
| | | Quantity | | Net realized | | | |
| | | sold | | price | | Revenue | |
| | | (mmbbls) | | ($/bbl) | | ($000's) | |
2004 | | | | | | | | | | |
| Crude sales sold FCA | | | - | | | - | | | - | |
| Crude sales sold non-FCA | | | 23.32 | | | 31.18 | | | 727,221 | |
| Kazgermunai export sales | | | 6.98 | | | 26.59 | | | 185,632 | |
| Royalty payments | | | 4.10 | | | 19.52 | | | 80,027 | |
| Total | | | 34.40 | | | 28.86 | | | 992,880 | |
| 2003 | | | | | | | | | | |
| Crude sales sold FCA | | | 2.89 | | | 15.50 | | | 44,781 | |
| Crude sales sold non-FCA | | | 19.40 | | | 23.22 | | | 450,542 | |
| Kazgermunai export sales | | | 5.70 | | | 17.78 | | | 101,350 | |
| Royalty payments | | | 2.03 | | | 12.05 | | | 24,453 | |
| Total | | | 30.02 | | | 20.69 | | | 621,126 | |
| 2002 | | | | | | | | | | |
| Crude sales sold FCA | | | 12.74 | | | 13.48 | | | 171,711 | |
| Crude sales sold non-FCA | | | 10.21 | | | 22.70 | | | 231,766 | |
| Kazgermunai export sales | | | 2.94 | | | 14.22 | | | 41,813 | |
| Royalty payments | | | 3.48 | | | 9.27 | | | 32,247 | |
| Crude oil domestic sales | | | 0.50 | | | 7.15 | | | 3,577 | |
| Total | | | 29.87 | | | 16.11 | | | 481,114 | |
As in our net return discussion, net realized prices are dependent on the world price for crude oil, the export route used and the point of sale or terms of sales, all of which may vary significantly from period to period. Our differential from Brent is our key performance indicator.
2004 versus 2003:
| 4 | Our increase of $371.8 million in crude oil sales for 2004 compared to 2003 was due to the increased market price for crude oil (average Brent for 2004 increased by $9.44/bbl) and higher sales volumes realized on non-FCA terms. |
| 4 | The positive effect from the increase in market prices was partially offset by higher hedging expenses that decreased our revenue by $42.1 million. |
| 4 | Royalty payment volumes are physical deliveries made quarterly in arrears for all fields with the exception of our North Kumkol and Kazgermunai fields. There were no royalty in-kind volumes in first half of 2003, because we settled our royalty obligations with cash payments. |
2003 versus 2002:
| 4 | Our increase of $140.0 million in crude oil revenue for 2003 compared to 2002 was due to the increase in the average price we receive for our exported crude oil. Our total volumes of crude oil sold were virtually unchanged as our increase in production was processed through our refinery. |
| 4 | We increased our net realized price by $4.58/bbl. We achieved this increase mainly because average Brent for the year was $3.81/bbl higher when compared to 2002. Additionally, we increased our non-FCA volumes, which obtain a higher price, as the sale is made closer to the final destination. |
| 4 | Kazgermunai also contributed to the increase because they increased crude oil revenue by $59.5 million due to an almost doubling of export volumes and a $3.56 increase in the price received per barrel. |
| 4 | We have dramatically increased the percentage of our oil export sales sold through non-FCA contracts in 2003, which were 64.6% in 2003 (34.2% in 2002). By the end of 2003 there were no crude oil sales sold on an FCA basis. |
Refined products
The tables below set forth the related tonnes of refined products sold, the average prices obtained and revenues received for 2004, 2003 and 2002:
| | | Tonnes | | Average | | | |
Year ended December 31 | | sold | | price | | Revenue | |
| | | | | ($/tonne) | | ($000's) | |
2004 | | | 3,298,956 | | | 193.82 | | | 639,405 | |
| 2003 | | | 3,617,085 | | | 133.07 | | | 481,326 | |
| 2002 | | | 3,160,062 | | | 105.26 | | | 332,639 | |
2004 versus 2003:
Refined product revenues of $639.4 million in 2004 showed an increase of $158.1 million as compared to 2003. The main contributing factors were as follows:
| 4 | Strong world crude oil prices during the period, which resulted in higher average product prices in Kazakhstan and its neighboring countries. This increased revenues by $160.1 million in 2004. |
| 4 | The shift from FCA to non-FCA export terms during the period. A portion of the non-FCA sales price includes the recovery of transportation costs to the delivery point where title transfers to the customer, usually at the Kazakhstan border. This transfer to non-FCA terms added approximately $40.3 million to refined products revenues. |
| 4 | The sale of our new product VGO, a product not produced or sold in 2003. The commissioning of the Vacuum Distillation Unit at our Shymkent refinery in January 2004 allowed us to further refine Mazut, a low-grade product, into VGO, which realizes a considerably higher price on the export market. VGO sales generated $66.6 million of revenues in 2004. |
| 4 | The foregoing factors were partially offset by $42.3 million due to the decrease in sales of refined products. |
The revenue increase in 2003 of $148.7 million was due to our higher average realized price of $133.07/tonne (compared to $105.26/tonne in 2002) and our higher sales volumes of 3.6 million tonnes (compared to 3.2 million tonnes in 2002).We were able to obtain higher prices and volumes for 2003 as compared to 2002, as demand in Kazakhstan increased.
We increased our refinery throughput in 2003, as we were experiencing interruptions in our ability to export crude oil at the beginning of the year. This led to a 457,023 tonne, or 14.5%, increase in refined product sales. Our average price increase of $27.81/tonne was mainly due to increases in prices received for gasoline and diesel.
PRODUCTION EXPENSES
Production expenses relate to the cost of producing crude oil in our Upstream operations. Based on the number of barrels of oil produced, these costs were as follows:
| | | Production | | Per barrel of | |
Year ended December 31 | | expenses | | oil produced | |
| | | ($000 s) | | ($/bbl) | |
2004 | | | 89,339 | | | 1.62 | |
| 2003 | | | 65,516 | | | 1.19 | |
| 2002 | | | 60,596 | | | 1.22 | |
2004 versus 2003:
Production expenses increased by $23.8 million, or $0.43/bbl, for the year ended December 31, 2004. The main contributing factors were as follows:
| 4 | The continued increase in water cut at our Kumkol South, South Kumkol and Kumkol North fields and additional wells placed on artificial lift resulted in increased expenditures of $5.9 million, or $0.11/bbl. Additional investments will be made during 2005 on water handling facilities which we expect to reduce our production expenses |
| 4 | In our KAM fields, we are operating single well batteries pending completion of infrastructure. We also commissioned a number of new facilities: Aryskum central processing facility, Aryskum gas compressor for gas re-injection, Maibulak water injection, Aryskum pumping station on our KAM pipeline, and we commenced installation of artificial lift, all of which led to higher costs of approximately $6.8 million, or $0.12/bbl. |
| 4 | Direct production expenses in our joint ventures did not significantly change in 2004 compared to 2003. However, our production expenses in 2003 included adjustments in our Turgai joint venture related to 2002 and the reversal of over accrued insurance costs, which reduced 2003 expenses by $2.3 million. There were also significant changes in the levels of inventory in Turgai that impacted our production expenses. These factors had an impact of $0.13/bbl on our consolidated production costs. |
2003 versus 2002:
Production expenses increased by $4.9 million in 2003. The main reason was the 11.4% increase in production volumes, which led to an increase of $3.8 million. The remaining $1.1 million was due to increased costs because of the increasing production of formation water.
ROYALTIES AND TAXES
The following table sets forth the components of royalties and taxes:
($000 s) | | 2004 | | 2003 | | 2002 | |
| Royalties and production bonus | | | 81,185 | | | 56,016 | | | 47,892 | |
| Tax assessments | | | 14,452 | | | 5,401 | | | 5,121 | |
| ARNM assessment | | | 5,045 | | | - | | | - | |
| Other taxes | | | 25,762 | | | 20,878 | | | 15,701 | |
| Royalties and taxes | | | 126,444 | | | 82,295 | | | 68,714 | |
Royalties and production bonus
Royalties are levied at differing rates for each of our oil fields. The table below sets forth the parameters for each production field. Royalty terms remain the same throughout the term of the license.
| | | | | Annual production | | | | | | | |
| | | | | at which | | Effective | | Effective | | Effective | |
| | | | | maximum royalty | | average royalty | | average royalty | | average royalty | |
| Field | | Range | | rate is charged | | rate for 2004 | | rate for 2003 | | rate for 2002 | |
| Kumkol South | | | 3.0 - 15.0 | % | | 11.62 mmbbls | | | 8.9 | % | | 10.3 | % | | 10.9 | % |
| Kumkol North | | | 9 | % | | Flat | | | 9.0 | % | | 9.0 | % | | 9.0 | % |
| South Kumkol | | | 10 | % | | Flat | | | 10.0 | % | | 10.0 | % | | 10.0 | % |
| Kyzylkiya | | | 1.5 - 2.5 | % | | 24.8 mmbbls* | | | 1.5 | % | | 1.5 | % | | 1.5 | % |
| Aryskum | | | 1.5 - 2.5 | % | | 52.7 mmbbls* | | | 1.5 | % | | 1.5 | % | | 1.5 | % |
| Maibulak | | | 3.0 - 6.0 | % | | 3.9 mmbbls | | | 3.0 | % | | 3.0 | % | | 3.0 | % |
| Kazgermunai Fields | | | 3.0 - 15.0 | % | | 11.62 mmbbls | | | 8.94 | % | | 6.12 | % | | 4.5 | % |
* | Royalty rate is based upon cumulative life of field production. |
Royalties and production bonus for the year ended December 31, 2004 were $81.2 million, which represented an effective overall royalty rate of 7.9% excluding production bonuses of $0.7 million for our Kumkol North field. Royalties and production bonus for 2003 were $56.0 million, which represented an effective overall royalty rate of 8.6% excluding production bonuses of $1.4 million for Kumkol North, Kumkol South and South Kumkol fields. The main reason for the lower overall royalty rate was that a higher proportion of production came from fields with lower royalty rates. Despite the decrease in the average rate, royalties and taxes increased due to the increase in crude oil prices.
Royalties and production bonus for 2002 were $47.9 million, an overall royalty rate of 9.0%, after excluding the production bonuses of $4.0 million. The reason for the lower overall royalty rate in 2003 was that a higher proportion of production came from fields with lower royalty rates.
Our production bonus expense was $0.7 million in 2004, $1.4 million in 2003 and $4.0 million in 2002. In 2004 production bonus expenses related only to our North Kumkol field. In 2003 and 2002 our production bonuses were related to our Kumkol South, South Kumkol and North Kumkol fields. The bonus decreased by $2.6 million in 2003, because we paid the final amount for our Kumkol South field in February of 2003 and on our South Kumkol field in October of 2003. We have to pay a further $1.0 million (our 50% share) for North Kumkol when the cumulative production reaches 15,000,000 tonnes (116.2 million barrels), which we expect to occur in 2005.
Tax assessments
Our tax assessments of $14.5 million in 2004 included the following amounts:
| 4 | $8.0 million in fines and penalties on road fund taxes related to assessments for 1998-1999 and $2.1 million for royalties on associated gas related to tax assessments for 2000-2001. See Note 18 to our consolidated financial statements for the year ended December 31, 2004. |
| 4 | Additional $2.9 million provided for 2002 and 2003, because we lost the tax cases on royalties on associated gas for 2000-2001. An additional provision of $1.6 million for penalties was recorded relating to interest charges on this tax assessment. |
Tax assessments of $5.4 million in 2003 included the following amounts related to the tax assessments for 2000 and 2001:
| 4 | $2.1 million of the assessments related to the revaluation of assets for tax purposes. |
| 4 | $1.7 million of social and employment fund taxes. |
| 4 | $0.2 million on royalties on associated gas. |
| 4 | $0.8 million of the assessments related to transfer pricing and $0.6 million of other taxes. |
Tax assessments of $5.1 million in 2002 include $2.9 million related to assessments for 1998 and 1999 and $2.2 million related to assessments for 2000 and 2001.
See Note 18 to our consolidated financial statements for the year ended December 31, 2004.
ARNM assessment
The Agency for Regulation of Natural Monopolies and Protection of Competition ( ARNM ) alleged that PetroKazakhstan Oil Products ( PKOP ), our subsidiary that operates our refinery, charged prices for refined oil products that in total were $6.3 million in excess of ARNM authorized maximum prices. In April 2004, following a Supreme Court decision, we paid $3.6 million to satisfy the assessment. PKOP provided an additional $1.4 million in December 2004. See Note 18 to our consolidated financial statements for the year ended December 31, 2004.
Other taxes
Other taxes of $25.8 million in 2004 included:
| 4 | Excise tax on refined products ($12.9 million in 2004 compared to $12.4 million in 2003). |
| 4 | Payment to satisfy an environmental claim ($2.0 million in 2004, nil in 2003). |
| 4 | Non-recoverable value added tax on crude oil ($4.3 million in 2004 compared to $4.1 million in 2003). |
| 4 | Various taxes, including property taxes, road fund and other ($6.6 million in 2004 compared to $4.4 million in 2003). |
The increase in other taxes for 2003 compared to 2002 of $5.2 million was mainly due to $4.1 million of expensed VAT and various other taxes. Tax legislation amendments introduced at the beginning of 2003 required the expensing of a portion of VAT for crude oil purchases made by the refinery.
TRANSPORTATION
Transportation costs are the costs of shipping crude oil from our central processing facility located at South Kumkol ( CPF ) to our Shymkent refinery, our rail terminals at Tekesu (adjacent to our refinery), Dzhusaly and the terminal at Atasu for oil destined for China. It also includes the costs of trucking crude oil from our KAM fields to the CPF, railway transportation, vessels chartering and pipeline costs under non-FCA crude sales contracts and for the export of refined products. Transportation costs also include transportation of crude produced by our Kazgermunai joint venture to its export customers.
As noted in our net return discussion, the changes in our transportation and selling costs are largely dependent on our choice of export routes and the terms of sales, which vary from period to period. Our differential from Brent is the key performance indicator, which can be used to assess the results of our exports. Please see the discussion of our differential inOverview and Strategy, Key Performance Indicators.
The table below sets out the components of transportation costs:
($000 s) | | 2004 | | 2003 | | 2002 | |
| Pipeline | | | 33,207 | | | 58,004 | | | 56,230 | |
| Kazgermunai transportation | | | 31,990 | | | 18,675 | | | 8,462 | |
| Crude oil export | | | 157,529 | | | 137,251 | | | 93,305 | |
| Refined products export | | | 40,320 | | | 2,011 | | | - | |
| Other | | | 8,763 | | | 9,046 | | | 5,804 | |
| Total | | | 271,809 | | | 224,987 | | | 163,801 | |
Pipeline
Pipeline costs decreased by $24.8 million during 2004 compared to 2003 primarily reflecting the following:
| 4 | Decrease of $19.8 million, as a result of a decrease in volumes sold for export through the Kumkol - Shymkent pipeline (2.5 mmbbls in 2004 compared to 15.7 mmbbls in 2003), partially offset by higher tariffs for the Kumkol - Shymkent pipeline in 2004 ($1.66/bbl in 2004 compared to $1.52/bbl in 2003) due to the strengthening of the Tenge to the U.S. dollar. |
| 4 | Decrease of $10.5 million in non-FCA pipeline costs (nil for 2004 compared to $10.5 million in 2003) because we did not use the Atyrau - Samara pipeline. |
| 4 | Decrease of $1.2 million, as a result of a decrease of 4.2 mmbbls in crude oil volumes sent to the refinery through the Kumkol - Shymkent pipeline. |
| 4 | A partial offset attributable to an increase of $6.7 million on volumes shipped through our KAM pipeline and through the Atasu terminal for China. Our KAM pipeline became operational in the third quarter of 2003; hence our expenses related to the KAM pipeline are higher by $4.0 million for 2004 compared to 2003, as there were no expenses for the first half of 2003. Our transportation expenses through Atasu terminal were higher by $2.0 million as we shipped 5.0 mmbbls in 2004 compared to 2.8 mmbbls in 2003. |
Pipeline costs slightly increased by $1.8 million during 2003 compared to 2002 primarily reflecting the following:
| 4 | $2.7 million increase attributable to higher volumes supplied to Downstream for processing (24.51 mmbbls in 2003 compared to 21.21 mmbbls in 2002). |
| 4 | $2.5 million due to the increased export tariff to Shymkent ($1.52/bbl in 2003 versus $1.41/bbl in 2002). |
| 4 | $1.6 million increase in non-FCA pipeline costs ($10.5 million for 2003 compared to $8.9 million for 2002) because of our use of the Atyrau-Samara pipeline for the first six months of 2003. |
| 4 | These increases were partially offset by $5.0 million in savings from using our KAM pipeline, when compared to exports of crude oil through our Tekesu rail terminal located in Shymkent. |
Kazgermunai transportation
Kazgermunai transportation increased by $13.3 million in 2004 compared to 2003 due to a 22% increase in sales volumes and increases in railway tariffs.
Crude oil export
Export transportation of crude oil increased by $20.3 million in 2004, as we moved our sales points closer to end-users. This included $8.2 million for sea freight and demurrage fees, as we chartered our own vessels for crude deliveries into the Mediterranean, and $3.6 million of additional railcar lease expenses in line with our strategy of securing control over our transportation. The remaining increase was the combination of higher crude export sales volumes and a different mix of routes.
Export transportation of crude oil increased by $44.0 million or 47.1% for 2003 compared to 2002 due to our increase in non-FCA sales. Non-FCA sales increased by 90.0% in 2003 compared to 2002 (19.40 mmbbls versus 10.21 mmbbls). Additionally, the ARNM approved a 6% increase in rail tariffs effective January 1, 2003.
Refined products export
In 2004 export transportation of refined products increased by $38.3 million, as we exported 435,800 tonnes of various products on a non-FCA basis as compared to only 22,000 tonnes during 2003.
Other
Other transportation costs are mainly trucking costs incurred to transport crude oil from the KAM fields to the CPF located at Kumkol.
REFINING
Refining costs represent the direct costs related to processing all crude oil including tollers volumes at the refinery.
Refining costs for 2004 were $21.6 million ($0.80/bbl) compared to $17.8 million ($0.58/bbl) in 2003. The main reasons for the $3.8 million increase in refining costs were higher repair costs incurred during the turnaround and to a lesser extent, additional purchased steam and electric power related to the start-up and operation of the Vacuum Distillation Unit during 2004. Major repairs of the main crude processing units, visbreaker and storage facilities were also completed throughout the year.
Refining costs for 2003 were $17.8 million ($0.58/bbl) compared to $21.7 million ($0.80/bbl) in 2002. The main reason for the $3.9 million decrease in refining costs was that purchased steam costs were lower as a result of process improvements and equipment upgrades combined with a lower price per unit. With no major turnaround in 2003, the refinery s repairs, maintenance and other expenses were also $1.0 million lower.
CRUDE OIL AND REFINED PRODUCT PURCHASES
Crude oil and refined product purchases represent the expensed portion of crude oil purchased for the refinery from third parties, as well as refined products purchased for resale. Purchases and sales between our Upstream and Downstream business units are eliminated on consolidation.
Our purchases of crude oil and refined products were as follows:
($000 s) | | 2004 | | 2003 | | 2002 | |
| Crude oil | | | 104,575 | | | 55,886 | | | 69,410 | |
| Refined products | | | 6,764 | | | 574 | | | 3,917 | |
| Total | | | 111,339 | | | 56,460 | | | 73,327 | |
Crude oil purchases are higher by $48.7 million in 2004 as compared to 2003. During the first quarter of 2004 we repurchased royalty-in-kind volumes for $17.1 million and subsequently resold them. The remaining purchases of crude oil were made from our joint ventures for further refining. The volumes purchased from the joint ventures during 2004 and 2003 are approximately the same, however, the increase in world crude oil prices led to higher purchase costs.
SELLING
Selling expenses for crude oil are comprised of customs, quality inspection and costs related to the export of crude oil. Selling expenses for refined products are comprised of the costs of operating the regional distribution centres and other administrative costs related to our Downstream operations.
($000 s) | | 2004 | | 2003 | | 2002 | |
| Crude oil | | | 18,084 | | | 10,495 | | | 3,471 | |
| Refined products | | | 19,850 | | | 18,034 | | | 19,782 | |
| Total | | | 37,934 | | | 28,529 | | | 23,253 | |
2004 versus 2003:
The increase in crude oil selling expenses in 2004 was mainly due to marketing management fees of $3.8 million charged by our partner in Turgai related to Turgai s export sales through the CPC pipeline.
In addition, Turgai selling expenses includes unloading fees, for crude oil sold at the CPC pipeline inlet at Atyrau. These loading fees were $1.4 million for 2004. The remaining increases in crude oil selling expenses are attributable to the administrative costs of our marketing and transportation business unit due to the increased level of activity.
Selling expenses related to refined products increased in 2004 due to increases in storage fees, transportation security fees and personnel costs. We did, however, take measures in the fourth quarter of 2004 to rationalize the domestic wholesale business resulting in the closure of two low volume distribution outlets and other cost reduction measures.
2003 versus 2002:
The increase in crude oil selling expenses during 2003 compared to 2002 was the direct result of increased export sales volumes related to non-FCA routes, for which all selling costs are borne by us, as well as the increase in Kazgermunai sales and a reclassification of certain crude oil marketing costs to selling from general and administrative expenses.
The decrease in selling expenses on refined products during 2003 was due to the fact that in 2002 Downstream refunded $1.1 million of transportation discounts it had received, as it had not met the throughput obligations under a transportation contract. This contract is no longer in effect.
GENERAL AND ADMINISTRATIVE
The table below analyzes total general and administrative costs for Upstream, Downstream and Corporate. In the case of Upstream and Downstream the general and administrative costs are also reflected on a per barrel basis.
| | | General and | | Per barrel of oil | |
| | | administrative | | produced or processed* | |
| | | ($000 s) | | ($/bbl) | |
2004 | | | | | | | |
| Upstream | | | 34,955 | | | 0.63 | |
| Downstream | | | 14,493 | | | 0.53 | |
| Corporate | | | 11,467 | | | | |
| Total | | | 60,915 | | | | |
| 2003 | | | | | | | |
| Upstream | | | 32,721 | | | 0.59 | |
| Downstream | | | 16,075 | | | 0.53 | |
| Corporate | | | 5,483 | | | | |
| Total | | | 54,279 | | | | |
| 2002 | | | | | | | |
| Upstream | | | 37,093 | | | 0.75 | |
| Downstream | | | 17,216 | | | 0.64 | |
| Corporate | | | 4,570 | | | | |
| Total | | | 58,879 | | | | |
* Including tollers volumes
2004 versus 2003:
| 4 | Downstream general and administrative expenses were lower in 2004, because in 2003 we recorded severance payments to the employees of the non-core business units divested in 2003 and related divestiture expenditures. |
| 4 | The increase in corporate expenses was mainly due to $4.0 million of compensation cost being recognized for stock options pursuant to a new accounting standard. See Note 2 to our consolidated financial statements. The remaining increase in corporate and Upstream expenses is attributable to increased activity levels. |
2003 versus 2002:
| 4 | Upstream expenses decreased by $4.4 million in 2003 due to the reclassification of certain costs relating to crude oil marketing to selling expenses. |
INTEREST AND FINANCING
The following table sets forth our interest and financing costs and any related amortization of debt issue costs or discounts upon issuance of the debt instrument:
($000 s) | | 2004 | | 2003 | | 2002 | |
| 9.625% Notes | | | 14,539 | | | 11,860 | | | - | |
| Term facility | | | 6,082 | | | 9,858 | | | 4,106 | |
| Commitment fees and amortization of deferred charges on $100 million committed credit facility | | | 629 | | | - | | | - | |
| Short-term debt | | | 790 | | | 754 | | | 1,470 | |
| 12% Notes | | | - | | | 8,718 | | | 24,936 | |
| Kazgermunai debt | | | 1,331 | | | 1,657 | | | 3,447 | |
| Term loans | | | 503 | | | 594 | | | 332 | |
| PKOP bonds | | | 469 | | | 2,576 | | | 1,514 | |
| Less portion capitalized | | | (13 | ) | | (438 | ) | | (332 | ) |
| Total | | | 24,330 | | | 35,579 | | | 35,473 | |
2004 versus 2003:
| 4 | Our 9.625% Notes interest expense increased in 2004 by $2.7 million, as the Notes were issued in February 2003. |
| 4 | Our term facility interest expense decreased by $3.8 million in 2004 due to the full repayment of the facility. |
| 4 | PKOP bonds were fully redeemed on February 26, 2004. |
| 4 | Our 12% Notes interest expense in 2003 was $8.7 million including $6.6 million of issue costs that were expensed when we redeemed these notes on February 2, 2003. |
2003 versus 2002:
| 4 | Our 9.625% Notes interest expense arose only in 2003 as these notes were issued in February 2003. |
| 4 | Our term facility interest expense increased by $5.8 million due to the repayment of the previous $60.0 million facility and entering a new $225.0 million facility. |
| 4 | Our 12% Notes interest expense in 2003 is $8.7 million including $6.6 million of issue costs that were expensed when we redeemed these notes, whereas 2002 includes interest for the entire year. |
| 4 | Interest on our Kazgermunai debt decreased by $1.8 million due to an $18.3 million (our 50% share) repayment of the debt. |
| 4 | Interest on our PKOP bonds increased by $1.1 million due to the issuance of the remaining 115,200 bonds in February 2003. |
DEPRECIATION AND DEPLETION
| | | Depreciation and | | Depreciation and | |
| | | depletion | | depletion | |
| | | ($000 s) | | ($/bbl*) | |
2004 | | | | | | | |
| Upstream | | | 83,927 | | | 1.52 | |
| Downstream | | | 20,338 | | | 0.89 | |
| Corporate | | | 1,255 | | | | |
| Total | | | 105,520 | | | | |
* | Downstream includes tollers volumes |
| | | Depreciation and | | Depreciation and | |
| | | depletion | | depletion | |
| | | ($000 s) | | ($/bbl*) | |
| 2003 | | | | | | | |
| Upstream | | | 63,321 | | | 1.15 | |
| Downstream | | | 18,849 | | | 0.62 | |
| Corporate | | | 182 | | | | |
| Total | | | 82,352 | | | | |
| | | | | | | | |
| 2002 | | | | | | | |
| Upstream | | | 32,970 | | | 0.66 | |
| Downstream | | | 13,347 | | | 0.49 | |
| Corporate | | | 94 | | | | |
| Total | | | 46,411 | | | | |
* | Downstream includes tollers volumes |
The increase in Upstream depreciation and depletion expense of $20.6 million was mainly due to the increase in our depletable assets and future development costs. Our Upstream depletion expense for 2004 includes accretion expense relating to our asset retirement obligations of $2.4 million ($2.1 million in 2003 and $1.8 million in 2002).
Upstream depreciation and depletion increased by $30.4 million during 2003 compared to 2002. This increase was mainly due to an increase in the amounts subject to depletion or depreciation as a result of capital expenditures. Our 11.4% increase in production and 10.4% decline in proved producing reserves also increased our depletion charge. Downstream depreciation increased by $5.5 million in 2003 compared to 2002 mainly due to additional depreciation for assets, which were under construction in 2002.
UNUSUAL ITEMS
There were no unusual items in 2004 and 2003.
We were named as defendants in a claim filed by a company alleging it was retained under a consulting contract. The arbitration decision was received in 2002 and we accrued and paid $7.1 million for full settlement of the claim.
INCOME TAXES
| | | 2004 | | 2003 | | 2002 | |
| Upstream | | | 218,214 | | | 78,893 | | | 71,807 | |
| Downstream | | | 75,253 | | | 72,370 | | | 18,691 | |
| Corporate | | | 7,616 | | | 4,359 | | | 9,845 | |
| Total | | | 301,083 | | | 155,622 | | | 100,343 | |
Income taxes increased by $145.5 million in 2004 compared to 2003 mainly due to the following:
| 4 | $98.5 million was due to an increase in income before taxes. |
| 4 | We provided for $35.0 million of excess profit tax in Turgai for 2004. See Note 18 to our consolidated financial statements. |
| 4 | $10.1 million of tax assessments settled in 2004 are not deductible for tax. |
| 4 | In Kazgermunai we incurred an additional $12.2 million of income tax because the marginal tax rate exceeded the statutory tax rate resulting in the effective tax rate becoming 38.6% for 2004. See Kazgermunai discussion in the following paragraphs. |
The increase in income taxes of $55.3 million in 2003 was mainly the result of the increase in sales volumes and in the price of crude oil and refined products, which led to an increase in income before income taxes of $211.1 million.
Kazakhstani income taxes are based upon stabilized tax regimes under the terms of our hydrocarbon contracts. The majority of the differences are temporary differences where an expense item is recorded for Canadian GAAP purposes in a different period than allowed under the terms of our hydrocarbon contracts. The income tax rate is 30%.
The foundation agreement for Kazgermunai provides for a tax on the profits of Kazgermunai with respect to its operations in the Akshabulak, Nurali and Aksai fields. The foundation agreement provides for taxes of:
Range ($ millions) | | Income tax rate | |
| Up $20.0 | | | 25 | % |
| $20.0 - $30.0 | | | 30 | % |
| $30.0 - $40.0 | | | 35 | % |
| Over $40.0 | | | 40 | % |
Income taxes in our corporate segment are the withholding taxes on the dividends paid from subsidiaries in Kazakhstan to Canada.
Excess profit tax has been negotiated with the Kazakhstani government in each hydrocarbon contract with the exception of the Kazgermunai licenses. With respect to the Kumkol South, South Kumkol and KAM fields, we are subject to excess profit tax at rates that vary from 0% to 30% based on the cumulative internal rate of return. With respect to North Kumkol, we are subject to excess profit tax at rates that vary from 0% to 50% based on the cumulative internal rate of return.
We have provided $70.0 million (our 50% share) for excess profit tax for North Kumkol in 2004. This amount is included in our current income taxes. Because excess profit tax is deductible in the following year, we have recorded a future income tax asset of $35.0 million, which represents 50% of our provision for excess profit tax.
We did not incur excess profit taxes in 2004 for any of our other fields.
Strategy: Capitalize on development opportunities and explore our undeveloped properties
CAPITAL EXPENDITURES AND COMMITMENTS
The table below sets forth a breakdown of our capital expenditures in 2004, 2003 and 2002:
| | | 2004 | | 2003 | | 2002 | |
| Upstream | | | | | | | | | | |
Development wells | | | 30,898 | | | 56,767 | | | 40,489 | |
Facilities and equipment | | | 90,945 | | | 92,002 | | | 67,884 | |
Exploration | | | 27,150 | | | 34,365 | | | 23,502 | |
| Downstream | | | | | | | | | | |
Refinery HS&E | | | 2,242 | | | 704 | | | 773 | |
Refinery sustaining | | | 5,802 | | | 2,571 | | | 4,019 | |
Refinery return projects | | | 3,661 | | | 15,024 | | | 3,364 | |
Marketing and other | | | 3,982 | | | 771 | | | 71 | |
| Corporate | | | 1,272 | | | 1,009 | | | - | |
| Total capital expenditure | | | 165,952 | | | 203,213 | | | 140,102 | |
| Less accrued amounts | | | (2,722 | ) | | (6,743 | ) | | (3,250 | ) |
| Total cash capital expenditure | | | 163,230 | | | 196,470 | | | 136,852 | |
Capital expenditures amounted to $166.0 million for the year 2004, compared to our budget of $176.0 million.
Development wells. In 2004 we continued developing our KAM fields and invested approximately $12.3 million in drilling 23 wells. At North Nurali, we have completed stimulation, testing and evaluation work at 3 wells and drilled an additional 2 wells, all of which amounted to $2.7 million. Turgai invested approximately $8.0 million (our 50% share) in drilling new wells. We have also spent $7.2 million (our 50% share) in Kazgermunai on further development of the Akshabulak, Aksai and Nurali fields.
Facilities and equipment. We spent approximately $24.6 million for facilities under our KAM fields development program, which included construction of flowlines and road facilities, installation of gas re-injection facilities in the Aryskum field as well as installation of artificial lift on certain wells. We have invested $10.0 million in upgrades, tanks, storage facilities and equipment for our crude loading facilities at Dzhusaly and continued to expand our railcar fleet by investing $30.0 million for an additional 800 railcars. Kazgermunai spent $5.9 million (our 50% share) on the first phase of our gas utilization plant in our Akshabulak field and we plan to spend $5.6 million in 2005 to complete the facility.
Exploration.Our 2004 exploration program focused on our Aryskum, Kolzhan, Zhamansu and Doshan licences. We acquired and analyzed seismic data and drilled exploration wells, investing $27.2 million in 2004. We have drilled 5 wells in Aryskum in 2004 and discovered a new reservoir, which will be further appraised in 2005. We have also carried out two seismic programs and drilled 5 wells on our Kolzhan license, all of which encountered hydrocarbons. This program proved that we have a northern extension to our Kyzylkiya field. An appraisal program is planned over this area in 2005. In 2004 we became the operator of two blocks, Zhamansu and Doshan in license 951 with a 75% interest. We spent $6.0 million on drilling exploration wells in these blocks, which remain highly prospective and will be further explored in 2005.
Our 2005 capital expenditure program is currently allocated as follows:
| Business Unit | | ($ millions) | |
Upstream (including joint ventures) | | | 211.0 | |
| Downstream | | | 14.0 | |
| Marketing and transportation | | | 2.0 | |
| Corporate | | | 16.0 | |
| Total | | | 243.0 | |
The key items included within the capital budget are:
Upstream
| 4 | Continued full field development of the KAM fields. |
| 4 | An exploration and appraisal program, including the drilling of 17 wells. |
| 4 | Significant seismic programs, both 3D and 2D. |
| 4 | Development of the East Kumkol field. |
| 4 | Pilot test production phase of the North Nurali field. |
| 4 | Kumkol South infill drilling and production facilities enhancements. |
| 4 | Phase 1 of the Kumkol South enhanced oil recovery ( EOR ) project. |
| 4 | Commissioning of the Akshabulak gas plant for LPG production. |
| 4 | Commissioning of additional Akshabulak facilities for increased production. |
| 4 | Completion of Kumkol North development drilling and facilities enhancements. |
The firm exploration and appraisal budget has been set at a base level of $20.0 million with additional funds available for potential appraisal wells and new opportunities.
Downstream
| 4 | Additional refinery equipment installation and process optimizations. |
| 4 | Expansion of retail stations. |
| 4 | Upgrading of equipment at distribution centers. |
Corporate
| 4 | First phase of construction of a head office in Astana, subject to obtaining a building permit. |
We have a commitment for construction of a gas plant at Kazgermunai; our 50% share is $11.5 million. These commitments are included in our capital budget for 2005. The remainder of our capital budget can be modified, if necessary, to meet changing circumstances.
Capital investments are judged against our internal investment criteria that require that:
| 4 | Investments generate a real internal rate of return of 15%. |
| 4 | That the present value discounted at 10% of the return from the investment is sufficient to repay the investment plus a 50% premium. |
| 4 | The long term real Brent oil price is $25.00/bbl. |
Contractual commitments
In addition to the above, we have the following contractual obligations as at December 31, 2004:
| | | Total commitments by period | |
($ millions) | | Total | | Within 1 year | | 1-3 years | | 4-5 years | | After 5 years | |
| Long-term debt | | | 134.9 | | | 15.5 | | | 3.7 | | | 1.9 | | | 113.8 | |
| Estimated interest payments | | | 92.8 | | | 17.9 | | | 36.9 | | | 37.6 | | | 0.4 | |
| Operating leases | | | 104.0 | | | 43.0 | | | 59.8 | | | 1.2 | | | - | |
| Capital leases | | | - | | | - | | | - | | | - | | | - | |
| Future site restoration costs | | | 32.5 | | | - | | | - | | | - | | | 32.5 | |
| Work commitments | | | 6.1 | | | 3.5 | | | 2.6 | | | - | | | - | |
| Purchase obligations | | | 12.2 | | | 12.2 | | | - | | | - | | | - | |
| Total | | | 382.5 | | | 92.1 | | | 103.0 | | | 40.7 | | | 146.7 | |
Long-term debt - please refer to Note 11 in our consolidated financial statements for the year ended December 31, 2004.
Estimated interest payments relate to our outstanding debt balances as at December 31, 2004.
Operating leases are mainly for rail cars that we use to transport our crude oil and refined products and certain equipment used in our Upstream operations. Although we are committed to lease rail cars, our contracts allow the termination with a 30-day notice. We have no capital leases.
We have an obligation of $32.5 million for future site restoration costs as at December 31, 2004, which are the estimated future cash outflows discounted at 8.5%. The total undiscounted estimated cash flows required to settle the obligations are $77.4 million with the expenditures being incurred over ten years commencing in 2014.
Work commitments are non-discretionary expenditures for seismic and drilling that we have contractually committed to under the terms of our Hydrocarbons Licenses.
Purchase obligations represent contractual obligations for goods and services for which the services have yet to be provided or for which we have not yet taken title to the goods. All other purchase commitments are discretionary.
Sales commitments
We have sales commitments under contracts with two customers to supply an agreed volume of crude oil within the first four months of 2005. The estimated value of these commitments is approximately $43.1 million.
LIQUIDITY
The levels of cash, current assets and current liabilities as at December 31, 2004 and December 31, 2003 are set out below:
As at December 31 ($000 s) | | 2004 | | 2003 | |
| Cash and cash equivalents | | | 199,105 | | | 184,660 | |
| Cash flow | | | 560,491 | | | 399,975 | |
| Working capital * | | | 215,681 | | | 151,737 | |
| Net debt ** | | | (48,702 | ) | | 135,220 | |
| Ratio of cash flow to net debt | | | - | | | 3.0 | |
| Ratio of cash flow to fixed charges*** | | | 20.9 | | | 10.6 | |
| Ratio of earnings to fixed charges **** | | | 30.9 | | | 13.6 | |
* | Working capital is net of cash and short-term debt |
** | Net debt includes short-term and long-term debt less cash |
*** | Fixed charges include interest expense and preferred dividends before tax |
**** | Earnings is income before income taxes plus fixed charges |
Our net working capital has increased mainly due to increases in our accounts receivable, inventory and prepaid expenses, partly offset by an increase in accounts payable. Our accounts receivable increased mainly because we sold 1.5 mmbbls of crude oil close to year end with payment due 30 days after the sale. Build up of unsold volumes of crude oil increased our inventory and prepaid expenses. The main components of the increase in accounts payable are income and excess profit tax, accrued dividends payable and amounts owed for crude oil purchased from one of our joint ventures.
Our restricted cash is $47.7 million as at December 31, 2004 ($35.5 million at December 31, 2003). Restricted cash includes $8.7 million of cash dedicated to a debt service reserve account for our term facility and $39.0 million of cash dedicated to a margin account for our hedging program. Though our term facility was fully repaid as at December 31, 2004, we still have a balance in our debt service reserve account because our hedging liability has not been discharged in full (see Note 8 to our consolidated financial statements).
The restricted cash balance related to our hedging program increased by $14.0 million compared to December 31, 2003 due to the change in the market value of our hedging contracts. Cash dedicated to our hedging margin account fluctuates on a weekly basis with fluctuations in the future Brent price for crude oil. As the year progresses we will settle our hedges, and the cash dedicated to our hedging margin account will likely reduce and is expected to be nil by December 31, 2005. See discussion of our hedging contracts in Note 15 to our consolidated financial statements for the year ended December 31, 2004.
Our long-term debt decreased substantially from $246.7 million at December 31, 2003 to $134.9 million at December 31, 2004, as we fully repaid our term facility at the end of September.
During the year ended December 31, 2004 Kazgermunai repaid $25.6 million of its long-term debt. Turgai repaid its shareholder loans of $22.0 million to us and $22.0 million to our partner. Turgai also paid each partner dividends of $25.5 million in the fourth quarter of 2004.
Our 9.625% Notes have a credit rating of B+ from Standard and Poors and Ba3 from Moody s. We are in compliance with our debt covenants as of December 31, 2004.
On May 25, 2004 we entered into a five and one half year $100.0 million committed credit facility. This facility is unsecured, bears interest at LIBOR plus 2.65% and is subject to annual review. $30.0 million of this facility has been dedicated to cover margin calls under our hedging program. In the event our credit rating decreases by 2 or more notches, we may be required to secure this facility with crude oil export contracts.
We also have available working capital facilities of $67.0 million. We believe we have sufficient funding and liquidity to meet our needs in 2005 through our cash flow and available credit facilities.
We have $93.9 million in future income tax assets, the recoverability of which is dependent on generating sufficient taxable income in our operating subsidiaries to realize our future income tax assets. Seventy percent of our future income tax assets are current and, accordingly, we expect to realize them within the next year.
RISK ANALYSIS
BUSINESS RISKS
Reserves and production
The addition of oil and gas reserves and our ability to develop these reserves is one of the key factors to our success. New exploration acreage must be acquired through acquisitions or obtaining additional licenses. We are actively pursuing acquisitions while adhering to our investment criteria. We have successfully acquired new exploration acreage in 2003 and 2004, including the Kolzhan, Zhamansu, Doshan and Karaganda blocks. We believe we are well positioned to continue to succeed as we have a demonstrated track record in discovering and developing reserves, continual involvement with the industry in Kazakhstan and with the Government of Kazakhstan and we have the financial capacity to execute transactions. This is a highly competitive process.
Our ability to discover new reserves and develop our reserves is another key to our success. We have introduced and continue to utilize Western technology in exploring for and developing reserves. We have the financial capacity to acquire and implement this technology but we compete for the staff and intellectual capacity necessary to fully utilize this technology. We have successfully addressed this through offering competitive compensation and recruiting on a worldwide basis. The recruitment of staff is a highly competitive process.
Evaluation of oil and gas reserves
The process of estimating our oil and gas reserves is complex and requires significant assumptions and decisions in the evaluation of engineering, geological, geophysical and financial information. On an annual basis McDaniel & Associates Consultants Ltd. of Calgary, Alberta, perform an independent evaluation of our reserves. This reserve evaluation may change substantively from year to year as a result of numerous factors, including but not limited to the development and economic conditions, under which we operate our business. As a result, despite all reasonable efforts involved in the process of evaluation, the estimation of our reserves may materially change from period to period.
Key performance indicators
Please refer to the section entitledKey Performance Indicators of our MD&A for a discussion of these indicators and their impact on our business.
Taxes
We have been engaged in litigation and disputes related to tax assessments. Future tax assessments could be significant as we experience inconsistent application and interpretation of the tax legislation applicable to each of our hydrocarbon contracts. The tax legislation applicable to each of our hydrocarbon contracts is stabilized at the legislation in effect on the date of signing the contract, all of which were signed from 1996 through 1998. As the legislation applicable to our contracts is from five to eight years old, the expertise pertaining to this legislation is diminishing within the tax inspectorate.
Kazakhstan environment and legislation
We have received assessments from the ARNM relating to the sale of refined products in Kazakhstan. The impact of these assessments will be significant, if we do not prevail in our view with respect to these assessments.
We believe we are currently in compliance with all existing environmental laws and regulations. However, as new environmental laws are enacted and the old laws are repealed, interpretation, application and enforcement of the laws may become inconsistent. Compliance in the future could require significant expenditures, which may adversely effect our operations.
MARKETING RISKS
Commodity prices
Commodity price risk related to conventional crude oil prices is our most significant market risk exposure. Crude oil prices are influenced by such worldwide factors as Organization of Petroleum Exporting Countries actions, political events and supply and demand fundamentals.
FINANCIAL RISKS
See Note 15 to our consolidated financial statements.
CRITICAL ACCOUNTING ESTIMATES
PROPERTY, PLANT AND EQUIPMENT
We follow the full cost method of accounting for oil and gas operations whereby all acquisition, exploration and development expenditures are capitalized. This may lead to the capitalization of costs for which no direct future benefit will be obtained.
We perform an impairment test on a quarterly basis to assess whether the carrying amount of our assets is recoverable from our undiscounted cash flow. This test is based on a number of estimates. We use our independent reservoir engineer s estimate of our production from our proved reserves, forecasts of crude oil prices and estimated costs to produce our reserves and run our operations. All of these estimates are subject to uncertainty.
We use the unit of production method for calculating depletion of our oil and gas assets. Our reserve estimates, production volumes and estimated future development costs have a significant impact on our depletion expense.
ASSET RETIREMENT OBLIGATIONS
As described in Note 2 to our consolidated financial statements, effective January 1, 2004, we adopted the new recommendation of the Canadian Institute of Chartered Accountants ( CICA ) regarding asset retirement obligations. This new standard changes the method of estimating and accounting for future site restoration costs, and requires recording the fair value of asset retirement obligations when the related asset is brought into service rather than accruing the obligation over the useful life of the asset.
We have estimated the fair value of our asset retirement obligations based on existing laws, current costs and industry practices. Our estimate can be affected by changes in laws, costs and industry practice.
CONTROL ENVIRONMENT
PetroKazakhstan maintains disclosure controls and procedures and internal control over financial reporting designed to ensure that information required to be disclosed in the reports filed under the United States Securities Exchange Act ( Exchange Act ) of 1934, as amended, and Multilateral Instrument 52-109 - Certificate of Discloser in Issuers Annual and Interim Filings ( MI 52-109 ) is recorded, processed, summarized and reported within the time periods specified in the Securities and Exchange Commission s rules and forms. PetroKazakhstan s Chief Executive Officer and Chief Financial Officer, after evaluating the effectiveness of PetroKazakhstan s disclosure controls and procedures (as defined in Exchange Act Rule 13a-15 (e) and in MI 52-109) as of December 31, 2004, concluded that as of such date PetroKazakhstan s disclosure controls and procedures were effective for the purpose for which they were designed.
During the fiscal year ended December 31, 2004, there were no changes in PetroKazakhstan s internal control over financial reporting that have materially affected, or are reasonably likely to materially affect, PetroKazakhstan s internal control over financial reporting.
We are in the process of implementing a number of major modifications to our ERP system. We are also in the process of undertaking a comprehensive review of our existing controls over financial reporting to facilitate compliance with Section 404 of the United States Sarbanes-Oxley Act of 2002. We expect that these initiatives will lead to significant business process redesign, some of which will relate to controls over financial reporting.
QUARTERLY INFORMATION
The table below sets out selected quarterly information for 2004, 2003 and 2002:
| | | | | Net Income Per Share | |
($000 s) | | Total revenue | | Net income | | Basic | | Diluted | |
2004, Quarter ended | | | | | | | | | | | | | |
| March 31 | | | 320,193 | | | 87,485 | | | 1.11 | | | 1.08 | |
June 30 | | | 398,501 | | | 122,028 | | | 1.54 | | | 1.51 | |
| September 30 | | | 518,602 | | | 176,218 | | | 2.30 | | | 2.27 | |
| December 31 | | | 405,131 | | | 114,937 | | | 1.51 | | | 1.49 | |
| 2003, Quarter ended | | | | | | | | | | | | | |
| March 31 | | | 248,923 | | | 68,552 | | | 0.87 | | | 0.83 | |
| June 30 | | | 254,601 | | | 68,430 | | | 0.88 | | | 0.84 | |
| September 30 | | | 303,152 | | | 91,150 | | | 1.17 | | | 1.12 | |
| December 31 | | | 310,648 | | | 88,808 | | | 1.14 | | | 1.09 | |
| 2002, Quarter ended | | | | | | | | | | | | | |
| March 31 | | | 143,331 | | | 22,860 | | | 0.28 | | | 0.27 | |
| June 30 | | | 177,398 | | | 33,456 | | | 0.41 | | | 0.40 | |
| September 30 | | | 247,962 | | | 60,230 | | | 0.74 | | | 0.71 | |
| December 31 | | | 256,659 | | | 44,851 | | | 0.56 | | | 0.54 | |
The historical quarterly information presented in these tables was restated due to the adoption of new accounting standards as described in Note 2 to our consolidated financial statements.
Quarterly highlights:
In the first quarter of 2004, our production decreased to 142,919 bopd from 164,559 in the previous quarter, a 13% decline. Throughout the quarter 19 Kumkol South wells were shut-in due to the border well issue with Turgai. There were also weather related restrictions, which led to reduced export shipments. The increased average Brent price of $32.03/bbl offset these decreases.
Our production levels in the last three quarters of 2004 remained at a lower level than our historical high at the end of 2003 due to increased water cut and the reduced production scheme for our Kumkol South field resulting from our border well dispute with Turgai. Our revenues and net income continued to grow in the second quarter and the third quarter of 2004 due to the increases in world crude oil prices, improvement of our differential and the production of VGO, our new product which decreased the production of low-value mazut. Average Brent was $35.32/bbl in the second quarter, $41.54/bbl in the third quarter and $43.85/bbl in the fourth quarter of 2004.
The last quarter of 2004 had lower revenues and net income than expected, because of deterioration in our differential and our inventory build up.
Increased world prices for crude oil in the first quarter of 2003 ($31.49/bbl) and improved prices for our refined products resulted in a 53% increase in our net income for the first quarter of 2003. However, because of transportation difficulties due to seasonal factors our crude oil exports were restricted, and we had to curtail our production to 140,765 bopd, a 10% decrease over the previous quarter.
During the last three quarters of 2003, we were continuously increasing our production in all fields (145,066 bopd in the second quarter, 154,712 bopd in the third quarter and 164,559 bopd in the fourth quarter of 2003). Together with the stable Brent price for crude oil (average $26.03/bbl in the second quarter, $28.38/bbl in the third quarter and $29.43/bbl in the fourth quarter of 2003) and improving prices for our refined products, we had steadily growing revenues and net income. Our refinery was fully operational throughout the year, as there was no major turnaround in 2003.
Our second quarter of 2002 results improved slightly compared to the first quarter of 2002 due to the increased average Brent crude oil price of $25.07/bbl as compared to $21.08/bbl in the previous quarter. This was offset in part by a 30-day shutdown of our refinery for a turnaround in the second quarter of 2002. Our production in the second quarter of 2002 was 117,844 bopd versus 123,372 bopd in the first quarter of 2002, mainly because of the major refinery turnaround.
We had a substantial increase in our sales and net income in the third quarter of 2002. Though the world crude oil prices did not increase materially ($26.91/bbl versus $25.07/bbl), our production reached 143,175 bopd and we also achieved record export sales. These achievements were partially offset by the continuing disappointing prices for refined products throughout 2002.
The transfer to non-FCA terms and a build up of inventory of crude oil in transit by the end of 2002 caused approximately $13.0 million of net income deferred from the fourth quarter of 2002 to the first quarter of 2003. This was the main reason for the decline in net income in the quarter. The Brent price was almost the same as in the third quarter of 2002 ($26.81/bbl), and our production reached 157,268 bopd.
| |
| Statement of Corporate Governance Practices |
The Board of Directors and senior management of the Corporation consider good corporate governance to be central to the effective and efficient operation of the Corporation and its business. The Board of Directors and management are committed not only to satisfying legal and regulatory requirements, but also to developing and maintaining corporate governance practices that reflect evolving best practices standards as appropriate to the Corporation and its business.
The Board of Directors and management have been following developments in corporate governance requirements and best practices standards in both Canada and the United States closely. The Corporation is listed on the New York Stock Exchange (the NYSE ). Although it is not required to comply with many of the corporate governance listing requirements imposed by the NYSE for domestic listed issuers, the Corporation has aligned its governance practices with those requirements. The Board of Directors and management have reviewed the corporate governance policy (Multilateral Instrument 58-201) released by certain of the Canadian securities regulators for comment in January 2004. To the extent necessary, the Corporation intends to adapt its governance practices to the best practices set out in the final form of that policy.
TSX CORPORATE GOVERNANCE POLICY GUIDELINES
The 14 corporate governance guidelines set out in the TSX Corporate Governance Policy and a brief discussion of the Corporation s corporate governance practices with reference to each guideline is set out below.
1. | The Board of Directors should explicitly assume responsibility for the stewardship of the Corporation, and specifically for: (a) adoption of a strategic planning process, (b) identification of principal risks and ensuring the implementation of appropriate systems to manage these risks, (c) succession planning, including appointing, training and monitoring senior management, (d) communications policy for the Corporation, and (e) integrity of the Corporation s internal control and management information systems. |
| | |
| | The mandate of the Board of Directors is to manage the business and affairs of the Corporation. Pursuant to this mandate, it has explicitly assumed responsibility for the stewardship of the Corporation and, as part of the overall stewardship responsibility, has assumed the responsibilities described below. |
| | |
| | a) | The Board of Directors provides input to management in the development of the Corporation s strategic plan, approves that plan and monitors management s execution of that plan. As part of the Board of Directors responsibility for the strategic planning process, the Board of Directors establishes the goals of the business of the Corporation with the input of management and strategies and policies within which the Corporation is managed. Management is required to seek approval of the Board of Directors for material deviations, financial or otherwise, from the approved business goals, strategies and policies. |
| | | |
| | b) | It is management s responsibility to identify the principal risks to the Corporation s business and to develop strategies to manage those risks. The Board of Directors receives regular reports from management on those risks, the systems in place to manage those risks and the effectiveness of those systems. |
| | c) | The Board of Directors is responsible for the appointment, appraisal and monitoring of the Corporation s senior management. The Corporation s policy is to attract management personnel whose prior experience results in them having been well trained for their responsibilities with the Corporation. The Board of Directors discusses succession issues with the CEO on a regular basis and becomes acquainted with other members of senior management, their experience and skill sets. The Board of Directors encourages senior management to participate in appropriate professional and personal development activities, courses and programs, and supports management s commitment to the training and development of all permanent employees. |
| | | |
| | d) | The Board of Directors oversees the policy of communications by the Corporation with its shareholders and, in conjunction with management, continues to review the Corporation s approach to communications with its shareholders, regulatory bodies, governments, media and the public. |
| | | |
| | e) | The Board of Directors oversees the integrity of the Corporation s internal control and management information systems, including through reports from management, from the external auditors and from the Audit Committee. In addition, a Disclosure Committee, composed of non-director members including financial officers of the Corporation, has been established to assist and advise the Chief Executive Officer and Chief Financial Officer with respect to the Corporation s internal controls and disclosure of financial information. |
| | | |
2. | Majority of directors should be unrelated (free from conflicting interest). |
| | |
| | The TSX Guidelines provide that the term unrelated director means a director who is independent of management and is free from any interest and any business or other relationship which could, or could reasonably be perceived to, materially interfere with the director s ability to act with a view to the best interests of the Corporation, other than interests and relationships arising from shareholdings. The Board of Directors consists of six members, five of whom are unrelated directors and one who is a related director. |
| | |
3. | Disclose for each director whether he or she is related, and how that conclusion was reached. |
| | |
| | The current Board of Directors is comprised of six directors, five of whom are unrelated to management. As the Corporation s Chief Executive Officer, Bernard F. Isautier is a related director. The remaining directors, Louis W. MacEachern, James B.C. Doak, Jacques Lefvre, Nurlan J. Kapparov and Jan Bonde Nielsen have no relationship with the Corporation other than as a director or a security holder and accordingly are all unrelated directors. The Corporation does not have a significant shareholder. |
| | |
4. | Appointment of a committee responsible for appointment/assessment of directors and that is comprised exclusively of outside (i.e. non-management) directors, a majority of whom are unrelated directors. |
| | |
| | The Corporate Governance Committee of the Board of Directors, which is comprised entirely of outside and unrelated directors, has been given the responsibility of assessing the effectiveness of the Board of Directors and its individual members as well as the committees of the Board of Directors. In addition, the Corporate Governance Committee has responsibility for identifying prospective nominees for the Board of Directors and recommending them to the Board of Directors and for establishing criteria for Board of Directors membership and retirement therefrom. |
5. | Implement a process for assessing the effectiveness of the Board of Directors as a whole and its committees and individual directors. |
| | |
| | The Corporate Governance Committee of the Board of Directors assesses, at least annually, the effectiveness of the Board of Directors and the committees of the Board of Directors. The assessments are carried out through one-on-one discussions between the Chair of the Corporate Governance Committee and each individual director. This process does not focus specifically on assessing the effectiveness of individual directors, but it provides an opportunity for each director to provide feedback on the effectiveness of the other directors. The Chair of the Corporate Governance Committee reports on the results of this process to the full Board of Directors. |
| | |
6. | Provide orientation and education programs for new directors. |
| | |
| | The directors who joined the Board of Directors most recently were provided with an orientation to the Corporation and education about the Corporation s business and the environment in which it operates through discussions with the CEO and other members of management and a review of certain corporate records. As new directors join the Board of Directors in the future, they will receive similar orientation and education. |
| | |
7. | Consider the size of the Board of Directors and the impact of the number on the Board of Directors effectiveness. |
| | |
| | The Corporation s articles require that the Board of Directors be comprised of three to nine directors. The number of directors is currently set at six. The Board of Directors is satisfied that this number allows for the balance of skill sets and experience appropriate to the effective discharge of the Board of Directors oversight responsibilities. |
| | |
8. | The Board of Directors should review the adequacy and form of the compensation of directors to ensure compensation realistically reflects responsibilities and risks involved. |
| | |
| | The Compensation Committee, which is comprised entirely of outside and unrelated directors, regularly reviews the adequacy and form of compensation of directors of the Corporation. Based on a review of the compensation paid to directors of Canadian companies of comparable size and on discussions among the directors, the Board of Directors is satisfied that it realistically reflects the responsibilities and risks involved. |
| | |
9. | Committees of the Board of Directors should generally be composed of outside directors, a majority of whom are unrelated, although some committees, such as the executive committee, may include one or more inside directors. |
| | |
| | The Board of Directors has established three committees: the Audit Committee, the Compensation Committee and the Corporate Governance Committee. All committees are comprised of outside directors, all of whom are also unrelated directors. |
10. | The Board of Directors should expressly assume responsibility for, or assign to a committee of directors, the general responsibility for developing the Corporation s approach to governance issues. |
| | |
| | The Corporate Governance Committee has the responsibility of developing the Corporation s approach to governance issues, and administering the Board of Directors relationship with management. This includes responsibility for: (i) assessing, at least annually, the effectiveness of the Board of Directors as a whole and the committees of the Board of Directors, (ii) reviewing annually the mandates of the Board of Directors and its committees and making recommendations for change, (iii) recommending procedures to permit the Board of Directors to function independently from management, (iv) reviewing and, if appropriate, approving requests from directors for the engagement of outside advisors, (v) preparing and maintaining corporate governance policies for the Corporation, and (vi) identifying prospective nominees for the Board of Directors and recommending them to the Board of Directors and establishing criteria for the Board of Directors membership and retirement therefrom. |
| | |
11. | The Board of Directors should define limits to management s responsibilities by developing (a) mandates for the Board of Directors and the Chief Executive Officer of the Corporation and (b) the corporate objectives for which the Chief Executive Officer is responsible. |
| | |
| | The Board of Directors is responsible for the overall stewardship of the Corporation and in furtherance thereof supervises the officers of the Corporation in their management of the business and affairs of the Corporation and manages the Corporation s strategic planning process. The Board of Directors has developed mandates and corporate objectives for which the Chief Executive Officer is responsible. The Board of Directors requires the Chief Executive Officer and other management of the Corporation to keep the Board of Directors informed in a timely and candid manner of the progress towards the achievement of the established goals and of any material deviation from such goals and from the Corporation s strategies and policies as approved by the Board of Directors. |
| | |
12. | Establish procedures to enable the Board of Directors to function independently of management. |
| | |
| | The importance of the independence of the Board of Directors from management is fully endorsed by the Corporation and its management. The Board of Directors considers it important to the ability of the CEO to function most effectively in Kazakhstan, that the CEO also be the Chairman of the Board of Directors. The Board of Directors discharges the responsibilities which are central to its oversight function through the Audit, Compensation and Corporate Governance Committees, each of which is comprised entirely of unrelated directors. Well-developed mandates for these committees, position descriptions for the Board of Directors and the CEO, Board of Directors assessment processes and ongoing discussions about effective governance and evolving best practices also support the independence of the Board of Directors from management. In addition to the CEO, each of the other directors are established businesspersons who are each satisfied that they discharge their responsibilities to the Corporation in an independent-minded way and do not believe that other, more formal procedures are necessary. |
13. | Establish an audit committee with a specifically defined mandate and direct communication channels with internal and external auditors, with all members being outside directors. The audit committee s duties should include oversight responsibility for management reporting on internal control and should ensure that management has designed and implemented an effective system of internal control. |
| | |
| | The Board of Directors has an Audit Committee, all the members of which are outside directors. The roles and responsibilities of the Audit Committee include responsibility for reviewing and making recommendations to the Board of Directors on (i) financial statements and the related reports of management and external auditors, (ii) accounting and financial reporting procedures and methods, (iii) internal audit procedures and reports, and (iv) matters relating to external auditors, including the appointment and terms of engagement of external auditors and their reports relating to accounting, financial and internal audit matters. The Audit Committee has direct communication channels with the external auditors. The Corporation has an internal audit function and the Audit Committee has a direct communication channel with the internal audit. |
| | |
| | The U.S. Securities and Exchange Commission (the SEC ) requires that a company filing under the U.S. Securities Exchange Act of 1934 (the Act ) disclose whether its board of directors has determined that there is at least one audit committee financial expert as defined by the SEC, on its audit committee. The Board of Directors of the Company has determined that Jacques Lefvre is such an audit committee financial expert fulfilling this requirement. The SEC further requires, pursuant to Rule 10A-3 of the Act, that each member of the audit committee be independent as that term is defined by the SEC. All of the members of the audit committee are independent as required by the SEC. |
| | |
14. | Implement a system to enable an individual director to engage outside advisors at the Corporation s expense. The engagement of the outside advisor should be subject to the approval of an appropriate committee of the Board of Directors. |
| | |
| | Any member of the Board of Directors may engage an outside advisor at the expense of the Corporation in appropriate circumstances, subject to the approval of the Corporate Governance Committee. |
DIFFERENCES IN CORPORATE GOVERNANCE PRACTICES OF THE CORPORATION COMPARED TO NYSE STANDARDS APPLICABLE TO U.S. DOMESTIC ISSUERS
As a Canadian company, the Corporation is not required to comply with many of the corporate governance listing requirements imposed by the NYSE for U.S. domestic issuers. The Corporation must however, provide a brief description of any significant difference between its corporate governance practices and those followed by U.S. companies under the NYSE listing standards. The following provides a summary of the significant differences between the Corporation s domestic practice and the NYSE rules.
| 4 | Section 303A.01 of the NYSE corporate governance rules requires a majority of directors of a U.S. domestic issuer to be independent and Section 303A.02 sets forth the independence standards for such directors. The TSX guidelines provide that the board of directors of a company should have a majority of unrelated directors. The principles for determining whether a director is unrelated differ significantly from the NYSE s independence standards. The Corporation follows the TSX guidelines |
| | |
| 4 | Section 303A.03 of the NYSE corporate governance rules requires non-management directors of a U.S. domestic issuer to meet at regularly scheduled executive sessions without management. Although non-management directors of the Corporation meet without management, such meetings do not currently follow a regular schedule. |
| | |
| 4 | Section 303A.05 of the NYSE corporate governance rules requires the compensation committee of a U.S. domestic issuer to review and approve corporate goals and objectives relevant to the Chief Executive Officer s compensation, evaluate the Chief Executive Officer s performance in light of these goals and, either as a committee or together with the other independent directors, determine and approve the Chief Executive Officer s compensation level based on this evaluation. The TSX guidelines provide that the board of directors should approve or develop the corporate objectives which the Chief Executive Officer is responsible for meeting. The Corporation follows the TSX guidelines relating to corporate objectives for which the Chief Executive Officer is responsible. |
| | |
| 4 | Section 303A.09 of the NYSE corporate governance rules requires a U.S. domestic issuer to adopt and disclose a set of corporate governance guidelines and to post such guidelines on the company s website. The Corporation has aligned its corporate governance practices with TSX guidelines as well as the policies released by certain Canadian securities regulators for comment in January 2004. The Corporate Governance Committee has not however, codified its corporate governance principles into formal guidelines in order to post them on its website. |
| | |
| 4 | Section 303A.12(a) of the NYSE corporate governance rules requires the Chief Executive Officer of a U.S. domestic issuer to annually certify that he or she is not aware of any violation by the company of NYSE corporate governance standards. As a Canadian company, the Corporation (and its Chief Executive Officer) is not subject to this requirement. However, in accordance with NYSE rules applicable to both U.S. domestic and foreign private issuers, the Chief Executive Officer is required to promptly notify the NYSE in writing after any executive officer becomes aware of any material non-compliance with the NYSE corporate governance standards applicable to the Corporation. |
The following diagram shows the principal operating subsidiaries of PetroKazakhstan Inc., their respective jurisdictions of incorporation and the percentage ownership PetroKazakhstan has, directly or indirectly, The Company conducts virtually all of its operations through, and virtually all its assets are held, directly or indirectly, by PKKR, Turgai, Kazgermunai, PKOP and PetroKazakhstan Marketing Ltd.
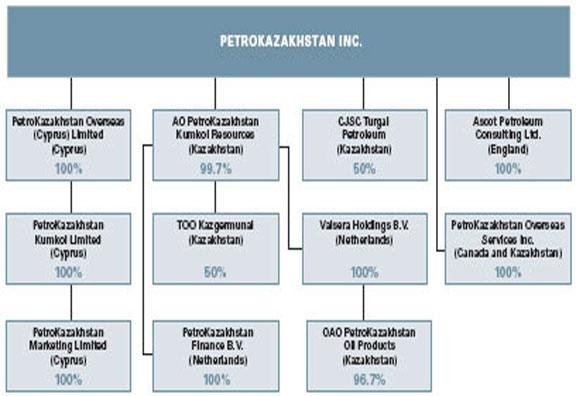
PetroKazakhstan Inc.(Canada) is our registered head office that directly or indirectly owns all of the other companies within the PetroKazakhstan group. PetroKazakhstan Overseas (Cyprus) Limited (Cyprus) is an intermediate holding company. PetroKazakhstan Kumkol Limited (Cyprus) is an intermediate holding company. PetroKazakhstan Marketing Limited (Cyprus) is a crude oil marketing subsidiary of the PetroKazakhstan group. AO PetroKazakhstan Kumkol Resources (Kazakhstan) is engaged in developing the Kumkol South, South Kumkol, KAM, East Kumkol, North Nurali fields and our exploration blocks. TOO Kazgermunai (Kazakhstan) is a 50% joint venture with RWE-DEA AG (RWE) (25%), Erdol-Erdgas Gommern GmbH (EEG) (17.5%), and International Finance Corporation (IFC) (7.5%) engaged in developing the Akshabulak, Nurali and Aksai fields. | | PetroKazakhstan Finance B.V.(Netherlands), a special purpose entity, is a wholly owned subsidiary of PKKR. CJSC Turgai Petroleum (Kazakhstan) is a 50% joint venture with Lukoil Overseas Ltd., engaged in developing the North Kumkol field. Valsera Holdings B.V. (Netherlands) is an intermediate holding company for our refining activities. OAO PetroKazakhstan Oil Products (Kazakhstan) is the company in which our refining activities take place. Ascot Petroleum Consulting Ltd. (England) provides management services to companies in the PetroKazakhstan group. PetroKazakhstan Overseas Services Inc.(Canada and Kazakhstan) supplies international goods and services for PetroKazakhstan s Kazakhstani operations and provides personnel services to the group. |