4Exhibit 1
Message to the shareholders
HIGHLIGHTS
PetroKazakhstan’s First Quarter 2004 highlights included the following:
| > | Net income per fully diluted share increased by 30.1% over the first quarter of 2003 |
| | |
| > | Record quarterly cash flow |
| | |
| > | Transportation differential significantly reduced due to KAM pipeline, use of CPC and sales to Iran |
| | |
| > | Four production wells drilled in the Kyzylkiya area. Extension of the Kyzylkiya field confirmed through drilling in the new Kolzhan license |
| | |
| > | Acquisition of new exploration acreage |
| | |
| > | Substantial Issuer Bid announced to repurchase C$160 million of common shares |
FINANCIAL HIGHLIGHTS
Three Months ended March 31
(EXPRESSED IN MILLIONS OF US$ EXCEPT PER SHARE AMOUNTS)
|
| | | | 2004 | | | 2003 | |
|
| Gross Revenue | | $ | 321.5 | | $ | 248.9 | |
| Net income | | | 87.5 | | | 68.6 | |
Per share (basic) | | | 1.11 | | | 0.87 | |
Per share (diluted) | | | 1.08 | | | 0.83 | |
| Cash flow | | | 114.7 | | | 88.9 | |
Per share (basic) | | | 1.46 | | | 1.12 | |
Per share (diluted) | | | 1.42 | | | 1.08 | |
| Weighted Average Shares Outstanding | | | | | | | |
Basic | | | 79,742,750 | | | 79,028,439 | |
Diluted | | | 80,658,736 | | | 82,358,224 | |
| Shares Outstanding at End of Period | | | 79,865,009 | | | 79,028,539 | |
|
PetroKazakhstan is pleased to announce its financial results for the first quarter of 2004 with $87.5 million of net income, a 27.6% increase over the first quarter of 2003 and $114.7 million of cash flow, a 29.0% increase over the first quarter of 2003.
Net income and cash flow per share (diluted) increased by 30.1% and 31.5% respectively.
SUBSTANTIAL ISSUER BID/ POTENTIAL ACQUISITIONS
With a view to making a special distribution to its shareholders in the most efficient means possible, the Board of Directors has determined that the company will return to shareholders up to C$160 million by way of a substantial issuer bid to be conducted in the form of a modified “Dutch auction”.
The bid will seek to repurchase C$160 million worth of shares at the resultant auction price. The auction pricing range will set a minimum price of C$40.00. The auction will be conducted with bid price increments of C$0.10 above the minimum price.
The Company has applied to securities regulators in both Canada and the United States to obtain certain exemptive relief in connection with the bid and will commence the bid once approval is granted by regulators in both countries. The Company currently expects to receive such approvals in the next few weeks. PetroKazakhstan will be making an announcement of the terms and conditions of the bid when such approvals have been granted and will mail the bid documents as soon as practicable thereafter.
Considering available cash and credit lines, this share repurchase will not affect the ability of the Company to finance in due course a potential material acquisition, based on the size of potential targets currently under review. In this regard, the Company is in advanced conversations for the purchase of the 50% interest in the Kazgermunai Joint Venture, which it does not currently own and is seeking the necessary consents for the potential transaction.
UPSTREAM OPERATIONS REVIEW PRODUCTION During the first quarter of 2004, PetroKazakhstan’s production volumes totaled 12.86 million barrels or an average of 142,919 barrels of oil per day (“bopd”) representing an increase of 1.5% over the first quarter 2003 production of 140,765 bopd and a 13.2% decrease over the fourth quarter of 2003 production rates of 164,559 bopd. Throughout the quarter, 19 Kumkol South wells remained shut in while a mutually acceptable resolution was sought with the neighbouring license holder Turgai Petroleum on operating conditions of wells located at the border between Kumkol South and Kumkol North. A technical regime was approved by the Regulatory Authorities of Kazakhstan in April and 17 of the wells are returning to production. As a result of production loss to date at Kumkol and continued shut in of two wells, the company has revised its forecast of average production for year 2004 to a range of 160,000 bopd to 165,000 bopd. FIELD DEVELOPMENTS Four production wells were drilled in the Kyzylkiya field this quarter. In addition, a well was drilled, tested and brought on production at 700 bopd from the recently acquired Kolzhan license. This well has confirmed a northern extension of the Kyzylkiya field; up to three further delineation wells will be drilled this year. In the Maibulak field a series of wells have been fracture stimulated resulting in improved production rates from 150 to 900 bopd. In addition, water injection facilities have been installed and are in operation, providing reservoir pressure maintenance and 100% voidage replacement. A gas injection system for the Aryskum field development has been designed and is under construction for completion in the second quarter of 2004. Preparations have been made for this year’s drilling campaign of up to 16 new production wells in Aryskum, which may include a horizontal well for enhanced production and reserves exploitation. Development of and production from the East Kumkol field is expected to recommence in the third quarter of 2004. This is subject to government approvals and conclusion of joint venture agreements with Turgai Petroleum as the field discovered by PetroKazakhstan extends into the Kumkol North license area. Kumkol North development continues with further well drilling and additionalseparation and water injection facilities to increase production up to 76,000 bopd (gross) in 2004. | | EXPLORATION AND APPRAISAL A deep exploration well drilled to 3,250 meters on the Dongelek prospect, north of the Kumkol field, is the first exploration well drilled into the southern portion of the Saralyn graben to the deeper horizons. Although the well was dry, oil shows were encountered confirming the presence of hydrocarbons, which will lead to further evaluation of the prospectivity of the graben. In March, a well was spudded on the Aryskum license to explore for hydrocarbons in horizons deeper than the main Aryskum reservoir, which could extend throughout the field. These primary deeper horizons have still to be penetrated but already some upper sands have been encountered which, if confirmed by well logging, could be tested to determine commerciality. Already the results indicate the need for other wells to investigate these previously undetermined sands. The current well should reach a total depth of 4,450 meters in early May. Further enhanced seismic interpretation of the North Nurali field has commenced along with the installation of temporary single well production units to continue the testing and appraisal of the reservoir. The pilot production phase will involve production from five North Nurali wells in 2004. In addition, two further delineation wells are planned in the second half of the year. NEW EXPLORATION LANDS PetroKazakhstan has been awarded two exploration areas to the north and to the south of the main Kyzylkiya field totaling 146 km2. The northern area is adjacent to the Kolzhan license (referred to above) and completes the land acquisition of the extension to the main Kyzylkiya oilfield. In addition, the Company considers there to be upside potential in the Kumkol formation, which underlies the main formation in this location. A well will soon be testing the prospectivity of this deeper formation. The Company also considers there to be a small satellite to the northern field extension lying approximately two kilometers to the east. The southern area contains potential flank satellite pools similar to those of the main Kyzylkiya field. 3D seismic will be acquired in this area in 2004. PetroKazakhstan has now received regulatory approval for becoming a 75% equity partner in License 951-D, which covers two blocks (the Doshan block and the Zhamansu block) in the South Turgai Basin over a total area of 4,290 km2. Four hundred and fifty kilometers of 2D seismic data have been acquired over the two blocks. An exploration well was spudded in the northern Doshan block south of the Aryskum field and is currently drilling. Two wells are planned in the southern Zhamansu block later in 2004. |
EXPLOITATION OF GAS RESOURCES Following the completion of the 55-megawatt power plant in Kumkol, which exploits part of the gas previously flared from Kumkol South, South Kumkol and Kumkol North reservoirs, PetroKazakhstan continues to assess additional methods to increase gas utilization. Evaluation has started on the feasibility of gas usage for miscible hydrocarbon injection for Enhanced Oil Recovery. A pilot project is being designed for one of the Kumkol fields. In parallel, assessment is being made of a Liquefied Petroleum Gas (LPG) facility in Kumkol. As a 50% partner in the Kazgermunai Joint Venture, PetroKazakhstan is also participating in Kazgermunai’s LPG extraction plant for the Akshabulak field. The 30 mmscfd plant will provide 2,900 bopd of LPG and 600 bopd of condensate. The dry gas will be provided to the city of Kyzylorda through a pipeline to be constructed by KazTransGas. DOWNSTREAM MARKETING, TRANSPORTATION AND REFINING CRUDE OIL LOGISTICS Volumes shipped during the first quarter of 2004 amounted to 7.44 million barrels (962 thousand tonnes) compared to 5.24 million barrels (678 thousand tonnes) during the same period in 2003 representing an increase of 42.0%. This was due to a combination of a greater number of available routes, the additional capacity provided by the KAM pipeline and Dzhusaly terminal and less severe winter weather problems in the region. Dzhusaly, which was not operational during the first quarter of 2003, represented 70% of export shipments during the first quarter of 2004. Although there were some shipping delays experienced by vessels passing through the Bosphorous straits due to tighter night time regulations by the Turkish authorities, generally the level of delays seen in 2003 were not experienced during the first quarter of 2004. Operational problems with the pipeline connecting Kumkol to the Atasu terminal, which is the most economic route for deliveries to China, restricted the volume that could be transshipped through this terminal. Limited shipments by rail from PetroKazakhstan rail-loading terminal at Tekesu were made to partly compensate for this. Monthly shipments via the CPC pipeline achieved 99.9% of their contractual limit by the final month of the quarter. CPC | | was not an available option during the first quarter of 2003. Deliveries to the Rey terminal at the Tehran refinery in Iran grew steadily throughout the quarter and are expected to reach their contractual limit mid 2004, once the remaining modifications to the discharge facilities at Rey are completed. CRUDE OIL PRICES AND TRANSPORTATION DIFFERENTIALS International crude oil prices remained buoyant during the first quarter of 2004. Average prices for Brent under Platts quotations were $32.03 per barrel for the first quarter of 2004 compared to $31.49 per barrel in the same period of 2003. Volatility remained high with a spread between the minimum and maximum quotations of $5.84 per barrel during the first three months of 2004. The comparable figure in 2003 was $9.73 per barrel. Net Returns measured at the Kumkol field gate per barrel improved as a result of substantial reductions on transportation differentials. REFINING AND REFINED PRODUCT SALES Refinery operations were stable throughout the quarter. The volumes processed at the refinery returned to more normal levels during the first quarter of 2004. Processing at the refinery during the first quarter of 2003 was higher than normal as a result of crude oil export restrictions during the period of severe weather disruptions. Consequently, refined product sales were reduced from 965 thousand tonnes during the first quarter of 2003 to 776 thousand tonnes during the first quarter of 2004. The production of VGO was halted during the first quarter as VGO was classified as a diesel under customs classification and was subject to an export ban during the spring agricultural season. Negotiations were successfully held with the authorities and VGO has been de-classified as a diesel product and will no longer be subject to export restrictions. VGO production will re-commence in the second quarter of 2004 and the sales values of the volumes produced and shipped in the first quarter will be reflected in the second quarter results. Respectfully submitted on behalf of the board of Directors, /s/ Bernard F. Isautier Bernard F. Isautier President and Chief Executive Officer May 3, 2004 |
MANAGEMENT’S DISCUSSION AND ANALYSIS
The following Management’s Discussion and Analysis (“MD&A”) of the financial condition and results of our operations should be read in conjunction with the unaudited consolidated financial statements of the Corporation included in this report and our MD&A and audited consolidated financial statements for the year ended December 31, 2003. Our financial statements have been prepared in accordance with Canadian GAAP. This discussion and analysis contains forward-looking statements, which involve risks and uncertainties. Our actual results could differ materially from those anticipated in the forward-looking statements.
In our MD&A we use certain terms, which are specific to the oil and gas industry, including “netback” and “cash flow”. These are non-GAAP terms with cash flow defined as cash generated from operating activities before changes in non-cash working capital and netback is defined within our MD&A.
Except as otherwise required by the context, reference in this MD&A to “our”, “we” or “us” refer to the combined business of PetroKazakhstan Inc. and all of its subsidiaries and joint ventures.
All numbers are in U.S. Dollars unless otherwise indicated.
|
| | Three months ended March 31 |
|
| | | | 2004 | | | 2003 | |
| |
| Net income ($000's) | | | 87,485 | | | 68,552 | |
| Cash flow ($000's)1 | | | 114,680 | | | 88,874 | |
| Basic net income per share | | | 1.11 | | | 0.87 | |
| Basic cash flow per share | | | 1.46 | | | 1.12 | |
| BOPD2 | | | 142,919 | | | 140,765 | |
| Capital expenditures | | | 39,125 | | | 50,321 | |
|
| 1 | Cash flow: We evaluate our operations based upon our net income and cash flow. Cash flow is a non-GAAP measure that represents cash flow from operations before changes in working capital. We consider this to be a key measure as we use this measure to evaluate our ability to generate cash to fund our growth through capital expenditures and our ability to repay debt. The comparable GAAP measure is cash flow from operating activities. The following table reconciles our non-GAAP measure cash flow to the comparable GAAP measure "Cash flow from operating activities". |
|
| | Three months ended March 31 |
|
| | | | 2004 | | | 2003 | |
| | | | ($000’s) | | | ($000’s) | |
|
| Cash flow | | | 114,680 | | | 88,874 | |
| Changes in non-cash operating working capital items | | | (19,560 | ) | | 15,940 | |
| Cash flow from operating activities | | | 95,120 | | | 104,778 | |
|
| 2 | We report production before royalties as we measure our Upstream operations on this basis, which is consistent with industry practice in Canada. |
NET RETURN PER BARREL
Set forth on the next page are the details of the average net return achieved for export sales and sales derived from the refining of our own crude. These tables show averages across all types of sales contracts and illustrate the relationship between exports of crude oil versus refining our own crude oil and marketing refined crude oil products.
|
| | Three months ended March 31, 2004 |
|
| | | | Crude Oil | | | Own Crude Oil | |
| | | | Exports | | Refined and Sold* | |
| | | | ($/bbl) | | | ($/bbl) | |
|
| Net sales price achieved | | | 24.24 | | | 18.37 | |
| Transportation costs | | | (7.63 | ) | | (0.96 | ) |
| Selling costs | | | (0.32 | ) | | (0.93 | ) |
| Crude utilized in refining | | | - | | | (1.25 | ) |
| Refining cost | | | - | | | (0.55 | ) |
| Royalties and taxes – downstream | | | - | | | (0.89 | ) |
| General and administrative costs – downstream | | | - | | | (0.47 | ) |
|
| Netback at Kumkol** | | | 16.29 | | | 13.32 | |
| Production Cost | | | (1.65 | ) | | (1.65 | ) |
| Royalties and taxes – upstream | | | (1.08 | ) | | (1.08 | ) |
| General and administrative costs – upstream | | | (0.56 | ) | | (0.56 | ) |
|
| Net return per barrel | | | 13.00 | | | 10.03 | |
|
|
| | Three months ended March 31, 2003 |
|
| | | | Crude Oil | | | Own Crude Oil | |
| | | | Exports | | Refined and Sold* | |
| | | | ($/bbl) | | | ($/bbl) | |
|
| Net sales price achieved | | | 23.21 | | | 13.76 | |
| Transportation costs | | | (8.32 | ) | | (0.91 | ) |
| Selling costs | | | (0.16 | ) | | (0.58 | ) |
| Crude utilized in refining | | | - | | | (0.75 | ) |
| Refining cost | | | - | | | (0.41 | ) |
| Royalties and taxes – downstream | | | - | | | (0.29 | ) |
| General and administrative costs – downstream | | | - | | | (0.50 | ) |
|
| Netback at Kumkol** | | | 14.73 | | | 10.32 | |
| Production Cost | | | (1.36 | ) | | (1.36 | ) |
| Royalties and taxes – upstream | | | (0.75 | ) | | (0.75 | ) |
| General and administrative costs – upstream | | | (0.61 | ) | | (0.61 | ) |
|
| Net return per barrel | | | 12.01 | | | 7.60 | |
|
* Net sales price achieved shown in these tables does not include the price received for purchased refined products resold.
** Average Platts Brent or a similar index for each respective period does not reflect our average realized Brent price because of the timing of recognition of sales for financial statement purposes. Financial statement sales revenue is the basis used to determine the net sales price achieved in these tables. Therefore, a comparison of average Platts Brent or similar index to our netback at Kumkol cannot be used to determine our differential.
During the first quarter of 2004, the netback at Kumkol for crude oil exports increased by $1.56/bbl compared to the same quarter of 2003 due to an increase in market prices (average Platts Brent was $32.03/bbl compared to $31.49/bbl in 2003) and savings in transportation costs.
The netback at Kumkol for own crude oil refined and sold increased by $3.00/bbl compared to the first quarter of 2003 mainly due to higher sales prices.
KEY PERFORMANCE INDICATORS
We measure the performance of our Upstream and Downstream operations using the following key performance indicators.
|
| | Three months ended March 31 |
|
| | | | 2004 | | | 2003 | |
|
| BOPD | | | 142,919 | | | 140,765 | |
| Differential* ($/bbl) | | | 12.71 | | | 14.89 | |
| Average refined products price ($/bbl) | | | 18.44 | | | 13.76 | |
| Production expenses ($/bbl) | | | 1.65 | | | 1.36 | |
| Refining cost ($/bbl)) | | | 0.55 | | | 0.41 | |
| General and administrative ($/bbl) | | | 1.03 | | | 1.11 | |
| Effective income tax rate % | | | 33.4 | % | | 33.1 | % |
|
* Our differential is calculated as the difference between the average Brent price for crude oil export sales received by PKKR and Turgai, and our netback at Kumkol. It is the sum of the costs and discounts incurred in order to transport and sell our crude oil to international markets. The sales revenue used in this measure differs from sales revenue in the statement of net income and the net return table for the following reasons:
• The differential does not include Kazgermunai sales over which we have limited control. Kazgermunai is excluded because the differential is used to measure the performance of our internal marketing and transportation group.
• The differential is calculated using finalized sales transactions. Our financial statements include estimates that may or may not reflect the finalized transactions.
BOPD.See Production and Processing for a discussion of our production.
Differentials. The graph below shows the evolution of our differential over the last three years and the first quarter of 2004. The improvement in our differential shows the impact of a full quarter of shipments through routes with better differentials, specifically the KAM Pipeline, Turgai CPC sales and sales to Chinese customers, from the Atasu terminal. Sales through the Atasu terminal represented a fourth of the quarter's total completed sales volumes. | | 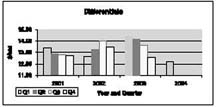 |
Production expenses. Production expenses were higher in the first quarter of 2004 compared to 2003 because of a number of contributing factors. Operating costs for our temporary truck offloading facility increased due to adverse winter weather conditions, we replaced a number of flowline pumps and we are using temporary power generators in single well operations in the KAM fields. These costs were also influenced by the increased number of production facilities commissioned in 2004 due to the development of the KAM fields.
Refining cost.Refining costs in the first quarter of 2004 were higher compared to 2003 due to the higher purchased energy costs related to the start-up of the vacuum distillation unit.
General and administrative expenses.Overall general and administrative expenses on an absolute basis are virtually unchanged in the first quarter of 2004 compared to 2003.
Effective income tax rate.The statutory tax rate in Kazakhstan, where all of our operations are located, is 30%. Our effective tax rate differs due to certain expenses, which cannot be deducted for statutory tax purposes. Our tax rate as a percentage of net income before tax in the first quarter of 2004 was 33.4% compared to 33.1% in the same quarter of 2003.
PRODUCTION AND PROCESSING
PRODUCTION
The following table sets forth our barrels of oil produced per day by field and on a consolidated basis.
|
| | Three months ended March 31 |
|
| Field | | | 2004 | | | 2003 | |
| | | | (BOPD) | | | (BOPD) | |
|
| Kumkol South | | | 42,241 | | | 56,676 | |
| Kumkol North | | | 33,428 | | | 25,709 | |
| South Kumkol | | | 25,816 | | | 30,770 | |
| Kyzylkiya | | | 9,425 | | | 6,750 | |
| Aryskum | | | 8,793 | | | 7,644 | |
| Maibulak | | | 2,064 | | | 444 | |
| North Nurali | | | 121 | | | - | |
| License #952 | | | 48 | | | - | |
| Kazgermunai Fields | | | 20,983 | | | 12,772 | |
|
| Total | | | 142,919 | | | 140,765 | |
|
During the first quarter of 2004 there was a temporary reduction of production at Kumkol South in order to harmonize the operation of certain wells at the border of Kumkol South and Kumkol North fields. These issues were resolved and production was resuming at the beginning of April 2004.
The increase in Kumkol North is due to the 33 new production wells that were drilled during 2003.
The lower production volumes in South Kumkol resulted from bottom-hole pump failures, which were replaced with lower capacity pumps until full capacity replacements were obtained and installed.
Production levels at Kyzylkiya increased primarily due to newly drilled wells. Aryskum production volumes increased through optimising bottom-hole flowing pressures. Maibulak production volumes increased due to positive stimulation (fracture treatment) response.
The increase in the production rates of the Kazgermunai fields is mainly due to Akshabulak field, where debottlenecking measures were completed.
The following table sets forth the movements in crude oil inventory for our Upstream operations for the three months ended March 31, 2004 and 2003.
|
| | Three months ended March 31 |
|
| | | | 2004 | | | 2003 | |
| | | | (MMbbls) | | | (MMbbls) | |
|
| Opening inventory of crude oil | | | 2.87 | | | 2.72 | |
| Production | | | 13.01 | | | 12.67 | |
| Crude oil purchased from third parties | | | 1.09 | | | - | |
| Crude oil purchased from joint ventures (50%) | | | 0.32 | | | 0.62 | |
| Sales or transfers | | | (14.68 | ) | | (12.81 | ) |
| Transportation losses | | | (0.05 | ) | | (0.01 | ) |
| Return of purchased crude | | | - | | | (0.65 | ) |
|
| Closing inventory of crude oil | | | 2.56 | | | 2.54 | |
|
The table on the next page sets out our total crude oil sales and transfers from Upstream operations for the three months ended March 31, 2004 and 2003.
|
| | Three months ended March 31 |
|
| | | | 2004 | | | 2004 | | | 2003 | | | 2003 | |
| | | | (MMbbls) | | | (%) | | | (MMbbls) | | | (%) | |
|
| Crude oil exports | | | 7.85 | | | 53.5 | | | 6.13 | | | 47.9 | |
| Crude oil transferred to Downstream | | | 4.15 | | | 28.2 | | | 5.4 | | | 42.1 | |
| Crude oil transferred to Downstream by joint ventures (50%) | | | 1.51 | | | 10.3 | | | 1.28 | | | 10.0 | |
| Royalty payments | | | 1.17 | | | 8.0 | | | - | | | - | |
| Crude oil domestic sales | | | - | | | - | | | - | | | - | |
|
| Total crude oil sales or transfers | | | 14.68 | | | 100.0 | | | 12.81 | | | 100.0 | |
|
REFINING
Our total processed volumes were as follows:
|
| | Three months ended March 31 |
|
| | | | 2004 | | | 2003 | |
| | | | (MMbbls) | | | (MMbbls) | |
|
| Feedstock refined into product | | | 7.08 | | | 8.03 | |
| Tolled volumes | | | 0.02 | | | 0.23 | |
|
| Total processed volumes* | | | 7.10 | | | 8.26 | |
|
*The total processed volumes are used for our per barrel calculations.
Sources of feedstock supplies for our refinery were as follows:
|
| | Three months ended March 31 |
|
| | | | 2004 | | | 2003 | |
| | | | (MMbbls) | | | (MMbbls) | |
|
| Acquired from PKKR | | | 4.15 | | | 5.40 | |
| Purchased from joint ventures (100%) | | | 3.03 | | | 2.56 | |
|
| Total feedstock acquired | | | 7.18 | | | 7.96 | |
|
The movements in our feedstock inventory at our refinery were as follows:
|
| | Three months ended March 31 |
|
| | | | 2004 | | | 2003 | |
| | | | (MMbbls) | | | (MMbbls) | |
|
| Opening inventory of crude oil feedstock | | | 0.03 | | | 0.20 | |
| Purchase and acquisition of feedstock | | | 7.18 | | | 7.96 | |
| Recoverable feedstock from traps | | | 0.02 | | | (0.05 | ) |
| Feedstock refined into product | | | (7.08 | ) | | (8.03 | ) |
|
| Closing inventory of feedstock | | | 0.15 | | | 0.08 | |
|
The movement in inventory of refined products was as follows:
|
| | Three months ended March 31 |
|
| | | | 2004 | | | 2003 | |
| | | | (MM tonnes*) | | | (MM tonnes*) | |
|
| Opening inventory of refined product | | | 0.26 | | | 0.22 | |
| Refined product from feedstock | | | 0.85 | | | 0.98 | |
| Refined product purchased | | | 0.03 | | | - | |
| Refined product sold | | | (0.78 | ) | | (0.96 | ) |
| Refined product internal use and yield losses | | | - | | | | |
|
| Closing inventory of refined product | | | 0.36 | | | 0.24 | |
|
*The inventory of products represents a mix of products for which no unique conversion from barrels to tonnes exists. The standard conversion used by us for crude oil is 7.746 barrels to the tonne.
RESULTS OF OPERATIONS
REVENUE
As at December 31, 2003, approximately 1.9 mmbbls of non-FCA sales were incomplete and hence, included in inventory. The net profit realized on these sales in the first quarter of 2004 was $17.0 million. As at March 31, 2004, approximately 1.2 mmbbls of non-FCA sales were incomplete. The effect of this was to cause an estimated $15.6 million of net income to be deferred into the second quarter of 2004.
REVENUE
|
| | Three months ended March 31 |
|
| | | | 2004 | | | 2003 | | | Change | | | % | |
|
| Crude oil | | | 207,478 | | | 142,242 | | | 65,236 | | | 45.9 | |
| Revenue products | | | 110,892 | | | 102,955 | | | 7,937 | | | 7.7 | |
| Service fees | | | 2,668 | | | 1,546 | | | 1,122 | | | 72.6 | |
| Interest income | | | 443 | | | 2,180 | | | (1,737 | ) | | (79.7 | ) |
|
| Total revenue | | | 321,481 | | | 248,923 | | | 72,558 | | | 29.1 | |
|
CRUDE OIL
The table below sets out the crude oil revenue, volumes sold and net realized prices:
THREE MONTHS ENDED MARCH 31, 2004
|
| | | Quantity sold in | | | Net Realized Price | | | Revenue | |
| | | | (MMbbls) | | | ($ per bbl) | | | ($000’s) | |
|
| Crude sales sold FCA | | | - | | | - | | | - | |
| Crude sales sold non-FCA | | | 6.26 | | | 25.40 | | | 158,994 | |
| Kazgermunai export sales | | | 1.59 | | | 19.71 | | | 31,340 | |
| Royalty payments | | | 1.17 | | | 14.65 | | | 17,144 | |
|
| Total | | | 9.02 | | | 23.00 | | | 207,478 | |
|
THREE MONTHS ENDED MARCH 31, 2003
|
| | | Quantity sold in | | | Net Realized Price | | | Revenue | |
| | | | (MMbbls) | | | ($ per bbl) | | | ($000’s) | |
|
| Crude sales sold FCA | | | 1.08 | | | 18.15 | | | 19,603 | |
| Crude sales sold non-FCA | | | 3.89 | | | 26.04 | | | 101,291 | |
| Kazgermunai export sales | | | 1.16 | | | 18.40 | | | 21,348 | |
| Royalty payments | | | - | | | - | | | - | |
|
| Total | | | 6.13 | | | 23.20 | | | 142,242 | |
|
Our increase of $65.2 million in crude oil revenue for the first quarter of 2004 compared to the same quarter of 2003 was due to the increase in exported volumes of 1.72 mmbbls and the absence of FCA sales.
The revenue shown for royalty payments represents the actual royalty expense for the last quarter of 2003, for which the payment was made in the first quarter of 2004.
REFINED PRODUCTS
The table below sets forth the related volumes of refined products sold, the average price obtained and revenue received for the three months ended March 31, 2004 and 2003.
|
| | Three months ended March 31 |
|
| | | | Tonnes | | | Average Price | | | Revenue | |
| | | | Sold | | | ($/tonne) | | | ($000’s) | |
|
2004 | | | 776,222 | | | 142.86 | | | 110,892 | |
| 2003 | | | 965,915 | | | 106.59 | | | 102,955 | |
|
The increase in refined products sales in the first quarter of 2004 compared to 2003 of $7.9 million was due to our higher average realized price of $142.86/tonne (compared to $106.59/tonne in 2003), offsetting a decrease in our sales volumes of 189,693 tonnes. We were able to obtain higher prices for the first quarter of 2004 compared to 2003, as the world price of crude oil increased resulting in higher market prices for refined products in Kazakhstan and its main competitor, Russia. Additionally, the demand for refined products in Kazakhstan has been increasing.
PRODUCTION EXPENSES
Production expenses relate to the cost of producing crude oil in our Upstream operations. Based on the number of barrels of oil produced, these costs were $1.65/bbl in the first quarter of 2004 compared to $1.36/bbl for the first quarter of 2003. The absolute amount of production expenses increased by $4.2 million in the first quarter of 2004. There were a number of contributing factors. Operating costs for our temporary truck offloading facility increased due to adverse winter weather conditions, we replaced a number of flowline pumps and we are using temporary power generators in single well operations in the KAM fields. These costs were also influenced by the increased number of production facilities commissioned in 2004 due to the development of the KAM fields.
ROYALTIES AND TAXES
The following table sets forth the components of royalties and taxes.
|
| | Three months ended March 31 |
|
| | | | 2004 | | | 2003 | |
| | | | ($000’s) | | | ($000’s) | |
|
| Royalties and production bonus | | | 11,486 | | | 6,218 | |
| Provision for ARNM assessment | | | 3,600 | | | - | |
| Other taxes | | | 5,295 | | | 5,585 | |
|
| Royalties and taxes | | | 20,381 | | | 11,803 | |
|
Royalties and Production Bonus
Royalties and production bonus for the first quarter of 2004 were $11.5 million, which represented an effective overall royalty rate of 5.5% excluding production bonuses of $0.2 million. Royalties and production bonus for the first quarter of 2003 were $6.2 million, an overall royalty rate of 5.8%, after excluding the production bonuses of $1.0 million. The reasons for the lower overall royalty rate were that a higher proportion of production came from fields with lower royalty rates and the temporary reduction in production at Kumkol South.
Provision for ARNM Assessment
As described in Note 20 to our 2003 Annual Report, the Agency for Regulation of Natural Monopolies and Protection of Competition ("ARNM") alleged that PKOP charged prices for refined oil products that in total were $6.3 million in excess of ARNM authorized maximum prices. In April 2004 following the Supreme Court decision we paid $3.6 million to satisfy the assessment. See Note 12 to the interim consolidated financial statements.
Other taxes
Other taxes in the first quarters of 2004 and 2003 include:
• excise tax on refined products ($2.4 million in 2004 compared to $2.2 million in 2003);
• excise tax on crude oil exports (nil in 2004 compared to $1.0 million in 2003);
• value added tax on crude oil ($1.6 million in 2004 compared to $1.2 million in 2003);
• various taxes, including property taxes, road fund and other ($1.3 million in 2004 compared to $1.2 in 2003).
TRANSPORTATION
The table below sets out the components of transportation costs.
|
| | Three months ended March 31 |
|
| | | | 2004 | | | 2003 | |
| | | | ($000’s) | | | ($000’s) | |
|
| Pipeline | | | 9,859 | | | 22,569 | |
| Kazgermunai transportation | | | 6,839 | | | 1,350 | |
| Railway | | | 46,476 | | | 29,334 | |
| Other | | | 905 | | | 1,750 | |
|
| Royalties and taxes | | | 64,079 | | | 55,003 | |
|
Pipeline
Pipeline costs decreased by $12.7 million in the first quarter of 2004 compared to 2003 primarily due to the following:
| | • | Decrease of $8.6 million in non-FCA pipeline costs (nil for the first quarter of 2004 compared to $8.6 million in the same quarter of 2003) because we did not use the Atyrau-Samara pipeline; |
| | • | Decrease of $5.3 million, as a result of a decrease in volumes sold for export through the Kumkol - Shymkent pipeline (1.5 mmbbls in the first quarter of 2004 compared to 5.4 mmbbls in the first quarter of 2003), partially offset by higher tariffs for the Kumkol - Shymkent pipeline in 2004 ($1.62/bbl in 2004 compared to $1.49/bbl in 2003); |
| | • | Increase of $1.7 million on volumes shipped through our KAM pipeline and through Atasu terminal to China (4.6 mmbbls in the first quarter of 2004). There were no sales through these routes in the first quarter of 2003. |
Railway
Railway transportation increased by $17.1 million or 58.4% for the first quarter of 2004 compared to 2003 due to our increase in non-FCA sales. Non-FCA sales increased by 60.9% in the first quarter of 2004 compared to the same quarter in 2003 (6.26 mmbbls versus 3.89 mmbbls).
Other
Other transportation costs are mainly trucking costs incurred to transport crude oil from the KAM fields to the CPF located at Kumkol. Trucking costs have significantly decreased in the first quarter of 2004 to $0.9 million from $1.8 million in the first quarter of 2003 due to the Aryskum pumping station, which connects the KAM fields to the KAM pipeline, which became operational in November 2003.
REFINING
Refining costs represent the direct costs related to processing all crude oil, including tollers’ volumes, at the refinery.
Refining costs for the first quarter of 2004 were $3.9 million ($0.55/bbl)compared to $3.4 million ($0.41/bbl) in the same quarter of 2003. The main reason for the $0.5 million increase in refining costs was due to the higher steam and electric power costs related to the startup of the vacuum distillation unit. This equated to $0.06/bbl. The remaining per barrel increase of $0.08/bbl is due to the lower processed volume of 1.16 mmbbls.
CRUDE OIL AND REFINED PRODUCT PURCHASES
Crude oil and refined product purchases represent the expensed portion of crude oil purchased for the refinery from third parties, as well as refined products purchased for resale. Purchases and sales between our Upstream and Downstream business units are eliminated on consolidation.
Our purchases of crude oil and refined products were as follows:
|
| | Three months ended March 31 |
|
| | | | 2004 | | | 2003 | |
| | | | ($000’s) | | | ($000’s) | |
|
| Crude oil | | | 30,644 | | | 9,370 | |
| Refined products | | | 2,912 | | | - | |
|
| Total | | | 33,556 | | | 9,370 | |
|
During the first quarter of 2004 we repurchased the royalty-in-kind volumes for $17.1 million and subsequently resold them. The remaining purchases of crude oil were made from one of our joint ventures.
SELLING
Selling expenses for crude oil are comprised of customs, quality inspection and costs related to the export of crude oil. Selling expenses for refined products are comprised of the costs of operating the distribution centres for our Downstream operations.
|
| | Three months ended March 31 |
|
| | | | 2004 | | | 2002 | |
| | | | ($000’s) | | | ($000’s) | |
|
| Crude oil | | | 4,125 | | | 1,848 | |
| Refined products | | | 4,332 | | | 3,623 | |
|
| Total | | | 8,457 | | | 5,471 | |
|
The increase in crude oil selling expenses during the first quarter of 2004 compared to the same quarter of 2003 was the direct result of increased export sales volumes related to non-FCA routes, for which all selling costs are absorbed by us, and the increase in Kazgermunai sales volumes.
GENERAL AND ADMINISTRATIVE
The table below analyzes total general and administrative costs for Upstream, Downstream and Corporate. In the case of Upstream and Downstream the general and administrative costs are also presented on a per barrel basis.
THREE MONTHS ENDED MARCH 31, 2004
|
| | | General and | | | Per barrel of oil | |
| | | | Administrative | | | produced or processed* | |
| | | | ($000’s) | | | ($/bbl) | |
|
| Upstream | | | 7,343 | | | 0.56 | |
| Downstream | | | 3,364 | | | 0.47 | |
| Corporate | | | 2,536 | | | | |
|
| Total | | | 13,243 | | | | |
|
* Including tollers’ volumes
THREE MONTHS ENDED MARCH 31, 2003
|
| | | | General and | | | Per barrel of oil | |
| | | | Administrative | | | produced or processed* | |
| | | | ($000’s) | | | ($/bbl) | |
|
| Upstream | | | 7,788 | | | 0.61 | |
| Downstream | | | 4,166 | | | 0.50 | |
| Corporate | | | 1,023 | | | | |
|
| Total | | | 12,977 | | | | |
|
* Including tollers’ volumes
INTEREST AND FINANCING
The following table sets forth our interest and financing costs and any related amortization of debt issue costs or discounts upon issuance of the debt instrument.
|
| | Three months ended March 31 |
|
| | | | 2004 | | | 2003 | |
| | | | ($000’s) | | | ($000’s) | |
|
| 9.625% Notes | | | 4,027 | | | 1,702 | |
| Term facility | | | 1,553 | | | 2,185 | |
| Kazgermunai debt | | | 410 | | | 974 | |
| PKOP bonds | | | 469 | | | 487 | |
| Short-term debt | | | 221 | | | 193 | |
| 12% Notes | | | - | | | 8,718 | |
| Accretion expense | | | 608 | | | 513 | |
| Term loans | | | 128 | | | - | |
| Less portion capitalized | | | (13 | ) | | - | |
|
| Total | | | 7,403 | | | 14,772 | |
|
| | • | Our 9.625% Notes interest expense increased in the first quarter of 2004 by $2.3 million, as the Notes were issued in February 2003. |
| | | |
| | • | Our term facility interest expense decreased by $0.6 million due to the repayment of a portion of the principal. |
| | | |
| | • | Interest on our Kazgermunai debt decreased by $0.6 million due to a $9.5 million (50%) repayment of a portion of the debt. |
| | | |
| | • | The PKOP bonds were fully redeemed on February 26, 2004. |
| | | |
| | • | Accretion expense represents the increase in the present value of our asset retirement obligations due to the passage of time. |
| | | |
| | • | Our 12% Notes interest expense in 2003 was $8.7 million including $6.6 million of issue costs that were expensed when we redeemed these notes on February 2, 2003. |
DEPRECIATION AND DEPLETION
THREE MONTHS ENDED MARCH 31, 2004
|
| | | Depreciation and | | | Depreciation and | |
| | | | Depletion ($000’s) | | | Depletion ($/bbl*) | |
|
| Upstream | | | 16,153 | | | 1.24 | |
| Downstream | | | 4,869 | | | 0.68 | |
| Corporate | | | 311 | | | | |
|
| Total | | | 21,333 | | | | |
|
* Downstream Includes tollers’ volumes
THREE MONTHS ENDED MARCH 31, 2003
|
| | | | Depreciation and | | | Depreciation and | |
| | | | Depletion ($000’s) | | | Depletion ($/bbl*) | |
|
| Upstream | | | 12,932 | | | 1.02 | |
| Downstream | | | 4,670 | | | 0.57 | |
| Corporate | | | 26 | | | | |
|
| Total | | | 17,628 | | | | |
|
* Downstream Includes tollers’ volumes
INCOME TAXES
|
| | Three months ended March 31 |
|
| | | | 2004 | | | 2003 | |
| | | | ($000’s) | | | ($000’s) | |
|
| Upstream | | | 25,897 | | | 22,200 | |
| Downstream | | | 16,760 | | | 11,755 | |
| Corporate | | | 1,568 | | | 232 | |
|
| Total | | | 44,225 | | | 34,187 | |
|
The increase in income taxes of $10.0 million in the first quarter of 2004 was mainly the result of the increase in sales volumes and in the price of crude oil and refined products, which led to an increase in income before income taxes of $29.0 million.
CAPITAL EXPENDITURES AND COMMITMENTS
The table below sets forth a breakdown of our capital expenditures for the three months ended March 31, 2004 and 2003.
|
| | Three months ended March 31 |
|
| | | | 2004 | | | 2003 | |
| | | | ($000’s) | | | ($000’s) | |
|
| Upstream | | | | | | | |
Development wells | | | 6,390 | | | 3,921 | |
Facilities and equipment | | | 23,566 | | | 36,735 | |
Exploration | | | 5,642 | | | 3,916 | |
| Downstream | | | | | | | |
Refinery HS&E | | | 542 | | | 227 | |
Refinery sustaining | | | 1,185 | | | 794 | |
Refinery return projects | | | 1,337 | | | 4,559 | |
Marketing & other | | | 181 | | | 11 | |
| Corporate | | | 282 | | | 159 | |
|
| Total capital expenditures | | | 39,125 | | | 50,321 | |
|
| Less accrued amounts | | | (4,089 | ) | | (3,221 | ) |
|
| Total cash capital expenditures | | | 35,036 | | | 47,100 | |
|
LIQUIDITY
The levels of cash, current assets and current liabilities as at March 31, 2004 and December 31, 2003 are set out below.
|
| | | As at | | | As at | |
| | | | March 31, 2004 | | | December 31, 2003 | |
| | | | ($000’s) | | | ($000’s) | |
|
| Cash | | | 206,485 | | | 184,660 | |
| Cash flow | | | 114,680 | | | 399,931 | |
| Working capital* | | | 168,860 | | | 151,737 | |
|
| Net debt** | | | 73,416 | | | 135,220 | |
|
| Ratio of cash flow to net debt*** | | | 6.2 | | | 3.0 | |
| Ratio of cash flow to fixed charges**** | | | 15.5 | | | 10.6 | |
| Ratio of earnings to fixed charges***** | | | 18.8 | | | 13.6 | |
|
* Working capital is net of cash and short-term debt
** Net debt includes short-term and long-term debt less cash
*** Quarterly cash flow is annualized
**** Fixed charges include interest expense and preferred dividends before tax
***** Earnings is income before income taxes plus fixed charges
Our net working capital has increased mainly because our accounts receivable have increased. All crude oil sales are now on a non-FCA basis and this led to a $13.0 million increase in accounts receivable.
INTERIM CONSOLIDATED STATEMENTS OF INCOME AND RETAINED EARNINGS (DEFICIT)
(EXPRESSED IN THOUSANDS OF UNITED STATES DOLLARS, EXCEPT PER SHARE AMOUNTS)
Unaudited
|
| | Three months ended March 31 |
| | | | 2004 | | | 2003 | |
|
REVENUE | | | | | | | |
Crude oil | | | 207,478 | | | 142,242 | |
Refined products | | | 110,892 | | | 102,955 | |
Service fees | | | 2,668 | | | 1,546 | |
Interest income | | | 443 | | | 2,180 | |
|
| | | | 321,481 | | | 248,923 | |
|
EXPENSES | | | | | | | |
Production | | | 21,447 | | | 17,256 | |
Royalties and taxes | | | 20,381 | | | 11,803 | |
Transportation | | | 64,079 | | | 55,003 | |
Refining | | | 3,908 | | | 3,352 | |
Crude oil and refined product purchases | | | 33,556 | | | 9,370 | |
Selling | | | 8,457 | | | 5,471 | |
General and administrative | | | 13,243 | | | 12,977 | |
Interest and financing costs | | | 7,403 | | | 14,772 | |
Depletion and depreciation | | | 21,333 | | | 17,628 | |
Foreign exchange gain | | | (4,684 | ) | | (2,098 | ) |
|
| | | | 189,123 | | | 145,534 | |
|
| INCOME BEFORE INCOME TAXES | | | 132,358 | | | 103,389 | |
|
| | | | | | | | |
| INCOME TAXES (Note 8) | | | | | | | |
Current provision | | | 45,359 | | | 36,172 | |
Future income tax | | | (1,134 | ) | | (1,985 | ) |
|
| | | | 44,225 | | | 34,187 | |
|
NET INCOME BEFORE NON-CONTROLLING INTEREST | | | 88,133 | | | 69,202 | |
| NON-CONTROLLING INTEREST | | | 648 | | | 650 | |
|
NET INCOME | | | 87,485 | | | 68,552 | |
|
RETAINED EARNINGS, BEGINNING OF YEAR | | | 378,819 | | | 73,151 | |
|
| Normal course issuer bid | | | - | | | (792 | ) |
| Preferred share dividends | | | (9 | ) | | (8 | ) |
|
| RETAINED EARNINGS, END OF PERIOD | | | 466,295 | | | 140,903 | |
|
| BASIC NET INCOME PER SHARE (Note 9) | | | 1,11 | | | 0.87 | |
|
| DILUTED NET INCOME PER SHARE (Note 9) | | | 1.08 | | | 0.83 | |
|
See accompanying notes to the interim consolidated financial statements.
INTERIM CONSOLIDATED BALANCE SHEETS
(EXPRESSED IN THOUSANDS OF UNITED STATES DOLLARS)
Unaudited
|
| | | As at | | | As at | |
| | | | March 31, | | | December 31, | |
| | | | 2004 | | | 2003 | |
|
ASSETS | | | | | | | |
| CURRENT | | | | | | | |
Cash | | | 206,485 | | | 184,660 | |
Accounts receivable | | | 174,675 | | | 150,293 | |
Inventory | | | 52,958 | | | 36,920 | |
Prepaid expenses | | | 37,475 | | | 44,901 | |
Current portion of future income tax asset | | | 16,305 | | | 14,697 | |
|
| | | | 487,899 | | | 431,471 | |
| Deferred charges | | | 6,318 | | | 6,729 | |
| Restricted cash (Note 5) | | | 36,868 | | | 35,468 | |
| Future income tax asset | | | 25,262 | | | 25,466 | |
| Property, plant and equipment | | | 555,940 | | | 542,317 | |
|
TOTAL ASSETS | | | 1,112,287 | | | 1,041,451 | |
|
LIABILITIES | | | | | | | |
| CURRENT | | | | | | | |
Accounts payable and accrued liabilities | | | 98,846 | | | 88,422 | |
Short-term debt (Note 6) | | | 46,173 | | | 73,225 | |
Prepayments for crude oil and refined products | | | 13,708 | | | 6,652 | |
|
| | | | 158,727 | | | 168,299 | |
| Long-term debt | | | 233,728 | | | 246,655 | |
| Asset retirement obligations (Note 2) | | | 29,233 | | | 28,625 | |
| Future income tax liability | | | 13,274 | | | 13,012 | |
|
| | | | 434,962 | | | 456,591 | |
|
| Non-controlling interest | | | 13,739 | | | 13,091 | |
| Preferred shares of subsidiary | | | 80 | | | 80 | |
COMMITMENTS AND CONTINGENCIES(Note 12) | | | | | | | |
SHAREHOLDERS’ EQUITY | | | | | | | |
Share capital (Note 7) | | | 195,272 | | | 191,695 | |
Contributed surplus | | | 1,939 | | | 1,175 | |
Retained earnings | | | 466,295 | | | 378,819 | |
|
| | | | 663,506 | | | 571,689 | |
|
TOTAL LIABILITIES AND SHAREHOLDERS’ EQUITY | | | 1,112,287 | | | 1,041,451 | |
|
See accompanying notes to the interim consolidated financial statements.
APPROVED BY THE BOARD OF DIRECTORS.
/s/BERNARD ISAUTIER | | /s/JACQUES LEFÈVRE |
| |
|
| BERNARD ISAUTIER | | JACQUES LEFÈVRE |
| Director | | Director |
INTERIM CONSOLIDATED STATEMENTS OF CASH FLOW
(EXPRESSED IN THOUSANDS OF UNITED STATES DOLLARS)
Unaudited
|
| | 3 months ended |
| | | | March 31, 2004 | | | March 31, 2003 | |
|
OPERATING ACTIVITIES | | | | | | | |
| Net income | | | 87,485 | | | 68,552 | |
| Items not affecting cash: | | | | | | | |
Depletion and depreciation | | | 21,333 | | | 17,628 | |
Amortization of deferred charges | | | 387 | | | 2,693 | |
Non-controlling interest | | | 648 | | | 650 | |
Other non-cash charges | | | 5,961 | | | 1,336 | |
Future income tax | | | (1,134 | ) | | (1,985 | ) |
|
| Cash flow | | | 114,680 | | | 88,874 | |
| Changes in non-cash operating working capital items | | | (19,560 | ) | | 15,904 | |
|
| Cash flow from operating activities | | | 95,120 | | | 104,778 | |
|
FINANCING ACTIVITIES | | | | | | | |
Short term debt | | | (24,494 | ) | | 50,502 | |
Purchase of common shares | | | - | | | (1,032 | ) |
Long term debt | | | (15,933 | ) | | 64,110 | |
Deferred charges paid | | | - | | | (2,451 | ) |
Proceeds from issue of share capital, net of share issuance costs | | | 3,577 | | | 450 | |
Preferred share dividends | | | (9 | ) | | (8 | ) |
|
| Cash flow from financing activities | | | (36,859 | ) | | 111,571 | |
|
INVESTING ACTIVITIES | | | | | | | |
Capital expenditures | | | (35,036 | ) | | (47,100 | ) |
Restricted cash | | | (1,400 | ) | | - | |
Purchase of preferred shares of subsidiary | | | - | | | (2 | ) |
|
| Cash flow used in investing activities | | | (36,436 | ) | | (47,102 | ) |
|
INCREASE IN CASH | | | 21,825 | | | 169,247 | |
|
CASH, BEGINNING OF PERIOD | | | 184,660 | | | 74,796 | |
|
CASH, END OF PERIOD | | | 206,485 | | | 244,043 | |
|
See accompanying notes to the interim consolidated financial statements.
NOTES TO THE INTERIM CONSOLIDATED FINANCIAL STATEMENTS
(EXPRESSED IN THOUSANDS OF UNITED STATES DOLLARS TABULAR AMOUNTS IN THOUSANDS OF DOLLARS, UNLESS OTHERWISE INDICATED)
UNAUDITED
| 1 | SIGNIFICANT ACCOUNTING POLICIES |
| | |
| | The interim consolidated financial statements of PetroKazakhstan Inc. (“PetroKazakhstan” or the “Corporation”) have been prepared by management in accordance with generally accepted accounting principles in Canada. Its main operating subsidiaries are PetroKazakhstan Kumkol Resources ("PKKR") and PetroKazakhstan Oil Products ("PKOP"). Certain information and disclosures normally required to be included in the notes to the annual financial statements have been omitted or condensed. The interim consolidated financial statements should be read in conjunction with the consolidated financial statements and the notes thereto in PetroKazakhstan’s Annual Report for the year ended December 31, 2003. The accounting principles applied are consistent with those as set out in the Corporation’s annual financial statements for the year ended December 31, 2003, except for the change in accounting standards as described in Note 2. |
| | |
| | The presentation of certain amounts for previous periods has been changed to conform with the presentation adopted for the current period. |
| | |
| 2 | CHANGE IN ACCOUNTING STANDARDS |
| | |
| | Asset Retirement Obligations |
| | |
| | Effective January 1, 2004, the Corporation adopted the new recommendation of the Canadian Institute of Chartered Accountants (“CICA”) regarding asset retirement obligations. This new standard changes the method of estimating and accounting for future site restoration costs. Total estimated asset retirement obligations are discounted to estimate the fair value of the obligation and recorded as a liability when the related assets are constructed and commissioned. The fair value increases the value of property, plant and equipment and is depleted over the life of the asset. Accretion expense, resulting from the changes in the present value of the liability due to the passage of time is recorded as part of interest and financing costs. |
| | |
| | Estimated cash flows are discounted at 8.5%. The total undiscounted estimated cash flows required to settle the obligations is $73.0 million with the expenditures being incurred over ten years commencing in 2014. |
| | |
| | The new standard has been applied retroactively, and the financial statements of prior periods have been restated. |
| | |
| | Adoption of the new standard of accounting for asset retirement obligations resulted in the following changes in the consolidated balance sheet and statement of income and retained earnings. |
| | |
| | Changes in consolidated balance sheets: |
|
Increase/(Decrease) | | | As at | | | As at | |
| | | | March 31, 2004 | | | December 31, 2003 | |
|
| Future income tax asset | | | 806 | | | 651 | |
| Property, plant and equipment | | | 15,000 | | | 15,181 | |
|
| Total assets | | | 15,806 | | | 15,832 | |
|
| Asset retirement obligations | | | 22,667 | | | 22,058 | |
| Retained earnings | | | (6,861 | ) | | (6,226 | ) |
|
| Total liabilities and shareholders’ equity | | | 15,806 | | | 15,832 | |
|
| | Changes in consolidated statements of income and retained earnings for the three months ended March 31, 2004 and 2003: |
|
| Increase / (decrease) | | | Three months | | | Three months | |
| | | | ended March 31, 2004 | | | ended March 31, 2003 | |
|
| Interest and financing costs | | | 608 | | | 513 | |
| Depletion and depreciation | | | 181 | | | 513 | |
|
| Income before income taxes | | | 789 | | | (1,086 | ) |
| Income taxes | | | 154 | | | 573 | |
|
| Net income | | | (635 | ) | | 245 | |
|
| Basic net income per share | | | (0.01 | ) | | 0.01 | |
| Diluted net income per share | | | (0.01 | ) | | - | |
|
| | The change in asset retirement obligations is as follows: |
|
| Asset retirement obligations liability as at January 1, 2003 | | | 22,831 | |
| Revisions | | | 3,670 | |
| Accretion expense | | | 2,124 | |
| Settlements | | | - | |
|
| Asset retirement obligations liability as at January 1, 2004 | | | 28,625 | |
|
| Revisions | | | - | |
| Accretion expense | | | 608 | |
| Settlements | | | - | |
|
| Asset retirement obligations as at March 31, 2004 | | | 29,233 | |
|
| | Full Cost Accounting |
| | |
| | In September 2003 the CICA issued Accounting Guideline 16 "Oil and Gas Accounting - Full Cost" ("AcG 16"), which replaced Accounting Guideline 5 "Full Cost Accounting in the Oil and Gas Industry" ("AcG 5"). The most significant change between AcG 16 and AcG 5 is that under AcG 16 the carrying value of oil and gas properties should not exceed their fair value. The fair value is equal to estimated future cash flows from proved and probable reserves using future price forecasts and costs discounted at a risk-free rate. This differs from the cost recovery ceiling test under AcG 5 that used undiscounted cash flows, and constant prices, less general and administrative, financing costs and taxes. The Corporation adopted AcG 16 effective January 1, 2004 and as at March 31, 2004 there were no indications of impairment. |
| | |
| | Impairment of Long-Lived Assets |
| | |
| | Effective January 1, 2004, the Corporation adopted the new recommendation of the CICA on impairment of long-lived assets issued in December 2002. This recommendation provides guidance on the recognition, measurement and disclosure of impairment of long-lived assets. There is a requirement to recognize an impairment loss for a long-lived asset when its carrying amount exceeds the sum of the undiscounted cash flows expected from its use and eventual disposition. The impairment loss is measured as the amount by which carrying amount of the asset exceeds its fair value. As at March 31, 2004 there were no indications of impairment of long-lived assets. |
| | |
| | Hedge Accounting |
| | |
| | Effective January 1, 2004, the Corporation adopted Accounting Guideline 13 "Hedging Relationships" (AcG 13"). AcG 13 provides guidance regarding the identification, designation, documentation and effectiveness of hedging relationships for the purposes of applying hedge accounting. This guideline establishes certain conditions for when hedge accounting may be applied. The Corporation has applied hedge accounting for the financial instruments disclosed in Note 10. |
| | |
| 3 | SEGMENTED INFORMATION |
| | |
| | On a primary basis the business segments are: |
| | | |
| | • | Upstream comprising the exploration, development and production of crude oil and natural gas. |
| | | |
| | • | Downstream comprising refining and the marketing and transportation of refined products and the management of the marketing and transportation of crude oil. |
| | | |
| | Upstream results include revenue from crude oil sales to Downstream, reflected as crude oil purchases in Downstream, as this presentation properly reflects segment results. This revenue is eliminated on consolidation. |
|
| | Three months ended March 31, 2004 |
|
| | | | Upstream | | | Downstream | | | Corporate | | | Eliminations | | | Consolidated | |
|
| REVENUE | | | | | | | | | | | | | | | | |
Crude oil | | | 224,136 | | | - | | | - | | | (16,658 | ) | | 207,478 | |
Refined products | | | 30,864 | | | 91,974 | | | - | | | (11,946 | ) | | 110,892 | |
Service fees | | | 2,417 | | | 180 | | | 71 | | | - | | | 2,668 | |
Interest income | | | 132 | | | 34 | | | 277 | | | - | | | 443 | |
|
| | | | 257,549 | | | 92,188 | | | 348 | | | (28,604 | ) | | 321,481 | |
|
| EXPENSES | | | | | | | | | | | | | | | | |
Production | | | 21,447 | | | - | | | - | | | - | | | 21,447 | |
Royalties and taxes | | | 16,510 | | | 3,871 | | | - | | | - | | | 20,381 | |
Transportation | | | 64,079 | | | - | | | - | | | - | | | 64,079 | |
Refining | | | - | | | 3,908 | | | - | | | - | | | 3,098 | |
Crude oil and refined product purchases | | | 34,980 | | | 27,180 | | | - | | | (28,604 | ) | | 33,556 | |
Selling | | | 4,125 | | | 4,332 | | | - | | | - | | | 8,457 | |
General and administrative | | | 7,343 | | | 3,364 | | | 2,536 | | | - | | | 13,243 | |
Interest and financing costs | | | 6,934 | | | 469 | | | - | | | - | | | 7,403 | |
Depletion and depreciation | | | 16,153 | | | 4,869 | | | 311 | | | - | | | 21,333 | |
Foreign exchange loss (gain) | | | 8,472 | | | (13,610 | ) | | 454 | | | - | | | (4,684 | ) |
|
| | | | 180,043 | | | 34,383 | | | 3,301 | | | (28,604 | ) | | 189,123 | |
|
| INCOME (LOSS) BEFORE INCOME TAXES | | | 77,506 | | | 57,805 | | | (2,953 | ) | | - | | | 132,358 | |
|
| INCOME TAXES | | | | | | | | | | | | | | | | |
Current Provision | | | 31,908 | | | 11,883 | | | 1,568 | | | - | | | 45,359 | |
Future income tax | | | (6,011 | ) | | 4,877 | | | - | | | - | | | (1,134 | ) |
|
| | | | 25,897 | | | 16,760 | | | 1,568 | | | - | | | 44,225 | |
|
| NON-CONTROLLING INTEREST | | | - | | | 648 | | | - | | | - | | | 648 | |
|
| NET INCOME (LOSS) | | | 51,609 | | | 40,397 | | | (4,521 | ) | | - | | | 87,485 | |
|
Revenue eliminations are intersegment revenue.
|
| | Three Months ended March 31, 2004 |
| | | | Export | | | Domestic | | | Consolidated | |
|
| Crude oil | | | 190,334 | | | 17,144 | | | 207,478 | |
| Refined products | | | 32,392 | | | 78,500 | | | 110,892 | |
|
|
| | As at March 31, 2004 |
| | | | Upstream | | | Downstream | | | Corporate | | | Consolidated | |
|
| Total assets | | | 798,430 | | | 171,311 | | | 142,546 | | | 1,112,287 | |
| Total liabilities | | | 391,518 | | | 50,870 | | | 6,393 | | | 448,781 | |
| Capital expenditures in the period | | | 35,575 | | | 3,268 | | | 282 | | | 39,125 | |
|
|
| | Three months ended March 31, 2003 |
|
| | | | Upstream | | | Downstream | | | Corporate | | | Eliminations | | | Consolidated | |
|
| REVENUE | | | | | | | | | | | | | | | | |
Crude oil | | | 176,459 | | | - | | | - | | | (34,217 | ) | | 142,242 | |
Refined products | | | 670 | | | 103,689 | | | - | | | (1,404 | ) | | 102,955 | |
Service fees | | | 691 | | | 847 | | | 8 | | | - | | | 1,546 | |
Interest income | | | 1,830 | | | 42 | | | 308 | | | - | | | 2,180 | |
|
| | | | 179,650 | | | 104,578 | | | 316 | | | (35,621 | ) | | 248,923 | |
|
| EXPENSES | | | | | | | | | | | | | | | | |
Production | | | 17,256 | | | - | | | - | | | - | | | 17,256 | |
Royalties and taxes | | | 9,415 | | | 2,388 | | | - | | | - | | | 11,803 | |
Transportation | | | 55,027 | | | (24 | ) | | - | | | - | | | 55,003 | |
Refining | | �� | - | | | 3,352 | | | - | | | - | | | 3,352 | |
Crude oil and refined product purchases | | | 2,104 | | | 42,887 | | | - | | | (35,621 | ) | | 9,370 | |
Selling | | | 2,017 | | | 3,454 | | | - | | | - | | | 5,471 | |
General and administrative | | | 7,788 | | | 4,166 | | | 1,023 | | | - | | | 12,977 | |
Interest and financing costs | | | 5,567 | | | 487 | | | 8,718 | | | - | | | 14,772 | |
Depletion and depreciation | | | 12,932 | | | 4,670 | | | 26 | | | - | | | 17,628 | |
Foreign exchange loss (gain) | | | (1,374 | ) | | (966 | ) | | 242 | | | - | | | (2,098 | ) |
|
| | | | 110,732 | | | 60,414 | | | 10,009 | | | (35,621 | ) | | 145,534 | |
|
| INCOME (LOSS) BEFORE INCOME TAXES | | | 68,918 | | | 44,164 | | | (9,693 | ) | | - | | | 103,389 | |
|
| INCOME TAXES | | | | | | | | | | | | | | | | |
Current Provision | | | 24,169 | | | 11,771 | | | 232 | | | - | | | 36,172 | |
Future income tax | | | (1,969 | ) | | (16 | ) | | - | | | - | | | (1,985 | ) |
|
| | | | 22,200 | | | 11,755 | | | 232 | | | - | | | 34,187 | |
|
| NON-CONTROLLING INTEREST | | | - | | | 650 | | | - | | | - | | | 650 | |
|
| NET INCOME (LOSS) | | | 46,718 | | | 31,759 | | | (9,925 | ) | | - | | | 68,552 | |
|
| | Included in Upstream crude oil revenue are sales to one customer in the amount of $27.3 million. Revenue eliminations are intersegment revenue. |
| | Three Months ended March 31, 2003 |
|
| | | | Export | | | Domestic | | | Consolidated | |
|
| Crude oil | | | 142,242 | | | - | | | 142,242 | |
| Refined products | | | 21,869 | | | 81,086 | | | 102,955 | |
|
| | | As at March 31, 2003 |
|
| | | | Upstream | | | Downstream | | | Corporate | | | Consolidated | |
|
| Total assets | | | 685,378 | | | 187.396 | | | 29,129 | | | 901,903 | |
| Total liabilities | | | 488,199 | | | 62,952 | | | 9,624 | | | 506,775 | |
| Capital expenditures in the period | | | 44,571 | | | 5,591 | | | 159 | | | 50,321 | |
|
| 4 | JOINT VENTURES |
| | |
| | The Corporation has the following interests in two joint ventures: |
| | |
| | a) a 50% equity shareholding with equivalent voting power in Turgai Petroleum CJSC (“Turgai”), which operates the northern part of the Kumkol field in Kazakhstan. |
| | |
| | b) a 50% equity shareholding with equivalent voting power in LLP Kazgermunai (“Kazgermunai”), which operates three oil fields in Kazakhstan: Akshabulak, Nurali and Aksai. |
| | |
| | The following amounts are included in the Corporation’s consolidated financial statements as a result of the proportionate consolidation of its joint ventures before consolidation eliminations: |
|
| | Three months ended March 31, 2004 |
|
| | | | Turgai | | | Kazgermunai | | | Total | |
|
| Cash | | | 18,681 | | | 28,010 | | | 46,691 | |
| Current assets, excluding cash | | | 41,570 | | | 35,994 | | | 77,564 | |
| Property, plant and equipment, net | | | 81,831 | | | 65,725 | | | 147,564 | |
| Current liabilities | | | 79,880 | | | 13,900 | | | 93,780 | |
| Long-term debt | | | - | | | 38,353 | | | 38,353 | |
| Revenue | | | 59,635 | | | 38,353 | | | 98,170 | |
| Expenses | | | 41,279 | | | 22,929 | | | 64,208 | |
| Net income | | | 18,356 | | | 15,606 | | | 33,962 | |
| Cash flow from operating activities | | | 11,260 | | | 19,780 | | | 31,040 | |
| Cash flow used in financing activities | | | - | | | - | | | - | |
| Cash flow used in investing activities | | | (949 | ) | | (2,203 | ) | | (3,152 | ) |
|
| | Revenue for the three months ended March 31, 2004 includes $10.3 million of crude oil sales made by Turgai to Downstream. This amount was eliminated on consolidation. |
|
| | Three months ended March 31, 2003 |
|
| | | | Turgai | | | Kazgermunai | | | Total | |
|
| Cash | | | 150 | | | 11,708 | | | 11,858 | |
| Current assets, excluding cash | | | 7,205 | | | 14,,661 | | | 21,866 | |
| Property, plant and equipment | | | 52,024 | | | 60,935 | | | 112,959 | |
| Current liabilities | | | 18,607 | | | 3,073 | | | 21,680 | |
| Long-term debt | | | - | | | 46,078 | | | 46,078 | |
| | | | | | | | | | | |
| Revenue | | | 30,216 | | | 22,134 | | | 52,350 | |
| Expenses | | | 22,559 | | | 12,689 | | | 35,248 | |
| Net income | | | 7,657 | | | 9,445 | | | 17,102 | |
| | | | | | | | | | | |
| Cash flow from operating activities | | | 10,059 | | | 12,763 | | | 22,822 | |
| Cash flow used in financing activities | | | - | | | - | | | - | |
| Cash flow used in investing activities | | | (10,216 | ) | | (3,909 | ) | | (14,125 | ) |
|
| | Revenue for the three months ended March 31, 2003 includes $9.1 million of crude oil sales made by Turgai and $0.5 million of crude oil sales made by Kazgermunai to Downstream. These amounts were eliminated on consolidation. |
| | |
| 5 | RESTRICTED CASH |
| | |
| | Restricted cash includes $10.5 million of cash dedicated to a debt service reserve account for the Corporation's Term Facility ($10.5 as at December 31, 2003). This cash is not available for general corporate purposes until the Term Facility is repaid in full. |
| | |
| | Restricted cash as at March 31, 2004 includes $26.4 million of cash dedicated to a margin account for the hedging program ($25.0 million as at December 31, 2003). |
|
| | March 31, 2004 | | | December 31, 2003 | |
|
| Current portion of term facility | | | 33,143 | | | 35,692 | |
| Current portion of term loans | | | 2,030 | | | 2,039 | |
| Joint venture loan payable | | | 11,000 | | | 11,000 | |
| PKOP bonds | | | - | | | 24,494 | |
|
| | | | 46,173 | | | 73,225 | |
|
| | The PKOP bonds were fully redeemed on February 26, 2004. |
| | |
| 7 | SHARE CAPITAL |
| | |
| | Authorized share capital consists of an unlimited number of Class A common shares, and an unlimited number of Class B redeemable preferred shares, issuable in series. |
| | |
| | Issued Class A common shares: |
|
| | Three months ended | Three months ended |
| | | March 31, 2004 | March 31, 2003 |
|
| | | Number | | | Amount | | | Number | | | Amount | |
|
| Balance, beginning of period | | | 77,920,226 | | | 191,695 | | | 78,956,875 | | | 193,723 | |
| Shares repurchased and cancelled | | | | | | | | | | | | | |
| pursuant to normal course issuer bid | | | - | | | - | | | (98,100 | ) | | (240 | ) |
| Stock options exercised for cash | | | 1,916,225 | | | 3,567 | | | 166,500 | | | 447 | |
| Corresponding convertible securities, converted | | | 28,558 | | | 10 | | | 3,264 | | | 3 | |
|
| Balance, end of period | | | 79,865,009 | | | 195,272 | | | 79,028,539 | | | 193,933 | |
|
| | A summary of the status of the Corporation's stock option plan as of March 31, 2004 and the changes during the three months ended March 31, 2004 and the year ended December 31, 2003 are presented below (expressed in Canadian dollars): |
| | | | Weighted Average | |
| | | Options | | Exercise Price | |
|
| Outstanding at December 31, 2002 | | | 4,850,136 | | | 5.01 | |
|
Granted | | | 791,000 | | | 25.82 | |
Exercised | | | (440,751 | ) | | 3.76 | |
Forfeited | | | (84,925 | ) | | 9.27 | |
|
| Outstanding at December 31, 2003 | | | 5,115,460 | | | 8.17 | |
|
Granted | | | 60,000 | | | 31.62 | |
Exercised | | | (1,944,783 | ) | | 2.42 | |
Forfeited | | | (64,225 | ) | | 12.31 | |
|
| Outstanding at September 30, 2004 | | | 3,166,452 | | | 12.07 | |
|
| Options excercisable at: | | | | | | | |
December 31, 2003 | | | 2,816,683 | | | 5.14 | |
March 31, 2004 | | | 867,546 | | | 2.93 | |
|
| 8 | INCOME TAXES |
| | |
| | The provision for income taxes differs from the results, which would have been obtained by applying the statutory tax rate of 30% to the Corporation's income before income taxes. This difference results from the following items: |
|
| | Three months ended March 31 |
|
| | | | 2004 | | | 2003 | |
|
| Statutory Kazakhstan income tax rate | | | 30 | % | | 30 | % |
| Expected tax expense | | | 39,708 | | | 31,017 | |
| Permanent differences, net | | | 4,517 | | | 3,170 | |
|
| Income tax expense | | | 44,225 | | | 34,187 | |
|
| 9 | NET INCOME PER SHARE |
| | |
| | The net income per share calculations are based on the weighted average and diluted numbers of Class A common shares outstanding during the period as follows: |
| | | Three months endedMarch 31 |
|
| | | | 2004 | | | 2003 | |
|
| Weighted average number of common | | | | | | | |
| shares outstanding | | | 78,742,750 | | | 79,082,439 | |
| Dilution from exercisable options | | | | | | | |
| (including convertible securities) | | | 1,915,986 | | | 3,275,785 | |
|
| Diluted number of shares outstanding | | | 80,658,736 | | | 82,358,224 | |
|
| | No options were excluded from the calculation of diluted number of shares outstanding for the three months ended March 31, 2004 and 2003, as the market price was in excess of exercise price. |
| | |
| 10 | FINANCIAL INSTRUMENTS |
| | |
| | The Corporation has entered into a commodity-hedging program where it is utilizing derivative instruments to manage the Corporation’s exposure to fluctuations in the price of crude oil. The Corporation has entered into the following contracts with a major financial institution. |
| | | | Price Ceiling or | |
Contract Amount | Contract | Contract | Contracted Price | Price Floor |
(bbls per month) | Period | Type | ($/bbl) | ($/bbl) |
|
| 75,000 | January 2004 to December 2004 | Zero cost collar | 28.00 | 17.00 |
| 75,000 | January 2004 to December 2004 | Zero cost collar | 29.00 | 17.00 |
| 75,000 | January 2004 to December 2004 | Zero cost collar | 29.25 | 17.00 |
| 37,500 | January 2004 to December 2004 | Zero cost collar | 29.60 | 17.00 |
| 110,000 | January 2004 to December 2004 | Zero cost collar | 30.20 | 18.00 |
| 120,000 | January 2005 to March 2005 | IPE Future | 26.30 - 26.52 | |
| 40,000 | April 2005 to June 2005 | IPE Future | 25.92 | |
| 458,333 | January 2005 to December 2005 | IPE Future | 25.65 - 25.90 | |
| 362,000 | January 2004 to March 2004 | Dated Brent | 29.80 - 29.82 | |
|
| | During the three months ended March 31, 2004, the Corporation has foregone revenue of $5.2 million through these contracts. |
| | |
| 11 | CASH FLOW INFORMATION |
| | |
| | Interest and income taxes paid: |
| | | Three months ended March 31 |
| | | | 2004 | | | 2003 | |
|
| Interest paid | | | 12,134 | | | 15,142 | |
|
| Income taxes paid | | | 42,413 | | | 25,418 | |
|
| 12 | COMMITMENTS AND CONTINGENCIES |
| | |
| | Agency for Regulation of Natural Monopolies and Protection of Competition (“ARNM”) |
| | |
| | PKOP |
| | |
| | The ARNM alleged that PKOP charged prices for refined oil products that in total were $6.3 million in excess of ARNM authorized maximum prices. The Corporation has always taken the position that the ARNM does not have the right to establish prices for PKOP under the terms of the Privatization Agreement relating to the Shymkent refinery, which operates in a highly competitive environment. PKOP initiated legal proceedings to annul the ARNM claim and the court of first instance reduced the ARNM claim to approximately $1.1 million. PKOP and the ARNM appealed this decision to the Supreme Court. The Supreme Court recognized approximately $3.6 million of the ARNM’s original assessment. This amount has been provided for in the financial statements. |
| | PKOP received an additional assessment from ARNM in the amount of $8.8 million for allegedly charging prices for refined products in excess of ARNM authorized maximum prices. PKOP plans to appeal this assessment. No provision has been made in the accompanying financial statements in respect of this assessment. |
| | |
| | PKOP’s position remains that the ARNM does not have the right to establish prices for the refinery, and the Corporation, as the party in interest under the Privatization Agreement for the Shymkent Refinery, has notified the Government of Kazakhstan that it is in breach of provisions of the Privatization Agreement. The Corporation has the right to proceed to international arbitration under the terms of the Privatization Agreement. |
| | |
| | Group companies |
| | |
| | The ARNM claimed $31 million from a group company for allegedly violating Kazakhstan’s competition law. The Corporation initiated legal proceedings and the court of first instance dismissed the ARNM claim. The ARNM has appealed this decision. The date to hear this appeal has not been set. |
| | |
| | The ARNM claimed approximately $91.4 million from group companies for allegedly violating Kazakhstan’s competition law. The group companies initiated legal action, and at the Astana City Court they were unsuccessful in their challenge of allegations by the ARNM that these companies had violated Kazakhstan competition laws. The judgment upheld the ARNM determination that these distributors had received unjustified revenues totaling approximately $91.4 million. The Corporation appealed this judgment to the Supreme Court. |
| | |
| | It remains the Corporation's view that the allegations are without justification; a highly competitive market exists for oil products within Kazakhstan and the current level of prices reflects current world crude oil prices, which are close to their historical high. Also, the prices charged by the group companies are competitive with Russian imports and with those charged by distributors of the other two refineries in Kazakhstan. |
| | |
| | The Corporation is considering its recourse rights under the terms of the Shymkent refinery Privatization Agreement, which clearly stipulates the right to sell any and all its products in Kazakhstan and abroad at free market prices. |
| | |
| | The Corporation will continue to seek a dialogue with the appropriate authorities to address the concerns related to the pricing of refined products and possible measures to be taken to further promote transparency and effective monitoring of the dynamics of competition, consistent with market economy principles. |
| | |
| 13 | SUBSEQUENT EVENTS |
| | |
| | The Supreme Court hearing for the ARNM claim of $91.4 million was held in April 2004 and the Court suspended the case but instructed the parties to seek an agreed settlement. |