MANAGEMENT’S DISCUSSION AND ANALYSIS
The following Management’s Discussion and Analysis (“MD&A”) of the financial condition and results of our operations should be read in conjunction with the unaudited consolidated financial statements of the Corporation included in this report and our MD&A and audited consolidated financial statements for the year ended December 31, 2003. Our financial statements have been prepared in accordance with Canadian GAAP. This discussion and analysis contains forward-looking statements, which involve risks and uncertainties. Our actual results could differ materially from those anticipated in the forward-looking statements.
In our MD&A we use certain terms including “netback” and “cash flow”. These are non-GAAP terms with cash flow defined as cash generated from operating activities before changes in non-cash working capital and netback is defined within our MD&A.
Except as otherwise required by the context, reference in this MD&A to “our”, “we” or “us” refer to the combined business of PetroKazakhstan Inc. and all of its subsidiaries and joint ventures.
All numbers are in U.S. Dollars unless otherwise indicated.
HIGHLIGHTS
Three months ended June 30 | |||||||
| 2004 | 2003 | ||||||
| Net income ($000's) | 122,028 | 68,430 | |||||
Cash flow ($000's)1 | 141,552 | 91,020 | |||||
| Basic net income per share | 1.54 | 0.88 | |||||
| Basic cash flow per share | 1.78 | 1.17 | |||||
| BOPD | 151,104 | 145,066 | |||||
| Capital expenditures ($000's) | 27,291 | 36,694 | |||||
Six months ended June 30 | |||||||
| 2004 | 2003 | ||||||
| Net income ($000's) | 209,513 | 136,982 | |||||
Cash flow ($000's)1 | 256,233 | 179,893 | |||||
| Basic net income per share | 2.64 | 1.74 | |||||
| Basic cash flow per share | 3.23 | 2.29 | |||||
| BOPD | 147,012 | 142,928 | |||||
| Capital expenditures ($000's) | 66,416 | 87,015 | |||||
| 1 | Cash flow: We evaluate our operations based upon our net income and cash flow. Cash flow is a non-GAAP measure that represents cash flow from operations before changes in working capital. We consider this to be a key measure as we use this measure to evaluate our ability to generate cash to fund our growth through capital expenditures and our ability to repay debt. The comparable GAAP measure is cash flow from operating activities. The following table reconciles our non-GAAP measure cash flow to the comparable GAAP measure "Cash flow from operating activities". |
Three months ended June 30 | |||||||
| 2004 | 2003 | ||||||
| ($000’s) | ($000’s) | ||||||
| Cash flow | 141,552 | 91,020 | |||||
| Changes in non-cash operating working capital items | 63,774 | (58,272 | ) | ||||
| Cash flow from operating activities | 205,326 | 32,748 | |||||
Six months ended June 30 | |||||||
| 2004 | 2003 | ||||||
| ($000’s) | ($000’s) | ||||||
| Cash flow | 256,233 | 179,893 | |||||
| Changes in non-cash operating working capital items | 44,214 | (42,368 | ) | ||||
| Cash flow from operating activities | 300,447 | 137,525 | |||||
| 5 | ||
NET RETURN PER BARREL
Set forth below are the details of the average net return achieved for crude oil export sales and sales derived from the refining of our own crude. These tables show averages across all types of sales contracts and illustrate the relationship between exports of crude oil versus refining our own crude oil and marketing refined crude oil products.
Three months ended June 30, 2004 | |||||||
Crude Oil |
| Own Crude Oil |
| ||||
| Exports |
| Refined and Sold* |
| |||
| ($/bbl) |
| ($/bbl) | ||||
| Net sales price achieved | 27.81 | 22.04 | |||||
| Transportation costs | (5.53 | ) | (1.85 | ) | |||
| Selling costs | (0.59 | ) | (0.76 | ) | |||
| Crude utilized in refining | - | (1.40 | ) | ||||
| Refining cost | - | (0.71 | ) | ||||
| Royalties and taxes – downstream | - | (0.64 | ) | ||||
| General and administrative costs – downstream | - | (0.45 | ) | ||||
| Netback at Kumkol** | 21.69 | 16.23 | |||||
| Production cost | (1.87 | ) | (1.87 | ) | |||
| Royalties and taxes – upstream | (1.50 | ) | (1.50 | ) | |||
| General and administrative costs – upstream | (0.58 | ) | (0.58 | ) | |||
| Net return per barrel | 17.74 | 12.28 | |||||
|
| Three months ended June 30, 2003 | |||||
|
| Crude Oil |
| Own Crude Oil |
| ||
|
| Exports |
| Refined and Sold* |
| ||
|
| ($/bbl) |
| ($/bbl) |
| ||
| Net sales price achieved | 18.56 | 14.66 | |||||
| Transportation costs | (7.89 | ) | (0.96 | ) | |||
| Selling costs | (0.34 | ) | (0.77 | ) | |||
| Crude utilized in refining | - | (0.86 | ) | ||||
| Refining cost | - | (0.72 | ) | ||||
| Royalties and taxes – downstream | - | (0.36 | ) | ||||
| General and administrative costs – downstream | - | (0.36 | ) | ||||
| Netback at Kumkol** | 10.33 | 10.63 | |||||
| Production cost | (1.28 | ) | (1.28 | ) | |||
| Royalties and taxes – upstream | (1.13 | ) | (1.13 | ) | |||
| General and administrative costs – upstream | (0.56 | ) | (0.56 | ) | |||
| Net return per barrel | 7.36 | 7.66 | |||||
* Net sales price achieved shown in these tables does not include the price received for purchased refined products resold.
** Average Platts Brent or a similar index for each respective period does not reflect our average realized Brent price because of the timing of recognition of sales for financial statement purposes and the terms of the sales. Financial statement sales revenue is the basis used to determine the net sales price achieved in these tables. Therefore, a comparison of average Platts Brent or similar index to our netback at Kumkol cannot be used to determine our differential.
During the second quarter of 2004, the netback at Kumkol for crude oil exports increased by $11.36/bbl compared to the same quarter of 2003 due to a significant increase in market prices (average Platts Brent was $35.32/bbl compared to $26.03/bbl in 2003) and savings in transportation costs.
The netback at Kumkol for own crude oil refined and sold increased by $5.60/bbl compared to the second quarter of 2003 due to higher sales prices, offset in part by increases in our transportation costs, because we exported some refined products volumes on a non-FCA basis.
| 6 | ||
|
| Six months ended June 30, 2004 | |||||
|
| Crude Oil |
| Own Crude Oil |
| ||
|
| Exports |
| Refined and Sold* |
| ||
|
| ($/bbl) |
| ($/bbl) |
| ||
| Net sales price achieved | 25.92 | 20.56 | |||||
| Transportation costs | (6.64 | ) | (1.55 | ) | |||
| Selling costs | (0.55 | ) | (0.92 | ) | |||
| Crude utilized in refining | - | (1.33 | ) | ||||
| Refining cost | - | (0.63 | ) | ||||
| Royalties and taxes – downstream | - | (0.76 | ) | ||||
| General and administrative costs – downstream | - | (0.46 | ) | ||||
| Netback at Kumkol** | 18.73 | 14.91 | |||||
| Production cost | (1.76 | ) | (1.76 | ) | |||
| Royalties and taxes – upstream | (1.30 | ) | (1.30 | ) | |||
| General and administrative costs – upstream | (0.57 | ) | (0.57 | ) | |||
| Net return per barrel | 15.10 | 11.28 | |||||
Six months ended June 30, 2003 | |||||||
|
| Crude Oil |
| Own Crude Oil |
| ||
|
| Exports |
| Refined and Sold* |
| ||
|
| ($/bbl) |
| ($/bbl) |
| ||
| Net sales price achieved | 20.70 | 14.38 | |||||
| Transportation costs | (7.98 | ) | (0.93 | ) | |||
| Selling costs | (0.34 | ) | (0.67 | ) | |||
| Crude utilized in refining | - | (0.86 | ) | ||||
| Refining cost | - | (0.56 | ) | ||||
| Royalties and taxes – downstream | - | (0.32 | ) | ||||
| General and administrative costs – downstream | - | (0.44 | ) | ||||
| Netback at Kumkol** | 12.38 | 10.60 | |||||
| Production cost | (1.32 | ) | (1.32 | ) | |||
| Royalties and taxes – upstream | (0.94 | ) | (0.94 | ) | |||
| General and administrative costs – upstream | (0.58 | ) | (0.58 | ) | |||
| Net return per barrel | 9.54 | 7.76 | |||||
During the first six months of 2004, the netback at Kumkol for crude oil exports increased by $6.35/bbl compared to the same period of 2003 due to a significant increase in market prices (average Platts Brent was $33.66/bbl compared to $28.76/bbl in 2003) and savings in transportation costs.
The netback at Kumkol for own crude oil refined and sold increased by $4.31/bbl compared to the second quarter of 2003 due to higher sales prices, offset in part by increases in our transportation and selling costs. Transportation costs increased because we exported some refined products volumes on a non-FCA basis.
KEY PERFORMANCE INDICATORS
We measure the performance of our Upstream and Downstream operations using the following key performance indicators.
Three months ended June 30 | |||||||
| 2004 | 2003 | ||||||
| BOPD | 151,104 | 145,066 | |||||
| Differential* ($/bbl) | 12.20 | 14.66 | |||||
| Average refined products price ($/bbl) | 22.04 | 14.97 | |||||
| Production expenses ($/bbl) | 1.87 | 1.28 | |||||
| Refining cost ($/bbl)) | 0.71 | 0.77 | |||||
| General and administrative ($/bbl) | 1.03 | 0.92 | |||||
| Effective income tax rate, % | 39.5 | % | 29.3 | % | |||
| 7 | ||
Six months ended June 30 | |||||||
| 2004 | 2003 | ||||||
| BOPD | 147,012 | 142,928 | |||||
| Differential* ($/bbl) | 12.47 | 14.72 | |||||
| Average refined products price ($/bbl) | 20.56 | 14.38 | |||||
| Production expenses ($/bbl) | 1.76 | 1.32 | |||||
| Refining cost ($/bbl)) | 0.63 | 0.58 | |||||
| General and administrative ($/bbl) | 1.03 | 1.02 | |||||
| Effective income tax rate, % | 37.1 | % | 31.2 | % | |||
| * Our differential is calculated as the difference between the average Brent price for crude oil export sales received by PKKR and Turgai, and our netback at Kumkol. It is the sum of the costs and discounts incurred in order to transport and sell our crude oil to international markets. The sales revenue used in this measure differs from sales revenue in the statement of net income and the net return table for the following reasons: | ||
| • | The differential does not include Kazgermunai sales over which we have limited control. Kazgermunai is excluded because the differential is used to measure the performance of our internal marketing and transportation group. | |
| • | The differential is calculated using finalized sales transactions. Our financial statements include estimates that may or may not reflect the finalized transactions. | |
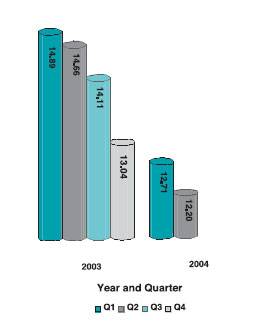
BOPD. See Production and Processing for a discussion of our production. Differentials. The graph to the right shows our differential over the last year and the first two quarters of 2004 ($/bbl). Our differential continued to improve during the quarter as a result of the increased shipments through CPC via the KAM pipeline, and better pricing received from some of our customers. Sales to Aktau and CPC are our most significant destinations, representing almost two thirds of the quarter’s total completed sales volumes. These constitute two of our five main destinations, where we have concentrated our efforts on routes that had the best differentials. Production expenses. Production expenses were higher in the second quarter of 2004 compared to 2003 because of a number of factors. We are using temporary power generators to operate single well batteries in the KAM fields pending construction of infrastructure. The increased number of production facilities commissioned in 2004 and the increasing water cut in a number of our fields has also increased production expenses. |
|
Refining cost.Refining costs in the second quarter of 2004 are consistent with the second quarter of 2003. Refining costs in the first six months of 2004 are higher due to higher purchased energy costs related to the start-up of the vacuum distillation unit.
General and administrative expenses.General and administrative expenses increased due to $1.3 million of compensation cost being recognized for stock options granted pursuant to the new CICA accounting standard, which we adopted at the beginning of 2004. The remaining increase is attributable to increased activity levels.
Effective income tax rate.The statutory tax rate in Kazakhstan, where all of our operations are located, is 30%. Our effective tax rate differs due to certain expenses, which cannot be deducted for statutory tax purposes. Our tax rate as a percentage of net income before tax in the second quarter of 2004 was 39.5% compared to 29.3% in the same quarter of 2003 (37.1% for the six months of 2004 compared to 31.2% for the same period of 2003). The effective income tax rates are higher in 2004 due to provisions for excess profit tax, whereas there was no provision in 2003.
| 8 | ||
PRODUCTION AND PROCESSING
PRODUCTION
The following table sets forth our barrels of oil produced per day by field and on a consolidated basis.
Three months ended June 30 | |||||||
| Field | 2004 | 2003 | |||||
(BOPD) | (BOPD) | ||||||
| Kumkol South | 50,014 | 62,550 | |||||
| Kumkol North | 34,844 | 29,459 | |||||
| South Kumkol | 23,311 | 27,488 | |||||
| Kyzylkiya | 9,783 | 7,310 | |||||
| Aryskum | 8,030 | 2,650 | |||||
| Maibulak | 2,446 | 576 | |||||
| North Nurali | 559 | - | |||||
| License #952 | 396 | - | |||||
| License #951 | 12 | - | |||||
| Kazgermunai Fields | 21,709 | 15,033 | |||||
| Total | 151,104 | 145,066 | |||||
Six months ended June 30 | |||||||
| Field | 2004 | 2003 | |||||
(BOPD) | (BOPD) | ||||||
| Kumkol South | 46,127 | 59,630 | |||||
| Kumkol North | 34,136 | 27,594 | |||||
| South Kumkol | 24,564 | 29,120 | |||||
| Kyzylkiya | 9,604 | 7,031 | |||||
| Aryskum | 8,411 | 5,133 | |||||
| Maibulak | 2,255 | 510 | |||||
| North Nurali | 340 | - | |||||
| License #952 | 222 | - | |||||
| License #951 | 6 | - | |||||
| Kazgermunai Fields | 21,347 | 13,909 | |||||
| Total | 147,012 | 142,927 | |||||
The decrease in Kumkol South production in the second quarter and for the first six months of 2004 was due to our field border well dispute with neighboring license holder, Turgai. We have resumed production with the exception of one well, which was not operational as of June 30, 2004. Also, production was impeded due to limited water handling capability. One of our Free Water Knock-out facilities remained out of production for three months due to an accident at the facility.
Increases in production from our Kumkol North field in the second quarter of 2004 were due to an increase in the number of production wells and a program to increase the size of the downhole pumps.
South Kumkol production was affected by bottom hole pump failures, requiring repair and replacement.
The increase in production from our KAM fields (Kyzylkiya, Aryskum, Maibulak) was due to the increased number of producing wells and implementation of our artificial lift program. At Maibulak, our wells became flowing wells as a result of our successful hydraulic fracturing campaign.
Kazgermunai completed surface facility debottlenecking measures in late 2003, leading to the increase in 2004 production.
| 9 | ||
INVENTORY
The following table sets forth the movements in crude oil inventory for our Upstream operations for the three and six months ended June 30, 2004 and 2003.
Three months ended June 30 | |||||||
2004 | 2003 | ||||||
(MMbbls) | (MMbbls) | ||||||
| Opening inventory of crude oil | 2.56 | 2.54 | |||||
| Production | 13.75 | 13.20 | |||||
| Crude oil purchased from third parties | - | - | |||||
| Crude oil purchased from joint ventures (50%) | (0.17 | ) | (0.21 | ) | |||
| Sales or transfers | (13.48 | ) | (13.33 | ) | |||
| Transportation losses | (0.05 | ) | (0.08 | ) | |||
| Closing inventory of crude oil | 2.61 | 2.12 | |||||
For operational reasons, we purchase and sell crude oil from our joint ventures. Crude oil purchased from the joint ventures is eliminated against crude oil revenue, as this more accurately portrays our business.
We do not eliminate crude oil purchased from our joint ventures that remains in inventory at each balance sheet date to ensure that we properly reflect the liability to our joint venture. In periods when our sales of crude oil purchased from our joint ventures are in excess of actual crude oil purchased from our joint ventures, we show a negative amount in our volume reconciliation table because part of the amount sold originated from opening inventory.
|
| Six months ended June 30 | |||||
|
|
| 2004 |
|
| 2003 |
|
|
|
| (MMbbls) |
|
| (MMbbls) |
|
| Opening inventory of crude oil | 2.87 | 2.72 | |||||
| Production | 26.76 | 25.87 | |||||
| Crude oil purchased from third parties | - | - | |||||
| Crude oil purchased from joint ventures (50%) | 0.15 | 0.41 | |||||
| Sales or transfers | (28.16 | ) | (26.14 | ) | |||
| Transportation losses | (0.10 | ) | (0.09 | ) | |||
| Return of purchased crude | - | (0.65 | ) | ||||
| Closing inventory of crude oil | 2.61 | 2.12 | |||||
Under the terms of an agreement with the company assigned by the government to market royalty in kind volumes for 2002 we purchased 0.65 mmbbls of crude oil, which was in our inventory at year-end. This oil was returned in the first quarter of 2003.
SALES OF CRUDE OIL
The following table sets out our total crude oil sales and transfers from Upstream operations for the three and six months ended June 30, 2004 and 2003.
|
| Three months ended June 30 | |||||||||||
|
|
| 2004 |
|
| 2004 |
|
| 2003 |
|
| 2003 |
|
|
|
| (MMbbls) |
|
| (%) |
|
| (MMbbls) |
|
| (%) |
|
| Crude oil exports | 6.99 | 51.9 | 7.23 | 54.2 | |||||||||
| Crude oil transferred to Downstream | 4.10 | 30.4 | 4.53 | 34.0 | |||||||||
| Crude oil transferred to Downstream by joint ventures (50%) | 1.68 | 12.5 | 1.57 | 11.8 | |||||||||
| Royalty payments | 0.71 | 5.2 | - | - | |||||||||
| Crude oil domestic sales | - | - | - | - | |||||||||
| Total crude oil sales or transfers | 13.48 | 100.0 | 13.33 | 100.0 | |||||||||
| 10 | ||
|
| Six months ended June 30 | |||||||||||
|
|
| 2004 |
|
| 2004 |
|
| 2003 |
|
| 2003 |
|
|
|
| (MMbbls) |
|
| (%) |
|
| (MMbbls) |
|
| (%) |
|
| Crude oil exports | 14.84 | 52.7 | 13.36 | 51.1 | |||||||||
| Crude oil transferred to Downstream | 8.25 | 29.2 | 9.93 | 38.0 | |||||||||
| Crude oil transferred to Downstream by joint ventures (50%) | 3.19 | 11.4 | 2.85 | 10.9 | |||||||||
| Royalty payments | 1.88 | 6.7 | - | - | |||||||||
| Crude oil domestic sales | - | - | - | - | |||||||||
| Total crude oil sales or transfers | 28.16 | 100.0 | 26.14 | 100.0 | |||||||||
REFINING
Our total processed volumes were as follows:
Three months ended June 30 | |||||||
|
|
| 2004 |
|
| 2003 |
|
|
|
| (MMbbls) |
|
| (MMbbls) |
|
| Feedstock refined into product | 7.62 | 7.52 | |||||
| Tolled volumes | 0.10 | - | |||||
| Total processed volumes* | 7.72 | 7.52 | |||||
Six months ended June 30 | |||||||
|
|
| 2004 |
|
| 2003 |
|
|
|
| (MMbbls) |
|
| (MMbbls) |
|
| Feedstock refined into product | 14.70 | 15.55 | |||||
| Tolled volumes | 0.13 | 0.23 | |||||
| Total processed volumes* | 14.83 | 15.78 | |||||
*The total processed volumes are used for our per barrel calculations.
Sources of feedstock supplies for our refinery were as follows:
Three months ended June 30 | |||||||
|
|
| 2004 |
|
| 2003 |
|
|
|
| (MMbbls) |
|
| (MMbbls) |
|
| Acquired from PKKR | 4.10 | 4.53 | |||||
| Purchased from joint ventures (100%) | 3.37 | 3.14 | |||||
| Total feedstock acquired | 7.47 | 7.67 | |||||
Six months ended June 30 | |||||||
|
|
| 2004 |
|
| 2003 |
|
|
|
| (MMbbls) |
|
| (MMbbls) |
|
| Acquired from PKKR | 8.25 | 9.93 | |||||
| Purchased from joint ventures (100%) | 6.40 | 5.70 | |||||
| Total feedstock acquired | 14.65 | 15.63 | |||||
| 11 | ||
| The movements in our feedstock inventory at our refinery were as follows: |
Three months ended June 30 | |||||||
|
|
| 2004 |
|
| 2003 |
|
|
|
| (MMbbls) |
|
| (MMbbls) |
|
| Opening inventory of crude oil feedstock | 0.15 | 0.08 | |||||
| Purchase and acquisition of feedstock | 7.47 | 7.67 | |||||
| Recoverable feedstock from traps | 0.05 | - | |||||
| Feedstock refined into product | (7.62 | ) | (7.52 | ) | |||
| Closing inventory of feedstock | 0.05 | 0.23 | |||||
Six months ended June 30 | |||||||
|
|
| 2004 |
|
| 2003 |
|
|
|
| (MMbbls) |
|
| (MMbbls) |
|
| Opening inventory of crude oil feedstock | 0.03 | 0.20 | |||||
| Purchase and acquisition of feedstock | 14.65 | 15.63 | |||||
| Recoverable feedstock from traps | 0.07 | (0.05 | ) | ||||
| Feedstock refined into product | (14.7 | ) | (15.55 | ) | |||
| Closing inventory of feedstock | 0.05 | 0.23 | |||||
The movement in inventory of refined products was as follows:
Three months ended June 30 | |||||||
|
|
| 2004 |
|
| 2003 |
|
|
|
| (MM tonnes*) |
|
| (MM tonnes*) |
|
| Opening inventory of refined product | 0.36 | 0.24 | |||||
| Refined product from feedstock | 0.93 | 0.91 | |||||
| Refined product purchased | 0.01 | 0.01 | |||||
| Refined product sold | (1.11 | ) | (1.04 | ) | |||
| Refined product internal use and yield losses | (0.01 | ) | - | ||||
| Closing inventory of refined product | 0.18 | 0.12 | |||||
Six months ended June 30 | |||||||
|
|
| 2004 |
|
| 2003 |
|
|
|
| (MM tonnes*) |
|
| (MM tonnes*) |
|
| Opening inventory of refined product | 0.26 | 0.22 | |||||
| Refined product from feedstock | 1.78 | 1.89 | |||||
| Refined product purchased | 0.04 | 0.01 | |||||
| Refined product sold | (1.89 | ) | (2.00 | ) | |||
| Refined product internal use and yield losses | (0.01 | ) | - | ||||
| Closing inventory of refined product | 0.18 | 0.12 | |||||
*The inventory of products represents a mix of products for which no unique conversion from barrels to tonnes exists. The standard conversion used by us for crude oil is 7.746 barrels to the tonne.
RESULTS OF OPERATIONS
REVENUE
As at March 31, 2004, approximately 1.2 mmbbls of non-FCA sales were incomplete and hence, included in inventory. The net profit realized on these sales in the second quarter of 2004 was $16.3 million, as compared to $15.6 million of net income estimated at March 31, 2004. As at June 30, 2004, approximately 1.3 mmbbls of non-FCA sales were incomplete and included in inventory. We expect to realize these volumes in the third quarter of 2004 for net profit of $18.1 million.
| 12 | ||
REVENUE
Three months ended June 30 | |||||||||||||
| 2004 | 2003 | Change | % | ||||||||||
| Crude oil | 206,086 | 134,175 | 71,911 | 53.6 | |||||||||
| Revenue products | 189,116 | 119,459 | 69,657 | 58.3 | |||||||||
| Service fees | 3,904 | 460 | 3,444 | 749.7 | |||||||||
| Interest income | 797 | 507 | 290 | 57.2 | |||||||||
| Total revenue | 399,903 | 254,601 | 145,302 | 57.1 | |||||||||
Six months ended June 30 | |||||||||||||
| 2004 | 2003 | Change | % | ||||||||||
| Crude oil | 413,564 | 276,417 | 137,147 | 49.6 | |||||||||
| Revenue products | 300,008 | 222,414 | 77,594 | 34.9 | |||||||||
| Service fees | 6,572 | 3,327 | 3,245 | 97.5 | |||||||||
| Interest income | 1,240 | 1,366 | (126 | ) | (9.2 | ) | |||||||
| Total revenue | 721,384 | 503,524 | 217,860 | 43.3 | |||||||||
CRUDE OIL
The table below sets out volumes sold and net realized prices and crude oil revenue:
THREE MONTHS ENDED JUNE 30, 2004
| Volumes Sold |
| Net Realized Price |
|
| Revenue |
| |||
| (MMbbls) |
| ($ per bbl) |
| ($000’s) | |||||
| Crude sales sold FCA | - | - | - | |||||||
| Crude sales sold non-FCA | 5.23 | 28.61 | 149,622 | |||||||
| Kazgermunai export sales | 1.76 | 25.46 | 44,815 | |||||||
| Royalty payments* | 0.71 | 16.41 | 11,649 | |||||||
| Total | 7.70 | 26.76 | 206,086 | |||||||
THREE MONTHS ENDED JUNE 30, 2003
Volumes Sold | Net Realized Price | Revenue | ||||||||
(MMbbls) | ($ per bbl) | ($000’s) | ||||||||
| Crude sales sold FCA | 1.43 | 13.77 | 19,689 | |||||||
| Crude sales sold non-FCA | 4.35 | 21.58 | 93,879 | |||||||
| Kazgermunai export sales | 1.45 | 14.21 | 20,607 | |||||||
| Royalty payments* | - | - | - | |||||||
| Total | 7.23 | 18.56 | 134,175 | |||||||
SIX MONTHS ENDED JUNE 30, 2004
| Volumes Sold |
| Net Realized Price |
|
| Revenue |
| |||
| (MMbbls) |
| ($ per bbl) |
| ($000’s) | |||||
| Crude sales sold FCA | - | - | - | |||||||
| Crude sales sold non-FCA | 11.49 | 26.86 | 308,616 | |||||||
| Kazgermunai export sales | 3.35 | 22.73 | 76,155 | |||||||
| Royalty payments* | 1.88 | 15.32 | 28,793 | |||||||
| Total | 16.72 | 24.73 | 413,564 | |||||||
SIX MONTHS ENDED JUNE 30, 2003
| Volumes Sold |
| Net Realized Price |
|
| Revenue |
| |||
| (MMbbls) |
| ($ per bbl) |
| ($000’s) | |||||
| Crude sales sold FCA | 2.51 | 15.65 | 39,292 | |||||||
| Crude sales sold non-FCA | 8.24 | 23.69 | 195,170 | |||||||
| Kazgermunai export sales | 2.61 | 16.07 | 41,955 | |||||||
| Royalty payments* | - | - | - | |||||||
| Total | 13.36 | 20.69 | 276,417 | |||||||
| 13 | ||
*Royalty price is the average sales price at wellhead.
Our increase in crude oil revenue for the second quarter and the first half of 2004 compared to the same period of 2003 was due to the absence of FCA sales and the increase in crude oil market prices.
Royalty payments represent deliveries for royalty in kind volumes. There were no royalty in kind volumes in the second quarter and first half of 2003, because we settled our royalty obligations in cash.
REFINED PRODUCT REVENUE
The table below sets forth the related tonnes of refined products sold, the average price obtained and revenue received for the three and six months ended June 30, 2004 and 2003.
Three months ended June 30 | ||||||||||
|
| Tonnes |
| Average Price |
|
| Revenue |
| ||
|
| Sold |
| ($/tonne) |
| ($000’s) | ||||
2004 | 1,107,668 | 170.73 | 189,116 | |||||||
| 2003 | 1,030,206 | 115.96 | 119,459 | |||||||
Six months ended June 30 | ||||||||||
|
| Tonnes |
|
| Average Price |
|
| Revenue |
| |
|
| Sold |
|
| ($/tonne) |
| ($000’s) | |||
2004 | 1,883,890 | 159.25 | 300,008 | |||||||
| 2003 | 1,996,121 | 111.42 | 222,414 | |||||||
The increase in refined products sales in the second quarter of 2004 compared to 2003 of $69.7 million was due to our higher average realized price of $170.73/tonne (compared to $115.96/tonne in 2003) and, to a lesser extent, increased sales volumes of 77,462 tonnes. We were able to obtain higher prices for the first six months of 2004 compared to 2003, as the world price of crude oil increased resulting in higher market prices for refined products in Kazakhstan.
PRODUCTION EXPENSES
Production expenses relate to the cost of producing crude oil in our Upstream operations. Based on the number of barrels of oil produced, these costs were $1.87/bbl in the second quarter of 2004 compared to $1.28/bbl for the second quarter of 2003. The absolute amount of production expenses increased by $8.8 million in the second quarter of 2004. There were a number of contributing factors.
We are experiencing higher chemical usage, an increase of $0.5 million for the second quarter, in our Kumkol South and South Kumkol fields due to the increasing water cut. Artificial lift spare parts usage increased by $0.8 million for the second quarter of 2004 and $1.3 million for the first six months of 2004. We expect these levels of expenditures to continue.
Our utilities increased by $0.9 million as the result of additional field pumps, production facilities, rented generators and wells on pump. The feasibility study for electricity supply to our KAM fields will be complete by the end of July 2004. The study has been undertaken to investigate two possible options, the first being to connect the KAM fields to our power generating facilities in Kumkol as well as the main power lines, and the second is to construct gas turbine power generating facilities in the KAM fields. We expect that completion of this project will reduce our production expenses in 2006.
Additionally, $1.2 million of the increase over the second quarter of 2003 was due to the fact that the second quarter of 2003 included a late audit adjustment in Turgai to reverse previously overaccrued costs.
Production expenses were $47.1 million during the six months ended June 30, 2004 ($1.76/bbl) compared to $34.1 million for the same period of 2003 ($1.32/bbl). In addition to the increases in the second quarter of 2004 described above, additional costs arose for our temporary truck offloading facility in the first quarter of 2004 due to adverse winter weather conditions. Additionally, approximately $1.8 million of the increase over the first six months of 2003 was due to the release of inventoried expenses, as sales volumes exceeded production volumes.
| 14 | ||
ROYALTIES AND TAXES
The following table sets forth the components of royalties and taxes.
Three months ended June 30 | |||||||
|
| 2004 |
|
| 2003 |
| |
|
| ($000’s) |
|
| ($000’s) | ||
| Royalties and production bonus | 17,878 | 11,525 | |||||
| Provision for ARNM assessment | - | - | |||||
| Tax assessments | 251 | 492 | |||||
| Other taxes | 7,414 | 5,600 | |||||
| Total | 25,543 | 17,617 | |||||
Six months ended June 30 | |||||||
| �� |
|
| 2004 |
|
| 2003 |
|
|
| ($000’s) |
|
| ($000’s) | ||
| Royalties and production bonus | 29,364 | 17,743 | |||||
| Provision for ARNM assessment | 3,600 | - | |||||
| Tax assessments | 251 | 492 | |||||
| Other taxes | 12,709 | 11,185 | |||||
| Total | 45,924 | 29,420 | |||||
Royalties and Production Bonus
Royalties and production bonus for the second quarter of 2004 were $17.9 million, which represented an effective overall royalty rate of 6.9% excluding production bonuses of $0.1 million. Royalties and production bonus for the second quarter of 2003 were $11.5 million, an overall royalty rate of 7.8%, after excluding the production bonuses of $0.3 million. The reasons for the lower overall royalty rate were that a higher proportion of production came from fields with lower royalty rates and the temporary reduction in production at Kumkol South.
Royalties and production bonus for the six months ended June 30, 2004 were $29.4 million, which represented an effective overall royalty rate of 6.2% excluding production bonuses of $0.3 million. Royalties and production bonus for the same period of 2003 were $17.7 million, which represented an effective overall royalty rate of 6.8% excluding production bonuses of $0.4 million. The decrease in the royalty rate was mainly due to the decreased production from Kumkol South, a field with higher royalty rates.
Provision for ARNM Assessment
As described in Note 20 to our 2003 Annual Report, the Agency for Regulation of Natural Monopolies and Protection of Competition ("ARNM") alleged that PetroKazakhstan Oil Products, our subsidiary operating the refinery, charged prices for refined oil products that in total were $6.3 million in excess of ARNM authorized maximum prices. In April 2004 following the Supreme Court decision we paid $3.6 million to satisfy the assessment. See Note 13 to the interim consolidated financial statements.
Tax Assessments
The tax assessments of $0.3 million during the second quarter of 2004 represent assessments on property taxes and social taxes. The tax assessments of $0.5 million in the second quarter of 2003 represent tax assessments received on excise and other taxes for 2000 and 2001.
Other Taxes
Other taxes of $7.4 million in the second quarter of 2004 include:
| • | excise tax on refined products ($4.6 million in 2004 compared to $2.3 million in 2003); | |
| • | value added tax on crude oil ($1.4 million in 2004 compared to $2.1 million in 2003); | |
| • | various taxes, including property taxes, road fund and other ($1.4 million in 2004 compared to $1.2 million in 2003). |
| 15 | ||
| Other taxes of $12.7 million in the six month period ended June 30, 2004 include: | ||
| • | excise tax on refined products ($7.0 million in 2004 compared to $4.5 million in 2003); | |
| • | excise tax on crude oil exports (nil in 2004 compared to $1.0 million in 2003); | |
| • | value added tax on crude oil ($3.0 million in 2004 compared to $3.3 million in 2003); | |
| • | various taxes, including property taxes, road fund and other ($2.7 million in 2004 compared to $2.4 million in 2003). | |
TRANSPORTATION
The table below sets out the components of transportation costs.
Three months ended June 30 | |||||||
2004 | 2003 | ||||||
($000’s) | ($000’s) | ||||||
| Pipeline | 8,528 | 15,468 | |||||
| Kazgermunai transportation | 7,704 | 4,760 | |||||
| Railway | 33,156 | 38,411 | |||||
| Other | 1,842 | 1,630 | |||||
| Total | 51,230 | 60,269 | |||||
Six months ended June 30 | |||||||
2004 | 2003 | ||||||
($000’s) | ($000’s) | ||||||
| Pipeline | 17,339 | 38,037 | |||||
| Kazgermunai transportation | 14,543 | 6,110 | |||||
| Railway | 79,632 | 67,745 | |||||
| Other | 3,795 | 3,380 | |||||
| Total | 115,309 | 115,272 | |||||
Pipeline
Pipeline costs decreased by $7.0 million in the second quarter of 2004 compared to 2003 primarily due to the following:
| • | Decrease of $1.5 million in non-FCA pipeline costs (nil for the second quarter of 2004 compared to $1.5 million in the same quarter of 2003) because we did not use the Atyrau-Samara pipeline; | |
| • | Decrease of $6.6 million, as a result of a decrease in volumes sold for export through the Kumkol - Shymkent pipeline (0.8 mmbbls in the second quarter of 2004 compared to 5.4 mmbbls in the second quarter of 2003), partially offset by higher tariffs for the Kumkol - Shymkent pipeline in 2004 ($1.64/bbl in 2004 compared to $1.49/bbl in 2003) due to the change in the exchange rate of Tenge to U.S. dollar; | |
| • | Increase of $1.1 million on volumes shipped through our KAM pipeline and through Atasu terminal to China (3.8 mmbbls through the KAM pipeline and 0.8 mmbbls through Atasu in the second quarter of 2004 compared to 0.3 mmbbls through Atasu and no shipments through the KAM pipeline in the second quarter of 2003). | |
| Pipeline costs decreased by $20.7 million during the six months ended June 30, 2004 compared to the same period of 2003 primarily due to the following: | ||
| • | Decrease of $10.1 million in non-FCA pipeline costs (nil for the first six months of 2004 compared to $10.1 million in the same period of 2003) because we did not use the Atyrau-Samara pipeline; | |
| • | Decrease of $11.9 million, as a result of a decrease in volumes sold for export through the Kumkol - Shymkent pipeline (2.3 mmbbls in 2004 compared to 10.8 mmbbls in 2003), partially offset by higher tariffs for the Kumkol - Shymkent pipeline in 2004 ($1.64/bbl in 2004 compared to $1.49/bbl in 2003) due to the change in the exchange rate of Tenge to U.S. dollar; | |
| • | Decrease of $1.5 million, as a result of a decrease of 1.6 mmbbls in crude oil volumes sent to the refinery through the Kumkol - Shymkent pipeline; | |
| • | Increase of $2.8 million on volumes shipped through our KAM pipeline and through Atasu terminal to China (7.7 mmbbls through the KAM pipeline and 1.6 mmbbls through Atasu in the first half of 2004 compared to 0.3 mmbbls through Atasu in the first half of 2003). There were no sales through the KAM pipeline in the first half of 2003. | |
| 16 | ||
Railway
Railway transportation decreased by $5.2 million in the second quarter of 2004 and increased by $11.9 million in the first six months of 2004 compared to the same periods of 2003 due to the use of sales routes, different from those used in 2003. Overall, railway costs are higher in the first six months of 2004 due to the increase in non-FCA sales and the absence of FCA sales in 2004, where revenue is reported net of transportation costs.
Other
Other transportation costs are mainly trucking costs incurred to transport crude oil from the KAM fields to the CPF located at Kumkol.
REFINING
Refining costs represent the direct costs related to processing all crude oil, including tollers’ volumes, at the refinery.
Refining costs for the second quarter of 2004 were $5.5 million ($0.71/bbl) consistent with $5.5 million ($0.72/bbl) in the same quarter of 2003. Refining costs for the six months ended June 30, 2004 were $9.4 million compared to $8.8 million in the same period of 2003. The main reason for the $0.6 million increase in refining costs was due to the higher steam and electric power costs related to the start-up of the vacuum distillation unit in the first quarter of 2004.
CRUDE OIL AND REFINED PRODUCT PURCHASES
Crude oil and refined product purchases represent the expensed portion of crude oil purchased for the refinery from third parties, as well as refined products purchased for resale. Purchases and sales between our Upstream and Downstream business units are eliminated on consolidation.
Our purchases of crude oil and refined products were as follows:
Three months ended June 30 | |||||||
|
| 2004 |
|
| 2003 |
| |
|
| ($000’s) |
|
| ($000’s) | ||
| Crude oil | 29,135 | 16,046 | |||||
| Refined products | 3,274 | - | |||||
| Total | 32,409 | 16,046 | |||||
|
| Six months ended June 30 | |||||
|
| 2004 |
|
| 2003 |
| |
|
| ($000’s) |
|
| ($000’s) | ||
| Crude oil | 59,779 | 25,416 | |||||
| Refined products | 6,186 | - | |||||
| Total | 65,965 | 25,416 | |||||
During the first quarter of 2004 we repurchased the royalty-in-kind volumes for $17.1 million and subsequently resold them. The remaining purchases of crude oil were made from our joint ventures.
SELLING
Selling expenses for crude oil are comprised of customs, quality inspection and costs related to the export of crude oil. Selling expenses for refined products are comprised of the costs of operating the distribution centres for our Downstream operations.
Three months ended June 30 | |||||||
|
| 2004 |
|
| 2003 |
| |
|
| ($000’s) |
|
| ($000’s) | ||
| Crude oil | 4,109 | 2,659 | |||||
| Refined products | 5,097 | 4,699 | |||||
| Total | 9,206 | 7,358 | |||||
| 17 | ||
|
| Six months ended June 30 | |||||
|
| 2004 |
|
| 2003 |
| |
|
| ($000’s) |
|
| ($000’s) | ||
| Crude oil | 8,234 | 4,507 | |||||
| Refined products | 9,429 | 8,322 | |||||
| Total | 17,663 | 12,829 | |||||
The increase in crude oil selling expenses during the second quarter and first six months of 2004 compared to the same periods of 2003 was the direct result of increased export sales volumes related to non-FCA routes, for which all selling costs are absorbed by us, and the increase in Kazgermunai sales volumes.
GENERAL AND ADMINISTRATIVE
The table below analyzes total general and administrative costs for Upstream, Downstream and Corporate. In the case of Upstream and Downstream the general and administrative costs are also presented on a per barrel basis.
THREE MONTHS ENDED JUNE 30, 2004
| General and |
| Per barrel of oil | ||||
| Administrative |
| produced or processed* | ||||
| ($000’s) |
| ($/bbl) | ||||
| Upstream | 7,917 | 0.58 | |||||
| Downstream | 3,467 | 0.45 | |||||
| Corporate | 4,280 | ||||||
| Total | 15,664 | ||||||
* Including tollers’ volumes
THREE MONTHS ENDED JUNE 30, 2003
| General and | Per barrel of oil | |||||
| Administrative | produced or processed* | |||||
| ($000’s) | ($/bbl) | |||||
| Upstream | 7,333 | 0.56 | |||||
| Downstream | 2,723 | 0.36 | |||||
| Corporate | 500 | ||||||
| Total | 10,556 | ||||||
* Including tollers’ volumes
The increase in general administrative expenses of $5.1 million was due to $1.3 million of compensation cost being recognized for stock options granted pursuant to the new CICA accounting standard, which we adopted at the beginning of 2004. The remaining increase is attributable to increased activity levels.
SIX MONTHS ENDED JUNE 30, 2004
| General and | Per barrel of oil | |||||
| Administrative | produced or processed* | |||||
| ($000’s) | ($/bbl) | |||||
| Upstream | 15,260 | 0.57 | |||||
| Downstream | 6,831 | 0.46 | |||||
| Corporate | 6,816 | ||||||
| Total | 28,907 | ||||||
* Including tollers’ volumes
| 18 | ||
SIX MONTHS ENDED JUNE 30, 2003
| General and | Per barrel of oil | |||||
| Administrative | produced or processed* | |||||
| ($000’s) | ($/bbl) | |||||
| Upstream | 15,121 | 0.58 | |||||
| Downstream | 6,889 | 0.44 | |||||
| Corporate | 1,523 | ||||||
| Total | 23,533 | ||||||
* Including tollers’ volumes
The increase in corporate general administrative expenses of $5.3 million was mainly due to $2.1 million of compensation cost being recognized for stock options granted pursuant to the new CICA accounting standard, which we adopted at the beginning of 2004. The remaining increase is attributable to increased activity levels.
INTEREST AND FINANCING
The following table sets forth our interest and financing costs and any related amortization of debt issue costs or discounts upon issuance of the debt instrument.
|
| Three months ended June 30 | |||||
|
| 2004 |
|
| 2003 |
| |
|
| ($000’s) |
|
| ($000’s) | ||
| 9.625% Notes | 3,504 | 3,150 | |||||
| Term facility | 1,251 | 3,176 | |||||
| Kazgermunai debt | 392 | (327 | ) | ||||
| PKOP bonds | - | 695 | |||||
| Short-term debt | 205 | 173 | |||||
| Accretion expense | 608 | 513 | |||||
| Term loans | 122 | - | |||||
| Less portion capitalized | - | - | |||||
| Total | 6,082 | 7,380 | |||||
The negative interest expense for Kazgermunai in the three months ended June 30, 2003 is attributable to a $0.6 million correction of interest expense made for the previous quarter.
|
| Six months ended June 30 | |||||
|
| 2004 |
|
| 2003 |
| |
|
| ($000’s) |
|
| ($000’s) | ||
| 9.625% Notes | 7,531 | 4,852 | |||||
| Term facility | 2,804 | 5,361 | |||||
| Kazgermunai debt | 802 | 647 | |||||
| PKOP bonds | 469 | 1,182 | |||||
| Short-term debt | 426 | 366 | |||||
| 12% Notes | - | 8,718 | |||||
| Accretion expense | 1,216 | 1,026 | |||||
| Term loans | 250 | - | |||||
| Less portion capitalized | (13 | ) | - | ||||
| Total | 13,485 | 22,152 | |||||
| 19 | ||
| • | Our 9.625% Notes interest expense increased in the first six months of 2004 by $2.7 million, as the Notes were issued in February 2003. | |
| • | Our term facility interest expense decreased by $1.9 million in the second quarter of 2004 and by $2.6 million in the first six months of 2004 due to the repayment of a portion of the principal. | |
| • | The PKOP bonds were fully redeemed on February 26, 2004. | |
| • | Accretion expense represents the increase in the present value of our asset retirement obligations due to the passage of time. | |
| • | Our 12% Notes interest expense in 2003 was $8.7 million including $6.6 million of issue costs that were expensed when we redeemed these notes on February 2, 2003. |
DEPRECIATION AND DEPLETION
THREE MONTHS ENDED JUNE 30, 2004
| Depreciation and | Depreciation and | |||||
| Depletion ($000’s) | Depletion ($/bbl*) | |||||
| Upstream | 21,638 | 1.57 | |||||
| Downstream | 5,046 | 0.65 | |||||
| Corporate | 314 | ||||||
| Total | 26,998 | ||||||
* Downstream includes tollers’ volumes
THREE MONTHS ENDED JUNE 30, 2003
| Depreciation and | Depreciation and | |||||
| Depletion ($000’s) | Depletion ($/bbl*) | |||||
| Upstream | 14,174 | 1.07 | |||||
| Downstream | 4,651 | 0.62 | |||||
| Corporate | 32 | ||||||
| Total | 18,857 | ||||||
* Downstream includes tollers’ volumes
The increase in upstream depreciation and depletion expenses of $7.4 million is mainly due to the $165.9 million of capital additions since the second quarter of 2003.
SIX MONTHS ENDED JUNE 30, 2004
| Depreciation and | Depreciation and | |||||
| Depletion ($000’s) | Depletion ($/bbl*) | |||||
| Upstream | 37,791 | 1.41 | |||||
| Downstream | 9,915 | 0.67 | |||||
| Corporate | 625 | ||||||
| Total | 48,331 | ||||||
* Downstream includes tollers’ volumes
SIX MONTHS ENDED JUNE 30, 2003
| Depreciation and | Depreciation and | |||||
| Depletion ($000’s) | Depletion ($/bbl*) | |||||
| Upstream | 27,106 | 1.05 | |||||
| Downstream | 9,321 | 0.59 | |||||
| Corporate | 58 | ||||||
| Total | 36,485 | ||||||
* Downstream includes tollers’ volumes
| 20 | ||
The increase in Upstream depreciation and depletion expenses of $10.7 million is mainly due to the $165.9 million of capital additions since the second quarter of 2003.
INCOME TAXES
Three months ended June 30 | |||||||
2004 | 2003 | ||||||
($000’s) | ($000’s) | ||||||
| Upstream | 44,988 | 15,357 | |||||
| Downstream | 33,890 | 13,297 | |||||
| Corporate | 1,114 | (104 | ) | ||||
| Total | 79,992 | 28,550 | |||||
Six months ended June 30 | |||||||
|
| 2004 |
|
| 2003 |
| |
|
| ($000’s) |
|
| ($000’s) | ||
| Upstream | 74,153 | 37,741 | |||||
| Downstream | 47,382 | 24,868 | |||||
| Corporate | 2,682 | 128 | |||||
| Total | 124,217 | 62,737 | |||||
Income taxes increased by $51.4 million in the second quarter of 2004 compared to the same quarter of 2003. $31.5 million of this increase is due to increases in sales volumes and in the price of crude oil and price of refined products, which led to an increase in income before income taxes of $105.1 million. We provided $6.8 million for excess profit tax in the second quarter of 2004. We also incurred additional $2.1 million of income tax in Kazgermunai, our joint venture, as the marginal tax rate exceeded the statutory rate of 30% per the sliding scale prescribed by the hydrocarbon contract and, therefore, the effective tax rate became 40% in the second quarter of 2004. The remaining increase of $11.0 million is due to various non-deductible expenses.
Income taxes increased by $61.5 million in the first six months of 2004 compared to the same period of 2003. $40.2 million of this increase is due to increase in income before income taxes of $134.1 million. We provided $9.8 million for excess profit tax in the first six months of 2004. We also incurred additional $1.5 million of income tax in Kazgermunai, because the marginal tax rate exceeded the statutory tax rate and, therefore, the effective tax rate became 36% for the first half of 2004. The remaining increase of $10.0 million is due to various non-deductible expenses.
Income taxes in our corporate segment are the withholding tax on the dividends paid from subsidiaries in Kazakhstan to Canada.
CAPITAL EXPENDITURES AND COMMITMENTS
The table below sets forth a breakdown of our capital expenditures.
|
| Three months ended June 30 | |||||
|
|
| 2004 |
|
| 2003 |
|
|
|
| ($000’s) |
|
| ($000’s) |
|
| Upstream | |||||||
Development wells | 9,940 | 9,497 | |||||
Facilities and equipment | 8,499 | 18,811 | |||||
Exploration | 6,049 | 4,545 | |||||
| Downstream | |||||||
Refinery HS&E | 1,350 | 113 | |||||
Refinery sustaining | 473 | 961 | |||||
Refinery return projects | 149 | 2,579 | |||||
Marketing & other | 469 | 5 | |||||
| Corporate | 362 | 183 | |||||
| Total capital expenditures | 27,291 | 36,694 | |||||
| Less accrued amounts | 727 | 1,670 | |||||
| Total cash capital expenditures | 28,018 | 38,364 | |||||
| 21 | ||
Six months ended June 30 | |||||||
|
| 2004 |
|
| 2003 |
| |
|
| ($000’s) |
|
| ($000’s) | ||
| Upstream | |||||||
Development wells | 16,330 | 13,418 | |||||
Facilities and equipment | 32,065 | 55,546 | |||||
Exploration | 11,691 | 8,461 | |||||
| Downstream | |||||||
Refinery HS&E | 1,892 | 340 | |||||
Refinery sustaining | 1,658 | 1,755 | |||||
Refinery return projects | 1,486 | 7,138 | |||||
Marketing & other | 650 | 16 | |||||
| Corporate | 644 | 341 | |||||
| Total capital expenditures | 66,416 | 87,015 | |||||
| Less accrued amounts | (3,362 | ) | (1,551 | ) | |||
| Total cash capital expenditures | 63,054 | 85,464 | |||||
LIQUIDITY
The levels of cash, current assets and current liabilities as at June 30, 2004 and December 31, 2003 are set out below.
| As at | As at | |||||
| June 30, 2004 | December 31, 2003 | |||||
| ($000’s) | ($000’s) | |||||
| Cash | 322,350 | 184,660 | |||||
| Cash flow (annualised) | 512,466 | 399,931 | |||||
| Working capital* | 103,726 | 151,737 | |||||
| Net debt** | (84,599 | ) | 135,220 | ||||
| Ratio of cash flow to net debt*** | (6.06 | ) | 3.0 | ||||
| Ratio of cash flow to fixed charges**** | 19.0 | 10.6 | |||||
| Ratio of earnings to fixed charges***** | 25.8 | 13.6 | |||||
* Working capital is net of cash and short-term debt
** Net debt includes short-term and long-term debt less cash
*** Quarterly cash flow is annualized
**** Fixed charges include interest expense and preferred dividends before tax
***** Earnings is income before income taxes plus fixed charges
Our net working capital has decreased due to increases in our accounts payable. The main components are income and excess profit tax, accrued dividends payable and amounts owed for crude oil purchased from one of our joint ventures.
Our restricted cash is $47.0 million as at June 30, 2004 ($35.5 million at December 31, 2003). Restricted cash includes $10.5 million of cash dedicated to a debt service reserve account for the Corporation's Term Facility and $36.5 million of cash dedicated to a margin account for the Corporation’s hedging program. There was no change in the balance on our debt service reserve account since December 31, 2003. The balance related to the hedging program increased by $11.5 million since December 31, 2003 due to the change in the mark-to-market valuation of our hedging contracts.
Our long-term debt substantially decreased from $246.7 million at December 31, 2003 to $195.1 million at June 30, 2004. During the first half of 2004, we made $16.8 million of principal repayments and $16.2 million of mandatory repayments on our term facility. Kazgermunai repaid $24.3 million of its long-term debt.
We have entered into a $100.0 million committed credit facility, which is subject to certain conditions precedent and final syndication. This facility further strengthens our financial position.
| 22 | ||