Exhibit 99.1
Message to the shareholders
HIGHLIGHTS
> | Net income of $2.27 per share (diluted) |
> | Further reductions in export differential |
> | Continued increases in the production of Vacuum Gasoil (“VGO”) |
> | Enhanced Oil Recovery project (“EOR”) approved |
> | New exploration successes at Aryskum and North Nurali |
> | Production guidance for 2005: 170,000 bopd |
> | 5,257,475 shares repurchased and cancelled |
> | Shares approved for listing on the Kazakhstan Stock Exchange |
FINANCIAL HIGHLIGHTS
| (IN MILLIONS OF US$ EXCEPT PER SHARE AMOUNTS) | Nine Months ended Sept. 30 | Three Months ended Sept. 30 | ||||||||||||
2004 | 2003 | 2004 | 2003 | |||||||||||
| Gross Revenue | $ | 1,237.3 | $ | 806.7 | $ | 518.6 | $ | 303.2 | ||||||
| Net income | 385.7 | 228.1 | 176.2 | 91.2 | ||||||||||
| Per share (basic) | 5.00 | 2.92 | 2.30 | 1.17 | ||||||||||
| Per share (diluted) | 4.89 | 2.81 | 2.27 | 1.12 | ||||||||||
| Cash flow | 443.2 | 288.4 | 186.9 | 108.5 | ||||||||||
| Per share (basic) | 5.75 | 3.69 | 2.44 | 1.40 | ||||||||||
| Per share (diluted) | 5.62 | 3.55 | 2.41 | 1.34 | ||||||||||
| Weighted Average Shares Outstanding | ||||||||||||||
| Basic | 77,118,191 | 78,258,611 | 76,652,399 | 77,707,623 | ||||||||||
| Diluted | 78,905,718 | 81,288,890 | 77,716,702 | 81,266,718 | ||||||||||
| Shares Outstanding at End of Period | 76,023,141 | 77,771,788 | 76,023,141 | 77,771,788 | ||||||||||
PetroKazakhstan is pleased to announce its financial results for the third quarter of 2004 with $176.2 million of net income, a 93.2% increase over the quarter ended September 30, 2003 and $186.9 million of cash flow, a 72.3% increase over the quarter ended September 30, 2003. This represents basic net income per share of $2.30 and basic cash flow per share of $2.44 for the quarter. The comparable figures for the quarter ended September 30, 2003 were $1.17 basic net income per share and $1.40 basic cash flow per share.
For the nine months ended September 30, 2004 net income was $385.7 million, a 69.1% increase over the same period of 2003, and cash flow of $443.2 million, a 53.7% increase over the same period of 2003. This represents basic net income per share of $5.00 and basic cash flow per share of $5.75. The comparable figures for the nine months ended September 30, 2003, were net income per share of $2.92 and basic cash flow per share of $3.69.
SHARE REPURCHASES
The Company’s substantial issuer bid share tender, which ended on July 19, 2004, has resulted in the repurchase and cancellation of 3,999,975 shares at C$40.00 per share.
The Company’s normal course issuer bid program was renewed on August 13, 2004 and will terminate on August 12, 2005. Under the terms of this share repurchase program, the Company repurchased and cancelled 1,257,500 shares at an average price of C$40.00 in the third quarter of 2004.
Due to the timing of the share cancellations, the full impact of these repurchases will be reflected in the fourth quarter.
At the end of the third quarter, the Company had 76,023,141 common shares outstanding and 1,688,545 options and convertible securities.
| 2 | ||
LISTING ON THE KAZAKHSTAN STOCK EXCHANGE On October 21, 2004 the Kazakhstan Stock Exchange announced that the common shares of PetroKazakhstan had been approved for listing on the Exchange. The Company believes that this will create an excellent opportunity for Kazakh investors to participate in the growth and success of a business operating in Kazakhstan. PetroKazakhstan is the first foreign company to be granted approval for listing. Trading in PetroKazakhstan shares on the Kazakhstan Stock Exchange is expected to commence in the fourth quarter of 2004. UPSTREAM OPERATIONS REVIEW PRODUCTION During the third quarter of 2004, PetroKazakhstan’s production volumes totaled 14.52 million barrels or an average of 157,786 barrels of oil per day (“bopd”) representing an increase of 2.0% over the third quarter 2003 average production of 154,712 bopd and a 4.4% increase over the second quarter of 2004 average production rate of 151,104 bopd. Development wells in Kyzylkiya, Aryskum, Kumkol North and Akshabulak fields have contributed to these increases. In spite of these increases, mechanical pump failures on some high rate wells as well as allocation of capacity at the Kumkol Central Processing Facility used by both PetroKazakhstan and the neighbouring field operator, Turgai Petroleum, has adversely affected overall production. While these limitations are being addressed and corrected, the Company is revising its expectation for the fourth quarter to about 158,000 bopd, bringing the anticipated 2004 annual average production down to 152,000 bopd (versus the prior estimate of 160,000 bopd). PetroKazakhstan’s budget for 2005 is based on an annual average net production of 170,000 bopd. FIELD DEVELOPMENTS The Aryskum development drilling campaign continued with eleven wells completed in the third quarter of 2004 bringing the total so far this year to fourteen. The Company plans to drill four more wells before the end of the year, one of which will be a horizontal well to improve production rates in the southern portion of the field. One production well has been drilled in the Kyzylkiya field and three in the neighbouring Kolzhan license to the north this quarter, bringing the total number of wells drilled in the area this year to thirteen. Work continues on the upgrade of the Akshabulak processing facilities that will enable production rates to increase to over 60,000 bopd (30,000 bopd net) by mid 2005. Two development and field delineation wells were drilled in the last quarter. | Production from the East Kumkol field resumed in the third quarter following regulatory authority approvals. ENHANCED OIL RECOVERY PROJECT Following the completion of a feasibility study for miscible hydrocarbon injection for enhanced oil recovery in the Kumkol field, the Company is now proceeding with a project to commence injection of a Liquefied Petroleum Gas (“LPG”) blend by mid 2005. It is expected that the oil recovery factor can be significantly increased through this proven technique. EXPLORATION AND APPRAISAL Of major importance has been the discovery of a new productive reservoir within the Aryskum field area below the extensive field gas cap. Well AK 401 was drilled as a gas injector but was drilled slightly deeper to examine the potential presence of a deeper reservoir below the gas cap. A 15 meter net oil section was encountered and the well is currently under test, producing light, 43 degree API crude on a reduced choke at a rate of 1,400 bopd. This is a completely new reservoir that has not been accounted for in previous reserves evaluations. A full appraisal drilling program will now be undertaken with the first well to be drilled before the end of the year. Interpretation of the 3D seismic of the Northern Kyzylkiya area is now complete and a potentially significant further extension to the field has been identified. A well is planned to test this potential field extension during the fourth quarter of 2004. Following completion of the enhanced seismic interpretation of the North Nurali field, two appraisal well locations were selected. The first of these appraisal wells has recently been completed. Good oil shows were encountered within the main Doshan reservoir interval. A second additional basement reservoir interval with oil shows was also encountered. Testing of both intervals is about to commence. The second appraisal well is currently drilling. An 85 square kilometre (“km2”) 3D seismic survey was acquired to the north of the North Nurali field to evaluate potential satellite structures along this trend. PetroKazakhstan holds a 75% interest and operatorship of License 951-D which covers two blocks (the Doshan block and the Zhamansu block) in the South Turgai Basin over a total area of 4,290 km2. Following interpretation of 2D seismic data acquired earlier this year a series of prospects have been identified within the Zhamansu block. Four exploration wells will be drilled within this block by the end of 2004. The existing D-3 well within the Doshan block has been re-tested at low rates of around 100 bopd. This well is being considered for future fracture stimulation. In total, the Company drilled ten exploration wells in the first three quarters of 2004 with a success ratio of 80% and plans to drill seven additional exploration wells in the fourth quarter of 2004. |
| 3 | ||
EXPLOITATION OF GAS AND LPG RESERVES PetroKazakhstan, as a 50% partner in the Kazgermunai Joint Venture, is also participating in Kazgermunai’s LPG extraction plant for the Akshabulak field. The 30 million standard cubic feet per day (“mmscfd”) plant will provide 2,900 bopd of LPG and 600 bopd of condensate. Facilities have been designed, and equipment is being procured. Construction has started for completion by mid 2005. The dry gas will be provided to the city of Kyzylorda through a pipeline to be constructed by KazTransGaz. DOWNSTREAM MARKETING, TRANSPORTATION AND REFINING CRUDE OIL LOGISTICS The volume of crude oil shipped from the Company’s loading stations during the third quarter of 2004 was 7.83 mmbbls (1,012 thousand tonnes) which represents an increase of 10% compared to the second quarter of 2004 and the third quarter of 2003. The Company’s terminal at Dzhusaly handled approximately 69% of all crude oil shipments, slightly down on the previous quarter, as the performance of the state operated pipeline and terminal at Atasu improved substantially from the operational problems experienced during the second quarter. Shipments to the Tehran refinery were reduced to 41% of the previous quarter volumes as the Ministry of Energy and Mineral Resources (“MEMR”) restricted export quotas on that route. There is an on going dialogue between PetroKazakhstan and the MEMR. PetroKazakhstan’s contention is that these restrictions are not justified as all the logistics are provided and managed by PetroKazakhstan, that there is capacity and that this route is in the best interests of the Company, the Republic of Kazakhstan as well as Iran and the neighbouring transit countries. Management remains confident that ultimately a positive outcome to these discussions can be achieved. Caspian Pipeline Consortium (“CPC”) deliveries continued to grow towards their contractual maximum and were up 4% on the previous quarter. Current deliveries account for approximately 96% of the contractual maximum and the fourth quarter of 2004 should see the maximum achieved. CRUDE OIL PRICES AND TRANSPORTATION DIFFERENTIALS International crude oil prices continued their upward drive. The average of the daily mean of Platts quotations for Brent Dated was up $6.22 per barrel against the previous quarter and stood at $41.54 per barrel. The spread of Brent quotations during the third quarter also rose dramatically to $12.47 with a maximum quotation of $47.25. OPEC supplied increased quantities of heavy sour crude oil on the market and consequently there was a widening in the differential between the values of light sweet and heavy sour crude oil. Having started the year at $1.60 per barrel, the discount for Urals in the Mediterranean finished the third quarter at $7.00 per barrel. A similar effect was seen on the Oman/Dubai quotations versus Brent Dated. The premium of Kumkol priced Cost, Insurance and Freight (“CIF”) in the Mediterranean over Brent improved throughout the third quarter closing at 92.5 US cents per barrel. | The combination of higher international market prices and reduced transportation costs saw a significant improvement in the net return per barrel measured at the production field gate compared to both the second quarter of 2004 and the third quarter of 2003. REFINING AND REFINED PRODUCT SALES Refinery throughput was slightly down at 7.18 mmbbls in the third quarter of 2004 compared to 7.7 mmbbls during the second quarter of 2004. Average weighted refined product prices rose as VGO sales accounted for a larger percentage of the sales mix. Production of VGO is planned to increase during the fourth quarter and further benefits will be seen from this during the coming months. Despite these improvements, domestic net returns continued to lag export net returns by a substantial margin. In accordance with the timetable agreed with the Ministry of Energy and Mineral Resources, the refinery has been making preparations for its annual maintenance shutdown scheduled from mid October to mid November. Closing inventories of refined products are broadly in line with those at the end of the same quarter in the preceding three years. Nevertheless, it is anticipated that some refined products will be either imported or purchased to ensure the Company can continue to supply its regular customers on the domestic and export markets. Additionally, the Company has in place a crude oil export program for October and November to ensure that the additional crude oil available for export during the refinery shutdown can be handled without any restriction to its crude oil production. During the refinery turnaround, equipment will be installed to extend the cycle of future planned refinery maintenance shutdowns to three to five years, instead of the current one year cycle. DIRECTORS AND OFFICERS Mr. Jean-Paul Bisnaire has elected to resign from the Board of Directors of the Company, effective October 31, 2004, following his recent appointment as Senior Executive Vice President of Manulife Financial. The Board of Directors is grateful to Mr. Bisnaire for his outstanding contribution to the Company both as a Legal Advisor and as a Director. The Company is pleased to announce, effective November 1, 2004, the appointment of Clayton J. Clift as Chief Financial Officer. Mr. Clift has held the position of Vice President, Finance of the Company’s upstream and downstream operating subsidiaries since December 2000. Respectfully submitted on behalf of the board of Directors,  Bernard F. Isautier President and Chief Executive Officer October 28, 2004 |
| 4 | ||
MANAGEMENT’S DISCUSSION AND ANALYSIS
The following Management’s Discussion and Analysis (“MD&A”) of the financial condition and results of our operations should be read in conjunction with the unaudited consolidated financial statements of the Corporation included in this report and our MD&A and audited consolidated financial statements for the year ended December 31, 2003. Our financial statements have been prepared in accordance with Canadian GAAP. This discussion and analysis contains forward-looking statements, which involve risks and uncertainties. Our actual results could differ materially from those anticipated in the forward-looking statements.
In our MD&A we use certain terms including “netback” and “cash flow”. These are non-GAAP terms with cash flow defined as cash generated from operating activities before changes in non-cash working capital and netback is defined within our MD&A.
Except as otherwise required by the context, reference in this MD&A to “our”, “we” or “us” refer to the combined business of PetroKazakhstan Inc. and all of its subsidiaries and joint ventures.
All numbers are in U.S. Dollars unless otherwise indicated.
HIGHLIGHTS
Three months ended September 30 | |||||||
2004 | 2003 | ||||||
| Net income ($000’s) | 176,218 | 91,150 | |||||
Cash flow ($000’s)1 | 186,944 | 108,498 | |||||
| Basic net income per share | 2.30 | 1.17 | |||||
| Basic cash flow per share | 2.44 | 1.40 | |||||
| BOPD | 157,786 | 154,712 | |||||
| Capital expenditures | 32,284 | 37,079 | |||||
Nine months ended September 30 | |||||||
2004 | 2003 | ||||||
| Net income ($000’s) | 385,731 | 228,132 | |||||
Cash flow ($000’s)1 | 443,177 | 288,391 | |||||
| Basic net income per share | 5.00 | 2.92 | |||||
| Basic cash flow per share | 5.75 | 3.69 | |||||
| BOPD | 150,630 | 146,898 | |||||
| Capital expenditures | 98,700 | 124,094 | |||||
1 Cash flow: We evaluate our operations based upon our net income and cash flow. Cash flow is a non-GAAP measure that represents cash flow from operations before changes in working capital. We consider this to be a key measure as we use this measure to evaluate our ability to generate cash to fund our growth through capital expenditures and our ability to repay debt. The comparable GAAP measure is cash flow from operating activities. The following table reconciles our non-GAAP measure cash flow to the comparable GAAP measure “Cash flow from operating activities”.
Three months ended September 30 | |||||||
2004 | 2003 | ||||||
($’000s) | ($’000s) | ||||||
| Cash flow | 186,944 | 108,498 | |||||
| Changes in non-cash operating working capital items | 5,479 | (3,094 | ) | ||||
| Cash flow from operating activities | 192,423 | 105,404 | |||||
Nine months ended September 30 | |||||||
2004 | 2003 | ||||||
($’000s) | ($’000s) | ||||||
| Cash flow | 443,177 | 288,391 | |||||
| Changes in non-cash operating working capital items | 49,693 | (45,462 | ) | ||||
| Cash flow from operating activities | 492,870 | 242,929 | |||||
| 5 | ||
NET RETURN PER BARREL
Set forth below are the details of the average net return achieved for crude oil export sales and sales derived from the refining of our own crude. These tables show averages across all types of sales contracts and illustrate the relationship between exports of crude oil versus refining our own crude oil and marketing refined crude oil products.
Three months ended September 30, 2004 | |||||||
Crude Oil | Own Crude Oil | ||||||
Exports | Refined and Sold* | ||||||
($/bbl) | ($/bbl) | ||||||
| Net sales price achieved | 35.75 | 28.15 | |||||
| Transportation costs | (6.18 | ) | (3.13 | ) | |||
| Selling costs | (0.61 | ) | (0.76 | ) | |||
| Crude utilized in refining | - | (1.75 | ) | ||||
| Refining cost | - | (0.81 | ) | ||||
| Royalties and taxes - downstream | - | (0.55 | ) | ||||
| General and administrative costs - downstream | - | (0.56 | ) | ||||
| Netback at Kumkol** | 28.96 | 20.59 | |||||
| Production cost | (1.61 | ) | (1.61 | ) | |||
| Royalties and taxes - upstream | (3.34 | ) | (3.34 | ) | |||
| General and administrative costs - upstream | (0.65 | ) | (0.65 | ) | |||
| Net return per barrel | 23.36 | 14.99 | |||||
Three months ended September 30, 2003 | |||||||
Crude Oil | Own Crude Oil | ||||||
Exports | Refined and Sold* | ||||||
($/bbl) | ($/bbl) | ||||||
| Net sales price achieved | 21.56 | 18.29 | |||||
| Transportation costs | (7.75 | ) | (1.40 | ) | |||
| Selling costs | (0.47 | ) | (0.70 | ) | |||
| Crude utilized in refining | - | (1.06 | ) | ||||
| Refining cost | - | (0.49 | ) | ||||
| Royalties and taxes - downstream | - | (0.02 | ) | ||||
| General and administrative costs - downstream | - | (0.47 | ) | ||||
| Netback at Kumkol** | 13.34 | 14.15 | |||||
| Production cost | (1.11 | ) | (1.11 | ) | |||
| Royalties and taxes - upstream | (1.73 | ) | (1.73 | ) | |||
| General and administrative costs - upstream | (0.59 | ) | (0.59 | ) | |||
| Net return per barrel | 9.91 | 10.72 | |||||
| * | Net sales price achieved shown in these tables does not include the price received for purchased refined products resold. |
| ** | Average Platts Brent or a similar index for each respective period does not reflect our average realized Brent price because of the timing of recognition of sales for financial statement purposes and the terms of the sales. Financial statement sales revenue is the basis used to determine the net sales price achieved in these tables. Therefore, a comparison of average Platts Brent or similar index to our netback at Kumkol cannot be used to determine our differential. |
During the third quarter of 2004, the netback at Kumkol for crude oil exports increased by $15.62/bbl compared to the same quarter of 2003 due to a substantial increase in market prices (average Platts Brent was $41.54/bbl compared to $28.38/bbl in 2003). This was partly offset by foregone revenue due to our hedging program, which had a negative impact of $1.60 per barrel sold in the third quarter of 2004 compared to $0.04/bbl in the same quarter of 2003. Transportation costs decreased by $1.57/bbl due to the use of sales routes, different from those used in the previous year, and savings in pipeline costs. Royalties and taxes increased by $1.61/bbl due to the accrual of tax assessments relating to penalties and fines and royalties on gas (See Note 15 to the consolidated financial statements). The increase in royaltie s was also due to the increase in crude oil prices.
The netback at Kumkol for own crude oil refined and sold increased by $6.44/bbl compared to the third quarter of 2003 due to higher sales prices, offset in part by increases in our transportation costs, because we exported some refined products volumes on a non-FCA basis.
| 6 | ||
Nine months ended September 30, 2004 | |||||||
Crude Oil | Own Crude Oil | ||||||
Exports | Refined and Sold* | ||||||
($/bbl) | ($/bbl) | ||||||
| Net sales price achieved | 29.48 | 23.01 | |||||
| Transportation costs | (6.47 | ) | (1.99 | ) | |||
| Selling costs | (0.57 | ) | (0.68 | ) | |||
| Crude utilized in refining | - | (1.45 | ) | ||||
| Refining cost | - | (0.69 | ) | ||||
| Royalties and taxes - downstream | - | (0.69 | ) | ||||
| General and administrative costs - downstream | - | (0.49 | ) | ||||
| Netback at Kumkol** | 22.44 | 17.02 | |||||
| Production cost | (1.71 | ) | (1.71 | ) | |||
| Royalties and taxes - upstream | (1.99 | ) | (1.99 | ) | |||
| General and administrative costs - upstream | (0.60 | ) | (0.60 | ) | |||
| Net return per barrel | 18.14 | 12.72 | |||||
Nine months ended September 30, 2003 | |||||||
Crude Oil | Own Crude Oil | ||||||
Exports | Refined and Sold* | ||||||
($/bbl) | ($/bbl) | ||||||
| Net sales price achieved | 21.00 | 15.66 | |||||
| Transportation costs | (7.97 | ) | (1.12 | ) | |||
| Selling costs | (0.38 | ) | (0.68 | ) | |||
| Crude utilized in refining | - | (0.91 | ) | ||||
| Refining cost | - | (0.54 | ) | ||||
| Royalties and taxes - downstream | - | (0.14 | ) | ||||
| General and administrative costs - downstream | - | (0.45 | ) | ||||
| Netback at Kumkol** | 12.65 | 11.82 | |||||
| Production cost | (1.25 | ) | (1.25 | ) | |||
| Royalties and taxes - upstream | (1.27 | ) | (1.27 | ) | |||
| General and administrative costs - upstream | (0.59 | ) | (0.59 | ) | |||
| Net return per barrel | 9.54 | 8.71 | |||||
| * | Net sales price achieved shown in these tables does not include the price received for purchased refined products resold. |
| ** | Average Platts Brent or a similar index for each respective period does not reflect our average realized Brent price because of the timing of recognition of sales for financial statement purposes and the terms of the sales. Financial statement sales revenue is the basis used to determine the net sales price achieved in these tables. Therefore, a comparison of average Platts Brent or similar index to our netback at Kumkol cannot be used to determine our differential. |
During the first nine months of 2004, the netback at Kumkol for crude oil exports increased by $9.79/bbl compared to the same period of 2003 due to a significant increase in market prices (average Platts Brent was $36.36/bbl compared to $28.63/bbl in 2003) and savings in transportation costs. This was partially offset by foregone revenue due to our hedging program, which had a negative impact of $1.09 per barrel sold in the first three quarters of 2004 compared to $0.20/bbl for the same period in 2003. Transportation costs decreased by $1.50/bbl due to the use of sales routes, different from those used in the previous year, and savings in pipeline costs. Royalties and taxes increased by $0.72/bbl due to the accrual of tax assessments relating to penalties and fines and royalties on gas (See Note 15 to the consolidated financial statements). The increase in royalties was also due to the increase in crude oil prices.
The netback at Kumkol for own crude oil refined and sold increased by $5.20/bbl compared to the third quarter of 2003 due to higher sales prices, offset in part by increases in our transportation and selling costs. Transportation costs increased because we exported some refined products volumes on a non-FCA basis.
| 7 | ||
KEY PERFORMANCE INDICATORS
We measure the performance of our Upstream and Downstream operations using the following key performance indicators.
Three months ended September 30 | |||||||
2004 | 2003 | ||||||
| BOPD | 157,786 | 154,712 | |||||
| Differential* ($/bbl) | 11.66 | 14.11 | |||||
| Average refined products price ($/bbl) | 28.15 | 18.29 | |||||
| Production expense ($/bbl) | 1.61 | 1.11 | |||||
| Refining cost ($/bbl) | 0.81 | 0.49 | |||||
| General and administrative ($/bbl) | 1.21 | 1.06 | |||||
| Effective income tax rate, % | 35.5 | % | 30.9 | % | |||
Nine months ended September 30 | |||||||
2004 | 2003 | ||||||
| BOPD | 150,630 | 146,898 | |||||
| Differential* ($/bbl) | 12.12 | 14.53 | |||||
| Average refined products price ($/bbl) | 23.01 | 15.66 | |||||
| Production expense ($/bbl) | 1.71 | 1.25 | |||||
| Refining cost ($/bbl) | 0.69 | 0.54 | |||||
| General and administrative ($/bbl) | 1.09 | 1.04 | |||||
| Effective income tax rate, % | 36.4 | % | 31.1 | % | |||
* | Our differential is calculated as the difference between the average Brent price received for finalized crude oil export sales made by PKKR and Turgai, and our netback at Kumkol. It is the sum of the costs and discounts incurred in order to transport and sell our crude oil to international markets. The sales revenue used in this measure differs from sales revenue in the statement of net income and the net return table for the following reasons: | |
| • | The differential does not include Kazgermunai sales over which we have limited control. Kazgermunai is excluded because the differential is used to measure the performance of our internal marketing and transportation group. | |
| • | The differential is calculated using finalized sales transactions. Our financial statements include estimates on shipments in transit at the end of the quarter that may slightly differ from the final transactions. | |
BOPD. See Production and Processing for a discussion of our production. Differentials. The graph to the right shows our differential over the last year and the first three quarters of 2004 ($/bbl) based on completed sales. Production expenses. Production expenses were higher in the third quarter and nine months of 2004 compared to 2003 because of a number of factors. We continue to use temporary power generators to operate single well batteries in the KAM fields pending construction of infrastructure. The water cut in a number of our fields including our JV Turgai continued to increase resulting in higher production expenses. The number of wells commissioned in 2004 is higher compared to 2003. Refining cost. Refining costs for the third quarter and the first nine months of 2004 are higher by $1.7 million and $2.3 million, respectively, when compared to the same periods of 2003. The main reasons for the increase are higher costs for repairs and purchased energy. Purchased energy costs were higher due to the continuous operation of the vacuum distillation unit during the third quarter of 2004. | 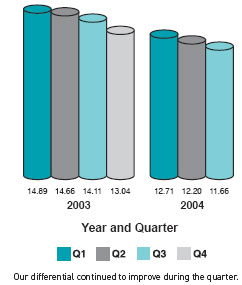 |
General and administrative expenses. General and administrative expenses increased in the third quarter of 2004 due to $0.7 million ($2.8 million for nine months of 2004) of compensation cost being recognized for stock options granted pursuant to the new accounting standard, which we adopted at the beginning of 2004. The remaining increase is attributable to increased activity levels.
Effective income tax rate. The statutory tax rate in Kazakhstan, where all of our operations are located, is 30%. Our effective tax rate differs due to certain expenses, which cannot be deducted for statutory tax purposes. Our tax rate as a percentage of net income before tax in the third quarter of 2004 was 35.5% compared to 30.9% in the same quarter of 2003 (36.4% for the
| 8 | ||
nine months of 2004 compared to 31.1% for the same period of 2003). The effective income tax rates are higher in 2004 due to provisions for excess profit tax in our Turgai joint venture, whereas there was no provision in 2003. The effective rate also increased in the third quarter of 2004 due to the accrual of taxes under dispute (see Royalties and Taxes).
PRODUCTION AND PROCESSING
PRODUCTION
The following table sets forth our barrels of oil produced per day by field and on a consolidated basis.
Three months ended September 30 | |||||||
| Field | 2004 | 2003 | |||||
(BOPD) | (BOPD) | ||||||
| Kumkol South | 48,126 | 57,137 | |||||
| Kumkol North | 36,703 | 31,169 | |||||
| South Kumkol | 22,400 | 29,551 | |||||
| Kyzylkiya | 11,727 | 8,681 | |||||
| Aryskum | 10,659 | 8,984 | |||||
| Maibulak | 1,951 | 1,174 | |||||
| North Nurali | 827 | - | |||||
| East Kumkol | 752 | - | |||||
| License #952 | 371 | - | |||||
| License #951 | 15 | - | |||||
| Kazgermunai Fields | 24,255 | 18,016 | |||||
| Total | 157,786 | 154,712 | |||||
Nine months ended September 30 | |||||||
| Field | 2004 | 2003 | |||||
(BOPD) | (BOPD) | ||||||
| Kumkol South | 46,799 | 58,789 | |||||
| Kumkol North | 34,998 | 28,799 | |||||
| South Kumkol | 23,837 | 29,265 | |||||
| Kyzylkiya | 10,317 | 7,587 | |||||
| Aryskum | 9,166 | 6,431 | |||||
| Maibulak | 2,153 | 734 | |||||
| North Nurali | 504 | - | |||||
| East Kumkol | 252 | - | |||||
| License #952 | 272 | - | |||||
| License #951 | 9 | - | |||||
| Kazgermunai Fields | 22,323 | 15,293 | |||||
| Total | 150,630 | 146,898 | |||||
Kumkol South. The decrease in Kumkol South production in the third quarter and for the first nine months of 2004 was mainly due to 18 wells that border the Kumkol North field that were shut-in for the first four months of 2004 and are now on a reduced production scheme under a technical regime designed to equalize the reservoir pressure along the border between the fields. Additionally, during the third quarter of 2004 water injection capacity has been a limiting factor in optimizing our production due to increased water production from our Kumkol South, South Kumkol and Kumkol North fields.
Kumkol North. Increases in production from our Kumkol North field were due to an increase in the number of production wells and installation of artificial lift.
South Kumkol. South Kumkol production decreased due to declining reservoir pressure which necessitated conversion of three of our producing wells to water injection wells. We had 22 producing wells in the third quarter of 2003 as opposed to 18 producing wells in the same quarter of 2004.
KAM fields. The increase in production from our KAM fields (Kyzylkiya, Aryskum, Maibulak) was due to the increased number of wells put on production and implementation of our artificial lift program.
| 9 | ||
East Kumkol. East Kumkol is currently on an extended production test, pending completion of a hydrocarbon production contract and finalization of a joint operating agreement with our 40% partner Turgai.
Kazgermunai fields. Kazgermunai completed surface facility debottlenecking measures in late 2003, leading to the increase in 2004 production. The increase in production was also due to PetroKazakhstan accepting Kazgermunai trucked oil at Kumkol with a higher watercut than was acceptable at the truck off loading stations in Kyzylorda.
INVENTORY
The following table sets forth the movements in crude oil inventory for our Upstream operations for the three and nine months ended September 30, 2004 and 2003.
Three months ended September 30 | |||||||
2004 | 2003 | ||||||
(MMbbls) | (MMbbls) | ||||||
| Opening inventory of crude oil | 2.61 | 2.12 | |||||
| Production | 14.52 | 14.23 | |||||
| Crude oil purchased from third parties | - | 0.02 | |||||
| Crude oil purchased from joint ventures (50%) | 0.07 | 0.13 | |||||
| Sales or transfers | (14.87 | ) | (14.37 | ) | |||
| Field and transportation losses | (0.10 | ) | (0.04 | ) | |||
| Closing inventory of crude oil | 2.23 | 2.09 | |||||
Nine months ended September 30 | |||||||
2004 | 2003 | ||||||
(MMbbls) | (MMbbls) | ||||||
| Opening inventory of crude oil | 2.87 | 2.72 | |||||
| Production | 41.28 | 40.10 | |||||
| Crude oil purchased from third parties | 1.09 | 0.02 | |||||
| Crude oil purchased from joint ventures (50%) | 0.22 | 0.54 | |||||
| Sales or transfers | (43.04 | ) | (40.51 | ) | |||
| Field and transportation losses | (0.19 | ) | (0.13 | ) | |||
| Return of purchased crude | - | (0.65 | ) | ||||
| Closing inventory of crude oil | 2.23 | 2.09 | |||||
SALES OF CRUDE OIL
The following table sets out our total crude oil sales and transfers from Upstream operations for the three and nine months ended September 30, 2004 and 2003.
Three months ended September 30 | |||||||||||||
2004 | 2004 | 2003 | 2003 | ||||||||||
MMbbls | % | MMbbls | % | ||||||||||
| Crude oil exports | 8.45 | 56.8 | % | 7.22 | 50.2 | % | |||||||
| Crude oil transferred to downstream | 3.97 | 26.7 | % | 4.62 | 32.2 | % | |||||||
| Crude oil transferred to downstream by joint ventures (50%) | 1.50 | 10.1 | % | 1.72 | 12.0 | % | |||||||
| Royalty payments | 0.95 | 6.4 | % | 0.81 | 5.6 | % | |||||||
| Total crude oil sales or transfers | 14.87 | 100.0 | % | 14.37 | 100.0 | % | |||||||
Nine months ended September 30 | |||||||||||||
2004 | 2004 | 2003 | 2003 | ||||||||||
MMbbls | % | MMbbls | % | ||||||||||
| Crude oil exports | 23.29 | 54.1 | % | 20.58 | 50.8 | % | |||||||
| Crude oil transferred to downstream | 12.22 | 28.4 | % | 14.55 | 35.9 | % | |||||||
| Crude oil transferred to downstream by joint ventures (50%) | 4.70 | 10.9 | % | 4.57 | 11.3 | % | |||||||
| Royalty payments | 2.83 | 6.6 | % | 0.81 | 2.0 | % | |||||||
| Total crude oil sales or transfers | 43.04 | 100.0 | % | 40.51 | 100.0 | % | |||||||
| 10 | ||
REFINING
Our total processed volumes were as follows:
Three months ended September 30 | |||||||
2004 | 2003 | ||||||
(MMbbls) | (MMbbls) | ||||||
| Feedstock refined into product | 7.04 | 8.30 | |||||
| Tolled volumes | 0.14 | - | |||||
| Total processed volumes* | 7.18 | 8.30 | |||||
Nine months ended September 30 | |||||||
2004 | 2003 | ||||||
(MMbbls) | (MMbbls) | ||||||
| Feedstock refined into product | 21.74 | 23.85 | |||||
| Tolled volumes | 0.27 | 0.23 | |||||
| Total processed volumes* | 22.01 | 24.08 | |||||
*The total processed volumes are used for our per barrel calculations.
Sources of feedstock supplies for our refinery were as follows:
Three months ended September 30 | |||||||
2004 | 2003 | ||||||
(MMbbls) | (MMbbls) | ||||||
| Acquired from PKKR | 3.97 | 4.62 | |||||
| Purchased from joint ventures (100%) | 3.00 | 3.44 | |||||
| Purchased from third parties | 0.01 | 0.07 | |||||
| Total feedstock acquired | 6.98 | 8.13 | |||||
Nine months ended September 30 | |||||||
2004 | 2003 | ||||||
(MMbbls) | (MMbbls) | ||||||
| Acquired from PKKR | 12.22 | 14.55 | |||||
| Purchased from joint ventures (100%) | 9.40 | 9.14 | |||||
| Purchased from third parties | 0.01 | 0.07 | |||||
| Total feedstock acquired | 21.63 | 23.76 | |||||
The movements in our feedstock inventory at our refinery were as follows:
Three months ended September 30 | |||||||
2004 | 2003 | ||||||
(MMbbls) | (MMbbls) | ||||||
| Opening inventory of crude oil feedstock | 0.05 | 0.23 | |||||
| Purchase and acquisition of feedstock | 6.98 | 8.13 | |||||
| Recoverable feedstock from traps | 0.03 | - | |||||
| Feedstock refined into product | (7.04 | ) | (8.30 | ) | |||
| Closing inventory of feedstock | 0.02 | 0.06 | |||||
Nine months ended September 30 | |||||||
2004 | 2003 | ||||||
(MMbbls) | (MMbbls) | ||||||
| Opening inventory of crude oil feedstock | 0.03 | 0.20 | |||||
| Purchase and acquisition of feedstock | 21.63 | 23.76 | |||||
| Recoverable feedstock from traps | 0.10 | (0.05 | ) | ||||
| Feedstock refined into product | (21.74 | ) | (23.85 | ) | |||
| Closing inventory of feedstock | 0.02 | 0.06 | |||||
| 11 | ||
The movement in inventory of refined products was as follows:
Three months ended September 30 | |||||||
2004 | 2003 | ||||||
(MM Tonnes)* | (MM Tonnes)* | ||||||
| Opening inventory of refined product | 0.18 | 0.12 | |||||
| Refined product from feedstock | 0.85 | 1.01 | |||||
| Refined product purchased | 0.01 | - | |||||
| Refined product sold | (0.90 | ) | (0.97 | ) | |||
| Refined product internal use | (0.01 | ) | - | ||||
| Closing inventory of refined product | 0.13 | 0.16 | |||||
Nine months ended September 30 | |||||||
2004 | 2003 | ||||||
(MM Tonnes)* | (MM Tonnes)* | ||||||
| Opening inventory of refined product | 0.26 | 0.22 | |||||
| Refined product from feedstock | 2.63 | 2.90 | |||||
| Refined product purchased | 0.05 | 0.01 | |||||
| Refined product sold | (2.78 | ) | (2.97 | ) | |||
| Refined product internal use | (0.03 | ) | - | ||||
| Closing inventory of refined product | 0.13 | 0.16 | |||||
| * | The inventory of products represents a mix of products for which no unique conversion from barrels to tonnes exists. The standard conversion used by us for crude oil is 7.746 barrels to the tonne. |
RESULTS OF OPERATIONS
REVENUE
As at June 30, 2004, approximately 1.3 mmbbls of non-FCA sales were in transit and hence, included in inventory. The net income realized on these sales in the third quarter of 2004 was $20.0 million, as compared to $18.1 million of net income estimated at June 30, 2004. As at September 30, 2004, approximately 0.8 mmbbls of non-FCA sales were in transit and included in inventory. We expect to realize these volumes in the fourth quarter of 2004 for net income of $16.0 million.
Three months ended September 30 | |||||||||||||
2004 | 2003 | Change | |||||||||||
($000’s) | ($000’s) | ($000’s) | % | ||||||||||
| Crude oil | 321,676 | 163,955 | 157,721 | 96.2 | |||||||||
| Refined products | 195,466 | 137,355 | 58,111 | 42.3 | |||||||||
| Service fees | 284 | 864 | (580 | ) | (67.1 | ) | |||||||
| Interest income | 1,176 | 978 | 198 | 20.2 | |||||||||
| Total revenue | 518,602 | 303,152 | 215,450 | 71.1 | |||||||||
Nine months ended September 30 | |||||||||||||
2004 | 2003 | Change | |||||||||||
($000’s) | ($000’s) | ($000’s) | % | ||||||||||
| Crude oil | 735,240 | 440,372 | 294,868 | 67.0 | |||||||||
| Refined products | 495,474 | 359,769 | 135,705 | 37.7 | |||||||||
| Service fees | 4,166 | 4,191 | (25 | ) | (0.6 | ) | |||||||
| Interest income | 2,416 | 2,344 | 72 | 3.1 | |||||||||
| Total revenue | 1,237,296 | 806,676 | 430,620 | 53.4 | |||||||||
| 12 | ||
CRUDE OIL
The table below sets out volumes sold, net realized prices and crude oil revenue:
THREE MONTHS ENDED SEPTEMBER 30, 2004
Volumes Sold | Net Realized Price | Revenue | ||||||||
(MMbbls) | ($/bbl) | ($000’s) | ||||||||
| Crude sales sold FCA | - | - | - | |||||||
| Crude sales sold non-FCA | 6.72 | 38.10 | 256,020 | |||||||
| Kazgermunai export sales | 1.73 | 26.60 | 46,017 | |||||||
| Royalty payments* | 0.95 | 20.67 | 19,639 | |||||||
| Total | 9.40 | 34.22 | 321,676 | |||||||
THREE MONTHS ENDED SEPTEMBER 30, 2003
Volumes Sold | Net Realized Price | Revenue | ||||||||
(MMbbls) | ($/bbl) | ($000’s) | ||||||||
| Crude sales sold FCA | 0.38 | 14.44 | 5,489 | |||||||
| Crude sales sold non-FCA | 5.34 | 22.75 | 121,495 | |||||||
| Kazgermunai export sales | 1.50 | 19.15 | 28,727 | |||||||
| Royalty payments* | 0.81 | 10.18 | 8,244 | |||||||
| Total | 8.03 | 20.42 | 163,955 | |||||||
NINE MONTHS ENDED SEPTEMBER 30, 2004
Volumes Sold | Net Realized Price | Revenue | ||||||||
(MMbbls) | ($/bbl) | ($000’s) | ||||||||
| Crude sales sold FCA | - | - | - | |||||||
| Crude sales sold non-FCA | 18.21 | 31.01 | 564,636 | |||||||
| Kazgermunai export sales | 5.08 | 24.05 | 122,172 | |||||||
| Royalty payments* | 2.83 | 17.11 | 48,432 | |||||||
| Total | 26.12 | 28.15 | 735,240 | |||||||
NINE MONTHS ENDED SEPTEMBER 30, 2003
Volumes Sold | Net Realized Price | Revenue | ||||||||
(MMbbls) | ($/bbl) | ($000’s) | ||||||||
| Crude sales sold FCA | 2.89 | 15.49 | 44,781 | |||||||
| Crude sales sold non-FCA | 13.58 | 23.32 | 316,665 | |||||||
| Kazgermunai export sales | 4.11 | 17.20 | 70,682 | |||||||
| Royalty payments* | 0.81 | 10.18 | 8,244 | |||||||
| Total | 21.39 | 20.59 | 440,372 | |||||||
| * | Royalty price is the average sales price at wellhead. |
Our increase in crude oil revenue for the third quarter and the first nine months of 2004 compared to the same periods in 2003 was due to the substantial increase in crude oil market prices and the absence of FCA sales.
Royalty payments represent deliveries for royalty in kind volumes. There were no royalty in kind volumes in the second quarter and first half of 2003, because we settled our royalty obligations in cash.
| 13 | ||
REFINED PRODUCT REVENUE
The tables below set forth the related tonnes of refined products sold, the average prices obtained and revenues received for the three and nine months ended September 30, 2004 and 2003.
Three months ended September 30 | ||||||||||
Tonnes | Average Price | Revenue | ||||||||
Sold | ($/tonne) | ($000’s) | ||||||||
2004 | 896,499 | 218.03 | 195,466 | |||||||
| 2003 | 969,634 | 141.66 | 137,355 | |||||||
Nine months ended September 30 | ||||||||||
Tonnes | Average Price | Revenue | ||||||||
Sold | ($/tonne) | ($000’s) | ||||||||
2004 | 2,780,389 | 178.20 | 495,474 | |||||||
| 2003 | 2,965,755 | 121.31 | 359,769 | |||||||
Third quarter 2004 revenues included the sale of 105,513 tonnes (131,011 tonnes for the first nine months of 2004) of our new product Vacuum Gasoil (“VGO”), a product not produced or sold in 2003. VGO generated revenues of $27.2 million in the third quarter of 2004 ($33.0 million in the first nine months).
PRODUCTION EXPENSES
Production expenses relate to the cost of producing crude oil in our Upstream operations. Based on the number of barrels of oil produced, these costs were as follows:
Production | Per barrel of oil | ||||||
Expenses | Produced | ||||||
($000’s) | ($/bbl) | ||||||
Three months ended September 30, 2004 | 23,392 | 1.61 | |||||
| Three months ended September 30, 2003 | 15,812 | 1.11 | |||||
Nine months ended September 30, 2004 | 70,508 | 1.71 | |||||
| Nine months ended September 30, 2003 | 49,961 | 1.25 | |||||
Production expenses increased by $7.6 million for the third quarter of 2004. The factors were as follows.
| • | The increase in water cut at our Kumkol South, South Kumkol and Turgai fields and additional wells placed on artificial lift resulted in increased expenditures of $4.5 million. | |
| • | Our production expenses increased by $1.7 million due to the release of inventoried production expenses, as sales volumes exceeded production volumes. This accounts for $0.12/bbl increase in our per unit costs. |
Production expenses increased by $20.5 million for the nine months ended September 30, 2004. The contributing factors were as follows.
| • | The continued increase in water cut at our Kumkol South, South Kumkol and Turgai fields and additional wells placed on artificial lift resulted in the increased expenditures of $9.6 million. Additional capital will be invested during 2005 on EOR ("Enhanced Oil Recovery") and water handling facilities, that will reduce our production expenses. | |
| • | In our KAM fields we are operating single well batteries pending completion of infrastructure. We also commissioned a number of new facilities, Aryskum CPF, Aryskum gas compressor for gas re-injection, Maibulak water injection, Aryskum pumping station on our KAM pipeline, and we commenced installation of artificial lift, all of which led to higher costs of approximately $5.5 million. | |
| • | During 2005 we will be installing flowlines to tie in the single wells at KAM fields to our main facilities and we are also planning to increase capacities of the existing facilities to handle the increasing fluid production. | |
| • | Our production expenses increased by $2.7 million due to the release of inventoried production expenses, as sales volumes exceeded production volumes. This accounts for $0.07/bbl increase in our per unit costs. |
| 14 | ||
Our upstream operations have embarked on a program focused on reducing our production expenses. A number of initiatives have been identified and we are in the process of implementation. The third quarter results demonstrate that this program is having an impact.
ROYALTIES AND TAXES
The following table sets forth the components of royalties and taxes.
Three months ended September 30 | |||||||
2004 | 2003 | ||||||
($000’s) | ($000’s) | ||||||
| Royalties and production bonus | 30,635 | 18,695 | |||||
| Tax assessments | 14,562 | - | |||||
| Other taxes | 7,209 | 6,034 | |||||
| Total | 52,406 | 24,729 | |||||
Nine months ended September 30 | |||||||
2004 | 2003 | ||||||
($000’s) | ($000’s) | ||||||
| Royalties and production bonus | 59,999 | 36,439 | |||||
| Tax assessments | 14,813 | 492 | |||||
| ARNM assessment | 3,600 | - | |||||
| Other taxes | 18,801 | 17,218 | |||||
| Total | 97,213 | 54,149 | |||||
Royalties and Production Bonus
Royalties and production bonus for the third quarter of 2004 were $30.6 million, which represented an effective overall royalty rate of 8.6% excluding production bonuses of $0.2 million. Royalties and production bonus for the third quarter of 2003 were $18.7 million, an overall royalty rate of 9.9%, after excluding the production bonuses of $0.3 million. The reasons for the lower overall royalty rate were that a higher proportion of production came from fields with lower royalty rates and the temporary reduction in production at Kumkol South. Despite the decrease in the average rate, royalties and taxes increased due to the increase in crude oil prices.
Royalties and production bonus for the nine months ended September 30, 2004 were $60.0 million, which represented an effective overall royalty rate of 7.1% excluding production bonuses of $0.5 million. Royalties and production bonus for the same period of 2003 were $36.4 million, which represented an effective overall royalty rate of 7.9% excluding production bonuses of $0.7 million. The decrease in the royalty rate was mainly due to the decreased production from Kumkol South, a field with higher royalty rates.
Tax Assessments
As described in Note 15 to our consolidated financial statements, tax assessments totalling $13.0 million were recorded in the third quarter of 2004. There were $8.0 million in fines and penalties relating to an assessment for road fund taxes and $5.0 million for royalties on associated gas. An additional provision of $1.6 million for penalties was recorded relating to interest charges on this tax assessment.
For the nine months of 2004 we received assessments amounting to $0.3 million for property taxes and social taxes. Tax assessments of $0.5 million in the first nine months of 2003 represent tax assessments received on excise and other taxes for 2000 and 2001.
ARNM Assessment
As described in Note 20 to our 2003 annual report, the Agency for Regulation of Natural Monopolies and Protection of Competition (“ARNM”) alleged that PetroKazakhstan Oil Products, our subsidiary operating our refinery, charged prices for refined oil products that in total were $6.3 million in excess of ARNM authorized maximum prices. In April 2004 following a Supreme Court decision, we paid $3.6 million to satisfy the assessment. See Note 15 to the interim consolidated financial statements.
| 15 | ||
Other Taxes
Other taxes of $7.2 million in the third quarter of 2004 include:
| • | excise tax on refined products ($3.7 million in 2004 compared to $4.0 million in 2003); | |
| • | value added tax on crude oil ($2.0 million in 2004 compared to $0.8 million in 2003); | |
| • | various taxes, including property taxes, road fund and other ($1.5 million in 2004 compared to $1.2 million in 2003). |
Other taxes of $18.8 million in the first nine month periods ended September 30, 2004 include:
| • | Excise tax on refined products ($10.8 million in 2004 compared to $8.6 million in 2003); | |
| • | Excise tax on crude oil exports (nil in 2004 compared to $1.0 million in 2003); | |
| • | Value added tax on crude oil ($3.4 million in 2004 compared to $4.2 million in 2003); | |
| • | Various taxes, including property taxes, road fund and other ($4.6 million in 2004 compared to $3.4 million in 2003). |
TRANSPORTATION
The table below sets out the components of transportation costs.
Three months ended September 30 | |||||||
2004 | 2003 | ||||||
($000’s) | ($000’s) | ||||||
| Pipeline | 8,347 | 11,350 | |||||
| Kazgermunai transportation | 7,923 | 5,904 | |||||
| Railway - crude oil | 39,537 | 33,667 | |||||
| Railway - refined products | 13,576 | 2,011 | |||||
| Other | 3,179 | 3,387 | |||||
| Total | 72,562 | 56,319 | |||||
Nine months ended September 30 | |||||||
2004 | 2003 | ||||||
($000’s) | ($000’s) | ||||||
| Pipeline | 25,686 | 49,387 | |||||
| Kazgermunai transportation | 22,466 | 12,014 | |||||
| Railway - crude oil | 113,117 | 101,412 | |||||
| Railway - refined products | 19,628 | 2,011 | |||||
| Other | 6,974 | 6,767 | |||||
| Total | 187,871 | 171,591 | |||||
Pipeline
Pipeline costs decreased by $3.0 million in the third quarter of 2004 compared to 2003 primarily due to the following:
| • | Decrease of $3.1 million, as a result of a decrease in volumes sold for export through the Kumkol - Shymkent pipeline (0.2 mmbbls in the third quarter of 2004 compared to 2.2 mmbbls in the third quarter of 2003), partially offset by higher tariffs for the Kumkol - Shymkent pipeline in 2004 ($1.65/bbl in 2004 compared to $1.54/bbl in 2003) due to the change in the exchange rate of Tenge to U.S. dollar; | |
| • | Decrease of $0.6 million, as a result of a decrease of 1.0 mmbbls in crude oil volumes sent to the refinery through the Kumkol - Shymkent pipeline, partially offset by the increase in the pipeline rate ($0.89/bbl in 2004 compared to $0.84/bbl in 2003) due to the change in the exchange rate of Tenge to U.S. dollar; | |
| • | Increase of $0.7 million due to volumes shipped through Atasu terminal to China (2.1 mmbbls in the third quarter of 2004 compared to 1.2 mmbbls in the third quarter of 2003). |
| 16 | ||
Pipeline costs decreased by $23.7 million during the nine months ended September 30, 2004 compared to the same period of 2003 primarily due to the following:
| • | Decrease of $10.5 million in non-FCA pipeline costs (nil for the first nine months of 2004 compared to $10.5 million in the same period of 2003) because we did not use the Atyrau-Samara pipeline; | |
| • | Decrease of $15.0 million, as a result of a decrease in volumes sold for export through the Kumkol - Shymkent pipeline (2.5 mmbbls in 2004 compared to 13.0 mmbbls in 2003), partially offset by higher tariffs for the Kumkol - Shymkent pipeline in 2004 ($1.65/bbl in 2004 compared to $1.51/bbl in 2003) due to the change in the exchange rate of Tenge to U.S. dollar; | |
| • | Decrease of $2.1 million, as a result of a decrease of 2.6 mmbbls in crude oil volumes sent to the refinery through the Kumkol - Shymkent pipeline; | |
| • | Increase of $3.9 million on volumes shipped through our KAM pipeline and through Atasu terminal to China. Our KAM pipeline became operational in the third quarter of 2003, hence our expenses related to the KAM pipeline are higher by $2.3 million for the first nine months of 2004 compared to the same period of 2003, as there were no expenses for the first half of 2003. Our transportation expenses through Atasu terminal were higher by $1.6 million as we shipped 3.4 mmbbls in the first nine months of 2004 compared to 1.5 mmbbls in the first nine months of 2003. |
Railway - Crude Oil
Railway transportation of crude oil increased by $5.9 million in the third quarter of 2004 due to our increased sales volumes. Railway costs are higher in the first nine months of 2004 by $11.7 million due to the increase in sales volumes.
Railway - Refined Products
Railway transportation of refined products increased by $11.6 million in the third quarter of 2004, as we exported 155,702 tonnes of various products on a non-FCA basis in the third quarter of 2004 compared to 22,000 tonnes sold for export on a non-FCA basis in the same quarter of 2003.
Other
Other transportation costs are mainly trucking costs incurred to transport crude oil from the KAM fields.
REFINING
Refining costs represent the direct costs related to processing crude oil sold as refined products during the period and the refining costs attached to volumes processed on behalf of tollers.
Refining costs for the third quarter of 2004 were $5.8 million ($0.81/bbl) compared to $4.1 million ($0.49/bbl) in the same quarter of 2003. Refining costs for the nine months ended September 30, 2004 were $15.2 million ($0.69/bbl) compared to $12.9 million ($0.54/bbl) in the same period of 2003.The main reasons for the $2.3 million increase in refining costs were higher repair costs and additional purchased steam and electric power related to the start-up and operation of the vacuum distillation unit during 2004. During the third quarter of 2004 the vacuum distillation unit operated continuously at an average rate of more than 43,500 tonnes per month, up significantly from 7,700 tonnes per month during the first half of the year.
| 17 | ||
CRUDE OIL AND REFINED PRODUCT PURCHASES
Crude oil and refined product purchases represent the expensed portion of crude oil purchased for the refinery from third parties, as well as refined products purchased for resale. Purchases and sales between our Upstream and Downstream business units are eliminated on consolidation.
Our purchases of crude oil and refined products were as follows:
Three months ended September 30 | |||||||
2004 | 2003 | ||||||
($000’s) | ($000’s) | ||||||
| Crude oil | 28,055 | 16,978 | |||||
| Refined products | - | - | |||||
| Total | 28,055 | 16,978 | |||||
Nine months ended September 30 | |||||||
| �� | 2004 | 2003 | |||||
($000’s) | ($000’s) | ||||||
| Crude oil | 86,261 | 42,394 | |||||
| Refined products | 6,186 | - | |||||
| Total | 92,447 | 42,394 | |||||
During the first quarter of 2004 we repurchased the royalty-in-kind volumes for $17.1 million and subsequently resold them. The remaining purchases of crude oil were made from our joint ventures. The volumes purchased from our joint ventures are approximately at the same level as in the third quarter and first nine months of 2003, however, the increase in crude oil prices led to higher costs.
SELLING
Selling expenses for crude oil are comprised of customs, quality inspection and costs related to the export of crude oil. Selling expenses for refined products are comprised of the costs of operating the regional distribution centres and other costs related to our Downstream operations.
Three months ended September 30 | |||||||
2004 | 2003 | ||||||
($000’s) | ($000’s) | ||||||
| Crude oil | 5,151 | 3,371 | |||||
| Refined products | 5,254 | 4,133 | |||||
| Total | 10,405 | 7,504 | |||||
Nine months ended September 30 | |||||||
2004 | 2003 | ||||||
($000’s) | ($000’s) | ||||||
| Crude oil | 13,385 | 7,878 | |||||
| Refined products | 14,683 | 12,455 | |||||
| Total | 28,068 | 20,333 | |||||
The increase in crude oil selling expenses during the third quarter and first nine months of 2004 compared to the same periods of 2003 was the direct result of increased export sales volumes related to non-FCA routes, for which all selling costs are absorbed by us, and the increase in Kazgermunai sales volumes.
Selling expenses related to refined products also increased during the third quarter and first nine months of 2004 compared to the same periods of 2003 due to increases in storage fees, transportation security fees and personnel costs.
| 18 | ||
GENERAL AND ADMINISTRATIVE
The table below analyzes total general and administrative costs for Upstream, Downstream and Corporate. In the case of Upstream and Downstream the general and administrative costs are also presented on a per barrel basis.
THREE MONTHS ENDED SEPTEMBER 30, 2004
General and | Per barrel of oil | ||||||
Administrative | produced or processed* | ||||||
($000’s) | ($/bbl) | ||||||
| Upstream | 9,418 | 0.65 | |||||
| Downstream | 4,038 | 0.56 | |||||
| Corporate | 2,130 | ||||||
| Total | 15,586 | ||||||
| * | Including tollers’ volumes |
THREE MONTHS ENDED SEPTEMBER 30, 2003
General and | Per barrel of oil | ||||||
Administrative | produced or processed* | ||||||
($000’s) | ($/bbl) | ||||||
| Upstream | 8,415 | 0.59 | |||||
| Downstream | 3,861 | 0.47 | |||||
| Corporate | 1,385 | ||||||
| Total | 13,661 | ||||||
| * | Including tollers’ volumes |
The increase in upstream general and administrative expenses was due to a $1.0 million charitable donation. The increase in corporate was due to $0.7 million of compensation cost being recognized for stock options granted pursuant to the new accounting standard.
NINE MONTHS ENDED SEPTEMBER 30, 2004
General and | Per barrel of oil | ||||||
Administrative | produced or processed* | ||||||
($000’s) | ($/bbl) | ||||||
| Upstream | 24,678 | 0.60 | |||||
| Downstream | 10,869 | 0.49 | |||||
| Corporate | 8,946 | ||||||
| Total | 44,493 | ||||||
| * | Including tollers’ volumes |
NINE MONTHS ENDED SEPTEMBER 30, 2003
General and | Per barrel of oil | ||||||
Administrative | produced or processed* | ||||||
($000’s) | ($/bbl) | ||||||
| Upstream | 23,536 | 0.59 | |||||
| Downstream | 10,750 | 0.45 | |||||
| Corporate | 2,908 | ||||||
| Total | 37,194 | ||||||
| * | Including tollers’ volumes |
The increase in upstream general and administrative expenses was due to a $1.0 million charitable donation. The increase in corporate expenses was mainly due to $2.8 million of compensation cost being recognized for stock options granted pursuant to the new accounting standard. The remaining increase is attributable to increased activity levels.
| 19 | ||
INTEREST AND FINANCING
The following table sets forth our interest and financing costs and any related amortization of debt issue costs or discounts upon issuance of the debt instrument.
Three months ended September 30 | |||||||
2004 | 2003 | ||||||
($000’s) | ($000’s) | ||||||
| 9.625% Notes | 3,504 | 3,845 | |||||
| Term facility | 3,278 | 2,428 | |||||
| Kazgermunai debt | 251 | 420 | |||||
| PKOP bonds | - | 699 | |||||
| Short-term debt | 334 | 243 | |||||
| Accretion expense | 608 | 513 | |||||
| Term loans | 129 | - | |||||
| Less portion capitalized | - | - | |||||
| Total | 8,104 | 8,148 | |||||
The interest on our term facility increased in the third quarter of 2004 due to $2.1 million of expensed deferred costs following the early repayment of the term facility. This was offset by a $1.3 million decrease in interest expense for the term facility compared to the same quarter of 2003 as the principal has been reduced through monthly principal repayments.
Nine months ended September 30 | |||||||
2004 | 2003 | ||||||
($000’s) | ($000’s) | ||||||
| 9.625% Notes | 11,035 | �� | 8,697 | ||||
| Term facility | 6,082 | 7,790 | |||||
| Kazgermunai debt | 1,053 | 1,067 | |||||
| PKOP bonds | 469 | 1,881 | |||||
| Short-term debt | 760 | 608 | |||||
| 12% Notes | - | 8,718 | |||||
| Accretion expense | 1,824 | 1,539 | |||||
| Term loans | 379 | - | |||||
| Less portion capitalized | (13 | ) | - | ||||
| Total | 21,589 | 30,300 | |||||
| • | Our 9.625% Notes interest expense increased in the first nine months of 2004 by $2.3 million, as the Notes were issued in February 2003. | |
| • | Our term facility interest expense decreased by $1.7 million in the first nine months of 2004 due to the full repayment of the facility, which was partially offset by $2.1 million of expensed deferred costs following early repayment. | |
| • | PKOP bonds were fully redeemed on February 26, 2004. | |
| • | Accretion expense represents the increase in the present value of our asset retirement obligations due to the passage of time. | |
| • | Our 12% Notes interest expense in 2003 was $8.7 million including $6.6 million of issue costs that were expensed when we redeemed these notes on February 2, 2003. |
| 20 | ||
DEPRECIATION AND DEPLETION
THREE MONTHS ENDED SEPTEMBER 30, 2004
Depreciation and | Depreciation and | ||||||
Depletion ($000’s) | Depletion ($/bbl*) | ||||||
| Upstream | 24,419 | 1.68 | |||||
| Downstream | 5,170 | 0.72 | |||||
| Corporate | 319 | ||||||
| Total | 29,908 | ||||||
| * | Downstream includes tollers’ volumes |
THREE MONTHS ENDED SEPTEMBER 30, 2003
Depreciation and | Depreciation and | ||||||
Depletion ($000’s) | Depletion ($/bbl*) | ||||||
| Upstream | 16,355 | 1.15 | |||||
| Downstream | 4,784 | 0.58 | |||||
| Corporate | 24 | ||||||
| Total | 21,163 | ||||||
| * | Downstream includes tollers’ volumes |
The increase in upstream depreciation and depletion expense of $8.1 million includes $13.1 million of additional depletion due to the increase in the depletable assets and future development costs, partially offset by $5.2 million due to the decrease of the depletion rate. The depletion rate decreased from 6.5% in the third quarter of 2003 to 4.1% in 2004 due to the changes in the reserve base. Starting January 1, 2004 we use the proved reserves to calculate depletion, as opposed to proved developed reserves used in 2003, because this resulted in a more representative charge to earnings.
NINE MONTHS ENDED SEPTEMBER 30, 2004
Depreciation and | Depreciation and | ||||||
Depletion ($000’s) | Depletion ($/bbl*) | ||||||
| Upstream | 62,210 | 1.51 | |||||
| Downstream | 15,085 | 0.69 | |||||
| Corporate | 944 | ||||||
| Total | 78,239 | ||||||
| * | Downstream includes tollers’ volumes |
NINE MONTHS ENDED SEPTEMBER 30, 2003
Depreciation and | Depreciation and | ||||||
Depletion ($000’s) | Depletion ($/bbl*) | ||||||
| Upstream | 43,461 | 1.08 | |||||
| Downstream | 14,105 | 0.59 | |||||
| Corporate | 82 | ||||||
| Total | 57,648 | ||||||
| * | Downstream includes tollers’ volumes |
The increase in upstream depreciation and depletion expense of $18.7 million includes $33.1 of additional depletion due to the increase in depletable assets and future development costs, partially offset by $14.5 million due to the decrease of the depletion rate. The depletion rate decreased from 18.5% in the first nine months of 2003 to 11.8% in the same period of 2004 due to the changes in the reserve base as noted above.
| 21 | ||
INCOME TAXES
Three months ended September 30 | |||||||
2004 | 2003 | ||||||
($000’s) | ($000’s) | ||||||
| Upstream | 80,867 | 17,878 | |||||
| Downstream | 16,030 | 21,549 | |||||
| Corporate | (84 | ) | 1,666 | ||||
| Total | 96,813 | 41,093 | |||||
Nine months ended September 30 | |||||||
2004 | 2003 | ||||||
($000’s) | ($000’s) | ||||||
| Upstream | 155,020 | 55,619 | |||||
| Downstream | 63,412 | 46,417 | |||||
| Corporate | 2,598 | 1,794 | |||||
| Total | 221,030 | 103,830 | |||||
Income taxes increased by $55.7 million in the third quarter of 2004 compared to the same quarter of 2003 mainly due to an increase in income before taxes. We also provided $15.2 million for excess profit tax in the third quarter of 2004 for our joint venture Turgai. $10.1 million of our tax assessments recorded in the third quarter of 2004 are not deductible for tax, which increases our taxes by $3.0 million. In Kazgermunai, our joint venture, we incurred an additional $4.3 million of income tax, as the marginal tax rate exceeded the statutory rate of 30% per the sliding scale prescribed by the hydrocarbon contract and, therefore, the effective tax rate became 40% in the third quarter of 2004.
Income taxes increased by $117.2 million in the first nine months of 2004 compared to the same period of 2003 mainly due to an increase in income before taxes. We also provided $25.1 million for excess profit tax in the first nine months of 2004 for our joint venture Turgai. $10.1 million of our tax assessments recorded in the third quarter of 2004 are not deductible for tax, which increases our taxes by $3.0 million. In Kazgermunai we incurred an additional $7.5 million of income tax because the marginal tax rate exceeded the statutory tax rate and, therefore, the effective tax rate became 38% for the first nine months of 2004.
Income taxes in our corporate segment are the withholding tax on the dividends paid from subsidiaries in Kazakhstan to Canada.
CAPITAL EXPENDITURES AND COMMITMENTS
The tables below set forth a breakdown of our capital expenditures.
Three months ended September 30 | ||||||||
2004 | 2003 | |||||||
($000’s) | ($000’s) | |||||||
| Upstream | ||||||||
| Development wells | 11,647 | 12,718 | ||||||
| Facilities and equipment | 10,600 | 13,743 | ||||||
| Exploration | 7,474 | 7,885 | ||||||
| Downstream | ||||||||
| Refinery HS&E | 67 | 128 | ||||||
| Refinery sustaining | 688 | 569 | ||||||
| Refinery return projects | 500 | 1,606 | ||||||
| Marketing & other | 891 | 10 | ||||||
| Corporate | 417 | 420 | ||||||
| Total capital expenditure | 32,284 | 37,079 | ||||||
| Less accrued amounts | (909 | ) | (1,063 | ) | ||||
| Total cash capital expenditure | 31,375 | 36,016 | ||||||
| 22 | ||
Nine months ended September 30 | ||||||||
2004 | 2003 | |||||||
($000’s) | ($000’s) | |||||||
| Upstream | ||||||||
| Development wells | 27,977 | 26,136 | ||||||
| Facilities and equipment | 42,665 | 69,290 | ||||||
| Exploration | 19,165 | 16,346 | ||||||
| Downstream | ||||||||
| Refinery HS&E | 1,959 | 468 | ||||||
| Refinery sustaining | 2,346 | 2,324 | ||||||
| Refinery return projects | 1,986 | 8,744 | ||||||
| Marketing & other | 1,541 | 25 | ||||||
| Corporate | 1,061 | 761 | ||||||
| Total capital expenditure | 98,700 | 124,094 | ||||||
| Less accrued amounts | (4,271 | ) | (2,614 | ) | ||||
| Total cash capital expenditure | 94,429 | 121,480 | ||||||
LIQUIDITY
The levels of cash, current assets and current liabilities as at September 30, 2004 and December 31, 2003 are set out below.
As at | As at | ||||||
September 30, 2004 | December 31, 2003 | ||||||
($000’s) | ($000’s) | ||||||
| Cash | 245,975 | 184,660 | |||||
| Cash flow (annualised) | 590,903 | 399,931 | |||||
| Working capital* | 116,678 | 151,737 | |||||
| Net debt** | (79,453 | ) | 135,220 | ||||
| Ratio of cash flow to net debt*** | (7.4 | ) | 3.0 | ||||
| Ratio of cash flow to fixed charges**** | 20.5 | 10.6 | |||||
| Ratio of earnings to fixed charges***** | 29.1 | 13.6 | |||||
* Working capital is net of cash and short-term debt
** Net debt includes short-term and long-term debt less cash
*** Quarterly cash flow is annualized
**** Fixed charges include interest expense and preferred dividends before tax
***** Earnings is income before income taxes plus fixed charges
Our net working capital has decreased mainly due to increases in our accounts payable, offset in part by increases in our accounts receivable. The main components of the increase in accounts payable are income and excess profit tax, accrued dividends payable and amounts owed for crude oil purchased from one of our joint ventures. Our accounts receivable increased due to the significant increase in crude oil prices.
Our restricted cash is $50.7 million as at September 30, 2004 ($35.5 million at December 31, 2003). Restricted cash includes $8.8 million of cash dedicated to a debt service reserve account for the Corporation’s Term Facility and $41.9 million of cash dedicated to a margin account for the Corporation’s hedging program. Though our term facility was fully repaid as at September 30, 2004, we still have a balance in our debt service reserve account because our hedging liability has not been discharged in full. The restricted cash balance related to the hedging program has increased by $16.9 million since December 31, 2003 due to the change in the mark-to-market valuation of our hedging contracts.
Our long-term debt substantially decreased from $246.7 million at December 31, 2003 to $150.7 million at September 30, 2004. As at September 30, 2004 we fully repaid our Term Facility. During the nine months ended September 30, 2004 Kazgermunai repaid $24.3 million of its long-term debt.
We have entered into a $100.0 million committed unsecured credit facility, $30.0 million of which is dedicated to margin calls related to our hedging program.
| 23 | ||
INTERIM CONSOLIDATED STATEMENTS OF INCOME AND RETAINED EARNINGS
(EXPRESSED IN THOUSANDS OF UNITED STATES DOLLARS, EXCEPT PER SHARE AMOUNTS)
Unaudited
Three Months Ended September 30 | Nine Months Ended September 30 | |||||||||||||
2004 | 2003 | 2004 | 2003 | |||||||||||
| REVENUE | ||||||||||||||
| Crude oil | 321,676 | 163,955 | 735,240 | 440,372 | ||||||||||
| Refined products | 195,466 | 137,355 | 495,474 | 359,769 | ||||||||||
| Service fees | 284 | 864 | 4,166 | 4,191 | ||||||||||
| Interest income | 1,176 | 978 | 2,416 | 2,344 | ||||||||||
518,602 | 303,152 | 1,237,296 | 806,676 | |||||||||||
| EXPENSES | ||||||||||||||
| Production | 23,392 | 15,812 | 70,508 | 49,961 | ||||||||||
| Royalties and taxes | 52,406 | 24,729 | 97,213 | 54,149 | ||||||||||
| Transportation | 72,562 | 56,319 | 187,871 | 171,591 | ||||||||||
| Refining | 5,815 | 4,094 | 15,217 | 12,898 | ||||||||||
| Crude oil and refined product purchases | 28,055 | 16,978 | 92,447 | 42,394 | ||||||||||
| Selling | 10,405 | 7,504 | 28,068 | 20,333 | ||||||||||
| General and administrative | 15,586 | 13,661 | 44,493 | 37,194 | ||||||||||
| Interest and financing costs | 8,104 | 8,148 | 21,589 | 30,300 | ||||||||||
| Depletion and depreciation | 29,908 | 21,163 | 78,239 | 57,648 | ||||||||||
| Foreign exchange (gain) / loss | (566 | ) | 1,950 | (6,361 | ) | (3,576 | ) | |||||||
245,667 | 170,358 | 629,284 | 472,892 | |||||||||||
| INCOME BEFORE INCOME TAXES | 272,935 | 132,794 | 608,012 | 333,784 | ||||||||||
| INCOME TAXES (Note 11) | ||||||||||||||
| Current provision | 119,401 | 45,891 | 254,403 | 109,143 | ||||||||||
| Future income tax | (22,588 | ) | (4,798 | ) | (33,373 | ) | (5,313 | ) | ||||||
96,813 | 41,093 | 221,030 | 103,830 | |||||||||||
| NET INCOME BEFORE NON-CONTROLLING INTEREST | 176,122 | 91,701 | 386,982 | 229,954 | ||||||||||
| NON-CONTROLLING INTEREST | (96 | ) | 551 | 1,251 | 1,822 | |||||||||
| NET INCOME | 176,218 | 91,150 | 385,731 | 228,132 | ||||||||||
| RETAINED EARNINGS, BEGINNING OF PERIOD | 570,609 | 198,885 | 378,819 | 73,151 | ||||||||||
| Substantial course issuer bid (Note 10) | (111,335 | ) | - | (111,335 | ) | - | ||||||||
| Normal course issuer bid (Note 10) | (35,528 | ) | - | (35,528 | ) | (11,232 | ) | |||||||
| Common share dividends | (8,669 | ) | - | (26,375 | ) | - | ||||||||
| Preferred share dividends | (9 | ) | (8 | ) | (26 | ) | (24 | ) | ||||||
| RETAINED EARNINGS, END OF PERIOD | 591,286 | 290,027 | 591,286 | 290,027 | ||||||||||
| BASIC NET INCOME PER SHARE (Note 12) | 2.30 | 1.17 | 5.00 | 2.92 | ||||||||||
| DILUTED NET INCOME PER SHARE (Note 12) | 2.27 | 1.12 | 4.89 | 2.81 | ||||||||||
See accompanying notes to the interim consolidated financial statements.
| 24 | ||
INTERIM CONSOLIDATED BALANCE SHEETS
(EXPRESSED IN THOUSANDS OF UNITED STATES DOLLARS)
UNAUDITED
As at | As at | |||||||
September 30, | December 31, | |||||||
2004 | 2003 | |||||||
| ASSETS | ||||||||
| CURRENT | ||||||||
| Cash | 245,975 | 184,660 | ||||||
| Accounts receivable (Note 6) | 219,406 | 150,293 | ||||||
| Inventory | 42,344 | 36,920 | ||||||
| Prepaid expenses | 49,369 | 44,901 | ||||||
| Current portion of future income tax asset (Note 11) | 42,809 | 14,697 | ||||||
599,903 | 431,471 | |||||||
| Deferred charges | 3,990 | 6,729 | ||||||
| Restricted cash (Note 5) | 50,691 | 35,468 | ||||||
| Future income tax asset (Note 11) | 27,548 | 25,466 | ||||||
| Property, plant and equipment | 560,496 | 542,317 | ||||||
| TOTAL ASSETS | 1,242,628 | 1,041,451 | ||||||
| LIABILITIES | ||||||||
| CURRENT | ||||||||
| Accounts payable and accrued liabilities (Note 7) | 227,936 | 88,422 | ||||||
| Short-term debt (Note 8) | 15,822 | 73,225 | ||||||
| Prepayments for crude oil and refined products | 9,314 | 6,652 | ||||||
253,072 | 168,299 | |||||||
| Long-term debt (Note 9) | 150,700 | 246,655 | ||||||
| Asset retirement obligations (Note 2) | 30,313 | 28,625 | ||||||
| Future income tax liability (Note 11) | 9,833 | 13,012 | ||||||
443,918 | 456,591 | |||||||
| Non-controlling interest | 14,342 | 13,091 | ||||||
| Preferred shares of subsidiary | 80 | 80 | ||||||
| COMMITMENTS AND CONTINGENCIES (Note 15) | ||||||||
| SHAREHOLDERS’ EQUITY | ||||||||
| Share capital (Note 10) | 189,026 | 191,695 | ||||||
| Contributed surplus | 3,976 | 1,175 | ||||||
| Retained earnings | 591,286 | 378,819 | ||||||
784,288 | 571,689 | |||||||
| TOTAL LIABILITIES AND SHAREHOLDERS’ EQUITY | 1,242,628 | 1,041,451 | ||||||
See accompanying notes to the interim consolidated financial statements.
APPROVED BY THE BOARD OF DIRECTORS.
|  |
| BERNARD ISAUTIER | JACQUES LEFÈVRE |
| Director | Director |
| 25 | ||
INTERIM CONSOLIDATED STATEMENTS OF CASH FLOW
(EXPRESSED IN THOUSANDS OF UNITED STATES DOLLARS)
UNAUDITED
Three Months Ended September 30 | Nine Months Ended September 30 | |||||||||||||
2004 | 2003 | 2004 | 2003 | |||||||||||
| OPERATING ACTIVITIES | ||||||||||||||
| Net income | 176,218 | 91,150 | 385,731 | 228,132 | ||||||||||
| Items not affecting cash: | ||||||||||||||
| Depletion and depreciation | 29,908 | 21,163 | 78,239 | 57,648 | ||||||||||
| Amortization of deferred charges | 2,527 | 510 | 3,310 | 3,562 | ||||||||||
| Non-controlling interest | (96 | ) | 551 | 1,251 | 1,822 | |||||||||
| Other non-cash charges | 975 | (78 | ) | 8,019 | 2,540 | |||||||||
| Future income tax | (22,588 | ) | (4,798 | ) | (33,373 | ) | (5,313 | ) | ||||||
| Cash flow | 186,944 | 108,498 | 443,177 | 288,391 | ||||||||||
| Changes in non-cash operating working capital items | 5,479 | (3,094 | ) | 49,693 | (45,462 | ) | ||||||||
| Cash flow from operating activities | 192,423 | 105,404 | 492,870 | 242,929 | ||||||||||
| FINANCING ACTIVITIES | ||||||||||||||
| Short-term debt | 2,856 | (8,294 | ) | (21,638 | ) | 8,381 | ||||||||
| Common share dividends | (8,743 | ) | - | (17,572 | ) | - | ||||||||
| Purchase of common shares under a Normal Course Issuer Bid (Note 10) | (38,648 | ) | - | (38,648 | ) | (14,847 | ) | |||||||
| Purchase of common shares under a Substantial Course Issuer Bid (Note 10) | (121,117 | ) | - | (121,117 | ) | - | ||||||||
| Long-term debt | (74,110 | ) | (16,268 | ) | (132,435 | ) | 82,540 | |||||||
| Deferred charges paid | (50 | ) | - | (700 | ) | (3,601 | ) | |||||||
| Proceeds from issue of share capital, net of share issuance costs | 6,061 | 322 | 10,233 | 792 | ||||||||||
| Preferred share dividends | (9 | ) | (8 | ) | (26 | ) | (24 | ) | ||||||
| Cash flow (used in) from financing activities | (233,760 | ) | (24,248 | ) | (321,903 | ) | 73,241 | |||||||
| INVESTING ACTIVITIES | ||||||||||||||
| Restricted cash | (3,663 | ) | (35,468 | ) | (15,223 | ) | (35,468 | ) | ||||||
| Capital expenditures | (31,375 | ) | (36,016 | ) | (94,429 | ) | (121,480 | ) | ||||||
| Proceeds from sale of fixed assets | - | 1,258 | - | 1,258 | ||||||||||
| Purchase of preferred shares of subsidiary | - | - | - | (4 | ) | |||||||||
| Cash flow (used in) investing activities | (35,038 | ) | (70,226 | ) | (109,652 | ) | (155,694 | ) | ||||||
| (DECREASE) / INCREASE IN CASH | (76,375 | ) | 10,930 | 61,315 | 160,476 | |||||||||
| CASH, BEGINNING OF PERIOD | 322,350 | 224,342 | 184,660 | 74,796 | ||||||||||
| CASH, END OF PERIOD | 245,975 | 235,272 | 245,975 | 235,272 | ||||||||||
See accompanying notes to the interim consolidated financial statements.
| 26 | ||
NOTES TO THE INTERIM CONSOLIDATED FINANCIAL STATEMENTS
(EXPRESSED IN THOUSANDS OF UNITED STATES DOLLARS, TABULAR AMOUNTS IN THOUSANDS OF DOLLARS, UNLESS OTHERWISE INDICATED)
UNAUDITED
1 | SIGNIFICANT ACCOUNTING POLICIES |
| The interim consolidated financial statements of PetroKazakhstan Inc. (“PetroKazakhstan” or the “Corporation”) have been prepared by management in accordance with generally accepted accounting principles in Canada. Its main operating subsidiaries are PetroKazakhstan Kumkol Resources (“PKKR”) and PetroKazakhstan Oil Products (“PKOP”). Certain information and disclosures normally required to be included in the notes to the annual financial statements have been omitted or condensed. The interim consolidated financial statements should be read in conjunction with the consolidated financial statements and the notes thereto in PetroKazakhstan’s Annual Report for the year ended December 31, 2003. The accounting principles applied are consistent with those as set ou t in the Corporation’s annual financial statements for the year ended December 31, 2003, except for the changes in accounting standards as described in Note 2. | |
| The presentation of certain amounts for previous periods has been changed to conform with the presentation adopted for the current period. | |
2 | ACCOUNTING CHANGES |
Asset Retirement Obligations | |
| Effective January 1, 2004, the Corporation adopted the new recommendation of the Canadian Institute of Chartered Accountants (“CICA”) regarding asset retirement obligations. This new standard changes the method of estimating and accounting for future site restoration costs. Total estimated asset retirement obligations are discounted to estimate the fair value of the obligation and recorded as a liability when the related assets are constructed and commissioned. The fair value of the obligation increases the value of property, plant and equipment and is depleted over the life of the asset. Accretion expense, resulting from increase in the present value of the liability due to the passage of time is recorded as part of interest and financing costs. | |
| Estimated cash flows are discounted at 8.5%. The total undiscounted estimated cash flows required to settle the obligations is $73.0 million with the expenditures being incurred over ten years commencing in 2014. | |
| The new standard has been applied retroactively, and the financial statements of prior periods have been restated. | |
| Adoption of the new standard of accounting for asset retirement obligations resulted in the following changes in the consolidated balance sheet and statement of income and retained earnings. | |
| Changes in consolidated balance sheets: | |
Increase / (decrease) | As at | As at | |||||
September 30, 2004 | December 31, 2003 | ||||||
| Future income tax asset | 436 | 651 | |||||
| Property, plant and equipment | 14,638 | 15,181 | |||||
| Total assets | 15,074 | 15,832 | |||||
| Asset retirement obligations | 21,629 | 22,058 | |||||
| Retained earnings | (6,555 | ) | (6,226 | ) | |||
| Total liabilities and shareholders’ equity | 15,074 | 15,832 | |||||
| 27 | ||
| Changes in consolidated statements of income and retained earnings for the three months ended September 30, 2004 and 2003: |
Increase / (decrease) | Three months ended September 30 | ||||||
2004 | 2003 | ||||||
| Interest and financing costs | 608 | 513 | |||||
| Depletion and depreciation | (578 | ) | (1,214 | ) | |||
| Income before income taxes | (30 | ) | 701 | ||||
| Income taxes | 74 | (284 | ) | ||||
| Net income | (104 | ) | 417 | ||||
| Basic net income per share | - | 0.01 | |||||
| Diluted net income per share | - | 0.01 | |||||
| Changes in consolidated statements of income and retained earnings for the nine months ended September 30, 2004 and 2003: |
Increase / (decrease) | Nine months ended September 30 | ||||||
2004 | 2003 | ||||||
| Interest and financing costs | 1,825 | 1,539 | |||||
| Depletion and depreciation | (1,711 | ) | (3,230 | ) | |||
| Income before income taxes | (114 | ) | 1,691 | ||||
| Income taxes | 215 | (727 | ) | ||||
| Net income | (329 | ) | 964 | ||||
| Basic net income per share | - | 0.01 | |||||
| Diluted net income per share | - | 0.01 | |||||
| The change in asset retirement obligations is as follows: |
| Asset retirement obligations liability as at January 1, 2004 | 28,625 | |||
| Revisions | - | |||
| Accretion expense | 1,825 | |||
| Settlements | (137 | ) | ||
| Asset retirement obligations liability as at September 30, 2004 | 30,313 | |||
| 28 | ||
Full Cost Accounting | |
| In September 2003 the CICA issued Accounting Guideline 16 “Oil and Gas Accounting - Full Cost” (“AcG 16”), which replaced Accounting Guideline 5 “Full Cost Accounting in the Oil and Gas Industry” (“AcG 5”). The most significant change between AcG 16 and AcG 5 is that under AcG 16 the carrying value of oil and gas properties should not exceed their fair value. The fair value is equal to estimated future cash flows from proved and probable reserves using future price forecasts and costs discounted at a risk-free rate. This differs from the cost recovery ceiling test under AcG 5 that used undiscounted cash flows, and constant prices, less general and administrative, financing costs and taxes. The Corporation adopted AcG 16 effective January 1, 2004 and as at Septemb er 30, 2004 there were no indications of impairment. | |
Depletion of Property, Plant and Equipment | |
| Effective January 1, 2004 PetroKazakhstan commenced using proved reserves to calculate depletion. Previously, the Corporation used proved developed reserves. The impact on the three months ended September 30, 2004 was a decrease in depletion expense of $0.2 million. There was no material impact for the nine months ended September 30, 2004. | |
| Proved developed reserves were previously used to calculate depletion because this resulted in a more representative charge to earnings. | |
Impairment of Long-Lived Assets | |
| Effective January 1, 2004, the Corporation adopted the new recommendation of the CICA issued in December 2002 on impairment of long-lived assets. This recommendation provides guidance on the recognition, measurement and disclosure of impairment of long-lived assets. There is a requirement to recognize an impairment loss for a long-lived asset when its carrying amount exceeds the sum of the undiscounted cash flows expected from its use and eventual disposition. The impairment loss is measured as the amount by which carrying amount of the asset exceeds its fair value. As at September 30, 2004 there were no indications of impairment of long-lived assets. | |
Hedge Accounting | |
| Effective January 1, 2004, the Corporation adopted Accounting Guideline 13 “Hedging Relationships” (AcG 13”). AcG 13 provides guidance regarding the identification, designation, documentation and effectiveness of hedging relationships for the purposes of applying hedge accounting. This guideline establishes certain conditions for when hedge accounting may be applied. The Corporation has applied hedge accounting for the financial instruments disclosed in Note 13. |
| 29 | ||
3 | SEGMENTED INFORMATION | |
| On a primary basis the business segments are: | ||
| • | Upstream comprising the exploration, development and production of crude oil and natural gas. | |
| • | Downstream comprising refining and the marketing and transportation of refined products and the management of the marketing and transportation of crude oil. | |
| Upstream results include revenue from crude oil sales to Downstream, reflected as crude oil purchases in Downstream, as this presentation properly reflects segment results. This revenue is eliminated on consolidation. | ||
Three months ended September 30, 2004 | |||||||||||||||||
Upstream | Downstream | Corporate | Eliminations | Consolidated | |||||||||||||
| REVENUE | |||||||||||||||||
| Crude oil | 366,860 | - | - | (45,184 | ) | 321,676 | |||||||||||
| Refined products | 63,565 | 153,720 | - | (21,819 | ) | 195,466 | |||||||||||
| Service fees | 77 | 197 | 10 | - | 284 | ||||||||||||
| Interest income | 454 | 298 | 424 | - | 1,176 | ||||||||||||
430,956 | 154,215 | 434 | (67,003 | ) | 518,602 | ||||||||||||
| EXPENSES | |||||||||||||||||
| Production | 23,392 | - | - | - | 23,392 | ||||||||||||
| Royalties and taxes | 52,150 | 256 | - | - | 52,406 | ||||||||||||
| Transportation | 72,562 | - | - | - | 72,562 | ||||||||||||
| Refining | - | 5,815 | - | - | 5,815 | ||||||||||||
| Crude oil and refined product purchases | 8,817 | 86,241 | - | (67,003 | ) | 28,055 | |||||||||||
| Selling | 5,151 | 5,254 | - | - | 10,405 | ||||||||||||
| General and administrative | 9,418 | 4,038 | 2,130 | - | 15,586 | ||||||||||||
| Interest and financing costs | 8,099 | - | 5 | - | 8,104 | ||||||||||||
| Depletion and depreciation | 24,419 | 5,170 | 319 | - | 29,908 | ||||||||||||
| Foreign exchange loss (gain) | 1,664 | (2,311 | ) | 81 | - | (566 | ) | ||||||||||
205,672 | 104,463 | 2,535 | (67,003 | ) | 245,667 | ||||||||||||
| INCOME (LOSS) BEFORE INCOME TAXES | 225,284 | 49,752 | (2,101 | ) | - | 272,935 | |||||||||||
| INCOME TAXES | |||||||||||||||||
| Current provision | 102,481 | 17,004 | (84 | ) | - | 119,401 | |||||||||||
| Future income tax | (21,614 | ) | (974 | ) | - | - | (22,588 | ) | |||||||||
80,867 | 16,030 | (84 | ) | - | 96,813 | ||||||||||||
| NON-CONTROLLING INTEREST | - | (96 | ) | - | - | (96 | ) | ||||||||||
| NET INCOME (LOSS) | 144,417 | 33,818 | (2,017 | ) | - | 176,218 | |||||||||||
| Eliminations are intersegment revenue. |
Three months ended September 30, 2004 | ||||||||||
Export | Domestic | Consolidated | ||||||||
| Crude oil | 302,037 | 19,639 | 321,676 | |||||||
| Refined products | 64,087 | 131,379 | 195,466 | |||||||
As at September 30, 2004 | |||||||||||||
Upstream | Downstream | Corporate | Consolidated | ||||||||||
| Total assets | 997,917 | 163,934 | 80,777 | 1,242,628 | |||||||||
| Total liabilities | 373,922 | 70,426 | 13,992 | 458,340 | |||||||||
| Capital expenditures in the quarter | 29,721 | 2,146 | 417 | 32,284 | |||||||||
| 30 | ||
Three months ended September 30, 2003 | |||||||||||||||||
Upstream | Downstream | Corporate | Eliminations | Consolidated | |||||||||||||
| REVENUE | |||||||||||||||||
| Crude oil | 181,344 | - | - | (17,389 | ) | 163,955 | |||||||||||
| Refined products | 28,406 | 122,575 | - | (13,626 | ) | 137,355 | |||||||||||
| Service fees | 851 | - | 13 | - | 864 | ||||||||||||
| Interest income | 210 | 151 | 617 | - | 978 | ||||||||||||
| 210,811 | 122,726 | 630 | (31,015 | ) | 303,152 | ||||||||||||
| EXPENSES | |||||||||||||||||
| Production | 15,812 | - | - | - | 15,812 | ||||||||||||
| Royalties and taxes | 24,553 | 176 | - | - | 24,729 | ||||||||||||
| Transportation | 54,307 | 2,012 | - | - | 56,319 | ||||||||||||
| Refining | - | 4,094 | - | - | 4,094 | ||||||||||||
| Crude oil and refined product purchases | 21,423 | 26,570 | - | (31,015 | ) | 16,978 | |||||||||||
| Selling | 3,371 | 4,133 | - | - | 7,504 | ||||||||||||
| General and administrative | 8,415 | 3,861 | 1,385 | - | 13,661 | ||||||||||||
| Interest and financing costs | 7,449 | 699 | - | - | 8,148 | ||||||||||||
| Depletion and depreciation | 16,355 | 4,784 | 24 | - | 21,163 | ||||||||||||
| Foreign exchange (gain) loss | 1,390 | 427 | 133 | - | 1,950 | ||||||||||||
| 153,075 | 46,756 | 1,542 | (31,015 | ) | 170,358 | ||||||||||||
| INCOME (LOSS) BEFORE INCOME TAXES | 57,736 | 75,970 | (912 | ) | - | 132,794 | |||||||||||
| INCOME TAXES | |||||||||||||||||
| Current provision | 19,027 | 25,198 | 1,666 | - | 45,891 | ||||||||||||
| Future income tax | (1,149 | ) | (3,649 | ) | - | - | (4,798 | ) | |||||||||
| 17,878 | 21,549 | 1,666 | - | 41,093 | |||||||||||||
| NON-CONTROLLING INTEREST | - | 551 | - | - | 551 | ||||||||||||
| NET INCOME (LOSS) | 39,858 | 53,870 | (2,578 | ) | - | 91,150 | |||||||||||
| Eliminations are intersegment revenue. |
Three months ended September 30, 2003 | ||||||||||
Export | Domestic | Consolidated | ||||||||
| Crude oil | 155,711 | 8,244 | 163,955 | |||||||
| Refined products | 33,449 | 103,906 | 137,355 | |||||||
As at September 30, 2003 | |||||||||||||
Upstream | Downstream | Corporate | Consolidated | ||||||||||
| Total assets | 703,799 | 170,266 | 150,397 | 1,024,462 | |||||||||
| Total liabilities | 470,325 | 56,318 | 4,234 | 530,877 | |||||||||
| Capital expenditures in the quarter | 34,346 | 2,313 | 420 | 37,079 | |||||||||
| 31 | ||
Nine months ended September 30, 2004 | |||||||||||||||||
Upstream | Downstream | Corporate | Eliminations | Consolidated | |||||||||||||
| REVENUE | |||||||||||||||||
| Crude oil | 812,761 | - | - | (77,521 | ) | 735,240 | |||||||||||
| Refined products | 156,366 | 390,388 | - | (51,280 | ) | 495,474 | |||||||||||
| Service fees | 1,971 | 1,966 | 229 | - | 4,166 | ||||||||||||
| Interest income | 797 | 522 | 1,097 | - | 2,416 | ||||||||||||
971,895 | 392,876 | 1,326 | (128,801 | ) | 1,237,296 | ||||||||||||
| EXPENSES | |||||||||||||||||
| Production | 70,508 | - | - | - | 70,508 | ||||||||||||
| Royalties and taxes | 92,749 | 4,464 | - | - | 97,213 | ||||||||||||
| Transportation | 187,871 | - | - | - | 187,871 | ||||||||||||
| Refining | - | 15,217 | - | - | 15,217 | ||||||||||||
| Crude oil and refined product purchases | 72,649 | 148,599 | - | (128,801 | ) | 92,447 | |||||||||||
| Selling | 13,385 | 14,683 | - | - | 28,068 | ||||||||||||
| General and administrative | 24,678 | 10,869 | 8,946 | - | 44,493 | ||||||||||||
| Interest and financing costs | 21,115 | 469 | 5 | - | 21,589 | ||||||||||||
| Depletion and depreciation | 62,210 | 15,085 | 944 | - | 78,239 | ||||||||||||
| Foreign exchange loss (gain) | 300 | (8,034 | ) | 1,373 | - | (6,361 | ) | ||||||||||
545,465 | 201,352 | 11,268 | (128,801 | ) | 629,284 | ||||||||||||
| INCOME (LOSS) BEFORE INCOME TAXES | 426,430 | 191,524 | (9,942 | ) | - | 608,012 | |||||||||||
| INCOME TAXES | |||||||||||||||||
| Current provision | 188,203 | 63,602 | 2,598 | - | 254,403 | ||||||||||||
| Future income tax | (33,183 | ) | (190 | ) | - | - | (33,373 | ) | |||||||||
155,020 | 63,412 | 2,598 | - | 221,030 | |||||||||||||
| NON-CONTROLLING INTEREST | - | 1,251 | - | - | 1,251 | ||||||||||||
| NET INCOME (LOSS) | 271,410 | 126,861 | (12,540 | ) | - | 385,731 | |||||||||||
| Eliminations are intersegment revenue. |
Nine months ended September 30, 2004 | ||||||||||
Export | Domestic | Consolidated | ||||||||
| Crude oil | 686,808 | 48,432 | 735,240 | |||||||
| Refined products | 158,882 | 336,592 | 495,474 | |||||||
As at September 30, 2004 | |||||||||||||
Upstream | Downstream | Corporate | Consolidated | ||||||||||
| Total assets | 997,917 | 163,934 | 80,777 | 1,242,628 | |||||||||
| Total liabilities | 373,922 | 70,426 | 13,992 | 458,340 | |||||||||
| Capital expenditures in the nine months | 89,807 | 7,832 | 1,061 | 98,700 | |||||||||
| 32 | ||
Nine months ended September 30, 2003 | |||||||||||||||||
Upstream | Downstream | Corporate | Eliminations | Consolidated | |||||||||||||
| REVENUE | |||||||||||||||||
| Crude oil | 526,937 | - | - | (86,565 | ) | 440,372 | |||||||||||
| Refined products | 42,942 | 339,266 | - | (22,439 | ) | 359,769 | |||||||||||
| Services fees | 3,218 | 935 | 38 | - | 4,191 | ||||||||||||
| Interest income | 719 | 304 | 1,321 | - | 2,344 | ||||||||||||
| 573,816 | 340,505 | 1,359 | (109,004 | ) | 806,676 | ||||||||||||
| EXPENSES | |||||||||||||||||
| Production | 49,961 | - | - | - | 49,961 | ||||||||||||
| Royalties and taxes | 50,886 | 3,263 | - | - | 54,149 | ||||||||||||
| Transportation | 169,579 | 2,012 | - | - | 171,591 | ||||||||||||
| Refining | - | 12,898 | - | - | 12,898 | ||||||||||||
| Crude oil and refined product purchases | 32,335 | 119,063 | - | (109,004 | ) | 42,394 | |||||||||||
| Selling | 7,878 | 12,455 | - | - | 20,333 | ||||||||||||
| General and administrative | 23,536 | 10,750 | 2,908 | - | 37,194 | ||||||||||||
| Interest and financing costs | 19,656 | 1,881 | 8,763 | - | 30,300 | ||||||||||||
| Depletion and depreciation | 43,461 | 14,105 | 82 | - | 57,648 | ||||||||||||
| Foreign exchange (gain) loss | (2,278 | ) | (2,023 | ) | 725 | - | (3,576 | ) | |||||||||
| 395,014 | 174,404 | 12,478 | (109,004 | ) | 472,892 | ||||||||||||
| INCOME (LOSS) BEFORE INCOME TAXES | 178,802 | 166,101 | (11,119 | ) | - | 333,784 | |||||||||||
| INCOME TAXES | |||||||||||||||||
| Current provision | 58,075 | 49,274 | 1,794 | - | 109,143 | ||||||||||||
| Future income tax | (2,456 | ) | (2,857 | ) | - | - | (5,313 | ) | |||||||||
| 55,619 | 46,417 | 1,794 | - | 103,830 | |||||||||||||
| NON-CONTROLLING INTEREST | - | 1,822 | - | - | 1,822 | ||||||||||||
| NET INCOME (LOSS) | 123,183 | 117,862 | (12,913 | ) | - | 228,132 | |||||||||||
| Eliminations are intersegment revenue. |
Nine months ended September 30, 2003 | ||||||||||
Export | Domestic | Consolidated | ||||||||
| Crude oil | 432,128 | 8,244 | 440,372 | |||||||
| Refined products | 82,352 | 277,417 | 359,769 | |||||||
As at September 30, 2003 | |||||||||||||
Upstream | Downstream | Corporate | Consolidated | ||||||||||
| Total assets | 703,799 | 170,266 | 150,397 | 1,024,462 | |||||||||
| Total liabilities | 470,325 | 56,318 | 4,234 | 530,877 | |||||||||
| Capital expenditures in the nine months | 111,772 | 11,561 | 761 | 124,094 | |||||||||
| 33 | ||
4 | JOINT VENTURES | |
| The Corporation has the following interests in two joint ventures: | ||
| a) | a 50% equity shareholding with equivalent voting power in Turgai Petroleum CJSC (“Turgai”), which operates the northern part of the Kumkol field in Kazakhstan. | |
| b) | a 50% equity shareholding with equivalent voting power in LLP Kazgermunai (“Kazgermunai”), which operates three oil fields in Kazakhstan: Akshabulak, Nurali and Aksai. | |
| The following amounts are included in the Corporation’s consolidated financial statements as a result of the proportionate consolidation of its joint ventures before consolidation eliminations: | ||
Three months ended September 30, 2004 | ||||||||||
Turgai | Kazgermunai | Total | ||||||||
| Cash | 74,543 | 43,682 | 118,225 | |||||||
| Current assets, excluding cash | 77,588 | 54,867 | 132,455 | |||||||
| Property, plant and equipment, net | 79,277 | 63,248 | 142,525 | |||||||
| Current liabilities | 87,174 | 26,194 | 113,368 | |||||||
| Long-term debt | - | 14,662 | 14,662 | |||||||
| Revenue | 104,360 | 66,469 | 170,829 | |||||||
| Expenses | 50,044 | 39,400 | 89,444 | |||||||
| Net income | 54,316 | 27,069 | 81,385 | |||||||
| Cash flow from operating activities | 50,673 | 23,148 | 73,821 | |||||||
| Cash flow used in financing activities | - | - | - | |||||||
| Cash flow used in investing activities | (4,271 | ) | (3,670 | ) | (7,941 | ) | ||||
| Revenue for the three months ended September 30, 2004 includes $32.1 million of crude oil sales made by Turgai and $2.5 million of crude oil sales made by Kazgermunai to Downstream. These amounts were eliminated on consolidation. |
Three months ended September 30, 2003 | ||||||||||
Turgai | Kazgermunai | Total | ||||||||
| Cash | 18,106 | 11,105 | 29,211 | |||||||
| Current assets, excluding cash | 5,647 | 28,966 | 34,613 | |||||||
| Property, plant and equipment, net | 65,365 | 59,940 | 125,305 | |||||||
| Current liabilities | 27,395 | 6,712 | 34,107 | |||||||
| Long-term debt | - | 40,626 | 40,626 | |||||||
| Revenue | 30,132 | 32,673 | 62,805 | |||||||
| Expenses | 20,092 | 20,763 | 40,855 | |||||||
| Net income | 10,040 | 11,910 | 21,950 | |||||||
| Cash flow from operating activities | 13,551 | 7,977 | 21,528 | |||||||
| Cash flow used in financing activities | - | - | - | |||||||
| Cash flow used in investing activities | (8,651 | ) | (5,153 | ) | (13,804 | ) | ||||
| Revenue for the three months ended September 30, 2003 includes $11.8 million of crude oil sales made by Turgai to Downstream. This amount was eliminated on consolidation. |
| 34 | ||
Nine months ended September 30, 2004 | ||||||||||
Turgai | Kazgermunai | Total | ||||||||
| Revenue | 228,868 | 154,023 | 382,891 | |||||||
| Expenses | 128,638 | 94,002 | 222,640 | |||||||
| Net income | 100,230 | 60,021 | 160,251 | |||||||
| Cash flow from operating activities | 72,979 | 65,752 | 138,731 | |||||||
| Cash flow used in financing activities | - | (24,266 | ) | (24,266 | ) | |||||
| Cash flow used in investing activities | (6,805 | ) | (8,236 | ) | (15,041 | ) | ||||
| Revenue for the nine months ended September 30, 2004 includes $54.4 million of crude oil sales made by Turgai and $4.5 million of crude oil sales made by Kazgermunai to Downstream. These amounts were eliminated on consolidation. |
Nine months ended September 30, 2003 | ||||||||||
Turgai | Kazgermunai | Total | ||||||||
| Revenue | 89,842 | 75,460 | 165,302 | |||||||
| Expenses | 58,902 | 49,336 | 108,238 | |||||||
| Net income | 30,940 | 26,124 | 57,064 | |||||||
| Cash flow from operating activities | 47,865 | 25,670 | 73,535 | |||||||
| Cash flow used in financing activities | - | (6,016 | ) | (6,016 | ) | |||||
| Cash flow used in investing activities | (30,067 | ) | (11,404 | ) | (41,471 | ) | ||||
| Revenue for the nine months ended September 30, 2003 includes $30.5 million of crude oil sales made by Turgai to Downstream. This amount was eliminated on consolidation. | |
5 | RESTRICTED CASH |
| Restricted cash includes $8.8 million of cash dedicated to a debt service reserve account for the Corporation’s term facility ($10.5 as at December 31, 2003). As of September 30, 2004 the term facility was repaid in full. The Corporation has a balance in the debt service reserve account because the hedging liabilities associated with the term facility have not been discharged in full. | |
| Restricted cash as at September 30, 2004 includes $41.9 million of cash dedicated to a margin account for the Corporation’s hedging program ($25.0 million as at December 31, 2003). | |
| Restricted cash is not available for current purposes. | |
6 | ACCOUNTS RECEIVABLE |
| Accounts receivable consist of the following: |
September 30, 2004 | December 31, 2003 | ||||||
| Trade | 154,946 | 70,282 | |||||
| Value added tax recoverable | 30,135 | 22,864 | |||||
| Due from Turgai | 23,587 | 37,231 | |||||
| Other | 10,738 | 19,916 | |||||
219,406 | 150,293 | ||||||
| 35 | ||
7 | ACCOUNTS PAYABLE AND ACCRUED LIABILITIES |
| Accounts payable and accrued liabilities consist of the following: |
September 30, 2004 | December 31, 2003 | ||||||
| Trade | 114,345 | 66,115 | |||||
| Royalties | 24,318 | 16,133 | |||||
| Income taxes | 74,710 | - | |||||
| Common share dividends | 8,803 | - | |||||
| Other | 5,760 | 6,174 | |||||
227,936 | 88,422 | ||||||
8 | SHORT-TERM DEBT |
September 30, 2004 | December 31, 2003 | ||||||
| Current portion of term facility | - | 35,692 | |||||
| Current portion of term loans | 1,966 | 2,039 | |||||
| Joint venture loan payable | 11,000 | 11,000 | |||||
| Working capital facilities | 2,856 | - | |||||
| PKOP bonds | - | 24,494 | |||||
15,822 | 73,225 | ||||||
| The PKOP bonds were fully redeemed on February 26, 2004. | |
9 | LONG-TERM DEBT |
September 30, 2004 | December 31, 2003 | ||||||
| 9.625% bonds | 125,000 | 125,000 | |||||
| Long-term portion of term facility | - | 71,384 | |||||
| Long-term portion of term loans | 11,038 | 12,528 | |||||
| Kazgermunai debt | 14,662 | 37,743 | |||||
150,700 | 246,655 | ||||||
| On January 2, 2003, PetroKazakhstan Kumkol Resources (“PKKR”) entered into a $225.0 million term facility secured by crude oil export contracts. This facility was repayable in 42 equal monthly installments commencing July 2003. The facility bore interest at a rate of LIBOR plus 3.25% per annum. PKKR drew $190.0 million under this facility and chose not to utilize the remainder. As of September 30, 2004 the Corporation had fully repaid the term facility. $2.1 million of unamortized issue costs related to the term facility have been expensed. | |
| On May 25, 2004 the Corporation entered into a five and one half year $100.0 million committed credit facility. This facility is unsecured, bears interest at LIBOR plus 2.65% and is subject to annual review. $30.0 million of this facility has been dedicated to cover margin calls under the Corporation’s hedging program. This amount is not available for general corporate purposes. | |
| On June 24, 2004 Kazgermunai repaid $24.3 million of its outstanding subordinated debt. |
| 36 | ||
10 | SHARE CAPITAL |
| Authorized share capital consists of an unlimited number of Class A common shares, and an unlimited number of Class B redeemable preferred shares, issuable in series. | |
Issued Class A common shares: |
Three Months Ended | Three Months Ended | ||||||||||||
September 30, 2004 | September 30, 2003 | ||||||||||||
Number | Amount | Number | Amount | ||||||||||
| Balance, beginning of period | 80,597,166 | 195,867 | 77,653,139 | 190,577 | |||||||||
| Shares repurchased and cancelled pursuant to Normal Course IssuerBid (a) | (1,257,500 | ) | (3,120 | ) | - | - | |||||||
| Shares repurchased and cancelled pursuant to Substantial Course IssuerBid (b) | (3,999,975 | ) | (9,782 | ) | - | - | |||||||
| Stock options exercised for cash | 683,450 | 6,061 | 103,350 | 325 | |||||||||
| Corresponding convertible securities, converted | - | - | 15,299 | (3 | ) | ||||||||
| Balance, end of period | 76,023,141 | 189,026 | 77,771,788 | 190,899 | |||||||||
Nine Months Ended | Nine Months Ended | ||||||||||||
September 30, 2004 | September 30, 2003 | ||||||||||||
Number | Amount | Number | Amount | ||||||||||
| Balance, beginning of period | 77,920,226 | 191,695 | 78,956,875 | 193,723 | |||||||||
| Shares repurchased and cancelled pursuant to Normal Course IssuerBid (a) | (1,257,500 | ) | (3,120 | ) | (1,477,400 | ) | (3,616 | ) | |||||
| Shares repurchased and cancelled pursuant to Substantial Course IssuerBid (b) | (3,999,975 | ) | (9,782 | ) | - | - | |||||||
| Stock options exercised for cash | 3,331,832 | 10,224 | 273,750 | 792 | |||||||||
| Corresponding convertible securities, converted | 28,558 | 9 | 18,563 | - | |||||||||
| Balance, end of period | 76,023,141 | 189,026 | 77,771,788 | 190,899 | |||||||||
| (a) | The Corporation has renewed its Normal Course Issuer Bid in connection with its share repurchase program. The share repurchase program enables the Corporation to repurchase 7,091,429 Class A common shares during the period from August 13, 2004 to August 12, 2005. The Corporation purchased and cancelled 1,257,500 shares at an average price of C$40.0 per share under this program. The excess of cost over the book value for the shares purchased was applied to retained earnings. | |
| (b) | In June 2004 the Corporation commenced a Substantial Course Issuer Bid to repurchase, for cancellation, up to C$160 million of its Class A common shares. As at September 30, 2004, the Corporation had purchased and cancelled 3,999,975 shares at an average price of C$40.0 per share. The excess of cost over the book value for the shares purchased was applied to retained earnings. | |
| A summary of the status of the Corporation’s stock option plan as of September 30, 2004 and the changes during the nine months ended September 30, 2004 and the year ended December 31, 2003 are presented below (weighted average exercise price expressed in Canadian dollars): | ||
Weighted Average | ||||||||
Options | Exercise Price | |||||||
| Outstanding at December 31, 2003 | 5,115,460 | 8.17 | ||||||
| Granted | 60,000 | 31.62 | ||||||
| Exercised | (3,360,390 | ) | 4.15 | |||||
| Forfeited | (126,525 | ) | 16.13 | |||||
| Outstanding at September 30, 2004 | 1,688,545 | 16.41 | ||||||
| Options exercisable as at: | ||||||||
| December 31, 2003 | 2,816,683 | 5.14 | ||||||
| September 30, 2004 | 513,642 | 10.9 | ||||||
| 37 | ||
| The pro forma net income per share for the three and nine months ended September 30, 2003 and 2004, had we recognized compensation expense using the fair value of common stock options granted for all stock options outstanding prior to January 1, 2003 follows: |
Three Months Ended | Nine Months Ended | |||||||||||||
September 30 | September 30 | |||||||||||||
2004 | 2003 | 2004 | 2003 | |||||||||||
| Net income | ||||||||||||||
| As reported | 176,218 | 91,150 | 385,731 | 228,132 | ||||||||||
| Pro forma | 176,199 | 91,104 | 385,588 | 227,847 | ||||||||||
| Basic net income per share | ||||||||||||||
| As reported | 2.30 | 1.17 | 5.00 | 2.92 | ||||||||||
| Pro forma | 2.29 | 1.17 | 5.00 | 2.91 | ||||||||||
| Diluted net income per share | ||||||||||||||
| As reported | 2.27 | 1.12 | 4.89 | 2.81 | ||||||||||
| Pro forma | 2.26 | 1.12 | 4.89 | 2.80 | ||||||||||
11 | INCOME TAXES |
| The provision for income taxes differs from the results, which would have been obtained by applying the statutory tax rate of 30% to the Corporation’s income before income taxes. This difference results from the following items: |
Three Months Ended | Nine Months Ended | ||||||||||||
September 30 | September 30 | ||||||||||||
2004 | 2003 | 2004 | 2003 | ||||||||||
| Statutory Kazakhstan income tax rate | 30 | % | 30 | % | 30 | % | 30 | % | |||||
| Expected tax expense | 81,881 | 39,838 | 182,404 | 100,135 | |||||||||
| Effect of higher tax rate in Kazgermunai | 2,041 | - | 3,506 | - | |||||||||
| Excess profit tax provision | 15,224 | - | 25,057 | - | |||||||||
| Other permanent differences, net | (2,333 | ) | 1,255 | 10,063 | 3,695 | ||||||||
| Income tax expense | 96,813 | 41,093 | 221,030 | 103,830 | |||||||||
| The following are the major future income tax assets and liabilities arising from temporary differences between the carrying values and tax basis of the following assets and liabilities: | |
Future income tax assets: |
September 30, 2004 | December 31, 2003 | ||||||
| Fixed assets | 27,891 | 23,126 | |||||
| Excess profit tax | 25,057 | - | |||||
| Provision for inter-company profit eliminations | 10,463 | 9,087 | |||||
| Provision for royalties | 5,235 | 4,831 | |||||
| Provision for obsolete inventories | 1,263 | 1,180 | |||||
| Provision for doubtful debts | 70 | 1,515 | |||||
| Other | 378 | 424 | |||||
| Total future income tax assets | 70,357 | 40,163 | |||||
| Less: current portion of future income tax assets | 42,809 | 14,697 | |||||
| Long-term future income tax assets | 27,548 | 25,466 | |||||
Future income tax liabilities: | |||||||
| Fixed assets | 9,833 | 13,012 | |||||
| Excess profit tax is in addition to statutory income taxes, which are at a rate of 30%, and excess profit tax takes effect after the field has achieved a cumulative internal rate of return higher than 20% for the specific field. The excess profit tax ranges from 0% to 30% of taxable income for the year for PKKR and from 0% to 50% for Turgai. |
| 38 | ||
| A provision has been made for expected excess profit tax for the 2004 tax year for Turgai. Excess profit tax paid in one year is deductible for excess profit tax purposes in the following year. This gives rise to a future income tax credit for one half of the current year’s provision. | |
12 | NET INCOME PER SHARE |
| The net income per share calculations are based on the weighted average and diluted numbers of Class A common shares outstanding during the period as follows: |
Three Months Ended | Nine Months Ended | ||||||||||||
September 30 | September 30 | ||||||||||||
2004 | 2003 | 2004 | 2003 | ||||||||||
| Weighted average number of common shares outstanding | 76,652,399 | 77,707,623 | 77,118,191 | 78,258,611 | |||||||||
| Dilution from exercisable options (including convertible securities) | 1,064,303 | 3,559,095 | 1,787,528 | 3,030,279 | |||||||||
| Diluted number of shares outstanding | 77,716,702 | 81,266,718 | 78,905,718 | 81,288,890 | |||||||||
| No options were excluded from the calculation of diluted number of shares outstanding for the three months ended September 30, 2004 and 2003, as the market price was in excess of exercise price. | |
13 | FINANCIAL INSTRUMENTS |
| The Corporation’s financial instruments include cash, accounts receivable, all current liabilities and long-term debt. The fair value of cash, accounts receivable and current liabilities approximates their carrying amounts due to the short-term maturity of these instruments. The fair value of Kazgermunai debt and the term loans approximates their carrying value as they bear interest at market rates. The fair value of the 9.625% Notes is $135.0 million versus the carrying value of $125.0 million as at September 30, 2004 as determined through reference to the market price. | |
| The Corporation has entered into a commodity-hedging program where it is utilizing derivative instruments to manage the Corporation’s exposure to fluctuations in the price of crude oil. The Corporation has entered into the following contracts with major financial institutions. |
Price Ceiling or | Price | |||||||
Contract Amount | Contract | Contract | Contracted Price | Floor | ||||
(bbls per month) | Period | Type | ($/bbl) | ($/bbl) | ||||
| 362,000 | January 2004 to March 2004 | Dated Brent | 29.80-29.82 | |||||
| 75,000 | January 2004 to December 2004 | Zero cost collar | 28.00 | 17.00 | ||||
| 75,000 | January 2004 to December 2004 | Zero cost collar | 29.00 | 17.00 | ||||
| 75,000 | January 2004 to December 2004 | Zero cost collar | 29.25 | 17.00 | ||||
| 37,500 | January 2004 to December 2004 | Zero cost collar | 29.60 | 17.00 | ||||
| 110,000 | January 2004 to December 2004 | Zero cost collar | 30.20 | 18.00 | ||||
| 120,000 | January 2005 to March 2005 | IPE Future | 26.30 - 26.52 | |||||
| 40,000 | April 2005 to June 2005 | IPE Future | 25.92 | |||||
| 458,333 | January 2005 to December 2005 | IPE Future | 25.65 - 25.90 | |||||
| During the three months ended September 30, 2004, the Corporation has foregone revenue of $13.5 million through these contracts ($25.5 million during the nine months ended September 30, 2004). | |
| The unrealized loss under these hedges as at September 30, 2004 is $87.3 million. |
| 39 | ||
14 | CASH FLOW INFORMATION |
| Interest and income taxes paid: |
Three Months Ended | Nine Months Ended | ||||||||||||
September 30 | September 30 | ||||||||||||
2004 | 2003 | 2004 | 2003 | ||||||||||
| Interest paid | 7,098 | 8,478 | 17,801 | 30,983 | |||||||||
| Income taxes paid | 67,626 | 43,185 | 171,740 | 104,654 | |||||||||
15 | COMMITMENTS AND CONTINGENCIES |
Agency for Regulation of Natural Monopolies and Protection of Competition (“ARNM”) | |
PKOP | |
| The ARNM alleged that PKOP charged prices for refined oil products that in total were $6.3 million in excess of ARNM authorized maximum prices. PKOP initiated legal proceedings to annul the ARNM claim and the court of first instance reduced the ARNM claim to approximately $1.1 million. PKOP and the ARNM appealed this decision to the Supreme Court. The Supreme Court recognized approximately $3.6 million of the ARNM’s original assessment. This amount has been paid and recorded in the financial statements. | |
| PKOP received an additional assessment from ARNM in the amount of $8.8 million for allegedly charging prices for refined products in excess of ARNM authorized maximum prices. PKOP appealed this assessment. The ARNM revoked approximately $5.2 million of the assessment and the court of the first instance recognized approximately $1.4 million of the remaining $3.6 million. PKOP has appealed this decision. No provision has been made in the accompanying financial statements for this assessment. | |
| PKOP’s position remains that the ARNM does not have the right to establish prices for the refinery, and the Corporation, as the party in interest under the Privatization Agreement for the Shymkent Refinery, has notified the Government of Kazakhstan that it is in breach of provisions of the Privatization Agreement. The Corporation has the right to proceed to international arbitration under the terms of the Privatization Agreement. | |
Group companies | |
| The ARNM claimed $34.1 million ($31.0 million at December 31, 2003 Tenge/US Dollar exchange rate) from a group company for allegedly violating Kazakhstan’s competition law. The group company initiated legal proceedings and the court of first instance dismissed the ARNM claim. The ARNM appealed this decision; the appellate court upheld the decision of the lower court. The ARNM has filed a motion to re-open the court case on the basis of new information. The Court hearing to determine whether the case may be reopened is expected to take place during the fourth quarter 2004. No provision has been made in the financial statements for this assessment. | |
| The ARNM claimed approximately $96.4 million ($91.4 million at December 31, 2003 Tenge/US Dollar exchange rate) from group companies for allegedly violating Kazakhstan’s competition law. The group companies initiated legal action, and at the Astana City Court were unsuccessful in their challenge of allegations by the ARNM that these companies had violated Kazakhstan competition laws. The initial trial court judgment upheld the ARNM determination that these distributors had received unjustified revenues totaling approximately $96.4 million. The group companies appealed this judgment to the Supreme Court. The initial Supreme Court hearing on the matter was held in the second quarter of 2004 and the Court suspended the case and instructed the parties to seek an agreed settlement. During the period fr om April to May 13, the parties did engage in discussions aimed at a settlement, but were unable to resolve the matter through negotiations. On May 13, 2004, after a hearing on the merits, the Supreme Court overturned the lower court decision which was in favour of the ARNM and sent the case back to the Astana City Court for a new trial. During the third quarter 2004, the General Prosecutor’s office filed a protest regarding May 13 decision of the Supreme Court with the Supreme Court Supervisory Panel. On August 25, 2004, the Supervisory Panel issued an opinion upholding the May 13 decision and returned the case to the Astana City Court. In September 2004 the Astana City Court issued a ruling suspending further consideration of the merits of the case pending the completion of parallel investigations being conducted by the “Agency of the Republic of Kazakhstan for Fight Against Economic and Corruption Criminality”. The group companies have appealed this ruling. | |
| It remains the Corporation’s view that the allegations leveled against the group companies are without justification; |
| 40 | ||
| a highly competitive market exists for oil products within Kazakhstan and the current level of prices reflects current world crude oil prices, which are at new highs. Also, the prices charged by the group companies are competitive with Russian imports and with those charged by distributors of the other two refineries in Kazakhstan. | |
| The Corporation is considering its recourse rights under the terms of the Shymkent refinery Privatization Agreement, which clearly stipulates the right to sell any and all its products in Kazakhstan and abroad at free market prices. | |
| The Corporation will continue to seek a dialogue with the appropriate authorities to address the concerns related to the pricing of refined products and possible measures to be taken to further promote transparency and effective monitoring of the dynamics of competition, consistent with market economy principles. | |
Tax matters | |
| The local and national tax environment in the Republic of Kazakhstan is subject to change and inconsistent application, interpretation and enforcement. Non-compliance with Kazakhstan laws and regulations, as interpreted by the Kazakh authorities, can lead to the imposition of fines, penalties and interest. | |
| In response to the Corporation’s submission, the Minister of Finance initiated the creation of a high-level Working Group between its Officials and the Corporation’s representatives to address and seek resolution of all outstanding tax issues through dialogue and negotiations. On January 22, 2004, the Working Group signed a memorandum that sets out the agreed resolution of several important tax issues which were pending. Certain actions, such as the approval of the amendments to hydrocarbon contracts and issuance of instruction letters were required to fully implement the terms of the memorandum. The hydrocarbon contract amendments were approved on July 21, 2004, but the instruction letter has not been issued. The terms of this memorandum are reflected in the ensuing discussion of the Corpora tion’s tax matters. | |
Tax assessments 1998 and 1999 | |
| PKKR received tax assessments for 1998 and 1999. The assessment was for a total of approximately $10.5 million including taxes, fines, interest and penalties. PKKR was successful in challenging the assessments at the first level of the court system and was unsuccessful on the majority of the issues at the Supreme Court level. Specifically, PKKR was unsuccessful in obtaining agreement of the Supervisory Panel of the Supreme Court to hear its appeal on the assessed taxes. The Corporation provided for $2.9 million of the $10.5 million total assessment in the December 31, 2002 consolidated financial statements. PKKR has been disputing the remaining $7.6 million (currently $8.0 million due to strengthening of the tenge), which relates to fines and penalties assessed, because PKKR believes there was an incor rect application of the provisions of tax legislation. PKKR has since paid this amount to stop the further accumulation of fines and penalties and has recorded this payment as an account receivable pending resolution of the issue. The Working Group agreed with PKKR’s position and determined that there was an incorrect application of the provisions of the tax legislation. This matter was simultaneously appealed to the Supervisory Panel of the Supreme Court due to time limitations and the Supervisory Panel remanded the case back to the lower court for a retrial. The lower court rejected the Supreme Court’s instruction, a retrial was not held, and the lower court let the original decision stand. The lower court’s refusal to comply with the Supervisory Panel’s instruction was appealed to the Supervisory Panel. The Supervisory Panel refused to hear the appeal. | |
| The Ministry of Finance has requested that the Working Group memorandum be revised to reflect the Court’s decision. The Corporation does not agree and intends to pursue this matter with the Ministry of Finance. The Corporation believes and the Ministry of Finance has previously agreed that there was an incorrect application of the provisions of the tax act. Due to the uncertainty of the outcome the Corporation has recorded, as an expense, the remaining amount of approximately $8.0 million. | |
Tax assessments 2000 and 2001 | |
| PKKR also received assessments for 2000 and 2001. Challenges to the assessments were divided into two court cases. The first case was for amounts totaling approximately $13.0 million and at the first level of the court system PKKR was successful on $6.8 million of the $13.0 million and was unsuccessful on the remainder. The major issue on which PKKR was unsuccessful was the assessment of royalties on flared associated gas for approximately $4.5 million (currently $5.0 million due to strengthening of the tenge). PKKR believes the claim for royalties on flared associated gas, which has no commercial value, contravenes the provisions of its Hydrocarbon Contracts. PKKR appealed to the Supreme Court and the Supervisory Panel of the Supreme Court and was unsuccessful. As at December 31, 2003 PKKR had accrued and paid $0.2 million for the tax assessments on royalty on associated gas for the years 2002-2003. |
| 41 | ||
| A further provision of $1.7 million was made regarding other issues. As at September 30, 2004 PKKR has recorded as an expense an additional $5.0 million for royalties on associated gas for the years 1998-2001. Additionally the Corporation has provided for $1.6 million relating to interest charges on this tax assessment. | |
Excess profit tax | |
| The Corporation, through its subsidiary PKKR and joint venture Turgai, is subject to excess profit tax under the terms of the Hydrocarbon Exploration and Production contracts they have for oil and gas production. The contracts are specific to each field. Excess profit tax is in addition to statutory income taxes, which are at a rate of 30%, and excess profit tax takes effect after the field has achieved a cumulative internal rate of return higher than 20% for the specific field. The excess profit tax ranges from 0% to 30% of taxable income for the year for PKKR and from 0% to 50% for Turgai. | |
| During 2004, Turgai was subject to a tax audit for the years 2002-2003 and received a tax assessment for approximately $148.0 million including penalties and interest (the Corporation’s 50% share is $74.0 million). The major issue is an assessment for excess profit taxes. The Ministry of Finance has adopted the position that expenditures relating to construction in progress are not allowed as a cash outflow when computing the internal rate of return. The Corporation believes this position is contrary to the concept of an internal rate of return calculation and counter to the legislation of the Republic of Kazakhstan. The Corporation through Turgai will appeal this assessment. | |
| No provision has been made for this assessment. |
| 42 | ||