PetroKazakhstan is pleased to announce its financial results for the second quarter of 2005 achieving $138.7 million of net income and $164.4 million of cash flow. This represents basic net income per share of $1.86 and basic cash flow per share of $2.20 for the quarter. The comparable figures for the quarter ended June 30, 2004 were $1.54 basic net income per share and $1.80 basic cash flow per share.
For the six months ended June 30, 2005 net income was $304.4 million and cash flow was $350.8 million. This represented basic net income per share of $4.04 and basic cash flow per share of $4.66. The comparable figures for the six months ended June 30, 2004, were net income per share of $2.64 and basic cash flow per share of $3.20.
As the Company has previously announced, it has been approached by a number of parties concerning the possible merger or acquisition of the Company. The Board of Directors has set up an Independent Committee to consider these approaches.
The Company also announces the resignation of Mr. Jan Bonde Neilsen from PetroKazakhstan’s Board of Directors. Mr. Bonde Neilsen had been a Director since 2004.
In the second quarter of 2005 the Company repurchased and cancelled 1,806,100 shares at an average price of C$41.30 per share, under its approved Normal Course Issuer Bid program.
During the second quarter of 2005, PetroKazakhstan’s production volumes totalled 9.64 million barrels of oil or an average of 105,947 barrels of oil per day (“bopd”) representing a 30% decrease compared to the second quarter 2004 production of 151,104 bopd.
The refinery operated without interruption during the second quarter. Average weighted refined product prices improved by approximately $24/tonne representing a 10% increase. The price improvements were as a result of stronger export prices driven by a combination of the international market and a higher proportion of non-FCA contracts where the Company sells closer to the final end user. Domestic refined product prices also firmed in response to strengthening international market prices.
In June 2005, the government of Kazakhstan, as is usual at this time of the year, issued an order banning the export of diesel during the harvest season. On this occasion however, the text of the order included Vacuum Gas Oil (“VGO”) although the detailed listing each of the custom product codes for the different types of diesel did not include the code for VGO. As a result, the customs authorities were unable to approve the export of the Company’s VGO and these exports ceased early June. The Company is in discussions with the Government to correct this anomaly. During the second quarter a new transportation route for VGO was successfully commissioned via the port of Batumi in Georgia.
Bernard F. Isautier
The following Management’s Discussion and Analysis (“MD&A”) of the financial condition and results of our operations should be read in conjunction with our consolidated financial statements and notes relating thereto that are included elsewhere in this report. Our financial statements have been prepared in accordance with Canadian generally accepted accounting principles (“GAAP”). This discussion and analysis contains forward-looking statements, which involve risks and uncertainties. Our actual results could differ materially from those anticipated in the forward-looking statements.
These forward-looking statements can generally be identified by the use of statements that include phrases such as “believe”, “expect”, “anticipate”, “intend”, “plan”, “likely”, “will” or similar words or phrases. Similarly, statements that describe our objectives, plans or goals are or may be forward-looking statements. These forward-looking statements are based on our current expectations and projections about future events. However, whether actual results and developments will conform with our expectations and projections is subject to a number of risks and uncertainties, including, among other things, the risks and uncertainties described under section “Risk Analysis” and the risk factors described in our Annual Information Form for the year ended December 31, 2004 under the heading “Risk Factors”. These are not necessarily all of the important factors that could cause actual results to differ materially from those expressed in any of our forward-looking statements. Other known or unpredictable factors could also harm our results. Consequently, there can be no assurance that the actual results or developments anticipated by us will be realized or, even if substantially realized, that they will have the expected consequences to, or affects on, us. Unless otherwise required by applicable securities law, we disclaim any intention or obligation to publicly update or revise any forward-looking statements, whether as a result of new information, future events or otherwise.
In our MD&A we use certain terms, which are specific to the oil and gas industry, including “net return” and “cash flow”. These are non-GAAP terms defined within our MD&A.
Except as otherwise required by the context, reference in this MD&A to “our”, “we” or “us” refer to the combined business of PetroKazakhstan Inc. and all of its subsidiaries and joint ventures.
Additional information filed with Canadian securities commissions and the United States Securities and Exchange Commission, including our quarterly and annual reports and our Annual Information Form (AIF/40-F), are available on line at www.sedar.com and www.sec.gov.
Production. See Volumetrics, Upstream for a discussion of our production.
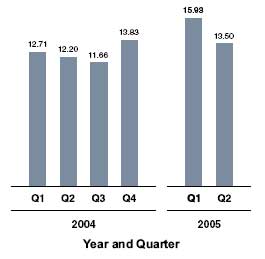
Differentials. The graph to the right shows the evolution of our differential.
* Our differential is calculated as the difference between the average Brent price for crude oil export sales received by PetroKazakhstan and our net return at Kumkol. Differential is a non-GAAP measure that is the sum of the costs and discounts incurred in order to transport and sell our crude oil to international markets. The sales revenue used in this measure differs from sales revenue in the statement of net income and the net return table for the following reason: • The differential does not include Joint Venture sales because the differential is used to measure the performance of our own internal marketing group and transportation group. • The differential does not include sales where we buy and sell for export third party owned crude oil. The term "Differential" does not have a standardized meaning prescribed by Canadian GAAP and is, therefore, unlikely to be comparable to similar measures prescribed by other companies. | | Our differential decreased for the second quarter of 2005 for a number of reasons. |
The computation of our differential has been changed so that sales made by our Joint Venture Turgai are not included because as of January 1, 2005 our joint marketing agreements have been terminated by Turgai.
The impact of excluding these sales for prior periods is immaterial, and therefore the differential for these periods has not been re-stated.
We have curtailed production to comply with gas flaring restrictions which has led to less crude available for export sales. Consequently, we have focused on our two main export routes, Aktau to Batumi and China. Exports through Batumi, which represented approximately 75% of our completed sales, benefited from better freight rates and less demurrage. Sales to China utilizing the Atasu pipeline resumed contributing to the overall improvement of our overall differential.
Outlook. The expected decrease in sales volumes and the ARNM’s recently announced 6.5% increase in rail-car tariffs (effective July 1, 2005) combined with our rail car lease commitments means that we do not expect a significant improvement in the overall differential for the third quarter.
Refining costs. Refining costs per barrel were higher in the second quarter of 2005 by $0.19/bbl compared to the same quarter of 2004. This was due to lower processed volumes, which decreased by 0.52 mmbbls (6.7%), and the payment of national employee bonuses for year 2004 performance. Refining costs increased by $0.12/bbl in the first six months of 2005 due to lower processed volumes, national employee bonuses for year 2004 performance and minor repair and maintenance works carried out at the refinery during the first quarter.
General and administrative expenses. General and administrative expenses increased by $1.30/bbl in the second quarter of 2005 compared to the same period in 2004 mainly due to $0.47/bbl of litigation related expenses, $0.28/bbl reflecting the impact of reduced production due to gas flaring restrictions and $0.23/bbl of inventory and bad debt provisions.
The increase in general and administrative expenses during the six months of 2005 by $0.71/bbl compared to the same period in 2004 is mainly due to $0.20/bbl of litigation related expenses, $0.10/bbl of increased bad debt and inventory provisions, $0.11/bbl reflecting the impact of reduced production and $0.08/bbl of additional stock based compensation expense and management services charged to our joint ventures in the first quarter of 2005.
Effective income tax rate. Our effective income tax rate increased from 39.5% (37.1% in the six months of 2004) to 41.4% (39.4% in the six months of 2005) in the second quarter of 2005 mainly due to increased excess profit tax payable by our Turgai joint venture.
Crude oil and refined products inventory and in transit. Our crude oil and refined products inventory declined by 2.0 million barrels compared to March 31, 2005. This inventory drawdown led to approximately $34.5 million of net income in the second quarter of 2005.
VOLUMETRICS
UPSTREAM
PRODUCTION
The following table sets forth our barrels of oil produced per day by field.
| | | | |
| | | Three months ended June 30 | |
Field | | 2005 (BOPD) | | 2004 (BOPD) | |
| Kumkol South | | | 20,583 | | | 50,014 | |
| Kumkol North | | | 30,994 | | | 34,844 | |
| South Kumkol | | | 22,275 | | | 23,311 | |
| Kyzylkiya | | | 3,290 | | | 9,783 | |
| Aryskum | | | 13,299 | | | 8,030 | |
| Maibulak | | | 876 | | | 2,446 | |
| North Nurali | | | - | | | 559 | |
| License #952 | | | 28 | | | 396 | |
| License #951 | | | - | | | 12 | |
| Kazgermunai Fields | | | 14,602 | | | 21,709 | |
| Total | | | 105,947 | | | 151,104 | |
| | | | |
| | | Six months ended June 30 | |
Field | | 2005 (BOPD) | | 2004 (BOPD) | |
| Kumkol South | | | 28,318 | | | 46,127 | |
| Kumkol North | | | 34,142 | | | 34,136 | |
| South Kumkol | | | 23,403 | | | 24,564 | |
| Kyzylkiya | | | 5,935 | | | 9,604 | |
| Aryskum | | | 15,373 | | | 8,411 | |
| Maibulak | | | 1,226 | | | 2,255 | |
| North Nurali | | | 51 | | | 340 | |
| License #952 | | | 209 | | | 222 | |
| License #951 | | | - | | | 6 | |
| Kazgermunai Fields | | | 19,192 | | | 21,347 | |
| Total | | | 127,849 | | | 147,012 | |
Production has been curtailed at all fields in the second quarter of 2005 due to gas flaring restrictions. However, we have maintained our development programs in order to achieve full production potential when the issue of gas utilisation is fully resolved by the middle of 2006 or earlier (see Note 14 of the interim consolidated financial statements).
IMPACT OF GAS FLARING RESTRICTIONS
On April 26, 2005 our subsidiary PKKR commenced the process of reducing production in accordance with new legislation passed in December 2004 prohibiting gas flaring, except under limited circumstances. Turgai and Kazgermunai also reduced production to comply with the new legislation.
Considering our 50% share in Turgai and Kazgermunai, it is estimated that our net share of production in the third quarter of 2005 will be curtailed to approximately 91,500 bopd.
| | | | | | |
| | | Actual production for the quarter ended | | Forecasted production for the quarter ended | |
| | | March 31, 2005 (BOPD) | | June 30, 2005 (BOPD) | | September 30, 2005 (BOPD) | |
| PKKR | | | 88,574 | | | 60,351 | | | 48,000 | |
| Turgai (50%) | | | 37,326 | | | 30,994 | | | 27,000 | |
| Kazgermunai (50%) | | | 23,832 | | | 14,602 | | | 16,500 | |
| Total | | | 149,732 | | | 105,947 | | | 91,500 | |
Kazgermunai is nearing completion of its gas processing facility, which should enable Kazgermunai to increase production before the end of the third quarter of 2005.
We remain hopeful that, in view of our current investment program to achieve full gas utilization by mid - 2006, it will be allowed to resume production at higher rates prior to the completion of our gas re-injection program.
CRUDE OIL INVENTORIES AND MOVEMENTS
The following table sets forth the movements in inventory for our Upstream operations for the three and six months ended June 30.
| | | | |
| | | Three months ended June 30 | |
| | | 2005 (MMbbls) | | 2004 (MMbbls) | |
| Opening inventory of crude oil | | | 4.03 | | | 2.56 | |
| Production | | | 9.66 | | | 13.75 | |
| Crude oil purchased from third parties | | | 0.54 | | | - | |
| Crude oil received from Turgai per court decision (50%) | | | 0.23 | | | - | |
| Crude oil purchased from joint ventures (50%) | | | (0.02 | ) | | (0.17 | ) |
| Sales or transfers | | | (11.57 | ) | | (13.48 | ) |
| Field and transportation losses | | | (0.07 | ) | | (0.05 | ) |
| Closing inventory of crude oil | | | 2.80 | | | 2.61 | |
| | | | |
| | | Six months ended June 30 | |
| | | 2005 (MMbbls) | | 2004 (MMbbls) | |
| Opening inventory of crude oil | | | 3.95 | | | 2.87 | |
| Production | | | 23.12 | | | 26.76 | |
| Crude oil purchased from third parties | | | 0.54 | | | 1.09 | |
| Crude oil received from Turgai per court decision (50%) | | | 0.23 | | | - | |
| Crude oil purchased from joint ventures (50%) | | | - | | | 0.15 | |
| Sales or transfers | | | (24.94 | ) | | (28.16 | ) |
| Field and transportation losses | | | (0.10 | ) | | (0.10 | ) |
| Closing inventory of crude oil | | | 2.80 | | | 2.61 | |
The following table sets forth the movements from Upstream operations for the three and six months ended June 30.
| | | | |
| | | Three months ended June 30 | |
| | | 2005 (MMbbls) | | 2005 % | | 2004 (MMbbls) | | 2004 % | |
| Crude oil exports | | | 6.43 | | | 55.6 | % | | 6.99 | | | 51.9 | % |
| Crude oil transferred to Downstream | | | 3.00 | | | 25.9 | % | | 4.10 | | | 30.4 | % |
| Crude oil transferred to Downstream by joint ventures (50%) | | | (0.08 | ) | | (0.7 | %) | | 1.68 | | | 12.5 | % |
| Crude oil tolled by joint ventures (50%) | | | 1.57 | | | 13.6 | % | | - | | | - | |
| Royalty payments | | | 0.65 | | | 5.6 | % | | 0.71 | | | 5.2 | % |
| Total crude oil sales or transfers | | | 11.57 | | | 100.0 | % | | 13.48 | | | 100.0 | % |
| | | | |
| | | Six months ended June 30 | |
| | | 2005 (MMbbls) | | 2005 % | | 2004 (MMbbls) | | 2004 % | |
| Crude oil exports | | | 13.52 | | | 54.2 | % | | 14.84 | | | 52.7 | % |
| Crude oil transferred to Downstream | | | 6.68 | | | 26.8 | % | | 8.25 | | | 29.3 | % |
| Crude oil transferred to Downstream by joint ventures (50%) | | | 1.48 | | | 5.9 | % | | 3.19 | | | 11.3 | % |
| Crude oil tolled by joint ventures (50%) | | | 1.65 | | | 6.6 | % | | - | | | - | |
| Royalty payments | | | 1.61 | | | 6.5 | % | | 1.88 | | | 6.7 | % |
| Total crude oil sales or transfers | | | 24.94 | | | 100.0 | % | | 28.16 | | | 100.0 | % |
DOWNSTREAM
REFINING
Our total processed volumes were as follows:
| | | | |
| | | Three months ended June 30 | |
| | | 2005 (MMbbls) | | 2004 (MMbbls) | |
| Feedstock refined into product | | | 5.43 | | | 7.62 | |
| Tolled volumes | | | 1.77 | | | 0.10 | |
| Total processed volumes* | | | 7.20 | | | 7.72 | |
| | | | |
| | | Six months ended June 30 | |
| | | 2005 (MMbbls) | | 2004 (MMbbls) | |
| Feedstock refined into product | | | 12.14 | | | 14.70 | |
| Tolled volumes | | | 2.13 | | | 0.13 | |
| Total processed volumes* | | | 14.27 | | | 14.83 | |
*The total processed volumes are used for our per barrel calculations.
Sources of feedstock supplies for our refinery were as follows:
| | | | |
| | | Three months ended June 30 | |
| | | 2005 (MMbbls) | | 2004 (MMbbls) | |
| Acquired from PKKR | | | 3.00 | | | 4.10 | |
| Purchased from joint ventures (100%) | | | (0.15 | ) | | 3.37 | |
| Tolled by joint ventures (50%)* | | | 1.57 | | | - | |
| Purchased from third parties | | | 0.75 | | | - | |
| Total feedstock acquired | | | 5.17 | | | 7.47 | |
| | | | |
| | | Six months ended June 30 | |
| | | 2005 (MMbbls) | | 2004 (MMbbls) | |
| Acquired from PKKR | | | 6.68 | | | 8.25 | |
| Purchased from joint ventures (100%) | | | 2.97 | | | 6.40 | |
| Tolled by joint ventures (50%)* | | | 1.65 | | | - | |
| Purchased from third parties | | | 0.99 | | | - | |
| Total feedstock acquired | | | 12.29 | | | 14.65 | |
*50% of volumes tolled by our joint ventures are attributable to our joint venture partners and are not included in our inventory movements and ending inventory.
FEEDSTOCK AND REFINED PRODUCTS INVENTORIES AND MOVEMENTS
The movements in our feedstock inventory at our refinery were as follows:
| | | | |
| | | Three months ended June 30 | |
| | | 2005 (MMbbls) | | 2004 (MMbbls) | |
| Opening inventory of crude oil feedstock | | | 0.46 | | | 0.15 | |
| Purchase and acquisition of feedstock | | | 5.17 | | | 7.47 | |
| Recoverable feedstock from traps* | | | - | | | 0.05 | |
| Feedstock refined into product | | | (5.43 | ) | | (7.62 | ) |
| Closing inventory of feedstock | | | 0.20 | | | 0.05 | |
| | | | |
| | | Six months ended June 30 | |
| | | 2005 (MMbbls) | | 2004 (MMbbls) | |
| Opening inventory of crude oil feedstock | | | 0.03 | | | 0.03 | |
| Purchase and acquisition of feedstock | | | 12.29 | | | 14.65 | |
| Recoverable feedstock from traps* | | | 0.02 | | | 0.07 | |
| Feedstock refined into product | | | (12.14 | ) | | (14.70 | ) |
| Closing inventory of feedstock | | | 0.20 | | | 0.05 | |
* This represents trapped oil processed, net of trapped oil recovered.
The movement in inventory of refined products was as follows:
| | | | |
| | | Three months ended June 30 | |
| | | 2005 (MM Tonnes)* | | 2004 (MM Tonnes)* | |
| Opening inventory of refined product | | | 0.28 | | | 0.36 | |
| Refined product from feedstock** | | | 0.66 | | | 0.93 | |
| Refined product purchased | | | 0.02 | | | 0.01 | |
| Refined product sold | | | (0.75 | ) | | (1.11 | ) |
| Refined product internal use and yield losses | | | - | | | (0.01 | ) |
| Closing inventory of refined product | | | 0.21 | | | 0.18 | |
| | | | |
| | | Six months ended June 30 | |
| | | 2005 (MM Tonnes)* | | 2004 (MM Tonnes)* | |
| Opening inventory of refined product | | | 0.21 | | | 0.26 | |
| Refined product from feedstock** | | | 1.47 | | | 1.78 | |
| Refined product purchased | | | 0.02 | | | 0.04 | |
| Refined product sold | | | (1.49 | ) | | (1.89 | ) |
| Refined product internal use and yield losses | | | - | | | (0.01 | ) |
| Closing inventory of refined product | | | 0.21 | | | 0.18 | |
*The inventory of products represents a mix of products for which no unique conversion from barrels to tonnes exists. The standard conversion used by us for crude oil is 7.746 barrels to the tonne.
** Refined products from feedstock are presented as actual output from refined volumes of crude oil.
RESULTS OF OPERATIONS
NET RETURN PER BARREL
Set forth below are the details of the average net return achieved for crude oil export sales and sales derived from the refining of our own crude. Net return per barrel is a non-GAAP measure that shows averages across all types of sales contracts and illustrates the relationship between exports of crude oil versus refining our own crude oil and marketing refined crude oil products. Net return per barrel does not have a standardized meaning prescribed by Canadian GAAP and is therefore unlikely to be comparable to similar measures presented by other companies.
| | | | |
| | | Three months ended June 30, 2005 | |
| | | Crude Oil Exports ($/bbl) | | Own Crude Oil Refined and Sold** ($/bbl) | |
| Net realized price | | | 38.22* | | | 41.39 | |
| Transportation costs | | | (9.21 | ) | | (7.11 | ) |
| Selling costs | | | (0.26 | ) | | (0.59 | ) |
| Crude utilized in refining*** | | | - | | | (1.79 | ) |
| Refining cost | | | - | | | (0.89 | ) |
| Royalties and taxes - downstream | | | - | | | (1.40 | ) |
| General and administrative costs - downstream | | | - | | | (0.72 | ) |
| Net return at Kumkol**** | | | 28.75 | | | 28.89 | |
| Production cost | | | (2.15 | ) | | (2.15 | ) |
| Royalties and taxes - upstream | | | (1.33 | ) | | (1.33 | ) |
| General and administrative costs - upstream | | | (1.61 | ) | | (1.61 | ) |
| Net return per barrel | | | 23.66 | | | 23.80 | |
| | | | |
| | | Three months ended June 30, 2004 | |
| | | Crude Oil Exports ($/bbl) | | Own Crude Oil Refined and Sold** ($/bbl) | |
| Net realized price | | | 27.81* | | | 22.85 | |
| Transportation costs | | | (5.65 | ) | | (2.09 | ) |
| Selling costs | | | (0.34 | ) | | (0.46 | ) |
| Crude utilized in refining*** | | | - | | | (1.40 | ) |
| Refining cost | | | - | | | (0.70 | ) |
| Royalties and taxes - downstream | | | - | | | (1.18 | ) |
| General and administrative costs - downstream | | | - | | | (0.45 | ) |
| Net return at Kumkol**** | | | 21.82 | | | 16.57 | |
| Production cost | | | (2.00 | ) | | (2.00 | ) |
| Royalties and taxes - upstream | | | (1.50 | ) | | (1.50 | ) |
| General and administrative costs - upstream | | | (0.58 | ) | | (0.58 | ) |
| Net return per barrel | | | 17.74 | | | 12.49 | |
* Net realized price for own crude oil exports is shown net of hedging expenses ($6.70/bbl in the second quarter of 2005 compared to $0.96/bbl in the second quarter of 2004).
** Net realized price shown in these tables does not include the price received for purchased refined products re-sold.
***Crude utilized in refining is our fuel consumption and yield loss percentage from refining our crude oil applied to the overall sales price received for our products.
**** Average Brent or a similar index for each respective period does not reflect our average realized Brent price because of the timing of recognition of sales for financial statement purposes and the terms of the sales. Financial statement sales revenue is the basis used to determine the net sales price achieved in these tables. Therefore, a comparison of average Brent or similar index to our net return at Kumkol cannot be used to determine our differential.
Net return at Kumkol for own crude oil exports increased by $6.93/bbl in the second quarter of 2005 as compared to the same quarter of 2004 primarily due to:
| | • | A significant increase in the prices of crude oil, with average Brent in the second quarter of 2005 of $51.63/bbl compared to $35.32/bbl in the second quarter of 2004. This was offset in part by foregone revenue due to our hedging program, which had a negative impact of $6.70 per barrel in 2005 compared to $0.96/bbl in 2004. See Note 12 to our interim consolidated financial statements. |
Net return at Kumkol for own crude oil refined and sold increased by $12.32/bbl in the second quarter of 2005 primarily due to:
| | • | Higher sales prices in both export and domestic markets following the price increase for crude oil; |
| | | |
| | • | An improved yield, whereby a higher value products mix was produced. |
| | | | |
| | | Six months ended June 30, 2005 | |
| | | Crude Oil Exports ($/bbl) | | Own Crude Oil Refined and Sold** ($/bbl) | |
| Net realized price | | | 37.29* | | | 39.80 | |
| Transportation costs | | | (8.87 | ) | | (6.93 | ) |
| Selling costs | | | (0.30 | ) | | (0.55 | ) |
| Crude utilized in refining*** | | | - | | | (2.17 | ) |
| Refining cost | | | - | | | (0.76 | ) |
| Royalties and taxes - downstream | | | - | | | (1.31 | ) |
| General and administrative costs - downstream | | | - | | | (0.63 | ) |
| Net return at Kumkol**** | | | 28.12 | | | 27.45 | |
| Production cost | | | (1.87 | ) | | (1.87 | ) |
| Royalties and taxes - upstream | | | (1.25 | ) | | (1.25 | ) |
| General and administrative costs - upstream | | | (1.10 | ) | | (1.10 | ) |
| Net return per barrel | | | 23.90 | | | 23.23 | |
| | | | |
| | | Six months ended June 30, 2004 | |
| | | Crude Oil Exports ($/bbl) | | Own Crude Oil Refined and Sold** ($/bbl) | |
| Net realized price | | | 25.92* | | | 21.38 | |
| Transportation costs | | | (6.78 | ) | | (1.83 | ) |
| Selling costs | | | (0.30 | ) | | (0.50 | ) |
| Crude utilized in refining*** | | | - | | | (1.33 | ) |
| Refining cost | | | - | | | (0.64 | ) |
| Royalties and taxes - downstream | | | - | | | (1.25 | ) |
| General and administrative costs - downstream | | | - | | | (0.45 | ) |
| Net return at Kumkol**** | | | 18.84 | | | 15.38 | |
| Production cost | | | (1.87 | ) | | (1.87 | ) |
| Royalties and taxes - upstream | | | (1.30 | ) | | (1.30 | ) |
| General and administrative costs - upstream | | | (0.57 | ) | | (0.57 | ) |
| Net return per barrel | | | 15.10 | | | 11.64 | |
* Net realized price for own crude oil exports is shown net of hedging expenses ($5.99/bbl for the six months of 2005 compared to $0.80/bbl for the same period of 2004).
** Net realized price shown in these tables does not include the price received for purchased refined products re-sold.
***Crude utilized in refining is our fuel consumption and yield loss percentage from refining our crude oil applied to the overall sales price received for our products.
**** Average Brent or a similar index for each respective period does not reflect our average realized Brent price because of the timing of recognition of sales for financial statement purposes and the terms of the sales. Financial statement sales revenue is the basis used to determine the net sales price achieved in these tables. Therefore, a comparison of average Brent or similar index to our net return at Kumkol cannot be used to determine our differential.
Net return at Kumkol for own crude oil exports increased by $9.28/bbl during the six months of 2005 as compared to the same period of 2004 primarily due to:
| | • | A significant increase in the prices of crude oil, with average Brent for the six months of 2005 of $49.64/bbl compared to $33.66/bbl in the same period of 2004. This was offset in part by foregone revenue due to our hedging program, which had a negative impact of $5.99 per barrel in 2005 compared to $0.80/bbl in 2004. See Note 12 to our interim consolidated financial statements. |
Net return at Kumkol for own crude oil refined and sold increased by $12.07/bbl in the six months of 2005 primarily due to:
| | • | Higher sales prices in both export and domestic markets following the price increase for crude oil; |
| | | |
| | • | An improved yield, whereby a higher value products mix was produced. |
REVENUE
As at March 31, 2005, approximately 1.9 mmbbls of crude oil were in transit and hence, included in inventory. The net income realized on the sale of these volumes in the second quarter of 2005 was $47.0 million, as compared to $43.6 million of net income estimated at March 31, 2005. As at June 30, 2005, approximately 1.3 mmbbls were in transit and included in inventory. We expect to realize sales for these volumes in the third quarter of 2005 leading to net income of $33.4 million.
As at June 30, 2005, our total company wide crude oil and refined products inventories (including those in the field, at the refinery, in various storage locations and in transit) was 4.64 mmbbls. These inventories are recorded at cost until sold and delivered. The realization of these inventories at current market prices (net of transportation costs in effect at the reporting date) would result in estimated additional net income of $95.4 million.
The table below sets out the crude oil revenue, volumes sold and net realized prices:
| | | | |
| | | Three months ended June 30, 2005 | |
| | | Quantity sold (MMbbls) | | Realized price net of transportation costs ($/bbl) | | Revenue at field gate ($000’s) | | Transportation costs to point of sale ($000’s) | | Revenue at point of sale ($000’s) | |
| PKKR export sales | | | 3.27 | | | 36.47 | | | 119,185 | | | 37,682 | | | 156,867 | |
| Joint ventures export sales | | | 2.62 | | | 34.80 | | | 91,183 | | | 16,512 | | | 107,695 | |
| Royalty payments | | | 0.65 | | | 29.44 | | | 19,137 | | | - | | | 19,137 | |
| | | | 6.54 | | | 35.10 | | | 229,505 | | | 54,194 | | | 283,699 | |
| Impact of hedges | | | | | | | | | | | | | | | (39,478 | ) |
| Purchased crude export sales* | | | | | | | | | | | | | | | 24,553 | |
| Total | | | | | | | | | | | | | | | 268,774 | |
*Purchased crude export sales includes crude oil volumes purchased from third parties to top up tankers and volumes purchased and resold.
| | | | |
| | | Three months ended June 30, 2004 | |
| | | Quantity sold (MMbbls) | | Realized price net of transportation costs ($/bbl) | | Revenue at field gate ($000’s) | | Transportation costs to point of sale ($000’s) | | Revenue at point of sale ($000’s) | |
| PKKR export sales | | | 3.67 | | | 22.82 | | | 83,754 | | | 24,537 | | | 108,291 | |
| Joint ventures export sales | | | 3.32 | | | 23.06 | | | 76,564 | | | 16,277 | | | 92,841 | |
| Royalty payments | | | 0.71 | | | 16.41 | | | 11,649 | | | - | | | 11,649 | |
| | | | 7.70 | | | 22.33 | | | 171,967 | | | 40,814 | | | 212,781 | |
| Impact of hedges | | | | | | | | | | | | | | | (6,695 | ) |
| Total | | | | | | | | | | | | | | | 206,086 | |
| | • | The increase of $62.7 million in crude oil sales for the second quarter of 2005 compared to the same quarter of 2004 was due to the increased market price for crude oil (average Brent for the second quarter of 2005 increased by $16.31/bbl). |
| | | |
| | • | The positive effect of the increase in market prices was partially offset by the increase in foregone revenue of $32.8 million from our hedging program and lower sales volumes. |
| | | |
| | • | Royalty payment volumes are physical deliveries made quarterly in arrears for all fields with the exception of our Kumkol North and Kazgermunai fields. |
| | | | |
| | | Six months ended June 30, 2005 | |
| | | Quantity sold (MMbbls) | | Realized price net of transportation costs ($/bbl) | | Revenue at field gate ($000’s) | | Transportation costs to point of sale ($000’s) | | Revenue at point of sale ($000’s) | |
| PKKR export sales | | | 7.05 | | | 34.84 | | | 245,568 | | | 80,650 | | | 326,218 | |
| Joint ventures export sales | | | 5.93 | | | 33.84 | | | 200,674 | | | 34,815 | | | 235,489 | |
| Royalty payments | | | 1.61 | | | 25.26 | | | 40,672 | | | - | | | 40,672 | |
| | | | 14.59 | | | 33.38 | | | 486,914 | | | 115,465 | | | 602,379 | |
| Impact of hedges | | | | | | | | | | | | | | | (77,748 | ) |
| Purchased crude export sales* | | | | | | | | | | | | | | | 24,553 | |
| Total | | | | | | | | | | | | | | | 549,184 | |
*Purchased crude export sales includes crude oil volumes purchased from third parties to top up tankers and volumes purchased and resold.
| | | | |
| | | Six months ended June 30, 2004 | |
| | | Quantity sold (MMbbls) | | Realized price net of transportation costs ($/bbl) | | Revenue at field gate ($000’s) | | Transportation costs to point of sale ($000’s) | | Revenue at point of sale ($000’s) | |
| PKKR export sales | | | 8.46 | | | 20.40 | | | 172,607 | | | 64,009 | | | 236,616 | |
| Joint ventures export sales | | | 6.38 | | | 19.30 | | | 123,148 | | | 36,941 | | | 160,089 | |
| Royalty payments | | | 1.88 | | | 15.32 | | | 28,793 | | | - | | | 28,793 | |
| | | | 16.72 | | | 19.41 | | | 324,548 | | | 100,950 | | | 425,498 | |
| Impact of hedges | | | | | | | | | | | | | | | (11,934 | ) |
| Total | | | | | | | | | | | | | | | 413,564 | |
Our net realized prices are dependent on the world price for crude oil, the export route used and the point of sale or terms of sales, all of which may vary significantly from period to period. Our differential from Brent is our key performance indicator.
| | • | The increase of $135.6 million in crude oil sales for the six months of 2005 compared to the same period in 2004 was due to the increased market price for crude oil (average Brent for the period increased by $15.98/bbl). |
| | | |
| | • | The positive effect of the increase in market prices was partially offset by the increase in foregone revenue of $65.8 million from our hedging program and lower sales volumes. |
| | | |
| | • | Royalty payment volumes are physical deliveries made quarterly in arrears for all fields with the exception of our Kumkol North and Kazgermunai fields. |
REFINED PRODUCTS
The tables below set forth the related tonnes of refined products sold, the average prices obtained and revenues received for the three and six months ended June 30, 2005 and 2004.
| | | | |
| | | Three months ended June 30 | |
| | | Tonnes sold | | Average price at refinery gate ($/tonne) | | Transportation costs to point of sale | | Revenue at point of sale ($000’s) | |
2005 | | | 749,177 | | | 272.39 | | | 32,729 | | | 236,799 | |
| 2004 | | | 1,107,668 | | | 168.60 | | | 10,198 | | | 196,949 | |
| | | | |
| | | Six months ended June 30 | |
| | | Tonnes sold | | Average price at refinery gate ($/tonne) | | Transportation costs to point of sale | | Revenue at point of sale ($000’s) | |
2005 | | | 1,486,224 | | | 261.16 | | | 66,994 | | | 455,141 | |
| 2004 | | | 1,883,890 | | | 158.86 | | | 13,624 | | | 312,896 | |
Refined product revenues of $236.8 million in the second quarter of 2005 ($455.1 million in the six months of 2005) showed an increase of $39.9 million as compared to the second quarter of 2004 ($142.2 million compared to the six months of 2005). The main contributing factors were as follows:
| | • | Strong world crude oil prices during the period, which resulted in higher average product prices in Kazakhstan and neighboring countries. |
| | | |
| | • | In 2005 VGO sales increased by 146,033 tonnes over the second quarter and the six months of 2004. |
| | | |
| | • | The reduction of refined products sales volumes during the three and six month periods ended June 30, 2005 compared to the same periods in 2004 resulted from our reduced production and the fact that commencing May 2005 the crude oil shipped to the refinery by Turgai, has been tolled, or processed for a fee and Turgai retains title to and sells the refined products. |
PRODUCTION EXPENSES
Production expenses relate to the cost of producing crude oil in our Upstream operations. Based on the number of barrels of oil produced, these costs were as follows:
| | | | |
| | | Three months ended June 30 | |
| | | Production expenses ($000’s) | | Per barrel of oil produced ($/bbl) | |
2005 | | | 20,770 | | | 2.15 | |
| 2004 | | | 27,452 | | | 2.00 | |
| | | | |
| | | Six months ended June 30 | |
| | | Production expenses ($000’s) | | Per barrel of oil produced ($/bbl) | |
2005 | | | 43,166 | | | 1.87 | |
| 2004 | | | 49,916 | | | 1.87 | |
The higher expenses per barrel are due to the lower production volumes in 2005.
ROYALTIES AND TAXES
The following table sets forth the components of royalties and taxes.
| | | | |
| | | Three months ended June 30 | |
| | | 2005 ($000’s) | | 2004 ($000’s) | |
| Royalties and production bonus | | | 22,640 | | | 17,878 | |
| Fines and penalties cancelled per court decision | | | (7,899 | ) | | - | |
| Tax assessments | | | - | | | 251 | |
| Other taxes | | | 8,098 | | | 11,470 | |
| Royalties and taxes | | | 22,839 | | | 29,599 | |
| | | | |
| | | Six months ended June 30 | |
| | | 2005 ($000’s) | | 2004 ($000’s) | |
| Royalties and production bonus | | | 38,660 | | | 29,364 | |
| Fines and penalties cancelled per court decision | | | (7,899 | ) | | - | |
| ARNM assessment | | | - | | | 3,600 | |
| Tax assessments | | | - | | | 251 | |
| Other taxes | | | 16,917 | | | 18,758 | |
| Royalties and taxes | | | 47,678 | | | 51,973 | |
Royalties for the three months ended June 30, 2005 were $22.6 million, which represented an effective overall royalty rate of 6.8%. Royalties and production bonus for the three months 2004 were $17.9 million, which represented an effective overall royalty rate of 6.9% excluding production bonuses of $0.1 million for Kumkol North.
Royalties for the six months ended June 30, 2005 were $38.7 million, which represented an effective overall royalty rate of 5.98%. Royalties and production bonus for the six months 2004 were $29.4 million, which represented an effective overall royalty rate of 6.2% excluding production bonuses of $0.3 million.
In the second quarter of 2004, production bonus expenses related only to our Kumkol North field. In March 2005, the cumulative production at this field reached 15,000,000 tonnes (116.2 million barrels) and we paid a further $1.0 million of the production bonus (our 50% share) in April 2005. We do not have any further liabilities for production bonuses on any of our producing fields.
FINES AND PENALTIES CANCELLED PER COURT DECISION
As discussed in Note 15 to our interim consolidated financial statements, following a decision of the Supervisory Panel of the Supreme Court on road tax assessments previously booked as an expense. We reversed $7.9 million from royalties and taxes and recorded this amount as an accounts receivable in the interim consolidated financial statements.
OTHER TAXES
Other taxes of $8.1 million in the second quarter of 2005 ($11.5 million in the second quarter of 2004) included:
| | • | excise tax on refined products ($6.4 million in 2005 compared to $9.3 million in 2004 due to lower refined products sale in the current period); |
| | | |
| | • | various taxes, including property taxes, road fund and other ($1.7 million in 2005 compared to $2.2 million in the second quarter of 2004). |
Other taxes of $16.9 million in the six months of 2005 ($18.8 million in the six months of 2004) included:
| | • | excise tax on refined products ($12.5 million in 2005 compared to $14.2 million in 2004 due to lower refined products sale in the current period); |
| | | |
| | • | various taxes, including property taxes, road fund and other ($4.4 million in 2005 compared to $4.6 million for the six months of 2004). |
TRANSPORTATION
The table below sets out the components of transportation costs.
| | | | |
| | | Three months ended June 30 | |
| | | 2005 ($000’s) | | 2004 ($000’s) | |
| Pipeline | | | 3,679 | | | 3,478 | |
| Crude oil for processing | | | 9,996 | | | 5,056 | |
| Kazgermunai transportation | | | 6,173 | | | 8,659 | |
| Crude oil export | | | 43,174 | | | 27,329 | |
| Refined products transportation | | | 33,018 | | | 10,198 | |
| Other | | | 2,491 | | | 768 | |
| Total | | | 98,531 | | | 55,488 | |
| | | | |
| | | Six months ended June 30 | |
| | | 2005 ($000’s) | | 2004 ($000’s) | |
| Pipeline | | | 5,680 | | | 7,309 | |
| Crude oil for processing | | | 17,912 | | | 10,041 | |
| Kazgermunai transportation | | | 16,041 | | | 16,520 | |
| Crude oil export | | | 91,593 | | | 74,856 | |
| Refined products transportation | | | 65,179 | | | 13,624 | |
| Other | | | 3,332 | | | 1,754 | |
| Total | | | 199,737 | | | 124,104 | |
As noted in our net return discussion, the changes in our transportation and selling costs are largely dependent on our choice of export routes and the terms of sales, which vary from period to period. Our differential from Brent is the key performance indicator, which can be used to assess the results of our exports. Please see the discussion of our differential.
Pipeline
Pipeline costs decreased by $1.6 million during the six months of 2005 compared to the same period in 2004 mainly due to decreased export volumes through KTO pipeline system.
Crude oil for processing
Transportation costs to deliver crude oil for processing increased by $4.9 million in the second quarter of 2005 compared to the same period in 2004 ($7.9 million during the six months of 2005) mainly due to increased purchases made by our refinery at the Russian border as opposed to the Kumkol field gate in 2004.
Crude oil export
Transportation of exported crude oil increased by $15.8 million in the second quarter of 2005 compared to the same period in 2004 ($16.7 million in the six months of 2005) mainly due to the increased share of deals with final destination points further away from Kazakhstan and closer to our end buyers at the port of Batumi.
At the end of 2004 we entered into a number of operating leases for rail cars (see Note 18 to our annual consolidated financial statements). The number of leased cars was based on our expected production levels in 2005. As a result of our production curtailment, the fixed charges for leased cars have led to increased transportation expense on both an absolute and per barrel basis.
We have recently served termination notices with varying terms of notice (from 30 to 90 days) to the lessors for over 1,800 rail cars out of our existing fleet of approximately 4,000 leased rail cars.
Refined products transportation
Transportation expenses for refined products increased by $22.8 million in the second quarter of 2005 ($51.6 million during the six months of 2005) due to increased export volumes sold closer to our end buyers in 2005. Such sales of products in the second quarter and the six months of 2004 were significantly lower compared to the same periods in 2005.
REFINING
| | | | |
| | | Three months ended June 30 | |
| | | Refining expenses ($000’s) | | Per barrel of oil processed ($/bbl) | |
2005 | | | 6,376 | | | 0.89 | |
| 2004 | | | 5,427 | | | 0.70 | |
| | | | |
| | | Six months ended June 30 | |
| | | Refining expenses ($000’s) | | Per barrel of oil processed ($/bbl) | |
2005 | | | 10,823 | | | 0.76 | |
| 2004 | | | 9,515 | | | 0.64 | |
Refining costs per barrel were higher in the second quarter of 2005 by $0.19/bbl compared to the same quarter of 2004. This was due to lower processed volumes, which decreased by 0.52 mmbbls (6.7%), and the payment of national employee bonuses for year 2004 performance. Refining costs increased by $0.12/bbl in the first six months of 2005 due to lower processed volumes, national employee bonuses for year 2004 performance and minor repair and maintenance works carried out at the refinery during the first quarter.
CRUDE OIL AND REFINED PRODUCT PURCHASES
Crude oil and refined product purchases represent the expensed portion of crude oil purchased for the refinery from third parties, as well as refined products purchased for resale. Purchases and sales between our Upstream and Downstream business units are eliminated on consolidation.
Crude oil purchases in the second quarter of 2005 include $14.0 million for crude purchased to top up tankers at Batumi. In addition, 230,000 bbls of crude oil were purchased from third parties for approximately $8.5 million and re-sold in the second quarter of 2005. There were no such purchases in 2004.
Our purchases of crude oil and refined products were as follows:
| | | | |
| | | Three months ended June 30 | |
| | | 2005 ($000’s) | | 2004 ($000’s) | |
| Crude oil | | | 51,947 | | | 28,363 | |
| Refined products | | | 5,349 | | | 3,274 | |
| Total | | | 57,296 | | | 31,637 | |
| | | | |
| | | Six months ended June 30 | |
| | | 2005 ($000’s) | | 2004 ($000’s) | |
| Crude oil | | | 80,159 | | | 58,256 | |
| Refined products | | | 5,349 | | | 6,186 | |
| Total | | | 85,508 | | | 64,442 | |
SELLING
Selling expenses for crude oil are comprised of marketing overheads allocated to our Upstream operations and fixed marketing charges relating to crude oil export. Selling expenses for refined products are comprised of the costs of operating the regional distribution centres and other administrative costs related to our Downstream operations.
| | | | |
| | | Three months ended June 30 | |
| | | 2005 ($000’s) | | 2004 ($000’s) | |
| Crude oil | | | 1,557 | | | 2,385 | |
| Refined products | | | 3,428 | | | 3,956 | |
| Total | | | 4,985 | | | 6,341 | |
| | | | |
| | | Six months ended June 30 | |
| | | 2005 ($000’s) | | 2004 ($000’s) | |
| Crude oil | | | 3,842 | | | 4,503 | |
| Refined products | | | 6,275 | | | 7,286 | |
| Total | | | 10,117 | | | 11,789 | |
GENERAL AND ADMINISTRATIVE
The table below analyzes total general and administrative costs for Upstream, Downstream and Corporate. In the case of Upstream and Downstream the general and administrative costs are also reflected on a per barrel basis.
| | | | |
| | | Three months ended June 30, 2005 | |
| | | General and Administrative ($000’s) | | Per barrel of oil produced or processed* ($/bbl) | |
| Upstream | | | 15,493 | | | 1.61 | |
| Downstream | | | 5,197 | | | 0.72 | |
| Corporate | | | 6,452 | | | | |
| Total | | | 27,142 | | | | |
| | | | |
| | | Three months ended June 30, 2004 | |
| | | General and Administrative ($000’s) | | Per barrel of oil produced or processed* ($/bbl) | |
| Upstream | | | 7,917 | | | 0.58 | |
| Downstream | | | 3,505 | | | 0.45 | |
| Corporate | | | 4,280 | | | | |
| Total | | | 15,702 | | | | |
Upstream general and administrative expenses increased by $7.6 million during the second quarter of 2005 compared to the same period in 2004 mainly due to the following:
| | • | $1.7 million of legal and other expenses incurred by our Kazgermunai joint venture for capital commitments settlement (Note 14 to the interim consolidated financial statements); |
| | | |
| | • | $1.7 million of settlement paid by PKKR to Turgai for the central processing facility curtailment (Note 14 to the interim consolidated financial statements); |
| | | |
| | • | $1.1 million relating to court fees incurred as a result of litigation regarding our central processing facility curtailment (Note 14 to the interim consolidated financial statements); |
| | | |
| | • | $1.1 million of bad debt provision; |
| | | |
| | • | $0.5 million of management services charged to our Kazgermunai joint venture; |
| | | |
| | • | $0.3 million of social tax assessment in Kazgermunai for the years 2001-2002 (see Note 14 to our interim consolidated financial statements); |
| | | |
| | • | $0.3 million of donations made by Turgai. |
The residual $0.9 million increase in general and administrative expenses in the three months of 2005 compared with the same period in 2004 relates to our joint ventures and reflects the increased activity level.
Downstream general and administrative expenses during the second quarter of 2005 are $1.7 million higher compared to the same period in 2004 mainly due to an increase in our provision for obsolete inventory totalling $0.8 million and a $0.4 million increase in corporate charges.
Corporate general and administrative expenses increased by $2.2 in the second quarter of 2005 compared to the same period in 2004 mainly due to legal services relating to litigation with Lukoil (Note 14 to the interim consolidated financial statements).
| | | | |
| | | Six months ended June 30, 2005 | |
| | | General and Administrative ($000’s) | | Per barrel of oil produced or processed* ($/bbl) | |
| Upstream | | | 25,540 | | | 1.10 | |
| Downstream | | | 8,993 | | | 0.63 | |
| Corporate | | | 9,048 | | | | |
| Total | | | 43,581 | | | | |
| | | | |
| | | Six months ended June 30, 2004 | |
| | | General and Administrative ($000’s) | | Per barrel of oil produced or processed* ($/bbl) | |
| Upstream | | | 15,260 | | | 0.57 | |
| Downstream | | | 6,669 | | | 0.45 | |
| Corporate | | | 6,816 | | | | |
| Total | | | 28,745 | | | | |
* Including tollers’ volumes
Upstream general and administrative expenses increased by $10.3 million during the six months of 2005 compared to the same period in 2004 mainly due to:
| | • | $1.7 million of legal and other expenses incurred by our Kazgermunai joint venture for capital commitments settlement (Note 14 to the interim consolidated financial statements); |
| | • | $1.7 million of settlement paid by PKKR to Turgai for the central processing facility curtailment (Note 14 to the interim consolidated financial statements); |
| | • | $1.1 million relating to court fees incurred as a result of the litigation regarding our central processing facility curtailment (Note 14 to the interim consolidated financial statements); |
| | • | $1.1 million of bad debt provision; |
| | • | $1.5 million of management services charged to our Turgai and Kazgermunai joint ventures; |
| | • | $0.3 million of social tax assessment in Kazgermunai for the years 2001-2002 (see Note 14 to our interim consolidated financial statements); |
| | • | $0.3 million of donations made by Turgai. |
The residual $2.6 million increase in general and administrative expenses in the six months of 2005 compared with the same period in 2004 includes:
| | • | $1.7 million increase in general and administrative expenses of our joint ventures reflecting the increased activity level; |
| | • | $0.7 million in salaries for employees hired in 2005 and employee bonuses. |
Downstream general and administrative expenses for the six months of 2005 are $2.3 million higher compared to the same period in 2004 mainly due to an increase in our provision for obsolete inventory totalling $0.8 million and a $0.8 million increase in corporate charges.
Corporate general and administrative expenses increased by $2.2 in the six months of 2005 compared to the same period in 2004 mainly due to legal services relating to litigation with Lukoil (Note 14 to the interim consolidated financial statements) and $1.0 million of additional stock based compensation expense.
INTEREST AND FINANCING
The following table sets forth our interest and financing costs and any related amortization of debt issue costs or discounts upon issuance of the debt instrument.
| | | | |
| | | Three months ended June 30 | |
| | | 2005 ($000’s) | | 2004 ($000’s) | |
| 9.625% Notes | | | 3,504 | | | 3,504 | |
| Commitment fees and amortization of deferred charges on $100 million committed credit facility | | | 461 | | | - | |
| Kazgermunai debt | | | 201 | | | 392 | |
| Term loans | | | 132 | | | 122 | |
| Short-term debt | | | 592 | | | 205 | |
| Term facility | | | - | | | 1,250 | |
| Total | | | 4,890 | | | 5,473 | |
| | | | |
| | | Six months ended June 30 | |
| | | 2005 ($000’s) | | 2004 ($000’s) | |
| 9.625% Notes | | | 7,009 | | | 7,531 | |
| Commitment fees and amortization of deferred charges on $100 million committed credit facility | | | 809 | | | - | |
| Kazgermunai debt | | | 398 | | | 802 | |
| Term loans | | | 266 | | | 250 | |
| Short-term debt | | | 629 | | | 426 | |
| Term facility | | | - | | | 2,803 | |
| PKOP bonds | | | - | | | 469 | |
| Less portion capitalized | | | - | | | (13 | ) |
| Total | | | 9,111 | | | 12,268 | |
We did not incur interest expense on our term facility in 2005, as it was fully repaid in September 2004.
The PKOP bonds were fully redeemed on February 26, 2004.
DEPRECIATION, DEPLETION AND ACCRETION
| | | | |
| | | Three months ended June 30, 2005 | |
| | | Depreciation, Depletion and Accretion ($000’s) | | Depreciation and Depletion ($/bbl*) | |
| Upstream | | | 21,567 | | | 2.24 | |
| Downstream | | | 3,328 | | | 0.46 | |
| Corporate | | | 36 | | | | |
| Total | | | 24,931 | | | | |
* Downstream includes tollers’ volumes
| | | | |
| | | Three months ended June 30, 2004 | |
| | | Depreciation, Depletion and Accretion ($000’s) | | Depreciation and Depletion ($/bbl*) | |
| Upstream | | | 22,247 | | | 1.62 | |
| Downstream | | | 5,046 | | | 0.65 | |
| Corporate | | | 314 | | | | |
| Total | | | 27,607 | | | | |
* Downstream includes tollers’ volumes
Upstream depletion and depreciation expense of $2.24/bbl during the second quarter of 2005 and $1.62/bbl during the second quarter of 2004 includes:
• Depletion of oil and gas assets of $1.62/bbl in the second quarter of 2005 compared to $1.31/bbl in the same period of 2004. The $0.31/bbl increase in depletion expense in the current period was mainly due to the increase in our depletable assets and future development costs.
• Straight-line depreciation and accretion expense relating to our asset retirement obligation represent fixed charges and were $0.52/bbl in the second quarter of 2005 compared to $0.30/bbl in the same period of 2004. The $0.22/bbl increase in the current period reflects the impact of reduced production due to gas flaring restrictions.
Downstream depreciation expense decreased by $1.7 million in the second quarter of 2005 compared to the same quarter in 2004 due to certain Downstream assets becoming fully depreciated in 2004.
| | | | |
| | | Six months ended June 30, 2005 | |
| | | Depreciation, Depletion and Accretion ($000’s) | | Depreciation and Depletion ($/bbl*) | |
| Upstream | | | 46,811 | | | 2.02 | |
| Downstream | | | 6,485 | | | 0.45 | |
| Corporate | | | 113 | | | | |
| Total | | | 53,409 | | | | |
* Downstream includes tollers’ volumes
| | | | |
| | | Six months ended June 30, 2004 | |
| | | Depreciation, Depletion and Accretion ($000’s) | | Depreciation and Depletion ($/bbl*) | |
| Upstream | | | 39,008 | | | 1.46 | |
| Downstream | | | 9,915 | | | 0.67 | |
| Corporate | | | 625 | | | | |
| Total | | | 49,548 | | | | |
* Downstream includes tollers’ volumes
Upstream depletion and depreciation expense of $2.02/bbl during the six months of 2005 and $1.46/bbl during the six months of 2004 includes:
• Depletion expense of oil and gas assets of $1.62/bbl in the six months of 2005 compared to $1.16/bbl in the same period of 2004. The $0.46/bbl increase in depletion expense in the current period was mainly due to the increase in our depletable assets and future development costs.
• Straight-line depreciation and accretion expense relating to our asset retirement obligation represent fixed charges and were $0.44/bbl in the first half of 2005 compared to $0.29/bbl in the same period of 2004. The $0.15/bbl increase in the current period reflects the impact of reduced production due to gas flaring restrictions.
Downstream depreciation expense decreased by $3.4 million in the six months ended June 30, 2005 compared to the same period in 2004 due to certain Downstream assets becoming fully depreciated in 2004.
INCOME TAXES
| | | | |
| | | Three months ended June 30 | |
| | | 2005 | | 2004 | |
| Upstream | | | 78,633 | | | 46,790 | |
| Downstream | | | 19,503 | | | 32,088 | |
| Corporate | | | 23 | | | 1,114 | |
| Total | | | 98,159 | | | 79,992 | |
| | | | |
| | | Six months ended June 30 | |
| | | 2005 | | 2004 | |
| Upstream | | | 160,007 | | | 72,820 | |
| Downstream | | | 37,477 | | | 48,715 | |
| Corporate | | | 210 | | | 2,682 | |
| Total | | | 197,694 | | | 124,217 | |
Income taxes increased by $18.2 million in the second quarter of 2005 compared to the same period in 2004 mainly due to the following:
• $10.3 million was due to an increase in income before taxes.
• Excess profit tax in Turgai increased by $12.6 million in the second quarter of 2005 compared to the same quarter in 2004. See Note 10 to our interim consolidated financial statements.
Income taxes increased by $73.5 million in the six months of 2005 compared to the same period in 2004 mainly due to the following:
• $50.2 million was due to an increase in income before taxes.
• Excess profit tax in Turgai increased by $25.0 million in the six months of 2005 compared to the same period in 2004. See Note 10 to our interim consolidated financial statements.
CAPITAL EXPENDITURES AND COMMITMENTS
The table below sets forth a breakdown of our capital expenditures in the second quarter and six months of 2005 and 2004.
| | | | |
| | | Three months ended June 30 | |
| | | 2005 | | 2004 | |
| Upstream | | | | | | | |
Development wells | | | 18,388 | | | 9,940 | |
Facilities and equipment | | | 16,436 | | | 8,499 | |
Exploration | | | 3,494 | | | 6,049 | |
Kazgermunai infrastructure settlement | | | 15,600 | | | - | |
| Downstream | | | | | | | |
Refinery HS&E | | | 13 | | | 1,350 | |
Refinery sustaining | | | 623 | | | 473 | |
Refinery return projects | | | 652 | | | 149 | |
Marketing & other | | | 2,141 | | | 469 | |
| Corporate | | | 292 | | | 362 | |
| Total capital expenditure | | | 57,639 | | | 27,291 | |
| Less accrued amounts | | | (485 | ) | | 727 | |
| Total cash capital expenditure | | | 57,154 | | | 28,018 | |
| | | | |
| | | Six months ended June 30 | |
| | | 2005 | | 2004 | |
| Upstream | | | | | | | |
Development wells | | | 36,039 | | | 16,330 | |
Facilities and equipment | | | 18,624 | | | 32,065 | |
Exploration | | | 4,436 | | | 11,691 | |
Kazgermunai infrastructure settlement | | | 15,600 | | | - | |
| Downstream | | | | | | | |
Refinery HS&E | | | 159 | | | 1,892 | |
Refinery sustaining | | | 1,115 | | | 1,658 | |
Refinery return projects | | | 652 | | | 1,486 | |
Marketing & other | | | 10,754 | | | 650 | |
| Corporate | | | 827 | | | 644 | |
| Total capital expenditure | | | 88,206 | | | 66,416 | |
| Less accrued amounts | | | (8,724 | ) | | (3,362 | ) |
| Total cash capital expenditure | | | 79,482 | | | 63,054 | |
We have an active drilling program at our Aryskum and Kyzylkiya fields, which was the main reason for the substantial increase in development expenditures in the second quarter and the first six months of 2005. We drilled 12 wells in the second quarter of 2005 as opposed to 7 wells in the same period of 2004 (26 wells during the six months of 2005 compared to 11 wells in the same period of 2004).
As discussed in Note 14 to our interim consolidated financial statements, during the second quarter of 2005, our joint venture Kazgermunai settled an infrastructure claim lodged by the Kzyl-Oda Regional Oblast Akimat for $31.2 million (our share is $15.6 million). This payment represents full satisfaction of Kazgermunai’s infrastructure obligations under the terms of its Foundation Agreement, supplementary agreements and subsequent amendments and, accordingly, it was capitalized.
Upstream facilities and equipment for the three and six months ended June 30, 2005 include $7.0 million relating to the gas utilization plant at the Akshabulak field operated by Kazgermunai joint venture (our share is 50%).
Upstream facilities and equipment in the six months of 2004 included $10.4 million relating to the purchase of railcars and $11.0 million relating to the completion of our KAM pipeline and Gas utilization plant.
Expenditures for marketing and other assets in Downstream for the six months of 2005 include the purchase of 100 LPG railcars for $5.5 million.
TAX ASSESSMENTS AND LITIGATION
Please refer to Note 14 of our interim consolidated financial statements for a detailed description of each item.
LIQUIDITY
The levels of cash and cash equivalents, current assets and current liabilities as at June 30, 2005 and December 31, 2004 are set out below.
| | | | | | |
| | | As at June 30, 2005 ($000’s) | | As at December 31, 2004 ($000’s) | |
| Cash and cash equivalents* | | | 388,551 | | | 199,105 | |
| Cash flow | | | 350,799 | | | 560,491 | |
| Working capital** | | | 209,417 | | | 215,681 | |
| Net debt*** | | | (184,084 | ) | | (48,702 | ) |
| Ratio of cash flow to net debt | | | - | | | - | |
| Ratio of cash flow to fixed charges**** | | | 38.4 | | | 20.9 | |
| Ratio of earnings to fixed charges***** | | | 56.1 | | | 30.9 | |
* Cash and cash equivalents do not include restricted cash
**Working capital is net of cash and cash equivalents and short-term debt
*** Net debt includes short-term and long-term debt less cash and cash equivalents
**** Fixed charges include interest expense and preferred dividends before tax
***** Earnings is income before income taxes plus fixed charges
Restricted cash as at June 30, 2005 includes $64.0 million of cash dedicated to a margin account for our hedging program ($39.0 million as at December 31, 2004). The restricted cash balance related to our hedging program increased by $25.0 million compared to December 31, 2004 due to the increase in the price of crude oil. Cash dedicated to our hedging margin account fluctuates on a weekly basis with fluctuations in the future Brent price for crude oil. As the year progresses we will settle our hedges, and the cash dedicated to our hedging margin account will likely reduce and is expected to be nil by December 31, 2005.
We have $104.6 million in future income tax assets, the recoverability of which is dependent on generating sufficient taxable income in our operating subsidiaries to realize our future income tax assets. The majority (55%) of our future income tax assets is current and, accordingly, we expect to realize them within the next year.
Our 9.625% Notes have a credit rating of B+ from Standard and Poors and Ba3 from Moody’s. We are in compliance with our debt covenants as of June 30, 2005.
We also have available working capital facilities of $190.0 million. We believe we have sufficient funding and liquidity to meet our needs in 2005 through our cash flow and available credit facilities.
INTERIM CONSOLIDATED STATEMENTS OF INCOME AND RETAINED EARNINGS
(EXPRESSED IN THOUSANDS OF UNITED STATES DOLLARS, EXCEPT PER SHARE AMOUNTS)
UNAUDITED
| | | | | | |
| | | Three Months Ended June 30 | | Six Months Ended June 30 | |
| | | 2005 | | 2004 | | 2005 | | 2004 | |
REVENUE | | | | | | | | | | | | | |
Crude oil | | | 268,774 | | | 206,086 | | | 549,184 | | | 413,564 | |
Refined products | | | 236,799 | | | 196,949 | | | 455,141 | | | 312,896 | |
Service fees | | | 2,699 | | | 2,502 | | | 5,252 | | | 3,882 | |
Interest income | | | 1,313 | | | 797 | | | 2,492 | | | 1,240 | |
| | | | 509,585 | | | 406,334 | | | 1,012,069 | | | 731,582 | |
EXPENSES | | | | | | | | | | | | | |
Production | | | 20,770 | | | 27,452 | | | 43,166 | | | 49,916 | |
Royalties and taxes | | | 22,839 | | | 29,599 | | | 47,678 | | | 51,973 | |
Transportation | | | 98,531 | | | 55,488 | | | 199,737 | | | 124,104 | |
Refining | | | 6,376 | | | 5,427 | | | 10,823 | | | 9,515 | |
Crude oil and refined product purchases | | | 57,296 | | | 31,637 | | | 85,508 | | | 64,442 | |
Selling | | | 4,985 | | | 6,341 | | | 10,117 | | | 11,789 | |
General and administrative | | | 27,142 | | | 15,702 | | | 43,581 | | | 28,745 | |
Interest and financing costs | | | 4,890 | | | 5,473 | | | 9,111 | | | 12,268 | |
Depletion and depreciation | | | 24,931 | | | 27,607 | | | 53,409 | | | 49,548 | |
Foreign exchange loss (gain) | | | 4,931 | | | (1,111 | ) | | 6,613 | | | (5,795 | ) |
| | | | 272,691 | | | 203,615 | | | 509,743 | | | 396,505 | |
| INCOME BEFORE INCOME TAXES | | | 236,894 | | | 202,719 | | | 502,326 | | | 335,077 | |
| INCOME TAXES (Note 10) | | | | | | | | | | | | | |
Current provision | | | 101,242 | | | 89,643 | | | 210,673 | | | 135,002 | |
Future income tax benefit | | | (3,083 | ) | | (9,651 | ) | | (12,979 | ) | | (10,785 | ) |
| | | | 98,159 | | | 79,992 | | | 197,694 | | | 124,217 | |
NET INCOME BEFORE NON-CONTROLLING INTEREST | | | 138,735 | | | 122,727 | | | 304,632 | | | 210,860 | |
| NON-CONTROLLING INTEREST | | | 42 | | | (699 | ) | | (216 | ) | | (1,347 | ) |
NET INCOME | | | 138,777 | | | 122,028 | | | 304,416 | | | 209,513 | |
| RETAINED EARNINGS, BEGINNING OF PERIOD | | | 821,901 | | | 466,295 | | | 693,336 | | | 378,819 | |
| Normal course issuer bid | | | (56,251 | ) | | - | | | (81,129 | ) | | - | |
| Common share dividends | | | (11,501 | ) | | (17,706 | ) | | (23,692 | ) | | (17,706 | ) |
| Preferred share dividends | | | (4 | ) | | (8 | ) | | (9 | ) | | (17 | ) |
RETAINED EARNINGS, END OF PERIOD | | | 892,922 | | | 570,609 | | | 892,922 | | | 570,609 | |
| BASIC NET INCOME PER SHARE (Note 11) | | | 1.86 | | | 1.54 | | | 4.04 | | | 2.64 | |
| DILUTED NET INCOME PER SHARE (Note 11) | | | 1.85 | | | 1.51 | | | 4.02 | | | 2.60 | |
See accompanying notes to the interim consolidated financial statements.
INTERIM CONSOLIDATED BALANCE SHEETS
(EXPRESSED IN THOUSANDS OF UNITED STATES DOLLARS)
UNAUDITED
| | | | | | |
| | | As at June 30, 2005 | | As at December 31, 2004 | |
ASSETS | | | | | | | |
| CURRENT | | | | | | | |
Cash and cash equivalents | | | 388,551 | | | 199,105 | |
Accounts receivable (Note 5) | | | 162,927 | | | 198,504 | |
Inventory (Note 6) | | | 66,712 | | | 61,242 | |
Prepaid expenses | | | 49,333 | | | 62,179 | |
Current portion of future income tax asset | | | 57,767 | | | 65,431 | |
| | | | 725,290 | | | 586,461 | |
| Deferred charges | | | 4,161 | | | 4,662 | |
| Restricted cash (Note 4) | | | 64,035 | | | 47,741 | |
| Future income tax asset | | | 46,823 | | | 28,470 | |
| Property, plant and equipment | | | 631,972 | | | 601,747 | |
TOTAL ASSETS | | | 1,472,281 | | | 1,269,081 | |
LIABILITIES | | | | | | | |
| CURRENT | | | | | | | |
Accounts payable and accrued liabilities (Note 7) | | | 123,595 | | | 161,759 | |
Short-term debt (Note 8) | | | 70,938 | | | 15,541 | |
Prepayments for crude oil and refined products | | | 3,727 | | | 9,916 | |
| | | | 198,260 | | | 187,216 | |
| Long-term debt | | | 133,529 | | | 134,862 | |
| Asset retirement obligations | | | 33,995 | | | 32,499 | |
| Future income tax liability | | | 6,701 | | | 9,936 | |
| | | | 372,485 | | | 364,513 | |
| Non-controlling interest | | | 12,206 | | | 14,411 | |
| Preferred shares of subsidiary | | | 80 | | | 80 | |
COMMITMENTS AND CONTINGENCIES (Note 14) | | | | | | | |
| SHAREHOLDERS’ EQUITY | | | | | | | |
Share capital (Note 9) | | | 187,100 | | | 191,529 | |
Contributed surplus | | | 7,488 | | | 5,212 | |
Retained earnings | | | 892,922 | | | 693,336 | |
| | | | 1,087,510 | | | 890,077 | |
TOTAL LIABILITIES AND SHAREHOLDERS’ EQUITY | | | 1,472,281 | | | 1,269,081 | |
See accompanying notes to the interim consolidated financial statements.
| | | | | | |
| | | June 30, 2005 | | December 31, 2004 | |
| Current portion of term loans | | | 2,039 | | | 2,039 | |
| Kazgermunai debt | | | 13,899 | | | 13,502 | |
| Working capital facilities | | | 55,000 | | | - | |
| | | | 70,938 | | | 15,541 | |
Working capital facilities
The Corporation has three revolving working capital facilities available totaling $190.0 million, with $175.0 million committed and $15.0 million uncommitted, secured by a corporate guarantee. The facilities have interest rates ranging from LIBOR plus 2.65% per annum to 10% per annum.
$30.0 million of the committed facilities has been dedicated to cover margin calls under the Corporation’s hedging program. This amount is not available for general corporate purposes.
As at June 30, 2005 the Corporation had drawn $55.0 million under these facilities, bearing an annual interest rate of 8%.
9 SHARE CAPITAL
Authorized share capital consists of an unlimited number of Class A common shares, and an unlimited number of Class B redeemable preferred shares, issuable in series.
| Issued Class A common shares: | | | | | |
| | | Three Months Ended June 30, 2005 | | Three Months Ended June 30, 2004 | |
| | | Number | | Amount | | Number | | Amount | |
| Balance, beginning of period | | | 75,728,337 | | | 190,913 | | | 79,865,009 | | | 195,271 | |
| Shares repurchased and cancelled pursuant to normal course issuer bid | | | (1,806,100 | ) | | (4,593 | ) | | - | | | - | |
| Stock options exercised for cash | | | 74,113 | | | 780 | | | 732,157 | | | 596 | |
| Balance, end of period | | | 73,996,350 | | | 187,100 | | | 80,597,166 | | | 195,867 | |
| | | | | | |
| | | Six Months Ended June 30, 2005 | | Six Months Ended June 30, 2004 | |
| | | Number | | Amount | | Number | | Amount | |
| Balance, beginning of period | | | 76,223,130 | | | 191,529 | | | 77,920,226 | | | 191,695 | |
Shares repurchased and cancelled pursuant to normal course issuer bid | | | (2,538,900 | ) | | (6,451 | ) | | - | | | - | |
| Stock options exercised for cash | | | 303,961 | | | 2,019 | | | 2,648,382 | | | 4,163 | |
| Corresponding convertible securities, converted | | | 8,159 | | | 3 | | | 28,558 | | | 9 | |
| Balance, end of period | | | 73,996,350 | | | 187,100 | | | 80,597,166 | | | 195,867 | |
In August 2004, the Corporation renewed its Normal Course Issuer Bid program which enabled the Corporation to repurchase 7,091,429 Class A common shares during the period from August 13, 2004 to August 12, 2005. The Corporation repurchased and cancelled 1,806,100 shares at an average price of C$41.3 per share during the three months ended June 30, 2005 (2,538,900 shares at an average price of C$42.2 per share during the six months ended June 30, 2005). The excess of cost over the book value for the shares repurchased was applied to retained earnings.
A summary of the status of the Corporation’s stock option plan as of June 30, 2005 and the changes during the six months ended June 30, 2005 and the year ended December 31, 2004 are presented below (weighted average exercise price expressed in Canadian dollars):
| | | Options | | Weighted Average Exercise Price | |
| Outstanding at December 31, 2003 | | | 5,115,460 | | | 8.17 | |
Granted | | | 724,100 | | | 42.50 | |
Exercised | | | (3,560,379 | ) | | 4.77 | |
Forfeited | | | (192,525 | ) | | 15.94 | |
| Outstanding at December 31, 2004 | | | 2,086,656 | | | 25.17 | |
Granted | | | 321,000 | | | 40.00 | |
Exercised | | | (312,120 | ) | | 8.03 | |
Forfeited | | | (28,084 | ) | | 18.83 | |
| Outstanding at June 30, 2005 | | | 2,067,452 | | | 30.16 | |
| Options exercisable as at: | | | | | | | |
December 31, 2004 | | | 866,903 | | | 16.29 | |
June 30, 2005 | | | 593,935 | | | 20.06 | |
10 INCOME TAXES
The provision for income taxes differs from the results which would have been obtained by applying the statutory tax rate of 30% to the Corporation’s income before income taxes. This difference results from the following items:
| | | | | | |
| | | Three Months Ended June 30 | | Six Months Ended June 30 | |
| | | 2005 | | 2004 | | 2005 | | 2004 | |
| Income before income taxes | | | 236,894 | | | 202,719 | | | 502,326 | | | 335,077 | |
| Statutory Kazakhstan income tax rate | | | 30 | % | | 30 | % | | 30 | % | | 30 | % |
| Expected tax expense | | | 71,068 | | | 60,816 | | | 150,698 | | | 100,523 | |
| Effect of higher tax rate in Kazgermunai | | | 4,253 | | | 2,138 | | | 5,732 | | | 1,465 | |
| Excess profit tax provision | | | 19,450 | | | 6,833 | | | 34,843 | | | 9,833 | |
| Income tax assessment in Turgai for 2002 - 2003 | | | 2,629 | | | - | | | 2,629 | | | - | |
| Other permanent differences, net | | | 759 | | | 10,205 | | | 3,792 | | | 12,396 | |
| Income tax expense | | | 98,159 | | | 79,992 | | | 197,694 | | | 124,217 | |
11 NET INCOME PER SHARE
The net income per share calculations are based on the weighted average and diluted numbers of Class A common shares outstanding during the period as follows:
| | | | | | |
| | | Three Months Ended June 30 | | Six Months Ended June 30 | |
| | | 2005 | | 2004 | | 2005 | | 2004 | |
| Weighted average number of common shares outstanding | | | 74,666,131 | | | 79,442,775 | | | 75,288,966 | | | 79,257,431 | |
| Dilution from exercisable options (including convertible securities) | | | 350,245 | | | 1,278,756 | | | 452,441 | | | 1,227,461 | |
| Diluted number of shares outstanding | | | 75,016,376 | | | 80,721,531 | | | 75,741,407 | | | 80,484,892 | |
698,100 options were excluded from the calculation of diluted number of shares outstanding for the three months ended June 30, 2005 (683,100 for the six months ended June 30, 2005) as the exercise price was in excess of the average market price. No options were excluded from the calculation of diluted number of shares outstanding for the three and six months ended June 30, 2004 as the market price was in excess of the exercise price.
12 FINANCIAL INSTRUMENTS
The Corporation’s financial instruments include cash and cash equivalents, accounts receivable, all current liabilities and long-term debt. The fair value of cash and cash equivalents, accounts receivable and current liabilities approximates their carrying amounts due to the short-term maturity of these instruments. The fair value of Kazgermunai debt and the term loans approximates their carrying value as they bear interest at market rates. The fair value of the 9.625% Notes is $136.8 million versus the carrying value of $125.0 million as at June 30, 2005 as determined through reference to the market price.
The Corporation has entered into a commodity-hedging program where it is utilizing derivative instruments to manage the Corporation’s exposure to fluctuations in the price of crude oil. The Corporation had entered into the following contracts with major financial institutions.
Contract Amount (bbls per month) | | Contract Period | | Contract Type | | Price Ceiling or Contracted Price | |
| 120,000 | | | January 2005 to March 2005 | | | IPE Future | | | 26.30-26.52 | |
| 40,000 | | | April 2005 to June 2005 | | | IPE Future | | | 25.92 | |
| 458,333 | | | January 2005 to December 2005 | | | IPE Future | | | 25.65-25.90 | |
During the three months ended June 30, 2005 the Corporation has foregone revenue of $39.5 million through these contracts ($77.7 million during the six months ended June 30, 2005).
The unrealized loss under these hedges as at June 30, 2005 is $84.8 million. This amount is deferred and recognized in the consolidated statement of income when the related contract is settled. The fair value of these hedges was determined based on future Brent crude oil prices as at June 30, 2005.
13 CASH FLOW INFORMATION
Interest and income taxes paid:
| | | | | | |
| | | Three Months Ended June 30 | | Six Months Ended June 30 | |
| | | 2005 | | 2004 | | 2005 | | 2004 | |
| Interest paid | | | 1,117 | | | 2,205 | | | 7,531 | | | 10,702 | |
| Income taxes paid | | | 168,098 | | | 61,701 | | | 238,263 | | | 104,114 | |
14 COMMITMENTS AND CONTINGENCIES
TAX ASSESSMENTS
Turgai tax assessments
During 2004, Turgai was subject to a tax audit for the years 2002-2003 and received a tax assessment for $150.0 million at current exchange rates including penalties and interest (the Corporation’s 50% share is $75.0 million).
The major assessment in the tax audit was for excess profit taxes of approximately $101.5 million including fines and penalties (the Corporation’s 50% share is $50.75 million). The assessment was based on the position that expenditures relating to construction in progress are not allowed as a cash outflow when computing the internal rate of return until construction is completed and depreciation has commenced. The Corporation believes this position is contrary to the concept of an internal rate of return calculation and counter to the legislation of the Republic of Kazakhstan. The Corporation, the other 50% shareholder Lukoil and Turgai entered into discussions regarding this assessment with the Ministry of Finance. These discussions are being held to determine the correct method of calculating excess profit tax and to clarify the interpretation of current legislation. The assessment on excess profit tax has been removed pending conclusion of these discussions. Upon agreement with the Ministry of Finance, Turgai will present a proposed Hydrocarbon Contract amendment to the Ministry of Energy and Mineral Resources, clarifying the method of calculating excess profit tax. A final assessment pertaining to excess profit tax may be issued depending on the outcome of the discussions. The outcome of these discussions can not be determined, and, therefore, no amounts have been recorded in these interim consolidated financial statements.
The remaining amount of $48.5 million was discussed with the Ministry of Finance and Turgai appealed through the courts. Turgai was successful with respect to $20.5 million, was unsuccessful on $11.9 million with the balance of $16.1 million still pending a decision on appeal. Of the assessments upheld by the courts, $10.7 million related to accelerated depreciation claims that were disallowed under Turgai’s stabilized tax legislation. The Corporation has recorded its 50% share of the $11.9 million of assessments upheld by the courts as an expense in the current period and recorded a future income tax benefit amounting to $3.3 million on the accelerated depreciation.
PKKR and PKOP transfer pricing assessments
In April 2005, the Corporation, through its subsidiaries, received two assessments on transfer pricing for 2002 and 2003, including $61.9 million for PKKR and $11.7 million for PKOP (at current exchange rates). For crude oil sales, the majority of the assessment pertains to the differentials to market benchmarks negotiated with purchasers of PKKR’s crude oil that reflect transportation costs to the corresponding markets. For refined products, the major portion of the assessment relates to applying retail prices to the Corporation’s wholesale sales transactions.
The Corporation believes these assessments are incorrect, as they fail to apply the correct market prices for the type of sales transaction and to recognize the arms length nature of the transactions. The Corporation has appealed these assessments and is currently engaged in discussions with the tax authorities. No provision has been made in the interim consolidated financial statements for these assessments.
Kazgermunai tax assessments
In late 2003, the Corporation, through its joint venture Kazgermunai, received tax assessments for 2001 and 2002 amounting to $9.6 million at current exchange rates (the Corporation’s 50% share - $4.8 million). Kazgermunai appealed these assessments and prevailed with respect to $4.2 million, was unsuccessful regarding $0.5 million with the outcome of the remaining $4.9 million still pending while under appeal. The Corporation has recorded $0.25 million, its 50% share of the assessment upheld by the court, in these interim consolidated financial statements.
In late 2004, Kazgermunai received a transfer pricing assessment for 2003 for approximately $6.1 million at current exchange rates (the Corporation’s 50% share - $3.05 million). Neither the Corporation nor Kazgermunai agree with this assessment, and Kazgermunai is currently disputing this assessment through the legal system. No amounts were recorded related to this assessment in the interim consolidated financial statements.
Tax inspections
The Corporation’s operating subsidiaries in Kazakhstan are currently the subject of tax inspections for the years 2002 through 2004. These inspections are expected to be complete and assessments, if any, issued in the third or fourth quarter of 2005.
Agency for Regulation of Natural Monopolies and Protection of Competition (“ARNM”)
The ARNM claimed $32.7 million (at current exchange rates) from a group distribution company for allegedly violating Kazakhstan’s competition law. The group distribution company initiated legal proceedings and the court of first instance dismissed the ARNM claim. The ARNM appealed this decision; the appellate court upheld the decision of the lower court. The ARNM has filed a motion to re-open the court case on the basis of new information.
The ARNM also claimed approximately $97.3 million (at current exchange rates) from group distribution companies for allegedly violating Kazakhstan’s competition law. The group distribution companies initiated legal action, and at the Astana City Court were unsuccessful in their challenge of allegations by the ARNM that these companies had violated Kazakhstan competition laws. The initial trial court judgment upheld the ARNM determination that these group distribution companies had received unjustified revenues totaling approximately $97.3 million.
The group distribution companies appealed this judgment to the Supreme Court. The initial Supreme Court hearing on the matter was held in the second quarter of 2004 and the Court suspended the case and instructed the parties to seek an agreed settlement. During the period from April to May 13, 2004 the parties did engage in discussions aimed at a settlement, but were unable to resolve the matter through negotiations.
On May 13, 2004, after a hearing on the merits, the Supreme Court overturned the lower court decision which was in favour of the ARNM and sent the case back to the Astana City Court for a new trial. During the third quarter of 2004, the General Prosecutor’s office filed a protest regarding the May 13 decision of the Supreme Court with the Supreme Court Supervisory Panel. On August 25, 2004, the Supervisory Panel issued an opinion upholding the May 13 decision and returned the case to the Astana City Court. In September 2004, the Astana City Court issued a ruling suspending further consideration of the merits of the case pending the completion of parallel investigations being conducted by the “Agency of the Republic of Kazakhstan for Fight Against Economic and Corruption Criminality” (“Finance Police”). This suspension was removed in late 2004 and the case was reviewed by economic and financial experts under order of the Court. It was expected that the economic and financial expertise would be concluded during the spring of 2005 and that the case would, at that point, be subject to further review and decision by the Astana City Court.
In April 2005, the Finance Police placed a lien on the property of PKOP for $13.4 billion Tenge (approximately $98.9 million) to secure the ARNM’s claim for approximately $97.3 million (at current exchange rates) against group distribution companies and the amounts claimed as damages under the criminal charges brought against certain executives of PKOP. The Corporation has appealed this lien to the General Prosecutor’s Office and if unsuccessful will appeal in court.
It remains the Corporation’s view that the allegations leveled against the group distribution companies are without justification. A highly competitive market exists for oil products within Kazakhstan and the current level of prices reflects current world crude oil prices. Also, the prices charged by the group distribution companies are competitive with Russian imports and with those charged by distributors of the other two refineries in Kazakhstan.
The Corporation is considering its recourse rights under the terms of the Shymkent refinery Privatization Agreement, which clearly stipulates the right to sell any and all its products in Kazakhstan and abroad at free market prices.
The Corporation will continue to seek a dialogue with the appropriate authorities to address the concerns related to the pricing of refined products and possible measures to be taken to further promote transparency and effective monitoring of the dynamics of competition, consistent with market economy principles. The Corporation has not provided for these amounts in the interim consolidated financial statements. See Note 15 Subsequent Events.
Curtailment of production
On April 26, 2005 the Corporation’s subsidiary PKKR commenced the process of reducing production in accordance with new legislation passed in December 2004 prohibiting gas flaring except under limited circumstances. Turgai and Kazgermunai also reduced production to comply with the new legislation.
The Corporation remains hopeful that, in view of its current investment program to achieve full gas utilization by mid - 2006, it will be allowed to resume production at higher rates prior to the completion of its gas re-injection program.
Kazgermunai social infrastructure obligations
In February 2005, the Corporation’s joint venture Kazgermunai, received a claim filed by the Kyzylorda Regional Oblast Akimat (regional administration) for failure to fulfill infrastructure obligations amounting to $31.2 million alleged to arise from the terms of its Foundation Agreement, supplementary agreements, and subsequent amendments to these agreements. The claim was for approximately $102.0 million (the Corporation’s 50% share is $51.0 million), with $31.2 million relating to infrastructure obligations and the remainder being interest charges.
In May 2005, Kazgermunai and the Akimat reached a settlement agreement under which Kazgermunai agreed to pay $31.2 million (the Corporation’s 50% share is $15.6 million) for fulfillment of all of its infrastructure obligations. The Corporation capitalized this payment as it settles one of the alleged obligations of Kazgermunai under its Foundation Agreement.
LITIGATION
TURGAI CLAIMS AGAINST PKKR
Migration of crude oil
In May 2005, Turgai filed a claim that alleged that PKKR has produced crude oil that originated from Turgai’s license area. The claim is for approximately $188.2 million at current exchange rates. The first hearing was to be held on June 21, 2005 and was delayed until July 14, 2005.
The Corporation believes that this claim is groundless, has documented numerous technical and legal counter arguments in support of its position, and, therefore, has made no provision for this claim in these interim consolidated financial statements. See Note 15 Subsequent Events.
Return of crude oil
In May 2005, Turgai filed a claim seeking that PKKR return to Turgai approximately 395,000 tonnes of crude oil (3.1 million barrels) that Turgai alleged PKKR should not have shipped to the Shymkent refinery. The Corporation disagrees with this claim, on the basis that the crude oil was shipped in accordance with the MEMR monthly refinery supply plan, as well as applicable Turgai shareholder agreements and board resolutions. Additionally, PKOP had paid
Turgai for the crude oil and Turgai had accepted the payment. The court of first instance, the Kyzylorda Specialized Interdistrict Economic Court, ruled in Turgai’s favor and PKKR has filed an appeal. The Appellate Court hearing was scheduled to take place on July 20, 2005. See Note 15 Subsequent Events.
Central processing facility curtailment
In February 2005, the Corporation, through PKKR, received a claim filed by Turgai for $18.3 million in damages related to the temporary production curtailment of Turgai in late December 2004 and alleged lost revenue from export sales.
The claim was separated into two cases. The first case, for $13.1 million, related to the alleged lost revenue from export sales of 60,000 tonnes. In March 2005, the Kyzylorda Interregional Economic Court issued a decision in favor of Turgai. PKKR filed an appeal, the hearing of which was held in April 2005. The Appellate Court issued a decision requiring PKKR to pay Turgai $13.1 million for the alleged lost revenues from export sales of 60,000 tonnes (0.46 million barrels), and, in return, Turgai was required to transfer title to 60,000 tonnes of crude oil to PKKR. PKKR does not plan to appeal this ruling. The Corporation has recorded the transaction as a purchase of crude oil in the interim consolidated financial statements.
The second case, for $5.2 million, related to compensation for damages from the curtailment of production. The Court of first instance ruled in favor of Turgai; PKKR appealed and the Appellate Court ruled in Turgai’s favor but reduced the amount to $3.5 million. The Corporation has recorded the consolidated impact of $1.7 million as part of general and administrative expenses in the interim consolidated financial statements.
Price received for crude sold to PKOP
In April 2005, Turgai filed two claims with respect to the price paid by PKOP for purchased crude oil. In the first claim, which covers the period from August to October 2004, Turgai is claiming approximately $5.5 million at current exchange rates for the alleged difference between market price and the price paid by PKOP for crude oil purchased from Turgai and is seeking to invalidate offsets totaling $31.7 million that PKOP made for amounts owed by Turgai. The court of first instance, the Kyzylorda Specialized Interdistrict Economic Court, ruled in Turgai’s favor and PKOP has lodged an appeal. The Appellate Court hearing took place on July 20, 2005. See Note 15 Subsequent Events.
No provision has been made in the interim consolidated financial statements because the Corporation believes that Turgai’s claims are groundless. The purchase price for crude oil is based upon a formula that has been approved and agreed to by Turgai’s Board of Directors and its shareholders.
The second claim is for November and December 2004 crude oil purchases and is claiming approximately $7.3 million for the alleged difference between market price and the price paid by PKOP for crude oil purchased from Turgai. The court of first instance, the Kyzylorda Specialized Interdistrict Economic Court, ruled in Turgai’s favor and PKOP has appealed. The Appellate Court hearing was expected to take place in July 2005. The date of the hearing has not been set. No provision has been made in the interim consolidated financial statements as the Corporation believes that Turgai’s claims are groundless.
Invalidation of export contracts
In June 2005, Turgai filed a claim seeking damages of approximately $3.5 million for earlier actions taken by PetroKazakhstan Inc. and PKKR to invalidate certain Turgai export contracts. Turgai petitioned the Kyzylorda Specialized Interregional Economic Court to post as security the Corporation’s shares in Turgai pending the outcome of the court proceedings.
PetroKazakhstan Inc. and PKKR are continuing to take measures to release the shares and will vigorously defend themselves. In the event that hearings proceed, PetroKazakhstan believes the claims are groundless as Turgai sustained no damage. In the unlikely event that PetroKazakhstan loses the case, payment of the damages awarded will immediately release the security on PetroKazakhstan Inc.’s shares in Turgai.
LUKOIL LITIGATION
PetroKazakhstan vs Lukoil Stockholm Arbitration
On July 6, 2004, PetroKazakhstan filed a Request for Arbitration with the Arbitration Institute of the Stockholm Chamber of Commerce against Lukoil Overseas Kumkol BV (“Lukoil”) seeking compensation for lost profits which PetroKazakhstan would have received as a 50% shareholder of Turgai Petroleum but for Lukoil’s failure to finance the
joint venture as provided under the Foundation Agreements for the Joint Venture and for Lukoil’s actions in violation of corporate governance obligations and tender approval requirements. The Statement of Claim also includes damages for costs incurred due to Lukoil-initiated litigation in Kazakhstan, to force a PetroKazakhstan subsidiary, PKOP, to accept crude oil for processing rather than sale, and will also claim any losses incurred in current Kazakh litigation, relating to crude oil sales pricing in August-December 2004 and crude oil delivery and pricing in January-March 2005.
PetroKazakhstan submitted its full Statement of Claim on April 22, 2005 and its statement of the damages it is seeking on June 30, 2005. PetroKazakhstan’s Statement of Damages claims $293 million, and injunctive relief to halt all actions that violate corporate governance obligations.
Lukoil submitted its Preliminary Statement of Defense and Counterclaim on July 7, 2004 and claimed $252 million for Turgai and $4 million for Lukoil, together with a request for a $600 million letter of credit as a surety against PetroKazakhstan requests for injunctive relief.
Lukoil is expected to file its Statement of Damages on October 3, 2005.
A preliminary hearing is scheduled before the Tribunal on September 19, 2005.
The outcome of this litigation can not be determined, and, accordingly, no amounts have been recorded in the interim consolidated financial statements.
PetroKazakhstan vs Lukoil Amsterdam litigation
On July 21, 2004, PKKR filed a claim in the District Court of Amsterdam against Lukoil for damages suffered by PKKR as a result of unlawful actions by Lukoil related to the shut-in of certain wells located at the border of the Kumkol North and the Kumkol South fields. The preliminary amount of the claim, as at the date of the filing, was an initial $65 million. This amount increases daily as the production of Kumkol South continues to be partly constrained.
The outcome of this litigation can not be determined, and, accordingly, no amounts have been recorded in the interim consolidated financial statements.
PetroKazakhstan vs Lukoil/Turgai Paris Arbitration
On May 9, 2005, PetroKazakhstan filed a Request for Arbitration with the Arbitration Institute of the International Chamber of Commerce, Paris. PetroKazakhstan is seeking clarification of Turgai’s and Lukoil’s obligations and other terms of the KAM pipeline agreements. Lukoil and Turgai have agreed to consolidate all KAM pipeline related disputes under this arbitration and have withdrawn all KAM pipeline related claims from the Kazakh court system. As part of this agreement, Lukoil and Turgai have dropped an earlier claim brought in the Kazakh Courts seeking to invalidate the arbitration clauses of the KAM pipeline agreements.
Lukoil/Turgai vs PetroKazakhstan Stockholm Arbitration
In April 2005, the Corporation received a copy of a Request for Arbitration filed with the Arbitration Institute of the Stockholm Chamber of Commerce by Lukoil and Turgai against PetroKazakhstan Inc. for $100 million. This amount represents the alleged difference between market prices and the prices paid by PKOP for crude oil purchased from Turgai during the period from October 2003 to November 2004.
The Corporation believes the claim is without merit, as the price paid was in accordance with prevailing agreements. No provision has been made in the interim consolidated financial statements for this claim.
MINISTRY OF ENERGY AND MINERAL RESOURCES GEOLOGY AND SUBSURFACE USE COMMITTEE (“COMMITTEE”) OF THE REPUBLIC OF KAZAKHSTAN VS. PKKR
In May 2005, the Committee filed a claim against PKKR for approximately $4.4 million for violation of a no flaring injunction received earlier in the year. The first hearing was held on July 6, 2005 with the decision in favor of the Committee. The Corporation does not agree with the decision and plans to appeal. The Corporation has not provided for this claim in the interim consolidated financial statements.
PKOP vs. SFE Ltd.
In October 2004, PKOP filed a claim against SFE Ltd., a minority shareholder in PKOP, for enforcement of a share redemption agreement pursuant to SFE Ltd. requesting redemption after voting against a reorganization of PKOP from
a joint stock company to an LLP. SFE Ltd. has filed a number of counter claims with the most significant disputing the valuation of its shares in PKOP and obtaining injunctions prohibiting PKOP from entering into certain transactions.
The case regarding the injunction prohibiting certain transactions has progressed through the Kazakhstan court system and in May of 2005, the Supreme Court ruled that pending the outcome of the dispute, PKOP is prohibited from entering into transactions, which would decrease the equity of PKOP and that PKOP can not enter into share transactions. The remaining cases are progressing through the court system.
The outcome of the litigation can not be determined, and, therefore, no amounts were recorded in the interim consolidated financial statements.
OTHER LITIGATION
The Corporation is involved in certain other litigation and claims associated with the normal course of operations. Management believes that settlements, if any, would not have a material impact on the Corporation’s interim consolidated financial statements.
15 SUBSEQUENT EVENTS
ARNM
On July 13, 2005 the City Court of Astana rendered a decision adverse to the group distribution companies for an aggregate amount of approximately $55.4 million. The judgement may be appealed to the Supreme Court of Kazakhstan. The outcome of the appeal can not be determined, therefore, no provision has been made in the interim consolidated financial statements for this judgement.
The Corporation, through its subsidiaries in Kazakhstan, has been involved in extensive negotiations aimed towards a settlement. The Corporation does not view this judgement as an obstacle to the settlement of the civil and related criminal cases.
TURGAI CLAIMS AGAINST PKKR
Migration of crude oil
At a hearing on July 18, 2005, the court requested that MEMR experts review the technical arguments. This process is expected to require a number of months to complete.
Return of crude oil
On July 20, 2005 the Appellate Court, the Board of Civil Affairs of Kyzylorda Oblast Court, ruled in Turgai’s favor and obligated PKKR to return approximately 395,000 tonnes to Turgai.
Turgai argued that PKKR was obliged to transfer crude oil into the Kaztransoil pipeline system for export under a Services Contract. PKKR argued in its appeal that oil was forwarded to the Shymkent Refinery, by a different route in accordance with the MEMR monthly refinery supply plan, as well as existing contractual obligations of Turgai approved by Shareholder Resolutions and also other contractual arrangements approved by Lukoil.
The Corporation also noted that Turgai received and accepted money from PKOP for the crude oil supplied to the refinery by Turgai.
PKKR intends to appeal this decision to the Supervisory Panel of the Board on Civil Affairs of the Kyzylorda Oblast Court but in the meantime, as required by law, PKKR will execute the court decision and return the crude oil to Turgai.
The Corporation will, in any event, pursue reimbursement of damages at international arbitration, owing to Lukoil’s failure to comply with shareholders agreements related to Turgai and breaches of corporate governance rules.
These interim consolidated financial statements still record the deliveries of Turgai crude oil made to Shymkent in January-March 2005 as sales of Turgai, because the Corporation does not agree with this decision and will appeal.
Price received for crude sold to PKOP
On July 20, 2005 the Appellate Court of the South Kazakhstan Oblast issued a decision that PKOP should reimburse the alleged difference of approximately $5.5 million between alleged market price and the price paid by PKOP for crude
oil purchased from Turgai during the period from August to October 2004. PKOP disagrees with this decision as Turgai was contractually bound to supply PKOP, at the price paid by PKOP, because there was a crude purchase contract in force that had been approved by the shareholders, Lukoil and PetroKazakhstan.
PKOP will appeal again to the Supervisory Panel of the South Kazakhstan Oblast Court, but in the meantime, as required by law, will pay the amount in question. The Corporation will, in any event, pursue reimbursement in international arbitration owing to Lukoil’s wrongful failure to comply with the requirements of the Kazakhstan Law on Joint Stock Companies and other breaches of the Corporation’s shareholder agreement with Lukoil. The Corporation has not recorded any provision for this decision, as it does not agree and plans to further appeal.
ROAD TAX ASSESSMENTS FOR 1998 AND 1999
PKKR has been disputing approximately $7.9 million (using current exchange rates) in assessed fines and penalties relating to assessments received for the 1998 and 1999 taxation years.
This matter was previously appealed to the Supervisory Panel of the Supreme Court (“Supervisory Panel”), and they remanded the case back to the lower court in Kyzylorda for a retrial. The lower court rejected the Supervisory Panel’s instruction, a retrial was not held, and the lower court let the original decision stand.
The Corporation recorded, as an expense, $8.0 million in the consolidated financial statements for the year ended December 31, 2004.
The lower court’s refusal to comply with the Supervisory Panel’s instruction was appealed to the Supervisory Panel. On July 19, 2005 a hearing was held, whereby the Supervisory Panel issued a decision in favor of PKKR. The Corporation reversed $7.9 million from royalties and expenses and recorded this amount as an account receivable in its interim consolidated financial statements.