
UMB Financial Second Quarter 2016 July 26, 2016 Exhibit 99.6
Cautionary Notice about Forward-Looking Statements This presentation contains, and our other communications may contain, forward-looking statements within the meaning of the Private Securities Litigation Reform Act of 1995. These statements can be identified by the fact that they do not relate strictly to historical or current facts—such as our statements about expected cost savings and other results of efficiency initiatives and our statements about asset sensitivity. Forward-looking statements often use words such as “believe,” “expect,” “anticipate,” “intend,” “estimate,” “project,” “outlook,” “forecast,” “target,” “trend,” “plan,” “goal,” or other words of comparable meaning or future-tense or conditional verbs such as “may,” “will,” “should,” “would,” or “could.” Forward-looking statements convey our expectations, intentions, or forecasts about future events, circumstances, results, or aspirations. All forward-looking statements are subject to assumptions, risks, and uncertainties, which may change over time and many of which are beyond our control. You should not rely on any forward-looking statement as a prediction or guarantee about the future. Our actual future objectives, strategies, plans, prospects, performance, condition, or results may differ materially from those set forth in any forward-looking statement. Some of the factors that may cause actual results or other future events, circumstances, or aspirations to differ from those in forward-looking statements are described in our Annual Report on Form 10-K for the year ended December 31, 2015, our subsequent Quarterly Reports on Form 10-Q or Current Reports on Form 8-K, or other applicable documents that are filed or furnished with the Securities and Exchange Commission (SEC). Any forward-looking statement made by us or on our behalf speaks only as of the date that it was made. We do not undertake to update any forward-looking statement to reflect the impact of events, circumstances, or results that arise after the date that the statement was made. You, however, should consult further disclosures (including disclosures of a forward-looking nature) that we may make in any subsequent Annual Report on Form 10-K, Quarterly Report on Form 10-Q, Current Report on Form 8-K, or other applicable document that is filed or furnished with the SEC.

2Q 2016 Performance Highlights
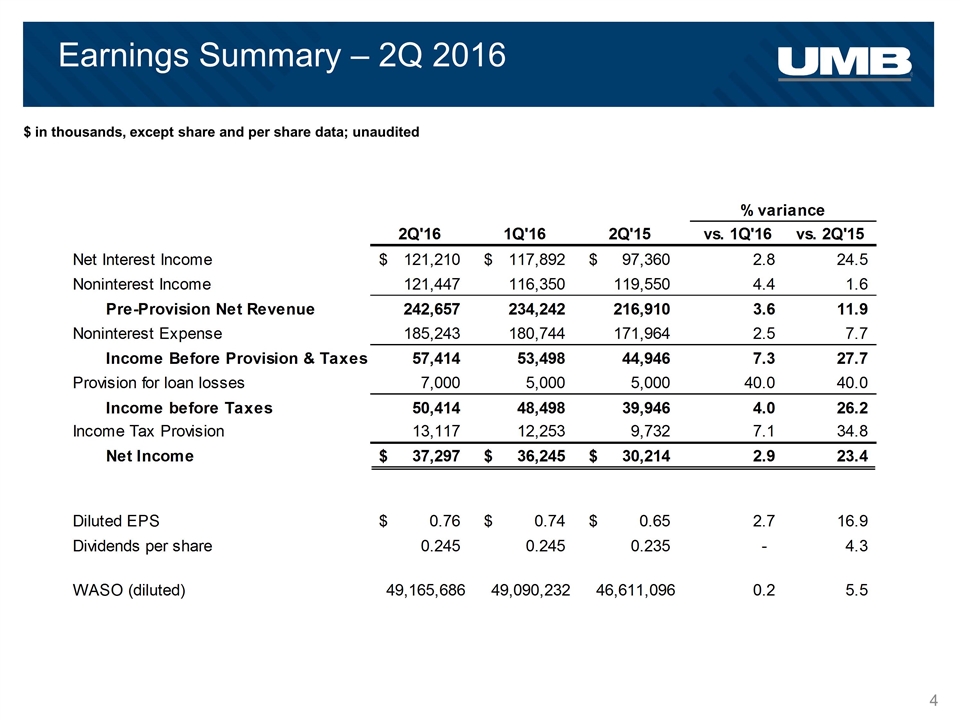
Earnings Summary – 2Q 2016 $ in thousands, except share and per share data; unaudited
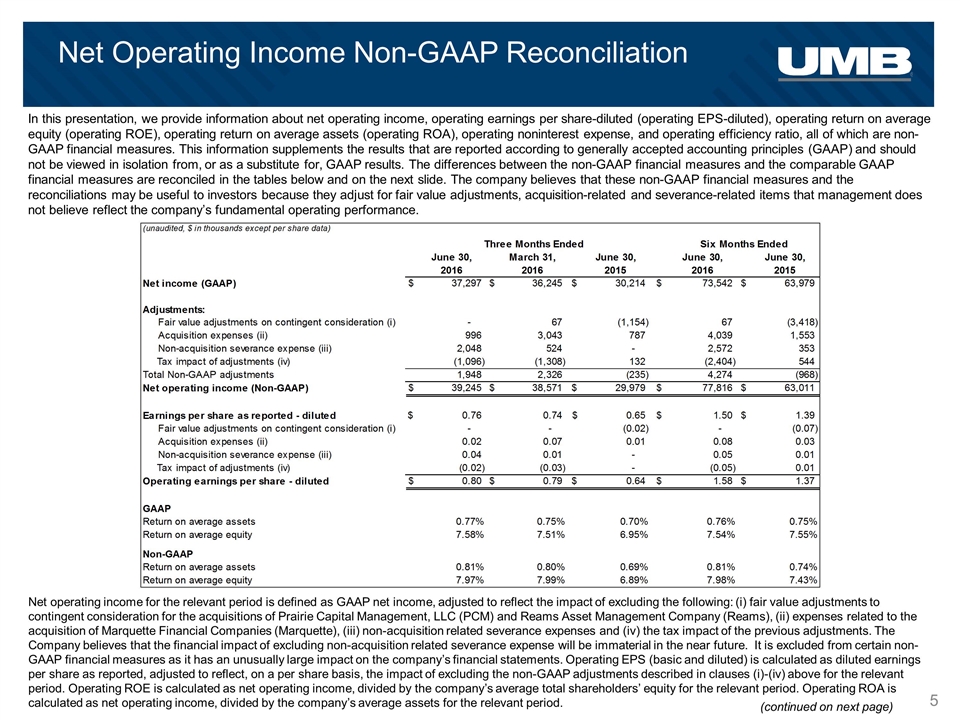
Net Operating Income Non-GAAP Reconciliation In this presentation, we provide information about net operating income, operating earnings per share-diluted (operating EPS-diluted), operating return on average equity (operating ROE), operating return on average assets (operating ROA), operating noninterest expense, and operating efficiency ratio, all of which are non-GAAP financial measures. This information supplements the results that are reported according to generally accepted accounting principles (GAAP) and should not be viewed in isolation from, or as a substitute for, GAAP results. The differences between the non-GAAP financial measures and the comparable GAAP financial measures are reconciled in the tables below and on the next slide. The company believes that these non-GAAP financial measures and the reconciliations may be useful to investors because they adjust for fair value adjustments, acquisition-related and severance-related items that management does not believe reflect the company’s fundamental operating performance. Net operating income for the relevant period is defined as GAAP net income, adjusted to reflect the impact of excluding the following: (i) fair value adjustments to contingent consideration for the acquisitions of Prairie Capital Management, LLC (PCM) and Reams Asset Management Company (Reams), (ii) expenses related to the acquisition of Marquette Financial Companies (Marquette), (iii) non-acquisition related severance expenses and (iv) the tax impact of the previous adjustments. The Company believes that the financial impact of excluding non-acquisition related severance expense will be immaterial in the near future. It is excluded from certain non-GAAP financial measures as it has an unusually large impact on the company’s financial statements. Operating EPS (basic and diluted) is calculated as diluted earnings per share as reported, adjusted to reflect, on a per share basis, the impact of excluding the non-GAAP adjustments described in clauses (i)-(iv) above for the relevant period. Operating ROE is calculated as net operating income, divided by the company’s average total shareholders’ equity for the relevant period. Operating ROA is calculated as net operating income, divided by the company’s average assets for the relevant period. (continued on next page)
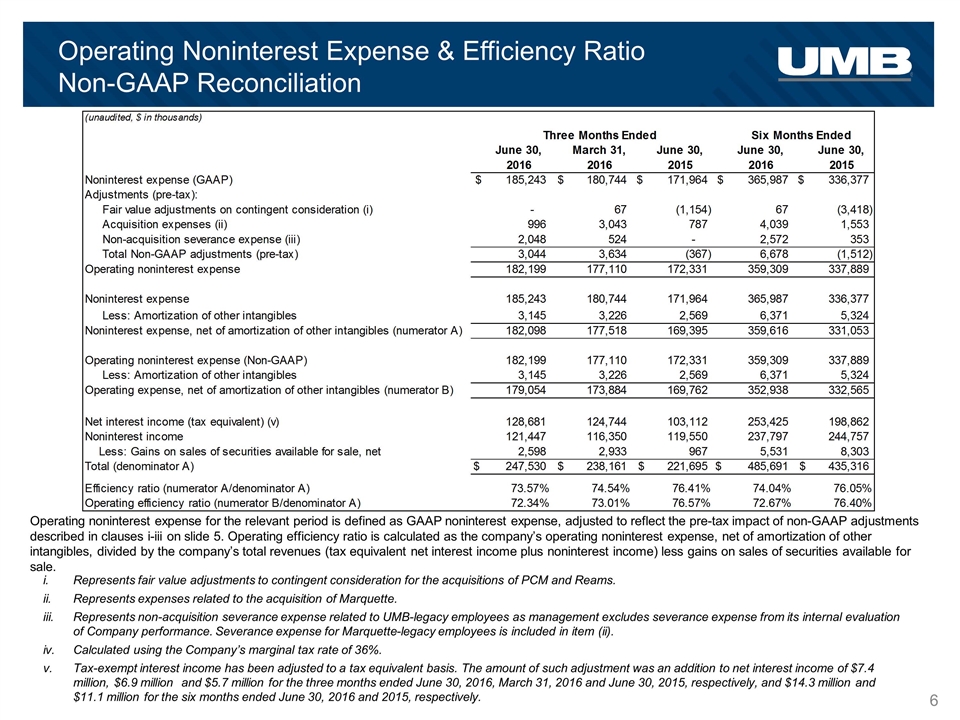
Operating Noninterest Expense & Efficiency Ratio Non-GAAP Reconciliation Operating noninterest expense for the relevant period is defined as GAAP noninterest expense, adjusted to reflect the pre-tax impact of non-GAAP adjustments described in clauses i-iii on slide 5. Operating efficiency ratio is calculated as the company’s operating noninterest expense, net of amortization of other intangibles, divided by the company’s total revenues (tax equivalent net interest income plus noninterest income) less gains on sales of securities available for sale. Represents fair value adjustments to contingent consideration for the acquisitions of PCM and Reams. Represents expenses related to the acquisition of Marquette. Represents non-acquisition severance expense related to UMB-legacy employees as management excludes severance expense from its internal evaluation of Company performance. Severance expense for Marquette-legacy employees is included in item (ii). Calculated using the Company’s marginal tax rate of 36%. Tax-exempt interest income has been adjusted to a tax equivalent basis. The amount of such adjustment was an addition to net interest income of $7.4 million, $6.9 million and $5.7 million for the three months ended June 30, 2016, March 31, 2016 and June 30, 2015, respectively, and $14.3 million and $11.1 million for the six months ended June 30, 2016 and 2015, respectively.
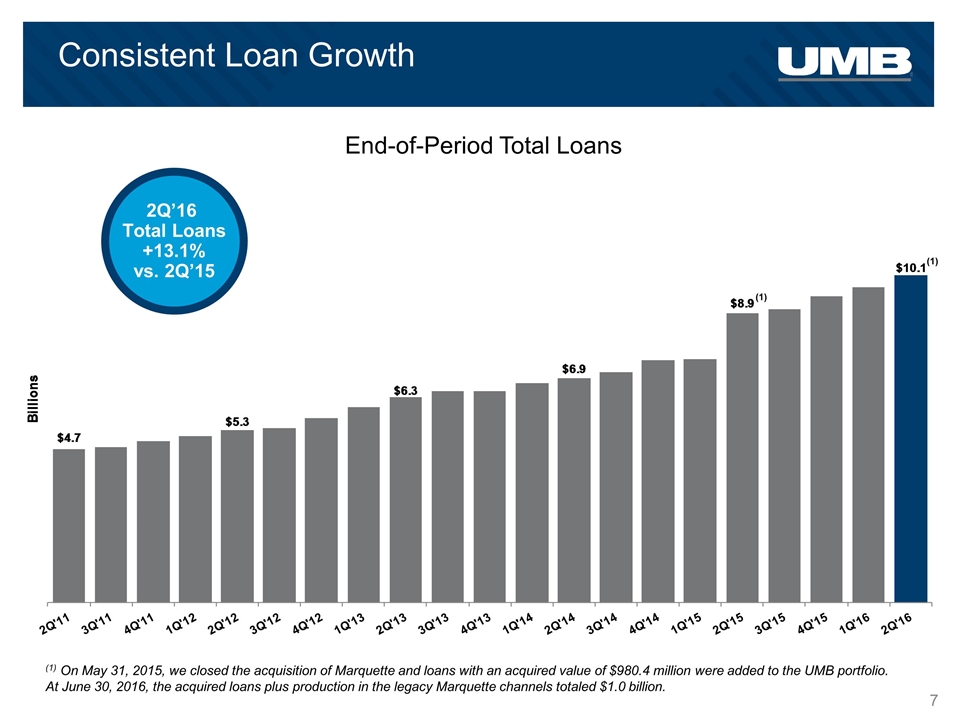
Consistent Loan Growth End-of-Period Total Loans 2Q’16 Total Loans +13.1% vs. 2Q’15 (1) On May 31, 2015, we closed the acquisition of Marquette and loans with an acquired value of $980.4 million were added to the UMB portfolio. At June 30, 2016, the acquired loans plus production in the legacy Marquette channels totaled $1.0 billion. (1) (1)
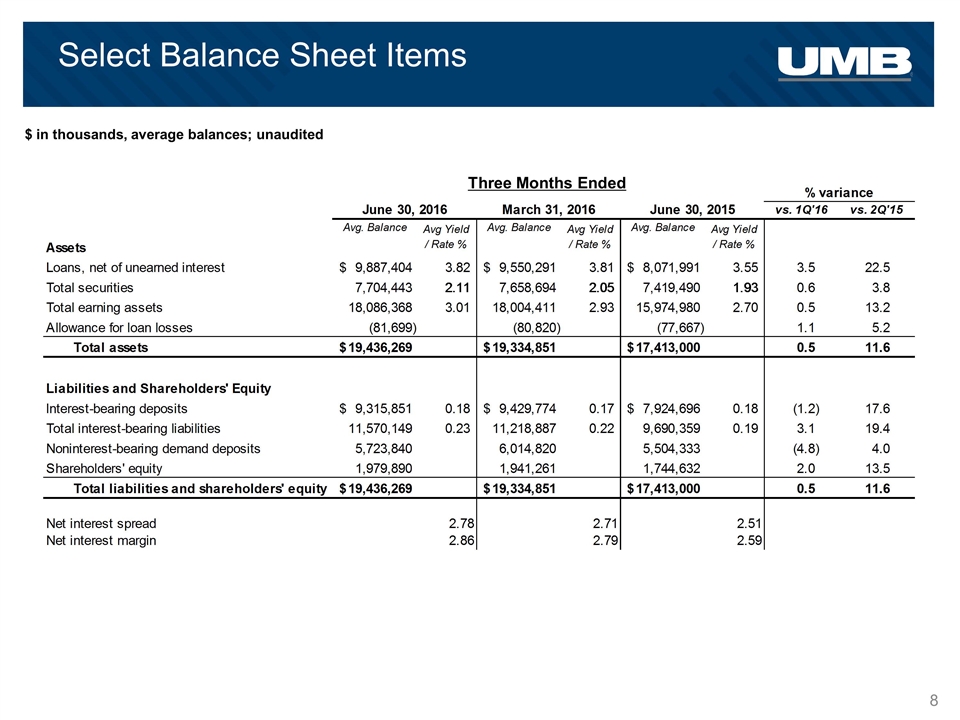
Select Balance Sheet Items $ in thousands, average balances; unaudited Three Months Ended
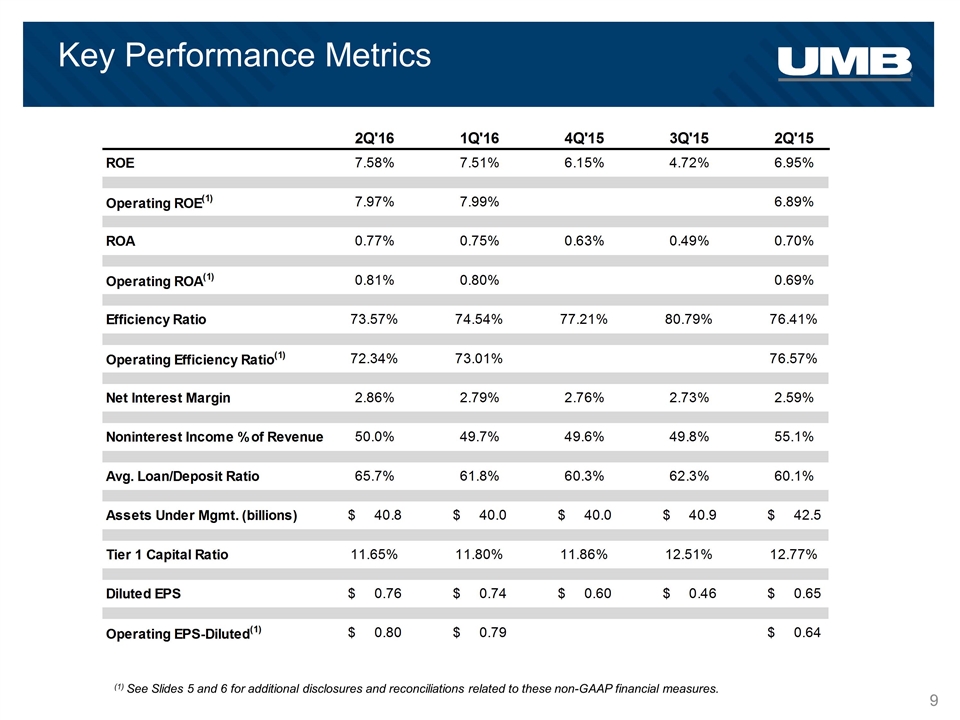
Key Performance Metrics (1) See Slides 5 and 6 for additional disclosures and reconciliations related to these non-GAAP financial measures.
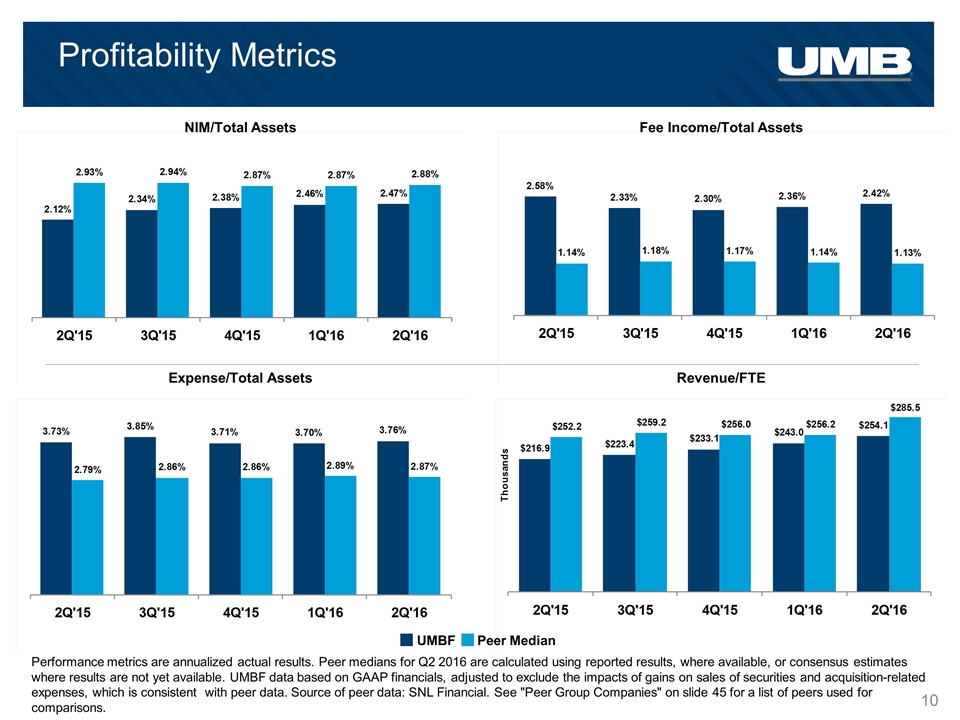
Profitability Metrics NIM/Total Assets Fee Income/Total Assets Expense/Total Assets Revenue/FTE UMBF Peer Median Performance metrics are annualized actual results. Peer medians for Q2 2016 are calculated using reported results, where available, or consensus estimates where results are not yet available. UMBF data based on GAAP financials, adjusted to exclude the impacts of gains on sales of securities and acquisition-related expenses, which is consistent with peer data. Source of peer data: SNL Financial. See "Peer Group Companies" on slide 45 for a list of peers used for comparisons.
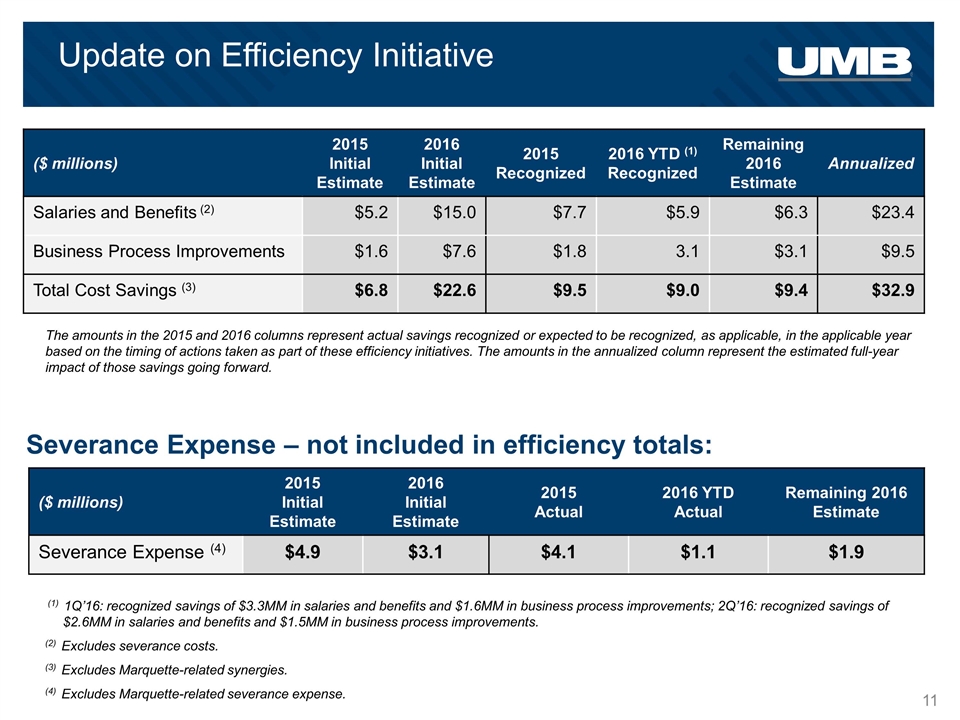
Update on Efficiency Initiative (1) 1Q’16: recognized savings of $3.3MM in salaries and benefits and $1.6MM in business process improvements; 2Q’16: recognized savings of $2.6MM in salaries and benefits and $1.5MM in business process improvements. (2) Excludes severance costs. (3) Excludes Marquette-related synergies. (4) Excludes Marquette-related severance expense. The amounts in the 2015 and 2016 columns represent actual savings recognized or expected to be recognized, as applicable, in the applicable year based on the timing of actions taken as part of these efficiency initiatives. The amounts in the annualized column represent the estimated full-year impact of those savings going forward. ($ millions) 2015 Initial Estimate 2016 Initial Estimate 2015 Recognized 2016 YTD (1) Recognized Remaining 2016 Estimate Annualized Salaries and Benefits (2) $5.2 $15.0 $7.7 $5.9 $6.3 $23.4 Business Process Improvements $1.6 $7.6 $1.8 3.1 $3.1 $9.5 Total Cost Savings (3) $6.8 $22.6 $9.5 $9.0 $9.4 $32.9 Severance Expense – not included in efficiency totals: ($ millions) 2015 Initial Estimate 2016 Initial Estimate 2015 Actual 2016 YTD Actual Remaining 2016 Estimate Severance Expense (4) $4.9 $3.1 $4.1 $1.1 $1.9

2Q 2016 Financials
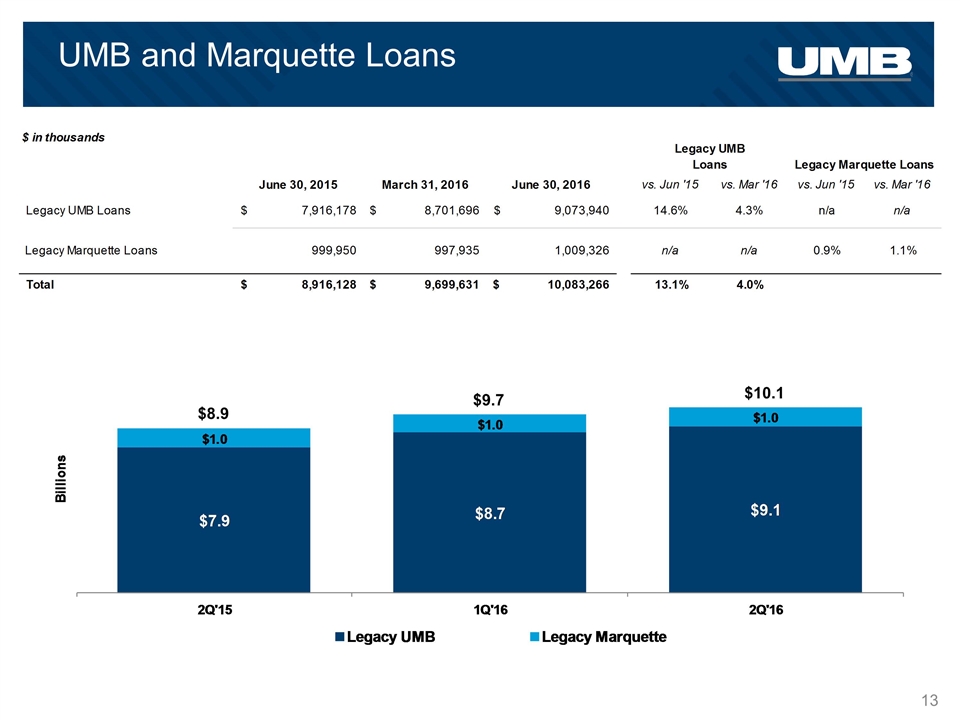
UMB and Marquette Loans $10.1 $9.7 $8.9
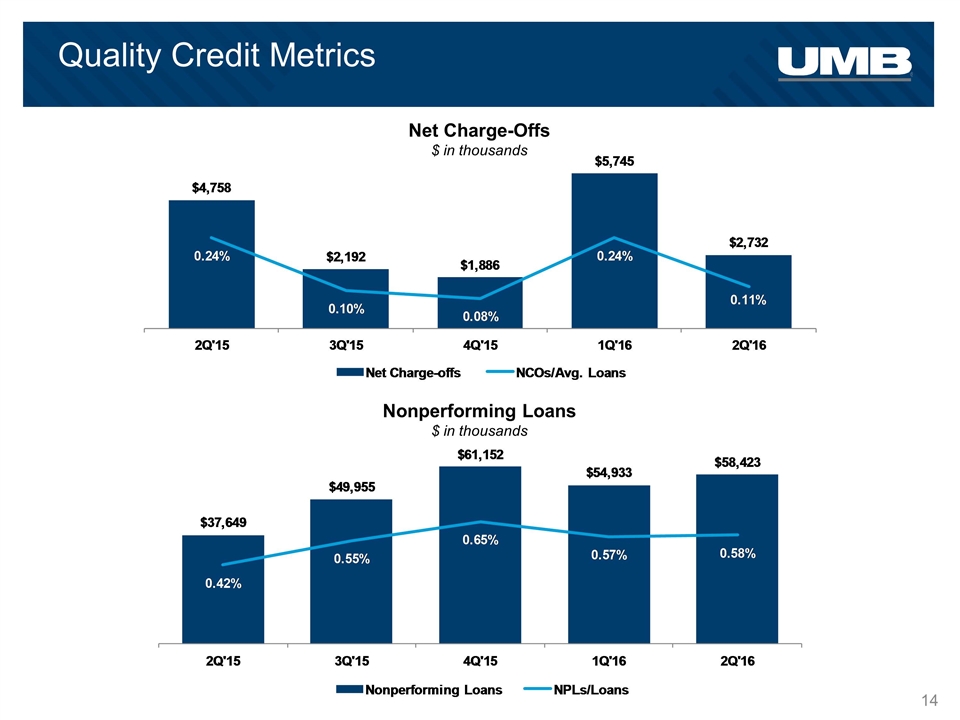
Quality Credit Metrics Net Charge-Offs $ in thousands Nonperforming Loans $ in thousands
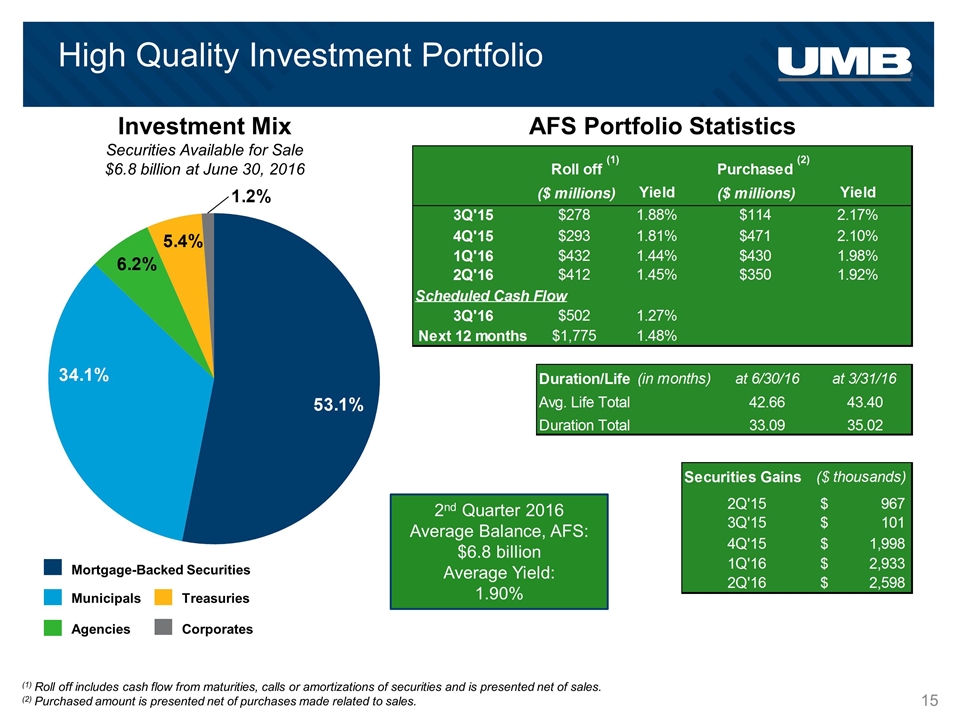
2nd Quarter 2016 Average Balance, AFS: $6.8 billion Average Yield: 1.90% Investment Mix Securities Available for Sale $6.8 billion at June 30, 2016 High Quality Investment Portfolio Agencies Corporates Municipals Mortgage-Backed Securities Treasuries AFS Portfolio Statistics (2) (1) Roll off includes cash flow from maturities, calls or amortizations of securities and is presented net of sales. (2) Purchased amount is presented net of purchases made related to sales. (1)
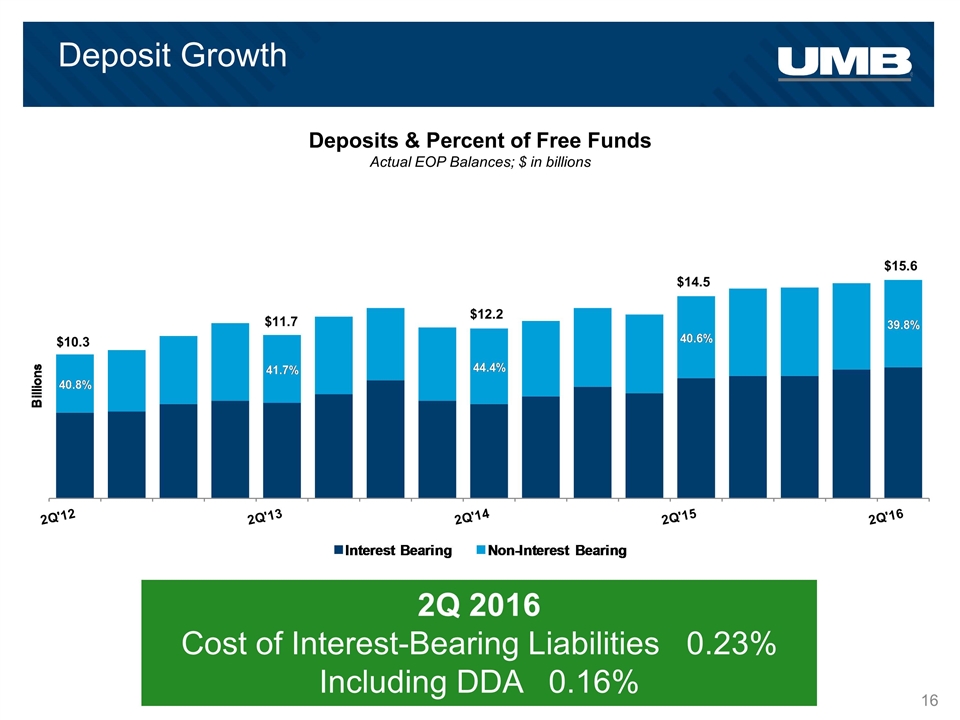
Deposit Growth Deposits & Percent of Free Funds Actual EOP Balances; $ in billions 2Q 2016 Cost of Interest-Bearing Liabilities 0.23% Including DDA 0.16% $10.3 $12.2 $11.7 $14.5 $15.6
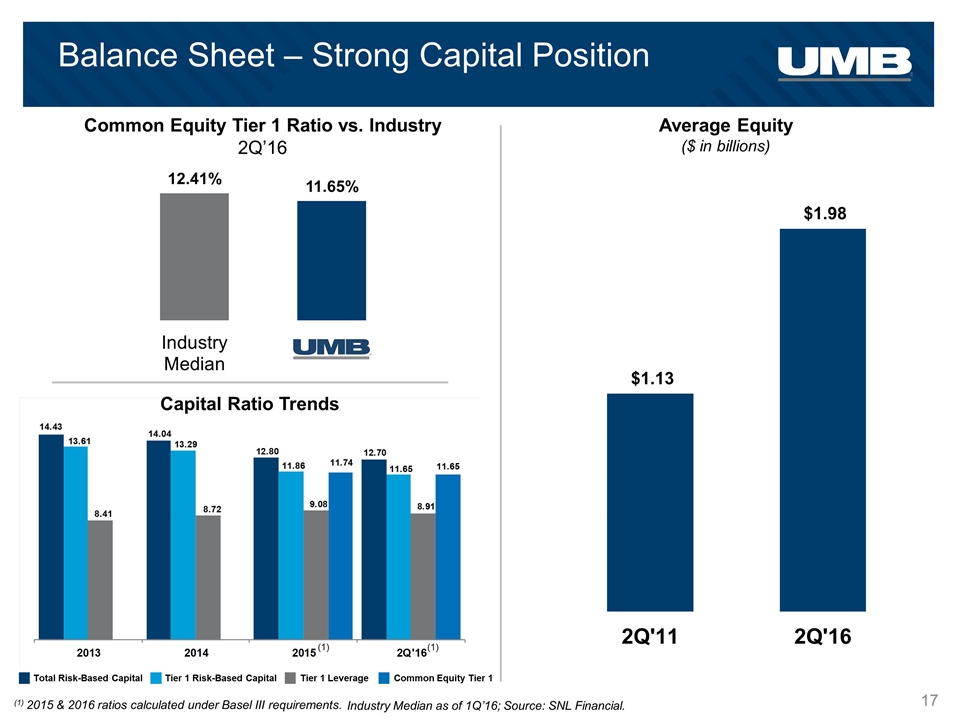
Balance Sheet – Strong Capital Position Common Equity Tier 1 Ratio vs. Industry 2Q’16 Average Equity ($ in billions) Capital Ratio Trends Industry Median as of 1Q’16; Source: SNL Financial. (1) 2015 & 2016 ratios calculated under Basel III requirements. Total Risk-Based Capital Tier 1 Risk-Based Capital Tier 1 Leverage Common Equity Tier 1 (1) (1)
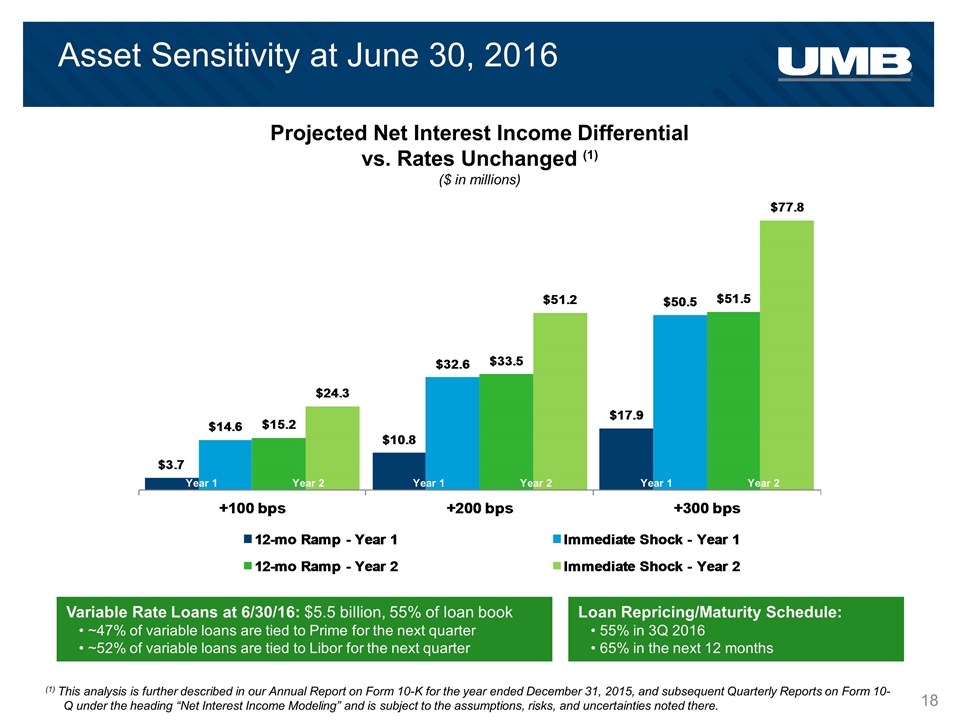
Year 1 Year 2 Year 1 Year 2 Year 1 Year 2 Asset Sensitivity at June 30, 2016 Projected Net Interest Income Differential vs. Rates Unchanged (1) ($ in millions) (1) This analysis is further described in our Annual Report on Form 10-K for the year ended December 31, 2015, and subsequent Quarterly Reports on Form 10-Q under the heading “Net Interest Income Modeling” and is subject to the assumptions, risks, and uncertainties noted there. Variable Rate Loans at 6/30/16: $5.5 billion, 55% of loan book ~47% of variable loans are tied to Prime for the next quarter ~52% of variable loans are tied to Libor for the next quarter Loan Repricing/Maturity Schedule: 55% in 3Q 2016 65% in the next 12 months
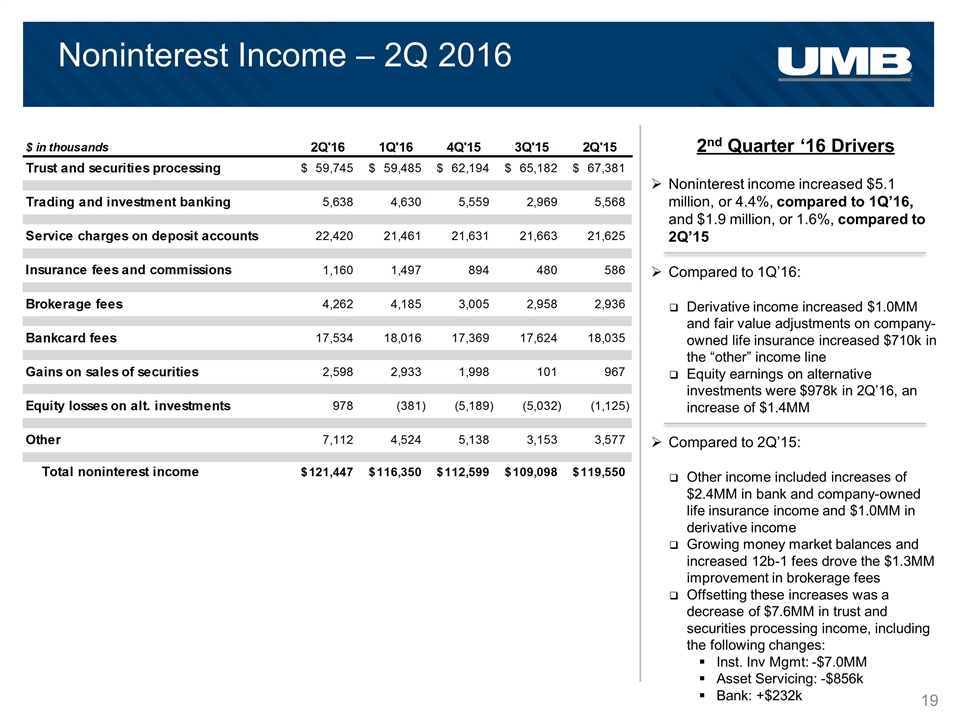
Noninterest Income – 2Q 2016 Noninterest income increased $5.1 million, or 4.4%, compared to 1Q’16, and $1.9 million, or 1.6%, compared to 2Q’15 Compared to 1Q’16: Derivative income increased $1.0MM and fair value adjustments on company-owned life insurance increased $710k in the “other” income line Equity earnings on alternative investments were $978k in 2Q’16, an increase of $1.4MM Compared to 2Q’15: Other income included increases of $2.4MM in bank and company-owned life insurance income and $1.0MM in derivative income Growing money market balances and increased 12b-1 fees drove the $1.3MM improvement in brokerage fees Offsetting these increases was a decrease of $7.6MM in trust and securities processing income, including the following changes: Inst. Inv Mgmt: -$7.0MM Asset Servicing: -$856k Bank: +$232k 2nd Quarter ‘16 Drivers
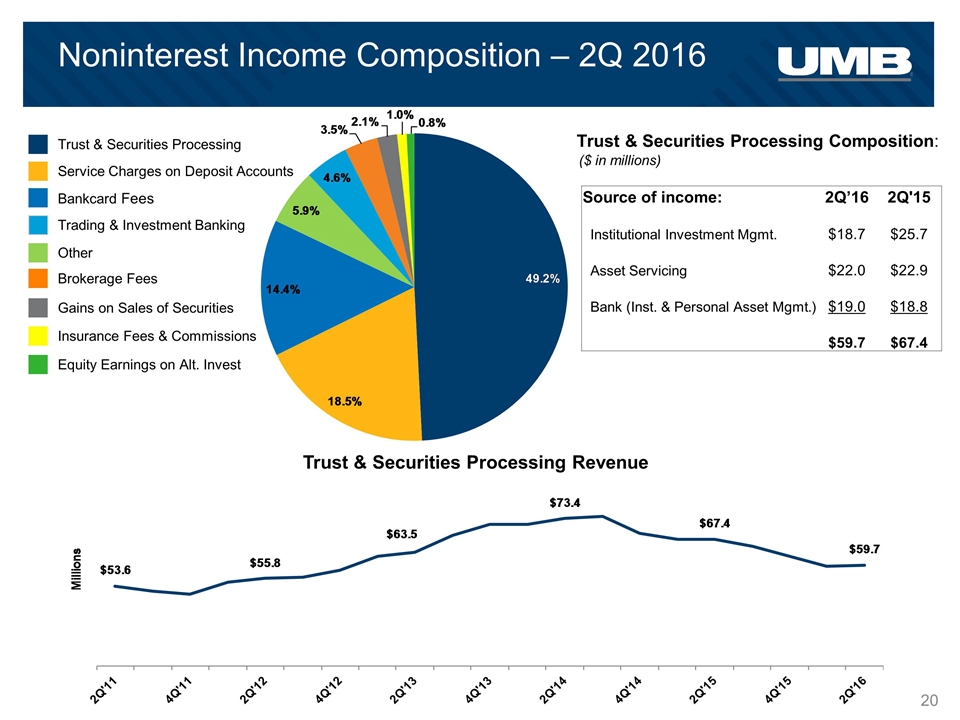
Bankcard Fees Noninterest Income Composition – 2Q 2016 Trust & Securities Processing Revenue Trust & Securities Processing Composition: Service Charges on Deposit Accounts Trust & Securities Processing Gains on Sales of Securities Other Brokerage Fees Trading & Investment Banking ($ in millions) Insurance Fees & Commissions Source of income: 2Q’16 2Q'15 Institutional Investment Mgmt. $18.7 $25.7 Asset Servicing $22.0 $22.9 Bank (Inst. & Personal Asset Mgmt.) $19.0 $18.8 $59.7 $67.4 Equity Earnings on Alt. Invest
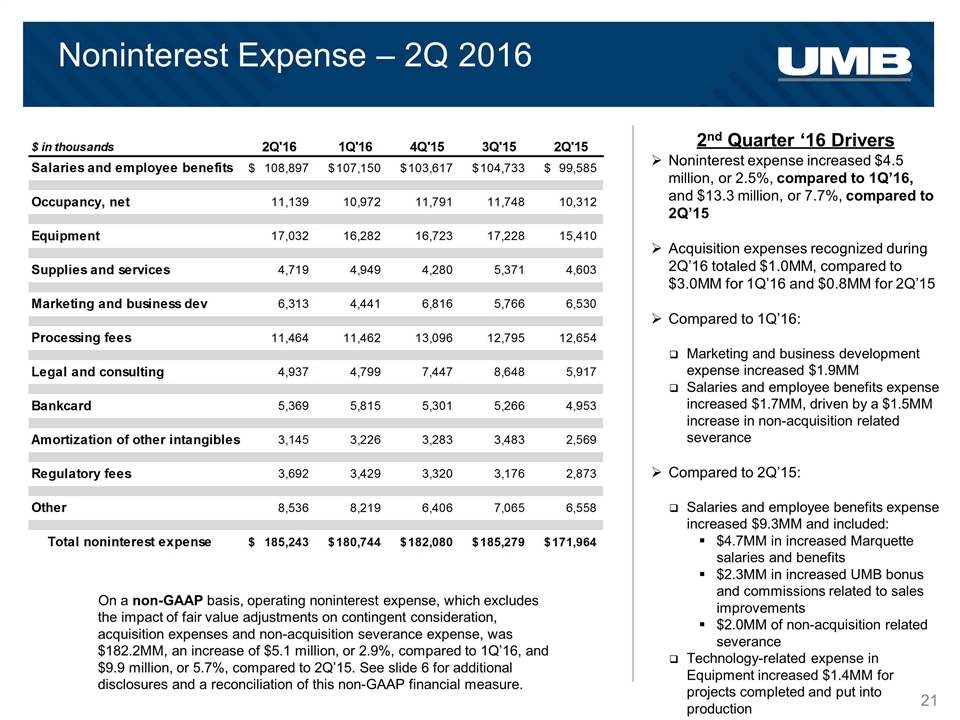
Noninterest Expense – 2Q 2016 2nd Quarter ‘16 Drivers Noninterest expense increased $4.5 million, or 2.5%, compared to 1Q’16, and $13.3 million, or 7.7%, compared to 2Q’15 Acquisition expenses recognized during 2Q’16 totaled $1.0MM, compared to $3.0MM for 1Q’16 and $0.8MM for 2Q’15 Compared to 1Q’16: Marketing and business development expense increased $1.9MM Salaries and employee benefits expense increased $1.7MM, driven by a $1.5MM increase in non-acquisition related severance Compared to 2Q’15: Salaries and employee benefits expense increased $9.3MM and included: $4.7MM in increased Marquette salaries and benefits $2.3MM in increased UMB bonus and commissions related to sales improvements $2.0MM of non-acquisition related severance Technology-related expense in Equipment increased $1.4MM for projects completed and put into production On a non-GAAP basis, operating noninterest expense, which excludes the impact of fair value adjustments on contingent consideration, acquisition expenses and non-acquisition severance expense, was $182.2MM, an increase of $5.1 million, or 2.9%, compared to 1Q’16, and $9.9 million, or 5.7%, compared to 2Q’15. See slide 6 for additional disclosures and a reconciliation of this non-GAAP financial measure.

Business Segment Updates
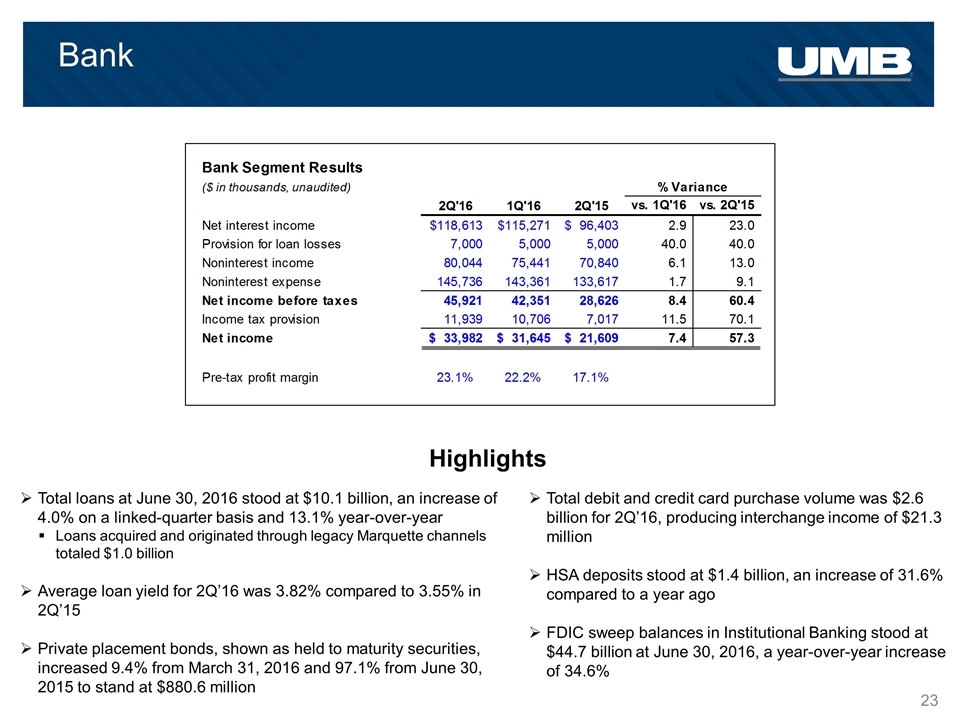
Bank Highlights Total loans at June 30, 2016 stood at $10.1 billion, an increase of 4.0% on a linked-quarter basis and 13.1% year-over-year Loans acquired and originated through legacy Marquette channels totaled $1.0 billion Average loan yield for 2Q’16 was 3.82% compared to 3.55% in 2Q’15 Private placement bonds, shown as held to maturity securities, increased 9.4% from March 31, 2016 and 97.1% from June 30, 2015 to stand at $880.6 million Total debit and credit card purchase volume was $2.6 billion for 2Q’16, producing interchange income of $21.3 million HSA deposits stood at $1.4 billion, an increase of 31.6% compared to a year ago FDIC sweep balances in Institutional Banking stood at $44.7 billion at June 30, 2016, a year-over-year increase of 34.6%
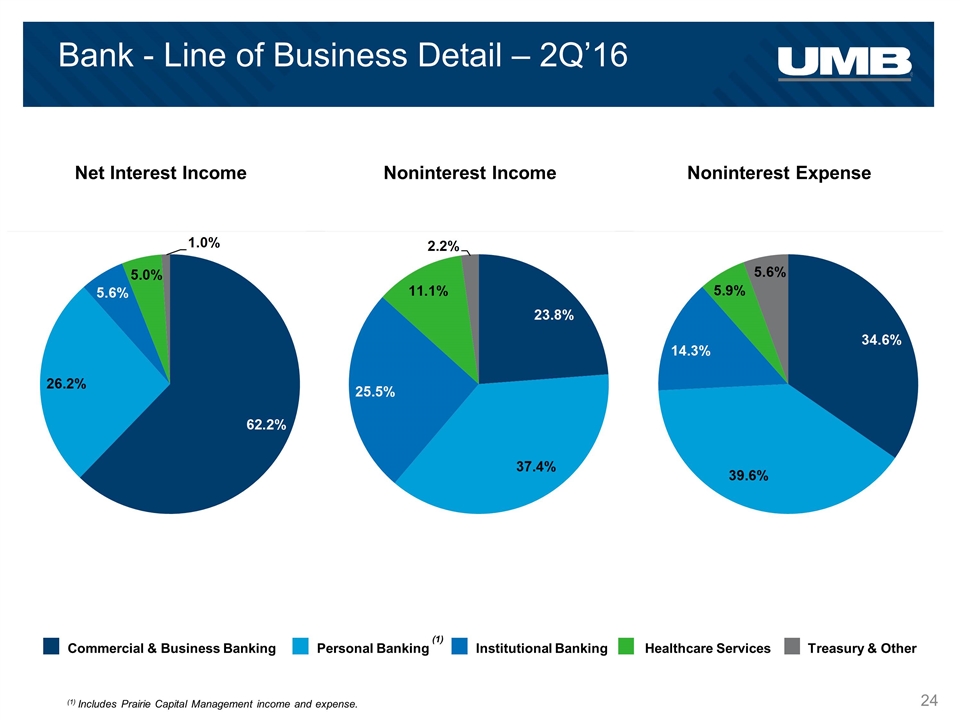
Bank - Line of Business Detail – 2Q’16 (1) Includes Prairie Capital Management income and expense. Net Interest Income Noninterest Income Noninterest Expense Personal Banking Commercial & Business Banking Institutional Banking Healthcare Services Treasury & Other (1)
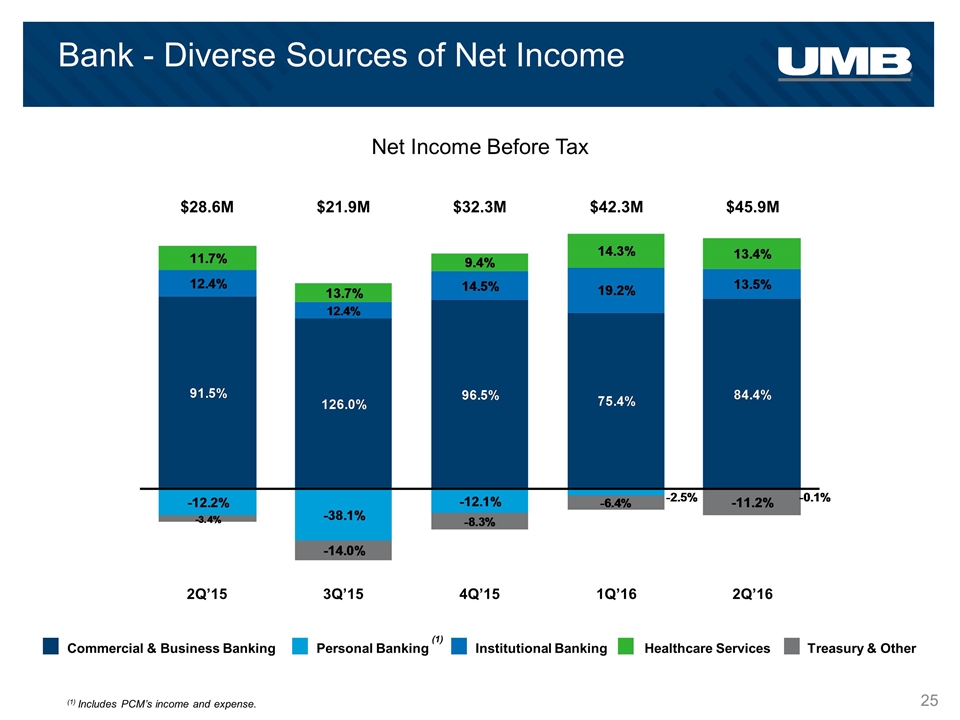
Bank - Diverse Sources of Net Income (1) Includes PCM’s income and expense. Personal Banking Commercial & Business Banking Institutional Banking Healthcare Services Treasury & Other (1) Net Income Before Tax 2Q’15 3Q’15 4Q’15 2Q’16 1Q’16 $28.6M $21.9M $32.3M $45.9M $42.3M
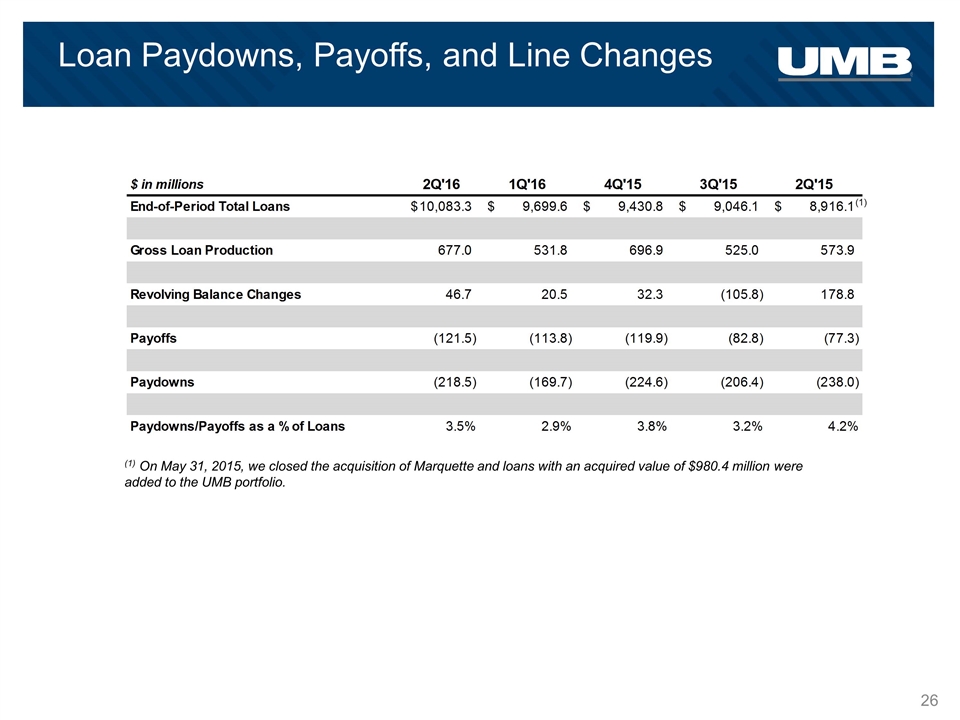
Loan Paydowns, Payoffs, and Line Changes (1) On May 31, 2015, we closed the acquisition of Marquette and loans with an acquired value of $980.4 million were added to the UMB portfolio. (1)
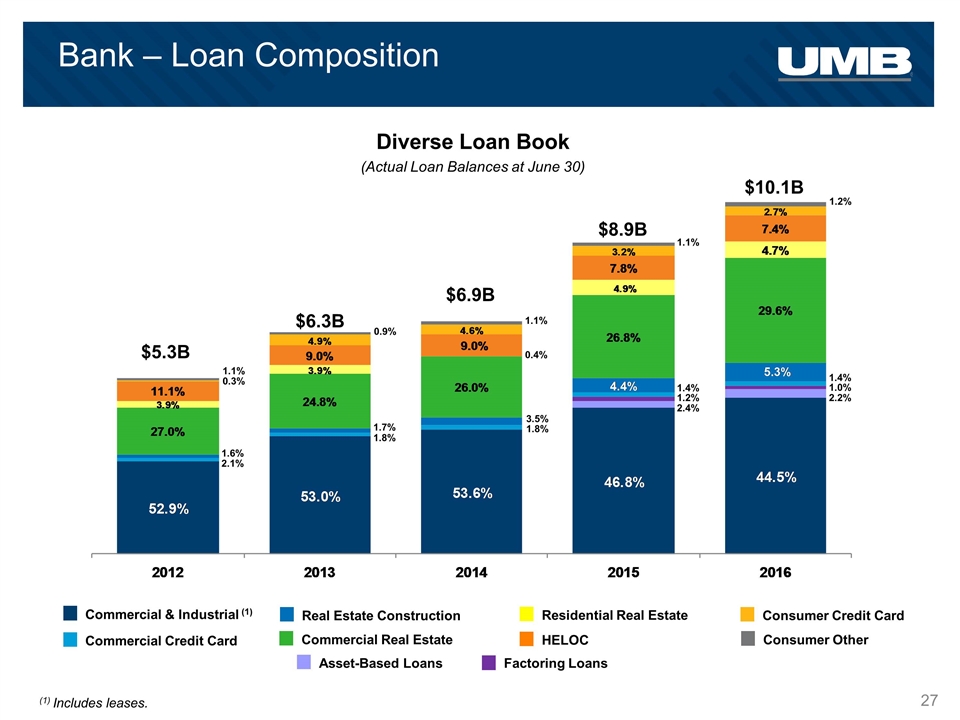
Bank – Loan Composition Diverse Loan Book (Actual Loan Balances at June 30) Commercial Credit Card Commercial & Industrial (1) HELOC Residential Real Estate Real Estate Construction Commercial Real Estate Consumer Credit Card Consumer Other $5.3B $6.3B $6.9B $8.9B $10.1B 1.2% 2.4% 3.5% 1.8% 1.7% 1.8% 1.6% 2.1% Factoring Loans Asset-Based Loans (1) Includes leases. 1.1% 0.3% 0.9% 1.1% 0.4% 1.2% 1.4% 1.1% 2.2% 1.0% 1.4%

Bank – Regional Lending (2) Arizona loan balances include $603.9MM legacy UMB loans and $393.6MM legacy Marquette loans. (1) Texas loan balances include $340.7MM legacy UMB loans and $296.2MM legacy Marquette loans. Colorado Kansas City Kansas Greater MO St. Louis Arizona Texas Oklahoma Marquette Transportation Fin (Natl. Sales) Nebraska Marquette Business Credit (Natl. Sales) $145.9 $277.9 $146.1 $189.2 $229.8 $201.8 $340.1 $248.3 $5.3B $6.3B $6.9B $8.9B $10.1B $218.2 $101.3 (1) (2) $88.5 Loans by Region (Actual Loan Balances at June 30, $ in millions) High Growth Regions 2Q’16 vs. 2Q’15 Texas +27.1% Arizona +25.6% Colorado +16.2% $223.1 $219.4 $107.4
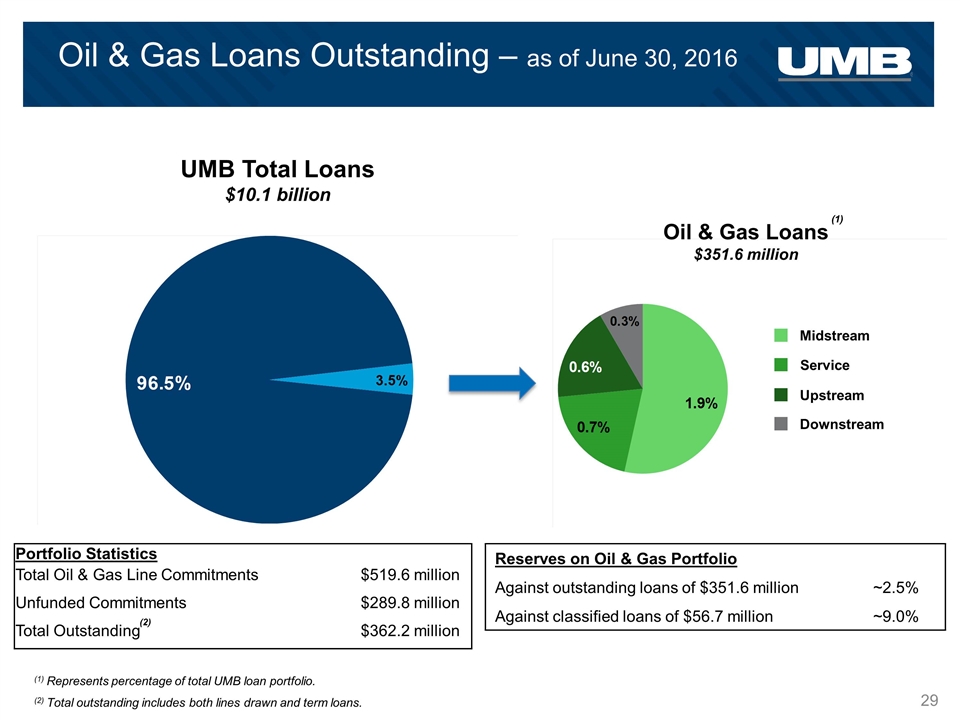
Oil & Gas Loans Outstanding – as of June 30, 2016 Service Midstream Upstream Downstream UMB Total Loans $10.1 billion Oil & Gas Loans $351.6 million Reserves on Oil & Gas Portfolio Against outstanding loans of $351.6 million ~2.5% Against classified loans of $56.7 million ~9.0% Portfolio Statistics Total Oil & Gas Line Commitments $519.6 million Unfunded Commitments $289.8 million Total Outstanding $362.2 million (2) Total outstanding includes both lines drawn and term loans. (2) (1) Represents percentage of total UMB loan portfolio. (1)
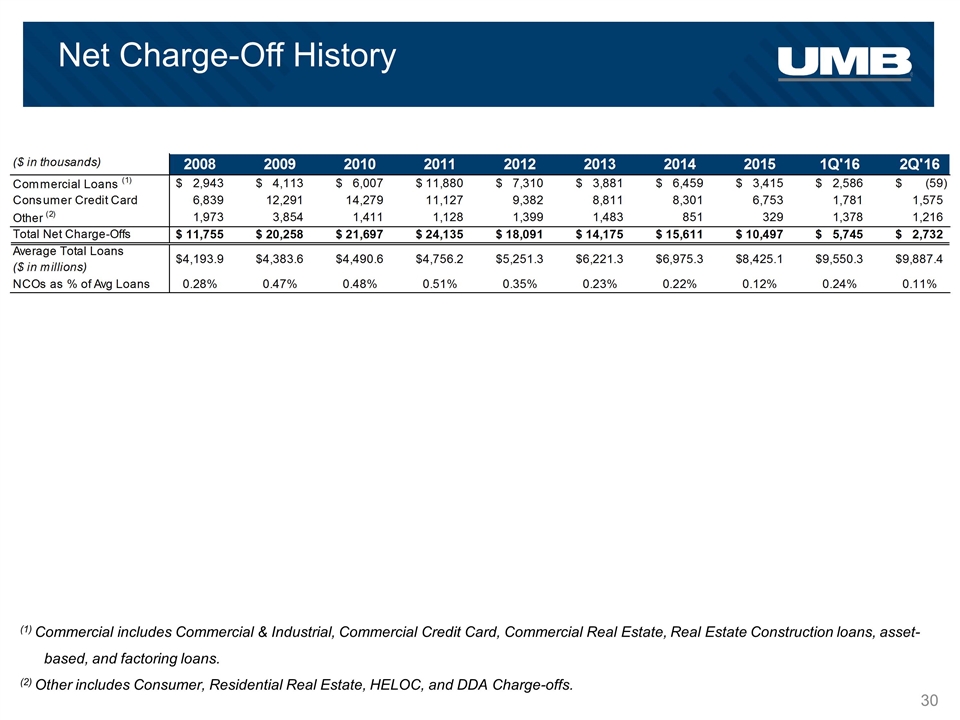
Net Charge-Off History (1) Commercial includes Commercial & Industrial, Commercial Credit Card, Commercial Real Estate, Real Estate Construction loans, asset- based, and factoring loans. (2) Other includes Consumer, Residential Real Estate, HELOC, and DDA Charge-offs.
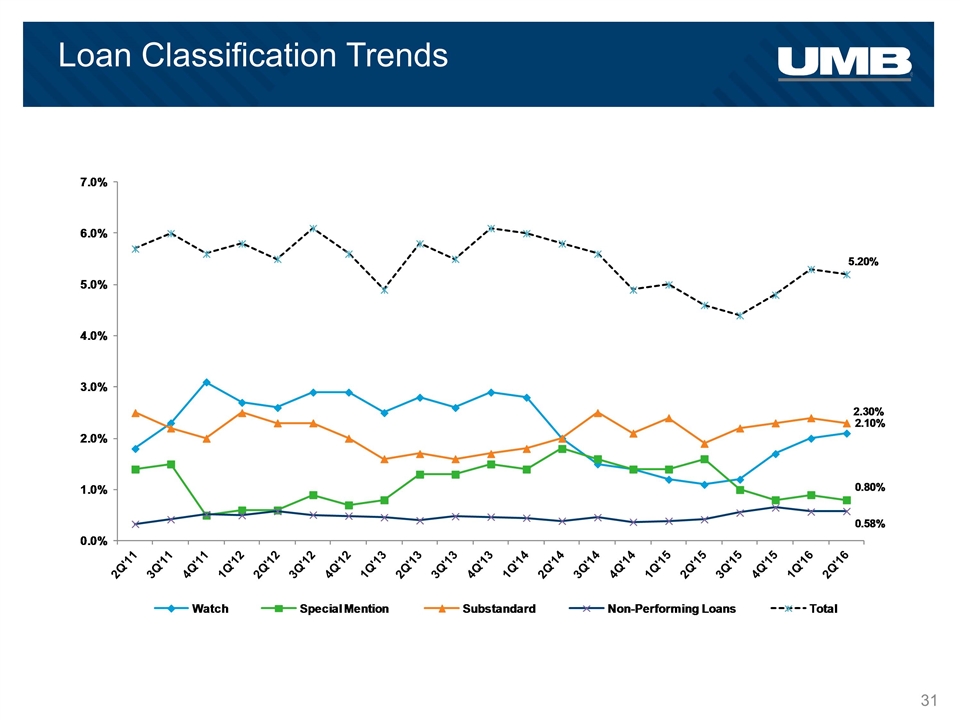
Loan Classification Trends
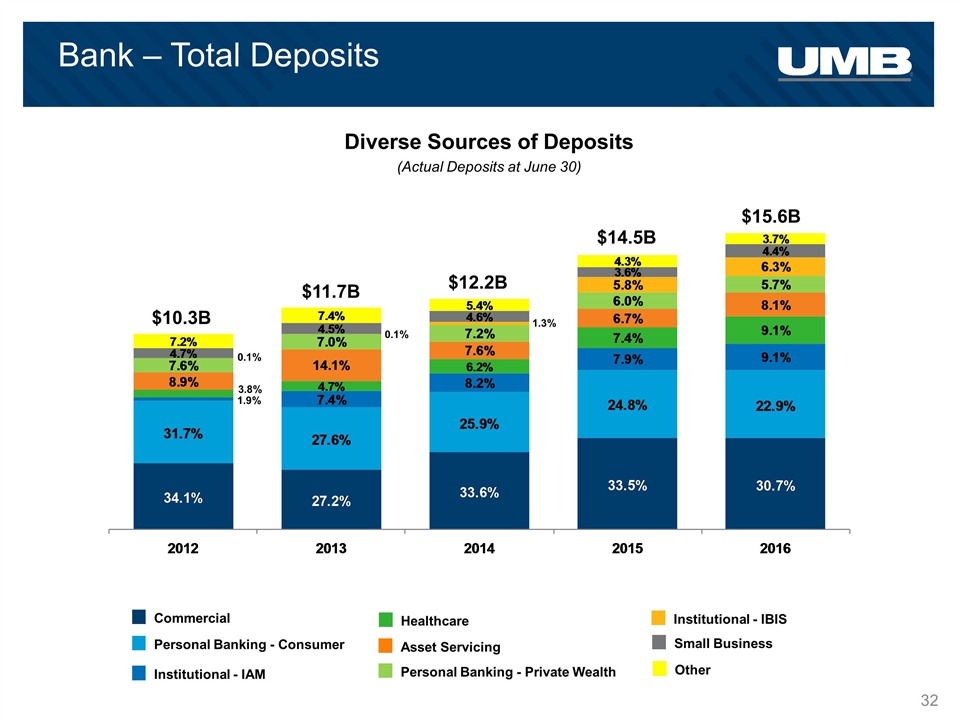
Bank – Total Deposits Diverse Sources of Deposits (Actual Deposits at June 30) $10.3B $11.7B $12.2B $14.5B $15.6B Personal Banking - Consumer Commercial Institutional - IAM Personal Banking - Private Wealth Asset Servicing Healthcare Institutional - IBIS Small Business Other 1.9% 1.3% 3.8% 0.1% 0.1%
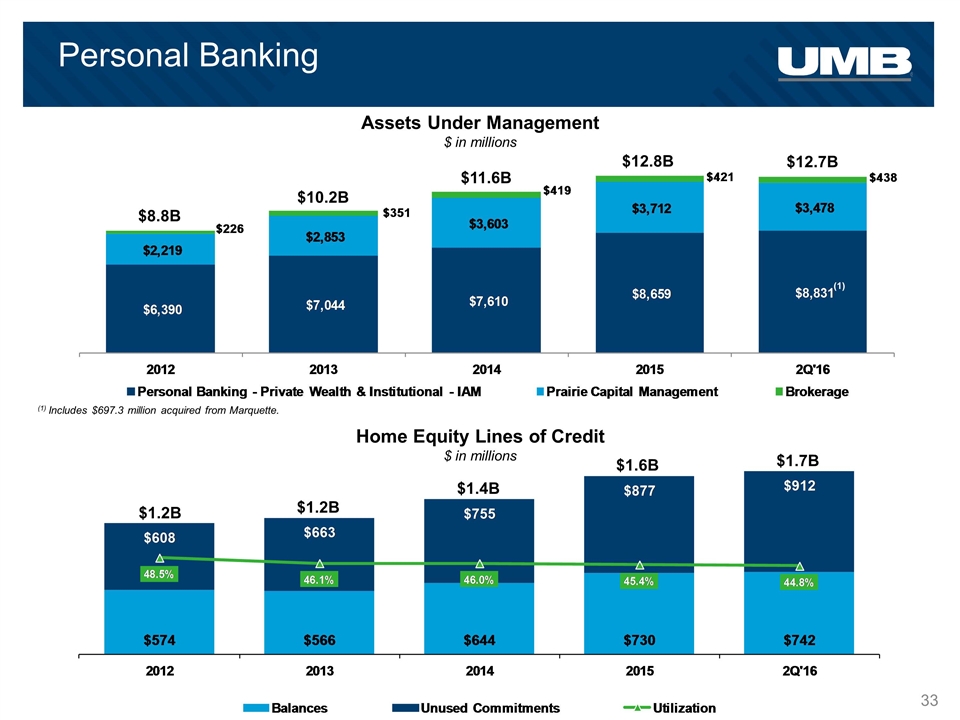
$8.8B $10.2B $11.6B $12.8B $12.7B $1.2B $1.2B $1.4B $1.6B $1.7B Home Equity Lines of Credit $ in millions Assets Under Management $ in millions Personal Banking (1) (1) Includes $697.3 million acquired from Marquette.
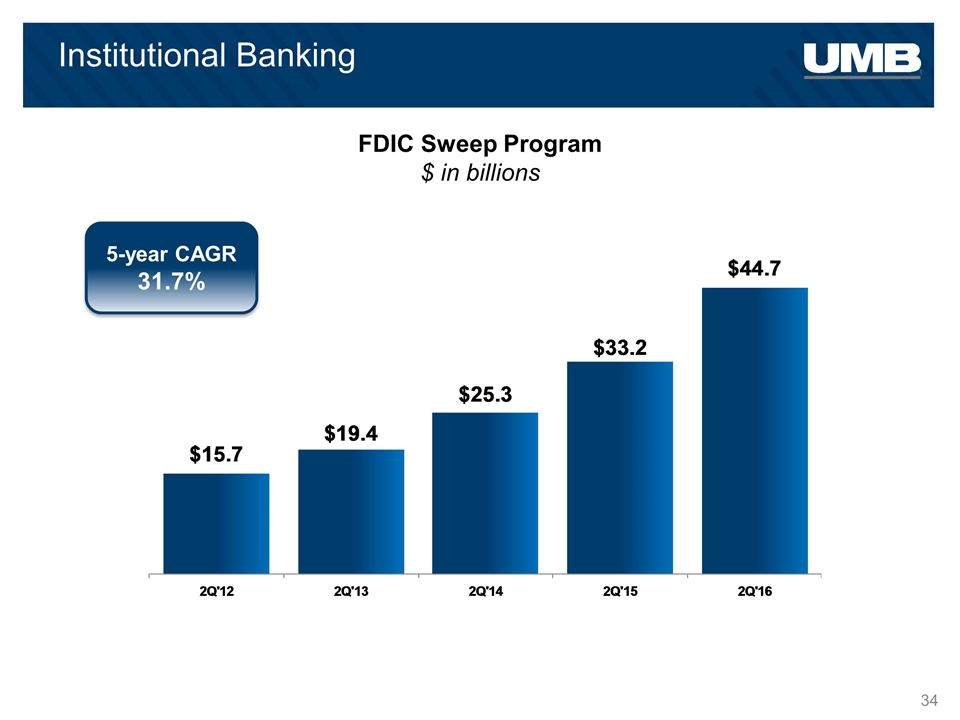
Institutional Banking FDIC Sweep Program $ in billions 5-year CAGR 31.7%
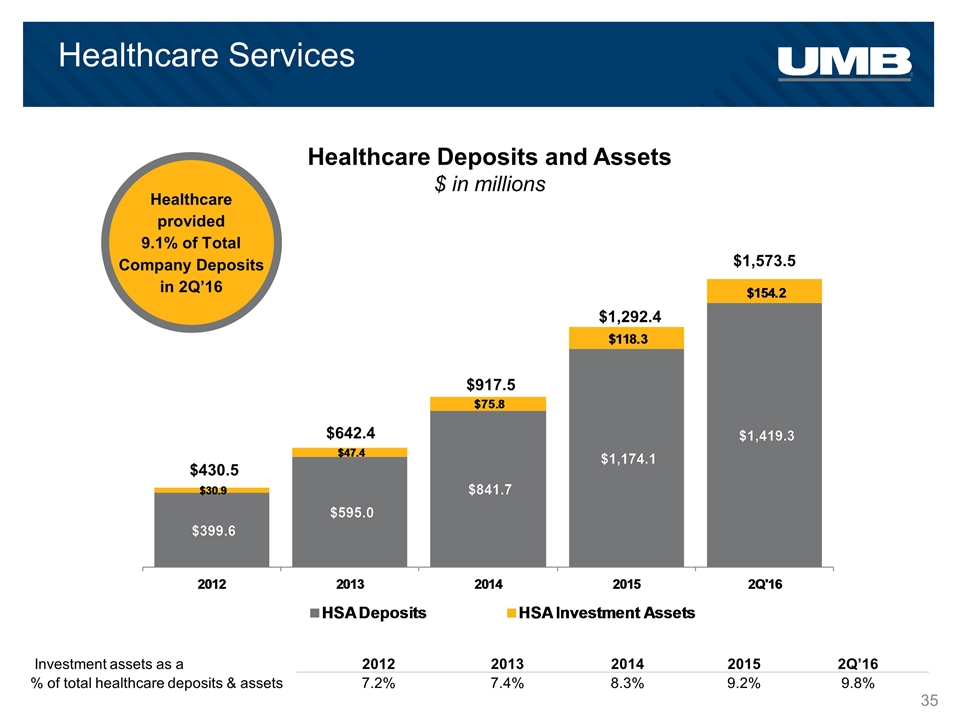
Healthcare Services Healthcare Deposits and Assets $ in millions $430.5 $642.4 $917.5 $1,292.4 $1,573.5 Healthcare provided 9.1% of Total Company Deposits in 2Q’16 Investment assets as a 2012 2013 2014 2015 2Q’16 % of total healthcare deposits & assets 7.2% 7.4% 8.3% 9.2% 9.8%
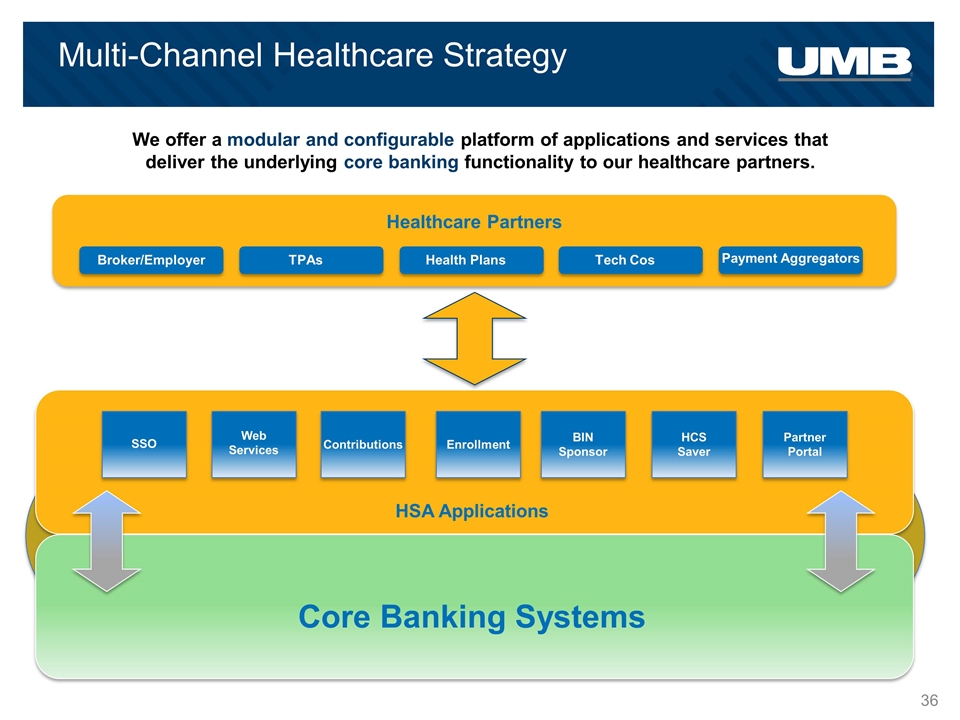
We offer a modular and configurable platform of applications and services that deliver the underlying core banking functionality to our healthcare partners. Broker/Employer TPAs Health Plans Tech Cos Payment Aggregators Healthcare Partners HSA Applications SSO Web Services Contributions Enrollment BIN Sponsor HCS Saver Partner Portal Core Banking Systems Multi-Channel Healthcare Strategy
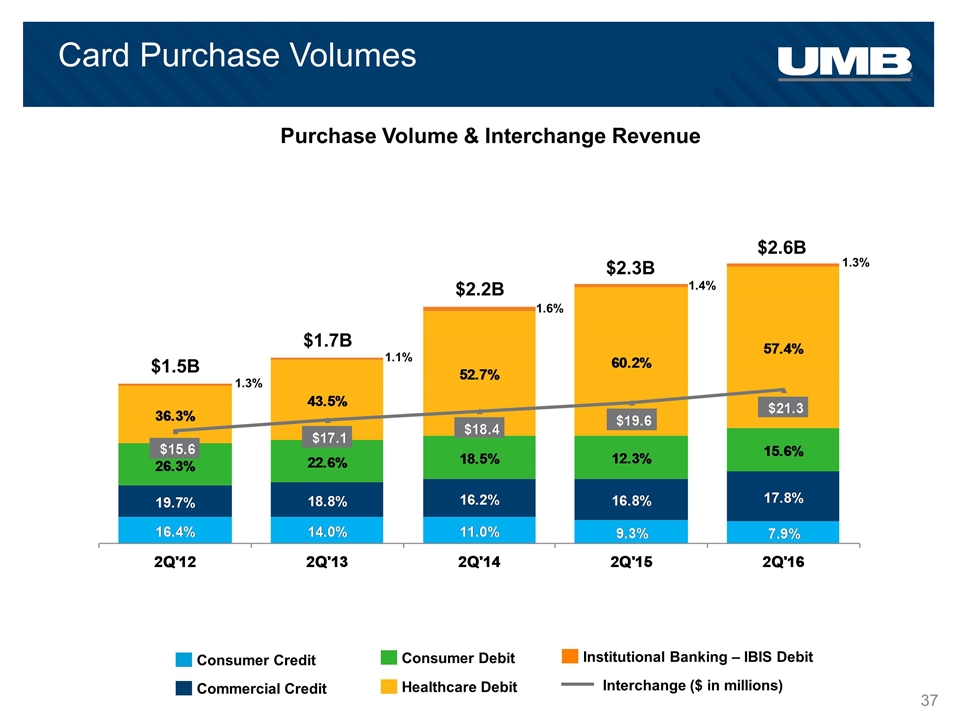
Card Purchase Volumes Purchase Volume & Interchange Revenue Commercial Credit Consumer Credit Consumer Debit Healthcare Debit Institutional Banking – IBIS Debit Interchange ($ in millions) $2.6B $1.5B $1.7B $2.2B $2.3B 1.3% 1.1% 1.6% 1.4% 1.3%
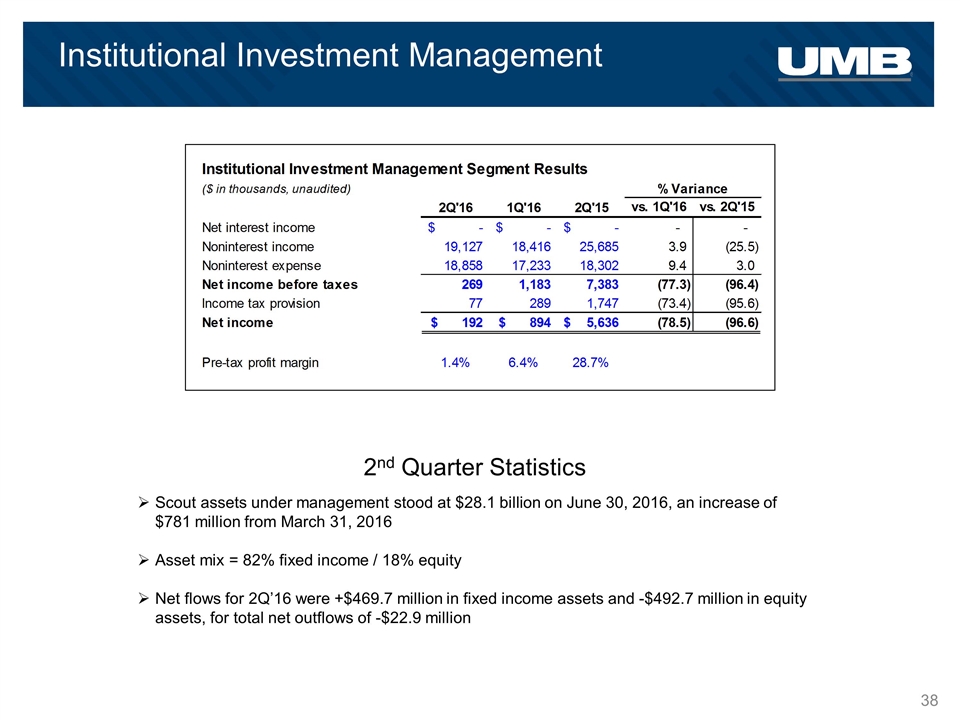
Institutional Investment Management Scout assets under management stood at $28.1 billion on June 30, 2016, an increase of $781 million from March 31, 2016 Asset mix = 82% fixed income / 18% equity Net flows for 2Q’16 were +$469.7 million in fixed income assets and -$492.7 million in equity assets, for total net outflows of -$22.9 million 2nd Quarter Statistics
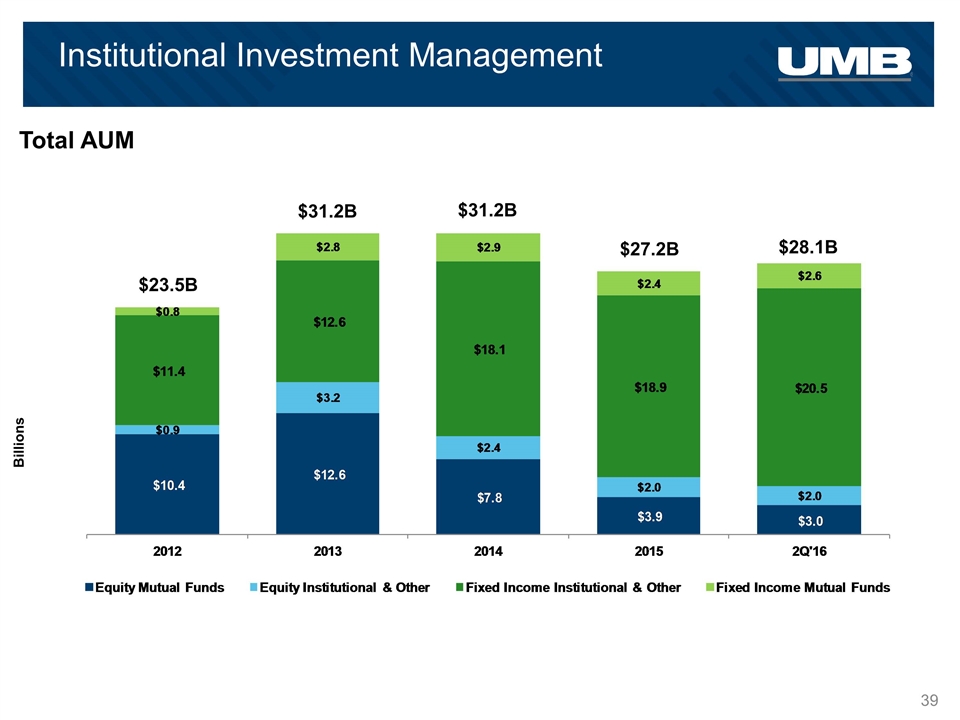
Total AUM $28.1B $23.5B $31.2B Institutional Investment Management $31.2B $27.2B Billions
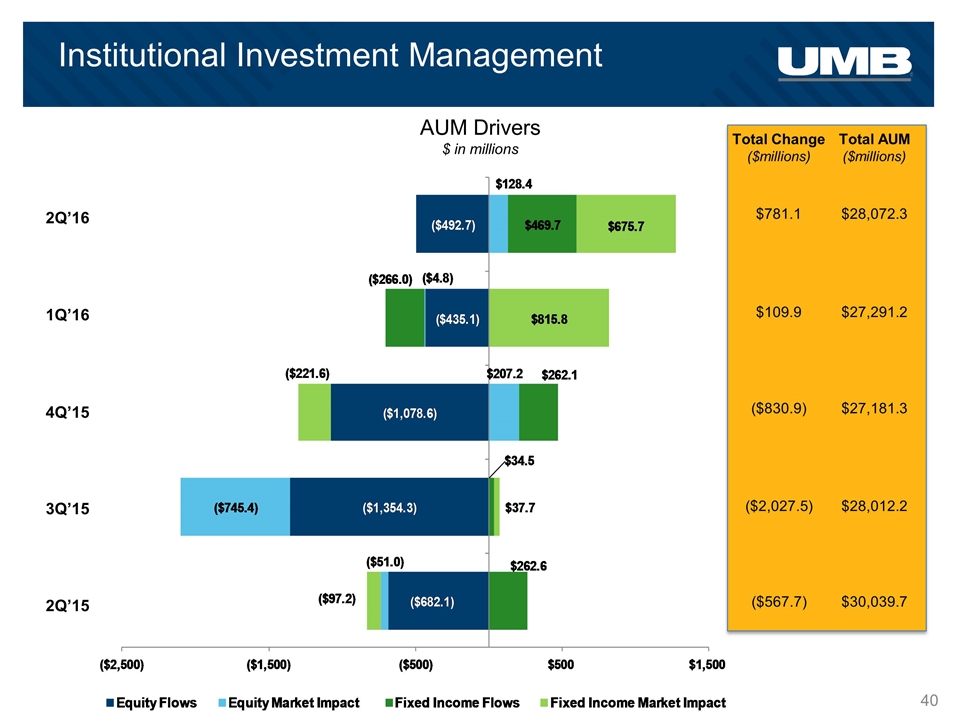
AUM Drivers $ in millions ($830.9) ($2,027.5) Total Change ($millions) $27,181.3 $28,012.2 Total AUM ($millions) Institutional Investment Management ($567.7) $30,039.7 $109.9 $27,291.2 $781.1 $28,072.3 2Q’16 1Q’16 4Q’15 3Q’15 2Q’15
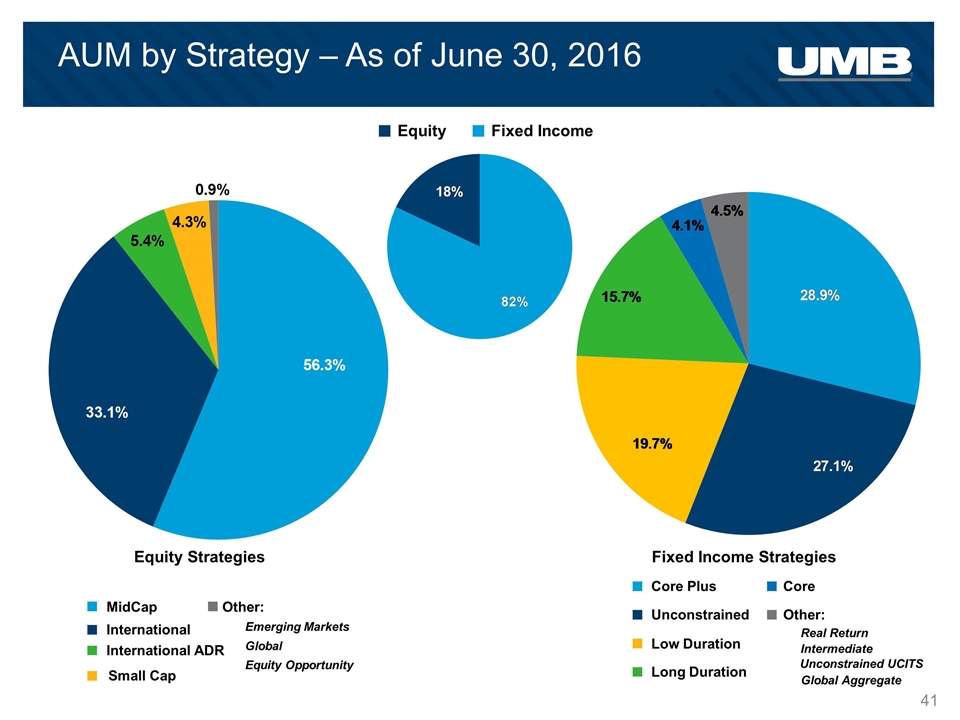
AUM by Strategy – As of June 30, 2016 Equity Fixed Income Equity Strategies International MidCap International ADR Emerging Markets Global Small Cap Other: Equity Opportunity Fixed Income Strategies Core Plus Low Duration Long Duration Core Real Return Unconstrained Intermediate Other: Global Aggregate Unconstrained UCITS
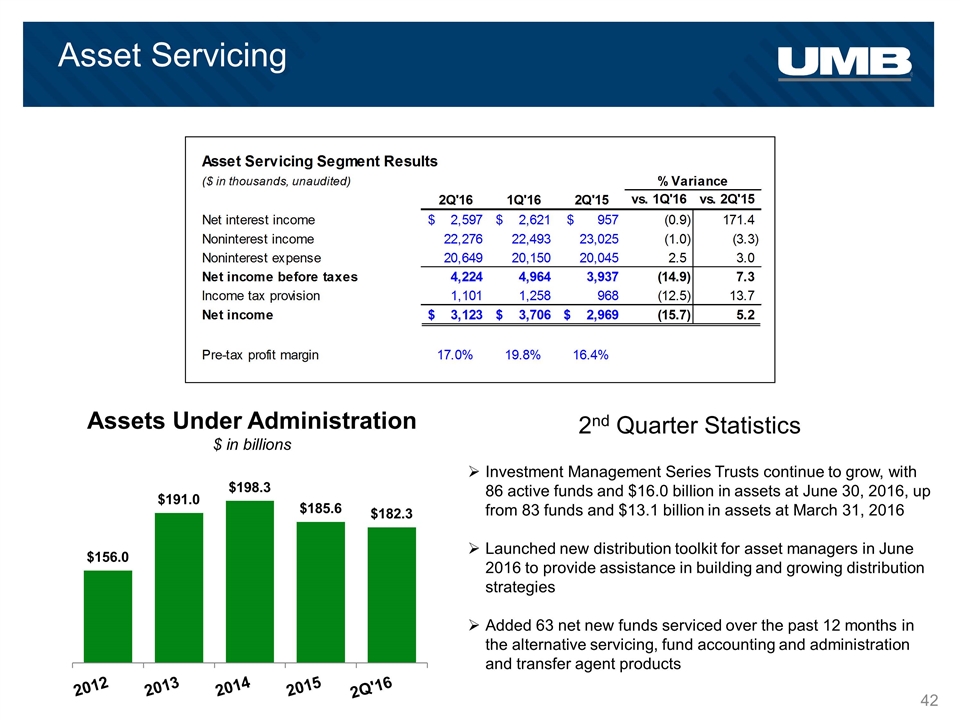
Asset Servicing Assets Under Administration $ in billions Investment Management Series Trusts continue to grow, with 86 active funds and $16.0 billion in assets at June 30, 2016, up from 83 funds and $13.1 billion in assets at March 31, 2016 Launched new distribution toolkit for asset managers in June 2016 to provide assistance in building and growing distribution strategies Added 63 net new funds serviced over the past 12 months in the alternative servicing, fund accounting and administration and transfer agent products 2nd Quarter Statistics
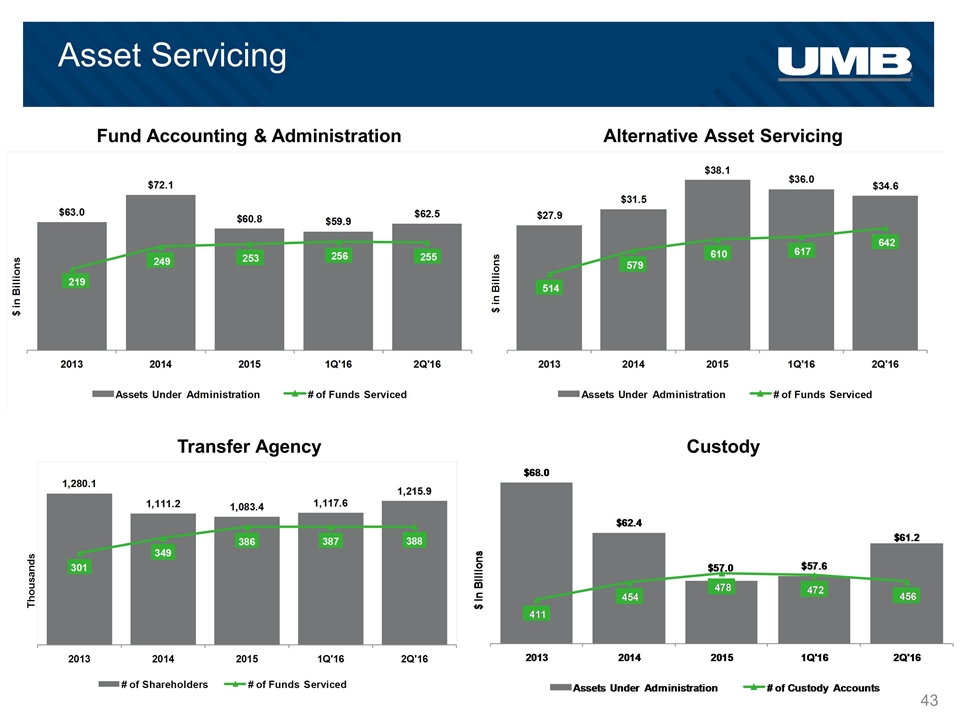
Asset Servicing Fund Accounting & Administration Alternative Asset Servicing Custody Transfer Agency

Appendix
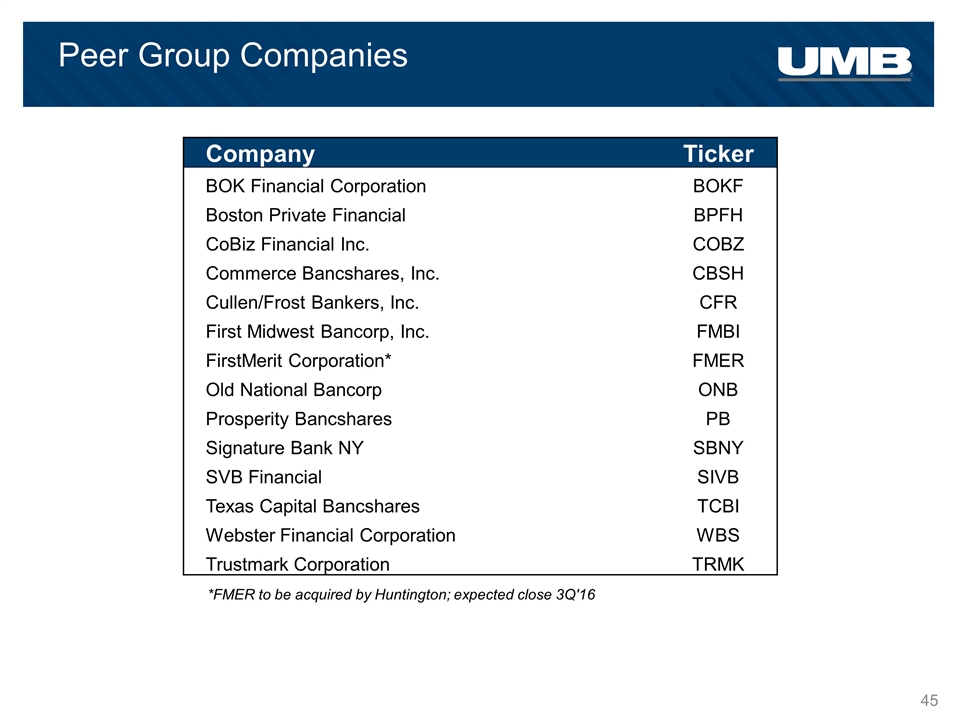
Peer Group Companies Company Ticker BOK Financial Corporation BOKF Boston Private Financial BPFH CoBiz Financial Inc. COBZ Commerce Bancshares, Inc. CBSH Cullen/Frost Bankers, Inc. CFR First Midwest Bancorp, Inc. FMBI FirstMerit Corporation* FMER Old National Bancorp ONB Prosperity Bancshares PB Signature Bank NY SBNY SVB Financial SIVB Texas Capital Bancshares TCBI Webster Financial Corporation WBS Trustmark Corporation TRMK *FMER to be acquired by Huntington; expected close 3Q'16
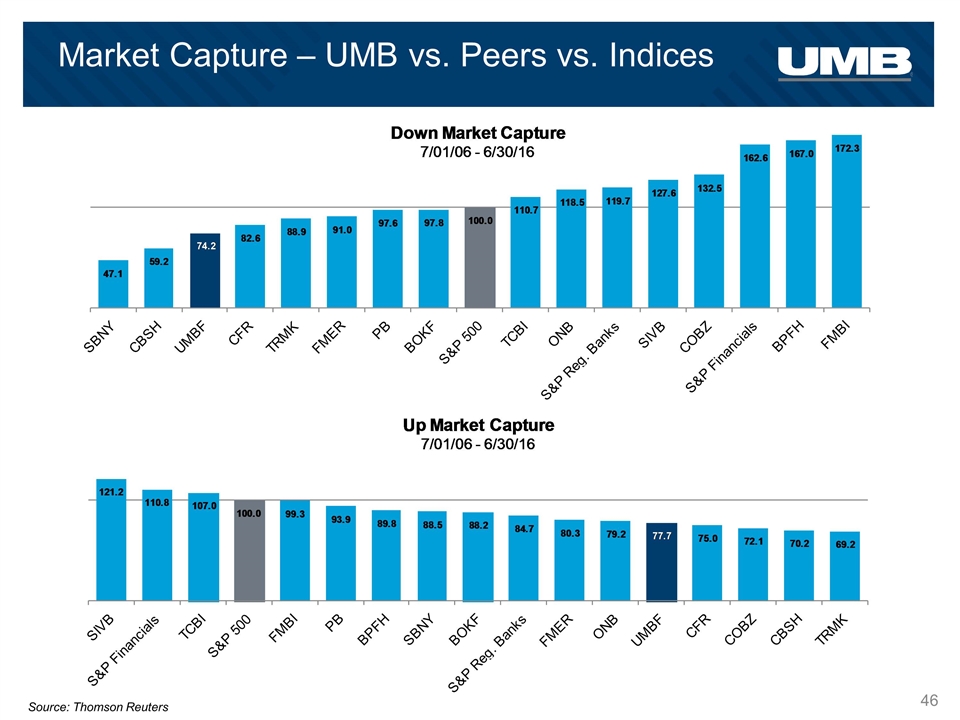
Market Capture – UMB vs. Peers vs. Indices Source: Thomson Reuters
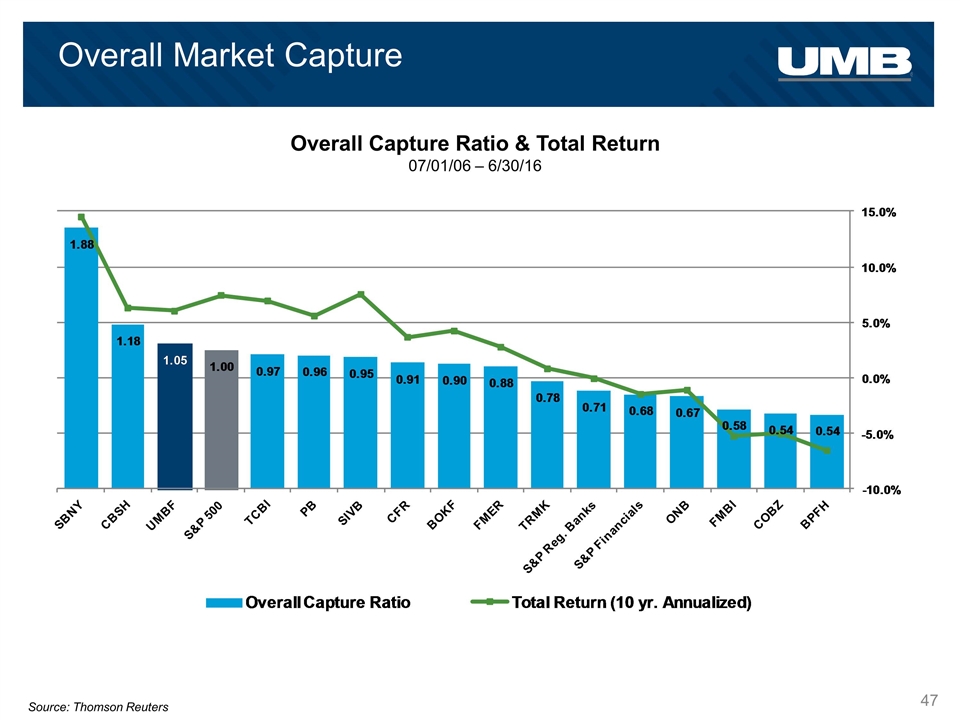
Overall Market Capture Overall Capture Ratio & Total Return 07/01/06 – 6/30/16 Source: Thomson Reuters

UMB Financial Second Quarter 2016


