FORNRG: Executing and Delivering FORNRG driving improved availability through capacity recovery and reduced EFOR Target NRG Classic Operations Target NRG Corporate Target NRG Texas $35 $81 $162 $200 $122 FORNRG EBITDA ($mm) EFOR at Coal Plants 2006 Goal - Ind. Avg: 6.1% 2008 Goal - 1st Quartile: 3.7% Extracting Value Plant 2006 2005 % Improvement Huntley 5.3% 11.7% 55% Dunkirk 7.9% 9.4% 16% Indian River 6.2% 9.2% 33% BC II 3.3% 7.3% 55% Classic NRG YTD EFOR* Plant 2006 2005 % Improvement Parish 2.2% 3.3% 33% Limestone 1.4% 1.4% - STP 0.0% 1.1% nm NRG Texas YTD EFOR* *NRG Texas EFOR does not include de-rate hours in EFOR calculation *YTD through October 2006 |
Commercial Ops: Locking in the Medium Term Hedging Baseload Power 5% 1% 2% 5% 8% 91% 77% 68% 56% 58% 9% 22% 2007 2008 2009 2010 2011 2012 Q3 Hedged Energy New Hedges Open Energy Hedged Fuel 1. Energy position as of 11/22/06; 2006 reflects balance of year revenues and ancillary services. 2. Includes Northeast, South Central and Texas portfolios within the U.S portfolio and excludes Thermal and International. 3. Includes financial gas swaps (reflected in equivalent MWh by taking the volume in MMBtu's and divided by the forward market heat rate in ERCOT). 4. Hedge percentages are subject to change due to market volatility and commodity prices which drive changes in expected generation. 5. Hedged fuel represents weighted average of coal and uranium. Extracting Locking in 2010 - 2012 with flexibility to do more Value as market opportunity permits 2 |
Commercial Ops: Locking in the Medium Term Extracting Locking in 2010 - 2012 with flexibility to do more Value as market opportunity permits 2 Locking in Dark Spread 12/28/2005 3/3/2006 12.00 11/27/2006 10.00 Henry Hub 8.00 $/mmbtu 6.00 4.00 PRB Forward Prices 2.00 12/28/2005 3/3/2006 11/27/2006 - - 2006 2007 2008 2009 2010 2011 |
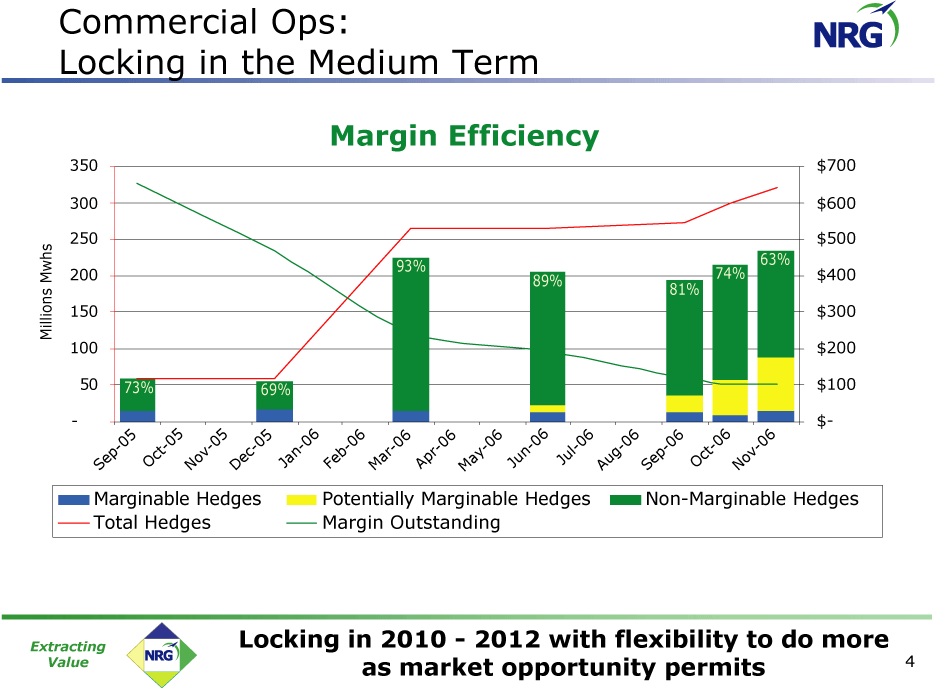
Commercial Ops: Locking in the Medium Term Extracting Locking in 2010 - 2012 with flexibility to do more Value as market opportunity permits 2 - - 50 100 150 200 250 300 350 (S)(e)(p)(-) (0)5 (O)(c) 73% (t)(-) Total Hedges (0)5 (N)(o v)(-) Marginable Hedges (0)5 (D)(e)(c)(-) (0)5 (J) 69% (a)(n) (-)(0)6 (F)(e)(b)(-) (0)6 (M)(a)(r)(-) (0)6 93% (A)(p)(r)(-) (0)6 (M)(a y)(-) (0)6 Margin Outstanding (J)(u n)(-) (0)6 89% (J)(u)(l)(-) Potentially Marginable Hedges (0)6 Margin Efficiency (A)(u g)(-) (0)6 (S)(e)(p)(-) (0)6 81% (O)(c)(t)(-) (0)6 74% (N)(o v)(-) Non-Marginable Hedges (0)6 63% $- $100 $200 $300 $400 $500 $600 $700 |
Commercial Ops: Hedge Profile Sensitivities Reduce NRG’s gross margin exposure to changes in gas price Gas Price Sensitivity Gross margin change ($mm) from $1/mmBtu $ 5 0 0 gas price change $ 4 0 0 432 $ 3 0 0 $ 2 0 0 238 $38 175 $ 10 0 125 56 $ 0 (51) (117) ( $ 10 0 ) (153) (216) (227) ( $ 2 0 0 ) ( $ 3 0 0 ) Pre-Hedge Reset: Rising Gas Prices Pre-Hedge Reset: Falling Gas Prices (432) ( $ 4 0 0 ) Post-Hedge Reset: Rising Gas Prices Post-Hedge Reset: Falling Gas Prices ( $ 5 0 0 ) 2007 2008 2009 2010 2011 2012 Note: Based on current market prices of gas and power and due to the asymmetric payout nature of some of the instruments used for hedging, the losses from a $1/mmBtu downward move in gas for years 2007 to 2011 will be lower relative to an upward move. Mitigating gas risk while preserving Extracting Value long term heat rate upside 3 |
And preserve heat rate upside. Heat Rate Sensitivity Gross margin change ($mm) from 1 mmBtu/Mwh expansion in market heat rate $500 $400 $300 $200 $100 $0 2007 2008 2009 2010 2011 2012 |
Financial: Enhancing Liquidity Oct. 31, June 30, Dec. 31, $ in millions 2006 2006 2005 Unrestricted Cash $ 1,478 $ 957 $ 506 Restricted Cash 71 58 64 Total Cash $ 1,549 $ 1,015 $ 570 LC Capacity $ 1,000 $ 1,000 $ 350 Current use 842 884 312 Availability $ 158 $ 116 $ 38 Revolver Capacity $ 1,000 $ 1,000 $ 150 Non Trade LCs issued 159 154 - Availability $ 841 $ 846 $ 150 Total Liquidity $ 2,548 $ 1,977 $ 758 Note: June and December balances are not restated for discontinued operations Exlcudes impact of November 2006 hedge reset transaction Return Excess Free cash flow continues to drive liquidity Capital to all time highs 7 |